UNITED STATES
SECURITIES AND EXCHANGE COMMISSION
Washington, D.C. 20549
FORM N-CSR
Certified Shareholder Report of
Registered Management Investment Companies
Investment Company Act File Number: 811-05888
SMALLCAP World Fund, Inc.
(Exact Name of Registrant as Specified in Charter)
333 South Hope Street
Los Angeles, California 90071
(Address of Principal Executive Offices)
Registrant's telephone number, including area code: (213) 486-9200
Date of fiscal year end: September 30
Date of reporting period: September 30, 2013
Patrick F. Quan
SMALLCAP World Fund, Inc.
333 South Hope Street
Los Angeles, California 90071
(Name and Address of Agent for Service)
Copies to:
Mark D. Perlow
K&L Gates LLP
Four Embarcadero Center, Suite 1200
San Francisco, California 94111
(Counsel for the Registrant)
ITEM 1 – Reports to Stockholders

Developed economies are
fueling global growth.
Special feature page 4
 | SMALLCAP World Fund® Annual report
for the year ended
September 30, 2013 |
SMALLCAP World Fund seeks long-term growth of capital through investments in smaller companies in the United States and around the world.
This fund is one of more than 40 offered by one of the nation’s largest mutual fund families, American Funds, from Capital Group. For more than 80 years, Capital has invested with a long-term focus based on thorough research and attention to risk.
Fund results shown in this report, unless otherwise indicated, are for Class A shares at net asset value. If a sales charge (maximum 5.75%) had been deducted, the results would have been lower. Results are for past periods and are not predictive of results for future periods. Current and future results may be lower or higher than those shown. Share prices and returns will vary, so investors may lose money. Investing for short periods makes losses more likely. Investments are not FDIC-insured, nor are they deposits of or guaranteed by a bank or any other entity, so they may lose value. For current information and month-end results, visit americanfunds.com.
See page 3 for Class A share results with relevant sales charges deducted. For other share class results, visit americanfunds.com and americanfundsretirement.com.
Investment results assume all distributions are reinvested and reflect applicable fees and expenses. When applicable, investment results reflect fee waivers, without which results would have been lower. Visit americanfunds.com for more information.
Investing outside the United States may be subject to risks, such as currency fluctuations and political instability. These risks may be heightened in connection with investments in developing countries. Investing in small-capitalization stocks can involve greater risk than is customarily associated with investing in stocks of larger, more established companies. Refer to the fund prospectus and the Risk Factors section of this report for more information on these and other risks associated with investing in the fund.

Special feature
Contents
Fellow investors:
Economic activity improved across the globe during SMALLCAP World Fund’s most recent fiscal year, prompting equity rallies in several major markets. In that environment, the fund produced a total return of 26.3% for the 12-month period ended September 30, 2013. This figure assumes the reinvestment of dividends, which totaled 54 cents a share for the fiscal year.
By way of comparison, the MSCI All Country World Small Cap Index, an unmanaged measure of global small-capitalization stocks, saw a total return of 25.0% for the same period. The index does not include management fees or other expenses. The Lipper Global Small-/Mid-Cap Funds Average, the fund’s peer group, returned 24.1%. The fund also surpassed the Lipper peer group measure over five- and 10-year periods, as well as through the lifetime of the fund.
The fund has changed its peer group category from the Lipper Global Small-Cap Funds Average to the Lipper Global Small-/Mid-Cap Funds Average; we feel that the latter category includes funds with investment objectives and strategies more similar to that of SMALLCAP World Fund.
The year in review
The strong equity rallies in markets around the world were spurred on by quantitative easing (QE), a monetary policy deployed by a number of the largest central banks in order to keep interest rates low and, ideally, restore confidence and economic growth. Concerns persist that a variety of economic problems — from a slowdown in developing nations’ growth to a spike in energy prices — could potentially derail the continued economic recovery from the 2008 financial crisis.
The United States has seen a strong equity rally over the past year, though economic growth has remained muted. In the spring, the Federal Reserve began to discuss tapering off QE by cutting back on bond repurchasing, though has backtracked somewhat since. The Fed’s benchmark rate remains steady, and it’s likely that stronger, more consistent economic improvement, particularly with regard to unemployment, will be needed before the Fed changes policy.
Europe continued to work through its fiscal and monetary issues, and with fewer headline crises than in past years, though economic growth in many nations remains poor. Peripheral European nations
Results at a glance
For periods ended September 30, 2013, with all distributions reinvested
| | | Cumulative
total returns | | Average annual total returns |
| | | 1 year | | 5 years | | 10 years | | Lifetime
(since 4/30/90) |
| | | | | | | | | | | | | | | | | |
| SMALLCAP World Fund (Class A shares) | | | 26.3 | % | | | 12.3 | % | | | 11.0 | % | | | 9.9 | % |
| MSCI All Country World Small Cap Index* | | | 25.0 | | | | 12.5 | | | | 11.1 | | | | n/a | |
| Lipper Global Small-/Mid-Cap Funds Average | | | 24.1 | | | | 10.9 | | | | 9.7 | | | | 9.7 | |
| * | The market index is unmanaged and, therefore, has no expenses. It is a free float-adjusted market capitalization weighted index that is designed to measure equity market results of smaller capitalization companies in both developed and emerging markets. Results reflect dividends net of withholding taxes. This index was not in existence as of the date the fund began investment operations; therefore, lifetime results are not available. |
endured deflationary and fiscal pressures, brought on by broader euro-zone policies, which will take time to work through. Equities in emerging markets began to sell off somewhat during the year, as the potential for rising rates in the U.S. prompted concerns that the flow of new credit in developing nations would be stemmed. For more on the interplay between developed and emerging markets, we suggest you turn to our special feature, beginning on page 4.
How the fund responded
The equities held by SMALLCAP World Fund originate from 40 different nations around the world. Just over 45% of the fund’s holdings were in U.S. equities, and these provided some of the strongest returns for the fund. The fund’s Japanese holdings, while just 3.9% of the portfolio, were among the strongest contributors as well. The weakest returns — while still positive overall — came from emerging markets.
The fund continues to be broadly diversified across sectors as well as geography. Consumer discretionary stocks, which represented 21% of the portfolio, provided the largest returns, while health care stocks, at 13% of the portfolio, were also strong contributors. The fund’s holdings in the energy sector, representing 5% of the portfolio, detracted from overall returns.
Among individual equities, each of the fund’s top 10 holdings produced positive returns. A number of the top holdings were up substantially including Netflix, which gained 468.0% in market value for the period; top holding ENN Energy Holdings returned 32.0%. Among detractors, Ophir Energy lost 45.0%.
The road ahead
The current market environment reflects a maturing bull market. Investors remain ambivalent about the prospects for stronger economic growth — and perhaps rightly so. This has kept many investors from delving into small-cap stocks more fully. There is, we believe, room for the current bull market to continue.
Of course, short-term projections of economic growth and stock market returns are notoriously difficult to make with a great deal of certainty. Our overwhelming focus remains on building a portfolio of small-cap investments that we believe can deliver robust absolute returns over the medium to long term. While this can be a challenging task in a fast-changing world, we remain convinced that continued change will allow for the creation of small companies that, in our view, could grow into rewarding investments for our shareholders.
It’s worth noting that prices of small-capitalization stocks historically have been more volatile than those of their large-cap counterparts, and this may be the case going forward. That said, and despite the difficult market environments over the past decade, the fund’s returns surpass those of certain large-cap measures, such as the MSCI EAFE (Europe, Australasia, Far East) Index. The fund’s returns have beaten those of the MSCI EAFE over one-, three-, five- and 10-year periods, and over the lifetime of the fund. The fund’s average annual total return has been 11.0% over the past decade, materially ahead of the official rate of inflation.
In closing, we thank you for the confidence you have placed in us; it is an honor and responsibility we take very seriously.
Sincerely,

Jonathan Knowles
Vice Chairman of the Board

Gregory W. Wendt
President
November 8, 2013
For current information about the fund, visit americanfunds.com.
Where are SMALLCAP’s holdings located?
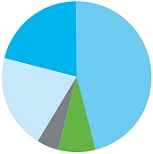
| As of September 30, 2013 | Percent of net assets |
| ▀ | United States | | | 46.3 | % |
| ▀ | Asia & Pacific Basin | | | 20.6 | |
| ▀ | Europe | | | 20.3 | |
| ▀ | Other (including Canada & Latin America) | | | 4.9 | |
| ▀ | Short-term securities & other assets less liabilities | | | 7.9 | |
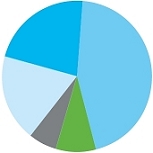
| | As of September 30, 2012 | Percent of
net assets |
| ▀ | United States | | | 44.9 | % |
| ▀ | Asia & Pacific Basin | | | 21.7 | |
| ▀ | Europe | | | 18.6 | |
| ▀ | Other (including Canada & Latin America) | | | 6.3 | |
| ▀ | Short-term securities & other assets less liabilities | | | 8.5 | |
Largest equity holdings
| | Percent of
net assets |
| Netflix | | | 1.5 | % |
| Regeneron Pharmaceuticals | | | 1.4 | |
| Lions Gate Entertainment | | | 1.1 | |
| ENN Energy Holdings | | | 1.0 | |
| AAC Technologies Holdings | | | .9 | |
| Domino’s Pizza | | | .8 | |
| Tesla | | | .8 | |
| DSW | | | .8 | |
| ASOS | | | .7 | |
| Incyte | | | .7 | |
The value of a long-term perspective
This chart shows how a $10,000 investment in SMALLCAP World Fund’s Class A shares grew from April 30, 1990 — the fund’s inception — through September 30, 2013, the end of the fund’s latest fiscal year. As you can see, the $10,000 would have grown to $86,795 even after deducting the maximum 5.75% sales charge.
Fund results shown reflect deduction of the maximum sales charge of 5.75% on the $10,000 investment.1 Thus, the net amount invested was $9,425.
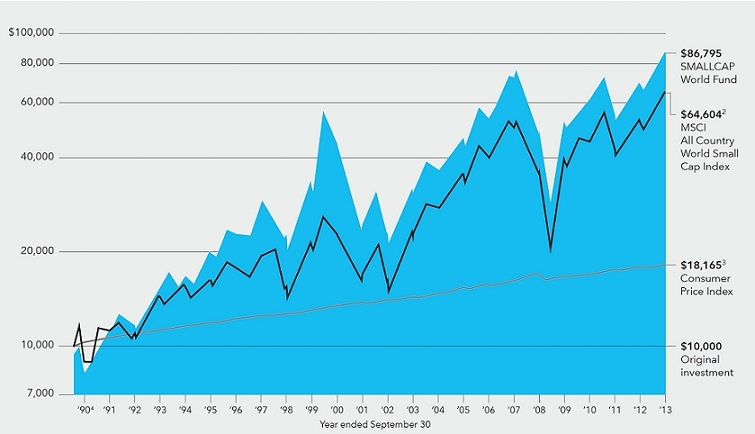
Past results are not predictive of results for future periods. The results shown are before taxes on fund distributions and sale of fund shares.
| 1 | As outlined in the prospectus, the sales charge is reduced for accounts (and aggregated investments) of $25,000 or more and is eliminated for purchases of $1 million or more. There is no sales charge on dividends or capital gain distributions that are reinvested in additional shares. |
| 2 | The MSCI All Country World Small Cap Index is unmanaged and, therefore, has no expenses. Results reflect dividends net of withholding taxes. Because the index was not in existence at the time of the fund’s inception, cumulative returns through May 1994 reflect the returns of the S&P Developed <$1.2 Billion Index. |
| 3 | Computed from data supplied by the U.S. Department of Labor, Bureau of Labor Statistics. |
| 4 | For the period April 30, 1990 (when the fund began operations) through September 30, 1990. |
Average annual total returns based on a $1,000 investment (for periods ended September 30, 2013)*
| | | 1 year | | 5 years | | 10 years |
| | | | | | | |
| Class A shares | | 19.01% | | 10.93% | | 10.32% |
*Assumes reinvestment of all distributions and payment of the maximum 5.75% sales charge.
The total annual fund operating expense ratio is 1.13% for Class A shares as of the prospectus dated December 1, 2013 (unaudited).
Investment results assume all distributions are reinvested and reflect applicable fees and expenses. When applicable, investment results reflect fee waivers, without which results would have been lower. Visit americanfunds.com for more information.

Developed economies are fueling global growth.
Developed economies are showing better growth compared to emerging markets. But regardless of economic cycles, developed economies played host to some of the most influential, innovative companies in the world.
For more than a decade, investors in small-capitalization stocks have looked to emerging markets for new, high-growth companies — and with great success. Such companies have been, and will continue to be, a staple of SMALLCAP World Fund. Yet with economic growth slowing in many developing nations, it’s the companies from the developed world — the U.S. and Japan in particular — that have thrived.
“The benefits of going global are clear, and you can see it in the long-term results of this fund,” says portfolio manager Greg Wendt, “but right now, equities from developed markets have done particularly well, and we’ve been able to take advantage of that because we continued to do our research.”
“To be clear, economic growth doesn’t always correlate well to stock market returns, but what we’re seeing in the developed world is encouraging,” says portfolio manager Jonathan Knowles. “Really, those areas of the world always have been home to those really great, really ‘disruptive’ companies that not only can grow, but can change the world by creating new markets and, in essence, changing the way people do things.”
A Japanese renaissance?
Second acts have become almost commonplace in American politics, but remain very rare in Japan. Yet Shinzo Abe, Japan’s prime minster, returned to power last year in a convincing vote, one that gave him a mandate to try to lift Japan out of two decades of economic malaise. And he’s taking major, sometimes controversial, steps to do it.
“For years, you had companies dealing with little-to-no growth and a strong currency that harmed exports. Out of that, you ended up with some highly efficient companies,” says portfolio manager Blair Frank. “If you spur the economy and weaken the currency, those companies could see huge amounts of growth without really having to do a lot.”
The success of Abe’s “three-arrow” policy — monetary stimulus, more government spending and regulatory reform to encourage investment —remains to be seen, but already there’s been a sense of confidence in Japan not seen in years. “Up until a few weeks ago, I had my doubts, but I went to Japan and talked with a lot of companies there,” says portfolio manager Brady Enright, who notes the fund has maintained a

consistent presence in Japan for many years. “And time and again, they’re reporting the first signs of improvements, whether it’s an increase in sales or loan volume. It’s different.”
The government’s moves could benefit small companies like fund holding MonotaRO, an online and mail-order distributor of industrial parts. The company exploited a niche in parts distribution — commonly done via catalogs and wholesalers in Japan —by making online ordering easy and promising same- or next-day delivery on large portions of their inventory.
“MonotaRO is a great example of why we need to be doing research all around the world, not just in places that are doing well,” says investment analyst Roz Hongsaranagon. “We actually heard about them from another company, and we found nobody else had done any research on them. We don’t have to rely on a strong Japanese economy with this company, but if the economy does get better, growth could accelerate.”
Disruptive companies at home
Equities from the United States have been a staple of SMALLCAP World Fund for a number of reasons. The U.S. boasts a business-friendly regulatory environment and a highly educated workforce. It also has a history of incubating disruptive companies.
“One of the things I’ve always tried to do is find those acorns that can turn into oaks,” Jonathan says. “Perhaps more than anywhere else, they tend to be in the United States.”
With emerging-market economic growth slowing, the U.S. is on its way to becoming an engine of global growth once more. SMALLCAP’s portfolio managers and investment analysts have identified areas in which the U.S. has excelled recently: cloud computing, “big data,” health-care innovation and energy development.
“You see emerging markets come to the fore now and then, but it’s in the developed world where you see those companies pushing the envelope,” says investment analyst Andraz Razen. “There’s been a network of innovation here for more than 200 years.”
Tesla, for example, was founded by a South African who chose to set up shop in Silicon Valley because of the network of software programmers and innovators there. Andraz believes the big difference

between the electric vehicle maker and its competitors is that it leverages the software know-how in the region to create a more efficient vehicle.
“You see the same story in biotech, where a wave of innovation is occurring. Every month we hear from companies that are developing promising new approaches to treating diseases that historically have been very debilitating or lethal,” Brady adds. “Or in energy, where innovation around shale and fracking are altering the world’s supply-and-demand balance for fossil fuels. The rest of the world remains three to five years behind the United States. These are the disruptors, the ones who can start with a clean sheet of paper and do something different without a legacy business to worry about.”
Europe in recovery
Economic growth in Europe remains stymied as the euro zone recovers from not only the global economic recession but also the banking crises there. Yet as with Japan, the fund’s research efforts have spanned many economic cycles. And there are glimmers of optimism.
“Certainly, the economies in Europe have been through a lot, but many of them have also done the right things to come out of it,” Jonathan says. “Take a look at Ireland. They’ve bottomed out and done the right things, cut their imports, cut their pay. And now they have a current-account surplus, they’re saving again and they’ve rebalanced their economy.
Even in Spain, with such high unemployment, they’re recapitalizing the banks and starting to turn a corner.”
And even in the midst of tough times, there are small-capitalization companies that have made their mark. In the United Kingdom, online fashion retailer ASOS has gathered numerous brands alongside its own house label and paired it with free shipping. The company, whose initials stand for “As Seen On Screen,” specializes in finding or duplicating trends depicted in the media. The company has expanded from the U.K. to the U.S., Australia and elsewhere.
“I first met with ASOS in the summer of 2008. There weren’t many successful companies around to compare ASOS with, unfortunately. On the contrary,
Finding favor: developed versus emerging market equities
Individual equities, certain industries, even entire geographic regions can come into — or fall out of — favor among equity investors. This chart illustrates the give-and-take between developed economy stocks, as represented by the MSCI World Small Cap Index, and emerging markets equities, as represented by the MSCI Emerging Markets Small Cap Index. While these trends are noteworthy, SMALLCAP World Fund continues to research potential investments throughout the world, in part so that there are portions of the portfolio poised to potentially make gains during different market environments.
| | Source: MSCI |
| | |
| | The market indexes are unmanaged and, therefore, have no expenses. Results for MSCI indexes reflect dividends net of withholding taxes. |
| | |
| * | Based on periods that align with SMALLCAP World Fund’s fiscal year (October 1–September 30). |
I found a lot of unsuccessful ones — but ASOS felt very different. I was struck by the strength and professionalism of its management team, who built the company on solid foundations — sophisticated supply chain and IT systems, for example —and with several years of experience at running successful fashion bricks and mortar companies,” says investment analyst Lara Pellini. “They have a very strong proprietary brand which accounts for 55% of group sales, and also a very broad product offering. They offer free shipping to 241 countries from their distribution center in the U.K. They have eight local language websites, with 65% of their sales now coming outside of the U.K.”
A global focus
Regardless of the current market environment, the fund continues to look across the globe — in developed and emerging markets alike — for potential equity investments. Indeed, as Roz pointed out, it’s because of the fund’s global research that many of today’s top holdings were uncovered in the first place.
Thus, the fund continues to look at companies in emerging markets, and will do so in the future. Many developing countries enjoyed prosperity while the U.S. kept its interest rates low; those rates are essentially global lending benchmarks, and much of the cheap capital that resulted ended up in emerging markets.
With the U.S. looking to tighten its monetary policy in the months ahead, capital is now flowing back to the developed world.
“These things can go back and forth,” Greg says. “That’s why we have people all over the world covering markets through thick and thin. Right now, somebody’s out there in an emerging market meeting with a great company. And we’re going to take a look at it no matter where it is.” n
Summary investment portfolio September 30, 2013
| Industry sector diversification | Percent of net assets |
| Country diversification | | Percent of
net assets |
| United States | | | 46.3 | % |
| United Kingdom | | | 8.9 | |
| Euro zone* | | | 7.5 | |
| Japan | | | 3.9 | |
| Hong Kong | | | 3.6 | |
| China | | | 3.3 | |
| Canada | | | 2.5 | |
| India | | | 2.1 | |
| Philippines | | | 2.1 | |
| Switzerland | | | 1.5 | |
| Australia | | | 1.4 | |
| Other countries | | | 9.0 | |
| Short-term securities & other assets less liabilities | | | 7.9 | |
| * | Countries using the euro as a common currency; those represented in the fund’s portfolio are Austria, Belgium, Finland, France, Germany, Greece, Ireland, Italy, the Netherlands, Portugal, Slovenia and Spain. |
| Common stocks 91.34% | | Shares | | | Value
(000) | | | Percent
of net
assets | |
| Consumer discretionary 21.45% | | | | | | | | | | | | |
| Netflix, Inc.1 | | | 1,143,723 | | | $ | 353,651 | | | | 1.45 | % |
| Internet subscription service for watching TV shows and movies. | | | | | | | | | | | | |
| Lions Gate Entertainment Corp.1,2 | | | 7,381,000 | | | | 258,704 | | | | 1.06 | |
| Independent motion picture and television producer and distributor. | | | | | | | | | | | | |
| Domino’s Pizza, Inc.2 | | | 2,940,000 | | | | 199,773 | | | | .82 | |
| Major global pizza delivery chain. | | | | | | | | | | | | |
| Tesla Motors, Inc.1 | | | 1,006,663 | | | | 194,709 | | | | .80 | |
| Manufacturer of electric cars and components. | | | | | | | | | | | | |
| DSW Inc., Class A | | | 2,246,500 | | | | 191,671 | | | | .78 | |
| U.S.-based retailer of footwear and accessories. | | | | | | | | | | | | |
| ASOS PLC1 | | | 2,174,955 | | | | 181,016 | | | | .74 | |
| Global online fashion and beauty retailer. | | | | | | | | | | | | |
| Paddy Power PLC | | | 1,967,177 | | | | 157,682 | | | | .64 | |
| Betting and gaming company operating primarily in the U.K., Ireland and Australia. | | | | | | | | | | | | |
| Melco International Development Ltd. | | | 58,168,000 | | | | 155,997 | | | | .64 | |
| Engaged in the leisure and entertainment business in Hong Kong, Macau, China and the Philippines. | | | | | | | | | | | | |
| TOD’S SpA | | | 744,000 | | | | 139,504 | | | | .57 | |
| Italian manufacturer of shoes, leather goods and accessories, and apparel. | | | | | | | | | | | | |
| Mr Price Group Ltd. | | | 8,228,383 | | | | 113,957 | | | | .47 | |
| Retail distribution chain based in South Africa. | | | | | | | | | | | | |
| Five Below, Inc.1 | | | 2,584,833 | | | | 113,086 | | | | .46 | |
| Operates as a specialty value retailer throughout the U.S. | | | | | | | | | | | | |
| Melco Crown Entertainment Ltd. (ADR)1 | | | 3,350,000 | | | | 106,631 | | | | .44 | |
| Casino gaming and resort operator based in Macau. | | | | | | | | | | | | |
| Dollarama Inc. | | | 1,155,000 | | | | 93,864 | | | | .38 | |
| Dollar store operator in Canada. | | | | | | | | | | | | |
| Ted Baker PLC2 | | | 2,882,993 | | | | 89,472 | | | | .36 | |
| British clothing retailer. | | | | | | | | | | | | |
| | | Shares | | | Value
(000) | | | Percent
of net
assets | |
| Chow Sang Sang Holdings International Ltd. | | | 28,609,000 | | | $ | 82,995 | | | | .34 | % |
| Jewelry store operator in China, with additional stores in Hong Kong, Macau and Taiwan. | | | | | | | | | | | | |
| John Wiley & Sons, Inc., Class A | | | 1,681,683 | | | | 80,199 | | | | .33 | |
| Global publisher specializing in academic publishing. | | | | | | | | | | | | |
| Rightmove PLC | | | 2,054,206 | | | | 78,782 | | | | .32 | |
| Operates a residential property website in the U.K. | | | | | | | | | | | | |
| Other securities | | | | | | | 2,651,711 | | | | 10.85 | |
| | | | | | | | 5,243,404 | | | | 21.45 | |
| | | | | | | | | | | | | |
| Health care 13.44% | | | | | | | | | | | | |
| Regeneron Pharmaceuticals, Inc.1 | | | 1,064,020 | | | | 332,900 | | | | 1.36 | |
| Biotechnology company focused on the treatment of serious medical conditions. | | | | | | | | | | | | |
| Incyte Corp.1 | | | 4,445,600 | | | | 169,600 | | | | .69 | |
| Biotechnology company focused on developing small molecule drugs for oncology and inflammation. | | | | | | | | | | | | |
| Synageva BioPharma Corp.1,2 | | | 2,230,074 | | | | 141,186 | | | | .58 | |
| Clinical stage biopharmaceutical company focused on life-threatening rare diseases and unmet medical needs. | | | | | | | | | | | | |
| Pharmacyclics, Inc.1 | | | 894,556 | | | | 123,824 | | | | .51 | |
| Biopharmaceutical company focused on the treatment of cancer and immune-mediated diseases. | | | | | | | | | | | | |
| Molina Healthcare, Inc.1,2 | | | 3,417,000 | | | | 121,645 | | | | .50 | |
| Managed care organization focused on Medicaid-related solutions for low-income families and individuals. | | | | | | | | | | | | |
| athenahealth, Inc.1 | | | 950,221 | | | | 103,156 | | | | .42 | |
| Provider of health care business and clinical services for physician practices. | | | | | | | | | | | | |
| BioMarin Pharmaceutical Inc.1 | | | 1,422,500 | | | | 102,733 | | | | .42 | |
| Biotechnology company engaged in the treatment of serious diseases and medical conditions. | | | | | | | | | | | | |
| Hikma Pharmaceuticals PLC | | | 5,814,153 | | | | 97,890 | | | | .40 | |
| Multinational pharmaceutical company based in the U.K. | | | | | | | | | | | | |
| Sysmex Corp. | | | 1,470,000 | | | | 93,618 | | | | .38 | |
| Japan-based manufacturer of medical laboratory testing equipment. | | | | | | | | | | | | |
| ArthroCare Corp.1,2 | | | 2,232,950 | | | | 79,448 | | | | .33 | |
| Maker of disposable medical devices for minimally invasive surgical procedures. | | | | | | | | | | | | |
| Endo Health Solutions Inc.1 | | | 1,745,100 | | | | 79,297 | | | | .33 | |
| Specialty health care solutions company focused on pain management. | | | | | | | | | | | | |
| Other securities | | | | | | | 1,838,648 | | | | 7.52 | |
| | | | | | | | 3,283,945 | | | | 13.44 | |
| | | | | | | | | | | | | |
| Industrials 11.98% | | | | | | | | | | | | |
| Moog Inc., Class A1,2 | | | 2,282,800 | | | | 133,932 | | | | .55 | |
| Manufacturer of precision motion control components and systems. | | | | | | | | | | | | |
| ITT Corp. | | | 3,581,621 | | | | 128,759 | | | | .52 | |
| Manufacturer of critical components and customized technology solutions for a variety of industries. | | | | | | | | | | | | |
| Intertek Group PLC | | | 2,225,000 | | | | 119,048 | | | | .49 | |
| Provider of business research, consulting and training to the financial services industry. | | | | | | | | | | | | |
| MonotaRO Co., Ltd.2 | | | 3,348,300 | | | | 97,797 | | | | .40 | |
| Retailer of indirect factory materials to domestic manufacturing companies through mail order. | | | | | | | | | | | | |
| Chart Industries, Inc.1 | | | 768,400 | | | | 94,544 | | | | .39 | |
| Global manufacturer of engineered equipment for cryogenic and heat transfer applications. | | | | | | | | | | | | |
| Common stocks (continued) | | Shares | | | Value
(000) | | | Percent
of net
assets | |
| Industrials (continued) | | | | | | | | | | | | |
| US Airways Group, Inc.1 | | | 4,627,000 | | | $ | 87,728 | | | | .36 | % |
| Air carrier serving the U.S., Canada, Mexico, Europe, the Middle East, the Caribbean, and Central and South America. | | | | | | | | | | | | |
| Other securities | | | | | | | 2,266,912 | | | | 9.27 | |
| | | | | | | | 2,928,720 | | | | 11.98 | |
| | | | | | | | | | | | | |
| Information technology 11.30% | | | | | | | | | | | | |
| AAC Technologies Holdings Inc. | | | 45,727,000 | | | | 207,826 | | | | .85 | |
| China-based manufacturer of miniature acoustic components. | | | | | | | | | | | | |
| Vistaprint NV1,2 | | | 1,860,000 | | | | 105,127 | | | | .43 | |
| Online provider of marketing products and services to micro businesses worldwide. | | | | | | | | | | | | |
| OpenTable, Inc.1,2 | | | 1,490,000 | | | | 104,270 | | | | .43 | |
| Provider of online restaurant reservation solutions. | | | | | | | | | | | | |
| Demandware, Inc.1,2 | | | 2,200,000 | | | | 101,926 | | | | .42 | |
| Provider of on-demand e-commerce solutions. | | | | | | | | | | | | |
| ASM International NV | | | 2,798,000 | | | | 97,281 | | | | .40 | |
| Makes machinery used in semiconductor assembly, packaging and testing. | | | | | | | | | | | | |
| Concur Technologies, Inc.1 | | | 858,869 | | | | 94,905 | | | | .39 | |
| Provider of integrated travel and expense management solutions. | | | | | | | | | | | | |
| National Instruments Corp. | | | 2,960,479 | | | | 91,568 | | | | .37 | |
| Develops and manufactures hardware and software for test and measurement instrumentation. | | | | | | | | | | | | |
| Other securities | | | | | | | 1,957,411 | | | | 8.01 | |
| | | | | | | | 2,760,314 | | | | 11.30 | |
| | | | | | | | | | | | | |
| Financials 8.93% | | | | | | | | | | | | |
| Financial Engines, Inc. | | | 2,335,000 | | | | 138,792 | | | | .57 | |
| Investment advisory firm focused on portfolio management, investment advice and retirement income services. | | | | | | | | | | | | |
| SVB Financial Group1 | | | 1,355,900 | | | | 117,109 | | | | .48 | |
| Financial services provider for companies in the technology, life science, venture capital, private equity and premium wine markets. | | | | | | | | | | | | |
| Ocwen Financial Corp.1 | | | 1,900,000 | | | | 105,963 | | | | .43 | |
| Engaged in the servicing and origination of residential and commercial mortgage loans. | | | | | | | | | | | | |
| GT Capital Holdings, Inc. | | | 5,852,200 | | | | 102,151 | | | | .42 | |
| Investment holding company engaged in banking, real estate development, power generation, and automotive and life insurance. | | | | | | | | | | | | |
| Onex Corp. | | | 1,855,700 | | | | 97,465 | | | | .40 | |
| Private equity investment company based in Canada. | | | | | | | | | | | | |
| Validus Holdings, Ltd. | | | 2,495,000 | | | | 92,265 | | | | .38 | |
| Provides insurance and reinsurance coverage in the property, marine and specialty lines markets. | | | | | | | | | | | | |
| Other securities | | | | | | | 1,528,402 | | | | 6.25 | |
| | | | | | | | 2,182,147 | | | | 8.93 | |
| | | | | | | | | | | | | |
| Consumer staples 5.43% | | | | | | | | | | | | |
| Super Group Ltd.2 | | | 44,597,000 | | | | 150,724 | | | | .62 | |
| Singapore-based manufacturer of food and beverage products. | | | | | | | | | | | | |
| Puregold Price Club, Inc.2 | | | 149,636,300 | | | | 143,313 | | | | .58 | |
| Operates wholesale and retail stores, including supermarkets. | | | | | | | | | | | | |
| PZ Cussons PLC | | | 14,102,300 | | | | 94,494 | | | | .39 | |
| Develops and manufactures personal health care products and consumer goods. | | | | | | | | | | | | |
| Other securities | | | | | | | 939,140 | | | | 3.84 | |
| | | | | | | | 1,327,671 | | | | 5.43 | |
| | | Shares | | | Value
(000) | | | Percent
of net
assets | |
| Energy 5.19% | | | | | | | | | | | | |
| Ophir Energy PLC1,2 | | | 30,708,378 | | | $ | 165,945 | | | | .68 | % |
| Oil and gas exploration company with assets in Africa. | | | | | | | | | | | | |
| InterOil Corp.1 | | | 2,129,500 | | | | 151,855 | | | | .62 | |
| Engaged in the exploration and development of oil and natural gas properties in Papua New Guinea. | | | | | | | | | | | | |
| Other securities | | | | | | | 949,570 | | | | 3.89 | |
| | | | | | | | 1,267,370 | | | | 5.19 | |
| | | | | | | | | | | | | |
| Materials 5.14% | | | | | | | | | | | | |
| Chr. Hansen Holding A/S | | | 3,426,000 | | | | 121,303 | | | | .50 | |
| Denmark-based manufacturer of food cultures and colorings, probiotics, phytonutrients and enzymes for the food, pharmaceutical, nutritional and agricultural industries. | | | | | | | | | | | | |
| AptarGroup, Inc. | | | 1,832,591 | | | | 110,194 | | | | .45 | |
| Manufacturer of dispensing systems for fragrances, pharmaceuticals and personal care products. | | | | | | | | | | | | |
| Schweitzer-Mauduit International, Inc.2 | | | 1,742,800 | | | | 105,492 | | | | .43 | |
| Manufacturer of reconstituted tobacco products and specialized paper products. | | | | | | | | | | | | |
| James Hardie Industries PLC (CDI) | | | 9,733,929 | | | | 96,983 | | | | .40 | |
| Makes building materials including fiber cement, which is used in siding, walls and roofing. | | | | | | | | | | | | |
| Other securities | | | | | | | 822,494 | | | | 3.36 | |
| | | | | | | | 1,256,466 | | | | 5.14 | |
| | | | | | | | | | | | | |
| Utilities 2.09% | | | | | | | | | | | | |
| ENN Energy Holdings Ltd. | | | 42,058,296 | | | | 233,720 | | | | .95 | |
| China-based operator of gas pipeline infrastructure and a distributor of piped and bottled gas. | | | | | | | | | | | | |
| Other securities | | | | | | | 278,154 | | | | 1.14 | |
| | | | | | | | 511,874 | | | | 2.09 | |
| | | | | | | | | | | | | |
| Telecommunication services 1.43% | | | | | | | | | | | | |
| Telephone and Data Systems, Inc. | | | 2,731,869 | | | | 80,727 | | | | .33 | |
| Provides wireless and local telephone services in the U.S. | | | | | | | | | | | | |
| Other securities | | | | | | | 269,883 | | | | 1.10 | |
| | | | | | | | 350,610 | | | | 1.43 | |
| | | | | | | | | | | | | |
| Miscellaneous 4.96% | | | | | | | | | | | | |
| Other common stocks in initial period of acquisition | | | | | | | 1,212,383 | | | | 4.96 | |
| | | | | | | | | | | | | |
| Total common stocks (cost: $15,135,101,000) | | | | | | | 22,324,904 | | | | 91.34 | |
| | | | | | | | | | | | | |
| Warrants 0.00% | | | | | | | | | | | | |
| Energy 0.00% | | | | | | | | | | | | |
| Other securities | | | | | | | — | | | | .00 | |
| | | | | | | | | | | | | |
| Total warrants (cost: $1,125,000) | | | | | | | — | | | | .00 | |
| | | | | | | | | | | | | |
| Convertible securities 0.50% | | | | | | | | | | | | |
| Other 0.50% | | | | | | | | | | | | |
| Other securities | | | | | | | 121,349 | | | | .50 | |
| | | | | | | | | | | | | |
| Total convertible securities (cost: $81,559,000) | | | | | | | 121,349 | | | | .50 | |
| Bonds, notes & other debt instruments 0.30% | | Principal
amount
(000) | | | Value
(000) | | | Percent
of net
assets | |
| U.S. Treasury bonds & notes 0.30% | | | | | | | | | | | | |
| Other securities | | | | | | $ | 72,574 | | | | .30 | % |
| | | | | | | | | | | | | |
| Total bonds, notes & other debt instruments (cost: $72,526,000) | | | | | | | 72,574 | | | | .30 | |
| | | | | | | | | | | | | |
| Short-term securities 8.21% | | | | | | | | | | | | |
Freddie Mac 0.08%–0.16%
due 10/22/2013–5/1/2014 | | $ | 573,800 | | | | 573,714 | | | | 2.35 | |
Fannie Mae 0.13%–0.16%
due 10/1–12/16/2013 | | | 160,200 | | | | 160,196 | | | | .65 | |
Bank of Nova Scotia 0.09%–0.18%
due 12/4/2013–1/24/2014 | | | 146,800 | | | | 146,724 | | | | .60 | |
Nordea Bank AB 0.15%–0.225%
due 11/18/2013–1/3/20143 | | | 125,500 | | | | 125,470 | | | | .51 | |
Federal Home Loan Bank 0.05%–0.13%
due 10/4/2013–3/21/2014 | | | 117,600 | | | | 117,591 | | | | .48 | |
Toronto-Dominion Holdings USA Inc. 0.12%–0.23%
due 10/24/2013–2/24/20143 | | | 101,700 | | | | 101,679 | | | | .42 | |
Sumitomo Mitsui Banking Corp. 0.15%–0.215%
due 10/23–12/5/20133 | | | 97,500 | | | | 97,485 | | | | .40 | |
| Other securities | | | | | | | 684,811 | | | | 2.80 | |
| | | | | | | | | | | | | |
| Total short-term securities (cost: $2,007,485,000) | | | | | | | 2,007,670 | | | | 8.21 | |
| Total investment securities (cost: $17,297,796,000) | | | | | | | 24,526,497 | | | | 100.35 | |
| Other assets less liabilities | | | | | | | (85,824 | ) | | | (.35 | ) |
| | | | | | | | | | | | | |
| Net assets | | | | | | $ | 24,440,673 | | | | 100.00 | % |
This summary investment portfolio is designed to streamline the report and help investors better focus on the fund’s principal holdings. See the inside back cover for details on how to obtain a complete schedule of portfolio holdings.
The descriptions of the companies shown in the summary investment portfolio, which were obtained from published reports and other sources believed to be reliable, are supplemental and are not covered by the Report of Independent Registered Public Accounting Firm.
As permitted by U.S. Securities and Exchange Commission regulations, “Miscellaneous” securities include holdings in their first year of acquisition that have not previously been publicly disclosed.
“Other securities” includes all issues that are not disclosed separately in the summary investment portfolio, including a portion of a security which was pledged as collateral for net losses on unsettled forward currency contracts. The total value of pledged collateral was $349,000, which represented less than .01% of the net assets of the fund.
Forward currency contracts
The fund has entered into forward currency contracts to sell currencies as shown in the following table. The average notional amount of open forward currency contracts was $165,919,000 over the prior 12-month period.
| | | | | | | | | | | Unrealized | |
| | | | | | | | | | | appreciation | |
| | | | | | | Contract amount | | (depreciation) | |
| | | | | | | Receive | | Deliver | | at 9/30/2013 | |
| | | Settlement date | | Counterparty | | (000) | | (000) | | (000) | |
| Sales: | | | | | | | | | | | | |
| Australian dollars | | 10/21/2013 | | Barclays Bank PLC | | $9,148 | | A$9,800 | | | $ 19 | |
| Australian dollars | | 10/24/2013 | | UBS AG | | $3,756 | | A$4,000 | | | 31 | |
| British pounds | | 11/1/2013 | | UBS AG | | $185,541 | | £115,100 | | | (743 | ) |
| Euros | | 10/25/2013 | | HSBC Bank | | $9,253 | | €6,950 | | | (150 | ) |
| Japanese yen | | 10/10/2013 | | Bank of New York Mellon | | $35,644 | | ¥3,550,000 | | | (474 | ) |
| Japanese yen | | 10/11/2013 | | Barclays Bank PLC | | $32,554 | | ¥3,242,712 | | | (438 | ) |
| Japanese yen | | 10/21/2013 | | Bank of New York Mellon | | $8,842 | | ¥875,000 | | | (61 | ) |
| Japanese yen | | 10/24/2013 | | Bank of New York Mellon | | $20,026 | | ¥1,990,000 | | | (222 | ) |
| | | | | | | | | | | | | |
| | | | | | | | | | | | $(2,038 | ) |
Investments in affiliates
A company is considered to be an affiliate of the fund under the Investment Company Act of 1940 if the fund’s holdings in that company represent 5% or more of the outstanding voting shares. The value of the fund’s holdings in affiliated companies is included in “Other securities” under the respective industry sectors in the summary investment portfolio. Further details on these holdings and related transactions during the year ended September 30, 2013, appear below.
| | | Beginning
shares or
principal
amount | | | Additions | | | Reductions | | | Ending
shares or
principal
amount | | | Dividend
or interest
income
(000) | | | Value of
affiliates at
9/30/2013
(000) | |
| Lions Gate Entertainment Corp.1 | | | 8,000,000 | | | | 106,121 | | | | 725,121 | | | | 7,381,000 | | | $ | — | | | $ | 258,704 | |
| Domino’s Pizza, Inc. | | | 850,000 | | | | 2,090,000 | | | | — | | | | 2,940,000 | | | | 1,399 | | | | 199,773 | |
| Ophir Energy PLC1 | | | 16,717,585 | | | | 18,443,083 | | | | 4,452,290 | | | | 30,708,378 | | | | — | | | | 165,945 | |
| Super Group Ltd. | | | 44,597,000 | | | | — | | | | — | | | | 44,597,000 | | | | 2,549 | | | | 150,724 | |
| Puregold Price Club, Inc. | | | 87,206,000 | | | | 72,127,500 | | | | 9,697,200 | | | | 149,636,300 | | | | 316 | | | | 143,313 | |
| Synageva BioPharma Corp.1 | | | 1,570,000 | | | | 690,074 | | | | 30,000 | | | | 2,230,074 | | | | — | | | | 141,186 | |
| Moog Inc., Class A1 | | | 1,192,800 | | | | 1,090,000 | | | | — | | | | 2,282,800 | | | | — | | | | 133,932 | |
| Molina Healthcare, Inc.1 | | | 1,850,000 | | | | 1,567,000 | | | | — | | | | 3,417,000 | | | | — | | | | 121,645 | |
| Schweitzer-Mauduit International, Inc. | | | 2,370,000 | | | | 112,800 | | | | 740,000 | | | | 1,742,800 | | | | 2,415 | | | | 105,492 | |
| Vistaprint NV1 | | | 2,050,000 | | | | — | | | | 190,000 | | | | 1,860,000 | | | | — | | | | 105,127 | |
| OpenTable, Inc.1 | | | 1,290,000 | | | | 200,000 | | | | — | | | | 1,490,000 | | | | — | | | | 104,270 | |
| Demandware, Inc.1,4 | | | 507,171 | | | | 1,692,829 | | | | — | | | | 2,200,000 | | | | — | | | | 101,926 | |
| MonotaRO Co., Ltd. | | | 1,006,500 | | | | 2,341,800 | | | | — | | | | 3,348,300 | | | | 282 | | | | 97,797 | |
| Ted Baker PLC | | | — | | | | 2,882,993 | | | | — | | | | 2,882,993 | | | | 360 | | | | 89,472 | |
| ArthroCare Corp.1 | | | 1,809,802 | | | | 423,148 | | | | — | | | | 2,232,950 | | | | — | | | | 79,448 | |
| Coupons.com Inc., Series B, convertible preferred1,5,6 | | | 8,191,724 | | | | — | | | | — | | | | 8,191,724 | | | | — | | | | 77,657 | |
| Northgate PLC | | | 10,626,805 | | | | — | | | | — | | | | 10,626,805 | | | | 1,208 | | | | 73,976 | |
| Manila Water Co., Inc. | | | 81,300,900 | | | | 22,900,000 | | | | — | | | | 104,200,900 | | | | 1,081 | | | | 67,608 | |
| OM Group, Inc.1 | | | — | | | | 1,820,000 | | | | — | | | | 1,820,000 | | | | — | | | | 61,480 | |
| Domino’s Pizza Enterprises Ltd. | | | 3,602,300 | | | | 1,550,065 | | | | 400,000 | | | | 4,752,365 | | | | 1,268 | | | | 60,473 | |
| Exelixis, Inc.1 | | | 5,962,000 | | | | 3,254,800 | | | | — | | | | 9,216,800 | | | | — | | | | 53,642 | |
| Emeritus Corp.1 | | | 2,730,000 | | | | — | | | | 300 | | | | 2,729,700 | | | | — | | | | 50,581 | |
| Galapagos NV1 | | | 1,554,436 | | | | 1,574,492 | | | | 750,000 | | | | 2,378,928 | | | | — | | | | 50,206 | |
| Responsys, Inc.1 | | | — | | | | 2,815,000 | | | | — | | | | 2,815,000 | | | | — | | | | 46,447 | |
| Autoneum Holding AG | | | 373,780 | | | | — | | | | — | | | | 373,780 | | | | 261 | | | | 44,886 | |
| LSL Property Services PLC | | | — | | | | 5,956,350 | | | | — | | | | 5,956,350 | | | | — | | | | 44,670 | |
| bluebird bio, Inc.1,5,6 | | | — | | | | 1,179,648 | | | | — | | | | 1,179,648 | | | | — | | | | 28,623 | |
| bluebird bio, Inc.1 | | | — | | | | 516,000 | | | | — | | | | 516,000 | | | | — | | | | 13,911 | |
| bluebird bio, Inc., Series D, convertible preferred7 | | | 22,374,386 | | | | — | | | | 22,374,386 | | | | — | | | | — | | | | — | |
| Goodpack Ltd. | | | 30,060,000 | | | | 5,272,000 | | | | 4,555,000 | | | | 30,777,000 | | | | 1,227 | | | | 42,441 | |
| Goodpack Ltd., warrants, expire 20127 | | | 5,272,000 | | | | — | | | | 5,272,000 | | | | — | | | | — | | | | — | |
| Comfort Systems USA, Inc. | | | 2,476,000 | | | | — | | | | — | | | | 2,476,000 | | | | 508 | | | | 41,621 | |
| Orexigen Therapeutics, Inc.1,4 | | | 894,900 | | | | 5,640,100 | | | | — | | | | 6,535,000 | | | | — | | | | 40,125 | |
| Kingdee International Software Group Co. Ltd.1 | | | 123,194,000 | | | | 11,674,000 | | | | — | | | | 134,868,000 | | | | — | | | | 38,778 | |
| Iridium Communications Inc.1 | | | 4,206,609 | | | | 1,003,391 | | | | 488,188 | | | | 4,721,812 | | | | — | | | | 32,486 | |
| Iridium Communications Inc., Series A, convertible preferred3 | | | 60,000 | | | | — | | | | — | | | | 60,000 | | | | 400 | | | | 5,979 | |
| KEYW Holding Corp.1,4 | | | 1,613,500 | | | | 1,222,900 | | | | — | | | | 2,836,400 | | | | — | | | | 38,150 | |
| Cadence Pharmaceuticals, Inc.1 | | | 6,130,469 | | | | — | | | | 190,500 | | | | 5,939,969 | | | | — | | | | 37,481 | |
| | | Beginning
shares or
principal
amount | | | Additions | | | Reductions | | | Ending
shares or
principal
amount | | | Dividend
or interest
income
(000) | | | Value of
affiliates at
9/30/2013
(000) | |
| Mistras Group, Inc.1 | | | — | | | | 2,052,000 | | | | — | | | | 2,052,000 | | | $ | — | | | $ | 34,884 | |
| Bizim Toptan Satis Magazalari AS, non-registered shares | | | 1,720,474 | | | | 1,581,500 | | | | 835,974 | | | | 2,466,000 | | | | 298 | | | | 31,862 | |
| Tsukui Corp. | | | — | | | | 2,595,000 | | | | — | | | | 2,595,000 | | | | 150 | | | | 31,575 | |
| Boer Power Holdings Ltd. | | | 31,753,000 | | | | 7,449,000 | | | | — | | | | 39,202,000 | | | | 491 | | | | 29,063 | |
| Mothercare PLC1 | | | 4,480,000 | | | | — | | | | — | | | | 4,480,000 | | | | — | | | | 27,343 | |
| AIA Engineering Ltd. | | | 2,915,050 | | | | 1,925,000 | | | | — | | | | 4,840,050 | | | | 318 | | | | 24,299 | |
| Orthofix International NV1 | | | 1,110,100 | | | | 50,000 | | | | 43,274 | | | | 1,116,826 | | | | — | | | | 23,297 | |
| Houston Wire & Cable Co. | | | 1,678,900 | | | | — | | | | — | | | | 1,678,900 | | | | 672 | | | | 22,615 | |
| Frigoglass SAIC1 | | | 3,052,380 | | | | — | | | | — | | | | 3,052,380 | | | | — | | | | 22,588 | |
| XenoPort, Inc.1 | | | 2,792,000 | | | | 828,000 | | | | — | | | | 3,620,000 | | | | — | | | | 20,562 | |
| Greenko Group PLC1 | | | 9,144,000 | | | | 604,155 | | | | — | | | | 9,748,155 | | | | — | | | | 19,490 | |
| Suprema Inc.1 | | | — | | | | 868,200 | | | | — | | | | 868,200 | | | | — | | | | 19,268 | |
| Gem Diamonds Ltd.1 | | | 7,350,000 | | | | 400,000 | | | | — | | | | 7,750,000 | | | | — | | | | 18,945 | |
| Home Federal Bancorp, Inc. | | | 1,384,249 | | | | — | | | | — | | | | 1,384,249 | | | | 498 | | | | 17,414 | |
| ChemoCentryx, Inc.1 | | | 668,596 | | | | 2,463,204 | | | | — | | | | 3,131,800 | | | | — | | | | 17,413 | |
| Cox and Kings (India) Ltd. | | | 10,592,000 | | | | — | | | | — | | | | 10,592,000 | | | | 160 | | | | 14,990 | |
| Cox and Kings (India) Ltd. (GDR)5 | | | 330,000 | | | | — | | | | — | | | | 330,000 | | | | 5 | | | | 467 | |
| Agilysys, Inc.1 | | | 520,313 | | | | 760,278 | | | | — | | | | 1,280,591 | | | | — | | | | 15,265 | |
| Mytrah Energy Ltd.1 | | | 7,918,000 | | | | 2,500,000 | | | | — | | | | 10,418,000 | | | | — | | | | 15,095 | |
| ValueVision Media, Inc., Class A1 | | | 3,875,293 | | | | — | | | | 434,532 | | | | 3,440,761 | | | | — | | | | 14,967 | |
| Vocus, Inc.1 | | | — | | | | 1,513,538 | | | | — | | | | 1,513,538 | | | | — | | | | 14,091 | |
| Mahindra Lifespace Developers Ltd. | | | 2,157,380 | | | | — | | | | — | | | | 2,157,380 | | | | 216 | | | | 13,980 | |
| BNK Petroleum Inc.1 | | | 5,763,380 | | | | 5,780,000 | | | | — | | | | 11,543,380 | | | | — | | | | 13,672 | |
| Manappuram Finance Ltd. | | | 50,330,986 | | | | 4,600,000 | | | | — | | | | 54,930,986 | | | | 1,902 | | | | 12,723 | |
| ARC Document Solutions, Inc.1 | | | — | | | | 2,765,764 | | | | — | | | | 2,765,764 | | | | — | | | | 12,695 | |
| Ultragenyx Pharmaceutical Inc., Series B, convertible preferred5,6 | | | — | | | | 2,789,614 | | | | — | | | | 2,789,614 | | | | — | | | | 12,490 | |
| TravelCenters of America LLC1 | | | — | | | | 1,581,250 | | | | — | | | | 1,581,250 | | | | — | | | | 12,413 | |
| First Southern Bancorp, Inc.1,5,6 | | | 1,344,915 | | | | — | | | | — | | | | 1,344,915 | | | | — | | | | 7,155 | |
| First Southern Bancorp, Inc., Series C, convertible preferred1,5,6 | | | 2,299 | | | | — | | | | — | | | | 2,299 | | | | — | | | | 4,759 | |
| Falkland Oil and Gas Ltd.1 | | | 24,225,000 | | | | — | | | | — | | | | 24,225,000 | | | | — | | | | 11,079 | |
| Lekoil Ltd. (CDI)1,3 | | | — | | | | 14,070,000 | | | | — | | | | 14,070,000 | | | | — | | | | 9,709 | |
| Duluth Metals Ltd.1 | | | 4,208,800 | | | | 3,490,900 | | | | — | | | | 7,699,700 | | | | — | | | | 8,821 | |
| Mvelaserve Ltd.1 | | | 9,194,800 | | | | — | | | | — | | | | 9,194,800 | | | | — | | | | 8,224 | |
| Tilaknager Industries Ltd. | | | 8,890,000 | | | | — | | | | — | | | | 8,890,000 | | | | 108 | | | | 8,073 | |
| Tribhovandas Bhimji Zaveri Ltd. | | | — | | | | 3,439,332 | | | | — | | | | 3,439,332 | | | | 127 | | | | 6,859 | |
| Mood Media Corp.1,3 | | | 6,375,000 | | | | — | | | | — | | | | 6,375,000 | | | | — | | | | 4,147 | |
| Mood Media Corp. (CDI)1,3 | | | 3,710,000 | | | | — | | | | — | | | | 3,710,000 | | | | — | | | | 2,413 | |
| Cape Lambert Resources Ltd.1 | | | 32,790,132 | | | | 14,540,693 | | | | — | | | | 47,330,825 | | | | — | | | | 5,740 | |
| Powerland AG, non-registered shares1 | | | 1,200,000 | | | | — | | | | — | | | | 1,200,000 | | | | — | | | | 4,886 | |
| China High Precision Automation Group Ltd.5 | | | 67,422,000 | | | | — | | | | — | | | | 67,422,000 | | | | 174 | | | | 3,477 | |
| Talwalkars Better Value Fitness Ltd. | | | 1,446,000 | | | | 248,000 | | | | — | | | | 1,694,000 | | | | 42 | | | | 3,340 | |
| Petrodorado Energy Ltd.1 | | | 38,400,000 | | | | — | | | | — | | | | 38,400,000 | | | | — | | | | 1,491 | |
| Gran Colombia Gold SA1 | | | 30,175,000 | | | | — | | | | 29,268,300 | | | | 906,700 | | | | — | | | | 1,118 | |
| Gran Colombia Gold SA, warrants, expire 2015 | | | 1,086,500 | | | | — | | | | 1,086,500 | | | | — | | | | — | | | | — | |
| | | Beginning
shares or
principal
amount | | | Additions | | | Reductions | | | Ending
shares or principal
amount | | | Dividend
or interest
income
(000) | | | Value of
affiliates at
9/30/2013
(000) | |
| CEC Unet PLC1,5 | | | 35,100,775 | | | | — | | | | — | | | | 35,100,775 | | | $ | — | | | $ | — | |
| Achillion Pharmaceuticals, Inc.1,7 | | | 3,750,000 | | | | 1,245,000 | | | | 865,000 | | | | 4,130,000 | | | | — | | | | — | |
| Afferro Mining Inc.7 | | | 6,460,000 | | | | — | | | | 6,460,000 | | | | — | | | | — | | | | — | |
| African Petroleum Corp. Ltd.1,7 | | | 93,646,868 | | | | 1,838,153 | | | | 31,250,294 | | | | 64,234,727 | | | | — | | | | — | |
| AVEO Pharmaceuticals, Inc.7 | | | 3,387,200 | | | | 759,800 | | | | 4,147,000 | | | | — | | | | — | | | | — | |
| BG Medicine, Inc.7 | | | 1,418,968 | | | | — | | | | 1,418,968 | | | | — | | | | — | | | | — | |
| Bloomsbury Publishing PLC7 | | | 21,695,000 | | | | — | | | | 21,695,000 | | | | — | | | | 82 | | | | — | |
| BrisConnections Unit Trusts7 | | | 27,290,000 | | | | — | | | | 27,290,000 | | | | — | | | | — | | | | — | |
| CJ CGV Co., Ltd.7 | | | 1,235,000 | | | | — | | | | 1,235,000 | | | | — | | | | 112 | | | | — | |
| Coal of Africa Ltd.1,7 | | | 55,734,459 | | | | 14,100,000 | | | | 18,375,774 | | | | 51,458,685 | | | | — | | | | — | |
| Comstock Resources, Inc.7 | | | 3,078,111 | | | | — | | | | 1,280,000 | | | | 1,798,111 | | | | 450 | | | | — | |
| Cymer, Inc.7 | | | 1,670,000 | | | | 25,000 | | | | 1,695,000 | | | | — | | | | — | | | | — | |
| Delticom AG7 | | | 761,501 | | | | — | | | | 761,501 | | | | — | | | | — | | | | — | |
| Douglas Dynamics, Inc.7 | | | 1,175,000 | | | | — | | | | 1,175,000 | | | | — | | | | 233 | | | | — | |
| EACOM Timber Corp.7 | | | 26,200,000 | | | | — | | | | 26,200,000 | | | | — | | | | — | | | | — | |
| Eastern Platinum Ltd.1,7 | | | 27,281,450 | | | | 37,125,000 | | | | 27,281,450 | | | | 37,125,000 | | | | — | | | | — | |
| Ebix, Inc.7 | | | 1,465,000 | | | | 745,000 | | | | 2,210,000 | | | | — | | | | 211 | | | | — | |
| ENN Energy Holdings Ltd.7 | | | 55,644,296 | | | | — | | | | 13,586,000 | | | | 42,058,296 | | | | 2,404 | | | | — | |
| Ennis, Inc.7 | | | 1,472,589 | | | | — | | | | 422,589 | | | | 1,050,000 | | | | 873 | | | | — | |
| Exponent, Inc.7 | | | 936,400 | | | | — | | | | 320,000 | | | | 616,400 | | | | 277 | | | | — | |
| Greatview Aseptic Packaging Co. Ltd.7 | | | 50,033,000 | | | | 17,900,000 | | | | 22,700,000 | | | | 45,233,000 | | | | 875 | | | | — | |
| Green Packet Bhd7 | | | 34,933,616 | | | | — | | | | 34,933,616 | | | | — | | | | — | | | | — | |
| Hittite Microwave Corp.1,7 | | | 1,794,950 | | | | — | | | | 1,034,000 | | | | 760,950 | | | | — | | | | — | |
| Home Loan Servicing Solutions, Ltd.7 | | | 1,546,400 | | | | 965,000 | | | | 212,400 | | | | 2,299,000 | | | | 3,776 | | | | — | |
| Immersion Corp.1,7 | | | 2,254,000 | | | | — | | | | 894,100 | | | | 1,359,900 | | | | — | | | | — | |
| InterOil Corp.1,7 | | | 2,461,200 | | | | — | | | | 331,700 | | | | 2,129,500 | | | | — | | | | — | |
| Liquidity Services, Inc.1,7 | | | 832,536 | | | | 1,263,667 | | | | 715,803 | | | | 1,380,400 | | | | — | | | | — | |
| MD Medical Group Investments PLC (GDR)5,7 | | | — | | | | 2,582,900 | | | | 84,200 | | | | 2,498,700 | | | | 489 | | | | — | |
| MD Medical Group Investments PLC (GDR)3,5,7 | | | — | | | | 1,179,100 | | | | — | | | | 1,179,100 | | | | — | | | | — | |
| National Financial Partners Corp. 4.00% convertible notes 20177 | | $ | 4,000,000 | | | | — | | | $ | 4,000,000 | | | | — | | | | 76 | | | | — | |
| National Financial Partners Corp.7 | | | 3,174,800 | | | | — | | | | 3,174,800 | | | | — | | | | — | | | | — | |
| NewSat Ltd.1,4,7 | | | 2,086,578 | | | | 12,313,985 | | | | — | | | | 14,400,563 | | | | — | | | | — | |
| NewSat Ltd.1,3,7 | | | — | | | | 12,155,000 | | | | — | | | | 12,155,000 | | | | — | | | | — | |
| NuVasive, Inc.1,7 | | | 2,492,536 | | | | — | | | | 985,100 | | | | 1,507,436 | | | | — | | | | — | |
| Pacific Coal Resources Ltd., warrants, expire 20161,5,7 | | | 8,500,000 | | | | — | | | | 7,285,715 | | | | 1,214,285 | | | | — | | | | — | |
| Pacific Coal Resources Ltd.7 | | | 18,280,000 | | | | — | | | | 18,280,000 | | | | — | | | | — | | | | — | |
| PT Sumber Alfaria Trijaya Tbk7 | | | 219,452,500 | | | | 805,617,000 | | | | 238,702,280 | | | | 786,367,220 | | | | 404 | | | | — | |
| Quantum Corp.7 | | | 13,699,097 | | | | — | | | | 13,699,097 | | | | — | | | | — | | | | — | |
| SPS Commerce, Inc.1,7 | | | 1,051,300 | | | | — | | | | 479,300 | | | | 572,000 | | | | — | | | | — | |
| Standard Parking Corp.7 | | | 1,048,600 | | | | — | | | | 1,048,600 | | | | — | | | | — | | | | — | |
| U.S. Auto Parts Network, Inc.7 | | | 1,980,000 | | | | — | | | | 1,980,000 | | | | — | | | | — | | | | — | |
| Yip’s Chemical Holdings Ltd.7 | | | 27,628,000 | | | | 2,350,000 | | | | 3,090,000 | | | | 26,888,000 | | | | 921 | | | | — | |
| Youku Inc., Class A (ADR)1,7 | | | 1,400,000 | | | | 810,000 | | | | 1,910,000 | | | | 300,000 | | | | — | | | | — | |
| | | | | | | | | | | | | | | | | | | $ | 29,618 | | | $ | 3,554,732 | |
The following footnotes apply to either the individual securities noted or one or more of the securities aggregated and listed as a single line item.
| 1 | Security did not produce income during the last 12 months. |
| 2 | Represents an affiliated company as defined under the Investment Company Act of 1940. |
| 3 | Acquired in a transaction exempt from registration under Rule 144A or section 4(2) of the Securities Act of 1933. May be resold in the U.S. in transactions exempt from registration, normally to qualified institutional buyers. The total value of all such securities, including those in “Other securities,” was $1,051,911,000, which represented 4.30% of the net assets of the fund. |
| 4 | This security was an unaffiliated issuer in its initial period of acquisition at 9/30/2012; it was not publicly disclosed. |
| 5 | Valued under fair value procedures adopted by authority of the board of directors. The total value of all such securities, including those in “Miscellaneous,” was $235,631,000, which represented .96% of the net assets of the fund. |
| 6 | Acquired through a private placement transaction exempt from registration under the Securities Act of 1933. May be subject to legal or contractual restrictions on resale. Further details on these holdings appear below. |
| | | Acquisition
date(s) | | Cost
(000) | | | Value
(000) | | | Percent of
net assets | |
| Coupons.com Inc., Series B, convertible preferred | | 6/1/2011 | | $ | 45,000 | | | $ | 77,657 | | | | .32 | % |
| bluebird bio, Inc. | | 7/20/2012 | | | 11,149 | | | | 28,623 | | | | .12 | |
| Ultragenyx Pharmaceutical Inc., Series B, convertible preferred | | 12/17/2012 | | | 7,726 | | | | 12,490 | | | | .05 | |
| First Southern Bancorp, Inc. | | 12/17/2009 | | | 22,070 | | | | 7,155 | | | | .03 | |
| First Southern Bancorp, Inc., Series C, convertible preferred | | 12/17/2009 | | | — | | | | 4,759 | | | | .02 | |
| Other restricted securities | | 10/5/2005-12/12/2012 | | | 104,275 | | | | 70,076 | | | | .29 | |
| Total restricted securities | | | | $ | 190,220 | | | $ | 200,760 | | | | .83 | % |
| 7 | Unaffiliated issuer at 9/30/2013. |
Key to abbreviations and symbols
ADR = American Depositary Receipts
CDI = CREST Depository Interest
GDR = Global Depositary Receipts
A$ = Australian dollars
€ = Euros
£ = British pounds
¥ = Japanese yen
See Notes to Financial Statements
Financial statements
| Statement of assets and liabilities | | |
| at September 30, 2013 | | (dollars in thousands) |
| | | |
| Assets: | | | | | | | | |
| Investment securities, at value: | | | | | | | | |
| Unaffiliated issuers (cost: $14,371,437) | | $ | 20,971,765 | | | | | |
| Affiliated issuers (cost: $2,926,359) | | | 3,554,732 | | | $ | 24,526,497 | |
| Cash denominated in currencies other than U.S. dollars (cost: $571) | | | | | | | 571 | |
| Cash | | | | | | | 433 | |
| Unrealized appreciation on open forward currency contracts | | | | | | | 50 | |
| Receivables for: | | | | | | | | |
| Sales of investments | | | 71,055 | | | | | |
| Sales of fund’s shares | | | 27,884 | | | | | |
| Dividends and interest | | | 19,898 | | | | 118,837 | |
| | | | | | | | 24,646,388 | |
| Liabilities: | | | | | | | | |
| Unrealized depreciation on open forward currency contracts | | | | | | | 2,088 | |
| Payables for: | | | | | | | | |
| Purchases of investments | | | 123,355 | | | | | |
| Repurchases of fund’s shares | | | 47,117 | | | | | |
| Closed forward currency contracts | | | 7,489 | | | | | |
| Investment advisory services | | | 12,448 | | | | | |
| Services provided by related parties | | | 9,952 | | | | | |
| Directors’ deferred compensation | | | 2,771 | | | | | |
| Other | | | 495 | | | | 203,627 | |
| Net assets at September 30, 2013 | | | | | | $ | 24,440,673 | |
| | | | | | | | | |
| Net assets consist of: | | | | | | | | |
| Capital paid in on shares of capital stock | | | | | | $ | 16,190,107 | |
| Distributions in excess of net investment income | | | | | | | (177,799 | ) |
| Undistributed net realized gain | | | | | | | 1,201,518 | |
| Net unrealized appreciation | | | | | | | 7,226,847 | |
| Net assets at September 30, 2013 | | | | | | $ | 24,440,673 | |
(dollars and shares in thousands, except per-share amounts)
Total authorized capital stock — 1,000,000 shares, $.01 par value
(503,032 total shares outstanding)
| | | Net assets | | | Shares
outstanding | | | Net asset
value per share | |
| Class A | | $ | 16,454,122 | | | | 336,383 | | | $ | 48.91 | |
| Class B | | | 185,139 | | | | 4,019 | | | | 46.06 | |
| Class C | | | 919,983 | | | | 20,202 | | | | 45.54 | |
| Class F-1 | | | 867,994 | | | | 17,892 | | | | 48.51 | |
| Class F-2 | | | 628,977 | | | | 12,827 | | | | 49.03 | |
| Class 529-A | | | 883,701 | | | | 18,186 | | | | 48.59 | |
| Class 529-B | | | 25,467 | | | | 548 | | | | 46.52 | |
| Class 529-C | | | 272,651 | | | | 5,892 | | | | 46.27 | |
| Class 529-E | | | 47,710 | | | | 997 | | | | 47.87 | |
| Class 529-F-1 | | | 73,408 | | | | 1,506 | | | | 48.73 | |
| Class R-1 | | | 41,678 | | | | 895 | | | | 46.56 | |
| Class R-2 | | | 736,561 | | | | 15,821 | | | | 46.56 | |
| Class R-3 | | | 835,737 | | | | 17,487 | | | | 47.79 | |
| Class R-4 | | | 712,107 | | | | 14,655 | | | | 48.59 | |
| Class R-5 | | | 549,736 | | | | 11,115 | | | | 49.46 | |
| Class R-6 | | | 1,205,702 | | | | 24,607 | | | | 49.00 | |
See Notes to Financial Statements
| Statement of operations | | | |
| for the year ended September 30, 2013 | | (dollars in thousands) | |
| | | | |
| Investment income: | | | | | | | | |
| Income: | | | | | | | | |
| Dividends (net of non-U.S. taxes of $13,296; also includes $29,542 from affiliates) | | $ | 271,605 | | | | | |
| Interest (includes $76 from affiliates) | | | 3,474 | | | $ | 275,079 | |
| Fees and expenses*: | | | | | | | | |
| Investment advisory services | | | 136,894 | | | | | |
| Distribution services | | | 62,007 | | | | | |
| Transfer agent services | | | 40,507 | | | | | |
| Administrative services | | | 4,810 | | | | | |
| Reports to shareholders | | | 1,452 | | | | | |
| Registration statement and prospectus | | | 424 | | | | | |
| Directors’ compensation | | | 818 | | | | | |
| Auditing and legal | | | 184 | | | | | |
| Custodian | | | 4,167 | | | | | |
| State and local taxes | | | 118 | | | | | |
| Other | | | 1,288 | | | | 252,669 | |
| Net investment income | | | | | | | 22,410 | |
| | | | | | | | | |
| Net realized gain and unrealized appreciation on investments, forward currency contracts and currency: | | | | | | | | |
| Net realized gain (loss) on: | | | | | | | | |
| Investments (net of non-U.S. taxes of $51; also includes $37,824 net loss from affiliates) | | | 1,826,413 | | | | | |
| Forward currency contracts | | | (8,633 | ) | | | | |
| Currency transactions | | | (6,051 | ) | | | 1,811,729 | |
| Net unrealized appreciation (depreciation) on: | | | | | | | | |
| Investments | | | 3,232,727 | | | | | |
| Forward currency contracts | | | (2,033 | ) | | | | |
| Currency translations | | | 205 | | | | 3,230,899 | |
| Net realized gain and unrealized appreciation on investments, forward currency contracts and currency | | | | | | | 5,042,628 | |
| | | | | | | | | |
| Net increase in net assets resulting from operations | | | | | | $ | 5,065,038 | |
*Additional information related to class-specific fees and expenses is included in the Notes to Financial Statements.
Statements of changes in net assets
(dollars in thousands)
| | | Year ended September 30 | |
| | | 2013 | | | 2012 | |
| Operations: | | | | | | | | |
| Net investment income | | $ | 22,410 | | | $ | 31,013 | |
| Net realized gain on investments, forward currency contracts, and currency transactions | | | 1,811,729 | | | | 680,973 | |
| Net unrealized appreciation on investments, forward currency contracts, and currency translations | | | 3,230,899 | | | | 3,429,858 | |
| Net increase in net assets resulting from operations | | | 5,065,038 | | | | 4,141,844 | |
| | | | | | | | | |
| Dividends paid to shareholders from net investment income | | | (257,779 | ) | | | (53,307 | ) |
| | | | | | | | | |
| Net capital share transactions | | | (27,946 | ) | | | (1,481,164 | ) |
| | | | | | | | | |
| Total increase in net assets | | | 4,779,313 | | | | 2,607,373 | |
| | | | | | | | | |
| Net assets: | | | | | | | | |
| Beginning of year | | | 19,661,360 | | | | 17,053,987 | |
End of year (including distributions in excess of net investment income:
$(177,799) and $(72,885), respectively) | | $ | 24,440,673 | | | $ | 19,661,360 | |
See Notes to Financial Statements
Notes to financial statements
1. Organization
SMALLCAP World Fund, Inc. (the “fund”) is registered under the Investment Company Act of 1940 as an open-end, diversified management investment company. The fund seeks long-term growth of capital through investments in smaller companies in the U.S. and around the world. Shareholders approved a proposal to reorganize the fund from a Maryland corporation to a Delaware statutory trust. The reorganization may be completed in 2013 or 2014; however, the fund reserves the right to delay the implementation.
The fund has 16 share classes consisting of five retail share classes (Classes A, B and C, as well as two F share classes, F-1 and F-2), five 529 college savings plan share classes (Classes 529-A, 529-B, 529-C, 529-E and 529-F-1) and six retirement plan share classes (Classes R-1, R-2, R-3, R-4, R-5 and R-6). The 529 college savings plan share classes can be used to save for college education. The retirement plan share classes are generally offered only through eligible employer-sponsored retirement plans. The fund’s share classes are further described below:
| Share class | | Initial sales
charge | | Contingent deferred sales
charge upon redemption | | Conversion feature | |
| Classes A and 529-A | | Up to 5.75% | | None (except 1% for certain redemptions within one year of purchase without an initial sales charge) | | None | |
| Classes B and 529-B* | | None | | Declines from 5% to 0% for redemptions within six years of purchase | | Classes B and 529-B convert to Classes A and 529-A, respectively, after eight years | |
| Class C | | None | | 1% for redemptions within one year of purchase | | Class C converts to Class F-1 after 10 years | |
| Class 529-C | | None | | 1% for redemptions within one year of purchase | | None | |
| Class 529-E | | None | | None | | None | |
| Classes F-1, F-2 and 529-F-1 | | None | | None | | None | |
| Classes R-1, R-2, R-3, R-4, R-5 and R-6 | | None | | None | | None | |
* Class B and 529-B shares of the fund are not available for purchase.
Holders of all share classes have equal pro rata rights to assets, dividends and liquidation proceeds. Each share class has identical voting rights, except for the exclusive right to vote on matters affecting only its class. Share classes have different fees and expenses (“class-specific fees and expenses”), primarily due to different arrangements for distribution, administrative and shareholder services. Differences in class-specific fees and expenses will result in differences in net investment income and, therefore, the payment of different per-share dividends by each share class.
2. Significant accounting policies
The financial statements have been prepared to comply with accounting principles generally accepted in the United States of America. These principles require management to make estimates and assumptions that affect reported amounts and disclosures. Actual results could differ from those estimates. The fund follows the significant accounting policies described below, as well as the valuation policies described in the next section on valuation.
Security transactions and related investment income — Security transactions are recorded by the fund as of the date the trades are executed with brokers. Realized gains and losses from security transactions are determined based on the specific identified cost of the securities. In the event a security is purchased with a delayed payment date, the fund will segregate liquid assets sufficient to meet its payment obligations. Dividend income is recognized on the ex-dividend date and interest income is recognized on an accrual basis. Market discounts, premiums and original issue discounts on fixed-income securities are amortized daily over the expected life of the security.
Class allocations — Income, fees and expenses (other than class-specific fees and expenses) and realized and unrealized gains and losses are allocated daily among the various share classes based on their relative net assets. Class-specific fees and expenses, such as distribution, administrative and shareholder services, are charged directly to the respective share class.
Dividends and distributions to shareholders — Dividends and distributions to shareholders are recorded on the ex-dividend date.
Currency translation — Assets and liabilities, including investment securities, denominated in currencies other than U.S. dollars are translated into U.S. dollars at the exchange rates supplied by one or more pricing vendors on the valuation date. Purchases and sales of investment securities and income and expenses are translated into U.S. dollars at the exchange rates on the dates of such transactions. On the accompanying financial statements, the effects of changes in exchange rates on investment securities are included with the net realized gain or loss and net unrealized appreciation or depreciation on investments. The realized gain or loss and unrealized appreciation or depreciation resulting from all other transactions denominated in currencies other than U.S. dollars are disclosed separately.
3. Valuation
Capital Research and Management Company (“CRMC”), the fund’s investment adviser, values the fund’s investments at fair value as defined by accounting principles generally accepted in the United States of America. The net asset value of each share class of the fund is generally determined as of approximately 4:00 p.m. New York time each day the New York Stock Exchange is open.
Methods and inputs — The fund’s investment adviser uses the following methods and inputs to establish the fair value of the fund’s assets and liabilities. Use of particular methods and inputs may vary over time based on availability and relevance as market and economic conditions evolve.
Equity securities are generally valued at the official closing price of, or the last reported sale price on, the exchange or market on which such securities are traded, as of the close of business on the day the securities are being valued or, lacking any sales, at the last available bid price. Prices for each security are taken from the principal exchange or market on which the security trades.
Fixed-income securities, including short-term securities purchased with more than 60 days left to maturity, are generally valued at prices obtained from one or more pricing vendors. Vendors value such securities based on one or more of the inputs described in the following table. The table provides examples of inputs that are commonly relevant for valuing particular classes of fixed-income securities in which the fund is authorized to invest. However, these classifications are not exclusive, and any of the inputs may be used to value any other class of fixed-income security.
| Fixed-income class | Examples of standard inputs |
| All | Benchmark yields, transactions, bids, offers, quotations from dealers and trading systems, new issues, spreads and other relationships observed in the markets among comparable securities; and proprietary pricing models such as yield measures calculated using factors such as cash flows, financial or collateral performance and other reference data (collectively referred to as “standard inputs”) |
| Corporate bonds & notes; convertible securities | Standard inputs and underlying equity of the issuer |
| Bonds & notes of governments & government agencies | Standard inputs and interest rate volatilities |
When the fund’s investment adviser deems it appropriate to do so (such as when vendor prices are unavailable or not deemed to be representative), fixed-income securities will be valued in good faith at the mean quoted bid and ask prices that are reasonably and timely available (or bid prices, if ask prices are not available) or at prices for securities of comparable maturity, quality and type.
Securities with both fixed-income and equity characteristics, or equity securities traded principally among fixed-income dealers, are generally valued in the manner described above for either equity or fixed-income securities, depending on which method is deemed most appropriate by the fund’s investment adviser. Short-term securities purchased within 60 days to maturity are valued at amortized cost, which approximates fair value. The value of short-term securities originally purchased with maturities greater than 60 days is determined based on an amortized value to par when they reach 60 days. Forward currency contracts are valued at the mean of representative quoted bid and ask prices, generally based on prices supplied by one or more pricing vendors.
Securities and other assets for which representative market quotations are not readily available or are considered unreliable by the fund’s investment adviser are fair valued as determined in good faith under fair valuation guidelines adopted by authority of the fund’s board of directors as further described below. The investment adviser follows fair valuation guidelines, consistent with U.S. Securities and Exchange Commission rules and guidance, to consider relevant principles and factors when making fair value determinations. The investment adviser considers relevant indications of value that are reasonably and timely available to it in determining the fair value to be assigned to a particular security, such as the type and cost of the security; contractual or legal restrictions on resale of the security; relevant financial or business developments of the issuer; actively traded similar or related securities; conversion or exchange rights on the security; related corporate actions; significant events occurring after the close of
trading in the security; and changes in overall market conditions. In addition, the closing prices of equity securities that trade in markets outside U.S. time zones may be adjusted to reflect significant events that occur after the close of local trading but before the net asset value of each share class of the fund is determined. Fair valuations and valuations of investments that are not actively trading involve judgment and may differ materially from valuations that would have been used had greater market activity occurred.
Processes and structure — The fund’s board of directors has delegated authority to the fund’s investment adviser to make fair value determinations, subject to board oversight. The investment adviser has established a Joint Fair Valuation Committee (the “Fair Valuation Committee”) to administer, implement and oversee the fair valuation process, and to make fair value decisions. The Fair Valuation Committee regularly reviews its own fair value decisions, as well as decisions made under its standing instructions to the investment adviser’s valuation teams. The Fair Valuation Committee reviews changes in fair value measurements from period to period and may, as deemed appropriate, update the fair valuation guidelines to better reflect the results of back testing and address new or evolving issues. The Fair Valuation Committee reports any changes to the fair valuation guidelines to the board of directors with supplemental information to support the changes. The fund’s board and audit committee also regularly review reports that describe fair value determinations and methods.
The fund’s investment adviser has also established a Fixed-Income Pricing Review Group to administer and oversee the fixed-income valuation process, including the use of fixed-income pricing vendors. This group regularly reviews pricing vendor information and market data. Pricing decisions, processes and controls over security valuation are also subject to additional internal reviews, including an annual control self-evaluation program facilitated by the investment adviser’s compliance group.
Classifications — The fund’s investment adviser classifies the fund’s assets and liabilities into three levels based on the inputs used to value the assets or liabilities. Level 1 values are based on quoted prices in active markets for identical securities. Level 2 values are based on significant observable market inputs, such as quoted prices for similar securities and quoted prices in inactive markets. Certain securities trading outside the U.S. may transfer between Level 1 and Level 2 due to valuation adjustments resulting from significant market movements following the close of local trading. Level 3 values are based on significant unobservable inputs that reflect the investment adviser’s determination of assumptions that market participants might reasonably use in valuing the securities. The valuation levels are not necessarily an indication of the risk or liquidity associated with the underlying investment. For example, U.S. government securities are reflected as Level 2 because the inputs used to determine fair value may not always be quoted prices in an active market. The following tables present the fund’s valuation levels as of September 30, 2013 (dollars in thousands):
| | | Investment securities | |
| | | Level 1 | | | Level 2 | | | Level 3 | | | Total | |
| Assets: | | | | | | | | | | | | | | | | |
| Common stocks: | | | | | | | | | | | | | | | | |
| Consumer discretionary | | $ | 5,242,907 | | | $ | 467 | | | $ | 30 | | | $ | 5,243,404 | |
| Health care | | | 3,209,386 | | | | 74,559 | | | | — | | | | 3,283,945 | |
| Industrials | | | 2,928,720 | | | | — | | | | — | | | | 2,928,720 | |
| Information technology | | | 2,756,837 | | | | — | | | | 3,477 | | | | 2,760,314 | |
| Financials | | | 2,141,857 | | | | — | | | | 40,290 | | | | 2,182,147 | |
| Consumer staples | | | 1,327,671 | | | | — | | | | — | | | | 1,327,671 | |
| Energy | | | 1,267,370 | | | | — | | | | — | | | | 1,267,370 | |
| Materials | | | 1,255,151 | | | | — | | | | 1,315 | | | | 1,256,466 | |
| Utilities | | | 511,874 | | | | — | | | | — | | | | 511,874 | |
| Telecommunication services | | | 337,846 | | | | — | | | | 12,764 | | | | 350,610 | |
| Miscellaneous | | | 1,204,560 | | | | 7,823 | | | | — | | | | 1,212,383 | |
| Warrants | | | — | | | | — | | | | — | | | | — | |
| Convertible securities | | | — | | | | 26,443 | | | | 94,906 | | | | 121,349 | |
| Bonds, notes & other debt instruments | | | — | | | | 72,574 | | | | — | | | | 72,574 | |
| Short-term securities | | | — | | | | 2,007,670 | | | | — | | | | 2,007,670 | |
| Total | | $ | 22,184,179 | | | $ | 2,189,536 | | | $ | 152,782 | | | $ | 24,526,497 | |
| | | Other investments* | |
| | | Level 1 | | | Level 2 | | | Level 3 | | | Total | |
| Assets: | | | | | | | | | | | | | | | | |
| Unrealized appreciation on open forward currency contracts | | $ | — | | | $ | 50 | | | $ | — | | | $ | 50 | |
| Liabilities: | | | | | | | | | | | | | | | | |
| Unrealized depreciation on open forward currency contracts | | | — | | | | (2,088 | ) | | | — | | | | (2,088 | ) |
| Total | | $ | — | | | $ | (2,038 | ) | | $ | — | | | $ | (2,038 | ) |
| * | Forward currency contracts are not included in the investment portfolio. |
4. Risk factors
Investing in the fund may involve certain risks including, but not limited to, those described below.
Market conditions — The prices of, and the income generated by, the securities held by the fund may decline due to market conditions and other factors, including those directly involving the issuers of securities held by the fund.
Investing in growth-oriented stocks — Growth-oriented stocks may involve larger price swings and greater potential for loss than other types of investments. These risks may be even greater in the case of smaller capitalization stocks.
Investing in small companies — Investing in smaller companies may pose additional risks. For example, it is often more difficult to value or dispose of small company stocks and more difficult to obtain information about smaller companies than about larger companies. In addition, the prices of these stocks may be more volatile than stocks of larger, more established companies.
Investing outside the U.S. — Securities of issuers domiciled outside the U.S., or with significant operations outside the U.S., may lose value because of adverse political, social, economic or market developments in the countries or regions in which the issuers operate. These securities may also lose value due to changes in foreign currency exchange rates against the U.S. dollar and/or currencies of other countries. Securities markets in certain countries may be more volatile and/or less liquid than those in the U.S. Investments outside the U.S. may also be subject to different settlement and accounting practices and different regulatory, legal and reporting standards, and may be more difficult to value, than those in the U.S. The risks of investing outside the U.S. may be heightened in connection with investments in emerging markets.
Investing in emerging markets — Investing in emerging markets may involve risks in addition to and greater than those generally associated with investing in the securities markets of developed countries. For instance, developing countries may have less developed legal and accounting systems than those in developed countries. The governments of these countries may be less stable and more likely to impose capital controls, nationalize a company or industry, place restrictions on foreign ownership and on withdrawing sale proceeds of securities from the country, and/or impose punitive taxes that could adversely affect the prices of securities. In addition, the economies of these countries may be dependent on relatively few industries that are more susceptible to local and global changes. Securities markets in these countries can also be relatively small and have substantially lower trading volumes. As a result, securities issued in these countries may be more volatile and less liquid, and may be more difficult to value, than securities issued in countries with more developed economies and/or markets. Additionally, there may be increased settlement risks for transactions in local securities.
Management — The investment adviser to the fund actively manages the fund’s investments. Consequently, the fund is subject to the risk that the methods and analyses employed by the investment adviser in this process may not produce the desired results. This could cause the fund to lose value or its investment results to lag relevant benchmarks or other funds with similar objectives.
5. Certain investment techniques
Forward currency contracts — The fund has entered into forward currency contracts, which represent agreements to exchange currencies on specific future dates at predetermined rates. The fund’s investment adviser uses forward currency contracts to manage the fund’s exposure to changes in exchange rates. Upon entering into these contracts, risks may arise from the potential inability of counterparties to meet the terms of their contracts and from possible movements in exchange rates.
On a daily basis, the fund’s investment adviser values forward currency contracts and records unrealized appreciation or depreciation for open forward currency contracts in the fund’s statement of assets and liabilities. Realized gains or losses are recorded at the time the forward currency contract is closed or offset by another contract with the same broker for the same settlement date and currency. Closed forward currency contracts that have not reached their settlement date are included in the respective receivables or payables for closed forward currency contracts in the fund’s statement of assets and liabilities. Net realized gains or losses from closed forward currency contracts and net unrealized appreciation or depreciation from open forward currency contracts are recorded in the fund’s statement of operations.
Collateral — To reduce the risk to counterparties of forward currency contracts, the fund has entered into a collateral program with certain counterparties. The program calls for the fund to either receive or pledge collateral based on the net gain or loss on unsettled forward currency contracts by counterparty. The purpose of the collateral is to cover potential losses that could occur in the event that either party cannot meet its contractual obligations.
6. Taxation and distributions
Federal income taxation — The fund complies with the requirements under Subchapter M of the Internal Revenue Code applicable to mutual funds and intends to distribute substantially all of its net taxable income and net capital gains each year. The fund is not subject to income taxes to the extent such distributions are made. Therefore, no federal income tax provision is required.
As of and during the period ended September 30, 2013, the fund did not have a liability for any unrecognized tax benefits. The fund recognizes interest and penalties, if any, related to unrecognized tax benefits as income tax expense in the statement of operations. During the period, the fund did not incur any interest or penalties.
The fund is not subject to examination by U.S. federal tax authorities for tax years before 2009, by state tax authorities for tax years before 2008 and by tax authorities outside the U.S. for tax years before 2006.
Non-U.S. taxation — Dividend and interest income are recorded net of non-U.S. taxes paid. Gains realized by the fund on the sale of securities in certain countries are subject to non-U.S. taxes. The fund records a liability based on unrealized gains to provide for potential non-U.S. taxes payable upon the sale of these securities.
Distributions — Distributions paid to shareholders are based on net investment income and net realized gains determined on a tax basis, which may differ from net investment income and net realized gains for financial reporting purposes. These differences are due primarily to different treatment for items such as currency gains and losses; short-term capital gains and losses; capital losses related to sales of certain securities within 30 days of purchase; unrealized appreciation of certain investments in securities outside the U.S.; deferred expenses; cost of investments sold; net capital losses; net operating losses; and income on certain investments. The fiscal year in which amounts are distributed may differ from the year in which the net investment income and net realized gains are recorded by the fund for financial reporting purposes. The fund may also designate a portion of the amount paid to redeeming shareholders as a distribution for tax purposes.
During the year ended September 30, 2013, the fund reclassified $60,921,000 from undistributed net realized gain and $69,534,000 from capital paid in on shares of capital stock to distributions in excess of net investment income; and $48,142,000 from undistributed net realized gain to capital paid in on shares of capital stock to align financial reporting with tax reporting. The fund also utilized capital loss carryforward of $476,072,000.
As of September 30, 2013, the tax basis components of distributable earnings, unrealized appreciation (depreciation) and cost of investment securities were as follows (dollars in thousands):
| Undistributed long-term capital gains | | $ | 1,229,754 | |
| Late year ordinary loss deferral* | | | (43,980 | ) |
| Gross unrealized appreciation on investment securities | | | 8,166,841 | |
| Gross unrealized depreciation on investment securities | | | (1,099,455 | ) |
| Net unrealized appreciation on investment securities | | | 7,067,386 | |
| Cost of investment securities | | | 17,459,111 | |
*This deferral is considered incurred in the subsequent year.
Tax-basis distributions paid to shareholders from ordinary income were as follows (dollars in thousands):
| | | Year ended September 30 | |
| Share class | | 2013 | | | 2012 | |
| Class A | | $ | 182,045 | | | $ | 38,933 | |
| Class B | | | 999 | | | | — | |
| Class C | | | 5,125 | | | | — | |
| Class F-1 | | | 8,428 | | | | 1,913 | |
| Class F-2 | | | 7,141 | | | | 1,886 | |
| Class 529-A | | | 9,344 | | | | 1,827 | |
| Class 529-B | | | 97 | | | | — | |
| Class 529-C | | | 1,428 | | | | — | |
| Class 529-E | | | 423 | | | | 6 | |
| Class 529-F-1 | | | 843 | | | | 243 | |
| Class R-1 | | | 253 | | | | — | |
| Class R-2 | | | 4,501 | | | | — | |
| Class R-3 | | | 7,719 | | | | — | |
| Class R-4 | | | 8,016 | | | | 1,787 | |
| Class R-5 | | | 7,046 | | | | 2,345 | |
| Class R-6 | | | 14,371 | | | | 4,367 | |
| Total | | $ | 257,779 | | | $ | 53,307 | |
7. Fees and transactions with related parties
CRMC, the fund’s investment adviser, is the parent company of American Funds Distributors,® Inc. (“AFD”), the principal underwriter of the fund’s shares, and American Funds Service Company® (“AFS”), the fund’s transfer agent. CRMC, AFD and AFS are considered related parties to the fund.
Investment advisory services — The fund has an investment advisory and service agreement with CRMC that provides for monthly fees accrued daily. These fees are based on a series of decreasing annual rates beginning with 0.800% on the first $1 billion of daily net assets and decreasing to 0.595% on such assets in excess of $27 billion. For the year ended September 30, 2013, the investment advisory services fee was $136,894,000, which was equivalent to an annualized rate of 0.636% of average daily net assets.
Class-specific fees and expenses — Expenses that are specific to individual share classes are accrued directly to the respective share class. The principal class-specific fees and expenses are described below:
Distribution services — The fund has plans of distribution for all share classes, except Class F-2, R-5 and R-6 shares. Under the plans, the board of directors approves certain categories of expenses that are used to finance activities primarily intended to sell fund shares and service existing accounts. The plans provide for payments, based on an annualized percentage of average daily net assets, ranging from 0.30% to 1.00% as noted on the following page. In some cases, the board of directors has limited the amounts that may be paid to less than the maximum allowed by the plans. All share classes with a plan may use up to 0.25% of average daily net assets to pay service fees, or to compensate AFD for paying service fees, to firms that have entered into agreements with AFD to provide certain shareholder services. The remaining amounts available to be paid under each plan are paid to dealers to compensate them for their sales activities.
For Class A and 529-A shares, distribution-related expenses include the reimbursement of dealer and wholesaler commissions paid by AFD for certain shares sold without a sales charge. These share classes reimburse AFD for amounts billed within the prior 15 months but only to the extent that the overall annual expense limit of 0.30% is not exceeded. As of September 30, 2013, there were no unreimbursed expenses subject to reimbursement for Class A or 529-A shares.
| | Share class | | Currently approved limits | | Plan limits |
| | Class A | | | 0.30 | % | | | 0.30 | % |
| | Class 529-A | | | 0.30 | | | | 0.50 | |
| | Classes B and 529-B | | | 1.00 | | | | 1.00 | |
| | Classes C, 529-C and R-1 | | | 1.00 | | | | 1.00 | |
| | Class R-2 | | | 0.75 | | | | 1.00 | |
| | Classes 529-E and R-3 | | | 0.50 | | | | 0.75 | |
| | Classes F-1, 529-F-1 and R-4 | | | 0.25 | | | | 0.50 | |
Transfer agent services — The fund has a shareholder services agreement with AFS under which the fund compensates AFS for providing transfer agent services to each of the fund’s share classes. These services include recordkeeping, shareholder communications and transaction processing. In addition, the fund reimburses AFS for amounts paid to third parties for performing transfer agent services on behalf of fund shareholders.
Administrative services — The fund has an administrative services agreement with CRMC under which the fund compensates CRMC for providing administrative services to Class A, C, F, 529 and R shares. These services include, but are not limited to, coordinating, monitoring, assisting and overseeing third parties that provide services to fund shareholders. Under the agreement, Class A shares pay an annual fee of 0.01% and Class C, F, 529 and R shares pay an annual fee of 0.05% of their respective average daily net assets.
529 plan services — Each 529 share class is subject to service fees to compensate the Commonwealth of Virginia for the maintenance of the 529 college savings plan. The quarterly fee is based on a series of decreasing annual rates beginning with 0.10% on the first $30 billion of the net assets invested in Class 529 shares of the American Funds and decreasing to 0.06% on such assets between $120 billion and $150 billion. The fee for any given calendar quarter is accrued and calculated on the basis of the average net assets of Class 529 shares of the American Funds for the last month of the prior calendar quarter. The fee is included in other expenses on the accompanying financial statements. The Commonwealth of Virginia is not considered a related party.
For the year ended September 30, 2013, class-specific expenses under the agreements were as follows (dollars in thousands):
| | Share class | | Distribution
services | | | Transfer agent
services | | | Administrative
services | | | 529 plan
services |
| | Class A | | | $34,884 | | | | $30,447 | | | | $1,463 | | | Not applicable |
| | Class B | | | 1,935 | | | | 431 | | | | Not applicable | | | Not applicable |
| | Class C | | | 8,246 | | | | 1,745 | | | | 414 | | | Not applicable |
| | Class F-1 | | | 1,772 | | | | 751 | | | | 355 | | | Not applicable |
| | Class F-2 | | | Not applicable | | | | 490 | | | | 247 | | | Not applicable |
| | Class 529-A | | | 1,615 | | | | 1,230 | | | | 386 | | | $758 |
| | Class 529-B | | | 264 | | | | 48 | | | | 14 | | | 26 |
| | Class 529-C | | | 2,409 | | | | 414 | | | | 121 | | | 238 |
| | Class 529-E | | | 208 | | | | 47 | | | | 21 | | | 41 |
| | Class 529-F-1 | | | — | | | | 98 | | | | 31 | | | 61 |
| | Class R-1 | | | 373 | | | | 54 | | | | 19 | | | Not applicable |
| | Class R-2 | | | 5,042 | | | | 2,495 | | | | 340 | | | Not applicable |
| | Class R-3 | | | 3,718 | | | | 1,387 | | | | 374 | | | Not applicable |
| | Class R-4 | | | 1,541 | | | | 630 | | | | 309 | | | Not applicable |
| | Class R-5 | | | Not applicable | | | | 231 | | | | 234 | | | Not applicable |
| | Class R-6 | | | Not applicable | | | | 9 | | | | 482 | | | Not applicable |
| | Total class-specific expenses | | | $62,007 | | | | $40,507 | | | | $4,810 | | | $1,124 |
Directors’ deferred compensation — Directors who are unaffiliated with CRMC may elect to defer the cash payment of part or all of their compensation. These deferred amounts, which remain as liabilities of the fund, are treated as if invested in shares of the fund or other American Funds. These amounts represent general, unsecured liabilities of the fund and vary according to the total returns of the selected funds. Directors’ compensation of $818,000, shown on the accompanying financial statements, includes $390,000 in current fees (either paid in cash or deferred) and a net increase of $428,000 in the value of the deferred amounts.
Affiliated officers and directors — Officers and certain directors of the fund are or may be considered to be affiliated with CRMC, AFD and AFS. No affiliated officers or directors received any compensation directly from the fund.
8. Capital share transactions
Capital share transactions in the fund were as follows (dollars and shares in thousands):
| | | Sales* | | | Reinvestments of
dividends | | | Repurchases* | | | Net (decrease)
increase | |
| Share class | | Amount | | | Shares | | | Amount | | | Shares | | | Amount | | | Shares | | | Amount | | | Shares | |
| | | | | | | | | | | | | | | | | | | | | | | | | |
| Year ended September 30, 2013 | | | | | | | | | | | | | | | | |
| | | | | | | | | | | | | | | | | | | | | | | | | |
| Class A | | $ | 1,557,151 | | | | 36,059 | | | $ | 178,221 | | | | 4,529 | | | $ | (2,101,305 | ) | | | (49,421 | ) | | $ | (365,933 | ) | | | (8,833 | ) |
| Class B | | | 5,244 | | | | 129 | | | | 990 | | | | 26 | | | | (78,159 | ) | | | (1,942 | ) | | | (71,925 | ) | | | (1,787 | ) |
| Class C | | | 115,494 | | | | 2,852 | | | | 5,050 | | | | 137 | | | | (163,006 | ) | | | (4,082 | ) | | | (42,462 | ) | | | (1,093 | ) |
| Class F-1 | | | 230,756 | | | | 5,343 | | | | 8,312 | | | | 213 | | | | (183,653 | ) | | | (4,490 | ) | | | 55,415 | | | | 1,066 | |
| Class F-2 | | | 261,399 | | | | 6,191 | | | | 6,474 | | | | 164 | | | | (98,197 | ) | | | (2,254 | ) | | | 169,676 | | | | 4,101 | |
| Class 529-A | | | 105,543 | | | | 2,476 | | | | 9,343 | | | | 239 | | | | (93,329 | ) | | | (2,193 | ) | | | 21,557 | | | | 522 | |
| Class 529-B | | | 680 | | | | 17 | | | | 97 | | | | 3 | | | | (10,704 | ) | | | (264 | ) | | | (9,927 | ) | | | (244 | ) |
| Class 529-C | | | 31,723 | | | | 779 | | | | 1,427 | | | | 38 | | | | (35,946 | ) | | | (884 | ) | | | (2,796 | ) | | | (67 | ) |
| Class 529-E | | | 5,599 | | | | 134 | | | | 422 | | | | 11 | | | | (5,392 | ) | | | (130 | ) | | | 629 | | | | 15 | |
| Class 529-F-1 | | | 15,329 | | | | 359 | | | | 842 | | | | 21 | | | | (9,884 | ) | | | (230 | ) | | | 6,287 | | | | 150 | |
| Class R-1 | | | 8,611 | | | | 209 | | | | 252 | | | | 7 | | | | (12,509 | ) | | | (308 | ) | | | (3,646 | ) | | | (92 | ) |
| Class R-2 | | | 155,700 | | | | 3,807 | | | | 4,497 | | | | 120 | | | | (221,139 | ) | | | (5,411 | ) | | | (60,942 | ) | | | (1,484 | ) |
| Class R-3 | | | 212,178 | | | | 5,045 | | | | 7,712 | | | | 200 | | | | (244,770 | ) | | | (5,852 | ) | | | (24,880 | ) | | | (607 | ) |
| Class R-4 | | | 189,212 | | | | 4,445 | | | | 8,015 | | | | 205 | | | | (173,149 | ) | | | (4,082 | ) | | | 24,078 | | | | 568 | |
| Class R-5 | | | 151,856 | | | | 3,552 | | | | 7,030 | | | | 177 | | | | (99,358 | ) | | | (2,287 | ) | | | 59,528 | | | | 1,442 | |
| Class R-6 | | | 282,881 | | | | 6,554 | | | | 14,371 | | | | 366 | | | | (79,857 | ) | | | (1,824 | ) | | | 217,395 | | | | 5,096 | |
| Total net increase (decrease) | | $ | 3,329,356 | | | | 77,951 | | | $ | 253,055 | | | | 6,456 | | | $ | (3,610,357 | ) | | | (85,654 | ) | | $ | (27,946 | ) | | | (1,247 | ) |
| | | | | | | | | | | | | | | | | | | | | | | | | | | | | | | | | |
| Year ended September 30, 2012 | | | | | | | | | | | | | | | | | | | | | |
| | | | | | | | | | | | | | | | | | | | | | | | | | | | | | | | | |
| Class A | | $ | 1,129,356 | | | | 31,144 | | | $ | 38,004 | | | | 1,143 | | | $ | (2,385,076 | ) | | | (66,322 | ) | | $ | (1,217,716 | ) | | | (34,035 | ) |
| Class B | | | 6,271 | | | | 183 | | | | — | | | | — | | | | (112,865 | ) | | | (3,323 | ) | | | (106,594 | ) | | | (3,140 | ) |
| Class C | | | 77,342 | | | | 2,274 | | | | — | | | | — | | | | (188,550 | ) | | | (5,607 | ) | | | (111,208 | ) | | | (3,333 | ) |
| Class F-1 | | | 161,169 | | | | 4,494 | | | | 1,888 | | | | 58 | | | | (227,868 | ) | | | (6,443 | ) | | | (64,811 | ) | | | (1,891 | ) |
| Class F-2 | | | 84,080 | | | | 2,327 | | | | 1,659 | | | | 50 | | | | (75,430 | ) | | | (2,093 | ) | | | 10,309 | | | | 284 | |
| Class 529-A | | | 91,331 | | | | 2,547 | | | | 1,827 | | | | 55 | | | | (80,519 | ) | | | (2,248 | ) | | | 12,639 | | | | 354 | |
| Class 529-B | | | 936 | | | | 27 | | | | — | | | | — | | | | (14,974 | ) | | | (438 | ) | | | (14,038 | ) | | | (411 | ) |
| Class 529-C | | | 28,268 | | | | 822 | | | | — | | | | — | | | | (36,326 | ) | | | (1,062 | ) | | | (8,058 | ) | | | (240 | ) |
| Class 529-E | | | 4,601 | | | | 131 | | | | 6 | | | | — | † | | | (5,377 | ) | | | (152 | ) | | | (770 | ) | | | (21 | ) |
| Class 529-F-1 | | | 10,007 | | | | 279 | | | | 241 | | | | 7 | | | | (10,405 | ) | | | (293 | ) | | | (157 | ) | | | (7 | ) |
| Class R-1 | | | 8,012 | | | | 232 | | | | — | | | | — | | | | (13,756 | ) | | | (399 | ) | | | (5,744 | ) | | | (167 | ) |
| Class R-2 | | | 155,041 | | | | 4,478 | | | | — | | | | — | | | | (224,117 | ) | | | (6,504 | ) | | | (69,076 | ) | | | (2,026 | ) |
| Class R-3 | | | 194,396 | | | | 5,494 | | | | — | | | | — | | | | (228,474 | ) | | | (6,466 | ) | | | (34,078 | ) | | | (972 | ) |
| Class R-4 | | | 167,985 | | | | 4,674 | | | | 1,787 | | | | 54 | | | | (171,407 | ) | | | (4,762 | ) | | | (1,635 | ) | | | (34 | ) |
| Class R-5 | | | 82,196 | | | | 2,246 | | | | 2,339 | | | | 70 | | | | (91,255 | ) | | | (2,512 | ) | | | (6,720 | ) | | | (196 | ) |
| Class R-6 | | | 188,508 | | | | 5,258 | | | | 4,365 | | | | 131 | | | | (56,380 | ) | | | (1,542 | ) | | | 136,493 | | | | 3,847 | |
| Total net increase (decrease) | | $ | 2,389,499 | | | | 66,610 | | | $ | 52,116 | | | | 1,568 | | | $ | (3,922,779 | ) | | | (110,166 | ) | | $ | (1,481,164 | ) | | | (41,988 | ) |
*Includes exchanges between share classes of the fund.
†Amount less than one thousand.
9. Investment transactions
The fund made purchases and sales of investment securities, excluding short-term securities and U.S. government obligations, if any, of $7,309,123,000 and $7,862,942,000, respectively, during the year ended September 30, 2013.
Financial highlights
| | | | | Income (loss) from
investment operations1 | | | | | | | | | | | | | | | | | | | | | |
| | | Net asset
value,
beginning
of period | | Net
investment
income
(loss) | | | Net gains
(losses) on
securities
(both
realized and
unrealized) | | | Total from
investment
operations | | | Dividends
(from net
investment
income) | | | Net asset
value, end
of period | | | Total
return2,3 | | | Net assets,
end of period
(in millions) | | Ratio of
expenses to
average net
assets before
waivers | | | Ratio of
expenses to
average net
assets after
waivers3 | | | Ratio of
net income
(loss) to
average
net assets3 | |
| Class A: | | | | | | | | | | | | | | | | | | | | | | | | | | | | | | | | | | | | | | | | | | |
| Year ended 9/30/2013 | | $ | 39.27 | | $ | .06 | | | $ | 10.12 | | | $ | 10.18 | | | $ | (.54 | ) | | $ | 48.91 | | | | 26.29 | % | | $ | 16,454 | | | 1.13 | % | | | 1.13 | % | | | .15 | % |
| Year ended 9/30/2012 | | | 31.45 | | | .08 | | | | 7.85 | | | | 7.93 | | | | (.11 | ) | | | 39.27 | | | | 25.26 | | | | 13,557 | | | 1.14 | | | | 1.14 | | | | .23 | |
| Year ended 9/30/2011 | | | 35.82 | | | .09 | | | | (3.94 | ) | | | (3.85 | ) | | | (.52 | ) | | | 31.45 | | | | (11.01 | ) | | | 11,926 | | | 1.09 | | | | 1.09 | | | | .23 | |
| Year ended 9/30/2010 | | | 30.26 | | | .14 | | | | 5.62 | | | | 5.76 | | | | (.20 | ) | | | 35.82 | | | | 19.11 | | | | 14,432 | | | 1.13 | | | | 1.13 | | | | .43 | |
| Year ended 9/30/2009 | | | 28.46 | | | .19 | | | | 1.61 | | | | 1.80 | | | | — | | | | 30.26 | | | | 6.32 | | | | 12,814 | | | 1.25 | | | | 1.24 | | | | .82 | |
| Class B: | | | | | | | | | | | | | | | | | | | | | | | | | | | | | | | | | | | | | | | | | | |
| Year ended 9/30/2013 | | | 36.95 | | | (.26 | ) | | | 9.56 | | | | 9.30 | | | | (.19 | ) | | | 46.06 | | | | 25.29 | | | | 185 | | | 1.89 | | | | 1.89 | | | | (.63 | ) |
| Year ended 9/30/2012 | | | 29.72 | | | (.20 | ) | | | 7.43 | | | | 7.23 | | | | — | | | | 36.95 | | | | 24.33 | | | | 214 | | | 1.90 | | | | 1.90 | | | | (.58 | ) |
| Year ended 9/30/2011 | | | 33.87 | | | (.20 | ) | | | (3.71 | ) | | | (3.91 | ) | | | (.24 | ) | | | 29.72 | | | | (11.68 | ) | | | 266 | | | 1.86 | | | | 1.86 | | | | (.55 | ) |
| Year ended 9/30/2010 | | | 28.66 | | | (.11 | ) | | | 5.32 | | | | 5.21 | | | | — | | | | 33.87 | | | | 18.18 | | | | 397 | | | 1.89 | | | | 1.89 | | | | (.37 | ) |
| Year ended 9/30/2009 | | | 27.16 | | | .01 | | | | 1.49 | | | | 1.50 | | | | — | | | | 28.66 | | | | 5.52 | | | | 428 | | | 2.02 | | | | 2.00 | | | | .06 | |
| Class C: | | | | | | | | | | | | | | | | | | | | | | | | | | | | | | | | | | | | | | | | | | |
| Year ended 9/30/2013 | | | 36.60 | | | (.26 | ) | | | 9.45 | | | | 9.19 | | | | (.25 | ) | | | 45.54 | | | | 25.26 | | | | 920 | | | 1.93 | | | | 1.93 | | | | (.65 | ) |
| Year ended 9/30/2012 | | | 29.44 | | | (.19 | ) | | | 7.35 | | | | 7.16 | | | | — | | | | 36.60 | | | | 24.32 | | | | 779 | | | 1.93 | | | | 1.93 | | | | (.56 | ) |
| Year ended 9/30/2011 | | | 33.61 | | | (.19 | ) | | | (3.69 | ) | | | (3.88 | ) | | | (.29 | ) | | | 29.44 | | | | (11.70 | ) | | | 725 | | | 1.86 | | | | 1.86 | | | | (.53 | ) |
| Year ended 9/30/2010 | | | 28.44 | | | (.10 | ) | | | 5.28 | | | | 5.18 | | | | (.01 | ) | | | 33.61 | | | | 18.19 | | | | 865 | | | 1.88 | | | | 1.88 | | | | (.32 | ) |
| Year ended 9/30/2009 | | | 26.93 | | | .03 | | | | 1.48 | | | | 1.51 | | | | — | | | | 28.44 | | | | 5.64 | | | | 738 | | | 1.94 | | | | 1.92 | | | | .13 | |
| Class F-1: | | | | | | | | | | | | | | | | | | | | | | | | | | | | | | | | | | | | | | | | | | |
| Year ended 9/30/2013 | | | 38.94 | | | .09 | | | | 10.03 | | | | 10.12 | | | | (.55 | ) | | | 48.51 | | | | 26.33 | | | | 868 | | | 1.07 | | | | 1.07 | | | | .21 | |
| Year ended 9/30/2012 | | | 31.18 | | | .09 | | | | 7.78 | | | | 7.87 | | | | (.11 | ) | | | 38.94 | | | | 25.30 | | | | 655 | | | 1.12 | | | | 1.12 | | | | .25 | |
| Year ended 9/30/2011 | | | 35.53 | | | .10 | | | | (3.92 | ) | | | (3.82 | ) | | | (.53 | ) | | | 31.18 | | | | (11.02 | ) | | | 583 | | | 1.08 | | | | 1.08 | | | | .25 | |
| Year ended 9/30/2010 | | | 30.03 | | | .15 | | | | 5.57 | | | | 5.72 | | | | (.22 | ) | | | 35.53 | | | | 19.16 | | | | 654 | | | 1.10 | | | | 1.10 | | | | .46 | |
| Year ended 9/30/2009 | | | 28.21 | | | .21 | | | | 1.61 | | | | 1.82 | | | | — | | | | 30.03 | | | | 6.45 | | | | 543 | | | 1.14 | | | | 1.13 | | | | .94 | |
| Class F-2: | | | | | | | | | | | | | | | | | | | | | | | | | | | | | | | | | | | | | | | | | | |
| Year ended 9/30/2013 | | | 39.38 | | | .21 | | | | 10.12 | | | | 10.33 | | | | (.68 | ) | | | 49.03 | | | | 26.68 | | | | 629 | | | .82 | | | | .82 | | | | .48 | |
| Year ended 9/30/2012 | | | 31.54 | | | .20 | | | | 7.86 | | | | 8.06 | | | | (.22 | ) | | | 39.38 | | | | 25.69 | | | | 344 | | | .83 | | | | .83 | | | | .55 | |
| Year ended 9/30/2011 | | | 35.93 | | | .20 | | | | (3.96 | ) | | | (3.76 | ) | | | (.63 | ) | | | 31.54 | | | | (10.79 | ) | | | 266 | | | .82 | | | | .82 | | | | .53 | |
| Year ended 9/30/2010 | | | 30.39 | | | .25 | | | | 5.63 | | | | 5.88 | | | | (.34 | ) | | | 35.93 | | | | 19.46 | | | | 246 | | | .81 | | | | .81 | | | | .78 | |
| Year ended 9/30/2009 | | | 28.47 | | | .23 | | | | 1.69 | | | | 1.92 | | | | — | | | | 30.39 | | | | 6.78 | | | | 158 | | | .87 | | | | .87 | | | | .91 | |
| Class 529-A: | | | | | | | | | | | | | | | | | | | | | | | | | | | | | | | | | | | | | | | | | | |
| Year ended 9/30/2013 | | | 39.03 | | | .04 | | | | 10.05 | | | | 10.09 | | | | (.53 | ) | | | 48.59 | | | | 26.18 | | | | 884 | | | 1.19 | | | | 1.19 | | | | .09 | |
| Year ended 9/30/2012 | | | 31.27 | | | .07 | | | | 7.80 | | | | 7.87 | | | | (.11 | ) | | | 39.03 | | | | 25.22 | | | | 689 | | | 1.19 | | | | 1.19 | | | | .19 | |
| Year ended 9/30/2011 | | | 35.63 | | | .08 | | | | (3.92 | ) | | | (3.84 | ) | | | (.52 | ) | | | 31.27 | | | | (11.05 | ) | | | 541 | | | 1.14 | | | | 1.14 | | | | .20 | |
| Year ended 9/30/2010 | | | 30.13 | | | .13 | | | | 5.58 | | | | 5.71 | | | | (.21 | ) | | | 35.63 | | | | 19.06 | | | | 548 | | | 1.16 | | | | 1.16 | | | | .41 | |
| Year ended 9/30/2009 | | | 28.32 | | | .19 | | | | 1.62 | | | | 1.81 | | | | — | | | | 30.13 | | | | 6.39 | | | | 421 | | | 1.22 | | | | 1.21 | | | | .84 | |
| Class 529-B: | | | | | | | | | | | | | | | | | | | | | | | | | | | | | | | | | | | | | | | | | | |
| Year ended 9/30/2013 | | | 37.30 | | | (.30 | ) | | | 9.66 | | | | 9.36 | | | | (.14 | ) | | | 46.52 | | | | 25.17 | | | | 25 | | | 1.99 | | | | 1.99 | | | | (.73 | ) |
| Year ended 9/30/2012 | | | 30.03 | | | (.23 | ) | | | 7.50 | | | | 7.27 | | | | — | | | | 37.30 | | | | 24.21 | | | | 30 | | | 2.01 | | | | 2.01 | | | | (.68 | ) |
| Year ended 9/30/2011 | | | 34.23 | | | (.23 | ) | | | (3.76 | ) | | | (3.99 | ) | | | (.21 | ) | | | 30.03 | | | | (11.78 | ) | | | 36 | | | 1.95 | | | | 1.95 | | | | (.63 | ) |
| Year ended 9/30/2010 | | | 28.98 | | | (.13 | ) | | | 5.38 | | | | 5.25 | | | | — | | | | 34.23 | | | | 18.12 | | | | 52 | | | 1.97 | | | | 1.97 | | | | (.44 | ) |
| Year ended 9/30/2009 | | | 27.47 | | | .01 | | | | 1.50 | | | | 1.51 | | | | — | | | | 28.98 | | | | 5.50 | | | | 51 | | | 2.05 | | | | 2.03 | | | | .02 | |
| Class 529-C: | | | | | | | | | | | | | | | | | | | | | | | | | | | | | | | | | | | | | | | | | | |
| Year ended 9/30/2013 | | | 37.20 | | | (.29 | ) | | | 9.60 | | | | 9.31 | | | | (.24 | ) | | | 46.27 | | | | 25.21 | | | | 273 | | | 1.98 | | | | 1.98 | | | | (.70 | ) |
| Year ended 9/30/2012 | | | 29.95 | | | (.21 | ) | | | 7.46 | | | | 7.25 | | | | — | | | | 37.20 | | | | 24.21 | | | | 222 | | | 2.00 | | | | 2.00 | | | | (.62 | ) |
| Year ended 9/30/2011 | | | 34.19 | | | (.22 | ) | | | (3.76 | ) | | | (3.98 | ) | | | (.26 | ) | | | 29.95 | | | | (11.77 | ) | | | 186 | | | 1.94 | | | | 1.94 | | | | (.61 | ) |
| Year ended 9/30/2010 | | | 28.94 | | | (.12 | ) | | | 5.37 | | | | 5.25 | | | | — | | | | 34.19 | | | | 18.10 | | | | 194 | | | 1.97 | | | | 1.97 | | | | (.40 | ) |
| Year ended 9/30/2009 | | | 27.43 | | | .01 | | | | 1.50 | | | | 1.51 | | | | — | | | | 28.94 | | | | 5.54 | | | | 155 | | | 2.04 | | | | 2.03 | | | | .02 | |
| Class 529-E: | | | | | | | | | | | | | | | | | | | | | | | | | | | | | | | | | | | | | | | | | | |
| Year ended 9/30/2013 | | | 38.45 | | | (.06 | ) | | | 9.91 | | | | 9.85 | | | | (.43 | ) | | | 47.87 | | | | 25.90 | | | | 48 | | | 1.43 | | | | 1.43 | | | | (.15 | ) |
| Year ended 9/30/2012 | | | 30.79 | | | (.03 | ) | | | 7.70 | | | | 7.67 | | | | (.01 | ) | | | 38.45 | | | | 24.90 | | | | 38 | | | 1.45 | | | | 1.45 | | | | (.07 | ) |
| Year ended 9/30/2011 | | | 35.11 | | | (.03 | ) | | | (3.87 | ) | | | (3.90 | ) | | | (.42 | ) | | | 30.79 | | | | (11.32 | ) | | | 31 | | | 1.43 | | | | 1.43 | | | | (.08 | ) |
| Year ended 9/30/2010 | | | 29.70 | | | .04 | | | | 5.50 | | | | 5.54 | | | | (.13 | ) | | | 35.11 | | | | 18.71 | | | | 31 | | | 1.46 | | | | 1.46 | | | | .11 | |
| Year ended 9/30/2009 | | | 28.00 | | | .12 | | | | 1.58 | | | | 1.70 | | | | — | | | | 29.70 | | | | 6.07 | | | | 25 | | | 1.52 | | | | 1.51 | | | | .54 | |
See page 28 for footnotes.
Financial highlights (continued)
| | | | | Income (loss) from
investment operations1 | | | | | | | | | | | | | | | | | | | | | |
| | | Net asset
value,
beginning
of period | | Net
investment
income
(loss) | | | Net gains
(losses) on
securities
(both
realized and
unrealized) | | | Total from
investment
operations | | | Dividends
(from net
investment
income) | | | Net asset
value, end
of period | | | Total
return3 | | | Net assets,
end of period
(in millions) | | Ratio of
expenses to
average net
assets before
waivers | | | Ratio of
expenses to
average net
assets after
waivers3 | | | Ratio of
net income
(loss) to
average
net assets3 | |
| Class 529-F-1: | | | | | | | | | | | | | | | | | | | | | | | | | | | | | | | | | | | | | | | | | | |
| Year ended 9/30/2013 | | $ | 39.14 | | $ | .13 | | | $ | 10.07 | | | $ | 10.20 | | | $ | (.61 | ) | | $ | 48.73 | | | | 26.43 | % | | $ | 73 | | | .98 | % | | | .98 | % | | | .30 | % |
| Year ended 9/30/2012 | | | 31.35 | | | .14 | | | | 7.83 | | | | 7.97 | | | | (.18 | ) | | | 39.14 | | | | 25.51 | | | | 53 | | | .99 | | | | .99 | | | | .39 | |
| Year ended 9/30/2011 | | | 35.72 | | | .15 | | | | (3.94 | ) | | | (3.79 | ) | | | (.58 | ) | | | 31.35 | | | | (10.90 | ) | | | 43 | | | .94 | | | | .94 | | | | .40 | |
| Year ended 9/30/2010 | | | 30.20 | | | .20 | | | | 5.59 | | | | 5.79 | | | | (.27 | ) | | | 35.72 | | | | 19.31 | | | | 47 | | | .95 | | | | .95 | | | | .62 | |
| Year ended 9/30/2009 | | | 28.33 | | | .24 | | | | 1.63 | | | | 1.87 | | | | — | | | | 30.20 | | | | 6.60 | | | | 35 | | | 1.02 | | | | 1.01 | | | | 1.04 | |
| Class R-1: | | | | | | | | | | | | | | | | | | | | | | | | | | | | | | | | | | | | | | | | | | |
| Year ended 9/30/2013 | | | 37.40 | | | (.23 | ) | | | 9.66 | | | | 9.43 | | | | (.27 | ) | | | 46.56 | | | | 25.37 | | | | 42 | | | 1.84 | | | | 1.84 | | | | (.57 | ) |
| Year ended 9/30/2012 | | | 30.07 | | | (.17 | ) | | | 7.50 | | | | 7.33 | | | | — | | | | 37.40 | | | | 24.38 | | | | 37 | | | 1.86 | | | | 1.86 | | | | (.50 | ) |
| Year ended 9/30/2011 | | | 34.32 | | | (.19 | ) | | | (3.77 | ) | | | (3.96 | ) | | | (.29 | ) | | | 30.07 | | | | (11.68 | ) | | | 35 | | | 1.84 | | | | 1.84 | | | | (.52 | ) |
| Year ended 9/30/2010 | | | 29.05 | | | (.09 | ) | | | 5.39 | | | | 5.30 | | | | (.03 | ) | | | 34.32 | | | | 18.25 | | | | 43 | | | 1.87 | | | | 1.87 | | | | (.30 | ) |
| Year ended 9/30/2009 | | | 27.51 | | | .02 | | | | 1.52 | | | | 1.54 | | | | — | | | | 29.05 | | | | 5.60 | | | | 36 | | | 1.94 | | | | 1.93 | | | | .11 | |
| Class R-2: | | | | | | | | | | | | | | | | | | | | | | | | | | | | | | | | | | | | | | | | | | |
| Year ended 9/30/2013 | | | 37.39 | | | (.23 | ) | | | 9.67 | | | | 9.44 | | | | (.27 | ) | | | 46.56 | | | | 25.41 | | | | 736 | | | 1.83 | | | | 1.83 | | | | (.55 | ) |
| Year ended 9/30/2012 | | | 30.07 | | | (.18 | ) | | | 7.50 | | | | 7.32 | | | | — | | | | 37.39 | | | | 24.34 | | | | 647 | | | 1.89 | | | | 1.89 | | | | (.52 | ) |
| Year ended 9/30/2011 | | | 34.30 | | | (.20 | ) | | | (3.76 | ) | | | (3.96 | ) | | | (.27 | ) | | | 30.07 | | | | (11.72 | ) | | | 581 | | | 1.86 | | | | 1.86 | | | | (.54 | ) |
| Year ended 9/30/2010 | | | 29.03 | | | (.11 | ) | | | 5.38 | | | | 5.27 | | | | — | | | | 34.30 | | | | 18.19 | | | | 712 | | | 1.93 | | | | 1.93 | | | | (.37 | ) |
| Year ended 9/30/2009 | | | 27.55 | | | (.02 | ) | | | 1.50 | | | | 1.48 | | | | — | | | | 29.03 | | | | 5.37 | | | | 603 | | | 2.15 | | | | 2.14 | | | | (.09 | ) |
| Class R-3: | | | | | | | | | | | | | | | | | | | | | | | | | | | | | | | | | | | | | | | | | | |
| Year ended 9/30/2013 | | | 38.39 | | | (.05 | ) | | | 9.89 | | | | 9.84 | | | | (.44 | ) | | | 47.79 | | | | 25.90 | | | | 836 | | | 1.40 | | | | 1.40 | | | | (.12 | ) |
| Year ended 9/30/2012 | | | 30.73 | | | (.02 | ) | | | 7.68 | | | | 7.66 | | | | — | | | | 38.39 | | | | 24.92 | | | | 694 | | | 1.42 | | | | 1.42 | | | | (.05 | ) |
| Year ended 9/30/2011 | | | 35.03 | | | (.03 | ) | | | (3.84 | ) | | | (3.87 | ) | | | (.43 | ) | | | 30.73 | | | | (11.28 | ) | | | 586 | | | 1.41 | | | | 1.41 | | | | (.08 | ) |
| Year ended 9/30/2010 | | | 29.64 | | | .04 | | | | 5.49 | | | | 5.53 | | | | (.14 | ) | | | 35.03 | | | | 18.71 | | | | 667 | | | 1.44 | | | | 1.44 | | | | .13 | |
| Year ended 9/30/2009 | | | 27.94 | | | .12 | | | | 1.58 | | | | 1.70 | | | | — | | | | 29.64 | | | | 6.05 | | | | 534 | | | 1.53 | | | | 1.51 | | | | .53 | |
| Class R-4: | | | | | | | | | | | | | | | | | | | | | | | | | | | | | | | | | | | | | | | | | | |
| Year ended 9/30/2013 | | | 39.03 | | | .09 | | | | 10.04 | | | | 10.13 | | | | (.57 | ) | | | 48.59 | | | | 26.31 | | | | 712 | | | 1.07 | | | | 1.07 | | | | .21 | |
| Year ended 9/30/2012 | | | 31.25 | | | .11 | | | | 7.80 | | | | 7.91 | | | | (.13 | ) | | | 39.03 | | | | 25.38 | | | | 550 | | | 1.08 | | | | 1.08 | | | | .30 | |
| Year ended 9/30/2011 | | | 35.60 | | | .10 | | | | (3.91 | ) | | | (3.81 | ) | | | (.54 | ) | | | 31.25 | | | | (10.98 | ) | | | 441 | | | 1.07 | | | | 1.07 | | | | .26 | |
| Year ended 9/30/2010 | | | 30.12 | | | .15 | | | | 5.58 | | | | 5.73 | | | | (.25 | ) | | | 35.60 | | | | 19.15 | | | | 486 | | | 1.09 | | | | 1.09 | | | | .48 | |
| Year ended 9/30/2009 | | | 28.29 | | | .20 | | | | 1.63 | | | | 1.83 | | | | — | | | | 30.12 | | | | 6.47 | | | | 378 | | | 1.14 | | | | 1.13 | | | | .88 | |
| Class R-5: | | | | | | | | | | | | | | | | | | | | | | | | | | | | | | | | | | | | | | | | | | |
| Year ended 9/30/2013 | | | 39.71 | | | .22 | | | | 10.22 | | | | 10.44 | | | | (.69 | ) | | | 49.46 | | | | 26.72 | | | | 550 | | | .77 | | | | .77 | | | | .51 | |
| Year ended 9/30/2012 | | | 31.80 | | | .22 | | | | 7.93 | | | | 8.15 | | | | (.24 | ) | | | 39.71 | | | | 25.77 | | | | 384 | | | .78 | | | | .78 | | | | .60 | |
| Year ended 9/30/2011 | | | 36.21 | | | .22 | | | | (3.99 | ) | | | (3.77 | ) | | | (.64 | ) | | | 31.80 | | | | (10.74 | ) | | | 314 | | | .77 | | | | .77 | | | | .56 | |
| Year ended 9/30/2010 | | | 30.60 | | | .26 | | | | 5.66 | | | | 5.92 | | | | (.31 | ) | | | 36.21 | | | | 19.50 | | | | 347 | | | .78 | | | | .78 | | | | .79 | |
| Year ended 9/30/2009 | | | 28.64 | | | .28 | | | | 1.68 | | | | 1.96 | | | | — | | | | 30.60 | | | | 6.84 | | | | 260 | | | .82 | | | | .80 | | | | 1.26 | |
| Class R-6: | | | | | | | | | | | | | | | | | | | | | | | | | | | | | | | | | | | | | | | | | | |
| Year ended 9/30/2013 | | | 39.34 | | | .25 | | | | 10.12 | | | | 10.37 | | | | (.71 | ) | | | 49.00 | | | | 26.80 | | | | 1,206 | | | .72 | | | | .72 | | | | .57 | |
| Year ended 9/30/2012 | | | 31.52 | | | .24 | | | | 7.84 | | | | 8.08 | | | | (.26 | ) | | | 39.34 | | | | 25.79 | | | | 768 | | | .73 | | | | .73 | | | | .67 | |
| Year ended 9/30/2011 | | | 35.89 | | | .24 | | | | (3.96 | ) | | | (3.72 | ) | | | (.65 | ) | | | 31.52 | | | | (10.68 | ) | | | 494 | | | .72 | | | | .72 | | | | .64 | |
| Year ended 9/30/2010 | | | 30.31 | | | .27 | | | | 5.62 | | | | 5.89 | | | | (.31 | ) | | | 35.89 | | | | 19.57 | | | | 411 | | | .73 | | | | .73 | | | | .84 | |
| Period from 5/1/2009 to 9/30/20094 | | | 22.33 | | | .13 | | | | 7.85 | | | | 7.98 | | | | — | | | | 30.31 | | | | 35.74 | | | | 317 | | | .33 | | | | .33 | | | | .51 | |
| | | Year ended September 30 |
| | | 2013 | | 2012 | | 2011 | | 2010 | | 2009 |
| Portfolio turnover rate for all share classes | | | 37 | % | | | 35 | % | | | 39 | % | | | 45 | % | | | 56 | % |
| 1 | Based on average shares outstanding. |
| 2 | Total returns exclude any applicable sales charges, including contingent deferred sales charges. |
| 3 | This column reflects the impact, if any, of certain waivers from CRMC. During one of the periods shown, CRMC reduced fees for investment advisory services. |
| 4 | Based on operations for the period shown and, accordingly, is not representative of a full year. |
See Notes to Financial Statements
Report of Independent Registered Public Accounting Firm
To the Shareholders and Board of Directors of SMALLCAP World Fund, Inc.:
We have audited the accompanying statement of assets and liabilities of SMALLCAP World Fund, Inc. (the “Fund”), including the summary investment portfolio, as of September 30, 2013, and the related statement of operations for the year then ended, the statements of changes in net assets for each of the two years in the period then ended, and the financial highlights for each of the periods presented. These financial statements and financial highlights are the responsibility of the Fund’s management. Our responsibility is to express an opinion on these financial statements and financial highlights based on our audits.
We conducted our audits in accordance with the standards of the Public Company Accounting Oversight Board (United States). Those standards require that we plan and perform the audit to obtain reasonable assurance about whether the financial statements and financial highlights are free of material misstatement. The Fund is not required to have, nor were we engaged to perform, an audit of its internal control over financial reporting. Our audits included consideration of internal control over financial reporting as a basis for designing audit procedures that are appropriate in the circumstances, but not for the purpose of expressing an opinion on the effectiveness of the Fund’s internal control over financial reporting. Accordingly, we express no such opinion. An audit also includes examining, on a test basis, evidence supporting the amounts and disclosures in the financial statements, assessing the accounting principles used and significant estimates made by management, as well as evaluating the overall financial statement presentation. Our procedures included confirmation of securities owned as of September 30, 2013, by correspondence with the custodian and brokers; where replies were not received from brokers, we performed other auditing procedures. We believe that our audits provide a reasonable basis for our opinion.
In our opinion, such financial statements and financial highlights referred to above present fairly, in all material respects, the financial position of SMALLCAP World Fund, Inc. as of September 30, 2013, the results of its operations for the year then ended, the changes in its net assets for each of the two years in the period then ended, and the financial highlights for each of the periods presented, in conformity with accounting principles generally accepted in the United States of America.
Deloitte & Touche LLP
Costa Mesa, California
November 8, 2013
As a fund shareholder, you incur two types of costs: (1) transaction costs, such as initial sales charges on purchase payments and contingent deferred sales charges on redemptions (loads), and (2) ongoing costs, including management fees, distribution and service (12b-1) fees, and other expenses. This example is intended to help you understand your ongoing costs (in dollars) of investing in the fund so you can compare these costs with the ongoing costs of investing in other mutual funds. The example is based on an investment of $1,000 invested at the beginning of the period and held for the entire six-month period (April 1, 2013, through September 30, 2013).
Actual expenses:
The first line of each share class in the table on the following page provides information about actual account values and actual expenses. You may use the information in this line, together with the amount you invested, to estimate the expenses that you paid over the period. Simply divide your account value by $1,000 (for example, an $8,600 account value divided by $1,000 = 8.6), then multiply the result by the number in the first line under the heading entitled “Expenses paid during period” to estimate the expenses you paid on your account during this period.
Hypothetical example for comparison purposes:
The second line of each share class in the table on the following page provides information about hypothetical account values and hypothetical expenses based on the actual expense ratio for the share class and an assumed rate of return of 5.00% per year before expenses, which is not the actual return of the share class. The hypothetical account values and expenses may not be used to estimate the actual ending account balance or expenses you paid for the period. You may use this information to compare the ongoing costs of investing in the fund and other funds. To do so, compare this 5.00% hypothetical example with the 5.00% hypothetical examples that appear in the shareholder reports of the other funds.
Notes:
There are some account fees that are charged to certain types of accounts, such as individual retirement accounts and 529 college savings plan accounts (generally, a $10 fee is charged to set up the account and an additional $10 fee is charged to the account annually), that would increase the amount of expenses paid on your account. In addition, retirement plan participants may be subject to certain fees charged by the plan sponsor, and Class F-1, F-2 and 529-F-1 shareholders may be subject to fees charged by financial intermediaries, typically ranging from 0.75% to 1.50% of assets annually depending on services offered. You can estimate the impact of these fees by adding the amount of the fees to the total estimated expenses you paid on your account during the period as calculated above. In addition, your ending account value would be lower by the amount of these fees.
Note that the expenses shown in the table on the following page are meant to highlight your ongoing costs only and do not reflect any transactional costs, such as sales charges (loads). Therefore, the second line of each share class in the table is useful in comparing ongoing costs only and will not help you determine the relative total costs of owning different funds. In addition, if these transactional costs were included, your costs would have been higher.
| | | Beginning
account value
4/1/2013 | | | Ending
account value
9/30/2013 | | | Expenses paid
during period* | | | Annualized
expense ratio | |
| Class A — actual return | | $ | 1,000.00 | | | $ | 1,123.84 | | | $ | 5.91 | | | | 1.11 | % |
| Class A — assumed 5% return | | | 1,000.00 | | | | 1,019.50 | | | | 5.62 | | | | 1.11 | |
| Class B — actual return | | | 1,000.00 | | | | 1,119.30 | | | | 9.93 | | | | 1.87 | |
| Class B — assumed 5% return | | | 1,000.00 | | | | 1,015.69 | | | | 9.45 | | | | 1.87 | |
| Class C — actual return | | | 1,000.00 | | | | 1,119.19 | | | | 10.15 | | | | 1.91 | |
| Class C — assumed 5% return | | | 1,000.00 | | | | 1,015.49 | | | | 9.65 | | | | 1.91 | |
| Class F-1 — actual return | | | 1,000.00 | | | | 1,123.69 | | | | 5.80 | | | | 1.09 | |
| Class F-1 — assumed 5% return | | | 1,000.00 | | | | 1,019.60 | | | | 5.52 | | | | 1.09 | |
| Class F-2 — actual return | | | 1,000.00 | | | | 1,125.57 | | | | 4.32 | | | | .81 | |
| Class F-2 — assumed 5% return | | | 1,000.00 | | | | 1,021.01 | | | | 4.10 | | | | .81 | |
| Class 529-A — actual return | | | 1,000.00 | | | | 1,123.21 | | | | 6.28 | | | | 1.18 | |
| Class 529-A — assumed 5% return | | | 1,000.00 | | | | 1,019.15 | | | | 5.97 | | | | 1.18 | |
| Class 529-B — actual return | | | 1,000.00 | | | | 1,118.81 | | | | 10.52 | | | | 1.98 | |
| Class 529-B — assumed 5% return | | | 1,000.00 | | | | 1,015.14 | | | | 10.00 | | | | 1.98 | |
| Class 529-C — actual return | | | 1,000.00 | | | | 1,118.96 | | | | 10.46 | | | | 1.97 | |
| Class 529-C — assumed 5% return | | | 1,000.00 | | | | 1,015.19 | | | | 9.95 | | | | 1.97 | |
| Class 529-E — actual return | | | 1,000.00 | | | | 1,122.12 | | | | 7.55 | | | | 1.42 | |
| Class 529-E — assumed 5% return | | | 1,000.00 | | | | 1,017.95 | | | | 7.18 | | | | 1.42 | |
| Class 529-F-1 — actual return | | | 1,000.00 | | | | 1,124.35 | | | | 5.17 | | | | .97 | |
| Class 529-F-1 — assumed 5% return | | | 1,000.00 | | | | 1,020.21 | | | | 4.91 | | | | .97 | |
| Class R-1 — actual return | | | 1,000.00 | | | | 1,119.49 | | | | 9.78 | | | | 1.84 | |
| Class R-1 — assumed 5% return | | | 1,000.00 | | | | 1,015.84 | | | | 9.30 | | | | 1.84 | |
| Class R-2 — actual return | | | 1,000.00 | | | | 1,119.77 | | | | 9.62 | | | | 1.81 | |
| Class R-2 — assumed 5% return | | | 1,000.00 | | | | 1,015.99 | | | | 9.15 | | | | 1.81 | |
| Class R-3 — actual return | | | 1,000.00 | | | | 1,122.11 | | | | 7.45 | | | | 1.40 | |
| Class R-3 — assumed 5% return | | | 1,000.00 | | | | 1,018.05 | | | | 7.08 | | | | 1.40 | |
| Class R-4 — actual return | | | 1,000.00 | | | | 1,123.98 | | | | 5.70 | | | | 1.07 | |
| Class R-4 — assumed 5% return | | | 1,000.00 | | | | 1,019.70 | | | | 5.42 | | | | 1.07 | |
| Class R-5 — actual return | | | 1,000.00 | | | | 1,125.61 | | | | 4.10 | | | | .77 | |
| Class R-5 — assumed 5% return | | | 1,000.00 | | | | 1,021.21 | | | | 3.90 | | | | .77 | |
| Class R-6 — actual return | | | 1,000.00 | | | | 1,125.92 | | | | 3.84 | | | | .72 | |
| Class R-6 — assumed 5% return | | | 1,000.00 | | | | 1,021.46 | | | | 3.65 | | | | .72 | |
| * | The “expenses paid during period” are equal to the “annualized expense ratio,” multiplied by the average account value over the period, multiplied by the number of days in the period, and divided by 365 (to reflect the one-half year period). |
Approval of Investment Advisory and Service Agreement
The fund’s board has approved the fund’s Investment Advisory and Service Agreement (the “agreement”) with Capital Research and Management Company (“CRMC”) for an additional one-year term through November 30, 2014. The board approved the agreement following the recommendation of the fund’s Contracts Committee (the “committee”), which is composed of all of the fund’s independent board members. The board and the committee determined that the fund’s advisory fee structure was fair and reasonable in relation to the services provided and that approving the agreement was in the best interests of the fund and its shareholders.
In reaching this decision, the board and the committee took into account information furnished to them throughout the year, as well as information prepared specifically in connection with their review of the agreement, and were advised by their independent counsel. They considered the following factors, among others, but did not identify any single issue or particular piece of information that, in isolation, was the controlling factor, and each board and committee member did not necessarily attribute the same weight to each factor.
1. Nature, extent and quality of services
The board and the committee considered the depth and quality of CRMC’s investment management process, including its global research capabilities; the experience, capability and integrity of its senior management and other personnel; the low turnover rates of its key personnel; the overall financial strength and stability of its organization; and the ongoing evolution of CRMC’s organizational structure designed to maintain and strengthen these qualities. The board and the committee also considered the nature, extent and quality of administrative, compliance and shareholder services provided by CRMC to the fund under the agreement and other agreements, as well as the benefits to fund shareholders from investing in a fund that is part of a large family of funds. The board and the committee concluded that the nature, extent and quality of the services provided by CRMC have benefited and should continue to benefit the fund and its shareholders.
2. Investment results
The board and the committee considered the investment results of the fund in light of its objective of pursuing long term growth of capital. They compared the fund’s investment results with those of other relevant funds (including funds that form the basis of the Lipper index for the category in which the fund is included) and market data such as relevant market and fund indexes, over various periods through March 31, 2013. This report, including the letter to shareholders and related disclosures, contains certain information about the fund’s investment results. The board and the committee reviewed the fund’s investment results measured against the various indexes, including the MSCI All Country World Small Cap Index and the Lipper Global Small/Mid-Cap Funds Index. They noted that the investment results of the fund were mixed, generally comparing favorably to the Lipper Global Small/Mid-Cap Funds Index for the five-year period and over shorter periods, and below the MSCI All Country World Small Cap index for the 10-year period, the five-year period and over shorter periods. The board and the committee concluded that the fund’s investment results have been satisfactory and that CRMC’s record in managing the fund indicated that its continued management should benefit the fund and its shareholders.
3. Advisory fees and total expenses
The board and the committee compared the advisory fees and total expense levels of the fund to those of other relevant funds. They observed that the fund’s advisory fees and expenses generally compared favorably to those of other similar funds included in the Lipper Global Small/Mid-Cap Funds category. The board and the committee also noted the breakpoint discounts in the fund’s advisory fee structure that reduce the level of fees charged by CRMC to the fund as fund assets increase. In addition, they reviewed information regarding effective advisory fees charged to non-mutual fund clients by CRMC and its affiliates. They noted that, to the extent there were differences between the advisory fees paid by the fund and the advisory fees paid by those clients, the differences appropriately reflected the investment, operational and regulatory differences between advising the fund and the other clients. The board and the committee concluded that the fund’s cost structure was fair and reasonable in relation to the services provided, and that the fund’s shareholders receive reasonable value in return for the advisory fees and other amounts paid to CRMC by the fund.
4. Ancillary benefits
The board and the committee considered a variety of other benefits that CRMC and its affiliates receive as a result of CRMC’s relationship with the fund and the other American Funds, including fees for administrative services provided to certain share classes; fees paid to CRMC’s affiliated transfer agent; sales charges and distribution fees received and retained by the fund’s principal underwriter, an affiliate of CRMC; and possible ancillary benefits to CRMC’s institutional management affiliates. The board and the committee reviewed CRMC’s portfolio trading practices, noting that while CRMC receives the benefit of research provided by broker-dealers executing portfolio transactions on behalf of the fund, it does not obtain third-party research or other services in return for allocating brokerage to such broker-dealers. The board and the committee took these ancillary benefits into account in evaluating the reasonableness of the advisory fees and other amounts paid to CRMC by the fund.
5. Adviser financial information
The board and the committee reviewed information regarding CRMC’s costs of providing services to the American Funds, including personnel, systems and resources of investment, compliance, trading, accounting and other administrative operations. They considered CRMC’s costs and willingness to invest in technology, infrastructure and staff to maintain and expand services and capabilities, respond to industry and regulatory developments, and attract and retain qualified personnel. They noted information regarding the compensation structure for CRMC’s investment professionals. The board and the committee also compared CRMC’s profitability to the reported results of several large, publicly held investment management companies. The board and the committee noted the competitiveness and cyclicality of both the mutual fund industry and the capital markets, and the importance in that environment of CRMC’s long-term profitability for maintaining its independence, company culture and management continuity. They further considered the breakpoint discounts in the fund’s advisory fee structure. The board and the committee concluded that the fund’s advisory fee structure reflected a reasonable sharing of benefits between CRMC and the fund’s shareholders.
We are required to advise you of the federal tax status of certain distributions received by shareholders during the fiscal year. The fund hereby designates the following amounts for the fund’s fiscal year ended September 30, 2013:
| Long-term capital gains | $48,142,000 |
| Foreign taxes | $0.03 per share |
| Foreign source income | $0.44 per share |
| Qualified dividend income | 100% |
| Corporate dividends received deduction | $48,826,000 |
Individual shareholders should refer to their Form 1099 or other tax information, which will be mailed in January 2014, to determine the calendar year amounts to be included on their 2013 tax returns. Shareholders should consult their tax advisors.
Board of directors and other officers
“Independent” directors1
| Name and age | | Year first
elected
a director
of the fund2 | | Principal occupation(s) during past five years | | Number of
portfolios in fund
complex overseen
by director | | Other directorships3
held by director |
| Ronald P. Badie, 70 | | 2010 | | Retired; former Vice Chairman, Deutsche Bank Alex. Brown | | 3 | | Amphenol Corporation; Nautilus, Inc. |
| Joseph C. Berenato, 67 Chairman of the Board (Independent and Non-Executive) | | 2000 | | Former Chairman and CEO, Ducommun Incorporated (aerospace components manufacturer) | | 6 | | Ducommun Incorporated |
| Louise H. Bryson, 69 | | 2010 | | Chair Emerita of the Board of Trustees, J. Paul Getty Trust; former President, Distribution, Lifetime Entertainment Network; former Executive Vice President and General Manager, Lifetime Movie Network | | 7 | | None |
| Robert J. Denison, 72 | | 2010 | | Chair, First Security Management (private investment) | | 6 | | None |
| Mary Anne Dolan, 66 | | 2008 | | Founder and President, MAD Ink (communications company) | | 10 | | None |
| John G. Freund, 60 | | 2000 | | Founder and Managing Director, Skyline Ventures (venture capital investor in health care companies) | | 3 | | Mako Surgical Corporation; Tetraphase Pharmaceuticals, Inc.; XenoPort, Inc. |
| Leonade D. Jones, 66 | | 1995 | | Retired; former Treasurer, The Washington Post Company (1987–1996) | | 10 | | None |
| William H. Kling, 71 | | 1990 | | President Emeritus, American Public Media | | 10 | | None |
| Christopher E. Stone, 57 | | 2007 | | President, Open Society Foundations; former Professor of the Practice of Criminal Justice, John F. Kennedy School of Government, Harvard University | | 6 | | None |
Robert A. Fox and John G. McDonald, directors of the fund since 2010, have retired from the board. The directors thank Mr. Fox and Prof. McDonald for their service and dedication to the fund.
“Interested” directors4,5
Name, age and
position with fund | | Year first
elected
a director
or officer
of the fund2 | | Principal occupation(s) during past five years
and positions held with affiliated entities or
the principal underwriter of the fund | | Number of
portfolios in fund
complex overseen
by director | | Other directorships3
held by director |
Jonathan Knowles, Ph.D., 52
Vice Chairman of the Board | | 2000 | | Director, Capital Research and Management Company; Senior Vice President — Capital World Investors, Capital Research Company6 | | 1 | | None |
| Gregory W. Wendt, 52 President | | 1992 | | Senior Vice President — Capital Research Global Investors, Capital Research Company6 | | 1 | | None |
| | | | | | | | | |
The fund’s statement of additional information includes further details about fund directors and is available without charge upon request by calling American Funds Service Company at (800) 421-4225 or by visiting the American Funds website at americanfunds.com. The address for all directors and officers of the fund is 333 South Hope Street, Los Angeles, CA 90071, Attention: Secretary.
See page 36 for footnotes.
Other officers5
Name, age and
position with fund | | Year first
elected
an officer
of the fund2 | | Principal occupation(s) during past five years and positions held with affiliated entities
or the principal underwriter of the fund |
Paul F. Roye, 59
Executive Vice President | | 2007 | | Senior Vice President — Fund Business Management Group, Capital Research and Management Company; Chief Legal Officer, Capital Research and Management Company; Director, American Funds Service Company6 |
Brady L. Enright, 46
Senior Vice President | | 2004 | | Senior Vice President — Capital World Investors, Capital Research and Management Company |
J. Blair Frank, 47
Senior Vice President | | 1999 | | Senior Vice President — Capital Research Global Investors, Capital Research and Management Company |
Lawrence Kymisis, 43
Senior Vice President | | 2008 | | Senior Vice President — Capital Research Global Investors, Capital Research Company6 |
Walter R. Burkley, 47
Vice President | | 2007 | | Senior Vice President and Senior Counsel — Fund Business Management Group, Capital Research and Management Company; Director, Capital Research Company6 |
Grant L. Cambridge, 51
Vice President | | 2001 | | Senior Vice President — Capital Research Global Investors, Capital Research Company6 |
Bradford F. Freer, 44
Vice President | | 2008 | | Senior Vice President — Capital World Investors, Capital Research Company6 |
Patrick F. Quan, 55
Secretary | | 2010 | | Vice President — Fund Business Management Group, Capital Research and Management Company |
Jeffrey P. Regal, 42
Treasurer | | 2010 | | Vice President — Fund Business Management Group, Capital Research and Management Company |
Julie E. Lawton, 40
Assistant Secretary | | 2010 | | Assistant Vice President — Fund Business Management Group, Capital Research and Management Company |
Dori Laskin, 62
Assistant Treasurer | | 2011 | | Vice President — Fund Business Management Group, Capital Research and Management Company |
Neal F. Wellons, 42
Assistant Treasurer | | 2008 | | Vice President — Fund Business Management Group, Capital Research and Management Company |
| 1 | The term “independent” director refers to a director who is not an “interested person” of the fund within the meaning of the Investment Company Act of 1940. |
| 2 | Directors and officers of the fund serve until their resignation, removal or retirement. |
| 3 | This includes all directorships (other than those in the American Funds or other funds managed by Capital Research and Management Company) that are held by each director as a trustee or director of a public company or a registered investment company. |
| 4 | “Interested persons” within the meaning of the Investment Company Act of 1940, on the basis of their affiliation with the fund’s investment adviser, Capital Research and Management Company, or affiliated entities (including the fund’s principal underwriter). |
| 5 | All of the officers listed, except Messrs. Cambridge, Frank and Kymisis, are officers and/or directors/trustees of one or more of the other funds for which Capital Research and Management Company serves as investment adviser. |
| 6 | Company affiliated with Capital Research and Management Company. |
Offices of the fund and of the investment adviser
Capital Research and Management Company
333 South Hope Street
Los Angeles, CA 90071-1406
6455 Irvine Center Drive
Irvine, CA 92618-4518
Transfer agent for shareholder accounts
American Funds Service Company
(Write to the address near you.)
P.O. Box 6007
Indianapolis, IN 46206-6007
P.O. Box 2280
Norfolk, VA 23501-2280
Custodian of assets
State Street Bank and Trust Company
One Lincoln Street
Boston, MA 02111
Counsel
K&L Gates LLP
Four Embarcadero Center, Suite 1200
San Francisco, CA 94111-5994
Independent registered public accounting firm
Deloitte & Touche LLP
695 Town Center Drive
Suite 1200
Costa Mesa, CA 92626-7188
Principal underwriter
American Funds Distributors, Inc.
333 South Hope Street
Los Angeles, CA 90071-1406
Investors should carefully consider investment objectives, risks, charges and expenses. This and other important information is contained in the fund prospectus and summary prospectus, which can be obtained from your financial professional and should be read carefully before investing. You may also call American Funds Service Company (AFS) at (800) 421-4225 or visit the American Funds website at americanfunds.com.
“American Funds Proxy Voting Procedures and Principles” — which describes how we vote proxies relating to portfolio securities — is available on the American Funds website or upon request by calling AFS. The fund files its proxy voting record with the U.S. Securities and Exchange Commission (SEC) for the 12 months ended June 30 by August 31. The proxy voting record is available free of charge on the SEC website at sec.gov and on the American Funds website.
A complete September 30, 2013, portfolio of SMALLCAP World Fund’s investments is available free of charge by calling AFS or visiting the SEC website (where it is part of Form N-CSR).
SMALLCAP World Fund files a complete list of its portfolio holdings with the SEC for the first and third quarters of each fiscal year on Form N-Q. This filing is available free of charge on the SEC website. You may also review or, for a fee, copy this filing at the SEC’s Public Reference Room in Washington, D.C. Additional information regarding the operation of the Public Reference Room may be obtained by calling the SEC’s Office of Investor Education and Advocacy at (800) SEC-0330. Additionally, the list of portfolio holdings is available by calling AFS.
This report is for the information of shareholders of SMALLCAP World Fund, but it also may be used as sales literature when preceded or accompanied by the current prospectus or summary prospectus, which gives details about charges, expenses, investment objectives and operating policies of the fund. If used as sales material after December 31, 2013, this report must be accompanied by an American Funds statistical update for the most recently completed calendar quarter.
The American Funds Advantage
Since 1931, American Funds, part of Capital Group, has helped investors pursue long-term investment success. Our consistent approach — in combination with The Capital SystemSM — has resulted in a superior long-term track record.
| | Aligned with investor success |
| | We base our decisions on a long-term perspective, which we believe aligns our goals with the interests of our clients. Our portfolio managers average 25 years of investment experience, including 20 years at our company, reflecting a career commitment to our long-term approach.1 |
| | |
| | The Capital SystemSM |
| | Our investment process, The Capital System, combines individual accountability with teamwork. Each fund is divided into portions that are managed independently by investment professionals with diverse backgrounds, ages and investment approaches. An extensive global research effort is the backbone of our system. |
| | |
| | Superior long-term track record |
| | Our equity funds have beaten their Lipper peer indexes in 90% of 10-year periods and 96% of 20-year periods. Our fixed-income funds have beaten their Lipper indexes in 58% of 10-year periods and 63% of 20-year periods.2 Our fund management fees have been among the lowest in the industry.3 |
| | 1 | Portfolio manager experience as of December 31, 2012. |
| | 2 | Based on Class A share results for rolling periods through December 31, 2012. Periods covered are the shorter of the fund’s lifetime or since the comparable Lipper index inception date. |
| | 3 | Based on management fees for the 20-year period ended December 31, 2012, versus comparable Lipper categories, excluding funds of funds. |

ITEM 2 – Code of Ethics
The Registrant has adopted a Code of Ethics that applies to its Principal Executive Officer and Principal Financial Officer. The Registrant undertakes to provide to any person without charge, upon request, a copy of the Code of Ethics. Such request can be made to American Funds Service Company at 800/421-9225 or to the Secretary of the Registrant, 333 South Hope Street, Los Angeles, California 90071.
ITEM 3 – Audit Committee Financial Expert
The Registrant’s board has determined that Christopher E. Stone, a member of the Registrant’s audit committee, is an “audit committee financial expert” and "independent," as such terms are defined in this Item. This designation will not increase the designee’s duties, obligations or liability as compared to his or her duties, obligations and liability as a member of the audit committee and of the board, nor will it reduce the responsibility of the other audit committee members. There may be other individuals who, through education or experience, would qualify as "audit committee financial experts" if the board had designated them as such. Most importantly, the board believes each member of the audit committee contributes significantly to the effective oversight of the Registrant’s financial statements and condition.
ITEM 4 – Principal Accountant Fees and Services
| | Registrant: |
| | | a) Audit Fees: |
| | | | 2012 | $118,000 |
| | | | 2013 | $125,000 |
| | | | |
| | | b) Audit-Related Fees: |
| | | | 2012 | $ 6,000 |
| | | | 2013 | $ 7,000 |
| | | | The audit-related fees consist of assurance and related services relating to the examination of the Registrant’s investment adviser conducted in accordance with Statement on Standards for Attestation Engagements Number 16 issued by the American Institute of Certified Public Accountants. |
| | | | |
| | | c) Tax Fees: |
| | | | 2012 | $ 37,000 |
| | | | 2013 | $ 6,000 |
| | | | The tax fees consist of professional services relating to the preparation of the Registrant’s tax returns including returns relating to the Registrant’s investments in non-U.S. jurisdictions. |
| | | | |
| | | d) All Other Fees: |
| | | | 2012 | None |
| | | | 2013 | None |
| | | | |
| | Adviser and affiliates (includes only fees for non-audit services billed to the adviser and affiliates for engagements that relate directly to the operations and financial reporting of the Registrant and were subject to the pre-approval policies described below): |
| | | a) Audit Fees: |
| | | | Not Applicable |
| | | | |
| | | b) Audit-Related Fees: |
| | | | 2012 | $ 1,028,000 |
| | | | 2013 | $ 1,046,000 |
| | | | The audit-related fees consist of assurance and related services relating to the examination of the Registrant’s transfer agent, principal underwriter and investment adviser conducted in accordance with Statement on Standards for Attestation Engagements Number 16 issued by the American Institute of Certified Public Accountants. |
| | | | |
| | | c) Tax Fees: |
| | | | 2012 | $ 18,000 |
| | | | 2013 | $ 28,000 |
| | | | The tax fees consist of consulting services relating to the Registrant’s investments. |
| | | | |
| | | d) All Other Fees: |
| | | | 2012 | $ 2,000 |
| | | | 2013 | $ 2,000 |
| | | | The other fees consist of subscription services related to an accounting research tool. |
All audit and permissible non-audit services that the Registrant’s audit committee considers compatible with maintaining the independent registered public accounting firm’s independence are required to be pre-approved by the committee. The pre-approval requirement will extend to all non-audit services provided to the Registrant, the investment adviser, and any entity controlling, controlled by, or under common control with the investment adviser that provides ongoing services to the Registrant, if the engagement relates directly to the operations and financial reporting of the Registrant. The committee will not delegate its responsibility to pre-approve these services to the investment adviser. The committee may delegate to one or more committee members the authority to review and pre-approve audit and permissible non-audit services. Actions taken under any such delegation will be reported to the full committee at its next meeting. The pre-approval requirement is waived with respect to non-audit services if certain conditions are met. The pre-approval requirement was not waived for any of the non-audit services listed above provided to the Registrant, adviser and affiliates.
Aggregate non-audit fees paid to the Registrant’s auditors, including fees for all services billed to the Registrant, adviser and affiliates that provide ongoing services to the Registrant, were $1,613,000 for fiscal year 2012 and $1,544,000 for fiscal year 2013. The non-audit services represented by these amounts were brought to the attention of the committee and considered to be compatible with maintaining the auditors’ independence.
ITEM 5 – Audit Committee of Listed Registrants
Not applicable to this Registrant, insofar as the Registrant is not a listed issuer as defined in Rule 10A-3 under the Securities Exchange Act of 1934.
ITEM 6 – Schedule of Investments
 | SMALLCAP World Fund, Inc.® Investment portfolio September 20, 2013 |
| Common stocks 91.34% | | |
| | | Value |
| Consumer discretionary 21.45% | Shares | (000) |
| | | |
| Netflix, Inc.1 | 1,143,723 | $353,651 |
| Lions Gate Entertainment Corp.1,2 | 7,381,000 | 258,704 |
| Domino’s Pizza, Inc.2 | 2,940,000 | 199,773 |
| Tesla Motors, Inc.1 | 1,006,663 | 194,709 |
| DSW Inc., Class A | 2,246,500 | 191,671 |
| ASOS PLC1 | 2,174,955 | 181,016 |
| Paddy Power PLC | 1,967,177 | 157,682 |
| Melco International Development Ltd. | 58,168,000 | 155,997 |
| TOD’S SpA | 744,000 | 139,504 |
| Mr Price Group Ltd. | 8,228,383 | 113,957 |
| Five Below, Inc.1 | 2,584,833 | 113,086 |
| Melco Crown Entertainment Ltd. (ADR)1 | 3,350,000 | 106,631 |
| Dollarama Inc. | 1,155,000 | 93,864 |
| Ted Baker PLC2 | 2,882,993 | 89,472 |
| Chow Sang Sang Holdings International Ltd. | 28,609,000 | 82,995 |
| John Wiley & Sons, Inc., Class A | 1,681,683 | 80,199 |
| Rightmove PLC | 2,054,206 | 78,782 |
| Wendy’s Co. | 9,123,000 | 77,363 |
| Tiffany & Co. | 947,000 | 72,559 |
| Liberty Global PLC, Class A1 | 495,098 | 39,286 |
| Liberty Global PLC, Class C1 | 369,694 | 27,886 |
| START TODAY Co., Ltd. | 2,348,700 | 66,068 |
| Minth Group Ltd. | 32,284,000 | 64,352 |
| Penske Automotive Group, Inc. | 1,502,000 | 64,180 |
| Inchcape PLC | 6,465,600 | 63,902 |
| L’Occitane International SA | 23,640,250 | 61,723 |
| Domino’s Pizza Enterprises Ltd.2 | 4,752,365 | 60,473 |
| Tile Shop Holdings, Inc.1 | 2,025,000 | 59,717 |
| YOOX SpA1 | 1,641,469 | 56,272 |
| Ocado Group PLC1 | 8,533,708 | 54,708 |
| Brunello Cucinelli SpA | 1,672,530 | 54,350 |
| SeaWorld Entertainment, Inc. | 1,781,700 | 52,792 |
| William Hill PLC | 7,947,800 | 51,853 |
| Techtronic Industries Co. Ltd. | 19,300,000 | 50,266 |
| Gentex Corp. | 1,954,567 | 50,017 |
| Domino’s Pizza Group PLC | 5,289,000 | 50,004 |
| Jumbo SA1 | 3,967,140 | 49,430 |
| Entertainment One Ltd.1 | 13,659,782 | 48,540 |
| Arcos Dorados Holdings Inc., Class A | 3,885,000 | 46,037 |
| Autoneum Holding AG2 | 373,780 | 44,886 |
| Jarden Corp.1 | 862,500 | 41,745 |
| Jubilant FoodWorks Ltd.1 | 2,220,098 | 41,003 |
| Group 1 Automotive, Inc. | 490,000 | 38,063 |
| Hyundai Home Shopping Co., Ltd. | 256,200 | 37,667 |
| HUGO BOSS AG | 280,231 | 36,251 |
| Common stocks | | |
| | | Value |
| Consumer discretionary (continued) | Shares | (000) |
| | | |
| Brinker International, Inc. | 890,000 | $36,072 |
| Zhongsheng Group Holdings Ltd. | 22,854,000 | 36,008 |
| CTC Media, Inc. | 3,376,500 | 35,487 |
| Ctrip.com International, Ltd. (ADR)1 | 588,300 | 34,374 |
| Bloomin’ Brands, Inc.1 | 1,400,000 | 33,054 |
| Coway Co., Ltd. | 581,000 | 32,167 |
| Giordano International Ltd. | 35,020,000 | 31,923 |
| PT Matahari Department Store Tbk1 | 34,388,000 | 31,180 |
| Valeo SA, non-registered shares | 365,000 | 31,168 |
| Don Quijote Co., Ltd. | 496,000 | 31,033 |
| lululemon athletica inc.1 | 422,800 | 30,902 |
| Winnebago Industries, Inc.1 | 1,161,516 | 30,153 |
| Leggett & Platt, Inc. | 990,000 | 29,849 |
| Boyd Gaming Corp.1 | 2,049,000 | 28,993 |
| Bloomberry Resorts Corp.1 | 122,594,600 | 28,213 |
| SodaStream International Ltd.1 | 450,000 | 28,076 |
| TAKKT AG | 1,456,778 | 27,434 |
| Mothercare PLC1,2 | 4,480,000 | 27,343 |
| Daily Mail and General Trust PLC, Class A, nonvoting | 2,210,000 | 27,263 |
| Navitas Ltd. | 4,625,000 | 26,794 |
| Unibet Group PLC (SDR) | 662,500 | 26,596 |
| Home Inns & Hotels Management Inc. (ADR)1 | 796,000 | 26,427 |
| CJ Home Shopping Co., Ltd. | 76,100 | 24,805 |
| Ekornes ASA | 1,336,625 | 22,673 |
| Café de Coral Holdings Ltd. | 7,238,000 | 22,444 |
| PT Ace Hardware Indonesia Tbk | 369,360,000 | 22,327 |
| Lennar Corp., Class A | 619,000 | 21,913 |
| Parkson Retail Asia Ltd. | 23,182,000 | 21,158 |
| Murphy USA Inc.1 | 510,000 | 20,599 |
| Zee Entertainment Enterprises Ltd. | 5,385,000 | 19,655 |
| Headlam Group PLC | 2,809,685 | 17,558 |
| Chipotle Mexican Grill, Inc.1 | 39,890 | 17,101 |
| Eros International PLC1 | 4,115,000 | 16,321 |
| China Lodging Group, Ltd. (ADR)1 | 840,000 | 15,952 |
| Stella International Holdings Ltd. | 6,090,500 | 15,643 |
| Cox and Kings (India) Ltd.2 | 10,592,000 | 14,990 |
| Cox and Kings (India) Ltd. (GDR)2,3 | 330,000 | 467 |
| Toll Brothers, Inc.1 | 471,800 | 15,300 |
| ValueVision Media, Inc., Class A1,2 | 3,440,761 | 14,967 |
| Weight Watchers International, Inc. | 382,000 | 14,275 |
| Hankook Tire Co., Ltd. | 233,473 | 13,339 |
| TravelCenters of America LLC1,2 | 1,581,250 | 12,413 |
| Sotheby’s Holdings, Inc. | 250,000 | 12,283 |
| eLong, Inc. (ADR)1 | 690,000 | 12,130 |
| Intercontinental Hotels Group PLC | 401,966 | 11,726 |
| CTS Eventim AG | 263,000 | 11,599 |
| HT Media Ltd. | 8,179,036 | 11,464 |
| SHW AG, non-registered shares | 230,000 | 10,021 |
| American Axle & Manufacturing Holdings, Inc.1 | 505,000 | 9,959 |
| D.R. Horton, Inc. | 490,000 | 9,521 |
| GVC Holdings PLC | 1,663,694 | 9,130 |
| Gourmet Master Co., Ltd. | 1,262,000 | 9,049 |
| zooplus AG, non-registered shares1 | 130,000 | 8,774 |
| Common stocks | | |
| | | Value |
| Consumer discretionary (continued) | Shares | (000) |
| | | |
| Mando Corp. | 72,600 | $ 8,613 |
| China Zenix Auto International Ltd. (ADR)1 | 2,152,000 | 7,962 |
| POLYTEC Holding AG, non-registered shares | 834,369 | 7,325 |
| Tribhovandas Bhimji Zaveri Ltd.2 | 3,439,332 | 6,859 |
| Mood Media Corp.1,2,4 | 6,375,000 | 4,147 |
| Mood Media Corp. (CDI)1,2,4 | 3,710,000 | 2,413 |
| Golden Eagle Retail Group Ltd. | 4,136,000 | 6,453 |
| Bijou Brigitte modische Accessoires AG | 52,000 | 5,273 |
| Powerland AG, non-registered shares1,2 | 1,200,000 | 4,886 |
| Talwalkars Better Value Fitness Ltd.2 | 1,694,000 | 3,340 |
| Alpargatas SA, preferred nominative | 449,020 | 2,891 |
| Ten Alps PLC1 | 3,439,001 | 61 |
| Five Star Travel Corp.1,3,4 | 96,033 | 30 |
| CEC Unet PLC1,2,3 | 35,100,775 | — |
| Spot Runner, Inc.1,3,5 | 2,980,544 | — |
| Fontainebleau Resorts LLC, Class A, nonvoting units1,3,5 | 1,900,000 | — |
| | | 5,243,404 |
| | | |
| Health care 13.44% | | |
| | | |
| Regeneron Pharmaceuticals, Inc.1 | 1,064,020 | 332,900 |
| Incyte Corp.1 | 4,445,600 | 169,600 |
| Synageva BioPharma Corp.1,2 | 2,230,074 | 141,186 |
| Pharmacyclics, Inc.1 | 894,556 | 123,824 |
| Molina Healthcare, Inc.1,2 | 3,417,000 | 121,645 |
| athenahealth, Inc.1 | 950,221 | 103,156 |
| BioMarin Pharmaceutical Inc.1 | 1,422,500 | 102,733 |
| Hikma Pharmaceuticals PLC | 5,814,153 | 97,890 |
| Sysmex Corp. | 1,470,000 | 93,618 |
| ArthroCare Corp.1,2 | 2,232,950 | 79,448 |
| Endo Health Solutions Inc.1 | 1,745,100 | 79,297 |
| Alnylam Pharmaceuticals, Inc.1 | 1,213,000 | 77,644 |
| Sirona Dental Systems, Inc.1 | 1,053,000 | 70,477 |
| Grifols, SA, Class A, non-registered shares | 1,234,575 | 50,690 |
| Grifols, SA, Class B, non-registered shares | 463,950 | 14,232 |
| Myriad Genetics, Inc.1 | 2,758,800 | 64,832 |
| Centene Corp.1 | 918,500 | 58,747 |
| Illumina, Inc.1 | 726,600 | 58,731 |
| Intuitive Surgical, Inc.1 | 155,000 | 58,322 |
| Algeta ASA1 | 1,460,500 | 56,348 |
| Exelixis, Inc.1,2 | 9,216,800 | 53,642 |
| Fisher & Paykel Healthcare Corp. Ltd. | 17,602,493 | 52,924 |
| Emeritus Corp.1,2 | 2,729,700 | 50,581 |
| Galapagos NV1,2 | 2,378,928 | 50,206 |
| Insulet Corp.1 | 1,310,400 | 47,489 |
| Nihon Kohden Corp. | 1,129,600 | 46,140 |
| MD Medical Group Investments PLC (GDR)3 | 2,498,700 | 31,209 |
| MD Medical Group Investments PLC (GDR)3,4 | 1,179,100 | 14,727 |
| GN Store Nord AS | 2,137,699 | 44,979 |
| Carl Zeiss Meditec AG, non-registered shares | 1,430,000 | 42,696 |
| bluebird bio, Inc.1,2,3,5 | 1,179,648 | 28,623 |
| bluebird bio, Inc.1,2 | 516,000 | 13,911 |
| VCA Antech, Inc.1 | 1,540,000 | 42,288 |
| Hologic, Inc.1 | 1,965,000 | 40,577 |
| Common stocks | | |
| | | Value |
| Health care (continued) | Shares | (000) |
| | | |
| Orexigen Therapeutics, Inc.1,2 | 6,535,000 | $ 40,125 |
| Genomma Lab Internacional, SAB de CV, Series B1 | 17,303,000 | 39,498 |
| Teleflex Inc. | 460,700 | 37,906 |
| Cadence Pharmaceuticals, Inc. 1,2 | 5,939,969 | 37,481 |
| Fleury SA, ordinary nominative | 4,500,900 | 37,266 |
| NuVasive, Inc.1 | 1,507,436 | 36,917 |
| Theravance, Inc.1 | 897,000 | 36,678 |
| Novadaq Technologies Inc.1 | 2,170,615 | 35,989 |
| Covance Inc.1 | 400,000 | 34,584 |
| Virbac SA | 160,200 | 32,509 |
| Tsukui Corp.2 | 2,595,000 | 31,575 |
| Celesio AG | 1,300,000 | 29,265 |
| PerkinElmer, Inc. | 745,000 | 28,124 |
| Ironwood Pharmaceuticals, Inc., Class A1 | 1,995,000 | 23,641 |
| Orthofix International NV1,2 | 1,116,826 | 23,297 |
| QIAGEN NV1 | 968,751 | 20,884 |
| XenoPort, Inc.1,2 | 3,620,000 | 20,562 |
| Wright Medical Group, Inc.1 | 770,485 | 20,094 |
| Nobel Biocare Holding AG1 | 1,350,000 | 19,929 |
| Intercept Pharmaceuticals, Inc.1 | 270,000 | 18,638 |
| HeartWare International, Inc.1 | 250,000 | 18,303 |
| ChemoCentryx, Inc.1,2 | 3,131,800 | 17,413 |
| Seattle Genetics, Inc.1 | 372,000 | 16,305 |
| MEDICA SA | 565,000 | 14,072 |
| JSC Pharmstandard (GDR)1 | 924,610 | 13,130 |
| Achillion Pharmaceuticals, Inc.1 | 4,130,000 | 12,473 |
| CONMED Corp. | 365,000 | 12,406 |
| Abaxis, Inc. | 262,000 | 11,030 |
| Idenix Pharmaceuticals, Inc.1 | 1,920,000 | 10,003 |
| Medivation, Inc.1 | 160,000 | 9,591 |
| ARIAD Pharmaceuticals, Inc.1 | 520,000 | 9,568 |
| Tsumura & Co. | 315,000 | 9,223 |
| Krka, dd, Novo mesto | 99,787 | 7,418 |
| Merck Ltd. | 299,383 | 2,736 |
| | | 3,283,945 |
| | | |
| Industrials 11.98% | | |
| | | |
| Moog Inc., Class A1,2 | 2,282,800 | 133,932 |
| ITT Corp. | 3,581,621 | 128,759 |
| Intertek Group PLC | 2,225,000 | 119,048 |
| MonotaRO Co., Ltd.2 | 3,348,300 | 97,797 |
| Chart Industries, Inc.1 | 768,400 | 94,544 |
| US Airways Group, Inc.1 | 4,627,000 | 87,728 |
| Northgate PLC2 | 10,626,805 | 73,976 |
| BELIMO Holding AG | 28,050 | 72,114 |
| Oshkosh Corp.1 | 1,340,000 | 65,633 |
| MTU Aero Engines AG | 691,302 | 64,587 |
| IDEX Corp. | 875,000 | 57,094 |
| MITIE Group PLC | 11,709,000 | 56,090 |
| Polypore International, Inc.1 | 1,360,000 | 55,719 |
| Waste Connections, Inc. | 1,206,000 | 54,764 |
| Herman Miller, Inc. | 1,790,000 | 52,232 |
| AirAsia Bhd. | 66,490,000 | 52,221 |
| Common stocks | | |
| | | Value |
| Industrials (continued) | Shares | (000) |
| | | |
| Globaltrans Investment PLC (GDR) | 2,028,246 | $29,410 |
| Globaltrans Investment PLC (GDR)4 | 1,529,400 | 22,176 |
| Loomis AB, Class B | 2,317,410 | 51,024 |
| Clean Harbors, Inc.1 | 813,000 | 47,691 |
| Watsco, Inc. | 486,700 | 45,881 |
| PARK24 Co., Ltd. | 2,508,000 | 44,524 |
| DKSH Holding AG | 519,551 | 44,352 |
| Exponent, Inc. | 616,400 | 44,282 |
| Goodpack Ltd.2 | 30,777,000 | 42,441 |
| Danieli & C. Officine Meccaniche SpA, nonconvertible shares1 | 2,170,903 | 42,438 |
| Alliance Global Group, Inc. | 77,994,000 | 42,096 |
| Comfort Systems USA, Inc.2 | 2,476,000 | 41,621 |
| Landstar System, Inc. | 691,000 | 38,682 |
| KEYW Holding Corp.1,2 | 2,836,400 | 38,150 |
| Japan Airport Terminal Co. Ltd. | 1,581,000 | 36,495 |
| OSG Corp. | 2,003,300 | 34,952 |
| Mistras Group, Inc.1,2 | 2,052,000 | 34,884 |
| Harsco Corp. | 1,390,994 | 34,636 |
| Masco Corp. | 1,625,000 | 34,580 |
| Uponor Oyj | 1,785,000 | 33,663 |
| Proto Labs, Inc.1 | 420,452 | 32,118 |
| Meggitt PLC | 3,470,000 | 30,840 |
| BTS Rail Mass Transit Growth Infrastructure Fund | 98,183,700 | 30,447 |
| Boer Power Holdings Ltd.2 | 39,202,000 | 29,063 |
| SAI Global Ltd. | 6,912,243 | 28,695 |
| Steelcase Inc., Class A | 1,690,000 | 28,088 |
| TransDigm Group Inc. | 190,000 | 26,353 |
| Harmonic Drive Systems Inc. | 1,232,400 | 25,427 |
| Graco Inc. | 340,000 | 25,180 |
| AIA Engineering Ltd.2 | 4,840,050 | 24,299 |
| Blount International, Inc.1 | 1,950,500 | 23,621 |
| Johnson Electric Holdings Ltd. | 31,420,000 | 22,727 |
| Houston Wire & Cable Co.2 | 1,678,900 | 22,615 |
| Frigoglass SAIC1,2 | 3,052,380 | 22,588 |
| TrueBlue, Inc.1 | 913,000 | 21,921 |
| Geberit AG | 74,000 | 19,982 |
| National Express Group PLC | 4,727,700 | 19,616 |
| Luxfer Holdings PLC (ADR) | 1,200,000 | 19,176 |
| Ennis, Inc. | 1,050,000 | 18,942 |
| Flughafen Zürich AG | 35,400 | 18,662 |
| Beacon Roofing Supply, Inc.1 | 500,000 | 18,435 |
| Société BIC SA | 155,500 | 18,081 |
| SATS Ltd. | 6,770,000 | 17,592 |
| King Slide Works Co., Ltd. | 1,999,000 | 17,477 |
| Concentric AB | 1,520,905 | 16,980 |
| Qantas Airways Ltd.1 | 11,800,000 | 16,237 |
| Wienerberger AG | 868,000 | 15,242 |
| Regus PLC | 5,145,000 | 15,159 |
| NORMA Group SE, non-registered shares | 311,800 | 15,021 |
| Go-Ahead Group PLC | 550,000 | 14,941 |
| PT AKR Corporindo Tbk | 40,759,000 | 14,079 |
| Singamas Container Holdings Ltd. | 56,310,000 | 13,795 |
| Carborundum Universal Ltd. | 7,985,000 | 13,265 |
| Common stocks | | |
| | | Value |
| Industrials (continued) | Shares | (000) |
| | | |
| Robert Half International Inc. | 337,000 | $ 13,153 |
| Cebu Air, Inc. | 10,800,000 | 13,023 |
| ARC Document Solutions, Inc.1,2 | 2,765,764 | 12,695 |
| Zumtobel AG | 765,918 | 12,330 |
| United Stationers Inc. | 272,000 | 11,832 |
| USG Corp.1 | 397,000 | 11,346 |
| Mine Safety Appliances Co. | 216,000 | 11,148 |
| Amara Raja Batteries Ltd. | 2,173,886 | 10,098 |
| Andritz AG | 170,000 | 9,994 |
| Teleperformance SA | 204,247 | 9,881 |
| Cummins India Ltd. | 1,418,800 | 9,252 |
| SIA Engineering Co. Ltd. | 2,196,000 | 8,507 |
| Pipavav Defence and Offshore Engineering Co. Ltd.1 | 9,925,000 | 8,267 |
| Mvelaserve Ltd.1,2 | 9,194,800 | 8,224 |
| Pfeiffer Vacuum Technology AG, non-registered shares | 64,000 | 7,836 |
| Gujarat Pipavav Port Ltd.1 | 10,180,000 | 7,504 |
| Global Ports Investments PLC (GDR) | 539,000 | 7,223 |
| China Automation Group Ltd. | 27,000,000 | 5,396 |
| TD Power Systems Ltd. | 1,209,982 | 3,935 |
| Securitas AB, Class B | 17,139 | 196 |
| | | 2,928,720 |
| Information technology 11.30% | | |
| | | |
| AAC Technologies Holdings Inc. | 45,727,000 | 207,826 |
| Vistaprint NV1,2 | 1,860,000 | 105,127 |
| OpenTable, Inc.1,2 | 1,490,000 | 104,270 |
| Demandware, Inc.1,2 | 2,200,000 | 101,926 |
| ASM International NV | 2,798,000 | 97,281 |
| Concur Technologies, Inc.1 | 858,869 | 94,905 |
| National Instruments Corp. | 2,960,479 | 91,568 |
| MercadoLibre, Inc. | 575,000 | 77,573 |
| Anritsu Corp. | 4,975,000 | 63,064 |
| MICROS Systems, Inc.1 | 1,235,000 | 61,676 |
| Playtech PLC | 4,552,421 | 54,243 |
| Itron, Inc.1 | 1,229,900 | 52,677 |
| OBIC Co., Ltd. | 1,583,300 | 50,981 |
| Hittite Microwave Corp.1 | 760,950 | 49,728 |
| AVEVA Group PLC | 1,178,495 | 49,566 |
| Palo Alto Networks, Inc.1 | 1,031,050 | 47,243 |
| Spectris PLC | 1,314,600 | 46,948 |
| Responsys, Inc.1,2 | 2,815,000 | 46,447 |
| Liquidity Services, Inc.1 | 1,380,400 | 46,326 |
| CoStar Group, Inc.1 | 272,000 | 45,669 |
| Oxford Instruments PLC | 2,232,800 | 45,545 |
| Semiconductor Manufacturing International Corp.1 | 657,550,000 | 44,086 |
| Dolby Laboratories, Inc., Class A | 1,268,400 | 43,772 |
| Wacom Co., Ltd. | 4,547,000 | 43,437 |
| Finisar Corp.1 | 1,902,000 | 43,042 |
| Yaskawa Electric Corp. | 3,020,000 | 42,368 |
| Alcatel-Lucent1 | 11,726,125 | 42,007 |
| ASML Holding NV (New York registered) | 408,321 | 40,326 |
| CDW Corp.1 | 1,760,000 | 40,181 |
| Kingdee International Software Group Co. Ltd.1,2 | 134,868,000 | 38,778 |
| Common stocks | | |
| | | Value |
| Information technology (continued) | Shares | (000) |
| | | |
| SPS Commerce, Inc.1 | 572,000 | $ 38,278 |
| International Rectifier Corp.1 | 1,497,734 | 37,099 |
| Active Network, Inc.1 | 2,570,000 | 36,777 |
| Power Integrations, Inc. | 622,100 | 33,687 |
| Guidewire Software, Inc.1 | 680,000 | 32,035 |
| Autodesk, Inc.1 | 705,000 | 29,025 |
| Global Payments Inc. | 561,116 | 28,662 |
| QIWI PLC, Class B (ADR) | 915,000 | 28,603 |
| Ultimate Software Group, Inc.1 | 193,600 | 28,537 |
| Neopost SA | 375,295 | 27,330 |
| Trimble Navigation Ltd.1 | 840,000 | 24,956 |
| Compuware Corp. | 2,186,752 | 24,492 |
| Ellie Mae, Inc.1 | 700,000 | 22,407 |
| Blackhawk Network Holdings, Inc., Class A1 | 921,500 | 22,144 |
| SINA Corp.1 | 270,000 | 21,916 |
| FireEye, Inc.1 | 517,100 | 21,475 |
| Splunk Inc.1 | 349,200 | 20,966 |
| KLA-Tencor Corp. | 340,650 | 20,728 |
| Persistent Systems Ltd. | 1,999,379 | 20,228 |
| Suprema Inc.1,2 | 868,200 | 19,268 |
| Belden Inc. | 300,000 | 19,215 |
| Hamamatsu Photonics KK | 495,000 | 18,607 |
| Semtech Corp.1 | 620,000 | 18,594 |
| Immersion Corp.1 | 1,359,900 | 17,937 |
| Hana Microelectronics PCL | 23,935,000 | 17,676 |
| Halma PLC | 1,865,000 | 17,104 |
| Demand Media, Inc.1 | 2,696,660 | 17,043 |
| Pandora Media, Inc.1 | 675,000 | 16,963 |
| SciQuest, Inc.1 | 740,000 | 16,620 |
| Info Edge (India) Ltd. | 3,160,000 | 16,016 |
| Agilysys, Inc.1,2 | 1,280,591 | 15,265 |
| Vocus, Inc.1,2 | 1,513,538 | 14,091 |
| RealPage, Inc.1 | 548,000 | 12,692 |
| Tangoe, Inc.1 | 500,000 | 11,930 |
| Kapsch TrafficCom AG, non-registered shares | 227,001 | 11,240 |
| PT Multipolar Tbk | 370,740,000 | 11,205 |
| Monster Worldwide, Inc.1 | 2,226,000 | 9,839 |
| PChome Online Inc. | 1,649,788 | 9,486 |
| Youku Inc., Class A (ADR)1 | 300,000 | 8,220 |
| Kingboard Laminates Holdings Ltd. | 13,477,281 | 5,560 |
| NetSuite Inc.1 | 50,000 | 5,397 |
| Cognex Corp. | 161,202 | 5,055 |
| China High Precision Automation Group Ltd.2,3 | 67,422,000 | 3,477 |
| WIN Semiconductors Corp. | 3,690,000 | 3,476 |
| Remark Media, Inc.1 | 108,065 | 407 |
| | | 2,760,314 |
| | | |
| Financials 8.93% | | |
| | | |
| Financial Engines, Inc. | 2,335,000 | 138,792 |
| SVB Financial Group1 | 1,355,900 | 117,109 |
| Ocwen Financial Corp.1 | 1,900,000 | 105,963 |
| GT Capital Holdings, Inc. | 5,852,200 | 102,151 |
| Onex Corp. | 1,855,700 | 97,465 |
| Common stocks | | |
| | | Value |
| Financials (continued) | Shares | (000) |
| | | |
| Validus Holdings, Ltd. | 2,495,000 | $92,265 |
| Tokyo Tatemono Co., Ltd. | 7,865,000 | 71,853 |
| Kotak Mahindra Bank Ltd. | 5,540,098 | 60,007 |
| East West Bancorp, Inc. | 1,855,000 | 59,267 |
| Greenhill & Co., Inc. | 1,167,000 | 58,210 |
| HCC Insurance Holdings, Inc. | 1,257,000 | 55,082 |
| Altisource Portfolio Solutions SA1 | 392,773 | 54,992 |
| First Republic Bank | 1,141,825 | 53,243 |
| Home Loan Servicing Solutions, Ltd. | 2,299,000 | 50,601 |
| Sterling Financial Corp.4 | 1,666,668 | 47,750 |
| Sterling Financial Corp. | 24,500 | 702 |
| Altisource Asset Management Corp.1 | 90,869 | 47,751 |
| LSL Property Services PLC2 | 5,956,350 | 44,670 |
| BOK Financial Corp. | 680,000 | 43,078 |
| Security Bank Corp. | 14,213,260 | 42,796 |
| VZ Holding AG | 255,548 | 42,669 |
| Fibra Uno Administración, SA de CV | 15,355,891 | 42,539 |
| Rayonier Inc.1 | 728,400 | 40,535 |
| Assured Guaranty Ltd. | 2,100,000 | 39,375 |
| Altisource Residential Corp. | 1,543,731 | 35,475 |
| Kemper Corp. | 1,000,000 | 33,600 |
| Talmer Bancorp, Inc., Class A1,3,5 | 3,068,056 | 33,135 |
| East West Banking Corp.1 | 52,440,000 | 32,338 |
| Leucadia National Corp. | 1,104,516 | 30,087 |
| ING Vysya Bank Ltd. | 3,220,297 | 27,558 |
| Primerica, Inc. | 650,000 | 26,221 |
| Banca Generali SpA | 1,123,069 | 25,373 |
| Shriram Transport Finance Co. Ltd. | 2,749,484 | 25,202 |
| Old Republic International Corp. | 1,635,000 | 25,179 |
| Mercury General Corp. | 500,000 | 24,155 |
| Starwood Property Trust, Inc. | 980,000 | 23,491 |
| Tune Ins Holdings Bhd.1 | 36,816,000 | 23,042 |
| Redwood Trust, Inc. | 1,110,000 | 21,856 |
| Endurance Specialty Holdings Ltd. | 400,000 | 21,488 |
| Capitol Federal Financial, Inc. | 1,697,000 | 21,094 |
| Popular, Inc.1 | 781,229 | 20,492 |
| GRUH Finance Ltd. | 5,450,000 | 18,647 |
| RenaissanceRe Holdings Ltd. | 205,000 | 18,559 |
| Macquarie Mexican REIT | 10,776,000 | 18,367 |
| K. Wah International Holdings Ltd. | 33,275,000 | 17,933 |
| Brait SE1 | 4,211,232 | 17,931 |
| Crédito Real, SAB de CV1 | 10,961,030 | 17,493 |
| Home Federal Bancorp, Inc.2 | 1,384,249 | 17,414 |
| ICG Group, Inc.1 | 1,137,000 | 16,134 |
| Mahindra Lifespace Developers Ltd.2 | 2,157,380 | 13,980 |
| CenterState Banks, Inc. | 1,375,400 | 13,314 |
| Manappuram Finance Ltd.2 | 54,930,986 | 12,723 |
| PT Agung Podomoro Land Tbk | 513,736,500 | 12,422 |
| Bao Viet Holdings | 4,137,486 | 7,329 |
| First Southern Bancorp, Inc. 1,2,3,5 | 1,344,915 | 7,155 |
| Metropolitan Bank & Trust Co. | 3,252,015 | 6,199 |
| Supalai PCL | 6,894,900 | 3,483 |
| ARA Asset Management Ltd. | 2,446,620 | 3,189 |
| Common stocks | | |
| | | Value |
| Financials (continued) | Shares | (000) |
| | | |
| Siam Future Development PCL | 6,602,449 | $ 1,224 |
| | | 2,182,147 |
| Consumer staples 5.43% | | |
| | | |
| Super Group Ltd.2 | 44,597,000 | 150,724 |
| Puregold Price Club, Inc.2 | 149,636,300 | 143,313 |
| PZ Cussons PLC | 14,102,300 | 94,494 |
| Raia Drogasil SA, ordinary nominative | 8,579,374 | 70,956 |
| Nu Skin Enterprises, Inc., Class A | 687,200 | 65,793 |
| Emmi AG | 208,600 | 62,164 |
| Glanbia PLC | 4,737,600 | 62,048 |
| Emami Ltd. | 7,815,000 | 60,543 |
| Coca-Cola Icecek AS, Class C | 2,240,297 | 57,115 |
| O’Key Group SA (GDR) | 4,234,800 | 50,394 |
| Hypermarcas SA, ordinary nominative | 6,182,300 | 49,876 |
| Davide Campari-Milano SpA | 5,388,500 | 46,728 |
| Herbalife Ltd. | 630,000 | 43,955 |
| PT Sumber Alfaria Trijaya Tbk | 786,367,220 | 38,707 |
| Green Mountain Coffee Roasters, Inc.1 | 492,000 | 37,062 |
| Sprouts Farmers Market, Inc.1 | 780,600 | 34,651 |
| Bizim Toptan Satis Magazalari AS, non-registered shares2 | 2,466,000 | 31,862 |
| COSMOS Pharmaceutical Corp. | 242,200 | 31,810 |
| Origin Enterprises PLC | 3,213,300 | 29,295 |
| Kernel Holding SA1 | 1,642,578 | 25,931 |
| Wumart Stores, Inc., Class H | 11,980,000 | 21,347 |
| Eurocash SA | 1,365,000 | 21,034 |
| Petra Foods Ltd. | 6,683,000 | 18,431 |
| VST Industries Ltd. | 715,400 | 17,157 |
| PriceSmart, Inc. | 167,700 | 15,972 |
| Real Nutriceutical Group Ltd. | 39,400,000 | 10,058 |
| Sundrug Co., Ltd. | 194,900 | 9,716 |
| Tilaknager Industries Ltd.2 | 8,890,000 | 8,073 |
| Marfrig Alimentos SA, ordinary nominative1 | 2,003,206 | 5,468 |
| R.E.A. Holdings plc4 | 800,000 | 4,954 |
| HITEJINRO CO., LTD. | 178,039 | 4,531 |
| Godfrey Phillips India Ltd. | 86,075 | 3,509 |
| | | 1,327,671 |
| | | |
| Energy 5.19% | | |
| | | |
| Ophir Energy PLC1,2 | 30,708,378 | 165,945 |
| InterOil Corp.1 | 2,129,500 | 151,855 |
| Zhaikmunai LP (GDR)4 | 4,669,500 | 60,704 |
| Zhaikmunai LP (GDR) | 353,650 | 4,597 |
| Peyto Exploration & Development Corp. | 2,084,500 | 61,601 |
| Keyera Corp. | 971,200 | 55,195 |
| Frank’s International NV | 1,814,600 | 54,311 |
| Bonanza Creek Energy, Inc.1 | 1,095,000 | 52,845 |
| Pacific Rubiales Energy Corp. | 2,651,038 | 52,349 |
| Gulf Keystone Petroleum Ltd.1,4 | 15,715,000 | 49,356 |
| Concho Resources Inc.1 | 403,000 | 43,850 |
| Ultra Petroleum Corp.1 | 2,047,000 | 42,107 |
| Paramount Resources Ltd.1 | 1,105,000 | 38,587 |
| Africa Oil Corp.1 | 2,973,292 | 23,612 |
| Common stocks | | |
| | | Value |
| Energy (continued) | Shares | (000) |
| | | |
| Africa Oil Corp.1,5 | 1,865,775 | $ 14,817 |
| Diamondback Energy, Inc.1 | 900,000 | 38,376 |
| C&J Energy Services, Inc.1 | 1,849,000 | 37,128 |
| Core Laboratories NV | 213,900 | 36,194 |
| Oasis Petroleum Inc.1 | 724,000 | 35,570 |
| Heritage Oil Ltd.1 | 10,628,000 | 30,626 |
| Comstock Resources, Inc. | 1,798,111 | 28,608 |
| Exillon Energy PLC1 | 7,684,660 | 25,877 |
| SBM Offshore NV1 | 842,670 | 16,695 |
| Tourmaline Oil Corp.1 | 410,000 | 16,658 |
| Genel Energy PLC1 | 1,067,800 | 16,232 |
| Bill Barrett Corp.1 | 550,000 | 13,811 |
| BNK Petroleum Inc.1,2 | 11,543,380 | 13,672 |
| Amerisur Resources PLC1 | 16,000,000 | 12,757 |
| Falkland Oil and Gas Ltd.1,2 | 24,225,000 | 11,079 |
| Lekoil Ltd. (CDI)1,2,4 | 14,070,000 | 9,709 |
| Tethys Petroleum Ltd.1 | 12,161,000 | 7,910 |
| Tethys Petroleum Ltd. (GBP denominated)1 | 1,147,487 | 743 |
| African Petroleum Corp. Ltd.1 | 64,234,727 | 7,191 |
| Coal of Africa Ltd.1 | 51,458,685 | 6,998 |
| Kværner ASA | 3,320,000 | 5,471 |
| Semirara Mining Corp. | 909,910 | 5,016 |
| Borders & Southern Petroleum PLC1 | 20,265,000 | 5,003 |
| Prosafe SE | 600,000 | 4,789 |
| Hunting PLC | 350,000 | 4,519 |
| Range Resources Ltd.1 | 100,000,000 | 3,327 |
| Petrodorado Energy Ltd.1,2 | 38,400,000 | 1,491 |
| LNG Energy Ltd.1,4 | 13,000,000 | 189 |
| | | 1,267,370 |
| Materials 5.14% | | |
| | | |
| Chr. Hansen Holding A/S | 3,426,000 | 121,303 |
| AptarGroup, Inc. | 1,832,591 | 110,194 |
| Schweitzer-Mauduit International, Inc.2 | 1,742,800 | 105,492 |
| James Hardie Industries PLC (CDI) | 9,733,929 | 96,983 |
| Yingde Gases Group Co. Ltd. | 74,894,250 | 73,196 |
| OM Group, Inc.1,2 | 1,820,000 | 61,480 |
| PolyOne Corp. | 1,992,000 | 61,174 |
| Kenmare Resources PLC1 | 109,972,782 | 50,740 |
| African Minerals Ltd.1 | 11,233,121 | 40,917 |
| Synthomer PLC | 10,400,000 | 40,088 |
| Silgan Holdings Inc. | 838,500 | 39,409 |
| Boral Ltd. | 7,960,000 | 35,644 |
| CPMC Holdings Ltd. | 46,500,000 | 34,594 |
| Frutarom Industries Ltd. | 1,776,332 | 32,396 |
| Sealed Air Corp. | 1,135,000 | 30,861 |
| FUCHS PETROLUB AG | 358,647 | 25,909 |
| Greatview Aseptic Packaging Co. Ltd. | 45,233,000 | 25,836 |
| Tiangong International Co. Ltd. | 96,106,000 | 25,402 |
| Symrise AG | 532,000 | 23,567 |
| Yip’s Chemical Holdings Ltd. | 26,888,000 | 23,366 |
| Ube Industries, Ltd. | 12,412,000 | 23,360 |
| Stillwater Mining Co.1 | 1,990,000 | 21,910 |
| Common stocks | | |
| | | Value |
| Materials (continued) | Shares | (000) |
| | | |
| Valspar Corp. | 333,700 | $ 21,167 |
| Croda International PLC | 470,000 | 20,201 |
| Arkema SA | 180,000 | 20,053 |
| Gem Diamonds Ltd.1,2 | 7,750,000 | 18,945 |
| Lonmin PLC1 | 2,910,000 | 15,042 |
| Mountain Province Diamonds Inc.1 | 2,222,222 | 11,801 |
| Duluth Metals Ltd.1,2 | 7,699,700 | 8,821 |
| Sirius Minerals PLC1 | 52,304,735 | 8,434 |
| United Phosphorus Ltd. | 2,950,000 | 6,825 |
| Cape Lambert Resources Ltd.1,2 | 47,330,825 | 5,740 |
| J.K. Cement Ltd. | 1,788,638 | 5,358 |
| Siam City Cement PCL | 183,400 | 2,369 |
| Eastern Platinum Ltd.1 | 37,125,000 | 2,343 |
| China Forestry Holdings Co., Ltd.1,3 | 29,142,000 | 1,315 |
| Gran Colombia Gold SA1,2 | 906,700 | 1,118 |
| Hummingbird Resources PLC1 | 1,650,000 | 1,082 |
| Mwana Africa PLC1,4 | 45,749,230 | 1,000 |
| Rusoro Mining Ltd.1 | 21,437,000 | 624 |
| Vatukoula Gold Mines PLC1 | 3,214,081 | 407 |
| | | 1,256,466 |
| | | |
| Utilities 2.09% | | |
| | | |
| ENN Energy Holdings Ltd. | 42,058,296 | 233,720 |
| Manila Water Co., Inc.2 | 104,200,900 | 67,608 |
| Infraestructura Energética Nova, SAB de CV1 | 16,939,800 | 65,394 |
| APR Energy PLC | 3,371,600 | 53,027 |
| Ratchaburi Electricity Generating Holding PCL | 13,308,300 | 21,273 |
| Ratchaburi Electricity Generating Holding PCL, nonvoting depository receipt | 9,186,700 | 14,685 |
| Energy World Corp. Ltd.1 | 47,700,000 | 21,582 |
| Greenko Group PLC1,2 | 9,748,155 | 19,490 |
| Mytrah Energy Ltd.1,2 | 10,418,000 | 15,095 |
| | | 511,874 |
| | | |
| Telecommunication services 1.43% | | |
| | | |
| Telephone and Data Systems, Inc. | 2,731,869 | 80,727 |
| Cogent Communications Group, Inc. | 1,765,000 | 56,921 |
| PT Sarana Menara Nusantara Tbk1 | 150,403,500 | 36,042 |
| NII Holdings, Inc., Class B1 | 5,595,000 | 33,962 |
| Total Access Communication PCL | 9,964,000 | 33,765 |
| Iridium Communications Inc.1,2 | 4,721,812 | 32,486 |
| T-Mobile US, Inc. | 576,650 | 14,976 |
| tw telecom inc.1 | 500,000 | 14,933 |
| Hellenic Telecommunications Organization SA1 | 1,250,000 | 13,021 |
| Visto Corp.1,3,5 | 3,636,364 | 12,764 |
| NewSat Ltd.1 | 14,400,563 | 6,180 |
| NewSat Ltd.1,4 | 12,155,000 | 5,216 |
| Hutchison Telecommunications Hong Kong Holdings Ltd. | 22,200,000 | 9,617 |
| | | 350,610 |
| | | |
| Miscellaneous 4.96% | | |
| | | |
| Other common stocks in initial period of acquisition | | 1,212,383 |
| Total common stocks (cost: $15,135,101,000) | | 22,324,904 |
| | | |
| Warrants 0.00% | | |
| | | Value |
| Energy 0.00% | Shares | (000) |
| | | |
| Pacific Coal Resources Ltd., warrants, expire 20161,3 | 1,214,285 | $ — |
| Total warrants (cost: $1,125,000) | | — |
| Convertible securities 0.50% | | |
| | Shares or | |
| Consumer discretionary 0.32% | principal amount | |
| | | |
| Coupons.com Inc., Series B, convertible preferred1,2,3,5 | 8,191,724 | 77,657 |
| Spot Runner, Inc., Series C, convertible preferred1,3,5 | 1,626,016 | — |
| | | 77,657 |
| | | |
| Financials 0.06% | | |
| | | |
| OFG Bancorp, Series C, 8.75% noncumulative convertible preferred5 | 6,000 | 9,360 |
| First Southern Bancorp, Inc., Series C, convertible preferred1,2,3,5 | 2,299 | 4,759 |
| | | 14,119 |
| | | |
| Health care 0.05% | | |
| | | |
| Ultragenyx Pharmaceutical Inc., Series B, convertible preferred2,3,5 | 2,789,614 | 12,490 |
| | | |
| Energy 0.05% | | |
| | | |
| Clean Energy Fuels Corp. 5.25% convertible notes 20184 | $10,833,000 | 11,104 |
| | | |
| Telecommunication services 0.02% | | |
| | | |
| Iridium Communications Inc., Series A, convertible preferred2,4 | 60,000 | 5,979 |
| Total convertible securities (cost: $81,559,000) | | 121,349 |
| Bonds, notes & other debt instruments 0.30% | | |
| | Principal amount | |
| U.S. Treasury bonds & notes 0.30% | (000) | |
| | | |
| U.S. Treasury 0.25% 2014 | $ 5,000 | 5,005 |
| U.S. Treasury 0.25% 2015 | 19,700 | 19,698 |
| U.S. Treasury 4.00% 20156 | 45,500 | 47,871 |
| Total bonds, notes & other debt instruments (cost: $72,526,000) | | 72,574 |
| | | |
| Short-term securities 8.21% | | |
| | | |
| Freddie Mac 0.08%–0.16% due 10/22/2013–5/1/2014 | 573,800 | 573,714 |
| Fannie Mae 0.13%–0.16% due 10/1–12/16/2013 | 160,200 | 160,196 |
| Bank of Nova Scotia 0.09%–0.18% due 12/4/2013–1/24/2014 | 146,800 | 146,724 |
| Nordea Bank AB 0.15%–0.225% due 11/18/2013–1/3/20144 | 125,500 | 125,470 |
| Federal Home Loan Bank 0.05%–0.13% due 10/4/2013–3/21/2014 | 117,600 | 117,591 |
| Toronto-Dominion Holdings USA Inc. 0.12%–0.23% due 10/24/2013–2/24/20144 | 101,700 | 101,679 |
| Sumitomo Mitsui Banking Corp. 0.15%–0.215% due 10/23–12/5/20134 | 97,500 | 97,485 |
| Victory Receivables Corp. 0.16%–0.17% due 10/1–10/16/20134 | 64,700 | 64,698 |
| Mitsubishi UFJ Trust and Banking Corp. 0.14% due 10/9/20134 | 11,900 | 11,900 |
| International Bank for Reconstruction and Development 0.08%–0.12% due 10/4–10/15/2013 | 72,900 | 72,898 |
| Thunder Bay Funding, LLC 0.20%–0.22% due 11/15–11/25/20134 | 68,695 | 68,675 |
| BHP Billiton Finance (USA) Limited 0.11% due 11/19–11/21/20134 | 56,100 | 56,085 |
| KfW 0.165% due 11/8/20134 | 50,000 | 49,994 |
| | | |
| | Principal amount | Value |
| Short-term securities | (000) | (000) |
| | | |
| Toyota Credit Canada Inc. 0.14%–0.17% due 10/8–10/28/2013 | $43,000 | $ 42,998 |
| BNZ International Funding Ltd. 0.205% due 10/11/20134 | 42,000 | 41,998 |
| American Honda Finance Corp. 0.11% due 11/6/2013 | 41,200 | 41,193 |
| Federal Farm Credit Banks 0.15% due 11/21/2013 | 39,900 | 39,899 |
| Commonwealth Bank of Australia 0.22% due 10/29/20134 | 30,200 | 30,197 |
| Coca-Cola Co. 0.12% due 10/4/20134 | 30,000 | 30,000 |
| Electricité de France 0.17% due 10/16/20134 | 25,400 | 25,398 |
| Québec (Province of) 0.12% due 11/26/20134 | 25,000 | 24,992 |
| Svenska Handelsbanken Inc. 0.18% due 11/20/20134 | 24,800 | 24,794 |
| Private Export Funding Corp. 0.23% due 11/5/20134 | 23,000 | 22,997 |
| Chariot Funding, LLC 0.24% due 12/11/20134 | 20,000 | 19,996 |
| Wal-Mart Stores, Inc. 0.08% due 10/30/20134 | 16,100 | 16,099 |
| Total short-term securities (cost: $2,007,485,000) | | 2,007,670 |
| Total investment securities (cost: $17,297,796,000) | | 24,526,497 |
| Other assets less liabilities | | (85,824) |
| Net assets | | $24,440,673 |
As permitted by U.S. Securities and Exchange Commission regulations, “Miscellaneous” securities include holdings in their first year of acquisition that have not previously been publicly disclosed.
1Security did not produce income during the last 12 months.
2Represents an affiliated company as defined under the Investment Company Act of 1940.
3Valued under fair value procedures adopted by authority of the board of directors. The total value of all such securities, including those in "Miscellaneous," was $235,631,000, which represented .96% of the net assets of the fund.
4Acquired in a transaction exempt from registration under Rule 144A or section 4(2) of the Securities Act of 1933. May be resold in the U.S. in transactions exempt from registration, normally to qualified institutional buyers. The total value of all such securities was $1,051,911,000, which represented 4.30% of the net assets of the fund.
5Acquired through a private placement transaction exempt from registration under the Securities Act of 1933. May be subject to legal or contractual restrictions on resale. Further details on these holdings appear below.
| | | | | Percent | |
| | Acquisition | Cost | Value | of net | |
| | date(s) | (000) | (000) | assets | |
| | | | | | |
| Coupons.com Inc., Series B, convertible preferred | 6/1/2011 | $ 45,000 | $ 77,657 | .32% | |
| Talmer Bancorp, Inc., Class A | 4/28/2010–12/12/2012 | 21,244 | 33,135 | .14 | |
| bluebird bio, Inc. | 7/20/2012 | 11,149 | 28,623 | .12 | |
| Africa Oil Corp. | 8/27/2012 | 20,000 | 14,817 | .06 | |
| Visto Corp. | 12/3/2012 | 14,460 | 12,764 | .05 | |
| Ultragenyx Pharmaceutical Inc., Series B, | | | | | |
| convertible preferred | 12/17/2012 | 7,726 | 12,490 | .05 | |
| OFG Bancorp, Series C, 8.75% noncumulative | | | | | |
| convertible preferred | 6/28/2012 | 6,000 | 9,360 | .04 | |
| First Southern Bancorp, Inc. | 12/17/2009 | 22,070 | 7,155 | .03 | |
| First Southern Bancorp, Inc., Series C, convertible preferred | 12/17/2009 | — | 4,759 | .02 | |
| Fontainebleau Resorts LLC, Class A, nonvoting units | 10/5/2005–6/1/2007 | 21,500 | — | .00 | |
| Spot Runner, Inc. | 10/25/2006–3/20/2008 | 15,071 | — | .00 | |
| Spot Runner, Inc., Series C, convertible preferred | 12/25/2006 | 6,000 | — | .00 | |
| Total restricted securities | | $190,220 | $200,760 | .83% | |
6A portion of this security was pledged as collateral for net losses on unsettled forward currency contracts. The total value of pledged collateral was $349,000, which represented less than .01% of the net assets of the fund.
Key to abbreviations
ADR = American Depositary Receipts
CDI = CREST Depository Interest
GDR = Global Depositary Receipts
SDR = Swedish Depositary Receipts
Investments are not FDIC-insured, nor are they deposits of or guaranteed by a bank or any other entity, so they may lose value.
Investors should carefully consider investment objectives, risks, charges and expenses. This and other important information is contained in the fund prospectus and summary prospectus, which can be obtained from your financial professional and should be read carefully before investing. You may also call American Funds Service Company (AFS) at (800) 421-4225 or visit the American Funds website at americanfunds.com.
MFGEFPX-035-1113O-S37718
REPORT OF INDEPENDENT REGISTERED PUBLIC ACCOUNTING FIRM ON INVESTMENT PORTFOLIO
To the Shareholders and Board of Directors of
SMALLCAP World Fund, Inc.:
We have audited, in accordance with the standards of the Public Company Accounting Oversight Board (United States), the financial statements of SMALLCAP World Fund, Inc. (the “Fund”) as of September 30, 2013, and for the year then ended and have issued our report thereon dated November 8, 2013, which report and financial statements are included in Item 1 of this Certified Shareholder Report on Form N-CSR. Our audit also included the Fund’s investment portfolio (the “Schedule”) as of September 30, 2013, appearing in Item 6 of this Form N-CSR. This Schedule is the responsibility of the Fund’s management. Our responsibility is to express an opinion based on our audit. In our opinion, the Schedule referred to above, when considered in relation to the basic financial statements taken as a whole of the Fund referred to above, presents fairly, in all material respects, the information set forth therein.
DELOITTE & TOUCHE LLP
Costa Mesa, California
November 8, 2013
ITEM 7 – Disclosure of Proxy Voting Policies and Procedures for Closed-End Management Investment Companies
Not applicable to this Registrant, insofar as the Registrant is not a closed-end management investment company.
ITEM 8 – Portfolio Managers of Closed-End Management Investment Companies
Not applicable to this Registrant, insofar as the Registrant is not a closed-end management investment company.
ITEM 9 – Purchases of Equity Securities by Closed-End Management Investment Company and Affiliated Purchasers
Not applicable to this Registrant, insofar as the Registrant is not a closed-end management investment company.
ITEM 10 – Submission of Matters to a Vote of Security Holders
There have been no material changes to the procedures by which shareholders may recommend nominees to the Registrant’s board of directors since the Registrant last submitted a proxy statement to its shareholders. The procedures are as follows. The Registrant has a nominating and governance committee comprised solely of persons who are not considered ‘‘interested persons’’ of the Registrant within the meaning of the Investment Company Act of 1940, as amended. The committee periodically reviews such issues as the board’s composition, responsibilities, committees, compensation and other relevant issues, and recommends any appropriate changes to the full board of directors. While the committee normally is able to identify from its own resources an ample number of qualified candidates, it will consider shareholder suggestions of persons to be considered as nominees to fill future vacancies on the board. Such suggestions must be sent in writing to the nominating and governance committee of the Registrant, c/o the Registrant’s Secretary, and must be accompanied by complete biographical and occupational data on the prospective nominee, along with a written consent of the prospective nominee for consideration of his or her name by the nominating and governance committee.
ITEM 11 – Controls and Procedures
| (a) | The Registrant’s Principal Executive Officer and Principal Financial Officer have concluded, based on their evaluation of the Registrant’s disclosure controls and procedures (as such term is defined in Rule 30a-3 under the Investment Company Act of 1940), that such controls and procedures are adequate and reasonably designed to achieve the purposes described in paragraph (c) of such rule. |
| | |
| (b) | There were no changes in the Registrant’s internal controls over financial reporting (as defined in Rule 30a-3(d) under the Investment Company Act of 1940) that occurred during the Registrant’s second fiscal quarter of the period covered by this report that has materially affected, or is reasonably likely to materially affect, the Registrant’s internal control over financial reporting. |
ITEM 12 – Exhibits
| (a)(1) | The Code of Ethics that is the subject of the disclosure required by Item 2 is attached as an exhibit hereto. |
| | |
| (a)(2) | The certifications required by Rule 30a-2 of the Investment Company Act of 1940 and Sections 302 and 906 of the Sarbanes-Oxley Act of 2002 are attached as exhibits hereto. |
SIGNATURES
Pursuant to the requirements of the Securities Exchange Act of 1934 and the Investment Company Act of 1940, the Registrant has duly caused this report to be signed on its behalf by the undersigned, thereunto duly authorized.
| | SMALLCAP WORLD FUND, INC. |
| | |
| | By /s/ Paul F. Roye |
| | Paul F. Roye, Executive Vice President and Principal Executive Officer |
| | |
| | Date: November 29, 2013 |
Pursuant to the requirements of the Securities Exchange Act of 1934 and the Investment Company Act of 1940, this report has been signed below by the following persons on behalf of the Registrant and in the capacities and on the dates indicated.
| By /s/ Paul F. Roye |
Paul F. Roye, Executive Vice President and Principal Executive Officer |
| |
| Date: November 29, 2013 |
| By /s/ Jeffrey P. Regal |
Jeffrey P. Regal, Treasurer and Principal Financial Officer |
| |
| Date: November 29, 2013 |