UNITED STATES
SECURITIES AND EXCHANGE COMMISSION
Washington, DC 20549
FORMN-CSR
CERTIFIED SHAREHOLDER REPORT OF REGISTERED
MANAGEMENT INVESTMENT COMPANIES
Investment Company Act file number811-06135
Templeton Institutional Funds
(Exact name of registrant as specified in charter)
300 S.E. 2nd Street, Fort Lauderdale, FL 33301-1923
(Address of principal executive offices) Zip code)
Craig S. Tyle, One Franklin Parkway, San Mateo, CA 94403-1906
(Name and address of agent for service)
Registrant’s telephone number, including area code: (954)527-7500
Date of fiscal year end: 12/31
Date of reporting period: 12/31/18
| Item 1. | Reports to Stockholders. |
Internet Delivery of Fund Reports Unless You Request Paper Copies:Effective January 1, 2021, as permitted by the SEC, paper copies of the Fund’s shareholder reports will no longer be sent by mail, unless you specifically request them from the Fund or your financial intermediary. Instead, the reports will be made available on a website, and you will be notified by mail each time a report is posted and provided with a website link to access the report.
If you already elected to receive shareholder reports electronically, you will not be affected by this change and you need not take any action. If you have not signed up for electronic delivery, we would encourage you to join fellow shareholders who have. You may elect to receive shareholder reports and other communications electronically from the Fund by calling (800)321-8563 or by contacting your financial intermediary.
You may elect to continue to receive paper copies of all your future shareholder reports free of charge by contacting your financial intermediary or, if you invest directly with a Fund, calling (800)321-8563 to let the Fund know of your request. Your election to receive reports in paper will apply to all funds held in your account.
Franklin Templeton
Successful investing begins with ambition. And achievement only comes when you reach for it. That’s why we continually strive to deliver better outcomes for investors. No matter what your goals are, our deep, global investment expertise allows us to offer solutions that can help.
During our more than 70 years of experience, we’ve managed through all kinds of markets—up, down and those in between. We’re always preparing for what may come next. It’s because of this, combined with our strength as one of the world’s largest asset managers that we’ve earned the trust of millions of investors around the world.
Contents
Annual Report
Visitftinstitutional.comfor fund updates, to access your account, or to find investment insights.
|
Not FDIC Insured | May Lose Value | No Bank Guarantee |
| | | | | | |
| | | |
| ftinstitutional.com | | Not part of the annual report | | | 1 | |
Annual Report
Economic and Market Overview
The global economy expanded during the 12 months under review, despite weakness in certain regions. Global developed and emerging market stocks were aided at certain points during the period by higher crude oil prices, upbeat economic data, easing trade tensions and encouraging corporate earnings reports, as well as indications of a slower pace of interest-rate increases from the U.S. Federal Reserve (Fed).
However, various factors weighed on global markets during the period, including concerns about tighter regulation of technology companies, political uncertainties in the U.S. and the European Union, and major central banks’ interest-rate path and unwinding of monetary stimulus measures. Markets were further pressured by U.S. trade disputes with its allies and China, and their impact on global growth and corporate earnings. In this environment, global stocks, as measured by the MSCI All Country World Index, had a-8.93% total return for the 12 months ended December 31, 2018.1
The U.S. economy grew during the12-month period. After moderating for three consecutive quarters, the economy grew faster in 2018’s second quarter, driven by consumer spending, business investment, exports and government spending. However, growth moderated in the third quarter due to declines in exports and housing investment. The unemployment rate declined from 4.1% in December 2017 to 3.9% atperiod-end.2 Annual inflation, as measured by the Consumer Price Index, decreased from 2.1% in December 2017 to 1.9% atperiod-end.2 The Fed raised its target range for the federal funds rate four times during the period, to 2.25%–2.50%, and continued reducing its balance sheet as part of an ongoing plan to normalize monetary policy. At its December meeting, the Fed reduced the projected 2019 rate increases to two, compared to three projected previously.
In Europe, the U.K.’s quarterly economic growth moderated in 2018’s first quarter, but accelerated in 2018’s second and third quarters. The Bank of England raised its key policy rate once during the review period. After moderating in 2018’s first quarter, the eurozone’s quarterly growth remained stable in the second quarter, but eased in the third quarter. The bloc’s annual inflation rate ended the period higher than in December 2017. The European Central Bank (ECB) kept its benchmark interest rate unchanged during the period. In December 2018, the ECB confirmed its plan to conclude its bond purchase program at the
end of 2018 and reiterated it expects key interest rates to remain unchanged through the summer of 2019.
In Asia, Japan’s quarterly gross domestic product (GDP) grew in 2018’s second quarter, following a contraction in the first quarter, but contracted again in the third quarter. The Bank of Japan left its benchmark interest rate unchanged during the period and continued its monetary stimulus measures.
In emerging markets, Brazil’s quarterly GDP growth remained stable in 2018’s first and second quarters, but accelerated in the third quarter. The Central Bank of Brazil lowered its benchmark interest rate twice during the period. Russia’s annual GDP growth rate accelerated in 2018’s first and second quarters, but moderated in the third quarter. After lowering its key rate twice early in the period, the Bank of Russia raised it twice in the period’s second half to curtail inflation risks. China’s annual GDP grew at a stable rate in 2018’s first quarter, but it moderated in the second and third quarters. The People’s Bank of China left its benchmark interest rate unchanged during the period, but it took measures to improve financial liquidity to mitigate the negative effects of the U.S.-China trade dispute and support economic growth. Overall, emerging market stocks, as measured by the MSCI Emerging Markets Index, had a-14.25% total return during the period.1
The foregoing information reflects our analysis and opinions as of December 31, 2018. The information is not a complete analysis of every aspect of any market, country, industry, security or fund. Statements of fact are from sources considered reliable.
1. Source: Morningstar.
2. Source: U.S. Bureau of Labor Statistics
See www.franklintempletondatasources.com for additional data provider information.
| | | | |
| | | |
| 2 | | Annual Report | | ftinstitutional.com |
Foreign Smaller Companies Series
This annual report for Foreign Smaller Companies Series (Fund) covers the fiscal year ended December 31, 2018. Effective at the market close on December 10, 2013, the Fund closed to new investors; existing shareholders may add to their accounts. Effective June 25, 2018, the Fund reopened to new investors.
Your Fund’s Goal and Main Investments
The Fund seeks long-term capital growth. Under normal market conditions, the Fund invests at least 80% of its net assets in investments of smaller companies located outside the U.S., including emerging markets.
Performance Overview
The Fund had a-18.48% cumulative total return for the 12 months under review. In comparison, the MSCI All Country World Index (ACWI) ex USA Small Cap Index, which measures performance of global developed and emerging marketsmall-cap equities, excluding the U.S., had a-17.89% total return.1 Please note, index performance information is provided for reference and we do not attempt to track the index but rather undertake investments on the basis of fundamental research. You can find the Fund’s long-term performance data in the Performance Summary beginning on page 6.
Performance data represent past performance, which does not guarantee future results. Investment return and principal value will fluctuate, and you may have a gain or loss when you sell your shares. Current performance may differ from figures shown. For most recentmonth-end performance, go toftinstitutional.comor call a Franklin Templeton Institutional Services representative at (800)321-8563.
Investment Strategy
When choosing equity investments, we apply abottom-up, value-oriented, long-term approach, focusing on the market price of a company’s securities relative to our evaluation of the company’s long-term earnings, asset value and cash flow potential. We also consider a company’s price/earnings ratio, profit margins and liquidation value.
Manager’s Discussion
The Fund had some underperformers during the period under review. U.K.-based Man Group, an alternative investment
Geographic Composition
Based on Total Net Assets as of 12/31/18
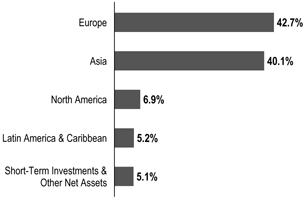
manager, was impacted by concerns about the U.K.’s exit from the European Union. However, Man Group has continued to experience positive business momentum with sustained net inflows, and we favorably view company management’s diversification of the business through merger and acquisition activity.
Norway-based XXL is a leading sporting-goods retailer. The company enjoys large economies of scale, which position it as alow-cost retailer with no reliance on any specific supplier. Coupled with a weakening competitive landscape, we believe XXL is poised for continued growth in the Nordic region given itslow-price, wide-range product assortment and robust omni-channel platform. This dynamic should, in our view, allow XXL to continue to gain market share as competitors leave the market. We also believe in its ability to scale its successful Nordic model into new geographies, mainly Austria and Switzerland, while continuing to grow its online platform.
Shares of IDOM, Japan’s largest specialist inused-car purchasing, fell due to weak financial results. Looking at the longer term, we believe IDOM can benefit from the growing structural and demographical demand for used cars in Japan, which is still at a low base compared to that of the U.S. IDOM also has a distinct competitive advantage through its larger scale to grow its dealership network in Japan.
It is important to recognize the effect of currency movements on the Fund’s performance. In general, if the value of the U.S. dollar goes up compared with a foreign currency, an investment
1. Source: Morningstar.
The index is unmanaged and includes reinvestment of any income or distributions. It does not reflect any fees, expenses or sales charges. One cannot invest directly in an index, and an index is not representative of the Fund’s portfolio.
The dollar value, number of shares or principal amount, and names of all portfolio holdings are listed in the Fund’s Statement of Investments (SOI). The SOI begins on page 27.
| | | | | | |
| | | |
| ftinstitutional.com | | Annual Report | | | 3 | |
FOREIGN SMALLER COMPANIES SERIES
| | | | |
| Portfolio Composition | | | |
| 12/31/18 | | | |
| |
| Sector/Industry | | % of Total
Net Assets | |
Machinery | | | 11.0% | |
Leisure Products | | | 10.2% | |
Textiles, Apparel & Luxury Goods | | | 7.1% | |
Electronic Equipment, Instruments & Components | | | 6.7% | |
Food Products | | | 4.9% | |
Professional Services | | | 3.9% | |
Banks | | | 4.0% | |
Household Durables | | | 3.7% | |
Capital Markets | | | 3.6% | |
Specialty Retail | | | 3.4% | |
Containers & Packaging | | | 2.4% | |
Construction & Engineering | | | 2.3% | |
Real Estate Management & Development | | | 2.3% | |
Insurance | | | 2.1% | |
Personal Products | | | 2.1% | |
Other | | | 25.2% | |
Short-Term Investments & Other Net Assets | | | 5.1% | |
traded in that foreign currency will go down in value because it will be worth fewer U.S. dollars. This can have a negative effect on Fund performance. Conversely, when the U.S. dollar weakens in relation to a foreign currency, an investment traded in that foreign currency will increase in value, which can contribute to Fund performance. For the 12 months ended December 31, 2018, the U.S. dollar rose in value relative to most currencies. As a result, the Fund’s performance was negatively affected by the portfolio’s investment predominantly in securities withnon-U.S. currency exposure.
Conversely, several holdings performed well during the period under review. Amer Sports, based in Finland, holds an attractive portfolio of well-known global sports equipment brands that have driven strong operating performance. In September 2018, a consortium made an offer for Amer Sports, and the shares rose in anticipation of the deal, which is expected to close on June 30, 2019.
Capcom is a small-capitalization game software developer based in Japan.2 Sales of packaged games and downloadable games for consoles, personal computer games and mobile games are its main earnings drivers. The company has continued to develop popular game franchises such as “Monster Hunter: World,” a major hit in the U.S., Japan and
2. Not held byperiod-end.
See www.franklintempletondatasources.com for additional data provider information.
| | | | |
| Top 10 Holdings | | | |
| 12/31/18 | | | |
| |
Company Sector/Industry, Country | | % of Total
Net Assets | |
Amer Sports OYJ Leisure Products, Finland | | | 2.9% | |
Techtronic Industries Co. Ltd. Household Durables, Hong Kong | | | 1.9% | |
Interpump Group SpA Machinery, Italy | | | 1.9% | |
Technogym SpA Leisure Products, Italy | | | 1.9% | |
Fuji Oil Holdings Inc. Food Products, Japan | | | 1.9% | |
Tsumura & Co. Pharmaceuticals, Japan | | | 1.8% | |
The Thule Group AB Leisure Products, Sweden | | | 1.7% | |
Huhtamaki OYJ Containers & Packaging, Finland | | | 1.6% | |
Man Group PLC Capital Markets, U.K. | | | 1.6% | |
Gerresheimer AG Life Sciences Tools & Services, Germany | | | 1.6% | |
Europe. Company management plans to actively seek partnerships in mobile to leverage its intellectual property, and this is a key component of our investment thesis.
Laird is a U.K.-based supplier of products such as“shark-fin” antennae for wireless connections and electromagnetic interference shielding for Apple’s iPhone and iPad products.2 The firm’s shares surged during the period after the company agreed to a takeover by a U.S. private equity firm.
Thank you for your continued participation in Foreign Smaller Companies Series. We look forward to serving your future investment needs.
| | |
 | | 
Harlan B. Hodes, CPA Portfolio Manager |
| | | | |
| | | |
| 4 | | Annual Report | | ftinstitutional.com |
FOREIGN SMALLER COMPANIES SERIES
The foregoing information reflects our analysis, opinions and portfolio holdings as of December 31, 2018, the end of the reporting period. The way we implement our main investment strategies and the resulting portfolio holdings may change depending on factors such as market and economic conditions. These opinions may not be relied upon as investment advice or an offer for a particular security. The information is not a complete analysis of every aspect of any market, country, industry, security or the Fund. Statements of fact are from sources considered reliable, but the investment manager makes no representation or warranty as to their completeness or accuracy. Although historical performance is no guarantee of future results, these insights may help you understand our investment management philosophy.
| | | | | | |
| | | |
| ftinstitutional.com | | Annual Report | | | 5 | |
FOREIGN SMALLER COMPANIES SERIES
Performance Summary as of December 31, 2018
The performance table and graph do not reflect any taxes that a shareholder would pay on Fund dividends, capital gain distributions, if any, or any realized gains on the sale of Fund shares. Total return reflects reinvestment of the Fund’s dividends and capital gain distributions, if any, and any unrealized gains or losses. Your dividend income will vary depending on dividends or interest paid by securities in the Fund’s portfolio, adjusted for operating expenses. Capital gain distributions are net profits realized from the sale of portfolio securities.
Performance as of 12/31/181
| | | | | | | | |
| | |
| | | Cumulative
Total Return2
| | | Average Annual
Total Return3 | |
| | |
1-Year | | | -18.48% | | | | -18.48% | |
| | |
5-Year | | | +6.82% | | | | +1.33% | |
| | |
10-Year | | | +187.16% | | | | +11.13% | |
Performance data represent past performance, which does not guarantee future results. Investment return and principal value will fluctuate, and you may have a gain or loss when you sell your shares. Current performance may differ from figures shown. For most recentmonth-end performance, go toftinstitutional.comor call a Franklin Templeton Institutional Services representative at (800)321-8563.
See page 8 for Performance Summary footnotes.
| | | | |
| | | |
| 6 | | Annual Report | | ftinstitutional.com |
FOREIGN SMALLER COMPANIES SERIES
PERFORMANCE SUMMARY
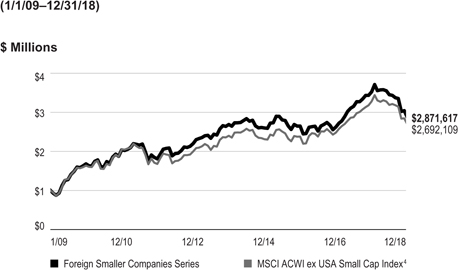
Total Return Index Comparison for a Hypothetical $1,000,000 Investment1
Total return represents the change in value of an investment over the periods shown. It includes any applicable maximum sales charge, Fund expenses, account fees and reinvested distributions. The unmanaged index includes reinvestment of any income or distributions. It differs from the Fund in composition and does not pay management fees or expenses. One cannot invest directly in an index.
See page 8 for Performance Summary footnotes.
| | | | | | |
| | | |
| ftinstitutional.com | | Annual Report | | | 7 | |
FOREIGN SMALLER COMPANIES SERIES
PERFORMANCE SUMMARY
Distributions(1/1/18–12/31/18)
| | | | | | |
| | |
Net Investment
Income | | Long-Term Capital Gain | | Total | |
| | |
$0.2076 | | $2.3079 | | | $2.5155 | |
Total Annual Operating Expenses5
| | | | | | |
| | |
| | | With Fee
Waiver | | Without Fee
Waiver | |
| | |
| | | 0.99% | | | 1.00% | |
All investments involve risks, including possible loss of principal. Smaller, midsized and relatively new or unseasoned companies can be particularly sensitive to changing economic conditions, and their prospects for growth are less certain than those of larger, more established companies. Historically, these securities have exhibited greater price volatility than large-company stocks, particularly over the short term. Special risks are associated with foreign investing, including currency fluctuations, economic instability and political developments. Investments in emerging markets involve heightened risks related to the same factors, in addition to those associated with these markets’ smaller size and lesser liquidity. Because the Fund may invest its assets in companies in a specific region, including Europe, it is subject to greater risks of adverse developments in that region and/or the surrounding regions than a fund that is more broadly diversified geographically. Political, social or economic disruptions in the region, even in countries in which the Fund is not invested, may adversely affect the value of securities held by the Fund. Current political and financial uncertainty surrounding the European Union may increase market volatility and the economic risk of investing in companies in Europe. The Fund is actively managed but there is no guarantee that the manager’s investment decisions will produce the desired results. The Fund’s prospectus also includes a description of the main investment risks.
1. The Fund has a fee waiver associated with any investment it makes in a Franklin Templeton money fund and/or other Franklin Templeton fund, contractually guaranteed through 4/30/19. Fund investment results reflect the fee waiver; without this waiver, the results would have been lower.
2. Cumulative total return represents the change in value of an investment over the periods indicated.
3. Average annual total return represents the average annual change in value of an investment over the periods indicated. Return for less than one year, if any, has not been annualized.
4. Source: Morningstar. The MSCI ACWI ex USA Small Cap Index is a free float-adjusted, market capitalization-weighted index designed to measure performance ofsmall-cap equity securities of global developed and emerging markets, excluding the U.S.
5. Figures are as stated in the Fund’s current prospectus and may differ from the expense ratios disclosed in the Your Fund’s Expenses and Financial Highlights sections in this report. In periods of market volatility, assets may decline significantly, causing total annual Fund operating expenses to become higher than the figures shown.
See www.franklintempletondatasources.com for additional data provider information.
| | | | |
| | | |
| 8 | | Annual Report | | ftinstitutional.com |
FOREIGN SMALLER COMPANIES SERIES
Your Fund’s Expenses
As a Fund shareholder, you can incur two types of costs: (1) transaction costs, including sales charges (loads) on Fund purchases and redemptions, if applicable; and (2) ongoing Fund costs, including management fees, distribution and service(12b-1) fees, if applicable, and other Fund expenses. All mutual funds have ongoing costs, sometimes referred to as operating expenses. The table below shows ongoing costs of investing in the Fund and can help you understand these costs and compare them with those of other mutual funds. The table assumes a $1,000 investment held for the six months indicated.
Actual Fund Expenses
The table below provides information about actual account values and actual expenses in the columns under the heading “Actual.” In these columns the Fund’s actual return, which includes the effect of Fund expenses, is used to calculate the “Ending Account Value.” You can estimate the expenses you paid during the period by following these steps (of course, your account value and expenses will differ from those in this illustration): Divide your account value by $1,000 (if your account had an $8,600 value, then $8,600 ÷ $1,000 = 8.6). Then multiply the result by the number in the row for your class of shares under the headings “Actual” and “Expenses Paid During Period” (if Actual Expenses Paid During Period were $7.50, then 8.6 x $7.50 = $64.50). In this illustration, the actual expenses paid this period are $64.50.
Hypothetical Example for Comparison with Other Funds
Under the heading “Hypothetical” in the table, information is provided about hypothetical account values and hypothetical expenses based on the Fund’s actual expense ratio and an assumed rate of return of 5% per year before expenses, which is not the Fund’s actual return. This information may not be used to estimate the actual ending account balance or expenses you paid for the period, but it can help you compare ongoing costs of investing in the Fund with those of other funds. To do so, compare this 5% hypothetical example for the class of shares you hold with the 5% hypothetical examples that appear in the shareholder reports of other funds.
Please note that expenses shown in the table are meant to highlight ongoing costs and do not reflect any transactional costs. Therefore, information under the heading “Hypothetical” is useful in comparing ongoing costs only, and will not help you compare total costs of owning different funds. In addition, if transactional costs were included, your total costs would have been higher.
| | | | | | | | | | | | |
| | | | |
| | | | | Actual
(actual return after expenses) | | Hypothetical
(5% annual return before expenses) | | |
| | | | | | |
| | | Beginning
Account
Value 7/1/18 | | Ending
Account Value 12/31/18 | | Paid During
Period
7/1/18–12/31/181,2 | | Ending
Account
Value 12/31/18 | | Paid During
Period
7/1/18–12/31/181,2 | | Net
Annualized
Expense
Ratio2 |
| | | | | | |
| | | $1,000 | | $832.10 | | $4.66 | | $1,020.11 | | $5.14 | | 1.01% |
1. Expenses are equal to the annualized expense ratio for thesix-month period as indicated above—in the far right column—multiplied by the simple average account value over the period indicated, and then multiplied by 184/365 to reflect theone-half year period.
2. Reflects expenses after fee waivers and expense reimbursements. Does not include acquired fund fees and expenses.
| | | | | | |
| | | |
| ftinstitutional.com | | Annual Report | | | 9 | |
Global Equity Series
This annual report for Global Equity Series (Fund) covers the fiscal year ended December 31, 2018.
Your Fund’s Goal and Main Investments
The Fund seeks long-term capital growth. Under normal market conditions, the Fund invests at least 80% of its net assets in equity securities of companies located anywhere in the world, including developing markets.
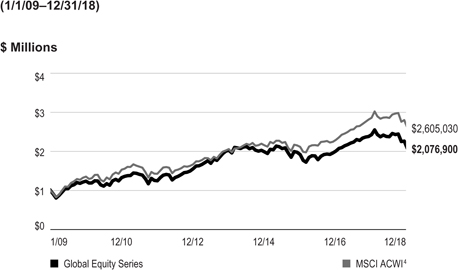
Performance Overview
The Fund had a-14.49% cumulative total return for the 12 months under review. For comparison, the Fund’s benchmark, the MSCI All Country World Index (ACWI), which measures stock market performance in global developed and emerging markets, had a-8.93% total return.1 Please note, index performance information is provided for reference and we do not attempt to track an index but rather undertake investments on the basis of fundamental research. You can find the Fund’s long-term performance data in the Performance Summary beginning on page 14.
Performance data represent past performance, which does not guarantee future results. Investment return and principal value will fluctuate, and you may have a gain or loss when you sell your shares. Current performance may differ from figures shown. For most recentmonth-end performance, go toftinstitutional.comor call a Franklin Templeton Institutional Services representative at (800)321-8563.
Investment Strategy
We employ abottom-up, value-oriented, long-term investment strategy. We focus on the market price of a company’s securities relative to our evaluation of the company’s long-term earnings, asset value and cash flow potential. We also consider a company’s price/earnings ratio, profit margins and liquidation value. We attempt to identify those companies that offer above-average opportunities for capital appreciation in various countries and industries where economic and political factors, including currency movements, are favorable to capital growth.
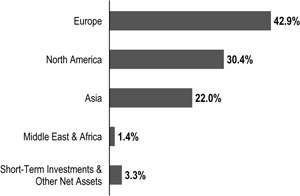
Geographic Composition
Based on Total Net Assets as of 12/31/18
Manager’s Discussion
Global equities delivered the worst annual loss in a decade in 2018 as growing concerns about geopolitical turmoil, monetary policy tightening and late-cycle economic conditions led to episodes of heightened volatility. Global value stocks underperformed global growth stocks for the past 10 years, extending one of value’s longest droughts on record. Yet, as the year progressed, value improved, breaking out in August and then limiting losses in the volatile fourth quarter. Also encouraging, international and emerging market stocks outperformed the long-dominant U.S. market in the fourth quarter as the globalsell-off accelerated. While it’s far too early to declare a regime change in equity markets, late developments brought some initial signs of the long-anticipated rotation out of last cycle’s winners. We continue to view this shift out of expensive and into cheaper stocks as the ultimate outcome of policy normalization and cycle transition.
The Fund underperformed its benchmark, the MSCI ACWI, during the year in review. Relative weakness during the period was largely due to stock selection in the financials and information technology (IT) sectors, as well as in the U.S. market.2
An overweighted allocation also hindered relative results in the financials sector, led lower by bank stocks in the U.S. and Europe. U.S. universal bank Citigroup, French lender BNP
1. Source: Morningstar.
The index is unmanaged and includes reinvestment of any income or distributions. It does not reflect any fees, expenses or sales charges. One cannot invest directly in an index, and an index is not representative of the Fund’s portfolio.
2. The financials sector comprises banks, capital markets, consumer finance, diversified financial services, insurance, and thrifts and mortgage finance in the SOI. The IT sector comprises communications equipment; electronic equipment, instruments and components; semiconductors and semiconductor equipment; software; and technology hardware, storage and peripherals in the SOI.
The dollar value, number of shares or principal amount, and names of all portfolio holdings are listed in the Fund’s Statement of Investments (SOI).
The SOI begins on page 32.
| | | | |
| | | |
10 | | Annual Report | | ftinstitutional.com |
GLOBAL EQUITY SERIES
| | | | |
| Portfolio Composition | | |
12/31/18 | | |
| | | | |
| Sector/Industry | | % of Total
Net Assets | |
Banks | | | 13.6% | |
Pharmaceuticals | | | 11.4% | |
Oil, Gas & Consumable Fuels | | | 10.0% | |
Biotechnology | | | 5.6% | |
Food & Staples Retailing | | | 4.0% | |
Wireless Telecommunication Services | | | 3.2% | |
Industrial Conglomerates | | | 3.1% | |
Chemicals | | | 3.0% | |
Diversified Telecommunication Services | | | 3.0% | |
Multi-Utilities | | | 2.8% | |
Software | | | 2.5% | |
Semiconductors & Semiconductor Equipment | | | 2.4% | |
Media | | | 2.2% | |
Consumer Finance | | | 2.3% | |
Insurance | | | 2.2% | |
Technology Hardware, Storage & Peripherals | | | 2.1% | |
Other | | | 23.3% | |
Short-Term Investments & Other Net Assets | | | 3.3% | |
Paribas and Swiss investment bank UBS Group detracted significantly from Fund performance. We continued to gradually reposition our financials holdings in 2018 to consolidate and rationalize exposure amid heightened uncertainty. In the U.S., we’ve been finding what we believe to be the best opportunities recently among cheap universal banks and consumer finance firms with distinct value catalysts. In Europe, we have selectively reduced exposure to a handful of domestically focused banks with concentrated political risks. Our thesis on European banks rests largely on valuation and shareholder returns. European lenders currently trade at the same multiple relative to trailing12-month earnings as they did in the depths of the eurozone sovereign debt crisis, despite significant progress restructuring and recapitalizing to improve asset quality and returns. Depressed valuations combined with generous shareholder returns have resulted in dividend yields exceeding price/earnings ratios recently at a number of European banks. We believe unhealed scars from the global financial crisis assure that banks will remain an easy target for bearish investors during periods of rising risk aversion. Yet, despite depressed valuations, we see fewer excesses and more resilience in the banking system today than during past crisis periods. In our analysis, deep value remains.
Stock-specific weakness and an underweighted allocation pressured the IT sector, led lower by U.S. communications equipment firm CommScope Holding. Its shares slumped after company management announced it would increase leverage for a multi-billion dollar acquisition. The IT sector has been one of the biggest beneficiaries of the macro environment over the course of this cycle, offering good organic growth opportunities in an otherwise tepid economic environment. It has also generated high margins and strong free cash flows during a period of extraordinarily low interest rates. However, we have been wary of the valuation excesses this low interest-rate environment has created, most notably among consumer-oriented internet stocks. Although we never had exposure to what we considered the most overvalued parts of the sector, we have owned a number of outperforming technology stocks, and used strength in 2018 to sell holdings we considered fully valued.
Stock selection in the underweighted consumer discretionary sector and even-weighted materials sector also detracted from relative performance.3 From the consumer discretionary sector, U.K. home improvement retailer Kingfisher declined to levels that we believe are too cheap for a free cash-flow generative company that is well positioned to benefit from restructuring initiatives and cyclical improvements. It is worth noting that the consumer discretionary sector also delivered the Fund’s top contributor in 2018, U.S. automotive supplies retailer Advance Auto Parts (not held atperiod-end). Its shares rallied after the company boosted full-year 2018 sales guidance, citing an improving demand environment. With the stock up significantly in 2018 (compared to a loss for the broad U.S. market), current valuations and higher expectations have reduced the risk-reward proposition, and we took profits during the review period.
From the materials sector, shares of German chemicals firm Lanxess declined as investors overlooked solid results and focused instead on near-term concerns of elevated supply and weak demand in the global petrochemicals segment. The opportunity set remains mixed in the global materials sector more broadly. We believe select chemicals stocks offer opportunities to own high-quality businesses, despite near-term macro headwinds. Similarly, in construction materials, we are seeing some renewed opportunities among stocks that have declined amid cyclical concerns. In mining, we are finding opportunities among precious metals firms featuring cheap valuations, strong balance sheets and defensive characteristics.
3. The consumer discretionary sector comprises auto components; household durables; leisure products; specialty retail; and textiles, apparel and luxury goods in the SOI. The materials sector comprises chemicals, construction materials, and metals and mining in the SOI.
| | | | | | |
| | | |
| ftinstitutional.com | | Annual Report | | | 11 | |
GLOBAL EQUITY SERIES
We believe these stocks will eventually find support in an environment of historically high debt levels, resurgent volatility and growing central bank reserve demand.
Turning to contributors, stock selection in the overweighted communication services sector aided relative performance.4 Chinese telecommunication services operator China Telecom and Luxembourg-based satellite operator SES led the sector. China Telecom’s shares rallied after the company confirmed its entry into the Philippine market as the country’s third major telecommunication services provider. Recent strength notwithstanding, broader industry concerns seem to be overshadowing the solid operating performance and attractive valuation of China Telecom, and we remain holders in anticipation of additional upside. SES advanced after results showed stabilization in the firm’s video business as well as better-than-expected growth in other key segments. Here, too, sentiment remains generally weak, though recent progress highlights some of the positive changes being delivered by a new management team working to repair the balance sheet and seize long-term growth opportunities.
An underweighted allocation and stock selection in the industrials sector also contributed to relative results, led by Danish wind turbine manufacturer Vestas Wind Systems.5 Its shares surged after the firm maintained full-year 2018 guidance in the face of tougher competition, signaling to analysts that company management expects a strong finish to the year. We were encouraged by the stabilization in pricing and strength in new orders, and we continue to believe Vestas is well positioned to participate in the long-term growth of the wind manufacturing industry.
From a regional standpoint, stock selection and an unfavorable underweighting in the U.S. were primarily responsible for underperformance. In Asia, an overweighting and stock selection in South Korea detracted from relative results, while in Europe, stock selection in France and an overweighting in Germany hindered results.
It is important to recognize the effect of currency movements on the Fund’s performance. In general, if the value of the U.S. dollar goes up compared with a foreign currency, an investment traded in that foreign currency will go down in value because it will be worth fewer U.S. dollars. This can have a negative effect on Fund performance. Conversely, when the U.S. dollar
CFA® is a trademark owned by CFA Institute.
| | | | |
Company Sector/Industry, Country | | % of Total
Net Assets | |
Oracle Corp.
Software, U.S. | | | 2.5% | |
BP PLC
Oil, Gas & Consumable Fuels, U.K. | | | 2.4% | |
Roche Holding AG
Pharmaceuticals, Switzerland | | | 2.1% | |
Royal Dutch Shell PLC
Oil, Gas & Consumable Fuels, U.K. | | | 2.1% | |
Samsung Electronics Co. Ltd.
Technology Hardware, Storage & Peripherals,
South Korea | | | 2.1% | |
Sanofi
Pharmaceuticals, France | | | 2.0% | |
Standard Chartered PLC
Banks, U.K. | | | 2.0% | |
BNP Paribas SA
Banks, France | | | 1.8% | |
Citigroup Inc.
Banks, U.S. | | | 1.7% | |
Shire PLC
Biotechnology, U.K. | | | 1.7% | |
weakens in relation to a foreign currency, an investment traded in that foreign currency will increase in value, which can contribute to Fund performance. For the 12 months ended December 31, 2018, the U.S. dollar rose in value relative to most currencies. As a result, the Fund’s performance was negatively affected by the portfolio’s investment predominantly in securities withnon-U.S. currency exposure.
Thank you for your continued participation in Global Equity Series. We look forward to serving your future investment needs.
| | |
| | | Peter A. Nori, CFA |
| | Antonio T. Docal, CFA |
| | Matthew R. Nagle, CFA |
| |
| | Portfolio Management Team |
.
4. The communication services sector comprises diversified telecommunication services, interactive media and services, media and wireless telecommunication services in the SOI.
5. The industrials sector comprises aerospace and defense, air freight and logistics, building products, electrical equipment, industrial conglomerates and machinery in the SOI.
See www.franklintempletondatasources.com for additional data provider information.
| | | | |
| | | |
| 12 | | Annual Report | | ftinstitutional.com |
GLOBAL EQUITY SERIES
The foregoing information reflects our analysis, opinions and portfolio holdings as of December 31, 2018, the end of the reporting period. The way we implement our main investment strategies and the resulting portfolio holdings may change depending on factors such as market and economic conditions. These opinions may not be relied upon as investment advice or an offer for a particular security. The information is not a complete analysis of every aspect of any market, country, industry, security or the Fund. Statements of fact are from sources considered reliable, but the investment manager makes no representation or warranty as to their completeness or accuracy. Although historical performance is no guarantee of future results, these insights may help you understand our investment management philosophy.
| | | | | | |
| | | |
| ftinstitutional.com | | Annual Report | | | 13 | |
GLOBAL EQUITY SERIES
Performance Summary as of December 31, 2018
The performance table and graph do not reflect any taxes that a shareholder would pay on Fund dividends, capital gain distributions, if any, or any realized gains on the sale of Fund shares. Total return reflects reinvestment of the Fund’s dividends and capital gain distributions, if any, and any unrealized gains or losses. Your dividend income will vary depending on dividends or interest paid by securities in the Fund’s portfolio, adjusted for operating expenses. Capital gain distributions are net profits realized from the sale of portfolio securities.
Performance as of 12/31/181
| | | | | | | | | | |
| | | |
| | | Cumulative
Total Return2 | | | | | | Average Annual
Total Return3 |
| | | |
1-Year | | | -14.49% | | | | | | | -14.49% |
5-Year | | | +2.38% | | | | | | | +0.47% |
10-Year | | | +107.69% | | | | | | | +7.58% |
Performance data represent past performance, which does not guarantee future results. Investment return and principal value will fluctuate, and you may have a gain or loss when you sell your shares. Current performance may differ from figures shown. For most recentmonth-end performance, go toftinstitutional.comor call a Franklin Templeton Institutional Services representative at (800)321-8563.
See page 16 for Performance Summary footnotes.
| | | | |
| | | |
| 14 | | Annual Report | | ftinstitutional.com |
GLOBAL EQUITY SERIES
PERFORMANCE SUMMARY
Total Return Index Comparison for a Hypothetical $10,000 Investment1
Total return represents the change in value of an investment over the periods shown. It includes any applicable maximum sales charge, Fund expenses, account fees and reinvested distributions. The unmanaged index includes reinvestment of any income or distributions. It differs from the Fund in composition and does not pay management fees or expenses. One cannot invest directly in an index.
See page 16 for Performance Summary footnotes.
| | | | | | |
| | | |
| ftinstitutional.com | | Annual Report | | | 15 | |
GLOBAL EQUITY SERIES
PERFORMANCE SUMMARY
Distributions(1/1/18–12/31/18)
| | | | | | | | | | | | |
| | | |
Net Investment
Income | | Short-Term
Capital Gain | | | Long-Term
Capital Gain | | | Total | |
$0.1601 | | | $0.1366 | | | | $1.1878 | | | | $1.4845 | |
Total Annual Operating Expenses5
| | | | | | |
| | |
| | | With Fee Waiver | | Without Fee Waiver | |
| | |
| | | 0.82% | | | 0.82%% | |
All investments involve risks, including possible loss of principal. Special risks are associated with foreign investing, including currency fluctuations, economic instability and political developments; investments in emerging markets involve heightened risks related to the same factors. Because the Fund may invest its assets in companies in a specific region, including Europe, it is subject to greater risks of adverse developments in that region and/or the surrounding regions than a fund that is more broadly diversified geographically. Political, social or economic disruptions in the region, even in countries in which the Fund is not invested, may adversely affect the value of securities held by the Fund. Current political and financial uncertainty surrounding the European Union may increase market volatility and the economic risk of investing in companies in Europe. In addition, smaller-company stocks have historically experienced more price volatility than larger-company stocks, especially over the short term. The Fund is actively managed but there is no guarantee that the manager’s investment decisions will produce the desired results. The Fund’s prospectus also includes a description of the main investment risks.
1. The Fund has a fee waiver associated with any investment it makes in a Franklin Templeton money fund and/or other Franklin Templeton fund, contractually guaranteed through 4/30/19. Fund investment results reflect the fee waiver; without this waiver, the results would have been lower.
2. Cumulative total return represents the change in value of an investment over the periods indicated.
3. Average annual total return represents the average annual change in value of an investment over the periods indicated. Return for less than one year, if any, has not been annualized.
4. Source: Morningstar. The MSCI ACWI is a free float-adjusted, market capitalization-weighted index designed to measure equity market performance of global developed and emerging markets.
5. Figures are as stated in the Fund’s current prospectus and may differ from the expense ratios disclosed in the Your Fund’s Expenses and Financial Highlights sections in this report. In periods of market volatility, assets may decline significantly, causing total annual Fund operating expenses to become higher than the figures shown.
See www.franklintempletondatasources.com for additional data provider information.
| | | | |
| | | |
| 16 | | Annual Report | | ftinstitutional.com |
GLOBAL EQUITY SERIES
Your Fund’s Expenses
As a Fund shareholder, you can incur two types of costs: (1) transaction costs, including sales charges (loads) on Fund purchases and redemptions, if applicable; and (2) ongoing Fund costs, including management fees, distribution and service(12b-1) fees, if applicable, and other Fund expenses. All mutual funds have ongoing costs, sometimes referred to as operating expenses. The table below shows ongoing costs of investing in the Fund and can help you understand these costs and compare them with those of other mutual funds. The table assumes a $1,000 investment held for the six months indicated.
Actual Fund Expenses
The table below provides information about actual account values and actual expenses in the columns under the heading “Actual.” In these columns the Fund’s actual return, which includes the effect of Fund expenses, is used to calculate the “Ending Account Value.” You can estimate the expenses you paid during the period by following these steps (of course, your account value and expenses will differ from those in this illustration): Divide your account value by $1,000 (if your account had an $8,600 value, then $8,600 ÷ $1,000 = 8.6). Then multiply the result by the number in the row for your class of shares under the headings “Actual” and “Expenses Paid During Period” (if Actual Expenses Paid During Period were $7.50, then 8.6 x $7.50 = $64.50). In this illustration, the actual expenses paid this period are $64.50.
Hypothetical Example for Comparison with Other Funds
Under the heading “Hypothetical” in the table, information is provided about hypothetical account values and hypothetical expenses based on the Fund’s actual expense ratio and an assumed rate of return of 5% per year before expenses, which is not the Fund’s actual return. This information may not be used to estimate the actual ending account balance or expenses you paid for the period, but it can help you compare ongoing costs of investing in the Fund with those of other funds. To do so, compare this 5% hypothetical example for the class of shares you hold with the 5% hypothetical examples that appear in the shareholder reports of other funds.
Please note that expenses shown in the table are meant to highlight ongoing costs and do not reflect any transactional costs. Therefore, information under the heading “Hypothetical” is useful in comparing ongoing costs only, and will not help you compare total costs of owning different funds. In addition, if transactional costs were included, your total costs would have been higher.
| | | | | | | | | | | | |
| | | | |
| | | | | Actual
(actual return after expenses) | | Hypothetical
(5% annual return before expenses) | | |
| | | | | | |
| | | Beginning
Account
Value 7/1/18 | | Ending
Account
Value 12/31/18 | | Paid During
Period
7/1/18–12/31/181,2 | | Ending
Account
Value 12/31/18 | | Paid During
Period
7/1/18–12/31/181,2 | | Net
Annualized
Expense
Ratio2 |
| | | | | | |
| | | $1,000 | | $874.10 | | $4.11 | | $1,020.82 | | $4.43 | | 0.87% |
1. Expenses are equal to the annualized expense ratio for thesix-month period as indicated above—in the far right column—multiplied by the simple average account value over the period indicated, and then multiplied by 184/365 to reflect theone-half year period.
2. Reflects expenses after fee waivers and expense reimbursements. Does not include acquired fund fees and expenses.
| | | | | | |
| | | |
| ftinstitutional.com | | Annual Report | | | 17 | |
International Equity Series
This annual report for International Equity Series (Fund) covers the fiscal year ended December 31, 2018.
Your Fund’s Goal and Main Investments
The Fund seeks long-term capital growth. Under normal market conditions, the Fund invests at least 80% of its net assets in foreign(non-U.S.) equity securities. The Fund predominantly invests in companies located outside the U.S. including companies located in developing markets countries.
Performance Overview
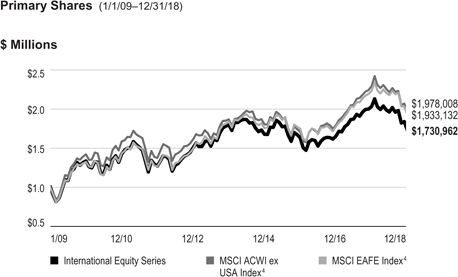
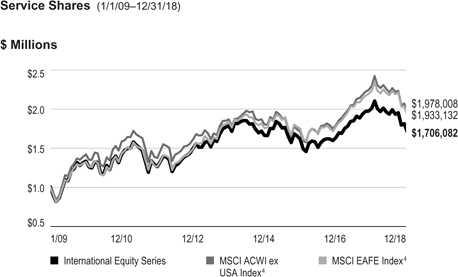
The Fund’s Primary shares had a-14.87% cumulative total return for the 12 months under review. For comparison, the Fund’s benchmark, the MSCI All Country World Index (ACWI) ex USA Index, which measures stock market performance in global developed and emerging markets excluding the U.S., had a-13.78% total return for the period under review.1 The Fund’s other benchmark, the MSCI Europe, Australasia, Far East (EAFE) Index, which measures stock market performance in global developed markets excluding the U.S. and Canada, had a-13.36% total return.1 Please note, index performance information is provided for reference and we do not attempt to track an index but rather undertake investments on the basis of fundamental research. You can find the Fund’s long-term performance data in the Performance Summary beginning on page 22.
Performance data represent past performance, which does not guarantee future results. Investment return and principal value will fluctuate, and you may have a gain or loss when you sell your shares. Current performance may differ from figures shown. For most recentmonth-end performance, go toftinstitutional.comor call a Franklin Templeton Institutional Services representative at (800)321-8563.
Investment Strategy
We employ abottom-up, value-oriented, long-term investment strategy. We focus on the market price of a company’s securities relative to our evaluation of the company’s long-term earnings, asset value and cash flow potential. We also consider a company’s price/earnings ratio, profit margins and liquidation value. We attempt to identify those companies that offer above-average opportunities for capital appreciation in various
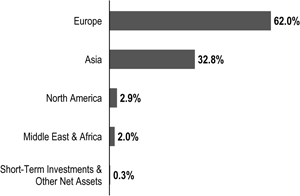
Geographic Composition
Based on Total Net Assets as of 12/31/18
countries and industries where economic and political factors, including currency movements, are favorable to capital growth.
Manager’s Discussion
International equities had the worst annual loss in a decade in 2018 as growing concerns about geopolitical turmoil, monetary policy tightening and late-cycle economic conditions led to episodes of heightened volatility. International value stocks underperformed international growth stocks for the past 10 years, extending one of value’s longest droughts on record. Yet, as the year progressed, value improved, breaking out in August and then limiting losses in the volatile fourth quarter. Also encouraging, international and emerging market stocks outperformed the long-dominant U.S. market in the fourth quarter as the globalsell-off accelerated. While it’s far too early to declare a regime change in equity markets, late developments brought some initial signs of the long-anticipated rotation out of last cycle’s winners. We continue to view this shift out of expensive and into cheaper stocks as the ultimate outcome of policy normalization and cycle transition.
The Fund underperformed its benchmark, the MSCI ACWI ex USA Index, during the year in review. Relative weakness during the period was partly due to stock selection in the financials sector and European markets.2
European banks led financials holdings lower. French lender BNP Paribas, Irish lender Bank of Ireland Group, Dutch banking group ING Groep and Swiss investment bank UBS
1. Source: Morningstar.
The indexes are unmanaged and include reinvested dividends. They do not reflect any fees, expenses or sales charges. One cannot invest directly in an index, and an index is not representative of the Fund’s portfolio.
2. The financials sector comprises banks, capital markets, insurance, and thrifts and mortgage finance in the SOI.
The dollar value, number of shares or principal amount, and names of all portfolio holdings are listed in the Fund’s Statement of Investments (SOI).
The SOI begins on page 37.
| | | | |
| | | |
| 18 | | Annual Report | | ftinstitutional.com |
INTERNATIONAL EQUITY SERIES
Group finished among the Fund’s biggest detractors. We continued to gradually reposition our financials portfolio in 2018 to rationalize holdings and reduce concentrated political risk. Our thesis on European banks rests largely on valuation and shareholder returns. European lenders currently trade at the same earnings multiple as they did in the depths of the eurozone sovereign debt crisis, despite significant progress restructuring and recapitalizing to improve asset quality and returns. Depressed valuations combined with generous shareholder returns have resulted in dividend yields exceeding price/earnings ratios recently at a number of European banks. In Asia, we believe prospects for improving corporate governance and political stability, combined with rising interest rates and solid economic growth, should benefit banks over time. We believe unhealed scars from the global financial crisis assure that banks will remain an easy target for bearish investors during periods of rising risk aversion. Yet, despite depressed valuations, we see fewer excesses and more resilience in the banking system today than during past crisis periods. In our analysis, deep value remains.
Stock selection in even-weighted materials3 also hindered relative results, as the sector was pressured by German chemicals firm Lanxess, German cement manufacturer HeidelbergCement4 and French materials producer Compagnie de Saint-Gobain. These stocks declined sharply due to concerns about a cyclical slowdown; however, we believe low valuation multiples on reduced earnings expectations should offer downside support and long-term upside potential from current levels. The opportunity set remains mixed in the global materials sector more broadly. As in construction materials, select chemicals stocks are suffering from near-term macro headwinds, creating opportunities in high-quality businesses for patient investors. In mining, we are finding opportunities among precious metals firms featuring cheap valuations, strong balance sheets and defensive characteristics. We believe these stocks will eventually find support in an environment of historically high debt levels, resurgent volatility and growing central bank reserve demand.
Consumer discretionary and information technology (IT) holdings also lagged as stock selection offset the benefits of a cautious underweighting to these expensive sectors.5 From the consumer discretionary sector, U.K. home improvement retailer
| | | | |
| Portfolio Composition | | | | |
| 12/31/18 | | | | |
| |
| Sector/Industry | | % of Total
Net Assets | |
Banks | | | 17.0% | |
Pharmaceuticals | | | 13.4% | |
Oil, Gas & Consumable Fuels | | | 11.1% | |
Diversified Telecommunication Services | | | 5.0% | |
Semiconductors & Semiconductor Equipment | | | 3.6% | |
Chemicals | | | 3.6% | |
Industrial Conglomerates | | | 3.2% | |
Wireless Telecommunication Services | | | 3.1% | |
Insurance | | | 3.0% | |
Multi-Utilities | | | 2.8% | |
Metals & Mining | | | 2.6% | |
Technology Hardware, Storage & Peripherals | | | 2.5% | |
Biotechnology | | | 2.2% | |
Capital Markets | | | 2.2% | |
Real Estate Management & Development | | | 2.1% | |
Other | | | 22.3% | |
Short-Term Investments & Other Net Assets | | | 0.3% | |
Kingfisher declined to levels that we believe are too cheap for a free cash-flow generative company that is well positioned to benefit from restructuring initiatives and cyclical improvements. IT stocks were led lower by Japanese factory automation firm Omron, which declined after indicating that U.S.-China trade tensions could negatively impact sales. The IT sector in general has been one of the biggest beneficiaries of the macro environment over the course of this cycle, offering good organic growth opportunities in an otherwise tepid economic environment. It has also generated high margins and strong free cash flows during a period of extraordinarily low interest rates. However, we have been wary of the valuation excesses this low interest-rate environment has created, most notably among consumer-oriented internet stocks. Although we never had exposure to what we considered the most overvalued parts of the sector, we have owned a number of outperforming technology stocks, and used strength in 2018 to sell holdings we considered fully valued.
Turning to contributors, stock selection in the overweighted communication services sector buoyed relative results.6 Chinese telecommunication services operator China Telecom
3. The materials sector comprises chemicals, construction materials, and metals and mining in the SOI.
4. Not held atperiod-end.
5. The consumer discretionary sector comprises auto components, household durables, multiline retail and specialty retail in the SOI. The IT sector comprises electronic equipment, instruments and components; semiconductors and semiconductor equipment; and technology hardware, storage and peripherals in the SOI.
6. The communication services sector comprises diversified telecommunication services, entertainment, interactive media and services, media and wireless telecommunication services in the SOI.
| | | | | | |
| | | |
| ftinstitutional.com | | Annual Report | | | 19 | |
INTERNATIONAL EQUITY SERIES
and Luxembourg-based satellite operator SES were the sector’s top contributors. China Telecom’s shares rallied after the company confirmed its entry into the Philippine market as the country’s third major telecommunication services provider. Recent strength notwithstanding, broader industry concerns seem to be overshadowing the solid operating performance and attractive valuation of China Telecom, and we remain holders in anticipation of additional upside. SES advanced after results showed stabilization in the firm’s video business as well as better-than-expected growth in other key segments. Here, too, sentiment remains generally weak, though recent progress highlights some of the positive changes being delivered by a new management team working to repair the balance sheet and seize long-term growth opportunities.
Overweighted allocations in the health care and energy sectors also notably helped relative results, with the health care sector contributing three of the Fund’s top contributors: U.K.-based medical technology firm LivaNova4 (not part of the index), French pharmaceuticals giant Sanofi and U.K. biotechnology firm Shire.7 However, the health care sector also had one of the Fund’s biggest detractors: German pharmaceuticals and chemicals firm Bayer, which declined due to an adverse court ruling that was subsequently reduced. In our view, health care remains an attractive sector at this point in the cycle. Unlike other defensive sectors such as consumer staples and utilities, health care is less of a simple bond proxy, offering defensiveness independent of interest-rate fluctuations. The sector also offers growth through innovation and untapped market potential. Indeed, over the past five years, pharmaceuticals industry revenue growth has well exceeded that of the broader market. Atyear-end, the sector was generating significantly higher profit margins than the global market with lower-than-average leverage ratios. Investors might expect to pay a premium for such attributes, but the sector trades at a discount based onprice-to-free-cash flow ratio, with some of that cash returning to shareholders through a dividend yield comparable with10-year U.S. Treasuries. Concerns persist about regulation and pricing in the global pharmaceuticals industry, but we believe history suggests companies capable of innovating to provide products that address unmet medical needs will continue to thrive and profit. These are the companies in which we seek to invest.
| | | | |
| Top 10 Holdings | | | | |
| 12/31/18 | | | | |
| |
Company Sector/Industry, Country | | % of Total Net Assets | |
Royal Dutch Shell PLC | | | 3.5% | |
| Oil, Gas & Consumable Fuels, U.K. | | | | |
BP PLC | | | 3.4% | |
| Oil, Gas & Consumable Fuels, U.K. | | | | |
Standard Chartered PLC | | | 2.8% | |
| Banks, U.K. | | | | |
Sanofi | | | 2.7% | |
| Pharmaceuticals, France | | | | |
Samsung Electronics Co. Ltd. | | | 2.5% | |
Technology Hardware, Storage & Peripherals, | | | | |
| South Korea | | | | |
Roche Holding AG | | | 2.4% | |
| Pharmaceuticals, Switzerland | | | | |
BNP Paribas SA | | | 2.4% | |
| Banks, France | | | | |
Shire PLC | | | 2.2% | |
| Biotechnology, U.K. | | | | |
UBS Group AG | | | 2.1% | |
| Capital Markets, Switzerland | | | | |
China Telecom Corp. Ltd. | | | 2.0% | |
| Diversified Telecommunication Services, China | | | | |
Energy remains another high-conviction overweighted allocation. As the price of oil rose above our estimate of the marginal cost of demand in late 2017 through early 2018, we began taking profits on higher-volatility, price-sensitive oilfield services and exploration and production stocks. This allowed us to shift resources into more defensive integrated oil producers with still-modest valuations and high dividend yields. The rise of U.S. shale as the industry’s swing producer means oil market fundamentals are becoming increasingly driven by a highly leveraged,low-intensity production regime functioning in a market-based economy. Compared to the regime led by Saudi Arabia and the Organization of the Petroleum Exporting Countries, that means a more rapid supply response to prevailing imbalances and, ultimately, shorter, more volatile cycles. Going into 2019, we remain constructive on our more defensive positioning, but with oil prices falling back to levels on the cost curve historically associated with support, we have begun using weakness to again search for bargains in the more cyclical parts of the sector.
7. The health care sector comprises biotechnology, health care equipment and supplies, health care providers and services, life sciences tools and services, and pharmaceuticals in the SOI. The energy sector comprises oil, gas and consumable fuels in the SOI.
| | | | |
| | | |
| 20 | | Annual Report | | ftinstitutional.com |
INTERNATIONAL EQUITY SERIES
Finally, a favorable underweighting in industrials contributed to relative results, led by Danish wind turbine manufacturer Vestas Wind Systems.8 Its shares surged after the firm maintained full-year 2018 guidance in the face of tougher competition, signaling to analysts that company management expects a strong finish to the year. We were encouraged by the stabilization in pricing and strength in new orders, and we continue to believe Vestas is well positioned to participate in the long-term growth of the wind manufacturing industry.
From a regional standpoint, stock selection and an underweighting in Asia contributed to relative performance, buoyed by stock selection in China. On the other hand, stock selection in overweighted European holdings detracted, as weakness in France and Germany offset relative strength in Luxembourg, the U.K. and Denmark.
It is important to recognize the effect of currency movements on the Fund’s performance. In general, if the value of the U.S. dollar goes up compared with a foreign currency, an investment traded in that foreign currency will go down in value because it will be worth fewer U.S. dollars. This can have a negative effect on Fund performance. Conversely, when the U.S. dollar weakens in relation to a foreign currency, an investment traded in that foreign currency will increase in value, which can contribute to Fund performance. For the 12 months ended December 31, 2018, the U.S. dollar rose in value relative to most currencies. As a result, the Fund’s performance was negatively affected by the portfolio’s investment predominantly in securities withnon-U.S. currency exposure.
Thank you for your continued participation in International Equity Series. We look forward to serving your future investment needs.
| | |
 | | 
Antonio T. Docal, CFA Lead Portfolio Manager Peter A. Nori, CFA Matthew R. Nagle, CFA Portfolio Management Team |
The foregoing information reflects our analysis, opinions and portfolio holdings as of December 31, 2018, the end of the reporting period. The way we implement our main investment strategies and the resulting portfolio holdings may change depending on factors such as market and economic conditions. These opinions may not be relied upon as investment advice or an offer for a particular security. The information is not a complete analysis of every aspect of any market, country, industry, security or the Fund. Statements of fact are from sources considered reliable, but the investment manager makes no representation or warranty as to their completeness or accuracy. Although historical performance is no guarantee of future results, these insights may help you understand our investment management philosophy.
8. The industrials sector comprises building products, electrical equipment, industrial conglomerates and marine in the SOI.
See www.franklintempletondatasources.com for additional data provider information.
| | | | | | |
| | | |
| ftinstitutional.com | | Annual Report | | | 21 | |
INTERNATIONAL EQUITY SERIES
Performance Summary as of December 31, 2018
The performance table and graphs do not reflect any taxes that a shareholder would pay on Fund dividends, capital gain distributions, if any, or any realized gains on the sale of Fund shares. Total return reflects reinvestment of the Fund’s dividends and capital gain distributions, if any, and any unrealized gains or losses. Your dividend income will vary depending on dividends or interest paid by securities in the Fund’s portfolio, adjusted for operating expenses of each class. Capital gain distributions are net profits realized from the sale of portfolio securities.
Performance as of 12/31/181
| | | | | | | | |
| | |
| Share Class | | Cumulative
Total Return2 | | | Average Annual
Total Return3 | |
| | |
| Primary | | | | | | | | |
| | |
1-Year | | | -14.87% | | | | -14.87% | |
| | |
5-Year | | | -3.83% | | | | -0.78% | |
| | |
10-Year | | | +73.10% | | | | +5.64% | |
| | |
| Service | | | | | | | | |
| | |
1-Year | | | -15.01% | | | | -15.01% | |
| | |
5-Year | | | -4.58% | | | | -0.93% | |
| | |
10-Year | | | +70.61% | | | | +5.49% | |
Performance data represent past performance, which does not guarantee future results. Investment return and principal value will fluctuate, and you may have a gain or loss when you sell your shares. Current performance may differ from figures shown. For most recentmonth-end performance, go toftinstitutional.comor call a Franklin Templeton Institutional Services representative at (800)321-8563.
See page 24 for Performance Summary footnotes.
| | | | |
| | | |
| 22 | | Annual Report | | ftinstitutional.com |
INTERNATIONAL EQUITY SERIES
PERFORMANCE SUMMARY
Total Return Index Comparison for a Hypothetical $10,000 Investment1
Total return represents the change in value of an investment over the periods shown. It includes any applicable maximum sales charge, Fund expenses, account fees and reinvested distributions. The unmanaged indexes include reinvestment of any income or distributions. They differ from the Fund in composition and do not pay management fees or expenses. One cannot invest directly in an index.
See page 24 for Performance Summary footnotes.
| | | | | | |
| | | |
| ftinstitutional.com | | Annual Report | | | 23 | |
INTERNATIONAL EQUITY SERIES
PERFORMANCE SUMMARY
Distributions(1/1/18–12/31/18)
| | | | | | | | | | | | | | | | |
| Share Class | | Net Investment
Income | | | Short-Term
Capital Gain | | | Long-Term
Capital Gain | | | Total | |
| | | | |
Primary | | | $0.4237 | | | | $0.0517 | | | | $3.4111 | | | | $3.8865 | |
Service | | | $0.3614 | | | | $0.0517 | | | | $3.4111 | | | | $3.8242 | |
Total Annual Operating Expenses5
| | | | | | | | | | | | |
Share Class | | With Fee
Waiver | | | | | | Without Fee
Waiver | |
| | | |
Primary | | | 0.79% | | | | | | | | 0.79% | |
Service | | | 0.94% | | | | | | | | 0.94% | |
Each class of shares is available to certain eligible investors and has different annual fees and expenses, as described in the prospectus.
All investments involve risks, including possible loss of principal. Foreign investing involves special risks, including currency fluctuations, economic instability and political developments. Investments in developing markets involve heightened risks related to the same factors, in addition to those associated with these markets’ small or midcap size and lesser liquidity. Because the Fund may invest in companies in a specific region, including Europe, it is subject to greater risks of adverse developments in that region and/or the surrounding regions than a fund that is more broadly diversified geographically. Political, social or economic disruptions in the region, even in countries in which the Fund is not invested, may adversely affect the value of securities held by the Fund. Current political uncertainty surrounding the European Union (EU) and the financial instability of some countries in the EU may increase market volatility and the economic risk of investing in companies in Europe. Value securities may not increase in price as anticipated or may decline further in value. The Fund is actively managed but there is no guarantee that the manager’s investment decisions will produce the desired results. The Fund’s prospectus also includes a description of the main investment risks.
1. The Fund has a fee waiver associated with any investment it makes in a Franklin Templeton money fund and/or other Franklin Templeton fund, contractually guaranteed through 4/30/19. Fund investment results reflect the fee waiver; without this waiver, the results would have been lower.
2. Cumulative total return represents the change in value of an investment over the periods indicated.
3. Average annual total return represents the average annual change in value of an investment over the periods indicated. Return for less then one year, if any, has not been annualized.
4. Source: Morningstar. The MSCI ACWI ex USA Index is a free float-adjusted, market capitalization-weighted index designed to measure equity market performance of global developed and emerging markets, excluding the U.S. The MSCI EAFE Index is a free float-adjusted, market capitalization-weighted index designed to measure equity market performance of global developed markets excluding the U.S. and Canada.
5. Figures are as stated in the Fund’s current prospectus and may differ from the expense ratios disclosed in the Your Fund’s Expenses and Financial Highlights sections in this report. In periods of market volatility, assets may decline significantly, causing total annual Fund operating expenses to become higher than the figures shown.
See www.franklintempletondatasources.com for additional data provider information.
| | | | |
| | | |
| 24 | | Annual Report | | ftinstitutional.com |
INTERNATIONAL EQUITY SERIES
Your Fund’s Expenses
As a Fund shareholder, you can incur two types of costs: (1) transaction costs, including sales charges (loads) on Fund purchases and redemptions, if applicable; and (2) ongoing Fund costs, including management fees, distribution and service(12b-1) fees, if applicable, and other Fund expenses. All mutual funds have ongoing costs, sometimes referred to as operating expenses. The table below shows ongoing costs of investing in the Fund and can help you understand these costs and compare them with those of other mutual funds. The table assumes a $1,000 investment held for the six months indicated.
Actual Fund Expenses
The table below provides information about actual account values and actual expenses in the columns under the heading “Actual.” In these columns the Fund’s actual return, which includes the effect of Fund expenses, is used to calculate the “Ending Account Value” for each class of shares. You can estimate the expenses you paid during the period by following these steps (of course, your account value and expenses will differ from those in this illustration): Divide your account value by $1,000 (if your account had an $8,600 value, then $8,600 ÷ $1,000 = 8.6). Then multiply the result by the number in the row for your class of shares under the headings “Actual” and “Expenses Paid During Period” (if Actual Expenses Paid During Period were $7.50, then 8.6 x $7.50 =$64.50). In this illustration, the actual expenses paid this period are $64.50.
Hypothetical Example for Comparison with Other Funds
Under the heading “Hypothetical” in the table, information is provided about hypothetical account values and hypothetical expenses based on the Fund’s actual expense ratio and an assumed rate of return of 5% per year before expenses, which is not the Fund’s actual return. This information may not be used to estimate the actual ending account balance or expenses you paid for the period, but it can help you compare ongoing costs of investing in the Fund with those of other funds. To do so, compare this 5% hypothetical example for the class of shares you hold with the 5% hypothetical examples that appear in the shareholder reports of other funds.
Please note that expenses shown in the table are meant to highlight ongoing costs and do not reflect any transactional costs. Therefore, information under the heading “Hypothetical” is useful in comparing ongoing costs only, and will not help you compare total costs of owning different funds. In addition, if transactional costs were included, your total costs would have been higher.
| | | | | | | | | | | | |
| | | | |
| | | | | Actual
(actual return after expenses) | | Hypothetical
(5% annual return before expenses) | | |
| | | | | | |
Share
Class | | Beginning
Account
Value 7/1/18 | | Ending
Account
Value 12/31/18 | | Expenses Paid During
Period 7/1/18–12/31/181,2 | | Ending
Account
Value 12/31/18 | | Expenses Paid During
Period 7/1/18–12/31/181,2 | | Net
Annualized
Expense
Ratio2 |
| | | | | | |
| | | | | | |
| Primary Shares | | $1,000 | | $882.20 | | $3.80 | | $1,021.17 | | $4.08 | | 0.80% |
Service Shares | | $1,000 | | $881.40 | | $4.51 | | $1,020.42 | | $4.84 | | 0.95% |
1. Expenses are equal to the annualized expense ratio for thesix-month period as indicated above—in the far right column—multiplied by the simple average account value over the period indicated, and then multiplied by 184/365 to reflect theone-half year period.
2. Reflects expenses after fee waivers and expense reimbursements. Does not include acquired fund fees and expenses.
| | | | | | |
| | | |
| ftinstitutional.com | | Annual Report | | | 25 | |
TEMPLETON INSTITUTIONAL FUNDS
Financial Highlights
Foreign Smaller Companies Series
| | | | | | | | | | | | | | | | | | | | |
| | | Year Ended December 31, | |
| | | 2018 | | | 2017 | | | 2016 | | | 2015 | | | 2014 | |
| |
| | | | | |
Per share operating performance
(for a share outstanding throughout the year) | | | | | | | | | | | | | | | | | | | | |
| | | | | |
Net asset value, beginning of year | | | $25.08 | | | | $19.93 | | | | $20.90 | | | | $20.80 | | | | $21.96 | |
| | | | |
| | | | | |
| Income from investment operationsa: | | | | | | | | | | | | | | | | | | | | |
| | | | | |
Net investment incomeb | | | 0.37 | | | | 0.30 | | | | 0.29 | | | | 0.28 | | | | 0.25 | |
| | | | | |
Net realized and unrealized gains (losses) | | | (4.97 | ) | | | 6.49 | | | | (0.48 | ) | | | 0.12 | | | | (0.98) | |
| | | | |
| | | | | |
Total from investment operations | | | (4.60 | ) | | | 6.79 | | | | (0.19 | ) | | | 0.40 | | | | (0.73) | |
| | | | |
| | | | | |
| Less distributions from: | | | | | | | | | | | | | | | | | | | | |
| | | | | |
Net investment income | | | (0.21 | ) | | | (0.68 | ) | | | (0.41 | ) | | | (0.28 | ) | | | (0.16) | |
| | | | | |
Net realized gains | | | (2.31 | ) | | | (0.96 | ) | | | (0.37 | ) | | | (0.02 | ) | | | (0.27) | |
| | | | |
| | | | | |
Total distributions | | | (2.52 | ) | | | (1.64 | ) | | | (0.78 | ) | | | (0.30 | ) | | | (0.43) | |
| | | | |
| | | | | |
Net asset value, end of year | | | $17.96 | | | | $25.08 | | | | $19.93 | | | | $20.90 | | | | $20.80 | |
| | | | |
| | | | | |
Total return | | | (18.48)% | | | | 34.18% | | | | (0.85)% | | | | 1.88% | | | | (3.32)% | |
| | | | | |
| Ratios to average net assets | | | | | | | | | | | | | | | | | | | | |
| | | | | |
Expenses before waiver and payments by affiliates | | | 1.01% | | | | 0.99% | | | | 0.99% | | | | 0.98% | | | | 0.98% | |
| | | | | |
Expenses net of waiver and payments by affiliates | | | 1.00%c | | | | 0.98%c | | | | 0.98%c | | | | 0.98%c,d | | | | 0.98% | |
| | | | | |
Net investment income | | | 1.54% | | | | 1.28% | | | | 1.44% | | | | 1.28% | | | | 1.15% | |
| | | | | |
| Supplemental data | | | | | | | | | | | | | | | | | | | | |
| | | | | |
Net assets, end of year (000’s) | | | $739,576 | | | | $1,040,180 | | | | $931,879 | | | | $1,260,407 | | | | $1,281,733 | |
| | | | | |
Portfolio turnover rate | | | 34.10% | | | | 25.97% | | | | 21.36% | | | | 29.11% | | | | 21.36% | |
aThe amount shown for a share outstanding throughout the period may not correlate with the Statement of Operations for the period due to the timing of sales and repurchases of the Fund’s shares in relation to income earned and/or fluctuating fair value of the investments of the Fund.
bBased on average daily shares outstanding.
cBenefit of expense reduction rounds to less than 0.01%.
dBenefit of waiver and payments by affiliates rounds to less than 0.01%.
| | | | |
| | | |
| 26 | | Annual Report | The accompanying notes are an integral part of these financial statements. | | ftinstitutional.com |
TEMPLETON INSTITUTIONAL FUNDS
Statement of Investments, December 31, 2018
Foreign Smaller Companies Series
| | | | | | | | | | | | | | |
| | | | |
| | | | | Industry | | | Shares | | | Value | |
| | Common Stocks 94.1% | | | | | | | | | | | | |
| | Belgium 2.5% | | | | | | | | | | | | |
| | Barco NV | |
| Electronic Equipment, Instruments &
Components |
| | | 93,695 | | | $ | 10,617,481 | |
| | Ontex Group NV | | | Personal Products | | | | 372,131 | | | | 7,632,340 | |
| | | | | | | | | | | | | | |
| | | | | | | | | | | 18,249,821 | |
| | | | | | | | | | | | | | |
| | Bermuda 0.7% | | | | | | | | | | | | |
| | Axis Capital Holdings Ltd. | | | Insurance | | | | 100,730 | | | | 5,201,697 | |
| | | | | | | | | | | | | | |
| | Brazil 3.1% | | | | | | | | | | | | |
| | Camil Alimentos SA | | | Food Products | | | | 5,386,800 | | | | 9,784,719 | |
| | Grendene SA | | | Textiles, Apparel & Luxury Goods | | | | 2,662,100 | | | | 5,624,276 | |
| | M. Dias Branco SA | | | Food Products | | | | 677,000 | | | | 7,465,533 | |
| | | | | | | | | | | | | | |
| | | | | | | | | | | 22,874,528 | |
| | | | | | | | | | | | | | |
| | Canada 6.9% | | | | | | | | | | | | |
| a | | Badger Daylighting Ltd. | | | Construction & Engineering | | | | 442,900 | | | | 10,464,504 | |
| | Canaccord Genuity Group Inc. | | | Capital Markets | | | | 1,507,938 | | | | 6,374,448 | |
| b | | Canada Goose Holdings Inc. | | | Textiles, Apparel & Luxury Goods | | | | 92,900 | | | | 4,061,887 | |
| | Canadian Western Bank | | | Banks | | | | 410,881 | | | | 7,838,632 | |
| | Mullen Group Ltd. | | | Energy Equipment & Services | | | | 655,000 | | | | 5,859,226 | |
| | The North West Co. Inc. | | | Food & Staples Retailing | | | | 385,700 | | | | 8,878,489 | |
| | Russel Metals Inc. | | | Trading Companies & Distributors | | | | 198,300 | | | | 3,098,823 | |
| | Shawcor Ltd. | | | Energy Equipment & Services | | | | 378,800 | | | | 4,601,270 | |
| | | | | | | | | | | | | | |
| | | | | | | | | | | 51,177,279 | |
| | | | | | | | | | | | | | |
| | China 5.7% | | | | | | | | | | | | |
| | China ZhengTong Auto Services Holdings Ltd. | | | Specialty Retail | | | | 9,586,500 | | | | 5,717,254 | |
| | Goodbaby International Holdings Ltd. | | | Leisure Products | | | | 19,530,600 | | | | 6,135,659 | |
| | Greatview Aseptic Packaging Co. Ltd. | | | Containers & Packaging | | | | 11,537,300 | | | | 6,261,864 | |
| | Hollysys Automation Technologies Ltd. | |
| Electronic Equipment, Instruments &
Components |
| | | 461,200 | | | | 8,075,612 | |
| | Shanghai Haohai Biological Technology Co. Ltd., H | | | Biotechnology | | | | 1,075,100 | | | | 5,368,292 | |
| | Xtep International Holdings Ltd. | | | Textiles, Apparel & Luxury Goods | | | | 19,791,300 | | | | 10,741,718 | |
| | | | | | | | | | | | | | |
| | | | | | | | | | | 42,300,399 | |
| | | | | | | | | | | | | | |
| | Colombia 0.6% | | | | | | | | | | | | |
| b | | Gran Tierra Energy Inc. | | | Oil, Gas & Consumable Fuels | | | | 1,985,400 | | | | 4,334,585 | |
| | | | | | | | | | | | | | |
| | Denmark 1.2% | | | | | | | | | | | | |
| b | | Nilfisk Holding AS | | | Machinery | | | | 257,196 | | | | 9,143,522 | |
| | | | | | | | | | | | | | |
| | Finland 4.8% | | | | | | | | | | | | |
| | Amer Sports OYJ | | | Leisure Products | | | | 489,997 | | | | 21,542,397 | |
| | Huhtamaki OYJ | | | Containers & Packaging | | | | 382,149 | | | | 11,853,041 | |
| b | | Outotec OYJ | | | Machinery | | | | 559,478 | | | | 1,970,587 | |
| | | | | | | | | | | | | | |
| | | | | | | | | | | 35,366,025 | |
| | | | | | | | | | | | | | |
| | France 0.5% | | | | | | | | | | | | |
| | Maisons du Monde SA | | | Specialty Retail | | | | 196,571 | | | | 3,763,611 | |
| | | | | | | | | | | | | | |
| | Germany 7.8% | | | | | | | | | | | | |
| | Gerresheimer AG | | | Life Sciences Tools & Services | | | | 172,674 | | | | 11,347,078 | |
| | Grand City Properties SA | | | Real Estate Management & Development | | | | 429,791 | | | | 9,341,914 | |
| | Jenoptik AG | |
| Electronic Equipment, Instruments &
Components |
| | | 314,891 | | | | 8,210,959 | |
| | Rational AG | | | Machinery | | | | 19,861 | | | | 11,286,595 | |
| | Stabilus SA | | | Machinery | | | | 115,360 | | | | 7,255,663 | |
| | | | | | |
| | | |
| ftinstitutional.com | | Annual Report | | | 27 | |
TEMPLETON INSTITUTIONAL FUNDS
STATEMENT OF INVESTMENTS
Foreign Smaller Companies Series(continued)
| | | | | | | | | | | | | | |
| | | | |
| | | | | Industry | | | Shares | | | Value | |
| | Common Stocks(continued) | | | | | | | | | | | | |
| | Germany(continued) | | | | | | | | | | | | |
b | | zooplus AG | | | Internet & Direct Marketing Retail | | | | 77,365 | | | $ | 10,604,162 | |
| | | | | | | | | | | | | | |
| | | | | | | | | | | | | 58,046,371 | |
| | | | | | | | | | | | | | |
| | Hong Kong 4.7% | | | | | | | | | | | | |
a | | PAX Global Technology Ltd. | |
| Electronic Equipment, Instruments &
Components |
| | | 12,976,000 | | | | 4,689,621 | |
| | Techtronic Industries Co. Ltd. | | | Household Durables | | | | 2,686,000 | | | | 14,269,536 | |
| | Value Partners Group Ltd. | | | Capital Markets | | | | 11,573,000 | | | | 8,025,208 | |
| | VTech Holdings Ltd. | | | Communications Equipment | | | | 905,900 | | | | 7,496,625 | |
| | | | | | | | | | | | | | |
| | | | | | | | | | | | | 34,480,990 | |
| | | | | | | | | | | | | | |
| | India 1.3% | | | | | | | | | | | | |
| | DCB Bank Ltd. | | | Banks | | | | 1,920,522 | | | | 4,672,249 | |
| | Dewan Housing Finance Corp. Ltd. | | | Thrifts & Mortgage Finance | | | | 937,492 | | | | 3,360,795 | |
| | Welspun India Ltd. | | | Textiles, Apparel & Luxury Goods | | | | 1,725,873 | | | | 1,483,501 | |
| | | | | | | | | | | | | | |
| | | | | | | | | | | | | 9,516,545 | |
| | | | | | | | | | | | | | |
| | Indonesia 0.2% | | | | | | | | | | | | |
b | | PT XL Axiata Tbk | | | Wireless Telecommunication Services | | | | 9,183,500 | | | | 1,264,487 | |
| | | | | | | | | | | | | | |
| | Italy 4.3% | | | | | | | | | | | | |
| | Interpump Group SpA | | | Machinery | | | | 474,872 | | | | 14,167,329 | |
| | Technogym SpA | | | Leisure Products | | | | 1,311,892 | | | | 14,075,471 | |
a | | Tod’s SpA | | | Textiles, Apparel & Luxury Goods | | | | 81,719 | | | | 3,868,899 | |
| | | | | | | | | | | | | | |
| | | | | | | | | | | | | 32,111,699 | |
| | | | | | | | | | | | | | |
| | Japan 19.8% | | | | | | | | | | | | |
| | Anicom Holdings Inc. | | | Insurance | | | | 317,100 | | | | 10,545,890 | |
| | Asahi Co. Ltd. | | | Specialty Retail | | | | 322,100 | | | | 4,043,883 | |
| | Asics Corp. | | | Textiles, Apparel & Luxury Goods | | | | 745,500 | | | | 9,556,820 | |
| | Bunka Shutter Co. Ltd. | | | Building Products | | | | 906,500 | | | | 5,905,484 | |
| | Daibiru Corp. | | | Real Estate Management & Development | | | | 769,400 | | | | 7,623,799 | |
| | Descente Ltd. | | | Textiles, Apparel & Luxury Goods | | | | 267,271 | | | | 4,404,119 | |
| | Dowa Holdings Co. Ltd. | | | Metals & Mining | | | | 249,200 | | | | 7,503,285 | |
| | Fuji Oil Holdings Inc. | | | Food Products | | | | 429,400 | | | | 13,751,770 | |
| | Idec Corp. | | | Electrical Equipment | | | | 418,200 | | | | 7,192,582 | |
a | | IDOM Inc. | | | Specialty Retail | | | | 1,530,200 | | | | 5,096,013 | |
| | Kobayashi Pharmaceutical Co. Ltd. | | | Personal Products | | | | 114,000 | | | | 7,769,890 | |
| | MEITEC Corp. | | | Professional Services | | | | 277,700 | | | | 11,313,234 | |
| | Morita Holdings Corp. | | | Machinery | | | | 401,500 | | | | 6,579,325 | |
a | | N Field Co. Ltd. | | | Health Care Providers & Services | | | | 525,700 | | | | 4,523,130 | |
| | Nihon Parkerizing Co. Ltd. | | | Chemicals | | | | 494,500 | | | | 5,739,088 | |
| | Square Enix Holdings Co. Ltd. | | | Entertainment | | | | 162,200 | | | | 4,420,542 | |
| | Tadano Ltd. | | | Machinery | | | | 573,000 | | | | 5,222,874 | |
| | TechnoPro Holdings Inc. | | | Professional Services | | | | 162,300 | | | | 6,700,798 | |
| | Tsumura & Co. | | | Pharmaceuticals | | | | 484,100 | | | | 13,493,846 | |
| | Zojirushi Corp. | | | Household Durables | | | | 533,000 | | | | 4,692,929 | |
| | | | | | | | | | | | | | |
| | | | | | | | | | | | | 146,079,301 | |
| | | | | | | | | | | | | | |
| | Netherlands 4.7% | | | | | | | | | | | | |
| | Aalberts Industries NV | | | Machinery | | | | 107,221 | | | | 3,568,903 | |
| | Accell Group NV | | | Leisure Products | | | | 223,552 | | | | 4,825,788 | |
| | Arcadis NV | | | Construction & Engineering | | | | 560,239 | | | | 6,842,887 | |
| | Intertrust NV | | | Professional Services | | | | 667,727 | | | | 11,239,048 | |
| | | | |
| | | |
| 28 | | Annual Report | | ftinstitutional.com |
TEMPLETON INSTITUTIONAL FUNDS
STATEMENT OF INVESTMENTS
Foreign Smaller Companies Series(continued)
| | | | | | | | | | | | | | |
| | | | |
| | | | | Industry | | | Shares | | | Value | |
| | Common Stocks(continued) | | | | | | | | | | | | |
| | Netherlands(continued) | �� | | | | | | | | | | | |
| | PostNL NV | | | Air Freight & Logistics | | | | 3,717,996 | | | $ | 8,507,379 | |
| | | | | | | | | | | | | | |
| | | | | | | | | | | | | 34,984,005 | |
| | | | | | | | | | | | | | |
| | Norway 0.3% | | | | | | | | | | | | |
a | | XXL ASA | | | Specialty Retail | | | | 754,546 | | | | 2,284,397 | |
| | | | | | | | | | | | | | |
| | Poland 0.9% | | | | | | | | | | | | |
| | CCC SA | | | Textiles, Apparel & Luxury Goods | | | | 123,733 | | | | 6,390,720 | |
| | | | | | | | | | | | | | |
| | South Korea 2.3% | | | | | | | | | | | | |
| | BNK Financial Group Inc. | | | Banks | | | | 1,010,307 | | | | 6,649,442 | |
| | DGB Financial Group Inc. | | | Banks | | | | 1,350,972 | | | | 10,080,342 | |
| | | | | | | | | | | | | | |
| | | | | | | | | | | | | 16,729,784 | |
| | | | | | | | | | | | | | |
| | Spain 1.5% | | | | | | | | | | | | |
| | Construcciones y Auxiliar de Ferrocarriles SA | | | Machinery | | | | 272,712 | | | | 11,311,537 | |
| | | | | | | | | | | | | | |
| | Sweden 4.4% | | | | | | | | | | | | |
| | Cloetta AB, B | | | Food Products | | | | 1,908,364 | | | | 5,215,685 | |
| | Dometic Group AB | | | Auto Components | | | | 560,286 | | | | 3,496,650 | |
| | Duni AB | | | Household Durables | | | | 294,786 | | | | 3,259,771 | |
| | Granges AB | | | Metals & Mining | | | | 551,828 | | | | 5,012,533 | |
| | Tethys Oil AB | | | Oil, Gas & Consumable Fuels | | | | 394,735 | | | | 2,877,457 | |
c | | The Thule Group AB, Reg S | | | Leisure Products | | | | 698,770 | | | | 12,793,787 | |
| | | | | | | | | | | | | | |
| | | | | | | | | | | | | 32,655,883 | |
| | | | | | | | | | | | | | |
| | Switzerland 3.2% | | | | | | | | | | | | |
| | Bucher Industries AG | | | Machinery | | | | 39,521 | | | | 10,664,337 | |
| | Logitech International SA | | | Technology Hardware, Storage & Peripherals | | | | 173,800 | | | | 5,436,464 | |
b | | Luxoft Holding Inc. | | | IT Services | | | | 144,300 | | | | 4,389,606 | |
| | Tecan Group AG | | | Life Sciences Tools & Services | | | | 16,779 | | | | 3,267,268 | |
| | | | | | | | | | | | | | |
| | | | | | | | | | | | | 23,757,675 | |
| | | | | | | | | | | | | | |
| | Taiwan 6.1% | | | | | | | | | | | | |
| | Chicony Electronics Co. Ltd. | | | Technology Hardware, Storage & Peripherals | | | | 3,820,037 | | | | 7,815,613 | |
| | Giant Manufacturing Co. Ltd. | | | Leisure Products | | | | 2,030,482 | | | | 9,589,328 | |
| | King Yuan Electronics Co. Ltd. | | | Semiconductors & Semiconductor Equipment | | | | 14,671,000 | | | | 11,148,176 | |
| | Merida Industry Co. Ltd. | | | Leisure Products | | | | 1,414,000 | | | | 6,377,488 | |
| | Tripod Technology Corp. | | | Electronic Equipment, Instruments | | | | | | | | | |
| | | | | & Components | | | | 4,005,000 | | | | 10,445,436 | |
| | | | | | | | | | | | | | |
| | | | | | | | | | | | | 45,376,041 | |
| | | | | | | | | | | | | | |
| | United Kingdom 6.6% | | | | | | | | | | | | |
| | Bellway PLC | | | Household Durables | | | | 96,629 | | | | 3,099,137 | |
| | Bovis Homes Group PLC | | | Household Durables | | | | 260,759 | | | | 2,865,769 | |
| | Card Factory PLC | | | Specialty Retail | | | | 1,751,709 | | | | 3,873,525 | |
| | De La Rue PLC | | | Commercial Services & Supplies | | | | 701,690 | | | | 3,785,131 | |
| | Greggs PLC | | | Hotels, Restaurants & Leisure | | | | 692,023 | | | | 11,172,479 | |
| | Man Group PLC | | | Capital Markets | | | | 6,721,157 | | | | 11,399,636 | |
| | Oxford Instruments PLC | |
| Electronic Equipment, Instruments &
Components |
| | | 570,733 | | | | 6,623,228 | |
| | SIG PLC | | | Trading Companies & Distributors | | | | 4,223,764 | | | | 5,914,218 | |
| | | | | | | | | | | | | | |
| | | | | | | | | | | | | 48,733,123 | |
| | | | | | | | | | | | | | |
| | Total Common Stocks (Cost $642,451,179) | | | | | | | | | | | 696,134,025 | |
| | | | | | | | | | | | | | |
| | | | | | |
| | | |
| ftinstitutional.com | | Annual Report | | | 29 | |
TEMPLETON INSTITUTIONAL FUNDS
STATEMENT OF INVESTMENTS
Foreign Smaller Companies Series(continued)
| | | | | | | | | | | | | | |
| | | | | | Industry | | | | Shares | | | | Value | |
| | | | |
| | | Preferred Stocks (Cost $3,527,800) 0.8% | | | | | | | | | |
| | | Brazil 0.8% | | | | | | | | | |
| d | | Alpargatas SA, 2.771%, pfd | | | Textiles, Apparel & Luxury Goods | | | | 1,249,600 | | | $ | 5,479,727 | |
| | | | | | | | | | | | | | |
| | | Total Investments before Short Term
Investments (Cost $645,978,979) | | | | | | | | 701,613,752 | |
| | | | | | | | | | | | | | |
| | | | | | | | Principal
Amount | | | | |
| | Short Term Investments 3.6% | | | | | | | | | | | | |
| | | | |
| | | U.S. Government and Agency Securities (Cost $7,599,092)
1.0% | | | | | | | | | |
| | | United States 1.0% | | | | | | | | | |
| e | | FHLB, 1/02/19 | | | | | | $ | 7,600,000 | | | | 7,600,000 | |
| | | | | | | | | | | | | | |
| | | | | | | | Shares | | | | |
| | | | | | | | | | | | | | |
| f | | Investments from Cash Collateral Received for Loaned
Securities 2.6% | | | | | | | | | |
| | | Money Market Funds (Cost $19,099,595) 2.6% | | | | | | | | | |
| | | United States 2.6% | | | | | | | | | |
| g,h | | Institutional Fiduciary Trust Money Market Portfolio, 1.99% | | | | | | | 19,099,595 | | | | 19,099,595 | |
| | | | | | | | | | | | | | |
| | Total Investments (Cost $672,677,666) 98.5% | | | | | | | | | | | 728,313,347 | |
| | Other Assets, less Liabilities 1.5% | | | | | | | | | | | 11,262,937 | |
| | | | | | | | | | | | | | |
| | Net Assets 100.0% | | | | | | | | | | $ | 739,576,284 | |
| | | | | | | | | | | | | | |
See Abbreviations on page 58.
aA portion or all of the security is on loan at December 31, 2018. See Note 1(c).
bNon-income producing.
cSecurity was purchased pursuant to Regulation S under the Securities Act of 1933, which exempts from registration securities offered and sold outside of the United States. Such a security cannot be sold in the United States without either an effective registration statement filed pursuant to the Securities Act of 1933, or pursuant to an exemption from registration. This security has been deemed liquid under guidelines approved by the Trust’s Board of Trustees. At December 31, 2018, the value of this security was $12,793,787, representing 1.7% of net assets.
dVariable rate security. The rate shown represents the yield at period end.
eThe security was issued on a discount basis with no stated coupon rate.
fSee Note 1(c) regarding securities on loan.
gSee Note 3(d) regarding investments in affiliated management investment companies.
hThe rate shown is the annualizedseven-day effective yield at period end.
| | | | |
| | | |
| 30 | | Annual Report | The accompanying notes are an integral part of these financial statements. | | ftinstitutional.com |
TEMPLETON INSTITUTIONAL FUNDS
Financial Highlights
Global Equity Series
| | | | | | | | | | | | | | | | | | | | |
| | | Year Ended December 31, | |
| | | | | |
| | | 2018 | | | 2017 | | | 2016 | | | 2015 | | | 2014 | |
| |
| | | | | |
| Per share operating performance | | | | | | | | | | | | | | | | | | | | |
| | | | | |
(for a share outstanding throughout the year) | | | | | | | | | | | | | | | | | | | | |
| | | | | |
Net asset value, beginning of year | | | $10.59 | | | | $ 8.95 | | | | $ 8.73 | | | | $ 9.64 | | | | $11.53 | |
| | | | |
| | | | | |
Income from investment operationsa: | | | | | | | | | | | | | | | | | | | | |
| | | | | |
Net investment incomeb | | | 0.16 | | | | 0.16 | | | | 0.16 | | | | 0.14 | | | | 0.25c | |
| | | | | |
Net realized and unrealized gains (losses) | | | (1.71) | | | | 1.71 | | | | 0.25 | | | | (0.43) | | | | (0.46) | |
| | | | |
| | | | | |
Total from investment operations | | | (1.55) | | | | 1.87 | | | | 0.41 | | | | (0.29) | | | | (0.21) | |
| | | | |
| | | | | |
Less distributions from: | | | | | | | | | | | | | | | | | | | | |
| | | | | |
Net investment income | | | (0.16) | | | | (0.19) | | | | (0.15) | | | | (0.16) | | | | (0.26) | |
| | | | | |
Net realized gains | | | (1.32) | | | | (0.04) | | | | (0.04) | | | | (0.46) | | | | (1.42) | |
| | | | |
| | | | | |
Total distributions | | | (1.48) | | | | (0.23) | | | | (0.19) | | | | (0.62) | | | | (1.68) | |
| | | | |
| | | | | |
Net asset value, end of year | | | $ 7.56 | | | | $10.59 | | | | $ 8.95 | | | | $ 8.73 | | | | $ 9.64 | |
| | | | |
| | | | | |
Total return | | | (14.49)% | | | | 20.88% | | | | 4.67% | | | | (3.43)% | | | | (2.01)% | |
| | | | | |
| Ratios to average net assets | | | | | | | | | | | | | | | | | | | | |
Expenses | | | 0.85% | d | | | 0.82% | d,e | | | 0.84% | d | | | 0.81% | d,e | | | 0.92% | |
Net investment income | | | 1.54% | | | | 1.65% | | | | 1.82% | | | | 1.47% | | | | 2.21% | c |
| | | | | | |
| Supplemental data | | | | | | | | | | | | | | | | | | | | |
Net assets, end of year (000’s) | | | $243,400 | | | | $327,015 | | | | $280,709 | | | | $282,830 | | | | $467,375 | |
Portfolio turnover rate | | | 34.14% | | | | 25.27% | | | | 27.91% | | | | 36.88% | | | | 35.50% | |
aThe amount shown for a share outstanding throughout the period may not correlate with the Statement of Operations for the period due to the timing of sales and repurchases of the Fund’s shares in relation to income earned and/or fluctuating fair value of the investments of the Fund.
bBased on average daily shares outstanding.
cNet investment income per share includes approximately $0.09 per share related to income received in the form of special dividends in connection with certain Fund holdings. Excluding this amount, the ratio of net investment income to average net assets would have been 1.43%.
dBenefit of waiver and payments by affiliates rounds to less than 0.01%.
eBenefit of expense reduction rounds to less than 0.01%.
| | | | | | | | |
| | | |
| ftinstitutional.com | | The accompanying notes are an integral part of these financial statements. | Annual Report | | | 31 | |
TEMPLETON INSTITUTIONAL FUNDS
Statement of Investments, December 31, 2018
Global Equity Series
| | | | | | | | | | | | | | | | |
| | | | |
| | | | | | Industry | | | Shares | | | Value | |
| | | | Common Stocks 96.4% | | | | | | | | | |
| | | | Canada 2.2% | | | | | | | | | |
| | | | Alamos Gold Inc., A | | | Metals & Mining | | | | 288,330 | | | $ | 1,037,988 | |
| | | | Husky Energy Inc. | | | Oil, Gas & Consumable Fuels | | | | 226,500 | | | | 2,341,416 | |
| | | | Wheaton Precious Metals Corp. | | | Metals & Mining | | | | 99,900 | | | | 1,950,500 | |
| | | | | | | | | | | | | | | | |
| | | | | | | | | | | | | | | 5,329,904 | |
| | | | | | | | | | | | | | | | |
| | | | China 5.6% | | | | | | | | | |
| | | | |
| | a | | | Baidu Inc., ADR | | | Interactive Media & Services | | | | 14,760 | | | | 2,340,936 | |
| | | | China Life Insurance Co. Ltd., H | | | Insurance | | | | 1,197,000 | | | | 2,543,654 | |
| | | | China Mobile Ltd. | | | Wireless Telecommunication Services | | | | 362,000 | | | | 3,483,392 | |
| | | | China Telecom Corp. Ltd., H | | | Diversified Telecommunication Services | | | | 7,412,000 | | | | 3,786,220 | |
| | | | Kunlun Energy Co. Ltd. | | | Oil, Gas & Consumable Fuels | | | | 1,408,400 | | | | 1,492,845 | |
| | | | | | | | | | | | | | | | |
| | | | | | | | | | | | | | | 13,647,047 | |
| | | | | | | | | | | | | | | | |
| | | | Denmark 1.5% | | | | | | | | | |
| | | | Vestas Wind Systems AS | | | Electrical Equipment | | | | 46,631 | | | | 3,530,010 | |
| | | | | | | | | | | | | | | | |
| | | | France 8.8% | | | | | | | | | |
| | | | AXA SA | | | Insurance | | | | 130,035 | | | | 2,809,731 | |
| | | | BNP Paribas SA | | | Banks | | | | 97,232 | | | | 4,397,847 | |
| | | | Cie Generale des Etablissements Michelin SCA | | | Auto Components | | | | 18,051 | | | | 1,793,202 | |
| | | | Compagnie de Saint-Gobain | | | Building Products | | | | 67,254 | | | | 2,247,444 | |
| | | | Sanofi | | | Pharmaceuticals | | | | 55,961 | | | | 4,851,328 | |
| | | | Total SA | | | Oil, Gas & Consumable Fuels | | | | 35,982 | | | | 1,903,917 | |
| | | | Veolia Environnement SA | | | Multi-Utilities | | | | 166,767 | | | | 3,430,870 | |
| | | | | | | | | | | | | | | | |
| | | | | | | | | | | | | | | 21,434,339 | |
| | | | | | | | | | | | | | | | |
| | | | Germany 6.4% | | | | | | | | | |
| | | | Bayer AG | | | Pharmaceuticals | | | | 50,089 | | | | 3,483,780 | |
| | | | E.ON SE | | | Multi-Utilities | | | | 356,068 | | | | 3,515,014 | |
| | | | Lanxess AG | | | Chemicals | | | | 41,593 | | | | 1,912,381 | |
| | | | Merck KGaA | | | Pharmaceuticals | | | | 25,730 | | | | 2,648,569 | |
| | | | Siemens AG, ADR | | | Industrial Conglomerates | | | | 71,437 | | | | 4,006,187 | |
| | | | | | | | | | | | | | | | |
| | | | | | | | | | | | | | | 15,565,931 | |
| | | | | | | | | | | | | | | | |
| | | | Hong Kong 1.4% | | | | | | | | | |
| | | | CK Hutchison Holdings Ltd. | | | Industrial Conglomerates | | | | 350,540 | | | | 3,366,402 | |
| | | | | | | | | | | | | | | | |
| | | | India 0.2% | | | | | | | | | |
| | | | Housing Development Finance Corp. Ltd. | | | Thrifts & Mortgage Finance | | | | 21,285 | | | | 602,218 | |
| | | | | | | | | | | | | | | | |
| | | | Ireland 2.1% | | | | | | | | | |
| | | | Bank of Ireland Group PLC | | | Banks | | | | 396,345 | | | | 2,205,365 | |
| | | | CRH PLC | | | Construction Materials | | | | 112,877 | | | | 2,989,882 | |
| | | | | | | | | | | | | | | 5,195,247 | |
| | | | Israel 1.4% | | | | | | | | | |
| | | | |
| | a | | | Teva Pharmaceutical Industries Ltd., ADR | | | Pharmaceuticals | | | | 222,363 | | | | 3,428,837 | |
| | | | | | | | | | | | | | | | |
| | | | Italy 1.2% | | | | | | | | | |
| | | | Eni SpA | | | Oil, Gas & Consumable Fuels | | | | 179,243 | | | | 2,831,661 | |
| | | | | | | | | | | | | | | | |
| | | | Japan 7.6% | | | | | | | | | |
| | | | IHI Corp. | | | Machinery | | | | 37,000 | | | | 1,022,902 | |
| | | | Mitsui Fudosan Co. Ltd. | | | Real Estate Management & Development | | | | 140,500 | | | | 3,134,329 | |
| | | | Omron Corp. | |
| Electronic Equipment, Instruments &
Components |
| | | 49,800 | | | | 1,817,518 | |
| | | | Panasonic Corp. | | | Household Durables | | | | 276,600 | | | | 2,500,000 | |
| | | | Seven & i Holdings Co. Ltd. | | | Food & Staples Retailing | | | | 90,700 | | | | 3,958,194 | |
| | | | | | |
| | | |
| 32 | | Annual Report | | | ftinstitutional.com | |
TEMPLETON INSTITUTIONAL FUNDS
STATEMENT OF INVESTMENTS
| | | | | | | | | | | | | | | | |
| Global Equity Series(continued) | | | | | | | | | |
| | | | |
| | | | | | Industry | | | Shares | | | Value | |
| | | | Common Stocks(continued) | | | | | | | | | |
| | | | Japan(continued) | | | | | | | | | |
| | | | SoftBank Group Corp. | | | Wireless Telecommunication Services | | | | 16,000 | | | $ | 1,066,423 | |
| | | | Sumitomo Mitsui Financial Group Inc. | | | Banks | | | | 36,100 | | | | 1,200,589 | |
| | | | Suntory Beverage & Food Ltd. | | | Beverages | | | | 84,700 | | | | 3,833,139 | |
| | | | | | | | | | | | | | | | |
| | | | |
| | | | | | | | | | | | | | | 18,533,094 | |
| | | | | | | | | | | | | | | | |
| | | | Luxembourg 0.7% | | | | | | | | | |
| | | | SES SA, IDR | | | Media | | | | 94,986 | | | | 1,818,632 | |
| | | | | | | | | | | | | | | | |
| | | | Netherlands 3.0% | | | | | | | | | |
| | | | ING Groep NV | | | Banks | | | | 329,684 | | | | 3,554,645 | |
| | | | NXP Semiconductors NV | | | Semiconductors & Semiconductor Equipment | | | | 33,000 | | | | 2,418,240 | |
| | a | | | QIAGEN NV | | | Life Sciences Tools & Services | | | | 41,532 | | | | 1,419,242 | |
| | | | | | | | | | | | | | | | |
| | | | |
| | | | | | | | | | | | | | | 7,392,127 | |
| | | | | | | | | | | | | | | | |
| | | | Norway 1.2% | | | | | | | | | |
| | | | Yara International ASA | | | Chemicals | | | | 75,205 | | | | 2,898,701 | |
| | | | | | | | | | | | | | | | |
| | | | Singapore 1.4% | | | | | | | | | |
| | | | Singapore Telecommunications Ltd. | | | Diversified Telecommunication Services | | | | 1,553,304 | | | | 3,338,968 | |
| | | | | | | | | | | | | | | | |
| | | | South Korea 2.9% | | | | | | | | | |
| | | | Hana Financial Group Inc. | | | Banks | | | | 60,590 | | | | 1,972,136 | |
| | | | Samsung Electronics Co. Ltd. | | | Technology Hardware, Storage & Peripherals | | | | 144,272 | | | | 5,013,268 | |
| | | | | | | | | | | | | | | | |
| | | | |
| | | | | | | | | | | | | | | 6,985,404 | |
| | | | | | | | | | | | | | | | |
| | | | Switzerland 4.8% | | | | | | | | | |
| | | | Novartis AG | | | Pharmaceuticals | | | | 29,004 | | | | 2,485,499 | |
| | | | Roche Holding AG | | | Pharmaceuticals | | | | 20,769 | | | | 5,159,232 | |
| | | | UBS Group AG | | | Capital Markets | | | | 314,933 | | | | 3,930,231 | |
| | | | | | | | | | | | | | | | |
| | | | |
| | | | | | | | | | | | | | | 11,574,962 | |
| | | | | | | | | | | | | | | | |
| | | | Taiwan 1.4% | | | | | | | | | |
| | | | |
| | | | Taiwan Semiconductor Manufacturing Co. Ltd., ADR | | | Semiconductors & Semiconductor Equipment | | | | 90,240 | | | | 3,330,758 | |
| | | | | | | | | | | | | | | | |
| | | | |
| | | | Thailand 1.5% | | | | | | | | | |
| | | | |
| | | | Bangkok Bank PCL, NVDR | | | Banks | | | | 566,300 | | | | 3,554,697 | |
| | | | | | | | | | | | | | | | |
| | | | |
| | | | United Kingdom 12.9% | | | | | | | | | |
| | | | BAE Systems PLC | | | Aerospace & Defense | | | | 274,809 | | | | 1,609,267 | |
| | | | Barclays PLC | | | Banks | | | | 646,101 | | | | 1,240,195 | |
| | | | BP PLC | | | Oil, Gas & Consumable Fuels | | | | 940,685 | | | | 5,949,458 | |
| | | | HSBC Holdings PLC | | | Banks | | | | 354,800 | | | | 2,936,088 | |
| | | | Kingfisher PLC | | | Specialty Retail | | | | 893,933 | | | | 2,365,475 | |
| | | | Royal Dutch Shell PLC, B | | | Oil, Gas & Consumable Fuels | | | | 168,100 | | | | 5,016,247 | |
| | | | Shire PLC | | | Biotechnology | | | | 69,835 | | | | 4,069,909 | |
| | | | Standard Chartered PLC | | | Banks | | | | 620,149 | | | | 4,818,618 | |
| | | | Vodafone Group PLC | | | Wireless Telecommunication Services | | | | 1,789,378 | | | | 3,489,032 | |
| | | | | | | | | | | | | | | | |
| | | | |
| | | | | | | | | | | | | | | 31,494,289 | |
| | | | | | | | | | | | | | | | |
| | | | United States 28.2% | | | | | | | | | |
| | | | Allergan PLC | | | Pharmaceuticals | | | | 27,740 | | | | 3,707,728 | |
| | | | Ally Financial Inc. | | | Consumer Finance | | | | 82,100 | | | | 1,860,386 | |
| | | | Amgen Inc. | | | Biotechnology | | | | 18,000 | | | | 3,504,060 | |
| | | | Apache Corp. | | | Oil, Gas & Consumable Fuels | | | | 40,050 | | | | 1,051,313 | |
| | | | Capital One Financial Corp. | | | Consumer Finance | | | | 47,340 | | | | 3,578,431 | |
| | a | | | Celgene Corp. | | | Biotechnology | | | | 40,860 | | | | 2,618,717 | |
| | | | Citigroup Inc. | | | Banks | | | | 81,620 | | | | 4,249,137 | |
| | | | Comcast Corp., A | | | Media | | | | 106,340 | | | | 3,620,877 | |
| | | | | | |
| | | |
| ftinstitutional.com | | Annual Report | | | 33 | |
TEMPLETON INSTITUTIONAL FUNDS
STATEMENT OF INVESTMENTS
| | | | | | | | | | | | | | | | |
Global Equity Series(continued) | | | | | | | | | |
| | | | |
| | | | | | Industry | | | Shares | | | Value | |
| | | | Common Stocks(continued) | | | | | | | | | |
| | | | United States(continued) | | | | | | | | | |
| | a | | | CommScope Holding Co. Inc. | | | Communications Equipment | | | | 109,000 | | | $ | 1,786,510 | |
| | | | Coty Inc., A | | | Personal Products | | | | 216,300 | | | | 1,418,928 | |
| | | | Eastman Chemical Co. | | | Chemicals | | | | 17,570 | | | | 1,284,543 | |
| | | | Eli Lilly & Co. | | | Pharmaceuticals | | | | 16,670 | | | | 1,929,052 | |
| | | | Exxon Mobil Corp. | | | Oil, Gas & Consumable Fuels | | | | 56,800 | | | | 3,873,192 | |
| | | | Gilead Sciences Inc. | | | Biotechnology | | | | 55,110 | | | | 3,447,131 | |
| | | | Kellogg Co. | | | Food Products | | | | 42,300 | | | | 2,411,523 | |
| | a | | | Knowles Corp. | |
| Electronic Equipment, Instruments
& Components |
| | | 20,000 | | | | 266,200 | |
| | | | The Kroger Co. | | | Food & Staples Retailing | | | | 87,500 | | | | 2,406,250 | |
| | | | LyondellBasell Industries NV, A | | | Chemicals | | | | 14,700 | | | | 1,222,452 | |
| | a | | | Mattel Inc. | | | Leisure Products | | | | 177,900 | | | | 1,777,221 | |
| | | | Medtronic PLC | | | Health Care Equipment & Supplies | | | | 13,380 | | | | 1,217,045 | |
| | | | Oracle Corp. | | | Software | | | | 133,710 | | | | 6,037,006 | |
| | | | Tapestry Inc. | | | Textiles, Apparel & Luxury Goods | | | | 59,900 | | | | 2,021,625 | |
| | | | United Parcel Service Inc., B | | | Air Freight & Logistics | | | | 36,500 | | | | 3,559,845 | |
| | | | Voya Financial Inc. | | | Diversified Financial Services | | | | 82,070 | | | | 3,294,290 | |
| | | | Walgreens Boots Alliance Inc. | | | Food & Staples Retailing | | | | 51,700 | | | | 3,532,661 | |
| | | | Wells Fargo & Co. | | | Banks | | | | 66,600 | | | | 3,068,928 | |
| | | | | | | | | | | | | | | | |
| | | | | | | | | | | | | | | 68,745,051 | |
| | | | | | | | | | | | | | | | |
| | | | Total Common Stocks (Cost $243,881,437) | | | | | | | | | | | 234,598,279 | |
| | | | | | | | | | | | | | | | |
| | | | Preferred Stocks (Cost $1,775,190) 0.3% | | | | | | | | | |
| | | | Germany 0.3% | | | | | | | | | |
| | | | |
| | b | | | Draegerwerk AG & Co. KGaA, 0.99%, pfd | | | Health Care Equipment & Supplies | | | | 14,500 | | | | 772,253 | |
| | | | | | | | | | | | | | | | |
| | | | Total Investments before Short Term Investments (Cost $245,656,627) | | | | | | | | | | | 235,370,532 | |
| | | | | | | | | | | | | | | | |
| | | | |
| | | | | | | | | Principal
Amount | | | | |
| | | | Short Term Investments (Cost $7,000,000) 2.9% | | | | | | | | | |
| | | | Time Deposits 2.9% | | | | | | | | | | | | |
| | | | United States 2.9% | | | | | | | | | | | | |
| | | | Royal Bank of Canada, 2.35%, 1/02/19 | | | | | | $ | 7,000,000 | | | | 7,000,000 | |
| | | | | | | | | | | | | | | | |
| | | | Total Investments (Cost $252,656,627) 99.6% | | | | | | | | 242,370,532 | |
| | | | Other Assets, less Liabilities 0.4% | | | | | | | | | | | 1,029,488 | |
| | | | | | | | | | | | | | | | |
| | | | Net Assets 100.0% | | | | | | | | | | $ | 243,400,020 | |
| | | | | | | | | | | | | | | | |
See Abbreviations on page 58.
aNon-income producing.
bVariable rate security. The rate shown represents the yield at period end.
| | | | | | |
| | | |
| 34 | | Annual Report | The accompanying notes are an integral part of these financial statements. | | ftinstitutional.com |
TEMPLETON INSTITUTIONAL FUNDS
Financial Highlights
International Equity Series
| | | | | | | | | | | | | | | | | | | | |
| |
| | | Year Ended December 31, | |
| | | | | |
| | | 2018 | | | 2017 | | | 2016 | | | 2015 | | | 2014 | |
| |
| | | | | |
| Primary Shares | | | | | | | | | | | | | | | | | | | | |
| | | | | |
Per share operating performance
(for a share outstanding throughout the year) | | | | | | | | | | | | | | | | | | | | |
| | | | | |
Net asset value, beginning of year | | | $21.99 | | | | $18.65 | | | | $19.05 | | | | $20.05 | | | | $22.72 | |
| | | | |
| | | | | |
| Income from investment operationsa: | | | | | | | | | | | | | | | | | | | | |
| | | | | |
Net investment incomeb | | | 0.42 | | | | 0.45 | | | | 0.45 | | | | 0.45 | | | | 0.74c | |
| | | | | |
Net realized and unrealized gains (losses) | | | (3.66 | ) | | | 3.81 | | | | (0.20 | ) | | | (0.98 | ) | | | (2.27) | |
| | | | |
| | | | | |
Total from investment operations | | | (3.24 | ) | | | 4.26 | | | | 0.25 | | | | (0.53 | ) | | | (1.53) | |
| | | | |
| | | | | |
| Less distributions from: | | | | | | | | | | | | | | | | | | | | |
| | | | | |
Net investment income | | | (0.42 | ) | | | (0.64 | ) | | | (0.46 | ) | | | (0.47 | ) | | | (0.79) | |
| | | | | |
Net realized gains | | | (3.46 | ) | | | (0.28 | ) | | | (0.19 | ) | | | — | | | | (0.35) | |
| | | | |
| | | | | |
Total distributions | | | (3.88 | ) | | | (0.92 | ) | | | (0.65 | ) | | | (0.47 | ) | | | (1.14) | |
| | | | |
| | | | | |
Net asset value, end of year | | | $14.87 | | | | $21.99 | | | | $18.65 | | | | $19.05 | | | | $20.05 | |
| | | | |
| | | | | |
Total return | | | (14.87)% | | | | 22.92% | | | | 1.30% | | | | (2.67)% | | | | (6.78)% | |
| | | | | |
| Ratios to average net assets | | | | | | | | | | | | | | | | | | | | |
| | | | | |
Expensesd | | | 0.80% | e | | | 0.78% | | | | 0.78% | | | | 0.78% | | | | 0.78% | |
| | | | | |
Net investment income | | | 1.98% | | | | 2.13% | | | | 2.44% | | | | 2.16% | | | | 3.27% | c |
| | | | | | |
| Supplemental data | | | | | | | | | | | | | | | | | | | | |
| | | | | |
Net assets, end of year (000’s) | | | $2,785,308 | | | | $4,412,494 | | | | $4,539,205 | | | | $5,077,937 | | | | $6,210,850 | |
| | | | | |
Portfolio turnover rate | | | 25.60% | f | | | 16.39% | f | | | 14.88% | | | | 16.16% | | | | 14.97% | |
aThe amount shown for a share outstanding throughout the period may not correlate with the Statement of Operations for the period due to the timing of sales and repurchases of the Fund’s shares in relation to income earned and/or fluctuating fair value of the investments of the Fund.
bBased on average daily shares outstanding.
cNet investment income per share includes approximately $0.29 per share related to income received in the form of special dividends in connection with certain Fund holdings. Excluding this amount, the ratio of net investment income to average net assets would have been 2.00%.
dBenefit of waiver and payments by affiliates rounds to less than 0.01%.
eBenefit of expense reduction rounds to less than 0.01%.
fExcludes the value of portfolio securities delivered as a result of a redemptionin-kind. See Note 9.
| | | | | | |
| | | |
| ftinstitutional.com | | The accompanying notes are an integral part of these financial statements. | Annual Report | | | 35 | |
TEMPLETON INSTITUTIONAL FUNDS
FINANCIAL HIGHLIGHTS
International Equity Series(continued)
| | | | | | | | | | | | | | | | | | | | |
| | | Year Ended December 31, | |
| | | | | |
| | | 2018 | | | 2017 | | | 2016 | | | 2015 | | | 2014 | |
| | | | | |
Service Shares | | | | | | | | | | | | | | | | | | | | |
| | | | | |
| Per share operating performance | | | | | | | | | | | | | | | | | | | | |
(for a share outstanding throughout the year) | | | | | | | | | | | | | | | | | | | | |
| | | | | |
Net asset value, beginning of year | | | $22.07 | | | | $18.72 | | | | $19.11 | | | | $20.11 | | | | $22.79 | |
| | | | |
| | | | | |
Income from investment operationsa: | | | | | | | | | | | | | | | | | | | | |
| | | | | |
Net investment incomeb | | | 0.38 | | | | 0.39 | | | | 0.42 | | | | 0.36 | | | | 0.71c | |
| | | | | |
Net realized and unrealized gains (losses) | | | (3.66 | ) | | | 3.85 | | | | (0.20 | ) | | | (0.92 | ) | | | (2.28) | |
| | | | |
| | | | | |
Total from investment operations | | | (3.28 | ) | | | 4.24 | | | | 0.22 | | | | (0.56 | ) | | | (1.57) | |
| | | | |
| | | | | |
Less distributions from: | | | | | | | | | | | | | | | | | | | | |
| | | | | |
Net investment income | | | (0.36 | ) | | | (0.61 | ) | | | (0.42 | ) | | | (0.44 | ) | | | (0.76) | |
| | | | | |
Net realized gains | | | (3.46 | ) | | | (0.28 | ) | | | (0.19 | ) | | | — | | | | (0.35) | |
| | | | |
| | | | | |
Total distributions | | | (3.82 | ) | | | (0.89 | ) | | | (0.61 | ) | | | (0.44 | ) | | | (1.11) | |
| | | | |
| | | | | |
Net asset value, end of year | | | $14.97 | | | | $22.07 | | | | $18.72 | | | | $19.11 | | | | $20.11 | |
| | | | |
| | | | | |
Total return | | | (15.01)% | | | | 22.73% | | | | 1.15% | | | | (2.80)% | | | | (6.95)% | |
| | | | | |
Ratios to average net assets | | | | | | | | | | | | | | | | | | | | |
| | | | | |
Expensesd | | | 0.95% | e | | | 0.93% | | | | 0.93% | | | | 0.93% | | | | 0.93% | |
| | | | | |
Net investment income | | | 1.83% | | | | 1.98% | | | | 2.29% | | | | 2.01% | | | | 3.12%c | |
| | | | | |
Supplemental data | | | | | | | | | | | | | | | | | | | | |
| | | | | |
Net assets, end of year (000’s) | | | $5,375 | | | | $14,164 | | | | $8,624 | | | | $12,525 | | | | $6,985 | |
| | | | | |
Portfolio turnover rate | | | 25.60% | f | | | 16.39%f | | | | 14.88% | | | | 16.16% | | | | 14.97% | |
aThe amount shown for a share outstanding throughout the period may not correlate with the Statement of Operations for the period due to the timing of sales and repurchases of the Fund’s shares in relation to income earned and/or fluctuating fair value of the investments of the Fund.
bBased on average daily shares outstanding.
cNet investment income per share includes approximately $0.29 per share related to income received in the form of special dividends in connection with certain Fund holdings. Excluding this amount, the ratio of net investment income to average net assets would have been 1.85%.
dBenefit of waiver and payments by affiliates rounds to less than 0.01%.
eBenefit of expense reduction rounds to less than 0.01%.
fExcludes the value of portfolio securities delivered as a result of a redemptionin-kind. See Note 9.
| | | | |
| | | |
| 36 | | Annual Report | The accompanying notes are an integral part of these financial statements. | | ftinstitutional.com |
TEMPLETON INSTITUTIONAL FUNDS
Statement of Investments, December 31, 2018
International Equity Series
| | | | | | | | | | | | | | |
| | | | |
| | | | | Industry | | | Shares | | | Value | |
| | Common Stocks 99.7% | | | | | | | | | | | | |
| | Canada 2.9% | | | | | | | | | | | | |
| | Goldcorp Inc. | | | Metals & Mining | | | | 2,673,507 | | | $ | 26,187,617 | |
| | Husky Energy Inc. | | | Oil, Gas & Consumable Fuels | | | | 2,073,763 | | | | 21,437,266 | |
| | Wheaton Precious Metals Corp. | | | Metals & Mining | | | | 1,760,681 | | | | 34,376,460 | |
| | | | | | | | | | | | | | |
| | | | | | | | | | | | | 82,001,343 | |
| | | | | | | | | | | | | | |
| | China 8.0% | | | | | | | | | | | | |
a | | Baidu Inc., ADR | | | Interactive Media & Services | | | | 202,488 | | | | 32,114,597 | |
| | China Life Insurance Co. Ltd., H | | | Insurance | | | | 19,237,448 | | | | 40,880,038 | |
| | China Mobile Ltd. | | | Wireless Telecommunication Services | | | | 5,045,264 | | | | 48,548,706 | |
| | China Telecom Corp. Ltd., H | | | Diversified Telecommunication Services | | | | 107,876,881 | | | | 55,105,998 | |
| | NetEase Inc., ADR | | | Entertainment | | | | 92,994 | | | | 21,887,998 | |
| | Sinopharm Group Co. Ltd., H | | | Health Care Providers & Services | | | | 6,200,776 | | | | 26,052,682 | |
| | | | | | | | | | | | | | |
| | | | | | | | | | | | | 224,590,019 | |
| | | | | | | | | | | | | | |
| | Denmark 2.9% | | | | | | | | | | | | |
| | A.P. Moeller-Maersk AS, B | | | Marine | | | | 24,805 | | | | 31,203,936 | |
| | Vestas Wind Systems AS | | | Electrical Equipment | | | | 651,629 | | | | 49,328,914 | |
| | | | | | | | | | | | | | |
| | | | | | | | | | | | | 80,532,850 | |
| | | | | | | | | | | | | | |
| | France 11.9% | | | | | | | | | | | | |
| | AXA SA | | | Insurance | | | | 1,868,526 | | | | 40,374,167 | |
| | BNP Paribas SA | | | Banks | | | | 1,456,391 | | | | 65,873,225 | |
| | Cie Generale des Etablissements Michelin SCA | | | Auto Components | | | | 354,392 | | | | 35,205,605 | |
| | Compagnie de Saint-Gobain | | | Building Products | | | | 938,617 | | | | 31,366,004 | |
| | Sanofi | | | Pharmaceuticals | | | | 850,652 | | | | 73,744,063 | |
| | Total SA | | | Oil, Gas & Consumable Fuels | | | | 952,046 | | | | 50,375,650 | |
| | Veolia Environnement SA. | | | Multi-Utilities | | | | 1,647,960 | | | | 33,903,214 | |
| | | | | | | | | | | | | | |
| | | | | | | | | | | | | 330,841,928 | |
| | | | | | | | | | | | | | |
| | Germany 10.5% | | | | | | | | | | | | |
| | Bayer AG | | | Pharmaceuticals | | | | 654,206 | | | | 45,501,211 | |
| | E.ON SE | | | Multi-Utilities | | | | 4,598,490 | | | | 45,395,137 | |
| | Fresenius Medical Care AG & Co. KGaA | | | Health Care Providers & Services | | | | 332,009 | | | | 21,522,171 | |
| | Infineon Technologies AG | | | Semiconductors & Semiconductor Equipment | | | | 1,364,983 | | | | 27,330,432 | |
| | Lanxess AG | | | Chemicals | | | | 565,610 | | | | 26,005,861 | |
| | Merck KGaA | | | Pharmaceuticals | | | | 447,333 | | | | 46,047,121 | |
| | Siemens AG | | | Industrial Conglomerates | | | | 364,226 | | | | 40,649,971 | |
| | Telefonica Deutschland Holding AG | | | Diversified Telecommunication Services | | | | 10,459,680 | | | | 41,170,246 | |
| | | | | | | | | | | | | | |
| | | | | | | | | | | | | 293,622,150 | |
| | | | | | | | | | | | | | |
| | Hong Kong 2.6% | | | | | | | | | | | | |
| | CK Asset Holdings Ltd. | | | Real Estate Management & Development | | | | 3,311,394 | | | | 24,231,259 | |
| | CK Hutchison Holdings Ltd. | | | Industrial Conglomerates | | | | 5,034,294 | | | | 48,346,710 | |
| | | | | | | | | | | | | | |
| | | | | | | | | | | | | 72,577,969 | |
| | | | | | | | | | | | | | |
| | India 1.1% | | | | | | | | | | | | |
| | Housing Development Finance Corp. Ltd. | | | Thrifts & Mortgage Finance | | | | 1,113,053 | | | | 31,491,704 | |
| | | | | | | | | | | | | | |
| | Ireland 3.3% | | | | | | | | | | | | |
| | Bank of Ireland Group PLC | | | Banks | | | | 7,223,710 | | | | 40,194,569 | |
| | CRH PLC | | | Construction Materials | | | | 1,997,813 | | | | 52,763,093 | |
| | | | | | | | | | | | | | |
| | | | | | | | | | | | | 92,957,662 | |
| | | | | | | | | | | | | | |
| | Israel 2.0% | | | | | | | | | | | | |
a | | Teva Pharmaceutical Industries Ltd., ADR | | | Pharmaceuticals | | | | 3,530,691 | | | | 54,443,255 | |
| | | | | | | | | | | | | | |
| | | | | | |
| | | |
| ftinstitutional.com | | Annual Report | | | 37 | |
TEMPLETON INSTITUTIONAL FUNDS
STATEMENT OF INVESTMENTS
| | | | | | | | | | | | | | |
International Equity Series(continued) | | | | | | | | | | | | |
| | | | |
| | | | | Industry | | | Shares | | | Value | |
| | Common Stocks(continued) | | | | | | | | | | | | |
| | Italy 2.5% | | | | | | | | | | | | |
| | Eni SpA | | | Oil, Gas & Consumable Fuels | | | | 2,916,584 | | | $ | 46,075,867 | |
| | UniCredit SpA | | | Banks | | | | 2,117,768 | | | | 23,988,797 | |
| | | | | | | | | | | | | | |
| | | | | | | | | | | | | 70,064,664 | |
| | | | | | | | | | | | | | |
| | Japan 10.6% | | | | | | | | | | | | |
| | Astellas Pharma Inc. | | | Pharmaceuticals | | | | 3,383,700 | | | | 43,268,755 | |
| | Ezaki Glico Co. Ltd. | | | Food Products | | | | 589,200 | | | | 29,997,591 | |
| | Mitsui Fudosan Co. Ltd. | | | Real Estate Management & Development | | | | 1,478,490 | | | | 32,982,738 | |
| | Omron Corp. | |
| Electronic Equipment, Instruments &
Components |
| | | 363,351 | | | | 13,260,986 | |
| | Panasonic Corp. | | | Household Durables | | | | 2,818,945 | | | | 25,478,530 | |
| | Ryohin Keikaku Co. Ltd. | | | Multiline Retail | | | | 31,594 | | | | 7,653,474 | |
| | Seven & i Holdings Co. Ltd. | | | Food & Staples Retailing | | | | 863,700 | | | | 37,692,309 | |
| | Sumitomo Metal Mining Co. Ltd. | | | Metals & Mining | | | | 483,700 | | | | 13,008,264 | |
| | Sumitomo Mitsui Financial Group Inc. | | | Banks | | | | 868,900 | | | | 28,897,267 | |
| | Sumitomo Rubber Industries Ltd. | | | Auto Components | | | | 1,542,554 | | | | 18,296,717 | |
| | Suntory Beverage & Food Ltd. | | | Beverages | | | | 1,001,279 | | | | 45,313,356 | |
| | | | | | | | | | | | | | |
| | | | |
| | | | | | | | | | | | | 295,849,987 | |
| | | | | | | | | | | | | | |
| | Luxembourg 1.8% | | | | | | | | | | | | |
| | SES SA, IDR | | | Media | | | | 2,655,458 | | | | 50,842,241 | |
| | | | | | | | | | | | | | |
| | Netherlands 4.4% | | | | | | | | | | | | |
| | Akzo Nobel NV | | | Chemicals | | | | 360,410 | | | | 29,072,226 | |
| | ING Groep NV | | | Banks | | | | 4,275,869 | | | | 46,102,324 | |
| | NXP Semiconductors NV | | | Semiconductors & Semiconductor Equipment | | | | 431,896 | | | | 31,649,339 | |
a | | QIAGEN NV | | | Life Sciences Tools & Services | | | | 435,361 | | | | 14,877,262 | |
| | | | | | | | | | | | | | |
| | | | |
| | | | | | | | | | | | | 121,701,151 | |
| | | | | | | | | | | | | | |
| | Norway 1.0% | | | | | | | | | | | | |
| | Yara International ASA | | | Chemicals | | | | 712,400 | | | | 27,458,742 | |
| | | | | | | | | | | | | | |
| | Singapore 1.5% | | | | | | | | | | | | |
| | Singapore Telecommunications Ltd. | | | Diversified Telecommunication Services | | | | 19,628,276 | | | | 42,192,765 | |
| | | | | | | | | | | | | | |
| | South Korea 5.7% | | | | | | | | | | | | |
| | Hana Financial Group Inc. | | | Banks | | | | 1,188,465 | | | | 38,683,191 | |
| | KB Financial Group Inc. | | | Banks | | | | 1,181,874 | | | | 49,346,007 | |
| | Samsung Electronics Co. Ltd. | | | Technology Hardware, Storage & Peripherals | | | | 2,020,022 | | | | 70,193,184 | |
| | | | | | | | | | | | | | |
| | | | | | | | | | | | | 158,222,382 | |
| | | | | | | | | | | | | | |
| | Sweden 0.5% | | | | | | | | | | | | |
| | Getinge AB, B. | | | Health Care Equipment & Supplies | | | | 1,698,552 | | | | 15,365,019 | |
| | | | | | | | | | | | | | |
| | Switzerland 6.3% | | | | | | | | | | | | |
| | Novartis AG | | | Pharmaceuticals | | | | 548,903 | | | | 47,038,258 | |
| | Roche Holding AG | | | Pharmaceuticals | | | | 272,852 | | | | 67,779,234 | |
| | UBS Group AG | | | Capital Markets | | | | 4,782,728 | | | | 59,686,430 | |
| | | | | | | | | | | | | | |
| | | | | | | | | | | | | 174,503,922 | |
| | | | | | | | | | | | | | |
| | Taiwan 1.5% | | | | | | | | | | | | |
| | Taiwan Semiconductor Manufacturing Co. Ltd. | | | Semiconductors & Semiconductor Equipment | | | | 5,615,492 | | | | 41,386,196 | |
| | | | | | | | | | | | | | |
| | Thailand 1.8% | | | | | | | | | | | | |
| | Bangkok Bank PCL, fgn | | | Banks | | | | 179,132 | | | | 1,146,578 | |
| | Bangkok Bank PCL, NVDR | | | Banks | | | | 7,846,531 | | | | 49,253,117 | |
| | | | | | | | | | | | | | |
| | | | | | | | | | | | | 50,399,695 | |
| | | | | | | | | | | | | | |
| | | | |
| | | |
| 38 | | Annual Report | | ftinstitutional.com |
TEMPLETON INSTITUTIONAL FUNDS
STATEMENT OF INVESTMENTS
| | | | | | | | | | | | | | |
| International Equity Series(continued) | | | | | | | | | | | | |
| | | | |
| | | | | Industry | | | Shares | | | Value | |
| | | Common Stocks(continued) | | | | | | | | | |
| | United Kingdom 16.9% | | | | | | | | | | | | |
| | BP PLC | | | Oil, Gas & Consumable Fuels | | | | 14,959,587 | | | $ | 94,613,436 | |
| | HSBC Holdings PLC | | | Banks | | | | 5,993,515 | | | | 49,598,336 | |
| | Johnson Matthey PLC | | | Chemicals | | | | 467,223 | | | | 16,677,173 | |
| | Kingfisher PLC | | | Specialty Retail | | | | 13,025,425 | | | | 34,467,145 | |
| | Royal Dutch Shell PLC, B. | | | Oil, Gas & Consumable Fuels | | | | 1,247,124 | | | | 37,215,239 | |
| | Royal Dutch Shell PLC, B, ADR | | | Oil, Gas & Consumable Fuels | | | | 1,030,989 | | | | 61,797,481 | |
| | Shire PLC | | | Biotechnology | | | | 1,031,858 | | | | 60,135,573 | |
| | Standard Chartered PLC | | | Banks | | | | 10,087,207 | | | | 78,378,585 | |
| | Vodafone Group PLC | | | Wireless Telecommunication Services | | | | 19,629,019 | | | | 38,273,783 | |
| | | | | | | | | | | | | | |
| | | | |
| | | | | | | | | | | | | 471,156,751 | |
| | | | | | | | | | | | | | |
| | Total Common Stocks
(Cost $2,479,833,711) | | | | | | | | 2,782,202,395 | |
| | | | | | | | | | | | | | |
| | | | | | | | | | |
| | | Short Term Investments (Cost $29,986,483) 1.1% | | | | | | |
| | | Money Market Funds 1.1% | | | | | | |
| | | United States 1.1% | | | | | | |
| b,c | | Institutional Fiduciary Trust Money Market Portfolio, 1.99% | | | 29,986,483 | | | | 29,986,483 | |
| | | | | | | | | | |
| | Total Investments (Cost $2,509,820,194) 100.8% | | | | | | | 2,812,188,878 | |
| | Other Assets, less Liabilities (0.8)% | | | | | | | (21,505,614 | ) |
| | | | | | | | | | |
| | Net Assets 100.0% | | | | | | $ | 2,790,683,264 | |
| | | | | | | | | | |
See Abbreviations on page 58.
aNon-income producing.
bSee Note 3(d) regarding investments in affiliated management investment companies.
cThe rate shown is the annualizedseven-day effective yield at period end.
| | | | | | |
| | | |
| ftinstitutional.com | | The accompanying notes are an integral part of these financial statements. | Annual Report | | | 39 | |
TEMPLETON INSTITUTIONAL FUNDS
Financial Statements
Statements of Assets and Liabilities
December 31, 2018
| | | | | | | | |
| | | Foreign Smaller
Companies Series | | | Global Equity Series | |
| |
| | |
Assets: | | | | | | | | |
Investments in securities: | | | | | | | | |
Cost - Unaffiliated issuers | | | $653,578,071 | | | | $252,656,627 | |
Cost -Non-controlled affiliates (Note 3d) | | | 19,099,595 | | | | — | |
| | | | |
Value - Unaffiliated issuers+ | | | $709,213,752 | | | | $242,370,532 | |
Value -Non-controlled affiliates (Note 3d) | | | 19,099,595 | | | | — | |
Cash | | | 1,046,666 | | | | 267,483 | |
Receivables: | | | | | | | | |
Investment securities sold | | | 24,362,294 | | | | 69,228 | |
Capital shares sold | | | 4,871,799 | | | | 17,448 | |
Dividends | | | 2,590,792 | | | | 848,456 | |
Foreign tax refund | | | — | | | | 9,707 | |
European Union tax reclaims | | | 739,236 | | | | 51,378 | |
Affiliates | | | 61,260 | | | | — | |
Due from custodian
| | | 37,415 | | | | — | |
Other assets | | | 124 | | | | 40 | |
| | | | |
| | |
Total assets | | | 762,022,933 | | | | 243,634,272 | |
| | | | |
Liabilities: | | | | | | | | |
Payables: | | | | | | | | |
Investment securities purchased | | | 242,273 | | | | — | |
Capital shares redeemed | | | 2,318,242 | | | | — | |
Management fees | | | 618,660 | | | | 163,970 | |
Transfer agent fees | | | 17,972 | | | | 4,429 | |
Professional fees | | | 63,161 | | | | 49,664 | |
Payable upon return of securities loaned | | | 19,137,010 | | | | — | |
Accrued expenses and other liabilities | | | 49,331 | | | | 16,189 | |
| | | | |
Total liabilities | | | 22,446,649 | | | | 234,252 | |
| | | | |
Net assets, at value | | | $739,576,284 | | | | $243,400,020 | |
| | | | |
Net assets consist of: | | | | | | | | |
Paid-in capital | | | $685,168,449 | | | | $249,539,436 | |
Total distributable earnings (loss) | | | 54,407,835 | | | | (6,139,416 | ) |
| | | | |
Net assets, at value | | | $739,576,284 | | | | $243,400,020 | |
| | | | |
Shares outstanding | | | 41,187,812 | | | | 32,205,443 | |
| | | | |
Net asset value per share | | | $17.96 | | | | $7.56 | |
| | | | |
| | |
+Includes securities loaned | | | $ 18,228,006 | | | | $ — | |
| | | | |
| | | |
| 40 | | Annual Report | The accompanying notes are an integral part of these financial statements. | | ftinstitutional.com |
TEMPLETON INSTITUTIONAL FUNDS
FINANCIAL STATEMENTS
Statements of Assets and Liabilities(continued)
December 31, 2018
| | | | |
| |
| International
Equity Series |
|
| |
| |
Assets: | | | | |
Investments in securities: | | | | |
Cost - Unaffiliated issuers | | | $2,479,833,711 | |
Cost -Non-controlled affiliates (Note 3d) | | | 29,986,483 | |
| | | | |
Value - Unaffiliated issuers. | | | $2,782,202,395 | |
Value -Non-controlled affiliates (Note 3d) | | | 29,986,483 | |
Receivables: | | | | |
Investment securities sold | | | 37,134,472 | |
Capital shares sold | | | 2,629,864 | |
Dividends | | | 17,256,657 | |
European Union tax reclaims | | | 7,538,705 | |
Affiliates | | | 146,261 | |
Other assets | | | 521 | |
| | | | |
Total assets | | | 2,876,895,358 | |
| | | | |
Liabilities: | | | | |
Payables: | | | | |
Capital shares redeemed | | | 83,866,547 | |
Management fees | | | 1,938,849 | |
Transfer agent fees | | | 78,668 | |
Professional fees | | | 72,270 | |
Accrued expenses and other liabilities | | | 255,760 | |
| | | | |
Total liabilities | | | 86,212,094 | |
| | | | |
Net assets, at value | | | $2,790,683,264 | |
| | | | |
Net assets consist of: | | | | |
Paid-in capital | | | $2,524,461,199 | |
Total distributable earnings (loss) | | | 266,222,065 | |
| | | | |
Net assets, at value | | | $2,790,683,264 | |
| | | | |
| |
| Primary Shares: | | | | |
Net assets, at value | | | $2,785,307,986 | |
| | | | |
Shares outstanding | | | 187,300,938 | |
| | | | |
Net asset value per share | | | $14.87 | |
| | | | |
| |
| Service Shares: | | | | |
Net assets, at value | | | $ 5,375,278 | |
| | | | |
Shares outstanding | | | 359,016 | |
| | | | |
Net asset value per share | | | $14.97 | |
| | | | |
| | | | | | |
| | | |
| ftinstitutional.com | | The accompanying notes are an integral part of these financial statements. | Annual Report | | | 41 | |
TEMPLETON INSTITUTIONAL FUNDS
FINANCIAL STATEMENTS
Statements of Operations
for the year ended December 31, 2018
| | | | | | | | |
| | |
| | | Foreign Smaller
Companies Series | | | Global
Equity Series | |
| |
| | |
Investment income: | | | | | | | | |
Dividends: (net of foreign taxes)* | | | | | | | | |
Unaffiliated issuers | | | $ 21,986,973 | | | | $ 7,024,582 | |
| | |
Interest: | | | | | | | | |
Unaffiliated issuers | | | 750,459 | | | | 169,262 | |
| | |
Income from securities loaned: | | | | | | | | |
Unaffiliated issuers (net of fees and rebates) | | | 1,446,274 | | | | — | |
Non-controlled affiliates (Note 3d) | | | 129,356 | | | | 2,539 | |
Other income (Note 1d) | | | 263,896 | | | | — | |
| | | | |
Total investment income | | | 24,576,958 | | | | 7,196,383 | |
| | | | |
Expenses: | | | | | | | | |
Management fees (Note 3a) | | | 9,187,884 | | | | 2,335,220 | |
Transfer agent fees (Note 3c) | | | 259,852 | | | | 62,952 | |
Custodian fees (Note 4) | | | 143,207 | | | | 19,766 | |
Reports to shareholders | | | 21,267 | | | | 5,896 | |
Registration and filing fees | | | 35,282 | | | | 23,813 | |
Professional fees | | | 99,841 | | | | 72,386 | |
Trustees’ fees and expenses | | | 56,485 | | | | 17,325 | |
Other | | | 38,116 | | | | 31,478 | |
| | | | |
Total expenses | | | 9,841,934 | | | | 2,568,836 | |
Expense reductions (Note 4) | | | (1,932 | ) | | | — | |
Expenses waived/paid by affiliates (Note 3d and 3e) | | | (135,934 | ) | | | (805 | ) |
| | | | |
Net expenses | | | 9,704,068 | | | | 2,568,031 | |
| | | | |
Net investment income | | | 14,872,890 | | | | 4,628,352 | |
| | | | |
Realized and unrealized gains (losses): | | | | | | | | |
Net realized gain (loss) from: | | | | | | | | |
Investments:# | | | | | | | | |
Unaffiliated issuers | | | 76,216,101 | | | | 42,519,015 | |
Foreign currency transactions | | | (100,151 | ) | | | (1,146 | ) |
| | | | |
Net realized gain (loss) | | | 76,115,950 | | | | 42,517,869 | |
| | | | |
Net change in unrealized appreciation (depreciation) on: | | | | | | | | |
Investments: | | | | | | | | |
Unaffiliated issuers | | | (270,977,841 | ) | | | (89,386,207 | ) |
Translation of other assets and liabilities denominated in foreign currencies | | | (39,791 | ) | | | (30,516 | ) |
Change in deferred taxes on unrealized appreciation | | | 120,033 | | | | — | |
| | | | |
Net change in unrealized appreciation (depreciation) | | | (270,897,599 | ) | | | (89,416,723 | ) |
| | | | |
Net realized and unrealized gain (loss) | | | (194,781,649 | ) | | | (46,898,854 | ) |
| | | | |
Net increase (decrease) in net assets resulting from operations | | | $(179,908,759 | ) | | | $(42,270,502 | ) |
| | | | |
| | |
*Foreign taxes withheld on dividends | | | $ 2,571,691 | | | | $ 538,848 | |
#Net of foreign taxes | | | $ — | | | | $ 9,836 | |
| | | | |
| | | |
| 42 | | Annual Report | The accompanying notes are an integral part of these financial statements. | | ftinstitutional.com |
TEMPLETON INSTITUTIONAL FUNDS
FINANCIAL STATEMENTS
Statements of Operations(continued)
for the year ended December 31, 2018
| | | | |
| |
| | | International
Equity Series | |
| |
| |
Investment income: | | | | |
Dividends: (net of foreign taxes)* | | | | |
Unaffiliated issuers | | | $ 106,575,052 | |
Non-controlled affiliates (Note 3d) | | | 795,172 | |
Interest: | | | | |
Unaffiliated issuers | | | 6,852 | |
Income from securities loaned: | | | | |
Non-controlled affiliates (Note 3d) | | | 33,970 | |
Other income (Note 1d) | | | 331,673 | |
| | | | |
Total investment income | | | 107,742,719 | |
| | | | |
Expenses: | | | | |
Management fees (Note 3a) | | | 29,460,564 | |
Transfer agent fees: (Note 3c) | | | | |
Primary Shares | | | 922,833 | |
Service Shares | | | 2,689 | |
Sub-transfer agent fees - Service Shares (Note 3c) | | | 20,127 | |
Custodian fees (Note 4) | | | 451,207 | |
Reports to shareholders | | | 42,792 | |
Registration and filing fees | | | 74,209 | |
Professional fees | | | 152,676 | |
Trustees’ fees and expenses | | | 229,110 | |
Other | | | 94,727 | |
| | | | |
Total expenses | | | 31,450,934 | |
Expense reductions (Note 4) | | | (1,514 | ) |
Expenses waived/paid by affiliates (Note 3d and 3e) | | | (367,304 | ) |
| | | | |
Net expenses | | | 31,082,116 | |
| | | | |
Net investment income | | | 76,660,603 | |
| | | | |
Realized and unrealized gains (losses): | | | | |
Net realized gain (loss) from: | | | | |
Investments:+ | | | | |
Unaffiliated issuers | | | 567,624,789 | |
Foreign currency transactions | | | (1,668,501 | ) |
| | | | |
Net realized gain (loss) | | | 565,956,288 | |
| | | | |
Net change in unrealized appreciation (depreciation) on: | | | | |
Investments: | | | | |
Unaffiliated issuers | | | (1,198,509,000 | ) |
Translation of other assets and liabilities
denominated in foreign currencies | | | (1,116,353 | ) |
| | | | |
Net change in unrealized appreciation (depreciation) | | | (1,199,625,353 | ) |
| | | | |
Net realized and unrealized gain (loss) | | | (633,669,065 | ) |
| | | | |
Net increase (decrease) in net assets resulting from operations | | | $ (557,008,462 | ) |
| | | | |
| |
*Foreign taxes withheld on dividends | | | $ 10,001,912 | |
+Includes gains from a redemptionin-kind (Note 9) | | | $ 7,694,963 | |
| | | | | | |
| | | |
| ftinstitutional.com | | The accompanying notes are an integral part of these financial statements. | Annual Report | | | 43 | |
TEMPLETON INSTITUTIONAL FUNDS
FINANCIAL STATEMENTS
Statements of Changes in Net Assets
| | | | | | | | | | | | | | | | |
| | |
| | | Foreign Smaller
Companies Series | | | Global
Equity Series | |
| | |
| | | Year Ended December 31, | | | Year Ended December 31, | |
| | | | |
| | | 2018 | | | 2017 | | | 2018 | | | 2017 | |
| | | | |
Increase (decrease) in net assets: | | | | | | | | | | | | | | | | |
Operations: | | | | | | | | | | | | | | | | |
Net investment income | | $ | 14,872,890 | | | $ | 13,021,091 | | | $ | 4,628,352 | | | $ | 5,016,840 | |
Net realized gain (loss) | | | 76,115,950 | | | | 73,589,228 | | | | 42,517,869 | | | | 6,669,126 | |
Net change in unrealized appreciation (depreciation) | | | (270,897,599 | ) | | | 210,102,374 | | | | (89,416,723 | ) | | | 45,386,301 | |
| | | | |
Net increase (decrease) in net assets resulting from operations | | | (179,908,759 | ) | | | 296,712,693 | | | | (42,270,502 | ) | | | 57,072,267 | |
| | | | |
Distributions to shareholders (Note 1e) | | | (96,356,359 | ) | | | (64,408,145 | ) | | | (40,339,519 | ) | | | (6,879,337 | ) |
| | | | |
Capital share transactions (Note 2) | | | (24,338,362 | ) | | | (124,003,541 | ) | | | (1,005,433 | ) | | | (3,886,825 | ) |
| | | | |
Net increase (decrease) in net assets | | | (300,603,480 | ) | | | 108,301,007 | | | | (83,615,454 | ) | | | 46,306,105 | |
Net assets: | | | | | | | | | | | | | | | | |
Beginning of year | | | 1,040,179,764 | | | | 931,878,757 | | | | 327,015,474 | | | | 280,709,369 | |
| | | | |
| | | | |
End of year (Note 1e) | | $ | 739,576,284 | | | $ | 1,040,179,764 | | | $ | 243,400,020 | | | $ | 327,015,474 | |
| | | | |
| | | | |
| | | |
| 44 | | Annual Report | The accompanying notes are an integral part of these financial statements. | | ftinstitutional.com |
TEMPLETON INSTITUTIONAL FUNDS
FINANCIAL STATEMENTS
Statements of Changes in Net Assets(continued)
| | | | | | | | |
| |
| | | International
Equity Series | |
| |
| | | Year Ended December 31, | |
| | |
| | | 2018 | | | 2017 | |
| | |
Increase (decrease) in net assets: | | | | | | | | |
Operations: | | | | | | | | |
Net investment income | | $ | 76,660,603 | | | $ | 100,855,422 | |
Net realized gain (loss) | | | 565,956,288 | | | | 353,346,497 | |
Net change in unrealized appreciation (depreciation) | | | (1,199,625,353 | ) | | | 523,980,414 | |
| | | | |
Net increase (decrease) in net assets resulting from operations | | | (557,008,462 | ) | | | 978,182,333 | |
| | | | |
Distributions to shareholders: (Note 1e) | | | | | | | | |
Primary Shares | | | (637,173,060 | ) | | | (184,007,377 | ) |
Service Shares | | | (1,520,248 | ) | | | (560,876 | ) |
| | | | |
| | |
Total distributions to shareholders | | | (638,693,308 | ) | | | (184,568,253 | ) |
| | | | |
| | |
Capital share transactions: (Note 2) | | | | | | | | |
Primary Shares | | | (435,086,569 | ) | | | (918,597,405 | ) |
Service Shares | | | (5,186,724 | ) | | | 3,812,990 | |
| | | | |
| | |
Total capital share transactions | | | (440,273,293 | ) | | | (914,784,415 | ) |
| | | | |
| | |
Net increase (decrease) in net assets | | | (1,635,975,063 | ) | | | (121,170,335 | ) |
Net assets: | | | | | | | | |
Beginning of year | | | 4,426,658,327 | | | | 4,547,828,662 | |
| | | | |
| | |
End of year (Note 1e) | | $ | 2,790,683,264 | | | $ | 4,426,658,327 | |
| | | | |
| | | | | | |
| | | |
| ftinstitutional.com | | The accompanying notes are an integral part of these financial statements. | Annual Report | | | 45 | |
TEMPLETON INSTITUTIONAL FUNDS
Notes to Financial Statements
1. Organization and Significant Accounting Policies
Templeton Institutional Funds (Trust) is registered under the Investment Company Act of 1940 (1940 Act) as anopen-end management investment company, consisting of three separate funds (Funds) and applies the specialized accounting and reporting guidance in U.S. Generally Accepted Accounting Principles (U.S. GAAP). International Equity Series offers Primary and Service Shares. Each class of shares may differ by its initial sales load, contingent deferred sales charges, voting rights on matters affecting a single class, its exchange privilege and fees due to differing arrangements for distribution and transfer agent fees. Foreign Smaller Companies Series was closed to new investors with limited exceptions effective at the close of market on December 10, 2013. Effective June 25, 2018, Foreign Smaller Companies Series reopened to new investors.
The following summarizes the Funds’ significant accounting policies.
a. Financial Instrument Valuation
The Funds’ investments in financial instruments are carried at fair value daily. Fair value is the price that would be received to sell an asset or paid to transfer a liability in an orderly transaction between market participants on the measurement date. The Funds calculate the net asset value (NAV) per share each business day as of 4 p.m. Eastern time or the regularly scheduled close of the New York Stock Exchange (NYSE), whichever is earlier. Under compliance policies and procedures approved by the Trust’s Board of Trustees (the Board), the Funds’ administrator has responsibility for oversight of valuation, including leading the cross-functional Valuation Committee (VC). The Funds may utilize independent pricing services, quotations from securities and financial instrument dealers, and other market sources to determine fair value.
Equity securities listed on an exchange or on the NASDAQ National Market System are valued at the last quoted sale price or the official closing price of the day, respectively. Foreign equity securities are valued as of the close of trading on the foreign stock exchange on which the security is primarily traded, or as of 4 p.m. Eastern time. The value is then converted into its U.S. dollar equivalent at the foreign exchange rate in effect at 4 p.m. Eastern time on the day that the value of the security is determined.Over-the-counter (OTC) securities are valued within the range of the most recent quoted bid and ask prices. Securities that trade in multiple markets or on multiple
exchanges are valued according to the broadest and most representative market. Certain equity securities are valued based upon fundamental characteristics or relationships to similar securities.
Debt securities generally trade in the OTC market rather than on a securities exchange. The Funds’ pricing services use multiple valuation techniques to determine fair value. In instances where sufficient market activity exists, the pricing services may utilize a market-based approach through which quotes from market makers are used to determine fair value. In instances where sufficient market activity may not exist or is limited, the pricing services also utilize proprietary valuation models which may consider market characteristics such as benchmark yield curves, credit spreads, estimated default rates, anticipated market interest rate volatility, coupon rates, anticipated timing of principal repayments, underlying collateral, and other unique security features in order to estimate the relevant cash flows, which are then discounted to calculate the fair value.
Investments inopen-end mutual funds are valued at the closing NAV. Investments in time deposits are valued at cost, which approximates fair value.
The Funds have procedures to determine the fair value of financial instruments for which market prices are not reliable or readily available. Under these procedures, the Funds primarily employ a market-based approach which may use related or comparable assets or liabilities, recent transactions, market multiples, book values, and other relevant information for the investment to determine the fair value of the investment. An income-based valuation approach may also be used in which the anticipated future cash flows of the investment are discounted to calculate fair value. Discounts may also be applied due to the nature or duration of any restrictions on the disposition of the investments. Due to the inherent uncertainty of valuations of such investments, the fair values may differ significantly from the values that would have been used had an active market existed.
Trading in securities on foreign securities stock exchanges and OTC markets may be completed before 4 p.m. Eastern time. In addition, trading in certain foreign markets may not take place on every Funds’ business day. Occasionally, events occur between the time at which trading in a foreign security is completed and 4 p.m. Eastern time that might call into question the reliability of the value of a portfolio security held by the Fund. As a result, differences may arise between the value of
| | | | |
| | | |
| 46 | | Annual Report | | ftinstitutional.com |
TEMPLETON INSTITUTIONAL FUNDS
NOTES TO FINANCIAL STATEMENTS
the Funds’ portfolio securities as determined at the foreign market close and the latest indications of value at 4 p.m. Eastern time. In order to minimize the potential for these differences, the VC monitors price movements following the close of trading in foreign stock markets through a series of country specific market proxies (such as baskets of American Depositary Receipts, futures contracts and exchange traded funds). These price movements are measured against established trigger thresholds for each specific market proxy to assist in determining if an event has occurred that may call into question the reliability of the values of the foreign securities held by the Funds. If such an event occurs, the securities may be valued using fair value procedures, which may include the use of independent pricing services. At December 31, 2018, a market event occurred resulting in a portion of the securities held by the Funds being valued using fair value procedures.
When the last day of the reporting period is anon-business day, certain foreign markets may be open on those days that the Funds’ NAV is not calculated, which could result in differences between the value of the Funds’ portfolio securities on the last business day and the last calendar day of the reporting period. Any significant security valuation changes due to an open foreign market are adjusted and reflected by the Funds for financial reporting purposes.
b. Foreign Currency Translation
Portfolio securities and other assets and liabilities denominated in foreign currencies are translated into U.S. dollars based on the exchange rate of such currencies against U.S. dollars on the date of valuation. The Funds may enter into foreign currency exchange contracts to facilitate transactions denominated in a foreign currency. Purchases and sales of securities, income and expense items denominated in foreign currencies are translated into U.S. dollars at the exchange rate in effect on the transaction date. Portfolio securities and assets and liabilities denominated in foreign currencies contain risks that those currencies will decline in value relative to the U.S. dollar. Occasionally, events may impact the availability or reliability of foreign exchange rates used to convert the U.S. dollar equivalent value. If such an event occurs, the foreign exchange rate will be valued at fair value using procedures established and approved by the Board.
The Funds do not separately report the effect of changes in foreign exchange rates from changes in market prices on securities held. Such changes are included in net realized and unrealized gain or loss from investments in the Statements of Operations.
Realized foreign exchange gains or losses arise from sales of foreign currencies, currency gains or losses realized between the trade and settlement dates on securities transactions and the difference between the recorded amounts of dividends, interest, and foreign withholding taxes and the U.S. dollar equivalent of the amounts actually received or paid. Net unrealized foreign exchange gains and losses arise from changes in foreign exchange rates on foreign denominated assets and liabilities other than investments in securities held at the end of the reporting period.
c. Securities Lending
Certain or all Funds participate in an agency based securities lending program to earn additional income. The Fund receives cash collateral against the loaned securities in an amount equal to at least 102% of the fair value of the loaned securities. Collateral is maintained over the life of the loan in an amount not less than 100% of the fair value of loaned securities, as determined at the close of Fund business each day; any additional collateral required due to changes in security values is delivered to the Fund on the next business day. The collateral is deposited into a joint cash account with other funds and is used to invest in a money market fund managed by Franklin Advisers, Inc., an affiliate of the Funds. The Fund may receive income from the investment of cash collateral, in addition to lending fees and rebates paid by the borrower. Income from securities loaned, net of fees paid to the securities lending agent and/or third-party vendor, is reported separately in the Statements of Operations. The Fund bears the market risk with respect to the collateral investment, securities loaned, and the risk that the agent may default on its obligations to the Fund. If the borrower defaults on its obligation to return the securities loaned, the Fund has the right to repurchase the securities in the open market using the collateral received. The securities lending agent has agreed to indemnify the Fund in the event of default by a third party borrower. At December 31, 2018, Global Equity Series and International Equity Series had no securities on loan.
| | | | | | |
| | | |
| ftinstitutional.com | | Annual Report | | | 47 | |
TEMPLETON INSTITUTIONAL FUNDS
NOTES TO FINANCIAL STATEMENTS
1. Organization and Significant Accounting Policies(continued)
d. Income and Deferred Taxes
It is each Fund’s policy to qualify as a regulated investment company under the Internal Revenue Code. Each Fund intends to distribute to shareholders substantially all of its taxable income and net realized gains to relieve it from federal income and excise taxes. As a result, no provision for U.S. federal income taxes is required.
The Funds may be subject to foreign taxation related to income received, capital gains on the sale of securities and certain foreign currency transactions in the foreign jurisdictions in which the Funds invest. Foreign taxes, if any, are recorded based on the tax regulations and rates that exist in the foreign markets in which the Funds invest. When a capital gain tax is determined to apply, certain or all Funds record an estimated deferred tax liability in an amount that would be payable if the securities were disposed of on the valuation date.
As a result of several court cases, in certain countries across the European Union, certain or all Funds filed additional tax reclaims for previously withheld taxes on dividends earned in those countries (EU reclaims). These additional filings are subject to various administrative proceedings by the local jurisdictions’ tax authorities within the European Union, as well as a number of related judicial proceedings. Income recognized, if any, for EU reclaims is reflected as other income in the Statements of Operations and any related receivable, if any, is reflected as European Union tax reclaims in the Statements of Assets and Liabilities. When uncertainty exists as to the ultimate resolution of these proceedings, the likelihood of receipt of these EU reclaims, and the potential timing of payment, no amounts are reflected in the financial statements. For U.S. income tax purposes, EU reclaims received by the Funds, if any, reduce the amounts of foreign taxes Fund shareholders can use as tax credits in their individual income tax returns.
Each Fund may recognize an income tax liability related to its uncertain tax positions under U.S. GAAP when the uncertain tax position has a less than 50% probability that it will be sustained upon examination by the tax authorities based on its technical merits. As of December 31, 2018, each Fund has determined that no tax liability is required in its financial statements related to uncertain tax positions for any open tax years (or expected to be taken in future tax years). Open tax
years are those that remain subject to examination and are based on the statute of limitations in each jurisdiction in which the Fund invests.
e. Security Transactions, Investment Income, Expenses and Distributions
Security transactions are accounted for on trade date. Realized gains and losses on security transactions are determined on a specific identification basis. Interest income and estimated expenses are accrued daily. Amortization of premium and accretion of discount on debt securities are included in interest income. Dividend income is recorded on theex-dividend date except for certain dividends from securities where the dividend rate is not available. In such cases, the dividend is recorded as soon as the information is received by the Funds. Distributions to shareholders are recorded on theex-dividend date. Distributable earnings are determined according to income tax regulations (tax basis) and may differ from earnings recorded in accordance with U.S. GAAP. These differences may be permanent or temporary. Permanent differences are reclassified among capital accounts to reflect their tax character. These reclassifications have no impact on net assets or the results of operations. Temporary differences are not reclassified, as they may reverse in subsequent periods.*
Common expenses incurred by the Trust are allocated among the Funds based on the ratio of net assets of each Fund to the combined net assets of the Trust or based on the ratio of number of shareholders of each Fund to the combined number of shareholders of the Trust. Fund specific expenses are charged directly to the Fund that incurred the expense.
Realized and unrealized gains and losses and net investment income, excluding class specific expenses, are allocated daily to each class of shares based upon the relative proportion of net assets of each class. Differences in per share distributions by class are generally due to differences in class specific expenses.
f. Accounting Estimates
The preparation of financial statements in accordance with U.S. GAAP requires management to make estimates and assumptions that affect the reported amounts of assets and liabilities at the date of the financial statements and the amounts of income and expenses during the reporting period. Actual results could differ from those estimates.
| | | | |
| | | |
| 48 | | Annual Report | | ftinstitutional.com |
TEMPLETON INSTITUTIONAL FUNDS
NOTES TO FINANCIAL STATEMENTS
g. Guarantees and Indemnifications
Under the Trust’s organizational documents, its officers and trustees are indemnified by the Trust against certain liabilities arising out of the performance of their duties to the Trust. Additionally, in the normal course of business, the Trust, on behalf of the Funds, enters into contracts with service providers
that contain general indemnification clauses. The Trust’s maximum exposure under these arrangements is unknown as this would involve future claims that may be made against the Trust that have not yet occurred. Currently, the Trust expects the risk of loss to be remote.
*Effective during the current reporting period, it is no longer required to present certain line items in the Statements of Changes in Net Assets. The below prior period amounts affected by this change are shown as they were in the prior year Statements of Changes in Net Assets.
For the year ended December 31, 2017, distributions to shareholders were as follows:
| | | | | | | | |
| | | Foreign Smaller
Companies Series | | | Global
Equity Series | |
Distributions from net investment income | | | $ (26,684,552) | | | | $(5,755,645) | |
Distributions from net realized gains | | | (37,723,593) | | | | (1,123,692) | |
| | |
| | | International
Equity Series | | | | |
Distributions from net investment income: | | | | | | | | |
Primary Shares | | | (127,842,638) | | | | | |
Service Shares | | | (382,337) | | | | | |
Distributions from net realized gains: | | | | | | | | |
Primary Shares | | | (56,164,739) | | | | | |
Service Shares | | | (178,539) | | | | | |
For the year ended December 31, 2017, distributions in excess of net investment income included in net assets were as follows:
| | | | | | | | |
| Fund | | Distributions in excess
of net investment income | | | | |
Foreign Smaller Companies Series | | | $(11,763,155 | ) | | | | |
Global Equity Series | | | $ (643,910 | ) | | | | |
International Equity Series | | | $(56,754,552 | ) | | | | |
| | | | | | |
| | | |
| ftinstitutional.com | | Annual Report | | | 49 | |
TEMPLETON INSTITUTIONAL FUNDS
NOTES TO FINANCIAL STATEMENTS
2. Shares of Beneficial Interest
At December 31, 2018, there were an unlimited number of shares authorized (without par value). Transactions in the Funds’ shares were as follows:
| | | | | | | | | | | | | | | | | | | | |
| | | |
| | | Foreign Smaller
Companies Series | | | | | | Global
Equity Series | |
| | | | | |
| | | Shares | | | Amount | | | | | | Shares | | | Amount | |
| Year ended December 31, 2018 | | | | | | | | | | | | | | | | | | | | |
Shares sold | | | 6,842,715 | | | $ | 162,910,674 | | | | | | | | 85,559 | | | $ | 876,948 | |
Shares issued in reinvestment of distributions | | | 4,713,629 | | | | 87,292,455 | | | | | | | | 5,328,643 | | | | 40,339,518 | |
Shares redeemed | | | (11,846,909 | ) | | | (274,541,491 | ) | | | | | | | (4,091,307 | ) | | | (42,221,899 | ) |
| | | | |
Net increase (decrease) | | | (290,565 | ) | | $ | (24,338,362 | ) | | | | | | | 1,322,895 | | | $ | (1,005,433 | ) |
| | | | |
| Year ended December 31, 2017 | | | | | | | | | | | | | | | | | | | | |
Shares sold | | | 4,597,046 | | | $ | 107,028,602 | | | | | | | | 1,172,155 | | | $ | 11,992,491 | |
Shares issued in reinvestment of distributions | | | 2,304,062 | | | | 57,025,539 | | | | | | | | 652,710 | | | | 6,879,337 | |
Shares redeemed | | | (12,178,847 | ) | | | (288,057,682 | ) | | | | | | | (2,300,263 | ) | | | (22,758,653 | ) |
| | | | |
Net increase (decrease) | | | (5,277,739 | ) | | $ | (124,003,541 | ) | | | | | | | (475,398 | ) | | $ | (3,886,825 | ) |
| | | | |
| | | | | | | | |
| |
| | | International
Equity Series | |
| | |
| | | Shares | | | Amount | |
| |
| | |
| Primary Shares: | | | | | | | | |
| Year ended December 31, 2018 | | | | | | | | |
| Shares sold | | | 15,662,166 | | | $ | 325,319,078 | |
| Shares issued in reinvestment of distributions | | | 36,602,476 | | | | 566,322,098 | |
| Shares redeemedin-kind (Note 9) | | | (5,016,384 | ) | | | (93,431,162 | ) |
| Shares redeemed | | | (60,570,466 | ) | | | (1,233,296,583 | ) |
| | | | |
| Net increase (decrease) | | | (13,322,208 | ) | | $ | (435,086,569 | ) |
| | | | |
| Year ended December 31, 2017 | | | | | | | | |
| Shares sold | | | 25,057,295 | | | $ | 517,786,830 | |
| Shares issued in reinvestment of distributions | | | 7,303,655 | | | | 159,119,329 | |
| Shares redeemedin-kind (Note 9) | | | (19,099,929 | ) | | | (421,197,360 | ) |
| Shares redeemed | | | (55,993,290 | ) | | | (1,174,306,204 | ) |
| | | | |
| Net increase (decrease) | | | (42,732,269 | ) | | $ | (918,597,405 | ) |
| | | | |
| Service Shares: | | | | | | | | |
| Year ended December 31, 2018 | | | | | | | | |
| Shares sold | | | 139,737 | | | $ | 2,896,584 | |
| Shares issued in reinvestment of distributions | | | 93,866 | | | | 1,508,078 | |
| Shares redeemed | | | (516,313 | ) | | | (9,591,386 | ) |
| | | | |
| Net increase (decrease) | | | (282,710 | ) | | $ | (5,186,724 | ) |
| | | | |
| Year ended December 31, 2017 | | | | | | | | |
| Shares sold | | | 272,954 | | | $ | 5,774,008 | |
| Shares issued in reinvestment of distributions | | | 25,407 | | | | 555,560 | |
| Shares redeemed | | | (117,301 | ) | | | (2,516,578 | ) |
| | | | |
| Net increase (decrease) | | | 181,060 | | | $ | 3,812,990 | |
| | | | |
| | | | |
| | | |
| 50 | | Annual Report | | ftinstitutional.com |
TEMPLETON INSTITUTIONAL FUNDS
NOTES TO FINANCIAL STATEMENTS
3. Transactions with Affiliates
Franklin Resources, Inc. is the holding company for various subsidiaries that together are referred to as Franklin Templeton. Certain officers and trustees of the Trust are also officers and/or directors of the following subsidiaries:
| | |
| |
| Subsidiary | | Affiliation |
Templeton Investment Counsel, LLC (TIC) | | Investment manager |
Franklin Templeton Services, LLC (FT Services) | | Administrative manager |
Franklin Templeton Distributors, Inc. (Distributors) | | Principal underwriter |
Franklin Templeton Investor Services, LLC (Investor Services) | | Transfer agent |
a. Management Fees
Foreign Smaller Companies Series pays an investment management fee to TIC based on the average daily net assets of the Fund as follows:
| | |
| |
| Annualized Fee Rate | | Net Assets |
0.950% | | Up to and including $1 billion |
0.930% | | Over $1 billion, up to and including $5 billion |
0.910% | | Over $5 billion, up to and including $10 billion |
0.890% | | Over $10 billion, up to and including $15 billion |
0.870% | | Over $15 billion, up to and including $20 billion |
0.850% | | In excess of $20 billion |
Global Equity Series pays an investment management fee to TIC based on the average daily net assets of the Fund as follows:
| | |
| |
| Annualized Fee Rate | | Net Assets |
0.780% | | Up to and including $200 million |
0.765% | | Over $200 million, up to and including $700 million |
0.730% | | Over $700 million, up to and including $1 billion |
0.715% | | Over $1 billion, up to and including $1.2 billion |
0.690% | | Over $1.2 billion, up to and including $5 billion |
0.675% | | Over $5 billion, up to and including $10 billion |
0.655% | | Over $10 billion, up to and including $15 billion |
0.635% | | Over $15 billion, up to and including $20 billion |
0.615% | | Over $20 billion, up to and including $25 billion |
0.605% | | Over $25 billion, up to and including $30 billion |
0.595% | | Over $30 billion, up to and including $35 billion |
0.585% | | Over $35 billion, up to and including $40 billion |
0.575% | | Over $40 billion, up to and including $45 billion |
0.565% | | In excess of $45 billion |
| | | | | | |
| | | |
| ftinstitutional.com | | Annual Report | | | 51 | |
TEMPLETON INSTITUTIONAL FUNDS
NOTES TO FINANCIAL STATEMENTS
3. Transactions with Affiliates(continued)
a. Management Fees(continued)
International Equity Series pays an investment management fee to TIC based on the average daily net assets of the Fund as follows:
| | |
| |
| Annualized Fee Rate | | Net Assets |
0.775% | | Up to and including $1 billion |
0.755% | | Over $1 billion, up to and including $5 billion |
0.735% | | Over $5 billion, up to and including $10 billion |
0.715% | | Over $10 billion, up to and including $15 billion |
0.695% | | Over $15 billion, up to and including $20 billion |
0.675% | | In excess of $20 billion |
For the year ended December 31, 2018, each Fund’s gross effective investment management fee rate based on average daily net assets was as follows:
| | | | | | | | | | | | |
| | | |
Foreign Smaller
Companies Series | | | Global
Equity Series | | | International
Equity Series | | | |
| | 0.950% | | | | 0.776% | | | | 0.761% | | | |
b. Administrative Fees
Under an agreement with TIC, FT Services provides administrative services to the Funds. The fee is paid by TIC based on each of the Funds’ average daily net assets, and is not an additional expense of the Funds.
c. Transfer Agent Fees
Each class of shares pays transfer agent fees to Investor Services for its performance of shareholder servicing obligations. The fees are based on an annualized asset based fee of 0.02% plus a transaction based fee. In addition, each class reimburses Investor Services for out of pocket expenses incurred and reimburses shareholder servicing fees paid to third parties. These fees are allocated daily based upon their relative proportion of such classes’ aggregate net assets.
For the year ended December 31, 2018, the Funds paid transfer agent fees as noted in the Statements of Operations of which the following amounts were retained by Investor Services:
| | | | | | | | | | | | | | |
| | | | |
| | | Foreign Smaller
Companies Series | | | Global
Equity Series | | | International
Equity Series | | | |
Transfer agent fees | | | $257,169 | | | | $63,168 | | | | $929,188 | | | |
International Equity Series’ Service shares may pay up to 0.15% of average daily net assets forsub-transfer agency fees as noted in the Statements of Operations.
| | | | |
| | | |
| 52 | | Annual Report | | ftinstitutional.com |
TEMPLETON INSTITUTIONAL FUNDS
NOTES TO FINANCIAL STATEMENTS
d. Investments in Affiliated Management Investment Companies
Certain or all Funds invest in one or more affiliated management investment companies for purposes other than exercising a controlling influence over the management or policies. Management fees paid by the Funds are waived on assets invested in the affiliated management investment companies, as noted in the Statements of Operations, in an amount not to exceed the management and administrative fees paid directly or indirectly by each affiliate. During the year ended December 31, 2018, investments in affiliated management investment companies were as follows:
| | | | | | | | | | | | | | | | | | | | | | | | | | | | | | | | |
| | | | | | | | |
| | | Number of
Shares Held at Beginning
of Year | | | Gross Additions | | | Gross
Reductions | | | Number of
Shares Held at End of Year | | | Value at End of Year | | | Investment
Income | | | Realized
Gain
(Loss) | | | Net Change in
Unrealized
Appreciation
(Depreciation) | |
Foreign Smaller Companies Series | | | | | | | | | | | | | | | | | | | | | | | | | | | | | | | | |
| Non-Controlled Affiliates | | | | | | | | | | | | | | | | | | | | | | | | | | | | | | | | |
| | | | | | | | | | | | | | | | | | | | | |
| Income from
securities
loaned |
| | | | | | | | |
Institutional Fiduciary Trust Money | | | | | | | | | | | | | | | | | | | | | | | | | | | | | | | | |
Market Portfolio, 1.99% | | | 27,923,489 | | | | 87,374,033 | | | | (96,197,927 | ) | | | 19,099,595 | | | | $ 19,099,595 | | | $ | 129,356 | | | | $ — | | | | $ — | |
| | | | | | | | | | | | | | | | | | | | |
Global Equity Series | | | | | | | | | | | | | | | | | | | | | | | | | | | | | | | | |
Non-Controlled Affiliates | | | | | | | | | | | | | | | | | | | | | | | | | | | | | | | | |
| | | | | | | | | | | | | | | | | | | | | |
| Income from
securities
loaned |
| | | | | | | | |
Institutional Fiduciary Trust Money | | | | | | | | | | | | | | | | | | | | | | | | | | | | | | | | |
Market Portfolio, 1.99% | | | — | | | | 5,143,490 | | | | (5,143,490 | ) | | | — | | | $ | — | | | $ | 2,539 | | | | $ — | | | | $ — | |
| | | | | | | | | | | | | | | | | | | | |
International Equity Series | | | | | | | | | | | | | | | | | | | | | | | | | | | | | | | | |
Non-Controlled Affiliates | | | | | | | | | | | | | | | | | | | | | | | | | | | | | | | | |
| | | | | | | | | | | | | | | | | | | | | | | Dividends | | | | | | | | | |
Institutional Fiduciary Trust Money | | | | | | | | | | | | | | | | | | | | | | | | | | | | | | | | |
Market Portfolio, 1.99% | | | 136,672,218 | | | | 1,136,808,328 | | | | (1,243,494,063 | ) | | | 29,986,483 | | | $ | 29,986,483 | | | $ | 795,172 | | | | $ — | | | | $ — | |
| | | | | | | | | | | | | | | | | | | | | |
| Income from
securities
loaned |
| | | | | | | | |
Institutional Fiduciary Trust Money | | | | | | | | | | | | | | | | | | | | | | | | | | | | | | | | |
Market Portfolio, 1.99% | | | — | | | | 83,340,968 | | | | (83,340,968 | ) | | | — | | | | — | | | | 33,970 | | | | — | | | | — | |
| | | | | | | | | | | | | | | | | | | | |
Total Affiliated Securities | | | | | | | | | | | | | | | | | | $ | 29,986,483 | | | $ | 829,142 | | | | $ — | | | | $ — | |
| | | | | | | | | | | | | | | | | | | | |
e. Waiver and Expense Reimbursements
Investor Services has voluntarily agreed in advance to waive or limit its fees so that the new transfer agent fee arrangement, effective November 1, 2017, will not increase the fees retained by more than 0.02% based on the average net assets of each class. Investor Services may discontinue this waiver in the future.
f. Interfund Transactions
Certain or all Funds engaged in purchases and sales of investments with funds or other accounts that have common investment managers (or affiliated investment managers), directors, trustees or officers. These purchases and sales for the year ended December 31, 2018, were as follows:
| | | | |
| |
| | | Foreign Smaller Companies Series | |
Purchases | | $ | 1,012,970 | |
Sales | | $ | — | |
| | | | | | |
| | | |
| ftinstitutional.com | | Annual Report | | | 53 | |
TEMPLETON INSTITUTIONAL FUNDS
NOTES TO FINANCIAL STATEMENTS
4. Expense Offset Arrangement
The Funds have entered into an arrangement with their custodian whereby credits realized as a result of uninvested cash balances are used to reduce a portion of the Funds’ custodian expenses. During the year ended December 31, 2018, the custodian fees were reduced as noted in the Statements of Operations.
5. Income Taxes
For tax purposes, the Funds may elect to defer any portion of a post-October capital loss or late-year ordinary loss to the first day of the following fiscal year. At December 31, 2018, International Equity Series had deferred losses of $9,195,415.
The tax character of distributions during the years ended December 31, 2018 and 2017, were as follows:
| | | | | | | | | | | | | | | | |
| | | Foreign Smaller Companies Series | | | Global Equity Series | |
| | | 2018 | | | 2017 | | | 2018 | | | 2017 | |
Distributions paid from: | | | | | | | | | | | | | | | | |
Ordinary income | | $ | 7,955,394 | | | $ | 30,489,899 | | | $ | 8,061,699 | | | $ | 5,755,645 | |
Long term capital gain | | | 88,400,965 | | | | 33,918,246 | | | | 32,277,820 | | | | 1,123,692 | |
| | $ | 96,356,359 | | | $ | 64,408,145 | | | $ | 40,339,519 | | | $ | 6,879,337 | |
| | | | | | | | |
| | | International Equity Series | |
| | | 2018 | | | 2017 | |
Distributions paid from: | | | | | | | | |
Ordinary income | | $ | 77,972,193 | | | $ | 128,224,975 | |
Long term capital gain | | | 560,721,115 | | | | 56,343,278 | |
| | $ | 638,693,308 | | | $ | 184,568,253 | |
At December 31, 2018, the cost of investments, net unrealized appreciation (depreciation) and undistributed ordinary income and undistributed long term capital gains for income tax purposes were as follows:
| | | | | | | | | | | | | | | |
| | | Foreign Smaller
Companies Series | | Global Equity Series | | International
Equity Series |
| | | |
Cost of investments | | | $ | 675,979,997 | | | | $ | 254,263,784 | | | | $ | 2,557,517,908 | |
| | | |
Unrealized appreciation | | | $ | 156,921,597 | | | | $ | 22,334,267 | | | | $ | 535,272,812 | |
| | | |
Unrealized depreciation | | | | (104,588,247 | ) | | | | (34,227,519 | ) | | | | (280,601,842 | ) |
| | | |
Net unrealized appreciation (depreciation) | | | $ | 52,333,350 | | | | $ | (11,893,252 | ) | | | $ | 254,670,970 | |
| | | |
Distributable earnings: | | | | | | | | | | | | | | | |
| | | |
Undistributed ordinary income | | | $ | 1,196,998 | | | | $ | 620,688 | | | | $ | 13,227,010 | |
| | | |
Undistributed long term capital gains | | | | — | | | | | 5,087,179 | | | | | — | |
| | | |
Total distributable earnings | | | $ | 1,196,998 | | | | $ | 5,707,867 | | | | $ | 13,227,010 | |
Differences between income and/or capital gains as determined on a book basis and a tax basis are primarily due to differing treatment of passive foreign investment company shares.
The Funds utilized a tax accounting practice to treat a portion of the proceeds from capital shares redeemed as a distribution from net investment income and realized capital gains.
| | | | |
| | | |
| 54 | | Annual Report | | ftinstitutional.com |
TEMPLETON INSTITUTIONAL FUNDS
NOTES TO FINANCIAL STATEMENTS
6. Investment Transactions
Purchases and sales of investments (excluding short term securities andin-kind transactions) for the year ended December 31, 2018, were as follows:
| | | | | | | | | | | | | | |
| | | Foreign Smaller
Companies Series | | | Global
Equity Series | | | International
Equity Series | | | |
Purchases | | | $313,250,441 | | | | $ 99,035,924 | | | | $ 969,447,815 | | | |
Sales | | | $414,031,336 | | | | $133,865,988 | | | | $1,862,477,379 | | | |
At December 31, 2018, in connection with securities lending transactions, certain or all Funds loaned investments and received cash collateral as follows:
| | |
| |
| | | Foreign Smaller
Companies Series |
Securities lending transactionsa: | | |
Equity investmentsb | | $19,137,010 |
aThe agreements can be terminated at any time.
bThe gross amount of recognized liability for such transactions is included in payable upon return of securities loaned in the Statements of Assets and Liabilities.
7. Concentration of Risk
Investing in foreign securities may include certain risks and considerations not typically associated with investing in U.S. securities, such as fluctuating currency values and changing local and regional economic, political and social conditions, which may result in greater market volatility. Current political and financial uncertainty surrounding the European Union may increase market volatility and the economic risk of investing in securities in Europe. In addition, certain foreign securities may not be as liquid as U.S. securities.
8. Credit Facility
The Funds, together with other U.S. registered and foreign investment funds (collectively, Borrowers), managed by Franklin Templeton, are borrowers in a joint syndicated senior unsecured credit facility totaling $2 billion (Global Credit Facility) which matured on February 8, 2019. This Global Credit Facility provides a source of funds to the Borrowers for temporary and emergency purposes, including the ability to meet future unanticipated or unusually large redemption requests. Effective February 8, 2019, the Borrowers renewed the Global Credit Facility for a one year term, maturing February 7, 2020, for a total of $2 billion.
Under the terms of the Global Credit Facility, the Funds shall, in addition to interest charged on any borrowings made by the Funds and other costs incurred by the Funds, pay their share of fees and expenses incurred in connection with the implementation and maintenance of the Global Credit Facility, based upon their relative share of the aggregate net assets of all of the Borrowers, including an annual commitment fee of 0.15% based upon the unused portion of the Global Credit Facility. These fees are reflected in other expenses in the Statements of Operations. During the year ended December 31, 2018, the Funds did not use the Global Credit Facility.
9. RedemptionIn-Kind
During the years ended December 31, 2018, and December 31, 2017, International Equity Series realized $7,694,963 and $116,160,039, respectively, of net gains resulting from redemptionsin-kind in which a shareholder redeemed fund shares for cash and securities held by the Fund. Because such gains are not taxable to the Fund and are not distributed to remaining shareholders, they have been reclassified from accumulated net realized gains topaid-in capital.
| | | | | | |
| | | |
| ftinstitutional.com | | Annual Report | | | 55 | |
TEMPLETON INSTITUTIONAL FUNDS
NOTES TO FINANCIAL STATEMENTS
10. Fair Value Measurements
The Funds follow a fair value hierarchy that distinguishes between market data obtained from independent sources (observable inputs) and the Funds’ own market assumptions (unobservable inputs). These inputs are used in determining the value of the Funds’ financial instruments and are summarized in the following fair value hierarchy:
| | • | | Level 1 – quoted prices in active markets for identical financial instruments |
| | • | | Level 2 – other significant observable inputs (including quoted prices for similar financial instruments, interest rates, prepayment speed, credit risk, etc.) |
| | • | | Level 3 – significant unobservable inputs (including the Funds’ own assumptions in determining the fair value of financial instruments) |
The input levels are not necessarily an indication of the risk or liquidity associated with financial instruments at that level.
A summary of inputs used as of December 31, 2018, in valuing the Funds’ assets carried at fair value, is as follows:
| | | | | | | | | | | | | | | | |
| | | | |
| | | Level 1 | | | Level 2 | | | Level 3 | | | Total | |
| | | | |
| Foreign Smaller Companies Series | | | | | | | | | | | | | | | | |
Assets: | | | | | | | | | | | | | | | | |
Investments in Securities:a | | | | | | | | | | | | | | | | |
Equity Investments:b | | | | | | | | | | | | | | | | |
Auto Components | | $ | — | | | $ | 3,496,650 | | | $ | — | | | $ | 3,496,650 | |
Electronic Equipment, Instruments & | | | | | | | | | | | | | | | | |
Components | | | 40,451,378 | | | | 8,210,959 | | | | — | | | | 48,662,337 | |
Food Products | | | 31,002,022 | | | | 5,215,685 | | | | — | | | | 36,217,707 | |
Household Durables | | | 24,927,371 | | | | 3,259,771 | | | | — | | | | 28,187,142 | |
Internet & Direct Marketing Retail | | | — | | | | 10,604,162 | | | | — | | | | 10,604,162 | |
Leisure Products | | | 48,470,660 | | | | 26,869,258 | | | | — | | | | 75,339,918 | |
Life Sciences Tools & Services | | | — | | | | 14,614,346 | | | | — | | | | 14,614,346 | |
Machinery | | | 28,653,226 | | | | 52,517,446 | | | | — | | | | 81,170,672 | |
Metals & Mining | | | 7,503,285 | | | | 5,012,533 | | | | — | | | | 12,515,818 | |
Oil, Gas & Consumable Fuels | | | 4,334,585 | | | | 2,877,457 | | | | — | | | | 7,212,042 | |
Real Estate Management & Development | | | 7,623,799 | | | | 9,341,914 | | | | — | | | | 16,965,713 | |
Specialty Retail | | | 22,494,286 | | | | 2,284,397 | | | | — | | | | 24,778,683 | |
Textiles, Apparel & Luxury Goods | | | 47,742,768 | | | | 3,868,899 | | | | — | | | | 51,611,667 | |
All Other Equity Investments | | | 290,236,895 | | | | — | | | | — | | | | 290,236,895 | |
Short Term Investments | | | 19,099,595 | | | | 7,600,000 | | | | — | | | | 26,699,595 | |
| | | | |
Total Investments in Securities | | $ | 572,539,870 | | | $ | 155,773,477 | | | $ | — | | | $ | 728,313,347 | |
| | | | |
| | | | |
| | | |
| 56 | | Annual Report | | ftinstitutional.com |
TEMPLETON INSTITUTIONAL FUNDS
NOTES TO FINANCIAL STATEMENTS
| | | | | | | | | | | | | | | | |
| | | | |
| | | Level 1 | | | Level 2 | | | Level 3 | | | Total | |
| | | | |
| Global Equity Series | | | | | | | | | | | | | | | | |
Assets: | | | | | | | | | | | | | | | | |
Investments in Securities:a | | | | | | | | | | | | | | | | |
Equity Investments:b | | | | | | | | | | | | | | | | |
Banks | | $ | 30,992,880 | | | $ | 2,205,365 | | | $ | — | | | $ | 33,198,245 | |
Capital Markets | | | — | | | | 3,930,231 | | | | — | | | | 3,930,231 | |
Chemicals | | | 2,506,995 | | | | 4,811,082 | | | | — | | | | 7,318,077 | |
Construction Materials | | | — | | | | 2,989,882 | | | | — | | | | 2,989,882 | |
Electrical Equipment | | | — | | | | 3,530,010 | | | | — | | | | 3,530,010 | |
Health Care Equipment & Supplies | | | 1,217,045 | | | | 772,253 | | | | — | | | | 1,989,298 | |
Life Sciences Tools & Services | | | — | | | | 1,419,242 | | | | — | | | | 1,419,242 | |
Multi-Utilities | | | 3,430,870 | | | | 3,515,014 | | | | — | | | | 6,945,884 | |
Oil, Gas & Consumable Fuels | | | 21,628,388 | | | | 2,831,661 | | | | — | | | | 24,460,049 | |
Pharmaceuticals | | | 13,916,945 | | | | 13,777,080 | | | | — | | | | 27,694,025 | |
All Other Equity Investments | | | 121,895,589 | | | | — | | | | — | | | | 121,895,589 | |
Short Term Investments | | | — | | | | 7,000,000 | | | | — | | | | 7,000,000 | |
| | | | |
Total Investments in Securities | | $ | 195,588,712 | | | $ | 46,781,820 | | | $ | — | | | $ | 242,370,532 | |
| | | | |
| | | | |
| International Equity Series | | | | | | | | | | | | | | | | |
Assets: | | | | | | | | | | | | | | | | |
Investments in Securities:a | | | | | | | | | | | | | | | | |
Equity Investments:b | | | | | | | | | | | | | | | | |
Banks | | $ | 407,278,630 | | | $ | 64,183,366 | | | $ | — | | | $ | 471,461,996 | |
Capital Markets | | | — | | | | 59,686,430 | | | | — | | | | 59,686,430 | |
Chemicals | | | 45,749,399 | | | | 53,464,603 | | | | — | | | | 99,214,002 | |
Diversified Telecommunication Services | | | 97,298,763 | | | | 41,170,246 | | | | — | | | | 138,469,009 | |
Electrical Equipment | | | — | | | | 49,328,914 | | | | — | | | | 49,328,914 | |
Health Care Equipment & Supplies | | | — | | | | 15,365,019 | | | | — | | | | 15,365,019 | |
Health Care Providers & Services | | | 26,052,682 | | | | 21,522,171 | | | | — | | | | 47,574,853 | |
Industrial Conglomerates | | | 48,346,710 | | | | 40,649,971 | | | | — | | | | 88,996,681 | |
Life Sciences Tools & Services | | | — | | | | 14,877,262 | | | | — | | | | 14,877,262 | |
Marine | | | — | | | | 31,203,936 | | | | — | | | | 31,203,936 | |
Multi-Utilities | | | 33,903,214 | | | | 45,395,137 | | | | — | | | | 79,298,351 | |
Oil, Gas & Consumable Fuels | | | 265,439,072 | | | | 46,075,867 | | | | — | | | | 311,514,939 | |
Pharmaceuticals | | | 171,456,073 | | | | 206,365,824 | | | | — | | | | 377,821,897 | |
Semiconductors & Semiconductor Equipment | | | 73,035,535 | | | | 27,330,432 | | | | — | | | | 100,365,967 | |
All Other Equity Investments | | | 897,023,139 | | | | — | | | | — | | | | 897,023,139 | |
Short Term Investments | | | 29,986,483 | | | | — | | | | — | | | | 29,986,483 | |
| | | | |
Total Investments in Securities | | $ | 2,095,569,700 | | | $ | 716,619,178 | | | $ | — | | | $ | 2,812,188,878 | |
| | | | |
| | | | | | | | | | | | | | | | |
aFor detailed categories, see the accompanying Statement of Investments.
bIncludes common and preferred stocks.
11. Subsequent Events
The Funds have evaluated subsequent events through the issuance of the financial statements and determined that no events have occurred that require disclosure, other than those already disclosed in the financial statements.
| | | | | | |
| | | |
| ftinstitutional.com | | Annual Report | | | 57 | |
TEMPLETON INSTITUTIONAL FUNDS
NOTES TO FINANCIAL STATEMENTS
Abbreviations
| | |
| Selected Portfolio |
| |
| ADR | | American Depositary Receipt |
| FHLB | | Federal Home Loan Bank |
| IDR | | International Depositary Receipt |
| NVDR | | Non-Voting Depositary Receipt |
| | | | |
| | | |
| 58 | | Annual Report | | ftinstitutional.com |
TEMPLETON INSTITUTIONAL FUNDS
Report of Independent Registered Public Accounting Firm
To the Board of Trustees of Templeton Institutional Funds and Shareholders of Foreign Smaller Companies Series, Global Equity Series and International Equity Series
Opinions on the Financial Statements
We have audited the accompanying statements of assets and liabilities, including the statements of investments, of Foreign Smaller Companies Series, Global Equity Series and International Equity Series (the “Funds”) as of December 31, 2018, the related statements of operations for the year ended December 31, 2018, the statements of changes in net assets for each of the two years in the period ended December 31, 2018, including the related notes, and the financial highlights for each of the five years in the period ended December 31, 2018 (collectively referred to as the “financial statements”). In our opinion, the financial statements present fairly, in all material respects, the financial position of each of the Funds as of December 31, 2018, the results of each of their operations for the year then ended, the changes in each of their net assets for each of the two years in the period ended December 31, 2018 and each of the financial highlights for each of the five years in the period ended December 31, 2018 in conformity with accounting principles generally accepted in the United States of America.
Basis for Opinions
These financial statements are the responsibility of the Funds’ management. Our responsibility is to express an opinion on the Funds’ financial statements based on our audits. We are a public accounting firm registered with the Public Company Accounting Oversight Board (United States) (PCAOB) and are required to be independent with respect to the Funds in accordance with the U.S. federal securities laws and the applicable rules and regulations of the Securities and Exchange Commission and the PCAOB.
We conducted our audits of these financial statements in accordance with the standards of the PCAOB. Those standards require that we plan and perform the audit to obtain reasonable assurance about whether the financial statements are free of material misstatement, whether due to error or fraud.
Our audits included performing procedures to assess the risks of material misstatement of the financial statements, whether due to error or fraud, and performing procedures that respond to those risks. Such procedures included examining, on a test basis, evidence regarding the amounts and disclosures in the financial statements. Our audits also included evaluating the accounting principles used and significant estimates made by management, as well as evaluating the overall presentation of the financial statements. Our procedures included confirmation of securities owned as of December 31, 2018 by correspondence with the custodian, transfer agent and brokers; when replies were not received from brokers, we performed other auditing procedures. We believe that our audits provide a reasonable basis for our opinions.
PricewaterhouseCoopers LLP
San Francisco, California
February 15, 2019
We have served as the auditor of one or more investment companies in the Franklin Templeton Group of Funds since 1948.
| | | | | | |
| | | |
| ftinstitutional.com | | Annual Report | | | 59 | |
TEMPLETON INSTITUTION FUNDS
Tax Information (unaudited)
Under Section 852(b)(3)(C) of the Internal Revenue Code, the Funds hereby report the maximum amount allowable but no less than the following amounts as long term capital gain dividends for the fiscal year ended December 31, 2018:
| | | | | | | | | | |
| | | |
| | | Foreign Smaller Companies Series | | | Global
Equity Series | | | International
Equity Series |
| | | |
| | | $90,587,726 | | | | $34,926,880 | | | $617,629,219 |
Under Section 871(k)(2)(C) of the Internal Revenue Code, the Funds hereby report the maximum amount allowable but no less than the following amounts as short term capital gain dividends for purposes of the tax imposed under Section 871(a)(1)(A) of the Internal Revenue Code for the fiscal year ended December 31, 2018:
| | | | | | | | | | |
| | | |
| | | Foreign Smaller
Companies Series | | | Global
Equity Series | | | International
Equity Series |
| | | |
| | | $ — | | | | $3,706,555 | | | $8,406,792 |
Under Section 854(b)(1)(A) of the Internal Revenue Code, the Funds hereby report the following percentage amounts of the ordinary income dividends as income qualifying for the dividends received deduction for the fiscal year ended December 31, 2018:
| | | | | | | | | | |
| | | |
| | | Foreign Smaller
Companies Series | | | Global
Equity Series | | | International
Equity Series |
| | | |
| | | 0.00% | | | | 18.49% | | | 0.00% |
Under Section 854(b)(1)(B) of the Internal Revenue Code, the Funds hereby report the maximum amount allowable but no less than the following amounts as qualified dividends for purposes of the maximum rate under Section 1(h)(11) of the Internal Revenue Code for the fiscal year ended December 31, 2018:
| | | | | | | | | | |
| | | |
| | | Foreign Smaller
Companies Series | | | Global
Equity Series | | | International
Equity Series |
| | | |
| | | $13,724,322 | | | | $6,356,181 | | | $91,768,373 |
Distributions, including qualified dividend income, paid during calendar year 2018 will be reported to shareholders on Form1099-DIV bymid-February 2019. Shareholders are advised to check with their tax advisors for information on the treatment of these amounts on their individual income tax returns.
At December 31, 2018, more than 50% of the Funds’ total assets were invested in securities of foreign issuers. In most instances, foreign taxes were withheld from income paid to the Funds on these investments. As shown in the table below, the Funds hereby report to shareholders the foreign source income and foreign taxes paid, pursuant to Section 853 of the Internal Revenue Code. This written statement will allow shareholders of record on December 20, 2018, to treat their proportionate share of foreign taxes paid by the Funds as having been paid directly by them. The shareholder shall consider these amounts as foreign taxes paid in the tax year in which they receive the Fund distribution.
The following table provides a detailed analysis of foreign tax paid, foreign source income, and foreign source qualified dividends as reported by the Funds to shareholders of record.
| | | | | | | | | | | | |
| | | |
| Class | | Foreign Tax Paid
Per Share | | | Foreign Source
Income Per Share | | | Foreign Source Qualified
Dividends Per Share | |
| | | |
Foreign Smaller Companies Series | | | | | | | | | | | | |
Fund Shares | | | $0.0429 | | | | $0.3262 | | | | $0.1870 | |
Global Equity Series | | | | | | | | | | | | |
Fund Shares | | | $0.0193 | | | | $0.1719 | | | | $0.1377 | |
International Equity Series | | | | | | | | | | | | |
Primary Shares | | | $0.0514 | | | | $0.5188 | | | | $0.4110 | |
Service Shares | | | $0.0514 | | | | $0.4582 | | | | $0.3628 | |
| | | | |
| | | |
| 60 | | Annual Report | | ftinstitutional.com |
TEMPLETON INSTITUTION FUNDS
Foreign Tax Paid Per Share (Column 1) is the amount per share available to you, as a tax credit (assuming you held your shares in the Fund for a minimum of 16 days during the31-day period beginning 15 days before theex-dividend date of the Fund’s distribution to which the foreign taxes relate), or, as a tax deduction.
Foreign Source Income Per Share (Column 2) is the amount per share of income dividends attributable to foreign securities held by the Funds, plus any foreign taxes withheld on these dividends. The amounts reported include foreign source qualified dividends that have not been adjusted for the rate differential applicable to such dividend income.1
Foreign Source Qualified Dividends Per Share (Column 3) is the amount per share of foreign source qualified dividends, plus any foreign taxes withheld on these dividends. These amounts represent the portion of the Foreign Source Income reported to you in column 2 that were derived from qualified foreign securities held by the Funds.1
Bymid-February 2019, shareholders will receive Form1099-DIV which will include their share of taxes paid and foreign source income distributed during the calendar year 2018. The Foreign Source Income reported on Form1099-DIV has not been adjusted for the rate differential on foreign source qualified dividend income. Shareholders are advised to check with their tax advisors for information on the treatment of these amounts on their 2018 individual income tax returns.
1Qualified dividends are taxed at reduced long term capital gains tax rates. In determining the amount of foreign tax credit that may be applied against the U.S. tax liability of individuals receiving foreign source qualified dividends, adjustments may be required to the foreign tax credit limitation calculation to reflect the rate differential applicable to such dividend income. The rules however permit certain individuals to elect not to apply the rate differential adjustments for capital gains and/or dividends for any taxable year. Please consult your tax advisor and the instructions to Form 1116 for more information.
| | | | | | |
| | | |
| ftinstitutional.com | | Annual Report | | | 61 | |
TEMPLETON INSTITUTIONAL FUNDS
Board Members and Officers
The name, year of birth and address of the officers and board members, as well as their affiliations, positions held with the Trust, principal occupations during at least the past five years and number of US registered portfolios overseen in the Franklin Templeton Investments fund complex, are shown below. Generally, each board member serves until that person’s successor is elected and qualified.
Independent Board Members
| | | | | | | | |
Name,Year of Birth and Address | | Position | | Length of
Time Served | | Number of Portfolios in
Fund Complex Overseen
by Board Member* | | Other Directorships Held
During at Least the Past 5 Years |
| | | | |
Harris J. Ashton (1932)
300 S.E. 2nd Street
Fort Lauderdale, FL 33301-1923 | | Trustee | | Since 1992 | | 136 | | Bar-S Foods (meat packing company) (1981-2010). |
|
Principal Occupation During at Least the Past 5 Years: Director of various companies; andformerly, Director, RBC Holdings, Inc. (bank holding company) (until 2002); and President, Chief Executive Officer and Chairman of the Board, General Host Corporation (nursery and craft centers) (until 1998). |
| | | | |
Ann Torre Bates (1958)
300 S.E. 2nd Street
Fort Lauderdale, FL 33301-1923 | | Trustee | | Since 2008 | | 38 | | Ares Capital Corporation (specialty finance company) (2010-present), United Natural Foods, Inc. (distributor of natural, organic and specialty foods) (2013-present), Allied Capital Corporation (financial services) (2003-2010), SLM Corporation (Sallie Mae) (1997-2014) and Navient Corporation (loan management, servicing and asset recovery) (2014-2016). |
|
Principal Occupation During at Least the Past 5 Years: Director of various companies; andformerly, Executive Vice President and Chief Financial Officer, NHP Incorporated (manager of multifamily housing) (1995-1997); and Vice President and Treasurer, US Airways, Inc. (until 1995). |
| | | | |
Mary C. Choksi (1950)
300 S.E. 2nd Street
Fort Lauderdale, FL 33301-1923 | | Trustee | | Since 2016 | | 136 | | Avis Budget Group Inc. (car rental) (2007-present), Omnicom Group Inc. (advertising and marketing communications services) (2011-present) and White Mountains Insurance Group, Ltd. (holding company) (2017-present). |
|
Principal Occupation During at Least the Past 5 Years: Director of various companies; andformerly, Founder and Senior Advisor, Strategic Investment Group (investment management group) (2015-2017); Founding Partner and Senior Managing Director, Strategic Investment Group (1987-2015); Founding Partner and Managing Director, Emerging Markets Management LLC (investment management firm) (1987-2011); and Loan Officer/Senior Loan Officer/Senior Pension Investment Officer, World Bank Group (international financial institution) (1977-1987). |
| | | | |
Edith E. Holiday (1952)
300 S.E. 2nd Street
Fort Lauderdale, FL 33301-1923 | | Lead Independent Trustee | | Trustee since 1996 and Lead Independent Trustee since 2007 | | 136 | | Hess Corporation (exploration of oil and gas) (1993-present), Canadian National Railway (railroad) (2001-present), White Mountains Insurance Group, Ltd. (holding company) (2004-present), Santander Consumer USA Holdings, Inc. (consumer finance) (2016-present), RTI International Metals, Inc.(manufacture and distribution of titanium) (1999-2015) and H.J. Heinz Company (processed foods and allied products) (1994-2013). |
|
Principal Occupation During at Least the Past 5 Years: Director or Trustee of various companies and trusts; andformerly, Assistant to the President of the United States and Secretary of the Cabinet (1990-1993); General Counsel to the United States Treasury Department (1989-1990); and Counselor to the Secretary and Assistant Secretary for Public Affairs and Public Liaison-United States Treasury Department (1988-1989). |
| | | | |
| | | |
| 62 | | Annual Report | | ftinstitutional.com |
TEMPLETON INSTITUTIONAL FUNDS
Independent Board Members(continued)
| | | | | | | | |
Name,Year of Birth and Address | | Position | | Length of
Time Served | | Number of Portfolios in
Fund Complex Overseen
by Board Member* | | Other Directorships Held During at Least the Past 5 Years |
| | | | |
J. Michael Luttig (1954)
300 S.E. 2nd Street
Fort Lauderdale, FL 33301-1923 | | Trustee | | Since 2009 | | 136 | | Boeing Capital Corporation (aircraft financing) (2006-2013). |
|
Principal Occupation During at Least the Past 5 Years: Executive Vice President, General Counsel and member of the Executive Council, The Boeing Company (aerospace company) (2006-present); andformerly, Federal Appeals Court Judge, U.S. Court of Appeals for the Fourth Circuit (1991-2006). |
| | | | |
David W. Niemiec (1949)
300 S.E. 2nd Street
Fort Lauderdale, FL 33301-1923 | | Trustee | | Since 2005 | | 38 | | Hess Midstream Partners LP (oil and gas midstream infrastructure) (2017-present). |
|
Principal Occupation During at Least the Past 5 Years: Advisor, Saratoga Partners (private equity fund); andformerly, Managing Director, Saratoga Partners (1998-2001) and SBC Warburg Dillon Read (investment banking) (1997-1998); Vice Chairman, Dillon, Read & Co. Inc. (investment banking) (1991-1997); and Chief Financial Officer, Dillon, Read & Co. Inc. (1982-1997). |
| | | | |
Larry D. Thompson (1945)
300 S.E. 2nd Street
Fort Lauderdale, FL 33301-1923 | | Trustee | | Since 2005 | | 136 | | The Southern Company (energy company) (2014-present; previously 2010-2012), Graham Holdings Company (education and media organization) (2011-present) and Cbeyond, Inc. (business communications provider) (2010-2012). |
| | |
| Principal Occupation During at Least the Past 5 Years: | | | | |
Director of various companies; Counsel, Finch McCranie, LLP (law firm) (2015-present); Independent Compliance Monitor and Auditor, Volkswagen AG (manufacturer of automobiles and commercial vehicles) (2017-present); John A. Sibley Professor of Corporate and Business Law, University of Georgia School of Law (2015-present; previously 2011-2012); andformerly, Executive Vice President – Government Affairs, General Counsel and Corporate Secretary, PepsiCo, Inc. (consumer products) (2012-2014); Senior Vice President – Government Affairs, General Counsel and Secretary, PepsiCo, Inc. (2004-2011); Senior Fellow of The Brookings Institution (2003-2004); Visiting Professor, University of Georgia School of Law (2004); and Deputy Attorney General, U.S. Department of Justice (2001-2003). |
| | | | | |
Constantine D. Tseretopoulos (1954) 300 S.E. 2nd Street Fort Lauderdale, FL 33301-1923 | | Trustee | | Since 1990 | | 24 | | None |
|
Principal Occupation During at Least the Past 5 Years: Physician, Chief of Staff, owner and operator of the Lyford Cay Hospital (1987-present); director of various nonprofit organizations; andformerly, Cardiology Fellow, University of Maryland (1985-1987); and Internal Medicine Resident, Greater Baltimore Medical Center(1982-1985). |
| | | | |
Robert E. Wade (1946) 300 S.E. 2nd Street Fort Lauderdale, FL 33301-1923 | | Trustee | | Since 2007 | | 38 | | El Oro Ltd (investments) (2003-present). |
|
Principal Occupation During at Least the Past 5 Years: Attorney at law engaged in private practice as a sole practitioner (1972-2008) and member of various boards. |
| | | | | | |
| | | |
| ftinstitutional.com | | Annual Report | | | 63 | |
TEMPLETON INSTITUTIONAL FUNDS
Interested Board Members and Officers
| | | | | | | | |
Name,Year of Birth and Address | | Position | | Length of
Time Served | | Number of Portfolios in
Fund Complex Overseen
by Board Member* | | Other Directorships Held
During at Least the Past 5 Years |
| | | | |
**Gregory E. Johnson (1961) One Franklin Parkway San Mateo, CA 94403-1906 | | Trustee | | Since 2007 | | 150 | | None |
|
Principal Occupation During at Least the Past 5 Years: Chairman of the Board, Member – Office of the Chairman, Director and Chief Executive Officer, Franklin Resources, Inc.; officer and/or director or trustee, as the case may be, of some of the other subsidiaries of Franklin Resources, Inc. and of 42 of the investment companies in Franklin Templeton Investments; Vice Chairman, Investment Company Institute; andformerly, President, Franklin Resources, Inc. (1994-2015). |
| | | | |
**Rupert H. Johnson, Jr. (1940) One Franklin Parkway San Mateo, CA 94403-1906 | | Chairman of the Board, Trustee and Vice President | | Chairman of the Board, Trustee since 2013
and Vice President since 1996 | | 136 | | None |
|
Principal Occupation During at Least the Past 5 Years: Vice Chairman, Member – Office of the Chairman and Director, Franklin Resources, Inc.; Director, Franklin Advisers, Inc.; Senior Vice President, Franklin Advisory Services, LLC; and officer and/or director or trustee, as the case may be, of some of the other subsidiaries of Franklin Resources, Inc. and of 40 of the investment companies in Franklin Templeton Investments. |
| | | | |
Alison E. Baur (1964) One Franklin Parkway San Mateo, CA 94403-1906 | | Vice President | | Since 2012 | | Not Applicable | | Not Applicable |
|
Principal Occupation During at Least the Past 5 Years: Deputy General Counsel, Franklin Templeton Investments; and officer of some of the other subsidiaries of Franklin Resources, Inc. and of 44 of the investment companies in Franklin Templeton Investments. |
| | | | |
Norman J. Boersma (1957) Lyford Cay
Nassau, Bahamas | | President and Chief Executive
Officer – Investment Management | | Since 2012 | | Not Applicable | | Not Applicable |
|
Principal Occupation During at Least the Past 5 Years: Chairman of the Board, President and Chief Executive Officer, Templeton Global Advisors Ltd.; Chief Investment Officer of Templeton Global Equity Group; officer of five of the investment companies in Franklin Templeton Investments; andformerly, Executive Vice President, Franklin Templeton Investments Corp. (1993-2014). |
| | | | |
Aliya S. Gordon (1973) One Franklin Parkway San Mateo, CA 94403-1906 | | Vice President | | Since 2009 | | Not Applicable | | Not Applicable |
|
Principal Occupation During at Least the Past 5 Years: Senior Associate General Counsel, Franklin Templeton Investments; and officer of 44 of the investment companies in Franklin Templeton Investments. |
| | | | |
Steven J. Gray (1955) One Franklin Parkway San Mateo, CA 94403-1906 | | Vice President | | Since 2009 | | Not Applicable | | Not Applicable |
|
Principal Occupation During at Least the Past 5 Years: Senior Associate General Counsel, Franklin Templeton Investments; Vice President, Franklin Templeton Distributors, Inc. and FASA, LLC; and officer of 44 of the investment companies in Franklin Templeton Investments. |
| | | | |
Matthew T. Hinkle (1971) One Franklin Parkway San Mateo, CA 94403-1906 | | Chief Executive Officer – Finance and Administration | | Since 2017 | | Not Applicable | | Not Applicable |
|
Principal Occupation During at Least the Past 5 Years: Senior Vice President, Franklin Templeton Services, LLC; officer of 44 of the investment companies in Franklin Templeton Investments; andformerly, Vice President, Global Tax (2012-April 2017) and Treasurer/Assistant Treasurer, Franklin Templeton Investments (2009-2017). |
| | | | |
| | | |
| 64 | | Annual Report | | ftinstitutional.com |
TEMPLETON INSTITUTIONAL FUNDS
Interested Board Members and Officers(continued)
| | | | | | | | |
Name,Year of Birth and Address | | Position | | Length of
Time Served | | Number of Portfolios in
Fund Complex Overseen
by Board Member* | | Other Directorships Held
During at Least the Past 5 Years |
| | | | |
Robert G. Kubilis (1973) 300 S.E. 2nd Street Fort Lauderdale, FL 33301-1923 | | Chief Financial Officer, Chief Accounting Officer and Treasurer | | Since 2017 | | Not Applicable | | Not Applicable |
|
Principal Occupation During at Least the Past 5 Years: Treasurer, U.S. Fund Administration & Reporting, Franklin Templeton Investments; and officer of 16 of the investment companies in Franklin Templeton Investments. |
| | | | |
Robert Lim (1948) One Franklin Parkway
San Mateo, CA 94403-1906 | | Vice President
–AML Compliance | | Since 2016 | | Not Applicable | | Not Applicable |
|
Principal Occupation During at Least the Past 5 Years: Vice President, Franklin Templeton Companies, LLC; Chief Compliance Officer, Franklin Templeton Distributors, Inc. and Franklin Templeton Investor Services, LLC; and officer of 44 of the investment companies in Franklin Templeton Investments. |
| | | | |
Kimberly H. Novotny (1972) 300 S.E. 2nd Street
Fort Lauderdale, FL 33301-1923 | | Vice President | | Since 2013 | | Not Applicable | | Not Applicable |
|
Principal Occupation During at Least the Past 5 Years: Associate General Counsel, Franklin Templeton Investments; Vice President and Corporate Secretary, Fiduciary Trust International of the South; Vice President, Templeton Investment Counsel, LLC; Assistant Secretary, Franklin Resources, Inc.; and officer of 44 of the investment companies in Franklin Templeton Investments. |
| | | | |
Robert C. Rosselot (1960) 300 S.E. 2nd Street
Fort Lauderdale, FL 33301-1923 | | Chief
Compliance
Officer | | Since 2013 | | Not Applicable | | Not Applicable |
|
Principal Occupation During at Least the Past 5 Years: Director, Global Compliance, Franklin Templeton Investments; Vice President, Franklin Templeton Companies, LLC; officer of 44 of the investment companies in Franklin Templeton Investments; andformerly, Senior Associate General Counsel, Franklin Templeton Investments (2007-2013); and Secretary and Vice President, Templeton Group of Funds (2004-2013). |
| | | | |
Navid J. Tofigh (1972) One Franklin Parkway
San Mateo, CA 94403-1906 | | Vice President | | Since 2015 | | Not Applicable | | Not Applicable |
|
Principal Occupation During at Least the Past 5 Years: Associate General Counsel, Franklin Templeton Investments; and officer of 44 of the investment companies in Franklin Templeton Investments. |
| | | | |
Craig S. Tyle (1960) One Franklin Parkway
San Mateo, CA 94403-1906 | | Vice President | | Since 2005 | | Not Applicable | | Not Applicable |
|
Principal Occupation During at Least the Past 5 Years: General Counsel and Executive Vice President, Franklin Resources, Inc.; and officer of some of the other subsidiaries of Franklin Resources, Inc. and of 44 of the investment companies in Franklin Templeton Investments. |
| | | | |
Lori A. Weber (1964) 300 S.E. 2nd Street
Fort Lauderdale, FL 33301-1923 | | Vice President
and Secretary | | Vice President
since 2011
and Secretary since 2013 | | Not Applicable | | Not Applicable |
|
Principal Occupation During at Least the Past 5 Years: Senior Associate General Counsel, Franklin Templeton Investments; Assistant Secretary, Franklin Resources, Inc.; Vice President and Secretary, Templeton Investment Counsel, LLC; and officer of 44 of the investment companies in Franklin Templeton Investments. |
| | | | | | |
| ftinstitutional.com | | Annual Report | | | 65 | |
TEMPLETON INSTITUTIONAL FUNDS
*We base the number of portfolios on each separate series of the U.S. registered investment companies within the Franklin Templeton Investments fund complex. These portfolios have a common investment manager or affiliated investment managers.
**Gregory E. Johnson is considered to be an interested person of the Fund under the federal securities laws due to his position as an officer and director of Franklin Resources, Inc. (Resources), which is the parent company of the Fund’s investment manager and distributor. Rupert H. Johnson, Jr. is considered to be an interested person of the Fund under the federal securities laws due to his position as an officer and director and major shareholder of Resources.
Note 1: Rupert H. Johnson, Jr. is the uncle of Gregory E. Johnson.
Note 2: Officer information is current as of the date of this report. It is possible that after this date, information about officers may change.
The Sarbanes-Oxley Act of 2002 and Rules adopted by the US Securities and Exchange Commission require the Fund to disclose whether the Fund’s Audit Committee includes at least one member who is an audit committee financial expert within the meaning of such Act and Rules. The Fund’s Board has determined that there is at least one such financial expert on the Audit Committee and has designated each of Ann Torre Bates and David W. Niemiec as an audit committee financial expert. The Board believes that Ms. Bates and Mr. Niemiec qualify as such an expert in view of their extensive business background and experience. Ms. Bates has served as a member of the Fund Audit Committee since 2008. She currently serves as a director of Ares Capital Corporation (2010-present) and United Natural Foods, Inc. (2013-present) and was formerly a director of Navient Corporation from 2014 to 2016, SLM Corporation from 1997 to 2014 and Allied Capital Corporation from 2003 to 2010, Executive Vice President and Chief Financial Officer of NHP Incorporated from 1995 to 1997 and Vice President and Treasurer of US Airways, Inc. until 1995. Mr. Niemiec has served as a member of the Fund Audit Committee since 2005, currently serves as an Advisor to Saratoga Partners and was formerly its Managing Director from 1998 to 2001 and serves as a director of Hess Midstream Partners LP (2017-present). Mr. Niemiec was formerly a director of Emeritus Corporation from 1999 to 2010 and OSI Pharmaceuticals, Inc. from 2006 to 2010, Managing Director of SBC Warburg Dillon Read from 1997 to 1998, and was Vice Chairman from 1991 to 1997 and Chief Financial Officer from 1982 to 1997 of Dillon, Read & Co. Inc. As a result of such background and experience, the Board believes that Ms. Bates and Mr. Niemiec have each acquired an understanding of generally accepted accounting principles and financial statements, the general application of such principles in connection with the accounting estimates, accruals and reserves, and analyzing and evaluating financial statements that present a breadth and level of complexity of accounting issues generally comparable to those of the Fund, as well as an understanding of internal controls and procedures for financial reporting and an understanding of audit committee functions. Ms. Bates and Mr. Niemiec are independent Board members as that term is defined under the applicable US Securities and Exchange Commission Rules and Releases.
The Statement of Additional Information (SAI) includes additional information about the board members and is available, without charge, upon request. Shareholders may call (800) DIALBEN/342-5236 to request the SAI.
| | | | |
| | | |
| 66 | | Annual Report | | ftinstitutional.com |
TEMPLETON INSTITUTIONAL FUNDS
Shareholder Information
Proxy Voting Policies and Procedures
The Funds’ investment manager has established Proxy Voting Policies and Procedures (Policies) that the Funds use to determine how to vote proxies relating to portfolio securities. Shareholders may view the Funds’ complete Policies online at franklintempleton.com. Alternatively, shareholders may request copies of the Policies free of charge by calling the Proxy Group collect at (954)527-7678 or by sending a written request to: Franklin Templeton Companies, LLC, 300 S.E. 2nd Street, Fort Lauderdale, FL 33301, Attention: Proxy Group. Copies of the Funds’ proxy voting records are also made available online at franklintempleton.com and posted on the U.S. Securities and Exchange Commission’s website at sec.gov and reflect the most recent12-month period ended June 30.
Quarterly Statement of Investments
The Trust files a complete statement of investments with the U.S. Securities and Exchange Commission for the first and third quarters for each fiscal year on FormN-Q. Shareholders may view the filed FormN-Q by visiting the Commission’s website at sec.gov. The filed form may also be viewed and copied at the Commission’s Public Reference Room in Washington, DC. Information regarding the operations of the Public Reference Room may be obtained by calling(800) SEC-0330.
Householding of Reports
and Prospectuses
You will receive each Fund’s financial reports every six months as well as an annual updated summary prospectus (prospectus available upon request). To reduce Fund expenses, we try to identify related shareholders in a household and send only one copy of the financial reports and summary prospectus. This process, called “householding,” will continue indefinitely unless you instruct us otherwise. If you prefer not to have these documents householded, please call us at (800)632-2301. At any time you may view current prospectuses/summary prospectuses and financial reports on our website. If you choose, you may receive these documents through electronic delivery.
| | | | | | |
| | | |
ftinstitutional.com | | Annual Report | | | 67 | |
This page intentionally left blank.
Annual Report
Templeton Institutional Funds
Investment Manager
Templeton Investment Counsel, LLC
Distributor
Franklin Templeton Distributors, Inc.
Shareholder Services
(800)321-8563
ftinstitutional.com
Authorized for distribution only when accompanied or preceded by a summary prospectus and/or prospectus. Investors should carefully consider a fund’s investment goals, risks, charges and expenses before investing. A prospectus contains this and other information; please read it carefully before investing.
To help ensure we provide you with quality service, all calls to and from our service areas are monitored and/or recorded.
| | |
| © 2019 Franklin Templeton Investments. All rights reserved. | | ZTIF A 02/19 |
(a) The Registrant has adopted a code of ethics that applies to its principal executive officers and principal financial and accounting officer.
(c) N/A
(d) N/A
(f) Pursuant to Item 12(a)(1), the Registrant is attaching as an exhibit a copy of its code of ethics that applies to its principal
| Item 4. | Principal Accountant Fees and Services. |
(a) Audit Fees
The aggregate fees paid to the principal accountant for professional services rendered by the principal accountant for the audit of the registrant’s annual financial statements or for services that are normally provided by the principal accountant in connection with statutory and regulatory filings or engagements were $149,555 for the fiscal year ended December 31, 2018 and $194,933 for the fiscal year ended December 31, 2017.
(b) Audit-Related Fees
The aggregate fees paid to the principal accountant for assurance and related services rendered by the principal accountant to the registrant that are reasonably related to the performance of the audit of the registrant’s financial statements and are not reported under paragraph (a) of Item 4 were $3,102 for the fiscal year ended December 31, 2018 and $3,071 for the fiscal year ended December 31, 2017. The services for which these fees were paid included attestation services.
There were no fees paid to the principal accountant for assurance and related services rendered by the principal accountant to the registrant’s investment adviser and any entity controlling, controlled by or under common control with the investment adviser that provides ongoing services to the registrant that are reasonably related to the performance of the audit of their financial statements.
(c) Tax Fees
There were no fees paid to the principal accountant for professional services rendered by the principal accountant to the registrant for tax compliance, tax advice and tax planning.
There were no fees paid to the principal accountant for professional services rendered by the principal accountant to the registrant’s investment adviser and any entity controlling, controlled by or under common control with the investment adviser that provides ongoing services to the registrant for tax compliance, tax advice and tax planning.
(d) All Other Fees
The aggregate fees paid to the principal accountant for products and services rendered by the principal accountant to the registrant not reported in paragraphs (a)-(c) of Item 4 were $2,211 for the fiscal
year ended December 31, 2018 and $0 for the fiscal year ended December 31, 2017. The services for which these fees were paid included review of materials provided to the fund Board in connection with the investment management contract renewal process.
The aggregate fees paid to the principal accountant for products and services rendered by the principal accountant to the registrant’s investment adviser and any entity controlling, controlled by or under common control with the investment adviser that provides ongoing services to the registrant not reported in paragraphs (a)-(c) of Item 4 were $7,500 for the fiscal year ended December 31, 2018 and $14,000 for the fiscal year ended December 31, 2017. The services for which these fees were paid included the issuance of an Auditor’s Certificate for South Korean regulatory shareholders disclosures and benchmarking services in connection with the ICI TA Survey.
(e) (1) The registrant’s audit committee is directly responsible for approving the services to be provided by the auditors, including:
(i)pre-approval of all audit and audit related services;
(ii)pre-approval of allnon-audit related services to be provided to the Fund by the auditors;
(iii)pre-approval of allnon-audit related services to be provided to the registrant by the auditors to the registrant’s investment adviser or to any entity that controls, is controlled by or is under common control with the registrant’s investment adviser and that provides ongoing services to the registrant where thenon-audit services relate directly to the operations or financial reporting of the registrant; and
(iv) establishment by the audit committee, if deemed necessary or appropriate, as an alternative to committeepre-approval of services to be provided by the auditors, as required by paragraphs (ii) and (iii) above, of policies and procedures to permit such services to bepre-approved by other means, such as through establishment of guidelines or by action of a designated member or members of the committee; provided the policies and procedures are detailed as to the particular service and the committee is informed of each service and such policies and procedures do not include delegation of audit committee responsibilities, as contemplated under the Securities Exchange Act of 1934, to management; subject, in the case of (ii) through (iv), to any waivers, exceptions or exemptions that may be available under applicable law or rules.
(e) (2) None of the services provided to the registrant described in paragraphs (b)-(d) of Item 4 were approved by the audit committee pursuant to paragraph (c)(7)(i)(C) of Rule2-01 of regulationS-X.
(f) No disclosures are required by this Item 4(f).
(g) The aggregatenon-audit fees paid to the principal accountant for services rendered by the principal accountant to the registrant and the registrant’s investment adviser and any entity controlling, controlled by or under common control with the investment adviser that provides ongoing services to the registrant were $12,813 for the fiscal year
ended December 31, 2018 and $17,071 for the fiscal year ended December 31, 2017.
(h) The registrant’s audit committee of the board has considered whether the provision ofnon-audit services that were rendered to the registrant’s investment adviser (not including anysub-adviser whose role is primarily portfolio management and is subcontracted with or overseen by another investment adviser), and any entity controlling, controlled by, or under common control with the investment adviser that provides ongoing services to the registrant that were notpre-approved pursuant to paragraph (c)(7)(ii) of Rule2-01 of RegulationS-X is compatible with maintaining the principal accountant’s independence.
| Item 5. | Audit Committee of Listed Registrants. N/A |
| Item 6. | Schedule of Investments. N/A |
| Item 7. | Disclosure of Proxy Voting Policies and Procedures forClosed-End Management Investment Companies. N/A |
| Item 8. | Portfolio Managers ofClosed-End Management Investment Companies. N/A |
| Item 9. | Purchases of Equity Securities byClosed-End Management Investment Company and Affiliated Purchasers. N/A |
| Item 10. | Submission of Matters to a Vote of Security Holders. |
There have been no changes to the procedures by which shareholders may recommend nominees to the Registrant’s Board of Trustees that would require disclosure herein.
| Item 11. | Controls and Procedures. |
(a) Evaluation of Disclosure Controls and Procedures. The Registrant maintains disclosure controls and procedures that are designed to provide reasonable assurance that information required to be disclosed in the Registrant’s filings under the Securities Exchange Act of 1934, as amended, and the Investment Company Act of 1940 is recorded, processed, summarized and reported within the periods specified in the rules and forms of the Securities and Exchange Commission. Such information is accumulated and communicated to the Registrant’s management, including its principal executive officer and principal financial officer, as appropriate, to allow timely decisions regarding required disclosure. The Registrant’s management, including the principal executive officer and the principal financial officer, recognizes that any set of controls and procedures, no matter how well designed and operated, can provide only reasonable assurance of achieving the desired control objectives.
Within 90 days prior to the filing date of this Shareholder Report on FormN-CSR, the Registrant had carried out an evaluation, under the supervision and with the participation of the Registrant’s management, including the Registrant’s principal executive officer and the Registrant’s principal financial officer, of the effectiveness of the design and operation of the Registrant’s disclosure controls and procedures. Based on such evaluation, the Registrant’s principal executive officer and principal financial officer concluded that the Registrant’s disclosure controls and procedures were not effective related to internal control over financial reporting specific to the monitoring of market events following the close of trading in foreign stock markets that assist in determining the reliability of the values of the foreign securities held by the Funds and which may require the use of fair valuation factors to account for changes in the values of those securities subsequent to the local close of the foreign market but prior to the net asset calculation of the Funds. As a result, a material weakness exists at period end for the Foreign Smaller Companies Series, Global Equity Series, and International Equity Series. There are no misstatements to current and previously issued financial statements. However, this material weakness could result in misstatements of security values and unrealized gains or losses and associated disclosures that would result in a material misstatement of the interim or annual financial statements that would not be prevented or detected.
Effective November 1, 2018, the Registrant’s controls were enhanced through the implementation of a daily secondary review of market events following the close of trading on foreign stock markets to ensure the appropriate application of market level fair value. Registrant’s management believes this will facilitate the remediation of the control deficiency we have identified and strengthen the internal control over financial reporting. This material weakness will not be considered remediated until the applicable controls operate for a sufficient period of time and management has concluded, through testing, that these controls are operating effectively.
(b) Changes in Internal Controls. As described above, there have been changes in the Registrant’s internal control over financial reporting that occurred during the period covered by this report that have materially affected, or is reasonably likely to materially affect, the internal control over financial reporting.
| Item 12. | Disclosure of Securities Lending Activities forClosed-End Management Investment Company. N/A |
(a)(1)Code of Ethics
(a)(2) Certifications pursuant to Section 302 of the Sarbanes-Oxley Act of 2002 of Matthew T. Hinkle, Chief Executive Officer – Finance and Administration, and Robert G. Kubilis, Chief Financial Officer and Chief Accounting Officer
(b) Certifications pursuant to Section 906 of the Sarbanes-Oxley Act of
2002 of Matthew T. Hinkle, Chief Executive Officer – Finance and Administration, and Robert G. Kubilis, Chief Financial Officer and Chief Accounting Officer
SIGNATURES
Pursuant to the requirements of the Securities Exchange Act of 1934 and the Investment Company Act of 1940, the registrant has duly caused this report to be signed on its behalf by the undersigned, thereunto duly authorized.
| | |
| TEMPLETON INSTITUTIONAL FUNDS |
| |
| By | | /s/ MATTHEW T. HINKLE |
| | Matthew T. Hinkle Chief Executive Officer – Finance and Administration |
Date February 26, 2019
Pursuant to the requirements of the Securities Exchange Act of 1934 and the Investment Company Act of 1940, this report has been signed below by the following persons on behalf of the registrant and in the capacities and on the dates indicated.
| | |
| |
| By | | /s/ MATTHEW T. HINKLE |
| | Matthew T. Hinkle Chief Executive Officer – Finance and Administration |
Date February 26, 2019
| | |
| |
| By | | /s/ ROBERT G. KUBILIS |
| | Robert G. Kubilis Chief Financial Officer and Chief Accounting Officer |
Date February 26, 2019