UNITED STATES
SECURITIES AND EXCHANGE COMMISSION
Washington, DC 20549
FORM N-CSR
CERTIFIED SHAREHOLDER REPORT OF REGISTERED
MANAGEMENT INVESTMENT COMPANIES
Investment Company Act file number 811-06135
Templeton Institutional Funds
(Exact name of registrant as specified in charter)
300 S.E. 2nd Street, Fort Lauderdale, FL 33301-1923
(Address of principal executive offices) (Zip code)
Craig S. Tyle, One Franklin Parkway, San Mateo, CA 94403-1906
(Name and address of agent for service)
Registrant’s telephone number, including area code: (954) 527-7500
Date of fiscal year end: 12/31
Date of reporting period: 12/31/17
| Item 1. | Reports to Stockholders. |
Annual Report
December 31, 2017
Templeton Institutional Funds
Emerging Markets Series Foreign Smaller Companies Series Global Equity Series International Equity Series
Franklin Templeton Investments
Gain From Our Perspective®
At Franklin Templeton Investments, we’re dedicated to one goal: delivering exceptional asset management for our clients. By bringing together multiple, world-class investment teams in a single firm, we’re able to offer specialized expertise across styles and asset classes, all supported by the strength and resources of one of the world’s largest asset managers. This has helped us to become a trusted partner to individual and institutional investors across the globe.
Annual Report
Visit ftinstitutional.com for fund updates, to access your account, or to find investment insights.
Not FDIC Insured | May Lose Value | No Bank Guarantee
|
| ftinstitutional.com | Not part of the annual report | 1 | ||||
Annual Report
The global economy grew moderately during the 12-month period under review. In this environment, global developed and emerging market stocks generated a +24.62% total return, as measured by the MSCI All Country World Index.1 Global markets were aided by price gains in oil and other commodities, generally upbeat economic data across regions, the European Central Bank’s (ECB’s) extension of its monetary easing program, and investor optimism about pro-growth and pro-business policies in the US. The prospect for reforms in the European Union (EU) with Emmanuel Macron’s election as France’s president, encouraging corporate earnings reports and the passage of the US tax reform bill also supported global stocks.
However, global markets reflected investor concerns about the terms of the UK’s exit from the EU, political uncertainty in the US and the EU, and geopolitical tensions in the Korean peninsula and other regions. Other concerns included the health of European banks, global oil oversupply despite a pact by major oil-producing countries to extend production cuts, and comments from key central bankers around the world about potentially raising interest rates.
After strengthening in 2017’s second and third quarters, the US economy moderated in the fourth quarter. The economy grew faster in 2017 than in 2016, however, largely due to growth in consumer spending, business investment and exports. The unemployment rate decreased from 4.7% in December 2016 to 4.1% at period-end.2 Annual inflation, as measured by the Consumer Price Index, was 2.1% in December 2016, and while it varied over the 12-month period, remained unchanged at period-end.2 The US Federal Reserve (Fed) raised its target range for the federal funds rate 0.25% three times during the period, amid signs of a growing US economy, strengthening labor market and improving business spending. At its December meeting, the Fed confirmed that the monthly balance sheet reduction would increase from US$10 billion to US$20 billion beginning in January 2018.
In Europe, the UK’s economic growth moderated in 2017 compared to 2016, largely due to slower growth in the services sector. In November, the Bank of England raised its key policy rate 0.25%, its first increase in a decade. The eurozone’s growth accelerated in 2017’s second and third quarters, but moderated in the fourth quarter. However, the eurozone’s 2017
economic growth rate was the fastest in a decade. The bloc’s annual inflation rate, while low, ended higher than in December 2016. The ECB kept its benchmark interest rate unchanged during the period. However, at its October meeting, the ECB extended the time frame for its massive bond-buying program from December 2017 to at least September 2018, while reducing the amount of monthly bond purchases in half beginning in January 2018.
In Asia, Japan’s quarterly gross domestic product (GDP) grew for the seventh consecutive quarter, although third-quarter 2017 growth was lower than the previous quarter. The Bank of Japan left its benchmark interest rate unchanged during the period and continued its monetary stimulus measures.
In emerging markets, Brazil’s quarterly GDP grew for the third consecutive quarter, although third-quarter 2017 growth slowed from the previous quarter. The country’s central bank cut its benchmark interest rate several times during the period to spur economic growth. Russia’s GDP grew in 2017’s first three quarters compared to the prior-year periods, amid the Bank of Russia’s continued policy support. China’s GDP grew faster in 2017 than in 2016, supported by solid growth in industrial production, services, fixed-asset investment, retail sales, and imports and exports. The People’s Bank of China left its benchmark interest rate unchanged during the period. Overall, emerging market stocks, as measured by the MSCI Emerging Markets Index, rose substantially during the period.
The foregoing information reflects our analysis and opinions as of December 31, 2017. The information is not a complete analysis of every aspect of any market, country, industry, security or fund. Statements of fact are from sources considered reliable.
1. Source: Morningstar.
2. Source: US Bureau of Labor Statistics
See www.franklintempletondatasources.com for additional data provider information.
| 2 | Annual Report | ftinstitutional.com | ||
We are pleased to bring you Emerging Markets Series’ (Fund’s) annual report for the fiscal year ended December 31, 2017. As previously communicated, the Fund is anticipated to be liquidated on or about March 16, 2018 (Liquidation Date), but may be delayed if unforeseen circumstances arise. Effective at the close of market on January 5, 2018, the Fund closed to all new investors, with limited exceptions. The Fund will not accept any additional purchases after the close of market on or about March 9, 2018. The Fund reserves the right to change this policy at any time. Shareholders of the Fund on the Liquidation Date will have their accounts liquidated and the proceeds will be delivered to them.
Your Fund’s Goal and Main Investments
The Fund seeks long-term capital growth. Under normal market conditions, the Fund invests at least 80% of its net assets in securities issued by “emerging market companies,” as defined in the Fund’s prospectus.
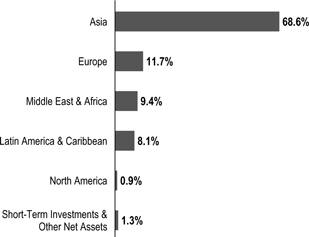
Geographic Composition
Based on Total Net Assets as of 12/31/17
Performance Overview
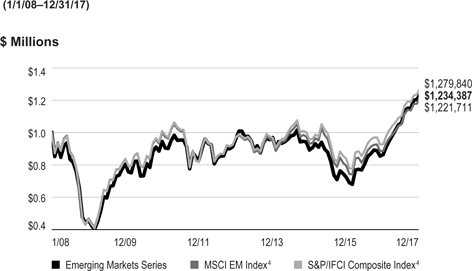
The Fund delivered a +42.84% cumulative total return for the 12 months under review. In comparison, the Standard & Poor’s®/International Finance Corporation Investable (S&P®/IFCI) Composite Index generated a +37.89% total return, and the MSCI Emerging Markets (EM) Index posted a total return of +37.75% during the same period.1 The indexes
measure global emerging market stock performance. Please note, index performance information is provided for reference and we do not attempt to track an index but rather undertake investments on the basis of fundamental research. The Fund’s return reflects the effect of fees and expenses for professional management, while an index does not have such costs. In addition, an index is not subject to investment flows while the Fund is subject to purchases and redemptions that could impact performance. You can find the Fund’s long-term performance data in the Performance Summary beginning on page 7.
Performance data represent past performance, which does not guarantee future results. Investment return and principal value will fluctuate, and you may have a gain or loss when you sell your shares. Current performance may differ from figures shown. For most recent month-end performance, go to ftinstitutional.com or call a Franklin Templeton Institutional Services representative at (800) 321-8563.
Investment Strategy
Our investment strategy employs a fundamental research, value-oriented, long-term approach. We focus on the market price of a company’s securities relative to our evaluation of the company’s long-term earnings, asset value and cash flow potential. We also consider a company’s profit and loss outlook, balance sheet strength, cash flow trends and asset value in relation to the current price of the company’s securities. Our analysis considers the company’s corporate governance behavior as well as its position in its sector, the economic framework and political environment.
Manager’s Discussion
During the 12 months under review, key contributors to the Fund’s absolute performance included investments in Brilliance China Automotive Holdings, Naspers and Samsung Electronics.
Brilliance China Automotive manufactures and sells automobiles for the Chinese domestic market, predominantly through its joint venture with BMW,2 a German luxury car manufacturer. The company reported strong sales volume and profit growth in 2017, supported by generally robust demand. The rise of China’s upper middle class has continued to drive luxury car demand in the country, as buyers pay more attention
1. Source: Morningstar.
The indexes are unmanaged and include reinvestment of any income or distributions. They do not reflect any fees, expenses or sales charges. One cannot invest directly in an index, and an index is not representative of the Fund’s portfolio.
2. Not a Fund holding.
The dollar value, number of shares or principal amount, and names of all portfolio holdings are listed in the Fund’s Statement of Investments (SOI). The SOI begins on page 35.
| ftinstitutional.com | Annual Report | 3 | ||||
EMERGING MARKETS SERIES
to vehicle performance and product quality. The announcement of a joint venture between Brilliance China Automotive and French automobile manufacturer Groupe Renault2 to manufacture and sell light commercial vehicles under the Jinbei, Renault and Huasong brands further supported share price performance.
Naspers is an internet and media group based in South Africa. It has sizable investments in some of the world’s leading technology companies, including China-based Tencent Holdings3 and Russia-based Mail.Ru Group.3 Shares of Naspers rose during the 12-month period, largely driven by positive sentiment in Tencent, one of the world’s largest and most widely used internet service portals. Tencent reported strong year-over-year growth in quarterly earnings throughout 2017, driven by its online gaming, advertising and social networking segments. Investors also viewed positively Naspers’s addition of new investments in the online food delivery segment in 2017.
| Top 10 Countries | ||||
| 12/31/17 | ||||
| % of Total Net Assets | ||||
| China | 21.6% | |||
| South Korea | 18.3% | |||
| Taiwan | 11.5% | |||
| South Africa | 8.5% | |||
| Russia | 6.7% | |||
| India | 6.3% | |||
| Brazil | 5.4% | |||
| Thailand | 3.7% | |||
| Indonesia | 3.3% | |||
| UK | 3.0% | |||
Samsung Electronics is a major South Korea-based manufacturer of consumer electronics. It is one of the world’s largest manufacturers of mobile phones, smartphones, tablets and televisions. The company is also a leading supplier of memory chips for high-end phones and is a key provider of OLED (organic light-emitting diode) displays. Its share price increase was driven by solid quarterly corporate sales and earnings results reported in 2017, a new shareholder return policy for 2018-2020, including plans to boost its dividends, and a cancelation of existing company-held treasury shares. News that Samsung Electronics dethroned Intel2 to become the world’s largest chip producer in 2017 in revenue terms also contributed to investor sentiment.
| Top 10 Holdings | ||||
12/31/17
| ||||
| Company Sector/Industry, Country | % of Total Net Assets | |||
| Samsung Electronics Co. Ltd. | 7.5% | |||
Technology Hardware, Storage & Peripherals, South Korea | ||||
| Naspers Ltd. Media, South Africa | 7.3% | |||
| Taiwan Semiconductor Manufacturing Co. Ltd. Semiconductors & Semiconductor Equipment, Taiwan | 6.1% | |||
| Brilliance China Automotive Holdings Ltd. Automobiles, China | 6.1% | |||
| Alibaba Group Holding Ltd. Internet Software & Services, China | 4.0% | |||
| Tencent Holdings Ltd. Internet Software & Services, China | 3.3% | |||
| Unilever PLC Personal Products, UK | 3.0% | |||
| ICICI Bank Ltd. Banks, India | 2.5% | |||
Hon Hai Precision Industry Co. Ltd. Electronic Equipment, Instruments & Components, Taiwan | 1.9% | |||
| Sberbank of Russia PJSC Banks, Russia | 1.9% | |||
In contrast, key detractors from the Fund’s absolute performance included positions in Habib Bank, IMAX and Glenmark Pharmaceuticals.
Habib Bank is Pakistan’s biggest bank and one of the country’s largest companies in asset terms. News of a significant fine by the New York State Department of Financial Services on the bank’s New York branch for failure to comply with New York laws and regulations designed to combat money laundering, terrorist financing and other illicit financial transactions weighed on the bank’s profits and share price. Additionally, following Pakistan’s upgrade from the MSCI Frontier Markets Index to the MSCI EM Index, the Pakistani market corrected sharply due to political turmoil and weaker-than-expected foreign investment inflows.
IMAX is one of the world’s leading entertainment technology companies, specializing in immersive motion picture technologies. Its systems are used globally, and it has a notable market position in China. Disappointing corporate results for the first two quarters of 2017 pressured the US-based company’s shares. Revenues and gross profit margin declined in the second quarter compared to the year-ago period,
3. Also a Fund holding.
| 4 | Annual Report | ftinstitutional.com | ||
EMERGING MARKETS SERIES
following a decline in first-quarter gross margin. Third-quarter results, however, were better than expected, with revenue, earnings and gross margin all exceeding market forecasts, driven by a successful cost-cutting program and higher sales, leading its share price to rebound from period lows. The company also announced a new share-repurchase program to enhance shareholder value.
Glenmark Pharmaceuticals is an India-based manufacturer of generic drugs and pharmaceutical ingredients. Glenmark produces formulation products in areas such as oncology, respiratory and cardiology. It also researches and develops its own chemical and biological entities. In addition to India, the US is its main market. Its share price declined significantly in May 2017 as the company announced a weaker-than-expected first-quarter operating performance with disappointing revenue growth. Sales in India were impacted by the government’s demonetization efforts (recall of large-denominated currency notes from circulation), with price pressures also evident in other key markets. Better-than-expected second-quarter results and approval from the US Food & Drug Administration for a birth control pill in late 2017 provided investors with some reasons to remain optimistic.
It is important to recognize the effect of currency movements on the Fund’s performance. In general, if the value of the US dollar goes up compared with a foreign currency, an investment traded in that foreign currency will go down in value because it will be worth fewer US dollars. This can have a negative effect on Fund performance. Conversely, when the US dollar weakens in relation to a foreign currency, an investment traded in that foreign currency will increase in value, which can contribute to Fund performance. For the 12 months ended December 31, 2017, the US dollar declined in value relative to most currencies. As a result, the Fund’s performance was positively affected by the portfolio’s investment predominantly in securities with non-US currency exposure. However, one cannot expect the same result in future periods.
During the 12-month period, we increased the Fund’s holdings in Russia, South Korea and Peru as we identified companies in these countries with what we considered solid fundamentals. We also made some purchases in Mexico. In sector terms, we
increased holdings in financials and materials.4 Key purchases included new investments in Sberbank of Russia, Russia’s leading bank, and South Korea-based POSCO, one of the world’s biggest steel producers. Additionally, we increased the Fund’s positions in Alibaba Group Holding, China’s largest e-commerce company, and Compania de Minas Buenaventura, a major precious metals company in Peru.
Conversely, we reduced the Fund’s investments in India and made some sales in China and South Africa to focus on securities we considered to be more attractively valued within our investment universe. In sector terms, we made some sales in information technology (IT) and reduced holdings in industrials, consumer discretionary and consumer staples.5 Key sales included reducing investments in the aforementioned Brilliance China Automotive Holding and Tencent Holdings. We also closed the Fund’s position in Remgro, a South African holding company with interests in food, finance and health care.
Thank you for your participation in Emerging Markets Series. It has been a pleasure serving your investment needs.
 |
Chetan Sehgal, CFA Portfolio Manager |

CFA® is a trademark owned by CFA Institute.
4. The financials sector comprises banks, capital markets, diversified financial services and insurance in the SOI. The materials sector comprises chemicals, construction materials, and metals and mining in the SOI.
5. The IT sector comprises electronic equipment, instruments and components; internet software and services; IT services; semiconductors and semiconductor equipment; software; and technology hardware, storage and peripherals in the SOI. The industrials sector comprises construction and engineering, industrial conglomerates, trading companies and distributors, and transportation infrastructure in the SOI. The consumer discretionary sector comprises auto components; automobiles; distributors; hotels, restaurants and leisure; internet and direct marketing retail; media; multiline retail; and textiles, apparel and luxury goods in the SOI. The consumer staples sector comprises beverages, food and staples retailing, food products and personal products in the SOI.
See www.franklintempletondatasources.com for additional data provider information.
| ftinstitutional.com | Annual Report | 5 | ||||
EMERGING MARKETS SERIES
The foregoing information reflects our analysis, opinions and portfolio holdings as of December 31, 2017, the end of the reporting period. The way we implement our main investment strategies and the resulting portfolio holdings may change depending on factors such as market and economic conditions. These opinions may not be relied upon as investment advice or an offer for a particular security. The information is not a complete analysis of every aspect of any market, country, industry, security or the Fund. Statements of fact are from sources considered reliable, but the investment manager makes no representation or warranty as to their completeness or accuracy. Although historical performance is no guarantee of future results, these insights may help you understand our investment management philosophy.
| 6 | Annual Report | ftinstitutional.com | ||
EMERGING MARKETS SERIES
Performance Summary as of December 31, 2017
The performance table and graph do not reflect any taxes that a shareholder would pay on Fund dividends, capital gain distributions, if any, or any realized gains on the sale of Fund shares. Total return reflects reinvestment of the Fund’s dividends and capital gain distributions, if any, and any unrealized gains or losses. Your dividend income will vary depending on dividends or interest paid by securities in the Fund’s portfolio, adjusted for operating expenses. Capital gain distributions are net profits realized from the sale of portfolio securities.
Performance as of 12/31/171
|
| Cumulative Total Return2 | Average Annual Total Return3 | ||||
1-Year | +42.84% | +42.84% | ||||
5-Year | +28.24% | +5.10% | ||||
10-Year | +23.44% | +2.13% | ||||
Performance data represent past performance, which does not guarantee future results. Investment return and principal value will fluctuate, and you may have a gain or loss when you sell your shares. Current performance may differ from figures shown. For most recent month-end performance, go to ftinstitutional.com or call a Franklin Templeton Institutional Services representative at (800) 321-8563.
See page 9 for Performance Summary footnotes.
| ftinstitutional.com | Annual Report | 7 | ||||
EMERGING MARKETS SERIES
PERFORMANCE SUMMARY
Total Return Index Comparison for a Hypothetical $1,000,000 Investment1
Total return represents the change in value of an investment over the periods shown. It includes any applicable maximum sales charge, Fund expenses, account fees and reinvested distributions. The unmanaged indexes include reinvestment of any income or distributions. They differ from the Fund in composition and do not pay management fees or expenses. One cannot invest directly in an index.
See page 9 for Performance Summary footnotes.
| 8 | Annual Report | ftinstitutional.com | ||
EMERGING MARKETS SERIES
PERFORMANCE SUMMARY
| Distributions (1/1/17–12/31/17) |
| Net Investment | ||
| Income | ||
| $0.0519 | ||
Total Annual Operating Expenses5
| With Waiver | Without Waiver | |||
| 1.31% | 1.44% |
All investments involve risks, including possible loss of principal. Special risks are associated with foreign investing, including currency fluctuations, economic instability and political developments. Investments in emerging markets, of which frontier markets are a subset, involve heightened risks related to the same factors, in addition to those associated with these markets’ smaller size, lesser liquidity and lack of established legal, political, business and social frameworks to support securities markets. Because these frameworks are typically even less developed in frontier markets, as well as various factors including the increased potential for extreme price volatility, illiquidity, trade barriers and exchange controls, the risks associated with emerging markets are magnified in frontier markets. The Fund’s ability to invest in smaller company securities that may have limited liquidity involves additional risks, such as relatively small revenues, limited product lines and small market share. Historically, these stocks have exhibited greater price volatility than larger company stocks, especially over the short term. The Fund is actively managed but there is no guarantee that the manager’s investment decisions will produce the desired results. The Fund’s prospectus also includes a description of the main investment risks.
1. The Fund has an expense reduction and a fee waiver associated with any investments it makes in a Franklin Templeton money fund and/or other Franklin Templeton fund, contractually guaranteed through 4/30/18. Fund investment results reflect the expense reduction and fee waiver; without these reductions, the results would have been lower.
2. Cumulative total return represents the change in value of an investment over the periods indicated.
3. Average annual total return represents the average annual change in value of an investment over the periods indicated. Return for less than one year, if any, has not been annualized.
4. Source: Morningstar. The MSCI EM Index is a free float-adjusted, market capitalization-weighted index designed to measure equity market performance of global emerging markets. The S&P/IFCI Composite Index is a free float-adjusted, market capitalization-weighted index designed to measure equity performance of global emerging markets.
5. Figures are as stated in the Fund’s current prospectus and may differ from the expense ratios disclosed in the Your Fund’s Expenses and Financial Highlights sections in this report. In periods of market volatility, assets may decline significantly, causing total annual Fund operating expenses to become higher than the figures shown.
See www.franklintempletondatasources.com for additional data provider information.
| ftinstitutional.com | Annual Report | 9 | ||||
EMERGING MARKETS SERIES
Your Fund’s Expenses
As a Fund shareholder, you can incur two types of costs: (1) transaction costs, including sales charges (loads) on Fund purchases and redemptions, if applicable; and (2) ongoing Fund costs, including management fees, distribution and service (12b-1) fees, if applicable, and other Fund expenses. All mutual funds have ongoing costs, sometimes referred to as operating expenses. The table below shows ongoing costs of investing in the Fund and can help you understand these costs and compare them with those of other mutual funds. The table assumes a $1,000 investment held for the six months indicated.
Actual Fund Expenses
The table below provides information about actual account values and actual expenses in the columns under the heading “Actual.” In these columns the Fund’s actual return, which includes the effect of Fund expenses, is used to calculate the “Ending Account Value.” You can estimate the expenses you paid during the period by following these steps (of course, your account value and expenses will differ from those in this illustration): Divide your account value by $1,000 (if your account had an $8,600 value, then $8,600 ÷ $1,000 = 8.6). Then multiply the result by the number in the row for your class of shares under the headings “Actual” and “Expenses Paid During Period” (if Actual Expenses Paid During Period were $7.50, then 8.6 x $7.50 = $64.50). In this illustration, the actual expenses paid this period are $64.50.
Hypothetical Example for Comparison with Other Funds
Under the heading “Hypothetical” in the table, information is provided about hypothetical account values and hypothetical expenses based on the Fund’s actual expense ratio and an assumed rate of return of 5% per year before expenses, which is not the Fund’s actual return. This information may not be used to estimate the actual ending account balance or expenses you paid for the period, but it can help you compare ongoing costs of investing in the Fund with those of other funds. To do so, compare this 5% hypothetical example for the class of shares you hold with the 5% hypothetical examples that appear in the shareholder reports of other funds.
Please note that expenses shown in the table are meant to highlight ongoing costs and do not reflect any transactional costs. Therefore, information under the heading “Hypothetical” is useful in comparing ongoing costs only, and will not help you compare total costs of owning different funds. In addition, if transactional costs were included, your total costs would have been higher.
| Actual (actual return after expenses) | Hypothetical (5% annual return before expenses) | |||||||||||
| Beginning Account Value 7/1/17 | Ending Account Value 12/31/17 | Expenses Paid During Period 7/1/17–12/31/171,2 | Ending Account Value 12/31/17 | Expenses Paid During 7/1/17–12/31/171,2 | Net Annualized Expense Ratio2 | |||||||
|
|
|
| |||||||||
| $1,000 | $1,164.50 | $8.18 | $1,017.64 | $7.63 | 1.50% | |||||||
1. Expenses are equal to the annualized expense ratio for the six-month period as indicated above—in the far right column—multiplied by the simple average account value over the period indicated, and then multiplied by 184/365 to reflect the one-half year period.
2. Reflects expenses after fee waivers and expense reimbursements. Does not include acquired fund fees and expenses.
10 |
Annual Report |
ftinstitutional.com |
Foreign Smaller Companies Series
We are pleased to bring you Foreign Smaller Companies Series’ (Fund’s) annual report for the fiscal year ended December 31, 2017. Effective at the market close on December 10, 2013, the Fund closed to new investors. Existing shareholders may add to their accounts. We believe this closure will help us manage the inflow of assets and allow us to effectively manage our current level of assets.
Your Fund’s Goal and Main Investments
The Fund seeks long-term capital growth. Under normal market conditions, the Fund invests at least 80% of its net assets in investments of smaller companies located outside the US, including emerging markets.
Performance Overview
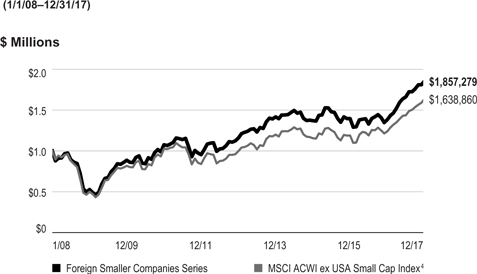
The Fund’s Class A shares delivered a +34.18% cumulative total return for the 12 months under review. In comparison, the MSCI All Country World Index (ACWI) ex USA Small Cap Index, which measures performance of global developed and emerging market small-cap equities, excluding the US, posted a +32.12% total return.1 Please note, index performance information is provided for reference and we do not attempt to track the index but rather undertake investments on the basis of fundamental research. You can find the Fund’s long-term performance data in the Performance Summary beginning on page 14.
Performance data represent past performance, which does not guarantee future results. Investment return and principal value will fluctuate, and you may have a gain or loss when you sell your shares. Current performance may differ from figures shown. For most recent month-end performance, go to ftinstitutional.com or call a Franklin Templeton Institutional Services representative at (800) 321-8563.
Investment Strategy
When choosing equity investments, we apply a bottom-up, value-oriented, long-term approach, focusing on the market price of a company’s securities relative to our evaluation of the company’s long-term earnings, asset value and cash flow potential. We also consider a company’s price/earnings ratio, profit margins and liquidation value.
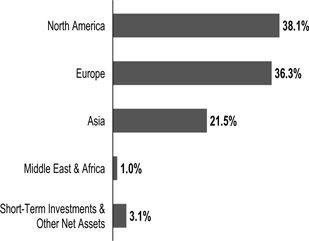
Geographic Composition
Based on Total Net Assets as of 12/31/17
Manager’s Discussion
Several holdings performed well during the period under review. India-based Dewan Housing Finance benefited from a positive shift in sentiment, its low valuation and secular growth opportunities in the mortgage finance industry. Despite the recent share price appreciation, Dewan has continued to trade at what we consider to be a sizable discount to many of its peers. This is partially due to Dewan’s relatively low return on equity, a measure of profitability that is mainly a function of the company’s extensive branch network relative to other firms. Over time, we believe Dewan could see the benefits of its branch network, including higher asset density and better operating leverage.
Italy-based Interpump Group manufactures piston pumps and hydraulic products. Historically, about two-thirds of earnings growth has been driven by mergers and acquisitions (M&A) done at what we considered attractive multiples and with related synergies. After doubling its revenues over the last five years, we felt Interpump’s M&A engine has remained well in place, with several options under scrutiny. Exposure to end markets such as trucks, agriculture and construction equipment, and earth-moving machines, particularly in the US (a geographical market that accounts for a significant portion of the group’s revenues), also helped drive growth.
Based in Hong Kong, Techtronic Industries is a leading global power tools company. Its shares benefited from strong financial results as demand growth for power tools has outpaced that of
1. Source: Morningstar.
The index is unmanaged and includes reinvestment of any income or distributions. It does not reflect any fees, expenses or sales charges. One cannot invest directly in an index, and an index is not representative of the Fund’s portfolio.
See www.franklintempletondatasources.com for additional data provider information.
The dollar value, number of shares or principal amount, and names of all portfolio holdings are listed in the Fund’s Statement of Investments (SOI). The SOI begins on page 40.
| ftinstitutional.com | Annual Report | 11 | ||||
FOREIGN SMALLER COMPANIES SERIES
average home improvement products during the past two to three years. We believe the company offers increasing economies of scale, manufacturing rationalization and an ongoing mix shift toward higher margin products.
| Portfolio Composition | ||||
| 12/31/17 | ||||
| Sector/Industry | % of Total Net Assets | |||
Machinery | 11.4% | |||
Leisure Products | 7.7% | |||
Textiles, Apparel & Luxury Goods | 7.1% | |||
Electronic Equipment, Instruments & Components | 6.5% | |||
Capital Markets | 5.9% | |||
Household Durables | 3.7% | |||
Food Products | 3.5% | |||
Banks | 3.5% | |||
Construction & Engineering | 2.8% | |||
Professional Services | 2.7% | |||
Specialty Retail | 2.7% | |||
Containers & Packaging | 2.6% | |||
Real Estate Management & Development | 2.6% | |||
Personal Products | 2.4% | |||
Thrifts & Mortgage Finance | 2.2% | |||
Life Sciences Tools & Services | �� | 2.2% | ||
Other | 26.2% | |||
Short-Term Investments & Other Net Assets | 4.3% | |||
In contrast, some holdings detracted from Fund performance. Shares of Japan-based sportswear exporter ASICS fell due to weak sales of lifestyle and running shoes in the US. We believe the company has substantial further potential for expanding its sales channels and take full advantage of its untapped brand value. The global popularity of fitness and running and a growing recognition of ASICS products’ high performance should, in our view, remain a growth driver for the company.
Mullen Group is a Canadian oil services company that owns a network of independently operated businesses. Fluctuations in oil prices impacted the share price during the period. However, Mullen has a diversified business mix and a track record of generating attractive returns on capital. The company’s strategy is to be the dominant player in select niche markets with favorable competitive dynamics (i.e., better pricing power, higher barriers to entry). Mullen typically navigates through business cycles strategically, which includes maintaining a balance sheet that allows for opportunistic acquisitions. We believe the company is well positioned to capitalize on a recovery in energy markets.
| Top 10 Holdings | ||||
| 12/31/17 | ||||
Company Sector/Industry, Country | % of Total Net Assets | |||
Techtronic Industries Co. Ltd. Household Durables, Hong Kong | 2.0% | |||
The Thule Group AB Leisure Products, Sweden | 2.0% | |||
Bucher Industries AG Machinery, Switzerland | 2.0% | |||
Technogym SpA Leisure Products, Italy | 1.9% | |||
Man Group PLC Capital Markets, UK | 1.9% | |||
Interpump Group SpA Machinery, Italy | 1.9% | |||
Dewan Housing Finance Corp. Ltd. Thrifts & Mortgage Finance, India | 1.8% | |||
Amer Sports OYJ Leisure Products, Finland | 1.8% | |||
Huhtamaki OYJ Containers & Packaging, Finland | 1.7% | |||
Rational AG Machinery, Germany | 1.6% | |||
Colombia’s Gran Tierra Energy (GTE) is an oil and gas exploration and production company operating in South America. Despite short-term underperformance, we believe GTE’s strong balance sheet, low-cost producing assets in Colombia and effective leadership position the company to withstand commodity price volatility and eventually benefit from a recovery in oil prices. GTE’s net-cash balance sheet should, in our view, enable the company to replace future production declines with potential organic and inorganic opportunities at discounted prices.
It is important to recognize the effect of currency movements on the Fund’s performance. In general, if the value of the US dollar goes up compared with a foreign currency, an investment traded in that foreign currency will go down in value because it will be worth fewer US dollars. This can have a negative effect on Fund performance. Conversely, when the US dollar weakens in relation to a foreign currency, an investment traded in that foreign currency will increase in value, which can contribute to Fund performance. For the 12 months ended December 31, 2017, the US dollar declined in value relative to most currencies. As a result, the Fund’s performance was positively affected by the portfolio’s investment predominantly in securities with non-US currency exposure. However, one cannot expect the same result in future periods.
| 12 | Annual Report | ftinstitutional.com | ||
FOREIGN SMALLER COMPANIES SERIES
Thank you for your continued participation in Foreign Smaller Companies Series. We look forward to serving your future investment needs.
 |
Harlan B. Hodes, CPA Portfolio Manager |

The foregoing information reflects our analysis, opinions and portfolio holdings as of December 31, 2017, the end of the reporting period. The way we implement our main investment strategies and the resulting portfolio holdings may change depending on factors such as market and economic conditions. These opinions may not be relied upon as investment advice or an offer for a particular security. The information is not a complete analysis of every aspect of any market, country, industry, security or the Fund. Statements of fact are from sources considered reliable, but the investment manager makes no representation or warranty as to their completeness or accuracy. Although historical performance is no guarantee of future results, these insights may help you understand our investment management philosophy.
| ftinstitutional.com | Annual Report | 13 | ||||
FOREIGN SMALLER COMPANIES SERIES
Performance Summary as of December 31, 2017
The performance table and graph do not reflect any taxes that a shareholder would pay on Fund dividends, capital gain distributions, if any, or any realized gains on the sale of Fund shares. Total return reflects reinvestment of the Fund’s dividends and capital gain distributions, if any, and any unrealized gains or losses. Your dividend income will vary depending on dividends or interest paid by securities in the Fund’s portfolio, adjusted for operating expenses. Capital gain distributions are net profits realized from the sale of portfolio securities.
Performance as of 12/31/171
|
| Cumulative Total Return2 | Average Annual Total Return3 | ||||||
1-Year | +34.18% | +34.18% | ||||||
5-Year | +60.19% | +9.88% | ||||||
10-Year | +85.73% | +6.39% | ||||||
Performance data represent past performance, which does not guarantee future results. Investment return and principal value will fluctuate, and you may have a gain or loss when you sell your shares. Current performance may differ from figures shown. For most recent month-end performance, go to ftinstitutional.com or call a Franklin Templeton Institutional Services representative at (800) 321-8563.
See page 16 for Performance Summary footnotes.
| 14 | Annual Report | ftinstitutional.com | ||
FOREIGN SMALLER COMPANIES SERIES
PERFORMANCE SUMMARY
Total Return Index Comparison for a Hypothetical $1,000,000 Investment1
Total return represents the change in value of an investment over the periods shown. It includes any applicable maximum sales charge, Fund expenses, account fees and reinvested distributions. The unmanaged index includes reinvestment of any income or distributions. It differs from the Fund in composition and does not pay management fees or expenses. One cannot invest directly in an index.
See page 16 for Performance Summary footnotes.
| ftinstitutional.com | Annual Report | 15 | ||||
FOREIGN SMALLER COMPANIES SERIES
PERFORMANCE SUMMARY
Distributions (1/1/17–12/31/17)
| Net Investment Income | Short-Term Capital Gain | Long-Term Capital Gain | Total | |||||||||
| $0.6795 | $ | 0.0969 | $ | 0.8637 | $ | 1.6401 | ||||||
Total Annual Operating Expenses5
| With Waiver | Without Waiver | |||
| 0.98% | 0.99% | |||
All investments involve risks, including possible loss of principal. The Fund invests in foreign securities, which can involve exposure to currency volatility and political, economic and regulatory uncertainty. Emerging markets involve heightened risks related to the same factors, in addition to those associated with their relatively small size and lesser liquidity. The Fund’s investments in smaller company stocks carry special risks as such stocks have historically exhibited greater price volatility than large company stocks, particularly over the short term. Additionally, smaller companies often have relatively small revenues, limited product lines and small market share. The Fund is actively managed but there is no guarantee that the manager’s investment decisions will produce the desired results. The Fund’s prospectus also includes a description of the main investment risks.
1. The Fund has a fee waiver associated with any investment it makes in a Franklin Templeton money fund and/or other Franklin Templeton fund, contractually guaranteed through 4/30/18. Fund investment results reflect the fee waiver; without this waiver, the results would have been lower.
2. Cumulative total return represents the change in value of an investment over the periods indicated.
3. Average annual total return represents the average annual change in value of an investment over the periods indicated. Return for less than one year, if any, has not been annualized.
4. Source: Morningstar. The MSCI ACWI ex USA Small Cap Index is a free float-adjusted, market capitalization-weighted index designed to measure performance of small-cap equity securities of global developed and emerging markets, excluding the US.
5. Figures are as stated in the Fund’s current prospectus and may differ from the expense ratios disclosed in the Your Fund’s Expenses and Financial Highlights sections in this report. In periods of market volatility, assets may decline significantly, causing total annual Fund operating expenses to become higher than the figures shown.
See www.franklintempletondatasources.com for additional data provider information.
| 16 | annual Report | ftinstitutional.com | ||
FOREIGN SMALLER COMPANIES SERIES
Your Fund’s Expenses
As a Fund shareholder, you can incur two types of costs: (1) transaction costs, including sales charges (loads) on Fund purchases and redemptions, if applicable; and (2) ongoing Fund costs, including management fees, distribution and service (12b-1) fees, if applicable, and other Fund expenses. All mutual funds have ongoing costs, sometimes referred to as operating expenses. The table below shows ongoing costs of investing in the Fund and can help you understand these costs and compare them with those of other mutual funds. The table assumes a $1,000 investment held for the six months indicated.
Actual Fund Expenses
The table below provides information about actual account values and actual expenses in the columns under the heading “Actual.” In these columns the Fund’s actual return, which includes the effect of Fund expenses, is used to calculate the “Ending Account Value.” You can estimate the expenses you paid during the period by following these steps (of course, your account value and expenses will differ from those in this illustration): Divide your account value by $1,000 (if your account had an $8,600 value, then $8,600 ÷ $1,000 = 8.6). Then multiply the result by the number in the row for your class of shares under the headings “Actual” and “Expenses Paid During Period” (if Actual Expenses Paid During Period were $7.50, then 8.6 x $7.50 = $64.50). In this illustration, the actual expenses paid this period are $64.50.
Hypothetical Example for Comparison with Other Funds
Under the heading “Hypothetical” in the table, information is provided about hypothetical account values and hypothetical expenses based on the Fund’s actual expense ratio and an assumed rate of return of 5% per year before expenses, which is not the Fund’s actual return. This information may not be used to estimate the actual ending account balance or expenses you paid for the period, but it can help you compare ongoing costs of investing in the Fund with those of other funds. To do so, compare this 5% hypothetical example for the class of shares you hold with the 5% hypothetical examples that appear in the shareholder reports of other funds.
Please note that expenses shown in the table are meant to highlight ongoing costs and do not reflect any transactional costs. Therefore, information under the heading “Hypothetical” is useful in comparing ongoing costs only, and will not help you compare total costs of owning different funds. In addition, if transactional costs were included, your total costs would have been higher.
| Actual (actual return after expenses) | Hypothetical (5% annual return before expenses) | |||||||||||
| Beginning Account Value 7/1/17 | Ending Account Value 12/31/17 | Expenses Paid During | Ending Account Value 12/31/17 | Expenses Paid During Period 7/1/17–12/31/171,2 | Net Annualized Expense Ratio2 | |||||||
|
|
|
| |||||||||
$1,000 | $1,117.00 | $5.23 | $1,020.27 | $4.99 | 0.98% | |||||||
1. Expenses are equal to the annualized expense ratio for the six-month period as indicated above—in the far right column—multiplied by the simple average account value over the period indicated, and then multiplied by 184/365 to reflect the one-half year period.
2. Reflects expenses after fee waivers and expense reimbursements. Does not include acquired fund fees and expenses.
| ftinstitutional.com | Annual Report | 17 | ||||
This annual report for Global Equity Series (Fund) covers the fiscal year ended December 31, 2017.
Your Fund’s Goal and Main Investments
The Fund seeks long-term capital growth. Under normal market conditions, the Fund invests at least 80% of its net assets in equity securities of companies located anywhere in the world, including developing markets.
Performance Overview
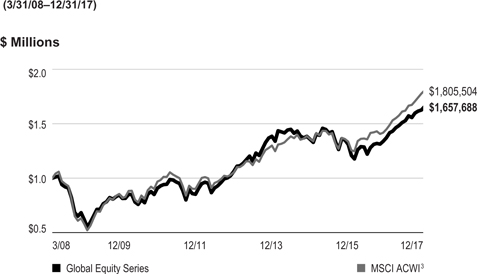
The Fund delivered a +20.88% cumulative total return for the 12 months under review. For comparison, the Fund’s benchmark, the MSCI All Country World Index (ACWI), which measures stock market performance in global developed and emerging markets, generated a +24.62% total return.1 Please note, index performance information is provided for reference and we do not attempt to track an index but rather undertake investments on the basis of fundamental research. You can find the Fund’s long-term performance data in the Performance Summary beginning on page 22.
Performance data represent past performance, which does not guarantee future results. Investment return and principal value will fluctuate, and you may have a gain or loss when you sell your shares. Current performance may differ from figures shown. For most recent month-end performance, go to ftinstitutional.com or call a Franklin Templeton Institutional Services representative at (800) 321-8563.
Investment Strategy
We employ a bottom-up, value-oriented, long-term investment strategy. We focus on the market price of a company’s securities relative to our evaluation of the company’s long-term earnings, asset value and cash flow potential. We also consider a company’s price/earnings ratio, profit margins and liquidation value.
Manager’s Discussion
Global equities rallied in 2017 as investors looked beyond political turmoil and nascent monetary policy tightening and focused instead on global growth and on fiscal stimulus that could potentially contribute to corporate earnings. Economic and corporate fundamentals supported the rally. For the first time in a decade, all countries tracked by the Organisation for
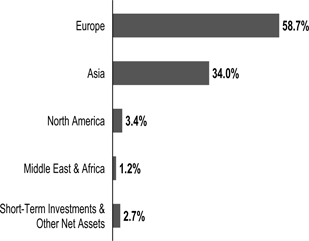
Geographic Composition
Based on Total Net Assets as of 12/31/17
Economic Co-operation and Development are projected to post positive economic growth, while business confidence in many major economies neared or exceeded pre-financial crisis highs. The headline risks unnerving investors at the beginning of 2017—from a potential US political crisis to a US Federal Reserve policy mistake, to a populist uprising in Europe or nuclear conflict on the Korean peninsula—largely failed to materialize.
Continued market strength belied a transition in leadership in 2017. For the most part, these were shifts for which the Fund was reasonably well positioned. Perhaps the most significant change was the underperformance of the US relative to international markets. Our preference for cheaper, earlier-cycle international markets over the more mature and expensive US market has long been articulated, and the Fund benefited from its underweighted positioning in the US and overweighted positioning in international markets. A big pullback in the US dollar accompanied US underperformance as many investors sold the dollar at the onset of the rate hike news and attempted to price the impact of deficit-enhancing fiscal stimulus. Soft dollar proxies responded in-kind, with emerging markets, as measured by the MSCI Emerging Markets Index, posting their best year since 2009. Industrial commodities rode the same tailwinds as emerging markets, climbing to multi-year highs. The crude oil price recovery in the second half of 2017 affirmed our conviction to remain overweighted in the energy sector despite supply concerns that battered crude oil in the first
1. Source: Morningstar.
The index is unmanaged and includes reinvestment of any income or distributions. It does not reflect any fees, expenses or sales charges. One cannot invest directly in an index, and an index is not representative of the Fund’s portfolio.
The dollar value, number of shares or principal amount, and names of all portfolio holdings are listed in the Fund’s Statement of Investments (SOI). The SOI begins on page 45.
| 18 | Annual Report | ftinstitutional.com |
GLOBAL EQUITY SERIES
half of the period.2 As expected, China remained stable in anticipation of President Xi Jinping’s momentous power consolidation in November, while in Japan and South Korea, anticipated improvements in corporate profitability and governance continued to materialize, albeit slowly. Our decision to stay the course in Europe, where we have believed that political risks were overstated and economic conditions were improving, was rewarded by the biggest annual gain for continental stocks (in USD terms) in nearly a decade.
Yet, despite these positive developments and posting double-digit percentage absolute gains, the Fund underper-formed its benchmark, the MSCI ACWI. A major performance challenge came from stock selection, a headwind that has been exacerbated recently by the continued underperformance of value versus growth. After outperforming growth in 2016, value lagged growth in 2017, with global growth outperforming global value in the past 10 years. Nevertheless, we continue to believe that buying stocks at a discount to their intrinsic value is among the best long-term strategies for investment success, and we anticipate a recovery in lowly valued stocks once this mature, policy-driven cycle eventually transitions.
Turning to the portfolio, stock selection and an overweighting in health care led the sector to be the Fund’s most significant sector laggard, pressured by stock-specific weakness.3 Israel-based generic drugmaker Teva Pharmaceutical Industries was a major detractor, declining after management lowered earnings guidance, raising concerns about the firm’s debt profile. Our analysis indicates that Teva does not have a liquidity problem and should be able to address balance sheet issues, cut costs and deliver on a more conservative outlook. Encouragingly, the stock began to recover at the end of 2017 after a seasoned chief executive officer joined the firm and announced a restructuring plan aimed at significantly reducing costs. In addition, US biotechnology firm Allergan declined due to concerns about generic competition. Despite the market’s excessive focus on product-specific headwinds, Allergan as a whole has one of the industry’s most durable drug portfolios when it comes to exclusivity and patent protection, according to our analysis. Additionally, we feel the company has an industry-leading research and development (R&D) pipeline which, in conjunction with its base businesses, should continue to drive strong earnings and free cash flow growth over our investment horizon.
| Portfolio Composition | ||
| 12/31/17 | ||
| Sector/Industry | % of Total Net Assets | |
Banks | 12.1% | |
Oil, Gas & Consumable Fuels | 11.5% | |
Pharmaceuticals | 8.2% | |
Technology Hardware, Storage & Peripherals | 4.7% | |
Biotechnology | 4.5% | |
Software | 3.9% | |
Insurance | 3.8% | |
Wireless Telecommunication Services | 3.8% | |
Chemicals | 3.4% | |
Internet Software & Services | 3.1% | |
Media | 2.8% | |
Diversified Telecommunication Services | 2.8% | |
Metals & Mining | 2.3% | |
Aerospace & Defense | 2.2% | |
Other | 27.8% | |
Short-Term Investments & Other Net Assets | 3.1% | |
More broadly, concerns about generic competition, regulatory scrutiny and a consolidating payor sector all took their toll on health care stocks in 2017. Yet, we believe pricing pressures and generic competition are best addressed through innovation, and innovation is fueled by R&D, which has doubled in the pharmaceuticals industry in the past 30 years. Furthermore, despite the political controversy surrounding drug pricing, prescription drug costs account for less than 15% of health care spending in the US and the European Union. Given the efficacy of prescription drugs and their ability to reduce costs elsewhere in the health care system, we believe they likely represent good value for the money. The sector is not often cheap based on free cash flow multiples, and we are finding the best values among innovative firms capable of commanding pricing power and are consistently generating cash flow by successfully addressing unmet medical needs. It is rare to find highly cash-generative, innovative businesses with enormous growth potential trading in what we consider deep value territory, but we believe select biotechnology and pharmaceuticals firms offer such a proposition.
Stock selection in underweighted information technology (IT) and consumer discretionary sectors also negatively impacted
2. The energy sector comprises energy equipment and services and oil, gas and consumable fuels in the SOI.
3. The health care sector comprises biotechnology, health care equipment and supplies, health care providers and services, life sciences tools and services, and pharmaceuticals in the SOI.
| ftinstitutional.com | Annual Report | 19 | ||||
GLOBAL EQUITY SERIES
the Fund’s relative performance.4 In the IT sector, shares of Japanese office electronics manufacturer Konica Minolta detracted amid erratic earnings results and delayed value recognition from the acquisition of a medical testing firm.5 We remain constructive on the company’s ability to deploy high free cash flow toward shareholder returns and investments that diversify its operating portfolio. However, the stock rebounded strongly in the second half of 2017, and we liquidated our position in preference of opportunities that we considered more attractively valued. In the consumer discretionary sector, shares of Luxembourg-based satellite and network services provider SES declined after management delivered a second consecutive quarter of disappointing results. The adverse newsflow has cast doubts on management’s credibility and led to a stock price decline and a much lower price-to-book valuation multiple compared to the company’s industry peers. Our analysis implies that the stock is now trading at replacement cost for a business with very high barriers to entry and valuable orbital satellite slots that cannot be replicated. Additionally, the company’s high single-digit dividend and free cash flow yields, as well as a contract backlog equivalent to four years of revenue, lead us to believe the stock remains undervalued.
Turning to contributors, stock selection overcame a detractive overweighting in the telecommunication services sector, led by Norway’s leading mobile operator Telenor.6 Its shares rose to an all-time high during the 12-month period amid continued evidence of solid earnings growth and profit margin expansion. Although Telenor has continued to report strong earnings results and make significant progress with its multi-year cost-reduction program, the stock is no longer a bargain, in our analysis, and we continue to monitor the position for attractive profit-taking opportunities.
Stock selection in the financials sector led the Fund’s overweighted financials holdings overall to outperform the index’s financials components, with South Korean lender Hana Financial Group among the Fund’s top relative contributors.7 Its shares rallied to a record high as investors overlooked geopolitical tensions and domestic political turmoil in 2017 and focused instead on improving corporate fundamentals and an upgraded earnings outlook attributable, in part, to the first South Korean interest rate hike in six years. Over the long term, we believe rising interest rates and improving economic
| Top 10 Holdings | ||
| 12/31/17 | ||
Company Sector/Industry, Country |
% of Total | |
Samsung Electronics Co. Ltd. Technology Hardware, Storage & Peripherals, South Korea | 2.6% | |
BP PLC Oil, Gas & Consumable Fuels, UK | 2.6% | |
Apple Inc. Technology Hardware, Storage & Peripherals, US | 2.1% | |
Royal Dutch Shell PLC Oil, Gas & Consumable Fuels, UK | 2.0% | |
Alphabet Inc. Internet Software & Services, US | 2.0% | |
Microsoft Corp. Software, US | 2.0% | |
Oracle Corp. Software, US | 1.9% | |
Citigroup Inc. Banks, US | 1.9% | |
JPMorgan Chase & Co. Banks, US | 1.8% | |
Vodafone Group PLC Wireless Telecommunication Services, UK | 1.7% |
conditions will be the key drivers for this stock’s performance, and we remain constructive on the holding due to its low valuations and the South Korean economy’s early-cycle momentum. We also remain constructive on our European financials holdings, although value is no longer as abundant as it once was in the sector following a meaningful recovery. The European banking sector in general continues to make encouraging progress. Earnings revisions have returned to a positive trajectory, regulatory capital has been largely rebuilt and the bulk of post-crisis re-regulation efforts are now complete. As economic data have improved and political risks have receded, credit demand has increased. With the bulk of recovery behind it, we believe sector performance will now be more dependent on factors outside management control, such as the trajectory of interest rates and credit demand. For these reasons, in our assessment, value opportunities in European banks have become somewhat more selective recently.
4. The IT sector comprises communications equipment; electronic equipment, instruments and components; internet software and services; IT services; semiconductors and semiconductor equipment; software; and technology hardware, storage and peripherals in the SOI. The consumer discretionary sector comprises auto components, household durables, media, multiline retail and specialty retail in the SOI
5. No longer held by period-end.
6. The telecommunication services sector comprises diversified telecommunication services and wireless telecommunication services in the SOI.
7. The financials sector comprises banks, capital markets, consumer finance, diversified financial services, insurance, and thrifts and mortgage finance in the SOI.
| 20 | Annual Report | ftinstitutional.com | ||
GLOBAL EQUITY SERIES
Stock selection also drove the outperformance relative to the benchmark of the Fund’s industrials8 holdings, led by German airline Deutsche Lufthansa.5 Its stock rose during the period amid a confluence of positive news, including a successful labor agreement with the pilots’ union and increasing challenges for competitors. We have long viewed Lufthansa as a cyclically depressed and undervalued industry stalwart with a solid strategic plan and the financial strength to survive and flourish once the cycle turned. With the company making solid progress on the operational front and with industry conditions evolving in its favor, we took the opportunity to sell our stake to realize a considerable profit.
From a regional standpoint, stock selection more than offset favorable allocations in major regions, particularly overweightings in Asia and Europe and an underweighting in North America.
It is important to recognize the effect of currency movements on the Fund’s performance. In general, if the value of the US dollar goes up compared with a foreign currency, an investment traded in that foreign currency will go down in value because it will be worth fewer US dollars. This can have a negative effect on Fund performance. Conversely, when the US dollar weakens in relation to a foreign currency, an investment traded in that foreign currency will increase in value, which can contribute to Fund performance. For the 12 months ended December 31, 2017, the US dollar declined in value relative to most currencies. As a result, the Fund’s performance was positively affected by the portfolio’s substantial investment in securities with non-US currency exposure. However, one cannot expect the same result in future periods.
We remain constructive on the Fund’s positioning and outlook despite recent challenges. We believe value’s headwinds stem largely from unconventional monetary policies, which, since the global financial crisis, has depressed interest rates and sent investors out the risk curve in search of growth and yield. We believe these policies are unsustainable for three reasons. First, they increase social inequality, which has political consequences; second, they inflate asset prices, which creates stability risks; and third, rising inflationary pressures and falling unemployment give data-dependent central bankers reasons to begin reversing such policies. As policies transition, we believe the mature cycle will eventually change, as it always has, and with it the conditions unfavorable to value. We would not want to own the leaders of the last cycle during this
transition: the growth stocks and bond proxies trading at expensive valuations. However, the stocks left behind—those of companies whose long-term fundamentals have been overlooked and undervalued by a short-term focused market—appear to us well-positioned over a long-term investment horizon we believe is likely to include a turning point in this mature cycle.
Subsequent to fiscal year-end December 31, 2017, Cindy Sweeting retired effective January 1, 2018. Her responsibilities have been allocated to others in the portfolio management team.
Thank you for your continued participation in Global Equity Series. We look forward to serving your future investment needs.
| Peter A. Nori, CFA | ||||
| Antonio T. Docal, CFA | ||||
| Cindy L. Sweeting, CFA | ||||
| Portfolio Management Team | ||||
The foregoing information reflects our analysis, opinions and portfolio holdings as of December 31, 2017, the end of the reporting period. The way we implement our main investment strategies and the resulting portfolio holdings may change depending on factors such as market and economic conditions. These opinions may not be relied upon as investment advice or an offer for a particular security. The information is not a complete analysis of every aspect of any market, country, industry, security or the Fund. Statements of fact are from sources considered reliable, but the investment manager makes no representation or warranty as to their completeness or accuracy. Although historical performance is no guarantee of future results, these insights may help you understand our investment management philosophy.
8. The industrials sector comprises aerospace and defense, building products, industrial conglomerates and machinery in the SOI.
See www.franklintempletondatasources.com for additional data provider information.
| ftinstitutional.com | Annual Report | 21 | ||||
GLOBAL EQUITY SERIES
Performance Summary as of December 31, 2017
The performance table and graph do not reflect any taxes that a shareholder would pay on Fund dividends, capital gain distributions, if any, or any realized gains on the sale of Fund shares. Total return reflects reinvestment of the Fund’s dividends and capital gain distributions, if any, and any unrealized gains or losses. Your dividend income will vary depending on dividends or interest paid by securities in the Fund’s portfolio, adjusted for operating expenses. Capital gain distributions are net profits realized from the sale of portfolio securities.
Performance as of 12/31/17
|
| Cumulative Total Return1 | Average Annual Total Return2 | ||||
1-Year | +20.88% | +20.88% | ||||
5-Year | +56.15% | +9.32% | ||||
Since Inception (3/31/08) | +65.77% | +5.32% | ||||
Performance data represent past performance, which does not guarantee future results. Investment return and principal value will fluctuate, and you may have a gain or loss when you sell your shares. Current performance may differ from figures shown. For most recent month-end performance, go to ftinstitutional.com or call a Franklin Templeton Institutional Services representative at (800) 321-8563.
See page 24 for Performance Summary footnotes.
| 22 | Annual Report | ftinstitutional.com | ||
GLOBAL EQUITY SERIES
PERFORMANCE SUMMARY
Total Return Index Comparison for a Hypothetical $1,000,000 Investment
Total return represents the change in value of an investment over the periods shown. It includes any applicable maximum sales charge, Fund expenses, account fees and reinvested distributions. The unmanaged index includes reinvestment of any income or distributions. It differs from the Fund in composition and does not pay management fees or expenses. One cannot invest directly in an index.
See page 24 for Performance Summary footnotes.
| ftinstitutional.com | Annual Report | 23 | ||||
GLOBAL EQUITY SERIES
PERFORMANCE SUMMARY
Distributions (1/1/17–12/31/17)
Net Investment Income | Long-Term Capital Gain | Total | ||||||
$0.1898 | $0.0371 | $0.2269 | ||||||
Total Annual Operating Expenses4
|
0.84% |
|
All investments involve risks, including possible loss of principal. Special risks are associated with foreign investing, including currency fluctuations, economic instability and political developments; investments in emerging markets involve heightened risks related to the same factors. To the extent the Fund focuses on particular countries, regions, industries, sectors or types of investment from time to time, it may be subject to greater risks of adverse developments in such areas of focus than a fund that invests in a wider variety of countries, regions, industries, sectors or investments. The Fund is actively managed but there is no guarantee that the manager’s investment decisions will produce the desired results. The Fund’s prospectus also includes a description of the main investment risks.
1. Cumulative total return represents the change in value of an investment over the periods indicated.
2. Average annual total return represents the average annual change in value of an investment over the periods indicated. Return for less than one year, if any, has not been annualized.
3. Source: Morningstar. The MSCI ACWI is a free float-adjusted, market capitalization-weighted index designed to measure equity market performance of global developed and emerging markets.
4. Figures are as stated in the Fund’s current prospectus and may differ from the expense ratios disclosed in the Your Fund’s Expenses and Financial Highlights sections in this report. In periods of market volatility, assets may decline significantly, causing total annual Fund operating expenses to become higher than the figures shown.
See www.franklintempletondatasources.com for additional data provider information.
| 24 | Annual Report | ftinstitutional.com | ||
GLOBAL EQUITY SERIES
Your Fund’s Expenses
As a Fund shareholder, you can incur two types of costs: (1) transaction costs, including sales charges (loads) on Fund purchases and redemptions, if applicable; and (2) ongoing Fund costs, including management fees, distribution and service (12b-1) fees, if applicable, and other Fund expenses. All mutual funds have ongoing costs, sometimes referred to as operating expenses. The table below shows ongoing costs of investing in the Fund and can help you understand these costs and compare them with those of other mutual funds. The table assumes a $1,000 investment held for the six months indicated.
Actual Fund Expenses
The table below provides information about actual account values and actual expenses in the columns under the heading “Actual.” In these columns the Fund’s actual return, which includes the effect of Fund expenses, is used to calculate the “Ending Account Value.” You can estimate the expenses you paid during the period by following these steps (of course, your account value and expenses will differ from those in this illustration): Divide your account value by $1,000 (if your account had an $8,600 value, then $8,600 ÷ $1,000 = 8.6). Then multiply the result by the number in the row for your class of shares under the headings “Actual” and “Expenses Paid During Period” (if Actual Expenses Paid During Period were $7.50, then 8.6 x $7.50 = $64.50). In this illustration, the actual expenses paid this period are $64.50.
Hypothetical Example for Comparison with Other Funds
Under the heading “Hypothetical” in the table, information is provided about hypothetical account values and hypothetical expenses based on the Fund’s actual expense ratio and an assumed rate of return of 5% per year before expenses, which is not the Fund’s actual return. This information may not be used to estimate the actual ending account balance or expenses you paid for the period, but it can help you compare ongoing costs of investing in the Fund with those of other funds. To do so, compare this 5% hypothetical example for the class of shares you hold with the 5% hypothetical examples that appear in the shareholder reports of other funds.
Please note that expenses shown in the table are meant to highlight ongoing costs and do not reflect any transactional costs. Therefore, information under the heading “Hypothetical” is useful in comparing ongoing costs only, and will not help you compare total costs of owning different funds. In addition, if transactional costs were included, your total costs would have been higher.
| Actual (actual return after expenses) | Hypothetical (5% annual return before expenses) | |||||||||||
| Beginning Account Value 7/1/17 | Ending Account Value 12/31/17 | Expenses Paid During Period 7/1/17–12/31/171 | Ending Account Value 12/31/17 | Expenses Paid During Period 7/1/17–12/31/171 | Net Annualized Expense Ratio | |||||||
|
|
|
| |||||||||
| $1,000 | $1,085.10 | $4.31 | $1,021.07 | $4.18 | 0.82% | |||||||
1. Expenses are equal to the annualized expense ratio for the six-month period as indicated above—in the far right column—multiplied by the simple average account value over the period indicated, and then multiplied by 184/365 to reflect the one-half year period.
| ftinstitutional.com | Annual Report | 25 | ||||
This annual report for International Equity Series (Fund) covers the fiscal year ended December 31, 2017.
Your Fund’s Goal and Main Investments
The Fund seeks long-term capital growth. Under normal market conditions, the Fund invests at least 80% of its net assets in foreign (non-US) equity securities. The Fund predominantly invests in companies located outside the US including companies located in developing markets countries.
Performance Overview
The Fund’s Primary shares delivered a +22.92% cumulative total return for the 12 months under review. For comparison, the Fund’s benchmark, the MSCI All Country World Index (ACWI) ex USA Index, which measures stock market performance in global developed and emerging markets excluding the US, generated a +27.77% total return for the period under review.1 The Fund’s other benchmark, the MSCI Europe, Australasia, Far East (EAFE) Index, which measures stock market performance in global developed markets excluding the US and Canada, posted a +25.62% total return.1 Please note, index performance information is provided for reference and we do not attempt to track an index but rather undertake investments on the basis of fundamental research. You can find the Fund’s long-term performance data in the Performance Summary beginning on page 30.
Performance data represent past performance, which does not guarantee future results. Investment return and principal value will fluctuate, and you may have a gain or loss when you sell your shares. Current performance may differ from figures shown. For most recent month-end performance, go to ftinstitutional.com or call a Franklin Templeton Institutional Services representative at (800) 321-8563.
Investment Strategy
We employ a bottom-up, value-oriented, long-term investment strategy. We focus on the market price of a company’s securities relative to our evaluation of the company’s long-term earnings, asset value and cash flow potential. We also consider a company’s price/earnings ratio, profit margins and liquidation value.
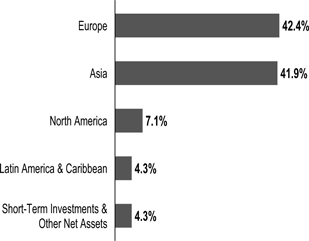
Geographic Composition
Based on Total Net Assets as of 12/31/17
Manager’s Discussion
International equities rallied in 2017 as investors looked beyond political turmoil and nascent monetary policy tightening and focused instead on global growth and on fiscal stimulus that could potentially contribute to corporate earnings. Economic and corporate fundamentals supported the rally. For the first time in a decade, all countries tracked by the Organisation for Economic Co-operation and Development are projected to post positive economic growth, while business confidence in many major economies neared or exceeded pre-financial crisis highs. The headline risks unnerving investors at the beginning of 2017—from a potential US political crisis to a US Federal Reserve policy mistake, to a populist uprising in Europe or nuclear conflict on the Korean peninsula—largely failed to materialize.
Continued market strength belied a transition in leadership in 2017. For the most part, these were shifts for which the Fund was reasonably well positioned. Perhaps the most significant change was the underperformance of the US relative to international markets. A big pullback in the US dollar accompanied US underperformance as investors sold the dollar at the onset of the rate hike news and attempted to price the impact of deficit-enhancing fiscal stimulus. Soft dollar proxies responded in-kind, with emerging markets, as measured by the MSCI Emerging Markets Index, posting their best year since 2009. Industrial commodities rode the same tailwinds as emerging markets, climbing to multi-year highs. The crude oil price recovery in the second half of 2017 affirmed our
1. Source: Morningstar.
The indexes are unmanaged and include reinvested dividends. They do not reflect any fees, expenses or sales charges. One cannot invest directly in an index, and an index is not representative of the Fund’s portfolio.
The dollar value, number of shares or principal amount, and names of all portfolio holdings are listed in the Fund’s Statement of Investments (SOI). The SOI begins on page 51.
| 26 | Annual Report | ftinstitutional.com | ||
INTERNATIONAL EQUITY SERIES
conviction to remain overweighted in the energy sector despite supply concerns that battered crude oil in the first half of the period.2 As expected, China remained stable in anticipation of President Xi Jinping’s momentous power consolidation in November, while in Japan and South Korea, anticipated improvements in corporate profitability and governance continued to materialize, albeit slowly. Our decision to stay the course in Europe, where we have believed that political risks were overstated and economic conditions were improving, was rewarded by the biggest annual gain for continental stocks (in USD terms) in nearly a decade.
Yet, despite these positive developments and posting double-digit percentage absolute gains, the Fund underper-formed its benchmark, the MSCI ACWI ex USA Index. The biggest performance challenge came from stock selection, a headwind that has been exacerbated recently by the continued underperformance of value versus growth. After outperforming growth in 2016, value lagged growth in 2017, with global growth outperforming global value in the past 10 years. Nevertheless, we continue to believe that buying stocks at a discount to their intrinsic value is among the best long-term strategies for investment success, and we anticipate a recovery in lowly valued stocks once this mature, policy-driven cycle eventually transitions.
Turning to the portfolio, stock selection and an overweighting in the health care sector detracted significantly from the Fund’s relative performance, pressured by stock-specific weakness.3 Israel-based generic drugmaker Teva Pharmaceutical Industries was a major detractor, declining after management lowered earnings guidance, raising concerns about the firm’s debt profile. Our analysis indicates that Teva does not have a liquidity problem and should be able to address balance sheet issues, cut costs and deliver on a more conservative outlook. Encouragingly, the stock began to recover at the end of 2017 after a seasoned chief executive officer joined the firm and announced a restructuring plan aimed at significantly reducing costs.
More broadly, concerns about generic competition, regulatory scrutiny and a consolidating payor sector all took their toll on health care stocks in 2017. Yet, we believe pricing pressures and generic competition are best addressed through innovation, and innovation is fueled by research and development, which has doubled in the pharmaceuticals industry in the past
| Portfolio Composition | ||
| 12/31/17 | ||
| Sector/Industry | % of Total Net Assets | |
Banks | 12.8% | |
Oil, Gas & Consumable Fuels | 11.5% | |
Pharmaceuticals | 10.2% | |
Insurance | 5.8% | |
Technology Hardware, Storage & Peripherals | 5.5% | |
Diversified Telecommunication Services | 5.1% | |
Wireless Telecommunication Services | 3.7% | |
Chemicals | 3.5% | |
Metals & Mining | 3.1% | |
Industrial Conglomerates | 2.9% | |
Aerospace & Defense | 2.6% | |
Construction Materials | 2.4% | |
Semiconductors & Semiconductor Equipment | 2.2% | |
Other | 26.0% | |
Short-Term Investments & Other Net Assets | 2.7% |
30 years. Furthermore, despite the political controversy surrounding drug pricing, prescription drug costs account for less than 15% of health care spending in the US and the European Union. Given the efficacy of prescription drugs and their ability to reduce costs elsewhere in the health care system, we believe they likely represent good value for the money. The sector has not often been cheap based on free cash flow valuation multiples, and we are finding the best values among innovative firms capable of commanding pricing power and are consistently generating cash flow by successfully addressing unmet medical needs. It is rare to find highly cash-generative, innovative businesses with enormous growth potential trading in what we consider deep value territory, but we believe select biotechnology and pharmaceuticals firms offer such a proposition.
An overweighting and stock selection in energy also detracted from relative performance as early sector weakness and stock-specific issues overshadowed a late rebound in crude oil that helped oil stocks recover strongly in the second half of the period. UK-based oilfield services company Petrofac was the sector’s biggest laggard, declining amid a regulatory investigation.4 We had been constructive on the stock given its healthy backlog, strategic refocus on core assets and prudent balance sheet deleveraging, but the escalating fraud
2. The energy sector comprises energy equipment and services and oil, gas and consumable fuels in the SOI.
3. The health care sector comprises biotechnology, health care equipment and supplies, health care providers and services, life sciences tools and services, and pharmaceuticals in the SOI.
4. No longer held by period-end.
| ftinstitutional.com | Annual Report | 27 | ||||
INTERNATIONAL EQUITY SERIES
investigation seemed to us a thesis changer and we divested our holdings to avoid further downside risk. More generally, we expect oil could trade in the US$50-70 range in the near term, barring any exogenous shocks such as a Venezuela supply disruption, abrupt move in the US dollar, or unexpected strategy change or quota non-adherence by the Organization of the Petroleum Exporting Countries. Sustained pricing at this level would likely offer additional upside to our energy sector holdings, some of which still reflect sub-$50 crude oil price. However, given the availability of supply from the industry’s marginal oil producer—US shale—we expect sustained high oil prices to lead to increased output, potentially capping price appreciation. Although we maintained our sector overweighting and remained constructive on the Fund’s energy holdings, we have begun to selectively reduce exposure at this point in the cycle.
Turning to contributors, stock selection in the financials sector led the Fund’s financials holdings overall to outperform the index, led by European and Asian stocks.5 In Europe, shares of Dutch insurer ASR Nederland rallied strongly after the firm’s initial public offering in 2016. The company has maintained one of the highest regulatory capital ratios among its Dutch peers, while employing its excess capital to buy back shares at levels that exceeded investor expectations. ASR has been able to achieve such results by surpassing its own targets for investment returns in its life insurance segment and improving the combined ratio in its non-life insurance business. ASR’s ability to sustainably generate capital as legacy policies run off further supports a favorable outlook for shareholder and capital returns. The Fund also benefited from holdings in Asian lenders, including South Korean banks KB Financial Group and Hana Financial Group, as well as Singaporean bank DBS Group Holdings. KB and Hana performed well as investors overlooked geopolitical tensions and domestic political turmoil in 2017 and focused instead on improving corporate fundamentals and upgraded earnings outlooks attributable, in part, to the first South Korean interest rate hike in six years. Over the long-term, we believe rising interest rates and improving economic conditions will be the key drivers for these stocks’ performance, and we remain constructive on the holdings given their low valuations and the South Korean economy’s early-cycle momentum. We also remain constructive on our European financials holdings, although value is no longer as abundant as it once was in the sector following a meaningful recovery. The European banking sector in general continues to make encouraging progress. Earnings
| Top 10 Holdings | ||
12/31/17
| ||
| Company Sector/Industry, Country | % of Total Net Assets | |
Samsung Electronics Co. Ltd. Technology Hardware, Storage & Peripherals, South Korea | 3.5% | |
BP PLC Oil, Gas & Consumable Fuels, UK | 2.8% | |
Royal Dutch Shell PLC Oil, Gas & Consumable Fuels, UK | 2.7% | |
Roche Holding AG Pharmaceuticals, Switzerland | 2.0% | |
| BNP Paribas SA Banks, France | 1.9% | |
HSBC Holdings PLC Banks, UK | 1.8% | |
Telenor ASA Diversified Telecommunication Services, Norway | 1.7% | |
Standard Chartered PLC Banks, UK | 1.7% | |
Bayer AG Pharmaceuticals, Germany | 1.7% | |
CK Hutchison Holdings Ltd. Industrial Conglomerates, Hong Kong | 1.5% |
revisions have returned to a positive trajectory, regulatory capital has been largely rebuilt and the bulk of post-crisis re-regulation efforts are now complete. As economic data have improved and political risks have receded, credit demand has increased. With the bulk of recovery behind it, we believe sector performance will now be more dependent on factors outside management control, such as the trajectory of interest rates and credit demand. For these reasons, in our assessment, value opportunities in European banks have become somewhat more selective recently.
From a regional standpoint, stock selection and an overweighting in Europe detracted, as relative headwinds in the UK and France offset strengths in the Netherlands and Norway. In Asia, relative weakness among Chinese and, to a lesser extent, Japanese holdings (despite double-digit percentage absolute gains in both markets), offset strength in South Korea.
It is important to recognize the effect of currency movements on the Fund’s performance. In general, if the value of the US dollar goes up compared with a foreign currency, an investment traded in that foreign currency will go down in value because it will be worth fewer US dollars. This can have a negative effect
5. The financials sector comprises banks, capital markets, diversified financial services, insurance, and thrifts and mortgage finance in the SOI.
See www.franklintempletondatasources.com for additional data provider information.
| 28 | Annual Report | ftinstitutional.com | ||
INTERNATIONAL EQUITY SERIES
on Fund performance. Conversely, when the US dollar weakens in relation to a foreign currency, an investment traded in that foreign currency will increase in value, which can contribute to Fund performance. For the 12 months ended December 31, 2017, the US dollar declined in value relative to most currencies. As a result, the Fund’s performance was positively affected by the portfolio’s investment predominantly in securities with non-US currency exposure. However, one cannot expect the same result in future periods.
We remain constructive on the Fund’s positioning and outlook despite recent challenges. We believe value’s headwinds stem largely from unconventional monetary policies, which, since the global financial crisis, has depressed interest rates and sent investors out the risk curve in search of growth and yield. We believe these policies are unsustainable for three reasons. First, they increase social inequality, which has political consequences; second, they inflate asset prices, which creates stability risks; and third, rising inflationary pressures and falling unemployment give data-dependent central bankers reasons to begin reversing them. As policies transition, we believe the mature cycle will eventually change, as it always has, and with it the conditions unfavorable to value. We would not want to own the leaders of the last cycle during this transition: the growth stocks and bond proxies trading at expensive valuations. However, the stocks left behind—those of companies whose long-term fundamentals have been overlooked and undervalued by a short-term focused market—appear to us well-positioned over a long-term investment horizon we believe is likely to include a turning point in this mature cycle.
Subsequent to fiscal year-end December 31, 2017, Cindy Sweeting retired effective January 1, 2018. Her responsibilities have been allocated to others in the portfolio management team.
Thank you for your continued participation in International Equity Series. We look forward to serving your future investment needs.
 |
Cindy L. Sweeting, CFA Director of Portfolio Management – Templeton Global Equity Group President – Templeton Investment Counsel, LLC
Peter A. Nori, CFA Antonio T. Docal, CFA
Portfolio Management Team |

The foregoing information reflects our analysis, opinions and portfolio holdings as of December 31, 2017, the end of the reporting period. The way we implement our main investment strategies and the resulting portfolio holdings may change depending on factors such as market and economic conditions. These opinions may not be relied upon as investment advice or an offer for a particular security. The information is not a complete analysis of every aspect of any market, country, industry, security or the Fund. Statements of fact are from sources considered reliable, but the investment manager makes no representation or warranty as to their completeness or accuracy. Although historical performance is no guarantee of future results, these insights may help you understand our investment management philosophy.
| ftinstitutional.com | Annual Report | 29 | ||||
INTERNATIONAL EQUITY SERIES
Performance Summary as of December 31, 2017
The performance table and graphs do not reflect any taxes that a shareholder would pay on Fund dividends, capital gain distributions, if any, or any realized gains on the sale of Fund shares. Total return reflects reinvestment of the Fund’s dividends and capital gain distributions, if any, and any unrealized gains or losses. Your dividend income will vary depending on dividends or interest paid by securities in the Fund’s portfolio, adjusted for operating expenses of each class. Capital gain distributions are net profits realized from the sale of portfolio securities.
Performance as of 12/31/17
| Share Class | Cumulative Total Return1 | Average Annual Total Return2 | ||||||
| Primary | ||||||||
1-Year | +22.92% | +22.92% | ||||||
5-Year | +35.01% | +6.19% | ||||||
10-Year | +17.63% | +1.64% | ||||||
| Service | ||||||||
1-Year | +22.73% | +22.73% | ||||||
5-Year | +33.96% | +6.02% | ||||||
10-Year | +15.60% | +1.46% | ||||||
Performance data represent past performance, which does not guarantee future results. Investment return and principal value will fluctuate, and you may have a gain or loss when you sell your shares. Current performance may differ from figures shown. For most recent month-end performance, go to ftinstitutional.com or call a Franklin Templeton Institutional Services representative at (800) 321-8563.
See page 32 for Performance Summary footnotes.
| 30 | Annual Report | ftinstitutional.com | ||
INTERNATIONAL EQUITY SERIES
PERFORMANCE SUMMARY
Total Return Index Comparison for a Hypothetical $1,000,000 Investment
Total return represents the change in value of an investment over the periods shown. It includes any applicable maximum sales charge, Fund expenses, account fees and reinvested distributions. The unmanaged indexes include reinvestment of any income or distributions. They differ from the Fund in composition and do not pay management fees or expenses. One cannot invest directly in an index.
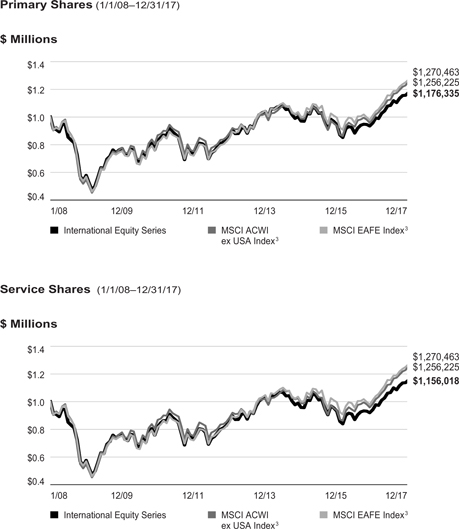
See page 32 for Performance Summary footnotes.
| ftinstitutional.com | Annual Report | 31 | ||||
INTERNATIONAL EQUITY SERIES
PERFORMANCE SUMMARY
Distributions (1/1/17–12/31/17)
| Share Class | Net Investment Income | Long-Term Capital Gain | Total | |||||||||
| Primary | $0.6383 | $0.2842 | $0.9225 | |||||||||
| Secondary | $0.6097 | $0.2842 | $0.8939 | |||||||||
Total Annual Operating Expenses4
| Share Class | ||||
Primary | 0.78 | % | ||
Service | 0.93 | % | ||
Each class of shares is available to certain eligible investors and has different annual fees and expenses, as described in the prospectus.
All investments involve risks, including possible loss of principal. Special risks are associated with foreign investing, including currency fluctuations, economic instability and political developments; investments in emerging markets involve heightened risks related to the same factors. To the extent the Fund focuses on particular countries, regions, industries, sectors or types of investment from time to time, it may be subject to greater risks of adverse developments in such areas of focus than a fund that invests in a wider variety of countries, regions, industries, sectors or investments. The Fund is actively managed but there is no guarantee that the manager’s investment decisions will produce the desired results. The Fund’s prospectus also includes a description of the main investment risks.
1. Cumulative total return represents the change in value of an investment over the periods indicated.
2. Average annual total return represents the average annual change in value of an investment over the periods indicated. Return for less then one year, if any, has not been annualized.
3. Source: Morningstar. The MSCI ACWI ex USA is a free float-adjusted, market capitalization-weighted index designed to measure equity market performance of global developed and emerging markets, excluding the US. The MSCI EAFE Index is a free float-adjusted, market capitalization-weighted index designed to measure equity market performance of global developed markets excluding the US and Canada.
4. Figures are as stated in the Fund’s current prospectus and may differ from the expense ratios disclosed in the Your Fund’s Expenses and Financial Highlights sections in this report. In periods of market volatility, assets may decline significantly, causing total annual Fund operating expenses to become higher than the figures shown.
See www.franklintempletondatasources.com for additional data provider information.
| 32 | Annual Report | ftinstitutional.com | ||
INTERNATIONAL EQUITY SERIES
Your Fund’s Expenses
As a Fund shareholder, you can incur two types of costs: (1) transaction costs, including sales charges (loads) on Fund purchases and redemptions, if applicable; and (2) ongoing Fund costs, including management fees, distribution and service (12b-1) fees, if applicable, and other Fund expenses. All mutual funds have ongoing costs, sometimes referred to as operating expenses. The table below shows ongoing costs of investing in the Fund and can help you understand these costs and compare them with those of other mutual funds. The table assumes a $1,000 investment held for the six months indicated.
Actual Fund Expenses
The table below provides information about actual account values and actual expenses in the columns under the heading “Actual.” In these columns the Fund’s actual return, which includes the effect of Fund expenses, is used to calculate the “Ending Account Value” for each class of shares. You can estimate the expenses you paid during the period by following these steps (of course, your account value and expenses will differ from those in this illustration): Divide your account value by $1,000 (if your account had an $8,600 value, then $8,600 ÷ $1,000 = 8.6). Then multiply the result by the number in the row for your class of shares under the headings “Actual” and “Expenses Paid During Period” (if Actual Expenses Paid During Period were $7.50, then 8.6 x $7.50 = $64.50). In this illustration, the actual expenses paid this period are $64.50.
Hypothetical Example for Comparison with Other Funds
Under the heading “Hypothetical” in the table, information is provided about hypothetical account values and hypothetical expenses based on the Fund’s actual expense ratio and an assumed rate of return of 5% per year before expenses, which is not the Fund’s actual return. This information may not be used to estimate the actual ending account balance or expenses you paid for the period, but it can help you compare ongoing costs of investing in the Fund with those of other funds. To do so, compare this 5% hypothetical example for the class of shares you hold with the 5% hypothetical examples that appear in the shareholder reports of other funds.
Please note that expenses shown in the table are meant to highlight ongoing costs and do not reflect any transactional costs. Therefore, information under the heading “Hypothetical” is useful in comparing ongoing costs only, and will not help you compare total costs of owning different funds. In addition, if transactional costs were included, your total costs would have been higher.
| Actual (actual return after expenses) | Hypothetical (5% annual return before expenses) | |||||||||||
| Share Class | Beginning Account Value 7/1/17 | Ending Account Value 12/31/17 | Expenses Paid During Period 7/1/17–12/31/171 | Ending Account Value 12/31/17 | Expenses Paid During Period 7/1/17–12/31/171 | Net Annualized Expense Ratio | ||||||
|
|
|
| |||||||||
| Primary Shares | $1,000 | $1,085.40 | $4.15 | $1,021.22 | $4.02 | 0.79% | ||||||
Service Shares | $1,000 | $1,084.70 | $4.94 | $1,020.47 | $4.79 | 0.94% | ||||||
1. Expenses are equal to the annualized expense ratio for the six-month period as indicated above—in the far right column—multiplied by the simple average account value over the period indicated, and then multiplied by 184/365 to reflect the one-half year period.
| ftinstitutional.com | Annual Report | 33 | ||||
TEMPLETON INSTITUTIONAL FUNDS
Emerging Markets Series
| Year Ended December 31, | ||||||||||||||||||||
| 2017 | 2016 | 2015 | 2014 | 2013 | ||||||||||||||||
| Per share operating performance (for a share outstanding throughout the year) | ||||||||||||||||||||
Net asset value, beginning of year | $4.28 | $3.65 | $4.59 | $7.31 | $10.49 | |||||||||||||||
|
| |||||||||||||||||||
| Income from investment operationsa: | ||||||||||||||||||||
Net investment incomeb | 0.04 | 0.03 | 0.04 | 0.12 | c | 0.13 | ||||||||||||||
Net realized and unrealized gains (losses) | 1.79 | 0.68 | (0.90 | ) | (0.70 | ) | (0.13 | ) | ||||||||||||
|
| |||||||||||||||||||
Total from investment operations | 1.83 | 0.71 | (0.86 | ) | (0.58 | ) | — | |||||||||||||
|
| |||||||||||||||||||
| Less distributions from: | ||||||||||||||||||||
Net investment income | (0.05 | ) | (0.08 | ) | (0.06 | ) | (0.19 | ) | (0.13 | ) | ||||||||||
Net realized gains | — | — | (0.02 | ) | (1.95 | ) | (3.05 | ) | ||||||||||||
|
| |||||||||||||||||||
Total distributions | (0.05 | ) | (0.08 | ) | (0.08 | ) | (2.14 | ) | (3.18 | ) | ||||||||||
|
| |||||||||||||||||||
Net asset value, end of year | $ 6.06 | $ 4.28 | $ 3.65 | $ 4.59 | $ 7.31 | |||||||||||||||
|
| |||||||||||||||||||
Total return | 42.84% | 19.45% | (18.88)% | (8.01)% | 0.72% | |||||||||||||||
| Ratios to average net assets | ||||||||||||||||||||
Expenses before waiver and payments by affiliates | 1.57% | 1.44% | 1.33% | 1.32% | 1.32% | |||||||||||||||
Expenses net of waiver and payments by affiliates | 1.44% | d | 1.33% | 1.32% | 1.32% | 1.29% | ||||||||||||||
Net investment income | 0.67% | 0.79% | 0.83% | 1.74% | c | 1.23% | ||||||||||||||
| Supplemental data | ||||||||||||||||||||
Net assets, end of year (000’s) | $57,269 | $40,879 | $71,434 | $101,861 | $165,216 | |||||||||||||||
Portfolio turnover rate | 20.82% | 17.55% | 69.65% | 78.18% | 52.07% | |||||||||||||||
aThe amount shown for a share outstanding throughout the period may not correlate with the Statement of Operations for the period due to the timing of sales and repurchases of the Fund’s shares in relation to income earned and/or fluctuating fair value of the investments of the Fund.
bBased on average daily shares outstanding.
cNet investment income per share includes approximately $0.03 per share related to income received in the form of special dividends in connection with certain Fund holdings. Excluding this amount, the ratio of net investment income to average net assets would have been 1.33%.
dBenefit of expense reduction rounds to less than 0.01%.
| 34 | Annual Report | The accompanying notes are an integral part of these financial statements. | ftinstitutional.com | ||
TEMPLETON INSTITUTIONAL FUNDS
Statement of Investments, December 31, 2017
| Emerging Markets Series | ||||||||||||||
| Industry | Shares | Value | ||||||||||||
| Common Stocks 94.7% | ||||||||||||||
| Argentina 0.1% | ||||||||||||||
| a | Cablevision Holding SA, ADR | Media | 2,560 | $ | 64,775 | |||||||||
| b | Grupo Clarin SA, GDR, Reg S | Media | 756 | 4,574 | ||||||||||
|
| |||||||||||||
|
69,349 |
| ||||||||||||
|
| |||||||||||||
| Belgium 0.5% | ||||||||||||||
Anheuser-Busch InBev SA/NV | Beverages | 2,739 | 306,049 | |||||||||||
|
| |||||||||||||
| Brazil 1.9% | ||||||||||||||
| a | B2W Cia Digital | Internet & Direct Marketing Retail | 21,400 | 132,440 | ||||||||||
B3 SA - Brasil Bolsa Balcao | Capital Markets | 38,100 | 262,017 | |||||||||||
Lojas Americanas SA | Multiline Retail | 78,900 | 312,746 | |||||||||||
M. Dias Branco SA | Food Products | 600 | 9,437 | |||||||||||
Mahle-Metal Leve SA | Auto Components | 20,500 | 147,726 | |||||||||||
Totvs SA | Software | 24,600 | 221,979 | |||||||||||
|
| |||||||||||||
|
1,086,345 |
| ||||||||||||
|
| |||||||||||||
| Cambodia 0.8% | ||||||||||||||
NagaCorp Ltd. | Hotels, Restaurants & Leisure | 576,000 | 446,772 | |||||||||||
|
| |||||||||||||
| China 21.6% | ||||||||||||||
| a | Alibaba Group Holding Ltd., ADR | Internet Software & Services | 13,192 | 2,274,696 | ||||||||||
BAIC Motor Corp. Ltd., H | Automobiles | 397,000 | 517,284 | |||||||||||
| a | Baidu Inc., ADR | Internet Software & Services | 1,835 | 429,775 | ||||||||||
Brilliance China Automotive Holdings Ltd. | Automobiles | 1,299,900 | 3,477,337 | |||||||||||
China Life Insurance Co. Ltd., H | Insurance | 28,000 | 87,983 | |||||||||||
China Mobile Ltd. | Wireless Telecommunication Services | 24,500 | 248,517 | |||||||||||
China Petroleum & Chemical Corp., H | Oil, Gas & Consumable Fuels | 824,500 | 604,694 | |||||||||||
CNOOC Ltd. | Oil, Gas & Consumable Fuels | 324,600 | 466,157 | |||||||||||
COSCO Shipping Ports Ltd. | Transportation Infrastructure | 172,582 | 179,588 | |||||||||||
Inner Mongolia Yitai Coal Co. Ltd., B | Oil, Gas & Consumable Fuels | 53,500 | 77,093 | |||||||||||
NetEase Inc., ADR | Internet Software & Services | 345 | 119,049 | |||||||||||
Ping An Bank Co. Ltd., A | Banks | 314,700 | 643,266 | |||||||||||
Ping An Insurance Group Co. of China Ltd., A | Insurance | 78,007 | 839,097 | |||||||||||
Poly Culture Group Corp. Ltd., H | Media | 57,500 | 116,136 | |||||||||||
Tencent Holdings Ltd. | Internet Software & Services | 36,300 | 1,886,354 | |||||||||||
Uni-President China Holdings Ltd. | Food Products | 294,800 | 246,772 | |||||||||||
Weifu High-Technology Co. Ltd., B | Auto Components | 66,986 | 143,269 | |||||||||||
|
| |||||||||||||
|
12,357,067 |
| ||||||||||||
|
| |||||||||||||
| Czech Republic 0.5% | ||||||||||||||
Moneta Money Bank AS | Banks | 68,210 | 263,960 | |||||||||||
|
| |||||||||||||
| Hong Kong 2.5% | ||||||||||||||
Dairy Farm International Holdings Ltd. | Food & Staples Retailing | 10,119 | 79,535 | |||||||||||
MGM China Holdings Ltd. | Hotels, Restaurants & Leisure | 235,400 | 712,571 | |||||||||||
Sands China Ltd. | Hotels, Restaurants & Leisure | 126,000 | 650,736 | |||||||||||
|
| |||||||||||||
|
1,442,842 |
| ||||||||||||
|
| |||||||||||||
| Hungary 1.0% | ||||||||||||||
Richter Gedeon Nyrt | Pharmaceuticals | 22,261 | 582,650 | |||||||||||
|
| |||||||||||||
| India 6.3% | ||||||||||||||
Bajaj Holdings & Investment Ltd. | Diversified Financial Services | 3,924 | 176,245 | |||||||||||
Biocon Ltd. | Biotechnology | 79,852 | 672,063 | |||||||||||
Glenmark Pharmaceuticals Ltd. | Pharmaceuticals | 40,694 | 379,116 | |||||||||||
ICICI Bank Ltd. | Banks | 286,830 | 1,410,787 | |||||||||||
Infosys Ltd. | IT Services | 15,676 | 255,877 | |||||||||||
| ftinstitutional.com | Annual Report | 35 | ||||
TEMPLETON INSTITUTIONAL FUNDS
STATEMENT OF INVESTMENTS
| Emerging Markets Series (continued) | ||||||||||||||
| Industry | Shares | Value | ||||||||||||
| Common Stocks (continued) | ||||||||||||||
| India (continued) | ||||||||||||||
Reliance Industries Ltd. | Oil, Gas & Consumable Fuels | 13,094 | $ | 188,913 | ||||||||||
Tata Chemicals Ltd. | Chemicals | 25,000 | 286,478 | |||||||||||
| a | Tata Motors Ltd., A | Automobiles | 55,668 | 212,853 | ||||||||||
|
| |||||||||||||
|
3,582,332 |
| ||||||||||||
|
| |||||||||||||
| Indonesia 3.3% | ||||||||||||||
Astra International Tbk PT | Automobiles | 1,719,600 | 1,051,976 | |||||||||||
Bank Danamon Indonesia Tbk PT | Banks | 891,700 | 456,776 | |||||||||||
Perusahaan Gas Negara (Persero) Tbk PT | Gas Utilities | 797,500 | 102,865 | |||||||||||
Semen Indonesia (Persero) Tbk PT | Construction Materials | 372,600 | 271,881 | |||||||||||
|
| |||||||||||||
|
1,883,498 |
| ||||||||||||
|
| |||||||||||||
| Kenya 0.4% | ||||||||||||||
Equity Group Holdings Ltd. | Banks | 579,300 | 224,535 | |||||||||||
|
| |||||||||||||
| Mexico 1.1% | ||||||||||||||
Grupo Financiero Santander Mexico SAB de CV, B, ADR | Banks | 73,212 | 535,180 | |||||||||||
Nemak SAB de CV | Auto Components | 137,500 | 99,790 | |||||||||||
|
| |||||||||||||
|
634,970 |
| ||||||||||||
|
| |||||||||||||
| Nigeria 0.0%† | ||||||||||||||
Nigerian Breweries PLC | Beverages | 38,224 | 14,334 | |||||||||||
|
| |||||||||||||
| Pakistan 0.4% | ||||||||||||||
Habib Bank Ltd. | Banks | 171,400 | 258,571 | |||||||||||
|
| |||||||||||||
| Peru 1.5% | ||||||||||||||
Compania de Minas Buenaventura SA, ADR | Metals & Mining | 43,920 | 618,393 | |||||||||||
| b | Intercorp Financial Services Inc., Reg S | Banks | 5,700 | 218,025 | ||||||||||
|
| |||||||||||||
|
836,418 |
| ||||||||||||
|
| |||||||||||||
| Russia 6.7% | ||||||||||||||
Gazprom PJSC, ADR | Oil, Gas & Consumable Fuels | 44,300 | 195,363 | |||||||||||
LUKOIL PJSC, ADR | Oil, Gas & Consumable Fuels | 10,650 | 609,393 | |||||||||||
| a,b | Mail.Ru Group Ltd., GDR, Reg S | Internet Software & Services | 20,854 | 602,681 | ||||||||||
MMC Norilsk Nickel PJSC, ADR | Metals & Mining | 16,400 | 307,336 | |||||||||||
Sberbank of Russia PJSC, ADR | Banks | 63,151 | 1,069,146 | |||||||||||
| a | Yandex NV, A | Internet Software & Services | 32,204 | 1,054,681 | ||||||||||
|
| |||||||||||||
|
3,838,600 |
| ||||||||||||
|
| |||||||||||||
| Singapore 0.2% | ||||||||||||||
DBS Group Holdings Ltd. | Banks | 6,452 | 119,874 | |||||||||||
|
| |||||||||||||
| South Africa 8.5% | ||||||||||||||
Massmart Holdings Ltd. | Food & Staples Retailing | 51,057 | 575,838 | |||||||||||
MTN Group Ltd. | Wireless Telecommunication Services | 11,656 | 128,690 | |||||||||||
Naspers Ltd., N | Media | 15,029 | 4,191,998 | |||||||||||
|
| |||||||||||||
|
4,896,526 |
| ||||||||||||
|
| |||||||||||||
| South Korea 18.3% | ||||||||||||||
Daelim Industrial Co. Ltd. | Construction & Engineering | 7,426 | 573,278 | |||||||||||
Fila Korea Ltd. | Textiles, Apparel & Luxury Goods | 8,416 | 643,397 | |||||||||||
Hankook Tire Co. Ltd. | Auto Components | 3,598 | 184,050 | |||||||||||
Hankook Tire Worldwide Co. Ltd. | Diversified Financial Services | 9,074 | 160,673 | |||||||||||
Hanon Systems | Auto Components | 38,655 | 503,389 | |||||||||||
Hite Jinro Co. Ltd. | Beverages | 8,080 | 182,436 | |||||||||||
Hyundai Development Co-Engineering & Construction | Construction & Engineering | 21,600 | 780,119 | |||||||||||
iMarketKorea Inc. | Trading Companies & Distributors | 15,123 | 127,657 | |||||||||||
| 36 | Annual Report | ftinstitutional.com | ||
TEMPLETON INSTITUTIONAL FUNDS
STATEMENT OF INVESTMENTS
| Emerging Markets Series (continued) | ||||||||||||||
| Industry | Shares | Value | ||||||||||||
| Common Stocks (continued) | ||||||||||||||
| South Korea (continued) | ||||||||||||||
Interpark Holdings Corp. | Internet & Direct Marketing Retail | 9,693 | $ | 35,780 | ||||||||||
KT Skylife Co. Ltd. | Media | 35,290 | 444,690 | |||||||||||
LG Corp. | Industrial Conglomerates | 2,126 | 181,254 | |||||||||||
Naver Corp. | Internet Software & Services | 570 | 464,598 | |||||||||||
POSCO | Metals & Mining | 2,804 | 873,479 | |||||||||||
Samsung Electronics Co. Ltd. | Technology Hardware, Storage & Peripherals | 1,802 | 4,301,671 | |||||||||||
SK Hynix Inc. | Semiconductors & Semiconductor Equipment | 14,460 | 1,036,365 | |||||||||||
|
| |||||||||||||
|
10,492,836 |
| ||||||||||||
|
| |||||||||||||
| Taiwan 11.5% | ||||||||||||||
Catcher Technology Co. Ltd. | Technology Hardware, Storage & Peripherals | 51,000 | 563,859 | |||||||||||
FIT Hon Teng Ltd. | Electronic Equipment, Instruments | |||||||||||||
| & Components | 320,400 | 216,940 | ||||||||||||
Hon Hai Precision Industry Co. Ltd. | Electronic Equipment, Instruments | |||||||||||||
| & Components | 344,920 | 1,106,832 | ||||||||||||
Largan Precision Co. Ltd. | Electronic Equipment, Instruments | |||||||||||||
| & Components | 3,000 | 406,512 | ||||||||||||
PChome Online Inc. | Internet Software & Services | 66,859 | 308,750 | |||||||||||
Pegatron Corp. | Technology Hardware, Storage & Peripherals | 146,000 | 354,333 | |||||||||||
Primax Electronics Ltd. | Technology Hardware, Storage & Peripherals | 61,000 | 162,436 | |||||||||||
Taiwan Semiconductor Manufacturing Co. Ltd. | Semiconductors & Semiconductor Equipment | 450,000 | 3,481,141 | |||||||||||
|
| |||||||||||||
|
6,600,803 |
| ||||||||||||
|
| |||||||||||||
| Thailand 3.7% | ||||||||||||||
Kasikornbank PCL, fgn | Banks | 111,900 | 821,127 | |||||||||||
Land and Houses PCL, fgn | Real Estate Management & Development | 1,107,300 | 356,974 | |||||||||||
PTT Exploration and Production PCL, fgn | Oil, Gas & Consumable Fuels | 89,900 | 276,021 | |||||||||||
Siam Commercial Bank PCL, fgn | Banks | 43,100 | 198,496 | |||||||||||
Thai Beverage PCL, fgn | Beverages | 646,900 | 444,970 | |||||||||||
|
| |||||||||||||
|
2,097,588 |
| ||||||||||||
|
| |||||||||||||
| United Kingdom 3.0% | ||||||||||||||
Unilever PLC | Personal Products | 30,419 | 1,694,728 | |||||||||||
|
| |||||||||||||
| United States 0.9% | ||||||||||||||
| a | IMAX Corp. | Media | 22,882 | 529,718 | ||||||||||
|
| |||||||||||||
Total Common Stocks (Cost $36,244,358) |
|
|
54,260,365 |
| ||||||||||
|
| |||||||||||||
| c | Participatory Notes (Cost $214,724) 0.5% |
| ||||||||||||
Saudi Arabia 0.5% | ||||||||||||||
HSBC Bank PLC, Saudi Basic Industries Corp., 1/22/18 | Chemicals | 9,704 | 263,928 | |||||||||||
|
| |||||||||||||
| Preferred Stocks 3.5% | ||||||||||||||
| Brazil 3.5% | ||||||||||||||
| d | Banco Bradesco SA, 3.687%, ADR, pfd | Banks | 93,532 | 957,768 | ||||||||||
| d | Itau Unibanco Holding SA, 3.67%, ADR, pfd | Banks | 78,746 | 1,023,698 | ||||||||||
|
| |||||||||||||
Total Preferred Stocks (Cost $949,978) |
|
1,981,466 |
| |||||||||||
|
| |||||||||||||
Total Investments before Short Term Investments (Cost $37,409,060) | 56,505,759 | |||||||||||||
|
| |||||||||||||
| ftinstitutional.com | Annual Report | 37 | ||||
TEMPLETON INSTITUTIONAL FUNDS
STATEMENT OF INVESTMENTS
| Emerging Markets Series (continued) | ||||||||||||||
| Shares | Value | |||||||||||||
Short Term Investments (Cost $763,014) 1.3% | ||||||||||||||
| Money Market Funds 1.3% | ||||||||||||||
| United States 1.3% | ||||||||||||||
| e,f | Institutional Fiduciary Trust Money Market Portfolio, 0.89% | 763,014 | $ | 763,014 | ||||||||||
|
| |||||||||||||
| Total Investments (Cost $38,172,074) 100.0% | 57,268,773 | |||||||||||||
| Other Assets, less Liabilities 0.0%† | 631 | |||||||||||||
|
| |||||||||||||
| Net Assets 100.0% |
$57,269,404 | |||||||||||||
|
| |||||||||||||
See Abbreviations on page 73.
†Rounds to less than 0.1% of net assets.
aNon-income producing.
bSecurity was purchased pursuant to Regulation S under the Securities Act of 1933, which exempts from registration securities offered and sold outside of the United States. Such a security cannot be sold in the United States without either an effective registration statement filed pursuant to the Securities Act of 1933, or pursuant to an exemption from registration. These securities have been deemed liquid under guidelines approved by the Trust’s Board of Trustees. At December 31, 2017, the aggregate value of these securities was $825,280, representing 1.4% of net assets.
cSee Note 1(c) regarding Participatory Notes.
dVariable rate security. The rate shown represents the yield at period end.
eSee Note 3(d) regarding investments in affiliated management investment companies.
fThe rate shown is the annualized seven-day yield at period end.
| 38 | Annual Report | The accompanying notes are an integral part of these financial statements. | ftinstitutional.com | ||
TEMPLETON INSTITUTIONAL FUNDS
Financial Highlights
Foreign Smaller Companies Series
| Year Ended December 31, | ||||||||||||||||||||
| 2017 | 2016 | 2015 | 2014 | 2013 | ||||||||||||||||
| ||||||||||||||||||||
Per share operating performance (for a share outstanding throughout the year) | ||||||||||||||||||||
| Net asset value, beginning of year | $19.93 | $20.90 | $20.80 | $21.96 | $18.31 | |||||||||||||||
|
| |||||||||||||||||||
| Income from investment operationsa: | ||||||||||||||||||||
| Net investment incomeb | 0.30 | 0.29 | 0.28 | 0.25 | 0.24 | |||||||||||||||
| Net realized and unrealized gains (losses) | 6.49 | (0.48) | 0.12 | (0.98) | 3.82 | |||||||||||||||
|
| |||||||||||||||||||
| Total from investment operations | 6.79 | (0.19) | 0.40 | (0.73) | 4.06 | |||||||||||||||
|
| |||||||||||||||||||
| Less distributions from: | ||||||||||||||||||||
| Net investment income | (0.68) | (0.41) | (0.28) | (0.16) | (0.30) | |||||||||||||||
| Net realized gains | (0.96) | (0.37) | (0.02) | (0.27) | (0.11) | |||||||||||||||
|
| |||||||||||||||||||
| Total distributions | (1.64) | (0.78) | (0.30) | (0.43) | (0.41) | |||||||||||||||
|
| |||||||||||||||||||
| Net asset value, end of year | $25.08 | $19.93 | $20.90 | $20.80 | $21.96 | |||||||||||||||
|
| |||||||||||||||||||
| Total return | 34.18% | (0.85)% | 1.88% | (3.32)% | 22.24% | |||||||||||||||
| Ratios to average net assets | ||||||||||||||||||||
| Expenses before waiver and payments by affiliates | 0.99% | 0.99% | 0.98% | 0.98% | 0.99% | |||||||||||||||
| Expenses net of waiver and payments by affiliates | 0.98%c | 0.98%c | 0.98%c,d | 0.98% | 0.98%c | |||||||||||||||
| Net investment income | 1.28% | 1.44% | 1.28% | 1.15% | 1.16% | |||||||||||||||
| Supplemental data | ||||||||||||||||||||
| Net assets, end of year (000’s) | $1,040,180 | $931,879 | $1,260,407 | $1,281,733 | $1,252,797 | |||||||||||||||
| Portfolio turnover rate | 25.97% | 21.36% | 29.11% | 21.36% | 23.84% | |||||||||||||||
aThe amount shown for a share outstanding throughout the period may not correlate with the Statement of Operations for the period due to the timing of sales and repurchases of the Fund’s shares in relation to income earned and/or fluctuating fair value of the investments of the Fund.
bBased on average daily shares outstanding.
cBenefit of expense reduction rounds to less than 0.01%.
dBenefit of waiver and payments by affiliates rounds to less than 0.01%.
| ftinstitutional.com | The accompanying notes are an integral part of these financial statements. | Annual Report | 39 | ||||
TEMPLETON INSTITUTIONAL FUNDS
Statement of Investments, December 31, 2017
Foreign Smaller Companies Series
| Industry | Shares | Value | ||||||||||||||
| Common Stocks 95.0% | ||||||||||||||||
| Belgium 2.2% | ||||||||||||||||
Barco NV | | Electronic Equipment, Instruments & Components |
| 129,792 | $ | 13,898,407 | ||||||||||
Ontex Group NV | Personal Products | 269,584 | 8,919,048 | |||||||||||||
|
| |||||||||||||||
| 22,817,455 | ||||||||||||||||
|
| |||||||||||||||
| Bermuda 0.5% | ||||||||||||||||
Axis Capital Holdings Ltd. | Insurance | 95,650 | 4,807,369 | |||||||||||||
|
| |||||||||||||||
| Brazil 2.5% | ||||||||||||||||
Camil Alimentos SA | Food Products | 4,004,500 | 9,465,874 | |||||||||||||
Grendene SA | Textiles, Apparel & Luxury Goods | 793,000 | 6,810,925 | |||||||||||||
M. Dias Branco SA | Food Products | 608,200 | 9,566,098 | |||||||||||||
|
| |||||||||||||||
| 25,842,897 | ||||||||||||||||
|
| |||||||||||||||
| Canada 7.1% | ||||||||||||||||
Alamos Gold Inc., A | Metals & Mining | 1,013,900 | 6,600,489 | |||||||||||||
| a | Badger Daylighting Ltd. | Construction & Engineering | 616,500 | 13,329,464 | ||||||||||||
Canaccord Genuity Group Inc. | Capital Markets | 1,913,238 | 8,827,285 | |||||||||||||
| b | Canada Goose Holdings Inc. | Textiles, Apparel & Luxury Goods | 101,300 | 3,199,923 | ||||||||||||
Canadian Western Bank | Banks | 460,289 | 14,371,445 | |||||||||||||
| a | Genworth MI Canada Inc. | Thrifts & Mortgage Finance | 126,600 | 4,380,797 | ||||||||||||
Mullen Group Ltd. | Energy Equipment & Services | 714,400 | 8,944,918 | |||||||||||||
Russel Metals Inc. | Trading Companies & Distributors | 241,500 | 5,603,814 | |||||||||||||
Shawcor Ltd. | Energy Equipment & Services | 388,500 | 8,474,004 | |||||||||||||
|
| |||||||||||||||
| 73,732,139 | ||||||||||||||||
|
| |||||||||||||||
| China 4.5% | ||||||||||||||||
China ZhengTong Auto Services Holdings Ltd. | Specialty Retail | 10,462,000 | 10,592,091 | |||||||||||||
Goodbaby International Holdings Ltd. | Household Products | 15,882,600 | 8,721,063 | |||||||||||||
Greatview Aseptic Packaging Co. Ltd. | Containers & Packaging | 13,051,300 | 9,521,802 | |||||||||||||
Hollysys Automation Technologies Ltd. | Electronic Equipment, Instruments | |||||||||||||||
| & Components | 231,900 | 5,164,413 | ||||||||||||||
Shanghai Haohai Biological Technology Co. Ltd., H | Biotechnology | 1,102,800 | 5,286,145 | |||||||||||||
Xtep International Holdings Ltd. | Textiles, Apparel & Luxury Goods | 19,671,800 | 7,679,527 | |||||||||||||
|
| |||||||||||||||
| 46,965,041 | ||||||||||||||||
|
| |||||||||||||||
| Colombia 0.6% | ||||||||||||||||
| b | Gran Tierra Energy Inc. | Oil, Gas & Consumable Fuels | 2,358,600 | 6,397,921 | ||||||||||||
|
| |||||||||||||||
| Finland 4.1% | ||||||||||||||||
Amer Sports OYJ | Leisure Products | 665,809 | 18,445,162 | |||||||||||||
Huhtamaki OYJ | Containers & Packaging | 431,877 | 18,135,812 | |||||||||||||
| b | Outotec OYJ | Machinery | 681,772 | 5,807,730 | ||||||||||||
|
| |||||||||||||||
| 42,388,704 | ||||||||||||||||
|
| |||||||||||||||
| Germany 7.2% | ||||||||||||||||
Gerresheimer AG | Life Sciences Tools & Services | 198,681 | 16,476,651 | |||||||||||||
Grand City Properties SA | Real Estate Management & Development | 489,231 | 11,534,145 | |||||||||||||
Jenoptik AG | Electronic Equipment, Instruments | |||||||||||||||
| & Components | 463,186 | 15,307,599 | ||||||||||||||
Rational AG | Machinery | 26,354 | 16,986,012 | |||||||||||||
Stabilus SA | Machinery | 162,230 | 14,588,535 | |||||||||||||
|
| |||||||||||||||
| 74,892,942 | ||||||||||||||||
|
| |||||||||||||||
| 40 | Annual Report | ftinstitutional.com | ||
TEMPLETON INSTITUTIONAL FUNDS
STATEMENT OF INVESTMENTS
Foreign Smaller Companies Series (continued) | ||||||||||||||||
| Industry | Shares | Value | ||||||||||||||
| Common Stocks (continued) | ||||||||||||||||
| Hong Kong 5.4% | ||||||||||||||||
| a | PAX Global Technology Ltd. | Electronic Equipment, Instruments | ||||||||||||||
| & Components | 11,412,000 | $ | 5,112,347 | |||||||||||||
Stella International Holdings Ltd. | Textiles, Apparel & Luxury Goods | 2,793,062 | 4,218,452 | |||||||||||||
Techtronic Industries Co. Ltd. | Household Durables | 3,183,500 | 20,760,583 | |||||||||||||
Value Partners Group Ltd. | Capital Markets | 12,630,000 | 13,417,511 | |||||||||||||
VTech Holdings Ltd. | Communications Equipment | 959,200 | 12,571,863 | |||||||||||||
|
| |||||||||||||||
| 56,080,756 | ||||||||||||||||
|
| |||||||||||||||
| India 1.8% | ||||||||||||||||
Dewan Housing Finance Corp. Ltd. | Thrifts & Mortgage Finance | 2,098,232 | 19,151,626 | |||||||||||||
|
| |||||||||||||||
| Italy 5.2% | ||||||||||||||||
Azimut Holding SpA | Capital Markets | 419,733 | 8,042,423 | |||||||||||||
Interpump Group SpA | Machinery | 614,224 | 19,322,724 | |||||||||||||
Technogym SpA | Leisure Products | 2,075,132 | 20,104,679 | |||||||||||||
| a | Tod’s SpA | Textiles, Apparel & Luxury Goods | 88,814 | 6,489,446 | ||||||||||||
|
| |||||||||||||||
| 53,959,272 | ||||||||||||||||
|
| |||||||||||||||
| Japan 21.8% | ||||||||||||||||
Anicom Holdings Inc. | Insurance | 436,100 | 14,067,742 | |||||||||||||
Asahi Co. Ltd. | Specialty Retail | 351,600 | 4,093,705 | |||||||||||||
Asics Corp. | Textiles, Apparel & Luxury Goods | 760,400 | 12,119,434 | |||||||||||||
Bunka Shutter Co. Ltd. | Building Products | 1,045,400 | 10,065,750 | |||||||||||||
Capcom Co. Ltd. | Software | 334,000 | 10,596,353 | |||||||||||||
Daibiru Corp. | Real Estate Management & Development | 839,600 | 10,580,219 | |||||||||||||
Descente Ltd. | Textiles, Apparel & Luxury Goods | 572,671 | 9,894,755 | |||||||||||||
Dowa Holdings Co. Ltd. | Metals & Mining | 333,500 | 13,614,057 | |||||||||||||
Fuji Oil Holdings Inc. | Food Products | 430,200 | 12,579,394 | |||||||||||||
Idec Corp. | Electrical Equipment | 232,600 | 5,540,208 | |||||||||||||
IDOM Inc. | Specialty Retail | 1,323,900 | 9,398,944 | |||||||||||||
Kobayashi Pharmaceutical Co. Ltd. | Personal Products | 237,200 | 15,408,475 | |||||||||||||
KYB Corp. | Auto Components | 69,400 | 4,058,624 | |||||||||||||
MEITEC Corp. | Professional Services | 321,500 | 16,890,269 | |||||||||||||
Morita Holdings Corp. | Machinery | 233,800 | 4,400,673 | |||||||||||||
| a | N Field Co. Ltd. | Health Care Providers & Services | 378,600 | 5,160,666 | ||||||||||||
Nachi-Fujikoshi Corp. | Machinery | 1,312,000 | 8,802,165 | |||||||||||||
Nihon Parkerizing Co. Ltd. | Chemicals | 667,400 | 11,259,062 | |||||||||||||
Square Enix Holdings Co. Ltd. | Software | 104,900 | 4,989,697 | |||||||||||||
Sumitomo Rubber Industries Ltd. | Auto Components | 550,600 | 10,241,448 | |||||||||||||
TechnoPro Holdings Inc. | Professional Services | 217,200 | 11,796,282 | |||||||||||||
Tsumura & Co. | Pharmaceuticals | 470,200 | 15,626,738 | |||||||||||||
Ushio Inc. | Electrical Equipment | 371,700 | 5,314,005 | |||||||||||||
|
| |||||||||||||||
| 226,498,665 | ||||||||||||||||
|
| |||||||||||||||
| Netherlands 4.2% | ||||||||||||||||
Aalberts Industries NV | Machinery | 183,173 | 9,317,191 | |||||||||||||
Accell Group NV | Leisure Products | 225,365 | 6,335,307 | |||||||||||||
Arcadis NV | Construction & Engineering | 675,797 | 15,450,199 | |||||||||||||
Beter Bed Holding NV | Specialty Retail | 287,790 | 4,571,646 | |||||||||||||
| c | Refresco Group NV, Reg S | Beverages | 355,304 | 8,440,616 | ||||||||||||
|
| |||||||||||||||
| 44,114,959 | ||||||||||||||||
|
| |||||||||||||||
| Norway 0.7% | ||||||||||||||||
Tomra Systems ASA | Commercial Services & Supplies | 467,060 | 7,481,836 | |||||||||||||
|
| |||||||||||||||
| ftinstitutional.com | Annual Report | 41 | ||||
TEMPLETON INSTITUTIONAL FUNDS
STATEMENT OF INVESTMENTS
Foreign Smaller Companies Series (continued) | ||||||||||||||||
| Industry | Shares | Value | ||||||||||||||
| Common Stocks (continued) | ||||||||||||||||
| Philippines 0.2% | ||||||||||||||||
Vista Land & Lifescapes Inc. | Real Estate Management & Development | 20,636,600 | $ | 2,471,548 | ||||||||||||
|
| |||||||||||||||
| Poland 1.0% | ||||||||||||||||
CCC SA | Textiles, Apparel & Luxury Goods | 129,204 | 10,577,866 | |||||||||||||
|
| |||||||||||||||
| South Korea 3.3% | ||||||||||||||||
BNK Financial Group Inc. | Banks | 898,849 | 7,932,692 | |||||||||||||
DGB Financial Group Inc. | Banks | 1,374,452 | 13,585,168 | |||||||||||||
| b | Hyundai Mipo Dockyard Co. Ltd. | Machinery | 83,625 | 6,165,863 | ||||||||||||
Korea Investment Holdings Co. Ltd. | Capital Markets | 98,813 | 6,387,724 | |||||||||||||
|
| |||||||||||||||
| 34,071,447 | ||||||||||||||||
|
| |||||||||||||||
| Spain 1.2% | ||||||||||||||||
Construcciones y Auxiliar de Ferrocarriles SA | Machinery | 309,069 | 12,674,662 | |||||||||||||
|
| |||||||||||||||
| Sweden 3.8% | ||||||||||||||||
Bulten AB | Auto Components | 299,720 | 4,475,778 | |||||||||||||
Cloetta AB, B | Food Products | 1,482,450 | 5,367,267 | |||||||||||||
Duni AB | Household Durables | 286,318 | 4,232,014 | |||||||||||||
Tethys Oil AB | Oil, Gas & Consumable Fuels | 669,086 | 5,362,835 | |||||||||||||
| c | The Thule Group AB, Reg S | Leisure Products | 911,710 | 20,549,929 | ||||||||||||
|
| |||||||||||||||
| 39,987,823 | ||||||||||||||||
|
| |||||||||||||||
| Switzerland 3.9% | ||||||||||||||||
Bucher Industries AG | Machinery | 50,471 | 20,512,666 | |||||||||||||
Logitech International SA | Technology Hardware, Storage & Peripherals | 283,500 | 9,536,940 | |||||||||||||
Tecan Group AG | Life Sciences Tools & Services | 30,987 | 6,446,415 | |||||||||||||
Vontobel Holding AG | Capital Markets | 58,039 | 3,663,364 | |||||||||||||
|
| |||||||||||||||
| 40,159,385 | ||||||||||||||||
|
| |||||||||||||||
| Taiwan 4.6% | ||||||||||||||||
Chicony Electronics Co. Ltd. | Technology Hardware, Storage & Peripherals | 3,755,510 | 9,494,160 | |||||||||||||
Giant Manufacturing Co. Ltd. | Leisure Products | 1,635,482 | 9,013,426 | |||||||||||||
King Yuan Electronics Co. Ltd. | Semiconductors & Semiconductor Equipment | 11,616,000 | 11,844,272 | |||||||||||||
Merida Industry Co. Ltd. | Leisure Products | 1,295,000 | 5,456,399 | |||||||||||||
Tripod Technology Corp. | Electronic Equipment, Instruments & Components | 3,905,000 | 12,241,379 | |||||||||||||
|
| |||||||||||||||
| 48,049,636 | ||||||||||||||||
|
| |||||||||||||||
| Thailand 0.3% | ||||||||||||||||
L.P.N. Development PCL, fgn | Real Estate Management & Development | 7,389,200 | 2,994,702 | |||||||||||||
|
| |||||||||||||||
| Turkey 0.5% | ||||||||||||||||
| b | Mavi Giyim Sanayi Ve Ticaret AS, B | Textiles, Apparel & Luxury Goods | 351,370 | 5,376,315 | ||||||||||||
|
| |||||||||||||||
| United Kingdom 8.4% | ||||||||||||||||
Bellway PLC | Household Durables | 110,302 | 5,307,350 | |||||||||||||
Bovis Homes Group PLC | Household Durables | 284,563 | 4,503,857 | |||||||||||||
DFS Furniture PLC | Household Durables | 1,601,304 | 4,238,463 | |||||||||||||
Greggs PLC | Hotels, Restaurants & Leisure | 861,993 | 16,285,458 | |||||||||||||
Laird PLC | Electronic Equipment, Instruments | |||||||||||||||
| & Components | 3,920,954 | 7,280,697 | ||||||||||||||
| b | LivaNova PLC | Health Care Equipment & Supplies | 82,651 | 6,605,468 | ||||||||||||
Man Group PLC | Capital Markets | 7,034,665 | 19,645,924 | |||||||||||||
Oxford Instruments PLC | Electronic Equipment, Instruments | |||||||||||||||
| & Components | 713,228 | 8,196,651 | ||||||||||||||
SIG PLC | Trading Companies & Distributors | 4,469,368 | 10,634,829 | |||||||||||||
| 42 | Annual Report | ftinstitutional.com | ||
TEMPLETON INSTITUTIONAL FUNDS
STATEMENT OF INVESTMENTS
Foreign Smaller Companies Series (continued) | ||||||||||||||||
| Industry | Shares | Value | ||||||||||||||
| Common Stocks (continued) | ||||||||||||||||
| United Kingdom (continued) | ||||||||||||||||
| b | Vectura Group PLC | Pharmaceuticals | 2,749,640 | $ | 4,370,497 | |||||||||||
|
| |||||||||||||||
| 87,069,194 | ||||||||||||||||
|
| |||||||||||||||
Total Common Stocks (Cost $665,267,184) |
|
988,564,160 |
| |||||||||||||
|
| |||||||||||||||
| Preferred Stocks (Cost $3,871,899) 0.7% | ||||||||||||||||
| Brazil 0.7% | ||||||||||||||||
| d | Alpargatas SA, 1.953%, pfd | Textiles, Apparel & Luxury Goods | 1,363,700 | 7,183,977 | ||||||||||||
|
| |||||||||||||||
Total Investments before Short Term | 995,748,137 | |||||||||||||||
|
| |||||||||||||||
| Principal Amount | ||||||||||||||||
| Short Term Investments 6.4% | ||||||||||||||||
U.S. Government and Agency Securities | ||||||||||||||||
| United States 3.7% | ||||||||||||||||
| e | FHLB, 1/02/18 | $ | 38,300,000 | 38,300,000 | ||||||||||||
|
| |||||||||||||||
| Shares | ||||||||||||||||
| f | Investments from Cash Collateral Received from Loaned Securities (Cost $27,923,489) 2.7% | |||||||||||||||
| Money Market Funds 2.7% | ||||||||||||||||
| United States 2.7% | ||||||||||||||||
| g,h | Institutional Fiduciary Trust Money Market Portfolio, 0.89% . | 27,923,489 | 27,923,489 | |||||||||||||
|
| |||||||||||||||
Total Investments (Cost $735,358,104) | 1,061,971,626 | |||||||||||||||
Other Assets, less Liabilities (2.1)% | (21,791,862 | ) | ||||||||||||||
|
| |||||||||||||||
Net Assets 100.0% |
$ |
1,040,179,764 |
| |||||||||||||
|
| |||||||||||||||
See Abbreviations on page 73.
aA portion or all of the security is on loan at December 31, 2017. See Note 1(d).
bNon-income producing.
cSecurity was purchased pursuant to Regulation S under the Securities Act of 1933, which exempts from registration securities offered and sold outside of the United States. Such a security cannot be sold in the United States without either an effective registration statement filed pursuant to the Securities Act of 1933, or pursuant to an exemption from registration. These securities have been deemed liquid under guidelines approved by the Trust’s Board of Trustees. At December 31, 2017, the aggregate value of these securities was $28,990,545, representing 2.8% of net assets.
dVariable rate security. The rate shown represents the yield at period end.
eThe security was issued on a discount basis with no stated coupon rate.
fSee Note 1(d) regarding securities on loan.
gSee Note 3(d) regarding investments in affiliated management investment companies.
hThe rate shown is the annualized seven-day yield at period end.
| ftinstitutional.com | The accompanying notes are an integral part of these financial statements. | Annual Report | 43 | ||||
TEMPLETON INSTITUTIONAL FUNDS
Financial Highlights
Global Equity Series
| Year Ended December 31, | ||||||||||||||||||||
| 2017 | 2016 | 2015 | 2014 | 2013 | ||||||||||||||||
| ||||||||||||||||||||
| Per share operating performance (for a share outstanding throughout the year) | ||||||||||||||||||||
Net asset value, beginning of year | $8.95 | $8.73 | $9.64 | $11.53 | $9.88 | |||||||||||||||
|
| |||||||||||||||||||
| Income from investment operationsa: | ||||||||||||||||||||
Net investment incomeb | 0.16 | 0.16 | 0.14 | 0.25c | 0.14 | |||||||||||||||
Net realized and unrealized gains (losses) | 1.71 | 0.25 | (0.43 | ) | (0.46 | ) | 2.84 | |||||||||||||
|
| |||||||||||||||||||
Total from investment operations | 1.87 | 0.41 | (0.29 | ) | (0.21 | ) | 2.98 | |||||||||||||
|
| |||||||||||||||||||
| Less distributions from: | ||||||||||||||||||||
Net investment income | (0.19 | ) | (0.15 | ) | (0.16 | ) | (0.26 | ) | (0.13 | ) | ||||||||||
Net realized gains | (0.04 | ) | (0.04 | ) | (0.46 | ) | (1.42 | ) | (1.20 | ) | ||||||||||
|
| |||||||||||||||||||
Total distributions | (0.23 | ) | (0.19 | ) | (0.62 | ) | (1.68 | ) | (1.33 | ) | ||||||||||
|
| |||||||||||||||||||
Net asset value, end of year | $10.59 | $8.95 | $8.73 | $9.64 | $11.53 | |||||||||||||||
|
| |||||||||||||||||||
Total return | 20.88% | 4.67% | (3.43)% | (2.01)% | 30.43% | |||||||||||||||
| Ratios to average net assets | ||||||||||||||||||||
Expenses before waiver and payments by affiliates and expense reduction | 0.82% | 0.84% | 0.81% | 0.92% | 0.94% | |||||||||||||||
Expenses net of waiver and payments by affiliates and expense reduction | 0.82% | d,e | 0.84% | 0.81% | d,e | 0.92% | 0.90% | e | ||||||||||||
Net investment income | 1.65% | 1.82% | 1.47% | 2.21% | c | 1.26% | ||||||||||||||
| Supplemental data | ||||||||||||||||||||
Net assets, end of year (000’s) | $327,015 | $280,709 | $282,830 | $467,375 | $491,602 | |||||||||||||||
Portfolio turnover rate | 25.27% | 27.91% | 36.88% | 35.50% | 42.66% | |||||||||||||||
aThe amount shown for a share outstanding throughout the period may not correlate with the Statement of Operations for the period due to the timing of sales and repurchases of the Fund’s shares in relation to income earned and/or fluctuating fair value of the investments of the Fund.
bBased on average daily shares outstanding.
cNet investment income per share includes approximately $0.09 per share related to income received in the form of special dividends in connection with certain Fund holdings. Excluding this amount, the ratio of net investment income to average net assets would have been 1.43%.
dBenefit of waiver and payments by affiliates rounds to less than 0.01%.
eBenefit of expense reduction rounds to less than 0.01%.
| 44 | Annual Report | The accompanying notes are an integral part of these financial statements. | ftinstitutional.com | ||
TEMPLETON INSTITUTIONAL FUNDS
Statement of Investments, December 31, 2017
| Global Equity Series | ||||||||||||||||
| Industry | Shares | Value | ||||||||||||||
| Common Stocks 96.5% | ||||||||||||||||
| Belgium 0.4% | ||||||||||||||||
UCB SA | Pharmaceuticals | 15,470 | $ | 1,228,361 | ||||||||||||
|
| |||||||||||||||
| Canada 2.9% | ||||||||||||||||
Alamos Gold Inc., A | Metals & Mining | 288,330 | 1,877,028 | |||||||||||||
| a | Husky Energy Inc. | Oil, Gas & Consumable Fuels | 364,700 | 5,149,491 | ||||||||||||
Tahoe Resources Inc. | Metals & Mining | 83,700 | 401,488 | |||||||||||||
Wheaton Precious Metals Corp. | Metals & Mining | 99,900 | 2,208,433 | |||||||||||||
|
| |||||||||||||||
|
9,636,440 |
| ||||||||||||||
|
| |||||||||||||||
| China 5.1% | ||||||||||||||||
| a | Baidu Inc., ADR | Internet Software & Services | 15,660 | 3,667,729 | ||||||||||||
China Life Insurance Co. Ltd., H. | Insurance | 966,000 | 3,035,422 | |||||||||||||
China Mobile Ltd. | Wireless Telecommunication Services | 214,000 | 2,170,719 | |||||||||||||
China Telecom Corp. Ltd., H | Diversified Telecommunication Services | 7,412,000 | 3,529,140 | |||||||||||||
Kunlun Energy Co. Ltd. | Oil, Gas & Consumable Fuels | 1,570,000 | 1,635,741 | |||||||||||||
Shanghai Pharmaceuticals Holding Co. Ltd., H | Health Care Providers & Services | 509,200 | 1,378,444 | |||||||||||||
Sinopharm Group Co. Ltd. | Health Care Providers & Services | 311,600 | 1,348,046 | |||||||||||||
|
| |||||||||||||||
|
16,765,241 |
| ||||||||||||||
|
| |||||||||||||||
| France 6.2% | ||||||||||||||||
AXA SA | Insurance | 130,035 | 3,859,056 | |||||||||||||
BNP Paribas SA | Banks | 64,264 | 4,799,721 | |||||||||||||
Cie Generale des Etablissements Michelin, B | Auto Components | 16,888 | 2,422,349 | |||||||||||||
Compagnie de Saint-Gobain | Building Products | 55,516 | 3,062,640 | |||||||||||||
Sanofi | Pharmaceuticals | 32,210 | 2,776,684 | |||||||||||||
Total SA | Oil, Gas & Consumable Fuels | 28,402 | 1,569,063 | |||||||||||||
Veolia Environnement SA | Multi-Utilities | 68,218 | 1,741,315 | |||||||||||||
|
| |||||||||||||||
|
20,230,828 |
| ||||||||||||||
|
| |||||||||||||||
| Germany 5.8% | ||||||||||||||||
Bayer AG | Pharmaceuticals | 29,510 | 3,682,235 | |||||||||||||
HeidelbergCement AG | Construction Materials | 13,410 | 1,452,061 | |||||||||||||
innogy SE | Multi-Utilities | 40,680 | 1,594,797 | |||||||||||||
Lanxess AG. | Chemicals | 52,721 | 4,193,152 | |||||||||||||
Merck KGaA | Pharmaceuticals | 25,730 | 2,770,659 | |||||||||||||
| a | MorphoSys AG | Life Sciences Tools & Services | 25,980 | 2,387,060 | ||||||||||||
Siemens AG, ADR | Industrial Conglomerates | 40,275 | 2,789,849 | |||||||||||||
|
| |||||||||||||||
|
18,869,813 |
| ||||||||||||||
|
| |||||||||||||||
| Hong Kong 0.9% | ||||||||||||||||
CK Hutchison Holdings Ltd. | Industrial Conglomerates | 234,040 | 2,938,662 | |||||||||||||
|
| |||||||||||||||
| India 0.2% | ||||||||||||||||
Housing Development Finance Corp. Ltd. | Thrifts & Mortgage Finance | 21,285 | 570,267 | |||||||||||||
|
| |||||||||||||||
| Ireland 1.1% | ||||||||||||||||
| a | Bank of Ireland Group PLC | Banks | 157,195 | 1,338,135 | ||||||||||||
CRH PLC | Construction Materials | 60,390 | 2,170,418 | |||||||||||||
|
| |||||||||||||||
|
3,508,553 |
| ||||||||||||||
|
| |||||||||||||||
| Israel 1.0% | ||||||||||||||||
Teva Pharmaceutical Industries Ltd., ADR | Pharmaceuticals | 169,898 | 3,219,567 | |||||||||||||
|
| |||||||||||||||
| Japan 8.7% | ||||||||||||||||
IHI Corp. | Machinery | 49,600 | 1,650,619 | |||||||||||||
INPEX Corp. | Oil, Gas & Consumable Fuels | 158,200 | 1,978,114 | |||||||||||||
Mitsui Fudosan Co. Ltd. | Real Estate Management & Development | 70,800 | 1,586,458 | |||||||||||||
| ftinstitutional.com | Annual Report | 45 | ||||
TEMPLETON INSTITUTIONAL FUNDS
STATEMENT OF INVESTMENTS
| Global Equity Series (continued) | ||||||||||||||||
| Industry | Shares | Value | ||||||||||||||
| Common Stocks (continued) | ||||||||||||||||
| Japan (continued) | ||||||||||||||||
Omron Corp. | Electronic Equipment, Instruments | |||||||||||||||
| & Components | 59,300 | $ | 3,536,371 | |||||||||||||
Panasonic Corp. | Household Durables | 311,500 | 4,559,784 | |||||||||||||
Ryohin Keikaku Co. Ltd. | Multiline Retail | 11,200 | 3,488,663 | |||||||||||||
SoftBank Group Corp. | Wireless Telecommunication Services | 57,000 | 4,512,047 | |||||||||||||
Sumitomo Metal Mining Co. Ltd. | Metals & Mining | 73,500 | 3,377,406 | |||||||||||||
Suntory Beverage & Food Ltd. | Beverages | 84,700 | 3,765,781 | |||||||||||||
|
| |||||||||||||||
|
28,455,243 |
| ||||||||||||||
|
| |||||||||||||||
| Luxembourg 0.4% | ||||||||||||||||
SES SA, IDR | Media | 95,350 | 1,488,356 | |||||||||||||
|
| |||||||||||||||
| Netherlands 2.1% | ||||||||||||||||
ING Groep NV | Banks | 135,218 | 2,486,245 | |||||||||||||
NN Group NV | Insurance | 60,681 | 2,629,719 | |||||||||||||
QIAGEN NV | Life Sciences Tools & Services | 57,575 | 1,809,165 | |||||||||||||
|
| |||||||||||||||
|
6,925,129 |
| ||||||||||||||
|
| |||||||||||||||
| Norway 1.8% | ||||||||||||||||
Telenor ASA | Diversified Telecommunication Services | 185,116 | 3,966,610 | |||||||||||||
Yara International ASA | Chemicals | 40,614 | 1,863,722 | |||||||||||||
|
| |||||||||||||||
|
5,830,332 |
| ||||||||||||||
|
| |||||||||||||||
| Portugal 1.4% | ||||||||||||||||
Galp Energia SGPS SA, B | Oil, Gas & Consumable Fuels | 242,940 | 4,466,922 | |||||||||||||
|
| |||||||||||||||
| Singapore 0.5% | ||||||||||||||||
Singapore Telecommunications Ltd. | Diversified Telecommunication Services | 627,204 | 1,674,107 | |||||||||||||
|
| |||||||||||||||
| South Korea 3.9% | ||||||||||||||||
Hana Financial Group Inc. | Banks | 60,590 | 2,826,918 | |||||||||||||
Hyundai Mobis Co. Ltd. | Auto Components | 6,165 | 1,519,049 | |||||||||||||
Samsung Electronics Co. Ltd. | Technology Hardware, Storage & Peripherals | 3,591 | 8,572,309 | |||||||||||||
|
| |||||||||||||||
|
12,918,276 |
| ||||||||||||||
|
| |||||||||||||||
| Switzerland 2.3% | ||||||||||||||||
Roche Holding AG | Pharmaceuticals | 14,360 | 3,632,924 | |||||||||||||
UBS Group AG | Capital Markets | 220,250 | 4,055,304 | |||||||||||||
|
| |||||||||||||||
|
7,688,228 |
| ||||||||||||||
|
| |||||||||||||||
| Taiwan 1.1% | ||||||||||||||||
Taiwan Semiconductor Manufacturing Co. Ltd., ADR | Semiconductors & Semiconductor Equipment | 90,240 | 3,578,016 | |||||||||||||
|
| |||||||||||||||
| Thailand 1.1% | ||||||||||||||||
Bangkok Bank PCL, NVDR | Banks | 566,300 | 3,512,208 | |||||||||||||
|
| |||||||||||||||
| United Kingdom 14.4% | ||||||||||||||||
BAE Systems PLC | Aerospace & Defense | 414,804 | 3,209,786 | |||||||||||||
Barclays PLC | Banks | 1,013,040 | 2,778,530 | |||||||||||||
BP PLC | Oil, Gas & Consumable Fuels | 1,198,659 | 8,461,097 | |||||||||||||
GlaxoSmithKline PLC | Pharmaceuticals | 74,600 | 1,332,334 | |||||||||||||
HSBC Holdings PLC | Banks | 539,200 | 5,517,710 | |||||||||||||
Kingfisher PLC | Specialty Retail | 386,087 | 1,760,738 | |||||||||||||
| a | LivaNova PLC | Health Care Equipment & Supplies | 37,100 | 2,965,032 | ||||||||||||
Rolls-Royce Holdings PLC | Aerospace & Defense | 145,920 | 1,669,078 | |||||||||||||
| a | Rolls-Royce Holdings PLC, interim line | Aerospace & Defense | 6,712,320 | 9,065 | ||||||||||||
Royal Dutch Shell PLC, B | Oil, Gas & Consumable Fuels | 197,794 | 6,700,477 | |||||||||||||
Shire PLC | Biotechnology | 59,320 | 3,124,239 | |||||||||||||
| 46 | Annual Report | ftinstitutional.com | ||
TEMPLETON INSTITUTIONAL FUNDS
STATEMENT OF INVESTMENTS
| Global Equity Series (continued) | ||||||||||||||||
| Industry | Shares | Value | ||||||||||||||
| Common Stocks (continued) | ||||||||||||||||
| United Kingdom (continued) | ||||||||||||||||
| a | Standard Chartered PLC | Banks | 385,129 | $ | 4,057,280 | |||||||||||
Vodafone Group PLC | Wireless Telecommunication Services | 1,789,378 | 5,678,694 | |||||||||||||
|
| |||||||||||||||
|
47,264,060 |
| ||||||||||||||
|
| |||||||||||||||
| United States 35.2% | ||||||||||||||||
Advance Auto Parts Inc. | Specialty Retail | 17,700 | 1,764,513 | |||||||||||||
Allergan PLC | Pharmaceuticals | 18,040 | 2,950,983 | |||||||||||||
| a | Alphabet Inc., A | Internet Software & Services | 6,180 | 6,510,012 | ||||||||||||
American International Group Inc. | Insurance | 47,690 | 2,841,370 | |||||||||||||
Amgen Inc. | Biotechnology | 24,000 | 4,173,600 | |||||||||||||
Apache Corp. | Oil, Gas & Consumable Fuels | 40,050 | 1,690,911 | |||||||||||||
Apple Inc. | Technology Hardware, Storage & Peripherals | 41,090 | 6,953,661 | |||||||||||||
Capital One Financial Corp. | Consumer Finance | 47,340 | 4,714,117 | |||||||||||||
| a | Celgene Corp. | Biotechnology | 30,560 | 3,189,242 | ||||||||||||
Citigroup Inc. | Banks | 81,620 | 6,073,344 | |||||||||||||
Comcast Corp., A | Media | 134,640 | 5,392,332 | |||||||||||||
| a | CommScope Holding Co. Inc. | Communications Equipment | 77,900 | 2,946,957 | ||||||||||||
ConocoPhillips | Oil, Gas & Consumable Fuels | 73,370 | 4,027,279 | |||||||||||||
Coty Inc., A | Personal Products | 180,600 | 3,592,134 | |||||||||||||
Devon Energy Corp. | Oil, Gas & Consumable Fuels | 46,820 | 1,938,348 | |||||||||||||
DXC Technology Co. | IT Services | 28,130 | 2,669,537 | |||||||||||||
Eastman Chemical Co. | Chemicals | 17,570 | 1,627,685 | |||||||||||||
Eli Lilly & Co. | Pharmaceuticals | 41,070 | 3,468,772 | |||||||||||||
Gilead Sciences Inc. | Biotechnology | 55,110 | 3,948,080 | |||||||||||||
Helmerich & Payne Inc. | Energy Equipment & Services | 31,900 | 2,062,016 | |||||||||||||
Intel Corp. | Semiconductors & Semiconductor Equipment | 43,900 | 2,026,424 | |||||||||||||
JPMorgan Chase & Co. | Banks | 53,760 | 5,749,094 | |||||||||||||
| a | Knowles Corp. | Electronic Equipment, Instruments | ||||||||||||||
| & Components | 148,000 | 2,169,680 | ||||||||||||||
LyondellBasell Industries NV, A | Chemicals | 29,400 | 3,243,408 | |||||||||||||
Medtronic PLC | Health Care Equipment & Supplies | 18,580 | 1,500,335 | |||||||||||||
Microsoft Corp. | Software | 75,380 | 6,448,005 | |||||||||||||
Oracle Corp. | Software | 133,710 | 6,321,809 | |||||||||||||
Pfizer Inc. | Pharmaceuticals | 38,800 | 1,405,336 | |||||||||||||
Rockwell Collins Inc. | Aerospace & Defense | 18,050 | 2,447,941 | |||||||||||||
Stanley Black & Decker Inc. | Machinery | 9,520 | 1,615,449 | |||||||||||||
Twenty-First Century Fox Inc., A | Media | 68,120 | 2,352,184 | |||||||||||||
Voya Financial Inc. | Diversified Financial Services | 92,270 | 4,564,597 | |||||||||||||
Walgreens Boots Alliance Inc. | Food & Staples Retailing | 36,490 | 2,649,904 | |||||||||||||
|
| |||||||||||||||
|
115,029,059 |
| ||||||||||||||
|
| |||||||||||||||
Total Common Stocks (Cost $236,180,177) | 315,797,668 | |||||||||||||||
|
| |||||||||||||||
Preferred Stocks (Cost $1,775,190) 0.4% | ||||||||||||||||
| Germany 0.4% | ||||||||||||||||
| b | Draegerwerk AG & Co. KGaA, 0.263%, pfd | Health Care Equipment & Supplies | 14,500 | 1,257,811 | ||||||||||||
|
| |||||||||||||||
Total Investments before Short Term Investments (Cost $237,955,367) | 317,055,479 | |||||||||||||||
|
| |||||||||||||||
| ftinstitutional.com | Annual Report | 47 | ||||
TEMPLETON INSTITUTIONAL FUNDS
STATEMENT OF INVESTMENTS
| Global Equity Series (continued) | ||||||||||||
| Principal Amount | Value | |||||||||||
| Short Term Investments (Cost $9,100,000) 2.8% | ||||||||||||
| Time Deposits 2.8% | ||||||||||||
| United States 2.8% | ||||||||||||
Royal Bank of Canada, 1.35%, 1/02/18 | $ | 9,100,000 | $ | 9,100,000 | ||||||||
|
| |||||||||||
Total Investments (Cost $247,055,367) 99.7% | 326,155,479 | |||||||||||
Other Assets, less Liabilities 0.3% | 859,995 | |||||||||||
|
| |||||||||||
Net Assets 100.0% |
$ |
327,015,474 |
| |||||||||
|
| |||||||||||
See Abbreviations on page 73.
aNon-income producing.
bVariable rate security. The rate shown represents the yield at period end.
| 48 | Annual Report | The accompanying notes are an integral part of these financial statements. | ftinstitutional.com | ||
TEMPLETON INSTITUTIONAL FUNDS
Financial Highlights
International Equity Series
| Year Ended December 31, | ||||||||||||||||||||
| 2017 | 2016 | 2015 | 2014 | 2013 | ||||||||||||||||
| ||||||||||||||||||||
| Primary Shares | ||||||||||||||||||||
| Per share operating performance (for a share outstanding throughout the year) | ||||||||||||||||||||
Net asset value, beginning of year | $18.65 | $19.05 | $20.05 | $22.72 | $19.60 | |||||||||||||||
|
| |||||||||||||||||||
| Income from investment operationsa: | ||||||||||||||||||||
Net investment incomeb | 0.45 | 0.45 | 0.45 | 0.74 | c | 0.45 | ||||||||||||||
Net realized and unrealized gains (losses) | 3.81 | (0.20 | ) | (0.98 | ) | (2.27 | ) | 3.36 | ||||||||||||
|
| |||||||||||||||||||
Total from investment operations | 4.26 | 0.25 | (0.53 | ) | (1.53 | ) | 3.81 | |||||||||||||
|
| |||||||||||||||||||
| Less distributions from: | ||||||||||||||||||||
Net investment income | (0.64 | ) | (0.46 | ) | (0.47 | ) | (0.79 | ) | (0.44 | ) | ||||||||||
Net realized gains | (0.28 | ) | (0.19 | ) | — | (0.35 | ) | (0.25 | ) | |||||||||||
|
| |||||||||||||||||||
Total distributions | (0.92 | ) | (0.65 | ) | (0.47 | ) | (1.14 | ) | (0.69 | ) | ||||||||||
|
| |||||||||||||||||||
Net asset value, end of year. | $21.99 | $18.65 | $19.05 | $20.05 | $22.72 | |||||||||||||||
|
| |||||||||||||||||||
Total return | 22.92% | 1.30% | (2.67)% | (6.78)% | 19.51% | |||||||||||||||
| Ratios to average net assets | ||||||||||||||||||||
Expenses | 0.78% | d | 0.78% | d | 0.78% | d | 0.78% | d | 0.79% | |||||||||||
Net investment income | 2.13% | 2.44% | 2.16% | 3.27% | c | 2.12% | ||||||||||||||
| Supplemental data | ||||||||||||||||||||
Net assets, end of year (000’s) | $4,412,494 | $4,539,205 | $5,077,937 | $6,210,850 | $6,815,920 | |||||||||||||||
Portfolio turnover rate | 16.39% | e | 14.88% | 16.16% | 14.97% | 15.89% | ||||||||||||||
aThe amount shown for a share outstanding throughout the period may not correlate with the Statement of Operations for the period due to the timing of sales and repurchases of the Fund’s shares in relation to income earned and/or fluctuating fair value of the investments of the Fund.
bBased on average daily shares outstanding.
cNet investment income per share includes approximately $0.29 per share related to income received in the form of special dividends in connection with certain Fund holdings. Excluding this amount, the ratio of net investment income to average net assets would have been 2.00%.
dBenefit of waiver and payments by affiliates rounds to less than 0.01%.
eExcludes the value of portfolio securities delivered as a result of a redemption in-kind. See Note 10.
| ftinstitutional.com | The accompanying notes are an integral part of these financial statements. | Annual Report | 49 | ||||
TEMPLETON INSTITUTIONAL FUNDS
FINANCIAL HIGHLIGHTS
International Equity Series (continued)
| Year Ended December 31, | ||||||||||||||||||||
| 2017 | 2016 | 2015 | 2014 | 2013 | ||||||||||||||||
| ||||||||||||||||||||
| Service Shares | ||||||||||||||||||||
| Per share operating performance (for a share outstanding throughout the year) | ||||||||||||||||||||
Net asset value, beginning of year | $18.72 | $19.11 | $20.11 | $22.79 | $19.62 | |||||||||||||||
|
| |||||||||||||||||||
| Income from investment operationsa: | ||||||||||||||||||||
Net investment incomeb | 0.39 | 0.42 | 0.36 | 0.71 | c | 0.48 | ||||||||||||||
Net realized and unrealized gains (losses) | 3.85 | (0.20 | ) | (0.92 | ) | (2.28 | ) | 3.30 | ||||||||||||
|
| |||||||||||||||||||
Total from investment operations | 4.24 | 0.22 | (0.56 | ) | (1.57 | ) | 3.78 | |||||||||||||
|
| |||||||||||||||||||
| Less distributions from: | ||||||||||||||||||||
Net investment income | (0.61 | ) | (0.42 | ) | (0.44 | ) | (0.76 | ) | (0.36 | ) | ||||||||||
Net realized gains | (0.28 | ) | (0.19 | ) | — | (0.35 | ) | (0.25 | ) | |||||||||||
|
| |||||||||||||||||||
Total distributions | (0.89 | ) | (0.61 | ) | (0.44 | ) | (1.11 | ) | (0.61 | ) | ||||||||||
|
| |||||||||||||||||||
Net asset value, end of year | $22.07 | $18.72 | $19.11 | $20.11 | $22.79 | |||||||||||||||
|
| |||||||||||||||||||
Total return | 22.73% | 1.15% | (2.80)% | (6.95)% | 19.31% | |||||||||||||||
| Ratios to average net assets | ||||||||||||||||||||
Expenses | 0.93% | d | 0.93% | d | 0.93% | d | 0.93% | d | 0.94% | |||||||||||
Net investment income | 1.98% | 2.29% | 2.01% | 3.12% | c | 1.97% | ||||||||||||||
| Supplemental data | ||||||||||||||||||||
Net assets, end of year (000’s) | $14,164 | $8,624 | $12,525 | $6,985 | $7,705 | |||||||||||||||
Portfolio turnover rate | 16.39% | e | 14.88% | 16.16% | 14.97% | 15.89% | ||||||||||||||
aThe amount shown for a share outstanding throughout the period may not correlate with the Statement of Operations for the period due to the timing of sales and repurchases of the Fund’s shares in relation to income earned and/or fluctuating fair value of the investments of the Fund.
bBased on average daily shares outstanding.
cNet investment income per share includes approximately $0.29 per share related to income received in the form of special dividends in connection with certain Fund holdings. Excluding this amount, the ratio of net investment income to average net assets would have been 1.85%.
dBenefit of waiver and payments by affiliates rounds to less than 0.01%.
eExcludes the value of portfolio securities delivered as a result of a redemption in-kind. See Note 10.
| 50 | Annual Report | The accompanying notes are an integral part of these financial statements. | ftinstitutional.com | ||
TEMPLETON INSTITUTIONAL FUNDS
Statement of Investments, December 31, 2017
| International Equity Series | ||||||||||||||
| Industry | Shares | Value | ||||||||||||
| Common Stocks 97.3% | ||||||||||||||
| Belgium 0.8% | ||||||||||||||
UCB SA | Pharmaceuticals | 467,079 | $ | 37,087,366 | ||||||||||
|
| |||||||||||||
| Canada 2.9% | ||||||||||||||
| a | Husky Energy Inc. | Oil, Gas & Consumable Fuels | 1,888,903 | 26,670,932 | ||||||||||
Suncor Energy Inc. | Oil, Gas & Consumable Fuels | 1,372,331 | 50,380,300 | |||||||||||
Tahoe Resources Inc. | Metals & Mining | 1,356,425 | 6,506,438 | |||||||||||
Wheaton Precious Metals Corp. | Metals & Mining | 1,991,332 | 44,021,252 | |||||||||||
|
| |||||||||||||
|
127,578,922 |
| ||||||||||||
|
| |||||||||||||
| China 6.2% | ||||||||||||||
| a | Baidu Inc., ADR | Internet Software & Services | 240,517 | 56,331,487 | ||||||||||
China Life Insurance Co. Ltd., H | Insurance | 14,004,448 | 44,005,606 | |||||||||||
China Mobile Ltd. | Wireless Telecommunication Services | 4,469,764 | 45,339,255 | |||||||||||
China Telecom Corp. Ltd., H | Diversified Telecommunication Services | 115,218,881 | 54,860,165 | |||||||||||
Haier Electronics Group Co. Ltd. | Household Durables | 4,896,912 | 13,413,020 | |||||||||||
NetEase Inc., ADR | Internet Software & Services | 81,300 | 28,054,191 | |||||||||||
Sinopharm Group Co. Ltd. | Health Care Providers & Services | 7,110,776 | 30,762,683 | |||||||||||
|
| |||||||||||||
|
272,766,407 |
| ||||||||||||
|
| |||||||||||||
| Denmark 0.5% | ||||||||||||||
Orsted AS | Electric Utilities | 404,005 | 22,052,618 | |||||||||||
|
| |||||||||||||
| France 10.4% | ||||||||||||||
AXA SA | Insurance | 2,221,330 | 65,922,532 | |||||||||||
BNP Paribas SA | Banks | 1,125,022 | 84,025,141 | |||||||||||
Cie Generale des Etablissements Michelin, B | Auto Components | 378,513 | 54,292,428 | |||||||||||
Compagnie de Saint-Gobain | Building Products | 926,315 | 51,101,841 | |||||||||||
Sanofi | Pharmaceuticals | 781,278 | 67,350,566 | |||||||||||
Total SA | Oil, Gas & Consumable Fuels | 1,197,744 | 66,169,120 | |||||||||||
Veolia Environnement SA. | Multi-Utilities | 1,560,832 | 39,841,402 | |||||||||||
Zodiac Aerospace | Aerospace & Defense | 1,083,499 | 32,408,555 | |||||||||||
|
| |||||||||||||
|
461,111,585 |
| ||||||||||||
|
| |||||||||||||
| Germany 9.6% | ||||||||||||||
Bayer AG | Pharmaceuticals | 581,196 | 72,521,176 | |||||||||||
HeidelbergCement AG | Construction Materials | 427,495 | 46,289,995 | |||||||||||
Infineon Technologies AG | Semiconductors & Semiconductor Equipment | 1,842,002 | 50,466,129 | |||||||||||
innogy SE | Multi-Utilities | 1,161,677 | 45,541,766 | |||||||||||
Lanxess AG | Chemicals | 641,879 | 51,051,684 | |||||||||||
Merck KGaA | Pharmaceuticals | 576,692 | 62,099,380 | |||||||||||
Siemens AG | Industrial Conglomerates | 448,143 | 62,451,764 | |||||||||||
Telefonica Deutschland Holding AG | Diversified Telecommunication Services | 7,180,979 | 36,065,484 | |||||||||||
|
| |||||||||||||
|
426,487,378 |
| ||||||||||||
|
| |||||||||||||
| Hong Kong 2.6% | ||||||||||||||
AIA Group Ltd. | Insurance | 2,418,202 | 20,629,241 | |||||||||||
CK Asset Holdings Ltd. | Real Estate Management & Development | 3,016,394 | 26,369,342 | |||||||||||
CK Hutchison Holdings Ltd. | Industrial Conglomerates | 5,377,294 | 67,518,580 | |||||||||||
|
| |||||||||||||
|
114,517,163 |
| ||||||||||||
|
| |||||||||||||
| India 1.4% | ||||||||||||||
Housing Development Finance Corp. Ltd. | Thrifts & Mortgage Finance | 2,247,128 | 60,205,008 | |||||||||||
|
| |||||||||||||
| Ireland 1.6% | ||||||||||||||
| a | Bank of Ireland Group PLC | Banks | 1,605,300 | 13,665,247 | ||||||||||
CRH PLC | Construction Materials | 1,573,158 | 56,447,201 | |||||||||||
|
| |||||||||||||
|
70,112,448 |
| ||||||||||||
|
| |||||||||||||
| ftinstitutional.com | Annual Report | 51 | ||||
TEMPLETON INSTITUTIONAL FUNDS
STATEMENT OF INVESTMENTS
International Equity Series (continued)
| Industry | Shares | Value | ||||||||||||
| Common Stocks (continued) | ||||||||||||||
| Israel 1.2% | ||||||||||||||
Teva Pharmaceutical Industries Ltd., ADR | Pharmaceuticals | 2,770,284 | $ | 52,496,882 | ||||||||||
|
| |||||||||||||
| Italy 1.8% | ||||||||||||||
Eni SpA | Oil, Gas & Consumable Fuels | 2,684,985 | 44,455,943 | |||||||||||
Tenaris SA | Energy Equipment & Services | 2,215,102 | 34,975,063 | |||||||||||
|
| |||||||||||||
|
79,431,006 |
| ||||||||||||
|
| |||||||||||||
| Japan 11.9% | ||||||||||||||
Astellas Pharma Inc. | Pharmaceuticals | 2,621,600 | 33,431,594 | |||||||||||
INPEX Corp. | Oil, Gas & Consumable Fuels | 3,832,038 | 47,915,353 | |||||||||||
Konica Minolta Inc. | Technology Hardware, Storage & Peripherals | 3,220,024 | 30,975,782 | |||||||||||
Mitsui Fudosan Co. Ltd. | Real Estate Management & Development | 1,777,090 | 39,820,316 | |||||||||||
Omron Corp. | Electronic Equipment, Instruments | |||||||||||||
| & Components | 941,251 | 56,131,754 | ||||||||||||
Panasonic Corp. | Household Durables | 2,165,645 | 31,701,038 | |||||||||||
Ryohin Keikaku Co. Ltd. | Multiline Retail | 157,394 | 49,026,307 | |||||||||||
Seven & i Holdings Co. Ltd. | Food & Staples Retailing | 527,300 | 21,913,705 | |||||||||||
SoftBank Group Corp. | Wireless Telecommunication Services | 813,214 | 64,372,977 | |||||||||||
Sumitomo Metal Mining Co. Ltd. | Metals & Mining | 1,326,082 | 60,934,930 | |||||||||||
Sumitomo Rubber Industries Ltd. | Auto Components | 1,647,554 | 30,645,367 | |||||||||||
Suntory Beverage & Food Ltd. | Beverages | 1,352,979 | 60,153,745 | |||||||||||
|
| |||||||||||||
|
527,022,868 |
| ||||||||||||
|
| |||||||||||||
| Luxembourg 0.3% | ||||||||||||||
SES SA, IDR | Media | 759,601 | 11,856,915 | |||||||||||
|
| |||||||||||||
| Netherlands 5.6% | ||||||||||||||
Akzo Nobel NV | Chemicals | 506,000 | 44,330,357 | |||||||||||
ASR Nederland NV | Insurance | 603,636 | 24,845,139 | |||||||||||
ING Groep NV | Banks | 3,126,698 | 57,490,396 | |||||||||||
NN Group NV | Insurance | 940,038 | 40,738,219 | |||||||||||
QIAGEN NV | Life Sciences Tools & Services | 1,315,116 | 41,324,579 | |||||||||||
SBM Offshore NV | Energy Equipment & Services | 2,210,784 | 38,912,157 | |||||||||||
|
| |||||||||||||
|
247,640,847 |
| ||||||||||||
|
| |||||||||||||
| Norway 2.5% | ||||||||||||||
Telenor ASA | Diversified Telecommunication Services | 3,541,522 | 75,886,676 | |||||||||||
Yara International ASA | Chemicals | 760,884 | 34,915,946 | |||||||||||
|
| |||||||||||||
|
110,802,622 |
| ||||||||||||
|
| |||||||||||||
| Portugal 0.8% | ||||||||||||||
Galp Energia SGPS SA, B | Oil, Gas & Consumable Fuels | 1,887,942 | 34,713,469 | |||||||||||
|
| |||||||||||||
Singapore 2.8% | ||||||||||||||
DBS Group Holdings Ltd. | Banks | 2,630,891 | 48,880,480 | |||||||||||
Singapore Telecommunications Ltd. | Diversified Telecommunication Services | 20,964,276 | 55,956,983 | |||||||||||
United Overseas Bank Ltd. | Banks | 1,024,816 | 20,266,455 | |||||||||||
|
| |||||||||||||
|
125,103,918 |
| ||||||||||||
|
| |||||||||||||
| South Korea 5.5% | ||||||||||||||
Hana Financial Group Inc. | Banks | 758,840 | 35,404,831 | |||||||||||
KB Financial Group Inc. | Banks | 901,450 | 53,544,378 | |||||||||||
Samsung Electronics Co. Ltd. | Technology Hardware, Storage & Peripherals | 65,580 | 156,550,266 | |||||||||||
|
| |||||||||||||
|
245,499,475 |
| ||||||||||||
|
| |||||||||||||
| Sweden 0.7% | ||||||||||||||
Getinge AB, B | Health Care Equipment & Supplies | 2,011,526 | 29,180,270 | |||||||||||
|
| |||||||||||||
| 52 | Annual Report | ftinstitutional.com | ||
TEMPLETON INSTITUTIONAL FUNDS
STATEMENT OF INVESTMENTS
International Equity Series (continued)
| Industry | Shares | Value | ||||||||||||
| Common Stocks (continued) | ||||||||||||||
| Switzerland 5.6% | ||||||||||||||
Glencore PLC | Metals & Mining | 4,511,651 | $ | 23,761,761 | ||||||||||
Novartis AG | Pharmaceuticals | 511,590 | 43,264,757 | |||||||||||
Roche Holding AG | Pharmaceuticals | 350,283 | 88,617,806 | |||||||||||
Swiss Re AG | Insurance | 374,838 | 35,104,395 | |||||||||||
UBS Group AG | Capital Markets | 3,090,946 | 56,911,348 | |||||||||||
|
| |||||||||||||
|
247,660,067 |
| ||||||||||||
|
| |||||||||||||
| Taiwan 2.4% | ||||||||||||||
Catcher Technology Co. Ltd. | Technology Hardware, Storage & Peripherals | 2,925,000 | 32,338,962 | |||||||||||
Pegatron Corp. | Technology Hardware, Storage & Peripherals | 10,765,000 | 26,125,999 | |||||||||||
Taiwan Semiconductor Manufacturing Co. Ltd. | Semiconductors & Semiconductor Equipment | 6,258,492 | 48,414,869 | |||||||||||
|
| |||||||||||||
|
106,879,830 |
| ||||||||||||
|
| |||||||||||||
| Thailand 1.2% | ||||||||||||||
Bangkok Bank PCL, fgn | Banks | 191,232 | 1,285,840 | |||||||||||
Bangkok Bank PCL, NVDR | Banks | 8,380,531 | 51,976,274 | |||||||||||
|
| |||||||||||||
|
53,262,114 |
| ||||||||||||
|
| |||||||||||||
| United Kingdom 18.5% | ||||||||||||||
BAE Systems PLC | Aerospace & Defense | 7,119,366 | 55,090,214 | |||||||||||
Barclays PLC | Banks | 17,257,212 | 47,332,459 | |||||||||||
BP PLC | Oil, Gas & Consumable Fuels | 17,317,598 | 122,241,500 | |||||||||||
HSBC Holdings PLC | Banks | 7,716,315 | 78,962,144 | |||||||||||
Johnson Matthey PLC | Chemicals | 499,024 | 20,722,639 | |||||||||||
Kingfisher PLC | Specialty Retail | 12,865,424 | 58,672,376 | |||||||||||
| a | LivaNova PLC | Health Care Equipment & Supplies | 606,362 | 48,460,451 | ||||||||||
London Stock Exchange Group PLC | Capital Markets | 500,232 | 25,623,168 | |||||||||||
Rolls-Royce Holdings PLC | Aerospace & Defense | 2,687,511 | 30,740,588 | |||||||||||
| a | Rolls-Royce Holdings PLC, interim line | Aerospace & Defense | 105,292,620 | 142,192 | ||||||||||
Royal Dutch Shell PLC, B | Oil, Gas & Consumable Fuels | 1,332,009 | 45,123,188 | |||||||||||
Royal Dutch Shell PLC, B, ADR | Oil, Gas & Consumable Fuels | 1,101,123 | 75,195,690 | |||||||||||
Shire PLC | Biotechnology | 653,029 | 34,393,438 | |||||||||||
| a | Standard Chartered PLC | Banks | 7,124,630 | 75,056,984 | ||||||||||
Travis Perkins PLC | Trading Companies & Distributors | 2,034,696 | 43,057,325 | |||||||||||
Vodafone Group PLC | Wireless Telecommunication Services | 18,922,340 | 60,051,135 | |||||||||||
|
| |||||||||||||
|
820,865,491 |
| ||||||||||||
|
| |||||||||||||
| United States 0.5% | ||||||||||||||
Chubb Ltd. | Insurance | 147,480 | 21,551,252 | |||||||||||
|
| |||||||||||||
Total Common Stocks |
| 4,305,885,921 | ||||||||||||
|
| |||||||||||||
| ftinstitutional.com | Annual Report | 53 | ||||
TEMPLETON INSTITUTIONAL FUNDS
STATEMENT OF INVESTMENTS
International Equity Series (continued)
| Shares | Value | |||||||||
| Short Term Investments (Cost $136,672,218) 3.1% | ||||||||||
| Money Market Funds 3.1% | ||||||||||
| United States 3.1% | ||||||||||
| b,c | Institutional Fiduciary Trust Money Market Portfolio, 0.89% | 136,672,218 | $ | 136,672,218 | ||||||
|
| |||||||||
Total Investments (Cost $2,941,680,455) 100.4% | 4,442,558,139 | |||||||||
Other Assets, less Liabilities (0.4)% | (15,899,812 | ) | ||||||||
|
| |||||||||
Net Assets 100.0% | $ | 4,426,658,327 | ||||||||
|
| |||||||||
See Abbreviations on page 73.
aNon-income producing.
bSee Note 3(d) regarding investments in affiliated management investment companies.
cThe rate shown is the annualized seven-day yield at period end.
| 54 | Annual Report | The accompanying notes are an integral part of these financial statements. | ftinstitutional.com | ||
TEMPLETON INSTITUTIONAL FUNDS
Statements of Assets and Liabilities
December 31, 2017
| Emerging Markets Series | Foreign Smaller Companies Series | Global Equity Series | ||||||||||
| ||||||||||||
Assets: | ||||||||||||
+Investments in securities: | ||||||||||||
Cost - Unaffiliated issuers | $37,409,060 | $ 707,434,615 | $247,055,367 | |||||||||
Cost - Non-controlled affiliates (Note 3d) | 763,014 | 27,923,489 | — | |||||||||
|
| |||||||||||
Value - Unaffiliated issuers | $56,505,759 | $1,034,048,137 | $326,155,479 | |||||||||
Value - Non-controlled affiliates (Note 3d) | 763,014 | 27,923,489 | — | |||||||||
Cash | — | 2,176,692 | 130,861 | |||||||||
Receivables: | ||||||||||||
Investment securities sold | — | 1,220,744 | 1,592 | |||||||||
Capital shares sold | 11,996 | 302,810 | 25,927 | |||||||||
Dividends | 196,404 | 3,005,622 | 943,595 | |||||||||
Foreign tax refund | — | — | 10,578 | |||||||||
European Union tax reclaims | — | 1,068,598 | 53,898 | |||||||||
Other assets | 4 | 111 | 32 | |||||||||
|
| |||||||||||
Total assets | 57,477,177 | 1,069,746,203 | 327,321,962 | |||||||||
|
| |||||||||||
Liabilities: | ||||||||||||
Payables: | ||||||||||||
Investment securities purchased | — | 102,412 | 26,116 | |||||||||
Capital shares redeemed | 9,699 | 441,638 | — | |||||||||
Management fees | 49,671 | 815,873 | 212,243 | |||||||||
Transfer agent fees | 9,665 | 22,229 | 6,138 | |||||||||
Professional fees | 46,551 | 55,076 | 47,227 | |||||||||
Payable upon return of securities loaned | — | 27,923,489 | — | |||||||||
Deferred tax | 78,142 | 120,033 | — | |||||||||
Accrued expenses and other liabilities | 14,045 | 85,689 | 14,764 | |||||||||
|
| |||||||||||
Total liabilities | 207,773 | 29,566,439 | 306,488 | |||||||||
|
| |||||||||||
Net assets, at value | $57,269,404 | $1,040,179,764 | $327,015,474 | |||||||||
|
| |||||||||||
Net assets consist of: | ||||||||||||
Paid-in capital | $45,776,211 | $ 707,320,050 | $247,897,504 | |||||||||
Distributions in excess of net investment income | (74,349 | ) | (11,763,155 | ) | (643,910 | ) | ||||||
Net unrealized appreciation (depreciation) | 19,009,728 | 326,608,082 | 79,122,693 | |||||||||
Accumulated net realized gain (loss) | (7,442,186 | ) | 18,014,787 | 639,187 | ||||||||
|
| |||||||||||
Net assets, at value | $57,269,404 | $1,040,179,764 | $327,015,474 | |||||||||
|
| |||||||||||
Shares outstanding | 9,446,136 | 41,478,377 | 30,882,548 | |||||||||
|
| |||||||||||
Net asset value per share | $6.06 | $25.08 | $10.59 | |||||||||
|
| |||||||||||
+Includes securities loaned | $ — | $26,611,739 | $ | — | ||||||||
| ftinstitutional.com | The accompanying notes are an integral part of these financial statements. | Annual Report | 55 | ||||
TEMPLETON INSTITUTIONAL FUNDS
FINANCIAL STATEMENTS
Statements of Assets and Liabilities (continued)
December 31, 2017
| International Equity Series | ||||
| ||||
Assets: | ||||
Investments in securities: | ||||
Cost - Unaffiliated issuers | $2,805,008,237 | |||
Cost - Non-controlled affiliates (Note 3d) | 136,672,218 | |||
|
| |||
Value - Unaffiliated issuers | $4,305,885,921 | |||
Value - Non-controlled affiliates (Note 3d) | 136,672,218 | |||
Receivables: | ||||
Investment securities sold | 39,799,696 | |||
Capital shares sold | 2,930,780 | |||
Dividends | 18,308,647 | |||
European Union tax reclaims | 8,142,026 | |||
Other assets | 543 | |||
|
| |||
Total assets |
|
4,511,739,831 |
| |
|
| |||
Liabilities: | ||||
Payables: | ||||
Investment securities purchased | 527,492 | |||
Capital shares redeemed | 81,113,635 | |||
Management fees | 2,840,421 | |||
Transfer agent fees | 110,543 | |||
Professional fees | 70,462 | |||
Funds advanced by custodian | 623 | |||
Accrued expenses and other liabilities | 418,328 | |||
|
| |||
Total liabilities | 85,081,504 | |||
|
| |||
Net assets, at value |
|
$4,426,658,327 |
| |
|
| |||
Net assets consist of: | ||||
Paid-in capital | $2,901,051,586 | |||
Distributions in excess of net investment income | (56,754,552 | ) | ||
Net unrealized appreciation (depreciation) | 1,501,588,570 | |||
Accumulated net realized gain (loss) | 80,772,723 | |||
|
| |||
Net assets, at value | $4,426,658,327 | |||
|
| |||
| Primary Shares: | ||||
Net assets, at value | $4,412,493,885 | |||
|
| |||
Shares outstanding | 200,623,146 | |||
|
| |||
Net asset value per share | $21.99 | |||
|
| |||
| Service Shares: | ||||
Net assets, at value | $ 14,164,442 | |||
|
| |||
Shares outstanding | 641,726 | |||
|
| |||
Net asset value per share | $22.07 | |||
|
| |||
| 56 | Annual Report | The accompanying notes are an integral part of these financial statements. | ftinstitutional.com | ||
TEMPLETON INSTITUTIONAL FUNDS
FINANCIAL STATEMENTS
Statements of Operations
for the year ended December 31, 2017
| Emerging Markets Series | Foreign Smaller Companies Series | Global Equity Series | ||||||||||
| ||||||||||||
Investment income: | ||||||||||||
Dividends: (net of foreign taxes)* | ||||||||||||
Unaffiliated issuers | $ 1,042,428 | $ 20,945,390 | $ 7,426,421 | |||||||||
Non-controlled affiliates (Note 3d) | 5,066 | — | — | |||||||||
Interest: | ||||||||||||
Unaffiliated issuers | — | 370,127 | 93,905 | |||||||||
Income from securities loaned (net of fees and rebates) | — | 1,326,746 | 14,242 | |||||||||
Other income (Note 1e) | — | 291,652 | — | |||||||||
|
| |||||||||||
Total investment income | 1,047,494 | 22,933,915 | 7,534,568 | |||||||||
|
| |||||||||||
Expenses: | ||||||||||||
Management fees (Note 3a) | 583,118 | 9,631,498 | 2,360,978 | |||||||||
Transfer agent fees (Note 3c) | 14,536 | 60,240 | 12,275 | |||||||||
Custodian fees (Note 4) | 17,461 | 153,415 | 21,128 | |||||||||
Reports to shareholders | 3,656 | 11,059 | 3,246 | |||||||||
Registration and filing fees | 26,670 | 31,885 | 22,677 | |||||||||
Professional fees | 117,727 | 95,325 | 73,105 | |||||||||
Trustees’ fees and expenses | 463 | 36,171 | 10,650 | |||||||||
Other | 17,650 | 29,912 | 21,947 | |||||||||
|
| |||||||||||
Total expenses | 781,281 | 10,049,505 | 2,526,006 | |||||||||
Expense reductions (Note 4) | (76 | ) | (55,489 | ) | (6,812 | ) | ||||||
Expenses waived/paid by affiliates (Note 3d and 3e) | (65,198 | ) | (81,192 | ) | (1,466 | ) | ||||||
|
| |||||||||||
Net expenses | 716,007 | 9,912,824 | 2,517,728 | |||||||||
|
| |||||||||||
Net investment income | 331,487 | 13,021,091 | 5,016,840 | |||||||||
|
| |||||||||||
Realized and unrealized gains (losses): | ||||||||||||
Net realized gain (loss) from: | ||||||||||||
Investments:# | ||||||||||||
Unaffiliated issuers | 3,599,158 | 73,807,270 | 6,722,836 | |||||||||
Foreign currency transactions. | 6,594 | (218,042 | ) | (53,710 | ) | |||||||
|
| |||||||||||
Net realized gain (loss) | 3,605,752 | 73,589,228 | 6,669,126 | |||||||||
|
| |||||||||||
Net change in unrealized appreciation (depreciation) on: | ||||||||||||
Investments: | ||||||||||||
Unaffiliated issuers | 13,199,303 | 209,971,406 | 45,318,128 | |||||||||
Translation of other assets and liabilities denominated in foreign currencies | 11,472 | 251,001 | 68,173 | |||||||||
Change in deferred taxes on unrealized appreciation | 3,181 | (120,033 | ) | — | ||||||||
|
| |||||||||||
Net change in unrealized appreciation (depreciation) | 13,213,956 | 210,102,374 | 45,386,301 | |||||||||
|
| |||||||||||
Net realized and unrealized gain (loss) | 16,819,708 | 283,691,602 | 52,055,427 | |||||||||
|
| |||||||||||
Net increase (decrease) in net assets resulting from operations | $17,151,195 | $296,712,693 | $57,072,267 | |||||||||
|
| |||||||||||
*Foreign taxes withheld on dividends | $ 174,998 | $ 2,708,507 | $ 588,388 | |||||||||
#Net of foreign taxes | $ 21,094 | $ — | $ — | |||||||||
| ftinstitutional.com | The accompanying notes are an integral part of these financial statements. | Annual Report | 57 | ||||
TEMPLETON INSTITUTIONAL FUNDS
FINANCIAL STATEMENTS
Statements of Operations (continued)
for the year ended December 31, 2017
| International Equity Series | ||||
| ||||
Investment income: | ||||
Dividends: (net of foreign taxes)* | ||||
Unaffiliated issuers | $137,371,434 | |||
Non-controlled affiliates (Note 3d) | 337,192 | |||
Interest: | ||||
Unaffiliated issuers | 105,277 | |||
Income from securities loaned (net of fees and rebates) | 84,193 | |||
Other income (Note 1e) | 102,060 | |||
|
| |||
Total investment income |
|
138,000,156 |
| |
|
| |||
Expenses: | ||||
Management fees (Note 3a) | 35,985,222 | |||
Transfer agent fees: (Note 3c) | ||||
Primary Shares | 232,293 | |||
Service Shares | 563 | |||
Sub-transfer agent fees - Service Shares (Note 3c) | 18,055 | |||
Custodian fees (Note 4) | 586,899 | |||
Reports to shareholders | 61,523 | |||
Registration and filing fees | 72,864 | |||
Professional fees | 160,141 | |||
Trustees’ fees and expenses | 171,321 | |||
Other | 128,991 | |||
|
| |||
Total expenses | 37,417,872 | |||
Expense reductions (Note 4) | (9,077 | ) | ||
Expenses waived/paid by affiliates (Note 3d and 3e) | (264,061 | ) | ||
|
| |||
Net expenses |
|
37,144,734 |
| |
|
| |||
Net investment income |
|
100,855,422 |
| |
|
| |||
Realized and unrealized gains (losses): | ||||
Net realized gain (loss) from: | ||||
Investments:+ | ||||
Unaffiliated issuers | 352,487,205 | |||
Foreign currency transactions | 859,292 | |||
|
| |||
Net realized gain (loss) |
|
353,346,497 |
| |
|
| |||
Net change in unrealized appreciation (depreciation) on: | ||||
Investments: | ||||
Unaffiliated issuers | 522,116,580 | |||
Translation of other assets and liabilities | 1,863,834 | |||
|
| |||
Net change in unrealized appreciation (depreciation) | 523,980,414 | |||
|
| |||
Net realized and unrealized gain (loss) | 877,326,911 | |||
|
| |||
Net increase (decrease) in net assets resulting from operations | $978,182,333 | |||
|
| |||
*Foreign taxes withheld on dividends. | $ 14,323,032 | |||
+Includes gains from a redemption in-kind (Note 10) | $116,160,039 | |||
| 58 | Annual Report | The accompanying notes are an integral part of these financial statements. | ftinstitutional.com | ||
TEMPLETON INSTITUTIONAL FUNDS
FINANCIAL STATEMENTS
Statements of Changes in Net Assets
Emerging Markets Series | Foreign Smaller Companies Series | |||||||||||||||
| Year Ended December 31, | Year Ended December 31, | |||||||||||||||
| 2017 | 2016 | 2017 | 2016 | |||||||||||||
Increase (decrease) in net assets: | ||||||||||||||||
Operations: | ||||||||||||||||
Net investment income | $ | 331,487 | $ | 408,811 | $ | 13,021,091 | $ | 15,365,001 | ||||||||
Net realized gain (loss) | 3,605,752 | 2,205,680 | 73,589,228 | 13,765,470 | ||||||||||||
Net change in unrealized appreciation (depreciation) | 13,213,956 | 6,574,324 | 210,102,374 | (46,825,711 | ) | |||||||||||
|
| |||||||||||||||
Net increase (decrease) in net assets resulting from operations | 17,151,195 | 9,188,815 | 296,712,693 | (17,695,240 | ) | |||||||||||
|
| |||||||||||||||
Distributions to shareholders from: | ||||||||||||||||
Net investment income | (478,905 | ) | (765,866 | ) | (26,684,552 | ) | (18,779,194 | ) | ||||||||
Net realized gains | — | — | (37,723,593 | ) | (16,947,519 | ) | ||||||||||
|
| |||||||||||||||
Total distributions to shareholders | (478,905 | ) | (765,866 | ) | (64,408,145 | ) | (35,726,713 | ) | ||||||||
|
| |||||||||||||||
Capital share transactions (Note 2) | (282,155 | ) | (38,977,606 | ) | (124,003,541 | ) | (275,106,684 | ) | ||||||||
|
| |||||||||||||||
Net increase (decrease) in net assets | 16,390,135 | (30,554,657 | ) | 108,301,007 | (328,528,637 | ) | ||||||||||
Net assets: | ||||||||||||||||
Beginning of year | 40,879,269 | 71,433,926 | 931,878,757 | 1,260,407,394 | ||||||||||||
|
| |||||||||||||||
End of year | $ | 57,269,404 | $ | 40,879,269 | $ | 1,040,179,764 | $ | 931,878,757 | ||||||||
|
| |||||||||||||||
Distributions in excess of net investment income included in net assets: | ||||||||||||||||
End of year | $ | (74,349 | ) | $ | (411,645 | ) | $ | (11,763,155 | ) | $ | (4,326,825 | ) | ||||
|
| |||||||||||||||
| ftinstitutional.com | The accompanying notes are an integral part of these financial statements. | Annual Report | 59 | ||||
TEMPLETON INSTITUTIONAL FUNDS
FINANCIAL STATEMENTS
Statements of Changes in Net Assets (continued)
| Global Equity Series | International Equity Series | |||||||||||||||
| Year Ended December 31, | Year Ended December 31, | |||||||||||||||
| 2017 | 2016 | 2017 | 2016 | |||||||||||||
Increase (decrease) in net assets: | ||||||||||||||||
Operations: | ||||||||||||||||
Net investment income | $ 5,016,840 | $ 4,912,198 | $ 100,855,422 | $ 114,710,465 | ||||||||||||
Net realized gain (loss) | 6,669,126 | (3,325,690 | ) | 353,346,497 | (24,309,851 | ) | ||||||||||
Net change in unrealized appreciation (depreciation) | 45,386,301 | 10,998,974 | 523,980,414 | (38,429,032 | ) | |||||||||||
|
| |||||||||||||||
Net increase (decrease) in net assets resulting from operations | 57,072,267 | 12,585,482 | 978,182,333 | 51,971,582 | ||||||||||||
|
| |||||||||||||||
Distributions to shareholders from: | ||||||||||||||||
Net investment income | (5,755,645 | ) | (4,598,697 | ) | — | — | ||||||||||
Net realized gains | (1,123,692 | ) | (1,102,505 | ) | — | — | ||||||||||
Net investment income: | ||||||||||||||||
Primary Shares | — | — | (127,842,638 | ) | (111,420,196 | ) | ||||||||||
Service Shares | — | — | (382,337 | ) | (199,913 | ) | ||||||||||
Net realized gains: | ||||||||||||||||
Primary Shares | — | — | (56,164,739 | ) | (47,078,491 | ) | ||||||||||
Service Shares | — | — | (178,539 | ) | (118,885 | ) | ||||||||||
|
| |||||||||||||||
Total distributions to shareholders | (6,879,337 | ) | (5,701,202 | ) | (184,568,253 | ) | (158,817,485 | ) | ||||||||
|
| |||||||||||||||
Capital share transactions (Note 2) | (3,886,825 | ) | (9,004,806 | ) | — | — | ||||||||||
Capital share transactions: (Note 2) | ||||||||||||||||
Primary Shares | — | — | (918,597,405 | ) | (432,190,251 | ) | ||||||||||
Service Shares | — | — | 3,812,990 | (3,597,374 | ) | |||||||||||
|
| |||||||||||||||
Total capital share transactions | (3,886,825 | ) | (9,004,806 | ) | (914,784,415 | ) | (435,787,625 | ) | ||||||||
|
| |||||||||||||||
Net increase (decrease) in net assets | 46,306,105 | (2,120,526 | ) | (121,170,335 | ) | (542,633,528 | ) | |||||||||
Net assets: | ||||||||||||||||
Beginning of year | 280,709,369 | 282,829,895 | 4,547,828,662 | 5,090,462,190 | ||||||||||||
|
| |||||||||||||||
End of year | $327,015,474 | $280,709,369 | $4,426,658,327 | $4,547,828,662 | ||||||||||||
|
| |||||||||||||||
Undistributed net investment income included in net assets: | ||||||||||||||||
End of year | $ — | $ 44,691 | $ — | $ — | ||||||||||||
|
| |||||||||||||||
Distributions in excess of net investment income included in net assets: | ||||||||||||||||
End of year | $ (643,910 | ) | $ — | $ (56,754,552 | ) | $ (34,368,823 | ) | |||||||||
|
| |||||||||||||||
| 60 | Annual Report | The accompanying notes are an integral part of these financial statements. | ftinstitutional.com | ||
TEMPLETON INSTITUTIONAL FUNDS
1. Organization and Significant Accounting Policies
Templeton Institutional Funds (Trust) is registered under the Investment Company Act of 1940 (1940 Act) as an open-end management investment company, consisting of four separate funds (Funds) and applies the specialized accounting and reporting guidance in U.S. Generally Accepted Accounting Principles (U.S. GAAP). International Equity Series offers Primary and Service Shares. Each class of shares differs by its voting rights on matters affecting a single class and transfer agent fees. Foreign Smaller Companies Series was closed to new investors with limited exceptions effective at the close of market on December 10, 2013. Emerging Markets Series closed to all new investors, with limited exceptions, effective at the close of market on January 5, 2018.
The following summarizes the Funds’ significant accounting policies.
a. Financial Instrument Valuation
The Funds’ investments in financial instruments are carried at fair value daily. Fair value is the price that would be received to sell an asset or paid to transfer a liability in an orderly transaction between market participants on the measurement date. The Funds calculate the net asset value (NAV) per share as of 4 p.m. Eastern time each day the New York Stock Exchange (NYSE) is open for trading. Under compliance policies and procedures approved by the Trust’s Board of Trustees (the Board), the Funds’ administrator has responsibility for oversight of valuation, including leading the cross-functional Valuation Committee (VC). The VC provides administration and oversight of the Funds’ valuation policies and procedures, which are approved annually by the Board. Among other things, these procedures allow the Funds to utilize independent pricing services, quotations from securities and financial instrument dealers, and other market sources to determine fair value.
Equity securities listed on an exchange or on the NASDAQ National Market System are valued at the last quoted sale price or the official closing price of the day, respectively. Foreign equity securities are valued as of the close of trading on the foreign stock exchange on which the security is primarily traded, or as of 4 p.m. Eastern time. The value is then converted into its U.S. dollar equivalent at the foreign exchange rate in effect at 4 p.m. Eastern time on the day that the value of the security is determined. Over-the-counter (OTC) securities are
valued within the range of the most recent quoted bid and ask prices. Securities that trade in multiple markets or on multiple exchanges are valued according to the broadest and most representative market. Certain equity securities are valued based upon fundamental characteristics or relationships to similar securities.
Debt securities generally trade in the OTC market rather than on a securities exchange. The Funds’ pricing services use multiple valuation techniques to determine fair value. In instances where sufficient market activity exists, the pricing services may utilize a market-based approach through which quotes from market makers are used to determine fair value. In instances where sufficient market activity may not exist or is limited, the pricing services also utilize proprietary valuation models which may consider market characteristics such as benchmark yield curves, credit spreads, estimated default rates, anticipated market interest rate volatility, coupon rates, anticipated timing of principal repayments, underlying collateral, and other unique security features in order to estimate the relevant cash flows, which are then discounted to calculate the fair value.
Investments in open-end mutual funds are valued at the closing NAV. Time deposits are valued at cost, which approximates fair value.
The Funds have procedures to determine the fair value of financial instruments for which market prices are not reliable or readily available. Under these procedures, the VC convenes on a regular basis to review such financial instruments and considers a number of factors, including significant unobservable valuation inputs, when arriving at fair value. The VC primarily employs a market-based approach which may use related or comparable assets or liabilities, recent transactions, market multiples, book values, and other relevant information for the investment to determine the fair value of the investment. An income-based valuation approach may also be used in which the anticipated future cash flows of the investment are discounted to calculate fair value. Discounts may also be applied due to the nature or duration of any restrictions on the disposition of the investments. Due to the inherent uncertainty of valuations of such investments, the fair values may differ significantly from the values that would have been used had an active market existed. The VC employs various methods for calibrating these valuation approaches including a regular review of key inputs and assumptions, transactional back-testing or disposition analysis, and reviews of any related market activity.
| ftinstitutional.com | Annual Report | 61 | ||||
TEMPLETON INSTITUTIONAL FUNDS
NOTES TO FINANCIAL STATEMENTS
1. Organization and Significant Accounting Policies (continued)
a. Financial Instrument Valuation (continued)
Trading in securities on foreign securities stock exchanges and OTC markets may be completed before 4 p.m. Eastern time. In addition, trading in certain foreign markets may not take place on every Funds’ business day. Occasionally, events occur between the time at which trading in a foreign security is completed and 4 p.m. Eastern time that might call into question the reliability of the value of a portfolio security held by the Fund. As a result, differences may arise between the value of the Funds’ portfolio securities as determined at the foreign market close and the latest indications of value at 4 p.m. Eastern time. In order to minimize the potential for these differences, the VC monitors price movements following the close of trading in foreign stock markets through a series of country specific market proxies (such as baskets of American Depositary Receipts, futures contracts and exchange traded funds). These price movements are measured against established trigger thresholds for each specific market proxy to assist in determining if an event has occurred that may call into question the reliability of the values of the foreign securities held by the Funds. If such an event occurs, the securities may be valued using fair value procedures, which may include the use of independent pricing services.
When the last day of the reporting period is a non-business day, certain foreign markets may be open on those days that the Funds’ NAV is not calculated, which could result in differences between the value of the Funds’ portfolio securities on the last business day and the last calendar day of the reporting period. Any significant security valuation changes due to an open foreign market are adjusted and reflected by the Funds for financial reporting purposes.
b. Foreign Currency Translation
Portfolio securities and other assets and liabilities denominated in foreign currencies are translated into U.S. dollars based on the exchange rate of such currencies against U.S. dollars on the date of valuation. The Funds may enter into foreign currency exchange contracts to facilitate transactions denominated in a foreign currency. Purchases and sales of securities, income and expense items denominated in foreign currencies are translated into U.S. dollars at the exchange rate in effect on the transaction date. Portfolio securities and assets and liabilities denominated in foreign currencies contain risks that those currencies will
decline in value relative to the U.S. dollar. Occasionally, events may impact the availability or reliability of foreign exchange rates used to convert the U.S. dollar equivalent value. If such an event occurs, the foreign exchange rate will be valued at fair value using procedures established and approved by the Board.
The Funds do not separately report the effect of changes in foreign exchange rates from changes in market prices on securities held. Such changes are included in net realized and unrealized gain or loss from investments in the Statements of Operations.
Realized foreign exchange gains or losses arise from sales of foreign currencies, currency gains or losses realized between the trade and settlement dates on securities transactions and the difference between the recorded amounts of dividends, interest, and foreign withholding taxes and the U.S. dollar equivalent of the amounts actually received or paid. Net unrealized foreign exchange gains and losses arise from changes in foreign exchange rates on foreign denominated assets and liabilities other than investments in securities held at the end of the reporting period.
c. Participatory Notes
Certain or all Funds invest in Participatory Notes (P-Notes). P-Notes are promissory notes that are designed to offer a return linked to the performance of a particular underlying equity security or market. P-Notes are issued by banks or broker-dealers and allow the Fund to gain exposure to common stocks in certain foreign markets without registering with the market regulator. Income received from P-Notes is recorded as dividend income in the Statement of Operations. P-Notes may contain various risks including the potential inability of the counterparty to fulfill their obligations under the terms of the contract. These securities may be more volatile and less liquid than other investments held by the Fund.
d. Securities Lending
Certain or all Funds participate in an agency based securities lending program to earn additional income. The Fund receives cash collateral against the loaned securities in an amount equal to at least 102% of the fair value of the loaned securities. Collateral is maintained over the life of the loan in an amount not less than 100% of the fair value of loaned securities, as determined at the close of Fund business each day; any additional collateral required due to changes in security values is delivered to the Fund on the next business day. The collateral
| 62 | Annual Report | ftinstitutional.com | ||
TEMPLETON INSTITUTIONAL FUNDS
NOTES TO FINANCIAL STATEMENTS
is deposited into a joint cash account with other funds and is used to invest in a money market fund managed by Franklin Advisers, Inc., an affiliate of the Funds. The Fund may receive income from the investment of cash collateral, in addition to lending fees and rebates paid by the borrower. Income from securities loaned, net of fees paid to the securities lending agent and/or third-party vendor, is reported separately in the Statements of Operations. The Fund bears the market risk with respect to the collateral investment, securities loaned, and the risk that the agent may default on its obligations to the Fund. If the borrower defaults on its obligation to return the securities loaned, the Fund has the right to repurchase the securities in the open market using the collateral received. The securities lending agent has agreed to indemnify the Fund in the event of default by a third party borrower.
e. Income and Deferred Taxes
It is each Fund’s policy to qualify as a regulated investment company under the Internal Revenue Code. Each Fund intends to distribute to shareholders substantially all of its taxable income and net realized gains to relieve it from federal income and excise taxes. As a result, no provision for U.S. federal income taxes is required.
The Funds may be subject to foreign taxation related to income received, capital gains on the sale of securities and certain foreign currency transactions in the foreign jurisdictions in which the Funds invest. Foreign taxes, if any, are recorded based on the tax regulations and rates that exist in the foreign markets in which the Funds invest. When a capital gain tax is determined to apply, certain or all Funds record an estimated deferred tax liability in an amount that would be payable if the securities were disposed of on the valuation date.
As a result of several court cases, in certain countries across the European Union, certain or all Funds filed additional tax reclaims for previously withheld taxes on dividends earned in those countries (EU reclaims). These additional filings are subject to various administrative proceedings by the local jurisdictions’ tax authorities within the European Union, as well as a number of related judicial proceedings. Income recognized, if any, for EU reclaims is reflected as other income in the Statements of Operations and any related receivable, if any, is reflected as European Union tax reclaims in the Statements of Assets and Liabilities. When uncertainty exists as to the ultimate resolution of these proceedings, the likelihood of receipt of these EU reclaims, and the potential timing of
payment, no amounts are reflected in the financial statements. For U.S. income tax purposes, EU reclaims received by the Funds, if any, reduce the amounts of foreign taxes Fund shareholders can use as tax credits in their individual income tax returns.
Each Fund may recognize an income tax liability related to its uncertain tax positions under U.S. GAAP when the uncertain tax position has a less than 50% probability that it will be sustained upon examination by the tax authorities based on its technical merits. As of December 31, 2017, each Fund has determined that no tax liability is required in its financial statements related to uncertain tax positions for any open tax years (or expected to be taken in future tax years). Open tax years are those that remain subject to examination and are based on the statute of limitations in each jurisdiction in which the Fund invests.
f. Security Transactions, Investment Income, Expenses and Distributions
Security transactions are accounted for on trade date. Realized gains and losses on security transactions are determined on a specific identification basis. Interest income and estimated expenses are accrued daily. Amortization of premium and accretion of discount on debt securities are included in interest income. Dividend income is recorded on the ex-dividend date except for certain dividends from securities where the dividend rate is not available. In such cases, the dividend is recorded as soon as the information is received by the Funds. Distributions to shareholders are recorded on the ex-dividend date. Distributable earnings are determined according to income tax regulations (tax basis) and may differ from earnings recorded in accordance with U.S. GAAP. These differences may be permanent or temporary. Permanent differences are reclassified among capital accounts to reflect their tax character. These reclassifications have no impact on net assets or the results of operations. Temporary differences are not reclassified, as they may reverse in subsequent periods.
Common expenses incurred by the Trust are allocated among the Funds based on the ratio of net assets of each Fund to the combined net assets of the Trust. Fund specific expenses are charged directly to the Fund that incurred the expense.
| ftinstitutional.com | Annual Report | 63 | ||||
TEMPLETON INSTITUTIONAL FUNDS
NOTES TO FINANCIAL STATEMENTS
1. Organization and Significant Accounting Policies (continued)
f. Security Transactions, Investment Income, Expenses and Distributions (continued)
Realized and unrealized gains and losses and net investment income, excluding class specific expenses, are allocated daily to each class of shares based upon the relative proportion of net assets of each class. Differences in per share distributions by class are generally due to differences in class specific expenses.
g. Accounting Estimates
The preparation of financial statements in accordance with U.S. GAAP requires management to make estimates and assumptions that affect the reported amounts of assets and liabilities at the date of the financial statements and the amounts of income and expenses during the reporting period. Actual results could differ from those estimates.
h. Guarantees and Indemnifications
Under the Trust’s organizational documents, its officers and trustees are indemnified by the Trust against certain liabilities arising out of the performance of their duties to the Trust. Additionally, in the normal course of business, the Trust, on behalf of the Funds, enters into contracts with service providers that contain general indemnification clauses. The Trust’s maximum exposure under these arrangements is unknown as this would involve future claims that may be made against the Trust that have not yet occurred. Currently, the Trust expects the risk of loss to be remote.
2. Shares of Beneficial Interest
At December 31, 2017, there were an unlimited number of shares authorized (without par value). Transactions in the Funds’ shares were as follows:
| Emerging Markets Series | Foreign Smaller Companies Series | |||||||||||||||||
| Shares | Amount | Shares | Amount | |||||||||||||||
Year ended December 31, 2017 | ||||||||||||||||||
Shares sold | 2,214,777 | $ | 11,802,717 | 4,597,046 | $107,028,602 | |||||||||||||
Shares issued in reinvestment of distributions | 53,197 | 313,357 | 2,304,062 | 57,025,539 | ||||||||||||||
Shares redeemed | (2,367,672 | ) | (12,398,229 | ) | (12,178,847 | ) | (288,057,682) | |||||||||||
|
| |||||||||||||||||
Net increase (decrease) | (99,698 | ) | $ | (282,155 | ) | (5,277,739 | ) | $(124,003,541) | ||||||||||
|
| |||||||||||||||||
Year ended December 31, 2016 | ||||||||||||||||||
Shares sold | 1,610,965 | $ | 6,302,919 | 4,833,974 | $97,234,695 | |||||||||||||
Shares issued in reinvestment of distributions | 125,828 | 532,907 | 1,628,813 | 32,442,291 | ||||||||||||||
Shares redeemed | (11,753,686 | ) | (45,813,432 | ) | (20,026,557 | ) | (404,783,670) | |||||||||||
|
| |||||||||||||||||
Net increase (decrease) | (10,016,893 | ) | $ | (38,977,606 | ) | (13,563,770 | ) | $(275,106,684) | ||||||||||
|
| |||||||||||||||||
| 64 | Annual Report | ftinstitutional.com | ||
TEMPLETON INSTITUTIONAL FUNDS
NOTES TO FINANCIAL STATEMENTS
| Global Equity Series | ||||||||
| Shares | Amount | |||||||
| ||||||||
| Year ended December 31, 2017 | ||||||||
Shares sold | 1,172,155 | $ | 11,992,491 | |||||
Shares issued in reinvestment of distributions | 652,710 | 6,879,337 | ||||||
Shares redeemed | (2,300,263 | ) | (22,758,653 | ) | ||||
|
| |||||||
Net increase (decrease) |
|
(475,398 |
) | $ | (3,886,825 | ) | ||
|
| |||||||
| Year ended December 31, 2016 | ||||||||
Shares sold | 5,904,348 | $ | 50,777,649 | |||||
Shares issued in reinvestment of distributions | 622,766 | 5,571,015 | ||||||
Shares redeemed | (7,569,735 | ) | (65,353,470 | ) | ||||
|
| |||||||
Net increase (decrease) |
|
(1,042,621 |
) | $ | (9,004,806 | ) | ||
|
| |||||||
| International Equity Series | ||||||||
| Shares | Amount | |||||||
| ||||||||
| Primary Shares: | ||||||||
| Year ended December 31, 2017 | ||||||||
| Shares sold | 25,057,295 | $ | 517,786,830 | |||||
| Shares issued in reinvestment of distributions | 7,303,655 | 159,119,329 | ||||||
| Shares redeemed in-kind (Note 10) | (19,099,929 | ) | (421,197,360 | ) | ||||
| Shares redeemed | (55,993,290 | ) | (1,174,306,204 | ) | ||||
|
| |||||||
| Net increase (decrease) |
|
(42,732,269 |
) | $ | (918,597,405 | ) | ||
|
| |||||||
| Year ended December 31, 2016 | ||||||||
| Shares sold | 33,190,087 | $ | 605,288,189 | |||||
| Shares issued in reinvestment of distributions | 7,502,120 | 140,569,227 | ||||||
| Shares redeemed | (63,963,402 | ) | (1,178,047,667 | ) | ||||
|
| |||||||
| Net increase (decrease) |
|
(23,271,195 |
) | $ | (432,190,251 | ) | ||
|
| |||||||
| Service Shares: | ||||||||
| Year ended December 31, 2017 | ||||||||
| Shares sold | 272,954 | $ | 5,774,008 | |||||
| Shares issued in reinvestment of distributions | 25,407 | 555,560 | ||||||
| Shares redeemed | (117,301 | ) | (2,516,578 | ) | ||||
|
| |||||||
| Net increase (decrease) |
|
181,060 |
| $ | 3,812,990 | |||
|
| |||||||
| Year ended December 31, 2016 | ||||||||
| Shares sold | 356,445 | $ | 6,374,901 | |||||
| Shares issued in reinvestment of distributions | 16,838 | 316,996 | ||||||
| Shares redeemed | (568,197 | ) | (10,289,271 | ) | ||||
|
| |||||||
| Net increase (decrease) |
|
(194,914 |
) | $ | (3,597,374 | ) | ||
|
| |||||||
| ftinstitutional.com | Annual Report | 65 | ||||
TEMPLETON INSTITUTIONAL FUNDS
NOTES TO FINANCIAL STATEMENTS
3. Transactions with Affiliates
Franklin Resources, Inc. is the holding company for various subsidiaries that together are referred to as Franklin Templeton Investments. Certain officers and trustees of the Trust are also officers, and/or directors of the following subsidiaries:
| Subsidiary | Affiliation | |
Templeton Asset Management Ltd. (TAML) | Investment manager | |
Templeton Investment Counsel, LLC (TIC) | Investment manager | |
Franklin Templeton Services, LLC (FT Services) | Administrative manager | |
Franklin Templeton Distributors, Inc. (Distributors) | Principal underwriter | |
Franklin Templeton Investor Services, LLC (Investor Services) | Transfer agent |
a. Management Fees
Emerging Markets Series pays an investment management fee to TAML based on the average daily net assets of the Fund as follows:
| Annualized Fee Rate | Net Assets | |
1.175% | Up to and including $1 billion | |
1.125% | Over $1 billion, up to and including $5 billion | |
1.075% | Over $5 billion, up to and including $10 billion | |
1.025% | Over $10 billion, up to and including $15 billion | |
0.975% | Over $15 billion, up to and including $20 billion | |
0.925% | In excess of $20 billion |
Foreign Smaller Companies Series pays an investment management fee to TIC based on the average daily net assets of the Fund as follows:
| Annualized Fee Rate | Net Assets | |
0.950% | Up to and including $1 billion | |
0.930% | Over $1 billion, up to and including $5 billion | |
0.910% | Over $5 billion, up to and including $10 billion | |
0.890% | Over $10 billion, up to and including $15 billion | |
0.870% | Over $15 billion, up to and including $20 billion | |
0.850% | In excess of $20 billion |
| 66 | Annual Report | ftinstitutional.com | ||
TEMPLETON INSTITUTIONAL FUNDS
NOTES TO FINANCIAL STATEMENTS
Global Equity Series pays an investment management fee to TIC based on the average daily net assets of the Fund as follows:
| Annualized Fee Rate | Net Assets | |
0.780% | Up to and including $200 million | |
0.765% | Over $200 million, up to and including $700 million | |
0.730% | Over $700 million, up to and including $1 billion | |
0.715% | Over $1 billion, up to and including $1.2 billion | |
0.690% | Over $1.2 billion, up to and including $5 billion | |
0.675% | Over $5 billion, up to and including $10 billion | |
0.655% | Over $10 billion, up to and including $15 billion | |
0.635% | Over $15 billion, up to and including $20 billion | |
0.615% | Over $20 billion, up to and including $25 billion | |
0.605% | Over $25 billion, up to and including $30 billion | |
0.595% | Over $30 billion, up to and including $35 billion | |
0.585% | Over $35 billion, up to and including $40 billion | |
0.575% | Over $40 billion, up to and including $45 billion | |
0.565% | In excess of $45 billion |
International Equity Series pays an investment management fee to TIC based on the average daily net assets of the Fund as follows:
| Annualized Fee Rate | Net Assets | |
0.775% | Up to and including $1 billion | |
0.755% | Over $1 billion, up to and including $5 billion | |
0.735% | Over $5 billion, up to and including $10 billion | |
0.715% | Over $10 billion, up to and including $15 billion | |
0.695% | Over $15 billion, up to and including $20 billion | |
0.675% | In excess of $20 billion |
For the year ended December 31, 2017, each Fund’s gross effective investment management fee rate based on average daily net assets was as follows:
| Emerging Markets Series | Foreign Smaller Companies Series | Global Equity Series | International Equity Series | |||||||||
| 1.174% | 0.949% | 0.775% | 0.759% | |||||||||
b. Administrative Fees
Under an agreement with TAML, FT Services provides administrative services to Emerging Markets Series. The fee is paid by TAML based on the Fund’s average daily net assets, and is not an additional expense of the Fund.
Under agreements with TIC, FT Services provides administrative services to Foreign Smaller Companies Series, Global Equity Series, and International Equity Series. The fee is paid by TIC based on each of the Funds’ average daily net assets, and is not an additional expense of the Funds.
| ftinstitutional.com | Annual Report | 67 | ||||
TEMPLETON INSTITUTIONAL FUNDS
NOTES TO FINANCIAL STATEMENTS
3. Transactions with Affiliates (continued)
c. Transfer Agent Fees
Each class of shares pays transfer agent fees to Investor Services for its performance of shareholder servicing obligations. Effective November 1, 2017, the fees are based on an annualized asset based fee of 0.02% plus a transaction based fee. Prior to November 1, 2017, the fees were account based fees that varied based on fund or account type. In addition, each class reimburses Investor Services for out of pocket expenses incurred and reimburses shareholder servicing fees paid to third parties. These fees are allocated daily based upon their relative proportion of such classes’ aggregate net assets.
For the year ended December 31, 2017, the Funds paid transfer agent fees as noted in the Statements of Operations of which the following amounts were retained by Investor Services:
| Emerging Markets Series | Foreign Smaller Companies Series | Global Equity Series | International Equity Series | |||||||||||
Transfer agent fees | $3,998 | $48,187 | $11,547 | $194,096 | ||||||||||
International Equity Series’ Service shares may pay up to 0.15% of average daily net assets for sub-transfer agency fees as noted in the Statements of Operations.
d. Investments in Affiliated Management Investment Companies
Certain or all Funds invest in one or more affiliated management investment companies for purposes other than exercising a controlling influence over the management or policies. Management fees paid by the Funds are waived on assets invested in the affiliated management investment companies, as noted in the Statements of Operations, in an amount not to exceed the management and administrative fees paid directly or indirectly by each affiliate. Prior to January 1, 2014, the waiver was accounted for as a reduction to management fees. During the year ended December 31, 2017, investments in affiliated management investment companies were as follows:
Number of at Beginning | Gross Additions | Gross Reductions | Number of Held at End of Year | Value at End of Year | Dividend Income | Realized Gain (Loss) | Net Change in Unrealized Appreciation (Depreciation) | |||||||||||||||||||||||||
| Emerging Markets Series | ||||||||||||||||||||||||||||||||
| Non-Controlled Affiliates | ||||||||||||||||||||||||||||||||
Institutional Fiduciary Trust Money Market Portfolio, 0.89% | 234,539 | 12,129,139 | (11,600,664 | ) | 763,014 | $ | 763,014 | $ | 5,066 | $ — | $ — | |||||||||||||||||||||
|
| |||||||||||||||||||||||||||||||
| Foreign Smaller Companies Series | ||||||||||||||||||||||||||||||||
| Non-Controlled Affiliates | ||||||||||||||||||||||||||||||||
Institutional Fiduciary Trust Money Market Portfolio, 0.89% | 22,128,772 | 88,141,626 | (82,346,909 | ) | 27,923,489 | $ | 27,923,489 | $ | — | $ — | $ — | |||||||||||||||||||||
|
| |||||||||||||||||||||||||||||||
| Global Equity Series | ||||||||||||||||||||||||||||||||
| Non-Controlled Affiliates | ||||||||||||||||||||||||||||||||
Institutional Fiduciary Trust Money Market Portfolio, 0.89% | — | 15,027,692 | (15,027,692 | ) | — | $ | — | $ | — | $ — | $ — | |||||||||||||||||||||
|
| |||||||||||||||||||||||||||||||
| International Equity Series | ||||||||||||||||||||||||||||||||
| Non-Controlled Affiliates | ||||||||||||||||||||||||||||||||
Institutional Fiduciary Trust Money Market Portfolio, 0.89% | 55,224,352 | 1,202,621,339 | (1,121,173,473 | ) | 136,672,218 | $ | 136,672,218 | $ | 337,192 | $ — | $ — | |||||||||||||||||||||
|
| |||||||||||||||||||||||||||||||
| 68 | Annual Report | ftinstitutional.com | ||
TEMPLETON INSTITUTIONAL FUNDS
NOTES TO FINANCIAL STATEMENTS
e. Waiver and Expense Reimbursements
TAML has contractually agreed in advance to limit the investment management fees for Emerging Markets Series to 1.05% of the average daily net assets of the Fund until April 30, 2018. Total expenses waived or paid are not subject to recapture subsequent to the Fund’s fiscal year end.
4. Expense Offset Arrangement
The Funds have entered into an arrangement with their custodian whereby credits realized as a result of uninvested cash balances are used to reduce a portion of the Funds’ custodian expenses. During the year ended December 31, 2017, the custodian fees were reduced as noted in the Statements of Operations.
5. Income Taxes
For tax purposes, capital losses may be carried over to offset future capital gains, if any. At December 31, 2017, the capital loss carryforwards were as follows:
| Emerging Markets Series | ||
| Capital loss carryforwards not subject to expiration: | ||
Short term | $5,245,125 | |
Long term | 1,526,528 | |
| ||
Total capital loss carryforwards | $6,771,653 | |
|
During the year ended December 31, 2017, the Funds utilized capital loss carryforwards as follows:
| Emerging Markets Series | Global Equity Series | International Equity Series | ||||||||||
| $2,957,937 | $2,109,041 | $33,439,446 | ||||||||||
For tax purposes, the Funds may elect to defer any portion of a late-year ordinary loss to the first day of the following fiscal year. At December 31, 2017, Foreign Smaller Companies Series deferred late-year ordinary losses of $153,742.
The tax character of distributions paid during the years ended December 31, 2017 and 2016, was as follows:
Emerging Markets Series | Foreign Smaller Companies Series | |||||||||||||||
|
|
|
| |||||||||||||
| 2017 | 2016 | 2017 | 2016 | |||||||||||||
| Distributions paid from: | ||||||||||||||||
Ordinary income | $ | 478,905 | $ | 765,866 | $ | 30,489,899 | $ | 18,779,194 | ||||||||
Long term capital gain | — | — | 33,918,246 | 16,947,519 | ||||||||||||
|
| |||||||||||||||
| $ | 478,905 | $ | 765,866 | $ | 64,408,145 | $ | 35,726,713 | |||||||||
|
| |||||||||||||||
Global Equity Series | International Equity Series | |||||||||||||||
|
|
|
| |||||||||||||
| 2017 | 2016 | 2017 | 2016 | |||||||||||||
| Distributions paid from: | ||||||||||||||||
Ordinary income | $ | 5,755,645 | $ | 4,600,338 | $ | 128,224,975 | $ | 111,620,472 | ||||||||
Long term capital gain | 1,123,692 | 1,100,864 | 56,343,278 | 47,197,013 | ||||||||||||
|
| |||||||||||||||
| $ | 6,879,337 | $ | 5,701,202 | $ | 184,568,253 | $ | 158,817,485 | |||||||||
|
| |||||||||||||||
| ftinstitutional.com | Annual Report | 69 | ||||
TEMPLETON INSTITUTIONAL FUNDS
NOTES TO FINANCIAL STATEMENTS
5. Income Taxes (continued)
At December 31, 2017, the cost of investments, net unrealized appreciation (depreciation) and undistributed ordinary income for income tax purposes were as follows:
| Emerging Markets Series | Foreign Smaller Companies Series | Global Equity Series | International Equity Series | |||||||||||
| Cost of investments | $38,995,619 | $750,959,639 | $249,809,090 | $3,038,834,090 | ||||||||||
|
| |||||||||||||
| Unrealized appreciation |
|
$20,466,745 |
| $352,441,666 | $ 84,924,160 | $1,570,245,684 | ||||||||
| Unrealized depreciation | (2,193,591 | ) | (41,429,679 | ) | (8,577,771 | ) | (166,521,635) | |||||||
|
| |||||||||||||
| Net unrealized appreciation (depreciation) | $18,273,154 | $311,011,987 | $ 76,346,389 | $1,403,724,049 | ||||||||||
|
| |||||||||||||
| Undistributed ordinary income |
|
$ 93,544 |
| $ — | $ 489,470 | $ 11,578,794 | ||||||||
| Undistributed long term capital gains | — | 20,936,688 | 2,205,624 | 101,677,335 | ||||||||||
|
| |||||||||||||
| Distributable earnings | $ 93,544 | $ 20,936,688 | $ 2,695,094 | $ 113,256,129 | ||||||||||
|
| |||||||||||||
Differences between income and/or capital gains as determined on a book basis and a tax basis are primarily due to differing treatments of passive foreign investment company shares, corporate actions, wash sales and gains realized on in-kind shareholder redemptions.
Certain or all Funds utilized a tax accounting practice to treat a portion of the proceeds from capital shares redeemed as a distribution from realized capital gains.
6. Investment Transactions
Purchases and sales of investments (excluding short term securities and in-kind transactions) for the year ended December 31, 2017, were as follows:
| Emerging Markets Series | Foreign Smaller Companies Series | Global Equity Series | International Equity Series | |||||||||||
Purchases | $10,083,502 | $250,894,896 | $74,335,344 | $ 758,991,750 | ||||||||||
Sales | $11,050,358 | $435,527,925 | $81,099,720 | $1,393,152,803 | ||||||||||
At December 31, 2017, in connection with securities lending transactions, certain or all Funds loaned investments and received cash collateral as follows:
| Foreign Smaller Companies Series | ||
| Securities lending transactionsa: | ||
Equity investmentsb | $27,923,489 |
aThe agreements can be terminated at any time.
bThe gross amount of recognized liability for such transactions is included in payable upon return of securities loaned in the Statements of Assets and Liabilities.
7. Concentration of Risk
Investing in foreign securities may include certain risks and considerations not typically associated with investing in U.S. securities, such as fluctuating currency values and changing local and regional economic, political and social conditions, which may result in greater market volatility. In addition, certain foreign securities may not be as liquid as U.S. securities.
| 70 | Annual Report | ftinstitutional.com | ||
TEMPLETON INSTITUTIONAL FUNDS
NOTES TO FINANCIAL STATEMENTS
The United States and other nations have imposed and could impose additional sanctions on certain issuers in Russia due to regional conflicts. These sanctions could result in the devaluation of Russia’s currency, a downgrade in Russian issuers’ credit ratings, or a decline in the value and liquidity of Russian stocks or other securities. Such sanctions could also adversely affect Russia’s economy, possibly forcing the economy into a recession. The Fund may be prohibited from investing in securities issued by companies subject to such sanctions. In addition, if the Fund holds the securities of an issuer that is subject to such sanctions, an immediate freeze of that issuer’s securities could result, impairing the ability of the Fund to buy, sell, receive or deliver those securities. There is also the risk that countermeasures could be taken by Russia’s government, which could involve the seizure of the Fund’s assets. These risks could affect the value of the Fund’s portfolio. While the Fund holds securities of certain issuers impacted by the sanctions, existing investments satisfy the applicable terms and conditions of the sanctions. At December 31, 2017, Emerging Markets Series had 6.7% of its net assets invested in Russia.
8. Upcoming Liquidation
On December 7, 2017, the Board for Emerging Markets Series approved a proposal to liquidate the Fund. Effective January 5, 2018, Emerging Markets Series was closed to all new investments. The Fund is scheduled to liquidate on March 16, 2018.
9. Credit Facility
Certain or all Funds, together with other U.S. registered and foreign investment funds (collectively, Borrowers), managed by Franklin Templeton Investments, are borrowers in a joint syndicated senior unsecured credit facility totaling $2 billion (Global Credit Facility) which matured on February 9, 2018. This Global Credit Facility provides a source of funds to the Borrowers for temporary and emergency purposes, including the ability to meet future unanticipated or unusually large redemption requests. Effective February 9, 2018, the Borrowers renewed the Global Credit Facility for a one year term, maturing February 8, 2019, for a total of $2 billion.
Under the terms of the Global Credit Facility, the Funds shall, in addition to interest charged on any borrowings made by the Funds and other costs incurred by the Funds, pay their share of fees and expenses incurred in connection with the implementation and maintenance of the Global Credit Facility, based upon their relative share of the aggregate net assets of all of the Borrowers, including an annual commitment fee of 0.15% based upon the unused portion of the Global Credit Facility. These fees are reflected in other expenses in the Statements of Operations. During the year ended December 31, 2017, the Funds did not use the Global Credit Facility.
10. Redemption In-Kind
During the year ended December 31, 2017, International Equity Series realized $116,160,039 of net gains resulting from a redemption in-kind in which a shareholder redeemed fund shares for cash and securities held by the Fund. Because such gains are not taxable to the Fund, and are not distributed to remaining shareholders, they have been reclassified from accumulated net realized gains to paid-in capital.
11. Fair Value Measurements
The Funds follow a fair value hierarchy that distinguishes between market data obtained from independent sources (observable inputs) and the Funds’ own market assumptions (unobservable inputs). These inputs are used in determining the value of the Funds’ financial instruments and are summarized in the following fair value hierarchy:
| • | Level 1 – quoted prices in active markets for identical financial instruments |
| ftinstitutional.com | Annual Report | 71 | ||||
TEMPLETON INSTITUTIONAL FUNDS
NOTES TO FINANCIAL STATEMENTS
11. Fair Value Measurements (continued)
| • | Level 2 – other significant observable inputs (including quoted prices for similar financial instruments, interest rates, prepayment speed, credit risk, etc.) |
| • | Level 3 – significant unobservable inputs (including the Funds’ own assumptions in determining the fair value of financial instruments) |
The input levels are not necessarily an indication of the risk or liquidity associated with financial instruments at that level.
For movements between the levels within the fair value hierarchy, the Funds have adopted a policy of recognizing the transfers as of the date of the underlying event which caused the movement.
A summary of inputs used as of December 31, 2017, in valuing the Funds’ assets carried at fair value, is as follows:
| Level 1 | Level 2 | Level 3 | Total | |||||||||||||
| ||||||||||||||||
| Emerging Markets Series | ||||||||||||||||
Assets: | ||||||||||||||||
Investments in Securities:a | ||||||||||||||||
Equity Investmentsb | $ | 56,241,831 | $ | — | $ | — | $ | 56,241,831 | ||||||||
Participatory Notes | — | 263,928 | — | 263,928 | ||||||||||||
Short Term Investments | 763,014 | — | — | 763,014 | ||||||||||||
|
| |||||||||||||||
Total Investments in Securities | $ | 57,004,845 | $ | 263,928 | $ | — | $ | 57,268,773 | ||||||||
|
| |||||||||||||||
| Foreign Smaller Companies Series | ||||||||||||||||
Assets: | ||||||||||||||||
Investments in Securities:a | ||||||||||||||||
Equity Investmentsb | $ | 995,748,137 | $ | — | $ | — | $ | 995,748,137 | ||||||||
Short Term Investments | 27,923,489 | 38,300,000 | — | 66,223,489 | ||||||||||||
|
| |||||||||||||||
Total Investments in Securities | $ | 1,023,671,626 | $ | 38,300,000 | $ | — | $ | 1,061,971,626 | ||||||||
|
| |||||||||||||||
| Global Equity Series | ||||||||||||||||
Assets: | ||||||||||||||||
Investments in Securities:a | ||||||||||||||||
Equity Investments:b | ||||||||||||||||
Aerospace & Defense | $ | 7,326,805 | $ | 9,065 | $ | — | $ | 7,335,870 | ||||||||
All Other Equity Investments | 309,719,609 | — | — | 309,719,609 | ||||||||||||
Short Term Investments | — | 9,100,000 | — | 9,100,000 | ||||||||||||
|
| |||||||||||||||
Total Investments in Securities | $ | 317,046,414 | $ | 9,109,065 | $ | — | $ | 326,155,479 | ||||||||
|
| |||||||||||||||
| International Equity Series | ||||||||||||||||
Assets: | ||||||||||||||||
Investments in Securities:a | ||||||||||||||||
Equity Investments:b | ||||||||||||||||
Aerospace & Defense | $ | 118,239,357 | $ | 142,192 | $ | — | $ | 118,381,549 | ||||||||
All Other Equity Investments | 4,187,504,372 | — | — | 4,187,504,372 | ||||||||||||
Short Term Investments | 136,672,218 | — | — | 136,672,218 | ||||||||||||
|
| |||||||||||||||
Total Investments in Securities | $ | 4,442,415,947 | $ | 142,192 | $ | — | $ | 4,442,558,139 | ||||||||
|
| |||||||||||||||
a For detailed categories, see the accompanying Statement of Investments. bIncludes common and preferred stocks as well as other equity investments. | ||||||||||||||||
| 72 | Annual Report | ftinstitutional.com | ||
TEMPLETON INSTITUTIONAL FUNDS
NOTES TO FINANCIAL STATEMENTS
12. Subsequent Events
The Funds have evaluated subsequent events through the issuance of the financial statements and determined that no events have occurred that require disclosure, other than those already disclosed in the financial staements.
Abbreviations
| Selected Portfolio | ||
| ADR | American Depositary Receipt | |
| FHLB | Federal Home Loan Bank | |
| GDR | Global Depositary Receipt | |
| IDR | International Depositary Receipt | |
| NVDR | Non-Voting Depositary Receipt | |
| ftinstitutional.com | Annual Report | 73 | ||||
TEMPLETON INSTITUTIONAL FUNDS
Report of Independent Registered Public Accounting Firm
To the Board of Trustees and Shareholders of Templeton Institutional Funds
Opinions on the Financial Statements
We have audited the accompanying statements of assets and liabilities, including the statements of investments, of Emerging Markets Series, Foreign Smaller Companies Series, Global Equity Series, International Equity Series (the “Funds”) as of December 31, 2017, the related statements of operations for the year ended December 31, 2017, the statements of changes in net assets for each of the two years in the period ended December 31, 2017, including the related notes, and the financial highlights for each of the five years in the period ended December 31, 2017 (collectively referred to as the “financial statements”). In our opinion, the financial statements present fairly, in all material respects, the financial position of each of the Funds as of December 31, 2017, the results of each of their operations for the year then ended, the changes in each of their net assets for each of the two years in the period ended December 31, 2017 and each of the financial highlights for each of the five years in the period ended December 31, 2017 in conformity with accounting principles generally accepted in the United States of America.
Basis for Opinions
These financial statements are the responsibility of the Funds’ management. Our responsibility is to express an opinion on the Funds’ financial statements based on our audits. We are a public accounting firm registered with the Public Company Accounting Oversight Board (United States) (“PCAOB”) and are required to be independent with respect to the Funds in accordance with the U.S. federal securities laws and the applicable rules and regulations of the Securities and Exchange Commission and the PCAOB.
We conducted our audits of these financial statements in accordance with the standards of the PCAOB. Those standards require that we plan and perform the audit to obtain reasonable assurance about whether the financial statements are free of material misstatement, whether due to error or fraud.
Our audits included performing procedures to assess the risks of material misstatement of the financial statements, whether due to error or fraud, and performing procedures that respond to those risks. Such procedures included examining, on a test basis, evidence regarding the amounts and disclosures in the financial statements. Our audits also included evaluating the accounting principles used and significant estimates made by management, as well as evaluating the overall presentation of the financial statements. Our procedures included confirmation of securities owned as of December 31, 2017 by correspondence with the custodian, transfer agent, and brokers; when replies were not received from brokers, we performed other auditing procedures. We believe that our audits provide a reasonable basis for our opinions.
PricewaterhouseCoopers LLP
San Francisco, California
February 20, 2018
We have served as the auditor of one or more investment companies in the Franklin Templeton Group of Funds since 1948.
| 74 | Annual Report | ftinstitutional.com | ||
TEMPLETON INSTITUTIONAL FUNDS
Under Section 852(b)(3)(C) of the Internal Revenue Code (Code), the Funds hereby report the maximum amount allowable but no less than the following amounts as long term capital gain dividends for the fiscal year ended December 31, 2017:
| Emerging Markets Series | Foreign Smaller Companies Series | Global Equity Series | International Equity Series | |||||||||
| $- | $43,424,695 | $1,332,772 | $95,342,798 | |||||||||
Under Section 871(k)(2)(C) of the Code, the Funds hereby report the maximum amount allowable but no less than the following amounts as short term capital gain dividends for purposes of the tax imposed under Section 871(a)(1)(A) of the Code for the fiscal year ended December 31, 2017:
| Emerging Markets Series | Foreign Smaller Companies Series | Global Equity Series | International Equity Series | |||||||||
| $- | $4,440,190 | $- | $- | |||||||||
Under Section 854(b)(1)(A) of the Code, the Funds hereby report the following percentage amounts of the ordinary income dividends as income qualifying for the dividends received deduction for the fiscal year ended December 31, 2017:
| Emerging Markets Series | Foreign Smaller Companies Series | Global Equity Series | International Equity Series | |||||||||
| -% | -% | 33.10% | -% | |||||||||
Under Section 854(b)(1)(B) of the Code, the Funds hereby report the maximum amount allowable but no less than the following amounts as qualified dividends for purposes of the maximum rate under Section 1(h)(11) of the Code for the fiscal year ended December 31, 2017:
| Emerging Markets Series | Foreign Smaller Companies Series | Global Equity Series | International Equity Series | |||||||||
| $707,905 | $14,423,131 | $6,797,674 | $- | |||||||||
Distributions, including qualified dividend income, paid during calendar year 2017 will be reported to shareholders on Form 1099-DIV by mid-February 2018. Shareholders are advised to check with their tax advisors for information on the treatment of these amounts on their individual income tax returns.
At December 31, 2017, more than 50% of the Funds’ total assets were invested in securities of foreign issuers. In most instances, foreign taxes were withheld from income paid to the Funds on these investments. As shown in the table below, the Funds hereby report to shareholders the foreign source income and foreign taxes paid, pursuant to Section 853 of the Code. This written statement will allow shareholders of record on December 21, 2017, to treat their proportionate share of foreign taxes paid by the Funds as having been paid directly by them. The shareholder shall consider these amounts as foreign taxes paid in the tax year in which they receive the Fund distribution.
The following table provides a detailed analysis of foreign tax paid, foreign source income, and foreign source qualified dividends as reported by the Funds, to shareholders of record.
| Class | Foreign Tax Paid Per Share | Foreign Source Income Per Share | Foreign Source Qualified Dividends Per Share | |||||||||
Emerging Markets Series | ||||||||||||
Fund Shares | $0.0155 | $0.0543 | $0.0312 | |||||||||
Foreign Smaller Companies Series | ||||||||||||
Fund Shares | $0.0562 | $0.4750 | $0.2904 | |||||||||
Global Equity Series | ||||||||||||
Fund Shares | $0.0189 | $0.1418 | $0.1160 | |||||||||
| ftinstitutional.com | Annual Report | 75 | ||||
TEMPLETON INSTITUTIONAL FUNDS
| Class | Foreign Tax Paid Per Share | Foreign Source Income Per Share | Foreign Source Qualified Dividends Per Share | |||||||||
| International Equity Series | ||||||||||||
Primary Shares | $0.0680 | $0.5999 | $0.4385 | |||||||||
Service Shares | $0.0680 | $0.5751 | $0.4203 | |||||||||
Foreign Tax Paid Per Share (Column 1) is the amount per share available to you, as a tax credit (assuming you held your shares in the Fund for a minimum of 16 days during the 31-day period beginning 15 days before the ex-dividend date of the Fund’s distribution to which the foreign taxes relate), or, as a tax deduction.
Foreign Source Income Per Share (Column 2) is the amount per share of income dividends attributable to foreign securities held by the Funds, plus any foreign taxes withheld on these dividends. The amounts reported include foreign source qualified dividends that have not been adjusted for the rate differential applicable to such dividend income.1
Foreign Source Qualified Dividends Per Share (Column 3) is the amount per share of foreign source qualified dividends, plus any foreign taxes withheld on these dividends. These amounts represent the portion of the Foreign Source Income reported to you in column 2 that were derived from qualified foreign securities held by the Funds.1
By mid-February 2018, shareholders will receive Form 1099-DIV which will include their share of taxes paid and foreign source income distributed during the calendar year 2017. The Foreign Source Income reported on Form 1099-DIV has not been adjusted for the rate differential on foreign source qualified dividend income. Shareholders are advised to check with their tax advisors for information on the treatment of these amounts on their 2017 individual income tax returns.
1Qualified dividends are taxed at reduced long term capital gains tax rates. In determining the amount of foreign tax credit that may be applied against the U.S. tax liability of individuals receiving foreign source qualified dividends, adjustments may be required to the foreign tax credit limitation calculation to reflect the rate differential applicable to such dividend income. The rules however permit certain individuals to elect not to apply the rate differential adjustments for capital gains and/or dividends for any taxable year. Please consult your tax advisor and the instructions to Form 1116 for more information.
| 76 | Annual Report | ftinstitutional.com | ||
TEMPLETON INSTITUTIONAL FUNDS
Special Meeting of Shareholders
MEETING OF SHAREHOLDERS: OCTOBER 30, 2017 AND RECONVENED ON DECEMBER 15, 2017 AND DECEMBER 29, 2017
(UNAUDITED)
A Special Meeting of Shareholders of Templeton Institutional Funds was held at the offices of Franklin Templeton Investments, One Franklin Parkway, San Mateo, California on October 30, 2017 and reconvened on December 15, 2017 and December 29, 2017. The purpose of the meeting was to elect Trustees of Templeton Institutional Funds and to vote on the following proposals: for each of the Funds, to approve the use of a “manager of managers” structure whereby the Fund’s investment manager would be able to hire and replace subadvisers without shareholder approval; for each of the Funds, to approve an amended fundamental investment restriction regarding investments in commodities; and for Emerging Markets Series, to approve a new Subadvisory Agreement with Franklin Templeton Investment Management Limited. At the meeting, (i) the following persons were elected by the shareholders to serve as Trustees of Templeton Institutional Funds: Harris J. Ashton, Ann Torre Bates, Mary C. Choksi, Edith E. Holiday, Gregory E. Johnson, Rupert H. Johnson, Jr., J. Michael Luttig, David W. Niemiec, Larry D. Thompson, Constantine D. Tseretopoulos, and Robert E. Wade; (ii) the proposals to use a “manager of managers” structure and to approve the amended fundamental investment restriction regarding investments in commodities were approved by shareholders of each of Foreign Smaller Companies Series and Global Equity Series; (iii) sufficient votes were not received to pass the proposals to use a “manager of managers” structure and to approve the amended fundamental investment restriction regarding investments in commodities for each of International Equity Series and Emerging Markets Series; and (iv) for Emerging Markets Series, sufficient votes were not received to pass the proposal to approve a new Subadvisory Agreement with Franklin Templeton Investment Management Limited. No other business was transacted at the meeting.
The results of the voting at the meeting are as follows:
| Proposal 1. | To elect a Board of Trustees: |
| Name | For | Withheld | ||||||
Harris J. Ashton | 131,901,128 | 4,639,834 | ||||||
Ann Torre Bates | 131,911,425 | 4,629,538 | ||||||
Mary C. Choksi | 131,911,156 | 4,629,807 | ||||||
Edith E. Holiday | 131,911,473 | 4,629,489 | ||||||
Gregory E. Johnson | 131,911,429 | 4,629,534 | ||||||
Rupert H. Johnson, Jr. | 131,910,731 | 4,630,232 | ||||||
J. Michael Luttig | 131,911,380 | 4,629,582 | ||||||
David W. Niemiec | 131,911,337 | 4,629,625 | ||||||
Larry D. Thompson | 131,901,122 | 4,639,840 | ||||||
Constantine D. Tseretopoulos | 131,910,682 | 4,630,280 | ||||||
Robert E. Wade | 131,910,942 | 4,630,020 | ||||||
Total Trust Shares Outstanding*: 307,022,332 | ||||||||
* As of the record date.
| ftinstitutional.com | Annual Report | 77 | ||||
TEMPLETON INSTITUTIONAL FUNDS
SPECIAL MEETING OF SHAREHOLDERS
| Proposal 2. | To approve the use of a “manager of managers” structure whereby the Fund’s investment manager would be able to hire and replace subadvisers without shareholder approval: |
| Emerging Markets Series | ||||
Shares
| ||||
For | 4,090,294 | |||
Against | 2,313 | |||
Abstain | 10,631 | |||
Broker Non-Votes | 359,049 | |||
Total Fund Shares Voted | 4,462,287 | |||
Total Fund Shares Outstanding* | 9,060,852 | |||
| Foreign Smaller Companies Series | ||||
Shares
| ||||
For | 16,439,797 | |||
Against | 233,995 | |||
Abstain | 53,984 | |||
Broker Non-Votes | 5,136,387 | |||
Total Fund Shares Voted | 21,864,163 | |||
Total Fund Shares Outstanding* | 40,989,685 | |||
| Global Equity Series | ||||
Shares
| ||||
For | 14,250,332 | |||
Against | 3,536,311 | |||
Abstain | 0 | |||
Broker Non-Votes | 4,512 | |||
Total Fund Shares Voted | 17,791,155 | |||
Total Fund Shares Outstanding* | 31,120,583 | |||
| International Equity Series | ||||
Shares
| ||||
For | 80,833,864 | |||
Against | 1,491,959 | |||
Abstain | 827,552 | |||
Broker Non-Votes | 9,269,981 | |||
Total Fund Shares Voted | 92,423,357 | |||
Total Fund Shares Outstanding* | 225,851,212 | |||
| Proposal 3. | To approve an amended fundamental investment restriction regarding investments in commodities: |
| Emerging Markets Series | ||||
Shares
| ||||
For | 4,088,271 | |||
Against | 1,302 | |||
Abstain | 13,665 | |||
Broker Non-Votes | 359,049 | |||
Total Fund Shares Voted | 4,462,287 | |||
Total Fund Shares Outstanding* | 9,060,852 | |||
| 78 | Annual Report | ftinstitutional.com | ||
TEMPLETON INSTITUTIONAL FUNDS
SPECIAL MEETING OF SHAREHOLDERS
| Foreign Smaller Companies Series | ||||
Shares
| ||||
For | 16,630,599 | |||
Against | 40,456 | |||
Abstain | 56,722 | |||
Broker Non-Votes | 5,136,387 | |||
Total Fund Shares Voted | 21,864,163 | |||
Total Fund Shares Outstanding* | 40,989,685 | |||
| Global Equity Series | ||||
Shares
| ||||
For | 14,250,332 | |||
Against | 3,536,311 | |||
Abstain | 0 | |||
Broker Non-Votes | 4,512 | |||
Total Fund Shares Voted | 17,791,155 | |||
Total Fund Shares Outstanding* | 31,120,583 | |||
| International Equity Series | ||||
Shares
| ||||
For | 80,400,203 | |||
Against | 1,697,003 | |||
Abstain | 1,056,169 | |||
Broker Non-Votes | 9,269,981 | |||
Total Fund Shares Voted | 92,423,357 | |||
Total Fund Shares Outstanding* | 225,851,212 | |||
| Proposal 4. | For Emerging Markets Series, to approve a new Subadvisory Agreement with Franklin Templeton Investment Management Limited: |
Shares
| ||||
For | 4,090,517 | |||
Against | 1,302 | |||
Abstain | 11,419 | |||
Broker Non-Votes | 359,049 | |||
Total Fund Shares Voted | 4,462,287 | |||
Total Fund Shares Outstanding* | 9,606,852 | |||
| ftinstitutional.com | Annual Report | 79 | ||||
TEMPLETON INSTITUTIONAL FUNDS
The name, year of birth and address of the officers and board members, as well as their affiliations, positions held with the Trust, principal occupations during at least the past five years and number of US registered portfolios overseen in the Franklin Templeton Investments fund complex, are shown below. Generally, each board member serves until that person’s successor is elected and qualified.
Independent Board Members
Name, Year of Birth and Address
| Position
| Length of
| Number of Portfolios in
| Other Directorships Held During at Least the Past 5 Years
| ||||
Harris J. Ashton (1932) 300 S.E. 2nd Street Fort Lauderdale, FL 33301-1923 | Trustee | Since 1992 | 139 | Bar-S Foods (meat packing company) (1981-2010). | ||||
Principal Occupation During at Least the Past 5 Years: Director of various companies; and formerly, Director, RBC Holdings, Inc. (bank holding company) (until 2002); and President, Chief Executive Officer and Chairman of the Board, General Host Corporation (nursery and craft centers) (until 1998).
| ||||||||
Ann Torre Bates (1958) 300 S.E. 2nd Street Fort Lauderdale, FL 33301-1923 | Trustee | Since 2008 | 40 | Ares Capital Corporation (specialty finance company) (2010-present), United Natural Foods, Inc. (distributor of natural, organic and specialty foods) (2013-present), Allied Capital Corporation (financial services) (2003-2010), SLM Corporation (Sallie Mae) (1997-2014) and Navient Corporation (loan management, servicing and asset recovery) (2014-2016). | ||||
Principal Occupation During at Least the Past 5 Years: Director of various companies; and formerly, Executive Vice President and Chief Financial Officer, NHP Incorporated (manager of multifamily housing) (1995-1997); and Vice President and Treasurer, US Airways, Inc. (until 1995).
| ||||||||
Mary C. Choksi (1950) 300 S.E. 2nd Street Fort Lauderdale, FL 33301-1923 | Trustee | Since 2016 | 139 | Avis Budget Group Inc. (car rental) (2007-present), Omnicom Group Inc. (advertising and marketing communications services) (2011-present) and White Mountains Insurance Group, Ltd. (holding company) (2017-present). | ||||
Principal Occupation During at Least the Past 5 Years: Director of various companies; and formerly, Founder and Senior Advisor, Strategic Investment Group (investment management group) (2015-2017); Founding Partner and Senior Managing Director, Strategic Investment Group (1987-2015); Founding Partner and Managing Director, Emerging Markets Management LLC (investment management firm) (1987-2011); and Loan Officer/Senior Loan Officer/Senior Pension Investment Officer, World Bank Group (international financial institution) (1977-1987).
| ||||||||
Edith E. Holiday (1952) 300 S.E. 2nd Street Fort Lauderdale, FL 33301-1923 | Lead Independent Trustee | Trustee since 1996 and Lead Independent Trustee since 2007 | 139 | Hess Corporation (exploration of oil and gas) (1993-present), Canadian National Railway (railroad) (2001-present), White Mountains Insurance Group, Ltd. (holding company) (2004-present), Santander Consumer USA Holdings, Inc. (consumer finance) (2016-present), RTI International Metals, Inc. (manufacture and distribution of titanium) (1999-2015) and H.J. Heinz Company (processed foods and allied products) (1994-2013). | ||||
Principal Occupation During at Least the Past 5 Years: Director or Trustee of various companies and trusts; and formerly, Assistant to the President of the United States and Secretary of the Cabinet (1990-1993); General Counsel to the United States Treasury Department (1989-1990); and Counselor to the Secretary and Assistant Secretary for Public Affairs and Public Liaison - United States Treasury Department (1988-1989).
| ||||||||
| 80 | Annual Report | ftinstitutional.com | ||
TEMPLETON INSTITUTIONAL FUNDS
Independent Board Members (continued)
Name, Year of Birth and Address
| Position
| Length of
| Number of Portfolios in
| Other Directorships Held During at Least the Past 5 Years
| ||||
J. Michael Luttig (1954) 300 S.E. 2nd Street Fort Lauderdale, FL 33301-1923 | Trustee | Since 2009 | 139 | Boeing Capital Corporation (aircraft financing) (2006-2013). | ||||
Principal Occupation During at Least the Past 5 Years: Executive Vice President, General Counsel and member of the Executive Council, The Boeing Company (aerospace company) (2006-present); and formerly, Federal Appeals Court Judge, U.S. Court of Appeals for the Fourth Circuit (1991-2006).
| ||||||||
David W. Niemiec (1949) 300 S.E. 2nd Street Fort Lauderdale, FL 33301-1923 | Trustee | Since 2005 | 40 | Hess Midstream Partners LO (oil and gas midstream infrastructure) (2017-present). | ||||
Principal Occupation During at Least the Past 5 Years: Advisor, Saratoga Partners (private equity fund); and formerly, Managing Director, Saratoga Partners (1998-2001) and SBC Warburg Dillon Read (investment banking) (1997-1998); Vice Chairman, Dillon, Read & Co. Inc. (investment banking) (1991-1997); and Chief Financial Officer, Dillon, Read & Co. Inc. (1982-1997).
| ||||||||
Larry D. Thompson (1945) 300 S.E. 2nd Street Fort Lauderdale, FL 33301-1923 | Trustee | Since 2005 | 139 | The Southern Company (energy company) (2014-present; previously 2010-2012), Graham Holdings Company (education and media organization) (2011-present) and Cbeyond, Inc. (business communications provider) (2010-2012). | ||||
Principal Occupation During at Least the Past 5 Years: Director of various companies; Counsel, Finch McCranie, LLP (law firm) (2015-present); Independent Compliance Monitor and Auditor, Volkswagen AG (manufacturer of automobiles and commercial vehicles) (2017-present); John A. Sibley Professor of Corporate and Business Law, University of Georgia School of Law (2015-present; previously 2011-2012); and formerly, Executive Vice President - Government Affairs, General Counsel and Corporate Secretary, PepsiCo, Inc. (consumer products) (2012-2014); Senior Vice President - Government Affairs, General Counsel and Secretary, PepsiCo, Inc. (2004-2011); Senior Fellow of The Brookings Institution (2003-2004); Visiting Professor, University of Georgia School of Law (2004); and Deputy Attorney General, U.S. Department of Justice (2001-2003).
| ||||||||
Constantine D. Tseretopoulos (1954) 300 S.E. 2nd Street Fort Lauderdale, FL 33301-1923 | Trustee | Since 1990 | 26 | None | ||||
Principal Occupation During at Least the Past 5 Years: Physician, Chief of Staff, owner and operator of the Lyford Cay Hospital (1987-present); director of various nonprofit organizations; and formerly, Cardiology Fellow, University of Maryland (1985-1987); and Internal Medicine Resident, Greater Baltimore Medical Center (1982-1985).
| ||||||||
Robert E. Wade (1946) 300 S.E. 2nd Street Fort Lauderdale, FL 33301-1923 | Trustee | Since 2007 | 40 | El Oro Ltd (investments) (2003-present). | ||||
Principal Occupation During at Least the Past 5 Years: Attorney at law engaged in private practice as a sole practitioner (1972-2008) and member of various boards.
| ||||||||
| ftinstitutional.com | Annual Report | 81 | ||||
TEMPLETON INSTITUTIONAL FUNDS
Interested Board Members and Officers
Name, Year of Birth and Address
| Position
| Length of
| Number of Portfolios in
| Other Directorships Held During at Least the Past 5 Years
| ||||
**Gregory E. Johnson (1961) One Franklin Parkway San Mateo, CA 94403-1906 | Trustee | Since 2007 | 153 | None | ||||
Principal Occupation During at Least the Past 5 Years: Chairman of the Board, Member - Office of the Chairman, Director and Chief Executive Officer, Franklin Resources, Inc.; officer and/or director or trustee, as the case may be, of some of the other subsidiaries of Franklin Resources, Inc. and of 43 of the investment companies in Franklin Templeton Investments; Vice Chairman, Investment Company Institute; and formerly, President, Franklin Resources, Inc. (1994-2015).
| ||||||||
**Rupert H. Johnson, Jr. (1940) One Franklin Parkway San Mateo, CA 94403-1906 | Chairman of the Board, Trustee and Vice President | Chairman of the Board and Trustee since 2013 Vice President since 1996 | 139 | None | ||||
Principal Occupation During at Least the Past 5 Years: Vice Chairman, Member - Office of the Chairman and Director, Franklin Resources, Inc.; Director, Franklin Advisers, Inc.; Senior Vice President, Franklin Advisory Services, LLC; and officer and/or director or trustee, as the case may be, of some of the other subsidiaries of Franklin Resources, Inc. and of 41 of the investment companies in Franklin Templeton Investments.
| ||||||||
Alison E. Baur (1964) One Franklin Parkway San Mateo, CA 94403-1906 | Vice President | Since 2012 | Not Applicable | Not Applicable | ||||
Principal Occupation During at Least the Past 5 Years: Deputy General Counsel, Franklin Templeton Investments; and officer of some of the other subsidiaries of Franklin Resources, Inc. and of 45 of the investment companies in Franklin Templeton Investments.
| ||||||||
Norman J. Boersma (1957) Lyford Cay Nassau, Bahamas | President and Chief Executive Officer – Investment Management | Since 2012 | Not Applicable | Not Applicable | ||||
Principal Occupation During at Least the Past 5 Years: Chairman of the Board, President and Chief Executive Officer, Templeton Global Advisors Ltd.; Chief Investment Officer of Templeton Global Equity Group; officer of six of the investment companies in Franklin Templeton Investments; and formerly, Executive Vice President, Franklin Templeton Investments Corp. (1993-2014).
| ||||||||
Aliya S. Gordon (1973) One Franklin Parkway San Mateo, CA 94403-1906 | Vice President | Since 2009 | Not Applicable | Not Applicable | ||||
Principal Occupation During at Least the Past 5 Years: Senior Associate General Counsel, Franklin Templeton Investments; and officer of 45 of the investment companies in Franklin Templeton Investments.
| ||||||||
Steven J. Gray (1955) One Franklin Parkway San Mateo, CA 94403-1906 | Vice President | Since 2009 | Not Applicable | Not Applicable | ||||
Principal Occupation During at Least the Past 5 Years: Senior Associate General Counsel, Franklin Templeton Investments; Vice President, Franklin Templeton Distributors, Inc. and FASA, LLC; and officer of 45 of the investment companies in Franklin Templeton Investments.
| ||||||||
Matthew T. Hinkle (1971) One Franklin Parkway San Mateo, CA 94403-1906 | Chief Executive Officer – Finance and Administration | Since June 2017 | Not Applicable | Not Applicable | ||||
Principal Occupation During at Least the Past 5 Years: Senior Vice President, Franklin Templeton Services, LLC; officer of 45 of the investment companies in Franklin Templeton Investments; and formerly, Vice President, Global Tax (2012-April 2017) and Treasurer/Assistant Treasurer, Franklin Templeton Investments (2009-2017).
| ||||||||
| 82 | Annual Report | ftinstitutional.com | ||
TEMPLETON INSTITUTIONAL FUNDS
Interested Board Members and Officers (continued)
Name, Year of Birth and Address
| Position
| Length of
| Number of Portfolios in
| Other Directorships Held During at Least the Past 5 Years
| ||||
Robert G. Kubilis (1973) 300 S.E. 2nd Street Fort Lauderdale, FL 33301-1923 | Chief Financial Officer and Chief Accounting Officer and Treasurer | Since June 2017 | Not Applicable | Not Applicable | ||||
Principal Occupation During at Least the Past 5 Years: Treasurer, U.S. Fund Administration & Reporting, Franklin Templeton Investments; and officer of 17 of the investment companies in Franklin Templeton Investments.
| ||||||||
Robert Lim (1948) One Franklin Parkway San Mateo, CA 94403-1906 | Vice President –AML Compliance | Since 2016 | Not Applicable | Not Applicable | ||||
Principal Occupation During at Least the Past 5 Years: Vice President, Franklin Templeton Companies, LLC; Chief Compliance Officer, Franklin Templeton Distributors, Inc. and Franklin Templeton Investor Services, LLC; and officer of 45 of the investment companies in Franklin Templeton Investments.
| ||||||||
Kimberly H. Novotny (1972) 300 S.E. 2nd Street Fort Lauderdale, FL 33301-1923 | Vice President | Since 2013 | Not Applicable | Not Applicable | ||||
Principal Occupation During at Least the Past 5 Years: Associate General Counsel, Franklin Templeton Investments; Vice President and Corporate Secretary, Fiduciary Trust International of the South; Vice President, Templeton Investment Counsel, LLC; Assistant Secretary, Franklin Resources, Inc.; and officer of 45 of the investment companies in Franklin Templeton Investments.
| ||||||||
Robert C. Rosselot (1960) 300 S.E. 2nd Street Fort Lauderdale, FL 33301-1923 | Chief Compliance Officer | Since 2013 | Not Applicable | Not Applicable | ||||
Principal Occupation During at Least the Past 5 Years: Director, Global Compliance, Franklin Templeton Investments; Vice President, Franklin Templeton Companies, LLC; officer of 45 of the investment companies in Franklin Templeton Investments; and formerly, Senior Associate General Counsel, Franklin Templeton Investments (2007-2013); and Secretary and Vice President, Templeton Group of Funds (2004-2013).
| ||||||||
Karen L. Skidmore (1952) One Franklin Parkway San Mateo, CA 94403-1906 | Vice President | Since 2009 | Not Applicable | Not Applicable | ||||
Principal Occupation During at Least the Past 5 Years: Senior Associate General Counsel, Franklin Templeton Investments; and officer of 45 of the investment companies in Franklin Templeton Investments.
| ||||||||
Navid J. Tofigh (1972) One Franklin Parkway San Mateo, CA 94403-1906 | Vice President | Since 2015 | Not Applicable | Not Applicable | ||||
Principal Occupation During at Least the Past 5 Years: Associate General Counsel, Franklin Templeton Investments; and officer of 45 of the investment companies in Franklin Templeton Investments.
| ||||||||
Craig S. Tyle (1960) One Franklin Parkway San Mateo, CA 94403-1906 | Vice President | Since 2005 | Not Applicable | Not Applicable | ||||
Principal Occupation During at Least the Past 5 Years: General Counsel and Executive Vice President, Franklin Resources, Inc.; and officer of some of the other subsidiaries of Franklin Resources, Inc. and of 45 of the investment companies in Franklin Templeton Investments.
| ||||||||
| ftinstitutional.com | Annual Report | 83 | ||||
TEMPLETON INSTITUTIONAL FUNDS
Interested Board Members and Officers (continued)
Name, Year of Birth and Address
| Position
| Length of
| Number of Portfolios in
| Other Directorships Held During at Least the Past 5 Years
| ||||
Lori A. Weber (1964) 300 S.E. 2nd Street Fort Lauderdale, FL 33301-1923 | Secretary and Vice President | Secretary since 2013 and Vice President since 2011 | Not Applicable | Not Applicable | ||||
Principal Occupation During at Least the Past 5 Years: Senior Associate General Counsel, Franklin Templeton Investments; Assistant Secretary, Franklin Resources, Inc.; Vice President and Secretary, Templeton Investment Counsel, LLC; and officer of 45 of the investment companies in Franklin Templeton Investments.
| ||||||||
*We base the number of portfolios on each separate series of the US registered investment companies within the Franklin Templeton Investments fund complex. These portfolios have a common investment manager or affiliated investment managers.
**Gregory E. Johnson is considered to be an interested person of the Fund under the federal securities laws due to his position as an officer and director of Franklin Resources, Inc. (Resources), which is the parent company of the Fund’s investment manager and distributor. Rupert H. Johnson, Jr. is considered to be an interested person of the Fund under the federal securities laws due to his position as officer and director and major shareholder of Resources.
Note 1: Rupert H. Johnson, Jr. is the uncle of Gregory E. Johnson.
Note 2: Officer information is current as of the date of this report. It is possible that after this date, information about officers may change.
The Sarbanes-Oxley Act of 2002 and Rules adopted by the US Securities and Exchange Commission require the Fund to disclose whether the Fund’s Audit Committee includes at least one member who is an audit committee financial expert within the meaning of such Act and Rules. The Fund’s Board has determined that there is at least one such financial expert on the Audit Committee and has designated each of Ann Torre Bates and David W. Niemiec as an audit committee financial expert. The Board believes that Ms. Bates and Mr. Niemiec qualify as such an expert in view of their extensive business background and experience. Ms. Bates has served as a member of the Fund Audit Committee since 2008. She currently serves as a director of Ares Capital Corporation (2010-present) and United Natural Foods, Inc. (2013-present) and was formerly a director of Navient Corporation from 2014 to 2016, SLM Corporation from 1997 to 2014 and Allied Capital Corporation from 2003 to 2010, Executive Vice President and Chief Financial Officer of NHP Incorporated from 1995 to 1997 and Vice President and Treasurer of US Airways, Inc. until 1995. Mr. Niemiec has served as a member of the Fund Audit Committee since 2005, currently serves as an Advisor to Saratoga Partners and was formerly its Managing Director from 1998 to 2001 and serves as a director of Hess Midstream Partners LP (2017-present). Mr. Niemiec was formerly a director of Emeritus Corporation from 1999 to 2010 and OSI Pharmaceuticals, Inc. from 2006 to 2010, Managing Director of SBC Warburg Dillon Read from 1997 to 1998, and was Vice Chairman from 1991 to 1997 and Chief Financial Officer from 1982 to 1997 of Dillon, Read & Co. Inc. As a result of such background and experience, the Board believes that Ms. Bates and Mr. Niemiec have each acquired an understanding of generally accepted accounting principles and financial statements, the general application of such principles in connection with the accounting estimates, accruals and reserves, and analyzing and evaluating financial statements that present a breadth and level of complexity of accounting issues generally comparable to those of the Fund, as well as an understanding of internal controls and procedures for financial reporting and an understanding of audit committee functions. Ms. Bates and Mr. Niemiec are independent Board members as that term is defined under the applicable US Securities and Exchange Commission Rules and Releases.
The Statement of Additional Information (SAI) includes additional information about the board members and is available, without charge, upon request. Shareholders may call (800) DIAL BEN/342-5236 to request the SAI.
| 84 | Annual Report | ftinstitutional.com | ||
TEMPLETON INSTITUTIONAL FUNDS
Proxy Voting Policies and Procedures
The Funds’ investment manager has established Proxy Voting Policies and Procedures (Policies) that the Funds use to determine how to vote proxies relating to portfolio securities. Shareholders may view the Funds’ complete Policies online at franklintempleton.com. Alternatively, shareholders may request copies of the Policies free of charge by calling the Proxy Group collect at (954) 527-7678 or by sending a written request to: Franklin Templeton Companies, LLC, 300 S.E. 2nd Street, Fort Lauderdale, FL 33301, Attention: Proxy Group. Copies of the Funds’ proxy voting records are also made available online at franklintempleton.com and posted on the US Securities and Exchange Commission’s website at sec.gov and reflect the most recent 12-month period ended June 30.
Quarterly Statement of Investments
The Funds file a complete statement of investments with the US Securities and Exchange Commission for the first and third quarters for each fiscal year on Form N-Q. Shareholders may view the filed Form N-Q by visiting the Commission’s website at sec.gov. The filed form may also be viewed and copied at the Commission’s Public Reference Room in Washington, DC. Information regarding the operations of the Public Reference Room may be obtained by calling (800) SEC-0330.
Householding of Reports and Prospectuses
You will receive each Fund’s financial reports every six months as well as an annual updated summary prospectus (prospectus available upon request). To reduce Fund expenses, we try to identify related shareholders in a household and send only one copy of the financial reports and summary prospectus. This process, called “householding,” will continue indefinitely unless you instruct us otherwise. If you prefer not to have these documents householded, please call us at (800) 632-2301. At any time you may view current prospectuses/summary prospectuses and financial reports on our website. If you choose, you may receive these documents through electronic delivery.
ftinstitutional.com |
Annual Report |
|
85 |
|
This page intentionally left blank.
This page intentionally left blank.
This page intentionally left blank.

Annual Report
Templeton Institutional Funds
Investment Managers
Templeton Asset Management Ltd.
Templeton Investment Counsel, LLC
Distributor
Franklin Templeton Distributors, Inc.
Shareholder Services
(800) 321-8563
ftinstitutional.com
Authorized for distribution only when accompanied or preceded by a summary prospectus and/or prospectus. Investors should carefully consider a fund’s investment goals, risks, charges and expenses before investing. A prospectus contains this and other information; please read it carefully before investing.
To help ensure we provide you with quality service, all calls to and from our service areas are monitored and/or recorded.
| © 2018 Franklin Templeton Investments. All rights reserved. | ZTIF A 02/18 |
| Item 2. | Code of Ethics. |
(a) The Registrant has adopted a code of ethics that applies to its principal executive officers and principal financial and accounting officer.
(c) N/A
(d) N/A
(f) Pursuant to Item 12(a)(1), the Registrant is attaching as an exhibit a copy of its code of ethics that applies to its principal executive officers and principal financial and accounting officer.
| Item 3. | Audit Committee Financial Expert. |
(a)(1) The Registrant has an audit committee financial expert serving on its audit committee.
(2) The audit committee financial expert is David W. Niemiec and he is “independent” as defined under the relevant Securities and Exchange Commission Rules and Releases.
| Item 4. | Principal Accountant Fees and Services. |
(a) Audit Fees
The aggregate fees paid to the principal accountant for professional services rendered by the principal accountant for the audit of the registrant’s annual financial statements or for services that are normally provided by the principal accountant in connection with statutory and regulatory filings or engagements were $191,672 for the fiscal year ended December 31, 2017 and $191,571 for the fiscal year ended December 31, 2016.
(b) Audit-Related Fees
The aggregate fees paid to the principal accountant for assurance and related services rendered by the principal accountant to the registrant that are reasonably related to the performance of the audit of the registrant’s financial statements and are not reported under paragraph (a) of Item 4 were $3,071 for the fiscal year ended December 31, 2017 and $3,011 for the fiscal year ended December 31, 2016. The services for which these fees were paid included attestation services.
There were no fees paid to the principal accountant for assurance and related services rendered by the principal accountant to the registrant’s investment adviser and any entity controlling, controlled by or under common control with the investment adviser that provides ongoing services to the registrant that are reasonably related to the performance of the audit of their financial statements.
(c) Tax Fees
There were no fees paid to the principal accountant for professional services rendered by the principal accountant to the registrant for tax compliance, tax advice and tax planning.
There were no fees paid to the principal accountant for professional services rendered by the principal accountant to the registrant’s investment adviser and any entity controlling, controlled by or under common control with the investment adviser that provides ongoing services to the registrant for tax compliance, tax advice and tax planning.
(d) All Other Fees
There were no fees paid to the principal accountant for products and services rendered by the principal accountant to the registrant not reported in paragraphs (a)-(c) of Item 4.
The aggregate fees paid to the principal accountant for products and services rendered by the principal accountant to the registrant’s investment adviser and any entity controlling, controlled by or under common control with the investment adviser that provides ongoing services to the registrant other than services reported in paragraphs (a)-(c) of Item 4 were $14,000 for the fiscal year ended December 31, 2017 and $0 for the fiscal year ended December 31, 2016. The services for which these fees were paid included benchmarking services in connection with the 2015 ICI TA Survey.
(e) (1) The registrant’s audit committee is directly responsible for approving the services to be provided by the auditors, including:
(i) pre-approval of all audit and audit related services;
(ii) pre-approval of all non-audit related services to be provided to the Fund by the auditors;
(iii) pre-approval of all non-audit related services to be provided to the registrant by the auditors to the registrant’s investment adviser or to any entity that controls, is controlled by or is under common control with the registrant’s investment adviser and that provides ongoing services to the registrant where the non-audit services relate directly to the operations or financial reporting of the registrant; and
(iv) establishment by the audit committee, if deemed necessary or appropriate, as an alternative to committee pre-approval of services to be provided by the auditors, as required by paragraphs (ii) and (iii) above, of policies and procedures to permit such services to be pre-approved by other means, such as through establishment of guidelines or by action of a designated member or members of the committee; provided the policies and procedures are detailed as to the particular service and the committee is informed of each service and such policies and procedures do not include delegation of audit committee responsibilities, as contemplated under the Securities Exchange Act of 1934, to management; subject, in the case of (ii) through (iv), to any waivers, exceptions or exemptions that may be available under applicable law or rules.
(e) (2) None of the services provided to the registrant described in paragraphs (b)-(d) of Item 4 were approved by the audit committee pursuant to paragraph (c)(7)(i)(C) of Rule 2-01 of regulation S-X.
(f) No disclosures are required by this Item 4(f).
(g) The aggregate non-audit fees paid to the principal accountant for services rendered by the principal accountant to the registrant and the registrant’s investment adviser and any entity controlling, controlled by or under common control with the investment adviser that provides ongoing services to the registrant were $17,071 for the fiscal year ended December 31, 2017 and $3,011 for the fiscal year ended December 31, 2016.
(h) The registrant’s audit committee of the board has considered whether the provision of non-audit services that were rendered to the registrant’s investment adviser (not including any sub-adviser whose role is primarily portfolio management and is subcontracted with or overseen by another investment adviser), and any entity controlling, controlled by, or under common control with the investment adviser that provides ongoing services to the registrant that were not pre-approved pursuant to paragraph (c)(7)(ii) of Rule 2-01 of Regulation S-X is compatible with maintaining the principal accountant’s independence.
| Item 5. | Audit Committee of Listed Registrants. N/A |
| Item 6. | Schedule of Investments. N/A |
| Item 7. | Disclosure of Proxy Voting Policies and Procedures for Closed-End Management Investment Companies. N/A |
| Item 8. | Portfolio Managers of Closed-End Management Investment Companies. N/A |
| Item 9. | Purchases of Equity Securities by Closed-End Management Investment Company and Affiliated Purchasers. N/A |
| Item 10. | Submission of Matters to a Vote of Security Holders. |
There have been no changes to the procedures by which shareholders may recommend nominees to the Registrant’s Board of Trustees that would require disclosure herein.
| Item 11. | Controls and Procedures. |
(a) Evaluation of Disclosure Controls and Procedures. The Registrant maintains disclosure controls and procedures that are designed to ensure that information required to be disclosed in the Registrant’s filings under the Securities Exchange Act of 1934 and the Investment Company Act of 1940 is recorded, processed, summarized and reported within the periods specified in the rules and forms of the Securities and Exchange Commission. Such information is accumulated and communicated to the Registrant’s management, including its principal executive officer and principal financial officer, as appropriate, to allow timely decisions regarding required disclosure. The Registrant’s management, including the principal executive officer and the principal
financial officer, recognizes that any set of controls and procedures, no matter how well designed and operated, can provide only reasonable assurance of achieving the desired control objectives.
Within 90 days prior to the filing date of this Shareholder Report on Form N-CSR, the Registrant had carried out an evaluation, under the supervision and with the participation of the Registrant’s management, including the Registrant’s principal executive officer and the Registrant’s principal financial officer, of the effectiveness of the design and operation of the Registrant’s disclosure controls and procedures. Based on such evaluation, the Registrant’s principal executive officer and principal financial officer concluded that the Registrant’s disclosure controls and procedures are effective.
(b) Changes in Internal Controls. There have been no changes in the Registrant’s internal controls or in other factors that could materially affect the internal controls over financial reporting subsequent to the date of their evaluation in connection with the preparation of this Shareholder Report on Form N-CSR.
| Item 12. | Exhibits. |
(a) (1) Code of Ethics
(a) (2) Certifications pursuant to Section 302 of the Sarbanes-Oxley Act of 2002 of Matthew T. Hinkle, Chief Executive Officer—Finance and Administration, and Robert G. Kubilis, Chief Financial Officer and Chief Accounting Officer
(b) Certifications pursuant to Section 906 of the Sarbanes-Oxley Act of 2002 of Matthew T. Hinkle, Chief Executive Officer—Finance and Administration, and Robert G. Kubilis, Chief Financial Officer and Chief Accounting Officer
SIGNATURES
Pursuant to the requirements of the Securities Exchange Act of 1934 and the Investment Company Act of 1940, the registrant has duly caused this report to be signed on its behalf by the undersigned, thereunto duly authorized.
TEMPLETON INSTITUTIONAL FUNDS
| By | /s/MATTHEW T. HINKLE | |
| Matthew T. Hinkle | ||
| Chief Executive Officer – | ||
| Finance and Administration | ||
| Date February 26, 2018 | ||
Pursuant to the requirements of the Securities Exchange Act of 1934 and the Investment Company Act of 1940, this report has been signed below by the following persons on behalf of the registrant and in the capacities and on the dates indicated.
| By | /s/MATTHEW T. HINKLE | |
| Matthew T. Hinkle | ||
| Chief Executive Officer – | ||
| Finance and Administration | ||
| Date February 26, 2018 | ||
| By | /s/ROBERT G. KUBILIS | |
| Robert G. Kubilis | ||
| Chief Financial Officer and | ||
| Chief Accounting Officer | ||
| Date February 26, 2018 | ||