Table of Contents
UNITED STATES
SECURITIES AND EXCHANGE COMMISSION
Washington, D.C. 20549
FORM N-CSRS
CERTIFIED SHAREHOLDER REPORT OF
REGISTERED MANAGEMENT INVESTMENT COMPANIES
Investment Company Act file number: Parnassus Funds (811-04044) and Parnassus Income Funds (811-06673)
Parnassus Funds
Parnassus Income Funds
(Exact name of registrant as specified in charter)
1 Market Street, Suite 1600, San Francisco, California 94105
(Address of principal executive offices) (Zip code)
Marc C. Mahon
Parnassus Funds
Parnassus Income Funds
1 Market Street, Suite 1600, San Francisco, California 94105
(Name and address of agent for service)
Registrant’s telephone number, including area code: (415) 778-0200
Date of fiscal year end: December 31
Date of reporting period: June 30, 2018
Table of Contents
Item 1: Report to Shareholders
Table of Contents
PARNASSUS FUNDS®
SEMIANNUAL REPORT ◾ JUNE 30, 2018
PARNASSUS FUNDS
| Parnassus FundSM | ||
Investor Shares | PARNX | |
Institutional Shares | PFPRX | |
| Parnassus Core Equity FundSM | ||
Investor Shares | PRBLX | |
Institutional Shares | PRILX | |
| Parnassus Endeavor FundSM | ||
Investor Shares | PARWX | |
Institutional Shares | PFPWX | |
| Parnassus Mid Cap FundSM | ||
Investor Shares | PARMX | |
Institutional Shares | PFPMX | |
| Parnassus Fixed Income FundSM | ||
Investor Shares | PRFIX | |
Institutional Shares | PFPLX | |
Table of Contents
| Letter from Parnassus Investments | 4 | |||
| Fund Performance and Commentary | ||||
| Parnassus Fund | 6 | |||
| Parnassus Core Equity Fund | 9 | |||
| Parnassus Endeavor Fund | 12 | |||
| Parnassus Mid Cap Fund | 15 | |||
| Parnassus Fixed Income Fund | 18 | |||
| Responsible Investing Notes | 21 | |||
| Fund Expenses | 22 | |||
| Portfolios of Investments | ||||
| Parnassus Fund | 24 | |||
| Parnassus Core Equity Fund | 26 | |||
| Parnassus Endeavor Fund | 29 | |||
| Parnassus Mid Cap Fund | 31 | |||
| Parnassus Fixed Income Fund | 33 | |||
| Financial Statements | 38 | |||
| Notes to Financial Statements | 44 | |||
| Financial Highlights | 56 | |||
| Additional Information | 62 | |||
Table of Contents
| PARNASSUS FUNDS | Semiannual Report • 2018 | |||
August 3, 2018
Stocks moved higher this quarter on the continued strength of technology and consumer shares, and a major rebound in the energy sector. The S&P 500 is now up 2.65% year-to-date, after posting a 3.43% return for the last three months. Our flagship offering, the Parnassus Core Equity Fund – Investor Shares, has been our best performing fund for the year, having gained 2.37%. Our top performer for the quarter was the Parnassus Mid Cap Fund – Investor Shares, whose 3.43% return outpaced the 2.82% gain for the Russell Midcap Index. Both funds are within one percentage point of their respective indexes for the year-to-date period. We’re optimistic that they’ll have strong second halves, and finish the year ahead of their benchmarks.
Our two fossil-free offerings, the Parnassus Endeavor Fund and the Parnassus Fund, have had challenging starts to 2018. Both funds have excellent long-term track records and terrific portfolio managers, so I expect their performance to improve soon.
Please see the following pages for more detailed information regarding each fund’s performance and the risks associated with investing in the Funds.
New Employees
We have three new employees at the firm. Kathryn Farthing is our new Head of Marketing Strategy. Prior to joining Parnassus, Kathryn served as Vice President of Global Brand and Advertising at BlackRock. Before that, she worked in various roles at Young & Rubicam, Schwartz Communications and Wells Fargo. Kathryn earned a bachelor’s degree in economics and sociology from Trinity College in Hartford, Connecticut.
Rachel Rowland, a Marketing Associate, helps with a variety of projects as part of the sales and marketing team. She recently graduated cum laude from St. Mary’s College in Moraga, California with a bachelor’s degree in business administration. Rachel was president of the school’s Undergraduate Student Advisory Board and rowed on the women’s crew team.
Darlene Ruiz joined the firm as a Shareholder Services Representative. She previously worked as a Compliance Specialist at Wells Fargo and as an Administrative Assistant at San Francisco Fire Credit Union. Darlene is a graduate of Mohawk Valley Community College in Utica, New York.
Interns
In addition to these new regular hires, we have eleven interns at the firm for the summer. Shivani Vohra is an MBA candidate at Harvard Business School. Before graduate school, she worked at Darlington Partners, an investment firm in the Bay Area, and Morgan Stanley. Shivani graduated from Yale University, where she majored in economics. In her free time, Shivani enjoys cooking and traveling.
Jake Wamala is an MBA candidate at the Haas School of Business at the University of California, Berkeley. Previously, he was a principal at OVO Fund, an independent financial consultant, and an analyst at Morgan Stanley. Jake received his bachelor’s degree in mechanical engineering from the Massachusetts Institute of Technology. Outside of school and work, he enjoys rooting for Boston sports teams and teaching chess to underrepresented youth in Oakland.
James Lee is an MBA candidate at the University of Pennsylvania’s Wharton School. He previously worked as a research associate at Dodge & Cox in San Francisco. James received his bachelor’s degree in economics from the Wharton School. In his free time, he enjoys playing squash, tasting wine and singing.
Michael Lowe is a rising senior at Tulane University, studying finance and economics. He is the president of Tulane’s Net Impact chapter, a global non-profit promoting sustainable business. Previously, Michael worked as a Summer Equity Research Analyst at Credit Suisse. Michael grew up in San Francisco, and he enjoys sports and outdoor activities.
4
Table of Contents
| Semiannual Report • 2018 | PARNASSUS FUNDS | |||
Mattias Ryou will be a senior at the University of Pennsylvania this fall, studying economics and consumer psychology. His previous experience includes interning at Sojung & Company, a small asset management firm in Seoul. Originally from South Korea, Mattias has lived in Scotland and Canada, and enjoys hip-hop dancing and snowboarding.
Elizabeth Fraysse is a rising senior at the University of California at Berkeley, pursuing a major in environmental economics. Previously, she worked as a case assistant at Knox Ricksen LLP and as an intern for the Center for Peace and Commerce. Elizabeth enjoys backpacking, paddle boarding and volunteering with her sorority.
Shelby Fabianac is an intern supporting our client service team. Shelby recently graduated from the University of San Francisco with a degree in finance. She completed her education with summa cum laude honors while working at Parnassus part-time and serving as a teaching assistant. In her spare time, Shelby enjoys cooking and exploring San Francisco.
Leah Weaver is an intern supporting our marketing team. She is a senior at the University of California, Berkeley, majoring in legal studies and rhetoric. Previously, Leah worked at Andra Founders Fund and the Phoebe Hearst Museum of Anthropology. She is active in Berkeley’s American Civil Liberties Union and is a member of the Kappa Alpha Pi pre-law fraternity. Leah is a classically trained singer and enjoys hiking, reading and writing.
Sophia Lee is an intern on our accounting team. She is pursuing a bachelor’s degree in psychology at the University of Arizona. Sophia is a San Francisco native, and enjoys tennis, volleyball and photography.
Nathan Su is a software engineering intern. He will be a senior this fall at the University of California, Berkeley, where he is studying computer science and economics. Previously, Nathan interned at sciRobot, a technology startup in San Francisco. For recreation, he enjoys hiking and playing sports.
Miguel Acevedo is also working this summer as a software engineering intern. He is a computer science major at the University of California, Davis. He’s a director for the annual hackathon hosted at Davis. Outside of work and school, Miguel likes to explore nature.
Thank you all for investing with the Parnassus Funds.
Sincerely,
|
Benjamin E. Allen President and CEO |

5
Table of Contents
| PARNASSUS FUNDS | Semiannual Report • 2018 | |||
Ticker: Investor Shares - PARNX
Ticker: Institutional Shares - PFPRX
As of June 30, 2018, the net asset value (“NAV”) of the Parnassus Fund – Investor Shares was $47.10, resulting in a gain of 1.03% for the second quarter. This compares to a gain of 3.43% for the S&P 500 Index (“S&P 500”) and a gain of 2.63% for the Lipper Multi-Cap Core Average, which represents the average return of the multi-cap core funds followed by Lipper (“Lipper average”).
Below is a table that summarizes the performance of the Fund, the S&P 500 and the Lipper average. The returns are for the one-, three-, five- and ten-year periods ended June 30, 2018.
Second Quarter Review
The Parnassus Fund – Investor Shares gained 1.03% for the quarter, trailing the S&P 500 by 240 basis points (one basis point is 1/100th of one percent). Sector allocation hurt our relative performance, as the Fund is overweight the financial services and
| Parnassus Fund | ||||||||||||||||||||||||
| Average Annual Total Returns (%) | One Year | Three Years | Five Years | Ten Years | Gross Expense Ratio | Net Expense Ratio | ||||||||||||||||||
| for period ended June 30, 2018 | ||||||||||||||||||||||||
| Parnassus Fund Investor Shares | 3.46 | 7.65 | 11.95 | 11.26 | 0.84 | 0.84 | ||||||||||||||||||
| Parnassus Fund Institutional Shares | 3.62 | 7.81 | 12.04 | 11.31 | 0.69 | 0.69 | ||||||||||||||||||
| S&P 500 Index | 14.37 | 11.93 | 13.42 | 10.17 | NA | NA | ||||||||||||||||||
| Lipper Multi-Cap Core Average | 12.16 | 8.88 | 11.18 | 8.58 | NA | NA | ||||||||||||||||||
The average annual total return for the Parnassus Fund-Institutional Shares from commencement (April 30, 2015) was 7.54%. Performance shown prior to the inception of the Institutional Shares reflects the performance of the Parnassus Fund-Investor Shares and includes expenses that are not applicable to and are higher than those of the Institutional Shares. The performance of Institutional Shares differs from that shown for the Investor Shares to the extent that the classes do not have the same expenses. Performance data quoted represent past performance and are no guarantee of future returns. Current performance may be lower or higher than the performance data quoted. Current performance information to the most recent month-end is available on the Parnassus website (www.parnassus.com). Investment return and principal value will fluctuate, so an investor’s shares, when redeemed, may be worth more or less than their original principal cost. Returns shown in the table do not reflect the deduction of taxes a shareholder may pay on fund distributions or redemption of shares. The S&P 500 is an unmanaged index of common stocks, and it is not possible to invest directly in an index. Index figures do not take any expenses, fees or taxes into account, but mutual fund returns do.
Before investing, an investor should carefully consider the investment objectives, risks, charges and expenses of the Fund and should carefully read the prospectus or summary prospectus, which contain this and other information. The prospectus or summary prospectus can be obtained on the Parnassus website or by calling (800) 999-3505.
industrials sectors, the two worst performing sectors this quarter. Meanwhile, the energy sector was the index’s best performer, which hurt our performance because the Fund doesn’t invest in fossil fuels. While oil prices may jump from time to time because of factors such as geopolitical concerns, over the long-term, we expect oil and gas stocks to underperform as renewable power sources and electric vehicles increase in relevance.
Our worst performer was Starbucks, the global coffee chain. Its stock reduced the Fund’s return by 39 basis points, as it declined 15.6% from $57.89 to $48.85. The company pre-announced weaker than expected sales for the quarter and lowered earnings guidance for the year. Growing competition caused revenue growth to slow in the U.S., while the company’s business in China was hurt by an interruption in delivery services. Management has numerous initiatives in place to turn around performance, such as adding loyalty members, introducing new food and beverage items and closing underperforming stores. We’re optimistic management will be able to reaccelerate growth, and with shares trading at their cheapest valuation in eight years, we think the risk-reward for this blue-chip company is attractive.
Shares of New York City-based Signature Bank subtracted 29 basis points from the Fund’s return, as its shares declined 9.9% from $141.95 to $127.88. The stock fell after the bank recorded a loss on its taxi loan book and the interest rate spread between its loans and deposits contracted. After this quarter, we believe the bank’s taxi loan losses are finally in the rearview mirror. While we don’t know exactly when the bank’s loan yields will rise enough to offset its higher deposit rates, we’re confident they eventually will, and we take
6
Table of Contents
| Semiannual Report • 2018 | PARNASSUS FUNDS | |||
comfort in the bank’s veteran management team and their exemplary track record. Despite the interest rate headwind, Signature’s revenue is expected to grow 6% this year due to the bank’s impressive loan growth, so we believe investors have over-reacted and the stock is now on the bargain table.
Logistics provider C.H. Robinson cut the Fund’s return by 27 basis points, as its stock slid 10.7% from $93.71 to $83.66. The stock dropped due to weak earnings from its international freight forwarding division, as the integration of several recent acquisitions is proving to be costlier than initially expected. We were disappointed with the division’s results, but it’s a small
part of Robinson, representing only 12% of the company’s 2017 operating income. Robinson’s domestic truck brokerage division is the driver of the company’s earnings. We expect the stock to rebound because truck brokerage earnings are surging, as the tightest truck market in over a decade is requiring shippers to pay more to access Robinson’s industry-leading network of carriers.
Two of our biggest winners this quarter, Mattel and Alliance Data Systems, were among last quarter’s biggest losers. As contrarian investors, we took advantage of the temporary weakness in their share prices and added to our positions to boost our gains when the stocks rebounded. Toy manufacturer Mattel was the Fund’s biggest winner, contributing 104 basis points to the Fund’s return as its stock jumped 24.9% from $13.15 to $16.42. The stock rallied as Mattel’s quarterly revenue exceeded investors’ expectations, driven by the excitement around Hot Wheels’ 50th anniversary and Barbie’s new career and role model dolls. The stock continued to move higher on speculation that the liquidation auction for Toys R Us, the largest U.S. toy store chain, may yield a new owner that revives the brand. We don’t know how the Toys R Us saga will end, but we believe there is significant upside in Mattel’s stock as its iconic brands return to their historical levels of profitability.
Motorola Solutions, the largest provider of mission-critical communications solutions, added 54 basis points to the Fund’s return as its shares rose 10.5% from $105.30 to $116.37. The stock moved higher after the company reported better-than-expected quarterly earnings and raised earnings guidance for the year due to broad-based global demand for Motorola’s land mobile radio systems.
Shares of Alliance Data Systems, a leading digital marketing firm and credit card issuer, contributed 49 basis points to the Fund’s return as its shares increased 9.6% from $212.86 to $233.20. Alliance Data’s shares rallied as its credit card loss rates stabilized during the quarter, and the company guided for loss rates to fall next quarter. We believe there is significant upside in the stock as Alliance Data’s industry leading profitability and growth rate shine through, now that the cloud of rising credit losses has passed.
Outlook and Strategy
The S&P 500 posted a solid gain during the second quarter, increasing 3.43%. The market rose steadily through mid-June, as the U.S. economy posted strong GDP growth and the unemployment rate fell to 3.8%, an 18-year low. However, stocks ended the quarter on a weaker note, as investors worried about an escalating trade war between the world’s two largest economies, the U.S. and China.
We’re closely following President Trump’s trade actions, and we’re hopeful that cooler heads will prevail. Not only do the U.S. and China have a lot to lose if they pursue protectionist policies, but the global
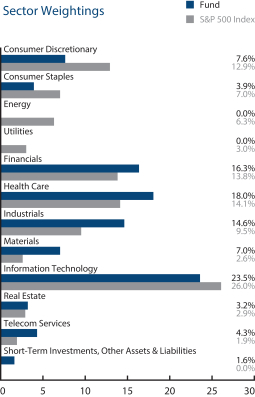
| Parnassus Fund as of June 30, 2018 (percentage of net assets) |
Top 10 Holdings
(percentage of net assets)
| Alliance Data Systems Corp. | 5.8% | |||
| Thomson Reuters Corp. | 5.4% | |||
| Motorola Solutions Inc. | 5.2% | |||
| Gilead Sciences Inc. | 4.6% | |||
| CVS Health Corp. | 4.4% | |||
| Cognizant Technology Solutions Corp. | 4.0% | |||
| Mondelez International Inc., Class A | 3.9% | |||
| Nielsen Holdings plc | 3.5% | |||
| Alphabet Inc., Class A | 3.4% | |||
| Mattel Inc. | 3.3% | |||
Portfolio characteristics and holdings are subject to change periodically.
7
Table of Contents
| PARNASSUS FUNDS | Semiannual Report • 2018 | |||
economy does as well. Trade tensions are coming at a time when we’re beginning to see cracks in the synchronized global growth that has benefited the market in 2017 and so far in 2018. Recent economic data has pointed to decelerating growth in Europe, while earnings growth for S&P 500 companies is expected to peak during the third quarter and meaningfully decelerate thereafter.
Despite the prospect of slower future growth, the S&P 500 Growth Index rose 7.4% during the quarter, continuing to outperform the S&P 500 Value Index, which increased just 2.9%. Growth has now outperformed Value for a rare sixth consecutive quarter. The S&P 500 Growth Index ended the quarter with a valuation of 19.1x forward earnings estimates, a 5.5x premium to the S&P 500 Value Index at 13.6x. This valuation gap is nearly the widest it’s been in the past 10 years, and more than double its 10-year average of 2.5x. We believe valuations will revert towards their mean and that Value will rotate back into favor. When it does, we expect to benefit.
During the quarter, we were excited to initiate positions in three well-run businesses that we believe have great long-term potential. The first new holding is 3M, a leading global provider of diversified industrial products. We had the opportunity to buy this blue-chip company after a rare 20% drop, as investors panicked after 3M slightly reduced its 2018 earnings guidance due to weakness in the dental and automotive refinish markets. We aren’t phased by the short-term blip, as 3M’s innovation engine and manufacturing expertise will be applied to diverse end markets globally to generate enviable long-term returns for shareholders.
We also invested in Zayo Group, a fiber-optic communications network owner. Zayo’s fiber network provides its customers with dedicated high capacity, low latency bandwidth. Zayo’s infrastructure is uniquely positioned to benefit from the unrelenting growth in data consumption.
The last newcomer to the Fund is telecommunications carrier T-Mobile. This disruptive company has done a great job gaining market share and growing its free cash flow, and now it has the additional opportunity to create substantial value if its announced merger with Sprint is approved by regulators. We believe the future is bright at T-Mobile whether the company remains independent or merges with Sprint.
To make room for our new holdings, we sold several stocks during the quarter. We said goodbye to Expeditors International, a logistics company specializing in international air and ocean deliveries, and semiconductor equipment manufacturer KLA-Tencor, primarily for valuation reasons after both stocks had big runs. We sold two dental businesses, Patterson Companies and Dentsply Sirona, as both have been dealing with a sluggish dental market. Additionally, Patterson has struggled with ongoing market share losses, while Dentsply Sirona faces an uncertain turnaround plan. Finally, we sold Nutrien, a fertilizer manufacturer, due to our concern that it would take longer than expected for fertilizer prices to rebound.
At quarter-end, the Fund remains underweight the technology sector because of the sector’s high valuation and elevated expectations. As a reminder, we do not have exposure to the energy and utility sectors due to our fossil fuel free mandate. We’re overweight the industrials, materials, and telecommunication services sectors because we’ve been able to identify a number of competitively advantaged and increasingly relevant businesses whose stocks are currently on sale. The Fund remains overweight financials, as rising interest rates and less regulation should benefit the sector.
The first half of 2018 has been marked by increasing volatility and rising global trade tensions. We’re not market forecasters, so we don’t know the market’s next move, but we believe the Fund is well-positioned for the future. We remain focused on investing in socially responsible companies, and we’re confident that our time-tested stock selection strategy is poised to outperform.
Yours truly,
 |
| |
Robert J. Klaber Portfolio Manager | Ian E. Sexsmith Portfolio Manager |

8
Table of Contents
| Semiannual Report • 2018 | PARNASSUS FUNDS | |||
Ticker: Investor Shares - PRBLX
Ticker: Institutional Shares - PRILX
As of June 30, 2018, the net asset value (NAV) of the Parnassus Core Equity Fund – Investor Shares was $43.43. After taking dividends into account, the total return for the second quarter was 2.64%. This compares to gains of 3.43% for the S&P 500 Index (“S&P 500”) and 2.03% for the Lipper Equity Income Fund Average, which represents the average of the equity income funds followed by Lipper (“Lipper average”). For the first half of 2018, the Fund posted a return of 2.37%, versus a gain of 2.65% for the S&P 500 and loss of 0.56% for the Lipper average.
Below is a table that summarizes the performances of the Parnassus Core Equity Fund, the S&P 500 and the Lipper average. The returns are for the one-, three-, five- and ten-year periods. We are pleased to report that the Fund outperforms the Lipper average for all periods.
| Parnassus Core Equity Fund | ||||||||||||||||||||||||
| Average Annual Total Returns (%) | One Year | Three Years | Five Years | Ten Years | Gross Expense Ratio | Net Expense Ratio | ||||||||||||||||||
| for period ended June 30, 2018 | ||||||||||||||||||||||||
| Parnassus Core Equity Fund Investor Shares | 11.63 | 9.86 | 11.96 | 10.41 | 0.87 | 0.87 | ||||||||||||||||||
| Parnassus Core Equity Fund Institutional Shares | 11.86 | 10.09 | 12.18 | 10.62 | 0.64 | 0.64 | ||||||||||||||||||
| S&P 500 Index | 14.37 | 11.93 | 13.42 | 10.17 | NA | NA | ||||||||||||||||||
| Lipper Equity Income Fund Average | 8.77 | 8.38 | 9.40 | 8.21 | NA | NA | ||||||||||||||||||
The average annual total return for the Parnassus Core Equity Fund-Institutional Shares from commencement (April 28, 2006) was 10.15%. Performance shown prior to the inception of the Institutional Shares reflects the performance of the Parnassus Core Equity Fund-Investor Shares and includes expenses that are not applicable to and are higher than those of the Institutional Shares. The performance of the Institutional Shares differs from that shown for the Investor Shares to the extent that the classes do not have the same expenses. Performance data quoted represent past performance and are no guarantee of future returns. Current performance may be lower or higher than the performance data quoted, and current performance information to the most recent month-end is available on the Parnassus website (www.parnassus.com). Investment return and principal value will fluctuate, so an investor’s shares, when redeemed, may be worth more or less than their original principal cost. Returns shown in the table do not reflect the deduction of taxes a shareholder may pay on fund distributions or redemption of shares. The S&P 500 is an unmanaged index of common stocks, and it is not possible to invest directly in an index. Index figures do not take any expenses, fees or taxes into account, but mutual fund returns do.
Before investing, an investor should carefully consider the investment objectives, risks, charges and expenses of the Fund and should carefully read the prospectus or summary prospectus, which contain this and other information. The prospectus or summary prospectus can be obtained on the Parnassus website or by calling (800) 999-3505.
Second Quarter Review
The Parnassus Core Equity Fund – Investor Shares gained 2.64% for the quarter, but trailed the S&P 500 by 80 basis points (one basis point is 1/100th of one percent). Our sector allocations reduced our return relative to the index by over 100 basis points in the quarter. The Fund was significantly underweight two of the best performing groups, energy and technology. In addition, the portfolio was overweight two of the worst performing sectors, consumer staples and industrials. Fortunately, our positive stock selection somewhat offset the negative effect of our sector allocations.
Three stocks trimmed the Fund’s return by 26 basis points or more. Coffee chain Starbucks reduced the Fund’s return by 46 basis points, as its stock declined 15.6% from $57.89 to $48.85. The company announced weaker than expected sales for the quarter and lowered earnings guidance for the year. Growing competition caused soft revenue growth in the U.S., while the company’s Chinese business was hurt by an interruption in delivery services. Management has numerous initiatives in place to turn around performance, such as adding additional loyalty members, introducing new food and beverage items and closing underperforming stores. With shares trading at bargain levels, we think the risk-reward for this blue-chip company is attractive.
Gilead Sciences, the biotechnology firm that makes therapies for HIV and hepatitis C (HCV), subtracted 30 basis points from the Fund’s return, as its stock declined 6.0% from $75.39 to $70.84. The company reported lower than expected sales across its two major franchises, leading investors to question management’s ability to achieve its annual sales target. The HIV business was
9
Table of Contents
| PARNASSUS FUNDS | Semiannual Report • 2018 | |||
impacted by unusually large inventory reductions at wholesalers, and the HCV business faced competitive pressure overseas. We are confident that these issues will resolve by the end of the year.
Xylem is a global industrial company providing a complete set of products for the water industry, including pumps, filters and measurement equipment. The company subtracted 26 basis points from the Fund’s return, as its stock declined 12.4% from $76.92 to $67.38. The stock was down because management reported that profits would be weaker than expected. The two key issues are higher material costs and lower margin projects in emerging markets. Management plans to mitigate these issues through price increases and productivity improvements.
Three stocks added at least 40 basis points to the Fund’s quarterly return. Praxair, one of the largest industrial gas companies in the world, added 51 basis points to the Fund’s return as the stock rose 9.6% from $144.30 to $158.15. Sales growth was broad-based, with management reporting increased demand for industrial gases in the chemical, manufacturing and metal markets. The company expects a continuation of strong volume growth across all end-markets, driven by the ongoing industrial recovery and solid pricing trends. Finally, management reaffirmed that the proposed merger with Linde remains on track to close in the second half of the year.
VF Corporation, the global apparel company with key brands such as The North Face, Vans and Timberland, increased the Fund’s return by 46 basis points, as its stock increased 10.0% from $74.12 to $81.52. The company benefited from strong demand for Vans sneakers. In addition, The North Face business continued its recovery, and its order book is the strongest that it’s been in several years.
Long-term holding Mastercard, a leading payments company, rose 12.2% from $175.16 to $196.52 and added 41 basis points to the Fund’s return. The stock climbed in the quarter as management indicated that the company is on track to hit 20% revenue growth in 2018. In addition to overall strong retail spending, the company is benefitting from a variety of new partnerships.
Outlook and Strategy
Overall, the economic backdrop appears supportive for our portfolio companies to continue posting strong earnings. GDP growth is expected to accelerate from 2.4% in the first quarter to 4.0% in second quarter according to ISS. The unemployment rate is at 4.0%, which is close to historic lows. Meanwhile, aggregate corporate profits for S&P 500 companies are estimated to rise 20.5% in the second quarter, according to Strategas. And while the federal funds rate increased 25 basis points in second quarter to 2.0%, interest rates are still at historically low levels. This means businesses and consumers should have ample access to credit for spending and investing.
While economic strength appears to be widespread, recent stock market wealth generation has been highly concentrated. Remarkably, the S&P 500’s first half return of 2.65% was powered by gains in just seven companies – Amazon, Apple, Microsoft, Netflix, Facebook, Nvidia and Alphabet (Google’s parent company). In other words, without these market leaders, the index would not have posted a gain over the last six months. While we own two of them, Apple and Alphabet, the remainder don’t currently meet our investment criteria due to valuation.
To illustrate the point of high valuations, consider Netflix. After soaring an incredible 102% during the first half, Netflix’s value has increased by
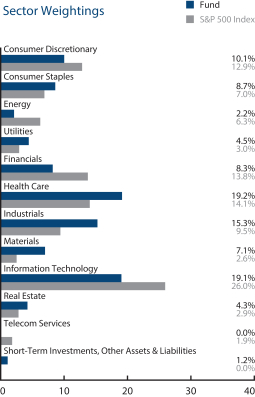
Parnassus Core Equity Fund as of June 30, 2018 (percentage of net assets) | ||
Top 10 Holdings
(percentage of net assets)
| Gilead Sciences Inc. | 4.9% | |||
| CVS Health Corp. | 4.7% | |||
| Praxair Inc. | 4.6% | |||
| The Walt Disney Co. | 4.5% | |||
| 3M Co. | 4.0% | |||
| Mastercard Inc., Class A | 3.6% | |||
| American Express Co. | 3.2% | |||
| The Clorox Company | 3.2% | |||
| United Parcel Service Inc., Class B | 3.0% | |||
| VF Corp. | 3.0% | |||
Portfolio characteristics and holdings are subject to change periodically.
10
Table of Contents
| Semiannual Report • 2018 | PARNASSUS FUNDS | |||
about $80 billion since the start of 2018. This means that investors are paying almost $20 for every $1 of additional revenues Netflix will generate this year. Clearly, Netflix needs to maintain high growth for many years to justify this valuation. Another problem is that Netflix is hemorrhaging cash, due to its massive investments in original content. For 2018 alone, the company expects negative cash flow of $3-4 billion, and cash flow should remain negative for several more years to come.
For these reasons, Netflix doesn’t pass the Fund’s valuation screen. By way of contrast, the Fund owns Disney, a media titan that trades at just 14 times estimated 2018 earnings. Remarkably, Disney’s market capitalization is less than that of Netflix, despite posting about seven times more profits. While we don’t know when investment sentiment will change in Disney’s favor, we’re confident that the company’s collection of assets, acquisition opportunities and valuation will lead to solid long-term returns from the current price.
During the quarter, the Fund exited one long-term holding and bought two new stocks. We sold Mondelez, the global food and beverage company with iconic brands such as Nabisco, Oreo, Cadbury and Trident. While we like the new CEO Dirk Van de Put, we’re concerned that Mondelez faces secular challenges due to changes in consumer preferences.
Our first new holding is 3M, a leading global provider of diversified industrial products. We had the opportunity to buy this blue-chip company after a rare 20% stock price drop. The stock fell after 3M reduced its 2018 earnings guidance due to weakness in the dental and automotive refinish markets. We’ve long admired 3M’s innovation engine and manufacturing expertise, and are excited that the company is in our portfolio.
The second addition to the Fund is Cadence Systems, which sells hardware and software for semiconductor companies to design integrated circuits and electronic products. There are three secular trends that are increasing the demand for the company’s solutions: 1) its customer base is expanding as non-semiconductor companies, such as Amazon and Google, need additional software and hardware tools to continue developing their own chips, 2) chip design complexity is increasing, which requires more sophisticated software, and 3) emerging technologies such as machine learning, autonomous driving and artificial intelligence are creating exponential growth in data processing and storage needs. Since becoming CEO in 2009, Lip-Bu Tan has led a successful recovery that has enabled the company to regain market share and transition from a laggard to an industry leader. We think that earnings growth could meaningfully accelerate over the next few years, and are delighted to have Cadence in the Fund.
Moving to industry positioning, the Fund is underweight the technology and consumer discretionary sectors, primarily due to valuation. The Fund is also underweight financials, based on the sector’s wide range of potential outcomes and the possibility for an inverted yield curve. While the Fund is still underweight the energy sector, we increased our position in our only energy stock, National Oilwell Varco, in the quarter due to improving fundamentals.
With our investment in 3M and our decision to more than double our position in performance coatings company PPG, we increased our industrials overweight. The positive economic environment should be a tailwind for this sector. We remain overweight healthcare, with a focus on companies that research and develop novel therapies, improve patient access and quality of care and/or reduce healthcare costs. The Fund continues to be overweight the consumer staples sector, headlined by our position in the household products company Clorox. We think these sector weightings make our fund defensively positioned relative to the S&P 500.
We are pleased that the Fund’s first half return is only narrowly behind the index despite our underweight position in so-called “FANG” (Facebook, Amazon, Netflix and Google) stocks. The portfolio has a fantastic collection of businesses that should grow earnings and cash flows over the long-term. We think they are all trading at reasonable valuations, which means they should generate solid long-term investment returns.
Thank you for your confidence and investment in the Parnassus Core Equity Fund.
Sincerely,
|
| |
Todd C. Ahlsten Lead Portfolio Manager | Benjamin E. Allen Portfolio Manager |

11
Table of Contents
| PARNASSUS FUNDS | Semiannual Report • 2018 | |||
Ticker: Investor Shares - PARWX
Ticker: Institutional Shares - PFPWX
As of June 30, 2018, the net asset value (“NAV”) of the Parnassus Endeavor Fund-Investor Shares was $36.85, so the Fund gained 1.63% in the second quarter. This compares to a gain of 3.43% for the S&P 500 Index (“S&P 500”) and a gain of 2.63% for the Lipper Multi-Cap Core Average, which represents the average return of the multi-cap core funds followed by Lipper (“Lipper average”). The Fund underperformed this quarter, causing us to lag the S&P 500 and the Lipper average for the one-year period as well. Longer-term, we are ahead of both benchmarks for all time periods (three-, five- and ten-years). See the table below for the details.
Second Quarter Review
The Parnassus Endeavor Fund gained 1.63% for the quarter, trailing the S&P 500 by 180 basis points (one basis point is 1/100th of one percent). The main reason for our underperformance this quarter is weakness in the health care sector. For a number of reasons, health care stocks are trading at very low levels at the present time. One important reason is the threat of
| Parnassus Endeavor Fund | ||||||||||||||||||||||||
| Average Annual Total Returns (%) | One Year | Three Years | Five Years | Ten Years | Gross Expense Ratio | Net Expense Ratio | ||||||||||||||||||
| for period ended June 30, 2018 | ||||||||||||||||||||||||
| Parnassus Endeavor Fund Investor Shares | 7.92 | 12.48 | 15.32 | 14.34 | 0.92 | 0.92 | ||||||||||||||||||
| Parnassus Endeavor Fund Institutional Shares | 8.15 | 12.71 | 15.46 | 14.41 | 0.72 | 0.72 | ||||||||||||||||||
| S&P 500 Index | 14.37 | 11.93 | 13.42 | 10.17 | NA | NA | ||||||||||||||||||
| Lipper Multi-Cap Core Average | 12.16 | 8.88 | 11.18 | 8.58 | NA | NA | ||||||||||||||||||
The average annual total return for the Parnassus Endeavor Fund-Institutional Shares from commencement (April 30, 2015) was 12.35%. Performance shown prior to the inception of the Institutional Shares reflects the performance of the Parnassus Endeavor Fund-Investor Shares and includes expenses that are not applicable to and are higher than those of the Institutional Shares. The performance of the Institutional Shares differs from that shown for the Investor Shares to the extent that the classes do not have the same expenses. Performance data quoted represent past performance and are no guarantee of future returns. Current performance may be lower or higher than the performance data quoted. Current performance information to the most recent month-end is available on the Parnassus website (www.parnassus.com). Investment return and principal value will fluctuate, so an investor’s shares, when redeemed, may be worth more or less than their original principal cost. Returns shown in the table do not reflect the deduction of taxes a shareholder may pay on fund distributions or redemption of shares. The S&P 500 is an unmanaged index of common stocks, and it is not possible to invest directly in an index. Index figures do not take any expenses, fees or taxes into account, but mutual fund returns do.
Before investing, an investor should carefully consider the investment objectives, risks, charges and expenses of the Fund and should carefully read the prospectus or summary prospectus, which contain this and other information. The prospectus or summary prospectus can be obtained on the Parnassus website or by calling (800) 999-3505.
price controls and other regulatory actions that have been discussed by government officials. In addition, there are company-specific issues that we will discuss below. The result is that these shares are trading at bargain prices. Since the Parnassus Endeavor Fund is a bargain-hunter, we have loaded up on health care stocks. At some point, these stocks should move higher, but in the meantime, our short-term performance doesn’t look very good. Four of the five companies that hurt us the most are in the health care sector.
Gilead Sciences, the biotechnology firm that makes therapies for HIV and hepatitis C (HCV), subtracted 64 basis points from the Fund’s return, as its stock declined 6.0% from $75.39 to $70.84. The company reported lower than expected sales across its two major franchises, leading investors to question management’s ability to achieve its annual sales guidance. The HIV business had unusually large inventory reductions at wholesalers, and the HCV business faced competitive pressure in markets outside the U.S. Management indicated that things should improve by the end of the year, with HCV market share expected to stabilize soon. Early prescription data also pointed to a strong start for Biktarvy, Gilead’s new once-a-day HIV drug.
Bristol-Myers Squibb subtracted 51 basis points from the Fund’s return, as its share price fell 12.5% from $63.25 to $55.34. This global pharmaceutical company specializes in treatments for cancer and heart disease, and is a leader in immuno-oncology, a new approach to cancer that uses the body’s own immune system to fight tumor cells. Bristol’s stock plunged after rival Merck reported impressive clinical data in lung cancer, a critical market for Bristol. We believe investors overreacted, since Bristol’s combination
12
Table of Contents
| Semiannual Report • 2018 | PARNASSUS FUNDS | |||
therapy also showed positive data with fewer side effects, and is already being used for several indications outside of lung cancer. Bristol’s strong balance sheet and long-term focused management should also help the company weather setbacks.
Perrigo, the leading producer of store-brand generic drugs, subtracted 48 basis points from the Fund’s return, as its stock fell 12.5% from $83.34 to $72.91. The shares dropped after the FDA delayed the launch of Perrigo’s generic version of ProAir, an asthma treatment. We held our position during the quarter, because we believe this product delay is just a bump in the road.
Perrigo’s core business continues to perform nicely, and we believe the company will ultimately bring a generic ProAir to the market, which should drive the stock higher.
Shares of New York City-based Signature Bank subtracted 38 basis points from the Fund’s return, as its shares fell 9.9% from $141.95 to $127.88. The stock fell after the bank recorded a loss on its taxi loans and the interest rate spread between its loans and deposits contracted. After this quarter, we believe the bank’s taxi loan losses should be in the rearview mirror. While we don’t know exactly when the bank’s loan yields will rise enough to offset its higher deposit rates, we’re confident they eventually will, and we take comfort in the bank’s veteran management team and their exemplary track record. Despite the interest rate headwind, Signature’s revenue is expected to grow 6% this year due to the bank’s impressive loan growth, so we believe investors have over-reacted and the stock is now on the bargain table.
Novartis, the Swiss pharmaceutical giant, trimmed 14 basis points from the Fund’s return, as the stock dropped 6.6% from $80.85 to $75.54. The stock fell after one of its key drugs, Cosentyx, reported lower than expected growth due to increasing competition in the psoriasis market. We decided to sell our shares primarily because of concerns around the company’s future growth prospects, but also due to Novartis’s payment to President Trump’s lawyer, Michael Cohen. Novartis paid Cohen for advice regarding health care policy under the Trump administration, and while the payment was legal, we think the act is questionable.
Our biggest winner was toy-manufacturer Mattel, which added 127 basis points to the Fund’s return as its stock jumped 24.9% from $13.15 to $16.42. The stock rallied as Mattel’s quarterly revenue exceeded investors’ expectations, driven by the excitement around Hot Wheels’ 50th anniversary and Barbie’s new career and role-model dolls. The stock continued to move higher on speculation that the liquidation auction for Toys R Us, the largest U.S. toy store chain, may yield a new owner that revives the brand. We don’t know how the Toys R Us saga will end, but we believe there is significant upside in Mattel’s stock, as its iconic brands return to their historical levels of profitability.
Hanesbrands, a leading manufacturer of undergarments and activewear, rose 19.5% from $18.42 to $22.02, increasing the Fund’s return by 81 basis points. The company’s turnaround is gaining traction, with global athletic wear brand Champion growing double digits, and online revenue growing over 20%. Management also hosted its first analyst day in four years, where the team reaffirmed profit targets and committed to pay down debt. The event energized investors who stocked up on Hanes’s discounted shares.
Shares of Alliance Data Systems, a leading digital marketing firm and credit-card issuer, contributed 43 basis points to the Fund’s return as its shares rose 9.6% from $212.86 to $233.20. Alliance Data’s shares
| Parnassus Endeavor Fund as of June 30, 2018 (percentage of net assets) |
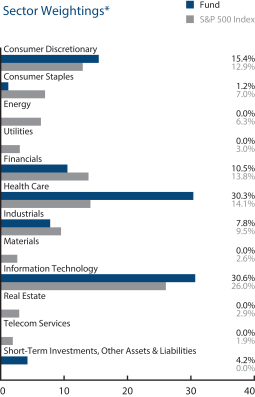
* For purposes of categorizing securities for diversification requirements under the Investment Company Act, the Fund uses industry classifications that are more specific than those used for the chart.
Top 10 Holdings
(percentage of net assets)
| QUALCOMM Inc. | 11.4% | |||
| Gilead Sciences Inc. | 10.4% | |||
| Mattel Inc. | 6.4% | |||
| Allergan plc | 5.5% | |||
| Micron Technology Inc. | 5.1% | |||
| Hanesbrands Inc. | 5.0% | |||
| CVS Health Corp. | 4.9% | |||
| Alliance Data Systems Corp. | 4.7% | |||
| United Parcel Service Inc., Class B | 4.4% | |||
| Bristol-Myers Squibb Co. | 4.0% | |||
Portfolio characteristics and holdings are subject to change periodically.
13
Table of Contents
| PARNASSUS FUNDS | Semiannual Report • 2018 | |||
rallied as its credit card loss-rates stabilized during the quarter, and the company guided for loss-rates to fall next quarter. We believe there is significant upside in the stock as Alliance Data’s industry leading profitability and growth rate shines through, now that the cloud of rising credit losses has passed.
Qualcomm added 39 basis points to the Fund’s return, as its stock climbed 1.3% from $55.41 to $56.12. The semiconductor company is a leading supplier of telecommunications components found in virtually every smartphone and wireless device in the world. Shares were whipsawed by President Trump’s on-again, off-again trade war with China, which could see tariffs placed on Qualcomm’s chips. The trade war could also halt Chinese regulatory approval of Qualcomm’s proposed acquisition of NXP Semiconductor. Shares finally moved higher after the company reported profits that met investor expectations.
VF Corp., a diversified apparel and footwear company, increased the Fund’s return by 34 basis points, as the stock jumped 10.0% from $74.12 to $81.52. The company’s top brands gained share in their categories, with sales of Vans shoes growing at nearly 40%. The retail environment in the U.S. has been weak, but VF Corp. avoided the slowdown through international expansion and its direct to consumer business. We think the company is positioned well for the long-term, but we trimmed our holdings as the stock price rose.
Outlook and Strategy
The stock market advanced in the second quarter, but it was a bumpy ride for investors, as the Trump administration inflamed trade tensions with both allies and rivals alike. Tariffs aimed at China escalated quickly, and Trump sought to curb Chinese purchases of U.S. technology on national security grounds. The president’s aggressive moves to remake the economic world order attracted counter-tariffs from China, the European Union, Mexico and Canada.
The market is behaving as though there is little to worry about, since the U.S. is negotiating from a position of strength. Trump’s tax cuts have helped investment spending, and corporations added 223,000 jobs in May. With unemployment at 18-year lows, the U.S. consumer is brimming with confidence. As long-term investors, we remain alert to any risks on the horizon. Corporate indebtedness has risen, valuations are high and trade wars can spiral out of control.
We added three stocks to the Fund, in view of current risks and opportunities. Starbucks is a household name in coffee that is making inroads in China, a massive growth market. Johnson Controls is a global supplier of technologies that help businesses heat and cool their buildings more efficiently. Finally, Biogen, a biopharmaceutical company based in Cambridge, Massachusetts, is a leader in the race to find a cure for Alzheimer’s and Parkinson’s disease. All three companies are exceptional places to work, which is a crucial advantage in today’s war for top talent.
Finally, I’m happy to announce that Billy Hwan has joined me as co-manager of the Parnassus Endeavor Fund. I will continue to manage your investment in the Fund as lead portfolio manager, and there is no change to the Fund’s mandate or methodology. The only difference is that now I have the dedicated help of an experienced hand. Billy and I have worked closely together since he joined Parnassus six years ago. I expect great contributions from Billy.
Thank you for your investment in the Parnassus Endeavor Fund.
Yours truly,
|
| |
Jerome L. Dodson Lead Portfolio Manager | Billy J. Hwan Portfolio Manager |


14
Table of Contents
| Semiannual Report • 2018 | PARNASSUS FUNDS | |||
Ticker: Investor Shares - PARMX
Ticker: Institutional Shares - PFPMX
As of June 30, 2018, the net asset value (“NAV”) of the Parnassus Mid Cap Fund – Investor Shares was $32.56, so the total return for the quarter was a gain of 3.43%. This compares to a gain of 2.82% for the Russell Midcap Index (“Russell”) and a gain of 2.90% for the Lipper Mid-Cap Core Fund Average, which represents the average mid-cap core funds followed by
| Parnassus Mid Cap Fund | ||||||||||||||||||||||||
| Average Annual Total Returns (%) | One Year | Three Years | Five Years | Ten Years | Gross Expense Ratio | Net Expense Ratio | ||||||||||||||||||
| for period ended June 30, 2018 | ||||||||||||||||||||||||
| Parnassus Mid Cap Fund Investor Shares | 8.16 | 10.81 | 11.70 | 11.42 | 1.01 | 0.99 | ||||||||||||||||||
| Parnassus Mid Cap Fund Institutional Shares | 8.39 | 11.04 | 11.86 | 11.50 | 0.75 | 0.75 | ||||||||||||||||||
| Russell Midcap Index | 12.33 | 9.58 | 12.22 | 10.23 | NA | NA | ||||||||||||||||||
| Lipper Mid-Cap Core Average | 10.44 | 7.83 | 10.38 | 8.79 | NA | NA | ||||||||||||||||||
The average annual total return for the Parnassus Mid Cap Fund-Institutional Shares from commencement (April 30, 2015) was 10.04%. Performance shown prior to the inception of the Institutional Shares reflects the performance of the Parnassus Mid Cap Fund-Investor Shares and includes expenses that are not applicable to and are higher than those of the Institutional Shares. The performance of the Institutional Shares differs from that shown for the Investor Shares to the extent that the classes do not have the same expenses. Performance data quoted represent past performance and are no guarantee of future returns. Current performance may be lower or higher than the performance data quoted. Current performance information to the most recent month-end is available on the Parnassus website (www.parnassus.com). Investment return and principal value will fluctuate, so an investor’s shares, when redeemed, may be worth more or less than their original principal cost. Returns shown in the table do not reflect the deduction of taxes a shareholder may pay on fund distributions or redemption of shares. The Russell Midcap Index is an unmanaged index of common stocks, and it is not possible to invest directly in an index. Index figures do not take any expenses, fees or taxes into account, but mutual fund returns do. Mid-cap companies can be more sensitive to changing economic conditions and have fewer financial resources than large-cap companies.
Before investing, an investor should carefully consider the investment objectives, risks, charges and expenses of the Fund and should carefully read the prospectus or summary prospectus, which contain this and other information. The prospectus or summary prospectus can be obtained on the Parnassus website or by calling (800) 999-3505. As described in the Fund’s current prospectus dated May 1, 2018, Parnassus Investments has contractually agreed to limit total operating expenses to 0.99% of net assets for the Parnassus Mid Cap Fund-Investor Shares and to 0.85% of net assets for the Parnassus Mid Cap Fund-Institutional Shares. This agreement will not be terminated prior to May 1, 2019, and may be continued indefinitely by the Adviser on a year-to-year basis.
Lipper (“Lipper average”). For the first half of 2018, the Fund is up 1.53% compared to a gain of 2.35% for the Russell and 1.58% for the Lipper average.
To the left is a table comparing the Parnassus Mid Cap Fund with the Russell and the Lipper average for the one-, three-, five- and ten-year periods. While the one-year performance is behind the benchmarks, we’re pleased that the Fund has done well over the longer-term, especially relative to its Lipper peer group.
Second Quarter Review
Mid-cap stocks were volatile during the quarter but posted a healthy gain. Investors are excited about President Trump’s corporate tax cuts, which are boosting corporate earnings. The economic picture is also rosy enough that investors largely ignored the Federal Reserve’s interest rate hikes and shrinking balance sheet. The heightening tariff wars between the U.S. and its major trading partners, the ongoing Mueller investigation as well concerns that domestic economic growth and corporate earnings are at a peak all contributed to the quarter’s volatility.
The Fund did better than its benchmarks during the quarter, beating the Russell by 61 basis points and the Lipper average by 53 basis points (one basis point is 1/100th of one percent). We’re generally not too excited by short-term performance, but the Fund’s June performance is noteworthy, as it beat the Russell by 212 basis points and its Lipper peers by 230 basis points.
From an allocation perspective, the Fund benefited from having an underweight position in financial stocks, the second-worst performing sector in the benchmark. The Fund’s underweight position in energy stocks hurt performance, as this was the best performing sector in the Russell. Most of the Fund’s performance came from stock selection rather than sector allocation.
Three stocks took more than 25 basis points from the Fund’s return. The worst performer was SEI Investments, the financial technology solutions
15
Table of Contents
| PARNASSUS FUNDS | Semiannual Report • 2018 | |||
provider and asset manager. The stock slumped 16.5% from $74.91 to $62.52, slicing 49 basis points from the Fund’s return. The company’s earnings are largely dependent on its level of assets under administration and management, so the stock dropped as volatility spiked and the prospect of a market drop grew. Additionally, a few noteworthy client losses and system implementation delays in its critical Private Banks segment spooked investors. We still like the story and believe Private Banks’ sales and operating margin will increase materially over the long-run.
Xylem, a leading infrastructure provider of fluid pumps, filtration and measurement equipment, subtracted 44 basis points from the Fund’s return, as its stock declined 12.4% from $76.92 to $67.38. The stock dropped because margins are facing headwinds from higher material costs and less-profitable emerging markets projects. Management is confident they will resolve these short-term issues through price increases and continued productivity improvements.
eBay, a leading global online marketplace, sliced 28 basis points from the Fund’s return, as its stock slumped 9.9% from $40.24 to $36.26. The shares fell after management provided a disappointing quarterly earnings outlook, driven by a deceleration in active buyer growth in its core Marketplace segment. We added to our position on the weakness since we believe the company’s investments to improve the online shopping experience, increase brand awareness and bring payments in-house will boost growth and profitability ahead.
Three stocks added more than 45 basis points to the Fund’s return this quarter. The best performer was Hanesbrands, Inc., a leading manufacturer of undergarments and activewear. The stock rose 19.5% from $18.42 to $22.02, increasing the Fund’s return by 64 basis points. The company’s turnaround is gaining traction as demonstrated by double-digit growth in Champion sales and 20% growth in online revenue. Management also hosted its first analyst day in four years, where the team reaffirmed profit targets and committed to pay down debt. The event energized investors who loaded up on Hanes’s discounted shares.
National Oilwell Varco, a global supplier of equipment and technology that help companies safely and efficiently drill wells in complex geological formations, added 49 basis points to the Fund’s return, as its stock rose 17.9% from $36.81 to $43.40. During the quarter, oil prices increased by 14.4% from $64.94 to $74.29 a barrel, which helped drive a recovery across its North American businesses. Management also expects international and offshore markets to gain momentum in 2019 and 2020. The improved cash flow outlook should be good for investors, as the company is considering more accretive acquisitions and returning cash to shareholders.
Motorola Solutions, the largest provider of mission-critical communications solutions, added 47 basis points to the Fund’s return as its shares rose 10.5% from $105.30 to $116.37. The stock moved higher after the company reported better-than-expected quarterly earnings and raised guidance for the year, due to broad-based global demand for Motorola’s land mobile radio systems.
Outlook and Strategy
The market is enjoying one of the longest bull-runs in history and is now up a whopping 368% since the March 2009 low. As we continue in
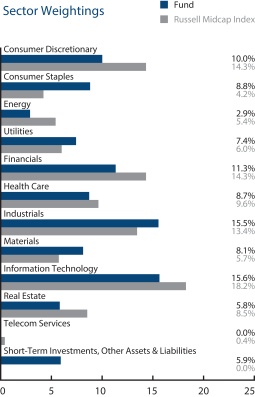
| Parnassus Mid Cap Fund as of June 30, 2018 (percentage of net assets) |
Top 10 Holdings
(percentage of net assets)
| Motorola Solutions Inc. | 4.5% | |||
| Fiserv Inc. | 4.4% | |||
| Hologic Inc. | 4.0% | |||
| Hanesbrands Inc. | 3.8% | |||
| Verisk Analytics Inc. | 3.7% | |||
| MDU Resources Group Inc. | 3.5% | |||
| Iron Mountain Inc. | 3.5% | |||
| The Clorox Company | 3.4% | |||
| Xylem Inc. | 3.3% | |||
| Teleflex Inc. | 3.3% | |||
Portfolio characteristics and holdings are subject to change periodically.
16
Table of Contents
| Semiannual Report • 2018 | PARNASSUS FUNDS | |||
the tenth year of this market expansion, the economy remains healthy. However, there are many issues that could reverse the market’s fortunes and have an adverse effect on our portfolio companies.
We’re considering all outcomes related to the current trade wars and the Mueller investigation. We’re also factoring risks related to the pace and extent of the Fed’s interest rate and quantitative easing actions. Regarding valuation, mid-cap stocks are more attractively priced than they have been for a while, but at 16 times forward earnings they are still trading above the 15-year average. Additionally, earnings are up to a large extent due to the corporate tax cuts, and it’s unclear if further gains are achievable. The combination of these factors strengthens our focus on owning high-quality, defensible businesses with asymmetric risk-reward opportunities.
We continue to own fewer real estate, energy, consumer discretionary and financial stocks than the benchmark, because the range of outcomes in these sectors is unusually wide. We’re optimistic these underweights will help the Fund out in the event of a market correction. Our largest overweight is in the traditionally defensive consumer staples sector. Our largest concentration of stocks is in the information technology sector, though we still have a lower percentage of the portfolio in this sector than the Russell.
We initiated relatively small positions in three semiconductor industry stocks this quarter. Each of these businesses enjoys favorable secular trends and competitive advantages. Integrated Device Technology provides analog mixed-signal solutions to support the computing, consumer and auto industries. The company has a strong competitive moat supported by its extensive patent portfolio and high product switching costs. We also bought shares in Synopsys and Cadence Design Systems, the dominant providers of electronic design automation (EDA) software products used to design and test semiconductors. Their products are used by traditional semiconductor manufacturers and, increasingly, companies like Google and Amazon. We’re comfortable owning both names, because they benefit from exciting trends, have expertise in serving distinct end-markets and enjoy recurring revenue, good free-cash generation, significant earnings growth potential and healthy balance sheets.
We also initiated a position in ACI Worldwide, a global software company that enables banks, financial intermediaries and merchants to process electronic payment transactions. ACI has a highly sticky customer base with very low attrition, increasingly valuable technology that streamlines banks’ complex payment processing systems and a strong brand. ACI is close to the end of an extensive investment cycle to develop its cloud business, so we expect revenue growth and margin expectations to move higher during our investment period.
We’re pleased the Fund had a good quarter but are more focused on providing longer-term outperformance. The Fund seeks to own high-quality businesses at good prices that can grow intrinsic value faster than our benchmarks. We are confident that this strategy will help the Fund outperform the market over the long-term, by participating in up markets, limiting losses in bear markets and avoiding permanent capital losses in varied market conditions.
Thank you for your investment in the Parnassus Mid Cap Fund.
Yours truly,
|
| |
Matthew D. Gershuny Lead Portfolio Manager | Lori A. Keith Portfolio Manager |


17
Table of Contents
| PARNASSUS FUNDS | Semiannual Report • 2018 | |||
Ticker: Investor Shares - PRFIX
Ticker: Institutional Shares - PFPLX
As of June 30, 2018, the NAV of the Parnassus Fixed Income Fund was $16.00, producing a loss for the quarter of 0.40% (including dividends). This compares to a loss of 0.16% for the Bloomberg Barclays U.S. Aggregate Bond Index (“Barclays Aggregate Index”) and a loss of 0.25% for the Lipper Core Bond Fund Average, which represents the average return of the funds followed by Lipper that invest at least 85% of their assets in domestic investment-grade bonds (“Lipper average”). For
| Parnassus Fixed Income Fund | ||||||||||||||||||||||||
| Average Annual Total Returns (%) | One Year | Three Years | Five Years | Ten Years | Gross Expense Ratio | Net Expense Ratio | ||||||||||||||||||
| for period ended June 30, 2018 | ||||||||||||||||||||||||
| Parnassus Fixed Income Fund Investor Shares | -1.37 | 1.33 | 1.57 | 3.06 | 0.82 | 0.68 | ||||||||||||||||||
| Parnassus Fixed Income Fund Institutional Shares | -1.16 | 1.51 | 1.69 | 3.12 | 0.49 | 0.47 | ||||||||||||||||||
| Bloomberg Barclays U.S. Aggregate Bond Index | -0.40 | 1.72 | 2.27 | 3.72 | NA | NA | ||||||||||||||||||
| Lipper Core Bond Funds Average | -0.52 | 1.60 | 2.14 | 3.66 | NA | NA | ||||||||||||||||||
The average annual total return for the Parnassus Fixed Income Fund-Institutional Shares from commencement (April 30, 2015) was 1.10%. Performance shown prior to the inception of the Institutional Shares reflects the performance of the Parnassus Fixed Income Fund-Investor Shares and includes expenses that are not applicable to and are higher than those of the Institutional Shares. The performance of the Institutional Shares differs from that shown for the Investor Shares to the extent that the classes do not have the same expenses. Performance data quoted represent past performance and are no guarantee of future returns. Current performance may be lower or higher than the performance data quoted. Current performance information to the most recent month-end is available on the Parnassus website (www.parnassus.com). Investment return and principal value will fluctuate, so an investor’s shares, when redeemed, may be worth more or less than their original cost. Returns shown in the table do not reflect the deduction of taxes a shareholder would pay in fund distributions or redemption of shares. The Bloomberg Barclays U.S. Aggregate Bond Index (formerly known as the Barclays U.S. Aggregate Bond Index) is an unmanaged index of bonds, and it is not possible to invest directly in an index. Index figures do not take any expenses, fees or taxes into account, but mutual fund returns do.
Before investing, an investor should carefully consider the investment objectives, risks, charges and expenses of the Fund and should carefully read the prospectus or summary prospectus, which contain this and other information. The prospectus or summary prospectus can be obtained on the Parnassus website or by calling (800) 999-3505. As described in the Fund’s current prospectus dated May 1, 2018, Parnassus Investments has contractually agreed to limit total operating expenses to 0.68% of net assets for the Parnassus Fixed Income Fund-Investor Shares and to 0.58% of net assets for the Parnassus Fixed Income Fund-Institutional Shares. This agreement will not be terminated prior to May 1, 2019, and may be continued indefinitely by the Adviser on a year-to-year basis.
the first half of 2018, the Fund posted a loss of 2.05%, as compared to a loss of 1.62% for the Barclays Aggregate Index and a loss of 1.67% for the Lipper average.
Below is a table comparing the performance of the Fund with that of the Barclays Aggregate Index and the Lipper average. Average annual total returns are for the one-, three-, five- and ten-year periods. For June 30, the 30-day subsidized SEC yield was 2.78%, and the unsubsidized SEC yield was 2.64%.
Second Quarter Review
The Parnassus Fixed Income Fund underperformed the Index in the quarter, weighed down by its overweight allocation to corporate bonds. Corporate bonds were again the worst performing asset class in the bond market, dragged down by concerns over newly announced mega-mergers and the potential for a trade war. While we are disappointed that the Fund as a whole underperformed the Index, we are pleased that the corporate portfolio substantially outperformed the Index. The corporate bonds held within the Parnassus Fixed Income Fund recorded a loss of 0.50% in the quarter, versus a loss of 0.99% in the Index. However, with corporate bonds down so much more than the other components of the Index – including mortgages and Treasuries – our corporate bond outperformance was not enough to overcome the deficit.
The top performing securities in the quarter are both positions in preferred stock. Preferred stock, despite its name, is a fixed income security. Its dividends are prioritized, fixed and paid on a set schedule.
Preferred stock issued by Sempra Energy gained 0.82% in the quarter and added 5 basis points (one basis point is 1/100th of one percent) to the total return. We purchased Sempra’s preferred stock in the first quarter, as we knew the company well from Parnassus Investments’ equity ownership and we believed the 6% yield was a great deal. The company is now involved
18
Table of Contents
| Semiannual Report • 2018 | PARNASSUS FUNDS | |||
in a battle with activist investors who want Sempra to refocus as a utility company and reduce leverage. The company’s stock jumped on the activist investor’s announcement and the preferred stock benefitted as well.
Preferred stock issued by Public Storage gained 2.47% and added 5 basis points to the total return. Investors were attracted to the company’s strong credit rating of A3 by Moody’s and the preferred stock’s coupon of 5.15%. Despite concern about the development of new storage facilities by competitors to compete with Public Storage, earnings are expected to increase for the year. The company also usually fares well in an economic downturn, so we continue to like the prospects for these preferred shares.
The worst performing bond in the quarter was issued by Verisk Analytics. The bond lost 7.39% and shaved 11 basis points from the total return. The Parnassus Fixed Income Fund only holds a few 30-year bonds, and this issue by Verisk is one of those positions. The long-term nature of the bond means that interest rate changes have an outsized impact on its value. We had an opportunity to meet the new CFO, Lee Shavel, several months ago and are confident in the new systems and metrics he is implementing. Despite the choppiness in the bond, we continue to believe it will perform well over the long-term.
In the quarter, the Fund held several bonds issued by Starbucks, which together make up one of the largest positions in the Fund. The bonds were down in the quarter and together, subtracted 11 basis points from the total return. Starbucks has lowered guidance three of the last four quarters and investors are unhappy with management’s inability to drive faster and more consistent growth. We share that frustration, but believe there is enormous power to the Starbucks brand, that leaders throughout the organization are strong and that management is motivated to find a solution.
Outlook and Strategy
In a quarter where the corporate portfolio substantially outperformed corporate bonds in the Index, it is disappointing to see the overall Fund underperform. The corporate portfolio’s relative outperformance is even more substantial on a year-to-date basis, losing 2.27% versus a loss of 3.32% for the Index. Despite the losses in this sector, we continue to believe that a strong overweight allocation to corporate bonds is the right strategy for the Fund. First, of the 44 corporations held in the Fund, 34 are also held in at least one of Parnassus’ equity funds. As a firm, we know these companies well and the Fund benefits from our
Parnassus Fixed Income Fund as of June 30, 2018 (percentage of net assets) |
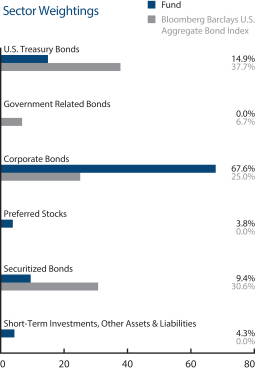
Portfolio characteristics and holdings are subject to change periodically.
team’s knowhow. Second, corporate bonds earn a higher yield than Treasuries and mortgages, so typically provide a higher return over the long run.
The bond market looks a lot different at the mid-point of the year than it did just six months ago. The 10-year Treasury rose from 2.46% to 2.85% and corporate bond yields rose even faster. As a result of these changes, we’ve made several adjustments to the Fund. One of the most substantial changes has been to the Fund’s duration. As a reminder, duration measures how sensitive the portfolio is to interest rate changes. A longer duration means that the Fund is more sensitive to interest rates, and vice versa.
To set the Fund’s duration, we run scenarios on the hypothetical path of interest rates and corporate spreads in the future. It’s important to know that we do not plot out our own forecasts. Our scenario analysis this quarter showed that the Fund would benefit from a slightly longer duration. Because rates have risen and corporate debt is cheaper, the bond market is more attractively priced. As of the end of the quarter, the Fund’s duration was 5.76 years, up from 5.34 years at the end of last quarter. By comparison, the Index has a duration of 6.02 years.
We extended the Fund’s duration by buying bonds that mature farther into the future and selling those that mature sooner. As an example, we extended our position in Masco, the manufacturer of Behr paint and Delta faucets, and in National Oilwell
19
Table of Contents
| PARNASSUS FUNDS | Semiannual Report • 2018 | |||
Varco as we believe these companies will continue to outperform. We also added a position in Aptiv during the quarter. Aptiv provides many high-tech components for cars, including radar, infotainment systems and sensors. The company is a pioneer of advanced safety systems, like automatic braking, and is also the first to generate revenue from autonomous driving. We expect the company’s technologies to be widely adapted across vehicles in the next decade, and so believe the bonds will do well.
Thank you for your investment in the Parnassus Fixed Income Fund.

Samantha D. Palm
Portfolio Manager
20
Table of Contents
| Semiannual Report • 2018 | PARNASSUS FUNDS | |||
Data privacy and security are important issues for responsible investors. In May, the European Union’s General Data Protection Regulation (GDPR) took effect. This regulation, which replaces a 1995 European directive, aims to give EU citizens more control over their data and how it’s used by companies. It also provides the “right to be forgotten,” allowing users to revoke consent to a company collecting and using their data. The GDPR requires rigorous cybersecurity management and imposes steep penalties for noncompliance. Companies failing to adhere to the GDPR may face fines of up to four percent of their annual revenue.
This regulation is very timely, given Facebook’s involvement with Cambridge Analytica. Facebook experienced a tumultuous two-month period after whistleblower Christopher Wylie revealed that his former political consulting employer, Cambridge Analytica, had inappropriately collected Facebook users’ data through a third party. Coverage of the controversy intensified as it became clear that Cambridge Analytica harvested user data on 50 million Americans to create psychological profiles for partisan target ads, voter turnout estimations and other political consulting services.
The effectiveness of Cambridge Analytica’s psychological profiles is still up for debate, but it’s clear that the company’s data collection and usage practices were deceptive at best. The company went bankrupt shortly after multiple government investigations into its practices were initiated. Facebook was left to explain how its privacy policy and practices allowed users’ data to be collected in such a manner, and the stock initially took a hit. However, the share price bounced back and continued to rise after posting solid results and guidance. While investors were quick to forgive and move on, the company continues to deal with the controversy and the reputational risk to its brand.
The large volume of information gathered by free web services and the high degree of accuracy this information allows a company to attain about a user’s behaviors is astonishing. For example, fingerprinting allows marketers and data brokers to gather unique characteristics from a person’s device, such as the type fonts, plugins and screen sizes, then use this information to create a unique trackable identification number for the device. The Cambridge Analytica event was a wake-up call to the public, governmental bodies and investors about these privacy-violating practices.
Some companies are proactively limiting the amount of user data that is trackable. Apple Inc., for example, has taken the stance that privacy is a human right. CEO Tim Cook recently said, “To me, it’s creepy when I look at something and all of a sudden it’s chasing me all the way across the web.” So, it wasn’t surprising when Apple announced during its Worldwide Developers Conference that the next version of Safari will feature strong antitracking features. Not only will the new Safari browser require users to approve websites using cookies, but it will also allow users to prevent marketers and data brokers from “fingerprinting” Apple devices. Users will be able to turn on an antitracking device that will make individual Apple users indistinguishable from each other.
While the company views privacy as a human right, there’s also a business component to this new privacy feature. Apple is generally not in the business of selling user data, and Safari is far from being the number one web browser. The Cambridge Analytica controversy presented an opportunity for Apple to increase its market share by offering existing and, importantly, new Safari users the option to implement strong privacy features. If all goes well, the innovative privacy features in Safari will provide the company another avenue for new customers to join the Apple ecosystem.
Thank you for your investment in the Parnassus Funds. It is a privilege to have you as an investor.
Yours truly,

Iyassu Essayas
Director of ESG Research
21
Table of Contents
| PARNASSUS FUNDS | Semiannual Report • 2018 | |||
As a shareholder of the Funds, you incur ongoing costs, which include portfolio management fees, administrative fees, shareholder reports, and other fund expenses. The Funds do not charge transaction fees, so you do not incur transaction costs such as sales charges (loads) on purchase payments, reinvested dividends, or other distributions, redemption fees, and exchange fees. The information on this page is intended to help you understand your ongoing costs of investing in the Funds and to compare these costs with the ongoing costs of investing in other mutual funds.
The following example is based on an investment of $1,000 invested at the beginning of the most recent six-month period and held for the period of January 1, 2018 through June 30, 2018.
Actual Expenses
In the example below, the first line for each Fund provides information about actual account values and actual expenses. You may use the information in this line, together with the amount you invested, to estimate the expenses that you paid over the period. Simply divide your account value by $1,000 (for example, $8,600 account value divided by $1,000 = 8.6), then multiply the result by the number in the first line under the heading entitled “Expenses Paid During Period” to estimate the expenses you paid on your account during this period.
Hypothetical Example for Comparison Purposes
The second line of each Fund provides information about hypothetical account values and hypothetical expenses based on the Fund’s expense ratio and an assumed rate of return of 5% per year before expenses, which is not the Fund’s actual return. You may compare the ongoing costs of investing in the Fund with other mutual funds by comparing this 5% hypothetical example with the 5% hypothetical examples that appear in the shareholder reports of other funds.
The hypothetical account values and expenses may not be used to estimate the actual ending account balance or expenses you paid for the period.
Please note that the expenses shown in the table are meant to highlight only your ongoing costs in these Funds. Therefore, the second line of each Fund is useful in comparing only ongoing costs and will not help you determine the relative total costs of owning other mutual funds, which may include transactional costs such as loads.
| Fund Expense Ratio | Beginning Account Value January 1, 2018 | Ending Account Value June 30, 2018 | Expenses Paid During Period | |||||||||||||
| Parnassus Fund – Investor Shares: Actual* | 0.84% | $1,000.00 | $975.80 | $4.12 | ||||||||||||
| Hypothetical (5% before expenses) | 0.84% | $1,000.00 | $1,020.63 | $4.21 | ||||||||||||
| Parnassus Fund – Institutional Shares: Actual* | 0.69% | $1,000.00 | $976.60 | $3.38 | ||||||||||||
| Hypothetical (5% before expenses) | 0.69% | $1,000.00 | $1,021.37 | $3.46 | ||||||||||||
| Parnassus Core Equity Fund – Investor Shares: Actual* | 0.87% | $1,000.00 | $1,023.70 | $4.37 | ||||||||||||
| Hypothetical (5% before expenses) | 0.87% | $1,000.00 | $1,020.48 | $4.36 | ||||||||||||
| Parnassus Core Equity Fund – Institutional Shares: Actual* | 0.64% | $1,000.00 | $1,025.00 | $3.21 | ||||||||||||
| Hypothetical (5% before expenses) | 0.64% | $1,000.00 | $1,021.62 | $3.21 | ||||||||||||
| Parnassus Endeavor Fund – Investor Shares: Actual* | 0.92% | $1,000.00 | $991.10 | $4.54 | ||||||||||||
| Hypothetical (5% before expenses) | 0.92% | $1,000.00 | $1,020.23 | $4.61 | ||||||||||||
| Parnassus Endeavor Fund – Institutional Shares: Actual* | 0.72% | $1,000.00 | $992.20 | $3.56 | ||||||||||||
| Hypothetical (5% before expenses) | 0.72% | $1,000.00 | $1,021.22 | $3.61 | ||||||||||||
| Parnassus Mid Cap Fund – Investor Shares: Actual* | 0.99% | $1,000.00 | $1,015.30 | $4.95 | ||||||||||||
| Hypothetical (5% before expenses) | 0.99% | $1,000.00 | $1,019.89 | $4.96 | ||||||||||||
| Parnassus Mid Cap Fund – Institutional Shares: Actual* | 0.75% | $1,000.00 | $1,016.50 | $3.75 | ||||||||||||
| Hypothetical (5% before expenses) | 0.75% | $1,000.00 | $1,021.08 | $3.76 | ||||||||||||
| Parnassus Fixed Income Fund – Investor Shares: Actual* | 0.68% | $1,000.00 | $979.50 | $3.34 | ||||||||||||
| Hypothetical (5% before expenses) | 0.68% | $1,000.00 | $1,021.42 | $3.41 | ||||||||||||
22
Table of Contents
| Semiannual Report • 2018 | PARNASSUS FUNDS | |||
Fund Expenses (unaudited) (continued)
| Fund Expense Ratio | Beginning Account Value January 1, 2018 | �� | Ending Account Value June 30, 2018 | Expenses Paid During Period | ||||||||||||
| Parnassus Fixed Income Fund – Institutional Shares: Actual* | 0.47% | $1,000.00 | $979.90 | $2.31 | ||||||||||||
| Hypothetical (5% before expenses) | 0.47% | $1,000.00 | $1,022.46 | $2.36 | ||||||||||||
* Expenses are calculated using the Funds’ annualized expense ratios, which represent ongoing expense as a percentage of net assets for the six months ended June 30, 2018. Expenses are calculated by multiplying the annualized expense ratio by the average account value of the period; then multiplying the result by the number of days in the most recent one-half year period (181); and then dividing that result by the number of days in the current fiscal year (365). Expense ratios for the most recent half year may differ from expense ratios based on one-year data in the financial highlights.
23
Table of Contents
| PARNASSUS FUNDS | Semiannual Report • 2018 | |||
Portfolio of Investments as of June 30, 2018 (unaudited)
| Equities | Shares | Market Value ($) | ||||||
| Air Freight & Logistics (4.3%) | ||||||||
| C.H. Robinson Worldwide Inc. | 280,000 | 23,424,800 | ||||||
| FedEx Corp. | 85,000 | 19,300,100 | ||||||
|
| |||||||
| 42,724,900 | ||||||||
|
| |||||||
| Banks (5.6%) | ||||||||
| First Horizon National Corp. | 1,600,000 | 28,544,000 | ||||||
| Signature Bank q | 210,000 | 26,854,800 | ||||||
|
| |||||||
| 55,398,800 | ||||||||
|
| |||||||
| Biotechnology (4.6%) | ||||||||
| Gilead Sciences Inc. | 646,000 | 45,762,640 | ||||||
|
| |||||||
| Capital Markets (8.0%) | ||||||||
| Charles Schwab Corp. | 500,000 | 25,550,000 | ||||||
| Thomson Reuters Corp. | 1,334,769 | 53,817,886 | ||||||
|
| |||||||
| 79,367,886 | ||||||||
|
| |||||||
| Chemicals (7.0%) | ||||||||
| Axalta Coating Systems Ltd. q | 673,680 | 20,419,241 | ||||||
| PPG Industries Inc. | 209,000 | 21,679,570 | ||||||
| Praxair Inc. | 175,000 | 27,676,250 | ||||||
|
| |||||||
| 69,775,061 | ||||||||
|
| |||||||
| Communications Equipment (5.2%) | ||||||||
| Motorola Solutions Inc. | 441,115 | 51,332,553 | ||||||
|
| |||||||
| Diversified Telecom Services (2.2%) | ||||||||
| Zayo Group Holdings Inc. q | 600,000 | 21,888,000 | ||||||
|
| |||||||
| Equity Real Estate Investment Trusts (3.2%) | ||||||||
| Public Storage | 140,000 | 31,760,400 | ||||||
|
| |||||||
| Food Products (3.9%) | ||||||||
| Mondelez International Inc., Class A | 935,500 | 38,355,500 | ||||||
|
| |||||||
| Health Care Equipment (3.3%) | ||||||||
| Hologic Inc. q | 811,734 | 32,266,427 | ||||||
|
| |||||||
| Health Care Providers & Services (4.4%) | ||||||||
| CVS Health Corp. | 680,000 | 43,758,000 | ||||||
|
| |||||||
| Hotel, Restaurant & Leisure (2.0%) | ||||||||
| Belmond Ltd. q | 1,765,147 | 19,681,389 | ||||||
|
| |||||||
| Industrial Manufacturing (3.0%) | ||||||||
| 3M Company | 151,627 | 29,828,063 | ||||||
|
| |||||||
| Equities | Shares | Market Value ($) | ||||||
| Internet Software & Services (5.8%) | ||||||||
| Alphabet Inc., Class A q | 30,000 | 33,875,700 | ||||||
| eBay Inc. q | 665,000 | 24,112,900 | ||||||
|
| |||||||
| 57,988,600 | ||||||||
|
| |||||||
| IT Services (9.8%) | ||||||||
| Alliance Data Systems Corp. | 245,000 | 57,134,000 | ||||||
| Cognizant Technology Solutions Corp. | 500,000 | 39,495,000 | ||||||
|
| |||||||
| 96,629,000 | ||||||||
|
| |||||||
| Leisure Products (3.3%) | ||||||||
| Mattel Inc. q l | 1,985,411 | 32,600,449 | ||||||
|
| |||||||
| Machinery (1.9%) | ||||||||
| Pentair plc | 460,000 | 19,356,800 | ||||||
|
| |||||||
| Mortgage Real Estate Investment Trusts (2.7%) | ||||||||
| Hannon Armstrong Sustainable Infrastructure Capital Inc. l | 455,000 | 8,986,250 | ||||||
| Redwood Trust Inc. | 1,100,000 | 18,117,000 | ||||||
|
| |||||||
| 27,103,250 | ||||||||
|
| |||||||
| Pharmaceuticals (5.7%) | ||||||||
| Allergan plc | 194,804 | 32,477,723 | ||||||
| Novartis AG (ADR) | 321,301 | 24,271,077 | ||||||
|
| |||||||
| 56,748,800 | ||||||||
|
| |||||||
| Professional Services (3.5%) | ||||||||
| Nielsen Holdings plc | 1,109,500 | 34,316,835 | ||||||
|
| |||||||
| Semiconductor Equipment (2.6%) | ||||||||
| Intel Corp. | 519,589 | 25,828,769 | ||||||
|
| |||||||
| Snack & Juice Bars (2.4%) | ||||||||
| Starbucks Corp. | 479,313 | 23,414,440 | ||||||
|
| |||||||
| Trading Companies & Distributors (1.9%) | ||||||||
| Air Lease Corp. | 440,000 | 18,466,800 | ||||||
|
| |||||||
| Wireless Telecom Services (2.1%) | ||||||||
| T-Mobile US Inc. | 352,000 | 21,032,000 | ||||||
|
| |||||||
| Total investment in equities (98.4%) (cost $887,778,047) | 975,385,362 | |||||||
|
| |||||||
The accompanying notes are an integral part of these financial statements.
24
Table of Contents
| Semiannual Report • 2018 | PARNASSUS FUNDS | |||
PARNASSUS FUND
Portfolio of Investments as of June 30, 2018 (unaudited) (continued)
| Short-Term Securities | Interest Rate | Maturity Date | Principal Amount ($) | Market Value ($) | ||||||||||||
| Certificates of Deposit (0.0%) a | ||||||||||||||||
| Albina Community Bank | 0.20 | % | 01/15/2019 | 250,000 | 244,575 | |||||||||||
|
| |||||||||||||||
| Certificates of Deposit Account Registry Service (0.1%) a | ||||||||||||||||
| CDARS agreement with Beneficial State Bank, dated 03/15/2018 Participating depository institutions: Amarillo National Bank, par 241,000; Bank of America, N.A., par 241,000; Peoples Bank, par 18,000; (cost $485,863) | 1.15 | % | 03/14/2019 | 500,000 | 485,863 | |||||||||||
|
| |||||||||||||||
| Community Development Loans (0.1%) a | ||||||||||||||||
| Boston Community Loan Fund | 1.00 | % | 04/15/2019 | 100,000 | 95,266 | |||||||||||
| Boston Community Loan Fund | 1.00 | % | 04/15/2019 | 100,000 | 95,266 | |||||||||||
| MicroVest Plus, LP Note | 2.25 | % | 10/15/2018 | 1,000,000 | 982,410 | |||||||||||
| Root Capital Loan Fund | 1.25 | % | 02/01/2019 | 100,000 | 96,466 | |||||||||||
| TMC Development Loan | 1.00 | % | 05/25/2019 | 100,000 | 94,592 | |||||||||||
| Vermont Community Loan Fund | 0.85 | % | 10/15/2018 | 100,000 | 98,258 | |||||||||||
|
| |||||||||||||||
| 1,462,258 | ||||||||||||||||
|
| |||||||||||||||
| Time Deposits (1.8%) | ||||||||||||||||
| BBH Cash Management Service | ||||||||||||||||
| ANZ, Melbourne | 1.27 | % | 07/02/2018 | 17,842,074 | 17,842,074 | |||||||||||
|
| |||||||||||||||
| Securities Purchased with Cash Collateral from Securities Lending | ||||||||||||||||
| Registered Investment Companies (3.5%) | ||||||||||||||||
| Invesco Aim Government & Agency Portfolio | ||||||||||||||||
| Short-Term Investments Trust, Institutional Class | 1.63 | % | 34,507,518 | |||||||||||||
|
| |||||||||||||||
| Total short-term securities (5.5%) (cost $54,542,288) | 54,542,288 | |||||||||||||||
|
| |||||||||||||||
| Total securities (103.9%) (cost $942,320,335) | 1,029,927,650 | |||||||||||||||
|
| |||||||||||||||
| Payable upon return of securities loaned (-3.5%) | (34,507,518 | ) | ||||||||||||||
|
| |||||||||||||||
| Other assets and liabilities (-0.4%) | (3,864,273 | ) | ||||||||||||||
|
| |||||||||||||||
| Total net assets (100.0%) | 991,555,859 | |||||||||||||||
|
| |||||||||||||||
q This security is non-income producing. |
| |||||||||||||||
l This security, or partial position of this security, was on loan at June 30, 2018. The total value of the securities on loan at June 30, 2018 was $33,678,985. |
| |||||||||||||||
a These securities are being fair valued. Market value adjustments have been applied to these securities to reflect potential early withdrawal. |
| |||||||||||||||
plc Public Limited Company | ||||||||||||||||
ADR American Depository Receipt | ||||||||||||||||
The accompanying notes are an integral part of these financial statements.
25
Table of Contents
| PARNASSUS FUNDS | Semiannual Report • 2018 | |||
Portfolio of Investments as of June 30, 2018 (unaudited)
| Equities | Shares | Market Value ($) | ||||||
| Air Freight & Logistics (3.0%) | ||||||||
| United Parcel Service Inc., Class B | 4,435,122 | 471,143,010 | ||||||
|
| |||||||
| Apparel & Luxury Goods (3.0%) | ||||||||
| VF Corp. | 5,761,646 | 469,689,382 | ||||||
|
| |||||||
| Banks (2.3%) | ||||||||
| First Republic Bank | 3,628,362 | 351,189,158 | ||||||
|
| |||||||
| Biotechnology (4.9%) | ||||||||
| Gilead Sciences Inc. | 10,740,062 | 760,825,993 | ||||||
|
| |||||||
| Capital Markets (2.8%) | ||||||||
| Charles Schwab Corp. | 8,480,463 | 433,351,659 | ||||||
|
| |||||||
| Chemicals (7.1%) | ||||||||
| PPG Industries Inc. | 3,737,607 | 387,701,974 | ||||||
| Praxair Inc. | 4,530,100 | 716,435,315 | ||||||
|
| |||||||
| 1,104,137,289 | ||||||||
|
| |||||||
| Commercial Services & Supplies (2.5%) | ||||||||
| Waste Management Inc. | 4,761,257 | 387,280,644 | ||||||
|
| |||||||
| Communications Equipment (2.7%) | ||||||||
| Motorola Solutions Inc. | 3,682,737 | 428,560,105 | ||||||
|
| |||||||
| Consumer Finance (6.9%) | ||||||||
| American Express Co. | 5,172,626 | 506,917,348 | ||||||
| Mastercard Inc., Class A | 2,883,460 | 566,657,559 | ||||||
|
| |||||||
| 1,073,574,907 | ||||||||
|
| |||||||
| Energy Equipment & Services (2.2%) | ||||||||
| National Oilwell Varco Inc. | 7,783,871 | 337,820,001 | ||||||
|
| |||||||
| Equity Real Estate Investment Trusts (4.3%) | ||||||||
| Iron Mountain Inc. | 9,724,670 | 340,460,697 | ||||||
| Public Storage | 1,435,983 | 325,767,103 | ||||||
|
| |||||||
| 666,227,800 | ||||||||
|
| |||||||
| Food & Staples Retailing (2.4%) | ||||||||
| Sysco Corp. | 5,490,031 | 374,914,217 | ||||||
|
| |||||||
| Health Care Equipment (5.2%) | ||||||||
| Danaher Corp. | 4,569,758 | 450,943,719 | ||||||
| Hologic Inc. q | 9,316,091 | 370,314,617 | ||||||
|
| |||||||
| 821,258,336 | ||||||||
|
| |||||||
| Health Care Providers & Services (4.6%) | ||||||||
| CVS Health Corp. | 11,295,198 | 726,845,991 | ||||||
|
| |||||||
| Health Care Technology (2.5%) | ||||||||
| Cerner Corp. q | 6,677,151 | 399,226,858 | ||||||
|
| |||||||
| Equities | Shares | Market Value ($) | ||||||
| Household Products (6.3%) | ||||||||
| The Clorox Company | 3,693,180 | 499,502,595 | ||||||
| The Procter & Gamble Co. | 3,896,237 | 304,140,260 | ||||||
| WD-40 Co. W | 1,220,000 | 178,425,000 | ||||||
|
| |||||||
| 982,067,855 | ||||||||
|
| |||||||
| Industrial Manufacturing (4.0%) | ||||||||
| 3M Co. | 3,175,354 | 624,655,639 | ||||||
|
| |||||||
| Internet Software & Services (4.7%) | ||||||||
| Alphabet Inc., Class A q | 314,291 | 354,894,254 | ||||||
| Alphabet Inc., Class C q | 339,650 | 378,930,523 | ||||||
|
| |||||||
| 733,824,777 | �� | |||||||
|
| |||||||
| Machinery (3.3%) | ||||||||
| Pentair plc | 5,071,456 | 213,406,868 | ||||||
| Xylem Inc. | 4,418,382 | 297,710,579 | ||||||
|
| |||||||
| 511,117,447 | ||||||||
|
| |||||||
| Media (4.5%) | ||||||||
| The Walt Disney Co. | 6,671,807 | 699,272,092 | ||||||
|
| |||||||
| Multi-Utilities (4.4%) | ||||||||
| MDU Resources Group Inc. W | 11,427,283 | 327,734,476 | ||||||
| Sempra Energy | 3,162,310 | 367,175,814 | ||||||
|
| |||||||
| 694,910,290 | ||||||||
|
| |||||||
| Pharmaceuticals (2.0%) | ||||||||
| Novartis AG (ADR) | 4,093,625 | 309,232,433 | ||||||
|
| |||||||
| Professional Services (2.5%) | ||||||||
| Verisk Analytics Inc. q | 3,584,925 | 385,881,327 | ||||||
|
| |||||||
| Semiconductor Equipment (3.4%) | ||||||||
| Intel Corp. | 7,717,674 | 383,645,575 | ||||||
| KLA-Tencor Corp. | 1,392,411 | 142,763,900 | ||||||
|
| |||||||
| 526,409,475 | ||||||||
|
| |||||||
| Snack & Juice Bars (2.6%) | ||||||||
| Starbucks Corp. | 8,483,529 | 414,420,392 | ||||||
|
| |||||||
| Software (2.5%) | ||||||||
| Cadence Design Systems Inc. q | 8,899,521 | 385,438,255 | ||||||
|
| |||||||
| Technology Hardware (2.2%) | ||||||||
| Apple Inc. | 1,848,717 | 342,216,004 | ||||||
|
| |||||||
| Total investment in equities (98.8%) (cost $12,252,001,414) | 15,415,491,336 | |||||||
|
| |||||||
The accompanying notes are an integral part of these financial statements.
26
Table of Contents
| Semiannual Report • 2018 | PARNASSUS FUNDS | |||
PARNASSUS CORE EQUITY FUND
Portfolio of Investments as of June 30, 2018 (unaudited) (continued)
| Short-Term Securities | Interest Rate | Maturity Date | Principal Amount ($) | Market Value ($) | ||||||||||||
| Certificates of Deposit (0.0%) a | ||||||||||||||||
| Community Trust Credit Union | 0.80 | % | 10/15/2018 | 250,000 | 247,096 | |||||||||||
| Urban Partnership Bank | 0.30 | % | 09/24/2018 | 250,000 | 247,672 | |||||||||||
|
| |||||||||||||||
| 494,768 | ||||||||||||||||
|
| |||||||||||||||
| Certificates of Deposit Account Registry Service (0.0%) a | ||||||||||||||||
| CDARS agreement with Beneficial State Bank, dated 03/15/2018 Participating depository institutions: Amarillo National Bank, par 241,000; Bank of America, N.A., par 241,000; First United Bank and Trust Company, par 37,607; LegacyTexas Bank, par 172,496; Meadows Bank, par 102,897; Parke Bank, par 241,000; Peoples Bank, par 241,000; Pioneer Bank, par 241,000; Signature Bank, par 241,000; The Park National Bank, par 241,000; (cost $2,000,000) | 1.15 | % | 03/14/2019 | 2,000,000 | 1,943,452 | |||||||||||
|
| |||||||||||||||
| Community Development Loans (0.1%) a | ||||||||||||||||
| Boston Community Loan Fund | 1.00 | % | 04/15/2019 | 100,000 | 95,266 | |||||||||||
| MicroVest Plus, LP Note | 2.25 | % | 04/15/2019 | 7,500,000 | 7,144,932 | |||||||||||
| New Hampshire Community Loan Fund | 1.00 | % | 07/31/2018 | 500,000 | 497,534 | |||||||||||
| Root Capital Loan Fund | 1.25 | % | 02/01/2019 | 200,000 | 192,932 | |||||||||||
| TMC Development Working Solutions | 1.00 | % | 05/25/2019 | 100,000 | 94,592 | |||||||||||
| Vermont Community Loan Fund | 0.85 | % | 04/15/2019 | 100,000 | 95,265 | |||||||||||
|
| |||||||||||||||
| 8,120,521 | ||||||||||||||||
|
| |||||||||||||||
| Time Deposits (1.1%) | ||||||||||||||||
| BBH Cash Management Service | ||||||||||||||||
| BBH, Grand Caymen | 1.27 | % | 07/02/2018 | 27,399,718 | 27,399,718 | |||||||||||
| Citibank, New York | 1.27 | % | 07/02/2018 | 57,591,596 | 57,591,596 | |||||||||||
| JPMorgan Chase, New York | 1.27 | % | 07/02/2018 | 90,738,751 | 90,738,751 | |||||||||||
|
| |||||||||||||||
| 175,730,065 | ||||||||||||||||
|
| |||||||||||||||
| Total short-term securities (1.2%) (cost $186,288,806) | 186,288,806 | |||||||||||||||
|
| |||||||||||||||
| Total securities (100%) (cost $12,438,290,220) | 15,601,780,142 | |||||||||||||||
|
| |||||||||||||||
| Other assets and liabilities (0.0%) | (1,449,431 | ) | ||||||||||||||
|
| |||||||||||||||
| Total net assets (100.0%) | 15,600,330,711 | |||||||||||||||
|
| |||||||||||||||
The accompanying notes are an integral part of these financial statements.
27
Table of Contents
| PARNASSUS FUNDS | Semiannual Report • 2018 | |||
PARNASSUS CORE EQUITY FUND
Portfolio of Investments as of June 30, 2018 (unaudited) (continued)
q This security is non-income producing. |
| |||||||||||||||
W Fund ownership consists of 5% or more of the shares outstanding of the Affiliated Issuer, as defined under the Investment Securities Act of 1940. |
| |||||||||||||||
a These securities are being fair valued. Market value adjustments have been applied to these securities to reflect potential early withdrawal. |
| |||||||||||||||
plc Public Limited Company | ||||||||||||||||
ADR American Depository Receipt | ||||||||||||||||
The accompanying notes are an integral part of these financial statements.
28
Table of Contents
| Semiannual Report • 2018 | PARNASSUS FUNDS | |||
Portfolio of Investments as of June 30, 2018 (unaudited)
| Equities | Shares | Market Value ($) | ||||||
| Air Freight & Logistics (4.3%) | ||||||||
| United Parcel Service Inc., Class B | 2,050,000 | 217,771,500 | ||||||
|
| |||||||
| Apparel & Luxury Goods (6.6%) | ||||||||
| Hanesbrands Inc. l | 11,400,000 | 251,028,000 | ||||||
| VF Corp. | 1,000,000 | 81,520,000 | ||||||
|
| |||||||
| 332,548,000 | ||||||||
|
| |||||||
| Banks (2.7%) | ||||||||
| Signature Bank q | 1,060,000 | 135,552,800 | ||||||
|
| |||||||
| Biotechnology (10.7%) | ||||||||
| Biogen Inc. q | 55,000 | 15,963,200 | ||||||
| Gilead Sciences Inc. | 7,300,000 | 517,132,000 | ||||||
|
| |||||||
| 533,095,200 | ||||||||
|
| |||||||
| Capital Markets (3.2%) | ||||||||
| Charles Schwab Corp. | 3,100,000 | 158,410,000 | ||||||
|
| |||||||
| Consumer Finance (4.6%) | ||||||||
| American Express Co. | 1,800,000 | 176,400,000 | ||||||
| Capital One Financial Corp. | 600,000 | 55,140,000 | ||||||
|
| |||||||
| 231,540,000 | ||||||||
|
| |||||||
| Food & Staples Retailing (1.2%) | ||||||||
| Costco Wholesale Corp. | 290,000 | 60,604,200 | ||||||
|
| |||||||
| Health Care Equipment (2.0%) | ||||||||
| Hologic Inc. q | 2,500,000 | 99,375,000 | ||||||
|
| |||||||
| Health Care Products (3.3%) | ||||||||
| Perrigo Co. plc | 2,250,000 | 164,047,500 | ||||||
|
| |||||||
| Health Care Providers & Services (4.9%) | ||||||||
| CVS Health Corp. | 3,800,000 | 244,530,000 | ||||||
|
| |||||||
| Industrial Manufacturing (1.3%) | ||||||||
| Johnson Controls International plc | 2,000,000 | 66,900,000 | ||||||
|
| |||||||
| Internet Software & Services (3.1%) | ||||||||
| Alphabet Inc., Class A q | 135,000 | 152,440,650 | ||||||
|
| |||||||
| Equities | Shares | Market Value ($) | ||||||
| IT Services (4.7%) | ||||||||
| Alliance Data Systems | 1,000,000 | 233,200,000 | ||||||
| International Business Machine Corp. | 10,190 | 1,423,543 | ||||||
|
| |||||||
| 234,623,543 | ||||||||
|
| |||||||
| Leisure Products (6.4%) | ||||||||
| Mattel Inc. l W | 19,500,000 | 320,190,000 | ||||||
|
| |||||||
| Machinery (1.4%) | ||||||||
| Cummins Inc. | 350,000 | 46,550,000 | ||||||
| Deere & Co. | 150,000 | 20,970,000 | ||||||
|
| |||||||
| 67,520,000 | ||||||||
|
| |||||||
| Pharmaceuticals (9.5%) | ||||||||
| Allergan plc | 1,650,000 | 275,088,000 | ||||||
| Bristol-Myers Squibb Co. | 3,600,000 | 199,224,000 | ||||||
|
| |||||||
| 474,312,000 | ||||||||
|
| |||||||
| Professional Services (0.7%) | ||||||||
| Nielsen Holdings plc | 1,140,000 | 35,260,200 | ||||||
|
| |||||||
| Semiconductor Equipment (19.2%) | ||||||||
| Applied Materials Inc. | 300,000 | 13,857,000 | ||||||
| Intel Corp. | 2,110,000 | 104,888,100 | ||||||
| Lam Research Corp. | 75,000 | 12,963,750 | ||||||
| Micron Technology Inc. q | 4,900,000 | 256,956,000 | ||||||
| QUALCOMM Inc. | 10,150,000 | 569,618,000 | ||||||
|
| |||||||
| 958,282,850 | ||||||||
|
| |||||||
| Snack & Juice Bars (2.4%) | ||||||||
| Starbucks Corp. | 2,400,000 | 117,240,000 | ||||||
|
| |||||||
| Software (3.5%) | ||||||||
| Autodesk Inc. q | 1,350,000 | 176,971,500 | ||||||
|
| |||||||
| Technology Hardware (0.1%) | ||||||||
| Apple Inc. | 25,000 | 4,627,750 | ||||||
|
| |||||||
| Total investment in equities (95.8%) (cost $4,386,715,250) | 4,785,842,693 | |||||||
|
| |||||||
The accompanying notes are an integral part of these financial statements.
29
Table of Contents
| PARNASSUS FUNDS | Semiannual Report • 2018 | |||
PARNASSUS ENDEAVOR FUND
Portfolio of Investments as of June 30, 2018 (unaudited) (continued)
| Short-Term Securities | Interest Rate | Maturity Date | Principal Amount ($) | Market Value ($) | ||||||||||||
| Certificates of Deposit (0.0%) a | ||||||||||||||||
| Urban Partnership Bank | 0.30 | % | 02/03/2019 | 250,000 | 244,055 | |||||||||||
|
| |||||||||||||||
| Certificates of Deposit Account Registry Service (0.0%) a | ||||||||||||||||
| CDARS agreement with Community Bank of the Bay, dated 03/15/2018 Participating depository institutions: Amarillo National Bank, par 241,000; Bank of America, N.A., par 241,000; Peoples Bank, par 18,000; (cost $500,000) | 1.15 | % | 03/14/2019 | 500,000 | 485,863 | |||||||||||
|
| |||||||||||||||
| Community Development Loans (0.0%) a | ||||||||||||||||
| Root Capital Loan Fund | 1.25 | % | 02/01/2019 | 100,000 | 96,466 | |||||||||||
| TMC Development Loan | 1.00 | % | 05/25/2019 | 100,000 | 94,592 | |||||||||||
|
| |||||||||||||||
| 191,058 | ||||||||||||||||
|
| |||||||||||||||
| Time Deposits (5.4%) | ||||||||||||||||
| BBH Cash Management Service | ||||||||||||||||
| ANZ, Melbourne | 1.27 | % | 07/02/2018 | 14,153,704 | 14,153,704 | |||||||||||
| BNP Paribas, Paris | 1.27 | % | 07/02/2018 | 135,000,000 | 135,000,000 | |||||||||||
| Standard Chartered Bank, London | 1.27 | % | 07/02/2018 | 20,877,943 | 20,877,943 | |||||||||||
| Sumitomo, Tokyo | 1.27 | % | 07/02/2018 | 97,334,154 | 97,334,154 | |||||||||||
|
| |||||||||||||||
| 267,365,801 | ||||||||||||||||
|
| |||||||||||||||
| Securities Purchased with Cash Collateral from Securities Lending | ||||||||||||||||
| Registered Investment Companies (5.9%) | ||||||||||||||||
| Invesco Aim Government & Agency Portfolio Short-Term Investments Trust, Institutional Class | 1.63 | % | 297,996,497 | |||||||||||||
|
| |||||||||||||||
| Total short-term securities (11.3%) (cost $566,283,274) | 566,283,274 | |||||||||||||||
|
| |||||||||||||||
| Total securities (107.1%) (cost $4,952,998,524) | 5,352,125,967 | |||||||||||||||
|
| |||||||||||||||
| Payable upon return of securities loaned (-5.9%) | (297,996,497 | ) | ||||||||||||||
|
| |||||||||||||||
| Other assets and liabilities (-1.2%) | (58,168,248 | ) | ||||||||||||||
|
| |||||||||||||||
| Total net assets (100.0%) | 4,995,961,222 | |||||||||||||||
|
| |||||||||||||||
l This security, or partial position of this security, was on loan at June 30, 2018. The total value of the securities on loan at June 30, 2018 was $290,832,442. |
| |||||||||||||||
q This security is non-income producing. |
| |||||||||||||||
W Fund ownership consists of 5% or more of the shares outstanding of the Affiliated Issuer, as defined under the Investment Securities Act of 1940. |
| |||||||||||||||
a These securities are being fair valued. Market value adjustments have been applied to these securities to reflect potential early withdrawal. |
| |||||||||||||||
plc Public Limited Company |
| |||||||||||||||
The accompanying notes are an integral part of these financial statements.
30
Table of Contents
| Semiannual Report • 2018 | PARNASSUS FUNDS | |||
Portfolio of Investments as of June 30, 2018 (unaudited)
| Equities | Shares | Market Value ($) | ||||||
| Air Freight & Logistics (2.0%) | ||||||||
| Expeditors International of Washington Inc. | 770,242 | 56,304,690 | ||||||
|
| |||||||
| Apparel & Luxury Goods (6.7%) | ||||||||
| Hanesbrands Inc. l | 4,880,808 | 107,475,392 | ||||||
| VF Corp. | 1,030,112 | 83,974,730 | ||||||
|
| |||||||
| 191,450,122 | ||||||||
|
| |||||||
| Banks (5.6%) | ||||||||
| First Horizon National Corp. | 4,959,737 | 88,481,708 | ||||||
| First Republic Bank | 731,622 | 70,813,694 | ||||||
|
| |||||||
| 159,295,402 | ||||||||
|
| |||||||
| Capital Markets (4.7%) | ||||||||
| SEI Investments Co. | 1,097,545 | 68,618,514 | ||||||
| Thomson Reuters Corp. | 1,602,772 | 64,623,767 | ||||||
|
| |||||||
| 133,242,281 | ||||||||
|
| |||||||
| Chemicals (8.1%) | ||||||||
| Axalta Coating Systems Ltd. q | 2,835,881 | 85,955,553 | ||||||
| Ecolab Inc. | 410,000 | 57,535,300 | ||||||
| Praxair Inc. | 541,265 | 85,601,060 | ||||||
|
| |||||||
| 229,091,913 | ||||||||
|
| |||||||
| Commercial Services & Supplies (0.9%) | ||||||||
| Waste Management Inc. | 321,500 | 26,150,810 | ||||||
|
| |||||||
| Communication Equipment (4.5%) | ||||||||
| Motorola Solutions Inc. | 1,104,766 | 128,561,619 | ||||||
|
| |||||||
| Energy Equipment & Services (2.9%) | ||||||||
| National Oilwell Varco Inc. | 1,896,362 | 82,302,111 | ||||||
|
| |||||||
| Equity Real Estate Investment Trusts (5.8%) | ||||||||
| Iron Mountain Inc. | 2,820,145 | 98,733,277 | ||||||
| Public Storage | 288,369 | 65,419,391 | ||||||
|
| |||||||
| 164,152,668 | ||||||||
|
| |||||||
| Food & Staples Retailing (2.9%) | ||||||||
| Sysco Corp. | 1,193,511 | 81,504,866 | ||||||
|
| |||||||
| Food Products (2.5%) | ||||||||
| McCormick & Co. | 620,298 | 72,010,395 | ||||||
|
| |||||||
| Gas Utilities (1.0%) | ||||||||
| Northwest Natural Gas Co. | 447,973 | 28,580,677 | ||||||
|
| |||||||
| Equities | Shares | Market Value ($) | ||||||
| Health Care Equipment (8.7%) | ||||||||
| Dentsply Sirona Inc. | 918,087 | 40,184,668 | ||||||
| Hologic Inc. q | 2,885,812 | 114,711,027 | ||||||
| Teleflex Inc. | 346,473 | 92,927,523 | ||||||
|
| |||||||
| 247,823,218 | ||||||||
|
| |||||||
| Household Products (3.4%) | ||||||||
| The Clorox Company | 718,623 | 97,193,761 | ||||||
|
| |||||||
| Insurance (1.0%) | ||||||||
| First American Financial Corp. | 572,998 | 29,635,457 | ||||||
|
| |||||||
| Internet Software & Services (2.6%) | ||||||||
| eBay Inc. q | 2,049,504 | 74,315,015 | ||||||
|
| |||||||
| IT Services (4.4%) | ||||||||
| Fiserv Inc. q | 1,700,310 | 125,975,968 | ||||||
|
| |||||||
| Machinery (8.9%) | ||||||||
| Fortive Corp. | 952,090 | 73,415,660 | ||||||
| Pentair plc | 2,001,916 | 84,240,625 | ||||||
| Xylem Inc. | 1,393,934 | 93,923,273 | ||||||
|
| |||||||
| 251,579,558 | ||||||||
|
| |||||||
| Media (3.2%) | ||||||||
| Shaw Communications Inc., Class B l | 4,528,796 | 92,160,999 | ||||||
|
| |||||||
| Multi-Utilities (6.4%) | ||||||||
| MDU Resources Group Inc. | 3,500,000 | 100,380,000 | ||||||
| Sempra Energy | 700,000 | 81,277,000 | ||||||
|
| |||||||
| 181,657,000 | ||||||||
|
| |||||||
| Professional Services (3.7%) | ||||||||
| Verisk Analytics Inc. q | 987,403 | 106,284,059 | ||||||
|
| |||||||
| Semiconductor Equipment (1.3%) | ||||||||
| Integrated Device Technology Inc. q | 1,129,907 | 36,021,435 | ||||||
|
| |||||||
| Software (2.9%) | ||||||||
| ACI Worldwide Inc. q | 373,239 | 9,207,806 | ||||||
| Cadence Design Systems Inc. q | 998,082 | 43,226,931 | ||||||
| Synopsys Inc. q | 339,671 | 29,065,647 | ||||||
|
| |||||||
| 81,500,384 | ||||||||
|
| |||||||
| Total investment in equities (94.1%) (cost $2,289,122,693) | 2,676,794,408 | |||||||
|
| |||||||
The accompanying notes are an integral part of these financial statements.
31
Table of Contents
| PARNASSUS FUNDS | Semiannual Report • 2018 | |||
PARNASSUS MID CAP FUND
Portfolio of Investments as of June 30, 2018 (unaudited) (continued)
| Short-Term Securities | Interest Rate | Maturity Date | Principal Amount ($) | Market Value ($) | ||||||||||||
| Certificates of Deposit (0.0%) a | ||||||||||||||||
| Albina Community Bank | 0.80 | % | 04/25/2019 | 250,000 | 241,809 | |||||||||||
| Beneficial State | 0.65 | % | 03/27/2019 | 250,000 | 242,630 | |||||||||||
| Urban Partnership Bank | 0.30 | % | 03/22/2019 | 250,000 | 242,767 | |||||||||||
|
| |||||||||||||||
| 727,206 | ||||||||||||||||
|
| |||||||||||||||
| Time Deposits (5.8%) | ||||||||||||||||
| BBH Cash Management Service | ||||||||||||||||
| Bank of Montreal, Montreal | 1.27 | % | 07/02/2018 | 109,261,248 | 109,261,248 | |||||||||||
| JPMorgan Chase, New York | 1.27 | % | 07/02/2018 | 56,005,732 | 56,005,732 | |||||||||||
|
| |||||||||||||||
| 165,266,980 | ||||||||||||||||
|
| |||||||||||||||
| Registered Investment Companies (2.1%) | ||||||||||||||||
| Invesco Aim Government & Agency Portfolio | ||||||||||||||||
| Short-Term Investments Trust, Institutional Class | 1.63 | % | 60,099,620 | |||||||||||||
|
| |||||||||||||||
| Total short-term securities (7.9%) (cost $226,093,806) | 226,093,806 | |||||||||||||||
|
| |||||||||||||||
| Total securities (102.0%) (cost $2,515,216,499) | 2,902,888,214 | |||||||||||||||
|
| |||||||||||||||
| Payable upon return of securities loaned (-2.1%) | (60,099,620 | ) | ||||||||||||||
|
| |||||||||||||||
| Other assets and liabilities (0.1%) | 2,769,271 | |||||||||||||||
|
| |||||||||||||||
| Total net assets (100.0%) | 2,845,557,865 | |||||||||||||||
|
| |||||||||||||||
l This security, or partial position of this security, was on loan at June 30, 2018. The total value of the securities on loan at June 30, 2018 was $58,649,292. |
| |||||||||||||||
q This security is non-income producing. |
| |||||||||||||||
a These securities are being fair valued. Market value adjustments have been applied to these securities to reflect potential early withdrawal. |
| |||||||||||||||
plc Public Limited Company | ||||||||||||||||
The accompanying notes are an integral part of these financial statements.
32
Table of Contents
| Semiannual Report • 2018 | PARNASSUS FUNDS | |||
Portfolio of Investments as of June 30, 2018 (unaudited)
| Preferred Stocks | Interest Rate | Maturity Date | Shares | Market Value ($) | ||||||||||||
| Equity Real Estate Investment Trusts (1.4%) | ||||||||||||||||
| Public Storage l | 5.15 | % | 06/02/2022 | 121,127 | 3,010,006 | |||||||||||
|
| |||||||||||||||
| Multi-Utilities (2.4%) | ||||||||||||||||
| Sempra Energy | 6.00 | % | 01/15/2021 | 50,000 | 5,160,500 | |||||||||||
|
| |||||||||||||||
| Total investment in preferred stocks (3.8%) (cost $8,037,583) | 8,170,506 | |||||||||||||||
|
| |||||||||||||||
| Commercial Mortgage-Backed Securities | Interest Rate | Maturity Date | Principal Amount ($) | Market Value ($) | ||||||||||||
| JP Morgan Mortgage Trust Series 2011-C4, Class A3 | 4.11 | % | 07/15/2046 | 105,190 | 105,083 | |||||||||||
| JP Morgan Mortgage Trust Series 2011-C4, Class A4 | 4.39 | % | 07/15/2046 | 1,000,000 | 1,027,073 | |||||||||||
| JP Morgan Mortgage Trust Series 2013-C13, Class A2 | 2.67 | % | 01/15/2046 | 327,551 | 327,099 | |||||||||||
| UBS-Barclays Mortgage Trust Series 2012-C2, Class A3 | 3.06 | % | 05/10/2063 | 717,397 | 717,571 | |||||||||||
|
| |||||||||||||||
| Total investment in commercial mortgage-backed securities (1.0%) (cost $2,192,393) | 2,176,826 | |||||||||||||||
|
| |||||||||||||||
| Corporate Bonds | Interest Rate | Maturity Date | Principal Amount ($) | Market Value ($) | ||||||||||||
| Air Freight & Logistics (3.1%) | ||||||||||||||||
| FedEx Corp. | 2.70 | % | 04/15/2023 | 3,500,000 | 3,368,729 | |||||||||||
| United Parcel Service Inc. | 2.45 | % | 10/01/2022 | 3,500,000 | 3,391,405 | |||||||||||
|
| |||||||||||||||
| 6,760,134 | ||||||||||||||||
|
| |||||||||||||||
| Airlines (0.5%) | ||||||||||||||||
| Southwest Air 07-1 Trust | 6.15 | % | 08/01/2022 | 1,115,695 | 1,183,199 | |||||||||||
|
| |||||||||||||||
| Apparel & Luxury Goods (3.2%) | ||||||||||||||||
| Hanesbrands Inc. | 4.63 | % | 05/15/2024 | 3,000,000 | 2,925,000 | |||||||||||
| VF Corp. | 3.50 | % | 09/01/2021 | 4,000,000 | 4,036,372 | |||||||||||
|
| |||||||||||||||
| 6,961,372 | ||||||||||||||||
|
| |||||||||||||||
| Auto Components (2.1%) | ||||||||||||||||
| APTIV plc | 4.25 | % | 01/15/2026 | 4,500,000 | 4,485,271 | |||||||||||
|
| |||||||||||||||
| Building Products (1.8%) | ||||||||||||||||
| Masco Corp. | 4.45 | % | 04/01/2025 | 4,000,000 | 4,013,476 | |||||||||||
|
| |||||||||||||||
| Capital Markets (1.8%) | ||||||||||||||||
| Charles Schwab Corp. | 3.45 | % | 02/13/2026 | 4,000,000 | 3,933,700 | |||||||||||
|
| |||||||||||||||
| Chemicals (1.8%) | ||||||||||||||||
| Praxair Inc. | 3.20 | % | 01/30/2026 | 3,977,000 | 3,891,132 | |||||||||||
|
| |||||||||||||||
The accompanying notes are an integral part of these financial statements.
33
Table of Contents
| PARNASSUS FUNDS | Semiannual Report • 2018 | |||
PARNASSUS FIXED INCOME FUND
Portfolio of Investments as of June 30, 2018 (unaudited) (continued)
| Corporate Bonds | Interest Rate | Maturity Date | Principal Amount ($) | Market Value ($) | ||||||||||||
| Commercial Services & Supplies (2.0%) | ||||||||||||||||
| Waste Management Inc. | 2.90 | % | 09/15/2022 | 2,500,000 | 2,446,105 | |||||||||||
| Waste Management Inc. | 3.50 | % | 05/15/2024 | 2,000,000 | 1,980,964 | |||||||||||
|
| |||||||||||||||
| 4,427,069 | ||||||||||||||||
|
| |||||||||||||||
| Consumer Finance (2.1%) | ||||||||||||||||
| Mastercard Inc. | 3.38 | % | 04/01/2024 | 4,500,000 | 4,489,997 | |||||||||||
|
| |||||||||||||||
| Containers & Packaging (1.6%) | ||||||||||||||||
| Sealed Air Corp. | 5.25 | % | 04/01/2023 | 3,500,000 | 3,570,000 | |||||||||||
|
| |||||||||||||||
| Energy Equipment & Services (1.2%) | ||||||||||||||||
| National Oilwell Varco Inc. | 3.95 | % | 12/01/2042 | 3,000,000 | 2,530,575 | |||||||||||
|
| |||||||||||||||
| Equity Real Estate Investment Trusts (2.7%) | ||||||||||||||||
| Iron Mountain Inc. | 6.00 | % | 08/15/2023 | 2,900,000 | 2,965,250 | |||||||||||
| Regency Centers LP | 3.75 | % | 06/15/2024 | 3,000,000 | 2,936,889 | |||||||||||
|
| |||||||||||||||
| 5,902,139 | ||||||||||||||||
|
| |||||||||||||||
| Food & Staples Retailing (1.5%) | ||||||||||||||||
| Costco Wholesale Corp. | 3.00 | % | 05/18/2027 | 3,500,000 | 3,341,300 | |||||||||||
|
| |||||||||||||||
| Health Care Equipment (3.4%) | ||||||||||||||||
| Danaher Corp. | 3.35 | % | 09/15/2025 | 3,750,000 | 3,683,842 | |||||||||||
| Hologic Inc. | 5.25 | % | 07/15/2022 | 4,000,000 | 3,820,000 | |||||||||||
|
| |||||||||||||||
| 7,503,842 | ||||||||||||||||
|
| |||||||||||||||
| Health Care Providers & Services (1.4%) | ||||||||||||||||
| CVS Health Corp. | 4.10 | % | 03/25/2025 | 3,000,000 | 2,984,103 | |||||||||||
|
| |||||||||||||||
| Hotel, Restaurant & Leisure (1.8%) | ||||||||||||||||
| Hilton Worldwide Finance LLC | 4.63 | % | 04/01/2025 | 4,000,000 | 3,900,000 | |||||||||||
|
| |||||||||||||||
| Household Products (1.6%) | ||||||||||||||||
| The Clorox Company | 3.50 | % | 12/15/2024 | 3,500,000 | 3,469,480 | |||||||||||
|
| |||||||||||||||
| Industrial Conglomerates (3.5%) | ||||||||||||||||
| 3M Company | 2.88 | % | 10/15/2027 | 4,000,000 | 3,784,336 | |||||||||||
| Pentair Finance SA | 3.15 | % | 09/15/2022 | 4,050,000 | 3,916,824 | |||||||||||
|
| |||||||||||||||
| 7,701,160 | ||||||||||||||||
|
| |||||||||||||||
| Internet Software & Services (1.6%) | ||||||||||||||||
| Alphabet Inc. | 2.00 | % | 08/15/2026 | 4,000,000 | 3,574,040 | |||||||||||
|
| |||||||||||||||
| Life Sciences Tools & Services (1.8%) | ||||||||||||||||
| Agilent Technologies Inc. | 3.20 | % | 10/01/2022 | 2,000,000 | 1,965,238 | |||||||||||
| Agilent Technologies Inc. | 3.05 | % | 09/22/2026 | 2,000,000 | 1,858,566 | |||||||||||
|
| |||||||||||||||
| 3,823,804 | ||||||||||||||||
|
| |||||||||||||||
The accompanying notes are an integral part of these financial statements.
34
Table of Contents
| Semiannual Report • 2018 | PARNASSUS FUNDS | |||
PARNASSUS FIXED INCOME FUND
Portfolio of Investments as of June 30, 2018 (unaudited) (continued)
| Corporate Bonds | Interest Rate | Maturity Date | Principal Amount ($) | Market Value ($) | ||||||||||||
| Machinery (2.6%) | ||||||||||||||||
| Fortive Corp. | 3.15 | % | 06/15/2026 | 3,000,000 | 2,786,253 | |||||||||||
| Xylem Inc. | 3.25 | % | 11/01/2026 | 3,000,000 | 2,820,207 | |||||||||||
|
| |||||||||||||||
| 5,606,460 | ||||||||||||||||
|
| |||||||||||||||
| Media (1.7%) | ||||||||||||||||
| The Walt Disney Co. l | 2.95 | % | 06/15/2027 | 4,000,000 | 3,790,388 | |||||||||||
|
| |||||||||||||||
| Multiline Retail (1.6%) | ||||||||||||||||
| Nordstrom Inc. | 4.00 | % | 10/15/2021 | �� | 1,500,000 | 1,511,911 | ||||||||||
| Nordstrom Inc. | 4.00 | % | 03/15/2027 | 2,000,000 | 1,924,438 | |||||||||||
|
| |||||||||||||||
| 3,436,349 | ||||||||||||||||
|
| |||||||||||||||
| Pharmaceuticals (4.3%) | ||||||||||||||||
| Bristol-Myers Squibb Co. | 3.25 | % | 02/27/2027 | 3,500,000 | 3,382,533 | |||||||||||
| Gilead Sciences Inc. | 3.70 | % | 04/01/2024 | 2,500,000 | 2,504,780 | |||||||||||
| Novartis Capital Corp. | 3.00 | % | 11/20/2025 | 3,500,000 | 3,377,217 | |||||||||||
|
| |||||||||||||||
| 9,264,530 | ||||||||||||||||
|
| |||||||||||||||
| Professional Services (2.8%) | ||||||||||||||||
| Nielsen Finance LLC | 5.00 | % | 04/15/2022 | 3,000,000 | 2,947,800 | |||||||||||
| Verisk Analytics Inc. | 5.50 | % | 06/15/2045 | 3,000,000 | 3,092,217 | |||||||||||
|
| |||||||||||||||
| 6,040,017 | ||||||||||||||||
|
| |||||||||||||||
| Semiconductor Equipment (3.1%) | ||||||||||||||||
| Altera Corp. | 4.10 | % | 11/15/2023 | 3,000,000 | 3,103,263 | |||||||||||
| Applied Materials Inc. | 3.90 | % | 10/01/2025 | 3,500,000 | 3,571,022 | |||||||||||
|
| |||||||||||||||
| 6,674,285 | ||||||||||||||||
|
| |||||||||||||||
| Snack & Juice Bars (2.0%) | ||||||||||||||||
| Starbucks Corp. | 2.45 | % | 06/15/2026 | 3,500,000 | 3,135,731 | |||||||||||
| Starbucks Corp. | 3.75 | % | 12/01/2047 | 1,500,000 | 1,303,758 | |||||||||||
|
| |||||||||||||||
| 4,439,489 | ||||||||||||||||
|
| |||||||||||||||
| Software (4.8%) | ||||||||||||||||
| Adobe Systems Inc. | 3.25 | % | 02/01/2025 | 3,000,000 | 2,951,391 | |||||||||||
| Autodesk Inc. | 4.38 | % | 06/15/2025 | 3,700,000 | 3,725,893 | |||||||||||
| Microsoft Corp. | 2.40 | % | 08/08/2026 | 4,000,000 | 3,700,184 | |||||||||||
|
| |||||||||||||||
| 10,377,468 | ||||||||||||||||
|
| |||||||||||||||
| Technology Hardware (2.6%) | ||||||||||||||||
| Apple Inc. | 2.85 | % | 02/23/2023 | 2,000,000 | 1,968,792 | |||||||||||
| Apple Inc. | 4.38 | % | 05/13/2045 | 3,500,000 | 3,603,026 | |||||||||||
|
| |||||||||||||||
| 5,571,818 | ||||||||||||||||
|
| |||||||||||||||
| Transportation & Infrastructure (1.6%) | ||||||||||||||||
| Burlington Northern Santa Fe Corp. | 3.85 | % | 09/01/2023 | 3,500,000 | 3,569,094 | |||||||||||
|
| |||||||||||||||
| Total investment in corporate bonds (67.6%) (cost $152,772,195) | 147,215,691 | |||||||||||||||
|
| |||||||||||||||
The accompanying notes are an integral part of these financial statements.
35
Table of Contents
| PARNASSUS FUNDS | Semiannual Report • 2018 | |||
PARNASSUS FIXED INCOME FUND
Portfolio of Investments as of June 30, 2018 (unaudited) (continued)
| Federal Agency Mortgage-Backed Securities | Interest Rate | Maturity Date | Principal Amount ($) | Market Value ($) | ||||||||||||
| Fannie Mae Pool 890430 | 3.50 | % | 07/01/2027 | 687,931 | 696,600 | |||||||||||
| Fannie Mae Pool AB5163 | 2.50 | % | 05/01/2027 | 2,105,349 | 2,063,122 | |||||||||||
| Fannie Mae Pool AK2413 | 4.00 | % | 02/01/2042 | 2,556,330 | 2,625,542 | |||||||||||
| Fannie Mae Pool AS2502 | 4.00 | % | 05/01/2044 | 981,399 | 1,005,321 | |||||||||||
| Fannie Mae Pool AV0971 | 3.50 | % | 08/01/2026 | 633,935 | 641,924 | |||||||||||
| Fannie Mae Pool BH1207 | 4.00 | % | 06/01/2047 | 4,048,464 | 4,140,421 | |||||||||||
| Freddie Mac Pool C91754 | 4.50 | % | 02/01/2034 | 783,801 | 819,043 | |||||||||||
| Freddie Mac Pool Q36308 | 4.00 | % | 09/01/2045 | 1,087,160 | 1,115,619 | |||||||||||
| Freddie Mac Pool Q52093 | 3.50 | % | 11/01/2047 | 4,328,522 | 4,308,702 | |||||||||||
| Freddie Mac Pool Q52832 | 4.00 | % | 12/01/2047 | 948,741 | 967,993 | |||||||||||
|
| |||||||||||||||
| Total investment in federal agency mortgage-backed securities (8.4%) (cost $19,067,574) | 18,384,287 | |||||||||||||||
|
| |||||||||||||||
| U.S. Government Treasury Bonds | Interest Rate | Maturity Date | Principal Amount ($) | Market Value ($) | ||||||||||||
| U.S. Treasury | 1.50 | % | 01/31/2019 | 3,000,000 | 2,987,460 | |||||||||||
| U.S. Treasury | 2.75 | % | 02/15/2019 | 3,000,000 | 3,009,258 | |||||||||||
| U.S. Treasury | 1.25 | % | 04/30/2019 | 3,000,000 | 2,973,633 | |||||||||||
| U.S. Treasury | 1.88 | % | 12/31/2019 | 3,000,000 | 2,973,165 | |||||||||||
| U.S. Treasury | 1.88 | % | 12/15/2020 | 2,000,000 | 1,966,406 | |||||||||||
| U.S. Treasury | 2.38 | % | 05/15/2027 | 3,000,000 | 2,889,024 | |||||||||||
| U.S. Treasury | 2.25 | % | 08/15/2027 | 3,000,000 | 2,855,274 | |||||||||||
| U.S. Treasury | 2.75 | % | 02/15/2028 | 3,000,000 | 2,974,335 | |||||||||||
| U.S. Treasury | 2.88 | % | 05/15/2028 | 3,000,000 | 3,005,976 | |||||||||||
| U.S. Treasury | 3.50 | % | 02/15/2039 | 2,000,000 | 2,178,906 | |||||||||||
| U.S. Treasury (TIPS) | 0.63 | % | 07/15/2021 | 1,111,490 | 1,115,637 | |||||||||||
| U.S. Treasury (TIPS) | 0.13 | % | 01/15/2022 | 1,106,820 | 1,087,885 | |||||||||||
| U.S. Treasury (TIPS) | 0.38 | % | 07/15/2025 | 1,056,380 | 1,037,592 | |||||||||||
| U.S. Treasury (TIPS) | 1.75 | % | 01/15/2028 | 1,195,790 | 1,306,605 | |||||||||||
|
| |||||||||||||||
| Total investment in U.S. government treasury bonds (14.9%) (cost $32,141,537) | 32,361,156 | |||||||||||||||
|
| |||||||||||||||
| Total investment in long-term securities (95.7%) (cost $214,211,282) | 208,308,466 | |||||||||||||||
|
| |||||||||||||||
| Short-Term Securities | Interest Rate | Maturity Date | Principal Amount ($) | Market Value ($) | ||||||||||||
| Community Development Loans (0.7%) a | ||||||||||||||||
| MicroVest Plus, LP Note | 2.25 | % | 10/15/2018 | 1,500,000 | 1,473,617 | |||||||||||
|
| |||||||||||||||
| Time Deposits (2.1%) | ||||||||||||||||
| BBH Cash Management Service | ||||||||||||||||
| Banco Santander, Madrid | 1.27 | % | 07/02/2018 | 4,630,389 | 4,630,389 | |||||||||||
|
| |||||||||||||||
The accompanying notes are an integral part of these financial statements.
36
Table of Contents
| Semiannual Report • 2018 | PARNASSUS FUNDS | |||
PARNASSUS FIXED INCOME FUND
Portfolio of Investments as of June 30, 2018 (unaudited) (continued)
| Short-Term Securities | Interest Rate | Maturity Date | Principal Amount ($) | Market Value ($) | ||||||||||||
| U.S. Treasury Bill (0.9%) | ||||||||||||||||
| U.S. Treasury Bill | 0.00 | % | 07/19/2018 | 2,000,000 | 1,998,782 | |||||||||||
|
| |||||||||||||||
| Securities Purchased with Cash Collateral from Securities Lending | ||||||||||||||||
| Registered Investment Companies (1.9%) | ||||||||||||||||
| Invesco Aim Government & Agency Portfolio | ||||||||||||||||
| Short-Term Investments Trust, Institutional Class | 1.63 | % | 4,162,150 | |||||||||||||
|
| |||||||||||||||
| Total short-term securities (5.6%) (cost $12,264,938) | 12,264,938 | |||||||||||||||
|
| |||||||||||||||
| Total securities (101.3%) (cost $226,476,220) | 220,573,404 | |||||||||||||||
|
| |||||||||||||||
| Payable upon return of securities loaned (-1.9%) | (4,162,150 | ) | ||||||||||||||
|
| |||||||||||||||
| Other assets and liabilities (0.6%) | 1,211,128 | |||||||||||||||
|
| |||||||||||||||
| Total net assets (100.0%) | 217,622,382 | |||||||||||||||
|
| |||||||||||||||
l This security, or partial position of this security, was on loan at June 30, 2018. The total value of the securities on loan at June 30, 2018 was $4,077,753. |
| |||||||||||||||
a This security is being fair valued. Market value adjustments have been applied to these securities to reflect potential early withdrawal. |
| |||||||||||||||
plc Public Limited Company | ||||||||||||||||
LP Limited Partnership | ||||||||||||||||
TIPS Treasury Inflation Protected Security | ||||||||||||||||
The accompanying notes are an integral part of these financial statements.
37
Table of Contents
| PARNASSUS FUNDS | Semiannual Report • 2018 | |||
STATEMENT OF ASSETS AND LIABILITIES
June 30, 2018 (unaudited)
| Parnassus Fund | Parnassus Core Equity Fund | Parnassus Endeavor Fund | ||||||||||
| Assets | ||||||||||||
| Investments in stocks and bonds, at market value – Unaffliliated | ||||||||||||
(cost $887,778,047, $11,961,024,450, $4,058,152,647, $2,289,122,693, $214,211,282) | $ | 975,385,362 | $ | 14,909,331,860 | $ | 4,465,652,693 | ||||||
| Investments in stocks, at market value – Affliliated | ||||||||||||
(cost of $0, $290,976,964, $328,562,603, $0, $0) | - | 506,159,476 | 320,190,000 | |||||||||
| Investments in short-term securities | ||||||||||||
(at cost which approximates market value) | 54,542,288 | 186,288,806 | 566,283,274 | |||||||||
| Cash | 12,624 | 207,591 | 241,853 | |||||||||
| Receivables | ||||||||||||
Investment securities sold | - | - | 59,146,532 | |||||||||
Dividends and interest | 791,522 | 14,850,281 | 783,491 | |||||||||
Capital shares sold | 753,952 | 11,105,117 | 3,495,358 | |||||||||
Due from Parnassus Investments | - | - | - | |||||||||
| Other assets | 30,747 | 44,597 | 224,694 | |||||||||
Total assets | $ | 1,031,516,495 | $ | 15,627,987,728 | $ | 5,416,017,895 | ||||||
| Liabilities | ||||||||||||
| Payable upon return of loaned securities | 34,507,518 | - | 297,996,497 | |||||||||
| Payable for investment securities purchased | 2,608,384 | - | 114,934,965 | |||||||||
| Capital shares redeemed | 2,625,000 | 24,829,811 | 6,669,735 | |||||||||
| Distributions payable | - | 1,313,582 | - | |||||||||
| Accounts payable and accrued expenses | 219,734 | 1,513,624 | 455,476 | |||||||||
Total liabilities | $ | 39,960,636 | $ | 27,657,017 | $ | 420,056,673 | ||||||
| Net assets | $ | 991,555,859 | $ | 15,600,330,711 | $ | 4,995,961,222 | ||||||
| Net assets consist of | ||||||||||||
| Undistributed net investment income | 8,133,661 | 361,177 | 32,950,427 | |||||||||
| Unrealized appreciation (depreciation) on securities and foreign currency | 87,607,315 | 3,163,489,922 | 399,127,443 | |||||||||
| Accumulated net realized gain (loss) on securities and foreign currency | 33,146,767 | 1,039,828,445 | 238,616,455 | |||||||||
| Capital paid-in | 862,668,116 | 11,396,651,167 | 4,325,266,897 | |||||||||
Total net assets | $ | 991,555,859 | $ | 15,600,330,711 | $ | 4,995,961,222 | ||||||
| Net asset value and offering per share | ||||||||||||
| Net assets investor shares | $ | 816,359,428 | $ | 9,046,916,896 | $ | 3,769,944,734 | ||||||
| Net assets institutional shares | $ | 175,196,431 | $ | 6,553,413,815 | $ | 1,226,016,488 | ||||||
| Shares outstanding investor shares | 17,331,286 | 208,287,989 | 102,299,245 | |||||||||
| Shares outstanding institutional shares | 3,717,962 | 150,664,011 | 33,208,600 | |||||||||
| Net asset values and redemption price per share | ||||||||||||
(Net asset value divided by shares outstanding) | ||||||||||||
Investor shares | $ | 47.10 | $ | 43.43 | $ | 36.85 | ||||||
Institutional shares | $ | 47.12 | $ | 43.50 | $ | 36.92 | ||||||
The accompanying notes are an integral part of these financial statements.
38
Table of Contents
| Semiannual Report • 2018 | PARNASSUS FUNDS | |||
| Parnassus Mid Cap Fund | Parnassus Fixed Income Fund | |||||||||||||
$ | 2,676,794,408 |
| $ | 208,308,466 | ||||||||||
| - | - | |||||||||||||
| 226,093,806 | 12,264,938 | |||||||||||||
| 176,213 | 4,903 | |||||||||||||
| 5,702,036 | - | |||||||||||||
| 4,383,364 | 1,623,067 | |||||||||||||
| 2,709,347 | 251,507 | |||||||||||||
| 45,000 | - | |||||||||||||
| 94,297 | 25,435 | |||||||||||||
| $ | 2,915,998,471 | $ | 222,478,316 | |||||||||||
| 60,099,620 | 4,162,150 | |||||||||||||
| 7,710,691 | - | |||||||||||||
| 2,297,010 | 616,265 | |||||||||||||
| - | 24,411 | |||||||||||||
| 333,285 | 53,108 | |||||||||||||
| $ | 70,440,606 | $ | 4,855,934 | |||||||||||
| $ | 2,845,557,865 | $ | 217,622,382 | |||||||||||
| 13,745,490 | 44,963 | |||||||||||||
| 387,671,715 |
| (5,902,816 | ) | ||||||||||
| 14,573,785 |
| (1,265,779 | ) | ||||||||||
| 2,429,566,875 | 224,746,014 | |||||||||||||
| $ | 2,845,557,865 | $ | 217,622,382 | |||||||||||
| $ | 1,919,255,885 | $ | 163,802,674 | |||||||||||
| $ | 926,301,980 | $ | 53,819,708 | |||||||||||
| 58,940,261 | 10,239,116 | |||||||||||||
| 28,383,011 | 3,364,958 | |||||||||||||
| $ | 32.56 | $ | 16.00 | |||||||||||
| $ | 32.64 | $ | 15.99 | |||||||||||
The accompanying notes are an integral part of these financial statements.
39
Table of Contents
| PARNASSUS FUNDS | Semiannual Report • 2018 | |||
STATEMENT OF OPERATIONS
Six Months Ended June 30, 2018 (unaudited)
| Parnassus Fund | Parnassus Core Equity Fund | Parnassus Endeavor Fund | ||||||||||
| Investment income | ||||||||||||
| Dividends – Unaffiliated | $ | 11,036,410 | $ | 154,696,938 | $ | 55,983,118 | ||||||
| Dividends – Affiliated | - | 5,811,011 | - | |||||||||
| Interest | 115,403 | 1,537,303 | 1,002,073 | |||||||||
| Securities lending | 43,014 | 254 | 228,640 | |||||||||
| Other income | 308 | 2,129 | 916 | |||||||||
| Foreign witholding tax | (279,793 | ) | (2,848,044 | ) | (935,994 | ) | ||||||
Total investment income | $ | 10,915,342 | $ | 159,199,591 | $ | 56,278,753 | ||||||
| Expenses | ||||||||||||
| Investment advisory fees | 3,197,847 | 45,912,441 | 17,324,342 | |||||||||
| Transfer agent fees | ||||||||||||
Investor shares | 131,915 | 224,770 | 185,905 | |||||||||
Institutional shares | 4,453 | 54,826 | 5,898 | |||||||||
| Fund administration | 165,466 | 2,501,056 | 831,404 | |||||||||
| Service provider fees | 556,838 | 10,480,946 | 4,174,332 | |||||||||
| Reports to shareholders | 75,088 | 1,050,207 | 422,534 | |||||||||
| Registration fees and expenses | 44,035 | 85,891 | 91,715 | |||||||||
| Custody fees | 23,675 | 243,536 | 100,676 | |||||||||
| Overdraft charges | 2,570 | 51,728 | 17,000 | |||||||||
| Professional fees | 34,119 | 139,037 | 92,211 | |||||||||
| Trustee fees and expenses | 10,248 | 153,642 | 48,877 | |||||||||
| Proxy voting fees | 1,638 | 1,638 | 1,638 | |||||||||
| Pricing service fees | 2,375 | 2,375 | 2,375 | |||||||||
| Other expenses | 7,603 | 93,124 | 29,419 | |||||||||
Total expenses | $ | 4,257,870 | $ | 60,995,217 | $ | 23,328,326 | ||||||
Fees waived by Parnassus Investments | - | - | - | |||||||||
Net expenses | $ | 4,257,870 | $ | 60,995,217 | $ | 23,328,326 | ||||||
Net investment gain | $ | 6,657,472 | $ | 98,204,374 | $ | 32,950,427 | ||||||
| Realized and unrealized gain (loss) on investments | ||||||||||||
| Net realized gain (loss) from securities transactions – Unaffiliated | 35,642,461 | 1,042,318,641 | 185,353,880 | |||||||||
| Net realized loss from securities transactions – Affiliated | - | - | (2,270,400 | ) | ||||||||
| Net change in unrealized depreciation of securities | (67,651,880 | ) | (752,316,403 | ) | (274,789,367 | ) | ||||||
| Net realized and unrealized gain (loss) on securities | $ | (32,009,419 | ) | $ | 290,002,238 | $ | (91,705,887 | ) | ||||
| Net increase (decrease) in net assets resulting from operations | $ | (25,351,947 | ) | $ | 388,206,612 | $ | (58,755,460 | ) | ||||
The accompanying notes are an integral part of these financial statements.
40
Table of Contents
| Semiannual Report • 2018 | PARNASSUS FUNDS | |||
| Parnassus Mid Cap Fund | Parnassus Fixed Income Fund | |||||||||||||
| $ | 23,991,826 | $ | 277,307 | |||||||||||
| - | - | |||||||||||||
| 801,600 | 3,288,807 | |||||||||||||
| 68,460 | 22,891 | |||||||||||||
| 472 | - | |||||||||||||
| (440,614 | ) | - | ||||||||||||
| $ | 24,421,744 | $ | 3,589,005 | |||||||||||
| 9,838,855 | 551,973 | |||||||||||||
| 108,425 | 33,612 | |||||||||||||
| 2,060 | 1,436 | |||||||||||||
| 437,768 | 35,487 | |||||||||||||
| 2,049,212 | 146,882 | |||||||||||||
| 326,372 | 10,041 | |||||||||||||
| 63,956 | 26,203 | |||||||||||||
| 54,269 | 6,157 | |||||||||||||
| - | - | |||||||||||||
| 47,654 | 22,330 | |||||||||||||
| 26,328 | 2,183 | |||||||||||||
| 1,638 | - | |||||||||||||
| 2,375 | 3,625 | |||||||||||||
| 16,978 | 1,975 | |||||||||||||
| $ | 12,975,890 | $ | 841,904 | |||||||||||
| (254,152 | ) | (133,027 | ) | |||||||||||
| $ | 12,721,738 | $ | 708,877 | |||||||||||
| $ | 11,700,006 | $ | 2,880,128 | |||||||||||
| 36,456,733 | (1,597,952 | ) | ||||||||||||
| - | - | |||||||||||||
| (2,735,678 | ) | (6,068,203 | ) | |||||||||||
| $ | 33,721,055 | $ | (7,666,155 | ) | ||||||||||
| $ | 45,421,061 | $ | (4,786,027 | ) | ||||||||||
The accompanying notes are an integral part of these financial statements.
41
Table of Contents
| PARNASSUS FUNDS | Semiannual Report • 2018 | |||
STATEMENT OF CHANGES IN NET ASSETS
June 30, 2018
| Parnassus Fund | Parnassus Core Equity Fund | |||||||||||||||
| Six Months Ended June 30, 2018 (unaudited) | Year Ended December 31, 2017 | Six Months Ended June 30, 2018 (unaudited) | Year Ended December 31, 2017 | |||||||||||||
| Investment income from operations | ||||||||||||||||
Net investment income | $ | 6,657,472 | $ | 9,822,319 | $ | 98,204,374 | $ | 181,507,478 | ||||||||
Net realized gain (loss) from securities transactions | 35,642,461 | 73,482,823 | 1,042,318,641 | 1,078,616,554 | ||||||||||||
Net change in unrealized appreciation (depreciation) of securities | (67,651,880 | ) | 64,635,974 | (752,316,403 | ) | 1,146,869,033 | ||||||||||
Increase (decrease) in net assets resulting from operations | $ | (25,351,947 | ) | $ | 147,941,116 | $ | 388,206,612 | $ | 2,406,993,065 | |||||||
| Distributions | ||||||||||||||||
From net investment income | ||||||||||||||||
Investor shares | - | (8,540,650 | ) | (53,207,348 | ) | (131,603,378 | ) | |||||||||
Institutional shares | - | (1,705,905 | ) | (42,702,324 | ) | (87,547,245 | ) | |||||||||
From realized capital gains | ||||||||||||||||
Investor shares | - | (61,266,353 | ) | - | (556,043,266 | ) | ||||||||||
Institutional shares | - | (9,983,715 | ) | - | (351,949,409 | ) | ||||||||||
Distributions to shareholders | $ | - | $ | (81,496,623 | ) | $ | (95,909,672 | ) | $ | (1,127,143,298 | ) | |||||
| Capital share transactions | ||||||||||||||||
Investor shares | ||||||||||||||||
Proceeds from sale of shares | 44,778,994 | 224,555,031 | 536,460,311 | 1,508,188,846 | ||||||||||||
Reinvestment of dividends | - | 67,850,609 | 52,434,590 | 681,913,192 | ||||||||||||
Shares repurchased | (130,398,808 | ) | (205,040,418 | ) | (1,592,650,104 | ) | (3,382,979,142 | ) | ||||||||
Institutional shares | ||||||||||||||||
Proceeds from sale of shares | 41,649,569 | 88,662,671 | 974,335,911 | 2,327,391,681 | ||||||||||||
Reinvestment of dividends | - | 11,219,954 | 39,947,070 | 356,456,177 | ||||||||||||
Shares repurchased | (24,798,129 | ) | (22,146,832 | ) | (817,731,391 | ) | (1,453,510,562 | ) | ||||||||
Increase (decrease) in net assets from capital share transactions | (68,768,374 | ) | 165,101,015 | (807,203,613 | ) | 37,460,192 | ||||||||||
Increase (decrease) in net assets | $ | (94,120,321 | ) | $ | 231,545,508 | $ | (514,906,673 | ) | $ | 1,317,309,959 | ||||||
| Net Assets | ||||||||||||||||
Beginning of year | 1,085,676,180 | 854,130,672 | 16,115,237,384 | 14,797,927,425 | ||||||||||||
End of period | $ | 991,555,859 | $ | 1,085,676,180 | $ | 15,600,330,711 | $ | 16,115,237,384 | ||||||||
Undistributed net investment income (loss) | $ | 8,133,661 | $ | 1,476,189 | $ | 361,177 | $ | (1,933,527 | ) | |||||||
| Shares issued and redeemed | ||||||||||||||||
Investor shares | ||||||||||||||||
Shares sold | 935,432 | 4,706,141 | 12,375,520 | 36,346,418 | ||||||||||||
Shares issued through dividend reinvestment | - | 1,425,829 | 1,226,515 | 16,203,184 | ||||||||||||
Shares repurchased | (2,730,990 | ) | (4,257,798 | ) | (36,633,367 | ) | (80,862,765 | ) | ||||||||
Institutional shares | ||||||||||||||||
Shares sold | 874,337 | 1,845,103 | 22,350,965 | 55,673,068 | ||||||||||||
Shares issued through dividend reinvestment | - | 235,501 | 931,699 | 8,450,001 | ||||||||||||
Shares repurchased | (522,299 | ) | (457,005 | ) | (18,767,987 | ) | (34,792,490 | ) | ||||||||
Net increase (decrease) in shares outstanding | ||||||||||||||||
Investor shares | (1,795,558 | ) | 1,874,172 | (23,031,332 | ) | (28,313,163 | ) | |||||||||
Institutional shares | 352,038 | 1,623,599 | 4,514,677 | 29,330,579 | ||||||||||||
The accompanying notes are an integral part of these financial statements.
42
Table of Contents
| Semiannual Report • 2018 | PARNASSUS FUNDS | |||
| Parnassus Endeavor Fund | Parnassus Mid Cap Fund | Parnassus Fixed Income Fund | ||||||||||||||||||||
| Six Months Ended June 30, 2018 (unaudited) | Year Ended December 31, 2017 | Six Months Ended June 30, 2018 (unaudited) | Year Ended December 31, 2017 | Six Months Ended June 30, 2018 (unaudited) | Year Ended December 31, 2017 | |||||||||||||||||
| $ | 32,950,427 | $ | 41,504,404 | $ | 11,700,006 | $ | 21,477,279 | $ | 2,880,128 | $ | 5,278,809 | |||||||||||
| 183,083,480 | 357,499,761 | 36,456,733 | 92,538,256 | (1,597,952 | ) | 677,256 | ||||||||||||||||
| (274,789,367 | ) | 374,012,412 | (2,735,678 | ) | 233,723,141 | (6,068,203 | ) | 1,144,295 | |||||||||||||
$ | (58,755,460 | ) | $ | 773,016,577 | $ | 45,421,061 | $ | 347,738,676 | $ | (4,786,027 | ) | $ | 7,100,360 | |||||||||
| - | (85,344,362 | ) | - | (29,790,546 | ) | (2,149,944 | ) | (4,505,190 | ) | |||||||||||||
| - | (22,407,670 | ) | - | (13,115,409 | ) | (685,222 | ) | (942,865 | ) | |||||||||||||
| - | (165,524,846 | ) | - | (52,199,294 | ) | - | - | |||||||||||||||
| - | (39,475,626 | ) | - | (20,048,314 | ) | - | - | |||||||||||||||
| $ | - | $ | (312,752,504 | ) | $ | - | $ | (115,153,563 | ) | $ | (2,835,166 | ) | $ | (5,448,055 | ) | |||||||
| 728,568,619 | 2,387,291,707 | 260,659,409 | 925,624,325 | 20,961,737 | 76,388,408 | |||||||||||||||||
| - | 234,871,765 | - | 78,144,137 | 2,100,981 | 4,326,813 | |||||||||||||||||
| (1,096,417,617 | ) | (1,331,479,320 | ) | (391,200,018 | ) | (656,479,341 | ) | (35,418,970 | ) | (93,582,289 | ) | |||||||||||
| 467,845,459 | 798,134,970 | 267,960,095 | 532,557,081 | 14,523,206 | 33,089,367 | |||||||||||||||||
| - | 59,314,656 | - | 30,597,593 | 606,524 | 808,023 | |||||||||||||||||
| (262,661,943 | ) | (193,847,799 | ) | (138,930,662 | ) | (117,149,172 | ) | (7,055,773 | ) | (7,329,331 | ) | |||||||||||
| (162,665,482 | ) | 1,954,285,979 | (1,511,176 | ) | 793,294,623 | (4,282,295 | ) | 13,700,991 | |||||||||||||
| $ | (221,420,942 | ) | $ | 2,414,550,052 | $ | 43,909,885 | $ | 1,025,879,736 | $ | (11,903,488 | ) | $ | 15,353,296 | |||||||||
| 5,217,382,164 | 2,802,832,112 | 2,801,647,980 | 1,775,768,244 | 229,525,870 | 214,172,574 | |||||||||||||||||
| $ | 4,995,961,222 | $ | 5,217,382,164 | $ | 2,845,557,865 | $ | 2,801,647,980 | $ | 217,622,382 | $ | 229,525,870 | |||||||||||
| $ | 32,950,427 | $ | - | $ | 13,745,490 | $ | 2,045,484 | $ | 44,963 | $ | - | |||||||||||
| 19,338,696 | 67,644,108 | 8,133,809 | 30,163,394 | 1,294,470 | 4,598,378 | |||||||||||||||||
| - | 6,215,559 | - | 2,438,127 | 130,404 | 260,645 | |||||||||||||||||
| (29,623,925 | ) | (37,274,595 | ) | (12,218,917 | ) | (21,208,638 | ) | (2,196,473 | ) | (5,629,448 | ) | |||||||||||
| 12,600,647 | 22,551,107 | 8,390,203 | 17,214,813 | 899,988 | 1,993,176 | |||||||||||||||||
| - | 1,567,221 | - | 952,351 | 37,671 | 48,673 | |||||||||||||||||
| (7,116,053 | ) | (5,339,429 | ) | (4,311,359 | ) | (3,729,961 | ) | (436,339 | ) | (441,259 | ) | |||||||||||
| (10,285,229 | ) | 36,585,072 | (4,085,108 | ) | 11,392,883 | (771,599 | ) | (770,425 | ) | |||||||||||||
| 5,484,594 | 18,778,899 | 4,078,844 | 14,437,203 | 501,320 | 1,600,590 | |||||||||||||||||
The accompanying notes are an integral part of these financial statements.
43
Table of Contents
| PARNASSUS FUNDS | Semiannual Report • 2018 | |||
1. Organization
The Parnassus Funds are comprised of two Trusts, the Parnassus Funds trust and the Parnassus Income Funds trust (collectively the “Trusts”), organized as Massachusetts Business Trusts registered under the Investment Company Act of 1940 as diversified, open-end investment management companies, and are comprised of five separate funds (collectively the “Funds”). The Parnassus Funds trust includes the Parnassus Fund, which commenced operations on December 27, 1984, the Parnassus Endeavor Fund and the Parnassus Mid Cap Fund, both of which commenced operations on April 29, 2005. The Parnassus Income Funds trust includes the Parnassus Core Equity Fund and the Parnassus Fixed Income Fund, both of which commenced operations on August 31, 1992. Each Fund has distinct investment objectives. In general, each of the Funds seeks long-term capital appreciation. Prior to May 1, 2014, the Parnassus Core Equity Fund was known as the Parnassus Equity Income Fund, and the Parnassus Endeavor Fund was known as the Parnassus Workplace Fund.
2. Significant Accounting Policies
The Funds are investment companies that apply the accounting and reporting guidance issued in Topic 946 by the U.S. Financial Accounting Standards Board. The presentation of the financial statements is made using specialized accounting principles applicable to investment companies.
Short-Term Securities
Short-term securities represent investments of excess cash and consist of time deposits, community development loans, certificates of deposit and money market funds.
Security Transactions and Related Investment Income and Expenses
Securities transactions are recorded on the date the securities are purchased or sold (trade date). Realized gains and losses on securities transactions are determined on the basis of first-in, first-out for both financial statement and federal income tax purposes. Dividend income is recognized on the ex-dividend date and interest income is recognized on an accrual basis. Discounts and premiums on securities purchased are amortized over the lives of the respective securities using the constant yield method, which approximates the interest method. Expenses are recorded on an accrual basis.
Class Allocations
Income, fees and expenses (other than class-specific fees and expenses) and realized and unrealized gains and losses are allocated daily among the various share classes based on their relative net assets. Class-specific fees and expenses, such as broker service fees, administrative and shareholder services, are charged directly to the respective share class.
Dividends and Distributions to Shareholders
Dividends and distributions to shareholders are recorded on the ex-dividend date to shareholders of record on the record date. The Parnassus Core Equity Fund pays income dividends quarterly and capital-gain dividends annually. The Parnassus Fixed Income Fund pays income dividends monthly and capital-gain dividends annually. The other Funds pay income and capital-gain dividends annually.
3. Securities Valuations
Methods and Inputs
Equity securities that are listed or traded on a national securities exchange are stated at market value, based on recorded closing sales on the exchange or on the NASDAQ’s National Market official closing price. In the absence of a recorded sale, and for over-the-counter securities, equity securities are stated at the mean between the last recorded bid and asked prices. Long-term, fixed-income securities are valued each business day using prices based on procedures established by independent pricing services and approved by the Board of Trustees (the “Trustees”). Fixed-income securities with an active market are valued at the “bid” price where such quotes are readily available from brokers and dealers and are representative of the actual market for such securities. Other fixed-income securities experiencing a less active market are valued as determined by the pricing services based on methods which include consideration of trading in securities of comparable yield, quality, coupon, maturity and type, as well as indications as to values from dealers and other market data without exclusive reliance upon quoted prices or over-the-counter prices, since such valuations are believed to reflect more accurately the value of such securities. Investments in registered investment companies are valued at their net asset value.
44
Table of Contents
| Semiannual Report • 2018 | PARNASSUS FUNDS | |||
Notes to Financial Statements (continued)
Investments where market quotations are not readily available are priced at their fair value, in accordance with procedures established by the Trustees. These investments include certificates of deposit and community development loans. These investments carry interest rates ranging from 0.20% to 2.25% with maturities of one year or less. In determining fair value, the Trustees may consider a variety of information including, but not limited to, the following: price based upon a multiple of earnings or sales, fundamental analytical data and an evaluation of market conditions. A valuation adjustment is applied to certificates of deposit, community development loans and other community development investments as an estimate of potential penalties for early withdrawal.
The Funds follow Accounting Standards Codification (“ASC”) 820, Fair Value Measurements and Disclosure, which defines fair value, establishes a framework for measuring fair value and expands disclosures about fair value measurements. Various inputs are used in determining the value of the Funds’ portfolio investments. These inputs are summarized in three levels, Level 1—unadjusted quoted prices in active markets for identical investments, Level 2—other significant observable inputs (including quoted prices for similar investments) and Level 3—significant unobservable inputs (including the Fund’s own assumptions in determining the fair value of investments).
Securities Lending
The Parnassus Funds have entered into an agreement with Brown Brothers Harriman & Co., dated July 29, 2009 (“Agreement”), to provide securities lending services to the Funds. Under this program, the proceeds (cash collateral) received from borrowers are used to invest in money market funds.
Under the Agreement, the borrowers pay the Funds negotiated lenders’ fees and the Funds receive cash collateral in an amount equal to 102% of the market value of loaned securities. The borrower of securities is at all times required to post cash collateral to the portfolio in an amount equal to 100% of the market value of the securities loaned based on the previous day’s market value of the securities loaned, marked-to-market daily. Any collateral shortfalls are adjusted the next business day. If the borrower defaults on its obligations to return the securities loaned because of insolvency or other reasons, the portfolio could experience delays and costs in recovering the securities loaned.
The agreement provides the right in the event of default for the non-defaulting party to liquidate the collateral and calculate a net exposure to the defaulting party or request additional collateral. In the event that a borrower defaults, the Funds, as lender, would offset the market value of the collateral received against the market value of the securities loaned. When the value of the collateral is greater than that of the market value of the securities loaned, the lender is left with a net amount payable to the defaulting party. However, bankruptcy or insolvency laws of a particular jurisdiction may impose restrictions on or prohibitions against such a right of offset in the event of a counterparty’s bankruptcy or insolvency. Under the agreement, the borrower can resell or re-pledge the loaned securities, and the Funds can reinvest cash collateral, or, upon an event of default, resell or re-pledge the collateral.
The Funds retained beneficial ownership and all economic benefits in the securities they have loaned and continues to receive interest paid by the securities and payments equivalent to dividends, and to participate in any changes in their market value, but does not have the proxy voting rights with respect to loaned securities. Each portfolio manager of the Funds has the responsibility to request that the securities lending agent call back securities which are out on loan to vote on material matters and it is the Funds’ policy that the portfolio managers vote on all material matters. However, the ability to timely recall shares for proxy voting purposes typically is not entirely within the control of the portfolio manager, the Funds or their securities lending agent. Under certain circumstances, the recall of shares in time for such shares to be voted may not be possible due to applicable proxy voting record dates and administrative considerations.
Income generated from securities lending is presented in the Statement of Operations. Cash collateral received by the Funds is reflected as an asset (securities purchased with cash collateral from securities lending) and the related liability (payable upon return of securities loaned) is presented in the Statement of Assets and Liabilities.
45
Table of Contents
| PARNASSUS FUNDS | Semiannual Report • 2018 | |||
Notes to Financial Statements (continued)
At June 30, 2018, the following tables are a summary of the Funds’ securities lending agreements by counterparty, which are subject to offset under the agreement:
| Parnassus Fund | ||||||||||||
| Counterparty | Securities Loaned at Value | Cash Collateral Received1 | Net Amount | |||||||||
| Barclays Capital Inc. | 980,923 | (980,923 | ) | - | ||||||||
| Credit Suisse Securities (USA) | 2,186,292 | (2,186,292 | ) | - | ||||||||
| Credit Suisse Securities (USA) | 4,295,786 | (4,295,786 | ) | - | ||||||||
| Goldman, Sach & Co. | 98,040 | (98,040 | ) | - | ||||||||
| Goldman, Sach & Co. | 653,600 | (653,600 | ) | - | ||||||||
| Goldman, Sach & Co. | 8,585,712 | (8,585,712 | ) | - | ||||||||
| JP Morgan Securities LLC | 833,177 | (833,177 | ) | - | ||||||||
| JP Morgan Securities LLC | 6,511,490 | (6,511,490 | ) | - | ||||||||
| JP Morgan Securities LLC | 3,196,104 | (3,196,104 | ) | - | ||||||||
| Merrill Lynch, Pierce, Fenner | 455,445 | (455,445 | ) | - | ||||||||
| MS Securities Services Inc. | 5,384,030 | (5,384,030 | ) | - | ||||||||
| UBS AG London Branch | 498,386 | (498,386 | ) | - | ||||||||
| Total | 33,678,985 | (33,678,985 | ) | - | ||||||||
| Parnassus Endeavor Fund | ||||||||||||
| Counterparty | Securities Loaned at Value | Cash Collateral Received1 | Net Amount | |||||||||
| Barclays Capital Inc. | 2,859,500 | (2,859,500 | ) | - | ||||||||
| Barclays Capital Inc. | 5,310,500 | (5,310,500 | ) | - | ||||||||
| Barclays Capital Inc. | 3,774,540 | (3,774,540 | ) | - | ||||||||
| Barclays Capital Inc. | 1,032,688 | (1,032,688 | ) | - | ||||||||
| Barclays Capital Inc. | 4,182,517 | (4,182,517 | ) | - | ||||||||
| BMO Capital Markets | 5,955,930 | (5,955,930 | ) | - | ||||||||
| Citigroup Global Markets Inc. | 22,876,000 | (22,876,000 | ) | - | ||||||||
| Citigroup Global Markets Inc. | 4,460,820 | (4,460,820 | ) | - | ||||||||
| Citigroup Global Markets Inc. | 10,621,000 | (10,621,000 | ) | - | ||||||||
| Citigroup Global Markets Inc. | 16,078,560 | (16,078,560 | ) | - | ||||||||
| Citigroup Global Markets Inc. | 4,085,000 | (4,085,000 | ) | - | ||||||||
| Citigroup Global Markets Inc. | 653,600 | (653,600 | ) | - | ||||||||
| Citigroup Global Markets Inc. | 10,888,976 | (10,888,976 | ) | - | ||||||||
| Credit Suisse Securities (USA) | 7,598,100 | (7,598,100 | ) | - | ||||||||
| Goldman, Sach & Co. | 1,893,806 | (1,893,806 | ) | - | ||||||||
| Goldman, Sach & Co. | 424,840 | (424,840 | ) | - | ||||||||
| Goldman, Sach & Co. | 2,369,300 | (2,369,300 | ) | - | ||||||||
| Goldman, Sach & Co. | 2,243,482 | (2,243,482 | ) | - | ||||||||
| Goldman, Sach & Co. | 22,876 | (22,876 | ) | - | ||||||||
| Goldman, Sach & Co. | 4,379,120 | (4,379,120 | ) | - | ||||||||
| Goldman, Sach & Co. | 836,074 | (836,074 | ) | - | ||||||||
| Goldman, Sach & Co. | 5,596,622 | (5,596,622 | ) | - | ||||||||
| Goldman, Sach & Co. | 3,198,700 | (3,198,700 | ) | - | ||||||||
| Goldman, Sach & Co. | 6,245,186 | (6,245,186 | ) | - | ||||||||
46
Table of Contents
| Semiannual Report • 2018 | PARNASSUS FUNDS | |||
Notes to Financial Statements (continued)
| Parnassus Endeavor Fund (continued) | ||||||||||||
| Counterparty | Securities Loaned at Value | Cash Collateral Received1 | Net Amount | |||||||||
| Goldman, Sach & Co. | 326,800 | (326,800 | ) | - | ||||||||
| Goldman, Sach & Co. | 1,352,952 | (1,352,952 | ) | - | ||||||||
| Goldman, Sach & Co. | 9,820,340 | (9,820,340 | ) | - | ||||||||
| Goldman, Sach & Co. | 321,898 | (321,898 | ) | - | ||||||||
| JP Morgan Securities LLC | 26,946,294 | (26,946,294 | ) | - | ||||||||
| JP Morgan Securities LLC | 4,783,976 | (4,783,976 | ) | - | ||||||||
| JP Morgan Securities LLC | 2,777,800 | (2,777,800 | ) | - | ||||||||
| JP Morgan Securities LLC | 6,536,000 | (6,536,000 | ) | - | ||||||||
| JP Morgan Securities LLC | 3,268,000 | (3,268,000 | ) | - | ||||||||
| JP Morgan Securities LLC | 8,170,000 | (8,170,000 | ) | - | ||||||||
| JP Morgan Securities LLC | 3,268,000 | (3,268,000 | ) | - | ||||||||
| JP Morgan Securities LLC | 3,339,896 | (3,339,896 | ) | - | ||||||||
| JP Morgan Securities LLC | 410,134 | (410,134 | ) | - | ||||||||
| JP Morgan Securities LLC | 3,594,800 | (3,594,800 | ) | - | ||||||||
| Merrill Lynch, Pierce, Fenner | 18,580,214 | (18,580,214 | ) | - | ||||||||
| Merrill Lynch, Pierce, Fenner | 6,045,800 | (6,045,800 | ) | - | ||||||||
| Merrill Lynch, Pierce, Fenner | 4,446,555 | (4,446,555 | ) | - | ||||||||
| MS Securities Services Inc. | 6,354,626 | (6,354,626 | ) | - | ||||||||
| MS Securities Services Inc. | 464,056 | (464,056 | ) | - | ||||||||
| MS Securities Services Inc. | 784,320 | (784,320 | ) | - | ||||||||
| MS Securities Services Inc. | 5,232,068 | (5,232,068 | ) | - | ||||||||
| MS Securities Services Inc. | 16,340,000 | (16,340,000 | ) | - | ||||||||
| MS Securities Services Inc. | 3,380,632 | (3,380,632 | ) | - | ||||||||
| MS Securities Services Inc. | 2,939,566 | (2,939,566 | ) | - | ||||||||
| MS Securities Services Inc. | 4,160,164 | (4,160,164 | ) | - | ||||||||
| UBS AG London Branch | 11,429,814 | (11,429,814 | ) | - | ||||||||
| UBS AG London Branch | 8,170,000 | (8,170,000 | ) | - | ||||||||
| Total | 290,832,442 | (290,832,442 | ) | - | ||||||||
| Parnassus Mid Cap Fund | ||||||||||||
| Counterparty | Securities Loaned at Value | Cash Collateral Received1 | Net Amount | |||||||||
| Barclays Capital Inc. | 2,157,468 | (2,157,468 | ) | - | ||||||||
| Goldman, Sach & Co. | 1,449,342 | (1,449,342 | ) | - | ||||||||
| Goldman, Sach & Co. | 1,255,214 | (1,255,214 | ) | - | ||||||||
| ING Financial Markets LLC | 3,858,294 | (3,858,294 | ) | - | ||||||||
| MS Securities Services Inc. | 3,013,396 | (3,013,396 | ) | - | ||||||||
| MS Securities Services Inc. | 9,538,744 | (9,538,744 | ) | - | ||||||||
| MS Securities Services Inc. | 23,304,184 | (23,304,184 | ) | - | ||||||||
| MS Securities Services Inc. | 1,804,508 | (1,804,508 | ) | - | ||||||||
| SG Americas Securities LLC | 12,071,808 | (12,071,808 | ) | - | ||||||||
| SG Americas Securities LLC | 196,334 | (196,334 | ) | - | ||||||||
| Total | 58,649,292 | (58,649,292 | ) | - | ||||||||
47
Table of Contents
| PARNASSUS FUNDS | Semiannual Report • 2018 | |||
Notes to Financial Statements (continued)
| Parnassus Fixed Income Fund | ||||||||||||
| Counterparty | Securities Loaned at Value | Cash Collateral Received1 | Net Amount | |||||||||
| Barclays Capital Inc. | 3,246,427 | (3,246,427 | ) | - | ||||||||
| Barclays Capital Inc. | 507,106 | (507,106 | ) | - | ||||||||
| Deutsche Bank Securities Inc. | 132,182 | (132,182 | ) | - | ||||||||
| National Financial Services LLC | 4,988 | (4,988 | ) | - | ||||||||
| National Financial Services LLC | 92,278 | (92,278 | ) | - | ||||||||
| National Financial Services LLC | 94,772 | (94,772 | ) | - | ||||||||
| Total | 4,077,753 | (4,077,753 | ) | - | ||||||||
| 1 | Collateral value of $34,507,518, $297,996,497, $60,099,620 and $4,162,150 has been received in connection with securities lending agreements for Parnassus Fund, Parnassus Endeavor Fund, Parnassus Mid Cap Fund and Parnassus Fixed Income Fund, respectively. Collateral received in excess of the value of the securities loaned from the individual counterparty is shown for financial reporting purposes in the Funds’ financial statements. |
As of June 30, 2018, the contractual maturity date is overnight and continuous for the gross obligation of the equity securities on loan in the Parnassus Fund, Parnassus Endeavor Fund and Parnassus Mid Cap Fund, in the amounts of $34,507,518, $297,996,497 and $60,099,620, respectively, as well as the corporate securities on loan in the Parnassus Fixed Income Fund in the amount of $4,162,150.
Community Development Investment Programs
The Parnassus Funds may each invest up to 2% of their assets in community investments and community-development loan funds. Each of the Funds may invest in obligations issued by community loan funds at below-market interest rates if the projects financed have a positive social impact. Generally, there is no secondary market on loan funds and thus these are considered illiquid.
As part of our community development investment program, the Parnassus Fund, Parnassus Core Equity Fund and Parnassus Endeavor Fund has entered into an agreement for fund investments through the Certificate of Deposit Account Registry Service (“CDARS”) network. The CDARS network allows members to place funds in time deposits with depository institutions whose accounts are insured by the Federal Deposit Insurance Corporation (“FDIC”). Provisions stipulate that participating institutions are FDIC insured; however, in the event of default or bankruptcy by any party to the agreement, the proceeds of the investment may be delayed or subject to legal proceedings and are subject to FDIC limits. While certain investments of the Funds may be bank deposits and may be covered by FDIC insurance, the Funds are themselves not covered by FDIC insurance.
The Parnassus Fund, Parnassus Core Equity Fund and Parnassus Fixed Income Fund holds debt instruments issued by MicroVest Plus, LP, a microfinance limited partnership specializing in providing capital to international microfinance institutions (“MFI’s”) that extend credit to developing countries and the entrepreneurial poor. This instrument may be subject to political and foreign currency exchange risk not normally associated with domestic debt instruments. MicroVest Plus, LP’s investment in MFI’s can be affected by, among other factors, commodity prices, inflation, interest rates, taxation, social instability, and other political, economic or diplomatic developments in or affecting the various countries where MFI’s operate.
Use of Estimates
The preparation of financial statements in conformity with GAAP requires management to make estimates and assumptions that affect the reported amounts of assets and liabilities at the date of the financial statements and the reported amount of revenues and expenses during the reporting period. Actual results could differ from those estimates.
48
Table of Contents
| Semiannual Report • 2018 | PARNASSUS FUNDS | |||
Notes to Financial Statements (continued)
Subsequent Events
Management has evaluated the impact of all subsequent events on the Funds through the date the financial statements were issued and has determined that there were no subsequent events requiring adjustment to or additional disclosure in the financial statements.
4. Risk Factors
Investing in the Parnassus Funds may involve certain risks including, but not limited to the following:
Market Conditions
The prices of, and the income generated by, the common stocks and other securities held by the Funds may decline in response to certain events taking place around the world, including those directly involving the companies whose securities are owned by the Funds; conditions affecting the general economy; overall market changes; local, regional or global political, social or economic instability; and currency, interest rate and commodity price fluctuations. Additionally, the values of, and the income generated by, most debt securities held by the Funds may be affected by changing interest rates and by changes in the effective maturities and credit ratings of these debt securities. The Funds’ investment adviser attempts to reduce these risks through diversification of the portfolio and ongoing credit analysis as well as by monitoring economic and legislative developments, but there can be no assurance that it will be successful at doing so. Investments in securities issued by entities based outside the U.S. may also be affected by currency controls; different accounting, auditing, financial reporting, and legal standards and practices; expropriation; changes in tax policy; greater market volatility; different securities market structures and higher transaction costs.
Investing Outside the U.S.
Securities of issuers domiciled outside the U.S., or with significant operations outside the U.S., may lose value because of political, social, economic or market developments or instability in the countries or regions in which the issuer operates. These securities may also lose value due to changes in foreign currency exchange rates against the U.S. dollar and/or currencies of other countries. Securities markets in certain countries may be more volatile and/or less liquid than those in the U.S. Investment outside the U.S. may also be subject to different settlement and accounting practices and different regulatory, legal and reporting standards, and may be more difficult to value, than those in the U.S. The risks of investing outside the U.S. may be heightened in connection with investments in emerging and developing countries.
Contractual Obligations
Under the Trusts’ organizational documents, its officers and Trustees may be indemnified against certain liabilities and expenses arising out of the performance of their duties to the Trusts. Additionally, the Trusts have a variety of indemnification obligations under contracts with its service providers. The Trusts’ maximum exposure under these arrangements is unknown, as this would involve future claims that may be made against the Trusts that have not yet occurred.
5. Taxation and Distributions
Federal Income Taxes
The Trusts intend to comply with the requirements of the Internal Revenue Code applicable to regulated investment companies and to distribute all taxable income to shareholders. Therefore, no federal income tax provision is required. Income distributions and capital-gain distributions are determined in accordance with income tax regulations, which may differ from U.S. Generally Accepted Accounting Principles (“GAAP”).
The Funds follow ASC 740, Income Taxes, relating to uncertainty in income taxes and disclosures. ASC 740 establishes a minimum threshold for income tax benefits to be recognized in the financial statements. These tax benefits must meet a “more likely than not” threshold, which means that based on technical merits, they have a more than 50% likelihood of being sustained upon examination by the tax authority. Tax benefits meeting this threshold are measured as the largest amount of tax benefit that is greater than 50% likely of being realized upon ultimate settlement with the tax authority. As of and during the year ended December 31, 2017, the Funds did not have a liability for any unrecognized tax benefits. The Funds recognize interest and penalties, if any, related to unrecognized tax benefits as income tax expense in the Statement of
49
Table of Contents
| PARNASSUS FUNDS | Semiannual Report • 2018 | |||
Notes to Financial Statements (continued)
Operations. During the year, the Funds did not incur interest or penalties. The Funds are not subject to examination by U.S. federal taxing authorities before 2014 or state taxing authorities before 2013.
Tax Matters and Distributions
At June 30, 2018, the cost of investments in securities and net unrealized appreciation/depreciation for income tax purposes were as follows:
| Parnassus Fund | Parnassus Core Equity Fund | Parnassus Endeavor Fund | Parnassus Mid Cap Fund | Parnassus Fixed Income Fund | ||||||||||||||||
| Cost of investment | $ | 887,778,047 | $ | 12,252,001,414 | $ | 4,386,715,250 | $ | 2,289,122,693 | $ | 214,211,282 | ||||||||||
| Gross unrealized appreciation | $ | 113,730,190 | $ | 3,289,061,983 | $ | 503,696,377 | $ | 408,212,083 | $ | 713,774 | ||||||||||
| Gross unrealized depreciation | $ | 26,122,875 | $ | 125,572,061 | $ | 104,568,934 | $ | 20,540,368 | $ | 6,616,590 | ||||||||||
| Net unrealized appreciation (depreciation) | $ | 87,607,315 | $ | 3,163,489,922 | $ | 399,127,443 | $ | 387,671,715 | $ | (5,902,816 | ) | |||||||||
Late year capital losses as of December 31, 2017, which are deferred until 2018 for income tax purposes were as follows:
| Fund | Capital | |||
| Parnassus Core Equity Fund | $ | 2,490,195 | ||
| Parnassus Mid Cap Fund | 19,048,330 | |||
Net realized gains differ for financial statement and income tax purposes primarily due to differing treatments of wash sales. Reclassifications as shown in the following table have been made in each Fund’s capital accounts to report these balances on a tax basis, excluding certain temporary differences, as of December 31, 2017. Additional permanent book to tax adjustments may be required in subsequent reporting periods. These reclassifications, which have no impact on the net asset value of the Funds, are primarily attributable to the reclassification of dividend income and certain differences in the computation of distributable income and capital gains under Federal tax rules versus GAAP.
6. Fair Value Measurements
The following table summarizes the portfolios’ financial assets as of June 30, 2018, that is valued at fair value on a recurring basis:
| Parnassus Fund | ||||||||||||||||
| Investment Securities | Level 1 | Level 2 | Level 3 | Total | ||||||||||||
| Equities: | ||||||||||||||||
Consumer Discretionary | $ | 75,696,278 | $ | - | $ | - | $ | 75,696,278 | ||||||||
Consumer Staples | 38,355,500 | - | - | 38,355,500 | ||||||||||||
Financials | 161,869,936 | - | - | 161,869,936 | ||||||||||||
Health Care | 178,535,867 | - | - | 178,535,867 | ||||||||||||
Industrials | 144,693,398 | - | - | 144,693,398 | ||||||||||||
Information Technology | 231,778,922 | - | - | 231,778,922 | ||||||||||||
Materials | 69,775,061 | - | - | 69,775,061 | ||||||||||||
Real Estate | 31,760,400 | - | - | 31,760,400 | ||||||||||||
Telecommunication Services | 42,920,000 | - | - | 42,920,000 | ||||||||||||
| Short-Term Investments | 52,349,592 | - | 2,192,696 | 54,542,288 | ||||||||||||
| Total | $ | 1,027,734,954 | $ | - | $ | 2,192,696 | $ | 1,029,927,650 | ||||||||
50
Table of Contents
| Semiannual Report • 2018 | PARNASSUS FUNDS | |||
Notes to Financial Statements (continued)
| Parnassus Core Equity Fund | ||||||||||||||||
| Investment Securities | Level 1 | Level 2 | Level 3 | Total | ||||||||||||
| Equities: | ||||||||||||||||
Consumer Discretionary | $ | 1,583,381,865 | $ | - | $ | - | $ | 1,583,381,865 | ||||||||
Consumer Staples | 1,356,982,072 | - | - | 1,356,982,072 | ||||||||||||
Energy | 337,820,001 | - | - | 337,820,001 | ||||||||||||
Financials | 1,291,458,165 | - | - | 1,291,458,165 | ||||||||||||
Health Care | 3,017,389,612 | - | - | 3,017,389,612 | ||||||||||||
Industrials | 2,380,078,068 | - | - | 2,380,078,068 | ||||||||||||
Information Technology | 2,983,106,173 | - | - | 2,983,106,173 | ||||||||||||
Materials | 1,104,137,289 | - | - | 1,104,137,289 | ||||||||||||
Real Estate | 666,227,800 | - | - | 666,227,800 | ||||||||||||
Utilities | 694,910,291 | - | - | 694,910,291 | ||||||||||||
| Short-Term Investments | 175,730,065 | - | 10,558,741 | 186,288,806 | ||||||||||||
| Total | $ | 15,591,221,401 | $ | - | $ | 10,558,741 | $ | 15,601,780,142 | ||||||||
| Parnassus Endeavor Fund | ||||||||||||||||
| Investment Securities | Level 1 | Level 2 | Level 3 | Total | ||||||||||||
| Equities: | ||||||||||||||||
Consumer Discretionary | $ | 769,978,000 | $ | - | $ | - | $ | 769,978,000 | ||||||||
Consumer Staples | 60,604,200 | - | - | 60,604,200 | ||||||||||||
Financials | 525,502,800 | - | - | 525,502,800 | ||||||||||||
Health Care | 1,515,359,700 | - | - | 1,515,359,700 | ||||||||||||
Industrials | 387,451,700 | - | - | 387,451,700 | ||||||||||||
Information Technology | 1,526,946,293 | - | - | 1,526,946,293 | ||||||||||||
| Short-Term Investments | 565,362,298 | - | 920,976 | 566,283,274 | ||||||||||||
| Total | $ | 5,351,204,991 | $ | - | $ | 920,976 | $ | 5,352,125,967 | ||||||||
| Parnassus Mid Cap Fund | ||||||||||||||||
| Investment Securities | Level 1 | Level 2 | Level 3 | Total | ||||||||||||
| Equities: | ||||||||||||||||
Consumer Discretionary | 283,611,121 | $ | - | $ | - | $ | 283,611,121 | |||||||||
Consumer Staples | 250,709,022 | - | - | 250,709,022 | ||||||||||||
Energy | 82,302,111 | - | - | 82,302,111 | ||||||||||||
Financials | 322,173,138 | - | - | 322,173,138 | ||||||||||||
Health Care | 247,823,218 | - | - | 247,823,218 | ||||||||||||
Industrials | 440,319,117 | - | - | 440,319,117 | ||||||||||||
Information Technology | 446,374,423 | - | - | 446,374,423 | ||||||||||||
Materials | 229,091,913 | - | - | 229,091,913 | ||||||||||||
Real Estate | 164,152,668 | - | - | 164,152,668 | ||||||||||||
Utilities | 210,237,677 | - | - | 210,237,677 | ||||||||||||
| Short-Term Investments | 225,366,600 | - | 727,206 | 226,093,806 | ||||||||||||
| Total | $ | 2,902,161,008 | $ | - | $ | 727,206 | $ | 2,902,888,214 | ||||||||
51
Table of Contents
| PARNASSUS FUNDS | Semiannual Report • 2018 | |||
Notes to Financial Statements (continued)
| Parnassus Fixed Income Fund | ||||||||||||||||
| Investment Securities | Level 1 | Level 2 | Level 3 | Total | ||||||||||||
Preferred Stocks | $ | 8,170,506 | $ | - | $ | - | $ | 8,170,506 | ||||||||
Commercial Mortgage-Backed Securities | - | 2,176,826 | - | 2,176,826 | ||||||||||||
Corporate Bonds | - | 147,215,691 | - | 147,215,691 | ||||||||||||
Federal Agency Mortgage-Backed Securities | - | 18,384,287 | - | 18,384,287 | ||||||||||||
U.S. Government Treasury Bonds | - | 32,361,156 | - | 32,361,156 | ||||||||||||
| Short-Term Investments | 10,791,321 | - | 1,473,617 | 12,264,938 | ||||||||||||
| Total | $ | 18,961,827 | $ | 200,137,960 | $ | 1,473,617 | $ | 220,573,404 | ||||||||
The following table reconciles the valuation of the Funds’ Level 3 investment securities and related transactions as of June 30, 2018:
| Parnassus Fund | Parnassus Core Equity Fund | Parnassus Endeavor Fund | Parnassus Mid Cap Fund | Parnassus Fixed Income Fund | ||||||||||||||||
| Certificates of Deposit | Certificates of Deposit | Certificates of Deposit | ||||||||||||||||||
| Community Development Loans | Community Development Loans | Community Development Loans | Certificates of Deposit | Community Development Loans | ||||||||||||||||
| Balance as of December 31, 2017 | $ | 2,435,636 | $ | 10,816,440 | $ | 942,210 | $ | 990,193 | $ | 1,428,987 | ||||||||||
| Discounts/premiums amortization | 7,060 | (257,699 | ) | (21,234 | ) | (12,987 | ) | 44,630 | ||||||||||||
| Purchases | 900,000 | 10,000,000 | 950,000 | 750,000 | - | |||||||||||||||
| Sales | (1,150,000 | ) | (10,000,000 | ) | (950,000 | ) | (1,000,000 | ) | - | |||||||||||
| Balance as of June 30, 2018 | $ | 2,192,696 | $ | 10,558,741 | $ | 920,976 | $ | 727,206 | $ | 1,473,617 | ||||||||||
There were no significant transfers between Level 1, Level 2 and Level 3.
Quantitative information about Level 3 fair value measurement:
| Fair Value at June 30, 2018 | Valuation Technique | Unobservable Input | Range (Weighted Average) | |||||||
| Parnassus Fund | ||||||||||
| Certificates of Deposit | $ | 730,438 | Liquidity Discount | Discount for Lack of Marketability | 4% | |||||
| Community Development Loans | $ | 1,462,258 | Liquidity Discount | Discount for Lack of Marketability and Probability of Default | 6% | |||||
| Parnassus Core Equity Fund | ||||||||||
| Certificates of Deposit | $ | 2,438,220 | Liquidity Discount | Discount for Lack of Marketability | 4% | |||||
| Community Development Loans | $ | 8,120,521 | Liquidity Discount | Discount for Lack of Marketability and Probability of Default | 6% | |||||
52
Table of Contents
| Semiannual Report • 2018 | PARNASSUS FUNDS | |||
Notes to Financial Statements (continued)
| Fair Value at June 30, 2018 | Valuation Technique | Unobservable Input | Range (Weighted Average) | |||||||
| Parnassus Endeavor Fund | ||||||||||
| Certificates of Deposit | $ | 729,918 | Liquidity Discount | Discount for Lack of Marketability | 4% | |||||
| Community Development Loans | $ | 191,058 | Liquidity Discount | Discount for Lack of Marketability and Probability of Default | 6% | |||||
| Parnassus Mid Cap Fund | ||||||||||
| Certificates of Deposit | $ | 727,206 | Liquidity Discount | Discount for Lack of Marketability | 4% | |||||
| Parnassus Fixed Income Fund | ||||||||||
| Community Development Loans | $ | 1,473,617 | Liquidity Discount | Discount for Lack of Marketability and Probability of Default | 6% | |||||
The significant unobservable inputs used in fair value measurement of the Fund’s Certificates of Deposits are a discount for lack of marketability. The significant unobservable inputs used in the fair value measurement of the Fund’s Community Development Loans are a discount for lack of marketability and a discount for the probability of default. Significant increases in any of these inputs in isolation would result in a lower fair value measurement. Generally, a change in the assumption used for probability of default should be accompanied by a directionally-similar change in the assumption used for the lack of marketability.
In accordance with procedures established by the Funds’ Trustees, all fair value securities as submitted by the Funds’ treasurer, are reviewed and approved by the Trustees. The Funds’ valuation committee is comprised of Independent Trustees who also comprise the Funds’ audit committee. The committee reviews the methodologies used by the Funds when securities have been identified as being fair valued and include the percentages used when determining liquidity discounts or discounts to be taken for lack of marketability. The Trustees review the changes in fair value measurement and methods used to substantiate the unobservable inputs on a quarterly basis.
7. Capital Stock
Capital stock consists of an unlimited number of authorized shares of capital stock with no par value.
8. Purchases and Sales of Securities
Purchases and proceeds from sales of securities, excluding short-term securities, for the six-month period ended June 30, 2018 were as follows:
| Fund | Affiliated Purchases | Unaffiliated Purchases | Affiliated Sales | Unaffiliated Sales | ||||||||||||
| Parnassus Fund | $ | - | $ | 281,170,903 | $ | - | $ | 326,857,007 | ||||||||
| Parnassus Core Equity Fund | 2,851,659 | 3,054,165,043 | - | 3,712,157,374 | ||||||||||||
| Parnassus Endeavor Fund | 47,141,478 | 1,396,868,515 | 3,095,014 | 1,397,365,049 | ||||||||||||
| Parnassus Mid Cap Fund | - | 426,022,145 | - | 403,385,562 | ||||||||||||
| Parnassus Fixed Income Fund | - | 65,467,679 | - | 57,396,034 | ||||||||||||
The above includes purchases and sales of U.S. Government securities in the amount of $19,707,461 and $24,214,609, respectively, within the Parnassus Fixed Income Fund.
53
Table of Contents
| PARNASSUS FUNDS | Semiannual Report • 2018 | |||
Notes to Financial Statements (continued)
9. Investment Advisory Agreement and Transactions with Affiliates
Under terms of an agreement which provides for furnishing investment management and advice to the Funds, Parnassus Investments is entitled to receive fees payable monthly, based on each Fund’s average daily net assets for the month, at the following annual rates:
Parnassus Fund: 0.70% of the first $100,000,000, 0.65% of the next $100,000,000 and 0.60% of the amount above $200,000,000. Parnassus Endeavor Fund: 0.85% of the first $100,000,000, 0.80% of the next $100,000,000, 0.75% of the next $300,000,000 and 0.65% of the amount above $500,000,000. Parnassus Mid Cap Fund: 0.85% of the first $100,000,000, 0.80% of the next $100,000,000, 0.75% of the next $300,000,000 and 0.70% of the amount above $500,000,000. For the six-month period ended June 30, 2018, Parnassus Investments has contractually agreed to limit total operating expenses to 0.99% of net assets for the Parnassus Mid Cap Fund – Investor Shares and to 0.85% of net assets for the Parnassus Mid Cap Fund – Institutional Shares.
Parnassus Core Equity Fund: 0.75% of the first $30,000,000, 0.70% of the next $70,000,000, 0.65% of the next $400,000,000, 0.60% of the next $9,500,000,000 and 0.55% of the amount above $10,000,000,000. Parnassus Fixed Income Fund: 0.50% of the first $200,000,000, 0.45% of the next $200,000,000 and 0.40% of the amount above $400,000,000. For the six-month period ended June 30, 2018, Parnassus Investments has contractually agreed to limit total operating expenses to 0.87% of net assets for the Parnassus Core Equity Fund – Investor Shares and to 0.78% of net assets for the Parnassus Core Equity Fund – Institutional Shares and 0.68% of net assets for the Parnassus Fixed Income Fund – Investor Shares and to 0.58% of net assets for the Parnassus Fixed Income Fund – Institutional Shares.
Parnassus Investments receives fees under terms of a separate agreement which provides for furnishing transfer agent and fund administration services to the Funds. The transfer agent fee was $2.50 per month per account plus any out-of-pocket expenses for the Parnassus Fund, Parnassus Endeavor Fund and Parnassus Mid Cap Fund. The transfer agent fee was $2.70 per month per account plus any out-of-pocket expenses for the Parnassus Core Equity Fund and Parnassus Fixed Income Fund. The Funds pay the monthly fee based on the number of accounts on record at each month-end. The fund administration reflects annual rates based on net assets for all Funds managed by Parnassus Investments and was allocated based on respective Fund net assets. The fund administration services fee was 0.02% of average net assets under this new agreement for the six-month period ended June 30, 2018.
Parnassus Investments may also arrange for third parties to provide certain services, including account maintenance, recordkeeping and other personal services to their clients who invest in the Funds. For these services, the Parnassus Funds – Investor Shares may pay service providers an aggregate service fee on investment accounts at a rate not to exceed 0.25% per annum of average daily net assets. The Parnassus Funds – Institutional Shares do not incur service provider fees.
10. Investments in affiliates
The 1940 Act defines “affiliated companies” to include investments in portfolio companies in which a Fund owns 5% or more of the outstanding voting shares. During the six-month period ended June 30, 2018, the Funds below held 5% or more of the outstanding voting shares of the noted portfolio companies. During this period, other Funds in the Trust may also have held voting shares of the issuers at a level below 5%.
54
Table of Contents
| Semiannual Report • 2018 | PARNASSUS FUNDS | |||
Notes to Financial Statements (continued)
A summary of transactions in securities of issuers affiliated with a Fund for the six-month period ended June 30, 2018 is set forth below.
| Beginning shares as of January 1, 2018 | Shares purchased | Shares sold | Ending shares as of June 30, 2018 | Market Value of affiliates | Net realized loss | Net unrealized appreciation (depreciation) | Dividend Income | |||||||||||||||||||||||||
| Parnassus Core Equity Fund | ||||||||||||||||||||||||||||||||
| Name of Company: | ||||||||||||||||||||||||||||||||
| MDU Resources Group Inc. | 11,324,166 | 103,117 | - | 11,427,283 | $ | 327,734,476 | $ | - | $ | 75,334,185 | $ | 4,493,411 | ||||||||||||||||||||
| WD-40 Co. | 1,220,000 | - | - | 1,220,000 | 178,425,000 | - | 139,848,327 | 1,317,600 | ||||||||||||||||||||||||
Total Affiliates | $ | 506,159,476 | $ | - | $ | 215,182,512 | $ | 5,811,011 | ||||||||||||||||||||||||
| Parnassus Endeavor Fund | ||||||||||||||||||||||||||||||||
| Name of Company: | ||||||||||||||||||||||||||||||||
| Mattel Inc. | 16,450,000 | 3,289,381 | 239,381 | 19,500,000 | $ | 320,190,000 | $ | (2,270,400 | ) | $ | (8,372,603 | ) | $ | - | ||||||||||||||||||
Total Affiliates | $ | 320,190,000 | $ | (2,270,400 | ) | $ | (8,372,603 | ) | $ | - | ||||||||||||||||||||||
55
Table of Contents
| PARNASSUS FUNDS | Semiannual Report • 2018 | |||
Selected data for each share of capital stock outstanding, total return and ratios/supplement data for the six-month period ended June 30, 2018 and each of the five years ended December 31 are as follows:
| For a Share Outstanding for the Period Ended | Net Asset Value Beginning of Year | Net Investment Income(a) | Net Realized and Unrealized Gain (Loss) on Securities(a) | Total from Investment Operations(a) | Dividends from Net Investment Income | Distributions from Net Realized Gains on Securities | Distributions from Return of Capital | Total Dividends and Distributions | ||||||||||||||||||||||||
| Parnassus Fund – Investor Shares | ||||||||||||||||||||||||||||||||
Six-Month Period Ended June 30, 2018 (unaudited) | $48.27 | $0.30 | $(1.47 | ) | $(1.17 | ) | $- | $- | $- | $- | ||||||||||||||||||||||
2017 | 44.97 | 0.46 | 6.68 | 7.14 | (0.45 | ) | (3.39 | ) | - | (3.84 | ) | |||||||||||||||||||||
2016 | 40.46 | 0.37 | 5.06 | 5.43 | (0.36 | ) | (0.56 | ) | - | (0.92 | ) | |||||||||||||||||||||
2015 | 48.09 | 0.32 | (0.01 | ) | 0.31 | (1.78 | ) | (6.16 | ) | - | (7.94 | ) | ||||||||||||||||||||
2014 | 45.86 | 0.22 | 6.47 | 6.69 | (1.62 | ) | (2.84 | ) | - | (4.46 | ) | |||||||||||||||||||||
2013 | 40.62 | 0.25 | 13.34 | 13.59 | (1.94 | ) | (6.41 | ) | - | (8.35 | ) | |||||||||||||||||||||
| Parnassus Fund – Institutional Shares | ||||||||||||||||||||||||||||||||
Six-Month Period Ended June 30, 2018 (unaudited) | 48.25 | 0.34 | (1.47 | ) | (1.13 | ) | - | - | - | - | ||||||||||||||||||||||
2017 | 44.95 | 0.54 | 6.67 | 7.21 | (0.52 | ) | (3.39 | ) | - | (3.91 | ) | |||||||||||||||||||||
2016 | 40.45 | 0.43 | 5.06 | 5.49 | (0.43 | ) | (0.56 | ) | - | (0.99 | ) | |||||||||||||||||||||
For the period ended December 31, 2015(d) | 49.44 | 0.28 | (1.27 | ) | (0.99 | ) | (1.84 | ) | (6.16 | ) | - | (8.00 | ) | |||||||||||||||||||
| Parnassus Core Equity Fund – Investor Shares | ||||||||||||||||||||||||||||||||
Six-Month Period Ended June 30, 2018 (unaudited) | 42.67 | 0.25 | 0.76 | 1.01 | (0.25 | ) | - | - | (0.25 | ) | ||||||||||||||||||||||
2017 | 39.29 | 0.45 | 5.98 | 6.43 | (0.55 | ) | (2.50 | ) | - | (3.05 | ) | |||||||||||||||||||||
2016 | 36.97 | 0.39 | 3.42 | 3.81 | (0.40 | ) | (1.09 | ) | - | (1.49 | ) | |||||||||||||||||||||
2015 | 40.69 | 0.40 | (0.56 | ) | (0.16 | ) | (0.80 | ) | (2.76 | ) | - | (3.56 | ) | |||||||||||||||||||
2014 | 36.68 | 0.43 | 4.84 | 5.27 | (0.59 | ) | (0.67 | ) | - | (1.26 | ) | |||||||||||||||||||||
2013 | 29.20 | 0.44 | 9.39 | 9.83 | (0.48 | ) | (1.87 | ) | - | (2.35 | ) | |||||||||||||||||||||
| Parnassus Core Equity Fund – Institutional Shares | ||||||||||||||||||||||||||||||||
Six-Month Period Ended June 30, 2018 (unaudited) | 42.73 | 0.30 | 0.76 | 1.06 | (0.29 | ) | - | - | (0.29 | ) | ||||||||||||||||||||||
2017 | 39.35 | 0.55 | 5.98 | 6.53 | (0.65 | ) | (2.50 | ) | - | (3.15 | ) | |||||||||||||||||||||
2016 | 37.03 | 0.48 | 3.41 | 3.89 | (0.48 | ) | (1.09 | ) | - | (1.57 | ) | |||||||||||||||||||||
2015 | 40.75 | 0.50 | (0.58 | ) | (0.08 | ) | (0.89 | ) | (2.75 | ) | - | (3.64 | ) | |||||||||||||||||||
2014 | 36.73 | 0.45 | 4.91 | 5.36 | (0.67 | ) | (0.67 | ) | - | (1.34 | ) | |||||||||||||||||||||
2013 | 29.26 | 0.49 | 9.39 | 9.88 | (0.54 | ) | (1.87 | ) | - | (2.41 | ) | |||||||||||||||||||||
| Parnassus Endeavor Fund – Investor Shares | ||||||||||||||||||||||||||||||||
Six-Month Period Ended June 30, 2018 (unaudited) | 37.18 | 0.22 | (0.55 | ) | (0.33 | ) | - | - | - | - | ||||||||||||||||||||||
2017 | 32.99 | 0.34 | 6.20 | 6.54 | (0.77 | ) | (1.58 | ) | - | (2.35 | ) | |||||||||||||||||||||
2016 | 28.07 | 0.19 | 5.80 | 5.99 | (0.32 | ) | (0.75 | ) | - | (1.07 | ) | |||||||||||||||||||||
2015 | 29.95 | 0.17 | 0.83 | 1.00 | (0.87 | ) | (2.01 | ) | - | (2.88 | ) | |||||||||||||||||||||
2014 | 26.99 | 0.18 | 4.79 | 4.97 | (0.51 | ) | (1.50 | ) | - | (2.01 | ) | |||||||||||||||||||||
2013 | 22.17 | 0.14 | 6.71 | 6.85 | (0.50 | ) | (1.53 | ) | - | (2.03 | ) | |||||||||||||||||||||
56
Table of Contents
| Semiannual Report • 2018 | PARNASSUS FUNDS | |||
| Net Asset Value End of Period | Total Overall Return | Net Assets End of Period (000s) | Ratio of Gross Expenses to Average Net Assets | Ratio of Net Expenses to Average Net Assets (Net of Waiver and Expense Offset Arrangements)(b,c) | Ratio of Net Investment Income to Average Net Assets | Portfolio Turnover Rate | ||||||||||||||||||||
| $47.10 |
| (2.42 | )% | $816,359 | 0.84 | % | 0.84 | % | 1.25 | % | 27.57 | % | |||||||||||||
| 48.27 | 16.08 | 923,262 | 0.84 | 0.84 | 0.96 | 37.45 | ||||||||||||||||||||
| 44.97 | 13.46 | 775,818 | 0.86 | 0.86 | 0.90 | 41.70 | ||||||||||||||||||||
| 40.46 | 0.26 | 708,944 | 0.84 | 0.84 | 0.64 | 68.52 | ||||||||||||||||||||
| 48.09 | 14.68 | 679,130 | 0.84 | 0.84 | 0.47 | 60.44 | ||||||||||||||||||||
| 45.86 | 34.22 | 572,301 | 0.86 | 0.86 | 0.54 | 64.87 | ||||||||||||||||||||
| 47.12 |
| (2.34 | ) | 175,196 | 0.69 | 0.69 | 1.41 | 27.57 | |||||||||||||||||
| 48.25 | 16.25 | 162,414 | 0.69 | 0.69 | 1.11 | 37.45 | ||||||||||||||||||||
| 44.95 | 13.59 | 78,313 | 0.71 | 0.71 | 1.04 | 41.70 | ||||||||||||||||||||
| 40.45 |
| (2.37 | )(e) | 45,941 | 0.70 | (f) | 0.70 | (f) | 0.90 | (f) | 42.95 | (e) | |||||||||||||
| 43.43 |
| 2.37 | 9,046,917 | 0.86 | 0.86 | 1.16 | 19.75 | ||||||||||||||||||
| 42.67 | 16.58 | 9,870,059 | 0.87 | 0.87 | 1.09 | 24.52 | ||||||||||||||||||||
| 39.29 | 10.41 | 10,200,768 | 0.87 | 0.87 | 1.03 | 22.89 | ||||||||||||||||||||
| 36.97 | (0.55 | ) | 8,368,394 | 0.88 | 0.88 | 1.03 | 26.90 | |||||||||||||||||||
| 40.69 | 14.48 | 8,558,905 | 0.87 | 0.87 | 1.11 | 14.32 | ||||||||||||||||||||
| 36.68 | 34.01 | 6,282,235 | 0.87 | 0.87 | 1.28 | 16.93 | ||||||||||||||||||||
| 43.50 |
| 2.50 | 6,553,414 | 0.64 | 0.64 | 1.38 | 19.75 | ||||||||||||||||||
| 42.73 | 16.81 | 6,245,179 | 0.64 | 0.64 | 1.31 | 24.52 | ||||||||||||||||||||
| 39.35 | 10.61 | 4,597,160 | 0.66 | 0.66 | 1.25 | 22.89 | ||||||||||||||||||||
| 37.03 | (0.34 | ) | 3,554,007 | 0.67 | 0.67 | 1.25 | 26.90 | |||||||||||||||||||
| 40.75 | 14.71 | 3,024,069 | 0.67 | 0.67 | 1.17 | 14.32 | ||||||||||||||||||||
| 36.73 | 34.13 | 1,809,054 | 0.69 | 0.69 | 1.44 | 16.93 | ||||||||||||||||||||
| 36.85 |
| (0.89 | ) | 3,769,945 | 0.94 | 0.94 | 1.21 | 27.95 | |||||||||||||||||
| 37.18 | 19.81 | 4,185,857 | 0.92 | 0.92 | 0.94 | 43.21 | ||||||||||||||||||||
| 32.99 | 21.42 | 2,507,515 | 0.97 | 0.95 | 0.64 | 34.08 | ||||||||||||||||||||
| 28.07 | 3.25 | 1,325,765 | 0.98 | 0.95 | 0.56 | 63.23 | ||||||||||||||||||||
| 29.95 | 18.51 | 770,332 | 1.02 | 0.95 | 0.62 | 39.51 | ||||||||||||||||||||
| 26.99 | 31.15 | 475,940 | 1.07 | 1.07 | 0.53 | 41.20 | ||||||||||||||||||||
57
Table of Contents
| PARNASSUS FUNDS | Semiannual Report • 2018 | |||
Financial Highlights (continued)
| For a Share Outstanding for the Period Ended | Net Asset Value Beginning of Year | Net Investment Income(a) | Net Realized and Unrealized Gain (Loss) on Securities(a) | Total from Investment Operations(a) | Dividends from Net Investment Income | Distributions from Net Realized Gains on Securities | Distributions from Return of Capital | Total Dividends and Distributions | ||||||||||||||||||||||||
| Parnassus Endeavor Fund – Institutional Shares | ||||||||||||||||||||||||||||||||
Six-Month Period Ended June 30, 2018 (unaudited) | $37.21 | $0.27 | $(0.56 | ) | $(0.29 | ) | $- | $- | $- | $- | ||||||||||||||||||||||
2017 | 33.01 | 0.41 | 6.21 | 6.62 | (0.84 | ) | (1.58 | ) | - | (2.42 | ) | |||||||||||||||||||||
2016 | 28.06 | 0.24 | 5.83 | 6.07 | (0.37 | ) | (0.75 | ) | - | (1.12 | ) | |||||||||||||||||||||
For the period ended December 31, 2015(d) | 31.03 | 0.16 | (0.20 | ) | (0.04 | ) | (0.92 | ) | (2.01 | ) | - | (2.93 | ) | |||||||||||||||||||
| Parnassus Mid Cap Fund – Investor Shares | ||||||||||||||||||||||||||||||||
Six-Month Period Ended June 30, 2018 (unaudited) | 32.07 | 0.12 | 0.37 | 0.49 | - | - | - | - | ||||||||||||||||||||||||
2017 | 28.87 | 0.26 | 4.29 | 4.55 | (0.48 | ) | (0.87 | ) | - | (1.35 | ) | |||||||||||||||||||||
2016 | 25.56 | 0.21 | 3.90 | 4.11 | (0.11 | ) | (0.69 | ) | - | (0.80 | ) | |||||||||||||||||||||
2015 | 27.40 | 0.21 | (0.41 | ) | (0.20 | ) | (0.18 | ) | (1.46 | ) | - | (1.64 | ) | |||||||||||||||||||
2014 | 25.10 | 0.22 | 2.60 | 2.82 | (0.20 | ) | (0.32 | ) | - | (0.52 | ) | |||||||||||||||||||||
2013 | 20.27 | 0.13 | 5.58 | 5.71 | (0.26 | ) | (0.62 | ) | - | (0.88 | ) | |||||||||||||||||||||
| Parnassus Mid Cap Fund – Institutional Shares | ||||||||||||||||||||||||||||||||
Six-Month Period Ended June 30, 2018 (unaudited) | 32.11 | 0.16 | 0.37 | 0.53 | - | - | - | - | ||||||||||||||||||||||||
2017 | 28.90 | 0.34 | 4.29 | 4.63 | (0.55 | ) | (0.87 | ) | - | (1.42 | ) | |||||||||||||||||||||
2016 | 25.57 | 0.27 | 3.89 | 4.16 | (0.14 | ) | (0.69 | ) | - | (0.83 | ) | |||||||||||||||||||||
For the period ended December 31, 2015(d) | 27.58 | 0.20 | (0.52 | ) | (0.32 | ) | (0.23 | ) | (1.46 | ) | - | (1.69 | ) | |||||||||||||||||||
| Parnassus Fixed Income Fund – Investor Shares | ||||||||||||||||||||||||||||||||
Six-Month Period Ended June 30, 2018 (unaudited) | 16.54 | 0.20 | (0.54 | ) | (0.34 | ) | (0.20 | ) | - | - | (0.20 | ) | ||||||||||||||||||||
2017 | 16.42 | 0.37 | 0.14 | 0.51 | (0.39 | ) | - | - | (0.39 | ) | ||||||||||||||||||||||
2016 | 16.44 | 0.34 | 0.06 | 0.40 | (0.36 | ) | (0.06 | ) | - | (0.42 | ) | |||||||||||||||||||||
2015 | 16.66 | 0.33 | (0.21 | ) | 0.12 | (0.33 | ) | (0.01 | ) | - | (0.34 | ) | ||||||||||||||||||||
2014 | 16.43 | 0.31 | 0.43 | 0.74 | (0.37 | ) | (0.14 | ) | - | (0.51 | ) | |||||||||||||||||||||
2013 | 17.56 | 0.29 | (0.76 | ) | (0.47 | ) | (0.29 | ) | (0.31 | ) | (0.06 | ) | (0.66 | ) | ||||||||||||||||||
58
Table of Contents
| Semiannual Report • 2018 | PARNASSUS FUNDS | |||
| Net Asset Value End of Period | Total Overall Return | Net Assets End of Period (000s) | Ratio of Gross Expenses to Average Net Assets | Ratio of Net Expenses to Average Net Assets (Net of Waiver and Expense Offset Arrangements)(b,c) | Ratio of Net Investment Income to Average Net Assets | Portfolio Turnover Rate | ||||||||||||||||||||
| $36.92 |
| (0.78 | )% | $1,226,016 | 0.73 | % | 0.73 | % | 1.43 | % | 27.95 | % | |||||||||||||
| 37.21 | 20.03 | 1,031,525 | 0.72 | 0.72 | 1.12 | 43.21 | ||||||||||||||||||||
| 33.01 | 21.68 | 295,317 | 0.74 | 0.74 | 0.80 | 34.08 | ||||||||||||||||||||
| 28.06 |
| (0.22 | )(e) | 46,806 | 0.75 | (f) | 0.75 | (f) | 0.80 | (f) | 42.60 | (e) | |||||||||||||
| 32.56 |
| 1.53 | 1,919,256 | 1.01 | 0.99 | 0.78 | 15.49 | ||||||||||||||||||
| 32.07 | 15.79 | 2,021,276 | 1.01 | 0.99 | 0.83 | 33.27 | ||||||||||||||||||||
| 28.87 | 16.07 | 1,490,587 | 1.01 | 0.99 | 0.75 | 18.81 | ||||||||||||||||||||
| 25.56 | (0.87 | ) | 543,251 | 1.07 | 0.99 | 0.77 | 58.01 | |||||||||||||||||||
| 27.40 | 11.24 | 305,297 | 1.09 | 1.09 | 0.84 | 21.62 | ||||||||||||||||||||
| 25.10 | 28.27 | 241,162 | 1.14 | 1.14 | 0.55 | 20.70 | ||||||||||||||||||||
| 32.64 |
| 1.65 | 926,302 | 0.77 | 0.77 | 1.02 | 15.49 | ||||||||||||||||||
| 32.11 | 16.04 | 780,372 | 0.75 | 0.75 | 1.09 | 33.27 | ||||||||||||||||||||
| 28.90 | 16.28 | 285,182 | 0.80 | 0.80 | 0.95 | 18.81 | ||||||||||||||||||||
| 25.57 |
| (1.30 | )(e) | 11,397 | 0.77 | (f) | 0.77 | (f) | 1.12 | (f) | 34.04 | (e) | |||||||||||||
| 16.00 |
| (2.05 | ) | 163,803 | 0.83 | 0.68 | 2.53 | 27.07 | |||||||||||||||||
| 16.54 | 3.10 | 182,161 | 0.82 | 0.68 | 2.25 | 38.48 | ||||||||||||||||||||
| 16.42 | 2.42 | 193,440 | 0.80 | 0.68 | 2.04 | 39.47 | ||||||||||||||||||||
| 16.44 | 0.70 | 182,130 | 0.79 | 0.68 | 1.98 | 35.80 | ||||||||||||||||||||
| 16.66 | 4.49 | 192,614 | 0.78 | 0.68 | 1.84 | 52.57 | ||||||||||||||||||||
| 16.43 | (2.71 | ) | 175,790 | 0.78 | 0.68 | 1.70 | 35.15 | |||||||||||||||||||
59
Table of Contents
| PARNASSUS FUNDS | Semiannual Report • 2018 | |||
Financial Highlights (continued)
| For a Share Outstanding for the Period Ended | Net Asset Value Beginning of Year | Net Investment Income(a) | Net Realized and Unrealized Gain (Loss) on Securities(a) | Total from Investment Operations(a) | Dividends from Net Investment Income | Distributions from Net Realized Gains on Securities | Distributions from Return of Capital | Total Dividends and Distributions | ||||||||||||||||||||||||
| Parnassus Fixed Income Fund – Institutional Shares | ||||||||||||||||||||||||||||||||
Six-Month Period Ended June 30, 2018 (unaudited) | $16.54 | $0.22 | $(0.55 | ) | $(0.33 | ) | $(0.22 | ) | $- | $- | $(0.22 | ) | ||||||||||||||||||||
2017 | 16.41 | 0.41 | 0.14 | 0.55 | (0.42 | ) | - | - | (0.42 | ) | ||||||||||||||||||||||
2016 | 16.44 | 0.38 | 0.04 | 0.42 | (0.39 | ) | (0.06 | ) | - | (0.45 | ) | |||||||||||||||||||||
For the period ended December 31, 2015(d) | 16.75 | 0.24 | (0.30 | ) | (0.06 | ) | (0.24 | ) | (0.01 | ) | - | (0.25 | ) | |||||||||||||||||||
60
Table of Contents
| Semiannual Report • 2018 | PARNASSUS FUNDS | |||
| Net Asset Value End of Period | Total Overall Return | Net Assets End of Period (000s) | Ratio of Gross Expenses to Average Net Assets | Ratio of Net Expenses to Average Net Assets (Net of Waiver and Expense Offset Arrangements)(b,c) | Ratio of Net Investment Income to Average Net Assets | Portfolio Turnover Rate | ||||||||||||||||||||
| $15.99 |
| (2.01 | )% | $53,820 | 0.48 | % | 0.48 | % | 2.76 | % | 27.07 | % | |||||||||||||
| 16.54 | 3.37 | 47,365 | 0.47 | 0.47 | 2.46 | 38.48 | ||||||||||||||||||||
| 16.41 | 2.55 | 20,733 | 0.49 | 0.49 | 2.22 | 39.47 | ||||||||||||||||||||
| 16.44 |
| (0.35 | )(e) | 7,731 | 0.49 | (f) | 0.49 | (f) | 2.14 | (f) | 24.24 | (e) | |||||||||||||
(a) Income (loss) from operations per share is based on average daily shares outstanding.
(b) Parnassus Investments has contractually limited expenses to an annualized rate of 0 .99% for the Parnassus Mid Cap Fund – Investor Shares and 0.68% for the Parnassus Fixed Income Fund – Investor Shares.
(c) Parnassus Investments has contractually limited expenses to an annualized rate of 0.85% for the Parnassus Mid Cap Fund – Institutional Shares and 0.58% for the Parnassus Fixed Income Fund – Institutional Shares.
(d) The Parnassus Fund – Institutional Shares, the Parnassus Endeavor Fund – Institutional Shares, the Parnassus Mid Cap Fund – Institutional Shares and the Parnassus Fixed Income Fund – Institutional Shares commenced operations on April 30, 2015, and the period shown is from April 30, 2015 through December 31, 2015.
(e) Not annualized for periods less than one year.
(f) Annualized.
61
Table of Contents
| PARNASSUS FUNDS | Semiannual Report • 2018 | |||
ADDITIONAL INFORMATION (unaudited)
Board of Trustees Consideration of Investment Advisory Agreements
Section 15(c) of the Investment Company Act of 1940 (the “1940 Act”) requires that the Board of Trustees (the “Trustees”) of the Parnassus Funds trust and the Parnassus Income Funds trust (the “Trusts”) which collectively are known as the Parnassus Funds (the “Funds”), meet in person to review and consider the continuation of any investment advisory agreement. In this regard, the Trustees who are not “interested persons” of the Trusts, as defined in the 1940 Act, (the “Independent Trustees”) met in person on March 22, 2018 and reviewed and re-approved the Trusts’ investment advisory agreements with Parnassus Investments. The Independent Trustees were provided with relevant information by Parnassus Investments, as described below, and were assisted in their evaluation of the investment advisory agreements by independent legal counsel, from whom they received assistance and advice, including a written memorandum, regarding the legal standards applicable to the consideration of advisory arrangements and with whom they met separately from Parnassus Investments’ management. In addition, the Trustees consider matters bearing on the management of the Funds and other arrangements at regular meetings throughout the year, including reviews of investment results and performance data at each regular meeting and periodic presentations from Parnassus Investments. Prior to approving the continuation of the investment advisory agreements, the Independent Trustees considered:
| • | the nature, extent and quality of the services provided by Parnassus Investments; |
| • | the degree to which the Parnassus Fund, the Parnassus Core Equity Fund, the Parnassus Endeavor Fund, the Parnassus Mid Cap Fund and the Parnassus Fixed Income Fund are being managed in accordance with each Fund’s stated investment objective; |
| • | the investment performance of the each of the Funds; |
| • | the cost of the services to be provided and profits to be realized by Parnassus Investments from its relationship with each of the Funds; |
| • | the extent to which economies of scale would be realized as each of the Funds grew and whether fee levels reflect these economies of scale; |
| • | the expense ratio of each of the Funds; and |
| • | the manner in which portfolio transactions for the Funds are conducted, including the use of soft dollars. |
In considering the nature, extent and quality of the services provided by Parnassus Investments, the Independent Trustees reviewed written and oral reports prepared by Parnassus Investments describing the portfolio management, shareholder communication and servicing, prospective shareholder assistance and regulatory compliance services provided by Parnassus Investments to the Funds. The Independent Trustees also considered a written report prepared by Broadridge, an independent provider of investment company data, comparing aspects of the portfolio management services provided by Parnassus Investments to similar services provided to a universe of comparable mutual funds (“Universe”). The Independent Trustees considered the experience of senior management and the qualifications, tenure, background and responsibilities of the portfolio managers primarily responsible for the day-to-day portfolio management of the Funds. The Independent Trustees evaluated the ability of Parnassus Investments, based on its financial condition, resources, reputation and other attributes to attract and retain qualified investment professionals, including research, advisory and supervisory personnel. The Independent Trustees further considered the compliance programs and compliance records of Parnassus Investments. In addition, the Independent Trustees took into account the administrative services provided to the Funds by Parnassus Investments. The Independent Trustees concluded that Parnassus Investments was providing essential services to the Funds.
The Independent Trustees compared the performance of each of the Funds to benchmark indices over various periods of time ending December 31, 2017 and to the Universe of comparable mutual funds as determined by Broadridge. The Independent Trustees noted that the performance for the Parnassus Fund performance was above the median performance of the Universe for the four-, five- and ten-year periods, and was below the median for the one-, two- and three year periods. The performance of the Parnassus Mid Cap Fund was above the median of the Universe for all time periods under review. The performance of the Parnassus Endeavor Fund was above the median for all time period except for the one-year period. The Parnassus Core Income Fund’s performance was above the median of the Universe for the one-, four-, five- and ten-year periods, and was below the median for the two- and three- year periods. The Independent Trustees further noted that the performance of the Parnassus Fixed Income Fund was below the median performance of the Universe for all time periods. The Independent Trustees concluded that the overall performance of the Funds warranted the continuation of the investment advisory agreements.
62
Table of Contents
| Semiannual Report • 2018 | PARNASSUS FUNDS | |||
ADDITIONAL INFORMATION (unaudited) (continued)
Board of Trustees Consideration of Investment Advisory Agreements (continued)
In concluding that the advisory fees payable by each of the Funds were reasonable, the Independent Trustees reviewed a report of the costs of services provided, and the profits realized, by Parnassus Investments from its relationship with each Fund, and concluded that such profits were reasonable and not excessive when compared to profitability guidelines set forth in relevant court cases. The Independent Trustees also reviewed reports comparing each Fund’s expense ratio and the advisory fees paid by each Fund to that of the applicable Universe and concluded that the advisory fee paid by each Fund and each Fund’s expense ratio was within the range of its respective Universe. The Independent Trustees noted that the Funds’ advisory fees were below the median for each Fund’s respective Universe except for the Parnassus Fixed Income Fund. The Independent Trustees noted that the investment advisory fee for each Fund contained a number of breakpoints in an effort to reflect economies of scale that might be realized as each Fund grew. The Independent Trustees also noted that actual or potential economies of scale will be reasonably shared with the Fund shareholders through these breakpoints, fee waivers and expense reimbursement arrangements applicable to the Funds.
The Independent Trustees reviewed reports discussing the manner in which portfolio transactions for the Funds were conducted, including the use of soft dollars. Based on these reports, the Independent Trustees concluded that the research obtained by Parnassus Investments was beneficial to the Funds and that Parnassus Investments was executing each Fund’s portfolio transactions in a manner designed to obtain best execution for the Funds.
Based on their careful consideration of the information and factors described above, the Independent Trustees concluded that the approval of the continuation of the investment advisory agreements for the Trusts was in the best interest of the Funds and their shareholders. The Independent Trustees unanimously approved the continuation of the investment advisory agreements for an additional one-year period.
63
Table of Contents
| PARNASSUS FUNDS | Semiannual Report • 2018 | |||
ADDITIONAL INFORMATION (unaudited) (continued)
Proxy Disclosures
Parnassus proxy voting policies and procedures are available, without charge, on our website (www.parnassus.com), on the Securities and Exchange Commission’s website (www.sec.gov) and by calling us at (800) 999-3505. The Funds file a proxy voting record with the Securities and Exchange Commission for the 12 months ended June 30. The most recent report is available by calling Parnassus or it may be obtained from the Securities and Exchange Commission’s website or the Parnassus website.
Quarterly Portfolio Schedule
The Funds file their complete schedule of portfolio holdings with the Securities and Exchange Commission for the first and third quarters of each fiscal year on Form N-Q. The quarterly portfolio holdings are available on the Securities and Exchange Commission’s website (www.sec.gov). The Funds’ Form N-Q may also be reviewed and copied at the Securities and Exchange Commission’s Public Reference Room in Washington, DC, and information on the operation of the Public Reference Room may be obtained by calling (800) SEC-0330.
64
Table of Contents
| Semiannual Report • 2018 | PARNASSUS FUNDS | |||
THIS PAGE LEFT INTENTIONALLY BLANK
65
Table of Contents
| PARNASSUS FUNDS | Semiannual Report • 2018 | |||
THIS PAGE LEFT INTENTIONALLY BLANK
66
Table of Contents
Go Paperless with E-Delivery
Sign up for electronic delivery of prospectuses, shareholder reports
and account statements at www.parnassus.com/gopaperless
If you do not hold your account directly with Parnassus, please contact
the firm that holds your account to inquire about electronic delivery.
PARNASSUS FUNDS
1 Market Street, Suite 1600
San Francisco, CA 94105
(800) 999-3505
www.parnassus.com
This report must be preceded or accompanied by a current prospectus.
Investment Adviser
Parnassus Investments
1 Market Street, Suite 1600
San Francisco, CA 94105
Legal Counsel
Foley and Lardner LLP
777 E. Wisconsin Ave.
Milwaukee, WI 53202
Independent Registered Public Accounting Firm
Deloitte and Touche LLP
555 Mission Street
San Francisco, CA 94105
Distributor
Parnassus Funds Distributor
1 Market Street, Suite 1600
San Francisco, CA 94105

Table of Contents
Item 2: Code of Ethics
Not applicable for semi-annual reports. The information required by this Item is only required in an annual report on Form N-CSR.
Item 3: Audit Committee Financial Expert
Not applicable for semi-annual reports. The information required by this Item is only required in an annual report on Form N-CSR.
Item 4: Principal Accountant Fees and Services
Not applicable for semi-annual reports. The information required by this Item is only required in an annual report on Form N-CSR.
Item 5: Not applicable.
Item 6: Included as part of the report to shareholders filed under Item 1 of this form.
Item 7: Not applicable.
Item 8: Not applicable.
Item 9: Not applicable.
Item 10: For the purposes of this Item, there have not been any material changes to the procedures by which shareholders may recommend nominees to the registrant’s board of trustees.
Item 11: Controls and Procedures.
(a) The registrant’s certifying officers have reasonably designed such disclosure controls and procedures to ensure material information relating to the registrant is made known to them by others, particularly during the period in which this report is being prepared. The registrant’s certifying officers have determined that the registrant’s disclosure controls and procedures are effective based on their evaluation of these controls and procedures as of a date within 90 days prior to the filing date of this report.
(b) There were no significant changes in the registrant’s internal controls over financial reporting, or in other factors that could significantly affect these controls, that occurred during the registrant’s fiscal half-year, including any corrective actions with regard to significant deficiencies and material weaknesses.
Item 12: Exhibits attached hereto.
(a)(1) Code of Ethics – Not applicable for semi-annual reports.
(a)(2) Certification for each principal executive and principal financial officer of the registrant as required by Rule 30a-2 under the Act (17 CFR 270.30a-2(a)) – Filed as an attachment to this filing.
(b) Certifications required by Rule 30a-2(b) under the Act (17 CFR 270.30a-2(b)), Rule 13a-14(b) or Rule 15d-14(b) under the Exchange Act (17 CFR 240.13a-14(b) or 240.15d-14(b)), and Section 1350 of Chapter 63 of Title 18 of the United States Code (18 U.S.C. 1350). A certification furnished pursuant to this paragraph will not be deemed “filed” for purposes of Section 18 of the Exchange Act (15 U.S.C. 78r), or otherwise subject to the liability of that section. Such certification will not be deemed to be incorporated by reference into any filing under the Securities Act of 1933 or the Exchange Act, except to the extent that the registrant specifically incorporates it by reference – Filed as an attachment to this filing.
Pursuant to the requirements of the Securities Exchange Act of 1934 and the Investment Company Act of 1940, the registrant has duly caused this report to be signed on its behalf by the undersigned, thereunto duly authorized.
Table of Contents
| Date: August 3, 2018 | By: /s/ Benjamin E. Allen | |||
| Benjamin E. Allen | ||||
| President |
Pursuant to the requirements of the Securities Exchange Act of 1934 and the Investment Company Act of 1940, this report has been signed below by the following persons on behalf of the registrant and in the capacities and on the dates indicated.
| Date: August 3, 2018 | ||||
By: /s/ Benjamin E. Allen | ||||
| Benjamin E. Allen | ||||
| President | ||||
| Date: August 3, 2018 | ||||
By: /s/ Marc C. Mahon | ||||
| Marc C. Mahon | ||||
| Treasurer | ||||