Table of Contents
UNITED STATES
SECURITIES AND EXCHANGE COMMISSION
Washington, D.C. 20549
FORM N-CSRS
CERTIFIED SHAREHOLDER REPORT OF
REGISTERED MANAGEMENT INVESTMENT COMPANIES
Investment Company Act file number: Parnassus Funds (811-04044) and Parnassus Income Funds (811-06673)
Parnassus Funds
Parnassus Income Funds
(Exact name of registrant as specified in charter)
1 Market Street, Suite 1600, San Francisco, California 94105
(Address of principal executive offices) (Zip code)
Marc C. Mahon
Parnassus Funds
Parnassus Income Funds
1 Market Street, Suite 1600, San Francisco, California 94105
(Name and address of agent for service)
Registrant’s telephone number, including area code: (415) 778-0200
Date of fiscal year end: December 31
Date of reporting period: June 30, 2020
Table of Contents
Item 1: Report to Shareholders
Table of Contents

Parnassus Funds Semiannual Report
June 30, 2020
Parnassus Core Equity FundSM
Investor Shares: PRBLX | Institutional Shares: PRILX
Parnassus Mid Cap FundSM
Investor Shares: PARMX | Institutional Shares: PFPMX
Parnassus Endeavor FundSM
Investor Shares: PARWX | Institutional Shares: PFPWX
Parnassus Mid Cap Growth FundSM
Investor Shares: PARNX | Institutional Shares: PFPRX
Parnassus Fixed Income FundSM
Investor Shares: PRFIX | Institutional Shares: PFPLX

Table of Contents
Beginning on January 1, 2021, as permitted by regulations adopted by the SEC, paper copies of the Funds’ shareholder reports will no longer be sent by mail, unless you specifically request paper copies of the reports from the Funds or from your financial intermediary, such as a broker-dealer or bank. Instead, the reports will be made available on the Funds’ website (www.parnassus.com), and you will be notified by mail each time a report is posted and provided with a website link to access the report.
If you already elected to receive shareholder reports electronically, you will not be affected by this change and you need not take any action. You may elect to receive shareholder reports and other communications from the Funds by contacting your financial intermediary (such as a broker-dealer or bank) or, if you are a direct investor, by calling 800-999-3505 or by sending an email request to shareholder@parnassus.com.
You may elect to receive all future reports in paper copies free of charge. If you invest through a financial intermediary, you can contact your financial intermediary to request that you continue to receive paper copies of your shareholder reports. If you invest directly with the Funds, you can call 800-999-3505 or send an email request to shareholder@parnassus.com to let the Funds know you wish to continue receiving paper copies of your shareholder reports. Your election to receive paper copies of reports will apply to all funds held in your account if you invest through your financial intermediary.
This report must be preceded or accompanied by a current fund prospectus.
Mutual fund investing involves risk, including the potential for loss of principal.
There are no assurances the Fund’s investments objectives and ESG strategies will be successful.
Table of Contents
| Letter from Parnassus Investments | 4 | |
| Fund Performance and Commentary | ||
| Parnassus Core Equity Fund | 7 | |
| 11 | ||
| Parnassus Endeavor Fund | 15 | |
| 19 | ||
| Parnassus Fixed Income Fund | 23 | |
| Responsible Investing Notes | 26 | |
| Fund Expenses | 28 | |
| Portfolios of Investments | ||
| Parnassus Core Equity Fund | 29 | |
| Parnassus Mid Cap Fund | 31 | |
| Parnassus Endeavor Fund | 33 | |
| 35 | ||
| Parnassus Fixed Income Fund | 37 | |
| Financial Statements | 42 | |
| Notes to Financial Statements | 48 | |
| Financial Highlights | 58 | |
| Additional Information | 62 | |
3
Table of Contents
 | Semiannual Report • 2020 | |||
August 7, 2020
The first half of 2020 has come to a close, and it’s almost incomprehensible how many unlikely and impactful events have occurred in just six months. The year began with two major political events, either one of which seemed at the time like it could be the story of the first half. The impeachment of Donald Trump dominated the national conversation until his acquittal on February 5. At the same time, we all watched the final stages of an unusually high-stakes Democratic primary battle. By the first week of March, Joe Biden’s decisive wins on Super Tuesday made him the odds-on favorite to win the nomination. But of course, by this time, the last thing on many people’s minds was politics.
In the second week of March, the World Health Organization declared COVID-19 a pandemic. The economic fallout that would inevitably result from the disease had already been anticipated by the stock market. Having made an all-time high in mid-February, the S&P 500 Index eventually gave up a third of its value in just over a month. This was the fastest 30% drop ever for American stocks, even worse than the previous top three declines, all of which happened during the Great Depression. The tragic loss of life caused by the virus, the devastating economic insecurity caused by unprecedented job losses and the evaporation of financial wealth were a staggering combination of blows to our national and individual psyches. As the curtain closed on the first quarter, it seemed impossible for anything else to take center stage.
The enormous and rapid support given to the economy and financial markets by Congress and the Federal Reserve made for a happy plot twist as we began the second quarter. Miraculously, the S&P 500 clawed its way back to positive territory for the year-to-date period on June 8. Like the first quarter decline, this rebound was also record-setting. Meanwhile, the real economy was still reeling and the pandemic raged on. But at least for stock market investors, there was positive momentum.
The murder of George Floyd by a Minneapolis police officer on May 25 changed all of this. By the first week of June, Mr. Floyd’s death had triggered massive and widespread protests across the nation and even overseas. The pain and outrage caused by more than 400 years of brutal and systemic racism in America took hold of our country as never before. For millions of Americans, and certainly for me personally, Mr. Floyd’s death and the movement it sparked brought a new awareness of the horror and profound unfairness caused by systemic racism.
Through all of this — impeachment, primaries, the pandemic, record-setting volatility and economic contraction, protests against racial injustice — we at Parnassus have done our best to focus on what we can control. First and foremost, this means managing your money as well as possible and continuing to provide high-quality service. I’m happy to report that our two largest funds, the Parnassus Core Equity Fund and the Parnassus Mid Cap Fund, outperformed their benchmarks for the first half of the year. Also noteworthy is the Parnassus Fixed Income Fund, which put up our best absolute return and also outpaced its benchmark for the first half. Lead portfolio manager, Samantha Palm, and recently added co-portfolio manager, Minh Bui, are doing a great job managing this fund. Meanwhile, our shareholder services team is ready to take your calls and receive your mail, just as it has been since the shelter-in-place began.
4
Table of Contents
| Semiannual Report • 2020 | | |||
As important as financial returns and service are, they are just part of what we offer. As responsible investors since our founding in 1984, we are keenly focused on the environmental, social and governance (ESG) impacts of our portfolio companies. As I write this letter, our director of ESG research, Iyassu Essayas, is leading a team effort to strengthen our anti-racism activities. We will report more about this in the months to come. You should also know that our team has done a tremendous job engaging with our portfolio companies on their responses to the pandemic, especially as they pertain to worker safety and job security. I think it’s more important than ever to demand environmental and social responsibility from one’s investment managers, and I’m very proud of the work that Iyassu, Rachel Nishimoto and Marissa LaFave have done so far this year leading our ESG efforts.
Interns
We have had interns for over 30 years at Parnassus, but there’s never been a summer like this one. Our research interns are all working remotely, and we’re doing our best to support and get to know them. So far, things are going much better than any of us expected. This is a tribute to our five interns, and our investment team members who are mentoring them.
Michael Beck is our only graduate student intern this year. He is an MBA candidate at the Haas School of Business at the University of California, Berkeley. Previously, Michael worked as a portfolio manager, analyst and trader for Opes Advisors, a Bay Area investment firm. Michael holds the Chartered Financial Analyst (CFA) designation and graduated with a mechanical engineering degree from the University of California, Los Angeles. Michael grew up in Southern California and enjoys basketball, skiing and visiting the beach.
Arda Erbil is also studying business at the Haas School, but as an undergraduate. Previously, Arda interned at TD Ameritrade as an analyst at the Office of the Chairman and was a venture capital intern at Redwood Consumer Group. In his free time, Arda enjoys sailing and volunteering on the Berkeley campus.
Andrew Green is pursuing a business major at the University of Michigan. Andrew is a portfolio manager for the TAMID Group student investment fund and consults for seed stage international startups. Previously, Andrew worked as a summer analyst for Ernst & Young’s mergers and acquisitions (M&A) Advisory group in Tel Aviv, Israel. Andrew grew up in South Florida and enjoys golfing, hiking, grilling and listening to classic rock music.
We have two interns from the University of Southern California (USC). Lena Shapiro is pursuing a degree in real estate development, and is a vice president of AIESEC, which is a global student-led nonprofit that creates cross-cultural volunteer experiences. She previously interned at a commercial and industrial real estate firm, Majestic Realty. When not working, Lena enjoys exploring the outdoors, playing volleyball and knitting.
Vivian Zhu is pursuing a dual degree in business administration and economics at USC. She is one of the student managers for the Undergraduate Investment Fund. Vivian previously worked at Zana Capital, a private equity firm in Singapore. In her free time, she enjoys volunteering and snowboarding.
5
Table of Contents
| Semiannual Report • 2020 | |||
Thank you all for investing with the Parnassus Funds.
Sincerely,

Benjamin E. Allen
President and CEO
6
Table of Contents
| Semiannual Report • 2020 | | |||
Ticker: Investor Shares - PRBLX
Ticker: Institutional Shares - PRILX
As of June��30, 2020, the net asset value (“NAV”) of the Parnassus Core Equity Fund – Investor Shares was $45.87. After taking dividends into account, the total return for the second quarter was a gain of 17.86%. This compares to a total return of 20.54% for the S&P 500 Index (“S&P 500”) and a gain of 15.43% for the Lipper Equity Income Funds Average, which represents the average return of the equity income funds followed by Lipper (“Lipper average”). Year-to-date, the Parnassus Core Equity Fund – Investor Shares posted a loss of 2.06% versus a decline of 3.08% for the S&P 500 and a loss of 12.87% for the Lipper average.
Below is a table that summarizes the performances of the Parnassus Core Equity Fund, the S&P 500 and the Lipper average. The returns are for the one-, three-, five- and ten-year periods. We are pleased to report the Fund outperformed the Lipper average for all periods.
Parnassus Core Equity Fund
| Average Annual Total Returns (%) | ||||||||||||||||||||||||
| for period ended June 30, 2020 | ||||||||||||||||||||||||
| One Year | Three Years | Five Years | Ten Years | Gross Expense Ratio | Net Expense Ratio | |||||||||||||||||||
| Parnassus Core Equity Fund – Investor Shares | 6.48 | 11.69 | 10.60 | 13.41 | 0.86 | 0.86 | ||||||||||||||||||
| Parnassus Core Equity Fund – Institutional Shares | 6.75 | 11.93 | 10.84 | 13.63 | 0.63 | 0.63 | ||||||||||||||||||
| S&P 500 Index | 7.51 | 10.73 | 10.73 | 13.99 | NA | NA | ||||||||||||||||||
| Lipper Equity Income Funds Average | -5.32 | 3.41 | 5.50 | 9.97 | NA | NA | ||||||||||||||||||
The average annual total return for the Parnassus Core Equity Fund – Institutional Shares from commencement (April 28, 2006) was 10.40%. Performance shown prior to the inception of the Institutional Shares reflects the performance of the Parnassus Core Equity Fund –Investor Shares and includes expenses that are not applicable to and are higher than those of the Institutional Shares. The performance of the Institutional Shares differs from that shown for the Investor Shares to the extent that the classes do not have the same expenses. Performance data quoted represent past performance and are no guarantee of future returns. Current performance may be lower or higher than the performance data quoted, and current performance information to the most recent month end is available on the Parnassus website (www.parnassus.com). Investment return and principal value will fluctuate, so an investor’s shares, when redeemed, may be worth more or less than their original principal cost. Returns shown in the table do not reflect the deduction of taxes a shareholder may pay on fund distributions or redemption of shares. The S&P 500 is an unmanaged index of common stocks, and it is not possible to invest directly in an index. Index figures do not take any expenses, fees or taxes into account, but mutual fund returns do. The estimated impact of individual stocks on the Fund’s performance is provided by FactSet.
Before investing, an investor should carefully consider the investment objectives, risks, charges and expenses of the Fund and should carefully read the prospectus or summary prospectus, which contain this and other information. The prospectus or summary prospectus can be obtained on the Parnassus website or by calling (800) 999-3505. As described in the Fund’s current prospectus dated May 1, 2020, Parnassus Investments has contractually agreed to limit total operating expenses to 0.86% of net assets for the Parnassus Core Equity Fund – Investor Shares and to 0.63% of net assets for the Parnassus Core Equity Fund – Institutional Shares. This agreement will not be terminated prior to May 1, 2021, and may be continued indefinitely by the Adviser on a year-to-year basis.
Second Quarter Review
We started the second quarter deeply troubled by the catastrophic human and economic toll caused by the COVID-19 pandemic. Then, as the quarter unfolded, long-standing societal racism against Black Americans was brutally brought to light with the tragic killing of George Floyd. There have been far too many tragedies like this. We deeply lament these injustices, and we don’t pretend to have all the answers. We do, though, as members of our communities, as employees at Parnassus, and as investors, recognize our responsibility to play our part in making this world a better place.
We are living through a disorienting time. While emotions were running high in the midst of the pandemic and widespread calls for racial justice, the stock market soared during the second quarter. In fact, the S&P 500 recorded its best 50-day period in history during the second quarter. Governments around the world, including the United States, provided trillions of dollars to fill the gap of lost wages caused by the pandemic lockdowns. This liquidity boost, coupled with the perception of a government backstop on the economy, fueled bullishness about the prospects of a “V-shaped” recovery.
While the Parnassus Core Equity Fund – Investor Shares had a strong gain of 17.86% for the quarter, it underperformed the 20.54% rise by the S&P 500. Our upside capture was below our expectations. That said, the Fund fell less than the benchmark during the first quarter, so we’re pleased that we’re still ahead of our benchmarks for the first half of the year. Overall, stock selection subtracted about 190 basis points from our
7
Table of Contents
| Semiannual Report • 2020 | |||
relative performance in the second quarter, while sector allocation was modestly negative. The Fund’s weakest stock selection was in the industrials, financials and communication services sectors.
The Fund had only one stock that trimmed the NAV by more than 15 basis points during the quarter. American Express, the iconic financial services firm, reduced the Fund’s return by 28 basis points. (One basis point is 1/100th of one percent.) The stock’s total return was negative 13.6%* to our average selling price in April. We sold the stock because American Express will endure elevated credit card loan losses due to the high unemployment rate, while we believe its payment volumes will be slower to rebound than other card networks, due to American Express’s outsized exposure to travel and entertainment.
The Fund had six stocks that added more than 100 basis points to the NAV this quarter. The biggest positive contributor to the Fund’s performance was Microsoft, which added 189 basis points to the Fund’s return, as the stock gained 29.4%. The company reported strong results and high near-term visibility into future earnings despite the impact of COVID-19. Microsoft is an increasingly important strategic partner to their corporate customers, and we believe they will continue to be one of the primary beneficiaries of the growth in cloud computing.
Amazon contributed 159 basis points to the Fund’s performance with a total return of 41.5%. The current environment has accelerated the shift to e-commerce, and demand has been so overwhelming that Amazon has increased headcount by over 100,000 so far this year. Amazon Web Services (AWS) continues to have spectacular results, as cloud computing demand grows unabated.
NVIDIA added 120 basis points to the Fund’s performance with a total return of 44.2% this quarter. The company announced a new datacenter product that promises significantly improved performance. This strong product execution, coupled with the closing of their Mellanox acquisition and excellent quarterly results, drove the shares higher.
Cadence and Synopsys both provide software for designing semiconductors, and each reported impressive earnings during the quarter. Cadence added 118 basis points to the Fund’s performance with a total return of 45.3%, while Synopsys contributed 111 basis points, as its stock returned 51.4%. Both companies are continuing to benefit from the secular trends of increasing semiconductor complexity and an expanding customer base.
Danaher is a leading manufacturer of testing and diagnostic equipment. Its stock returned 27.9%, contributing 109 basis points to the Fund’s performance. Investors appreciated Danaher’s solid quarterly earnings and its involvement with many of the COVID-19 vaccine and therapy trials, which could boost revenue if any of these are successful.
* For this report, we quote total return to the portfolio, which includes price change and dividends.
8
Table of Contents
| Semiannual Report • 2020 | | |||
Parnassus Core Equity Fund
as of June 30, 2020
(percentage of net assets)
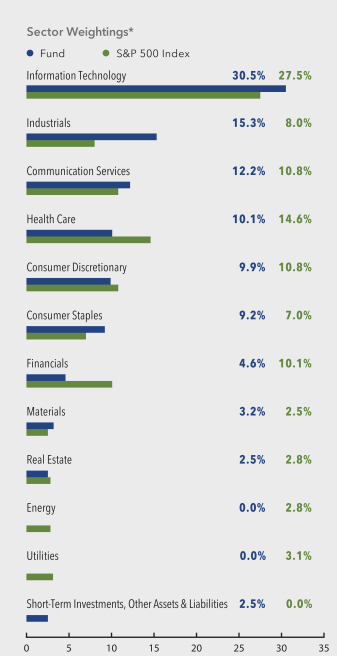
* For purposes of categorizing securities for diversification requirements under the Investment Company Act, the Fund uses industry classifications that are more specific than those used for the chart.
Portfolio characteristics and holdings are subject to change periodically.
| Top 10 Equity Holdings | ||||
| (percentage of net assets) | ||||
| Microsoft Corp. | 6.8% | |||
| Amazon.com Inc. | 5.4% | |||
| Danaher Corp. | 4.2% | |||
| Alphabet Inc., Class A | 4.0% | |||
| Comcast Corp., Class A | 4.0% | |||
| Mastercard Inc., Class A | 3.3% | |||
| Applied Materials Inc. | 3.3% | |||
| Costco Wholesale Corp. | 3.3% | |||
| Verizon Communications Inc. | 3.2% | |||
| Linde plc | 3.2% | |||
Portfolio characteristics and holdings are subject to change periodically.
Outlook and Strategy
Remarkably, the stock market has climbed back toward its previous peak. Clearly, the size and scope of the Federal Reserve’s actions, along with fiscal and monetary responses across the globe, have added liquidity and boosted equity markets. However, we’re concerned that investors are pricing in too much optimism about an economic recovery. As of June 30, the S&P 500 is trading at a valuation of 24.4 times 2021 earnings estimates, above its valuation of 20.8 times on February 19, the stock market’s all-time peak. The pandemic shows little signs of easing in the United States, and it’s unclear if the recent pick-up in economic activity reflects just an initial bounce due to pent-up demand or the beginning of a sustainable recovery to pre-pandemic levels.
Moving forward, the pandemic is likely to accelerate many structural changes already in progress. Recent events have emphasized technological disruption, global trade tensions, supply chains and calls for social change. As large cap core investors, we are intimately aware of the wide dispersion in performance between value and growth stocks. Certain internet and digital businesses exhibit winner-take-most dynamics, which creates a trend toward persistent winners and losers in certain sectors, and COVID-19 has only accelerated this trend. While some companies in the “value” category present opportunity thanks to their stable businesses and historically low valuations, many face earnings disruptions due to secular changes in the economy. Our focus is to build a portfolio that is anchored in the large cap core category, while identifying opportunities across the value and growth spectrum.
9
Table of Contents
| Semiannual Report • 2020 | |||
Given the wide range of economic outcomes ahead, we have chosen to own companies that sell essential product and have strong balance sheets and robust supply chains. In addition, we have spent considerable time discerning how our companies have responded to the pandemic on key issues, such as workplace safety, compensation, benefits and layoffs. We seek companies that are investing in their employees, retaining talent and building businesses that are positioned to emerge stronger over the long-term.
During the quarter, the Fund added to its technology holdings and is overweight the sector. We initiated a position in Micron, the memory semiconductor manufacturer. Long-term, we believe that growth in data, cloud computing and smart devices will fuel demand for Micron’s memory chips. We also bought shares of Intel, one of the few remaining owners of leading-edge semiconductor foundries. The digitization of the economy, along with advancements in artificial intelligence, should continue to drive strong growth in computer demand. We believe that Intel shares offer an opportunity to participate in this durable trend at an attractive valuation.
We reduced our underweight position in the consumer discretionary sector. The Fund bought shares of Booking Holdings, the online travel agency that owns and operates brands such as Booking.com, Priceline and KAYAK. The near-term prospects for the travel and hospitality sector have deteriorated meaningfully due to COVID-19. However, we believe that Booking’s shares are attractive as the company has ample liquidity, enjoys an increasingly advantaged competitive position and should benefit when travel inevitably returns.
The Fund remains overweight the industrials sector, and during the quarter added Kansas City Southern, a Class I railroad that links Mexico’s manufacturing regions to major markets in the U.S. and Canada. We believe that Kansas City Southern will be increasingly relevant as its strategically advantaged network enables it to participate in Mexico’s growing economy and to benefit from the reform of the Mexican energy
sector and the supply chain near-sourcing phenomenon.
We reduced our financials exposure during the quarter due to the sector’s exceptionally wide range of economic outcomes. Our main concern is that loan losses could wipe out a big portion of earnings and deplete capital for lenders if the economy doesn’t recover quickly. Meanwhile, lower interest rates will pressure earnings for lenders even in a strong economic recovery, as the Federal Reserve now projects that it won’t raise interest rates until 2023. Given this backdrop, we decided to sell our positions in Bank of America and American Express.
In the remaining sectors, the Fund had no material changes. We remain overweight the communications services sector with large positions in Comcast and Google’s parent company, Alphabet. We are also overweight the consumer staples sector, anchored by a large investment in Costco. We are underweight health care, with our most significant exposure in medical devices, life sciences and health care technology. We’re essentially equal weight materials and real estate. The Fund has zero exposure to the energy sector due to our fossil fuel free mandate. The Fund also has no holdings in the utility sector, as these stocks offer limited growth and trade at high valuations.
We deeply appreciate your trust and confidence in us, especially during these challenging times.
Sincerely,

Todd C. Ahlsten
Lead Portfolio Manager
Benjamin E. Allen
Portfolio Manager
10
Table of Contents
| Semiannual Report • 2020 | | |||
Ticker: Investor Shares - PARMX
Ticker: Institutional Shares - PFPMX
As of June 30, 2020, the net asset value (“NAV”) of the Parnassus Mid Cap Fund – Investor Shares was $32.65, so the total return for the quarter was a gain of 19.91%. This compares to a gain of 24.61% for the Russell Midcap Index (“Russell”) and a gain of 20.90% for the Lipper Mid-Cap Core Funds Average, which represents the average return of the mid-cap core fund followed by Lipper (“Lipper average”). For the first half of 2020, the Parnassus Mid Cap Fund – Investor Shares posted a loss of 8.36% compared to a loss of 9.13% for the Russell and a loss of 14.06% for the Lipper average.
Parnassus Mid Cap Fund
| Average Annual Total Returns (%) | ||||||||||||||||||||||||
| for period ended June 30, 2020 | ||||||||||||||||||||||||
| One Year | Three Years | Five Years | Ten Years | Gross Expense Ratio | Net Expense Ratio | |||||||||||||||||||
| Parnassus Mid Cap Fund – Investor Shares | -3.13 | 5.48 | 8.10 | 12.10 | 1.01 | 0.99 | ||||||||||||||||||
| Parnassus Mid Cap Fund – Institutional Shares | -2.86 | 5.72 | 8.34 | 12.24 | 0.75 | 0.75 | ||||||||||||||||||
| Russell Midcap Index | -2.24 | 5.79 | 6.76 | 12.35 | NA | NA | ||||||||||||||||||
| Lipper Mid-Cap Core Funds Average | -7.62 | 1.32 | 3.20 | 9.48 | NA | NA | ||||||||||||||||||
The average annual total return for the Parnassus Mid Cap Fund – Institutional Shares from commencement (April 30, 2015) was 7.83%. Performance shown prior to the inception of the Institutional Shares reflects the performance of the Parnassus Mid Cap Fund – Investor Shares and includes expenses that are not applicable to and are higher than those of the Institutional Shares. The performance of the Institutional Shares differs from that shown for the Investor Shares to the extent that the classes do not have the same expenses. Performance data quoted represent past performance and are no guarantee of future returns. Current performance may be lower or higher than the performance data quoted. Current performance information to the most recent month end is available on the Parnassus website (www.parnassus.com). Investment return and principal value will fluctuate, so an investor’s shares, when redeemed, may be worth more or less than their original principal cost. Returns shown in the table do not reflect the deduction of taxes a shareholder may pay on fund distributions or redemption of shares. The Russell Midcap Index is an unmanaged index of common stocks, and it is not possible to invest directly in an index. Index figures do not take any expenses, fees or taxes into account, but mutual fund returns do. Mid-cap companies can be more sensitive to changing economic conditions and have fewer financial resources than large-cap companies. The estimated impact of individual stocks on the Fund’s performance is provided by FactSet.
Before investing, an investor should carefully consider the investment objectives, risks, charges and expenses of the Fund and should carefully read the prospectus or summary prospectus, which contain this and other information. The prospectus or summary prospectus can be obtained on the Parnassus website or by calling (800) 999-3505. As described in the Fund’s current prospectus dated May 1, 2020, Parnassus Investments has contractually agreed to limit total operating expenses to 0.99% of net assets for the Parnassus Mid Cap Fund – Investor Shares and to 0.75% of net assets for the Parnassus Mid Cap Fund – Institutional Shares. This agreement will not be terminated prior to May 1, 2021, and may be continued indefinitely by the Adviser on a year-to-year basis.
To the left is a table comparing the Parnassus Mid Cap Fund with the Russell and the Lipper average for the one-, three-, five- and ten-year periods.
Second Quarter Review
Domestic equity markets surged in the second quarter, with major stock markets posting their best quarterly performance in more than twenty years. This quarter’s stellar performance was a welcome contrast to the first quarter of 2020, when equity markets plunged given the sharp economic contraction resulting from the COVID-19 outbreak and corresponding economic shut-down. Stocks rose despite the reinvigorated pandemic, nationwide protests for racial equality and severe economic contraction. Investors set their hopes on a sharp and swift economic recovery, taking solace in the fact that employment, real estate and consumer confidence metrics came in slightly better than pundits’ dire predictions. Congress’s commitments, delivered through the CARES Act and the Federal Reserve’s unfettering support, also helped instill a base note of confidence.
During the quarter, it was challenging for our lower beta portfolio to keep up with its surging benchmarks. The Parnassus Mid Cap Fund – Investor Shares returned 19.91% during the second quarter, which captured 81% of the Russell’s 24.61% return. We’re pleased with the Fund’s absolute quarterly return but are disappointed that we fell behind the rocketing Russell. The Fund trailed its Lipper peers by a narrow margin, capturing 95% of the Lipper’s 20.90% return. On a more positive note for the year-to-date period, the Fund is ahead of the Russell by 77 basis points and its Lipper peers by a whopping 570 basis points. (One basis point is 1/100th of one percent.)
11
Table of Contents
| Semiannual Report • 2020 | |||
From an allocation perspective, the Fund was hurt because of its underweight position in the consumer discretionary sector, the best performing sector in the Russell. On the flip side, the Fund benefitted from having underweight positions in the financials and utilities sectors, because these sectors performed relatively poorly. The Fund’s overweight position in the information technology sector also helped performance, because this was the second-best performing Russell sector.
The Fund’s performance during the quarter was overwhelmingly the result of stock selection rather than sector allocation. The worst performer was Portland General Electric, a vertically integrated electric utility serving customers in Oregon. The company subtracted 22 basis points from the Fund’s return, as its total return was negative 12.0%.* The shares dropped after management lowered the company’s annual earnings guidance, citing a steep decline in commercial demand and higher expenses due to the shut-down restrictions related to COVID-19. On top of this, the company cut its 2020-2021 capital investments, resulting in slower near-term growth. Despite the near-term challenges, we believe Portland is positioned to deliver its long-term earnings guidance of 4-6%, as it benefits from a growing customer base, robust backlog of renewable energy capital projects, a healthy balance sheet and regulatory support.
Western Digital, a leading manufacturer of NAND data storage and disk drives, subtracted 6 basis points from the Fund’s return, as its total return was negative 7.7%. The company posted disappointing earnings due to higher costs associated with COVID-19 and weaker than expected sales of its hard disk drive products. Investor sentiment soured after the company paused its dividend in order to reinvest in the business and pay down debt. We think the stock offers an asymmetric risk-reward and believe the company will benefit from improved pricing in the NAND flash market and secular tailwinds as the explosion of data consumption drives greater demand for data storage technology.
ACI Worldwide, a provider of electronic payments software, reduced the Fund’s total return by 5 basis points, as the stock’s total return was negative 2.9%. The stock dropped after management suspended its annual earnings guidance, as the company saw delayed orders for its payment software and lower
payment transaction volumes. Due to our concerns with the company’s slowing growth and elevated debt, we exited our remaining modest position in the stock.
On the positive side, the largest contributor was Hologic, a leading medical device manufacturer of mammography, surgical and diagnostics equipment, that contributed 186 basis points to the Fund’s return, as its total return was 62.4%. Despite the weakness in its surgical business as elective procedures were put on hold during the shelter-in-place restrictions, the company announced better than expected revenues, driven largely by robust demand for its COVID-19 tests using its Panther Fusion diagnostics equipment. We see further upside in the stock as demand for increased diagnostic testing drives additional Panther placements and the breast health and surgical segments gain further international market penetration.
Nuance Communications, a leading voice and analytics software applications provider, added 136 basis points to the Fund’s return, as its total return was 50.8%. The shares jumped after the company delivered higher than expected earnings, driven by increasing demand for its voice products that are used in contact centers. Investor sentiment rose after the company reiterated its long-term fiscal year 2023 targets, which call for 3-6% revenue growth and margin expansion. We believe Nuance is well-positioned to benefit from the adoption of its cloud-based technology solutions, especially in health care, and the company’s continued shift toward a recurring revenue-based subscription model.
Our third big winner was Synopsys, a leading provider of design software, semiconductor intellectual property and security software used by semiconductor companies and corporate enterprises. The stock contributed 124 basis points to the Fund’s return, as the total return of its shares was 51.4%. Robust order demand for its design software, along with improved margins in its Software Integrity segment, drove better than expected earnings. We remain bullish on the company’s long-term growth prospects, as its mission-critical design software is increasingly used by its customers to develop advanced chip designs and new technologies, including artificial intelligence, 5G and cloud-end markets.
12
* For this report, we quote total return to the portfolio, which includes price change and dividends.
Table of Contents
| Semiannual Report • 2020 | | |||
Parnassus Mid Cap Fund
as of June 30, 2020
(percentage of net assets)
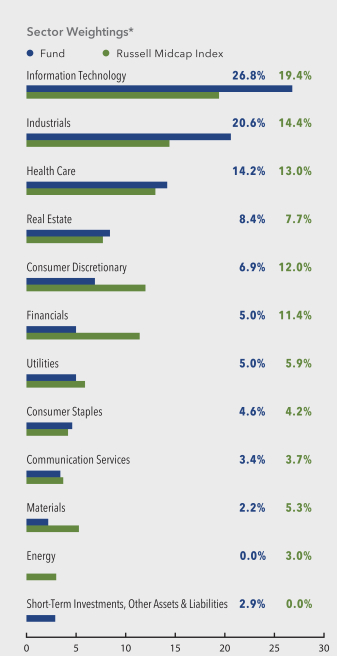
* For purposes of categorizing securities for diversification requirements under the Investment Company Act, the Fund uses industry classifications that are more specific than those used for the chart.
Portfolio characteristics and holdings are subject to change periodically.
| Top 10 Equity Holdings | ||||
| (percentage of net assets) | ||||
| Hologic Inc. | 4.1% | |||
| Republic Services Inc. | 3.8% | |||
| Nuance Communications Inc. | 3.6% | |||
| Teleflex Inc. | 3.4% | |||
| Cerner Corp. | 3.4% | |||
| Synopsys Inc. | 3.1% | |||
| Cadence Design Systems Inc. | 3.0% | |||
| Verisk Analytics Inc. | 3.0% | |||
| Jack Henry & Associates Inc. | 3.0% | |||
| Xylem Inc. | 2.8% | |||
Portfolio characteristics and holdings are subject to change periodically.
Strategy and Outlook
The path forward for the economy is uncertain, so we are proceeding cautiously and considering a wide range of outcomes. We are optimistic that a COVID-19 vaccine will eventually emerge, but we have an especially low degree of confidence in predicting how the pandemic will manifest and limited visibility into how consumer and corporate spending will trend.
Our long-term, fundamental, quality-focused approach seems especially prudent at this difficult-to-assess time. This process has offered strong upside participation over the long-term, but it is our focus on downside risks and avoiding permanent capital loss that is key to our strategy. We remain acutely aware that potential negatives abound, which at this point relate to the uncertainty surrounding COVID-19. The CARES Act has helped avert the most severe negative economic outcome, but without additional action, government payments are set to expire and furloughed consumer debt obligations will soon resume, which will hamper the economy. We also recognize that corporate earnings are depressed due to the impacts of the pandemic but are cautious given the Russell’s expensive valuation of almost 24 times forward earnings estimates, which is a 20-year high. On top of these issues, we continue to be concerned about the unresolved trade wars, slowing growth in China and Europe, and heightened geopolitical risks around the globe. Longer term, potential issues resulting from the rapidly rising U.S. debt will also factor into our range of outcomes.
13
Table of Contents
| Semiannual Report • 2020 | |||
Given the recent run-up in stocks, we continue to position the Fund to outperform in the event of a downturn. As a reflection of our bottom-up research process, the Fund is significantly underweight in the more cyclical consumer discretionary and financial sectors. In contrast, we are significantly overweight in the information technology sector, focusing on discrete opportunities with asymmetric risk-reward.
In the technology sector, we added shares of Western Digital Corporation, a leading player of data storage solutions including NAND flash, memory and hard disk drives. The company operates in a highly cyclical market but is poised to benefit from multi-year secular tailwinds. These include the exponential growth of data consumption and storage and further market share gains for its lower latency NAND storage solutions relative to hard disk drive solutions. With the stock trading at a depressed valuation, we think the risk-reward for the stock is compelling and feel that investors are underappreciating the earnings power of the business as its higher-margin NAND business becomes a larger portion of the overall business and margins expand.
We are also overweight the industrial sector, though as discussed in previous reports, we have a bias toward less cyclical industrial businesses, specifically those with secular growth opportunities, competitive advantages, predictable revenue streams, well-capitalized balance sheets and attractive valuations. Within industrials, we have a fundamental bet on the domestic logistics space, because we believe the domestic economy will recover with more velocity than the trade-dependent global economy. Our positions here include FedEx, CH Robinson and a new position, Kansas City Southern a leading operator of rail networks in the United States and Mexico.
Kansas City Southern has carved out a wide moat, supported by steep barriers to entry and significant scale with its 3,300 route miles in the United States. The company is uniquely positioned, with exclusive concession agreement in Mexico that enables it to
operate 3,200 miles of rail in Mexico. We believe the company is very well-positioned to deliver industry leading growth, as it benefits from cross-border intermodal volume growth, the near-shoring of supply chains to Mexico and North America and the implementation of its Precision Scheduled Railroad initiatives, which will drive significant cost savings over time.
We exited our position in Expeditors International this past quarter to further focus on the theme of domestic economic recovery. While we admire Expeditor’s asset-light logistics model focused on cross-border trade and high returns on capital, we are concerned about the company’s slowing growth due to weak trade volumes and relatively high valuation.
We own a relatively concentrated portfolio of companies that we believe have increasing relevancy, sustainable competitive advantages, prudent management teams, solid ESG records, compelling long-term risk-reward profiles and limited potential for permanent impairment. We continue to diligently use our process to identify new portfolio holdings and adjust or exit existing portfolio positions. We are confident that this strategy will lead to outperformance relative to our benchmarks over the long-term.
Thank you for your investment in the Parnassus Mid Cap Fund.
Yours truly,

Matthew D. Gershuny
Lead Portfolio Manager

Lori A. Keith
Portfolio Manager
14
Table of Contents
| Semiannual Report • 2020 | | |||
Ticker: Investor Shares - PARWX
Ticker: Institutional Shares - PFPWX
As of June 30, 2020, the net asset value (“NAV”) of the Parnassus Endeavor Fund – Investor Shares was $35.23, so the total return for the quarter was 23.10%. This compares to a gain of 20.54% for the S&P 500 Index (“S&P 500”) and a gain of 21.12% for the Lipper Multi-Cap Core Funds Average, which represents the average return of the multi-cap core funds followed by Lipper (“Lipper average”).
Although we’re ahead of both benchmarks for the quarter, we’re still behind them for the year-to-date, because we underperformed in the first quarter. The Parnassus Endeavor Fund – Investor Shares is still down 7.73% for the year-to-date, compared to a loss of 3.08% for the S&P 500 and a loss of 5.78% for the Lipper average.
Parnassus Endeavor Fund
| Average Annual Total Returns (%) | ||||||||||||||||||||||||
| for period ended June 30, 2020 | ||||||||||||||||||||||||
| One Year | Three Years | Five Years | Ten Years | Gross Expense Ratio | Net Expense Ratio | |||||||||||||||||||
| Parnassus Endeavor Fund – Investor Shares | 3.94 | 5.03 | 8.85 | 14.04 | 0.97 | 0.95 | ||||||||||||||||||
| Parnassus Endeavor Fund – Institutional Shares | 4.20 | 5.28 | 9.09 | 14.17 | 0.71 | 0.71 | ||||||||||||||||||
| S&P 500 Index | 7.51 | 10.73 | 10.73 | 13.99 | NA | NA | ||||||||||||||||||
| Lipper Multi-Cap Core Funds Average | 2.89 | 7.17 | 7.28 | 11.56 | NA | NA | ||||||||||||||||||
The average annual total return for the Parnassus Endeavor Fund – Institutional Shares from commencement (April 30, 2015) was 8.99%. Performance shown prior to the inception of the Institutional Shares reflects the performance of the Parnassus Endeavor Fund – Investor Shares and includes expenses that are not applicable to and are higher than those of the Institutional Shares. The performance of the Institutional Shares differs from that shown for the Investor Shares to the extent that the classes do not have the same expenses. Performance data quoted represent past performance and are no guarantee of future returns. Current performance may be lower or higher than the performance data quoted. Current performance information to the most recent month end is available on the Parnassus website (www.parnassus.com). Investment return and principal value will fluctuate, so an investor’s shares, when redeemed, may be worth more or less than their original principal cost. Returns shown in the table do not reflect the deduction of taxes a shareholder may pay on fund distributions or redemption of shares. The S&P 500 is an unmanaged index of common stocks, and it is not possible to invest directly in an index. Index figures do not take any expenses, fees or taxes into account, but mutual fund returns do. The estimated impact of individual stocks on the Fund’s performance is provided by FactSet.
Before investing, an investor should carefully consider the investment objectives, risks, charges and expenses of the Fund and should carefully read the prospectus or summary prospectus, which contain this and other information. The prospectus or summary prospectus can be obtained on the Parnassus website or by calling (800) 999-3505. As described in the Fund’s current prospectus dated May 1, 2020, Parnassus Investments has contractually agreed to limit total operating expenses to 0.95% of net assets for the Parnassus Endeavor Fund – Investor Shares and to 0.71% of net assets for the Parnassus Endeavor Fund – Institutional Shares. This agreement will not be terminated prior to May 1, 2021, and may be continued indefinitely by the Adviser on a year-to-year basis.
To the left is a table, showing the returns for the Parnassus Endeavor Fund for the one-, three-, five- and ten-year periods. We’re ahead of the Lipper average for the one-year period, but behind the S&P 500. For the three-year period, we’re behind both the S&P 500 and the Lipper average, because of our difficult first quarter. However, for the five-year period, we’re ahead of the Lipper average and we’re ahead of both indices for the ten-year period, so we still have a good long-term track record.
Company Analysis
Technology stocks contributed the most to our strong gains for the quarter, with five of our seven best-performing companies coming from that sector. Interestingly enough, the other two winners came from the low-tech apparel industry.
The best-performing issue was Applied Materials, which added 318 basis points to the NAV, as its share price increased 31.9%* from $45.82 to $60.45. (One basis point is 1/100th of one percent.) The stock’s performance mirrored what happened to the market as a whole. In the first quarter, it dropped 24.9% from $61.04 to $45.82, then in the second quarter, Applied gained back virtually everything it lost in the first quarter. In the March quarterly report, we wrote that Applied was seeing strong growth, because of increased manufacturing complexity and the demand for more chips – a demand that should keep growing for years because of increased manufacturing complexity. We indicated that the stock price sank due to concerns around possible disruptions in the supply chain and lower customer spending, but we saw this weakness as temporary, and we were confident of
* For this report, we quote total return to the portfolio, which includes price change and dividends.
15
Table of Contents
| Semiannual Report • 2020 | |||
Applied’s future growth. That’s pretty much what happened. The company is one of only two major suppliers of the equipment used in manufacturing semiconductors, so it has a very strong position in the marketplace.
The same thing happened with Micron Technology, which added 247 basis points to the value of each share, as its stock price rose from $42.06 to $51.52 for a total return of 22.5%. In the March quarter, Micron’s stock fell 21.8% from $53.78 to $42.06, so the stock basically did a round-trip, much like Applied Materials. The company had fairly good results in the first quarter, but the stock dropped because of concerns about consumer demand and possible disruption of the supply chain. In the last quarterly report, we wrote that, “The disruption will be temporary and Micron should survive the global pandemic because of its strong balance sheet and brisk demand for the quality memory chips that it supplies.” This is exactly what happened, and the share price is almost back to where it began the year, at $53.78.
Specialty retailer The Gap boosted the Fund’s return by 243 basis points, as its stock soared from $7.04 to $12.62 for a total return of 79.3%. Gap sells clothes and accessories under the Old Navy, Banana Republic, Athleta and other brands. Even as mandatory store closures depressed Americans demand for apparel, the company reported an acceleration in its e-commerce business, which now accounts for over one-quarter of total sales. Gap stores across the country also reopened with new safety protocols, and investors bid up the stock anticipating a return to full capacity. Finally, on June 26, Gap struck a 10-year partnership with popular rapper and artist Kanye West to bring West’s YEEZY brand into Gap stores and online in 2021.
Lam Research, the second member of the duopoly (with Applied Materials) that controls the semiconductor equipment market, followed a pattern very similar to Applied Materials and Micron Technology. The stock started the year at $297.40 a share, then dropped to $240.00 on March 31, before rising to $323.46 on June 30 for a gain of 35%. Unlike Applied and Micron, which ended the second quarter essentially where they started the year, Lam actually had a nice gain of almost 9% for the quarter. Lam faced headwinds from COVID-19 supply-chain disruptions and U.S. and China trade tensions just liked Applied
and Micron, but finished the quarter with strong demand and a backlog of orders. Lam will continue to play a critical role in semiconductors for years, with strong demand and new technologies requiring complex manufacturing processes.
Hanesbrands, a leading manufacturer of undergarments and athletic apparel, added 143 basis points to the Fund’s return, as its stock price jumped from $7.87 to $11.29 for a total return of 45.8%. Management noted some improving consumer demand as retail stores began to gradually reopen. The company also saw online sales accelerating through April, reaching triple-digit growth rates across several retail partners websites. Finally, the board of directors appointed Stephen Bratspies as CEO effective August 3. He joins Hanesbrands with over 25 years of experience, including 15 at Walmart, where he most recently served as the chief merchandising officer. His considerable experience with consumer products and knowledge of the evolving retail landscape should help the company capitalize on growth opportunities.
Apple added 127 basis points to the Fund’s return, as its stock appreciated from $254.29 to $364.80 for a total return of 43.8%. The company reported results that were better than expected despite store closures and supply chain disruptions. The near-term shift to remote work environments benefitted hardware sales, while services continued to demonstrate strong growth. In response to the volatile environment, management also increased their buyback authorization. We believe Apple stock should continue to benefit as we approach the 5G smartphone upgrade cycle.
Cisco Systems added 113 basis points to the Fund’s return, as its stock appreciated from $39.31 to $46.64 for a total return of 19.7%. The company reported better than expected quarterly results despite significant headwinds from COVID-19. Many of Cisco’s customers have paused spending due to the uncertainty, but the company was still able to deliver healthy margins, while their software portfolio benefitted from the accelerated adoption of digital tools. We believe Cisco’s scale and incumbency along with their strong balance sheet will help them emerge stronger from this pandemic.
16
Table of Contents
| Semiannual Report • 2020 | | |||
Parnassus Endeavor Fund
as of June 30, 2020
(percentage of net assets)
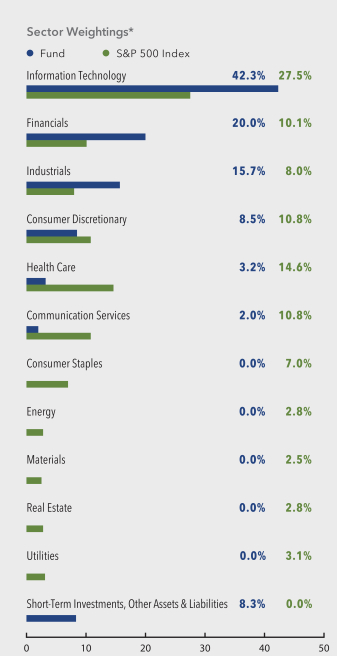
* For purposes of categorizing securities for diversification requirements under the Investment Company Act, the Fund uses industry classifications that are more specific than those used for the chart.
Portfolio characteristics and holdings are subject to change periodically.
| Top 10 Equity Holdings | ||||
| (percentage of net assets) | ||||
| Micron Technology Inc. | 11.8% | |||
| Applied Materials Inc. | 11.4% | |||
| Charles Schwab Corp. | 6.0% | |||
| Lam Research Corp. | 5.8% | |||
| The Gap Inc. | 4.7% | |||
| Capital One Financial Corp. | 4.5% | |||
| Cisco Systems Inc. | 4.2% | |||
| Apple Inc. | 3.9% | |||
| FedEx Corp. | 3.7% | |||
| W.W. Grainger Inc. | 3.7% | |||
Portfolio characteristics and holdings are subject to change periodically.
Outlook and Strategy
By Jerome L. Dodson
In the last quarterly report, I wrote that the stock market’s plunge was not a reasonable indicator of economic value, and that the disconnect between market price and intrinsic value was the most I had seen in 35 years. Well, the market has made a strong recovery, so I’m not surprised that we have gained back almost all that we lost, but I am surprised that it happened so quickly. The coronavirus is having a very negative effect on the economy, so I had expected the stock market to stay depressed for a while longer.
What seems to be happening is that investors are looking beyond the pandemic, expecting that science will find a cure very soon, and the economy will be back to normal. This has to be one of the fastest U-turn in history! The stock market started dropping in late February, hit bottom on March 23, then started climbing sharply to the point where now we’ve recovered virtually the entire loss. This experience shows why it’s important to stay invested at all times and not to try to time the market.
Although the market appears to be fully valued right now, it could still keep moving higher and go into an overvalued situation. For the most part, though, the stocks in the Parnassus Endeavor Fund are not overvalued, and I suspect that they will keep moving higher if the market stays strong.
17
Table of Contents
| Semiannual Report • 2020 | |||
Thank you for investing in the Parnassus Endeavor Fund.
Yours truly,

Jerome L. Dodson
Lead Portfolio Manager

Billy Hwan
Portfolio Manager
18
Table of Contents
| Semiannual Report • 2020 | | |||
Ticker: Investor Shares - PARNX
Ticker: Institutional Shares - PFPRX
As of June 30, 2020, the net asset value (“NAV”) of the Parnassus Mid Cap Growth Fund – Investor Shares was $50.99, resulting in a gain of 25.78% for the second quarter. During the quarter, we transitioned the Fund from a multi-cap strategy to a mid-cap growth strategy. To reflect the new strategy, our benchmark changed from the S&P 500 Index (“S&P 500”) to the Russell Midcap Growth Index (“Russell Midcap Growth”). We completed the transition mid-quarter, and the Fund’s 25.78% return for the second quarter was between the S&P 500’s return of 20.54% and the Russell Midcap Growth’s return of 30.26%. The Fund was substantially ahead of the 21.12% increase for the Lipper Multi-Cap Core Funds Average, which represents the average multi-cap core funds followed by Lipper (“Lipper average”). We anticipate that Lipper will eventually change the Fund’s peer group to reflect the new strategy.
Parnassus Mid Cap Growth Fund
| Average Annual Total Returns (%) | ||||||||||||||||||||||||
| for period ended June 30, 2020 | ||||||||||||||||||||||||
| One Year | Three Years | Five Years | Ten Years | Gross Expense Ratio | Net Expense Ratio | |||||||||||||||||||
| Parnassus Mid Cap Growth Fund – Investor Shares | 9.23 | 7.88 | 8.65 | 13.73 | 0.84 | 0.84 | ||||||||||||||||||
| Parnassus Mid Cap Growth Fund – Institutional Shares | 9.37 | 8.04 | 8.81 | 13.82 | 0.68 | 0.68 | ||||||||||||||||||
| Russell Midcap Growth Index | 11.91 | 14.76 | 11.60 | 15.09 | NA | NA | ||||||||||||||||||
| S&P 500 Index | 7.51 | 10.73 | 10.73 | 13.99 | NA | NA | ||||||||||||||||||
| Lipper Multi-Cap Core Funds Average | 2.89 | 7.17 | 7.28 | 11.56 | NA | NA | ||||||||||||||||||
The average annual total return for the Parnassus Mid Cap Growth Fund – Institutional Shares from commencement (April 30, 2015) was 8.61%. Performance shown prior to the inception of the Institutional Shares reflects the performance of the Parnassus Mid Cap Growth Fund – Investor Shares and includes expenses that are not applicable to and are higher than those of the Institutional Shares. The performance of Institutional Shares differs from that shown for the Investor Shares to the extent that the classes do not have the same expenses. Performance data quoted represent past performance and are no guarantee of future returns. Current performance may be lower or higher than the performance data quoted. Current performance information to the most recent month-end is available on the Parnassus website (www.parnassus.com). Investment return and principal value will fluctuate, so an investor’s shares, when redeemed, may be worth more or less than their original principal cost. Returns shown in the table do not reflect the deduction of taxes a shareholder may pay on fund distributions or redemption of shares. The Russell Midcap Growth and S&P 500 are unmanaged indexes of common stocks, and it is not possible to invest directly in an index. Index figures do not take any expenses, fees or taxes into account, but mutual fund returns do. The estimated impact of individual stocks on the Fund’s performance is provided by FactSet.
Before investing, an investor should carefully consider the investment objectives, risks, charges and expenses of the Fund and should carefully read the prospectus or summary prospectus, which contain this and other information. The prospectus or summary prospectus can be obtained on the Parnassus website or by calling (800) 999-3505. As described in the Fund’s current prospectus dated May 1, 2020, Parnassus Investments has contractually agreed to limit total operating expenses to 0.84% of net assets for the Parnassus Mid Cap Growth Fund – Investor Shares and to 0.68% of net assets for the Parnassus Mid Cap Growth Fund – Institutional Shares. This agreement will not be terminated prior to May 1, 2021, and may be continued indefinitely by the Adviser on a year-to-year basis. Prior to May 1, 2020, the benchmark for the Parnassus Mid Cap Growth Fund (formerly known as the Parnassus Fund) was the S&P 500 Index.
To the left is a table that summarizes the performance of the Parnassus Mid Cap Growth Fund, S&P 500, Russell Midcap Growth and Lipper average. The returns are for the one-, three-, five- and ten-year periods ended June 30, 2020.
Second Quarter Review
The quarter began with the mounting human and economic toll of the COVID-19 pandemic. Then, the tragic killing of George Floyd spurred protests globally in support of racial justice. We were deeply saddened by his killing, and we hope that this is the beginning of the end for the systemic racism that permeates our society. Despite the tumultuous backdrop, the S&P 500 bounced back from its dramatic first quarter loss to record one of its best quarters in history.
The Parnassus Mid Cap Growth Fund – Investor Shares rose 25.78% for the quarter, far exceeding the S&P 500’s gain of 20.54%, but trailing the Russell Midcap Growth’s gain of 30.26%. This was an eventful quarter for the Fund, as we transitioned it to a mid-cap growth strategy. We started trading to the new portfolio on May 1 and completed the transition on May 15. We’re pleased to report that from May 15 to June 30, the Fund’s gain of 12.36% outperformed the Russell Midcap Growth’s gain of 10.73%.
During the quarter, six stocks contributed more than 100 basis points to the Fund’s return (One basis point is 1/100th of one percent.), while only one subtracted more than 20 basis points. That stock was VF Corporation, the global apparel company with key brands such as The North Face, Vans and Timberland. Its shares dropped 9.6% to our average selling cost, trimming 24 basis points from the Fund’s return, as investors worried about the impact of store closures on its revenue and earnings. We sold the stock to make
19
Table of Contents
| Semiannual Report • 2020 | |||
room for faster-growing retailers that are better positioned for the new post-pandemic world, like Lululemon and Grocery Outlet.
Our best-performing stock this quarter was Square, which added an incredible 224 basis points to the Fund’s return as its stock soared 100.3%.* The stock spiked higher as Cash App, Square’s peer-to-peer mobile payment network, merged as a leading digital bank. COVID-19 and the federal government’s associated stimulus payments have caused Cash App’s adoption to inflect higher, as consumers avoid brick-and-mortar bank branches and value the convenience of Cash App’s mobile direct deposit accounts.
Autodesk, a leading provider of design and construction software, added 147 basis points to the Fund’s return as the stock jumped 53.2%. The company reported results that were in-line with expectations and provided encouraging commentary around user engagement. Autodesk also held an investor day during the quarter that highlighted the secular tailwinds benefiting the business and the company’s widening moat.
Microsoft added 126 basis points to the Fund’s return as the stock rose 14.5% to our average selling price. The company reported strong results and high near-term visibility, as it becomes an increasingly important strategic partner to its customers. We sold Microsoft during the Fund transition in May, as its market cap is too large for the Fund’s new strategy.
Cadence Design Systems provides software for designing semiconductors. Its stock added 121 basis points to the Fund’s performance, as its total return was 45.3%. Cadence reported impressive earnings during the quarter, as it continues to benefit from the secular trends of increasing semiconductor complexity and an expanding customer base.
KLA Corporation’s 36.0% total return contributed 120 basis points to the Fund’s performance. KLA dominates the semiconductor process control equipment space, and the company reported a solid quarter as semiconductor manufacturers continue to invest in KLA’s mission-critical equipment.
Gene sequencing giant Illumina added 115 basis points to the Fund’s return, as the stock increased 35.6%. The stock moved higher with the anticipation that sequencing could play an important role in expanding COVID-19 testing. Given Illumina’s dominant position in gene sequencing, it could become a big opportunity for the company.
* For this report, we quote total return to the portfolio, which includes price change and dividends.
20
Table of Contents
| Semiannual Report • 2020 | | |||
Parnassus Mid Cap Growth Fund
as of June 30, 2020 (percentage of net assets)
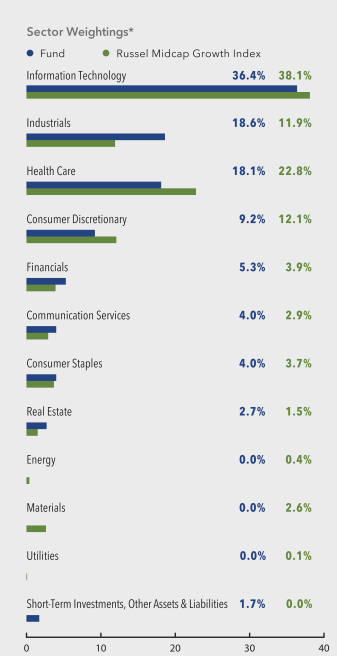
* For purposes of categorizing securities for diversification requirements under the Investment Company Act, the Fund uses industry classifications that are more specific than those used for the chart.
Portfolio characteristics and holdings are subject to change periodically.
| Top 10 Equity Holdings | ||||
| (percentage of net assets) | ||||
| Square Inc., Class A | 3.8% | |||
| Autodesk Inc. | 3.6% | |||
| Synopsys Inc. | 3.3% | |||
| Cerner Corp. | 3.2% | |||
| Cadence Design Systems Inc. | 3.2% | |||
| KLA Corporation | 3.1% | |||
| Agilent Technologies Inc. | 3.1% | |||
| Illumina Inc. | 3.0% | |||
| C.H. Robinson Worldwide Inc. | 3.0% | |||
| O’Reilly Automotive Inc. | 3.0% | |||
Portfolio characteristics and holdings are subject to change periodically.
Outlook and Strategy
Equity markets surged during the second quarter, with the Russell Midcap Growth Index up an astonishing 30.26% and the S&P 500 higher by 20.54%. Although the world continues to face a global pandemic and a weak economic environment, investors’ optimism was on full display, driven by a couple of factors. First, the Federal Reserve swiftly communicated that it will do whatever it takes to help bolster the economy. This includes buying securities and as keeping interest rates near 0% through 2022, which supports higher equity valuations and makes equities look attractive relative to other asset classes, such as bonds. In addition, due to the federal government’s fiscal stimulus programs, Goldman Sachs estimates that most unemployed workers have been making more money compared to when they were working. As a result, the market became confident that, as consumers spend their excess cash, the recovery would be quicker than originally expected.
In addition to the market’s strong rebound, the other exciting news during the quarter was that the Fund transitioned to become the Parnassus Mid Cap Growth Fund. We’re thrilled that the Fund consists of 44 high-quality and fast-growing companies that we believe will compound value year after year. These companies have positive ESG profiles, relatively low debt levels and represent what we believe are the winners of tomorrow. Since this is the first quarter for the new strategy, we wanted to provide more detail on our industry positioning and highlight some of our holdings.
Four sectors represent 82.3% of the Parnassus Mid Cap Growth Fund and 84.9% of the Russell Midcap Growth
21
Table of Contents
| Semiannual Report • 2020 | |||
Index as of June 30: Information technology, health care, consumer discretionary and industrials. The information technology sector represents 36.4% of the Fund and 38.1% of the Russell Midcap Growth Index, making it the largest sector in the benchmark. More than half of our exposure within information technology is to the software industry group, where we’re invested in companies that are winning in their markets through product design and innovation. Our software holdings include Autodesk, which focuses on the product design and construction end markets; Cadence and Synopsys, the dominant semiconductor design companies; Ansys, which provides engineering simulation; The Trade Desk, an online platform for digital ad buying; and Avalara, which automates tax compliance for businesses.
The industrials sector is 18.6% of our Fund compared to 11.9% for the benchmark, which makes it our largest overweight. Although the industrials sector is often associated with heavy equipment and machinery, this sector is more of a catch-all and our primary exposure is to best-in-class data providers. Our holdings include CoStar Group, a leading provider of commercial real estate data; Thomson Reuters, the premier provider of online research and data for legal, tax and accounting professionals; and Verisk Analytics, the dominant provider of risk assessment solutions for property and casualty insurers.
Health care represents 18.1% of our Fund and 22.8% of the benchmark. Within this sector, we’ve invested in companies with high recurring revenue and a long runway for growth. Importantly, we don’t have significant exposure to drug pricing risk or companies that depend on just one key drug. Examples of our holdings include Cerner and Veeva Systems, companies that are helping digitize the health care industry. We’re also invested in Illumina, the largest provider of gene sequencing instruments and consumables, as well as Agilent, a company whose products provide mission-critical testing across many end markets such as pharmaceuticals and food.
Consumer discretionary represents 9.2% of our Fund and 12.1% of the index. We’re underweight this cyclical sector due to our focus on resilient businesses with low financial leverage that can grow in most economic environments. We’re invested in category killers and consistent market share gainers, such as the athletic apparel retailer Lululemon and automotive aftermarket retailer O’Reilly Auto Parts. Another new addition, Pool Corporation, is the dominant distributor for pool related supplies.
In total, the remaining seven sectors account for 16.0% of the Fund and 15.1% of the benchmark. We’re overweight the financials sector, with our largest holdings being Morningstar, a provider of independent financial research and data, and MarketAxess, the largest electronic bond trading platform. None of our financials holdings take credit risk or have exposure to interest rates, as we focus on resilient businesses that can compound their earnings over time. We’re overweight the real estate sector, with our holdings in SBA Communications, an owner of wireless communication towers, and Americold Realty Trust, an owner of temperature-controlled food warehouses. We’re also overweight the communications services sector. We’re invested in the New York Times, the well-known publisher that is seeing robust online subscription growth, as well as Cable One, a provider of broadband services in rural communities.
Our exposure to the consumer staples sector is roughly in-line with the benchmark’s. We’re invested in spice manufacturer McCormick, as well as Grocery Outlet, an off-price grocery store. You’ll be amazed by the deals you find there!
We don’t own any materials companies because many of the stocks in the sector are highly levered and slow growers, so they’re not a good fit for the Fund. Finally, the Fund is fossil fuel free, so we don’t have exposure to the energy and utilities sectors.
The first half of the year has been a rollercoaster ride for the stock market. While we don’t know what the remainder of the year will bring, we have conviction that our portfolio of economically resilient and innovative growth compounders should perform well in any market environment.
Thank you for your investment in the Parnassus Mid Cap Growth Fund.
Your truly,

Robert J. Klaber
Portfolio Manager

Ian E. Sexsmith
Portfolio Manager
22
Table of Contents
| Semiannual Report • 2020 | | |||
Ticker: Investor Shares - PRFIX
Ticker: Institutional Shares - PFPLX
Effective May 1st, Minh Bui joined Lead Portfolio Manager Samantha Palm as Portfolio Manager of the Parnassus Fixed Income Fund. He has more than 15 years of experience at Parnassus in research and portfolio management roles. Mr. Bui served as portfolio manager for the Parnassus Fixed Income Fund from 2008 to 2013 before returning to an exclusive focus on research for several years, and he has been a member of the firm’s fixed income committee since its inception. While he will maintain his role as Senior Analyst covering equities, he will be a valuable resource to help Ms. Palm manage the Fund. As of June 30, 2020, the NAV of the Parnassus Fixed Income Fund was $18.03, producing a gain for the quarter of 3.20% (including dividends). This compares to a gain of 2.90% for the Barclays U.S. Aggregate Bond Index (“Barclays Aggregate Index”) and a gain of 4.95% for the Lipper Core Bond Fund Average, which represents the average return of the funds followed by Lipper that invest at least 85% of assets in domestic investment-grade bonds (“Lipper average”). For the first half of 2020, the Fund posted a gain of 6.65%, as compared to a gain of 6.14% for the Barclays Aggregate Index and a gain of 5.40% for the Lipper average.
Parnassus Fixed Income Fund
| Average Annual Total Returns (%) | ||||||||||||||||||||||||
| for period ended June 30, 2020 | ||||||||||||||||||||||||
| One Year | Three Years | Five Years | Ten Years | Gross Expense Ratio | Net Expense Ratio | |||||||||||||||||||
| Parnassus Fixed Income Fund – Investor Shares | 8.68 | 5.20 | 4.20 | 3.31 | 0.87 | 0.68 | ||||||||||||||||||
| Parnassus Fixed Income Fund – Institutional Shares | 8.99 | 5.46 | 4.42 | 3.42 | 0.49 | 0.45 | ||||||||||||||||||
| Bloomberg Barclays U.S. Aggregate Bond Index | 8.74 | 5.32 | 4.30 | 3.82 | NA | NA | ||||||||||||||||||
| Lipper Core Bond Funds Average | 7.82 | 4.81 | 3.97 | 3.81 | NA | NA | ||||||||||||||||||
The average annual total return for the Parnassus Fixed Income Fund – Institutional Shares from commencement (April 30, 2015) was 4.06%. Performance shown prior to the inception of the Institutional Shares reflects the performance of the Parnassus Fixed Income Fund – Investor Shares and includes expenses that are not applicable to and are higher than those of the Institutional Shares. The performance of the Institutional Shares differs from that shown for the Investor Shares to the extent that the classes do not have the same expenses. Performance data quoted represent past performance and are no guarantee of future returns. Current performance may be lower or higher than the performance data quoted. Current performance information to the most recent month end is available on the Parnassus website (www.parnassus.com). Investment return and principal value will fluctuate, so an investor’s shares, when redeemed, may be worth more or less than their original cost. Returns shown in the table do not reflect the deduction of taxes a shareholder would pay in fund distributions or redemption of shares. The Bloomberg Barclays U.S. Aggregate Bond Index (formerly known as the Barclays U.S. Aggregate Bond Index) is an unmanaged index of bonds, and it is not possible to invest directly in an index. Index figures do not take any expenses, fees or taxes into account, but mutual fund returns do. The estimated impact of individual stocks on the Fund’s performance is provided by FactSet.
Before investing, an investor should carefully consider the investment objectives, risks, charges and expenses of the Fund and should carefully read the prospectus or summary prospectus, which contain this and other information. The prospectus or summary prospectus can be obtained on the Parnassus website or by calling (800) 999 3505. As described in the Fund’s current prospectus dated May 1, 2020, Parnassus Investments has contractually agreed to limit total operating expenses to 0.68% of net assets for the Parnassus Fixed Income Fund – Investor Shares and to 0.45% of net assets for the Parnassus Fixed Income Fund – Institutional Shares. This agreement will not be terminated prior to May 1, 2021, and may be continued indefinitely by the Adviser on a year-to-year basis.
To the left is a table comparing the performance of the Fund with that of the Barclays Aggregate Index and the Lipper average. Average annual total returns are for the one-, three-, five- and ten-year periods. For June 30, the 30-day subsidized SEC yield was 0.35%, and the unsubsidized SEC yield was 0.30%.
Second Quarter in Review
The second quarter was another historic one, as the United States continued to grapple with the novel coronavirus. Despite a tragic escalation in deaths, the markets became jubilant at the prospect of a quick recovery. Investors seemed to overlook accelerating COVID-19 cases and, a nation rocked by social injustice and exceptionally high unemployment. In this historically turbulent quarter, the Parnassus Fixed Income Fund outperformed its index by 30 basis points. However, it trailed its Lipper peer group by 175 basis points, as its holdings were more conservatively positioned than the peer group. So far this year, the Fund is outperforming the Index and its Lipper group by 51 basis points and 125 basis points, respectively. (One basis point is 1/100th of one percent.)
In the quarter, the Fund gained 135 basis points from its positive allocation across fixed income asset classes, as a very substantial overweight position in corporate bonds drove returns. Over the course of the quarter, the Fund held an average of 46.20% of its assets in corporate bonds versus the Index at 26.43%. The Parnassus Fixed Income Fund also benefited from not owning securitized bonds, a sector comprising nearly a third of the index but that only gained 0.96% in the quarter. By comparison, corporate bonds in the index gained 8.86%, and our corporate bond portfolio
23
Table of Contents
| Semiannual Report • 2020 | |||
gained 6.97%. Corporate bond returns for the Fund were dampened by its shorter duration than the Index, at 6.16 years versus 8.37 years.
Selection, or the individual bonds we chose, removed 75 basis points from the total return, principally due to our short-duration position in corporate bonds. This is similar to the Fund’s prior performance so far in 2020. Across the first half of the year, the Fund has accumulated 188 basis points of attribution from positive allocation across fixed income asset classes, while selection has detracted 70 basis points from the total return.
Our best performing assets in the quarter were all corporate bonds. Corporate bonds were penalized in the first quarter as lock downs dried up revenue and credit markets froze, but these bonds came roaring back in the second quarter on optimism and the Federal Reserve’s assistance. Bonds issued by FedEx, with a coupon of 4.75% maturing in November of 2045, recorded the largest gain for the Fund.
The bonds gained 16.09%* in the quarter and contributed 24 basis points to the total return. FedEx reported higher revenue than expected by investors and it continues to take advantage of gains in e-commerce spending. The company has also been instrumental in helping to restore supply chains that have been impacted by COVID-19 across the world.
Bonds issued by Masco, the parent company of popular home improvement brands like Behr Paint and Delta Faucets, were another top performer. The 4.45% coupon issue maturing April of 2025 gained 14.86%, adding 21 basis points to the total return. Masco’s brands remained resilient during the lock down as Americans spent more time in their homes and decided to refresh them. Since the last recession, Masco’s management team has transformed the company to make it more stable and consistent, and their efforts have paid off.
Finally, bonds issued by Cadence Designs maturing in October 2024 with a 4.375% coupon gained 13.26%, adding 18 basis points to the total return. Cadence, which specializes in electronic design automation, has seen revenue growth and healthy booking throughout
the pandemic. However, the bonds were among the Fund’s worst performers in the first quarter. We believe Cadence’s business model was not well understood by investors during the credit freeze in March so the bonds saw a strong rally once the company’s strength became clear.
In a quarter where nearly every part of the fixed income market gained, the Parnassus Fixed Income Fund had very few losers. Several treasury bonds detracted a basis point due to the timing of purchases. The only bond that meaningfully detracted from performance were bonds issued by Nordstrom. These 4.0% coupon bonds maturing October 2024 removed 5 basis points from the total return. While we continue to believe that Nordstrom will survive the upheaval created by e-commerce due to its significant investments in technology and modern retail spaces, the bonds struggled. Given the headwinds that we expect the company to face over the coming year, we divested from the position.
* For this report, we quote total return to the portfolio, which includes price change and dividends.
24
Table of Contents
| Semiannual Report • 2020 | | |||
Parnassus Fixed Income Fund
as of June 30, 2020
(percentage of net assets)
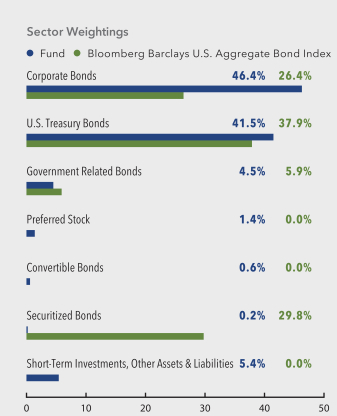
Portfolio characteristics and holdings are subject to change periodically.
Outlook and Strategy
After buckling under stress in the first quarter, the second quarter was exceptionally strong for risk assets, like corporate bonds. Many investors are clearly looking past the impact of COVID-19 on both the United States and globally. There’s no doubt that data has improved since the lockdowns of April, but it’s likely that the economy has simply experienced whiplash from pent-up demand and dislocated supply chains. At the same time, the Federal Reserve intervened to an unprecedented degree, providing the equivalent of a backstop to credit markets.
While it may not be clear how much growth the country will see this year or next, we do believe that certain changes are here to stay. Nearly every management team we spoke to last quarter celebrated the benefits of employees working from home. Consumers have shifted an enormous amount of spending to e-commerce, accelerating the adoption curve for everything from online grocery shopping to remote
exercise classes. Across the country, and the world, technology has become a powerful tool to connect with family, teachers and workplaces. The pandemic has pushed society from technological evolution to revolution.
We have continued to adjust the Fund to reflect today’s environment and, in addition to divesting from Nordstrom, we also divested from Hilton Hotels Corporation. While Hilton is one of the best-run hotel companies, we expect that travel will be restricted – and less appealing – for a long time to come. Corporate credit became more expensive throughout the quarter, but we still found good opportunities to invest in excellent companies. We initiated positions in Lowe’s Companies, Agilent Technologies, Applied Materials, McCormick, Roper Technologies and Becton Dickinson on expectations of future growth and balance sheet strength. Through these additions, corporate bond holdings increased to 47% of the Fund from 42% last quarter. Because the Fund comprise companies that are strategically important to the new economy, we believe it should weather market turbulence well.
Thank you for your investment in the Parnassus Fixed Income Fund.

Samantha D. Palm
Lead Portfolio Manager

Minh Bui
Portfolio Manager
25
Table of Contents
| Semiannual Report • 2020 | |||
We at Parnassus Investments are deeply saddened, though regrettably not surprised, by the tragedy that befell George Floyd. For far too long, many in our country have watched from the sidelines as Black Americans have experienced injustice, strife, terror, hypocrisy and exclusion. Oscar Grant, Michael Brown, Tamir Rice, Eric Garner, Alton Sterling, Sandra Bland, Laquan McDonald, Philando Castile, Trayvon Martin, Walter Scott, Breonna Taylor, Ahmaud Arbery, George Floyd and so many others have had their lives prematurely and unjustly taken from them. They deserved better. We can do better. Our country must do better.
Sometimes a shock is needed to remind us why certain ESG factors are so important. During the first quarter of the year, we were reminded of the importance of workplace health and safety as COVID-19 spread. The virus led to shelter in place requirements that rocked the United States and drove the ascent of the essential worker. Our economy came to a grinding halt with the loss of 40 million jobs and the S&P500 being down 19.60% in the first quarter, with a low 30.43% in March. Following that painful first quarter, during the
second quarter, we witnessed the murder of George Floyd, an overt display of systemic racism that reminded us why community issues are an important part of ESG. People responded to Floyd’s murder with massive protests across the nation seeking meaningful changes in our communities. Companies also took a stand against systemic racism and in favor of the Black Lives Matter movement. Many of these outspoken companies are held by the Parnassus Funds, including those below.
FedEx and Guidewire’s CEOs, Frederick W. Smith and Mike Rosenbaum, were among the first to make public statements about the recent killings of George Floyd, Ahmaud Arbery and Breonna Taylor that included calls to reject racism. While FedEx and Guidewire can do more, credit should be given to both CEOs, who were willing to take a risk by being first movers in raising their voices.
Mastercard, Micron, McCormick and Adobe executives took the highly unusual, but welcome, step of setting aside time during their earnings calls to address systemic racism.
The North Face, Lululemon Athletica, Verizon and many other companies banded together to participate
in the #StopHateForProfitCampaign, a call to action led by the NAACP, the Anti-Defamation League and other organizations. This campaign’s mission is to pull advertising dollars off digital platforms, notably Facebook, for their policies that allow hate speech to flourish.
Several companies promised millions of dollars to help address systemic racism. The Walt Disney Company pledged $5 million to support nonprofit organizations that advance social justice. Alphabet announced a $100 million fund to amplify Black artists’ reach on its YouTube platform. Alphabet also made a separate $100 million commitment to fund Black-led capital firms, startups and other organizations supporting Black American entrepreneurs. Apple’s CEO Tim Cook spoke out about racism during the company’s annual Worldwide Developers Conference keynote and committed $100 million to a new racial equity and justice initiative led by Apple Vice President Lisa Jackson. He also pledged to boost the company’s efforts to support Black colleges and educational institutions that focus on underserved populations.
Amazon’s CEO, Jeff Bezos, was criticized attacked for standing up against systemic racism. Bezos posted a screenshot of an email he received from a disgruntled customer who used disparaging words about Black Americans to explain why he was canceling his orders. Bezos replied that he is happy to lose this type of customer.
Some companies exited certain businesses that negatively impact Black Americans and other minority groups. IBM shut down its facial recognition business, citing that the company does not condone the use of any technology for mass surveillance, racial profiling, basic human rights violations or any other purpose not consistent with the firm’s values. Microsoft announced that it would stop selling its facial recognition software to the police until this type of software becomes federally regulated.
We live in a society where everyone can pursue positive change. I’m thankful that our firm and our investors can urge corporations to use their power to help bring about that change. Parnassus Investments’ most impactful tool is our ability to allocate capital. When we choose investments, we look for opportunities to foster ESG progress, including on issues of entrenched racism and essential workers’
26
Table of Contents
| Semiannual Report • 2020 | | |||
safety. We also encourage companies we hold to continue doing their part to address systemic racism and other ESG issues in a meaningful way.
Thank you for your investment in the Parnassus Funds. It is a privilege to have you as an investor.
Sincerely,

Iyassu Essayas
Director of ESG Research
27
Table of Contents
| Semiannual Report • 2020 | |||
As a shareholder of the Funds, you incur ongoing costs, which include portfolio management fees, administrative fees, shareholder reports, and other fund expenses. The Funds do not charge transaction fees, so you do not incur transaction costs such as sales charges (loads) on purchase payments, reinvested dividends, or other distributions, redemption fees, and exchange fees. The information on this page is intended to help you understand your ongoing costs of investing in the Funds and to compare these costs with the ongoing costs of investing in other mutual funds.
The following example is based on an investment of $1,000 invested at the beginning of the most recent six-month period and held for the period of January 1, 2020 through June 30, 2020.
Actual Expenses
In the example below, the first line for each Fund provides information about actual account values and actual expenses. You may use the information in this line, together with the amount you invested, to estimate the expenses that you paid over the period. Simply divide your account value by $1,000 (for example, $8,600 account value divided by $1,000 = 8.6), then multiply the result by the number in the first
line under the heading entitled “Expenses Paid During Period” to estimate the expenses you paid on your account during this period.
Hypothetical Example for Comparison Purposes
The second line of each Fund provides information about hypothetical account values and hypothetical expenses based on the Fund’s expense ratio and an assumed rate of return of 5% per year before expenses, which is not the Fund’s actual return. You may compare the ongoing costs of investing in the Fund with other mutual funds by comparing this 5% hypothetical example with the 5% hypothetical examples that appear in the shareholder reports of other funds.
The hypothetical account values and expenses may not be used to estimate the actual ending account balance or expenses you paid for the period.
Please note that the expenses shown in the table are meant to highlight only your ongoing costs in these Funds. Therefore, the second line of each Fund is useful in comparing only ongoing costs and will not help you determine the relative total costs of owning other mutual funds, which may include transactional costs such as loads.
| Fund Expense Ratio | Beginning Account Value January 1, 2020 | Ending Account Value June 30, 2020 | Expenses Paid During Period | |||||||||||||||||||||
| Parnassus Core Equity Fund - Investor Shares: Actual* | 0.86% | $1,000.00 | $979.40 | $4.23 | ||||||||||||||||||||
| Hypothetical (5% before expenses) | 0.86% | $1,000.00 | $1,020.59 | $4.32 | ||||||||||||||||||||
| Parnassus Core Equity Fund - Institutional Shares: Actual* | 0.63% | $1,000.00 | $980.70 | $3.10 | ||||||||||||||||||||
| Hypothetical (5% before expenses) | 0.63% | $1,000.00 | $1,021.73 | $3.17 | ||||||||||||||||||||
| Parnassus Mid Cap Fund - Investor Shares: Actual* | 0.99% | $1,000.00 | $916.40 | $4.72 | ||||||||||||||||||||
| Hypothetical (5% before expenses) | 0.99% | $1,000.00 | $1,019.94 | $4.97 | ||||||||||||||||||||
| Parnassus Mid Cap Fund - Institutional Shares: Actual* | 0.75% | $1,000.00 | $917.60 | $3.58 | ||||||||||||||||||||
| Hypothetical (5% before expenses) | 0.75% | $1,000.00 | $1,021.13 | $3.77 | ||||||||||||||||||||
| Parnassus Endeavor Fund - Investor Shares: Actual* | 0.95% | $1,000.00 | $922.70 | $4.54 | ||||||||||||||||||||
| Hypothetical (5% before expenses) | 0.95% | $1,000.00 | $1,020.14 | $4.77 | ||||||||||||||||||||
| Parnassus Endeavor Fund - Institutional Shares: Actual* | 0.71% | $1,000.00 | $924.10 | $3.40 | ||||||||||||||||||||
| Hypothetical (5% before expenses) | 0.71% | $1,000.00 | $1,021.33 | $3.57 | ||||||||||||||||||||
| Parnassus Mid Cap Growth Fund - Investor Shares: Actual* | 0.84% | $1,000.00 | $1,010.30 | $4.20 | ||||||||||||||||||||
| Hypothetical (5% before expenses) | 0.84% | $1,000.00 | $1,020.69 | $4.22 | ||||||||||||||||||||
| Parnassus Mid Cap Growth Fund - Institutional Shares: Actual* | 0.68% | $1,000.00 | $1,011.10 | $3.40 | ||||||||||||||||||||
| Hypothetical (5% before expenses) | 0.68% | $1,000.00 | $1,021.48 | $3.42 | ||||||||||||||||||||
| Parnassus Fixed Income Fund - Investor Shares: Actual* | 0.68% | $1,000.00 | $1,066.50 | $3.49 | ||||||||||||||||||||
| Hypothetical (5% before expenses) | 0.68% | $1,000.00 | $1,021.48 | $3.42 | ||||||||||||||||||||
| Parnassus Fixed Income Fund - Institutional Shares: Actual* | 0.45% | $1,000.00 | $1,068.20 | $2.31 | ||||||||||||||||||||
| Hypothetical (5% before expenses) | 0.45% | $1,000.00 | $1,022.63 | $2.26 | ||||||||||||||||||||
*Expenses are calculated using the Funds’ annualized expense ratios, which represent ongoing expense as a percentage of net assets for the six months ended June 30, 2020. Expenses are calculated by multiplying the annualized expense ratio by the average account value of the period; then multiplying the result by the number of days in the most recent one-half year period (182); and then dividing that result by the number of days in the current fiscal year (366). Expense ratios for the most recent half year may differ from expense ratios based on one-year data in the financial highlights.
28
Table of Contents
| Semiannual Report • 2020 | | |||
Portfolio of Investments as of June 30, 2020 (unaudited)
| Equities | Shares | Market Value ($) | ||||||
| Air Freight & Logistics (2.8%) | ||||||||
| FedEx Corp. | 3,615,224 | 506,926,709 | ||||||
|
| |||||||
| Airlines (0.9%) | ||||||||
| Southwest Airlines Co. | 4,677,568 | 159,879,274 | ||||||
|
| |||||||
| Apparel & Luxury Goods (2.2%) | ||||||||
| VF Corp. | 6,551,767 | 399,264,681 | ||||||
|
| |||||||
| Biotechnology (1.3%) | ||||||||
| Gilead Sciences Inc. | 3,104,258 | 238,841,611 | ||||||
|
| |||||||
| Capital Markets (4.6%) | ||||||||
| Charles Schwab Corp. | 9,065,935 | 305,884,647 | ||||||
| CME Group Inc. | 3,343,802 | 543,501,577 | ||||||
|
| |||||||
| 849,386,224 | ||||||||
|
| |||||||
| Chemicals (3.2%) | ||||||||
| Linde plc | 2,745,163 | 582,276,524 | ||||||
|
| |||||||
| Commercial Services & Supplies (2.6%) |
| |||||||
| Waste Management Inc. | 4,575,682 | 484,610,481 | ||||||
|
| |||||||
| Communications Equipment (2.0%) |
| |||||||
| Cisco Systems Inc. | 7,928,269 | 369,774,466 | ||||||
|
| |||||||
| Diversified Telecom Services (3.2%) |
| |||||||
| Verizon Communications Inc. | 10,638,510 | 586,501,056 | ||||||
|
| |||||||
| Equity Real Estate Investment Trusts (2.5%) | ||||||||
| AvalonBay Communities Inc. | 820,393 | 126,865,574 | ||||||
| Digital Realty Trust Inc. | 2,290,800 | 325,545,588 | ||||||
|
| |||||||
| 452,411,162 | ||||||||
|
| |||||||
| Food & Staples Retailing (3.3%) | ||||||||
| Costco Wholesale Corp. | 1,962,609 | 595,082,675 | ||||||
|
| |||||||
| Food Products (2.4%) | ||||||||
| Mondelez International Inc., Class A | 8,547,153 | 437,015,933 | ||||||
|
| |||||||
| Health Care Equipment (6.9%) | ||||||||
| Becton Dickinson and Company | 2,133,324 | 510,440,433 | ||||||
| Danaher Corp. | 4,300,363 | 760,433,189 | ||||||
|
| |||||||
| 1,270,873,622 | ||||||||
|
| |||||||
| Health Care Technology (1.9%) | ||||||||
| Cerner Corp. | 5,021,695 | 344,237,192 | ||||||
|
| |||||||
| Household Products (3.6%) | ||||||||
| The Clorox Company | 1,757,943 | 385,639,956 | ||||||
| The Procter & Gamble Co. | 2,288,340 | 273,616,814 | ||||||
|
| |||||||
| 659,256,770 | ||||||||
|
| |||||||
| Equities | Shares | Market Value ($) | ||||||
| Interactive Media & Services (4.0%) |
| |||||||
| Alphabet Inc., Class A q | 519,465 | 736,627,343 | ||||||
|
| |||||||
| Internet (5.4%) | ||||||||
| Amazon.com Inc. q | 358,594 | 989,296,299 | ||||||
|
| |||||||
| Internet & Catalog Retail (2.3%) |
| |||||||
| Booking Holdings Inc. q | 263,653 | 419,825,218 | ||||||
|
| |||||||
| IT Services (3.3%) | ||||||||
| Mastercard Inc., Class A | 2,073,542 | 613,146,369 | ||||||
|
| |||||||
| Machinery (5.3%) | ||||||||
| Deere & Co. | 3,278,931 | 515,284,007 | ||||||
| Pentair plc | 6,224,657 | 236,474,719 | ||||||
| Xylem Inc. | 3,431,400 | 222,903,744 | ||||||
|
| |||||||
| 974,662,470 | ||||||||
|
| |||||||
| Media (5.0%) | ||||||||
| Comcast Corp., Class A | 18,639,071 | 726,550,988 | ||||||
| The Walt Disney Co. | 1,637,304 | 182,575,769 | ||||||
|
| |||||||
| 909,126,757 | ||||||||
|
| |||||||
| Professional Services (2.4%) |
| |||||||
| Verisk Analytics Inc. | 2,576,286 | 438,483,877 | ||||||
|
| |||||||
| Road & Rail (1.3%) | ||||||||
| Kansas City Southern | 1,547,682 | 231,053,446 | ||||||
|
| |||||||
| Semiconductor Equipment (9.7%) |
| |||||||
| Applied Materials Inc. | 10,104,888 | 610,840,480 | ||||||
| Intel Corp. | 6,222,714 | 372,304,979 | ||||||
| Micron Technology Inc. q | 6,381,331 | 328,766,173 | ||||||
| NVIDIA Corp. | 1,239,594 | 470,934,157 | ||||||
|
| |||||||
| 1,782,845,789 | ||||||||
|
| |||||||
| Software (14.2%) | ||||||||
| Adobe Inc. q | 916,322 | 398,884,130 | ||||||
| Cadence Design Systems Inc. q | 4,883,142 | 468,586,306 | ||||||
| Microsoft Corp. | 6,155,888 | 1,252,784,767 | ||||||
| Synopsys Inc. q | 2,426,672 | 473,201,040 | ||||||
|
| |||||||
| 2,593,456,243 | ||||||||
|
| |||||||
| Technology Hardware (1.2%) |
| |||||||
| Apple Inc. | 604,378 | 220,477,094 | ||||||
|
| |||||||
| Total investment in equities (97.5%) (cost $13,853,207,713) |
| 17,845,339,285 | ||||||
|
| |||||||
The accompanying notes are an integral part of these financial statements.
29
Table of Contents
| Semiannual Report • 2020 | |||
Parnassus Core Equity Fund
Portfolio of Investments as of June 30, 2020 (unaudited) (continued)
| Short-Term Securities | Interest Rate | Maturity Date | Principal Amount ($) | Market Value ($) | ||||||||||||
| Certificates of Deposit (0.0%) a | ||||||||||||||||
| Providence Bank & Trust | 0.50 | % | 09/24/2020 | 250,000 | 247,677 | |||||||||||
| Self-Help Federal Credit Union | 2.12 | % | 10/16/2020 | 250,000 | 247,085 | |||||||||||
|
| |||||||||||||||
| 494,762 | ||||||||||||||||
|
| |||||||||||||||
| Certificates of Deposit Account Registry Service (0.0%) a |
| |||||||||||||||
| CDARS agreement with Beneficial State Bank, dated 03/12/2020 Participating depository institutions: Androscoggin Savings Bank, par 238,500; Bank of Weston, par 238,500; Catskill Hudson Bank, par 92,000; Industrial Bank, par 238,500; Primary Bank, par 238,500; Prime Alliance Bank, par 238,500; Regent Bank, par 238,500; The State Bank and Trust Company, par 238,500; United Bank, par 238,500; (cost $1,944,397) | 1.20 | % | 03/11/2021 | 2,000,000 | 1,944,397 | |||||||||||
|
| |||||||||||||||
| Community Development Loans (0.0%) a | ||||||||||||||||
| BlueHub Loan Fund | 1.00 | % | 04/15/2021 | 100,000 | 95,187 | |||||||||||
| New Hampshire Community Loan Fund | 1.00 | % | 07/31/2020 | 500,000 | 497,534 | |||||||||||
| Root Capital Loan Fund | 1.25 | % | 02/01/2021 | 200,000 | 192,926 | |||||||||||
| Vermont Community Loan Fund | 1.00 | % | 04/15/2021 | 100,000 | 95,187 | |||||||||||
|
| |||||||||||||||
| 880,834 | ||||||||||||||||
|
| |||||||||||||||
| Time Deposits (3.7%) | ||||||||||||||||
| ANZ, London | 0.01 | % | 07/01/2020 | 300,000,000 | 300,000,000 | |||||||||||
| Citibank, New York | 0.01 | % | 07/01/2020 | 279,116,050 | 279,116,050 | |||||||||||
| Sumitomo, Tokyo | 0.01 | % | 07/01/2020 | 106,926,825 | 106,926,825 | |||||||||||
|
| |||||||||||||||
| 686,042,875 | ||||||||||||||||
|
| |||||||||||||||
| Total short-term securities (3.7%) (cost $689,362,868) | 689,362,868 | |||||||||||||||
|
| |||||||||||||||
| Total securities (101.2%) (cost $14,542,570,581) | 18,534,702,153 | |||||||||||||||
|
| |||||||||||||||
| Other assets and liabilities (-1.2%) | (227,392,695 | ) | ||||||||||||||
|
| |||||||||||||||
| Total net assets (100.0%) | 18,307,309,458 | |||||||||||||||
|
| |||||||||||||||
q This security is non-income producing. a Market value adjustments have been applied to these securities to reflect potential early withdrawal. |
| |||||||||||||||
plc Public Limited Company | ||||||||||||||||
The accompanying notes are an integral part of these financial statements.
30
Table of Contents
| Semiannual Report • 2020 | | |||
Portfolio of Investments as of June 30, 2020 (unaudited)
| Equities | Shares | Market Value ($) | ||||||
| Air Freight & Logistics (4.6%) | ||||||||
| C.H. Robinson Worldwide Inc. | 1,544,653 | 122,120,266 | ||||||
| FedEx Corp. | 878,338 | 123,160,554 | ||||||
|
| |||||||
| 245,280,820 | ||||||||
|
| |||||||
| Apparel & Luxury Goods (2.0%) | ||||||||
| VF Corp. | 1,779,785 | 108,460,098 | ||||||
|
| |||||||
| Banks (3.4%) | ||||||||
| First Horizon National Corp. | 8,157,022 | 81,243,939 | ||||||
| First Republic Bank | 959,059 | 101,650,664 | ||||||
|
| |||||||
| 182,894,603 | ||||||||
|
| |||||||
| Capital Markets (0.5%) | ||||||||
| SEI Investments Co. | 461,351 | 25,365,078 | ||||||
|
| |||||||
| Chemicals (2.1%) | ||||||||
| PPG Industries Inc. | 1,079,066 | 114,445,740 | ||||||
|
| |||||||
| Commercial Services & Supplies (3.8%) |
| |||||||
| Republic Services Inc. | 2,444,604 | 200,579,758 | ||||||
|
| |||||||
| Communications Equipment (1.2%) | ||||||||
| Motorola Solutions Inc. | 454,751 | 63,724,258 | ||||||
|
| |||||||
| Electric Utilities (3.7%) | ||||||||
| IDACORP Inc. | 1,331,356 | 116,320,574 | ||||||
| Portland General Electric | 1,937,186 | 80,993,747 | ||||||
|
| |||||||
| 197,314,321 | ||||||||
|
| |||||||
| Electronic Equipment Instruments (2.8%) |
| |||||||
| Trimble Inc. q | 3,448,427 | 148,937,562 | ||||||
|
| |||||||
| Equity Real Estate Investment Trusts (8.4%) | ||||||||
| Americold Realty Trust | 3,622,565 | 131,499,110 | ||||||
| AvalonBay Communities Inc. | 361,790 | 55,947,206 | ||||||
| Digital Realty Trust Inc. | 940,746 | 133,689,414 | ||||||
| Public Storage | 278,907 | 53,519,464 | ||||||
| SBA Communications Corp. | 247,140 | 73,627,949 | ||||||
|
| |||||||
| 448,283,143 | ||||||||
|
| |||||||
| Food Products (2.1%) | ||||||||
| McCormick & Co. | 609,291 | 109,312,898 | ||||||
|
| |||||||
| Health Care Equipment (8.8%) | ||||||||
| Dentsply Sirona Inc. | 1,658,923 | 73,092,147 | ||||||
| Hologic Inc. q | 3,774,524 | 215,147,868 | ||||||
| Teleflex Inc. | 493,876 | 179,760,986 | ||||||
|
| |||||||
| 468,001,001 | ||||||||
|
| |||||||
| Health Care Technology (3.4%) | ||||||||
| Cerner Corp. | 2,609,993 | 178,915,020 | ||||||
|
| |||||||
| Household Products (2.5%) | ||||||||
| The Clorox Company | 604,004 | 132,500,357 | ||||||
|
| |||||||
| Equities | Shares | Market Value ($) | ||||||
| Industrial Conglomerates (2.8%) | ||||||||
| Roper Technologies Inc. | 379,205 | 147,230,133 | ||||||
|
| |||||||
| Insurance (1.1%) | ||||||||
| First American Financial Corp. | 1,168,021 | 56,088,368 | ||||||
|
| |||||||
| IT Services (3.0%) | ||||||||
| Jack Henry & Associates Inc. | 857,155 | 157,742,235 | ||||||
|
| |||||||
| Life Sciences Tools & Services (2.1%) |
| |||||||
| Agilent Technologies Inc. | 1,241,850 | 109,742,285 | ||||||
|
| |||||||
| Machinery (5.0%) | ||||||||
| Pentair plc | 2,971,647 | 112,892,870 | ||||||
| Xylem Inc. | 2,323,499 | 150,934,495 | ||||||
|
| |||||||
| 263,827,365 | ||||||||
|
| |||||||
| Media (3.4%) | ||||||||
| Cable One Inc. | 48,989 | 86,948,127 | ||||||
| Shaw Communications Inc., Class B l | 5,609,891 | 91,777,817 | ||||||
|
| |||||||
| 178,725,944 | ||||||||
|
| |||||||
| Multi-Utilities (1.3%) | ||||||||
| MDU Resources Group Inc. | 3,086,373 | 68,455,753 | ||||||
|
| |||||||
| Professional Services (3.0%) | ||||||||
| Verisk Analytics Inc. | 927,427 | 157,848,075 | ||||||
|
| |||||||
| Retail (2.5%) | ||||||||
| Burlington Stores Inc. q | 684,911 | 134,879,523 | ||||||
|
| |||||||
| Road & Rail (1.5%) | ||||||||
| Kansas City Southern | 548,877 | 81,941,847 | ||||||
|
| |||||||
| Semiconductor Equipment (4.5%) |
| |||||||
| KLA Corporation | 671,459 | 130,585,346 | ||||||
| Maxim Integrated Products Inc. | 1,789,362 | 108,453,231 | ||||||
|
| |||||||
| 239,038,577 | ||||||||
|
| |||||||
| Software (13.8%) | ||||||||
| Autodesk Inc. q | 536,734 | 128,381,405 | ||||||
| Cadence Design Systems Inc. q | 1,646,204 | 157,969,736 | ||||||
| Guidewire Software Inc. q | 819,090 | 90,796,127 | ||||||
| Nuance Communications Inc. q | 7,611,335 | 192,604,832 | ||||||
| Synopsys Inc. q | 839,291 | 163,661,745 | ||||||
|
| |||||||
| 733,413,845 | ||||||||
|
| |||||||
| Specialty Retail (2.3%) | ||||||||
| O’Reilly Automotive Inc. q | 296,407 | 124,985,940 | ||||||
|
| |||||||
| Technology Hardware (1.5%) | ||||||||
| Western Digital Corporation | 1,801,417 | 79,532,561 | ||||||
|
| |||||||
| Total investment in equities (97.1%) (cost $4,546,112,829) |
| 5,157,467,108 | ||||||
|
| |||||||
The accompanying notes are an integral part of these financial statements.
31
Table of Contents
| Semiannual Report • 2020 | |||
Parnassus Mid Cap Fund
Portfolio of Investments as of June 30, 2020 (unaudited) (continued)
| Short-Term Securities | Interest Rate | Maturity Date | Principal Amount ($) | Market Value ($) | ||||||||||||
| Certificates of Deposit (0.0%) a | ||||||||||||||||
| Beneficial State Bank | 0.65 | % | 03/27/2021 | 250,000 | 241,768 | |||||||||||
| Beneficial State Bank | 0.50 | % | 04/25/2021 | 250,000 | 242,630 | |||||||||||
| Providence Bank & Trust | 0.39 | % | 03/22/2021 | 250,000 | 242,765 | |||||||||||
|
| |||||||||||||||
| 727,163 | ||||||||||||||||
|
| |||||||||||||||
| Time Deposits (3.2%) | ||||||||||||||||
| JPM Chase, New York | 0.01 | % | 07/01/2020 | 115,883,629 | 115,883,629 | |||||||||||
| Sumitomo, Tokyo | 0.01 | % | 07/01/2020 | 51,542,587 | 51,542,587 | |||||||||||
|
| |||||||||||||||
| 167,426,216 | ||||||||||||||||
|
| |||||||||||||||
| Securities Purchased with Cash Collateral from Securities Lending |
| |||||||||||||||
| Registered Investment Companies (0.0%) | ||||||||||||||||
| Invesco Aim Government & Agency Portfolio | ||||||||||||||||
| Short-Term Investments Trust, Institutional Class | 0.10 | % | 352,085 | |||||||||||||
|
| |||||||||||||||
| Total short-term securities (3.2%) (cost $168,505,464) | 168,505,464 | |||||||||||||||
|
| |||||||||||||||
| Total securities (100.3%) (cost $4,714,618,293) | 5,325,972,572 | |||||||||||||||
|
| |||||||||||||||
| Payable upon return of securities loaned (0.0%) | (352,085 | ) | ||||||||||||||
|
| |||||||||||||||
| Other assets and liabilities (-0.3%) | (13,779,544 | ) | ||||||||||||||
|
| |||||||||||||||
| Total net assets (100.0%) | 5,311,840,943 | |||||||||||||||
|
| |||||||||||||||
q This security is non-income producing. l This security, or partial position of this security, was on loan at June 30, 2020. The total value of the securities on loan at June 30, 2020 was $342,836. a Market value adjustments have been applied to these securities to reflect potential early withdrawal. |
| |||||||||||||||
plc Public Limited Company | ||||||||||||||||
The accompanying notes are an integral part of these financial statements.
32
Table of Contents
| Semiannual Report • 2020 | | |||
Portfolio of Investments as of June 30, 2020 (unaudited)
| Equities | Shares | Market Value ($) | ||||||
| Air Freight & Logistics (6.5%) | ||||||||
| Expeditors International of Washington Inc. | 1,000,000 | 76,040,000 | ||||||
| FedEx Corp. | 750,000 | 105,165,000 | ||||||
|
| |||||||
| 181,205,000 | ||||||||
|
| |||||||
| Airlines (3.6%) | ||||||||
| Alaska Air Group Inc. | 2,750,000 | 99,715,000 | ||||||
|
| |||||||
| Apparel & Luxury Goods (3.8%) | ||||||||
| Hanesbrands Inc. | 5,622,920 | 63,482,767 | ||||||
| VF Corp. | 700,000 | 42,658,000 | ||||||
|
| |||||||
| 106,140,767 | ||||||||
|
| |||||||
| Banks (2.6%) | ||||||||
| Bank of America Corp. | 3,000,000 | 71,250,000 | ||||||
| SVB Financial Group q | 10,000 | 2,155,300 | ||||||
|
| |||||||
| 73,405,300 | ||||||||
|
| |||||||
| Capital Markets (6.0%) | ||||||||
| Charles Schwab Corp. | 4,950,000 | 167,013,000 | ||||||
|
| |||||||
| Communications Equipment (4.2%) | ||||||||
| Cisco Systems Inc. | 2,500,000 | 116,600,000 | ||||||
|
| |||||||
| Computer Peripherals (1.2%) | ||||||||
| Seagate Technology | 700,000 | 33,887,000 | ||||||
|
| |||||||
| Consumer Finance (9.3%) | ||||||||
| American Express Co. | 900,000 | 85,680,000 | ||||||
| Capital One Financial Corp. | 2,000,000 | 125,180,000 | ||||||
| Discover Financial Services | 1,000,000 | 50,090,000 | ||||||
|
| |||||||
| 260,950,000 | ||||||||
|
| |||||||
| Equities | Shares | Market Value ($) | ||||||
| Insurance (2.1%) | ||||||||
| The Progressive Corp. | 750,000 | 60,082,500 | ||||||
|
| |||||||
| Interactive Media (2.0%) | ||||||||
| Alphabet Inc., Class A q | 40,000 | 56,722,000 | ||||||
|
| |||||||
| IT Services (4.0%) | ||||||||
| International Business Machine Corp. | 170,000 | 20,530,900 | ||||||
| Mastercard Inc., Class A | 310,000 | 91,667,000 | ||||||
|
| |||||||
| 112,197,900 | ||||||||
|
| |||||||
| Life Sciences & Services (3.2%) | ||||||||
| Agilent Technologies Inc. | 1,000,000 | 88,370,000 | ||||||
|
| |||||||
| Machinery (2.0%) | ||||||||
| Cummins Inc. | 330,000 | 57,175,800 | ||||||
|
| |||||||
| Retail (4.7%) | ||||||||
| The Gap Inc. | 10,500,000 | 132,510,000 | ||||||
|
| |||||||
| Semiconductor Equipment (28.9%) |
| |||||||
| Applied Materials Inc. | 5,300,000 | 320,385,000 | ||||||
| Intel Corp. | 10,000 | 598,300 | ||||||
| Lam Research Corp. | 500,000 | 161,730,000 | ||||||
| Micron Technology Inc. q | 6,400,000 | 329,728,000 | ||||||
|
| |||||||
| 812,441,300 | ||||||||
|
| |||||||
| Technology Hardware (3.9%) | ||||||||
| Apple Inc. | 300,000 | 109,440,000 | ||||||
|
| |||||||
| Trading Companies & Distributors (3.7%) |
| |||||||
| W.W. Grainger Inc. | 330,000 | 103,672,800 | ||||||
|
| |||||||
| Total investment in equities (91.7%) (cost $2,169,368,544) |
| 2,571,528,367 | ||||||
|
| |||||||
The accompanying notes are an integral part of these financial statements.
33
Table of Contents
| Semiannual Report • 2020 | |||
Parnassus Endeavor Fund
Portfolio of Investments as of June 30, 2020 (unaudited) (continued)
| Short-Term Securities | Interest Rate | Maturity Date | Principal Amount ($) | Market Value ($) | ||||||||||||
| Certificates of Deposit (0.0%) a | ||||||||||||||||
| Providence Bank & Trust | 0.50 | % | 02/03/2021 | 250,000 | 244,051 | |||||||||||
|
| |||||||||||||||
| Certificates of Deposit Account Registry Service (0.0%) a | ||||||||||||||||
| CDARS agreement with Beneficial State Bank, dated 03/12/2020 Participating depository institutions: Androscoggin Savings Bank, par 238,500; Primary Bank, par 23,000; Regent Bank, par 238,500; (cost $486,098) | 1.20 | % | 03/11/2021 | 500,000 | 486,098 | |||||||||||
|
| |||||||||||||||
| Community Development Loans (0.0%) a | ||||||||||||||||
| Root Capital Loan Fund | 1.25 | % | 02/01/2021 | 100,000 | 96,463 | |||||||||||
|
| |||||||||||||||
| Time Deposits (7.7%) | ||||||||||||||||
| Banco Santander, Frankfurt | 0.01 | % | 07/01/2020 | 216,249,024 | 216,249,024 | |||||||||||
|
| |||||||||||||||
| Total short-term securities (7.7%) (cost $217,075,636) | 217,075,636 | |||||||||||||||
|
| |||||||||||||||
| Total securities (99.4%) (cost $2,386,444,180) | 2,788,604,003 | |||||||||||||||
|
| |||||||||||||||
| Other assets and liabilities (0.6%) | 16,388,071 | |||||||||||||||
|
| |||||||||||||||
| Total net assets (100.0%) | 2,804,992,074 | |||||||||||||||
|
| |||||||||||||||
q This security is non-income producing. a Market value adjustments have been applied to these securities to reflect potential early withdrawal. |
| |||||||||||||||
The accompanying notes are an integral part of these financial statements.
34
Table of Contents
| Semiannual Report • 2020 | | |||
Portfolio of Investments as of June 30, 2020 (unaudited)
| Equities | Shares | Market Value ($) | ||||||
| Air Freight & Logistics (3.0%) | ||||||||
| C.H. Robinson Worldwide Inc. | 356,256 | 28,165,599 | ||||||
|
| |||||||
| Apparel & Luxury Goods (1.3%) | ||||||||
| Lululemon Athletica Inc. q | 38,695 | 12,073,227 | ||||||
|
| |||||||
| Biotechnology (1.2%) | ||||||||
| BioMarin Pharmaceutical Inc. q | 89,720 | 11,066,065 | ||||||
|
| |||||||
| Capital Markets (4.4%) | ||||||||
| MarketAxess Holdings Inc. | 37,311 | 18,689,826 | ||||||
| Morningstar Inc. | 161,312 | 22,740,153 | ||||||
|
| |||||||
| 41,429,979 | ||||||||
|
| |||||||
| Commercial Services & Supplies (5.9%) |
| |||||||
| CoStar Group Inc. q | 39,586 | 28,132,583 | ||||||
| Waste Connections Inc. | 289,294 | 27,132,884 | ||||||
|
| |||||||
| 55,265,467 | ||||||||
|
| |||||||
| Distributors (2.2%) | ||||||||
| Pool Corporation | 75,781 | 20,602,580 | ||||||
|
| |||||||
| Electronic Equipment Instruments (2.0%) |
| |||||||
| Trimble Inc. q | 443,594 | 19,158,825 | ||||||
|
| |||||||
| Equity Real Estate Investment Trusts (2.7%) | ||||||||
| Americold Realty Trust | 361,820 | 13,134,066 | ||||||
| SBA Communications Corporation | 41,239 | 12,285,923 | ||||||
|
| |||||||
| 25,419,989 | ||||||||
|
| |||||||
| Food & Staples Retailing (2.0%) | ||||||||
| Grocery Outlet Holding Corp. q | 447,738 | 18,267,710 | ||||||
|
| |||||||
| Food Products (2.1%) | ||||||||
| McCormick & Co. | 107,316 | 19,253,564 | ||||||
|
| |||||||
| Health Care Equipment (6.5%) | ||||||||
| Dentsply Sirona Inc. | 425,437 | 18,744,754 | ||||||
| IDEXX Laboratories Inc. q | 72,901 | 24,068,994 | ||||||
| Teleflex Inc. | 49,423 | 17,988,984 | ||||||
|
| |||||||
| 60,802,732 | ||||||||
|
| |||||||
| Health Care Technology (4.3%) | ||||||||
| Cerner Corp. | 434,565 | 29,789,431 | ||||||
| Veeva Systems Inc. q | 44,926 | 10,531,553 | ||||||
|
| |||||||
| 40,320,984 | ||||||||
|
| |||||||
| Insurance (0.9%) | ||||||||
| SelectQuote Inc. q l | 329,180 | 8,338,129 | ||||||
|
| |||||||
| IT Services (8.0%) | ||||||||
| Broadridge Financial Solutions Inc. | 144,517 | 18,236,600 | ||||||
| Jack Henry & Associates Inc. | 114,717 | 21,111,369 | ||||||
| Square Inc., Class A q | 338,588 | 35,531,425 | ||||||
|
| |||||||
| 74,879,394 | ||||||||
|
| |||||||
| Equities | Shares | Market Value ($) | ||||||
| Life Sciences Tools & Services (6.1%) | ||||||||
| Agilent Technologies Inc. | 326,840 | 28,882,851 | ||||||
| Illumina Inc. q | 76,787 | 28,438,065 | ||||||
|
| |||||||
| 57,320,916 | ||||||||
|
| |||||||
| Machinery (1.9%) | ||||||||
| Xylem Inc. | 267,823 | 17,397,782 | ||||||
|
| |||||||
| Media (4.0%) | ||||||||
| Cable One Inc. | 9,642 | 17,113,104 | ||||||
| The New York Times Company | 477,961 | 20,088,701 | ||||||
|
| |||||||
| 37,201,805 | ||||||||
|
| |||||||
| Professional Services (5.2%) | ||||||||
| Thomson Reuters Corp. l | 365,841 | 24,866,213 | ||||||
| Verisk Analytics Inc. | 136,812 | 23,285,402 | ||||||
|
| |||||||
| 48,151,615 | ||||||||
|
| |||||||
| Retail (2.7%) | ||||||||
| Burlington Stores Inc. q | 129,329 | 25,468,760 | ||||||
|
| |||||||
| Road & Rail (2.7%) | ||||||||
| Old Dominion Freight Lines Inc. | 148,537 | 25,190,390 | ||||||
|
| |||||||
| Semiconductor Equipment (4.5%) | ||||||||
| KLA Corporation | 151,271 | 29,419,184 | ||||||
| Monolithic Power Systems Inc. | 51,414 | 12,185,118 | ||||||
|
| |||||||
| 41,604,302 | ||||||||
|
| |||||||
| Software (20.3%) | ||||||||
| Ansys Inc. q | 62,067 | 18,106,806 | ||||||
| Autodesk Inc. q | 141,835 | 33,925,514 | ||||||
| Avalara Inc. q | 95,922 | 12,766,259 | ||||||
| Cadence Design Systems Inc q | 308,155 | 29,570,554 | ||||||
| Fair Isaac Corporation q | 25,061 | 10,476,500 | ||||||
| Guidewire Software Inc. q | 190,170 | 21,080,344 | ||||||
| Nuance Communications Inc. q | 425,081 | 10,756,675 | ||||||
| Synopsys Inc. q | 159,137 | 31,031,715 | ||||||
| The Trade Desk Inc., Class A q | 54,830 | 22,288,395 | ||||||
|
| |||||||
| 190,002,762 | ||||||||
|
| |||||||
| Special Retail (3.0%) | ||||||||
| O’Reilly Automotive Inc. q | 66,772 | 28,155,749 | ||||||
|
| |||||||
| Technology Hardware (1.4%) | ||||||||
| Western Digital Corp. | 302,218 | 13,342,925 | ||||||
|
| |||||||
| Total investment in equities (98.3%) (cost $751,208,830) | 918,881,250 | |||||||
|
| |||||||
The accompanying notes are an integral part of these financial statements.
35
Table of Contents
| Semiannual Report • 2020 | |||
Parnassus Mid Cap Growth Fund
Portfolio of Investments as of June 30, 2020 (unaudited) (continued)
| Short-Term Securities | Interest Rate | Maturity Date | Principal Amount ($) | Market Value ($) | ||||||||||||
| Certificates of Deposit (0.0%) a | ||||||||||||||||
| Beneficial State Bank | 1.21 | % | 01/15/2021 | 250,000 | 244,590 | |||||||||||
|
| |||||||||||||||
| Certificates of Deposit Account Registry Service (0.1%) a | ||||||||||||||||
| CDARS agreement with Beneficial State Bank, dated 03/12/2020 Participating depository institutions: Adroscoggin Savings Bank, par 238,500; Primary Bank, par 23,000; Regent Bank, par 238,500; (cost $486,099) | 1.20 | % | 03/11/2021 | 500,000 | 486,099 | |||||||||||
|
| |||||||||||||||
| Community Development Loans (0.0%) a | ||||||||||||||||
| BlueHub Loan Fund | 1.00 | % | 04/15/2021 | 100,000 | 95,187 | |||||||||||
| BlueHub Loan Fund | 1.00 | % | 04/15/2021 | 100,000 | 95,187 | |||||||||||
| Root Capital Loan Fund | 1.25 | % | 02/01/2021 | 100,000 | 96,463 | |||||||||||
| Vermont Community Loan Fund | 1.00 | % | 10/15/2020 | 100,000 | 98,262 | |||||||||||
|
| |||||||||||||||
| 385,099 | ||||||||||||||||
|
| |||||||||||||||
| Time Deposits (1.6%) | ||||||||||||||||
| Banco Santander, Frankfurt | 0.01 | % | 07/01/2020 | 15,355,882 | 15,355,882 | |||||||||||
|
| |||||||||||||||
| Securities Purchased with Cash Collateral from Securities Lending |
| |||||||||||||||
| Registered Investment Companies (0.8%) | ||||||||||||||||
| Invesco Aim Government & Agency Portfolio | ||||||||||||||||
| Short-Term Investments Trust, Institutional Class | 0.10 | % | 7,177,267 | |||||||||||||
|
| |||||||||||||||
| Total short-term securities (2.5%) (cost $23,648,937) | 23,648,937 | |||||||||||||||
|
| |||||||||||||||
| Total securities (100.8%) (cost $774,857,767) | 942,530,187 | |||||||||||||||
|
| |||||||||||||||
| Payable upon return of securities loaned (-0.8%) | (7,177,267 | ) | ||||||||||||||
|
| |||||||||||||||
| Other assets and liabilities (0.0%) | (564,879 | ) | ||||||||||||||
|
| |||||||||||||||
| Total net assets (100.0%) | 934,788,041 | |||||||||||||||
|
| |||||||||||||||
q This security is non-income producing. |
| |||||||||||||||
l This security, or partial position of this security, was on loan at June 30, 2020. The total value of the securities on loan at June 30, 2020 was $7,034,818. |
| |||||||||||||||
a Market value adjustments have been applied to these securities to reflect potential early withdrawal. |
| |||||||||||||||
The accompanying notes are an integral part of these financial statements.
36
Table of Contents
| Semiannual Report • 2020 | | |||
Portfolio of Investments as of June 30, 2020 (unaudited)
| Preferred Stocks | Interest Rate | Maturity Date | Shares | Market Value ($) | ||||||||||||
| Equity Real Estate Investment Trusts (1.4%) | ||||||||||||||||
| Digital Realty Trust Inc. | 5.20 | % | 10/10/2024 | 59,000 | 1,485,030 | |||||||||||
| Public Storage | 5.15 | % | 06/02/2022 | 111,127 | 2,837,072 | |||||||||||
|
| |||||||||||||||
| Total investment in preferred stocks (1.4%) (cost $4,258,473) | 4,322,102 | |||||||||||||||
|
| |||||||||||||||
| Commercial Mortgage-Backed Securities | Principal Amount ($) | |||||||||||||||
| JP Morgan Mortgage Trust Series 2011-C4, Class A4 | 4.39 | % | 07/15/2046 | 286,491 | 292,047 | |||||||||||
| UBS-Barclays Mortgage Trust Series 2012-C2, Class A3 | 3.06 | % | 05/10/2063 | 380,120 | 383,286 | |||||||||||
|
| |||||||||||||||
Total investment in commercial mortgage- (cost $669,827) | 675,333 | |||||||||||||||
|
| |||||||||||||||
| Convertible Bonds | ||||||||||||||||
| Machinery (0.6%) | ||||||||||||||||
| Fortive Corp. | 0.88 | % | 02/15/2020 | 2,000,000 | 1,964,392 | |||||||||||
|
| |||||||||||||||
| Total investment in convertible bonds (0.6%) (cost $1,873,246) | 1,964,392 | |||||||||||||||
|
| |||||||||||||||
| Corporate Bonds | ||||||||||||||||
| Air Freight & Logistics (1.4%) | ||||||||||||||||
| FedEx Corp. | 4.75 | % | 11/15/2045 | 4,000,000 | 4,410,412 | |||||||||||
|
| |||||||||||||||
| Airlines (1.2%) | ||||||||||||||||
| Southwest Air 07-1 Trust | 6.15 | % | 08/01/2022 | 684,583 | 685,062 | |||||||||||
| Southwest Airlines Co. | 2.65 | % | 11/05/2020 | 3,000,000 | 3,001,829 | |||||||||||
|
| |||||||||||||||
| 3,686,891 | ||||||||||||||||
|
| |||||||||||||||
| Auto Components (0.9%) | ||||||||||||||||
| APTIV plc | 4.25 | % | 01/15/2026 | 2,500,000 | 2,760,845 | |||||||||||
|
| |||||||||||||||
| Building Products (1.4%) | ||||||||||||||||
| Masco Corp. | 4.45 | % | 04/01/2025 | 4,000,000 | 4,530,388 | |||||||||||
|
| |||||||||||||||
| Capital Markets (1.1%) | ||||||||||||||||
| Charles Schwab Corp. | 3.45 | % | 02/13/2026 | 3,000,000 | 3,376,100 | |||||||||||
|
| |||||||||||||||
| Chemicals (1.2%) | ||||||||||||||||
| Praxair Inc. | 3.20 | % | 01/30/2026 | 3,477,000 | 3,861,545 | |||||||||||
|
| |||||||||||||||
| Commercial Services & Supplies (1.4%) | ||||||||||||||||
| Waste Management Inc. | 3.50 | % | 05/15/2024 | 1,500,000 | 1,633,859 | |||||||||||
| Waste Management Inc. | 3.15 | % | 11/15/2027 | 2,500,000 | 2,798,485 | |||||||||||
|
| |||||||||||||||
| 4,432,344 | ||||||||||||||||
|
| |||||||||||||||
| Communications Equipment (0.8%) | ||||||||||||||||
| Cisco Systems Inc. | 2.50 | % | 09/20/2026 | 1,000,000 | 1,106,436 | |||||||||||
| Cisco Systems Inc. | 5.50 | % | 01/15/2040 | 1,000,000 | 1,458,015 | |||||||||||
|
| |||||||||||||||
| 2,564,451 | ||||||||||||||||
|
| |||||||||||||||
The accompanying notes are an integral part of these financial statements.
37
Table of Contents
| Semiannual Report • 2020 | |||
Parnassus Fixed Income Fund
Portfolio of Investments as of June 30, 2020 (unaudited) (continued)
| Corporate Bonds | Interest Rate | Maturity Date | Principal Amount ($) | Market Value ($) | ||||||||||||
| Consumer Durables & Apparel (1.2%) | ||||||||||||||||
| Nike Inc. | 2.75 | % | 03/27/2027 | 3,500,000 | 3,855,470 | |||||||||||
|
| |||||||||||||||
| Consumer Finance (1.4%) | ||||||||||||||||
| Mastercard Inc. | 3.38 | % | 04/01/2024 | 3,000,000 | 3,319,053 | |||||||||||
| Mastercard Inc. | 2.95 | % | 06/01/2029 | 1,000,000 | 1,124,268 | |||||||||||
|
| |||||||||||||||
| 4,443,321 | ||||||||||||||||
|
| |||||||||||||||
| Containers & Packaging (2.2%) | ||||||||||||||||
| Ball Corporation | 4.88 | % | 03/15/2026 | 4,000,000 | 4,350,000 | |||||||||||
| Sealed Air Corp. | 5.25 | % | 04/01/2023 | 2,500,000 | 2,613,650 | |||||||||||
|
| |||||||||||||||
| 6,963,650 | ||||||||||||||||
|
| |||||||||||||||
| Equity Real Estate Investment Trusts (1.3%) | ||||||||||||||||
| Iron Mountain Inc. | 5.25 | % | 03/15/2028 | 2,000,000 | 1,990,000 | |||||||||||
| Regency Centers LP | 3.75 | % | 06/15/2024 | 2,000,000 | 2,102,559 | |||||||||||
|
| |||||||||||||||
| 4,092,559 | ||||||||||||||||
|
| |||||||||||||||
| Food & Staples Retailing (2.2%) | ||||||||||||||||
| Costco Wholesale Corp. | 3.00 | % | 05/18/2027 | 3,000,000 | 3,373,212 | |||||||||||
| Mondelez International Inc. | 4.13 | % | 05/07/2028 | 3,000,000 | 3,562,953 | |||||||||||
|
| |||||||||||||||
| 6,936,165 | ||||||||||||||||
|
| |||||||||||||||
| Food Products (1.2%) | ||||||||||||||||
| McCormick & Co. | 3.40 | % | 08/15/2027 | 500,000 | 556,794 | |||||||||||
| McCormick & Co. | 2.50 | % | 04/15/2030 | 3,000,000 | 3,129,497 | |||||||||||
|
| |||||||||||||||
| 3,686,291 | ||||||||||||||||
|
| |||||||||||||||
| Health Care Equipment (3.5%) | ||||||||||||||||
| Becton Dickinson and Company | 6.70 | % | 08/01/2028 | 2,000,000 | 2,528,564 | |||||||||||
| Becton Dickinson and Company | 2.82 | % | 05/20/2030 | 1,500,000 | 1,587,164 | |||||||||||
| Danaher Corp. | 3.35 | % | 09/15/2025 | 4,000,000 | 4,462,083 | |||||||||||
| Hologic Inc. | 4.38 | % | 10/15/2025 | 2,500,000 | 2,524,475 | |||||||||||
|
| |||||||||||||||
| 11,102,286 | ||||||||||||||||
|
| |||||||||||||||
| Household Products (0.9%) | ||||||||||||||||
| The Clorox Company | 3.50 | % | 12/15/2024 | 2,500,000 | 2,773,316 | |||||||||||
|
| |||||||||||||||
| Industrial Conglomerates (1.0%) | ||||||||||||||||
| Roper Technologies Inc. | 2.95 | % | 09/15/2029 | 1,500,000 | 1,638,483 | |||||||||||
| Roper Technologies Inc. | 2.00 | % | 06/30/2030 | 1,500,000 | 1,501,119 | |||||||||||
|
| |||||||||||||||
| 3,139,602 | ||||||||||||||||
|
| |||||||||||||||
| Interactive Media & Services (0.8%) | ||||||||||||||||
| Alphabet Inc. | 2.00 | % | 08/15/2026 | 2,500,000 | 2,678,422 | |||||||||||
|
| |||||||||||||||
| Internet & Catalog Retail (1.7%) | ||||||||||||||||
| Amazon.com Inc. | 4.80 | % | 12/05/2034 | 4,000,000 | 5,478,855 | |||||||||||
|
| |||||||||||||||
| Life Sciences Tools & Services (1.4%) | ||||||||||||||||
| Agilent Technologies Inc. | 4.80 | % | 12/05/2034 | 4,000,000 | 4,347,591 | |||||||||||
|
| |||||||||||||||
| Machinery (2.0%) | ||||||||||||||||
| Pentair Finance SA | 3.15 | % | 09/15/2022 | 3,050,000 | 3,037,805 | |||||||||||
| Xylem Inc. | 3.25 | % | 11/01/2026 | 3,000,000 | 3,311,478 | |||||||||||
|
| |||||||||||||||
| 6,349,283 | ||||||||||||||||
|
| |||||||||||||||
The accompanying notes are an integral part of these financial statements.
38
Table of Contents
| Semiannual Report • 2020 | | |||
Parnassus Fixed Income Fund
Portfolio of Investments as of June 30, 2020 (unaudited) (continued)
| Corporate Bonds | Interest Rate | Maturity Date | Principal Amount ($) | Market Value ($) | ||||||||||||
| Media (1.7%) | ||||||||||||||||
| Comcast Corp. | 4.25 | % | 10/15/2030 | 4,500,000 | 5,514,312 | |||||||||||
|
| |||||||||||||||
| Pharmaceuticals (1.6%) | ||||||||||||||||
| Merck & Co. Inc. | 3.40 | % | 03/07/2029 | 3,500,000 | 4,038,435 | |||||||||||
| Merck & Co. Inc. | 2.45 | % | 06/24/2050 | 1,000,000 | 1,005,100 | |||||||||||
|
| |||||||||||||||
| 5,043,535 | ||||||||||||||||
|
| |||||||||||||||
| Retail (1.2%) | ||||||||||||||||
| Lowe’s Companies Inc. | 4.50 | % | 04/15/2030 | 3,000,000 | 3,680,379 | |||||||||||
|
| |||||||||||||||
| Semiconductor Equipment (1.8%) | ||||||||||||||||
| Applied Materials Inc. | 1.75 | % | 06/01/2030 | 3,500,000 | 3,577,092 | |||||||||||
| Lam Research Corp. | 4.00 | % | 03/15/2029 | 2,000,000 | 2,376,889 | |||||||||||
|
| |||||||||||||||
| 5,953,981 | ||||||||||||||||
|
| |||||||||||||||
| Snack & Juice Bars (0.8%) | ||||||||||||||||
| Starbucks Corp. | 2.45 | % | 06/15/2026 | 2,500,000 | 2,665,641 | |||||||||||
|
| |||||||||||||||
| Software (5.4%) | ||||||||||||||||
| Adobe Inc. | 3.25 | % | 02/01/2025 | 2,900,000 | 3,222,144 | |||||||||||
| Adobe Inc. | 2.30 | % | 02/01/2030 | 1,000,000 | 1,079,991 | |||||||||||
| Autodesk Inc. | 4.38 | % | 06/15/2025 | 3,500,000 | 3,993,011 | |||||||||||
| Cadence Design Systems Inc. | 4.38 | % | 10/15/2024 | 3,500,000 | 3,899,130 | |||||||||||
| Microsoft Corp. | 2.40 | % | 08/08/2026 | 1,500,000 | 1,637,181 | |||||||||||
| Microsoft Corp. | 4.25 | % | 02/06/2047 | 2,500,000 | 3,408,299 | |||||||||||
|
| |||||||||||||||
| 17,239,756 | ||||||||||||||||
|
| |||||||||||||||
| Technology Hardware (1.3%) | ||||||||||||||||
| Apple Inc. | 2.85 | % | 02/23/2023 | 2,000,000 | 2,123,869 | |||||||||||
| Apple Inc. | 4.38 | % | 05/13/2045 | 1,500,000 | 1,977,678 | |||||||||||
|
| |||||||||||||||
| 4,101,547 | ||||||||||||||||
|
| |||||||||||||||
| Telecom Services GIC (1.5%) | ||||||||||||||||
| Verizon Communications Inc. | 4.02 | % | 12/03/2029 | 4,000,000 | 4,770,314 | |||||||||||
|
| |||||||||||||||
| Transportation & Infrastructure (0.9%) | ||||||||||||||||
| Burlington Northern Santa Fe Corp. | 3.85 | % | 09/01/2023 | 2,500,000 | 2,736,186 | |||||||||||
|
| |||||||||||||||
| Total investment in corporate bonds (46.4%) (cost $138,522,729) | 147,175,438 | |||||||||||||||
|
| |||||||||||||||
| Supranational Bonds | ||||||||||||||||
| International Bank for Reconstruction & Development | 3.13 | % | 11/20/2025 | 4,000,000 | 4,549,913 | |||||||||||
| International Finance Corp. | 2.00 | % | 10/24/2022 | 5,000,000 | 5,198,569 | |||||||||||
| International Finance Corp. | 2.13 | % | 04/07/2026 | 4,000,000 | 4,355,306 | |||||||||||
|
| |||||||||||||||
| Total investment in supranational bonds (4.5%) (cost $12,755,109) | 14,103,788 | |||||||||||||||
|
| |||||||||||||||
| U.S. Government Treasury Bonds | ||||||||||||||||
| U.S. Treasury | 2.88 | % | 10/31/2020 | 2,000,000 | 2,017,785 | |||||||||||
| U.S. Treasury | 2.25 | % | 03/31/2021 | 3,000,000 | 3,046,641 | |||||||||||
| U.S. Treasury | 2.38 | % | 03/15/2022 | 3,000,000 | 3,112,266 | |||||||||||
| U.S. Treasury | 1.75 | % | 07/15/2022 | 3,000,000 | 3,096,445 | |||||||||||
| U.S. Treasury | 1.88 | % | 08/31/2022 | 2,000,000 | 2,073,672 | |||||||||||
The accompanying notes are an integral part of these financial statements.
39
Table of Contents
| Semiannual Report • 2020 | |||
Parnassus Fixed Income Fund
Portfolio of Investments as of June 30, 2020 (unaudited) (continued)
| U.S. Government Treasury Bonds | Interest Rate | Maturity Date | Principal Amount ($) | Market Value ($) | ||||||||||||
| U.S. Treasury | 1.38 | % | 02/15/2023 | 4,000,000 | 4,125,781 | |||||||||||
| U.S. Treasury | 2.50 | % | 03/31/2023 | 2,000,000 | 2,127,266 | |||||||||||
| U.S. Treasury | 2.88 | % | 10/31/2023 | 3,000,000 | 3,267,188 | |||||||||||
| U.S. Treasury | 2.50 | % | 01/31/2024 | 2,000,000 | 2,163,594 | |||||||||||
| U.S. Treasury | 2.38 | % | 02/29/2024 | 3,000,000 | 3,237,305 | |||||||||||
| U.S. Treasury | 2.13 | % | 03/31/2024 | 3,000,000 | 3,214,219 | |||||||||||
| U.S. Treasury | 2.00 | % | 05/31/2024 | 1,000,000 | 1,069,375 | |||||||||||
| U.S. Treasury | 1.75 | % | 07/31/2024 | 3,000,000 | 3,185,508 | |||||||||||
| U.S. Treasury | 1.25 | % | 08/31/2024 | 2,000,000 | 2,083,984 | |||||||||||
| U.S. Treasury | 2.25 | % | 11/15/2024 | 3,000,000 | 3,261,445 | |||||||||||
| U.S. Treasury | 1.50 | % | 11/30/2024 | 2,000,000 | 2,109,922 | |||||||||||
| U.S. Treasury | 1.38 | % | 01/31/2025 | 1,500,000 | 1,575,996 | |||||||||||
| U.S. Treasury | 2.00 | % | 02/15/2025 | 3,000,000 | 3,239,297 | |||||||||||
| U.S. Treasury | 0.50 | % | 03/31/2025 | 1,000,000 | 1,010,664 | |||||||||||
| U.S. Treasury | 0.38 | % | 04/30/2025 | 2,000,000 | 2,009,062 | |||||||||||
| U.S. Treasury | 2.25 | % | 11/15/2025 | 3,000,000 | 3,305,039 | |||||||||||
| U.S. Treasury | 2.63 | % | 01/31/2026 | 2,000,000 | 2,250,156 | |||||||||||
| U.S. Treasury | 2.25 | % | 03/31/2026 | 2,000,000 | 2,213,125 | |||||||||||
| U.S. Treasury | 1.88 | % | 07/31/2026 | 4,000,000 | 4,351,719 | |||||||||||
| U.S. Treasury | 2.00 | % | 11/15/2026 | 3,000,000 | 3,294,141 | |||||||||||
| U.S. Treasury | 1.63 | % | 11/30/2026 | 2,000,000 | 2,149,531 | |||||||||||
| U.S. Treasury | 2.25 | % | 02/15/2027 | 2,000,000 | 2,234,141 | |||||||||||
| U.S. Treasury | 0.63 | % | 03/31/2027 | 1,000,000 | 1,010,117 | |||||||||||
| U.S. Treasury | 2.38 | % | 05/15/2027 | 3,000,000 | 3,386,016 | |||||||||||
| U.S. Treasury | 2.25 | % | 08/15/2027 | 3,000,000 | 3,369,492 | |||||||||||
| U.S. Treasury | 2.75 | % | 02/15/2028 | 3,000,000 | 3,499,453 | |||||||||||
| U.S. Treasury | 2.88 | % | 05/15/2028 | 3,000,000 | 3,540,469 | |||||||||||
| U.S. Treasury | 2.88 | % | 08/15/2028 | 3,000,000 | 3,552,891 | |||||||||||
| U.S. Treasury | 3.13 | % | 11/15/2028 | 2,000,000 | 2,418,047 | |||||||||||
| U.S. Treasury | 2.63 | % | 02/15/2029 | 2,000,000 | 2,343,594 | |||||||||||
| U.S. Treasury | 2.38 | % | 05/15/2029 | 2,000,000 | 2,308,125 | |||||||||||
| U.S. Treasury | 1.63 | % | 08/15/2029 | 1,500,000 | 1,636,699 | |||||||||||
| U.S. Treasury | 1.75 | % | 11/15/2029 | 2,000,000 | 2,208,125 | |||||||||||
| U.S. Treasury | 1.50 | % | 02/15/2030 | 3,000,000 | 3,243,047 | |||||||||||
| U.S. Treasury | 0.63 | % | 05/15/2030 | 4,000,000 | 3,988,906 | |||||||||||
| U.S. Treasury | 3.50 | % | 02/15/2039 | 2,000,000 | 2,829,531 | |||||||||||
| U.S. Treasury | 3.13 | % | 11/15/2041 | 1,000,000 | 1,354,141 | |||||||||||
| U.S. Treasury | 2.75 | % | 08/15/2042 | 1,000,000 | 1,282,031 | |||||||||||
| U.S. Treasury | 3.00 | % | 05/15/2045 | 1,000,000 | 1,342,656 | |||||||||||
| U.S. Treasury | 2.50 | % | 02/15/2046 | 1,500,000 | 1,857,715 | |||||||||||
| U.S. Treasury | 3.00 | % | 08/15/2048 | 2,000,000 | 2,750,469 | |||||||||||
| U.S. Treasury | 3.00 | % | 02/15/2049 | 500,000 | 690,313 | |||||||||||
| U.S. Treasury | 2.88 | % | 05/15/2049 | 2,000,000 | 2,705,781 | |||||||||||
| U.S. Treasury | 2.25 | % | 08/15/2049 | 1,000,000 | 1,202,617 | |||||||||||
| U.S. Treasury | 2.00 | % | 02/15/2050 | 2,000,000 | 2,290,469 | |||||||||||
| U.S. Treasury | 1.25 | % | 05/15/2050 | 1,000,000 | 960,820 | |||||||||||
| U.S. Treasury (TIPS) | 0.63 | % | 07/15/2021 | 1,137,570 | 1,157,326 | |||||||||||
| U.S. Treasury (TIPS) | 0.13 | % | 01/15/2022 | 1,132,790 | 1,148,058 | |||||||||||
| U.S. Treasury (TIPS) | 0.38 | % | 07/15/2025 | 1,081,150 | 1,154,585 | |||||||||||
| U.S. Treasury (TIPS) | 1.75 | % | 01/15/2028 | 1,223,830 | 1,459,831 | |||||||||||
| Total investment in U.S. government treasury bonds (41.5%) (cost $120,679,551) |
| 131,516,591 | ||||||||||||||
|
| |||||||||||||||
| Total investment in long-term securities (94.6%) (cost $278,758,935) |
| 299,757,644 | ||||||||||||||
|
| |||||||||||||||
The accompanying notes are an integral part of these financial statements.
40
Table of Contents
| Semiannual Report • 2020 | | |||
Parnassus Fixed Income Fund
Portfolio of Investments as of June 30, 2020 (unaudited) (continued)
| Short-Term Securities | Interest Rate | Maturity Date | Principal Amount ($) | Market Value ($) | ||||||||||||
| Time Deposits (6.6%) | ||||||||||||||||
| Citibank, New York | 0.01 | % | 07/01/2020 | 20,883,950 | 20,883,950 | |||||||||||
|
| |||||||||||||||
| Total short-term securities (6.6%) (cost $20,883,950) |
| 20,883,950 | ||||||||||||||
|
| |||||||||||||||
| Total securities (101.2%) (cost $299,642,885) | 320,641,594 | |||||||||||||||
|
| |||||||||||||||
| Other assets and liabilities (-1.2%) | (3,619,617 | ) | ||||||||||||||
|
| |||||||||||||||
| Total net assets (100.0%) | 317,021,977 | |||||||||||||||
|
| |||||||||||||||
plc Public Limited Company | ||||||||||||||||
LP Limited Partnership | ||||||||||||||||
TIPS Treasury Inflation Protected Security | ||||||||||||||||
The accompanying notes are an integral part of these financial statements.
41
Table of Contents
| Semiannual Report • 2020 | |||
Statement of Assets and Liabilities
June 30, 2020 (unaudited)
| Parnassus Core Equity Fund | Parnassus Mid Cap Fund | |||||||
| Assets | ||||||||
Investments in stocks and bonds, at market value | ||||||||
(cost $13,853,207,713, $4,546,112,829, $2,169,368,544, $751,208,830, $278,758,935) | $ | 17,845,339,285 | $ | 5,157,467,108 | ||||
Investments in short-term securities | ||||||||
(at cost which approximates market value) | 689,362,868 | 168,505,464 | ||||||
Cash | 1,534 | 1,514 | ||||||
Receivables | ||||||||
Investment securities sold | 72,302,522 | - | ||||||
Dividends and interest | 18,642,893 | 6,943,935 | ||||||
Capital shares sold | 13,370,854 | 7,216,238 | ||||||
Due from Parnassus Investments | 14,045 | 4,743 | ||||||
Other assets | 53,565 | 34,708 | ||||||
Total assets | $ | 18,639,087,566 | $ | 5,340,173,710 | ||||
| Liabilities | ||||||||
Payable upon return of loaned securities | - | 352,085 | ||||||
Payable for investment securities purchased | 66,265,931 | 22,569,168 | ||||||
Capital shares redeemed | 260,793,766 | 4,593,805 | ||||||
Fees payable to Parnassus Investments | - | - | ||||||
Distributions payable | 1,480,831 | - | ||||||
Accounts payable and accrued expenses | 3,237,580 | 817,709 | ||||||
Total liabilities | $ | 331,778,108 | $ | 28,332,767 | ||||
Net assets | $ | 18,307,309,458 | $ | 5,311,840,943 | ||||
| Net assets consist of | ||||||||
Capital paid-in | 13,411,004,392 | 4,959,271,219 | ||||||
Total Distributable Earnings | 4,896,305,066 | 352,569,724 | ||||||
Total net assets | $ | 18,307,309,458 | $ | 5,311,840,943 | ||||
| Net asset value and offering per share | ||||||||
Net assets investor shares | $ | 9,445,633,327 | $ | 2,210,747,896 | ||||
Net assets institutional shares | $ | 8,861,676,131 | $ | 3,101,093,047 | ||||
Shares outstanding investor shares | 205,919,221 | 67,715,931 | ||||||
Shares outstanding institutional shares | 192,851,753 | 94,727,420 | ||||||
Net asset values and redemption price per share | ||||||||
(Net asset value divided by shares outstanding) | ||||||||
Investor shares | $ | 45.87 | $ | 32.65 | ||||
Institutional shares | $ | 45.95 | $ | 32.74 | ||||
The accompanying notes are an integral part of these financial statements.
42
Table of Contents
| Semiannual Report • 2020 | | |||
| Parnassus Endeavor Fund | Parnassus Mid Cap Growth Fund | Parnassus Fixed Income Fund | ||||||||
| $ | 2,571,528,367 | $ | 918,881,250 | $ | 299,757,644 | |||||
| 217,075,636 | 23,648,937 | 20,883,950 | ||||||||
| 2,136 | 158 | 125 | ||||||||
| 32,097,332 | - | - | ||||||||
| 1,725,226 | 361,710 | 1,868,542 | ||||||||
| 1,020,699 | 332,086 | 1,344,362 | ||||||||
| - | 762 | |||||||||
| 18,949 | 2,864 | 21,435 | ||||||||
| $ | 2,823,468,345 | $ | 943,227,005 | $ | 323,876,820 | |||||
| - | 7,177,267 | - | ||||||||
| 11,648,185 | - | 6,553,802 | ||||||||
| 5,454,199 | 895,701 | 171,249 | ||||||||
| 778 | 3,189 | - | ||||||||
| - | - | 15,627 | ||||||||
| 1,373,109 | 362,807 | 114,165 | ||||||||
| $ | 18,476,271 | $ | 8,438,964 | $ | 6,854,843 | |||||
| $ | 2,804,992,074 | $ | 934,788,041 | $ | 317,021,977 | |||||
| 2,470,572,946 | 743,168,038 | 296,324,245 | ||||||||
| 334,419,128 | 191,620,003 | 20,697,732 | ||||||||
| $ | 2,804,992,074 | $ | 934,788,041 | $ | 317,021,977 | |||||
| $ | 1,928,933,788 | $ | 759,464,620 | $ | 203,748,536 | |||||
| $ | 876,058,286 | $ | 175,323,421 | $ | 113,273,441 | |||||
| 54,748,474 | 14,894,450 | 11,299,357 | ||||||||
| 24,827,770 | 3,438,103 | 6,282,842 | ||||||||
| $ | 35.23 | $ | 50.99 | $ | 18.03 | |||||
| $ | 35.29 | $ | 50.99 | $ | 18.03 | |||||
The accompanying notes are an integral part of these financial statements.
43
Table of Contents
| Semiannual Report • 2020 | |||
Statement of Operations
Six Months Ended June 30, 2020 (unaudited)
| Parnassus Core Equity Fund | Parnassus Mid Cap Fund | |||||||
| Investment income | ||||||||
Dividends | $ | 144,730,588 | $ | 35,508,122 | ||||
Interest | 420,570 | 337,308 | ||||||
Securities lending | 623,841 | 13,412 | ||||||
Other income | 3,125 | - | ||||||
Foreign withholding tax | - | (338,690 | ) | |||||
Total investment income | $ | 145,778,124 | $ | 35,520,152 | ||||
| Expenses | ||||||||
Investment advisory fees | 50,542,806 | 16,995,091 | ||||||
Transfer agent fees | ||||||||
Investor shares | 126,165 | 43,439 | ||||||
Institutional shares | 26,953 | 5,244 | ||||||
Fund administration | 2,760,058 | 760,375 | ||||||
Service provider fees | 10,828,026 | 2,537,160 | ||||||
Reports to shareholders | 727,662 | 355,805 | ||||||
Registration fees and expenses | 34,163 | 14,396 | ||||||
Custody fees | 193,781 | 46,321 | ||||||
Professional fees | 178,502 | 83,002 | ||||||
Trustee fees and expenses | 157,363 | 42,324 | ||||||
Proxy voting fees | 2,002 | 2,002 | ||||||
Pricing service fees | 2,626 | 2,626 | ||||||
Other expenses | 97,992 | 23,217 | ||||||
Total expenses | $ | 65,678,099 | $ | 20,911,002 | ||||
Fees waived by Parnassus Investments | (430,826 | ) | (318,821 | ) | ||||
Net expenses | $ | 65,247,273 | $ | 20,592,181 | ||||
Net investment gain | $ | 80,530,851 | $ | 14,927,971 | ||||
| Realized and unrealized gain (loss) on investments | ||||||||
Net realized gain (loss) from securities transactions | 439,888,207 | (284,848,511 | ) | |||||
Net change in unrealized appreciation (depreciation) of securities | (895,649,675 | ) | (118,745,639 | ) | ||||
Net realized and unrealized gain (loss) on securities | $ | (455,761,468 | ) | $ | (403,594,150 | ) | ||
Net increase (decrease) in net assets resulting from operations | $ | (375,230,617 | ) | $ | (388,666,179 | ) | ||
The accompanying notes are an integral part of these financial statements.
44
Table of Contents
| Semiannual Report • 2020 | | |||
| Parnassus Endeavor Fund | Parnassus Mid Cap Growth Fund | Parnassus Fixed Income Fund | ||||||||
| $ | 32,073,970 | $ | 5,334,769 | $ | 132,153 | |||||
| 694,639 | 16,500 | 3,115,056 | ||||||||
| 230 | 6,160 | 12,802 | ||||||||
| - | - | - | ||||||||
| - | (190,980 | ) | - | |||||||
| $ | 32,768,839 | $ | 5,166,449 | $ | 3,260,011 | |||||
| 10,404,273 | 2,745,928 | 645,323 | ||||||||
| 74,887 | 115,276 | 31,830 | ||||||||
| 6,006 | 5,953 | 2,430 | ||||||||
| 491,388 | 141,085 | 41,969 | ||||||||
| 2,767,970 | 483,914 | 151,338 | ||||||||
| 186,861 | 42,548 | 17,649 | ||||||||
| 28,296 | 25,229 | 13,210 | ||||||||
| 40,404 | 11,619 | 3,562 | ||||||||
| 69,169 | 32,620 | 13,779 | ||||||||
| 32,727 | 8,350 | 2,004 | ||||||||
| 2,002 | 2,002 | - | ||||||||
| 2,626 | 2,626 | 3,724 | ||||||||
| 22,548 | 6,183 | 2,229 | ||||||||
| $ | 14,129,157 | $ | 3,623,333 | $ | 929,047 | |||||
| (477,318 | ) | (12,973 | ) | (129,412 | ) | |||||
| $ | 13,651,839 | $ | 3,610,360 | $ | 799,635 | |||||
| $ | 19,117,000 | $ | 1,556,089 | $ | 2,460,376 | |||||
| (41,601,802 | ) | 15,991,832 | 1,941,665 | |||||||
| (315,245,847 | ) | (15,200,511 | ) | 12,416,111 | ||||||
| $ | (356,847,649) | $ | 791,321 | $ | 14,357,776 | |||||
| $ | (337,730,649) | $ | 2,347,410 | $ | 16,818,152 | |||||
The accompanying notes are an integral part of these financial statements.
45
Table of Contents
| Semiannual Report • 2020 | |||
Statement of Changes in Net Assets
June 30, 2020
| Parnassus Core Equity Fund | Parnassus Mid Cap Fund | |||||||||||||||
| Six Months Ended June 30, 2020 (unaudited) | Year Ended December 31, 2019 | Six Months Ended June 30, 2020 (unaudited) | Year Ended December 31, 2019 | |||||||||||||
| Investment income from operations | ||||||||||||||||
Net investment income | $ | 80,530,851 | $ | 151,624,472 | $ | 14,927,971 | $ | 23,041,731 | ||||||||
Net realized gain (loss) from securities transactions | 439,888,207 | 1,594,459,978 | (284,848,511 | ) | 170,039,860 | |||||||||||
Net change in unrealized appreciation (depreciation) of securities | (895,649,675 | ) | 2,722,513,458 | (118,745,639 | ) | 695,768,216 | ||||||||||
Increase (decrease) in net assets resulting from operations | $ | (375,230,617) | $ 4,468,597,908 | $ | (388,666,179 | ) | $ | 888,849,807 | ||||||||
| Net Dividends and Distributions | ||||||||||||||||
Investor shares | (35,336,647 | ) | (755,650,931 | ) | - | (94,889,633 | ) | |||||||||
Institutional shares | (41,282,887 | ) | (663,599,210 | ) | - | (90,118,357 | ) | |||||||||
Distributions to shareholders | $ | (76,619,534 | ) | $ (1,419,250,141 | ) | $ | - | $ | (185,007,990 | ) | ||||||
| Capital share transactions | ||||||||||||||||
Investor shares | ||||||||||||||||
Proceeds from sale of shares | 1,028,565,258 | 1,429,175,074 | 466,265,143 | 723,944,551 | ||||||||||||
Reinvestment of dividends | 35,022,869 | 749,515,864 | - | 92,426,492 | ||||||||||||
Shares repurchased | (1,328,040,180 | ) | (2,039,908,236 | ) | (428,441,153 | ) | (605,369,554 | ) | ||||||||
Institutional shares | ||||||||||||||||
Proceeds from sale of shares | 1,938,671,234 | 2,332,522,353 | 992,762,515 | 1,562,499,111 | ||||||||||||
Reinvestment of dividends | 38,121,968 | 624,109,217 | - | 76,761,985 | ||||||||||||
Shares repurchased | (1,612,865,497 | ) | (2,201,307,385 | ) | (404,891,939 | ) | (305,205,925 | ) | ||||||||
Increase (decrease) in net assets from capital share transactions | 99,475,652 | 894,106,887 | 625,694,566 | 1,545,056,660 | ||||||||||||
Increase (decrease) in net assets | $ | (352,374,499 | ) | $ | 3,943,454,654 | $ | 237,028,387 | $ | 2,248,898,477 | |||||||
| Net Assets | ||||||||||||||||
Beginning of year | 18,659,683,957 | 14,716,229,303 | 5,074,812,556 | 2,825,914,079 | ||||||||||||
End of period | $ | 18,307,309,458 | $ | 18,659,683,957 | $ | 5,311,840,943 | $ | 5,074,812,556 | ||||||||
| Shares issued and redeemed | ||||||||||||||||
Investor shares | ||||||||||||||||
Shares sold | 23,739,223 | 31,445,989 | 14,943,415 | 21,196,071 | ||||||||||||
Shares issued through dividend reinvestment | 840,990 | 16,461,350 | - | 2,669,559 | ||||||||||||
Shares repurchased | (31,253,860 | ) | (44,933,242 | ) | (14,070,913 | ) | (17,749,710 | ) | ||||||||
Institutional shares | ||||||||||||||||
Shares sold | 45,495,914 | 51,032,786 | 32,451,149 | 45,016,922 | ||||||||||||
Shares issued through dividend reinvestment | 911,813 | 13,677,323 | - | 2,205,775 | ||||||||||||
Shares repurchased | (37,431,787 | ) | (48,392,534 | ) | (13,203,002 | ) | (8,870,335 | ) | ||||||||
Net increase (decrease) in shares outstanding | ||||||||||||||||
Investor shares | (6,673,647 | ) | 2,974,097 | 872,502 | 6,115,920 | |||||||||||
Institutional shares | 8,975,940 | 16,317,575 | 19,248,147 | 38,352,362 | ||||||||||||
The accompanying notes are an integral part of these financial statements.
46
Table of Contents
| Semiannual Report • 2020 | | |||
| Parnassus Endeavor Fund | Parnassus Mid Cap Growth Fund | Parnassus Fixed Income Fund | ||||||||||||||||||||
| Six Months Ended June 30, 2020 (unaudited) | Year Ended December 31, 2019 | Six Months Ended June 30, 2020 (unaudited) | Year Ended December 31, 2019 | Six Months Ended June 30, 2020 (unaudited) | Year Ended December 31, 2019 | |||||||||||||||||
| $ | 19,117,000 | $ | 31,778,301 | $ | 1,556,089 | $ | 5,975,640 | $ | 2,460,376 | $ | 5,100,524 | |||||||||||
| (41,601,802 | ) | 22,566,536 | 15,991,832 | 51,016,316 | 1,941,665 | 565,114 | ||||||||||||||||
| (315,245,847 | ) | 1,069,705,677 | (15,200,511 | ) | 183,806,745 | 12,416,111 | 14,212,338 | ||||||||||||||
$ | (337,730,649 | ) | $ | 1,124,050,514 | $ | 2,347,410 | $ | 240,798,701 | $ | 16,818,152 | $ | 19,877,976 | ||||||||||
| - | (21,606,947 | ) | - | (32,973,200 | ) | (1,544,610 | ) | (3,793,250 | ) | |||||||||||||
| - | (11,383,448 | ) | - | (7,725,685 | ) | (875,858 | ) | (1,579,710 | ) | |||||||||||||
| $ | - | $ | (32,990,395 | ) | $ | - | $ | (40,698,885 | ) | $ | (2,420,468) | $ | (5,372,960) | |||||||||
| 138,691,752 | 439,901,455 | 34,781,345 | 56,891,576 | 54,151,542 | 52,266,742 | |||||||||||||||||
| - | 21,222,492 | - | 32,249,144 | 1,513,553 | 3,722,481 | |||||||||||||||||
| (698,217,893 | ) | (1,284,896,175 | ) | (81,868,180 | ) | (135,188,844 | ) | (21,787,731 | ) | (63,637,812 | ) | |||||||||||
| 165,710,244 | 331,507,877 | 16,435,907 | 32,219,310 | 50,567,789 | 24,626,170 | |||||||||||||||||
| - | 9,393,820 | - | 7,168,595 | 812,684 | 1,412,688 | |||||||||||||||||
| (305,447,760 | ) | (463,843,985 | ) | (23,082,533 | ) | (47,425,183 | ) | (12,714,459 | ) | (18,320,545 | ) | |||||||||||
| (699,263,657 | ) | (946,714,516 | ) |
| (53,733,461 | ) | (54,085,402 | ) | 72,543,378 | 69,724 | ||||||||||||
| $ | (1,036,994,306 | ) | $ | 144,345,603 | $ | (51,386,051 | ) | $ | 146,014,414 | $ | 86,941,062 | $ | 14,574,740 | |||||||||
| 3,841,986,380 | 3,697,640,777 | 986,174,092 | 840,159,678 | 230,080,915 | 215,506,175 | |||||||||||||||||
| $ | 2,804,992,074 | $ | 3,841,986,380 | $ | 934,788,041 | $ | 986,174,092 | $ | 317,021,977 | $ | 230,080,915 | |||||||||||
| 4,101,676 | 12,974,874 | 748,116 | 1,191,457 | 3,061,296 | 3,102,481 | |||||||||||||||||
| - | 553,390 | - | 642,306 | 85,294 | 221,506 | |||||||||||||||||
| (21,053,630 | ) | (37,365,002 | ) | (1,779,901 | ) | (2,821,183 | ) | (1,241,773 | ) | (3,803,506 | ) | |||||||||||
| 5,193,553 | 9,606,266 | 345,957 | 675,568 | 2,857,944 | 1,466,177 | |||||||||||||||||
| - | 244,950 | - | 142,755 | 45,766 | 84,036 | |||||||||||||||||
| (9,277,556 | ) | (13,447,983 | ) | (525,358 | ) | (1,012,296 | ) | (723,307 | ) | (1,109,741 | ) | |||||||||||
| (16,951,954 | ) | (23,836,738 | ) | (1,031,785 | ) | (987,420 | ) | 1,904,817 | (479,519 | ) | ||||||||||||
| (4,084,003 | ) | (3,596,767 | ) | (179,401 | ) | (193,973 | ) | 2,180,403 | 440,472 | |||||||||||||
The accompanying notes are an integral part of these financial statements.
47
Table of Contents
| Semiannual Report • 2020 | |||
Notes to Financial Statements (continued)
1. Organization
The Parnassus Funds are comprised of two Trusts, the Parnassus Funds trust and the Parnassus Income Funds trust (collectively the “Trusts”), organized as Massachusetts Business Trusts registered under the Investment Company Act of 1940 as diversified, open-end investment management companies, and are comprised of five separate funds (collectively the “Funds”). The Parnassus Funds trust includes the Parnassus Mid Cap Fund and the Parnassus Endeavor Fund, both of which commenced operations on April 29, 2005, the Parnassus Mid Cap Growth Fund, which commenced operations on December 27, 1984. The Parnassus Income Funds trust includes the Parnassus Core Equity Fund and the Parnassus Fixed Income Fund, both of which commenced operations on August 31, 1992. Each Fund has distinct investment objectives. In general, each of the Funds seeks long-term capital appreciation. Prior to May 1, 2014, the Parnassus Core Equity Fund was known as the Parnassus Equity Income Fund, and the Parnassus Endeavor Fund was known as the Parnassus Workplace Fund. Prior to May 1 2020, the Parnassus Mid Cap Growth Fund was known as the Parnassus Fund.
2. Significant Accounting Policies
The Funds are investment companies that apply the accounting and reporting guidance issued in Topic 946 by the U.S. Financial Accounting Standards Board. The presentation of the financial statements is made using specialized accounting principles applicable to investment companies.
Short-Term Securities
Short-term securities represent investments of excess cash and consist of time deposits, community development loans, certificates of deposit and money market funds.
Security Transactions and Related Investment Income and Expenses
Securities transactions are recorded on the date the securities are purchased or sold (trade date). Realized gains and losses on securities transactions are determined on the basis of first-in, first-out for both financial statement and federal income tax purposes. Dividend income is recognized on the ex-dividend date and interest income is recognized on an accrual basis. Discounts and premiums on securities purchased are amortized over the lives of the respective securities using the constant yield method,
which approximates the interest method. Expenses are recorded on an accrual basis.
Class Allocations
Income, fees and expenses (other than class-specific fees and expenses) and realized and unrealized gains and losses are allocated daily among the various shares classes based on their relative net assets. Class-specific fees and expenses, such as broker service fees, administrative and shareholder services, are charged directly to the respective share class.
Dividends and Distributions to Shareholders
Dividends and distributions to shareholders are recorded on the ex-dividend date to shareholders of record on the record date. The Parnassus Core Equity Fund pays income dividends quarterly and capital-gain dividends annually. The Parnassus Fixed Income Fund pays income dividends monthly and capital-gain dividends annually. The other Funds pay income and capital-gain dividends annually.
3. Securities Valuations
Methods and Inputs
Equity securities that are listed or traded on a national securities exchange are stated at market value, based on recorded closing sales on the exchange or on the NASDAQ’s National Market official closing price. In the absence of a recorded sale, and for over-the-counter securities, equity securities are stated at the mean between the last recorded bid and asked prices. Long-term, fixed-income securities are valued each business day using prices based on procedures established by independent pricing services and approved by the Board of Trustees (the “Trustees”). Fixed-income securities with an active market are valued at the “bid” price where such quotes are readily available from brokers and dealers and are representative of the actual market for such securities. Other fixed-income securities experiencing a less active market are valued as determined by the pricing services based on methods which include consideration of trading in securities of comparable yield, quality, coupon, maturity and type, as well as indications as to values from dealers and other market data without exclusive reliance upon quoted prices or over-the-counter prices, since such valuations are believed to reflect more accurately the value of such securities. Mortgage-backed and asset-backed securities are valued as determined by the pricing services based on methods which include standard inputs and cashflows,
48
Table of Contents
| Semiannual Report • 2020 | | |||
Notes to Financial Statements (continued)
prepayment information, default rates, delinquency and loss assumptions, collateral characteristics, credit enhancements and specific deal information. Investments in registered investment companies are valued at their net asset value.
Investments where market quotations are not readily available are priced at their fair value, in accordance with procedures established by the Trustees. These investments include certificates of deposit and community development loans. These investments carry interest rates ranging from 0.39% to 2.12% with maturities of one year or less. In determining fair value, the Trustees may consider a variety of information including, but not limited to, the following: price based upon a multiple of earnings or sales, fundamental analytical data and an evaluation of market conditions. A valuation adjustment is applied to certificates of deposit, community development loans and other community development investments as an estimate of potential penalties for early withdrawal.
The Funds follow Accounting Standards Codification (“ASC”) 820, Fair Value Measurements and Disclosure, which defines fair value, establishes a framework for measuring fair value and expands disclosures about fair value measurements. Various inputs are used in determining the value of the Funds’ portfolio investments. These inputs are summarized in three levels, Level 1 – unadjusted quoted prices in active markets for identical investments, Level 2 – other significant observable inputs (including quoted prices for similar investments) and Level 3 – significant unobservable inputs (including the Fund’s own assumptions in determining the fair value of investments).
Securities Lending
The Parnassus Funds have entered into an agreement with Brown Brothers Harriman & Co., dated July 29, 2009 (“Agreement”), to provide securities lending services to the Funds. Under this program, the proceeds (cash collateral) received from borrowers are used to invest in money market funds.
Under the Agreement, the borrowers pay the Funds negotiated lenders’ fees and the Funds receive cash collateral in an amount equal to 102% of the market value of loaned securities. The borrower of securities is at all times required to post cash collateral to the portfolio in an amount equal to 100% of the market
value of the securities loaned based on the previous day’s market value of the securities loaned, marked-to-market daily. Any collateral shortfalls are adjusted the next business day. If the borrower defaults on its obligations to return the securities loaned because of insolvency or other reasons, the portfolio could experience delays and costs in recovering the securities loaned.
The agreement provides the right in the event of default for the non-defaulting party to liquidate the collateral and calculate a net exposure to the defaulting party or request additional collateral. In the event that a borrower defaults, the Funds, as lender, would offset the market value of the collateral received against the market value of the securities loaned. When the value of the collateral is greater than that of the market value of the securities loaned, the lender is left with a net amount payable to the defaulting party. However, bankruptcy or insolvency laws of a particular jurisdiction may impose restrictions on or prohibitions against such a right of offset in the event of a counterparty’s bankruptcy or insolvency. Under the agreement, the borrower can resell or re-pledge the loaned securities, and the Funds can reinvest cash collateral, or, upon an event of default, resell or re-pledge the collateral.
The Funds retained beneficial ownership and all economic benefits in the securities they have loaned and continues to receive interest paid by the securities and payments equivalent to dividends, and to participate in any changes in their market value, but does not have the proxy voting rights with respect to loaned securities. Each portfolio manager of the Funds has the responsibility to request that the securities lending agent call back securities which are out on loan to vote on material matters and it is the Funds’ policy that the portfolio managers vote on all material matters. However, the ability to timely recall shares for proxy voting purposes typically is not entirely within the control of the portfolio manager, the Funds or their securities lending agent. Under certain circumstances, the recall of shares in time for such shares to be voted may not be possible due to applicable proxy voting record dates and administrative considerations.
Income generated from securities lending is presented in the Statement of Operations. Cash collateral received by the Funds is reflected as an asset (securities purchased with cash collateral from
49
Table of Contents
| Semiannual Report • 2020 | |||
Notes to Financial Statements (continued)
securities lending) and the related liability (payable upon return of securities loaned) is presented in the Statement of Assets and Liabilities.
At June 30, 2020 the following tables are a summary of the Funds’ securities lending agreements by counterparty, which are subject to offset under the agreement:
| Parnassus Mid Cap Fund |
| |||||||||||||||||||
| Counterparty | Securities Loaned at Value | Cash Collateral Received1 | Net Amount | |||||||||||||||||
| Credit Suisse Securities (USA) | 342,836 | (342,836 | ) | - | ||||||||||||||||
Total | 342,836 | (342,836 | ) | - | ||||||||||||||||
| Parnassus Mid Cap Growth Fund |
| |||||||||||||||||||
| Counterparty | Securities Loaned at Value | Cash Collateral Received1 | Net Amount | |||||||||||||||||
| Goldman, Sachs, & Co. | 2,537,000 | (2,537,000 | ) | - | ||||||||||||||||
| SG Americas Securities, LLC | 6,422 | (6,422 | ) | - | ||||||||||||||||
| SG Americas Securities, LLC | 816,058 | (816,058 | ) | - | ||||||||||||||||
| SG Americas Securities, LLC | 234,115 | (234,115 | ) | - | ||||||||||||||||
| SG Americas Securities, LLC | 83,345 | (83,345 | ) | - | ||||||||||||||||
| SG Americas Securities, LLC | 127,091 | (127,091 | ) | - | ||||||||||||||||
| SG Americas Securities, LLC | 1,458,202 | (1,458,202 | ) | - | ||||||||||||||||
| SG Americas Securities, LLC | 1,772,585 | (1,772,585 | ) | - | ||||||||||||||||
Total | 7,034,818 | (7,034,818 | ) | - | ||||||||||||||||
1 Collateral value of $352,085 and $7,177,267 has been received in connection with securities lending agreements for Parnassus Mid Cap Fund and Parnassus Mid Cap Growth Fund, respectively. Collateral received in excess of the value of the securities loaned from the individual counterparty is shown for financial reporting purposes in the Funds’ financial statements.
As of June 30, 2020, the contractual maturity date is overnight and continuous for the gross obligation of the equity securities on loan in the Parnassus Mid Cap Fund and Parnassus Mid Cap Growth Fund, in the amounts of $352,085 and $7,177,267, respectively
Community Development Investment Programs
The Parnassus Funds may each invest up to 2% of their assets in community investments and community-development loan funds. Each of the Funds may invest in obligations issued by community loan funds at below-market interest rates if the projects financed have a positive social impact. Generally, there is no secondary market on loan funds and thus these are considered illiquid.
As part of our community development investment program, the Parnassus Core Euity Fund, Parnassus Mid Cap Fund, Parnassus Endeavor Fund and Parnassus Mid Cap Growth Fund has entered into an agreement for fund investments through the Certificate of Deposit Account Registry Service (“CDARS”) network. The CDARS network allows members to place funds in time deposits with depository institutions whose accounts are insured by the Federal Deposit Insurance Corporation (“FDIC”). Provisions stipulate that participating institutions are FDIC insured; however, in the event of default or bankruptcy by any party to the agreement, the proceeds of the investment may be delayed or subject to legal proceedings and are subject to FDIC limits. While certain investments of the Funds may be bank deposits and may be covered by FDIC insurance, the Funds are themselves not covered by FDIC insurance.
50
Table of Contents
| Semiannual Report • 2020 | | |||
Notes to Financial Statements (continued)
Use of Estimates
The preparation of financial statements in conformity with GAAP requires management to make estimates and assumptions that affect the reported amounts of assets and liabilities at the date of the financial statements and the reported amount of revenues and expenses during the reporting period. Actual results could differ from those estimates.
Subsequent Events
Management has evaluated the impact of all subsequent events on the Funds through the date the financial statements were issued and has determined that there were no subsequent events requiring adjustment to or additional disclosure in the financial statements.
4. Risk Factors
Investing in the Parnassus Funds may involve certain risks including, but not limited to the following:
Market Conditions
The prices of, and the income generated by, the common stocks and other securities held by the Funds may decline in response to certain events taking place around the world, including those directly involving the companies whose securities are owned by the Funds; conditions affecting the general economy; overall market changes; local, regional or global political, social or economic instability; and currency, interest rate and commodity price fluctuations. Additionally, the values of, and the income generated by, most debt securities held by the Funds may be affected by changing interest rates and by changes in the effective maturities and credit ratings of these debt securities. The Funds’ investment adviser attempts to reduce these risks through diversification of the portfolio and ongoing credit analysis as well as by monitoring economic and legislative developments, but there can be no assurance that it will be successful at doing so. Investments in securities issued by entities based outside the U.S. may also be affected by currency controls; different accounting, auditing, financial reporting, and legal standards and practices; expropriation; changes in tax policy; greater market volatility; different securities market structures and higher transaction costs.
Investing Outside the U.S.
Securities of issuers domiciled outside the U.S., or with significant operations outside the U.S., may lose value
because of political, social, economic or market developments or instability in the countries or regions in which the issuer operates. These securities may also lose value due to changes in foreign currency exchange rates against the U.S. dollar and/or currencies of other countries. Securities markets in certain countries may be more volatile and/or less liquid than those in the U.S. Investment outside the U.S. may also be subject to different settlement and accounting practices and different regulatory, legal and reporting standards, and may be more difficult to value, than those in the U.S. The risks of investing outside the U.S. may be heightened in connection with investments in emerging and developing countries.
Contractual Obligations
Under the Trusts’ organizational documents, its officers and Trustees may be indemnified against certain liabilities and expenses arising out of the performance of their duties to the Trusts. Additionally, the Trusts have a variety of indemnification obligations under contracts with its service providers. The Trusts’ maximum exposure under these arrangements is unknown, as this would involve future claims that may be made against the Trusts that have not yet occurred.
5. Taxation and Distributions
Federal Income Taxes
The Trusts intend to comply with the requirements of the Internal Revenue Code applicable to regulated investment companies and to distribute all taxable income to shareholders. Therefore, no federal income tax provision is required. Income distributions and capital-gain distributions are determined in accordance with income tax regulations, which may differ from U.S. Generally Accepted Accounting Principles (“GAAP”).
The Funds follow ASC 740, Income Taxes, relating to uncertainty in income taxes and disclosures. ASC 740 establishes a minimum threshold for income tax benefits to be recognized in the financial statements. These tax benefits must meet a “more likely than not” threshold, which means that based on technical merits, they have a more than 50% likelihood of being sustained upon examination by the tax authority. Tax benefits meeting this threshold are measured as the largest amount of tax benefit that is greater than 50% likely of being realized upon ultimate settlement with the tax authority. As of and during the year ended December 31, 2019, the Funds did not have a liability
51
Table of Contents
| Semiannual Report • 2020 | |||
Notes to Financial Statements (continued)
for any unrecognized tax benefits. The Funds recognize interest and penalties, if any, related to unrecognized tax benefits as income tax expense in the Statement of Operations. During the year, the Funds did not incur interest or penalties. The Funds are not subject to examination by U.S. federal taxing
authorities before 2016 or state taxing authorities before 2015.
Tax Matters and Distributions
At June 30, 2020, the cost of investments in securities and net unrealized appreciation/depreciation for income tax purposes were as follows:
| Parnassus Core Equity Fund | Parnassus Mid Cap Fund | Parnassus Endeavor Fund | Parnassus Mid Cap Growth Fund | Parnassus Fixed Income Fund | ||||||||||||||||||||||||
| Cost of investment | $ | 13,853,207,713 | $ | 4,546,112,829 | $ | 2,169,368,544 | $ | 751,208,830 | $ | 278,758,935 | ||||||||||||||||||
| Gross unrealized appreciation | $ | 4,587,008,211 | $ | 834,908,403 | $ | 542,321,208 | $ | 171,057,770 | $ | 21,315,804 | ||||||||||||||||||
| Gross unrealized depreciation | $ | (594,876,639 | ) | $ | (223,554,124 | ) | $ | (140,161,385 | ) | $ | (3,385,350 | ) | $ | (317,095 | ) | |||||||||||||
| Net unrealized appreciation | $ | 3,992,131,572 | $ | 611,354,279 | $ | 402,159,823 | $ | 167,672,420 | $ | 20,998,709 | ||||||||||||||||||
Net realized gains differ for financial statement and income tax purposes primarily due to differing treatments of wash sales. Reclassifications as shown in the following table have been made in each Fund’s capital accounts to report these balances on a tax basis, excluding certain temporary differences, as of December 31, 2019. Additional permanent book to tax adjustments may be required in subsequent reporting periods. These reclassifications, which have no impact on the net asset value of the Funds, are primarily
attributable to the reclassification of dividend income and certain differences in the computation of distributable income and capital gains under Federal tax rules versus GAAP.
6. Fair Value Measurements
The following table summarizes the portfolios’ financial assets as of June 30, 2020, that is valued at fair value on a recurring basis:
| Parnassus Core Equity Fund |
| |||||||||||||||||||||||
| Investment Securities | Level 1 | Level 2 | Level 3 | Total | ||||||||||||||||||||
Equities: | ||||||||||||||||||||||||
Communication Services | $ | 2,232,255,156 | $ | - | $ | - | $ | 2,232,255,156 | ||||||||||||||||
Consumer Discretionary | 1,808,386,198 | - | - | 1,808,386,198 | ||||||||||||||||||||
Consumer Staples | 1,691,355,377 | - | - | 1,691,355,377 | ||||||||||||||||||||
Financials | 849,386,224 | - | - | 849,386,224 | ||||||||||||||||||||
Health Care | 1,853,952,426 | - | - | 1,853,952,426 | ||||||||||||||||||||
Industrials | 2,795,616,257 | - | - | 2,795,616,257 | ||||||||||||||||||||
Information Technology | 5,579,699,961 | - | - | 5,579,699,961 | ||||||||||||||||||||
Materials | 582,276,524 | - | - | 582,276,524 | ||||||||||||||||||||
Real Estate | 452,411,162 | - | - | 452,411,162 | ||||||||||||||||||||
Short-Term Investments | 686,042,875 | - | 3,319,993 | 689,362,868 | ||||||||||||||||||||
Total | $ | 18,531,382,160 | $ | - | $ | 3,319,993 | $ | 18,534,702,153 | ||||||||||||||||
52
Table of Contents
| Semiannual Report • 2020 | | |||
Notes to Financial Statements (continued)
| Parnassus Mid Cap Fund |
| |||||||||||||||||||||||
| Investment Securities | Level 1 | Level 2 | Level 3 | Total | ||||||||||||||||||||
Equities: | ||||||||||||||||||||||||
Communication Services | $ | 178,725,943 | $ | - | $ | - | $ | 178,725,943 | ||||||||||||||||
Consumer Discretionary | 368,325,561 | - | - | 368,325,561 | ||||||||||||||||||||
Consumer Staples | 241,813,256 | - | - | 241,813,256 | ||||||||||||||||||||
Financials | 264,348,049 | - | - | 264,348,049 | ||||||||||||||||||||
Health Care | 756,658,307 | - | - | 756,658,307 | ||||||||||||||||||||
Industrials | 1,096,707,999 | - | - | 1,096,707,999 | ||||||||||||||||||||
Information Technology | 1,422,389,037 | - | - | 1,422,389,037 | ||||||||||||||||||||
Materials | 114,445,740 | - | - | 114,445,740 | ||||||||||||||||||||
Real Estate | 448,283,142 | - | - | 448,283,142 | ||||||||||||||||||||
Utilities | 265,770,074 | - | - | 265,770,074 | ||||||||||||||||||||
Short-Term Investments | 167,778,301 | - | 727,163 | 168,505,464 | ||||||||||||||||||||
Total | $ | 5,325,245,409 | $ | - | $ | 727,163 | $ | 5,325,972,572 | ||||||||||||||||
| Parnassus Endeavor Fund |
| |||||||||||||||||||||||
| Investment Securities | Level 1 | Level 2 | Level 3 | Total | ||||||||||||||||||||
Equities: | ||||||||||||||||||||||||
Communication Services | $ | 56,722,000 | $ | - | $ | - | $ | 56,722,000 | ||||||||||||||||
Consumer Discretionary | 238,650,767 | - | - | 238,650,767 | ||||||||||||||||||||
Financials | 561,450,800 | - | - | 561,450,800 | ||||||||||||||||||||
Health Care | 88,370,000 | - | - | 88,370,000 | ||||||||||||||||||||
Industrials | 441,768,600 | - | - | 441,768,600 | ||||||||||||||||||||
Information Technology | 1,184,566,200 | - | - | 1,184,566,200 | ||||||||||||||||||||
Short-Term Investments | 216,249,024 | - | 826,612 | 217,075,636 | ||||||||||||||||||||
Total | $ | 2,787,777,391 | $ | - | $ | 826,612 | $ | 2,788,604,003 | ||||||||||||||||
| Parnassus Mid Cap Growth Fund |
| |||||||||||||||||||||||
| Investment Securities | Level 1 | Level 2 | Level 3 | Total | ||||||||||||||||||||
Equities: | ||||||||||||||||||||||||
Communication Services | $ | 37,201,805 | $ | - | $ | - | $ | 37,201,805 | ||||||||||||||||
Consumer Discretionary | 86,300,317 | - | - | 86,300,317 | ||||||||||||||||||||
Consumer Staples | 37,521,274 | - | - | 37,521,274 | ||||||||||||||||||||
Financials | 49,768,108 | - | - | 49,768,108 | ||||||||||||||||||||
Health Care | 169,510,697 | - | - | 169,510,697 | ||||||||||||||||||||
Industrials | 174,170,853 | - | - | 174,170,853 | ||||||||||||||||||||
Information Technology | 338,988,207 | - | - | 338,988,207 | ||||||||||||||||||||
Real Estate | 25,419,989 | - | - | 25,419,989 | ||||||||||||||||||||
Short-Term Investments | 22,533,149 | - | 1,115,788 | 23,648,937 | ||||||||||||||||||||
Total | $ | 941,414,399 | $ | - | $ | 1,115,788 | $ | 942,530,187 | ||||||||||||||||
53
Table of Contents
| Semiannual Report • 2020 | |||
Notes to Financial Statements (continued)
| Parnassus Fixed Income Fund |
| |||||||||||||||||||||||
| Investment Securities | Level 1 | Level 2 | Level 3 | Total | ||||||||||||||||||||
Preferred Stock | $ | 4,322,102 | $ | - | $ | - | $ | 4,322,102 | ||||||||||||||||
Commercial Mortgage-Backed Securities | - | 675,333 | - | 675,333 | ||||||||||||||||||||
Convertible Bonds | - | 1,964,392 | - | 1,964,392 | ||||||||||||||||||||
Corporate Bonds | - | 147,175,438 | - | 147,175,438 | ||||||||||||||||||||
Supranational Bonds | - | 14,103,788 | - | 14,103,788 | ||||||||||||||||||||
U.S. Government Treasury Bonds | - | 131,516,591 | - | 131,516,591 | ||||||||||||||||||||
Short-Term Investments | 20,883,950 | - | - | 20,883,950 | ||||||||||||||||||||
Total | $ | 25,206,052 | $ | 295,435,542 | $ | - | $ | 320,641,594 | ||||||||||||||||
The following table reconciles the valuation of the Funds’ Level 3 investment securities and related transactions as of June 30, 2020:
| Parnassus Core Equity Fund | Parnassus Mid Cap Fund | Parnassus Endeavor Fund | Parnassus Mid Cap Growth Fund | |||||||||||||||||||||
| Certificates of Deposit | Certificates of Deposit | Certificates of Deposit | ||||||||||||||||||||||
| Community Development Loans | Certificates of Deposit | Community Development Loans | Community Development Loans | |||||||||||||||||||||
| Balance as of December 31, 2019 | $ | 3,444,929 | $ | 742,267 | $ | 942,266 | $ | 1,234,621 | ||||||||||||||||
| Discounts/premiums amortization | (24,936 | ) | (15,104 | ) | (15,654 | ) | (18,833 | ) | ||||||||||||||||
| Purchases | 1,050,000 | 750,000 | 850,000 | 2,900,000 | ||||||||||||||||||||
| Sales | (1,150,000 | ) | (750,000 | ) | (950,000 | ) | (3,000,000 | ) | ||||||||||||||||
| Balance as of June 30, 2020 | $ | 3,319,993 | $ | 727,163 | $ | 826,612 | $ | 1,115,788 | ||||||||||||||||
There were no significant transfers between Level 1, Level 2 and Level 3.
Quantitative information about Level 3 fair value measurement:
| Fair Value at June 30, 2020 | Valuation Technique | Unobservable Input | Range (Weighted Average) | |||||||||||||||
| Parnassus Core Equity Fund | ||||||||||||||||||
| Certificates of Deposit | $ | 2,439,159 | Liquidity Discount | Discount for Lack of Marketability | 4% | |||||||||||||
| Community Development Loans | $ | 880,834 | Liquidity Discount | Discount for Lack of Marketability and Probability of Default | 6% | |||||||||||||
| Parnassus Mid Cap Fund |
| |||||||||||||||||
| Certificates of Deposit | $ | 727,163 | Liquidity Discount | Discount for Lack of Marketability | 4% | |||||||||||||
| Parnassus Endeavor Fund |
| |||||||||||||||||
| Certificates of Deposit | $ | 730,149 | Liquidity Discount | Discount for Lack of Marketability | 4% | |||||||||||||
| Community Development Loans | $ | 96,463 | Liquidity Discount | Discount for Lack of Marketability and Probability of Default | 6% | |||||||||||||
54
Table of Contents
| Semiannual Report • 2020 | | |||
Notes to Financial Statements (continued)
| Fair Value at June 30, 2020 | Valuation Technique | Unobservable Input | Range (Weighted Average) | |||||||||||||||
| Parnassus Mid Cap Growth Fund |
| |||||||||||||||||
| Certificates of Deposit | $ | 730,689 | Liquidity Discount | Discount for Lack of Marketability | 4% | |||||||||||||
| Community Development Loans | $ | 385,099 | Liquidity Discount | Discount for Lack of Marketability and Probability of Default | 6% | |||||||||||||
The significant unobservable inputs used in fair value measurement of the Fund’s Certificates of Deposits are a discount for lack of marketability. The significant unobservable inputs used in the fair value measurement of the Fund’s Community Development Loans are a discount for lack of marketability and a discount for the probability of default. Significant increases in any of these inputs in isolation would result in a lower fair value measurement. Generally, a change in the assumption used for probability of default should be accompanied by a directionally-similar change in the assumption used for the lack of marketability.
In accordance with procedures established by the Funds’ Trustees, all fair value securities as submitted by the Funds’ treasurer, are reviewed and approved by the Trustees. The Funds’ valuation committee is
comprised of Independent Trustees who also comprise the Funds’ audit committee. The committee reviews the methodologies used by the Funds when securities have been identified as being fair valued and include the percentages used when determining liquidity discounts or discounts to be taken for lack of marketability. The Trustees review the changes in fair value measurement and methods used to substantiate the unobservable inputs on a quarterly basis.
7. Capital Stock
Capital stock consists of an unlimited number of authorized shares of capital stock with no par value.
8. Purchases and Sales of Securities
Purchases and proceeds from sales of securities, excluding short-term securities, for the six-month period ended June 30, 2020 were as follows:
| Fund | Affiliated Purchases | Unaffiliated Purchases | Affiliated Sales | Unaffiliated Sales | ||||||||||||||||||||
| Parnassus Core Equity Fund | $ | - | $ | 5,322,731,901 | $ | - | $ | 5,336,643,166 | ||||||||||||||||
| Parnassus Mid Cap Fund | - | 2,088,423,904 | - | 1,465,130,736 | ||||||||||||||||||||
| Parnassus Endeavor Fund | - | 1,107,589,889 | - | 1,518,276,273 | ||||||||||||||||||||
| Parnassus Mid Cap Growth Fund | - | 620,554,534 | - | 667,903,768 | ||||||||||||||||||||
| Parnassus Fixed Income Fund | - | 109,421,459 | - | 46,016,135 | ||||||||||||||||||||
The above includes purchases and sales of U.S. Government securities in the amount of $31,008,301 and $21,882,520, respectively, within the Parnassus Fixed Income Fund.
9. Investment Advisory Agreement and Transactions with Affiliates
Under terms of an agreement which provides for furnishing investment management and advice to the Funds, Parnassus Investments is entitled to receive fees payable monthly, based on each Fund’s average daily
net assets for the month, at the following annual rates:
Parnassus Mid Cap Fund: 0.85% of the first $100,000,000, 0.80% of the next $100,000,000, 0.75% of the next $300,000,000 and 0.70% of the amount above $500,000,000. Parnassus Endeavor Fund: 0.85% of the first $100,000,000, 0.80% of the next $100,000,000, 0.75% of the next $300,000,000 and 0.65% of the amount above $500,000,000. Parnassus Mid Cap Growth Fund: 0.70% of the first $100,000,000, 0.65% of the next $100,000,000 and 0.60% of the
55
Table of Contents
| Semiannual Report • 2020 | |||
Notes to Financial Statements (continued)
amount above $200,000,000. For the six-month period ended June 30, 2020, Parnassus Investments has contractually agreed to limit total operating expenses to 0.99% of the net assets of the Parnassus Mid Cap Fund – Investor Shares and to 0.75% of the net assets of the Parnassus Mid Cap Fund – Institutional Shares, 0.99% of net assets for the Parnassus Endeavor Fund – Investor Shares and to 0.71% of net assets for the Parnassus Endeavor Fund Institutional Shares, 0.84% of net assets for the Parnassus Mid Cap Growth Fund – Investor Shares and to 0.68% of net assets for the Parnassus Mid Cap Growth Fund – Institutional Shares.
Parnassus Core Equity Fund: 0.75% of the first $30,000,000, 0.70% of the next $70,000,000, 0.65% of the next $400,000,000, 0.60% of the next $9,500,000,000 and 0.55% of the amount above $10,000,000,000. Parnassus Fixed Income Fund: 0.50% of the first $200,000,000, 0.45% of the next $200,000,000 and 0.40% of the amount above $400,000,000. For the six-month period ended June 30, 2020, Parnassus Investments has contractually agreed to limit total operating expenses to 0.86% of net assets of the Parnassus Core Equity Fund – Investor Shares and to 0.63% of net assets for the Parnassus Core Equity Fund – Institutional Shares and 0.68% of net assets for the Parnassus Fixed Income Fund – Investor Shares and to 0.45% of net assets for the Parnassus Fixed Income Fund – Institutional Shares.
Parnassus Investments receives fees under terms of a separate agreement which provides for furnishing
transfer agent and fund administration services to the Funds. The transfer agent fee was $2.50 per month per account plus any out-of-pocket expenses for the Parnassus Mid Cap Fund, Parnassus Endeavor Fund and Parnassus Mid Cap Growth Fund. The transfer agent fee was $2.70 per month per account plus any out-of-pocket expenses for the Parnassus Core Equity Fund and Parnassus Fixed Income Fund. The Funds pay the monthly fee based on the number of accounts on record at each month-end. The fund administration reflects annual rates based on net assets for all Funds managed by Parnassus Investments and was allocated based on respective Fund net assets at the following annual rates: 0.08% of the first $500,000,000, 0.07% of the next $500,000,000 and 0.03% of the amount above $1,000,000,000. The fund administration services fee was 0.02% of average net assets under this new agreement for the six-month period ended June 30, 2020.
Parnassus Investments may also arrange for third parties to provide certain services, including account maintenance, recordkeeping and other personal services to their clients who invest in the Funds. For these services, the Parnassus Funds – Investor Shares may pay service providers an aggregate service fee on investment accounts at a rate not to exceed 0.25% per annum of average daily net assets. The Parnassus Funds – Institutional Shares do not incur service provider fees.
56
Table of Contents
| Semiannual Report • 2020 | | |||
THIS PAGE LEFT INTENTIONALLY BLANK
57
Table of Contents
| Semiannual Report • 2020 | |||
Selected data for each share of capital stock outstanding, total return and ratios/supplement data for the six-month period ended June 30, 2020 and each of the five years ended December 31 are as follows:
| For a Share Outstanding for the Period Ended | Net Asset Value Beginning of Period | Net Investment Income(a) | Net Realized and Unrealized Gain (Loss) on Securities(a) | Total from Investment Operations(a) | Dividends from Net Investment Income | Distributions from Net Realized Gain on Securities | Total Dividends and Distributions | |||||||||||||||||||||||||
| Parnassus Core Equity Fund – Investor Shares |
| |||||||||||||||||||||||||||||||
Six-Month Period Ended June 30, 2020 (unaudited) | $47.03 | $0.20 | $(1.19 | ) | $(0.99 | ) | $(0.17 | ) | $- | $(0.17 | ) | |||||||||||||||||||||
2019 | 38.99 | 0.36 | 11.45 | 11.81 | (0.34 | ) | (3.43 | ) | (3.77 | ) | ||||||||||||||||||||||
2018 | 42.67 | 0.45 | (0.38 | ) | 0.07 | (0.44 | ) | (3.31 | ) | (3.75 | ) | |||||||||||||||||||||
2017 | 39.29 | 0.45 | 5.98 | 6.43 | (0.55 | ) | (2.50 | ) | (3.05 | ) | ||||||||||||||||||||||
2016 | 36.97 | 0.39 | 3.42 | 3.81 | (0.40 | ) | (1.09 | ) | (1.49 | ) | ||||||||||||||||||||||
2015 | 40.69 | 0.40 | (0.56 | ) | (0.16 | ) | (0.80 | ) | (2.76 | ) | (3.56 | ) | ||||||||||||||||||||
| Parnassus Core Equity Fund – Institutional Shares |
| |||||||||||||||||||||||||||||||
Six-Month Period Ended June 30, 2020 (unaudited) | 47.10 | 0.21 | (1.14 | ) | (0.93 | ) | (0.22 | ) | - | (0.22 | ) | |||||||||||||||||||||
2019 | 39.05 | 0.46 | 11.47 | 11.93 | (0.45 | ) | (3.43 | ) | (3.88 | ) | ||||||||||||||||||||||
2018 | 42.73 | 0.55 | (0.37 | ) | 0.18 | (0.55 | ) | (3.31 | ) | (3.86 | ) | |||||||||||||||||||||
2017 | 39.35 | 0.55 | 5.98 | 6.53 | (0.65 | ) | (2.50 | ) | (3.15 | ) | ||||||||||||||||||||||
2016 | 37.03 | 0.48 | 3.41 | 3.89 | (0.48 | ) | (1.09 | ) | (1.57 | ) | ||||||||||||||||||||||
2015 | 40.75 | 0.50 | (0.58 | ) | (0.08 | ) | (0.89 | ) | (2.75 | ) | (3.64 | ) | ||||||||||||||||||||
| Parnassus Mid Cap Fund – Investor Shares |
| |||||||||||||||||||||||||||||||
Six-Month Period Ended June 30, 2020 (unaudited) | 35.63 | 0.09 | (3.07 | ) | (2.98 | ) | - | - | - | |||||||||||||||||||||||
2019 | 28.86 | 0.17 | 8.08 | 8.25 | (0.18 | ) | (1.30 | ) | (1.48 | ) | ||||||||||||||||||||||
2018 | 32.07 | 0.23 | (2.32 | ) | (2.09 | ) | (0.22 | ) | (0.90 | ) | (1.12 | ) | ||||||||||||||||||||
2017 | 28.87 | 0.26 | 4.29 | 4.55 | (0.48 | ) | (0.87 | ) | (1.35 | ) | ||||||||||||||||||||||
2016 | 25.56 | 0.21 | 3.90 | 4.11 | (0.11 | ) | (0.69 | ) | (0.80 | ) | ||||||||||||||||||||||
2015 | 27.40 | 0.21 | (0.41 | ) | (0.20 | ) | (0.18 | ) | (1.46 | ) | (1.64 | ) | ||||||||||||||||||||
| Parnassus Mid Cap Fund – Institutional Shares |
| |||||||||||||||||||||||||||||||
Six-Month Period Ended June 30, 2020 (unaudited) | 35.68 | 0.10 | (3.04 | ) | (2.94 | ) | - | - | - | |||||||||||||||||||||||
2019 | 28.90 | 0.27 | 8.07 | 8.34 | (0.26 | ) | (1.30 | ) | (1.56 | ) | ||||||||||||||||||||||
2018 | 32.11 | 0.31 | (2.33 | ) | (2.02 | ) | (0.29 | ) | (0.90 | ) | (1.19 | ) | ||||||||||||||||||||
2017 | 28.90 | 0.34 | 4.29 | 4.63 | (0.55 | ) | (0.87 | ) | (1.42 | ) | ||||||||||||||||||||||
2016 | 25.57 | 0.27 | 3.89 | 4.16 | (0.14 | ) | (0.69 | ) | (0.83 | ) | ||||||||||||||||||||||
For the period ended December 31, 2015(d) | 27.58 | 0.20 | (0.52 | ) | (0.32 | ) | (0.23 | ) | (1.46 | ) | (1.69 | ) | ||||||||||||||||||||
| Parnassus Endeavor Fund – Investor Shares |
| |||||||||||||||||||||||||||||||
Six-Month Period Ended June 30, 2020 (unaudited) | 38.18 | 0.21 | (3.16 | ) | (2.95 | ) | - | - | - | |||||||||||||||||||||||
2019 | 28.87 | 0.25 | 9.36 | 9.61 | (0.30 | ) | - | (0.30 | ) | |||||||||||||||||||||||
2018 | 37.18 | 0.38 | (5.13 | ) | (4.75 | ) | (0.52 | ) | (3.04 | ) | (3.56 | ) | ||||||||||||||||||||
2017 | 32.99 | 0.34 | 6.20 | 6.54 | (0.77 | ) | (1.58 | ) | (2.35 | ) | ||||||||||||||||||||||
2016 | 28.07 | 0.19 | 5.80 | 5.99 | (0.32 | ) | (0.75 | ) | (1.07 | ) | ||||||||||||||||||||||
2015 | 29.95 | 0.17 | 0.83 | 1.00 | (0.87 | ) | (2.01 | ) | (2.88 | ) | ||||||||||||||||||||||
58
Table of Contents
| Semiannual Report • 2020 | | |||
| Net Asset Value End of Period | Total Overall Return | Net Assets End of Period (000s) | Ratio of Gross Expenses to Average Net Assets | Ratio of Net Expenses to Average Net Assets (Net of Waiver and Expense Offset Arrangements)(b,c) | Ratio of Net Investment Income to Average Net Assets | Portfolio Turnover Rate | ||||||||||||||||||||
| $45.87 |
| (2.06 | ) | $9,445,633 | 0.87 | % | 0.86 | % | 0.91 | % | 30.88 | % | |||||||||||||
| 47.03 | 30.69 | 9,998,994 | 0.86 | 0.86 | 0.78 | 36.88 | ||||||||||||||||||||
| 38.99 | (0.18 | ) | 8,172,571 | 0.87 | 0.87 | 1.03 | 31.43 | |||||||||||||||||||
| 42.67 | 16.58 | 9,870,059 | 0.87 | 0.87 | 1.09 | 24.52 | ||||||||||||||||||||
| 39.29 | 10.41 | 10,200,768 | 0.87 | 0.87 | 1.03 | 22.89 | ||||||||||||||||||||
| 36.97 | (0.55 | ) | 8,368,394 | 0.88 | 0.88 | 1.03 | 26.90 | |||||||||||||||||||
| 45.95 |
| (1.93 | ) | 8,861,676 | 0.63 | 0.63 | 0.94 | 30.88 | |||||||||||||||||
| 47.10 | 30.96 | 8,660,689 | 0.63 | 0.63 | 1.02 | 36.88 | ||||||||||||||||||||
| 39.05 | 0.05 | 6,543,658 | 0.63 | 0.63 | 1.24 | 31.43 | ||||||||||||||||||||
| 42.73 | 16.81 | 6,245,179 | 0.64 | 0.64 | 1.31 | 24.52 | ||||||||||||||||||||
| 39.35 | 10.61 | 4,597,160 | 0.66 | 0.66 | 1.25 | 22.89 | ||||||||||||||||||||
| 37.03 | (0.34 | ) | 3,554,007 | 0.67 | 0.67 | 1.25 | 26.90 | |||||||||||||||||||
| 32.65 |
| (8.36 | ) | 2,210,748 | 1.00 | 0.99 | 0.58 | 31.04 | |||||||||||||||||
| 35.63 | 28.75 | 2,381,822 | 1.01 | 0.99 | 0.48 | 28.27 | ||||||||||||||||||||
| 28.86 | (6.64 | ) | 1,752,821 | 1.02 | 0.99 | 0.71 | 31.52 | |||||||||||||||||||
| 32.07 | 15.79 | 2,021,276 | 1.01 | 0.99 | 0.83 | 33.27 | ||||||||||||||||||||
| 28.87 | 16.07 | 1,490,587 | 1.01 | 0.99 | 0.75 | 18.81 | ||||||||||||||||||||
| 25.56 | (0.87 | ) | 543,251 | 1.07 | 0.99 | 0.77 | 58.01 | |||||||||||||||||||
| 32.74 |
| (8.24 | ) | 3,101,093 | 0.76 | 0.75 | 0.65 | 31.04 | |||||||||||||||||
| 35.68 | 29.02 | 2,692,990 | 0.75 | 0.75 | 0.77 | 28.27 | ||||||||||||||||||||
| 28.90 | (6.39 | ) | 1,073,093 | 0.75 | 0.75 | 0.95 | 31.52 | |||||||||||||||||||
| 32.11 | 16.04 | 780,372 | 0.75 | 0.75 | 1.09 | 33.27 | ||||||||||||||||||||
| 28.90 | 16.28 | 285,182 | 0.80 | 0.80 | 0.95 | 18.81 | ||||||||||||||||||||
| 25.57 |
| (1.30 | )(e) | 11,397 | 0.77 | (f) | 0.77 | (f) | 1.12 | (f) | 34.04 | (e) | |||||||||||||
| 35.23 |
| (7.73 | ) | 1,928,834 | 0.99 | 0.95 | 1.21 | 38.55 | |||||||||||||||||
| 38.18 | 33.29 | 2,737,805 | 0.97 | 0.95 | 0.73 | 57.29 | ||||||||||||||||||||
| 28.87 | (13.49 | ) | 2,758,361 | 0.95 | 0.95 | 1.04 | 70.96 | |||||||||||||||||||
| 37.18 | 19.81 | 4,185,857 | 0.92 | 0.92 | 0.94 | 43.21 | ||||||||||||||||||||
| 32.99 | 21.42 | 2,507,515 | 0.97 | 0.95 | 0.64 | 34.08 | ||||||||||||||||||||
| 28.07 | 3.25 | 1,325,765 | 0.98 | 0.95 | 0.56 | 63.23 | ||||||||||||||||||||
59
Table of Contents
| Semiannual Report • 2020 | |||
Financial Highlights (continued)
| For a Share Outstanding for the Period Ended | Net Asset Value Beginning of Period | Net Investment Income(a) | Net Realized and Unrealized Gain (Loss) on Securities(a) | Total from Investment Operations(a) | Dividends from Net Investment Income | Distributions from Net Realized Gain on Securities | Total Distributions | |||||||||||||||||||||||||
| Parnassus Endeavor Fund – Institutional Shares |
| |||||||||||||||||||||||||||||||
Six-Month Period Ended June 30, 2020 (unaudited) | $38.19 | $0.22 | $(3.12 | ) | $(2.90 | ) | $- | $- | $- | |||||||||||||||||||||||
2019 | 28.89 | 0.34 | 9.36 | 9.70 | (0.40 | ) | - | (0.40 | ) | |||||||||||||||||||||||
2018 | 37.21 | 0.46 | (5.13 | ) | (4.67 | ) | (0.61 | ) | (3.04 | ) | (3.65 | ) | ||||||||||||||||||||
2017 | 33.01 | 0.41 | 6.21 | 6.62 | (0.84 | ) | (1.58 | ) | (2.42 | ) | ||||||||||||||||||||||
2016 | 28.06 | 0.24 | 5.83 | 6.07 | (0.37 | ) | (0.75 | ) | (1.12 | ) | ||||||||||||||||||||||
For the period ended December 31, 2015(d) | 31.03 | 0.16 | (0.20 | ) | (0.04 | ) | (0.92 | ) | (2.01 | ) | (2.93 | ) | ||||||||||||||||||||
| Parnassus Mid Cap Growth Fund – Investor Shares |
| |||||||||||||||||||||||||||||||
Six-Month Period Ended June 30, 2020 (unaudited) | 50.47 | 0.08 | 0.44 | 0.52 | - | - | - | |||||||||||||||||||||||||
2019 | 40.54 | 0.29 | 11.77 | 12.06 | (1.28 | ) | (0.85 | ) | (2.13 | ) | ||||||||||||||||||||||
2018 | 48.27 | 0.50 | (5.01 | ) | (4.51 | ) | (0.54 | ) | (2.68 | ) | (3.22 | ) | ||||||||||||||||||||
2017 | 44.97 | 0.46 | 6.68 | 7.14 | (0.45 | ) | (3.39 | ) | (3.84 | ) | ||||||||||||||||||||||
2016 | 40.46 | 0.37 | 5.06 | 5.43 | (0.36 | ) | (0.56 | ) | (0.92 | ) | ||||||||||||||||||||||
2015 | 48.09 | 0.32 | (0.01 | ) | 0.31 | (1.78 | ) | (6.16 | ) | (7.94 | ) | |||||||||||||||||||||
| Parnassus Mid Cap Growth Fund – Institutional Shares |
| |||||||||||||||||||||||||||||||
Six-Month Period Ended June 30, 2020 (unaudited) | 50.43 | 0.08 | 0.48 | 0.56 | - | - | - | |||||||||||||||||||||||||
2019 | 40.52 | 0.37 | 11.75 | 12.12 | (1.36 | ) | (0.85 | ) | (2.21 | ) | ||||||||||||||||||||||
2018 | 48.25 | 0.58 | (5.02 | ) | (4.44 | ) | (0.61 | ) | (2.68 | ) | (3.29 | ) | ||||||||||||||||||||
2017 | 44.95 | 0.54 | 6.67 | 7.21 | (0.52 | ) | (3.39 | ) | (3.91 | ) | ||||||||||||||||||||||
2016 | 40.45 | 0.43 | 5.06 | 5.49 | (0.43 | ) | (0.56 | ) | (0.99 | ) | ||||||||||||||||||||||
For the period ended December 31, 2015(d) | 49.44 | 0.28 | (1.27 | ) | (0.99 | ) | (1.84 | ) | (6.16 | ) | (8.00 | ) | ||||||||||||||||||||
| Parnassus Fixed Income Fund – Investor Shares |
| |||||||||||||||||||||||||||||||
Six-Month Period Ended June 30, 2020 (unaudited) | 17.05 | 0.16 | 0.97 | 1.13 | (0.15 | ) | - | (0.15 | ) | |||||||||||||||||||||||
2019 | 15.92 | 0.37 | 1.15 | 1.52 | (0.39 | ) | - | (0.39 | ) | |||||||||||||||||||||||
2018 | 16.54 | 0.42 | (0.61 | ) | (0.19 | ) | (0.43 | ) | - | (0.43 | ) | |||||||||||||||||||||
2017 | 16.42 | 0.37 | 0.14 | 0.51 | (0.39 | ) | - | (0.39 | ) | |||||||||||||||||||||||
2016 | 16.44 | 0.34 | 0.06 | 0.40 | (0.36 | ) | (0.06 | ) | (0.42 | ) | ||||||||||||||||||||||
2015 | 16.66 | 0.33 | (0.21 | ) | 0.12 | (0.33 | ) | (0.01 | ) | (0.34 | ) | |||||||||||||||||||||
| Parnassus Fixed Income Fund – Institutional Shares |
| |||||||||||||||||||||||||||||||
Six-Month Period Ended June 30, 2020 (unaudited) | 17.04 | 0.18 | 0.98 | 1.16 | (0.17 | ) | - | (0.17 | ) | |||||||||||||||||||||||
2019 | 15.92 | 0.41 | 1.14 | 1.55 | (0.43 | ) | - | (0.43 | ) | |||||||||||||||||||||||
2018 | 16.54 | 0.46 | (0.61 | ) | (0.15 | ) | (0.47 | ) | - | (0.47 | ) | |||||||||||||||||||||
2017 | 16.41 | 0.41 | 0.14 | 0.55 | (0.42 | ) | - | (0.42 | ) | |||||||||||||||||||||||
2016 | 16.44 | 0.38 | 0.04 | 0.42 | (0.39 | ) | (0.06 | ) | (0.45 | ) | ||||||||||||||||||||||
For the period ended December 31, 2015(d) | 16.75 | 0.24 | (0.30 | ) | (0.06 | ) | (0.24 | ) | (0.01 | ) | (0.25 | ) | ||||||||||||||||||||
60
Table of Contents
| Semiannual Report • 2020 | | |||
| Net Asset Value End of Period | Total Overall Return | Net Assets End of Period (000s) | Ratio of Gross Expenses to Average Net Assets | Ratio of Net Expenses to Average Net Assets (Net of Waiver and Expense Offset Arrangements)(b,c) | Ratio of Net Investment Income to Average Net Assets | Portfolio Turnover Rate | ||||||||||||||||||||
| | $35.29 | (7.59 | )% | $876,058 | 0.73 | % | 0.71 | % | 1.28 | % | 38.55 | % | ||||||||||||||
| 38.19 | 33.57 | 1,104,181 | 0.71 | 0.71 | 0.97 | 57.29 | ||||||||||||||||||||
| 28.89 | (13.25 | ) | 939,280 | 0.72 | 0.72 | 1.25 | 70.96 | |||||||||||||||||||
| 37.21 | 20.03 | 1,031,525 | 0.72 | 0.72 | 1.12 | 43.21 | ||||||||||||||||||||
| 33.01 | 21.68 | 295,317 | 0.74 | 0.74 | 0.80 | 34.08 | ||||||||||||||||||||
| | 28.06 | (0.22 | )(e) | 46,806 | 0.75 | (f) | 0.75 | (f) | 0.80 | (f) | 42.60 | (e) | ||||||||||||||
| | 50.99 | 1.03 | 759,465 | 0.84 | 0.84 | 0.35 | 70.13 | |||||||||||||||||||
| 50.47 | 29.82 | 803,731 | 0.84 | 0.84 | 0.60 | 43.61 | ||||||||||||||||||||
| 40.54 | (9.73 | ) | 685,715 | 0.85 | 0.85 | 1.06 | 47.26 | |||||||||||||||||||
| 48.27 | 16.08 | 923,262 | 0.84 | 0.84 | 0.96 | 37.45 | ||||||||||||||||||||
| 44.97 | 13.46 | 775,818 | 0.86 | 0.86 | 0.90 | 41.70 | ||||||||||||||||||||
| 40.46 | 0.26 | 708,944 | 0.84 | 0.84 | 0.64 | 68.52 | ||||||||||||||||||||
| 50.99 |
| 1.11 | 175,323 | 0.68 | 0.68 | 0.35 | 70.13 | ||||||||||||||||||
| 50.43 | 29.98 | 182,443 | 0.68 | 0.68 | 0.76 | 43.61 | ||||||||||||||||||||
| 40.52 | (9.57 | ) | 154,445 | 0.69 | 0.69 | 1.21 | 47.26 | |||||||||||||||||||
| 48.25 | 16.25 | 162,414 | 0.69 | 0.69 | 1.11 | 37.45 | ||||||||||||||||||||
| 44.95 | 13.59 | �� | 78,313 | 0.71 | 0.71 | 1.04 | 41.70 | |||||||||||||||||||
| | 40.45 | (2.37 | )(e) | 45,941 | 0.70 | (f) | 0.70 | (f) | 0.90 | (f) | 42.95 | (e) | ||||||||||||||
| 18.03 |
| 6.65 | 203,749 | 0.77 | 0.68 | 1.78 | 17.86 | ||||||||||||||||||
| 17.05 | 9.63 | 160,158 | 0.87 | 0.68 | 2.22 | 53.98 | ||||||||||||||||||||
| 15.92 | (1.12 | ) | 157,213 | 0.86 | 0.68 | 2.64 | 46.43 | |||||||||||||||||||
| 16.54 | 3.10 | 182,161 | 0.82 | 0.68 | 2.25 | 38.48 | ||||||||||||||||||||
| 16.42 | 2.42 | 193,440 | 0.80 | 0.68 | 2.04 | 39.47 | ||||||||||||||||||||
| 16.44 | 0.70 | 182,130 | 0.79 | 0.68 | 1.98 | 35.80 | ||||||||||||||||||||
| 18.03 |
| 6.82 | 113,273 | 0.56 | 0.45 | 1.99 | 17.86 | ||||||||||||||||||
| 17.04 | 9.82 | 69,923 | 0.45 | 0.45 | 2.44 | 53.98 | ||||||||||||||||||||
| 15.92 | (0.89 | ) | 58,293 | 0.45 | 0.45 | 2.90 | 46.43 | |||||||||||||||||||
| 16.54 | 3.37 | 47,365 | 0.47 | 0.47 | 2.46 | 38.48 | ||||||||||||||||||||
| 16.41 | 2.55 | 20,733 | 0.49 | 0.49 | 2.22 | 39.47 | ||||||||||||||||||||
| | 16.44 | (0.35 | )(e) | 7,731 | 0.49 | (f) | 0.49 | (f) | 2.14 | (f) | 24.24 | (e) | ||||||||||||||
(a) Income (loss) from operations per share is based on average daily shares outstanding.
(b) Parnassus Investments has contractually limited expenses to an annualized rate of 0.86% for the Parnassus Core Equity Fund – Investor Shares, 0.99% for the Parnassus Mid Cap Fund – Investor Shares, 0.95% for the Parnassus Endeavor Fund – Investor Shares, 0.84% for the Parnassus Mid Cap Growth – Investor Shares and 0.68% for the Parnassus Fixed Income Fund – Investor Shares.
(c) Parnassus Investments has contractually limited expenses to an annualized rate of 0.63% for the Parnassus Core Equity Fund – Institutional Shares, 0.75% for the Parnassus Mid Cap Fund – Institutional Shares, 0.75% for the Parnassus Endeavor Fund – Institutional Shares, 0.68% for the Parnassus Mid Cap Growth – Institutional Shares and 0.45% for the Parnassus Fixed Income Fund – Institutional Shares.
(d) The Parnassus Mid Cap Fund – Institutional Shares, the Parnassus Endeavor Fund – Institutional Shares, the Parnassus Mid Cap Growth Fund – Institutional Shares and the Parnassus Fixed Income Fund – Institutional Shares commenced operations on April 30, 2015, and the period shown is from April 30, 2015 through December 31, 2015.
(e) Not annualized for periods less than one year.
(f) Annualized.
61
Table of Contents
| Semiannual Report • 2020 | |||
Additional Information (unaudited)
Board of Trustees Consideration of Investment Advisory Agreements
Section 15(c) of the Investment Company Act of 1940 (the “1940 Act”) requires that the Board of Trustees (the “Trustees”) of the Parnassus Funds trust and the Parnassus Income Funds trust (the “Trusts”) which collectively are known as the Parnassus Funds (the “Funds”), meet in person to review and consider the continuation of any investment advisory agreement. In this regard, the Trustees who are not “interested persons” of the Trusts, as defined in the 1940 Act, (the “Independent Trustees”) met in person on March 24, 2020 and reviewed and re-approved the Trusts’ investment advisory agreements with Parnassus Investments. The Independent Trustees were provided with relevant information by Parnassus Investments, as described below, and were assisted in their evaluation of the investment advisory agreements by independent legal counsel, from whom they received assistance and advice, including a written memorandum, regarding the legal standards applicable to the consideration of advisory arrangements and with whom they met separately from Parnassus Investments’ management. In addition, the Trustees consider matters bearing on the management of the Funds and other arrangements at regular meetings throughout the year, including reviews of investment results and performance data at each regular meeting and periodic presentations from Parnassus Investments. Prior to approving the continuation of the investment advisory agreements, the Independent Trustees considered:
| • | the nature, extent and quality of the services provided by Parnassus Investments; |
| • | the degree to which the Parnassus Core Equity Fund, the Parnassus Mid Cap Fund, the Parnassus Endeavor Fund, the Parnassus Mid Cap Growth Fund and the Parnassus Fixed Income Fund are being managed in accordance with each Fund’s stated investment objective; |
| • | the investment performance of the each of the Funds; |
| • | the cost of the services to be provided and profits to be realized by Parnassus Investments from its relationship with each of the Funds; |
| • | the extent to which economies of scale would be realized as each of the Funds grew and whether fee levels reflect these economies of scale; |
| • | the expense ratio of each of the Funds; and |
| • | the manner in which portfolio transactions for the Funds are conducted, including the use of soft dollars. |
In considering the nature, extent and quality of the services provided by Parnassus Investments, the Independent Trustees reviewed written and oral reports prepared by Parnassus Investments describing the portfolio management, shareholder communication and servicing, prospective shareholder assistance and regulatory compliance services provided by Parnassus Investments to the Funds. The Independent Trustees also considered a written report prepared by Broadridge, an independent provider of investment company data, comparing aspects of the portfolio management services provided by Parnassus Investments to similar services provided to a universe of comparable mutual funds (“Universe”). The Independent Trustees considered the experience of senior management and the qualifications, tenure, background and responsibilities of the portfolio managers primarily responsible for the day-to-day portfolio management of the Funds. The Independent Trustees evaluated the ability of Parnassus Investments, based on its financial condition, resources, reputation and other attributes to attract and retain qualified investment professionals, including research, advisory and supervisory personnel. The Independent Trustees further considered the compliance programs and compliance records of Parnassus Investments. In addition, the Independent Trustees took into account the administrative services provided to the Funds by Parnassus Investments. The Independent Trustees concluded that Parnassus Investments was providing essential services to the Funds.
The Independent Trustees compared the performance of each of the Funds to benchmark indices over various periods of time ending December 31, 2019 and to the Universe of comparable mutual funds as determined by Broadridge. The Independent Trustees noted that the performance for the Parnassus Mid Cap Growth Fund performance was above the median performance of the Universe for the one- and ten-year periods, and was below the median for the two-, three-, four- and five-year periods. The performance of the Parnassus Mid Cap Fund was above the median of the Universe for all time periods under review with the exception of the three-year period. The performance of the Parnassus Endeavor Fund was above the median for the one-, four-, five- and ten-year periods, and was
62
Table of Contents
| Semiannual Report • 2020 | | |||
Additional Information (unaudited) (continued)
Board of Trustees Consideration of Investment Advisory Agreements (continued)
below the median for the two- and three-year periods. The Parnassus Core Income Fund’s performance was above the median of the Universe for all time periods. The Independent Trustees further noted that the performance of the Parnassus Fixed Income Fund was above the median for the one- and two-year periods, and was below the median for the three-, four-, five- and ten-year periods. The Independent Trustees concluded that the overall performance of the Funds warranted the continuation of the investment advisory agreements.
In concluding that the advisory fees payable by each of the Funds were reasonable, the Independent Trustees reviewed a report of the costs of services provided, and the profits realized, by Parnassus Investments from its relationship with each Fund, and concluded that such profits were reasonable and not excessive when compared to profitability guidelines set forth in relevant court cases. The Independent Trustees also reviewed reports comparing each Fund’s expense ratio and the advisory fees paid by each Fund to that of the applicable Universe and concluded that the advisory fee paid by each Fund and each Fund’s expense ratio was within the range of its respective Universe. The Independent Trustees noted that the Funds’ advisory fees were below the median for the Parnassus Mid Cap Growth, Parnassus Core Equity and Parnassus Endeavor Fund’s respective Universe, equal to the median for the Parnassus Mid Cap Fund and above the median for the Parnassus Fixed Income Fund. The Independent Trustees noted that the investment advisory fee for each Fund contained a number of breakpoints in an effort to reflect economies of scale that might be realized as each Fund grew. The Independent Trustees also noted that actual or potential economies of scale will be reasonably shared with the Fund shareholders through these breakpoints, fee waivers and expense reimbursement arrangements applicable to the Funds.
The Independent Trustees reviewed reports discussing the manner in which portfolio transactions for the Funds were conducted, including the use of soft dollars. Based on these reports, the Independent
Trustees concluded that the research obtained by Parnassus Investments was beneficial to the Funds and that Parnassus Investments was executing each Fund’s portfolio transactions in a manner designed to obtain best execution for the Funds.
Based on their careful consideration of the information and factors described above, the Independent Trustees concluded that the approval of the continuation of the investment advisory agreements for the Trusts was in the best interest of the Funds and their shareholders. The Independent Trustees unanimously approved the continuation of the investment advisory agreements for an additional one-year period.
Proxy Disclosures
Parnassus proxy voting policies and procedures are available, without charge, on our website (www.parnassus.com), on the Securities and Exchange Commission’s website (www.sec.gov) and by calling us at (800) 999-3505. The Funds file a proxy voting record with the Securities and Exchange Commission for the 12 months ended June 30. The most recent report is available by calling Parnassus or it may be obtained from the Securities and Exchange Commission’s website or the Parnassus website.
Quarterly Portfolio Schedule
The Funds file their complete schedule of portfolio holdings with the Securities and Exchange Commission for the first and third quarters of each fiscal year as an exhibit to their reports on Form N-PORT. The Funds’ Form N-PORT reports are available on the Securities and Exchange Commission’s web site at http://www.sec.gov. The Funds publish their entire portfolio holdings information as of the end of each month and quarter on the Parnassus Funds’ website (www.parnassus.com). This information is available to anyone who visits the website and is updated on or about ten business days following the end of each month. Holdings information will remain on the website until updated for the subsequent time period.
63
Table of Contents
Investment Adviser
Parnassus Investments
1 Market Street, Suite 1600
San Francisco, CA 94105
Independent Registered Public Accounting Firm
Deloitte and Touche LLP
695 Town Center Drive, Suite 1000
Costa Mesa, CA 92626
Legal Counsel
Foley and Lardner LLP
777 E. Wisconsin Ave.
Milwaukee, WI 53202
Distributor
Parnassus Funds Distributor, LLC
Three Canal Plaza, Suite 100
Portland, ME 04101

Sign up for electronic delivery of prospectuses, shareholder reports
and account statements at www.parnassus.com/gopaperless
If you do not hold your account directly with Parnassus, please contact
the firm that holds your account to inquire about electronic delivery.

1 Market Street, Suite 1600 San Francisco, CA 94105^(800) 999-3505^www.parnassus.com
Table of Contents
Item 2: Code of Ethics
Not applicable for semi-annual reports. The information required by this Item is only required in an annual report on Form N-CSR.
Item 3: Audit Committee Financial Expert
Not applicable for semi-annual reports. The information required by this Item is only required in an annual report on Form N-CSR.
Item 4: Principal Accountant Fees and Services
Not applicable for semi-annual reports. The information required by this Item is only required in an annual report on Form N-CSR.
Item 5: Not applicable.
Item 6: Included as part of the report to shareholders filed under Item 1 of this form.
Item 7: Not applicable.
Item 8: Not applicable.
Item 9: Not applicable.
Item 10: For the purposes of this Item, there have not been any material changes to the procedures by which shareholders may recommend nominees to the registrant’s board of trustees.
Item 11: Controls and Procedures.
(a) The registrant’s certifying officers have reasonably designed such disclosure controls and procedures to ensure material information relating to the registrant is made known to them by others, particularly during the period in which this report is being prepared. The registrant’s certifying officers have determined that the registrant’s disclosure controls and procedures are effective based on their evaluation of these controls and procedures as of a date within 90 days prior to the filing date of this report.
(b) There were no significant changes in the registrant’s internal controls over financial reporting, or in other factors that could significantly affect these controls, that occurred during the registrant’s fiscal half-year, including any corrective actions with regard to significant deficiencies and material weaknesses.
Item 12: Exhibits attached hereto.
(a)(1) Code of Ethics – Not applicable for semi-annual reports.
Pursuant to the requirements of the Securities Exchange Act of 1934 and the Investment Company Act of 1940, the registrant has duly caused this report to be signed on its behalf by the undersigned, thereunto duly authorized.
Table of Contents
| Date: August 7, 2020 | By: /s/ Benjamin E. Allen | |||
| Benjamin E. Allen | ||||
| President |
Pursuant to the requirements of the Securities Exchange Act of 1934 and the Investment Company Act of 1940, this report has been signed below by the following persons on behalf of the registrant and in the capacities and on the dates indicated.
| Date: August 7, 2020 | ||||
By: /s/ Benjamin E. Allen | ||||
| Benjamin E. Allen | ||||
| President | ||||
| Date: August 7, 2020 | ||||
By: /s/ Marc C. Mahon | ||||
| Marc C. Mahon | ||||
Principal Financial Officer | ||||