UNITED STATES
SECURITIES AND EXCHANGE COMMISSION
Washington, DC 20549
FORM N-CSRS
CERTIFIED SHAREHOLDER REPORT OF REGISTERED MANAGEMENT INVESTMENT COMPANIES
Investment Company Act file number 811-06243
Franklin Strategic Series
(Exact name of registrant as specified in charter)
One Franklin Parkway, San Mateo, CA 94403-1906
(Address of principal executive offices) (Zip code)
Craig S. Tyle, One Franklin Parkway, San Mateo, CA 94403-1906
(Name and address of agent for service)
Registrant's telephone number, including area code: 650 312-2000
Date of fiscal year end: 4/30
Date of reporting period: 10/31/16
Item 1. Reports to Stockholders.
| Contents | |
| Semiannual Report | |
| Economic and Market Overview | 3 |
| Franklin Focused Core Equity Fund | 4 |
| Franklin Growth Opportunities Fund | 10 |
| Franklin Small Cap Growth Fund | 16 |
| Franklin Small-Mid Cap Growth Fund | 22 |
| Financial Highlights and Statements of Investments | 28 |
| Financial Statements | 61 |
| Notes to Financial Statements | 66 |
| Shareholder Information | 82 |
Visit franklintempleton.com for fund updates, to access your account, or to find helpful financial planning tools.
2 Semiannual Report
franklintempleton.com
Semiannual Report
Economic and Market Overview
The U.S. economy expanded during the six months under review. The economy grew at a faster pace in 2016’s third quarter than in the second quarter, mainly due to personal consumption expenditures, exports, private inventory investment, federal government spending and nonresidential fixed investment. Manufacturing conditions remained volatile but generally expanded, and the services sector continued to grow. The unemployment rate decreased slightly from 5.0% in April to 4.9% at period-end.1 Monthly retail sales were volatile but grew during most of the review period. Inflation, as measured by the Consumer Price Index, remained relatively subdued for most of the period, but rose slightly toward period-end.
The U.S. Federal Reserve (Fed) kept its target interest rate at 0.25–0.50% at its September meeting. The Fed noted that although the case for raising rates has strengthened, it will wait for further evidence of continued progress toward its objectives.
U.S. equity markets rose during the review period, benefiting from mostly upbeat economic data and better corporate earnings in the U.S., signs of improvement in the Chinese and European economies, and ongoing expansionary monetary policies from key central banks. A rally in crude oil prices and the Fed’s decision to keep interest rates unchanged at its September meeting further boosted investor confidence. However, the U.K.’s historic vote to leave the European Union (also known as “Brexit”) and global growth concerns weighed on market sentiment. The broad U.S. stock market ended the six-month period higher, as measured by the Standard & Poor’s 500 Index.
The foregoing information reflects our analysis and opinions as of October 31, 2016. The information is not a complete analysis of every aspect of any market, country, industry, security or fund. Statements of fact are from sources considered reliable.
1. Source: Bureau of Labor Statistics.
franklintempleton.com
Semiannual Report 3
Franklin Focused Core Equity Fund
This semiannual report for Franklin Focused Core Equity Fund covers the period ended October 31, 2016.
Your Fund’s Goal and Main Investments
The Fund seeks capital appreciation by normally investing at least 80% of its net assets in equity securities. The Fund normally invests primarily to predominantly in equity securities of large capitalization companies, which are similar in size to those in the Standard & Poor’s 500 Index (S&P 500®).
Performance Overview
The Fund’s Class A shares delivered a +4.04% cumulative total return for the six months under review. In comparison, the S&P 500, which tracks the broad U.S. stock market, generated a +4.06% total return.1 You can find more of the Fund’s performance data in the Performance Summary beginning on page 7.
Performance data represent past performance, which does not guarantee future results. Investment return and principal value will fluctuate, and you may have a gain or loss when you sell your shares. Current performance may differ from figures shown. For most recent month-end performance, go to franklintempleton.com or call (800) 342-5236.
Investment Strategy
We are research-driven, bottom-up, fundamental investors. Our investment approach is opportunistic and contrarian, and we seek to identify mispriced companies using fundamental analysis. We seek to take advantage of price dislocations that result from the market’s short-term focus. Our analysis includes the investigation of the valuation for each investment based upon the view that the price paid for the security is a critical factor determining long-term success. We rely on a team of analysts to help provide in-depth industry expertise and use both qualitative and quantitative analysis to evaluate companies. Our analysts identify each company’s market opportunity, competitive position, management and financial strength, business and financial risks, and valuation. We choose to invest in those companies that, in our opinion, offer the best trade-off between growth opportunity, business and financial risk, and valuation.
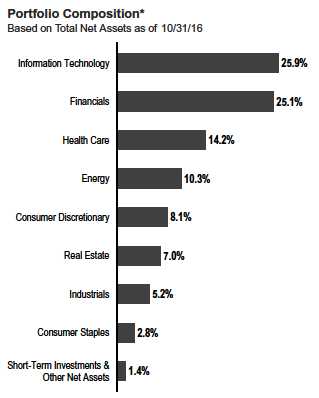
*Figures are stated as a percentage of total and may not equal 100% or may be
negative due to rounding, use of any derivatives, unsettled trades or other factors.
Manager’s Discussion
During the six months under review, key contributors to the Fund’s absolute performance included holdings in the information technology (IT), financials and energy sectors.
In IT, our investments in Microsoft, QUALCOMM and Alphabet helped performance. Microsoft, a software and IT services company, benefited from investors’ greater confidence in its ability to be relevant in cloud computing with its key productivity and server software franchises. Specifically, the company rapidly moved its productivity suite to Office 365 and found new growth opportunities for its server franchise with its Azure platform. In addition, the company executed well on various cost-containment and capital-return initiatives, with stepped-up share repurchases and a solid dividend. Shares of digital telecommunications product manufacturer QUALCOMM rose amid improved investor sentiment resulting from the company’s increased licensees in China and positive
1. Source: Morningstar.
The index is unmanaged and includes reinvestment of any income or distributions. It does not reflect any fees, expenses or sales charges. One cannot invest directly in an
index, and an index is not representative of the Fund’s portfolio.
The dollar value, number of shares or principal amount, and names of all portfolio holdings are listed in the Fund’s Statement of Investments (SOI).
The SOI begins on page 33.
4 Semiannual Report
franklintempleton.com
FRANKLIN FOCUSED CORE EQUITY FUND
launch and sales of the iPhone 7, which uses QUALCOMM chips. Further bolstering shares were rumors in September about QUALCOMM acquiring NXP Semiconductors, and confirmation of the deal in October. We believe NXP will help diversify QUALCOMM’s business focus away from the slowing and competitive smartphone market and into the growing “Internet of things,” the connection of common products such as cars and refrigerators to the Internet. Alphabet, the parent company of Internet-related services and products provider Google, performed well. The company generated strong revenue growth during the period, resulting from the addition of a new mobile advertising format and the success of advertising programs from its YouTube division. Additionally, the hiring of Ruth Porat as Alphabet’s chief financial officer in 2015 improved the company’s transparency, financial discipline and shareholder friendliness. Furthermore, the company’s core business exercised discipline, driving profit margin expansion during the period. Alphabet also scaled down or adjusted its strategy in several of its research and development projects.
| Top 10 Holdings | ||
| 10/31/16 | ||
| Company | % of Total | |
| Sector/Industry | Net Assets | |
| Microsoft Corp. | 6.2 | % |
| Information Technology | ||
| Allergan PLC | 5.7 | % |
| Health Care | ||
| Alphabet Inc. | 5.4 | % |
| Information Technology | ||
| The Hartford Financial Services Group Inc. | 4.9 | % |
| Financials | ||
| Anadarko Petroleum Corp. | 4.1 | % |
| Energy | ||
| Equinix Inc. | 4.1 | % |
| Real Estate | ||
| Altice NV | 4.1 | % |
| Consumer Discretionary | ||
| Willis Towers Watson PLC | 4.0 | % |
| Financials | ||
| The Charles Schwab Corp. | 3.8 | % |
| Financials | ||
| Schlumberger Ltd. | 3.7 | % |
| Energy |
In the financials sector, investment, retirement and financial services provider Charles Schwab performed well. The increase in federal funds rate following the Federal Reserve’s decision in December 2015 helped the company improve net interest margins and reduce money market fee waivers. Investors also believed the company could benefit from the Department of Labor’s new Fiduciary Rule. Our position in energy sector holding Anadarko Petroleum also boosted absolute performance during the reporting period. Anadarko’s shares rose as the company successfully sold assets to cover maturing debt and refinance longer duration bonds, which helped remove fears that restricted debt markets would limit the company’s operations. Later in the period, Anadarko announced it would acquire Freeport-McMoRan Oil & Gas’s deepwater Gulf of Mexico assets, which the company said would immediately add value. We believe this acquisition should increase the company’s production toward higher margin oil and also provide strong free cash flow that the company can redeploy onshore to accelerate its low-cost Permian Basin oil drilling.
Another key individual contributor was our investment in Netherlands-based multinational media and telecommunications company Altice. During the reporting period, the company’s earnings improved as recent U.S. acquisitions helped to offset a slowdown in France.
In contrast, key detractors from the Fund’s absolute performance included holdings in the consumer staples, health care and consumer discretionary sectors.
In the consumer staples sector, key detractors included our position in CVS Health, a retail drugstore operator and pharmacy-benefits manager. During the reporting period, scrutiny on pharmacy-benefits managers intensified due to an increased focus on prescription drug pricing. We believe this headwind is transient, and we expect that CVS Health’s integrated delivery model will be successful in the long term. Health care holding Valeant Pharmaceuticals International also hindered results. Valeant’s use of captive pharmacies and aggressive pricing behavior became untenable, in our view, in a divisive political environment. A lack of investor confidence in the company’s management eroded the business-aggressive merger-and-acquisition (M&A) model and led to a change in the senior management team.
Consumer discretionary holdings that hindered the Fund’s performance during the reporting period included BorgWarner2 and Twenty-First Century Fox. BorgWarner, which manufactures engineered automotive systems and components,
2. Not held at period-end.
See www.franklintempletondatasources.com for additional data provider information.
franklintempleton.com
Semiannual Report 5
FRANKLIN FOCUSED CORE EQUITY FUND
suffered from negative sentiment toward the automobile cycle in North America, where many investors seemed to believe demand had peaked, leading them to reduce exposure to the automobile industry in anticipation of declining earnings and profits. Twenty-First Century Fox suffered from foreign currency exchange headwinds, underperformance of its filmed entertainment segment relative to expectations and investor speculation about potential M&A activities that might dilute earnings per share, given the company’s past track record. However, outside of the filmed entertainment segment, the company’s core business fundamentals continued to be solid, in our view. Furthermore, the company said it is focused on capital allocation and has considered many potential acquisition targets. In addition, we believe Twenty-First Century Fox’s best-in-class assets with a global footprint should continue to gain market share and be more profitable for the company.
Another key individual detractor was our position in commercial real estate services firm CBRE Group, whose shares struggled despite the company’s solid operating results, which exceeded consensus expectations. Investor concerns about a potential weakening of the commercial real estate industry has resulted in a contraction of valuation multiples and led to the stock underperformance. We believe CBRE remains a high-quality operator in an industry with strong secular growth potential over the longer term. Its strong balance sheet and ample liquidity should allow the company to thrive in any prolonged downturn in the industry, in our analysis.
Thank you for your continued participation in Franklin Focused Core Equity Fund. We look forward to serving your future investment needs.

The foregoing information reflects our analysis, opinions and portfolio holdings as of October 31, 2016, the end of the reporting period. The way we implement our main investment strategies and the resulting portfolio holdings may change depending on factors such as market and economic conditions. These opinions may not be relied upon as investment advice or an offer for a particular security. The information is not a complete analysis of every aspect of any market, country, industry, security or the Fund. Statements of fact are from sources considered reliable, but the investment manager makes no representation or warranty as to their completeness or accuracy. Although historical performance is no guarantee of future results, these insights may help you understand our investment management philosophy.
6 Semiannual Report
franklintempleton.com
FRANKLIN FOCUSED CORE EQUITY FUND
Performance Summary as of October 31, 2016
The performance table does not reflect any taxes that a shareholder would pay on Fund dividends, capital gain distributions, if any, or any realized gains on the sale of Fund shares. Total return reflects reinvestment of the Fund’s dividends and capital gain distributions, if any, and any unrealized gains or losses.
Performance as of 10/31/161
Cumulative total return excludes sales charges. Average annual total returns include maximum sales charges. Sales charges will vary depending on the size of the investment and the class of share purchased. The maximum is 5.75% and the minimum is 0%. Class A: 5.75% maximum initial sales charge; Advisor Class: no sales charges. For other share classes, visit franklintempleton.com.
| Cumulative | Average Annual | Average Annual | ||||
| Share Class | Total Return2 | Total Return3 | Total Return (9/30/16)4 | |||
| A | ||||||
| 6-Month | +4.04 | % | -1.94 | % | ||
| 1-Year | -3.52 | % | -9.07 | % | -2.57 | % |
| 5-Year | +69.09 | % | +9.76 | % | +12.94 | % |
| Since Inception (12/13/07) | +61.57 | % | +4.85 | % | +5.08 | % |
| Advisor | ||||||
| 6-Month | +4.23 | % | +4.23 | % | ||
| 1-Year | -3.32 | % | -3.32 | % | +3.63 | % |
| 5-Year | +71.53 | % | +11.40 | % | +14.62 | % |
| Since Inception (12/13/07) | +65.54 | % | +5.84 | % | +6.08 | % |
Performance data represent past performance, which does not guarantee future results. Investment return and principal value will fluctuate, and you may have a gain or loss when you sell your shares. Current performance may differ from figures shown. For most recent month-end performance, go to franklintempleton.com or call (800) 342-5236.
See page 8 for Performance Summary footnotes.
franklintempleton.com
Semiannual Report 7
| FRANKLIN FOCUSED CORE EQUITY FUND | ||||
| PERFORMANCE SUMMARY | ||||
| Total Annual Operating Expenses5 | ||||
| Share Class | With Waiver | Without Waiver | ||
| A | 1.25 | % | 1.45 | % |
| Advisor | 1.00 | % | 1.20 | % |
Each class of shares is available to certain eligible investors and has different annual fees and expenses, as described in the prospectus.
All investments involve risks, including possible loss of principal. To the extent the Fund focuses on particular countries, regions, industries, sectors or types of
investment from time to time, it may be subject to greater risks of adverse developments in such areas of focus than a fund that invests in a wider variety of
countries, regions, industries, sectors or investments. The Fund may have investments in both growth and value stocks, or in stocks with characteristics of both.
Growth stock prices reflect projections of future earnings or revenues, and can, therefore, fall dramatically if the company fails to meet those projections. A value
stock may not increase in price as anticipated by the investment manager if other investors fail to recognize the company’s value and bid up the price, the markets
favor faster growing companies, or the factors that the investment manager believes will increase the price of the security do not occur. Foreign securities involve
special risks, including currency fluctuations and economic and political uncertainties. The Fund is actively managed but there is no guarantee that the manager’s
investment decisions will produce the desired results. The Fund’s prospectus also includes a description of the main investment risks.
1. The Fund has an expense reduction contractually guaranteed through 8/31/17. The Fund also has a fee waiver associated with any investments it makes in a Franklin
Templeton money fund and/or other Franklin Templeton fund, contractually guaranteed through its current fiscal year-end. Fund investment results reflect the expense reduction
and fee waiver; without these reductions, the results would have been lower.
2. Cumulative total return represents the change in value of an investment over the periods indicated.
3. Average annual total return represents the average annual change in value of an investment over the periods indicated. Return for less than one year, ifany,hasnotbeen
annualized.
4. In accordance with SEC rules, we provide standardized average annual total return information through the latest calendar quarter.
5. Figures are as stated in the Fund’s current prospectus and may differ from the expense ratios disclosed in the Your Fund’s Expenses and Financial Highlights sections in this
report. In periods of market volatility, assets may decline significantly, causing total annual Fund operating expenses to become higher than the figures shown.
8 Semiannual Report
franklintempleton.com
FRANKLIN FOCUSED CORE EQUITY FUND
Your Fund’s Expenses
As a Fund shareholder, you can incur two types of costs: (1) transaction costs, including sales charges (loads) on Fund purchases and redemptions; and (2) ongoing Fund costs, including management fees, distribution and service (12b-1) fees, and other Fund expenses. All mutual funds have ongoing costs, sometimes referred to as operating expenses. The table below shows ongoing costs of investing in the Fund and can help you understand these costs and compare them with those of other mutual funds. The table assumes a $1,000 investment held for the six months indicated.
Actual Fund Expenses
The table below provides information about actual account values and actual expenses in the columns under the heading “Actual.” In these columns the Fund’s actual return, which includes the effect of Fund expenses, is used to calculate the “Ending Account Value” for each class of shares. You can estimate the expenses you paid during the period by following these steps (of course, your account value and expenses will differ from those in this illustration): Divide your account value by $1,000 (if your account had an $8,600 value, then $8,600 ÷ $1,000 = 8.6). Then multiply the result by the number in the row for your class of shares under the headings “Actual” and “Expenses Paid During Period” (if Actual Expenses Paid During Period were $7.50, then 8.6 x $7.50 = $64.50). In this illustration, the actual expenses paid this period are $64.50.
Hypothetical Example for Comparison with Other Funds
Under the heading “Hypothetical” in the table, information is provided about hypothetical account values and hypothetical expenses based on the Fund’s actual expense ratio and an assumed rate of return of 5% per year before expenses, which is not the Fund’s actual return. This information may not be used to estimate the actual ending account balance or expenses you paid for the period, but it can help you compare ongoing costs of investing in the Fund with those of other funds. To do so, compare this 5% hypothetical example for the class of shares you hold with the 5% hypothetical examples that appear in the shareholder reports of other funds.
Please note that expenses shown in the table are meant to highlight ongoing costs and do not reflect any transactional costs. Therefore, information under the heading “Hypothetical” is useful in comparing ongoing costs only, and will not help you compare total costs of owning different funds. In addition, if transactional costs were included, your total costs would have been higher.
| Actual | Hypothetical | |||||||||||||
| (actual return after expenses) | (5% annual return before expenses) | |||||||||||||
| Expenses | Expenses | Net | ||||||||||||
| Beginning | Ending | Paid During | Ending | Paid During | Annualized | |||||||||
| Share | Account | Account | Period | Account | Period | Expense | ||||||||
| Class | Value 5/1/16 | Value 10/31/16 | 5/1/16–10/31/161,2 | Value 10/31/16 | 5/1/16–10/31/161,2 | Ratio2 | ||||||||
| A | $ | 1,000 | $ | 1,040.40 | $ | 6.43 | $ | 1,018.90 | $ | 6.36 | 1.25 | % | ||
| C | $ | 1,000 | $ | 1,036.60 | $ | 10.27 | $ | 1,015.12 | $ | 10.16 | 2.00 | % | ||
| R | $ | 1,000 | $ | 1,039.30 | $ | 7.40 | $ | 1,017.95 | $ | 7.32 | 1.44 | % | ||
| R6 | $ | 1,000 | $ | 1,043.00 | $ | 4.38 | $ | 1,020.92 | $ | 4.33 | 0.85 | % | ||
| Advisor | $ | 1,000 | $ | 1,042.30 | $ | 5.15 | $ | 1,020.16 | $ | 5.09 | 1.00 | % | ||
1. Expenses are equal to the annualized expense ratio for the six-month period as indicated above–in the far right column–multiplied by the simple average account value
over the period indicated, and then multiplied by 184/365 to reflect the one-half year period.
2. Reflects expenses after fee waivers and expense reimbursements. Does not include acquired fund fees and expenses.
franklintempleton.com
Semiannual Report 9
Franklin Growth Opportunities Fund
This semiannual report for Franklin Growth Opportunities Fund covers the period ended October 31, 2016. We welcome the former shareholders of Franklin Flex Cap Growth Fund who now own shares of Franklin Growth Opportunities Fund as a result of Franklin Flex Cap Growth Fund’s reorganization that took effect on August 26, 2016.
Your Fund’s Goal and Main Investments
The Fund seeks capital appreciation by normally investing substantially in equity securities of companies demonstrating accelerating growth, increasing profitability, or above-average growth or growth potential, when compared with the overall economy.
Performance Overview
The Fund’s Class A shares delivered a +3.39% cumulative total return for the six months under review. In comparison, the Fund’s narrow benchmark, the Russell 3000® Growth Index, which measures performance of Russell 3000® Index companies with higher price-to-book ratios and higher forecasted growth values, generated a +3.78% total return.1 The Fund’s broad benchmark, the Standard & Poor’s 500 Index, which tracks the broad U.S. stock market, produced a +4.06% total return.1 You can find the Fund’s long-term performance data in the Performance Summary beginning on page 13.
Performance data represent past performance, which does not guarantee future results. Investment return and principal value will fluctuate, and you may have a gain or loss when you sell your shares. Current performance may differ from figures shown. For most recent month-end performance, go to franklintempleton.com or call (800) 342-5236.
Investment Strategy
We use fundamental, bottom-up research to seek companies meeting our criteria of growth potential, quality and valuation. In seeking sustainable growth characteristics, we look for companies we believe can produce sustainable earnings and cash flow growth, evaluating the long-term market opportunity and competitive structure of an industry to target leaders and emerging leaders. We define quality companies as those with strong and improving competitive positions in attractive markets. We also believe important attributes of quality are experienced and talented management teams as well as
financial strength reflected in the capital structure, gross and operating margins, free cash flow generation and returns on capital employed. Our valuation analysis includes a range of potential outcomes based on an assessment of multiple scenarios. In assessing value, we consider whether security prices fully reflect the balance of the sustainable growth opportunities relative to business and financial risks.
Manager’s Discussion
During the six months under review, key contributors to the Fund’s performance relative to the Russell 3000® Growth Index included stock selection in the consumer staples sector. Stock selection in the telecommunication services and real estate sectors helped relative results to a lesser extent.
1. Source: Morningstar.
The indexes are unmanaged and include reinvestment of any income or distributions. They do not reflect any fees, expenses or sales charges. One cannot invest directly in an
index, and an index is not representative of the Fund’s portfolio.
The dollar value, number of shares or principal amount, and names of all portfolio holdings are listed in the Fund’s Statement of Investments (SOI).
The SOI begins on page 40.
10 Semiannual Report
franklintempleton.com
FRANKLIN GROWTH OPPORTUNITIES FUND
In consumer staples, WhiteWave Foods contributed to relative performance. The company’s shares surged as Danone announced in July its intention to acquire WhiteWave in an all-cash transaction. We decided to exit our position following the announcement as the deal was not expected to close until the end of the year, and we did not anticipate a competitive bidding process.
In the telecommunication services sector, wireless communications tower operator SBA Communications benefited performance as its valuations recovered from disintermediation fears at the beginning of 2016. Growth continued to be strong, particularly internationally, although the company continued to experience elevated customer turnover rates in its U.S. business. During the reporting period, the company elected to be taxed as a real estate investment trust (REIT) beginning with its taxable year ended December 31, 2016, a year earlier than investor expectations. We believe the election should have no effect on the company for the next several years as it uses up its tax losses.
In real estate, REIT American Tower, also a wireless tower operator, performed well during the six-month period as its stock recovered from investor concerns about disintermediation at the beginning of the year. The company’s international investments have driven growth for the company overall, while U.S. growth has continued to be solid and within the range of our investment framework. We believe the wireless tower industry continues to be healthy, with several potential catalysts for growth in the next several years.
Other key contributors included Netherlands-based semiconductor company NXP Semiconductors2 and video game maker Electronic Arts. Semiconductor stocks, in general, performed well during the reporting period. NXP’s shares were also supported by a rumored, then confirmed, intention by QUALCOMM to acquire the company for a significant premium late in the period. Electronic Arts benefited from the strength of new video game consoles from Sony and Microsoft. In addition, the company’s new management team has dramatically improved its financial performance, and investors seem optimistic about the company’s Star Wars titles, which are getting support from theatrical releases.
In contrast, key detractors from the Fund’s relative performance included stock selection in the industrials, financials and information technology (IT) sectors.
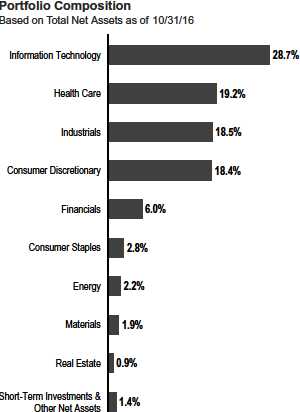
| Top 10 Holdings | ||
| 10/31/16 | ||
| Company | % of Total | |
| Sector/Industry | Net Assets | |
| Facebook Inc. | 5.8 | % |
| Information Technology | ||
| Alphabet Inc. | 4.6 | % |
| Information Technology | ||
| Amazon.com Inc. | 4.5 | % |
| Consumer Discretionary | ||
| Apple Inc. | 4.2 | % |
| Information Technology | ||
| Mastercard Inc. | 4.0 | % |
| Information Technology | ||
| Celgene Corp. | 3.2 | % |
| Health Care | ||
| Visa Inc. | 3.1 | % |
| Information Technology | ||
| NXP Semiconductors NV | 3.0 | % |
| Information Technology | ||
| Microsoft Corp. | 2.7 | % |
| Information Technology | ||
| Constellation Brands Inc. | 2.6 | % |
| Consumer Staples |
In industrials, our position in Allegiant Travel detracted from relative results as the company was impacted by a decline in airfares resulting from the addition of too much capacity as fuel prices were low and operations were profitable. This environment led to record industry profits, but the company’s stock price declined because investors viewed the added capacity as undisciplined oversupply that could not be easily reduced if demand weakened.
In the financials sector, our positions in Signature Bank and Affiliated Managers Group hindered the Fund’s results. Signature Bank’s stock suffered amid elevated losses in its Chicago taxi permit portfolio, as well as investor concerns that commercial real estate loan growth may slow. Shares of asset management company Affiliated Managers Group declined as asset managers performed poorly given investor concerns about the potential impact of the U.S. Department of Labor’s new Fiduciary Rule, which investors believed could accelerate the growth of exchange-traded funds versus actively managed investments. In addition, a weaker near-term outlook for performance fees and industry-wide demand for actively managed equities pressured shares.
2. Not part of the index.
See www.franklintempletondatasources.com for additional data provider information.
franklintempleton.com
Semiannual Report 11
FRANKLIN GROWTH OPPORTUNITIES FUND
In the IT sector, our positions in Apple and Microsoft detracted from the Fund’s relative performance. Our underweighting in Apple hurt results relative to the index as shares of the smartphone and media device designer and manufacturer rose during the reporting period as investors anticipated improving iPhone sales with the launch of the iPhone 7 in September. Our underweighting in Microsoft also detracted from relative performance, as its shares appreciated over the reporting period. Shares of the software and IT services company rose as investors gained greater confidence in the company’s ability to be relevant in cloud computing with its key productivity and server software franchises. Specifically, the company rapidly moved its productivity suite to Office 365 and found new growth opportunities for its server franchise with its Azure platform. In addition, the company executed well on various cost-containment and capital-return initiatives, with stepped-up share repurchases and a solid dividend.
Thank you for your continued participation in Franklin Growth Opportunities Fund. We look forward to serving your future investment needs.
The foregoing information reflects our analysis, opinions and portfolio holdings as of October 31, 2016, the end of the reporting period. The way we implement our main investment strategies and the resulting portfolio holdings may change depending on factors such as market and economic conditions. These opinions may not be relied upon as investment advice or an offer for a particular security. The information is not a complete analysis of every aspect of any market, country, industry, security or the Fund. Statements of fact are from sources considered reliable, but the investment manager makes no representation or warranty as to their completeness or accuracy. Although historical performance is no guarantee of future results, these insights may help you understand our investment management philosophy.

CFA® is a trademark owned by CFA Institute.
12 Semiannual Report
franklintempleton.com
FRANKLIN GROWTH OPPORTUNITIES FUND
Performance Summary as of October 31, 2016
The performance table does not reflect any taxes that a shareholder would pay on Fund dividends, capital gain distributions, if any, or any realized gains on the sale of Fund shares. Total return reflects reinvestment of the Fund’s dividends and capital gain distributions, if any, and any unrealized gains or losses.
Performance as of 10/31/161
Cumulative total return excludes sales charges. Average annual total returns include maximum sales charges. Sales charges will vary depending on the size of the investment and the class of share purchased. The maximum is 5.75% and the minimum is 0%. Class A: 5.75% maximum initial sales charge; Advisor Class: no sales charges. For other share classes, visit franklintempleton.com.
| Cumulative | Average Annual | Average Annual | ||||
| Share Class | Total Return2 | Total Return3 | Total Return (9/30/16)4 | |||
| A | ||||||
| 6-Month | +3.39 | % | -2.54 | % | ||
| 1-Year | -3.62 | % | -9.16 | % | -0.14 | % |
| 5-Year | +66.81 | % | +9.47 | % | +13.12 | % |
| 10-Year | +115.34 | % | +7.34 | % | +7.90 | % |
| Advisor | ||||||
| 6-Month | +3.51 | % | +3.51 | % | ||
| 1-Year | -3.40 | % | -3.40 | % | +6.21 | % |
| 5-Year | +69.22 | % | +11.09 | % | +14.81 | % |
| 10-Year | +121.68 | % | +8.29 | % | +8.86 | % |
Performance data represent past performance, which does not guarantee future results. Investment return and principal value will fluctuate, and you may have a gain or loss when you sell your shares. Current performance may differ from figures shown. For most recent month-end performance, go to franklintempleton.com or call (800) 342-5236.
See page 14 for Performance Summary footnotes.
franklintempleton.com
Semiannual Report 13
| FRANKLIN GROWTH OPPORTUNITIES FUND | ||||
| PERFORMANCE SUMMARY | ||||
| Total Annual Operating Expenses5 | ||||
| Share Class | With Waiver | Without Waiver | ||
| A | 0.94 | % | 1.03 | % |
| Advisor | 0.69 | % | 0.78 | % |
Each class of shares is available to certain eligible investors and has different annual fees and expenses, as described in the prospectus.
All investments involve risks, including possible loss of principal. Growth stock prices reflect projections of future earnings or revenues, and can, therefore, fall
dramatically if the company fails to meet those projections. Smaller, midsized and relatively new or unseasoned companies can be particularly sensitive to
changing economic conditions, and their prospects for growth are less certain than those of larger, more established companies. Historically, these securities
have experienced more price volatility than larger company stocks, especially over the short term. To the extent the Fund focuses on particular countries, regions,
industries, sectors or types of investment from time to time, it may be subject to greater risks of adverse developments in such areas of focus than a fund that
invests in a wider variety of countries, regions, industries, sectors or investments. The Fund is actively managed but there is no guarantee that the manager’s
investment decisions will produce the desired results. The Fund’s prospectus also includes a description of the main investment risks.
1. The Fund has an expense reduction contractually guaranteed through 8/31/17. The Fund also has a fee waiver associated with any investments it makes in a Franklin
Templeton money fund and/or other Franklin Templeton fund, contractually guaranteed through its current fiscal year-end. Fund investment results reflect the expense reduction
and fee waiver; without these reductions, the results would have been lower.
2. Cumulative total return represents the change in value of an investment over the periods indicated.
3. Average annual total return represents the average annual change in value of an investment over the periods indicated. Return for less than one year, ifany,hasnotbeen
annualized.
4. In accordance with SEC rules, we provide standardized average annual total return information through the latest calendar quarter.
5. Figures are as stated in the Fund’s current prospectus and may differ from the expense ratios disclosed in the Your Fund’s Expenses and Financial Highlights sections in this
report. In periods of market volatility, assets may decline significantly, causing total annual Fund operating expenses to become higher than the figures shown.
14 Semiannual Report
franklintempleton.com
FRANKLIN GROWTH OPPORTUNITIES FUND
Your Fund’s Expenses
As a Fund shareholder, you can incur two types of costs: (1) transaction costs, including sales charges (loads) on Fund purchases and redemptions; and (2) ongoing Fund costs, including management fees, distribution and service (12b-1) fees, and other Fund expenses. All mutual funds have ongoing costs, sometimes referred to as operating expenses. The table below shows ongoing costs of investing in the Fund and can help you understand these costs and compare them with those of other mutual funds. The table assumes a $1,000 investment held for the six months indicated.
Actual Fund Expenses
The table below provides information about actual account values and actual expenses in the columns under the heading “Actual.” In these columns the Fund’s actual return, which includes the effect of Fund expenses, is used to calculate the “Ending Account Value” for each class of shares. You can estimate the expenses you paid during the period by following these steps (of course, your account value and expenses will differ from those in this illustration): Divide your account value by $1,000 (if your account had an $8,600 value, then $8,600 ÷ $1,000 = 8.6). Then multiply the result by the number in the row for your class of shares under the headings “Actual” and “Expenses Paid During Period” (if Actual Expenses Paid During Period were $7.50, then 8.6 x $7.50 = $64.50). In this illustration, the actual expenses paid this period are $64.50.
Hypothetical Example for Comparison with Other Funds
Under the heading “Hypothetical” in the table, information is provided about hypothetical account values and hypothetical expenses based on the Fund’s actual expense ratio and an assumed rate of return of 5% per year before expenses, which is not the Fund’s actual return. This information may not be used to estimate the actual ending account balance or expenses you paid for the period, but it can help you compare ongoing costs of investing in the Fund with those of other funds. To do so, compare this 5% hypothetical example for the class of shares you hold with the 5% hypothetical examples that appear in the shareholder reports of other funds.
Please note that expenses shown in the table are meant to highlight ongoing costs and do not reflect any transactional costs. Therefore, information under the heading “Hypothetical” is useful in comparing ongoing costs only, and will not help you compare total costs of owning different funds. In addition, if transactional costs were included, your total costs would have been higher.
| Actual | Hypothetical | |||||||||||
| (actual return after expenses) | (5% annual return before expenses) | |||||||||||
| Expenses | Expenses | Net | ||||||||||
| Beginning | Ending | Paid During | Ending | Paid During | Annualized | |||||||
| Share | Account | Account | Period | Account | Period | Expense | ||||||
| Class | Value 5/1/16 | Value 10/31/16 | 5/1/16–10/31/161,2 | Value 10/31/16 | 5/1/16–10/31/161,2 | Ratio2 | ||||||
| A | $ | 1,000 | $ | 1,033.90 | $ | 5.13 | $ | 1,020.16 | $ | 5.09 | 1.00 | % |
| C | $ | 1,000 | $ | 1,029.70 | $ | 8.95 | $ | 1,016.38 | $ | 8.89 | 1.75 | % |
| R | $ | 1,000 | $ | 1,032.30 | $ | 6.40 | $ | 1,018.90 | $ | 6.36 | 1.25 | % |
| R6 | $ | 1,000 | $ | 1,035.80 | $ | 2.82 | $ | 1,022.43 | $ | 2.80 | 0.55 | % |
| Advisor | $ | 1,000 | $ | 1,035.10 | $ | 3.85 | $ | 1,021.42 | $ | 3.82 | 0.75 | % |
1. Expenses are equal to the annualized expense ratio for the six-month period as indicated above–in the far right column–multiplied by the simple average account value
over the period indicated, and then multiplied by 184/365 to reflect the one-half year period.
2. Reflects expenses after fee waivers and expense reimbursements. Does not include acquired fund fees and expenses.
franklintempleton.com
Semiannual Report 15
Franklin Small Cap Growth Fund
We are pleased to bring you Franklin Small Cap Growth Fund’s semiannual report for the period ended October 31, 2016. At the market close on February 12, 2015, the Fund closed to new investors with limited exceptions. Existing shareholders may add to their accounts. We believe this closure can help us effectively manage our current level of assets.
Your Fund’s Goal and Main Investments
The Fund seeks long-term capital growth by normally investing at least 80% of its net assets in equity securities of small cap companies, which for this Fund are those with market capitalizations not exceeding $1.5 billion or that of the highest market capitalization in the Russell 2000® Index, whichever is greater, at the time of purchase.1
Performance Overview
The Fund’s Class A shares delivered a +6.54% cumulative total return for the six months under review. In comparison, the Russell 2000® Growth Index, which measures performance of small cap companies with higher price-to-book ratios and higher forecasted growth values, generated a +4.71% total return.2 The Standard & Poor’s 500 Index, which tracks the broad U.S. stock market, produced a +4.06% total return.2 You can find the Fund’s long-term performance data in the Performance Summary beginning on page 19.
Performance data represent past performance, which does not guarantee future results. Investment return and principal value will fluctuate, and you may have a gain or loss when you sell your shares. Current performance may differ from figures shown. For most recent month-end performance, go to franklintempleton.com or call (800) 342-5236.
Investment Strategy
We use fundamental, bottom-up research to seek companies meeting our criteria of growth potential, quality and valuation. In seeking sustainable growth characteristics, we look for companies we believe can produce sustainable earnings and cash flow growth, evaluating the long-term market opportunity and competitive structure of an industry to target leaders and emerging leaders. We define quality companies as those with strong and improving competitive positions in attractive
markets. We also believe important attributes of quality are experienced and talented management teams as well as financial strength reflected in the capital structure, gross and operating margins, free cash flow generation and returns on capital employed. Our valuation analysis includes a range of potential outcomes based on an assessment of multiple scenarios. In assessing value, we consider whether security prices fully reflect the balance of the sustainable growth opportunities relative to business and financial risks.
Manager’s Discussion
During the six months under review, major contributors to the Fund’s performance relative to the Russell 2000® Growth Index included stock selection and an overweighting in the information technology (IT) sector. Stock selection in the consumer discretionary and industrials sectors helped performance to a lesser extent.
1. The Russell 2000 Index is market capitalization weighted and measures performance of the 2,000 smallest companies in the Russell 3000 Index, which represent a small
amount of the total market capitalization of the Russell 3000 Index.
2. Source: Morningstar.
The indexes are unmanaged and include reinvested dividends. They do not reflect any fees, expenses or sales charges. One cannot invest directly in an index, and an index is
not representative of the Fund’s portfolio.
The dollar value, number of shares or principal amount, and names of all portfolio holdings are listed in the Fund’s Statement of Investments (SOI).
The SOI begins on page 48.
16 Semiannual Report
franklintempleton.com
FRANKLIN SMALL CAP GROWTH FUND
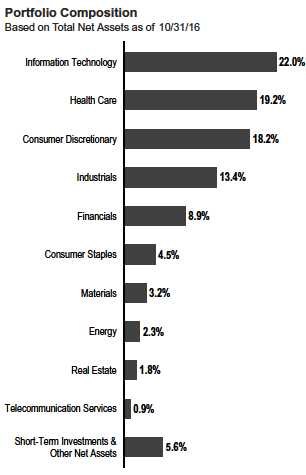
| Top 10 Holdings | ||
| 10/31/16 | ||
| Company | % of Total | |
| Sector/Industry | Net Assets | |
| 2U Inc. | 3.2 | % |
| Information Technology | ||
| Paylocity Holding Corp. | 1.8 | % |
| Information Technology | ||
| TreeHouse Foods Inc. | 1.7 | % |
| Consumer Staples | ||
| Grand Canyon Education Inc. | 1.7 | % |
| Consumer Discretionary | ||
| The Spectranetics Corp. | 1.6 | % |
| Health Care | ||
| Callidus Software Inc. | 1.6 | % |
| Information Technology | ||
| Zendesk Inc. | 1.6 | % |
| Information Technology | ||
| Nevro Corp. | 1.6 | % |
| Health Care | ||
| Astronics Corp. | 1.6 | % |
| Industrials | ||
| US Ecology Inc. | 1.5 | % |
| Industrials |
Within IT, software technology company Demandware’s shares3 rose as the company was acquired by Salesforce.com in July at a significant premium. Intersil, a high-performance analog semiconductor company with expertise in power and voltage management, also helped the Fund’s results.3,4 Since installing a new management team in 2013, the company has streamlined its product focus, which led to strong growth and profitability. In September, Renesas Electronics announced its intention to acquire Intersil. Given Intersil’s solid execution and the subsequent acquisition bid from Renesas, its shares advanced significantly during the reporting period. Shares of cloud-based software-as-a-service provider 2U benefited from quarterly results that continued to exceed market expectations, a strengthening pipeline of new university partners, an increase in programs to be launched through 2018, and the addition of a senior adviser in August to help the company more deeply explore international expansion.
In consumer discretionary, U.S. specialty bedding retailer Mattress Firm Holding also helped the Fund’s relative performance.3 In August, South African retailer Steinhoff International Holdings announced its intention to purchase Mattress Firm Holding at a significant premium. Cybersecurity firm KEYW Holding, in the industrials sector, contributed to the Fund’s relative performance during the reporting period.4 The company has undergone a quick turnaround with the arrival of Chief Executive Officer Bill Weber in 2015. He sold the company’s money-losing commercial cyber venture, strengthened its business development process and repaired KEYW’s relationship with Wall Street.
Another key contributor was medical devices company HeartWare International.3 In June, Medtronic announced it would acquire HeartWare at a significant premium.
In contrast, key detractors from the Fund’s relative performance included stock selection in the health care and consumer staples sectors.
In health care, our positions in Adeptus Health, Integer Holdings4 and Impax Laboratories hindered results. Shares of emergency room operator Adeptus Health declined amid investor concerns about the company’s earnings. Integer’s stock declined as the company’s sales and profits disappointed due to temporary delays in original equipment manufacturing product approvals for which Integer would supply components. Generic drug pricing pressures in Impax’s base business led to lower earnings, and the company’s inability to get high-value generic drugs approved by the U.S. Food and Drug Administration negatively impacted its ability to overcome such headwinds.
Consumer staples holdings that detracted from the Fund’s relative performance included food retailer Smart & Final Stores. The company’s sales slowed due to increased food deflationary pressures and higher-than-expected sales cannibalization resulting from new stores following an acquisition.
Another key relative detractor was our position in Zoe’s Kitchen. We believe the company, which operates fast-casual Mediterranean restaurants concentrated in the Southeastern U.S., has the potential to become a national concept, with a penetration rate of just 10% against company management’s long-term store target. However, the concept’s differentiated positioning has not been immune to the challenging restaurant industry environment. Deteriorating traffic trends, increasing labor costs and disappointing new-store productivity have weighed on the stock thus far in 2016. We expect trends to
3. Not held at period-end.
4. Not part of the index.
See www.franklintempletondatasources.com for additional data provider information.
franklintempleton.com
Semiannual Report 17
FRANKLIN SMALL CAP GROWTH FUND
gradually improve; nonetheless, we are cautious on the restaurant industry in the near term.
Thank you for your continued participation in Franklin Small Cap Growth Fund. We look forward to serving your future investment needs.

The foregoing information reflects our analysis, opinions and portfolio holdings as of October 31, 2016, the end of the reporting period. The way we implement our main investment strategies and the resulting portfolio holdings may change depending on factors such as market and economic conditions. These opinions may not be relied upon as investment advice or an offer for a particular security. The information is not a complete analysis of every aspect of any market, country, industry, security or the Fund. Statements of fact are from sources considered reliable, but the investment manager makes no representation or warranty as to their completeness or accuracy. Although historical performance is no guarantee of future results, these insights may help you understand our investment management philosophy.
18 Semiannual Report
franklintempleton.com
FRANKLIN SMALL CAP GROWTH FUND
Performance Summary as of October 31, 2016
The performance table does not reflect any taxes that a shareholder would pay on Fund dividends, capital gain distributions, if any, or any realized gains on the sale of Fund shares. Total return reflects reinvestment of the Fund’s dividends and capital gain distributions, if any, and any unrealized gains or losses.
Performance as of 10/31/161
Cumulative total return excludes sales charges. Average annual total returns include maximum sales charges. Sales charges will vary depending on the size of the investment and the class of share purchased. The maximum is 5.75% and the minimum is 0%. Class A: 5.75% maximum initial sales charge; Advisor Class: no sales charges. For other share classes, visit franklintempleton.com.
| Cumulative | Average Annual | Average Annual | ||||
| Share Class | Total Return2 | Total Return3 | Total Return (9/30/16)4 | |||
| A | ||||||
| 6-Month | +6.54 | % | +0.40 | % | ||
| 1-Year | +3.53 | % | -2.43 | % | +8.56 | % |
| 5-Year | +73.40 | % | +10.32 | % | +14.78 | % |
| 10-Year | +108.72 | % | +7.00 | % | +8.28 | % |
| Advisor | ||||||
| 6-Month | +6.66 | % | +6.66 | % | ||
| 1-Year | +3.83 | % | +3.83 | % | +15.54 | % |
| 5-Year | +75.89 | % | +11.96 | % | +16.46 | % |
| 10-Year | +114.78 | % | +7.94 | % | +9.23 | % |
Performance data represent past performance, which does not guarantee future results. Investment return and principal value will fluctuate, and you may have a gain or loss when you sell your shares. Current performance may differ from figures shown. For most recent month-end performance, go to franklintempleton.com or call (800) 342-5236.
See page 20 for Performance Summary footnotes.
franklintempleton.com
Semiannual Report 19
| FRANKLIN SMALL CAP GROWTH FUND | ||||
| PERFORMANCE SUMMARY | ||||
| Total Annual Operating Expenses5 | ||||
| Share Class | With Waiver | Without Waiver | ||
| A | 1.12 | % | 1.14 | % |
| Advisor | 0.87 | % | 0.89 | % |
Each class of shares is available to certain eligible investors and has different annual fees and expenses, as described in the prospectus.
All investments involve risks, including possible loss of principal. Smaller, midsized and relatively new or unseasoned companies can be particularly sensitive to
changing economic conditions, and their prospects for growth are less certain than those of larger, more established companies. Historically, these securities
have experienced more price volatility than larger company stocks, especially over the short term. Growth stock prices reflect projections of future earnings or
revenues, and can, therefore, fall dramatically if the company fails to meet those projections. To the extent the Fund focuses on particular countries, regions,
industries, sectors or types of investment from time to time, it may be subject to greater risks of adverse developments in such areas of focus than a fund that
invests in a wider variety of countries, regions, industries, sectors or investments. From time to time, the trading market for a particular security or type of security
in which the Fund invests may become less liquid or even illiquid. The Fund is actively managed but there is no guarantee that the manager’s investment
decisions will produce the desired results. The Fund’s prospectus also includes a description of the main investment risks.
1. The Fund has a fee waiver associated with any investment it makes in a Franklin Templeton money fund and/or other Franklin Templeton fund, contractually guaranteed
through its current fiscal year-end. Fund investment results reflect the fee waiver; without this waiver, the results would have been lower.
2. Cumulative total return represents the change in value of an investment over the periods indicated.
3. Average annual total return represents the average annual change in value of an investment over the periods indicated. Return for less than one year, ifany,hasnotbeen
annualized.
4. In accordance with SEC rules, we provide standardized average annual total return information through the latest calendar quarter.
5. Figures are as stated in the Fund’s current prospectus and may differ from the expense ratios disclosed in the Your Fund’s Expenses and Financial Highlights sections in this
report. In periods of market volatility, assets may decline significantly, causing total annual Fund operating expenses to become higher than the figures shown.
20 Semiannual Report
franklintempleton.com
FRANKLIN SMALL CAP GROWTH FUND
Your Fund’s Expenses
As a Fund shareholder, you can incur two types of costs: (1) transaction costs, including sales charges (loads) on Fund purchases and redemptions; and (2) ongoing Fund costs, including management fees, distribution and service (12b-1) fees, and other Fund expenses. All mutual funds have ongoing costs, sometimes referred to as operating expenses. The table below shows ongoing costs of investing in the Fund and can help you understand these costs and compare them with those of other mutual funds. The table assumes a $1,000 investment held for the six months indicated.
Actual Fund Expenses
The table below provides information about actual account values and actual expenses in the columns under the heading “Actual.” In these columns the Fund’s actual return, which includes the effect of Fund expenses, is used to calculate the “Ending Account Value” for each class of shares. You can estimate the expenses you paid during the period by following these steps (of course, your account value and expenses will differ from those in this illustration): Divide your account value by $1,000 (if your account had an $8,600 value, then $8,600 ÷ $1,000 = 8.6). Then multiply the result by the number in the row for your class of shares under the headings “Actual” and “Expenses Paid During Period” (if Actual Expenses Paid During Period were $7.50, then 8.6 x $7.50 = $64.50). In this illustration, the actual expenses paid this period are $64.50.
Hypothetical Example for Comparison with Other Funds
Under the heading “Hypothetical” in the table, information is provided about hypothetical account values and hypothetical expenses based on the Fund’s actual expense ratio and an assumed rate of return of 5% per year before expenses, which is not the Fund’s actual return. This information may not be used to estimate the actual ending account balance or expenses you paid for the period, but it can help you compare ongoing costs of investing in the Fund with those of other funds. To do so, compare this 5% hypothetical example for the class of shares you hold with the 5% hypothetical examples that appear in the shareholder reports of other funds.
Please note that expenses shown in the table are meant to highlight ongoing costs and do not reflect any transactional costs. Therefore, information under the heading “Hypothetical” is useful in comparing ongoing costs only, and will not help you compare total costs of owning different funds. In addition, if transactional costs were included, your total costs would have been higher.
| Actual | Hypothetical | |||||||||||
| (actual return after expenses) | (5% annual return before expenses) | |||||||||||
| Expenses | Expenses | Net | ||||||||||
| Beginning | Ending | Paid During | Ending | Paid During | Annualized | |||||||
| Share | Account | Account | Period | Account | Period | Expense | ||||||
| Class | Value 5/1/16 | Value 10/31/16 | 5/1/16–10/31/161,2 | Value 10/31/16 | 5/1/16–10/31/161,2 | Ratio2 | ||||||
| A | $ | 1,000 | $ | 1,065.40 | $ | 5.93 | $ | 1,019.46 | $ | 5.80 | 1.14 | % |
| C | $ | 1,000 | $ | 1,061.10 | $ | 9.82 | $ | 1,015.68 | $ | 9.60 | 1.89 | % |
| R | $ | 1,000 | $ | 1,063.70 | $ | 7.23 | $ | 1,018.20 | $ | 7.07 | 1.39 | % |
| R6 | $ | 1,000 | $ | 1,067.90 | $ | 3.28 | $ | 1,022.03 | $ | 3.21 | 0.63 | % |
| Advisor | $ | 1,000 | $ | 1,066.60 | $ | 4.64 | $ | 1,020.72 | $ | 4.53 | 0.89 | % |
1. Expenses are equal to the annualized expense ratio for the six-month period as indicated above–in the far right column–multiplied by the simple average account value
over the period indicated, and then multiplied by 184/365 to reflect the one-half year period.
2. Reflects expenses after fee waivers and expense reimbursements. Does not include acquired fund fees and expenses.
franklintempleton.com
Semiannual Report 21
Franklin Small-Mid Cap Growth Fund
This semiannual report for Franklin Small-Mid Cap Growth Fund covers the period ended October 31, 2016.
Your Fund’s Goal and Main Investments
The Fund seeks long-term capital growth by normally investing at least 80% of its net assets in equity securities of small-cap and mid-cap companies. The Fund defines small-cap companies as those within the market capitalization range of companies in the Russell 2500™ Index at the time of purchase, and mid-cap companies as those within the market capitalization range of the Russell Midcap® Index at the time of purchase.1
Performance Overview
The Fund’s Class A shares delivered a +3.23% cumulative total return for the six months under review. In comparison, the Russell Midcap® Growth Index, which measures performance of companies in the Russell Midcap® Index with higher price-to-book ratios and higher forecasted growth values, generated a +1.97% total return.2 Also in comparison, the Standard & Poor’s 500 Index, which tracks the broad U.S. stock market, produced a total return of +4.06% total return.2 You can find the Fund’s long-term performance data in the Performance Summary beginning on page 25.
Performance data represent past performance, which does not guarantee future results. Investment return and principal value will fluctuate, and you may have a gain or loss when you sell your shares. Current performance may differ from figures shown. For most recent month-end performance, go to franklintempleton.com or call (800) 342-5236.
Investment Strategy
We use fundamental, bottom-up research to seek companies meeting our criteria of growth potential, quality and valuation. In seeking sustainable growth characteristics, we look for companies we believe can produce sustainable earnings and cash flow growth, evaluating the long-term market opportunity and competitive structure of an industry to target leaders and emerging leaders. We define quality companies as those with strong and improving competitive positions in attractive markets. We also believe important attributes of quality are
experienced and talented management teams as well as financial strength reflected in the capital structure, gross and operating margins, free cash flow generation and returns on capital employed. Our valuation analysis includes a range of potential outcomes based on an assessment of multiple scenarios. In assessing value, we consider whether security prices fully reflect the balance of the sustainable growth opportunities relative to business and financial risks.
Manager’s Discussion
During the six months under review, key contributors to the Fund’s performance relative to the Russell Midcap® Growth Index included stock selection in the information technology (IT), consumer staples and health care sectors.
1. The Russell 2500 Index is market capitalization weighted and measures performance of the 2,500 smallest companies in the Russell 3000 Index, which represent a modest
amount of the Russell 3000 Index’s total market capitalization. The Russell Midcap Index is market capitalization weighted and measures performance of the smallest
companies in the Russell 1000 Index, which represent a modest amount of the Russell 1000 Index’s total market capitalization.
2. Source: Morningstar.
The indexes are unmanaged and include reinvested dividends. They do not reflect any fees, expense or sales charges. One cannot invest directly in an index, and an index is
not representative of the Fund’s portfolio.
The dollar value, number of shares or principal amount, and names of all portfolio holdings are listed in the Fund’s Statement of Investments (SOI).
The SOI begins on page 57.
22 Semiannual Report
franklintempleton.com
FRANKLIN SMALL-MID CAP GROWTH FUND
| Top 10 Holdings | ||
| 10/31/16 | ||
| Company | % of Total | |
| Sector/Industry | Net Assets | |
| Roper Technologies Inc. | 1.9 | % |
| Industrials | ||
| Willis Towers Watson PLC | 1.8 | % |
| Financials | ||
| Equinix Inc. | 1.7 | % |
| Real Estate | ||
| Edwards Lifesciences Corp. | 1.6 | % |
| Health Care | ||
| Quintiles IMS Holdings Inc. | 1.6 | % |
| Health Care | ||
| The Cooper Cos. Inc. | 1.5 | % |
| Health Care | ||
| IHS Markit Ltd. | 1.5 | % |
| Industrials | ||
| Vantiv Inc. | 1.4 | % |
| Information Technology | ||
| Genesee & Wyoming Inc. | 1.4 | % |
| Industrials | ||
| Palo Alto Networks Inc. | 1.4 | % |
| Information Technology |
In IT, our positions in Intersil,3,4 Cognex and NXP Semiconductors3 helped results. Intersil is a high-performance analog semiconductor company, with expertise in power and voltage management. Since installing a new management team in 2013, the company has streamlined its product focus, which led to strong growth and profitability. In September, Renesas Electronics announced its intention to acquire Intersil. Given Intersil’s solid execution and the subsequent acquisition bid from Renesas, its shares advanced significantly during the reporting period. Machine vision products provider Cognex performed well during the reporting period, due to incremental new business from a large consumer electronics customer, as well as continued strong growth in logistics and automotive end markets. The company has experienced significant positive earnings revisions thus far in 2016, and some multiple expansion, which drove shares higher. Further boosting shares were additional new business outside the large consumer electronics customer base and continued growth in its eRetailer customer base, combined with strong operating leverage amid strong sales growth. Semiconductor stocks, including Netherlands-based NXP Semiconductors’ shares, generally performed well during the reporting period. NXP’s shares were also supported by a rumored, then confirmed, intention by QUALCOMM to acquire the company for a significant premium late in the period.
Consumer staples holdings that contributed to relative results included WhiteWave Foods. The company’s shares surged as Danone announced in July its intention to acquire WhiteWave in an all-cash transaction. We decided to exit our position as the deal was not expected to close until the end of the year, and we did not anticipate a competitive bidding process. In health care, medical devices company Nevro performed well.4 The company’s shares rose in value amid greater-than-expected sales following the U.S. launch of a neuromodulation system.
In contrast, key detractors from the Fund’s relative performance included stock selection in the financials and energy sectors.
In financials, our positions in Affiliated Managers Group and Signature Bank hindered the Fund’s results. Shares of asset management company Affiliated Managers Group declined as asset managers performed poorly given investor concerns about the potential impact of the U.S. Department of Labor’s new Fiduciary Rule, which investors believed could accelerate the growth of exchange-traded funds versus actively managed investments. In addition, a weaker near-term outlook for performance fees and industry-wide demand for actively managed equities pressured shares. Signature Bank’s stock suffered amid elevated losses in its Chicago taxi permit portfolio, as well as investor concerns that commercial real estate loan growth may slow.
In the energy sector, shares of Superior Energy Services fell after the oil services company reported a bigger-than-expected third-quarter loss, due to weak revenues from its Gulf of Mexico and international operations.4 However, the company generated solid land-revenue quarterly growth.
Other key detractors included our positions in Zoe’s Kitchen and Impax Laboratories.4 We believe Zoe’s Kitchen, which operates fast-casual Mediterranean restaurants concentrated in the Southeastern U.S., has the potential to become a national concept, with a penetration rate of just 10% against management’s long-term store target. However, the concept’s differentiated positioning has not been immune to the challenging restaurant industry environment. Deteriorating traffic trends, increasing labor costs and disappointing
3. Not held at period-end.
4. Not part of the index.
See www.franklintempletondatasources.com for additional data provider information.
franklintempleton.com
Semiannual Report 23
FRANKLIN SMALL-MID CAP GROWTH FUND
new-store productivity have weighed on the stock thus far in 2016. We expect trends to gradually improve; nonetheless, we are cautious on the restaurant industry in the near term. Generic drug pricing pressures in Impax’s base business led to lower earnings, and the company’s inability to get high-value generic drugs approved by the U.S. Food and Drug Administration negatively impacted its ability to overcome such headwinds.
Thank you for your continued participation in Franklin Small-Mid Cap Growth Fund. We look forward to serving your future investment needs.

The foregoing information reflects our analysis, opinions and portfolio holdings as of October 31, 2016, the end of the reporting period. The way we implement our main investment strategies and the resulting portfolio holdings may change depending on factors such as market and economic conditions. These opinions may not be relied upon as investment advice or an offer for a particular security. The information is not a complete analysis of every aspect of any market, country, industry, security or the Fund. Statements of fact are from sources considered reliable, but the investment manager makes no representation or warranty as to their completeness or accuracy. Although historical performance is no guarantee of future results, these insights may help you understand our investment management philosophy.
John P. Scandalios has been a portfolio manager of the Fund since September 2016. He is a vice president, research analyst and portfolio manager with Franklin Equity Group. He is the leader of the Technology/Communications Research Team and specializes in research analysis of the semiconductor industry. Prior to joining Franklin Templeton as an analyst in 1996, Mr. Scandalios completed the management training program at Chase Manhattan in New York and was an assistant portfolio manager for Chase Private Bank in Los Angeles.
24 Semiannual Report
franklintempleton.com
FRANKLIN SMALL-MID CAP GROWTH FUND
Performance Summary as of October 31, 2016
The performance table does not reflect any taxes that a shareholder would pay on Fund dividends, capital gain distributions, if any, or any realized gains on the sale of Fund shares. Total return reflects reinvestment of the Fund’s dividends and capital gain distributions, if any, and any unrealized gains or losses.
Performance as of 10/31/161
Cumulative total return excludes sales charges. Average annual total returns include maximum sales charges. Sales charges will vary depending on the size of the investment and the class of share purchased. The maximum is 5.75% and the minimum is 0%. Class A: 5.75% maximum initial sales charge; Advisor Class: no sales charges. For other share classes, visit franklintempleton.com.
| Cumulative | Average Annual | Average Annual | ||||
| Share Class | Total Return2 | Total Return3 | Total Return (9/30/16)4 | |||
| A | ||||||
| 6-Month | +3.23 | % | -2.69 | % | ||
| 1-Year | -0.90 | % | -6.60 | % | +1.33 | % |
| 5-Year | +60.14 | % | +8.58 | % | +12.78 | % |
| 10-Year | +90.36 | % | +6.02 | % | +6.83 | % |
| Advisor | ||||||
| 6-Month | +3.37 | % | +3.37 | % | ||
| 1-Year | -0.68 | % | -0.68 | % | +7.80 | % |
| 5-Year | +62.11 | % | +10.14 | % | +14.41 | % |
| 10-Year | +95.17 | % | +6.92 | % | +7.73 | % |
Performance data represent past performance, which does not guarantee future results. Investment return and principal value will fluctuate, and you may have a gain or loss when you sell your shares. Current performance may differ from figures shown. For most recent month-end performance, go to franklintempleton.com or call (800) 342-5236.
See page 26 for Performance Summary footnotes.
franklintempleton.com
Semiannual Report 25
| FRANKLIN SMALL-MID CAP GROWTH FUND | ||||
| PERFORMANCE SUMMARY | ||||
| Total Annual Operating Expenses5 | ||||
| Share Class | With Waiver | Without Waiver | ||
| A | 0.96 | % | 0.97 | % |
| Advisor | 0.71 | % | 0.72 | % |
Each class of shares is available to certain eligible investors and has different annual fees and expenses, as described in the prospectus.
All investments involve risks, including possible loss of principal. Growth stock prices reflect projections of future earnings or revenues, and can, therefore, fall
dramatically if the company fails to meet those projections. Smaller, midsized and relatively new or unseasoned companies can be particularly sensitive to
changing economic conditions, and their prospects for growth are less certain than those of larger, more established companies. Historically, these securities
have experienced more price volatility than larger company stocks, especially over the short term. To the extent the Fund focuses on particular countries, regions,
industries, sectors or types of investment from time to time, it may be subject to greater risks of adverse developments in such areas of focus than a fund that
invests in a wider variety of countries, regions, industries, sectors or investments. From time to time, the trading market for a particular security or type of security
in which the Fund invests may become less liquid or even illiquid. The Fund is actively managed but there is no guarantee that the manager’s investment
decisions will produce the desired results. The Fund’s prospectus also includes a description of the main investment risks.
1. The Fund has a fee waiver associated with any investment it makes in a Franklin Templeton money fund and/or other Franklin Templeton fund, contractually guaranteed
through its current fiscal year-end. Fund investment results reflect the fee waiver; without this waiver, the results would have been lower.
2. Cumulative total return represents the change in value of an investment over the periods indicated.
3. Average annual total return represents the average annual change in value of an investment over the periods indicated. Return for less than one year, ifany,hasnotbeen
annualized.
4. In accordance with SEC rules, we provide standardized average annual total return information through the latest calendar quarter.
5. Figures are as stated in the Fund’s current prospectus and may differ from the expense ratios disclosed in the Your Fund’s Expenses and Financial Highlights sections in this
report. In periods of market volatility, assets may decline significantly, causing total annual Fund operating expenses to become higher than the figures shown.
26 Semiannual Report
franklintempleton.com
FRANKLIN SMALL-MID CAP GROWTH FUND
Your Fund’s Expenses
As a Fund shareholder, you can incur two types of costs: (1) transaction costs, including sales charges (loads) on Fund purchases and redemptions; and (2) ongoing Fund costs, including management fees, distribution and service (12b-1) fees, and other Fund expenses. All mutual funds have ongoing costs, sometimes referred to as operating expenses. The table below shows ongoing costs of investing in the Fund and can help you understand these costs and compare them with those of other mutual funds. The table assumes a $1,000 investment held for the six months indicated.
Actual Fund Expenses
The table below provides information about actual account values and actual expenses in the columns under the heading “Actual.” In these columns the Fund’s actual return, which includes the effect of Fund expenses, is used to calculate the “Ending Account Value” for each class of shares. You can estimate the expenses you paid during the period by following these steps (of course, your account value and expenses will differ from those in this illustration): Divide your account value by $1,000 (if your account had an $8,600 value, then $8,600 ÷ $1,000 = 8.6). Then multiply the result by the number in the row for your class of shares under the headings “Actual” and “Expenses Paid During Period” (if Actual Expenses Paid During Period were $7.50, then 8.6 x $7.50 = $64.50). In this illustration, the actual expenses paid this period are $64.50.
Hypothetical Example for Comparison with Other Funds
Under the heading “Hypothetical” in the table, information is provided about hypothetical account values and hypothetical expenses based on the Fund’s actual expense ratio and an assumed rate of return of 5% per year before expenses, which is not the Fund’s actual return. This information may not be used to estimate the actual ending account balance or expenses you paid for the period, but it can help you compare ongoing costs of investing in the Fund with those of other funds. To do so, compare this 5% hypothetical example for the class of shares you hold with the 5% hypothetical examples that appear in the shareholder reports of other funds.
Please note that expenses shown in the table are meant to highlight ongoing costs and do not reflect any transactional costs. Therefore, information under the heading “Hypothetical” is useful in comparing ongoing costs only, and will not help you compare total costs of owning different funds. In addition, if transactional costs were included, your total costs would have been higher.
| Actual | Hypothetical | |||||||||||
| (actual return after expenses) | (5% annual return before expenses) | |||||||||||
| Expenses | Expenses | Net | ||||||||||
| Beginning | Ending | Paid During | Ending | Paid During | Annualized | |||||||
| Share | Account | Account | Period | Account | Period | Expense | ||||||
| Class | Value 5/1/16 | Value 10/31/16 | 5/1/16–10/31/161,2 | Value 10/31/16 | 5/1/16–10/31/161,2 | Ratio2 | ||||||
| A | $ | 1,000 | $ | 1,032.30 | $ | 4.92 | $ | 1,020.37 | $ | 4.89 | 0.96 | % |
| C | $ | 1,000 | $ | 1,028.30 | $ | 8.74 | $ | 1,016.59 | $ | 8.69 | 1.71 | % |
| R | $ | 1,000 | $ | 1,031.30 | $ | 6.20 | $ | 1,019.11 | $ | 6.16 | 1.21 | % |
| R6 | $ | 1,000 | $ | 1,034.90 | $ | 2.41 | $ | 1,022.84 | $ | 2.40 | 0.47 | % |
| Advisor | $ | 1,000 | $ | 1,033.70 | $ | 3.64 | $ | 1,021.63 | $ | 3.62 | 0.71 | % |
1. Expenses are equal to the annualized expense ratio for the six-month period as indicated above–in the far right column–multiplied by the simple average account value
over the period indicated, and then multiplied by 184/365 to reflect the one-half year period.
2. Reflects expenses after fee waivers and expense reimbursements. Does not include acquired fund fees and expenses.
franklintempleton.com
Semiannual Report 27
FRANKLIN STRATEGIC SERIES
| Financial Highlights | ||||||||||||||||||
| Franklin Focused Core Equity Fund | ||||||||||||||||||
| Six Months Ended | ||||||||||||||||||
| October 31, 2016 | Year Ended April 30, | |||||||||||||||||
| (unaudited) | 2016 | 2015 | 2014 | 2013 | 2012 | |||||||||||||
| Class A | ||||||||||||||||||
| Per share operating performance | ||||||||||||||||||
| (for a share outstanding throughout the period) | ||||||||||||||||||
| Net asset value, beginning of period | $ | 13.12 | $ | 15.29 | $ | 13.38 | $ | 10.63 | $ | 9.47 | $ | 10.35 | ||||||
| Income from investment operationsa: | ||||||||||||||||||
| Net investment income (loss)b | (—)c | 0.07 | d | (0.01 | ) | 0.03 | 0.07 | 0.02 | ||||||||||
| Net realized and unrealized gains (losses) | 0.53 | (1.83 | ) | 2.23 | 2.92 | 1.16 | (0.31 | ) | ||||||||||
| Total from investment operations | 0.53 | (1.76 | ) | 2.22 | 2.95 | 1.23 | (0.29 | ) | ||||||||||
| Less distributions from: | ||||||||||||||||||
| Net investment income. | — | (0.06 | ) | — | (0.07 | ) | — | (0.11 | ) | |||||||||
| Net realized gains | — | (0.35 | ) | (0.31 | ) | (0.13 | ) | (0.07 | ) | (0.48 | ) | |||||||
| Total distributions | — | (0.41 | ) | (0.31 | ) | (0.20 | ) | (0.07 | ) | (0.59 | ) | |||||||
| Net asset value, end of period | $ | 13.65 | $ | 13.12 | $ | 15.29 | $ | 13.38 | $ | 10.63 | $ | 9.47 | ||||||
| Total returne | 4.04 | % | (11.70 | )% | 16.84 | % | 28.00 | % | 13.08 | % | (2.17 | )% | ||||||
| Ratios to average net assetsf | ||||||||||||||||||
| Expenses before waiver and payments by | ||||||||||||||||||
| affiliates | 1.50 | % | 1.46 | % | 1.54 | % | 1.73 | % | 1.89 | % | 1.81 | % | ||||||
| Expenses net of waiver and payments by | ||||||||||||||||||
| affiliates | 1.25 | %g | 1.25 | % | 1.28 | % | 1.22 | % | 1.19 | % | 1.21 | % | ||||||
| Net investment income (loss) | (0.05 | )% | 0.48 | %d | (0.07 | )% | 0.23 | % | 0.76 | % | 0.25 | % | ||||||
| Supplemental data | ||||||||||||||||||
| Net assets, end of period (000’s) | $ | 80,186 | $ | 100,483 | $ | 92,612 | $ | 40,372 | $ | 19,029 | $ | 26,253 | ||||||
| Portfolio turnover rate | 4.10 | % | 35.56 | % | 25.55 | % | 43.30 | % | 74.50 | % | 51.85 | % | ||||||
aThe amount shown for a share outstanding throughout the period may not correlate with the Statement of Operations for the period due to the timing of sales and
repurchases of the Fund’s shares in relation to income earned and/or fluctuating fair value of the investments of the Fund.
bBased on average daily shares outstanding.
cAmount rounds to less than $0.01 per share.
dNet investment income per share includes approximately $0.06 per share related to income received in the form of special dividends in connection with certain Fund
holdings. Excluding this amount, the ratio of net investment income to average net assets would have been 0.02%.
eTotal return does not reflect sales commissions or contingent deferred sales charges, if applicable, and is not annualized for periods less than one year.
fRatios are annualized for periods less than one year.
gBenefit of expense reduction rounds to less than 0.01%.
28 Semiannual Report | The accompanying notes are an integral part of these financial statements. franklintempleton.com
| FRANKLIN STRATEGIC SERIES | ||||||||||||||||||
| FINANCIAL HIGHLIGHTS | ||||||||||||||||||
| Franklin Focused Core Equity Fund (continued) | ||||||||||||||||||
| Six Months Ended | ||||||||||||||||||
| October 31, 2016 | Year Ended April 30, | |||||||||||||||||
| (unaudited) | 2016 | 2015 | 2014 | 2013 | 2012 | |||||||||||||
| Class C | ||||||||||||||||||
| Per share operating performance | ||||||||||||||||||
| (for a share outstanding throughout the period) | ||||||||||||||||||
| Net asset value, beginning of period | $ | 12.58 | $ | 14.73 | $ | 12.98 | $ | 10.36 | $ | 9.29 | $ | 10.14 | ||||||
| Income from investment operationsa: | ||||||||||||||||||
| Net investment income (loss)b | (0.05 | ) | (0.04 | )c | (0.11 | ) | (0.06 | ) | 0.01 | (0.04 | ) | |||||||
| Net realized and unrealized gains (losses) | 0.51 | (1.76 | ) | 2.17 | 2.84 | 1.13 | (0.29 | ) | ||||||||||
| Total from investment operations | 0.46 | (1.80 | ) | 2.06 | 2.78 | 1.14 | (0.33 | ) | ||||||||||
| Less distributions from: | ||||||||||||||||||
| Net investment income. | — | — | — | (0.03 | ) | — | (0.04 | ) | ||||||||||
| Net realized gains | — | (0.35 | ) | (0.31 | ) | (0.13 | ) | (0.07 | ) | (0.48 | ) | |||||||
| Total distributions | — | (0.35 | ) | (0.31 | ) | (0.16 | ) | (0.07 | ) | (0.52 | ) | |||||||
| Net asset value, end of period | $ | 13.04 | $ | 12.58 | $ | 14.73 | $ | 12.98 | $ | 10.36 | $ | 9.29 | ||||||
| Total returnd | 3.66 | % | (12.31 | )% | 16.12 | % | 26.99 | % | 12.36 | % | (2.66 | )% | ||||||
| Ratios to average net assetse | ||||||||||||||||||
| Expenses before waiver and payments by | ||||||||||||||||||
| affiliates | 2.25 | % | 2.20 | % | 2.24 | % | 2.43 | % | 2.59 | % | 2.50 | % | ||||||
| Expenses net of waiver and payments by | ||||||||||||||||||
| affiliates | 2.00 | %f | 1.99 | % | 1.98 | % | 1.92 | % | 1.89 | % | 1.90 | % | ||||||
| Net investment income (loss) | (0.80 | )% | (0.26 | )%c | (0.77 | )% | (0.47 | )% | 0.06 | % | (0.44 | )% | ||||||
| Supplemental data | ||||||||||||||||||
| Net assets, end of period (000’s) | $ | 20,048 | $ | 25,119 | $ | 18,758 | $ | 6,666 | $ | 2,502 | $ | 3,265 | ||||||
| Portfolio turnover rate | 4.10 | % | 35.56 | % | 25.55 | % | 43.30 | % | 74.50 | % | 51.85 | % | ||||||
aThe amount shown for a share outstanding throughout the period may not correlate with the Statement of Operations for the period due to the timing of sales and
repurchases of the Fund’s shares in relation to income earned and/or fluctuating fair value of the investments of the Fund.
bBased on average daily shares outstanding.
cNet investment income per share includes approximately $0.06 per share related to income received in the form of special dividends in connection with certain Fund
holdings. Excluding this amount, the ratio of net investment income to average net assets would have been (0.72)%.
dTotal return does not reflect sales commissions or contingent deferred sales charges, if applicable, and is not annualized for periods less than one year.
eRatios are annualized for periods less than one year.
fBenefit of expense reduction rounds to less than 0.01%.
franklintempleton.com The accompanying notes are an integral part of these financial statements. | Semiannual Report 29
| FRANKLIN STRATEGIC SERIES | ||||||||||||||||||
| FINANCIAL HIGHLIGHTS | ||||||||||||||||||
| Franklin Focused Core Equity Fund (continued) | ||||||||||||||||||
| Six Months Ended | ||||||||||||||||||
| October 31, 2016 | Year Ended April 30, | |||||||||||||||||
| (unaudited) | 2016 | 2015 | 2014 | 2013 | 2012 | |||||||||||||
| Class R | ||||||||||||||||||
| Per share operating performance | ||||||||||||||||||
| (for a share outstanding throughout the period) | ||||||||||||||||||
| Net asset value, beginning of period | $ | 12.98 | $ | 15.15 | $ | 13.28 | $ | 10.56 | $ | 9.43 | $ | 10.30 | ||||||
| Income from investment operationsa: | ||||||||||||||||||
| Net investment income (loss)b | (0.01 | ) | 0.03 | c | (0.04 | ) | 0.01 | 0.05 | 0.02 | |||||||||
| Net realized and unrealized gains (losses) | 0.52 | (1.81 | ) | 2.22 | 2.90 | 1.15 | (0.32 | ) | ||||||||||
| Total from investment operations | 0.51 | (1.78 | ) | 2.18 | 2.91 | 1.20 | (0.30 | ) | ||||||||||
| Less distributions from: | ||||||||||||||||||
| Net investment income. | — | (0.04 | ) | — | (0.06 | ) | — | (0.09 | ) | |||||||||
| Net realized gains | — | (0.35 | ) | (0.31 | ) | (0.13 | ) | (0.07 | ) | (0.48 | ) | |||||||
| Total distributions | — | (0.39 | ) | (0.31 | ) | (0.19 | ) | (0.07 | ) | (0.57 | ) | |||||||
| Net asset value, end of period | $ | 13.49 | $ | 12.98 | $ | 15.15 | $ | 13.28 | $ | 10.56 | $ | 9.43 | ||||||
| Total returnd | 3.93 | % | (11.91 | )% | 16.66 | % | 27.70 | % | 12.81 | % | (2.22 | )% | ||||||
| Ratios to average net assetse | ||||||||||||||||||
| Expenses before waiver and payments by | ||||||||||||||||||
| affiliates | 1.69 | % | 1.69 | % | 1.74 | % | 1.93 | % | 2.09 | % | 1.99 | % | ||||||
| Expenses net of waiver and payments by | ||||||||||||||||||
| affiliates | 1.44 | %f | 1.48 | % | 1.48 | % | 1.42 | % | 1.39 | % | 1.39 | % | ||||||
| Net investment income (loss) | (0.24 | )% | 0.25 | %c | (0.27 | )% | 0.03 | % | 0.56 | % | 0.07 | % | ||||||
| Supplemental data | ||||||||||||||||||
| Net assets, end of period (000’s) | $ | 145 | $ | 273 | $ | 169 | $ | 124 | $ | 76 | $ | 41 | ||||||
| Portfolio turnover rate | 4.10 | % | 35.56 | % | 25.55 | % | 43.30 | % | 74.50 | % | 51.85 | % | ||||||
aThe amount shown for a share outstanding throughout the period may not correlate with the Statement of Operations for the period due to the timing of sales and
repurchases of the Fund’s shares in relation to income earned and/or fluctuating fair value of the investments of the Fund.
bBased on average daily shares outstanding.
cNet investment income per share includes approximately $0.06 per share related to income received in the form of special dividends in connection with certain Fund
holdings. Excluding this amount, the ratio of net investment income to average net assets would have been (0.21)%.
dTotal return is not annualized for periods less than one year.
eRatios are annualized for periods less than one year.
fBenefit of expense reduction rounds to less than 0.01%.
30 Semiannual Report | The accompanying notes are an integral part of these financial statements. franklintempleton.com
FRANKLIN STRATEGIC SERIES
FINANCIAL HIGHLIGHTS
| Franklin Focused Core Equity Fund (continued) | ||||||||||||
| Six Months Ended | ||||||||||||
| October 31, 2016 | Year Ended April 30, | |||||||||||
| (unaudited) | 2016 | 2015 | 2014 | a | ||||||||
| Class R6 | ||||||||||||
| Per share operating performance | ||||||||||||
| (for a share outstanding throughout the period) | ||||||||||||
| Net asset value, beginning of period | $ | 13.27 | $ | 15.46 | $ | 13.49 | $ | 10.54 | ||||
| Income from investment operationsb: | ||||||||||||
| Net investment incomec | 0.03 | 0.12 | d | 0.05 | 0.07 | |||||||
| Net realized and unrealized gains (losses) | 0.54 | (1.85 | ) | 2.27 | 3.11 | |||||||
| Total from investment operations | 0.57 | (1.73 | ) | 2.32 | 3.18 | |||||||
| Less distributions from: | ||||||||||||
| Net investment income | — | (0.11 | ) | (0.04 | ) | (0.10 | ) | |||||
| Net realized gains | — | (0.35 | ) | (0.31 | ) | (0.13 | ) | |||||
| Total distributions | — | (0.46 | ) | (0.35 | ) | (0.23 | ) | |||||
| Net asset value, end of period | $ | 13.84 | $ | 13.27 | $ | 15.46 | $ | 13.49 | ||||
| Total returne | 4.30 | % | (11.32 | )% | 17.45 | % | 30.43 | % | ||||
| Ratios to average net assetsf | ||||||||||||
| Expenses before waiver and payments by affiliates | 1.07 | % | 1.04 | % | 1.09 | % | 2.28 | % | ||||
| Expenses net of waiver and payments by affiliates. | 0.85 | %g | 0.85 | % | 0.83 | % | 0.77 | % | ||||
| Net investment income | 0.35 | % | 0.88 | %d | 0.38 | % | 0.68 | % | ||||
| Supplemental data | ||||||||||||
| Net assets, end of period (000’s) | $ | 18,133 | $ | 33,640 | $ | 25,739 | $ | 14 | ||||
| Portfolio turnover rate. | 4.10 | % | 35.56 | % | 25.55 | % | 43.30 | % | ||||
aFor the year May 1, 2013 (effective date) to April 30, 2014.
bThe amount shown for a share outstanding throughout the period may not correlate with the Statement of Operations for the period due to the timing of sales and
repurchases of the Fund’s shares in relation to income earned and/or fluctuating fair value of the investments of the Fund.
cBased on average daily shares outstanding.
dNet investment income per share includes approximately $0.06 per share related to income received in the form of special dividends in connection with certain Fund
holdings. Excluding this amount, the ratio of net investment income to average net assets would have been 0.42%.
eTotal return is not annualized for periods less than one year.
fRatios are annualized for periods less than one year.
gBenefit of expense reduction rounds to less than 0.01%.
franklintempleton.com The accompanying notes are an integral part of these financial statements. | Semiannual Report 31
| FRANKLIN STRATEGIC SERIES | ||||||||||||||||||
| FINANCIAL HIGHLIGHTS | ||||||||||||||||||
| Franklin Focused Core Equity Fund (continued) | ||||||||||||||||||
| Six Months Ended | ||||||||||||||||||
| October 31, 2016 | Year Ended April 30, | |||||||||||||||||
| (unaudited) | 2016 | 2015 | 2014 | 2013 | 2012 | |||||||||||||
| Advisor Class | ||||||||||||||||||
| Per share operating performance | ||||||||||||||||||
| (for a share outstanding throughout the period) | ||||||||||||||||||
| Net asset value, beginning of period | $ | 13.25 | $ | 15.44 | $ | 13.48 | $ | 10.70 | $ | 9.50 | $ | 10.37 | ||||||
| Income from investment operationsa: | ||||||||||||||||||
| Net investment incomeb | 0.01 | 0.10 | c | 0.04 | 0.07 | 0.10 | 0.06 | |||||||||||
| Net realized and unrealized gains (losses) | 0.55 | (1.85 | ) | 2.25 | 2.93 | 1.17 | (0.32 | ) | ||||||||||
| Total from investment operations | 0.56 | (1.75 | ) | 2.29 | 3.00 | 1.27 | (0.26 | ) | ||||||||||
| Less distributions from: | ||||||||||||||||||
| Net investment income. | — | (0.09 | ) | (0.02 | ) | (0.09 | ) | — | (0.13 | ) | ||||||||
| Net realized gains | — | (0.35 | ) | (0.31 | ) | (0.13 | ) | (0.07 | ) | (0.48 | ) | |||||||
| Total distributions | — | (0.44 | ) | (0.33 | ) | (0.22 | ) | (0.07 | ) | (0.61 | ) | |||||||
| Net asset value, end of period | $ | 13.81 | $ | 13.25 | $ | 15.44 | $ | 13.48 | $ | 10.70 | $ | 9.50 | ||||||
| Total returnd | 4.23 | % | (11.45 | )% | 17.25 | % | 28.27 | % | 13.46 | % | (1.80 | )% | ||||||
| Ratios to average net assetse | ||||||||||||||||||
| Expenses before waiver and payments by | ||||||||||||||||||
| affiliates | 1.25 | % | 1.20 | % | 1.24 | % | 1.43 | % | 1.59 | % | 1.49 | % | ||||||
| Expenses net of waiver and payments by | ||||||||||||||||||
| affiliates | 1.00 | %f | 0.99 | % | 0.98 | % | 0.92 | % | 0.89 | % | 0.89 | % | ||||||
| Net investment income | 0.20 | % | 0.74 | %c | 0.23 | % | 0.53 | % | 1.06 | % | 0.57 | % | ||||||
| Supplemental data | ||||||||||||||||||
| Net assets, end of period (000’s) | $ | 12,267 | $ | 10,736 | $ | 9,914 | $ | 6,990 | $ | 4,347 | $ | 3,188 | ||||||
| Portfolio turnover rate | 4.10 | % | 35.56 | % | 25.55 | % | 43.30 | % | 74.50 | % | 51.85 | % | ||||||
aThe amount shown for a share outstanding throughout the period may not correlate with the Statement of Operations for the period due to the timing of sales and
repurchases of the Fund’s shares in relation to income earned and/or fluctuating fair value of the investments of the Fund.
bBased on average daily shares outstanding.
cNet investment income per share includes approximately $0.06 per share related to income received in the form of special dividends in connection with certain Fund
holdings. Excluding this amount, the ratio of net investment income to average net assets would have been 0.28%.
dTotal return is not annualized for periods less than one year.
eRatios are annualized for periods less than one year.
fBenefit of expense reduction rounds to less than 0.01%.
32 Semiannual Report | The accompanying notes are an integral part of these financial statements. franklintempleton.com
FRANKLIN STRATEGIC SERIES
| Statement of Investments, October 31, 2016 (unaudited) | ||||
| Franklin Focused Core Equity Fund | ||||
| Country | Shares | Value | ||
| Common Stocks 98.6% | ||||
| Consumer Discretionary 8.1% | ||||
| a Altice NV, A | Netherlands | 287,460 | $ | 5,300,912 |
| Twenty-First Century Fox Inc., B | United States | 175,860 | 4,640,945 | |
| The Walt Disney Co | United States | 7,120 | 659,953 | |
| 10,601,810 | ||||
| Consumer Staples 2.8% | ||||
| CVS Health Corp | United States | 43,400 | 3,649,940 | |
| Energy 10.3% | ||||
| Anadarko Petroleum Corp | United States | 89,280 | 5,306,803 | |
| Pioneer Natural Resources Co | United States | 18,150 | 3,249,213 | |
| Schlumberger Ltd | United States | 62,540 | 4,892,504 | |
| 13,448,520 | ||||
| Financials 25.1% | ||||
| BlackRock Inc | United States | 11,147 | 3,803,802 | |
| The Charles Schwab Corp | United States | 157,110 | 4,980,387 | |
| Citigroup Inc | United States | 54,580 | 2,682,607 | |
| The Hartford Financial Services Group Inc | United States | 146,620 | 6,467,408 | |
| JPMorgan Chase & Co | United States | 55,123 | 3,817,819 | |
| Moody’s Corp | United States | 23,560 | 2,368,251 | |
| Synchrony Financial | United States | 122,545 | 3,503,562 | |
| Willis Towers Watson PLC | United States | 41,600 | 5,237,440 | |
| 32,861,276 | ||||
| Health Care 14.2% | ||||
| Aetna Inc | United States | 37,990 | 4,078,227 | |
| a Allergan PLC | United States | 35,744 | 7,468,351 | |
| a Horizon Pharma PLC | United States | 154,000 | 2,574,880 | |
| Medtronic PLC | United States | 45,620 | 3,741,752 | |
| a Valeant Pharmaceuticals International Inc | United States | 37,320 | 665,789 | |
| 18,528,999 | ||||
| Industrials 5.2% | ||||
| a Genesee & Wyoming Inc | United States | 66,080 | 4,489,475 | |
| a IHS Markit Ltd | United States | 62,093 | 2,284,402 | |
| 6,773,877 | ||||
| Information Technology 25.9% | ||||
| a Adobe Systems Inc | United States | 25,110 | 2,699,576 | |
| a Alphabet Inc., A | United States | 4,200 | 3,401,580 | |
| a Alphabet Inc., C | United States | 4,750 | 3,726,565 | |
| a Blackhawk Network Holdings Inc | United States | 70,420 | 2,425,969 | |
| Mastercard Inc., A | United States | 43,160 | 4,618,983 | |
| Microsoft Corp | United States | 134,330 | 8,049,053 | |
| Motorola Solutions Inc | United States | 40,570 | 2,944,571 | |
| QUALCOMM Inc | United States | 63,700 | 4,377,464 | |
| Sabre Corp | United States | 64,520 | 1,666,552 | |
| 33,910,313 | ||||
| Real Estate 7.0% | ||||
| a CBRE Group Inc | United States | 149,410 | 3,848,802 | |
| Equinix Inc | United States | 14,851 | 5,305,965 | |
| 9,154,767 | ||||
| Total Common Stocks (Cost $117,978,991) | 128,929,502 | |||
franklintempleton.com
Semiannual Report 33
FRANKLIN STRATEGIC SERIES
STATEMENT OF INVESTMENTS (UNAUDITED)
| Franklin Focused Core Equity Fund (continued) | ||||
| Country | Shares | Value | ||
| Short Term Investments (Cost $852,031) 0.6% | ||||
| Money Market Funds 0.6% | ||||
| a,b Institutional Fiduciary Trust Money Market Portfolio | United States | 852,031 | $ | 852,031 |
| Total Investments (Cost $118,831,022) 99.2% | 129,781,533 | |||
| Other Assets, less Liabilities 0.8% | 997,241 | |||
| Net Assets 100.0% | $ | 130,778,774 |
aNon-income producing.
bSee Note 3(f) regarding investments in affiliated management investment companies.
34 Semiannual Report | The accompanying notes are an integral part of these financial statements. franklintempleton.com
FRANKLIN STRATEGIC SERIES
| Financial Highlights | ||||||||||||||||||
| Franklin Growth Opportunities Fund | ||||||||||||||||||
| Six Months Ended | ||||||||||||||||||
| October 31, 2016 | Year Ended April 30, | |||||||||||||||||
| (unaudited) | 2016 | 2015 | 2014 | 2013 | 2012 | |||||||||||||
| Class A | ||||||||||||||||||
| Per share operating performance | ||||||||||||||||||
| (for a share outstanding throughout the period) | ||||||||||||||||||
| Net asset value, beginning of period | $ | 30.40 | $ | 33.13 | $ | 28.48 | $ | 24.29 | $ | 23.02 | $ | 24.28 | ||||||
| Income from investment operationsa: | ||||||||||||||||||
| Net investment income (loss)b | (0.08 | ) | (0.19 | ) | (0.19 | ) | (0.19 | ) | (0.12 | ) | (0.16 | ) | ||||||
| Net realized and unrealized gains (losses) | 1.11 | (1.88 | ) | 5.50 | 5.11 | 1.95 | 0.40 | |||||||||||
| Total from investment operations | 1.03 | (2.07 | ) | 5.31 | 4.92 | 1.83 | 0.24 | |||||||||||
| Less distributions from net realized gains. | — | (0.66 | ) | (0.66 | ) | (0.73 | ) | (0.56 | ) | (1.50 | ) | |||||||
| Net asset value, end of period | $ | 31.43 | $ | 30.40 | $ | 33.13 | $ | 28.48 | $ | 24.29 | $ | 23.02 | ||||||
| Total returnc | 3.39 | % | (6.36 | )% | 18.87 | % | 20.26 | % | 8.29 | % | 1.90 | % | ||||||
| Ratios to average net assetsd | ||||||||||||||||||
| Expenses before waiver and payments by | ||||||||||||||||||
| affiliates | 1.06 | % | 1.11 | % | 1.18 | % | 1.17 | % | 1.25 | % | 1.28 | % | ||||||
| Expenses net of waiver and payments by | ||||||||||||||||||
| affiliates | 1.00 | %e | 1.10 | % | 1.18 | %f | 1.17 | %e,f | 1.25 | % | 1.28 | % | ||||||
| Net investment income (loss) | (0.48 | )% | (0.58 | )% | (0.59 | )% | (0.70 | )% | (0.56 | )% | (0.71 | )% | ||||||
| Supplemental data | ||||||||||||||||||
| Net assets, end of period (000’s) | $ | 2,281,539 | $ | 548,871 | $ | 457,619 | $ | 349,343 | $ | 213,639 | $ | 209,382 | ||||||
| Portfolio turnover rate | 23.98 | % | 25.56 | % | 40.64 | % | 36.64 | % | 58.76 | % | 63.57 | % | ||||||
aThe amount shown for a share outstanding throughout the period may not correlate with the Statement of Operations for the period due to the timing of sales and
repurchases of the Fund’s shares in relation to income earned and/or fluctuating fair value of the investments of the Fund.
bBased on average daily shares outstanding.
cTotal return does not reflect sales commissions or contingent deferred sales charges, if applicable, and is not annualized for periods less than one year.
dRatios are annualized for periods less than one year, except for non-recurring expenses, if any.
eBenefit of expense reduction rounds to less than 0.01%.
fBenefit of waiver and payments by affiliates rounds to less than 0.01%.
franklintempleton.com The accompanying notes are an integral part of these financial statements. | Semiannual Report 35
| FRANKLIN STRATEGIC SERIES | ||||||||||||||||||
| FINANCIAL HIGHLIGHTS | ||||||||||||||||||
| Franklin Growth Opportunities Fund (continued) | ||||||||||||||||||
| Six Months Ended | ||||||||||||||||||
| October 31, 2016 | Year Ended April 30, | |||||||||||||||||
| (unaudited) | 2016 | 2015 | 2014 | 2013 | 2012 | |||||||||||||
| Class C | ||||||||||||||||||
| Per share operating performance | ||||||||||||||||||
| (for a share outstanding throughout the period) | ||||||||||||||||||
| Net asset value, beginning of period | $ | 26.59 | $ | 29.27 | $ | 25.41 | $ | 21.89 | $ | 20.95 | $ | 22.40 | ||||||
| Income from investment operationsa: | ||||||||||||||||||
| Net investment income (loss)b | (0.17 | ) | (0.37 | ) | (0.36 | ) | (0.35 | ) | (0.26 | ) | (0.29 | ) | ||||||
| Net realized and unrealized gains (losses) | 0.96 | (1.65 | ) | 4.88 | 4.60 | 1.76 | 0.34 | |||||||||||
| Total from investment operations | 0.79 | (2.02 | ) | 4.52 | 4.25 | 1.50 | 0.05 | |||||||||||
| Less distributions from net realized gains. | — | (0.66 | ) | (0.66 | ) | (0.73 | ) | (0.56 | ) | (1.50 | ) | |||||||
| Net asset value, end of period | $ | 27.38 | $ | 26.59 | $ | 29.27 | $ | 25.41 | $ | 21.89 | $ | 20.95 | ||||||
| Total returnc | 2.97 | % | (7.03 | )% | 18.04 | % | 19.42 | % | 7.47 | % | 1.24 | % | ||||||
| Ratios to average net assetsd | ||||||||||||||||||
| Expenses before waiver and payments by | ||||||||||||||||||
| affiliates | 1.81 | % | 1.85 | % | 1.88 | % | 1.87 | % | 1.97 | % | 1.99 | % | ||||||
| Expenses net of waiver and payments by | ||||||||||||||||||
| affiliates | 1.75 | %e | 1.84 | % | 1.88 | %f | 1.87 | %e,f | 1.97 | % | 1.99 | % | ||||||
| Net investment income (loss) | (1.23 | )% | (1.32 | )% | (1.29 | )% | (1.40 | )% | (1.28 | )% | (1.42 | )% | ||||||
| Supplemental data | ||||||||||||||||||
| Net assets, end of period (000’s) | $ | 397,217 | $ | 137,882 | $ | 110,513 | $ | 85,883 | $ | 51,719 | $ | 50,453 | ||||||
| Portfolio turnover rate | 23.98 | % | 25.56 | % | 40.64 | % | 36.64 | % | 58.76 | % | 63.57 | % | ||||||
aThe amount shown for a share outstanding throughout the period may not correlate with the Statement of Operations for the period due to the timing of sales and
repurchases of the Fund’s shares in relation to income earned and/or fluctuating fair value of the investments of the Fund.
bBased on average daily shares outstanding.
cTotal return does not reflect sales commissions or contingent deferred sales charges, if applicable, and is not annualized for periods less than one year.
dRatios are annualized for periods less than one year, except for non-recurring expenses, if any.
eBenefit of expense reduction rounds to less than 0.01%.
fBenefit of waiver and payments by affiliates rounds to less than 0.01%.
36 Semiannual Report | The accompanying notes are an integral part of these financial statements. franklintempleton.com
| FRANKLIN STRATEGIC SERIES | ||||||||||||||||||
| FINANCIAL HIGHLIGHTS | ||||||||||||||||||
| Franklin Growth Opportunities Fund (continued) | ||||||||||||||||||
| Six Months Ended | ||||||||||||||||||
| October 31, 2016 | Year Ended April 30, | |||||||||||||||||
| (unaudited) | 2016 | 2015 | 2014 | 2013 | 2012 | |||||||||||||
| Class R | ||||||||||||||||||
| Per share operating performance | ||||||||||||||||||
| (for a share outstanding throughout the period) | ||||||||||||||||||
| Net asset value, beginning of period | $ | 29.37 | $ | 32.10 | $ | 27.67 | $ | 23.67 | $ | 22.49 | $ | 23.81 | ||||||
| Income from investment operationsa: | ||||||||||||||||||
| Net investment income (loss)b | (0.11 | ) | (0.26 | ) | (0.24 | ) | (0.24 | ) | (0.17 | ) | (0.20 | ) | ||||||
| Net realized and unrealized gains (losses) | 1.06 | (1.81 | ) | 5.33 | 4.97 | 1.91 | 0.38 | |||||||||||
| Total from investment operations | 0.95 | (2.07 | ) | 5.09 | 4.73 | 1.74 | 0.18 | |||||||||||
| Less distributions from net realized gains. | — | (0.66 | ) | (0.66 | ) | (0.73 | ) | (0.56 | ) | (1.50 | ) | |||||||
| Net asset value, end of period | $ | 30.32 | $ | 29.37 | $ | 32.10 | $ | 27.67 | $ | 23.67 | $ | 22.49 | ||||||
| Total returnc | 3.23 | % | (6.60 | )% | 18.63 | % | 19.99 | % | 8.03 | % | 1.73 | % | ||||||
| Ratios to average net assetsd | ||||||||||||||||||
| Expenses before waiver and payments by | ||||||||||||||||||
| affiliates | 1.31 | % | 1.35 | % | 1.38 | % | 1.37 | % | 1.47 | % | 1.49 | % | ||||||
| Expenses net of waiver and payments by | ||||||||||||||||||
| affiliates | 1.25 | %e | 1.34 | % | 1.38 | %f | 1.37 | %e,f | 1.47 | % | 1.49 | % | ||||||
| Net investment income (loss) | (0.73 | )% | (0.82 | )% | (0.79 | )% | (0.90 | )% | (0.78 | )% | (0.92 | )% | ||||||
| Supplemental data | ||||||||||||||||||
| Net assets, end of period (000’s) | $ | 52,268 | $ | 39,786 | $ | 48,266 | $ | 42,953 | $ | 34,399 | $ | 33,783 | ||||||
| Portfolio turnover rate | 23.98 | % | 25.56 | % | 40.64 | % | 36.64 | % | 58.76 | % | 63.57 | % | ||||||
aThe amount shown for a share outstanding throughout the period may not correlate with the Statement of Operations for the period due to the timing of sales and
repurchases of the Fund’s shares in relation to income earned and/or fluctuating fair value of the investments of the Fund.
bBased on average daily shares outstanding.
cTotal return is not annualized for periods less than one year.
dRatios are annualized for periods less than one year, except for non-recurring expenses, if any.
eBenefit of expense reduction rounds to less than 0.01%.
fBenefit of waiver and payments by affiliates rounds to less than 0.01%.
franklintempleton.com The accompanying notes are an integral part of these financial statements. | Semiannual Report 37
| FRANKLIN STRATEGIC SERIES | ||||||||||||
| FINANCIAL HIGHLIGHTS | ||||||||||||
| Franklin Growth Opportunities Fund (continued) | ||||||||||||
| Six Months Ended | ||||||||||||
| October 31, 2016 | Year Ended April 30, | |||||||||||
| (unaudited) | 2016 | 2015 | 2014 | a | ||||||||
| Class R6 | ||||||||||||
| Per share operating performance | ||||||||||||
| (for a share outstanding throughout the period) | ||||||||||||
| Net asset value, beginning of period | $ | 32.39 | $ | 35.09 | $ | 29.98 | $ | 24.99 | ||||
| Income from investment operationsb: | ||||||||||||
| Net investment income (loss)c | (—)d | (0.05 | ) | (0.03 | ) | (0.07 | ) | |||||
| Net realized and unrealized gains (losses) | 1.16 | (1.99 | ) | 5.80 | 5.79 | |||||||
| Total from investment operations | 1.16 | (2.04 | ) | 5.77 | 5.72 | |||||||
| Less distributions from net realized gains | — | (0.66 | ) | (0.66 | ) | (0.73 | ) | |||||
| Net asset value, end of period | $ | 33.55 | $ | 32.39 | $ | 35.09 | $ | 29.98 | ||||
| Total returne | 3.58 | % | (5.94 | )% | 19.47 | % | 22.90 | % | ||||
| Ratios to average net assetsf | ||||||||||||
| Expenses before waiver and payments by affiliates | 0.61 | % | 0.67 | % | 0.68 | % | 0.71 | % | ||||
| Expenses net of waiver and payments by affiliates. | 0.55 | %g | 0.66 | % | 0.68 | %h | 0.71 | %g,h | ||||
| Net investment income (loss) | (0.03 | )% | (0.14 | )% | (0.09 | )% | (0.24 | )% | ||||
| Supplemental data | ||||||||||||
| Net assets, end of period (000’s) | $ | 388,261 | $ | 235,620 | $ | 246,911 | $ | 180,843 | ||||
| Portfolio turnover rate. | 23.98 | % | 25.56 | % | 40.64 | % | 36.64 | % | ||||
aFor the year May 1, 2013 (effective date) to April 30, 2014.
bThe amount shown for a share outstanding throughout the period may not correlate with the Statement of Operations for the period due to the timing of sales and
repurchases of the Fund’s shares in relation to income earned and/or fluctuating fair value of the investments of the Fund.
cBased on average daily shares outstanding.
dAmount rounds to less than $0.01 per share.
eTotal return is not annualized for periods less than one year.
fRatios are annualized for periods less than one year, except for non-recurring expenses, if any.
gBenefit of expense reduction rounds to less than 0.01%.
hBenefit of waiver and payments by affiliates rounds to less than 0.01%.
38 Semiannual Report | The accompanying notes are an integral part of these financial statements. franklintempleton.com
| FRANKLIN STRATEGIC SERIES | ||||||||||||||||||
| FINANCIAL HIGHLIGHTS | ||||||||||||||||||
| Franklin Growth Opportunities Fund (continued) | ||||||||||||||||||
| Six Months Ended | ||||||||||||||||||
| October 31, 2016 | Year Ended April 30, | |||||||||||||||||
| (unaudited) | 2016 | 2015 | 2014 | 2013 | 2012 | |||||||||||||
| Advisor Class | ||||||||||||||||||
| Per share operating performance | ||||||||||||||||||
| (for a share outstanding throughout the period) | ||||||||||||||||||
| Net asset value, beginning of period | $ | 32.20 | $ | 34.96 | $ | 29.93 | $ | 25.43 | $ | 23.99 | $ | 25.16 | ||||||
| Income from investment operationsa: | ||||||||||||||||||
| Net investment income (loss)b | (0.04 | ) | (0.11 | ) | (0.10 | ) | (0.13 | ) | (0.06 | ) | (0.10 | ) | ||||||
| Net realized and unrealized gains (losses) | 1.17 | (1.99 | ) | 5.79 | 5.36 | 2.06 | 0.43 | |||||||||||
| Total from investment operations | 1.13 | (2.10 | ) | 5.69 | 5.23 | 2.00 | 0.33 | |||||||||||
| Less distributions from net realized gains. | — | (0.66 | ) | (0.66 | ) | (0.73 | ) | (0.56 | ) | (1.50 | ) | |||||||
| Net asset value, end of period | $ | 33.33 | $ | 32.20 | $ | 34.96 | $ | 29.93 | $ | 25.43 | $ | 23.99 | ||||||
| Total returnc | 3.51 | % | (6.11 | )% | 19.23 | % | 20.58 | % | 8.62 | % | 2.20 | % | ||||||
| Ratios to average net assetsd | ||||||||||||||||||
| Expenses before waiver and payments by | ||||||||||||||||||
| affiliates | 0.81 | % | 0.85 | % | 0.88 | % | 0.87 | % | 0.97 | % | 0.99 | % | ||||||
| Expenses net of waiver and payments by | ||||||||||||||||||
| affiliates | 0.75 | %e | 0.84 | % | 0.88 | %f | 0.87 | %e,f | 0.97 | % | 0.99 | % | ||||||
| Net investment income (loss) | (0.23 | )% | (0.32 | )% | (0.29 | )% | (0.40 | )% | (0.28 | )% | (0.42 | )% | ||||||
| Supplemental data | ||||||||||||||||||
| Net assets, end of period (000’s) | $ | 472,698 | $ | 256,377 | $ | 269,887 | $ | 224,469 | $ | 182,954 | $ | 154,708 | ||||||
| Portfolio turnover rate | 23.98 | % | 25.56 | % | 40.64 | % | 36.64 | % | 58.76 | % | 63.57 | % | ||||||
aThe amount shown for a share outstanding throughout the period may not correlate with the Statement of Operations for the period due to the timing of sales and
repurchases of the Fund’s shares in relation to income earned and/or fluctuating fair value of the investments of the Fund.
bBased on average daily shares outstanding.
cTotal return is not annualized for periods less than one year.
dRatios are annualized for periods less than one year, except for non-recurring expenses, if any.
eBenefit of expense reduction rounds to less than 0.01%.
fBenefit of waiver and payments by affiliates rounds to less than 0.01%.
franklintempleton.com The accompanying notes are an integral part of these financial statements. | Semiannual Report 39
| FRANKLIN STRATEGIC SERIES | ||||
| Statement of Investments, October 31, 2016 (unaudited) | ||||
| Franklin Growth Opportunities Fund | ||||
| Country | Shares | Value | ||
| Common Stocks 99.3% | ||||
| Consumer Discretionary 13.9% | ||||
| Advance Auto Parts Inc | United States | 100,000 | $ | 14,008,000 |
| a Amazon.com Inc | United States | 204,313 | 161,370,494 | |
| a Charter Communications Inc., A | United States | 167,006 | 41,733,129 | |
| Delphi Automotive PLC | United Kingdom | 84,409 | 5,492,494 | |
| a Global Eagle Entertainment Inc | United States | 750,000 | 6,037,500 | |
| Newell Brands Inc | United States | 694,891 | 33,368,666 | |
| NIKE Inc., B | United States | 1,070,525 | 53,718,944 | |
| a The Priceline Group Inc | United States | 32,189 | 47,453,989 | |
| Starbucks Corp | United States | 1,138,965 | 60,444,873 | |
| a TRI Pointe Group Inc | United States | 2,180,097 | 23,610,450 | |
| The Walt Disney Co | United States | 542,444 | 50,279,134 | |
| 497,517,673 | ||||
| Consumer Staples 6.0% | ||||
| Constellation Brands Inc., A | United States | 564,411 | 94,324,366 | |
| a Monster Beverage Corp | United States | 493,711 | 71,262,246 | |
| Pinnacle Foods Inc | United States | 558,433 | 28,714,625 | |
| a Post Holdings Inc | United States | 69,522 | 5,299,662 | |
| Reynolds American Inc | United States | 291,608 | 16,061,769 | |
| 215,662,668 | ||||
| Energy 1.3% | ||||
| Anadarko Petroleum Corp | United States | 218,719 | 13,000,657 | |
| Cabot Oil & Gas Corp., A | United States | 541,758 | 11,311,907 | |
| a Diamondback Energy Inc | United States | 119,768 | 10,933,621 | |
| Halliburton Co | United States | 268,183 | 12,336,418 | |
| 47,582,603 | ||||
| Financials 6.1% | ||||
| a Affiliated Managers Group Inc | United States | 191,214 | 25,366,449 | |
| BlackRock Inc | United States | 28,068 | 9,577,924 | |
| The Charles Schwab Corp | United States | 574,617 | 18,215,359 | |
| Intercontinental Exchange Inc | United States | 150,000 | 40,558,500 | |
| MarketAxess Holdings Inc | United States | 115,423 | 17,401,172 | |
| Moody’s Corp | United States | 341,920 | 34,369,799 | |
| a PRA Group Inc | United States | 350,000 | 11,165,000 | |
| a Signature Bank | United States | 315,722 | 38,063,444 | |
| a SVB Financial Group. | United States | 190,000 | 23,231,300 | |
| 217,948,947 | ||||
| Health Care 14.5% | ||||
| a,b Acerta Pharma BV | Netherlands | 35,601,435 | 1,970,682 | |
| a Allergan PLC | United States | 276,321 | 57,734,510 | |
| a Biogen Inc | United States | 160,478 | 44,962,726 | |
| a Celgene Corp | United States | 1,125,064 | 114,959,040 | |
| a DexCom Inc | United States | 210,000 | 16,430,400 | |
| a Edwards Lifesciences Corp | United States | 551,778 | 52,540,301 | |
| Eli Lilly & Co | United States | 231,174 | 17,069,888 | |
| a Envision Healthcare Holdings Inc | United States | 764,657 | 15,124,916 | |
| Gilead Sciences Inc | United States | 239,056 | 17,601,693 | |
| a,c Heron Therapeutics Inc | United States | 339,319 | 5,038,887 | |
| a Illumina Inc | United States | 136,188 | 18,540,634 | |
| a Incyte Corp | United States | 209,925 | 18,257,177 | |
| McKesson Corp | United States | 225,608 | 28,690,569 | |
40 Semiannual Report
franklintempleton.com
FRANKLIN STRATEGIC SERIES
STATEMENT OF INVESTMENTS (UNAUDITED)
| Franklin Growth Opportunities Fund (continued) | ||||
| Country | Shares | Value | ||
| Common Stocks (continued) | ||||
| Health Care (continued) | ||||
| Medtronic PLC | United States | 443,048 | $ | 36,338,797 |
| a Nevro Corp | United States | 232,249 | 21,348,328 | |
| a Regeneron Pharmaceuticals Inc | United States | 56,001 | 19,321,465 | |
| a,c Revance Therapeutics Inc | United States | 250,000 | 3,337,500 | |
| a Tesaro Inc | United States | 256,863 | 31,049,600 | |
| 520,317,113 | ||||
| Industrials 4.5% | ||||
| Allegiant Travel Co | United States | 47,532 | 6,554,663 | |
| Fortune Brands Home & Security Inc | United States | 327,452 | 17,888,703 | |
| General Electric Co | United States | 631,183 | 18,367,425 | |
| Honeywell International Inc | United States | 200,000 | 21,936,000 | |
| a IHS Markit Ltd | United States | 1,152,131 | 42,386,899 | |
| Raytheon Co | United States | 268,990 | 36,746,724 | |
| Roper Technologies Inc | United States | 104,343 | 18,083,685 | |
| 161,964,099 | ||||
| Information Technology 45.5% | ||||
| a Adobe Systems Inc | United States | 338,815 | 36,426,001 | |
| a Alibaba Group Holding Ltd., ADR | China | 175,969 | 17,894,288 | |
| a Alphabet Inc., A | United States | 46,341 | 37,531,576 | |
| a Alphabet Inc., C | United States | 165,660 | 129,966,896 | |
| Apple Inc | United States | 1,316,732 | 149,501,751 | |
| Broadcom Ltd | Singapore | 290,633 | 49,488,987 | |
| a BroadSoft Inc | United States | 139,852 | 5,810,851 | |
| a Cavium Inc | United States | 250,000 | 14,112,500 | |
| a CoStar Group Inc | United States | 149,698 | 28,011,490 | |
| a Electronic Arts Inc | United States | 433,672 | 34,051,925 | |
| a Ellie Mae Inc | United States | 150,000 | 15,883,500 | |
| a EPAM Systems Inc | United States | 300,000 | 19,311,000 | |
| a Facebook Inc., A. | United States | 1,586,182 | 207,773,980 | |
| a Fiserv Inc | United States | 128,421 | 12,646,900 | |
| a FleetCor Technologies Inc | United States | 218,235 | 38,256,596 | |
| a MACOM Technology Solutions Holdings Inc | United States | 188,896 | 6,943,817 | |
| Mastercard Inc., A | United States | 1,335,534 | 142,928,849 | |
| Microsoft Corp | United States | 1,637,344 | 98,109,653 | |
| a Mobileye NV | Israel | 506,302 | 18,824,308 | |
| a Nanometrics Inc | United States | 500,000 | 10,445,000 | |
| a,c Nutanix Inc., A | United States | 78,000 | 1,911,000 | |
| NVIDIA Corp | United States | 386,790 | 27,523,976 | |
| a NXP Semiconductors NV. | Netherlands | 1,091,600 | 109,160,000 | |
| a Palo Alto Networks Inc | United States | 374,170 | 57,558,571 | |
| a Paylocity Holding Corp | United States | 800,000 | 34,792,000 | |
| a Salesforce.com Inc | United States | 796,394 | 59,856,973 | |
| a ServiceNow Inc | United States | 639,646 | 56,231,280 | |
| a Splunk Inc | United States | 161,505 | 9,720,986 | |
| a Tyler Technologies Inc | United States | 380,250 | 60,992,100 | |
| a ViaSat Inc | United States | 110,543 | 7,810,968 | |
| Visa Inc., A | United States | 1,332,157 | 109,916,274 | |
| a Zendesk Inc | United States | 950,000 | 24,975,500 | |
| 1,634,369,496 | ||||
franklintempleton.com
Semiannual Report 41
FRANKLIN STRATEGIC SERIES
STATEMENT OF INVESTMENTS (UNAUDITED)
| Franklin Growth Opportunities Fund (continued) | |||||
| Country | Shares | Value | |||
| Common Stocks (continued) | |||||
| Materials 2.3% | |||||
| a Axalta Coating Systems Ltd | United States | 432,712 | $ | 10,869,726 | |
| Ecolab Inc | United States | 391,302 | 44,674,949 | ||
| Martin Marietta Materials Inc | United States | 154,153 | 28,576,883 | ||
| 84,121,558 | |||||
| Real Estate 3.1% | |||||
| American Tower Corp | United States | 481,991 | 56,484,525 | ||
| Equinix Inc | United States | 155,869 | 55,688,877 | ||
| 112,173,402 | |||||
| Telecommunication Services 2.1% | |||||
| a SBA Communications Corp | United States | 492,907 | 55,836,505 | ||
| a T-Mobile U.S. Inc | United States | 391,436 | 19,466,112 | ||
| 75,302,617 | |||||
| Total Common Stocks (Cost $2,359,091,029) | 3,566,960,176 | ||||
| Preferred Stocks 0.4% | |||||
| Consumer Discretionary 0.3% | |||||
| a,b Proterra Inc., pfd., 5, 144A | United States | 2,052,448 | 10,336,621 | ||
| Information Technology 0.1% | |||||
| a,b Tanium Inc., pfd., G. | United States | 805,800 | 2,865,962 | ||
| Total Preferred Stocks (Cost $14,336,854) | 13,202,583 | ||||
| Total Investments before Short Term Investments | |||||
| (Cost $2,373,427,883) | 3,580,162,759 | ||||
| Short Term Investments 1.1% | |||||
| Money Market Funds (Cost $18,804,299) 0.5% | |||||
| a,d Institutional Fiduciary Trust Money Market Portfolio. | United States | 18,804,299 | 18,804,299 | ||
| e Investments from Cash Collateral Received for Loaned | |||||
| Securities (Cost $19,959,725) 0.6% | |||||
| Money Market Funds 0.6% | |||||
| a,d Institutional Fiduciary Trust Money Market Portfolio. | United States | 19,959,725 | 19,959,725 | ||
| Total Investments (Cost $2,412,191,907) 100.8% | 3,618,926,783 | ||||
| Other Assets, less Liabilities (0.8)% | (26,942,768 | ) | |||
| Net Assets 100.0% | $ | 3,591,984,015 | |||
aNon-income producing.
bSee Note 7 regarding restricted securities.
cA portion or all of the security is on loan at October 31, 2016. See Note 1(c).
dSee Note 3(f) regarding investments in affiliated management investment companies.
eSee Note 1(c) regarding securities on loan.
42 Semiannual Report | The accompanying notes are an integral part of these financial statements. franklintempleton.com
FRANKLIN STRATEGIC SERIES
| Financial Highlights | ||||||||||||||||||
| Franklin Small Cap Growth Fund | ||||||||||||||||||
| Six Months Ended | ||||||||||||||||||
| October 31, 2016 | Year Ended April 30, | |||||||||||||||||
| (unaudited) | 2016 | 2015 | 2014 | 2013 | 2012 | |||||||||||||
| Class A | ||||||||||||||||||
| Per share operating performance | ||||||||||||||||||
| (for a share outstanding throughout the period) | ||||||||||||||||||
| Net asset value, beginning of period | $ | 16.37 | $ | 18.83 | $ | 18.20 | $ | 14.26 | $ | 12.84 | $ | 13.02 | ||||||
| Income from investment operationsa: | ||||||||||||||||||
| Net investment income (loss)b | (0.05 | ) | (0.08 | ) | (0.12 | ) | (0.15 | ) | (0.09 | ) | (0.07 | ) | ||||||
| Net realized and unrealized gains (losses) | 1.12 | (2.03 | ) | 1.57 | 4.75 | 1.87 | (0.11 | ) | ||||||||||
| Total from investment operations | 1.07 | (2.11 | ) | 1.45 | 4.60 | 1.78 | (0.18 | ) | ||||||||||
| Less distributions from net realized gains. | — | (0.35 | ) | (0.82 | ) | (0.66 | ) | (0.36 | ) | — | ||||||||
| Net asset value, end of period | $ | 17.44 | $ | 16.37 | $ | 18.83 | $ | 18.20 | $ | 14.26 | $ | 12.84 | ||||||
| Total returnc | 6.54 | % | (11.28 | )% | 8.34 | % | 32.40 | % | 14.35 | % | (1.38 | )% | ||||||
| Ratios to average net assetsd | ||||||||||||||||||
| Expenses before waiver and payments by | ||||||||||||||||||
| affiliates | 1.16 | % | 1.13 | % | 1.16 | % | 1.20 | % | 1.33 | % | 1.37 | % | ||||||
| Expenses net of waiver and payments by | ||||||||||||||||||
| affiliates | 1.14 | %e | 1.11 | %e | 1.16 | %f | 1.20 | %f | 1.33 | % | 1.37 | % | ||||||
| Net investment income (loss) | (0.60 | )% | (0.44 | )% | (0.66 | )% | (0.85 | )% | (0.68 | )% | (0.60 | )% | ||||||
| Supplemental data | ||||||||||||||||||
| Net assets, end of period (000’s) | $ | 732,318 | $ | 792,072 | $ | 1,164,218 | $ | 851,317 | $ | 327,882 | $ | 244,570 | ||||||
| Portfolio turnover rate | 15.45 | % | 43.99 | % | 30.15 | % | 40.35 | % | 41.02 | % | 50.08 | % | ||||||
aThe amount shown for a share outstanding throughout the period may not correlate with the Statement of Operations for the period due to the timing of sales and
repurchases of the Fund’s shares in relation to income earned and/or fluctuating fair value of the investments of the Fund.
bBased on average daily shares outstanding.
cTotal return does not reflect sales commissions or contingent deferred sales charges, if applicable, and is not annualized for periods less than one year.
dRatios are annualized for periods less than one year.
eBenefit of expense reduction rounds to less than 0.01%.
fBenefit of waiver and payments by affiliates and expense reduction rounds to less than 0.01%.
franklintempleton.com The accompanying notes are an integral part of these financial statements. | Semiannual Report 43
| FRANKLIN STRATEGIC SERIES | ||||||||||||||||||
| FINANCIAL HIGHLIGHTS | ||||||||||||||||||
| Franklin Small Cap Growth Fund (continued) | ||||||||||||||||||
| Six Months Ended | ||||||||||||||||||
| October 31, 2016 | Year Ended April 30, | |||||||||||||||||
| (unaudited) | 2016 | 2015 | 2014 | 2013 | 2012 | |||||||||||||
| Class C | ||||||||||||||||||
| Per share operating performance | ||||||||||||||||||
| (for a share outstanding throughout the period) | ||||||||||||||||||
| Net asset value, beginning of period | $ | 14.07 | $ | 16.36 | $ | 16.03 | $ | 12.70 | $ | 11.57 | $ | 11.80 | ||||||
| Income from investment operationsa: | ||||||||||||||||||
| Net investment income (loss)b | (0.10 | ) | (0.18 | ) | (0.22 | ) | (0.24 | ) | (0.16 | ) | (0.14 | ) | ||||||
| Net realized and unrealized gains (losses) | 0.96 | (1.76 | ) | 1.37 | 4.23 | 1.65 | (0.09 | ) | ||||||||||
| Total from investment operations | 0.86 | (1.94 | ) | 1.15 | 3.99 | 1.49 | (0.23 | ) | ||||||||||
| Less distributions from net realized gains. | — | (0.35 | ) | (0.82 | ) | (0.66 | ) | (0.36 | ) | — | ||||||||
| Net asset value, end of period | $ | 14.93 | $ | 14.07 | $ | 16.36 | $ | 16.03 | $ | 12.70 | $ | 11.57 | ||||||
| Total returnc | 6.11 | % | (11.95 | )% | 7.58 | % | 31.57 | % | 13.41 | % | (1.95 | )% | ||||||
| Ratios to average net assetsd | ||||||||||||||||||
| Expenses before waiver and payments by | ||||||||||||||||||
| affiliates | 1.91 | % | 1.88 | % | 1.87 | % | 1.90 | % | 2.03 | % | 2.07 | % | ||||||
| Expenses net of waiver and payments by | ||||||||||||||||||
| affiliates | 1.89 | %e | 1.86 | %e | 1.87 | %f | 1.90 | %f | 2.03 | % | 2.07 | % | ||||||
| Net investment income (loss) | (1.35 | )% | (1.19 | )% | (1.37 | )% | (1.55 | )% | (1.38 | )% | (1.30 | )% | ||||||
| Supplemental data | ||||||||||||||||||
| Net assets, end of period (000’s) | $ | 143,908 | $ | 157,175 | $ | 225,105 | $ | 187,271 | $ | 77,644 | $ | 67,212 | ||||||
| Portfolio turnover rate | 15.45 | % | 43.99 | % | 30.15 | % | 40.35 | % | 41.02 | % | 50.08 | % | ||||||
aThe amount shown for a share outstanding throughout the period may not correlate with the Statement of Operations for the period due to the timing of sales and
repurchases of the Fund’s shares in relation to income earned and/or fluctuating fair value of the investments of the Fund.
bBased on average daily shares outstanding.
cTotal return does not reflect sales commissions or contingent deferred sales charges, if applicable, and is not annualized for periods less than one year.
dRatios are annualized for periods less than one year.
eBenefit of expense reduction rounds to less than 0.01%.
fBenefit of waiver and payments by affiliates and expense reduction rounds to less than 0.01%.
44 Semiannual Report | The accompanying notes are an integral part of these financial statements. franklintempleton.com
| FRANKLIN STRATEGIC SERIES | ||||||||||||||||||
| FINANCIAL HIGHLIGHTS | ||||||||||||||||||
| Franklin Small Cap Growth Fund (continued) | ||||||||||||||||||
| Six Months Ended | ||||||||||||||||||
| October 31, 2016 | Year Ended April 30, | |||||||||||||||||
| (unaudited) | 2016 | 2015 | 2014 | 2013 | 2012 | |||||||||||||
| Class R | ||||||||||||||||||
| Per share operating performance | ||||||||||||||||||
| (for a share outstanding throughout the period) | ||||||||||||||||||
| Net asset value, beginning of period | $ | 15.70 | $ | 18.11 | $ | 17.57 | $ | 13.81 | $ | 12.48 | $ | 12.67 | ||||||
| Income from investment operationsa: | ||||||||||||||||||
| Net investment income (loss)b | (0.07 | ) | (0.12 | ) | (0.16 | ) | (0.18 | ) | (0.11 | ) | (0.09 | ) | ||||||
| Net realized and unrealized gains (losses) | 1.07 | (1.94 | ) | 1.52 | 4.60 | 1.80 | (0.10 | ) | ||||||||||
| Total from investment operations | 1.00 | (2.06 | ) | 1.36 | 4.42 | 1.69 | (0.19 | ) | ||||||||||
| Less distributions from net realized gains. | — | (0.35 | ) | (0.82 | ) | (0.66 | ) | (0.36 | ) | — | ||||||||
| Net asset value, end of period | $ | 16.70 | $ | 15.70 | $ | 18.11 | $ | 17.57 | $ | 13.81 | $ | 12.48 | ||||||
| Total returnc | 6.37 | % | (11.46 | )% | 8.12 | % | 32.15 | % | 14.04 | % | (1.50 | )% | ||||||
| Ratios to average net assetsd | ||||||||||||||||||
| Expenses before waiver and payments by | ||||||||||||||||||
| affiliates | 1.41 | % | 1.38 | % | 1.37 | % | 1.40 | % | 1.53 | % | 1.57 | % | ||||||
| Expenses net of waiver and payments by | ||||||||||||||||||
| affiliates | 1.39 | %e | 1.36 | %e | 1.37 | %f | 1.40 | %f | 1.53 | % | 1.57 | % | ||||||
| Net investment income (loss) | (0.85 | )% | (0.69 | )% | (0.87 | )% | (1.05 | )% | (0.88 | )% | (0.80 | )% | ||||||
| Supplemental data | ||||||||||||||||||
| Net assets, end of period (000’s) | $ | 75,692 | $ | 79,929 | $ | 92,455 | $ | 51,190 | $ | 15,783 | $ | 8,489 | ||||||
| Portfolio turnover rate | 15.45 | % | 43.99 | % | �� | 30.15 | % | 40.35 | % | 41.02 | % | 50.08 | % | |||||
aThe amount shown for a share outstanding throughout the period may not correlate with the Statement of Operations for the period due to the timing of sales and
repurchases of the Fund’s shares in relation to income earned and/or fluctuating fair value of the investments of the Fund.
bBased on average daily shares outstanding.
cTotal return is not annualized for periods less than one year.
dRatios are annualized for periods less than one year.
eBenefit of expense reduction rounds to less than 0.01%.
fBenefit of waiver and payments by affiliates and expense reduction rounds to less than 0.01%.
franklintempleton.com The accompanying notes are an integral part of these financial statements. | Semiannual Report 45
| FRANKLIN STRATEGIC SERIES | ||||||||||||
| FINANCIAL HIGHLIGHTS | ||||||||||||
| Franklin Small Cap Growth Fund (continued) | ||||||||||||
| Six Months Ended | ||||||||||||
| October 31, 2016 | Year Ended April 30, | |||||||||||
| (unaudited) | 2016 | 2015 | 2014 | a | ||||||||
| Class R6 | ||||||||||||
| Per share operating performance | ||||||||||||
| (for a share outstanding throughout the period) | ||||||||||||
| Net asset value, beginning of period | $ | 17.52 | $ | 20.02 | $ | 19.21 | $ | 14.64 | ||||
| Income from investment operationsb: | ||||||||||||
| Net investment income (loss)c | (0.01 | ) | 0.01 | (0.03 | ) | (0.06 | ) | |||||
| Net realized and unrealized gains (losses) | 1.20 | (2.16 | ) | 1.66 | 5.29 | |||||||
| Total from investment operations | 1.19 | (2.15 | ) | 1.63 | 5.23 | |||||||
| Less distributions from net realized gains | — | (0.35 | ) | (0.82 | ) | (0.66 | ) | |||||
| Net asset value, end of period | $ | 18.71 | $ | 17.52 | $ | 20.02 | $ | 19.21 | ||||
| Total returnd | 6.79 | % | (10.81 | )% | 8.91 | % | 35.80 | % | ||||
| Ratios to average net assetse | ||||||||||||
| Expenses before waiver and payments by affiliates | 0.65 | % | 0.63 | % | 0.66 | % | 0.72 | % | ||||
| Expenses net of waiver and payments by affiliates. | 0.63 | %f | 0.61 | %f | 0.66 | %g | 0.72 | %g | ||||
| Net investment income (loss) | (0.09 | )% | 0.06 | % | (0.16 | )% | (0.37 | )% | ||||
| Supplemental data | ||||||||||||
| Net assets, end of period (000’s) | $ | 906,333 | $ | 846,724 | $ | 844,293 | $ | 87,777 | ||||
| Portfolio turnover rate. | 15.45 | % | 43.99 | % | 30.15 | % | 40.35 | % | ||||
aFor the year May 1, 2013 (effective date) to April 30, 2014.
bThe amount shown for a share outstanding throughout the period may not correlate with the Statement of Operations for the period due to the timing of sales and
repurchases of the Fund’s shares in relation to income earned and/or fluctuating fair value of the investments of the Fund.
cBased on average daily shares outstanding.
dTotal return is not annualized for periods less than one year.
eRatios are annualized for periods less than one year.
fBenefit of expense reduction rounds to less than 0.01%.
gBenefit of waiver and payments by affiliates and expense reduction rounds to less than 0.01%.
46 Semiannual Report | The accompanying notes are an integral part of these financial statements. franklintempleton.com
| FRANKLIN STRATEGIC SERIES | ||||||||||||||||||
| FINANCIAL HIGHLIGHTS | ||||||||||||||||||
| Franklin Small Cap Growth Fund (continued) | ||||||||||||||||||
| Six Months Ended | ||||||||||||||||||
| October 31, 2016 | Year Ended April 30, | |||||||||||||||||
| (unaudited) | 2016 | 2015 | 2014 | 2013 | 2012 | |||||||||||||
| Advisor Class | ||||||||||||||||||
| Per share operating performance | ||||||||||||||||||
| (for a share outstanding throughout the period) | ||||||||||||||||||
| Net asset value, beginning of period | $ | 17.41 | $ | 19.94 | $ | 19.17 | $ | 14.94 | $ | 13.41 | $ | 13.55 | ||||||
| Income from investment operationsa: | ||||||||||||||||||
| Net investment income (loss)b | (0.03 | ) | (0.04 | ) | (0.07 | ) | (0.11 | ) | (0.05 | ) | (0.04 | ) | ||||||
| Net realized and unrealized gains (losses) | 1.19 | (2.14 | ) | 1.66 | 5.00 | 1.94 | (0.10 | ) | ||||||||||
| Total from investment operations | 1.16 | (2.18 | ) | 1.59 | 4.89 | 1.89 | (0.14 | ) | ||||||||||
| Less distributions from net realized gains. | — | (0.35 | ) | (0.82 | ) | (0.66 | ) | (0.36 | ) | — | ||||||||
| Net asset value, end of period | $ | 18.57 | $ | 17.41 | $ | 19.94 | $ | 19.17 | $ | 14.94 | $ | 13.41 | ||||||
| Total returnc | 6.66 | % | (11.06 | )% | 8.65 | % | 32.87 | % | 14.56 | % | (1.03 | )% | ||||||
| Ratios to average net assetsd | ||||||||||||||||||
| Expenses before waiver and payments by | ||||||||||||||||||
| affiliates | 0.91 | % | 0.88 | % | 0.87 | % | 0.90 | % | 1.03 | % | 1.07 | % | ||||||
| Expenses net of waiver and payments by | ||||||||||||||||||
| affiliates | 0.89 | %e | 0.86 | %e | 0.87 | %f | 0.90 | %f | 1.03 | % | 1.07 | % | ||||||
| Net investment income (loss) | (0.35 | )% | (0.19 | )% | (0.37 | )% | (0.55 | )% | (0.38 | )% | (0.30 | )% | ||||||
| Supplemental data | ||||||||||||||||||
| Net assets, end of period (000’s) | $ | 784,731 | $ | 850,975 | $ | 1,077,822 | $ | 427,406 | $ | 91,687 | $ | 49,159 | ||||||
| Portfolio turnover rate | 15.45 | % | 43.99 | % | 30.15 | % | 40.35 | % | 41.02 | % | 50.08 | % | ||||||
aThe amount shown for a share outstanding throughout the period may not correlate with the Statement of Operations for the period due to the timing of sales and
repurchases of the Fund’s shares in relation to income earned and/or fluctuating fair value of the investments of the Fund.
bBased on average daily shares outstanding.
cTotal return is not annualized for periods less than one year.
dRatios are annualized for periods less than one year.
eBenefit of expense reduction rounds to less than 0.01%.
fBenefit of waiver and payments by affiliates and expense reduction rounds to less than 0.01%.
franklintempleton.com The accompanying notes are an integral part of these financial statements. | Semiannual Report 47
FRANKLIN STRATEGIC SERIES
Statement of Investments, October 31, 2016 (unaudited)
Franklin Small Cap Growth Fund
| Shares | Value | ||
| Common Stocks 97.1% | |||
| Consumer Discretionary 17.3% | |||
| a At Home Group Inc | 1,059,500 | $ | 11,866,400 |
| a,b Boot Barn Holdings Inc | 1,067,239 | 13,660,659 | |
| a Buffalo Wild Wings Inc | 204,800 | 29,829,120 | |
| a,b Duluth Holdings Inc | 369,661 | 10,036,296 | |
| a Five Below Inc | 513,200 | 19,286,056 | |
| a Global Eagle Entertainment Inc | 2,049,456 | 16,498,121 | |
| a Grand Canyon Education Inc | 1,014,700 | 44,281,508 | |
| a The Habit Restaurants Inc., A | 1,218,700 | 17,244,605 | |
| a IMAX Corp | 983,600 | 29,753,900 | |
| KB Home | 1,716,700 | 24,960,818 | |
| Lithia Motors Inc | 258,000 | 22,131,240 | |
| a,c M/I Homes Inc | 1,385,700 | 29,806,407 | |
| a,b Nord Anglia Education Inc. (Hong Kong) | 874,936 | 18,846,122 | |
| a Shutterfly Inc | 461,300 | 22,603,700 | |
| a,c Sportsman’s Warehouse Holdings Inc | 3,295,000 | 30,314,000 | |
| a Tenneco Inc | 492,900 | 27,144,003 | |
| a Tile Shop Holdings Inc | 1,828,400 | 30,991,380 | |
| Wingstop Inc | 882,429 | 23,613,800 | |
| Wolverine World Wide Inc | 769,200 | 16,422,420 | |
| a Zoe’s Kitchen Inc | 735,200 | 16,666,984 | |
| 455,957,539 | |||
| Consumer Staples 2.8% | |||
| a,b Smart & Final Stores Inc | 2,439,100 | 29,269,200 | |
| a TreeHouse Foods Inc | 517,800 | 45,297,144 | |
| 74,566,344 | |||
| Energy 2.2% | |||
| a Callon Petroleum Co | 462,782 | 6,011,538 | |
| a Matador Resources Co | 1,410,939 | 30,772,580 | |
| Superior Energy Services Inc | 1,139,600 | 16,136,736 | |
| a Synergy Resources Corp | 946,100 | 6,471,324 | |
| 59,392,178 | |||
| Financials 6.0% | |||
| Chemical Financial Corp | 532,723 | 22,880,453 | |
| Evercore Partners Inc | 447,500 | 24,053,125 | |
| Houlihan Lokey Inc | 827,300 | 20,161,301 | |
| Kinsale Capital Group Inc | 218,600 | 5,257,330 | |
| Pinnacle Financial Partners Inc | 505,404 | 26,078,846 | |
| a PRA Group Inc | 941,500 | 30,033,850 | |
| a Western Alliance Bancorp | 799,300 | 29,861,848 | |
| 158,326,753 | |||
| Health Care 19.2% | |||
| a,b Aclaris Therapeutics Inc | 494,516 | 10,508,465 | |
| a,b Adeptus Health Inc., A | 1,000,600 | 30,138,072 | |
| a American Renal Associates Holdings Inc | 971,400 | 17,154,924 | |
| a,c Aratana Therapeutics Inc | 2,697,019 | 21,845,854 | |
| a Array BioPharma Inc | 1,365,900 | 7,785,630 | |
| a AveXis Inc | 338,400 | 16,074,000 | |
| a Celldex Therapeutics Inc | 1,719,100 | 5,415,165 | |
| a,b Collegium Pharmaceutical Inc | 806,200 | 12,068,814 | |
| a,b ConforMIS Inc | 911,600 | 6,955,508 | |
48 Semiannual Report
franklintempleton.com
FRANKLIN STRATEGIC SERIES
STATEMENT OF INVESTMENTS (UNAUDITED)
| Franklin Small Cap Growth Fund (continued) | |||
| Shares | Value | ||
| Common Stocks (continued) | |||
| Health Care (continued) | |||
| a,b Corium International Inc | 760,450 | $ | 3,612,138 |
| a DexCom Inc | 296,200 | 23,174,688 | |
| a Edge Therapeutics Inc | 583,400 | 6,108,198 | |
| a Foamix Pharmaceuticals Ltd. (Israel) | 457,580 | 3,637,761 | |
| a Halozyme Therapeutics Inc | 978,600 | 8,445,318 | |
| a HealthEquity Inc | 632,816 | 21,028,476 | |
| a,b Heron Therapeutics Inc | 1,127,593 | 16,744,756 | |
| a Impax Laboratories Inc | 1,272,100 | 25,569,210 | |
| a Integer Holdings Corp | 990,800 | 21,847,140 | |
| a iRhythm Technologies Inc | 339,400 | 8,468,030 | |
| a Karyopharm Therapeutics Inc | 1,373,386 | 9,943,315 | |
| a Lion Biotechnologies Inc | 1,169,400 | 7,308,750 | |
| a Neogen Corp | 537,900 | 28,341,951 | |
| a,b Neos Therapeutics Inc | 479,738 | 2,830,454 | |
| a Nevro Corp | 459,500 | 42,237,240 | |
| a Ophthotech Corp | 295,209 | 10,574,386 | |
| a PAREXEL International Corp | 449,100 | 26,164,566 | |
| a Patheon NV | 258,500 | 6,563,315 | |
| a,c Pfenex Inc | 1,175,631 | 9,416,804 | |
| a,b Revance Therapeutics Inc | 1,148,500 | 15,332,475 | |
| a Sage Therapeutics Inc | 389,900 | 16,976,246 | |
| a The Spectranetics Corp | 1,989,000 | 43,161,300 | |
| a Tandem Diabetes Care Inc | 1,136,600 | 6,876,430 | |
| a TherapeuticsMD Inc | 2,516,200 | 14,442,988 | |
| 506,752,367 | |||
| Industrials 18.5% | |||
| a The Advisory Board Co | 942,100 | 37,495,580 | |
| Allegiant Travel Co | 240,848 | 33,212,939 | |
| Altra Industrial Motion Corp | 884,100 | 26,080,950 | |
| Astronics Corp | 1,137,399 | 42,106,511 | |
| a Beacon Roofing Supply Inc | 706,800 | 29,713,872 | |
| Cubic Corp | 240,200 | 10,256,540 | |
| a DigitalGlobe Inc | 1,515,100 | 38,029,010 | |
| a Echo Global Logistics Inc | 292,725 | 6,205,770 | |
| a Huron Consulting Group Inc | 330,800 | 18,541,340 | |
| Interface Inc | 1,267,600 | 20,091,460 | |
| Kennametal Inc | 732,000 | 20,722,920 | |
| a,c The KEYW Holding Corp | 2,508,560 | 26,314,794 | |
| a Mercury Systems Inc | 1,089,500 | 30,266,310 | |
| Mobile Mini Inc | 1,041,800 | 26,409,630 | |
| a Spirit Airlines Inc | 717,200 | 34,375,396 | |
| Steelcase Inc., A | 1,482,323 | 19,789,012 | |
| a Univar Inc | 1,244,732 | 27,695,287 | |
| US Ecology Inc | 959,690 | 40,546,903 | |
| 487,854,224 | |||
| Information Technology 28.3% | |||
| a,c 2U Inc | 2,383,252 | 83,080,165 | |
| a Alarm.com Holdings Inc | 1,231,924 | 35,947,542 | |
| a Bazaarvoice Inc | 3,709,350 | 18,175,815 | |
| a Blackline Inc | 67,300 | 1,531,075 | |
| a Bottomline Technologies (de) Inc | 1,384,804 | 31,421,203 | |
franklintempleton.com
Semiannual Report 49
FRANKLIN STRATEGIC SERIES
STATEMENT OF INVESTMENTS (UNAUDITED)
| Franklin Small Cap Growth Fund (continued) | ||||
| Shares | Value | |||
| Common Stocks (continued) | ||||
| Information Technology (continued) | ||||
| a BroadSoft Inc | 705,674 | $ | 29,320,755 | |
| a Callidus Software Inc | 2,359,200 | 43,055,400 | ||
| a Cavium Inc | 662,400 | 37,392,480 | ||
| Cognex Corp | 252,800 | 13,044,480 | ||
| a Envestnet Inc | 1,043,522 | 36,888,502 | ||
| a FARO Technologies Inc | 277,400 | 9,306,770 | ||
| a Guidewire Software Inc | 585,900 | 33,659,955 | ||
| a Hubspot Inc | 514,629 | 26,992,291 | ||
| a Integrated Device Technology Inc | 1,863,200 | 38,586,872 | ||
| a Ixia | 1,529,600 | 18,278,720 | ||
| a,c Lattice Semiconductor Corp | 6,178,700 | 37,504,709 | ||
| a MACOM Technology Solutions Holdings Inc | 960,400 | 35,304,304 | ||
| a,c Nanometrics Inc | 1,411,800 | 29,492,502 | ||
| a Paylocity Holding Corp | 1,085,032 | 47,188,041 | ||
| a Proofpoint Inc | 364,600 | 28,577,348 | ||
| a Pure Storage Inc., A | 2,627,900 | 32,428,286 | ||
| a Q2 Holdings Inc | 222,187 | 6,243,455 | ||
| a Quantenna Communications Inc | 268,000 | 4,014,640 | ||
| a Shoretel Inc | 1,261,800 | 8,390,970 | ||
| a ViaSat Inc | 293,383 | 20,730,443 | ||
| a Zendesk Inc | 1,625,914 | 42,745,279 | ||
| 749,302,002 | ||||
| Materials 1.9% | ||||
| H.B. Fuller Co | 546,000 | 22,970,221 | ||
| a Ingevity Corp | 676,300 | 27,998,820 | ||
| 50,969,041 | ||||
| Real Estate 0.9% | ||||
| Coresite Realty Corp | 315,400 | 23,257,596 | ||
| Total Common Stocks (Cost $2,326,658,495) | 2,566,378,044 | |||
| Preferred Stocks 1.2% | ||||
| Consumer Discretionary 0.8% | ||||
| a,d DraftKings Inc., pfd., D | 825,201 | 3,401,127 | ||
| a,d DraftKings Inc., pfd., D-1 | 2,029,318 | 11,242,099 | ||
| a,d Proterra Inc., pfd., 5, 144A | 992,804 | 4,999,999 | ||
| 19,643,225 | ||||
| Information Technology 0.4% | ||||
| a,d Smule Inc., pfd., G, 144A | 1,542,673 | 11,099,995 | ||
| Total Preferred Stocks (Cost $36,099,991) | 30,743,220 | |||
| Principal | ||||
| Amount | ||||
| Convertible Bonds (Cost $6,200,000) 0.3% | ||||
| Consumer Discretionary 0.3% | ||||
| d DraftKings Inc., cvt., E, 5.00%, 12/23/16 | $ | 6,200,000 | 8,485,319 | |
| Total Investments before Short Term Investments (Cost $2,368,958,486) | 2,605,606,583 | |||
50 Semiannual Report
franklintempleton.com
FRANKLIN STRATEGIC SERIES
STATEMENT OF INVESTMENTS (UNAUDITED)
| Franklin Small Cap Growth Fund (continued) | ||||
| Shares | Value | |||
| Short Term Investments 4.6% | ||||
| Money Market Funds (Cost $53,368,082) 2.0% | ||||
| a,e Institutional Fiduciary Trust Money Market Portfolio | 53,368,082 | $ | 53,368,082 | |
| f Investments from Cash Collateral Received for Loaned Securities | ||||
| (Cost $69,579,325) 2.6% | ||||
| Money Market Funds 2.6% | ||||
| a,e Institutional Fiduciary Trust Money Market Portfolio | 69,579,325 | 69,579,325 | ||
| Total Investments (Cost $2,491,905,893) 103.2% | 2,728,553,990 | |||
| Other Assets, less Liabilities (3.2)% | (85,571,800 | ) | ||
| Net Assets 100.0% | $ | 2,642,982,190 |
aNon-income producing.
bA portion or all of the security is on loan at October 31, 2016. See Note 1(c).
cSee Note 8 regarding holdings of 5% voting securities.
dSee Note 7 regarding restricted securities.
eSee Note 3(f) regarding investments in affiliated management investment companies.
fSee Note 1(c) regarding securities on loan.
franklintempleton.com The accompanying notes are an integral part of these financial statements. | Semiannual Report 51
FRANKLIN STRATEGIC SERIES
| Financial Highlights | ||||||||||||||||||
| Franklin Small-Mid Cap Growth Fund | ||||||||||||||||||
| Six Months Ended | ||||||||||||||||||
| October 31, 2016 | Year Ended April 30, | |||||||||||||||||
| (unaudited) | 2016 | 2015 | 2014 | 2013 | 2012 | |||||||||||||
| Class A | ||||||||||||||||||
| Per share operating performance | ||||||||||||||||||
| (for a share outstanding throughout the period) | ||||||||||||||||||
| Net asset value, beginning of period | $ | 31.84 | $ | 38.38 | $ | 40.42 | $ | 38.01 | $ | 38.51 | $ | 41.47 | ||||||
| Income from investment operationsa: | ||||||||||||||||||
| Net investment income (loss)b | (0.07 | ) | (0.03 | )c | (0.14 | ) | (0.20 | ) | (0.10 | ) | (0.14 | ) | ||||||
| Net realized and unrealized gains (losses) | 1.10 | (3.37 | ) | 5.71 | 8.39 | 3.08 | (1.18 | ) | ||||||||||
| Total from investment operations | 1.03 | (3.40 | ) | 5.57 | 8.19 | 2.98 | (1.32 | ) | ||||||||||
| Less distributions from net realized gains. | — | (3.14 | ) | (7.61 | ) | (5.78 | ) | (3.48 | ) | (1.64 | ) | |||||||
| Net asset value, end of period | $ | 32.87 | $ | 31.84 | $ | 38.38 | $ | 40.42 | $ | 38.01 | $ | 38.51 | ||||||
| Total returnd | 3.23 | % | (9.02 | )% | 15.78 | % | 21.99 | % | 8.95 | % | (2.54 | )% | ||||||
| Ratios to average net assetse | ||||||||||||||||||
| Expenses before waiver and payments by | ||||||||||||||||||
| affiliates | 0.97 | % | 0.96 | % | 0.94 | % | 0.97 | % | 0.98 | % | 0.99 | % | ||||||
| Expenses net of waiver and payments by | ||||||||||||||||||
| affiliates | 0.96 | %f | 0.95 | %f | 0.94 | %g | 0.97 | %f,g | 0.98 | % | 0.99 | % | ||||||
| Net investment income (loss) | (0.39 | )% | (0.08 | )%c | (0.35 | )% | (0.48 | )% | (0.27 | )% | (0.38 | )% | ||||||
| Supplemental data | ||||||||||||||||||
| Net assets, end of period (000’s) | $ | 2,148,368 | $ | 2,231,822 | $ | 2,535,853 | $ | 2,371,448 | $ | 2,355,507 | $ | 2,492,205 | ||||||
| Portfolio turnover rate | 17.17 | % | 38.72 | % | 47.98 | % | 40.82 | % | 43.72 | % | 47.37 | % | ||||||
aThe amount shown for a share outstanding throughout the period may not correlate with the Statement of Operations for the period due to the timing of sales and
repurchases of the Fund’s shares in relation to income earned and/or fluctuating fair value of the investments of the Fund.
bBased on average daily shares outstanding.
cNet investment income per share includes approximately $0.11 per share related to income received in the form of special dividends in connection with certain Fund
holdings. Excluding this amount, the ratio of net investment income to average net assets would have been (0.38)%.
dTotal return does not reflect sales commissions or contingent deferred sales charges, if applicable, and is not annualized for periods less than one year.
eRatios are annualized for periods less than one year.
fBenefit of expense reduction rounds to less than 0.01%.
gBenefit of waiver and payments by affiliates rounds to less than 0.01%.
52 Semiannual Report | The accompanying notes are an integral part of these financial statements. franklintempleton.com
| FRANKLIN STRATEGIC SERIES | ||||||||||||||||||
| FINANCIAL HIGHLIGHTS | ||||||||||||||||||
| Franklin Small-Mid Cap Growth Fund (continued) | ||||||||||||||||||
| Six Months Ended | ||||||||||||||||||
| October 31, 2016 | Year Ended April 30, | |||||||||||||||||
| (unaudited) | 2016 | 2015 | 2014 | 2013 | 2012 | |||||||||||||
| Class C | ||||||||||||||||||
| Per share operating performance | ||||||||||||||||||
| (for a share outstanding throughout the period) | ||||||||||||||||||
| Net asset value, beginning of period | $ | 24.40 | $ | 30.43 | $ | 33.78 | $ | 32.80 | $ | 33.97 | $ | 37.10 | ||||||
| Income from investment operationsa: | ||||||||||||||||||
| Net investment income (loss)b | (0.15 | ) | (0.23 | )c | (0.36 | ) | (0.43 | ) | (0.32 | ) | (0.37 | ) | ||||||
| Net realized and unrealized gains (losses) | 0.84 | (2.66 | ) | 4.62 | 7.19 | 2.63 | (1.12 | ) | ||||||||||
| Total from investment operations | 0.69 | (2.89 | ) | 4.26 | 6.76 | 2.31 | (1.49 | ) | ||||||||||
| Less distributions from net realized gains. | — | (3.14 | ) | (7.61 | ) | (5.78 | ) | (3.48 | ) | (1.64 | ) | |||||||
| Net asset value, end of period | $ | 25.09 | $ | 24.40 | $ | 30.43 | $ | 33.78 | $ | 32.80 | $ | 33.97 | ||||||
| Total returnd | 2.83 | % | (9.72 | )% | 14.96 | % | 21.04 | % | 8.11 | % | (3.28 | )% | ||||||
| Ratios to average net assetse | ||||||||||||||||||
| Expenses before waiver and payments by | ||||||||||||||||||
| affiliates | 1.72 | % | 1.71 | % | 1.69 | % | 1.71 | % | 1.73 | % | 1.74 | % | ||||||
| Expenses net of waiver and payments by | ||||||||||||||||||
| affiliates | 1.71 | %f | 1.70 | %f | 1.69 | %g | 1.71 | %f,g | 1.73 | % | 1.74 | % | ||||||
| Net investment income (loss) | (1.14 | )% | (0.83 | )%c | (1.10 | )% | (1.23 | )% | (1.02 | )% | (1.13 | )% | ||||||
| Supplemental data | ||||||||||||||||||
| Net assets, end of period (000’s) | $ | 359,786 | $ | 377,024 | $ | 448,722 | $ | 404,923 | $ | 348,144 | $ | 367,272 | ||||||
| Portfolio turnover rate | 17.17 | % | 38.72 | % | 47.98 | % | 40.82 | % | 43.72 | % | 47.37 | % | ||||||
aThe amount shown for a share outstanding throughout the period may not correlate with the Statement of Operations for the period due to the timing of sales and
repurchases of the Fund’s shares in relation to income earned and/or fluctuating fair value of the investments of the Fund.
bBased on average daily shares outstanding.
cNet investment income per share includes approximately $0.11 per share related to income received in the form of special dividends in connection with certain Fund
holdings. Excluding this amount, the ratio of net investment income to average net assets would have been (1.13)%.
dTotal return does not reflect sales commissions or contingent deferred sales charges, if applicable, and is not annualized for periods less than one year.
eRatios are annualized for periods less than one year.
fBenefit of expense reduction rounds to less than 0.01%.
gBenefit of waiver and payments by affiliates rounds to less than 0.01%.
franklintempleton.com The accompanying notes are an integral part of these financial statements. | Semiannual Report 53
| FRANKLIN STRATEGIC SERIES | ||||||||||||||||||
| FINANCIAL HIGHLIGHTS | ||||||||||||||||||
| Franklin Small-Mid Cap Growth Fund (continued) | ||||||||||||||||||
| Six Months Ended | ||||||||||||||||||
| October 31, 2016 | Year Ended April 30, | |||||||||||||||||
| (unaudited) | 2016 | 2015 | 2014 | 2013 | 2012 | |||||||||||||
| Class R | ||||||||||||||||||
| Per share operating performance | ||||||||||||||||||
| (for a share outstanding throughout the period) | ||||||||||||||||||
| Net asset value, beginning of period | $ | 29.75 | $ | 36.18 | $ | 38.61 | $ | 36.61 | $ | 37.32 | $ | 40.35 | ||||||
| Income from investment operationsa: | ||||||||||||||||||
| Net investment income (loss)b | (0.10 | ) | (0.11 | )c | (0.23 | ) | (0.29 | ) | (0.18 | ) | (0.23 | ) | ||||||
| Net realized and unrealized gains (losses) | 1.03 | (3.18 | ) | 5.41 | 8.07 | 2.95 | (1.16 | ) | ||||||||||
| Total from investment operations | 0.93 | (3.29 | ) | 5.18 | 7.78 | 2.77 | (1.39 | ) | ||||||||||
| Less distributions from net realized gains. | — | (3.14 | ) | (7.61 | ) | (5.78 | ) | (3.48 | ) | (1.64 | ) | |||||||
| Net asset value, end of period | $ | 30.68 | $ | 29.75 | $ | 36.18 | $ | 38.61 | $ | 36.61 | $ | 37.32 | ||||||
| Total returnd | 3.13 | % | (9.24 | )% | 15.52 | % | 21.66 | % | 8.66 | % | (2.79 | )% | ||||||
| Ratios to average net assetse | ||||||||||||||||||
| Expenses before waiver and payments by | ||||||||||||||||||
| affiliates | 1.22 | % | 1.21 | % | 1.19 | % | 1.21 | % | 1.23 | % | 1.24 | % | ||||||
| Expenses net of waiver and payments by | ||||||||||||||||||
| affiliates | 1.21 | %f | 1.20 | %f | 1.19 | %g | 1.21 | %f,g | 1.23 | % | 1.24 | % | ||||||
| Net investment income (loss) | (0.64 | )% | (0.33 | )%c | (0.60 | )% | (0.73 | )% | (0.52 | )% | (0.63 | )% | ||||||
| Supplemental data | ||||||||||||||||||
| Net assets, end of period (000’s) | $ | 80,306 | $ | 86,989 | $ | 96,593 | $ | 85,921 | $ | 65,397 | $ | 64,743 | ||||||
| Portfolio turnover rate | 17.17 | % | 38.72 | % | 47.98 | % | 40.82 | % | 43.72 | % | 47.37 | % | ||||||
aThe amount shown for a share outstanding throughout the period may not correlate with the Statement of Operations for the period due to the timing of sales and
repurchases of the Fund’s shares in relation to income earned and/or fluctuating fair value of the investments of the Fund.
bBased on average daily shares outstanding.
cNet investment income per share includes approximately $0.11 per share related to income received in the form of special dividends in connection with certain Fund
holdings. Excluding this amount, the ratio of net investment income to average net assets would have been (0.63)%.
dTotal return is not annualized for periods less than one year.
eRatios are annualized for periods less than one year.
fBenefit of expense reduction rounds to less than 0.01%.
gBenefit of waiver and payments by affiliates rounds to less than 0.01%.
54 Semiannual Report | The accompanying notes are an integral part of these financial statements. franklintempleton.com
FRANKLIN STRATEGIC SERIES
FINANCIAL HIGHLIGHTS
| Franklin Small-Mid Cap Growth Fund (continued) | ||||||||||||
| Six Months Ended | ||||||||||||
| October 31, 2016 | Year Ended April 30, | |||||||||||
| (unaudited) | 2016 | 2015 | 2014 | a | ||||||||
| Class R6 | ||||||||||||
| Per share operating performance | ||||||||||||
| (for a share outstanding throughout the period) | ||||||||||||
| Net asset value, beginning of period | $ | 34.43 | $ | 41.04 | $ | 42.53 | $ | 38.96 | ||||
| Income from investment operationsb: | ||||||||||||
| Net investment incomec | 0.02 | 0.15 | d | 0.05 | 0.01 | |||||||
| Net realized and unrealized gains (losses) | 1.18 | (3.62 | ) | 6.07 | 9.34 | |||||||
| Total from investment operations | 1.20 | (3.47 | ) | 6.12 | 9.35 | |||||||
| Less distributions from net realized gains | — | (3.14 | ) | (7.61 | ) | (5.78 | ) | |||||
| Net asset value, end of period | $ | 35.63 | $ | 34.43 | $ | 14.04 | $ | 42.53 | ||||
| Total returne | 3.49 | % | (8.54 | )% | 16.32 | % | 24.43 | % | ||||
| Ratios to average net assetsf | ||||||||||||
| Expenses before waiver and payments by affiliates | 0.48 | % | 0.48 | % | 0.48 | % | 0.47 | % | ||||
| Expenses net of waiver and payments by affiliates. | 0.47 | %g | 0.47 | %g | 0.48 | %h | 0.47 | %g,h | ||||
| Net investment income | 0.10 | % | 0.40 | %d | 0.11 | % | 0.01 | % | ||||
| Supplemental data | ||||||||||||
| Net assets, end of period (000’s) | $ | 224,539 | $ | 242,237 | $ | 206,548 | $ | 157,153 | ||||
| Portfolio turnover rate. | 17.17 | % | 38.72 | % | 47.98 | % | 40.82 | % | ||||
aFor the year May 1, 2013 (effective date) to April 30, 2014.
bThe amount shown for a share outstanding throughout the period may not correlate with the Statement of Operations for the period due to the timing of sales and
repurchases of the Fund’s shares in relation to income earned and/or fluctuating fair value of the investments of the Fund.
cBased on average daily shares outstanding.
dNet investment income per share includes approximately $0.11 per share related to income received in the form of special dividends in connection with certain Fund
holdings. Excluding this amount, the ratio of net investment income to average net assets would have been 0.10%.
eTotal return is not annualized for periods less than one year.
fRatios are annualized for periods less than one year.
gBenefit of expense reduction rounds to less than 0.01%.
hBenefit of waiver and payments by affiliates rounds to less than 0.01%.
franklintempleton.com The accompanying notes are an integral part of these financial statements. | Semiannual Report 55
| FRANKLIN STRATEGIC SERIES | ||||||||||||||||||
| FINANCIAL HIGHLIGHTS | ||||||||||||||||||
| Franklin Small-Mid Cap Growth Fund (continued) | ||||||||||||||||||
| Six Months Ended | ||||||||||||||||||
| October 31, 2016 | Year Ended April 30, | |||||||||||||||||
| (unaudited) | 2016 | 2015 | 2014 | 2013 | 2012 | |||||||||||||
| Advisor Class | ||||||||||||||||||
| Per share operating performance | ||||||||||||||||||
| (for a share outstanding throughout the period) | ||||||||||||||||||
| Net asset value, beginning of period | $ | 34.15 | $ | 40.83 | $ | 42.44 | $ | 39.56 | $ | 39.83 | $ | 42.73 | ||||||
| Income from investment operationsa: | ||||||||||||||||||
| Net investment income (loss)b | (0.03 | ) | 0.06 | c | (0.04 | ) | (0.10 | ) | (0.01 | ) | (0.05 | ) | ||||||
| Net realized and unrealized gains (losses) | 1.18 | (3.60 | ) | 6.04 | 8.76 | 3.22 | (1.21 | ) | ||||||||||
| Total from investment operations | 1.15 | (3.54 | ) | 6.00 | 8.66 | 3.21 | (1.26 | ) | ||||||||||
| Less distributions from net realized gains. | — | (3.14 | ) | (7.61 | ) | (5.78 | ) | (3.48 | ) | (1.64 | ) | |||||||
| Net asset value, end of period | $ | 35.30 | $ | 34.15 | $ | 40.83 | $ | 42.44 | $ | 39.56 | $ | 39.83 | ||||||
| Total returnd | 3.37 | % | (8.79 | )% | 16.09 | % | 22.30 | % | 9.21 | % | (2.29 | )% | ||||||
| Ratios to average net assetse | ||||||||||||||||||
| Expenses before waiver and payments by | ||||||||||||||||||
| affiliates | 0.72 | % | 0.71 | % | 0.69 | % | 0.71 | % | 0.73 | % | 0.74 | % | ||||||
| Expenses net of waiver and payments by | ||||||||||||||||||
| affiliates | 0.71 | %f | 0.70 | %f | 0.69 | %g | 0.71 | %f,g | 0.73 | % | 0.74 | % | ||||||
| Net investment income (loss) | (0.14 | )% | 0.17 | %c | (0.10 | )% | (0.23 | )% | (0.02 | )% | (0.13 | )% | ||||||
| Supplemental data | ||||||||||||||||||
| Net assets, end of period (000’s) | $ | 535,389 | $ | 551,176 | $ | 708,617 | $ | 650,426 | $ | 909,895 | $ | 822,827 | ||||||
| Portfolio turnover rate | 17.17 | % | 38.72 | % | 47.98 | % | 40.82 | % | 43.72 | % | 47.37 | % | ||||||
aThe amount shown for a share outstanding throughout the period may not correlate with the Statement of Operations for the period due to the timing of sales and
repurchases of the Fund’s shares in relation to income earned and/or fluctuating fair value of the investments of the Fund.
bBased on average daily shares outstanding.
cNet investment income per share includes approximately $0.11 per share related to income received in the form of special dividends in connection with certain Fund
holdings. Excluding this amount, the ratio of net investment income to average net assets would have been (0.13)%.
dTotal return is not annualized for periods less than one year.
eRatios are annualized for periods less than one year.
fBenefit of expense reduction rounds to less than 0.01%.
gBenefit of waiver and payments by affiliates rounds to less than 0.01%.
56 Semiannual Report | The accompanying notes are an integral part of these financial statements. franklintempleton.com
| FRANKLIN STRATEGIC SERIES | |||
| Statement of Investments, October 31, 2016 (unaudited) | |||
| Franklin Small-Mid Cap Growth Fund | |||
| Shares | Value | ||
| Common Stocks 93.6% | |||
| Consumer Discretionary 17.4% | |||
| Advance Auto Parts Inc | 150,400 | $ | 21,068,032 |
| a Buffalo Wild Wings Inc | 202,900 | 29,552,385 | |
| Delphi Automotive PLC (United Kingdom) | 525,200 | 34,174,764 | |
| Dick’s Sporting Goods Inc | 692,600 | 38,543,190 | |
| a Dollar Tree Inc | 506,600 | 38,273,630 | |
| a Global Eagle Entertainment Inc | 1,737,084 | 13,983,526 | |
| a Grand Canyon Education Inc | 624,600 | 27,257,544 | |
| Hanesbrands Inc | 1,361,700 | 34,995,690 | |
| a IMAX Corp | 956,200 | 28,925,050 | |
| L Brands Inc | 594,800 | 42,938,612 | |
| a Liberty Broadband Corp., C | 279,300 | 18,615,345 | |
| Marriott International Inc., A | 391,800 | 26,916,660 | |
| Newell Brands Inc | 742,776 | 35,668,104 | |
| a Norwegian Cruise Line Holdings Ltd | 880,100 | 34,209,487 | |
| a NVR Inc | 17,900 | 27,261,700 | |
| a O’Reilly Automotive Inc | 127,500 | 33,716,100 | |
| Ross Stores Inc | 535,900 | 33,515,186 | |
| Tractor Supply Co | 431,200 | 27,006,056 | |
| b Under Armour Inc., A | 468,700 | 14,576,570 | |
| Under Armour Inc., C | 325,997 | 8,430,282 | |
| a,b Zoe’s Kitchen Inc | 567,500 | 12,865,225 | |
| 582,493,138 | |||
| Consumer Staples 4.5% | |||
| Molson Coors Brewing Co., B | 158,600 | 16,464,266 | |
| a Monster Beverage Corp | 241,000 | 34,785,940 | |
| Pinnacle Foods Inc | 726,500 | 37,356,630 | |
| a Post Holdings Inc | 386,100 | 29,432,403 | |
| a TreeHouse Foods Inc | 376,500 | 32,936,220 | |
| 150,975,459 | |||
| Energy 2.3% | |||
| Cabot Oil & Gas Corp., A | 1,189,510 | 24,836,969 | |
| a Concho Resources Inc | 129,000 | 16,375,260 | |
| Noble Energy Inc | 537,600 | 18,531,072 | |
| Superior Energy Services Inc | 1,252,200 | 17,731,152 | |
| 77,474,453 | |||
| Financials 8.9% | |||
| a Affiliated Managers Group Inc | 328,800 | 43,618,608 | |
| Arthur J. Gallagher & Co | 801,300 | 38,646,699 | |
| Lazard Ltd., A | 866,200 | 31,581,652 | |
| MarketAxess Holdings Inc | 144,200 | 21,739,592 | |
| Moody’s Corp | 285,000 | 28,648,200 | |
| a Signature Bank | 370,200 | 44,631,312 | |
| a SVB Financial Group | 240,000 | 29,344,800 | |
| Willis Towers Watson PLC | 472,900 | 59,538,110 | |
| 297,748,973 | |||
| Health Care 19.2% | |||
| a Acadia Pharmaceuticals Inc | 322,349 | 7,513,955 | |
| a Akorn Inc | 1,119,600 | 26,814,420 | |
| a BioMarin Pharmaceutical Inc | 156,066 | 12,566,434 | |
| a Celldex Therapeutics Inc | 793,900 | 2,500,785 | |
franklintempleton.com
Semiannual Report 57
FRANKLIN STRATEGIC SERIES
STATEMENT OF INVESTMENTS (UNAUDITED)
| Franklin Small-Mid Cap Growth Fund (continued) | |||
| Shares | Value | ||
| Common Stocks (continued) | |||
| Health Care (continued) | |||
| a Cerner Corp | 582,600 | $ | 34,128,708 |
| The Cooper Cos. Inc | 295,300 | 51,984,612 | |
| a DaVita Inc | 459,900 | 26,959,338 | |
| DENTSPLY SIRONA Inc | 442,000 | 25,445,940 | |
| a DexCom Inc | 504,114 | 39,441,879 | |
| a Edwards Lifesciences Corp | 574,200 | 54,675,324 | |
| a,b Heron Therapeutics Inc | 492,411 | 7,312,303 | |
| a Hologic Inc | 1,233,300 | 44,411,133 | |
| a Impax Laboratories Inc | 615,000 | 12,361,500 | |
| a Incyte Corp | 230,614 | 20,056,500 | |
| a Insulet Corp | 359,917 | 13,360,119 | |
| a iRhythm Technologies Inc | 180,640 | 4,506,968 | |
| a Mallinckrodt PLC | 606,480 | 35,940,005 | |
| a Mednax Inc | 128,500 | 7,870,625 | |
| a Mettler-Toledo International Inc | 104,500 | 42,226,360 | |
| a Neurocrine Biosciences Inc | 199,842 | 8,747,084 | |
| a Nevro Corp | 441,400 | 40,573,488 | |
| a Patheon NV | 229,400 | 5,824,466 | |
| a Penumbra Inc | 168,647 | 11,122,270 | |
| a Pfenex Inc | 955,500 | 7,653,555 | |
| a Quintiles IMS Holdings Inc | 728,400 | 52,255,416 | |
| a,b Revance Therapeutics Inc | 623,900 | 8,329,065 | |
| a Tesaro Inc | 180,545 | 21,824,280 | |
| a,b TherapeuticsMD Inc | 1,000,000 | 5,740,000 | |
| a Waters Corp | 70,000 | 9,739,800 | |
| 641,886,332 | |||
| Industrials 13.4% | |||
| Acuity Brands Inc | 119,700 | 26,761,329 | |
| Allegiant Travel Co | 107,109 | 14,770,331 | |
| B/E Aerospace Inc | 284,000 | 16,903,680 | |
| a DigitalGlobe Inc | 941,700 | 23,636,670 | |
| Dun & Bradstreet Corp | 310,100 | 38,715,985 | |
| a Genesee & Wyoming Inc | 680,200 | 46,212,788 | |
| a HD Supply Holdings Inc | 798,068 | 26,336,244 | |
| Hexcel Corp | 756,709 | 34,422,693 | |
| a IHS Markit Ltd | 1,339,415 | 49,277,078 | |
| J.B. Hunt Transport Services Inc | 227,800 | 18,590,758 | |
| Robert Half International Inc | 995,800 | 37,262,836 | |
| Roper Technologies Inc | 360,530 | 62,483,454 | |
| a Sensata Technologies Holding NV | 449,700 | 16,067,781 | |
| Stanley Black & Decker Inc | 126,100 | 14,355,224 | |
| a Verisk Analytics Inc | 292,800 | 23,877,840 | |
| 449,674,691 | |||
| Information Technology 22.0% | |||
| a 2U Inc | 1,036,800 | 36,142,848 | |
| a,b Alarm.com Holdings Inc | 145,000 | 4,231,100 | |
| a Alliance Data Systems Corp | 79,600 | 16,275,812 | |
| Analog Devices Inc | 291,500 | 18,685,150 | |
| a ANSYS Inc | 227,100 | 20,745,585 | |
| a Atlassian Corp. PLC (Australia) | 473,600 | 12,720,896 | |
| a Blackline Inc | 84,800 | 1,929,200 | |
58 Semiannual Report
franklintempleton.com
FRANKLIN STRATEGIC SERIES
STATEMENT OF INVESTMENTS (UNAUDITED)
| Franklin Small-Mid Cap Growth Fund (continued) | |||
| Shares | Value | ||
| Common Stocks (continued) | |||
| Information Technology (continued) | |||
| a Bottomline Technologies (de) Inc | 790,600 | $ | 17,938,714 |
| Cognex Corp | 511,800 | 26,408,880 | |
| a CoStar Group Inc | 242,600 | 45,395,312 | |
| CSRA Inc | 1,346,547 | 33,784,864 | |
| a Electronic Arts Inc | 312,500 | 24,537,500 | |
| Fidelity National Information Services Inc | 428,900 | 31,704,288 | |
| a FleetCor Technologies Inc | 243,800 | 42,738,140 | |
| a GoDaddy Inc., A | 981,800 | 35,138,622 | |
| a Integrated Device Technology Inc | 533,400 | 11,046,714 | |
| KLA-Tencor Corp | 269,000 | 20,204,590 | |
| Lam Research Corp | 296,400 | 28,709,304 | |
| Microchip Technology Inc | 354,800 | 21,483,140 | |
| a,b Nutanix Inc., A | 73,000 | 1,788,500 | |
| a NXP Semiconductors NV (Netherlands) | 427,893 | 42,789,300 | |
| a Palo Alto Networks Inc | 296,000 | 45,533,680 | |
| a Proofpoint Inc | 245,200 | 19,218,776 | |
| a Q2 Holdings Inc | 150,000 | 4,215,000 | |
| a Quantenna Communications Inc | 91,300 | 1,367,674 | |
| a Red Hat Inc | 495,600 | 38,384,220 | |
| a ServiceNow Inc | 479,600 | 42,161,636 | |
| a Vantiv Inc., A | 818,700 | 47,779,332 | |
| a ViaSat Inc | 348,050 | 24,593,213 | |
| a Workday Inc., A | 224,300 | 19,442,324 | |
| 737,094,314 | |||
| Materials 3.2% | |||
| a Axalta Coating Systems Ltd | 1,689,603 | 42,442,827 | |
| a Ingevity Corp | 305,000 | 12,627,000 | |
| International Flavors & Fragrances Inc | 85,000 | 11,116,300 | |
| Martin Marietta Materials Inc | 223,300 | 41,395,354 | |
| 107,581,481 | |||
| Real Estate 1.8% | |||
| Equinix Inc | 164,178 | 58,657,516 | |
| Telecommunication Services 0.9% | |||
| a SBA Communications Corp | 276,200 | 31,287,936 | |
| Total Common Stocks (Cost $2,440,338,916) | 3,134,874,293 | ||
| Preferred Stocks 0.6% | |||
| Consumer Discretionary 0.6% | |||
| a,c DraftKings Inc., pfd., D | 660,161 | 2,720,902 | |
| a,c DraftKings Inc., pfd., D-1 | 1,623,455 | 8,993,683 | |
| a,c Proterra Inc., pfd., 5, 144A | 1,416,913 | 7,135,914 | |
| Total Preferred Stocks (Cost $23,135,917) | 18,850,499 | ||
franklintempleton.com
Semiannual Report 59
FRANKLIN STRATEGIC SERIES
STATEMENT OF INVESTMENTS (UNAUDITED)
| Franklin Small-Mid Cap Growth Fund (continued) | |||||
| Principal | |||||
| Amount | Value | ||||
| Convertible Bonds (Cost $5,000,000) 0.2% | |||||
| Consumer Discretionary 0.2% | |||||
| c DraftKings Inc., cvt., E, 5.00%, 12/23/16 | $ | 5,000,000 | $ | 6,842,999 | |
| Total Investments before Short Term Investments (Cost $2,468,474,833) | 3,160,567,791 | ||||
| Shares | |||||
| Short Term Investments 6.2% | |||||
| Money Market Funds (Cost $154,214,625) 4.6% | |||||
| a,d Institutional Fiduciary Trust Money Market Portfolio | 154,214,625 | 154,214,625 | |||
| e Investments from Cash Collateral Received for Loaned Securities | |||||
| (Cost $53,434,796) 1.6% | |||||
| Money Market Funds 1.6% | |||||
| a,d Institutional Fiduciary Trust Money Market Portfolio | 53,434,796 | 53,434,796 | |||
| Total Investments (Cost $2,676,124,254) 100.6% | 3,368,217,212 | ||||
| Other Assets, less Liabilities (0.6)% | (19,829,456 | ) | |||
| Net Assets 100.0% | $ | 3,348,387,756 | |||
aNon-income producing.
bA portion or all of the security is on loan at October 31, 2016. See Note 1(c).
cSee Note 7 regarding restricted securities.
dSee Note 3(f) regarding investments in affiliated management investment companies.
eSee Note 1(c) regarding securities on loan.
60 Semiannual Report | The accompanying notes are an integral part of these financial statements. franklintempleton.com
| FRANKLIN STRATEGIC SERIES | ||||||||||||
| Financial Statements | ||||||||||||
| Statements of Assets and Liabilities | ||||||||||||
| October 31, 2016 (unaudited) | ||||||||||||
| Franklin | Franklin | Franklin | Franklin | |||||||||
| Focused Core | Growth | Small Cap | Small-Mid Cap | |||||||||
| Equity Fund | Opportunities Fund | Growth Fund | Growth Fund | |||||||||
| Assets: | ||||||||||||
| Investments in securities: | ||||||||||||
| Cost - Unaffiliated issuers | $ | 117,978,991 | $ | 2,373,427,883 | $ | 2,137,081,664 | $ | 2,468,474,833 | ||||
| Cost - Non-controlled affiliates (Note 3f and 8) | 852,031 | 38,764,024 | 354,824,229 | 207,649,421 | ||||||||
| Total cost of investments | $ | 118,831,022 | $ | 2,412,191,907 | $ | 2,491,905,893 | $ | 2,676,124,254 | ||||
| Value - Unaffiliated issuers | $ | 128,929,502 | $ | 3,580,162,759 | $ | 2,337,831,348 | $ | 3,160,567,791 | ||||
| Value - Non-controlled affiliates (Note 3f and 8) | 852,031 | 38,764,024 | 390,722,642 | 207,649,421 | ||||||||
| Total value of investments* | 129,781,533 | 3,618,926,783 | 2,728,553,990 | 3,368,217,212 | ||||||||
| Receivables: | ||||||||||||
| Investment securities sold ** | 1,345,785 | 3,018,135 | 4,473,368 | 85,663,990 | ||||||||
| Capital shares sold. | 144,286 | 2,359,235 | 1,568,322 | 2,484,761 | ||||||||
| Dividends and interest | 27,797 | 661,486 | 533,383 | 355,893 | ||||||||
| Affiliates | 41,349 | — | — | — | ||||||||
| Due from custodian | — | 304,800 | 783,200 | — | ||||||||
| Other assets | 40 | 1,236 | 3,240 | 701 | ||||||||
| Total assets | 131,340,790 | 3,625,271,675 | 2,735,915,503 | 3,456,722,557 | ||||||||
| Liabilities: | ||||||||||||
| Payables: | ||||||||||||
| Investment securities purchased | — | — | 14,666,050 | 45,766,165 | ||||||||
| Capital shares redeemed | 375,890 | 9,684,522 | 4,657,519 | 5,415,697 | ||||||||
| Management fees | 80,665 | 1,443,232 | 1,406,027 | 1,286,589 | ||||||||
| Distribution fees | 35,248 | 872,149 | 317,408 | 821,223 | ||||||||
| Transfer agent fees. | 39,268 | 696,552 | 1,233,741 | 1,480,353 | ||||||||
| Payable upon return of securities loaned | — | 20,264,525 | 70,362,525 | 53,434,796 | ||||||||
| Accrued expenses and other liabilities | 30,945 | 326,680 | 290,043 | 129,978 | ||||||||
| Total liabilities | 562,016 | 33,287,660 | 92,933,313 | 108,334,801 | ||||||||
| Net assets, at value | $ | 130,778,774 | $ | 3,591,984,015 | $ | 2,642,982,190 | $ | 3,348,387,756 | ||||
| Net assets consist of: | ||||||||||||
| Paid-in capital | $ | 131,603,770 | $ | 2,322,080,645 | $ | 2,537,526,592 | $ | 2,446,353,089 | ||||
| Undistributed net investment income (loss) | (111,399 | ) | (7,351,044 | ) | (8,245,085 | ) | (11,412,238 | ) | ||||
| Net unrealized appreciation (depreciation) | 10,950,735 | 1,206,640,097 | 236,648,097 | 692,092,958 | ||||||||
| Accumulated net realized gain (loss) | (11,664,332 | ) | 70,614,317 | (122,947,414 | ) | 221,353,947 | ||||||
| Net assets, at value | $ | 130,778,774 | $ | 3,591,984,015 | $ | 2,642,982,190 | $ | 3,348,387,756 | ||||
| *Includes securities loaned | $ | — | $ | 9,238,130 | $ | 68,709,390 | $ | 43,312,555 | ||||
| **Includes securities loaned. | $ | — | $ | — | $ | — | $ | 3,217,766 | ||||
franklintempleton.com The accompanying notes are an integral part of these financial statements. | Semiannual Report 61
| FRANKLIN STRATEGIC SERIES | |||||||||
| FINANCIAL STATEMENTS | |||||||||
| Statements of Assets and Liabilities (continued) | |||||||||
| October 31, 2016 (unaudited) | |||||||||
| Franklin | Franklin | Franklin | Franklin | ||||||
| Focused Core | Growth | Small Cap | Small-Mid Cap | ||||||
| Equity Fund | Opportunities Fund | Growth Fund | Growth Fund | ||||||
| Class A: | |||||||||
| Net assets, at value | $ | 80,186,320 | $ | 2,281,538,709 | $ | 732,317,627 | $ | 2,148,367,773 | |
| Shares outstanding | 5,874,094 | 72,599,723 | 41,982,108 | 65,363,368 | |||||
| Net asset value per sharea | $ | 13.65 | $ | 31.43 | $ | 17.44 | $ | 32.87 | |
| Maximum offering price per share (net asset value | |||||||||
| per share ÷ 94.25%) | $ | 14.48 | $ | 33.35 | $ | 18.50 | $ | 34.88 | |
| Class C: | |||||||||
| Net assets, at value | $ | 20,047,965 | $ | 397,217,461 | $ | 143,908,419 | $ | 359,786,181 | |
| Shares outstanding | 1,537,224 | 14,508,412 | 9,637,799 | 14,339,566 | |||||
| Net asset value and maximum offering price per | |||||||||
| sharea | $ | 13.04 | $ | 27.38 | $ | 14.93 | $ | 25.09 | |
| Class R: | |||||||||
| Net assets, at value | $ | 144,944 | $ | 52,268,242 | $ | 75,691,704 | $ | 80,305,626 | |
| Shares outstanding | 10,743 | 1,723,760 | 4,532,237 | 2,617,762 | |||||
| Net asset value and maximum offering price per | |||||||||
| share | $ | 13.49 | $ | 30.32 | $ | 16.70 | $ | 30.68 | |
| Class R6: | |||||||||
| Net assets, at value | $ | 18,133,045 | $ | 388,261,356 | $ | 906,333,135 | $ | 224,539,336 | |
| Shares outstanding | 1,309,921 | 11,571,199 | 48,439,448 | 6,301,846 | |||||
| Net asset value and maximum offering price per | |||||||||
| share | $ | 13.84 | $ | 33.55 | $ | 18.71 | $ | 35.63 | |
| Advisor Class: | |||||||||
| Net assets, at value | $ | 12,266,500 | $ | 472,698,247 | $ | 784,731,305 | $ | 535,388,840 | |
| Shares outstanding | 888,090 | 14,180,647 | 42,266,369 | 15,165,204 | |||||
| Net asset value and maximum offering price per | |||||||||
| share | $ | 13.81 | $ | 33.33 | $ | 18.57 | $ | 35.30 | |
aRedemption price is equal to net asset value less contingent deferred sales charges, if applicable.
62 Semiannual Report | The accompanying notes are an integral part of these financial statements. franklintempleton.com
| FRANKLIN STRATEGIC SERIES | ||||||||||||
| FINANCIAL STATEMENTS | ||||||||||||
| Statements of Operations | ||||||||||||
| for the six months ended October 31, 2016 (unaudited) | ||||||||||||
| Franklin | Franklin | Franklin | Franklin | |||||||||
| Focused Core | Growth | Small Cap | Small-Mid Cap | |||||||||
| Equity Fund | Opportunities Fund | Growth Fund | Growth Fund | |||||||||
| Investment income: | ||||||||||||
| Dividends | $ | 896,832 | $ | 5,360,261 | $ | 4,693,794 | $ | 9,547,973 | ||||
| Interest | — | — | 142,959 | 126,027 | ||||||||
| Income from securities loaned (net of fees and | ||||||||||||
| rebates) | — | 138,883 | 2,539,941 | 285,414 | ||||||||
| Total investment income | 896,832 | 5,499,144 | 7,376,694 | 9,959,414 | ||||||||
| Expenses: | ||||||||||||
| Management fees (Note 3a) | 713,826 | 6,179,933 | 8,505,598 | 8,101,338 | ||||||||
| Distribution fees: (Note 3c) | ||||||||||||
| Class A | 113,493 | 1,522,538 | 981,039 | 2,814,944 | ||||||||
| Class C | 114,869 | 1,185,551 | 775,804 | 1,907,305 | ||||||||
| Class R | 355 | 112,996 | 201,009 | 215,258 | ||||||||
| Transfer agent fees: (Note 3e) | ||||||||||||
| Class A | 82,138 | 1,203,028 | 1,030,177 | 2,713,020 | ||||||||
| Class C | 20,782 | 235,692 | 202,792 | 459,516 | ||||||||
| Class R | 146 | 45,285 | 105,130 | 104,291 | ||||||||
| Class R6 | 45 | 391 | 5,400 | 1,429 | ||||||||
| Advisor Class | 10,267 | 339,964 | 1,105,979 | 678,410 | ||||||||
| Custodian fees (Note 4) | 2,097 | 5,308 | 11,627 | 14,848 | ||||||||
| Reports to shareholders | 12,997 | 58,908 | 183,966 | 170,513 | ||||||||
| Registration and filing fees | 47,475 | 77,330 | 183,882 | 140,854 | ||||||||
| Professional fees | 19,545 | 23,041 | 26,176 | 28,205 | ||||||||
| Trustees’ fees and expenses | 954 | 6,306 | 16,466 | 19,432 | ||||||||
| Other | 4,113 | 140,384 | 25,413 | 30,410 | ||||||||
| Total expenses. | 1,143,102 | 11,136,655 | 13,360,458 | 17,399,773 | ||||||||
| Expense reductions (Note 4) | (6 | ) | (127 | ) | (258 | ) | (235 | ) | ||||
| Expenses waived/paid by affiliates (Note 3a, 3f | ||||||||||||
| and 3g) | (183,375 | ) | (648,969 | ) | (271,412 | ) | (282,600 | ) | ||||
| Net expenses | 959,721 | 10,487,559 | 13,088,788 | 17,116,938 | ||||||||
| Net investment income (loss) | (62,889 | ) | (4,988,415 | ) | (5,712,094 | ) | (7,157,524 | ) | ||||
| Realized and unrealized gains (losses): | ||||||||||||
| Net realized gain (loss) from: | ||||||||||||
| Investments: | ||||||||||||
| Unaffiliated issuers | (2,805,421 | ) | 81,394,478 | 81,012,903 | 194,499,314 | |||||||
| Non-controlled affiliates (Note 3f and 8) | — | — | (2,484,638 | ) | — | |||||||
| Foreign currency transactions | (447 | ) | 10,644 | — | 8,645 | |||||||
| Net realized gain (loss) | (2,805,868 | ) | 81,405,122 | 78,528,265 | 194,507,959 | |||||||
| Net change in unrealized appreciation (depreciation) | ||||||||||||
| on: | ||||||||||||
| Investments | 8,728,217 | (96,449,909 | ) | 103,150,609 | (69,669,832 | ) | ||||||
| Translation of other assets and liabilities | ||||||||||||
| denominated in foreign currencies | 224 | 2,386 | — | — | ||||||||
| Net change in unrealized appreciation | ||||||||||||
| (depreciation) | 8,728,441 | (96,447,523 | ) | 103,150,609 | (69,669,832 | ) | ||||||
| Net realized and unrealized gain (loss) | 5,922,573 | (15,042,401 | ) | 181,678,874 | 124,838,127 | |||||||
| Net increase (decrease) in net assets resulting from | ||||||||||||
| operations | $ | 5,859,684 | $ | (20,030,816 | ) | $ | 175,966,780 | $ | 117,680,603 | |||
franklintempleton.com The accompanying notes are an integral part of these financial statements. | Semiannual Report 63
| FRANKLIN STRATEGIC SERIES | ||||||||||||||
| FINANCIAL STATEMENTS | ||||||||||||||
| Statements of Changes in Net Assets | ||||||||||||||
| Franklin Focused Core | Franklin Growth | |||||||||||||
| Equity Fund | Opportunities Fund | |||||||||||||
| Six Months Ended | Six Months Ended | |||||||||||||
| October 31, 2016 | Year Ended | October 31, 2016 | Year Ended | |||||||||||
| (unaudited) | April 30, 2016 | (unaudited) | April 30, 2016 | |||||||||||
| Increase (decrease) in net assets: | ||||||||||||||
| Operations: | ||||||||||||||
| Net investment income (loss) | $ | (62,889 | ) | $ | 865,847 | $ | (4,988,415 | ) | $ | (6,485,092 | ) | |||
| Net realized gain (loss) | (2,805,868 | ) | (6,954,510 | ) | 81,405,122 | (7,640,390 | ) | |||||||
| Net change in unrealized appreciation | ||||||||||||||
| (depreciation) | 8,728,441 | (20,401,231 | ) | (96,447,523 | ) | (70,395,108 | ) | |||||||
| Net increase (decrease) in net assets | ||||||||||||||
| resulting from operations | 5,859,684 | (26,489,894 | ) | (20,030,816 | ) | (84,520,590 | ) | |||||||
| Distributions to shareholders from: | ||||||||||||||
| Net investment income: | ||||||||||||||
| Class A | — | (497,875 | ) | — | — | |||||||||
| Class R | — | (953 | ) | — | — | |||||||||
| Class R6 | — | (285,880 | ) | — | — | |||||||||
| Advisor Class. | — | (75,820 | ) | — | — | |||||||||
| Net realized gains: | ||||||||||||||
| Class A | — | (3,097,294 | ) | — | (11,684,036 | ) | ||||||||
| Class C | — | (753,648 | ) | — | (3,434,327 | ) | ||||||||
| Class R | — | (8,526 | ) | — | (919,987 | ) | ||||||||
| Class R6 | — | (947,505 | ) | — | (4,559,642 | ) | ||||||||
| Advisor Class. | — | (303,800 | ) | — | (5,175,160 | ) | ||||||||
| Total distributions to shareholders | — | (5,971,301 | ) | — | (25,773,152 | ) | ||||||||
| Capital share transactions: (Note 2) | ||||||||||||||
| Class A | (23,950,936 | ) | 27,607,644 | 1,757,995,371 | 142,478,599 | |||||||||
| Class C | (5,913,632 | ) | 10,981,811 | 262,510,735 | 42,387,168 | |||||||||
| Class R | (134,925 | ) | 158,571 | 11,556,581 | (4,630,356 | ) | ||||||||
| Class R6 | (16,417,147 | ) | 14,106,218 | 148,897,540 | 7,201,428 | |||||||||
| Advisor Class. | 1,084,628 | 2,665,730 | 212,518,547 | 8,197,076 | ||||||||||
| Total capital share transactions | (45,332,012 | ) | 55,519,974 | 2,393,478,774 | 195,633,915 | |||||||||
| Net increase (decrease) in net assets | (39,472,328 | ) | 23,058,779 | 2,373,447,958 | 85,340,173 | |||||||||
| Net assets: | ||||||||||||||
| Beginning of period | 170,251,102 | 147,192,323 | 1,218,536,057 | 1,133,195,884 | ||||||||||
| End of period | $ | 130,778,774 | $ | 170,251,102 | $ | 3,591,984,015 | $ | 1,218,536,057 | ||||||
| Undistributed net investment income (loss) included | ||||||||||||||
| in net assets: | ||||||||||||||
| End of period | $ | (111,399 | ) | $ | — | $ | (7,351,044 | ) | $ | (2,362,629 | ) | |||
| Distributions in excess of net investment income | ||||||||||||||
| included in net assets: | ||||||||||||||
| End of period | $ | — | $ | (48,510 | ) | $ | — | $ | — | |||||
64 Semiannual Report | The accompanying notes are an integral part of these financial statements. franklintempleton.com
| FRANKLIN STRATEGIC SERIES | ||||||||||||
| FINANCIAL STATEMENTS | ||||||||||||
| Statements of Changes in Net Assets (continued) | ||||||||||||
| Franklin Small Cap | Franklin Small-Mid Cap | |||||||||||
| Growth Fund | Growth Fund | |||||||||||
| Six Months Ended | Six Months Ended | |||||||||||
| October 31, 2016 | Year Ended | October 31, 2016 | Year Ended | |||||||||
| (unaudited) | April 30, 2016 | (unaudited) | April 30, 2016 | |||||||||
| Increase (decrease) in net assets: | ||||||||||||
| Operations: | ||||||||||||
| Net investment income (loss) | $ | (5,712,094 | ) | $ | (8,604,877 | ) | $ | (7,157,524 | ) | $ | (3,590,643 | ) |
| Net realized gain (loss) | 78,528,265 | (195,895,106 | ) | 194,507,959 | 192,892,797 | |||||||
| Net change in unrealized appreciation | ||||||||||||
| (depreciation) | 103,150,609 | (189,905,421 | ) | (69,669,832 | ) | (552,669,162 | ) | |||||
| Net increase (decrease) in net assets | ||||||||||||
| resulting from operations | 175,966,780 | (394,405,404 | ) | 117,680,603 | (363,367,008 | ) | ||||||
| Distributions to shareholders from: | ||||||||||||
| Net realized gains: | ||||||||||||
| Class A | — | (18,855,133 | ) | — | (203,767,135 | ) | ||||||
| Class C | — | (4,317,704 | ) | — | (45,252,717 | ) | ||||||
| Class R | — | (1,825,810 | ) | — | (8,434,665 | ) | ||||||
| Class R6 | — | (16,908,538 | ) | — | (20,262,074 | ) | ||||||
| Advisor Class | — | (17,868,315 | ) | — | (49,942,277 | ) | ||||||
| Total distributions to shareholders | — | (59,775,500 | ) | — | (327,658,868 | ) | ||||||
| Capital share transactions: (Note 2) | ||||||||||||
| Class A | (111,284,809 | ) | (221,885,481 | ) | (156,127,724 | ) | 128,177,630 | |||||
| Class C | (22,697,318 | ) | (37,262,306 | ) | (28,262,589 | ) | 17,363,176 | |||||
| Class R | (9,359,985 | ) | 564,740 | (9,495,722 | ) | 8,280,172 | ||||||
| Class R6 | 4,104,243 | 124,630,820 | (29,443,722 | ) | 75,185,512 | |||||||
| Advisor Class | (120,622,952 | ) | (88,883,508 | ) | (35,210,356 | ) | (45,066,011 | ) | ||||
| Total capital share transactions | (259,860,821 | ) | (222,835,735 | ) | (258,540,113 | ) | 183,940,479 | |||||
| Net increase (decrease) in net assets. | (83,894,041 | ) | (677,016,639 | ) | (140,859,510 | ) | (507,085,397 | ) | ||||
| Net assets: | ||||||||||||
| Beginning of period | 2,726,876,231 | 3,403,892,870 | 3,489,247,266 | 3,996,332,663 | ||||||||
| End of period | $ | 2,642,982,190 | $ | 2,726,876,231 | $ | 3,348,387,756 | $ | 3,489,247,266 | ||||
| Undistributed net investment income (loss) included | ||||||||||||
| in net assets: | ||||||||||||
| End of period | $ | (8,245,085 | ) | $ | (2,532,991 | ) | $ | (11,412,238 | ) | $ | (4,254,714 | ) |
franklintempleton.com The accompanying notes are an integral part of these financial statements. | Semiannual Report 65
FRANKLIN STRATEGIC SERIES
Notes to Financial Statements (unaudited)
1. Organization and Significant Accounting Policies
Franklin Strategic Series (Trust) is registered under the Investment Company Act of 1940 (1940 Act) as an open-end management investment company, consisting of nine separate funds, four of which are included in this report (Funds) and applies the specialized accounting and reporting guidance in U.S. Generally Accepted Accounting Principles (U.S. GAAP). The financial statements of the remaining funds in the Trust are presented separately. The Funds offer five classes of shares: Class A, Class C, Class R, Class R6, and Advisor Class. Each class of shares differs by its initial sales load, contingent deferred sales charges, voting rights on matters affecting a single class, its exchange privilege and fees primarily due to differing arrangements for distribution and transfer agent fees. Franklin Small Cap Growth Fund was closed to new investors with limited exceptions effective at the close of market February 12, 2015.
The following summarizes the Funds’ significant accounting policies.
a. Financial Instrument Valuation
The Funds’ investments in financial instruments are carried at fair value daily. Fair value is the price that would be received to sell an asset or paid to transfer a liability in an orderly transaction between market participants on the measurement date. The Funds calculate the net asset value (NAV) per share as of 4 p.m. Eastern time each day the New York Stock Exchange (NYSE) is open for trading. Under compliance policies and procedures approved by the Trust’s Board of Trustees (the Board), the Funds’ administrator has responsibility for oversight of valuation, including leading the cross-functional Valuation Committee (VC). The VC provides administration and oversight of the Funds’ valuation policies and procedures, which are approved annually by the Board. Among other things, these procedures allow the Funds to utilize independent pricing services, quotations from securities and financial instrument dealers, and other market sources to determine fair value.
Equity securities listed on an exchange or on the NASDAQ National Market System are valued at the last quoted sale price or the official closing price of the day, respectively. Foreign equity securities are valued as of the close of trading on the foreign stock exchange on which the security is primarily traded or as of 4 p.m. Eastern time, whichever is earlier. The value is then converted into its U.S. dollar equivalent at the foreign exchange rate in effect at 4 p.m. Eastern time on the day that the value of the security is determined. Over-the-counter (OTC) securities are valued within the range of the most recent quoted bid and ask prices. Securities that trade in multiple markets or on multiple exchanges are valued according to the broadest and most representative market. Certain equity securities are valued based upon fundamental characteristics or relationships to similar securities.
Debt securities generally trade in the OTC market rather than on a securities exchange. The Funds’ pricing services use multiple valuation techniques to determine fair value. In instances where sufficient market activity exists, the pricing services may utilize a market-based approach through which quotes from market makers are used to determine fair value. In instances where sufficient market activity may not exist or is limited, the pricing services also utilize proprietary valuation models which may consider market characteristics such as benchmark yield curves, credit spreads, estimated default rates, anticipated market interest rate volatility, coupon rates, anticipated timing of principal repayments, underlying collateral, and other unique security features in order to estimate the relevant cash flows, which are then discounted to calculate the fair value.
Investments in open-end mutual funds are valued at the closing NAV.
The Funds have procedures to determine the fair value of financial instruments for which market prices are not reliable or readily available. Under these procedures, the VC convenes on a regular basis to review such financial instruments and considers a number of factors, including significant unobservable valuation inputs, when arriving at fair value. The VC primarily employs a market-based approach which may use related or comparable assets or liabilities, recent transactions, market multiples, book values, and other relevant information for the investment to determine the fair value of the investment. An income-based valuation approach may also be used in which the anticipated future cash flows of the investment are discounted to calculate fair value. Discounts may also be applied due to the nature or duration of any restrictions on the disposition of the investments. Due to the inherent uncertainty of valuations of such investments, the fair values may differ significantly from the values that would have been used had an active market existed. The VC employs various methods for calibrating these valuation approaches including a regular
66 Semiannual Report
franklintempleton.com
FRANKLIN STRATEGIC SERIES
NOTES TO FINANCIAL STATEMENTS (UNAUDITED)
review of key inputs and assumptions, transactional back-testing or disposition analysis, and reviews of any related market activity.
Trading in securities on foreign securities stock exchanges and OTC markets may be completed before 4 p.m. Eastern time. In addition, trading in certain foreign markets may not take place on every NYSE business day. Occasionally, events occur between the time at which trading in a foreign security is completed and the close of the NYSE that might call into question the reliability of the value of a portfolio security held by the Fund. As a result, differences may arise between the value of the Funds’ portfolio securities as determined at the foreign market close and the latest indications of value at the close of the NYSE. In order to minimize the potential for these differences, the VC monitors price movements following the close of trading in foreign stock markets through a series of country specific market proxies (such as baskets of American Depositary Receipts, futures contracts and exchange traded funds). These price movements are measured against established trigger thresholds for each specific market proxy to assist in determining if an event has occurred that may call into question the reliability of the values of the foreign securities held by the Funds. If such an event occurs, the securities may be valued using fair value procedures, which may include the use of independent pricing services.
When the last day of the reporting period is a non-business day, certain foreign markets may be open on those days that the NYSE is closed, which could result in differences between the value of the Funds’ portfolio securities on the last business day and the last calendar day of the reporting period. Any significant security valuation changes due to an open foreign market are adjusted and reflected by the Funds for financial reporting purposes.
b. Foreign Currency Translation
Portfolio securities and other assets and liabilities denominated in foreign currencies are translated into U.S. dollars based on the exchange rate of such currencies against U.S. dollars on the date of valuation. The Funds may enter into foreign currency exchange contracts to facilitate transactions denominated in a foreign currency. Purchases and sales of securities, income and expense items denominated in foreign currencies are translated into U.S. dollars at the exchange rate in effect on the transaction date. Portfolio securities and assets and liabilities denominated in foreign currencies contain risks that those currencies will decline in value relative to the U.S. dollar. Occasionally, events may impact the availability or reliability of foreign exchange rates used to convert the U.S. dollar equivalent value. If such an event occurs, the foreign exchange rate will be valued at fair value using procedures established and approved by the Board.
The Funds do not separately report the effect of changes in foreign exchange rates from changes in market prices on securities held. Such changes are included in net realized and unrealized gain or loss from investments in the Statements of Operations.
Realized foreign exchange gains or losses arise from sales of foreign currencies, currency gains or losses realized between the trade and settlement dates on securities transactions and the difference between the recorded amounts of dividends, interest, and foreign withholding taxes and the U.S. dollar equivalent of the amounts actually received or paid. Net unrealized foreign exchange gains and losses arise from changes in foreign exchange rates on foreign denominated assets and liabilities other than investments in securities held at the end of the reporting period.
c. Securities Lending
Certain or all Funds participate in an agency based securities lending program to earn additional income. The Fund receives cash collateral against the loaned securities in an amount equal to at least 102% of the fair value of the loaned securities. Collateral is maintained over the life of the loan in an amount not less than 100% of the fair value of loaned securities, as determined at the close of Fund business each day; any additional collateral required due to changes in security values is delivered to the Fund on the next business day. The collateral is deposited into a joint cash account with other funds and is used to invest in a money market fund managed by Franklin Advisers, Inc., an affiliate of the Funds and/or uninvested cash as included in due from custodian in the Statements of Assets and Liabilities. The Fund may receive income from the investment of cash collateral, in addition to lending fees and rebates paid by the borrower. Income from securities loaned, net of fees paid to the securities lending agent and/or third-party vendor, is reported separately in the Statements of Operations. The Fund bears the market risk with respect to the collateral investment, securities loaned, and the risk that the agent may default on its obligations to the Fund. If the borrower defaults on its obligation to return the securities loaned, the Fund has the
franklintempleton.com
Semiannual Report 67
FRANKLIN STRATEGIC SERIES
NOTES TO FINANCIAL STATEMENTS (UNAUDITED)
1. Organization and Significant Accounting
Policies (continued)
c. Securities Lending (continued)
right to repurchase the securities in the open market using the collateral received. The securities lending agent has agreed to indemnify the Funds in the event of default by a third party borrower.
d. Income and Deferred Taxes
It is each Fund’s policy to qualify as a regulated investment company under the Internal Revenue Code. Each Fund intends to distribute to shareholders substantially all of its taxable income and net realized gains to relieve it from federal income and excise taxes. As a result, no provision for U.S. federal income taxes is required.
The Funds may be subject to foreign taxation related to income received, capital gains on the sale of securities and certain foreign currency transactions in the foreign jurisdictions in which the Funds invest. Foreign taxes, if any, are recorded based on the tax regulations and rates that exist in the foreign markets in which the Funds invest. When a capital gain tax is determined to apply, certain or all Funds record an estimated deferred tax liability in an amount that would be payable if the securities were disposed of on the valuation date.
Each Fund may recognize an income tax liability related to its uncertain tax positions under U.S. GAAP when the uncertain tax position has a less than 50% probability that it will be sustained upon examination by the tax authorities based on its technical merits. As of October 31, 2016, each Fund has determined that no tax liability is required in its financial statements related to uncertain tax positions for any open tax years (or expected to be taken in future tax years). Open tax years are those that remain subject to examination and are based on each tax jurisdiction’s statute of limitation.
e. Security Transactions, Investment Income, Expenses and Distributions
Security transactions are accounted for on trade date. Realized gains and losses on security transactions are determined on a specific identification basis. Interest income and estimated expenses are accrued daily. Dividend income is recorded on the ex-dividend date except for certain dividends from securities where the dividend rate is not available. In such cases, the dividend is recorded as soon as the information is received by the Funds. Distributions to shareholders are determined according to income tax regulations (tax basis). Distributable earnings determined on a tax basis may differ from earnings recorded in accordance with U.S. GAAP. These differences may be permanent or temporary. Permanent differences are reclassified among capital accounts to reflect their tax character. These reclassifications have no impact on net assets or the results of operations. Temporary differences are not reclassified, as they may reverse in subsequent periods.
Common expenses incurred by the Trust are allocated among the Funds based on the ratio of net assets of each Fund to the combined net assets of the Trust. Fund specific expenses are charged directly to the Fund that incurred the expense.
Realized and unrealized gains and losses and net investment income, not including class specific expenses, are allocated daily to each class of shares based upon the relative proportion of net assets of each class. Differences in per share distributions, by class, are generally due to differences in class specific expenses.
f. Accounting Estimates
The preparation of financial statements in accordance with U.S. GAAP requires management to make estimates and assumptions that affect the reported amounts of assets and liabilities at the date of the financial statements and the amounts of income and expenses during the reporting period. Actual results could differ from those estimates.
g. Guarantees and Indemnifications
Under the Trust’s organizational documents, its officers and trustees are indemnified by the Trust against certain liabilities arising out of the performance of their duties to the Trust. Additionally, in the normal course of business, the Trust, on behalf of the Funds, enters into contracts with service providers that contain general indemnification clauses. The Trust’s maximum exposure under these arrangements is unknown as this would involve future claims that may be made against the Trust that have not yet occurred. Currently, the Trust expects the risk of loss to be remote.
68 Semiannual Report
franklintempleton.com
FRANKLIN STRATEGIC SERIES
NOTES TO FINANCIAL STATEMENTS (UNAUDITED)
2. Shares of Beneficial Interest
At October 31, 2016, there were an unlimited number of shares authorized (without par value). Transactions in the Funds’ shares were as follows:
| Franklin Focused Core | Franklin Growth | ||||||||||
| Equity Fund | Opportunities Fund | ||||||||||
| Shares | Amount | Shares | Amount | ||||||||
| Class A Shares: | |||||||||||
| Six Months ended October 31, 2016 | |||||||||||
| Shares sold | 235,466 | $ | 3,155,314 | 5,163,015 | $ | 863,259,686 | |||||
| Shares issued on reorganization (Note 9) | — | — | 55,853,813 | 1,099,923,456 | |||||||
| Shares redeemed | (2,022,855 | ) | (27,106,250 | ) | (6,472,691 | ) | (205,187,771 | ) | |||
| Net increase (decrease) | (1,787,389 | ) | $ | (23,950,936 | ) | 54,544,137 | $ | 1,757,995,371 | |||
| Year ended April 30, 2016 | |||||||||||
| Shares sold | 5,194,472 | $ | 76,809,979 | 8,456,259 | $ | 274,758,449 | |||||
| Shares issued in reinvestment of distributions | 264,790 | 3,590,557 | 351,747 | 11,284,114 | |||||||
| Shares redeemed | (3,853,385 | ) | (52,792,892 | ) | (4,566,206 | ) | (143,563,964 | ) | |||
| Net increase (decrease) | 1,605,877 | $ | 27,607,644 | 4,241,800 | $ | 142,478,599 | |||||
| Class C Shares: | |||||||||||
| Six Months ended October 31, 2016 | |||||||||||
| Shares sold | 84,524 | $ | 1,079,777 | 232,956 | $ | 124,591,814 | |||||
| Shares issued on reorganization (Note 9) | — | — | 10,841,658 | 186,242,088 | |||||||
| Shares redeemed | (544,112 | ) | (6,993,409 | ) | (1,752,363 | ) | (48,323,167 | ) | |||
| Net increase (decrease) | (459,588 | ) | $ | (5,913,632 | ) | 9,322,251 | $ | 262,510,735 | |||
| Year ended April 30, 2016 | |||||||||||
| Shares sold | 1,399,717 | $ | 19,891,883 | 2,651,152 | $ | 76,378,591 | |||||
| Shares issued in reinvestment of distributions | 57,646 | 751,703 | 113,685 | 3,199,097 | |||||||
| Shares redeemed | (734,079 | ) | (9,661,775 | ) | (1,354,189 | ) | (37,190,520 | ) | |||
| Net increase (decrease) | 723,284 | $ | 10,981,811 | 1,410,648 | $ | 42,387,168 | |||||
| Class R Shares: | |||||||||||
| Six Months ended October 31, 2016 | |||||||||||
| Shares sold | 837 | $ | 10,953 | (126,931 | ) | $ | 5,433,232 | ||||
| Shares issued on reorganization (Note 9) | — | — | 783,369 | 14,890,143 | |||||||
| Shares redeemed | (11,117 | ) | (145,878 | ) | (287,458 | ) | (8,766,794 | ) | |||
| Net increase (decrease) | (10,280 | ) | $ | (134,925 | ) | 368,980 | $ | 11,556,581 | |||
| Year ended April 30, 2016 | |||||||||||
| Shares sold | 25,274 | $ | 366,702 | 367,541 | $ | 11,531,931 | |||||
| Shares issued in reinvestment of distributions | 706 | 9,480 | 29,367 | 910,971 | |||||||
| Shares redeemed | (16,124 | ) | (217,611 | ) | (545,651 | ) | (17,073,258 | ) | |||
| Net increase (decrease) | 9,856 | $ | 158,571 | (148,743 | ) | $ | (4,630,356 | ) | |||
franklintempleton.com
Semiannual Report 69
| FRANKLIN STRATEGIC SERIES | ||||||||||||
| NOTES TO FINANCIAL STATEMENTS (UNAUDITED) | ||||||||||||
| 2. Shares of Beneficial Interest (continued) | ||||||||||||
| Franklin Focused Core | Franklin Growth | |||||||||||
| Equity Fund | Opportunities Fund | |||||||||||
| Shares | Amount | Shares | Amount | |||||||||
| Class R6 Shares: | ||||||||||||
| Six Months ended October 31, 2016 | ||||||||||||
| Shares sold | 229,459 | $ | 3,111,415 | 633,971 | $ | 89,151,746 | ||||||
| Shares issued on reorganization (Note 9) | — | — | 5,075,827 | 106,635,112 | ||||||||
| Shares redeemed | (1,454,457 | ) | (19,528,562 | ) | (1,414,099 | ) | (46,889,318 | ) | ||||
| Net increase (decrease) | (1,224,998 | ) | $ | (16,417,147 | ) | 4,295,699 | $ | 148,897,540 | ||||
| Year ended April 30, 2016 | ||||||||||||
| Shares sold | 1,219,631 | $ | 18,751,979 | 1,320,454 | $ | 42,825,228 | ||||||
| Shares issued in reinvestment of distributions | 90,028 | 1,233,386 | 99,392 | 3,391,255 | ||||||||
| Shares redeemed | (439,680 | ) | (5,879,147 | ) | (1,180,480 | ) | (39,015,055 | ) | ||||
| Net increase (decrease) | 869,979 | $ | 14,106,218 | 239,366 | $ | 7,201,428 | ||||||
| Advisor Class Shares: | ||||||||||||
| Six Months ended October 31, 2016 | ||||||||||||
| Shares sold | 214,577 | $ | 2,970,836 | 1,578,740 | $ | 173,370,343 | ||||||
| Shares issued on reorganization (Note 9) | — | — | 9,066,575 | 189,308,776 | ||||||||
| Shares redeemed | (136,503 | ) | (1,886,208 | ) | (4,426,394 | ) | (150,160,572 | ) | ||||
| Net increase (decrease) | 78,074 | $ | 1,084,628 | 6,218,921 | $ | 212,518,547 | ||||||
| Year ended April 30, 2016 | ||||||||||||
| Shares sold | 433,979 | $ | 6,439,932 | 1,484,253 | $ | 49,836,416 | ||||||
| Shares issued in reinvestment of distributions | 20,306 | 277,987 | 149,430 | 5,073,151 | ||||||||
| Shares redeemed | (286,239 | ) | (4,052,189 | ) | (1,391,763 | ) | (46,712,491 | ) | ||||
| Net increase (decrease) | 168,046 | $ | 2,665,730 | 241,920 | $ | 8,197,076 | ||||||
| Franklin Small Cap | Franklin Small-Mid Cap | |||||||||||
| Growth Fund | Growth Fund | |||||||||||
| Shares | Amount | Shares | Amount | |||||||||
| Class A Shares: | ||||||||||||
| Six Months ended October 31, 2016 | ||||||||||||
| Shares sold | 1,955,370 | $ | 33,976,888 | 4,653,380 | $ | 153,774,077 | ||||||
| Shares redeemed | (8,348,689 | ) | (145,261,697 | ) | (9,389,913 | ) | (309,901,801 | ) | ||||
| Net increase (decrease) | (6,393,319 | ) | $ | (111,284,809 | ) | (4,736,533 | ) | $ | (156,127,724 | ) | ||
| Year ended April 30, 2016 | ||||||||||||
| Shares sold | 9,355,935 | $ | 164,566,603 | 12,907,569 | $ | 443,875,701 | ||||||
| Shares issued in reinvestment of distributions | 1,032,714 | 17,618,102 | 5,680,738 | 183,487,832 | ||||||||
| Shares redeemed | (23,836,334 | ) | (404,070,186 | ) | (14,552,480 | ) | (499,185,903 | ) | ||||
| Net increase (decrease) | (13,447,685 | ) | $ | (221,885,481 | ) | 4,035,827 | $ | 128,177,630 | ||||
70 Semiannual Report
franklintempleton.com
| FRANKLIN STRATEGIC SERIES | ||||||||||
| NOTES TO FINANCIAL STATEMENTS (UNAUDITED) | ||||||||||
| Franklin Small Cap | Franklin Small-Mid Cap | |||||||||
| Growth Fund | Growth Fund | |||||||||
| Shares | Amount | Shares | Amount | |||||||
| Class C Shares: | ||||||||||
| Six Months ended October 31, 2016 | ||||||||||
| Shares sold | 189,910 | $ | 2,827,886 | 513,196 | $ | 13,004,535 | ||||
| Shares redeemed | (1,724,115 | ) | (25,525,204 | ) | (1,628,019 | ) | (41,267,124 | ) | ||
| Net increase (decrease) | (1,534,205 | ) | $ | (22,697,318 | ) | (1,114,823 | ) | $ | (28,262,589 | ) |
| Year ended April 30, 2016 | ||||||||||
| Shares sold | 849,422 | $ | 12,859,934 | 2,150,607 | $ | 59,253,003 | ||||
| Shares issued in reinvestment of distributions | 266,930 | 3,923,876 | 1,699,234 | 42,175,007 | ||||||
| Shares redeemed | (3,707,026 | ) | (54,046,116 | ) | (3,139,510 | ) | (84,064,834 | ) | ||
| Net increase (decrease) | (2,590,674 | ) | $ | (37,262,306 | ) | 710,331 | $ | 17,363,176 | ||
| Class R Shares: | ||||||||||
| Six Months ended October 31, 2016 | ||||||||||
| Shares sold | 400,545 | $ | 6,662,426 | 286,464 | $ | 8,822,722 | ||||
| Shares redeemed | (960,596 | ) | (16,022,411 | ) | (592,436 | ) | (18,318,444 | ) | ||
| Net increase (decrease) | (560,051 | ) | $ | (9,359,985 | ) | (305,972 | ) | $ | (9,495,722 | ) |
| Year ended April 30, 2016 | ||||||||||
| Shares sold | 1,467,096 | $ | 24,818,077 | 970,177 | $ | 32,177,674 | ||||
| Shares issued in reinvestment of distributions | 110,763 | 1,813,185 | 271,520 | 8,205,344 | ||||||
| Shares redeemed | (1,590,105 | ) | (26,066,522 | ) | (987,525 | ) | (32,102,846 | ) | ||
| Net increase (decrease) | (12,246 | ) | $ | 564,740 | 254,172 | $ | 8,280,172 | |||
| Class R6 Shares: | ||||||||||
| Six Months ended October 31, 2016 | ||||||||||
| Shares sold | 5,543,030 | $ | 105,758,871 | 2,349,956 | $ | 82,422,208 | ||||
| Shares redeemed | (5,438,394 | ) | (101,654,628 | ) | (3,083,985 | ) | (111,865,930 | ) | ||
| Net increase (decrease) | 104,636 | $ | 4,104,243 | (734,029 | ) | $ | (29,443,722 | ) | ||
| Year ended April 30, 2016 | ||||||||||
| Shares sold | 16,170,895 | $ | 309,172,532 | 3,986,227 | $ | 144,238,638 | ||||
| Shares issued in reinvestment of distributions | 871,223 | 15,864,975 | 486,072 | 16,949,319 | ||||||
| Shares redeemed | (10,882,040 | ) | (200,406,687 | ) | (2,469,832 | ) | (86,002,445 | ) | ||
| Net increase (decrease) | 6,160,078 | $ | 124,630,820 | 2,002,467 | $ | 75,185,512 | ||||
| Advisor Class Shares: | ||||||||||
| Six Months ended October 31, 2016 | ||||||||||
| Shares sold | 3,160,020 | $ | 58,580,091 | 1,585,710 | $ | 56,976,859 | ||||
| Shares redeemed | (9,784,530 | ) | (179,203,043 | ) | (2,558,516 | ) | (92,187,215 | ) | ||
| Net increase (decrease) | (6,624,510 | ) | $ | (120,622,952 | ) | (972,806 | ) | $ | (35,210,356 | ) |
| Year ended April 30, 2016 | ||||||||||
| Shares sold | 13,824,812 | $ | 254,897,448 | 2,777,179 | $ | 103,360,464 | ||||
| Shares issued in reinvestment of distributions | 890,640 | 16,138,402 | 1,300,049 | 45,007,699 | ||||||
| Shares redeemed | (19,867,945 | ) | (359,919,358 | ) | (5,295,143 | ) | (193,434,174 | ) | ||
| Net increase (decrease) | (5,152,493 | ) | $ | (88,883,508 | ) | (1,217,915 | ) | $ | (45,066,011 | ) |
franklintempleton.com
Semiannual Report 71
FRANKLIN STRATEGIC SERIES
NOTES TO FINANCIAL STATEMENTS (UNAUDITED)
3. Transactions with Affiliates
Franklin Resources, Inc. is the holding company for various subsidiaries that together are referred to as Franklin Templeton Investments. Certain officers and trustees of the Trust are also officers and/or directors of the following subsidiaries:
| Subsidiary | Affiliation |
| Franklin Advisers, Inc. (Advisers) | Investment manager |
| Franklin Templeton Services, LLC (FT Services) | Administrative manager |
| Franklin Templeton Distributors, Inc. (Distributors) | Principal underwriter |
| Franklin Templeton Investor Services, LLC (Investor Services) | Transfer agent |
a. Management Fees
Franklin Focused Core Equity Fund pays an investment management fee to Advisers based on the average daily net assets of the Fund as follows:
| Annualized Fee Rate | Net Assets | |
| 0.950 | % | Up to and including $500 million |
| 0.850 | % | Over $500 million, up to and including $1 billion |
| 0.800 | % | Over $1 billion, up to and including $1.5 billion |
| 0.750 | % | Over $1.5 billion, up to and including $6.5 billion |
| 0.725 | % | Over $6.5 billion, up to and including $11.5 billion |
| 0.700 | % | Over $11.5 billion, up to and including $16.5 billion |
| 0.690 | % | Over $16.5 billion, up to and including $19 billion |
| 0.680 | % | Over $19 billion, up to and including $21.5 billion |
| 0.670 | % | In excess of $21.5 billion |
Franklin Growth Opportunities Fund pays an investment management fee to Advisers based on the average daily net assets of the Fund as follows:
| Annualized Fee Rate | Net Assets | |
| 0.700 | % | Up to and including $500 million |
| 0.600 | % | Over $500 million, up to and including $1 billion |
| 0.550 | % | Over $1 billion, up to and including $1.5 billion |
| 0.500 | % | Over $1.5 billion, up to and including $6.5 billion |
| 0.475 | % | Over $6.5 billion, up to and including $11.5 billion |
| 0.450 | % | Over $11.5 billion, up to and including $16.5 billion |
| 0.440 | % | Over $16.5 billion, up to and including $19 billion |
| 0.430 | % | Over $19 billion, up to and including $21.5 billion |
| 0.420 | % | In excess of $21.5 billion |
72 Semiannual Report
franklintempleton.com
FRANKLIN STRATEGIC SERIES
NOTES TO FINANCIAL STATEMENTS (UNAUDITED)
Franklin Small Cap Growth Fund pays an investment management fee to Advisers based on the average daily net assets of the Fund as follows:
| Annualized Fee Rate | Net Assets | |
| 0.750 | % | Up to and including $500 million |
| 0.650 | % | Over $500 million, up to and including $1 billion |
| 0.600 | % | Over $1 billion, up to and including $1.5 billion |
| 0.550 | % | Over $1.5 billion, up to and including $6.5 billion |
| 0.525 | % | Over $6.5 billion, up to and including $11.5 billion |
| 0.500 | % | Over $11.5 billion, up to and including $16.5 billion |
| 0.490 | % | Over $16.5 billion, up to and including $19 billion |
| 0.480 | % | Over $19 billion, up to and including $21.5 billion |
| 0.470 | % | In excess of $21.5 billion |
Franklin Small-Mid Cap Growth Fund pays an investment management fee to Advisers based on the average daily net assets of the Fund as follows:
| Annualized Fee Rate | Net Assets | |
| 0.625 | % | Up to and including $100 million |
| 0.500 | % | Over $100 million, up to and including $250 million |
| 0.450 | % | Over $250 million, up to and including $7.5 billion |
| 0.440 | % | Over $7.5 billion, up to and including $10 billion |
| 0.430 | % | Over $10 billion, up to and including $12.5 billion |
| 0.420 | % | Over $12.5 billion, up to and including $15 billion |
| 0.400 | % | In excess of $15 billion |
Effective August 27, 2016, Advisers has contractually agreed to waive or limit its fees so that the management fees paid by Franklin Growth Opportunities Fund do not exceed an annual rate of 0.46% of the fund’s average daily net assets through August 31, 2017.
For the period ended October 31, 2016, each Fund’s annualized effective investment management fee rate based on average daily net assets was as follows:
| Franklin | |||||||
| Franklin | Growth | Franklin | Franklin | ||||
| Focused Core | Opportunities | Small Cap | Small-Mid Cap | ||||
| Equity Fund | Fund | Growth Fund | Growth Fund | ||||
| 0.950 | % | 0.586 | % | 0.614 | % | 0.457 | % |
b. Administrative Fees
Under an agreement with Advisers, FT Services provides administrative services to the Funds. The fee is paid by Advisers based on each of the Funds’ average daily net assets, and is not an additional expense of the Funds.
c. Distribution Fees
The Board has adopted distribution plans for each share class, with the exception of Class R6 and Advisor Class shares, pursuant to Rule 12b-1 under the 1940 Act. Under the Funds’ Class A reimbursement distribution plans, the Funds reimburse Distributors for costs incurred in connection with the servicing, sale and distribution of each Fund’s shares up to the maximum annual plan rate. Under the Class A reimbursement distribution plans, costs exceeding the maximum for the current plan year cannot be reimbursed in subsequent periods. In addition, under the Funds’ Class C and R compensation distribution plans, the Funds pay Distributors for
franklintempleton.com
Semiannual Report 73
FRANKLIN STRATEGIC SERIES
NOTES TO FINANCIAL STATEMENTS (UNAUDITED)
| 3. | Transactions with Affiliates (continued) |
| c. | Distribution Fees (continued) |
costs incurred in connection with the servicing, sale and distribution of each Fund’s shares up to the maximum annual plan rate for each class. The plan year, for purposes of monitoring compliance with the maximum annual plan rates, is February 1 through January 31 for each Fund.
The maximum annual plan rates, based on the average daily net assets, for each class, are as follows:
| Franklin | Franklin | Franklin | Franklin | |||||
| Focused Core | Growth | Small Cap | Small-Mid Cap | |||||
| Equity Fund | Opportunities Fund | Growth Fund | Growth Fund | |||||
| Reimbursement Plans: | ||||||||
| Class A | 0.35 | % | 0.35 | % | 0.35 | % | 0.25 | % |
| Compensation Plans: | ||||||||
| Class C | 1.00 | % | 1.00 | % | 1.00 | % | 1.00 | % |
| Class R | 0.50 | % | 0.50 | % | 0.50 | % | 0.50 | % |
For Franklin Focused Core Equity Fund, Franklin Growth Opportunities Fund and Franklin Small Cap Growth Fund the Board has set the current rate at 0.25% per year for Class A shares until further notice and approval by the Board.
d. Sales Charges/Underwriting Agreements
Front-end sales charges and contingent deferred sales charges (CDSC) do not represent expenses of the Funds. These charges are deducted from the proceeds of sales of fund shares prior to investment or from redemption proceeds prior to remittance, as applicable. Distributors has advised the Funds of the following commission transactions related to the sales and redemptions of the Funds’ shares for the period:
| Franklin | Franklin | Franklin | Franklin | |||||
| Focused Core | Growth | Small Cap | Small-Mid Cap | |||||
| Equity Fund | Opportunities Fund | Growth Fund | Growth Fund | |||||
| Sales charges retained net of commissions paid to | ||||||||
| unaffiliated brokers/dealers | $ | 9,316 | $ | 119,326 | $ | 19,484 | $ | 287,096 |
| CDSC retained | $ | 2,254 | $ | 24,252 | $ | 3,958 | $ | 15,918 |
e. Transfer Agent Fees
Each class of shares, except for Class R6, pays transfer agent fees to Investor Services for its performance of shareholder servicing obligations and reimburses Investor Services for out of pocket expenses incurred, including shareholder servicing fees paid to third parties. These fees are allocated daily based upon their relative proportion of such classes’ aggregate net assets. Class R6 pays Investor Services transfer agent fees specific to that class.
For the period ended October 31, 2016, the Funds paid transfer agent fees as noted in the Statements of Operations of which the following amounts were retained by Investor Services:
| Franklin | Franklin | Franklin | Franklin | |||||
| Focused Core | Growth | Small Cap | Small-Mid Cap | |||||
| Equity Fund | Opportunities Fund | Growth Fund | Growth Fund | |||||
| Transfer agent fees | $ | 55,229 | $ | 1,236,565 | $ | 907,034 | $ | 1,786,486 |
74 Semiannual Report
franklintempleton.com
FRANKLIN STRATEGIC SERIES
NOTES TO FINANCIAL STATEMENTS (UNAUDITED)
f. Investments in Affiliated Management Investment Companies
Certain or all Funds invest in one or more affiliated management investment companies for purposes other than exercising a controlling influence over the management or policies. Management fees paid by the Funds are waived on assets invested in the affiliated management investment companies, as noted in the Statements of Operations, in an amount not to exceed the management and administrative fees paid directly or indirectly by each affiliate. Prior to May 1, 2013, the waiver was accounted for as a reduction to management fees. During the period ended October 31, 2016, certain or all Funds held investments in affiliated management investment companies as follows:
| % of | |||||||||||||
| Affiliated | |||||||||||||
| Number of | Number of | Fund Shares | |||||||||||
| Shares Held | Shares | Value | Outstanding | ||||||||||
| at Beginning | Gross | Gross | Held at End | at End | Investment | Realized | Held at End | ||||||
| of Period | Additions | Reductions | of Period | of Period | Income | Gain (Loss) | of Period | ||||||
| Franklin Focused Core Equity Fund | |||||||||||||
| Non-Controlled Affiliates | |||||||||||||
| Institutional Fiduciary Trust Money | |||||||||||||
| Market Portfolio | – | 23,855,232 | (23,003,201 | ) | 852,031 | $ | 852,031 | $ | – | $ | – | 0.0 | %a |
| Franklin Growth Opportunities Fund | |||||||||||||
| Non-Controlled Affiliates | |||||||||||||
| Institutional Fiduciary Trust Money | |||||||||||||
| Market Portfolio | 52,116,118 | 498,944,116 | (512,296,210 | ) | 38,764,024 | $ | 38,764,024 | $ | – | $ | – | 0.2 | % |
| Franklin Small Cap Growth Fund | |||||||||||||
| Non-Controlled Affiliates | |||||||||||||
| Institutional Fiduciary Trust Money | |||||||||||||
| Market Portfolio | 286,863,418 | 696,607,247 | (860,523,258 | ) | 122,947,407 | $ | 122,947,407 | $ | – | $ | – | 0.7 | % |
| Franklin Small-Mid Cap Growth Fund | |||||||||||||
| Non-Controlled Affiliates | |||||||||||||
| Institutional Fiduciary Trust Money | |||||||||||||
| Market Portfolio | 215,216,548 | 712,037,299 | (719,604,426 | ) | 207,649,421 | $ | 207,649,421 | $ | – | $ | – | 1.2 | % |
| aRounds to less than 0.1%. | |||||||||||||
g. Waiver and Expense Reimbursements
Advisers and Investor Services have contractually agreed in advance to waive or limit their respective fees and to assume as their own expense certain expenses otherwise payable by Franklin Focused Core Equity Fund so that the expenses (excluding distribution fees, and acquired fund fees and expenses) for Class A, Class C, Class R and Advisor Class of the Fund does not exceed 1.00% and Class R6 does not exceed 0.84% based on the average net assets of each class (other than certain non-routine expenses or costs, including those relating to litigation, indemnification, reorganizations, and liquidations) until August 31, 2017. Total expenses waived or paid are not subject to recapture subsequent to the fund’s fiscal year end.
Additionally, Investor Services has contractually agreed in advance to waive or limit its fees so that the Class R6 transfer agent fees for the Funds, except Franklin Focused Core Equity Fund do not exceed 0.01% until August 31, 2017. There were no Class R6 transfer agent fees waived during the period ended October 31, 2016.
franklintempleton.com
Semiannual Report 75
FRANKLIN STRATEGIC SERIES
NOTES TO FINANCIAL STATEMENTS (UNAUDITED)
3. Transactions with Affiliates (continued)
h. Other Affiliated Transactions
At October 31, 2016, one or more of the funds in Franklin Fund Allocator Series owned a percentage of the following Funds’ outstanding shares:
| Franklin | |||||
| Franklin | Growth | Franklin | |||
| Focused Core | Opportunities | Small Cap | |||
| Equity Fund | Fund | Growth Fund | |||
| 13.61 | % | 8.30 | % | 1.97 | % |
4. Expense Offset Arrangement
The Funds have entered into an arrangement with their custodian whereby credits realized as a result of uninvested cash balances are used to reduce a portion of the Funds’ custodian expenses. During the period ended October 31, 2016, the custodian fees were reduced as noted in the Statements of Operations.
5. Income Taxes
For tax purposes, capital losses may be carried over to offset future capital gains, if any. At April 30, 2016, the capital loss carryforwards were as follows:
| Franklin | Franklin | |||
| Growth | Small Cap | |||
| Opportunities Fund | Growth Fund | |||
| Capital loss carryforwards: | ||||
| Short term | $ | 7,179,088 | $ | 6,223,946 |
For tax purposes, the Funds may elect to defer any portion of a post-October capital loss or late-year ordinary loss to the first day of the following fiscal year. At April 30, 2016, the deferred post-October capital losses and late-year ordinary losses were as follows:
| Franklin | Franklin | Franklin | Franklin | |||||
| Focused Core | Growth | Small Cap | Small-Mid Cap | |||||
| Equity Fund | Opportunities Fund | Growth Fund | Growth Fund | |||||
| Realized capital losses | $ | 8,190,676 | $ | — | $ | 190,602,616 | $ | — |
| Late-year ordinary losses | $ | 48,511 | $ | 2,362,625 | $ | 2,532,992 | $ | 4,254,714 |
At October 31, 2016, the cost of investments and net unrealized appreciation (depreciation) for income tax purposes were as follows:
| Franklin | Franklin | Franklin | Franklin | |||||||||
| Focused Core | Growth | Small Cap | Small-Mid Cap | |||||||||
| Equity Fund | Opportunities Fund | Growth Fund | Growth Fund | |||||||||
| Cost of investments | $ | 119,498,812 | $ | 2,415,803,623 | $ | 2,496,555,012 | $ | 2,675,237,197 | ||||
| Unrealized appreciation | $ | 18,816,184 | $ | 1,254,798,183 | $ | 471,872,782 | $ | 815,342,208 | ||||
| Unrealized depreciation | (8,533,463 | ) | (51,675,023 | ) | (239,873,804 | ) | (122,362,193 | ) | ||||
| Net unrealized appreciation (depreciation) | $ | 10,282,721 | $ | 1,203,123,160 | $ | 231,998,978 | $ | 692,980,015 | ||||
Differences between income and/or capital gains as determined on a book basis and a tax basis are primarily due to differing treatments of wash sales.
76 Semiannual Report
franklintempleton.com
FRANKLIN STRATEGIC SERIES
NOTES TO FINANCIAL STATEMENTS (UNAUDITED)
6. Investment Transactions
Purchases and sales of investments (excluding short term securities) for the period ended October 31, 2016, were as follows:
| Franklin | Franklin | Franklin | Franklin | |||||
| Focused Core | Growth | Small Cap | Small-Mid Cap | |||||
| Equity Fund | Opportunities Fund | Growth Fund | Growth Fund | |||||
| Purchases | $ | 6,065,587 | $ | 541,011,089 | $ | 416,813,916 | $ | 581,719,447 |
| Sales | $ | 55,218,791 | $ | 713,312,808 | $ | 668,291,176 | $ | 955,095,540 |
At October 31, 2016, in connection with securities lending transactions, certain or all Funds loaned investments and received cash collateral as follows:
| Equity | ||
| Investmentsa | ||
| Securities lending transactionsb: | ||
| Franklin Growth Opportunities Fund | $ | 20,264,525 |
| Franklin Small Cap Growth Fund. | $ | 70,362,525 |
| Franklin Small-Mid Cap Growth Fund | $ | 53,434,796 |
aThe gross amount of recognized liability for such transactions is included in payable upon return of securities loaned in the Statements of Assets and Liabilities.
bThe agreements can be terminated at any time.
7. Restricted Securities
Certain or all Funds invest in securities that are restricted under the Securities Act of 1933 (1933 Act) or which are subject to legal, contractual, or other agreed upon restrictions on resale. Restricted securities are often purchased in private placement transactions, and cannot be sold without prior registration unless the sale is pursuant to an exemption under the 1933 Act. Disposal of these securities may require greater effort and expense, and prompt sale at an acceptable price may be difficult. The Funds may have registration rights for restricted securities. The issuer generally incurs all registration costs.
At October 31, 2016, certain or all Funds held investments in restricted securities, excluding certain securities exempt from registration under the 1933 Act deemed to be liquid, as follows:
| Principal | ||||||
| Amount/ | Acquisition | |||||
| Shares | Issuer | Date | Cost | Value | ||
| Franklin Growth Opportunities Fund | ||||||
| 35,601,435 | Acerta Pharma BV | 5/06/15 | $ | 2,048,084 | $ | 1,970,682 |
| 2,052,448 | Proterra Inc., pfd., 5, 144A | 9/21/16 | 10,336,621 | 10,336,621 | ||
| 805,800 | Tanium Inc., pfd., G | 9/14/15 | 4,000,233 | 2,865,962 | ||
| Total Restricted Securities (Value is 0.4% of Net Assets) | $ | 16,384,938 | $ | 15,173,265 | ||
| Franklin Small Cap Growth Fund | ||||||
| 6,200,000 | DraftKings Inc., cvt., E, 5.00% | 12/23/15 - 7/20/16 | $ | 6,200,000 | $ | 8,485,319 |
| 825,201 | DraftKings Inc., pfd., D | 8/07/15 | 4,444,444 | 3,401,127 | ||
| 2,029,318 | DraftKings Inc., pfd., D-1 | 8/07/15 | 15,555,553 | 11,242,099 | ||
| 992,804 | Proterra Inc., pfd., 5, 144A | 9/21/16 | 4,999,999 | 4,999,999 | ||
| 1,542,673 | Smule Inc., pfd., G, 144A | 5/31/16 | 11,099,995 | 11,099,995 | ||
| Total Restricted Securities (Value is 1.5% of Net Assets) | $ | 42,299,991 | $ | 39,228,539 | ||
| Franklin Small-Mid Cap Growth Fund | ||||||
| 5,000,000 | DraftKings Inc., cvt., E, 5.00% | 12/23/15 | $ | 5,000,000 | $ | 6,842,999 |
| 660,161 | DraftKings Inc., pfd., D | 8/07/15 | 3,555,556 | 2,720,902 | ||
| 1,623,455 | DraftKings Inc., pfd., D-1 | 8/07/15 | 12,444,447 | 8,993,683 | ||
| 1,416,913 | Proterra Inc., pfd., 5, 144A | 9/21/16 | 7,135,914 | 7,135,914 | ||
| Total Restricted Securities (Value is 0.8% of Net Assets) | $ | 28,135,917 | $ | 25,693,498 | ||
franklintempleton.com
Semiannual Report 77
FRANKLIN STRATEGIC SERIES
NOTES TO FINANCIAL STATEMENTS (UNAUDITED)
8. Holdings of 5% Voting Securities of Portfolio Companies
The 1940 Act defines "affiliated companies" to include investments in portfolio companies in which a fund owns 5% or more of the outstanding voting securities. During the period ended October 31, 2016, certain or all Funds held investments in “affiliated companies” as follows:
| Number of | Number of | |||||||||||
| Shares Held | Shares | Value at | Realized | |||||||||
| at Beginning | Gross | Gross | Held at End | End of | Investment | Capital | ||||||
| Name of Issuer | of Period | Additions | Reductions | of Period | Period | Income | Gain (Loss) | |||||
| Franklin Small Cap Growth Fund | ||||||||||||
| Non-Controlled Affiliates | ||||||||||||
| 2U Inc | 2,955,523 | — | (572,271 | ) | 2,383,252 | $ | 83,080,165 | $ | — | $ | 3,635,085 | |
| Aratana Therapeutics Inc | 2,697,019 | — | — | 2,697,019 | 21,845,854 | — | — | |||||
| The KEYW Holding Corp | 3,851,460 | — | (1,342,900 | ) | 2,508,560 | 26,314,794 | — | (3,467,313 | ) | |||
| Lattice Semiconductor Corp | 6,466,700 | — | (288,000 | ) | 6,178,700 | 37,504,709 | — | (119,213 | ) | |||
| M/I Homes Inc | 1,385,700 | — | — | 1,385,700 | 29,806,407 | — | — | |||||
| Nanometrics Inc | 1,610,800 | — | (199,000 | ) | 1,411,800 | 29,492,502 | — | 884,300 | ||||
| Pfenex Inc | 1,175,631 | — | — | 1,175,631 | 9,416,804 | — | — | |||||
| The Spectranetics Corp | 2,276,600 | — | (287,600 | ) | 1,989,000 | —a | — | (3,134,514 | ) | |||
| Sportsman’s Warehouse | ||||||||||||
| Holdings Inc | 2,972,800 | 322,200 | — | 3,295,000 | 30,314,000 | — | — | |||||
| US Ecology Inc | 1,119,090 | — | (159,400 | ) | 959,690 | —a | — | (282,983 | ) | |||
| Total Affiliated Securities (Value is 10.1% of Net Assets) | $ | 267,775,235 | $ | — | $ | (2,484,638 | ) | |||||
aAs of October 31, 2016, no longer an affiliate.
9. Reorganization
On August 26, 2016, Franklin Growth Opportunities Fund (Surviving Fund), pursuant to a plan of reorganization approved on August 5, 2016 by shareholders of Franklin Flex Cap Growth Fund (Acquired Fund), acquired 100% of the Acquired Fund’s net assets, primarily made up of investment securities, which included $1,013,454,475 of unrealized appreciation, through a tax-free exchange of 81,621,242 shares of the Surviving Fund (valued at $1,596,999,575). Immediately after the completion of the reorganization, the combined net assets of the Surviving Fund were $3,936,549,167.
The primary purpose for the reorganization was to combine the Acquired Fund with a fund that has identical investment goals and generally similar principal investment strategies and principal investment risk, better historical investment performance, both on a total return basis and a risk-adjusted basis, and more favorable sales prospects. The estimated cost of the reorganization was $797,000 of which the Surviving Fund and the Acquired Fund each paid 25% and Advisers paid 50%. The allocated portion of the Surviving Fund’s reorganization expenses are included with other expenses in the Statement of Operations.
Assuming the reorganization had been completed on May 1, 2016, the Surviving Fund’s pro forma results of operations, would have been as follows:
| Net Increase | |||||||
| Net Realized and | (Decrease) in Net | ||||||
| Unrealized Gain | Assets from | ||||||
| Period | Net Investment Income (Loss) | (Loss) | Operations | ||||
| For the period May 1, 2016 through October 31, 2016 | $ | (4,577,195 | ) | $ | 218,802,627 | $ | 214,225,432 |
78 Semiannual Report
franklintempleton.com
FRANKLIN STRATEGIC SERIES
NOTES TO FINANCIAL STATEMENTS (UNAUDITED)
Subsequent to the reorganization, the Suriviving Fund has been managed as a single entity. Accordingly, it is impracticable to identify the amounts of investment income and net investment income attributable to the Acquired Fund’s assets after the completion of the reorganization.
10. Credit Facility
Certain or all Funds, together with other U.S. registered and foreign investment funds (collectively, Borrowers), managed by Franklin Templeton Investments, are borrowers in a joint syndicated senior unsecured credit facility totaling $2 billion (Global Credit Facility) which matures on February 10, 2017. This Global Credit Facility provides a source of funds to the Borrowers for temporary and emergency purposes, including the ability to meet future unanticipated or unusually large redemption requests.
Under the terms of the Global Credit Facility, the Funds shall, in addition to interest charged on any borrowings made by the Funds and other costs incurred by the Funds, pay their share of fees and expenses incurred in connection with the implementation and maintenance of the Global Credit Facility, based upon their relative share of the aggregate net assets of all of the Borrowers, including an annual commitment fee of 0.15% based upon the unused portion of the Global Credit Facility. These fees are reflected in other expenses in the Statements of Operations. During the period ended October 31, 2016, the Funds did not use the Global Credit Facility.
11. Fair Value Measurements
The Funds follow a fair value hierarchy that distinguishes between market data obtained from independent sources (observable inputs) and the Funds’ own market assumptions (unobservable inputs). These inputs are used in determining the value of the Funds’ financial instruments and are summarized in the following fair value hierarchy:
- Level 1 – quoted prices in active markets for identical financial instruments
- Level 2 – other significant observable inputs (including quoted prices for similar financial instruments, interest rates, prepayment speed, credit risk, etc.)
- Level 3 – significant unobservable inputs (including the Funds’ own assumptions in determining the fair value of financial instruments)
The input levels are not necessarily an indication of the risk or liquidity associated with financial instruments at that level.
For movements between the levels within the fair value hierarchy, the Funds have adopted a policy of recognizing the transfers as of the date of the underlying event which caused the movement.
A summary of inputs used as of October 31, 2016, in valuing the Funds’ assets carried at fair value, is as follows:
| Level 1 | Level 2 | Level 3 | Total | |||||
| Franklin Focused Core Equity Fund | ||||||||
| Assets: | ||||||||
| Investments in Securities: | ||||||||
| Equity Investmentsa | $ | 128,929,502 | $ | — | $ | — | $ | 128,929,502 |
| Short Term Investments | 852,031 | — | — | 852,031 | ||||
| Total Investments in Securities | $ | 129,781,533 | $ | — | $ | — | $ | 129,781,533 |
franklintempleton.com
Semiannual Report 79
FRANKLIN STRATEGIC SERIES
NOTES TO FINANCIAL STATEMENTS (UNAUDITED)
| 11. Fair Value Measurements (continued) | |||||||||
| Level 1 | Level 2 | Level 3 | Total | ||||||
| Franklin Growth Opportunities Fund | |||||||||
| Assets: | |||||||||
| Investments in Securities: | |||||||||
| Equity Investments:b | |||||||||
| Consumer Discretionary | $ | 497,517,673 | $ | — | $ | 10,336,621 | $ | 507,854,294 | |
| Health Care | 518,346,431 | — | 1,970,682 | 520,317,113 | |||||
| Information Technology | 1,634,369,496 | — | 2,865,962 | 1,637,235,458 | |||||
| All Other Equity Investmentsa | 914,755,894 | — | — | 914,755,894 | |||||
| Short Term Investments | 38,764,024 | — | — | 38,764,024 | |||||
| Total Investments in Securities | $ | 3,603,753,518 | $ | — | $ | 15,173,265 | $ | 3,618,926,783 | |
| Receivables: | |||||||||
| Investment Securities Sold | $ | — | $ | — | $ | 3,018,135 | $ | 3,018,135 | |
| Franklin Small Cap Growth Fund | |||||||||
| Assets: | |||||||||
| Investments in Securities: | |||||||||
| Equity Investments:b | |||||||||
| Consumer Discretionary | $ | 455,957,539 | $ | — | $ | 19,643,225 | $ | 475,600,764 | |
| Information Technology | 749,302,002 | — | 11,099,995 | 760,401,997 | |||||
| All Other Equity Investmentsa | 1,361,118,503 | — | — | 1,361,118,503 | |||||
| Convertible Bonds | — | — | 8,485,319 | 8,485,319 | |||||
| Short Term Investments | 122,947,407 | — | — | 122,947,407 | |||||
| Total Investments in Securities | $ | 2,689,325,451 | $ | — | $ | 39,228,539 | $ | 2,728,553,990 | |
| Franklin Small-Mid Cap Growth Fund | |||||||||
| Assets: | |||||||||
| Investments in Securities: | |||||||||
| Equity Investments:b | |||||||||
| Consumer Discretionary | $ | 582,493,138 | $ | — | $ | 18,850,499 | $ | 601,343,637 | |
| All Other Equity Investmentsa | 2,552,381,155 | — | — | 2,552,381,155 | |||||
| Convertible Bonds | — | — | 6,842,999 | 6,842,999 | |||||
| Short Term Investments | 207,649,421 | — | — | 207,649,421 | |||||
| Total Investments in Securities | $ | 3,342,523,714 | $ | — | $ | 25,693,498 | $ | 3,368,217,212 | |
| aFor detailed categories, see the accompanying Statement of Investments. | |||||||||
| bIncludes common and preferred stocks. | |||||||||
80 Semiannual Report
franklintempleton.com
FRANKLIN STRATEGIC SERIES
NOTES TO FINANCIAL STATEMENTS (UNAUDITED)
A reconciliation of assets in which Level 3 inputs are used in determining fair value is presented when there are significant Level 3 financial instruments at the end of the period. At October 31, 2016, the reconciliation of assets is as follows:
| Net Change in | ||||||||||||||||
| Balance at | Transfers | Net Unrealized | Balance at | Unrealized Appreciation | ||||||||||||
| Beginning of | Into (Out of) | Cost Basis | Net Realized | Appreciation | End of | (Depreciation) on Assets | ||||||||||
| Period | Purchases | Sales | Level 3 | Adjustments | Gain (Loss) | (Depreciation) | Period | Held at Period End | ||||||||
| Franklin Small Cap Growth Fund | ||||||||||||||||
| Assets: | ||||||||||||||||
| Investments in Securities: | ||||||||||||||||
| Equity Investments:a | ||||||||||||||||
| Consumer Discretionary | $ | 10,761,537 | $ | 4,999,999 | $– | $– | $– | $– | $ | 3,881,689 | $ | 19,643,225 | $ | 3,881,689 | ||
| Information Technology | – | 11,099,995 | – | – | – | – | – | 11,099,995 | – | |||||||
| Convertible Bonds | 9,726,750 | 1,200,000 | – | – | – | – | (2,441,431 | ) | 8,485,319 | (2,441,431 | ) | |||||
| Total Investments in Securities | $ | 20,488,287 | $ | 17,299,994 | $– | $– | $– | $– | $ | 1,440,258 | $ | 39,228,539 | $ | 1,440,258 | ||
| aIncludes common and preferred stocks as well as other equity investments. | ||||||||||||||||
Significant unobservable valuation inputs developed by the VC for material Level 3 financial instruments and impact to fair value as a result of changes in unobservable valuation inputs as of October 31, 2016, are as follows:
| Impact to Fair | |||||||
| Fair Value at | Value if Input | ||||||
| Description | End of Period | Valuation Technique | Unobservable Input | Amount | Increasesa | ||
| Franklin Small Cap Growth Fund | |||||||
| Assets: | |||||||
| Investments in Securities: | |||||||
| Equity Investments:b | |||||||
| Consumer Discretionary | $ | 23,128,545 | Discounted Cash | Free Cash Flow | $4,940 | (mil) | Increasec |
| Flow Model | Discount Rate | 26.9 | % | Decreasec | |||
| Market Comparables | Discount for lack of marketability | 15.4 | % | Decreasec | |||
| All Other Investmentsd | 16,099,994 | ||||||
| Total | $ | 39,228,539 |
aRepresents the directional change in the fair value of the Level 3 financial instruments that would result from a significant and reasonable increase in the corresponding
input. A significant and reasonable decrease in the input would have the opposite effect. Significant impacts, if any, to fair value and/or net assets have been indicated.
bIncludes preferred stocks and convertible bonds.
cRepresents a significant impact to fair value but not net assets.
dIncludes fair value of immaterial financial instruments developed using various valuation techniques and unobservable inputs. May also include financial instruments with
values derived using prior transaction prices or third party pricing information without adjustment for which such inputs are also unobservable.
12. Subsequent Events
The Funds have evaluated subsequent events through the issuance of the financial statements and determined that no events have occurred that require disclosure.
| Abbreviations |
| Selected Portfolio |
| ADR American Depositary Receipt |
franklintempleton.com
Semiannual Report 81
FRANKLIN STRATEGIC SERIES
Shareholder Information
Proxy Voting Policies and Procedures
The Trust’s investment manager has established Proxy Voting Policies and Procedures (Policies) that the Trust uses to determine how to vote proxies relating to portfolio securities. Shareholders may view the Trust’s complete Policies online at franklintempleton.com. Alternatively, shareholders may request copies of the Policies free of charge by calling the Proxy Group collect at (954) 527-7678 or by sending a written request to: Franklin Templeton Companies, LLC, 300 S.E. 2nd Street, Fort Lauderdale, FL 33301, Attention: Proxy Group. Copies of the Trust’s proxy voting records are also made available online at franklintempleton.com and posted on the U.S. Securities and Exchange Commission’s website at sec.gov and reflect the most recent 12-month period ended June 30.
Quarterly Statement of Investments
The Trust files a complete statement of investments with the U.S. Securities and Exchange Commission for the first and third quarters for each fiscal year on Form N-Q. Shareholders may view the filed Form N-Q by visiting the Commission’s website at sec.gov. The filed form may also be viewed and copied at the Commission’s Public Reference Room in Washington, DC. Information regarding the operations of the Public Reference Room may be obtained by calling (800) SEC-0330.
82 Semiannual Report
franklintempleton.com
This page intentionally left blank.
This page intentionally left blank.
| Contents | |
| Semiannual Report | |
| Economic and Market Overview | 3 |
| Franklin Biotechnology Discovery Fund | 4 |
| Franklin Natural Resources Fund | 9 |
| Financial Highlights and Statements of Investments | 16 |
| Financial Statements | 31 |
| Notes to Financial Statements | 35 |
| Shareholder Information | 47 |
Visit franklintempleton.com for fund updates, to access your account, or to find helpful financial planning tools.
2 Semiannual Report
franklintempleton.com
Semiannual Report
Economic and Market Overview
The U.S. economy expanded during the six months under review. The economy grew at a faster pace in 2016’s third quarter than in the second quarter, mainly due to personal consumption expenditures, exports, private inventory investment, federal government spending and nonresidential fixed investment. Manufacturing conditions remained volatile but generally expanded, and the services sector continued to grow. The unemployment rate decreased slightly from 5.0% in April to 4.9% at period-end.1 Monthly retail sales were volatile but grew during most of the review period. Inflation, as measured by the Consumer Price Index, remained relatively subdued for most of the period, but rose slightly toward period-end.
The U.S. Federal Reserve (Fed) kept its target interest rate at 0.25–0.50% at its September meeting. The Fed noted that although the case for raising rates has strengthened, it will wait for further evidence of continued progress toward its objectives.
U.S. equity markets rose during the review period, benefiting from mostly upbeat economic data and better corporate earnings in the U.S., signs of improvement in the Chinese and European economies, and ongoing expansionary monetary policies from key central banks. A rally in crude oil prices and the Fed’s decision to keep interest rates unchanged at its September meeting further boosted investor confidence. However, the U.K.’s historic vote to leave the European Union (also known as “Brexit”) and global growth concerns weighed on market sentiment. The broad U.S. stock market ended the six-month period higher, as measured by the Standard & Poor’s 500 Index.
The foregoing information reflects our analysis and opinions as of October 31, 2016. The information is not a complete analysis of every aspect of any market, country, industry, security or fund. Statements of fact are from sources considered reliable.
1. Source: Bureau of Labor Statistics.
franklintempleton.com
Semiannual Report 3
Franklin Biotechnology Discovery Fund
This semiannual report for Franklin Biotechnology Discovery Fund covers the period ended October 31, 2016. Effective July 8, 2014, with limited exceptions, the Fund closed to new investors. Effective May 16, 2016, the Fund reopened to new investors.
Your Fund’s Goal and Main Investments
The Fund seeks capital appreciation by investing at least 80% of its net assets in securities of biotechnology companies and discovery research firms located in the U.S. and other countries.
Performance Overview
The Fund’s Class A shares delivered a +0.34% cumulative total return for the six months under review. In comparison, the NASDAQ Biotechnology Index®, which tracks U.S. and international-based biotechnology stocks, had a -4.18% total return.1 Also in comparison, the Standard & Poor’s 500 Index, which is a broad measure of the U.S. stock market, generated a +4.06% total return.1 Finally, domestic and international-based stocks, as measured by the NASDAQ Composite Index®, produced a +9.33% total return.1 You can find the Fund’s long-term performance data in the Performance Summary beginning on page 6.
Performance data represent past performance, which does not guarantee future results. Investment return and principal value will fluctuate, and you may have a gain or loss when you sell your shares. Current performance may differ from figures shown. For most recent month-end performance, go to franklintempleton.com or call (800) 342-5236.
Investment Strategy
We are research driven, fundamental investors, pursuing a growth strategy. As bottom-up investors focusing primarily on individual securities, we choose companies that have identifiable drivers of future earnings growth and that present, in our opinion, the best trade-off between earnings growth, business and financial risk, and valuation. We rely on a team of analysts to help provide in-depth industry expertise and use both qualitative and quantitative analysis to evaluate companies for distinct and sustainable competitive advantages likely to
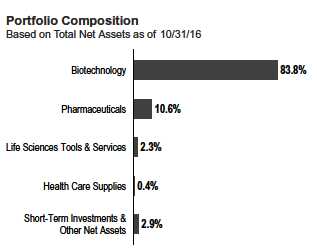
lead to growth in earnings and/or share price. Competitive advantages, such as a particular product niche, proven technology, sound financial position and strong management, are all factors we believe may contribute to strong growth potential.
Manager’s Discussion
During the six months under review, the biotechnology industry experienced significant volatility in response to increased scrutiny over drug pricing leading up to the U.S. presidential election in November. Please keep in mind that volatility is not uncommon in the biotechnology industry, and we seek to take advantage of short-term volatility by initiating positions or adding to existing holdings in companies we believe are undervalued.
Key contributors to the Fund’s absolute performance during the reporting period included Medivation,2 Anacor Pharmaceuticals2 and TESARO. Biopharmaceutical company Medivation was acquired by Pfizer at a significant premium, in a deal announced in August and closed in September, which led to strong appreciation for its shares. Anacor Pharmaceuticals, which focuses on discovering, developing and commercializing novel small-molecule therapeutics derived from its boron chemistry platform, also bolstered results as it was acquired by Pfizer in June at a significant premium. Oncology-focused biopharmaceutical company TESARO announced better-than-expected Phase 3 trial results in June for its PARP
1. Source: Morningstar.
The indexes are unmanaged and include reinvestment of any income or distributions. They do not reflect any fees, expenses or sales charges. One cannot invest directly in an
index, and an index is not representative of the Fund’s portfolio.
2. Not held at period-end.
See www.franklintempletondatasources.com for additional data provider information.
4 Semiannual Report
franklintempleton.com
FRANKLIN BIOTECHNOLOGY DISCOVERY FUND
inhibitor, niraparib, in ovarian cancer. We believe niraparib may have a best-in-class profile and that the trial results demonstrated a broad market potential for the drug.
| Top 10 Holdings | ||
| 10/31/16 | ||
| Company | % of Total | |
| Sector/Industry | Net Assets | |
| Celgene Corp. | 9.8 | % |
| Biotechnology | ||
| Biogen Inc. | 8.1 | % |
| Biotechnology | ||
| Tesaro Inc. | 7.6 | % |
| Biotechnology | ||
| Gilead Sciences Inc. | 7.6 | % |
| Biotechnology | ||
| Incyte Corp. | 4.8 | % |
| Biotechnology | ||
| Amgen Inc. | 4.5 | % |
| Biotechnology | ||
| Regeneron Pharmaceuticals Inc. | 3.2 | % |
| Biotechnology | ||
| Vertex Pharmaceuticals Inc. | 3.0 | % |
| Biotechnology | ||
| Alexion Pharmaceuticals Inc. | 2.8 | % |
| Biotechnology | ||
| BioMarin Pharmaceutical Inc. | 2.7 | % |
| Biotechnology |
In contrast, key detractors from the Fund’s absolute performance included Gilead Sciences, Heron Therapeutics and ACADIA Pharmaceuticals. Shares of biopharmaceutical company Gilead Sciences declined along with the health care sector. The company was pressured by weakening sales of its hepatitis C drug Harvoni. Gilead was also hampered by a lack of transformative merger-and-acquisition activity during the period. Clinical-stage biotechnology company Heron Therapeutics reported results that missed analysts’ expectations, which pressured its shares. Further hurting shares were delays in the U.S. Food and Drug Administraton’s approval of the company’s chemotherapy-induced nausea and vomiting treatment, Sustol, which was finally approved in August, signifying Heron’s first regulatory approval. ACADIA Pharmaceuticals, a biopharmaceutical company that develops and commercializes small-molecule drugs to address unmet medical needs in central nervous system disorders, launched its first and only commercial product, Parkinson’s disease psychosis drug Nuplazid, in May. However, second-quarter 2016 sales were well below the company’s significant expenses. Further pressuring shares were the company’s additional stock offerings in August, which diluted outstanding shares. The company is in the midst of an effort to transform itself from a clinical-stage enterprise into a commercial one, which has created some investor caution as this can be a challenging transition to execute successfully.
Thank you for your continued participation in Franklin Biotechnology Discovery Fund. We look forward to serving your future investment needs.

The foregoing information reflects our analysis, opinions and portfolio holdings as of October 31, 2016, the end of the reporting period. The way we implement our main investment strategies and the resulting portfolio holdings may change depending on factors such as market and economic conditions. These opinions may not be relied upon as investment advice or an offer for a particular security. The information is not a complete analysis of every aspect of any market, country, industry, security or the Fund. Statements of fact are from sources considered reliable, but the investment manager makes no representation or warranty as to their completeness or accuracy. Although historical performance is no guarantee of future results, these insights may help you understand our investment management philosophy.
CFA® is a trademark owned by CFA Institute.
franklintempleton.com
Semiannual Report 5
FRANKLIN BIOTECHNOLOGY DISCOVERY FUND
Performance Summary as of October 31, 2016
The performance table does not reflect any taxes that a shareholder would pay on Fund dividends, capital gain distributions, if any, or any realized gains on the sale of Fund shares. Total return reflects reinvestment of the Fund’s dividends and capital gain distributions, if any, and any unrealized gains or losses.
Performance as of 10/31/161
Cumulative total return excludes sales charges. Average annual total returns include maximum sales charges. Sales charges will vary depending on the size of the investment and the class of share purchased. The maximum is 5.75% and the minimum is 0%. Class A: 5.75% maximum initial sales charge; Advisor Class: no sales charges. For other share classes, visit franklintempleton.com.
| Cumulative | Average Annual | Average Annual | ||||
| Share Class | Total Return2 | Total Return3 | Total Return (9/30/16)4 | |||
| A | ||||||
| 6-Month | +0.34 | % | -5.43 | % | ||
| 1-Year | -18.42 | % | -23.11 | % | -8.78 | % |
| 5-Year | +150.84 | % | +18.78 | % | +23.70 | % |
| 10-Year | +209.05 | % | +11.28 | % | +13.47 | % |
| Advisor5 | ||||||
| 6-Month | +0.47 | % | +0.47 | % | ||
| 1-Year | -18.23 | % | -18.23 | % | -2.98 | % |
| 5-Year | +154.28 | % | +20.52 | % | +25.51 | % |
| 10-Year | +215.21 | % | +12.17 | % | +14.37 | % |
Performance data represent past performance, which does not guarantee future results. Investment return and principal value will fluctuate, and you may have a gain or loss when you sell your shares. Current performance may differ from figures shown. For most recent month-end performance, go to franklintempleton.com or call (800) 342-5236.
See page 7 for Performance Summary footnotes.
6 Semiannual Report
franklintempleton.com
| FRANKLIN BIOTECHNOLOGY DISCOVERY FUND | ||||
| PERFORMANCE SUMMARY | ||||
| Total Annual Operating Expenses6 | ||||
| Share Class | With Waiver | Without Waiver | ||
| A | 0.99 | % | 1.00 | % |
| Advisor5 | 0.75 | % | 0.76 | % |
Each class of shares is available to certain eligible investors and has different annual fees and expenses, as described in the prospectus.
All investments involve risks, including possible loss of principal. The Fund is a nondiversified fund that concentrates in a single sector, which involves risks such
as patent considerations, product liability, government regulatory requirements, and regulatory approval for new drugs and medical products. Biotechnology
companies often are small and/or relatively new. Smaller companies can be particularly sensitive to changes in economic conditions and have less certain growth
prospects than larger, more established companies and can be volatile, especially over the short term. The Fund may also invest in foreign companies, which
involve special risks, including currency fluctuations and political uncertainty. The Fund is actively managed but there is no guarantee that the manager’s
investment decisions will produce the desired results. The Fund’s prospectus also includes a description of the main investment risks.
1. The Fund has a fee waiver associated with any investment it makes in a Franklin Templeton money fund and/or other Franklin Templeton fund, contractually guaranteed
through its current fiscal year-end. Fund investment results reflect the fee waiver; without this waiver, the results would have been lower.
2. Cumulative total return represents the change in value of an investment over the periods indicated.
3. Average annual total return represents the average annual change in value of an investment over the periods indicated. Return for less than one year, ifany,hasnotbeen
annualized.
4. In accordance with SEC rules, we provide standardized average annual total return information through the latest calendar quarter.
5. Effective 9/1/09, the Fund began offering Advisor Class shares, which do not have sales charges or a Rule 12b-1 plan. Performance quotations for this class reflect the
following methods of calculation: (a) For periods prior to 9/1/09, a restated figure is used based upon the Fund’s Class A performance, excluding the effect ofClassA’s
maximum initial sales charge, but reflecting the effect of the Class A Rule 12b-1 fees; and (b) for periods after 9/1/09, actual Advisor Class performance is used reflecting all
charges and fees applicable to that class. Since 9/1/09 (commencement of sales), the cumulative and average annual total returns of Advisor Class shares were +222.34% and
+17.75%.
6. Figures are as stated in the Fund’s current prospectus and may differ from the expense ratios disclosed in the Your Fund’s Expenses and Financial Highlights sections in this
report. In periods of market volatility, assets may decline significantly, causing total annual Fund operating expenses to become higher than the figures shown.
franklintempleton.com
Semiannual Report 7
FRANKLIN BIOTECHNOLOGY DISCOVERY FUND
Your Fund’s Expenses
As a Fund shareholder, you can incur two types of costs: (1) transaction costs, including sales charges (loads) on Fund purchases and redemptions; and (2) ongoing Fund costs, including management fees, distribution and service (12b-1) fees, and other Fund expenses. All mutual funds have ongoing costs, sometimes referred to as operating expenses. The table below shows ongoing costs of investing in the Fund and can help you understand these costs and compare them with those of other mutual funds. The table assumes a $1,000 investment held for the six months indicated.
Actual Fund Expenses
The table below provides information about actual account values and actual expenses in the columns under the heading “Actual.” In these columns the Fund’s actual return, which includes the effect of Fund expenses, is used to calculate the “Ending Account Value” for each class of shares. You can estimate the expenses you paid during the period by following these steps (of course, your account value and expenses will differ from those in this illustration): Divide your account value by $1,000 (if your account had an $8,600 value, then $8,600 ÷ $1,000 = 8.6). Then multiply the result by the number in the row for your class of shares under the headings “Actual” and “Expenses Paid During Period” (if Actual Expenses Paid During Period were $7.50, then 8.6 x $7.50 = $64.50). In this illustration, the actual expenses paid this period are $64.50.
Hypothetical Example for Comparison with Other Funds
Under the heading “Hypothetical” in the table, information is provided about hypothetical account values and hypothetical expenses based on the Fund’s actual expense ratio and an assumed rate of return of 5% per year before expenses, which is not the Fund’s actual return. This information may not be used to estimate the actual ending account balance or expenses you paid for the period, but it can help you compare ongoing costs of investing in the Fund with those of other funds. To do so, compare this 5% hypothetical example for the class of shares you hold with the 5% hypothetical examples that appear in the shareholder reports of other funds.
Please note that expenses shown in the table are meant to highlight ongoing costs and do not reflect any transactional costs. Therefore, information under the heading “Hypothetical” is useful in comparing ongoing costs only, and will not help you compare total costs of owning different funds. In addition, if transactional costs were included, your total costs would have been higher.
| Actual | Hypothetical | |||||||||||
| (actual return after expenses) | (5% annual return before expenses) | |||||||||||
| Expenses | Expenses | Net | ||||||||||
| Beginning | Ending | Paid During | Ending | Paid During | Annualized | |||||||
| Share | Account | Account | Period | Account | Period | Expense | ||||||
| Class | Value 5/1/16 | Value 10/31/16 | 5/1/16–10/31/161,2 | Value 10/31/16 | 5/1/16–10/31/161,2 | Ratio2 | ||||||
| A | $ | 1,000 | $ | 1,003.40 | $ | 5.20 | $ | 1,020.01 | $ | 5.24 | 1.03 | % |
| C | $ | 1,000 | $ | 999.60 | $ | 8.97 | $ | 1,016.23 | $ | 9.05 | 1.78 | % |
| R6 | $ | 1,000 | $ | 1,005.50 | $ | 3.08 | $ | 1,022.13 | $ | 3.11 | 0.61 | % |
| Advisor | $ | 1,000 | $ | 1,004.70 | $ | 3.94 | $ | 1,021.27 | $ | 3.97 | 0.78 | % |
1. Expenses are equal to the annualized expense ratio for the six-month period as indicated above–in the far right column–multiplied by the simple average account value
over the period indicated, and then multiplied by 184/365 to reflect the one-half year period.
2. Reflects expenses after fee waivers and expense reimbursements. Does not include acquired fund fees and expenses.
8 Semiannual Report
franklintempleton.com
Franklin Natural Resources Fund
This semiannual report for Franklin Natural Resources Fund covers the period ended October 31, 2016.
Your Fund’s Goal and Main Investments
The Fund seeks high total return (total return consists of capital appreciation and current dividend and interest income) by investing, under normal market conditions, at least 80% of its net assets in equity and debt securities of companies that own, produce, refine, process, transport or market natural resources, as well as those that provide related services.
Performance Overview
The Fund’s Class A shares delivered a +0.12% cumulative total return for the six months under review. In comparison, the Standard & Poor’s (S&P®) North American Natural Resources Sector Index, which tracks companies involved in industries such as mining, energy, timber and forestry services, and the production of pulp and paper, generated a +1.73% total return.1 Also in comparison, the S&P 500 Index, which is a broad measure of the U.S. stock market, generated a +4.06% total return.1 Please note index performance information is provided for reference and we do not attempt to track any index but rather undertake investments on the basis of fundamental research. The Fund’s strategy, which focuses on companies with higher long-term growth potential, differs from the natural resources index’s large weighting in income-oriented companies that typically provide more limited opportunities for growth. This difference may occasionally lead to wide performance discrepancies, especially in periods when investors focus on short-term safety and yield or, conversely, when investors focus more heavily on companies with stronger growth prospects and greater commodity price leverage. You can find the Fund’s long-term performance data in the Performance Summary beginning on page 13.
Performance data represent past performance, which does not guarantee future results. Investment return and principal value will fluctuate, and you may have a gain or loss when you sell your shares. Current performance may differ from figures shown. For most recent month-end performance, go to franklintempleton.com or call (800) 342-5236.
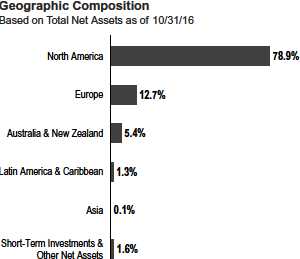
Investment Strategy
We are research driven, fundamental investors, pursuing a growth strategy. As bottom-up investors focusing primarily on individual securities, we choose companies that have identifiable drivers of future earnings growth and that present, in our opinion, the best trade-off between earnings growth, business and financial risk, and valuation. We rely on a team of analysts to help provide in-depth industry expertise and use both qualitative and quantitative analysis to evaluate companies for distinct and sustainable competitive advantages likely to lead to growth in earnings and/or share price. Competitive advantages, such as a particular product niche, proven technology, sound financial position and strong management, are all factors we believe may contribute to strong growth potential.
Sector Overview
Global commodity prices overall posted modest gains during the six months under review. Although energy commodities rose, several commodities, such as gold and copper, declined after reaching a period high in June, amid a stronger U.S. dollar and investor concerns about global economic growth. U.S. economic growth in the third quarter and China’s recent economic indicators added some support to commodity prices late in the period, and select metals rose significantly amid healthy demand and supply curtailments.
1. Source: Morningstar.
The indexes are unmanaged and include reinvestment of any income or distributions. They do not reflect any fees, expenses or sales charges. One cannot invest directly in an
index, and an index is not representative of the Fund’s portfolio.
See www.franklintempletondatasources.com for additional data provider information.
franklintempleton.com
Semiannual Report 9
FRANKLIN NATURAL RESOURCES FUND
After periods of volatility during the summer and early fall, crude oil prices settled slightly above where they began, helped in part by a preliminary agreement reached by members of the Organization of Petroleum Exporting Countries (OPEC) to curtail production, which helped ease concerns about rising oil exports from several members, particularly Libya and Nigeria. Crude oil prices reached a period low in early August as many investors became less optimistic about a swift energy market rebalancing amid wider concerns that an overhang of global crude oil and refined product inventories would continue to pressure markets. However, sentiment improved and oil prices surged beginning in late September after OPEC addressed the issue by agreeing on the need for production cuts and an output cap among its member nations, though a finalized deal remained uncertain and dependent on ratification at OPEC’s regularly scheduled November 30 meeting. The proposed supply reduction would be a positive development as OPEC production was running near a record high in the summer. However, many oil traders and analysts expressed doubts that the deal would come to fruition, with certain members, including Iran, Libya and Nigeria, trying to boost production, while Saudi Arabia and non-OPEC Russia have been pumping oil at record or near-record levels; as a result, oil prices faded toward period-end.
U.S. natural gas prices rose for the six months under review, with gains from the period’s first half supporting prices despite losses in the second half. Natural gas prices initially rallied as the supply surplus (compared to one-year and five-year averages) shrank from peak levels reached in early 2016. In addition to price-driven demand, relatively clean-burning natural gas has increasingly filled the power-generation void left by U.S. coal plant closures, with natural gas deliveries to generators reaching an all-time seasonal high. These factors, combined with curbed drilling activity across much of the country, resulted in smaller-than-anticipated storage injections. Despite some easing of supply, however, natural gas prices declined in the period’s second half amid investor concerns that inventories may remain at seasonally high levels due to warm fall weather in parts of the country and expectations for a mild start to winter.
Gold prices declined for the six-month period, as weakness in the second half erased gains in the first half. Supporting gold prices in the period’s first half were uncertainty tied to the U.K.’s vote to leave the European Union and signs that the U.S. Federal Reserve (Fed) would keep the federal funds target rate low for longer than previously forecast, triggering continued strong inflows to physical gold exchange-traded products (ETPs). However, gold bullion demand through ETPs slowed in the summer as several Fed officials indicated the Fed might move closer to raising rates amid generally stronger U.S. economic data. Silver fared better than gold and posted a slight gain for the period. Copper prices fell for the period amid ample supplies and subdued demand, though prices began a sharp rise in late October, driven partly by improving economic indicators from China and rising inflationary expectations. Iron ore prices followed a similar path, with declines for the period despite a rally in October as many investors grew optimistic about a possible rebound in demand as China’s economy stabilizes. Among other industrial metals, aluminum and zinc prices rose for similar reasons, while coking coal staged a strong rally due to Chinese supply curtailments and healthy demand.
Manager’s Discussion
During the six months under review, key contributors to the Fund’s performance relative to its benchmark, the S&P North American Natural Resources Sector Index, included stock selection and an overweighting in diversified metals and mining, as well as in oil and gas exploration and production (E&P), stock selection in gold, and stock selection and an underweighting in integrated oil and gas.
10 Semiannual Report
franklintempleton.com
FRANKLIN NATURAL RESOURCES FUND
| Top 10 Holdings | ||
| 10/31/16 | ||
| Company | % of Total | |
| Sector/Industry | Net Assets | |
| Schlumberger Ltd. | 5.0 | % |
| Energy Equipment & Services | ||
| Anadarko Petroleum Corp. | 3.7 | % |
| Oil, Gas & Consumable Fuels | ||
| Royal Dutch Shell PLC | 3.7 | % |
| Oil, Gas & Consumable Fuels | ||
| Noble Energy Inc. | 3.5 | % |
| Oil, Gas & Consumable Fuels | ||
| Occidental Petroleum Corp. | 3.5 | % |
| Oil, Gas & Consumable Fuels | ||
| EOG Resources Inc. | 3.2 | % |
| Oil, Gas & Consumable Fuels | ||
| Halliburton Co. | 3.1 | % |
| Energy Equipment & Services | ||
| BHP Billiton PLC | 2.6 | % |
| Metals & Mining | ||
| Chevron Corp. | 2.6 | % |
| Oil, Gas & Consumable Fuels | ||
| Pioneer Natural Resources Co. | 2.6 | % |
| Oil, Gas & Consumable Fuels |
Diversified metals and mining companies benefited from rising prices for several metals and coal due to tighter supply and demand fundamentals. Many of the Fund’s strong performers in the industry were not included in the benchmark index, notably diversified miners BHP Billiton (Australia), South32 (Australia) and Glencore (Switzerland). An overweighting in coking coal, zinc and copper producer Teck Resources (Canada) also aided Fund performance as its shares continued to rise sharply from lows reached in January 2016.
E&P companies continued to be a focus in the portfolio, and the Fund’s overall E&P holdings outperformed those of the benchmark’s, bolstering relative performance. Oil-focused companies generally rallied strongly over the six-month period amid waning U.S. production, market expectations for potential OPEC production curtailments and as oil prices appeared to be stabilizing in a higher range. An overweighting in Anadarko Petroleum, which performed well, helped relative returns.
Several off-benchmark holdings also delivered strong returns and helped relative performance, notably Aker BP (Norway) and Callon Petroleum.
The Fund’s overall gold holdings declined for the period but performed better than those of the index, driven by strong results from several off-benchmark investments, notably B2Gold (Canada). Lack of exposures to several underper-forming gold companies in the index also supported relative returns.
In the integrated oil and gas industry, the Fund’s relative performance was driven by a significant underweighting in Exxon Mobil, one of the index’s largest components, which declined during the period. Off-benchmark investments in Petroleo Brasileiro (Brazil) and BP (U.K.) also aided relative performance as both companies appeared to make progress in resolving issues that had been weighing on their shares. Namely, political and corporate leadership changes for Petrobras and greater certainty for BP’s liabilities tied to the Macondo accident.
In contrast, key detractors included a significant underweighting in oil and gas storage and transportation, which offset the benefits of favorable stock selection, as well as stock selection and an overweighting in oilfield services.
All of the Fund’s oil and gas storage and transportation holdings delivered double-digit percentage returns. However, the Fund’s lack of exposures to several outperforming index components, as well an underweighting in Spectra Energy, hampered relative performance.
Weakness in oilfield services was predominantly driven by underperformance of offshore-focused companies as many investors continued to favor onshore service providers due to their belief that onshore activity would be the first to recover and such companies would be the first to benefit, which we believe is a reasonable expectation. However, we also feel that valuations of several offshore-focused companies may be presenting a compelling long-term investment opportunity. Key detractors within the industry included Oceaneering International, Superior Energy Services and Dril-Quip.
franklintempleton.com
Semiannual Report 11
FRANKLIN NATURAL RESOURCES FUND
Thank you for your continued participation in Franklin Natural Resources Fund. We look forward to serving your future investment needs.

The foregoing information reflects our analysis, opinions and portfolio holdings as of October 31, 2016, the end of the reporting period. The way we implement our main investment strategies and the resulting portfolio holdings may change depending on factors such as market and economic conditions. These opinions may not be relied upon as investment advice or an offer for a particular security. The information is not a complete analysis of every aspect of any market, country, industry, security or the Fund. Statements of fact are from sources considered reliable, but the investment manager makes no representation or warranty as to their completeness or accuracy. Although historical performance is no guarantee of future results, these insights may help you understand our investment management philosophy.
12 Semiannual Report
franklintempleton.com
FRANKLIN NATURAL RESOURCES FUND
Performance Summary as of October 31, 2016
The performance table does not reflect any taxes that a shareholder would pay on Fund dividends, capital gain distributions, if any, or any realized gains on the sale of Fund shares. Total return reflects reinvestment of the Fund’s dividends and capital gain distributions, if any, and any unrealized gains or losses.
Performance as of 10/31/161
Cumulative total return excludes sales charges. Average annual total returns include maximum sales charges. Sales charges will vary depending on the size of the investment and the class of share purchased. The maximum is 5.75% and the minimum is 0%. Class A: 5.75% maximum initial sales charge; Advisor Class: no sales charges. For other share classes, visit franklintempleton.com.
| Cumulative | Average Annual | Average Annual | ||||
| Share Class | Total Return2 | Total Return3 | Total Return (9/30/16)4 | |||
| A | ||||||
| 6-Month | +0.12 | % | -5.65 | % | ||
| 1-Year | +4.91 | % | -1.13 | % | +13.50 | % |
| 5-Year | -29.69 | % | -7.90 | % | -3.62 | % |
| 10-Year | -2.13 | % | -0.81 | % | +0.17 | % |
| Advisor | ||||||
| 6-Month | +0.22 | % | +0.22 | % | ||
| 1-Year | +5.20 | % | +5.20 | % | +20.72 | % |
| 5-Year | -28.69 | % | -6.54 | % | -2.19 | % |
| 10-Year | +0.73 | % | +0.07 | % | +1.06 | % |
Performance data represent past performance, which does not guarantee future results. Investment return and principal value will fluctuate, and you may have a gain or loss when you sell your shares. Current performance may differ from figures shown. For most recent month-end performance, go to franklintempleton.com or call (800) 342-5236.
See page 14 for Performance Summary footnotes.
franklintempleton.com
Semiannual Report 13
| FRANKLIN NATURAL RESOURCES FUND | ||||
| PERFORMANCE SUMMARY | ||||
| Total Annual Operating Expenses5 | ||||
| Share Class | With Waiver | Without Waiver | ||
| A | 1.14 | % | 1.15 | % |
| Advisor | 0.87 | % | 0.88 | % |
Each class of shares is available to certain eligible investors and has different annual fees and expenses, as described in the prospectus.
All investments involve risks, including possible loss of principal. Investing in a fund concentrating in the natural resources sector involves special risks,
including increased susceptibility to adverse economic and regulatory developments affecting the sector. Smaller companies can be particularly sensitive to
changes in economic conditions and have less certain growth prospects than larger, more established companies and can be volatile, especially over the short
term. The Fund may also invest in foreign companies, which involve special risks, including currency fluctuations and political uncertainty. The Fund is actively
managed but there is no guarantee that the manager’s investment decisions will produce the desired results. The Fund’s prospectus also includes a description
of the main investment risks.
1. The Fund has a fee waiver associated with any investment it makes in a Franklin Templeton money fund and/or other Franklin Templeton fund, contractually guaranteed
through its current fiscal year-end. Fund investment results reflect the fee waiver; without this waiver, the results would have been lower.
2. Cumulative total return represents the change in value of an investment over the periods indicated.
3. Average annual total return represents the average annual change in value of an investment over the periods indicated. Return for less than one year, ifany,hasnotbeen
annualized.
4. In accordance with SEC rules, we provide standardized average annual total return information through the latest calendar quarter.
5. Figures are as stated in the Fund’s current prospectus and may differ from the expense ratios disclosed in the Your Fund’s Expenses and Financial Highlights sections in this
report. In periods of market volatility, assets may decline significantly, causing total annual Fund operating expenses to become higher than the figures shown.
14 Semiannual Report
franklintempleton.com
FRANKLIN NATURAL RESOURCES FUND
Your Fund’s Expenses
As a Fund shareholder, you can incur two types of costs: (1) transaction costs, including sales charges (loads) on Fund purchases and redemptions; and (2) ongoing Fund costs, including management fees, distribution and service (12b-1) fees, and other Fund expenses. All mutual funds have ongoing costs, sometimes referred to as operating expenses. The table below shows ongoing costs of investing in the Fund and can help you understand these costs and compare them with those of other mutual funds. The table assumes a $1,000 investment held for the six months indicated.
Actual Fund Expenses
The table below provides information about actual account values and actual expenses in the columns under the heading “Actual.” In these columns the Fund’s actual return, which includes the effect of Fund expenses, is used to calculate the “Ending Account Value” for each class of shares. You can estimate the expenses you paid during the period by following these steps (of course, your account value and expenses will differ from those in this illustration): Divide your account value by $1,000 (if your account had an $8,600 value, then $8,600 ÷ $1,000 = 8.6). Then multiply the result by the number in the row for your class of shares under the headings “Actual” and “Expenses Paid During Period” (if Actual Expenses Paid During Period were $7.50, then 8.6 x $7.50 = $64.50). In this illustration, the actual expenses paid this period are $64.50.
Hypothetical Example for Comparison with Other Funds
Under the heading “Hypothetical” in the table, information is provided about hypothetical account values and hypothetical expenses based on the Fund’s actual expense ratio and an assumed rate of return of 5% per year before expenses, which is not the Fund’s actual return. This information may not be used to estimate the actual ending account balance or expenses you paid for the period, but it can help you compare ongoing costs of investing in the Fund with those of other funds. To do so, compare this 5% hypothetical example for the class of shares you hold with the 5% hypothetical examples that appear in the shareholder reports of other funds.
Please note that expenses shown in the table are meant to highlight ongoing costs and do not reflect any transactional costs. Therefore, information under the heading “Hypothetical” is useful in comparing ongoing costs only, and will not help you compare total costs of owning different funds. In addition, if transactional costs were included, your total costs would have been higher.
| Actual | Hypothetical | |||||||||||
| (actual return after expenses) | (5% annual return before expenses) | |||||||||||
| Expenses | Expenses | Net | ||||||||||
| Beginning | Ending | Paid During | Ending | Paid During | Annualized | |||||||
| Share | Account | Account | Period | Account | Period | Expense | ||||||
| Class | Value 5/1/16 | Value 10/31/16 | 5/1/16–10/31/161,2 | Value 10/31/16 | 5/1/16–10/31/161,2 | Ratio2 | ||||||
| A | $ | 1,000 | $ | 1,001.20 | $ | 5.40 | $ | 1,019.81 | $ | 5.45 | 1.07 | % |
| C | $ | 1,000 | $ | 997.50 | $ | 9.16 | $ | 1,016.03 | $ | 9.25 | 1.82 | % |
| R6 | $ | 1,000 | $ | 1,003.40 | $ | 2.73 | $ | 1,022.48 | $ | 2.75 | 0.54 | % |
| Advisor | $ | 1,000 | $ | 1,002.20 | $ | 4.14 | $ | 1,021.07 | $ | 4.18 | 0.82 | % |
1. Expenses are equal to the annualized expense ratio for the six-month period as indicated above–in the far right column–multiplied by the simple average account value
over the period indicated, and then multiplied by 184/365 to reflect the one-half year period.
2. Reflects expenses after fee waivers and expense reimbursements. Does not include acquired fund fees and expenses.
franklintempleton.com
Semiannual Report 15
FRANKLIN STRATEGIC SERIES
| Financial Highlights | ||||||||||||||||||
| Franklin Biotechnology Discovery Fund | ||||||||||||||||||
| Six Months Ended | ||||||||||||||||||
| October 31, 2016 | Year Ended April 30, | |||||||||||||||||
| (unaudited) | 2016 | 2015 | 2014 | 2013 | 2012 | |||||||||||||
| Class A | ||||||||||||||||||
| Per share operating performance | ||||||||||||||||||
| (for a share outstanding throughout the period) | ||||||||||||||||||
| Net asset value, beginning of period | $ | 128.19 | $ | 182.30 | $ | 129.27 | $ | 105.95 | $ | 76.22 | $ | 77.78 | ||||||
| Income from investment operationsa: | ||||||||||||||||||
| Net investment income (loss)b | (0.39 | ) | (0.94 | ) | (1.09 | ) | (1.07 | ) | (0.76 | ) | (0.75 | ) | ||||||
| Net realized and unrealized gains (losses) | 0.82 | (39.39 | ) | 60.79 | 33.18 | 30.56 | 9.02 | |||||||||||
| Total from investment operations | 0.43 | (40.33 | ) | 59.70 | 32.11 | 29.80 | 8.27 | |||||||||||
| Less distributions from: | ||||||||||||||||||
| Net investment income. | — | — | — | — | (0.07 | ) | (0.52 | ) | ||||||||||
| Net realized gains | — | (13.78 | ) | (6.67 | ) | (8.79 | ) | — | (9.31 | ) | ||||||||
| Total distributions | — | (13.78 | ) | (6.67 | ) | (8.79 | ) | (0.07 | ) | (9.83 | ) | |||||||
| Net asset value, end of period | $ | 128.62 | $ | 128.19 | $ | 182.30 | $ | 129.27 | $ | 105.95 | $ | 76.22 | ||||||
| Total returnc | 0.34 | % | (23.55 | )% | 46.81 | % | 30.60 | % | 39.12 | % | 13.18 | % | ||||||
| Ratios to average net assetsd | ||||||||||||||||||
| Expenses before waiver and payments by | ||||||||||||||||||
| affiliates | 1.05 | % | 0.99 | % | 1.00 | % | 1.10 | % | 1.20 | % | 1.26 | % | ||||||
| Expenses net of waiver and payments by | ||||||||||||||||||
| affiliates | 1.03 | %e | 0.98 | %e | 1.00 | %e,f | 1.10 | %e,f | 1.20 | % | 1.26 | % | ||||||
| Net investment income (loss) | (0.58 | )% | (0.56 | )% | (0.67 | )% | (0.82 | )% | (0.88 | )% | (1.03 | )% | ||||||
| Supplemental data | ||||||||||||||||||
| Net assets, end of period (000’s) | $ | 1,069,318 | $ | 1,074,903 | $ | 1,601,906 | $ | 1,141,890 | $ | 653,718 | $ | 434,678 | ||||||
| Portfolio turnover rate | 19.46 | % | 22.13 | % | 41.43 | % | 48.70 | % | 33.64 | % | 46.54 | % | ||||||
aThe amount shown for a share outstanding throughout the period may not correlate with the Statement of Operations for the period due to the timing of sales and
repurchases of the Fund’s shares in relation to income earned and/or fluctuating fair value of the investments of the Fund.
bBased on average daily shares outstanding.
cTotal return does not reflect sales commissions or contingent deferred sales charges, if applicable, and is not annualized for periods less than one year.
dRatios are annualized for periods less than one year.
eBenefit of expense reduction rounds to less than 0.01%.
fBenefit of waiver and payments by affiliates rounds to less than 0.01%.
16 Semiannual Report | The accompanying notes are an integral part of these financial statements. franklintempleton.com
| FRANKLIN STRATEGIC SERIES | ||||||||||||
| FINANCIAL HIGHLIGHTS | ||||||||||||
| Franklin Biotechnology Discovery Fund (continued) | ||||||||||||
| Six Months Ended | ||||||||||||
| October 31, 2016 | Year Ended April 30, | |||||||||||
| (unaudited) | 2016 | 2015 | 2014 | a | ||||||||
| Class C | ||||||||||||
| Per share operating performance | ||||||||||||
| (for a share outstanding throughout the period) | ||||||||||||
| Net asset value, beginning of period | $ | 125.99 | $ | 180.67 | $ | 129.11 | $ | 159.15 | ||||
| Income from investment operationsb: | ||||||||||||
| Net investment income (loss)c | (0.90 | ) | (2.11 | ) | (2.38 | ) | (0.34 | ) | ||||
| Net realized and unrealized gains (losses) | 0.85 | (38.79 | ) | 60.61 | (29.70 | ) | ||||||
| Total from investment operations | (0.05 | ) | (40.90 | ) | 58.23 | (30.04 | ) | |||||
| Less distributions from net realized gains | — | (13.78 | ) | (6.67 | ) | — | ||||||
| Net asset value, end of period | $ | 125.94 | $ | 125.99 | $ | 180.67 | $ | 129.11 | ||||
| Total returnd | (0.04 | )% | (24.09 | )% | 45.76 | % | (18.88 | )% | ||||
| Ratios to average net assetse | ||||||||||||
| Expenses before waiver and payments by affiliates | 1.80 | % | 1.71 | % | 1.75 | % | 1.82 | % | ||||
| Expenses net of waiver and payments by affiliatesf | 1.78 | % | 1.70 | % | 1.75 | %g | 1.82 | %g | ||||
| Net investment income (loss) | (1.33 | )% | (1.28 | )% | (1.42 | )% | (1.52 | )% | ||||
| Supplemental data | ||||||||||||
| Net assets, end of period (000’s) | $ | 35,688 | $ | 17,562 | $ | 23,051 | $ | 5,486 | ||||
| Portfolio turnover rate. | 19.46 | % | 22.13 | % | 41.43 | % | 48.70 | % | ||||
aFor the period March 4, 2014 (effective date) to April 30, 2014.
bThe amount shown for a share outstanding throughout the period may not correlate with the Statement of Operations for the period due to the timing of sales and
repurchases of the Fund’s shares in relation to income earned and/or fluctuating fair value of the investments of the Fund.
cBased on average daily shares outstanding.
dTotal return does not reflect sales commissions or contingent deferred sales charges, if applicable, and is not annualized for periods less than one year.
eRatios are annualized for periods less than one year.
fBenefit of expense reduction rounds to less than 0.01%.
gBenefit of waiver and payments by affiliates rounds to less than 0.01%.
franklintempleton.com The accompanying notes are an integral part of these financial statements. | Semiannual Report 17
| FRANKLIN STRATEGIC SERIES | ||||||||||||
| FINANCIAL HIGHLIGHTS | ||||||||||||
| Franklin Biotechnology Discovery Fund (continued) | ||||||||||||
| Six Months Ended | ||||||||||||
| October 31, 2016 | Year Ended April 30, | |||||||||||
| (unaudited) | 2016 | 2015 | 2014 | a | ||||||||
| Class R6 | ||||||||||||
| Per share operating performance | ||||||||||||
| (for a share outstanding throughout the period) | ||||||||||||
| Net asset value, beginning of period | $ | 131.37 | $ | 185.75 | $ | 131.09 | $ | 104.56 | ||||
| Income from investment operationsb: | ||||||||||||
| Net investment income (loss)c | (0.13 | ) | (0.32 | ) | (0.45 | ) | (0.49 | ) | ||||
| Net realized and unrealized gains (losses) | 0.85 | (40.28 | ) | 61.78 | 35.81 | |||||||
| Total from investment operations | 0.72 | (40.60 | ) | 61.33 | 35.32 | |||||||
| Less distributions from net realized gains | — | (13.78 | ) | (6.67 | ) | (8.79 | ) | |||||
| Net asset value, end of period | $ | 132.09 | $ | 131.37 | $ | 185.75 | $ | 131.09 | ||||
| Total returnd | 0.55 | % | (23.24 | )% | 47.40 | % | 34.10 | % | ||||
| Ratios to average net assetse | ||||||||||||
| Expenses before waiver and payments by affiliates | 0.63 | % | 0.60 | % | 0.60 | % | 0.63 | % | ||||
| Expenses net of waiver and payments by affiliatesf | 0.61 | % | 0.59 | % | 0.60 | %g | 0.63 | %g | ||||
| Net investment income (loss) | (0.16 | )% | (0.17 | )% | (0.27 | )% | (0.35 | )% | ||||
| Supplemental data | ||||||||||||
| Net assets, end of period (000’s) | $ | 7,258 | $ | 5,568 | $ | 76,436 | $ | 50,846 | ||||
| Portfolio turnover rate. | 19.46 | % | 22.13 | % | 41.43 | % | 48.70 | % | ||||
aFor the period May 1, 2013 (effective date) to April 30, 2014.
bThe amount shown for a share outstanding throughout the period may not correlate with the Statement of Operations for the period due to the timing of sales and
repurchases of the Fund’s shares in relation to income earned and/or fluctuating fair value of the investments of the Fund.
cBased on average daily shares outstanding.
dTotal return is not annualized for periods less than one year.
eRatios are annualized for periods less than one year.
fBenefit of expense reduction rounds to less than 0.01%.
gBenefit of waiver and payments by affiliates rounds to less than 0.01%.
18 Semiannual Report | The accompanying notes are an integral part of these financial statements. franklintempleton.com
| FRANKLIN STRATEGIC SERIES | ||||||||||||||||||
| FINANCIAL HIGHLIGHTS | ||||||||||||||||||
| Franklin Biotechnology Discovery Fund (continued) | ||||||||||||||||||
| Six Months Ended | ||||||||||||||||||
| October 31, 2016 | Year Ended April 30, | |||||||||||||||||
| (unaudited) | 2016 | 2015 | 2014 | 2013 | 2012 | |||||||||||||
| Advisor Class | ||||||||||||||||||
| Per share operating performance | ||||||||||||||||||
| (for a share outstanding throughout the period) | ||||||||||||||||||
| Net asset value, beginning of period | $ | 130.67 | $ | 185.12 | $ | 130.86 | $ | 106.86 | $ | 76.65 | $ | 78.15 | ||||||
| Income from investment operationsa: | ||||||||||||||||||
| Net investment income (loss)b | (0.23 | ) | (0.55 | ) | (0.70 | ) | (0.69 | ) | (0.52 | ) | (0.53 | ) | ||||||
| Net realized and unrealized gains (losses) | 0.84 | (40.12 | ) | 61.63 | 33.48 | 30.80 | 9.05 | |||||||||||
| Total from investment operations | 0.61 | (40.67 | ) | 60.93 | 32.79 | 30.28 | 8.52 | |||||||||||
| Less distributions from: | ||||||||||||||||||
| Net investment income. | — | — | — | — | (0.07 | ) | (0.71 | ) | ||||||||||
| Net realized gains | — | (13.78 | ) | (6.67 | ) | (8.79 | ) | — | (9.31 | ) | ||||||||
| Total distributions | — | (13.78 | ) | (6.67 | ) | (8.79 | ) | (0.07 | ) | (10.02 | ) | |||||||
| Net asset value, end of period | $ | 131.28 | $ | 130.67 | $ | 185.12 | $ | 130.86 | $ | 106.86 | $ | 76.65 | ||||||
| Total returnc | 0.47 | % | (23.36 | )% | 47.17 | % | 31.02 | % | 39.51 | % | 13.51 | % | ||||||
| Ratios to average net assetsd | ||||||||||||||||||
| Expenses before waiver and payments by | ||||||||||||||||||
| affiliates | 0.80 | % | 0.75 | % | 0.75 | % | 0.80 | % | 0.91 | % | 0.97 | % | ||||||
| Expenses net of waiver and payments by | ||||||||||||||||||
| affiliates | 0.78 | %e | 0.74 | %e | 0.75 | %e,f | 0.80 | %e,f | 0.91 | % | 0.97 | % | ||||||
| Net investment income (loss) | (0.33 | )% | (0.32 | )% | (0.42 | )% | (0.52 | )% | (0.59 | )% | (0.74 | )% | ||||||
| Supplemental data | ||||||||||||||||||
| Net assets, end of period (000’s) | $ | 104,995 | $ | 93,263 | $ | 167,035 | $ | 91,012 | $ | 25,744 | $ | 9,330 | ||||||
| Portfolio turnover rate | 19.46 | % | 22.13 | % | 41.43 | % | 48.70 | % | 33.64 | % | 46.54 | % | ||||||
aThe amount shown for a share outstanding throughout the period may not correlate with the Statement of Operations for the period due to the timing of sales and
repurchases of the Fund’s shares in relation to income earned and/or fluctuating fair value of the investments of the Fund.
bBased on average daily shares outstanding.
cTotal return is not annualized for periods less than one year.
dRatios are annualized for periods less than one year.
eBenefit of expense reduction rounds to less than 0.01%.
fBenefit of waiver and payments by affiliates rounds to less than 0.01%.
franklintempleton.com The accompanying notes are an integral part of these financial statements. | Semiannual Report 19
| FRANKLIN STRATEGIC SERIES | ||||
| Statement of Investments, October 31, 2016 (unaudited) | ||||
| Franklin Biotechnology Discovery Fund | ||||
| Shares/ | ||||
| Country | Warrants | Value | ||
| Common Stocks and Other Equity Interests 96.7% | ||||
| Biotechnology 83.6% | ||||
| a Acadia Pharmaceuticals Inc | United States | 1,020,600 | $ | 23,790,186 |
| a Acceleron Pharma Inc | United States | 186,700 | 5,233,201 | |
| a,b ADMA Biologics Inc | United States | 135,600 | 756,648 | |
| a Alder Biopharmaceuticals Inc | United States | 94,400 | 2,289,200 | |
| a Alexion Pharmaceuticals Inc | United States | 261,600 | 34,138,800 | |
| a Alnylam Pharmaceuticals Inc | United States | 216,117 | 7,693,765 | |
| Amgen Inc | United States | 388,100 | 54,784,196 | |
| a Amicus Therapeutics Inc | United States | 736,100 | 5,079,090 | |
| a,b Anthera Pharmaceuticals Inc | United States | 1,207,262 | 2,655,976 | |
| a,b,c Aptose Biosciences Inc., 144A | Canada | 395,468 | 400,847 | |
| a,b Aquinox Pharmaceuticals Inc | Canada | 541,500 | 5,669,505 | |
| a,d ARCA biopharma Inc | United States | 478,077 | 1,051,769 | |
| a,d,e ARCA biopharma Inc., wts., 6/16/22. | United States | 1,338,619 | 19,054 | |
| a Array BioPharma Inc | United States | 1,119,800 | 6,382,860 | |
| a Audentes Therapeutics Inc | United States | 139,400 | 2,229,006 | |
| a AveXis Inc | United States | 287,580 | 13,660,050 | |
| a,b Axovant Sciences Ltd | United States | 589,582 | 7,257,754 | |
| a,b Bellicum Pharmaceuticals Inc | United States | 257,000 | 4,255,920 | |
| a Biogen Inc | United States | 353,061 | 98,920,631 | |
| a BioMarin Pharmaceutical Inc | United States | 410,256 | 33,033,813 | |
| a Bluebird Bio Inc | United States | 282,828 | 13,505,037 | |
| a Cara Therapeutics Inc | United States | 202,400 | 1,414,776 | |
| a,b Cascadian Therapeutics Inc | United States | 2,746,700 | 2,829,101 | |
| a Celgene Corp | United States | 1,167,500 | 119,295,150 | |
| a Celldex Therapeutics Inc | United States | 1,265,929 | 3,987,676 | |
| a,b Cellectis SA, ADR | France | 97,200 | 1,718,496 | |
| a ChemoCentryx Inc | United States | 817,508 | 4,888,698 | |
| a Clovis Oncology Inc | United States | 197,000 | 5,728,760 | |
| a Concert Pharmaceuticals Inc | United States | 263,800 | 2,036,536 | |
| a CRISPR Therapeutics AG. | Switzerland | 136,300 | 2,487,475 | |
| a,f CRISPR Therapeutics AG, Reg S | Switzerland | 137,714 | 2,400,143 | |
| a,b CytomX Therapeutics Inc | United States | 125,100 | 1,409,877 | |
| a,b Dynavax Technologies Corp | United States | 368,070 | 3,404,648 | |
| a Edge Therapeutics Inc | United States | 702,846 | 7,358,798 | |
| a Epizyme Inc | United States | 450,800 | 4,079,740 | |
| a Exelixis Inc | United States | 271,600 | 2,876,244 | |
| a,d,g Fate Therapeutics Inc | United States | 2,084,200 | 4,376,820 | |
| a,b Genocea Biosciences Inc | United States | 1,133,200 | 3,898,208 | |
| Gilead Sciences Inc | United States | 1,246,800 | 91,801,884 | |
| a GlycoMimetics Inc | United States | 379,800 | 2,290,194 | |
| a Halozyme Therapeutics Inc | United States | 426,600 | 3,681,558 | |
| a,b Heron Therapeutics Inc | United States | 1,700,356 | 25,250,287 | |
| a Immune Design Corp | United States | 241,427 | 1,291,634 | |
| a Incyte Corp | United States | 675,300 | 58,730,841 | |
| a,b,g Inotek Pharmaceuticals Corp | United States | 503,765 | 3,526,355 | |
| a,f Intarcia Therapeutics Inc., DD | United States | 80,195 | 4,811,700 | |
| a,b Intellia Therapeutics Inc | United States | 112,400 | 1,548,872 | |
| a Karyopharm Therapeutics Inc | United States | 652,554 | 4,724,491 | |
| a,b Kite Pharma Inc | United States | 115,344 | 5,108,586 | |
| a La Jolla Pharmaceutical Co | United States | 364,300 | 6,375,250 | |
| a Lion Biotechnologies Inc | United States | 1,378,100 | 8,613,125 | |
| a Loxo Oncology Inc | United States | 102,100 | 2,129,806 | |
20 Semiannual Report
franklintempleton.com
FRANKLIN STRATEGIC SERIES
STATEMENT OF INVESTMENTS (UNAUDITED)
| Franklin Biotechnology Discovery Fund (continued) | ||||
| Shares/ | ||||
| Country | Warrants | Value | ||
| Common Stocks and Other Equity Interests (continued) | ||||
| Biotechnology (continued) | ||||
| a MacroGenics Inc | United States | 223,000 | $ | 5,282,870 |
| a,b Merrimack Pharmaceuticals Inc | United States | 487,000 | 2,542,140 | |
| a Merus B.V | Netherlands | 240,506 | 4,281,007 | |
| a,b Minerva Neurosciences Inc | United States | 321,900 | 3,589,185 | |
| a,b Mirna Therapeutics Inc | United States | 545,947 | 682,434 | |
| a Natera Inc | United States | 474,962 | 4,027,678 | |
| a Neurocrine Biosciences Inc | United States | 683,800 | 29,929,926 | |
| a NewLink Genetics Corp | United States | 205,300 | 2,494,395 | |
| a Nivalis Therapeutics Inc | United States | 182,500 | 1,082,225 | |
| a,e Northwest Biotherapeutics Inc., wts., 2/20/19 | United States | 223,880 | 20,766 | |
| a,b Novavax Inc | United States | 2,054,100 | 3,122,232 | |
| a OncoMed Pharmaceuticals Inc | United States | 376,800 | 3,417,576 | |
| a Ophthotech Corp | United States | 205,032 | 7,344,246 | |
| a,b OvaScience Inc | United States | 250,154 | 1,260,776 | |
| a Pfenex Inc | United States | 532,384 | 4,264,396 | |
| a ProQR Therapeutics NV | Netherlands | 123,300 | 641,160 | |
| a Proteostasis Therapeutics Inc | United States | 235,700 | 1,678,184 | |
| a PTC Therapeutics Inc | United States | 160,000 | 993,600 | |
| a Ra Pharmaceuticals Inc | United States | 94,000 | 1,207,900 | |
| a Radius Health Inc | United States | 247,900 | 10,639,868 | |
| a Regeneron Pharmaceuticals Inc | United States | 113,209 | 39,059,369 | |
| a REGENXBIO Inc | United States | 345,200 | 5,436,900 | |
| a Retrophin Inc | United States | 417,094 | 7,862,222 | |
| a Sage Therapeutics Inc | United States | 293,870 | 12,795,100 | |
| a,b Sorrento Therapeutics Inc | United States | 132,951 | 764,468 | |
| a Stemline Therapeutics Inc | United States | 548,004 | 6,247,246 | |
| a Tesaro Inc | United States | 761,600 | 92,062,208 | |
| a Threshold Pharmaceuticals Inc., wts., 2/12/20. | United States | 439,500 | — | |
| a,b Trillium Therapeutics Inc | Canada | 158,100 | 2,158,065 | |
| a,b Vascular Biogenics Ltd | Israel | 340,900 | 1,687,455 | |
| a Vertex Pharmaceuticals Inc | United States | 485,800 | 36,852,788 | |
| a vTv Therapeutics Inc., A | United States | 370,900 | 1,999,151 | |
| a Xencor Inc | United States | 262,732 | 5,593,564 | |
| 1,017,904,137 | ||||
| Health Care Equipment & Supplies 0.4% | ||||
| a Derma Sciences Inc | United States | 1,019,400 | 4,536,330 | |
| Life Sciences Tools & Services 2.3% | ||||
| a Illumina Inc | United States | 202,200 | 27,527,508 | |
| Pharmaceuticals 10.4% | ||||
| a,f Acerta Pharma BV. | Netherlands | 107,297,280 | 5,939,334 | |
| a,b Aclaris Therapeutics Inc | United States | 330,562 | 7,024,442 | |
| a Agile Therapeutics Inc | United States | 526,800 | 4,003,680 | |
| a,b,d Alcobra Ltd | Israel | 1,737,306 | 3,335,628 | |
| a Aratana Therapeutics Inc | United States | 904,000 | 7,322,400 | |
| a,d,g BioPharmX Corp | United States | 216,000 | 67,630 | |
| a,c,d,g BioPharmX Corp., 144A | United States | 1,945,737 | 609,210 | |
| a,d,e,g BioPharmX Corp., wts., 3/29/21. | United States | 108,000 | 16,971 | |
| a Collegium Pharmaceutical Inc | United States | 301,000 | 4,505,970 | |
| a Dermira Inc | United States | 156,300 | 4,900,005 | |
| a,b Egalet Corp | United States | 951,600 | 5,338,476 | |
| a,b Flex Pharma Inc | United States | 170,200 | 827,172 | |
franklintempleton.com
Semiannual Report 21
FRANKLIN STRATEGIC SERIES
STATEMENT OF INVESTMENTS (UNAUDITED)
| Franklin Biotechnology Discovery Fund (continued) | |||||
| Shares/ | |||||
| Country | Warrants | Value | |||
| Common Stocks and Other Equity Interests (continued) | |||||
| Pharmaceuticals (continued) | |||||
| a Foamix Pharmaceuticals Ltd | Israel | 413,800 | $ | 3,289,710 | |
| a,b GW Pharmaceuticals PLC, ADR | United Kingdom | 160,367 | 18,825,482 | ||
| a Jazz Pharmaceuticals PLC | United States | 97,900 | 10,717,113 | ||
| a,b Marinus Pharmaceuticals Inc | United States | 831,820 | 1,006,502 | ||
| a The Medicines Co | United States | 405,700 | 13,367,815 | ||
| a,b Nabriva Therapeutics AG, ADR | Austria | 140,100 | 788,763 | ||
| a NantKwest Inc | United States | 409,274 | 2,451,551 | ||
| a Neos Therapeutics Inc | United States | 301,700 | 1,780,030 | ||
| a,b Novan Inc | United States | 208,100 | 4,370,100 | ||
| a Revance Therapeutics Inc | United States | 296,100 | 3,952,935 | ||
| a SciClone Pharmaceuticals Inc | United States | 427,495 | 3,826,080 | ||
| a TherapeuticsMD Inc | United States | 2,345,640 | 13,463,974 | ||
| a Theravance Biopharma Inc | Cayman Islands | 142,600 | 3,583,538 | ||
| a Zogenix Inc | United States | 246,315 | 2,007,467 | ||
| 127,321,978 | |||||
| Total Common Stocks and Other Equity Interests | |||||
| (Cost $874,001,481) | 1,177,289,953 | ||||
| Preferred Stocks 0.4% | |||||
| Biotechnology 0.2% | |||||
| a,f True North Therapeutics Inc., pfd., Series D, 144A. | United States | 759,880 | 1,900,004 | ||
| Pharmaceuticals 0.2% | |||||
| a,f G1 Therapeutics Inc., pfd | United States | 942,380 | 2,799,999 | ||
| Total Preferred Stocks | |||||
| (Cost $4,700,003) | 4,700,003 | ||||
| Total Investments before Short Term Investments | |||||
| (Cost $878,701,484) | 1,181,989,956 | ||||
| Short Term Investments 8.1% | |||||
| Money Market Funds (Cost $32,542,919) 2.7% | |||||
| a,h Institutional Fiduciary Trust Money Market Portfolio | United States | 32,542,919 | 32,542,919 | ||
| i Investments from Cash Collateral Received for Loaned | |||||
| Securities (Cost $66,456,062) 5.4% | |||||
| Money Market Funds 5.4% | |||||
| a,h Institutional Fiduciary Trust Money Market Portfolio | United States | 66,456,062 | 66,456,062 | ||
| Total Investments (Cost $977,700,465) 105.2%. | 1,280,988,937 | ||||
| Other Assets, less Liabilities (5.2)% | (63,730,644 | ) | |||
| Net Assets 100.0% | $ | 1,217,258,293 | |||
22 Semiannual Report
franklintempleton.com
FRANKLIN STRATEGIC SERIES
STATEMENT OF INVESTMENTS (UNAUDITED)
Franklin Biotechnology Discovery Fund (continued)
See Abbreviations on page 46.
aNon-income producing.
bA portion or all of the security is on loan at October 31, 2016. See Note 1(c).
cSecurity was purchased pursuant to Rule 144A under the Securities Act of 1933 and may be sold in transactions exempt from registration only to qualified institutional buyers
or in a public offering registered under the Securities Act of 1933.These securities have been deemed liquid under guidelines approved by the Trust’s Board of Trustees. At
October 31, 2016, the aggregate value of these securities was $1,010,057, representing less than 0.1% of net assets.
dSee Note 8 regarding holdings of 5% voting securities.
eSecurity has been deemed illiquid because it may not be able to be sold within seven days. At October 31, 2016, the aggregate value of these securities was $56,791,
representing less than 0.1% of net assets.
fSee Note 7 regarding restricted securities.
gAt October 31, 2016, pursuant to the Fund’s policies and the requirements of applicable securities law, the Fund is restricted from trading these securities at period end.
hSee Note 3(f) regarding investments in affiliated management investment companies.
iSee Note 6 regarding securities on loan.
franklintempleton.com The accompanying notes are an integral part of these financial statements. | Semiannual Report 23
FRANKLIN STRATEGIC SERIES
| Financial Highlights | ||||||||||||||||||
| Franklin Natural Resources Fund | ||||||||||||||||||
| Six Months Ended | ||||||||||||||||||
| October 31, 2016 | Year Ended April 30, | |||||||||||||||||
| (unaudited) | 2016 | 2015 | 2014 | 2013 | 2012 | |||||||||||||
| Class A | ||||||||||||||||||
| Per share operating performance | ||||||||||||||||||
| (for a share outstanding throughout the period) | ||||||||||||||||||
| Net asset value, beginning of period | $ | 25.02 | $ | 31.46 | $ | 39.79 | $ | 33.03 | $ | 35.81 | $ | 44.75 | ||||||
| Income from investment operationsa: | ||||||||||||||||||
| Net investment incomeb | 0.09 | 0.29 | 0.23 | 0.19 | 0.08 | 0.04 | ||||||||||||
| Net realized and unrealized gains (losses) | (0.06 | ) | (6.55 | ) | (8.27 | ) | 6.65 | (2.86 | ) | (8.72 | ) | |||||||
| Total from investment operations | 0.03 | (6.26 | ) | (8.04 | ) | 6.84 | (2.78 | ) | (8.68 | ) | ||||||||
| Less distributions from net investment income . | — | (0.18 | ) | (0.29 | ) | (0.08 | ) | — | (0.26 | ) | ||||||||
| Net asset value, end of period | $ | 25.05 | $ | 25.02 | $ | 31.46 | $ | 39.79 | $ | 33.03 | $ | 35.81 | ||||||
| Total returnc | 0.12 | % | (19.80 | )% | (20.07 | )% | 20.74 | % | (7.76 | )% | (19.36 | )% | ||||||
| Ratios to average net assetsd | ||||||||||||||||||
| Expenses before waiver and payments by | ||||||||||||||||||
| affiliates | 1.09 | % | 1.14 | % | 1.08 | % | 1.07 | % | 1.08 | % | 1.03 | % | ||||||
| Expenses net of waiver and payments by | ||||||||||||||||||
| affiliates | 1.07 | %e | 1.13 | % | 1.08 | %e,f | 1.07 | %e,f | 1.08 | % | 1.03 | % | ||||||
| Net investment income | 0.71 | % | 1.22 | % | 0.67 | % | 0.53 | % | 0.26 | % | 0.11 | % | ||||||
| Supplemental data | ||||||||||||||||||
| Net assets, end of period (000’s) | $ | 440,213 | $ | 461,596 | $ | 572,518 | $ | 624,250 | $ | 628,722 | $ | 827,693 | ||||||
| Portfolio turnover rate | 16.63 | % | 35.77 | % | 30.05 | % | 21.03 | % | 20.40 | % | 26.75 | % | ||||||
aThe amount shown for a share outstanding throughout the period may not correlate with the Statement of Operations for the period due to the timing of sales and
repurchases of the Fund’s shares in relation to income earned and/or fluctuating fair value of the investments of the Fund.
bBased on average daily shares outstanding.
cTotal return does not reflect sales commissions or contingent deferred sales charges, if applicable, and is not annualized for periods less than one year.
dRatios are annualized for periods less than one year.
eBenefit of expense reduction rounds to less than 0.01%.
fBenefit of waiver and payments by affiliates rounds to less than 0.01%.
24 Semiannual Report | The accompanying notes are an integral part of these financial statements. franklintempleton.com
| FRANKLIN STRATEGIC SERIES | ||||||||||||||||||
| FINANCIAL HIGHLIGHTS | ||||||||||||||||||
| Franklin Natural Resources Fund (continued) | ||||||||||||||||||
| Six Months Ended | ||||||||||||||||||
| October 31, 2016 | Year Ended April 30, | |||||||||||||||||
| (unaudited) | 2016 | 2015 | 2014 | 2013 | 2012 | |||||||||||||
| Class C | ||||||||||||||||||
| Per share operating performance | ||||||||||||||||||
| (for a share outstanding throughout the period) | ||||||||||||||||||
| Net asset value, beginning of period | $ | 24.25 | $ | 30.46 | $ | 38.39 | $ | 32.02 | $ | 34.96 | $ | 43.87 | ||||||
| Income from investment operationsa: | ||||||||||||||||||
| Net investment income (loss)b | (0.01 | ) | 0.11 | (0.01 | ) | (0.06 | ) | (0.14 | ) | (0.22 | ) | |||||||
| Net realized and unrealized gains (losses) | (0.05 | ) | (6.31 | ) | (7.91 | ) | 6.43 | (2.80 | ) | (8.53 | ) | |||||||
| Total from investment operations | (0.06 | ) | (6.20 | ) | (7.92 | ) | 6.37 | (2.94 | ) | (8.75 | ) | |||||||
| Less distributions from net investment income . | — | (0.01 | ) | (0.01 | ) | — | — | (0.16 | ) | |||||||||
| Net asset value, end of period | $ | 24.19 | $ | 24.25 | $ | 30.46 | $ | 38.39 | $ | 32.02 | $ | 34.96 | ||||||
| Total returnc | (0.25 | )% | (20.37 | )% | (20.63 | )% | 19.89 | % | (8.41 | )% | (19.91 | )% | ||||||
| Ratios to average net assetsd | ||||||||||||||||||
| Expenses before waiver and payments by | ||||||||||||||||||
| affiliates and expense reduction | 1.84 | % | 1.87 | % | 1.78 | % | 1.76 | % | 1.77 | % | 1.73 | % | ||||||
| Expenses net of waiver and payments by | ||||||||||||||||||
| affiliates and expense reduction | 1.82 | %e | 1.86 | % | 1.78 | %e,f | 1.76 | %e,f | 1.77 | % | 1.73 | % | ||||||
| Net investment income (loss) | (0.04 | )% | 0.49 | % | (0.03 | )% | (0.16 | )% | (0.43 | )% | (0.59 | )% | ||||||
| Supplemental data | ||||||||||||||||||
| Net assets, end of period (000’s) | $ | 105,746 | $ | 107,724 | $ | 123,735 | $ | 126,651 | $ | 130,424 | $ | 176,036 | ||||||
| Portfolio turnover rate | 16.63 | % | 35.77 | % | 30.05 | % | 21.03 | % | 20.40 | % | 26.75 | % | ||||||
aThe amount shown for a share outstanding throughout the period may not correlate with the Statement of Operations for the period due to the timing of sales and
repurchases of the Fund’s shares in relation to income earned and/or fluctuating fair value of the investments of the Fund.
bBased on average daily shares outstanding.
cTotal return does not reflect sales commissions or contingent deferred sales charges, if applicable, and is not annualized for periods less than one year.
dRatios are annualized for periods less than one year.
eBenefit of expense reduction rounds to less than 0.01%.
fBenefit of waiver and payments by affiliates rounds to less than 0.01%.
franklintempleton.com The accompanying notes are an integral part of these financial statements. | Semiannual Report 25
| FRANKLIN STRATEGIC SERIES | ||||||||||||
| FINANCIAL HIGHLIGHTS | ||||||||||||
| Franklin Natural Resources Fund (continued) | ||||||||||||
| Six Months Ended | ||||||||||||
| October 31, 2016 | Year Ended April 30, | |||||||||||
| (unaudited) | 2016 | 2015 | 2014 | a | ||||||||
| Class R6 | ||||||||||||
| Per share operating performance | ||||||||||||
| (for a share outstanding throughout the period) | ||||||||||||
| Net asset value, beginning of period | $ | 26.73 | $ | 33.62 | $ | 42.58 | $ | 38.28 | ||||
| Income from investment operationsb: | ||||||||||||
| Net investment incomec | 0.17 | 0.51 | 0.46 | 0.19 | ||||||||
| Net realized and unrealized gains (losses) | (0.08 | ) | (7.06 | ) | (8.92 | ) | 4.31 | |||||
| Total from investment operations | 0.09 | (6.55 | ) | (8.46 | ) | 4.50 | ||||||
| Less distributions from net investment income. | — | (0.34 | ) | (0.50 | ) | (0.20 | ) | |||||
| Net asset value, end of period | $ | 26.82 | $ | 26.73 | $ | 33.62 | $ | 42.58 | ||||
| Total returnd | 0.34 | % | (19.31 | )% | (19.61 | )% | 11.83 | % | ||||
| Ratios to average net assetse | ||||||||||||
| Expenses before waiver and payments by affiliates | 1.42 | % | 0.60 | % | 0.55 | % | 0.55 | % | ||||
| Expenses net of waiver and payments by affiliates. | 0.54 | %f | 0.55 | % | 0.54 | %f,g | 0.53 | %f,g | ||||
| Net investment income | 1.24 | % | 1.80 | % | 1.21 | % | 1.07 | % | ||||
| Supplemental data | ||||||||||||
| Net assets, end of period (000’s) | $ | 15 | $ | 15 | $ | 439 | $ | 939 | ||||
| Portfolio turnover rate. | 16.63 | % | 35.77 | % | 30.05 | % | 21.03 | % | ||||
aFor the period May 1, 2013 (effective date) to April 30, 2014.
bThe amount shown for a share outstanding throughout the period may not correlate with the Statement of Operations for the period due to the timing of sales and
repurchases of the Fund’s shares in relation to income earned and/or fluctuating fair value of the investments of the Fund.
cBased on average daily shares outstanding.
dTotal return is not annualized for periods less than one year.
eRatios are annualized for periods less than one year.
fBenefit of expense reduction rounds to less than 0.01%.
gBenefit of waiver and payments by affiliates rounds to less than 0.01%.
26 Semiannual Report | The accompanying notes are an integral part of these financial statements. franklintempleton.com
| FRANKLIN STRATEGIC SERIES | ||||||||||||||||||
| FINANCIAL HIGHLIGHTS | ||||||||||||||||||
| Franklin Natural Resources Fund (continued) | ||||||||||||||||||
| Six Months Ended | ||||||||||||||||||
| October 31, 2016 | Year Ended April 30, | |||||||||||||||||
| (unaudited) | 2016 | 2015 | 2014 | 2013 | 2012 | |||||||||||||
| Advisor Class | ||||||||||||||||||
| Per share operating performance | ||||||||||||||||||
| (for a share outstanding throughout the period) | ||||||||||||||||||
| Net asset value, beginning of period | $ | 26.71 | $ | 33.63 | $ | 42.52 | $ | 35.31 | $ | 38.17 | $ | 47.58 | ||||||
| Income from investment operationsa: | ||||||||||||||||||
| Net investment incomeb | 0.13 | 0.36 | 0.35 | 0.31 | 0.21 | 0.16 | ||||||||||||
| Net realized and unrealized gains (losses) | (0.07 | ) | (7.00 | ) | (8.85 | ) | 7.10 | (3.07 | ) | (9.27 | ) | |||||||
| Total from investment operations | 0.06 | (6.64 | ) | (8.50 | ) | 7.41 | (2.86 | ) | (9.11 | ) | ||||||||
| Less distributions from net investment income . | — | (0.28 | ) | (0.39 | ) | (0.20 | ) | — | (0.30 | ) | ||||||||
| Net asset value, end of period | $ | 26.77 | $ | 26.71 | $ | 33.63 | $ | 42.52 | $ | 35.31 | $ | 38.17 | ||||||
| Total returnc | 0.22 | % | (19.60 | )% | (19.81 | )% | 21.07 | % | (7.49 | )% | (19.10 | )% | ||||||
| Ratios to average net assetsd | ||||||||||||||||||
| Expenses before waiver and payments by | ||||||||||||||||||
| affiliates and expense reduction | 0.84 | % | 0.87 | % | 0.78 | % | 0.77 | % | 0.78 | % | 0.73 | % | ||||||
| Expenses net of waiver and payments by | ||||||||||||||||||
| affiliates and expense reduction | 0.82 | %e | 0.86 | % | 0.78 | %e,f | 0.77 | %e,f | 0.78 | % | 0.73 | % | ||||||
| Net investment income | 0.96 | % | 1.49 | % | 0.97 | % | 0.83 | % | 0.56 | % | 0.41 | % | ||||||
| Supplemental data | ||||||||||||||||||
| Net assets, end of period (000’s) | $ | 90,677 | $ | 90,177 | $ | 79,307 | $ | 94,651 | $ | 117,087 | $ | 235,810 | ||||||
| Portfolio turnover rate | 16.63 | % | 35.77 | % | 30.05 | % | 21.03 | % | 20.40 | % | 26.75 | % | ||||||
aThe amount shown for a share outstanding throughout the period may not correlate with the Statement of Operations for the period due to the timing of sales and
repurchases of the Fund’s shares in relation to income earned and/or fluctuating fair value of the investments of the Fund.
bBased on average daily shares outstanding.
cTotal return is not annualized for periods less than one year.
dRatios are annualized for periods less than one year.
eBenefit of expense reduction rounds to less than 0.01%.
fBenefit of waiver and payments by affiliates rounds to less than 0.01%.
franklintempleton.com The accompanying notes are an integral part of these financial statements. | Semiannual Report 27
FRANKLIN STRATEGIC SERIES
| Statement of Investments, October 31, 2016 (unaudited) | ||||
| Franklin Natural Resources Fund | ||||
| Country | Shares | Value | ||
| Common Stocks 97.5% | ||||
| Coal & Consumable Fuels 0.0% | ||||
| a,b Energy Coal Resources, 144A. | United States | 199,375 | $ | — |
| Copper 5.0% | ||||
| Antofagasta PLC | United Kingdom | 869,100 | 5,777,024 | |
| First Quantum Minerals Ltd | Canada | 367,900 | 3,493,233 | |
| a Freeport-McMoRan Inc., B | United States | 666,700 | 7,453,706 | |
| a Imperial Metals Corp | Canada | 388,300 | 1,490,401 | |
| a Lundin Mining Corp | Canada | 1,232,200 | 4,821,353 | |
| Sandfire Resources NL | Australia | 1,780,467 | 7,045,201 | |
| Southern Copper Corp | Mexico | 62,600 | 1,777,214 | |
| 31,858,132 | ||||
| Diversified Metals & Mining 6.9% | ||||
| BHP Billiton PLC, ADR | Australia | 557,500 | 16,858,800 | |
| a Glencore PLC | Switzerland | 2,035,700 | 6,230,005 | |
| HudBay Minerals Inc | Canada | 652,300 | 2,746,782 | |
| a Nautilus Minerals Inc | Canada | 3,895,831 | 493,603 | |
| Rio Tinto PLC, ADR | United Kingdom | 255,400 | 8,900,690 | |
| South32 Ltd | Australia | 1,765,200 | 3,452,098 | |
| Teck Resources Ltd., B. | Canada | 232,300 | 5,013,034 | |
| 43,695,012 | ||||
| Fertilizers & Agricultural Chemicals 1.2% | ||||
| The Mosaic Co | United States | 322,200 | 7,581,366 | |
| Gold 6.7% | ||||
| Agnico Eagle Mines Ltd | Canada | 68,200 | 3,462,481 | |
| Alamos Gold Inc., A | Canada | 370,300 | 2,903,340 | |
| a B2Gold Corp | Canada | 2,230,100 | 6,448,882 | |
| Barrick Gold Corp | Canada | 354,600 | 6,237,414 | |
| G-Resources Group Ltd | Hong Kong | 33,793,060 | 596,939 | |
| Goldcorp Inc | Canada | 446,000 | 6,779,200 | |
| a Guyana Goldfields Inc | Canada | 557,000 | 3,275,372 | |
| Newcrest Mining Ltd | Australia | 220,700 | 3,788,764 | |
| OceanaGold Corp | Australia | 1,014,010 | 3,098,521 | |
| Randgold Resources Ltd., ADR | United Kingdom | 26,700 | 2,369,091 | |
| Tahoe Resources Inc | United States | 278,300 | 3,335,244 | |
| 42,295,248 | ||||
| Integrated Oil & Gas 17.3% | ||||
| BP PLC, ADR | United Kingdom | 199,900 | 7,106,445 | |
| Chevron Corp | United States | 159,600 | 16,718,100 | |
| Exxon Mobil Corp | United States | 152,000 | 12,664,640 | |
| Occidental Petroleum Corp | United States | 307,000 | 22,383,370 | |
| a Petroleo Brasileiro SA, ADR | Brazil | 268,000 | 3,127,560 | |
| Royal Dutch Shell PLC, A | United Kingdom | 149,247 | 3,724,354 | |
| Royal Dutch Shell PLC, A, ADR | United Kingdom | 396,400 | 19,744,684 | |
| Suncor Energy Inc | Canada | 281,900 | 8,456,475 | |
| Total SA, B, ADR | France | 341,200 | 16,288,888 | |
| 110,214,516 | ||||
28 Semiannual Report
franklintempleton.com
FRANKLIN STRATEGIC SERIES
STATEMENT OF INVESTMENTS (UNAUDITED)
| Franklin Natural Resources Fund (continued) | ||||
| Country | Shares | Value | ||
| Common Stocks (continued) | ||||
| Oil & Gas Drilling 1.5% | ||||
| Ensco PLC, A | United States | 317,319 | $ | 2,481,434 |
| a Pioneer Energy Services Corp | United States | 908,743 | 3,226,038 | |
| Rowan Cos. PLC | United States | 265,900 | 3,528,493 | |
| 9,235,965 | ||||
| Oil & Gas Equipment & Services 18.3% | ||||
| Baker Hughes Inc | United States | 156,900 | 8,692,260 | |
| a Dril-Quip Inc | United States | 84,100 | 3,994,750 | |
| a FMC Technologies Inc | United States | 431,300 | 13,918,051 | |
| Halliburton Co | United States | 433,335 | 19,933,410 | |
| a Hornbeck Offshore Services Inc | United States | 151,800 | 602,646 | |
| Hunting PLC | United Kingdom | 253,600 | 1,563,088 | |
| a Mammoth Energy Services Inc | United States | 177,700 | 2,398,950 | |
| Oceaneering International Inc | United States | 294,400 | 7,006,720 | |
| a Oil States International Inc | United States | 167,600 | 4,902,300 | |
| a PHI Inc., non-voting | United States | 117,900 | 1,836,882 | |
| a RigNet Inc | United States | 135,600 | 2,034,000 | |
| a RPC Inc | United States | 164,600 | 2,842,642 | |
| Schlumberger Ltd | United States | 403,947 | 31,600,774 | |
| Superior Energy Services Inc | United States | 700,300 | 9,916,248 | |
| a Weatherford International PLC | United States | 1,099,000 | 5,297,180 | |
| 116,539,901 | ||||
| Oil & Gas Exploration & Production 33.1% | ||||
| a Aker BP ASA. | Norway | 243,900 | 3,914,610 | |
| Anadarko Petroleum Corp | United States | 400,900 | 23,829,496 | |
| Cabot Oil & Gas Corp., A | United States | 726,500 | 15,169,320 | |
| a Cairn Energy PLC | United Kingdom | 1,516,900 | 3,776,961 | |
| a Callon Petroleum Co | United States | 217,600 | 2,826,624 | |
| Canadian Natural Resources Ltd | Canada | 309,100 | 9,806,884 | |
| Cimarex Energy Co | United States | 36,100 | 4,661,593 | |
| a Cobalt International Energy Inc | United States | 693,200 | 654,450 | |
| a Concho Resources Inc | United States | 83,300 | 10,574,102 | |
| ConocoPhillips | United States | 269,700 | 11,718,465 | |
| a Diamondback Energy Inc | United States | 47,700 | 4,354,533 | |
| EOG Resources Inc | United States | 224,100 | 20,263,122 | |
| EQT Corp | United States | 217,200 | 14,335,200 | |
| a Gran Tierra Energy Inc | Colombia | 1,266,000 | 3,684,060 | |
| a Gulfport Energy Corp | United States | 260,000 | 6,268,600 | |
| Hess Corp | United States | 163,100 | 7,823,907 | |
| Marathon Oil Corp | United States | 318,600 | 4,199,148 | |
| a Matador Resources Co | United States | 370,346 | 8,077,246 | |
| Noble Energy Inc | United States | 650,300 | 22,415,841 | |
| a Ophir Energy PLC | United Kingdom | 1,750,000 | 1,483,517 | |
| Pioneer Natural Resources Co | United States | 93,000 | 16,648,860 | |
| a Rice Energy Inc | United States | 129,600 | 2,862,864 | |
| a,c,d Sanchez Energy Corp | United States | 87,580 | 557,885 | |
| SM Energy Co | United States | 120,500 | 4,052,415 | |
| a Synergy Resources Corp | United States | 1,026,000 | 7,017,840 | |
| 210,977,543 | ||||
franklintempleton.com
Semiannual Report 29
FRANKLIN STRATEGIC SERIES
STATEMENT OF INVESTMENTS (UNAUDITED)
| Franklin Natural Resources Fund (continued) | ||||||
| Country | Shares | Value | ||||
| Common Stocks (continued) | ||||||
| Oil & Gas Refining & Marketing 4.2% | ||||||
| HollyFrontier Corp | United States | 208,600 | $ | 5,204,570 | ||
| Marathon Petroleum Corp | United States | 137,200 | 5,980,548 | |||
| Phillips 66 | United States | 82,100 | 6,662,415 | |||
| Valero Energy Corp | United States | 152,500 | 9,034,100 | |||
| 26,881,633 | ||||||
| Oil & Gas Storage & Transportation 3.3% | ||||||
| Kinder Morgan Inc | United States | 673,100 | 13,751,433 | |||
| Spectra Energy Corp | United States | 178,700 | 7,471,447 | |||
| 21,222,880 | ||||||
| Total Common Stocks (Cost $569,682,570) | 620,502,196 | |||||
| Convertible Preferred Stocks 0.7% | ||||||
| Oil & Gas Exploration & Production 0.7% | ||||||
| d Sanchez Energy Corp., 4.875%, cvt. pfd., A | United States | 92,900 | 2,418,995 | |||
| d Sanchez Energy Corp., 6.50%, cvt. pfd., B | United States | 67,300 | 1,935,474 | |||
| Total Convertible Preferred Stocks (Cost $7,397,173) | 4,354,469 | |||||
| Preferred Stocks (Cost $2,376,164) 0.0% | ||||||
| Coal & Consumable Fuels 0.0% | ||||||
| a,b Energy Coal Resources, 144A, pfd | United States | 29,847 | — | |||
| Principal | ||||||
| Amount | ||||||
| Convertible Bonds (Cost $3,571,221) 0.2% | ||||||
| Oil & Gas Exploration & Production 0.2% | ||||||
| Cobalt International Energy Inc., cvt., senior bond, 3.125%, 5/15/24 | United States | $ | 4,787,000 | 1,615,613 | ||
| Total Investments before Short Term Investments | ||||||
| (Cost $583,027,128) | 626,472,278 | |||||
| Shares | ||||||
| Short Term Investments (Cost $12,333,817) 1.9% | ||||||
| Money Market Funds 1.9% | ||||||
| a,e Institutional Fiduciary Trust Money Market Portfolio | United States | 12,333,817 | 12,333,817 | |||
| Total Investments (Cost $595,360,945) 100.3%. | 638,806,095 | |||||
| Other Assets, less Liabilities (0.3)% | (2,154,596 | ) | ||||
| Net Assets 100.0% | $ | 636,651,499 | ||||
See Abbreviations on page 46.
aNon-income producing.
bSee Note 7 regarding restricted securities.
cSecurity has been deemed illiquid because it may not be able to be sold within seven days. At October 31, 2016, the aggregate value of this security was $557,885,
representing less than 0.1% of net assets.
dAt October 31, 2016, pursuant to the Fund’s policies and the requirements of applicable securities law, the Fund is restricted from trading these securities at period end.
eSee Note 3(f) regarding investments in affiliated management investment companies.
30 Semiannual Report | The accompanying notes are an integral part of these financial statements. franklintempleton.com
| FRANKLIN STRATEGIC SERIES | |||||||
| Financial Statements | |||||||
| Statements of Assets and Liabilities | |||||||
| October 31, 2016 (unaudited) | |||||||
| Franklin | |||||||
| Biotechnology | Franklin Natural | ||||||
| Discovery Fund | Resources Fund | ||||||
| Assets: | |||||||
| Investments in securities: | |||||||
| Cost - Unaffiliated issuers | $ | 858,599,821 | $ | 583,027,128 | |||
| Cost - Non-controlled affiliates (Note 3f and 8) | 119,100,644 | 12,333,817 | |||||
| Total cost of investments | $ | 977,700,465 | $ | 595,360,945 | |||
| Value - Unaffiliated issuers | $ | 1,172,512,874 | $ | 626,472,278 | |||
| Value - Non-controlled affiliates (Note 3f and 8) | 108,476,063 | 12,333,817 | |||||
| Total value of investments* | 1,280,988,937 | 638,806,095 | |||||
| Receivables: | |||||||
| Investment securities sold ** | 9,379,502 | 32,141 | |||||
| Capital shares sold | 1,557,672 | 627,206 | |||||
| Dividends and interest | 131,071 | 381,083 | |||||
| Due from custodian | 165,850 | — | |||||
| Other assets | 263 | 103 | |||||
| Total assets | 1,292,223,295 | 639,846,628 | |||||
| Liabilities: | |||||||
| Payables: | |||||||
| Investment securities purchased | 3,707,600 | 667,032 | |||||
| Capital shares redeemed | 3,273,793 | 1,737,061 | |||||
| Management fees | 625,393 | 267,420 | |||||
| Distribution fees | 270,158 | 189,096 | |||||
| Transfer agent fees | 427,004 | 270,962 | |||||
| Payable upon return of securities loaned | 66,621,911 | — | |||||
| Accrued expenses and other liabilities. | 39,143 | 63,558 | |||||
| Total liabilities | 74,965,002 | 3,195,129 | |||||
| Net assets, at value | $ | 1,217,258,293 | $ | 636,651,499 | |||
| Net assets consist of: | |||||||
| Paid-in capital | $ | 862,086,416 | $ | 744,930,323 | |||
| Undistributed net investment income (loss) | (11,638,591 | ) | 5,855,607 | ||||
| Net unrealized appreciation (depreciation) | 303,002,929 | 43,445,150 | |||||
| Accumulated net realized gain (loss) | 63,807,539 | (157,579,581 | ) | ||||
| Net assets, at value | $ | 1,217,258,293 | $ | 636,651,499 | |||
| *Includes securities loaned | $ | 63,627,274 | $ | — | |||
| **Includes securities loaned | $ | 140,280 | $ | — | |||
franklintempleton.com The accompanying notes are an integral part of these financial statements. | Semiannual Report 31
| FRANKLIN STRATEGIC SERIES | ||||||
| FINANCIAL STATEMENTS | ||||||
| Statements of Assets and Liabilities (continued) | ||||||
| October 31, 2016 (unaudited) | ||||||
| Franklin | ||||||
| Biotechnology | Franklin Natural | |||||
| Discovery Fund | Resources Fund | |||||
| Class A: | ||||||
| Net assets, at value | $ | 1,069,317,687 | $ | 440,212,975 | ||
| Shares outstanding. | 8,313,744 | 17,569,981 | ||||
| Net asset value per sharea | $ | 128.62 | $ | 25.05 | ||
| Maximum offering price per share (net asset value per share ÷ 94.25%) | $ | 136.47 | $ | 26.58 | ||
| Class C: | ||||||
| Net assets, at value | $ | 35,687,536 | $ | 105,746,418 | ||
| Shares outstanding. | 283,376 | 4,371,058 | ||||
| Net asset value and maximum offering price per share | $ | 125.94 | $ | 24.19 | ||
| Class R6: | ||||||
| Net assets, at value | $ | 7,258,245 | $ | 15,072 | ||
| Shares outstanding. | 54,950 | 562 | ||||
| Net asset value and maximum offering price per share | $ | 132.09 | $ | 26.82 | ||
| Advisor Class: | ||||||
| Net assets, at value | $ | 104,994,825 | $ | 90,677,034 | ||
| Shares outstanding. | 799,778 | 3,386,767 | ||||
| Net asset value and maximum offering price per share | $ | 131.28 | $ | 26.77 | ||
aRedemption price is equal to net asset value less contingent deferred sales charges, if applicable.
32 Semiannual Report | The accompanying notes are an integral part of these financial statements. franklintempleton.com
| FRANKLIN STRATEGIC SERIES | ||||||
| FINANCIAL STATEMENTS | ||||||
| Statements of Operations | ||||||
| for the six months ended October 31, 2016 (unaudited) | ||||||
| Franklin | ||||||
| Biotechnology | Franklin Natural | |||||
| Discovery Fund | Resources Fund | |||||
| Investment income: | ||||||
| Dividends | $ | 2,034,198 | $ | 5,661,444 | ||
| Interest | — | 133,382 | ||||
| Income from securities loaned (net of fees and rebates) | 824,146 | 1,691 | ||||
| Total investment income | 2,858,344 | 5,796,517 | ||||
| Expenses: | ||||||
| Management fees (Note 3a) | 3,804,252 | 1,593,781 | ||||
| Distribution fees: (Note 3c) | ||||||
| Class A | 1,403,423 | 567,792 | ||||
| Class C | 152,419 | 538,522 | ||||
| Transfer agent fees: (Note 3e) | ||||||
| Class A | 1,005,264 | 650,148 | ||||
| Class C | 26,776 | 154,167 | ||||
| Class R6 | 389 | 65 | ||||
| Advisor Class. | 95,451 | 129,077 | ||||
| Custodian fees (Note 4) | 5,513 | 6,092 | ||||
| Reports to shareholders | 91,420 | 94,005 | ||||
| Registration and filing fees | 51,627 | 57,735 | ||||
| Professional fees | 25,535 | 20,560 | ||||
| Trustees’ fees and expenses | 8,730 | 3,038 | ||||
| Other | 15,214 | 8,448 | ||||
| Total expenses. | 6,686,013 | 3,823,430 | ||||
| Expense reductions (Note 4) | (342 | ) | (56 | ) | ||
| Expenses waived/paid by affiliates (Note 3f and 3g) | (152,863 | ) | (51,949 | ) | ||
| Net expenses. | 6,532,808 | 3,771,425 | ||||
| Net investment income (loss) | (3,674,464 | ) | 2,025,092 | |||
| Realized and unrealized gains (losses): | ||||||
| Net realized gain (loss) from: | ||||||
| Investments | 64,857,397 | (14,339,518 | ) | |||
| Foreign currency transactions | 3,982 | 20,711 | ||||
| Net realized gain (loss) | 64,861,379 | (14,318,807 | ) | |||
| Net change in unrealized appreciation (depreciation) on: | ||||||
| Investments | (57,543,483 | ) | 13,072,908 | |||
| Translation of other assets and liabilities | ||||||
| denominated in foreign currencies | 7,297 | 3,514 | ||||
| Net change in unrealized appreciation (depreciation) | (57,536,186 | ) | 13,076,422 | |||
| Net realized and unrealized gain (loss) | 7,325,193 | (1,242,385 | ) | |||
| Net increase (decrease) in net assets resulting from operations | $ | 3,650,729 | $ | 782,707 | ||
franklintempleton.com The accompanying notes are an integral part of these financial statements. | Semiannual Report 33
| FRANKLIN STRATEGIC SERIES | ||||||||||||
| FINANCIAL STATEMENTS | ||||||||||||
| Statements of Changes in Net Assets | ||||||||||||
| Franklin Biotechnology | Franklin Natural | |||||||||||
| Discovery Fund | Resources Fund | |||||||||||
| Six Months Ended | Six Months Ended | |||||||||||
| October 31, 2016 | Year Ended | October 31, 2016 | Year Ended | |||||||||
| (unaudited) | April 30, 2016 | (unaudited) | April 30, 2016 | |||||||||
| Increase (decrease) in net assets: | ||||||||||||
| Operations: | ||||||||||||
| Net investment income (loss) | $ | (3,674,464 | ) | $ | (8,934,186 | ) | $ | 2,025,092 | $ | 6,662,268 | ||
| Net realized gain (loss) | 64,861,379 | 41,508,062 | (14,318,807 | ) | (105,823,288 | ) | ||||||
| Net change in unrealized appreciation | ||||||||||||
| (depreciation) | (57,536,186 | ) | (443,061,045 | ) | 13,076,422 | (46,797,418 | ) | |||||
| Net increase (decrease) in net assets | ||||||||||||
| resulting from operations | 3,650,729 | (410,487,169 | ) | 782,707 | (145,958,438 | ) | ||||||
| Distributions to shareholders from: | ||||||||||||
| Net investment income: | ||||||||||||
| Class A | — | — | — | (3,065,832 | ) | |||||||
| Class C. | — | — | — | (21,423 | ) | |||||||
| Class R6 | — | — | — | (5,056 | ) | |||||||
| Advisor Class | — | — | — | (880,846 | ) | |||||||
| Net realized gains: | ||||||||||||
| Class A | — | (115,150,452 | ) | — | — | |||||||
| Class C. | — | (1,868,138 | ) | — | — | |||||||
| Class R6 | — | (555,624 | ) | — | — | |||||||
| Advisor Class | — | (11,496,430 | ) | — | — | |||||||
| Total distributions to shareholders | — | (129,070,644 | ) | — | (3,973,157 | ) | ||||||
| Capital share transactions: (Note 2) | ||||||||||||
| Class A | (9,764,898 | ) | (51,384,188 | ) | (22,056,035 | ) | 1,840,165 | |||||
| Class C. | 18,869,913 | 2,640,554 | (1,796,104 | ) | 7,417,245 | |||||||
| Class R6 | 1,459,466 | (63,450,822 | ) | 258 | (222,058 | ) | ||||||
| Advisor Class | 11,746,845 | (25,379,192 | ) | 201,477 | 24,416,177 | |||||||
| Total capital share transactions | 22,311,326 | (137,573,648 | ) | (23,650,404 | ) | 33,451,529 | ||||||
| Net increase (decrease) in net assets | 25,962,055 | (677,131,461 | ) | (22,867,697 | ) | (116,480,066 | ) | |||||
| Net assets: | ||||||||||||
| Beginning of period | 1,191,296,238 | 1,868,427,699 | 659,519,196 | 775,999,262 | ||||||||
| End of period | $ | 1,217,258,293 | $ | 1,191,296,238 | $ | 636,651,499 | $ | 659,519,196 | ||||
| Undistributed net investment income (loss) included | ||||||||||||
| in net assets: | ||||||||||||
| End of period | $ | (11,638,591 | ) | $ | (7,964,127 | ) | $ | 5,855,607 | $ | 3,830,515 | ||
34 Semiannual Report | The accompanying notes are an integral part of these financial statements. franklintempleton.com
FRANKLIN STRATEGIC SERIES
Notes to Financial Statements (unaudited)
1. Organization and Significant Accounting Policies
Franklin Strategic Series (Trust) is registered under the Investment Company Act of 1940 (1940 Act) as an open-end management investment company, consisting of nine separate funds, two of which are included in this report (Funds) and applies the specialized accounting and reporting guidance in U.S. Generally Accepted Accounting Principles (U.S. GAAP). The financial statements of the remaining funds in the Trust are presented separately. The Funds offer four classes of shares: Class A, Class C, Class R6, and Advisor Class. Each class of shares differs by its initial sales load, contingent deferred sales charges, voting rights on matters affecting a single class, its exchange privilege and fees primarily due to differing arrangements for distribution and transfer agent fees. Franklin Biotechnology Discovery Fund was closed to new investors with limited exceptions effective at the close of market July 8, 2014. Effective May 16, 2016, the Fund reopened to new investors.
The following summarizes the Funds’ significant accounting policies.
a. Financial Instrument Valuation
The Funds’ investments in financial instruments are carried at fair value daily. Fair value is the price that would be received to sell an asset or paid to transfer a liability in an orderly transaction between market participants on the measurement date. The Funds calculate the net asset value (NAV) per share as of 4 p.m. Eastern time each day the New York Stock Exchange (NYSE) is open for trading. Under compliance policies and procedures approved by the Trust’s Board of Trustees (the Board), the Funds’ administrator has responsibility for oversight of valuation, including leading the cross-functional Valuation Committee (VC). The VC provides administration and oversight of the Funds’ valuation policies and procedures, which are approved annually by the Board. Among other things, these procedures allow the Funds to utilize independent pricing services, quotations from securities and financial instrument dealers, and other market sources to determine fair value.
Equity securities listed on an exchange or on the NASDAQ National Market System are valued at the last quoted sale price or the official closing price of the day, respectively. Foreign equity securities are valued as of the close of trading on the foreign stock exchange on which the security is primarily traded or as of 4 p.m. Eastern time, whichever is earlier. The value is then converted into its U.S. dollar equivalent at the foreign exchange rate in effect at 4 p.m. Eastern time on the day that the value of the security is determined. Over-the-counter (OTC) securities are valued within the range of the most recent quoted bid and ask prices. Securities that trade in multiple markets or on multiple exchanges are valued according to the broadest and most representative market. Certain equity securities are valued based upon fundamental characteristics or relationships to similar securities.
Debt securities generally trade in the OTC market rather than on a securities exchange. The Funds’ pricing services use multiple valuation techniques to determine fair value. In instances where sufficient market activity exists, the pricing services may utilize a market-based approach through which quotes from market makers are used to determine fair value. In instances where sufficient market activity may not exist or is limited, the pricing services also utilize proprietary valuation models which may consider market characteristics such as benchmark yield curves, credit spreads, estimated default rates, anticipated market interest rate volatility, coupon rates, anticipated timing of principal repayments, underlying collateral, and other unique security features in order to estimate the relevant cash flows, which are then discounted to calculate the fair value.
Investments in open-end mutual funds are valued at the closing NAV.
The Funds have procedures to determine the fair value of financial instruments for which market prices are not reliable or readily available. Under these procedures, the VC convenes on a regular basis to review such financial instruments and considers a number of factors, including significant unobservable valuation inputs, when arriving at fair value. The VC primarily employs a market-based approach which may use related or comparable assets or liabilities, recent transactions, market multiples, book values, and other relevant information for the investment to determine the fair value of the investment. An income-based valuation approach may also be used in which the anticipated future cash flows of the investment are discounted to calculate fair value. Discounts may also be applied due to the nature or duration of any restrictions on the disposition of the investments. Due to the inherent uncertainty of valuations of such investments, the fair values may differ significantly from the values that would have been used had an active market existed. The VC employs various methods for calibrating these valuation approaches including a regular
franklintempleton.com
Semiannual Report 35
FRANKLIN STRATEGIC SERIES
NOTES TO FINANCIAL STATEMENTS (UNAUDITED)
1. Organization and Significant Accounting
Policies (continued)
a. Financial Instrument Valuation (continued)
review of key inputs and assumptions, transactional back-testing or disposition analysis, and reviews of any related market activity.
Trading in securities on foreign securities stock exchanges and OTC markets may be completed before 4 p.m. Eastern time. In addition, trading in certain foreign markets may not take place on every NYSE business day. Occasionally, events occur between the time at which trading in a foreign security is completed and the close of the NYSE that might call into question the reliability of the value of a portfolio security held by the Fund. As a result, differences may arise between the value of the Funds’ portfolio securities as determined at the foreign market close and the latest indications of value at the close of the NYSE. In order to minimize the potential for these differences, the VC monitors price movements following the close of trading in foreign stock markets through a series of country specific market proxies (such as baskets of American Depositary Receipts, futures contracts and exchange traded funds). These price movements are measured against established trigger thresholds for each specific market proxy to assist in determining if an event has occurred that may call into question the reliability of the values of the foreign securities held by the Funds. If such an event occurs, the securities may be valued using fair value procedures, which may include the use of independent pricing services.
When the last day of the reporting period is a non-business day, certain foreign markets may be open on those days that the NYSE is closed, which could result in differences between the value of the Funds’ portfolio securities on the last business day and the last calendar day of the reporting period. Any significant security valuation changes due to an open foreign market are adjusted and reflected by the Funds for financial reporting purposes.
b. Foreign Currency Translation
Portfolio securities and other assets and liabilities denominated in foreign currencies are translated into U.S. dollars based on the exchange rate of such currencies against U.S. dollars on the date of valuation. The Funds may enter into foreign currency exchange contracts to facilitate transactions denominated in a foreign currency. Purchases and sales of securities, income and expense items denominated in foreign currencies are translated into U.S. dollars at the exchange rate in effect on the transaction date. Portfolio securities and assets and liabilities denominated in foreign currencies contain risks that those currencies will decline in value relative to the U.S. dollar. Occasionally, events may impact the availability or reliability of foreign exchange rates used to convert the U.S. dollar equivalent value. If such an event occurs, the foreign exchange rate will be valued at fair value using procedures established and approved by the Board.
The Funds do not separately report the effect of changes in foreign exchange rates from changes in market prices on securities held. Such changes are included in net realized and unrealized gain or loss from investments in the Statements of Operations.
Realized foreign exchange gains or losses arise from sales of foreign currencies, currency gains or losses realized between the trade and settlement dates on securities transactions and the difference between the recorded amounts of dividends, interest, and foreign withholding taxes and the U.S. dollar equivalent of the amounts actually received or paid. Net unrealized foreign exchange gains and losses arise from changes in foreign exchange rates on foreign denominated assets and liabilities other than investments in securities held at the end of the reporting period.
c. Securities Lending
Certain or all Funds participate in an agency based securities lending program to earn additional income. The Fund receives cash collateral against the loaned securities in an amount equal to at least 102% of the fair value of the loaned securities. Collateral is maintained over the life of the loan in an amount not less than 100% of the fair value of loaned securities, as determined at the close of Fund business each day; any additional collateral required due to changes in security values is delivered to the Fund on the next business day. The collateral is deposited into a joint cash account with other funds and is used to invest in a money market fund managed by Franklin Advisers, Inc., an affiliate of the Funds. The Fund may receive income from the investment of cash collateral, in addition to lending fees and rebates paid by the borrower. Income from securities loaned, net of fees paid to the securities lending agent and/or third-party vendor, is reported separately in the Statements of Operations. The Fund bears the market risk with respect to the collateral investment, securities loaned, and the risk that the agent may default on its obligations to the Fund. If
36 Semiannual Report
franklintempleton.com
FRANKLIN STRATEGIC SERIES
NOTES TO FINANCIAL STATEMENTS (UNAUDITED)
the borrower defaults on its obligation to return the securities loaned, the Fund has the right to repurchase the securities in the open market using the collateral received. The securities lending agent has agreed to indemnify the Fund in the event of default by a third party borrower.
d. Income and Deferred Taxes
It is each Fund’s policy to qualify as a regulated investment company under the Internal Revenue Code. Each Fund intends to distribute to shareholders substantially all of its taxable income and net realized gains to relieve it from federal income and excise taxes. As a result, no provision for U.S. federal income taxes is required.
The Funds may be subject to foreign taxation related to income received, capital gains on the sale of securities and certain foreign currency transactions in the foreign jurisdictions in which the Funds invest. Foreign taxes, if any, are recorded based on the tax regulations and rates that exist in the foreign markets in which the Funds invest. When a capital gain tax is determined to apply, certain or all Funds record an estimated deferred tax liability in an amount that would be payable if the securities were disposed of on the valuation date.
Each Fund may recognize an income tax liability related to its uncertain tax positions under U.S. GAAP when the uncertain tax position has a less than 50% probability that it will be sustained upon examination by the tax authorities based on its technical merits. As of October 31, 2016, the Fund has determined that no tax liability is required in its financial statements related to uncertain tax positions for any open tax years (or expected to be taken in future tax years). Open tax years are those that remain subject to examination and are based on each tax jurisdiction’s statute of limitation.
e. Security Transactions, Investment Income, Expenses and Distributions
Security transactions are accounted for on trade date. Realized gains and losses on security transactions are determined on a specific identification basis. Interest income and estimated expenses are accrued daily. Dividend income is recorded on the ex-dividend date except for certain dividends from securities where the dividend rate is not available. In such cases, the dividend is recorded as soon as the information is received by the Funds. Distributions to shareholders are recorded on the ex-dividend date and are determined according to income tax regulations (tax basis). Distributable earnings determined on a tax basis may differ from earnings recorded in accordance with U.S. GAAP. These differences may be permanent or temporary. Permanent differences are reclassified among capital accounts to reflect their tax character. These reclassifications have no impact on net assets or the results of operations. Temporary differences are not reclassified, as they may reverse in subsequent periods.
Common expenses incurred by the Trust are allocated among the Funds based on the ratio of net assets of each Fund to the combined net assets of the Trust. Fund specific expenses are charged directly to the Fund that incurred the expense.
Realized and unrealized gains and losses and net investment income, not including class specific expenses, are allocated daily to each class of shares based upon the relative proportion of net assets of each class. Differences in per share distributions, by class, are generally due to differences in class specific expenses.
f. Accounting Estimates
The preparation of financial statements in accordance with U.S. GAAP requires management to make estimates and assumptions that affect the reported amounts of assets and liabilities at the date of the financial statements and the amounts of income and expenses during the reporting period. Actual results could differ from those estimates.
g. Guarantees and Indemnifications
Under the Trust’s organizational documents, its officers and trustees are indemnified by the Trust against certain liabilities arising out of the performance of their duties to the Trust. Additionally, in the normal course of business, the Trust, on behalf of the Funds, enters into contracts with service providers that contain general indemnification clauses. The Trust’s maximum exposure under these arrangements is unknown as this would involve future claims that may be made against the Trust that have not yet occurred. Currently, the Trust expects the risk of loss to be remote.
franklintempleton.com
Semiannual Report 37
FRANKLIN STRATEGIC SERIES
NOTES TO FINANCIAL STATEMENTS (UNAUDITED)
2. Shares of Beneficial Interest
At October 31, 2016, there were an unlimited number of shares authorized (without par value). Transactions in the Funds’ shares were as follows:
| Franklin Biotechnology | Franklin Natural | |||||||||||
| Discovery Fund | Resources Fund | |||||||||||
| Shares | Amount | Shares | Amount | |||||||||
| Class A Shares: | ||||||||||||
| Six Months ended October 31, 2016 | ||||||||||||
| Shares sold | 1,256,832 | $ | 168,323,271 | 1,881,443 | $ | 46,667,401 | ||||||
| Shares redeemed | (1,328,430 | ) | (178,088,169 | ) | (2,758,267 | ) | (68,723,436 | ) | ||||
| Net increase (decrease) | (71,598 | ) | $ | (9,764,898 | ) | (876,824 | ) | $ | (22,056,035 | ) | ||
| Year ended April 30, 2016 | ||||||||||||
| Shares sold | 994,554 | $ | 169,501,230 | 5,741,950 | $ | 131,553,976 | ||||||
| Shares issued in reinvestment of distributions | 691,137 | 108,930,097 | 143,948 | 2,979,717 | ||||||||
| Shares redeemed | (2,087,610 | ) | (329,815,515 | ) | (5,636,208 | ) | (132,693,528 | ) | ||||
| Net increase (decrease) | (401,919 | ) | $ | (51,384,188 | ) | 249,690 | $ | 1,840,165 | ||||
| Class C Shares: | ||||||||||||
| Six Months ended October 31, 2016 | ||||||||||||
| Shares sold | 183,529 | $ | 24,097,970 | 446,845 | $ | 10,690,899 | ||||||
| Shares redeemed | (39,547 | ) | (5,228,057 | ) | (517,430 | ) | (12,487,003 | ) | ||||
| Net increase (decrease) | 143,982 | $ | 18,869,913 | (70,585 | ) | $ | (1,796,104 | ) | ||||
| Year ended April 30, 2016 | ||||||||||||
| Shares sold | 35,382 | $ | 6,172,232 | 1,548,932 | $ | 34,012,781 | ||||||
| Shares issued in reinvestment of distributions | 12,007 | 1,864,389 | 1,031 | 20,756 | ||||||||
| Shares redeemed | (35,581 | ) | (5,396,067 | ) | (1,170,096 | ) | (26,616,292 | ) | ||||
| Net increase (decrease) | 11,808 | $ | 2,640,554 | 379,867 | $ | 7,417,245 | ||||||
| Class R6 Shares: | ||||||||||||
| Six Months ended October 31, 2016 | ||||||||||||
| Shares sold | 28,134 | $ | 3,627,853 | 10 | $ | 258 | ||||||
| Shares redeemed | (15,570 | ) | (2,168,387 | ) | — | — | ||||||
| Net increase (decrease) | 12,564 | $ | 1,459,466 | 10 | $ | 258 | ||||||
| Year ended April 30, 2016 | ||||||||||||
| Shares sold | 21,331 | $ | 3,581,555 | 2,400 | $ | 64,684 | ||||||
| Shares issued in reinvestment of distributions | 3,445 | 555,624 | 229 | 5,056 | ||||||||
| Shares redeemed | (393,884 | ) | (67,588,001 | ) | (15,127 | ) | (291,798 | ) | ||||
| Net increase (decrease) | (369,108 | ) | $ | (63,450,822 | ) | (12,498 | ) | $ | (222,058 | ) | ||
| Advisor Class Shares: | ||||||||||||
| Six Months ended October 31, 2016 | ||||||||||||
| Shares sold | 251,805 | $ | 34,392,682 | 673,687 | $ | 17,756,846 | ||||||
| Shares redeemed | (165,732 | ) | (22,645,837 | ) | (663,830 | ) | (17,555,369 | ) | ||||
| Net increase (decrease) | 86,073 | $ | 11,746,845 | 9,857 | $ | 201,477 | ||||||
| Year ended April 30, 2016 | ||||||||||||
| Shares sold | 208,936 | $ | 35,072,346 | 2,472,344 | $ | 59,834,181 | ||||||
| Shares issued in reinvestment of distributions | 58,123 | 9,330,443 | 37,248 | 822,065 | ||||||||
| Shares redeemed | (455,659 | ) | (69,781,981 | ) | (1,490,983 | ) | (36,240,069 | ) | ||||
| Net increase (decrease) | (188,600 | ) | $ | (25,379,192 | ) | 1,018,609 | $ | 24,416,177 | ||||
38 Semiannual Report
franklintempleton.com
FRANKLIN STRATEGIC SERIES
NOTES TO FINANCIAL STATEMENTS (UNAUDITED)
3. Transactions with Affiliates
Franklin Resources, Inc. is the holding company for various subsidiaries that together are referred to as Franklin Templeton Investments. Certain officers and trustees of the Trust are also officers and/or directors of the following subsidiaries:
| Subsidiary | Affiliation |
| Franklin Advisers, Inc. (Advisers) | Investment manager |
| Franklin Templeton Services, LLC (FT Services) | Administrative manager |
| Franklin Templeton Distributors, Inc. (Distributors) | Principal underwriter |
| Franklin Templeton Investor Services, LLC (Investor Services) | Transfer agent |
a. Management Fees
Franklin Biotechnology Discovery Fund pays an investment management fee to Advisers based on the average daily net assets of the Fund as follows:
| Annualized Fee Rate | Net Assets | |
| 0.775 | % | Up to and including $100 million |
| 0.650 | % | Over $100 million, up to and including $200 million |
| 0.635 | % | Over $200 million, up to and including $250 million |
| 0.585 | % | Over $250 million, up to and including $700 million |
| 0.550 | % | Over $700 billion, up to and including $1.2 billion |
| 0.525 | % | Over $1.2 billion, up to and including $7.5 billion |
| 0.515 | % | Over $7.5 billion, up to and including $10 billion |
| 0.505 | % | Over $10 billion, up to and including $12.5 billion |
| 0.495 | % | Over $12.5 billion, up to and including $15 billion |
| 0.475 | % | in excess of $15 billion |
Franklin Natural Resources Fund pays an investment management fee to Advisers based on the average daily net assets of the Fund as follows:
| Annualized Fee Rate | Net Assets | |
| 0.625 | % | Up to and including $100 million |
| 0.500 | % | Over $100 million, up to and including $250 million |
| 0.450 | % | Over $250 million, up to and including $7.5 billion |
| 0.440 | % | Over $7.5 billion, up to and including $10 billion |
| 0.430 | % | Over $10 billion, up to and including $12.5 billion |
| 0.420 | % | Over $12.5 billion, up to and including $15 billion |
| 0.400 | % | In excess of $15 billion |
For the period ended October 31, 2016, each Fund’s effective investment management fee rate based on average daily net assets was as follows:
| Franklin | |||
| Biotechnology | Franklin Natural | ||
| Discovery Fund | Resources Fund | ||
| 0.589 | % | 0.489 | % |
franklintempleton.com
Semiannual Report 39
FRANKLIN STRATEGIC SERIES
NOTES TO FINANCIAL STATEMENTS (UNAUDITED)
3. Transactions with Affiliates (continued)
b. Administrative Fees
Under an agreement with Advisers, FT Services provides administrative services to the Funds. The fee is paid by Advisers based on the Fund’s average daily net assets, and is not an additional expense of the Funds.
c. Distribution Fees
The Board has adopted distribution plans for each share class, with the exception of Class R6 and Advisor Class shares, pursuant to Rule 12b-1 under the 1940 Act. Under the Funds’ Class A reimbursement distribution plans, the Funds reimburses Distributors for costs incurred in connection with the servicing, sale and distribution of the Fund’s shares up to the maximum annual plan rate for each class. Under the Class A reimbursement distribution plans, costs exceeding the maximum for the current plan year cannot be reimbursed in subsequent periods. In addition, under the Funds’ Class C compensation distribution plans, the Funds pay Distributors for costs incurred in connection with the servicing, sale and distribution of the Fund’s shares up to the maximum annual plan rate for each class. The plan year, for purposes of monitoring compliance with the maximum annual plan rates, is February 1 through January 31 for each Fund.
The maximum annual plan rates, based on the average daily net assets, for each class, are as follows:
| Class A | 0.35 | % |
| Class C | 1.00 | % |
Effective August 1, 2015, the Board has set the current rate at 0.25% per year for Class A shares until further notice and approval by the Board.
d. Sales Charges/Underwriting Agreements
Front-end sales charges and contingent deferred sales charges (CDSC) do not represent expenses of the Funds. These charges are deducted from the proceeds of sales of fund shares prior to investment or from redemption proceeds prior to remittance, as applicable. Distributors has advised the Funds of the following commission transactions related to the sales and redemptions of the Funds’ shares for the period:
| Franklin | ||||
| Biotechnology | Franklin Natural | |||
| Discovery Fund | Resources Fund | |||
| Sales charges retained net of commissions paid to | ||||
| unaffiliated brokers/dealers | $ | 434,037 | $ | 102,679 |
| CDSC retained | $ | 9,639 | $ | 11,855 |
| e. Transfer Agent Fees | ||||
Each class of shares, except for Class R6 pays transfer agent fees to Investor Services for its performance of shareholder servicing obligations and reimburses Investor Services for out of pocket expenses incurred, including shareholder servicing fees paid to third parties. These fees are allocated daily based upon their relative proportion of such classes’ aggregate net assets. Class R6 pays Investor Services transfer agent fees specific to that class.
For the period ended October 31, 2016, the Funds paid transfer agent fees as noted in the Statements of Operations of which the following amounts were retained by Investor Services:
| Franklin | ||||
| Biotechnology | Franklin Natural | |||
| Discovery Fund | Resources Fund | |||
| Transfer agent fees | $ | 475,366 | $ | 416,590 |
40 Semiannual Report
franklintempleton.com
FRANKLIN STRATEGIC SERIES
NOTES TO FINANCIAL STATEMENTS (UNAUDITED)
f. Investments in Affiliated Management Investment Companies
Certain or all Funds invest in one or more affiliated management investment companies for purposes other than exercising a controlling influence over the management or policies. Management fees paid by the Funds are waived on assets invested in the affiliated management investment companies, as noted in the Statements of Operations, in an amount not to exceed the management and administrative fees paid directly or indirectly by each affiliate. Prior to May 1, 2013, the waiver was accounted for as a reduction to management fees. During the period ended October 31, 2016, certain or all Funds held investments in affiliated management investment companies as follows:
| Number of | % of | ||||||||||
| Shares/ | Number of | Affiliated | |||||||||
| Warrants | Shares/ | Fund Shares | |||||||||
| Held at | Warrants | Value | Outstanding | ||||||||
| Beginning | Gross | Gross | Held at End | at End | Investment | Realized | Held at End | ||||
| of Period | Additions | Reductions | of Period | of Period | Income | Gain (Loss) | of Period | ||||
| Franklin Biotechnology Discovery Fund | |||||||||||
| Non-Controlled Affiliates | |||||||||||
| Institutional Fiduciary Trust Money | |||||||||||
| Market Portfolio | 82,758,981 | 435,939,860 | (419,699,860 | ) | 98,998,981 | $ | 98,998,981 | $ – | $ – | 0.6 | % |
| Franklin Natural Resources Fund | |||||||||||
| Non-Controlled Affiliates | |||||||||||
| Institutional Fiduciary Trust Money | |||||||||||
| Market Portfolio | 43,909,680 | 67,910,308 | (99,486,171 | ) | 12,333,817 | $ | 12,333,817 | $ – | $ – | 0.1 | % |
g. Waiver and Expense Reimbursements
Investor Services has contractually agreed in advance to waive or limit its fees so that the Class R6 transfer agent fees do not exceed 0.01% until August 31, 2016. For Franklin Biotechnology Discovery, there were no Class R6 transfer agent fees waived during the period ended October 31, 2016.
4. Expense Offset Arrangement
The Funds have entered into an arrangement with their custodian whereby credits realized as a result of uninvested cash balances are used to reduce a portion of the Funds’ custodian expenses. During the period ended October 31, 2016, the custodian fees were reduced as noted in the Statements of Operations.
5. Income Taxes
For tax purposes, capital losses may be carried over to offset future capital gains. Capital loss carryforwards with no expiration, if any, must be fully utilized before those losses with expiration dates.
At October 31, 2016, the capital loss carryforwards were as follows:
| Franklin Natural | ||
| Resources Fund | ||
| Capital loss carryforwards subject to expiration: | ||
| 2018 | $ | 12,737,677 |
| Capital loss carryforwards not subject to expiration: | ||
| Short term | 18,823,722 | |
| Long term | 95,547,646 | |
| Total capital loss carryforwards | $ | 127,109,045 |
franklintempleton.com
Semiannual Report 41
FRANKLIN STRATEGIC SERIES
NOTES TO FINANCIAL STATEMENTS (UNAUDITED)
5. Income Taxes (continued)
For tax purposes, the Funds may elect to defer any portion of a post-October capital loss to the first day of the following fiscal year. At April 30, 2016, Franklin Biotechnology Discovery Fund deferred late-year ordinary losses of $4,945,791.
At October 31, 2016, the cost of investments and net unrealized appreciation (depreciation) for income tax purposes were as follows:
| Franklin | ||||||
| Biotechnology | Franklin Natural | |||||
| Discovery Fund | Resources Fund | |||||
| Cost of investments | $ | 983,816,755 | $ | 614,202,599 | ||
| Unrealized appreciation | $ | 428,045,363 | $ | 117,745,783 | ||
| Unrealized depreciation | (130,873,181 | ) | (93,142,287 | ) | ||
| Net unrealized appreciation (depreciation) | $ | 297,172,182 | $ | 24,603,496 | ||
Differences between income and/or capital gains as determined on a book basis and a tax basis are primarily due to differing treatments of passive foreign investment company shares and wash sales.
6. Investment Transactions
Purchases and sales of investments (excluding short term securities) for the period ended October 31, 2016, were as follows:
| Franklin | ||||
| Biotechnology | Franklin Natural | |||
| Discovery Fund | Resources Fund | |||
| Purchases | $ | 239,268,316 | $ | 106,439,787 |
| Sales | $ | 240,573,082 | $ | 102,435,624 |
| Franklin | ||||
| Biotechnology | ||||
| Discovery Fund | ||||
| Securities lending transactionsa: | ||||
| Equity Investmentsb | $ | 66,456,062 | ||
aThe agreements open at year end can be terminated at any time.
bGross amount of recognized liabilities for securities lending transactions is included in payable upon return of securities loaned in the Statements of Assets and Liabilities.
7. Restricted Securities
Certain or all Funds invest in securities that are restricted under the Securities Act of 1933 (1933 Act) or which are subject to legal, contractual, or other agreed upon restrictions on resale. Restricted securities are often purchased in private placement transactions, and cannot be sold without prior registration unless the sale is pursuant to an exemption under the 1933 Act. Disposal of these securities may require greater effort and expense, and prompt sale at an acceptable price may be difficult. The Funds may have registration rights for restricted securities. The issuer generally incurs all registration costs.
42 Semiannual Report
franklintempleton.com
FRANKLIN STRATEGIC SERIES
NOTES TO FINANCIAL STATEMENTS (UNAUDITED)
At October 31, 2016, certain or all Funds held investments in restricted securities, excluding certain securities exempt from registration under the 1933 Act deemed to be liquid, as follows:
| Acquisition | ||||||
| Shares | Issuer | Date | Cost | Value | ||
| Franklin Biotechnology Discovery Fund | ||||||
| 107,297,280 | Acerta Pharma BV | 5/06/15 | $ | 6,172,605 | $ | 5,939,334 |
| 137,714 | CRISPR Therapeutics AG, Reg S. | 6/10/16 | 1,850,041 | 2,400,143 | ||
| 942,380 | G1 Therapeutics Inc., pfd | 4/26/16 | 2,799,999 | 2,799,999 | ||
| 80,195 | Intarcia Therapeutics Inc., DD | 3/26/14 | 2,597,516 | 4,811,700 | ||
| 759,880 | True North Therapeutics Inc., pfd., Series D, 144A | 10/05/16 | 1,900,004 | 1,900,004 | ||
| Total Restricted Securities (Value is 1.5% of Net Assets) | $ | 15,320,165 | $ | 17,851,180 | ||
| Franklin Natural Resources Fund | ||||||
| 199,375 | Energy Coal Resources, 144A | 11/16/05 - 5/05/06 | $ | 741,939 | $ | — |
| 29,847 | Energy Coal Resources, 144A, pfd | 3/17/09 | 2,376,164 | — | ||
| Total Restricted Securities (Value is —% of Net Assets) | $ | 3,118,103 | $ | — | ||
8. Holdings of 5% Voting Securities of Portfolio Companies
The 1940 Act defines "affiliated companies" to include investments in portfolio companies in which a fund owns 5% or more of the outstanding voting securities. During the period ended October 31, 2016, certain or all Funds held investments in “affiliated companies” as follows:
| Number of | Number of | |||||||||
| Shares Held | Shares | Value at | Realized | |||||||
| at Beginning | Gross | Gross | Held at End | End of | Investment | Gain | ||||
| Name of Issuer | of Period | Additions | Reductions | of Period | Period | Income | (Loss) | |||
| Franklin Biotechnology Discovery Fund | ||||||||||
| Non-Controlled Affiliates. | ||||||||||
| Alcobra Ltd | 1,367,755 | 369,551 | — | 1,737,306 | $ | 3,335,628 | $ | — | $ | — |
| ARCA biopharma Inc | 478,077 | — | — | 478,077 | 1,051,769 | — | — | |||
| ARCA biopharma Inc., wts., 6/16/22 | 1,338,619 | — | — | 1,338,619 | 19,054 | — | — | |||
| BioPharmX Corp | 216,000 | — | — | 216,000 | 67,630 | — | — | |||
| BiopharmX Corp., 144A. | 1,600,000 | 345,737 | — | 1,945,737 | 609,210 | — | — | |||
| Biopharmx Corp., wts., 3/29/21. | 108,000 | — | — | 108,000 | 16,971 | — | — | |||
| Fate Therapeutics Inc | 195,700 | 1,888,500 | — | 2,084,200 | 4,376,820 | — | — | |||
| Total Affiliated Securities (Value is 0.8% of Net Assets) | $ | 9,477,082 | $ | — | $ | — | ||||
9. Credit Facility
Certain or all Funds, together with other U.S. registered and foreign investment funds (collectively, Borrowers), managed by Franklin Templeton Investments, are borrowers in a joint syndicated senior unsecured credit facility totaling $2 billion (Global Credit Facility) which matures on February 10, 2017. This Global Credit Facility provides a source of funds to the Borrowers for temporary and emergency purposes, including the ability to meet future unanticipated or unusually large redemption requests.
Under the terms of the Global Credit Facility, the Funds shall, in addition to interest charged on any borrowings made by the Funds and other costs incurred by the Funds, pay their share of fees and expenses incurred in connection with the implementation and maintenance of the Global Credit Facility, based upon their relative share of the aggregate net assets of all of the Borrowers, including an annual commitment fee of 0.07% based upon the unused portion of the Global Credit Facility. Effective February 12, 2016, the annual commitment fee is 0.15%. These fees are reflected in other expenses in the Statements of Operations. During the year ended October 31, 2016, the Fund did not use the Global Credit Facility.
franklintempleton.com
Semiannual Report 43
FRANKLIN STRATEGIC SERIES
NOTES TO FINANCIAL STATEMENTS (UNAUDITED)
10. Fair Value Measurements
The Funds follow a fair value hierarchy that distinguishes between market data obtained from independent sources (observable inputs) and the Funds’ own market assumptions (unobservable inputs). These inputs are used in determining the value of the Funds’ financial instruments and are summarized in the following fair value hierarchy:
- Level 1 – quoted prices in active markets for identical financial instruments
- Level 2 – other significant observable inputs (including quoted prices for similar financial instruments, interest rates, prepayment speed, credit risk, etc.)
- Level 3 – significant unobservable inputs (including the Funds’ own assumptions in determining the fair value of financial instruments)
The input levels are not necessarily an indication of the risk or liquidity associated with financial instruments at that level.
For movements between the levels within the fair value hierarchy, the Funds have adopted a policy of recognizing the transfers as of the date of the underlying event which caused the movement.
A summary of inputs used as of October 31, 2016, in valuing the Funds’ assets carried at fair value, is as follows:
| Level 1 | Level 2 | Level 3 | Total | |||||
| Franklin Biotechnology Discovery Fund | ||||||||
| Assets: | ||||||||
| Investments in Securities: | ||||||||
| Equity Investments:a | ||||||||
| Biotechnology. | $ | 1,010,652,474 | $ | —b | $ | 9,151,667 | $ | 1,019,804,141 |
| Pharmaceuticals | 121,365,673 | — | 8,756,304 | 130,121,977 | ||||
| All Other Equity Investmentsc | 32,063,838 | — | — | 32,063,838 | ||||
| Short Term Investments | 98,998,981 | — | — | 98,998,981 | ||||
| Total Investments in Securities | $ | 1,263,080,966 | $ | — | $ | 17,907,971 | $ | 1,280,988,937 |
| Receivables: | ||||||||
| Investment Securities Sold | $ | — | $ | — | $ | 9,096,348 | $ | 9,096,348 |
| Franklin Natural Resources Fund | ||||||||
| Assets: | ||||||||
| Investments in Securities: | ||||||||
| Equity Investments:a | ||||||||
| Coal & Consumable Fuels | $ | — | $ | — | $ | —b | $ | — |
| Oil & Gas Exploration & Production | 210,977,543 | 4,354,469 | — | 215,332,012 | ||||
| All Other Equity Investmentsc | 409,524,653 | — | — | 409,524,653 | ||||
| Convertible Bonds | — | 1,615,613 | — | 1,615,613 | ||||
| Short Term Investments | 12,333,817 | — | — | 12,333,817 | ||||
| Total Investments in Securities | $ | 632,836,013 | $ | 5,970,082 | $ | — | $ | 638,806,095 |
aIncludes common, preferred and convertible preferred stocks as well as other equity investments.
bIncludes securities determined to have no value at October 31, 2016.
cFor detailed categories, see the accompanying Statement of Investments.
aIncludes common, preferred and convertible preferred stocks as well as other equity investments.
bIncludes securities determined to have no value at October 31, 2016.
cFor detailed categories, see the accompanying Statement of Investments.
44 Semiannual Report
franklintempleton.com
FRANKLIN STRATEGIC SERIES
NOTES TO FINANCIAL STATEMENTS (UNAUDITED)
A reconciliation of assets in which Level 3 inputs are used in determining fair value is presented when there are significant Level 3 financial instruments at the end of the period. At October 31, 2016, the reconciliation of assets is as follows:
| Net Change in | |||||||||||||||||||
| Unrealized | |||||||||||||||||||
| Appreciation | |||||||||||||||||||
| Net | Net | (Depreciation) | |||||||||||||||||
| Balance at | Transfers | Transfer | Realized | Unrealized | Balance | on Assets Held | |||||||||||||
| Beginning of | Into | Out of | Cost Basis | Gain | Appreciation | at End | at | ||||||||||||
| Period | Purchases | Sales | Level 3 | Level 3a | Adjustmentsb | (Loss) | (Depreciation) | of Period | Period End | ||||||||||
| Assets: | |||||||||||||||||||
| Investments in Securities:c | |||||||||||||||||||
| Equity Investments: | |||||||||||||||||||
| Biotechnology | $ | 3,195,479 | $ | 6,350,195 | $– | $– | $ | 2,024,472 | $ | 2,290,900 | $ | (1,404,100 | ) | $ | 743,665 | $ | 9,151,667 | $ | 2,206,143 |
| Pharmaceuticals | 8,460,560 | – | – | – | – | – | – | 295,744 | 8,756,304 | 295,744 | |||||||||
| Total Investments | |||||||||||||||||||
| in Securities | $ | 11,656,039 | $ | 6,350,195 | $– | $– | $ | 2,024,472 | $ | 2,290,900 | $ | (1,404,100 | ) | $ | 1,039,409 | $ | 17,907,971 | $ | 2,501,887 |
| Receivables: | |||||||||||||||||||
| Investment Securities Sold | $ | 9,089,004 | $ – | $– | $– | $ – | $ | – | $ – | $ | 7,344 | $ | 9,096,348 | $ | 7,344 |
aThe investments were transferred out of Level 3 as a result of the availability of a quoted price in an active market for identical securities.
bMay include accretion, amortization, partnership adjustments, and/or other cost basis adjustments.
cIncludes common and preferred stocks as well as other equity investments.
| Impact to Fair | |||||||
| Fair Value at | Valuation | Value if Input | |||||
| Description | End of Period | Technique | Unobservable Inputs | Amount/Range | Increasesa | ||
| Franklin Biotechnology Discovery Fund | |||||||
| Assets: | |||||||
| Investments in Securities: | |||||||
| Equity Investments:b | |||||||
| Biotechnology | $ | 2,400,143 | Discounted Cash | ||||
| Flow Model | Discount Rate | 4.50 | % | Decrease | |||
| Pharmaceutical | 5,939,334 | Probability Weighted | Free Cash Flowc | $3,000 | (mil) | Increased | |
| Discounted Cash | Discount for lack of | ||||||
| Flow Model | marketability | 12.50 | % | Decreasee | |||
| All Other Investmentsf | 9,568,494 | ||||||
| Total | $ | 17,907,971 | |||||
| Receivables: | |||||||
| Investment Securities Sold | $ | 9,096,348 | Discounted Cash Flow | Discount Rate | 1.4 | % | Decrease |
| Model | |||||||
aRepresents the directional change in the fair value of the Level 3 financial instruments that would result from a significant and reasonable increase in the corresponding
input. A significant and reasonable decrease in the input would have the opposite effect. Significant impacts, if any, to fair value and/or net assets have been indicated.
bIncludes preferred stocks.
cIncludes probability assumptions for various outcomes of contingent payments for clinical trials and regulatory approvals.
dRepresents a significant impact to fair value and net assets.
eRepresents a significant impact to fair value but not net assets.
fIncludes fair value of immaterial financial instruments developed using various valuation techniques and unobservable inputs. May also include financial instruments with
values derived using prior transaction prices or third party pricing information without adjustment for which such inputs are also unobservable.
franklintempleton.com Semiannual Report 45
FRANKLIN STRATEGIC SERIES
NOTES TO FINANCIAL STATEMENTS (UNAUDITED)
11. Subsequent Events
The Funds have evaluated subsequent events through the issuance of the financial statements and determined that no events have occurred that require disclosure.
| Abbreviations |
| Selected Portfolio |
| ADR American Depositary Receipt |
46 Semiannual Report
franklintempleton.com
FRANKLIN STRATEGIC SERIES
Shareholder Information
Proxy Voting Policies and Procedures
The Trust’s investment manager has established Proxy Voting
Policies and Procedures (Policies) that the Trust uses to
determine how to vote proxies relating to portfolio securities.
Shareholders may view the Trust’s complete Policies online at
franklintempleton.com. Alternatively, shareholders may request
copies of the Policies free of charge by calling the Proxy Group
collect at (954) 527-7678 or by sending a written request
to: Franklin Templeton Companies, LLC, 300 S.E. 2nd Street,
Fort Lauderdale, FL 33301, Attention: Proxy Group. Copies of
the Trust’s proxy voting records are also made available online
at franklintempleton.com and posted on the U.S. Securities and
Exchange Commission’s website at sec.gov and reflect the
most recent 12-month period ended June 30.
Quarterly Statement of Investments
The Trust files a complete statement of investments with the
U.S. Securities and Exchange Commission for the first and
third quarters for each fiscal year on Form N-Q. Shareholders
may view the filed Form N-Q by visiting the Commission’s
website at sec.gov. The filed form may also be viewed and
copied at the Commission’s Public Reference Room in
Washington, DC. Information regarding the operations of the
Public Reference Room may be obtained by calling (800)
SEC-0330.
franklintempleton.com
Semiannual Report 47
This page intentionally left blank.
| Contents | |
| Semiannual Report | |
| Franklin Flexible Alpha Bond Fund | 3 |
| Performance Summary | 7 |
| Your Fund’s Expenses | 9 |
| Financial Highlights and Statement of Investments | 10 |
| Financial Statements | 24 |
| Notes to Financial Statements | 28 |
| Shareholder Information | 41 |
Visit franklintempleton.com for fund updates, to access your account, or to find helpful financial planning tools.
2 Semiannual Report
franklintempleton.com
Semiannual Report
Franklin Flexible Alpha Bond Fund
We are pleased to bring you Franklin Flexible Alpha Bond Fund’s semiannual report for the period ended October 31, 2016.
Your Fund’s Goal and Main Investments
The Fund seeks to provide total return through a combination of current income and capital appreciation by investing at least 80% of its net assets in bonds and investments that provide exposure to bonds, including global debt obligations of any credit quality, maturity or duration, all varieties of fixed income, variable rate and floating rate debt securities and investments, and derivatives. The Fund aims to provide attractive risk-adjusted total returns over a full market cycle. A full market cycle is a period of time that spans a full business and economic cycle, which may include periods of rising and declining interest rates.
What is duration?
Duration is a measure of a bond’s price sensitivity to interest rate changes. In general, a portfolio of securities with a lower duration can be expected to be less sensitive to interest rate changes than a portfolio with a higher duration.
Performance Overview
For the six months under review, the Fund’s Class A shares delivered a +1.15% cumulative total return. In comparison, the LIBOR USD 3-Month Rate Index posted a +0.39% total return.1 The index tracks the interest rate at which banks offer to lend to one another in the wholesale money markets in London and is used to set the cost of various variable-rate loans. You can find more of the Fund’s performance data in the Performance Summary beginning on page 7.
Performance data represent past performance, which does not guarantee future results. Investment return and principal value will fluctuate, and you may have a gain or loss when you sell your shares. Current performance may differ from figures
| Sector Exposure* | ||
| 10/31/16 | ||
| % of Total | ||
| Net Assets | ||
| Investment-Grade Corporate Securities | 24.5 | % |
| Cash & Cash Equivalents | 19.0 | % |
| Residential Mortgage-Backed Securities | 12.1 | % |
| Floating Rate Loans | 6.5 | % |
| U.S. Treasuries | 5.5 | % |
| Municipal Bonds | 5.4 | % |
| Commercial Mortgage-Backed Securities | 5.2 | % |
| International Bonds | 4.7 | % |
| Asset-Backed Securities | 3.2 | % |
| Agency Mortgage-Backed Securities | 2.3 | % |
| Other | 1.5 | % |
| High Yield Corporate Securities | -2.0 | % |
| Interest-Rate Derivatives | -44.4 | % |
*Sector Exposure is intended to estimate the portfolio’s exposure to various
sectors, including any hedged or increased exposure through certain derivatives
held in the portfolio (or their underlying reference assets) and may not total 100% or
may be negative due to rounding, use of any derivatives, unsettled trades or other
factors. Interest-Rate Derivatives sector consists of Treasury, interest rate and other
derivatives that are primarily used for duration management; a negative number
indicates that the Fund is seeking to hedge interest rate risk.
shown. For most recent month-end performance, go to franklintempleton.com or call (800) 342-5236.
Economic and Market Overview
The U.S. economy expanded during the six months under review. The economy grew at a faster pace in 2016’s third quarter than in 2016’s second and first quarters and 2015’s fourth quarter, mainly due to personal consumption expenditures, exports, private inventory investment, federal government spending and nonresidential fixed investment. Manufacturing conditions remained volatile but generally expanded, and the services sector continued to grow. The unemployment rate decreased slightly from 5.0% in April to 4.9% at period-end.2 Monthly retail sales were volatile but grew during most of the review period. Inflation, as measured
1. Source: Bloomberg LP.
The index is unmanaged and includes reinvestment of any income or distributions. It does not reflect any fees, expenses or sales charges. One cannot invest directly in an
index, and an index is not representative of the Fund’s portfolio.
2. Source: Bureau of Labor Statistics.
See www.franklintempletondatasources.com for additional data provider information.
The dollar value, number of shares or principal amount, and names of all portfolio holdings are listed in the Fund’s Statement of Investments (SOI).
The SOI begins on page 15.
franklintempleton.com
Semiannual Report 3
FRANKLIN FLEXIBLE ALPHA BOND FUND
by the Consumer Price Index, remained subdued for most of the period, and rose slightly toward the period-end.
| Dividend Distributions* | |||||
| 5/1/16–10/31/16 | |||||
| Dividend per Share (cents) | |||||
| Advisor | |||||
| Month | Class A | Class C | Class R | Class R6 | Class |
| May | 1.0180 | 0.6150 | 0.6960 | 1.0770 | 1.0342 |
| June | 0.3727 | 0.2379 | 0.2670 | 0.3790 | 0.3793 |
| July | 0.3835 | 0.2480 | 0.2780 | 0.3900 | 0.3900 |
| August | 0.3873 | 0.2338 | 0.2730 | 0.3980 | 0.3941 |
| September | 0.6832 | 0.3944 | 0.4640 | 0.6990 | 0.6964 |
| October | 0.4992 | 0.2583 | 0.5080 | 0.5100 | 0.5080 |
| Total | 3.3439 | 1.9874 | 2.4860 | 3.4530 | 3.4020 |
*The distribution amount is the sum of the dividend payments to shareholders for
the period shown and includes only estimated tax-basis net investment income. All
Fund distributions will vary depending upon current market conditions, and past
distributions are not indicative of future trends.
The U.S. Federal Reserve (Fed) kept its target interest rate at 0.25–0.50% at its September meeting. The Fed noted that although the case for raising rates has strengthened, it will wait for further evidence of continued progress toward its objectives.
The 10-year Treasury yield, which moves inversely to price, shifted throughout the period. It rose from 1.83% on April 29, 2016, to a period high of 1.88% on May 2, 2016. However, negative interest rates in Japan and Europe, and central banks’ purchases of government bonds, pushed down the Treasury yield. The U.K.’s historic referendum to leave the European Union in June 2016 (also known as “Brexit”) also boosted safe haven buying by investors. The Treasury yield reached a period low of 1.37% in early July, and ended the period at 1.84%. The yield rose toward period-end, due to positive economic data and signals from the Fed on the possibility of an increase in interest rates in the near term.
During the period under review, global financial markets were broadly influenced by accommodative monetary policies of various global central banks, an improvement in commodity prices, generally encouraging economic data across regions and an Organization of the Petroleum Exporting Countries proposal to curb oil production. However, the impact of these factors was partially offset by a slowdown in the Chinese economy, geopolitical tensions in certain regions, uncertainty about the Fed’s timing for raising interest rates and worries about the health of European banks. In addition, global economic concerns and Brexit contributed to volatility in global stock markets. Over the period, the U.S. dollar strengthened against
| Currency Composition* | ||
| 10/31/16 | ||
| % of Total | ||
| Net Assets | ||
| North America | 104.0 | % |
| U.S. Dollar | 104.6 | % |
| Canadian Dollar | -0.6 | % |
| Latin America & Caribbean | 0.5 | % |
| Mexican Peso | 0.8 | % |
| Chilean Peso | -0.3 | % |
| Asia | 0.2 | % |
| Indian Rupee | 0.4 | % |
| Indonesian Rupiah | 0.2 | % |
| Malaysian Ringgit | 0.1 | % |
| Japanese Yen | -0.1 | % |
| Singapore Dollar | -0.2 | % |
| South Korean Won | -0.2 | % |
| Africa | -0.1 | % |
| South Africa Rand | -0.1 | % |
| Europe | -2.7 | % |
| Polish Zloty | -0.2 | % |
| British Pound | -0.5 | % |
| Euro | -2.0 | % |
| Australia & New Zealand | -1.9 | % |
| New Zealand Dollar | -0.7 | % |
| Australian Dollar | -1.2 | % |
*Currency Composition is intended to estimate the portfolio’s exposure to various
currencies, including any hedged or increased exposure through certain derivatives
held in the portfolio (or their underlying reference assets) and may not total 100% or
may be negative due to rounding, use of any derivatives, unsettled trades or other
factors.
the euro, weakened against the Japanese yen, and appreciated against numerous developed and emerging market currencies.
Investment Strategy
The Fund seeks to generate returns from various sources, other than solely from interest rates, by allocating its portfolio across various risks (such as credit, currency and duration risks). In employing this strategy, the Fund has the flexibility to invest across all debt asset classes without regard to country, sector, quality, maturity or duration and without reference to a benchmark index.
The Fund may engage in active and frequent trading as part of its investment strategies and, at any given time, may have a substantial amount of its assets invested in any class of debt securities, including, but not limited to: U.S. government and
4 Semiannual Report
franklintempleton.com
FRANKLIN FLEXIBLE ALPHA BOND FUND
agency securities; foreign government and supranational debt securities; corporate bonds; corporate loans (and loan participations); collateralized debt and loan obligations; preferred securities; various types of mortgage-backed securities and other asset-backed securities; municipal securities; and derivatives and other instruments with similar economic characteristics, or that provide exposure, to such debt securities.
Manager’s Discussion
During the period under review, the Fund posted a positive total return. The Fund’s basis trade positions (taking opposing long and short positions in two securities to profit from the convergence of their values), as well as yield curve and duration positioning, were the primary contributors to performance. In addition, the Fund’s exposure to residential mortgage-backed securities (RMBS), commercial mortgage-backed securities (CMBS), asset-backed securities and non-agency mortgage-backed securities contributed to performance. The Fund’s exposure to investment-grade corporates and senior floating rate loans was another positive source of alpha (excess return). Finally, the Fund’s exposure to Treasury inflation protected securities (TIPS) as well as currency exposure also contributed to results. In contrast, the Fund’s exposure to the corporate high yield sector was the primary detractor from performance over the period.
What is the yield curve?
The yield curve is a line that plots the interest rates, at a set point in time, of bonds having equal credit quality but differing maturity dates. The most frequently reported yield curve compares three-month, two-year and 30-year U.S. Treasury debt.
At period-end, we continued to maintain the strategy’s risk profile at a conservative level. We remained overweighted to the investment-grade corporate bond sector as well as securitized sectors including RMBS and CMBS. We continued to find what we considered value in credit hedged corporate positions as well. We sought to hedge all of the high yield corporate beta (or risk) in the Fund, although we retained exposure to select corporate loans and collateralized loan obligations. We also retained positions in TIPS as well as municipal bonds. The portfolio maintained an overweighting
to the U.S. dollar versus a basket of developed market and commodity-related currencies, although its various currency positions did not represent a significant portion of the Fund’s risk allocation.
The Fund utilized derivatives, including credit default and interest-rate swaps, currency forwards, Treasury futures, and currency, interest-rate swap and credit default swap options, principally as a tool for efficient portfolio management and to manage overall portfolio risk. These derivative transactions may provide the same, or similar, net long or short exposure to select currencies, interest rates, countries, duration or credit risks in a less expensive or more efficient way than by directly purchasing securities. In markets where portfolio securities are readily available, the cost difference during normal market conditions may be small.
What are swap agreements?
Swap agreements, such as interest-rate, currency and credit default swaps, are contracts between the Fund and another party (the swap counterparty). In a basic swap transaction, the Fund agrees with the swap counterparty to exchange the returns (or differentials in rates of return) earned or realized on a particular “notional amount” of underlying instruments. The notional amount is the set amount selected by the parties as the basis on which to calculate the obligations that they have agreed to exchange. The parties typically do not actually exchange the notional amount. Instead, they agree to exchange the returns that would be earned or realized if the notional amount were invested in given instruments or at given interest rates.
What is a currency forward contract?
A currency forward contract is an agreement between the Fund and a counterparty to buy or sell a foreign currency in exchange for another currency at a specific exchange rate on a future date.
What is a futures contract?
A futures contract is an agreement between the Fund and a counterparty made through a U.S. or foreign futures exchange to buy or sell an underlying instrument or asset at a specific priceonafuturedate.
franklintempleton.com
Semiannual Report 5
FRANKLIN FLEXIBLE ALPHA BOND FUND
What is an option?
An option is a contract to buy or sell a specific financial product known as the option’s underlying instrument at a specific price. The buyer of an option has the right, but not the obligation, to buy or sell the underlying instrument at or until a specified expiration date. Conversely, the seller (“writer”) of an option who opens a transaction is obligated to buy or sell the underlying instrument should the option holder exercise that right.
Thank you for your participation in Franklin Flexible Alpha Bond Fund. We look forward to serving your future investment needs.

The foregoing information reflects our analysis, opinions and portfolio holdings as of October 31, 2016, the end of the reporting period. The way we implement our main investment strategies and the resulting portfolio holdings may change depending on factors such as market and economic conditions. These opinions may not be relied upon as investment advice or an offer for a particular security. The information is not a complete analysis of every aspect of any market, country, industry, security or the Fund. Statements of fact are from sources considered reliable, but the investment manager makes no representation or warranty as to their completeness or accuracy. Although historical performance is no guarantee of future results, these insights may help you understand our investment management philosophy.
CFA® is a trademark owned by CFA Institute.
6 Semiannual Report
franklintempleton.com
FRANKLIN FLEXIBLE ALPHA BOND FUND
Performance Summary as of October 31, 2016
The performance tables do not reflect any taxes that a shareholder would pay on Fund dividends, capital gain distributions, if any, or any realized gains on the sale of Fund shares. Total return reflects reinvestment of the Fund’s dividends and capital gain distributions, if any, and any unrealized gains or losses.
Performance as of 10/31/161
Cumulative total return excludes sales charges. Average annual total returns include maximum sales charges. Sales charges will vary depending on the size of the investment and the class of share purchased. The maximum is 4.25% and the minimum is 0%. Class A: 4.25% maximum initial sales charge; Advisor Class: no sales charges. For other share classes, visit franklintempleton.com.
| Cumulative | Average Annual | Average Annual | ||||
| Share Class | Total Return2 | Total Return3 | Total Return (9/30/16)4 | |||
| A | ||||||
| 6-Month | +1.15 | % | -3.17 | % | ||
| 1-Year | +1.10 | % | -3.18 | % | -2.86 | % |
| Since Inception (8/3/15) | +0.81 | % | -2.78 | % | -3.02 | % |
| Advisor | ||||||
| 6-Month | +1.16 | % | +1.16 | % | ||
| 1-Year | +1.03 | % | +1.03 | % | +1.48 | % |
| Since Inception (8/3/15) | +0.84 | % | +0.67 | % | +0.68 | % |
| 30-Day Standardized Yield6 | ||||||
| Distribution | ||||||
| Share Class | Rate5 | (with waiver) | (without waiver) | |||
| A | 0.58 | % | 1.16 | % | -0.69 | % |
| Advisor | 0.62 | % | 1.23 | % | -0.69 | % |
Performance data represent past performance, which does not guarantee future results. Investment return and principal value will fluctuate, and you may have a gain or loss when you sell your shares. Current performance may differ from figures shown. For most recent month-end performance, go to franklintempleton.com or call (800) 342-5236.
See page 8 for Performance Summary footnotes.
franklintempleton.com
Semiannual Report 7
| FRANKLIN FLEXIBLE ALPHA BOND FUND | ||||
| PERFORMANCE SUMMARY | ||||
| Total Annual Operating Expenses7 | ||||
| Share Class | With Waiver | Without Waiver | ||
| A | 1.12 | % | 4.13 | % |
| Advisor | 0.87 | % | 3.88 | % |
Each class of shares is available to certain eligible investors and has different annual fees and expenses, as described in the prospectus.
All investments involve risks, including possible loss of principal. Changes in the financial strength of a bond issuer or in a bond’s credit rating may affect its
value. Interest rate movements and mortgage prepayments will affect the Fund’s share price and yield. Bond prices generally move in the opposite direction of
interest rates. Thus, as the prices of bonds in the Fund adjust to a rise in interest rates, the Fund’s share price may decline. The risks associated with higher
yielding, lower rated securities (commonly called junk bonds) include higher risk of default and loss of principal. Derivatives, including currency management
strategies, involve costs and can create economic leverage in the portfolio, which may result in significant volatility and cause the Fund to participate in losses (as
well as enable gains) in an amount that exceeds the Fund’s initial investment. The Fund may not achieve the anticipated benefits, and may realize losses when a
counterparty fails to perform as intended. Investments in foreign securities involve risks such as currency fluctuations, and political and economic uncertainty.
The Fund is actively managed but there is no guarantee that the manager’s investment decisions will produce the desired results. The Fund’s prospectus also
includes a description of the main investment risks.
1. The Fund has an expense reduction contractually guaranteed through 8/31/17. The Fund also has a fee waiver associated with any investments it makes in a Franklin
Templeton money fund and/or other Franklin Templeton fund, contractually guaranteed through its current fiscal year-end. Fund investment results reflect the expense reduction
and fee waiver; without these reductions, the results would have been lower.
2. Cumulative total return represents the change in value of an investment over the period indicated.
3. Average annual total return represents the average annual change in value of an investment over the periods indicated. Return for less than one year, ifany,hasnotbeen
annualized.
4. In accordance with SEC rules, we provide standardized total return information through the latest calendar quarter.
5. Distribution rate is based on an annualization of the sum of the respective class’s past 30 days’ daily distributions and the maximum offering price (NAV for Advisor Class) per
share on 10/31/16.
6. The Fund’s 30-day standardized yield is calculated over a trailing 30-day period using the yield to maturity on bonds and/or the dividends accrued on stocks. It may not equal
the Fund’s actual income distribution rate, which reflects the Fund’s past dividends paid to shareholders.
7. Figures are as stated in the Fund’s current prospectus and may differ from the expense ratios disclosed in the Your Fund’s Expenses and Financial Highlights sections in this
report. In periods of market volatility, assets may decline significantly, causing total annual Fund operating expenses to become higher than the figures shown.
8 Semiannual Report
franklintempleton.com
FRANKLIN FLEXIBLE ALPHA BOND FUND
Your Fund’s Expenses
As a Fund shareholder, you can incur two types of costs: (1) transaction costs, including sales charges (loads) on Fund purchases and redemptions; and (2) ongoing Fund costs, including management fees, distribution and service (12b-1) fees, and other Fund expenses. All mutual funds have ongoing costs, sometimes referred to as operating expenses. The table below shows ongoing costs of investing in the Fund and can help you understand these costs and compare them with those of other mutual funds. The table assumes a $1,000 investment held for the six months indicated.
Actual Fund Expenses
The table below provides information about actual account values and actual expenses in the columns under the heading “Actual.” In these columns the Fund’s actual return, which includes the effect of Fund expenses, is used to calculate the “Ending Account Value” for each class of shares. You can estimate the expenses you paid during the period by following these steps (of course, your account value and expenses will differ from those in this illustration): Divide your account value by $1,000 (if your account had an $8,600 value, then $8,600 ÷ $1,000 = 8.6). Then multiply the result by the number in the row for your class of shares under the headings “Actual” and “Expenses Paid During Period” (if Actual Expenses Paid During Period were $7.50, then 8.6 x $7.50 = $64.50). In this illustration, the actual expenses paid this period are $64.50.
Hypothetical Example for Comparison with Other Funds
Under the heading “Hypothetical” in the table, information is provided about hypothetical account values and hypothetical expenses based on the Fund’s actual expense ratio and an assumed rate of return of 5% per year before expenses, which is not the Fund’s actual return. This information may not be used to estimate the actual ending account balance or expenses you paid for the period, but it can help you compare ongoing costs of investing in the Fund with those of other funds. To do so, compare this 5% hypothetical example for the class of shares you hold with the 5% hypothetical examples that appear in the shareholder reports of other funds.
Please note that expenses shown in the table are meant to highlight ongoing costs and do not reflect any transactional costs. Therefore, information under the heading “Hypothetical” is useful in comparing ongoing costs only, and will not help you compare total costs of owning different funds. In addition, if transactional costs were included, your total costs would have been higher.
| Actual | Hypothetical | |||||||||||
| (actual return after expenses) | (5% annual return before expenses) | |||||||||||
| Expenses | Expenses | Net | ||||||||||
| Beginning | Ending | Paid During | Ending | Paid During | Annualized | |||||||
| Share | Account | Account | Period | Account | Period | Expense | ||||||
| Class | Value 5/1/16 | Value 10/31/16 | 5/1/16–10/31/161,2 | Value 10/31/16 | 5/1/16–10/31/161,2 | Ratio2 | ||||||
| A | $ | 1,000 | $ | 1,011.50 | $ | 3.40 | $ | 1,021.83 | $ | 3.41 | 0.67 | % |
| C | $ | 1,000 | $ | 1,008.10 | $ | 7.04 | $ | 1,018.20 | $ | 7.07 | 1.39 | % |
| R | $ | 1,000 | $ | 1,011.70 | $ | 4.16 | $ | 1,021.07 | $ | 4.18 | 0.82 | % |
| R6 | $ | 1,000 | $ | 1,010.60 | $ | 3.55 | $ | 1,021.68 | $ | 3.57 | 0.70 | % |
| Advisor | $ | 1,000 | $ | 1,011.60 | $ | 3.65 | $ | 1,021.58 | $ | 3.67 | 0.72 | % |
1. Expenses are equal to the annualized expense ratio for the six-month period as indicated above–in the far right column–multiplied by the simple average account value
over the period indicated, and then multiplied by 184/365 to reflect the one-half year period.
2. Reflects expenses after fee waivers and expense reimbursements. Does not include acquired fund fees and expenses.
franklintempleton.com
Semiannual Report 9
| FRANKLIN STRATEGIC SERIES | ||||||
| Financial Highlights | ||||||
| Franklin Flexible Alpha Bond Fund | ||||||
| Six Months Ended | Year Ended | |||||
| October 31, 2016 | April 30, | |||||
| (unaudited) | 2016 | a | ||||
| Class A | ||||||
| Per share operating performance | ||||||
| (for a share outstanding throughout the period) | ||||||
| Net asset value, beginning of period | $ | 9.88 | $ | 10.00 | ||
| Income from investment operationsb: | ||||||
| Net investment income. | 0.090 | 0.099 | ||||
| Net realized and unrealized gains (losses) | 0.023 | (0.123 | ) | |||
| Total from investment operations | 0.113 | (0.024 | ) | |||
| Less distributions from net investment income | (0.033 | ) | (0.096 | ) | ||
| Net asset value, end of period | $ | 9.96 | $ | 9.88 | ||
| Total returnc | 1.15 | % | (0.34 | )% | ||
| Ratios to average net assetsd | ||||||
| Expenses before waiver and payments by affiliates. | 2.99 | % | 3.47 | % | ||
| Expenses net of waiver and payments by affiliatese | 0.67 | % | 0.84 | % | ||
| Net investment income | 1.75 | % | 1.37 | % | ||
| Supplemental data | ||||||
| Net assets, end of period (000’s) | $ | 10,356 | $ | 10,200 | ||
| Portfolio turnover rate | 50.12 | % | 40.12 | % | ||
| Portfolio turnover rate excluding mortgage dollar rollsf | 31.55 | % | 30.05 | % | ||
aFor the period August 3, 2015 (commencement of operations) to April 30, 2016.
bThe amount shown for a share outstanding throughout the period may not correlate with the Statement of Operations for the period due to the timing of sales and
repurchases of the Fund’s shares in relation to income earned, adjustments to interest income for the inflation-indexed bonds, and/or fluctuating fair value of the investments
of the Fund.
cTotal return does not reflect sales commissions or contingent deferred sales charges, if applicable, and is not annualized for periods less than one year.
dRatios are annualized for periods less than one year, except for non-recurring expenses, if any.
eBenefit of expense reduction rounds to less than 0.01%.
fSee Note 1(e) regarding mortgage dollar rolls.
10 Semiannual Report | The accompanying notes are an integral part of these financial statements. franklintempleton.com
| FRANKLIN STRATEGIC SERIES | |||||||
| FINANCIAL HIGHLIGHTS | |||||||
| Franklin Flexible Alpha Bond Fund (continued) | |||||||
| Six Months Ended | Year Ended | ||||||
| October 31, 2016 | April 30, | ||||||
| (unaudited) | 2016 | a | |||||
| Class C | |||||||
| Per share operating performance | |||||||
| (for a share outstanding throughout the period) | |||||||
| Net asset value, beginning of period | $ | 9.86 | $ | 10.00 | |||
| Income from investment operationsb: | |||||||
| Net investment income. | 0.057 | 0.072 | |||||
| Net realized and unrealized gains (losses) | 0.013 | (0.131 | ) | ||||
| Total from investment operations | 0.070 | (0.059 | ) | ||||
| Less distributions from net investment income | (0.020 | ) | (0.081 | ) | |||
| Net asset value, end of period | $ | 9.91 | $ | 9.86 | |||
| Total returnc | 0.81 | % | (0.69 | )% | |||
| Ratios to average net assetsd | |||||||
| Expenses before waiver and payments by affiliates. | 3.71 | % | 3.98 | % | |||
| Expenses net of waiver and payments by affiliatese | 1.39 | % | 1.34 | % | |||
| Net investment income | 1.03 | % | 0.87 | % | |||
| Supplemental data | |||||||
| Net assets, end of period (000’s) | $ | 200 | $ | 204 | |||
| Portfolio turnover rate | 50.12 | % | 40.12 | % | |||
| Portfolio turnover rate excluding mortgage dollar rollsf | 31.55 | % | 30.05 | % | |||
aFor the period August 3, 2015 (commencement of operations) to April 30, 2016.
bThe amount shown for a share outstanding throughout the period may not correlate with the Statement of Operations for the period due to the timing of sales and
repurchases of the Fund’s shares in relation to income earned, adjustments to interest income for the inflation-indexed bonds, and/or fluctuating fair value of the investments
of the Fund.
cTotal return does not reflect sales commissions or contingent deferred sales charges, if applicable, and is not annualized for periods less than one year.
dRatios are annualized for periods less than one year, except for non-recurring expenses, if any.
eBenefit of expense reduction rounds to less than 0.01%.
fSee Note 1(e) regarding mortgage dollar rolls.
franklintempleton.com The accompanying notes are an integral part of these financial statements. | Semiannual Report 11
| FRANKLIN STRATEGIC SERIES | |||||||
| FINANCIAL HIGHLIGHTS | |||||||
| Franklin Flexible Alpha Bond Fund (continued) | |||||||
| Six Months Ended | Year Ended | ||||||
| October 31, 2016 | April 30, | ||||||
| (unaudited) | 2016 | a | |||||
| Class R | |||||||
| Per share operating performance | |||||||
| (for a share outstanding throughout the period) | |||||||
| Net asset value, beginning of period | $ | 9.86 | $ | 10.00 | |||
| Income from investment operationsb: | |||||||
| Net investment income. | 0.086 | 0.072 | |||||
| Net realized and unrealized gains (losses) | 0.019 | (0.127 | ) | ||||
| Total from investment operations | 0.105 | (0.055 | ) | ||||
| Less distributions from net investment income | (0.025 | ) | (0.085 | ) | |||
| Net asset value, end of period | $ | 9.94 | $ | 9.86 | |||
| Total returnc | 1.17 | % | (0.65 | )% | |||
| Ratios to average net assetsd | |||||||
| Expenses before waiver and payments by affiliates. | 3.14 | % | 3.84 | % | |||
| Expenses net of waiver and payments by affiliatese | 0.82 | % | 1.22 | % | |||
| Net investment income | 1.60 | % | 0.99 | % | |||
| Supplemental data | |||||||
| Net assets, end of period (000’s) | $ | 10 | $ | 10 | |||
| Portfolio turnover rate | 50.12 | % | 40.12 | % | |||
| Portfolio turnover rate excluding mortgage dollar rollsf | 31.55 | % | 30.05 | % | |||
aFor the period August 3, 2015 (commencement of operations) to April 30, 2016.
bThe amount shown for a share outstanding throughout the period may not correlate with the Statement of Operations for the period due to the timing of sales and
repurchases of the Fund’s shares in relation to income earned, adjustments to interest income for the inflation-indexed bonds, and/or fluctuating fair value of the investments
of the Fund.
cTotal return is not annualized for periods less than one year.
dRatios are annualized for periods less than one year, except for non-recurring expenses, if any.
eBenefit of expense reduction rounds to less than 0.01%.
fSee Note 1(e) regarding mortgage dollar rolls.
12 Semiannual Report | The accompanying notes are an integral part of these financial statements. franklintempleton.com
| FRANKLIN STRATEGIC SERIES | |||||||
| FINANCIAL HIGHLIGHTS | |||||||
| Franklin Flexible Alpha Bond Fund (continued) | |||||||
| Six Months Ended | Year Ended | ||||||
| October 31, 2016 | April 30, | ||||||
| (unaudited) | 2016 | a | |||||
| Class R6 | |||||||
| Per share operating performance | |||||||
| (for a share outstanding throughout the period) | |||||||
| Net asset value, beginning of period | $ | 9.88 | $ | 10.00 | |||
| Income from investment operationsb: | |||||||
| Net investment income. | 0.087 | 0.108 | |||||
| Net realized and unrealized gains (losses) | 0.018 | (0.124 | ) | ||||
| Total from investment operations | 0.105 | (0.016 | ) | ||||
| Less distributions from net investment income | (0.035 | ) | (0.104 | ) | |||
| Net asset value, end of period | $ | 9.95 | $ | 9.88 | |||
| Total returnc | 1.06 | % | (0.15 | )% | |||
| Ratios to average net assetsd | |||||||
| Expenses before waiver and payments by affiliates. | 3.02 | % | 3.72 | % | |||
| Expenses net of waiver and payments by affiliatese | 0.70 | % | 0.71 | % | |||
| Net investment income | 1.72 | % | 1.50 | % | |||
| Supplemental data | |||||||
| Net assets, end of period (000’s) | $ | 10 | $ | 10 | |||
| Portfolio turnover rate | 50.12 | % | 40.12 | % | |||
| Portfolio turnover rate excluding mortgage dollar rollsf | 31.55 | % | 30.05 | % | |||
aFor the period August 3, 2015 (commencement of operations) to April 30, 2016.
bThe amount shown for a share outstanding throughout the period may not correlate with the Statement of Operations for the period due to the timing of sales and
repurchases of the Fund’s shares in relation to income earned, adjustments to interest income for the inflation-indexed bonds, and/or fluctuating fair value of the investments
of the Fund.
cTotal return is not annualized for periods less than one year.
dRatios are annualized for periods less than one year, except for non-recurring expenses, if any.
eBenefit of expense reduction rounds to less than 0.01%.
fSee Note 1(e) regarding mortgage dollar rolls.
franklintempleton.com The accompanying notes are an integral part of these financial statements. | Semiannual Report 13
| FRANKLIN STRATEGIC SERIES | |||||||
| FINANCIAL HIGHLIGHTS | |||||||
| Franklin Flexible Alpha Bond Fund (continued) | |||||||
| Six Months Ended | Year Ended | ||||||
| October 31, 2016 | April 30, | ||||||
| (unaudited) | 2016 | a | |||||
| Advisor Class | |||||||
| Per share operating performance | |||||||
| (for a share outstanding throughout the period) | |||||||
| Net asset value, beginning of period | $ | 9.88 | $ | 10.00 | |||
| Income from investment operationsb: | |||||||
| Net investment income. | 0.086 | 0.107 | |||||
| Net realized and unrealized gains (losses) | �� | 0.018 | (0.129 | ) | |||
| Total from investment operations | 0.104 | (0.022 | ) | ||||
| Less distributions from net investment income | (0.034 | ) | (0.098 | ) | |||
| Net asset value, end of period | $ | 9.95 | $ | 9.88 | |||
| Total returnc | 1.16 | % | (0.31 | )% | |||
| Ratios to average net assetsd | |||||||
| Expenses before waiver and payments by affiliates. | 3.04 | % | 3.34 | % | |||
| Expenses net of waiver and payments by affiliatese | 0.72 | % | 0.71 | % | |||
| Net investment income | 1.70 | % | 1.50 | % | |||
| Supplemental data | |||||||
| Net assets, end of period (000’s) | $ | 333 | $ | 344 | |||
| Portfolio turnover rate | 50.12 | % | 40.12 | % | |||
| Portfolio turnover rate excluding mortgage dollar rollsf | 31.55 | % | 30.05 | % | |||
aFor the period August 3, 2015 (commencement of operations) to April 30, 2016.
bThe amount shown for a share outstanding throughout the period may not correlate with the Statement of Operations for the period due to the timing of sales and
repurchases of the Fund’s shares in relation to income earned, adjustments to interest income for the inflation-indexed bonds, and/or fluctuating fair value of the investments
of the Fund.
cTotal return is not annualized for periods less than one year.
dRatios are annualized for periods less than one year, except for non-recurring expenses, if any.
eBenefit of expense reduction rounds to less than 0.01%.
fSee Note 1(e) regarding mortgage dollar rolls.
14 Semiannual Report | The accompanying notes are an integral part of these financial statements. franklintempleton.com
FRANKLIN STRATEGIC SERIES
| Statement of Investments, October 31, 2016 (unaudited) | |||||
| Franklin Flexible Alpha Bond Fund | |||||
| Country | Shares | Value | |||
| Management Investment Companies (Cost $168,203) 1.5% | |||||
| Diversified Financials 1.5% | |||||
| PowerShares Senior Loan Portfolio ETF | United States | 7,100 | $ | 164,578 | |
| Principal | |||||
| Amount* | |||||
| Corporate Bonds 37.0% | |||||
| Banks 13.9% | |||||
| Bank of America Corp., senior bond, 5.50%, 12/04/19 | United States | 75,000 | GBP | 102,678 | |
| Bank of Nova Scotia, secured note, 1.875%, 4/26/21 | Canada | 100,000 | 100,024 | ||
| Capital One Financial Corp., senior note, 3.20%, 2/05/25 | United States | 100,000 | 101,457 | ||
| a Deutsche Bank AG, senior note, FRN, 2.121%, 8/20/20 | Germany | 100,000 | 96,261 | ||
| b The Export-Import Bank of China, senior note, 144A, 2.50%, 7/31/19 | China | 200,000 | 204,359 | ||
| a The Goldman Sachs Group Inc., senior note, FRN, 2.05%, 9/15/20 | United States | 100,000 | 100,783 | ||
| HSBC USA Inc., senior note, 2.00%, 8/07/18. | United States | 100,000 | 100,467 | ||
| Intesa Sanpaolo SpA, senior note, 3.875%, 1/15/19 | Italy | 200,000 | 206,024 | ||
| JPMorgan Chase & Co., senior note, 2.25%, 1/23/20 | United States | 100,000 | 100,881 | ||
| Morgan Stanley, senior note, 2.65%, 1/27/20 | United States | 100,000 | 101,822 | ||
| Royal Bank of Canada, secured note, 2.10%, 10/14/20 | Canada | 100,000 | 101,467 | ||
| b The Toronto-Dominion Bank, secured note, 144A, 2.25%, 3/15/21 | Canada | 200,000 | 203,242 | ||
| 1,519,465 | |||||
| Consumer Durables & Apparel 2.5% | |||||
| CalAtlantic Group Inc., senior note, 8.375%, 5/15/18 | United States | 250,000 | 275,244 | ||
| Consumer Services 0.9% | |||||
| Marriott International Inc., senior note, 2.875%, 3/01/21 | United States | 100,000 | 103,010 | ||
| Diversified Financials 3.8% | |||||
| b AIG Global Funding, secured note, 144A, 1.90%, 10/06/21 | United States | 50,000 | 49,462 | ||
| American Airlines Pass Through Trust, first lien, 2016-2, AA, 3.20%, 6/15/28 | United States | 50,000 | 50,937 | ||
| PHH Corp., senior note, 7.375%, 9/01/19 | United States | 200,000 | 209,500 | ||
| Springleaf Finance Corp., senior note, 6.00%, 6/01/20 | United States | 100,000 | 101,250 | ||
| 411,149 | |||||
| Energy 0.9% | |||||
| Canadian Natural Resources Ltd., senior note, 5.70%, 5/15/17 | Canada | 100,000 | 102,172 | ||
| Food & Staples Retailing 0.9% | |||||
| Walgreen Co., senior bond, 3.10%, 9/15/22. | United States | 100,000 | 103,559 | ||
| Food, Beverage & Tobacco 1.0% | |||||
| Altria Group Inc., senior bond, 4.25%, 8/09/42 | United States | 100,000 | 103,885 | ||
| Health Care Equipment & Services 1.8% | |||||
| Stryker Corp., senior note, 2.00%, 3/08/19 | United States | 50,000 | 50,489 | ||
| Tenet Healthcare Corp., senior note, 5.50%, 3/01/19 | United States | 150,000 | 147,375 | ||
| 197,864 | |||||
| Insurance 0.7% | |||||
| b Jackson National Life Global Funding, | |||||
| secured note, 144A, 2.25%, 4/29/21 | United States | 50,000 | 50,361 | ||
| secured note, 144A, 2.10%, 10/25/21 | United States | 25,000 | 24,961 | ||
| 75,322 | |||||
| Materials 2.9% | |||||
| Owens-Illinois Inc., senior note, 7.80%, 5/15/18 | United States | 200,000 | 216,500 | ||
| Reynolds Group Holdings Inc., senior note, 8.125%, 6/15/17 | United States | 100,000 | 103,625 | ||
| 320,125 | |||||
franklintempleton.com
Semiannual Report 15
FRANKLIN STRATEGIC SERIES
STATEMENT OF INVESTMENTS (UNAUDITED)
| Franklin Flexible Alpha Bond Fund (continued) | ||||||
| Principal | ||||||
| Country | Amount* | Value | ||||
| Corporate Bonds (continued) | ||||||
| Media 0.9% | ||||||
| Viacom Inc., senior bond, 3.125%, 6/15/22 | United States | 100,000 | $ | 101,633 | ||
| Pharmaceuticals, Biotechnology & Life Sciences 1.9% | ||||||
| Actavis Funding SCS, senior bond, 3.80%, 3/15/25 | United States | 100,000 | 104,068 | |||
| Baxalta Inc., senior note, 3.60%, 6/23/22 | United States | 100,000 | 104,297 | |||
| 208,365 | ||||||
| Technology Hardware & Equipment 2.4% | ||||||
| b Diamond 1 Finance Corp./Diamond 2 Finance Corp., senior secured note, first | ||||||
| lien, 144A, 3.48%, 6/01/19. | United States | 50,000 | 51,337 | |||
| a,b Hewlett Packard Enterprise Co., senior note, 144A, FRN, 3.038%, 10/05/18 | United States | 100,000 | 102,389 | |||
| b Sanmina Corp., senior note, first lien, 144A, 4.375%, 6/01/19 | United States | 100,000 | 104,500 | |||
| 258,226 | ||||||
| Telecommunication Services 1.0% | ||||||
| AT&T Inc., senior note, 3.95%, 1/15/25 | United States | 100,000 | 103,748 | |||
| Transportation 1.0% | ||||||
| XPO CNW Inc., senior bond, 7.25%, 1/15/18 | United States | 100,000 | 104,000 | |||
| Utilities 0.5% | ||||||
| The Southern Co., senior bond, 3.25%, 7/01/26 | United States | 50,000 | 51,500 | |||
| Total Corporate Bonds (Cost $3,957,312) | 4,039,267 | |||||
| Foreign Government and Agency Securities 2.4% | ||||||
| Government of Indonesia, senior bond, FR70, 8.375%, 3/15/24 | Indonesia | 263,000,000 | IDR | 21,517 | ||
| Government of Malaysia, 3.80%, 8/17/23 | Malaysia | 45,000 | MYR | 10,913 | ||
| Government of Mexico, 7.25%, 12/15/16. | Mexico | 5,800 | c | MXN | 30,816 | |
| d Government of New Zealand, senior bond, Reg S, 4.50%, 4/15/27 | New Zealand | 110,000 | NZD | 91,426 | ||
| d U.K. Treasury Note, Reg S, 2.00%, 9/07/25 | United Kingdom | 85,000 | GBP | 111,568 | ||
| Total Foreign Government and Agency Securities | ||||||
| (Cost $285,202) | 266,240 | |||||
| U.S. Government and Agency Securities 5.4% | ||||||
| U.S. Treasury Bond, 5.25%, 11/15/28 | United States | 60,000 | 81,232 | |||
| e U.S. Treasury Note, Index Linked, 0.125%, 1/15/23 | United States | 498,750 | 506,353 | |||
| Total U.S. Government and Agency Securities | ||||||
| (Cost $565,971) | 587,585 | |||||
| Asset-Backed Securities and Commercial Mortgage-Backed | ||||||
| Securities 26.8% | ||||||
| Banks 0.6% | ||||||
| a Citigroup Commercial Mortgage Trust, 2007-C6, AM, FRN, 5.90%, 12/10/49. | United States | 20,000 | 20,294 | |||
| a Impac Secured Assets CMN Owner Trust, 2004-4, M1, FRN, 1.299%, 2/25/35 | United States | 50,000 | 49,359 | |||
| 69,653 | ||||||
| Diversified Financials 26.2% | ||||||
| a,b Adirondack Park CLO Ltd., 2013-1A, B, 144A, FRN, 2.88%, 4/15/24 | United States | 100,000 | 100,593 | |||
| a American Express Credit Account Secured Note Trust, 2012-4, B, FRN, 1.085%, | ||||||
| 5/15/20 | United States | 100,000 | 99,982 | |||
| b BAMLL Commercial Mortgage Securities Trust, 2012-PARK, A, 144A, 2.959%, | ||||||
| 12/10/30 | United States | 100,000 | 103,765 | |||
| Banc of America Commercial Mortgage Trust, 2015-UBS7, A4, 3.705%, 9/15/48 | United States | 100,000 | 108,721 | |||
| a,b BlueMountain CLO Ltd., 2013-3A, A, 144A, FRN, 2.287%, 10/29/25. | United States | 6,437 | 6,437 | |||
| a Capital One Multi-Asset Execution Trust, 2004-B3, B3, FRN, 1.265%, 1/18/22 | United States | 150,000 | 150,284 | |||
16 Semiannual Report
franklintempleton.com
FRANKLIN STRATEGIC SERIES
STATEMENT OF INVESTMENTS (UNAUDITED)
| Franklin Flexible Alpha Bond Fund (continued) | ||||
| Principal | ||||
| Country | Amount* | Value | ||
| Asset-Backed Securities and Commercial Mortgage-Backed | ||||
| Securities (continued) | ||||
| Diversified Financials (continued) | ||||
| a,b Carlyle Global Market Strategies Ltd., 2014-2A, B2, 144A, FRN, 2.867%, 5/15/25 . | United States | 100,000 | $ | 100,736 |
| a,b Cent CLO, 2013-17A, A1, 144A, FRN, 2.187%, 1/30/25 | United States | 40,000 | 39,932 | |
| a Chase Issuance Trust, 2007-B1, B1, FRN, 0.785%, 4/15/19 | United States | 100,000 | 99,962 | |
| a,b Colony American Homes, 2015-1A, A, 144A, FRN, 1.735%, 7/17/32 | United States | 109,596 | 109,896 | |
| b Colony MFM Trust, 2014-1, A, 144A, 2.543%, 4/20/50 | United States | 120,230 | 119,871 | |
| a Conseco Finance Securitizations Corp., 2002-2, M1, FRN, 7.424%, 3/01/33 | United States | 90,000 | 100,542 | |
| b Core Industrial Trust, 2015-CALW, A, 144A, 3.04%, 2/10/34 | United States | 30,000 | 31,381 | |
| a,b Eaton Vance CDO Ltd., 2014-1A, A, 144A, FRN, 2.33%, 7/15/26 | United States | 24,000 | 24,001 | |
| a,b Eleven Madison Trust Mortgage Trust, 2015-11MD, A, 144A, FRN, 3.555%, | ||||
| 9/10/35 | United States | 100,000 | 107,224 | |
| a Fannie Mae Connecticut Avenue Securities, | ||||
| 2013-C01, M1, FRN, 2.534%, 10/25/23 | United States | 59,765 | 60,307 | |
| 2014-C02, 2M1, FRN, 1.484%, 5/25/24 | United States | 44,853 | 44,858 | |
| 2014-C02, 2M2, FRN, 3.134%, 5/25/24 | United States | 40,000 | 39,583 | |
| a FHLMC Structured Agency Credit Risk Debt Notes, 2015-DNA1, M2, FRN, | ||||
| 2.384%, 10/25/27 | United States | 250,000 | 252,580 | |
| a,b Galaxy XV CLO Ltd., 2013-15A, A, 144A, FRN, 2.13%, 4/15/25 | United States | 99,000 | 98,921 | |
| a,b Invitation Homes Trust, | ||||
| 2015-SFR1, A, 144A, FRN, 1.985%, 3/17/32 | United States | 96,265 | 96,921 | |
| 2015-SFR2, A, 144A, FRN, 1.881%, 6/17/32 | United States | 97,884 | 98,391 | |
| a IXIS Real Estate Capital Trust, 2005-HE4, A3, FRN, 1.214%, 2/25/36 | United States | 22,830 | 22,760 | |
| a,b Madison Park Funding XVIII Ltd., 2015-18A, C, 144A, FRN, 3.881%, 10/21/26 | United States | 100,000 | 100,326 | |
| a,b Octagon Investment Partners XXIII Ltd., | ||||
| 2015-1A, A1, 144A, FRN, 2.30%, 7/15/27 | United States | 18,490 | 18,484 | |
| 2015-1A, A2, 144A, FRN, 2.30%, 7/15/27 | United States | 17,554 | 17,541 | |
| a,b PPM Grayhawk CLO Ltd., 07-1A, B, 144A, FRN, 1.582%, 4/18/21 | United States | 100,000 | 97,181 | |
| a,b Resource Capital Corp. Ltd., 2015-CRE4, A, 144A, FRN, 1.935%, 8/15/32 | United States | 73,463 | 73,317 | |
| a,b SWAY Residential 2014-1 Trust, 2014-1, A, 144A, FRN, 1.835%, 1/17/32 | United States | 98,623 | 98,798 | |
| a Thornburg Mortgage Securities Trust, 2005-1, A3, FRN, 2.373%, 4/25/45 | United States | 40,110 | 40,275 | |
| a,b Towd Point Mortgage Trust, 2016-3, A1, 144A, FRN, 2.25%, 8/25/55 | United States | 93,137 | 93,513 | |
| a,b Tricon American Homes Trust, | ||||
| 2015-SFR1, A, 144A, FRN, 1.785%, 5/17/32 | United States | 99,492 | 99,582 | |
| 2015-SFR1, C, 144A, FRN, 2.435%, 5/17/32 | United States | 100,000 | 99,429 | |
| a,b Voya CLO Ltd., 2013-3A, A2, 144A, FRN, 2.682%, 1/18/26 | United States | 100,000 | 99,712 | |
| 2,855,806 | ||||
| Total Asset-Backed Securities and Commercial Mortgage- | ||||
| Backed Securities (Cost $2,893,148) | 2,925,459 | |||
| Mortgage-Backed Securities 2.3% | ||||
| Federal Home Loan Mortgage Corp. (FHLMC) Fixed Rate 0.7% | ||||
| f FHLMC Gold 30 Year, 3.00%, 11/01/46 | United States | 45,000 | 46,331 | |
| f FHLMC Gold 30 Year, 3.50%, 11/01/46 | United States | 30,000 | 31,489 | |
| 77,820 | ||||
| Federal National Mortgage Association (FNMA) Fixed Rate 1.2% | ||||
| f FNMA 30 Year, 3.00%, 11/01/46 | United States | 50,000 | 51,484 | |
| f FNMA 30 Year, 3.50%, 11/01/46 | United States | 60,000 | 62,998 | |
| f FNMA 30 Year, 4.00%, 11/01/46 | United States | 15,000 | 16,065 | |
| 130,547 | ||||
franklintempleton.com
Semiannual Report 17
FRANKLIN STRATEGIC SERIES
STATEMENT OF INVESTMENTS (UNAUDITED)
| Franklin Flexible Alpha Bond Fund (continued) | |||||
| Principal | |||||
| Country | Amount* | Value | |||
| Mortgage-Backed Securities (continued) | |||||
| Government National Mortgage Association (GNMA) Fixed Rate 0.4% | |||||
| f GNMA II SF 30 Year, 3.00%, 11/01/46 | United States | 20,000 | $ | 20,833 | |
| f GNMA II SF 30 Year, 3.50%, 11/01/46 | United States | 20,000 | 21,180 | ||
| 42,013 | |||||
| Total Mortgage-Backed Securities (Cost $250,718) | 250,380 | ||||
| Municipal Bonds 4.9% | |||||
| Cincinnati GO, Various Purpose, Improvement and Refunding, Series A, 5.00%, | |||||
| 12/01/25 | United States | 100,000 | 124,519 | ||
| Citizens Property Insurance Corp. Revenue, Coastal Account, senior secured, | |||||
| Series A1, 5.00%, 6/01/22 | United States | 125,000 | 145,979 | ||
| Colorado State Board of Governors University Enterprise System Revenue, | |||||
| Green Bonds, Series E-2, 5.00%, 3/01/25 | United States | 100,000 | 124,818 | ||
| Providence St. Joseph Health Obligated Group, 2.746%, 10/01/26 | United States | 15,000 | 14,882 | ||
| Teays Valley Local School District GO, Pickaway Fairfield and Franklin Counties, | |||||
| Refunding, 4.00%, 12/01/26. | United States | 100,000 | 113,987 | ||
| g Texas State GO, Transportation Commission-Highway Improvement, Series A, | |||||
| 5.00%, 4/01/21 | United States | 5,000 | 5,814 | ||
| Total Municipal Bonds (Cost $503,685) | 529,999 | ||||
| Number of | |||||
| Exchange | Contracts | ||||
| Options Purchased 0.2% | |||||
| Calls - Exchange-Traded | |||||
| Options on Interest Rate Futures 0.0%† | |||||
| Euro-Bund, November Strike Price 165 EUR, Expires 11/25/16 | EUX | 1 | EUR | 88 | |
| Notional | |||||
| Counterparty | Amount* | ||||
| Calls - Over-the-Counter | |||||
| Currency Options 0.0%† | |||||
| USD/MXN, November Strike Price 20.50 MXN, Expires 11/18/16 | JPHQ | 30,000 | 81 | ||
| Puts - Over-the-Counter | |||||
| Credit Default Swaptions 0.0%† | |||||
| Buy protection on CDX.NA.HY.27, Premium Rate 5.00%, Strike Price $103, | |||||
| Expires 12/21/16 | CITI | 100,000 | 902 | ||
| Buy protection on CDX.NA.HY.27, Premium Rate 5.00%, Strike Price $103, | |||||
| Expires 1/18/17 | CITI | 250,000 | 3,352 | ||
| Buy protection on CDX.NA.IG.26, Premium Rate 1.00%, Strike Price $80, Expires | |||||
| 11/16/16 | JPHQ | 500,000 | 80 | ||
| Buy protection on CDX.NA.IG.27, Premium Rate 1.00%, Strike Price $90, Expires | |||||
| 11/16/16 | CITI | 750,000 | 130 | ||
| 4,464 | |||||
18 Semiannual Report
franklintempleton.com
FRANKLIN STRATEGIC SERIES
STATEMENT OF INVESTMENTS (UNAUDITED)
| Franklin Flexible Alpha Bond Fund (continued) | |||||
| Notional | |||||
| Counterparty | Amount* | Value | |||
| Options Purchased (continued) | |||||
| Puts - Over-the-Counter (continued) | |||||
| Interest Rate Swaptions 0.2% | |||||
| Receive float 3 month USD LIBOR, Pay fixed 1.26%, Expires 12/12/16 | JPHQ | 600,000 | $ | 3,835 | |
| Receive float 3 month USD LIBOR, Pay fixed 1.55%, Expires 1/26/17 | CITI | 400,000 | 8,327 | ||
| Receive float 3 month USD LIBOR, Pay fixed 1.73%, Expires 2/27/17 | JPHQ | 300,000 | 4,337 | ||
| 16,499 | |||||
| Total Options Purchased (Cost $20,585) | 21,132 | ||||
| Total Investments before Short Term Investments | |||||
| (Cost $8,644,824) | 8,784,640 | ||||
| Country | Shares | ||||
| Short Term Investments (Cost $2,124,609) 19.5% | |||||
| Money Market Funds 19.5% | |||||
| h,i Institutional Fiduciary Trust Money Market Portfolio | United States | 2,124,609 | 2,124,609 | ||
| Total Investments (Cost $10,769,433) 100.0% | 10,909,249 | ||||
| Options Written (0.0)%† | (1,830 | ) | |||
| Other Assets, less Liabilities 0.0%† | 654 | ||||
| Net Assets 100.0%. | $ | 10,908,073 | |||
| Notional | |||||
| Counterparty | Amount* | ||||
| j Options Written (0.0)%† | |||||
| Puts - Over-the-Counter | |||||
| Credit Default Swaptions (0.0)%† | |||||
| Buy protection on CDX.NA.HY.27, Premium Rate 5.00%, Strike Price $100, | |||||
| Expires 12/21/16 | CITI | 100,000 | (339 | ) | |
| Buy protection on CDX.NA.HY.27, Premium Rate 5.00%, Strike Price $100, | |||||
| Expires 1/18/17 | CITI | 250,000 | (1,463 | ) | |
| Buy protection on CDX.NA.IG.26, Premium Rate 1.00%, Strike Price $100, | |||||
| Expires 11/16/16 | JPHQ | 500,000 | (28 | ) | |
| Total Options Written (Premiums received $2,300) | $ | (1,830 | ) | ||
franklintempleton.com
Semiannual Report 19
FRANKLIN STRATEGIC SERIES
STATEMENT OF INVESTMENTS (UNAUDITED)
Franklin Flexible Alpha Bond Fund (continued)
†Rounds to less than 0.1% of net assets.
*The principal/notional amount is stated in U.S. dollars unless otherwise indicated.
aThe coupon rate shown represents the rate at period end.
bSecurity was purchased pursuant to Rule 144A under the Securities Act of 1933 and may be sold in transactions exempt from registration only to qualified institutional buyers
or in a public offering registered under the Securities Act of 1933. These securities have been deemed liquid under guidelines approved by the Trust’s Board of Trustees. At
October 31, 2016, the aggregate value of these securities was $2,626,563, representing 24.1% of net assets.
cPrincipal amount is stated in 100 Mexican Peso Units.
dSecurity was purchased pursuant to Regulation S under the Securities Act of 1933, which exempts from registration securities offered and sold outside of the United States.
Such a security cannot be sold in the United States without either an effective registration statement filed pursuant to the Securities Act of 1933, or pursuant to an exemption
from registration. These securities have been deemed liquid under guidelines approved by the Trust’s Board of Trustees. At October 31, 2016, the aggregate value of these
securities was $202,994, representing 1.9% of net assets.
ePrincipal amount of security is adjusted for inflation. See Note 1(g).
fSecurity purchased on a to-be-announced (TBA) basis. See Note 1(c).
gSecurity purchased on a when-issued basis. See Note 1(c).
hNon-income producing.
iSee Note 3(f) regarding investments in affiliated management investment companies.
jSee Note 1(d) regarding written options.
20 Semiannual Report
franklintempleton.com
FRANKLIN STRATEGIC SERIES
STATEMENT OF INVESTMENTS (UNAUDITED)
| Franklin Flexible Alpha Bond Fund (continued) | ||||||||||||
| At October 31, 2016, the Fund had the following financial futures contracts outstanding. See Note 1(d). | ||||||||||||
| Financial Futures Contracts | ||||||||||||
| Number of | Notional | Expiration | Unrealized | Unrealized | ||||||||
| Description | Type | Contracts | Value | Date | Appreciation | Depreciation | ||||||
| Interest Rate Contracts | ||||||||||||
| 90 Day Eurodollar. | Short | 2 | $ | 495,100 | 3/13/17 | $ | — | $ | (76 | ) | ||
| Australian 10 Yr. Bond. | Long | 2 | 201,838 | 12/15/16 | — | (3,680 | ) | |||||
| Canadian 10 Yr. Bond | Long | 2 | 215,569 | 12/19/16 | — | (2,479 | ) | |||||
| Long Gilt | Long | 2 | 306,870 | 12/28/16 | — | (9,159 | ) | |||||
| U.S. Treasury 10 Yr. Note | Short | 2 | 259,250 | 12/20/16 | 2,745 | — | ||||||
| U.S. Treasury 2 Yr. Note | Short | 11 | 2,399,547 | 12/30/16 | 832 | — | ||||||
| U.S. Treasury 5 Yr. Note | Short | 12 | 1,449,562 | 12/30/16 | 4,878 | — | ||||||
| Total Financial Futures Contracts | $ | 8,455 | $ | (15,394 | ) | |||||||
| Net unrealized appreciation (depreciation) | $ | (6,939 | ) | |||||||||
| At October 31, 2016, the Fund had the following forward exchange contracts outstanding. See Note 1(d). | ||||||||||||
| Forward Exchange Contracts | ||||||||||||
| Contract | Settlement | Unrealized | Unrealized | |||||||||
| Currency | Counterpartya Type | Quantity | Amount | Date | Appreciation | Depreciation | ||||||
| OTC Forward Exchange Contracts | ||||||||||||
| Indian Rupee | RBS | Buy | 3,150,000 | $ | 46,529 | 11/10/16 | $ | 633 | $ | — | ||
| South African Rand. | RBS | Buy | 300,000 | 21,209 | 11/10/16 | 1,002 | — | |||||
| South African Rand. | RBS | Sell | 500,000 | 35,740 | 11/10/16 | — | (1,278 | ) | ||||
| Mexican Peso | RBS | Buy | 1,130,000 | 62,003 | 11/18/16 | — | (2,256 | ) | ||||
| Australian Dollar | UBSW | Sell | 144,000 | 110,333 | 12/15/16 | 884 | — | |||||
| Australian Dollar | UBSW | Sell | 28,000 | 21,142 | 12/15/16 | — | (140 | ) | ||||
| Canadian Dollar | RBS | Sell | 91,000 | 68,976 | 12/19/16 | 1,128 | — | |||||
| Japanese Yen | UBSW | Sell | 1,000,000 | 9,961 | 12/28/16 | 401 | — | |||||
| Euro | UBSW | Sell | 195,000 | 219,773 | 1/04/17 | 5,053 | — | |||||
| Chilean Peso | UBSW | Sell | 20,855,000 | 31,261 | 1/05/17 | — | (513 | ) | ||||
| New Zealand Dollar | RBS | Buy | 42,000 | 29,572 | 1/13/17 | 376 | — | |||||
| New Zealand Dollar | RBS | Sell | 282,000 | 204,986 | 1/13/17 | 3,902 | — | |||||
| Polish Zloty | RBS | Sell | 80,000 | 20,811 | 1/17/17 | 446 | — | |||||
| South Korean Won | RBS | Sell | 25,000,000 | 22,635 | 1/18/17 | 783 | — | |||||
| British Pound | UBSW | Sell | 127,000 | 156,106 | 2/08/17 | 274 | — | |||||
| Singapore Dollar | RBS | Sell | 28,000 | 20,209 | 2/14/17 | 72 | — | |||||
| British Pound | JPHQ | Sell | 86,300 | 115,081 | 8/15/19 | 7,042 | — | |||||
| Total Forward Exchange Contracts | $ | 21,996 | $ | (4,187 | ) | |||||||
| Net unrealized appreciation (depreciation) | $ | 17,809 | ||||||||||
| aMay be comprised of multiple contracts with the same counterparty, currency and settlement date. | ||||||||||||
franklintempleton.com
Semiannual Report 21
FRANKLIN STRATEGIC SERIES
STATEMENT OF INVESTMENTS (UNAUDITED)
| Franklin Flexible Alpha Bond Fund (continued) | |||||||||||||||||||
| At October 31, 2016, the Fund had the following credit default swap contracts outstanding. See Note 1(d). | |||||||||||||||||||
| Credit Default Swap Contracts | |||||||||||||||||||
| Unamortized | |||||||||||||||||||
| Periodic | Counter- | Upfront | |||||||||||||||||
| Payment | party/ | Notional | Expiration | Payments | Unrealized | Unrealized | |||||||||||||
| Description | Rate | Exchange | Amounta | Date | (Receipts) | Appreciation | Depreciation | Value | Ratingb | ||||||||||
| Centrally Cleared Swap Contracts | |||||||||||||||||||
| Contracts to Sell Protectionc | |||||||||||||||||||
| Traded Index | |||||||||||||||||||
| ITRX.EUR.25 | 1.00 | % | ICE | 50,000 | EUR | 6/20/21 | $ | 514 | $ | 389 | $ | – | $ | 903 | Investment | ||||
| Grade | |||||||||||||||||||
| ITRX.EUR.SNRFIN.26 | 1.00 | % | ICE | 70,000 | EUR | 12/20/21 | (63 | ) | 263 | – | 200 | Investment | |||||||
| Grade | |||||||||||||||||||
| TotalCentrallyClearedSwapContracts | $ | 451 | $ | 652 | $ | – | $ | 1,103 | |||||||||||
| OTC Swap Contracts | |||||||||||||||||||
| Contracts to Buy Protection | |||||||||||||||||||
| Single Name | |||||||||||||||||||
| The AES Corp | 5.00 | % | JPHQ | 40,000 | 6/20/21 | $ | (4,290 | ) | $ | – | $ | (1,145 | ) | $ | (5,435 | ) | |||
| CalAtlanticGroupInc | 5.00 | % | BZWS | 250,000 | 6/20/18 | (16,343 | ) | – | (3,073 | ) | (19,416 | ) | |||||||
| Canadian Natural Resources Ltd | 5.00 | % | GSCO | 100,000 | 6/20/17 | (2,311 | ) | – | (1,002 | ) | (3,313 | ) | |||||||
| LennarCorp | 5.00 | % | JPHQ | 25,000 | 9/20/20 | (2,825 | ) | – | (482 | ) | (3,307 | ) | |||||||
| OlinCorp | 1.00 | % | GSCO | 25,000 | 6/20/21 | 1,868 | – | (399 | ) | 1,469 | |||||||||
| Owens-Illinois Inc | 5.00 | % | CITI | 200,000 | 6/20/18 | (13,039 | ) | – | (3,817 | ) | (16,856 | ) | |||||||
| Pactiv LLC | 5.00 | % | CITI | 100,000 | 6/20/17 | (1,176 | ) | – | (2,381 | ) | (3,557 | ) | |||||||
| PHHCorp | 5.00 | % | BZWS | 200,000 | 9/20/19 | (2,589 | ) | – | (4,820 | ) | (7,409 | ) | |||||||
| Rite Aid Corp | 5.00 | % | JPHQ | 100,000 | 12/20/20 | (14,904 | ) | 246 | – | (14,658 | ) | ||||||||
| Sanmina Corp | 5.00 | % | BZWS | 100,000 | 6/20/19 | (11,339 | ) | – | (817 | ) | (12,156 | ) | |||||||
| SpringleafFinanceCorp | 5.00 | % | GSCO | 100,000 | 6/20/20 | (4,390 | ) | 4 | – | (4,386 | ) | ||||||||
| TenetHealthcareCorp | 5.00 | % | BZWS | 100,000 | 3/20/19 | (5,393 | ) | 367 | – | (5,026 | ) | ||||||||
| TenetHealthcareCorp | 5.00 | % | GSCO | 50,000 | 3/20/19 | (2,638 | ) | 125 | – | (2,513 | ) | ||||||||
| XPOCNWInc | 5.00 | % | JPHQ | 100,000 | 3/20/18 | (3,342 | ) | – | (415 | ) | (3,757 | ) | |||||||
| Contracts to Sell Protectionc | |||||||||||||||||||
| Single Name | |||||||||||||||||||
| American Tower Corp | 1.00 | % | GSCO | 100,000 | 3/20/21 | (1,642 | ) | 53 | – | (1,589 | ) | BBB- | |||||||
| Beazer Homes USA Inc | 5.00 | % | JPHQ | 25,000 | 9/20/20 | 315 | 800 | – | 1,115 | B- | |||||||||
| Calpine Corp | 5.00 | % | JPHQ | 40,000 | 6/20/21 | 2,190 | 598 | – | 2,788 | B | |||||||||
| Electricite de France SA | 1.00 | % | JPHQ | 25,000 | EUR | 9/20/20 | 472 | 11 | – | 483 | A- | ||||||||
| EngieSA | 1.00 | % | JPHQ | 25,000 | EUR | 9/20/20 | 590 | 147 | – | 737 | A- | ||||||||
| Government of Mexico | 1.00 | % | JPHQ | 10,000 | 9/20/20 | (164 | ) | 104 | – | (60 | ) | BBB+ | |||||||
| OrangeSA | 1.00 | % | JPHQ | 25,000 | EUR | 9/20/20 | 387 | 263 | – | 650 | BBB+ | ||||||||
| Sprint Communications Inc | 5.00 | % | JPHQ | 12,000 | 9/20/20 | - | 508 | – | 508 | B | |||||||||
| Traded Index | |||||||||||||||||||
| MCDX.NA.27 | 1.00 | % | CITI | 50,000 | 12/20/21 | 513 | – | (153 | ) | 360 | Investment | ||||||||
| Grade | |||||||||||||||||||
| TotalOTCSwapContracts | $ | (80,050 | ) | $ | 3,226 | $ | (18,504 | ) | $ | (95,328 | ) | ||||||||
| TotalCreditDefaultSwapContracts | $ | (79,599 | ) | $ | 3,878 | $ | (18,504 | ) | $ | (94,225 | ) | ||||||||
| Netunrealizedappreciation(depreciation) | $ | (14,626 | ) | ||||||||||||||||
22 Semiannual Report
franklintempleton.com
FRANKLIN STRATEGIC SERIES
STATEMENT OF INVESTMENTS (UNAUDITED)
Franklin Flexible Alpha Bond Fund (continued)
Credit Default Swap Contracts (continued)
aIn U.S. dollars unless otherwise indicated. For contracts to sell protection, the notional amount is equal to the maximum potential amount of the future payments and no
recourse provisions have been entered into in association with the contracts.
bBased on Standard and Poor’s (S&P) Rating for single name swaps and internal ratings for index swaps. Internal ratings based on mapping into equivalent ratings from
external vendors.
cThe Fund enters contracts to sell protection to create a long credit position. Performance triggers include default, bankruptcy or restructuring for single name swaps, and
failure to pay or bankruptcy of the underlying securities for traded index swaps.
At October 31, 2016, the Fund had the following interest rate swap contracts outstanding. See Note 1(d).
| Interest Rate Swap Contracts | |||||||||||||||
| Unamortized | |||||||||||||||
| Upfront | |||||||||||||||
| Notional | Expiration | Payments/ | Unrealized | Unrealized | |||||||||||
| Description | Exchange | Amount | Date | (Receipts) | Appreciation | Depreciation | Value | ||||||||
| Centrally Cleared Swap Contracts | |||||||||||||||
| Receive Floating rate 3-month USD BBA LIBOR + | |||||||||||||||
| 0.661% | |||||||||||||||
| Pay Fixed Semi-Annual 1.75% | LCH | $ | 680,000 | 3/15/24 | $ | (15,050 | ) | $ | 6,166 | $ | — | $ | (8,884 | ) | |
| Receive Floating rate 3-month USD BBA LIBOR | |||||||||||||||
| Pay Fixed rate 1.75% | LCH | 220,000 | 3/15/27 | (2,506 | ) | 2,314 | — | (192 | ) | ||||||
| Total Interest Rate Swap Contracts | $ | (17,556 | ) | $ | 8,480 | $ | — | $ | (9,076 | ) | |||||
| Net unrealized appreciation (depreciation) | $ | 8,480 |
See Notes 6 and 8 regarding investment transactions and other derivative information, respectively.
See Abbreviations on page 40.
franklintempleton.com The accompanying notes are an integral part of these financial statements. | Semiannual Report 23
| FRANKLIN STRATEGIC SERIES | |||
| Financial Statements | |||
| Statement of Assets and Liabilities | |||
| October 31, 2016 (unaudited) | |||
| Franklin Flexible Alpha Bond Fund | |||
| Assets: | |||
| Investments in securities: | |||
| Cost - Unaffiliated issuers | $ | 8,644,824 | |
| Cost - Non-controlled affiliates (Note 3f) | 2,124,609 | ||
| Total cost of investments | $ | 10,769,433 | |
| Value - Unaffiliated issuers | $ | 8,784,640 | |
| Value - Non-controlled affiliates (Note 3f) | 2,124,609 | ||
| Total value of investments | 10,909,249 | ||
| Foreign currency, at value (cost $90,001) | 89,293 | ||
| Receivables: | |||
| Capital shares sold | 2,300 | ||
| Interest | 63,630 | ||
| Affiliates | 125,197 | ||
| Due from brokers | 78,226 | ||
| OTC swap contracts (upfront payments $3,186) | 6,335 | ||
| Unrealized appreciation on OTC forward exchange contracts | 21,996 | ||
| Unrealized appreciation on OTC swap contracts | 3,226 | ||
| Other assets. | 39,984 | ||
| Total assets | 11,339,436 | ||
| Liabilities: | |||
| Payables: | |||
| Investment securities purchased | 256,840 | ||
| Capital shares redeemed | 88 | ||
| Distribution fees | 153 | ||
| Transfer agent fees | 402 | ||
| Professional fees. | 48,466 | ||
| Distributions to shareholders. | 4,982 | ||
| Variation margin | 751 | ||
| OTC swap contracts (upfront receipts $119,723) | 86,385 | ||
| Funds advanced by custodian | 6,998 | ||
| Options written, at value (premiums received $2,300) | 1,830 | ||
| Unrealized depreciation on OTC forward exchange contracts | 4,187 | ||
| Unrealized depreciation on OTC swap contracts | 18,504 | ||
| Accrued expenses and other liabilities | 1,777 | ||
| Total liabilities | 431,363 | ||
| Net assets, at value. | $ | 10,908,073 | |
| Net assets consist of: | |||
| Paid-in capital. | $ | 10,917,528 | |
| Undistributed net investment income | 80,156 | ||
| Net unrealized appreciation (depreciation) | 144,259 | ||
| Accumulated net realized gain (loss) | (233,870 | ) | |
| Net assets, at value. | $ | 10,908,073 | |
24 Semiannual Report | The accompanying notes are an integral part of these financial statements. franklintempleton.com
FRANKLIN STRATEGIC SERIES
FINANCIAL STATEMENTS
Statement of Assets and Liabilities (continued)
October 31, 2016 (unaudited)
| Franklin Flexible Alpha Bond Fund | ||
| Class A: | ||
| Net assets, at value. | $ | 10,355,597 |
| Shares outstanding | 1,040,116 | |
| Net asset value per sharea | $ | 9.96 |
| Maximum offering price per share (net asset value per share ÷ 95.75%) | $ | 10.40 |
| Class C: | ||
| Net assets, at value. | $ | 200,025 |
| Shares outstanding | 20,186 | |
| Net asset value and maximum offering price per sharea | $ | 9.91 |
| Class R: | ||
| Net assets, at value. | $ | 9,944 |
| Shares outstanding | 1,000 | |
| Net asset value and maximum offering price per share | $ | 9.94 |
| Class R6: | ||
| Net assets, at value. | $ | 9,952 |
| Shares outstanding | 1,000 | |
| Net asset value and maximum offering price per share | $ | 9.95 |
| Advisor Class: | ||
| Net assets, at value. | $ | 332,555 |
| Shares outstanding | 33,430 | |
| Net asset value and maximum offering price per share | $ | 9.95 |
aRedemption price is equal to net asset value less contingent deferred sales charges, if applicable.
franklintempleton.com The accompanying notes are an integral part of these financial statements. | Semiannual Report 25
| FRANKLIN STRATEGIC SERIES |
| FINANCIAL STATEMENTS |
Statement of Operations
for the six months ended October 31, 2016 (unaudited)
| Franklin Flexible Alpha Bond Fund | |||
| Investment income: | |||
| Dividends | $ | 4,000 | |
| Interest | 120,802 | ||
| Inflation principal adjustments | 7,740 | ||
| Total investment income | 132,542 | ||
| Expenses: | |||
| Management fees (Note 3a) | 30,159 | ||
| Distribution fees: (Note 3c) | |||
| Class C | 741 | ||
| Transfer agent fees: (Note 3e) | |||
| Class A | 986 | ||
| Class C | 21 | ||
| Class R | 1 | ||
| Advisor Class | 32 | ||
| Custodian fees (Note 4) | 76 | ||
| Reports to shareholders | 7,671 | ||
| Registration and filing fees | 23,684 | ||
| Professional fees | 45,278 | ||
| Amortization of offering costs. | 57,328 | ||
| Other | 23,105 | ||
| Total expenses | 189,082 | ||
| Expense reductions (Note 4) | (21 | ) | |
| Expenses waived/paid by affiliates (Note 3f and 3g) | (155,356 | ) | |
| Net expenses | 33,705 | ||
| Net investment income | 98,837 | ||
| Realized and unrealized gains (losses): | |||
| Net realized gain (loss) from: | |||
| Investments | 1,299 | ||
| Written options | 14,622 | ||
| Foreign currency transactions | (29,779 | ) | |
| Futures contracts | (17,455 | ) | |
| Swap contracts | (40,676 | ) | |
| Net realized gain (loss) | (71,989 | ) | |
| Net change in unrealized appreciation (depreciation) on: | |||
| Investments | 13,341 | ||
| Translation of other assets and liabilities | |||
| denominated in foreign currencies | 59,776 | ||
| Written options | (5,026 | ) | |
| Futures contracts | 11,950 | ||
| Swap contracts | 12,410 | ||
| Net change in unrealized appreciation (depreciation) | 92,451 | ||
| Net realized and unrealized gain (loss) | 20,462 | ||
| Net increase (decrease) in net assets resulting from operations | $ | 119,299 | |
26 Semiannual Report | The accompanying notes are an integral part of these financial statements. franklintempleton.com
| FRANKLIN STRATEGIC SERIES | ||||||
| FINANCIAL STATEMENTS | ||||||
| Statements of Changes in Net Assets | ||||||
| Franklin Flexible Alpha Bond Fund | ||||||
| Six Months Ended | ||||||
| October 31, 2016 | Year Ended | |||||
| (unaudited) | April 30, 2016a | |||||
| Increase (decrease) in net assets: | ||||||
| Operations: | ||||||
| Net investment income | $ | 98,837 | $ | 104,677 | ||
| Net realized gain (loss) | (71,989 | ) | (178,148 | ) | ||
| Net change in unrealized appreciation (depreciation) | 92,451 | 51,808 | ||||
| Net increase (decrease) in net assets resulting from operations | 119,299 | (21,663 | ) | |||
| Distributions to shareholders from: | ||||||
| Net investment income: | ||||||
| Class A | (34,666 | ) | (98,481 | ) | ||
| Class C | (416 | ) | (1,140 | ) | ||
| Class R | (25 | ) | (85 | ) | ||
| Class R6 | (34 | ) | (105 | ) | ||
| Advisor Class | (1,163 | ) | (1,870 | ) | ||
| Total distributions to shareholders | (36,304 | ) | (101,681 | ) | ||
| Capital share transactions: (Note 2) | ||||||
| Class A | 76,933 | 10,322,042 | ||||
| Class C | (5,142 | ) | 204,600 | |||
| Class R | — | 10,000 | ||||
| Class R6 | — | 10,000 | ||||
| Advisor Class | (14,046 | ) | 344,035 | |||
| Total capital share transactions | 57,745 | 10,890,677 | ||||
| Net increase (decrease) in net assets | 140,740 | 10,767,333 | ||||
| Net assets: | ||||||
| Beginning of period | 10,767,333 | — | ||||
| End of period. | $ | 10,908,073 | $ | 10,767,333 | ||
| Undistributed net investment income included in net assets: | ||||||
| End of period. | $ | 80,156 | $ | 17,623 | ||
aFor the period August 03, 2015 (commencement of operations) to April 30, 2016.
franklintempleton.com The accompanying notes are an integral part of these financial statements. | Semiannual Report 27
FRANKLIN STRATEGIC SERIES
Notes to Financial Statements (unaudited)
Franklin Flexible Alpha Bond Fund
1. Organization and Significant Accounting Policies
Franklin Strategic Series (Trust) is registered under the Investment Company Act of 1940 (1940 Act) as an open-end management investment company, consisting of ten separate funds and applies the specialized accounting and reporting guidance in U.S. Generally Accepted Accounting Principles (U.S. GAAP). Franklin Flexible Alpha Bond Fund (Fund) is included in this report. The financial statements of the remaining funds in the Trust are presented separately. The Fund offers five classes of shares: Class A, Class C, Class R, Class R6, and Advisor Class. Each class of shares differs by its initial sales load, contingent deferred sales charges, voting rights on matters affecting a single class, its exchange privilege and fees primarily due to differing arrangements for distribution and transfer agent fees.
The following summarizes the Fund’s significant accounting policies.
a. Financial Instrument Valuation
The Fund’s investments in financial instruments are carried at fair value daily. Fair value is the price that would be received to sell an asset or paid to transfer a liability in an orderly transaction between market participants on the measurement date. The Fund calculates the net asset value (NAV) per share as of 4 p.m. Eastern time each day the New York Stock Exchange (NYSE) is open for trading. Under compliance policies and procedures approved by the Trust’s Board of Trustees (the Board), the Fund’s administrator has responsibility for oversight of valuation, including leading the cross-functional Valuation Committee (VC). The VC provides administration and oversight of the Fund’s valuation policies and procedures, which are approved annually by the Board. Among other things, these procedures allow the Fund to utilize independent pricing services, quotations from securities and financial instrument dealers, and other market sources to determine fair value.
Equity securities, exchange traded funds and derivative financial instruments listed on an exchange or on the NASDAQ National Market System are valued at the last quoted sale price or the official closing price of the day, respectively. Over-the-counter (OTC) securities are valued within the range of the most recent quoted bid and ask prices. Securities that trade in multiple markets or on multiple exchanges are valued according to the broadest and most representative market. Certain equity securities are valued based upon fundamental characteristics or relationships to similar securities.
Debt securities generally trade in the OTC market rather than on a securities exchange. The Fund’s pricing services use multiple valuation techniques to determine fair value. In instances where sufficient market activity exists, the pricing services may utilize a market-based approach through which quotes from market makers are used to determine fair value. In instances where sufficient market activity may not exist or is limited, the pricing services also utilize proprietary valuation models which may consider market characteristics such as benchmark yield curves, credit spreads, estimated default rates, anticipated market interest rate volatility, coupon rates, anticipated timing of principal repayments, underlying collateral, and other unique security features in order to estimate the relevant cash flows, which are then discounted to calculate the fair value. Securities denominated in a foreign currency are converted into their U.S. dollar equivalent at the foreign exchange rate in effect at 4 p.m. Eastern time on the date that the values of the foreign debt securities are determined.
Investments in open-end mutual funds are valued at the closing NAV.
Certain derivative financial instruments trade in the OTC market. The Fund’s pricing services use various techniques including industry standard option pricing models and proprietary discounted cash flow models to determine the fair value of those instruments. The Fund’s net benefit or obligation under the derivative contract, as measured by the fair value of the contract, is included in net assets.
The Fund has procedures to determine the fair value of financial instruments for which market prices are not reliable or readily available. Under these procedures, the VC convenes on a regular basis to review such financial instruments and considers a number of factors, including significant unobservable valuation inputs, when arriving at fair value. The VC primarily employs a market-based approach which may use related or comparable assets or liabilities, recent transactions, market multiples, book values, and other relevant information for the investment to determine the fair value of the investment. An income-based valuation approach may also be used in which the anticipated future cash flows of the investment are discounted to calculate fair value. Discounts may also be applied due to the nature or duration of any restrictions on the disposition of the
28 Semiannual Report
franklintempleton.com
FRANKLIN STRATEGIC SERIES
NOTES TO FINANCIAL STATEMENTS (UNAUDITED)
Franklin Flexible Alpha Bond Fund (continued)
investments. Due to the inherent uncertainty of valuations of such investments, the fair values may differ significantly from the values that would have been used had an active market existed. The VC employs various methods for calibrating these valuation approaches including a regular review of key inputs and assumptions, transactional back-testing or disposition analysis, and reviews of any related market activity.
Trading in securities on foreign securities stock exchanges and OTC markets may be completed before 4 p.m. Eastern time. In addition, trading in certain foreign markets may not take place on every NYSE business day. Occasionally, events occur between the time at which trading in a foreign security is completed and the close of the NYSE that might call into question the reliability of the value of a portfolio security held by the Fund. As a result, differences may arise between the value of the Fund’s portfolio securities as determined at the foreign market close and the latest indications of value at the close of the NYSE. In order to minimize the potential for these differences, the VC monitors price movements following the close of trading in foreign stock markets through a series of country specific market proxies (such as baskets of American Depositary Receipts, futures contracts and exchange traded funds). These price movements are measured against established trigger thresholds for each specific market proxy to assist in determining if an event has occurred that may call into question the reliability of the values of the foreign securities held by the Fund. If such an event occurs, the securities may be valued using fair value procedures, which may include the use of independent pricing services.
When the last day of the reporting period is a non-business day, certain foreign markets may be open on those days that the NYSE is closed, which could result in differences between the value of the Fund’s portfolio securities on the last business day and the last calendar day of the reporting period. Any significant security valuation changes due to an open foreign market are adjusted and reflected by the Fund for financial reporting purposes.
b. Foreign Currency Translation
Portfolio securities and other assets and liabilities denominated in foreign currencies are translated into U.S. dollars based on the exchange rate of such currencies against U.S. dollars on the date of valuation. The Fund may enter into foreign currency exchange contracts to facilitate transactions denominated in a foreign currency. Purchases and sales of securities, income and expense items denominated in foreign currencies are translated into U.S. dollars at the exchange rate in effect on the transaction date. Portfolio securities and assets and liabilities denominated in foreign currencies contain risks that those currencies will decline in value relative to the U.S. dollar. Occasionally, events may impact the availability or reliability of foreign exchange rates used to convert the U.S. dollar equivalent value. If such an event occurs, the foreign exchange rate will be valued at fair value using procedures established and approved by the Board.
The Fund does not separately report the effect of changes in foreign exchange rates from changes in market prices on securities held. Such changes are included in net realized and unrealized gain or loss from investments in the Statement of Operations.
Realized foreign exchange gains or losses arise from sales of foreign currencies, currency gains or losses realized between the trade and settlement dates on securities transactions and the difference between the recorded amounts of dividends, interest, and foreign withholding taxes and the U.S. dollar equivalent of the amounts actually received or paid. Net unrealized foreign exchange gains and losses arise from changes in foreign exchange rates on foreign denominated assets and liabilities other than investments in securities held at the end of the reporting period.
c. Securities Purchased on a When-Issued and TBA Basis
The Fund purchases securities on a when-issued and to-be-announced (TBA) basis, with payment and delivery scheduled for a future date. These transactions are subject to market fluctuations and are subject to the risk that the value at delivery may be more or less than the trade date purchase price. Although the Fund will generally purchase these securities with the intention of holding the securities, it may sell the securities before the settlement date. Sufficient assets have been segregated for these securities.
d. Derivative Financial Instruments
The Fund invested in derivative financial instruments in order to manage risk or gain exposure to various other investments or markets. Derivatives are financial contracts based on an underlying or notional amount, require no initial investment or an initial net investment that is smaller than would normally be required to have a similar response to changes in market factors, and require or permit net settlement. Derivatives contain various risks including the potential inability of the counterparty to
franklintempleton.com
Semiannual Report 29
FRANKLIN STRATEGIC SERIES
NOTES TO FINANCIAL STATEMENTS (UNAUDITED)
Franklin Flexible Alpha Bond Fund (continued)
1. Organization and Significant Accounting
Policies (continued)
d. Derivative Financial Instruments (continued)
fulfill their obligations under the terms of the contract, the potential for an illiquid secondary market, and/or the potential for market movements which expose the Fund to gains or losses in excess of the amounts shown in the Statement of Assets and Liabilities. Realized gain and loss and unrealized appreciation and depreciation on these contracts for the period are included in the Statement of Operations.
Derivative counterparty credit risk is managed through a formal evaluation of the creditworthiness of all potential counter-parties. The Fund attempts to reduce its exposure to counterparty credit risk on OTC derivatives, whenever possible, by entering into International Swaps and Derivatives Association (ISDA) master agreements with certain counterparties. These agreements contain various provisions, including but not limited to collateral requirements, events of default, or early termination. Termination events applicable to the counterparty include certain deteriorations in the credit quality of the counterparty. Termination events applicable to the Fund include failure of the Fund to maintain certain net asset levels and/or limit the decline in net assets over various periods of time. In the event of default or early termination, the ISDA master agreement gives the non-defaulting party the right to net and close-out all transactions traded, whether or not arising under the ISDA agreement, to one net amount payable by one counterparty to the other. However, absent an event of default or early termination, OTC derivative assets and liabilities are presented gross and not offset in the Statement of Assets and Liabilities. Early termination by the counterparty may result in an immediate payment by the Fund of any net liability owed to that counterparty under the ISDA agreement.
Collateral requirements differ by type of derivative. Collateral or initial margin requirements are set by the broker or exchange clearing house for exchange traded and centrally cleared derivatives. Initial margin deposited is held at the exchange and can be in the form of cash and/or securities. For OTC derivatives traded under an ISDA master agreement, posting of collateral is required by either the Fund or the applicable counterparty if the total net exposure of all OTC derivatives with the applicable counterparty exceeds the minimum transfer amount, which typically ranges from $100,000 to $250,000, and can vary depending on the counterparty and the type of the agreement. Generally, collateral is determined at the close of Fund business each day and any additional collateral required due to changes in derivative values may be delivered by the Fund or the counterparty within a few business days. Collateral pledged and/or received by the Fund for OTC derivatives, if any, is held in segregated accounts with the Fund’s custodian/counterparty broker and can be in the form of cash and/or securities. Unrestricted cash may be invested according to the Fund’s investment objectives. To the extent that the amounts due to the Fund from its counterparties are not subject to collateralization or are not fully collateralized, the Fund bears the risk of loss from counterparty non-performance.
The Fund entered into exchange traded financial futures contracts primarily to manage and/or gain exposure to interest rate risk. A futures contract is an agreement between the Fund and a counterparty to buy or sell an asset at a specified price on a future date. Required initial margins are pledged by the Fund, and the daily change in fair value is accounted for as a variation margin payable or receivable in the Statement of Assets and Liabilities.
The Fund entered into OTC forward exchange contracts primarily to manage and/or gain exposure to certain foreign currencies. A forward exchange contract is an agreement between the Fund and a counterparty to buy or sell a foreign currency at a specific exchange rate on a future date.
The Fund entered into credit default swap contracts primarily to manage and/or gain exposure to credit risk. A credit default swap is an agreement between the Fund and a counterparty whereby the buyer of the contract receives credit protection and the seller of the contract guarantees the credit worthiness of a referenced debt obligation. These agreements may be privately negotiated in the over-the-counter market (OTC credit default swaps) or may be executed in a multilateral trade facility platform, such as a registered exchange (centrally cleared credit default swaps). The underlying referenced debt obligation may be a single issuer of corporate or sovereign debt, a credit index, a basket of issuers or indices, or a tranche of a credit index or basket of issuers or indices. In the event of a default of the underlying referenced debt obligation, the buyer is entitled to receive the notional amount of the credit default swap contract from the seller in exchange for the referenced debt obligation, a net settlement amount equal to the notional amount of the credit default swap less the recovery value of the referenced debt obligation, or other agreed upon amount. For centrally cleared credit default swaps, required initial margins are pledged by the
30 Semiannual Report
franklintempleton.com
FRANKLIN STRATEGIC SERIES
NOTES TO FINANCIAL STATEMENTS (UNAUDITED)
Franklin Flexible Alpha Bond Fund (continued)
Fund, and the daily change in fair value is accounted for as a variation margin payable or receivable in the Statement of Assets and Liabilities. Over the term of the contract, the buyer pays the seller a periodic stream of payments, provided that no event of default has occurred. Such periodic payments are accrued daily as an unrealized appreciation or depreciation until the payments are made, at which time they are realized. Upfront payments and receipts are reflected in the Statement of Assets and Liabilities and represent compensating factors between stated terms of the credit default swap agreement and prevailing market conditions (credit spreads and other relevant factors). These upfront payments and receipts are amortized over the term of the contract as a realized gain or loss in the Statement of Operations.
The Fund entered into interest rate swap contracts primarily to manage interest rate risk. An interest rate swap is an agreement between the Fund and a counterparty to exchange cash flows based on the difference between two interest rates, applied to a notional amount. These agreements may be privately negotiated in the over-the-counter market (OTC interest rate swaps) or may be executed on a registered exchange (centrally cleared interest rate swaps). For centrally cleared interest rate swaps, required initial margins are pledged by the Fund, and the daily change in fair value is accounted for as a variation margin payable or receivable in the Statement of Assets and Liabilities. Over the term of the contract, contractually required payments to be paid and to be received are accrued daily and recorded as unrealized depreciation and appreciation until the payments are made, at which time they are realized.
The Fund purchased or wrote exchange traded and/or OTC option contracts primarily to manage and/or gain exposure to interest rate, foreign exchange rate, credit risk. An option is a contract entitling the holder to purchase or sell a specific amount of shares or units of an asset or notional amount of a swap (swaption), at a specified price. When an option is purchased or written, an amount equal to the premium paid or received is recorded as an asset or liability, respectively. Certain option contracts are marked-to-market daily and the daily change in fair value is accounted for as variation margin payable or receivable in the Statement of Assets and Liabilities. Upon exercise of an option, the acquisition cost or sales proceeds of the underlying investment is adjusted by any premium received or paid. Upon expiration of an option, any premium received or paid is recorded as a realized gain or loss.
Upon closing an option other than through expiration or exercise, the difference between the premium received or paid and the cost to close the position is recorded as a realized gain or loss.
See Notes 6 and 8 regarding investment transactions and other derivative information, respectively.
e. Mortgage Dollar Rolls
The Fund enters into mortgage dollar rolls, typically on a TBA basis. Mortgage dollar rolls are agreements between the Fund and a financial institution where the Fund sells (or buys) mortgage-backed securities for delivery on a specified date and simultaneously contracts to repurchase (or sell) substantially similar (same type, coupon, and maturity) securities at a future date and at a predetermined price. Gains or losses are realized on the initial sale, and the difference between the repurchase price and the sale price is recorded as an unrealized gain or loss to the Fund upon entering into the mortgage dollar roll. In addition, the Fund may invest the cash proceeds that are received from the initial sale. During the period between the sale and repurchase, the Fund is not entitled to principal and interest paid on the mortgage backed securities. Transactions in mortgage dollar rolls are accounted for as purchases and sales and may result in an increase to the Fund’s portfolio turnover rate. The risks of mortgage dollar roll transactions include the potential inability of the counterparty to fulfill its obligations.
f. Income and Deferred Taxes
It is the Fund’s policy to qualify as a regulated investment company under the Internal Revenue Code. The Fund intends to distribute to shareholders substantially all of its taxable income and net realized gains to relieve it from federal income and excise taxes. As a result, no provision for U.S. federal income taxes is required.
The Fund may be subject to foreign taxation related to income received, capital gains on the sale of securities and certain foreign currency transactions in the foreign jurisdictions in which it invests. Foreign taxes, if any, are recorded based on the tax regulations and rates that exist in the foreign markets in which the Fund invests. When a capital gain tax is determined to apply, the Fund records an estimated deferred tax liability in an amount that would be payable if the securities were disposed of on the valuation date.
franklintempleton.com
Semiannual Report 31
FRANKLIN STRATEGIC SERIES
NOTES TO FINANCIAL STATEMENTS (UNAUDITED)
Franklin Flexible Alpha Bond Fund (continued)
1. Organization and Significant Accounting
Policies (continued)
f. Income and Deferred Taxes (continued)
The Fund may recognize an income tax liability related to its uncertain tax positions under U.S. GAAP when the uncertain tax position has a less than 50% probability that it will be sustained upon examination by the tax authorities based on its technical merits. As of October 31, 2016, the Fund has determined that no tax liability is required in its financial statements related to uncertain tax positions for any open tax years (or expected to be taken in future tax years). Open tax years are those that remain subject to examination and are based on each tax jurisdiction’s statute of limitation.
g. Security Transactions, Investment Income, Expenses and Distributions
Security transactions are accounted for on trade date. Realized gains and losses on security transactions are determined on a specific identification basis. Interest income and estimated expenses are accrued daily. Amortization of premium and accretion of discount on debt securities are included in interest income. Paydown gains and losses are recorded as an adjustment to interest income. Dividend income is recorded on the ex-dividend date. Dividends from net investment income are normally declared daily; these dividends may be reinvested or paid monthly to shareholders. Distributions to shareholders are determined according to income tax regulations (tax basis). Distributable earnings determined on a tax basis may differ from earnings recorded in accordance with U.S. GAAP. These differences may be permanent or temporary. Permanent differences are reclassified among capital accounts to reflect their tax character. These reclassifications have no impact on net assets or the results of operations. Temporary differences are not reclassified, as they may reverse in subsequent periods.
Common expenses incurred by the Trust are allocated among the Funds based on the ratio of net assets of each Fund to the combined net assets of the Trust. Fund specific expenses are charged directly to the Fund that incurred the expense.
Net investment income, not including class specific expenses, is allocated daily to each class of shares based upon the relative value of the settled shares of each class. Realized and unrealized gains and losses are allocated daily to each class of shares based upon the relative proportion of net assets of each class. Differences in per share distributions, by class, are generally due to differences in class specific expenses.
Inflation-indexed bonds are adjusted for inflation through periodic increases or decreases in the security’s interest accruals, face amount, or principal redemption value, by amounts corresponding to the rate of inflation as measured by an index. Any increase or decrease in the face amount or principal redemption value will be included as inflation principal adjustments in the Statement of Operations.
h. Offering Costs
Offering costs are amortized on a straight line basis over twelve months.
i. Accounting Estimates
The preparation of financial statements in accordance with U.S. GAAP requires management to make estimates and assumptions that affect the reported amounts of assets and liabilities at the date of the financial statements and the amounts of income and expenses during the reporting period. Actual results could differ from those estimates.
j. Guarantees and Indemnifications
Under the Trust’s organizational documents, its officers and trustees are indemnified by the Trust against certain liabilities arising out of the performance of their duties to the Trust. Additionally, in the normal course of business, the Trust, on behalf of the Fund, enters into contracts with service providers that contain general indemnification clauses. The Trust’s maximum exposure under these arrangements is unknown as this would involve future claims that may be made against the Trust that have not yet occurred. Currently, the Trust expects the risk of loss to be remote.
32 Semiannual Report
franklintempleton.com
FRANKLIN STRATEGIC SERIES
NOTES TO FINANCIAL STATEMENTS (UNAUDITED)
Franklin Flexible Alpha Bond Fund (continued)
2. Shares of Beneficial Interest
At October 31, 2016, there were an unlimited number of shares authorized (without par value). Transactions in the Fund’s shares were as follows:
| Six Months Ended | Year Ended | |||||||||||
| October 31, 2016 | April 30, 2016a | |||||||||||
| Shares | Amount | Shares | Amount | |||||||||
| Class A Shares: | ||||||||||||
| Shares sold | 8,236 | $ | 81,518 | 1,055,699 | $ | 10,552,738 | ||||||
| Shares issued in reinvestment of distributions | 137 | 1,361 | 319 | 3,152 | ||||||||
| Shares redeemed | (597 | ) | (5,946 | ) | (23,678 | ) | (233,848 | ) | ||||
| Net increase (decrease) | 7,776 | $ | 76,933 | 1,032,340 | $ | 10,322,042 | ||||||
| Class C Shares: | ||||||||||||
| Shares sold | 10,183 | $ | 100,682 | 44,749 | $ | 442,689 | ||||||
| Shares issued in reinvestment of distributions | 42 | 415 | 108 | 1,064 | ||||||||
| Shares redeemed | (10,701 | ) | (106,239 | ) | (24,195 | ) | (239,153 | ) | ||||
| Net increase (decrease) | (476 | ) | $ | (5,142 | ) | 20,662 | $ | 204,600 | ||||
| Class R Shares: | ||||||||||||
| Shares sold | — | $ | — | 1,000 | $ | 10,000 | ||||||
| Net increase (decrease) | — | $ | — | 1,000 | $ | 10,000 | ||||||
| Class R6 Shares: | ||||||||||||
| Shares sold | — | $ | — | 1,000 | $ | 10,000 | ||||||
| Net increase (decrease) | — | $ | — | 1,000 | $ | 10,000 | ||||||
| Advisor Class Shares: | ||||||||||||
| Shares sold | — | $ | — | 45,294 | $ | 447,368 | ||||||
| Shares issued in reinvestment of distributions | 117 | 1,160 | 177 | 1,748 | ||||||||
| Shares redeemed | (1,534 | ) | (15,206 | ) | (10,624 | ) | (105,081 | ) | ||||
| Net increase (decrease) | (1,417 | ) | $ | (14,046 | ) | 34,847 | $ | 344,035 | ||||
| aFor the period August 3, 2015 (commencement of operations) to April 30, 2016. | ||||||||||||
3. Transactions with Affiliates
Franklin Resources, Inc. is the holding company for various subsidiaries that together are referred to as Franklin Templeton Investments. Certain officers and trustees of the Fund are also officers and/or directors of the following subsidiaries:
| Subsidiary | Affiliation |
| Franklin Advisers, Inc. (Advisers) | Investment manager |
| Franklin Templeton Institutional, LLC (FT Institutional) | Investment manager |
| Franklin Templeton Services, LLC (FT Services) | Administrative manager |
| Franklin Templeton Distributors, Inc. (Distributors) | Principal underwriter |
| Franklin Templeton Investor Services, LLC (Investor Services) | Transfer agent |
franklintempleton.com
Semiannual Report 33
FRANKLIN STRATEGIC SERIES
NOTES TO FINANCIAL STATEMENTS (UNAUDITED)
Franklin Flexible Alpha Bond Fund (continued)
| 3. | Transactions with Affiliates (continued) |
| a. | Management Fees |
The Fund pays an investment management fee to Advisers based on the average daily net assets of the Fund as follows:
| Annualized Fee Rate | Net Assets | |
| 0.550 | % | Up to and including $1 billion |
| 0.500 | % | Over $1 billion, up to and including $5 billion |
| 0.450 | % | Over $5 billion, up to and including $10 billion |
| 0.445 | % | Over $10 billion, up to and including $15 billion |
| 0.440 | % | Over $15 billion, up to and including $20 billion |
| 0.435 | % | In excess of $20 billion |
For the period ended October 31, 2016, the annualized effective investment management fee rate was 0.550% of the Fund’s average daily net assets.
Under a subadvisory agreement, FT Instituitional, an affiliate of Advisers, provides subadvisory services to the Fund. The subadvisory fee is paid by Advisers based on the Fund’s average daily net assets, and is not an additional expense of the Fund.
b. Administrative Fees
Under an agreement with Advisers, FT Services provides administrative services to the Fund. The fee is paid by Advisers based on the Fund’s average daily net assets, and is not an additional expense of the Fund.
c. Distribution Fees
The Board has adopted distribution plans for each share class, with the exception of Class R6 and Advisor Class shares, pursuant to Rule 12b-1 under the 1940 Act. Under the Fund’s Class A reimbursement distribution plan, the Fund reimburses Distributors for costs incurred in connection with the servicing, sale and distribution of the Fund’s shares up to the maximum annual plan rate. Under the Class A reimbursement distribution plan, costs exceeding the maximum for the current plan year cannot be reimbursed in subsequent periods. In addition, under the Fund’s Class C and R compensation distribution plans, the Fund pays Distributors for costs incurred in connection with the servicing, sale and distribution of the Fund’s shares up to the maximum annual plan rate for each class. The plan year, for purposes of monitoring compliance with the maximum annual plan rates, is February 1 through January 31.
The maximum annual plan rates, based on the average daily net assets, for each class, are as follows:
| Class A | 0.25 | % |
| Class C | 0.65 | % |
| Class R | 0.50 | % |
| d. Sales Charges/Underwriting Agreements | ||
Front-end sales charges and contingent deferred sales charges (CDSC) do not represent expenses of the Fund. These charges are deducted from the proceeds of sales of Fund shares prior to investment or from redemption proceeds prior to remittance, as applicable. Distributors has advised the Fund of the following commission transactions related to the sales and redemptions of the Fund’s shares for the period:
| Sales charges retained net of commissions paid to unaffiliated | ||
| brokers/dealers | $ | 35 |
| CDSC retained | $ | 146 |
34 Semiannual Report
franklintempleton.com
FRANKLIN STRATEGIC SERIES
NOTES TO FINANCIAL STATEMENTS (UNAUDITED)
Franklin Flexible Alpha Bond Fund (continued)
e. Transfer Agent Fees
Each class of shares, except for Class R6, pays transfer agent fees to Investor Services for its performance of shareholder servicing obligations and reimburses Investor Services for out of pocket expenses incurred, including shareholder servicing fees paid to third parties. These fees are allocated daily based upon their relative proportion of such classes’ aggregate net assets. Class R6 pays Investor Services transfer agent fees specific to that class.
For the period ended October 31, 2016, the Fund paid transfer agent fees of $1,040, of which $664 was retained by Investor Services.
f. Investments in Affiliated Management Investment Companies
The Fund invests in one or more affiliated management investment companies for purposes other than exercising a controlling influence over the management or policies. Management fees paid by the Fund are waived on assets invested in the affiliated management investment companies, as noted in the Statement of Operations, in an amount not to exceed the management and administrative fees paid directly or indirectly by each affiliate. During the period ended October 31, 2016, the Fund held investments in affiliated management investment companies as follows:
| % of | |||||||||||
| Affiliated | |||||||||||
| Number of | Number of | Fund Shares | |||||||||
| Shares Held | Shares | Value | Outstanding | ||||||||
| at Beginning | Gross | Gross | Held at End | at End | Investment | Realized | Held at End | ||||
| of Period | Additions | Reductions | of Period | of Period | Income | Gain (Loss) | of Period | ||||
| Non-Controlled Affiliates | |||||||||||
| Institutional Fiduciary Trust Money Market | |||||||||||
| Portfolio | 2,033,538 | 1,465,607 | (1,374,536 | ) | 2,124,609 | $ | 2,124,609 | $ – | $ – | 0.0 | %a |
| aRounds to less than 0.1%. | |||||||||||
| g. Waiver and Expense Reimbursements | |||||||||||
Advisers has contractually agreed in advance to waive or limit its fees and to assume as its own expense certain expenses otherwise payable by the Fund so that the expenses (excluding distribution fees, and acquired fund fees and expenses) for Class A, Class C, Class R and Advisor Class of the Fund do not exceed 0.85%, and Class R6 does not exceed 0.71% based on the average net assets of each class (other than certain non-routine expenses or costs, including those relating to litigation, indemnification, reorganizations, and liquidations) until August 31, 2017.
h. Other Affiliated Transactions
At October 31, 2016, Franklin Resources, Inc. owned 91.1% of the Fund’s outstanding shares. Investment activities of this shareholder could have a material impact on the Fund.
4. Expense Offset Arrangement
The Fund has entered into an arrangement with its custodian whereby credits realized as a result of uninvested cash balances are used to reduce a portion of the Fund’s custodian expenses. During the period ended October 31, 2016, the custodian fees were reduced as noted in the the Statement of Operations.
5. Income Taxes
For tax purposes, capital losses may be carried over to offset future capital gains, if any.
franklintempleton.com
Semiannual Report 35
FRANKLIN STRATEGIC SERIES
NOTES TO FINANCIAL STATEMENTS (UNAUDITED)
Franklin Flexible Alpha Bond Fund (continued)
5. Income Taxes (continued)
At April 30, 2016, the capital loss carryforwards were as follows:
| Capital loss carryforwards: | ||
| Short term. | $ | 140,918 |
| Long term | 35,061 | |
| Total capital loss carryforwards | $ | 175,979 |
At October 31, 2016, the cost of investments and net unrealized appreciation (depreciation) for income tax purposes were as follows:
| Cost of investments | $ | 10,801,659 | |
| Unrealized appreciation | $ | 187,185 | |
| Unrealized depreciation | (79,595 | ) | |
| Net unrealized appreciation (depreciation) | $ | 107,590 | |
Differences between income and/or capital gains as determined on a book basis and a tax basis are primarily due to differing treatments of foreign currency transactions, bond discounts and premiums, and swaps.
6. Investment Transactions
Purchases and sales of investments (excluding short term securities) for the period ended October 31, 2016, aggregated $4,473,295 and $4,474,265, respectively.
Transactions in options and swaptions written during the period ended October 31, 2016, were as follows:
| Options | Swaptions | |||||||||
| Notional | Notional | |||||||||
| Amount | Premiums | Amount | Premiums | |||||||
| Options outstanding at April 30, 2016 | 170,000 | $ | 2,609 | 1,300,000 | $ | 7,135 | ||||
| Options written | — | — | 2,850,000 | 10,993 | ||||||
| Options expired | (170,000 | ) | (2,609 | ) | (1,700,000 | ) | (6,443 | ) | ||
| Options exercised | — | — | — | — | ||||||
| Options closed | — | — | (1,600,000 | ) | (9,385 | ) | ||||
| Options outstanding at October 31, 2016 | — | $ | — | 850,000 | $ | 2,300 | ||||
See Notes 1(d) and 8 regarding derivative financial instruments and other derivative information, respectively.
7. Credit Risk
At October 31, 2016, the Fund had 13.3% of its portfolio invested in high yield or other securities rated below investment grade and unrated securities, if any. These securities may be more sensitive to economic conditions causing greater price volatility and are potentially subject to a greater risk of loss due to default than higher rated securities.
36 Semiannual Report
franklintempleton.com
FRANKLIN STRATEGIC SERIES
NOTES TO FINANCIAL STATEMENTS (UNAUDITED)
Franklin Flexible Alpha Bond Fund (continued)
8. Other Derivative Information
At October 31, 2016, the Fund’s investments in derivative contracts are reflected in the Statement of Assets and Liabilities as follows:
| Asset Derivatives | Liability Derivatives | |||||||
| Derivative Contracts | ||||||||
| Not Accounted for as | Statement of Assets and | Statement of Assets and | ||||||
| Hedging Instruments | Liabilities Location | Fair Value | Liabilities Location | Fair Value | ||||
| Interest rate contracts | Investments in securities, at value | $ | 16,587 | a | Options written, at value | $ | — | |
| Variation margin | 16,934 | b | Variation margin | 15,394 | b | |||
| Foreign exchange contracts | Investments in securities, at value | 81 | a | Options written, at value | — | |||
| Unrealized appreciation on OTC | 21,996 | Unrealized depreciation on OTC | 4,187 | |||||
| forward exchange contracts | forward exchange contracts | |||||||
| Credit contracts | Investments in securities, at value | 4,464 | a | Options written, at value | 1,830 | |||
| Variation margin | 652 | b | Variation margin | — | ||||
| OTC swap contracts (premium | 6,335 | OTC swap contracts (premium | 86,385 | |||||
| paid) | received) | |||||||
| Unrealized appreciation on OTC | 3,226 | Unrealized depreciation on OTC | 18,504 | |||||
| swap contracts | swap contracts | |||||||
| Totals | $ | 70,275 | $ | 126,300 | ||||
aPurchased option contracts are included in investments in securities, at value in the Statement of Assets and Liabilities.
bThis amount reflects the cumulative appreciation (depreciation) of futures contracts and centrally cleared swap contracts as reported in the Statement of Investments. Only
the variation margin receivable/payable at period end is separately reported within the Statement of Assets and Liabilities. Prior variation margin movements were recorded to
cash upon receipt or payment.
For the period ended October 31, 2016, the effect of derivative contracts in the Fund’s Statement of Operations was as follows:
| Net Change in | ||||||||
| Unrealized | ||||||||
| Derivative Contracts | Net Realized | Appreciation | ||||||
| Not Accounted for as | Statement of Operations | Gain (Loss) for | Statement of Operations | (Depreciation) | ||||
| Hedging Instruments | Locations | the Period | Locations | for the Period | ||||
| Net realized gain (loss) from: | Net change in unrealized | |||||||
| appreciation (depreciation) on: | ||||||||
| Interest rate contracts. | Investments | $ | (21,564 | )a | Investments | $ | 3,374 | a |
| Written options | 700 | Written options | (700 | ) | ||||
| Futures contracts | (17,455 | ) | Futures contracts | 11,950 | ||||
| Swap contracts | (21,635 | ) | Swap contracts | 15,644 | ||||
| Foreign exchange contracts | Investments | (6,158 | )a | Investments | 4,555 | a | ||
| Written options | 2,609 | Written options | (2,560 | ) | ||||
| Foreign currency transactions | (29,377 | )b | Translation of other assets | 53,706 | b | |||
| and liabilities denominated | ||||||||
| in foreign currencies | ||||||||
| Credit contracts | Investments | (23,543 | )a | Investments | 118 | a | ||
| Written options | 11,313 | Written options | (1,766 | ) | ||||
| Swap contracts | (19,041 | ) | Swap contracts | (3,234 | ) | |||
| Totals | $ | (124,151 | ) | $ | 81,087 |
aPurchased option contracts are included in net realized gain (loss) from investments and net change in unrealized appreciation (depreciation) on investments in the
Statement of Operations.
bForward exchange contracts are included in net realized gain (loss) from foreign currency transactions and net change in unrealized appreciation (depreciation) on
translation of other assets and liabilities denominated in foreign currencies in the Statement of Operations.
For the period ended October 31, 2016, the average month end fair value of derivatives represented 1.2% of average month end net
assets. The average month end number of open derivatives contracts for the period was 82.
franklintempleton.com
Semiannual Report 37
FRANKLIN STRATEGIC SERIES
NOTES TO FINANCIAL STATEMENTS (UNAUDITED)
Franklin Flexible Alpha Bond Fund (continued)
8. Other Derivative Information (continued)
At October 31, 2016, the Fund’s OTC derivative assets and liabilities are as follows:
| Gross Amounts of | ||||
| Assets and Liabilities Presented | ||||
| in the Statement of Assets and Liabilities | ||||
| Assetsa | Liabilitiesa | |||
| Derivatives | ||||
| Forward exchange contracts | $ | 21,996 | $ | 4,187 |
| Options purchased. | 21,044 | — | ||
| Options written | — | 1,830 | ||
| Swap contracts | 9,561 | 104,889 | ||
| Total | $ | 52,601 | $ | 110,906 |
aAbsent an event of default or early termination, OTC derivative assets and liabilities are presented gross and not offset in the Statement of Assets and Liabilities.
At October 31, 2016, the Fund’s OTC derivative assets, which may be offset against the Fund’s OTC derivative liabilities and collateral received from the counterparty, are as follows:
| Amounts Not Offset in the | |||||||||||
| Statement of Assets and Liabilities | |||||||||||
| Gross | |||||||||||
| Amounts of | Financial | Financial | |||||||||
| Assets Presented in | Instruments | Instruments | Cash | Net Amount | |||||||
| the Statement of | Available for | Collateral | Collateral | (Not less | |||||||
| Assets and Liabilities | Offset | Received | Received | than zero) | |||||||
| Counterparty | |||||||||||
| BZWS. | $ | 367 | $ | (367 | ) | $ | — | $ | — | $ | — |
| CITI | 13,224 | (13,224 | ) | — | — | — | |||||
| GSCO | 2,050 | (2,050 | ) | — | — | — | |||||
| JPHQ | 22,006 | (22,006 | ) | — | — | — | |||||
| RBS | 8,342 | (3,534 | ) | — | — | 4,808 | |||||
| UBSW | 6,612 | (653 | ) | — | — | 5,959 | |||||
| Total | $ | 52,601 | $ | (41,834 | ) | $ | — | $ | — | $ | 10,767 |
At October 31, 2016, the Fund’s OTC derivative liabilities, which may be offset against the Fund’s OTC derivative assets and collateral pledged to the counterparty, are as follows:
| Amounts Not Offset in the | |||||||||||
| Statement of Assets and Liabilities | |||||||||||
| Gross | |||||||||||
| Amounts of | Financial | Financial | |||||||||
| Liabilities Presented in | Instruments | Instruments | Cash | Net Amount | |||||||
| the Statement of | Available for | Collateral | Collateral | (Not less | |||||||
| Assets and Liabilities | Offset | Pledged | Pledged | than zero) | |||||||
| Counterparty | |||||||||||
| BZWS. | $ | 44,375 | $ | (367 | ) | $ | — | $ | — | $ | 44,008 |
| CITI | 22,368 | (13,224 | ) | — | — | 9,144 | |||||
| GSCO | 12,382 | (2,050 | ) | — | — | 10,332 | |||||
| JPHQ | 27,594 | (22,006 | ) | — | — | 5,588 | |||||
| RBS | 3,534 | (3,534 | ) | — | — | — | |||||
| UBSW | 653 | (653 | ) | — | — | — | |||||
| Total | $ | 110,906 | $ | (41,834 | ) | $ | — | $ | — | $ | 69,072 |
See Notes 1(d) and 6 regarding derivative financial instruments and investment transactions, respectively.
38 Semiannual Report
franklintempleton.com
FRANKLIN STRATEGIC SERIES
NOTES TO FINANCIAL STATEMENTS (UNAUDITED)
Franklin Flexible Alpha Bond Fund (continued)
See Abbreviations on page 40.
9. Credit Facility
The Fund, together with other U.S. registered and foreign investment funds (collectively, Borrowers), managed by Franklin Templeton Investments, are borrowers in a joint syndicated senior unsecured credit facility totaling $2 billion (Global Credit Facility) which matures on February 10, 2017. This Global Credit Facility provides a source of funds to the Borrowers for temporary and emergency purposes, including the ability to meet future unanticipated or unusually large redemption requests.
Under the terms of the Global Credit Facility, the Fund shall, in addition to interest charged on any borrowings made by the Fund and other costs incurred by the Fund, pay its share of fees and expenses incurred in connection with the implementation and maintenance of the Global Credit Facility, based upon its relative share of the aggregate net assets of all of the Borrowers, including an annual commitment fee of 0.15% based upon the unused portion of the Global Credit Facility. These fees are reflected in other expenses in the Statement of Operations. During the period ended October 31, 2016, the Fund did not use the Global Credit Facility.
10. Fair Value Measurements
The Fund follows a fair value hierarchy that distinguishes between market data obtained from independent sources (observable inputs) and the Fund’s own market assumptions (unobservable inputs). These inputs are used in determining the value of the Fund’s financial instruments and are summarized in the following fair value hierarchy:
- Level 1 – quoted prices in active markets for identical financial instruments
- Level 2 – other significant observable inputs (including quoted prices for similar financial instruments, interest rates, prepayment speed, credit risk, etc.)
- Level 3 – significant unobservable inputs (including the Fund’s own assumptions in determining the fair value of financial instruments)
The input levels are not necessarily an indication of the risk or liquidity associated with financial instruments at that level.
For movements between the levels within the fair value hierarchy, the Fund has adopted a policy of recognizing the transfers as of the date of the underlying event which caused the movement.
franklintempleton.com
Semiannual Report 39
FRANKLIN STRATEGIC SERIES
NOTES TO FINANCIAL STATEMENTS (UNAUDITED)
Franklin Flexible Alpha Bond Fund (continued)
10. Fair Value Measurements (continued)
A summary of inputs used as of October 31, 2016, in valuing the Fund’s assets and liabilities carried at fair value, is as follows:
| Level 1 | Level 2 | Level 3 | Total | |||||
| Assets: | ||||||||
| Investments in Securities: | ||||||||
| Management Investment Companies | $ | 164,578 | $ | — | $ | — | $ | 164,578 |
| Corporate Bonds | — | 4,039,267 | — | 4,039,267 | ||||
| Foreign Government and Agency Securities | — | 266,240 | — | 266,240 | ||||
| U.S. Government and Agency Securities | — | 587,585 | — | 587,585 | ||||
| Asset-Backed Securities and Commercial | ||||||||
| Mortgage-Backed Securities. | — | 2,925,459 | — | 2,925,459 | ||||
| Mortgage-Backed Securities | — | 250,380 | — | 250,380 | ||||
| Municipal Bonds | — | 529,999 | — | 529,999 | ||||
| Options Purchased | 88 | 21,044 | — | 21,132 | ||||
| Short Term Investments | 2,124,609 | — | — | 2,124,609 | ||||
| Total Investments in Securities | $ | 2,289,275 | $ | 8,619,974 | $ | — | $ | 10,909,249 |
| Other Financial Instruments: | ||||||||
| Futures Contracts | $ | 8,455 | $ | — | $ | — | $ | 8,455 |
| Forward Exchange Contracts | — | 21,996 | — | 21,996 | ||||
| Swap Contracts. | — | 12,358 | — | 12,358 | ||||
| Total Other Financial Instruments | $ | 8,455 | $ | 34,354 | $ | — | $ | 42,809 |
| Liabilities: | ||||||||
| Other Financial Instruments: | ||||||||
| Options Written | $ | — | $ | 1,830 | $ | — | $ | 1,830 |
| Futures Contracts | 15,394 | — | — | 15,394 | ||||
| Forward Exchange Contracts | — | 4,187 | — | 4,187 | ||||
| Swap Contracts. | — | 18,504 | — | 18,504 | ||||
| Total Other Financial Instruments | $ | 15,394 | $ | 24,521 | $ | — | $ | 39,915 |
11. Subsequent Events
The Fund has evaluated subsequent events through the issuance of the financial statements and determined that no events have occurred that require disclosure.
| Abbreviations | |||||
| Counterparty/Exchange | Currency | Selected Portfolio | |||
| BZWS | Barclays Bank PLC | EUR | Euro | BBA | British Bankers Association |
| CITI | Citigroup, Inc. | GBP | British Pound | CDO | Collateralized Debt Obligation |
| EUX | Eurex | IDR | Indonesian Rupiah | CLO | Collateralized Loan Obligation |
| GSCO | Goldman Sachs Group, Inc. | MXN | Mexican Peso | ETF | Exchange Traded Fund |
| ICE | Intercontinental Exchange | MYR | Malaysian Ringgit | FRN | Floating Rate Note |
| JPHQ | JP Morgan Chase & Co. | NZD | New Zealand Dollar | GO | General Obligation |
| LCH | LCH Clearnet LLC | USD | United States Dollar | LIBOR | London InterBank Offered Rate |
| RBS | Royal Bank of Scotland PLC | MFM | Multi-Family Mortgage | ||
| UBSW | UBS AG | SF | Single Family | ||
40 Semiannual Report
franklintempleton.com
FRANKLIN STRATEGIC SERIES
FRANKLIN FLEXIBLE ALPHA BOND FUND
Shareholder Information
Proxy Voting Policies and Procedures
The Fund’s investment manager has established Proxy Voting
Policies and Procedures (Policies) that the Fund uses to
determine how to vote proxies relating to portfolio securities.
Shareholders may view the Fund’s complete Policies online at
franklintempleton.com. Alternatively, shareholders may request
copies of the Policies free of charge by calling the Proxy Group
collect at (954) 527-7678 or by sending a written request
to: Franklin Templeton Companies, LLC, 300 S.E. 2nd Street,
Fort Lauderdale, FL 33301, Attention: Proxy Group. Copies of
the Fund’s proxy voting records are also made available online
at franklintempleton.com and posted on the U.S. Securities and
Exchange Commission’s website at sec.gov and reflect the
most recent 12-month period ended June 30.
Quarterly Statement of Investments
The Trust, on behalf of the Fund, files a complete statement of
investments with the U.S. Securities and Exchange
Commission for the first and third quarters for each fiscal year
on Form N-Q. Shareholders may view the filed Form N-Q by
visiting the Commission’s website at sec.gov. The filed form
may also be viewed and copied at the Commission’s Public
Reference Room in Washington, DC. Information regarding the
operations of the Public Reference Room may be obtained by
calling (800) SEC-0330.
franklintempleton.com
Semiannual Report 41
This page intentionally left blank.
This page intentionally left blank.
This page intentionally left blank.
| Contents | |
| Semiannual Report | |
| Franklin Strategic Income Fund | 3 |
| Performance Summary | 6 |
| Your Fund’s Expenses | 8 |
| Consolidated Financial Highlights and Consolidated | |
| Statement of Investments | 9 |
| Consolidated Financial Statements | 37 |
| Notes to Consolidated Financial Statements | 41 |
| Shareholder Information | 57 |
Visit franklintempleton.com for fund updates, to access your account, or to find helpful financial planning tools.
2 Semiannual Report
franklintempleton.com
Semiannual Report
Franklin Strategic Income Fund
We are pleased to bring you Franklin Strategic Income Fund’s semiannual report for the period ended October 31, 2016.
Your Fund’s Goal and Main Investments
The Fund seeks a high level of current income, with capital appreciation over the long term as a secondary objective. The Fund uses an active asset allocation process and under normal market conditions invests at least 65% of its assets in U.S. and foreign debt securities, including those in emerging markets. The Fund may invest in all varieties of fixed and floating rate income securities, including bonds, corporate loans (and loan participations), mortgage-backed securities and other asset-backed securities and convertible securities.
Performance Overview
The Fund’s Class A shares delivered a +4.70% cumulative total return for the six months under review. In comparison, the Bloomberg Barclays U.S. Aggregate Bond Index, which represents the U.S. investment-grade fixed rate taxable bond market, generated a +1.51% total return.1 The Lipper Multi-Sector Income Funds Classification Average, which consists of funds chosen by Lipper that seek current income by allocating assets among different fixed income securities sectors, with a significant portion rated below investment grade, produced a +3.83% total return.2 You can find more of the Fund’s performance data in the Performance Summary beginning on page 6.
Performance data represent past performance, which does not guarantee future results. Investment return and principal value will fluctuate, and you may have a gain or loss when you sell your shares. Current performance may differ from figures shown. For most recent month-end performance, go to franklintempleton.com or call (800) 342-5236.
Economic and Market Overview
The U.S. economy expanded during the six months under review. The economy grew at a faster pace in 2016’s third quarter than in 2016’s second and first quarters and 2015’s fourth quarter, mainly due to personal consumption expenditures, exports, private inventory investment, federal government spending and nonresidential fixed investment. Manufacturing conditions remained volatile but generally expanded, and the services sector continued to grow. The unemployment rate decreased slightly from 5.0% in April to 4.9% at period-end.3 Monthly retail sales were volatile but grew during most of the review period. Inflation, as measured by the Consumer Price Index, remained subdued for most of the period, and rose slightly toward period-end.
The U.S. Federal Reserve (Fed) kept its target interest rate at 0.25–0.50% at its September meeting. The Fed noted that although the case for raising rates has strengthened, it will wait for further evidence of continued progress toward its objectives.
The 10-year Treasury yield, which moves inversely to price, shifted throughout the period. It rose from 1.83% on April 29, 2016, to a period high of 1.88% on May 02, 2016. However, negative interest rates in Japan and Europe, and central banks’ purchases of government bonds pushed down the Treasury yield. The U.K.’s historic referendum to leave the European Union in June 2016 (also known as “Brexit”) also boosted safe haven buying by investors. The Treasury yield reached a period low of 1.37% in early July, and ended the period at 1.84%. The yield rose toward period-end, due to positive economic data and signals from the Fed on the possibility of an increase in interest rates in the near term.
Investment Strategy
We use an active asset allocation strategy to try to achieve the Fund’s investment goals. We use a top-down analysis of
1. Source: Morningstar.
2. Source: Lipper, a Thomson Reuters Company. For the six-month period ended October 31, 2016, this category consisted of 329 funds. Lipper calculations do not include
sales charges or expense subsidization by a fund’s manager. Fund performance relative to the average may have differed if these or other factors had been considered.
The indexes are unmanaged and include reinvestment of any income or distributions. They do not reflect any fees, expenses or sales charges. One cannot invest directly in an
index, and an index is not representative of the Fund’s portfolio.
3. Source: Bureau of Labor Statistics.
See www.franklintempletondatasources.com for additional data provider information.
The dollar value, number of shares or principal amount, and names of all portfolio holdings are listed in the Fund’s Consolidated Statement of
Investments (SOI). The Consolidated SOI begins on page 14.
franklintempleton.com
Semiannual Report 3
| FRANKLIN STRATEGIC INCOME FUND | ||||
| Portfolio Composition* | ||||
| Based on Total Net Assets | ||||
| 10/31/16 | 4/30/16 | |||
| High Yield Corporate Bonds & Preferred | ||||
| Securities | 26.1 | % | 28.6 | % |
| Floating-Rate Loans | 22.2 | % | 21.1 | % |
| International Government & Agency Bonds | 12.3 | % | 14.5 | % |
| Investment-Grade Corporate Bonds & Preferred | ||||
| Securities | 17.1 | % | 10.3 | % |
| Mortgage-Backed Securities | 13.5 | % | 8.5 | % |
| U.S. Treasury Securities | 5.3 | % | 4.2 | % |
| Commercial Mortgage-Backed Securities | 2.4 | % | 4.0 | % |
| Other | 0.6 | % | 1.4 | % |
| Municipal Bonds | 0.9 | % | 1.1 | % |
| Equities | 0.7 | % | 0.2 | % |
| Asset-Backed Securities | 0.4 | % | 0.1 | % |
| Convertible Securities | 0.0 | %** | 0.0 | %** |
| Short-Term Investments & Other Net Assets | -1.5 | % | 6.0 | % |
*Figures reflect certain derivatives held in the portfolio (or their underlying reference
assets) and may not total 100% or may be negative due to rounding, use of any
derivatives, unsettled trades or other factors. The composition may not match the
SOI.
**Rounds to less than 0.1% of total net assets.
macroeconomic trends combined with a bottom-up fundamental analysis of market sectors, industries and issuers to try to take advantage of varying sector reactions to economic events. We regularly enter into various currency-related transactions involving derivative instruments, including currency and cross currency forwards, currency swaps, currency and currency index futures contracts and currency options. We may also enter into interest-rate and credit-related transactions involving derivative instruments, including interest-rate, fixed income total return and credit default swaps and interest rate and/or bond futures contracts.
What is a currency forward contract?
A currency forward contract is an agreement between the Fund and a counterparty to buy or sell a foreign currency in exchange for another currency at a specific exchange rate on a future date.
What is a futures contract?
A futures contract is an agreement between the Fund and a counterparty made through a U.S. or foreign futures exchange to buy or sell an underlying instrument or asset at a specific priceonafuturedate.
What are swap agreements?
Swap agreements, such as interest-rate, currency and credit default swaps, are contracts between the Fund and another party (the swap counterparty). In a basic swap transaction, the Fund agrees with the swap counterparty to exchange the returns (or differentials in rates of return) earned or realized on a particular “notional amount” of underlying instruments. The notional amount is the set amount selected by the parties as the basis on which to calculate the obligations that they have agreed to exchange. The parties typically do not actually exchange the notional amount. Instead, they agree to exchange the returns that would be earned or realized if the notional amount were invested in given instruments or at given interest rates.
Whatisanoption?
An option is a contract to buy or sell a specific financial product known as the option’s underlying instrument at a specific price. The buyer of an option has the right, but not the obligation, to buy or sell the underlying instrument at or until a specified expiration date. Conversely, the seller (“writer”) of an option who opens a transaction is obligated to buy or sell the underlying instrument should the option holder exercise that right.
Manager’s Discussion
For global fixed income markets, the six months under review were generally characterized by low levels of volatility and an increase in risk appetite amid low and negative interest rates. Interest rates fluctuated with rates moving marginally higher on the short end of the U.S. Treasury yield curve and rising on the longer end.
What is duration?
Duration is a measure of a bond’s price sensitivity to interest rate changes. In general, a portfolio of securities with a lower duration can be expected to be less sensitive to interest rate changes than a portfolio with a higher duration.
What is the yield curve?
The yield curve is a line that plots the interest rates, at a set point in time, of bonds having equal credit quality but differing maturity dates. The most frequently reported yield curve compares three-month, two-year and 30-year U.S. Treasury debt.
In this environment, many global fixed income sectors outpaced U.S. Treasuries on a duration-matched basis. Corporate credit, particularly high yield bonds and bank loans, were among the strongest performers, as were hard- and local-currency emerging market debt securities.
4 Semiannual Report
franklintempleton.com
FRANKLIN STRATEGIC INCOME FUND
| Dividend Distributions* | |||||
| 5/1/16–10/31/16 | |||||
| Dividend per Share (cents) | |||||
| Advisor | |||||
| Month | Class A | Class C | Class R | Class R6 | Class |
| May | 2.45 | 2.13 | 2.25 | 2.77 | 2.65 |
| June | 2.55 | 2.24 | 2.36 | 2.86 | 2.74 |
| July | 2.26 | 1.95 | 2.06 | 2.59 | 2.46 |
| August | 1.28 | 0.96 | 1.09 | 1.60 | 1.48 |
| September | 1.12 | 0.80 | 0.92 | 1.44 | 1.32 |
| October | 0.91 | 0.61 | 0.72 | 1.22 | 1.10 |
| Total | 10.57 | 8.69 | 9.40 | 12.48 | 11.75 |
*The distribution amount is the sum of the dividend payments to shareholders for
the period shown and includes only estimated tax-basis net investment income. All
Fund distributions will vary depending upon current market conditions, and past
distributions are not indicative of future trends.
During the period, the Fund’s overweighted exposure to corporate credit provided a significant boost to performance and high yield corporate bonds were the primary contributor. The Fund’s shorter duration positioning on the U.S. and global yield curves benefited performance. The portfolio’s modest positions in agency mortgage-backed securities (MBS), commercial MBS (CMBS) and non-agency residential MBS also added to our results. Performance was also supported by our exposure to sovereign and non-U.S. dollar-denominated debt and municipal bonds. In contrast, our currency positions hurt performance. Our short Japanese yen exposure was a significant detractor, as the yen strengthened versus the U.S. dollar.
Corporate credit fundamentals remained generally supportive and technical conditions continued to be strong as the low interest-rate backdrop provided strong demand for corporate credit. We remained allocated across spread sectors, both corporate and securitized. Over the period, we increased our exposure to investment-grade corporate credit and the senior secured floating rate loan and Treasury inflation protected securities sectors.
We pared our allocation to high yield corporate bonds and also reduced exposure over the period to CMBS. We continued to find what we considered opportunities in global bond markets outside the U.S, and maintained exposure to international bonds and currencies.
Thank you for your continued participation in Franklin Strategic Income Fund. We look forward to serving your future investment needs.

The foregoing information reflects our analysis, opinions and portfolio holdings as of October 31, 2016, the end of the reporting period. The way we implement our main investment strategies and the resulting portfolio holdings may change depending on factors such as market and economic conditions. These opinions may not be relied upon as investment advice or an offer for a particular security. The information is not a complete analysis of every aspect of any market, country, industry, security or the Fund. Statements of fact are from sources considered reliable, but the investment manager makes no representation or warranty as to their completeness or accuracy. Although historical performance is no guarantee of future results, these insights may help you understand our investment management philosophy.
CFA® is a trademark owned by CFA Institute.
franklintempleton.com
Semiannual Report 5
FRANKLIN STRATEGIC INCOME FUND
Performance Summary as of October 31, 2016
The performance table does not reflect any taxes that a shareholder would pay on Fund dividends, capital gain distributions, if any, or any realized gains on the sale of Fund shares. Total return reflects reinvestment of the Fund’s dividends and capital gain distributions, if any, and any unrealized gains or losses.
Performance as of 10/31/161
Cumulative total return excludes sales charges. Average annual total returns include maximum sales charges. Sales charges will vary depending on the size of the investment and the class of share purchased. The maximum is 4.25% and the minimum is 0%. Class A: 4.25% maximum initial sales charge; Advisor Class: no sales charges. For other share classes, visit franklintempleton.com.
| Cumulative | Average Annual | Average Annual | ||||
| Share Class | Total Return2 | Total Return3 | Total Return (9/30/16)4 | |||
| A | ||||||
| 6-Month | +4.70 | % | +0.29 | % | ||
| 1-Year | +5.26 | % | +0.78 | % | +2.23 | % |
| 5-Year | +20.62 | % | +2.92 | % | +3.71 | % |
| 10-Year | +66.89 | % | +4.80 | % | +4.89 | % |
| Advisor | ||||||
| 6-Month | +4.82 | % | +4.82 | % | ||
| 1-Year | +5.52 | % | +5.52 | % | +6.98 | % |
| 5-Year | +22.24 | % | +4.10 | % | +4.87 | % |
| 10-Year | +71.21 | % | +5.52 | % | +5.61 | % |
| Distribution | 30-Day Standardized Yield6 | |||||
| Share Class | Rate5 | (with waiver) (without waiver) | ||||
| A | 2.79 | % | 3.84 | % | 3.78 | % |
| Advisor | 3.16 | % | 4.27 | % | 4.21 | % |
Performance data represent past performance, which does not guarantee future results. Investment return and principal value will fluctuate, and you may have a gain or loss when you sell your shares. Current performance may differ from figures shown. For most recent month-end performance, go to franklintempleton.com or call (800) 342-5236.
See page 7 for Performance Summary footnotes.
6 Semiannual Report
franklintempleton.com
| FRANKLIN STRATEGIC INCOME FUND | |||||
| PERFORMANCE SUMMARY | |||||
| Total Annual Operating Expenses7 | |||||
| Share Class | With Waiver | Without Waiver | |||
| A | 0.88 | % | 0.92 | % | |
| Advisor | 0.63 | % | 0.67 | % | |
Each class of shares is available to certain eligible investors and has different annual fees and expenses, as described in the prospectus.
All investments involve risks, including possible loss of principal. Bond prices generally move in the opposite direction of interest rates. Thus, as prices of bonds
in the Fund adjust to a rise in interest rates, the Fund’s share price may decline. Changes in the financial strength of a bond issuer or in a bond’s credit rating may
affect its value. High yields reflect the higher credit risks associated with certain lower rated securities held in the portfolio. Floating rate loans and high yield
corporate bonds are rated below investment grade and are subject to greater risk of default, which could result in loss of principal—a risk that may be heightened
in a slowing economy. The risks of foreign securities include currency fluctuations and political uncertainty. Investing in derivative securities and the use of
foreign currency techniques involve special risks as such may not achieve the anticipated benefits and/or may result in losses to the Fund. The Fund is actively
managed but there is no guarantee that the manager’s investment decisions will produce the desired results. The Fund’s prospectus also includes a description
of the main investment risks.
1. The Fund has a fee waiver associated with any investment it makes in a Franklin Templeton money fund and/or other Franklin Templeton fund, contractually guaranteed
through its current fiscal year-end. Fund investment results reflect the fee waiver; without this waiver, the results would have been lower.
2. Cumulative total return represents the change in value of an investment over the periods indicated.
3. Average annual total return represents the average annual change in value of an investment over the periods indicated. Return for less than one year, ifany,hasnotbeen
annualized.
4. In accordance with SEC rules, we provide standardized average annual total return information through the latest calendar quarter.
5. Distribution rate is based on the sum of the respective class’s dividend distributions over the past six months and the maximum offering price (NAV for Advisor Class) per
share on 10/31/16.
6. The Fund’s 30-day standardized yield is calculated over a trailing 30-day period using the yield to maturity on bonds and/or the dividends accrued on stocks. It may not equal
the Fund’s actual income distribution rate, which reflects the Fund’s past dividends paid to shareholders.
7. Figures are as stated in the Fund’s current prospectus and may differ from the expense ratios disclosed in the Your Fund’s Expenses and Financial Highlights sections in this
report. In periods of market volatility, assets may decline significantly, causing total annual Fund operating expenses to become higher than the figures shown.
franklintempleton.com
Semiannual Report 7
FRANKLIN STRATEGIC INCOME FUND
Your Fund’s Expenses
As a Fund shareholder, you can incur two types of costs: (1) transaction costs, including sales charges (loads) on Fund purchases and redemptions; and (2) ongoing Fund costs, including management fees, distribution and service (12b-1) fees, and other Fund expenses. All mutual funds have ongoing costs, sometimes referred to as operating expenses. The table below shows ongoing costs of investing in the Fund and can help you understand these costs and compare them with those of other mutual funds. The table assumes a $1,000 investment held for the six months indicated.
Actual Fund Expenses
The table below provides information about actual account values and actual expenses in the columns under the heading “Actual.” In these columns the Fund’s actual return, which includes the effect of Fund expenses, is used to calculate the “Ending Account Value” for each class of shares. You can estimate the expenses you paid during the period by following these steps (of course, your account value and expenses will differ from those in this illustration): Divide your account value by $1,000 (if your account had an $8,600 value, then $8,600 ÷ $1,000 = 8.6). Then multiply the result by the number in the row for your class of shares under the headings “Actual” and “Expenses Paid During Period” (if Actual Expenses Paid During Period were $7.50, then 8.6 x $7.50 = $64.50). In this illustration, the actual expenses paid this period are $64.50.
Hypothetical Example for Comparison with Other Funds
Under the heading “Hypothetical” in the table, information is provided about hypothetical account values and hypothetical expenses based on the Fund’s actual expense ratio and an assumed rate of return of 5% per year before expenses, which is not the Fund’s actual return. This information may not be used to estimate the actual ending account balance or expenses you paid for the period, but it can help you compare ongoing costs of investing in the Fund with those of other funds. To do so, compare this 5% hypothetical example for the class of shares you hold with the 5% hypothetical examples that appear in the shareholder reports of other funds.
Please note that expenses shown in the table are meant to highlight ongoing costs and do not reflect any transactional costs. Therefore, information under the heading “Hypothetical” is useful in comparing ongoing costs only, and will not help you compare total costs of owning different funds. In addition, if transactional costs were included, your total costs would have been higher.
| Actual | Hypothetical | |||||||||||
| (actual return after expenses) | (5% annual return before expenses) | |||||||||||
| Expenses | Expenses | Net | ||||||||||
| Beginning | Ending | Paid During | Ending | Paid During | Annualized | |||||||
| Share | Account | Account | Period | Account | Period | Expense | ||||||
| Class | Value 5/1/16 | Value 10/31/16 | 5/1/16–10/31/161,2 | Value 10/31/16 | 5/1/16–10/31/161,2 | Ratio2 | ||||||
| A | $ | 1,000 | $ | 1,047.00 | $ | 4.18 | $ | 1,021.12 | $ | 4.13 | 0.81 | % |
| C | $ | 1,000 | $ | 1,046.10 | $ | 6.19 | $ | 1,019.16 | $ | 6.11 | 1.20 | % |
| R | $ | 1,000 | $ | 1,047.00 | $ | 5.47 | $ | 1,019.86 | $ | 5.40 | 1.06 | % |
| R6 | $ | 1,000 | $ | 1,050.10 | $ | 2.12 | $ | 1,023.14 | $ | 2.09 | 0.41 | % |
| Advisor | $ | 1,000 | $ | 1,048.20 | $ | 2.89 | $ | 1,022.38 | $ | 2.85 | 0.56 | % |
1. Expenses are equal to the annualized expense ratio for the six-month period as indicated above–in the far right column–multiplied by the simple average account value
over the period indicated, and then multiplied by 184/365 to reflect the one-half year period.
2. Reflects expenses after fee waivers and expense reimbursements. Does not include acquired fund fees and expenses.
8 Semiannual Report
franklintempleton.com
FRANKLIN STRATEGIC SERIES
| Consolidated Financial Highlights | ||||||||||||||||||
| Franklin Strategic Income Fund | ||||||||||||||||||
| Six Months Ended | ||||||||||||||||||
| October 31, 2016 | Year Ended April 30, | |||||||||||||||||
| (unaudited) | 2016 | 2015 | 2014 | 2013 | 2012 | |||||||||||||
| Class A | ||||||||||||||||||
| Per share operating performance | ||||||||||||||||||
| (for a share outstanding throughout the period) | ||||||||||||||||||
| Net asset value, beginning of period | $ | 9.32 | $ | 10.04 | $ | 10.57 | $ | 10.86 | $ | 10.48 | $ | 10.68 | ||||||
| Income from investment operationsa: | ||||||||||||||||||
| Net investment incomeb | 0.20 | 0.42 | 0.42 | 0.44 | 0.45 | 0.50 | ||||||||||||
| Net realized and unrealized gains (losses) | 0.24 | (0.74 | ) | (0.30 | ) | (0.18 | ) | 0.54 | (0.10 | ) | ||||||||
| Total from investment operations | 0.44 | (0.32 | ) | 0.12 | 0.26 | 0.99 | 0.40 | |||||||||||
| Less distributions from: | ||||||||||||||||||
| Net investment income and net foreign | ||||||||||||||||||
| currency gains. | (0.11 | ) | (0.40 | ) | (0.55 | ) | (0.45 | ) | (0.57 | ) | (0.60 | ) | ||||||
| Net realized gains | — | — | (0.10 | ) | (0.10 | ) | (0.04 | ) | — | |||||||||
| Total distributions | (0.11 | ) | (0.40 | ) | (0.65 | ) | (0.55 | ) | (0.61 | ) | (0.60 | ) | ||||||
| Net asset value, end of period | $ | 9.65 | $ | 9.32 | $ | 10.04 | $ | 10.57 | $ | 10.86 | $ | 10.48 | ||||||
| Total returnc | 4.70 | % | (3.14 | )% | 1.16 | % | 2.52 | % | 9.70 | % | 3.97 | % | ||||||
| Ratios to average net assetsd | ||||||||||||||||||
| Expenses before waiver and payments by | ||||||||||||||||||
| affiliates | 0.89 | % | 0.88 | % | 0.86 | % | 0.86 | % | 0.87 | % | 0.89 | % | ||||||
| Expenses net of waiver and payments by | ||||||||||||||||||
| affiliatese | 0.81 | % | 0.84 | % | 0.85 | % | 0.86 | %f | 0.87 | % | 0.89 | % | ||||||
| Net investment income | 4.12 | % | 4.44 | % | 4.03 | % | 4.16 | % | 4.21 | % | 4.81 | % | ||||||
| Supplemental data | ||||||||||||||||||
| Net assets, end of period (000’s) | $ | 4,264,538 | $ | 4,500,752 | $ | 5,242,844 | $ | 5,182,490 | $ | 4,966,834 | $ | 3,757,100 | ||||||
| Portfolio turnover rate | 86.52 | % | 88.04 | % | 72.51 | % | 54.11 | % | 47.27 | % | 36.11 | % | ||||||
| Portfolio turnover rate excluding mortgage | ||||||||||||||||||
| dollar rollsg | 62.45 | % | 48.33 | % | 49.36 | % | 54.11 | % | 44.33 | % | 36.11 | % | ||||||
aThe amount shown for a share outstanding throughout the period may not correlate with the Statement of Operations for the period due to the timing of sales and
repurchases of the Fund’s shares in relation to income earned and/or fluctuating fair value of the investments of the Fund.
bBased on average daily shares outstanding.
cTotal return does not reflect sales commissions or contingent deferred sales charges, if applicable and is not annualized for periods less than one year.
dRatios are annualized for periods less than one year.
eBenefit of expense reduction rounds to less than 0.01%.
fBenefit of waiver and payments by affiliates rounds to less than 0.01%.
gSee Note 1(h) regarding mortgage dollar rolls.
franklintempleton.com The accompanying notes are an integral part of these financial statements. | Semiannual Report 9
| FRANKLIN STRATEGIC SERIES | ||||||||||||||||||
| CONSOLIDATED FINANCIAL HIGHLIGHTS | ||||||||||||||||||
| Franklin Strategic Income Fund (continued) | ||||||||||||||||||
| Six Months Ended | ||||||||||||||||||
| October 31, 2016 | Year Ended April 30, | |||||||||||||||||
| (unaudited) | 2016 | 2015 | 2014 | 2013 | 2012 | |||||||||||||
| Class C | ||||||||||||||||||
| Per share operating performance | ||||||||||||||||||
| (for a share outstanding throughout the period) | ||||||||||||||||||
| Net asset value, beginning of period | $ | 9.31 | $ | 10.04 | $ | 10.57 | $ | 10.85 | $ | 10.48 | $ | 10.68 | ||||||
| Income from investment operationsa: | ||||||||||||||||||
| Net investment incomeb | 0.18 | 0.38 | 0.38 | 0.40 | 0.41 | 0.46 | ||||||||||||
| Net realized and unrealized gains (losses) | 0.25 | (0.75 | ) | (0.30 | ) | (0.17 | ) | 0.53 | (0.10 | ) | ||||||||
| Total from investment operations | 0.43 | (0.37 | ) | 0.08 | 0.23 | 0.94 | 0.36 | |||||||||||
| Less distributions from: | ||||||||||||||||||
| Net investment income and net foreign | ||||||||||||||||||
| currency gains. | (0.09 | ) | (0.36 | ) | (0.51 | ) | (0.41 | ) | (0.53 | ) | (0.56 | ) | ||||||
| Net realized gains | — | — | (0.10 | ) | (0.10 | ) | (0.04 | ) | — | |||||||||
| Total distributions | (0.09 | ) | (0.36 | ) | (0.61 | ) | (0.51 | ) | (0.57 | ) | (0.56 | ) | ||||||
| Net asset value, end of period | $ | 9.65 | $ | 9.31 | $ | 10.04 | $ | 10.57 | $ | 10.85 | $ | 10.48 | ||||||
| Total returnc | 4.61 | % | (3.64 | )% | 0.76 | % | 2.20 | % | 9.17 | % | 3.56 | % | ||||||
| Ratios to average net assetsd | ||||||||||||||||||
| Expenses before waiver and payments by | ||||||||||||||||||
| affiliates | 1.28 | % | 1.28 | % | 1.26 | % | 1.26 | % | 1.27 | % | 1.29 | % | ||||||
| Expenses net of waiver and payments by | ||||||||||||||||||
| affiliatese | 1.20 | % | 1.24 | % | 1.25 | % | 1.26 | %f | 1.27 | % | 1.29 | % | ||||||
| Net investment income | 3.73 | % | 4.04 | % | 3.63 | % | 3.76 | % | 3.81 | % | 4.41 | % | ||||||
| Supplemental data | ||||||||||||||||||
| Net assets, end of period (000’s) | $ | 1,548,807 | $ | 1,645,852 | $ | 2,070,739 | $ | 2,109,049 | $ | 2,108,962 | $ | 1,569,746 | ||||||
| Portfolio turnover rate | 86.52 | % | 88.04 | % | 72.51 | % | 54.11 | % | 47.27 | % | 36.11 | % | ||||||
| Portfolio turnover rate excluding mortgage | ||||||||||||||||||
| dollar rollsg | 62.45 | % | 48.33 | % | 49.36 | % | 54.11 | % | 44.33 | % | 36.11 | % | ||||||
aThe amount shown for a share outstanding throughout the period may not correlate with the Statement of Operations for the period due to the timing of sales and
repurchases of the Fund’s shares in relation to income earned and/or fluctuating fair value of the investments of the Fund.
bBased on average daily shares outstanding.
cTotal return does not reflect sales commissions or contingent deferred sales charges, if applicable and is not annualized for periods less than one year.
dRatios are annualized for periods less than one year.
eBenefit of expense reduction rounds to less than 0.01%.
fBenefit of waiver and payments by affiliates rounds to less than 0.01%.
gSee Note 1(h) regarding mortgage dollar rolls.
10 Semiannual Report | The accompanying notes are an integral part of these financial statements. franklintempleton.com
| FRANKLIN STRATEGIC SERIES | ||||||||||||||||||
| CONSOLIDATED FINANCIAL HIGHLIGHTS | ||||||||||||||||||
| Franklin Strategic Income Fund (continued) | ||||||||||||||||||
| Six Months Ended | ||||||||||||||||||
| October 31, 2016 | Year Ended April 30, | |||||||||||||||||
| (unaudited) | 2016 | 2015 | 2014 | 2013 | 2012 | |||||||||||||
| Class R | ||||||||||||||||||
| Per share operating performance | ||||||||||||||||||
| (for a share outstanding throughout the period) | ||||||||||||||||||
| Net asset value, beginning of period | $ | 9.28 | $ | 10.01 | $ | 10.54 | $ | 10.82 | $ | 10.45 | $ | 10.65 | ||||||
| Income from investment operationsa: | ||||||||||||||||||
| Net investment incomeb | 0.19 | 0.39 | 0.39 | 0.41 | 0.42 | 0.47 | ||||||||||||
| Net realized and unrealized gains (losses) | 0.24 | (0.74 | ) | (0.29 | ) | (0.17 | ) | 0.53 | (0.10 | ) | ||||||||
| Total from investment operations | 0.43 | (0.35 | ) | 0.10 | 0.24 | 0.95 | 0.37 | |||||||||||
| Less distributions from: | ||||||||||||||||||
| Net investment income and net foreign | ||||||||||||||||||
| currency gains. | (0.09 | ) | (0.38 | ) | (0.53 | ) | (0.42 | ) | (0.54 | ) | (0.57 | ) | ||||||
| Net realized gains | — | — | (0.10 | ) | (0.10 | ) | (0.04 | ) | — | |||||||||
| Total distributions | (0.09 | ) | (0.38 | ) | (0.63 | ) | (0.52 | ) | (0.58 | ) | (0.57 | ) | ||||||
| Net asset value, end of period | $ | 9.62 | $ | 9.28 | $ | 10.01 | $ | 10.54 | $ | 10.82 | $ | 10.45 | ||||||
| Total returnc | 4.70 | % | (3.50 | )% | 0.91 | % | 2.36 | % | 9.36 | % | 3.72 | % | ||||||
| Ratios to average net assetsd | ||||||||||||||||||
| Expenses before waiver and payments by | ||||||||||||||||||
| affiliates | 1.14 | % | 1.13 | % | 1.11 | % | 1.11 | % | 1.12 | % | 1.14 | % | ||||||
| Expenses net of waiver and payments by | ||||||||||||||||||
| affiliatese | 1.06 | % | 1.09 | % | 1.10 | % | 1.11 | %f | 1.12 | % | 1.14 | % | ||||||
| Net investment income | 3.87 | % | 4.19 | % | 3.78 | % | 3.91 | % | 3.96 | % | 4.56 | % | ||||||
| Supplemental data | ||||||||||||||||||
| Net assets, end of period (000’s) | $ | 168,960 | $ | 181,671 | $ | 223,758 | $ | 227,359 | $ | 260,647 | $ | 249,662 | ||||||
| Portfolio turnover rate | 86.52 | % | 88.04 | % | 72.51 | % | 54.11 | % | 47.27 | % | 36.11 | % | ||||||
| Portfolio turnover rate excluding mortgage | ||||||||||||||||||
| dollar rollsg | 62.45 | % | 48.33 | % | 49.36 | % | 54.11 | % | 44.33 | % | 36.11 | % | ||||||
aThe amount shown for a share outstanding throughout the period may not correlate with the Statement of Operations for the period due to the timing of sales and
repurchases of the Fund’s shares in relation to income earned and/or fluctuating fair value of the investments of the Fund.
bBased on average daily shares outstanding.
cTotal return is not annualized for periods less than one year.
dRatios are annualized for periods less than one year.
eBenefit of expense reduction rounds to less than 0.01%.
fBenefit of waiver and payments by affiliates rounds to less than 0.01%.
gSee Note 1(h) regarding mortgage dollar rolls.
franklintempleton.com The accompanying notes are an integral part of these financial statements. | Semiannual Report 11
| FRANKLIN STRATEGIC SERIES | ||||||||||||
| CONSOLIDATED FINANCIAL HIGHLIGHTS | ||||||||||||
| Franklin Strategic Income Fund (continued) | ||||||||||||
| Six Months Ended | ||||||||||||
| October 31, 2016 | Year Ended April 30, | |||||||||||
| (unaudited) | 2016 | 2015 | 2014 | a | ||||||||
| Class R6 | ||||||||||||
| Per share operating performance | ||||||||||||
| (for a share outstanding throughout the period) | ||||||||||||
| Net asset value, beginning of period | $ | 9.33 | $ | 10.05 | $ | 10.58 | $ | 10.87 | ||||
| Income from investment operationsb: | ||||||||||||
| Net investment incomec | 0.22 | 0.46 | 0.46 | 0.49 | ||||||||
| Net realized and unrealized gains (losses) | 0.24 | (0.74 | ) | (0.30 | ) | (0.19 | ) | |||||
| Total from investment operations | 0.46 | (0.28 | ) | 0.16 | 0.30 | |||||||
| Less distributions from: | ||||||||||||
| Net investment income and net foreign currency gains | (0.12 | ) | (0.44 | ) | (0.59 | ) | (0.49 | ) | ||||
| Net realized gains | — | — | (0.10 | ) | (0.10 | ) | ||||||
| Total distributions | (0.12 | ) | (0.44 | ) | (0.69 | ) | (0.59 | ) | ||||
| Net asset value, end of period | $ | 9.67 | $ | 9.33 | $ | 10.05 | $ | 10.58 | ||||
| Total returnd | 5.01 | % | (2.76 | )% | 1.54 | % | 2.90 | % | ||||
| Ratios to average net assetse | ||||||||||||
| Expenses before waiver and payments by affiliates | 0.49 | % | 0.49 | % | 0.48 | % | 0.48 | % | ||||
| Expenses net of waiver and payments by affiliatesf | 0.41 | % | 0.45 | % | 0.47 | % | 0.48 | %g | ||||
| Net investment income | 4.52 | % | 4.83 | % | 4.41 | % | 4.54 | % | ||||
| Supplemental data | ||||||||||||
| Net assets, end of period (000’s) | $ | 515,589 | $ | 286,503 | $ | 253,929 | $ | 247,007 | ||||
| Portfolio turnover rate. | 86.52 | % | 88.04 | % | 72.51 | % | 54.11 | % | ||||
| Portfolio turnover rate excluding mortgage dollar rollsh | 62.45 | % | 48.33 | % | 49.36 | % | 54.11 | % | ||||
aFor the year May 1, 2013 (effective date) to April 30, 2014.
bThe amount shown for a share outstanding throughout the period may not correlate with the Statement of Operations for the period due to the timing of sales and
repurchases of the Fund’s shares in relation to income earned and/or fluctuating fair value of the investments of the Fund.
cBased on average daily shares outstanding.
dTotal return is not annualized for periods less than one year.
eRatios are annualized for periods less than one year.
fBenefit of expense reduction rounds to less than 0.01%.
gBenefit of waiver and payments by affiliates rounds to less than 0.01%.
hSee Note 1(h) regarding mortgage dollar rolls.
12 Semiannual Report | The accompanying notes are an integral part of these financial statements. franklintempleton.com
| FRANKLIN STRATEGIC SERIES | ||||||||||||||||||
| CONSOLIDATED FINANCIAL HIGHLIGHTS | ||||||||||||||||||
| Franklin Strategic Income Fund (continued) | ||||||||||||||||||
| Six Months Ended | ||||||||||||||||||
| October 31, 2016 | Year Ended April 30, | |||||||||||||||||
| (unaudited) | 2016 | 2015 | 2014 | 2013 | 2012 | |||||||||||||
| Advisor Class | ||||||||||||||||||
| Per share operating performance | ||||||||||||||||||
| (for a share outstanding throughout the period) | ||||||||||||||||||
| Net asset value, beginning of period | $ | 9.33 | $ | 10.05 | $ | 10.58 | $ | 10.86 | $ | 10.49 | $ | 10.69 | ||||||
| Income from investment operationsa: | ||||||||||||||||||
| Net investment incomeb | 0.21 | 0.44 | 0.44 | 0.47 | 0.48 | 0.53 | ||||||||||||
| Net realized and unrealized gains (losses) | 0.24 | (0.74 | ) | (0.29 | ) | (0.17 | ) | 0.53 | (0.10 | ) | ||||||||
| Total from investment operations | 0.45 | (0.30 | ) | 0.15 | 0.30 | 1.01 | 0.43 | |||||||||||
| Less distributions from: | ||||||||||||||||||
| Net investment income and net foreign | ||||||||||||||||||
| currency gains. | (0.12 | ) | (0.42 | ) | (0.58 | ) | (0.48 | ) | (0.60 | ) | (0.63 | ) | ||||||
| Net realized gains | — | — | (0.10 | ) | (0.10 | ) | (0.04 | ) | — | |||||||||
| Total distributions | (0.12 | ) | (0.42 | ) | (0.68 | ) | (0.58 | ) | (0.64 | ) | (0.63 | ) | ||||||
| Net asset value, end of period | $ | 9.66 | $ | 9.33 | $ | 10.05 | $ | 10.58 | $ | 10.86 | $ | 10.49 | ||||||
| Total returnc | 4.82 | % | (2.89 | )% | 1.41 | % | 2.87 | % | 9.87 | % | 4.22 | % | ||||||
| Ratios to average net assetsd | ||||||||||||||||||
| Expenses before waiver and payments by | ||||||||||||||||||
| affiliates | 0.64 | % | 0.63 | % | 0.61 | % | 0.61 | % | 0.62 | % | 0.64 | % | ||||||
| Expenses net of waiver and payments by | ||||||||||||||||||
| affiliatese | 0.56 | % | 0.59 | % | 0.60 | % | 0.61 | %f | 0.62 | % | 0.64 | % | ||||||
| Net investment income | 4.37 | % | 4.69 | % | 4.28 | % | 4.41 | % | 4.46 | % | 5.06 | % | ||||||
| Supplemental data | ||||||||||||||||||
| Net assets, end of period (000’s) | $ | 977,538 | $ | 904,899 | $ | 1,130,796 | $ | 1,010,755 | $ | 956,001 | $ | 713,659 | ||||||
| Portfolio turnover rate | 86.52 | % | 88.04 | % | 72.51 | % | 54.11 | % | 47.27 | % | 36.11 | % | ||||||
| Portfolio turnover rate excluding mortgage | ||||||||||||||||||
| dollar rollsg | 62.45 | % | 48.33 | % | 49.36 | % | 54.11 | % | 44.33 | % | 36.11 | % | ||||||
aThe amount shown for a share outstanding throughout the period may not correlate with the Statement of Operations for the period due to the timing of sales and
repurchases of the Fund’s shares in relation to income earned and/or fluctuating fair value of the investments of the Fund.
bBased on average daily shares outstanding.
cTotal return is not annualized for periods less than one year.
dRatios are annualized for periods less than one year.
eBenefit of expense reduction rounds to less than 0.01%.
fBenefit of waiver and payments by affiliates rounds to less than 0.01%.
gSee Note 1(h) regarding mortgage dollar rolls.
franklintempleton.com The accompanying notes are an integral part of these financial statements. | Semiannual Report 13
FRANKLIN STRATEGIC SERIES
| Consolidated Statement of Investments, October 31, 2016 (unaudited) | ||||
| Franklin Strategic Income Fund | ||||
| Shares/ | ||||
| Country | Warrants | Value | ||
| Common Stocks and Other Equity Interests 0.7% | ||||
| Consumer Services 0.3% | ||||
| a,b,c Turtle Bay Resort | United States | 5,579,939 | $ | 19,356,810 |
| Energy 0.3% | ||||
| a,d Halcon Resources Corp | United States | 955,276 | 7,652,069 | |
| a Halcon Resources Corp., wts., 9/09/20 | United States | 75,770 | 191,698 | |
| a Midstates Petroleum Co. Inc | United States | 6,826 | 128,124 | |
| a Midstates Petroleum Co. Inc., wts., 4/21/20 | United States | 48,362 | — | |
| a Penn Virginia Corp | United States | 82,902 | 3,398,982 | |
| a,e Penn Virginia Corp., 144A | United States | 103,574 | 4,246,534 | |
| a W&T Offshore Inc | United States | 1,872,200 | 2,714,690 | |
| a,d Warrior Met Coal LLC, A | United States | 15,189 | 3,417,525 | |
| 21,749,622 | ||||
| Materials 0.0%† | ||||
| a Verso Corp., A | United States | 38,905 | 238,877 | |
| a Verso Corp., wts., 7/25/23 | United States | 4,095 | — | |
| 238,877 | ||||
| Transportation 0.0%† | ||||
| a,f CEVA Holdings LLC | United States | 1,570 | 313,994 | |
| Utilities 0.1% | ||||
| a Vistra Energy Corp | United States | 513,780 | 7,809,449 | |
| Total Common Stocks and Other Equity Interests | ||||
| (Cost $128,074,570) | 49,468,752 | |||
| Management Investment Companies 9.0% | ||||
| Diversified Financials 9.0% | ||||
| g Franklin Lower Tier Floating Rate Fund | United States | 37,387,579 | 388,456,948 | |
| g Franklin Middle Tier Floating Rate Fund | United States | 28,458,483 | 286,292,336 | |
| Total Management Investment Companies | ||||
| (Cost $657,471,286) | 674,749,284 | |||
| Convertible Preferred Stocks 0.0%† | ||||
| Transportation 0.0%† | ||||
| a,f CEVA Holdings LLC, cvt. pfd., A-1 | United States | 62 | 17,050 | |
| a,f CEVA Holdings LLC, cvt. pfd., A-2 | United States | 3,399 | 679,712 | |
| Total Convertible Preferred Stocks | ||||
| (Cost $5,149,789) | 696,762 | |||
| Principal | ||||
| Amount* | ||||
| Corporate Bonds 43.6% | ||||
| Automobiles & Components 1.0% | ||||
| Fiat Chrysler Automobiles NV, senior note, 5.25%, 4/15/23 | United Kingdom | 35,000,000 | 35,853,125 | |
| Ford Motor Credit Co. LLC, senior note, 3.096%, 5/04/23 | United States | 25,400,000 | 25,450,419 | |
| The Goodyear Tire & Rubber Co., | ||||
| senior bond, 5.00%, 5/31/26 | United States | 9,400,000 | 9,470,500 | |
| senior note, 5.125%, 11/15/23 | United States | 5,400,000 | 5,602,500 | |
| 76,376,544 | ||||
14 Semiannual Report
franklintempleton.com
FRANKLIN STRATEGIC SERIES
CONSOLIDATED STATEMENT OF INVESTMENTS (UNAUDITED)
| Franklin Strategic Income Fund (continued) | |||||
| Principal | |||||
| Country | Amount* | Value | |||
| Corporate Bonds (continued) | |||||
| Banks 4.8% | |||||
| Bank of America Corp., | |||||
| senior note, 6.40%, 8/28/17 | United States | 10,000,000 | $ | 10,403,790 | |
| senior note, 7.75%, 4/30/18 | United States | 3,700,000 | GBP | 4,962,587 | |
| senior note, 5.65%, 5/01/18 | United States | 5,000,000 | 5,290,605 | ||
| senior note, 3.50%, 4/19/26 | United States | 54,000,000 | 55,501,794 | ||
| Capital One Financial Corp., senior note, 3.20%, 2/05/25 | United States | 16,500,000 | 16,740,339 | ||
| CIT Group Inc., | |||||
| senior note, 5.375%, 5/15/20 | United States | 6,900,000 | 7,391,625 | ||
| senior note, 5.00%, 8/15/22 | United States | 18,000,000 | 19,310,040 | ||
| Citigroup Inc., | |||||
| senior note, 3.875%, 10/25/23 | United States | 20,000,000 | 21,309,600 | ||
| senior note, 3.30%, 4/27/25 | United States | 2,500,000 | 2,547,925 | ||
| senior note, 3.40%, 5/01/26 | United States | 31,300,000 | 31,901,555 | ||
| sub. bond, 5.50%, 9/13/25 | United States | 10,000,000 | 11,287,490 | ||
| sub. note, 4.05%, 7/30/22. | United States | 5,000,000 | 5,292,225 | ||
| JPMorgan Chase & Co., | |||||
| h junior sub. bond, R, 6.00% to 8/01/23, FRN thereafter, Perpetual . | United States | 10,000,000 | 10,425,000 | ||
| h junior sub. bond, X, 6.10% to 10/01/24, FRN thereafter, Perpetual. | United States | 5,000,000 | 5,260,750 | ||
| senior bond, 3.30%, 4/01/26 | United States | 10,000,000 | 10,204,690 | ||
| senior bond, 3.20%, 6/15/26 | United States | 15,000,000 | 15,179,610 | ||
| senior note, 4.25%, 10/15/20 | United States | 10,000,000 | 10,804,720 | ||
| senior note, 3.25%, 9/23/22 | United States | 5,000,000 | 5,203,590 | ||
| sub. note, 3.375%, 5/01/23 | United States | 10,000,000 | 10,275,330 | ||
| sub. note, 3.875%, 9/10/24 | United States | 10,000,000 | 10,465,170 | ||
| Royal Bank of Scotland Group PLC, | |||||
| sub. note, 6.125%, 12/15/22 | United Kingdom | 10,000,000 | 10,576,850 | ||
| sub. note, 5.125%, 5/28/24 | United Kingdom | 2,600,000 | 2,578,108 | ||
| Wells Fargo & Co., | |||||
| h junior sub. bond, S, 5.90% to 6/15/24, FRN thereafter, Perpetual | United States | 21,000,000 | 21,997,500 | ||
| senior note, 2.60%, 7/22/20 | United States | 10,000,000 | 10,197,300 | ||
| senior note, 3.00%, 4/22/26 | United States | 44,000,000 | 43,833,592 | ||
| 358,941,785 | |||||
| Capital Goods 0.7% | |||||
| e Cortes NP Acquisition Corp., senior note, 144A, 9.25%, 10/15/24 | United States | 16,900,000 | 17,787,250 | ||
| f,i Erickson Air-Crane Inc., Purchase Price Notes, 6.00%, 11/02/20 | United States | 790,098 | 82,649 | ||
| Meritor Inc., senior note, 6.75%, 6/15/21 | United States | 4,000,000 | 4,090,000 | ||
| Navistar International Corp., senior bond, 8.25%, 11/01/21 | United States | 11,400,000 | 11,214,750 | ||
| TransDigm Inc., | |||||
| senior sub. bond, 6.50%, 7/15/24 | United States | 4,000,000 | 4,230,000 | ||
| senior sub. bond, 6.50%, 5/15/25 | United States | 2,500,000 | 2,621,875 | ||
| e senior sub. bond, 144A, 6.375%, 6/15/26 | United States | 10,000,000 | 10,293,800 | ||
| senior sub. note, 6.00%, 7/15/22 | United States | 4,000,000 | 4,195,000 | ||
| 54,515,324 | |||||
| Commercial & Professional Services 0.3% | |||||
| United Rentals North America Inc., senior bond, 5.875%, 9/15/26 | United States | 20,500,000 | 20,983,800 | ||
| Consumer Durables & Apparel 0.7% | |||||
| e Hanesbrands Inc., senior bond, 144A, 4.875%, 5/15/26 | United States | 15,100,000 | 15,439,750 | ||
| KB Home, | |||||
| senior bond, 7.50%, 9/15/22 | United States | 5,000,000 | 5,437,500 | ||
| senior note, 7.00%, 12/15/21 | United States | 10,000,000 | 10,812,500 | ||
franklintempleton.com
Semiannual Report 15
FRANKLIN STRATEGIC SERIES
CONSOLIDATED STATEMENT OF INVESTMENTS (UNAUDITED)
| Franklin Strategic Income Fund (continued) | |||||
| Principal | |||||
| Country | Amount* | Value | |||
| Corporate Bonds (continued) | |||||
| Consumer Durables & Apparel (continued) | |||||
| PulteGroup Inc., senior bond, 5.00%, 1/15/27 | United States | 24,600,000 | $ | 24,507,750 | |
| 56,197,500 | |||||
| Consumer Services 1.9% | |||||
| e 1011778 BC ULC/New Red Finance Inc., secured note, second lien, | |||||
| 144A, 6.00%, 4/01/22 | Canada | 20,000,000 | 20,970,000 | ||
| GLP Capital LP/GLP Financing II Inc., senior note, 5.375%, 4/15/26 | United States | 6,100,000 | 6,481,250 | ||
| e International Game Technology PLC, | |||||
| senior secured bond, 144A, 6.50%, 2/15/25 | United States | 13,200,000 | 14,388,000 | ||
| senior secured note, 144A, 6.25%, 2/15/22 | United States | 20,500,000 | 21,832,500 | ||
| e KFC Holding Co./Pizza Hut Holdings LLC/Taco Bell of America LLC, | |||||
| senior note, 144A, 5.00%, 6/01/24. | United States | 8,900,000 | 9,167,000 | ||
| senior note, 144A, 5.25%, 6/01/26. | United States | 9,100,000 | 9,509,500 | ||
| Marriott International Inc., senior bond, 3.75%, 10/01/25 | United States | 30,000,000 | 31,537,950 | ||
| e Wynn Las Vegas LLC/Wynn Las Vegas Capital Corp., senior bond, | |||||
| 144A, 5.50%, 3/01/25 | United States | 13,700,000 | 13,768,500 | ||
| e Wynn Macau Ltd., senior note, 144A, 5.25%, 10/15/21 | Macau | 12,700,000 | 12,763,500 | ||
| 140,418,200 | |||||
| Diversified Financials 2.4% | |||||
| AerCap Ireland Capital Ltd./AerCap Global Aviation Trust, | |||||
| senior note, 4.625%, 10/30/20 | Netherlands | 5,800,000 | 6,112,910 | ||
| senior note, 5.00%, 10/01/21 | Netherlands | 10,600,000 | 11,342,318 | ||
| senior note, 4.625%, 7/01/22 | Netherlands | 9,100,000 | 9,574,337 | ||
| The Goldman Sachs Group Inc., | |||||
| senior note, 3.50%, 1/23/25 | United States | 33,800,000 | 34,737,071 | ||
| senior note, 3.75%, 2/25/26 | United States | 15,000,000 | 15,654,210 | ||
| e Lincoln Finance Ltd., senior secured note, 144A, 6.875%, 4/15/21 | Netherlands | 8,400,000 | EUR | 10,051,467 | |
| Morgan Stanley, | |||||
| senior note, 3.875%, 1/27/26 | United States | 43,100,000 | 45,520,884 | ||
| sub. bond, 3.95%, 4/23/27 | United States | 10,000,000 | 10,291,090 | ||
| Navient Corp., | |||||
| senior note, 5.875%, 3/25/21 | United States | 5,000,000 | 5,025,000 | ||
| senior note, 6.625%, 7/26/21 | United States | 8,000,000 | 8,080,000 | ||
| senior note, 6.125%, 3/25/24 | United States | 10,000,000 | 9,200,000 | ||
| e Transurban Finance Co. Pty. Ltd., 144A, 3.375%, 3/22/27 | Australia | 11,400,000 | 11,308,344 | ||
| 176,897,631 | |||||
| Energy 4.5% | |||||
| Access Midstream Partner LP/ACMP Finance Corp., senior note, | |||||
| 6.125%, 7/15/22 | United States | 7,300,000 | 7,515,299 | ||
| i BreitBurn Energy Partners LP/BreitBurn Finance Corp., senior bond, | |||||
| 7.875%, 4/15/22 | United States | 25,000,000 | 16,875,000 | ||
| e California Resources Corp., secured note, second lien, 144A, 8.00%, | |||||
| 12/15/22 | United States | 7,852,000 | 5,358,990 | ||
| e Calumet Specialty Products Partners LP/Calumet Finance Corp., | |||||
| senior note, 144A, 11.50%, 1/15/21 | United States | 8,900,000 | 10,079,250 | ||
| CGG SA, | |||||
| senior note, 6.50%, 6/01/21 | France | 8,600,000 | 4,386,000 | ||
| senior note, 6.875%, 1/15/22 | France | 6,100,000 | 3,080,500 | ||
16 Semiannual Report
franklintempleton.com
FRANKLIN STRATEGIC SERIES
CONSOLIDATED STATEMENT OF INVESTMENTS (UNAUDITED)
| Franklin Strategic Income Fund (continued) | ||||
| Principal | ||||
| Country | Amount* | Value | ||
| Corporate Bonds (continued) | ||||
| Energy (continued) | ||||
| i Chaparral Energy Inc., | ||||
| senior bond, 8.25%, 9/01/21 | United States | 8,000,000 | $ | 6,280,000 |
| senior bond, 7.625%, 11/15/22 | United States | 1,400,000 | 1,092,000 | |
| senior note, 9.875%, 10/01/20 | United States | 5,000,000 | 3,925,000 | |
| c,i CHC Helicopter SA, | ||||
| senior note, 9.375%, 6/01/21 | Canada | 5,000,000 | 1,025,500 | |
| senior secured note, first lien, 9.25%, 10/15/20 | Canada | 20,001,600 | 9,950,796 | |
| e Cheniere Corpus Christi Holdings LLC, senior secured note, 144A, | ||||
| 7.00%, 6/30/24 | United States | 8,800,000 | 9,372,000 | |
| CONSOL Energy Inc., senior note, 5.875%, 4/15/22 | United States | 20,000,000 | 18,508,000 | |
| Energy Transfer Equity LP, senior note, first lien, 7.50%, 10/15/20 | United States | 11,000,000 | 12,045,000 | |
| Energy Transfer Partners LP, senior note, 5.20%, 2/01/22 | United States | 10,000,000 | 10,973,580 | |
| i Energy XXI Gulf Coast Inc., | ||||
| f senior note, 9.25%, 12/15/17 | United States | 15,000,000 | 1,425,000 | |
| senior note, 7.50%, 12/15/21 | United States | 2,100,000 | 204,750 | |
| f senior note, 6.875%, 3/15/24 | United States | 10,000,000 | 975,000 | |
| e senior secured note, second lien, 144A, 11.00%, 3/15/20 | United States | 5,000,000 | 2,275,000 | |
| e EnQuest PLC, senior note, 144A, 7.00%, 4/15/22. | United Kingdom | 11,200,000 | 6,757,800 | |
| e,j Gaz Capital SA (OJSC Gazprom), loan participation, senior note, | ||||
| 144A, 3.85%, 2/06/20 | Russia | 20,000,000 | 20,081,100 | |
| e Kinder Morgan Finance Co. LLC, senior secured note, 144A, 6.00%, | ||||
| 1/15/18 | United States | 17,000,000 | 17,794,155 | |
| Kinder Morgan Inc., | ||||
| senior note, 7.00%, 6/15/17 | United States | 3,500,000 | 3,617,019 | |
| senior note, 6.50%, 9/15/20 | United States | 9,000,000 | 10,177,443 | |
| e,i Linn Energy LLC/Finance Corp., senior secured note, second lien, | ||||
| 144A, 12.00%, 12/15/20 | United States | 6,700,000 | 4,723,500 | |
| e LUKOIL International Finance BV, senior note, 144A, 4.563%, 4/24/23 . | Russia | 20,500,000 | 20,877,405 | |
| Martin Midstream Partners LP/Martin Midstream Finance Corp., senior | ||||
| note, 7.25%, 2/15/21 | United States | 20,000,000 | 19,250,000 | |
| PBF Holding Co. LLC, first lien, 8.25%, 2/15/20 | United States | 18,000,000 | 18,450,000 | |
| Regency Energy Partners LP/Regency Energy Finance Corp., | ||||
| senior bond, 5.50%, 4/15/23 | United States | 5,000,000 | 5,155,185 | |
| senior note, 5.875%, 3/01/22 | United States | 1,300,000 | 1,457,784 | |
| senior note, 5.00%, 10/01/22 | United States | 10,000,000 | 10,745,420 | |
| Sabine Pass Liquefaction LLC, | ||||
| first lien, 5.625%, 2/01/21. | United States | 20,000,000 | 21,200,000 | |
| first lien, 5.625%, 4/15/23. | United States | 6,200,000 | 6,618,500 | |
| senior secured note, first lien, 5.625%, 3/01/25 | United States | 5,000,000 | 5,306,250 | |
| c Sanchez Energy Corp., senior note, 6.125%, 1/15/23 | United States | 6,000,000 | 5,160,000 | |
| e,k W&T Offshore Inc., | ||||
| second lien, 144A, PIK, 9.00%, 5/15/20 | United States | 4,950,000 | 3,172,530 | |
| senior secured note, third lien, 144A, PIK, 8.50%, 6/15/21 | United States | 4,400,000 | 1,777,340 | |
| Weatherford International Ltd., | ||||
| senior note, 7.75%, 6/15/21 | United States | 9,000,000 | 9,123,750 | |
| senior note, 8.25%, 6/15/23 | United States | 10,500,000 | 10,893,750 | |
| e Woodside Finance Ltd., senior note, 144A, 3.70%, 9/15/26 | Australia | 12,500,000 | 12,523,937 | |
| 340,209,533 | ||||
franklintempleton.com
Semiannual Report 17
FRANKLIN STRATEGIC SERIES
CONSOLIDATED STATEMENT OF INVESTMENTS (UNAUDITED)
| Franklin Strategic Income Fund (continued) | ||||
| Principal | ||||
| Country | Amount* | Value | ||
| Corporate Bonds (continued) | ||||
| Food & Staples Retailing 0.9% | ||||
| e Cencosud SA, | ||||
| senior note, 144A, 4.875%, 1/20/23. | Chile | 8,600,000 | $ | 9,089,469 |
| senior note, 144A, 5.15%, 2/12/25. | Chile | 7,600,000 | 8,088,224 | |
| Kroger Co., senior bond, 2.65%, 10/15/26 | United States | 15,300,000 | 14,914,012 | |
| Walgreens Boots Alliance Inc., senior note, 3.80%, 11/18/24 | United States | 30,000,000 | 31,730,490 | |
| 63,822,195 | ||||
| Food, Beverage & Tobacco 1.5% | ||||
| Anheuser-Busch InBev Finance Inc., senior note, 3.30%, 2/01/23 | Belgium | 15,700,000 | 16,441,197 | |
| e Imperial Brands Finance PLC, senior note, 144A, 3.50%, 2/11/23 | United Kingdom | 25,400,000 | 26,238,010 | |
| e JBS USA LLC/Finance Inc., | ||||
| senior bond, 144A, 5.875%, 7/15/24 | United States | 6,800,000 | 6,868,000 | |
| senior note, 144A, 8.25%, 2/01/20. | United States | 11,000,000 | 11,357,500 | |
| senior note, 144A, 5.75%, 6/15/25. | United States | 5,000,000 | 4,925,000 | |
| Kraft Heinz Foods Co., senior bond, 3.00%, 6/01/26 | United States | 25,400,000 | 25,209,068 | |
| e Post Holdings Inc., | ||||
| senior note, 144A, 6.00%, 12/15/22. | United States | 10,000,000 | 10,587,500 | |
| senior note, 144A, 7.75%, 3/15/24. | United States | 9,000,000 | 9,936,000 | |
| 111,562,275 | ||||
| Health Care Equipment & Services 1.8% | ||||
| Centene Corp., senior note, 4.75%, 5/15/22. | United States | 12,000,000 | 12,240,000 | |
| CHS/Community Health Systems Inc., | ||||
| senior note, 8.00%, 11/15/19 | United States | 6,200,000 | 5,425,000 | |
| senior note, 7.125%, 7/15/20 | United States | 6,000,000 | 4,890,000 | |
| senior note, 6.875%, 2/01/22 | United States | 8,300,000 | 6,225,000 | |
| DaVita Inc., | ||||
| senior bond, 5.125%, 7/15/24 | United States | 10,000,000 | 9,768,750 | |
| senior bond, 5.00%, 5/01/25 | United States | 9,300,000 | 8,997,750 | |
| HCA Inc., | ||||
| senior bond, 5.875%, 5/01/23 | United States | 15,000,000 | 15,937,500 | |
| senior bond, 5.875%, 2/15/26 | United States | 3,000,000 | 3,157,500 | |
| senior note, 7.50%, 2/15/22 | United States | 5,000,000 | 5,700,000 | |
| senior secured bond, first lien, 5.875%, 3/15/22 | United States | 10,000,000 | 11,025,000 | |
| senior secured bond, first lien, 5.25%, 4/15/25 | United States | 10,000,000 | 10,500,000 | |
| e MPH Acquisition Holdings LLC, senior note, 144A, 7.125%, 6/01/24 | United States | 4,100,000 | 4,396,840 | |
| Stryker Corp., senior bond, 3.50%, 3/15/26 | United States | 4,800,000 | 5,009,683 | |
| Tenet Healthcare Corp., | ||||
| senior note, 5.00%, 3/01/19 | United States | 6,700,000 | 6,515,750 | |
| senior note, 5.50%, 3/01/19 | United States | 15,300,000 | 15,032,250 | |
| senior note, 8.125%, 4/01/22 | United States | 5,000,000 | 4,912,500 | |
| senior note, 6.75%, 6/15/23 | United States | 2,700,000 | 2,484,000 | |
| 132,217,523 | ||||
| Household & Personal Products 0.3% | ||||
| The Procter & Gamble Co., senior note, 2.45%, 11/03/26 | United States | 19,000,000 | 18,973,210 | |
| Insurance 1.0% | ||||
| MetLife Inc., | ||||
| senior note, 3.60%, 4/10/24 | United States | 24,200,000 | 25,669,521 | |
| senior note, 3.00%, 3/01/25 | United States | 2,400,000 | 2,438,659 | |
18 Semiannual Report
franklintempleton.com
FRANKLIN STRATEGIC SERIES
CONSOLIDATED STATEMENT OF INVESTMENTS (UNAUDITED)
| Franklin Strategic Income Fund (continued) | |||||
| Principal | |||||
| Country | Amount* | Value | |||
| Corporate Bonds (continued) | |||||
| Insurance (continued) | |||||
| e Nippon Life Insurance Co., sub. bond, 144A, 5.10% to 10/16/24, FRN | |||||
| thereafter, 10/16/44 | Japan | 35,000,000 | $ | 38,378,375 | |
| Prudential Financial Inc., 3.50%, 5/15/24. | United States | 9,900,000 | 10,397,901 | ||
| 76,884,456 | |||||
| Materials 4.7% | |||||
| ArcelorMittal, | |||||
| senior note, 6.50%, 3/01/21 | France | 17,600,000 | 19,372,936 | ||
| senior note, 6.125%, 6/01/25 | France | 2,700,000 | 2,970,000 | ||
| e,k ARD Finance SA, senior secured note, 144A, PIK, 7.125%, 9/15/23 | Luxembourg | 1,300,000 | 1,293,500 | ||
| e Ardagh Packaging Finance PLC/Ardagh MP Holdings USA Inc., | |||||
| senior note, 144A, 7.00%, 11/15/20. | Luxembourg | 1,764,706 | 1,826,471 | ||
| senior note, 144A, 6.75%, 1/31/21. | Luxembourg | 2,400,000 | 2,478,000 | ||
| senior note, 144A, 6.00%, 6/30/21. | Luxembourg | 5,100,000 | 5,253,000 | ||
| l senior secured note, 144A, FRN, 3.85%, 12/15/19 | Luxembourg | 8,700,000 | 8,863,125 | ||
| e Barminco Finance Pty. Ltd., senior note, 144A, 9.00%, 6/01/18 | Australia | 15,000,000 | 15,270,375 | ||
| e Cemex Finance LLC, senior secured note, first lien, 144A, 6.00%, | |||||
| 4/01/24 | Mexico | 5,800,000 | 6,033,827 | ||
| e Cemex SAB de CV, | |||||
| first lien, 144A, 5.70%, 1/11/25 | Mexico | 15,000,000 | 15,319,725 | ||
| senior secured bond, first lien, 144A, 6.125%, 5/05/25. | Mexico | 4,000,000 | 4,154,620 | ||
| e Ceramtec Group GmbH, senior note, 144A, 8.25%, 8/15/21 | Germany | 11,900,000 | EUR | 13,901,793 | |
| The Chemours Co., senior note, 6.625%, 5/15/23 | United States | 21,000,000 | 20,475,000 | ||
| e First Quantum Minerals Ltd., | |||||
| senior note, 144A, 6.75%, 2/15/20. | Canada | 7,500,000 | 7,218,750 | ||
| senior note, 144A, 7.00%, 2/15/21. | Canada | 10,000,000 | 9,600,000 | ||
| Freeport-McMoRan Inc., senior note, 4.55%, 11/14/24 | United States | 26,000,000 | 23,903,750 | ||
| e Glencore Finance Canada Ltd., senior bond, 144A, 4.95%, 11/15/21 | Switzerland | 13,300,000 | 14,180,300 | ||
| e Glencore Funding LLC, | |||||
| senior note, 144A, 4.125%, 5/30/23. | Switzerland | 5,000,000 | 4,969,580 | ||
| senior note, 144A, 4.625%, 4/29/24. | Switzerland | 2,500,000 | 2,549,200 | ||
| e INVISTA Finance LLC, senior secured note, 144A, 4.25%, 10/15/19 | United States | 30,000,000 | 30,221,670 | ||
| LYB International Finance BV, senior note, 4.00%, 7/15/23 | United States | 25,400,000 | 27,234,515 | ||
| e Novelis Corp., senior bond, 144A, 5.875%, 9/30/26 | United States | 12,400,000 | 12,586,000 | ||
| e Owens-Brockway Glass Container Inc., | |||||
| senior note, 144A, 5.00%, 1/15/22. | United States | 7,800,000 | 8,190,000 | ||
| senior note, 144A, 5.875%, 8/15/23. | United States | 12,500,000 | 13,343,750 | ||
| Reynolds Group Issuer Inc./Reynolds Group Issuer LLC/Reynolds | |||||
| Group Issuer Luxembourg SA, | |||||
| first lien, 5.75%, 10/15/20. | United States | 6,600,000 | 6,781,698 | ||
| e first lien, 144A, 5.125%, 7/15/23 | United States | 5,900,000 | 6,051,188 | ||
| e senior note, 144A, 7.00%, 7/15/24. | United States | 2,600,000 | 2,783,625 | ||
| senior note, 8.2, 8.25%, 2/15/21 | United States | 10,000,000 | 10,455,000 | ||
| e,l senior secured note, first lien, 144A, FRN, 4.38%, 7/15/21 | United States | 6,500,000 | 6,646,250 | ||
| e Sealed Air Corp., | |||||
| senior bond, 144A, 5.125%, 12/01/24 | United States | 11,300,000 | 12,034,500 | ||
| senior bond, 144A, 5.50%, 9/15/25 | United States | 2,600,000 | 2,778,750 | ||
| senior note, 144A, 4.875%, 12/01/22 | United States | 11,300,000 | 12,020,375 | ||
| Steel Dynamics Inc., | |||||
| senior bond, 5.50%, 10/01/24 | United States | 9,700,000 | 10,257,750 | ||
| senior note, 5.125%, 10/01/21 | United States | 9,200,000 | 9,637,000 | ||
| 350,656,023 | |||||
franklintempleton.com
Semiannual Report 19
FRANKLIN STRATEGIC SERIES
CONSOLIDATED STATEMENT OF INVESTMENTS (UNAUDITED)
| Franklin Strategic Income Fund (continued) | |||||
| Principal | |||||
| Country | Amount* | Value | |||
| Corporate Bonds (continued) | |||||
| Media 4.8% | |||||
| 21st Century Fox America Inc., senior note, 3.00%, 9/15/22 | United States | 6,100,000 | $ | 6,305,466 | |
| e Altice U.S. Finance I Corp., senior secured bond, 144A, 5.50%, | |||||
| 5/15/26 | United States | 22,000,000 | 22,495,000 | ||
| AMC Networks Inc., senior note, 5.00%, 4/01/24 | United States | 12,500,000 | 12,703,125 | ||
| CCO Holdings LLC/CCO Holdings Capital Corp., | |||||
| senior bond, 5.25%, 9/30/22 | United States | 15,000,000 | 15,656,250 | ||
| e senior bond, 144A, 5.375%, 5/01/25 | United States | 13,000,000 | 13,390,000 | ||
| Clear Channel Worldwide Holdings Inc., | |||||
| senior note, 6.50%, 11/15/22 | United States | 3,000,000 | 3,015,000 | ||
| senior note, 6.50%, 11/15/22 | United States | 5,000,000 | 5,120,000 | ||
| senior sub. note, 7.625%, 3/15/20 | United States | 900,000 | 850,500 | ||
| senior sub. note, 7.625%, 3/15/20 | United States | 6,400,000 | 6,224,000 | ||
| CSC Holdings LLC, senior note, 6.75%, 11/15/21 | United States | 22,000,000 | 23,210,000 | ||
| DISH DBS Corp., | |||||
| senior bond, 5.00%, 3/15/23 | United States | 10,000,000 | 9,875,000 | ||
| senior note, 6.75%, 6/01/21 | United States | 4,000,000 | 4,307,520 | ||
| senior note, 5.875%, 7/15/22 | United States | 3,000,000 | 3,120,000 | ||
| senior note, 5.875%, 11/15/24 | United States | 5,000,000 | 5,053,125 | ||
| Gannett Co. Inc., | |||||
| senior bond, 6.375%, 10/15/23 | United States | 12,000,000 | 12,735,000 | ||
| e senior bond, 144A, 5.50%, 9/15/24 | United States | 2,800,000 | 2,880,500 | ||
| senior note, 5.125%, 7/15/20 | United States | 9,800,000 | 10,204,250 | ||
| iHeartCommunications Inc., | |||||
| senior secured bond, first lien, 9.00%, 3/01/21 | United States | 23,800,000 | 17,106,250 | ||
| senior secured note, first lien, 9.00%, 9/15/22. | United States | 8,100,000 | 5,781,375 | ||
| e Nextstar Escrow Corp., senior note, 144A, 5.625%, 8/01/24 | United States | 21,300,000 | 21,193,500 | ||
| e Sirius XM Radio Inc., | |||||
| senior bond, 144A, 6.00%, 7/15/24 | United States | 14,600,000 | 15,530,750 | ||
| senior bond, 144A, 5.375%, 4/15/25 | United States | 10,000,000 | 10,250,000 | ||
| Time Warner Cable LLC, senior note, 4.00%, 9/01/21 | United States | 15,600,000 | 16,358,410 | ||
| Time Warner Inc., senior bond, 2.95%, 7/15/26 | United States | 25,400,000 | 25,102,109 | ||
| e Unitymedia Hessen GmbH & Co. KG/Unitymedia NRW GmbH, | |||||
| senior secured bond, first lien, 144A, 5.75%, 1/15/23 | Germany | 2,997,000 | EUR | 3,509,390 | |
| senior secured note, first lien, 144A, 5.625%, 4/15/23 | Germany | 1,520,000 | EUR | 1,777,668 | |
| e Unitymedia KabelBW GmbH, senior bond, 144A, 6.125%, 1/15/25 | Germany | 18,000,000 | 18,877,500 | ||
| e Univision Communications Inc., senior secured note, first lien, 144A, | |||||
| 5.125%, 2/15/25 | United States | 25,000,000 | 25,156,250 | ||
| e Virgin Media Finance PLC, senior bond, 144A, 6.375%, 10/15/24. | United Kingdom | 9,600,000 | GBP | 12,191,299 | |
| e Virgin Media Secured Finance PLC, | |||||
| senior secured bond, first lien, 144A, 5.50%, 1/15/25 | United Kingdom | 14,000,000 | 14,402,500 | ||
| senior secured note, first lien, 144A, 5.375%, 4/15/21 | United Kingdom | 3,870,000 | 4,015,125 | ||
| e Ziggo Secured Finance BV, senior secured bond, 144A, 4.25%, | |||||
| 1/15/27 | Netherlands | 8,600,000 | EUR | 9,439,790 | |
| 357,836,652 | |||||
| Pharmaceuticals, Biotechnology & Life Sciences 1.9% | |||||
| Actavis Funding SCS, senior bond, 3.80%, 3/15/25 | United States | 25,000,000 | 26,017,125 | ||
| Baxalta Inc., senior note, 4.00%, 6/23/25 | United States | 30,000,000 | 31,468,500 | ||
| Biogen Inc., senior note, 3.625%, 9/15/22 | United States | 14,900,000 | 15,903,575 | ||
| e Endo Finance LLC/Endo Ltd./Endo Finco Inc., | |||||
| senior bond, 144A, 6.00%, 2/01/25 | United States | 11,900,000 | 10,085,250 | ||
| senior note, 144A, 6.00%, 7/15/23. | United States | 5,000,000 | 4,350,000 | ||
20 Semiannual Report
franklintempleton.com
FRANKLIN STRATEGIC SERIES
CONSOLIDATED STATEMENT OF INVESTMENTS (UNAUDITED)
| Franklin Strategic Income Fund (continued) | |||||
| Principal | |||||
| Country | Amount* | Value | |||
| Corporate Bonds (continued) | |||||
| Pharmaceuticals, Biotechnology & Life Sciences (continued) | |||||
| Gilead Sciences Inc., senior bond, 3.65%, 3/01/26 | United States | 22,200,000 | $ | 23,307,580 | |
| e Jaguar Holding Co. II/Pharmaceutical Product Development LLC, | |||||
| senior note, 144A, 6.375%, 8/01/23 | United States | 15,000,000 | 15,120,000 | ||
| e Valeant Pharmaceuticals International, senior note, 144A, 6.375%, | |||||
| 10/15/20 | United States | 12,600,000 | 11,025,000 | ||
| e Valeant Pharmaceuticals International Inc., | |||||
| senior bond, 144A, 6.125%, 4/15/25 | United States | 3,100,000 | 2,394,750 | ||
| senior note, 144A, 5.50%, 3/01/23. | United States | 8,000,000 | 6,260,000 | ||
| 145,931,780 | |||||
| Real Estate 0.8% | |||||
| American Tower Corp., senior bond, 3.375%, 10/15/26 | United States | 28,900,000 | 28,802,925 | ||
| Equinix Inc., senior bond, 5.375%, 4/01/23 | United States | 25,000,000 | 26,218,750 | ||
| MPT Operating Partnership LP/MPT Finance Corp., senior bond, | |||||
| 5.25%, 8/01/26 | United States | 4,200,000 | 4,294,500 | ||
| 59,316,175 | |||||
| Retailing 1.0% | |||||
| e,i Edcon Ltd., secured note, 144A, 9.50%, 3/01/18 | South Africa | 15,325,000 | EUR | 4,205,372 | |
| Home Depot Inc., senior note, 2.125%, 9/15/26 | United States | 15,000,000 | 14,490,405 | ||
| Netflix Inc., | |||||
| senior bond, 5.875%, 2/15/25 | United States | 10,000,000 | 11,100,000 | ||
| e senior bond, 144A, 4.375%, 11/15/26 | United States | 11,800,000 | 11,608,250 | ||
| senior note, 5.50%, 2/15/22 | United States | 10,700,000 | 11,636,250 | ||
| e PetSmart Inc., senior note, 144A, 7.125%, 3/15/23 | United States | 20,000,000 | 20,975,000 | ||
| 74,015,277 | |||||
| Semiconductors & Semiconductor Equipment 0.2% | |||||
| Qorvo Inc., | |||||
| senior bond, 7.00%, 12/01/25 | United States | 4,300,000 | 4,730,000 | ||
| senior note, 6.75%, 12/01/23 | United States | 10,000,000 | 10,987,500 | ||
| 15,717,500 | |||||
| Software & Services 1.1% | |||||
| e BMC Software Finance Inc., senior note, 144A, 8.125%, 7/15/21 | United States | 22,000,000 | 20,240,000 | ||
| e First Data Corp., | |||||
| second lien, 144A, 5.75%, 1/15/24 | United States | 22,400,000 | 22,876,000 | ||
| senior note, 144A, 7.00%, 12/01/23. | United States | 7,500,000 | 7,903,125 | ||
| Fiserv Inc., senior bond, 3.85%, 6/01/25 | United States | 8,400,000 | 8,949,721 | ||
| Infor (U.S.) Inc., senior note, 6.50%, 5/15/22 | United States | 20,000,000 | 20,800,000 | ||
| 80,768,846 | |||||
| Technology Hardware & Equipment 0.8% | |||||
| e CommScope Technologies Finance LLC, senior bond, 144A, 6.00%, | |||||
| 6/15/25 | United States | 16,600,000 | 17,513,000 | ||
| e Diamond 1 Finance Corp./Diamond 2 Finance Corp., | |||||
| senior note, 144A, 5.875%, 6/15/21. | United States | 2,500,000 | 2,623,938 | ||
| senior note, 144A, 7.125%, 6/15/24. | United States | 12,600,000 | 13,816,114 | ||
| e Western Digital Corp., senior note, 144A, 10.50%, 4/01/24 | United States | 25,700,000 | 29,779,875 | ||
| 63,732,927 | |||||
franklintempleton.com
Semiannual Report 21
FRANKLIN STRATEGIC SERIES
CONSOLIDATED STATEMENT OF INVESTMENTS (UNAUDITED)
| Franklin Strategic Income Fund (continued) | |||||
| Principal | |||||
| Country | Amount* | Value | |||
| Corporate Bonds (continued) | |||||
| Telecommunication Services 3.3% | |||||
| AT&T Inc., senior bond, 3.40%, 5/15/25 | United States | 20,000,000 | $ | 19,939,260 | |
| CenturyLink Inc., | |||||
| senior bond, 6.75%, 12/01/23 | United States | 5,000,000 | 5,156,250 | ||
| senior bond, 5.625%, 4/01/25 | United States | 10,000,000 | 9,412,500 | ||
| senior note, 5.80%, 3/15/22 | United States | 2,000,000 | 2,037,500 | ||
| e Digicel Group Ltd., | |||||
| senior note, 144A, 8.25%, 9/30/20. | Bermuda | 10,000,000 | 8,842,250 | ||
| senior note, 144A, 7.125%, 4/01/22. | Bermuda | 3,000,000 | 2,387,460 | ||
| e Digicel Ltd., senior note, 144A, 6.00%, 4/15/21 | Bermuda | 10,000,000 | 8,986,450 | ||
| e Hughes Satellite Systems Corp., senior bond, 144A, 6.625%, 8/01/26 . | United States | 20,700,000 | 20,544,750 | ||
| Intelsat Jackson Holdings SA, | |||||
| senior bond, 5.50%, 8/01/23 | Luxembourg | 3,000,000 | 2,002,500 | ||
| senior note, 7.25%, 10/15/20 | Luxembourg | 15,000,000 | 11,325,000 | ||
| senior note, 7.50%, 4/01/21 | Luxembourg | 5,000,000 | 3,700,000 | ||
| e Millicom International Cellular SA, senior note, 144A, 6.625%, | |||||
| 10/15/21 | Colombia | 21,800,000 | 22,835,500 | ||
| Sprint Communications Inc., | |||||
| senior note, 6.00%, 11/15/22 | United States | 10,000,000 | 9,325,000 | ||
| e senior note, 144A, 9.00%, 11/15/18. | United States | 2,200,000 | 2,425,500 | ||
| e senior note, 144A, 7.00%, 3/01/20. | United States | 5,000,000 | 5,450,000 | ||
| e Sprint Spectrum Co. LLC/Sprint Spectrum Co. II LLC, 144A, 3.36%, | |||||
| 9/20/21 | United States | 15,800,000 | 15,977,750 | ||
| T-Mobile USA Inc., | |||||
| senior bond, 6.50%, 1/15/24 | United States | 5,000,000 | 5,375,000 | ||
| senior bond, 6.375%, 3/01/25 | United States | 14,700,000 | 15,793,386 | ||
| senior note, 6.633%, 4/28/21 | United States | 3,500,000 | 3,664,062 | ||
| senior note, 6.125%, 1/15/22 | United States | 2,000,000 | 2,120,000 | ||
| senior note, 6.731%, 4/28/22 | United States | 3,500,000 | 3,675,000 | ||
| senior note, 6.00%, 4/15/24 | United States | 4,200,000 | 4,478,250 | ||
| Verizon Communications Inc., senior note, 5.15%, 9/15/23 | United States | 22,000,000 | 25,162,808 | ||
| e Wind Acquisition Finance SA, | |||||
| senior secured note, 144A, 4.00%, 7/15/20 | Italy | 14,400,000 | EUR | 16,104,423 | |
| senior secured note, 144A, 7.00%, 4/23/21 | Italy | 17,300,000 | EUR | 19,819,465 | |
| 246,540,064 | |||||
| Transportation 0.8% | |||||
| FedEx Corp., senior bond, 3.25%, 4/01/26. | United States | 25,400,000 | 26,434,618 | ||
| e Florida East Coast Holdings Corp., | |||||
| secured note, first lien, 144A, 6.75%, 5/01/19 | United States | 7,600,000 | 7,676,000 | ||
| senior note, 144A, 9.75%, 5/01/20. | United States | 4,000,000 | 3,980,000 | ||
| e Stena International SA, senior secured bond, first lien, 144A, 5.75%, | |||||
| 3/01/24 | Sweden | 6,600,000 | 5,499,747 | ||
| United Airlines Pass Through Trust, second lien, 2016-1, A, 3.45%, | |||||
| 1/07/30 | United States | 13,800,000 | 14,231,250 | ||
| 57,821,615 | |||||
| Utilities 2.4% | |||||
| c Calpine Corp., | |||||
| senior bond, 5.75%, 1/15/25 | United States | 9,000,000 | 8,786,250 | ||
| senior note, 5.375%, 1/15/23 | United States | 10,000,000 | 9,950,000 | ||
| e senior secured bond, first lien, 144A, 7.875%, 1/15/23. | United States | 3,490,000 | 3,664,500 | ||
| e senior secured bond, first lien, 144A, 5.875%, 1/15/24. | United States | 2,000,000 | 2,115,000 | ||
| Dominion Resources Inc., senior bond, 2.85%, 8/15/26. | United States | 11,400,000 | 11,255,208 | ||
22 Semiannual Report
franklintempleton.com
FRANKLIN STRATEGIC SERIES
CONSOLIDATED STATEMENT OF INVESTMENTS (UNAUDITED)
| Franklin Strategic Income Fund (continued) | ||||
| Principal | ||||
| Country | Amount* | Value | ||
| Corporate Bonds (continued) | ||||
| Utilities (continued) | ||||
| e Dynegy Inc., senior note, 144A, 8.00%, 1/15/25 | United States | 18,300,000 | $ | 17,705,250 |
| e,h EDF SA, | ||||
| junior sub. bond, 144A, 5.625% to 1/22/24, FRN thereafter, | ||||
| Perpetual | France | 5,000,000 | 4,974,675 | |
| sub. note, 144A, 5.25% to 1/29/23, FRN thereafter, Perpetual | France | 25,000,000 | 24,860,625 | |
| Exelon Corp., senior bond, 3.95%, 6/15/25 | United States | 18,500,000 | 19,786,786 | |
| e InterGen NV, secured bond, 144A, 7.00%, 6/30/23 | Netherlands | 25,000,000 | 21,312,500 | |
| Sempra Energy, | ||||
| senior bond, 3.55%, 6/15/24 | United States | 8,800,000 | 9,268,169 | |
| senior note, 3.75%, 11/15/25 | United States | 12,300,000 | 13,046,315 | |
| The Southern Co., senior bond, 3.25%, 7/01/26 | United States | 32,300,000 | 33,268,903 | |
| 179,994,181 | ||||
| Total Corporate Bonds (Cost $3,308,137,353) | 3,260,331,016 | |||
| l,m Senior Floating Rate Interests 10.3% | ||||
| Automobiles & Components 0.3% | ||||
| TI Group Automotive Systems LLC, Initial U.S. Term Loan, 4.50%, | ||||
| 6/25/22 | United States | 23,967,597 | 24,047,289 | |
| Capital Goods 0.1% | ||||
| Doncasters U.S. Finance LLC, Second Lien Term Loan, 9.50%, | ||||
| 10/09/20 | United States | 736,591 | 696,078 | |
| n Harsco Corp., Initial Term Loan, 7.50%, 11/01/23 | United States | 2,319,670 | 2,348,666 | |
| Leidos (Abacus Innovations Corp.), B Term Loan, 3.284%, 8/16/23 | United States | 1,599,977 | 1,614,478 | |
| Ventia Pty. Ltd., Refinancing Term B Loans, 5.00%, 5/21/22 | Australia | 838,089 | 847,518 | |
| 5,506,740 | ||||
| Commercial & Professional Services 0.1% | ||||
| KAR Auction Services Inc., Tranche B-3 Term Loan, 4.375%, 3/09/23 . | United States | 9,466,397 | 9,588,674 | |
| Consumer Services 0.7% | ||||
| Aristocrat Technologies Inc., Term B-1 Loans, 3.631%, 10/20/21 | United States | 1,764,777 | 1,775,145 | |
| Fitness International LLC, Term B Loan, 6.00%, 7/01/20 | United States | 42,250,261 | 42,329,480 | |
| Prime Security Services Borrower LLC, Term B-1 Loans, 4.75%, | ||||
| 5/02/22 | United States | 6,587,407 | 6,641,753 | |
| c,k Turtle Bay Holdings LLC, Term Loan B, PIK, 3.375%, 6/30/17 | United States | 4,589,763 | 4,543,865 | |
| 55,290,243 | ||||
| Diversified Financials 0.1% | ||||
| First Eagle Investment Management, Initial Term Loans, 4.838%, | ||||
| 12/01/22 | United States | 5,282,024 | 5,275,422 | |
| Russell Investments US Institutional Holdco Inc., Initial Term Loan, | ||||
| 6.75%, 6/01/23 | United States | 3,596,447 | 3,609,933 | |
| 8,885,355 | ||||
| Energy 1.6% | ||||
| c Bowie Resource Holdings LLC, | ||||
| First Lien Initial Term Loan, 6.75%, 8/16/20 | United States | 29,130,317 | 24,178,163 | |
| Second Lien Initial Term Loan, 11.75%, 2/16/21 | United States | 16,060,827 | 13,250,183 | |
| Fieldwood Energy LLC, Loans, 3.875%, 10/01/18. | United States | 38,894,784 | 35,880,438 | |
| Foresight Energy LLC, Term Loans, 6.50%, 8/23/20 | United States | 14,228,000 | 13,516,600 | |
| McDermott Finance LLC, Term Loan, 8.25% - 8.484%, 4/16/19 | United States | 1,530,552 | 1,545,857 | |
| OSG Bulk Ships Inc., Initial Term Loan, 5.25%, 8/05/19 | United States | 9,854,499 | 9,780,591 | |
franklintempleton.com
Semiannual Report 23
FRANKLIN STRATEGIC SERIES
CONSOLIDATED STATEMENT OF INVESTMENTS (UNAUDITED)
| Franklin Strategic Income Fund (continued) | ||||
| Principal | ||||
| Country | Amount* | Value | ||
| l,m Senior Floating Rate Interests (continued) | ||||
| Energy (continued) | ||||
| OSG International Inc., Initial Term Loan, 5.75%, 8/05/19 | United States | 17,438,818 | $ | 17,427,918 |
| 115,579,750 | ||||
| Health Care Equipment & Services 0.3% | ||||
| Carestream Health Inc., Term Loan, 5.00%, 6/07/19 | United States | 4,887,059 | 4,556,307 | |
| Community Health Systems Inc., 2018 Term F Loans, 4.083%, | ||||
| 12/31/18 | United States | 20,752,218 | 20,333,459 | |
| 24,889,766 | ||||
| Household & Personal Products 0.0%† | ||||
| n Spectrum Brands Inc., Term Loans, 5.00%, 6/23/22 | United States | 361,187 | 365,100 | |
| Materials 1.2% | ||||
| The Chemours Co. LLC, Tranche B Term Loan, 3.75%, 5/12/22 | United States | 37,253,903 | 36,918,432 | |
| Cyanco Intermediate Corp., Initial Term Loan, 5.50%, 5/01/20 | United States | 8,117,635 | 8,137,929 | |
| FMG America Finance Inc. (Fortescue Metals Group), Loans, 3.75%, | ||||
| 6/30/19 | Australia | 15,072,394 | 15,079,463 | |
| Huntsman International LLC, 2015 Extended Term B Dollar Loan, | ||||
| 3.534% - 3.644%, 4/19/19 | United States | 3,279,246 | 3,299,741 | |
| Novelis Inc., Initial Term Loan, 4.00% - 4.088%, 6/02/22 | Canada | 8,220,350 | 8,255,287 | |
| c OCI Beaumont LLC, Term B-3 Loan, 7.75%, 8/20/19 | United States | 16,339,375 | 16,073,860 | |
| 87,764,712 | ||||
| Media 1.4% | ||||
| n Altice U.S. Finance I Corp., 2016 Refinancing Term Loans, 5.50%, | ||||
| 1/01/25 | United States | 1,991,087 | 2,001,043 | |
| n AMC Entertainment Holdings Inc., | ||||
| 2016 Incremental Term Loan, 5.25%, 12/15/23 | United States | 773,223 | 770,772 | |
| Initial Term Loans, 5.25%, 12/15/22. | United States | 1,209,648 | 1,209,624 | |
| Charter Communications Operating LLC (CCO Safari), Term A Loan, | ||||
| 2.54%, 5/18/21 | United States | 9,828,000 | 9,785,002 | |
| CSC Holdings Inc. (Cablevision), 2016 Extended Term Loans, 3.876%, | ||||
| 10/11/24 | United States | 12,991,079 | 13,053,333 | |
| n Lions Gate Entertainment Corp., Term Loan A, 5.00%, 10/12/21 | United States | 5,381,308 | 5,327,495 | |
| n Live Nation Entertainment Inc., Term B-2 Loans, 5.00%, 10/31/23 | United States | 773,223 | 775,156 | |
| Radio One Inc., Term Loan B, 5.04%, 12/31/18 | United States | 68,709,143 | 68,880,916 | |
| UPC Financing Partnership, Facility AN, 4.08%, 8/31/24 | Netherlands | 3,052,838 | 3,072,299 | |
| 104,875,640 | ||||
| Pharmaceuticals, Biotechnology & Life Sciences 1.5% | ||||
| Endo Luxembourg Finance Co. I S.A.R.L. and Endo LLC, 2015 | ||||
| Incremental Term B Loans, 3.75%, 9/25/22 | United States | 24,619,684 | 24,615,843 | |
| Grifols Worldwide Operations USA Inc., U.S. Tranche B Term Loan, | ||||
| 3.46%, 2/27/21 | United States | 30,211,970 | 30,514,090 | |
| n RPI Finance Trust, Term A-2 Term Loan A, 4.75%, 10/14/20 | United States | 6,722,349 | 6,687,594 | |
| Valeant Pharmaceuticals International Inc., | ||||
| n Series A-3 Tranche A Term Loan, 4.29%, 10/20/18 | United States | 26,249,759 | 26,211,487 | |
| Series C-2 Tranche B Term Loan, 5.25%, 12/11/19 | United States | 8,031,460 | 8,037,484 | |
| Series D-2 Tranche B Term Loan, 5.00%, 2/13/19 | United States | 13,451,174 | 13,449,977 | |
| Series F-1 Tranche B Term Loan, 5.50%, 4/01/22 | United States | 2,107,015 | 2,110,572 | |
| 111,627,047 | ||||
24 Semiannual Report
franklintempleton.com
FRANKLIN STRATEGIC SERIES
CONSOLIDATED STATEMENT OF INVESTMENTS (UNAUDITED)
| Franklin Strategic Income Fund (continued) | ||||
| Principal | ||||
| Country | Amount* | Value | ||
| l,m Senior Floating Rate Interests (continued) | ||||
| Retailing 0.6% | ||||
| Ascena Retail Group Inc., Tranche B Term Loan, 5.25%, 8/21/22 | United States | 35,667,667 | $ | 34,850,271 |
| Dollar Tree Inc., Term A-1 Loans, 2.25%, 7/06/20 | United States | 6,118,551 | 6,108,945 | |
| PetSmart Inc., Tranche B-2 Loans, 4.00%, 3/11/22. | United States | 3,463,627 | 3,474,451 | |
| 44,433,667 | ||||
| Semiconductors & Semiconductor Equipment 0.8% | ||||
| Avago Technologies Cayman Finance Ltd., Term B-3 Loans, 3.535%, | ||||
| 2/01/23 | Singapore | 19,590,865 | 19,817,395 | |
| MACOM Technology Solutions Holdings Inc., Initial Term Loan, | ||||
| 4.628%, 5/07/21 | United States | 7,237,979 | 7,319,406 | |
| MKS Instruments Inc., Tranche B-1 Term Loans, 4.25%, 5/01/23 | United States | 5,220,025 | 5,276,573 | |
| ON Semiconductor Corp., 2016 Replacement Term Loans, 3.777%, | ||||
| 3/31/23 | United States | 24,696,838 | 24,868,827 | |
| 57,282,201 | ||||
| Software & Services 0.8% | ||||
| n Global Payments Inc., Delayed Draw Term Loan (A-2), 4.75%, | ||||
| 10/31/21 | United States | 11,078,776 | 11,063,487 | |
| MoneyGram International Inc., Term Loan, 4.25%, 3/27/20 | United States | 48,410,794 | 47,261,038 | |
| n Rackspace Hosting Inc., Term B Loan, 6.50%, 11/03/23 | United States | 3,866,116 | 3,893,388 | |
| 62,217,913 | ||||
| Technology Hardware & Equipment 0.4% | ||||
| Ciena Corp., Term Loan, 3.75%, 7/15/19 | United States | 2,297,273 | 2,308,759 | |
| Dell International LLC, Term A-3 Loan, 2.54%, 12/31/18 | United States | 9,738,459 | 9,743,027 | |
| Western Digital Corp., Term Loan B-1, 4.50%, 4/29/23 | United States | 9,884,527 | 10,011,177 | |
| Zebra Technologies Corp., Refinancing Term Loan, 4.089%, 10/27/21 . | United States | 3,589,029 | 3,630,902 | |
| 25,693,865 | ||||
| Telecommunication Services 0.1% | ||||
| Consolidated Communications Inc., Initial Term Loan, 4.00%, | ||||
| 10/05/23 | United States | 2,408,059 | 2,426,119 | |
| Global Tel*Link Corp., Term Loan, 5.00%, 5/23/20 | United States | 2,850,121 | 2,777,087 | |
| 5,203,206 | ||||
| Transportation 0.2% | ||||
| Air Canada, Term Loan, 3.614%, 10/06/23 | Canada | 550,559 | 552,967 | |
| Navios Maritime Midstream Partners LP, Initial Term Loan, 5.50%, | ||||
| 6/18/20 | Marshall Islands | 13,365,559 | 13,131,662 | |
| Navios Maritime Partners LP, Initial Term Loan, 5.25%, 6/27/18 | Marshall Islands | 1,651,816 | 1,516,573 | |
| XPO Logistics Inc., Refinancing Term Loans, 4.25%, 10/30/21. | United States | 1,292,706 | 1,302,887 | |
| 16,504,089 | ||||
| Utilities 0.1% | ||||
| EFS Cogen Holdings I LLC (Linden), Term B Advance, 5.25%, 6/28/23. | United States | 1,765,214 | 1,785,073 | |
| NRG Energy Inc., Term Loans, 3.50%, 6/30/23 | United States | 8,608,425 | 8,636,402 | |
| 10,421,475 | ||||
| Total Senior Floating Rate Interests | ||||
| (Cost $773,399,453) | 770,176,732 | |||
franklintempleton.com
Semiannual Report 25
FRANKLIN STRATEGIC SERIES
CONSOLIDATED STATEMENT OF INVESTMENTS (UNAUDITED)
| Franklin Strategic Income Fund (continued) | ||||||
| Principal | ||||||
| Country | Amount* | Value | ||||
| Foreign Government and Agency Securities 11.4% | ||||||
| Government of the Philippines, senior note, 3-21, 2.875%, 5/22/17 | Philippines | 900,000,000 | PHP | $ | 18,674,407 | |
| Government of Hungary, 5.375%, 2/21/23 | Hungary | 16,250,000 | 18,469,750 | |||
| Government of Indonesia, | ||||||
| FR28, 10.00%, 7/15/17 | Indonesia | 10,200,000,000 | IDR | 801,076 | ||
| FR34, 12.80%, 6/15/21 | Indonesia | 169,210,000,000 | IDR | 15,967,180 | ||
| FR36, 11.50%, 9/15/19 | Indonesia | 35,400,000,000 | IDR | 3,042,018 | ||
| senior bond, FR39, 11.75%, 8/15/23 | Indonesia | 29,150,000,000 | IDR | 2,767,440 | ||
| senior bond, FR44, 10.00%, 9/15/24 | Indonesia | 8,340,000,000 | IDR | 742,087 | ||
| senior bond, FR56, 8.375%, 9/15/26 | Indonesia | 750,000,000,000 | IDR | 62,222,175 | ||
| senior bond, FR70, 8.375%, 3/15/24 | Indonesia | 140,000,000,000 | IDR | 11,453,862 | ||
| Government of Malaysia, | ||||||
| senior bond, 4.24%, 2/07/18 | Malaysia | 66,300,000 | MYR | 16,125,203 | ||
| senior bond, 3.26%, 3/01/18 | Malaysia | 266,000,000 | MYR | 63,931,943 | ||
| senior note, 3.58%, 9/28/18 | Malaysia | 293,200,000 | MYR | 70,842,572 | ||
| Government of Mexico, | ||||||
| 7.25%, 12/15/16 | Mexico | 11,765,870 | o | MXN | 62,513,821 | |
| 7.75%, 12/14/17 | Mexico | 4,000,000 | o | MXN | 21,812,980 | |
| senior note, 8.50%, 12/13/18 | Mexico | 11,540,000 | o | MXN | 64,743,102 | |
| senior note, M, 5.00%, 6/15/17 | Mexico | 9,500,000 | o | MXN | 50,311,573 | |
| e Government of Serbia, | ||||||
| senior note, 144A, 4.875%, 2/25/20. | Serbia | 29,400,000 | 30,474,276 | |||
| senior note, 144A, 7.25%, 9/28/21. | Serbia | 15,000,000 | 17,250,450 | |||
| e Government of Ukraine, | ||||||
| 144A, 7.75%, 9/01/22 | Ukraine | 2,200,000 | 2,157,265 | |||
| 144A, 7.75%, 9/01/23 | Ukraine | 4,355,000 | 4,246,234 | |||
| 144A, 7.75%, 9/01/24 | Ukraine | 4,355,000 | 4,208,672 | |||
| 144A, 7.75%, 9/01/25 | Ukraine | 4,355,000 | 4,185,264 | |||
| 144A, 7.75%, 9/01/26 | Ukraine | 4,355,000 | 4,170,021 | |||
| 144A, 7.75%, 9/01/27 | Ukraine | 4,354,000 | 4,152,627 | |||
| a,p 144A, VRI, GDP Linked Securities, 5/31/40 | Ukraine | 20,490,000 | 6,583,232 | |||
| q Government of Uruguay, | ||||||
| senior bond, Index Linked, 5.00%, 9/14/18 | Uruguay | 165,823,165 | UYU | 5,826,713 | ||
| senior bond, Index Linked, 4.375%, 12/15/28 | Uruguay | 2,061,475,481 | UYU | 66,906,419 | ||
| Korea Monetary Stabilization Bond, | ||||||
| senior note, 1.96%, 2/02/17 | South Korea | 23,000,000,000 | KRW | 20,139,736 | ||
| senior note, 1.56%, 10/02/17 | South Korea | 33,000,000,000 | KRW | 28,890,401 | ||
| Korea Treasury Bond, senior note, 3.00%, 12/10/16 | South Korea | 39,000,000,000 | KRW | 34,161,137 | ||
| Nota Do Tesouro Nacional, | ||||||
| 10.00%, 1/01/23 | Brazil | 48,902 | r | BRL | 14,486,477 | |
| s Index Linked, 6.00%, 8/15/18 | Brazil | 34,550 | r | BRL | 31,751,941 | |
| s Index Linked, 6.00%, 5/15/23 | Brazil | 33,800 | r | BRL | 31,254,920 | |
| senior note, 10.00%, 1/01/17 | Brazil | 142,250 | r | BRL | 44,280,555 | |
| senior note, 10.00%, 1/01/19 | Brazil | 25,000 | r | BRL | 7,634,429 | |
| q Uruguay Notas del Tesoro, 18, Index Linked, 2.25%, 8/23/17 | Uruguay | 138,904,812 | UYU | 4,769,675 | ||
| Total Foreign Government and Agency Securities | ||||||
| (Cost $961,663,298) | 851,951,633 | |||||
| U.S. Government and Agency Securities 5.2% | ||||||
| U.S. Treasury Bond, | ||||||
| 4.50%, 5/15/17 | United States | 8,000,000 | 8,169,528 | |||
| 7.125%, 2/15/23 | United States | 3,000,000 | 4,013,964 | |||
| 6.25%, 8/15/23 | United States | 4,000,000 | 5,210,392 | |||
| 6.875%, 8/15/25 | United States | 1,000,000 | 1,421,211 | |||
26 Semiannual Report
franklintempleton.com
FRANKLIN STRATEGIC SERIES
CONSOLIDATED STATEMENT OF INVESTMENTS (UNAUDITED)
| Franklin Strategic Income Fund (continued) | ||||
| Principal | ||||
| Country | Amount* | Value | ||
| U.S. Government and Agency Securities (continued) | ||||
| U.S. Treasury Bond, (continued) | ||||
| 6.50%, 11/15/26 | United States | 34,000,000 | $ | 48,600,756 |
| 5.25%, 2/15/29 | United States | 1,750,000 | 2,378,222 | |
| q Index Linked, 0.625%, 1/15/24 | United States | 51,557,971 | 53,913,707 | |
| q Index Linked, 2.375%, 1/15/25 | United States | 32,581,301 | 38,605,290 | |
| U.S. Treasury Note, | ||||
| 4.75%, 8/15/17 | United States | 7,000,000 | 7,223,944 | |
| 3.875%, 5/15/18 | United States | 22,000,000 | 23,050,588 | |
| 3.75%, 11/15/18 | United States | 39,000,000 | 41,253,147 | |
| 2.75%, 2/15/24 | United States | 33,000,000 | 35,538,822 | |
| 2.375%, 8/15/24 | United States | 5,000,000 | 5,251,660 | |
| q Index Linked, 2.125%, 1/15/19 | United States | 8,974,092 | 9,540,196 | |
| q Index Linked, 0.625%, 7/15/21 | United States | 10,685,855 | 11,216,386 | |
| q Index Linked, 0.125%, 7/15/24 | United States | 91,834,895 | 92,856,742 | |
| Total U.S. Government and Agency Securities | ||||
| (Cost $380,212,704) | 388,244,555 | |||
| Asset-Backed Securities and Commercial Mortgage- | ||||
| Backed Securities 9.4% | ||||
| Banks 1.9% | ||||
| Banc of America Commercial Mortgage Trust, 2006-4, AJ, 5.695%, | ||||
| 7/10/46 | United States | 7,001,265 | 6,955,255 | |
| l Bear Stearns Adjustable Rate Mortgage Trust, 2004-4, A6, FRN, | ||||
| 3.091%, 6/25/34 | United States | 13,671,806 | 13,732,403 | |
| Bear Stearns Commercial Mortgage Securities Trust, | ||||
| l 2006-PW11, AJ, FRN, 5.569%, 3/11/39 | United States | 19,604,000 | 18,850,144 | |
| 2006-PW13, AJ, 5.611%, 9/11/41 | United States | 2,797,681 | 2,809,911 | |
| l CD Mortgage Trust, 2006-CD3, AJ, FRN, 5.688%, 10/15/48 | United States | 21,795,000 | 12,877,576 | |
| l Citibank Credit Card Issuance Trust, | ||||
| 2013-A2, A2, FRN, 0.804%, 5/26/20 | United States | 7,230,000 | 7,243,808 | |
| 2013-A4, A4, FRN, 0.944%, 7/24/20 | United States | 7,666,000 | 7,695,694 | |
| Citigroup Commercial Mortgage Trust, | ||||
| 2006-C5, AJ, 5.482%, 10/15/49 | United States | 15,756,000 | 14,791,761 | |
| l 2007-C6, AM, FRN, 5.90%, 12/10/49. | United States | 14,650,000 | 14,865,425 | |
| l Commercial Mortgage Trust, 2006-GG7, AJ, FRN, 5.951%, 7/10/38 | United States | 12,633,000 | 11,661,030 | |
| CSAIL Commercial Mortgage Trust, 2015-C1, A4, 3.505%, 4/15/50 | United States | 10,050,000 | 10,712,024 | |
| l CWABS Asset-Backed Certificates Trust, 2005-11, AF4, FRN, 4.726%, | ||||
| 3/25/34 | United States | 2,800,000 | 2,832,805 | |
| l Merrill Lynch Mortgage Investors Trust, 2005-A6, 2A3, FRN, 0.914%, | ||||
| 8/25/35 | United States | 3,139,417 | 3,036,303 | |
| l Morgan Stanley Capital I Trust, | ||||
| 2007-IQ16, AM, FRN, 6.053%, 12/12/49 | United States | 3,102,000 | 3,216,736 | |
| 2007-IQ16, AMA, FRN, 6.252%, 12/12/49 | United States | 12,415,000 | 12,823,813 | |
| 144,104,688 | ||||
| Diversified Financials 7.5% | ||||
| e,l Ares Enhanced Loan Investment Strategy IR Ltd., 2013-IRAR, A2A, | ||||
| 144A, FRN, 2.782%, 7/23/25 | Cayman Islands | 8,410,000 | 8,354,914 | |
| e,l Ares Enhanced Loan Investment Strategy Ltd., 2013-IRAR, BR, 144A, | ||||
| FRN, 3.932%, 7/23/25. | United States | 9,000,000 | 8,958,240 | |
| e,l Atrium VIII, | ||||
| 8A, BR, 144A, FRN, 2.764%, 10/23/24 | Cayman Islands | 4,520,000 | 4,527,933 | |
| 8A, CR, 144A, FRN, 3.364%, 10/23/24 | Cayman Islands | 6,080,000 | 6,092,768 | |
franklintempleton.com
Semiannual Report 27
FRANKLIN STRATEGIC SERIES
CONSOLIDATED STATEMENT OF INVESTMENTS (UNAUDITED)
| Franklin Strategic Income Fund (continued) | ||||
| Principal | ||||
| Country | Amount* | Value | ||
| Asset-Backed Securities and Commercial Mortgage- | ||||
| Backed Securities (continued) | ||||
| Diversified Financials (continued) | ||||
| e,l Atrium X, 10A, C, 144A, FRN, 3.48%, 7/16/25 | United States | 13,950,000 | $ | 13,867,555 |
| e,l Atrium XI, 11A, C, 144A, FRN, 4.082%, 10/23/25 | Cayman Islands | 15,440,000 | 15,453,896 | |
| Banc of America Commercial Mortgage Trust, | ||||
| 2015-UBS7, A3, 3.441%, 9/15/48 | United States | 10,920,000 | 11,660,893 | |
| 2015-UBS7, A4, 3.705%, 9/15/48 | United States | 12,450,000 | 13,530,264 | |
| l Bank of America Credit Card Trust, 2005-A1, A, FRN, 0.865%, | ||||
| 6/15/20 | United States | 9,175,000 | 9,187,469 | |
| e,l BCAP LLC Trust, 2009-RR1, 2A2, 144A, FRN, 2.982%, 5/26/35 | United States | 9,473,234 | 9,056,743 | |
| e,l Burnham Park CLO Ltd., | ||||
| 2016-1A, A, 144A, FRN, 2.318%, 10/20/29 | Cayman Islands | 4,590,000 | 4,590,459 | |
| 2016-1A, B, 144A, FRN, 2.658%, 10/20/29 | Cayman Islands | 6,000,000 | 5,976,240 | |
| 2016-1A, C, 144A, FRN, 3.258%, 10/20/29 | Cayman Islands | 6,000,000 | 5,951,580 | |
| l Capital One Multi-Asset Execution Trust, | ||||
| 2014-A3, A3, FRN, 0.915%, 1/18/22 | United States | 4,265,000 | 4,277,422 | |
| 2016-A1, A1, FRN, 0.985%, 2/15/22 | United States | 32,250,000 | 32,403,055 | |
| 2016-A2, A2, FRN, 1.165%, 2/15/24 | United States | 44,033,000 | 44,307,264 | |
| e,l Carlyle Global Market Strategies CLO Ltd., | ||||
| 2012-4A, BR, 144A, FRN, 2.78%, 1/20/29 | United States | 6,540,000 | 6,550,627 | |
| 2012-4A, C1R, 144A, FRN, 3.48%, 1/20/29 | United States | 6,330,000 | 6,342,059 | |
| e,l Catamaran CLO Ltd., 2013-1A, C, 144A, FRN, 3.486%, 1/27/25 | United States | 11,250,000 | 11,114,662 | |
| e,l Cent CDO Ltd., 2007-15A, A2B, 144A, FRN, 1.185%, 3/11/21 | United States | 3,881,000 | 3,719,783 | |
| e,l Cent CLO LP, 2013-17A, B, 144A, FRN, 3.887%, 1/30/25 | United States | 7,450,980 | 7,522,882 | |
| l Chase Issuance Trust, | ||||
| 2012-A10, A10, FRN, 0.795%, 12/16/19 | United States | 5,205,000 | 5,212,711 | |
| 2013-A6, A6, FRN, 0.955%, 7/15/20 | United States | 12,040,000 | 12,095,563 | |
| e,l CIFC Funding Ltd., 2007-3A, A1J, 144A, FRN, 1.284%, 7/26/21 | United States | 3,578,729 | 3,557,794 | |
| e,l Cole Park CLO Ltd., 15-1A, B, 144A, FRN, 3.131%, 10/20/28 | Cayman Islands | 3,530,000 | 3,561,029 | |
| e Core Industrial Trust, 2015-CALW, A, 144A, 3.04%, 2/10/34 | United States | 15,065,000 | 15,758,439 | |
| e,l Cumberland Park CLO Ltd., | ||||
| 2015-2A, B, 144A, FRN, 2.981%, 7/20/26 | United States | 12,270,000 | 12,285,092 | |
| 2015-2A, C, 144A, FRN, 3.731%, 7/20/26 | United States | 1,850,000 | 1,846,300 | |
| l Discover Card Execution Note Trust, 2016-A2, A2, FRN, 1.075%, | ||||
| 9/15/21 | United States | 32,250,000 | 32,497,932 | |
| e,l Dryden 34 Senior Loan Fund, 2014-34A, B, 144A, FRN, 2.78%, | ||||
| 10/15/26 | Cayman Islands | 5,740,000 | 5,751,939 | |
| e,l Dryden XXV Senior Loan Fund, 2012-25A, CR, 144A, FRN, 3.354%, | ||||
| 1/15/25 | Cayman Islands | 4,949,000 | 4,949,000 | |
| e,l Eaton Vance CDO Ltd., | ||||
| 2014-1A, A, 144A, FRN, 2.33%, 7/15/26 | United States | 17,000,000 | 17,001,020 | |
| 2014-1A, B, 144A, FRN, 2.93%, 7/15/26 | United States | 4,320,500 | 4,325,814 | |
| 2014-1A, C, 144A, FRN, 3.88%, 7/15/26 | United States | 1,420,629 | 1,419,848 | |
| e,l Eleven Madison Trust Mortgage Trust, 2015-11MD, A, 144A, FRN, | ||||
| 3.555%, 9/10/35 | United States | 14,920,000 | 15,997,863 | |
| l FHLMC Structured Agency Credit Risk Debt Notes, | ||||
| 2014-DN1, M2, FRN, 2.734%, 2/25/24. | United States | 13,000,000 | 13,292,272 | |
| 2014-HQ2, M2, FRN, 2.734%, 9/25/24 | United States | 14,600,000 | 14,991,537 | |
| 2015-HQ1, M2, FRN, 2.734%, 3/25/25 | United States | 9,200,000 | 9,308,619 | |
28 Semiannual Report
franklintempleton.com
FRANKLIN STRATEGIC SERIES
CONSOLIDATED STATEMENT OF INVESTMENTS (UNAUDITED)
| Franklin Strategic Income Fund (continued) | ||||
| Principal | ||||
| Country | Amount* | Value | ||
| Asset-Backed Securities and Commercial Mortgage- | ||||
| Backed Securities (continued) | ||||
| Diversified Financials (continued) | ||||
| e,l Flagship CLO VIII Ltd., 2014-8A, A, 144A, FRN, 2.44%, 1/16/26 | Cayman Islands | 6,880,000 | $ | 6,903,117 |
| e,l Galaxy CLO Ltd., | ||||
| 2014-17A, AR, 144A, FRN, 2.28%, 7/15/26 | Cayman Islands | 9,540,000 | 9,550,303 | |
| 2014-17A, BR, 144A, FRN, 2.68%, 7/15/26 | Cayman Islands | 6,190,000 | 6,200,523 | |
| 2014-17A, C1R, 144A, FRN, 3.28%, 7/15/26 | Cayman Islands | 3,070,000 | 3,076,309 | |
| e G-Force LLC, 2005-RRA, C, 144A, 5.20%, 8/22/36. | United States | 11,144,000 | 10,744,655 | |
| l Impac Secured Assets Trust, 2007-2, FRN, 0.784%, 4/25/37 | United States | 3,280,592 | 2,996,491 | |
| e,l Invitation Homes Trust, 2015-SFR1, A, 144A, FRN, 1.985%, 3/17/32 | United States | 8,952,652 | 9,013,700 | |
| JP Morgan Chase Commercial Mortgage Securities Trust, 2006-CB17, | ||||
| AM, 5.464%, 12/12/43. | United States | 17,740,000 | 17,725,771 | |
| e,l LCM XVI LP, 16A, B, 144A, FRN, 2.88%, 7/15/26 | Cayman Islands | 7,650,000 | 7,674,671 | |
| e,l,t LCM XVII LP, | ||||
| 2017A, BR, FRN, 144A, 2.74%, 10/15/26. | United States | 4,590,000 | 4,590,000 | |
| 2017A, CR, 144A, FRN, 3.39%, 10/15/26 | United States | 4,240,000 | 4,240,000 | |
| l MortgageIT Trust, | ||||
| 2004-1, A2, FRN, 1.434%, 11/25/34 | United States | 3,820,359 | 3,643,233 | |
| 2005-5, A1, FRN, 0.794%, 12/25/35 | United States | 3,147,943 | 2,892,427 | |
| e,l Octagon Investment Partners XVII Ltd., 13-1A, B1, 144A, FRN, | ||||
| 2.582%, 10/25/25 | Cayman Islands | 5,660,000 | 5,658,727 | |
| e,l Octagon Investment Partners XXIII Ltd., 2015-1A, B, 144A, FRN, | ||||
| 2.88%, 7/15/27 | Cayman Islands | 4,590,000 | 4,617,081 | |
| l Opteum Mortgage Acceptance Corp. Trust, 2005-4, 1APT, FRN, | ||||
| 0.844%, 11/25/35 | United States | 5,380,043 | 5,076,504 | |
| l Structured Asset Mortgage Investments Trust, 2003-AR2, A1, FRN, | ||||
| 1.268%, 12/19/33 | United States | 4,897,231 | 4,720,836 | |
| l Structured Asset Securities Corp., 2005-2XS, 2A2, FRN, 2.025%, | ||||
| 2/25/35 | United States | 3,787,005 | 3,633,818 | |
| l Thornburg Mortgage Securities Trust, | ||||
| 2005-1, A3, FRN, 2.373%, 4/25/45 | United States | 5,030,859 | 5,051,528 | |
| 2005-2, A1, FRN, 2.775%, 7/25/45 | United States | 3,007,908 | 2,921,123 | |
| e,l Voya CLO Ltd., | ||||
| 2013-1A, B, 144A, FRN, 3.78%, 4/15/24 | United States | 2,740,000 | 2,734,575 | |
| 2013-2A, B, 144A, FRN, 3.562%, 4/25/25 | United States | 10,770,000 | 10,606,296 | |
| 2015-2A, B, 144A, FRN, 2.862%, 7/23/27 | Cayman Islands | 9,290,000 | 9,305,236 | |
| Wells Fargo Mortgage Backed Securities Trust, | ||||
| l 2004-W, A9, FRN, 2.99%, 11/25/34 | United States | 2,277,326 | 2,310,521 | |
| 2007-3, 3A1, 5.50%, 4/25/22 | United States | 554,747 | 568,715 | |
| e,l Westchester CLO Ltd., 2007-1A, A1A, 144A, FRN, 0.982%, 8/01/22 | United States | 3,807,283 | 3,782,612 | |
| 557,538,252 | ||||
| Total Asset-Backed Securities and Commercial | ||||
| Mortgage-Backed Securities (Cost $704,971,662) | 701,642,940 | |||
| Mortgage-Backed Securities 10.1% | ||||
| l Federal Home Loan Mortgage Corp. (FHLMC) Adjustable Rate | ||||
| 0.0%† | ||||
| FHLMC, 2.681%, 1/01/33 | United States | 79,021 | 82,326 | |
| Federal Home Loan Mortgage Corp. (FHLMC) Fixed Rate 4.9% | ||||
| FHLMC Gold 15 Year, 4.50%, 10/01/18 - 9/01/19 | United States | 280,701 | 288,600 | |
| FHLMC Gold 15 Year, 5.00%, 12/01/17 - 7/01/22 | United States | 404,535 | 421,518 | |
| FHLMC Gold 15 Year, 5.50%, 7/01/17 - 2/01/19 | United States | 28,239 | 28,755 | |
franklintempleton.com
Semiannual Report 29
FRANKLIN STRATEGIC SERIES
CONSOLIDATED STATEMENT OF INVESTMENTS (UNAUDITED)
| Franklin Strategic Income Fund (continued) | ||||
| Principal | ||||
| Country | Amount* | Value | ||
| Mortgage-Backed Securities (continued) | ||||
| Federal Home Loan Mortgage Corp. (FHLMC) Fixed | ||||
| Rate (continued) | ||||
| u FHLMC Gold 30 Year, 3.00%, 11/01/46 | United States | 142,000,000 | $ | 146,198,987 |
| FHLMC Gold 30 Year, 3.50%, 8/01/46. | United States | 49,552,245 | 52,081,111 | |
| FHLMC Gold 30 Year, 4.00%, 6/01/46. | United States | 145,624,503 | 156,152,275 | |
| FHLMC Gold 30 Year, 4.00%, 8/01/46. | United States | 7,457,300 | 7,991,671 | |
| FHLMC Gold 30 Year, 4.50%, 10/01/40 | United States | 236,485 | 259,614 | |
| FHLMC Gold 30 Year, 5.00%, 5/01/27 - 2/01/38 | United States | 1,972,178 | 2,188,435 | |
| FHLMC Gold 30 Year, 5.50%, 6/01/33 - 6/01/36 | United States | 1,392,475 | 1,593,258 | |
| FHLMC Gold 30 Year, 6.00%, 6/01/33 - 6/01/37 | United States | 382,686 | 438,474 | |
| FHLMC Gold 30 Year, 6.50%, 10/01/21 - 6/01/36 | United States | 253,128 | 290,582 | |
| FHLMC Gold 30 Year, 7.00%, 9/01/21 - 8/01/32 | United States | 39,792 | 42,864 | |
| FHLMC Gold 30 Year, 7.50%, 1/01/26 - 1/01/31 | United States | 8,351 | 9,735 | |
| FHLMC Gold 30 Year, 8.00%, 11/01/25 - 1/01/26 | United States | 232 | 240 | |
| FHLMC Gold 30 Year, 9.00%, 12/01/24 | United States | 136 | 156 | |
| 367,986,275 | ||||
| l Federal National Mortgage Association (FNMA) Adjustable Rate | ||||
| 0.0%† | ||||
| FNMA, 2.613% - 2.792%, 4/01/20 - 12/01/34 | United States | 240,070 | 253,078 | |
| Federal National Mortgage Association (FNMA) Fixed Rate 3.4% | ||||
| FNMA 15 Year, 4.50%, 3/01/20 | United States | 61,247 | 63,250 | |
| FNMA 15 Year, 5.00%, 1/01/18 - 6/01/18 | United States | 49,516 | 50,831 | |
| FNMA 15 Year, 5.50%, 11/01/16 - 4/01/22 | United States | 170,794 | 178,181 | |
| FNMA 30 Year, 2.50%, 7/01/27 | United States | 457,954 | 471,795 | |
| u FNMA 30 Year, 3.00%, 11/01/46. | United States | 160,000,000 | 164,750,005 | |
| FNMA 30 Year, 3.50%, 7/01/46 | United States | 71,675,033 | 75,290,355 | |
| FNMA 30 Year, 4.50%, 3/01/28 - 2/01/41 | United States | 747,198 | 819,032 | |
| FNMA 30 Year, 5.00%, 9/01/23 - 10/01/35 | United States | 2,188,320 | 2,426,922 | |
| FNMA 30 Year, 5.50%, 9/01/33 - 12/01/35 | United States | 1,851,643 | 2,104,098 | |
| FNMA 30 Year, 6.00%, 6/01/34 - 5/01/38 | United States | 3,787,925 | 4,358,258 | |
| FNMA 30 Year, 6.50%, 3/01/28 - 10/01/37 | United States | 619,143 | 712,927 | |
| FNMA 30 Year, 7.50%, 10/01/29. | United States | 8,490 | 9,857 | |
| FNMA 30 Year, 8.00%, 1/01/25 - 5/01/26 | United States | 4,326 | 5,170 | |
| FNMA 30 Year, 8.50%, 7/01/25 | United States | 504 | 520 | |
| 251,241,201 | ||||
| Government National Mortgage Association (GNMA) Fixed Rate | ||||
| 1.8% | ||||
| GNMA I SF 30 Year, 5.00%, 6/15/34 - 7/15/34 | United States | 223,692 | 251,252 | |
| GNMA I SF 30 Year, 5.50%, 2/15/33 - 6/15/36 | United States | 667,747 | 762,947 | |
| GNMA I SF 30 Year, 6.00%, 8/15/36 | United States | 57,713 | 67,084 | |
| GNMA I SF 30 Year, 6.50%, 12/15/28 - 3/15/32 | United States | 52,364 | 60,217 | |
| GNMA I SF 30 Year, 7.00%, 11/15/27 - 5/15/28 | United States | 22,869 | 25,107 | |
| GNMA I SF 30 Year, 7.50%, 9/15/23 - 5/15/27 | United States | 3,221 | 3,597 | |
| GNMA I SF 30 Year, 8.00%, 2/15/25 - 9/15/27 | United States | 4,651 | 5,206 | |
| GNMA I SF 30 Year, 8.50%, 8/15/24 | United States | 77 | 86 | |
| GNMA I SF 30 Year, 9.00%, 1/15/25 | United States | 291 | 292 | |
| GNMA I SF 30 Year, 9.50%, 6/15/25 | United States | 511 | 513 | |
| u GNMA II SF 30 Year, 3.00%, 11/01/46 | United States | 77,000,000 | 80,206,329 | |
| GNMA II SF 30 Year, 3.50%, 8/20/46 | United States | 50,578,630 | 53,637,557 | |
| GNMA II SF 30 Year, 5.00%, 9/20/33 - 11/20/33 | United States | 336,351 | 377,585 | |
| GNMA II SF 30 Year, 5.50%, 6/20/34 | United States | 168,012 | 190,531 | |
30 Semiannual Report
franklintempleton.com
FRANKLIN STRATEGIC SERIES
CONSOLIDATED STATEMENT OF INVESTMENTS (UNAUDITED)
| Franklin Strategic Income Fund (continued) | ||||
| Principal | ||||
| Country | Amount* | Value | ||
| Mortgage-Backed Securities (continued) | ||||
| Government National Mortgage Association (GNMA) Fixed | ||||
| Rate (continued) | ||||
| GNMA II SF 30 Year, 6.00%, 11/20/34 | United States | 151,035 | $ | 177,224 |
| GNMA II SF 30 Year, 6.50%, 7/20/28 - 12/20/31 | United States | 80,359 | 94,997 | |
| GNMA II SF 30 Year, 7.50%, 4/20/32 | United States | 19,140 | 21,862 | |
| 135,882,386 | ||||
| Total Mortgage-Backed Securities | ||||
| (Cost $756,288,505) | 755,445,266 | |||
| Municipal Bonds 0.9% | ||||
| Illinois State GO, Build America Bonds, 7.35%, 7/01/35 | United States | 8,000,000 | 8,978,240 | |
| New Jersey EDA Revenue, School Facilities Construction, Refunding, | ||||
| Series NN, 5.00%, 3/01/30. | United States | 5,200,000 | 5,685,368 | |
| New York City HDC Capital Fund Grant Program Revenue, New York | ||||
| City Housing Authority Program, Series B1, 5.00%, 7/01/33. | United States | 3,500,000 | 4,106,410 | |
| Port Authority of New York and New Jersey Revenue, Consolidated, | ||||
| One Hundred Ninety-First Series, 4.823%, 6/01/45 | United States | 14,165,000 | 15,468,605 | |
| Puerto Rico Electric Power Authority Power Revenue, | ||||
| Series A, 6.75%, 7/01/36 | United States | 30,900,000 | 21,197,400 | |
| Series XX, 5.25%, 7/01/40 | United States | 15,000,000 | 10,200,000 | |
| Total Municipal Bonds (Cost $68,463,476) | 65,636,023 | |||
| Shares | ||||
| Escrows and Litigation Trusts 0.0%† | ||||
| a,f Midstates Petroleum Co. Inc./Midstates Petroleum Co. LLC, Escrow | ||||
| Account | United States | 15,000,000 | — | |
| a,f NewPage Corp., Litigation Trust | United States | 14,000,000 | — | |
| a,f Penn Virginia Corp., Escrow Account | United States | 15,000,000 | 375,000 | |
| a,f Vistra Energy Corp., Escrow Account | United States | 30,000,000 | 348,000 | |
| a,f Vistra Energy Corp., Escrow Account | United States | 513,780 | 950,492 | |
| Total Escrows and Litigation Trusts (Cost $—) | 1,673,492 | |||
| Notional | ||||
| Counterparty | Amount* | |||
| Options Purchased 0.0%† | ||||
| Calls - Over-the-Counter | ||||
| Currency Options 0.0%† | ||||
| USD/KRW, November Strike Price 1149 KRW, Expires 11/18/16 | JPHQ | 38,000,000 | 300,542 | |
| USD/MXN, November Strike Price 20.30 MXN, Expires 11/18/16 | JPHQ | 38,000,000 | 136,116 | |
| USD/MXN, November Strike Price 20.50 MXN, Expires 11/18/16 | JPHQ | 38,000,000 | 102,410 | |
| Puts - Over-the-Counter | ||||
| Credit Default Swaptions 0.0%† | ||||
| Buy protection on CDX.NA.HY.27, Premium Rate 5.00%, Strike Price | ||||
| $103, Expires 11/16/16 | FBCO | 76,000,000 | 217,968 | |
franklintempleton.com
Semiannual Report 31
FRANKLIN STRATEGIC SERIES
CONSOLIDATED STATEMENT OF INVESTMENTS (UNAUDITED)
| Franklin Strategic Income Fund (continued) | ||||||
| Notional | ||||||
| Counterparty | Amount* | Value | ||||
| Options Purchased (continued) | ||||||
| Puts - Over-the-Counter (continued) | ||||||
| Currency Options 0.0%† | ||||||
| CAD/JPY, November Strike Price 75.50 JPY, Expires 11/18/16 | CITI | 50,000,000 | CAD | $ | 172,462 | |
| Total Options Purchased (Cost $3,055,380) | 929,498 | |||||
| Total Investments before Short Term Investments | ||||||
| (Cost $7,746,887,476) | 7,520,945,953 | |||||
| Principal | ||||||
| Country | Amount* | |||||
| Short Term Investments 4.4% | ||||||
| U.S. Government and Agency Securities (Cost $3,095,383) 0.1% | ||||||
| v,w U.S. Treasury Bill, 3/02/17 | United States | 3,100,000 | 3,096,404 | |||
| Total Investments before Money Market Funds | ||||||
| (Cost $7,749,982,859) | 7,524,042,357 | |||||
| Shares | ||||||
| Money Market Funds (Cost $323,347,720) 4.3% | ||||||
| a,g Institutional Fiduciary Trust Money Market Portfolio | United States | 323,347,720 | 323,347,720 | |||
| Total Investments (Cost $8,073,330,579) 105.0% | 7,847,390,077 | |||||
| Other Assets, less Liabilities (5.0)%. | (371,958,472 | ) | ||||
| Net Assets 100.0%. | $ | 7,475,431,605 | ||||
32 Semiannual Report
franklintempleton.com
FRANKLIN STRATEGIC SERIES
CONSOLIDATED STATEMENT OF INVESTMENTS (UNAUDITED)
Franklin Strategic Income Fund (continued)
†Rounds to less than 0.1% of net assets.
*The principal/notional amount is stated in U.S. dollars unless otherwise indicated.
aNon-income producing.
bThe security is owned by FT Holdings Corporation II, a wholly-owned subsidiary of the Fund. See Note 1(g).
cAt October 31, 2016, pursuant to the Fund’s policies and the requirements of applicable securities law, the Fund is restricted from trading these securities at period end.
dSee Note 8 regarding restricted securities.
eSecurity was purchased pursuant to Rule 144A under the Securities Act of 1933 and may be sold in transactions exempt from registration only to qualified institutional buyers
or in a public offering registered under the Securities Act of 1933. These securities have been deemed liquid under guidelines approved by the Trust’s Board of Trustees. At
October 31, 2016, the aggregate value of these securities was $1,607,459,560, representing 21.5% of net assets.
fSecurity has been deemed illiquid because it may not be able to be sold within seven days. At October 31, 2016, the aggregate value of these securities was $21,240,757,
representing 0.3% of net assets.
gSee Note 3(f) regarding investments in affiliated management investment companies.
hPerpetual security with no stated maturity date.
iSee Note 7 regarding defaulted securities.
jSee Note 1(f) regarding loan participation notes.
kIncome may be received in additional securities and/or cash.
lThe coupon rate shown represents the rate at period end.
mSee Note 1(i) regarding senior floating rate interests.
nA portion or all of the security purchased on a delayed delivery basis. See Note 1(c).
oPrincipal amount is stated in 100 Mexican Peso Units.
pThe principal represents the notional amount. See Note 1(d) regarding value recovery instruments.
qPrincipal amount of security is adjusted for inflation. See Note 1(k).
rPrincipal amount is stated in 1,000 Brazilian Real Units.
sRedemption price at maturity is adjusted for inflation. See Note 1(k).
tSecurity purchased on a when-issued basis. See Note 1(c).
uSecurity purchased on a to-be-announced (TBA) basis. See Note 1(c).
vThe security was issued on a discount basis with no stated coupon rate.
wA portion or all of the security has been segregated as collateral for open futures contracts. At October 31, 2016, the value of this security and/or cash pledged amounted to
$2,714,247, representing less than 0.1% of net assets.
franklintempleton.com
Semiannual Report 33
FRANKLIN STRATEGIC SERIES
CONSOLIDATED STATEMENT OF INVESTMENTS (UNAUDITED)
| Franklin Strategic Income Fund (continued) | ||||||||||||
| At October 31, 2016, the Fund had the following financial futures contracts outstanding. See Note 1(d). | ||||||||||||
| Financial Futures Contracts | ||||||||||||
| Number of | Notional Expiration | Unrealized | Unrealized | |||||||||
| Description | Type | Contracts | Value | Date Appreciation | Depreciation | |||||||
| Interest Rate Contracts | ||||||||||||
| Euro-Bund | Long | 145 | $ | 25,810,856 | 12/08/16 | $ | — | $ | (541,467 | ) | ||
| Long Gilt | Long | 496 | 76,103,736 | 12/28/16 | — | (2,671,975 | ) | |||||
| U.S. 10 Yr. Ultra | Long | 361 | 51,087,141 | 12/20/16 | — | (892,216 | ) | |||||
| Total Financial Futures Contracts | $ | — | $ | (4,105,658 | ) | |||||||
| Net unrealized appreciation (depreciation) | $ | (4,105,658 | ) | |||||||||
| At October 31, 2016, the Fund had the following forward exchange contracts outstanding. See Note 1(d). | ||||||||||||
| Forward Exchange Contracts | ||||||||||||
| Contract | Settlement | Unrealized | Unrealized | |||||||||
| Currency | Counterpartya Type | Quantity | Amount | Date | Appreciation | Depreciation | ||||||
| OTC Forward Exchange Contracts | ||||||||||||
| Canadian Dollar. | JPHQ | Sell | 50,000,000 | $ | 37,985,839 | 12/15/16 | $ | 708,265 | $ | — | ||
| Indian Rupee. | DBAB | Buy | 1,472,000,000 | 21,379,811 | 12/15/16 | 555,275 | — | |||||
| Indian Rupee. | DBAB | Sell | 1,472,000,000 | 21,333,333 | 12/15/16 | — | (601,753 | ) | ||||
| Japanese Yen | BZWS | Buy | 386,912,500 | 3,719,490 | 12/15/16 | — | (23,330 | ) | ||||
| Japanese Yen | BZWS | Sell | 386,912,500 | 3,668,895 | 12/15/16 | — | (27,264 | ) | ||||
| Japanese Yen | DBAB | Buy | 4,562,115,000 | 43,870,709 | 12/15/16 | — | (289,008 | ) | ||||
| Japanese Yen | DBAB | Sell | 4,562,115,000 | 43,368,998 | 12/15/16 | — | (212,703 | ) | ||||
| Japanese Yen | JPHQ | Buy | 2,136,360,000 | 20,535,012 | 12/15/16 | — | (126,451 | ) | ||||
| Japanese Yen | JPHQ | Sell | 2,136,360,000 | 20,286,971 | 12/15/16 | — | (121,591 | ) | ||||
| Japanese Yen | MSCO | Buy | 39,600,000 | 380,791 | 12/15/16 | — | (2,494 | ) | ||||
| Japanese Yen | MSCO | Sell | 39,600,000 | 375,622 | 12/15/16 | — | (2,675 | ) | ||||
| Malaysian Ringgit | DBAB | Buy | 706,000 | 171,776 | 12/15/16 | — | (3,723 | ) | ||||
| Malaysian Ringgit | HSBK | Buy | 1,130,000 | 274,272 | 12/15/16 | — | (5,291 | ) | ||||
| Malaysian Ringgit | JPHQ | Buy | 2,290,000 | 541,819 | 12/15/16 | 3,282 | — | |||||
| Mexican Peso | JPHQ | Sell | 387,000,000 | 19,440,886 | 12/15/16 | — | (960,096 | ) | ||||
| South Korean Won | JPHQ | Sell | 96,100,000,000 | 82,063,106 | 12/15/16 | — | (1,941,309 | ) | ||||
| Australian Dollar | JPHQ | Sell | 72,000,000 | 53,703,000 | 2/23/17 | — | (933,975 | ) | ||||
| British Pound. | JPHQ | Sell | 10,000,000 | 13,192,500 | 2/23/17 | 918,656 | — | |||||
| Euro | JPHQ | Buy | 13,500,000 | 15,257,498 | 2/23/17 | — | (358,527 | ) | ||||
| Euro | JPHQ | Sell | 158,000,000 | 175,248,070 | 2/23/17 | 874,933 | — | |||||
| Indian Rupee. | JPHQ | Buy | 2,886,000,000 | 41,537,133 | 2/23/17 | 1,054,094 | — | |||||
| Indian Rupee. | JPHQ | Sell | 557,000,000 | 8,176,747 | 2/23/17 | — | (43,389 | ) | ||||
| Japanese Yen | JPHQ | Buy | 9,900,000,000 | 98,948,349 | 2/23/17 | — | (4,078,075 | ) | ||||
| Japanese Yen | JPHQ | Sell | 15,400,000,000 | 148,574,075 | 2/23/17 | 998,094 | — | |||||
| Australian Dollar | DBAB | Sell | 72,000,000 | 53,632,080 | 4/27/17 | — | (929,812 | ) | ||||
| Australian Dollar | JPHQ | Sell | 21,200,000 | 16,001,442 | 4/27/17 | — | (64,004 | ) | ||||
| British Pound. | JPHQ | Sell | 11,500,000 | 15,433,460 | 4/27/17 | 1,300,862 | — | |||||
| Euro | DBAB | Buy | 10,700,000 | 11,756,090 | 4/27/17 | 86,467 | — | |||||
| Euro | DBAB | Sell | 158,000,000 | 175,841,360 | 4/27/17 | 969,952 | — | |||||
| Euro | JPHQ | Sell | 14,400,000 | 16,352,928 | 4/27/17 | 415,281 | — | |||||
| Indian Rupee. | DBAB | Buy | 2,886,000,000 | 41,228,571 | 4/27/17 | 976,793 | — | |||||
| Japanese Yen | DBAB | Sell | 15,400,000,000 | 149,054,376 | 4/27/17 | 1,065,179 | — | |||||
34 Semiannual Report
franklintempleton.com
FRANKLIN STRATEGIC SERIES CONSOLIDATED STATEMENT OF INVESTMENTS (UNAUDITED)
Franklin Strategic Income Fund (continued)
Forward Exchange Contracts (continued)
| Contract | Settlement | Unrealized | Unrealized | |||||||
| Currency | Counterpartya Type | Quantity | Amount | Date | Appreciation | Depreciation | ||||
| OTC Forward Exchange Contracts (continued) | ||||||||||
| British Pound. | JPHQ Sell | 8,300,000 | $ | 10,951,850 | 8/15/18 | $ | 645,388 | $ | — | |
| Total Forward Exchange Contracts | $ | 10,572,521 | $ | (10,725,470 | ) | |||||
| Net unrealized appreciation (depreciation) | $ | (152,949 | ) | |||||||
| aMay be comprised of multiple contracts with the same counterparty, currency and settlement date. | ||||||||||
| At October 31, 2016, the Fund had the following credit default swap contracts outstanding. See Note 1(d). | |||||||||||||||||||
| Credit Default Swap Contracts | |||||||||||||||||||
| Unamortized | |||||||||||||||||||
| Periodic | Counter- | Upfront | |||||||||||||||||
| Payment | party/ | Notional | Expiration | Payments | Unrealized | Unrealized | |||||||||||||
| Description | Rate | Exchange | Amounta | Date | (Receipts) | Appreciation | Depreciation | Value | Ratingb | ||||||||||
| Centrally Cleared Swap Contract | |||||||||||||||||||
| Contracts to Buy Protection | |||||||||||||||||||
| Traded Index | |||||||||||||||||||
| CDX.NA.HY.27 | 5.00 | % | ICE | $ | 89,000,000 | 12/20/21 | $ | (2,890,253 | ) | $ | – | $ | (634,462 | ) | $ | (3,524,715 | ) | ||
| OTC Swap Contracts | |||||||||||||||||||
| Contracts to Buy Protection | |||||||||||||||||||
| Single Name | |||||||||||||||||||
| The Royal Bank of | |||||||||||||||||||
| ScotlandPLC | 1.00 | % | JPHQ | 4,700,000 | EUR | 6/20/21 | 542,379 | – | (174,582 | ) | 367,797 | ||||||||
| Contracts to Sell Protectionc | |||||||||||||||||||
| Traded Index | |||||||||||||||||||
| MCDX.NA.27 | 1.00 | % | CITI | 123,700,000 | 12/20/21 | 1,269,408 | – | (379,446 | ) | 889,962 | Investment | ||||||||
| Grade | |||||||||||||||||||
| TotalOTCSwapContracts | 1,811,787 | – | (554,028 | ) | 1,257,759 | ||||||||||||||
| TotalCreditDefaultSwapContracts | $ | (1,078,466 | ) | $ | – | $ | (1,188,490 | ) | $ | (2,266,956 | ) | ||||||||
| Netunrealizedappreciation(depreciation) | $ | (1,188,490 | ) | ||||||||||||||||
aIn U.S. dollars unless otherwise indicated. For contracts to sell protection, the notional amount is equal to the maximum potential amount of the future payments and no
recourse provisions have been entered into in association with the contracts.
bBased on Standards and Poor’s (S&P) Rating for single name swaps and internal ratings for index swaps. Internal ratings based on mapping into equivalent ratings from
external vendors.
cThe Fund enters contracts to sell protection to create a long credit position. Performance triggers include default, bankruptcy or restructuring for single name swaps and
failure to pay or bankruptcy of the underlying securities for traded index swaps.
franklintempleton.com
Semiannual Report 35
FRANKLIN STRATEGIC SERIES
CONSOLIDATED STATEMENT OF INVESTMENTS (UNAUDITED)
| Franklin Strategic Income Fund (continued) | ||||||||
| At October 31, 2016, the Fund had the following total return swap contracts outstanding. See Note 1(d). | ||||||||
| Total Return Swap Contracts | ||||||||
| Notional | Expiration | Unrealized | Unrealized | |||||
| Underlying Instruments | Financing Rate | Counterparty | Value | Date | Appreciation | Depreciation | ||
| OTC Swap Contracts | ||||||||
| Long | ||||||||
| iBoxx USD Liquid HY Index | 3-Month BBA USD LIBOR | GSCO | $ | 17,500,000 | 3/20/17 | $ | 939,303 | $ — |
| Net unrealized appreciation (depreciation) | $ | 939,303 | ||||||
See Note 10 regarding other derivative information.
See Abbreviations on page 56.
36 Semiannual Report | The accompanying notes are an integral part of these financial statements. franklintempleton.com
FRANKLIN STRATEGIC SERIES
Consolidated Financial Statements
Consolidated Statement of Assets and Liabilities
October 31, 2016 (unaudited)
| Franklin Strategic Income Fund | |||
| Assets: | |||
| Investments in securities: | |||
| Cost - Unaffiliated issuers | $ | 7,092,511,573 | |
| Cost - Controlled affiliates (Note 3f) | 657,471,286 | ||
| Cost - Non-controlled affiliates (Note 3f) | 323,347,720 | ||
| Total cost of investments | $ | 8,073,330,579 | |
| Value - Unaffiliated issuers | $ | 6,849,293,073 | |
| Value - Controlled affiliates (Note 3f) | 674,749,284 | ||
| Value - Non-controlled affiliates (Note 3f) | 323,347,720 | ||
| Total value of investments | 7,847,390,077 | ||
| Cash. | 21,491,396 | ||
| Restricted Cash (Note 1e) | 3,740,000 | ||
| Foreign currency, at value (cost $6,570,144) | 6,594,383 | ||
| Receivables: | |||
| Investment securities sold | 16,516,609 | ||
| Capital shares sold | 9,588,712 | ||
| Dividends and interest | 63,890,440 | ||
| Due from brokers | 6,809,069 | ||
| Variation margin | 289,383 | ||
| OTC swap contracts (upfront payments $1,867,064) | 1,811,787 | ||
| Unrealized appreciation on OTC forward exchange contracts | 10,572,521 | ||
| Unrealized appreciation on OTC swap contracts | 939,303 | ||
| Other assets | 4,818 | ||
| Total assets | 7,989,638,498 | ||
| Liabilities: | |||
| Payables: | |||
| Investment securities purchased | 465,573,140 | ||
| Capital shares redeemed | 24,538,450 | ||
| Management fees | 2,515,761 | ||
| Distribution fees | 1,853,465 | ||
| Transfer agent fees | 1,903,708 | ||
| Distributions to shareholders | 467,579 | ||
| Due to brokers | 5,020,000 | ||
| Unrealized depreciation on OTC forward exchange contracts | 10,725,470 | ||
| Unrealized depreciation on OTC swap contracts | 554,028 | ||
| Unrealized depreciation on unfunded loan commitments (Note 9) | 8,667 | ||
| Deferred tax. | 418,867 | ||
| Accrued expenses and other liabilities. | 627,758 | ||
| Total liabilities | 514,206,893 | ||
| Net assets, at value | $ | 7,475,431,605 | |
| Net assets consist of: | |||
| Paid-in capital | $ | 8,070,354,674 | |
| Distributions in excess of net investment income | (72,495,637 | ) | |
| Net unrealized appreciation (depreciation) | (231,226,853 | ) | |
| Accumulated net realized gain (loss) | (291,200,579 | ) | |
| Net assets, at value | $ | 7,475,431,605 | |
franklintempleton.com The accompanying notes are an integral part of these financial statements. | Semiannual Report 37
| FRANKLIN STRATEGIC SERIES | ||
| CONSOLIDATED FINANCIAL STATEMENTS | ||
| Franklin Strategic Income Fund (continued) | ||
| Class A: | ||
| Net assets, at value | $ | 4,264,537,908 |
| Shares outstanding. | 441,817,982 | |
| Net asset value per sharea | $ | 9.65 |
| Maximum offering price per share (net asset value per share ÷ 95.75%) | $ | 10.08 |
| Class C: | ||
| Net assets, at value | $ | 1,548,806,908 |
| Shares outstanding. | 160,502,267 | |
| Net asset value and maximum offering price per sharea | $ | 9.65 |
| Class R: | ||
| Net assets, at value | $ | 168,960,249 |
| Shares outstanding. | 17,569,236 | |
| Net asset value and maximum offering price per share | $ | 9.62 |
| Class R6: | ||
| Net assets, at value | $ | 515,589,015 |
| Shares outstanding. | 53,339,447 | |
| Net asset value and maximum offering price per share | $ | 9.67 |
| Advisor Class: | ||
| Net assets, at value | $ | 977,537,525 |
| Shares outstanding. | 101,175,517 | |
| Net asset value and maximum offering price per share | $ | 9.66 |
aRedemption price is equal to net asset value less contingent deferred sales charges, if applicable.
38 Semiannual Report | The accompanying notes are an integral part of these financial statements. franklintempleton.com
FRANKLIN STRATEGIC SERIES
CONSOLIDATED FINANCIAL STATEMENTS
Consolidated Statement of Operations
for the six months ended October 31, 2016 (unaudited)
| Franklin Strategic Income Fund | |||
| Investment income: | |||
| Dividends: | |||
| Unaffiliated issuers | $ | 975,456 | |
| Controlled affiliates (Note 3f) | 30,850,293 | ||
| Interest. | 156,128,154 | ||
| Total investment income | 187,953,903 | ||
| Expenses: | |||
| Management fees (Note 3a) | 17,269,849 | ||
| Distribution fees: (Note 3c) | |||
| Class A. | 5,561,465 | ||
| Class C | 5,224,099 | ||
| Class R | 440,889 | ||
| Transfer agent fees: (Note 3e) | |||
| Class A. | 3,403,189 | ||
| Class C | 1,238,600 | ||
| Class R | 134,884 | ||
| Class R6. | 1,502 | ||
| Advisor Class | 720,591 | ||
| Custodian fees (Note 4) | 319,502 | ||
| Reports to shareholders | 398,719 | ||
| Registration and filing fees | 176,625 | ||
| Professional fees | 108,713 | ||
| Trustees’ fees and expenses | 42,234 | ||
| Other | 189,187 | ||
| Total expenses | 35,230,048 | ||
| Expense reductions (Note 4) | (35,380 | ) | |
| Expenses waived/paid by affiliates (Note 3f) | (2,920,434 | ) | |
| Net expenses | 32,274,234 | ||
| Net investment income | 155,679,669 | ||
| Realized and unrealized gains (losses): | |||
| Net realized gain (loss) from: | |||
| Investments: | |||
| Unaffiliated issuers | (33,616,413 | ) | |
| Controlled affiliates (Note 3f) | (614,734 | ) | |
| Foreign currency transactions | (31,706,256 | ) | |
| Futures contracts | 411,607 | ||
| Swap contracts | 1,189,106 | ||
| Net realized gain (loss) | (64,336,690 | ) | |
| Net change in unrealized appreciation (depreciation) on: | |||
| Investments. | 216,558,248 | ||
| Translation of other assets and liabilities | |||
| denominated in foreign currencies | 45,334,930 | ||
| Futures contracts | (4,105,658 | ) | |
| Swap contracts | (594,043 | ) | |
| Change in deferred taxes on unrealized appreciation | 151,240 | ||
| Net change in unrealized appreciation (depreciation) | 257,344,717 | ||
| Net realized and unrealized gain (loss) | 193,008,027 | ||
| Net increase (decrease) in net assets resulting from operations | $ | 348,687,696 | |
franklintempleton.com The accompanying notes are an integral part of these financial statements. | Semiannual Report 39
| FRANKLIN STRATEGIC SERIES | ||||||
| CONSOLIDATED FINANCIAL STATEMENTS | ||||||
| Consolidated Statements of Changes in Net Assets | ||||||
| Franklin Strategic Income Fund | ||||||
| Six Months Ended | ||||||
| October 31, 2016 | Year Ended | |||||
| (unaudited) | April 30, 2016 | |||||
| Increase (decrease) in net assets: | ||||||
| Operations: | ||||||
| Net investment income | $ | 155,679,669 | $ | 355,162,709 | ||
| Net realized gain (loss) | (64,336,690 | ) | (321,053,396 | ) | ||
| Net change in unrealized appreciation (depreciation) | 257,344,717 | (343,721,849 | ) | |||
| Net increase (decrease) in net assets resulting from operations | 348,687,696 | (309,612,536 | ) | |||
| Distributions to shareholders from: | ||||||
| Net investment income: | ||||||
| Class A. | (49,220,939 | ) | (203,235,139 | ) | ||
| Class C | (14,756,088 | ) | (69,997,315 | ) | ||
| Class R | (1,749,616 | ) | (8,052,939 | ) | ||
| Class R6. | (5,434,977 | ) | (12,383,078 | ) | ||
| Advisor Class | (11,443,670 | ) | (45,388,450 | ) | ||
| Total distributions to shareholders | (82,605,290 | ) | (339,056,921 | ) | ||
| Capital share transactions: (Note 2) | ||||||
| Class A. | (393,392,965 | ) | (361,847,394 | ) | ||
| Class C | (154,140,493 | ) | (276,223,074 | ) | ||
| Class R | (18,894,453 | ) | (25,817,388 | ) | ||
| Class R6. | 216,278,382 | 52,377,445 | ||||
| Advisor Class | 39,821,754 | (142,209,084 | ) | |||
| Total capital share transactions. | (310,327,775 | ) | (753,719,495 | ) | ||
| Net increase (decrease) in net assets | (44,245,369 | ) | (1,402,388,952 | ) | ||
| Net assets: | ||||||
| Beginning of period | 7,519,676,974 | 8,922,065,926 | ||||
| End of period | $ | 7,475,431,605 | $ | 7,519,676,974 | ||
| Distributions in excess of net investment income included in net assets: | ||||||
| End of period | $ | (72,495,637 | ) | $ | (145,570,016 | ) |
40 Semiannual Report | The accompanying notes are an integral part of these financial statements. franklintempleton.com
FRANKLIN STRATEGIC SERIES
Notes to Consolidated Financial Statements (unaudited)
Franklin Strategic Income Fund
1. Organization and Significant Accounting Policies
Franklin Strategic Series (Trust) is registered under the Investment Company Act of 1940 (1940 Act) as an open-end management investment company, consisting of nine separate funds and applies the specialized accounting and reporting guidance in U.S. Generally Accepted Accounting Principles (U.S. GAAP). Franklin Strategic Income Fund (Fund) is included in this report. The financial statements of the remaining funds in the Trust are presented separately. The Fund offers five classes of shares: Class A, Class C, Class R, Class R6, and Advisor Class. Each class of shares differs by its initial sales load, contingent deferred sales charges, voting rights on matters affecting a single class, its exchange privilege and fees primarily due to differing arrangements for distribution and transfer agent fees.
The following summarizes the Fund’s significant accounting policies.
a. Financial Instrument Valuation
The Fund’s investments in financial instruments are carried at fair value daily. Fair value is the price that would be received to sell an asset or paid to transfer a liability in an orderly transaction between market participants on the measurement date. The Fund calculates the net asset value (NAV) per share as of 4 p.m. Eastern time each day the New York Stock Exchange (NYSE) is open for trading. Under compliance policies and procedures approved by the Trust’s Board of Trustees (the Board), the Fund’s administrator has responsibility for oversight of valuation, including leading the cross-functional Valuation Committee (VC). The VC provides administration and oversight of the Fund’s valuation policies and procedures, which are approved annually by the Board. Among other things, these procedures allow the Fund to utilize independent pricing services, quotations from securities and financial instrument dealers, and other market sources to determine fair value.
Equity securities and derivative financial instruments listed on an exchange or on the NASDAQ National Market System are valued at the last quoted sale price or the official closing price of the day, respectively. Foreign equity securities are valued as of the close of trading on the foreign stock exchange on which the security is primarily traded or as of 4 p.m. Eastern time, whichever is earlier. The value is then converted into its U.S. dollar equivalent at the foreign exchange rate in effect at 4 p.m.
Eastern time on the day that the value of the security is determined. Over-the-counter (OTC) securities are valued within the range of the most recent quoted bid and ask prices. Securities that trade in multiple markets or on multiple exchanges are valued according to the broadest and most representative market. Certain equity securities are valued based upon fundamental characteristics or relationships to similar securities.
Debt securities generally trade in the OTC market rather than on a securities exchange. The Fund’s pricing services use multiple valuation techniques to determine fair value. In instances where sufficient market activity exists, the pricing services may utilize a market-based approach through which quotes from market makers are used to determine fair value. In instances where sufficient market activity may not exist or is limited, the pricing services also utilize proprietary valuation models which may consider market characteristics such as benchmark yield curves, credit spreads, estimated default rates, anticipated market interest rate volatility, coupon rates, anticipated timing of principal repayments, underlying collateral, and other unique security features in order to estimate the relevant cash flows, which are then discounted to calculate the fair value. Securities denominated in a foreign currency are converted into their U.S. dollar equivalent at the foreign exchange rate in effect at 4 p.m. Eastern time on the date that the values of the foreign debt securities are determined.
Investments in open-end mutual funds are valued at the closing NAV.
Certain derivative financial instruments trade in the OTC market. The Fund’s pricing services use various techniques including industry standard option pricing models and proprietary discounted cash flow models to determine the fair value of those instruments. The Fund’s net benefit or obligation under the derivative contract, as measured by the fair value of the contract, is included in net assets.
The Fund has procedures to determine the fair value of financial instruments for which market prices are not reliable or readily available. Under these procedures, the VC convenes on a regular basis to review such financial instruments and considers a number of factors, including significant unobservable valuation inputs, when arriving at fair value. The VC primarily employs a market-based approach which may use related or comparable assets or liabilities, recent transactions, market multiples, book values, and other relevant information for the
franklintempleton.com
Semiannual Report 41
FRANKLIN STRATEGIC SERIES
NOTES TO CONSOLIDATED FINANCIAL STATEMENTS (UNAUDITED)
Franklin Strategic Income Fund (continued)
1. Organization and Significant Accounting
Policies (continued)
a. Financial Instrument Valuation (continued)
investment to determine the fair value of the investment. An income-based valuation approach may also be used in which the anticipated future cash flows of the investment are discounted to calculate fair value. Discounts may also be applied due to the nature or duration of any restrictions on the disposition of the investments. Due to the inherent uncertainty of valuations of such investments, the fair values may differ significantly from the values that would have been used had an active market existed. The VC employs various methods for calibrating these valuation approaches including a regular review of key inputs and assumptions, transactional back-testing or disposition analysis, and reviews of any related market activity.
Trading in securities on foreign securities stock exchanges and OTC markets may be completed before 4 p.m. Eastern time. In addition, trading in certain foreign markets may not take place on every NYSE business day. Occasionally, events occur between the time at which trading in a foreign security is completed and the close of the NYSE that might call into question the reliability of the value of a portfolio security held by the Fund. As a result, differences may arise between the value of the Fund’s portfolio securities as determined at the foreign market close and the latest indications of value at the close of the NYSE. In order to minimize the potential for these differences, the VC monitors price movements following the close of trading in foreign stock markets through a series of country specific market proxies (such as baskets of American Depositary Receipts, futures contracts and exchange traded funds). These price movements are measured against established trigger thresholds for each specific market proxy to assist in determining if an event has occurred that may call into question the reliability of the values of the foreign securities held by the Fund. If such an event occurs, the securities may be valued using fair value procedures, which may include the use of independent pricing services.
When the last day of the reporting period is a non-business day, certain foreign markets may be open on those days that the NYSE is closed, which could result in differences between the value of the Fund’s portfolio securities on the last business day and the last calendar day of the reporting period. Any significant security valuation changes due to an open foreign market are adjusted and reflected by the Fund for financial reporting purposes.
b. Foreign Currency Translation
Portfolio securities and other assets and liabilities denominated in foreign currencies are translated into U.S. dollars based on the exchange rate of such currencies against U.S. dollars on the date of valuation. The Fund may enter into foreign currency exchange contracts to facilitate transactions denominated in a foreign currency. Purchases and sales of securities, income and expense items denominated in foreign currencies are translated into U.S. dollars at the exchange rate in effect on the transaction date. Portfolio securities and assets and liabilities denominated in foreign currencies contain risks that those currencies will decline in value relative to the U.S. dollar. Occasionally, events may impact the availability or reliability of foreign exchange rates used to convert the U.S. dollar equivalent value. If such an event occurs, the foreign exchange rate will be valued at fair value using procedures established and approved by the Board.
The Fund does not separately report the effect of changes in foreign exchange rates from changes in market prices on securities held. Such changes are included in net realized and unrealized gain or loss from investments in the consolidated Statement of Operations.
Realized foreign exchange gains or losses arise from sales of foreign currencies, currency gains or losses realized between the trade and settlement dates on securities transactions and the difference between the recorded amounts of dividends, interest, and foreign withholding taxes and the U.S. dollar equivalent of the amounts actually received or paid. Net unrealized foreign exchange gains and losses arise from changes in foreign exchange rates on foreign denominated assets and liabilities other than investments in securities held at the end of the reporting period.
c. Securities Purchased on a When-Issued, Delayed Delivery and TBA Basis
The Fund purchases securities on a when-issued or delayed delivery and to-be-announced (TBA) basis, with payment and delivery scheduled for a future date. These transactions are subject to market fluctuations and are subject to the risk that the value at delivery may be more or less than the trade date purchase price. Although the Fund will generally purchase these securities with the intention of holding the securities, it may sell
42 Semiannual Report
franklintempleton.com
FRANKLIN STRATEGIC SERIES
NOTES TO CONSOLIDATED FINANCIAL STATEMENTS (UNAUDITED)
Franklin Strategic Income Fund (continued)
the securities before the settlement date. Sufficient assets have been segregated for these securities and collateral has been pledged and/or received for open TBA trades.
d. Derivative Financial Instruments
The Fund invested in derivative financial instruments in order to manage risk or gain exposure to various other investments or markets. Derivatives are financial contracts based on an underlying or notional amount, require no initial investment or an initial net investment that is smaller than would normally be required to have a similar response to changes in market factors, and require or permit net settlement. Derivatives contain various risks including the potential inability of the counterparty to fulfill their obligations under the terms of the contract, the potential for an illiquid secondary market, and/or the potential for market movements which expose the Fund to gains or losses in excess of the amounts shown in the Consolidated Statement of Assets and Liabilities. Realized gain and loss and unrealized appreciation and depreciation on these contracts for the period are included in the Consolidated Statement of Operations.
Derivative counterparty credit risk is managed through a formal evaluation of the creditworthiness of all potential counterparties The Fund attempts to reduce its exposure to counterparty credit risk on OTC derivatives, whenever possible, by entering into International Swaps and Derivatives Association (ISDA) master agreements with certain counterparties. These agreements contain various provisions, including but not limited to collateral requirements, events of default, or early termination. Termination events applicable to the counterparty include certain deteriorations in the credit quality of the counterparty. Termination events applicable to the Fund include failure of the Fund to maintain certain net asset levels and/or limit the decline in net assets over various periods of time. In the event of default or early termination, the ISDA master agreement gives the non-defaulting party the right to net and close-out all transactions traded, whether or not arising under the ISDA agreement, to one net amount payable by one counterparty to the other. However, absent an event of default or early termination, OTC derivative assets and liabilities are presented gross and not offset in the Consolidated Statement of Assets and Liabilities. Early termination by the counterparty may result in an immediate payment by the Fund of any net liability owed to that counterparty under the ISDA agreement.
Collateral requirements differ by type of derivative. Collateral or initial margin requirements are set by the broker or exchange clearing house for exchange traded and centrally cleared derivatives. Initial margin deposited is held at the exchange and can be in the form of cash and/or securities. For OTC derivatives traded under an ISDA master agreement, posting of collateral is required by either the Fund or the applicable counterparty if the total net exposure of all OTC derivatives with the applicable counterparty exceeds the minimum transfer amount, which typically ranges from $100,000 to $250,000, and can vary depending on the counterparty and the type of the agreement. Generally, collateral is determined at the close of Fund business each day and any additional collateral required due to changes in derivative values may be delivered by the Fund or the counterparty within a few business days. Collateral pledged and/or received by the Fund for OTC derivatives, if any, is held in segregated accounts with the Fund’s custodian/counterparty broker and can be in the form of cash and/or securities. Unrestricted cash may be invested according to the Fund’s investment objectives. To the extent that the amounts due to the Fund from its counterparties are not subject to collateralization or are not fully collateralized, the Fund bears the risk of loss from counterparty non-performance.
The Fund entered into exchange traded financial futures contracts primarily to manage and/or gain exposure to interest rate risk. A futures contract is an agreement between the Fund and a counterparty to buy or sell an asset at a specified price on a future date. Required initial margins are pledged by the Fund, and the daily change in fair value is accounted for as a variation margin payable or receivable in the Consolidated Statement of Assets and Liabilities.
The Fund entered into OTC forward exchange contracts primarily to manage and/or gain exposure to certain foreign currencies. A forward exchange contract is an agreement between the Fund and a counterparty to buy or sell a foreign currency at a specific exchange rate on a future date.
The Fund entered into credit default swap contracts primarily to manage exposure to credit risk. A credit default swap is an agreement between the Fund and a counterparty whereby the buyer of the contract receives credit protection and the seller of the contract guarantees the credit worthiness of a referenced debt obligation. These agreements may be privately negotiated in the over-the-counter market (OTC credit default swaps) or may be executed in a multilateral trade facility platform, such as a registered exchange (centrally cleared credit default swaps).
franklintempleton.com
Semiannual Report 43
FRANKLIN STRATEGIC SERIES
NOTES TO CONSOLIDATED FINANCIAL STATEMENTS (UNAUDITED)
Franklin Strategic Income Fund (continued)
1. Organization and Significant Accounting
Policies (continued)
d. Derivative Financial Instruments (continued)
The underlying referenced debt obligation may be a single issuer of corporate or sovereign debt, a credit index, a basket of issuers or indices, or a tranche of a credit index or basket of issuers or indices. In the event of a default of the underlying referenced debt obligation, the buyer is entitled to receive the notional amount of the credit default swap contract from the seller in exchange for the referenced debt obligation, a net settlement amount equal to the notional amount of the credit default swap less the recovery value of the referenced debt obligation, or other agreed upon amount. For centrally cleared credit default swaps, required initial margins are pledged by the Fund, and the daily change in fair value is accounted for as a variation margin payable or receivable in the Consolidated Statement of Assets and Liabilities. Over the term of the contract, the buyer pays the seller a periodic stream of payments, provided that no event of default has occurred. Such periodic payments are accrued daily as an unrealized appreciation or depreciation until the payments are made, at which time they are realized. Upfront payments and receipts are reflected in the Consolidated Statement of Assets and Liabilities and represent compensating factors between stated terms of the credit default swap agreement and prevailing market conditions (credit spreads and other relevant factors). These upfront payments and receipts are amortized over the term of the contract as a realized gain or loss in the Consolidated Statement of Operations.
The Fund entered into OTC total return swap contracts primarily to manage and/or gain exposure to interest rate risk of an underlying instrument such as a stock, bond, index or basket of securities or indices. A total return swap is an agreement between the Fund and a counterparty to exchange a return linked to an underlying instrument for a floating or fixed rate payment, both based upon a notional amount. Over the term of the contract, contractually required payments to be paid or received are accrued daily and recorded as unrealized appreciation or depreciation until the payments are made, at which time they are recognized as realized gain or loss.
The Fund purchased or wrote OTC option contracts primarily to manage and/or gain exposure to foreign exchange rate and credit risk. An option is a contract entitling the holder to purchase or sell a specific amount of shares or units of an asset or notional amount of a swap (swaption), at a specified price. When an option is purchased or written, an amount equal to the premium paid or received is recorded as an asset or liability, respectively. Upon exercise of an option, the acquisition cost or sales proceeds of the underlying investment is adjusted by any premium received or paid. Upon expiration of an option, any premium received or paid is recorded as a realized gain or loss. Upon closing an option other than through expiration or exercise, the difference between the premium received or paid and the cost to close the position is recorded as a realized gain or loss.
The Fund invests in value recovery instruments (VRI) primarily to gain exposure to growth risk. Periodic payments from VRI are dependent on established benchmarks for underlying variables. VRI has a notional amount, which is used to calculate amounts of payments to holders. Payments are recorded upon receipt as realized gains in the Consolidated Statement of Operations. The risks of investing in VRI include growth risk, liquidity, and the potential loss of investment.
See Note 10 regarding other derivative information.
e. Restricted Cash
At October 31, 2016, the Fund held restricted cash in connection with investments in certain derivative securities. Restricted cash is held in a segregated account with the Fund’s custodian and is reflected in the Consolidated Statement of Assets and Liabilities.
f. Loan Participation Notes
The Fund invests in loan participation notes (Participations). Participations are loans originally issued to a borrower by one or more financial institutions (the Lender) and subsequently sold to other investors, such as the Fund. Participations typically result in the Fund having a contractual relationship only with the Lender and not with the borrower. The Fund has the right to receive from the Lender any payments of principal, interest and fees which the Lender received from the borrower. The Fund generally has no rights to either enforce compliance by the borrower with the terms of the loan agreement or to any collateral relating to the original loan. As a result, the Fund assumes the credit risk of both the borrower and the Lender that is selling the Participation. The Participations may also involve interest rate risk and liquidity risk, including the potential default or insolvency of the borrower and/or the Lender.
44 Semiannual Report
franklintempleton.com
FRANKLIN STRATEGIC SERIES
NOTES TO CONSOLIDATED FINANCIAL STATEMENTS (UNAUDITED)
Franklin Strategic Income Fund (continued)
g. FT Holdings Corporation II (FT Subsidiary)
The Fund invests in certain financial instruments through its investment in FT subsidiary. FT subsidiary is a Delaware Corporation, is a wholly-owned subsidiary of the Fund, and is able to invest in certain financial instruments consistent with the investment objective of the Fund. At October 31, 2016, FT subsidiary’s investment, Turtle Bay Resort, as well as any other assets and liabilities of FT subsidiary are reflected in the Fund’s Consolidated Statement of Investments and Consolidated Statement of Assets and Liabilities. The financial statements have been consolidated and include the accounts of the Fund and FT subsidiary. All intercompany transactions and balances have been eliminated. At October 31, 2016, the net assets of FT subsidiary were $19,409,489, representing less than 1% of the Fund’s consolidated net assets. The Fund’s investments in FT subsidiary is limited to 25% of consolidated assets.
h. Mortgage Dollar Rolls
The Fund enters into mortgage dollar rolls, typically on a TBA basis. Mortgage dollar rolls are agreements between the Fund and a financial institution where the Fund sells (or buys) mortgage-backed securities for delivery on a specified date and simultaneously contracts to repurchase (or sell) substantially similar (same type, coupon, and maturity) securities at a future date and at a predetermined price. Gains or losses are realized on the initial sale, and the difference between the repurchase price and the sale price is recorded as an unrealized gain or loss to the Fund upon entering into the mortgage dollar roll. In addition, the Fund may invest the cash proceeds that are received from the initial sale. During the period between the sale and repurchase, the Fund is not entitled to principal and interest paid on the mortgage backed securities. Transactions in mortgage dollar rolls are accounted for as purchases and sales and may result in an increase to the Fund’s portfolio turnover rate. The risks of mortgage dollar roll transactions include the potential inability of the counterparty to fulfill its obligations.
i. Senior Floating Rate Interests
The Fund invests in senior secured corporate loans that pay interest at rates which are periodically reset by reference to a base lending rate plus a spread. These base lending rates are generally the prime rate offered by a designated U.S. bank or the London InterBank Offered Rate (LIBOR). Senior secured corporate loans often require prepayment of principal from excess cash flows or at the discretion of the borrower. As a result, actual maturity may be substantially less than the stated maturity. Senior secured corporate loans in which the Fund invests are generally readily marketable, but may be subject to certain restrictions on resale.
j. Income and Deferred Taxes
It is the Fund’s policy to qualify as a regulated investment company under the Internal Revenue Code. The Fund intends to distribute to shareholders substantially all of its taxable income and net realized gains to relieve it from federal income and excise taxes. As a result, no provision for U.S. federal income taxes is required.
The Fund may be subject to foreign taxation related to income received, capital gains on the sale of securities and certain foreign currency transactions in the foreign jurisdictions in which it invests. Foreign taxes, if any, are recorded based on the tax regulations and rates that exist in the foreign markets in which the Fund invests. When a capital gain tax is determined to apply, the Fund records an estimated deferred tax liability in an amount that would be payable if the securities were disposed of on the valuation date.
The Fund may recognize an income tax liability related to its uncertain tax positions under U.S. GAAP when the uncertain tax position has a less than 50% probability that it will be sustained upon examination by the tax authorities based on its technical merits. As of October 31, 2016, the Fund has determined that no tax liability is required in its financial statements related to uncertain tax positions for any open tax years (or expected to be taken in future tax years). Open tax years are those that remain subject to examination and are based on each tax jurisdiction’s statute of limitation.
k. Security Transactions, Investment Income, Expenses and Distributions
Security transactions are accounted for on trade date. Realized gains and losses on security transactions are determined on a specific identification basis. Interest income and estimated expenses are accrued daily. Amortization of premium and accretion of discount on debt securities are included in interest income. Paydown gains and losses are recorded as an adjustment to interest income. Facility fees are recognized as income over the expected term of the loan. Dividend income is recorded on the ex-dividend date. Distributions to shareholders are recorded on the ex-dividend date and are determined according to income tax regulations (tax basis). Distributable earnings determined on a tax basis may differ from earnings
franklintempleton.com
Semiannual Report 45
FRANKLIN STRATEGIC SERIES
NOTES TO CONSOLIDATED FINANCIAL STATEMENTS (UNAUDITED)
Franklin Strategic Income Fund (continued)
1. Organization and Significant Accounting
Policies (continued)
k. Security Transactions, Investment Income, Expenses and Distributions (continued)
recorded in accordance with U.S. GAAP. These differences may be permanent or temporary. Permanent differences are reclassified among capital accounts to reflect their tax character. These reclassifications have no impact on net assets or the results of operations. Temporary differences are not reclassified, as they may reverse in subsequent periods.
Common expenses incurred by the Trust are allocated among the Funds based on the ratio of net assets of each Fund to the combined net assets of the Trust. Fund specific expenses are charged directly to the Fund that incurred the expense.
Realized and unrealized gains and losses and net investment income, not including class specific expenses, are allocated daily to each class of shares based upon the relative proportion of net assets of each class. Differences in per share distributions, by class, are generally due to differences in class specific expenses.
Inflation-indexed bonds are adjusted for inflation through periodic increases or decreases in the security’s interest accruals, face amount, or principal redemption value, by amounts corresponding to the rate of inflation as measured by an index. Any increase or decrease in the face amount or principal redemption value will be included as interest income in the Consolidated Statement of Operations.
l. Accounting Estimates
The preparation of financial statements in accordance with U.S. GAAP requires management to make estimates and assumptions that affect the reported amounts of assets and liabilities at the date of the financial statements and the amounts of income and expenses during the reporting period. Actual results could differ from those estimates.
m. Guarantees and Indemnifications
Under the Trust’s organizational documents, its officers and trustees are indemnified by the Trust against certain liabilities arising out of the performance of their duties to the Trust. Additionally, in the normal course of business, the Trust, on behalf of the Fund, enters into contracts with service providers that contain general indemnification clauses. The Trust’s maximum exposure under these arrangements is unknown as this would involve future claims that may be made against the Trust that have not yet occurred. Currently, the Trust expects the risk of loss to be remote.
2. Shares of Beneficial Interest
At October 31, 2016, there were an unlimited number of shares authorized (without par value). Transactions in the Fund’s shares were as follows:
| Six Months Ended | Year Ended | |||||||||
| October 31, 2016 | April 30, 2016 | |||||||||
| Shares | Amount | Shares | Amount | |||||||
| Class A Shares: | ||||||||||
| Shares sold | 26,577,084 | $ | 252,439,665 | 86,621,299 | $ | 820,474,987 | ||||
| Shares issued in reinvestment of distributions | 4,839,444 | 45,867,634 | 19,950,107 | 187,902,460 | ||||||
| Shares redeemed | (72,684,550 | ) | (691,700,264 | ) | (145,536,164 | ) | (1,370,224,841 | ) | ||
| Net increase (decrease) | (41,268,022 | ) | $ | (393,392,965 | ) | (38,964,758 | ) | $ | (361,847,394 | ) |
| Class C Shares: | ||||||||||
| Shares sold | 6,682,259 | $ | 63,431,450 | 23,699,305 | $ | 225,556,988 | ||||
| Shares issued in reinvestment of distributions | 1,410,957 | 13,360,685 | 6,662,132 | 62,783,652 | ||||||
| Shares redeemed | (24,287,197 | ) | (230,932,628 | ) | (59,915,146 | ) | (564,563,714 | ) | ||
| Net increase (decrease) | (16,193,981 | ) | $ | (154,140,493 | ) | (29,553,709 | ) | $ | (276,223,074 | ) |
46 Semiannual Report
franklintempleton.com
| FRANKLIN STRATEGIC SERIES | ||||||||||
| NOTES TO CONSOLIDATED FINANCIAL STATEMENTS (UNAUDITED) | ||||||||||
| Franklin Strategic Income Fund (continued) | ||||||||||
| Six Months Ended | Year Ended | |||||||||
| October 31, 2016 | April 30, 2016 | |||||||||
| Shares | Amount | Shares | Amount | |||||||
| Class R Shares: | ||||||||||
| Shares sold | 1,559,595 | $ | 14,823,595 | 3,750,305 | $ | 35,486,868 | ||||
| Shares issued in reinvestment of distributions | 180,602 | 1,704,918 | 836,414 | 7,856,192 | ||||||
| Shares redeemed | (3,740,705 | ) | (35,422,966 | ) | (7,375,237 | ) | (69,160,448 | ) | ||
| Net increase (decrease) | (2,000,508 | ) | $ | (18,894,453 | ) | (2,788,518 | ) | $ | (25,817,388 | ) |
| Class R6 Shares: | ||||||||||
| Shares sold | 27,632,808 | $ | 264,182,860 | 7,061,535 | $ | 67,749,297 | ||||
| Shares issued in reinvestment of distributions | 552,205 | 5,260,957 | 1,263,743 | 11,900,261 | ||||||
| Shares redeemed | (5,556,726 | ) | (53,165,435 | ) | (2,868,916 | ) | (27,272,113 | ) | ||
| Net increase (decrease) | 22,628,287 | $ | 216,278,382 | 5,456,362 | $ | 52,377,445 | ||||
| Advisor Class Shares: | ||||||||||
| Shares sold | 28,276,741 | $ | 270,177,410 | 29,938,042 | $ | 283,540,799 | ||||
| Shares issued in reinvestment of distributions | 1,126,409 | 10,697,664 | 4,428,844 | 41,793,674 | ||||||
| Shares redeemed | (25,261,167 | ) | (241,053,320 | ) | (49,826,590 | ) | (467,543,557 | ) | ||
| Net increase (decrease) | 4,141,983 | $ | 39,821,754 | (15,459,704 | ) | $ | (142,209,084 | ) | ||
3. Transactions with Affiliates
Franklin Resources, Inc. is the holding company for various subsidiaries that together are referred to as Franklin Templeton Investments. Certain officers and trustees of the Trust are also officers and/or directors of the following subsidiaries:
| Subsidiary | Affiliation |
| Franklin Advisers, Inc. (Advisers) | Investment manager |
| Franklin Templeton Services, LLC (FT Services) | Administrative manager |
| Franklin Templeton Distributors, Inc. (Distributors) | Principal underwriter |
| Franklin Templeton Investor Services, LLC (Investor Services) | Transfer agent |
| a. Management Fees | |
The Fund pays an investment management fee to Advisers based on the average daily net assets of the Fund as follows:
| Annualized Fee Rate | Net Assets | |
| 0.625 | % | Up to and including $100 million |
| 0.500 | % | Over $100 million, up to and including $250 million |
| 0.450 | % | Over $250 million, up to and including $7.5 billion |
| 0.440 | % | Over $7.5 billion, up to and including $10 billion |
| 0.430 | % | Over $10 billion, up to and including $12.5 billion |
| 0.420 | % | Over $12.5 billion, up to and including $15 billion |
| 0.400 | % | Over $15 billion, up to and including $17.5 billion |
| 0.380 | % | Over $17.5 billion, up to and including $20 billion |
| 0.360 | % | Over $20 billion, up to and including $35 billion |
| 0.355 | % | Over $35 billion, up to and including $50 billion |
| 0.350 | % | In excess of $50 billion |
franklintempleton.com
Semiannual Report 47
FRANKLIN STRATEGIC SERIES
NOTES TO CONSOLIDATED FINANCIAL STATEMENTS (UNAUDITED)
Franklin Strategic Income Fund (continued)
| 3. | Transactions with Affiliates (continued) |
| a. | Management Fees (continued) |
For the period ended October 31, 2016, the annualized effective investment management fee rate was 0.453% of the Fund’s average daily net assets.
b. Administrative Fees
Under an agreement with Advisers, FT Services provides administrative services to the Fund. The fee is paid by Advisers based on the Fund’s average daily net assets, and is not an additional expense of the Fund.
c. Distribution Fees
The Board has adopted distribution plans for each share class, with the exception of Class R6 and Advisor Class shares, pursuant to Rule 12b-1 under the 1940 Act. Under the Fund’s Class A reimbursement distribution plan, the Fund reimburses Distributors for costs incurred in connection with the servicing, sale and distribution of the Fund’s shares up to the maximum annual plan rate. Under the Class A reimbursement distribution plan, costs exceeding the maximum for the current plan year cannot be reimbursed in subsequent periods. In addition, under the Fund’s Class C and R compensation distribution plans, the Fund pays Distributors for costs incurred in connection with the servicing, sale and distribution of the Fund’s shares up to the maximum annual plan rate for each class. The plan year, for purposes of monitoring compliance with the maximum annual plan rates, is February 1 through January 31.
The maximum annual plan rates, based on the average daily net assets, for each class, are as follows:
| Class A | 0.25 | % |
| Class C | 0.65 | % |
| Class R | 0.50 | % |
| d. Sales Charges/Underwriting Agreements | ||
Front-end sales charges and contingent deferred sales charges (CDSC) do not represent expenses of the Fund. These charges are deducted from the proceeds of sales of Fund shares prior to investment or from redemption proceeds prior to remittance, as applicable. Distributors has advised the Fund of the following commission transactions related to the sales and redemptions of the Fund’s shares for the period:
| Sales charges retained net of commissions paid to | ||
| unaffiliated brokers/dealers | $ | 511,838 |
| CDSC retained | $ | 52,460 |
| e. Transfer Agent Fees | ||
Each class of shares, except for Class R6, pays transfer agent fees to Investor Services for its performance of shareholder servicing obligations and reimburses Investor Services for out of pocket expenses incurred, including shareholder servicing fees paid to third parties. These fees are allocated daily based upon their relative proportion of such classes’ aggregate net assets. Class R6 pays Investor Services transfer agent fees specific to that class.
For the period ended October 31, 2016, the Fund paid transfer agent fees of $5,498,766, of which $2,242,311 was retained by Investor Services.
48 Semiannual Report
franklintempleton.com
FRANKLIN STRATEGIC SERIES
NOTES TO CONSOLIDATED FINANCIAL STATEMENTS (UNAUDITED)
Franklin Strategic Income Fund (continued)
f. Investments in Affiliated Management Investment Companies
The Fund invests in one or more affiliated management investment companies for purposes other than exercising a controlling influence over the management or policies. Management fees paid by the Fund are waived on assets invested in the affiliated management investment companies, as noted in the Statement of Operations, in an amount not to exceed the management and administrative fees paid directly or indirectly by each affiliate. Prior to May 1, 2013, the waiver was accounted for as a reduction to management fees. During the period ended October 31, 2016, the Fund held investments in affiliated management investment companies as follows:
| % of | ||||||||||||||
| Affiliated | ||||||||||||||
| Number of | Number of | Fund Shares | ||||||||||||
| Shares Held | Shares | Value | Outstanding | |||||||||||
| at Beginning | Gross | Gross | Held at End | at End | Investment | Realized | Held at End | |||||||
| of Period | Additions | Reductions | of Period | of Period | Income | Gain (Loss) | of Period | |||||||
| Controlled Affiliates | ||||||||||||||
| Franklin Lower Tier Floating | ||||||||||||||
| RateFund | 38,346,600 | – | (959,021 | ) | 37,387,579 | $ | 388,456,948 | $ | 21,050,803 | $ | (182,214 | ) | 85.7 | % |
| Franklin Middle Tier Floating | ||||||||||||||
| RateFund | 29,441,483 | – | (983,000 | ) | 28,458,483 | 286,292,336 | 9,799,490 | (432,520 | ) | 80.2 | % | |||
| Non-Controlled Affiliates | ||||||||||||||
| Institutional Fiduciary Trust | ||||||||||||||
| Money Market Portfolio | 910,963,589 | 994,530,124 | (1,582,145,993 | ) | 323,347,720 | 323,347,720 | – | – | 1.9 | % | ||||
| Total | $ | 998,097,004 | $ | 30,850,293 | $ | (614,734 | ) | |||||||
| g. Waiver and Expense Reimbursements | ||||||||||||||
Investor Services has contractually agreed in advance to waive or limit its fees so that the Class R6 transfer agent fees do not exceed 0.01% until August 31, 2017. There were no Class R6 transfer agent fees waived during the period ended October 31, 2016.
h. Other Affiliated Transactions
At October 31, 2016, one or more of the funds in Franklin Fund Allocator Series owned 5.9% of the Fund’s outstanding shares.
i. Interfund Transactions
The Fund engaged in purchases and sales of investments with funds or other accounts that have common investment managers (or affiliated investment managers), directors, trustees or officers. During the period ended October 31, 2016, the purchase and sale transactions aggregated $0 and $4,898,250, respectively.
4. Expense Offset Arrangement
The Fund has entered into an arrangement with its custodian whereby credits realized as a result of uninvested cash balances are used to reduce a portion of the Fund’s custodian expenses. During the period ended October 31, 2016, the custodian fees were reduced as noted in the Consolidated Statement of Operations.
franklintempleton.com
Semiannual Report 49
FRANKLIN STRATEGIC SERIES
NOTES TO CONSOLIDATED FINANCIAL STATEMENTS (UNAUDITED)
Franklin Strategic Income Fund (continued)
5. Income Taxes
For tax purposes, capital losses may be carried over to offset future capital gains, if any. At April 30, 2016, the capital loss carryforwards were as follows:
| Capital loss carryforwards: | ||
| Short Term | $ | 17,612,779 |
| Long Term | 208,700,025 | |
| Total capital loss carryforwards | $ | 226,312,804 |
For tax purposes, the Fund may elect to defer any portion of a late-year ordinary loss to the first day of the following year. At April 30, 2016, the Fund deferred late-year ordinary losses of $173,412,246.
At October 31, 2016, the cost of investments and net unrealized appreciation (depreciation), for income tax purposes were as follows:
| Cost of investments. | $ | 8,096,748,810 | |
| Unrealized appreciation | $ | 186,870,444 | |
| Unrealized depreciation | (436,229,177 | ) | |
| Net unrealized appreciation (depreciation) | $ | (249,358,733 | ) |
Differences between income and/or capital gains as determined on a book basis and a tax basis are primarily due to differing treatments of foreign currency transactions and bond discounts and premiums.
6. Investment Transactions
Purchases and sales of investments (excluding short term securities) for the period ended October 31, 2016, aggregated $6,644,447,428 and $6,258,990,007, respectively.
7. Credit Risk and Defaulted Securities
At October 31, 2016, the Fund had 47.9% of its portfolio invested in high yield, senior secured floating rate notes, or other securities rated below investment grade and unrated securities, if any. These securities may be more sensitive to economic conditions causing greater price volatility and are potentially subject to a greater risk of loss due to default than higher rated securities.
The Fund held defaulted securities and/or other securities for which the income has been deemed uncollectible. At October 31, 2016, the aggregate value of these securities was $53,039,567, representing 0.7% of the Fund’s net assets. The Fund discontinues accruing income on securities for which income has been deemed uncollectible and provides an estimate for losses on interest receivable. The securities have been identified in the accompanying Consolidated Statement of Investments.
8. Restricted Securities
The Fund invests in securities that are restricted under the Securities Act of 1933 (1933 Act) or which are subject to legal, contractual, or other agreed upon restrictions on resale. Restricted securities are often purchased in private placement transactions, and cannot be sold without prior registration unless the sale is pursuant to an exemption under the 1933 Act. Disposal of these securities may require greater effort and expense, and prompt sale at an acceptable price may be difficult. The Fund may have registration rights for restricted securities. The issuer generally incurs all registration costs.
50 Semiannual Report
franklintempleton.com
FRANKLIN STRATEGIC SERIES
NOTES TO CONSOLIDATED FINANCIAL STATEMENTS (UNAUDITED)
Franklin Strategic Income Fund (continued)
At October 31, 2016, the Fund held investments in restricted securities, excluding certain securities exempt from registration under the 1933 Act deemed to be liquid, as follows:
| Shares/ | Acquisition | |||||
| Units | Issuer | Dates | Cost | Value | ||
| 955,276 | a Halcon Resources Corp | 10/23/12 - 11/24/15 | $ | 24,687,967 | $ | 7,652,069 |
| 15,189 | Warrior Met Coal LLC, A | 5/28/14 - 11/13/14 | 29,562,025 | 3,417,525 | ||
| Total Restricted Securities (Value is 0.1% of Net Assets) | $ | 54,249,992 | $ | 11,069,594 | ||
| aThe Fund also invests in unrestricted securities or other investments in the issuer, valued at $191,698 as of October 31, 2016. | ||||||
9. Unfunded Loan Commitments
The Fund enters into certain credit agreements, all or a portion of which may be unfunded. The Fund is obligated to fund these loan commitments at the borrowers’ discretion. Unfunded loan commitments and funded portions of credit agreements are marked to market daily and any unrealized appreciation or depreciation is included in the Consolidated Statement of Assets and Liabilities and the Consolidated Statement of Operations. Funded portions of credit agreements are presented in the Consolidated Statement of Investments.
| At October 31, 2016, unfunded commitments were as follows: | ||
| Unfunded | ||
| Borrower | Commitment | |
| Global Tel*Link Corp, Revolving Commitment | $ | 1,478,221 |
10. Other Derivative Information
At October 31, 2016, the Fund’s investments in derivative contracts are reflected in the Consolidated Statement of Assets and Liabilities as follows:
| Asset Derivatives | Liability Derivatives | |||
| Derivative Contracts | Consolidated Statement of | Consolidated Statement of | ||
| Not Accounted for as | Assets and Liabilities | Assets and Liabilities | ||
| Hedging Instruments | Location | Fair Value | Location | Fair Value |
| Interest rate contracts | Variation margin | $ — | Variation margin | $ | 4,105,658 | a |
| Unrealized appreciation on OTC | 939,303 | Unrealized depreciation on OTC | — | |||
| swap contracts | swap contracts | |||||
| Foreign exchange contracts. | Investments in securities, at value | 711,530 | b | Options written, at value | — | |
| Unrealized appreciation on OTC | 10,572,521 | Unrealized depreciation on OTC | 10,725,470 | |||
| forward exchange contracts | forward exchange contracts | |||||
| Credit contracts | Investments in securities, at value | 217,968 | b | Investments in securities, at value | — | |
| Variation margin | — | Variation margin | 634,462 | a | ||
| OTC swap contracts (upfront | 1,811,787 | OTC swap contracts (upfront | — | |||
| payments) | receipts) | |||||
franklintempleton.com
Semiannual Report 51
| FRANKLIN STRATEGIC SERIES | ||||||
| NOTES TO CONSOLIDATED FINANCIAL STATEMENTS (UNAUDITED) | ||||||
| Franklin Strategic Income Fund (continued) | ||||||
| 10. Other Derivative Information (continued) | ||||||
| Asset Derivatives | Liability Derivatives | |||||
| Derivative Contracts | Consolidated Statement of | Consolidated Statement of | ||||
| Not Accounted for as | Assets and Liabilities | Assets and Liabilities | ||||
| Hedging Instruments | Location | Fair Value | Location | Fair Value | ||
| Unrealized appreciation on OTC | — | Unrealized depreciation on OTC | 554,028 | |||
| swap contracts | swap contracts | |||||
| Value recovery instruments | Investments in securities, at value | 6,583,232 | Investments in securities, at value | — | ||
| Totals | $ | 20,836,341 | $ | 16,019,618 | ||
a This amount reflects the cumulative appreciation (depreciation) of futures contracts and centrally cleared swap contracts as reported in the Consolidated Statement of
Investments. Only the variation margin receivable/payable at period end is separately reported within the Consolidated Statement of Assets and Liabilities. Prior variation
margin movements were recorded to cash upon receipt or payment.
b Purchased option contracts are included in investments in securities, at value in the Consolidated Statement of Assets and Liabilities.
| For the period ended October 31, 2016, the effect of derivative contracts in the Fund’s Consolidated Statement of Operations was as | ||||||||
| follows: | ||||||||
| Net Change in | ||||||||
| Unrealized | ||||||||
| Derivative Contracts | Net Realized | Appreciation | ||||||
| Not Accounted for as | Consolidated Statement of | Gain (Loss) for | Consolidated Statement of | (Depreciation) | ||||
| Hedging Instruments | Operations Locations | the Period | Operations Locations | for the Period | ||||
| Net realized gain (loss) from: | Net change in unrealized | |||||||
| appreciation (depreciation) on: | ||||||||
| Interest rate contracts | Futures contracts | $ | 411,607 | Futures contracts | $ | (4,105,658 | ) | |
| Foreign exchange contracts | Investments | 438,900 | a | Investments | (1,865,050 | )a | ||
| Foreign currency transactions | (31,651,929 | )b | Translation of other assets and | 46,215,962 | b | |||
| liabilities denominated in | ||||||||
| foreign currencies | ||||||||
| Credit contracts. | Investments | — | Investments | (260,832 | )a | |||
| Swap contracts | 1,189,106 | Swap contracts | (594,043 | ) | ||||
| Value recovery instruments | Investments | — | Investments | 149,372 | ||||
| Totals | $ | (29,612,316 | ) | $ | 39,541,751 | |||
aPurchased option contracts are included in net realized gain (loss) from investments and net change in unrealized appreciation (depreciation) on investments in the
Consolidated Statement of Operations.
bForward exchange contracts are included in net realized gain (loss) from foreign currency transactions and net change in unrealized appreciation (depreciation) on
translation of other assets and liabilities denominated in foreign currencies in the Consolidated Statement of Operations.
| At October 31, 2016, the Fund’s OTC derivative assets and liabilities, are as follows: | ||||
| Gross Amounts of | ||||
| Assets and Liabilities Presented | ||||
| in the Consolidated Statement of Assets and Liabilities | ||||
| Assetsa | Liabilitiesa | |||
| Derivatives | ||||
| Forward Exchange Contracts | $ | 10,572,521 | $ | 10,725,470 |
| Options Purchased | 929,498 | — | ||
| Swap Contracts | 2,751,090 | 554,028 | ||
| Total | $ | 14,253,109 | $ | 11,279,498 |
aAbsent an event of default or early termination, OTC derivative assets and liabilities are presented gross and not offset in the Consolidated Statement of Assets and
Liabilities.
52 Semiannual Report
franklintempleton.com
FRANKLIN STRATEGIC SERIES
NOTES TO CONSOLIDATED FINANCIAL STATEMENTS (UNAUDITED)
Franklin Strategic Income Fund (continued)
At October 31, 2016, the Fund’s OTC derivative assets, which may be offset against the Fund’s OTC derivative liabilities and collateral received from the counterparty, are as follows:
| Amounts Not Offset in the | ||||||||||||
| Consolidated Statement of Assets and Liabilities | ||||||||||||
| Gross | ||||||||||||
| Amounts of | Financial | Financial | ||||||||||
| Assets Presented in | Instruments | Instruments | Cash | Net Amount | ||||||||
| the Consolidated Statement of | Available for | Collateral | Collateral | (Not less | ||||||||
| Assets and Liabilities | Offset | Receiveda,b | Receivedb | than zero) | ||||||||
| Counterparty | ||||||||||||
| BZWS | $ | — | $ | — | $ | — | $ | — | $ | — | ||
| CITI. | 1,441,870 | (379,446 | ) | — | (860,000 | ) | 202,424 | |||||
| DBAB | 3,653,666 | (2,036,999 | ) | — | (1,616,667 | ) | — | |||||
| FBCO | 217,968 | — | — | (217,968 | ) | — | ||||||
| GSCO | 939,303 | — | — | (939,303 | ) | — | ||||||
| HSBK | — | — | — | — | — | |||||||
| JPHQ | 8,000,302 | (8,000,302 | ) | — | — | — | ||||||
| MSCO | — | — | — | — | — | |||||||
| Total | $ | 14,253,109 | $ | (10,416,747 | ) | $ | — | $ | (3,633,938 | ) | $ | 202,424 |
aAt October 31, 2016, the Fund received U.S. Government Agency Securities as collateral for derivatives.
bIn some instances, the collateral amount disclosed in the table above was adjusted due to the requirement to limit collateral amount to avoid the effect of overcollateral-
ization. Actual collateral received and/or pledged may be more than the amount disclosed herein.
| At October 31, 2016, the Fund’s OTC derivative liabilities, which may be offset against the Fund’s OTC derivative assets and | |||||||||||||
| collateral pledged to the counterparty, are as follows: | |||||||||||||
| Amounts Not Offset in the | |||||||||||||
| Consolidated Statement of Assets and Liabilities | |||||||||||||
| Gross | |||||||||||||
| Amounts of | Financial | Financial | |||||||||||
| Liabilities Presented in | Instruments | Instruments | Cash | Net Amount | |||||||||
| the Consolidated Statement of | Available for | Collateral | Collateral | (Not less | |||||||||
| Assets and Liabilities | Offset | Pledged | Pledgeda | than zero) | |||||||||
| Counterparty | |||||||||||||
| BZWS | $ | 50,594 | $ | — | $ | — | $ | — | $ | 50,594 | |||
| CITI. | 379,446 | (379,446 | ) | — | — | — | |||||||
| DBAB | 2,036,999 | (2,036,999 | ) | — | — | — | |||||||
| FBCO | — | — | — | — | — | ||||||||
| GSCO | — | — | — | — | — | ||||||||
| HSBK | 5,291 | — | — | (5,291 | ) | — | |||||||
| JPHQ | 8,801,999 | (8,000,302 | ) | — | — | 801,697 | |||||||
| MSCO | 5,169 | — | — | — | 5,169 | ||||||||
| Total | $ | 11,279,498 | $ | (10,416,747 | ) | $ | — | $ | (5,291 | ) | $ | 857,460 | |
aIn some instances, the collateral amount disclosed in the table above was adjusted due to the requirement to limit collateral amount to avoid the effect of overcollateral-
ization. Actual collateral received and/or pledged may be more than the amount disclosed herein.
For the year ended October 31, 2016, the average month end fair value of derivatives represented 0.8% of average month end net assets. The average month end number of open derivative contracts for the period was 76.
See Note 1(d) regarding derivative financial instruments.
See Abbreviations on page 56.
franklintempleton.com
Semiannual Report 53
FRANKLIN STRATEGIC SERIES
NOTES TO CONSOLIDATED FINANCIAL STATEMENTS (UNAUDITED)
Franklin Strategic Income Fund (continued)
11. Credit Facility
The Fund, together with other U.S. registered and foreign investment funds (collectively, Borrowers), managed by Franklin Templeton Investments, are borrowers in a joint syndicated senior unsecured credit facility totaling $2 billion (Global Credit Facility) which matures on February 10, 2017. This Global Credit Facility provides a source of funds to the Borrowers for temporary and emergency purposes, including the ability to meet future unanticipated or unusually large redemption requests.
Under the terms of the Global Credit Facility, the Fund shall, in addition to interest charged on any borrowings made by the Fund and other costs incurred by the Fund, pay its share of fees and expenses incurred in connection with the implementation and maintenance of the Global Credit Facility, based upon its relative share of the aggregate net assets of all of the Borrowers, including an annual commitment fee of 0.15% based upon the unused portion of the Global Credit Facility. These fees are reflected in other expenses in the Consolidated Statement of Operations. During the period ended October 31, 2016, the Fund did not use the Global Credit Facility.
12. Fair Value Measurements
The Fund follows a fair value hierarchy that distinguishes between market data obtained from independent sources (observable inputs) and the Fund’s own market assumptions (unobservable inputs). These inputs are used in determining the value of the Fund’s financial instruments and are summarized in the following fair value hierarchy:
- Level 1 – quoted prices in active markets for identical financial instruments
- Level 2 – other significant observable inputs (including quoted prices for similar financial instruments, interest rates, prepayment speed, credit risk, etc.)
- Level 3 – significant unobservable inputs (including the Fund’s own assumptions in determining the fair value of financial instruments)
The input levels are not necessarily an indication of the risk or liquidity associated with financial instruments at that level.
For movements between the levels within the fair value hierarchy, the Fund has adopted a policy of recognizing the transfers as of the date of the underlying event which caused the movement.
54 Semiannual Report
franklintempleton.com
FRANKLIN STRATEGIC SERIES
NOTES TO CONSOLIDATED FINANCIAL STATEMENTS (UNAUDITED)
Franklin Strategic Income Fund (continued)
A summary of inputs used as of October 31, 2016, in valuing the Fund’s assets and liabilities carried at fair value, is as follows:
| Level 1 | Level 2 | Level 3 | Total | ||||||
| Assets: | |||||||||
| Investments in Securities: | |||||||||
| Equity Investments:a | |||||||||
| Consumer Services | $ | — | $ | 19,356,810 | $ | — | $ | 19,356,810 | |
| Energy. | 3,034,512 | 7,645,516 | 11,069,594 | b | 21,749,622 | ||||
| Transportation | — | — | 1,010,756 | 1,010,756 | |||||
| All Other Equity Investmentsc | 682,797,610 | —b | — | 682,797,610 | |||||
| Corporate Bonds | — | 3,259,222,867 | 1,108,149 | 3,260,331,016 | |||||
| Senior Floating Rate Interests | — | 770,176,732 | — | 770,176,732 | |||||
| Foreign Government and Agency Securities | — | 851,951,633 | — | 851,951,633 | |||||
| U.S. Government and Agency Securities | — | 388,244,555 | — | 388,244,555 | |||||
| Asset-Backed Securities and Commercial | |||||||||
| Mortgage-Backed Securities. | — | 701,642,940 | — | 701,642,940 | |||||
| Mortgage-Backed Securities | — | 755,445,266 | — | 755,445,266 | |||||
| Municipal Bonds | — | 65,636,023 | — | 65,636,023 | |||||
| Escrows and Litigation Trusts | — | 950,492 | 723,000 | b | 1,673,492 | ||||
| Options Purchased | — | 929,498 | — | 929,498 | |||||
| Short Term Investments | 326,444,124 | — | — | 326,444,124 | |||||
| Total Investments in Securities | $ | 1,012,276,246 | $ | 6,821,202,332 | $ | 13,911,499 | $ | 7,847,390,077 | |
| Other Financial Instruments: | |||||||||
| Forward Exchange Contracts | $ | — | $ | 10,572,521 | $ | — | $ | 10,572,521 | |
| Swap Contracts. | — | 939,303 | — | 939,303 | |||||
| Total Other Financial Instruments | $ | — | $ | 11,511,824 | $ | — | $ | 11,511,824 | |
| Liabilities: | |||||||||
| Other Financial Instruments: | |||||||||
| Futures Contracts | $ | 4,105,658 | $ | — | $ | — | $ | 4,105,658 | |
| Forward Exchange Contracts | — | 10,725,470 | — | 10,725,470 | |||||
| Swap Contracts. | — | 1,188,490 | — | 1,188,490 | |||||
| Unfunded Loan Commitments. | — | 8,667 | — | 8,667 | |||||
| Total Other Financial Instruments | $ | 4,105,658 | $ | 11,922,627 | $ | — | $ | 16,028,285 | |
aIncludes common and convertible preferred stocks and management investment companies as well as other equity interests.
bIncludes securities determined to have no value at October 31, 2016.
cFor detailed categories, see the accompanying Consolidated Statement of Investments.
A reconciliation of assets in which Level 3 inputs are used in determining fair value is presented when there are significant Level 3 financial instruments at the end of the period.
13. Subsequent Events
The Fund has evaluated subsequent events through the issuance of the financial statements and determined that no events have occurred that require disclosure.
franklintempleton.com
Semiannual Report 55
FRANKLIN STRATEGIC SERIES
NOTES TO CONSOLIDATED FINANCIAL STATEMENTS (UNAUDITED)
| Franklin Strategic Income Fund (continued) | |||||
| Abbreviations | |||||
| Counterparty/Exchange | Currency | Selected Portfolio | |||
| BZWS | Barclays Bank PLC | BRL | Brazilian Real | BBA | British Bankers Association |
| CITI | Citigroup, Inc. | CAD | Canadian Dollar | CDO | Collateralized Debt Obligation |
| DBAB | Deutsche Bank AG | EUR | Euro | CLO | Collateralized Loan Obligation |
| FBCO | Credit Suisse | GBP | British Pound | EDA | Economic Development Authority |
| GSCO | Goldman Sachs Bank | IDR | Indonesian Rupiah | FRN | Floating Rate Note |
| HSBK | HSBC Bank PLC | KRW | South Korean | GDP | Gross Domestic Product |
| ICE | Intercontinental Exchange | MXN | Mexican Peso | GO | General Obligation |
| JPHQ | JP Morgan Chase & Co. | MYR | Malaysian Ringgit | HDC | Housing Development Corp. |
| MSCO | Morgan Stanley | PHP | Philippine Peso | LIBOR | London InterBank Offered Rate |
| USD | United States Dollar | PIK | Payment-In-Kind | ||
| UYU | Uruguayan Peso | SF | Single Family | ||
| VRI | Value Recovery Instruments | ||||
| Index | |
| CDX.NA.HY.27 | CDX North America High Yield Index |
| MCDX.NA.27 | MCDX North America Index |
56 Semiannual Report
franklintempleton.com
FRANKLIN STRATEGIC SERIES
FRANKLIN STRATEGIC INCOME FUND
Shareholder Information
Proxy Voting Policies and Procedures
The Fund’s investment manager has established Proxy Voting
Policies and Procedures (Policies) that the Fund uses to
determine how to vote proxies relating to portfolio securities.
Shareholders may view the Fund’s complete Policies online at
franklintempleton.com. Alternatively, shareholders may request
copies of the Policies free of charge by calling the Proxy Group
collect at (954) 527-7678 or by sending a written request
to: Franklin Templeton Companies, LLC, 300 S.E. 2nd Street,
Fort Lauderdale, FL 33301, Attention: Proxy Group. Copies of
the Fund’s proxy voting records are also made available online
at franklintempleton.com and posted on the U.S. Securities and
Exchange Commission’s website at sec.gov and reflect the
most recent 12-month period ended June 30.
Quarterly Statement of Investments
The Trust, on behalf of the Fund, files a complete statement of
investments with the U.S. Securities and Exchange
Commission for the first and third quarters for each fiscal year
on Form N-Q. Shareholders may view the filed Form N-Q by
visiting the Commission’s website at sec.gov. The filed form
may also be viewed and copied at the Commission’s Public
Reference Room in Washington, DC. Information regarding the
operations of the Public Reference Room may be obtained by
calling (800) SEC-0330.
franklintempleton.com
Semiannual Report 57
This page intentionally left blank.
This page intentionally left blank.
This page intentionally left blank.
| Contents | |
| Semiannual Report | |
| Franklin Global Government Bond Fund | 3 |
| Performance Summary | 6 |
| Your Fund’s Expenses | 8 |
| Financial Highlights and Statement of Investments | 9 |
| Financial Statements | 16 |
| Notes to Financial Statements | 20 |
| Shareholder Information | 29 |
Visit franklintempleton.com for fund updates, to access your account, or to find helpful financial planning tools.
2 Semiannual Report
franklintempleton.com
Semiannual Report
Franklin Global Government Bond Fund
This semiannual report for Franklin Global Government Bond Fund covers the period ended October 31, 2016.
Your Fund’s Goal and Main Investments
The Fund seeks total return, consisting of interest income and capital appreciation. Under normal market conditions, the Fund invests at least 80% of its net assets in "government bonds" of issuers located around the world. Government bonds include floating, variable and fixed-rate debt securities of any maturity, such as bonds, notes, bills and debentures, issued or guaranteed by governments, government agencies or instrumentalities, including government-sponsored entities, supra-national entities and public-private partnerships.
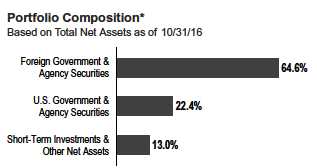
*Figures represent the net Fund exposure and include certain derivatives held in
the portfolio (or their underlying reference assets) or unsettled trades and may not
total 100% or may be negative due to rounding, use of any derivatives or other
factors.
Performance Overview
For the six months under review, the Fund’s Class A shares had a -1.50% cumulative total return. In comparison, global government bonds, as measured by the Fund’s benchmark, the Citigroup World Government Bond Index (WGBI), had a -1.08% cumulative total return for the same period.1 You can find more of the Fund’s performance data in the Performance Summary beginning on page 6.
Performance data represent past performance, which does not guarantee future results. Investment return and principal value will fluctuate, and you may have a gain or loss when you sell your shares. Current performance may differ from figures shown. For most recent month-end performance, go to franklintempleton.com or call (800) 342-5236.
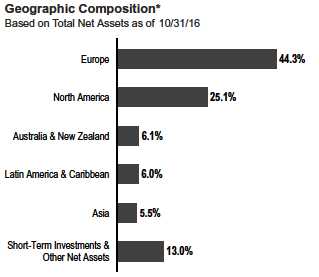
*Figures represent the net Fund exposure and include certain derivatives held in
the portfolio (or their underlying reference assets) or unsettled trades and may not
total 100% or may be negative due to rounding, use of any derivatives or other
factors.
Economic and Market Overview
During the six months under review, global government bonds declined modestly, as measured by the Citigroup WGBI. At the beginning of the period, the U.S. economy was picking up after a faltering start in 2016, and the U.S. Federal Reserve (Fed) signaled the strong possibility of an increase in interest rates during the summer. However, a far weaker-than-expected monthly U.S. payroll report at the start of June quashed such speculation, and was swiftly followed by the unexpected decision in a referendum by U.K. voters to leave the European Union (also known as “Brexit”). In the aftermath of the Brexit
1. Source: Morningstar.
The index is unmanaged and includes reinvestment of any income or distributions. It does not reflect any fees, expenses or sales charges. One cannot invest directly in an
index, and an index is not representative of the Fund’s portfolio.
See www.franklintempletondatasources.com for additional data provider information.
The dollar value, number of shares or principal amount, and names of all portfolio holdings are listed in the Fund’s Statement of Investments (SOI).
The SOI begins on page 14.
franklintempleton.com
Semiannual Report 3
FRANKLIN GLOBAL GOVERNMENT BOND FUND
vote, demand for perceived safe haven assets surged, driving the yields of many sovereign bonds down to historic lows.
German bunds were in such demand that 10-year bund yields turned negative in the latter part of the period. Economic growth in the eurozone was also holding up well, indicating that the European Central Bank’s program of monetary easing helped stimulate domestic demand. However, inflation in the region remained weak, underlining the amount of continued excess capacity.
| Dividend Distributions* | |||||
| 5/1/16–10/31/16 | |||||
| Dividend per Share (cents) | |||||
| Advisor | |||||
| Month | Class A | Class C | Class R | Class R6 | Class |
| May | 1.56 | 1.08 | 1.22 | 1.70 | 1.62 |
| June | 0.24 | — | — | 0.30 | 0.28 |
| July | 0.26 | 0.01 | 0.14 | 0.57 | 0.55 |
| August | 0.26 | — | — | 0.33 | 0.31 |
| September | 0.26 | — | — | 0.33 | 0.32 |
| October | 0.09 | — | — | 0.34 | 0.32 |
| Total | 2.67 | 1.09 | 1.36 | 3.57 | 3.40 |
*The distribution amount is the sum of the dividend payments to shareholders for
the period shown and includes only estimated tax-basis net investment income. All
Fund distributions will vary depending upon current market conditions, and past
distributions are not indicative of future trends.
Following the Bank of Japan’s (BOJ’s) surprise decision at the beginning of 2016 to adopt negative interest rates, by July Japanese government bond yields had fallen to record low levels on expectations of further rate cuts. However, the BOJ refrained from such a move at its July meeting, causing investors to reassess, leading to a sharp sell-off in Japanese government bonds. In September, the BOJ again left interest rates unchanged, but unveiled a ceiling on benchmark government bond yields and pledged to continue asset purchases until inflation stabilizes above its target rate.
Investment Strategy
We invest selectively in bonds around the world based upon our assessment of changing market, political and economic conditions. While seeking opportunities, we consider various factors including interest rates, currency exchange rates and credit risks. We use top-down macroeconomic research, bottom-up sector-specific research and quantitative analysis to identify and to seek to exploit market inefficiencies while employing a disciplined risk management process. We may use various currency-related derivative instruments, including currency forward and currency futures contracts, as well as various interest rate/bond-related derivative instruments, including interest rate/bond futures contracts and swap agreements.
What is a currency forward contract?
A currency forward contract is an agreement between the Fund and a counterparty to buy or sell a foreign currency in exchange for another currency at a specific exchange rate on a future date.
What is a futures contract?
A futures contract is an agreement between the Fund and a counterparty made through a U.S. or foreign futures exchange to buy or sell an underlying instrument or asset at a specific priceonafuturedate.
What are swap agreements?
Swap agreements, such as interest-rate, currency and credit default swaps, are contracts between the Fund and another party (the swap counterparty). In a basic swap transaction, the Fund agrees with the swap counterparty to exchange the returns (or differentials in rates of return) earned or realized on a particular “notional amount” of underlying instruments. The notional amount is the set amount selected by the parties as the basis on which to calculate the obligations that they have agreed to exchange. The parties typically do not actually exchange the notional amount. Instead, they agree to exchange the returns that would be earned or realized if the notional amount were invested in given instruments or at given interest rates.
Manager’s Discussion
During the six months ended October 31, 2016, the Fund underperformed its benchmark, the Citigroup WGBI. The Fund’s currency allocation detracted from relative performance, while positioning among emerging market bonds contributed to the Fund’s relative results.
The Fund’s currency allocation was hurt by an underweighted exposure to the Japanese yen, which rose sharply against the U.S. dollar early in the period.
The Fund’s duration and yield curve positioning also detracted from relative performance, partly due to an overweighted duration exposure to eurozone bonds, the prices of which fell sharply in October.
In contrast, the Fund’s exposure to and selection among emerging market bonds, which outperformed other government bonds due to strong investor demand for higher yielding assets, helped relative results.
4 Semiannual Report
franklintempleton.com
FRANKLIN GLOBAL GOVERNMENT BOND FUND
What is duration?
Duration is a measure of a bond’s price sensitivity to interest rate changes. In general, a portfolio of securities with a lower duration can be expected to be less sensitive to interest rate changes than a portfolio with a higher duration.
What is the yield curve?
The yield curve is a line that plots the interest rates, at a set point in time, of bonds having equal credit quality but differing maturity dates. The most frequently reported yield curve compares three-month, two-year and 30-year U.S. Treasury debt.
| Currency Composition* | ||
| 10/31/16 | ||
| % of Total | ||
| Net Assets | ||
| North America | 56.7 | % |
| U.S. Dollar | 53.9 | % |
| Canadian Dollar | 2.8 | % |
| Europe | 30.4 | % |
| Polish Zloty | 3.2 | % |
| British Pound Sterling | 4.6 | % |
| Euro | 22.6 | % |
| Asia | 8.3 | % |
| Malaysian Ringgit | 2.1 | % |
| Singapore Dollar | 0.1 | % |
| Japanese Yen | 6.1 | % |
| Latin America & Caribbean | 4.4 | % |
| Mexican Peso | 4.4 | % |
| Australia & New Zealand | 0.2 | % |
| Australian Dollar | 0.2 | % |
*Figures represent the net Fund exposure and include certain derivatives held in
the portfolio (or their underlying reference assets) or unsettled trades and may not
total 100% or may be negative due to rounding, use of any derivatives or other
factors.
The Fund’s positions denominated in currencies other than the U.S. dollar, the euro, the Japanese yen and the British pound also had a positive impact on relative performance.
Thank you for your participation in Franklin Global Government Bond Fund. We look forward to serving your future investment needs.

The foregoing information reflects our analysis, opinions and portfolio holdings as of October 31, 2016, the end of the reporting period. The way we implement our main investment strategies and the resulting portfolio holdings may change depending on factors such as market and economic conditions. These opinions may not be relied upon as investment advice or an offer for a particular security. The information is not a complete analysis of every aspect of any market, country, industry, security or the Fund. Statements of fact are from sources considered reliable, but the investment manager makes no representation or warranty as to their completeness or accuracy. Although historical performance is no guarantee of future results, these insights may help you understand our investment management philosophy.
franklintempleton.com
Semiannual Report 5
FRANKLIN GLOBAL GOVERNMENT BOND FUND
Performance Summary as of October 31, 2016
The performance table does not reflect any taxes that a shareholder would pay on Fund dividends, capital gain distributions, if any, or any realized gains on the sale of Fund shares. Total return reflects reinvestment of the Fund’s dividends and capital gain distributions, if any, and any unrealized gains or losses.
Performance as of 10/31/161
Cumulative total return excludes sales charges. Average annual total returns include maximum sales charges. Sales charges will vary depending on the size of the investment and the class of share purchased. The maximum is 4.25% and the minimum is 0%. Class A: 4.25% maximum initial sales charge; Advisor Class: no sales charges. For other share classes, visit franklintempleton.com.
| Cumulative | Average Annual | Average Annual | ||||
| Share Class | Total Return2 | Total Return3 | Total Return (9/30/16)4 | |||
| A | ||||||
| 6-Month | -1.50 | % | -5.73 | % | ||
| 1-Year | +0.10 | % | -4.14 | % | -0.64 | % |
| 3-Year | +0.07 | % | -1.42 | % | -0.01 | % |
| Since Inception (9/6/13) | +3.10 | % | -0.40 | % | +0.58 | % |
| Advisor | ||||||
| 6-Month | -1.42 | % | -1.42 | % | ||
| 1-Year | +0.10 | % | +0.10 | % | +3.96 | % |
| 3-Year | +0.61 | % | +0.20 | % | +1.65 | % |
| Since Inception (9/6/13) | +3.65 | % | +1.15 | % | +2.20 | % |
| 30-Day Standardized Yield6 | ||||||
| Distribution | ||||||
| Share Class | Rate5 | (with waiver) | (without waiver) | |||
| A | 0.11 | % | 0.82 | % | -0.35 | % |
| Advisor | 0.41 | % | 0.98 | % | -0.26 | % |
Performance data represent past performance, which does not guarantee future results. Investment return and principal value will fluctuate, and you may have a gain or loss when you sell your shares. Current performance may differ from figures shown. For most recent month-end performance, go to franklintempleton.com or call (800) 342-5236.
See page 7 for Performance Summary footnotes.
6 Semiannual Report
franklintempleton.com
| FRANKLIN GLOBAL GOVERNMENT BOND FUND | ||||
| PERFORMANCE SUMMARY | ||||
| Total Annual Operating Expenses7 | ||||
| Share Class | With Waiver | Without Waiver | ||
| A | 0.86 | % | 2.17 | % |
| Advisor | 0.61 | % | 1.92 | % |
Each class of shares is available to certain eligible investors and has different annual fees and expenses, as described in the prospectus.
All investments involve risks, including possible loss of principal. Special risks are associated with investing in foreign securities, including risks associated with
political and economic developments, trading practices, availability of information, limited markets and currency exchange rate fluctuations and policies.
Sovereign debt securities are subject to various risks in addition to those relating to debt securities and foreign securities generally, including, but not limited to,
the risk that a governmental entity may be unwilling or unable to pay interest and repay principal on its sovereign debt. Investments in emerging market countries
are subject to all of the risks of foreign investing generally and have additional heightened risks due to a lack of established legal, political, business and social
frameworks to support securities markets. Changes in interest rates will affect the value of the Fund’s portfolio and its share price and yield. Bond prices
generally move in the opposite direction of interest rates. Thus, as prices of bonds in the Fund adjust to a rise in interest rates, the Fund’s share price may
decline. Derivatives, including currency management strategies, involve costs and can create economic leverage in the portfolio that may result in significant
volatility and cause the Fund to participate in losses (as well as gains) in an amount that exceeds the Fund’s initial investment. The Fund is actively managed but
there is no guarantee that the manager’s investment decisions will produce the desired results. The Fund’s prospectus also includes a description of the main
investment risks.
1. The Fund has an expense reduction contractually guaranteed through 8/31/17. The Fund also has a fee waiver associated with any investments it makes in a Franklin
Templeton money fund and/or other Franklin Templeton fund, contractually guaranteed through its current fiscal year-end. Fund investment results reflect the expense reduction
and fee waiver; without these reductions, the results would have been lower.
2. Cumulative total return represents the change in value of an investment over the periods indicated.
3. Average annual total return represents the average annual change in value of an investment over the periods indicated. Return for less than one year, ifany,hasnotbeen
annualized.
4. In accordance with SEC rules, we provide standardized total return information through the latest calendar quarter.
5. Distribution rate is based on an annualization of the respective class’s October dividend and the maximum offering price (NAV for Advisor Class) per share on 10/31/16.
6. The Fund’s 30-day standardized yield is calculated over a trailing 30-day period using the yield to maturity on bonds and/or the dividends accrued on stocks. It may not equal
the Fund’s actual income distribution rate, which reflects the Fund’s past dividends paid to shareholders.
7. Figures are as stated in the Fund’s current prospectus and may differ from the expense ratios disclosed in the Your Fund’s Expenses and Financial Highlights sections in this
report. In periods of market volatility, assets may decline significantly, causing total annual Fund operating expenses to become higher than the figures shown.
franklintempleton.com
Semiannual Report 7
FRANKLIN GLOBAL GOVERNMENT BOND FUND
Your Fund’s Expenses
As a Fund shareholder, you can incur two types of costs: (1) transaction costs, including sales charges (loads) on Fund purchases and redemptions; and (2) ongoing Fund costs, including management fees, distribution and service (12b-1) fees, and other Fund expenses. All mutual funds have ongoing costs, sometimes referred to as operating expenses. The table below shows ongoing costs of investing in the Fund and can help you understand these costs and compare them with those of other mutual funds. The table assumes a $1,000 investment held for the six months indicated.
Actual Fund Expenses
The table below provides information about actual account values and actual expenses in the columns under the heading “Actual.” In these columns the Fund’s actual return, which includes the effect of Fund expenses, is used to calculate the “Ending Account Value” for each class of shares. You can estimate the expenses you paid during the period by following these steps (of course, your account value and expenses will differ from those in this illustration): Divide your account value by $1,000 (if your account had an $8,600 value, then $8,600 ÷ $1,000 = 8.6). Then multiply the result by the number in the row for your class of shares under the headings “Actual” and “Expenses Paid During Period” (if Actual Expenses Paid During Period were $7.50, then 8.6 x $7.50 = $64.50). In this illustration, the actual expenses paid this period are $64.50.
Hypothetical Example for Comparison with Other Funds
Under the heading “Hypothetical” in the table, information is provided about hypothetical account values and hypothetical expenses based on the Fund’s actual expense ratio and an assumed rate of return of 5% per year before expenses, which is not the Fund’s actual return. This information may not be used to estimate the actual ending account balance or expenses you paid for the period, but it can help you compare ongoing costs of investing in the Fund with those of other funds. To do so, compare this 5% hypothetical example for the class of shares you hold with the 5% hypothetical examples that appear in the shareholder reports of other funds.
Please note that expenses shown in the table are meant to highlight ongoing costs and do not reflect any transactional costs. Therefore, information under the heading “Hypothetical” is useful in comparing ongoing costs only, and will not help you compare total costs of owning different funds. In addition, if transactional costs were included, your total costs would have been higher.
| Actual | Hypothetical | |||||||||||
| (actual return after expenses) | (5% annual return before expenses) | |||||||||||
| Expenses | Expenses | Net | ||||||||||
| Beginning | Ending | Paid During | Ending | Paid During | Annualized | |||||||
| Share | Account | Account | Period | Account | Period | Expense | ||||||
| Class | Value 5/1/16 | Value 10/31/16 | 5/1/16–10/31/161,2 | Value 10/31/16 | 5/1/16–10/31/161,2 | Ratio2 | ||||||
| A | $ | 1,000 | $ | 985.00 | $ | 3.80 | $ | 1,021.37 | $ | 3.87 | 0.76 | % |
| C | $ | 1,000 | $ | 983.40 | $ | 6.25 | $ | 1,018.90 | $ | 6.36 | 1.25 | % |
| R | $ | 1,000 | $ | 986.80 | $ | 3.21 | $ | 1,021.98 | $ | 3.26 | 0.64 | % |
| R6 | $ | 1,000 | $ | 985.90 | $ | 2.80 | $ | 1,022.38 | $ | 2.85 | 0.56 | % |
| Advisor | $ | 1,000 | $ | 985.80 | $ | 3.00 | $ | 1,022.18 | $ | 3.06 | 0.60 | % |
1. Expenses are equal to the annualized expense ratio for the six-month period as indicated above–in the far right column–multiplied by the simple average account value
over the period indicated, and then multiplied by 184/365 to reflect the one-half year period.
2. Reflects expenses after fee waivers and expense reimbursements. Does not include acquired fund fees and expenses.
8 Semiannual Report
franklintempleton.com
FRANKLIN STRATEGIC SERIES
| Financial Highlights | ||||||||||||
| Franklin Global Government Bond Fund | ||||||||||||
| Six Months Ended | ||||||||||||
| October 31, 2016 | Year Ended April 30, | |||||||||||
| (unaudited) | 2016 | 2015 | 2014 | a | ||||||||
| Class A | ||||||||||||
| Per share operating performance | ||||||||||||
| (for a share outstanding throughout the period) | ||||||||||||
| Net asset value, beginning of period | $ | 9.59 | $ | 9.81 | $ | 10.45 | $ | 10.00 | ||||
| Income from investment operationsb: | ||||||||||||
| Net investment incomec | 0.06 | 0.12 | 0.17 | 0.11 | ||||||||
| Net realized and unrealized gains (losses) | (0.20 | ) | (0.17 | ) | (0.24 | ) | 0.47 | |||||
| Total from investment operations | (0.14 | ) | (0.05 | ) | (0.07 | ) | 0.58 | |||||
| Less distributions from: | ||||||||||||
| Net investment income and net foreign currency gains | (0.03 | ) | (0.17 | ) | (0.40 | ) | (0.13 | ) | ||||
| Net realized gains | — | — | (0.17 | ) | — | |||||||
| Total distributions | (0.03 | ) | (0.17 | ) | (0.57 | ) | (0.13 | ) | ||||
| Net asset value, end of period | $ | 9.42 | $ | 9.59 | $ | 9.81 | $ | 10.45 | ||||
| Total returnd | (1.50 | )% | (0.44 | )% | (0.64 | )% | 5.81 | % | ||||
| Ratios to average net assetse | ||||||||||||
| Expenses before waiver and payments by affiliates | 1.94 | % | 1.98 | % | 2.37 | % | 3.22 | % | ||||
| Expenses net of waiver and payments by affiliates. | 0.76 | % | 0.67 | % | 0.64 | % | 0.57 | % | ||||
| Net investment income | 1.28 | % | 1.23 | % | 1.63 | % | 1.62 | % | ||||
| Supplemental data | ||||||||||||
| Net assets, end of period (000’s) | $ | 13,068 | $ | 13,356 | $ | 11,487 | $ | 11,232 | ||||
| Portfolio turnover rate. | 16.98 | % | 37.97 | % | 60.28 | % | 13.24 | % | ||||
aFor the period September 6, 2013 (commencement of operations) to April 30, 2014.
bThe amount shown for a share outstanding throughout the period may not correlate with the Statement of Operations for the period due to the timing of sales and
repurchases of the Fund’s shares in relation to income earned and/or fluctuating fair value of the investments of the Fund.
cBased on average daily shares outstanding.
dTotal return does not reflect sales commissions or contingent deferred sales charges, if applicable, and is not annualized for periods less than one year.
eRatios are annualized for periods less than one year.
franklintempleton.com The accompanying notes are an integral part of these financial statements. | Semiannual Report 9
| FRANKLIN STRATEGIC SERIES | ||||||||||||
| FINANCIAL HIGHLIGHTS | ||||||||||||
| Franklin Global Government Bond Fund (continued) | ||||||||||||
| Six Months Ended | ||||||||||||
| October 31, 2016 | Year Ended April 30, | |||||||||||
| (unaudited) | 2016 | 2015 | 2014 | a | ||||||||
| Class C | ||||||||||||
| Per share operating performance | ||||||||||||
| (for a share outstanding throughout the period) | ||||||||||||
| Net asset value, beginning of period | $ | 9.57 | $ | 9.79 | $ | 10.44 | $ | 10.00 | ||||
| Income from investment operationsb: | ||||||||||||
| Net investment incomec | 0.04 | 0.06 | 0.10 | 0.08 | ||||||||
| Net realized and unrealized gains (losses) | (0.20 | ) | (0.16 | ) | (0.24 | ) | 0.46 | |||||
| Total from investment operations | (0.16 | ) | (0.10 | ) | (0.14 | ) | 0.54 | |||||
| Less distributions from: | ||||||||||||
| Net investment income and net foreign currency gains | (0.01 | ) | (0.12 | ) | (0.34 | ) | (0.10 | ) | ||||
| Net realized gains | — | — | (0.17 | ) | — | |||||||
| Total distributions | (0.01 | ) | (0.12 | ) | (0.51 | ) | (0.10 | ) | ||||
| Net asset value, end of period | $ | 9.40 | $ | 9.57 | $ | 9.79 | $ | 10.44 | ||||
| Total returnd | (1.66 | )% | (1.03 | )% | (1.34 | )% | 5.46 | % | ||||
| Ratios to average net assetse | ||||||||||||
| Expenses before waiver and payments by affiliates | 2.43 | % | 2.56 | % | 2.95 | % | 3.81 | % | ||||
| Expenses net of waiver and payments by affiliates. | 1.25 | % | 1.25 | % | 1.22 | % | 1.16 | % | ||||
| Net investment income | 0.79 | % | 0.65 | % | 1.05 | % | 1.03 | % | ||||
| Supplemental data | ||||||||||||
| Net assets, end of period (000’s) | $ | 396 | $ | 509 | $ | 292 | $ | 156 | ||||
| Portfolio turnover rate. | 16.98 | % | 37.97 | % | 60.28 | % | 13.24 | % | ||||
aFor the period September 6, 2013 (commencement of operations) to April 30, 2014.
bThe amount shown for a share outstanding throughout the period may not correlate with the Statement of Operations for the period due to the timing of sales and
repurchases of the Fund’s shares in relation to income earned and/or fluctuating fair value of the investments of the Fund.
cBased on average daily shares outstanding.
dTotal return does not reflect sales commissions or contingent deferred sales charges, if applicable, and is not annualized for periods less than one year.
eRatios are annualized for periods less than one year.
10 Semiannual Report | The accompanying notes are an integral part of these financial statements. franklintempleton.com
| FRANKLIN STRATEGIC SERIES | ||||||||||||
| FINANCIAL HIGHLIGHTS | ||||||||||||
| Franklin Global Government Bond Fund (continued) | ||||||||||||
| Six Months Ended | ||||||||||||
| October 31, 2016 | Year Ended April 30, | |||||||||||
| (unaudited) | 2016 | 2015 | 2014 | a | ||||||||
| Class R | ||||||||||||
| Per share operating performance | ||||||||||||
| (for a share outstanding throughout the period) | ||||||||||||
| Net asset value, beginning of period | $ | 9.58 | $ | 9.80 | $ | 10.44 | $ | 10.00 | ||||
| Income from investment operationsb: | ||||||||||||
| Net investment incomec | 0.07 | 0.08 | 0.12 | 0.08 | ||||||||
| Net realized and unrealized gains (losses) | (0.21 | ) | (0.16 | ) | (0.23 | ) | 0.47 | |||||
| Total from investment operations | (0.14 | ) | (0.08 | ) | (0.11 | ) | 0.55 | |||||
| Less distributions from: | ||||||||||||
| Net investment income and net foreign currency gains | (0.01 | ) | (0.14 | ) | (0.36 | ) | (0.11 | ) | ||||
| Net realized gains | — | — | (0.17 | ) | — | |||||||
| Total distributions | (0.01 | ) | (0.14 | ) | (0.53 | ) | (0.11 | ) | ||||
| Net asset value, end of period | $ | 9.43 | $ | 9.58 | $ | 9.80 | $ | 10.44 | ||||
| Total returnd | (1.32 | )% | (0.90 | )% | (1.07 | )% | 5.52 | % | ||||
| Ratios to average net assetse | ||||||||||||
| Expenses before waiver and payments by affiliates | 1.82 | % | 2.39 | % | 2.82 | % | 3.66 | % | ||||
| Expenses net of waiver and payments by affiliates. | 0.64 | % | 1.08 | % | 1.09 | % | 1.01 | % | ||||
| Net investment income | 1.40 | % | 0.82 | % | 1.18 | % | 1.18 | % | ||||
| Supplemental data | ||||||||||||
| Net assets, end of period (000’s) | $ | 9 | $ | 10 | $ | 10 | $ | 10 | ||||
| Portfolio turnover rate. | 16.98 | % | 37.97 | % | 60.28 | % | 13.24 | % | ||||
aFor the period September 6, 2013 (commencement of operations) to April 30, 2014.
bThe amount shown for a share outstanding throughout the period may not correlate with the Statement of Operations for the period due to the timing of sales and
repurchases of the Fund’s shares in relation to income earned and/or fluctuating fair value of the investments of the Fund.
cBased on average daily shares outstanding.
dTotal return is not annualized for periods less than one year.
eRatios are annualized for periods less than one year.
franklintempleton.com The accompanying notes are an integral part of these financial statements. | Semiannual Report 11
| FRANKLIN STRATEGIC SERIES | ||||||||||||
| FINANCIAL HIGHLIGHTS | ||||||||||||
| Franklin Global Government Bond Fund (continued) | ||||||||||||
| Six Months Ended | ||||||||||||
| October 31, 2016 | Year Ended April 30, | |||||||||||
| (unaudited) | 2016 | 2015 | 2014 | a | ||||||||
| Class R6 | ||||||||||||
| Per share operating performance | ||||||||||||
| (for a share outstanding throughout the period) | ||||||||||||
| Net asset value, beginning of period | $ | 9.59 | $ | 9.81 | $ | 10.45 | $ | 10.00 | ||||
| Income from investment operationsb: | ||||||||||||
| Net investment incomec | 0.07 | 0.13 | 0.18 | 0.11 | ||||||||
| Net realized and unrealized gains (losses) | (0.20 | ) | (0.17 | ) | (0.24 | ) | 0.48 | |||||
| Total from investment operations | (0.13 | ) | (0.04 | ) | (0.06 | ) | 0.59 | |||||
| Less distributions from: | ||||||||||||
| Net investment income and net foreign currency gains | (0.04 | ) | (0.18 | ) | (0.41 | ) | (0.14 | ) | ||||
| Net realized gains | — | — | (0.17 | ) | — | |||||||
| Total distributions | (0.04 | ) | (0.18 | ) | (0.58 | ) | (0.14 | ) | ||||
| Net asset value, end of period | $ | 9.42 | $ | 9.59 | $ | 9.81 | $ | 10.45 | ||||
| Total returnd | (1.41 | )% | (0.38 | )% | (0.62 | )% | 5.91 | % | ||||
| Ratios to average net assetse | ||||||||||||
| Expenses before waiver and payments by affiliates | 2.54 | % | 2.82 | % | 3.04 | % | 3.78 | % | ||||
| Expenses net of waiver and payments by affiliates. | 0.56 | % | 0.59 | % | 0.57 | % | 0.51 | % | ||||
| Net investment income | 1.48 | % | 1.31 | % | 1.70 | % | 1.68 | % | ||||
| Supplemental data | ||||||||||||
| Net assets, end of period (000’s) | $ | 9 | $ | 10 | $ | 10 | $ | 10 | ||||
| Portfolio turnover rate. | 16.98 | % | 37.97 | % | 60.28 | % | 13.24 | % | ||||
a For the period September 6, 2013 (commencement of operations) to April 30, 2014.
bThe amount shown for a share outstanding throughout the period may not correlate with the Statement of Operations for the period due to the timing of sales and
repurchases of the Fund’s shares in relation to income earned and/or fluctuating fair value of the investments of the Fund.
cBased on average daily shares outstanding.
dTotal return is not annualized for periods less than one year.
eRatios are annualized for periods less than one year.
12 Semiannual Report | The accompanying notes are an integral part of these financial statements. franklintempleton.com
| FRANKLIN STRATEGIC SERIES | ||||||||||||
| FINANCIAL HIGHLIGHTS | ||||||||||||
| Franklin Global Government Bond Fund (continued) | ||||||||||||
| Six Months Ended | ||||||||||||
| October 31, 2016 | Year Ended April 30, | |||||||||||
| (unaudited) | 2016 | 2015 | 2014 | a | ||||||||
| Advisor Class | ||||||||||||
| Per share operating performance | ||||||||||||
| (for a share outstanding throughout the period) | ||||||||||||
| Net asset value, beginning of period | $ | 9.61 | $ | 9.83 | $ | 10.49 | $ | 10.00 | ||||
| Income from investment operationsb: | ||||||||||||
| Net investment incomec | 0.07 | 0.12 | 0.17 | 0.10 | ||||||||
| Net realized and unrealized gains (losses) | (0.20 | ) | (0.16 | ) | (0.24 | ) | 0.52 | |||||
| Total from investment operations | (0.13 | ) | (0.04 | ) | (0.07 | ) | 0.62 | |||||
| Less distributions from: | ||||||||||||
| Net investment income and net foreign currency gains | (0.03 | ) | (0.18 | ) | (0.42 | ) | (0.13 | ) | ||||
| Net realized gains | — | — | (0.17 | ) | — | |||||||
| Total distributions | (0.03 | ) | (0.18 | ) | (0.59 | ) | (0.13 | ) | ||||
| Net asset value, end of period | $ | 9.45 | $ | 9.61 | $ | 9.83 | $ | 10.49 | ||||
| Total returnd | (1.42 | )% | (0.38 | )% | (0.65 | )% | 6.24 | % | ||||
| Ratios to average net assetse | ||||||||||||
| Expenses before waiver and payments by affiliates | 1.78 | % | 1.91 | % | 2.30 | % | 3.16 | % | ||||
| Expenses net of waiver and payments by affiliates. | 0.60 | % | 0.60 | % | 0.57 | % | 0.51 | % | ||||
| Net investment income | 1.44 | % | 1.30 | % | 1.70 | % | 1.68 | % | ||||
| Supplemental data | ||||||||||||
| Net assets, end of period (000’s) | $ | 321 | $ | 10 | $ | 10 | $ | 10 | ||||
| Portfolio turnover rate. | 16.98 | % | 37.97 | % | 60.28 | % | 13.24 | % | ||||
aFor the period September 6, 2013 (commencement of operations) to April 30, 2014.
bThe amount shown for a share outstanding throughout the period may not correlate with the Statement of Operations for the period due to the timing of sales and
repurchases of the Fund’s shares in relation to income earned and/or fluctuating fair value of the investments of the Fund.
cBased on average daily shares outstanding.
dTotal return is not annualized for periods less than one year.
eRatios are annualized for periods less than one year.
franklintempleton.com The accompanying notes are an integral part of these financial statements. | Semiannual Report 13
| FRANKLIN STRATEGIC SERIES | ||||||
| Statement of Investments, October 31, 2016 (unaudited) | ||||||
| Franklin Global Government Bond Fund | ||||||
| Principal | ||||||
| Country | Amount* | Value | ||||
| Foreign Government and Agency Securities 64.6% | ||||||
| Government of Canada, 2.75%, 6/01/22. | Canada | 450,000 | CAD | $ | 372,218 | |
| Government of Chile, 3.875%, 8/05/20 | Chile | 100,000 | 107,968 | |||
| a Government of Finland, senior bond, Reg S, 2.00%, 4/15/24 | Finland | 350,000 | EUR | 442,027 | ||
| a Government of France, Reg S, 1.00%, 5/25/19 | France | 160,000 | EUR | 182,627 | ||
| a Government of Germany, Reg S, 1.50%, 2/15/23 | Germany | 375,000 | EUR | 458,496 | ||
| a Government of Indonesia, Reg S, 4.875%, 5/05/21 | Indonesia | 200,000 | 217,931 | |||
| a Government of Lithuania, senior note, Reg S, 6.625%, 2/01/22 | Lithuania | 200,000 | 242,587 | |||
| Government of Malaysia, | ||||||
| senior bond, 4.24%, 2/07/18 | Malaysia | 650,000 | MYR | 158,090 | ||
| senior note, 3.654%, 10/31/19 | Malaysia | 550,000 | MYR | 133,326 | ||
| Government of Mexico, | ||||||
| 7.75%, 12/14/17 | Mexico | 30,000 | b | MXN | 163,597 | |
| 8.00%, 12/07/23 | Mexico | 30,000 | b | MXN | 176,237 | |
| senior bond, 5.95%, 3/19/19 | Mexico | 100,000 | 110,300 | |||
| Government of Peru, senior bond, 6.55%, 3/14/37. | Peru | 200,000 | 275,000 | |||
| Government of Poland, | ||||||
| 3.25%, 7/25/19. | Poland | 1,400,000 | PLN | 368,943 | ||
| 4.00%, 10/25/23 | Poland | 1,150,000 | PLN | 314,744 | ||
| 2.50%, 7/25/26. | Poland | 2,000,000 | PLN | 485,175 | ||
| Government of Singapore, 2.375%, 4/01/17 | Singapore | 350,000 | SGD | 253,264 | ||
| a Government of Spain, | ||||||
| senior bond, Reg S, 5.15%, 10/31/44 | Spain | 300,000 | EUR | 523,694 | ||
| senior note, Reg S, 5.15%, 10/31/28 | Spain | 200,000 | EUR | 310,141 | ||
| Italy Treasury Bond, | ||||||
| a Reg S, 3.50%, 3/01/30 | Italy | 700,000 | EUR | 912,057 | ||
| senior bond, 4.25%, 9/01/19 | Italy | 160,000 | EUR | 195,698 | ||
| senior bond, 5.50%, 9/01/22 | Italy | 450,000 | EUR | 625,578 | ||
| a senior bond, Reg S, 5.00%, 8/01/34 | Italy | 270,000 | EUR | 416,897 | ||
| a Queensland Treasury Corp., | ||||||
| senior bond, Reg S, 5.75%, 7/22/24 | Australia | 600,000 | AUD | 561,270 | ||
| senior note, Reg S, 6.00%, 7/21/22. | Australia | 300,000 | AUD | 274,795 | ||
| a United Kingdom Treasury Bond, Reg S, 4.25%, 6/07/32 | United Kingdom | 380,000 | GBP | 633,929 | ||
| Total Foreign Government and Agency Securities | ||||||
| (Cost $9,332,926) | 8,916,589 | |||||
| U.S. Government and Agency Securities 22.4% | ||||||
| U.S. Treasury Bond, | ||||||
| 4.375%, 11/15/39 | United States | 480,000 | 644,156 | |||
| 2.50%, 2/15/45. | United States | 140,000 | 137,761 | |||
| c Index Linked, 3.375%, 4/15/32 | United States | 162,823 | 236,414 | |||
| U.S. Treasury Note, | ||||||
| 0.75%, 1/15/17. | United States | 300,000 | 300,296 | |||
| 1.875%, 8/31/17 | United States | 700,000 | 707,055 | |||
| 2.625%, 11/15/20 | United States | 850,000 | 897,231 | |||
| c Index Linked, 1.25%, 7/15/20 | United States | 165,652 | 176,951 | |||
| Total U.S. Government and Agency Securities | ||||||
| (Cost $3,010,133) | 3,099,864 | |||||
| Total Investments before Short Term Investments | ||||||
| (Cost $12,343,059) | 12,016,453 | |||||
14 Semiannual Report
franklintempleton.com
FRANKLIN STRATEGIC SERIES
STATEMENT OF INVESTMENTS (UNAUDITED)
| Franklin Global Government Bond Fund (continued) | ||||
| Country | Shares | Value | ||
| Short Term Investments (Cost $1,310,293) 9.5% | ||||
| Money Market Funds 9.5% | ||||
| d,e Institutional Fiduciary Trust Money Market Portfolio | United States | 1,310,293 | $ | 1,310,293 |
| Total Investments (Cost $13,653,352) 96.5% | 13,326,746 | |||
| Other Assets, less Liabilities 3.5% | 477,374 | |||
| Net Assets 100.0% | $ | 13,804,120 |
*The principal amount is stated in U.S. dollars unless otherwise indicated.
aSecurity was purchased pursuant to Regulation S under the Securities Act of 1933, which exempts from registration securities offered and sold outside of the United States.
Such a security cannot be sold in the United States without either an effective registration statement filed pursuant to the Securities Act of 1933, or pursuant to an exemption
from registration. These securities have been deemed liquid under guidelines approved by the Trust’s Board of Trustees. At October 31, 2016, the aggregate value of these
securities was $5,176,451, representing 37.5% of net assets.
bPrincipal amount is stated in 100 Mexican Peso Units.
cPrincipal amount of security is adjusted for inflation. See Note 1(e).
dNon-income producing.
eSee regarding investments in affiliated management investment companies.
| At October 31, 2016, the Fund had the following forward exchange contracts outstanding. See Note 1(c). | |||||||||||
| Forward Exchange Contracts | |||||||||||
| Contract | Settlement | Unrealized | Unrealized | ||||||||
| Currency | Counterpartya Type | Quantity | Amount | Date | Appreciation | Depreciation | |||||
| OTC Forward Exchange Contracts | |||||||||||
| Australian Dollar | BZWS | Sell | 1,100,000 | $ | 822,910 | 12/14/16 | $ | — | $ | (13,182 | ) |
| Euro. | CITI | Sell | 920,000 | 1,036,189 | 12/14/16 | 24,324 | — | ||||
| Japanese Yen | CITI | Buy | 88,000,000 | 865,905 | 12/14/16 | — | (25,294 | ) | |||
| Malaysian Ringgit | BZWS | Sell | 900,000 | 216,988 | 12/14/16 | 2,747 | — | ||||
| Mexican Peso | DBW | Buy | 5,000,000 | 260,158 | 12/14/16 | 3,448 | — | ||||
| Polish Zloty | BZWS | Sell | 2,900,000 | 748,088 | 12/14/16 | 9,441 | — | ||||
| Singapore Dollar | CITI | Sell | 350,000 | 256,839 | 12/14/16 | 5,175 | — | ||||
| Total Forward Exchange Contracts | $ | 45,135 | $ | (38,476 | ) | ||||||
| Net unrealized appreciation (depreciation) | $ | 6,659 | |||||||||
| aMay be comprised of multiple contracts with the same counterparty, currency and settlement date. | |||||||||||
See Abbreviations on page 28.
franklintempleton.com The accompanying notes are an integral part of these financial statements. | Semiannual Report 15
| FRANKLIN STRATEGIC SERIES | |||
| Financial Statements | |||
| Statement of Assets and Liabilities | |||
| October 31, 2016 (unaudited) | |||
| Franklin Global Government Bond Fund | |||
| Assets: | |||
| Investments in securities: | |||
| Cost - Unaffiliated issuers | $ | 12,343,059 | |
| Cost - Non-controlled affiliates (Note 3f) | 1,310,293 | ||
| Total cost of investments | $ | 13,653,352 | |
| Value - Unaffiliated issuers | $ | 12,016,453 | |
| Value - Non-controlled affiliates (Note 3f) | 1,310,293 | ||
| Total value of investments | 13,326,746 | ||
| Foreign currency, at value (cost $351,264) | 351,598 | ||
| Receivables: | |||
| Capital shares sold | 8,317 | ||
| Interest | 99,692 | ||
| Affiliates | 37,132 | ||
| Unrealized appreciation on OTC forward exchange contracts | 45,135 | ||
| Other assets. | 35,279 | ||
| Total assets | 13,903,899 | ||
| Liabilities: | |||
| Payables: | |||
| Capital shares redeemed | 26,139 | ||
| Distribution fees | 1,533 | ||
| Transfer agent fees | 1,941 | ||
| Professional fees. | 28,535 | ||
| Unrealized depreciation on OTC forward exchange contracts | 38,476 | ||
| Accrued expenses and other liabilities | 3,155 | ||
| Total liabilities | 99,779 | ||
| Net assets, at value. | $ | 13,804,120 | |
| Net assets consist of: | |||
| Paid-in capital. | $ | 14,545,672 | |
| Distributions in excess of net investment income. | (143,853 | ) | |
| Net unrealized appreciation (depreciation) | (320,806 | ) | |
| Accumulated net realized gain (loss) | (276,893 | ) | |
| Net assets, at value. | $ | 13,804,120 | |
16 Semiannual Report | The accompanying notes are an integral part of these financial statements. franklintempleton.com
FRANKLIN STRATEGIC SERIES
FINANCIAL STATEMENTS
Statement of Assets and Liabilities (continued)
October 31, 2016 (unaudited)
| Franklin Global Government Bond Fund | ||
| Class A: | ||
| Net assets, at value. | $ | 13,068,206 |
| Shares outstanding | 1,387,362 | |
| Net asset value per sharea | $ | 9.42 |
| Maximum offering price per share (net asset value per share ÷ 95.75%) | $ | 9.84 |
| Class C: | ||
| Net assets, at value. | $ | 396,216 |
| Shares outstanding | 42,173 | |
| Net asset value and maximum offering price per sharea | $ | 9.40 |
| Class R: | ||
| Net assets, at value. | $ | 9,426 |
| Shares outstanding | 1,000 | |
| Net asset value and maximum offering price per share | $ | 9.43 |
| Class R6: | ||
| Net assets, at value. | $ | 9,418 |
| Shares outstanding | 1,000 | |
| Net asset value and maximum offering price per share | $ | 9.42 |
| Advisor Class: | ||
| Net assets, at value. | $ | 320,854 |
| Shares outstanding | 33,969 | |
| Net asset value and maximum offering price per share | $ | 9.45 |
aRedemption price is equal to net asset value less contingent deferred sales charges, if applicable.
franklintempleton.com The accompanying notes are an integral part of these financial statements. | Semiannual Report 17
| FRANKLIN STRATEGIC SERIES |
| FINANCIAL STATEMENTS |
Statement of Operations
for the six months ended October 31, 2016 (unaudited)
| Franklin Global Government Bond Fund | |||
| Investment income: | |||
| Interest | $ | 141,697 | |
| Expenses: | |||
| Management fees (Note 3a) | 45,098 | ||
| Distribution fees: (Note 3c) | |||
| Class A | 10,910 | ||
| Class C | 1,523 | ||
| Class R | 2 | ||
| Transfer agent fees: (Note 3e) | |||
| Class A | 5,901 | ||
| Class C | 209 | ||
| Class R | 5 | ||
| Class R6 | 41 | ||
| Advisor Class | 48 | ||
| Custodian fees (Note 4) | 882 | ||
| Reports to shareholders | 5,302 | ||
| Registration and filing fees | 34,220 | ||
| Professional fees | 28,916 | ||
| Other | 3,188 | ||
| Total expenses | 136,245 | ||
| Expenses waived/paid by affiliates (Note 3g) | (82,230 | ) | |
| Net expenses | 54,015 | ||
| Net investment income | 87,682 | ||
| Realized and unrealized gains (losses): | |||
| Net realized gain (loss) from: | |||
| Investments | (44,191 | ) | |
| Foreign currency transactions | (133,173 | ) | |
| Net realized gain (loss) | (177,364 | ) | |
| Net change in unrealized appreciation (depreciation) on: | |||
| Investments | (282,954 | ) | |
| Translation of other assets and liabilities | |||
| denominated in foreign currencies | 174,908 | ||
| Net change in unrealized appreciation (depreciation) | (108,046 | ) | |
| Net realized and unrealized gain (loss) | (285,410 | ) | |
| Net increase (decrease) in net assets resulting from operations | $ | (197,728 | ) |
18 Semiannual Report | The accompanying notes are an integral part of these financial statements. franklintempleton.com
| FRANKLIN STRATEGIC SERIES | ||||||
| FINANCIAL STATEMENTS | ||||||
| Statements of Changes in Net Assets | ||||||
| Franklin Global Government Bond Fund | ||||||
| Six Months Ended | ||||||
| October 31, 2016 | Year Ended | |||||
| (unaudited) | April 30, 2016 | |||||
| Increase (decrease) in net assets: | ||||||
| Operations: | ||||||
| Net investment income | $ | 87,682 | $ | 146,029 | ||
| Net realized gain (loss) | (177,364 | ) | (259,529 | ) | ||
| Net change in unrealized appreciation (depreciation) | (108,046 | ) | 94,403 | |||
| Net increase (decrease) in net assets resulting from operations. | (197,728 | ) | (19,097 | ) | ||
| Distributions to shareholders from: | ||||||
| Net investment income: | ||||||
| Class A | (37,065 | ) | (207,807 | ) | ||
| Class C | (576 | ) | (4,106 | ) | ||
| Class R | (13 | ) | (139 | ) | ||
| Class R6 | (36 | ) | (179 | ) | ||
| Advisor Class | (217 | ) | (196 | ) | ||
| Total distributions to shareholders | (37,907 | ) | (212,427 | ) | ||
| Capital share transactions: (Note 2) | ||||||
| Class A | (66,674 | ) | 2,094,584 | |||
| Class C | (107,037 | ) | 222,515 | |||
| Advisor Class | 319,549 | 25 | ||||
| Total capital share transactions | 145,838 | 2,317,124 | ||||
| Net increase (decrease) in net assets. | (89,797 | ) | 2,085,600 | |||
| Net assets: | ||||||
| Beginning of period | 13,893,917 | 11,808,317 | ||||
| End of period | $ | 13,804,120 | $ | 13,893,917 | ||
| Distributions in excess of net investment income included in net assets: | ||||||
| End of period | $ | (143,853 | ) | $ | (193,628 | ) |
franklintempleton.com The accompanying notes are an integral part of these financial statements. | Semiannual Report 19
FRANKLIN STRATEGIC SERIES
Notes to Financial Statements (unaudited)
Franklin Global Government Bond Fund
1. Organization and Significant Accounting Policies
Franklin Strategic Series (Trust) is registered under the Investment Company Act of 1940 (1940 Act) as an open-end management investment company, consisting of nine separate funds and applies the specialized accounting and reporting guidance in U.S. Generally Accepted Accounting Principles (U.S. GAAP). Franklin Global Government Bond Fund (Fund) is included in this report. The financial statements of the remaining funds in the Trust are presented separately. The Fund offers five classes of shares: Class A, Class C, Class R, Class R6, and Advisor Class. Each class of shares differs by its initial sales load, contingent deferred sales charges, voting rights on matters affecting a single class, its exchange privilege and fees primarily due to differing arrangements for distribution and transfer agent fees.
The following summarizes the Fund’s significant accounting policies.
a. Financial Instrument Valuation
The Fund’s investments in financial instruments are carried at fair value daily. Fair value is the price that would be received to sell an asset or paid to transfer a liability in an orderly transaction between market participants on the measurement date. The Fund calculates the net asset value (NAV) per share as of 4 p.m. Eastern time each day the New York Stock Exchange (NYSE) is open for trading. Under compliance policies and procedures approved by the Trust’s Board of Trustees (the Board), the Fund’s administrator has responsibility for oversight of valuation, including leading the cross-functional Valuation Committee (VC). The VC provides administration and oversight of the Fund’s valuation policies and procedures, which are approved annually by the Board. Among other things, these procedures allow the Fund to utilize independent pricing services, quotations from securities and financial instrument dealers, and other market sources to determine fair value.
Debt securities generally trade in the over-the-counter (OTC) market rather than on a securities exchange. The Fund’s pricing services use multiple valuation techniques to determine fair value. In instances where sufficient market activity exists, the pricing services may utilize a market-based approach through which quotes from market makers are used to determine fair value. In instances where sufficient market activity may not exist or is limited, the pricing services also utilize proprietary valuation models which may consider market characteristics such as benchmark yield curves, credit spreads, estimated default rates, anticipated market interest rate volatility, coupon rates, anticipated timing of principal repayments, underlying collateral, and other unique security features in order to estimate the relevant cash flows, which are then discounted to calculate the fair value. Securities denominated in a foreign currency are converted into their U.S. dollar equivalent at the foreign exchange rate in effect at 4 p.m. Eastern time on the date that the values of the foreign debt securities are determined.
Investments in open-end mutual funds are valued at the closing NAV.
Certain derivative financial instruments (derivatives) trade in the OTC market. The Fund’s pricing services use various techniques including industry standard option pricing models and proprietary discounted cash flow models to determine the fair value of those instruments. The Fund’s net benefit or obligation under the derivative contract, as measured by the fair value of the contract, is included in net assets.
The Fund has procedures to determine the fair value of financial instruments for which market prices are not reliable or readily available. Under these procedures, the VC convenes on a regular basis to review such financial instruments and considers a number of factors, including significant unobservable valuation inputs, when arriving at fair value. The VC primarily employs a market-based approach which may use related or comparable assets or liabilities, recent transactions, market multiples, book values, and other relevant information for the investment to determine the fair value of the investment. An income-based valuation approach may also be used in which the anticipated future cash flows of the investment are discounted to calculate fair value. Discounts may also be applied due to the nature or duration of any restrictions on the disposition of the investments. Due to the inherent uncertainty of valuations of such investments, the fair values may differ significantly from the values that would have been used had an active market existed. The VC employs various methods for calibrating these valuation approaches including a regular review of key inputs and assumptions, transactional back-testing or disposition analysis, and reviews of any related market activity.
Trading in securities on foreign securities stock exchanges and OTC markets may be completed before 4 p.m. Eastern time. In addition, trading in certain foreign markets may not take place on every NYSE business day. Occasionally, events occur
20 Semiannual Report
franklintempleton.com
FRANKLIN STRATEGIC SERIES
NOTES TO FINANCIAL STATEMENTS (UNAUDITED)
Franklin Global Government Bond Fund (continued)
between the time at which trading in a foreign security is completed and the close of the NYSE that might call into question the reliability of the value of a portfolio security held by the Fund. As a result, differences may arise between the value of the Fund’s portfolio securities as determined at the foreign market close and the latest indications of value at the close of the NYSE. In order to minimize the potential for these differences, the VC monitors price movements following the close of trading in foreign stock markets through a series of country specific market proxies (such as baskets of American Depositary Receipts, futures contracts and exchange traded funds). These price movements are measured against established trigger thresholds for each specific market proxy to assist in determining if an event has occurred that may call into question the reliability of the values of the foreign securities held by the Fund. If such an event occurs, the securities may be valued using fair value procedures, which may include the use of independent pricing services.
When the last day of the reporting period is a non-business day, certain foreign markets may be open on those days that the NYSE is closed, which could result in differences between the value of the Fund’s portfolio securities on the last business day and the last calendar day of the reporting period. Any significant security valuation changes due to an open foreign market are adjusted and reflected by the Fund for financial reporting purposes.
b. Foreign Currency Translation
Portfolio securities and other assets and liabilities denominated in foreign currencies are translated into U.S. dollars based on the exchange rate of such currencies against U.S. dollars on the date of valuation. The Fund may enter into foreign currency exchange contracts to facilitate transactions denominated in a foreign currency. Purchases and sales of securities, income and expense items denominated in foreign currencies are translated into U.S. dollars at the exchange rate in effect on the transaction date. Portfolio securities and assets and liabilities denominated in foreign currencies contain risks that those currencies will decline in value relative to the U.S. dollar. Occasionally, events may impact the availability or reliability of foreign exchange rates used to convert the U.S. dollar equivalent value. If such an event occurs, the foreign exchange rate will be valued at fair value using procedures established and approved by the Board.
The Fund does not separately report the effect of changes in foreign exchange rates from changes in market prices on securities held. Such changes are included in net realized and unrealized gain or loss from investments in the Statement of Operations.
Realized foreign exchange gains or losses arise from sales of foreign currencies, currency gains or losses realized between the trade and settlement dates on securities transactions and the difference between the recorded amounts of dividends, interest, and foreign withholding taxes and the U.S. dollar equivalent of the amounts actually received or paid. Net unrealized foreign exchange gains and losses arise from changes in foreign exchange rates on foreign denominated assets and liabilities other than investments in securities held at the end of the reporting period.
c. Derivative Financial Instruments
The Fund invested in derivatives in order to manage risk or gain exposure to various other investments or markets. Derivatives are financial contracts based on an underlying or notional amount, require no initial investment or an initial net investment that is smaller than would normally be required to have a similar response to changes in market factors, and require or permit net settlement. Derivatives contain various risks including the potential inability of the counterparty to fulfill their obligations under the terms of the contract, the potential for an illiquid secondary market, and/or the potential for market movements which expose the Fund to gains or losses in excess of the amounts shown in the Statement of Assets and Liabilities. Realized gain and loss and unrealized appreciation and depreciation on these contracts for the period are included in the Statement of Operations.
Derivative counterparty credit risk is managed through a formal evaluation of the creditworthiness of all potential counterparties The Fund attempts to reduce its exposure to counterparty credit risk on OTC derivatives, whenever possible, by entering into International Swaps and Derivatives Association (ISDA) master agreements with certain counterparties. These agreements contain various provisions, including but not limited to collateral requirements, events of default, or early termination. Termination events applicable to the counterparty include certain deteriorations in the credit quality of the counterparty. Termination events applicable to the Fund include failure of the Fund to maintain certain net asset levels and/or limit the decline in net assets over various periods of time. In the event of default
franklintempleton.com
Semiannual Report 21
FRANKLIN STRATEGIC SERIES
NOTES TO FINANCIAL STATEMENTS (UNAUDITED)
Franklin Global Government Bond Fund (continued)
1. Organization and Significant Accounting
Policies (continued)
c. Derivative Financial Instruments (continued)
or early termination, the ISDA master agreement gives the non-defaulting party the right to net and close-out all transactions traded, whether or not arising under the ISDA agreement, to one net amount payable by one counterparty to the other. However, absent an event of default or early termination, OTC derivative assets and liabilities are presented gross and not offset in the Statement of Assets and Liabilities. Early termination by the counterparty may result in an immediate payment by the Fund of any net liability owed to that counterparty under the ISDA agreement. At October 31, 2016, the Fund had OTC derivatives in a net liability position of $994.
Collateral requirements differ by type of derivative. Collateral terms are contract specific for OTC derivatives. For OTC derivatives traded under an ISDA master agreement, posting of collateral is required by either the Fund or the applicable counterparty if the total net exposure of all OTC derivatives with the applicable counterparty exceeds the minimum transfer amount, which typically ranges from $100,000 to $250,000, and can vary depending on the counterparty and the type of the agreement. Generally, collateral is determined at the close of Fund business each day and any additional collateral required due to changes in derivative values may be delivered by the Fund or the counterparty within a few business days. Collateral pledged and/or received by the Fund, if any, is held in segregated accounts with the Fund’s custodian/counterparty broker and can be in the form of cash and/or securities. Unrestricted cash may be invested according to the Fund’s investment objectives. To the extent that the amounts due to the Fund from its counterparties are not subject to collateralization or are not fully collateralized, the Fund bears the risk of loss from counterparty non-performance.
The Fund entered into OTC forward exchange contracts primarily to manage exposure to certain foreign currencies. A forward exchange contract is an agreement between the Fund and a counterparty to buy or sell a foreign currency at a specific exchange rate on a future date.
See Note 8 regarding other derivative information.
d. Income and Deferred Taxes
It is the Fund’s policy to qualify as a regulated investment company under the Internal Revenue Code. The Fund intends to distribute to shareholders substantially all of its taxable income and net realized gains to relieve it from federal income and excise taxes. As a result, no provision for U.S. federal income taxes is required.
The Fund may be subject to foreign taxation related to income received, capital gains on the sale of securities and certain foreign currency transactions in the foreign jurisdictions in which it invests. Foreign taxes, if any, are recorded based on the tax regulations and rates that exist in the foreign markets in which the Fund invests. When a capital gain tax is determined to apply, the Fund records an estimated deferred tax liability in an amount that would be payable if the securities were disposed of on the valuation date.
The Fund may recognize an income tax liability related to its uncertain tax positions under U.S. GAAP when the uncertain tax position has a less than 50% probability that it will be sustained upon examination by the tax authorities based on its technical merits. As of October 31, 2016, the Fund has determined that no tax liability is required in its financial statements related to uncertain tax positions for any open tax years (or expected to be taken in future tax years). Open tax years are those that remain subject to examination and are based on each tax jurisdiction’s statute of limitation.
e. Security Transactions, Investment Income, Expenses and Distributions
Security transactions are accounted for on trade date. Realized gains and losses on security transactions are determined on a specific identification basis. Interest income and estimated expenses are accrued daily. Amortization of premium and accretion of discount on debt securities are included in interest income. Distributions to shareholders are recorded on the ex-dividend date and are determined according to income tax regulations (tax basis). Distributable earnings determined on a tax basis may differ from earnings recorded in accordance with U.S. GAAP. These differences may be permanent or temporary. Permanent differences are reclassified among capital accounts to reflect their tax character. These reclassifications have no impact on net assets or the results of operations. Temporary differences are not reclassified, as they may reverse in subsequent periods.
22 Semiannual Report
franklintempleton.com
FRANKLIN STRATEGIC SERIES
NOTES TO FINANCIAL STATEMENTS (UNAUDITED)
Franklin Global Government Bond Fund (continued)
Common expenses incurred by the Trust are allocated among the Funds based on the ratio of net assets of each Fund to the combined net assets of the Trust. Fund specific expenses are charged directly to the Fund that incurred the expense.
Realized and unrealized gains and losses and net investment income, not including class specific expenses, are allocated daily to each class of shares based upon the relative proportion of net assets of each class. Differences in per share distributions, by class, are generally due to differences in class specific expenses.
Inflation-indexed bonds are adjusted for inflation through periodic increases or decreases in the security’s interest accruals, face amount, or principal redemption value, by amounts corresponding to the rate of inflation as measured by an index. Any increase or decrease in the face amount or principal redemption value will be included as interest income in the Statement of Operations.
f. Accounting Estimates
The preparation of financial statements in accordance with U.S. GAAP requires management to make estimates and assumptions that affect the reported amounts of assets and liabilities at the date of the financial statements and the amounts of income and expenses during the reporting period. Actual results could differ from those estimates.
g. Guarantees and Indemnifications
Under the Trust’s organizational documents, its officers and trustees are indemnified by the Trust against certain liabilities arising out of the performance of their duties to the Trust. Additionally, in the normal course of business, the Trust, on behalf of the Fund, enters into contracts with service providers that contain general indemnification clauses. The Trust’s maximum exposure under these arrangements is unknown as this would involve future claims that may be made against the Trust that have not yet occurred. Currently, the Trust expects the risk of loss to be remote.
2. Shares of Beneficial Interest
At October 31, 2016, there were an unlimited number of shares authorized (without par value). Transactions in the Fund’s shares were as follows:
| Six Months Ended | Year Ended | ||||||||||
| October 31, 2016a | April 30, 2016a | ||||||||||
| Shares | Amount | Shares | Amount | ||||||||
| Class A Shares: | |||||||||||
| Shares sold | 285,093 | $ | 2,747,171 | 332,524 | $ | 3,141,724 | |||||
| Shares issued in reinvestment of distributions | 1,244 | 11,918 | 3,698 | 35,024 | |||||||
| Shares redeemed | (292,291 | ) | (2,825,763 | ) | (114,211 | ) | (1,082,164 | ) | |||
| Net increase (decrease) | (5,954 | ) | $ | (66,674 | ) | 222,011 | $ | 2,094,584 | |||
| Class C Shares: | |||||||||||
| Shares sold | 12,702 | $ | 122,119 | 44,024 | $ | 416,435 | |||||
| Shares issued in reinvestment of distributions | 60 | 576 | 421 | 3,989 | |||||||
| Shares redeemed | (23,756 | ) | (229,732 | ) | (21,056 | ) | (197,909 | ) | |||
| Net increase (decrease) | (10,994 | ) | $ | (107,037 | ) | 23,389 | $ | 222,515 | |||
franklintempleton.com
Semiannual Report 23
FRANKLIN STRATEGIC SERIES
NOTES TO FINANCIAL STATEMENTS (UNAUDITED)
| Franklin Global Government Bond Fund (continued) | ||||||||||
| 2. Shares of Beneficial Interest (continued) | ||||||||||
| Six Months Ended | Year Ended | |||||||||
| October 31, 2016a | April 30, 2016a | |||||||||
| Shares | Amount | Shares | Amount | |||||||
| Advisor Class Shares: | ||||||||||
| Shares sold | 41,599 | $ | 403,999 | 1,207 | $ | 11,435 | ||||
| Shares issued in reinvestment of distributions | 19 | 183 | — | — | ||||||
| Shares redeemed | (8,649 | ) | (84,633 | ) | (1,207 | ) | (11,410 | ) | ||
| Net increase (decrease) | 32,969 | $ | 319,549 | — | $ | 25 | ||||
| aDuring the period Class R and Class R6 did not report any share transactions. | ||||||||||
3. Transactions with Affiliates
Franklin Resources, Inc. is the holding company for various subsidiaries that together are referred to as Franklin Templeton Investments. Certain officers and trustees of the Fund are also officers and/or directors of the following subsidiaries:
| Subsidiary | Affiliation |
| Franklin Templeton Investment Management Limited (FTIML) | Investment manager |
| Franklin Templeton Services, LLC (FT Services) | Administrative manager |
| Franklin Templeton Distributors, Inc. (Distributors) | Principal underwriter |
| Franklin Templeton Investor Services, LLC (Investor Services) | Transfer agent |
a. Management Fees
The Fund pays an investment management fee to FTIML based on the average daily net assets of the Fund as follows:
| Annualized Fee Rate | Net Assets | |
| 0.650 | % | Up to and including $1 billion |
| 0.600 | % | Over $1 billion, up to and including $5 billion |
| 0.550 | % | Over $5 billion, up to and including $10 billion |
| 0.545 | % | Over $10 billion, up to and including $15 billion |
| 0.540 | % | Over $15 billion, up to and including $20 billion |
| 0.535 | % | In excess of $20 billion |
For the period ended October 31, 2016, the annualized effective investment management fee rate was 0.650% of the Fund’s average daily net assets.
b. Administrative Fees
Under an agreement with FTIML, FT Services provides administrative services to the Fund. The fee is paid by FTIML based on the Fund’s average daily net assets, and is not an additional expense of the Fund.
c. Distribution Fees
The Board has adopted distribution plans for each share class, with the exception of Class R6 and Advisor Class shares, pursuant to Rule 12b-1 under the 1940 Act. Under the Fund’s Class A reimbursement distribution plan, the Fund reimburses Distributors for costs incurred in connection with the servicing, sale and distribution of the Fund’s shares up to the maximum annual plan rate. Under the Class A reimbursement distribution plans, costs exceeding the maximum for the current plan year cannot be reimbursed
24 Semiannual Report
franklintempleton.com
FRANKLIN STRATEGIC SERIES
NOTES TO FINANCIAL STATEMENTS (UNAUDITED)
Franklin Global Government Bond Fund (continued)
in subsequent periods. In addition, under the Fund’s Class C and R compensation distribution plans, the Fund pays Distributors for costs incurred in connection with the servicing, sale and distribution of the Fund’s shares up to the maximum annual plan rate for each class. The plan year, for purposes of monitoring compliance with the maximum annual plan rates, is February 1 through January 31.
The maximum annual plan rates, based on the average daily net assets, for each class, are as follows:
| Class A | 0.25 | % |
| Class C | 0.65 | % |
| Class R | 0.50 | % |
| d. Sales Charges/Underwriting Agreements | ||
Front-end sales charges and contingent deferred sales charges (CDSC) do not represent expenses of the Fund. These charges are deducted from the proceeds of sales of Fund shares prior to investment or from redemption proceeds prior to remittance, as applicable. Distributors has advised the Fund of the following commission transactions related to the sales and redemptions of the Fund’s shares for the period:
| Sales charges retained net of commissions paid to unaffiliated | ||
| brokers/dealers | $ | 2,164 |
| CDSC retained | $ | 7 |
| e. Transfer Agent Fees | ||
Each class of shares, except for Class R6, pays transfer agent fees to Investor Services for its performance of shareholder servicing obligations and reimburses Investor Services for out of pocket expenses incurred, including shareholder servicing fees paid to third parties. These fees are allocated daily based upon their relative proportion of such classes’ aggregate net assets. Class R6 pays Investor Services transfer agent fees specific to that class.
For the period ended October 31, 2016, the Fund paid transfer agent fees of $6,204, of which $3,531 was retained by Investor Services.
f. Investments in Affiliated Management Investment Companies
The Fund invests in one or more affiliated management investment companies for purposes other than exercising a controlling influence over the management or policies. Management fees paid by the Fund are waived on assets invested in the affiliated management investment company, as noted in the Statement of Operations, in an amount not to exceed the management and administrative fees paid directly or indirectly by each affiliate. During the period ended October 31, 2016, the Fund held investments in affiliated management companies as follows:
| % of | |||||||||||
| Affiliated | |||||||||||
| Number of | Number of | Fund Shares | |||||||||
| Shares Held | Shares | Value | Outstanding | ||||||||
| at Beginning | Gross | Gross | Held at End | at End | Investment | Realized | Held at End | ||||
| of Period | Additions | Reductions | of Period | of Period | Income | Gain (Loss) | of Period | ||||
| Non-Controlled Affiliates | |||||||||||
| Institutional Fiduciary Trust Money Market | |||||||||||
| Portfolio | 2,527,951 | 3,706,061 | (4,923,719 | ) | 1,310,293 | $ | 1,310,293 | $- | $- | 0.0 | %a |
| aRounds to less than 0.1%. | |||||||||||
franklintempleton.com
Semiannual Report 25
FRANKLIN STRATEGIC SERIES
NOTES TO FINANCIAL STATEMENTS (UNAUDITED)
Franklin Global Government Bond Fund (continued) 3. Transactions with Affiliates (continued) g. Waiver and Expense Reimbursements
FTIML and Investor Services have contractually agreed in advance to waive or limit their respective fees and to assume as their own expense certain expenses otherwise payable by the Fund so that the expenses (excluding distribution fees, and acquired fund fees and expenses) for Class A, Class C, Class R and Advisor Class of the Fund do not exceed 0.60%, and Class R6 does not exceed 0.59% based on the average net assets of each class (other than certain non-routine expenses or costs, including those relating to litigation, indemnification, reorganizations, and liquidations) until August 31, 2017. Total expenses waived or paid are not subject to recapture subsequent to the Fund’s fiscal year end.
h. Other Affiliated Transactions
At October 31, 2016, Franklin Advisers, Inc. an affiliate of FTIML, owned 54.54% of the Fund’s outstanding shares. Investment activities of this shareholder could have a material impact on the Fund.
4. Expense Offset Arrangement
The Fund has entered into an arrangement with its custodian whereby credits realized as a result of uninvested cash balances are used to reduce a portion of the Fund’s custodian expenses. During the period ended October 31, 2016, there were no credits earned.
5. Income Taxes
For tax purposes, capital losses may be carried over to offset future capital gains, if any. At April 30, 2016, the capital loss carryforwards were as follows:
| Capital loss carryforward not subject to expiration: | ||
| Short term | $ | 81,524 |
| Long term | 18,005 | |
| Total capital loss carryforwards | $ | 99,529 |
For tax purposes, the Fund may elect to defer any portion of a late-year ordinary loss to the first day of the following fiscal year. At April 30, 2016 the Fund deferred late-year ordinary losses of $171,179.
At October 31, 2016, the cost of investments and net unrealized appreciation (depreciation) for income tax purposes were as follows:
| Cost of investments | $ | 13,831,355 | |
| Unrealized appreciation | $ | 297,922 | |
| Unrealized depreciation | (802,531 | ) | |
| Net unrealized appreciation (depreciation) | $ | (504,609 | ) |
Differences between income and/or capital gains as determined on a book basis and a tax basis are primarily due to differing treatments of bond discounts and premiums, foreign currency transactions, and tax straddles.
6. Investment Transactions
Purchases and sales of investments (excluding short term securities) for the period ended October 31, 2016, aggregated $3,417,680 and $2,096,366, respectively.
26 Semiannual Report
franklintempleton.com
FRANKLIN STRATEGIC SERIES
NOTES TO FINANCIAL STATEMENTS (UNAUDITED)
Franklin Global Government Bond Fund (continued)
7. Concentration of Risk
Investing in foreign securities may include certain risks and considerations not typically associated with investing in U.S. securities, such as fluctuating currency values and changing local and regional economic, political and social conditions, which may result in greater market volatility. In addition, certain foreign securities may not be as liquid as U.S. securities.
8. Other Derivative Information
At October 31, 2016, the Fund’s investments in derivative contracts are reflected in the Statement of Assets and Liabilities as follows:
| Asset Derivatives | Liability Derivatives | |||||
| Derivative Contracts | Statement of | Statement of | ||||
| Not Accounted for as | Assets and Liabilities | Assets and Liabilities | ||||
| Hedging Instruments | Location | Fair Value | Location | Fair Value | ||
| Foreign exchange contracts | Unrealized appreciation on OTC | $ | 45,135 | Unrealized depreciation on OTC | $ | 38,476 |
| forward exchange contracts | forward exchange contracts | |||||
For the period ended October 31, 2016, the effect of derivative contracts in the Fund’s Statement of Operations was as follows:
| Net Change in | ||||||||
| Unrealized | ||||||||
| Derivative Contracts | Net Realized | Appreciation | ||||||
| Not Accounted for as | Statement of | Gain (Loss) for | Statement of | (Depreciation) | ||||
| Hedging Instruments | Operations Locations | the Period | Operations Locations | for the Period | ||||
| Net realized gain (loss) from: | Net change in unrealized | |||||||
| appreciation (depreciation) on: | ||||||||
| Foreign exchange contracts | Foreign currency transactions | $ | (106,883 | )a | Translation of other assets and | $ | 177,622 | a |
| liabilities denominated in foreign | ||||||||
| currencies | ||||||||
aForward exchange contracts are included in net realized gain (loss) from foreign currency transactions and net change in unrealized appreciation (depreciation) on
translation of other assets and liabilities denominated in foreign currencies in the Statement of Operations.
For the period ended October 31, 2016, the average month end fair value of derivatives represented 0.51% of average month end net assets. The average month end number of open derivative contracts for the period was 7.
9. Credit Facility
The Fund, together with other U.S. registered and foreign investment funds (collectively, Borrowers), managed by Franklin Templeton Investments, are borrowers in a joint syndicated senior unsecured credit facility totaling $2 billion (Global Credit Facility) which, matures on February 10, 2017. This Global Credit Facility provides a source of funds to the Borrowers for temporary and emergency purposes, including the ability to meet future unanticipated or unusually large redemption requests.
Under the terms of the Global Credit Facility, the Fund shall, in addition to interest charged on any borrowings made by the Fund and other costs incurred by the Fund, pay its share of fees and expenses incurred in connection with the implementation and maintenance of the Global Credit Facility, based upon its relative share of the aggregate net assets of all of the Borrowers, including an annual commitment fee of 0.15% based upon the unused portion of the Global Credit Facility. These fees are reflected in other expenses in the Statement of Operations. During the period ended October 31, 2016, the Fund did not use the Global Credit Facility.
franklintempleton.com
Semiannual Report 27
FRANKLIN STRATEGIC SERIES
NOTES TO FINANCIAL STATEMENTS (UNAUDITED)
Franklin Global Government Bond Fund (continued)
10. Fair Value Measurements
The Fund follows a fair value hierarchy that distinguishes between market data obtained from independent sources (observable inputs) and the Fund’s own market assumptions (unobservable inputs). These inputs are used in determining the value of the Fund’s financial instruments and are summarized in the following fair value hierarchy:
- Level 1 – quoted prices in active markets for identical financial instruments
- Level 2 – other significant observable inputs (including quoted prices for similar financial instruments, interest rates, prepayment speed, credit risk, etc.)
- Level 3 – significant unobservable inputs (including the Fund’s own assumptions in determining the fair value of financial instruments)
The input levels are not necessarily an indication of the risk or liquidity associated with financial instruments at that level.
For movements between the levels within the fair value hierarchy, the Fund has adopted a policy of recognizing the transfers as of the date of the underlying event which caused the movement.
A summary of inputs used as of October 31, 2016, in valuing the Fund’s assets and liabilities carried at fair value, is as follows:
| Level 1 | Level 2 | Level 3 | Total | |||||
| Assets: | ||||||||
| Investments in Securities: | ||||||||
| Foreign Government and Agency Securities | $ | — | $ | 8,916,589 | $ | — | $ | 8,916,589 |
| U.S. Government and Agency Securities | — | 3,099,864 | — | 3,099,864 | ||||
| Short Term Investments | 1,310,293 | — | — | 1,310,293 | ||||
| Total Investments in Securities | $ | 1,310,293 | $ | 12,016,453 | $ | — | $ | 13,326,746 |
| Other Financial Instruments: | ||||||||
| Forward Exchange Contracts | $ | — | $ | 45,135 | $ | — | $ | 45,135 |
| Liabilities: | ||||||||
| Other Financial Instruments: | ||||||||
| Forward Exchange Contracts | $ | — | $ | 38,476 | $ | — | $ | 38,476 |
11. Subsequent Events
The Fund has evaluated subsequent events through the issuance of the financial statements and determined that no events have occurred that require disclosure.
| Abbreviations | |||
| Counterparty | Currency | ||
| BZWS | Barclays Bank PLC | AUD | Australian Dollar |
| CITI | Citigroup, Inc. | CAD | Canadian Dollar |
| RBCCM | Royal Bank of Canada | EUR | Euro |
| GBP | British Pound | ||
| MXN | Mexican Peso | ||
| MYR | Malaysian Ringgit | ||
| PLN | Polish Zloty | ||
| SGD | Singapore Dollar | ||
28 Semiannual Report
franklintempleton.com
FRANKLIN STRATEGIC SERIES
FRANKLIN GLOBAL GOVERNMENT BOND FUND
Shareholder Information
Proxy Voting Policies and Procedures
The Fund’s investment manager has established Proxy Voting
Policies and Procedures (Policies) that the Fund uses to
determine how to vote proxies relating to portfolio securities.
Shareholders may view the Fund’s complete Policies online at
franklintempleton.com. Alternatively, shareholders may request
copies of the Policies free of charge by calling the Proxy Group
collect at (954) 527-7678 or by sending a written request
to: Franklin Templeton Companies, LLC, 300 S.E. 2nd Street,
Fort Lauderdale, FL 33301, Attention: Proxy Group. Copies of
the Fund’s proxy voting records are also made available online
at franklintempleton.com and posted on the U.S. Securities and
Exchange Commission’s website at sec.gov and reflect the
most recent 12-month period ended June 30.
Quarterly Statement of Investments
The Trust, on behalf of the Fund, files a complete statement of
investments with the U.S. Securities and Exchange
Commission for the first and third quarters for each fiscal year
on Form N-Q. Shareholders may view the filed Form N-Q by
visiting the Commission’s website at sec.gov. The filed form
may also be viewed and copied at the Commission’s Public
Reference Room in Washington, DC. Information regarding the
operations of the Public Reference Room may be obtained by
calling (800) SEC-0330.
franklintempleton.com
Semiannual Report 29
This page intentionally left blank.
This page intentionally left blank.
This page intentionally left blank.
Item 2. Code of Ethics.
(a) The Registrant has adopted a code of ethics that applies to its principal executive officers and principal financial and accounting officer.
(c) N/A
(d) N/A
(f) Pursuant to Item 12(a)(1), the Registrant is attaching as an exhibit a copy of its code of ethics that applies to its principal executive officers and principal financial and accounting officer.
Item 3. Audit Committee Financial Expert.
(a)(1) The Registrant has an audit committee financial expert serving on its audit committee.
(2) The audit committee financial expert is John B. Wilson and he is "independent" as defined under the relevant Securities and Exchange Commission Rules and Releases.
Item 4. Principal Accountant Fees and Services. N/A
Item 5. Audit Committee of Listed Registrants. N/A
Item 6. Schedule of Investments. N/A
Item 7. Disclosure of Proxy Voting Policies and Procedures for Closed-End Management Investment Companies. N/A
Item 8. Portfolio Managers of Closed-End Management Investment Companies. N/A
Item 9. Purchases of Equity Securities by Closed-End Management Investment Company and Affiliated Purchasers. N/A
Item 10. Submission of Matters to a Vote of Security Holders.
There have been no changes to the procedures by which shareholders may recommend nominees to the Registrant's Board of Trustees that would require disclosure herein.
Item 11. Controls and Procedures.
(a) Evaluation of Disclosure Controls and Procedures. The Registrant maintains disclosure controls and procedures that are designed to ensure that information required to be disclosed in the Registrant’s filings under the Securities Exchange Act of 1934 and the Investment Company Act of 1940 is recorded, processed, summarized and reported within the periods specified in the rules and forms of the Securities and Exchange Commission. Such information is accumulated and communicated to the Registrant’s management, including its principal executive officer and principal financial officer, as appropriate, to allow timely decisions regarding required disclosure. The Registrant’s management, including the principal executive officer and the principal financial officer, recognizes that any set of controls and procedures, no matter how well designed and operated, can provide only reasonable assurance of achieving the desired control objectives.
Within 90 days prior to the filing date of this Shareholder Report on Form N-CSR, the Registrant had carried out an evaluation, under the supervision and with the participation of the Registrant’s management, including the Registrant’s principal executive officer and the Registrant’s principal financial officer, of the effectiveness of the design and operation of the Registrant’s disclosure controls and procedures. Based on such evaluation, the Registrant’s principal executive officer and principal financial officer concluded that the Registrant’s disclosure controls and procedures are effective.
(b) Changes in Internal Controls. There have been no changes in the Registrant’s internal controls or in other factors that could materially affect the internal controls over financial reporting subsequent to the date of their evaluation in connection with the preparation of this Shareholder Report on Form N-CSR.
Item 12. Exhibits.
(a) (1) Code of Ethics
(a) (2) Certifications pursuant to Section 302 of the Sarbanes-Oxley Act of 2002 of Laura F. Fergerson, Chief Executive Officer - Finance and Administration, and Gaston Gardey, Chief Financial Officer and Chief Accounting Officer
(b) Certifications pursuant to Section 906 of the Sarbanes-Oxley Act of 2002 of Laura F. Fergerson, Chief Executive Officer - Finance and Administration, and Gaston Gardey, Chief Financial Officer and Chief Accounting Officer
SIGNATURES
Pursuant to the requirements of the Securities Exchange Act of 1934 and the Investment Company Act of 1940, the registrant has duly caused this report to be signed on its behalf by the undersigned, thereunto duly authorized.
FRANKLIN STRATEGIC SERIES
By /s/Laura F. Fergerson
Laura F. Fergerson
Chief Executive Officer –
Finance and Administration
Date December 27, 2016
Pursuant to the requirements of the Securities Exchange Act of 1934 and the Investment Company Act of 1940, this report has been signed below by the following persons on behalf of the registrant and in the capacities and on the dates indicated.
By /s/Laura F. Fergerson
Laura F. Fergerson
Chief Executive Officer –
Finance and Administration
Date December 27, 2016
By /s/Gaston Gardey
Gaston Gardey
Chief Financial Officer and
Chief Accounting Officer
Date December 27, 2016