UNITED STATES
SECURITIES AND EXCHANGE COMMISSION
Washington, DC 20549
FORM N-CSRS
CERTIFIED SHAREHOLDER REPORT OF REGISTERED
MANAGEMENT INVESTMENT COMPANIES
Investment Company Act file number 811-06243
Franklin Strategic Series
(Exact name of registrant as specified in charter)
One Franklin Parkway, San Mateo, CA 94403-1906
(Address of principal executive offices) (Zip code)
Craig S. Tyle, One Franklin Parkway, San Mateo, CA 94403-1906
(Name and address of agent for service)
Registrant’s telephone number, including area code: 650 312-2000
Date of fiscal year end: 4/30
Date of reporting period: 10/31/17
Item 1. Reports to Stockholders.
 | Semiannual Report and Shareholder Letter October 31, 2017 | |||

Franklin Focused Core Equity Fund
Franklin Growth Opportunities Fund
Franklin Small Cap Growth Fund
Franklin Small-Mid Cap Growth Fund

Sign up for electronic delivery at franklintempleton.com/edelivery
Franklin Templeton Investments
Gain From Our Perspective®
At Franklin Templeton Investments, we’re dedicated to one goal: delivering exceptional asset management for our clients. By bringing together multiple, world-class investment teams in a single firm, we’re able to offer specialized expertise across styles and asset classes, all supported by the strength and resources of one of the world’s largest asset managers. This has helped us to become a trusted partner to individual and institutional investors across the globe.
Dear Shareholder:
During the six months ended October 31, 2017, mostly upbeat economic data, improved US corporate earnings and a supportive monetary policy were positives for US securities markets. At its June meeting, the US Federal Reserve (Fed) increased its target range for the federal funds rate a quarter point to 1.00%–1.25%. Despite low inflation, the Fed made this decision amid signs of a strengthening labor market and moderately rising economic activity. The 10-year US Treasury yield began the period at 2.29% and ended the period at 2.38%. In this environment, US stocks, as measured by the Standard & Poor’s 500® Index, generated a +9.10% total return for the six-month period.1
We are committed to our long-term perspective and disciplined investment approach as we conduct a rigorous, fundamental analysis of securities with a regular emphasis on investment risk management.
We believe active, professional investment management serves investors well. We also recognize the important role of financial advisors in today’s markets and encourage investors to continue to seek their advice. Amid changing markets and economic conditions, we are confident investors with a well-diversified portfolio and a patient, long-term outlook should be well positioned for the years ahead.
In addition, Franklin Strategic Series’ semiannual report includes more detail about prevailing conditions and a
discussion about investment decisions during the period. Please remember all securities markets fluctuate, as do mutual fund share prices.
We thank you for investing with Franklin Templeton, welcome your questions and comments, and look forward to serving your future investment needs.
Sincerely,

Edward B. Jamieson
President and Chief Executive Officer –
Investment Management
Franklin Strategic Series
This letter reflects our analysis and opinions as of October 31, 2017, unless otherwise indicated. The information is not a complete analysis of every aspect of any market, country, industry, security or fund. Statements of fact are from sources considered reliable.
1. Source: Morningstar.
See www.franklintempletondatasources.com for additional data provider information.
Not FDIC Insured
|
|
|
May Lose Value
|
|
|
No Bank Guarantee
|
| franklintempleton.com | Not part of the semiannual report | 1 | ||
Semiannual Report | ||||
| 3 | ||||
| 4 | ||||
| 10 | ||||
| 16 | ||||
| 22 | ||||
| 28 | ||||
| 61 | ||||
| 66 | ||||
|
| 82
|
| |
Visit franklintempleton.com for fund updates, to access your account, or to find helpful financial planning tools.
| 2 | Semiannual Report | franklintempleton.com | ||
Semiannual Report
The US economy grew during the six months under review. The economy grew faster in 2017’s third quarter than in the second quarter, driven by consumer spending, inventory investment, business investment and exports. The manufacturing and services sectors expanded during the period. The unemployment rate decreased from 4.4% in April 2017 to 4.1% at period-end.1 Monthly retail sales were volatile during the period. Annual inflation, as measured by the Consumer Price Index, decreased from 2.2% in April 2017 to 2.0% at period-end.1
At its June meeting, the US Federal Reserve (Fed) raised its target range for the federal funds rate 0.25% to 1.00%–1.25%, amid signs of a growing US economy, strengthening labor market and improving business spending. At its July and September 2017 meetings, the Fed kept its target range unchanged. Furthermore in September, the Fed mentioned that it would begin implementing its balance sheet reduction in October. The minutes of the Fed’s September meeting released in October suggested that many committee members were concerned that low inflation readings this year might not be transitory and could be more persistent than expected.
US equity markets rose during the period, benefiting from mostly upbeat economic data and better US corporate earnings. The markets were also supported by investor optimism arising from Emmanuel Macron’s victory in France’s presidential election, comments from the US Fed chair indicating optimism about the US economy and the likelihood of gradual rate hikes, and the Senate’s approval of a budget plan that raised expectations for tax reforms. However, geopolitical tensions in the Korean peninsula and uncertainty about President Trump’s ability to implement reforms curbed market sentiment. The broad US stock market, as measured by the Standard & Poor’s 500 Index, generated +9.10% total return for the period.2
The foregoing information reflects our analysis and opinions as of October 31, 2017. The information is not a complete analysis of every aspect of any market, country, industry, security or fund. Statements of fact are from sources considered reliable.
1. Source: Bureau of Labor Statistics.
2. Source: Morningstar.
See www.franklintempletondatasources.com for additional data provider information.
| franklintempleton.com | Semiannual Report | 3 | ||
Franklin Focused Core Equity Fund
This semiannual report for Franklin Focused Core Equity Fund covers the period ended October 31, 2017.
Your Fund’s Goal and Main Investments
The Fund seeks capital appreciation by normally investing at least 80% of its net assets in equity securities (predominantly common stocks). The Fund normally invests primarily to predominantly in equity securities of large capitalization companies, which are similar in size to those in the Standard & Poor’s 500 Index (S&P 500®).
Performance Overview
The Fund’s Class A shares delivered a +2.70% cumulative total return for the six months under review. In comparison, the S&P 500, which tracks the broad US stock market, generated a +9.10% total return.1 You can find the Fund’s long-term performance data in the Performance Summary beginning on page 7.
Performance data represent past performance, which does not guarantee future results. Investment return and principal value will fluctuate, and you may have a gain or loss when you sell your shares. Current performance may differ from figures shown. For most recent month-end performance, go to franklintempleton.com or call (800) 342-5236.
Investment Strategy
We are research-driven, bottom-up, fundamental investors. Our investment approach is opportunistic and contrarian, and we seek to identify mispriced companies using fundamental analysis. We seek to take advantage of price dislocations that result from the market’s short-term focus. Our analysis includes the investigation of the valuation for each investment based upon the view that the price paid for the security is a critical factor determining long-term success. Nonetheless, we may regard an investment as worthwhile due to its future risk-return prospects even when it is not currently considered undervalued. We generally use a team of analysts to help provide in-depth industry expertise and use both qualitative and quantitative analysis to evaluate companies. Our analysts help to identify and assess factors such as a company’s market opportunity, competitive position, management and financial strength, business and financial risks, and valuation. We choose to invest
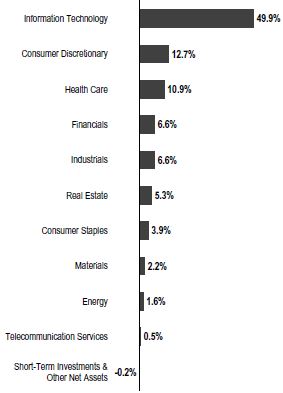
Portfolio Composition
Based on Total Net Assets as of 10/31/17

in those companies that, in our opinion, offer the best trade-off between growth opportunity, business and financial risk, and valuation.
Manager’s Discussion
During the six months under review, key contributors to the Fund’s absolute performance included holdings in the information technology (IT), financials and real estate sectors.
Within the IT sector, payment solutions firm Mastercard, software and IT services company Microsoft and Google’s parent company Alphabet drove performance. Mastercard benefited from accelerating revenue growth resulting from better cross-border volumes. The British pound’s weakness led to increased inbound travel to the UK, which boosted cross-border payments. The company continued to generate significant operating leverage over its fixed-cost infrastructure. At a recent investor day, it increased its long-term outlook as management expected earnings per share to grow significantly over the next few years. Microsoft performed strongly over the
1. Source: Morningstar.
The index is unmanaged and includes reinvestment of any income or distributions. It does not reflect any fees, expenses or sales charges. One cannot invest directly in an index, and an index is not representative of the Fund’s portfolio.
See www.franklintempletondatasources.com for additional data provider information.
The dollar value, number of shares or principal amount, and names of all portfolio holdings are listed in the Fund’s Statement of Investments (SOI). The SOI begins on page 33.
| 4 | Semiannual Report | franklintempleton.com | ||
FRANKLIN FOCUSED CORE EQUITY FUND
past six months as investors perceived stability in its PC and on-premises data center software businesses, as well as strong growth and gross profit margin leverage in its Office 365 and Azure cloud businesses. Alphabet increased its share of the global advertising market due to strong performance in Google mobile search and YouTube, while Android’s status as a leading mobile operating system helped the company gain mobile users. Alphabet continued to invest in potential new product lines, such as self-driving car technology Waymo. Although Google continued to face regulatory scrutiny in Europe, we believe the complaints will not have a meaningful negative impact on the business.
In the financials sector, financial services firm Charles Schwab and advisory, brokerage and solutions services provider Willis Towers Watson aided results. Charles Schwab’s shares rose amid rising revenue resulting from higher federal funds target rate and growth in client assets under management due to strong market returns and an acceleration of inflows. Willis Towers Watson generated higher growth rates and delivered on its cost-savings targets after a difficult transition period following the merger of Willis Group Holdings and Towers Watson. Additionally, we believe the large natural catastrophe losses in 2017’s third quarter could potentially lead to a more favorable property and casualty insurance rate environment, which could support revenue growth.
In the real estate sector, data center provider Equinix contributed to results as the company continued to generate consistent growth fueled by hybrid cloud deployments and continuous global expansion. In our view, supply and demand dynamics are still very favorable for data center companies, which are reflected in good pricing trends across the board.
Elsewhere, Aetna, a provider of health insurance products and related services, also helped Fund performance.
In contrast, key detractors from the Fund’s absolute performance included holdings in the consumer discretionary, energy and health care sectors.
Within consumer discretionary, cable-based and mobile telephony services provider Altice and media company Twenty-First Century Fox hurt results. Shares of Netherlands-based Altice, which derives its revenue predominantly from France and the US, declined amid deteriorating fundamentals in France and decelerating growth rate in the US cable business. Although the deterioration in France led to concerns about management’s execution and strategy, we believe the French mobile and fixed market is a unique one where it is difficult to compare its competitive dynamics with the US. In our view, the
| Top 10 Holdings | ||||
| 10/31/17 | ||||
Company Sector/Industry | % of Total Net Assets | |||
Alphabet Inc. Information Technology
|
|
7.4% |
| |
The Charles Schwab Corp. Financials
|
|
5.7% |
| |
Mastercard Inc. Information Technology
|
|
5.4% |
| |
Microsoft Corp. Information Technology
|
|
5.3% |
| |
Genesee & Wyoming Inc. Industrials
|
|
5.0% |
| |
JPMorgan Chase & Co. Financials
|
|
4.1% |
| |
Equinix Inc. Real Estate
|
|
4.0% |
| |
Allergan PLC Health Care
|
|
3.8% |
| |
Altice NV Consumer Discretionary
|
|
3.7% |
| |
Twenty-First Century Fox Inc. Consumer Discretionary
|
|
3.4% |
| |
US business is healthy and should continue to outperform going forward, driving attractive free cash flow growth for the overall company. Twenty-First Century Fox delivered solid earnings results during the period, but increased UK government scrutiny on the company’s effort to acquire the remaining stake in Sky, along with increased pressures on US media businesses, drove the stock lower during the period. We believe the company has very attractive assets that could outperform its peers and take market share, as we are finally seeing in recent results.
In the energy sector, Anadarko Petroleum, an independent exploration and production company, and Schlumberger, a technology provider to the oil and gas industry, hindered performance. Anadarko’s shares declined as the company’s quarterly production disappointed versus growth expectations and the market reacted to a tragic house accident in Colorado linked to a pipeline connected to an Anadarko-owned well. Anadarko began a large share buyback to address its poor performance. Also, the energy sector underperformed the broader equity market during the period, as investors grew impatient with the pace of crude oil market rebalancing, after the Organization of the Petroleum Exporting Countries agreed to limit crude oil production. Shares of Schlumberger weakened over the reporting period due to oil price volatility and ongoing uncertainty related to global spending trends. This
| franklintempleton.com | Semiannual Report | 5 | ||||
FRANKLIN FOCUSED CORE EQUITY FUND
uncertainty, along with ongoing weakness in international markets, resulted in lower earnings expectations throughout the period.
In health care, shares of pharmaceutical products firm Allergan were impacted by a US Federal District Court’s ruling that generic companies did not infringe on the company’s patent for dry eye medicine Restasis. Investors expressed concerns that the company’s revenue could decline in 2018 if the US Food and Drug Administration approves generic versions of Restasis.
Other key individual detractors from Fund performance included positions in Sabre, a technology solutions provider to the global travel and tourism industry, and CVS Health, a health care services provider. Sabre continued to be well positioned in a consolidated industry, but a modest revenue growth potential dampened investor sentiment. The company’s investments to improve its core global distribution systems and IT services offerings contributed to elevated costs. Further pressuring shares were customer deferrals and the loss of a major airline customer, which led to lowered earnings and free cash flow expectations.
Thank you for your continued participation in Franklin Focused Core Equity Fund.
 |
Brent Loder Lead Portfolio Manager | |
|
Chris Anderson | |
| Portfolio Management Team | ||


The foregoing information reflects our analysis, opinions and portfolio holdings as of October 31, 2017, the end of the reporting period. The way we implement our main investment strategies and the resulting portfolio holdings may change depending on factors such as market and economic conditions. These opinions may not be relied upon as investment advice or an offer for a particular security. The information is not a complete analysis of every aspect of any market, country, industry, security or the Fund. Statements of fact are from sources considered reliable, but the investment manager makes no representation or warranty as to their completeness or accuracy. Although historical performance is no guarantee of future results, these insights may help you understand our investment management philosophy.
| 6 | Semiannual Report | franklintempleton.com | ||
FRANKLIN FOCUSED CORE EQUITY FUND
Performance Summary as of October 31, 2017
The performance table does not reflect any taxes that a shareholder would pay on Fund dividends, capital gain distributions, if any, or any realized gains on the sale of Fund shares. Total return reflects reinvestment of the Fund’s dividends and capital gain distributions, if any, and any unrealized gains or losses. Your dividend income will vary depending on dividends or interest paid by securities in the Fund’s portfolio, adjusted for operating expenses of each class. Capital gain distributions are net profits realized from the sale of portfolio securities.
Performance as of 10/31/171
Cumulative total return excludes sales charges. Average annual total return includes maximum sales charges. Sales charges will vary depending on the size of the investment and the class of share purchased. The maximum is 5.75% and the minimum is 0%. Class A: 5.75% maximum initial sales charge; Advisor Class: no sales charges. For other share classes, visit franklintempleton.com.
| Share Class | Cumulative Total Return2 | Average Annual Total Return3 | ||
A 6-Month
| +2.70%
| -3.22%
| ||
1-Year
| +14.36%
| +7.80%
| ||
5-Year
| +85.24%
| +11.80%
| ||
Since Inception (12/13/07)
| +84.77%
| +5.77%
| ||
Advisor 6-Month
| +2.86%
| +2.86%
| ||
1-Year
| +14.63%
| +14.63%
| ||
5-Year
| +87.64%
| +13.41%
| ||
Since Inception (12/13/07)
| +89.75%
| +6.69%
| ||
Performance data represent past performance, which does not guarantee future results. Investment return and principal value will fluctuate, and you may have a gain or loss when you sell your shares. Current performance may differ from figures shown. For most recent month-end performance, go to franklintempleton.com or call (800) 342-5236.
See page 8 for Performance Summary footnotes.
| franklintempleton.com | Semiannual Report | 7 | ||||
FRANKLIN FOCUSED CORE EQUITY FUND
PERFORMANCE SUMMARY
Total Annual Operating Expenses4
| Share Class | With Waiver | Without Waiver | ||||||
A | 1.25% | 1.47% | ||||||
Advisor | 1.00% | 1.22% | ||||||
Each class of shares is available to certain eligible investors and has different annual fees and expenses, as described in the prospectus.
All investments involve risks, including possible loss of principal. To the extent the Fund focuses on particular countries, regions, industries, sectors or types of investment from time to time, it may be subject to greater risks of adverse developments in such areas of focus than a fund that invests in a wider variety of countries, regions, industries, sectors or investments. The Fund may have investments in both growth and value stocks, or in stocks with characteristics of both. Growth stock prices reflect projections of future earnings or revenues, and can, therefore, fall dramatically if the company fails to meet those projections. A value stock may not increase in price as anticipated by the investment manager if other investors fail to recognize the company’s value and bid up the price, the markets favor faster growing companies, or the factors that the investment manager believes will increase the price of the security do not occur. Foreign securities involve special risks, including currency fluctuations and economic and political uncertainties. The Fund is actively managed but there is no guarantee that the manager’s investment decisions will produce the desired results. The Fund’s prospectus also includes a description of the main investment risks.
1. The Fund has an expense reduction and a fee waiver associated with any investments it makes in a Franklin Templeton money fund and/or other Franklin Templeton fund, contractually guaranteed through 8/31/18. Fund investment results reflect the expense reduction and fee waiver; without these reductions, the results would have been lower.
2. Cumulative total return represents the change in value of an investment over the periods indicated.
3. Average annual total return represents the average annual change in value of an investment over the periods indicated. Return for less than one year, if any, has not been annualized.
4. Figures are as stated in the Fund’s current prospectus and may differ from the expense ratios disclosed in the Your Fund’s Expenses and Financial Highlights sections in this report. In periods of market volatility, assets may decline significantly, causing total annual Fund operating expenses to become higher than the figures shown.
| 8 | Semiannual Report | franklintempleton.com | ||
FRANKLIN FOCUSED CORE EQUITY FUND
Your Fund’s Expenses
As a Fund shareholder, you can incur two types of costs: (1) transaction costs, including sales charges (loads) on Fund purchases and redemptions; and (2) ongoing Fund costs, including management fees, distribution and service (12b-1) fees, and other Fund expenses. All mutual funds have ongoing costs, sometimes referred to as operating expenses. The table below shows ongoing costs of investing in the Fund and can help you understand these costs and compare them with those of other mutual funds. The table assumes a $1,000 investment held for the six months indicated.
Actual Fund Expenses
The table below provides information about actual account values and actual expenses in the columns under the heading “Actual.” In these columns the Fund’s actual return, which includes the effect of Fund expenses, is used to calculate the “Ending Account Value” for each class of shares. You can estimate the expenses you paid during the period by following these steps (of course, your account value and expenses will differ from those in this illustration): Divide your account value by $1,000 (if your account had an $8,600 value, then $8,600 ÷ $1,000 = 8.6). Then multiply the result by the number in the row for your class of shares under the headings “Actual” and “Expenses Paid During Period” (if Actual Expenses Paid During Period were $7.50, then 8.6 x $7.50 = $64.50). In this illustration, the actual expenses paid this period are $64.50.
Hypothetical Example for Comparison with Other Funds
Under the heading “Hypothetical” in the table, information is provided about hypothetical account values and hypothetical expenses based on the Fund’s actual expense ratio and an assumed rate of return of 5% per year before expenses, which is not the Fund’s actual return. This information may not be used to estimate the actual ending account balance or expenses you paid for the period, but it can help you compare ongoing costs of investing in the Fund with those of other funds. To do so, compare this 5% hypothetical example for the class of shares you hold with the 5% hypothetical examples that appear in the shareholder reports of other funds.
Please note that expenses shown in the table are meant to highlight ongoing costs and do not reflect any transactional costs. Therefore, information under the heading “Hypothetical” is useful in comparing ongoing costs only, and will not help you compare total costs of owning different funds. In addition, if transactional costs were included, your total costs would have been higher.
Actual (actual return after expenses) | Hypothetical (5% annual return before | |||||||||||||||||
| Share Class | Beginning Account Value 5/1/17 | Ending Account Value 10/31/17 | Expenses Paid During 5/1/17–10/31/171,2 | Ending Account Value 10/31/17 | Expenses Paid During Period 5/1/17–10/31/171,2 | Net Annualized Expense Ratio2 | ||||||||||||
| A | $1,000 | $1,027.00 | $ 6.39 | $1,018.90 | $ 6.36 | 1.25% | ||||||||||||
| C | $1,000 | $1,023.50 | $10.20 | $1,015.12 | $10.16 | 2.00% | ||||||||||||
| R | $1,000 | $1,026.60 | $ 6.84 | $1,018.45 | $ 6.82 | 1.34% | ||||||||||||
| R6 | $1,000 | $1,028.50 | $ 4.29 | $1,020.97 | $ 4.28 | 0.84% | ||||||||||||
| Advisor | $1,000 | $1,028.60 | $ 5.11 | $1,020.16 | $ 5.09 | 1.00% | ||||||||||||
1. Expenses are equal to the annualized expense ratio for the six-month period as indicated above—in the far right column—multiplied by the simple average account value over the period indicated, and then multiplied by 184/365 to reflect the one-half year period.
2. Reflects expenses after fee waivers and expense reimbursements. Does not include acquired fund fees and expenses.
| franklintempleton.com | Semiannual Report | 9 | ||||
Franklin Growth Opportunities Fund
This semiannual report for Franklin Growth Opportunities Fund covers the period ended October 31, 2017.
Your Fund’s Goal and Main Investments
The Fund seeks capital appreciation by normally investing predominantly in equity securities of companies demonstrating accelerating growth, increasing profitability, or above-average growth or growth potential, when compared with the overall economy.
Performance Overview
The Fund’s Class A shares delivered a +11.66% cumulative total return for the six months under review. In comparison, the Fund’s narrow benchmark, the Russell 3000® Growth Index, which measures performance of Russell 3000® Index companies with relatively higher price-to-book ratios and higher forecasted growth values, generated a +12.41% total return.1 The Fund’s broad benchmark, the Standard & Poor’s 500 Index (S&P 500), which tracks the broad US stock market, produced a +9.10% total return.1 You can find the Fund’s long-term performance data in the Performance Summary beginning on page 13.
Performance data represent past performance, which does not guarantee future results. Investment return and principal value will fluctuate, and you may have a gain or loss when you sell your shares. Current performance may differ from figures shown. For most recent month-end performance, go to franklintempleton.com or call (800) 342-5236.
Investment Strategy
We use fundamental, bottom-up research to seek companies meeting our criteria of growth potential, quality and valuation. In seeking sustainable growth characteristics, we look for companies we believe can produce sustainable earnings and cash flow growth, evaluating the long-term market opportunity and competitive structure of an industry to target leaders and emerging leaders. We define quality companies as those with strong and improving competitive positions in attractive markets. We also believe important attributes of quality are experienced and talented management teams as well as financial strength reflected in the capital structure, gross and
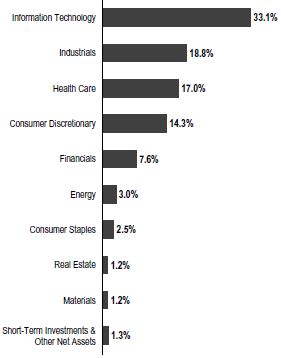
Portfolio Composition*
Based on Total Net Assets as of 10/31/17
*Figures reflect certain derivatives held in the portfolio (or their underlying reference assets) and may not total 100% or may be negative due to roundings, use of derivatives, unsettled trades or other factors.
operating margins, free cash flow generation and returns on capital employed. Our valuation analysis includes a range of potential outcomes based on an assessment of multiple scenarios. In assessing value, we consider whether security prices fully reflect the balance of the sustainable growth opportunities relative to business and financial risks.
Manager’s Discussion
During the six months under review, most sectors represented in the Fund’s portfolio had positive returns and contributed to absolute performance. Relative to the Russell 3000® Growth Index, stock selection and an overweighting in the information
1. Source: Morningstar.
Frank Russell Company is the source and owner of the trademarks, service marks and copyrights related to the Russell Indexes. Russell® is a trademark of Frank Russell Company.
The indexes are unmanaged and include reinvestment of any income or distributions. They do not reflect any fees, expenses or sales charges. One cannot invest directly in an index, and an index is not representative of the Fund’s portfolio.
The dollar value, number of shares or principal amount, and names of all portfolio holdings are listed in the Fund’s Statement of Investments (SOI). The SOI begins on page 40.
| 10 | Semiannual Report | franklintempleton.com | ||
FRANKLIN GROWTH OPPORTUNITIES FUND
technology (IT) sector contributed to the Fund’s performance. Stock selection and underweightings in the consumer staples and consumer discretionary sectors also boosted relative results.
In the IT sector, Mastercard and NVIDIA contributed to the Fund’s relative performance. Global payment solutions provider Mastercard benefited from accelerating revenue growth resulting from better cross-border volumes. The British pound’s weakness led to increased inbound travel to the UK, which boosted cross-border payments. The company continued to generate significant operating leverage over its fixed cost infrastructure. At a recent investor day, it increased its long-term outlook as management expected earnings per share to grow significantly over the next few years. Semiconductor company NVIDIA performed well as the company continues to grow very rapidly, and we feel it has continued powerful growth opportunities in artificial intelligence, virtual reality, software simulation and gaming.
Within consumer staples, Constellation Brands, which engages in the production, marketing and distribution of beverage alcohol products, benefited performance as the beer segment’s core brands, Modelo and Corona, significantly outperformed the industry. In addition, the company’s wine and spirits segment performed particularly well driven by a focus on premium brands. Energy drink company Monster Beverage also supported the Fund’s results. International sales growth accelerated driven by additional distribution in China and other high growth markets. US sales rebounded as supply constraints for select products were resolved.
In the consumer discretionary sector, online retail shopping services provider Amazon.com contributed to the Fund’s performance as it continued to see rapid growth in its global e-commerce business, driven by strong adoption of its Prime subscription service. It invested aggressively in fulfillment centers and logistics to achieve faster delivery times for a widening selection of products. We believe Amazon.com’s acquisition of Whole Foods Market was a significant step forward in the highly fragmented grocery category where its market share in the US is small. Amazon Web Services, a leader in cloud computing, also drove profitability for Amazon.com.
Another key individual contributor was real estate investment trust and wireless communications infrastructure operator SBA
2. Not a Fund holding.
See www.franklintempletondatasources.com for additional data provider information.
Top 10 Holdings | ||||
| 10/31/17 | ||||
Company Sector/Industry | % of Total Net Assets | |||
Amazon.com Inc. Consumer Discretionary
|
|
6.1% |
| |
Apple Inc. Information Technology
|
|
5.7% |
| |
Facebook Inc. Information Technology
|
|
5.6% |
| |
Mastercard Inc. Information Technology
|
|
4.7% |
| |
Alphabet Inc. Information Technology
|
|
4.0% |
| |
Microsoft Corp. Information Technology
|
|
3.8% |
| |
Visa Inc. Information Technology
|
|
3.8% |
| |
Broadcom Ltd. Information Technology
|
|
2.4% |
| |
SBA Communications Corp. Real Estate
|
|
2.4% |
| |
Adobe Systems Inc. Information Technology
|
|
2.3% |
| |
Communications. The company had a positive growth trajectory driven by accelerating growth in the US. We believe AT&T’s2 First Responder Network Authority deployment may result in augmented growth for SBA. T-Mobile US and Sprint2 merger’s difficulties have also helped the company.
In contrast, key detractors from the Fund’s relative performance included stock selection and an underweighting in the health care sector. Stock selection in the financials sector also hindered relative results, as did an overweighted position in the energy sector.
In health care, integrated global biopharmaceutical company Celgene detracted due to disappointing operational execution and a drug failure during the period leading to a lowering of long-term guidance. Investors were concerned about the company’s intellectual property position and the durability of its marketed products longer term. Shares of pharmaceutical products firm Allergan were impacted by a US Federal District Court’s ruling that generic companies did not infringe on the company’s patent for dry eye medicine Restasis. Investors expressed concerns that the company’s revenue could decline in 2018 if the US Food and Drug Administration approves generic versions of Restasis.
| franklintempleton.com | Semiannual Report | 11 | ||||
FRANKLIN GROWTH OPPORTUNITIES FUND
In the financials sector, our positions in MarketAxess and Signature Bank hindered the Fund’s results. Electronic trading platform operator MarketAxess was negatively impacted by the record low volatility market environment, which dampened trading activity. Slower volume growth, as well as reports that competitors are trying to grow their presence in the corporate bond market, hindered the stock. Encouragingly, the company continued to grow volumes ahead of the industry and remained a dominant liquidity pool among electronic venues. We believe that the company may be the primary beneficiary of the secular shift toward electronic trading in the corporate bond market. Commercial bank services provider Signature Bank experienced rapid expense growth and slower loan growth. Additionally, rising funding costs negatively impacted the bank’s net interest margin.
In energy, independent exploration and production company Anadarko Petroleum’s shares declined as the company’s quarterly production disappointed versus growth expectations and the market reacted to a tragic house accident in Colorado linked to a pipeline connected to an Anadarko-owned well. Anadarko began a large share buyback to address its poor performance. Also, the energy group underperformed the broader equity market in 2017, as investors grew impatient with the pace of crude oil market rebalancing, after the Organization of the Petroleum Exporting Countries agreed to limit crude oil production. Another energy holding, oil and natural gas company Halliburton, detracted from the Fund’s performance. Although shares of Halliburton performed better than the the oilfield services sector, they lagged compared to the broader market as a result of oil price volatility and ongoing uncertainty related to spending trends in the US and globally. Despite generally positive fundamental trends resulting in significant revenue and earnings growth over the time period, analysts were recalibrating earnings estimates lower for 2018.
Elsewhere, wireless company T-Mobile hindered results in the telecommunication services sector due to the collapse of merger conversations between T-Mobile and Sprint. However, T-Mobile remained the only growth company in the US wireless space and continued to gain market share.
CFA® is a trademark owned by CFA Institute.
Thank you for your continued participation in Franklin Growth Opportunities Fund. We look forward to serving your future investment needs.
 |
Grant Bowers Lead Portfolio Manager | |
 |
Sara Araghi, CFA | |
| Portfolio Management Team | ||


The foregoing information reflects our analysis, opinions and portfolio holdings as of October 31, 2017, the end of the reporting period. The way we implement our main investment strategies and the resulting portfolio holdings may change depending on factors such as market and economic conditions. These opinions may not be relied upon as investment advice or an offer for a particular security. The information is not a complete analysis of every aspect of any market, country, industry, security or the Fund. Statements of fact are from sources considered reliable, but the investment manager makes no representation or warranty as to their completeness or accuracy. Although historical performance is no guarantee of future results, these insights may help you understand our investment management philosophy.
| 12 | Semiannual Report | franklintempleton.com | ||
FRANKLIN GROWTH OPPORTUNITIES FUND
Performance Summary as of October 31, 2017
The performance table does not reflect any taxes that a shareholder would pay on Fund dividends, capital gain distributions, if any, or any realized gains on the sale of Fund shares. Total return reflects reinvestment of the Fund’s dividends and capital gain distributions, if any, and any unrealized gains or losses. Your dividend income will vary depending on dividends or interest paid by securities in the Fund’s portfolio, adjusted for operating expenses of each class. Capital gain distributions are net profits realized from the sale of portfolio securities.
Performance as of 10/31/171
Cumulative total return excludes sales charges. Average annual total return includes maximum sales charges. Sales charges will vary depending on the size of the investment and the class of share purchased. The maximum is 5.75% and the minimum is 0%. Class A: 5.75% maximum initial sales charge; Advisor Class: no sales charges. For other share classes, visit franklintempleton.com.
| Share Class | Cumulative Total Return2 | Average Annual Total Return3 | ||
A | ||||
6-Month
| +11.66%4 | +5.25% | ||
1-Year
| +26.23% | +18.96% | ||
5-Year
| +104.38% | +14.01% | ||
10-Year
| +102.11% | +6.66% | ||
Advisor | ||||
6-Month
| +11.78%4 | +11.78% | ||
1-Year
| +26.57% | +26.57% | ||
5-Year
| +107.29% | +15.70% | ||
10-Year
| +108.05% | +7.60% |
Performance data represent past performance, which does not guarantee future results. Investment return and principal value will fluctuate, and you may have a gain or loss when you sell your shares. Current performance may differ from figures shown. For most recent month-end performance, go to franklintempleton.com or call (800) 342-5236.
See page 14 for Performance Summary footnotes.
| franklintempleton.com | Semiannual Report | 13 | ||||
FRANKLIN GROWTH OPPORTUNITIES FUND
PERFORMANCE SUMMARY
Total Annual Operating Expenses5
| Share Class | With Waiver | Without Waiver | ||||||
A | 1.04% | 1.05% | ||||||
Advisor | 0.79% | 0.80% | ||||||
Each class of shares is available to certain eligible investors and has different annual fees and expenses, as described in the prospectus.
All investments involve risks, including possible loss of principal. Growth stock prices reflect projections of future earnings or revenues, and can, therefore, fall dramatically if the company fails to meet those projections. Smaller, midsized and relatively new or unseasoned companies can be particularly sensitive to changing economic conditions, and their prospects for growth are less certain than those of larger, more established companies. Historically, these securities have experienced more price volatility than larger company stocks, especially over the short term. To the extent the Fund focuses on particular countries, regions, industries, sectors or types of investment from time to time, it may be subject to greater risks of adverse developments in such areas of focus than a fund that invests in a wider variety of countries, regions, industries, sectors or investments. The Fund is actively managed but there is no guarantee that the manager’s investment decisions will produce the desired results. The Fund’s prospectus also includes a description of the main investment risks.
1. The Fund has a fee waiver associated with any investment it makes in a Franklin Templeton money fund and/or other Franklin Templeton fund, contractually guaranteed through 8/31/18. Fund investment results reflect the fee waiver; without this waiver, the results would have been lower.
2. Cumulative total return represents the change in value of an investment over the periods indicated.
3. Average annual total return represents the average annual change in value of an investment over the periods indicated. Return for less than one year, if any, has not been annualized.
4. Total return information is based on net asset values calculated for shareholder transactions. Certain adjustments were made to the net assets of the Fund at 10/31/17 for financial reporting purposes, and as a result, the total returns based on those net asset values differ from the adjusted total returns reported in the Financial Highlights.
5. Figures are as stated in the Fund’s current prospectus and may differ from the expense ratios disclosed in the Your Fund’s Expenses and Financial Highlights sections in this report. In periods of market volatility, assets may decline significantly, causing total annual Fund operating expenses to become higher than the figures shown.
| 14 | Semiannual Report | franklintempleton.com | ||
FRANKLIN GROWTH OPPORTUNITIES FUND
Your Fund’s Expenses
As a Fund shareholder, you can incur two types of costs: (1) transaction costs, including sales charges (loads) on Fund purchases and redemptions; and (2) ongoing Fund costs, including management fees, distribution and service (12b-1) fees, and other Fund expenses. All mutual funds have ongoing costs, sometimes referred to as operating expenses. The table below shows ongoing costs of investing in the Fund and can help you understand these costs and compare them with those of other mutual funds. The table assumes a $1,000 investment held for the six months indicated.
Actual Fund Expenses
The table below provides information about actual account values and actual expenses in the columns under the heading “Actual.” In these columns the Fund’s actual return, which includes the effect of Fund expenses, is used to calculate the “Ending Account Value” for each class of shares. You can estimate the expenses you paid during the period by following these steps (of course, your account value and expenses will differ from those in this illustration): Divide your account value by $1,000 (if your account had an $8,600 value, then $8,600 ÷ $1,000 = 8.6). Then multiply the result by the number in the row for your class of shares under the headings “Actual” and “Expenses Paid During Period” (if Actual Expenses Paid During Period were $7.50, then 8.6 x $7.50 = $64.50). In this illustration, the actual expenses paid this period are $64.50.
Hypothetical Example for Comparison with Other Funds
Under the heading “Hypothetical” in the table, information is provided about hypothetical account values and hypothetical expenses based on the Fund’s actual expense ratio and an assumed rate of return of 5% per year before expenses, which is not the Fund’s actual return. This information may not be used to estimate the actual ending account balance or expenses you paid for the period, but it can help you compare ongoing costs of investing in the Fund with those of other funds. To do so, compare this 5% hypothetical example for the class of shares you hold with the 5% hypothetical examples that appear in the shareholder reports of other funds.
Please note that expenses shown in the table are meant to highlight ongoing costs and do not reflect any transactional costs. Therefore, information under the heading “Hypothetical” is useful in comparing ongoing costs only, and will not help you compare total costs of owning different funds. In addition, if transactional costs were included, your total costs would have been higher.
Actual (actual return after expenses) | Hypothetical (5% annual return before expenses) | |||||||||||||||||
| Share Class | Beginning Account Value 5/1/17 | Ending Account Value 10/31/17 | Expenses Paid During Period 5/1/17–10/31/171,2 | Ending Account Value 10/31/17 | Expenses Paid During Period 5/1/17–10/31/171,2 | Net Annualized Expense Ratio2 | ||||||||||||
| A | $1,000 | $1,116.60 | $5.39 | $1,020.11 | $5.14 | 1.01% | ||||||||||||
| C | $1,000 | $1,112.50 | $9.37 | $1,016.33 | $8.94 | 1.76% | ||||||||||||
| R | $1,000 | $1,115.50 | $6.72 | $1,018.85 | $6.41 | 1.26% | ||||||||||||
| R6 | $1,000 | $1,119.60 | $2.72 | $1,022.63 | $2.60 | 0.51% | ||||||||||||
| Advisor | $1,000 | $1,117.80 | $4.06 | $1,021.37 | $3.87 | 0.76% | ||||||||||||
1. Expenses are equal to the annualized expense ratio for the six-month period as indicated above—in the far right column—multiplied by the simple average account value over the period indicated, and then multiplied by 184/365 to reflect the one-half year period.
2. Reflects expenses after fee waivers and expense reimbursements. Does not include acquired fund fees and expenses.
| franklintempleton.com | Semiannual Report | 15 | ||||
Franklin Small Cap Growth Fund
This semiannual report for Franklin Small Cap Growth Fund covers the period ended October 31, 2017. At the market close on February 12, 2015, the Fund closed to new investors with limited exceptions. Existing shareholders may add to their accounts. Effective April 28, 2017, the Fund opened Class R6 shares to new investors who are eligible to purchase Class R6 shares.
Your Fund’s Goal and Main Investments
The Fund seeks long-term capital growth by normally investing at least 80% of its net assets in equity securities (predominantly common stocks) of small cap companies, which for this Fund are those with market capitalizations not exceeding $1.5 billion or that of the highest market capitalization in the Russell 2000® Index, whichever is greater, at the time of purchase.1
Performance Overview
The Fund’s Class A shares delivered a +8.52% cumulative total return for the six months under review. In comparison, the Russell 2000® Growth Index, which measures performance of small cap companies with relatively higher price-to-book ratios and higher forecasted growth values, generated a +8.01% total return.2 The Standard & Poor’s 500 Index (S&P 500), which tracks the broad US stock market, produced a +9.10% total return.2 You can find the Fund’s long-term performance data in the Performance Summary beginning on page 19.
Performance data represent past performance, which does not guarantee future results. Investment return and principal value will fluctuate, and you may have a gain or loss when you sell your shares. Current performance may differ from figures shown. For most recent month-end performance, go to franklintempleton.com or call (800) 342-5236.
Investment Strategy
We use fundamental, bottom-up research to seek companies meeting our criteria of growth potential, quality and valuation. In seeking sustainable growth characteristics, we look for companies we believe can produce sustainable earnings and cash flow growth, evaluating the long-term market opportunity and competitive structure of an industry to target leaders and emerging leaders. We define quality companies as those with
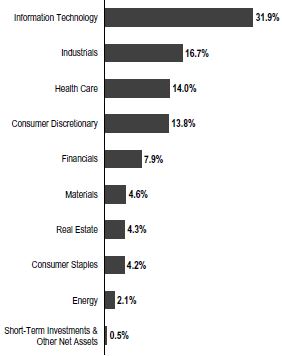
Portfolio Composition
Based on Total Net Assets as of 10/31/17
strong and improving competitive positions in attractive markets. We also believe important attributes of quality are experienced and talented management teams as well as financial strength reflected in the capital structure, gross and operating margins, free cash flow generation and returns on capital employed. Our valuation analysis includes a range of potential outcomes based on an assessment of multiple scenarios. In assessing value, we consider whether security prices fully reflect the balance of the sustainable growth opportunities relative to business and financial risks.
Manager’s Discussion
During the six months under review, most sectors represented in the Fund’s portfolio posted positive returns and contributed to absolute performance. Relative to the Russell 2000® Growth Index, key contributors to the Fund’s performance included stock selection and an overweighting in the information
1. The Russell 2000 Index is market capitalization weighted and measures performance of the 2,000 smallest companies in the Russell 3000 Index, which represent a small amount of the total market capitalization of the Russell 3000 Index.
2. Source: Morningstar.
The indexes are unmanaged and include reinvested dividends. They do not reflect any fees, expenses or sales charges. One cannot invest directly in an index, and an index is not representative of the Fund’s portfolio.
The dollar value, number of shares or principal amount, and names of all portfolio holdings are listed in the Fund’s Statement of Investments (SOI). The SOI begins on page 48.
| 16 | Semiannual Report | franklintempleton.com | ||
FRANKLIN SMALL CAP GROWTH FUND
technology (IT) sector. Stock selection and underweightings in the real estate and materials sectors also contributed to relative results.
In the IT sector, 2U, which provides cloud-based software-as-a-service solutions for non-profit colleges and universities, performed well. Its stock benefited from an accelerating growth outlook for a number of new university program partnerships over the past year and a meaningful expansion of the company’s addressable market through the acquisition of short-course provider GetSmarter. Alarm.com Holdings also performed well. The acquisition of Connect from iControl3 made Alarm.com the leading provider of smart home solutions to the home security market. The potential added value from this deal, in addition to a consistently better-than-expected recurring revenue trend, supported the stock price. Pure Storage performed well over the period as investors gained confidence in its technology differentiation and progress toward profitability. Investors also viewed favorably the company’s chief operating officer change and recent artificial intelligence contract with a leading social networking company.
Other key contributors included Spectranetics, Mercury Systems and iRythm Technologies. The share price of medical device maker Spectranetics4 rose after the company announced that it would be acquired by Philips.3 Mercury Systems, a commercial provider of secure sensor and safety-critical processing subsystems, performed well during the period and beat analyst expectations for sales, profit margin, earnings and bookings. Through successful acquisition integration, management has positioned the company to align with areas of defense spending that it anticipates would grow. iRhythm Technologies, a health care equipment and supplies company, performed well due to stronger-than-expected adoption of its ZioXT cardiac arrhythmia monitoring product.
In contrast, key detractors from the Fund’s relative performance included stock selection and overweighted allocations in the consumer staples, consumer discretionary and industrials sectors.
Within consumer staples, Smart & Final hurt the Fund’s relative performance as product cost deflation and a very competitive pricing environment contributed to slowing sales momentum. We continue to like the company’s differentiated positioning, however. Hostess Brands and TreeHouse Foods also hindered results in the sector. Amid a challenging retail
3. Not a Fund holding.
4. No longer held by period-end.
See www.franklintempletondatasources.com for additional data provider information.
| Top 10 Holdings | ||||
| 10/31/17 | ||||
Company Sector/Industry | % of Total Net Assets | |||
2U Inc. Information Technology
|
|
3.2% |
| |
Mercury Systems Inc. Industrials
|
|
2.0% |
| |
Integrated Device Technology Inc. Information Technology
|
|
1.8% |
| |
Zendesk Inc. Information Technology
|
|
1.8% |
| |
Nevro Corp. Health Care
|
|
1.8% |
| |
US Ecology Inc. Industrials
|
|
1.7% |
| |
Paylocity Holding Corp. Information Technology
|
|
1.6% |
| |
Univar Inc. Industrials
|
|
1.5% |
| |
Integer Holdings Corp. Health Care
|
|
1.5% |
| |
Hubspot Inc. Information Technology
|
|
1.5% |
| |
environment, both companies announced disappointing quarterly revenues and profits.
In the consumer discretionary sector, Tile Shop Holdings detracted from results.4 The company has been facing increasing competitive pressure, leading to slower sales growth and profitability than analyst forecast.
In industrials, Spirit Airlines and KeyW Holding detracted from relative Fund performance. The airline has been suffering from aggressive pricing in its markets by the legacy airlines, leading to declining fares, margin and profits. KeyW Holding had a tough year largely due to uncertainty around the defense budget and delays in the awarding of contracts. Additionally, its acquisition of Sotera Defense Solutions resulted in greater expenses than initially anticipated.
Elsewhere, medical device company DexCom detracted from relative performance. Its stock fell over the period due to rising investor anxiety about the pending US launch of a competing glucose monitor product from Abbott Laboratories.3
| franklintempleton.com | Semiannual Report | 17 | ||||
FRANKLIN SMALL CAP GROWTH FUND
Thank you for your continued participation in Franklin Small Cap Growth Fund. We look forward to serving your future investment needs.
 |
Michael P. McCarthy, CFA Lead Portfolio Manager | |
|
Bradley T. Carris, CFA | |
| Portfolio Management Team | ||


The foregoing information reflects our analysis, opinions and portfolio holdings as of October 31, 2017, the end of the reporting period. The way we implement our main investment strategies and the resulting portfolio holdings may change depending on factors such as market and economic conditions. These opinions may not be relied upon as investment advice or an offer for a particular security. The information is not a complete analysis of every aspect of any market, country, industry, security or the Fund. Statements of fact are from sources considered reliable, but the investment manager makes no representation or warranty as to their completeness or accuracy. Although historical performance is no guarantee of future results, these insights may help you understand our investment management philosophy.
| 18 | Semiannual Report | franklintempleton.com | ||
FRANKLIN SMALL CAP GROWTH FUND
Performance Summary as of October 31, 2017
The performance table does not reflect any taxes that a shareholder would pay on Fund dividends, capital gain distributions, if any, or any realized gains on the sale of Fund shares. Total return reflects reinvestment of the Fund’s dividends and capital gain distributions, if any, and any unrealized gains or losses. Your dividend income will vary depending on dividends or interest paid by securities in the Fund’s portfolio, adjusted for operating expenses of each class. Capital gain distributions are net profits realized from the sale of portfolio securities.
Performance as of 10/31/171
Cumulative total return excludes sales charges. Average annual total return includes maximum sales charges. Sales charges will vary depending on the size of the investment and the class of share purchased. The maximum is 5.75% and the minimum is 0%. Class A: 5.75% maximum initial sales charge; Advisor Class: no sales charges. For other share classes, visit franklintempleton.com.
Share Class | Cumulative Total Return2 | Average Annual Total Return3 | ||
| A | ||||
6-Month | +8.52% | +2.26% | ||
1-Year | +21.90% | +14.92% | ||
5-Year | +96.49% | +13.12% | ||
10-Year | +117.37% | +7.44% | ||
| Advisor | ||||
6-Month | +8.67% | +8.67% | ||
1-Year | +22.13% | +22.13% | ||
5-Year | +99.18% | +14.78% | ||
10-Year | +123.69% | +8.38% | ||
Performance data represent past performance, which does not guarantee future results. Investment return and principal value will fluctuate, and you may have a gain or loss when you sell your shares. Current performance may differ from figures shown. For most recent month-end performance, go to franklintempleton.com or call (800) 342-5236.
See page 20 for Performance Summary footnotes.
| franklintempleton.com | Semiannual Report | 19 | ||||
FRANKLIN SMALL CAP GROWTH FUND
PERFORMANCE SUMMARY
Total Annual Operating Expenses4
| Share Class | With Waiver | Without Waiver | ||||||
A | 1.10% | 1.12% | ||||||
Advisor | 0.85% | 0.87% | ||||||
Each class of shares is available to certain eligible investors and has different annual fees and expenses, as described in the prospectus.
All investments involve risks, including possible loss of principal. Smaller, midsized and relatively new or unseasoned companies can be particularly sensitive to changing economic conditions, and their prospects for growth are less certain than those of larger, more established companies. Historically, these securities have experienced more price volatility than larger company stocks, especially over the short term. Growth stock prices reflect projections of future earnings or revenues, and can, therefore, fall dramatically if the company fails to meet those projections. To the extent the Fund focuses on particular countries, regions, industries, sectors or types of investment from time to time, it may be subject to greater risks of adverse developments in such areas of focus than a fund that invests in a wider variety of countries, regions, industries, sectors or investments. From time to time, the trading market for a particular security or type of security in which the Fund invests may become less liquid or even illiquid. The Fund is actively managed but there is no guarantee that the manager’s investment decisions will produce the desired results. The Fund’s prospectus also includes a description of the main investment risks.
1. The Fund has a fee waiver associated with any investment it makes in a Franklin Templeton money fund and/or other Franklin Templeton fund, contractually guaranteed through 8/31/18. Fund investment results reflect the fee waiver; without this waiver, the results would have been lower.
2. Cumulative total return represents the change in value of an investment over the periods indicated.
3. Average annual total return represents the average annual change in value of an investment over the periods indicated. Return for less than one year, if any, has not been annualized.
4. Figures are as stated in the Fund’s current prospectus and may differ from the expense ratios disclosed in the Your Fund’s Expenses and Financial Highlights sections in this report. In periods of market volatility, assets may decline significantly, causing total annual Fund operating expenses to become higher than the figures shown.
| 20 | Semiannual Report | franklintempleton.com | ||
FRANKLIN SMALL CAP GROWTH FUND
Your Fund’s Expenses
As a Fund shareholder, you can incur two types of costs: (1) transaction costs, including sales charges (loads) on Fund purchases and redemptions; and (2) ongoing Fund costs, including management fees, distribution and service (12b-1) fees, and other Fund expenses. All mutual funds have ongoing costs, sometimes referred to as operating expenses. The table below shows ongoing costs of investing in the Fund and can help you understand these costs and compare them with those of other mutual funds. The table assumes a $1,000 investment held for the six months indicated.
Actual Fund Expenses
The table below provides information about actual account values and actual expenses in the columns under the heading “Actual.” In these columns the Fund’s actual return, which includes the effect of Fund expenses, is used to calculate the “Ending Account Value” for each class of shares. You can estimate the expenses you paid during the period by following these steps (of course, your account value and expenses will differ from those in this illustration): Divide your account value by $1,000 (if your account had an $8,600 value, then $8,600 ÷ $1,000 = 8.6). Then multiply the result by the number in the row for your class of shares under the headings “Actual” and “Expenses Paid During Period” (if Actual Expenses Paid During Period were $7.50, then 8.6 x $7.50 = $64.50). In this illustration, the actual expenses paid this period are $64.50.
Hypothetical Example for Comparison with Other Funds
Under the heading “Hypothetical” in the table, information is provided about hypothetical account values and hypothetical expenses based on the Fund’s actual expense ratio and an assumed rate of return of 5% per year before expenses, which is not the Fund’s actual return. This information may not be used to estimate the actual ending account balance or expenses you paid for the period, but it can help you compare ongoing costs of investing in the Fund with those of other funds. To do so, compare this 5% hypothetical example for the class of shares you hold with the 5% hypothetical examples that appear in the shareholder reports of other funds.
Please note that expenses shown in the table are meant to highlight ongoing costs and do not reflect any transactional costs. Therefore, information under the heading “Hypothetical” is useful in comparing ongoing costs only, and will not help you compare total costs of owning different funds. In addition, if transactional costs were included, your total costs would have been higher.
Actual (actual return after expenses) | Hypothetical (5% annual return before expenses) | |||||||||||||||||
| Share Class | Beginning Account | Ending Account Value 10/31/17 | Expenses Paid During 5/1/17–10/31/171,2 | Ending Account Value 10/31/17 | Expenses Paid During 5/1/17–10/31/171,2 | Net Annualized Expense Ratio2 | ||||||||||||
| A | $1,000 | $1,085.20 | $5.83 | $1,019.61 | $5.65 | 1.11% | ||||||||||||
| C | $1,000 | $1,081.40 | $9.76 | $1,015.83 | $9.45 | 1.86% | ||||||||||||
| R | $1,000 | $1,083.80 | $7.14 | $1,018.35 | $6.92 | 1.36% | ||||||||||||
| R6 | $1,000 | $1,088.30 | $3.26 | $1,022.08 | $3.16 | 0.62% | ||||||||||||
| Advisor | $1,000 | $1,086.70 | $4.52 | $1,020.87 | $4.38 | 0.86% | ||||||||||||
1. Expenses are equal to the annualized expense ratio for the six-month period as indicated above—in the far right column—multiplied by the simple average account value over the period indicated, and then multiplied by 184/365 to reflect the one-half year period.
2. Reflects expenses after fee waivers and expense reimbursements. Does not include acquired fund fees and expenses.
| franklintempleton.com | Semiannual Report | 21 | ||||
Franklin Small-Mid Cap Growth Fund
This semiannual report for Franklin Small-Mid Cap Growth Fund covers the period ended October 31, 2017.
Your Fund’s Goal and Main Investments
The Fund seeks long-term capital growth by normally investing at least 80% of its net assets in equity securities of small-cap and mid-cap companies. The Fund defines small-cap companies as those within the market capitalization range of companies in the Russell 2500™ Index at the time of purchase, and mid-cap companies as those within the market capitalization range of the Russell Midcap® Index at the time of purchase.1
Performance Overview
The Fund’s Class A shares delivered a +9.40% cumulative total return for the six months under review. In comparison, the Russell Midcap® Growth Index, which measures performance of companies in the Russell Midcap® Index with relatively higher price-to-book ratios and higher forecasted growth values, generated a +11.14% total return.2 Also in comparison, the Standard & Poor’s 500 Index (S&P 500), which tracks the broad US stock market, produced a total return of +9.10% total return.2 You can find the Fund’s long-term performance data in the Performance Summary beginning on page 25.
Performance data represent past performance, which does not guarantee future results. Investment return and principal value will fluctuate, and you may have a gain or loss when you sell your shares. Current performance may differ from figures shown. For most recent month-end performance, go to franklintempleton.com or call (800) 342-5236.
Investment Strategy
We use fundamental, bottom-up research to seek companies meeting our criteria of growth potential, quality and valuation. In seeking sustainable growth characteristics, we look for companies we believe can produce sustainable earnings and cash flow growth, evaluating the long-term market opportunity and competitive structure of an industry to target leaders and emerging leaders. We define quality companies as those with strong and improving competitive positions in attractive markets. We also believe important attributes of quality are
Portfolio Composition
Based on Total Net Assets as of 10/31/17
experienced and talented management teams as well as financial strength reflected in the capital structure, gross and operating margins, free cash flow generation and returns on capital employed. Our valuation analysis includes a range of potential outcomes based on an assessment of multiple scenarios. In assessing value, we consider whether security prices fully reflect the balance of the sustainable growth opportunities relative to business and financial risks.
Manager’s Discussion
During the six months under review, contributors to the Fund’s performance relative to the Russell Midcap® Growth Index included stock selection and an overweighting in the information technology (IT) sector. Additionally, our underweighting in consumer discretionary more than offset the
1. The Russell 2500 Index is market capitalization weighted and measures performance of the 2,500 smallest companies in the Russell 3000 Index, which represent a modest amount of the Russell 3000 Index’s total market capitalization. The Russell Midcap Index is market capitalization weighted and measures performance of the smallest companies in the Russell 1000 Index, which represent a modest amount of the Russell 1000 Index’s total market capitalization.
2. Source: Morningstar.
The indexes are unmanaged and include reinvested dividends. They do not reflect any fees, expenses or sales charges. One cannot invest directly in an index, and an index is not representative of the Fund’s portfolio.
The dollar value, number of shares or principal amount, and names of all portfolio holdings are listed in the Fund’s Statement of Investments (SOI). The SOI begins on page 57.
| 22 | Semiannual Report | franklintempleton.com | ||
FRANKLIN SMALL-MID CAP GROWTH FUND
negative effect of stock selection. Stock selection in real estate also helped relative results.
In the IT sector, 2U, which provides cloud-based software-as-a-service solutions for non-profit colleges and universities, performed well. Its stock benefited from an accelerating growth outlook for a number of new university program partnerships over the past year and a meaningful expansion of the company’s addressable market through the acquisition of short-course provider GetSmarter.
Machine vision products provider Cognex also performed well during the period, reporting stellar growth rates as its primary industrial automation markets remained very strong. In addition, its position in the warehouses and consumer electronic end markets drove growth well above its targeted range, resulting in fourth quarter revenue guidance well above expectations.
The stock of ServiceNow, a cloud computing company, rose during the period as its core IT service management solutions showed sustained growth and its emerging management offerings for IT operations and enterprise service gained traction. Investors were also encouraged by a chief executive officer change in April.
Within consumer discretionary, NVR benefited performance. The company, which builds and sells residential properties, steadily improved profit margins, while expanding orders over the period under review. As in past periods, the company used a disciplined capital allocation strategy, and its asset-light model aided their positive returns on investment.
In real estate, a key contributor was real estate investment trust and wireless communications infrastructure operator SBA Communications. The company had a positive growth trajectory driven by accelerating growth in the US. We believe AT&T’s3 First Responder Network Authority deployment may result in augmented growth for SBA. T-Mobile and Sprint merger’s difficulties have also helped the company.3
In other sectors, health care company Mettler-Toledo International contributed to the Fund’s performance. Better-than-expected earnings were made possible by strong revenue growth, which was driven by a rising end-market demand.
In contrast, the Fund’s relative performance was hurt by stock selection and underweightings in the health care and materials
| Top 10 Holdings | ||||
| 10/31/17 | ||||
Company Sector/Industry | % of Total Net Assets | |||
Roper Technologies Inc. Industrials | 2.4% | |||
2U Inc. Information Technology | 1.8% | |||
Rockwell Automation Inc. Industrials | 1.8% | |||
ServiceNow Inc. Information Technology | 1.7% | |||
Cognex Corp. Information Technology | 1.7% | |||
NVR Inc. Consumer Discretionary | 1.7% | |||
Equinix Inc. Real Estate | 1.6% | |||
Vantiv Inc. Information Technology | 1.6% | |||
Mettler-Toledo International Inc. Health Care | 1.5% | |||
SBA Communications Corp. Real Estate | 1.5% | |||
sectors and stock selection and an overweighting in the financials sector. In health care, medical device companies DexCom and Hologic detracted from performance. DexCom’s stock fell over the period due to rising investor anxiety about the pending US launch of a competing glucose monitor product from Abbott Laboratories.3 Hologic performed worse than expected due to the negative impact on sales growth caused by sales force turnover at the newly acquired Cynosure aesthetics products business.
In materials, Axalta Coating Systems hurt Fund performance. Rumors of a possible acquisition by another company fueled positive performance in the first half of the year, but shares declined over the period as a whole due to a sharp rise in raw materials costs, which compressed profit margins.
In financials, our position in electronic trading platform operator MarketAxess hindered the Fund’s results. The company was negatively impacted by the record low volatility market environment, which dampened trading activity. Slower volume growth, as well as reports that competitors are trying to grow their presence in the corporate bond market, hindered the stock. Encouragingly, the company continued to grow volumes ahead of the industry and remained a dominant liquidity pool
3. Not a Fund holding.
| franklintempleton.com | Semiannual Report | 23 | ||||
FRANKLIN SMALL-MID CAP GROWTH FUND
among electronic venues. We believe that the company may be the primary beneficiary of the secular shift toward electronic trading in the corporate bond market.
In other sectors, semiconductor company NVIDIA had positive absolute returns but hurt the Fund’s relative performance due to an underweighting.4
Revenue growth for Newell Brands, a consumer and commercial products manufacturer and marketer, slowed as retailers reassessed how much inventory they want to carry with more product sales moving online.
Motion picture technologies company IMAX declined during the period, largely because of disappointing domestic summer box office revenue, driven largely by poorly reviewed films and franchise fatigue.4
Thank you for your continued participation in Franklin Small-Mid Cap Growth Fund. We look forward to serving your future investment needs.
 |
Edward B. Jamieson Lead Portfolio Manager | |
 |
John P. Scandalios
Michael P. McCarthy, CFA James Cross, CFA
Portfolio Management Team | |

The foregoing information reflects our analysis, opinions and portfolio holdings as of October 31, 2017, the end of the reporting period. The way we implement our main investment strategies and the resulting portfolio holdings may change depending on factors such as market and economic conditions. These opinions may not be relied upon as investment advice or an offer for a particular security. The information is not a complete analysis of every aspect of any market, country, industry, security or the Fund. Statements of fact are from sources considered reliable, but the investment manager makes no representation or warranty as to their completeness or accuracy. Although historical performance is no guarantee of future results, these insights may help you understand our investment management philosophy.
4. No longer held at period-end.
See www.franklintempletondatasources.com for additional data provider information.
| 24 | Semiannual Report | franklintempleton.com | ||
FRANKLIN SMALL-MID CAP GROWTH FUND
Performance Summary as of October 31, 2017
The performance table does not reflect any taxes that a shareholder would pay on Fund dividends, capital gain distributions, if any, or any realized gains on the sale of Fund shares. Total return reflects reinvestment of the Fund’s dividends and capital gain distributions, if any, and any unrealized gains or losses. Your dividend income will vary depending on dividends or interest paid by securities in the Fund’s portfolio, adjusted for operating expenses of each class. Capital gain distributions are net profits realized from the sale of portfolio securities.
Performance as of 10/31/171
Cumulative total return excludes sales charges. Average annual total return includes maximum sales charges. Sales charges will vary depending on the size of the investment and the class of share purchased. The maximum is 5.75% and the minimum is 0%. Class A: 5.75% maximum initial sales charge; Advisor Class: no sales charges. For other share classes, visit franklintempleton.com.
| Share Class | Cumulative Total Return2 | Average Annual Total Return3 |
| |||||||
| A | ||||||||||
6-Month | +9.40% | +3.10% | ||||||||
1-Year | +21.84% | +14.82% | ||||||||
5-Year | +87.45% | +12.05% | ||||||||
10-Year | +84.28% | +5.67% | ||||||||
| Advisor | ||||||||||
6-Month | +9.54% | +9.54% | ||||||||
1-Year | +22.17% | +22.17% | ||||||||
5-Year | +89.80% | +13.67% | ||||||||
10-Year | +88.97% | +6.57% | ||||||||
Performance data represent past performance, which does not guarantee future results. Investment return and principal value will fluctuate, and you may have a gain or loss when you sell your shares. Current performance may differ from figures shown. For most recent month-end performance, go to franklintempleton.com or call (800) 342-5236.
See page 26 for Performance Summary footnotes.
| franklintempleton.com | Semiannual Report | 25 | ||||
FRANKLIN SMALL-MID CAP GROWTH FUND
PERFORMANCE SUMMARY
| Total Annual Operating Expenses4 | ||||||||
| Share Class | With Waiver | Without Waiver | ||||||
A | 0.95% | 0.96% | ||||||
Advisor | 0.70% | 0.71% | ||||||
Each class of shares is available to certain eligible investors and has different annual fees and expenses, as described in the prospectus.
All investments involve risks, including possible loss of principal. Growth stock prices reflect projections of future earnings or revenues, and can, therefore, fall dramatically if the company fails to meet those projections. Smaller, midsized and relatively new or unseasoned companies can be particularly sensitive to changing economic conditions, and their prospects for growth are less certain than those of larger, more established companies. Historically, these securities have experienced more price volatility than larger company stocks, especially over the short term. To the extent the Fund focuses on particular countries, regions, industries, sectors or types of investment from time to time, it may be subject to greater risks of adverse developments in such areas of focus than a fund that invests in a wider variety of countries, regions, industries, sectors or investments. From time to time, the trading market for a particular security or type of security in which the Fund invests may become less liquid or even illiquid. The Fund is actively managed but there is no guarantee that the manager’s investment decisions will produce the desired results. The Fund’s prospectus also includes a description of the main investment risks.
1. The Fund has a fee waiver associated with any investment it makes in a Franklin Templeton money fund and/or other Franklin Templeton fund, contractually guaranteed through 8/31/18. Fund investment results reflect the fee waiver; without this waiver, the results would have been lower.
2. Cumulative total return represents the change in value of an investment over the periods indicated.
3. Average annual total return represents the average annual change in value of an investment over the periods indicated. Return for less than one year, if any, has not been annualized.
4. Figures are as stated in the Fund’s current prospectus and may differ from the expense ratios disclosed in the Your Fund’s Expenses and Financial Highlights sections in this report. In periods of market volatility, assets may decline significantly, causing total annual Fund operating expenses to become higher than the figures shown.
| 26 | Semiannual Report | franklintempleton.com | ||
FRANKLIN SMALL-MID CAP GROWTH FUND
Your Fund’s Expenses
As a Fund shareholder, you can incur two types of costs: (1) transaction costs, including sales charges (loads) on Fund purchases and redemptions; and (2) ongoing Fund costs, including management fees, distribution and service (12b-1) fees, and other Fund expenses. All mutual funds have ongoing costs, sometimes referred to as operating expenses. The table below shows ongoing costs of investing in the Fund and can help you understand these costs and compare them with those of other mutual funds. The table assumes a $1,000 investment held for the six months indicated.
Actual Fund Expenses
The table below provides information about actual account values and actual expenses in the columns under the heading “Actual.” In these columns the Fund’s actual return, which includes the effect of Fund expenses, is used to calculate the “Ending Account Value” for each class of shares. You can estimate the expenses you paid during the period by following these steps (of course, your account value and expenses will differ from those in this illustration): Divide your account value by $1,000 (if your account had an $8,600 value, then $8,600 ÷ $1,000 = 8.6). Then multiply the result by the number in the row for your class of shares under the headings “Actual” and “Expenses Paid During Period” (if Actual Expenses Paid During Period were $7.50, then 8.6 x $7.50 = $64.50). In this illustration, the actual expenses paid this period are $64.50.
Hypothetical Example for Comparison with Other Funds
Under the heading “Hypothetical” in the table, information is provided about hypothetical account values and hypothetical expenses based on the Fund’s actual expense ratio and an assumed rate of return of 5% per year before expenses, which is not the Fund’s actual return. This information may not be used to estimate the actual ending account balance or expenses you paid for the period, but it can help you compare ongoing costs of investing in the Fund with those of other funds. To do so, compare this 5% hypothetical example for the class of shares you hold with the 5% hypothetical examples that appear in the shareholder reports of other funds.
Please note that expenses shown in the table are meant to highlight ongoing costs and do not reflect any transactional costs. Therefore, information under the heading “Hypothetical” is useful in comparing ongoing costs only, and will not help you compare total costs of owning different funds. In addition, if transactional costs were included, your total costs would have been higher.
| Actual (actual return after expenses) | Hypothetical (5% annual return before expenses) | |||||||||||||||||
| Share Class | Beginning Account Value 5/1/17 | Ending Account Value 10/31/17 | Expenses Paid During 5/1/17–10/31/171,2 | Ending Account Value 10/31/17 | Expenses Paid During 5/1/17–10/31/171,2 | Net Annualized Expense Ratio2 | ||||||||||||
|
|
|
|
| ||||||||||||||
| A | $1,000 | $1,094.00 | $5.33 | $1,020.11 | $5.14 | 1.01% | ||||||||||||
| C | $1,000 | $1,089.90 | $9.27 | $1,016.33 | $8.94 | 1.76% | ||||||||||||
| R | $1,000 | $1,092.60 | $6.65 | $1,018.85 | $6.41 | 1.26% | ||||||||||||
| R6 | $1,000 | $1,097.60 | $2.48 | $1,022.84 | $2.40 | 0.47% | ||||||||||||
| Advisor | $1,000 | $1,095.40 | $4.01 | $1,021.37 | $3.87 | 0.76% | ||||||||||||
1. Expenses are equal to the annualized expense ratio for the six-month period as indicated above—in the far right column—multiplied by the simple average account value over the period indicated, and then multiplied by 184/365 to reflect the one-half year period.
2. Reflects expenses after fee waivers and expense reimbursements. Does not include acquired fund fees and expenses.
| franklintempleton.com | Semiannual Report | 27 | ||||
FRANKLIN STRATEGIC SERIES
Franklin Focused Core Equity Fund
Six Months Ended October 31, 2017 | Year Ended April 30, | |||||||||||||||||||||||
| (unaudited) | 2017 | 2016 | 2015 | 2014 | 2013 | |||||||||||||||||||
| Class A | ||||||||||||||||||||||||
| Per share operating performance (for a share outstanding throughout the period) | ||||||||||||||||||||||||
Net asset value, beginning of period | $15.20 | $13.12 | $15.29 | $13.38 | $10.63 | $9.47 | ||||||||||||||||||
|
| |||||||||||||||||||||||
| Income from investment operationsa: | ||||||||||||||||||||||||
Net investment income (loss)b | (0.01) | (0.01) | 0.07c | (0.01) | 0.03 | 0.07 | ||||||||||||||||||
Net realized and unrealized gains (losses) | 0.42 | 2.09 | (1.83 | ) | 2.23 | 2.92 | 1.16 | |||||||||||||||||
|
| |||||||||||||||||||||||
| Total from investment operations | 0.41 | 2.08 | (1.76) | 2.22 | 2.95 | 1.23 | ||||||||||||||||||
|
| |||||||||||||||||||||||
Less distributions from: | ||||||||||||||||||||||||
Net investment income | — | — | (0.06) | — | (0.07) | — | ||||||||||||||||||
Net realized gains | — | — | (0.35) | (0.31) | (0.13) | (0.07) | ||||||||||||||||||
|
| |||||||||||||||||||||||
Total distributions | — | — | (0.41) | (0.31) | (0.20) | (0.07) | ||||||||||||||||||
|
| |||||||||||||||||||||||
| Net asset value, end of period | $15.61 | $15.20 | $13.12 | $15.29 | $13.38 | $10.63 | ||||||||||||||||||
|
| |||||||||||||||||||||||
Total returnd | 2.70% | 15.85% | (11.70)% | 16.84% | 28.00% | 13.08% | ||||||||||||||||||
| Ratios to average net assetse | ||||||||||||||||||||||||
Expenses before waiver and payments by affiliates | 1.55% | 1.47% | 1.46% | 1.54% | 1.73% | 1.89% | ||||||||||||||||||
Expenses net of waiver and payments by affiliates | 1.25%f | 1.24%f | 1.25% | 1.28% | 1.22% | 1.19% | ||||||||||||||||||
Net investment income (loss) | (0.09)% | (0.04)% | 0.48%c | (0.07)% | 0.23% | 0.76% | ||||||||||||||||||
| Supplemental data | ||||||||||||||||||||||||
Net assets, end of period (000’s) | $67,853 | $77,733 | $100,483 | $92,612 | $40,372 | $19,029 | ||||||||||||||||||
Portfolio turnover rate | 16.29% | 17.45% | 35.56% | 25.55% | 43.30% | 74.50% | ||||||||||||||||||
aThe amount shown for a share outstanding throughout the period may not correlate with the Statement of Operations for the period due to the timing of sales and repurchases of the Fund’s shares in relation to income earned and/or fluctuating fair value of the investments of the Fund.
bBased on average daily shares outstanding.
cNet investment income per share includes approximately $0.06 per share related to income received in the form of special dividends in connection with certain Fund holdings. Excluding this amount, the ratio of net investment income to average net assets would have been 0.02%.
dTotal return does not reflect sales commissions or contingent deferred sales charges, if applicable, and is not annualized for periods less than one year.
eRatios are annualized for periods less than one year, except for non-recurring expenses, if any.
fBenefit of expense reduction rounds to less than 0.01%.
| 28 | Semiannual Report | The accompanying notes are an integral part of these financial statements. | franklintempleton.com | ||
FRANKLIN STRATEGIC SERIES
FINANCIAL HIGHLIGHTS
Franklin Focused Core Equity Fund (continued)
Six Months Ended October 31, 2017 | Year Ended April 30, | |||||||||||||||||||||||
| (unaudited) | 2017 | 2016 | 2015 | 2014 | 2013 | |||||||||||||||||||
| Class C | ||||||||||||||||||||||||
| Per share operating performance (for a share outstanding throughout the period) | ||||||||||||||||||||||||
Net asset value, beginning of period | $14.46 | $12.58 | $14.73 | $12.98 | $10.36 | $9.29 | ||||||||||||||||||
|
| |||||||||||||||||||||||
| Income from investment operationsa: | ||||||||||||||||||||||||
Net investment income (loss)b | (0.06) | (0.10) | (0.04)c | (0.11) | (0.06) | 0.01 | ||||||||||||||||||
Net realized and unrealized gains (losses) | 0.40 | 1.98 | (1.76) | 2.17 | 2.84 | 1.13 | ||||||||||||||||||
|
| |||||||||||||||||||||||
| Total from investment operations | 0.34 | 1.88 | (1.80) | 2.06 | 2.78 | 1.14 | ||||||||||||||||||
|
| |||||||||||||||||||||||
| Less distributions from: | ||||||||||||||||||||||||
Net investment income | — | — | — | — | (0.03) | — | ||||||||||||||||||
Net realized gains | — | — | (0.35) | (0.31) | (0.13) | (0.07) | ||||||||||||||||||
|
| |||||||||||||||||||||||
Total distributions | — | — | (0.35) | (0.31) | (0.16) | (0.07) | ||||||||||||||||||
|
| |||||||||||||||||||||||
Net asset value, end of period | $14.80 | $14.46 | $12.58 | $14.73 | $12.98 | $10.36 | ||||||||||||||||||
|
| |||||||||||||||||||||||
Total returnd | 2.35% | 14.94% | (12.31)% | 16.12% | 26.99% | 12.36% | ||||||||||||||||||
| Ratios to average net assetse | ||||||||||||||||||||||||
Expenses before waiver and payments by affiliates | 2.30% | 2.21% | 2.20% | 2.24% | 2.43% | 2.59% | ||||||||||||||||||
Expenses net of waiver and payments by affiliates | 2.00%f | 1.98%f | 1.99% | 1.98% | 1.92% | 1.89% | ||||||||||||||||||
Net investment income (loss) | (0.84)% | (0.78)% | (0.26)%c | (0.77)% | (0.47)% | 0.06% | ||||||||||||||||||
| Supplemental data | ||||||||||||||||||||||||
Net assets, end of period (000’s) | $18,665 | $20,341 | $25,119 | $18,758 | $6,666 | $2,502 | ||||||||||||||||||
Portfolio turnover rate | 16.29% | 17.45% | 35.56% | 25.55% | 43.30% | 74.50% | ||||||||||||||||||
aThe amount shown for a share outstanding throughout the period may not correlate with the Statement of Operations for the period due to the timing of sales and repurchases of the Fund’s shares in relation to income earned and/or fluctuating fair value of the investments of the Fund.
bBased on average daily shares outstanding.
cNet investment income per share includes approximately $0.06 per share related to income received in the form of special dividends in connection with certain Fund holdings. Excluding this amount, the ratio of net investment income to average net assets would have been (0.72)%.
dTotal return does not reflect sales commissions or contingent deferred sales charges, if applicable, and is not annualized for periods less than one year.
eRatios are annualized for periods less than one year, except for non-recurring expenses, if any.
fBenefit of expense reduction rounds to less than 0.01%.
| franklintempleton.com | The accompanying notes are an integral part of these financial statements. | Semiannual Report | 29 | ||||
FRANKLIN STRATEGIC SERIES
FINANCIAL HIGHLIGHTS
Franklin Focused Core Equity Fund (continued)
Six Months Ended October 31, 2017 | Year Ended April 30, | |||||||||||||||||||||||
| (unaudited) | 2017 | 2016 | 2015 | 2014 | 2013 | |||||||||||||||||||
| Class R | ||||||||||||||||||||||||
| Per share operating performance (for a share outstanding throughout the period) | ||||||||||||||||||||||||
Net asset value, beginning of period | $15.01 | $12.98 | $15.15 | $13.28 | $10.56 | $9.43 | ||||||||||||||||||
|
| |||||||||||||||||||||||
| Income from investment operationsa: | ||||||||||||||||||||||||
Net investment income (loss)b | (0.01 | ) | (0.03 | ) | 0.03 | c | (0.04 | ) | 0.01 | 0.05 | ||||||||||||||
Net realized and unrealized gains (losses) | 0.41 | 2.06 | (1.81 | ) | 2.22 | 2.90 | 1.15 | |||||||||||||||||
|
| |||||||||||||||||||||||
Total from investment operations | 0.40 | 2.03 | (1.78 | ) | 2.18 | 2.91 | 1.20 | |||||||||||||||||
|
| |||||||||||||||||||||||
Less distributions from: | ||||||||||||||||||||||||
Net investment income | — | — | (0.04 | ) | — | (0.06 | ) | — | ||||||||||||||||
Net realized gains | — | — | (0.35 | ) | (0.31 | ) | (0.13 | ) | (0.07 | ) | ||||||||||||||
|
| |||||||||||||||||||||||
Total distributions | — | — | (0.39 | ) | (0.31 | ) | (0.19 | ) | (0.07 | ) | ||||||||||||||
|
| |||||||||||||||||||||||
Net asset value, end of period | $15.41 | $15.01 | $12.98 | $15.15 | $13.28 | $10.56 | ||||||||||||||||||
|
| |||||||||||||||||||||||
Total returnd | 2.66% | 15.64% | (11.91)% | 16.66% | 27.70% | 12.81% | ||||||||||||||||||
| Ratios to average net assetse | ||||||||||||||||||||||||
Expenses before waiver and payments by affiliates | 1.64% | 1.64% | 1.69% | 1.74% | 1.93% | 2.09% | ||||||||||||||||||
Expenses net of waiver and payments by affiliates | 1.34% | f | 1.41% | f | 1.48% | 1.48% | 1.42% | 1.39% | ||||||||||||||||
Net investment income (loss) | (0.18)% | (0.21)% | 0.25% | c | (0.27)% | 0.03% | 0.56% | |||||||||||||||||
| Supplemental data | ||||||||||||||||||||||||
Net assets, end of period (000’s) | $164 | $166 | $273 | $169 | $124 | $76 | ||||||||||||||||||
Portfolio turnover rate | 16.29% | 17.45% | 35.56% | 25.55% | 43.30% | 74.50% | ||||||||||||||||||
aThe amount shown for a share outstanding throughout the period may not correlate with the Statement of Operations for the period due to the timing of sales and repurchases of the Fund’s shares in relation to income earned and/or fluctuating fair value of the investments of the Fund.
bBased on average daily shares outstanding.
cNet investment income per share includes approximately $0.06 per share related to income received in the form of special dividends in connection with certain Fund holdings. Excluding this amount, the ratio of net investment income to average net assets would have been (0.21)%.
dTotal return is not annualized for periods less than one year.
eRatios are annualized for periods less than one year, except for non-recurring expenses, if any.
fBenefit of expense reduction rounds to less than 0.01%.
| 30 | Semiannual Report | The accompanying notes are an integral part of these financial statements. | franklintempleton.com | ||
FRANKLIN STRATEGIC SERIES
FINANCIAL HIGHLIGHTS
Franklin Focused Core Equity Fund (continued)
Six Months Ended October 31, 2017 | Year Ended April 30, | |||||||||||||||||||
| (unaudited) | 2017 | 2016 | 2015 | 2014a | ||||||||||||||||
| Class R6 | ||||||||||||||||||||
| Per share operating performance (for a share outstanding throughout the period) | ||||||||||||||||||||
Net asset value, beginning of period | $15.44 | $13.27 | $15.46 | $13.49 | $10.54 | |||||||||||||||
|
| |||||||||||||||||||
| Income from investment operationsb: | ||||||||||||||||||||
Net investment incomec | 0.07 | 0.05 | 0.12d | 0.05 | 0.07 | |||||||||||||||
Net realized and unrealized gains (losses) | 0.37 | 2.12 | (1.85) | 2.27 | 3.11 | |||||||||||||||
|
| |||||||||||||||||||
Total from investment operations | 0.44 | 2.17 | (1.73) | 2.32 | 3.18 | |||||||||||||||
|
| |||||||||||||||||||
Less distributions from: | ||||||||||||||||||||
Net investment income | — | — | (0.11 | ) | (0.04 | ) | (0.10 | ) | ||||||||||||
Net realized gains | — | — | (0.35 | ) | (0.31 | ) | (0.13 | ) | ||||||||||||
|
| |||||||||||||||||||
Total distributions | — | — | (0.46) | (0.35) | (0.23) | |||||||||||||||
|
| |||||||||||||||||||
Net asset value, end of period | $15.88 | $15.44 | $13.27 | $15.46 | $13.49 | |||||||||||||||
|
| |||||||||||||||||||
Total returne | 2.85% | 16.35% | (11.32)% | 17.45% | 30.43% | |||||||||||||||
| Ratios to average net assetsf | ||||||||||||||||||||
Expenses before waiver and payments by affiliates | 1.10% | 1.06% | 1.04% | 1.09% | 2.28% | |||||||||||||||
Expenses net of waiver and payments by affiliates | 0.84%g | 0.84%g | 0.85% | 0.83% | 0.77% | |||||||||||||||
Net investment income | 0.32% | 0.36% | 0.88%d | 0.38% | 0.68% | |||||||||||||||
| Supplemental data | ||||||||||||||||||||
Net assets, end of period (000’s) | $858 | $20,401 | $33,640 | $25,739 | $14 | |||||||||||||||
Portfolio turnover rate | 16.29% | 17.45% | 35.56% | 25.55% | 43.30% | |||||||||||||||
aFor the year May 1, 2013 (effective date) to April 30, 2014.
bThe amount shown for a share outstanding throughout the period may not correlate with the Statement of Operations for the period due to the timing of sales and repurchases of the Fund’s shares in relation to income earned and/or fluctuating fair value of the investments of the Fund.
cBased on average daily shares outstanding.
dNet investment income per share includes approximately $0.06 per share related to income received in the form of special dividends in connection with certain Fund holdings. Excluding this amount, the ratio of net investment income to average net assets would have been 0.42%.
eTotal return is not annualized for periods less than one year.
fRatios are annualized for periods less than one year, except for non-recurring expenses, if any.
gBenefit of expense reduction rounds to less than 0.01%.
| franklintempleton.com | The accompanying notes are an integral part of these financial statements. | Semiannual Report | 31 | ||||
FRANKLIN STRATEGIC SERIES
FINANCIAL HIGHLIGHTS
Franklin Focused Core Equity Fund (continued)
Six Months Ended October 31, 2017 | Year Ended April 30, | |||||||||||||||||||||||
| (unaudited) | 2017 | 2016 | 2015 | 2014 | 2013 | |||||||||||||||||||
| Advisor Class | ||||||||||||||||||||||||
| Per share operating performance (for a share outstanding throughout the period) | ||||||||||||||||||||||||
Net asset value, beginning of period | $15.39 | $13.25 | $15.44 | $13.48 | $10.70 | $9.50 | ||||||||||||||||||
|
| |||||||||||||||||||||||
| Income from investment operationsa: | ||||||||||||||||||||||||
Net investment incomeb | 0.01 | 0.03 | 0.10c | 0.04 | 0.07 | 0.10 | ||||||||||||||||||
Net realized and unrealized gains (losses) | 0.43 | 2.11 | (1.85) | 2.25 | 2.93 | 1.17 | ||||||||||||||||||
|
| |||||||||||||||||||||||
Total from investment operations | 0.44 | 2.14 | (1.75) | 2.29 | 3.00 | 1.27 | ||||||||||||||||||
|
| |||||||||||||||||||||||
Less distributions from: | ||||||||||||||||||||||||
Net investment income | — | — | (0.09) | (0.02) | (0.09) | — | ||||||||||||||||||
Net realized gains | — | — | (0.35) | (0.31) | (0.13) | (0.07) | ||||||||||||||||||
|
| |||||||||||||||||||||||
Total distributions | — | — | (0.44) | (0.33) | (0.22) | (0.07) | ||||||||||||||||||
|
| |||||||||||||||||||||||
Net asset value, end of period | $15.83 | $15.39 | $13.25 | $15.44 | $13.48 | $10.70 | ||||||||||||||||||
|
| |||||||||||||||||||||||
Total returnd | 2.86% | 16.15% | (11.45)% | 17.25% | 28.27% | 13.46% | ||||||||||||||||||
| Ratios to average net assetse | ||||||||||||||||||||||||
Expenses before waiver and payments by affiliates | 1.30% | 1.22% | 1.20% | 1.24% | 1.43% | 1.59% | ||||||||||||||||||
Expenses net of waiver and payments by affiliates | 1.00%f | 0.99%f | 0.99% | 0.98% | 0.92% | 0.89% | ||||||||||||||||||
Net investment income | 0.16% | 0.21% | 0.74%c | 0.23% | 0.53% | 1.06% | ||||||||||||||||||
| Supplemental data | ||||||||||||||||||||||||
Net assets, end of period (000’s) | $13,497 | $13,077 | $10,736 | $9,914 | $6,990 | $4,347 | ||||||||||||||||||
Portfolio turnover rate | 16.29% | 17.45% | 35.56% | 25.55% | 43.30% | 74.50% | ||||||||||||||||||
aThe amount shown for a share outstanding throughout the period may not correlate with the Statement of Operations for the period due to the timing of sales and repurchases of the Fund’s shares in relation to income earned and/or fluctuating fair value of the investments of the Fund.
bBased on average daily shares outstanding.
cNet investment income per share includes approximately $0.06 per share related to income received in the form of special dividends in connection with certain Fund holdings. Excluding this amount, the ratio of net investment income to average net assets would have been 0.28%.
dTotal return is not annualized for periods less than one year.
eRatios are annualized for periods less than one year, except for non-recurring expenses, if any.
fBenefit of expense reduction rounds to less than 0.01%.
| 32 | Semiannual Report | The accompanying notes are an integral part of these financial statements. | franklintempleton.com | ||
FRANKLIN STRATEGIC SERIES
Statement of Investments, October 31, 2017 (unaudited)
Franklin Focused Core Equity Fund
| Country | Shares | Value | ||||||||||||
Common Stocks 99.9% | ||||||||||||||
| Consumer Discretionary 7.1% | ||||||||||||||
| a | Altice NV, A | Netherlands | 195,875 | $ | 3,695,766 | |||||||||
Twenty-First Century Fox Inc., B | United States | 136,110 | 3,464,000 | |||||||||||
|
| |||||||||||||
| 7,159,766 | ||||||||||||||
|
| |||||||||||||
| Consumer Staples 2.1% | ||||||||||||||
CVS Health Corp. | United States | 30,930 | 2,119,633 | |||||||||||
|
| |||||||||||||
| Energy 7.6% | ||||||||||||||
Anadarko Petroleum Corp. | United States | 35,850 | 1,769,915 | |||||||||||
Pioneer Natural Resources Co. | United States | 18,320 | 2,741,954 | |||||||||||
Schlumberger Ltd. | United States | 49,390 | 3,160,960 | |||||||||||
|
| |||||||||||||
| 7,672,829 | ||||||||||||||
|
| |||||||||||||
| Financials 24.7% | ||||||||||||||
| a | Athene Holding Ltd., A | United States | 48,950 | 2,551,764 | ||||||||||
Bank of America Corp. | United States | 103,630 | 2,838,426 | |||||||||||
The Charles Schwab Corp. | United States | 127,660 | 5,724,274 | |||||||||||
JPMorgan Chase & Co. | United States | 40,853 | 4,110,220 | |||||||||||
S&P Global Inc. | United States | 15,750 | 2,464,403 | |||||||||||
SunTrust Banks Inc. | United States | 21,340 | 1,284,881 | |||||||||||
Synchrony Financial | United States | 92,765 | 3,025,994 | |||||||||||
Willis Towers Watson PLC | United States | 18,400 | 2,963,872 | |||||||||||
|
| |||||||||||||
| 24,963,834 | ||||||||||||||
|
| |||||||||||||
| Health Care 9.7% | ||||||||||||||
Aetna Inc. | United States | 19,900 | 3,383,597 | |||||||||||
Allergan PLC | United States | 21,824 | 3,867,868 | |||||||||||
Medtronic PLC | United States | 32,060 | 2,581,471 | |||||||||||
|
| |||||||||||||
| 9,832,936 | ||||||||||||||
|
| |||||||||||||
| Industrials 14.0% | ||||||||||||||
Equifax Inc. | United States | 18,900 | 2,051,217 | |||||||||||
General Dynamics Corp. | United States | 13,550 | 2,750,379 | |||||||||||
General Electric Co. | United States | 67,100 | 1,352,736 | |||||||||||
| a | Genesee & Wyoming Inc. | United States | 70,270 | 5,043,980 | ||||||||||
| a | IHS Markit Ltd. | United States | 69,193 | 2,948,314 | ||||||||||
|
| |||||||||||||
| 14,146,626 | ||||||||||||||
|
| |||||||||||||
| Information Technology 29.1% | ||||||||||||||
| a | Alphabet Inc., A | United States | 3,640 | 3,760,266 | ||||||||||
| a | Alphabet Inc., C | United States | 3,650 | 3,710,736 | ||||||||||
Analog Devices Inc. | United States | 33,600 | 3,067,680 | |||||||||||
| a | Blackhawk Network Holdings Inc. | United States | 47,130 | 1,600,063 | ||||||||||
| a | Facebook Inc., A | United States | 5,500 | 990,330 | ||||||||||
| a | GoDaddy Inc., A | United States | 59,300 | 2,769,310 | ||||||||||
Mastercard Inc., A | United States | 36,970 | 5,500,027 | |||||||||||
Microsoft Corp. | United States | 64,530 | 5,367,605 | |||||||||||
Motorola Solutions Inc. | United States | 5,750 | 520,605 | |||||||||||
Sabre Corp. | United States | 109,770 | 2,147,101 | |||||||||||
|
| |||||||||||||
| 29,433,723 | ||||||||||||||
|
| |||||||||||||
| franklintempleton.com | Semiannual Report | 33 | ||
FRANKLIN STRATEGIC SERIES
STATEMENT OF INVESTMENTS (UNAUDITED)
Franklin Focused Core Equity Fund (continued)
| Country | Shares | Value | ||||||||||||
Common Stocks (continued) | ||||||||||||||
Real Estate 5.6% | ||||||||||||||
a | CBRE Group Inc. | United States | 42,210 | $ | 1,659,697 | |||||||||
Equinix Inc. | United States | 8,651 | 4,009,739 | |||||||||||
|
| |||||||||||||
| 5,669,436 | ||||||||||||||
|
| |||||||||||||
Total Common Stocks (Cost $80,142,967) | 100,998,783 | |||||||||||||
|
| |||||||||||||
Short Term Investments (Cost $183,850) 0.2% | ||||||||||||||
Money Market Funds 0.2% | ||||||||||||||
b,c | Institutional Fiduciary Trust Money Market Portfolio, 0.69% | United States | 183,850 | 183,850 | ||||||||||
|
| |||||||||||||
Total Investments (Cost $80,326,817) 100.1% | 101,182,633 | |||||||||||||
Other Assets, less Liabilities (0.1)% | (145,809 | ) | ||||||||||||
|
| |||||||||||||
Net Assets 100.0% | $ | 101,036,824 | ||||||||||||
|
| |||||||||||||
aNon-income producing.
bSee Note 3(f) regarding investments in affiliated management investment companies.
cThe rate shown is the annualized seven-day yield at period end.
| 34 | Semiannual Report | The accompanying notes are an integral part of these financial statements. | franklintempleton.com | ||
FRANKLIN STRATEGIC SERIES
Financial Highlights
Franklin Growth Opportunities Fund
Six Months Ended October 31, 2017 | Year Ended April 30, | |||||||||||||||||||||||
| (unaudited) | 2017 | 2016 | 2015 | 2014 | 2013 | |||||||||||||||||||
| Class A | ||||||||||||||||||||||||
| Per share operating performance | ||||||||||||||||||||||||
(for a share outstanding throughout the period) | ||||||||||||||||||||||||
Net asset value, beginning of period | $ 34.81 | $30.40 | $33.13 | $28.48 | $24.29 | $23.02 | ||||||||||||||||||
|
| |||||||||||||||||||||||
Income from investment operationsa: | ||||||||||||||||||||||||
Net investment income (loss)b | (0.05) | (0.09) | (0.19) | (0.19) | (0.19) | (0.12) | ||||||||||||||||||
Net realized and unrealized gains (losses) | 4.12 | 5.14 | (1.88) | 5.50 | 5.11 | 1.95 | ||||||||||||||||||
|
| |||||||||||||||||||||||
Total from investment operations | 4.07 | 5.05 | (2.07) | 5.31 | 4.92 | 1.83 | ||||||||||||||||||
|
| |||||||||||||||||||||||
Less distributions from net realized gains | — | (0.64) | (0.66) | (0.66) | (0.73) | (0.56) | ||||||||||||||||||
|
| |||||||||||||||||||||||
Net asset value, end of period | $38.88 | $34.81 | $30.40 | $33.13 | $28.48 | $24.29 | ||||||||||||||||||
|
| |||||||||||||||||||||||
Total returnc | 11.69% | 16.88% | (6.36)% | 18.87% | 20.26% | 8.29% | ||||||||||||||||||
| Ratios to average net assetsd | ||||||||||||||||||||||||
Expenses before waiver and payments by affiliates | 1.07% | 1.05% | 1.11% | 1.18% | 1.17% | 1.25% | ||||||||||||||||||
Expenses net of waiver and payments by affiliates | 1.01%e | 0.97%e | 1.10% | 1.18%f | 1.17%e,f | 1.25% | ||||||||||||||||||
Net investment income (loss) | (0.27)% | (0.30)% | (0.58)% | (0.59)% | (0.70)% | (0.56)% | ||||||||||||||||||
| Supplemental data | ||||||||||||||||||||||||
Net assets, end of period (000’s) | $2,356,734 | $2,272,831 | $548,871 | $457,619 | $349,343 | $213,639 | ||||||||||||||||||
Portfolio turnover rate | 10.71% | 47.75% | 25.56% | 40.64% | 36.64% | 58.76% | ||||||||||||||||||
aThe amount shown for a share outstanding throughout the period may not correlate with the Statement of Operations for the period due to the timing of sales and repurchases of the Fund’s shares in relation to income earned and/or fluctuating fair value of the investments of the Fund.
bBased on average daily shares outstanding.
cTotal return does not reflect sales commissions or contingent deferred sales charges, if applicable, and is not annualized for periods less than one year.
dRatios are annualized for periods less than one year, except for non-recurring expenses, if any.
eBenefit of expense reduction rounds to less than 0.01%.
fBenefit of waiver and payments by affiliates rounds to less than 0.01%.
| franklintempleton.com | The accompanying notes are an integral part of these financial statements. | Semiannual Report | 35 | ||||
FRANKLIN STRATEGIC SERIES
FINANCIAL HIGHLIGHTS
Franklin Growth Opportunities Fund (continued)
Six Months Ended October 31, 2017 | Year Ended April 30, | |||||||||||||||||||||||
| (unaudited) | 2017 | 2016 | 2015 | 2014 | 2013 | |||||||||||||||||||
| Class C | ||||||||||||||||||||||||
Per share operating performance (for a share outstanding throughout the period) | ||||||||||||||||||||||||
Net asset value, beginning of period | $30.12 | $26.59 | $29.27 | $25.41 | $21.89 | $20.95 | ||||||||||||||||||
|
| |||||||||||||||||||||||
Income from investment operationsa: | ||||||||||||||||||||||||
Net investment income (loss)b | (0.17 | ) | (0.29 | ) | (0.37 | ) | (0.36 | ) | (0.35 | ) | (0.26 | ) | ||||||||||||
Net realized and unrealized gains (losses) | 3.57 | 4.46 | (1.65 | ) | 4.88 | 4.60 | 1.76 | |||||||||||||||||
|
| |||||||||||||||||||||||
Total from investment operations | 3.40 | 4.17 | (2.02) | 4.52 | 4.25 | 1.50 | ||||||||||||||||||
|
| |||||||||||||||||||||||
Less distributions from net realized gains | — | (0.64) | (0.66) | (0.66) | (0.73) | (0.56) | ||||||||||||||||||
|
| |||||||||||||||||||||||
Net asset value, end of period | $33.52 | $30.12 | $26.59 | $29.27 | $25.41 | $21.89 | ||||||||||||||||||
|
| |||||||||||||||||||||||
Total returnc | 11.29% | 15.98% | (7.03)% | 18.04% | 19.42% | 7.47% | ||||||||||||||||||
| Ratios to average net assetsd | ||||||||||||||||||||||||
Expenses before waiver and payments by affiliates | 1.82% | 1.80% | 1.85% | 1.88% | 1.87% | 1.97% | ||||||||||||||||||
Expenses net of waiver and payments by affiliates | 1.76%e | 1.72%e | 1.84% | 1.88%f | 1.87%e,f | 1.97% | ||||||||||||||||||
Net investment income (loss) | (1.02)% | (1.05)% | (1.32)% | (1.29)% | (1.40)% | (1.28)% | ||||||||||||||||||
| Supplemental data | ||||||||||||||||||||||||
Net assets, end of period (000’s) | $396,390 | $390,123 | $137,882 | $110,513 | $85,883 | $51,719 | ||||||||||||||||||
Portfolio turnover rate | 10.71% | 47.75% | 25.56% | 40.64% | 36.64% | 58.76% | ||||||||||||||||||
aThe amount shown for a share outstanding throughout the period may not correlate with the Statement of Operations for the period due to the timing of sales and repurchases of the Fund’s shares in relation to income earned and/or fluctuating fair value of the investments of the Fund.
bBased on average daily shares outstanding.
cTotal return does not reflect sales commissions or contingent deferred sales charges, if applicable, and is not annualized for periods less than one year.
dRatios are annualized for periods less than one year, except for non-recurring expenses, if any.
eBenefit of expense reduction rounds to less than 0.01%.
fBenefit of waiver and payments by affiliates rounds to less than 0.01%.
| 36 | Semiannual Report | The accompanying notes are an integral part of these financial statements. | franklintempleton.com | ||
FRANKLIN STRATEGIC SERIES
FINANCIAL HIGHLIGHTS
Franklin Growth Opportunities Fund (continued)
Six Months Ended October 31, 2017 | Year Ended April 30, | |||||||||||||||||||||||
| (unaudited) | 2017 | 2016 | 2015 | 2014 | 2013 | |||||||||||||||||||
| Class R | ||||||||||||||||||||||||
Per share operating performance (for a share outstanding throughout the period) | ||||||||||||||||||||||||
Net asset value, beginning of period | $33.52 | $29.37 | $32.10 | $27.67 | $23.67 | $22.49 | ||||||||||||||||||
|
| |||||||||||||||||||||||
Income from investment operationsa: | ||||||||||||||||||||||||
Net investment income (loss)b | (0.09) | (0.17) | (0.26) | (0.24) | (0.24) | (0.17) | ||||||||||||||||||
Net realized and unrealized gains (losses) | 3.97 | 4.96 | (1.81) | 5.33 | 4.97 | 1.91 | ||||||||||||||||||
|
| |||||||||||||||||||||||
Total from investment operations | 3.88 | 4.79 | (2.07) | 5.09 | 4.73 | 1.74 | ||||||||||||||||||
|
| |||||||||||||||||||||||
Less distributions from net realized gains | — | (0.64) | (0.66) | (0.66) | (0.73) | (0.56) | ||||||||||||||||||
|
| |||||||||||||||||||||||
Net asset value, end of period | $37.40 | $33.52 | $29.37 | $32.10 | $27.67 | $23.67 | ||||||||||||||||||
|
| |||||||||||||||||||||||
Total returnc | 11.58% | 16.62% | (6.60)% | 18.63% | 19.99% | 8.03% | ||||||||||||||||||
| Ratios to average net assetsd | ||||||||||||||||||||||||
Expenses before waiver and payments by affiliates | 1.32% | 1.30% | 1.35% | 1.38% | 1.37% | 1.47% | ||||||||||||||||||
Expenses net of waiver and payments by affiliates | 1.26%e | 1.22%e | 1.34% | 1.38%f | 1.37%e,f | 1.47% | ||||||||||||||||||
Net investment income (loss) | (0.52)% | (0.55)% | (0.82)% | (0.79)% | (0.90)% | (0.78)% | ||||||||||||||||||
| Supplemental data | ||||||||||||||||||||||||
Net assets, end of period (000’s) | $46,762 | $50,429 | $39,786 | $48,266 | $42,953 | $34,399 | ||||||||||||||||||
Portfolio turnover rate | 10.71% | 47.75% | 25.56% | 40.64% | 36.64% | 58.76% | ||||||||||||||||||
aThe amount shown for a share outstanding throughout the period may not correlate with the Statement of Operations for the period due to the timing of sales and repurchases of the Fund’s shares in relation to income earned and/or fluctuating fair value of the investments of the Fund.
bBased on average daily shares outstanding.
cTotal return is not annualized for periods less than one year.
dRatios are annualized for periods less than one year, except for non-recurring expenses, if any.
eBenefit of expense reduction rounds to less than 0.01%.
fBenefit of waiver and payments by affiliates rounds to less than 0.01%.
| franklintempleton.com | The accompanying notes are an integral part of these financial statements. | Semiannual Report | 37 | ||||
FRANKLIN STRATEGIC SERIES
FINANCIAL HIGHLIGHTS
Franklin Growth Opportunities Fund (continued)
Six Months Ended October 31, 2017 | Year Ended April 30, | |||||||||||||||||||
| (unaudited) | 2017 | 2016 | 2015 | 2014a | ||||||||||||||||
| Class R6 | ||||||||||||||||||||
Per share operating performance (for a share outstanding throughout the period) | ||||||||||||||||||||
Net asset value, beginning of period | $37.30 | $32.39 | $35.09 | $29.98 | $24.99 | |||||||||||||||
|
| |||||||||||||||||||
Income from investment operationsb: | ||||||||||||||||||||
Net investment income (loss)c | 0.05 | 0.05 | (0.05) | (0.03) | (0.07) | |||||||||||||||
Net realized and unrealized gains (losses) | 4.43 | 5.50 | (1.99) | 5.80 | 5.79 | |||||||||||||||
|
| |||||||||||||||||||
Total from investment operations. | 4.48 | 5.55 | (2.04) | 5.77 | 5.72 | |||||||||||||||
|
| |||||||||||||||||||
Less distributions from net realized gains | — | (0.64) | (0.66) | (0.66) | (0.73) | |||||||||||||||
|
| |||||||||||||||||||
Net asset value, end of period. | $41.78 | $37.30 | $32.39 | $35.09 | $29.98 | |||||||||||||||
|
| |||||||||||||||||||
Total returnd | 12.01% | 17.42% | (5.94)% | 19.47% | 22.90% | |||||||||||||||
| Ratios to average net assetse | ||||||||||||||||||||
Expenses before waiver and payments by affiliates | 0.57% | 0.59% | 0.67% | 0.68% | 0.71% | |||||||||||||||
Expenses net of waiver and payments by affiliates | 0.51%f | 0.51%f | 0.66% | 0.68%g | 0.71%f,g | |||||||||||||||
Net investment income (loss) | 0.23% | 0.16% | (0.14)% | (0.09)% | (0.24)% | |||||||||||||||
| Supplemental data | ||||||||||||||||||||
Net assets, end of period (000’s) | $353,808 | $291,825 | $235,620 | $246,911 | $180,843 | |||||||||||||||
Portfolio turnover rate | 10.71% | 47.75% | 25.56% | 40.64% | 36.64% | |||||||||||||||
aFor the year May 1, 2013 (effective date) to April 30, 2014.
bThe amount shown for a share outstanding throughout the period may not correlate with the Statement of Operations for the period due to the timing of sales and repurchases of the Fund’s shares in relation to income earned and/or fluctuating fair value of the investments of the Fund.
cBased on average daily shares outstanding.
dTotal return is not annualized for periods less than one year.
eRatios are annualized for periods less than one year, except for non-recurring expenses, if any.
fBenefit of expense reduction rounds to less than 0.01%.
gBenefit of waiver and payments by affiliates rounds to less than 0.01%.
| 38 | Semiannual Report | The accompanying notes are an integral part of these financial statements. | franklintempleton.com | ||
FRANKLIN STRATEGIC SERIES
FINANCIAL HIGHLIGHTS
Franklin Growth Opportunities Fund (continued)
Six Months Ended October 31, 2017 | Year Ended April 30, | |||||||||||||||||||||||
| (unaudited) | 2017 | 2016 | 2015 | 2014 | 2013 | |||||||||||||||||||
| Advisor Class | ||||||||||||||||||||||||
| Per share operating performance | ||||||||||||||||||||||||
(for a share outstanding throughout the period) | ||||||||||||||||||||||||
Net asset value, beginning of period | $37.02 | $32.20 | $34.96 | $29.93 | $25.43 | $23.99 | ||||||||||||||||||
|
| |||||||||||||||||||||||
Income from investment operationsa: | ||||||||||||||||||||||||
Net investment income (loss)b | (0.01) | (0.02) | (0.11) | (0.10) | (0.13) | (0.06) | ||||||||||||||||||
Net realized and unrealized gains (losses) | 4.39 | 5.48 | (1.99) | 5.79 | 5.36 | 2.06 | ||||||||||||||||||
|
| |||||||||||||||||||||||
Total from investment operations | 4.38 | 5.46 | (2.10) | 5.69 | 5.23 | 2.00 | ||||||||||||||||||
|
| |||||||||||||||||||||||
Less distributions from net realized gains | — | (0.64) | (0.66) | (0.66) | (0.73) | (0.56) | ||||||||||||||||||
|
| |||||||||||||||||||||||
Net asset value, end of period | $41.40 | $37.02 | $32.20 | $34.96 | $29.93 | $25.43 | ||||||||||||||||||
|
| |||||||||||||||||||||||
Total returnc | 11.83% | 17.21% | (6.11)% | 19.23% | 20.58% | 8.62% | ||||||||||||||||||
| Ratios to average net assetsd | ||||||||||||||||||||||||
Expenses before waiver and payments by affiliates | 0.82% | 0.80% | 0.85% | 0.88% | 0.87% | 0.97% | ||||||||||||||||||
Expenses net of waiver and payments by affiliates | 0.76% | e | 0.72% | e | 0.84% | 0.88% | f | 0.87% | e,f | 0.97% | ||||||||||||||
Net investment income (loss) | (0.02)% | (0.05)% | (0.32)% | (0.29)% | (0.40)% | (0.28)% | ||||||||||||||||||
| Supplemental data | ||||||||||||||||||||||||
Net assets, end of period (000’s) | $559,283 | $537,193 | $256,377 | $269,887 | $224,469 | $182,954 | ||||||||||||||||||
Portfolio turnover rate | 10.71% | 47.75% | 25.56% | 40.64% | 36.64% | 58.76% | ||||||||||||||||||
aThe amount shown for a share outstanding throughout the period may not correlate with the Statement of Operations for the period due to the timing of sales and repurchases of the Fund’s shares in relation to income earned and/or fluctuating fair value of the investments of the Fund.
bBased on average daily shares outstanding.
cTotal return is not annualized for periods less than one year.
dRatios are annualized for periods less than one year, except for non-recurring expenses, if any.
eBenefit of expense reduction rounds to less than 0.01%.
fBenefit of waiver and payments by affiliates rounds to less than 0.01%.
| franklintempleton.com | The accompanying notes are an integral part of these financial statements. | Semiannual Report | 39 | ||||
FRANKLIN STRATEGIC SERIES
Statement of Investments, October 31, 2017 (unaudited)
Franklin Growth Opportunities Fund
| Country | Shares | Value | ||||||||||||
Common Stocks 99.7% | ||||||||||||||
| Consumer Discretionary 12.3% | ||||||||||||||
a | Amazon.com Inc. | United States | 204,170 | $ | 225,665,017 | |||||||||
a | Charter Communications Inc., A | United States | 158,077 | 52,824,591 | ||||||||||
Comcast Corp., A | United States | 1,016,904 | 36,639,051 | |||||||||||
Delphi Automotive PLC | United States | 80,705 | 8,020,463 | |||||||||||
Las Vegas Sands Corp. | United States | 602,866 | 38,209,647 | |||||||||||
a | The Priceline Group Inc. | United States | 26,505 | 50,676,500 | ||||||||||
Starbucks Corp. | United States | 393,070 | 21,555,959 | |||||||||||
The Walt Disney Co. | United States | 236,269 | 23,109,471 | |||||||||||
|
| |||||||||||||
| 456,700,699 | ||||||||||||||
|
| |||||||||||||
| Consumer Staples 3.9% | ||||||||||||||
Constellation Brands Inc., A | United States | 271,085 | 59,392,013 | |||||||||||
a | Hostess Brands Inc., A | United States | 632,891 | 7,297,233 | ||||||||||
a | Monster Beverage Corp. | United States | 791,289 | 45,839,372 | ||||||||||
Pinnacle Foods Inc. | United States | 580,302 | 31,580,035 | |||||||||||
|
| |||||||||||||
| 144,108,653 | ||||||||||||||
|
| |||||||||||||
| Energy 1.6% | ||||||||||||||
Anadarko Petroleum Corp. | United States | 574,781 | 28,376,938 | |||||||||||
a | Diamondback Energy Inc. | United States | 113,534 | 12,166,304 | ||||||||||
Halliburton Co. | United States | 438,310 | 18,733,369 | |||||||||||
|
| |||||||||||||
| 59,276,611 | ||||||||||||||
|
| |||||||||||||
| Financials 6.6% | ||||||||||||||
a | Athene Holding Ltd., A | United States | 738,554 | 38,500,820 | ||||||||||
The Charles Schwab Corp. | United States | 1,233,025 | 55,288,841 | |||||||||||
Intercontinental Exchange Inc. | United States | 437,687 | 28,931,111 | |||||||||||
MarketAxess Holdings Inc. | United States | 225,350 | 39,210,900 | |||||||||||
S&P Global Inc. | United States | 196,455 | 30,739,314 | |||||||||||
a | Signature Bank | United States | 142,199 | 18,487,292 | ||||||||||
a | SVB Financial Group | United States | 161,783 | 35,475,776 | ||||||||||
|
| |||||||||||||
| 246,634,054 | ||||||||||||||
|
| |||||||||||||
| Health Care 10.9% | ||||||||||||||
a | ABIOMED Inc. | United States | 110,473 | 21,312,451 | ||||||||||
Allergan PLC | United States | 82,174 | 14,563,698 | |||||||||||
a | Biogen Inc. | United States | 69,412 | 21,632,944 | ||||||||||
Bristol-Myers Squibb Co. | United States | 761,821 | 46,973,883 | |||||||||||
a | Celgene Corp. | United States | 596,033 | 60,181,452 | ||||||||||
a | Clovis Oncology Inc. | United States | 245,438 | 18,498,662 | ||||||||||
a | Edwards Lifesciences Corp. | United States | 380,596 | 38,908,329 | ||||||||||
a | Heron Therapeutics Inc. | United States | 1,072,964 | 16,469,997 | ||||||||||
a | Incyte Corp. | United States | 322,377 | 36,509,195 | ||||||||||
Medtronic PLC | United States | 220,100 | 17,722,452 | |||||||||||
a | Nevro Corp. | United States | 248,308 | 21,746,815 | ||||||||||
a | Revance Therapeutics Inc. | United States | 242,812 | 6,313,112 | ||||||||||
UnitedHealth Group Inc. | United States | 397,500 | 83,562,450 | |||||||||||
|
| |||||||||||||
| 404,395,440 | ||||||||||||||
|
| |||||||||||||
| Industrials 6.6% | ||||||||||||||
Allegiant Travel Co. | United States | 45,773 | 6,243,437 | |||||||||||
a | Azul SA, ADR | Brazil | 400,900 | 10,138,761 | ||||||||||
General Electric Co. | United States | 745,988 | 15,039,118 | |||||||||||
Honeywell International Inc. | United States | 282,542 | 40,731,255 | |||||||||||
a | IHS Markit Ltd. | United States | 924,631 | 39,398,527 | ||||||||||
| 40 | Semiannual Report | franklintempleton.com | ||
FRANKLIN STRATEGIC SERIES
STATEMENT OF INVESTMENTS (UNAUDITED)
Franklin Growth Opportunities Fund (continued)
| Country | Shares | Value | ||||||||||||
Common Stocks (continued) | ||||||||||||||
| Industrials (continued) | ||||||||||||||
Raytheon Co. | United States | 337,915 | $ | 60,892,283 | ||||||||||
Rockwell Automation Inc. | United States | 113,124 | 22,717,562 | |||||||||||
Roper Technologies Inc. | United States | 99,758 | 25,754,523 | |||||||||||
a | Univar Inc. | United States | 812,994 | 24,186,571 | ||||||||||
|
| |||||||||||||
| 245,102,037 | ||||||||||||||
|
| |||||||||||||
| Information Technology 49.8% | ||||||||||||||
a | Adobe Systems Inc. | United States | 483,345 | 84,662,710 | ||||||||||
a | Alibaba Group Holding Ltd., ADR | China | 101,628 | 18,790,001 | ||||||||||
a | Alphabet Inc., C | United States | 145,139 | 147,554,113 | ||||||||||
Analog Devices Inc. | United States | 310,630 | 28,360,519 | |||||||||||
Apple Inc. | United States | 1,248,186 | 210,993,362 | |||||||||||
Applied Materials Inc. | United States | 791,683 | 44,674,672 | |||||||||||
a | Autodesk Inc. | United States | 494,868 | 61,838,705 | ||||||||||
Broadcom Ltd. | United States | 335,201 | 88,462,896 | |||||||||||
a | CoStar Group Inc. | United States | 141,904 | 41,968,108 | ||||||||||
a | Electronic Arts Inc. | United States | 280,936 | 33,599,946 | ||||||||||
a | Facebook Inc., A | United States | 1,164,741 | 209,723,265 | ||||||||||
a | Fiserv Inc. | United States | 247,117 | 31,984,353 | ||||||||||
a | InterXion Holding NV | Netherlands | 535,277 | 28,578,439 | ||||||||||
KLA-Tencor Corp. | United States | 175,778 | 19,140,466 | |||||||||||
Mastercard Inc., A | United States | 1,174,305 | 174,701,355 | |||||||||||
Microsoft Corp. | United States | 1,700,250 | 141,426,795 | |||||||||||
Monolithic Power Systems | United States | 184,899 | 22,496,661 | |||||||||||
NVIDIA Corp. | United States | 319,803 | 66,138,458 | |||||||||||
a | Palo Alto Networks Inc. | United States | 139,845 | 20,585,184 | ||||||||||
a | PayPal Holdings Inc. | United States | 281,628 | 20,434,928 | ||||||||||
a | Q2 Holdings Inc. | United States | 226,885 | 9,653,957 | ||||||||||
a | Salesforce.com Inc. | United States | 569,618 | 58,294,706 | ||||||||||
a,b | Sea Ltd., ADR | Singapore | 195,700 | 2,951,156 | ||||||||||
a | ServiceNow Inc. | United States | 563,952 | 71,266,614 | ||||||||||
a | Tyler Technologies Inc. | United States | 114,597 | 20,316,902 | ||||||||||
Visa Inc., A | United States | 1,273,628 | 140,073,608 | |||||||||||
Xilinx Inc. | United States | 441,225 | 32,513,870 | |||||||||||
a | Zendesk Inc. | United States | 604,286 | 18,732,866 | ||||||||||
|
| |||||||||||||
| 1,849,918,615 | ||||||||||||||
|
| |||||||||||||
| Materials 2.2% | ||||||||||||||
Albemarle Corp. | United States | 138,377 | 19,495,936 | |||||||||||
a | Axalta Coating Systems Ltd. | United States | 413,701 | 13,755,558 | ||||||||||
Ecolab Inc. | United States | 177,726 | 23,221,679 | |||||||||||
a | Ingevity Corp. | United States | 376,584 | 26,824,078 | ||||||||||
|
| |||||||||||||
| 83,297,251 | ||||||||||||||
|
| |||||||||||||
| Real Estate 5.3% | ||||||||||||||
American Tower Corp. | United States | 387,587 | 55,684,624 | |||||||||||
Equinix Inc. | United States | 111,661 | 51,754,874 | |||||||||||
a | SBA Communications Corp., A | United States | 559,919 | 88,008,068 | ||||||||||
|
| |||||||||||||
| 195,447,566 | ||||||||||||||
|
| |||||||||||||
| Telecommunication Services 0.5% | ||||||||||||||
a | T-Mobile U.S. Inc. | United States | 296,083 | 17,696,881 | ||||||||||
|
| |||||||||||||
Total Common Stocks (Cost $1,973,867,027) | 3,702,577,807 | |||||||||||||
|
| |||||||||||||
| franklintempleton.com | Semiannual Report | 41 | ||||
FRANKLIN STRATEGIC SERIES
STATEMENT OF INVESTMENTS (UNAUDITED)
Franklin Growth Opportunities Fund (continued)
| Country | Shares | Value | ||||||||||||
Preferred Stocks 0.5% | ||||||||||||||
| Consumer Discretionary 0.4% | ||||||||||||||
a,c,d | Proterra Inc., pfd., 5, 144A. | United States | 2,362,202 | $ | 13,086,268 | |||||||||
a,c,d | Proterra Inc., pfd., 6 | United States | 596,775 | 3,306,050 | ||||||||||
|
| |||||||||||||
| 16,392,318 | ||||||||||||||
|
| |||||||||||||
| Information Technology 0.1% | ||||||||||||||
a,c,d | Tanium Inc., pfd., G | United States | 805,800 | 4,000,233 | ||||||||||
|
| |||||||||||||
Total Preferred Stocks (Cost $19,202,901) | 20,392,551 | |||||||||||||
|
| |||||||||||||
Total Investments before Short Term Investments | 3,722,970,358 | |||||||||||||
|
| |||||||||||||
Short Term Investments 0.1% | ||||||||||||||
Money Market Funds (Cost $10,605) 0.0%† | ||||||||||||||
e,f | Institutional Fiduciary Trust Money Market Portfolio, 0.69% | United States | 10,605 | 10,605 | ||||||||||
|
| |||||||||||||
g | Investments from Cash Collateral Received for Loaned Securities | |||||||||||||
| Money Market Funds 0.1% | ||||||||||||||
e,f | Institutional Fiduciary Trust Money Market Portfolio, 0.69% | United States | 2,682,500 | 2,682,500 | ||||||||||
|
| |||||||||||||
Total Investments (Cost $1,995,763,033) 100.3% | 3,725,663,463 | |||||||||||||
Other Assets, less Liabilities (0.3)% | (12,686,100 | ) | ||||||||||||
|
| |||||||||||||
Net Assets 100.0% | $ | 3,712,977,363 | ||||||||||||
|
| |||||||||||||
See Abbreviations on page 81.
†Rounds to less than 0.1% of net assets.
aNon-income producing.
bA portion or all of the security is on loan at October 31, 2017. See Note 1(d).
cFair valued using significant unobservable inputs. See Note 11 regarding fair value measurements.
dSee Note 7 regarding restricted securities.
eSee Note 3(f) regarding investments in affiliated management investment companies.
fThe rate shown is the annualized seven-day yield at period end.
gSee Note 1(d) regarding securities on loan.
| 42 | Semiannual Report | The accompanying notes are an integral part of these financial statements. | franklintempleton.com | ||
FRANKLIN STRATEGIC SERIES
Financial Highlights
Franklin Small Cap Growth Fund
| Six Months Ended October 31, 2017 | Year Ended April 30, | |||||||||||||||||||||||
| (unaudited) | 2017 | 2016 | 2015 | 2014 | 2013 | |||||||||||||||||||
| Class A | ||||||||||||||||||||||||
| Per share operating performance | ||||||||||||||||||||||||
(for a share outstanding throughout the period) | ||||||||||||||||||||||||
Net asset value, beginning of period | $19.60 | $16.37 | $18.83 | $18.20 | $14.26 | $12.84 | ||||||||||||||||||
|
| |||||||||||||||||||||||
Income from investment operationsa: | ||||||||||||||||||||||||
Net investment income (loss)b | (0.07 | ) | (0.11 | ) | (0.08 | ) | (0.12 | ) | (0.15 | ) | (0.09 | ) | ||||||||||||
Net realized and unrealized gains (losses) | 1.74 | 3.34 | (2.03 | ) | 1.57 | 4.75 | 1.87 | |||||||||||||||||
|
| |||||||||||||||||||||||
Total from investment operations | 1.67 | 3.23 | (2.11 | ) | 1.45 | 4.60 | 1.78 | |||||||||||||||||
|
| |||||||||||||||||||||||
Less distributions from net realized gains | — | — | (0.35 | ) | (0.82 | ) | (0.66 | ) | (0.36 | ) | ||||||||||||||
|
| |||||||||||||||||||||||
Net asset value, end of period | $21.27 | $19.60 | $16.37 | $18.83 | $18.20 | $14.26 | ||||||||||||||||||
|
| |||||||||||||||||||||||
Total returnc | 8.52% | 19.73% | (11.28)% | 8.34% | 32.40% | 14.35% | ||||||||||||||||||
| Ratios to average net assetsd | ||||||||||||||||||||||||
Expenses before waiver and payments by affiliates | 1.13% | 1.10% | 1.13% | 1.16% | 1.20% | 1.33% | ||||||||||||||||||
Expenses net of waiver and payments by affiliates | 1.11% | e | 1.08% | e | 1.11% | e | 1.16% | f | 1.20% | f | 1.33% | |||||||||||||
Net investment income (loss) | (0.69)% | (0.61)% | (0.44)% | (0.66)% | (0.85)% | (0.68)% | ||||||||||||||||||
| Supplemental data | ||||||||||||||||||||||||
Net assets, end of period (000’s) | $683,307 | $719,752 | $792,072 | $1,164,218 | $851,317 | $327,882 | ||||||||||||||||||
Portfolio turnover rate | 13.97% | 29.93% | 43.99% | 30.15% | 40.35% | 41.02% | ||||||||||||||||||
aThe amount shown for a share outstanding throughout the period may not correlate with the Statement of Operations for the period due to the timing of sales and repurchases of the Fund’s shares in relation to income earned and/or fluctuating fair value of the investments of the Fund.
bBased on average daily shares outstanding.
cTotal return does not reflect sales commissions or contingent deferred sales charges, if applicable, and is not annualized for periods less than one year.
dRatios are annualized for periods less than one year, except for non-recurring expenses, if any.
eBenefit of expense reduction rounds to less than 0.01%.
fBenefit of waiver and payments by affiliates and expense reduction rounds to less than 0.01%.
| franklintempleton.com | The accompanying notes are an integral part of these financial statements. | Semiannual Report | 43 | ||||
FRANKLIN STRATEGIC SERIES
FINANCIAL HIGHLIGHTS
Franklin Small Cap Growth Fund (continued)
| Six Months Ended October 31, 2017 | Year Ended April 30, | |||||||||||||||||||||||
| (unaudited) | 2017 | 2016 | 2015 | 2014 | 2013 | |||||||||||||||||||
| Class C | ||||||||||||||||||||||||
| Per share operating performance | ||||||||||||||||||||||||
(for a share outstanding throughout the period) | ||||||||||||||||||||||||
Net asset value, beginning of period | $16.71 | $14.07 | $16.36 | $16.03 | $12.70 | $11.57 | ||||||||||||||||||
|
| |||||||||||||||||||||||
Income from investment operationsa: | ||||||||||||||||||||||||
Net investment income (loss)b | (0.12 | ) | (0.21 | ) | (0.18 | ) | (0.22 | ) | (0.24 | ) | (0.16 | ) | ||||||||||||
Net realized and unrealized gains (losses) | 1.48 | 2.85 | (1.76 | ) | 1.37 | 4.23 | 1.65 | |||||||||||||||||
|
| |||||||||||||||||||||||
Total from investment operations | 1.36 | 2.64 | (1.94 | ) | 1.15 | 3.99 | 1.49 | |||||||||||||||||
|
| |||||||||||||||||||||||
Less distributions from net realized gains | — | — | (0.35 | ) | (0.82 | ) | (0.66 | ) | (0.36 | ) | ||||||||||||||
|
| |||||||||||||||||||||||
Net asset value, end of period | $18.07 | $16.71 | $14.07 | $16.36 | $16.03 | $12.70 | ||||||||||||||||||
|
| |||||||||||||||||||||||
Total returnc | 8.14% | 18.76% | (11.95)% | 7.58% | 31.57% | 13.41% | ||||||||||||||||||
| Ratios to average net assetsd | ||||||||||||||||||||||||
Expenses before waiver and payments by affiliates | 1.88% | 1.85% | 1.88% | 1.87% | 1.90% | 2.03% | ||||||||||||||||||
Expenses net of waiver and payments by affiliates | 1.86% | e | 1.83% | e | 1.86% | e | 1.87% | f | 1.90% | f | 2.03% | |||||||||||||
Net investment income (loss) | (1.44)% | (1.36)% | (1.19)% | (1.37)% | (1.55)% | (1.38)% | ||||||||||||||||||
| Supplemental data | ||||||||||||||||||||||||
Net assets, end of period (000’s) | $132,005 | $142,539 | $157,175 | $225,105 | $187,271 | $77,644 | ||||||||||||||||||
Portfolio turnover rate | 13.97% | 29.93% | 43.99% | 30.15% | 40.35% | 41.02% | ||||||||||||||||||
aThe amount shown for a share outstanding throughout the period may not correlate with the Statement of Operations for the period due to the timing of sales and repurchases of the Fund’s shares in relation to income earned and/or fluctuating fair value of the investments of the Fund.
bBased on average daily shares outstanding.
cTotal return does not reflect sales commissions or contingent deferred sales charges, if applicable, and is not annualized for periods less than one year.
dRatios are annualized for periods less than one year, except for non-recurring expenses, if any.
eBenefit of expense reduction rounds to less than 0.01%.
fBenefit of waiver and payments by affiliates and expense reduction rounds to less than 0.01%.
| 44 | Semiannual Report | The accompanying notes are an integral part of these financial statements. | franklintempleton.com | ||
FRANKLIN STRATEGIC SERIES
FINANCIAL HIGHLIGHTS
Franklin Small Cap Growth Fund (continued)
| Six Months Ended October 31, 2017 | Year Ended April 30, | |||||||||||||||||||||||
| (unaudited) | 2017 | 2016 | 2015 | 2014 | 2013 | |||||||||||||||||||
| Class R | ||||||||||||||||||||||||
| Per share operating performance | ||||||||||||||||||||||||
(for a share outstanding throughout the period) | ||||||||||||||||||||||||
Net asset value, beginning of period | $18.74 | $15.70 | $18.11 | $17.57 | $13.81 | $12.48 | ||||||||||||||||||
|
| |||||||||||||||||||||||
Income from investment operationsa: | ||||||||||||||||||||||||
Net investment income (loss)b | (0.09 | ) | (0.15 | ) | (0.12 | ) | (0.16 | ) | (0.18 | ) | (0.11 | ) | ||||||||||||
Net realized and unrealized gains (losses) | 1.66 | 3.19 | (1.94 | ) | 1.52 | 4.60 | 1.80 | |||||||||||||||||
|
| |||||||||||||||||||||||
Total from investment operations | 1.57 | 3.04 | (2.06 | ) | 1.36 | 4.42 | 1.69 | |||||||||||||||||
|
| |||||||||||||||||||||||
Less distributions from net realized gains | — | — | (0.35 | ) | (0.82 | ) | (0.66 | ) | (0.36 | ) | ||||||||||||||
|
| |||||||||||||||||||||||
Net asset value, end of period | $20.31 | $18.74 | $15.70 | $18.11 | $17.57 | $13.81 | ||||||||||||||||||
|
| |||||||||||||||||||||||
Total returnc | 8.38% | 19.36% | (11.46)% | 8.12% | 32.15% | 14.04% | ||||||||||||||||||
| Ratios to average net assetsd | ||||||||||||||||||||||||
Expenses before waiver and payments by affiliates | 1.38% | 1.35% | 1.38% | 1.37% | 1.40% | 1.53% | ||||||||||||||||||
Expenses net of waiver and payments by affiliates | 1.36% | e | 1.33% | e | 1.36% | e | 1.37% | f | 1.40% | f | 1.53% | |||||||||||||
Net investment income (loss) | (0.94)% | (0.86)% | (0.69)% | (0.87)% | (1.05)% | (0.88)% | ||||||||||||||||||
| Supplemental data | ||||||||||||||||||||||||
Net assets, end of period (000’s) | $74,697 | $79,995 | $79,929 | $92,455 | $51,190 | $15,783 | ||||||||||||||||||
Portfolio turnover rate | 13.97% | 29.93% | 43.99% | 30.15% | 40.35% | 41.02% | ||||||||||||||||||
aThe amount shown for a share outstanding throughout the period may not correlate with the Statement of Operations for the period due to the timing of sales and repurchases of the Fund’s shares in relation to income earned and/or fluctuating fair value of the investments of the Fund.
bBased on average daily shares outstanding.
cTotal return is not annualized for periods less than one year.
dRatios are annualized for periods less than one year, except for non-recurring expenses, if any.
eBenefit of expense reduction rounds to less than 0.01%.
fBenefit of waiver and payments by affiliates and expense reduction rounds to less than 0.01%.
| franklintempleton.com | The accompanying notes are an integral part of these financial statements. | Semiannual Report | 45 | ||||
FRANKLIN STRATEGIC SERIES
FINANCIAL HIGHLIGHTS
Franklin Small Cap Growth Fund (continued)
| Six Months Ended October 31, 2017 | Year Ended April 30, | |||||||||||||||||||
| (unaudited) | 2017 | 2016 | 2015 | 2014a | ||||||||||||||||
| Class R6 | ||||||||||||||||||||
| Per share operating performance | ||||||||||||||||||||
(for a share outstanding throughout the period) | ||||||||||||||||||||
Net asset value, beginning of period | $21.06 | $17.52 | $20.02 | $19.21 | $14.64 | |||||||||||||||
|
| |||||||||||||||||||
Income from investment operationsb: | ||||||||||||||||||||
Net investment income (loss)c | (0.02 | ) | (0.03 | ) | 0.01 | (0.03 | ) | (0.06 | ) | |||||||||||
Net realized and unrealized gains (losses) | 1.88 | 3.57 | (2.16 | ) | 1.66 | 5.29 | ||||||||||||||
|
| |||||||||||||||||||
Total from investment operations. | 1.86 | 3.54 | (2.15 | ) | 1.63 | 5.23 | ||||||||||||||
|
| |||||||||||||||||||
Less distributions from net realized gains | — | — | (0.35 | ) | (0.82 | ) | (0.66 | ) | ||||||||||||
|
| |||||||||||||||||||
Net asset value, end of period. | $22.92 | $21.06 | $17.52 | $20.02 | $19.21 | |||||||||||||||
|
| |||||||||||||||||||
Total returnd | 8.83% | 20.21% | (10.81)% | 8.91% | 35.80% | |||||||||||||||
| Ratios to average net assetse | ||||||||||||||||||||
Expenses before waiver and payments by affiliates | 0.64% | 0.63% | 0.63% | 0.66% | 0.72% | |||||||||||||||
Expenses net of waiver and payments by affiliates | 0.62% | f | 0.61% | f | 0.61% | f | 0.66% | g | 0.72% | g | ||||||||||
Net investment income (loss) | (0.20)% | (0.14)% | 0.06% | (0.16)% | (0.37)% | |||||||||||||||
| Supplemental data | ||||||||||||||||||||
Net assets, end of period (000’s) | $915,732 | $858,972 | $846,724 | $844,293 | $87,777 | |||||||||||||||
Portfolio turnover rate | 13.97% | 29.93% | 43.99% | 30.15% | 40.35% | |||||||||||||||
aFor the year May 1, 2013 (effective date) to April 30, 2014
bThe amount shown for a share outstanding throughout the period may not correlate with the Statement of Operations for the period due to the timing of sales and repurchases of the Fund’s shares in relation to income earned and/or fluctuating fair value of the investments of the Fund.
cBased on average daily shares outstanding.
dTotal return is not annualized for periods less than one year.
eRatios are annualized for periods less than one year, except for non-recurring expenses, if any.
fBenefit of expense reduction rounds to less than 0.01%.
gBenefit of waiver and payments by affiliates and expense reduction rounds to less than 0.01%.
| 46 | Semiannual Report | The accompanying notes are an integral part of these financial statements. | franklintempleton.com | ||
FRANKLIN STRATEGIC SERIES
FINANCIAL HIGHLIGHTS
Franklin Small Cap Growth Fund (continued)
| Six Months Ended October 31, 2017 | Year Ended April 30, | |||||||||||||||||||||||
| (unaudited) | 2017 | 2016 | 2015 | 2014 | 2013 | |||||||||||||||||||
| Advisor Class | ||||||||||||||||||||||||
| Per share operating performance | ||||||||||||||||||||||||
(for a share outstanding throughout the period) | ||||||||||||||||||||||||
Net asset value, beginning of period | $20.88 | $17.41 | $19.94 | $19.17 | $14.94 | $13.41 | ||||||||||||||||||
|
| |||||||||||||||||||||||
Income from investment operationsa: | ||||||||||||||||||||||||
Net investment income (loss)b | (0.05 | ) | (0.07 | ) | (0.04 | ) | (0.07 | ) | (0.11 | ) | (0.05 | ) | ||||||||||||
Net realized and unrealized gains (losses) | 1.86 | 3.54 | (2.14 | ) | 1.66 | 5.00 | 1.94 | |||||||||||||||||
|
| |||||||||||||||||||||||
Total from investment operations | 1.81 | 3.47 | (2.18 | ) | 1.59 | 4.89 | 1.89 | |||||||||||||||||
|
| |||||||||||||||||||||||
Less distributions from net realized gains | — | — | (0.35 | ) | (0.82 | ) | (0.66 | ) | (0.36 | ) | ||||||||||||||
|
| |||||||||||||||||||||||
Net asset value, end of period | $22.69 | $20.88 | $17.41 | $19.94 | $19.17 | $14.94 | ||||||||||||||||||
|
| |||||||||||||||||||||||
Total returnc | 8.67% | 19.93% | (11.06)% | 8.65% | 32.87% | 14.56% | ||||||||||||||||||
| Ratios to average net assetsd | ||||||||||||||||||||||||
Expenses before waiver and payments by affiliates | 0.88% | 0.85% | 0.88% | 0.87% | 0.90% | 1.03% | ||||||||||||||||||
Expenses net of waiver and payments by affiliates | 0.86% | e | 0.83% | e | 0.86% | e | 0.87% | f | 0.90% | f | 1.03% | |||||||||||||
Net investment income (loss) | (0.44)% | (0.36)% | (0.19)% | (0.37)% | (0.55)% | (0.38)% | ||||||||||||||||||
| Supplemental data | ||||||||||||||||||||||||
Net assets, end of period (000’s) | $758,993 | $805,661 | $850,975 | $1,077,822 | $427,406 | $91,687 | ||||||||||||||||||
Portfolio turnover rate | 13.97% | 29.93% | 43.99% | 30.15% | 40.35% | 41.02% | ||||||||||||||||||
aThe amount shown for a share outstanding throughout the period may not correlate with the Statement of Operations for the period due to the timing of sales and repurchases of the Fund’s shares in relation to income earned and/or fluctuating fair value of the investments of the Fund.
bBased on average daily shares outstanding.
cTotal return is not annualized for periods less than one year.
dRatios are annualized for periods less than one year, except for non-recurring expenses, if any.
eBenefit of expense reduction rounds to less than 0.01%.
fBenefit of waiver and payments by affiliates and expense reduction rounds to less than 0.01%.
| franklintempleton.com | The accompanying notes are an integral part of these financial statements. | Semiannual Report | 47 | ||||
FRANKLIN STRATEGIC SERIES
Statement of Investments, October 31, 2017 (unaudited)
Franklin Small Cap Growth Fund
| Shares | Value | |||||||
Common Stocks 97.2% | ||||||||
| Consumer Discretionary 13.4% | ||||||||
aAt Home Group Inc. | 792,800 | $ | 16,252,400 | |||||
a,bBoot Barn Holdings Inc. | 1,674,939 | 13,784,748 | ||||||
aBuffalo Wild Wings Inc. | 120,500 | 14,243,100 | ||||||
aDave & Buster’s Entertainment Inc. | 445,900 | 21,492,380 | ||||||
a,c,dDraftKings Inc. | 9,905,685 | 15,448,919 | ||||||
a,eDuluth Holdings Inc. | 973,942 | 20,121,642 | ||||||
aFive Below Inc. | 365,400 | 20,188,350 | ||||||
aGlobal Eagle Entertainment Inc. | 2,049,456 | 4,980,178 | ||||||
aGrand Canyon Education Inc. | 307,800 | 27,551,178 | ||||||
aThe Habit Restaurants Inc., A | 613,100 | 7,541,130 | ||||||
aIMAX Corp. | 1,003,600 | 24,337,300 | ||||||
aLaureate Education Inc., A | 1,267,200 | 16,942,464 | ||||||
Lithia Motors Inc. | 253,300 | 28,668,494 | ||||||
aM/I Homes Inc. | 949,876 | 31,725,858 | ||||||
aNational Vision Holdings Inc. | 35,700 | 1,028,160 | ||||||
aShutterfly Inc. | 265,400 | 11,332,580 | ||||||
a,b,eSportsman’s Warehouse Holdings Inc. | 4,162,000 | 17,064,200 | ||||||
Tenneco Inc. | 329,400 | 19,141,434 | ||||||
Wingstop Inc. | 982,529 | 33,278,257 | ||||||
|
| |||||||
| 345,122,772 | ||||||||
|
| |||||||
Consumer Staples 2.5%
| ||||||||
aHostess Brands Inc., A | 1,991,100 | 22,957,383 | ||||||
aSmart & Final Stores Inc. | 3,244,100 | 19,464,600 | ||||||
aTreeHouse Foods Inc. | 346,400 | 22,994,032 | ||||||
|
| |||||||
| 65,416,015 | ||||||||
|
| |||||||
Energy 3.0%
| ||||||||
aMatador Resources Co. | 1,002,839 | 26,625,375 | ||||||
aResolute Energy Corp. | 516,200 | 15,501,486 | ||||||
aSRC Energy Inc. | 2,013,800 | 19,211,652 | ||||||
aSuperior Energy Services Inc. | 1,711,400 | 15,094,548 | ||||||
|
| |||||||
| 76,433,061 | ||||||||
|
| |||||||
Financials 7.6%
| ||||||||
aCF Corp., A | 788,900 | 8,599,010 | ||||||
Chemical Financial Corp. | 265,923 | 14,011,483 | ||||||
Evercore Inc. | 265,200 | 21,242,520 | ||||||
Houlihan Lokey Inc. | 429,700 | 17,888,411 | ||||||
LegacyTexas Financial Group Inc. | 408,300 | 16,287,087 | ||||||
MB Financial Inc. | 628,400 | 28,868,696 | ||||||
Pinnacle Financial Partners Inc. | 499,804 | 33,087,025 | ||||||
aPRA Group Inc. | 641,200 | 17,889,480 | ||||||
aWestern Alliance Bancorp. | 648,700 | 36,197,460 | ||||||
|
| |||||||
| 194,071,172 | ||||||||
|
| |||||||
Health Care 17.0%
| ||||||||
aAclaris Therapeutics Inc. | 412,716 | 10,404,570 | ||||||
aAmerican Renal Associates Holdings Inc. | 668,900 | 8,113,757 | ||||||
aAmicus Therapeutics Inc. | 724,700 | 10,319,728 | ||||||
a,bAratana Therapeutics Inc. | 2,697,019 | 15,453,919 | ||||||
aArray BioPharma Inc. | 1,401,200 | 14,642,540 | ||||||
aAveXis Inc. | 136,085 | 14,222,243 | ||||||
aClovis Oncology Inc. | 103,600 | 7,808,332 | ||||||
| 48 | Semiannual Report | franklintempleton.com | ||
FRANKLIN STRATEGIC SERIES
STATEMENT OF INVESTMENTS (UNAUDITED)
Franklin Small Cap Growth Fund (continued)
| Shares | Value | |||||||
Common Stocks (continued) | ||||||||
| Health Care (continued) | ||||||||
a,eCollegium Pharmaceutical Inc. | 899,800 | $ | 9,294,934 | |||||
aCorium International Inc. | 851,750 | 8,585,640 | ||||||
aDexCom Inc. | 566,800 | 25,488,996 | ||||||
aEdge Therapeutics Inc. | 657,000 | 7,135,020 | ||||||
a,eFoamix Pharmaceuticals Ltd. (Israel) | 457,580 | 2,795,814 | ||||||
aG1 Therapeutics Inc. | 244,600 | 5,779,898 | ||||||
aHealthEquity Inc. | 273,116 | 13,715,886 | ||||||
aHeron Therapeutics Inc. | 1,185,993 | 18,204,993 | ||||||
aInteger Holdings Corp. | 782,000 | 38,005,200 | ||||||
aIovance Biotherapeutics Inc. | 1,422,800 | 11,062,270 | ||||||
aiRhythm Technologies Inc. | 681,797 | 34,737,557 | ||||||
aKaryopharm Therapeutics Inc. | 1,277,686 | 13,045,174 | ||||||
aLoxo Oncology Inc. | 106,458 | 9,172,421 | ||||||
aNeogen Corp. | 354,500 | 28,430,900 | ||||||
a,eNeos Therapeutics Inc. | 608,738 | 6,330,875 | ||||||
aNevro Corp. | 513,500 | 44,972,330 | ||||||
aPenumbra Inc. | 172,100 | 17,304,655 | ||||||
a,bPfenex Inc. | 1,175,631 | 3,714,994 | ||||||
aRevance Therapeutics Inc. | 933,800 | 24,278,800 | ||||||
aSage Therapeutics Inc. | 142,100 | 8,992,088 | ||||||
a,eTG Therapeutics Inc. | 875,000 | 7,131,250 | ||||||
a,eTherapeuticsMD Inc. | 2,627,000 | 12,399,440 | ||||||
aTivity Health Inc. | 110,178 | 5,095,733 | ||||||
|
| |||||||
| 436,639,957 | ||||||||
|
| |||||||
Industrials 18.8%
| ||||||||
Allegiant Travel Co. | 236,848 | 32,306,067 | ||||||
Altra Industrial Motion Corp. | 666,400 | 31,920,560 | ||||||
aAstronics Corp. | 1,074,519 | 36,963,453 | ||||||
aBeacon Roofing Supply Inc. | 674,100 | 37,351,881 | ||||||
Cubic Corp. | 547,400 | 29,860,670 | ||||||
a,bEcho Global Logistics Inc. | 1,403,825 | 33,761,991 | ||||||
Granite Construction Inc. | 328,000 | 20,890,320 | ||||||
Kennametal Inc. | 852,000 | 37,189,800 | ||||||
a,bThe KeyW Holding Corp. | 3,006,882 | 22,701,959 | ||||||
aMercury Systems Inc. | 1,024,700 | 51,716,609 | ||||||
Mobile Mini Inc. | 750,400 | 24,838,240 | ||||||
aSpirit Airlines Inc. | 747,900 | 27,739,611 | ||||||
Steelcase Inc., A | 812,383 | 11,820,173 | ||||||
aUnivar Inc. | 1,326,932 | 39,476,227 | ||||||
US Ecology Inc. | 902,090 | 42,894,380 | ||||||
|
| |||||||
| 481,431,941 | ||||||||
|
| |||||||
Information Technology 32.5%
| ||||||||
a2U Inc. | 1,280,472 | 81,476,433 | ||||||
aAlarm.com Holdings Inc. | 620,424 | 28,961,392 | ||||||
aBazaarvoice Inc. | 2,946,550 | 14,217,104 | ||||||
aBroadSoft Inc. | 579,974 | 31,811,574 | ||||||
aCallidus Software Inc. | 1,411,800 | 35,789,130 | ||||||
aCavium Inc. | 519,200 | 35,819,608 | ||||||
Cognex Corp. | 215,300 | 26,514,195 | ||||||
aEnvestnet Inc. | 607,022 | 32,414,975 | ||||||
aFARO Technologies Inc. | 276,193 | 14,306,798 | ||||||
| franklintempleton.com | Semiannual Report | 49 | ||||
FRANKLIN STRATEGIC SERIES
STATEMENT OF INVESTMENTS (UNAUDITED)
Franklin Small Cap Growth Fund (continued)
| Shares | Value | |||||||
Common Stocks (continued) | ||||||||
| Information Technology (continued) | ||||||||
aForeScout Technologies Inc. | 51,300 | $ | 1,326,105 | |||||
aGuidewire Software Inc. | 405,700 | 32,447,886 | ||||||
aHubspot Inc. | 438,429 | 37,946,030 | ||||||
aInphi Corp. | 710,100 | 29,099,898 | ||||||
aIntegrated Device Technology Inc. | 1,525,400 | 47,394,178 | ||||||
aInterXion Holding NV (Netherlands) | 480,595 | 25,658,967 | ||||||
aLattice Semiconductor Corp. | 4,092,400 | 23,940,540 | ||||||
aMACOM Technology Solutions Holdings Inc. | 525,700 | 21,490,616 | ||||||
ManTech International Corp., A | 237,300 | 11,013,093 | ||||||
aMongoDB Inc. | 13,500 | 411,480 | ||||||
Monolithic Power Systems | 173,700 | 21,134,079 | ||||||
aNanometrics Inc. | 558,400 | 15,785,968 | ||||||
aPaylocity Holding Corp. | 747,832 | 39,941,707 | ||||||
aProofpoint Inc. | 134,400 | 12,419,904 | ||||||
aPure Storage Inc., A | 1,935,900 | 31,806,837 | ||||||
aQ2 Holdings Inc. | 622,300 | 26,478,865 | ||||||
aRealPage Inc. | 421,200 | 18,237,960 | ||||||
aTwilio Inc., A | 919,702 | �� | 29,384,479 | |||||
aViaSat Inc. | 492,183 | 32,041,113 | ||||||
aWEX Inc. | 227,100 | 28,067,289 | ||||||
aZendesk Inc. | 1,483,714 | 45,995,134 | ||||||
|
| |||||||
| 833,333,337 | ||||||||
|
| |||||||
Materials 1.2% | ||||||||
aIngevity Corp. | 420,200 | 29,930,846 | ||||||
|
| |||||||
Real Estate 1.2% | ||||||||
Coresite Realty Corp. | 289,100 | 32,017,825 | ||||||
|
| |||||||
Total Common Stocks (Cost $1,892,179,022) | 2,494,396,926 | |||||||
|
| |||||||
Preferred Stocks 1.5% | ||||||||
| Consumer Discretionary 0.9% | ||||||||
a,c,dProterra Inc., pfd., 5, 144A | 1,787,047 | 9,899,990 | ||||||
a,c,dProterra Inc., pfd., 6 | 877,611 | 4,861,842 | ||||||
a,c,dTula Technology Inc., E | 3,611,111 | 6,500,000 | ||||||
|
| |||||||
| 21,261,832 | ||||||||
|
| |||||||
Information Technology 0.6% | ||||||||
a,c,dSmule Inc., pfd., G, 144A | 1,542,673 | 13,122,593 | ||||||
a,c,dSmule Inc., pfd., H, 144A | 352,675 | 2,999,995 | ||||||
|
| |||||||
| 16,122,588 | ||||||||
|
| |||||||
Total Preferred Stocks (Cost $34,461,833) | 37,384,420 | |||||||
|
| |||||||
Total Investments before Short Term Investments (Cost $1,926,640,855) | 2,531,781,346 | |||||||
|
| |||||||
Short Term Investments 3.8%
| ||||||||
| Money Market Funds (Cost $37,767,775) 1.5% | ||||||||
f,gInstitutional Fiduciary Trust Money Market Portfolio, 0.69% | 37,767,775 | 37,767,775 | ||||||
|
| |||||||
| 50 | Semiannual Report | franklintempleton.com | ||
FRANKLIN STRATEGIC SERIES
STATEMENT OF INVESTMENTS (UNAUDITED)
Franklin Small Cap Growth Fund (continued)
| Shares | Value | |||||||
hInvestments from Cash Collateral Received for Loaned Securities (Cost $58,065,150) 2.3% | ||||||||
| Money Market Funds 2.3% | ||||||||
f,gInstitutional Fiduciary Trust Money Market Portfolio, 0.69% | 58,065,150 | $ | 58,065,150 | |||||
|
| |||||||
Total Investments (Cost $2,022,473,780) 102.5% | 2,627,614,271 | |||||||
Other Assets, less Liabilities (2.5)% | (62,881,134 | ) | ||||||
|
| |||||||
Net Assets 100.0% | $ | 2,564,733,137 | ||||||
|
| |||||||
aNon-income producing.
bSee Note 9 regarding holdings of 5% voting securities.
cFair valued using significant unobservable inputs. See Note 11 regarding fair value measurements.
dSee Note 7 regarding restricted securities.
eA portion or all of the security is on loan at October 31, 2017. See Note 1(d).
fSee Note 3(f) regarding investments in affiliated management investment companies.
gThe rate shown is the annualized seven-day yield at period end.
hSee Note 1(d) regarding securities on loan.
| franklintempleton.com | The accompanying notes are an integral part of these financial statements. | Semiannual Report | 51 | ||||
FRANKLIN STRATEGIC SERIES
Financial Highlights
Franklin Small-Mid Cap Growth Fund
Six Months Ended October 31, 2017 | Year Ended April 30, | |||||||||||||||||||||||
| (unaudited) | 2017 | 2016 | 2015 | 2014 | 2013 | |||||||||||||||||||
| Class A | ||||||||||||||||||||||||
| Per share operating performance | ||||||||||||||||||||||||
(for a share outstanding throughout the period) | ||||||||||||||||||||||||
Net asset value, beginning of period | $34.35 | $31.84 | $38.38 | $40.42 | $38.01 | $38.51 | ||||||||||||||||||
|
| |||||||||||||||||||||||
| Income from investment operationsa: | ||||||||||||||||||||||||
Net investment income (loss)b | (0.09 | ) | (0.11 | ) | (0.03 | )c | (0.14 | ) | (0.20 | ) | (0.10 | ) | ||||||||||||
Net realized and unrealized gains (losses) | 3.32 | 4.73 | (3.37 | ) | 5.71 | 8.39 | 3.08 | |||||||||||||||||
|
| |||||||||||||||||||||||
Total from investment operations | 3.23 | 4.62 | (3.40 | ) | 5.57 | 8.19 | 2.98 | |||||||||||||||||
|
| |||||||||||||||||||||||
Less distributions from net realized gains | — | (2.11 | ) | (3.14 | ) | (7.61 | ) | (5.78 | ) | (3.48 | ) | |||||||||||||
|
| |||||||||||||||||||||||
Net asset value, end of period | $37.58 | $34.35 | $31.84 | $38.38 | $40.42 | $38.01 | ||||||||||||||||||
|
| |||||||||||||||||||||||
Total returnd | 9.40% | 15.01% | (9.02 | )% | 15.78% | 21.99% | 8.95% | |||||||||||||||||
| Ratios to average net assetse | ||||||||||||||||||||||||
Expenses before waiver and payments by affiliates | 1.03% | 0.95% | 0.96% | 0.94% | 0.96% | 0.98% | ||||||||||||||||||
Expenses net of waiver and payments by affiliates | 1.01% | f | 0.94% | f | 0.95% | f | 0.94% | g | 0.96% | f,g | 0.98% | |||||||||||||
Net investment income (loss) | (0.43)% | (0.34)% | (0.08)% | c | (0.35)% | (0.48)% | (0.27)% | |||||||||||||||||
| Supplemental data | ||||||||||||||||||||||||
Net assets, end of period (000’s) | $2,306,834 | $2,303,113 | $2,231,822 | $2,535,853 | $2,371,448 | $2,355,507 | ||||||||||||||||||
Portfolio turnover rate | 26.02% | 35.46% | 38.72% | 47.98% | 40.82% | 43.72% | ||||||||||||||||||
aThe amount shown for a share outstanding throughout the period may not correlate with the Statement of Operations for the period due to the timing of sales and repurchases of the Fund’s shares in relation to income earned and/or fluctuating fair value of the investments of the Fund.
bBased on average daily shares outstanding.
cNet investment income per share includes approximately $0.11 per share related to income received in the form of special dividends in connection with certain Fund holdings. Excluding this amount, the ratio of net investment income to average net assets would have been (0.38)%.
dTotal return does not reflect sales commissions or contingent deferred sales charges, if applicable, and is not annualized for periods less than one year.
eRatios are annualized for periods less than one year, except for non-recurring expenses, if any.
fBenefit of expense reduction rounds to less than 0.01%.
gBenefit of waiver and payments by affiliates rounds to less than 0.01%.
| 52 | Semiannual Report | The accompanying notes are an integral part of these financial statements. | franklintempleton.com | ||
FRANKLIN STRATEGIC SERIES
FINANCIAL HIGHLIGHTS
Franklin Small-Mid Cap Growth Fund (continued)
Six Months Ended October 31, 2017 | Year Ended April 30, | |||||||||||||||||||||||
| (unaudited) | 2017 | 2016 | 2015 | 2014 | 2013 | |||||||||||||||||||
| Class C | ||||||||||||||||||||||||
| Per share operating performance | ||||||||||||||||||||||||
(for a share outstanding throughout the period) | ||||||||||||||||||||||||
Net asset value, beginning of period | $25.59 | $24.40 | $30.43 | $33.78 | $32.80 | $33.97 | ||||||||||||||||||
|
| |||||||||||||||||||||||
| Income from investment operationsa: | ||||||||||||||||||||||||
Net investment income (loss)b | (0.17 | ) | (0.27 | ) | (0.23 | )c | (0.36 | ) | (0.43 | ) | (0.32 | ) | ||||||||||||
Net realized and unrealized gains (losses) | 2.47 | 3.57 | (2.66 | ) | 4.62 | 7.19 | 2.63 | |||||||||||||||||
|
| |||||||||||||||||||||||
Total from investment operations | 2.30 | 3.30 | (2.89 | ) | 4.26 | 6.76 | 2.31 | |||||||||||||||||
|
| |||||||||||||||||||||||
Less distributions from net realized gains | — | (2.11 | ) | (3.14 | ) | (7.61 | ) | (5.78 | ) | (3.48 | ) | |||||||||||||
|
| |||||||||||||||||||||||
Net asset value, end of period | $27.89 | $25.59 | $24.40 | $30.43 | $33.78 | $32.80 | ||||||||||||||||||
|
| |||||||||||||||||||||||
Total returnd | 8.99% | 14.15% |
| (9.72)% |
| 14.96% | 21.04% | 8.11% | ||||||||||||||||
| Ratios to average net assetse | ||||||||||||||||||||||||
Expenses before waiver and payments by affiliates | 1.78% | 1.70% | 1.71% | 1.69% | 1.71% | 1.73% | ||||||||||||||||||
Expenses net of waiver and payments by affiliates | 1.76% | f | 1.69% | f | 1.70% | f | 1.69% | g | 1.71% | f,g | 1.73% | |||||||||||||
Net investment income (loss) | (1.18)% | (1.09)% | (0.83)% | c | (1.10)% | (1.23)% | (1.02)% | |||||||||||||||||
| Supplemental data | ||||||||||||||||||||||||
Net assets, end of period (000’s) | $345,839 | $371,262 | $377,024 | $448,722 | $404,923 | $348,144 | ||||||||||||||||||
Portfolio turnover rate | 26.02% | 35.46% | 38.72% | 47.98% | 40.82% | 43.72% | ||||||||||||||||||
aThe amount shown for a share outstanding throughout the period may not correlate with the Statement of Operations for the period due to the timing of sales and repurchases of the Fund’s shares in relation to income earned and/or fluctuating fair value of the investments of the Fund.
bBased on average daily shares outstanding.
cNet investment income per share includes approximately $0.11 per share related to income received in the form of special dividends in connection with certain Fund holdings. Excluding this amount, the ratio of net investment income to average net assets would have been (1.13)%.
dTotal return does not reflect sales commissions or contingent deferred sales charges, if applicable, and is not annualized for periods less than one year.
eRatios are annualized for periods less than one year, except for non-recurring expenses, if any.
fBenefit of expense reduction rounds to less than 0.01%.
gBenefit of waiver and payments by affiliates rounds to less than 0.01%.
| franklintempleton.com | The accompanying notes are an integral part of these financial statements. | Semiannual Report | 53 | ||||
FRANKLIN STRATEGIC SERIES
FINANCIAL HIGHLIGHTS
Franklin Small-Mid Cap Growth Fund (continued)
| Six Months Ended October 31, 2017 | Year Ended April 30, | |||||||||||||||||||||||
| (unaudited) | 2017 | 2016 | 2015 | 2014 | 2013 | |||||||||||||||||||
| Class R | ||||||||||||||||||||||||
| Per share operating performance | ||||||||||||||||||||||||
(for a share outstanding throughout the period) | ||||||||||||||||||||||||
Net asset value, beginning of period | $31.87 | $29.75 | $36.18 | $38.61 | $36.61 | $37.32 | ||||||||||||||||||
|
| |||||||||||||||||||||||
| Income from investment operationsa: | ||||||||||||||||||||||||
Net investment income (loss)b | (0.13 | ) | (0.18 | ) | (0.11 | )c | (0.23 | ) | (0.29 | ) | (0.18 | ) | ||||||||||||
Net realized and unrealized gains (losses) | 3.08 | 4.41 | (3.18 | ) | 5.41 | 8.07 | 2.95 | |||||||||||||||||
|
| |||||||||||||||||||||||
Total from investment operations | 2.95 | 4.23 | (3.29 | ) | 5.18 | 7.78 | 2.77 | |||||||||||||||||
|
| |||||||||||||||||||||||
Less distributions from net realized gains | — | (2.11 | ) | (3.14 | ) | (7.61 | ) | (5.78 | ) | (3.48 | ) | |||||||||||||
|
| |||||||||||||||||||||||
Net asset value, end of period | $34.82 | $31.87 | $29.75 | $36.18 | $38.61 | $36.61 | ||||||||||||||||||
|
| |||||||||||||||||||||||
Total returnd | 9.26% | 14.70% | (9.24)% | 15.52% | 21.66% | 8.66% | ||||||||||||||||||
| Ratios to average net assetse | ||||||||||||||||||||||||
Expenses before waiver and payments by affiliates | 1.28% | 1.19% | 1.21% | 1.19% | 1.21% | 1.23% | ||||||||||||||||||
Expenses net of waiver and payments by affiliates | 1.26% | f | 1.18% | f | 1.20% | f | 1.19% | g | 1.21% | f,g | 1.23% | |||||||||||||
Net investment income (loss) | (0.68)% | (0.58)% | (0.33)% | c | (0.60)% | (0.73)% | (0.52)% | |||||||||||||||||
| Supplemental data | ||||||||||||||||||||||||
Net assets, end of period (000’s) | $74,881 | $81,864 | $86,989 | $96,593 | $85,921 | $65,397 | ||||||||||||||||||
Portfolio turnover rate | 26.02% | 35.46% | 38.72% | 47.98% | 40.82% | 43.72% | ||||||||||||||||||
aThe amount shown for a share outstanding throughout the period may not correlate with the Statement of Operations for the period due to the timing of sales and repurchases of the Fund’s shares in relation to income earned and/or fluctuating fair value of the investments of the Fund.
bBased on average daily shares outstanding.
cNet investment income per share includes approximately $0.11 per share related to income received in the form of special dividends in connection with certain Fund holdings. Excluding this amount, the ratio of net investment income to average net assets would have been (0.63)%.
dTotal return is not annualized for periods less than one year.
eRatios are annualized for periods less than one year, except for non-recurring expenses, if any.
fBenefit of expense reduction rounds to less than 0.01%.
gBenefit of waiver and payments by affiliates rounds to less than 0.01%.
| 54 | Semiannual Report | The accompanying notes are an integral part of these financial statements. | franklintempleton.com | ||
FRANKLIN STRATEGIC SERIES
FINANCIAL HIGHLIGHTS
Franklin Small-Mid Cap Growth Fund (continued)
| Six Months Ended October 31, 2017 | Year Ended April 30, | |||||||||||||||||||
| (unaudited) | 2017 | 2016 | 2015 | 2014a | ||||||||||||||||
| Class R6 | ||||||||||||||||||||
| Per share operating performance | ||||||||||||||||||||
(for a share outstanding throughout the period) | ||||||||||||||||||||
Net asset value, beginning of period | $37.51 | $34.43 | $41.04 | $42.53 | $38.96 | |||||||||||||||
|
| |||||||||||||||||||
| Income from investment operationsb: | ||||||||||||||||||||
Net investment incomec | 0.02 | 0.05 | 0.15 | d | 0.05 | 0.01 | ||||||||||||||
Net realized and unrealized gains (losses) | 3.64 | 5.14 | (3.62 | ) | 6.07 | 9.34 | ||||||||||||||
|
| |||||||||||||||||||
Total from investment operations. | 3.66 | 5.19 | (3.47 | ) | 6.12 | 9.35 | ||||||||||||||
|
| |||||||||||||||||||
Less distributions from net realized gains | — | (2.11 | ) | (3.14 | ) | (7.61 | ) | (5.78 | ) | |||||||||||
|
| |||||||||||||||||||
Net asset value, end of period. | $41.17 | $37.51 | $34.43 | $41.04 | $42.53 | |||||||||||||||
|
| |||||||||||||||||||
Total returne | 9.76% | 15.51% | (8.54)% | 16.32% | 24.43% | |||||||||||||||
| Ratios to average net assetsf | ||||||||||||||||||||
Expenses before waiver and payments by affiliates | 0.49% | 0.48% | 0.48% | 0.48% | 0.47% | |||||||||||||||
Expenses net of waiver and payments by affiliates | 0.47% | g | 0.47% | g | 0.47% | g | 0.48% | h | 0.47% | g,h | ||||||||||
Net investment income. | 0.11% | 0.13% | 0.40% | d | 0.11% | 0.01% | ||||||||||||||
| Supplemental data | ||||||||||||||||||||
Net assets, end of period (000’s) | $249,425 | $222,577 | $242,237 | $206,548 | $157,153 | |||||||||||||||
Portfolio turnover rate | 26.02% | 35.46% | 38.72% | 47.98% | 40.82% | |||||||||||||||
aFor the year May 1, 2013 (effective date) to April 30, 2014.
bThe amount shown for a share outstanding throughout the period may not correlate with the Statement of Operations for the period due to the timing of sales and repurchases of the Fund’s shares in relation to income earned and/or fluctuating fair value of the investments of the Fund.
cBased on average daily shares outstanding.
dNet investment income per share includes approximately $0.11 per share related to income received in the form of special dividends in connection with certain Fund holdings. Excluding this amount, the ratio of net investment income to average net assets would have been 0.10%.
eTotal return is not annualized for periods less than one year.
fRatios are annualized for periods less than one year, except for non-recurring expenses, if any.
gBenefit of expense reduction rounds to less than 0.01%.
hBenefit of waiver and payments by affiliates rounds to less than 0.01%.
| franklintempleton.com | The accompanying notes are an integral part of these financial statements. | Semiannual Report | 55 | ||||
FRANKLIN STRATEGIC SERIES
FINANCIAL HIGHLIGHTS
Franklin Small-Mid Cap Growth Fund (continued)
| Six Months Ended October 31, 2017 | Year Ended April 30, | |||||||||||||||||||||||
| (unaudited) | 2017 | 2016 | 2015 | 2014 | 2013 | |||||||||||||||||||
| Advisor Class | ||||||||||||||||||||||||
| Per share operating performance | ||||||||||||||||||||||||
(for a share outstanding throughout the period) | ||||||||||||||||||||||||
Net asset value, beginning of period | $37.11 | $34.15 | $40.83 | $42.44 | $39.56 | $39.83 | ||||||||||||||||||
|
| |||||||||||||||||||||||
| Income from investment operationsa: | ||||||||||||||||||||||||
Net investment income (loss)b | (0.05 | ) | (0.03 | ) | 0.06 | c | (0.04 | ) | (0.10 | ) | (0.01 | ) | ||||||||||||
Net realized and unrealized gains (losses) | 3.59 | 5.10 | (3.60 | ) | 6.04 | 8.76 | 3.22 | |||||||||||||||||
|
| |||||||||||||||||||||||
Total from investment operations | 3.54 | 5.07 | (3.54 | ) | 6.00 | 8.66 | 3.21 | |||||||||||||||||
|
| |||||||||||||||||||||||
Less distributions from net realized gains | — | (2.11 | ) | (3.14 | ) | (7.61 | ) | (5.78 | ) | (3.48 | ) | |||||||||||||
|
| |||||||||||||||||||||||
Net asset value, end of period | $40.65 | $37.11 | $34.15 | $40.83 | $42.44 | $39.56 | ||||||||||||||||||
|
| |||||||||||||||||||||||
Total returnd | 9.54% | 15.28% | (8.79)% | 16.09% | 22.30% | 9.21% | ||||||||||||||||||
| Ratios to average net assetse | ||||||||||||||||||||||||
Expenses before waiver and payments by affiliates | 0.78% | 0.70% | 0.71% | 0.69% | 0.71% | 0.73% | ||||||||||||||||||
Expenses net of waiver and payments by affiliates | 0.76% | f | 0.69% | f | 0.70% | f | 0.69% | g | 0.71% | f,g | 0.73% | |||||||||||||
Net investment income (loss) | (0.18)% | (0.09)% | 0.17% | c | (0.10)% | (0.23)% | (0.02)% | |||||||||||||||||
| Supplemental data | ||||||||||||||||||||||||
Net assets, end of period (000’s) | $567,978 | $584,840 | $551,176 | $708,617 | $650,426 | $909,895 | ||||||||||||||||||
Portfolio turnover rate | 26.02% | 35.46% | 38.72% | 47.98% | 40.82% | 43.72% | ||||||||||||||||||
aThe amount shown for a share outstanding throughout the period may not correlate with the Statement of Operations for the period due to the timing of sales and repurchases of the Fund’s shares in relation to income earned and/or fluctuating fair value of the investments of the Fund.
bBased on average daily shares outstanding.
cNet investment income per share includes approximately $0.11 per share related to income received in the form of special dividends in connection with certain Fund holdings. Excluding this amount, the ratio of net investment income to average net assets would have been (0.13)%.
dTotal return is not annualized for periods less than one year.
eRatios are annualized for periods less than one year, except for non-recurring expenses, if any.
fBenefit of expense reduction rounds to less than 0.01%.
gBenefit of waiver and payments by affiliates rounds to less than 0.01%.
| 56 | Semiannual Report | The accompanying notes are an integral part of these financial statements. | franklintempleton.com | ||
FRANKLIN STRATEGIC SERIES
Statement of Investments, October 31, 2017 (unaudited)
Franklin Small-Mid Cap Growth Fund
| Shares | Value | |||||||||
Common Stocks 99.3% | ||||||||||
| Consumer Discretionary 13.6% | ||||||||||
a | Burlington Stores Inc. | 186,200 | $ | 17,482,318 | ||||||
Delphi Automotive PLC | 519,200 | 51,598,096 | ||||||||
a | Dollar Tree Inc. | 506,600 | 46,227,250 | |||||||
Dominos Pizza Inc. | 147,000 | 26,901,000 | ||||||||
a,b,c | DraftKings Inc. | 7,974,537 | 12,437,097 | |||||||
Expedia Inc. | 299,000 | 37,273,340 | ||||||||
a | Grand Canyon Education Inc. | 408,000 | 36,520,080 | |||||||
a | Laureate Education Inc., A | 645,300 | 8,627,661 | |||||||
a | Liberty Broadband Corp., C | 428,500 | 37,403,765 | |||||||
MGM Resorts International | 120,000 | 3,762,000 | ||||||||
a | National Vision Holdings Inc. | 53,400 | 1,537,920 | |||||||
Newell Brands Inc. | 677,276 | 27,619,315 | ||||||||
a | Norwegian Cruise Line Holdings Ltd. | 515,000 | 28,711,250 | |||||||
a | NVR Inc. | 18,100 | 59,392,797 | |||||||
a | O’Reilly Automotive Inc. | 83,300 | 17,572,135 | |||||||
Ross Stores Inc. | 487,700 | 30,964,073 | ||||||||
Thor Industries Inc. | 116,500 | 15,869,630 | ||||||||
Tractor Supply Co. | 331,900 | 20,000,294 | ||||||||
Vail Resorts Inc. | 8,000 | 1,832,160 | ||||||||
|
| |||||||||
| 481,732,181 | ||||||||||
|
| |||||||||
Consumer Staples 4.2%
| ||||||||||
Church & Dwight Co. Inc. | 721,800 | 32,603,706 | ||||||||
a | Hostess Brands Inc., A | 726,300 | 8,374,239 | |||||||
Lamb Weston Holdings Inc. | 125,000 | 6,373,750 | ||||||||
a | Monster Beverage Corp. | 538,900 | 31,218,477 | |||||||
Pinnacle Foods Inc. | 607,000 | 33,032,940 | ||||||||
a | Post Holdings Inc. | 433,000 | 35,908,690 | |||||||
|
| |||||||||
| 147,511,802 | ||||||||||
|
| |||||||||
Energy 2.1%
| ||||||||||
Cabot Oil & Gas Corp., A | 1,039,510 | 28,794,427 | ||||||||
a | Concho Resources Inc. | 82,500 | 11,072,325 | |||||||
a | Jagged Peak Energy Inc. | 1,560,000 | 21,668,400 | |||||||
d | RPC Inc. | 546,400 | 13,282,984 | |||||||
|
| |||||||||
| 74,818,136 | ||||||||||
|
| |||||||||
Financials 7.9%
| ||||||||||
Affiliated Managers Group Inc. | 187,000 | 34,875,500 | ||||||||
Arthur J. Gallagher & Co. | 659,000 | 41,734,470 | ||||||||
CBOE Global Markets Inc. | 262,000 | 29,621,720 | ||||||||
First Republic Bank/CA | 283,000 | 27,564,200 | ||||||||
MarketAxess Holdings Inc. | 150,500 | 26,187,000 | ||||||||
Moody’s Corp. | 201,000 | 28,624,410 | ||||||||
The Progressive Corp. | 336,000 | 16,346,400 | ||||||||
a | SVB Financial Group | 180,100 | 39,492,328 | |||||||
a | Western Alliance Bancorp. | 65,000 | 3,627,000 | |||||||
Willis Towers Watson PLC | 187,600 | 30,218,608 | ||||||||
|
| |||||||||
| 278,291,636 | ||||||||||
|
| |||||||||
Health Care 14.0%
| ||||||||||
a | ABIOMED Inc. | 45,500 | 8,777,860 | |||||||
a | Acadia Pharmaceuticals Inc. | 260,049 | 9,057,507 | |||||||
a | Agios Pharmaceuticals Inc. | 55,100 | 3,541,277 | |||||||
| franklintempleton.com | Semiannual Report | 57 | ||||
FRANKLIN STRATEGIC SERIES
STATEMENT OF INVESTMENTS (UNAUDITED)
Franklin Small-Mid Cap Growth Fund (continued)
| Shares | Value | |||||||
| Common Stocks (continued) | ||||||||
| Health Care (continued) | ||||||||
a Alkermes PLC | 146,100 | $ | 7,123,836 | |||||
a Alnylam Pharmaceuticals Inc. | 37,000 | 4,508,080 | ||||||
a BioMarin Pharmaceutical Inc. | 215,766 | 17,712,231 | ||||||
a Bioverativ Inc. | 126,100 | 7,124,650 | ||||||
a Centene Corp. | 58,000 | 5,432,860 | ||||||
a Cerner Corp. | 373,502 | 25,218,855 | ||||||
The Cooper Cos. Inc. | 70,300 | 16,890,278 | ||||||
a DexCom Inc. | 268,314 | 12,066,080 | ||||||
a Edwards Lifesciences Corp. | 494,600 | 50,562,958 | ||||||
a Exelixis Inc. | 356,600 | 8,840,114 | ||||||
a Hologic Inc. | 810,000 | 30,658,500 | ||||||
a Illumina Inc. | 217,000 | 44,526,230 | ||||||
a Incyte Corp. | 230,614 | 26,117,035 | ||||||
a Insulet Corp. | 284,217 | 16,714,802 | ||||||
a Ionis Pharmaceuticals Inc. | 78,000 | 4,454,580 | ||||||
a iRhythm Technologies Inc. | 191,450 | 9,754,377 | ||||||
a Jazz Pharmaceuticals PLC | 61,000 | 8,633,330 | ||||||
a Mettler-Toledo International Inc. | 78,800 | 53,791,244 | ||||||
a Neurocrine Biosciences Inc. | 214,842 | 13,343,837 | ||||||
a Nevro Corp. | 221,500 | 19,398,970 | ||||||
a Penumbra Inc. | 161,647 | 16,253,606 | ||||||
a Revance Therapeutics Inc. | 344,100 | 8,946,600 | ||||||
a Seattle Genetics Inc. | 81,500 | 4,996,765 | ||||||
a Tesaro Inc. | 64,545 | 7,472,375 | ||||||
a Waters Corp. | 140,000 | 27,447,000 | ||||||
Zoetis Inc. | 409,000 | 26,102,380 | ||||||
|
| |||||||
| 495,468,217 | ||||||||
|
| |||||||
| Industrials 16.7% | ||||||||
Acuity Brands Inc. | 34,300 | 5,734,960 | ||||||
Allegiant Travel Co. | 60,609 | 8,267,068 | ||||||
BWX Technologies Inc. | 284,000 | 17,017,280 | ||||||
Cummins Inc. | 69,000 | 12,204,720 | ||||||
Dun & Bradstreet Corp. | 253,500 | 29,616,405 | ||||||
Fortive Corp. | 363,100 | 26,237,606 | ||||||
a Gardner Denver Holdings Inc. | 384,780 | 11,100,903 | ||||||
Hexcel Corp. | 656,709 | 39,855,669 | ||||||
IDEX Corp. | 175,000 | 22,436,750 | ||||||
a IHS Markit Ltd. | 901,815 | 38,426,337 | ||||||
J.B. Hunt Transport Services Inc. | 281,000 | 29,895,590 | ||||||
Old Dominion Freight Line Inc. | 103,000 | 12,476,390 | ||||||
Republic Services Inc. | 260,000 | 16,918,200 | ||||||
Rockwell Automation Inc. | 311,700 | 62,595,594 | ||||||
Rockwell Collins Inc. | 146,700 | 19,892,520 | ||||||
Roper Technologies Inc. | 327,530 | 84,558,420 | ||||||
Snap-on Inc. | 20,000 | 3,155,600 | ||||||
Stanley Black & Decker Inc. | 215,000 | 34,733,250 | ||||||
Textron Inc. | 443,800 | 23,406,012 | ||||||
a Univar Inc. | 922,000 | 27,429,500 | ||||||
a Verisk Analytics Inc. | 402,800 | 34,258,140 | ||||||
a WABCO Holdings Inc. | 226,000 | 33,350,820 | ||||||
|
| |||||||
| 593,567,734 | ||||||||
|
| |||||||
| 58 | Semiannual Report | franklintempleton.com | ||
FRANKLIN STRATEGIC SERIES
STATEMENT OF INVESTMENTS (UNAUDITED)
Franklin Small-Mid Cap Growth Fund (continued)
| Shares | Value | |||||||||
| Common Stocks (continued) | ||||||||||
| Information Technology 31.9% | ||||||||||
a | 2U Inc. | 992,100 | $ | 63,127,323 | ||||||
a | Alarm.com Holdings Inc. | 377,000 | 17,598,360 | |||||||
Alliance Data Systems Corp. | 62,000 | 13,871,260 | ||||||||
Amphenol Corp., A | 440,000 | 38,280,000 | ||||||||
Analog Devices Inc. | 508,500 | 46,426,050 | ||||||||
a | ANSYS Inc. | 140,200 | 19,166,742 | |||||||
a | Atlassian Corp. PLC (Australia) | 420,000 | 20,315,400 | |||||||
a | Autodesk Inc. | 415,000 | 51,858,400 | |||||||
a | Black Knight Inc. | 155,000 | 7,029,250 | |||||||
a | Blackline Inc. | 130,000 | 4,617,600 | |||||||
a | Cavium Inc. | 305,000 | 21,041,950 | |||||||
Cognex Corp. | 486,800 | 59,949,420 | ||||||||
a | CoStar Group Inc. | 156,700 | 46,344,025 | |||||||
CSRA Inc. | 1,025,347 | 32,800,851 | ||||||||
DXC Technology Co | 260,000 | 23,795,200 | ||||||||
Fidelity National Information Services Inc. | 500,900 | 46,463,484 | ||||||||
a | Fiserv Inc. | 207,000 | 26,792,010 | |||||||
a | FleetCor Technologies Inc. | 185,300 | 30,624,531 | |||||||
a | ForeScout Technologies Inc. | 76,000 | 1,964,600 | |||||||
a | GoDaddy Inc., A | 981,800 | 45,850,060 | |||||||
a | Guidewire Software Inc. | 162,000 | 12,956,760 | |||||||
a,d | Inphi Corp. | 488,000 | 19,998,240 | |||||||
a | Integrated Device Technology Inc. | 617,000 | 19,170,190 | |||||||
a | IPG Photonics Corp. | 19,000 | 4,045,290 | |||||||
KLA-Tencor Corp. | 325,000 | 35,389,250 | ||||||||
Lam Research Corp. | 236,000 | 49,222,520 | ||||||||
LogMeIn Inc. | 166,000 | 20,094,300 | ||||||||
Microchip Technology Inc. | 479,800 | 45,485,040 | ||||||||
a | MongoDB Inc. | 19,200 | 585,216 | |||||||
Monolithic Power Systems | 174,500 | 21,231,415 | ||||||||
a | Palo Alto Networks Inc. | 122,100 | 17,973,120 | |||||||
a | Q2 Holdings Inc. | 181,700 | 7,731,335 | |||||||
a | Red Hat Inc. | 150,500 | 18,184,915 | |||||||
a | ServiceNow Inc. | 487,600 | 61,618,012 | |||||||
a | Shopify Inc., A (Canada) | 20,000 | 1,989,800 | |||||||
a | Square Inc., A | 548,000 | 20,380,120 | |||||||
Symantec Corp. | 202,000 | 6,565,000 | ||||||||
a | Vantiv Inc., A | 818,700 | 57,309,000 | |||||||
a | ViaSat Inc. | 442,050 | 28,777,455 | |||||||
a | Wix.com Ltd. (Israel) | 63,000 | 4,397,400 | |||||||
a | Workday Inc., A | 350,000 | 38,846,500 | |||||||
a | Zendesk Inc. | 615,000 | 19,065,000 | |||||||
|
| |||||||||
| 1,128,932,394 | ||||||||||
|
| |||||||||
Materials 4.6% | ||||||||||
Albemarle Corp. | 90,000 | 12,680,100 | ||||||||
Avery Dennison Corp. | 100,000 | 10,617,000 | ||||||||
a | Axalta Coating Systems Ltd. | 940,203 | 31,261,750 | |||||||
Ball Corp. | 442,000 | 18,975,060 | ||||||||
a | Ingevity Corp. | 317,780 | 22,635,469 | |||||||
International Flavors & Fragrances Inc. | 171,000 | 25,208,820 | ||||||||
Packaging Corp. of America | 151,000 | 17,556,770 | ||||||||
| franklintempleton.com | Semiannual Report | 59 | ||||
FRANKLIN STRATEGIC SERIES
STATEMENT OF INVESTMENTS (UNAUDITED)
Franklin Small-Mid Cap Growth Fund (continued)
| Shares | Value | |||||||||
Common Stocks (continued) | ||||||||||
| Materials (continued) | ||||||||||
Vulcan Materials Co | 203,000 | $ | 24,715,250 | |||||||
|
| |||||||||
| 163,650,219 | ||||||||||
|
| |||||||||
| Real Estate 4.3% | ||||||||||
American Campus Communities Inc. | 368,000 | 15,301,440 | ||||||||
a | CBRE Group Inc. | 677,100 | 26,623,572 | |||||||
Equinix Inc. | 125,478 | 58,159,053 | ||||||||
a | SBA Communications Corp., A | 340,000 | 53,441,200 | |||||||
|
| |||||||||
| 153,525,265 | ||||||||||
|
| |||||||||
Total Common Stocks (Cost $2,423,838,605) | 3,517,497,584 | |||||||||
|
| |||||||||
Preferred Stocks (Cost $7,135,914) 0.2% | ||||||||||
Consumer Discretionary 0.2% | ||||||||||
a,b,c | Proterra Inc., pfd., 5, 144A | 1,416,913 | 7,849,500 | |||||||
|
| |||||||||
Total Investments before Short Term Investments (Cost $2,430,974,519) | 3,525,347,084 | |||||||||
|
| |||||||||
Short Term Investments 0.9% | ||||||||||
Money Market Funds (Cost $20,134,072) 0.6% | ||||||||||
e,f | Institutional Fiduciary Trust Money Market Portfolio, 0.69% | 20,134,072 | 20,134,072 | |||||||
|
| |||||||||
g | Investments from Cash Collateral Received for Loaned Securities (Cost $12,640,700) 0.3% | |||||||||
Money Market Funds 0.3% | ||||||||||
e,f | Institutional Fiduciary Trust Money Market Portfolio, 0.69% | 12,640,700 | 12,640,700 | |||||||
|
| |||||||||
Total Investments (Cost $2,463,749,291) 100.4% | 3,558,121,856 | |||||||||
Other Assets, less Liabilities (0.4)% | (13,165,074 | ) | ||||||||
|
| |||||||||
Net Assets 100.0% | $ | 3,544,956,782 | ||||||||
|
| |||||||||
aNon-income producing.
bFair valued using significant unobservable inputs. See Note 11 regarding fair value measurements.
cSee Note 7 regarding restricted securities.
dA portion or all of the security is on loan at October 31, 2017. See Note 1(d).
eSee Note 3(f) regarding investments in affiliated management investment companies.
fThe rate shown is the annualized seven-day yield at period end.
gSee Note 1(d) regarding securities on loan.
| 60 | Semiannual Report | The accompanying notes are an integral part of these financial statements. | franklintempleton.com | ||
FRANKLIN STRATEGIC SERIES
Statements of Assets and Liabilities
October 31, 2017 (unaudited)
| Franklin Focused Core Equity Fund | Franklin Growth Opportunities Fund | Franklin Growth Fund | Franklin Small-Mid Cap Growth Fund | |||||||||||||
Assets: | ||||||||||||||||
+Investments in securities: | ||||||||||||||||
Cost - Unaffiliated issuers | $ 80,142,967 | $1,993,069,928 | $1,764,832,757 | $2,430,974,519 | ||||||||||||
Cost - Non-controlled affiliates (Note 3f and 9) | 183,850 | 2,693,105 | 257,641,023 | 32,774,772 | ||||||||||||
|
| |||||||||||||||
Value - Unaffiliated issuers | $100,998,783 | $3,722,970,358 | $2,425,299,535 | $3,525,347,084 | ||||||||||||
Value - Non-controlled affiliates (Note 3f and 9) | 183,850 | 2,693,105 | 202,314,736 | 32,774,772 | ||||||||||||
Cash | 775 | — | — | — | ||||||||||||
Receivables: | ||||||||||||||||
Investment securities sold | — | 13,984,364 | 8,097,075 | 5,730,079 | ||||||||||||
Capital shares sold. | 45,476 | 23,485,288 | 1,083,776 | 3,978,094 | ||||||||||||
Dividends | 35,215 | 851,803 | 109,519 | 221,184 | ||||||||||||
Due from custodian | — | — | 68,475 | — | ||||||||||||
Other assets | 41 | 1,001 | 829 | 1,016 | ||||||||||||
|
| |||||||||||||||
Total assets | 101,264,140 | 3,763,985,919 | 2,636,973,945 | 3,568,052,229 | ||||||||||||
|
| |||||||||||||||
Liabilities: | ||||||||||||||||
Payables: | ||||||||||||||||
Investment securities purchased | — | 9,024,787 | 5,023,923 | — | ||||||||||||
Capital shares redeemed | 84,246 | 25,545,370 | 6,252,761 | 4,222,008 | ||||||||||||
Management fees | 60,234 | 1,698,857 | 1,318,995 | 1,388,355 | ||||||||||||
Distribution fees | 30,729 | 847,040 | 283,383 | 840,569 | ||||||||||||
Transfer agent fees. | 21,770 | 2,123,450 | 1,011,131 | 3,795,531 | ||||||||||||
Trustees’ fees and expenses | 159 | — | 1,107 | 697 | ||||||||||||
Funds advanced by custodian | — | 8,964,616 | — | — | ||||||||||||
Payable upon return of securities loaned | — | 2,682,500 | 58,133,625 | 12,640,700 | ||||||||||||
Accrued expenses and other liabilities | 30,178 | 121,936 | 215,883 | 207,587 | ||||||||||||
|
| |||||||||||||||
Total liabilities | 227,316 | 51,008,556 | 72,240,808 | 23,095,447 | ||||||||||||
|
| |||||||||||||||
Net assets, at value | $101,036,824 | $3,712,977,363 | $2,564,733,137 | $3,544,956,782 | ||||||||||||
|
| |||||||||||||||
Net assets consist of: | ||||||||||||||||
Paid-in capital | $ 84,524,609 | $1,694,830,885 | $1,918,372,933 | $2,164,476,485 | ||||||||||||
Undistributed net investment income (loss) | (153,816 | ) | (9,181,293 | ) | (10,488,198 | ) | (11,281,481 | ) | ||||||||
Net unrealized appreciation (depreciation) | 20,855,816 | 1,729,900,430 | 605,140,491 | 1,094,372,565 | ||||||||||||
Accumulated net realized gain (loss) | (4,189,785 | ) | 297,427,341 | 51,707,911 | 297,389,213 | |||||||||||
|
| |||||||||||||||
Net assets, at value | $101,036,824 | $3,712,977,363 | $2,564,733,137 | $3,544,956,782 | ||||||||||||
|
| |||||||||||||||
+Includes securities loaned | $ — | $ 2,789,800 | $ 57,169,978 | $ 12,542,710 | ||||||||||||
| franklintempleton.com | The accompanying notes are an integral part of these financial statements. | Semiannual Report | 61 | ||||
FRANKLIN STRATEGIC SERIES
FINANCIAL STATEMENTS
Statements of Assets and Liabilities (continued)
October 31, 2017 (unaudited)
| Franklin Focused Core Equity Fund | Franklin Growth Opportunities Fund | Franklin Small Cap Growth Fund | Franklin Small-Mid Cap Growth Fund | |||||||||||||
| Class A: | ||||||||||||||||
Net assets, at value | $67,852,568 | $2,356,734,460 | $683,306,811 | $2,306,834,411 | ||||||||||||
|
| |||||||||||||||
Shares outstanding | 4,346,292 | 60,609,537 | 32,131,137 | 61,379,042 | ||||||||||||
|
| |||||||||||||||
Net asset value per sharea | $15.61 | $38.88 | $21.27 | $37.58 | ||||||||||||
|
| |||||||||||||||
Maximum offering price per share (net asset value per share ÷ 94.25%) | $16.56 | $41.25 | $ 22.57 | $39.87 | ||||||||||||
|
| |||||||||||||||
| Class C: | ||||||||||||||||
Net assets, at value | $18,664,553 | $ 396,389,738 | $132,005,018 | $ 345,838,853 | ||||||||||||
|
| |||||||||||||||
Shares outstanding | 1,260,878 | 11,825,471 | 7,306,023 | 12,400,076 | ||||||||||||
|
| |||||||||||||||
Net asset value and maximum offering price per sharea | $14.80 | $33.52 | $18.07 | $27.89 | ||||||||||||
|
| |||||||||||||||
| Class R: | ||||||||||||||||
Net assets, at value | $ 164,011 | $ 46,761,924 | $ 74,696,546 | $ 74,880,865 | ||||||||||||
|
| |||||||||||||||
Shares outstanding | 10,645 | 1,250,455 | 3,677,801 | 2,150,286 | ||||||||||||
|
| |||||||||||||||
Net asset value and maximum offering price per share | $15.41 | $37.40 | $20.31 | $34.82 | ||||||||||||
|
| |||||||||||||||
| Class R6: | ||||||||||||||||
Net assets, at value | $ 858,410 | $ 353,808,426 | $915,731,849 | $ 249,424,785 | ||||||||||||
|
| |||||||||||||||
Shares outstanding | 54,043 | 8,469,324 | 39,960,404 | 6,057,914 | ||||||||||||
|
| |||||||||||||||
Net asset value and maximum offering price per share | $15.88 | $41.78 | $22.92 | $41.17 | ||||||||||||
|
| |||||||||||||||
| Advisor Class: | ||||||||||||||||
Net assets, at value | $13,497,282 | $ 559,282,815 | $758,992,913 | $ 567,977,868 | ||||||||||||
|
| |||||||||||||||
Shares outstanding | 852,498 | 13,510,638 | 33,448,006 | 13,971,135 | ||||||||||||
|
| |||||||||||||||
Net asset value and maximum offering price per share | $15.83 | $41.40 | $22.69 | $40.65 | ||||||||||||
|
| |||||||||||||||
aRedemption price is equal to net asset value less contingent deferred sales charges, if applicable.
| 62 | Semiannual Report | The accompanying notes are an integral part of these financial statements. | franklintempleton.com | ||
FRANKLIN STRATEGIC SERIES
FINANCIAL STATEMENTS
Statements of Operations
for the six months ended October 31, 2017 (unaudited)
| Franklin Focused Core Equity Fund | Franklin Growth Opportunities Fund | Franklin Small Cap Growth Fund | Franklin Small-Mid Cap Growth Fund | |||||||||||||
Investment income: | ||||||||||||||||
Dividends: | ||||||||||||||||
Unaffiliated issuers | $ 637,989 | $ 13,295,211 | $ 4,083,089 | $ 10,037,100 | ||||||||||||
Non-controlled affiliates (Note 3f and 9) | 2,748 | 74,480 | 114,048 | 343,696 | ||||||||||||
Interest: | ||||||||||||||||
Unaffiliated issuers | — | — | — | 8,968 | ||||||||||||
Income from securities loaned (net of fees and rebates) | — | 48,068 | 1,168,664 | 97,121 | ||||||||||||
Other income | — | — | 42,949 | 42,629 | ||||||||||||
|
| |||||||||||||||
Total investment income | 640,737 | 13,417,759 | 5,408,750 | 10,529,514 | ||||||||||||
|
| |||||||||||||||
Expenses: | ||||||||||||||||
Management fees (Note 3a) | 523,640 | 9,987,631 | 7,938,484 | 8,282,905 | ||||||||||||
Distribution fees: (Note 3c) | ||||||||||||||||
Class A | 91,297 | 2,912,665 | 871,724 | 2,971,013 | ||||||||||||
Class C | 97,805 | 1,966,776 | 671,055 | 1,783,551 | ||||||||||||
Class R | 348 | 120,293 | 189,833 | 203,191 | ||||||||||||
Transfer agent fees: (Note 3e) | ||||||||||||||||
Class A | 95,201 | 3,178,652 | 876,933 | 4,485,318 | ||||||||||||
Class C | 25,503 | 536,636 | 168,557 | 673,166 | ||||||||||||
Class R | 269 | 65,799 | 95,371 | 154,369 | ||||||||||||
Class R6 | 229 | 1,197 | 11,257 | 6,989 | ||||||||||||
Advisor Class | 17,784 | 773,901 | 983,281 | 1,073,760 | ||||||||||||
Custodian fees (Note 4) | 1,774 | 16,390 | 10,784 | 14,711 | ||||||||||||
Reports to shareholders | 8,984 | 161,837 | 119,435 | 162,454 | ||||||||||||
Registration and filing fees | 38,101 | 86,616 | 64,593 | 93,102 | ||||||||||||
Professional fees | 20,365 | 33,361 | 32,120 | 36,301 | ||||||||||||
Trustees’ fees and expenses | 782 | 15,241 | 14,463 | 18,431 | ||||||||||||
Other | 4,781 | 34,980 | 24,950 | 33,339 | ||||||||||||
|
| |||||||||||||||
Total expenses | 926,863 | 19,891,975 | 12,072,840 | 19,992,600 | ||||||||||||
Expense reductions (Note 4) | (44 | ) | (1,498 | ) | (78 | ) | (8 | ) | ||||||||
Expenses waived/paid by affiliates (Note 3f and 3g) | (190,161 | ) | (1,088,134 | ) | (201,262 | ) | (230,433 | ) | ||||||||
|
| |||||||||||||||
Net expenses | 736,658 | 18,802,343 | 11,871,500 | 19,762,159 | ||||||||||||
|
| |||||||||||||||
Net investment income (loss) | (95,921 | ) | (5,384,584 | ) | (6,462,750 | ) | (9,232,645 | ) | ||||||||
|
| |||||||||||||||
Realized and unrealized gains (losses): | ||||||||||||||||
Net realized gain (loss) from: | ||||||||||||||||
Investments: | ||||||||||||||||
Unaffiliated issuers | 4,974,171 | 120,310,787 | 141,938,087 | 204,500,345 | ||||||||||||
Written options | 7,133 | — | — | — | ||||||||||||
Foreign currency transactions | 1,276 | 4 | — | — | ||||||||||||
|
| |||||||||||||||
Net realized gain (loss) | 4,982,580 | 120,310,791 | 141,938,087 | 204,500,345 | ||||||||||||
|
| |||||||||||||||
Net change in unrealized appreciation (depreciation) on: | ||||||||||||||||
Investments: | ||||||||||||||||
Unaffiliated issuers | (2,266,310 | ) | 285,337,587 | 78,681,519 | 128,101,980 | |||||||||||
Non-controlled affiliates (Note 3f and 9) | — | — | (4,418,120 | ) | — | |||||||||||
Translation of other assets and liabilities denominated in foreign currencies | — | 84,732 | — | — | ||||||||||||
|
| |||||||||||||||
Net change in unrealized appreciation | ||||||||||||||||
(depreciation) | (2,266,310 | ) | 285,422,319 | 74,263,399 | 128,101,980 | |||||||||||
|
| |||||||||||||||
Net realized and unrealized gain (loss) | 2,716,270 | 405,733,110 | 216,201,486 | 332,602,325 | ||||||||||||
|
| |||||||||||||||
Net increase (decrease) in net assets resulting from operations | $2,620,349 | $400,348,526 | $209,738,736 | $323,369,680 | ||||||||||||
|
| |||||||||||||||
| franklintempleton.com | The accompanying notes are an integral part of these financial statements. | Semiannual Report | 63 | ||||
FRANKLIN STRATEGIC SERIES
FINANCIAL STATEMENTS
Statements of Changes in Net Assets
Franklin Focused Core Equity Fund | Franklin Growth Opportunities Fund | |||||||||||||||
Six Months Ended (unaudited) | Year Ended April 30, 2017 | Six Months Ended October 31, 2017 | Year Ended April 30, 2017 | |||||||||||||
Increase (decrease) in net assets: | ||||||||||||||||
Operations: | ||||||||||||||||
Net investment income (loss) | $ | (95,921 | ) | $ | (90,591 | ) | $ | (5,384,584 | ) | $ | (8,309,467 | ) | ||||
Net realized gain (loss) | 4,982,580 | (314,124 | ) | 120,310,791 | 270,084,144 | |||||||||||
Net change in unrealized appreciation (depreciation) | (2,266,310 | ) | 20,899,832 | 285,422,319 | 141,390,491 | |||||||||||
Net increase (decrease) in net assets resulting from operations | 2,620,349 | 20,495,117 | 400,348,526 | 403,165,168 | ||||||||||||
Distributions to shareholders from: | ||||||||||||||||
Net realized gains: | ||||||||||||||||
Class A | — | — | — | (44,859,072 | ) | |||||||||||
Class C | — | — | — | (8,913,159 | ) | |||||||||||
Class R | — | — | — | (1,075,523 | ) | |||||||||||
Class R6 | — | — | — | (5,023,963 | ) | |||||||||||
Advisor Class | — | — | — | (9,033,594 | ) | |||||||||||
Total distributions to shareholders | — | — | — | (68,905,311 | ) | |||||||||||
Capital share transactions: (Note 2) | ||||||||||||||||
Class A | (11,765,077 | ) | (35,011,790 | ) | (171,823,908 | ) | 1,519,824,161 | |||||||||
Class C | (2,111,395 | ) | (7,689,560 | ) | (35,514,321 | ) | 218,581,841 | |||||||||
Class R | (7,705 | ) | (130,011 | ) | (8,893,728 | ) | 4,640,014 | |||||||||
Class R6 | (19,443,672 | ) | (16,295,505 | ) | 27,139,456 | 22,457,460 | ||||||||||
Advisor Class | 24,891 | 100,080 | (40,679,204 | ) | 224,101,152 | |||||||||||
Total capital share transactions | (33,302,958 | ) | (59,026,786 | ) | (229,771,705 | ) | 1,989,604,628 | |||||||||
Net increase (decrease) in net assets | (30,682,609 | ) | (38,531,669 | ) | 170,576,821 | 2,323,864,485 | ||||||||||
Net assets: | ||||||||||||||||
Beginning of period | 131,719,433 | 170,251,102 | 3,542,400,542 | 1,218,536,057 | ||||||||||||
End of period | $ | 101,036,824 | $ | 131,719,433 | $ | 3,712,977,363 | $ | 3,542,400,542 | ||||||||
Undistributed net investment income (loss) included in net assets: | ||||||||||||||||
End of period | $ | (153,816 | ) | $ | (57,895 | ) | $ | (9,181,293 | ) | $ | (3,796,709 | ) | ||||
| 64 | Semiannual Report | The accompanying notes are an integral part of these financial statements. | franklintempleton.com | ||
FRANKLIN STRATEGIC SERIES
FINANCIAL STATEMENTS
Statements of Changes in Net Assets (continued)
Franklin Small Cap Growth Fund | Franklin Small-Mid Cap Growth Fund | |||||||||||||||
| Six Months Ended October 31, 2017 (unaudited) | Year Ended April 30, 2017 | Six Months Ended October 31, 2017 (unaudited) | Year Ended April 30, 2017 | |||||||||||||
Increase (decrease) in net assets: | ||||||||||||||||
Operations: | ||||||||||||||||
Net investment income (loss) | $ | (6,462,750 | ) | $ | (11,583,844 | ) | $ | (9,232,645 | ) | $ | (12,367,765 | ) | ||||
Net realized gain (loss) | 141,938,087 | 111,251,692 | 204,500,345 | 296,137,194 | ||||||||||||
Net change in unrealized appreciation (depreciation) | 74,263,399 | 397,379,604 | 128,101,980 | 204,507,795 | ||||||||||||
Net increase (decrease) in net assets resulting from operations | 209,738,736 | 497,047,452 | 323,369,680 | 488,277,224 | ||||||||||||
Distributions to shareholders from: | ||||||||||||||||
Net realized gains: | ||||||||||||||||
Class A | — | — | — | (136,505,889 | ) | |||||||||||
Class C | — | — | — | (29,638,216 | ) | |||||||||||
Class R | — | — | — | (5,497,412 | ) | |||||||||||
Class R6 | — | — | — | (12,322,477 | ) | |||||||||||
Advisor Class | — | — | — | (31,556,678 | ) | |||||||||||
Total distributions to shareholders | — | — | — | (215,520,672 | ) | |||||||||||
Capital share transactions: (Note 2) | ||||||||||||||||
Class A | (92,515,072 | ) | (210,965,256 | ) | (207,836,205 | ) | (104,570,061 | ) | ||||||||
Class C | (20,730,377 | ) | (40,612,322 | ) | (55,946,356 | ) | (25,199,072 | ) | ||||||||
Class R | (11,290,601 | ) | (14,134,257 | ) | (14,107,946 | ) | (11,196,875 | ) | ||||||||
Class R6 | (16,923,504 | ) | (157,322,943 | ) | 4,535,260 | (42,853,407 | ) | |||||||||
Advisor Class | (110,464,211 | ) | (193,970,739 | ) | (68,714,543 | ) | (14,527,511 | ) | ||||||||
Total capital share transactions | (251,923,765 | ) | (617,005,517 | ) | (342,069,790 | ) | (198,346,926 | ) | ||||||||
Net increase (decrease) in net assets | (42,185,029 | ) | (119,958,065 | ) | (18,700,110 | ) | 74,409,626 | |||||||||
Net assets: | ||||||||||||||||
Beginning of period | 2,606,918,166 | 2,726,876,231 | 3,563,656,892 | 3,489,247,266 | ||||||||||||
End of period | $ | 2,564,733,137 | $ | 2,606,918,166 | $ | 3,544,956,782 | $ | 3,563,656,892 | ||||||||
Undistributed net investment income (loss) included in net assets: | ||||||||||||||||
End of period | $ | (10,488,198 | ) | $ | (4,025,448 | ) | $ | (11,281,481 | ) | $ | (2,048,836 | ) | ||||
| franklintempleton.com | The accompanying notes are an integral part of these financial statements. | Semiannual Report | 65 | ||||
FRANKLIN STRATEGIC SERIES
Notes to Financial Statements (unaudited)
1. Organization and Significant Accounting Policies
Franklin Strategic Series (Trust) is registered under the Investment Company Act of 1940 (1940 Act) as an open-end management investment company, consisting of eight separate funds, four of which are included in this report (Funds) and applies the specialized accounting and reporting guidance in U.S. Generally Accepted Accounting Principles (U.S. GAAP). The Funds offer five classes of shares: Class A, Class C, Class R, Class R6, and Advisor Class. Each class of shares may differ by its initial sales load, contingent deferred sales charges, voting rights on matters affecting a single class, its exchange privilege and fees due to differing arrangements for distribution and transfer agent fees.
Franklin Small Cap Growth Fund was closed to new investors with limited exceptions effective at the close of market February 12, 2015. Effective April 28, 2017, the fund opened Class R6 shares to new investors who are eligible to purchase Class R6 shares.
The following summarizes the Funds’ significant accounting policies.
a. Financial Instrument Valuation
The Funds’ investments in financial instruments are carried at fair value daily. Fair value is the price that would be received to sell an asset or paid to transfer a liability in an orderly transaction between market participants on the measurement date. The Funds calculate the net asset value (NAV) per share as of 4 p.m. Eastern time each day the New York Stock Exchange (NYSE) is open for trading. Under compliance policies and procedures approved by the Trust’s Board of Trustees (the Board), the Funds’ administrator has responsibility for oversight of valuation, including leading the cross-functional Valuation Committee (VC). The VC provides administration and oversight of the Funds’ valuation policies and procedures, which are approved annually by the Board. Among other things, these procedures allow the Funds to utilize independent pricing services, quotations from securities and financial instrument dealers, and other market sources to determine fair value.
Equity securities and derivative financial instruments listed on an exchange or on the NASDAQ National Market System are valued at the last quoted sale price or the official closing price of the day, respectively. Foreign equity securities are valued as
of the close of trading on the foreign stock exchange on which the security is primarily traded, or as of 4 p.m. Eastern time. The value is then converted into its U.S. dollar equivalent at the foreign exchange rate in effect at 4 p.m. Eastern time on the day that the value of the security is determined. Over-the-counter (OTC) securities are valued within the range of the most recent quoted bid and ask prices. Securities that trade in multiple markets or on multiple exchanges are valued according to the broadest and most representative market. Certain equity securities are valued based upon fundamental characteristics or relationships to similar securities.
Investments in open-end mutual funds are valued at the closing NAV.
The Funds have procedures to determine the fair value of financial instruments for which market prices are not reliable or readily available. Under these procedures, the VC convenes on a regular basis to review such financial instruments and considers a number of factors, including significant unobservable valuation inputs, when arriving at fair value. The VC primarily employs a market-based approach which may use related or comparable assets or liabilities, recent transactions, market multiples, book values, and other relevant information for the investment to determine the fair value of the investment. An income-based valuation approach may also be used in which the anticipated future cash flows of the investment are discounted to calculate fair value. Discounts may also be applied due to the nature or duration of any restrictions on the disposition of the investments. Due to the inherent uncertainty of valuations of such investments, the fair values may differ significantly from the values that would have been used had an active market existed. The VC employs various methods for calibrating these valuation approaches including a regular review of key inputs and assumptions, transactional back-testing or disposition analysis, and reviews of any related market activity.
Trading in securities on foreign securities stock exchanges and OTC markets may be completed before 4 p.m. Eastern time. In addition, trading in certain foreign markets may not take place on every Funds’ business day. Occasionally, events occur between the time at which trading in a foreign security is completed and 4 p.m. Eastern time that might call into question the reliability of the value of a portfolio security held by the Fund. As a result, differences may arise between the value of the Funds’ portfolio securities as determined at the foreign market close and the latest indications of value at 4 p.m. Eastern
| 66 | Semiannual Report | franklintempleton.com | ||
FRANKLIN STRATEGIC SERIES
NOTES TO FINANCIAL STATEMENTS (UNAUDITED)
time. In order to minimize the potential for these differences, the VC monitors price movements following the close of trading in foreign stock markets through a series of country specific market proxies (such as baskets of American Depositary Receipts, futures contracts and exchange traded funds). These price movements are measured against established trigger thresholds for each specific market proxy to assist in determining if an event has occurred that may call into question the reliability of the values of the foreign securities held by the Funds. If such an event occurs, the securities may be valued using fair value procedures, which may include the use of independent pricing services.
When the last day of the reporting period is a non-business day, certain foreign markets may be open on those days that the Funds’ NAV is not calculated, which could result in differences between the value of the Funds’ portfolio securities on the last business day and the last calendar day of the reporting period. Any significant security valuation changes due to an open foreign market are adjusted and reflected by the Funds for financial reporting purposes.
b. Foreign Currency Translation
Portfolio securities and other assets and liabilities denominated in foreign currencies are translated into U.S. dollars based on the exchange rate of such currencies against U.S. dollars on the date of valuation. The Funds may enter into foreign currency exchange contracts to facilitate transactions denominated in a foreign currency. Purchases and sales of securities, income and expense items denominated in foreign currencies are translated into U.S. dollars at the exchange rate in effect on the transaction date. Portfolio securities and assets and liabilities denominated in foreign currencies contain risks that those currencies will decline in value relative to the U.S. dollar. Occasionally, events may impact the availability or reliability of foreign exchange rates used to convert the U.S. dollar equivalent value. If such an event occurs, the foreign exchange rate will be valued at fair value using procedures established and approved by the Board.
The Funds do not separately report the effect of changes in foreign exchange rates from changes in market prices on securities held. Such changes are included in net realized and unrealized gain or loss from investments in the Statements of Operations.
Realized foreign exchange gains or losses arise from sales of foreign currencies, currency gains or losses realized between the trade and settlement dates on securities transactions and the difference between the recorded amounts of dividends, interest, and foreign withholding taxes and the U.S. dollar equivalent of the amounts actually received or paid. Net unrealized foreign exchange gains and losses arise from changes in foreign exchange rates on foreign denominated assets and liabilities other than investments in securities held at the end of the reporting period.
c. Derivative Financial Instruments
Certain or all Funds invested in derivative financial instruments in order to manage risk or gain exposure to various other investments or markets. Derivatives are financial contracts based on an underlying or notional amount, require no initial investment or an initial net investment that is smaller than would normally be required to have a similar response to changes in market factors, and require or permit net settlement. Derivatives contain various risks including the potential inability of the counterparty to fulfill their obligations under the terms of the contract, the potential for an illiquid secondary market, and/or the potential for market movements which expose the Fund to gains or losses in excess of the amounts shown in the Statements of Assets and Liabilities. Realized gain and loss and unrealized appreciation and depreciation on these contracts for the period are included in the Statements of Operations.
Collateral requirements differ by type of derivative. Collateral or initial margin requirements are set by the broker or exchange clearing house for exchange traded and centrally cleared derivatives. Initial margin deposited is held at the exchange and can be in the form of cash and/or securities.
Certain or all Funds purchased or wrote exchange traded option contracts primarily to manage and/or gain exposure to equity price risk. An option is a contract entitling the holder to purchase or sell a specific amount of shares or units of an asset or notional amount of a swap (swaption), at a specified price. When an option is purchased or written, an amount equal to the premium paid or received is recorded as an asset or liability, respectively. Upon exercise of an option, the acquisition cost or sales proceeds of the underlying investment is adjusted by any premium received or paid. Upon expiration of an option, any premium received or paid is recorded as a realized gain or loss.
| franklintempleton.com | Semiannual Report | 67 | ||||
FRANKLIN STRATEGIC SERIES
NOTES TO FINANCIAL STATEMENTS (UNAUDITED)
1. Organization and Significant Accounting
Policies (continued)
c. Derivative Financial Instruments (continued)
Upon closing an option other than through expiration or exercise, the difference between the premium received or paid and the cost to close the position is recorded as a realized gain or loss.
See Note 8 regarding other derivative information.
d. Securities Lending
Certain or all Funds participate in an agency based securities lending program to earn additional income. The Fund receives cash collateral against the loaned securities in an amount equal to at least 102% of the fair value of the loaned securities. Collateral is maintained over the life of the loan in an amount not less than 100% of the fair value of loaned securities, as determined at the close of Fund business each day; any additional collateral required due to changes in security values is delivered to the Fund on the next business day. The collateral is deposited into a joint cash account with other funds and is used to invest in a money market fund managed by Franklin Advisers, Inc., an affiliate of the Funds, and/or uninvested cash as included in due from custodian in the Statements of Assets and Liabilities. The Fund may receive income from the investment of cash collateral, in addition to lending fees and rebates paid by the borrower. Income from securities loaned, net of fees paid to the securities lending agent and/or third-party vendor, is reported separately in the Statements of Operations. The Fund bears the market risk with respect to the collateral investment, securities loaned, and the risk that the agent may default on its obligations to the Fund. If the borrower defaults on its obligation to return the securities loaned, the Fund has the right to repurchase the securities in the open market using the collateral received. The securities lending agent has agreed to indemnify the Fund in the event of default by a third party borrower.
e. Income and Deferred Taxes
It is each Fund’s policy to qualify as a regulated investment company under the Internal Revenue Code. Each Fund intends to distribute to shareholders substantially all of its taxable income and net realized gains to relieve it from federal income and excise taxes. As a result, no provision for U.S. federal income taxes is required.
The Funds may be subject to foreign taxation related to income received, capital gains on the sale of securities and certain foreign currency transactions in the foreign jurisdictions in which the Funds invest. Foreign taxes, if any, are recorded based on the tax regulations and rates that exist in the foreign markets in which the Funds invest. When a capital gain tax is determined to apply, certain or all Funds record an estimated deferred tax liability in an amount that would be payable if the securities were disposed of on the valuation date.
Each Fund may recognize an income tax liability related to its uncertain tax positions under U.S. GAAP when the uncertain tax position has a less than 50% probability that it will be sustained upon examination by the tax authorities based on its technical merits. As of October 31, 2017, each Fund has determined that no tax liability is required in its financial statements related to uncertain tax positions for any open tax years (or expected to be taken in future tax years). Open tax years are those that remain subject to examination and are based on the statute of limitations in each jurisdiction in which the Fund invests.
f. Security Transactions, Investment Income, Expenses and
Distributions
Security transactions are accounted for on trade date. Realized gains and losses on security transactions are determined on a specific identification basis. Interest income and estimated expenses are accrued daily. Dividend income is recorded on the ex-dividend date except for certain dividends from securities where the dividend rate is not available. In such cases, the dividend is recorded as soon as the information is received by the Funds. Distributions to shareholders are recorded on the ex-dividend date. Distributable earnings are determined according to income tax regulations (tax basis) and may differ from earnings recorded in accordance with U.S. GAAP. These differences may be permanent or temporary. Permanent differences are reclassified among capital accounts to reflect their tax character. These reclassifications have no impact on net assets or the results of operations. Temporary differences are not reclassified, as they may reverse in subsequent periods.
Common expenses incurred by the Trust are allocated among the Funds based on the ratio of net assets of each Fund to the combined net assets of the Trust. Fund specific expenses are charged directly to the Fund that incurred the expense.
| 68 | Semiannual Report | franklintempleton.com | ||
FRANKLIN STRATEGIC SERIES
NOTES TO FINANCIAL STATEMENTS (UNAUDITED)
Realized and unrealized gains and losses and net investment income, excluding class specific expenses, are allocated daily to each class of shares based upon the relative proportion of net assets of each class. Differences in per share distributions by class are generally due to differences in class specific expenses.
g. Accounting Estimates
The preparation of financial statements in accordance with U.S. GAAP requires management to make estimates and assumptions that affect the reported amounts of assets and liabilities at the date of the financial statements and the amounts of income and expenses during the reporting period. Actual results could differ from those estimates.
h. Guarantees and Indemnifications
Under the Trust’s organizational documents, its officers and trustees are indemnified by the Trust against certain liabilities arising out of the performance of their duties to the Trust. Additionally, in the normal course of business, the Trust, on behalf of the Funds, enters into contracts with service providers that contain general indemnification clauses. The Trust’s maximum exposure under these arrangements is unknown as this would involve future claims that may be made against the Trust that have not yet occurred. Currently, the Trust expects the risk of loss to be remote.
2. Shares of Beneficial Interest
At October 31, 2017, there were an unlimited number of shares authorized (without par value). Transactions in the Funds’ shares were as follows:
Franklin Focused Core Equity Fund | Franklin Growth Opportunities Fund | |||||||||||||||
| Shares | Amount | Shares | Amount | |||||||||||||
| Class A Shares: | ||||||||||||||||
| Six Months ended October 31, 2017 | ||||||||||||||||
| Shares sold | 205,718 | $ | 3,151,211 | 3,654,426 | $ | 135,220,780 | ||||||||||
| Shares redeemed | (974,359 | ) | (14,916,288 | ) | (8,332,140 | ) | (307,044,688 | ) | ||||||||
|
| |||||||||||||||
| Net increase (decrease) | (768,641 | ) | $ | (11,765,077 | ) | (4,677,714 | ) | $ | (171,823,908 | ) | ||||||
|
| |||||||||||||||
| Year ended April 30, 2017 | ||||||||||||||||
| Shares sold | 766,686 | $ | 10,993,989 | 8,855,024 | $ | 285,856,595 | ||||||||||
| Shares issued in reinvestment of distributions | — | — | 1,336,770 | 41,439,884 | ||||||||||||
| Shares issued on reorganization | — | — | 55,853,813 | 1,797,934,327 | ||||||||||||
| Shares redeemed | (3,313,236 | ) | (46,005,779 | ) | (18,813,942 | ) | (605,406,645 | ) | ||||||||
|
| |||||||||||||||
| Net increase (decrease) | (2,546,550 | ) | $ | (35,011,790 | ) | 47,231,665 | $ | 1,519,824,161 | ||||||||
|
| |||||||||||||||
| Class C Shares: | ||||||||||||||||
| Six Months ended October 31, 2017 | ||||||||||||||||
| Shares sold | 86,031 | $ | 1,252,210 | 623,267 | $ | 19,695,780 | ||||||||||
| Shares redeemed | (231,420 | ) | (3,363,605 | ) | (1,748,126 | ) | (55,210,101 | ) | ||||||||
|
| |||||||||||||||
| Net increase (decrease) | (145,389 | ) | $ | (2,111,395 | ) | (1,124,859 | ) | $ | (35,514,321 | ) | ||||||
|
| |||||||||||||||
| Year ended April 30, 2017 | ||||||||||||||||
| Shares sold | 210,816 | $ | 2,860,457 | 905,877 | $ | 25,435,592 | ||||||||||
| Shares issued in reinvestment of distributions | — | — | 320,376 | 8,618,123 | ||||||||||||
| Shares issued on reorganization | — | — | 10,841,658 | 304,433,926 | ||||||||||||
| Shares redeemed | (801,361 | ) | (10,550,017 | ) | (4,303,742 | ) | (119,905,800 | ) | ||||||||
|
| |||||||||||||||
| Net increase (decrease) | (590,545 | ) | $ | (7,689,560 | ) | 7,764,169 | $ | 218,581,841 | ||||||||
|
| |||||||||||||||
| franklintempleton.com | Semiannual Report | 69 | ||||
FRANKLIN STRATEGIC SERIES
NOTES TO FINANCIAL STATEMENTS (UNAUDITED)
2. Shares of Beneficial Interest (continued)
Franklin Focused Core Equity Fund | Franklin Growth Opportunities Fund | |||||||||||||||
| Shares | Amount | Shares | Amount | |||||||||||||
| Class R Shares: | ||||||||||||||||
| Six Months ended October 31, 2017 | ||||||||||||||||
| Shares sold | 4,790 | $ | 72,450 | 91,719 | $ | 3,214,258 | ||||||||||
| Shares redeemed | (5,233 | ) | (80,155 | ) | (345,560 | ) | (12,107,986 | ) | ||||||||
|
| |||||||||||||||
| Net increase (decrease) | (443 | ) | $ | (7,705 | ) | (253,841 | ) | $ | (8,893,728 | ) | ||||||
|
|
|
|
|
|
|
| |||||||||
| Year ended April 30, 2017 | ||||||||||||||||
| Shares sold | 1,428 | $ | 19,514 | 11,331 | $ | 316,184 | ||||||||||
| Shares issued in reinvestment of distributions | — | — | 35,650 | 1,065,216 | ||||||||||||
| Shares issued on reorganization | — | — | 783,369 | 24,339,319 | ||||||||||||
| Shares redeemed | (11,363 | ) | (149,525 | ) | (680,834 | ) | (21,080,705 | ) | ||||||||
|
| |||||||||||||||
| Net increase (decrease) | (9,935 | ) | $ | (130,011 | ) | 149,516 | $ | 4,640,014 | ||||||||
|
| |||||||||||||||
| Class R6 Shares: | ||||||||||||||||
| Six Months ended October 31, 2017 | ||||||||||||||||
| Shares sold | 73,460 | $ | 1,160,444 | 1,090,005 | $ | 44,541,820 | ||||||||||
| Shares redeemed | (1,340,826 | ) | (20,604,116 | ) | (443,985 | ) | (17,402,364 | ) | ||||||||
|
| |||||||||||||||
| Net increase (decrease) | (1,267,366 | ) | $ | (19,443,672 | ) | 646,020 | $ | 27,139,456 | ||||||||
|
| |||||||||||||||
| Year ended April 30, 2017 | ||||||||||||||||
| Shares sold | 403,349 | $ | 5,673,073 | 854,113 | $ | 29,053,360 | ||||||||||
| Shares issued in reinvestment of distributions | — | — | 113,533 | 3,764,740 | ||||||||||||
| Shares issued on reorganization | — | — | 5,075,827 | 174,304,065 | ||||||||||||
| Shares redeemed | (1,616,859 | ) | (21,968,578 | ) | (5,495,669 | ) | (184,664,705 | ) | ||||||||
|
| |||||||||||||||
| Net increase (decrease) | (1,213,510 | ) | $ | (16,295,505 | ) | 547,804 | $ | 22,457,460 | ||||||||
|
| |||||||||||||||
| Advisor Class Shares: | ||||||||||||||||
| Six Months ended October 31, 2017 | ||||||||||||||||
| Shares sold | 167,603 | $ | 2,595,388 | 1,365,644 | $ | 53,117,593 | ||||||||||
| Shares redeemed | (164,672 | ) | (2,570,497 | ) | (2,367,708 | ) | (93,796,797 | ) | ||||||||
|
| |||||||||||||||
| Net increase (decrease) | 2,931 | $ | 24,891 | (1,002,064 | ) | $ | (40,679,204 | ) | ||||||||
|
| |||||||||||||||
| Year ended April 30, 2017 | ||||||||||||||||
| Shares sold | 870,779 | $ | 12,465,363 | 3,995,406 | $ | 136,490,569 | ||||||||||
| Shares issued in reinvestment of distributions | — | — | 268,379 | 8,837,733 | ||||||||||||
| Shares issued on reorganization | — | — | 9,066,575 | 309,442,413 | ||||||||||||
| Shares redeemed | (831,228 | ) | (12,365,283 | ) | (6,779,384 | ) | (230,669,563 | ) | ||||||||
|
| |||||||||||||||
| Net increase (decrease) | 39,551 | $ | 100,080 | 6,550,976 | $ | 224,101,152 | ||||||||||
|
| |||||||||||||||
| 70 | Semiannual Report | franklintempleton.com | ||
FRANKLIN STRATEGIC SERIES
NOTES TO FINANCIAL STATEMENTS (UNAUDITED)
Franklin Small Cap Growth Fund | Franklin Small-Mid Cap Growth Fund | |||||||||||||||
| Shares | Amount | Shares | Amount | |||||||||||||
| Class A Shares: | ||||||||||||||||
| Six Months ended October 31, 2017 | ||||||||||||||||
| Shares sold | 1,642,516 | $ | 32,761,159 | 5,475,179 | $ | 195,577,844 | ||||||||||
| Shares redeemed | (6,241,548 | ) | (125,276,231 | ) | (11,143,414 | ) | (403,414,049 | ) | ||||||||
|
| |||||||||||||||
| Net increase (decrease) | (4,599,032 | ) | $ | (92,515,072 | ) | (5,668,235 | ) | $ | (207,836,205 | ) | ||||||
|
| |||||||||||||||
| Year ended April 30, 2017 | ||||||||||||||||
| Shares sold | 4,458,478 | $ | 81,421,221 | 12,398,150 | $ | 412,209,497 | ||||||||||
| Shares issued in reinvestment of distributions | — | — | 3,813,303 | 122,521,421 | ||||||||||||
| Shares redeemed | (16,103,736 | ) | (292,386,477 | ) | (19,264,077 | ) | (639,300,979 | ) | ||||||||
|
| |||||||||||||||
| Net increase (decrease) | (11,645,258 | ) | $ | (210,965,256 | ) | (3,052,624 | ) | $ | (104,570,061 | ) | ||||||
|
| |||||||||||||||
| Class C Shares: | ||||||||||||||||
| Six Months ended October 31, 2017 | ||||||||||||||||
| Shares sold | 120,108 | $ | 2,040,815 | 555,286 | $ | 14,714,813 | ||||||||||
| Shares redeemed | (1,343,382 | ) | (22,771,192 | ) | (2,664,012 | ) | (70,661,169 | ) | ||||||||
|
| |||||||||||||||
| Net increase (decrease) | (1,223,274 | ) | $ | (20,730,377 | ) | (2,108,726 | ) | $ | (55,946,356 | ) | ||||||
|
| |||||||||||||||
| Year ended April 30, 2017 | ||||||||||||||||
| Shares sold | 428,443 | $ | 6,699,404 | 1,514,724 | $ | 38,005,629 | ||||||||||
| Shares issued in reinvestment of distributions | — | — | 1,158,597 | 27,806,305 | ||||||||||||
| Shares redeemed | (3,071,150 | ) | (47,311,726 | ) | (3,618,908 | ) | (91,011,006 | ) | ||||||||
|
| |||||||||||||||
| Net increase (decrease) | (2,642,707 | ) | $ | (40,612,322 | ) | (945,587 | ) | $ | (25,199,072 | ) | ||||||
|
| |||||||||||||||
| Class R Shares: | ||||||||||||||||
| Six Months ended October 31, 2017 | ||||||||||||||||
| Shares sold | 271,703 | $ | 5,212,415 | 290,194 | $ | 9,525,729 | ||||||||||
| Shares redeemed | (862,975 | ) | (16,503,016 | ) | (708,501 | ) | (23,633,675 | ) | ||||||||
|
| |||||||||||||||
| Net increase (decrease) | (591,272 | ) | $ | (11,290,601 | ) | (418,307 | ) | $ | (14,107,946 | ) | ||||||
|
| |||||||||||||||
| Year ended April 30, 2017 | ||||||||||||||||
| Shares sold | 925,913 | $ | 16,178,854 | 667,776 | $ | 20,604,680 | ||||||||||
| Shares issued in reinvestment of distributions | — | — | 177,385 | 5,293,167 | ||||||||||||
| Shares redeemed | (1,749,128 | ) | (30,313,111 | ) | (1,200,302 | ) | (37,094,722 | ) | ||||||||
|
| |||||||||||||||
| Net increase (decrease) | (823,215 | ) | $ | (14,134,257 | ) | (355,141 | ) | $ | (11,196,875 | ) | ||||||
|
| |||||||||||||||
Class R6 Shares: | ||||||||||||||||
| Six Months ended October 31, 2017 | ||||||||||||||||
| Shares sold | 4,666,388 | $ | 100,610,744 | 979,129 | $ | 37,895,425 | ||||||||||
| Shares redeemed | (5,487,496 | ) | (117,534,248 | ) | (854,263 | ) | (33,360,165 | ) | ||||||||
|
| |||||||||||||||
| Net increase (decrease) | (821,108 | ) | $ | (16,923,504 | ) | 124,866 | $ | 4,535,260 | ||||||||
|
| |||||||||||||||
| Year ended April 30, 2017 | ||||||||||||||||
| Shares sold | 13,928,123 | $ | 275,768,482 | 3,167,526 | $ | 112,096,496 | ||||||||||
| Shares issued in reinvestment of distributions | — | — | 337,444 | 11,820,661 | ||||||||||||
| Shares redeemed | (21,481,423 | ) | (433,091,425 | ) | (4,607,797 | ) | (166,770,564 | ) | ||||||||
|
| |||||||||||||||
| Net increase (decrease) | (7,553,300 | ) | $ | (157,322,943 | ) | (1,102,827 | ) | $ | (42,853,407 | ) | ||||||
|
| |||||||||||||||
| franklintempleton.com | Semiannual Report | 71 | ||||
FRANKLIN STRATEGIC SERIES
NOTES TO FINANCIAL STATEMENTS (UNAUDITED)
2. Shares of Beneficial Interest (continued)
Franklin Small Cap Growth Fund | Franklin Small-Mid Cap Growth Fund | |||||||||||||||
| Shares | Amount | Shares | Amount | |||||||||||||
| Advisor Class Shares: | ||||||||||||||||
| Six Months ended October 31, 2017 | ||||||||||||||||
| Shares sold | 2,499,749 | $ | 53,083,682 | 1,659,367 | $ | 63,777,401 | ||||||||||
| Shares redeemed | (7,631,931 | ) | (163,547,893 | ) | (3,447,517 | ) | (132,491,944 | ) | ||||||||
|
| |||||||||||||||
| Net increase (decrease) | (5,132,182 | ) | $ | (110,464,211 | ) | (1,788,150 | ) | $ | (68,714,543 | ) | ||||||
|
| |||||||||||||||
| Year ended April 30, 2017 | ||||||||||||||||
| Shares sold | 9,430,468 | $ | 185,643,970 | 4,591,094 | $ | 165,044,336 | ||||||||||
| Shares issued in reinvestment of distributions | — | — | 844,407 | 29,284,034 | ||||||||||||
| Shares redeemed | (19,741,159 | ) | (379,614,709 | ) | (5,814,226 | ) | (208,855,881 | ) | ||||||||
|
| |||||||||||||||
| Net increase (decrease) | (10,310,691 | ) | $ | (193,970,739 | ) | (378,725 | ) | $ | (14,527,511 | ) | ||||||
|
| |||||||||||||||
3. Transactions with Affiliates
Franklin Resources, Inc. is the holding company for various subsidiaries that together are referred to as Franklin Templeton Investments. Certain officers and trustees of the Trust are also officers and/or directors of the following subsidiaries:
| Subsidiary | Affiliation | |
Franklin Advisers, Inc. (Advisers)
| Investment manager
| |
Franklin Templeton Services, LLC (FT Services)
| Administrative manager
| |
Franklin Templeton Distributors, Inc. (Distributors)
| Principal underwriter
| |
Franklin Templeton Investor Services, LLC (Investor Services)
| Transfer agent
|
a. Management Fees
Franklin Focused Core Equity Fund pays an investment management fee to Advisers based on the average daily net assets of the Fund as follows:
| Annualized Fee Rate | Net Assets | |
0.950%
| Up to and including $500 million
| |
0.850%
| Over $500 million, up to and including $1 billion
| |
0.800%
| Over $1 billion, up to and including $1.5 billion
| |
0.750%
| Over $1.5 billion, up to and including $6.5 billion
| |
0.725%
| Over $6.5 billion, up to and including $11.5 billion
| |
0.700%
| Over $11.5 billion, up to and including $16.5 billion
| |
0.690%
| Over $16.5 billion, up to and including $19 billion
| |
0.680%
| Over $19 billion, up to and including $21.5 billion
| |
0.670%
| In excess of $21.5 billion
|
| 72 | Semiannual Report | franklintempleton.com | ||
FRANKLIN STRATEGIC SERIES
NOTES TO FINANCIAL STATEMENTS (UNAUDITED)
Franklin Growth Opportunities Fund pays an investment management fee to Advisers based on the average daily net assets of the Fund as follows:
| Annualized Fee Rate | Net Assets | |
0.700%
| Up to and including $500 million
| |
0.600%
| Over $500 million, up to and including $1 billion
| |
0.550%
| Over $1 billion, up to and including $1.5 billion
| |
0.500%
| Over $1.5 billion, up to and including $6.5 billion
| |
0.475%
| Over $6.5 billion, up to and including $11.5 billion
| |
0.450%
| Over $11.5 billion, up to and including $16.5 billion
| |
0.440%
| Over $16.5 billion, up to and including $19 billion
| |
0.430%
| Over $19 billion, up to and including $21.5 billion
| |
0.420%
| In excess of $21.5 billion
|
Franklin Small Cap Growth Fund pays an investment management fee to Advisers based on the average daily net assets of the Fund as follows:
| Annualized Fee Rate | Net Assets | |
0.750%
| Up to and including $500 million
| |
0.650%
| Over $500 million, up to and including $1 billion
| |
0.600%
| Over $1 billion, up to and including $1.5 billion
| |
0.550%
| Over $1.5 billion, up to and including $6.5 billion
| |
0.525%
| Over $6.5 billion, up to and including $11.5 billion
| |
0.500%
| Over $11.5 billion, up to and including $16.5 billion
| |
0.490%
| Over $16.5 billion, up to and including $19 billion
| |
0.480%
| Over $19 billion, up to and including $21.5 billion
| |
0.470%
| In excess of $21.5 billion
|
Franklin Small-Mid Cap Growth Fund pays an investment management fee to Advisers based on the average daily net assets of the Fund as follows:
| Annualized Fee Rate | Net Assets | |
0.625%
| Up to and including $100 million
| |
0.500%
| Over $100 million, up to and including $250 million
| |
0.450%
| Over $250 million, up to and including $7.5 billion
| |
0.440%
| Over $7.5 billion, up to and including $10 billion
| |
0.430%
| Over $10 billion, up to and including $12.5 billion
| |
0.420%
| Over $12.5 billion, up to and including $15 billion
| |
0.400%
| In excess of $15 billion
|
For the period ended October 31, 2017, each Fund’s annualized effective investment management fee rate based on average daily net assets was as follows:
Franklin Focused Core Equity Fund | Franklin Growth Opportunities Fund | Franklin Small Cap Growth Fund | Franklin Small-Mid Cap Growth Fund | |||
0.950% | 0.548% | 0.619% | 0.457% | |||
| franklintempleton.com | Semiannual Report | 73 | ||||
FRANKLIN STRATEGIC SERIES
NOTES TO FINANCIAL STATEMENTS (UNAUDITED)
3. Transactions with Affiliates (continued)
b. Administrative Fees
Under an agreement with Advisers, FT Services provides administrative services to the Funds. The fee is paid by Advisers based on each of the Funds’ average daily net assets, and is not an additional expense of the Funds.
c. Distribution Fees
The Board has adopted distribution plans for each share class, with the exception of Class R6 and Advisor Class shares, pursuant to Rule 12b-1 under the 1940 Act. Under the Funds’ Class A reimbursement distribution plans, the Funds reimburse Distributors for costs incurred in connection with the servicing, sale and distribution of each Fund’s shares up to the maximum annual plan rate. Under the Class A reimbursement distribution plans, costs exceeding the maximum for the current plan year cannot be reimbursed in subsequent periods. In addition, under the Funds’ Class C and R compensation distribution plans, the Funds pay Distributors for costs incurred in connection with the servicing, sale and distribution of each Fund’s shares up to the maximum annual plan rate for each class. The plan year, for purposes of monitoring compliance with the maximum annual plan rates, is February 1 through January 31 for each Fund.
The maximum annual plan rates, based on the average daily net assets, for each class, are as follows:
Franklin Focused Core Equity Fund | Franklin Growth Opportunities Fund | Franklin Small Cap Growth Fund | Franklin Small-Mid Cap Growth Fund | |||||||||||||
Reimbursement Plans: | ||||||||||||||||
Class A | 0.35% | 0.35% | 0.35% | 0.25% | ||||||||||||
Compensation Plans: | ||||||||||||||||
Class C | 1.00% | 1.00% | 1.00% | 1.00% | ||||||||||||
Class R | 0.50% | 0.50% | 0.50% | 0.50% | ||||||||||||
For Franklin Focused Core Equity Fund, Franklin Growth Opportunities Fund and Franklin Small Cap Growth Fund, the Board has set the current rate at 0.25% per year for Class A shares until further notice and approval by the Board.
d. Sales Charges/Underwriting Agreements
Front-end sales charges and contingent deferred sales charges (CDSC) do not represent expenses of the Funds. These charges are deducted from the proceeds of sales of fund shares prior to investment or from redemption proceeds prior to remittance, as applicable. Distributors has advised the Funds of the following commission transactions related to the sales and redemptions of the Funds’ shares for the period:
Franklin Focused Core Equity Fund | Franklin Growth Opportunities Fund | Franklin Small Cap Growth Fund | Franklin Small-Mid Cap Growth Fund | |||||||||||||
Sales charges retained net of commissions paid to unaffiliated brokers/dealers | $7,709 | $183,420 | $13,980 | $274,089 | ||||||||||||
CDSC retained | $ 765 | $ 9,939 | $ 1,884 | $ 18,538 | ||||||||||||
e. Transfer Agent Fees
Each class of shares, except for Class R6, pays transfer agent fees to Investor Services for its performance of shareholder servicing obligations and reimburses Investor Services for out of pocket expenses incurred, including shareholder servicing fees paid to third parties. These fees are allocated daily based upon their relative proportion of such classes’ aggregate net assets. Class R6 pays Investor Services transfer agent fees specific to that class.
| 74 | Semiannual Report | franklintempleton.com | ||
FRANKLIN STRATEGIC SERIES
NOTES TO FINANCIAL STATEMENTS (UNAUDITED)
For the period ended October 31, 2017, the Funds paid transfer agent fees as noted in the Statements of Operations of which the following amounts were retained by Investor Services:
Franklin Focused Core Equity Fund | Franklin Growth Opportunities Fund | Franklin Small Cap Growth Fund | Franklin Small-Mid Cap Growth Fund | |||||||||||||
Transfer agent fees | $44,771 | $1,742,927 | $769,224 | $1,745,353 | ||||||||||||
f. Investments in Affiliated Management Investment Companies
Certain or all Funds invest in one or more affiliated management investment companies for purposes other than exercising a controlling influence over the management or policies. Management fees paid by the Funds are waived on assets invested in the affiliated management investment companies, as noted in the Statements of Operations, in an amount not to exceed the management and administrative fees paid directly or indirectly by each affiliate. Prior to May 1, 2013, the waiver was accounted for as a reduction to management fees. During the period ended October 31, 2017, investments in affiliated management investment companies were as follows:
Number of at Beginning of Period | Gross Additions | Gross Reductions | Number of of Period | Value at End of Period | Dividend Income | Realized Gain (Loss) | Net Change in Unrealized Appreciation (Depreciation) | |||||||||||||||||||||||||
| Franklin Focused Core Equity Fund | ||||||||||||||||||||||||||||||||
| Non-Controlled Affiliates | ||||||||||||||||||||||||||||||||
Institutional Fiduciary Trust Money Market Portfolio, 0.69% | 2,075,737 | 10,432,479 | (12,324,366 | ) | 183,850 | $ | 183,850 | $ | 2,748 | $— | $— | |||||||||||||||||||||
| Franklin Growth Opportunities Fund | ||||||||||||||||||||||||||||||||
| Non-Controlled Affiliates | ||||||||||||||||||||||||||||||||
Institutional Fiduciary Trust Money Market Portfolio, 0.69% | 55,627,362 | 401,879,058 | (454,813,315 | ) | 2,693,105 | $ | 2,693,105 | $ | 74,480 | $— | $— | |||||||||||||||||||||
| Franklin Small Cap Growth Fund | ||||||||||||||||||||||||||||||||
| Non-Controlled Affiliates | ||||||||||||||||||||||||||||||||
Institutional Fiduciary Trust Money Market Portfolio, 0.69% | 106,566,728 | 446,881,813 | (457,615,616 | ) | 95,832,925 | $ | 95,832,925 | $ | 114,048 | $— | $— | |||||||||||||||||||||
| Franklin Small-Mid Cap Growth Fund | ||||||||||||||||||||||||||||||||
| Non-Controlled Affiliates | ||||||||||||||||||||||||||||||||
Institutional Fiduciary Trust Money Market Portfolio, 0.69% | 133,872,460 | 482,258,879 | (583,356,567 | ) | 32,774,772 | $ | 32,774,772 | $ | 343,696 | $— | $— | |||||||||||||||||||||
g. Waiver and Expense Reimbursements
Advisers and Investor Services have contractually agreed in advance to waive or limit their respective fees and to assume as their own expense certain expenses otherwise payable by Franklin Focused Core Equity Fund so that the expenses (excluding distribution fees, and acquired fund fees and expenses) for Class A, Class C, Class R and Advisor Class of the Fund does not exceed 1.00%, and Class R6 does not exceed 0.84% based on the average net assets of each class (other than certain non-routine expenses or costs, including those relating to litigation, indemnification, reorganizations, and liquidations) until August 31, 2018. Total expenses waived or paid are not subject to recapture subsequent to the Fund’s fiscal year end.
Additionally, Advisers had contractually agreed to waive or limit its fees so that the management fees paid by Franklin Growth Opportunities Fund did not exceed an annual rate of 0.46% of the fund’s average daily net assets through August 31, 2017. Total expenses waived or paid are not subject to recapture subsequent to the Fund’s fiscal year end. Effective September 1, 2017, the contractual waiver was eliminated.
| franklintempleton.com | Semiannual Report | 75 | ||||
FRANKLIN STRATEGIC SERIES
NOTES TO FINANCIAL STATEMENTS (UNAUDITED)
3. Transactions with Affiliates (continued)
h. Other Affiliated Transactions
At October 31, 2017, one or more of the funds in Franklin Fund Allocator Series owned a percentage of the following Funds’ outstanding shares:
Franklin Growth Opportunities Fund | Franklin Small Cap Growth Fund | |||||||
| 5.7% | 2.1% | |||||||
i. Interfund Transactions
Certain or all Funds engaged in purchases and sales of investments with funds or other accounts that have common investment managers (or affiliated investment managers), directors, trustees or officers. These purchases and sales for the period ended October 31, 2017, were as follows:
Franklin Growth Opportunities Fund | Franklin Small-Mid Cap Growth Fund | |||||||
Purchases | $3,065,000 | $ — | ||||||
Sales. | $ — | $ 7,546,199 | ||||||
4. Expense Offset Arrangement
The Funds have entered into an arrangement with their custodian whereby credits realized as a result of uninvested cash balances are used to reduce a portion of the Funds’ custodian expenses. During the period ended October 31, 2017, the custodian fees were reduced as noted in the Statements of Operations.
5. Income Taxes
For tax purposes, capital losses may be carried over to offset future capital gains, if any. At April 30, 2017, the capital loss carryforwards were as follows:
Franklin Focused Core Equity Fund | Franklin Small Cap Growth Fund | |||||||
Capital loss carryforwards: | ||||||||
Short term | $5,899,323 | $38,560,351 | ||||||
Long term. | 2,295,643 | 47,722,757 | ||||||
|
| |||||||
Total capital loss carryforwards | $8,194,966 | $86,283,108 | ||||||
|
| |||||||
For tax purposes, the Funds may elect to defer any portion of a late-year ordinary loss to the first day of the following fiscal year. At April 30, 2017, deferred late-year ordinary losses were as follows:
Franklin Focused Core Equity Fund | Franklin Growth Opportunities Fund | Franklin Small Cap Growth Fund | Franklin Small-Mid Cap Growth Fund | |||||||||||||
Late-year ordinary losses | $57,897 | $3,796,709 | $4,076,576 | $2,089,932 | ||||||||||||
| 76 | Semiannual Report | franklintempleton.com | ||
FRANKLIN STRATEGIC SERIES
NOTES TO FINANCIAL STATEMENTS (UNAUDITED)
At October 31, 2017, the cost of investments and net unrealized appreciation (depreciation) for income tax purposes were as follows:
| Franklin Focused Core Equity Fund | Franklin Growth Opportunities Fund | Franklin Small Cap | Franklin Small-Mid Cap Growth Fund | |||||||||||||
Cost of investments |
|
$81,304,217 |
|
|
$2,000,947,835 |
|
|
$2,026,420,849 |
|
|
$2,468,218,046 |
| ||||
|
| |||||||||||||||
Unrealized appreciation | $23,996,530 | $1,744,704,884 | $809,031,727 | $1,120,374,746 | ||||||||||||
Unrealized depreciation | (4,118,114 | ) | (19,989,256 | ) | (207,838,305 | ) | (30,470,936) | |||||||||
|
| |||||||||||||||
Net unrealized appreciation (depreciation) | $19,878,416 | $1,724,715,628 | $601,193,422 | $1,089,903,810 | ||||||||||||
|
| |||||||||||||||
Differences between income and/or capital gains as determined on a book basis and a tax basis are primarily due to differing treatments of wash sales.
6. Investment Transactions
Purchases and sales of investments (excluding short term securities) for the period ended October 31, 2017, were as follows:
Franklin Focused Core Equity Fund | Franklin Growth Opportunities Fund | Franklin Small Cap Growth Fund | Franklin Small-Mid Cap Growth Fund | |||||||||||||
Purchases |
|
$17,985,246 |
|
|
$384,722,548 |
|
|
$352,454,991 |
|
|
$ 904,772,747 |
| ||||
Sales | $49,448,455 | $571,509,523 | $608,220,046 | $1,160,040,090 | ||||||||||||
At October 31, 2017, in connection with securities lending transactions, certain or all Funds loaned investments and received cash collateral as follows:
| Equity Investmentsa | ||||
Securities lending transactionsb: | ||||
Franklin Growth Opportunities Fund | $ 2,682,500 | |||
Franklin Small Cap Growth Fund. | $58,133,625 | |||
Franklin Small-Mid Cap Growth Fund | $12,640,700 | |||
aThe gross amount of recognized liability for such transactions is included in payable upon return of securities loaned in the Statements of Assets and Liabilities. bThe agreements can be terminated at any time.
7. Restricted Securities
Certain or all Funds invest in securities that are restricted under the Securities Act of 1933 (1933 Act). Restricted securities are often purchased in private placement transactions, and cannot be sold without prior registration unless the sale is pursuant to an exemption under the 1933 Act. Disposal of these securities may require greater effort and expense, and prompt sale at an acceptable price may be difficult. The Funds may have registration rights for restricted securities. The issuer generally incurs all registration costs.
At October 31, 2017, investments in restricted securities, excluding securities exempt from registration under the 1933 Act deemed to be liquid, were as follows:
| Shares Issuer | Acquisition Date | Cost | Value | |||||||||
Franklin Growth Opportunities Fund | ||||||||||||
2,362,202 Proterra Inc., pfd., 5, 144A. | 9/21/16 - 1/13/17 | $ | 11,896,616 | $ | 13,086,268 | |||||||
596,775 Proterra Inc., pfd., 6 | 6/07/17 | 3,306,052 | 3,306,050 | |||||||||
| franklintempleton.com | Semiannual Report | 77 | ||||
FRANKLIN STRATEGIC SERIES
NOTES TO FINANCIAL STATEMENTS (UNAUDITED)
7. Restricted Securities (continued)
| Shares | Issuer | Acquisition Date | Cost | Value | ||||||||||||
Franklin Growth Opportunities Fund (continued) | ||||||||||||||||
| 805,800 | Tanium Inc., pfd., G | 9/14/15 | $ | 4,000,233 | $ | 4,000,233 | ||||||||||
|
| |||||||||||||||
Total Restricted Securities (Value is 0.5% of Net Assets) | $ | 19,202,901 | $ | 20,392,551 | ||||||||||||
|
| |||||||||||||||
Franklin Small Cap Growth Fund | ||||||||||||||||
| 9,905,685 | DraftKings Inc. | 8/07/15 - 3/02/17 | $ | 26,627,302 | $ | 15,448,919 | ||||||||||
| 1,787,047 | Proterra Inc., pfd., 5, 144A. | 9/21/16 - 1/13/17 | 8,999,998 | 9,899,990 | ||||||||||||
| 877,611 | Proterra Inc., pfd., 6 | 6/07/17 | 4,861,845 | 4,861,842 | ||||||||||||
| 1,542,673 | Smule Inc., pfd., G, 144A. | 5/31/16 | 11,099,995 | 13,122,593 | ||||||||||||
| 352,675 | Smule Inc., pfd., H, 144A. | 4/27/17 | 2,999,995 | 2,999,995 | ||||||||||||
| 3,611,111 | Tula Technology Inc., E | 9/08/17 | 6,500,000 | 6,500,000 | ||||||||||||
|
| |||||||||||||||
Total Restricted Securities (Value is 2.1% of Net Assets) | $ | 61,089,135 | $ | 52,833,339 | ||||||||||||
|
| |||||||||||||||
Franklin Small-Mid Cap Growth Fund | ||||||||||||||||
| 7,974,537 | DraftKings Inc. | 8/07/15 - 3/02/17 | $ | 21,380,303 | $ | 12,437,097 | ||||||||||
| 1,416,913 | Proterra Inc., pfd., 5, 144A. | 9/21/16 | 7,135,914 | 7,849,500 | ||||||||||||
|
| |||||||||||||||
Total Restricted Securities(Value is 0.6% of Net Assets) |
| $ | 28,516,217 | $ | 20,286,597 | |||||||||||
|
| |||||||||||||||
8. Other Derivative Information
For the period ended October 31, 2017, the effect of derivative contracts in the Fund’s Statement of Operations was as follows:
Derivative Contracts Not Accounted for as Hedging Instruments | Statement of Operations Location | Net Realized Gain (Loss) for the Period | Statement of Operations Location | Net Change in Unrealized Appreciation (Depreciation) for the Period | ||||||||
| Net realized gain (loss) from: | Net change in unrealized | |||||||||||
| appreciation (depreciation) on: | ||||||||||||
| Equity contracts | Written options | $7,133 | Written options | $— | ||||||||
For the period ended October 31, 2017, the average month end notional amount of options contracts represented $0.
See Note 1(c) regarding derivative financial instruments.
9. Holdings of 5% Voting Securities of Portfolio Companies
The 1940 Act defines “affiliated companies” to include investments in portfolio companies in which a fund owns 5% or more of the outstanding voting securities. During the period ended October 31, 2017, investments in “affiliated companies” were as follows:
| Name of Issuer | Number of at Beginning | Gross Additions | Gross Reductions | Number of at End of Period | Value at End of Period | Dividend Income | Realized Gain (Loss) | Net Change in Unrealized Appreciation (Depreciation) | ||||||||||||||||||||||||
| Franklin Small Cap Growth Fund | ||||||||||||||||||||||||||||||||
| Non-Controlled Affiliates | ||||||||||||||||||||||||||||||||
Aratana Therapeutics Inc. | 2,697,019 | — | — | 2,697,019 | $ | 15,453,919 | $ — | $ — | $(1,267,599 | ) | ||||||||||||||||||||||
Boot Barn Holdings Inc. | 1,288,939 | 386,000 | — | 1,674,939 | 13,784,748 | — | — | (2,943,721 | ) | |||||||||||||||||||||||
Echo Global Logistics Inc. | 1,006,625 | 397,200 | — | 1,403,825 | 33,761,991 | — | — | 7,881,872 | ||||||||||||||||||||||||
The KeyW Holding Corp. | 3,006,882 | — | — | 3,006,882 | 22,701,959 | — | — | (5,833,351 | ) | |||||||||||||||||||||||
Pfenex Inc. | 1,175,631 | — | — | 1,175,631 | 3,714,994 | — | — | (1,939,791 | ) | |||||||||||||||||||||||
| 78 | Semiannual Report | franklintempleton.com | ||
FRANKLIN STRATEGIC SERIES
NOTES TO FINANCIAL STATEMENTS (UNAUDITED)
| Name of Issuer | Number of at Beginning | Gross Additions | Gross Reductions | Number of at End of Period | Value at End of Period | Dividend Income | Realized Gain (Loss) | Net Change in Unrealized Appreciation (Depreciation) | ||||||||||||||||||||||||
| Franklin Small Cap Growth Fund (continued) | ||||||||||||||||||||||||||||||||
| Non-Controlled Affiliates (continued) | ||||||||||||||||||||||||||||||||
Sportsman’s Warehouse Holdings Inc. | 3,944,700 | 217,300 | — | 4,162,000 | $ | 17,064,200 | $ — | $ — | $ (315,530 | ) | ||||||||||||||||||||||
|
| |||||||||||||||||||||||||||||||
Total Affiliated Securities (Value is 4.2% of Net Assets) |
| $ | 106,481,811 | $ — | $ — | $(4,418,120 | ) | |||||||||||||||||||||||||
|
| |||||||||||||||||||||||||||||||
10. Credit Facility
The Funds, together with other U.S. registered and foreign investment funds (collectively, Borrowers), managed by Franklin Templeton Investments, are borrowers in a joint syndicated senior unsecured credit facility totaling $2 billion (Global Credit Facility) which matures on February 9, 2018. This Global Credit Facility provides a source of funds to the Borrowers for temporary and emergency purposes, including the ability to meet future unanticipated or unusually large redemption requests.
Under the terms of the Global Credit Facility, the Funds shall, in addition to interest charged on any borrowings made by the Funds and other costs incurred by the Funds, pay their share of fees and expenses incurred in connection with the implementation and maintenance of the Global Credit Facility, based upon their relative share of the aggregate net assets of all of the Borrowers, including an annual commitment fee of 0.15% based upon the unused portion of the Global Credit Facility. These fees are reflected in other expenses in the Statements of Operations. During the period ended October 31, 2017, the Funds did not use the Global Credit Facility.
11. Fair Value Measurements
The Funds follow a fair value hierarchy that distinguishes between market data obtained from independent sources (observable inputs) and the Funds’ own market assumptions (unobservable inputs). These inputs are used in determining the value of the Funds’ financial instruments and are summarized in the following fair value hierarchy:
| • | Level 1 – quoted prices in active markets for identical financial instruments |
| • | Level 2 – other significant observable inputs (including quoted prices for similar financial instruments, interest rates, prepayment speed, credit risk, etc.) |
| • | Level 3 – significant unobservable inputs (including the Funds’ own assumptions in determining the fair value of financial instruments) |
The input levels are not necessarily an indication of the risk or liquidity associated with financial instruments at that level.
For movements between the levels within the fair value hierarchy, the Funds have adopted a policy of recognizing the transfers as of the date of the underlying event which caused the movement.
| franklintempleton.com | Semiannual Report | 79 | ||||
FRANKLIN STRATEGIC SERIES
NOTES TO FINANCIAL STATEMENTS (UNAUDITED)
11. Fair Value Measurements (continued)
A summary of inputs used as of October 31, 2017, in valuing the Funds’ assets carried at fair value, is as follows:
| Level 1 | Level 2 | Level 3 | Total | |||||||||||||
| Franklin Focused Core Equity Fund | ||||||||||||||||
Assets: | ||||||||||||||||
Investments in Securities: | ||||||||||||||||
Equity Investmentsa | $ | 100,998,783 | $ | — | $ | — | $ | 100,998,783 | ||||||||
Short Term Investments | 183,850 | — | — | 183,850 | ||||||||||||
|
| |||||||||||||||
Total Investments in Securities | $ | 101,182,633 | $ | — | $ | — | $ | 101,182,633 | ||||||||
|
| |||||||||||||||
| Franklin Growth Opportunities Fund | ||||||||||||||||
Assets: | ||||||||||||||||
Investments in Securities: | ||||||||||||||||
Equity Investments:b | ||||||||||||||||
Consumer Discretionary | $ | 456,700,699 | $ | — | $ | 16,392,318 | $ | 473,093,017 | ||||||||
Information Technology | 1,849,918,615 | — | 4,000,233 | 1,853,918,848 | ||||||||||||
All Other Equity Investmentsa | 1,395,958,493 | — | — | 1,395,958,493 | ||||||||||||
Short Term Investments | 2,693,105 | — | — | 2,693,105 | ||||||||||||
|
| |||||||||||||||
Total Investments in Securities | $ | 3,705,270,912 | $ | — | $ | 20,392,551 | $ | 3,725,663,463 | ||||||||
|
| |||||||||||||||
| Franklin Small Cap Growth Fund | ||||||||||||||||
Assets: | ||||||||||||||||
Investments in Securities: | ||||||||||||||||
Equity Investments:b | ||||||||||||||||
Consumer Discretionary | $ | 329,673,853 | $ | — | $ | 36,710,751 | $ | 366,384,604 | ||||||||
Information Technology | 833,333,337 | — | 16,122,588 | 849,455,925 | ||||||||||||
All Other Equity Investmentsa | 1,315,940,817 | — | — | 1,315,940,817 | ||||||||||||
Short Term Investments | 95,832,925 | — | — | 95,832,925 | ||||||||||||
|
| |||||||||||||||
Total Investments in Securities | $ | 2,574,780,932 | $ | — | $ | 52,833,339 | $ | 2,627,614,271 | ||||||||
|
| |||||||||||||||
| Franklin Small-Mid Cap Growth Fund | ||||||||||||||||
Assets: | ||||||||||||||||
Investments in Securities: | ||||||||||||||||
Equity Investments:b | ||||||||||||||||
Consumer Discretionary | $ | 469,295,084 | $ | — | $ | 20,286,597 | $ | 489,581,681 | ||||||||
All Other Equity Investmentsa | 3,035,765,403 | — | — | 3,035,765,403 | ||||||||||||
Short Term Investments | 32,774,772 | — | — | 32,774,772 | ||||||||||||
|
| |||||||||||||||
Total Investments in Securities | $ | 3,537,835,259 | $ | — | $ | 20,286,597 | $ | 3,558,121,856 | ||||||||
|
| |||||||||||||||
aFor detailed categories, see the accompanying Statement of Investments.
bIncludes common and preferred stocks.
| 80 | Semiannual Report | franklintempleton.com | ||
FRANKLIN STRATEGIC SERIES
NOTES TO FINANCIAL STATEMENTS (UNAUDITED)
A reconciliation of assets in which Level 3 inputs are used in determining fair value is presented when there are significant Level 3 financial instruments at the beginning and/or end of the period. At October 31, 2017, the reconciliation of assets is as follows:
| Balance at Beginning of Period | Purchases | Sales | Transfer Into (Out of) Level 3 | Cost Basis Adjustments | Net Realized Gain (Loss) | Net Unrealized Appreciation (Depreciation) | Balance at End of Period | Net Change in Period End | ||||||||||||||||||||||||||||
| Franklin Small Cap Growth Fund | ||||||||||||||||||||||||||||||||||||
Assets: | ||||||||||||||||||||||||||||||||||||
Investments in Securities: |
| |||||||||||||||||||||||||||||||||||
Equity Investments:a |
| |||||||||||||||||||||||||||||||||||
Consumer Discretionary | $28,079,771 | $11,361,846 | $— | $— | $— | $— | $(2,730,866 | ) | $36,710,751 | $(2,730,866 | ) | |||||||||||||||||||||||||
Information Technology | 16,122,588 | — | — | — | — | — | — | 16,122,588 | — | |||||||||||||||||||||||||||
|
| |||||||||||||||||||||||||||||||||||
Total Investments in Securities | $44,202,359 | $11,361,846 | $— | $— | $— | $— | $(2,730,866 | ) | $52,833,339 | $(2,730,866 | ) | |||||||||||||||||||||||||
|
| |||||||||||||||||||||||||||||||||||
aIncludes preferred stocks.
Significant unobservable valuation inputs for material Level 3 financial instruments and impact to fair value as a result of changes in unobservable valuation inputs as of October 31, 2017, are as follows:
| Description | Fair Value at End of Year | Valuation Technique | Unobservable Input | Amount | Impact to Fair Value if Input Increasesa | |||||||||||||||
| Franklin Small Cap Growth Fund | ||||||||||||||||||||
Assets: | ||||||||||||||||||||
Investments in Securities: | ||||||||||||||||||||
Equity Investments:b | ||||||||||||||||||||
Consumer Discretionary | $ | 15,448,919 | Market Transaction | | Implied Enterprise Value | | $ | 775 (mil | ) | Increase | ||||||||||
All Other Investmentsc | 37,384,420 | |||||||||||||||||||
| Total | $ | 52,833,339 | ||||||||||||||||||
aRepresents the directional change in the fair value of the Level 3 financial instruments that would result from a significant and reasonable increase in the corresponding input. A significant and reasonable decrease in the input would have the opposite effect. Significant impacts, if any, to fair value and/or net assets have been indicated.
bIncludes preferred stocks.
cIncludes financial instruments with values derived using prior transaction prices or third party pricing information without adjustment for which such inputs are unobservable. May also include fair value of immaterial financial instruments developed using various valuation techniques and unobservable inputs.
12. Subsequent Events
The Funds have evaluated subsequent events through the issuance of the financial statements and determined that no events have occurred that require disclosure.
Abbreviations
| Selected Portfolio | ||
| ADR | American Depositary Receipt |
| franklintempleton.com | Semiannual Report | 81 | ||||
FRANKLIN STRATEGIC SERIES
Proxy Voting Policies and Procedures
The Trust’s investment manager has established Proxy Voting Policies and Procedures (Policies) that the Trust uses to determine how to vote proxies relating to portfolio securities. Shareholders may view the Trust’s complete Policies online at franklintempleton.com. Alternatively, shareholders may request copies of the Policies free of charge by calling the Proxy Group collect at (954) 527-7678 or by sending a written request to: Franklin Templeton Companies, LLC, 300 S.E. 2nd Street, Fort Lauderdale, FL 33301, Attention: Proxy Group. Copies of the Trust’s proxy voting records are also made available online at franklintempleton.com and posted on the US Securities and Exchange Commission’s website at sec.gov and reflect the most recent 12-month period ended June 30.
Quarterly Statement of Investments
The Trust files a complete statement of investments with the US Securities and Exchange Commission for the first and third quarters for each fiscal year on Form N-Q. Shareholders may view the filed Form N-Q by visiting the Commission’s website at sec.gov. The filed form may also be viewed and copied at the Commission’s Public Reference Room in Washington, DC. Information regarding the operations of the Public Reference Room may be obtained by calling (800) SEC-0330.
| 82 | Semiannual Report | franklintempleton.com | ||
This page intentionally left blank.
This page intentionally left blank.
|
Semiannual Report and Shareholder Letter | |
| Franklin Strategic Series | ||
| Investment Manager | ||
| Franklin Advisers, Inc. | ||
| Distributor | ||
| Franklin Templeton Distributors, Inc. | ||
| (800) DIAL BEN® / 342-5236 | ||
| franklintempleton.com | ||
| Shareholder Services | ||
| (800) 632-2301 |
Authorized for distribution only when accompanied or preceded by a summary prospectus and/or prospectus. Investors should carefully consider a fund’s investment goals, risks, charges and expenses before investing. A prospectus contains this and other information; please read it carefully before investing.
To help ensure we provide you with quality service, all calls to and from our service areas are monitored and/or recorded.
| © 2017 Franklin Templeton Investments. All rights reserved. | FSS1 S2017 12/17 |
| Semiannual Report and Shareholder Letter
October 31, 2017 | |||
Franklin Biotechnology Discovery Fund
Franklin Natural Resources Fund
Sign up for electronic delivery at franklintempleton.com/edelivery
Franklin Templeton Investments
Gain From Our Perspective®
At Franklin Templeton Investments, we’re dedicated to one goal: delivering exceptional asset management for our clients. By bringing together multiple, world-class investment teams in a single firm, we’re able to offer specialized expertise across styles and asset classes, all supported by the strength and resources of one of the world’s largest asset managers. This has helped us to become a trusted partner to individual and institutional investors across the globe.
Dear Shareholder:
During the six months ended October 31, 2017, mostly upbeat economic data, improved US corporate earnings and a supportive monetary policy were positives for US securities markets. At its June meeting, the US Federal Reserve (Fed) increased its target range for the federal funds rate a quarter point to 1.00%–1.25%. Despite low inflation, the Fed made this decision amid signs of a strengthening labor market and moderately rising economic activity. The 10-year US Treasury yield began the period at 2.29% and ended the period at 2.38%. In this environment, US stocks, as measured by the Standard & Poor’s 500® Index, generated a +9.10% total return for the six-month period.1
We are committed to our long-term perspective and disciplined investment approach as we conduct a rigorous, fundamental analysis of securities with a regular emphasis on investment risk management.
We believe active, professional investment management serves investors well. We also recognize the important role of financial advisors in today’s markets and encourage investors to continue to seek their advice. Amid changing markets and economic conditions, we are confident investors with a well-diversified portfolio and a patient, long-term outlook should be well positioned for the years ahead.
In addition, Franklin Strategic Series’ semiannual report includes more detail about prevailing conditions and a
discussion about investment decisions during the period. Please remember all securities markets fluctuate, as do mutual fund share prices.
We thank you for investing with Franklin Templeton, welcome your questions and comments, and look forward to serving your future investment needs.
Sincerely,
Edward B. Jamieson
President and Chief Executive Officer –
Investment Management
Franklin Strategic Series
This letter reflects our analysis and opinions as of October 31, 2017, unless otherwise indicated. The information is not a complete analysis of every aspect of any market, country, industry, security or fund. Statements of fact are from sources considered reliable.
1. Source: Morningstar
See www.franklintempletondatasources.com for additional data provider information.
Not FDIC Insured | May Lose Value | No Bank Guarantee
|
franklintempleton.com |
Not part of the semiannual report |
|
1 |
|
Contents | ||||
| 3 | ||||
| 4 | ||||
| 9 | ||||
| 16 | ||||
| 30 | ||||
| 34 | ||||
| 46 | ||||
Visit franklintempleton.com for fund updates, to access your account, or to find helpful financial planning tools.
2 |
Semiannual Report |
franklintempleton.com | ||
The US economy grew during the six months under review. The economy grew faster in 2017’s third quarter than in the second quarter, driven by consumer spending, inventory investment, business investment and exports. The manufacturing and services sectors expanded during the period. The unemployment rate decreased from 4.4% in April 2017 to 4.1% at period-end.1 Monthly retail sales were volatile during the period. Annual inflation, as measured by the Consumer Price Index, decreased from 2.2% in April 2017 to 2.0% at period-end.1
At its June meeting, the US Federal Reserve (Fed) raised its target range for the federal funds rate 0.25% to 1.00%–1.25%, amid signs of a growing US economy, strengthening labor market and improving business spending. At its July and September 2017 meetings, the Fed kept its target range unchanged. Furthermore in September, the Fed mentioned that it would begin implementing its balance sheet reduction in October. The minutes of the Fed’s September meeting released in October suggested that many committee members were concerned that low inflation readings this year might not be transitory and could be more persistent than expected.
US equity markets rose during the period, benefiting from mostly upbeat economic data and better US corporate earnings. The markets were also supported by investor optimism arising from Emmanuel Macron’s victory in France’s presidential election, comments from the US Fed chair indicating optimism about the US economy and the likelihood of gradual rate hikes, and the Senate’s approval of a budget plan that raised expectations for tax reforms. However, geopolitical tensions in the Korean peninsula and uncertainty about President Trump’s ability to implement reforms curbed market sentiment. The broad US stock market, as measured by the Standard & Poor’s® 500 Index, generated +9.10% total return for the period.2
The foregoing information reflects our analysis and opinions as of October 31, 2017. The information is not a complete analysis of every aspect of any market, country, industry, security or fund. Statements of fact are from sources considered reliable.
1. Source: Bureau of Labor Statistics.
2. Source: Morningstar.
See www.franklintempletondatasources.com for additional data provider information.
franklintempleton.com |
Semiannual Report |
|
3 |
|
Franklin Biotechnology Discovery Fund
This semiannual report for Franklin Biotechnology Discovery Fund covers the period ended October 31, 2017.
Your Fund’s Goal and Main Investments
The Fund seeks capital appreciation by investing at least 80% of its net assets in securities of biotechnology companies and discovery research firms located in the US and other countries.
Performance Overview
The Fund’s Class A shares delivered a +2.16% cumulative total return for the six months under review. In comparison, the NASDAQ Biotechnology Index®, which tracks US and international-based biotechnology stocks, generated a +5.88% total return.1 Also in comparison, the Standard & Poor’s 500 Index (S&P 500®), which is a broad measure of the US stock market, produced a +9.10% total return.1 Finally, domestic and international-based stocks, as measured by the NASDAQ Composite Index®, posted a +11.85% total return.1 You can find the Fund’s long-term performance data in the Performance Summary beginning on page 6.
Performance data represent past performance, which does not guarantee future results. Investment return and principal value will fluctuate, and you may have a gain or loss when you sell your shares. Current performance may differ from figures shown. For most recent month-end performance, go to franklintempleton.com or call (800) 342-5236.
Investment Strategy
We are research-driven, fundamental investors, pursuing a growth strategy. As bottom-up investors focusing primarily on individual securities, we choose companies that have identifiable drivers of future earnings growth and that present, in our opinion, the best trade-off between earnings growth, business and financial risk, and valuation. We rely on a team of analysts to help provide in-depth industry expertise and use both qualitative and quantitative analysis to evaluate companies for distinct and sustainable competitive advantages likely to lead to growth in earnings and/or share price. Competitive advantages, such as a particular product niche, proven
Portfolio Composition
Based on Total Net Assets as of 10/31/17
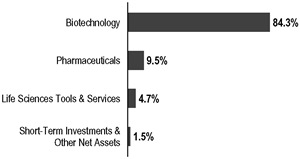
technology, sound financial position and strong management, are all factors we believe may contribute to strong growth potential.
Manager’s Discussion
During the six months under review, the biotechnology industry experienced significant volatility in response to uncertainty about the future of the Affordable Care Act. Please keep in mind that volatility is not uncommon in the biotechnology industry, and we seek to take advantage of short-term volatility by initiating positions or adding to existing holdings in companies we believe are undervalued.
Key contributors to the Fund’s absolute performance during the reporting period included Puma Biotechnology,2 Vertex Pharmaceuticals and Kite Pharma.3 Puma Biotechnology, a development stage biopharmaceutical company, bolstered results as it received FDA approval for its early-stage breast cancer treatment drug Nerlynx and launched the medication in July. Puma’s stock performed well after we purchased it during the period, as early feedback from physicians suggested a fast launch trajectory. Vertex Pharmaceuticals engages in the business of discovering, developing, manufacturing and commercializing small molecule drugs for patients with serious diseases. In July, the company announced positive results from its “triple combination” studies in cystic fibrosis patients. Vertex was studying the combination of three new experimental drugs on top of its two approved drugs, tezacaftor and ivacaftor, in a patient population where those two approved drugs alone had minimal efficacy. We believe this opened up a
1. Source: Morningstar.
The indexes are unmanaged and include reinvestment of any income or distributions. They do not reflect any fees, expenses or sales charges. One cannot invest directly in an index, and an index is not representative of the Fund’s portfolio.
2. Not part of the index.
3. Not held at period-end.
The dollar value, number of shares or principal amount, and names of all portfolio holdings are listed in the Fund’s Statement of Investments (SOI). The SOI begins on page 20.
4 |
Semiannual Report |
franklintempleton.com |
F R A N K L I N B I O T E C H N O L O G Y D I S C O V E R Y F U N D
significant new patient population for Vertex. Clinical-stage biopharmaceutical company firm Kite Pharma benefited from its acquisition by Gilead at a significant premium. The company develops and commercializes novel cancer immunotherapy products.
In contrast, key detractors from the Fund’s absolute performance included Axovant Sciences,2 Tesaro and Celgene. Axovant Sciences, a clinical-stage biopharmaceutical company, hindered results due to a failed Phase 3 trial for its investigational Alzheimer’s disease drug intepirdine in September. This was the lead program for Axovant and the primary value driver for the company. Oncology-focused biopharmaceutical company Tesaro experienced weak performance as early reports suggested that tolerability of its ovarian cancer treatment drug Zejula was an issue and physicians favored AstraZeneca’s Lynparza. Merck4 formed a strategic collaboration with AstraZeneca4 to develop Lynparza in combination with Merck’s drugs, becoming a formidable competitor. Biotechnology firm Celgene halted Phase 3 clinical trials for its Crohn’s disease drug due to a lack of efficacy. Additionally, Celgene’s third quarter results were disappointing as revenues for its psoriasis medication Otezla came in significantly below expectations due to increased competition and discounting. The company also reduced long-term guidance.
Thank you for your continued participation in Franklin Biotechnology Discovery Fund. We look forward to serving your future investment needs.
 |
| |
Evan McCulloch, CFA | ||
| Lead Portfolio Manager | ||
| Steven Kornfeld, CFA | ||
| Portfolio Management Team | ||

| CFA® is a trademark owned by CFA Institute. |
| 4. Not a Fund holding. |
| See www.franklintempletondatasources.com for additional data provider information. |
| Top 10 Holdings | ||||
| 10/31/17 | ||||
Company Sector/Industry | % of Total Net Assets | |||
Celgene Corp. Biotechnology | 7.5% | |||
Alexion Pharmaceuticals Inc. Biotechnology | 7.4% | |||
Incyte Corp. Biotechnology | 5.3% | |||
Biogen Inc. Biotechnology | 5.3% | |||
Illumina Inc. Life Sciences Tools & Services | 4.7% | |||
Regeneron Pharmaceuticals Inc. Biotechnology | 4.6% | |||
Gilead Sciences Inc. Biotechnology | 4.6% | |||
Vertex Pharmaceuticals Inc. Biotechnology | 4.2% | |||
Neurocrine Biosciences Inc. Biotechnology | 3.9% | |||
Clovis Oncology Inc. Biotechnology | 3.5% | |||
The foregoing information reflects our analysis, opinions and portfolio holdings as of October 31, 2017, the end of the reporting period. The way we implement our main investment strategies and the resulting portfolio holdings may change depending on factors such as market and economic conditions. These opinions may not be relied upon as investment advice or an offer for a particular security. The information is not a complete analysis of every aspect of any market, country, industry, security or the Fund. Statements of fact are from sources considered reliable, but the investment manager makes no representation or warranty as to their completeness or accuracy. Although historical performance is no guarantee of future results, these insights may help you understand our investment management philosophy.
franklintempleton.com |
Semiannual Report |
|
5 |
|
F R A N K L I N B I O T E C H N O L O G Y D I S C O V E R Y F U N D
Performance Summary as of October 31, 2017
The performance table does not reflect any taxes that a shareholder would pay on Fund dividends, capital gain distributions, if any, or any realized gains on the sale of Fund shares. Total return reflects reinvestment of the Fund’s dividends and capital gain distributions, if any, and any unrealized gains or losses. Your dividend income will vary depending on dividends or interest paid by securities in the Fund’s portfolio, adjusted for operating expenses of each class. Capital gain distributions are net profits realized from the sale of portfolio securities.
Performance as of 10/31/171
Cumulative total return excludes sales charges. Average annual total return includes maximum sales charges. Sales charges will vary depending on the size of the investment and the class of share purchased. The maximum is 5.75% and the minimum is 0%. Class A: 5.75% maximum initial sales charge; Advisor Class: no sales charges. For other share classes, visit franklintempleton.com.
| Share Class | Cumulative Total Return2 | Average Annual Total Return3 | ||
A | ||||
6-Month | +2.16% | -3.71% | ||
1-Year
|
+22.18%
|
+15.16%
| ||
5-Year
|
+131.55%
|
+16.89%
| ||
10-Year
|
+234.42%
|
+12.16%
| ||
Advisor4 | ||||
6-Month
| +2.29%
| +2.29%
| ||
1-Year
|
+22.49%
|
+22.49%
| ||
5-Year
|
+134.66%
|
+18.60%
| ||
10-Year
|
+241.94%
|
+13.08%
|
Performance data represent past performance, which does not guarantee future results. Investment return and principal value will fluctuate, and you may have a gain or loss when you sell your shares. Current performance may differ from figures shown. For most recent month-end performance, go to franklintempleton.com or call (800) 342-5236.
See page 7 for Performance Summary footnotes.
6 |
Semiannual Report |
franklintempleton.com |
F R A N K L I N B I O T E C H N O L O G Y D I S C O V E R Y F U N D
P E R F O R M A N C E S U M M A R Y
Total Annual Operating Expenses5
Share Class
| With Waiver
| Without Waiver
| ||||||
A
|
| 1.04%
|
|
| 1.06%
|
| ||
Advisor
|
| 0.79%
|
|
| 0.81%
|
| ||
Each class of shares is available to certain eligible investors and has different annual fees and expenses, as described in the prospectus.
All investments involve risks, including possible loss of principal. The Fund is a nondiversified fund that concentrates in a single sector, which involves risks such as patent considerations, product liability, government regulatory requirements, and regulatory approval for new drugs and medical products. Biotechnology companies often are small and/or relatively new. Smaller companies can be particularly sensitive to changes in economic conditions and have less certain growth prospects than larger, more established companies and can be volatile, especially over the short term. The Fund may also invest in foreign companies, which involve special risks, including currency fluctuations and political uncertainty. The Fund is actively managed but there is no guarantee that the manager’s investment decisions will produce the desired results. The Fund’s prospectus also includes a description of the main investment risks.
1. The Fund has a fee waiver associated with any investment it makes in a Franklin Templeton money fund and/or other Franklin Templeton fund, contractually guaranteed through 8/31/18. Fund investment results reflect the fee waiver; without this waiver, the results would have been lower.
2. Cumulative total return represents the change in value of an investment over the periods indicated.
3. Average annual total return represents the average annual change in value of an investment over the periods indicated. Return for less than one year, if any, has not been annualized.
4. Effective 9/1/09, the Fund began offering Advisor Class shares, which do not have sales charges or a Rule 12b-1 plan. Performance quotations for this class reflect the following methods of calculation: (a) For periods prior to 9/1/09, a restated figure is used based upon the Fund’s Class A performance, excluding the effect of Class A’s maximum initial sales charge, but reflecting the effect of the Class A Rule 12b-1 fees; and (b) for periods after 9/1/09, actual Advisor Class performance is used reflecting all charges and fees applicable to that class. Since 9/1/09 (commencement of sales), the cumulative and average annual total returns of Advisor Class shares were +294.85% and +18.32%.
5. Figures are as stated in the Fund’s current prospectus and may differ from the expense ratios disclosed in the Your Fund’s Expenses and Financial Highlights sections in this report. In periods of market volatility, assets may decline significantly, causing total annual Fund operating expenses to become higher than the figures shown.
franklintempleton.com |
Semiannual Report |
|
7 |
|
F R A N K L I N B I O T E C H N O L O G Y D I S C O V E R Y F U N D
Your Fund’s Expenses
As a Fund shareholder, you can incur two types of costs: (1) transaction costs, including sales charges (loads) on Fund purchases and redemptions; and (2) ongoing Fund costs, including management fees, distribution and service (12b-1) fees, and other Fund expenses. All mutual funds have ongoing costs, sometimes referred to as operating expenses. The table below shows ongoing costs of investing in the Fund and can help you understand these costs and compare them with those of other mutual funds. The table assumes a $1,000 investment held for the six months indicated.
Actual Fund Expenses
The table below provides information about actual account values and actual expenses in the columns under the heading “Actual.” In these columns the Fund’s actual return, which includes the effect of Fund expenses, is used to calculate the “Ending Account Value” for each class of shares. You can estimate the expenses you paid during the period by following these steps (of course, your account value and expenses will differ from those in this illustration): Divide your account value by $1,000 (if your account had an $8,600 value, then $8,600 ÷ $1,000 = 8.6). Then multiply the result by the number in the row for your class of shares under the headings “Actual” and “Expenses Paid During Period” (if Actual Expenses Paid During Period were $7.50, then 8.6 x $7.50 = $64.50). In this illustration, the actual expenses paid this period are $64.50.
Hypothetical Example for Comparison with Other Funds
Under the heading “Hypothetical” in the table, information is provided about hypothetical account values and hypothetical expenses based on the Fund’s actual expense ratio and an assumed rate of return of 5% per year before expenses, which is not the Fund’s actual return. This information may not be used to estimate the actual ending account balance or expenses you paid for the period, but it can help you compare ongoing costs of investing in the Fund with those of other funds. To do so, compare this 5% hypothetical example for the class of shares you hold with the 5% hypothetical examples that appear in the shareholder reports of other funds.
Please note that expenses shown in the table are meant to highlight ongoing costs and do not reflect any transactional costs. Therefore, information under the heading “Hypothetical” is useful in comparing ongoing costs only, and will not help you compare total costs of owning different funds. In addition, if transactional costs were included, your total costs would have been higher.
Actual (actual return after expenses) | Hypothetical (5% annual return before expenses) | |||||||||||||||||||
|
| |||||||||||||||||||
Share Class | Beginning Account Value 5/1/17 | Ending Account Value 10/31/17 | Expenses Paid During | Ending Account Value 10/31/17 | Expenses Paid During 5/1/17–10/31/171,2 |
| Net Annualized Ratio2 | |||||||||||||
|
|
|
| |||||||||||||||||
A |
$1,000 |
$1,021.60 |
$5.25 |
$1,020.01 |
$5.24 |
1.03% | ||||||||||||||
| C | $1,000 | $1,017.70 | $9.05 | $1,016.23 | $9.05 | 1.78% | ||||||||||||||
| R6 | $1,000 | $1,024.00 | $3.01 | $1,022.23 | $3.01 | 0.59% | ||||||||||||||
| Advisor | $1,000 | $1,022.90 | $3.98 | $1,021.27 | $3.97 | 0.78% | ||||||||||||||
1. Expenses are equal to the annualized expense ratio for the six-month period as indicated above—in the far right column—multiplied by the simple average account value over the period indicated, and then multiplied by 184/365 to reflect the one-half year period.
2. Reflects expenses after fee waivers and expense reimbursements. Does not include acquired fund fees and expenses.
8 |
Semiannual Report |
franklintempleton.com |
Franklin Natural Resources Fund
This semiannual report for Franklin Natural Resources Fund covers the period ended October 31, 2017.
Your Fund’s Goal and Main Investments
The Fund seeks high total return (total return consists of capital appreciation and current dividend and interest income) by investing, under normal market conditions, at least 80% of its net assets in equity and debt securities of companies that own, produce, refine, process, transport or market natural resources, as well as those that provide related services.
Performance Overview
The Fund’s Class A shares had a -0.40% cumulative total return for the six months under review. In comparison, the Standard & Poor’s (S&P®) North American Natural Resources Sector Index, which tracks companies involved in industries such as mining, energy, timber and forestry services, and the production of pulp and paper, generated a +1.57% total return.1 Also in comparison, the S&P 500, which is a broad measure of the US stock market, generated a +9.10% total return.1 Please note index performance information is provided for reference and we do not attempt to track any index but rather undertake investments on the basis of fundamental research. The Fund’s strategy, which focuses on companies with higher long-term growth potential, differs from the natural resources index’s large weighting in income-oriented companies that we believe typically provide more limited opportunities for growth. This difference may occasionally lead to wide performance discrepancies, especially in periods when investors focus on short-term safety and yield or, conversely, when investors focus more heavily on companies with stronger growth prospects and greater commodity price leverage. You can find the Fund’s long-term performance data in the Performance Summary beginning on page 13.
Performance data represent past performance, which does not guarantee future results. Investment return and principal value will fluctuate, and you may have a gain or loss when you sell your shares. Current performance may differ from figures shown. For most recent month-end performance, go to franklintempleton.com or call (800) 342-5236.
Geographic Composition
Based on Total Net Assets as of 10/31/17
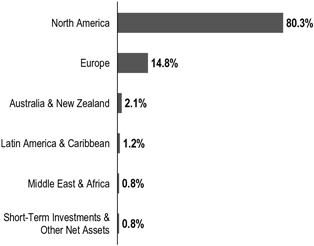
Investment Strategy
We are research-driven, fundamental investors, pursuing a growth strategy. As bottom-up investors focusing primarily on individual securities, we choose companies that have identifiable drivers of future earnings growth and that present, in our opinion, the best trade-off between earnings growth, business and financial risk, and valuation. We rely on a team of analysts to help provide in-depth industry expertise and use both qualitative and quantitative analysis to evaluate companies for distinct and sustainable competitive advantages likely to lead to growth in earnings and/or share price. Competitive advantages, such as a particular product niche, proven technology, sound financial position and strong management, are all factors we believe may contribute to strong growth potential.
Sector Overview
Global commodity prices were mixed during the six months under review. Although oil and select metals rose, several commodities, such as natural gas and silver, declined. Following an overall downtrend in 2017’s second quarter, global commodities in general benefited from a synchronized recovery across the global economy, firming demand outlooks for a wide range of metals and energy products, a slow-moving Federal Reserve and the support of a weaker US dollar. Industrial commodity prices, in particular, pointed to rising demand, primarily from China, the world’s largest consumer of
1. Source: Morningstar.
The indexes are unmanaged and include reinvestment of any income or distributions. They do not reflect any fees, expenses or sales charges. One cannot invest directly in an index, and an index is not representative of the Fund’s portfolio.
The dollar value, number of shares or principal amount, and names of all portfolio holdings are listed in the Fund’s Statement of Investments (SOI). The SOI begins on page 27.
franklintempleton.com | Semiannual Report | 9 |
F R A N K L I N N A T U R A L R E S O U R C E S F U N D
such metals that are integral to its construction and real estate infrastructure. For the declining commodities, oversupply concerns superseded any boost they might have received from consumer demand and the weaker dollar.
Crude oil prices rose during the period and booked their first back-to-back monthly gain of the year in October. Oil benefited from positive global demand trends and output restraint that tightened supply-and-demand fundamentals. This included optimism that major suppliers in the Organization of Petroleum Exporting Countries (OPEC) and partners, including Russia, would extend their previously agreed-upon production curbs. Although crude oil prices declined in the second quarter of 2017, they also recorded a strong rally in June, after US producers appeared to curtail their drilling activity and government data showed a sharp drop in US gasoline supplies as summer demand picked up. During the third quarter of 2017, crude oil prices rose in response to tensions between the US and Iran and potential for disrupted crude exports out of Iraqi Kurdistan, in addition to robust compliance by participants in the OPEC deal to limit production.
Overall, US natural gas prices declined during the six months under review, despite a period of stability during the summer months. At period-end, slowing supply growth was helping to balance the market, which was evidenced by inventory builds throughout the month that were generally in line with seasonal expectations. Exports have been key to increased demand recently. An ongoing increase in US exports could accelerate inventory declines as new natural gas export terminals on the Gulf Coast ramp up shipments. In addition, producers began reducing the number of active drilling rigs, indicating that production could struggle to keep pace in 2018. Nonetheless, the total US rig count increased for the six-month period.
Gold prices fluctuated throughout the period, but rose slightly at period-end amid dollar weakness. Among other precious metals, platinum prices declined and palladium prices rose. Silver prices declined slightly, yet the metal’s demand in industrial and technical applications such as smartphones and solar panels continued to grow. Gains for industrial metals such as copper, aluminum and zinc were countered by a decline in iron ore at the end of the period. Expectations for increased demand emerged for copper’s use in electric vehicles and other manufactured goods at a time when there is a lack of new copper discoveries and limited spending on new copper projects to replace declining production at older mines.
Manager’s Discussion
The economy as a whole was generally supportive of commodities during the six-month period, with signs of
Portfolio Composition
Based on Total Net Assets as of 10/31/17
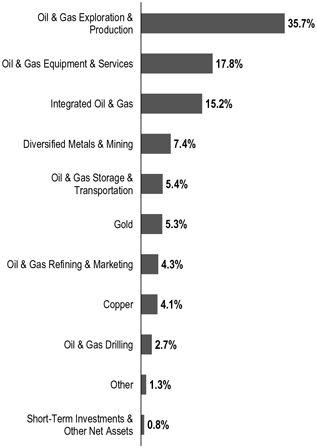
strengthening global economic growth, a weakening US dollar over most of the period and rising commodity prices. However, there were some pockets and periods of weakness. In this environment, the Fund underperformed the S&P North American Natural Resources Sector Index as a result of an overweighting and stock selection in oilfield services, an underweighting in oil and gas refining and marketing (R&M), partially offset by stock selection, and stock selection in gold. A lack of exposure to sectors with limited direct commodity exposure such as paper and packaging also detracted from relative performance.
Oilfield services holdings detracted from relative performance as analysts lowered earnings expectations for 2018 despite currently robust operating conditions. Smaller and mid-capitalization companies, offshore companies and companies with non-US exposure suffered the most (such as Superior Energy, Oil States, Oceaneering and Weatherford), while onshore US pure plays performed well. This performance was perplexing to us given a recovery in energy markets in the second half of the period and flat-to-positive performance from oil and gas exploration and production (E&P) and integrated oil
10 |
Semiannual Report |
franklintempleton.com |
F R A N K L I N N A T U R A L R E S O U R C E S F U N D
| Top 10 Holdings | ||||
| 10/31/17 | ||||
Company Sector/Industry | % of Total Net Assets | |||
Schlumberger Ltd. Oil & Gas Equipment & Services | 4.2% | |||
Anadarko Petroleum Corp. Oil & Gas Exploration & Production | 3.6% | |||
EOG Resources Inc. Oil & Gas Exploration & Production | 3.5% | |||
Halliburton Co. Oil & Gas Equipment & Services | 3.4% | |||
Noble Energy Inc. Oil & Gas Exploration & Production | 3.0% | |||
Suncor Energy Inc. Integrated Oil & Gas | 2.9% | |||
ConocoPhillips Oil & Gas Exploration & Production | 2.8% | |||
Concho Resources Inc. Oil & Gas Exploration & Production | 2.8% | |||
Royal Dutch Shell PLC Integrated Oil & Gas | 2.6% | |||
Kinder Morgan Inc. Oil & Gas Storage & Transportation | 2.5% | |||
companies, but we view this as a function of the complexity of predicting oil prices, spending trends and oilfield services earnings in an uncertain environment.
R&M benefited from a strong profit margin environment, supported by rising US production, widening price spreads between US and international oil grades (such as WTI/Brent), and strong refining margins driven higher by hurricane disruptions. A lack of exposure to Andeavor and underweightings in Valero and Phillips 66 were the biggest detractors, although an overweighting in HollyFrontier helped to offset these detractors.
The Fund’s gold holdings suffered from significant declines in relatively small positions in Guyana Goldfields2 and Tahoe Resources, both of which declined due to company-specific exposure to host-country risks.
In contrast, contributors to the Fund’s relative performance included overweightings in diversified metals and mining and copper, as well as stock selection in the integrated oil and gas sector, partially offset by an underweighting in the sector. Stock selection in E&P, partially offset by an overweighting in the sector, also helped.
Metals markets performed well as the result of tightening supply and demand conditions for several metals, partly driven by China’s efforts to curtail pollution and improve profitability in certain segments of their economy (such as coal). Uncertainty related to the longevity of such moves is prevalent, but rising metals prices combined with most mining companies’ efforts to reduce costs and capital spending over the past several years improved their financial outlook considerably, allowing many to generate free cash flow and pay down or term out debt. Many diversified metals and mining holdings in the Fund appreciated significantly. The same dynamic benefited our copper holdings (formally included in diversified metals and mining). Top contributors to the Fund’s relative performance were diversified miners BHP, Glencore and Rio Tinto, and Lundin Mining and Antofagasta in the copper sector.2
Fund positioning in integrated oil and gas benefited relative performance with a large proportion of investments focused in European-based majors such as Royal Dutch Shell,2 BP2 and Total,2 which all performed well. Generally speaking, European integrateds appeared to us to have lower valuations and higher dividend yields than their US counterparts, and although we remained overweighted, the gaps have closed somewhat after the shares’ strong relative performance.
It is important to recognize the effect of currency movements on the Fund’s performance. In general, if the value of the US dollar goes up compared with a foreign currency, an investment traded in that foreign currency will go down in value because it will be worth fewer US dollars. This can have a negative effect on Fund performance. Conversely, when the US dollar weakens in relation to a foreign currency, an investment traded in that foreign currency will increase in value, which can contribute to Fund performance. For the six months ended October 31, 2017, the US dollar declined in value relative to most currencies. As a result, the Fund’s performance was positively affected by currency appreciation from the portfolio’s significant investment in securities with non-US currency exposure. However, one cannot expect the same result in future periods. Whether the US dollar goes up or weakens compared with foreign currencies, company-specific factors may offset the effects of the currency movements on the value of individual investments and, possibly, the Fund’s performance overall.
2. Not part of the index.
See www.franklintempletondatasources.com for additional data provider information.
franklintempleton.com |
Semiannual Report |
|
11 |
|
F R A N K L I N N A T U R A L R E S O U R C E S F U N D
Thank you for your continued participation in Franklin Natural Resources Fund. We look forward to serving your future investment needs.
 |
Frederick G. Fromm, CFA | |
 |
Matthew J. Adams, CFA | |
| Stephen M. Land, CFA | ||
| Portfolio Management Team | ||


The foregoing information reflects our analysis, opinions and portfolio holdings as of October 31, 2017, the end of the reporting period. The way we implement our main investment strategies and the resulting portfolio holdings may change depending on factors such as market and economic conditions. These opinions may not be relied upon as investment advice or an offer for a particular security. The information is not a complete analysis of every aspect of any market, country, industry, security or the Fund. Statements of fact are from sources considered reliable, but the investment manager makes no representation or warranty as to their completeness or accuracy. Although historical performance is no guarantee of future results, these insights may help you understand our investment management philosophy.
12 |
Semiannual Report |
franklintempleton.com |
F R A N K L I N N A T U R A L R E S O U R C E S F U N D
Performance Summary as of October 31, 2017
The performance table does not reflect any taxes that a shareholder would pay on Fund dividends, capital gain distributions, if any, or any realized gains on the sale of Fund shares. Total return reflects reinvestment of the Fund’s dividends and capital gain distributions, if any, and any unrealized gains or losses. Your dividend income will vary depending on dividends or interest paid by securities in the Fund’s portfolio, adjusted for operating expenses of each class. Capital gain distributions are net profits realized from the sale of portfolio securities.
Performance as of 10/31/171
Cumulative total return excludes sales charges. Average annual total return includes maximum sales charges. Sales charges will vary depending on the size of the investment and the class of share purchased. The maximum is 5.75% and the minimum is 0%. Class A: 5.75% maximum initial sales charge; Advisor Class: no sales charges. For other share classes, visit franklintempleton.com.
| Share Class | Cumulative Total Return2 | Average Annual Total Return3 | ||
A
| ||||
6-Month
| -0.40%
| -6.12%
| ||
1-Year
| +0.85%
| -4.96%
| ||
5-Year
| -21.61%
| -5.87%
| ||
10-Year
| -33.70%
| -4.59%
| ||
Advisor
| ||||
6-Month
| -0.30%
| -0.30%
| ||
1-Year
| +1.08%
| +1.08%
| ||
5-Year
| -20.51%
| -4.49%
| ||
10-Year
| -31.79%
| -3.75%
| ||
Performance data represent past performance, which does not guarantee future results. Investment return and principal value will fluctuate, and you may have a gain or loss when you sell your shares. Current performance may differ from figures shown. For most recent month-end performance, go to franklintempleton.com or call (800) 342-5236.
See page 14 for Performance Summary footnotes.
franklintempleton.com |
Semiannual Report |
|
13 |
|
F R A N K L I N N A T U R A L R E S O U R C E S F U N D
P E R F O R M A N C E S U M M A R Y
Total Annual Operating Expenses4
Share Class
| With Waiver
| Without Waiver
| ||||||
A
|
| 1.06%
|
|
| 1.07%
|
| ||
Advisor
|
| 0.81%
|
|
| 0.82%
|
| ||
Each class of shares is available to certain eligible investors and has different annual fees and expenses, as described in the prospectus.
All investments involve risks, including possible loss of principal. Investing in a fund concentrating in the natural resources sector involves special risks, including increased susceptibility to adverse economic and regulatory developments affecting the sector. Smaller companies can be particularly sensitive to changes in economic conditions and have less certain growth prospects than larger, more established companies and can be volatile, especially over the short term. The Fund may also invest in foreign companies, which involve special risks, including currency fluctuations and political uncertainty. The Fund is actively managed but there is no guarantee that the manager’s investment decisions will produce the desired results. The Fund’s prospectus also includes a description of the main investment risks.
1. The Fund has a fee waiver associated with any investment it makes in a Franklin Templeton money fund and/or other Franklin Templeton fund, contractually guaranteed through 8/31/18. Fund investment results reflect the fee waiver; without this waiver, the results would have been lower.
2. Cumulative total return represents the change in value of an investment over the periods indicated.
3. Average annual total return represents the average annual change in value of an investment over the periods indicated. Return for less than one year, if any, has not been annualized.
4. Figures are as stated in the Fund’s current prospectus and may differ from the expense ratios disclosed in the Your Fund’s Expenses and Financial Highlights sections in this report. In periods of market volatility, assets may decline significantly, causing total annual Fund operating expenses to become higher than the figures shown.
14 |
Semiannual Report |
franklintempleton.com |
F R A N K L I N N A T U R A L R E S O U R C E S F U N D
Your Fund’s Expenses
As a Fund shareholder, you can incur two types of costs: (1) transaction costs, including sales charges (loads) on Fund purchases and redemptions; and (2) ongoing Fund costs, including management fees, distribution and service (12b-1) fees, and other Fund expenses. All mutual funds have ongoing costs, sometimes referred to as operating expenses. The table below shows ongoing costs of investing in the Fund and can help you understand these costs and compare them with those of other mutual funds. The table assumes a $1,000 investment held for the six months indicated.
Actual Fund Expenses
The table below provides information about actual account values and actual expenses in the columns under the heading “Actual.” In these columns the Fund’s actual return, which includes the effect of Fund expenses, is used to calculate the “Ending Account Value” for each class of shares. You can estimate the expenses you paid during the period by following these steps (of course, your account value and expenses will differ from those in this illustration): Divide your account value by $1,000 (if your account had an $8,600 value, then $8,600 ÷ $1,000 = 8.6). Then multiply the result by the number in the row for your class of shares under the headings “Actual” and “Expenses Paid During Period” (if Actual Expenses Paid During Period were $7.50, then 8.6 x $7.50 = $64.50). In this illustration, the actual expenses paid this period are $64.50.
Hypothetical Example for Comparison with Other Funds
Under the heading “Hypothetical” in the table, information is provided about hypothetical account values and hypothetical expenses based on the Fund’s actual expense ratio and an assumed rate of return of 5% per year before expenses, which is not the Fund’s actual return. This information may not be used to estimate the actual ending account balance or expenses you paid for the period, but it can help you compare ongoing costs of investing in the Fund with those of other funds. To do so, compare this 5% hypothetical example for the class of shares you hold with the 5% hypothetical examples that appear in the shareholder reports of other funds.
Please note that expenses shown in the table are meant to highlight ongoing costs and do not reflect any transactional costs. Therefore, information under the heading “Hypothetical” is useful in comparing ongoing costs only, and will not help you compare total costs of owning different funds. In addition, if transactional costs were included, your total costs would have been higher.
Actual (actual return after expenses)
| Hypothetical
| |||||||||||||||||
Share
| Beginning
| Ending
| Expenses
| Ending
| Expenses
| Net
| ||||||||||||
| A | $1,000 | $996.00 | $5.84 | $1,019.36 | $5.90 | 1.16% | ||||||||||||
| C | $1,000 | $992.20 | $9.59 | $1,015.58 | $9.70 | 1.91% | ||||||||||||
| R6 | $1,000 | $999.30 | $2.82 | $1,022.38 | $2.85 | 0.56% | ||||||||||||
| Advisor | $1,000 | $997.00 | $4.58 | $1,020.62 | $4.63 | 0.91% | ||||||||||||
1. Expenses are equal to the annualized expense ratio for the six-month period as indicated above—in the far right column—multiplied by the simple average account value over the period indicated, and then multiplied by 184/365 to reflect the one-half year period.
2. Reflects expenses after fee waivers and expense reimbursements. Does not include acquired fund fees and expenses.
franklintempleton.com |
Semiannual Report |
|
15 |
|
F R A N K L I N S T R A T E G I C S E R I E S
Franklin Biotechnology Discovery Fund
Six Months Ended (unaudited) | Year Ended April 30,
| |||||||||||||||||||||||
| 2017 | 2016 | 2015 | 2014 | 2013 | ||||||||||||||||||||
| Class A | ||||||||||||||||||||||||
| Per share operating performance | ||||||||||||||||||||||||
(for a share outstanding throughout the period) | ||||||||||||||||||||||||
Net asset value, beginning of period | $147.22 | $128.19 | $182.30 | $129.27 | $105.95 | $76.22 | ||||||||||||||||||
|
| |||||||||||||||||||||||
Income from investment operationsa: | ||||||||||||||||||||||||
Net investment income (loss)b | (0.32 | ) | (0.79 | ) | (0.94 | ) | (1.09 | ) | (1.07 | ) | (0.76) | |||||||||||||
Net realized and unrealized gains (losses) | 3.50 | 25.75 | (39.39 | ) | 60.79 | 33.18 | 30.56 | |||||||||||||||||
|
| |||||||||||||||||||||||
Total from investment operations | 3.18 | 24.96 | (40.33 | ) | 59.70 | 32.11 | 29.80 | |||||||||||||||||
|
| |||||||||||||||||||||||
Less distributions from: | ||||||||||||||||||||||||
Net investment income | — | (1.73 | ) | — | — | — | (0.07) | |||||||||||||||||
Net realized gains | — | (4.20 | ) | (13.78 | ) | (6.67 | ) | (8.79 | ) | — | ||||||||||||||
|
| |||||||||||||||||||||||
Total distributions | — | (5.93 | ) | (13.78 | ) | (6.67 | ) | (8.79 | ) | (0.07) | ||||||||||||||
|
| |||||||||||||||||||||||
Net asset value, end of period | $150.40 | $147.22 | $128.19 | $182.30 | $129.27 | $105.95 | ||||||||||||||||||
|
| |||||||||||||||||||||||
Total returnc | 2.16% | 20.02% | (23.55)% | 46.81% | 30.60% | 39.12% | ||||||||||||||||||
| Ratios to average net assetsd | ||||||||||||||||||||||||
Expenses before waiver and payments by affiliates | 1.05% | 1.04% | 0.99% | 1.00% | 1.10% | 1.20% | ||||||||||||||||||
Expenses net of waiver and payments by affiliates | 1.03% | e | 1.02% | e | 0.98% | e | 1.00% | e,f | 1.10% | e,f | 1.20% | |||||||||||||
Net investment income (loss) | (0.38)% | (0.58)% | (0.56)% | (0.67)% | (0.82)% | (0.88)% | ||||||||||||||||||
| Supplemental data | ||||||||||||||||||||||||
Net assets, end of period (000’s) | $1,153,401 | $1,176,687 | $1,074,903 | $1,601,906 | $1,141,890 | $653,718 | ||||||||||||||||||
Portfolio turnover rate | 12.14% | 34.12% | 22.13% | 41.43% | 48.70% | 33.64% | ||||||||||||||||||
aThe amount shown for a share outstanding throughout the period may not correlate with the Statement of Operations for the period due to the timing of sales and repurchases of the Fund’s shares in relation to income earned and/or fluctuating fair value of the investments of the Fund.
bBased on average daily shares outstanding.
cTotal return does not reflect sales commissions or contingent deferred sales charges, if applicable, and is not annualized for periods less than one year.
dRatios are annualized for periods less than one year, except for non-recurring expenses, if any.
eBenefit of expense reduction rounds to less than 0.01%.
fBenefit of waiver and payments by affiliates rounds to less than 0.01%.
16 | Semiannual Report | The accompanying notes are an integral part of these financial statements. |
franklintempleton.com |
F R A N K L I N S T R A T E G I C S E R I E S
F I N A N C I A L H I G H L I G H T S
Franklin Biotechnology Discovery Fund (continued)
Six Months Ended (unaudited) | Year Ended April 30,
| |||||||||||||||||||
| 2017 | 2016 | 2015 | 2014a | |||||||||||||||||
| Class C | ||||||||||||||||||||
| Per share operating performance | ||||||||||||||||||||
(for a share outstanding throughout the period) | ||||||||||||||||||||
Net asset value, beginning of period | $143.98 | $125.99 | $180.67 | $129.11 | $159.15 | |||||||||||||||
|
| |||||||||||||||||||
Income from investment operationsb: | ||||||||||||||||||||
Net investment income (loss)c | (0.87 | ) | (1.81 | ) | (2.11 | ) | (2.38 | ) | (0.34) | |||||||||||
Net realized and unrealized gains (losses) | 3.42 | 25.29 | (38.79 | ) | 60.61 | (29.70) | ||||||||||||||
|
| |||||||||||||||||||
Total from investment operations | 2.55 | 23.48 | (40.90 | ) | 58.23 | (30.04) | ||||||||||||||
|
| |||||||||||||||||||
Less distributions from: | ||||||||||||||||||||
Net investment income | — | (1.29 | ) | — | — | — | ||||||||||||||
Net realized gains | — | (4.20 | ) | (13.78 | ) | (6.67 | ) | — | ||||||||||||
|
| |||||||||||||||||||
Total distributions | — | (5.49 | ) | (13.78 | ) | (6.67 | ) | — | ||||||||||||
|
| |||||||||||||||||||
Net asset value, end of period | $146.53 | $143.98 | $125.99 | $180.67 | $129.11 | |||||||||||||||
|
| |||||||||||||||||||
Total returnd | 1.77% | 19.14% | (24.09)% | 45.76% | (18.88)% | |||||||||||||||
| Ratios to average net assetse | ||||||||||||||||||||
Expenses before waiver and payments by affiliates | 1.80% | 1.79% | 1.71% | 1.75% | 1.82% | |||||||||||||||
Expenses net of waiver and payments by affiliatesf | 1.78% | 1.77% | 1.70% | 1.75% | g | 1.82%g | ||||||||||||||
Net investment income (loss) | (1.13)% | (1.33)% | (1.28)% | (1.42)% | (1.52)% | |||||||||||||||
| Supplemental data | ||||||||||||||||||||
Net assets, end of period (000’s) | $57,334 | $53,935 | $17,562 | $23,051 | $5,486 | |||||||||||||||
Portfolio turnover rate | 12.14% | 34.12% | 22.13% | 41.43% | 48.70% | |||||||||||||||
aFor the period March 4, 2014 (effective date) to April 30, 2014.
bThe amount shown for a share outstanding throughout the period may not correlate with the Statement of Operations for the period due to the timing of sales and repurchases of the Fund’s shares in relation to income earned and/or fluctuating fair value of the investments of the Fund.
cBased on average daily shares outstanding.
dTotal return does not reflect sales commissions or contingent deferred sales charges, if applicable, and is not annualized for periods less than one year.
eRatios are annualized for periods less than one year, except for non-recurring expenses, if any.
fBenefit of expense reduction rounds to less than 0.01%.
gBenefit of waiver and payments by affiliates rounds to less than 0.01%.
franklintempleton.com |
The accompanying notes are an integral part of these financial statements. | Semiannual Report |
|
17 |
|
F R A N K L I N S T R A T E G I C S E R I E S
F I N A N C I A L H I G H L I G H T S
Franklin Biotechnology Discovery Fund (continued)
Six Months Ended (unaudited) | Year Ended April 30,
| |||||||||||||||||||
| 2017 | 2016 | 2015 | 2014a | |||||||||||||||||
| Class R6 | ||||||||||||||||||||
| Per share operating performance | ||||||||||||||||||||
(for a share outstanding throughout the period) | ||||||||||||||||||||
Net asset value, beginning of period | $151.03 | $131.37 | $185.75 | $131.09 | $104.56 | |||||||||||||||
|
| |||||||||||||||||||
Income from investment operationsb: | ||||||||||||||||||||
Net investment income (loss)c | 0.03 | (0.25 | ) | (0.32 | ) | (0.45 | ) | (0.49) | ||||||||||||
Net realized and unrealized gains (losses) | 3.59 | 26.41 | (40.28 | ) | 61.78 | 35.81 | ||||||||||||||
|
| |||||||||||||||||||
Total from investment operations. | 3.62 | 26.16 | (40.60 | ) | 61.33 | 35.32 | ||||||||||||||
|
| |||||||||||||||||||
Less distributions from: | ||||||||||||||||||||
Net investment income | — | (2.30 | ) | — | — | — | ||||||||||||||
Net realized gains | — | (4.20 | ) | (13.78 | ) | (6.67 | ) | (8.79) | ||||||||||||
|
| |||||||||||||||||||
Total distributions | — | (6.50 | ) | (13.78 | ) | (6.67 | ) | (8.79) | ||||||||||||
|
| |||||||||||||||||||
Net asset value, end of period. | $154.65 | $151.03 | $131.37 | $185.75 | $131.09 | |||||||||||||||
|
| |||||||||||||||||||
Total returnd | 2.40% | 20.50% | (23.24)% | 47.40% | 34.10% | |||||||||||||||
| Ratios to average net assetse | ||||||||||||||||||||
Expenses before waiver and payments by affiliates | 0.62% | 0.63% | 0.60% | 0.60% | 0.63% | |||||||||||||||
Expenses net of waiver and payments by affiliatesf | 0.59% | 0.61% | 0.59% | 0.60% | g | 0.63%g | ||||||||||||||
Net investment income (loss) | 0.05% | (0.17)% | (0.17)% | (0.27)% | (0.35)% | |||||||||||||||
| Supplemental data | ||||||||||||||||||||
Net assets, end of period (000’s) | $8,872 | $8,891 | $5,568 | $76,436 | $50,846 | |||||||||||||||
Portfolio turnover rate | 12.14% | 34.12% | 22.13% | 41.43% | 48.70% | |||||||||||||||
aFor the year May 1, 2013 (effective date) to April 30, 2014.
bThe amount shown for a share outstanding throughout the period may not correlate with the Statement of Operations for the period due to the timing of sales and repurchases of the Fund’s shares in relation to income earned and/or fluctuating fair value of the investments of the Fund.
cBased on average daily shares outstanding.
dTotal return is not annualized for periods less than one year.
eRatios are annualized for periods less than one year, except for non-recurring expenses, if any.
fBenefit of expense reduction rounds to less than 0.01%.
gBenefit of waiver and payments by affiliates rounds to less than 0.01%.
18 |
Semiannual Report | The accompanying notes are an integral part of these financial statements. |
franklintempleton.com |
F R A N K L I N S T R A T E G I S S E R I E S
F I N A N C I A L H I G H L I G H T S
Franklin Biotechnology Discovery Fund (continued)
Six Months Ended (unaudited) | Year Ended April 30,
| |||||||||||||||||||||||
| 2017 | 2016 | 2015 | 2014 | 2013 | ||||||||||||||||||||
Advisor Class | ||||||||||||||||||||||||
Per share operating performance (for a share outstanding throughout the period) | ||||||||||||||||||||||||
Net asset value, beginning of period | $150.20 | $130.67 | $185.12 | $130.86 | $106.86 | $76.65 | ||||||||||||||||||
|
| |||||||||||||||||||||||
Income from investment operationsa: | ||||||||||||||||||||||||
Net investment income (loss)b | (0.14 | ) | (0.46 | ) | (0.55 | ) | (0.70 | ) | (0.69 | ) | (0.52) | |||||||||||||
Net realized and unrealized gains (losses) | 3.58 | 26.27 | (40.12 | ) | 61.63 | 33.48 | 30.80 | |||||||||||||||||
|
| |||||||||||||||||||||||
Total from investment operations | 3.44 | 25.81 | �� | (40.67 | ) | 60.93 | 32.79 | 30.28 | ||||||||||||||||
|
| |||||||||||||||||||||||
Less distributions from: | ||||||||||||||||||||||||
Net investment income | — | (2.08 | ) | — | — | — | (0.07) | |||||||||||||||||
Net realized gains | — | (4.20 | ) | (13.78 | ) | (6.67 | ) | (8.79 | ) | — | ||||||||||||||
|
| |||||||||||||||||||||||
Total distributions | — | (6.28 | ) | (13.78 | ) | (6.67 | ) | (8.79 | ) | (0.07) | ||||||||||||||
|
| |||||||||||||||||||||||
Net asset value, end of period | $153.64 | $150.20 | $130.67 | $185.12 | $130.86 | $106.86 | ||||||||||||||||||
|
| |||||||||||||||||||||||
Total returnc | 2.29% | 20.32% | (23.36 | )% | 47.17% | 31.02% | 39.51% | |||||||||||||||||
| Ratios to average net assetsd | ||||||||||||||||||||||||
Expenses before waiver and payments by affiliates | 0.80% | 0.79% | 0.75% | 0.75% | 0.80% | 0.91% | ||||||||||||||||||
Expenses net of waiver and payments by affiliates | 0.78% | e | 0.77% | e | 0.74% | e | 0.75% | e,f | 0.80% | e,f | 0.91% | |||||||||||||
Net investment income (loss) | (0.13)% | (0.33)% | (0.32)% | (0.42)% | (0.52)% | (0.59)% | ||||||||||||||||||
| Supplemental data | ||||||||||||||||||||||||
Net assets, end of period (000’s) | $182,670 | $159,894 | $93,263 | $167,035 | $91,012 | $25,744 | ||||||||||||||||||
Portfolio turnover rate | 12.14% | 34.12% | 22.13% | 41.43% | 48.70% | 33.64% | ||||||||||||||||||
aThe amount shown for a share outstanding throughout the period may not correlate with the Statement of Operations for the period due to the timing of sales and repurchases of the Fund’s shares in relation to income earned and/or fluctuating fair value of the investments of the Fund.
bBased on average daily shares outstanding.
cTotal return is not annualized for periods less than one year.
dRatios are annualized for periods less than one year, except for non-recurring expenses, if any.
eBenefit of expense reduction rounds to less than 0.01%.
fBenefit of waiver and payments by affiliates rounds to less than 0.01%.
franklintempleton.com |
The accompanying notes are an integral part of these financial statements. | Semiannual Report |
|
19 |
|
F R A N K L I N S T R A T E G I C S E R I E S
Statement of Investments, October 31, 2017 (unaudited)
Franklin Biotechnology Discovery Fund
Country
| Shares/
| Value
| ||||||||||||
| ||||||||||||||
Common Stocks and Other Equity Interests 98.4% | ||||||||||||||
Biotechnology 84.2%
| ||||||||||||||
a | Acadia Pharmaceuticals Inc. | United States | 1,017,000 | $ | 35,422,110 | |||||||||
a | Acceleron Pharma Inc. | United States | 166,700 | 6,501,300 | ||||||||||
a | Aimmune Therapeutics Inc. | United States | 150,000 | 4,360,500 | ||||||||||
a | Alexion Pharmaceuticals Inc. | United States | 871,100 | 104,235,826 | ||||||||||
Amgen Inc. | United States | 253,900 | 44,488,358 | |||||||||||
a | Amicus Therapeutics Inc. | United States | 933,900 | 13,298,736 | ||||||||||
a | AnaptysBio Inc. | United States | 102,470 | 6,766,094 | ||||||||||
a,b | Aquinox Pharmaceuticals Inc. | Canada | 469,500 | 5,291,265 | ||||||||||
a,b | ARCA biopharma Inc. | United States | 478,077 | 621,500 | ||||||||||
a,c | ARCA biopharma Inc., wts., 6/16/22 | United States | 1,338,619 | 46,185 | ||||||||||
a,b | Argenx SE, ADR | Netherlands | 125,500 | 2,876,460 | ||||||||||
a | Array BioPharma Inc. | United States | 2,416,900 | 25,256,605 | ||||||||||
a | Audentes Therapeutics Inc. | United States | 139,400 | 3,706,646 | ||||||||||
a,b | Aurinia Pharmaceuticals Inc. | Canada | 459,100 | 2,699,508 | ||||||||||
a | AveXis Inc. | United States | 87,426 | 9,136,891 | ||||||||||
a | Axovant Sciences Ltd. | United States | 383,734 | 2,010,766 | ||||||||||
a | Biogen Inc. | United States | 236,461 | 73,695,435 | ||||||||||
a | BioMarin Pharmaceutical Inc. | United States | 410,256 | 33,677,915 | ||||||||||
a | Bioverativ Inc. | United States | 134,280 | 7,586,820 | ||||||||||
a | Bluebird Bio Inc. | United States | 83,600 | 11,628,760 | ||||||||||
a | Calithera Biosciences Inc. | United States | 275,500 | 4,435,550 | ||||||||||
a,b | Cara Therapeutics Inc. | United States | 159,600 | 2,001,384 | ||||||||||
a | Celgene Corp. | United States | 1,047,400 | 105,755,978 | ||||||||||
a | ChemoCentryx Inc. | United States | 743,808 | 4,886,819 | ||||||||||
a | Clovis Oncology Inc. | United States | 644,100 | 48,545,817 | ||||||||||
a | Concert Pharmaceuticals Inc. | United States | 263,800 | 4,497,790 | ||||||||||
a,b | CRISPR Therapeutics AG | Switzerland | 274,014 | 5,288,470 | ||||||||||
a | CytomX Therapeutics Inc. | United States | 125,100 | 2,502,000 | ||||||||||
a | Deciphera Pharmaceuticals Inc. | United States | 93,800 | 1,800,022 | ||||||||||
a,b | DelMar Pharmaceuticals Inc. | Canada | 388,770 | 345,228 | ||||||||||
a,c | DelMar Pharmaceuticals Inc., wts., 4/12/22 | Canada | 291,578 | 15,270 | ||||||||||
a | Dynavax Technologies Corp. | United States | 368,070 | 8,097,540 | ||||||||||
a | Edge Therapeutics Inc. | United States | 889,946 | 9,664,814 | ||||||||||
a | Enanta Pharmaceuticals Inc. | United States | 110,500 | 5,488,535 | ||||||||||
a | Epizyme Inc. | United States | 371,700 | 6,207,390 | ||||||||||
a | Exelixis Inc. | United States | 765,100 | 18,966,829 | ||||||||||
a,d | Fate Therapeutics Inc. | United States | 2,373,777 | 11,322,916 | ||||||||||
a | G1 Therapeutics Inc. | United States | 123,000 | 2,906,490 | ||||||||||
a,c,e | G1 Therapeutics Inc., Private Placement | United States | 314,126 | 7,267,468 | ||||||||||
Gilead Sciences Inc. | United States | 854,100 | 64,023,336 | |||||||||||
a | GlycoMimetics Inc. | United States | 670,100 | 7,706,150 | ||||||||||
a | Heron Therapeutics Inc. | United States | 1,781,023 | 27,338,703 | ||||||||||
a | Immune Design Corp. | United States | 1,039,227 | 5,144,174 | ||||||||||
a | ImmunoGen Inc. | United States | 1,041,200 | 6,038,960 | ||||||||||
a | Incyte Corp. | United States | 653,200 | 73,974,900 | ||||||||||
a,c,e | Intarcia Therapeutics Inc., DD | United States | 80,195 | 3,484,900 | ||||||||||
a | Iovance Biotherapeutics Inc. | United States | 1,378,100 | 10,714,727 | ||||||||||
a | Karyopharm Therapeutics Inc. | United States | 652,554 | 6,662,576 | ||||||||||
a | Loxo Oncology Inc. | United States | 94,200 | 8,116,272 | ||||||||||
a | MacroGenics Inc. | United States | 180,200 | 3,566,158 | ||||||||||
b | Merrimack Pharmaceuticals Inc. | United States | 140,218 | 1,646,159 | ||||||||||
a | Merus BV | Netherlands | 240,506 | 3,802,400 | ||||||||||
20 | Semiannual Report | franklintempleton.com |
F R A N K L I N S T R A T E G I C S E R I E S
S T A T E M E N T O F I N V E S T M E N T S ( U N A U D I T E D )
Franklin Biotechnology Discovery Fund (continued)
| Shares/ | ||||||||||||||
Country
| Warrants
| Value
| ||||||||||||
| ||||||||||||||
| Common Stocks and Other Equity Interests (continued) | ||||||||||||||
Biotechnology (continued)
| ||||||||||||||
a | Minerva Neurosciences Inc. | United States | 426,800 | $ | 2,688,840 | |||||||||
a | Molecular Templates Inc., wts., 2/12/20 | United States | 439,500 | — | ||||||||||
a | Natera Inc. | United States | 392,629 | 4,314,993 | ||||||||||
a | Neurocrine Biosciences Inc. | United States | 874,300 | 54,302,773 | ||||||||||
a,b | Nightstar Therapeutics PLC, ADR | United States | 122,000 | 2,677,900 | ||||||||||
a,c | Northwest Biotherapeutics Inc., wts., 2/20/19 | United States | 223,880 | — | ||||||||||
a,c,e | Odonate Therapeutics LLC, Reg D | United States | 93,991 | 2,799,992 | ||||||||||
a | OvaScience Inc. | United States | 250,154 | 380,234 | ||||||||||
a | Pfenex Inc. | United States | 532,384 | 1,682,333 | ||||||||||
a,b | ProQR Therapeutics NV | Netherlands | 123,300 | 468,540 | ||||||||||
a,b | Proteostasis Therapeutics Inc. | United States | 88,600 | 166,568 | ||||||||||
a | Puma Biotechnology Inc. | United States | 288,800 | 36,764,240 | ||||||||||
a,b | Radius Health Inc. | United States | 157,400 | 5,054,114 | ||||||||||
a | Regeneron Pharmaceuticals Inc. | United States | 159,109 | 64,060,466 | ||||||||||
a | REGENXBIO Inc. | United States | 345,200 | 10,338,740 | ||||||||||
a | Retrophin Inc. | United States | 376,194 | 9,355,945 | ||||||||||
a | Rhythm Pharmaceuticals Inc. | United States | 49,300 | 1,261,094 | ||||||||||
a | Sage Therapeutics Inc. | United States | 113,870 | 7,205,694 | ||||||||||
a,b | Synlogic Inc. | United States | 77,990 | 1,139,434 | ||||||||||
a | Tesaro Inc. | United States | 320,944 | 37,155,687 | ||||||||||
a,b | TG Therapeutics Inc. | United States | 504,000 | 4,107,600 | ||||||||||
a | Vertex Pharmaceuticals Inc. | United States | 400,800 | 58,608,984 | ||||||||||
a | vTv Therapeutics Inc., A | United States | 317,100 | 2,004,072 | ||||||||||
a | Xencor Inc. | United States | 186,632 | 3,691,581 | ||||||||||
a,b | Zai Lab Ltd., ADR | China | 93,600 | 2,528,136 | ||||||||||
a | Zymeworks Inc. | Canada | 295,900 | 2,485,560 | ||||||||||
|
| |||||||||||||
| 1,180,766,925 | ||||||||||||||
|
| |||||||||||||
Life Sciences Tools & Services 4.7% | ||||||||||||||
a | Illumina Inc. | United States | 320,400 | 65,742,876 | ||||||||||
|
| |||||||||||||
Pharmaceuticals 9.5% | ||||||||||||||
a | Aclaris Therapeutics Inc. | United States | 583,062 | 14,698,993 | ||||||||||
a | Agile Therapeutics Inc. | United States | 999,100 | 4,745,725 | ||||||||||
a,d | Alcobra Ltd. | Israel | 1,737,306 | 2,727,570 | ||||||||||
a | Aratana Therapeutics Inc. | United States | 1,102,000 | 6,314,460 | ||||||||||
a | BioPharmX Corp. | United States | 1,991,575 | 364,060 | ||||||||||
a,f | BioPharmX Corp., 144A | United States | 1,945,737 | 355,681 | ||||||||||
a,c | BioPharmX Corp., wts., 3/29/21 | United States | 108,000 | 3,661 | ||||||||||
a,c | BioPharmX Corp., wts., 11/22/23 | United States | 1,679,900 | 120,074 | ||||||||||
a,b | Collegium Pharmaceutical Inc. | United States | 442,700 | 4,573,091 | ||||||||||
a | Cymabay Therapeutics Inc. | United States | 547,200 | 5,050,656 | ||||||||||
a,b | Egalet Corp. | United States | 1,032,677 | 1,012,023 | ||||||||||
a | Flex Pharma Inc. | United States | 170,200 | 456,136 | ||||||||||
a | Foamix Pharmaceuticals Ltd. | Israel | 371,100 | 2,267,421 | ||||||||||
a | GW Pharmaceuticals PLC, ADR | United Kingdom | 68,367 | 7,380,218 | ||||||||||
a | Jazz Pharmaceuticals PLC | United States | 97,900 | 13,855,787 | ||||||||||
a,b | Marinus Pharmaceuticals Inc. | United States | 831,820 | 4,608,283 | ||||||||||
a | The Medicines Co. | United States | 373,200 | 10,725,768 | ||||||||||
a | Nabriva Therapeutics PLC | Ireland | 140,100 | 857,412 | ||||||||||
a | Neos Therapeutics Inc. | United States | 614,800 | 6,393,920 | ||||||||||
a,b | Novan Inc. | United States | 120,969 | 736,701 | ||||||||||
a | Paratek Pharmaceuticals Inc. | United States | 131,500 | 2,814,100 | ||||||||||
franklintempleton.com | Semiannual Report | 21 |
F R A N K L I N S T R A T E G I C S E R I E S
S T A T E M E N T O F I N V E S T M E N T S ( U N A U D I T E D )
Franklin Biotechnology Discovery Fund (continued)
| Shares/ | ||||||||||||||
Country
| Warrants
| Value
| ||||||||||||
| ||||||||||||||
| Common Stocks and Other Equity Interests (continued) | ||||||||||||||
Pharmaceuticals (continued) | ||||||||||||||
a,b | Reata Pharmaceuticals Inc. | United States | 91,000 | $ | 2,755,480 | |||||||||
a | Revance Therapeutics Inc. | United States | 592,200 | 15,397,200 | ||||||||||
a,b | TherapeuticsMD Inc. | United States | 2,847,040 | 13,438,029 | ||||||||||
a | Zogenix Inc. | United States | 292,015 | 10,950,563 | ||||||||||
|
| |||||||||||||
| 132,603,012 | ||||||||||||||
|
| |||||||||||||
Total Common Stocks and Other Equity Interests | 1,379,112,813 | |||||||||||||
|
| |||||||||||||
Escrows and Litigation Trusts (Cost $2,788,760) 0.1% | ||||||||||||||
a,c | True North Therapeutics Inc., Escrow Account | United States | 759,880 | 1,346,728 | ||||||||||
|
| |||||||||||||
Total Investments before Short Term Investments | 1,380,459,541 | |||||||||||||
|
| |||||||||||||
Short Term Investments 5.2% | ||||||||||||||
Money Market Funds (Cost $24,306,864) 1.7% | ||||||||||||||
g,h | Institutional Fiduciary Trust Money Market Portfolio, 0.69% | United States | 24,306,864 | 24,306,864 | ||||||||||
|
| |||||||||||||
i | Investments from Cash Collateral Received for Loaned | |||||||||||||
Money Market Funds 3.5%
| ||||||||||||||
g,h | Institutional Fiduciary Trust Money Market Portfolio, 0.69% | United States | 48,868,987 | 48,868,987 | ||||||||||
|
| |||||||||||||
Total Investments (Cost $927,809,806) 103.7% | 1,453,635,392 | |||||||||||||
Other Assets, less Liabilities (3.7)% | (51,358,838 | ) | ||||||||||||
|
| |||||||||||||
Net Assets 100.0% | $ | 1,402,276,554 | ||||||||||||
|
| |||||||||||||
See Abbreviations on page 45.
aNon-income producing.
bA portion or all of the security is on loan at October 31, 2017. See Note 1(c).
cFair valued using significant unobservable inputs. See Note 11 regarding fair value measurements.
dSee Note 9 regarding holdings of 5% voting securities.
eSee Note 8 regarding restricted securities.
fSecurity was purchased pursuant to Rule 144A under the Securities Act of 1933 and may be sold in transactions exempt from registration only to qualified institutional buyers or in a public offering registered under the Securities Act of 1933. These securities have been deemed liquid under guidelines approved by the Trust’s Board of Trustees. At October 31, 2017, the aggregate value of these securities was $355,681, representing less than 0.1% of net assets.
gSee Note 3(f) regarding investments in affiliated management investment companies.
hThe rate shown is the annualized seven-day yield at period end.
iSee Note 1(c) regarding securities on loan.
22 | Semiannual Report | The accompanying notes are an integral part of these financial statements. | franklintempleton.com |
F R A N K L I N S T R A T E G I C S E R I E S
Financial Highlights
Franklin Natural Resources Fund
Six Months Ended October 31, 2017 (unaudited)
| Year Ended April 30,
| |||||||||||||||||||||||
2017
| 2016
| 2015
| 2014
| 2013
| ||||||||||||||||||||
| ||||||||||||||||||||||||
Class A | ||||||||||||||||||||||||
Per share operating performance (for a share outstanding throughout the period) | ||||||||||||||||||||||||
Net asset value, beginning of period | $25.11 | $25.02 | $31.46 | $39.79 | $33.03 | $35.81 | ||||||||||||||||||
|
| |||||||||||||||||||||||
Income from investment operationsa: | ||||||||||||||||||||||||
Net investment incomeb | 0.25 | c | 0.20 | 0.29 | 0.23 | 0.19 | 0.08 | |||||||||||||||||
Net realized and unrealized gains (losses) | (0.35 | ) | 0.17 | (6.55 | ) | (8.27 | ) | 6.65 | (2.86) | |||||||||||||||
|
| |||||||||||||||||||||||
Total from investment operations | (0.10 | ) | 0.37 | (6.26 | ) | (8.04 | ) | 6.84 | (2.78) | |||||||||||||||
|
| |||||||||||||||||||||||
Less distributions from net investment income | — | (0.28 | ) | (0.18 | ) | (0.29 | ) | (0.08 | ) | — | ||||||||||||||
|
| |||||||||||||||||||||||
Net asset value, end of period | $25.01 | $25.11 | $25.02 | $31.46 | $39.79 | $33.03 | ||||||||||||||||||
|
| |||||||||||||||||||||||
Total returnd | (0.40)% | 1.37% | (19.80)% | (20.07)% | 20.74% | (7.76)% | ||||||||||||||||||
| Ratios to average net assetse | ||||||||||||||||||||||||
Expenses before waiver and payments by affiliates | 1.17% | 1.06% | 1.14% | 1.08% | 1.07% | 1.08% | ||||||||||||||||||
Expenses net of waiver and payments by affiliates | 1.16% | f | 1.05% | f | 1.13% | 1.08% | f,g | 1.07% | f,g | 1.08% | ||||||||||||||
Net investment income | 2.16% | c | 0.79% | 1.22% | 0.67% | 0.53% | 0.26% | |||||||||||||||||
| Supplemental data | ||||||||||||||||||||||||
Net assets, end of period (000’s) | $345,759 | $398,703 | $461,596 | $572,518 | $624,250 | $628,722 | ||||||||||||||||||
Portfolio turnover rate | 14.81% | 29.74% | 35.77% | 30.05% | 21.03% | 20.40% | ||||||||||||||||||
aThe amount shown for a share outstanding throughout the period may not correlate with the Statement of Operations for the period due to the timing of sales and repurchases of the Fund’s shares in relation to income earned and/or fluctuating fair value of the investments of the Fund.
bBased on average daily shares outstanding.
cNet investment income per share includes approximately $0.15 per share related to income received in the form of special dividends in connection with certain Fund holdings. Excluding this amount, the ratio of net investment income to average net assets would have been 0.91%.
dTotal return does not reflect sales commissions or contingent deferred sales charges, if applicable, and is not annualized for periods less than one year.
eRatios are annualized for periods less than one year, except for non-recurring expenses, if any.
fBenefit of expense reduction rounds to less than 0.01%.
gBenefit of waiver and payments by affiliates rounds to less than 0.01%.
franklintempleton.com |
The accompanying notes are an integral part of these financial statements. | Semiannual Report |
|
23 |
|
F R A N K L I N S T R A T E G I C S E R I E S
F I N A N C I A L H I G H L I G H T S
Franklin Natural Resources Fund (continued)
Six Months Ended October 31, 2017 (unaudited) | Year Ended April 30, | |||||||||||||||||||||||
| 2017 | 2016 | 2015 | 2014 | 2013 | ||||||||||||||||||||
| ||||||||||||||||||||||||
Class C | ||||||||||||||||||||||||
Per share operating performance (for a share outstanding throughout the period) | ||||||||||||||||||||||||
Net asset value, beginning of period | $24.28 | $24.25 | $30.46 | $38.39 | $32.02 | $34.96 | ||||||||||||||||||
|
| |||||||||||||||||||||||
Income from investment operationsa: | ||||||||||||||||||||||||
Net investment income (loss)b | 0.16 | c | 0.01 | 0.11 | (0.01 | ) | (0.06 | ) | (0.14) | |||||||||||||||
Net realized and unrealized gains (losses) | (0.35 | ) | 0.15 | (6.31 | ) | (7.91 | ) | 6.43 | (2.80) | |||||||||||||||
|
| |||||||||||||||||||||||
Total from investment operations | (0.19 | ) | 0.16 | (6.20 | ) | (7.92 | ) | 6.37 | (2.94) | |||||||||||||||
|
| |||||||||||||||||||||||
Less distributions from net investment income | — | (0.13 | ) | (0.01 | ) | (0.01 | ) | — | — | |||||||||||||||
|
| |||||||||||||||||||||||
Net asset value, end of period | $24.09 | $24.28 | $24.25 | $30.46 | $38.39 | $32.02 | ||||||||||||||||||
|
| |||||||||||||||||||||||
Total returnd | (0.78)% | 0.63% | (20.37)% | (20.63)% | 19.89% | (8.41)% | ||||||||||||||||||
| Ratios to average net assetse | ||||||||||||||||||||||||
Expenses before waiver and payments by affiliates | 1.92% | 1.81% | 1.87% | 1.78% | 1.76% | 1.77% | ||||||||||||||||||
Expenses net of waiver and payments by affiliates | 1.91% | f | 1.80% | f | 1.86% | 1.78% | f,g | 1.76% | f,g | 1.77% | ||||||||||||||
Net investment income (loss) | 1.41% | c | 0.04% | 0.49% | (0.03)% | (0.16)% | (0.43)% | |||||||||||||||||
| Supplemental data | ||||||||||||||||||||||||
Net assets, end of period (000’s) | $84,402 | $96,835 | $107,724 | $123,735 | $126,651 | $130,424 | ||||||||||||||||||
Portfolio turnover rate | 14.81% | 29.74% | 35.77% | 30.05% | 21.03% | 20.40% | ||||||||||||||||||
aThe amount shown for a share outstanding throughout the period may not correlate with the Statement of Operations for the period due to the timing of sales and repurchases of the Fund’s shares in relation to income earned and/or fluctuating fair value of the investments of the Fund.
bBased on average daily shares outstanding.
cNet investment income per share includes approximately $0.15 per share related to income received in the form of special dividends in connection with certain Fund holdings. Excluding this amount, the ratio of net investment income to average net assets would have been 0.16%.
dTotal return does not reflect sales commissions or contingent deferred sales charges, if applicable, and is not annualized for periods less than one year.
eRatios are annualized for periods less than one year, except for non-recurring expenses, if any.
fBenefit of expense reduction rounds to less than 0.01%.
gBenefit of waiver and payments by affiliates rounds to less than 0.01%.
24 |
Semiannual Report | The accompanying notes are an integral part of these financial statements. |
franklintempleton.com |
F R A N K L I N S T R A T E G I C S E R I E S
F I N A N C I A L H I G H L I G H T S
Franklin Natural Resources Fund (continued)
Six Months Ended October 31, 2017 (unaudited) | Year Ended April 30, | |||||||||||||||||||
| 2017 | 2016 | 2015 | 2014a | |||||||||||||||||
| ||||||||||||||||||||
Class R6
| ||||||||||||||||||||
Per share operating performance (for a share outstanding throughout the period) | ||||||||||||||||||||
Net asset value, beginning of period | $26.87 | $26.73 | $33.62 | $42.58 | $38.28 | |||||||||||||||
|
| |||||||||||||||||||
Income from investment operationsb: | ||||||||||||||||||||
Net investment incomec | 0.34 | d | 0.47 | 0.51 | 0.46 | 0.19 | ||||||||||||||
Net realized and unrealized gains (losses) | (0.36 | ) | 0.04 | (7.06 | ) | (8.92 | ) | 4.31 | ||||||||||||
|
| |||||||||||||||||||
Total from investment operations | (0.02 | ) | 0.51 | (6.55 | ) | (8.46 | ) | 4.50 | ||||||||||||
|
| |||||||||||||||||||
Less distributions from net investment income | — | (0.37 | ) | (0.34 | ) | (0.50 | ) | (0.20) | ||||||||||||
|
| |||||||||||||||||||
Net asset value, end of period | $26.85 | $26.87 | $26.73 | $33.62 | $42.58 | |||||||||||||||
|
| |||||||||||||||||||
Total returne | (0.07)% | 1.89% | (19.31)% | (19.61)% | 11.83% | |||||||||||||||
| Ratios to average net assetsf | ||||||||||||||||||||
Expenses before waiver and payments by affiliates | 0.78% | 0.83% | 0.60% | 0.55% | 0.55% | |||||||||||||||
Expenses net of waiver and payments by affiliates | 0.56% | g | 0.54% | g | 0.55% | 0.54% | g | 0.53% | g | |||||||||||
Net investment income | 2.76% | d | 1.30% | 1.80% | 1.21% | 1.07% | ||||||||||||||
| Supplemental data | ||||||||||||||||||||
Net assets, end of period (000’s) | $721 | $218 | $15 | $439 | $939 | |||||||||||||||
Portfolio turnover rate | 14.81% | 29.74% | 35.77% | 30.05% | 21.03% | |||||||||||||||
aFor the period September 20, 2013 (effective date) to April 30, 2014.
bThe amount shown for a share outstanding throughout the period may not correlate with the Statement of Operations for the period due to the timing of sales and repurchases of the Fund’s shares in relation to income earned and/or fluctuating fair value of the investments of the Fund.
cBased on average daily shares outstanding.
dNet investment income per share includes approximately $0.15 per share related to income received in the form of special dividends in connection with certain Fund holdings. Excluding this amount, the ratio of net investment income to average net assets would have been 1.51%.
eTotal return is not annualized for periods less than one year.
fRatios are annualized for periods less than one year, except for non-recurring expenses, if any.
gBenefit of expense reduction rounds to less than 0.01%.
franklintempleton.com |
The accompanying notes are an integral part of these financial statements. | Semiannual Report |
|
25 |
|
F R A N K L I N S T R A T E G I C S E R I E S
F I N A N C I A L H I G H L I G H T S
Franklin Natural Resources Fund (continued)
Six Months Ended October 31, 2017 (unaudited) | Year Ended April 30, | |||||||||||||||||||||||
| 2017 | 2016 | 2015 | 2014 | 2013 | ||||||||||||||||||||
| ||||||||||||||||||||||||
Advisor Class | ||||||||||||||||||||||||
Per share operating performance (for a share outstanding throughout the period) | ||||||||||||||||||||||||
Net asset value, beginning of period | $26.81 | $26.71 | $33.63 | $42.52 | $35.31 | $38.17 | ||||||||||||||||||
|
| |||||||||||||||||||||||
Income from investment operationsa: | ||||||||||||||||||||||||
Net investment incomeb | 0.31 | c | 0.29 | 0.36 | 0.35 | 0.31 | 0.21 | |||||||||||||||||
Net realized and unrealized gains (losses) | (0.39 | ) | 0.17 | (7.00 | ) | (8.85 | ) | 7.10 | (3.07) | |||||||||||||||
|
| |||||||||||||||||||||||
Total from investment operations | (0.08 | ) | 0.46 | (6.64 | ) | (8.50 | ) | 7.41 | (2.86) | |||||||||||||||
|
| |||||||||||||||||||||||
Less distributions from net investment income | — | (0.36 | ) | (0.28 | ) | (0.39 | ) | (0.20 | ) | — | ||||||||||||||
|
| |||||||||||||||||||||||
Net asset value, end of period | $26.73 | $26.81 | $26.71 | $33.63 | $42.52 | $35.31 | ||||||||||||||||||
|
| |||||||||||||||||||||||
Total returnd | (0.30)% | 1.64% | (19.60)% | (19.81)% | 21.07% | (7.49)% | ||||||||||||||||||
| Ratios to average net assetse | ||||||||||||||||||||||||
Expenses before waiver and payments by affiliates | 0.92% | 0.81% | 0.87% | 0.78% | 0.77% | 0.78% | ||||||||||||||||||
Expenses net of waiver and payments by affiliates | 0.91% | f | 0.80% | f | 0.86% | 0.78% | f,g | 0.77% | f,g | 0.78% | ||||||||||||||
Net investment income | 2.41% | c | 1.04% | 1.49% | 0.97% | 0.83% | 0.56% | |||||||||||||||||
| Supplemental data | ||||||||||||||||||||||||
Net assets, end of period (000’s) | $85,872 | $94,070 | $90,185 | $79,307 | $94,651 | $117,087 | ||||||||||||||||||
Portfolio turnover rate | 14.81% | 29.74% | 35.77% | 30.05% | 21.03% | 20.40% | ||||||||||||||||||
aThe amount shown for a share outstanding throughout the period may not correlate with the Statement of Operations for the period due to the timing of sales and repurchases of the Fund’s shares in relation to income earned and/or fluctuating fair value of the investments of the Fund.
bBased on average daily shares outstanding.
cNet investment income per share includes approximately $0.15 per share related to income received in the form of special dividends in connection with certain Fund holdings. Excluding this amount, the ratio of net investment income to average net assets would have been 1.16%.
dTotal return is not annualized for periods less than one year.
eRatios are annualized for periods less than one year, except for non-recurring expenses, if any.
fBenefit of expense reduction rounds to less than 0.01%.
gBenefit of waiver and payments by affiliates rounds to less than 0.01%.
26 |
Semiannual Report | The accompanying notes are an integral part of these financial statements. |
franklintempleton.com |
F R A N K L I N S T R A T E G I C S E R I E S
Statement of Investments, October 31, 2017 (unaudited)
Franklin Natural Resources Fund
| Country | Shares | Value | ||||||||||||
Common Stocks 98.1% | ||||||||||||||
| Construction Materials 0.3% | ||||||||||||||
a | Cemex SAB de CV, CPO, ADR | Mexico | 191,800 | $ | 1,555,498 | |||||||||
|
| |||||||||||||
| Copper 4.1% | ||||||||||||||
Antofagasta PLC | United Kingdom | 420,800 | 5,335,767 | |||||||||||
First Quantum Minerals Ltd. | Zambia | 349,400 | 3,909,768 | |||||||||||
a | Freeport-McMoRan Inc. | United States | 274,200 | 3,833,316 | ||||||||||
a | Imperial Metals Corp. | Canada | 364,500 | 839,491 | ||||||||||
Lundin Mining Corp. | Canada | 329,900 | 2,517,325 | |||||||||||
Sandfire Resources NL | Australia | 1,072,167 | 4,711,685 | |||||||||||
|
| |||||||||||||
|
21,147,352 |
| ||||||||||||
|
| |||||||||||||
| Diversified Metals & Mining 7.4% | ||||||||||||||
BHP Billiton PLC, ADR | United Kingdom | 332,100 | 12,061,872 | |||||||||||
Glencore PLC | Switzerland | 1,843,200 | 8,888,414 | |||||||||||
Hudbay Minerals Inc. | Canada | 168,600 | 1,253,828 | |||||||||||
a | Nautilus Minerals Inc. | Canada | 3,895,831 | 634,426 | ||||||||||
a | Nexa Resources SA | Peru | 146,300 | 2,658,271 | ||||||||||
Rio Tinto PLC, ADR | United Kingdom | 114,200 | 5,473,606 | |||||||||||
South32 Ltd. | Australia | 963,300 | 2,485,384 | |||||||||||
Teck Resources Ltd., B | Canada | 243,900 | 4,985,316 | |||||||||||
|
| |||||||||||||
|
38,441,117 |
| ||||||||||||
|
| |||||||||||||
| Gold 5.3% | ||||||||||||||
Agnico Eagle Mines Ltd. | Canada | 67,800 | 3,028,405 | |||||||||||
Alamos Gold Inc., A | Canada | 473,500 | 2,999,880 | |||||||||||
a | B2Gold Corp. | Canada | 1,894,000 | 4,817,433 | ||||||||||
Barrick Gold Corp. | Canada | 279,000 | 4,031,550 | |||||||||||
Goldcorp Inc. | Canada | 266,800 | 3,484,408 | |||||||||||
a | Guyana Goldfields Inc. | Canada | 758,600 | 2,706,029 | ||||||||||
Newcrest Mining Ltd. | Australia | 142,400 | 2,443,171 | |||||||||||
OceanaGold Corp. | Australia | 473,310 | 1,269,941 | |||||||||||
Randgold Resources Ltd., ADR | United Kingdom | 5,400 | 530,658 | |||||||||||
Tahoe Resources Inc. | Canada | 444,700 | 2,134,615 | |||||||||||
|
| |||||||||||||
|
27,446,090 |
| ||||||||||||
|
| |||||||||||||
| Integrated Oil & Gas 15.2% | ||||||||||||||
BP PLC, ADR | United Kingdom | 127,500 | 5,185,425 | |||||||||||
Chevron Corp. | United States | 106,500 | 12,342,285 | |||||||||||
Exxon Mobil Corp. | United States | 127,000 | 10,585,450 | |||||||||||
Occidental Petroleum Corp. | United States | 200,100 | 12,920,457 | |||||||||||
a | Petroleo Brasileiro SA, ADR | Brazil | 206,400 | 2,198,160 | ||||||||||
Royal Dutch Shell PLC, A, ADR | United Kingdom | 211,200 | 13,311,936 | |||||||||||
Suncor Energy Inc. | Canada | 444,100 | 15,084,006 | |||||||||||
Total SA, B, ADR | France | 120,710 | 6,725,961 | |||||||||||
|
| |||||||||||||
|
78,353,680 |
| ||||||||||||
|
| |||||||||||||
| Oil & Gas Drilling 2.7% | ||||||||||||||
Ensco PLC, A | United States | 346,719 | 1,868,815 | |||||||||||
Patterson-UTI Energy Inc. | United States | 258,600 | 5,115,108 | |||||||||||
a | Pioneer Energy Services Corp. | United States | 1,898,343 | 3,606,852 | ||||||||||
a | Rowan Cos. PLC | United States | 248,400 | 3,559,572 | ||||||||||
|
| |||||||||||||
|
14,150,347 |
| ||||||||||||
|
| |||||||||||||
franklintempleton.com |
Semiannual Report |
|
27 |
|
F R A N K L I N S T R A T E G I C S E R I E S
S T A T E M E N T O F I N V E S T M E N T S ( U N A U D I T E D )
Franklin Natural Resources Fund (continued)
Country
| Shares
| Value
| ||||||||||||
Common Stocks (continued) | ||||||||||||||
| Oil & Gas Equipment & Services 17.8% | ||||||||||||||
Baker Hughes a GE Co., A | United States | 155,400 | $ | 4,884,222 | ||||||||||
a | Dril-Quip Inc. | United States | 57,800 | 2,433,380 | ||||||||||
Halliburton Co. | United States | 414,935 | 17,734,322 | |||||||||||
a | Hunting PLC | United Kingdom | 253,600 | 1,763,645 | ||||||||||
a | Mammoth Energy Services Inc. | United States | 82,800 | 1,633,644 | ||||||||||
Oceaneering International Inc. | United States | 252,000 | 5,095,440 | |||||||||||
a | Oil States International Inc. | United States | 183,800 | 4,236,590 | ||||||||||
a | PHI Inc., non-voting | United States | 104,500 | 1,221,605 | ||||||||||
a | ProPetro Holding Corp. | United States | 98,450 | 1,499,393 | ||||||||||
a | Ranger Energy Services Inc. | United States | 127,400 | 1,477,840 | ||||||||||
RPC Inc. | United States | 207,400 | 5,041,894 | |||||||||||
Schlumberger Ltd. | United States | 339,847 | 21,750,208 | |||||||||||
a | Superior Energy Services Inc. | United States | 1,166,800 | 10,291,176 | ||||||||||
a | TechnipFMC PLC | United Kingdom | 382,500 | 10,476,675 | ||||||||||
a | Weatherford International PLC | United States | 731,000 | 2,536,570 | ||||||||||
|
| |||||||||||||
|
92,076,604 |
| ||||||||||||
|
| |||||||||||||
| Oil & Gas Exploration & Production 34.6% | ||||||||||||||
Anadarko Petroleum Corp. | United States | 373,300 | 18,429,821 | |||||||||||
Cabot Oil & Gas Corp., A | United States | 464,500 | 12,866,650 | |||||||||||
a | Cairn Energy PLC | United Kingdom | 1,903,100 | 5,344,558 | ||||||||||
a | Callon Petroleum Co. | United States | 507,200 | 5,624,848 | ||||||||||
Canadian Natural Resources Ltd. | Canada | 297,800 | 10,396,616 | |||||||||||
a | Concho Resources Inc. | United States | 107,900 | 14,481,259 | ||||||||||
ConocoPhillips | United States | 287,200 | 14,690,280 | |||||||||||
a | Diamondback Energy Inc. | United States | 93,400 | 10,008,744 | ||||||||||
EOG Resources Inc. | United States | 182,400 | 18,216,288 | |||||||||||
EQT Corp. | United States | 164,900 | 10,312,846 | |||||||||||
Hess Corp. | United States | 215,500 | 9,516,480 | |||||||||||
a | Jagged Peak Energy Inc. | United States | 492,300 | 6,838,047 | ||||||||||
a | Matador Resources Co. | United States | 197,346 | 5,239,536 | ||||||||||
Noble Energy Inc. | United States | 562,100 | 15,665,727 | |||||||||||
Pioneer Natural Resources Co. | United States | 87,300 | 13,066,191 | |||||||||||
a | Resolute Energy Corp. | United States | 178,300 | 5,354,349 | ||||||||||
a | Sanchez Energy Corp. | United States | 22,916 | 99,226 | ||||||||||
a | SRC Energy Inc. | United States | 282,900 | 2,698,866 | ||||||||||
|
| |||||||||||||
|
178,850,332 |
| ||||||||||||
|
| |||||||||||||
| Oil & Gas Refining & Marketing 4.3% | ||||||||||||||
HollyFrontier Corp. | United States | 147,800 | 5,461,210 | |||||||||||
Marathon Petroleum Corp. | United States | 92,400 | 5,519,976 | |||||||||||
Phillips 66 | United States | 60,500 | 5,510,340 | |||||||||||
Valero Energy Corp. | United States | 69,700 | 5,498,633 | |||||||||||
|
| |||||||||||||
|
21,990,159 |
| ||||||||||||
|
| |||||||||||||
| Oil & Gas Storage & Transportation 5.4% | ||||||||||||||
Enbridge Inc. | Canada | 216,147 | 8,313,014 | |||||||||||
Kinder Morgan Inc. | United States | 723,400 | 13,100,774 | |||||||||||
Targa Resources Corp. | United States | 156,500 | 6,494,750 | |||||||||||
|
| |||||||||||||
|
27,908,538 |
| ||||||||||||
|
| |||||||||||||
28 |
Semiannual Report |
franklintempleton.com |
F R A N K L I N S T R A T E G I C S E R I E S
S T A T E M E N T O F I N V E S T M E N T S ( U N A U D I T E D )
Franklin Natural Resources Fund (continued)
Country
| Shares
| Value
| ||||||||||||
Common Stocks (continued) | ||||||||||||||
| Specialty Chemicals 0.6% | ||||||||||||||
Albemarle Corp. | United States | 9,700 | $ | 1,366,633 | ||||||||||
Umicore SA | Belgium | 32,200 | 1,439,436 | |||||||||||
|
| |||||||||||||
|
2,806,069 |
| ||||||||||||
|
| |||||||||||||
| Trading Companies & Distributors 0.4% | ||||||||||||||
a | Univar Inc. | United States | 64,300 | 1,912,925 | ||||||||||
|
| |||||||||||||
| Total Common Stocks (Cost $434,206,105) |
|
506,638,711 |
| |||||||||||
|
| |||||||||||||
Convertible Preferred Stocks 1.0% | ||||||||||||||
| Oil & Gas Exploration & Production 1.0% | ||||||||||||||
Hess Corp., 8.00%, cvt. pfd. | United States | 52,900 | 2,920,080 | |||||||||||
Sanchez Energy Corp., 4.875%, cvt. pfd., A | United States | 84,500 | 1,378,406 | |||||||||||
Sanchez Energy Corp., 6.50%, cvt. pfd., B | United States | 56,000 | 1,032,080 | |||||||||||
|
| |||||||||||||
| Total Convertible Preferred Stocks (Cost $9,744,127) |
|
5,330,566 |
| |||||||||||
|
| |||||||||||||
Principal | ||||||||||||||
| Convertible Bonds (Cost $3,695,183) 0.1% | ||||||||||||||
| Oil & Gas Exploration & Production 0.1% | ||||||||||||||
Cobalt International Energy Inc., cvt., senior bond, 3.125%, 5/15/24 | United States | $ | 4,787,000 | 646,245 | ||||||||||
|
| |||||||||||||
Total Investments before Short Term Investments |
|
512,615,522 |
| |||||||||||
|
| |||||||||||||
Shares | ||||||||||||||
| Short Term Investments (Cost $3,576,752) 0.7% | ||||||||||||||
Money Market Funds 0.7% | ||||||||||||||
b,c | Institutional Fiduciary Trust Money Market Portfolio, 0.69% | United States | 3,576,752 | 3,576,752 | ||||||||||
|
| |||||||||||||
| Total Investments (Cost $451,222,167) 99.9% | 516,192,274 | |||||||||||||
| Other Assets, less Liabilities 0.1% | 562,013 | |||||||||||||
|
| |||||||||||||
| Net Assets 100.0% |
$ |
516,754,287 |
| |||||||||||
|
| |||||||||||||
See Abbreviations on page 45.
aNon-income producing.
bSee Note 3(f) regarding investments in affiliated management investment companies.
cThe rate shown is the annualized seven-day yield at period end.
franklintempleton.com |
The accompanying notes are an integral part of these financial statements. | Semiannual Report |
|
29 |
|
F R A N K L I N S T R A T E G I C S E R I E S
Statements of Assets and Liabilities
October 31, 2017 (unaudited)
| Franklin Biotechnology Discovery Fund | Franklin Natural Resources Fund | |||||||
Assets: | ||||||||
Investments in securities: | ||||||||
Cost - Unaffiliated issuers | $ 839,480,581 | $ 447,645,415 | ||||||
Cost - Non-controlled affiliates (Note 3f and 9) | 88,329,225 | 3,576,752 | ||||||
|
| |||||||
Value - Unaffiliated issuers | $1,366,409,055 | $ 512,615,522 | ||||||
Value - Non-controlled affiliates (Note 3f and 9) | 87,226,337 | 3,576,752 | �� | |||||
Receivables: | ||||||||
Investment securities sold | — | 2,390,214 | ||||||
Capital shares sold | 1,729,524 | 312,315 | ||||||
Dividends and interest | 190,763 | 631,020 | ||||||
Due from custodian | 144,000 | — | ||||||
Other assets | 384 | 200 | ||||||
|
| |||||||
Total assets | 1,455,700,063 | 519,526,023 | ||||||
|
| |||||||
Liabilities: | ||||||||
Payables: | ||||||||
Investment securities purchased | 710,786 | 753,138 | ||||||
Capital shares redeemed | 1,817,543 | 1,010,721 | ||||||
Management fees | 713,867 | 218,844 | ||||||
Distribution fees | 313,480 | 147,749 | ||||||
Transfer agent fees | 799,590 | 573,478 | ||||||
Payable upon return of securities loaned | 49,012,987 | — | ||||||
Accrued expenses and other liabilities | 55,256 | 67,806 | ||||||
|
| |||||||
Total liabilities | 53,423,509 | 2,771,736 | ||||||
|
| |||||||
Net assets, at value | $1,402,276,554 | $ 516,754,287 | ||||||
|
| |||||||
Net assets consist of: | ||||||||
Paid-in capital | $ 847,055,103 | $ 626,100,149 | ||||||
Undistributed net investment income (loss) | (9,129,010 | ) | 7,198,917 | |||||
Net unrealized appreciation (depreciation) | 525,825,586 | 64,963,161 | ||||||
Accumulated net realized gain (loss) | 38,524,875 | (181,507,940 | ) | |||||
|
| |||||||
Net assets, at value | $1,402,276,554 | $ 516,754,287 | ||||||
|
| |||||||
+Includes securities loaned | $ 47,185,993 | $ — | ||||||
30 |
Semiannual Report | The accompanying notes are an integral part of these financial statements. |
franklintempleton.com |
F R A N K L I N S T R A T E G I C S E R I E S
F I N A N C I A L S T A T E M E N T S
Statements of Assets and Liabilities (continued)
October 31, 2017 (unaudited)
| Franklin Biotechnology Discovery Fund | Franklin Natural Resources Fund | |||||||
| Class A: | ||||||||
Net assets, at value | $ | 1,153,401,345 | $345,759,071 | |||||
|
| |||||||
Shares outstanding. | 7,668,840 | 13,826,523 | ||||||
|
| |||||||
Net asset value per sharea | $150.40 | $25.01 | ||||||
|
| |||||||
Maximum offering price per share (net asset value per share ÷ 94.25%) | $159.58 | $26.54 | ||||||
|
| |||||||
| Class C: | ||||||||
Net assets, at value | $ | 57,333,561 | $ 84,401,861 | |||||
|
| |||||||
Shares outstanding | 391,286 | 3,504,120 | ||||||
|
| |||||||
Net asset value and maximum offering price per sharea | $146.53 | $24.09 | ||||||
|
| |||||||
| Class R6: | ||||||||
Net assets, at value | $ | 8,871,794 | $721,428 | |||||
|
| |||||||
Shares outstanding | 57,366 | 26,872 | ||||||
|
| |||||||
Net asset value and maximum offering price per share | $154.65 | $26.85 | ||||||
|
| |||||||
| Advisor Class: | ||||||||
Net assets, at value | $ | 182,669,854 | $ 85,871,927 | |||||
|
| |||||||
Shares outstanding | 1,188,965 | 3,212,323 | ||||||
|
| |||||||
Net asset value and maximum offering price per share | $153.64 | $26.73 | ||||||
|
| |||||||
aRedemption price is equal to net asset value less contingent deferred sales charges, if applicable.
franklintempleton.com |
The accompanying notes are an integral part of these financial statements. | Semiannual Report |
|
31 |
|
F R A N K L I N S T R A T E G I C S E R I E S
F I N A N C I A L S T A T E M E N T S
Statements of Operations
for the six months ended October 31, 2017 (unaudited)
| Franklin Biotechnology Discovery Fund | Franklin Natural Resources Fund | |||||||
Investment income: | ||||||||
Dividends: | ||||||||
Unaffiliated issuers | $ 2,951,773 | $ 8,712,320 | ||||||
Non-controlled affiliates (Note 3f and 9) | 92,765 | 13,973 | ||||||
Interest: | ||||||||
Unaffiliated issuers | — | 138,039 | ||||||
Income from securities loaned (net of fees and rebates) | 1,597,327 | 28,778 | ||||||
|
| |||||||
Total investment income | 4,641,865 | 8,893,110 | ||||||
|
| |||||||
Expenses: | ||||||||
Management fees (Note 3a) | 4,190,633 | 1,333,937 | ||||||
Distribution fees: (Note 3c) | ||||||||
Class A | 1,492,340 | 450,344 | ||||||
Class C | 287,965 | 438,347 | ||||||
Transfer agent fees: (Note 3e) | ||||||||
Class A | 1,332,049 | 762,175 | ||||||
Class C | 64,275 | 185,717 | ||||||
Class R6 | 721 | 361 | ||||||
Advisor Class | 199,096 | 185,747 | ||||||
Custodian fees (Note 4) | 6,576 | 6,748 | ||||||
Reports to shareholders | 77,041 | 73,408 | ||||||
Registration and filing fees | 54,317 | 41,674 | ||||||
Professional fees | 34,298 | 21,550 | ||||||
Trustees’ fees and expenses | 6,790 | 3,355 | ||||||
Other | 14,547 | 8,960 | ||||||
|
| |||||||
Total expenses | 7,760,648 | 3,512,323 | ||||||
Expense reductions (Note 4) | (151 | ) | (225 | ) | ||||
Expenses waived/paid by affiliates (Note 3f and 3g) | (158,337 | ) | (13,364 | ) | ||||
|
| |||||||
Net expenses | 7,602,160 | 3,498,734 | ||||||
|
| |||||||
Net investment income (loss) | (2,960,295 | ) | 5,394,376 | |||||
|
| |||||||
Realized and unrealized gains (losses): | ||||||||
Net realized gain (loss) from: | ||||||||
Investments: | ||||||||
Unaffiliated issuers | 11,944,670 | (22,022,340 | ) | |||||
Foreign currency transactions | (721 | ) | 20,568 | |||||
|
| |||||||
Net realized gain (loss) | 11,943,949 | (22,001,772 | ) | |||||
|
| |||||||
Net change in unrealized appreciation (depreciation) on: | ||||||||
Investments: | ||||||||
Unaffiliated issuers | 18,783,201 | 11,360,107 | ||||||
Non-controlled affiliates (Note 3f and 9) | 1,156,948 | — | ||||||
Translation of other assets and liabilities denominated in foreign currencies | 255,698 | (8,723 | ) | |||||
|
| |||||||
Net change in unrealized appreciation (depreciation) | 20,195,847 | 11,351,384 | ||||||
|
| |||||||
Net realized and unrealized gain (loss) | 32,139,796 | (10,650,388 | ) | |||||
|
| |||||||
Net increase (decrease) in net assets resulting from operations | $29,179,501 | $ (5,256,012 | ) | |||||
|
| |||||||
32 |
Semiannual Report | The accompanying notes are an integral part of these financial statements. |
franklintempleton.com |
F R A N K L I N S T R A T E G I C S E R I E S
F I N A N C I A L S T A T E M E N T S
Statements of Changes in Net Assets
Franklin Biotechnology Discovery Fund | Franklin Natural Resources Fund | |||||||||||||||
|
| |||||||||||||||
| Six Months Ended October 31, 2017 (unaudited) | Year Ended April 30, 2017 | Six Months Ended October 31, 2017 (unaudited) | Year Ended April 30, 2017 | |||||||||||||
Increase (decrease) in net assets: | ||||||||||||||||
Operations: | ||||||||||||||||
Net investment income (loss) | $ (2,960,295 | ) | $ (7,464,858 | ) | $ 5,394,376 | $ 4,573,924 | ||||||||||
Net realized gain (loss) | 11,943,949 | 98,018,256 | (22,001,772 | ) | (16,276,712 | ) | ||||||||||
Net change in unrealized appreciation (depreciation) | 20,195,847 | 145,090,624 | 11,351,384 | 23,243,049 | ||||||||||||
|
| |||||||||||||||
Net increase (decrease) in net assets resulting from operations | 29,179,501 | 235,644,022 | (5,256,012 | ) | 11,540,261 | |||||||||||
|
| |||||||||||||||
Distributions to shareholders from: | ||||||||||||||||
Net investment income: | ||||||||||||||||
Class A | — | (14,076,436 | ) | — | (4,756,117 | ) | ||||||||||
Class C | — | (408,909 | ) | — | (577,641 | ) | ||||||||||
Class R6 | — | (126,292 | ) | — | (212 | ) | ||||||||||
Advisor Class | — | (1,688,739 | ) | — | (1,234,610 | ) | ||||||||||
Net realized gains: | ||||||||||||||||
Class A | — | (34,234,146 | ) | — | — | |||||||||||
Class C | — | (1,330,584 | ) | — | — | |||||||||||
Class R6 | — | (230,582 | ) | — | — | |||||||||||
Advisor Class | — | (3,411,647 | ) | — | — | |||||||||||
|
| |||||||||||||||
Total distributions to shareholders | — | (55,507,335 | ) | — | (6,568,580 | ) | ||||||||||
|
| |||||||||||||||
Capital share transactions: (Note 2) | ||||||||||||||||
Class A | (47,548,229 | ) | (55,488,311 | ) | (49,442,552 | ) | (66,989,230 | ) | ||||||||
Class C | 2,438,917 | 31,398,641 | (11,311,029 | ) | (11,600,701 | ) | ||||||||||
Class R6 | (178,909 | ) | 2,002,691 | 501,180 | 222,601 | |||||||||||
Advisor Class | 18,978,022 | 50,061,306 | (7,563,225 | ) | 3,702,378 | |||||||||||
|
| |||||||||||||||
Total capital share transactions | (26,310,199 | ) | 27,974,327 | (67,815,626 | ) | (74,664,952 | ) | |||||||||
|
| |||||||||||||||
Net increase (decrease) in net assets | 2,869,302 | 208,111,014 | (73,071,638 | ) | (69,693,271 | ) | ||||||||||
Net assets: | ||||||||||||||||
Beginning of period | 1,399,407,252 | 1,191,296,238 | 589,825,925 | 659,519,196 | ||||||||||||
|
| |||||||||||||||
End of period | $1,402,276,554 | $1,399,407,252 | $516,754,287 | $589,825,925 | ||||||||||||
|
| |||||||||||||||
Undistributed net investment income (loss) included in net assets: | ||||||||||||||||
End of period | $ (9,129,010 | ) | $ — | $ 7,198,917 | $ 1,804,541 | |||||||||||
|
| |||||||||||||||
Distributions in excess of net investment income included in net assets: | ||||||||||||||||
End of period | $ — | $ (6,168,715 | ) | $ — | $ — | |||||||||||
|
| |||||||||||||||
franklintempleton.com |
The accompanying notes are an integral part of these financial statements. | Semiannual Report |
33 |
F R A N K L I N S T R A T E G I C S E R I E S
Notes to Financial Statements (unaudited)
1. Organization and Significant Accounting Policies
Franklin Strategic Series (Trust) is registered under the Investment Company Act of 1940 (1940 Act) as an open-end management investment company, consisting of eight separate funds, two of which are included in this report (Funds) and applies the specialized accounting and reporting guidance in U.S. Generally Accepted Accounting Principles (U.S. GAAP). The Funds offer four classes of shares: Class A, Class C, Class R6, and Advisor Class. Each class of shares may differ by its initial sales load, contingent deferred sales charges, voting rights on matters affecting a single class, its exchange privilege and fees due to differing arrangements for distribution and transfer agent fees.
The following summarizes the Funds’ significant accounting policies.
a. Financial Instrument Valuation
The Funds’ investments in financial instruments are carried at fair value daily. Fair value is the price that would be received to sell an asset or paid to transfer a liability in an orderly transaction between market participants on the measurement date. The Funds calculate the net asset value (NAV) per share as of 4 p.m. Eastern time each day the New York Stock Exchange (NYSE) is open for trading. Under compliance policies and procedures approved by the Trust’s Board of Trustees (the Board), the Funds’ administrator has responsibility for oversight of valuation, including leading the cross-functional Valuation Committee (VC). The VC provides administration and oversight of the Funds’ valuation policies and procedures, which are approved annually by the Board. Among other things, these procedures allow the Funds to utilize independent pricing services, quotations from securities and financial instrument dealers, and other market sources to determine fair value.
Equity securities listed on an exchange or on the NASDAQ National Market System are valued at the last quoted sale price or the official closing price of the day, respectively. Foreign equity securities are valued as of the close of trading on the foreign stock exchange on which the security is primarily traded, or as of 4 p.m. Eastern time. The value is then converted into its U.S. dollar equivalent at the foreign exchange rate in effect at 4 p.m. Eastern time on the day that the value of the security is determined. Over-the-counter (OTC) securities are valued within the range of the most recent quoted bid and ask
prices. Securities that trade in multiple markets or on multiple exchanges are valued according to the broadest and most representative market. Certain equity securities are valued based upon fundamental characteristics or relationships to similar securities.
Debt securities generally trade in the OTC market rather than on a securities exchange. The Funds’ pricing services use multiple valuation techniques to determine fair value. In instances where sufficient market activity exists, the pricing services may utilize a market-based approach through which quotes from market makers are used to determine fair value. In instances where sufficient market activity may not exist or is limited, the pricing services also utilize proprietary valuation models which may consider market characteristics such as benchmark yield curves, credit spreads, estimated default rates, anticipated market interest rate volatility, coupon rates, anticipated timing of principal repayments, underlying collateral, and other unique security features in order to estimate the relevant cash flows, which are then discounted to calculate the fair value.
Investments in open-end mutual funds are valued at the closing NAV.
The Funds have procedures to determine the fair value of financial instruments for which market prices are not reliable or readily available. Under these procedures, the VC convenes on a regular basis to review such financial instruments and considers a number of factors, including significant unobservable valuation inputs, when arriving at fair value. The VC primarily employs a market-based approach which may use related or comparable assets or liabilities, recent transactions, market multiples, book values, and other relevant information for the investment to determine the fair value of the investment. An income-based valuation approach may also be used in which the anticipated future cash flows of the investment are discounted to calculate fair value. Discounts may also be applied due to the nature or duration of any restrictions on the disposition of the investments. Due to the inherent uncertainty of valuations of such investments, the fair values may differ significantly from the values that would have been used had an active market existed. The VC employs various methods for calibrating these valuation approaches including a regular review of key inputs and assumptions, transactional back-testing or disposition analysis, and reviews of any related market activity.
34 | Semiannual Report | franklintempleton.com |
F R A N K L I N S T R A T E G I C S E R I E S
N O T E S T O F I N A N C I A L S T A T E M E N T S (U N A U D I T E D)
Trading in securities on foreign securities stock exchanges and OTC markets may be completed before 4 p.m. Eastern time. In addition, trading in certain foreign markets may not take place on every Funds’ business day. Occasionally, events occur between the time at which trading in a foreign security is completed and 4 p.m. Eastern time that might call into question the reliability of the value of a portfolio security held by the Fund. As a result, differences may arise between the value of the Funds’ portfolio securities as determined at the foreign market close and the latest indications of value at 4 p.m. Eastern time. In order to minimize the potential for these differences, the VC monitors price movements following the close of trading in foreign stock markets through a series of country specific market proxies (such as baskets of American Depositary Receipts, futures contracts and exchange traded funds). These price movements are measured against established trigger thresholds for each specific market proxy to assist in determining if an event has occurred that may call into question the reliability of the values of the foreign securities held by the Funds. If such an event occurs, the securities may be valued using fair value procedures, which may include the use of independent pricing services.
When the last day of the reporting period is a non-business day, certain foreign markets may be open on those days that the Funds’ NAV is not calculated, which could result in differences between the value of the Funds’ portfolio securities on the last business day and the last calendar day of the reporting period. Any significant security valuation changes due to an open foreign market are adjusted and reflected by the Funds for financial reporting purposes.
b. Foreign Currency Translation
Portfolio securities and other assets and liabilities denominated in foreign currencies are translated into U.S. dollars based on the exchange rate of such currencies against U.S. dollars on the date of valuation. The Funds may enter into foreign currency exchange contracts to facilitate transactions denominated in a foreign currency. Purchases and sales of securities, income and expense items denominated in foreign currencies are translated into U.S. dollars at the exchange rate in effect on the transaction date. Portfolio securities and assets and liabilities denominated in foreign currencies contain risks that those currencies will decline in value relative to the U.S. dollar. Occasionally, events may impact the availability or reliability of foreign exchange
rates used to convert the U.S. dollar equivalent value. If such an event occurs, the foreign exchange rate will be valued at fair value using procedures established and approved by the Board.
The Funds do not separately report the effect of changes in foreign exchange rates from changes in market prices on securities held. Such changes are included in net realized and unrealized gain or loss from investments in the Statements of Operations.
Realized foreign exchange gains or losses arise from sales of foreign currencies, currency gains or losses realized between the trade and settlement dates on securities transactions and the difference between the recorded amounts of dividends, interest, and foreign withholding taxes and the U.S. dollar equivalent of the amounts actually received or paid. Net unrealized foreign exchange gains and losses arise from changes in foreign exchange rates on foreign denominated assets and liabilities other than investments in securities held at the end of the reporting period.
c. Securities Lending
Certain or all Funds participate in an agency based securities lending program to earn additional income. The Fund receives cash collateral against the loaned securities in an amount equal to at least 102% of the fair value of the loaned securities. Collateral is maintained over the life of the loan in an amount not less than 100% of the fair value of loaned securities, as determined at the close of Fund business each day; any additional collateral required due to changes in security values is delivered to the Fund on the next business day. The collateral is deposited into a joint cash account with other funds and is used to invest in a money market fund managed by Franklin Advisers, Inc., an affiliate of the Funds, and/or uninvested cash as included in due from custodian in the Statements of Assets and Liabilities. The Fund may receive income from the investment of cash collateral, in addition to lending fees and rebates paid by the borrower. Income from securities loaned, net of fees paid to the securities lending agent and/or third-party vendor, is reported separately in the Statements of Operations. The Fund bears the market risk with respect to the collateral investment, securities loaned, and the risk that the agent may default on its obligations to the Fund. If the borrower defaults on its obligation to return the securities loaned, the Fund has the
| franklintempleton.com |
Semiannual Report | 35 |
F R A N K L I N S T R A T E G I C S E R I E S
N O T E S T O F I N A N C I A L S T A T E M E N T S (U N A U D I T E D)
1. Organization and Significant Accounting Policies (continued)
c. Securities Lending (continued)
right to repurchase the securities in the open market using the collateral received. The securities lending agent has agreed to indemnify the Fund in the event of default by a third party borrower.
d. Income and Deferred Taxes
It is each Fund’s policy to qualify as a regulated investment company under the Internal Revenue Code. Each Fund intends to distribute to shareholders substantially all of its taxable income and net realized gains to relieve it from federal income and excise taxes. As a result, no provision for U.S. federal income taxes is required.
The Funds may be subject to foreign taxation related to income received, capital gains on the sale of securities and certain foreign currency transactions in the foreign jurisdictions in which the Funds invest. Foreign taxes, if any, are recorded based on the tax regulations and rates that exist in the foreign markets in which the Funds invest. When a capital gain tax is determined to apply, certain or all Funds record an estimated deferred tax liability in an amount that would be payable if the securities were disposed of on the valuation date.
Each Fund may recognize an income tax liability related to its uncertain tax positions under U.S. GAAP when the uncertain tax position has a less than 50% probability that it will be sustained upon examination by the tax authorities based on its technical merits. As of October 31, 2017, each Fund has determined that no tax liability is required in its financial statements related to uncertain tax positions for any open tax years (or expected to be taken in future tax years). Open tax years are those that remain subject to examination and are based on the statute of limitations in each jurisdiction in which the Fund invests.
e. Security Transactions, Investment Income, Expenses and Distributions
Security transactions are accounted for on trade date. Realized gains and losses on security transactions are determined on a specific identification basis. Interest income and estimated expenses are accrued daily. Dividend income is recorded on the
ex-dividend date except for certain dividends from securities where the dividend rate is not available. In such cases, the dividend is recorded as soon as the information is received by the Funds. Distributions to shareholders are recorded on the ex-dividend date. Distributable earnings are determined according to income tax regulations (tax basis) and may differ from earnings recorded in accordance with U.S. GAAP. These differences may be permanent or temporary. Permanent differences are reclassified among capital accounts to reflect their tax character. These reclassifications have no impact on net assets or the results of operations. Temporary differences are not reclassified, as they may reverse in subsequent periods.
Common expenses incurred by the Trust are allocated among the Funds based on the ratio of net assets of each Fund to the combined net assets of the Trust. Fund specific expenses are charged directly to the Fund that incurred the expense.
Realized and unrealized gains and losses and net investment income, excluding class specific expenses, are allocated daily to each class of shares based upon the relative proportion of net assets of each class. Differences in per share distributions by class are generally due to differences in class specific expenses.
f. Accounting Estimates
The preparation of financial statements in accordance with U.S. GAAP requires management to make estimates and assumptions that affect the reported amounts of assets and liabilities at the date of the financial statements and the amounts of income and expenses during the reporting period. Actual results could differ from those estimates.
g. Guarantees and Indemnifications
Under the Trust’s organizational documents, its officers and trustees are indemnified by the Trust against certain liabilities arising out of the performance of their duties to the Trust. Additionally, in the normal course of business, the Trust, on behalf of the Funds, enters into contracts with service providers that contain general indemnification clauses. The Trust’s maximum exposure under these arrangements is unknown as this would involve future claims that may be made against the Trust that have not yet occurred. Currently, the Trust expects the risk of loss to be remote.
36 | Semiannual Report | franklintempleton.com |
F R A N K L I N S T R A T E G I C S E R I E S
N O T E S T O F I N A N C I A L S T A T E M E N T S ( U N A U D I T E D )
2. Shares of Beneficial Interest
At October 31, 2017, there were an unlimited number of shares authorized (without par value). Transactions in the Funds’ shares were as follows:
| Franklin Biotechnology Discovery Fund | Franklin Natural Resources Fund | |||||||||||||||
| Shares | Amount | Shares | Amount | |||||||||||||
Class A Shares: | ||||||||||||||||
| Six Months ended October 31, 2017 | ||||||||||||||||
| Shares sold | 575,501 | $ | 87,656,031 | 830,412 | $ | 20,106,697 | ||||||||||
| Shares redeemed | (899,105 | ) | (135,204,260 | ) | (2,881,078 | ) | (69,549,249 | ) | ||||||||
|
| |||||||||||||||
| Net increase (decrease) | (323,604 | ) | $ | (47,548,229 | ) | (2,050,666 | ) | $ | (49,442,552 | ) | ||||||
|
| |||||||||||||||
| Year ended April 30, 2017 | ||||||||||||||||
| Shares sold | 2,141,244 | $ | 293,440,540 | 3,407,729 | $ | 87,917,703 | ||||||||||
| Shares issued in reinvestment of distributions | 347,251 | 45,878,780 | 168,961 | 4,629,546 | ||||||||||||
| Shares redeemed | (2,881,393 | ) | (394,807,631 | ) | (6,146,306 | ) | (159,536,479 | ) | ||||||||
|
| |||||||||||||||
| Net increase (decrease) | (392,898 | ) | $ | (55,488,311 | ) | (2,569,616 | ) | $ | (66,989,230 | ) | ||||||
|
| |||||||||||||||
| Class C Shares: | ||||||||||||||||
| Six Months ended October 31, 2017 | ||||||||||||||||
| Shares sold | 74,216 | $ | 11,003,461 | 228,238 | $ | 5,319,625 | ||||||||||
| Shares redeemed | (57,547 | ) | (8,564,544 | ) | (712,605 | ) | (16,630,654 | ) | ||||||||
|
| |||||||||||||||
| Net increase (decrease) | 16,669 | $ | 2,438,917 | (484,367 | ) | $ | (11,311,029 | ) | ||||||||
|
| |||||||||||||||
| Year ended April 30, 2017 | ||||||||||||||||
| Shares sold | 314,992 | $ | 42,287,943 | 801,399 | $ | 19,979,661 | ||||||||||
| Shares issued in reinvestment of distributions | 13,374 | 1,732,743 | 21,022 | 558,336 | ||||||||||||
| Shares redeemed | (93,143 | ) | (12,622,045 | ) | (1,275,577 | ) | (32,138,698 | ) | ||||||||
|
| |||||||||||||||
| Net increase (decrease) | 235,223 | $ | 31,398,641 | (453,156 | ) | $ | (11,600,701 | ) | ||||||||
|
| |||||||||||||||
| Class R6 Shares: | ||||||||||||||||
| Six Months ended October 31, 2017 | ||||||||||||||||
| Shares sold | 7,928 | $ | 1,235,782 | 19,957 | $ | 532,956 | ||||||||||
| Shares redeemed | (9,428 | ) | (1,414,691 | ) | (1,201 | ) | (31,776 | ) | ||||||||
|
| |||||||||||||||
| Net increase (decrease) | (1,500 | ) | $ | (178,909 | ) | 18,756 | $ | 501,180 | ||||||||
|
| |||||||||||||||
| Year ended April 30, 2017 | ||||||||||||||||
| Shares sold | 38,854 | $ | 5,153,854 | 7,779 | $ | 228,431 | ||||||||||
| Shares issued in reinvestment of distributions | 2,637 | 356,874 | 7 | 211 | ||||||||||||
| Shares redeemed | (25,011 | ) | (3,508,037 | ) | (222 | ) | (6,041 | ) | ||||||||
|
| |||||||||||||||
| Net increase (decrease) | 16,480 | $ | 2,002,691 | 7,564 | $ | 222,601 | ||||||||||
|
| |||||||||||||||
| Advisor Class Shares: | ||||||||||||||||
| Six Months ended October 31, 2017 | ||||||||||||||||
| Shares sold | 274,372 | $ | 41,961,084 | 644,649 | $ | 16,663,010 | ||||||||||
| Shares redeemed | (149,939 | ) | (22,983,062 | ) | (941,122 | ) | (24,226,235 | ) | ||||||||
|
| |||||||||||||||
| Net increase (decrease) | 124,433 | $ | 18,978,022 | (296,473 | ) | $ | (7,563,225 | ) | ||||||||
|
| |||||||||||||||
| Year ended April 30, 2017 | ||||||||||||||||
| Shares sold | 662,833 | $ | 93,724,820 | 1,645,341 | $ | 45,812,950 | ||||||||||
| Shares issued in reinvestment of distributions | 31,641 | 4,260,757 | 40,400 | 1,180,483 | ||||||||||||
| Shares redeemed | (343,647 | ) | (47,924,271 | ) | (1,553,855 | ) | (43,291,055 | ) | ||||||||
|
| |||||||||||||||
| Net increase (decrease) | 350,827 | $ | 50,061,306 | 131,886 | $ | 3,702,378 | ||||||||||
|
| |||||||||||||||
| franklintempleton.com |
Semiannual Report | 37 |
F R A N K L I N S T R A T E G I C S E R I E S
N O T E S T O F I N A N C I A L S T A T E M E N T S ( U N A U D I T E D )
3. Transactions with Affiliates
Franklin Resources, Inc. is the holding company for various subsidiaries that together are referred to as Franklin Templeton Investments. Certain officers and trustees of the Trust are also officers and/or directors of the following subsidiaries:
| Subsidiary | Affiliation | |
Franklin Advisers, Inc. (Advisers)
| Investment manager
| |
Franklin Templeton Services, LLC (FT Services)
| Administrative manager
| |
Franklin Templeton Distributors, Inc. (Distributors)
| Principal underwriter
| |
Franklin Templeton Investor Services, LLC (Investor Services)
| Transfer agent
|
a. Management Fees
Franklin Biotechnology Discovery Fund pays an investment management fee to Advisers based on the average daily net assets of the Fund as follows:
| Annualized Fee Rate | Net Assets | |
0.775%
|
Up to and including $100 million
| |
0.650%
| Over $100 million, up to and including $200 million
| |
0.635%
| Over $200 million, up to and including $250 million
| |
0.585%
| Over $250 million, up to and including $700 million
| |
0.550%
| Over $700 million, up to and including $1.2 billion
| |
0.525%
| Over $1.2 billion, up to and including $7.5 billion
| |
0.515%
| Over $7.5 billion, up to and including $10 billion
| |
0.505%
| Over $10 billion, up to and including $12.5 billion
| |
0.495%
| Over $12.5 billion, up to and including $15 billion
| |
0.475%
| in excess of $15 billion
|
Franklin Natural Resources Fund pays an investment management fee to Advisers based on the average daily net assets of the Fund as follows:
| Annualized Fee Rate | Net Assets | |
0.625%
| Up to and including $100 million
| |
0.500%
| Over $100 million, up to and including $250 million
| |
0.450%
| Over $250 million, up to and including $7.5 billion
| |
0.440%
| Over $7.5 billion, up to and including $10 billion
| |
0.430%
| Over $10 billion, up to and including $12.5 billion
| |
0.420%
| Over $12.5 billion, up to and including $15 billion
| |
0.400%
| In excess of $15 billion
|
For the period ended October 31, 2017, each Fund’s annualized effective investment management fee rate based on average daily net assets was as follows:
Franklin Biotechnology Discovery Fund | Franklin Natural Resources Fund | |||||
0.583%
| 0.497%
|
38 | Semiannual Report | franklintempleton.com |
F R A N K L I N S T R A T E G I C S E R I E S
N O T E S T O F I N A N C I A L S T A T E M E N T S ( U N A U D I T E D )
b. Administrative Fees
Under an agreement with Advisers, FT Services provides administrative services to the Funds. The fee is paid by Advisers based on the Funds’ average daily net assets, and is not an additional expense of the Funds.
c. Distribution Fees
The Board has adopted distribution plans for each share class, with the exception of Class R6 and Advisor Class shares, pursuant to Rule 12b-1 under the 1940 Act. Under the Funds’ Class A reimbursement distribution plans, the Funds reimburse Distributors for costs incurred in connection with the servicing, sale and distribution of each Fund’s shares up to the maximum annual plan rate for each class. Under the Class A reimbursement distribution plans, costs exceeding the maximum for the current plan year cannot be reimbursed in subsequent periods. In addition, under the Funds’ Class C compensation distribution plans, the Funds pays Distributors for costs incurred in connection with the servicing, sale and distribution of each Fund’s shares up to the maximum annual plan rate for each class. The plan year, for purposes of monitoring compliance with the maximum annual plan rates, is February 1 through January 31 for each Fund.
The maximum annual plan rates, based on the average daily net assets, for each class, are as follows:
Class A | 0.35 | % | ||
Class C | 1.00 | % |
The Board has set the current rate at 0.25% per year for Class A shares until further notice and approval by the Board.
d. Sales Charges/Underwriting Agreements
Front-end sales charges and contingent deferred sales charges (CDSC) do not represent expenses of the Funds. These charges are deducted from the proceeds of sales of fund shares prior to investment or from redemption proceeds prior to remittance, as applicable. Distributors has advised the Funds of the following commission transactions related to the sales and redemptions of the Funds’ shares for the period:
| Franklin Biotechnology Discovery Fund | Franklin Natural Resources Fund | |||||
| ||||||
Sales charges retained net of commissions paid to | $205,313 | $35,061 | ||||
CDSC retained |
$ 9,394 |
$ 6,341 | ||||
e. Transfer Agent Fees
Each class of shares, except for Class R6 pays transfer agent fees to Investor Services for its performance of shareholder servicing obligations and reimburses Investor Services for out of pocket expenses incurred, including shareholder servicing fees paid to third parties. These fees are allocated daily based upon their relative proportion of such classes’ aggregate net assets. Class R6 pays Investor Services transfer agent fees specific to that class.
For the period ended October 31, 2017, the Funds paid transfer agent fees as noted in the Statements of Operations of which the following amounts were retained by Investor Services:
| Franklin Biotechnology Discovery Fund | Franklin Natural Resources Fund | |||||
| ||||||
Transfer agent fees | $486,317 | $356,002 | ||||
| franklintempleton.com | Semiannual Report |
|
39 |
|
F R A N K L I N S T R A T E G I C S E R I E S
N O T E S T O F I N A N C I A L S T A T E M E N T S ( U N A U D I T E D )
3. Transactions with Affiliates (continued)
f. Investments in Affiliated Management Investment Companies
Certain or all Funds invest in one or more affiliated management investment companies for purposes other than exercising a controlling influence over the management or policies. Management fees paid by the Funds are waived on assets invested in the affiliated management investment companies, as noted in the Statements of Operations, in an amount not to exceed the management and administrative fees paid directly or indirectly by each affiliate. Prior to May 1, 2013, the waiver was accounted for as a reduction to management fees. During the period ended October 31, 2017, investments in affiliated management investment companies were as follows:
| Number of Shares Held at Beginning of Period | Gross Additions | Gross Reductions | Number of Shares Held at End of Period | Value at End | Dividend Income | Realized Gain (Loss) | Net Change in Unrealized (Depreciation) | |||||||||||||||||||||||||
| Franklin Biotechnology Discovery Fund | ||||||||||||||||||||||||||||||||
| Non-Controlled Affiliates | ||||||||||||||||||||||||||||||||
Institutional Fiduciary Trust Money Market Portfolio, 0.69% | 85,673,142 | 321,451,108 | (333,948,399 | ) | 73,175,851 | $ | 73,175,851 | $ | 92,765 | $ — | $ — | |||||||||||||||||||||
|
| |||||||||||||||||||||||||||||||
Franklin Natural Resources Fund | ||||||||||||||||||||||||||||||||
| Non-Controlled Affiliates | ||||||||||||||||||||||||||||||||
Institutional Fiduciary Trust Money Market Portfolio, 0.69% | 7,627,816 | 77,337,891 | (81,388,955 | ) | 3,576,752 | $ | 3,576,752 | $ | 13,973 | $ — | $ — | |||||||||||||||||||||
|
| |||||||||||||||||||||||||||||||
g. Waiver and Expense Reimbursements
For Franklin Biotechnology Discovery Fund, Investor Services has voluntarily agreed in advance to waive or limit its fees so that the Class R6 transfer agent fees do not exceed 0.01%. For Franklin Natural Resources Fund, Investor Services has contractually agreed in advance to waive or limit its fees so that the Class R6 transfer agent fees do not exceed 0.03% until August 31, 2018. Investor Services may discontinue this waiver in the future.
h. Interfund Transactions
Franklin Biotechnology Discovery Fund engaged in purchases and sales of investments with funds or other accounts that have common investment managers (or affiliated investment managers), directors, trustees or officers. During the period ended October 31, 2017, these purchase and sale transactions aggregated $1,236,222 and $0, respectively.
4. Expense Offset Arrangement
The Funds have entered into an arrangement with their custodian whereby credits realized as a result of uninvested cash balances are used to reduce a portion of the Funds’ custodian expenses. During the period ended October 31, 2017, the custodian fees were reduced as noted in the Statements of Operations.
5. Income Taxes
For tax purposes, capital losses may be carried over to offset future capital gains. Capital loss carryforwards with no expiration, if any, must be fully utilized before those losses with expiration dates.
40 | Semiannual Report | franklintempleton.com |
F R A N K L I N S T R A T E G I C S E R I E S
N O T E S T O F I N A N C I A L S T A T E M E N T S ( U N A U D I T E D )
At April 30, 2017, the capital loss carryforwards were as follows:
| Franklin Natural Resources Fund | ||||
Capital loss carryforwards subject to expiration: | ||||
2018 | 12,737,677 | |||
Capital loss carryforwards not subject to expiration: | ||||
Short term | 10,125,851 | |||
Long term | 21,740,159 | |||
|
| |||
Total capital loss carryforwards | 44,603,687 | |||
|
| |||
At October 31, 2017, the cost of investments and net unrealized appreciation (depreciation) for income tax purposes were as follows:
| Franklin Biotechnology Discovery Fund | Franklin Natural Resources Fund | |||||||
Cost of investments | $937,827,135 | $468,620,877 | ||||||
|
| |||||||
Unrealized appreciation | $608,674,289 | $111,324,759 | ||||||
Unrealized depreciation | (92,866,032 | ) | (63,753,362 | ) | ||||
|
| |||||||
Net unrealized appreciation (depreciation) | $515,808,257 | $ 47,571,397 | ||||||
|
| |||||||
Differences between income and/or capital gains as determined on a book basis and a tax basis are primarily due to differing treatments of passive foreign investment company shares and wash sales.
6. Investment Transactions
Purchases and sales of investments (excluding short term securities) for the period ended October 31, 2017, were as follows:
| Franklin Biotechnology Discovery Fund | Franklin Natural Resources Fund | |||||||
Purchases | $169,281,482 | $ 78,850,409 | ||||||
Sales | $189,641,619 | $136,880,783 | ||||||
At October 31, 2017, in connection with securities lending transactions, certain or all Funds loaned investments and received cash collateral as follows:
Franklin Biotechnology Discovery Fund | ||||
Securities lending transactionsa: | ||||
Equity Investmentsb | $49,012,987 | |||
aThe agreements can be terminated at any time.
bThe gross amount of recognized liability for such transactions is included in payable upon return of securities loaned in the Statements of Assets and Liabilities.
7. Concentration of Risk
Investing in foreign securities may include certain risks and considerations not typically associated with investing in U.S. securities, such as fluctuating currency values and changing local and regional economic, political and social conditions, which may result in greater market volatility. In addition, certain foreign securities may not be as liquid as U.S. securities.
| franklintempleton.com |
Semiannual Report | 41 |
F R A N K L I N S T R A T E G I C S E R I E S
N O T E S T O F I N A N C I A L S T A T E M E N T S ( U N A U D I T E D )
8. Restricted Securities
Certain or all Funds invest in securities that are restricted under the Securities Act of 1933 (1933 Act). Restricted securities are often purchased in private placement transactions, and cannot be sold without prior registration unless the sale is pursuant to an exemption under the 1933 Act. Disposal of these securities may require greater effort and expense, and prompt sale at an acceptable price may be difficult. The Funds may have registration rights for restricted securities. The issuer generally incurs all registration costs.
At October 31, 2017, investments in restricted securities, excluding securities exempt from registration under the 1933 Act deemed to be liquid, were as follows:
| Shares | Issuer | Acquisition Date | Cost | Value | ||||||||||
| Franklin Biotechnology Discovery Fund | ||||||||||||||
| 314,126 | G1 Therapeutics Inc., Private Placement | 4/26/16 | $ | 2,799,999 | $ | 7,267,468 | ||||||||
| 80,195 | Intarcia Therapeutics Inc., DD. | 3/26/14 | 2,597,516 | 3,484,900 | ||||||||||
| 93,991 | Odonate Therapeutics LLC, Reg D | 9/01/17 | 2,799,992 | 2,799,992 | ||||||||||
|
| |||||||||||||
| Total Restricted Securities (Value is 1.0% of Net Assets) | $ | 8,197,507 | $ | 13,552,360 | ||||||||||
|
| |||||||||||||
9. Holdings of 5% Voting Securities of Portfolio Companies
The 1940 Act defines “affiliated companies” to include investments in portfolio companies in which a fund owns 5% or more of the outstanding voting securities. During the period ended October 31, 2017, investments in “affiliated companies” were as follows:
| Name of Issuer | Number of Shares/ Warrants Held at Beginning of Period | Gross Additions | Gross Reductions | Number of Shares/ Warrants Held at End of Period | Value at End of Period | Dividend Income | Realized Gain (Loss) | Net Change in Unrealized Appreciation (Depreciation) | ||||||||||||||||||||||||
| Franklin Biotechnology Discovery Fund | ||||||||||||||||||||||||||||||||
| Non-Controlled Affiliates | ||||||||||||||||||||||||||||||||
Alcobra Ltd. | 1,737,306 | — | — | 1,737,306 | $ 2,727,570 | $ — | $ — | $ 729,668 | ||||||||||||||||||||||||
ARCA biopharma Inc. | 478,077 | — | — | 478,077 | — | a | — | — | — | a | ||||||||||||||||||||||
ARCA biopharma Inc., wts., 6/16/22 | 1,338,619 | — | — | 1,338,619 | — | a | — | — | — | a | ||||||||||||||||||||||
BioPharmX Corp. | 1,900,375 | 91,200 | — | 1,991,575 | — | a | — | — | — | a | ||||||||||||||||||||||
BioPharmX Corp., 144A | 1,945,737 | — | — | 1,945,737 | — | a | — | — | — | a | ||||||||||||||||||||||
BioPharmX Corp., wts., 3/29/21 | 108,000 | — | — | 108,000 | — | a | — | — | — | a | ||||||||||||||||||||||
BioPharmX Corp., wts., 11/22/23 | 1,259,925 | 419,975 | — | 1,679,900 | — | a | — | — | — | a | ||||||||||||||||||||||
Fate Therapeutics Inc. | 2,373,777 | — | — | 2,373,777 | 11,322,916 | — | — | 427,280 | ||||||||||||||||||||||||
|
| |||||||||||||||||||||||||||||||
Total Affiliated Securities (Value is 1.0% of Net Assets) |
| $14,050,486 | $ — | $ — | $1,156,948 | |||||||||||||||||||||||||||
|
| |||||||||||||||||||||||||||||||
aAs of October 31, 2017, no longer an affiliate.
10. Credit Facility
The Funds, together with other U.S. registered and foreign investment funds (collectively, Borrowers), managed by Franklin Templeton Investments, are borrowers in a joint syndicated senior unsecured credit facility totaling $2 billion (Global Credit Facility) which matures on February 9, 2018. This Global Credit Facility provides a source of funds to the Borrowers for temporary and emergency purposes, including the ability to meet future unanticipated or unusually large redemption requests.
42 | Semiannual Report | franklintempleton.com |
F R A N K L I N S T R A T E G I C S E R I E S
N O T E S T O F I N A N C I A L S T A T E M E N T S ( U N A U D I T E D )
Under the terms of the Global Credit Facility, the Funds shall, in addition to interest charged on any borrowings made by the Funds and other costs incurred by the Funds, pay their share of fees and expenses incurred in connection with the implementation and maintenance of the Global Credit Facility, based upon their relative share of the aggregate net assets of all of the Borrowers, including an annual commitment fee of 0.15% based upon the unused portion of the Global Credit Facility. These fees are reflected in other expenses in the Statements of Operations. During the period ended October 31, 2017, the Funds did not use the Global Credit Facility.
11. Fair Value Measurements
The Funds follow a fair value hierarchy that distinguishes between market data obtained from independent sources (observable inputs) and the Funds’ own market assumptions (unobservable inputs). These inputs are used in determining the value of the Funds’ financial instruments and are summarized in the following fair value hierarchy:
| • | Level 1 – quoted prices in active markets for identical financial instruments |
| • | Level 2 – other significant observable inputs (including quoted prices for similar financial instruments, interest rates, prepayment speed, credit risk, etc.) |
| • | Level 3 – significant unobservable inputs (including the Funds’ own assumptions in determining the fair value of financial instruments) |
The input levels are not necessarily an indication of the risk or liquidity associated with financial instruments at that level.
For movements between the levels within the fair value hierarchy, the Funds have adopted a policy of recognizing the transfers as of the date of the underlying event which caused the movement.
A summary of inputs used as of October 31, 2017, in valuing the Funds’ assets carried at fair value, is as follows:
| Level 1 | Level 2 | Level 3 | Total | |||||||||||||
| Franklin Biotechnology Discovery Fund | ||||||||||||||||
Assets: | ||||||||||||||||
Investments in Securities: | ||||||||||||||||
Equity Investments:a | ||||||||||||||||
Biotechnology | $ | 1,167,153,110 | $ | — | b | $ | 13,613,815 | $ | 1,180,766,925 | |||||||
Pharmaceuticals | 132,479,277 | — | 123,735 | 132,603,012 | ||||||||||||
All Other Equity Investmentsc | 65,742,876 | — | — | 65,742,876 | ||||||||||||
Escrows and Litigation Trusts | — | — | 1,346,728 | 1,346,728 | ||||||||||||
Short Term Investments | 73,175,851 | — | — | 73,175,851 | ||||||||||||
|
| |||||||||||||||
Total Investments in Securities | $ | 1,438,551,114 | $ | — | $ | 15,084,278 | $ | 1,453,635,392 | ||||||||
|
| |||||||||||||||
| Franklin Natural Resources Fund | ||||||||||||||||
Assets: | ||||||||||||||||
Investments in Securities: | ||||||||||||||||
Equity Investments:a | ||||||||||||||||
Oil & Gas Exploration & Production | $ | 181,770,412 | $ | 2,410,486 | $ | — | $ | 184,180,898 | ||||||||
All Other Equity Investmentsc | 327,788,379 | — | — | 327,788,379 | ||||||||||||
Convertible Bonds | — | 646,245 | — | 646,245 | ||||||||||||
Short Term Investments | 3,576,752 | — | — | 3,576,752 | ||||||||||||
|
| |||||||||||||||
Total Investments in Securities | $ | 513,135,543 | $ | 3,056,731 | $ | — | $ | 516,192,274 | ||||||||
|
| |||||||||||||||
aIncludes common and convertible preferred stocks as well as other equity investments.
bIncludes securities determined to have no value at October 31, 2017.
cFor detailed categories, see the accompanying Statement of Investments.
| franklintempleton.com | Semiannual Report |
|
43 |
|
F R A N K L I N S T R A T E G I C S E R I E S
N O T E S T O F I N A N C I A L S T A T E M E N T S ( U N A U D I T E D )
11. Fair Value Measurements (continued)
A reconciliation of assets in which Level 3 inputs are used in determining fair value is presented when there are significant Level 3 financial instruments at the beginning and/or end of the period. At October 31, 2017, the reconciliation of assets is as follows:
| Balance at Beginning of Period | Purchases | Sales | Transfer Into Level 3a | Transfer Out of Level 3 | Cost Basis Adjustments | Net Realized Gain (Loss) | Net Unrealized Appreciation (Depreciation) | Balance at End of Period | Net Change in Unrealized Appreciation (Depreciation) on Assets Held at Period End | |||||||||||||||||||||||||||||||
| Franklin Biotechnology Discovery Fund | ||||||||||||||||||||||||||||||||||||||||
| Assets: | ||||||||||||||||||||||||||||||||||||||||
Investments in Securities: | ||||||||||||||||||||||||||||||||||||||||
Equity Investments:b | ||||||||||||||||||||||||||||||||||||||||
Biotechnology | $ 9,166,510 | $2,799,992 | $ (7,312,581 | ) | $4,813,486 | $ — | $ — | $3,562,537 | $ 583,871 | $13,613,815 | $975,092 | |||||||||||||||||||||||||||||
Pharmaceuticals | 7,765,403 | — | (6,380,617 | ) | — | — | — | (2,591,988 | ) | 1,330,937 | 123,735 | (460,563 | ) | |||||||||||||||||||||||||||
Escrows and Litigation Trusts | — | — | — | 1,308,937 | — | — | — | 37,791 | 1,346,728 | 37,791 | ||||||||||||||||||||||||||||||
|
| |||||||||||||||||||||||||||||||||||||||
Total Investments in Securities | $16,931,913 | $2,799,992 | $(13,693,198 | ) | $6,122,423 | $ — | $ — | $ 970,549 | $1,952,599 | $15,084,278 | $552,320 | |||||||||||||||||||||||||||||
|
| |||||||||||||||||||||||||||||||||||||||
| Receivables: | ||||||||||||||||||||||||||||||||||||||||
Investment Securities Sold | $ 9,126,475 | $ — | $ — | $ — | $(9,381,849 | ) | $ — | $ — | $ 255,374 | $ — | $ — | |||||||||||||||||||||||||||||
|
| |||||||||||||||||||||||||||||||||||||||
aThe investments were transferred into Level 3 as a result of the unavailability of other significant observable valuation inputs. May include amounts related to a corporate action.
bIncludes common and preferred stocks as well as other equity investments.
Significant unobservable valuation inputs for material Level 3 financial instruments and impact to fair value as a result of changes in unobservable valuation inputs as of October 31, 2017, are as follows:
| Description | Fair Value at End of Period | Valuation Technique | Unobservable Inputs | Amount/Range | Impact to Fair Value if Input Increasesa | |||||||||||||
| Franklin Biotechnology Discovery Fund | ||||||||||||||||||
| Assets: | ||||||||||||||||||
Investments in Securities: | ||||||||||||||||||
Equity Investments: | ||||||||||||||||||
Biotechnology | $10,752,368 | Discounted Cash Flow | Free cash flow | $ 75.9 / share | Increaseb | |||||||||||||
| ||||||||||||||||||
Discount for lack of marketability | 2.1% - 35.0% | Decreaseb | ||||||||||||||||
| ||||||||||||||||||
| Discount rate | 10.0% | Decreaseb | ||||||||||||||||
| ||||||||||||||||||
| Probability rate | 90.0% | Increaseb | ||||||||||||||||
All Other Investmentsc | 4,331,910 | |||||||||||||||||
Total | $15,084,278 | |||||||||||||||||
aRepresents the directional change in the fair value of the Level 3 financial instruments that would result from a significant and reasonable increase in the corresponding input. A significant and reasonable decrease in the input would have the opposite effect. Significant impacts, if any, to fair value and/or net assets have been indicated.
bRepresents a significant impact to fair value but not net assets.
cIncludes financial instruments with values derived using prior transaction prices or third party pricing information without adjustment for which such inputs are unobservable. May also include fair value of immaterial financial instruments developed using various valuation techniques and unobservable inputs.
44 | Semiannual Report | franklintempleton.com |
F R A N K L I N S T R A T E G I C S E R I E S
N O T E S T O F I N A N C I A L S T A T E M E N T S ( U N A U D I T E D )
12. Subsequent Events
The Funds have evaluated subsequent events through the issuance of the financial statements and determined that no events have occurred that require disclosure.
Abbreviations
| ||
| Selected Portfolio | ||
| ADR | American Depositary Receipt | |
| CPO | Certificate of Ordinary Participation (usually | |
| Mexico) | ||
| franklintempleton.com | Semiannual Report |
|
45 |
|
F R A N K L I N S T R A T E G I C S E R I E S
Proxy Voting Policies and Procedures
The Trust’s investment manager has established Proxy Voting Policies and Procedures (Policies) that the Trust uses to determine how to vote proxies relating to portfolio securities. Shareholders may view the Trust’s complete Policies online at franklintempleton.com. Alternatively, shareholders may request copies of the Policies free of charge by calling the Proxy Group collect at (954) 527-7678 or by sending a written request to: Franklin Templeton Companies, LLC, 300 S.E. 2nd Street, Fort Lauderdale, FL 33301, Attention: Proxy Group. Copies of the Trust’s proxy voting records are also made available online at franklintempleton.com and posted on the US Securities and Exchange Commission’s website at sec.gov and reflect the most recent 12-month period ended June 30.
Quarterly Statement of Investments
The Trust files a complete statement of investments with the US Securities and Exchange Commission for the first and third quarters for each fiscal year on Form N-Q. Shareholders may view the filed Form N-Q by visiting the Commission’s website at sec.gov. The filed form may also be viewed and copied at the Commission’s Public Reference Room in Washington, DC. Information regarding the operations of the Public Reference Room may be obtained by calling (800) SEC-0330.
46 | Semiannual Report | franklintempleton.com |
This page intentionally left blank.
This page intentionally left blank.
 | Semiannual Report and Shareholder Letter Franklin Strategic Series
Investment Manager Franklin Advisers, Inc.
Distributor Franklin Templeton Distributors, Inc. (800) DIAL BEN® / 342-5236 franklintempleton.com
Shareholder Services (800) 632-2301 |
Authorized for distribution only when accompanied or preceded by a summary prospectus and/or prospectus. Investors should carefully consider a fund’s investment goals, risks, charges and expenses before investing. A prospectus contains this and other information; please read it carefully before investing.
To help ensure we provide you with quality service, all calls to and from our service areas are monitored and/or recorded.
| © 2017 Franklin Templeton Investments. All rights reserved. | FSS2 S2017 12/17 |
| Semiannual Report and Shareholder Letter
October 31, 2017
| |||
Sign up for electronic delivery at franklintempleton.com/edelivery
Franklin Templeton Investments
Gain From Our Perspective®
At Franklin Templeton Investments, we’re dedicated to one goal: delivering exceptional asset management for our clients. By bringing together multiple, world-class investment teams in a single firm, we’re able to offer specialized expertise across styles and asset classes, all supported by the strength and resources of one of the world’s largest asset managers. This has helped us to become a trusted partner to individual and institutional investors across the globe.
Dear Shareholder:
During the six months ended October 31, 2017, the global economy expanded moderately amid generally upbeat economic data across regions. Investor confidence was buoyed by pro-business policies in the US and the accommodative monetary policies of various central banks, though certain policymakers hinted at the possible policy tightening in the future. During the period, the US Federal Reserve raised its federal funds target rate 0.25% and began normalizing its balance sheet in October, while the European Central Bank kept its benchmark interest rate unchanged. In this environment, global government bonds, as measured by the Citigroup World Government Bond Index, recorded gains in US dollar and local currency terms.
We are committed to our long-term perspective and disciplined investment approach as we conduct a rigorous, fundamental analysis of securities with a regular emphasis on investment risk management.
We believe active, professional investment management serves investors well. We also recognize the important role of financial advisors in today’s markets and encourage investors to continue to seek their advice. Amid changing markets and economic conditions,
we are confident investors with a well-diversified portfolio and a patient, long-term outlook should be well positioned for the years ahead.
In addition, Franklin Flexible Alpha Bond Fund’s semiannual report includes more detail about prevailing conditions and a discussion
about investment decisions during the period. Please remember all securities markets fluctuate, as do mutual fund share prices.
We thank you for investing with Franklin Templeton, welcome your questions and comments, and look forward to serving your investment needs in the years ahead.
Sincerely,

Edward B. Jamieson
President and Chief Executive Officer – Investment
Management
Franklin Strategic Series
This letter reflects our analysis and opinions as of October 31, 2017, unless otherwise indicated. The information is not a complete analysis of every aspect of any market, country, industry, security or fund. Statements of fact are from sources considered reliable.
Not FDIC Insured
|
|
|
May Lose Value
|
|
|
No Bank Guarantee
|
franklintempleton.com |
Not part of the semiannual report |
1 | ||
| 3 | ||||
| 7 | ||||
| 9 | ||||
| 10 | ||||
| 30 | ||||
| 34 | ||||
|
| 48
|
| |
Visit franklintempleton.com for fund updates, to access your account, or to find helpful financial planning tools.
| 2 | Semiannual Report | franklintempleton.com | ||
Franklin Flexible Alpha Bond Fund
This semiannual report for Franklin Flexible Alpha Bond Fund covers the period ended October 31, 2017.
Your Fund’s Goal and Main Investments
The Fund seeks to provide total return through a combination of current income and capital appreciation by investing at least 80% of its net assets in bonds and investments that provide exposure to bonds, including global debt obligations of any credit quality, maturity or duration, all varieties of fixed income, variable rate and floating rate debt securities and investments, and derivatives. The Fund aims to provide attractive risk-adjusted total returns over a full market cycle. A full market cycle is a period of time that spans a full business and economic cycle, which may include periods of rising and declining interest rates.
What is duration?
Duration is a measure of a bond’s price sensitivity to interest-rate changes. In general, a portfolio of securities with a lower duration can be expected to be less sensitive to interest-rate changes than a portfolio with a higher duration.
|
Performance Overview
For the six months under review, the Fund’s Class A shares delivered a +0.48% cumulative total return. In comparison, the LIBOR USD 3-Month Rate Index posted a +0.66% total return.1 The index tracks the interest rate at which banks offer to lend to one another in the wholesale money markets in London and is used to set the cost of various variable-rate loans. You can find more of the Fund’s performance data in the Performance Summary beginning on page 7.
Performance data represent past performance, which does not guarantee future results. Investment return and principal value will fluctuate, and you may have a gain or loss when you sell your shares. Current performance may differ from figures shown. For most recent month-end performance, go to franklintempleton.com or call (800) 342-5236.
| Sector Exposure* | ||||
| 10/31/17 | ||||
% of Total Net Assets | ||||
Investment-Grade Corporate Securities
|
|
22.6%
|
| |
Floating Rate Loans
|
|
16.9%
|
| |
Residential Mortgage-Backed Securities
|
|
16.3%
|
| |
US Treasuries
|
|
5.9%
|
| |
Covered Bonds
|
|
5.7%
|
| |
Commercial Mortgage-Backed Securities
|
|
4.9%
|
| |
International Bonds
|
|
4.4%
|
| |
High Yield Corporate Securities
|
|
1.3%
|
| |
Agency Mortgage-Backed Securities
|
|
0.9%
|
| |
Municipal Bonds
|
| �� 0.5%
|
| |
Asset-Backed Securities
|
|
0.1%
|
| |
Other
|
|
0.0%**
|
| |
Interest-Rate Derivatives
|
|
-32.8%
|
| |
Cash & Cash Equivalents
|
|
24.6%
|
| |
*Sector Exposure is intended to estimate the portfolio’s exposure to various sectors, including any hedged or increased exposure through certain derivatives held in the portfolio (or their underlying reference assets) and may not total 100% or may be negative due to rounding, use of any derivatives, unsettled trades or other factors. Interest-Rate Derivatives sector consists of Treasury, interest rate and other derivatives that are primarily used for duration management; a negative number indicates that the Fund is seeking to hedge interest rate risk.
**Rounds to less than 0.1%.
Economic and Market Overview
The US economy grew during the six months under review. The economy grew faster in 2017’s third quarter than in the second quarter, driven by consumer spending, inventory investment, business investment and exports. The manufacturing and services sectors expanded during the period. The unemployment rate decreased from 4.4% in April 2017 to 4.1% at period-end.2 Monthly retail sales were volatile during the period. Annual inflation, as measured by the Consumer Price Index, decreased from 2.2% in April 2017 to 2.0% at period-end.2
1. Source: Bloomberg LP.
The index is unmanaged and includes reinvestment of any income or distributions. It does not reflect any fees, expenses or sales charges. One cannot invest directly in an index, and an index is not representative of the Fund’s portfolio.
2. Source: Bureau of Labor Statistics.
See www.franklintempletondatasources.com for additional data provider information.
The dollar value, number of shares or principal amount, and names of all portfolio holdings are listed in the Fund’s Statement of Investments (SOI). The SOI begins on page 15.
franklintempleton.com | Semiannual Report | 3 |
F R A N K L I N F L E X I B L E A L P H A B O N D F U N D
| Dividend Distributions* | ||||||||||||||||||||
| 5/1/17–10/31/17 | ||||||||||||||||||||
| Dividend per Share (cents) | ||||||||||||||||||||
| Month | Class A | Class C | Class R | Class R6 | Advisor Class | |||||||||||||||
May
|
|
1.3706
|
|
|
0.8901
|
|
|
1.1328
|
|
|
1.4030
|
|
|
1.3903
|
| |||||
June
|
|
1.2890
|
|
|
0.9290
|
|
|
1.1133
|
|
|
1.3020
|
|
|
1.3024
|
| |||||
July
|
|
0.6152
|
|
|
0.4054
|
|
|
—
|
|
|
0.6660
|
|
|
0.6657
|
| |||||
August
|
|
1.4611
|
|
|
1.0107
|
|
|
0.6373
|
|
|
1.4940
|
|
|
1.4897
|
| |||||
September
|
|
0.9137
|
|
|
0.4742
|
|
|
0.6020
|
|
|
0.9467
|
|
|
0.9376
|
| |||||
October
|
|
1.0382
|
|
|
0.6053
|
|
|
0.5725
|
|
|
1.0740
|
|
|
1.0657
|
| |||||
Total
|
|
6.6878
|
|
|
4.3147
|
|
|
4.0579
|
|
|
6.8857
|
|
|
6.8514
|
| |||||
*The distribution amount is the sum of all estimated tax-basis net investment income distributions for the period shown. A portion or all of the distribution may be reclassified as return of capital or capital gain once final tax designations are known. All Fund distributions will vary depending upon current market conditions, and past distributions are not indicative of future trends.
At its June meeting, the US Federal Reserve (Fed) raised its target range for the federal funds rate 0.25% to 1.00%–1.25%, amid signs of a growing US economy, strengthening labor market and improving business spending. At its July and September 2017 meetings, the Fed kept its target range unchanged. Furthermore in September, the Fed mentioned that it would begin implementing its balance sheet reduction in October. The minutes of the Fed’s September meeting released in October suggested that many committee members were concerned that low inflation readings this year might not be transitory and could be more persistent than expected.
The 10-year Treasury yield, which moves inversely to its price, shifted throughout the period. In June, the yield rose due to renewed optimism for improvement in economic growth, while in July, the yield rose further amid hawkish comments from key central bankers around the world. Easing concerns about Hurricane Irma’s impact, the Fed’s proposed balance sheet normalization in October, and the Senate’s approval of a budget plan that raised expectations for tax reforms, pushed up yields further toward period-end. However, geopolitical tensions in the Korean peninsula, US political turmoil, and uncertainty on whether the Fed would raise rates again in 2017 resulted in a decline in the yield. The possible appointment of Jerome Powell, viewed as more dovish than other contenders, as the next Fed chair, dragged on the Treasury yield toward period-end. Overall, the 10-year Treasury yield rose from 2.29% at the beginning of the period to 2.38% at period-end.
Investment Strategy
The Fund seeks to generate returns from various sources, other than solely from interest rates, by allocating its portfolio across various risks (such as credit, currency and duration risks). In employing
| Currency Composition* | ||||
| 10/31/17 | ||||
| % of Total Net Assets | ||||
North America
| 100.5% | |||
US Dollar
| 101.0% | |||
Canadian Dollar
| -0.5% | |||
Latin America & Caribbean
| 0.7% | |||
Mexican Peso
| 0.8% | |||
Chilean Peso
| -0.1% | |||
Asia
| -0.1% | |||
Indian Rupee
| 0.3% | |||
Indonesian Rupiah
| 0.2% | |||
Singapore Dollar
| -0.1% | |||
Japanese Yen
| -0.1% | |||
South Korean Won
| -0.4% | |||
Australia & New Zealand
| -0.3% | |||
New Zealand Dollar
| 0.1% | |||
Australian Dollar
| -0.4% | |||
Europe
| -0.8% | |||
Polish Zloty
| 0.2% | |||
Swedish Krona
| 0.2% | |||
Euro
| -0.4% | |||
British Pound
| -0.8% | |||
*Currency Composition is intended to estimate the portfolio’s exposure to various currencies, including any hedged or increased exposure through certain derivatives held in the portfolio (or their underlying reference assets) and may not total 100% or may be negative due to rounding, use of any derivatives, unsettled trades or other factors.
this strategy, the Fund has the flexibility to invest across all debt asset classes without regard to country, sector, quality, maturity or duration and without reference to a benchmark index.
The Fund may engage in active and frequent trading as part of its investment strategies and, at any given time, may have a substantial amount of its assets invested in any class of debt securities, including, but not limited to: U.S. government and agency securities; foreign government and supranational debt securities; corporate bonds; corporate loans (and loan participations); collateralized debt and loan obligations; preferred securities; various types of mortgage-backed securities and other asset-backed securities; municipal
| 4 | Semiannual Report | franklintempleton.com | ||
F R A N K L I N F L E X I B L E A L P H A B O N D F U N D
securities; and derivatives and other instruments with similar economic characteristics, or that provide exposure, to such debt securities.
Manager’s Discussion
Over the six-month period the Fund posted a positive total return. The Fund’s spread sector exposure was the primary contributor to performance, driven primarily by the Fund’s exposure to investment-grade corporate bonds, floating rate loans (including collateralized loan obligations), residential mortgage-backed securities (RMBS), commercial mortgage-backed securities (CMBS) as well as the Fund’s exposure to municipal bonds and sovereign bonds. The Fund’s yield curve and duration positioning also contributed to performance, driven primarily by duration exposure in the US. In contrast, the Fund’s foreign currency exposure detracted from returns, influenced primarily by short euro and Canadian dollar exposures. Additionally, the Fund’s basis-trade positions (taking opposing long and short positions in the two securities to profit from the convergence of their values) also detracted, while the Fund’s exposure to the high-yield corporate credit sector also hurt performance marginally.
What is the yield curve?
A yield curve is a line that plots the yield to maturity of bonds having equal credit quality against their maturity dates.
|
At period-end, we continued to invest in a broad set of global fixed income sectors, with a goal of achieving more consistent positive alpha with a risk-diversified portfolio. Additionally, the Fund’s risk profile was maintained at a conservative level. We remained overweighted in the investment-grade corporate bond sector as well as securitized sectors, including RMBS and CMBS, compared to other sectors. We continued to find what we considered value in credit-hedged corporate positions as well. We sought to hedge all of the high-yield corporate beta (or risk) in the Fund, although we retained exposure to select floating rate loans and collateralized loan obligations. We also retained positions in Treasury Inflation-Protected Securities (TIPS) as well as covered bonds. Overall, portfolio duration remained relatively neutral toward US interest-rate and non-US duration positions. The portfolio maintained an overweighting to the US dollar versus a basket of developed market and commodity-related currencies, although they did not represent a significant portion of the Fund’s risk allocation.
The Fund utilized derivatives, including credit default and currency swaps, currency forwards, Treasury futures, interest-rate swaps, total return swaps and inflation index swaps, principally as a tool for
efficient portfolio management and to manage overall portfolio risk. These derivative transactions may provide the same, or similar, net long or short exposure to select currencies, interest rates, countries, duration or credit risks in a less expensive way than by directly purchasing securities. In those markets where portfolio securities are readily available, the cost difference in normal market conditions may be small. Overall, the portfolio continued to meet its risk-adjusted return target and remained in the lower end of our targeted risk range. Much of the Fund’s derivatives positioning was to seek to hedge various risks in the portfolio and achieve the goal of a stable return profile.
What are swap agreements?
Swap agreements, such as interest-rate, currency and credit default swaps, are contracts between the Fund and another party (the swap counterparty). In a basic swap transaction, the Fund agrees with the swap counterparty to exchange the returns (or differentials in rates of return) earned or realized on a particular “notional amount” of underlying instruments. The notional amount is the set amount selected by the parties as the basis on which to calculate the obligations that they have agreed to exchange. The parties typically do not actually exchange the notional amount. Instead, they agree to exchange the returns that would be earned or realized if the notional amount were invested in given instruments or at given interest rates.
|
What is a currency forward contract?
A currency forward contract is an agreement between the Fund and a counterparty to buy or sell a foreign currency in exchange for another currency at a specific exchange rate on a future date.
|
What is a futures contract?
A futures contract is an agreement between the Fund and a counterparty made through a US or foreign futures exchange to buy or sell an underlying instrument or asset at a specific price on a future date.
|
| franklintempleton.com | Semiannual Report | 5 | ||||
F R A N K L I N F L E X I B L E A L P H A B O N D F U N D
What is an option?
An option is a contract to buy or sell a specific financial product known as the option’s underlying instrument at a specific price. The buyer of an option has the right, but not the obligation, to buy or sell the underlying instrument at or until a specified expiration date. Conversely, the seller (“writer”) of an option who opens a transaction is obligated to buy or sell the underlying instrument should the option holder exercise that right.
|
Thank you for your participation in Franklin Flexible Alpha Bond Fund. We look forward to serving your future investment needs.
 |
David Yuen, CFA, FRM | |
 |
Michael J. Materasso | |
Portfolio Management Team | ||


CFA® is a trademark owned by CFA Institute.
The foregoing information reflects our analysis, opinions and portfolio holdings as of October 31, 2017, the end of the reporting period. The way we implement our main investment strategies and the resulting portfolio holdings may change depending on factors such as market and economic conditions. These opinions may not be relied upon as investment advice or an offer for a particular security. The information is not a complete analysis of every aspect of any market, country, industry, security or the Fund. Statements of fact are from sources considered reliable, but the investment manager makes no representation or warranty as to their completeness or accuracy. Although historical performance is no guarantee of future results, these insights may help you understand our investment management philosophy.
6 |
Semiannual Report |
franklintempleton.com |
F R A N K L I N F L E X I B L E A L P H A B O N D F U N D
Performance Summary as of October 31, 2017
The performance tables do not reflect any taxes that a shareholder would pay on Fund dividends, capital gain distributions, if any, or any realized gains on the sale of Fund shares. Total return reflects reinvestment of the Fund’s dividends and capital gain distributions, if any, and any unrealized gains or losses. Your dividend income will vary depending on dividends or interest paid by securities in the Fund’s portfolio, adjusted for operating expenses of each class. Capital gain distributions are net profits realized from the sale of portfolio securities.
Performance as of 10/31/171
Cumulative total return excludes sales charges. Average annual total return includes maximum sales charges. Sales charges will vary depending on the size of the investment and the class of share purchased. The maximum is 4.25% and the minimum is 0%. Class A: 4.25% maximum initial sales charge; Advisor Class: no sales charges. For other share classes, visit franklintempleton.com.
| Share Class | | Cumulative Total Return | 2 | | Average Annual Total Return | 3 | ||
A | ||||||||
6-Month | +0.48% | -3.81% | ||||||
1-Year | +1.54% | -2.76% | ||||||
Since Inception (8/3/15) | +2.35% | -0.88% | ||||||
Advisor | ||||||||
6-Month | +0.49% | +0.49% | ||||||
1-Year | +1.46% | +1.46% | ||||||
Since Inception (8/3/15) | +2.31% | +1.02% | ||||||
| Share Class | Distribution Rate4 | 30-Day Standardized Yield5 | ||||||||||||||
| (with waiver) | (without waiver) | |||||||||||||||
A |
|
1.15% |
|
|
1.08% |
|
|
1.08% |
| |||||||
Advisor | 1.24% | 1.17% | 1.17% | |||||||||||||
Performance data represent past performance, which does not guarantee future results. Investment return and principal value will fluctuate, and you may have a gain or loss when you sell your shares. Current performance may differ from figures shown. For most recent month-end performance, go to franklintempleton.com or call (800) 342-5236.
See page 8 for Performance Summary footnotes.
franklintempleton.com |
Semiannual Report |
|
7 |
|
F R A N K L I N F L E X I B L E A L P H A B O N D F U N D
P E R F O R M A N C E S U M M A R Y
Distributions (5/1/17–10/31/17)
| Share Class | Net Investment Income | |||
A |
|
$0.066878 |
| |
C |
|
$0.043147 |
| |
R |
|
$0.040579 |
| |
R6 |
|
$0.068857 |
| |
Advisor
|
|
$0.068514
|
| |
Total Annual Operating Expenses6
| Share Class | With Waiver | Without Waiver | ||||||
A |
|
0.93% |
|
|
3.30% |
| ||
Advisor |
|
0.89% |
|
|
3.26% |
| ||
Each class of shares is available to certain eligible investors and has different annual fees and expenses, as described in the prospectus.
All investments involve risks, including possible loss of principal. Changes in the financial strength of a bond issuer or in a bond’s credit rating may affect its value. Interest rate movements and mortgage prepayments will affect the Fund’s share price and yield. Bond prices generally move in the opposite direction of interest rates. Thus, as the prices of bonds in the Fund adjust to a rise in interest rates, the Fund’s share price may decline. The risks associated with higher yielding, lower rated securities (commonly called junk bonds) include higher risk of default and loss of principal. Derivatives, including currency management strategies, involve costs and can create economic leverage in the portfolio, which may result in significant volatility and cause the Fund to participate in losses (as well as enable gains) in an amount that exceeds the Fund’s initial investment. The Fund may not achieve the anticipated benefits, and may realize losses when a counterparty fails to perform as intended. Investments in foreign securities involve risks such as currency fluctuations, and political and economic uncertainty. The Fund is actively managed but there is no guarantee that the manager’s investment decisions will produce the desired results. The Fund’s prospectus also includes a description of the main investment risks.
1. The Fund has an expense reduction and a fee waiver associated with any investments it makes in a Franklin Templeton money fund and/or other Franklin Templeton fund, contractually guaranteed through 8/31/18. Fund investment results reflect the expense reduction and fee waiver; without these reductions, the results would have been lower.
2. Cumulative total return represents the change in value of an investment over the periods indicated.
3. Average annual total return represents the average annual change in value of an investment over the periods indicated. Return for less than one year, if any, has not been annualized.
4. Distribution rate is based on an annualization of the sum of the respective class’s past 30 days’ daily distributions and the maximum offering price (NAV for Advisor Class) per share on 10/31/17.
5. The Fund’s 30-day standardized yield is calculated over a trailing 30-day period using the yield to maturity on bonds and/or the dividends accrued on stocks. It may not equal the Fund’s actual income distribution rate, which reflects the Fund’s past dividends paid to shareholders.
6. Figures are as stated in the Fund’s current prospectus and may differ from the expense ratios disclosed in the Your Fund’s Expenses and Financial Highlights sections in this report. In periods of market volatility, assets may decline significantly, causing total annual Fund operating expenses to become higher than the figures shown.
8 |
Semiannual Report |
franklintempleton.com |
F R A N K L I N F L E X I B L E A L P H A B O N D F U N D
As a Fund shareholder, you can incur two types of costs: (1) transaction costs, including sales charges (loads) on Fund purchases and redemptions; and (2) ongoing Fund costs, including management fees, distribution and service (12b-1) fees, and other Fund expenses. All mutual funds have ongoing costs, sometimes referred to as operating expenses. The table below shows ongoing costs of investing in the Fund and can help you understand these costs and compare them with those of other mutual funds. The table assumes a $1,000 investment held for the six months indicated.
Actual Fund Expenses
The table below provides information about actual account values and actual expenses in the columns under the heading “Actual.” In these columns the Fund’s actual return, which includes the effect of Fund expenses, is used to calculate the “Ending Account Value” for each class of shares. You can estimate the expenses you paid during the period by following these steps (of course, your account value and expenses will differ from those in this illustration): Divide your account value by $1,000 (if your account had an $8,600 value, then $8,600 ÷ $1,000 = 8.6). Then multiply the result by the number in the row for your class of shares under the headings “Actual” and “Expenses Paid During Period” (if Actual Expenses Paid During Period were $7.50, then 8.6 x $7.50 = $64.50). In this illustration, the actual expenses paid this period are $64.50.
Hypothetical Example for Comparison with Other Funds
Under the heading “Hypothetical” in the table, information is provided about hypothetical account values and hypothetical expenses based on the Fund’s actual expense ratio and an assumed rate of return of 5% per year before expenses, which is not the Fund’s actual return. This information may not be used to estimate the actual ending account balance or expenses you paid for the period, but it can help you compare ongoing costs of investing in the Fund with those of other funds. To do so, compare this 5% hypothetical example for the class of shares you hold with the 5% hypothetical examples that appear in the shareholder reports of other funds.
Please note that expenses shown in the table are meant to highlight ongoing costs and do not reflect any transactional costs. Therefore, information under the heading “Hypothetical” is useful in comparing ongoing costs only, and will not help you compare total costs of owning different funds. In addition, if transactional costs were included, your total costs would have been higher.
Actual (actual return after expenses) | Hypothetical (5% annual return before expenses) | |||||||||||||||||
| Share Class | Beginning Account Value 5/1/17 |
Ending Account Value 10/31/17 |
Expenses Paid During Period 5/1/17–10/31/171,2 |
Ending Account Value 10/31/17 |
Expenses Paid During Period 5/1/17–10/31/171,2 |
Net Annualized Expense Ratio2 | ||||||||||||
A |
$1,000 |
$1,004.80 |
$4.40 |
$1,020.82 |
$4.43 |
0.87% | ||||||||||||
| C | $1,000 | $1,002.40 | $7.47 | $1,017.74 | $7.53 | 1.48% | ||||||||||||
| R | $1,000 | $1,002.10 | $6.76 | $1,018.45 | $6.82 | 1.34% | ||||||||||||
| R6 | $1,000 | $1,006.00 | $3.99 | $1,021.22 | $4.02 | 0.79% | ||||||||||||
| Advisor | $1,000 | $1,004.90 | $4.19 | $1,021.02 | $4.23 | 0.83% | ||||||||||||
1. Expenses are equal to the annualized expense ratio for the six-month period as indicated above—in the far right column—multiplied by the simple average account value over the period indicated, and then multiplied by 184/365 to reflect the one-half year period.
2. Reflects expenses after fee waivers and expense reimbursements. Does not include acquired fund fees and expenses.
franklintempleton.com |
Semiannual Report |
|
9 |
|
F R A N K L I N S T R A T E G I C S E R I E S
Franklin Flexible Alpha Bond Fund
Six Months Ended (unaudited) | Year Ended April 30, | |||||||
| 2017 | 2016a | |||||||
Class A | ||||||||
Per share operating performance | ||||||||
Net asset value, beginning of period | $ 9.86 | $ 9.88 | $ 10.00 | |||||
| ||||||||
Income from investment operationsb: | ||||||||
Net investment income | 0.082 | 0.180 | 0.099 | |||||
Net realized and unrealized gains (losses) | (0.025) | 0.017 | (0.123) | |||||
| ||||||||
Total from investment operations | 0.057 | 0.197 | (0.024) | |||||
| ||||||||
Less distributions from net investment income | (0.067) | (0.217) | (0.096) | |||||
| ||||||||
Net asset value, end of period | $ 9.85 | $ 9.86 | $ 9.88 | |||||
| ||||||||
Total returnc | 0.48% | 2.22% | (0.34)% | |||||
| Ratios to average net assetsd | ||||||||
Expenses before waiver and payments by affiliates | 1.24% | 3.17% | 3.47% | |||||
Expenses net of waiver and payments by affiliatese | 0.87% | 0.67% | 0.84% | |||||
Net investment income | 1.24% | 1.83% | 1.37% | |||||
| Supplemental data | ||||||||
Net assets, end of period (000’s) | $10,470 | $10,443 | $10,200 | |||||
Portfolio turnover rate | 16.57% | 90.37% | 40.12% | |||||
Portfolio turnover rate excluding mortgage dollar rollsf | 9.98% | 57.79% | 30.05% | |||||
aFor the period August 3, 2015 (commencement of operations) to April 30, 2016.
bThe amount shown for a share outstanding throughout the period may not correlate with the Statement of Operations for the period due to the timing of sales and repurchases of the Fund’s shares in relation to income earned and/or fluctuating fair value of the investments of the Fund.
cTotal return does not reflect sales commissions or contingent deferred sales charges, if applicable, and is not annualized for periods less than one year.
dRatios are annualized for periods less than one year, except for non-recurring expenses, if any.
eBenefit of expense reduction rounds to less than 0.01%.
fSee Note 1(e) regarding mortgage dollar rolls.
10 |
Semiannual Report | The accompanying notes are an integral part of these financial statements. |
franklintempleton.com |
F R A N K L I N S T R A T E G I C S E R I E S
F I N A N C I A L H I G H L I G H T S
Franklin Flexible Alpha Bond Fund (continued)
Six Months Ended October 31, 2017 (unaudited) | Year Ended April 30, | |||||||
| 2017 | 2016a | |||||||
Class C | ||||||||
| Per share operating performance | ||||||||
(for a share outstanding throughout the period) | ||||||||
Net asset value, beginning of period | $ 9.80 | $ 9.86 | $ 10.00 | |||||
| ||||||||
Income from investment operationsb: | ||||||||
Net investment income | 0.044 | 0.130 | 0.072 | |||||
Net realized and unrealized gains (losses) | (0.011) | (0.006) | (0.131) | |||||
| ||||||||
Total from investment operations | 0.033 | 0.124 | (0.059) | |||||
| ||||||||
Less distributions from net investment income | (0.043) | (0.184) | (0.081) | |||||
| ||||||||
Net asset value, end of period | $ 9.79 | $ 9.80 | $ 9.86 | |||||
| ||||||||
Total returnc | 0.24% | 1.47% | (0.69)% | |||||
| Ratios to average net assetsd | ||||||||
Expenses before waiver and payments by affiliates | 1.85% | 3.88% | 3.98% | |||||
Expenses net of waiver and payments by affiliatese | 1.48% | 1.38% | 1.34% | |||||
Net investment income | 0.63% | 1.12% | 0.87% | |||||
| Supplemental data | ||||||||
Net assets, end of period (000’s) | $234 | $245 | $204 | |||||
Portfolio turnover rate | 16.57% | 90.37% | 40.12% | |||||
Portfolio turnover rate excluding mortgage dollar rollsf | 9.98% | 57.79% | 30.05% | |||||
aFor the period August 3, 2015 (commencement of operations) to April 30, 2016.
bThe amount shown for a share outstanding throughout the period may not correlate with the Statement of Operations for the period due to the timing of sales and repurchases of the Fund’s shares in relation to income earned and/or fluctuating fair value of the investments of the Fund.
cTotal return does not reflect sales commissions or contingent deferred sales charges, if applicable, and is not annualized for periods less than one year.
dRatios are annualized for periods less than one year, except for non-recurring expenses, if any.
eBenefit of expense reduction rounds to less than 0.01%.
fSee Note 1(e) regarding mortgage dollar rolls.
franklintempleton.com |
The accompanying notes are an integral part of these financial statements. | Semiannual Report | 11 |
F R A N K L I N S T R A T E G I C S E R I E S
F I N A N C I A L H I G H L I G H T S
Franklin Flexible Alpha Bond Fund (continued)
Six Months Ended (unaudited) | Year Ended April 30, | |||||||
| 2017 | 2016a | |||||||
Class R | ||||||||
| Per share operating performance | ||||||||
(for a share outstanding throughout the period) | ||||||||
Net asset value, beginning of period | $ 9.86 | $ 9.86 | $ 10.00 | |||||
| ||||||||
Income from investment operationsb: | ||||||||
Net investment income | 0.054 | 0.112 | 0.072 | |||||
Net realized and unrealized gains (losses) | (0.033) | 0.095 | (0.127) | |||||
| ||||||||
Total from investment operations | 0.021 | 0.207 | (0.055) | |||||
| ||||||||
Less distributions from net investment income | (0.041) | (0.207) | (0.085) | |||||
| ||||||||
Net asset value, end of period | $ 9.84 | $ 9.86 | $ 9.86 | |||||
| ||||||||
Total returnc | 0.21% | 2.21% | (0.65)% | |||||
| Ratios to average net assetsd | ||||||||
Expenses before waiver and payments by affiliates | 1.71% | 3.36% | 3.84% | |||||
Expenses net of waiver and payments by affiliatese | 1.34% | 0.86% | 1.22% | |||||
Net investment income | 0.77% | 1.64% | 0.99% | |||||
| Supplemental data | ||||||||
Net assets, end of period (000’s) | $60 | $60 | $10 | |||||
Portfolio turnover rate | 16.57% | 90.37% | 40.12% | |||||
Portfolio turnover rate excluding mortgage dollar rollsf | 9.98% | 57.79% | 30.05% | |||||
aFor the period August 3, 2015 (commencement of operations) to April 30, 2016.
bThe amount shown for a share outstanding throughout the period may not correlate with the Statement of Operations for the period due to the timing of sales and repurchases of the Fund’s shares in relation to income earned and/or fluctuating fair value of the investments of the Fund.
cTotal return is not annualized for periods less than one year.
dRatios are annualized for periods less than one year, except for non-recurring expenses, if any.
eBenefit of expense reduction rounds to less than 0.01%.
fSee Note 1(e) regarding mortgage dollar rolls.
12 |
Semiannual Report | The accompanying notes are an integral part of these financial statements. |
franklintempleton.com |
F R A N K L I N S T R A T E G I C S E R I E S
F I N A N C I A L H I G H L I G H T S
Franklin Flexible Alpha Bond Fund (continued)
Six Months Ended October 31, 2017 (unaudited) | Year Ended April 30, | |||||||
| 2017 | 2016a | |||||||
Class R6 | ||||||||
| Per share operating performance | ||||||||
(for a share outstanding throughout the period) | ||||||||
Net asset value, beginning of period | $ 9.86 | $ 9.88 | $ 10.00 | |||||
| ||||||||
Income from investment operationsb: | ||||||||
Net investment income | 0.102 | 0.177 | 0.108 | |||||
Net realized and unrealized gains (losses) | (0.043) | 0.022 | (0.124) | |||||
| ||||||||
Total from investment operations | 0.059 | 0.199 | (0.016) | |||||
| ||||||||
Less distributions from net investment income | (0.069) | (0.219) | (0.104) | |||||
| ||||||||
Net asset value, end of period | $ 9.85 | $ 9.86 | $ 9.88 | |||||
| ||||||||
Total returnc | 0.60% | 2.03% | (0.15)% | |||||
| Ratios to average net assetsd | ||||||||
Expenses before waiver and payments by affiliates | 1.16% | 5.23% | 3.72% | |||||
Expenses net of waiver and payments by affiliatese | 0.79% | 0.71% | 0.71% | |||||
Net investment income | 1.32% | 1.79% | 1.50% | |||||
| Supplemental data | ||||||||
Net assets, end of period (000’s) | $100,213 | $10 | $10 | |||||
Portfolio turnover rate | 16.57% | 90.37% | 40.12% | |||||
Portfolio turnover rate excluding mortgage dollar rollsf | 9.98% | 57.79% | 30.05% | |||||
aFor the period August 3, 2015 (commencement of operations) to April 30, 2016.
bThe amount shown for a share outstanding throughout the period may not correlate with the Statement of Operations for the period due to the timing of sales and repurchases of the Fund’s shares in relation to income earned and/or fluctuating fair value of the investments of the Fund.
cTotal return is not annualized for periods less than one year.
dRatios are annualized for periods less than one year, except for non-recurring expenses, if any.
eBenefit of expense reduction rounds to less than 0.01%.
fSee Note 1(e) regarding mortgage dollar rolls.
franklintempleton.com |
The accompanying notes are an integral part of these financial statements. | Semiannual Report |
13 |
F R A N K L I N S T R A T E G I C S E R I E S
F I N A N C I A L H I G H L I G H T S
Franklin Flexible Alpha Bond Fund (continued)
Six Months Ended (unaudited) | Year Ended April 30,
| |||||||
| 2017 | 2016a | |||||||
Advisor Class | ||||||||
| Per share operating performance | ||||||||
(for a share outstanding throughout the period) | ||||||||
Net asset value, beginning of period | $ 9.85 | $ 9.88 | $ 10.00 | |||||
Income from investment operationsb: | ||||||||
Net investment income | 0.085 | 0.166 | 0.107 | |||||
Net realized and unrealized gains (losses) | (0.026) | 0.023 | (0.129) | |||||
Total from investment operations | 0.059 | 0.189 | (0.022) | |||||
Less distributions from net investment income | (0.069) | (0.219) | (0.098) | |||||
Net asset value, end of period | $ 9.84 | $ 9.85 | $ 9.88 | |||||
Total returnc | 0.49% | 2.13% | (0.31)% | |||||
| Ratios to average net assetsd | ||||||||
Expenses before waiver and payments by affiliates | 1.20% | 3.22% | 3.34% | |||||
Expenses net of waiver and payments by affiliatese | 0.83% | 0.72% | 0.71% | |||||
Net investment income | 1.28% | 1.78% | 1.50% | |||||
| Supplemental data | ||||||||
Net assets, end of period (000’s) | $237 | $232 | $344 | |||||
Portfolio turnover rate | 16.57% | 90.37% | 40.12% | |||||
Portfolio turnover rate excluding mortgage dollar rollsf | 9.98% | 57.79% | 30.05% | |||||
aFor the period August 3, 2015 (commencement of operations) to April 30, 2016.
bThe amount shown for a share outstanding throughout the period may not correlate with the Statement of Operations for the period due to the timing of sales and repurchases of the Fund’s shares in relation to income earned and/or fluctuating fair value of the investments of the Fund.
cTotal return is not annualized for periods less than one year.
dRatios are annualized for periods less than one year, except for non-recurring expenses, if any.
eBenefit of expense reduction rounds to less than 0.01%.
fSee Note 1(e) regarding mortgage dollar rolls.
14 |
Semiannual Report | The accompanying notes are an integral part of these financial statements. |
franklintempleton.com |
F R A N K L I N S T R A T E G I C S E R I E S
Statement of Investments, October 31, 2017 (unaudited)
Franklin Flexible Alpha Bond Fund
| Country | Shares | Value | ||||||||||||
| ||||||||||||||
| Management Investment Companies (Cost $3,397,061) 3.1% | ||||||||||||||
| Diversified Financials 3.1% | ||||||||||||||
| PowerShares Senior Loan Portfolio ETF | United States | 146,765 | $ | 3,393,207 | ||||||||||
|
| |||||||||||||
| Principal | ||||||||||||||
| Amount | * | |||||||||||||
|
| |||||||||||||
| Corporate Bonds 33.6% | ||||||||||||||
| Automobiles & Components 0.4% | ||||||||||||||
| Delphi Corp., senior bond, 4.15%, 3/15/24 | United Kingdom | 400,000 | 424,934 | |||||||||||
|
| |||||||||||||
| Banks 10.8% | ||||||||||||||
a | Banca Monte dei Paschi di Siena SpA, secured note, Reg S, 2.125%, 11/26/25 | Italy | 800,000 | EUR | 994,440 | |||||||||
a | Banca Popolare di Milano Scarl, secured note, Reg S, 0.625%, 6/08/23 | Italy | 1,100,000 | EUR | 1,280,164 | |||||||||
a | Banco Comercial Portugues SA, secured note, Reg S, 0.75%, 5/31/22 | Portugal | 900,000 | EUR | 1,061,442 | |||||||||
a | Banco Popolare SC, secured note, Reg S, 0.75%, 3/31/22 | Italy | 700,000 | EUR | 826,557 | |||||||||
| Bank of America Corp., | ||||||||||||||
senior bond, 5.50%, 12/04/19 | United States | 75,000 | GBP | 108,660 | ||||||||||
senior note, 2.25%, 4/21/20 | United States | 400,000 | 400,490 | |||||||||||
senior note, 3.50%, 4/19/26 | United States | 400,000 | 407,899 | |||||||||||
| Bank of Nova Scotia, secured note, 1.875%, 4/26/21 | Canada | 100,000 | 98,909 | |||||||||||
| Caixa Geral de Depositos SA, | ||||||||||||||
secured note, 3.00%, 1/15/19 | Portugal | 1,000,000 | EUR | 1,209,048 | ||||||||||
a secured note, Reg S, 1.00%, 1/27/22 | Portugal | 100,000 | EUR | 118,987 | ||||||||||
| Citigroup Inc., | ||||||||||||||
senior note, 2.65%, 10/26/20 | United States | 450,000 | 454,506 | |||||||||||
senior note, 3.40%, 5/01/26 | United States | 500,000 | 505,421 | |||||||||||
| HSBC Holdings PLC, | ||||||||||||||
senior note, 4.30%, 3/08/26 | United Kingdom | 500,000 | 536,968 | |||||||||||
senior note, 3.262% to 3/13/22, FRN thereafter, 3/13/23 | United Kingdom | 400,000 | 409,346 | |||||||||||
| HSBC USA Inc., senior note, 2.00%, 8/07/18 | United States | 100,000 | 100,246 | |||||||||||
| Industrial & Commercial Bank of China Ltd., senior note, 2.452%, 10/20/21 | China | 300,000 | 296,169 | |||||||||||
| Intesa Sanpaolo SpA, senior note, 3.875%, 1/15/19 | Italy | 500,000 | 510,088 | |||||||||||
| JPMorgan Chase & Co., | ||||||||||||||
senior bond, 3.30%, 4/01/26 | United States | 400,000 | 403,473 | |||||||||||
senior note, 2.25%, 1/23/20 | United States | 100,000 | 100,501 | |||||||||||
senior note, 2.40%, 6/07/21 | United States | 600,000 | 601,240 | |||||||||||
b | Kookmin Bank, secured note, 144A, 2.25%, 2/03/21 | South Korea | 400,000 | 394,049 | ||||||||||
| PHH Corp., senior note, 7.375%, 9/01/19 | United States | 200,000 | 216,000 | |||||||||||
| Royal Bank of Canada, secured note, 2.10%, 10/14/20 | Canada | 100,000 | 99,873 | |||||||||||
b | The Toronto-Dominion Bank, secured note, 144A, 2.25%, 3/15/21 | Canada | 200,000 | 199,961 | ||||||||||
| Wells Fargo & Co., | ||||||||||||||
senior note, 2.50%, 3/04/21 | United States | 200,000 | 200,889 | |||||||||||
senior note, 3.00%, 4/22/26 | United States | 500,000 | 490,883 | |||||||||||
|
| |||||||||||||
|
12,026,209 |
| ||||||||||||
|
| |||||||||||||
| Capital Goods 0.5% | ||||||||||||||
| Aircastle Ltd., senior note, 4.125%, 5/01/24 | United States | 150,000 | 153,750 | |||||||||||
| TransDigm Inc., senior sub. bond, 6.50%, 7/15/24 | United States | 30,000 | 31,050 | |||||||||||
| United Technologies Corp., senior note, 1.95%, 11/01/21 | United States | 400,000 | 393,551 | |||||||||||
|
| |||||||||||||
|
578,351 |
| ||||||||||||
|
| |||||||||||||
| Consumer Durables & Apparel 0.3% | ||||||||||||||
| CalAtlantic Group Inc., senior note, 8.375%, 5/15/18 | United States | 250,000 | 258,750 | |||||||||||
| KB Home, senior note, 8.00%, 3/15/20 | United States | 100,000 | 111,750 | |||||||||||
|
| |||||||||||||
|
370,500 |
| ||||||||||||
|
| |||||||||||||
| franklintempleton.com | Semiannual Report | 15 | ||||
F R A N K L I N S T R A T E G I C S E R I E S
S T A T E M E N T O F I N V E S T M E N T S ( U N A U D I T E D )
Franklin Flexible Alpha Bond Fund (continued)
| Principal | ||||||||||||||
| Country | Amount | * | Value | |||||||||||
| ||||||||||||||
Corporate Bonds (continued) | ||||||||||||||
Consumer Services 0.7% | ||||||||||||||
| Marriott International Inc., senior note, 2.875%, 3/01/21 | United States | 250,000 | $ | 252,780 | ||||||||||
| b | Wynn Macau Ltd., senior note, 144A, 4.875%, 10/01/24 | Macau | 525,000 | 535,085 | ||||||||||
|
| |||||||||||||
|
787,865 |
| ||||||||||||
|
| |||||||||||||
Diversified Financials 3.6% | ||||||||||||||
Capital One Financial Corp., senior note, 3.05%, 3/09/22 | United States | 600,000 | 609,046 | |||||||||||
senior note, 3.20%, 2/05/25 | United States | 500,000 | 498,072 | |||||||||||
| c | Deutsche Bank AG, senior note, FRN, 2.626%, (3-month USD LIBOR + 1.31%), 8/20/20 | Germany | 100,000 | 101,338 | ||||||||||
| b | Dexia Credit Local SA, senior note, 144A, 2.375%, 9/20/22 | France | 250,000 | 249,390 | ||||||||||
The Goldman Sachs Group Inc., senior note, 3.75%, 5/22/25 | United States | 400,000 | 412,909 | |||||||||||
csenior note, FRN, 2.52%, (3-month USD LIBOR + 1.20%), 9/15/20 | United States | 500,000 | 509,825 | |||||||||||
Morgan Stanley, senior note, 2.65%, 1/27/20 | United States | 500,000 | 504,694 | |||||||||||
senior note, 3.70%, 10/23/24 | United States | 500,000 | 520,042 | |||||||||||
| b | Protective Life Global Funding, secured note, 144A, 2.615%, 8/22/22 | United States | 500,000 | 496,838 | ||||||||||
| Springleaf Finance Corp., senior note, 6.00%, 6/01/20 | United States | 60,000 | 63,075 | |||||||||||
|
| |||||||||||||
|
3,965,229 |
| ||||||||||||
|
| |||||||||||||
Energy 2.0% | ||||||||||||||
| Energy Transfer Partners LP, senior note, 6.50%, 2/01/42 | United States | 50,000 | 57,244 | |||||||||||
| Enterprise Products Operating LLC, senior note, 3.35%, 3/15/23 | United States | 400,000 | 412,512 | |||||||||||
| Exxon Mobil Corp., senior note, 3.043%, 3/01/26 | United States | 700,000 | 715,798 | |||||||||||
| Oceaneering International Inc., senior note, 4.65%, 11/15/24 | United States | 50,000 | 49,762 | |||||||||||
| Sabine Pass Liquefaction LLC, senior secured note, first lien, 5.625%, 4/15/23 | United States | 450,000 | 500,303 | |||||||||||
| b | Sinopec Group Overseas Development 2015 Ltd., senior note, 144A, 2.50%, 4/28/20 | China | 500,000 | 500,925 | ||||||||||
|
| |||||||||||||
|
2,236,544 |
| ||||||||||||
|
| |||||||||||||
Food & Staples Retailing 0.6% | ||||||||||||||
| The Kroger Co., senior note, 3.40%, 4/15/22 | United States | 250,000 | 257,185 | |||||||||||
| Walgreen Co., senior bond, 3.10%, 9/15/22 | United States | 400,000 | 405,850 | |||||||||||
|
| |||||||||||||
|
663,035 |
| ||||||||||||
|
| |||||||||||||
Food, Beverage & Tobacco 1.1% | ||||||||||||||
| Anheuser-Busch Inbev Finance Inc., senior bond, 3.65%, 2/01/26 | Belgium | 400,000 | 413,399 | |||||||||||
| Bunge Ltd. Finance Corp., senior note, 3.25%, 8/15/26 | United States | 50,000 | 48,609 | |||||||||||
| b | Imperial Brands Finance PLC, senior note, 144A, 4.25%, 7/21/25 | United Kingdom | 400,000 | 421,480 | ||||||||||
| Kraft Heinz Foods Co., senior note, 3.50%, 7/15/22 | United States | 250,000 | 258,538 | |||||||||||
| Reynolds American Inc., senior note, 4.45%, 6/12/25 | United Kingdom | 100,000 | 107,735 | |||||||||||
|
| |||||||||||||
|
1,249,761 |
| ||||||||||||
|
| |||||||||||||
Health Care Equipment & Services 0.5% | ||||||||||||||
| HCA Inc., senior secured bond, first lien, 5.875%, 3/15/22 | United States | 150,000 | 164,625 | |||||||||||
| Stryker Corp., senior note, 2.00%, 3/08/19 | United States | 250,000 | 250,604 | |||||||||||
| Tenet Healthcare Corp., senior note, 5.50%, 3/01/19 | United States | 90,000 | 91,687 | |||||||||||
| b | Universal Health Services Inc., senior secured note, first lien, 144A, 3.75%, 8/01/19 | United States | 50,000 | 51,188 | ||||||||||
|
| |||||||||||||
|
558,104 |
| ||||||||||||
|
| |||||||||||||
Household & Personal Products 0.1% | ||||||||||||||
| Avon Products Inc., senior note, 6.50%, 3/01/19 | United Kingdom | 50,000 | 50,375 | |||||||||||
|
| |||||||||||||
| 16 | Semiannual Report | franklintempleton.com | ||
F R A N K L I N S T R A T E G I C S E R I E S
S T A T E M E N T O F I N V E S T M E N T S ( U N A U D I T E D )
Franklin Flexible Alpha Bond Fund (continued)
| Principal | ||||||||||||||||
| Country | Amount | * | Value | |||||||||||||
Corporate Bonds (continued) | ||||||||||||||||
Insurance 3.0% | ||||||||||||||||
b | AIG Global Funding, | |||||||||||||||
secured note, 144A, 1.90%, 10/06/21 | United States | 50,000 | $ | 48,723 | ||||||||||||
secured note, 144A, 2.70%, 12/15/21 | United States | 100,000 | 100,381 | |||||||||||||
b | Athene Global Funding, | |||||||||||||||
secured note, 144A, 2.75%, 4/20/20 | United States | 50,000 | 50,339 | |||||||||||||
secured note, 144A, 3.00%, 7/01/22 | United States | 1,050,000 | 1,047,855 | |||||||||||||
b | Jackson National Life Global Funding, | |||||||||||||||
secured note, 144A, 2.25%, 4/29/21 | United States | 50,000 | 49,831 | |||||||||||||
secured note, 144A, 2.10%, 10/25/21 | United States | 25,000 | 24,670 | |||||||||||||
senior secured note, 144A, 2.50%, 6/27/22 | United States | 200,000 | 199,579 | |||||||||||||
b | Massmutual Global Funding II, secured note, 144A, 2.50%, 10/17/22 | United States | 600,000 | 598,620 | ||||||||||||
b | Metropolitan Life Global Funding I, secured note, 144A, 2.65%, 4/08/22 | United States | 600,000 | 604,460 | ||||||||||||
b | Nuveen Finance LLC, senior note, 144A, 2.95%, 11/01/19 | United States | 500,000 | 507,926 | ||||||||||||
b | Principal Life Global Funding II, senior secured note, 144A, 2.625%, 11/19/20 | United States | 100,000 | 101,058 | ||||||||||||
|
| |||||||||||||||
| 3,333,442 | ||||||||||||||||
|
| |||||||||||||||
| Materials 0.7% | ||||||||||||||||
| Freeport-McMoRan Inc., senior note, 4.00%, 11/14/21 | United States | 215,000 | 217,687 | |||||||||||||
b | Glencore Funding LLC, senior note, 144A, 3.00%, 10/27/22 | Switzerland | 100,000 | 100,072 | ||||||||||||
| LYB International Finance BV, senior note, 4.00%, 7/15/23 | United States | 300,000 | 317,310 | |||||||||||||
b | Sealed Air Corp., senior bond, 144A, 5.25%, 4/01/23 | United States | 150,000 | 162,000 | ||||||||||||
|
| |||||||||||||||
| 797,069 | ||||||||||||||||
|
| |||||||||||||||
| Media 0.4% | ||||||||||||||||
| Time Warner Inc., senior bond, 3.40%, 6/15/22 | United States | 400,000 | 411,347 | |||||||||||||
|
| |||||||||||||||
| Pharmaceuticals, Biotechnology & Life Sciences 2.2% | ||||||||||||||||
| Actavis Funding SCS, senior bond, 3.80%, 3/15/25 | United States | 400,000 | 410,038 | |||||||||||||
| Amgen Inc., | ||||||||||||||||
senior note, 2.60%, 8/19/26 | United States | 200,000 | 191,707 | |||||||||||||
senior note, 3.20%, 11/02/27 | United States | 550,000 | 550,000 | |||||||||||||
| Baxalta Inc., | ||||||||||||||||
senior note, 2.875%, 6/23/20 | United States | 400,000 | 405,973 | |||||||||||||
senior note, 3.60%, 6/23/22 | United States | 100,000 | 103,604 | |||||||||||||
| Biogen Inc., senior note, 2.90%, 9/15/20 | United States | 400,000 | 408,580 | |||||||||||||
| Celgene Corp., | ||||||||||||||||
senior bond, 3.875%, 8/15/25 | United States | 200,000 | 208,270 | |||||||||||||
d senior bond, 3.45%, 11/15/27 | United States | 200,000 | 200,000 | |||||||||||||
|
| |||||||||||||||
| 2,478,172 | ||||||||||||||||
|
| |||||||||||||||
Real Estate 0.8% | ||||||||||||||||
| American Tower Corp., senior bond, 3.50%, 1/31/23 | United States | 400,000 | 412,509 | |||||||||||||
| Kimco Realty Corp., senior note, 3.30%, 2/01/25 | United States | 200,000 | 200,695 | |||||||||||||
| Prologis LP, senior note, 4.25%, 8/15/23 | United States | 200,000 | 216,891 | |||||||||||||
| Realty Income Corp., senior bond, 3.25%, 10/15/22 | United States | 50,000 | 51,106 | |||||||||||||
|
| |||||||||||||||
| 881,201 | ||||||||||||||||
|
| |||||||||||||||
Retailing 0.4% | ||||||||||||||||
b | Amazon.com Inc., senior note, 144A, 2.40%, 2/22/23 | United States | 200,000 | 198,834 | ||||||||||||
b | PetSmart Inc., senior note, 144A, 7.125%, 3/15/23 | United States | 350,000 | 267,750 | ||||||||||||
|
| |||||||||||||||
| 466,584 | ||||||||||||||||
|
| |||||||||||||||
Semiconductors & Semiconductor Equipment 0.3% | ||||||||||||||||
b | Broadcom Corp./Broadcom Cayman Finance Ltd., senior note, 144A, 3.625%, 1/15/24 | United States | 300,000 | 309,853 | ||||||||||||
|
| |||||||||||||||
franklintempleton.com |
Semiannual Report |
|
17 |
|
F R A N K L I N S T R A T E G I C S E R I E S
S T A T E M E N T O F I N V E S T M E N T S ( U N A U D I T E D )
Franklin Flexible Alpha Bond Fund (continued)
| Country | | Principal Amount | * | Value | ||||||||||
| ||||||||||||||
| Corporate Bonds (continued) | ||||||||||||||
| Software & Services 0.4% | ||||||||||||||
| Fiserv Inc., senior bond, 3.85%, 6/01/25 | United States | 400,000 | $ | 419,511 | ||||||||||
|
| |||||||||||||
| Technology Hardware & Equipment 0.4% | ||||||||||||||
b | Dell International LLC/EMC Corp., senior secured note, first lien, 144A, 3.48%, 6/01/19 | United States | 250,000 | 254,558 | ||||||||||
b | Sanmina Corp., senior note, first lien, 144A, 4.375%, 6/01/19 | United States | 100,000 | 102,958 | ||||||||||
| Tech Data Corp., senior bond, 4.95%, 2/15/27 | United States | 50,000 | 52,593 | |||||||||||
|
| |||||||||||||
| 410,109 | ||||||||||||||
|
| |||||||||||||
| Telecommunication Services 0.7% | ||||||||||||||
| AT&T Inc., senior note, 3.95%, 1/15/25 | United States | 100,000 | 102,818 | |||||||||||
| Telefonica Emisiones S.A.U., senior note, 4.103%, 3/08/27 | Spain | 400,000 | 412,538 | |||||||||||
| Verizon Communications Inc., senior note, 2.45%, 11/01/22 | United States | 250,000 | 248,686 | |||||||||||
|
| |||||||||||||
| 764,042 | ||||||||||||||
|
| |||||||||||||
| Transportation 0.8% | ||||||||||||||
| American Airlines Pass Through Trust, first lien, 2016-2, AA, 3.20%, 6/15/28 | United States | 48,700 | 48,807 | |||||||||||
| FedEx Corp., senior bond, 3.20%, 2/01/25 | United States | 450,000 | 460,051 | |||||||||||
b | Transurban Finance Co. Pty. Ltd., senior secured bond, 144A, 3.375%, 3/22/27 | Australia | 400,000 | 392,878 | ||||||||||
|
| |||||||||||||
| 901,736 | ||||||||||||||
|
| |||||||||||||
| Utilities 2.9% | ||||||||||||||
| Calpine Corp., senior note, 5.375%, 1/15/23 | United States | 65,000 | 63,456 | |||||||||||
b | Colbun SA, senior note, 144A, 3.95%, 10/11/27 | Chile | 200,000 | 200,298 | ||||||||||
| Dominion Energy Inc., | ||||||||||||||
senior bond, 3.90%, 10/01/25 | United States | 50,000 | 52,423 | |||||||||||
senior bond, 2.85%, 8/15/26 | United States | 600,000 | 582,527 | |||||||||||
b,e | EDF SA, junior sub. bond, 144A, 5.625% to 1/22/24, FRN thereafter, Perpetual | France | 700,000 | 739,875 | ||||||||||
| Kinder Morgan Energy Partners LP, senior bond, 6.50%, 9/01/39 | United States | 50,000 | 58,039 | |||||||||||
| The Southern Co., senior bond, 3.25%, 7/01/26 | United States | 550,000 | 547,929 | |||||||||||
b | State Grid Overseas Invesments 2016 Ltd., senior note, 144A, 3.50%, 5/04/27 | China | 500,000 | 511,103 | ||||||||||
b | Three Gorges Finance I Cayman Islands Ltd., senior note, 144A, 3.70%, 6/10/25 | China | 500,000 | 518,437 | ||||||||||
|
| |||||||||||||
| 3,274,087 | ||||||||||||||
|
| |||||||||||||
| Total Corporate Bonds (Cost $37,441,164) | 37,358,060 | |||||||||||||
|
| |||||||||||||
| Foreign Government and Agency Securities 0.9% | ||||||||||||||
b | The Export-Import Bank of China, senior note, 144A, 2.50%, 7/31/19 | China | 200,000 | 200,928 | ||||||||||
| Export-Import Bank of Korea, senior note, 2.875%, 1/21/25 | South Korea | 700,000 | 686,742 | |||||||||||
| Government of Indonesia, senior bond, FR70, 8.375%, 3/15/24 | Indonesia | 263,000,000 | IDR | 21,012 | ||||||||||
a | United Kingdom Treasury Bond, Reg S, 2.00%, 9/07/25 | United Kingdom | 85,000 | GBP | 120,364 | |||||||||
|
| |||||||||||||
Total Foreign Government and Agency Securities | 1,029,046 | |||||||||||||
|
| |||||||||||||
| U.S. Government and Agency Securities 2.9% | ||||||||||||||
f | U.S. Treasury Bond, Index Linked, 0.625%, 1/15/24 | United States | 105,214 | 107,214 | ||||||||||
f | U.S. Treasury Note, | |||||||||||||
Index Linked, 0.125%, 1/15/23 | United States | 588,154 | 585,693 | |||||||||||
Index Linked, 0.25%, 1/15/25 | United States | 2,591,209 | 2,563,224 | |||||||||||
|
| |||||||||||||
Total U.S. Government and Agency Securities | 3,256,131 | |||||||||||||
|
| |||||||||||||
| 18 | Semiannual Report | franklintempleton.com | ||
F R A N K L I N S T R A T E G I C S E R I E S
S T A T E M E N T O F I N V E S T M E N T S ( U N A U D I T E D )
Franklin Flexible Alpha Bond Fund (continued)
| Country | | Principal Amount | * | Value | ||||||||||
Asset-Backed Securities and Commercial Mortgage-Backed Securities 35.1% | ||||||||||||||
| Banks 0.0%† | ||||||||||||||
g | Impac Secured Assets Corp., 2004-4, M1, FRN, 2.003%, (1-month USD LIBOR + 0.765%), 2/25/35 | United States | 50,000 | $ | 50,141 | |||||||||
|
| |||||||||||||
| Diversified Financials 35.1% | ||||||||||||||
b,g | AMMC CLO 21 Ltd., 2017-21A, C, 144A, FRN, 3.487%, (3-month USD LIBOR + 2.10%), 11/02/30 | United States | 400,000 | 401,292 | ||||||||||
b,g | Atrium X, 10A, CR, 144A, FRN, 3.309%, (3-month USD LIBOR + 1.95%), 7/16/25 | United States | 60,000 | 60,279 | ||||||||||
b,d,g | Atrium XIII, | |||||||||||||
2013A, C, 144A, FRN, 3.171%, (3-month USD LIBOR + 1.80%), 11/21/30 | United States | 600,000 | 600,000 | |||||||||||
2013-A, B, 144A, FRN, 2.871%, (3-month USD LIBOR + 1.50%), 11/21/30 | United States | 2,000,000 | 2,000,000 | |||||||||||
b | BAMLL Commercial Mortgage Securities Trust, | |||||||||||||
2012-PARK, A, 144A, 2.959%, 12/10/30 | United States | 100,000 | 101,984 | |||||||||||
2015-200P, A, 144A, 3.218%, 4/14/33 | United States | 600,000 | 609,971 | |||||||||||
| Banc of America Commercial Mortgage Trust, 2015-UBS7, A4, 3.705%, 9/15/48 | United States | 100,000 | 105,205 | |||||||||||
b,g | BlueMountain Fuji U.S. CLO I Ltd., 2017-1A, C, 144A, FRN, 3.637%, (3-month USD LIBOR + 2.35%), 7/20/29 | United States | 60,000 | 60,673 | ||||||||||
b,g | BlueMountain Fuji U.S. CLO II Ltd., 2017-2A, A1A, 144A, FRN, 2.531%, (3-month USD LIBOR + 1.20%), 10/20/30 | United States | 250,000 | 250,007 | ||||||||||
g | Capital One Multi-Asset Execution Trust, 2004-B3, B3, FRN, 1.969%, (1-month USD LIBOR + 0.73%), 1/18/22 | United States | 150,000 | 150,540 | ||||||||||
b,g | Carlyle Global Market Strategies CLO Ltd., 2014-3A, A1AR, 144A, FRN, 2.524%, (3-month USD LIBOR + 1.15%), 7/27/26 | United States | 150,000 | 150,822 | ||||||||||
b,g | Carlyle U.S. CLO Ltd., | |||||||||||||
2017-2A, B, 144A, FRN, 3.731%, (3-month USD LIBOR + 2.40%), 7/20/31 | United States | 60,000 | 60,504 | |||||||||||
d 2017-4A, B, 144A, FRN, 3.221%, (3-month USD LIBOR + 1.85%), 1/15/30 | United States | 600,000 | 600,000 | |||||||||||
d 2017-4A, C, 144A, FRN, 4.171%, (3-month USD LIBOR + 2.80%), 1/15/30 | United States | 400,000 | 400,000 | |||||||||||
b,g | Cent CLO, 2013-17A, A1, 144A, FRN, 2.678%, (3-month USD LIBOR + 1.30%), 1/30/25 | United States | 23,532 | 23,562 | ||||||||||
b,h | CGRBS Commercial Mortgage Trust, 2013-VN05, C, 144A, FRN, 3.703%, 3/13/35 | United States | 450,000 | 457,196 | ||||||||||
b,g | Colony American Homes, 2015-1A, A, 144A, FRN, 2.437%, (1-month USD LIBOR + 1.20%), 7/17/32 | United States | 104,986 | 105,268 | ||||||||||
COMM Mortgage Trust, | ||||||||||||||
h,i 2014-UBS4, XA, IO, FRN, 1.379%, 8/10/47 | United States | 337,541 | 18,358 | |||||||||||
b 2015-3BP, A, 144A, 3.178%, 2/10/35 | United States | 600,000 | 608,785 | |||||||||||
h | Conseco Finance Securitizations Corp., 2002-2, M1, FRN, 7.424%, 3/01/33 | United States | 78,827 | 86,783 | ||||||||||
b | Core Industrial Trust, 2015-CALW, A, 144A, 3.04%, 2/10/34 | United States | 30,000 | 30,713 | ||||||||||
b,g | Dryden 31 Senior Loan Fund, 2014-31A, AR, 144A, FRN, 2.434%, (3-month USD LIBOR + 1.08%), 4/18/26 | United States | 150,000 | 150,428 | ||||||||||
b,g | Dryden 34 Senior Loan Fund, 14-34A, AR, 144A, FRN, 2.519%, (3-month USD LIBOR + 1.16%), 10/15/26 | United States | 90,000 | 90,405 | ||||||||||
b,g | Dryden 49 Senior Loan Fund, 2017-49A, C, 144A, FRN, 3.704%, (3-month USD LIBOR + 2.35%), 7/18/30 | United States | 60,000 | 60,443 | ||||||||||
b,g | Eaton Vance CDO Ltd., 2014-1A, AR, 144A, FRN, 2.559%, (3-month USD LIBOR + 1.20%), 7/15/26 | United States | 24,000 | 24,108 | ||||||||||
b,h | Eleven Madison Trust Mortgage Trust, 2015-11MD, A, 144A, FRN, 3.673%, 9/10/35 | United States | 100,000 | 104,079 |
franklintempleton.com |
Semiannual Report |
19 |
F R A N K L I N S T R A T E G I C S E R I E S
S T A T E M E N T O F I N V E S T M E N T S ( U N A U D I T E D )
Franklin Flexible Alpha Bond Fund (continued)
| Principal | ||||||||||||||
| Country | Amount | * | Value | |||||||||||
| ||||||||||||||
Asset-Backed Securities and Commercial Mortgage-Backed Securities (continued) | ||||||||||||||
Diversified Financials (continued) | ||||||||||||||
g | FHLMC Structured Agency Credit Risk Debt Notes, | |||||||||||||
2014-DN1, M2, FRN, 3.438%, (1-month USD LIBOR + 2.20%), 2/25/24 | United States | 576,581 | $ | 594,316 | ||||||||||
2014-HQ2, M2, FRN, 3.438%, (1-month USD LIBOR + 2.20%), 9/25/24 | United States | 600,000 | 619,520 | |||||||||||
2014-HQ3, M2, FRN, 3.888%, (1-month USD LIBOR + 2.65%), 10/25/24 | United States | 525,550 | 527,118 | |||||||||||
2015-DN1, M3, FRN, 5.388%, (1-month USD LIBOR + 4.15%), 1/25/25 | United States | 600,000 | 647,240 | |||||||||||
2015-DNA1, M2, FRN, 3.088%, (1-month USD LIBOR + 1.85%), 10/25/27 | United States | 250,000 | 255,838 | |||||||||||
2015-DNA1, M3, FRN, 4.538%, (1-month USD LIBOR + 3.30%), 10/25/27 | United States | 600,000 | 668,207 | |||||||||||
2015-DNA2, M2, FRN, 3.838%, (1-month USD LIBOR + 2.60%), 12/25/27 | United States | 221,956 | 226,856 | |||||||||||
2015-DNA2, M3, FRN, 5.138%, (1-month USD LIBOR + 3.90%), 12/25/27 | United States | 600,000 | 659,133 | |||||||||||
2015-DNA3, M2, FRN, 4.088%, (1-month USD LIBOR + 2.85%), 4/25/28 | United States | 638,497 | 661,767 | |||||||||||
2015-HQ1, M2, FRN, 3.438%, (1-month USD LIBOR + 2.20%), 3/25/25 | United States | 505,806 | 509,829 | |||||||||||
2015-HQA2, M2, FRN, 4.038%, (1-month USD LIBOR + 2.80%), 5/25/28 | United States | 442,224 | 457,099 | |||||||||||
2016-DNA1, M1, FRN, 2.688%, (1-month USD LIBOR + 1.45%), 7/25/28 | United States | 304,851 | 305,598 | |||||||||||
2016-DNA1, M3, FRN, 6.788%, (1-month USD LIBOR + 5.55%), 7/25/28 | United States | 550,000 | 642,661 | |||||||||||
2016-DNA2, M2, FRN, 3.438%, (1-month USD LIBOR + 2.20%), 10/25/28 | United States | 600,000 | 609,326 | |||||||||||
2016-DNA3, M2, FRN, 3.238%, (1-month USD LIBOR + 2.00%), 12/25/28 | United States | 396,000 | 404,277 | |||||||||||
2016-HQA2, M2, FRN, 3.488%, (1-month USD LIBOR + 2.25%), 11/25/28 | United States | 600,000 | 617,355 | |||||||||||
2016-HQA3, M1, FRN, 2.038%, (1-month USD LIBOR + 0.80%), 3/25/29 | United States | 439,392 | 440,249 | |||||||||||
2016-HQA3, M2, FRN, 2.588%, (1-month USD LIBOR + 1.35%), 3/25/29 | United States | 350,000 | 354,324 | |||||||||||
2016-HQA4, M2, FRN, 2.538%, (1-month USD LIBOR + 1.30%), 4/25/29 | United States | 700,000 | 709,481 | |||||||||||
g | FNMA Connecticut Avenue Securities, | |||||||||||||
2013-C01, M1, FRN, 3.238%, (1-month USD LIBOR + 2.00%), 10/25/23 | United States | 27,082 | 27,301 | |||||||||||
2014-C02, 1M2, FRN, 3.838%, (1-month USD LIBOR + 2.60%), 5/25/24 | United States | 600,000 | 629,742 | |||||||||||
2014-C02, 2M1, FRN, 2.188%, (1-month USD LIBOR + 0.95%), 5/25/24 | United States | 3,571 | 3,573 | |||||||||||
2014-C02, 2M2, FRN, 3.838%, (1-month USD LIBOR + 2.60%), 5/25/24 | United States | 40,000 | 41,649 | |||||||||||
2014-C03, 1M2, FRN, 4.238%, (1-month USD LIBOR + 3.00%), 7/25/24 | United States | 650,000 | 687,184 | |||||||||||
2014-C03, 2M2, FRN, 4.138%, (1-month USD LIBOR + 2.90%), 7/25/24 | United States | 591,842 | 621,865 | |||||||||||
2014-C04, 1M1, FRN, 6.138%, (1-month USD LIBOR + 4.90%), 11/25/24 | United States | 620,601 | 705,259 | |||||||||||
2014-C04, 2M2, FRN, 6.238%, (1-month USD LIBOR + 5.00%), 11/25/24 | United States | 533,992 | 599,965 | |||||||||||
2015-C01, 1M2, FRN, 5.538%, (1-month USD LIBOR + 4.30%), 2/25/25 | United States | 39,779 | 42,809 | |||||||||||
2015-C01, 2M2, FRN, 5.788%, (1-month USD LIBOR + 4.55%), 2/25/25 | United States | 52,580 | 56,201 | |||||||||||
2015-C02, 1M2, FRN, 5.238%, (1-month USD LIBOR + 4.00%), 5/25/25 | United States | 8,258 | 8,856 | |||||||||||
2015-C02, 2M2, FRN, 5.238%, (1-month USD LIBOR + 4.00%), 5/25/25 | United States | 19,146 | 20,286 | |||||||||||
2015-C03, 1M2, FRN, 6.238%, (1-month USD LIBOR + 5.00%), 7/25/25 | United States | 579,469 | 640,866 | |||||||||||
2015-C03, 2M2, FRN, 6.238%, (1-month USD LIBOR + 5.00%), 7/25/25 | United States | 46,941 | 51,355 | |||||||||||
2017-C01, 1B1, FRN, 6.988%, (1-month USD LIBOR + 5.75%), 7/25/29 | United States | 33,000 | 37,322 | |||||||||||
b,g | Gilbert Park CLO Ltd., | |||||||||||||
2017-1A, B, 144A, FRN, 2.965%, (3-month USD LIBOR + 1.60%), 10/15/30 | United States | 3,000,000 | 3,007,470 | |||||||||||
2017-1A, D, 144A, FRN, 4.315%, (3-month USD LIBOR + 2.95%), 10/15/30 | United States | 400,000 | 399,100 | |||||||||||
GS Mortgage Securities Trust, | ||||||||||||||
2016-GS3, A4, 2.85%, 10/10/49 | United States | 600,000 | 593,439 | |||||||||||
2017-GS5, A4, 3.674%, 3/10/50 | United States | 600,000 | 632,006 | |||||||||||
b,g | Invitation Homes Trust, | |||||||||||||
2015-SFR1, A, 144A, FRN, 2.687%, (1-month USD LIBOR + 1.45%), 3/17/32 | United States | 694,682 | 699,781 | |||||||||||
2015-SFR2, A, 144A, FRN, 2.587%, (1-month USD LIBOR + 1.35%), 6/17/32 | United States | 485,630 | 486,914 | |||||||||||
2015-SFR3, A, 144A, FRN, 2.537%, (1-month USD LIBOR + 1.30%), 8/17/32 | United States | 667,532 | 672,988 | |||||||||||
2015-SFR3, D, 144A, FRN, 3.987%, (1-month USD LIBOR + 2.75%), 8/17/32 | United States | 100,000 | 100,822 | |||||||||||
| 20 | Semiannual Report | franklintempleton.com | ||
F R A N K L I N S T R A T E G I C S E R I E S
S T A T E M E N T O F I N V E S T M E N T S ( U N A U D I T E D )
Franklin Flexible Alpha Bond Fund (continued)
| Country | | Principal Amount | * | Value | ||||||||||||
| ||||||||||||||||
Asset-Backed Securities and Commercial Mortgage-Backed Securities (continued) | ||||||||||||||||
| Diversified Financials (continued) | ||||||||||||||||
b,h | J.P. Morgan Chase Commercial Mortgage Securities, 2016-Nine, A, 144A, FRN, 2.949%, 10/06/38 | United States | 600,000 | $ | 592,924 | |||||||||||
h | JPMBB Commercial Mortgage Securities Trust, 2015-C30, AS, FRN, 4.226%, 7/15/48 | United States | 450,000 | 477,307 | ||||||||||||
JPMCC Commercial Mortgage Securities Trust, 2017-JP6, A5, 3.49%, 7/15/50 | United States | 600,000 | 621,481 | |||||||||||||
h,i | JPMDB Commercial Mortgage Securities Trust, 2017-C5, XA, IO, FRN, 1.027%, 3/15/50 | United States | 199,454 | 14,197 | ||||||||||||
b | Morgan Stanley Capital I Trust, 2014-150E, A, 144A, 3.912%, 9/09/32 | United States | 450,000 | 475,839 | ||||||||||||
b,d,g | Neuberger Berman CLO Ltd., 2017-26A, B, 144A, FRN, 2.871%, (3-month USD LIBOR + 1.50%), 10/18/30 | United States | 539,475 | 539,475 | ||||||||||||
b,d,g | Octagon Investment Partners 33 Ltd., | |||||||||||||||
2017-1A, A2, 144A, FRN, 2.871%, (3-month USD LIBOR + 1.50%), 1/20/31 | United States | 2,000,000 | 2,000,000 | |||||||||||||
2017-1A, B, 144A, FRN, 3.221%, (3-month USD LIBOR + 1.85%), 1/20/31 | United States | 500,000 | 500,000 | |||||||||||||
2017-1A, C, 144A, FRN, 4.121%, (3-month USD LIBOR + 2.75%), 1/20/31 | United States | 250,000 | 250,000 | |||||||||||||
b,g | Octagon Investment Partners XXIII Ltd., | |||||||||||||||
2015-1A, A1, 144A, FRN, 2.779%, (3-month USD LIBOR + 1.42%), 7/15/27 | United States | 18,490 | 18,605 | |||||||||||||
2015-1A, A2, 144A, FRN, 2.779%, (3-month USD LIBOR + 1.42%), 7/15/27 | United States | 17,554 | 17,659 | |||||||||||||
b,g | Resource Capital Corp. Ltd., 2015-CRE4, A, 144A, FRN, 2.639%, (1-month USD LIBOR + 1.40%), 8/15/32 | United States | 26,164 | 26,134 | ||||||||||||
b,d | TCI-Flatiron CLO Ltd., | |||||||||||||||
g 2017-1A, B, 144A, FRN, 2.931%, (3-month USD LIBOR + 1.56%), 11/17/30 | United States | 2,000,000 | 2,000,000 | |||||||||||||
j 2017-1A, C, 144A, FRN, 11/17/30 | United States | 1,200,000 | 1,200,000 | |||||||||||||
j 2017-1A, D, 144A, FRN, 11/17/30 | United States | 250,000 | 250,000 | |||||||||||||
h | Thornburg Mortgage Securities Trust, 2005-1, A3, FRN, 3.028%, 4/25/45 | United States | 33,644 | 33,849 | ||||||||||||
b | Towd Point Mortgage Trust, | |||||||||||||||
h 2015-2, 2A1, 144A, FRN, 3.75%, 11/25/57 | United States | 592,733 | 608,093 | |||||||||||||
h 2016-3, A1, 144A, FRN, 2.25%, 4/25/56 | United States | 71,364 | 71,083 | |||||||||||||
h 2016-5, A1, 144A, FRN, 2.50%, 10/25/56 | United States | 590,630 | 590,623 | |||||||||||||
h 2017-4, A1, 144A, FRN, 2.75%, 6/25/57 | United States | 332,444 | 334,012 | |||||||||||||
g 2017-5, 144A, FRN, 1.838%, (1-month USD LIBOR + 0.60%), 2/25/57 | United States | 220,000 | 220,000 | |||||||||||||
b,g | West CLO Ltd., 2014-1A, A2R, 144A, FRN, 2.704%, (3-month USD LIBOR + 1.35%), 7/18/26 | United States | 170,000 | 171,074 | ||||||||||||
|
| |||||||||||||||
| 39,000,707 | ||||||||||||||||
|
| |||||||||||||||
Real Estate 0.0%† | ||||||||||||||||
b | Colony MFM Trust, 2014-1, A, 144A, 2.543%, 4/20/50 | United States | 31,637 | 31,497 | ||||||||||||
|
| |||||||||||||||
Total Asset-Backed Securities and Commercial Mortgage-Backed Securities (Cost $39,057,822) | 39,082,345 | |||||||||||||||
|
| |||||||||||||||
Mortgage-Backed Securities 3.3% | ||||||||||||||||
Federal National Mortgage Association (FNMA) Fixed Rate 3.3% | ||||||||||||||||
k | FNMA 15 Year, 3.00%, 11/01/32 | United States | 3,250,000 | 3,329,441 | ||||||||||||
FNMA, 3.50%, 7/01/56 | United States | 282,059 | 289,378 | |||||||||||||
|
| |||||||||||||||
Total Mortgage-Backed Securities (Cost $3,609,717) | 3,618,819 | |||||||||||||||
|
| |||||||||||||||
franklintempleton.com |
Semiannual Report |
|
21 |
|
F R A N K L I N S T R A T E G I C S E R I E S
S T A T E M E N T O F I N V E S T M E N T S ( U N A U D I T E D )
Franklin Flexible Alpha Bond Fund (continued)
| Principal | ||||||||||||||||
| Country | Amount | * | Value | |||||||||||||
| ||||||||||||||||
Municipal Bonds 0.5% | ||||||||||||||||
Cincinnati GO, Various Purpose, Improvement and Refunding, Series A, 5.00%, 12/01/25 | United States | 100,000 | $ | 121,238 | ||||||||||||
Citizens Property Insurance Corp. Revenue, Coastal Account, senior secured, Series A-1, 5.00%, 6/01/22 | United States | 125,000 | 142,040 | |||||||||||||
Colorado State Board of Governors University Enterprise System Revenue, Green Bonds, Series E-2, 5.00%, 3/01/25 | United States | 100,000 | 121,728 | |||||||||||||
| Providence St. Joseph Health Obligated Group, 2.746%, 10/01/26 | United States | 15,000 | 14,370 | |||||||||||||
Teays Valley Local School District GO, Pickaway Fairfield and Franklin Counties, Refunding, 4.00%, 12/01/26 | United States | 100,000 | 109,475 | |||||||||||||
Texas State GO, Transportation Commission-Highway Improvement, Series A, 5.00%, 4/01/21 | United States | 5,000 | 5,621 | |||||||||||||
|
| |||||||||||||||
Total Municipal Bonds (Cost $495,886) |
|
514,472 |
| |||||||||||||
|
| |||||||||||||||
| Number of | Notional | |||||||||||||||
| Contracts | Amount | * | ||||||||||||||
|
|
|
| |||||||||||||
Options Purchased 0.0%† | ||||||||||||||||
Puts - Over-the-Counter | ||||||||||||||||
Credit Default Swaptions 0.0%† | ||||||||||||||||
Buy protection on CDX.NA.IG.28, Premium Rate 1.00%, Strike Price $67.50, Counterparty BZWS, Expires 11/15/17 | 1 | 400,000 | 7 | |||||||||||||
Buy protection on CDX.NA.IG.29, Premium Rate 1.00%, Strike Price $60, Counterparty BZWS, Expires 3/21/18 | 1 | 3,000,000 | 8,154 | |||||||||||||
|
| |||||||||||||||
|
8,161 |
| ||||||||||||||
|
| |||||||||||||||
Management Investment Companies 0.0%† | ||||||||||||||||
iShares iBoxx High Yield Corporate Bond ETF, January Strike Price $87, Counterparty CITI, Expires 1/19/18 | 150 | 15,000 | 126 | |||||||||||||
|
| |||||||||||||||
Total Options Purchased (Cost $25,376) |
|
8,287 |
| |||||||||||||
|
| |||||||||||||||
Total Investments before Short Term Investments | 88,260,367 | |||||||||||||||
|
| |||||||||||||||
| Country | Shares | |||||||||||||||
|
|
|
| |||||||||||||
Short Term Investments (Cost $37,468,384) 33.7% | ||||||||||||||||
Money Market Funds 33.7% | ||||||||||||||||
l,m | Institutional Fiduciary Trust Money Market Portfolio, 0.69% | United States | 37,468,384 | 37,468,384 | ||||||||||||
|
| |||||||||||||||
Total Investments (Cost $125,805,872) 113.1% |
|
125,728,751 |
| |||||||||||||
Options Written (0.0)%† | (3,350 | ) | ||||||||||||||
TBA Sale Commitments (2.4)% | (2,641,478 | ) | ||||||||||||||
Other Assets, less Liabilities (10.7)% | (11,870,838 | ) | ||||||||||||||
|
| |||||||||||||||
Net Assets 100.0% |
$ |
111,213,085 |
| |||||||||||||
|
| |||||||||||||||
| Principal | ||||||||||||||||
| Amount | * | |||||||||||||||
|
| |||||||||||||||
TBA Sale Commitments (Proceeds $2,630,754) | ||||||||||||||||
Federal National Mortgage Association (FNMA) Fixed Rate (2.4)% | ||||||||||||||||
n | FNMA 30 Year, 3.50%, 11/01/47 | United States | 2,570,000 | $ | (2,641,478 | ) | ||||||||||
|
| |||||||||||||||
22 | Semiannual Report | franklintempleton.com |
F R A N K L I N S T R A T E G I C S E R I E S
S T A T E M E N T O F I N V E S T M E N T S ( U N A U D I T E D )
Franklin Flexible Alpha Bond Fund (continued)
| Number of | Notional | |||||||||||||||
| Contracts | Amount | * | Value | |||||||||||||
| ||||||||||||||||
| o | Options Written (0.0)%† | |||||||||||||||
Puts - Over-the-Counter | ||||||||||||||||
Credit Default Swaptions (0.0)%† | ||||||||||||||||
Buy protection on CDX.NA.IG.29, Premium Rate 1.00%, Strike Price $75, Counterparty BZWS, Expires 3/21/18 | 1 | 3,000,000 | $ (3,306 | ) | ||||||||||||
|
| |||||||||||||||
Management Investment Companies (0.0)%† | ||||||||||||||||
iShares iBoxx High Yield Corporate Bond ETF, January Strike Price $84, Counterparty CITI, Expires 1/19/18 | 150 | 15,000 | (44 | ) | ||||||||||||
|
| |||||||||||||||
Total Options Written (Premiums received $10,860) | $ | (3,350 | ) | |||||||||||||
|
| |||||||||||||||
†Rounds to less than 0.1% of net assets.
*The principal/notional amount is stated in U.S. dollars unless otherwise indicated.
aSecurity was purchased pursuant to Regulation S under the Securities Act of 1933, which exempts from registration securities offered and sold outside of the United States. Such a security cannot be sold in the United States without either an effective registration statement filed pursuant to the Securities Act of 1933, or pursuant to an exemption from registration. These securities have been deemed liquid under guidelines approved by the Trust’s Board of Trustees. At October 31, 2017, the aggregate value of these securities was $4,401,954, representing 4.0% of net assets.
bSecurity was purchased pursuant to Rule 144A under the Securities Act of 1933 and may be sold in transactions exempt from registration only to qualified institutional buyers or in a public offering registered under the Securities Act of 1933. These securities have been deemed liquid under guidelines approved by the Trust’s Board of Trustees. At October 31, 2017, the aggregate value of these securities was $32,356,514, representing 29.1% of net assets.
cThe coupon rate shown represents the rate at period end.
dSecurity purchased on a when-issued basis. See Note 1(c).
ePerpetual security with no stated maturity date.
fPrincipal amount of security is adjusted for inflation. See Note 1(g).
gThe coupon rate shown represents the rate inclusive of any caps or floors, if applicable, in effect at period end.
hAdjustable rate security with an interest rate that is not based on a published reference index and spread. The rate is based on the structure of the agreement and current market conditions. The coupon rate shown represents the rate at period end.
iInvestment in an interest-only security entitles holders to receive only the interest payment on the underlying instruments. The principal amount shown is the notional amount of the underlying instruments.
jThe coupon rate will be determined at time of issue.
kSecurity purchased on a to-be-announced (TBA) basis. See Note 1(c).
lSee Note 3(f) regarding investments in affiliated management investment companies.
mThe rate shown is the annualized seven-day yield at period end.
nSecurity sold on a TBA basis resulting in a short position. As such, the Fund is not subject to fees and expenses associated with short sale transactions.
oSee Note 1(d) regarding written options.
franklintempleton.com | Semiannual Report | 23 |
F R A N K L I N S T R A T E G I C S E R I E S
S T A T E M E N T O F I N V E S T M E N T S ( U N A U D I T E D )
Franklin Flexible Alpha Bond Fund (continued)
At October 31, 2017, the Fund had the following futures contracts outstanding. See Note 1(d).
| Description | Type | | Number of Contracts | | | Notional Amount | * | | Expiration Date | | | Value/ Unrealized Appreciation (Depreciation) | | |||||||
| Interest Rate Contracts | ||||||||||||||||||||
Australian 10 Yr. Bond | Long | 14 | $ | 1,381,098 | 12/15/17 | $ 14,058 | ||||||||||||||
Canadian 10 Yr. Bond | Long | 13 | 1,385,437 | 12/18/17 | 16,392 | |||||||||||||||
Long Gilt | Long | 8 | 1,321,330 | 12/27/17 | 652 | |||||||||||||||
U.S. Treasury 2 Yr. Note | Short | 68 | 14,644,438 | 12/29/17 | 47,361 | |||||||||||||||
U.S. Treasury 5 Yr. Note | Short | 47 | 5,507,812 | 12/29/17 | 32,028 | |||||||||||||||
U.S. Treasury 10 Yr. Note | Short | 146 | 18,240,875 | 12/19/17 | 207,941 | |||||||||||||||
U.S. Treasury 10 Yr. Ultra | Short | 17 | 2,276,672 | 12/19/17 | 4,080 | |||||||||||||||
|
| |||||||||||||||||||
Total Futures Contracts | $322,512 | |||||||||||||||||||
|
| |||||||||||||||||||
*As of period end.
At October 31, 2017, the Fund had the following forward exchange contracts outstanding. See Note 1(d).
| Currency | Counterpartya | Type | Quantity | | Contract Amount | * | | Settlement Date | | | Unrealized Appreciation | | | Unrealized Depreciation | | |||||||||||||||||
| OTC Forward Exchange Contracts | ||||||||||||||||||||||||||||||||
South Korean Won | RBS | Sell | 525,000,000 | 464,067 | 11/03/17 | $ | — | $ | (5,493 | ) | ||||||||||||||||||||||
Indonesian Rupiah | JPHQ | Buy | 2,647,500,000 | 199,255 | 11/08/17 | — | (4,195 | ) | ||||||||||||||||||||||||
Polish Zloty | RBS | Buy | 800,000 | 224,210 | 11/09/17 | — | (4,354 | ) | ||||||||||||||||||||||||
Swedish Krona | UBSW | Buy | 1,900,000 | 239,383 | 11/10/17 | — | (12,323 | ) | ||||||||||||||||||||||||
Canadian Dollar | UBSW | Sell | 662,000 | 542,831 | 11/28/17 | 29,356 | — | |||||||||||||||||||||||||
Australian Dollar | UBSW | Sell | 658,000 | 525,800 | 12/14/17 | 22,264 | — | |||||||||||||||||||||||||
New Zealand Dollar | UBSW | Buy | 155,000 | 113,049 | 12/27/17 | — | (7,087 | ) | ||||||||||||||||||||||||
British Pound | UBSW | Sell | 200,000 | 262,660 | 12/28/17 | — | (3,541 | ) | ||||||||||||||||||||||||
British Pound | UBSW | Sell | 592,000 | 798,691 | 12/28/17 | 10,737 | — | |||||||||||||||||||||||||
Indian Rupee | RBS | Buy | 24,000,000 | 362,867 | 1/05/18 | 5,378 | — | |||||||||||||||||||||||||
Canadian Dollar | RBS | Sell | 91,000 | 73,046 | 1/16/18 | 2,419 | — | |||||||||||||||||||||||||
Canadian Dollar | UBSW | Sell | 26,000 | 26,674 | AUD | 1/16/18 | 228 | — | ||||||||||||||||||||||||
Euro | UBSW | Buy | 250,000 | 291,325 | 1/25/18 | 1,456 | — | |||||||||||||||||||||||||
Euro | UBSW | Sell | 697,000 | 827,039 | 1/25/18 | 10,767 | — | |||||||||||||||||||||||||
Chilean Peso | UBSW | Sell | 61,500,000 | 98,246 | 1/30/18 | 1,741 | — | |||||||||||||||||||||||||
Mexican Peso | RBS | Buy | 18,328,000 | 943,769 | 2/09/18 | — | (4,702 | ) | ||||||||||||||||||||||||
Singapore Dollar | RBS | Sell | 147,000 | 107,700 | 2/13/18 | — | (299 | ) | ||||||||||||||||||||||||
Japanese Yen | UBSW | Sell | 10,965,074 | 96,879 | 2/14/18 | — | (125 | ) | ||||||||||||||||||||||||
Japanese Yen | JPHQ | Sell | 1,200,000 | 10,840 | 4/19/18 | 186 | — | |||||||||||||||||||||||||
Japanese Yen | JPHQ | Buy | 35,719,260 | 324,259 | 12/17/18 | — | (2,161 | ) | ||||||||||||||||||||||||
Japanese Yen | JPHQ | Sell | 35,719,260 | 324,187 | 12/17/18 | 2,089 | — | |||||||||||||||||||||||||
24 |
Semiannual Report |
franklintempleton.com |
F R A N K L I N S T R A T E G I C S E R I E S
S T A T E M E N T O F I N V E S T M E N T S ( U N A U D I T E D )
Franklin Flexible Alpha Bond Fund (continued)
Forward Exchange Contracts (continued)
| Currency | Counterpartya | Type | Quantity | | Contract Amount | * | | Settlement Date | | | Unrealized Appreciation | | | Unrealized Depreciation | | |||||||||
OTC Forward Exchange Contracts (continued) | ||||||||||||||||||||||||
British Pound | JPHQ | Sell | 86,300 | 115,081 | 8/15/19 | $ — | $ (1,964) | |||||||||||||||||
|
| |||||||||||||||||||||||
Total Forward Exchange Contracts | $ 86,621 | $ (46,244) | ||||||||||||||||||||||
|
| |||||||||||||||||||||||
Net unrealized appreciation (depreciation) | $ 40,377 | |||||||||||||||||||||||
|
| |||||||||||||||||||||||
*In U.S. dollars unless otherwise indicated.
aMay be comprised of multiple contracts with the same counterparty, currency and settlement date.
At October 31, 2017, the Fund had the following credit default swap contracts outstanding. See Note 1(d).
Credit Default Swap Contracts
| Description | | Periodic Payment Rate Received (Paid) | | | Payment Frequency | | | Counter- party | | | Maturity Date | | | Notional Amount | a | Value | | Unamortized Upfront Payments (Receipts) | | | Unrealized Appreciation (Depreciation) | | Ratingb | |||||||||||||||||
| Centrally Cleared Swap Contracts | ||||||||||||||||||||||||||||||||||||||||
| Contracts to Buy Protectionc | ||||||||||||||||||||||||||||||||||||||||
| Single Name | ||||||||||||||||||||||||||||||||||||||||
Olin Corp | (1.00)% | Quarterly | 12/20/21 | 10,000 | $ | (135 | ) | $ | 478 | $ | (613 | ) | ||||||||||||||||||||||||||||
| Traded Index | ||||||||||||||||||||||||||||||||||||||||
CDX.NA.HY.29 | (5.00)% | Quarterly | 12/20/22 | 60,000 | (5,370 | ) | (4,212 | ) | (1,158 | ) | ||||||||||||||||||||||||||||||
ITRX.EUR.28 | (1.00)% | Quarterly | 12/20/22 | 2,800,000 | EUR | (86,861 | ) | (73,446 | ) | (13,415 | ) | |||||||||||||||||||||||||||||
| Contracts to Sell Protectionc,d | ||||||||||||||||||||||||||||||||||||||||
| Traded Index | ||||||||||||||||||||||||||||||||||||||||
CDX.NA.IG.29 | 1.00% | Quarterly | 12/20/22 | 3,330,000 | 80,380 | 68,370 | 12,010 | Investment | ||||||||||||||||||||||||||||||||
|
| |||||||||||||||||||||||||||||||||||||||
| Grade | ||||||||||||||||||||||||||||||||||||||||
Total Centrally Cleared Swap Contracts |
| $ | (11,986 | ) | $ | (8,810 | ) | $ (3,176 | ) | |||||||||||||||||||||||||||||||
|
| |||||||||||||||||||||||||||||||||||||||
| OTC Swap Contracts | ||||||||||||||||||||||||||||||||||||||||
| Contracts to Buy Protectionc | ||||||||||||||||||||||||||||||||||||||||
| Single Name | ||||||||||||||||||||||||||||||||||||||||
The AES Corp | (5.00)% | Quarterly | JPHQ | 6/20/21 | 30,000 | $ | (4,452 | ) | $ | (2,428 | ) | $ | (2,024 | ) | ||||||||||||||||||||||||||
The AES Corp | (5.00)% | Quarterly | JPHQ | 6/20/22 | 35,000 | (5,679 | ) | (4,380 | ) | (1,299 | ) | |||||||||||||||||||||||||||||
Ally Financial Inc. | (5.00)% | Quarterly | CITI | 12/20/22 | 150,000 | (29,491 | ) | (28,124 | ) | (1,367 | ) | |||||||||||||||||||||||||||||
Ally Financial Inc. | (5.00)% | Quarterly | JPHQ | 12/20/22 | 250,000 | (49,152 | ) | (47,230 | ) | (1,922 | ) | |||||||||||||||||||||||||||||
Avon Products Inc. | (5.00)% | Quarterly | JPHQ | 3/20/19 | 50,000 | (1,300 | ) | (2,464 | ) | 1,164 | ||||||||||||||||||||||||||||||
Best Buy Co. Inc. | (5.00)% | Quarterly | BZWS | 6/20/22 | 10,000 | (1,795 | ) | (1,590 | ) | (205 | ) | |||||||||||||||||||||||||||||
Best Buy Co. Inc. | (5.00)% | Quarterly | CITI | 6/20/22 | 420,000 | (75,383 | ) | (71,063 | ) | (4,320 | ) | |||||||||||||||||||||||||||||
Best Buy Co. Inc. | (5.00)% | Quarterly | JPHQ | 6/20/22 | 10,000 | (1,795 | ) | (1,641 | ) | (154 | ) | |||||||||||||||||||||||||||||
Bombardier Inc. | (5.00)% | Quarterly | BZWS | 6/20/22 | 30,000 | (2,243 | ) | (2,204 | ) | (39 | ) | |||||||||||||||||||||||||||||
Boyd Gaming Corp. | (5.00)% | Quarterly | BZWS | 6/20/22 | 525,000 | (95,255 | ) | (91,772 | ) | (3,483 | ) | |||||||||||||||||||||||||||||
CalAtlantic Group Inc. | (5.00)% | Quarterly | BZWS | 6/20/18 | 250,000 | (9,310 | ) | (6,351 | ) | (2,959 | ) | |||||||||||||||||||||||||||||
The Gap Inc. | (1.00)% | Quarterly | CITI | 6/20/22 | 20,000 | 360 | 1,185 | (825 | ) | |||||||||||||||||||||||||||||||
The Gap Inc. | (1.00)% | Quarterly | JPHQ | 6/20/22 | 175,000 | 3,156 | 4,220 | (1,064 | ) | |||||||||||||||||||||||||||||||
KB Home | (5.00)% | Quarterly | JPHQ | 3/20/20 | 100,000 | (11,491 | ) | (8,490 | ) | (3,001 | ) | |||||||||||||||||||||||||||||
Kohl’s Corp. | (1.00)% | Quarterly | BZWS | 6/20/22 | 20,000 | 683 | 1,096 | (413 | ) | |||||||||||||||||||||||||||||||
| franklintempleton.com | Semiannual Report | 25 | ||||
F R A N K L I N S T R A T E G I C S E R I E S
S T A T E M E N T O F I N V E S T M E N T S ( U N A U D I T E D )
Franklin Flexible Alpha Bond Fund (continued)
Credit Default Swap Contracts (continued)
| Description | Periodic Payment Rate Received (Paid) | Payment Frequency | Counter- party | Maturity Date | Notional Amounta | Value | Unamortized Upfront | Unrealized Appreciation (Depreciation) | Ratingb | |||||||||||||||||||||||||||||||
OTC Swap Contracts (continued) | ||||||||||||||||||||||||||||||||||||||||
Contracts to Buy Protectionc (continued) |
| |||||||||||||||||||||||||||||||||||||||
Single Name (continued) | ||||||||||||||||||||||||||||||||||||||||
Kohl’s Corp. | (1.00)% | Quarterly | JPHQ | 6/20/22 | 175,000 | $ | 5,975 | $ | 4,797 | $ | 1,178 | |||||||||||||||||||||||||||||
L Brands Inc. | (1.00)% | Quarterly | CITI | 6/20/22 | 195,000 | 7,156 | 10,617 | (3,461 | ) | |||||||||||||||||||||||||||||||
Macy’s Retail Holdings Inc. | (1.00)% | Quarterly | BZWS | 6/20/22 | 20,000 | 1,486 | 1,394 | 92 | ||||||||||||||||||||||||||||||||
Macy’s Retail Holdings Inc. | (1.00)% | Quarterly | CITI | 6/20/22 | 175,000 | 13,004 | 10,176 | 2,828 | ||||||||||||||||||||||||||||||||
Nabors Industries Inc. | (1.00)% | Quarterly | JPHQ | 6/20/20 | 25,000 | 455 | 619 | (164 | ) | |||||||||||||||||||||||||||||||
Olin Corp. | (1.00)% | Quarterly | GSCO | 6/20/21 | 25,000 | (415 | ) | 1,465 | (1,880 | ) | ||||||||||||||||||||||||||||||
PHH Corp. | (5.00)% | Quarterly | BZWS | 9/20/19 | 200,000 | (18,797 | ) | (1,693 | ) | (17,104 | ) | |||||||||||||||||||||||||||||
Sanmina Corp. | (5.00)% | Quarterly | BZWS | 6/20/19 | 100,000 | (8,495 | ) | (7,037 | ) | (1,458 | ) | |||||||||||||||||||||||||||||
Springleaf Finance Corp. | (5.00)% | Quarterly | GSCO | 6/20/20 | 60,000 | (6,308 | ) | (1,910 | ) | (4,398 | ) | |||||||||||||||||||||||||||||
Target Corp. | (1.00)% | Quarterly | CITI | 6/20/22 | 40,000 | (1,048 | ) | (605 | ) | (443 | ) | |||||||||||||||||||||||||||||
Target Corp. | (1.00)% | Quarterly | JPHQ | 6/20/22 | 400,000 | (10,472 | ) | (7,922 | ) | (2,550 | ) | |||||||||||||||||||||||||||||
Tenet Healthcare Corp. | (5.00)% | Quarterly | BZWS | 3/20/19 | 90,000 | (4,766 | ) | (2,817 | ) | (1,949 | ) | |||||||||||||||||||||||||||||
Universal Health Services Inc. | (5.00)% | Quarterly | BZWS | 9/20/19 | 50,000 | (4,721 | ) | (3,916 | ) | (805 | ) | |||||||||||||||||||||||||||||
| Contracts to Sell Protectionc,d | ||||||||||||||||||||||||||||||||||||||||
| Single Name | ||||||||||||||||||||||||||||||||||||||||
American Tower Corp. | 1.00% | Quarterly | GSCO | 3/20/21 | 100,000 | (844 | ) | (1,268 | ) | 424 | BBB- | |||||||||||||||||||||||||||||
Anadarko Petroleum Corp. | 1.00% | Quarterly | BZWS | 6/20/24 | 200,000 | (6,165 | ) | (10,370 | ) | 4,205 | BBB | |||||||||||||||||||||||||||||
Anadarko Petroleum Corp. | 1.00% | Quarterly | JPHQ | 6/20/24 | 50,000 | (1,541 | ) | (3,059 | ) | 1,518 | BBB | |||||||||||||||||||||||||||||
Capital One Financial Corp. | 1.00% | Quarterly | JPHQ | 12/20/22 | 150,000 | 2,376 | 2,674 | (298 | ) | BBB | ||||||||||||||||||||||||||||||
Enterprise Products Operating LLC | 1.00% | Quarterly | GSCO | 3/20/23 | 50,000 | 489 | (676 | ) | 1,165 | BBB+ | ||||||||||||||||||||||||||||||
Goldman Sachs Group Inc. | 1.00% | Quarterly | BZWS | 12/20/22 | 250,000 | 5,088 | 4,847 | 241 | BBB+ | |||||||||||||||||||||||||||||||
Goldman Sachs Group Inc. | 1.00% | Quarterly | JPHQ | 12/20/22 | 150,000 | 3,053 | 2,877 | 176 | BBB+ | |||||||||||||||||||||||||||||||
Government of Brazil | 1.00% | Quarterly | CITI | 12/20/22 | 240,000 | (7,678 | ) | (11,696 | ) | 4,018 | BB | |||||||||||||||||||||||||||||
Government of Indonesia | 1.00% | Quarterly | CITI | 12/20/22 | 240,000 | 994 | (783 | ) | 1,777 | BBB- | ||||||||||||||||||||||||||||||
Government of Malaysia | 1.00% | Quarterly | CITI | 12/20/22 | 275,000 | 5,236 | 3,286 | 1,950 | NR | |||||||||||||||||||||||||||||||
Government of Mexico | 1.00% | Quarterly | CITI | 12/20/22 | 250,000 | (488 | ) | (1,637 | ) | 1,149 | BBB+ | |||||||||||||||||||||||||||||
Morgan Stanley | 1.00% | Quarterly | BZWS | 12/20/22 | 250,000 | 5,193 | 5,434 | (241 | ) | BBB+ | ||||||||||||||||||||||||||||||
Nabors Industries Inc. | 1.00% | Quarterly | JPHQ | 6/20/22 | 25,000 | (2,778 | ) | (3,065 | ) | 287 | BB | |||||||||||||||||||||||||||||
Simon Property Group LP | 1.00% | Quarterly | CITI | 6/20/22 | 780,000 | 13,488 | 11,919 | 1,569 | A | |||||||||||||||||||||||||||||||
Simon Property Group LP | 1.00% | Quarterly | JPHQ | 6/20/22 | 50,000 | 865 | 458 | 407 | A | |||||||||||||||||||||||||||||||
26 |
Semiannual Report |
franklintempleton.com |
F R A N K L I N S T R A T E G I C S E R I E S
S T A T E M E N T O F I N V E S T M E N T S ( U N A U D I T E D )
Franklin Flexible Alpha Bond Fund (continued)
Credit Default Swap Contracts (continued)
| Description | Periodic Payment Rate Received (Paid) | Payment Frequency | Counter- party | Maturity Date | Notional Amounta | Value | Unamortized Upfront Payments (Receipts) | Unrealized Appreciation (Depreciation) | Ratingb | |||||||||||||||||||||||||||||
OTC Swap Contracts (continued) |
| |||||||||||||||||||||||||||||||||||||
Contracts to Sell Protectionc,d (continued) |
| |||||||||||||||||||||||||||||||||||||
Single Name (continued) |
| |||||||||||||||||||||||||||||||||||||
Sprint Communications Inc. | 5.00% | Quarterly | JPHQ | 9/20/20 | 12,000 | $ | 1,326 | $ | (1 | ) | $ | 1,327 | B | |||||||||||||||||||||||||
| Traded Index | ||||||||||||||||||||||||||||||||||||||
eCitibank Bespoke Hong Kong Index, Mezzanine Tranche 3-5% | 1.00% | Quarterly | CITI | 12/20/18 | 30,000 | 30 | (730 | ) | 760 | Non- | ||||||||||||||||||||||||||||
| | Investment Grade | | ||||||||||||||||||||||||||||||||||||
eCitibank Bespoke Index, Mezzanine Tranche 6-10% | 0.63% | Quarterly | CITI | 12/20/18 | 1,000,000 | 345 | - | 345 | Non- | |||||||||||||||||||||||||||||
| | Investment Grade | | ||||||||||||||||||||||||||||||||||||
eCitibank Bespoke Lisbon Index, Equity Tranche 0-3% | 0.00% | Quarterly | CITI | 6/20/19 | 10,000 | (1,182 | ) | (1,935 | ) | 753 | Non- | |||||||||||||||||||||||||||
| | Investment Grade | | ||||||||||||||||||||||||||||||||||||
eCitibank Bespoke Verona Index, Equity Tranche 0-3% | 0.00% | Quarterly | CITI | 12/20/19 | 15,000 | (2,751 | ) | (3,221 | ) | 470 | Non- | |||||||||||||||||||||||||||
| | Investment Grade | | ||||||||||||||||||||||||||||||||||||
eCitibank Bespoke Verona Index, Mezzanine Tranche 7-15% | 0.40% | Quarterly | CITI | 12/20/19 | 280,000 | 254 | - | 254 | Non- | |||||||||||||||||||||||||||||
|
| |||||||||||||||||||||||||||||||||||||
| | Investment Grade | | ||||||||||||||||||||||||||||||||||||
Total OTC Swap Contracts |
| $ | (294,783 | ) | $ | (265,014 | ) | $ | (29,769) | |||||||||||||||||||||||||||||
|
| |||||||||||||||||||||||||||||||||||||
Total Credit Default Swap Contracts |
| $ | (306,769 | ) | $ | (273,824 | ) | $ | (32,945) | |||||||||||||||||||||||||||||
|
| |||||||||||||||||||||||||||||||||||||
aIn U.S. dollars unless otherwise indicated. For contracts to sell protection, the notional amount is equal to the maximum potential amount of the future payments and no recourse provisions have been entered into in association with the contracts.
bBased on Standard and Poor’s (S&P) Rating for single name swaps and internal ratings for index swaps. Internal ratings based on mapping into equivalent ratings from external vendors.
cPerformance triggers for settlement of contract include default, bankruptcy or restructuring for single name swaps, and failure to pay or bankruptcy of the underlying securities for traded index swaps.
dThe Fund enters contracts to sell protection to create a long credit position.
eRepresents a custom index comprised of a basket of underlying issuers.
franklintempleton.com |
Semiannual Report |
|
27 |
|
F R A N K L I N S T R A T E G I C S E R I E S
S T A T E M E N T O F I N V E S T M E N T S ( U N A U D I T E D )
Franklin Flexible Alpha Bond Fund (continued)
At October 31, 2017, the Fund had the following cross-currency swap contracts outstanding. See Note 1(d).
Cross-Currency Swap Contracts
| Description | Payment Frequency | Counter- party | Maturity Date | Notional Amount | Value/ Unrealized Appreciation (Depreciation) | |||||||||||||||||||
| OTC Swap Contracts | ||||||||||||||||||||||||
Receive Floating 3-month USD LIBOR + 0.7275% | Quarterly | 1,185,000 | USD | |||||||||||||||||||||
Pay Fixed 0.10% | Annual | HSBK | 1/15/19 | 1,000,000 | EUR | $ 20,546 | ||||||||||||||||||
Receive Floating 3-month USD LIBOR + 1.1225% | Quarterly | 111,500 | USD | |||||||||||||||||||||
Pay Fixed 0.75% | Annual | HSBK | 4/01/22 | 100,000 | EUR | (5,191 | ) | |||||||||||||||||
Receive Floating 3-month USD LIBOR + 1.045% | Quarterly | 1,552,200 | USD | |||||||||||||||||||||
Pay Fixed 0.75% | Annual | HSBK | 5/31/22 | 1,300,000 | EUR | 38,410 | ||||||||||||||||||
Receive Floating 3-month USD LIBOR + 0.821% | Quarterly | 466,000 | USD | |||||||||||||||||||||
Pay Fixed 0.625% | Annual | BNDP | 6/08/23 | 400,000 | EUR | — | ||||||||||||||||||
Receive Floating 3-month USD LIBOR + 0.7825% | Quarterly | 957,600 | USD | |||||||||||||||||||||
Pay Fixed 0.625% | Annual | HSBK | 6/08/23 | 800,000 | EUR | 25,546 | ||||||||||||||||||
Receive Floating 3-month USD LIBOR + 1.395% | Quarterly | 358,500 | USD | |||||||||||||||||||||
Pay Fixed 1.50% | Annual | HSBK | 11/26/25 | 300,000 | EUR | 8,919 | ||||||||||||||||||
Receive Floating 3-month USD LIBOR + 1.415% | Quarterly | 598,500 | USD | |||||||||||||||||||||
Pay Fixed 1.50% | Annual | HSBK | 11/26/25 | 500,000 | EUR | 15,965 | ||||||||||||||||||
|
| |||||||||||||||||||||||
Total Cross Currency Swap Contracts | $104,195 | |||||||||||||||||||||||
|
| |||||||||||||||||||||||
At October 31, 2017, the Fund had the following inflation index swap contracts outstanding. See Note 1(d).
Inflation Index Swap Contracts
| Description | Payment Frequency | Maturity Date | Notional Amount | Value/ Unrealized Appreciaton (Depreciation) | ||||||||||||
| Centrally Cleared Swap Contracts | ||||||||||||||||
Receive variable change in USA-CPI-U | At maturity | |||||||||||||||
Pay Fixed 2.079% | At maturity | 9/18/24 | $2,500,000 | $1,771 | ||||||||||||
Receive variable change in USA-CPI-U | At maturity | |||||||||||||||
Pay Fixed 2.07% | At maturity | 9/26/24 | 800,000 | (69 | ) | |||||||||||
|
| |||||||||||||||
Total Inflation Index Swap Contracts | $1,702 | |||||||||||||||
|
| |||||||||||||||
At October 31, 2017, the Fund had the following total return swap contracts outstanding. See Note 1(d).
Total Return Swap Contracts
| Underlying Instruments | Financing Rate | Payment Frequency | Counterparty | Maturity Date | Notional Value | Value/ Unrealized Appreciation (Depreciation) | ||||||||||||||||||
| OTC Swap Contracts | ||||||||||||||||||||||||
| Longa | ||||||||||||||||||||||||
iBoxx USD Liquid High Yield Index | 3-month USD LIBOR | Quarterly | CITI | 3/20/18 | $30,000 | $ 777 | ||||||||||||||||||
iBoxx USD Liquid High Yield Index | 3-month USD LIBOR | Quarterly | CITI | 6/20/18 | 30,000 | 976 | ||||||||||||||||||
28 | Semiannual Report | franklintempleton.com |
F R A N K L I N S T R A T E G I C S E R I E S
S T A T E M E N T O F I N V E S T M E N T S ( U N A U D I T E D )
Franklin Flexible Alpha Bond Fund (continued)
Total Return Swap Contracts (continued)
| Underlying Instruments | Financing Rate | Payment Frequency | Counterparty | Maturity Date | Notional Value | Value/ Unrealized Appreciation (Depreciation) | ||||||||||||||||||
OTC Swap Contracts (continued) | ||||||||||||||||||||||||
Longa (continued) | ||||||||||||||||||||||||
Markit iBoxx USD Liquid Leveraged Loan Index | 3-month USD LIBOR | Quarterly | CITI | 3/20/18 | $160,000 | $ (317 | ) | |||||||||||||||||
|
| |||||||||||||||||||||||
Total Total Return Swap Contracts | $1,436 | |||||||||||||||||||||||
|
| |||||||||||||||||||||||
aThe Fund receives the total return on the underlying instrument and pays a variable financing rate.
See Note 8 regarding other derivative information.
See Abbreviations on page 47.
| franklintempleton.com | The accompanying notes are an integral part of these financial statements. | Semiannual Report | 29 | ||||
F R A N K L I N S T R A T E G I C S E R I E S
Statement of Assets and Liabilities
October 31, 2017 (unaudited)
Franklin Flexible Alpha Bond Fund
Assets: | ||||
Investments in securities: | ||||
Cost - Unaffiliated issuers | $ 88,337,488 | |||
Cost - Non-controlled affiliates (Note 3f) | 37,468,384 | |||
|
| |||
Value - Unaffiliated issuers |
|
$ 88,260,367 |
| |
Value - Non-controlled affiliates (Note 3f) | 37,468,384 | |||
Cash | 50 | |||
Foreign currency, at value (cost $61,757) | 61,736 | |||
Receivables: | ||||
Investment securities sold | 2,810,636 | |||
Capital shares sold | 27 | |||
Interest | 426,019 | |||
Variation margin on futures contracts | 26,845 | |||
Initial margin on futures contracts | 302,751 | |||
Variation margin on centrally cleared swap contracts | 1,987 | |||
Initial margin on centrally cleared swap contracts. | 208,068 | |||
OTC swap contracts (upfront payments $68,977) | 67,064 | |||
Unrealized appreciation on OTC forward exchange contracts | 86,621 | |||
Unrealized appreciation on OTC swap contracts | 139,196 | |||
Other assets | 34,345 | |||
|
| |||
Total assets |
|
129,894,096 |
| |
|
| |||
Liabilities: | ||||
Payables: | ||||
Investment securities purchased | 15,416,552 | |||
Capital shares redeemed | 144 | |||
Management fees | 32,606 | |||
Distribution fees | 519 | |||
Transfer agent fees | 1,908 | |||
Distributions to shareholders | 119,624 | |||
OTC swap contracts (upfront receipts $379,371) | 332,078 | |||
Options written, at value (premiums received $10,860) | 3,350 | |||
TBA sale commitments, at value (proceeds $2,630,754) | 2,641,478 | |||
Unrealized depreciation on OTC forward exchange contracts | 46,244 | |||
Unrealized depreciation on OTC swap contracts | 63,334 | |||
Accrued expenses and other liabilities | 23,174 | |||
|
| |||
Total liabilities |
|
18,681,011 |
| |
|
| |||
Net assets, at value |
|
$111,213,085 |
| |
|
| |||
Net assets consist of: | ||||
Paid-in capital | $111,123,304 | |||
Distributions in excess of net investment income | (2,526 | ) | ||
Net unrealized appreciation (depreciation) | 349,803 | |||
Accumulated net realized gain (loss) | (257,496 | ) | ||
|
| |||
Net assets, at value |
|
$111,213,085 |
| |
|
|
30 | Semiannual Report | The accompanying notes are an integral part of these financial statements. | franklintempleton.com |
F R A N K L I N S T R A T E G I C S E R I E S
F I N A N C I A L S T A T E M E N T S
Statement of Assets and Liabilities (continued)
October 31, 2017 (unaudited)
Franklin Flexible Alpha Bond Fund
| Class A: | ||||
Net assets, at value | $ | 10,469,806 | ||
|
| |||
Shares outstanding | 1,062,913 | |||
|
| |||
Net asset value per sharea | $9.85 | |||
|
| |||
Maximum offering price per share (net asset value per share ÷ 95.75%) | $10.29 | |||
|
| |||
| Class C: | ||||
Net assets, at value | $ | 233,518 | ||
|
| |||
Shares outstanding | 23,857 | |||
|
| |||
Net asset value and maximum offering price per sharea | $9.79 | |||
|
| |||
| Class R: | ||||
Net assets, at value | $ | 60,231 | ||
|
| |||
Shares outstanding | 6,121 | |||
|
| |||
Net asset value and maximum offering price per share | $9.84 | |||
|
| |||
| Class R6: | ||||
Net assets, at value | $ | 100,212,563 | ||
|
| |||
Shares outstanding | 10,173,940 | |||
|
| |||
Net asset value and maximum offering price per share | $9.85 | |||
|
| |||
| Advisor Class: | ||||
Net assets, at value | $ | 236,967 | ||
|
| |||
Shares outstanding | 24,075 | |||
|
| |||
Net asset value and maximum offering price per share | $9.84 | |||
|
|
aRedemption price is equal to net asset value less contingent deferred sales charges, if applicable.
| franklintempleton.com | The accompanying notes are an integral part of these financial statements. | Semiannual Report | 31 | ||||
F R A N K L I N S T R A T E G I C S E R I E S
F I N A N C I A L S T A T E M E N T S
Statement of Operations
for the six months ended October 31, 2017 (unaudited)
Franklin Flexible Alpha Bond Fund
Investment income: | ||||
Dividends: | ||||
Unaffiliated issuers | $ | 21,986 | ||
Non-controlled affiliates (Note 3f) | 43,511 | |||
Interest: | ||||
Unaffiliated issuers | 330,486 | |||
|
| |||
Total investment income | 395,983 | |||
|
| |||
Expenses: | ||||
Management fees (Note 3a) | 101,380 | |||
Distribution fees: (Note 3c) | ||||
Class A | 2,075 | |||
Class C | 669 | |||
Class R | 193 | |||
Transfer agent fees: (Note 3e) | ||||
Class A | 2,825 | |||
Class C | 55 | |||
Class R | 16 | |||
Class R6 | 154 | |||
Advisor Class | 64 | |||
Custodian fees (Note 4) | 773 | |||
Reports to shareholders | 5,522 | |||
Registration and filing fees | 38,098 | |||
Professional fees | 41,444 | |||
Pricing fees | 20,330 | |||
Other | 9,931 | |||
|
| |||
Total expenses | 223,529 | |||
Expense reductions (Note 4) | (23 | ) | ||
Expenses waived/paid by affiliates (Note 3f and 3g) | (68,863 | ) | ||
|
| |||
Net expenses | 154,643 | |||
|
| |||
Net investment income | 241,340 | |||
|
| |||
Realized and unrealized gains (losses): | ||||
Net realized gain (loss) from: | ||||
Investments: | ||||
Unaffiliated issuers | 15,356 | |||
Written options | 3,477 | |||
Foreign currency transactions | 2,332 | |||
Forward exchange contracts | (70,339 | ) | ||
Futures contracts | (42,532 | ) | ||
TBA sale commitments | (3,492 | ) | ||
Swap contracts | (18,237 | ) | ||
|
| |||
Net realized gain (loss) | (113,435 | ) | ||
|
| |||
Net change in unrealized appreciation (depreciation) on: | ||||
Investments: | ||||
Unaffiliated issuers | (193,197 | ) | ||
Translation of other assets and liabilities denominated in foreign currencies | (1,673 | ) | ||
Forward exchange contracts | 36,939 | |||
Written options | 6,553 | |||
Futures contracts | 328,793 | |||
TBA sale commitments | (10,724 | ) | ||
Swap contracts | 105,499 | |||
|
| |||
Net change in unrealized appreciation (depreciation) | 272,190 | |||
|
| |||
Net realized and unrealized gain (loss) | 158,755 | |||
|
| |||
Net increase (decrease) in net assets resulting from operations | $ | 400,095 | ||
|
|
32 | Semiannual Report | The accompanying notes are an integral part of these financial statements. | franklintempleton.com |
F R A N K L I N S T R A T E G I C S E R I E S
F I N A N C I A L S T A T E M E N T S
Statements of Changes in Net Assets
Franklin Flexible Alpha Bond Fund
| Six Months Ended October 31, 2017 (unaudited) | Year Ended April 30, 2017 | |||||||
Increase (decrease) in net assets: | ||||||||
Operations: | ||||||||
Net investment income | $ 241,340 | $ | 198,634 | |||||
Net realized gain (loss) | (113,435 | ) | (6,779 | ) | ||||
Net change in unrealized appreciation (depreciation) | 272,190 | 25,805 | ||||||
|
| |||||||
Net increase (decrease) in net assets resulting from operations | 400,095 | 217,660 | ||||||
|
| |||||||
Distributions to shareholders from: | ||||||||
Net investment income: | ||||||||
Class A | (71,102 | ) | (228,517 | ) | ||||
Class C | (938 | ) | (3,853 | ) | ||||
Class R | (248 | ) | (1,041 | ) | ||||
Class R6 | (136,457 | ) | (220 | ) | ||||
Advisor Class | (1,639 | ) | (6,710 | ) | ||||
|
| |||||||
Total distributions to shareholders | (210,384 | ) | (240,341 | ) | ||||
|
| |||||||
Capital share transactions: (Note 2) | ||||||||
Class A | 39,255 | 263,641 | ||||||
Class C | (11,346 | ) | 42,152 | |||||
Class R | 207 | 50,835 | ||||||
Class R6 | 100,000,000 | — | ||||||
Advisor Class | 5,089 | (111,111 | ) | |||||
|
| |||||||
Total capital share transactions | 100,033,205 | 245,517 | ||||||
|
| |||||||
Net increase (decrease) in net assets | 100,222,916 | 222,836 | ||||||
Net assets: | ||||||||
Beginning of period | 10,990,169 | 10,767,333 | ||||||
|
| |||||||
End of period | $111,213,085 | $ | 10,990,169 | |||||
|
| |||||||
Distributions in excess of net investment income included in net assets: | ||||||||
End of period | $ (2,526 | ) | $ | (33,482 | ) | |||
|
| |||||||
| franklintempleton.com | The accompanying notes are an integral part of these financial statements. | Semiannual Report | 33 | ||||
F R A N K L I N S T R A T E G I C S E R I E S
Notes to Financial Statements (unaudited)
Franklin Flexible Alpha Bond Fund
1. Organization and Significant Accounting Policies
Franklin Strategic Series (Trust) is registered under the Investment Company Act of 1940 (1940 Act) as an open-end management investment company, consisting of eight separate funds and applies the specialized accounting and reporting guidance in U.S. Generally Accepted Accounting Principles (U.S. GAAP). Franklin Flexible Alpha Bond Fund (Fund) is included in this report. The Fund offers five classes of shares: Class A, Class C, Class R, Class R6, and Advisor Class. Each class of shares may differ by its initial sales load, contingent deferred sales charges, voting rights on matters affecting a single class, its exchange privilege and fees due to differing arrangements for distribution and transfer agent fees.
The following summarizes the Fund’s significant accounting policies.
a. Financial Instrument Valuation
The Fund’s investments in financial instruments are carried at fair value daily. Fair value is the price that would be received to sell an asset or paid to transfer a liability in an orderly transaction between market participants on the measurement date. The Fund calculates the net asset value (NAV) per share as of 4 p.m. Eastern time each day the New York Stock Exchange (NYSE) is open for trading. Under compliance policies and procedures approved by the Trust’s Board of Trustees (the Board), the Fund’s administrator has responsibility for oversight of valuation, including leading the cross-functional Valuation Committee (VC). The VC provides administration and oversight of the Fund’s valuation policies and procedures, which are approved annually by the Board. Among other things, these procedures allow the Fund to utilize independent pricing services, quotations from securities and financial instrument dealers, and other market sources to determine fair value.
Equity securities, exchange traded funds, and derivative financial instruments listed on an exchange or on the NASDAQ National Market System are valued at the last quoted sale price or the official closing price of the day, respectively. Over-the-counter (OTC) securities are valued within the range of the most recent quoted bid and ask prices. Securities that trade in multiple markets or on multiple exchanges are valued according to the broadest and most representative market. Certain equity securities are valued based upon fundamental characteristics or relationships to similar securities.
Debt securities generally trade in the OTC market rather than on a securities exchange. The Fund’s pricing services use multiple valuation techniques to determine fair value. In instances where sufficient market activity exists, the pricing services may utilize a market-based approach through which quotes from market makers are used to determine fair value. In instances where sufficient market activity may not exist or is limited, the pricing services also utilize proprietary valuation models which may consider market characteristics such as benchmark yield curves, credit spreads, estimated default rates, anticipated market interest rate volatility, coupon rates, anticipated timing of principal repayments, underlying collateral, and other unique security features in order to estimate the relevant cash flows, which are then discounted to calculate the fair value. Securities denominated in a foreign currency are converted into their U.S. dollar equivalent at the foreign exchange rate in effect at 4 p.m. Eastern time on the date that the values of the foreign debt securities are determined.
Investments in open-end mutual funds are valued at the closing NAV.
Certain derivative financial instruments are centrally cleared or trade in the OTC market. The Fund’s pricing services use various techniques including industry standard option pricing models and proprietary discounted cash flow models to determine the fair value of those instruments. The Fund’s net benefit or obligation under the derivative contract, as measured by the fair value of the contract, is included in net assets.
The Fund has procedures to determine the fair value of financial instruments for which market prices are not reliable or readily available. Under these procedures, the VC convenes on a regular basis to review such financial instruments and considers a number of factors, including significant unobservable valuation inputs, when arriving at fair value. The VC primarily employs a market-based approach which may use related or comparable assets or liabilities, recent transactions, market multiples, book values, and other relevant information for the investment to determine the fair value of the investment. An income-based valuation approach may also be used in which the anticipated future cash flows of the investment are discounted to calculate fair value. Discounts may also be applied due to the nature or duration of any restrictions on the disposition of the investments. Due to the inherent uncertainty of valuations of such investments, the fair values may differ significantly from the values that would have been used had an active market existed. The VC employs various methods for calibrating these
34 | Semiannual Report | franklintempleton.com |
F R A N K L I N S T R A T E G I C S E R I E S
N O T E S T O F I N A N C I A L S T A T E M E N T S ( U N A U D I T E D )
Franklin Flexible Alpha Bond Fund (continued)
valuation approaches including a regular review of key inputs and assumptions, transactional back-testing or disposition analysis, and reviews of any related market activity.
Trading in securities on foreign securities stock exchanges and OTC markets may be completed before 4 p.m. Eastern time. In addition, trading in certain foreign markets may not take place on every Fund’s business day. Occasionally, events occur between the time at which trading in a foreign security is completed and 4 p.m. Eastern time that might call into question the reliability of the value of a portfolio security held by the Fund. As a result, differences may arise between the value of the Fund’s portfolio securities as determined at the foreign market close and the latest indications of value at 4 p.m. Eastern time. In order to minimize the potential for these differences, the VC monitors price movements following the close of trading in foreign stock markets through a series of country specific market proxies (such as baskets of American Depositary Receipts, futures contracts and exchange traded funds). These price movements are measured against established trigger thresholds for each specific market proxy to assist in determining if an event has occurred that may call into question the reliability of the values of the foreign securities held by the Fund. If such an event occurs, the securities may be valued using fair value procedures, which may include the use of independent pricing services.
When the last day of the reporting period is a non-business day, certain foreign markets may be open on those days that the Fund’s NAV is not calculated, which could result in differences between the value of the Fund’s portfolio securities on the last business day and the last calendar day of the reporting period. Any significant security valuation changes due to an open foreign market are adjusted and reflected by the Fund for financial reporting purposes.
b. Foreign Currency Translation
Portfolio securities and other assets and liabilities denominated in foreign currencies are translated into U.S. dollars based on the exchange rate of such currencies against U.S. dollars on the date of valuation. The Fund may enter into foreign currency exchange contracts to facilitate transactions denominated in a foreign currency. Purchases and sales of securities, income and expense items denominated in foreign currencies are translated into U.S. dollars at the exchange rate in effect on the transaction date. Portfolio securities and assets and liabilities denominated in foreign currencies contain risks that those currencies will decline in
value relative to the U.S. dollar. Occasionally, events may impact the availability or reliability of foreign exchange rates used to convert the U.S. dollar equivalent value. If such an event occurs, the foreign exchange rate will be valued at fair value using procedures established and approved by the Board.
The Fund does not separately report the effect of changes in foreign exchange rates from changes in market prices on securities held. Such changes are included in net realized and unrealized gain or loss from investments in the Statement of Operations.
Realized foreign exchange gains or losses arise from sales of foreign currencies, currency gains or losses realized between the trade and settlement dates on securities transactions and the difference between the recorded amounts of dividends, interest, and foreign withholding taxes and the U.S. dollar equivalent of the amounts actually received or paid. Net unrealized foreign exchange gains and losses arise from changes in foreign exchange rates on foreign denominated assets and liabilities other than investments in securities held at the end of the reporting period.
c. Securities Purchased on a When-Issued and TBA Basis
The Fund purchases securities on a when-issued and TBA basis, with payment and delivery scheduled for a future date. These transactions are subject to market fluctuations and are subject to the risk that the value at delivery may be more or less than the trade date purchase price. Although the Fund will generally purchase these securities with the intention of holding the securities, it may sell the securities before the settlement date. Sufficient assets have been segregated for these securities.
d. Derivative Financial Instruments
The Fund invested in derivative financial instruments in order to manage risk or gain exposure to various other investments or markets. Derivatives are financial contracts based on an underlying or notional amount, require no initial investment or an initial net investment that is smaller than would normally be required to have a similar response to changes in market factors, and require or permit net settlement. Derivatives contain various risks including the potential inability of the counterparty to fulfill their obligations under the terms of the contract, the potential for an illiquid secondary market, and/or the potential for market movements which expose the Fund to gains or losses in excess of the amounts shown in the Statement of Assets and
| franklintempleton.com | Semiannual Report | 35 | ||||
F R A N K L I N S T R A T E G I C S E R I E S
N O T E S T O F I N A N C I A L S T A T E M E N T S ( U N A U D I T E D )
Franklin Flexible Alpha Bond Fund (continued)
1. Organization and Significant Accounting
Policies (continued)
d. Derivative Financial Instruments (continued)
Liabilities. Realized gain and loss and unrealized appreciation and depreciation on these contracts for the period are included in the Statement of Operations.
Derivative counterparty credit risk is managed through a formal evaluation of the creditworthiness of all potential counter-parties. The Fund attempts to reduce its exposure to counterparty credit risk on OTC derivatives, whenever possible, by entering into International Swaps and Derivatives Association (ISDA) master agreements with certain counterparties. These agreements contain various provisions, including but not limited to collateral requirements, events of default, or early termination. Termination events applicable to the counterparty include certain deteriorations in the credit quality of the counterparty. Termination events applicable to the Fund include failure of the Fund to maintain certain net asset levels and/or limit the decline in net assets over various periods of time. In the event of default or early termination, the ISDA master agreement gives the non-defaulting party the right to net and close-out all transactions traded, whether or not arising under the ISDA agreement, to one net amount payable by one counterparty to the other. However, absent an event of default or early termination, OTC derivative assets and liabilities are presented gross and not offset in the Statement of Assets and Liabilities. Early termination by the counterparty may result in an immediate payment by the Fund of any net liability owed to that counterparty under the ISDA agreement.
Collateral requirements differ by type of derivative. Collateral or initial margin requirements are set by the broker or exchange clearing house for exchange traded and centrally cleared derivatives. Initial margin deposited is held at the exchange and can be in the form of cash and/or securities. For OTC derivatives traded under an ISDA master agreement, posting of collateral is required by either the Fund or the applicable counterparty if the total net exposure of all OTC derivatives with the applicable counterparty exceeds the minimum transfer amount, which typically ranges from $100,000 to $250,000, and can vary depending on the counterparty and the type of the agreement. Generally, collateral is determined at the close of Fund business each day and any additional collateral required due to changes in derivative values may be delivered by the Fund or the counterparty the next business day, or within a few
business days. Collateral pledged and/or received by the Fund for OTC derivatives, if any, is held in segregated accounts with the Fund’s custodian/counterparty broker and can be in the form of cash and/or securities. Unrestricted cash may be invested according to the Fund’s investment objectives. To the extent that the amounts due to the Fund from its counterparties are not subject to collateralization or are not fully collateralized, the Fund bears the risk of loss from counterparty non-performance.
The Fund entered into exchange traded futures contracts primarily to manage and/or gain exposure to interest rate risk. A futures contract is an agreement between the Fund and a counterparty to buy or sell an asset at a specified price on a future date. Required initial margins are pledged by the Fund, and the daily change in fair value is accounted for as a variation margin payable or receivable Statement of Assets and Liabilities.
The Fund entered into OTC forward exchange contracts primarily to manage and/or gain exposure to certain foreign currencies. A forward exchange contract is an agreement between the Fund and a counterparty to buy or sell a foreign currency at a specific exchange rate on a future date.
The Fund entered into credit default swap contracts primarily to manage and/or gain exposure to credit risk. A credit default swap is an agreement between the Fund and a counterparty whereby the buyer of the contract receives credit protection and the seller of the contract guarantees the credit worthiness of a referenced debt obligation. These agreements may be privately negotiated in the over-the-counter market (OTC credit default swaps) or may be executed in a multilateral trade facility platform, such as a registered exchange (centrally cleared credit default swaps). The underlying referenced debt obligation may be a single issuer of corporate or sovereign debt, a credit index, a basket of issuers or indices, or a tranche of a credit index or basket of issuers or indices. In the event of a default of the underlying referenced debt obligation, the buyer is entitled to receive the notional amount of the credit default swap contract from the seller in exchange for the referenced debt obligation, a net settlement amount equal to the notional amount of the credit default swap less the recovery value of the referenced debt obligation, or other agreed upon amount. For centrally cleared credit default swaps, required initial margins are pledged by the Fund, and the daily change in fair value is accounted for as a variation margin payable or receivable in the Statement of Assets and Liabilities. Over the term of the contract, the buyer pays the seller a periodic stream of payments, provided that no
36 | Semiannual Report | franklintempleton.com |
F R A N K L I N S T R A T E G I C S E R I E S
N O T E S T O F I N A N C I A L S T A T E M E N T S ( U N A U D I T E D )
Franklin Flexible Alpha Bond Fund (continued)
event of default has occurred. Such periodic payments are accrued daily as an unrealized appreciation or depreciation until the payments are made, at which time they are realized. Upfront payments and receipts are reflected in the Statement of Assets and Liabilities and represent compensating factors between stated terms of the credit default swap agreement and prevailing market conditions (credit spreads and other relevant factors). These upfront payments and receipts are amortized over the term of the contract as a realized gain or loss in the Statement of Operations.
The Fund entered into OTC cross currency swap contracts primarily to manage and/or gain exposure to interest rate risk and certain foreign currencies. A cross currency swap is an agreement between the Fund and a counterparty to exchange cash flows (determined using either a fixed or floating rate) based on the notional amounts of two different currencies. The notional amounts are typically determined based on the spot exchange rates at the opening of the contract. Cross currency swaps may require the exchange of notional amounts at the opening and/or closing of the contract. Over the term of the contract, contractually required payments to be paid and to be received are accrued daily and recorded as unrealized depreciation and appreciation until the payments are made, at which time they are realized. Upfront payments and receipts are reflected in the Statement of Assets and Liabilities and represent compensating factors between stated terms of the cross currency swap contract and prevailing market conditions (interest rate spreads and other relevant factors). These upfront payments and receipts are amortized over the term of the contract as a realized gain or loss in the Statement of Operations.
The Fund entered into inflation index swap contracts primarily to manage and/or gain exposure to inflation risk. An inflation index swap is an agreement between the Fund and a counterparty to exchange cash flows whereby one party makes payments based on the percentage change in an index that serves as a measure of inflation and the other party makes a regular payment based on a compounded fixed rate, applied to a notional amount. These agreements may be privately negotiated in the over-the-counter market (OTC inflation index swap) or may be executed on a registered exchange (centrally cleared inflation index swap). For centrally cleared inflation index swaps, required initial margins are pledged by the Fund, and the daily change in fair value is accounted for as a variation margin payable or receivable. Over the term of the contract, contractually required payments to be paid and to be received
are accrued daily and recorded as unrealized depreciation and appreciation until the payments are made, at which time they are realized. Typically, an inflation index swap has payment obligations netted and exchanged upon maturity.
The Fund entered into OTC total return swap contracts primarily to manage and/or gain exposure to interest rate risk of an underlying instrument such as a stock, bond, index or basket of securities or indices. A total return swap is an agreement between the Fund and a counterparty to exchange a return linked to an underlying instrument for a floating or fixed rate payment, both based upon a notional amount. Over the term of the contract, contractually required payments to be paid or received are accrued daily and recorded as unrealized appreciation or depreciation until the payments are made, at which time they are recognized as realized gain or loss.
The Fund purchased or wrote exchange traded and/or OTC option contracts primarily to manage and/or gain exposure to interest rate and credit risk. An option is a contract entitling the holder to purchase or sell a specific amount of shares or units of an asset or notional amount of a swap (swaption), at a specified price. When an option is purchased or written, an amount equal to the premium paid or received is recorded as an asset or liability, respectively. Certain option contracts are marked-to-market daily and the daily change in fair value is accounted for as variation margin payable or receivable in the Statement of Assets and Liabilities. Upon exercise of an option, the acquisition cost or sales proceeds of the underlying investment is adjusted by any premium received or paid. Upon expiration of an option, any premium received or paid is recorded as a realized gain or loss. Upon closing an option other than through expiration or exercise, the difference between the premium received or paid and the cost to close the position is recorded as a realized gain or loss.
See Note 8 regarding other derivative information.
e. Mortgage Dollar Rolls
The Fund enters into mortgage dollar rolls, typically on a TBA basis. Mortgage dollar rolls are agreements between the Fund and a financial institution where the Fund sells (or buys) mortgage-backed securities for delivery on a specified date and simultaneously contracts to repurchase (or sell) substantially similar (same type, coupon, and maturity) securities at a future date and at a predetermined price. Gains or losses are realized on the initial sale, and the difference between the repurchase
| franklintempleton.com | Semiannual Report | 37 | ||||
F R A N K L I N S T R A T E G I C S E R I E S
N O T E S T O F I N A N C I A L S T A T E M E N T S ( U N A U D I T E D )
Franklin Flexible Alpha Bond Fund (continued)
1. Organization and Significant Accounting
Policies (continued)
e. Mortgage Dollar Rolls (continued)
price and the sale price is recorded as an unrealized gain or loss to the Fund upon entering into the mortgage dollar roll. In addition, the Fund may invest the cash proceeds that are received from the initial sale. During the period between the sale and repurchase, the Fund is not entitled to principal and interest paid on the mortgage backed securities. Transactions in mortgage dollar rolls are accounted for as purchases and sales and may result in an increase to the Fund’s portfolio turnover rate. The risks of mortgage dollar roll transactions include the potential inability of the counterparty to fulfill its obligations.
f. Income and Deferred Taxes
It is the Fund’s policy to qualify as a regulated investment company under the Internal Revenue Code. The Fund intends to distribute to shareholders substantially all of its taxable income and net realized gains to relieve it from federal income and excise taxes. As a result, no provision for U.S. federal income taxes is required.
The Fund may be subject to foreign taxation related to income received, capital gains on the sale of securities and certain foreign currency transactions in the foreign jurisdictions in which it invests. Foreign taxes, if any, are recorded based on the tax regulations and rates that exist in the foreign markets in which the Fund invests. When a capital gain tax is determined to apply, the Fund records an estimated deferred tax liability in an amount that would be payable if the securities were disposed of on the valuation date.
The Fund may recognize an income tax liability related to its uncertain tax positions under U.S. GAAP when the uncertain tax position has a less than 50% probability that it will be sustained upon examination by the tax authorities based on its technical merits. As of October 31, 2017, the Fund has determined that no tax liability is required in its financial statements related to uncertain tax positions for any open tax years (or expected to be taken in future tax years). Open tax years are those that remain subject to examination and are based on the statute of limitations in each jurisdiction in which the Fund invests.
g. Security Transactions, Investment Income, Expenses and Distributions
Security transactions are accounted for on trade date. Realized gains and losses on security transactions are determined on a specific identification basis. Interest income and estimated expenses are accrued daily. Amortization of premium and accretion of discount on debt securities are included in interest income. Paydown gains and losses are recorded as an adjustment to interest income. Dividend income is recorded on the ex-dividend date. Dividends from net investment income are normally declared daily; these dividends may be reinvested or paid monthly to shareholders. Distributions from realized capital gains and other distributions, if any, are recorded on the ex-dividend date. Distributable earnings are determined according to income tax regulations (tax basis) and may differ from earnings recorded in accordance with U.S. GAAP. These differences may be permanent or temporary. Permanent differences are reclassified among capital accounts to reflect their tax character. These reclassifications have no impact on net assets or the results of operations. Temporary differences are not reclassified, as they may reverse in subsequent periods.
Common expenses incurred by the Trust are allocated among the Funds based on the ratio of net assets of each Fund to the combined net assets of the Trust. Fund specific expenses are charged directly to the Fund that incurred the expense.
Net investment income, excluding class specific expenses, is allocated daily to each class of shares based upon the relative value of the settled shares of each class. Realized and unrealized gains and losses are allocated daily to each class of shares based upon the relative proportion of net assets of each class. Differences in per share distributions by class are generally due to differences in class specific expenses.
Inflation-indexed bonds are adjusted for inflation through periodic increases or decreases in the security’s interest accruals, face amount, or principal redemption value, by amounts corresponding to the rate of inflation as measured by an index. Any increase or decrease in the face amount or principal redemption value will be included as interest income in the Statement of Operations.
h. Accounting Estimates
The preparation of financial statements in accordance with U.S. GAAP requires management to make estimates and assumptions that affect the reported amounts of assets and
38 | Semiannual Report | franklintempleton.com |
F R A N K L I N S T R A T E G I C S E R I E S
N O T E S T O F I N A N C I A L S T A T E M E N T S ( U N A U D I T E D )
Franklin Flexible Alpha Bond Fund (continued)
liabilities at the date of the financial statements and the amounts of income and expenses during the reporting period. Actual results could differ from those estimates.
i. Guarantees and Indemnifications
Under the Trust’s organizational documents, its officers and trustees are indemnified by the Trust against certain liabilities arising out of the performance of their duties to the Trust.
Additionally, in the normal course of business, the Trust, on behalf of the Fund, enters into contracts with service providers that contain general indemnification clauses. The Trust’s maximum exposure under these arrangements is unknown as this would involve future claims that may be made against the Trust that have not yet occurred. Currently, the Trust expects the risk of loss to be remote.
2. Shares of Beneficial Interest
At October 31, 2017, there were an unlimited number of shares authorized (without par value). Transactions in the Fund’s shares were as follows:
Six Months Ended October 31, 2017 | Year Ended April 30, 2017 | |||||||||||||||
|
| |||||||||||||||
| Shares | Amount | Shares | Amount | |||||||||||||
| Class A Shares: | ||||||||||||||||
Shares sold | 9,507 | $ | 93,767 | 33,507 | $ | 331,682 | ||||||||||
Shares issued in reinvestment of distributions | 450 | 4,430 | 1,227 | 12,100 | ||||||||||||
Shares redeemed | (5,983 | ) | (58,942 | ) | (8,135 | ) | (80,141) | |||||||||
|
| |||||||||||||||
Net increase (decrease) | 3,974 | $ | 39,255 | 26,599 | $ | 263,641 | ||||||||||
|
| |||||||||||||||
Class C Shares: | ||||||||||||||||
Shares sold | 16,750 | $ | 164,181 | 20,061 | $ | 197,723 | ||||||||||
Shares issued in reinvestment of distributions | 93 | 915 | 393 | 3,853 | ||||||||||||
Shares redeemed | (17,997 | ) | (176,442 | ) | (16,105 | ) | (159,424) | |||||||||
|
| |||||||||||||||
Net increase (decrease) | (1,154 | ) | $ | (11,346 | ) | 4,349 | $ | 42,152 | ||||||||
|
| |||||||||||||||
Class R Shares: | ||||||||||||||||
Shares sold | — | $ | — | 5,015 | $ | 50,000 | ||||||||||
Shares issued in reinvestment of distributions | 21 | 207 | 85 | 835 | ||||||||||||
|
| |||||||||||||||
Net increase (decrease) | 21 | $ | 207 | 5,100 | $ | 50,835 | ||||||||||
|
| |||||||||||||||
Class R6 Shares: | ||||||||||||||||
Shares sold | 10,172,940 | $ | 100,000,000 | — | $ | — | ||||||||||
|
| |||||||||||||||
Advisor Class Shares: | ||||||||||||||||
Shares sold | 388 | $ | 3,824 | 4,318 | $ | 42,500 | ||||||||||
Shares issued in reinvestment of distributions | 167 | 1,640 | 662 | 6,531 | ||||||||||||
Shares redeemed | (38 | ) | (375 | ) | (16,269 | ) | (160,142) | |||||||||
|
| |||||||||||||||
Net increase (decrease) | 517 | $ | 5,089 | (11,289 | ) | $ | (111,111) | |||||||||
|
| |||||||||||||||
franklintempleton.com |
Semiannual Report |
39 |
F R A N K L I N S T R A T E G I C S E R I E S
N O T E S T O F I N A N C I A L S T A T E M E N T S ( U N A U D I T E D )
Franklin Flexible Alpha Bond Fund (continued)
3. Transactions with Affiliates
Franklin Resources, Inc. is the holding company for various subsidiaries that together are referred to as Franklin Templeton Investments. Certain officers and trustees of the Trust are also officers and/or directors of the following subsidiaries:
| Subsidiary | Affiliation | |
Franklin Advisers, Inc. (Advisers) | Investment manager | |
Franklin Templeton Institutional, LLC (FT Institutional) | Investment manager | |
Franklin Templeton Services, LLC (FT Services) | Administrative manager | |
Franklin Templeton Distributors, Inc. (Distributors) | Principal underwriter | |
Franklin Templeton Investor Services, LLC (Investor Services) | Transfer agent | |
a. Management Fees
The Fund pays an investment management fee to Advisers based on the average daily net assets of the Fund as follows:
| Annualized Fee Rate | Net Assets | |
0.550% | Up to and including $1 billion | |
0.500% | Over $1 billion, up to and including $5 billion | |
0.450% | Over $5 billion, up to and including $10 billion | |
0.445% | Over $10 billion, up to and including $15 billion | |
0.440% | Over $15 billion, up to and including $20 billion | |
0.435% | In excess of $20 billion | |
For the period ended October 31, 2017, the annualized effective investment management fee rate was 0.550% of the Fund’s average daily net assets.
Under a subadvisory agreement, FT Instituitional, an affiliate of Advisers, provides subadvisory services to the Fund. The subadvisory fee is paid by Advisers based on the Fund’s average daily net assets, and is not an additional expense of the Fund.
b. Administrative Fees
Under an agreement with Advisers, FT Services provides administrative services to the Fund. The fee is paid by Advisers based on the Fund’s average daily net assets, and is not an additional expense of the Fund.
c. Distribution Fees
The Board has adopted distribution plans for each share class, with the exception of Class R6 and Advisor Class shares, pursuant to Rule 12b-1 under the 1940 Act. Under the Fund’s Class A reimbursement distribution plan, the Fund reimburses Distributors for costs incurred in connection with the servicing, sale and distribution of the Fund’s shares up to the maximum annual plan rate. Under the Class A reimbursement distribution plan, costs exceeding the maximum for the current plan year cannot be reimbursed in subsequent periods. In addition, under the Fund’s Class C and R compensation distribution plans, the Fund pays Distributors for costs incurred in connection with the servicing, sale and distribution of the Fund’s shares up to the maximum annual plan rate for each class. The plan year, for purposes of monitoring compliance with the maximum annual plan rates, is February 1 through January 31.
The maximum annual plan rates, based on the average daily net assets, for each class, are as follows:
Class A | 0.25 | % | ||
Class C | 0.65 | % | ||
Class R | 0.50 | % |
40 | Semiannual Report | franklintempleton.com |
F R A N K L I N S T R A T E G I C S E R I E S
N O T E S T O F I N A N C I A L S T A T E M E N T S ( U N A U D I T E D )
Franklin Flexible Alpha Bond Fund (continued)
d. Sales Charges/Underwriting Agreements
Front-end sales charges and contingent deferred sales charges (CDSC) do not represent expenses of the Fund. These charges are deducted from the proceeds of sales of Fund shares prior to investment or from redemption proceeds prior to remittance, as applicable. Distributors has advised the Fund of the following commission transactions related to the sales and redemptions of the Fund’s shares for the period:
Sales charges retained net of commissions paid to unaffiliated brokers/dealers | $ | 419 | ||
CDSC retained | $ | — |
e. Transfer Agent Fees
Each class of shares, except for Class R6, pays transfer agent fees to Investor Services for its performance of shareholder servicing obligations and reimburses Investor Services for out of pocket expenses incurred, including shareholder servicing fees paid to third parties. These fees are allocated daily based upon their relative proportion of such classes’ aggregate net assets. Class R6 pays Investor Services transfer agent fees specific to that class.
For the period ended October 31, 2017, the Fund paid transfer agent fees of $3,114, of which $961 was retained by Investor Services.
f. Investments in Affiliated Management Investment Companies
The Fund invests in one or more affiliated management investment companies for purposes other than exercising a controlling influence over the management or policies. Management fees paid by the Fund are waived on assets invested in the affiliated management investment companies, as noted in the Statement of Operations, in an amount not to exceed the management and administrative fees paid directly or indirectly by each affiliate. During the period ended October 31, 2017, the Fund held investments in affiliated management investment companies as follows:
| Number of Shares Held at Beginning of Period | Gross Additions | Gross Reductions | Number of Shares Held at End of Period | Value at End of Period | Dividend Income | Realized Gain (Loss) | Net Change in Unrealized | |||||||||||||||||||||||||
Non-Controlled Affiliates | ||||||||||||||||||||||||||||||||
Institutional Fiduciary Trust Money Market Portfolio, 0.68% | 1,305,181 | 99,761,860 | (63,598,657 | ) | 37,468,384 | $37,468,384 | $43,511 | $ — | $ — | |||||||||||||||||||||||
g. Waiver and Expense Reimbursements
Advisers and Investor Services have contractually agreed in advance to waive or limit their respective fees and to assume as their own expense certain expenses otherwise payable by the Fund so that the expenses (excluding distribution fees, and acquired fund fees and expenses) for each class of the Fund do not exceed 0.85% based on the average net assets of each class (other than certain non-routine expenses or costs, including those relating to litigation, indemnification, reorganizations, and liquidations) until August 31, 2018. Total expenses waived or paid are not subject to recapture subsequent to the Fund’s fiscal year end. Prior to September 1, 2017, expenses for Class R6 were limited to 0.71%.
franklintempleton.com | Semiannual Report | 41 |
F R A N K L I N S T R A T E G I C S E R I E S
N O T E S T O F I N A N C I A L S T A T E M E N T S ( U N A U D I T E D )
Franklin Flexible Alpha Bond Fund (continued)
3. Transactions with Affiliates (continued)
h. Other Affiliated Transactions
At October 31, 2017, the shares of the Fund were owned by the following entities/investment companies:
| Shares | Percentage of Outstanding Sharesa | |||||
Franklin Total Return Fund | 10,172,940 | 90.1% | ||||
Franklin Resources, Inc. | 997,000 | 8.8% | ||||
|
| |||||
| 11,169,940 | 98.9% | |||||
|
| |||||
aInvestment activities of significant shareholders could have a material impact on the Fund.
4. Expense Offset Arrangement
The Fund has entered into an arrangement with its custodian whereby credits realized as a result of uninvested cash balances are used to reduce a portion of the Fund’s custodian expenses. During the period ended October 31, 2017, the custodian fees were reduced as noted in the the Statement of Operations.
5. Income Taxes
For tax purposes, capital losses may be carried over to offset future capital gains, if any.
At April 30, 2017, the capital loss carryforwards were as follows:
Capital loss carryforwards: | ||||
Short term | $124,272 | |||
Long term | 31,677 | |||
|
| |||
Total capital loss carryforwards | $155,949 | |||
|
|
At October 31, 2017, the cost of investments and net unrealized appreciation (depreciation) for income tax purposes were as follows:
Cost of investments | $122,952,574 | |
| ||
Unrealized appreciation | $ 771,307 | |
Unrealized depreciation | (468,787) | |
| ||
Net unrealized appreciation (depreciation) | $ 302,520 | |
| ||
Differences between income and/or capital gains as determined on a book basis and a tax basis are primarily due to differing treatments of foreign currency transactions, bond discounts and premiums and financial futures transactions.
6. Investment Transactions
Purchases and sales of investments (excluding short term securities) for the period ended October 31, 2017, aggregated $83,542,284 and $4,878,191, respectively.
42 |
Semiannual Report |
franklintempleton.com |
F R A N K L I N S T R A T E G I C S E R I E S
N O T E S T O F I N A N C I A L S T A T E M E N T S ( U N A U D I T E D )
Franklin Flexible Alpha Bond Fund (continued)
7. Credit Risk
At October 31, 2017, the Fund had 10.8% of its portfolio invested in high yield or other securities rated below investment grade and unrated securities, if any. These securities may be more sensitive to economic conditions causing greater price volatility and are potentially subject to a greater risk of loss due to default than higher rated securities.
8. Other Derivative Information
At October 31, 2017, the Fund’s investments in derivative contracts are reflected in the Statement of Assets and Liabilities as follows:
| Asset Derivatives | Liability Derivatives | |||||||||||
Derivative Contracts Not Accounted for as Hedging Instruments | Statement of Assets and Liabilities Location | Fair Value | Statement of Assets and Liabilities Location | Fair Value | ||||||||
Interest rate contracts | Investments in securities, at value | $ 126 | a | Options written, at value | $ 44 | |||||||
Variation margin on futures | 322,512 | b | Variation margin on futures | — | ||||||||
Unrealized appreciation on OTC swap contracts | 111,139 | Unrealized depreciation on OTC | 5,508 | |||||||||
Foreign exchange contracts | Unrealized appreciation on OTC | 86,621 | Unrealized depreciation on OTC | 46,244 | ||||||||
Credit contracts | Investments in securities, at value | 8,161 | a | Options written, at value | 3,306 | |||||||
Variation margin on centrally | 12,010 | b | Variation margin on centrally | 15,186 | b | |||||||
OTC swap contracts (premium | 67,064 | OTC swap contracts (premium | 332,078 | |||||||||
Unrealized appreciation on OTC | 28,057 | Unrealized depreciation on OTC | 57,826 | |||||||||
Inflation contracts | Variation margin on centrally | 1,771 | b | Variation margin on centrally | 69 | b | ||||||
|
|
|
| |||||||||
Totals | $637,461 | $460,261 | ||||||||||
|
|
|
| |||||||||
aPurchased option contracts are included in investments in securities, at value in the Statement of Assets and Liabilities.
bThis amount reflects the cumulative appreciation (depreciation) of futures contracts and centrally cleared swap contracts as reported in the Statement of Investments. Only the variation margin receivable/payable at period end is separately reported within the Statement of Assets and Liabilities. Prior variation margin movements were recorded to cash upon receipt or payment.
franklintempleton.com | Semiannual Report | 43 |
F R A N K L I N S T R A T E G I C S E R I E S
N O T E S T O F I N A N C I A L S T A T E M E N T S ( U N A U D I T E D )
Franklin Flexible Alpha Bond Fund (continued)
8. Other Derivative Information (continued)
For the period ended October 31, 2017, the effect of derivative contracts in the Fund’s Statement of Operations was as follows:
Derivative Contracts Not Accounted for as Hedging Instruments | Statement of Operations Location | Net Realized Gain (Loss) for the Period | Statement of Operations Location | Net Change in Unrealized Appreciation (Depreciation) for the Period | ||||
Net realized gain (loss) from: |
Net change in unrealized appreciation (depreciation) on: | |||||||
Interest rate contracts | Investments
| $ (18,924)a | Investments | $ (5,482)a | ||||
Written options
| 3,477 | Written options | 5,449 | |||||
Futures contracts
| (42,532) | Futures contracts | 328,793 | |||||
Swap contracts
| (2,159) | Swap contracts | 108,252 | |||||
Foreign exchange contracts | Investments
| (488)a | Investments | 74a | ||||
Forward exchange contracts
| (70,339) | Forward exchange contracts | 36,939 | |||||
Credit contracts | Investments
| (3,612)a | Investments | (1,897)a | ||||
Written options
| — | Written options | 1,104 | |||||
Swap contracts
| (14,487) | Swap contracts | (4,455) | |||||
Inflation contracts | Swap contracts | (1,591) | Swap contracts | 1,702 | ||||
|
| |||||||
Totals | $(150,655) | $470,479 | ||||||
|
|
aPurchased option contracts are included in net realized gain (loss) from investments and net change in unrealized appreciation (depreciation) on investments in the Statement of Operations.
For the period ended October 31, 2017, the average month end notional amount of futures contracts, options and swap contracts, and the average month end contract value of forward exchange contracts were as follows:
Futures Contracts | $16,073,762 | |||
Options | 2,359,613 | |||
Swap contracts | 8,056,003 | |||
Forward exchange contracts | 3,296,690 |
At October 31, 2017, the Fund’s OTC derivative assets and liabilities are as follows:
| Gross Amounts of Assets and Liabilities Presented in the Statement of Assets and Liabilities | ||||||||
| Assetsa | Liabilitiesa | |||||||
Derivatives | ||||||||
Forward exchange contracts | $ 86,621 | $ 46,244 | ||||||
Options purchased | 8,287 | — | ||||||
Options written | — | 3,350 | ||||||
Swap contracts | 206,260 | 395,412 | ||||||
|
| |||||||
Total | $301,168 | $445,006 | ||||||
|
| |||||||
aAbsent an event of default or early termination, OTC derivative assets and liabilities are presented gross and not offset in the Statement of Assets and Liabilities.
44 |
Semiannual Report |
franklintempleton.com |
F R A N K L I N S T R A T E G I C S E R I E S
N O T E S T O F I N A N C I A L S T A T E M E N T S ( U N A U D I T E D )
Franklin Flexible Alpha Bond Fund (continued)
At October 31, 2017, the Fund’s OTC derivative assets, which may be offset against the Fund’s OTC derivative liabilities and collateral received from the counterparty, are as follows:
| Amounts Not Offset in the | ||||||||||||||||||||
| Statement of Assets and Liabilities | ||||||||||||||||||||
Gross Amounts of | Financial Instruments Available for Offset | Financial Instruments Collateral Received | Cash Collateral Received | Net Amount (Not less than zero) | ||||||||||||||||
| Counterparty | ||||||||||||||||||||
BZWS | $ 25,470 | $ (25,470 | ) | $ — | $ — | $ — | ||||||||||||||
CITI | 54,935 | (54,935 | ) | — | — | — | ||||||||||||||
GSCO | 3,054 | (3,054 | ) | — | — | — | ||||||||||||||
HSBK | 109,386 | (5,191 | ) | — | — | 104,195 | ||||||||||||||
JPHQ | 23,977 | (23,977 | ) | — | — | — | ||||||||||||||
RBS | 7,797 | (7,797 | ) | — | — | — | ||||||||||||||
UBSW | 76,549 | (23,076 | ) | — | — | 53,473 | ||||||||||||||
|
| |||||||||||||||||||
Total | $301,168 | $(143,500 | ) | $ — | $ — | $157,668 | ||||||||||||||
|
| |||||||||||||||||||
At October 31, 2017, the Fund’s OTC derivative liabilities, which may be offset against the Fund’s OTC derivative assets and collateral pledged to the counterparty, are as follows:
| Amounts Not Offset in the | ||||||||||||||||||||
| Statement of Assets and Liabilities | ||||||||||||||||||||
Gross Amounts of | Financial Instruments Available for Offset | Financial Instruments Collateral Pledged | Cash Collateral Pledged | Net Amount (Not less than zero) | ||||||||||||||||
| Counterparty | ||||||||||||||||||||
BZWS | $159,712 | $ (25,470 | ) | $ — | $ — | $134,242 | ||||||||||||||
CITI | 130,571 | (54,935 | ) | — | — | 75,636 | ||||||||||||||
GSCO | 10,132 | (3,054 | ) | — | — | 7,078 | ||||||||||||||
HSBK | 5,191 | (5,191 | ) | — | — | — | ||||||||||||||
JPHQ | 101,476 | (23,977 | ) | — | — | 77,499 | ||||||||||||||
RBS | 14,848 | (7,797 | ) | — | — | 7,051 | ||||||||||||||
UBSW | 23,076 | (23,076 | ) | — | — | — | ||||||||||||||
|
| |||||||||||||||||||
Total | $445,006 | $(143,500 | ) | $ — | $ — | $301,506 | ||||||||||||||
|
| |||||||||||||||||||
See Note 1(d) regarding derivative financial instruments.
See Abbreviations on page 47.
9. Credit Facility
The Fund, together with other U.S. registered and foreign investment funds (collectively, Borrowers), managed by Franklin Templeton Investments, are borrowers in a joint syndicated senior unsecured credit facility totaling $2 billion (Global Credit Facility) which matures on February 9, 2018. This Global Credit Facility provides a source of funds to the Borrowers for temporary and emergency purposes, including the ability to meet future unanticipated or unusually large redemption requests.
franklintempleton.com | Semiannual Report | 45 |
F R A N K L I N S T R A T E G I C S E R I E S
N O T E S T O F I N A N C I A L S T A T E M E N T S ( U N A U D I T E D )
Franklin Flexible Alpha Bond Fund (continued)
9. Credit Facility (continued)
Under the terms of the Global Credit Facility, the Fund shall, in addition to interest charged on any borrowings made by the Fund and other costs incurred by the Fund, pay its share of fees and expenses incurred in connection with the implementation and maintenance of the Global Credit Facility, based upon its relative share of the aggregate net assets of all of the Borrowers, including an annual commitment fee of 0.15% based upon the unused portion of the Global Credit Facility. These fees are reflected in other expenses in the Statement of Operations. During the period ended October 31, 2017, the Fund did not use the Global Credit Facility.
10. Fair Value Measurements
The Fund follows a fair value hierarchy that distinguishes between market data obtained from independent sources (observable inputs) and the Fund’s own market assumptions (unobservable inputs). These inputs are used in determining the value of the Fund’s financial instruments and are summarized in the following fair value hierarchy:
| • | Level 1 – quoted prices in active markets for identical financial instruments |
| • | Level 2 – other significant observable inputs (including quoted prices for similar financial instruments, interest rates, prepayment speed, credit risk, etc.) |
| • | Level 3 – significant unobservable inputs (including the Fund’s own assumptions in determining the fair value of financial instruments) |
The input levels are not necessarily an indication of the risk or liquidity associated with financial instruments at that level.
For movements between the levels within the fair value hierarchy, the Fund has adopted a policy of recognizing the transfers as of the date of the underlying event which caused the movement.
A summary of inputs used as of October 31, 2017, in valuing the Fund’s assets and liabilities carried at fair value, is as follows:
| Level 1 | Level 2 | Level 3 | Total | |||||||||||||
| Assets: | ||||||||||||||||
Investments in Securities: | ||||||||||||||||
Management Investment Companies | $ 3,393,207 | $ | — | $ | — | $ | 3,393,207 | |||||||||
Corporate Bonds | — | 37,358,060 | — | 37,358,060 | ||||||||||||
Foreign Government and Agency Securities | — | 1,029,046 | — | 1,029,046 | ||||||||||||
U.S. Government and Agency Securities | — | 3,256,131 | — | 3,256,131 | ||||||||||||
Asset-Backed Securities and Commercial Mortgage-Backed Securities | — | 39,082,345 | — | 39,082,345 | ||||||||||||
Mortgage-Backed Securities | — | 3,618,819 | — | 3,618,819 | ||||||||||||
Municipal Bonds | — | 514,472 | — | 514,472 | ||||||||||||
Options Purchased | 126 | 8,161 | — | 8,287 | ||||||||||||
Short Term Investments | 37,468,384 | — | — | 37,468,384 | ||||||||||||
|
| |||||||||||||||
Total Investments in Securities | $ 40,861,717 | $ | 84,867,034 | $ | — | $ | 125,728,751 | |||||||||
|
| |||||||||||||||
Other Financial Instruments: | ||||||||||||||||
Futures Contracts | $ 322,512 | $ | — | $ | — | $ | 322,512 | |||||||||
Forward Exchange Contracts | — | 86,621 | — | 86,621 | ||||||||||||
Swap Contracts | — | 152,977 | — | 152,977 | ||||||||||||
|
| |||||||||||||||
Total Other Financial Instruments | $ 322,512 | $ | 239,598 | $ | — | $ | 562,110 | |||||||||
|
| |||||||||||||||
46 | Semiannual Report | franklintempleton.com |
F R A N K L I N S T R A T E G I C S E R I E S
N O T E S T O F I N A N C I A L S T A T E M E N T S ( U N A U D I T E D )
Franklin Flexible Alpha Bond Fund (continued)
| Level 1 | Level 2 | Level 3 | Total | |||||||||||||
| Liabilities: | ||||||||||||||||
Other Financial Instruments: | ||||||||||||||||
Options Written | $ 44 | $ | 3,306 | $ | — | $ | 3,350 | |||||||||
TBA Sales Commitments | — | 2,641,478 | — | 2,641,478 | ||||||||||||
Forward Exchange Contracts | — | 46,244 | — | 46,244 | ||||||||||||
Swap Contracts | — | 78,589 | — | 78,589 | ||||||||||||
|
| |||||||||||||||
Total Other Financial Instruments | $ �� 44 | $ | 2,769,617 | $ | — | $ | 2,769,661 | |||||||||
|
| |||||||||||||||
11. New Accounting Pronouncements
In March 2017, the Financial Accounting Standards Board (FASB) issued Accounting Standards Update (ASU) No. 2017-08, Receivables—Nonrefundable Fees and Other Costs (Subtopic 310-20): Premium Amortization on Purchased Callable Debt Securities. The amendments in the ASU shorten the amortization period for certain callable debt securities acquired at a premium, to be amortized to the earliest call date. The ASU does not require an accounting change for securities acquired at a discount, which continues to be amortized to maturity. The ASU is effective for fiscal years and interim periods within those fiscal years beginning after December 15, 2018. Management is currently evaluating the impact, if any, of applying this provision.
12. Subsequent Events
The Fund has evaluated subsequent events through the issuance of the financial statements and determined that no events have occurred that require disclosure.
Abbreviations
| Counterparty/Exchange | Currency | Selected Portfolio | ||||||||
| BNDP | BNP Paribas | AUD | Australian Dollar | CDO | Collateralized Debt Obligation | |||||
| BZWS | Barclays Bank PLC | EUR | Euro | CLO | Collateralized Loan Obligation | |||||
| CITI | Citigroup, Inc. | GBP | British Pound | ETF | Exchange Traded Fund | |||||
| GSCO | Goldman Sachs Group, Inc. | IDR | Indonesian Rupiah | FHLMC | Federal Home Loan Mortgage Corp | |||||
| HSBK | HSBC Bank PLC | USD | United States Dollar | FRN | Floating Rate Note | |||||
| JPHQ | JP Morgan Chase & Co. | GO | General Obligation | |||||||
| RBS | Royal Bank of Scotland PLC | IO | Interest Only | |||||||
| UBSW | UBS AG | LIBOR | London InterBank Offered Rate | |||||||
| MFM | Multi-Family Mortgage | |||||||||
| SFR | Single Family Revenue | |||||||||
| Index | ||||||||
| CDX.NA.HY.Series number | CDX North America High Yield Index | |||||||
| CDX.NA.IG.Series number | CDX North America Investment Grade Index | |||||||
| ITRX.EUR.Series number | iTraxx Europe Index | |||||||
franklintempleton.com | Semiannual Report | 47 |
F R A N K L I N S T R A T E G I C S E R I E S
F R A N K L I N F L E X I B L E A L P H A B O N D F U N D
Proxy Voting Policies and Procedures
The Fund’s investment manager has established Proxy Voting Policies and Procedures (Policies) that the Fund uses to determine how to vote proxies relating to portfolio securities. Shareholders may view the Fund’s complete Policies online at franklintempleton.com. Alternatively, shareholders may request copies of the Policies free of charge by calling the Proxy Group collect at (954) 527-7678 or by sending a written request to: Franklin Templeton Companies, LLC, 300 S.E. 2nd Street, Fort Lauderdale, FL 33301, Attention: Proxy Group. Copies of the Fund’s proxy voting records are also made available online at franklintempleton.com and posted on the US Securities and Exchange Commission’s website at sec.gov and reflect the most recent 12-month period ended June 30.
Quarterly Statement of Investments
The Trust, on behalf of the Fund, files a complete statement of investments with the US Securities and Exchange Commission for the first and third quarters for each fiscal year on Form N-Q. Shareholders may view the filed Form N-Q by visiting the Commission’s website at sec.gov. The filed form may also be viewed and copied at the Commission’s Public Reference Room in Washington, DC. Information regarding the operations of the Public Reference Room may be obtained by calling (800) SEC-0330.
48 | Semiannual Report | franklintempleton.com |
|
Semiannual Report and Shareholder Letter | |
| Franklin Flexible Alpha Bond Fund | ||
| Investment Manager | ||
| Franklin Advisers, Inc. | ||
| Subadvisor | ||
| Franklin Templeton Institutional, LLC | ||
| Distributor | ||
| Franklin Templeton Distributors, Inc. | ||
| (800) DIAL BEN® / 342-5236 | ||
| franklintempleton.com | ||
| Shareholder Services | ||
| (800) 632-2301 |
Authorized for distribution only when accompanied or preceded by a summary prospectus and/or prospectus. Investors should carefully consider a fund’s investment goals, risks, charges and expenses before investing. A prospectus contains this and other information; please read it carefully before investing.
To help ensure we provide you with quality service, all calls to and from our service areas are monitored and/or recorded.
| © 2017 Franklin Templeton Investments. All rights reserved. | 953 S2017 12/17 |
 | Semiannual Report and Shareholder Letter
October 31, 2017 | |||
Sign up for electronic delivery at franklintempleton.com/edelivery
Franklin Templeton Investments
Gain From Our Perspective®
At Franklin Templeton Investments, we’re dedicated to one goal: delivering exceptional asset management for our clients. By bringing together multiple, world-class investment teams in a single firm, we’re able to offer specialized expertise across styles and asset classes, all supported by the strength and resources of one of the world’s largest asset managers. This has helped us to become a trusted partner to individual and institutional investors across the globe.
Dear Shareholder:
During the six months ended October 31, 2017, mostly upbeat economic data, improved US corporate earnings and a supportive monetary policy were positives for US securities markets. At its June meeting, the US Federal Reserve (Fed) increased its target range for the federal funds rate a quarter point to 1.00%–1.25%. Despite low inflation, the Fed made this decision amid signs of a strengthening labor market and moderately rising economic activity. The 10-year US Treasury yield began the period at 2.29% and ended the period at 2.38%. In this environment, US stocks, as measured by the Standard & Poor’s 500® Index, generated a +9.10% total return for the six-month period.1 Investment-grade bonds, as measured by the Bloomberg Barclays US Aggregate Bond Index, posted a +1.58% total return.1
We are committed to our long-term perspective and disciplined investment approach as we conduct a rigorous, fundamental analysis of securities with a regular emphasis on investment risk management.
We believe active, professional investment management serves investors well. We also recognize the important role of financial advisors in today’s markets and encourage investors to continue to seek their advice. Amid changing markets and economic conditions, we are confident investors with a well-diversified portfolio and a patient, long-term outlook should be well positioned for the years ahead.
In addition, Franklin Strategic Income Fund’s semiannual report includes more detail about prevailing conditions and a discussion about investment decisions during the period. Please remember all securities markets fluctuate, as do mutual fund share prices.
Sincerely,
Edward B. Jamieson
President and Chief Executive Officer –
Investment Management
Franklin Strategic Series
This letter reflects our analysis and opinions as of October 31, 2017, unless otherwise indicated. The information is not a complete analysis of every aspect of any market, country, industry, security or fund. Statements of fact are from sources considered reliable.
1. Source: Morningstar.
See www.franklintempletondatasources.com for additional data provider information.
Not FDIC Insured
|
|
|
May Lose Value
|
|
|
No Bank Guarantee
|
franklintempleton.com |
Not part of the semiannual report |
1 | ||
Semiannual Report | ||||
| 3 | ||||
| 6 | ||||
| 8 | ||||
| Consolidated Financial Highlights and Consolidated Statement of Investments | 9 | |||
| 39 | ||||
| 44 | ||||
| 60 | |||
Visit franklintempleton.com for fund updates, to access your account, or to find helpful financial planning tools.
| 2 | Semiannual Report | franklintempleton.com | ||
Semiannual Report
Franklin Strategic Income Fund
This semiannual report for Franklin Strategic Income Fund covers the period ended October 31, 2017.
Your Fund’s Goal and Main Investments
The Fund seeks a high level of current income, with capital appreciation over the long term as a secondary objective. The Fund uses an active asset allocation process and under normal market conditions invests at least 65% of its assets in US and foreign debt securities, including those in emerging markets.
The Fund may invest in all varieties of fixed, variable and floating rate income securities, including bonds, US and foreign government and agency securities, corporate loans (and loan participations), mortgage-backed securities and other asset-backed securities and convertible securities.
Performance Overview
The Fund’s Class A shares delivered a +1.89% cumulative total return for the six months under review. In comparison, the Bloomberg Barclays US Aggregate Bond Index, which represents the US investment-grade fixed rate taxable bond market, generated a +1.58% total return.1 The Lipper Multi-Sector Income Funds Classification Average, which consists of funds chosen by Lipper that seek current income by allocating assets among different fixed income securities sectors, with a significant portion rated below investment grade, produced a +2.72% total return.2 You can find more of the Fund’s performance data in the Performance Summary beginning on page 6.
Performance data represent past performance, which does not guarantee future results. Investment return and principal value will fluctuate, and you may have a gain or loss when you sell your shares. Current performance may differ from figures shown. For most recent month-end performance, go to franklintempleton.com or call (800) 342-5236.
Economic and Market Overview
The US economy grew during the six months under review. The economy grew faster in 2017’s third quarter than in the second quarter, driven by consumer spending, inventory investment, business investment and exports. The manufacturing and services sectors expanded during the period. The unemployment rate decreased from 4.4% in April 2017 to 4.1% at period-end.3 Monthly retail sales were volatile during the period. Annual inflation, as measured by the Consumer Price Index, decreased from 2.2% in April 2017 to 2.0% at period-end.3
At its June meeting, the US Federal Reserve (Fed) raised its target range for the federal funds rate 0.25% to 1.00%–1.25%, amid signs of a growing US economy, strengthening labor market and improving business spending. At its July and September 2017 meetings, the Fed kept its target range unchanged. Furthermore in September, the Fed mentioned that it would begin implementing its balance sheet reduction in October. The minutes of the Fed’s September meeting released in October suggested that many committee members were concerned that low inflation readings this year might not be transitory and could be more persistent than expected.
The 10-year Treasury yield, which moves inversely to its price, shifted throughout the period. In June, the yield rose due to renewed optimism for improvement in economic growth, while in July, the yield rose further amid hawkish comments from key central bankers around the world. Easing concerns about Hurricane Irma’s impact, the Fed’s proposed balance sheet normalization in October, and the Senate’s approval of a budget plan that raised expectations for tax reforms, pushed up yields further toward period-end. However, geopolitical tensions in the Korean peninsula, US political turmoil, and uncertainty on whether the Fed would raise rates again in 2017 resulted in a decline in the yield. The possible appointment of Jerome Powell, viewed as more dovish than other contenders, as the
1. Source: Morningstar.
2. Source: Lipper, a Thomson Reuters Company. For the six-month period ended October 31, 2017, this category consisted of 338 funds. Lipper calculations do not include sales charges or expense subsidization by a fund’s manager. Fund performance relative to the average may have differed if these or other factors had been considered. The indexes are unmanaged and include reinvestment of any income or distributions. They do not reflect any fees, expenses or sales charges. One cannot invest directly in an index, and an index is not representative of the Fund’s portfolio.
3. Source: Bureau of Labor Statistics.
See www.franklintempletondatasources.com for additional data provider information.
The dollar value, number of shares or principal amount, and names of all portfolio holdings are listed in the Fund’s Consolidated Statement of Investments (SOI). The Consolidated SOI begins on page 14.
| franklintempleton.com | Semiannual Report | 3 | ||
FRANKLIN STRATEGIC INCOME FUND
next Fed chair, dragged on the Treasury yield toward period-end. Overall, the 10-year Treasury yield rose from 2.29% at the beginning of the period to 2.38% at period-end.
Portfolio Composition*
Based on Consolidated Net Assets
| 10/31/17 | 4/30/17 | |||||||
| High Yield Corporate Bonds | 29.0% | 28.8% | ||||||
| Investment-Grade Corporate Bonds | 18.0% | 17.0% | ||||||
| Floating-Rate Loans | 16.7% | 16.6% | ||||||
| Mortgage-Backed Securities | 13.0% | 12.8% | ||||||
| International Government & Agency Bonds | 8.2% | 8.5% | ||||||
| US Treasury Securities | 6.5% | 6.5% | ||||||
| Collateralized Loan Obligations | 4.2% | 4.1% | �� | |||||
| Commercial Mortgage-Backed Securities | 2.5% | 2.0% | ||||||
| Asset-Backed Securities | 2.4% | 2.3% | ||||||
| Other | 2.1% | 2.5% | ||||||
| Municipal Bonds | 1.0% | 2.1% | ||||||
| Short-Term Investments & Other Net Assets | -3.6% | -3.2% | ||||||
*Figures reflect certain derivatives held in the portfolio (or their underlying reference assets) and may not total 100% or may be negative due to rounding, use of any derivatives, unsettled trades or other factors. The compostion may not macth the SOI.
Investment Strategy
We use an active asset allocation strategy to try to achieve the Fund’s investment goals. We employ a top-down analysis of macroeconomic trends combined with a bottom-up fundamental analysis of market sectors, industries and issuers to try to take advantage of varying sector reactions to economic events. We regularly enter into various currency-related transactions involving derivative instruments, including currency and cross currency forwards, currency swaps, currency and currency index futures contracts and currency options. We may also enter into interest-rate and credit-related transactions involving derivative instruments, including interest-rate, fixed income total return and credit default swaps and interest rate and/or bond futures contracts.
What is a currency forward contract?
A currency forward contract is an agreement between the Fund and a counterparty to buy or sell a foreign currency in exchange for another currency at a specific exchange rate on a future date.
What is a futures contract?
A futures contract is an agreement between the Fund and a counterparty made through a US or foreign futures exchange to buy or sell an underlying instrument or asset at a specific price on a future date.
What are swap agreements?
Swap agreements, such as interest-rate, currency and credit default swaps, are contracts between the Fund and another party (the swap counterparty). In a basic swap transaction, the Fund agrees with the swap counterparty to exchange the returns (or differentials in rates of return) earned or realized on a particular “notional amount” of underlying instruments. The notional amount is the set amount selected by the parties as the basis on which to calculate the obligations that they have agreed to exchange. The parties typically do not actually exchange the notional amount. Instead, they agree to exchange the returns that would be earned or realized if the notional amount were invested in given instruments or at given interest rates.
What is an option?
An option is a contract to buy or sell a specific financial product known as the option’s underlying instrument at a specific price. The buyer of an option has the right, but not the obligation, to buy or sell the underlying instrument at or until a specified expiration date. Conversely, the seller (“writer”) of an option who opens a transaction is obligated to buy or sell the underlying instrument should the option holder exercise that right.
Manager’s Discussion
For global fixed income markets, the six months under review were generally characterized by low levels of volatility and an increase in risk appetite amid low and negative interest rates. Although this has helped facilitate economic recovery, it has also led to increased indebtedness among some of the major economies, such as Australia, Canada, China and South Korea. This increased leverage has rendered some economies more sensitive to any future rise in interest rates or tighter financial conditions.
In this environment, all global fixed income sectors outpaced US Treasuries on a duration-matched basis. Corporate credit, particularly high yield bonds, were the strongest performers, as were emerging market debt securities.
What is duration?
Duration is a measure of a bond’s price sensitivity to interest-rate changes. In general, a portfolio of securities with a lower duration can be expected to be less sensitive to interest-rate changes than a portfolio with a higher duration.
During the period, the Fund’s exposure to high yield bonds provided a significant boost to performance. Additionally, our non-US duration exposure also added to results. Both senior secured floating-rate loans and emerging market sovereign debt
| 4 | Semiannual Report | franklintempleton.com | ||
FRANKLIN STRATEGIC INCOME FUND
Dividend Distributions*
5/1/17–10/31/17
| Dividend per Share (cents) | ||||||||||||||||||||
| Month | Class A | Class C | Class R | Class R6 | Advisor Class | |||||||||||||||
May
|
|
2.10
|
|
|
1.77
|
|
|
1.89
|
|
|
2.42
|
|
|
2.30
|
| |||||
June
|
|
2.09
|
|
|
1.76
|
|
|
1.88
|
|
|
2.42
|
|
|
2.30
|
| |||||
July
|
|
2.09
|
|
|
1.76
|
|
|
1.88
|
|
|
2.42
|
|
|
2.29
|
| |||||
August
|
|
2.09
|
|
|
1.75
|
|
|
1.88
|
|
|
2.43
|
|
|
2.30
|
| |||||
September
|
|
2.09
|
|
|
1.76
|
|
|
1.89
|
|
|
2.42
|
|
|
2.30
|
| |||||
October
|
|
2.08
|
|
|
1.74
|
|
|
1.87
|
|
|
2.59
|
|
|
2.29
|
| |||||
Total
|
|
12.54
|
|
|
10.54
|
|
|
11.29
|
|
|
14.70
|
|
|
13.78
|
| |||||
*The distribution amount is the sum of all estimated tax-basis net investment income distributions for the period shown. A portion or all of the distribution may be reclassified as return of capital or capital gain once final tax designations are known. All Fund distributions will vary depending upon current market conditions and past distributions are not indicative of future trends.
securities also benefited returns. In contrast, our exposure to foreign currencies and tax-exempt municipal securities hurt performance. The Fund’s more defensive duration positioning on the US yield curve also detracted.
What is the yield curve?
A yield curve is a line that plots the yield to maturity of bonds having equal credit quality against their maturity dates.
Corporate credit fundamentals remained generally supportive and technical conditions continued to be strong as the low interest-rate backdrop provided strong demand for corporate credit. We remained allocated across spread sectors, both corporate and securitized. Over the period, we increased our exposure to high yield corporate credit and emerging market sovereign debt securities. We also added to Treasury Inflation-Protected Securities and fixed-rate agency mortgage-backed securities.
We reduced allocation to tax-exempt and taxable municipal bonds as well as Treasuries. We continued to find what we considered opportunities in global bond markets outside the US, but pared our exposure over the period.
Thank you for your continued participation in Franklin Strategic Income Fund. We look forward to serving your future investment needs.
 |
Christopher J. Molumphy, CFA |

 |
Roger A. Bayston, CFA | |
Patricia O’Connor, CFA
Portfolio Management Team | ||

The foregoing information reflects our analysis, opinions and portfolio holdings as of October 31, 2017, the end of the reporting period. The way we implement our main investment strategies and the resulting portfolio holdings may change depending on factors such as market and economic conditions. These opinions may not be relied upon as investment advice or an offer for a particular security. The information is not a complete analysis of every aspect of any market, country, industry, security or the Fund. Statements of fact are from sources considered reliable, but the investment manager makes no representation or warranty as to their completeness or accuracy. Although historical performance is no guarantee of future results, these insights may help you understand our investment management philosophy.
CFA® is a trademark owned by CFA Institute.
| franklintempleton.com | Semiannual Report | 5 | ||
FRANKLIN STRATEGIC INCOME FUND
Performance Summary as of October 31, 2017
The performance tables do not reflect any taxes that a shareholder would pay on Fund dividends, capital gain distributions, if any, or any realized gains on the sale of Fund shares. Total return reflects reinvestment of the Fund’s dividends and capital gain distributions, if any, and any unrealized gains or losses. Your dividend income will vary depending on dividends or interest paid by securities in the Fund’s portfolio, adjusted for operating expenses of each class. Capital gain distributions are net profits realized from the sale of portfolio securities.
Performance as of 10/31/171
Cumulative total return excludes sales charges. Average annual total return includes maximum sales charges. Sales charges will vary depending on the size of the investment and the class of share purchased. The maximum is 4.25% and the minimum is 0%. Class A: 4.25% maximum initial sales charge; Advisor Class: no sales charges. For other share classes, visit franklintempleton.com.
Share Class | | Cumulative Total Return | 2 | | Average Annual Total Return | 3 | ||
| ||||||||
| A | ||||||||
6-Month | +1.89% | -2.47% | ||||||
| ||||||||
1-Year | +4.62% | +0.16% | ||||||
| ||||||||
5-Year | +15.44% | +2.02% | ||||||
| ||||||||
10-Year | +61.25% | +4.44% | ||||||
| ||||||||
| Advisor | ||||||||
6-Month | +2.02% | +2.02% | ||||||
| ||||||||
1-Year | +4.88% | +4.88% | ||||||
| ||||||||
5-Year | +16.90% | +3.17% | ||||||
| ||||||||
10-Year | +65.27% | +5.15% | ||||||
| ||||||||
| Distribution | 30-Day Standardized Yield5 | |||||||||||||||
| Share Class | Rate4 | (with waiver) | (without waiver) | |||||||||||||
A | 1.86% | 3.50% | 3.45% | |||||||||||||
Advisor | 2.19% | 3.91% | 3.87% | |||||||||||||
Performance data represent past performance, which does not guarantee future results. Investment return and principal value will fluctuate, and you may have a gain or loss when you sell your shares. Current performance may differ from figures shown. For most recent month-end performance, go to franklintempleton.com or call (800) 342-5236.
See page 7 for Performance Summary footnotes.
| 6 | Semiannual Report | franklintempleton.com | ||
FRANKLIN STRATEGIC INCOME FUND
PERFORMANCE SUMMARY
Distributions (5/1/17–10/31/17)
| Share Class | Net Investment Income | |||
A | $0.1254 | |||
| C | $0.1054 | |||
| R | $0.1129 | |||
| R6 | $0.1470 | |||
| Advisor | $0.1378 | |||
Total Annual Operating Expenses6
| Share Class | With Waiver | Without Waiver | ||||||
A
|
|
0.92% |
|
|
0.98% |
| ||
Advisor
|
|
0.67% |
|
|
0.73% |
| ||
Each class of shares is available to certain eligible investors and has different annual fees and expenses, as described in the prospectus.
All investments involve risks, including possible loss of principal. Bond prices generally move in the opposite direction of interest rates. Thus, as prices of bonds in the Fund adjust to a rise in interest rates, the Fund’s share price may decline. Changes in the financial strength of a bond issuer or in a bond’s credit rating may affect its value. High yields reflect the higher credit risks associated with certain lower rated securities held in the portfolio. Floating rate loans and high yield corporate bonds are rated below investment grade and are subject to greater risk of default, which could result in loss of principal—a risk that may be heightened in a slowing economy. The risks of foreign securities include currency fluctuations and political uncertainty. Investments in developing markets involve heightened risks related to the same factors, in addition to those associated with their relatively small size and lesser liquidity. Investing in derivative securities and the use of foreign currency techniques involve special risks as such may not achieve the anticipated benefits and/or may result in losses to the Fund. The Fund is actively managed but there is no guarantee that the manager’s investment decisions will produce the desired results. The Fund’s prospectus also includes a description of the main investment risks.
1. The Fund has a fee waiver associated with any investment it makes in a Franklin Templeton money fund and/or other Franklin Templeton fund, contractually guaranteed through 8/31/18. Fund investment results reflect the fee waiver; without this waiver, the results would have been lower.
2. Cumulative total return represents the change in value of an investment over the periods indicated.
3. Average annual total return represents the average annual change in value of an investment over the periods indicated. Return for less than one year, if any, has not been annualized.
4. Distribution rate is based on the sum of the respective class’s dividend distributions over the past 12 months and the maximum offering price (NAV for Advisor Class) per share on 10/31/17.
5. The Fund’s 30-day standardized yield is calculated over a trailing 30-day period using the yield to maturity on bonds and/or the dividends accrued on stocks. It may not equal the Fund’s actual income distribution rate, which reflects the Fund’s past dividends paid to shareholders.
6. Figures are as stated in the Fund’s current prospectus and may differ from the expense ratios disclosed in the Your Fund’s Expenses and Consolidated Financial Highlights sections in this report. In periods of market volatility, assets may decline significantly, causing total annual Fund operating expenses to become higher than the figures shown.
| franklintempleton.com | Semiannual Report | 7 | ||
FRANKLIN STRATEGIC INCOME FUND
As a Fund shareholder, you can incur two types of costs: (1) transaction costs, including sales charges (loads) on Fund purchases and redemptions; and (2) ongoing Fund costs, including management fees, distribution and service (12b-1) fees, and other Fund expenses. All mutual funds have ongoing costs, sometimes referred to as operating expenses. The table below shows ongoing costs of investing in the Fund and can help you understand these costs and compare them with those of other mutual funds. The table assumes a $1,000 investment held for the six months indicated.
Actual Fund Expenses
The table below provides information about actual account values and actual expenses in the columns under the heading “Actual.” In these columns the Fund’s actual return, which includes the effect of Fund expenses, is used to calculate the “Ending Account Value” for each class of shares. You can estimate the expenses you paid during the period by following these steps (of course, your account value and expenses will differ from those in this illustration): Divide your account value by $1,000 (if your account had an $8,600 value, then $8,600 ÷ $1,000 = 8.6). Then multiply the result by the number in the row for your class of shares under the headings “Actual” and “Expenses Paid During Period” (if Actual Expenses Paid During Period were $7.50, then 8.6 x $7.50 = $64.50). In this illustration, the actual expenses paid this period are $64.50.
Hypothetical Example for Comparison with Other Funds
Under the heading “Hypothetical” in the table, information is provided about hypothetical account values and hypothetical expenses based on the Fund’s actual expense ratio and an assumed rate of return of 5% per year before expenses, which is not the Fund’s actual return. This information may not be used to estimate the actual ending account balance or expenses you paid for the period, but it can help you compare ongoing costs of investing in the Fund with those of other funds. To do so, compare this 5% hypothetical example for the class of shares you hold with the 5% hypothetical examples that appear in the shareholder reports of other funds.
Please note that expenses shown in the table are meant to highlight ongoing costs and do not reflect any transactional costs. Therefore, information under the heading “Hypothetical” is useful in comparing ongoing costs only, and will not help you compare total costs of owning different funds. In addition, if transactional costs were included, your total costs would have been higher.
Actual (actual return after expenses) | Hypothetical (5% annual return before expenses) | |||||||||||||||||
|
| |||||||||||||||||
| Share Class | Beginning Account Value 5/1/17 | Ending Account Value 10/31/17 | Expenses Period | Ending Account Value 10/31/17 | Expenses Paid During | Net Annualized Expense Ratio2 | ||||||||||||
|
|
|
| |||||||||||||||
| A | $1,000 | $1,018.90 | $4.33 | $1,020.92 | $4.33 | 0.85% | ||||||||||||
| C | $1,000 | $1,015.80 | $6.35 | $1,018.90 | $6.36 | 1.25% | ||||||||||||
| R | $1,000 | $1,016.70 | $5.59 | $1,019.66 | $5.60 | 1.10% | ||||||||||||
| R6 | $1,000 | $1,020.10 | $2.19 | $1,023.04 | $2.19 | 0.43% | ||||||||||||
| Advisor | $1,000 | $1,020.20 | $3.06 | $1,022.18 | $3.06 | 0.60% | ||||||||||||
1. Expenses are equal to the annualized expense ratio for the six-month period as indicated above—in the far right column—multiplied by the simple average account value over the period indicated, and then multiplied by 184/365 to reflect the one-half year period.
2. Reflects expenses after fee waivers and expense reimbursements. Does not include acquired fund fees and expenses.
| 8 | Semiannual Report | franklintempleton.com | ||
FRANKLIN STRATEGIC SERIES
Consolidated Financial Highlights
Franklin Strategic Income Fund
| Six Months Ended October 31, 2017 | Year Ended April 30, | |||||||||||||||||||||||
|
| |||||||||||||||||||||||
| (unaudited) | 2017 | 2016 | 2015 | 2014 | 2013 | |||||||||||||||||||
| ||||||||||||||||||||||||
Class A | ||||||||||||||||||||||||
| Per share operating performance (for a share outstanding throughout the period) | ||||||||||||||||||||||||
Net asset value, beginning of period | $ 9.84 | $ 9.32 | $10.04 | $10.57 | $10.86 | $10.48 | ||||||||||||||||||
|
| |||||||||||||||||||||||
Income from investment operationsa: | ||||||||||||||||||||||||
Net investment incomeb | 0.19 | 0.39 | 0.42 | 0.42 | 0.44 | 0.45 | ||||||||||||||||||
Net realized and unrealized gains (losses) | (— | )c | 0.30 | (0.74) | (0.30) | (0.18 | ) | 0.54 | ||||||||||||||||
|
| |||||||||||||||||||||||
Total from investment operations | 0.19 | 0.69 | (0.32 | ) | 0.12 | 0.26 | 0.99 | |||||||||||||||||
|
| |||||||||||||||||||||||
Less distributions from: | ||||||||||||||||||||||||
Net investment income and net foreign currency gains | (0.13 | ) | (0.17 | ) | (0.40 | ) | (0.55 | ) | (0.45 | ) | (0.57 | ) | ||||||||||||
Net realized gains | — | — | — | (0.10 | ) | (0.10 | ) | (0.04 | ) | |||||||||||||||
|
| |||||||||||||||||||||||
Total distributions | (0.13 | ) | (0.17 | ) | (0.40 | ) | (0.65 | ) | (0.55 | ) | (0.61 | ) | ||||||||||||
|
| |||||||||||||||||||||||
Net asset value, end of period | $ 9.90 | $ 9.84 | $ 9.32 | $10.04 | $10.57 | $10.86 | ||||||||||||||||||
|
| |||||||||||||||||||||||
Total returnd | 1.89% | 7.50% | (3.14)% | 1.16% | 2.52% | 9.70% | ||||||||||||||||||
| Ratios to average net assetse | ||||||||||||||||||||||||
Expenses before waiver and payments by affiliates | 0.90% | 0.88% | 0.88% | 0.86% | 0.86% | 0.87% | ||||||||||||||||||
Expenses net of waiver and payments by affiliatesf | 0.85% | 0.82% | 0.84% | 0.85% | 0.86%g | 0.87% | ||||||||||||||||||
Net investment income | 3.77% | 4.08% | 4.44% | 4.03% | 4.16% | 4.21% | ||||||||||||||||||
| Supplemental data | ||||||||||||||||||||||||
Net assets, end of period (000’s) | $3,624,769 | $3,833,786 | $4,500,752 | $5,242,844 | $5,182,490 | $4,966,834 | ||||||||||||||||||
Portfolio turnover rate | 52.73% | 140.83% | 88.04% | 72.51% | 54.11% | 47.27% | ||||||||||||||||||
Portfolio turnover rate excluding mortgage dollar rollsh | 19.54% | 87.33% | 48.33% | 49.36% | 54.11% | 44.33% | ||||||||||||||||||
aThe amount shown for a share outstanding throughout the period may not correlate with the Consolidated Statement of Operations for the period due to the timing of sales and repurchases of the Fund’s shares in relation to income earned and/or fluctuating fair value of the investments of the Fund.
bBased on average daily shares outstanding.
cAmount rounds to less than $0.01 per share.
dTotal return does not reflect sales commissions or contingent deferred sales charges, if applicable and is not annualized for periods less than one year.
eRatios are annualized for periods less than one year, except for non-recurring expenses, if any.
fBenefit of expense reduction rounds to less than 0.01%.
gBenefit of waiver and payments by affiliates rounds to less than 0.01%.
hSee Note 1(h) regarding mortgage dollar rolls.
| franklintempleton.com | The accompanying notes are an integral part of these consolidated financial statements. | Semiannual Report | 9 | ||
FRANKLIN STRATEGIC SERIES
CONSOLIDATED FINANCIAL HIGHLIGHTS
Franklin Strategic Income Fund (continued)
| Six Months Ended October 31, 2017 | Year Ended April 30, | |||||||||||||||||||||||
| (unaudited) | 2017 | 2016 | 2015 | 2014 | 2013 | |||||||||||||||||||
Class C | ||||||||||||||||||||||||
| Per share operating performance (for a share outstanding throughout the period) | ||||||||||||||||||||||||
Net asset value, beginning of period | $ 9.84 | $ 9.31 | $10.04 | $10.57 | $10.85 | $10.48 | ||||||||||||||||||
Income from investment operationsa: | ||||||||||||||||||||||||
Net investment incomeb | 0.17 | 0.35 | 0.38 | 0.38 | 0.40 | 0.41 | ||||||||||||||||||
Net realized and unrealized gains (losses) | (— | )c | 0.31 | (0.75 | ) | (0.30 | ) | (0.17 | ) | 0.53 | ||||||||||||||
Total from investment operations | 0.17 | 0.66 | (0.37 | ) | 0.08 | 0.23 | 0.94 | |||||||||||||||||
Less distributions from: | ||||||||||||||||||||||||
Net investment income and net foreign currency gains | (0.11 | ) | (0.13) | (0.36 | ) | (0.51 | ) | (0.41 | ) | (0.53 | ) | |||||||||||||
Net realized gains | — | — | — | (0.10 | ) | (0.10 | ) | (0.04 | ) | |||||||||||||||
Total distributions | (0.11 | ) | (0.13 | ) | (0.36 | ) | (0.61 | ) | (0.51 | ) | (0.57 | ) | ||||||||||||
Net asset value, end of period | $ 9.90 | $ 9.84 | $ 9.31 | $10.04 | $10.57 | $10.85 | ||||||||||||||||||
Total returnd | 1.58% | 7.19% | (3.64)% | 0.76% | 2.20% | 9.17% | ||||||||||||||||||
| Ratios to average net assetse | ||||||||||||||||||||||||
Expenses before waiver and payments by affiliates | 1.30% | 1.28% | 1.28% | 1.26% | 1.26% | 1.27% | ||||||||||||||||||
Expenses net of waiver and payments by affiliatesf | 1.25% | 1.22% | 1.24% | 1.25% | 1.26% | g | 1.27% | |||||||||||||||||
Net investment income | 3.37% | 3.68% | 4.04% | 3.63% | 3.76% | 3.81% | ||||||||||||||||||
| Supplemental data | ||||||||||||||||||||||||
Net assets, end of period (000’s) | $1,234,019 | $1,385,981 | $1,645,852 | $2,070,739 | $2,109,049 | $2,108,962 | ||||||||||||||||||
Portfolio turnover rate | 52.73% | 140.83% | 88.04% | 72.51% | 54.11% | 47.27% | ||||||||||||||||||
Portfolio turnover rate excluding mortgage dollar rollsh | 19.54% | 87.33% | 48.33% | 49.36% | 54.11% | 44.33% | ||||||||||||||||||
aThe amount shown for a share outstanding throughout the period may not correlate with the Consolidated Statement of Operations for the period due to the timing of sales and repurchases of the Fund’s shares in relation to income earned and/or fluctuating fair value of the investments of the Fund.
bBased on average daily shares outstanding.
cAmount rounds to less than $0.01 per share.
dTotal return does not reflect sales commissions or contingent deferred sales charges, if applicable and is not annualized for periods less than one year.
eRatios are annualized for periods less than one year, except for non-recurring expenses, if any.
fBenefit of expense reduction rounds to less than 0.01%.
gBenefit of waiver and payments by affiliates rounds to less than 0.01%.
hSee Note 1(h) regarding mortgage dollar rolls.
| 10 | Semiannual Report | The accompanying notes are an integral part of these consolidated financial statements. | franklintempleton.com | ||
FRANKLIN STRATEGIC SERIES
CONSOLIDATED FINANCIAL HIGHLIGHTS
Franklin Strategic Income Fund (continued)
| Six Months Ended October 31, 2017 | Year Ended April 30, | |||||||||||||||||||||
| (unaudited) | 2017 | 2016 | 2015 | 2014 | 2013 | |||||||||||||||||
Class R | ||||||||||||||||||||||
| Per share operating performance (for a share outstanding throughout the period) | ||||||||||||||||||||||
Net asset value, beginning of period | $ 9.81 | $ 9.28 | $10.01 | $10.54 | $10.82 | $10.45 | ||||||||||||||||
Income from investment operationsa: | ||||||||||||||||||||||
Net investment incomeb | 0.17 | 0.37 | 0.39 | 0.39 | 0.41 | 0.42 | ||||||||||||||||
Net realized and unrealized gains (losses) | (0.01) | 0.31 | (0.74 | ) | (0.29 | ) | (0.17 | ) | 0.53 | |||||||||||||
Total from investment operations | 0.16 | 0.68 | (0.35 | ) | 0.10 | 0.24 | 0.95 | |||||||||||||||
Less distributions from: | ||||||||||||||||||||||
Net investment income and net foreign currency gains | (0.11) | (0.15 | ) | (0.38 | ) | (0.53 | ) | (0.42 | ) | (0.54 | ) | |||||||||||
Net realized gains | — | — | — | (0.10 | ) | (0.10 | ) | (0.04 | ) | |||||||||||||
Total distributions | (0.11) | (0.15 | ) | (0.38 | ) | (0.63 | ) | (0.52 | ) | (0.58 | ) | |||||||||||
Net asset value, end of period | $ 9.86 | $ 9.81 | $ 9.28 | $10.01 | $10.54 | $10.82 | ||||||||||||||||
Total returnc | 1.67% | 7.38% | (3.50 | )% | 0.91% | 2.36% | 9.36% | |||||||||||||||
| Ratios to average net assetsd | ||||||||||||||||||||||
Expenses before waiver and payments by affiliates | 1.15% | 1.13% | 1.13% | 1.11% | 1.11% | 1.12% | ||||||||||||||||
Expenses net of waiver and payments by affiliatese | 1.10% | 1.07% | 1.09% | 1.10% | 1.11%f | 1.12% | ||||||||||||||||
Net investment income | 3.52% | 3.83% | 4.19% | 3.78% | 3.91% | 3.96% | ||||||||||||||||
| Supplemental data | ||||||||||||||||||||||
Net assets, end of period (000’s) | $125,715 | $ | 146,552 | $ | 181,671 | $ | 223,758 | $ | 227,359 | $ | 260,647 | |||||||||||
Portfolio turnover rate | 52.73% | 140.83% | 88.04% | 72.51% | 54.11% | 47.27% | ||||||||||||||||
Portfolio turnover rate excluding mortgage dollar rollsg | 19.54% | 87.33% | 48.33% | 49.36% | 54.11% | 44.33% | ||||||||||||||||
aThe amount shown for a share outstanding throughout the period may not correlate with the Consolidated Statement of Operations for the period due to the timing of sales and repurchases of the Fund’s shares in relation to income earned and/or fluctuating fair value of the investments of the Fund.
bBased on average daily shares outstanding.
cTotal return is not annualized for periods less than one year.
dRatios are annualized for periods less than one year, except for non-recurring expenses, if any.
eBenefit of expense reduction rounds to less than 0.01%.
fBenefit of waiver and payments by affiliates rounds to less than 0.01%.
gSee Note 1(h) regarding mortgage dollar rolls.
| franklintempleton.com | The accompanying notes are an integral part of these consolidated financial statements. | Semiannual Report | 11 | ||
FRANKLIN STRATEGIC SERIES
CONSOLIDATED FINANCIAL HIGHLIGHTS
Franklin Strategic Income Fund (continued)
| Six Months Ended October 31, 2017 | Year Ended April 30, | |||||||||||||||
| (unaudited) | 2017 | 2016 | 2015 | 2014a | ||||||||||||
Class R6 | ||||||||||||||||
| Per share operating performance (for a share outstanding throughout the period) | ||||||||||||||||
Net asset value, beginning of period | $ 9.86 | $ 9.33 | $10.05 | $10.58 | $10.87 | |||||||||||
Income from investment operationsb: | ||||||||||||||||
Net investment incomec | 0.21 | 0.43 | 0.46 | 0.46 | 0.49 | |||||||||||
Net realized and unrealized gains (losses) | (0.01) | 0.31 | (0.74 | ) | (0.30 | ) | (0.19) | |||||||||
Total from investment operations | 0.20 | 0.74 | (0.28 | ) | 0.16 | 0.30 | ||||||||||
Less distributions from: | ||||||||||||||||
Net investment income and net foreign currency gains | (0.15) | (0.21 | ) | (0.44 | ) | (0.59 | ) | (0.49) | ||||||||
Net realized gains | — | — | — | (0.10 | ) | (0.10) | ||||||||||
Total distributions | (0.15) | (0.21 | ) | (0.44 | ) | (0.69 | ) | (0.59) | ||||||||
Net asset value, end of period | $ 9.91 | $ 9.86 | $ 9.33 | $10.05 | $10.58 | |||||||||||
Total returnd | 2.01% | 8.03% | (2.76)% | 1.54% | 2.90% | |||||||||||
| Ratios to average net assetse | ||||||||||||||||
Expenses before waiver and payments by affiliates | 0.48% | 0.48% | 0.49% | 0.48% | 0.48% | |||||||||||
Expenses net of waiver and payments by affiliatesf | 0.43% | 0.42% | 0.45% | 0.47% | 0.48%g | |||||||||||
Net investment income | 4.19% | 4.48% | 4.83% | 4.41% | 4.54% | |||||||||||
| Supplemental data | ||||||||||||||||
Net assets, end of period (000’s) | $346,033 | $369,106 | $ | 286,503 | $ | 253,929 | $247,007 | |||||||||
Portfolio turnover rate | 52.73% | 140.83% | 88.04% | 72.51% | 54.11% | |||||||||||
Portfolio turnover rate excluding mortgage dollar rollsh | 19.54% | 87.33% | 48.33% | 49.36% | 54.11% | |||||||||||
aFor the year May 1, 2013 (effective date) to April 30, 2014.
bThe amount shown for a share outstanding throughout the period may not correlate with the Consolidated Statement of Operations for the period due to the timing of sales and repurchases of the Fund’s shares in relation to income earned and/or fluctuating fair value of the investments of the Fund.
cBased on average daily shares outstanding.
dTotal return is not annualized for periods less than one year.
eRatios are annualized for periods less than one year, except for non-recurring expenses, if any.
fBenefit of expense reduction rounds to less than 0.01%.
gBenefit of waiver and payments by affiliates rounds to less than 0.01%.
hSee Note 1(h) regarding mortgage dollar rolls.
| 12 | Semiannual Report | The accompanying notes are an integral part of these consolidated financial statements. | franklintempleton.com | ||
FRANKLIN STRATEGIC SERIES
CONSOLIDATED FINANCIAL HIGHLIGHTS
Franklin Strategic Income Fund (continued)
| Six Months Ended October 31, 2017 | Year Ended April 30, | |||||||||||||||||||||
| (unaudited) | 2017 | 2016 | 2015 | 2014 | 2013 | |||||||||||||||||
Advisor Class | ||||||||||||||||||||||
| Per share operating performance (for a share outstanding throughout the period) | ||||||||||||||||||||||
Net asset value, beginning of period | $ 9.85 | $ 9.33 | $10.05 | $10.58 | $10.86 | $10.49 | ||||||||||||||||
Income from investment operationsa: | ||||||||||||||||||||||
Net investment incomeb | 0.20 | 0.42 | 0.44 | 0.44 | 0.47 | 0.48 | ||||||||||||||||
Net realized and unrealized gains (losses) | (—)c | 0.30 | (0.74 | ) | (0.29 | ) | (0.17 | ) | 0.53 | |||||||||||||
Total from investment operations | 0.20 | 0.72 | (0.30 | ) | 0.15 | 0.30 | 1.01 | |||||||||||||||
Less distributions from: | ||||||||||||||||||||||
Net investment income and net foreign currency gains | (0.14) | (0.20 | ) | (0.42 | ) | (0.58 | ) | (0.48 | ) | (0.60 | ) | |||||||||||
Net realized gains | — | — | — | (0.10 | ) | (0.10 | ) | (0.04 | ) | |||||||||||||
Total distributions | (0.14) | (0.20 | ) | (0.42 | ) | (0.68 | ) | (0.58 | ) | (0.64 | ) | |||||||||||
Net asset value, end of period | $ 9.91 | $ 9.85 | $ 9.33 | $10.05 | $10.58 | $10.86 | ||||||||||||||||
Total returnd | 2.02% | 7.76% | (2.89)% | 1.41% | 2.87% | 9.87% | ||||||||||||||||
| Ratios to average net assetse | ||||||||||||||||||||||
Expenses before waiver and payments by | 0.65% | 0.63% | 0.63% | 0.61% | 0.61% | 0.62% | ||||||||||||||||
Expenses net of waiver and payments by | 0.60% | 0.57% | 0.59% | 0.60% | 0.61% | g | 0.62% | |||||||||||||||
Net investment income | 4.02% | 4.33% | 4.69% | 4.28% | 4.41% | 4.46% | ||||||||||||||||
| Supplemental data | ||||||||||||||||||||||
Net assets, end of period (000’s) | $1,079,820 | $ | 1,070,103 | $ | 904,899 | $ | 1,130,796 | $ | 1,010,755 | $ | 956,001 | |||||||||||
Portfolio turnover rate | 52.73% | 140.83% | 88.04% | 72.51% | 54.11% | 47.27% | ||||||||||||||||
Portfolio turnover rate excluding mortgage | 19.54% | 87.33% | 48.33% | 49.36% | 54.11% | 44.33% | ||||||||||||||||
aThe amount shown for a share outstanding throughout the period may not correlate with the Consolidated Statement of Operations for the period due to the timing of sales and repurchases of the Fund’s shares in relation to income earned and/or fluctuating fair value of the investments of the Fund.
bBased on average daily shares outstanding.
cAmount rounds to less than $0.01 per share.
dTotal return is not annualized for periods less than one year.
eRatios are annualized for periods less than one year, except for non-recurring expenses, if any.
fBenefit of expense reduction rounds to less than 0.01%.
gBenefit of waiver and payments by affiliates rounds to less than 0.01%.
hSee Note 1(h) regarding mortgage dollar rolls.
| franklintempleton.com | The accompanying notes are an integral part of these consolidated financial statements. | Semiannual Report | 13 | ||
FRANKLIN STRATEGIC SERIES
Consolidated Statement of Investments, October 31, 2017 (unaudited)
Franklin Strategic Income Fund
| Country | Shares/ Warrants | Value | ||||||||||
Common Stocks and Other Equity Interests 1.1% |
| |||||||||||
Consumer Services 0.4% | ||||||||||||
a,aa,ab Turtle Bay Resort | United States | 5,579,939 | $ | 25,946,719 | ||||||||
|
| |||||||||||
Energy 0.6% | ||||||||||||
a Chaparral Energy Inc., A | United States | 448,417 | 10,739,587 | |||||||||
a,b Chaparral Energy Inc., A, 144A | United States | 3,418 | 81,861 | |||||||||
a Chaparral Energy Inc., B | United States | 94,305 | 2,258,605 | |||||||||
a,c CHC Group LLC | Cayman Islands | 168,355 | 1,346,840 | |||||||||
a Energy XXI Gulf Coast Inc. | United States | 244,178 | 2,087,722 | |||||||||
a Energy XXI Gulf Coast Inc., wts., 12/30/21 | United States | 47,227 | 9,445 | |||||||||
a Halcon Resources Corp. | United States | 955,276 | 6,285,716 | |||||||||
a Halcon Resources Corp., wts., 9/09/20 | United States | 75,770 | 37,885 | |||||||||
a Linn Energy Inc. | United States | 239,823 | 9,245,177 | |||||||||
a Midstates Petroleum Co. Inc. | United States | 6,826 | 104,097 | |||||||||
a,ab Midstates Petroleum Co. Inc., wts., 4/21/20 | United States | 48,362 | 3,237 | |||||||||
a Penn Virginia Corp. | United States | 145,654 | 5,676,136 | |||||||||
|
| |||||||||||
|
37,876,308 |
| ||||||||||
|
| |||||||||||
Materials 0.1% | ||||||||||||
a Verso Corp., A | United States | 38,905 | 272,724 | |||||||||
a Verso Corp., wts., 7/25/23 | United States | 4,095 | 41 | |||||||||
Warrior Met Coal Inc. | United States | 78,024 | 2,030,184 | |||||||||
|
| |||||||||||
|
2,302,949 |
| ||||||||||
|
| |||||||||||
Retailing 0.0%† | ||||||||||||
a,ab,d Holdco 2, A | South Africa | 125,940,079 | 89,153 | |||||||||
a,ab,d Holdco 2, B | South Africa | 12,532,821 | 8,872 | |||||||||
|
| |||||||||||
|
98,025 |
| ||||||||||
|
| |||||||||||
Transportation 0.0%† | ||||||||||||
a CEVA Holdings LLC | United States | 1,570 | 635,838 | |||||||||
|
| |||||||||||
Total Common Stocks and Other Equity Interests |
| |||||||||||
(Cost $126,344,481) |
| 66,859,839 | ||||||||||
|
| |||||||||||
Management Investment Companies 7.5% |
| |||||||||||
Diversified Financials 7.5% | ||||||||||||
e Franklin Lower Tier Floating Rate Fund | United States | 25,361,119 | 264,262,857 | |||||||||
e Franklin Middle Tier Floating Rate Fund | United States | 21,833,687 | 214,406,811 | |||||||||
|
| |||||||||||
Total Management Investment Companies |
| |||||||||||
(Cost $470,958,729) |
| 478,669,668 | ||||||||||
|
| |||||||||||
Convertible Preferred Stocks 0.0%† |
| |||||||||||
Transportation 0.0%† | ||||||||||||
a,ab CEVA Holdings LLC, cvt. pfd., A-1 | United States | 62 | 34,100 | |||||||||
a CEVA Holdings LLC, cvt. pfd., A-2 | United States | 3,399 | 1,376,417 | |||||||||
|
| |||||||||||
Total Convertible Preferred Stocks |
| |||||||||||
(Cost $5,149,789) |
| 1,410,517 | ||||||||||
|
| |||||||||||
| 14 | Semiannual Report | franklintempleton.com | ||
FRANKLIN STRATEGIC SERIES
CONSOLIDATED STATEMENT OF INVESTMENTS (UNAUDITED)
Franklin Strategic Income Fund (continued)
| Country | Principal Amount* | Value | ||||||||||||||
Convertible Bonds (Cost $16,016,242) 0.2% |
| |||||||||||||||
Energy 0.2% | ||||||||||||||||
CHC Group LLC/CHC Finance Ltd., cvt., secured note, zero cpn., 10/01/20 | Cayman Islands | 8,657,428 | $ | 12,553,271 | ||||||||||||
|
| |||||||||||||||
Corporate Bonds 47.9% |
| |||||||||||||||
Automobiles & Components 0.5% |
| |||||||||||||||
Fiat Chrysler Automobiles NV, senior note, 5.25%, 4/15/23 | United Kingdom | 10,000,000 | 10,646,350 | |||||||||||||
Ford Motor Credit Co. LLC, senior note, 3.096%, 5/04/23 | United States | 4,600,000 | 4,598,301 | |||||||||||||
The Goodyear Tire & Rubber Co., | ||||||||||||||||
senior bond, 5.00%, 5/31/26 | United States | 16,000,000 | 16,460,000 | |||||||||||||
senior note, 5.125%, 11/15/23 | United States | 2,900,000 | 2,997,875 | |||||||||||||
|
| |||||||||||||||
| 34,702,526 | ||||||||||||||||
|
| |||||||||||||||
Banks 4.4% | ||||||||||||||||
Bank of America Corp., | ||||||||||||||||
senior note, 5.65%, 5/01/18 | United States | 5,000,000 | 5,096,840 | |||||||||||||
senior note, 3.50%, 4/19/26 | United States | 46,000,000 | 46,908,379 | |||||||||||||
f senior note, Reg S, 7.75%, 4/30/18 | United States | 3,700,000 | GBP | 5,083,711 | ||||||||||||
CIT Group Inc., | ||||||||||||||||
senior note, 5.375%, 5/15/20 | United States | 447,000 | 480,525 | |||||||||||||
senior note, 5.00%, 8/15/22 | United States | 14,817,000 | 15,965,317 | |||||||||||||
Citigroup Inc., | ||||||||||||||||
senior note, 3.875%, 10/25/23 | United States | 20,000,000 | 20,951,013 | |||||||||||||
senior note, 3.30%, 4/27/25 | United States | 2,500,000 | 2,535,087 | |||||||||||||
senior note, 3.40%, 5/01/26 | United States | 23,300,000 | 23,552,608 | |||||||||||||
sub. bond, 5.50%, 9/13/25 | United States | 10,000,000 | 11,303,532 | |||||||||||||
sub. note, 4.05%, 7/30/22 | United States | 5,000,000 | 5,259,008 | |||||||||||||
JPMorgan Chase & Co., | ||||||||||||||||
g junior sub. bond, R, 6.00% to 8/01/23, FRN thereafter, Perpetual | United States | 10,000,000 | 11,050,000 | |||||||||||||
g junior sub. bond, X, 6.10% to 10/01/24, FRN thereafter, Perpetual | United States | 5,000,000 | 5,581,250 | |||||||||||||
senior bond, 3.30%, 4/01/26 | United States | 10,000,000 | 10,086,834 | |||||||||||||
senior bond, 3.20%, 6/15/26 | United States | 7,000,000 | 7,000,640 | |||||||||||||
senior note, 4.25%, 10/15/20 | United States | 10,000,000 | 10,577,106 | |||||||||||||
senior note, 3.25%, 9/23/22 | United States | 5,000,000 | 5,148,282 | |||||||||||||
sub. note, 3.375%, 5/01/23 | United States | 10,000,000 | 10,262,084 | |||||||||||||
sub. note, 3.875%, 9/10/24 | United States | 10,000,000 | 10,446,749 | |||||||||||||
Royal Bank of Scotland Group PLC, sub. note, 5.125%, 5/28/24 | United Kingdom | 7,600,000 | 8,130,062 | |||||||||||||
Wells Fargo & Co., | ||||||||||||||||
g junior sub. bond, S, 5.90% to 6/15/24, FRN thereafter, Perpetual | United States | 21,000,000 | 23,053,800 | |||||||||||||
senior note, 2.60%, 7/22/20 | United States | 10,000,000 | 10,136,209 | |||||||||||||
senior note, 3.00%, 4/22/26 | United States | 36,000,000 | 35,343,548 | |||||||||||||
|
| |||||||||||||||
| 283,952,584 | ||||||||||||||||
|
| |||||||||||||||
Capital Goods 1.2% | ||||||||||||||||
Aircastle Ltd., senior note, 4.125%, 5/01/24 | United States | 25,500,000 | 26,137,500 | |||||||||||||
b Beacon Escrow Corp., senior note, 144A, 4.875%, 11/01/25 | United States | 11,000,000 | 11,206,250 | |||||||||||||
Navistar International Corp., senior bond, 8.25%, 11/01/21 | United States | 11,400,000 | 11,447,310 | |||||||||||||
b Terex Corp., senior note, 144A, 5.625%, 2/01/25 | United States | 4,600,000 | 4,904,750 | |||||||||||||
TransDigm Inc., | ||||||||||||||||
senior sub. bond, 6.50%, 5/15/25 | United States | 1,600,000 | 1,654,000 | |||||||||||||
senior sub. bond, 6.375%, 6/15/26 | United States | 2,000,000 | 2,045,000 | |||||||||||||
| franklintempleton.com | Semiannual Report | 15 | ||
FRANKLIN STRATEGIC SERIES
CONSOLIDATED STATEMENT OF INVESTMENTS (UNAUDITED)
Franklin Strategic Income Fund (continued)
| Country | Principal Amount* | Value | ||||||||||||||
Corporate Bonds (continued) | ||||||||||||||||
Capital Goods (continued) | ||||||||||||||||
b Vertiv Group Corp., senior note, 144A, 9.25%, 10/15/24 | United States | 16,900,000 | $ | 18,590,000 | ||||||||||||
|
| |||||||||||||||
| 75,984,810 | ||||||||||||||||
|
| |||||||||||||||
Commercial & Professional Services 0.6% | ||||||||||||||||
b West Corp., senior note, 144A, 8.50%, 10/15/25 | United States | 17,300,000 | 17,008,063 | |||||||||||||
United Rentals North America Inc., senior bond, 5.875%, 9/15/26 | United States | 20,500,000 | 22,434,687 | |||||||||||||
|
| |||||||||||||||
| 39,442,750 | ||||||||||||||||
|
| |||||||||||||||
Consumer Durables & Apparel 1.1% | ||||||||||||||||
b Hanesbrands Inc., senior bond, 144A, 4.875%, 5/15/26 | United States | 25,100,000 | 25,978,500 | |||||||||||||
KB Home, | ||||||||||||||||
senior bond, 7.50%, 9/15/22 | United States | 5,000,000 | 5,812,500 | |||||||||||||
senior note, 7.00%, 12/15/21 | United States | 10,000,000 | 11,325,000 | |||||||||||||
PulteGroup Inc., senior bond, 5.00%, 1/15/27 | United States | 24,600,000 | 26,014,500 | |||||||||||||
|
| |||||||||||||||
| 69,130,500 | ||||||||||||||||
|
| |||||||||||||||
Consumer Services 1.9% | ||||||||||||||||
b 1011778 BC ULC/New Red Finance Inc., | ||||||||||||||||
secured note, second lien, 144A, 5.00%, 10/15/25 | Canada | 11,500,000 | 11,730,000 | |||||||||||||
senior secured note, first lien, 144A, 4.25%, 5/15/24 | Canada | 9,000,000 | 9,087,300 | |||||||||||||
b International Game Technology PLC, | ||||||||||||||||
senior secured bond, 144A, 6.50%, 2/15/25 | United States | 13,200,000 | 14,866,500 | |||||||||||||
senior secured note, 144A, 6.25%, 2/15/22 | United States | 15,000,000 | 16,518,750 | |||||||||||||
b KFC Holding Co./Pizza Hut Holdings LLC/Taco Bell of America LLC, | ||||||||||||||||
senior note, 144A, 5.00%, 6/01/24 | United States | 8,900,000 | 9,411,750 | |||||||||||||
senior note, 144A, 5.25%, 6/01/26 | United States | 9,100,000 | 9,692,865 | |||||||||||||
Marriott International Inc., senior bond, 3.75%, 10/01/25 | United States | 30,000,000 | 31,120,804 | |||||||||||||
b Wynn Las Vegas LLC/Wynn Las Vegas Capital Corp., senior | United States | 13,700,000 | 14,419,250 | |||||||||||||
b Wynn Macau Ltd., senior note, 144A, 4.875%, 10/01/24 | Macau | 5,200,000 | 5,299,892 | |||||||||||||
|
| |||||||||||||||
| 122,147,111 | ||||||||||||||||
|
| |||||||||||||||
Diversified Financials 2.5% | ||||||||||||||||
Capital One Financial Corp., senior note, 3.20%, 2/05/25 | United States | 20,000,000 | 19,922,865 | |||||||||||||
The Goldman Sachs Group Inc., | ||||||||||||||||
senior note, 3.50%, 1/23/25 | United States | 33,800,000 | 34,356,193 | |||||||||||||
senior note, 3.75%, 2/25/26 | United States | 15,000,000 | 15,415,010 | |||||||||||||
b Lincoln Finance Ltd., senior secured note, 144A, 6.875%, 4/15/21 | Netherlands | 8,400,000 | EUR | 10,359,268 | ||||||||||||
Morgan Stanley, | ||||||||||||||||
senior bond, 3.591% to 7/22/27, FRN thereafter, 7/22/28 | United States | 10,000,000 | 10,088,995 | |||||||||||||
senior note, 3.875%, 1/27/26 | United States | 43,100,000 | 44,987,167 | |||||||||||||
Navient Corp., | ||||||||||||||||
senior note, 5.875%, 3/25/21 | United States | 5,000,000 | 5,275,000 | |||||||||||||
senior note, 6.625%, 7/26/21 | United States | 8,000,000 | 8,590,000 | |||||||||||||
senior note, 6.125%, 3/25/24 | United States | 10,000,000 | 10,312,500 | |||||||||||||
|
| |||||||||||||||
| 159,306,998 | ||||||||||||||||
|
| |||||||||||||||
| 16 | Semiannual Report | franklintempleton.com | ||
FRANKLIN STRATEGIC SERIES
CONSOLIDATED STATEMENT OF INVESTMENTS (UNAUDITED)
Franklin Strategic Income Fund (continued)
| Country | Principal Amount* | Value | ||||||||||||
Corporate Bonds (continued) | ||||||||||||||
Energy 4.1% | ||||||||||||||
b BG Energy Capital PLC, senior note, 144A, 5.125%, 10/15/41 | United Kingdom | 600,000 | $ | 697,915 | ||||||||||
h BreitBurn Energy Partners LP/BreitBurn Finance Corp., senior bond, 7.875%, 4/15/22 | United States | 12,500,000 | 437,500 | |||||||||||
b California Resources Corp., secured note, second lien, 144A, 8.00%, 12/15/22 | United States | 7,852,000 | 5,231,395 | |||||||||||
b Calumet Specialty Products Partners LP/Calumet Finance Corp., senior note, 144A, 11.50%, 1/15/21 | United States | 8,900,000 | 10,290,625 | |||||||||||
Cheniere Corpus Christi Holdings LLC, | ||||||||||||||
senior secured note, first lien, 7.00%, 6/30/24 | United States | 8,800,000 | 10,087,000 | |||||||||||
senior secured note, first lien, 5.875%, 3/31/25 | United States | 8,200,000 | 8,907,250 | |||||||||||
b Cheniere Energy Partners LP, senior secured note, first lien, 144A, 5.25%, 10/01/25 | United States | 11,900,000 | 12,286,750 | |||||||||||
CONSOL Energy Inc., senior note, 5.875%, 4/15/22 | United States | 20,000,000 | 20,500,000 | |||||||||||
Energy Transfer Equity LP, senior note, first lien, 7.50%, 10/15/20 | United States | 11,000,000 | 12,430,000 | |||||||||||
Energy Transfer Partners LP, senior note, 5.20%, 2/01/22 | United States | 10,000,000 | 10,887,484 | |||||||||||
b,i EnQuest PLC, senior note, 144A, PIK, 7.00%, 10/15/23 | United Kingdom | 12,420,408 | 8,866,807 | |||||||||||
Enterprise Products Operating LLC, senior bond, 6.125%, 10/15/39 | United States | 200,000 | 250,483 | |||||||||||
Exxon Mobil Corp., senior bond, 4.114%, 3/01/46 | United States | 1,900,000 | 2,072,862 | |||||||||||
b,j Gaz Capital SA (OJSC Gazprom), loan participation, senior note, 144A, 3.85%, 2/06/20 | Russia | 20,000,000 | 20,327,900 | |||||||||||
Kinder Morgan Inc., | ||||||||||||||
senior bond, 4.30%, 6/01/25 | United States | 17,000,000 | 17,876,363 | |||||||||||
senior note, 3.15%, 1/15/23 | United States | 9,000,000 | 9,062,755 | |||||||||||
Martin Midstream Partners LP/Martin Midstream Finance Corp., senior note, 7.25%, 2/15/21 | United States | 20,000,000 | 20,450,000 | |||||||||||
Oceaneering International Inc., senior note, 4.65%, 11/15/24 | United States | 2,100,000 | 2,089,991 | |||||||||||
Regency Energy Partners LP/Regency Energy Finance Corp., | ||||||||||||||
senior note, 5.875%, 3/01/22 | United States | 1,300,000 | 1,440,475 | |||||||||||
senior note, 5.00%, 10/01/22 | United States | 10,000,000 | 10,803,773 | |||||||||||
Sabine Pass Liquefaction LLC, | ||||||||||||||
senior secured note, first lien, 5.625%, 2/01/21 | United States | 20,000,000 | 21,707,661 | |||||||||||
senior secured note, first lien, 5.625%, 4/15/23 | United States | 6,200,000 | 6,893,071 | |||||||||||
senior secured note, first lien, 5.625%, 3/01/25 | United States | 5,000,000 | 5,562,739 | |||||||||||
Sanchez Energy Corp., senior note, 6.125%, 1/15/23 | United States | 6,000,000 | 5,040,000 | |||||||||||
b,i W&T Offshore Inc., | ||||||||||||||
secured note, second lien, 144A, PIK, 10.75%, 5/15/20 | United States | 5,050,512 | 4,523,266 | |||||||||||
senior secured note, third lien, 144A, PIK, 10.00%, 6/15/21 | United States | 4,519,777 | 3,462,420 | |||||||||||
Weatherford International Ltd., | ||||||||||||||
senior note, 7.75%, 6/15/21 | United States | 9,000,000 | 9,303,750 | |||||||||||
senior note, 8.25%, 6/15/23 | United States | 10,500,000 | 10,578,750 | |||||||||||
b Woodside Finance Ltd., | ||||||||||||||
senior bond, 144A, 3.70%, 3/15/28 | Australia | 7,100,000 | 7,139,369 | |||||||||||
senior note, 144A, 3.70%, 9/15/26 | Australia | 5,400,000 | 5,471,474 | |||||||||||
|
| |||||||||||||
| 264,679,828 | ||||||||||||||
|
| |||||||||||||
Food & Staples Retailing 0.7% | ||||||||||||||
Kroger Co., senior bond, 2.65%, 10/15/26 | United States | 15,300,000 | 14,192,452 | |||||||||||
Walgreens Boots Alliance Inc., senior note, 3.80%, 11/18/24 | United States | 30,000,000 | 30,831,495 | |||||||||||
|
| |||||||||||||
| 45,023,947 | ||||||||||||||
|
| |||||||||||||
| franklintempleton.com | Semiannual Report | 17 | ||
FRANKLIN STRATEGIC SERIES
CONSOLIDATED STATEMENT OF INVESTMENTS (UNAUDITED)
Franklin Strategic Income Fund (continued)
| Country | Principal Amount* | Value | ||||||||||||||
Corporate Bonds (continued) | ||||||||||||||||
Food, Beverage & Tobacco 1.7% | ||||||||||||||||
Anheuser-Busch InBev Finance Inc., senior note, 3.30%, 2/01/23 | Belgium | 15,700,000 | $ | 16,213,948 | ||||||||||||
Bunge Ltd. Finance Corp., senior note, 3.25%, 8/15/26 | United States | 2,000,000 | 1,944,371 | |||||||||||||
Coca-Cola Femsa SAB de CV, senior bond, 5.25%, 11/26/43 | Mexico | 1,800,000 | 2,101,465 | |||||||||||||
b Imperial Brands Finance PLC, senior note, 144A, 3.50%, 2/11/23 | United Kingdom | 20,400,000 | 20,855,909 | |||||||||||||
b JBS USA LLC/Finance Inc., senior bond, 144A, 5.875%, 7/15/24 | United States | 5,800,000 | 5,727,500 | |||||||||||||
Kraft Heinz Foods Co., senior bond, 3.00%, 6/01/26 | United States | 25,400,000 | 24,587,241 | |||||||||||||
b Lamb Weston Holdings Inc., | ||||||||||||||||
senior note, 144A, 4.625%, 11/01/24 | United States | 6,500,000 | 6,825,000 | |||||||||||||
senior note, 144A, 4.875%, 11/01/26 | United States | 16,500,000 | 17,386,875 | |||||||||||||
b Post Holdings Inc., senior note, 144A, 6.00%, 12/15/22 | United States | 10,000,000 | 10,512,500 | |||||||||||||
Reynolds American Inc., senior note, 4.45%, 6/12/25 | United Kingdom | 1,900,000 | 2,046,958 | |||||||||||||
|
| |||||||||||||||
| 108,201,767 | ||||||||||||||||
|
| |||||||||||||||
Health Care Equipment & Services 2.1% | ||||||||||||||||
Anthem Inc., senior bond, 3.30%, 1/15/23 | United States | 2,000,000 | 2,053,542 | |||||||||||||
b Avantor Inc., senior secured note, first lien, 144A, 6.00%, 10/01/24 | United States | 7,200,000 | 7,353,000 | |||||||||||||
Centene Corp., senior note, 4.75%, 5/15/22 | United States | 12,000,000 | 12,630,000 | |||||||||||||
CHS/Community Health Systems Inc., | ||||||||||||||||
senior note, 7.125%, 7/15/20 | United States | 2,000,000 | 1,742,500 | |||||||||||||
senior note, 6.875%, 2/01/22 | United States | 8,300,000 | 6,100,500 | |||||||||||||
senior secured note, first lien, 6.25%, 3/31/23 | United States | 3,900,000 | 3,758,625 | |||||||||||||
DaVita Inc., | ||||||||||||||||
senior bond, 5.125%, 7/15/24 | United States | 10,000,000 | 10,043,750 | |||||||||||||
senior bond, 5.00%, 5/01/25 | United States | 9,300,000 | 9,183,750 | |||||||||||||
HCA Inc., | ||||||||||||||||
senior bond, 5.875%, 5/01/23 | United States | 15,000,000 | 16,106,250 | |||||||||||||
senior bond, 5.875%, 2/15/26 | United States | 3,000,000 | 3,161,250 | |||||||||||||
senior secured bond, first lien, 5.875%, 3/15/22 | United States | 5,000,000 | 5,487,500 | |||||||||||||
senior secured bond, first lien, 5.25%, 4/15/25 | United States | 10,000,000 | 10,675,000 | |||||||||||||
senior secured bond, first lien, 5.50%, 6/15/47 | United States | 12,000,000 | 12,240,000 | |||||||||||||
b MPH Acquisition Holdings LLC, senior note, 144A, 7.125%, 6/01/24 | United States | 11,100,000 | 11,974,125 | |||||||||||||
Stryker Corp., senior bond, 3.50%, 3/15/26 | United States | 4,800,000 | 4,960,261 | |||||||||||||
Tenet Healthcare Corp., | ||||||||||||||||
senior note, 5.50%, 3/01/19 | United States | 7,000,000 | 7,131,250 | |||||||||||||
senior note, 8.125%, 4/01/22 | United States | 5,000,000 | 5,025,000 | |||||||||||||
senior note, 6.75%, 6/15/23 | United States | 2,700,000 | 2,544,750 | |||||||||||||
|
| |||||||||||||||
| 132,171,053 | ||||||||||||||||
|
| |||||||||||||||
Insurance 1.0% | ||||||||||||||||
MetLife Inc., | ||||||||||||||||
senior note, 3.60%, 4/10/24 | United States | 12,300,000 | 12,935,560 | |||||||||||||
senior note, 3.00%, 3/01/25 | United States | 2,400,000 | 2,413,096 | |||||||||||||
b Nippon Life Insurance Co., sub. bond, 144A, 5.10% to 10/16/24, FRN thereafter, 10/16/44 | Japan | 35,000,000 | 37,550,625 | |||||||||||||
Prudential Financial Inc., senior note, 3.50%, 5/15/24 | United States | 9,900,000 | 10,331,078 | |||||||||||||
|
| |||||||||||||||
| 63,230,359 | ||||||||||||||||
|
| |||||||||||||||
Materials 6.0% | ||||||||||||||||
ArcelorMittal, | ||||||||||||||||
senior note, 6.00%, 3/01/21 | France | 17,600,000 | 19,360,704 | |||||||||||||
senior note, 6.125%, 6/01/25 | France | 2,700,000 | 3,128,625 | |||||||||||||
| 18 | Semiannual Report | franklintempleton.com | ||
FRANKLIN STRATEGIC SERIES
CONSOLIDATED STATEMENT OF INVESTMENTS (UNAUDITED)
Franklin Strategic Income Fund (continued)
| Principal | ||||||||||||||
| Country | Amount* | Value | ||||||||||||
| ||||||||||||||
Corporate Bonds (continued) | ||||||||||||||
Materials (continued) | ||||||||||||||
i | ARD Finance SA, secured note, PIK, 7.125%, 9/15/23 | Luxembourg | 1,300,000 | $ | 1,392,625 | |||||||||
b | Ardagh Packaging Finance PLC/Ardagh MP Holdings USA Inc., | |||||||||||||
senior note, 144A, 6.00%, 6/30/21 | Luxembourg | 5,100,000 | 5,253,000 | |||||||||||
senior note, 144A, 6.00%, 2/15/25 | Luxembourg | 11,500,000 | 12,218,750 | |||||||||||
b | BWAY Holding Co., senior note, 144A, 7.25%, 4/15/25 | United States | 21,200,000 | 22,048,000 | ||||||||||
b | Cemex Finance LLC, senior secured note, first lien, 144A, 6.00%, 4/01/24 | Mexico | 5,800,000 | 6,146,666 | ||||||||||
b | Cemex SAB de CV, | |||||||||||||
senior secured bond, first lien, 144A, 5.70%, 1/11/25 | Mexico | 15,000,000 | 15,865,725 | |||||||||||
senior secured bond, first lien, 144A, 6.125%, 5/05/25 | Mexico | 4,000,000 | 4,268,720 | |||||||||||
b | Ceramtec Group GmbH, senior note, 144A, 8.25%, 8/15/21 | Germany | 11,900,000 | EUR | 14,637,226 | |||||||||
| The Chemours Co., senior note, 6.625%, 5/15/23 | United States | 21,000,000 | 22,365,000 | |||||||||||
b | First Quantum Minerals Ltd., | |||||||||||||
senior note, 144A, 7.00%, 2/15/21 | Zambia | 8,000,000 | 8,330,000 | |||||||||||
senior note, 144A, 7.25%, 4/01/23 | Zambia | 7,200,000 | 7,650,000 | |||||||||||
b | FMG Resources (August 2006) Pty. Ltd., senior note, 144A, 5.125%, 5/15/24 | Australia | 7,700,000 | 7,908,901 | ||||||||||
| Freeport-McMoRan Inc., senior note, 4.55%, 11/14/24 | United States | 26,000,000 | 26,065,000 | |||||||||||
b | Glencore Finance Canada Ltd., senior bond, 144A, 4.95%, 11/15/21 | Switzerland | 13,300,000 | 14,390,504 | ||||||||||
b | Glencore Funding LLC, | |||||||||||||
senior note, 144A, 4.125%, 5/30/23 | Switzerland | 5,000,000 | 5,244,621 | |||||||||||
senior note, 144A, 4.625%, 4/29/24 | Switzerland | 2,500,000 | 2,668,430 | |||||||||||
b | INVISTA Finance LLC, senior secured note, 144A, 4.25%, 10/15/19 | United States | 30,000,000 | 31,050,000 | ||||||||||
| LYB International Finance BV, senior note, 4.00%, 7/15/23 | United States | 20,400,000 | 21,577,080 | |||||||||||
b | New Gold Inc., senior note, 144A, 6.375%, 5/15/25 | Canada | 6,900,000 | 7,348,500 | ||||||||||
b | Northwest Acquisitions ULC/Dominion Finco Inc., secured note,second lien, 144A, 7.125%, 11/01/22 | United States | 3,800,000 | 3,961,500 | ||||||||||
b | Novelis Corp., senior bond, 144A, 5.875%, 9/30/26 | United States | 15,400,000 | 15,910,048 | ||||||||||
b | Owens-Brockway Glass Container Inc., | |||||||||||||
senior note, 144A, 5.00%, 1/15/22 | United States | 7,800,000 | 8,277,750 | |||||||||||
senior note, 144A, 5.875%, 8/15/23 | United States | 12,500,000 | 13,742,187 | |||||||||||
Reynolds Group Issuer Inc./Reynolds Group Issuer LLC/Reynolds Group Issuer | ||||||||||||||
b senior note, 144A, 7.00%, 7/15/24 | United States | 5,600,000 | 5,988,500 | |||||||||||
senior secured note, first lien, 5.75%, 10/15/20 | United States | 6,600,000 | 6,723,816 | |||||||||||
b senior secured note, first lien, 144A, 5.125%, 7/15/23 | United States | 5,900,000 | 6,150,750 | |||||||||||
b,k senior secured note, first lien, 144A, FRN, 4.859%, (3-month USD LIBOR + 3.50%), 7/15/21 | United States | 6,500,000 | 6,649,012 | |||||||||||
b | Sealed Air Corp., | |||||||||||||
senior bond, 144A, 5.125%, 12/01/24 | United States | 11,300,000 | 12,175,750 | |||||||||||
senior bond, 144A, 5.50%, 9/15/25 | United States | 2,600,000 | 2,873,000 | |||||||||||
senior note, 144A, 4.875%, 12/01/22 | United States | 11,300,000 | 12,020,375 | |||||||||||
b | Sociedad Quimica y Minera de Chile SA, senior note, 144A, 3.625%, 4/03/23 | Chile | 1,500,000 | 1,520,063 | ||||||||||
| Steel Dynamics Inc., | ||||||||||||||
senior bond, 5.50%, 10/01/24 | United States | 9,700,000 | 10,412,756 | |||||||||||
senior note, 5.125%, 10/01/21 | United States | 9,200,000 | 9,464,500 | |||||||||||
| franklintempleton.com | Semiannual Report | 19 | ||
FRANKLIN STRATEGIC SERIES
CONSOLIDATED STATEMENT OF INVESTMENTS (UNAUDITED)
Franklin Strategic Income Fund (continued)
| Principal | ||||||||||||||
| Country | Amount* | Value | ||||||||||||
| ||||||||||||||
Corporate Bonds (continued) | ||||||||||||||
Materials (continued) | ||||||||||||||
b | SunCoke Energy Partners LP/SunCoke Energy Partners Finance Corp., senior note, 144A, 7.50%, 6/15/25 | United States | 8,500,000 | $ | 8,967,500 | |||||||||
|
| |||||||||||||
| 383,755,584 | ||||||||||||||
|
| |||||||||||||
| Media 5.4% | ||||||||||||||
| 21st Century Fox America Inc., senior note, 3.00%, 9/15/22 | United States | 6,100,000 | 6,216,920 | |||||||||||
b | Altice U.S. Finance I Corp., senior secured bond, 144A, 5.50%, 5/15/26 | United States | 22,000,000 | 22,935,000 | ||||||||||
| AMC Networks Inc., senior note, 5.00%, 4/01/24 | United States | 18,000,000 | 18,371,250 | |||||||||||
| CCO Holdings LLC/CCO Holdings Capital Corp., | ||||||||||||||
senior bond, 5.25%, 9/30/22 | United States | 8,500,000 | 8,770,938 | |||||||||||
b senior bond, 144A, 5.375%, 5/01/25 | United States | 13,000,000 | 13,520,000 | |||||||||||
| Clear Channel Worldwide Holdings Inc., | ||||||||||||||
senior note, 6.50%, 11/15/22 | United States | 3,000,000 | 3,112,500 | |||||||||||
senior note, 6.50%, 11/15/22 | United States | 5,000,000 | 5,200,000 | |||||||||||
senior sub. note, 7.625%, 3/15/20 | United States | 900,000 | 900,000 | |||||||||||
senior sub. note, 7.625%, 3/15/20 | United States | 6,400,000 | 6,416,000 | |||||||||||
| CSC Holdings LLC, senior note, 6.75%, 11/15/21 | United States | 22,000,000 | 24,310,000 | |||||||||||
| DISH DBS Corp., | ||||||||||||||
senior bond, 5.00%, 3/15/23 | United States | 10,000,000 | 9,700,000 | |||||||||||
senior note, 6.75%, 6/01/21 | United States | 4,000,000 | 4,210,000 | |||||||||||
senior note, 5.875%, 7/15/22 | United States | 3,000,000 | 3,030,000 | |||||||||||
senior note, 5.875%, 11/15/24 | United States | 5,000,000 | 5,025,000 | |||||||||||
| iHeartCommunications Inc., | ||||||||||||||
senior secured bond, first lien, 9.00%, 3/01/21 | United States | 13,000,000 | 9,408,750 | |||||||||||
senior secured note, first lien, 9.00%, 9/15/22 | United States | 8,100,000 | 5,892,750 | |||||||||||
b | Nexstar Broadcasting Inc., senior note, 144A, 5.625%, 8/01/24 | United States | 21,300,000 | 21,912,375 | ||||||||||
b | Sirius XM Radio Inc., | |||||||||||||
senior bond, 144A, 6.00%, 7/15/24 | United States | 14,600,000 | 15,622,000 | |||||||||||
senior bond, 144A, 5.375%, 4/15/25 | United States | 10,000,000 | 10,562,500 | |||||||||||
| Tegna Inc., | ||||||||||||||
senior bond, 6.375%, 10/15/23 | United States | 12,000,000 | 12,780,000 | |||||||||||
b senior bond, 144A, 5.50%, 9/15/24 | United States | 2,800,000 | 2,950,500 | |||||||||||
senior note, 5.125%, 7/15/20 | United States | 9,800,000 | 10,057,250 | |||||||||||
| Time Warner Cable LLC, senior note, 4.00%, 9/01/21 | United States | 15,600,000 | 16,184,198 | |||||||||||
| Time Warner Inc., senior bond, 2.95%, 7/15/26 | United States | 25,400,000 | 24,128,956 | |||||||||||
b | Unitymedia Hessen GmbH & Co. KG/Unitymedia NRW GmbH, | |||||||||||||
senior secured bond, first lien, 144A, 5.75%, 1/15/23 | Germany | 2,697,300 | EUR | 3,271,221 | ||||||||||
senior secured note, first lien, 144A, 5.625%, 4/15/23 | Germany | 1,330,000 | EUR | 1,631,804 | ||||||||||
b | Unitymedia KabelBW GmbH, senior bond, 144A, 6.125%, 1/15/25 | Germany | 18,000,000 | 19,260,000 | ||||||||||
b | Univision Communications Inc., senior secured note, first lien, 144A, 5.125%, 2/15/25 | United States | 25,000,000 | 24,906,250 | ||||||||||
b | Virgin Media Finance PLC, senior bond, 144A, 6.375%, 10/15/24 | United Kingdom | 9,600,000 | GBP | 13,860,027 | |||||||||
b | Virgin Media Secured Finance PLC, senior secured bond, first lien, 144A, 5.50%, 1/15/25 | United Kingdom | 14,000,000 | 14,682,500 | ||||||||||
b | Ziggo Secured Finance BV, senior secured bond, 144A, 4.25%, 1/15/27 | Netherlands | 8,600,000 | EUR | 10,747,341 | |||||||||
|
| |||||||||||||
| 349,576,030 | ||||||||||||||
|
| |||||||||||||
| 20 | Semiannual Report | franklintempleton.com | ||
FRANKLIN STRATEGIC SERIES
CONSOLIDATED STATEMENT OF INVESTMENTS (UNAUDITED)
Franklin Strategic Income Fund (continued)
| Country | Principal Amount* | Value | ||||||||||||
| Corporate Bonds (continued) | ||||||||||||||
Pharmaceuticals, Biotechnology & Life Sciences 2.0% | ||||||||||||||
| Actavis Funding SCS, senior bond, 3.80%, 3/15/25 | United States | 25,000,000 | $ | 25,627,351 | ||||||||||
| Baxalta Inc., senior note, 4.00%, 6/23/25 | United States | 25,000,000 | 26,236,568 | |||||||||||
| Biogen Inc., senior note, 3.625%, 9/15/22 | United States | 14,900,000 | 15,614,878 | |||||||||||
l | Celgene Corp., senior bond, 3.45%, 11/15/27 | United States | 7,900,000 | 7,900,000 | ||||||||||
b,i | Eagle Holdings Co. II LLC, senior note, 144A, PIK, 7.625%, 5/15/22 | United States | 3,300,000 | 3,415,500 | ||||||||||
b | Endo DAC/Endo Finance LLC/Endo Finco Inc., | |||||||||||||
senior bond, 144A, 6.00%, 2/01/25 | United States | 11,900,000 | 9,520,000 | |||||||||||
senior note, 144A, 6.00%, 7/15/23 | United States | 5,000,000 | 4,075,000 | |||||||||||
b | Jaguar Holding Co. II/Pharmaceutical Product Development LLC, senior note, 144A, 6.375%, 8/01/23 | United States | 12,900,000 | 13,496,625 | ||||||||||
b | Valeant Pharmaceuticals International, senior note, 144A, 6.375%, 10/15/20 | United States | 9,000,000 | 8,966,250 | ||||||||||
b | Valeant Pharmaceuticals International Inc., | |||||||||||||
senior bond, 144A, 6.125%, 4/15/25 | United States | 3,100,000 | 2,615,625 | |||||||||||
senior note, 144A, 5.50%, 3/01/23 | United States | 8,000,000 | 6,740,000 | |||||||||||
senior note, first lien, 144A, 7.00%, 3/15/24 | United States | 2,100,000 | 2,278,500 | |||||||||||
|
| |||||||||||||
|
126,486,297 |
| ||||||||||||
|
| |||||||||||||
Real Estate 1.1% | ||||||||||||||
| American Tower Corp., senior bond, 3.375%, 10/15/26 | United States | 28,900,000 | 28,602,464 | |||||||||||
| Equinix Inc., senior bond, 5.375%, 4/01/23 | United States | 25,000,000 | 25,937,500 | |||||||||||
| MPT Operating Partnership LP/MPT Finance Corp., | ||||||||||||||
senior bond, 5.25%, 8/01/26 | United States | 4,200,000 | 4,393,956 | |||||||||||
senior bond, 5.00%, 10/15/27 | United States | 10,700,000 | 11,021,000 | |||||||||||
|
| |||||||||||||
|
69,954,920 |
| ||||||||||||
|
| |||||||||||||
Retailing 1.0% | ||||||||||||||
b | Amazon.com Inc., senior note, 144A, 2.80%, 8/22/24 | United States | 8,900,000 | 8,922,384 | ||||||||||
| Home Depot Inc., senior note, 2.125%, 9/15/26 | United States | 15,000,000 | 14,118,345 | |||||||||||
| JD.com Inc., senior note, 3.125%, 4/29/21 | China | 2,000,000 | 2,007,220 | |||||||||||
d,i | K2016470219 South Africa Ltd., 3.00%, senior secured note, 144A, PIK, 12/31/22 | South Africa | 9,404,450 | 279,340 | ||||||||||
d,i | K2016740260 South Africa Ltd., 25.00%, senior secured note, 144A, PIK, 12/31/22 | South Africa | 1,480,536 | 1,264,150 | ||||||||||
| Netflix Inc., | ||||||||||||||
senior bond, 5.875%, 2/15/25 | United States | 10,000,000 | 10,821,000 | |||||||||||
b senior bond, 144A, 4.375%, 11/15/26 | United States | 11,800,000 | 11,593,500 | |||||||||||
b | PetSmart Inc., senior note, 144A, 7.125%, 3/15/23 | United States | 20,000,000 | 15,300,000 | ||||||||||
|
| |||||||||||||
|
64,305,939 |
| ||||||||||||
|
| |||||||||||||
Semiconductors & Semiconductor Equipment 0.5% | ||||||||||||||
b | Broadcom Corp./Broadcom Cayman Finance Ltd., senior note, 144A, 3.875%, 1/15/27 | United States | 19,000,000 | 19,583,217 | ||||||||||
| Qorvo Inc., | ||||||||||||||
senior bond, 7.00%, 12/01/25 | United States | 4,300,000 | 4,919,415 | |||||||||||
senior note, 6.75%, 12/01/23 | United States | 10,000,000 | 10,862,500 | |||||||||||
|
| |||||||||||||
|
35,365,132 |
| ||||||||||||
|
| |||||||||||||
Software & Services 1.4% | ||||||||||||||
b | BMC Software Finance Inc., senior note, 144A, 8.125%, 7/15/21 | United States | 19,800,000 | 20,369,250 | ||||||||||
b | First Data Corp., | |||||||||||||
secured note, second lien, 144A, 5.75%, 1/15/24 | United States | 22,400,000 | 23,520,000 | |||||||||||
senior note, 144A, 7.00%, 12/01/23 | United States | 7,500,000 | 8,043,900 | |||||||||||
| franklintempleton.com | Semiannual Report | 21 | ||
FRANKLIN STRATEGIC SERIES
CONSOLIDATED STATEMENT OF INVESTMENTS (UNAUDITED)
Franklin Strategic Income Fund (continued)
Country
| Principal
| Value
| ||||||||||||
| Corporate Bonds (continued) | ||||||||||||||
| Software & Services (continued) | ||||||||||||||
| Fiserv Inc., senior bond, 3.85%, 6/01/25 | United States | 8,400,000 | $ | 8,809,722 | ||||||||||
| Infor (U.S.) Inc., senior note, 6.50%, 5/15/22 | United States | 20,000,000 | 20,996,000 | |||||||||||
b | Symantec Corp., senior note, 144A, 5.00%, 4/15/25 | United States | 8,500,000 | 8,903,750 | ||||||||||
|
| |||||||||||||
| 90,642,622 | ||||||||||||||
|
| |||||||||||||
| Technology Hardware & Equipment 0.6% | ||||||||||||||
b | CommScope Technologies LLC, senior bond, 144A, 6.00%, 6/15/25 | United States | 16,600,000 | 17,596,000 | ||||||||||
b | Dell International LLC/EMC Corp., | |||||||||||||
senior note, 144A, 5.875%, 6/15/21 | United States | 2,500,000 | 2,624,379 | |||||||||||
senior note, 144A, 7.125%, 6/15/24 | United States | 12,600,000 | 13,912,397 | |||||||||||
| Tech Data Corp., senior bond, 4.95%, 2/15/27 | United States | 1,900,000 | 1,998,531 | |||||||||||
|
| |||||||||||||
| 36,131,307 | ||||||||||||||
|
| |||||||||||||
| Telecommunication Services 3.4% | ||||||||||||||
| AT&T Inc., senior bond, 3.40%, 5/15/25 | United States | 20,000,000 | 19,803,604 | |||||||||||
| CenturyLink Inc., | ||||||||||||||
senior bond, 6.75%, 12/01/23 | United States | 3,500,000 | 3,654,000 | |||||||||||
senior bond, 5.625%, 4/01/25 | United States | 2,700,000 | 2,642,625 | |||||||||||
b | Digicel Group Ltd., | |||||||||||||
senior note, 144A, 8.25%, 9/30/20 | Bermuda | 10,000,000 | 9,937,500 | |||||||||||
senior note, 144A, 7.125%, 4/01/22 | Bermuda | 3,000,000 | 2,826,420 | |||||||||||
b | Digicel Ltd., senior note, 144A, 6.00%, 4/15/21 | Bermuda | 10,000,000 | 9,880,200 | ||||||||||
| Hughes Satellite Systems Corp., senior bond, 6.625%, 8/01/26 | United States | 17,200,000 | 18,189,000 | |||||||||||
| Intelsat Jackson Holdings SA, | ||||||||||||||
senior note, 7.25%, 10/15/20 | Luxembourg | 15,000,000 | 14,508,000 | |||||||||||
senior note, 7.50%, 4/01/21 | Luxembourg | 5,000,000 | 4,762,500 | |||||||||||
| Sprint Communications Inc., | ||||||||||||||
senior note, 6.00%, 11/15/22 | United States | 10,000,000 | 10,525,000 | |||||||||||
b senior note, 144A, 9.00%, 11/15/18 | United States | 816,000 | 865,980 | |||||||||||
b senior note, 144A, 7.00%, 3/01/20 | United States | 5,000,000 | 5,437,500 | |||||||||||
b | Sprint Spectrum Co. LLC/Sprint Spectrum Co. II LLC, first lien, 144A, 3.36%, 3/20/23 | United States | 15,800,000 | 16,068,600 | ||||||||||
| T-Mobile USA Inc., | ||||||||||||||
senior bond, 6.50%, 1/15/24 | United States | 5,000,000 | 5,350,000 | |||||||||||
senior bond, 6.375%, 3/01/25 | United States | 14,700,000 | 15,912,750 | |||||||||||
senior note, 6.125%, 1/15/22 | United States | 2,000,000 | 2,085,000 | |||||||||||
senior note, 6.00%, 4/15/24 | United States | 4,200,000 | 4,504,500 | |||||||||||
senior note, 5.125%, 4/15/25 | United States | 6,000,000 | 6,298,200 | |||||||||||
| Verizon Communications Inc., senior note, 5.15%, 9/15/23 | United States | 22,000,000 | 24,683,820 | |||||||||||
b | Wind Acquisition Finance SA, | |||||||||||||
senior secured note, 144A, 4.00%, 7/15/20 | Italy | 14,400,000 | EUR | 16,945,912 | ||||||||||
senior secured note, 144A, 7.00%, 4/23/21 | Italy | 17,300,000 | EUR | 20,916,834 | ||||||||||
|
| |||||||||||||
| 215,797,945 | ||||||||||||||
|
| |||||||||||||
| Transportation 1.4% | ||||||||||||||
b | DAE Funding LLC, | |||||||||||||
senior note, 144A, 4.50%, 8/01/22 | United Arab Emirates | 6,000,000 | 6,083,280 | |||||||||||
senior note, 144A, 5.00%, 8/01/24 | United Arab Emirates | 8,000,000 | 8,177,040 | |||||||||||
| FedEx Corp., senior bond, 3.25%, 4/01/26 | United States | 25,400,000 | 25,750,246 | |||||||||||
b | Park Aerospace Holdings Ltd., | |||||||||||||
senior note, 144A, 5.25%, 8/15/22 | Ireland | 5,000,000 | 5,200,400 | |||||||||||
senior note, 144A, 5.50%, 2/15/24 | Ireland | 17,400,000 | 18,030,750 | |||||||||||
| 22 | Semiannual Report | franklintempleton.com | ||
FRANKLIN STRATEGIC SERIES
CONSOLIDATED STATEMENT OF INVESTMENTS (UNAUDITED)
Franklin Strategic Income Fund (continued)
Country
| Principal
| Value | ||||||||||||
Corporate Bonds (continued) | ||||||||||||||
| Transportation (continued) | ||||||||||||||
b | Transurban Finance Co. Pty. Ltd., senior secured bond, 144A, 3.375%, 3/22/27 | Australia | 11,400,000 | $ | 11,197,023 | |||||||||
United Airlines Pass Through Trust, second lien, 2016-1, A, 3.45%, 1/07/30 | United States | 13,800,000 | 14,093,250 | |||||||||||
|
| |||||||||||||
| 88,531,989 | ||||||||||||||
|
| |||||||||||||
| Utilities 3.3% | ||||||||||||||
Calpine Corp., | ||||||||||||||
senior bond, 5.75%, 1/15/25 | United States | 9,000,000 | 8,589,375 | |||||||||||
senior note, 5.375%, 1/15/23 | United States | 10,000,000 | 9,762,500 | |||||||||||
b senior secured bond, first lien, 144A, 5.875%, 1/15/24 | United States | 2,000,000 | 2,080,000 | |||||||||||
b | Colbun SA, senior note, 144A, 3.95%, 10/11/27 | Chile | 6,200,000 | 6,209,238 | ||||||||||
Dominion Energy Inc., senior bond, 2.85%, 8/15/26 | United States | 11,400,000 | 11,068,009 | |||||||||||
b | Dynegy Inc., senior note, 144A, 8.00%, 1/15/25 | United States | 28,300,000 | 31,094,625 | ||||||||||
b,g | EDF SA, | |||||||||||||
junior sub. bond, 144A, 5.625% to 1/22/24, FRN thereafter,Perpetual | France | 5,000,000 | 5,284,825 | |||||||||||
junior sub. note, 144A, 5.25% to 1/29/23, FRN thereafter, Perpetual | France | 25,000,000 | 26,019,625 | |||||||||||
Exelon Corp., senior bond, 3.95%, 6/15/25 | United States | 18,500,000 | 19,386,730 | |||||||||||
b | InterGen NV, secured bond, 144A, 7.00%, 6/30/23 | Netherlands | 25,000,000 | 24,378,500 | ||||||||||
Sempra Energy, | ||||||||||||||
senior bond, 3.55%, 6/15/24 | United States | 8,800,000 | 9,075,022 | |||||||||||
senior note, 3.75%, 11/15/25 | United States | 12,300,000 | 12,761,043 | |||||||||||
The Southern Co., senior bond, 3.25%, 7/01/26 | United States | 32,300,000 | 32,178,355 | |||||||||||
b | Talen Energy Supply LLC, senior note, 144A, 9.50%, 7/15/22 | United States | 15,900,000 | 16,416,750 | ||||||||||
|
| |||||||||||||
| 214,304,597 | ||||||||||||||
|
| |||||||||||||
| Total Corporate Bonds (Cost $3,033,571,493) | 3,072,826,595 | |||||||||||||
|
| |||||||||||||
k,m | Senior Floating Rate Interests 9.9% | |||||||||||||
Automobiles & Components 0.3% | ||||||||||||||
TI Group Automotive Systems LLC, Initial US Term Loan, 3.992%, | United States | 19,315,471 | 19,406,022 | |||||||||||
|
| |||||||||||||
Capital Goods 0.2% | ||||||||||||||
Allison Transmission Inc., Term Loans, 3.25%, (LIBOR + 2.00%), 9/23/22 | United States | 8,656,332 | 8,717,506 | |||||||||||
Doncasters U.S. Finance LLC, Second Lien Term Loan, 9.583%, (LIBOR + 8.25%), 10/09/20 | United States | 736,591 | 699,761 | |||||||||||
Harsco Corp., Initial Term Loan, 6.25%, (LIBOR + 5.00%), 11/02/23 | United States | 2,302,272 | 2,344,480 | |||||||||||
Leidos Innovations Corp., Term Loan B, 3.25%, (LIBOR + 2.00%), 8/16/23 | United States | 1,587,978 | 1,600,715 | |||||||||||
|
| |||||||||||||
| 13,362,462 | ||||||||||||||
|
| |||||||||||||
| Commercial & Professional Services 0.1% | ||||||||||||||
KAR Auction Services Inc., Term Loan B, 3.875%, (LIBOR + 2.50%), 3/09/23 | United States | 7,377,440 | 7,435,847 | |||||||||||
Ventia Pty. Ltd., Term B Loans (USD), 4.833%, (LIBOR + 3.50%), 5/21/22 | Australia | 836,261 | 842,533 | |||||||||||
|
| |||||||||||||
| 8,278,380 | ||||||||||||||
|
| |||||||||||||
| franklintempleton.com | Semiannual Report | 23 | ||
FRANKLIN STRATEGIC SERIES
CONSOLIDATED STATEMENT OF INVESTMENTS (UNAUDITED)
Franklin Strategic Income Fund (continued)
| Principal | ||||||||||||||
| Country | Amount* | Value | ||||||||||||
| ||||||||||||||
k,m | Senior Floating Rate Interests (continued) | |||||||||||||
Consumer Services 0.8% | ||||||||||||||
| Aristocrat Technologies Inc., Term B-2 Loans, 3.363%, (LIBOR + 2.00%), 10/20/21 | United States | 1,676,538 | $ | 1,689,119 | ||||||||||
| Avis Budget Car Rental LLC, Tranche B Term Loan, 3.34%, | ||||||||||||||
| (LIBOR + 2.00%), 3/15/22 | United States | 6,424,028 | 6,410,981 | |||||||||||
| Eldorado Resorts Inc., Initial Term Loan, 3.50%, (LIBOR + 2.25%), 4/17/24 | United States | 3,600,153 | 3,611,404 | |||||||||||
| Fitness International LLC, Term A Loan, 4.492%, (LIBOR + 3.25%), 4/01/20 | United States | 30,116,296 | 30,154,092 | |||||||||||
| Greektown Holdings LLC, Initial Term Loan, 4.242%, (LIBOR + 3.00%), 4/25/24 | United States | 3,033,283 | 3,048,922 | |||||||||||
| NVA Holdings Inc., Second Lien Term Loan, 8.333%, (LIBOR + 7.00%), 8/14/22 | United States | 867,941 | 876,621 | |||||||||||
i | Turtle Bay Holdings LLC, Term Loan B, PIK, 4.00%, (LIBOR + 2.75%), 12/31/18 | United States | 4,719,023 | 4,648,237 | ||||||||||
|
| |||||||||||||
|
50,439,376 |
| ||||||||||||
|
| |||||||||||||
Diversified Financials 0.1% | ||||||||||||||
| First Eagle Holdings Inc., Initial Term Loans, 4.365%, (LIBOR + 3.00%), 12/01/22 | United States | 5,242,276 | 5,292,240 | |||||||||||
Russell Investments US Institutional Holdco Inc., Term Loan B, 5.485%, | United States | 3,560,392 | 3,608,607 | |||||||||||
|
| |||||||||||||
|
8,900,847 |
| ||||||||||||
|
| |||||||||||||
Energy 1.7% | ||||||||||||||
| Bowie Resource Holdings LLC, | ||||||||||||||
First Lien Initial Term Loan, 6.992%, (LIBOR + 5.75%), 8/14/20 | United States | 26,305,965 | 25,977,141 | |||||||||||
Second Lien Initial Term Loan, 11.992%, (LIBOR + 10.75%), 2/16/21 | United States | 16,760,827 | 16,551,317 | |||||||||||
| Fieldwood Energy LLC, Loans, 4.208%, (LIBOR + 2.875%), 10/01/18 | United States | 49,391,396 | 47,477,479 | |||||||||||
| Foresight Energy LLC, Term Loans, 7.083%, (LIBOR + 5.75%), 3/28/22. | United States | 4,236,235 | 4,008,537 | |||||||||||
International Seaways Operating Corp., Initial Term Loans, 6.75%, | United States | 8,446,875 | 8,499,668 | |||||||||||
| OSG Bulk Ships Inc., Initial Term Loan, 5.57%, (LIBOR + 4.25%), 8/05/19 | United States | 9,459,728 | 9,164,111 | |||||||||||
|
| |||||||||||||
|
111,678,253 |
| ||||||||||||
|
| |||||||||||||
Food & Staples Retailing 0.3% | ||||||||||||||
| Aramark Corp., U.S. Term A Loan, 2.992%, (LIBOR + 1.75%), 3/28/22. | United States | 6,127,201 | 6,159,755 | |||||||||||
| Smart & Final Stores LLC, First Lien Term Loan, 4.833%, (LIBOR + 3.50%), 11/15/22 | United States | 11,875,171 | 11,523,868 | |||||||||||
|
| |||||||||||||
|
17,683,623 |
| ||||||||||||
|
| |||||||||||||
Food, Beverage & Tobacco 0.5% | ||||||||||||||
CSM Bakery Supplies LLC, Second Lien Term Loan, 9.08%, (LIBOR + 7.75%), 7/03/21 | United States | 10,000,000 | 9,437,500 | |||||||||||
JBS USA LUX SA, New Initial Term Loans, 3.739%, (LIBOR + 2.50%), 10/30/22 | Brazil | 23,731,637 | 23,390,494 | |||||||||||
|
| |||||||||||||
|
32,827,994 |
| ||||||||||||
|
| |||||||||||||
| 24 | Semiannual Report | franklintempleton.com | ||
FRANKLIN STRATEGIC SERIES
CONSOLIDATED STATEMENT OF INVESTMENTS (UNAUDITED)
Franklin Strategic Income Fund (continued)
| Principal | ||||||||||||||
| Country | Amount* | Value | ||||||||||||
| ||||||||||||||
k,m | Senior Floating Rate Interests (continued) | |||||||||||||
| Health Care Equipment & Services 0.0%† | ||||||||||||||
| U.S. Renal Care Inc., Initial Term Loan, 5.583%, (LIBOR + 4.25%), 12/31/22 | United States | 3,500,021 | $ | 3,392,833 | ||||||||||
|
| |||||||||||||
| Household & Personal Products 0.1% | ||||||||||||||
| Spectrum Brands Inc., USD Term Loans, 3.242% - 3.312%, (LIBOR + 2.00%), 6/23/22 | United States | 4,176,371 | 4,209,523 | |||||||||||
|
| |||||||||||||
| Materials 0.9% | ||||||||||||||
| Ashland LLC, Term B Loan, 3.264% -3.319%, (LIBOR + 2.00%), 5/17/24 | United States | 4,134,258 | 4,163,541 | |||||||||||
| Chemours Co., Tranche B-1 US Term Loans, 3.75%, (LIBOR + 2.50%), 5/12/22 | United States | 28,164,201 | 28,472,261 | |||||||||||
| Cyanco Intermediate Corp., Initial Term Loan, 5.742%, (LIBOR + 4.50%), 5/01/20 | United States | 7,489,654 | 7,569,231 | |||||||||||
| OCI Beaumont LLC, Term B-3 Loan, 8.064%, (LIBOR + 6.75%), 8/20/19 | United States | 9,110,543 | 9,251,000 | |||||||||||
| Oxbow Carbon LLC, | ||||||||||||||
Tranche A-1 Term Loan, 4.242%, (LIBOR + 3.00%), 10/21/19 | United States | 4,659,394 | 4,662,306 | |||||||||||
Tranche B Term Loan, 4.742%, (LIBOR + 3.50%), 1/19/20 | United States | 5,355,738 | 5,429,380 | |||||||||||
|
| |||||||||||||
|
59,547,719 |
| ||||||||||||
|
| |||||||||||||
| Media 0.6% | ||||||||||||||
Altice US Finance I Corp., March 2017 Refinancing Term Loan Commitments, 3.492%, (LIBOR + 2.25%), 7/28/25 | United States | 1,981,144 | 1,982,692 | |||||||||||
AMC Entertainment Holdings Inc., 2016 Incremental Term Loans, 3.489%, | United States | 4,574,628 | 4,569,385 | |||||||||||
n Initial Term Loans, 3.489%, (LIBOR + 2.25%), 12/15/22 | United States | 5,987,709 | 5,999,469 | |||||||||||
Charter Communications Operating LLC, Term Loan A-1, 3.00%, | United States | 9,324,000 | 9,336,485 | |||||||||||
CSC Holdings LLC (Cablevision), March 2017 Incremental Term Loans, 3.489%, | United States | 12,893,809 | 12,877,601 | |||||||||||
Lions Gate Entertainment Corp., Term A Loan, 3.242%, (LIBOR + 2.00%), 12/08/21 | United States | 5,179,509 | 5,194,078 | |||||||||||
|
| |||||||||||||
|
39,959,710 |
| ||||||||||||
|
| |||||||||||||
| Pharmaceuticals, Biotechnology & Life Sciences 1.1% | ||||||||||||||
| Endo Luxembourg Finance Co. I S.A.R.L. and Endo LLC, Initial Term Loans, 5.50%, (LIBOR + 4.25%), 4/29/24 | United States | 19,961,172 | 20,245,618 | |||||||||||
Grifols Worldwide Operations USA Inc., Tranche B Term Loan, 3.452%, | United States | 26,020,134 | 26,141,362 | |||||||||||
INC Research Holdings Inc., Initial Term B Loans, 3.492%, | United States | 6,033,258 | 6,071,594 | |||||||||||
RPI Finance Trust, Term A-3 Loan, 3.083%, (LIBOR + 1.75%), 10/14/21 | United States | 6,431,478 | 6,443,537 | |||||||||||
Valeant Pharmaceuticals International Inc., Series F Tranche B Term Loan, 5.99%, | United States | 9,639,655 | 9,837,268 | |||||||||||
|
| |||||||||||||
|
68,739,379 |
| ||||||||||||
|
| |||||||||||||
| franklintempleton.com | Semiannual Report | 25 | ||
FRANKLIN STRATEGIC SERIES
CONSOLIDATED STATEMENT OF INVESTMENTS (UNAUDITED)
Franklin Strategic Income Fund (continued)
| Principal | ||||||||||||||
| Country | Amount* | Value | ||||||||||||
| ||||||||||||||
k,m | Senior Floating Rate Interests (continued) | |||||||||||||
Retailing 1.1% | ||||||||||||||
Ascena Retail Group Inc., Tranche B Term Loan, 5.75%, (LIBOR + 4.50%), 8/21/22 | United States | 35,164,991 | $ | 30,670,483 | ||||||||||
| Dollar Tree Inc., Term A-1 Loans, 2.75%, (LIBOR + 1.50%), 7/06/20 | United States | 4,353,418 | 4,343,841 | |||||||||||
n | Jo-Ann Stores Inc., Initial Loans, 6.551%, (LIBOR + 5.00%), 10/21/23 | United States | 12,757,011 | 12,222,811 | ||||||||||
n | PetSmart Inc., Tranche B-2 Loans, 4.24%, (LIBOR + 3.00%), 3/11/22 | United States | 25,888,276 | 22,308,419 | ||||||||||
|
| |||||||||||||
|
69,545,554 |
| ||||||||||||
|
| |||||||||||||
Semiconductors & Semiconductor Equipment 0.4% | ||||||||||||||
MACOM Technology Solutions Holdings Inc., Initial Term Loans, 3.489%, | United States | 2,992,500 | 3,000,604 | |||||||||||
MKS Instruments Inc., Tranche B-3 Term Loans, 3.492%, (LIBOR + 2.25%), 4/29/23 | United States | 3,503,560 | 3,538,049 | |||||||||||
ON Semiconductor Corp., 2017 Replacement Term Loans, 3.492%, (LIBOR + 2.25%), 3/31/23 | United States | 16,158,709 | 16,248,761 | |||||||||||
|
| |||||||||||||
|
22,787,414 |
| ||||||||||||
|
| |||||||||||||
Software & Services 0.2% | ||||||||||||||
| Global Payments Inc., Term A-2 Loan, 2.952%, (LIBOR + 1.75%), 5/02/22. | United States | 6,221,148 | 6,225,036 | |||||||||||
| Rackspace Hosting Inc., 2017 Refinancing Term B Loans, 4.311%, (LIBOR + 3.00%), 11/03/23 | United States | 3,846,810 | 3,846,468 | |||||||||||
| Wex Inc., Term Loan B, 3.992%, (LIBOR + 2.75%), 7/01/23 | United States | 1,881,934 | 1,903,842 | |||||||||||
|
| |||||||||||||
|
11,975,346 |
| ||||||||||||
|
| |||||||||||||
Technology Hardware & Equipment 0.2% | ||||||||||||||
| Ciena Corp., Refinancing Term Loan, 3.739%, (LIBOR + 2.50%), 1/28/22 | United States | 1,849,465 | 1,858,712 | |||||||||||
Commscope Inc., Tranche 5 Term Loans, 3.242% - 3.38%, (LIBOR + 2.00%), 12/29/22 | United States | 893,025 | 900,817 | |||||||||||
| Western Digital Corp., US Term B-2 Loan, 3.99%, (LIBOR + 2.75%), 4/29/23 | United States | 9,785,805 | 9,856,146 | |||||||||||
|
| |||||||||||||
|
12,615,675 |
| ||||||||||||
|
| |||||||||||||
Telecommunication Services 0.1% | ||||||||||||||
| Consolidated Communications Inc., Initial Term Loan, 4.25%, (LIBOR + 3.00%), 10/05/23. | United States | 2,387,057 | 2,352,743 | |||||||||||
| Global Tel*Link Corp., Term Loan, 5.333%, (LIBOR + 4.00%), 5/23/20 | United States | 2,798,251 | 2,832,793 | |||||||||||
|
| |||||||||||||
|
5,185,536 |
| ||||||||||||
|
| |||||||||||||
Transportation 0.6% | ||||||||||||||
| Air Canada, Term Loan, 3.568%, (LIBOR + 2.25%), 10/06/23 | Canada | 550,559 | 554,573 | |||||||||||
| The Hertz Corp., Tranche B-1 Term Loan, 4.00%, (LIBOR + 2.75%), 6/30/23 | United States | 18,230,814 | 18,203,760 | |||||||||||
Navios Maritime Midstream Partners LP, Term Loan, 5.83%, (LIBOR + 4.50%), 6/18/20 | Marshall Islands | 13,230,212 | 13,197,136 | |||||||||||
| United Airlines Inc., Class B Term Loans, 3.63%, (LIBOR + 2.25%), 4/01/24 | United States | 3,157,846 | 3,176,399 | |||||||||||
| XPO Logistics Inc., Loans, 3.599%, (LIBOR + 2.25%), 11/01/21 | United States | 2,737,990 | 2,756,822 | |||||||||||
|
| |||||||||||||
|
37,888,690 |
| ||||||||||||
|
| |||||||||||||
| 26 | Semiannual Report | franklintempleton.com | ||
FRANKLIN STRATEGIC SERIES
CONSOLIDATED STATEMENT OF INVESTMENTS (UNAUDITED)
Franklin Strategic Income Fund (continued)
| Principal | ||||||||||||||
| Country | Amount* | Value | ||||||||||||
| ||||||||||||||
k,m | Senior Floating Rate Interests (continued) | |||||||||||||
Utilities 0.6% | ||||||||||||||
Calpine Construction Finance Co. LP, Term B-1 Loan, 3.50%, | United States | 13,165,557 | $ | 13,208,754 | ||||||||||
EFS Cogen Holdings I LLC (Linden), Term B Advance, 4.84%, | United States | 6,461,108 | 6,517,643 | |||||||||||
| Lightstone Holdco LLC, | ||||||||||||||
Initial Term B Loan, 5.742%, (LIBOR + 4.50%), 1/30/24 | United States | 8,848,325 | 8,901,557 | |||||||||||
Initial Term C Loan, 5.742%, (LIBOR + 4.50%), 1/30/24 | United States | 551,341 | 554,657 | |||||||||||
| NRG Energy Inc., Term Loans, 3.583%, (LIBOR + 2.25%), 6/30/23 | United States | 8,522,125 | 8,548,782 | |||||||||||
|
| |||||||||||||
|
37,731,393 |
| ||||||||||||
|
| |||||||||||||
| Total Senior Floating Rate Interests (Cost $638,801,632) | 636,155,729 | |||||||||||||
|
| |||||||||||||
| Foreign Government and Agency Securities 7.8% | ||||||||||||||
| Government of Hungary, 5.375%, 2/21/23 | Hungary | 16,250,000 | 18,223,562 | |||||||||||
| Government of Indonesia, | ||||||||||||||
FR34, 12.80%, 6/15/21 | Indonesia | 169,210,000,000 | IDR | 15,049,554 | ||||||||||
FR36, 11.50%, 9/15/19 | Indonesia | 35,400,000,000 | IDR | 2,869,846 | ||||||||||
senior bond, FR39, 11.75%, 8/15/23 | Indonesia | 29,150,000,000 | IDR | 2,669,980 | ||||||||||
senior bond, FR44, 10.00%, 9/15/24 | Indonesia | 8,340,000,000 | IDR | 723,774 | ||||||||||
senior bond, FR56, 8.375%, 9/15/26 | Indonesia | 750,000,000,000 | IDR | 60,760,350 | ||||||||||
senior bond, FR70, 8.375%, 3/15/24 | Indonesia | 140,000,000,000 | IDR | 11,185,398 | ||||||||||
| Government of Malaysia, | ||||||||||||||
senior bond, 4.24%, 2/07/18 | Malaysia | 66,300,000 | MYR | 15,719,460 | ||||||||||
senior note, 3.58%, 9/28/18 | Malaysia | 39,800,000 | MYR | 9,448,174 | ||||||||||
Government of Mexico, 7.75%, 12/14/17 | Mexico | 4,000,000o | MXN | 20,881,458 | ||||||||||
senior note, 8.50%, 12/13/18 | Mexico | 25,140,000o | MXN | 133,030,932 | ||||||||||
b | Government of Serbia, | |||||||||||||
senior note, 144A, 4.875%, 2/25/20 | Serbia | 29,400,000 | 30,678,312 | |||||||||||
senior note, 144A, 7.25%, 9/28/21 | Serbia | 15,000,000 | 17,281,125 | |||||||||||
b | Government of Ukraine, | |||||||||||||
144A, 7.75%, 9/01/22 | Ukraine | 2,200,000 | 2,356,915 | |||||||||||
144A, 7.75%, 9/01/23 | Ukraine | 4,355,000 | 4,632,849 | |||||||||||
144A, 7.75%, 9/01/24 | Ukraine | 4,355,000 | 4,574,340 | |||||||||||
144A, 7.75%, 9/01/25 | Ukraine | 4,355,000 | 4,530,180 | |||||||||||
144A, 7.75%, 9/01/26 | Ukraine | 4,355,000 | 4,499,259 | |||||||||||
144A, 7.75%, 9/01/27 | Ukraine | 4,354,000 | 4,494,308 | |||||||||||
a,p 144A, VRI, GDP Linked Security, 5/31/40 | Ukraine | 20,490,000 | 11,769,456 | |||||||||||
| Nota Do Tesouro Nacional, | ||||||||||||||
10.00%, 1/01/21 | Brazil | 80,000q | BRL | 25,093,399 | ||||||||||
10.00%, 1/01/23 | Brazil | 123,902q | BRL | 38,526,855 | ||||||||||
r Index Linked, 6.00%, 8/15/18 | Brazil | 34,550q | BRL | 32,713,424 | ||||||||||
r Index Linked, 6.00%, 5/15/23 | Brazil | 19,500q | BRL | 19,124,223 | ||||||||||
senior note, 10.00%, 1/01/19 | Brazil | 25,000q | BRL | 7,865,094 | ||||||||||
|
| |||||||||||||
| Total Foreign Government and Agency Securities (Cost $522,988,664) | 498,702,227 | |||||||||||||
|
| |||||||||||||
| franklintempleton.com | Semiannual Report | 27 | ||
FRANKLIN STRATEGIC SERIES
CONSOLIDATED STATEMENT OF INVESTMENTS (UNAUDITED)
Franklin Strategic Income Fund (continued)
| Principal | ||||||||||||||||
| Country | Amount* | Value | ||||||||||||||
| ||||||||||||||||
U.S. Government and Agency Securities 6.4% | ||||||||||||||||
U.S. Treasury Bond, | ||||||||||||||||
7.125%, 2/15/23 | United States | 3,000,000 | $ | 3,761,777 | ||||||||||||
6.25%, 8/15/23 | United States | 4,000,000 | 4,906,016 | |||||||||||||
6.875%, 8/15/25 | United States | 1,000,000 | 1,331,699 | |||||||||||||
6.50%, 11/15/26 | United States | 34,000,000 | 45,614,453 | |||||||||||||
5.25%, 2/15/29 | United States | 1,750,000 | 2,242,734 | |||||||||||||
3.00%, 11/15/45 | United States | 50,000,000 | 51,261,719 | |||||||||||||
s Index Linked, 0.625%, 1/15/24 | United States | 82,013,952 | 83,573,603 | |||||||||||||
s Index Linked, 2.375%, 1/15/25 | United States | 33,210,828 | 37,859,644 | |||||||||||||
| U.S. Treasury Note, | ||||||||||||||||
3.875%, 5/15/18 | United States | 22,000,000 | 22,301,946 | |||||||||||||
3.75%, 11/15/18 | United States | 39,000,000 | 39,897,305 | |||||||||||||
2.375%, 8/15/24 | United States | 5,000,000 | 5,049,707 | |||||||||||||
s Index Linked, 2.125%, 1/15/19 | United States | 9,147,487 | 9,410,239 | |||||||||||||
s Index Linked, 0.625%, 7/15/21 | United States | 10,892,324 | 11,171,563 | |||||||||||||
s Index Linked, 0.125%, 7/15/24 | United States | 93,609,304 | 92,521,765 | |||||||||||||
|
| |||||||||||||||
Total U.S. Government and Agency Securities (Cost $409,936,036) | 410,904,170 | |||||||||||||||
|
| |||||||||||||||
Asset-Backed Securities and Commercial Mortgage-Backed Securities 12.3% | ||||||||||||||||
Banks 1.1% | ||||||||||||||||
Banc of America Commercial Mortgage Trust, 2006-4, AJ, 5.695%, 7/10/46 | United States | 1,842,707 | 1,854,452 | |||||||||||||
t | Bear Stearns ARM Trust, 2004-4, A6, FRN, 3.499%, 6/25/34 | United States | 10,653,692 | 10,862,540 | ||||||||||||
u | Citibank Credit Card Issuance Trust, | |||||||||||||||
2013-A2, A2, FRN, 1.518%, (1-month USD LIBOR + 0.28%), 5/26/20 | United States | 7,230,000 | 7,241,202 | |||||||||||||
2013-A4, A4, FRN, 1.658%, (1-month USD LIBOR + 0.42%), 7/24/20 | United States | 7,666,000 | 7,687,632 | |||||||||||||
| Citigroup Commercial Mortgage Trust, 2006-C5, AJ, 5.482%, 10/15/49 | United States | 9,996,590 | 9,402,796 | |||||||||||||
t | Commercial Mortgage Trust, 2006-GG7, AJ, FRN, 5.766%, 7/10/38 | United States | 12,633,000 | 11,841,416 | ||||||||||||
| CSAIL Commercial Mortgage Trust, 2015-C1, A4, 3.505%, 4/15/50 | United States | 10,050,000 | 10,447,123 | |||||||||||||
t | CWABS Asset-Backed Certificates Trust, 2005-11, AF4, FRN, 4.645%, 3/25/34 | United States | 2,800,000 | 2,815,280 | ||||||||||||
u | Merrill Lynch Mortgage Investors Trust, 2005-A6, 2A3, FRN, 1.618%, | United States | 2,221,426 | 2,200,734 | ||||||||||||
t | Morgan Stanley Capital I Trust, | |||||||||||||||
2007-IQ16, AM, FRN, 6.111%, 12/12/49 | United States | 635,674 | 636,865 | |||||||||||||
2007-IQ16, AMA, FRN, 6.091%, 12/12/49 | United States | 5,181,146 | 5,217,483 | |||||||||||||
|
| |||||||||||||||
| 70,207,523 | ||||||||||||||||
|
| |||||||||||||||
Diversified Financials 11.2% | ||||||||||||||||
b,u | Ares XLIII CLO Ltd., 2017-43A, A, 144A, FRN, 2.579%, | United States | 3,870,000 | 3,899,644 | ||||||||||||
b,u | Atrium VIII, | |||||||||||||||
8A, BR, 144A, FRN, 3.263%, (3-month USD LIBOR + 1.90%), 10/23/24 | United States | 4,520,000 | 4,572,387 | |||||||||||||
8A, CR, 144A, FRN, 3.863%, (3-month USD LIBOR + 2.50%), 10/23/24 | United States | 6,080,000 | 6,157,277 | |||||||||||||
| 28 | Semiannual Report | franklintempleton.com | ||
FRANKLIN STRATEGIC SERIES
CONSOLIDATED STATEMENT OF INVESTMENTS (UNAUDITED)
Franklin Strategic Income Fund (continued)
| Country | Principal Amount* | Value | ||||||||||||||
| Asset-Backed Securities and Commercial | ||||||||||||||||
Mortgage-Backed Securities (continued) | ||||||||||||||||
Diversified Financials (continued) | ||||||||||||||||
b,u | Atrium XI, 11A, CR, 144A, FRN, 3.513%, (3-month USD LIBOR + 2.15%), 10/23/25 | United States | 15,440,000 | $ | 15,497,282 | |||||||||||
Banc of America Commercial Mortgage Trust, | ||||||||||||||||
2015-UBS7, A3, 3.441%, 9/15/48 | United States | 10,920,000 | 11,302,672 | |||||||||||||
2015-UBS7, A4, 3.705%, 9/15/48 | United States | 12,450,000 | 13,098,042 | |||||||||||||
t 2015-UBS7, B, FRN, 4.366%, 9/15/48 | United States | 6,740,000 | 7,130,954 | |||||||||||||
u | Bank of America Credit Card Trust, 2005-A1, A, FRN, 1.569%, | United States | 9,175,000 | 9,181,535 | ||||||||||||
b,t | BCAP LLC Trust, 2009-RR1, 2A2, 144A, FRN, 3.35%, 5/26/35 | United States | 9,382,129 | 9,041,103 | ||||||||||||
b,u | BlueMountain CLO Ltd., | |||||||||||||||
2012-2A, BR, 144A, FRN, 3.216%, (3-month USD LIBOR + 1.90%), 11/20/28 | United States | 6,710,000 | 6,808,302 | |||||||||||||
2012-2A, CR, 144A, FRN, 3.916%, (3-month USD LIBOR + 2.60%), 11/20/28 | United States | 2,730,000 | 2,786,538 | |||||||||||||
b,u | BlueMountain Fuji U.S. CLO II Ltd., 2017-2A, A1A, 144A, FRN, | United States | 4,200,000 | 4,200,126 | ||||||||||||
b,u | Burnham Park CLO Ltd., | |||||||||||||||
2016-1A, A, 144A, FRN, 2.793%, (3-month USD LIBOR + 1.43%), 10/20/29 | United States | 4,590,000 | 4,640,582 | |||||||||||||
2016-1A, B, 144A, FRN, 3.163%, (3-month USD LIBOR + 1.80%), 10/20/29 | United States | 6,000,000 | 6,064,980 | |||||||||||||
2016-1A, C, 144A, FRN, 3.763%, (3-month USD LIBOR + 2.40%), 10/20/29 | United States | 6,000,000 | 6,051,540 | |||||||||||||
u | Capital One Multi-Asset Execution Trust, | |||||||||||||||
2014-A3, A3, FRN, 1.619%, (1-month USD LIBOR + 0.38%), 1/18/22 | United States | 4,265,000 | 4,283,277 | |||||||||||||
2016-A1, A1, FRN, 1.689%, (1-month USD LIBOR + 0.45%), 2/15/22 | United States | 32,250,000 | 32,433,380 | |||||||||||||
2016-A2, A2, FRN, 1.869%, (1-month USD LIBOR + 0.63%), 2/15/24 | United States | 44,033,000 | 44,656,939 | |||||||||||||
b,u | Carlyle Global Market Strategies CLO Ltd., | |||||||||||||||
2012-4A, BR, 144A, FRN, 3.263%, (3-month USD LIBOR + 1.90%), 1/20/29 | United States | 6,540,000 | 6,619,657 | |||||||||||||
2012-4A, C1R, 144A, FRN, 3.963%, (3-month USD LIBOR + 2.60%), 1/20/29 | United States | 6,330,000 | 6,461,537 | |||||||||||||
b,u | Carlyle U.S. CLO Ltd., 2017-2A, A1B, 144A, FRN, 2.551%, (3-month USD LIBOR + 1.22%), 7/20/31 | United States | 8,500,000 | 8,508,840 | ||||||||||||
b,u | Catamaran CLO Ltd., | |||||||||||||||
2013-1A, A, 144A, FRN, 2.524%, (3-month USD LIBOR + 1.15%), 1/27/25 | United States | 3,714,596 | 3,730,309 | |||||||||||||
2013-1A, C, 144A, FRN, 3.974%, (3-month USD LIBOR + 2.60%), 1/27/25 | United States | 11,250,000 | 11,316,488 | |||||||||||||
2014-2A, BR, 144A, FRN, 4.304%, (3-month USD LIBOR + 2.95%), 10/18/26 | United States | 11,770,000 | 11,871,222 | |||||||||||||
| franklintempleton.com | Semiannual Report | 29 | ||
FRANKLIN STRATEGIC SERIES
CONSOLIDATED STATEMENT OF INVESTMENTS (UNAUDITED)
Franklin Strategic Income Fund (continued)
| Country | Principal Amount* | Value | ||||||||||||||
| Asset-Backed Securities and Commercial | ||||||||||||||||
Mortgage-Backed Securities (continued) | ||||||||||||||||
Diversified Financials (continued) | ||||||||||||||||
b,u | Cent CLO 20 Ltd., 13-20A, AR, 144A, FRN, 2.467%, (3-month USD LIBOR + 1.10%), 1/25/26 | United States | 2,000,000 | $ | 2,003,980 | |||||||||||
b,u | Cent CLO LP, | |||||||||||||||
2013-17A, B, 144A, FRN, 4.378%, (3-month USD LIBOR + 3.00%), 1/30/25 | United States | 7,450,980 | 7,472,066 | |||||||||||||
2014-22A, A2AR, 144A, FRN, 3.262%, (3-month USD LIBOR + 1.95%), 11/07/26 | United States | 5,224,000 | 5,282,248 | |||||||||||||
2014-22A, BR, 144A, FRN, 4.262%, (3-month USD LIBOR + 2.95%), 11/07/26 | United States | 4,416,410 | 4,525,407 | |||||||||||||
b,t | CGRBS Commercial Mortgage Trust, 2013-VN05, C, 144A, FRN, 3.703%, 3/13/35 | United States | 7,700,000 | 7,823,138 | ||||||||||||
u | Chase Issuance Trust, | |||||||||||||||
2012-A10, A10, FRN, 1.499%, (1-month USD LIBOR + 0.26%), 12/16/19 | United States | 5,205,000 | 5,206,625 | |||||||||||||
2013-A6, A6, FRN, 1.659%, (1-month USD LIBOR + 0.42%), 7/15/20 | United States | 12,040,000 | 12,072,783 | |||||||||||||
b,u | Cole Park CLO Ltd., 15-1A, B, 144A, FRN, 3.613%, (3-month USD LIBOR + 2.25%), 10/20/28 | United States | 3,530,000 | 3,594,528 | ||||||||||||
t | COMM Mortgage Trust, 2014-CR19, B, FRN, 4.703%, 8/10/47 | United States | 7,700,000 | 8,234,973 | ||||||||||||
b | Core Industrial Trust, 2015-CALW, A, 144A, 3.04%, 2/10/34 | United States | 15,065,000 | 15,423,057 | ||||||||||||
b,u | Cumberland Park CLO Ltd., | |||||||||||||||
2015-2A, B, 144A, FRN, 3.463%, (3-month USD LIBOR + 2.10%), 7/20/26 | United States | 12,270,000 | 12,416,627 | |||||||||||||
2015-2A, C, 144A, FRN, 4.213%, (3-month USD LIBOR + 2.85%), 7/20/26 | United States | 1,850,000 | 1,882,930 | |||||||||||||
u | Discover Card Execution Note Trust, 2016-A2, A2, FRN, 1.779%, | |||||||||||||||
(1-month USD LIBOR + 0.54%), 9/15/21 | United States | 32,250,000 | 32,452,769 | |||||||||||||
b,u | Dryden 33 Senior Loan Fund, | |||||||||||||||
2014-33A, BR, 144A, FRN, 3.209%, (3-month USD LIBOR + 1.85%), 10/15/28 | United States | 7,030,000 | 7,178,192 | |||||||||||||
2014-33A, CR, 144A, FRN, 3.859%, (3-month USD LIBOR + 2.50%), 10/15/28 | United States | 3,530,000 | 3,603,424 | |||||||||||||
b,u | Dryden 34 Senior Loan Fund, 14-34A, AR, 144A, FRN, 2.519%, | |||||||||||||||
(3-month USD LIBOR + 1.16%), 10/15/26 | United States | 2,000,000 | 2,009,000 | |||||||||||||
b,u | Eaton Vance CDO Ltd., 2014-1A, AR, 144A, FRN, 2.559%, | |||||||||||||||
(3-month USD LIBOR + 1.20%), 7/15/26 | United States | 17,022,000 | 17,098,599 | |||||||||||||
b,t | Eleven Madison Trust Mortgage Trust, 2015-11MD, A, 144A, | |||||||||||||||
FRN, 3.673%, 9/10/35 | United States | 14,920,000 | 15,528,629 | |||||||||||||
u | FHLMC Structured Agency Credit Risk Debt Notes, | |||||||||||||||
2014-DN1, M2, FRN, 3.438%, (1-month USD LIBOR + 2.20%), 2/25/24 | United States | 11,531,627 | 11,886,322 | |||||||||||||
2014-DN4, M3, FRN, 5.788%, (1-month USD LIBOR + 4.55%), 10/25/24 | United States | 7,444,231 | 8,112,298 | |||||||||||||
2014-HQ2, M2, FRN, 3.438%, (1-month USD LIBOR + 2.20%), 9/25/24 | United States | 14,600,000 | 15,074,977 | |||||||||||||
2015-HQ1, M2, FRN, 3.438%, (1-month USD LIBOR + 2.20%), 3/25/25 | United States | 3,894,070 | 3,925,043 | |||||||||||||
2015-HQ1, M3, FRN, 5.038%, (1-month USD LIBOR + 3.80%), 3/25/25 | United States | 3,880,000 | 4,212,710 | |||||||||||||
| 30 | Semiannual Report | franklintempleton.com | ||
FRANKLIN STRATEGIC SERIES
CONSOLIDATED STATEMENT OF INVESTMENTS (UNAUDITED)
Franklin Strategic Income Fund (continued)
| Country | Principal Amount* | Value | ||||||||||
| Asset-Backed Securities and Commercial | ||||||||||||
Mortgage-Backed Securities (continued) | ||||||||||||
Diversified Financials (continued) | ||||||||||||
b,u Flagship CLO VIII Ltd., 2014-8A, AR, 144A, FRN, 2.609%, | ||||||||||||
(3-month USD LIBOR + 1.25%), 1/16/26 | United States | 6,880,000 | $ | 6,910,341 | ||||||||
u FNMA Connecticut Avenue Securities, | ||||||||||||
2014-C03, 1M2, FRN, 4.238%, (1-month USD LIBOR + 3.00%), 7/25/24 | United States | 7,360,000 | 7,781,032 | |||||||||
2015-C01, 1M2, FRN, 5.538%, (1-month USD LIBOR + 4.30%), 2/25/25 | United States | 8,878,618 | 9,554,866 | |||||||||
2015-C01, 2M2, FRN, 5.788%, (1-month USD LIBOR + 4.55%), 2/25/25 | United States | 17,891,023 | 19,123,163 | |||||||||
2015-C02, 1M2, FRN, 5.238%, (1-month USD LIBOR + 4.00%), 5/25/25 | United States | 10,785,277 | 11,566,532 | |||||||||
2015-C02, 2M2, FRN, 5.238%, (1-month USD LIBOR + 4.00%), 5/25/25 | United States | 12,425,962 | 13,165,729 | |||||||||
2015-C03, 2M2, FRN, 6.238%, (1-month USD LIBOR + 5.00%), 7/25/25 | United States | 19,161,083 | 20,963,248 | |||||||||
2017-C01, 1M2, FRN, 4.788%, (1-month USD LIBOR + 3.55%), 7/25/29 | United States | 20,720,000 | 22,072,925 | |||||||||
b,u Galaxy CLO Ltd., | ||||||||||||
2014-17A, AR, 144A, FRN, 2.759%, (3-month USD LIBOR + 1.40%), 7/15/26 | United States | 9,540,000 | 9,604,490 | |||||||||
2014-17A, BR, 144A, FRN, 3.159%, (3-month USD LIBOR + 1.80%), 7/15/26 | United States | 6,190,000 | 6,216,555 | |||||||||
2014-17A, C1R, 144A, FRN, 3.759%, (3-month USD LIBOR + 2.40%), 7/15/26 | United States | 3,070,000 | 3,091,766 | |||||||||
b G-Force LLC, 2005-RRA, C, 144A, 5.20%, 8/22/36 | United States | 9,440,779 | 9,326,465 | |||||||||
GS Mortgage Securities Trust, | ||||||||||||
t 2016-GS3, B, FRN, 3.395%, 10/10/49 | United States | 8,037,000 | 7,967,716 | |||||||||
2017-GS6, B, 3.869%, 5/10/50 | United States | 7,700,000 | 7,901,164 | |||||||||
u Impac Secured Assets Trust, 2007-2, FRN, 1.488%, (1-month USD LIBOR + 0.25%), 4/25/37 | United States | 2,094,863 | 2,091,889 | |||||||||
b,u Invitation Homes Trust, 2015-SFR1, A, 144A, FRN, 2.687%, (1-month USD LIBOR + 1.45%), 3/17/32 | United States | 8,834,119 | 8,898,963 | |||||||||
b,t J.P. Morgan Chase Commercial Mortgage Securities, 2016-Nine, B, 144A, FRN, 2.854%, 10/06/38 | United States | 9,600,000 | 9,220,956 | |||||||||
JPMCC Commercial Mortgage Securities Trust, 2017-JP6, B, 3.946%, 7/15/50 | United States | 9,250,000 | 9,476,595 | |||||||||
b,u LCM XVI LP, 2016A, BR, 144A, FRN, 2.859%, (3-month USD LIBOR + 1.50%), 7/15/26 | United States | 6,900,000 | 6,938,157 | |||||||||
b,u LCM XVII LP, 2017A, BR, 144A, FRN, 3.209%, (3-month USD LIBOR + 1.85%), 10/15/26 | United States | 4,590,000 | 4,617,402 | |||||||||
2017A, CR, 144A, FRN, 3.859%, (3-month USD LIBOR + 2.50%), 10/15/26 | United States | 4,240,000 | 4,281,043 | |||||||||
b,u LCM XXIV Ltd., 24A, A, 144A, FRN, 2.673%, (3-month USD LIBOR + 1.31%), 3/20/30 | United States | 4,300,000 | 4,319,737 | |||||||||
b,u Madison Park Funding XXIII Ltd., | ||||||||||||
2017-23A, B, 144A, FRN, 3.009%, (3-month USD LIBOR + 1.70%), 7/27/30 | United States | 2,400,000 | 2,425,512 | |||||||||
2017-23A, C, 144A, FRN, 3.659%, (3-month USD LIBOR + 2.35%), 7/27/30 | United States | 5,000,000 | 5,024,379 | |||||||||
| franklintempleton.com | Semiannual Report | 31 | ||
FRANKLIN STRATEGIC SERIES
CONSOLIDATED STATEMENT OF INVESTMENTS (UNAUDITED)
Franklin Strategic Income Fund (continued)
| Country | Principal Amount* | Value | ||||||||||||
| Asset-Backed Securities and Commercial | ||||||||||||||
Mortgage-Backed Securities (continued) | ||||||||||||||
Diversified Financials (continued) | ||||||||||||||
b,u | Magnetite XVIII Ltd., 2016-18A, B, 144A, FRN, 3.065%, (3-month USD LIBOR + 1.75%), 11/15/28 | United States | 2,090,000 | $ | 2,105,842 | |||||||||
u | MortgageIT Trust, | |||||||||||||
2004-1, A2, FRN, 2.137%, (1-month USD LIBOR + 0.90%), 11/25/34 | United States | 2,844,664 | 2,800,903 | |||||||||||
2005-5, A1, FRN, 1.498%, (1-month USD LIBOR + 0.26%), 12/25/35 | United States | 2,412,828 | 2,415,012 | |||||||||||
b,u | Octagon Investment Partners 30 Ltd., 144A, FRN, 2.683%, (3-month USD LIBOR + 1.32%), 3/17/30 | United States | 4,300,000 | 4,311,094 | ||||||||||
b,u | Octagon Investment Partners XX Ltd., 2014-1A, AR, 144A, FRN, 2.439%, (3-month USD LIBOR + 1.13%), 8/12/26 | United States | 6,800,000 | 6,836,516 | ||||||||||
b,u | Octagon Investment Partners XXIII Ltd., 2015-1A, B, 144A, FRN, 3.359%, (3-month USD LIBOR + 2.00%), 7/15/27 | United States | 4,590,000 | 4,639,572 | ||||||||||
u | Opteum Mortgage Acceptance Corp. Trust, 2005-4, 1APT, FRN, 1.548%, (1-month USD LIBOR + 0.31%), 11/25/35 | United States | 3,789,623 | 3,718,042 | ||||||||||
u | Structured Asset Mortgage Investments Trust, 2003-AR2, A1, FRN, 1.978%, (1-month USD LIBOR + 0.74%), 12/19/33 | United States | 3,987,082 | 3,878,851 | ||||||||||
u | Structured Asset Securities Corp., 2005-2XS, 2A2, FRN, 2.735%, (1-month USD LIBOR + 1.50%), 2/25/35 | United States | 2,953,753 | 2,916,292 | ||||||||||
t | Thornburg Mortgage Securities Trust, 2005-1, A3, FRN, 3.028%, 4/25/45 | United States | 4,219,847 | 4,245,518 | ||||||||||
b,u | Voya CLO Ltd., | |||||||||||||
2013-2A, B, 144A, FRN, 4.047%, (3-month USD LIBOR + 2.68%), 4/25/25 | United States | 10,770,000 | 10,820,727 | |||||||||||
2015-2A, B, 144A, FRN, 3.343%, (3-month USD LIBOR + 1.98%), 7/23/27 | United States | 9,290,000 | 9,378,255 | |||||||||||
Wells Fargo Mortgage Backed Securities Trust, | ||||||||||||||
t2004-W, A9, FRN, 3.616%, 11/25/34 | United States | 1,655,335 | 1,695,485 | |||||||||||
2007-3, 3A1, 5.50%, 4/25/22 | United States | 333,193 | 340,705 | |||||||||||
|
| |||||||||||||
| 719,978,377 | ||||||||||||||
|
| |||||||||||||
| Total Asset-Backed Securities and Commercial | ||||||||||||||
| Mortgage-Backed Securities | ||||||||||||||
| (Cost $784,448,640) | 790,185,900 | |||||||||||||
|
| |||||||||||||
| Mortgage-Backed Securities 9.8% | ||||||||||||||
v | Federal Home Loan Mortgage Corp. (FHLMC) Adjustable Rate 0.0%† | |||||||||||||
FHLMC, 2.948%, (US 1 Year CMT T-Note +/- MBS Margin), 1/01/33 | United States | 33,096 | 34,226 | |||||||||||
|
| |||||||||||||
| Federal Home Loan Mortgage Corp. (FHLMC) Fixed Rate 4.4% | ||||||||||||||
FHLMC Gold 15 Year, 4.50%, 10/01/18 - 9/01/19 | United States | 123,675 | 126,154 | |||||||||||
FHLMC Gold 15 Year, 5.00%, 12/01/17 - 7/01/22 | United States | 234,655 | 241,667 | |||||||||||
FHLMC Gold 15 Year, 5.50%, 10/01/18 - 2/01/19 | United States | 2,244 | 2,260 | |||||||||||
w | FHLMC Gold 30 Year, 3.00%, 11/01/47 | United States | 77,000,000 | 77,059,369 | ||||||||||
FHLMC Gold 30 Year, 3.50%, 6/01/47 | United States | 35,113,983 | 36,127,532 | |||||||||||
w | FHLMC Gold 30 Year, 3.50%, 11/01/47 | United States | 52,000,000 | 53,452,345 | ||||||||||
FHLMC Gold 30 Year, 4.00%, 8/01/47 | United States | 104,185,941 | 109,403,991 | |||||||||||
FHLMC Gold 30 Year, 4.50%, 10/01/40 | United States | 190,101 | 203,808 | |||||||||||
FHLMC Gold 30 Year, 5.00%, 5/01/27 - 2/01/38 | United States | 1,581,381 | 1,718,995 | |||||||||||
FHLMC Gold 30 Year, 5.50%, 6/01/33 - 6/01/36 | United States | 1,096,294 | 1,224,510 | |||||||||||
| 32 | Semiannual Report | franklintempleton.com | ||
FRANKLIN STRATEGIC SERIES
CONSOLIDATED STATEMENT OF INVESTMENTS (UNAUDITED)
Franklin Strategic Income Fund (continued)
| Country | Principal Amount* | Value | ||||||||||||
| Mortgage-Backed Securities (continued) | ||||||||||||||
| Federal Home Loan Mortgage Corp. (FHLMC) Fixed Rate | ||||||||||||||
(continued) | ||||||||||||||
| FHLMC Gold 30 Year, 6.00%, 6/01/33 - 6/01/37 | United States | 309,656 | $ | 348,927 | ||||||||||
| FHLMC Gold 30 Year, 6.50%, 10/01/21 - 6/01/36 | United States | 198,722 | 220,278 | |||||||||||
| FHLMC Gold 30 Year, 7.00%, 9/01/21 - 8/01/32 | United States | 31,561 | 33,134 | |||||||||||
| FHLMC Gold 30 Year, 7.50%, 1/01/26 - 1/01/31 | United States | 7,163 | 8,294 | |||||||||||
| FHLMC Gold 30 Year, 8.00%, 11/01/25 - 1/01/26 | United States | 206 | 212 | |||||||||||
| FHLMC Gold 30 Year, 9.00%, 12/01/24 | United States | 110 | 122 | |||||||||||
|
| |||||||||||||
| 280,171,598 | ||||||||||||||
|
| |||||||||||||
| v | Federal National Mortgage Association (FNMA) Adjustable Rate 0.0%† | |||||||||||||
FNMA, 2.955% - 2.994%, (US 1 Year CMT T-Note +/- MBS | ||||||||||||||
Margin), 4/01/20 - 12/01/34 | United States | 181,061 | 191,029 | |||||||||||
|
| |||||||||||||
| Federal National Mortgage Association (FNMA) Fixed Rate 3.6% | ||||||||||||||
FNMA 15 Year, 2.50%, 7/01/27 | United States | 371,392 | 375,464 | |||||||||||
FNMA 15 Year, 4.50%, 3/01/20 | United States | 35,206 | 35,819 | |||||||||||
FNMA 15 Year, 5.00%, 1/01/18 - 6/01/18 | United States | 12,328 | 12,532 | |||||||||||
FNMA 15 Year, 5.50%, 12/01/17 - 4/01/22 | United States | 70,952 | 73,191 | |||||||||||
w | FNMA 30 Year, 3.00%, 11/01/47 | United States | 90,000,000 | 90,045,705 | ||||||||||
FNMA 30 Year, 3.50%, 5/01/47 | United States | 51,193,405 | 52,664,851 | |||||||||||
w | FNMA 30 Year, 3.50%, 11/01/47 | United States | 53,000,000 | 54,474,064 | ||||||||||
w | FNMA 30 Year, 4.00%, 11/01/47 | United States | 25,000,000 | 26,234,376 | ||||||||||
FNMA 30 Year, 4.50%, 3/01/28 - 2/01/41 | United States | 596,062 | 641,389 | |||||||||||
FNMA 30 Year, 5.00%, 9/01/23 - 10/01/35 | United States | 1,718,939 | 1,878,911 | |||||||||||
FNMA 30 Year, 5.50%, 9/01/33 - 12/01/35 | United States | 1,446,908 | 1,614,125 | |||||||||||
FNMA 30 Year, 6.00%, 6/01/34 - 5/01/38 | United States | 2,802,544 | 3,167,342 | |||||||||||
FNMA 30 Year, 6.50%, 3/01/28 - 10/01/37 | United States | 436,901 | 495,202 | |||||||||||
FNMA 30 Year, 7.50%, 10/01/29 | United States | 6,977 | 8,159 | |||||||||||
FNMA 30 Year, 8.00%, 1/01/25 - 5/01/26 | United States | 3,712 | 4,280 | |||||||||||
FNMA 30 Year, 8.50%, 7/01/25 | United States | 462 | 474 | |||||||||||
|
| |||||||||||||
| 231,725,884 | ||||||||||||||
|
| |||||||||||||
| Government National Mortgage Association (GNMA) Fixed Rate 1.8% | ||||||||||||||
GNMA I SF 30 Year, 5.00%, 6/15/34 - 7/15/34 | United States | 188,239 | 206,135 | |||||||||||
GNMA I SF 30 Year, 5.50%, 2/15/33 - 6/15/36 | United States | 480,141 | 537,237 | |||||||||||
GNMA I SF 30 Year, 6.00%, 8/15/36 | United States | 33,408 | 37,590 | |||||||||||
GNMA I SF 30 Year, 6.50%, 12/15/28 - 3/15/32 | United States | 45,103 | 49,937 | |||||||||||
GNMA I SF 30 Year, 7.00%, 11/15/27 - 5/15/28 | United States | 19,824 | 21,274 | |||||||||||
GNMA I SF 30 Year, 7.50%, 9/15/23 - 5/15/27 | United States | 1,667 | 1,806 | |||||||||||
GNMA I SF 30 Year, 8.00%, 2/15/25 - 9/15/27 | United States | 4,267 | 4,663 | |||||||||||
GNMA I SF 30 Year, 8.50%, 8/15/24 | United States | 70 | 76 | |||||||||||
GNMA I SF 30 Year, 9.00%, 1/15/25 | United States | 258 | 259 | |||||||||||
GNMA I SF 30 Year, 9.50%, 6/15/25 | United States | 472 | 474 | |||||||||||
w | GNMA II SF 30 Year, 3.00%, 11/01/47 | United States | 57,000,000 | 57,667,967 | ||||||||||
GNMA II SF 30 Year, 3.50%, 9/20/47 | United States | 35,799,795 | 37,182,605 | |||||||||||
w | GNMA II SF 30 Year, 3.50%, 11/01/47 | United States | 20,000,000 | 20,746,094 | ||||||||||
GNMA II SF 30 Year, 5.00%, 9/20/33 - 11/20/33 | United States | 265,044 | 291,917 | |||||||||||
GNMA II SF 30 Year, 5.50%, 6/20/34 | United States | 136,716 | 152,530 | |||||||||||
GNMA II SF 30 Year, 6.00%, 11/20/34 | United States | 126,832 | 144,704 | |||||||||||
GNMA II SF 30 Year, 6.50%, 7/20/28 - 12/20/31 | United States | 69,489 | 79,987 | |||||||||||
| franklintempleton.com | Semiannual Report | 33 | ||
FRANKLIN STRATEGIC SERIES
CONSOLIDATED STATEMENT OF INVESTMENTS (UNAUDITED)
| Franklin Strategic Income Fund (continued) | ||||||||||
| Country | Principal Amount* | Value | ||||||||
Mortgage-Backed Securities (continued) | ||||||||||
Government National Mortgage Association (GNMA) Fixed Rate (continued) | ||||||||||
GNMA II SF 30 Year, 7.50%, 4/20/32 | United States | 18,132 | $ | 20,205 | ||||||
|
| |||||||||
|
117,145,460 |
| ||||||||
|
| |||||||||
Total Mortgage-Backed Securities | 629,268,197 | |||||||||
|
| |||||||||
Municipal Bonds 1.0% | ||||||||||
California State GO, Various Purpose, Refunding, 5.00%, 9/01/29. | United States | 17,200,000 | 20,906,944 | |||||||
New Jersey EDA Revenue, School Facilities Construction, | United States | 5,200,000 | 5,602,272 | |||||||
New York City HDC Capital Fund Grant Program Revenue, New York City Housing Authority Program, Series B1, 5.00%, 7/01/33. | United States | 3,500,000 | 3,920,035 | |||||||
Port Authority of New York and New Jersey Revenue, Consolidated, One Hundred Ninety-First Series, 4.823%, 6/01/45. | United States | 14,165,000 | 15,501,609 | |||||||
h Puerto Rico Electric Power Authority Power Revenue, | ||||||||||
Series A, 6.75%, 7/01/36 | United States | 30,900,000 | 10,699,125 | |||||||
Series XX, 5.25%, 7/01/40 | United States | 15,000,000 | 5,193,750 | |||||||
|
| |||||||||
Total Municipal Bonds (Cost $80,628,766) | 61,823,735 | |||||||||
|
| |||||||||
| Shares | ||||||||||
Escrows and Litigation Trusts 0.0%† | ||||||||||
a,ab Midstates Petroleum Co. Inc./Midstates Petroleum Co. LLC, Escrow Account | United States | 15,000,000 | — | |||||||
a,ab NewPage Corp., Litigation Trust | United States | 14,000,000 | — | |||||||
a Penn Virginia Corp., Escrow Account | United States | 15,000,000 | 56,250 | |||||||
a,ab Vistra Energy Corp., Escrow Account. | United States | 30,000,000 | 348,000 | |||||||
|
| |||||||||
Total Escrows and Litigation Trusts | 404,250 | |||||||||
|
| |||||||||
Total Investments before Short Term Investments | 6,659,764,098 | |||||||||
|
| |||||||||
| Principal Amount* | ||||||||||
Short Term Investments 1.4% | ||||||||||
U.S. Government and Agency Securities (Cost $3,398,513) 0.0%† | ||||||||||
x,y U.S. Treasury Bill, 11/16/17 | United States | 3,400,000 | 3,398,623 | |||||||
|
| |||||||||
Total Investments before Money Market Funds | 6,663,162,721 | |||||||||
|
| |||||||||
| 34 | Semiannual Report | franklintempleton.com | ||
FRANKLIN STRATEGIC SERIES
CONSOLIDATED STATEMENT OF INVESTMENTS (UNAUDITED)
| Franklin Strategic Income Fund (continued) | ||||||||||||
| Country | Shares | Value | ||||||||||
Money Market Funds (Cost $88,938,214) 1.4% | ||||||||||||
e,z Institutional Fiduciary Trust Money Market Portfolio, 0.69% | United States | 88,938,214 | $ | 88,938,214 | ||||||||
|
| |||||||||||
Total Investments (Cost $6,811,191,796) 105.3% | 6,752,100,935 | |||||||||||
Other Assets, less Liabilities (5.3)% | (341,743,806) | |||||||||||
|
| |||||||||||
Net Assets 100.0% | $ | 6,410,357,129 | ||||||||||
|
| |||||||||||
†Rounds to less than 0.1% of net assets.
*The principal amount is stated in U.S. dollars unless otherwise indicated.
aNon-income producing.
aaThe security is owned by FT Holdings Corporation ll, a wholly-owned subsidiary of the Fund. See Note 1(g).
abFair valued using significant unobservable inputs. See Note 13 regarding fair value measurements.
bSecurity was purchased pursuant to Rule 144A under the Securities Act of 1933 and may be sold in transactions exempt from registration only to qualified institutional buyers or in a public offering registered under the Securities Act of 1933. These securities have been deemed liquid under guidelines approved by the Trust’s Board of Trustees. At October 31, 2017, the aggregate value of these securities was $1,687,146,884, representing 26.3% of net assets.
cSee Note 11 regarding holdings of 5% voting securities.
dSee Note 8 regarding restricted securities.
eSee Note 3(f) regarding investments in affiliated management investment companies.
fSecurity was purchased pursuant to Regulation S under the Securities Act of 1933, which exempts from registration securities offered and sold outside of the United States. Such a security cannot be sold in the United States without either an effective registration statement filed pursuant to the Securities Act of 1933, or pursuant to an exemption from registration. This security has been deemed liquid under guidelines approved by the Trust’s Board of Trustees. At October 31, 2017, the value of this security was $5,083,711, representing less than 0.1% of net assets.
gPerpetual security with no stated maturity date.
hSee Note 7 regarding defaulted securities.
iIncome may be received in additional securities and/or cash.
jSee Note 1(f) regarding loan participation notes.
kThe coupon rate shown represents the rate at period end.
lSecurity purchased on a when-issued basis. See Note 1(c).
mSee Note 1(i) regarding senior floating rate interests.
nA portion or all of the security purchased on a delayed delivery basis. See Note 1(c).
oPrincipal amount is stated in 100 Mexican Peso Units.
pThe principal represents the notional amount. See Note 1(d) regarding value recovery instruments.
qPrincipal amount is stated in 1,000 Brazilian Real Units.
rRedemption price at maturity is adjusted for inflation. See Note 1(k).
sPrincipal amount of security is adjusted for inflation. See Note 1(k).
tAdjustable rate security with an interest rate that is not based on a published reference index and spread. The rate is based on the structure of the agreement and current market conditions. The coupon rate shown represents the rate at period end.
uThe coupon rate shown represents the rate inclusive of any caps or floors, if applicable, in effect at period end.
vAdjustable Rate Mortgage-Backed Security (ARM); the rate shown is the effective rate at period end. ARM rates are not based on a published reference rate and spread, but instead pass-through weighted average interest income inclusive of any caps or floors, if applicable, from the underlying mortgage loans in which the majority of mortgages pay interest based on the index shown at their designated reset dates plus a spread, less the applicable servicing and guaranty fee (MBS margin).
wSecurity purchased on a to-be-announced (TBA) basis. See Note 1(c).
xThe security was issued on a discount basis with no stated coupon rate.
yA portion or all of the security has been segregated as collateral for open futures contracts. At October 31, 2017, the value of this security and/or cash pledged amounted to $2,957,802, representing less than 0.1% of net assets.
zThe rate shown is the annualized seven-day yield at period end.
| franklintempleton.com | Semiannual Report | 35 | ||
FRANKLIN STRATEGIC SERIES
CONSOLIDATED STATEMENT OF INVESTMENTS (UNAUDITED)
Franklin Strategic Income Fund (continued)
At October 31, 2017, the Fund had the following futures contracts outstanding. See Note 1(d).
Futures Contracts
| Description | Type | Number of Contracts | Notional Amount* | Expiration Date | Value/ Unrealized Appreciation (Depreciation) | |||||||||||||||
| ||||||||||||||||||||
| Interest Rate Contracts | ||||||||||||||||||||
Euro-Bund | Long | 145 | $27,493,722 | 12/07/17 | $ (12,171) | |||||||||||||||
Long Gilt | Long | 496 | 81,922,426 | 12/27/17 | (1,793,000 | ) | ||||||||||||||
U.S. Treasury 10 Yr. Note Ultra | Long | 196 | 26,248,688 | 12/19/17 | (386,394 | ) | ||||||||||||||
U.S. Treasury 30 Yr. Bond | Long | 214 | 32,628,313 | 12/19/17 | (555,543 | ) | ||||||||||||||
|
| |||||||||||||||||||
Total Futures Contracts | $(2,747,108) | |||||||||||||||||||
|
| |||||||||||||||||||
*As of period end.
At October 31, 2017, the Fund had the following forward exchange contracts outstanding. See Note 1(d).
Forward Exchange Contracts
| Currency | Counterpartya | Type | Quantity | Contract Amount* | Settlement Date | Unrealized Appreciation | Unrealized Depreciation | |||||||||||||||||||||
| ||||||||||||||||||||||||||||
| OTC Forward Exchange Contracts | ||||||||||||||||||||||||||||
Argentine Peso | JPHQ | Buy | 270,000,000 | 14,346,440 | 11/13/17 | $ | 824,798 | $ | — | |||||||||||||||||||
Argentine Peso | JPHQ | Buy | 55,000,000 | 3,078,904 | 12/26/17 | — | (66,560 | ) | ||||||||||||||||||||
Colombian Peso | JPHQ | Buy | 31,000,000,000 | 10,584,178 | 12/26/17 | — | (447,856 | ) | ||||||||||||||||||||
Australian Dollar | JPHQ | Sell | 21,200,000 | 16,625,570 | 1/25/18 | 407,364 | — | |||||||||||||||||||||
British Pound | DBAB | Sell | 16,500,000 | 21,774,225 | 1/25/18 | — | (207,059 | ) | ||||||||||||||||||||
Canadian Dollar | JPHQ | Sell | 50,000,000 | 39,828,578 | 1/25/18 | 1,019,047 | — | |||||||||||||||||||||
Euro | JPHQ | Sell | 14,400,000 | 17,004,240 | 1/25/18 | 140,076 | — | |||||||||||||||||||||
Indian Rupee | DBAB | Buy | 2,886,000,000 | 44,128,440 | 1/25/18 | 53,595 | — | |||||||||||||||||||||
Japanese Yen | DBAB | Sell | 7,400,000,000 | 66,445,183 | 1/25/18 | 1,051,625 | — | |||||||||||||||||||||
Australian Dollar | JPHQ | Sell | 61,000,000 | 47,939,290 | 2/12/18 | 1,278,646 | — | |||||||||||||||||||||
British Pound | JPHQ | Sell | 6,500,000 | 8,490,300 | 2/12/18 | — | (173,804 | ) | ||||||||||||||||||||
Euro | JPHQ | Sell | 132,000,000 | 156,171,840 | 2/12/18 | 1,414,744 | — | |||||||||||||||||||||
Indian Rupee | JPHQ | Buy | 2,200,000,000 | 33,768,227 | 2/12/18 | — | (154,953 | ) | ||||||||||||||||||||
Japanese Yen | JPHQ | Sell | 4,000,000,000 | 36,717,122 | 2/14/18 | 1,330,691 | — | |||||||||||||||||||||
Polish Zloty | JPHQ | Buy | 60,000,000 | 16,414,522 | 2/20/18 | 86,907 | — | |||||||||||||||||||||
Indian Rupee | JPHQ | Buy | 212,000,000 | 3,171,754 | 4/12/18 | 46,552 | — | |||||||||||||||||||||
Mexican Peso | JPHQ | Buy | 60,000,000 | 3,146,633 | 4/12/18 | — | (102,093 | ) | ||||||||||||||||||||
Australian Dollar | DBAB | Sell | 43,000,000 | 33,693,940 | 4/19/18 | 813,945 | — | |||||||||||||||||||||
British Pound | JPHQ | Sell | 13,300,000 | 142,350,565 | SEK | 4/19/18 | — | (575,497 | ) | |||||||||||||||||||
British Pound | JPHQ | Sell | 15,000,000 | 19,874,325 | 4/19/18 | — | (160,247 | ) | ||||||||||||||||||||
Canadian Dollar | JPHQ | Sell | 47,000,000 | 37,447,335 | 4/19/18 | 940,407 | — | |||||||||||||||||||||
Euro | DBAB | Sell | 43,200,000 | 51,273,648 | 4/19/18 | 422,184 | — | |||||||||||||||||||||
Japanese Yen | DBAB | Sell | 8,000,000,000 | 72,163,088 | 4/19/18 | 1,137,328 | — | |||||||||||||||||||||
Swedish Krona | JPHQ | Buy | 9,560,000 | 1,155,877 | 4/19/18 | — | (1,530 | ) | ||||||||||||||||||||
| 36 | Semiannual Report | franklintempleton.com | ||
FRANKLIN STRATEGIC SERIES
CONSOLIDATED STATEMENT OF INVESTMENTS (UNAUDITED)
Franklin Strategic Income Fund (continued)
Forward Exchange Contracts (continued)
| Currency | Counterpartya | Type | Quantity | Contract Amount* | Settlement Date | Unrealized Appreciation | Unrealized Depreciation | |||||||||||||||||||||
| ||||||||||||||||||||||||||||
| OTC Forward Exchange Contracts (continued) | ||||||||||||||||||||||||||||
British Pound | JPHQ | Sell | 8,300,000 | 10,951,850 | 8/15/18 | $ | — | $ | (175,650 | ) | ||||||||||||||||||
|
| |||||||||||||||||||||||||||
Total Forward Exchange Contracts | $ | 10,967,909 | $ | (2,065,249 | ) | |||||||||||||||||||||||
|
| |||||||||||||||||||||||||||
Net unrealized appreciation (depreciation) |
| $ | 8,902,660 | |||||||||||||||||||||||||
|
| |||||||||||||||||||||||||||
*In U.S. dollars unless otherwise indicated.
aMay be comprised of multiple contracts with the same counterparty, currency and settlement date.
At October 31, 2017, the Fund had the following credit default swap contracts outstanding. See Note 1(d).
Credit Default Swap Contracts
| Description | Periodic Payment Rate Received (Paid) | Payment Frequency | Counter- party | Maturity Date | Notional Amounta | Value | Unamortized Upfront Payments (Receipts) | Unrealized Appreciation (Depreciation) | Ratingb | |||||||||||||||||||||||||||
| ||||||||||||||||||||||||||||||||||||
| OTC Swap Contracts | ||||||||||||||||||||||||||||||||||||
Contracts to Buy Protectionc | ||||||||||||||||||||||||||||||||||||
| Single Name | ||||||||||||||||||||||||||||||||||||
Ally Financial Inc. | (5.00)% | Quarterly | CITI | 12/20/22 | $ | 7,350,000 | $ | (1,445,080 | ) | $ | (1,378,099 | ) | $ | (66,981 | ) | |||||||||||||||||||||
Ally Financial Inc. | (5.00)% | Quarterly | JPHQ | 12/20/22 | 12,450,000 | (2,447,789 | ) | (2,350,662 | ) | (97,127 | ) | |||||||||||||||||||||||||
Best Buy Co. Inc. | (5.00)% | Quarterly | BZWS | 6/20/22 | 2,650,000 | (475,626 | ) | (421,265 | ) | (54,361 | ) | |||||||||||||||||||||||||
Best Buy Co. Inc. | (5.00)% | Quarterly | CITI | 6/20/22 | 24,000,000 | (4,307,560 | ) | (3,906,167 | ) | (401,393 | ) | |||||||||||||||||||||||||
The Gap Inc. | (1.00)% | Quarterly | CITI | 6/20/22 | 11,300,000 | 203,812 | 669,284 | (465,472 | ) | |||||||||||||||||||||||||||
Kohl’s Corp. | (1.00)% | Quarterly | CITI | 6/20/22 | 12,900,000 | 440,440 | 661,396 | (220,956 | ) | |||||||||||||||||||||||||||
L Brands Inc. | (1.00)% | Quarterly | CITI | 6/20/22 | 11,300,000 | 414,707 | 711,183 | (296,476 | ) | |||||||||||||||||||||||||||
Macy’s Retail Holdings Inc. | (1.00)% | Quarterly | CITI | 6/20/22 | 10,800,000 | 802,526 | 735,434 | 67,092 | ||||||||||||||||||||||||||||
Target Corp. | (1.00)% | Quarterly | CITI | 6/20/22 | 26,650,000 | (697,720 | ) | (405,203 | ) | (292,517 | ) | |||||||||||||||||||||||||
| Contracts to Sell Protectionc,d | ||||||||||||||||||||||||||||||||||||
| Single Name | ||||||||||||||||||||||||||||||||||||
Government of Argentina | 5.00% | Quarterly | CITI | 12/20/22 | 48,600,000 | 6,050,337 | 4,215,539 | 1,834,798 | B+ | |||||||||||||||||||||||||||
Government of Brazil | 1.00% | Quarterly | FBCO | 12/20/22 | 20,300,000 | (649,385 | ) | (999,083 | ) | 349,698 | BB | |||||||||||||||||||||||||
Government of Colombia | 1.00% | Quarterly | JPHQ | 12/20/22 | 36,100,000 | 74,361 | (532,654 | ) | 607,015 | BBB | ||||||||||||||||||||||||||
Government of Mexico | 1.00% | Quarterly | FBCO | 12/20/22 | 16,000,000 | 51,622 | (84,352 | ) | 135,974 | BBB+ | ||||||||||||||||||||||||||
| Traded Index | ||||||||||||||||||||||||||||||||||||
eCitibank Bespoke Index, | ||||||||||||||||||||||||||||||||||||
Mezzanine Tranche 5-8% | 0.50% | Quarterly | CITI | 6/20/18 | 30,000,000 | (98,043 | ) | - | (98,043 | ) | Non- | |||||||||||||||||||||||||
| Investment | ||||||||||||||||||||||||||||||||||||
| Grade | ||||||||||||||||||||||||||||||||||||
eCitibank Bespoke Lisbon | ||||||||||||||||||||||||||||||||||||
Index, Equity Tranche 0-3% | 0.00% | Quarterly | CITI | 6/20/19 | 5,440,000 | (642,830 | ) | (1,052,669 | ) | 409,839 | Non- | |||||||||||||||||||||||||
| Investment | ||||||||||||||||||||||||||||||||||||
| Grade | ||||||||||||||||||||||||||||||||||||
| franklintempleton.com | Semiannual Report | 37 | ||
FRANKLIN STRATEGIC SERIES
CONSOLIDATED STATEMENT OF INVESTMENTS (UNAUDITED)
Franklin Strategic Income Fund (continued)
Credit Default Swap Contracts (continued)
| Description | Periodic Payment Rate Received (Paid) | Payment Frequency | Counter- party | Maturity Date | Notional Amounta | Value | Unamortized Upfront Payments (Receipts) | Unrealized Appreciation (Depreciation) | Ratingb | |||||||||||||||||||||||||||
| ||||||||||||||||||||||||||||||||||||
| OTC Swap Contracts (continued) | ||||||||||||||||||||||||||||||||||||
| Contracts to Sell Protectionc,d (continued) | ||||||||||||||||||||||||||||||||||||
| Traded Index (continued) | ||||||||||||||||||||||||||||||||||||
eCitibank Bespoke Verona Index, Equity Tranche 0-3% | 0.00% | Quarterly | CITI | 12/20/19 | $ | 10,900,000 | $ | (1,998,799 | ) | $ | (2,340,438 | ) | $ | 341,639 | Non- | |||||||||||||||||||||
| Investment | ||||||||||||||||||||||||||||||||||||
| Grade | ||||||||||||||||||||||||||||||||||||
eCitibank Bespoke Verona Index, Mezzanine Tranche 7-15% | 0.40% | Quarterly | CITI | 12/20/19 | 31,000,000 | 28,157 | - | 28,157 | Non- | |||||||||||||||||||||||||||
| Investment | ||||||||||||||||||||||||||||||||||||
| Grade | ||||||||||||||||||||||||||||||||||||
MCDX.NA.29 | 1.00% | Quarterly | CITI | 12/20/22 | 23,060,000 | 591,039 | 577,090 | 13,949 | Investment | |||||||||||||||||||||||||||
|
| |||||||||||||||||||||||||||||||||||
| Grade | ||||||||||||||||||||||||||||||||||||
Total Credit Default Swap Contracts |
| $ | (4,105,831 | ) | $ | (5,900,666 | ) | $1,794,835 | ||||||||||||||||||||||||||||
|
| |||||||||||||||||||||||||||||||||||
aFor contracts to sell protection, the notional amount is equal to the maximum potential amount of the future payments and no recourse provisions have been entered into in association with the contracts.
bBased on Standard and Poor’s (S&P) Rating for single name swaps and internal ratings for index swaps. Internal ratings based on mapping into equivalent ratings from external vendors.
cPerformance triggers for settlement of contract include default, bankruptcy or restructuring for single name swaps and failure to pay or bankruptcy of the underlying securities for traded index swaps.
dThe fund enters contracts to sell protection to create a long credit position.
eRepresents a custom index comprised of a basket of underlying issuers.
See Note 10 regarding other derivative information.
See Abbreviations on page 59.
| 38 | Semiannual Report | The accompanying notes are an integral part of these consolidated financial statements. | franklintempleton.com | ||
FRANKLIN STRATEGIC SERIES
Consolidated Financial Statements
Consolidated Statement of Assets and Liabilities
October 31, 2017 (unaudited)
Franklin Strategic Income Fund
Assets: | ||||
Investments in securities: | ||||
Cost - Unaffiliated issuers | $ | 6,248,853,705 | ||
Cost - Controlled affiliates (Note 3f and 11) | 470,958,729 | |||
Cost - Non-controlled affiliates (Note 3f and 11) | 91,379,362 | |||
|
| |||
Value - Unaffiliated issuers | $ | 6,183,146,213 | ||
Value - Controlled affiliates (Note 3f and 11) | 478,669,668 | |||
Value - Non-controlled affiliates (Note 3f and 11) | 90,285,054 | |||
Cash | 7,520,267 | |||
Restricted cash for OTC derivative contracts (Note 1e) | 3,990,000 | |||
Foreign currency, at value (cost $1,457,428) | 1,453,560 | |||
Receivables: | ||||
Investment securities sold | 12,966,757 | |||
Capital shares sold | 39,789,265 | |||
Dividends and interest | 60,343,751 | |||
Initial margin on centrally cleared swap contracts | 881,908 | |||
Collateral due from brokers on: | ||||
OTC derivative contracts | 2,170,000 | |||
TBA transactions | 70,000 | |||
OTC swap contracts (upfront payments $7,906,065) | 7,569,926 | |||
Unrealized appreciation on OTC forward exchange contracts | 10,967,909 | |||
Unrealized appreciation on OTC swap contracts | 3,788,161 | |||
Unrealized appreciation on unfunded loan commitments (Note 9) | 28,767 | |||
Other assets | 6,233 | |||
|
| |||
Total assets |
|
6,903,647,439 |
| |
|
| |||
Liabilities: | ||||
Payables: | ||||
Investment securities purchased | 419,824,855 | |||
Capital shares redeemed | 43,727,558 | |||
Management fees | 2,228,099 | |||
Distribution fees | 1,515,249 | |||
Transfer agent fees | 2,603,508 | |||
Trustees’ fees and expenses | 4,467 | |||
Distributions to shareholders | 896,514 | |||
Variation margin on futures contracts | 32,803 | |||
Collateral due to brokers on: | ||||
OTC derivative contracts | 3,990,000 | |||
OTC swap contracts (upfront receipts $14,653,782) | 13,470,592 | |||
Unrealized depreciation on OTC forward exchange contracts | 2,065,249 | |||
Unrealized depreciation on OTC swap contracts | 1,993,326 | |||
Deferred tax | 488,680 | |||
Accrued expenses and other liabilities | 449,410 | |||
|
| |||
Total liabilities |
|
493,290,310 |
| |
|
| |||
Net assets, at value |
$ |
6,410,357,129 |
| |
|
| |||
Net assets consist of: | ||||
Paid-in capital | $ | 6,835,010,137 | ||
Distributions in excess of net investment income | (77,099,636 | ) | ||
Net unrealized appreciation (depreciation) | (51,985,731 | ) | ||
Accumulated net realized gain (loss) | (295,567,641 | ) | ||
|
| |||
Net assets, at value |
$ |
6,410,357,129 |
| |
|
|
| franklintempleton.com | The accompanying notes are an integral part of these consolidated financial statements. | Semiannual Report | 39 | ||
FRANKLIN STRATEGIC SERIES
CONSOLIDATED FINANCIAL STATEMENTS
Franklin Strategic Income Fund (continued)
| Class A: | ||||
Net assets, at value | $ | 3,624,769,264 | ||
|
| |||
Shares outstanding | 366,262,236 | |||
|
| |||
Net asset value per sharea | $9.90 | |||
|
| |||
Maximum offering price per share (net asset value per share ÷ 95.75%) | $10.34 | |||
|
| |||
| Class C: | ||||
Net assets, at value | $ | 1,234,019,278 | ||
|
| |||
Shares outstanding | 124,705,168 | |||
|
| |||
Net asset value and maximum offering price per sharea | $9.90 | |||
|
| |||
| Class R: | ||||
Net assets, at value | $ | 125,715,422 | ||
|
| |||
Shares outstanding | 12,749,597 | |||
|
| |||
Net asset value and maximum offering price per share | $9.86 | |||
|
| |||
| Class R6: | ||||
Net assets, at value | $ | 346,033,458 | ||
|
| |||
Shares outstanding | 34,909,621 | |||
|
| |||
Net asset value and maximum offering price per share | $9.91 | |||
|
| |||
| Advisor Class: | ||||
Net assets, at value | $ | 1,079,819,707 | ||
|
| |||
Shares outstanding | 108,990,115 | |||
|
| |||
Net asset value and maximum offering price per share | $9.91 | |||
|
| |||
aRedemption price is equal to net asset value less contingent deferred sales charges, if applicable.
| 40 | Semiannual Report | The accompanying notes are an integral part of these consolidated financial statements. | franklintempleton.com | ||
FRANKLIN STRATEGIC SERIES
CONSOLIDATED FINANCIAL STATEMENTS
Consolidated Statement of Operations
for the six months ended October 31, 2017 (unaudited)
Franklin Strategic Income Fund
Investment income: | ||||
Dividends: | ||||
Unaffiliated issuers | $ | 21,182 | ||
Controlled affiliates (Note 3f and 11) | 19,592,125 | |||
Non-controlled affiliates (Note 3f and 11) | 226,452 | |||
Interest: | ||||
Unaffiliated issuers | 134,252,955 | |||
|
| |||
Total investment income |
|
154,092,714 |
| |
|
| |||
Expenses: | ||||
Management fees (Note 3a) | 15,149,809 | |||
Distribution fees: (Note 3c) | ||||
Class A | 4,694,288 | |||
Class C | 4,283,532 | |||
Class R | 338,303 | |||
Transfer agent fees: (Note 3e) | ||||
Class A | 3,536,024 | |||
Class C | 1,242,103 | |||
Class R | 127,374 | |||
Class R6 | 3,248 | |||
Advisor Class | 1,029,631 | |||
Custodian fees (Note 4) | 164,760 | |||
Reports to shareholders | 328,192 | |||
Registration and filing fees | 108,988 | |||
Professional fees | 92,592 | |||
Trustees’ fees and expenses | 38,630 | |||
Other | 104,823 | |||
|
| |||
Total expenses |
|
31,242,297 |
| |
Expense reductions (Note 4) | (64,244 | ) | ||
Expenses waived/paid by affiliates (Note 3f) | (1,541,857 | ) | ||
|
| |||
Net expenses |
|
29,636,196 |
| |
|
| |||
Net investment income |
|
124,456,518 |
| |
|
| |||
Realized and unrealized gains (losses): | ||||
Net realized gain (loss) from: | ||||
Investments: | ||||
Unaffiliated issuers | (10,772,503 | ) | ||
Foreign currency transactions | 208,285 | |||
Forward exchange contracts | (25,519,404 | ) | ||
Futures contracts | 5,536,673 | |||
Swap contracts | 1,465,399 | |||
|
| |||
Net realized gain (loss) |
|
(29,081,550 |
) | |
|
| |||
Net change in unrealized appreciation (depreciation) on: | ||||
Investments: | ||||
Unaffiliated issuers | 30,068,682 | |||
Controlled affiliates (Note 3f and 11) | (8,537,031 | ) | ||
Non-controlled affiliates (Note 3f and 11) | (673,420 | ) | ||
Translation of other assets and liabilities denominated in foreign currencies | (620,954 | ) | ||
Forward exchange contracts | 8,363,756 |
| franklintempleton.com | The accompanying notes are an integral part of these consolidated financial statements. | Semiannual Report | 41 | ||
FRANKLIN STRATEGIC SERIES
CONSOLIDATED FINANCIAL STATEMENTS
Consolidated Statement of Operations (continued)
for the six months ended October 31, 2017 (unaudited)
Franklin Strategic Income Fund
Futures contracts | (5,756,973 | ) | ||
Swap contracts | 2,193,012 | |||
Change in deferred taxes on unrealized appreciation | (42,227 | ) | ||
|
| |||
Net change in unrealized appreciation (depreciation) |
|
24,994,845 |
| |
|
| |||
Net realized and unrealized gain (loss) |
|
(4,086,705 |
) | |
|
| |||
Net increase (decrease) in net assets resulting from operations |
$ |
120,369,813 |
| |
|
|
| 42 | Semiannual Report | The accompanying notes are an integral part of these consolidated financial statements. | franklintempleton.com | ||
FRANKLIN STRATEGIC SERIES
CONSOLIDATED FINANCIAL STATEMENTS
Consolidated Statements of Changes in Net Assets
Franklin Strategic Income Fund
| Six Months Ended October 31, 2017 (unaudited) | Year Ended April 30, 2017 | |||||||
| ||||||||
Increase (decrease) in net assets: | ||||||||
Operations: | ||||||||
Net investment income | $ | 124,456,518 | $ | 296,053,367 | ||||
Net realized gain (loss) | (29,081,550 | ) | (178,596,599 | ) | ||||
Net change in unrealized appreciation (depreciation) | 24,994,845 | 411,590,994 | ||||||
|
| |||||||
Net increase (decrease) in net assets resulting from operations |
|
120,369,813 |
|
|
529,047,762 |
| ||
|
| |||||||
Distributions to shareholders from: | ||||||||
Net investment income: | ||||||||
Class A | (46,957,038 | ) | (76,684,998 | ) | ||||
Class C | (13,786,388 | ) | (21,849,570 | ) | ||||
Class R | (1,520,488 | ) | (2,644,424 | ) | ||||
Class R6 | (5,448,989 | ) | (9,361,333 | ) | ||||
Advisor Class | (15,073,070 | ) | (19,738,810 | ) | ||||
|
| |||||||
Total distributions to shareholders |
|
(82,785,973 |
) |
|
(130,279,135 |
) | ||
|
| |||||||
Capital share transactions: (Note 2) | ||||||||
Class A | (230,052,345 | ) | (898,775,869 | ) | ||||
Class C | (159,535,005 | ) | (344,124,057 | ) | ||||
Class R | (21,607,966 | ) | (44,210,930 | ) | ||||
Class R6 | (25,260,852 | ) | 61,813,436 | |||||
Advisor Class | 3,702,500 | 112,378,776 | ||||||
|
| |||||||
Total capital share transactions |
|
(432,753,668 |
) |
|
(1,112,918,644 |
) | ||
|
| |||||||
Net increase (decrease) in net assets |
|
(395,169,828 |
) |
|
(714,150,017 |
) | ||
Net assets: | ||||||||
Beginning of period | 6,805,526,957 | 7,519,676,974 | ||||||
|
| |||||||
End of period |
$ |
6,410,357,129 |
|
$ |
6,805,526,957 |
| ||
|
| |||||||
Distributions in excess of net investment income included in net assets: | ||||||||
End of period | $ | (77,099,636 | ) | $ | (118,770,181 | ) | ||
|
| |||||||
| franklintempleton.com | The accompanying notes are an integral part of these consolidated financial statements. | Semiannual Report | 43 | ||
FRANKLIN STRATEGIC SERIES
Notes to Consolidated Financial Statements (unaudited)
Franklin Strategic Income Fund
1. Organization and Significant Accounting Policies
Franklin Strategic Series (Trust) is registered under the Investment Company Act of 1940 (1940 Act) as an open-end management investment company, consisting of eight separate funds and applies the specialized accounting and reporting guidance in U.S. Generally Accepted Accounting Principles (U.S. GAAP). Franklin Strategic Income Fund (Fund) is included in this report. The Fund offers five classes of shares: Class A, Class C, Class R, Class R6, and Advisor Class. Each class of shares may differ by its initial sales load, contingent deferred sales charges, voting rights on matters affecting a single class, its exchange privilege and fees due to differing arrangements for distribution and transfer agent fees.
The following summarizes the Fund’s significant accounting policies.
a. Financial Instrument Valuation
The Fund’s investments in financial instruments are carried at fair value daily. Fair value is the price that would be received to sell an asset or paid to transfer a liability in an orderly transaction between market participants on the measurement date. The Fund calculates the net asset value (NAV) per share as of 4 p.m. Eastern time each day the New York Stock Exchange (NYSE) is open for trading. Under compliance policies and procedures approved by the Trust’s Board of Trustees (the Board), the Fund’s administrator has responsibility for oversight of valuation, including leading the cross-functional Valuation Committee (VC). The VC provides administration and oversight of the Fund’s valuation policies and procedures, which are approved annually by the Board. Among other things, these procedures allow the Fund to utilize independent pricing services, quotations from securities and financial instrument dealers, and other market sources to determine fair value.
Equity securities and derivative financial instruments listed on an exchange or on the NASDAQ National Market System are valued at the last quoted sale price or the official closing price of the day, respectively. Foreign equity securities are valued as of the close of trading on the foreign stock exchange on which the security is primarily traded, or as of 4 p.m. Eastern time. The value is then converted into its U.S. dollar equivalent at the foreign exchange rate in effect at 4 p.m. Eastern time on the day that the value of the security is determined. Over-the-counter (OTC) securities are valued within the range of the most recent
quoted bid and ask prices. Securities that trade in multiple markets or on multiple exchanges are valued according to the broadest and most representative market. Certain equity securities are valued based upon fundamental characteristics or relationships to similar securities.
Debt securities generally trade in the OTC market rather than on a securities exchange. The Fund’s pricing services use multiple valuation techniques to determine fair value. In instances where sufficient market activity exists, the pricing services may utilize a market-based approach through which quotes from market makers are used to determine fair value. In instances where sufficient market activity may not exist or is limited, the pricing services also utilize proprietary valuation models which may consider market characteristics such as benchmark yield curves, credit spreads, estimated default rates, anticipated market interest rate volatility, coupon rates, anticipated timing of principal repayments, underlying collateral, and other unique security features in order to estimate the relevant cash flows, which are then discounted to calculate the fair value. Securities denominated in a foreign currency are converted into their U.S. dollar equivalent at the foreign exchange rate in effect at 4 p.m. Eastern time on the date that the values of the foreign debt securities are determined.
Investments in open-end mutual funds are valued at the closing NAV.
Certain derivative financial instruments are centrally cleared or traded in the OTC market. The Fund’s pricing services use various techniques including industry standard option pricing models and proprietary discounted cash flow models to determine the fair value of those instruments. The Fund’s net benefit or obligation under the derivative contract, as measured by the fair value of the contract, is included in net assets.
The Fund has procedures to determine the fair value of financial instruments for which market prices are not reliable or readily available. Under these procedures, the VC convenes on a regular basis to review such financial instruments and considers a number of factors, including significant unobservable valuation inputs, when arriving at fair value. The VC primarily employs a market-based approach which may use related or comparable assets or liabilities, recent transactions, market multiples, book values, and other relevant information for the investment to determine the fair value of the investment. An income-based valuation approach may also be used in which the anticipated future cash flows of the investment are discounted to
| 44 | Semiannual Report | franklintempleton.com | ||
FRANKLIN STRATEGIC SERIES
NOTES TO CONSOLIDATED FINANCIAL STATEMENTS (UNAUDITED)
Franklin Strategic Income Fund (continued)
calculate fair value. Discounts may also be applied due to the nature or duration of any restrictions on the disposition of the investments. Due to the inherent uncertainty of valuations of such investments, the fair values may differ significantly from the values that would have been used had an active market existed. The VC employs various methods for calibrating these valuation approaches including a regular review of key inputs and assumptions, transactional back-testing or disposition analysis, and reviews of any related market activity.
Trading in securities on foreign securities stock exchanges and OTC markets may be completed before 4 p.m. Eastern time. In addition, trading in certain foreign markets may not take place on every Fund’s business day. Occasionally, events occur between the time at which trading in a foreign security is completed and 4 p.m. Eastern time that might call into question the reliability of the value of a portfolio security held by the Fund. As a result, differences may arise between the value of the Fund’s portfolio securities as determined at the foreign market close and the latest indications of value at 4 p.m. Eastern time. In order to minimize the potential for these differences, the VC monitors price movements following the close of trading in foreign stock markets through a series of country specific market proxies (such as baskets of American Depositary Receipts, futures contracts and exchange traded funds). These price movements are measured against established trigger thresholds for each specific market proxy to assist in determining if an event has occurred that may call into question the reliability of the values of the foreign securities held by the Fund. If such an event occurs, the securities may be valued using fair value procedures, which may include the use of independent pricing services.
When the last day of the reporting period is a non-business day, certain foreign markets may be open on those days that the Fund’s NAV is not calculated, which could result in differences between the value of the Fund’s portfolio securities on the last business day and the last calendar day of the reporting period. Any significant security valuation changes due to an open foreign market are adjusted and reflected by the Fund for financial reporting purposes.
b. Foreign Currency Translation
Portfolio securities and other assets and liabilities denominated in foreign currencies are translated into U.S. dollars based on the exchange rate of such currencies against U.S. dollars on the date of valuation. The Fund may enter into foreign currency
exchange contracts to facilitate transactions denominated in a foreign currency. Purchases and sales of securities, income and expense items denominated in foreign currencies are translated into U.S. dollars at the exchange rate in effect on the transaction date. Portfolio securities and assets and liabilities denominated in foreign currencies contain risks that those currencies will decline in value relative to the U.S. dollar. Occasionally, events may impact the availability or reliability of foreign exchange rates used to convert the U.S. dollar equivalent value. If such an event occurs, the foreign exchange rate will be valued at fair value using procedures established and approved by the Board.
The Fund does not separately report the effect of changes in foreign exchange rates from changes in market prices on securities held. Such changes are included in net realized and unrealized gain or loss from investments in the Consolidated Statement of Operations.
Realized foreign exchange gains or losses arise from sales of foreign currencies, currency gains or losses realized between the trade and settlement dates on securities transactions and the difference between the recorded amounts of dividends, interest, and foreign withholding taxes and the U.S. dollar equivalent of the amounts actually received or paid. Net unrealized foreign exchange gains and losses arise from changes in foreign exchange rates on foreign denominated assets and liabilities other than investments in securities held at the end of the reporting period.
c. Securities Purchased on a When-Issued, Delayed Delivery and TBA Basis
The Fund purchases securities on a when-issued or delayed delivery and to-be-announced (TBA) basis, with payment and delivery scheduled for a future date. These transactions are subject to market fluctuations and are subject to the risk that the value at delivery may be more or less than the trade date purchase price. Although the Fund will generally purchase these securities with the intention of holding the securities, it may sell the securities before the settlement date. Sufficient assets have been segregated for these securities and collateral has been pledged and/or received for open TBA trades.
d. Derivative Financial Instruments
The Fund invested in derivative financial instruments in order to manage risk or gain exposure to various other investments or markets. Derivatives are financial contracts based on an underlying or notional amount, require no initial investment or
| franklintempleton.com | Semiannual Report | 45 | ||
FRANKLIN STRATEGIC SERIES
NOTES TO CONSOLIDATED FINANCIAL STATEMENTS (UNAUDITED)
Franklin Strategic Income Fund (continued)
1. Organization and Significant Accounting Policies (continued)
d. Derivative Financial Instruments (continued)
an initial net investment that is smaller than would normally be required to have a similar response to changes in market factors, and require or permit net settlement. Derivatives contain various risks including the potential inability of the counterparty to fulfill their obligations under the terms of the contract, the potential for an illiquid secondary market, and/or the potential for market movements which expose the Fund to gains or losses in excess of the amounts shown in the Consolidated Statement of Assets and Liabilities. Realized gain and loss and unrealized appreciation and depreciation on these contracts for the period are included in the Consolidated Statement of Operations.
Derivative counterparty credit risk is managed through a formal evaluation of the creditworthiness of all potential counterparties. The Fund attempts to reduce its exposure to counterparty credit risk on OTC derivatives, whenever possible, by entering into International Swaps and Derivatives Association (ISDA) master agreements with certain counterparties. These agreements contain various provisions, including but not limited to collateral requirements, events of default, or early termination. Termination events applicable to the counterparty include certain deteriorations in the credit quality of the counterparty. Termination events applicable to the Fund include failure of the Fund to maintain certain net asset levels and/or limit the decline in net assets over various periods of time. In the event of default or early termination, the ISDA master agreement gives the non-defaulting party the right to net and close-out all transactions traded, whether or not arising under the ISDA agreement, to one net amount payable by one counterparty to the other. However, absent an event of default or early termination, OTC derivative assets and liabilities are presented gross and not offset in the Consolidated Statement of Assets and Liabilities. Early termination by the counterparty may result in an immediate payment by the Fund of any net liability owed to that counterparty under the ISDA agreement.
Collateral requirements differ by type of derivative. Collateral or initial margin requirements are set by the broker or exchange clearing house for exchange traded and centrally cleared derivatives. Initial margin deposited is held at the exchange and can be in the form of cash and/or securities. For OTC derivatives traded under an ISDA master agreement, posting of collateral is required by either the Fund or the applicable
counterparty if the total net exposure of all OTC derivatives with the applicable counterparty exceeds the minimum transfer amount, which typically ranges from $100,000 to $250,000, and can vary depending on the counterparty and the type of the agreement. Generally, collateral is determined at the close of Fund business each day and any additional collateral required due to changes in derivative values may be delivered by the Fund or the counterparty the next business day, or within a few business days. Collateral pledged and/or received by the Fund for OTC derivatives, if any, is held in segregated accounts with the Fund’s custodian/counterparty broker and can be in the form of cash and/or securities. Unrestricted cash may be invested according to the Fund’s investment objectives. To the extent that the amounts due to the Fund from its counterparties are not subject to collateralization or are not fully collateralized, the Fund bears the risk of loss from counterparty non-performance.
The Fund entered into exchange traded futures contracts primarily to manage and/or gain exposure to interest rate risk. A futures contract is an agreement between the Fund and a counterparty to buy or sell an asset at a specified price on a future date. Required initial margins are pledged by the Fund, and the daily change in fair value is accounted for as a variation margin payable or receivable in the Consolidated Statement of Assets and Liabilities.
The Fund entered into OTC forward exchange contracts primarily to manage and/or gain exposure to certain foreign currencies. A forward exchange contract is an agreement between the Fund and a counterparty to buy or sell a foreign currency at a specific exchange rate on a future date.
The Fund entered into credit default swap contracts primarily to manage exposure to credit risk. A credit default swap is an agreement between the Fund and a counterparty whereby the buyer of the contract receives credit protection and the seller of the contract guarantees the credit worthiness of a referenced debt obligation. These agreements may be privately negotiated in the over-the-counter market (OTC credit default swaps) or may be executed in a multilateral trade facility platform, such as a registered exchange (centrally cleared credit default swaps). The underlying referenced debt obligation may be a single issuer of corporate or sovereign debt, a credit index, a basket of issuers or indices, or a tranche of a credit index or basket of issuers or indices. In the event of a default of the underlying referenced debt obligation, the buyer is entitled to receive the notional amount of the credit default swap contract from the seller in exchange for the referenced debt obligation, a net
| 46 | Semiannual Report | franklintempleton.com | ||
FRANKLIN STRATEGIC SERIES
NOTES TO CONSOLIDATED FINANCIAL STATEMENTS (UNAUDITED)
Franklin Strategic Income Fund (continued)
settlement amount equal to the notional amount of the credit default swap less the recovery value of the referenced debt obligation, or other agreed upon amount. For centrally cleared credit default swaps, required initial margins are pledged by the Fund, and the daily change in fair value is accounted for as a variation margin payable or receivable in the Consolidated Statement of Assets and Liabilities. Over the term of the contract, the buyer pays the seller a periodic stream of payments, provided that no event of default has occurred. Such periodic payments are accrued daily as an unrealized appreciation or depreciation until the payments are made, at which time they are realized. Upfront payments and receipts are reflected in the Consolidated Statement of Assets and Liabilities and represent compensating factors between stated terms of the credit default swap agreement and prevailing market conditions (credit spreads and other relevant factors). These upfront payments and receipts are amortized over the term of the contract as a realized gain or loss in the Consolidated Statement of Operations.
The Fund invests in value recovery instruments (VRI) primarily to gain exposure to growth risk. Periodic payments from VRI are dependent on established benchmarks for underlying variables. VRI has a notional amount, which is used to calculate amounts of payments to holders. Payments are recorded upon receipt as realized gains in the Consolidated Statement of Operations. The risks of investing in VRI include growth risk, liquidity, and the potential loss of investment.
See Note 10 regarding other derivative information.
e. Restricted Cash
At October 31, 2017, the Fund held restricted cash in connection with investments in certain derivative securities. Restricted cash is held in a segregated account with the Fund’s custodian and is reflected in the Consolidated Statement of Assets and Liabilities.
f. Loan Participation Notes
The Fund invests in loan participation notes (Participations). Participations are loans originally issued to a borrower by one or more financial institutions (the Lender) and subsequently sold to other investors, such as the Fund. Participations typically result in the Fund having a contractual relationship only with the Lender and not with the borrower. The Fund has the right to receive from the Lender any payments of principal, interest and fees which the Lender received from the borrower. The Fund
generally has no rights to either enforce compliance by the borrower with the terms of the loan agreement or to any collateral relating to the original loan. As a result, the Fund assumes the credit risk of both the borrower and the Lender that is selling the Participation. The Participations may also involve interest rate risk and liquidity risk, including the potential default or insolvency of the borrower and/or the Lender.
g. FT Holdings Corporation II (FT Subsidiary)
The Fund invests in certain financial instruments through its investment in FT Subsidiary. FT Subsidiary is a Delaware Corporation, is a wholly-owned subsidiary of the Fund, and is able to invest in certain financial instruments consistent with the investment objective of the Fund. At October 31, 2017, FT Subsidiary’s investment, Turtle Bay Resort, as well as any other assets and liabilities of FT Subsidiary are reflected in the Fund’s Consolidated Statement of Investments and Consolidated Statement of Assets and Liabilities. The financial statements have been consolidated and include the accounts of the Fund and FT Subsidiary. All intercompany transactions and balances have been eliminated. At October 31, 2017, the net assets of FT Subsidiary were $26,241,235, representing less than 1% of the Fund’s consolidated net assets. The Fund’s investment in FT Subsidiary is limited to 25% of consolidated assets.
h. Mortgage Dollar Rolls
The Fund enters into mortgage dollar rolls, typically on a TBA basis. Mortgage dollar rolls are agreements between the Fund and a financial institution where the Fund sells (or buys) mortgage-backed securities for delivery on a specified date and simultaneously contracts to repurchase (or sell) substantially similar (same type, coupon, and maturity) securities at a future date and at a predetermined price. Gains or losses are realized on the initial sale, and the difference between the repurchase price and the sale price is recorded as an unrealized gain or loss to the Fund upon entering into the mortgage dollar roll. In addition, the Fund may invest the cash proceeds that are received from the initial sale. During the period between the sale and repurchase, the Fund is not entitled to principal and interest paid on the mortgage backed securities. Transactions in mortgage dollar rolls are accounted for as purchases and sales and may result in an increase to the Fund’s portfolio turnover rate. The risks of mortgage dollar roll transactions include the potential inability of the counterparty to fulfill its obligations.
| franklintempleton.com | Semiannual Report | 47 | ||
FRANKLIN STRATEGIC SERIES
NOTES TO CONSOLIDATED FINANCIAL STATEMENTS (UNAUDITED)
Franklin Strategic Income Fund (continued)
1. Organization and Significant Accounting Policies (continued)
i. Senior Floating Rate Interests
The Fund invests in senior secured corporate loans that pay interest at rates which are periodically reset by reference to a base lending rate plus a spread. These base lending rates are generally the prime rate offered by a designated U.S. bank or the London InterBank Offered Rate (LIBOR). Senior secured corporate loans often require prepayment of principal from excess cash flows or at the discretion of the borrower. As a result, actual maturity may be substantially less than the stated maturity. Senior secured corporate loans in which the Fund invests are generally readily marketable, but may be subject to certain restrictions on resale.
j. Income and Deferred Taxes
It is the Fund’s policy to qualify as a regulated investment company under the Internal Revenue Code. The Fund intends to distribute to shareholders substantially all of its taxable income and net realized gains to relieve it from federal income and excise taxes. As a result, no provision for U.S. federal income taxes is required.
The Fund may be subject to foreign taxation related to income received, capital gains on the sale of securities and certain foreign currency transactions in the foreign jurisdictions in which it invests. Foreign taxes, if any, are recorded based on the tax regulations and rates that exist in the foreign markets in which the Fund invests. When a capital gain tax is determined to apply, the Fund records an estimated deferred tax liability in an amount that would be payable if the securities were disposed of on the valuation date.
The Fund may recognize an income tax liability related to its uncertain tax positions under U.S. GAAP when the uncertain tax position has a less than 50% probability that it will be sustained upon examination by the tax authorities based on its technical merits. As of October 31, 2017, the Fund has determined that no tax liability is required in its financial statements related to uncertain tax positions for any open tax years (or expected to be taken in future tax years). Open tax years are those that remain subject to examination and are based on the statute of limitations in each jurisdiction in which the Fund invests.
k. Security Transactions, Investment Income, Expenses and Distributions
Security transactions are accounted for on trade date. Realized gains and losses on security transactions are determined on a specific identification basis. Interest income and estimated expenses are accrued daily. Amortization of premium and accretion of discount on debt securities are included in interest income. Paydown gains and losses are recorded as an adjustment to interest income. Facility fees are recognized as income over the expected term of the loan. Dividend income is recorded on the ex-dividend date except for certain dividends from securities where the dividend rate is not available. In such cases, the dividend is recorded as soon as the information is received by the Fund. Distributions to shareholders are recorded on the ex-dividend date. Distributable earnings are determined according to income tax regulations (tax basis) and may differ from earnings recorded in accordance with U.S. GAAP. These differences may be permanent or temporary. Permanent differences are reclassified among capital accounts to reflect their tax character. These reclassifications have no impact on net assets or the results of operations. Temporary differences are not reclassified, as they may reverse in subsequent periods.
Common expenses incurred by the Trust are allocated among the Funds based on the ratio of net assets of each Fund to the combined net assets of the Trust. Fund specific expenses are charged directly to the Fund that incurred the expense.
Realized and unrealized gains and losses and net investment income, excluding class specific expenses, are allocated daily to each class of shares based upon the relative proportion of net assets of each class. Differences in per share distributions by class are generally due to differences in class specific expenses.
Inflation-indexed bonds are adjusted for inflation through periodic increases or decreases in the security’s interest accruals, face amount, or principal redemption value, by amounts corresponding to the rate of inflation as measured by an index. Any increase or decrease in the face amount or principal redemption value will be included as interest income in the Consolidated Statement of Operations.
l. Accounting Estimates
The preparation of financial statements in accordance with U.S. GAAP requires management to make estimates and assumptions that affect the reported amounts of assets and
| 48 | Semiannual Report | franklintempleton.com | ||
FRANKLIN STRATEGIC SERIES
NOTES TO CONSOLIDATED FINANCIAL STATEMENTS (UNAUDITED)
Franklin Strategic Income Fund (continued)
liabilities at the date of the financial statements and the amounts of income and expenses during the reporting period. Actual results could differ from those estimates.
m. Guarantees and Indemnifications
Under the Trust’s organizational documents, its officers and trustees are indemnified by the Trust against certain liabilities arising out of the performance of their duties to the Trust.
Additionally, in the normal course of business, the Trust, on behalf of the Fund, enters into contracts with service providers that contain general indemnification clauses. The Trust’s maximum exposure under these arrangements is unknown as this would involve future claims that may be made against the Trust that have not yet occurred. Currently, the Trust expects the risk of loss to be remote.
2. Shares of Beneficial Interest
At October 31, 2017, there were an unlimited number of shares authorized (without par value). Transactions in the Fund’s shares were as follows:
Six Months Ended October 31, 2017 | Year Ended April 30, 2017 | |||||||||||||||||||
|
| |||||||||||||||||||
| Shares | Amount | Shares | Amount | |||||||||||||||||
| ||||||||||||||||||||
| Class A Shares: | ||||||||||||||||||||
| Shares sold | 25,902,034 | $ | 256,297,016 | 52,682,489 | $ | 505,267,299 | ||||||||||||||
| Shares issued in reinvestment of distributions | 4,405,997 | 43,551,720 | 7,476,400 | 71,451,152 | ||||||||||||||||
| Shares redeemed | (53,567,035 | ) | (529,901,081 | ) | (153,723,653 | ) | (1,475,494,320 | ) | ||||||||||||
|
| |||||||||||||||||||
Net increase (decrease) | (23,259,004 | ) | $ | (230,052,345 | ) | (93,564,764 | ) | $ | (898,775,869 | ) | ||||||||||
|
| |||||||||||||||||||
| Class C Shares: | ||||||||||||||||||||
| Shares sold | 4,616,694 | $ | 45,636,355 | 12,084,940 | $ | 115,680,760 | ||||||||||||||
| Shares issued in reinvestment of distributions | 1,292,686 | 12,775,427 | 2,077,286 | 19,824,729 | ||||||||||||||||
| Shares redeemed | (22,044,140 | ) | (217,946,787 | ) | (50,018,546 | ) | (479,629,546 | ) | ||||||||||||
|
| |||||||||||||||||||
Net increase (decrease) | (16,134,760 | ) | $ | (159,535,005 | ) | (35,856,320 | ) | $ | (344,124,057 | ) | ||||||||||
|
| |||||||||||||||||||
| Class R Shares: | ||||||||||||||||||||
| Shares sold | 1,037,405 | $ | 10,219,113 | 3,506,082 | $ | 33,582,209 | ||||||||||||||
| Shares issued in reinvestment of distributions | 150,262 | 1,479,939 | 270,945 | 2,577,967 | ||||||||||||||||
| Shares redeemed | (3,382,579 | ) | (33,307,018 | ) | (8,402,262 | ) | (80,371,106 | ) | ||||||||||||
|
| |||||||||||||||||||
Net increase (decrease) | (2,194,912 | ) | $ | (21,607,966 | ) | (4,625,235 | ) | $ | (44,210,930 | ) | ||||||||||
|
| |||||||||||||||||||
| Class R6 Shares: | ||||||||||||||||||||
| Shares sold | 3,078,389 | $ | 30,400,447 | 29,445,785 | $ | 281,752,337 | ||||||||||||||
| Shares issued in reinvestment of distributions | 527,528 | 5,222,553 | 939,596 | 9,020,539 | ||||||||||||||||
| Shares redeemed | (6,142,368 | ) | (60,883,852 | ) | (23,650,469 | ) | (228,959,440 | ) | ||||||||||||
|
| |||||||||||||||||||
Net increase (decrease) | (2,536,451 | ) | $ | (25,260,852 | ) | 6,734,912 | $ | 61,813,436 | ||||||||||||
|
| |||||||||||||||||||
| Advisor Class Shares: | ||||||||||||||||||||
| Shares sold | 16,032,143 | $ | 158,766,285 | 56,693,852 | $ | 545,767,778 | ||||||||||||||
| Shares issued in reinvestment of distributions | 1,445,932 | 14,307,327 | 1,934,521 | 18,551,538 | ||||||||||||||||
| Shares redeemed | (17,100,431 | ) | (169,371,112 | ) | (47,049,436 | ) | (451,940,540 | ) | ||||||||||||
|
| |||||||||||||||||||
Net increase (decrease) | 377,644 | $ | 3,702,500 | 11,578,937 | $ | 112,378,776 | ||||||||||||||
|
| |||||||||||||||||||
| franklintempleton.com | Semiannual Report | 49 | ||
FRANKLIN STRATEGIC SERIES
NOTES TO CONSOLIDATED FINANCIAL STATEMENTS (UNAUDITED)
Franklin Strategic Income Fund (continued)
3. Transactions with Affiliates
Franklin Resources, Inc. is the holding company for various subsidiaries that together are referred to as Franklin Templeton Investments. Certain officers and trustees of the Trust are also officers and/or directors of the following subsidiaries:
| Subsidiary | Affiliation | |
Franklin Advisers, Inc. (Advisers) | Investment manager | |
Franklin Templeton Services, LLC (FT Services) | Administrative manager | |
Franklin Templeton Distributors, Inc. (Distributors) | Principal underwriter | |
Franklin Templeton Investor Services, LLC (Investor Services) | Transfer agent |
a. Management Fees
The Fund pays an investment management fee to Advisers based on the average daily net assets of the Fund as follows:
| Annualized Fee Rate | Net Assets | |
0.625% | Up to and including $100 million | |
0.500% | Over $100 million, up to and including $250 million | |
0.450% | Over $250 million, up to and including $7.5 billion | |
0.440% | Over $7.5 billion, up to and including $10 billion | |
0.430% | Over $10 billion, up to and including $12.5 billion | |
0.420% | Over $12.5 billion, up to and including $15 billion | |
0.400% | Over $15 billion, up to and including $17.5 billion | |
0.380% | Over $17.5 billion, up to and including $20 billion | |
0.360% | Over $20 billion, up to and including $35 billion | |
0.355% | Over $35 billion, up to and including $50 billion | |
0.350% | In excess of $50 billion |
For the period ended October 31, 2017, the annualized effective investment management fee rate was 0.454% of the Fund’s average daily net assets.
b. Administrative Fees
Under an agreement with Advisers, FT Services provides administrative services to the Fund. The fee is paid by Advisers based on the Fund’s average daily net assets, and is not an additional expense of the Fund.
c. Distribution Fees
The Board has adopted distribution plans for each share class, with the exception of Class R6 and Advisor Class shares, pursuant to Rule 12b-1 under the 1940 Act. Under the Fund’s Class A reimbursement distribution plan, the Fund reimburses Distributors for costs incurred in connection with the servicing, sale and distribution of the Fund’s shares up to the maximum annual plan rate. Under the Class A reimbursement distribution plan, costs exceeding the maximum for the current plan year cannot be reimbursed in subsequent periods. In addition, under the Fund’s Class C and R compensation distribution plans, the Fund pays Distributors for costs incurred in connection with the servicing, sale and distribution of the Fund’s shares up to the maximum annual plan rate for each class. The plan year, for purposes of monitoring compliance with the maximum annual plan rates, is February 1 through January 31.
| 50 | Semiannual Report | franklintempleton.com | ||
FRANKLIN STRATEGIC SERIES
NOTES TO CONSOLIDATED FINANCIAL STATEMENTS (UNAUDITED)
Franklin Strategic Income Fund (continued)
The maximum annual plan rates, based on the average daily net assets, for each class, are as follows:
Class A | 0.25 | % | ||
Class C | 0.65 | % | ||
Class R | 0.50 | % |
d. Sales Charges/Underwriting Agreements
Front-end sales charges and contingent deferred sales charges (CDSC) do not represent expenses of the Fund. These charges are deducted from the proceeds of sales of Fund shares prior to investment or from redemption proceeds prior to remittance, as applicable. Distributors has advised the Fund of the following commission transactions related to the sales and redemptions of the Fund’s shares for the period:
Sales charges retained net of commissions paid to unaffiliated brokers/dealers | $ | 314,758 | ||
CDSC retained | $ | 36,441 |
e. Transfer Agent Fees
Each class of shares, except for Class R6, pays transfer agent fees to Investor Services for its performance of shareholder servicing obligations and reimburses Investor Services for out of pocket expenses incurred, including shareholder servicing fees paid to third parties. These fees are allocated daily based upon their relative proportion of such classes’ aggregate net assets. Class R6 pays Investor Services transfer agent fees specific to that class.
For the period ended October 31, 2017, the Fund paid transfer agent fees of $5,938,380, of which $2,076,331 was retained by Investor Services.
f. Investments in Affiliated Management Investment Companies
The Fund invests in one or more affiliated management investment companies for purposes other than exercising a controlling influence over the management or policies. Management fees paid by the Fund are waived on assets invested in the affiliated management investment companies, as noted in the Consolidated Statement of Operations, in an amount not to exceed the management and administrative fees paid directly or indirectly by each affiliate. Prior to May 1, 2013, the waiver was accounted for as a reduction to management fees. During the period ended October 31, 2017, the Fund held investments in affiliated management investment companies as follows:
Number of at Beginning | Gross Additions | Gross Reductions | Number of Held at End | Value at End of Period | Dividend Income | Realized Gain (Loss) | Net Change in Unrealized Appreciation (Depreciation) | |||||||||||||||||||||||||
| Controlled Affiliates | ||||||||||||||||||||||||||||||||
Franklin Lower Tier Floating Rate Fund | 25,361,119 | — | — | 25,361,119 | $264,262,857 | $ | 12,128,017 | $ — | $ | (3,296,946 | ) | |||||||||||||||||||||
Franklin Middle Tier Floating Rate Fund | 21,833,687 | — | — | 21,833,687 | 214,406,811 | 7,464,108 | — | (5,240,085 | ) | |||||||||||||||||||||||
|
| |||||||||||||||||||||||||||||||
Total Controlled Affiliates |
|
$478,669,668 |
|
$ |
19,592,125 |
|
|
$ — |
|
$ |
(8,537,031 |
) | ||||||||||||||||||||
|
| |||||||||||||||||||||||||||||||
| Non-Controlled Affiliates | ||||||||||||||||||||||||||||||||
Institutional Fiduciary Trust | ||||||||||||||||||||||||||||||||
Money Market Portfolio, 0.69% | 204,828,690 | 518,839,715 | (634,730,191 | ) | 88,938,214 | 88,938,214 | 226,452 | — | — | |||||||||||||||||||||||
|
| |||||||||||||||||||||||||||||||
Total Affiliated Securities |
|
$567,607,882 |
|
$ |
19,818,577 |
|
|
$ — |
|
$ |
(8,537,031 |
) | ||||||||||||||||||||
|
| |||||||||||||||||||||||||||||||
| franklintempleton.com | Semiannual Report | 51 | ||
FRANKLIN STRATEGIC SERIES
NOTES TO CONSOLIDATED FINANCIAL STATEMENTS (UNAUDITED)
Franklin Strategic Income Fund (continued)
3. Transactions with Affiliates (continued)
g. Interfund Transactions
The Fund engaged in purchases and sales of investments with funds or other accounts that have common investment managers (or affiliated investment managers), directors, trustees or officers. During the period ended October 31, 2017, these purchase and sale transactions aggregated $1,216,368 and $0, respectively.
4. Expense Offset Arrangement
The Fund has entered into an arrangement with its custodian whereby credits realized as a result of uninvested cash balances are used to reduce a portion of the Fund’s custodian expenses. During the period ended October 31, 2017, the custodian fees were reduced as noted in the Consolidated Statement of Operations.
5. Income Taxes
For tax purposes, capital losses may be carried over to offset future capital gains, if any. At April 30, 2017, the capital loss carryforwards were as follows:
Capital loss carryforwards: | ||||
Short Term | $ | 17,059,753 | ||
Long Term | 246,333,535 | |||
Total capital loss carryforwards |
$ |
263,393,288 |
|
For tax purposes, the Fund may elect to defer any portion of a late-year ordinary loss to the first day of the following fiscal year. At April 30, 2017, the Fund deferred late-year ordinary losses of $84,249,471.
At October 31, 2017, the cost of investments and net unrealized appreciation (depreciation) for income tax purposes were as follows:
Cost of investments. | $ | 6,838,733,396 | ||
Unrealized appreciation | $ | 199,062,445 | ||
Unrealized depreciation | (283,712,065) | |||
Net unrealized appreciation (depreciation) |
$ |
(84,649,620) |
| |
Differences between income and/or capital gains as determined on a book basis and a tax basis are primarily due to differing treatments of defaulted securities, foreign currency transactions, bond discounts and premiums and inflation related adjustments on foreign securities.
6. Investment Transactions
Purchases and sales of investments (excluding short term securities) for the period ended October 31, 2017, aggregated $3,618,434,582 and $3,952,346,985, respectively.
7. Credit Risk and Defaulted Securities
At October 31, 2017, the Fund had 46.8% of its portfolio invested in high yield, senior secured floating rate notes, or other securities rated below investment grade and unrated securities, if any. These securities may be more sensitive to economic conditions causing greater price volatility and are potentially subject to a greater risk of loss due to default than higher rated securities.
| 52 | Semiannual Report | franklintempleton.com | ||
FRANKLIN STRATEGIC SERIES
NOTES TO CONSOLIDATED FINANCIAL STATEMENTS (UNAUDITED)
Franklin Strategic Income Fund (continued)
The Fund held defaulted securities and/or other securities for which the income has been deemed uncollectible. At October 31, 2017, the value of these securities was $16,330,375, representing 0.3% of the Fund’s net assets. The Fund discontinues accruing income on securities for which income has been deemed uncollectible and provides an estimate for losses on interest receivable. The securities have been identified in the accompanying Consolidated Statement of Investments.
8. Restricted Securities
The Fund invests in securities that are restricted under the Securities Act of 1933 (1933 Act). Restricted securities are often purchased in private placement transactions, and cannot be sold without prior registration unless the sale is pursuant to an exemption under the 1933 Act. Disposal of these securities may require greater effort and expense, and prompt sale at an acceptable price may be difficult. The Fund may have registration rights for restricted securities. The issuer generally incurs all registration costs.
At October 31, 2017, investments in restricted securities, excluding securities exempt from registration under the 1933 Act deemed to be liquid, were as follows:
| Principal Amount/ Shares | Issuer | Acquisition Date | Cost | Value | ||||||||
| 125,940,079 | Holdco 2, A | 2/08/13 - 2/01/17 | $ | 977,122 | $ | 89,153 | ||||||
| 12,532,821 | Holdco 2, B | 2/01/17 | 9,305 | 8,872 | ||||||||
| 9,404,450 | K2016470219 South Africa Ltd., 3.00%, senior secured note, 144A, PIK, 12/31/22 | 2/08/13 - 6/30/17 | 17,524,962 | 279,340 | ||||||||
| 1,480,536 | K2016740260 South Africa Ltd., 25.00%, senior secured note, 144A, PIK, 12/31/22 | 2/01/17 - 6/30/17 | 1,473,549 | 1,264,150 | ||||||||
|
| |||||||||||
Total Restricted Securities (Value is 0.0%† of Net Assets) |
$ |
19,984,938 |
|
$ |
1,641,515 |
| ||||||
|
| |||||||||||
†Rounds to less than 0.1% of net assets.
9. Unfunded Loan Commitments
The Fund enters into certain credit agreements, all or a portion of which may be unfunded. The Fund is obligated to fund these loan commitments at the borrowers’ discretion. Unfunded loan commitments and funded portions of credit agreements are marked to market daily and any unrealized appreciation or depreciation is included in the Consolidated Statement of Assets and Liabilities and the Consolidated Statement of Operations. Funded portions of credit agreements are presented in the Consolidated Statement of Investments.
At October 31, 2017, unfunded commitments were as follows:
| Borrower | Unfunded Commitment | |||
| ||||
Global Tel*Link Corp, Revolving Commitment | $1,478,221 | |||
|
| |||
| franklintempleton.com | Semiannual Report | 53 | ||
FRANKLIN STRATEGIC SERIES
NOTES TO CONSOLIDATED FINANCIAL STATEMENTS (UNAUDITED)
Franklin Strategic Income Fund (continued)
10. Other Derivative Information
At October 31, 2017, the Fund’s investments in derivative contracts are reflected in the Consolidated Statement of Assets and Liabilities as follows:
| Asset Derivatives | Liability Derivatives | |||||||||||||
Derivative Contracts Not Accounted for as Hedging Instruments | Consolidated Statement of Assets and Liabilities Location | Fair Value | Consolidated Statement of Assets and Liabilities Location | Fair Value | ||||||||||
Interest rate contracts | Variation margin on futures contracts | $ — | Variation margin on futures contracts | | $ 2,747,108a | | ||||||||
Foreign exchange contracts | Unrealized appreciation on OTC forward exchange contracts | 10,967,909 | Unrealized depreciation on OTC forward exchange contracts | 2,065,249 | ||||||||||
Credit contracts | OTC swap contracts (upfront payments) | 7,569,926 | OTC swap contracts (upfront receipts) | 13,470,592 | ||||||||||
Unrealized appreciation on OTC swap contracts | 3,788,161 | Unrealized depreciation on OTC swap contracts | 1,993,326 | |||||||||||
Value recovery instruments | Investments in securities, at value | 11,769,456 | ||||||||||||
|
|
|
| |||||||||||
Totals |
|
$34,095,452 |
|
|
$20,276,275 |
| ||||||||
|
|
|
| |||||||||||
aThis amount reflects the cumulative appreciation (depreciation) of futures contracts as reported in the Consolidated Statement of Investments. Only the variation margin receivable/payable at period end is separately reported within the Consolidated Statement of Assets and Liabilities. Prior variation margin movements were recorded to cash upon receipt or payment.
For the period ended October 31, 2017, the effect of derivative contracts in the Fund’s Consolidated Statement of Operations was as follows:
| Derivative Contracts Not Accounted for as Hedging Instruments | Consolidated Statement of Operations Location | Net Realized Gain (Loss) for | Consolidated Statement of Operations Location | Net Change in Unrealized Appreciation (Depreciation) for the Period | ||||||||||
| ||||||||||||||
| Net realized gain (loss) from: | Net change in unrealized appreciation (depreciation) on: | |||||||||||||
Interest rate contracts | Futures contracts | $ 5,536,673 | Futures contracts | $(5,756,973 | ) | |||||||||
Foreign exchange contracts | Forward exchange contracts | (25,519,404) | Forward exchange contracts | 8,363,756 | ||||||||||
Credit contracts | Swap contracts | 1,465,399 | Swap contracts | 2,193,012 | ||||||||||
Value recovery instruments | Investments | — | Investments | 4,512,718 | ||||||||||
|
|
|
| |||||||||||
Totals |
|
$(18,517,332) |
|
|
$ 9,312,513 |
| ||||||||
|
|
|
| |||||||||||
For the period ended October 31, 2017, the average month end notional amount of futures contracts and swap contracts represented $174,854,311 and $277,839,371, respectively. The average month end contract value and fair value of forward exchange contracts and VRI, was $908,726,621 and $9,555,447, respectively.
| 54 | Semiannual Report | franklintempleton.com | ||
FRANKLIN STRATEGIC SERIES
NOTES TO CONSOLIDATED FINANCIAL STATEMENTS (UNAUDITED)
Franklin Strategic Income Fund (continued)
At October 31, 2017, the Fund’s OTC derivative assets and liabilities are as follows:
| Gross Amounts of Assets and Liabilities Presented in the Consolidated Statement of Assets and Liabilities | ||||||||
| Assetsa | Liabilitiesa | |||||||
| Derivatives | ||||||||
Forward exchange contracts | $10,967,909 | $ 2,065,249 | ||||||
Swap contracts | 11,358,087 | 15,463,918 | ||||||
|
| |||||||
Total | $22,325,996 | $17,529,167 | ||||||
|
| |||||||
aAbsent an event of default or early termination, OTC derivative assets and liabilities are presented gross and not offset in the Consolidated Statement of Assets and Liabilities.
At October 31, 2017, the Fund’s OTC derivative assets, which may be offset against the Fund’s OTC derivative liabilities and collateral received from the counterparty, are as follows:
Amounts Not Offset in the Consolidated Statement of Assets and Liabilities | ||||||||||||||||||||||||||||
|
| |||||||||||||||||||||||||||
Gross Amounts of Assets Presented in the Consolidated Statement of Assets and Liabilities | Financial Instruments Available for Offset | Financial Instruments Collateral Receiveda | Cash Collateral Receivedb | Net Amount (Not less than zero) | ||||||||||||||||||||||||
| Counterparty | ||||||||||||||||||||||||||||
BZWS | $ — | $ — | $ — | $ — | $ — | |||||||||||||||||||||||
CITI | 10,265,400 | (10,265,400) | — | — | — | |||||||||||||||||||||||
DBAB | 3,478,677 | (207,059) | (2,987,132) | — | 284,486 | |||||||||||||||||||||||
FBCO | 485,672 | (485,672) | — | — | — | |||||||||||||||||||||||
JPHQ | 8,096,247 | (4,838,633) | — | (3,257,614) | — | |||||||||||||||||||||||
|
| |||||||||||||||||||||||||||
Total |
|
$22,325,996 |
|
|
$(15,796,764) |
|
|
$(2,987,132) |
|
|
$(3,257,614) |
|
|
$ 284,486 |
| |||||||||||||
|
| |||||||||||||||||||||||||||
At October 31, 2017, the Fund’s OTC derivative liabilities, which may be offset against the Fund’s OTC derivative assets and collateral pledged to the counterparty, are as follows:
| Amounts Not Offset in the Consolidated Statement of Assets and Liabilities | ||||||||||||||||||||||||||||
|
| |||||||||||||||||||||||||||
Gross Amounts of | Financial Instruments Available for Offset | Financial Instruments Collateral Pledged | Cash Collateral Pledgedb | Net Amount (Not less than zero) | ||||||||||||||||||||||||
Counterparty | ||||||||||||||||||||||||||||
BZWS | $ 475,626 | $ — | $ — | $(460,000) | $15,626 | |||||||||||||||||||||||
CITI | 10,924,414 | (10,265,400) | — | (659,014) | — | |||||||||||||||||||||||
DBAB | 207,059 | (207,059) | — | — | — | |||||||||||||||||||||||
FBCO | 1,083,435 | (485,672) | — | (597,763) | — | |||||||||||||||||||||||
JPHQ | 4,838,633 | (4,838,633) | — | — | — | |||||||||||||||||||||||
|
| |||||||||||||||||||||||||||
Total | $17,529,167 | $(15,796,764) | $ — | $(1,716,777) | $15,626 | |||||||||||||||||||||||
|
| |||||||||||||||||||||||||||
aAt October 31, 2017, the Fund received U.S. Treasury Bonds as collateral for derivatives.
bIn some instances, the collateral amounts disclosed in the table above were adjusted due to the requirement to limit the collateral amounts to avoid the effect of overcollateralization. Actual collateral received and/or pledged may be more than the amounts disclosed herein.
See Note 1(d) regarding derivative financial instruments.
See Abbreviations on page 59.
| franklintempleton.com | Semiannual Report | 55 | ||
FRANKLIN STRATEGIC SERIES
NOTES TO CONSOLIDATED FINANCIAL STATEMENTS (UNAUDITED)
Franklin Strategic Income Fund (continued)
11. Holdings of 5% Voting Securities of Portfolio Companies
The 1940 Act defines “affiliated companies” to include investments in portfolio companies in which a fund owns 5% or more of the outstanding voting securities. During the period ended October 31, 2017, investments in “affiliated companies” were as follows:
| Name of Issuer | Number of Shares Held at Beginning of Period | Gross Additions | Gross Reductions | Number of of Period | Value at End | Dividend Income | Realized Gain (Loss) | Net Change in Unrealized Appreciation (Depreciation) | ||||||||||||||||||||||||
| ||||||||||||||||||||||||||||||||
| Non-Controlled Affiliates | ||||||||||||||||||||||||||||||||
CHC Group LLC (Value is 0.0%a of Net Assets) | 168,355 | — | — | 168,355 | $1,346,840 | $— | $— | $(673,420 | ) | |||||||||||||||||||||||
|
| |||||||||||||||||||||||||||||||
aRounds to less than 0.1% of net assets.
12. Credit Facility
The Fund, together with other U.S. registered and foreign investment funds (collectively, Borrowers), managed by Franklin Templeton Investments, are borrowers in a joint syndicated senior unsecured credit facility totaling $2 billion (Global Credit Facility) which matures on February 9, 2018. This Global Credit Facility provides a source of funds to the Borrowers for temporary and emergency purposes, including the ability to meet future unanticipated or unusually large redemption requests.
Under the terms of the Global Credit Facility, the Fund shall, in addition to interest charged on any borrowings made by the Fund and other costs incurred by the Fund, pay its share of fees and expenses incurred in connection with the implementation and maintenance of the Global Credit Facility, based upon its relative share of the aggregate net assets of all of the Borrowers, including an annual commitment fee of 0.15% based upon the unused portion of the Global Credit Facility. These fees are reflected in other expenses in the Consolidated Statement of Operations. During the period ended October 31, 2017, the Fund did not use the Global Credit Facility.
13. Fair Value Measurements
The Fund follows a fair value hierarchy that distinguishes between market data obtained from independent sources (observable inputs) and the Fund’s own market assumptions (unobservable inputs). These inputs are used in determining the value of the Fund’s financial instruments and are summarized in the following fair value hierarchy:
| • | Level 1 – quoted prices in active markets for identical financial instruments |
| • | Level 2 – other significant observable inputs (including quoted prices for similar financial instruments, interest rates, prepayment speed, credit risk, etc.) |
| • | Level 3 – significant unobservable inputs (including the Fund’s own assumptions in determining the fair value of financial instruments) |
The input levels are not necessarily an indication of the risk or liquidity associated with financial instruments at that level.
For movements between the levels within the fair value hierarchy, the Fund has adopted a policy of recognizing the transfers as of the date of the underlying event which caused the movement.
| 56 | Semiannual Report | franklintempleton.com | ||
FRANKLIN STRATEGIC SERIES
NOTES TO CONSOLIDATED FINANCIAL STATEMENTS (UNAUDITED)
Franklin Strategic Income Fund (continued)
A summary of inputs used as of October 31, 2017, in valuing the Fund’s assets and liabilities carried at fair value, is as follows:
| Level 1 | Level 2 | Level 3 | Total | |||||||||||||
Assets: | ||||||||||||||||
Investments in Securities: | ||||||||||||||||
Equity Investments:a | ||||||||||||||||
Consumer Services | $ | — | $ | — | $ | 25,946,719 | $ | 25,946,719 | ||||||||
Energy. | 34,267,626 | 3,605,445 | 3,237 | 37,876,308 | ||||||||||||
Materials | 2,302,908 | 41 | — | 2,302,949 | ||||||||||||
Retailing | — | — | 98,025 | 98,025 | ||||||||||||
Transportation | — | 2,012,255 | 34,100 | 2,046,355 | ||||||||||||
All Other Equity Investmentsb | 478,669,668 | — | — | 478,669,668 | ||||||||||||
Convertible Bonds | — | 12,553,271 | — | 12,553,271 | ||||||||||||
Corporate Bonds | — | 3,072,826,595 | — | 3,072,826,595 | ||||||||||||
Senior Floating Rate Interests | — | 636,155,729 | — | 636,155,729 | ||||||||||||
Foreign Government and Agency Securities | — | 498,702,227 | — | 498,702,227 | ||||||||||||
U.S. Government and Agency Securities | — | 410,904,170 | — | 410,904,170 | ||||||||||||
Asset-Backed Securities and Commercial | ||||||||||||||||
Mortgage-Backed Securities | — | 790,185,900 | — | 790,185,900 | ||||||||||||
Mortgage-Backed Securities | — | 629,268,197 | — | 629,268,197 | ||||||||||||
Municipal Bonds | — | 61,823,735 | — | 61,823,735 | ||||||||||||
Escrows and Litigation Trusts | — | 56,250 | 348,000 | c | 404,250 | |||||||||||
Short Term Investments | 92,336,837 | — | — | 92,336,837 | ||||||||||||
|
| |||||||||||||||
Total Investments in Securities
|
$
|
607,577,039
|
|
$
|
6,118,093,815
|
|
$
|
26,430,081
|
|
$
|
6,752,100,935
|
| ||||
|
| |||||||||||||||
Other Financial Instruments: | ||||||||||||||||
Forward Exchange Contracts | $ | — | $ | 10,967,909 | $ | — | $ | 10,967,909 | ||||||||
Swap Contracts | — | 3,788,161 | — | 3,788,161 | ||||||||||||
Unfunded Loan Commitments | — | 28,767 | — | 28,767 | ||||||||||||
|
| |||||||||||||||
Total Other Financial Instruments
|
$
|
—
|
|
$
|
14,784,837
|
|
$
|
—
|
|
$
|
14,784,837
|
| ||||
|
| |||||||||||||||
Liabilities: | ||||||||||||||||
Other Financial Instruments: | ||||||||||||||||
Futures Contracts | $ | 2,747,108 | $ | — | $ | — | $ | 2,747,108 | ||||||||
Forward Exchange Contracts | — | 2,065,249 | — | 2,065,249 | ||||||||||||
Swap Contracts | — | 1,993,326 | — | 1,993,326 | ||||||||||||
|
| |||||||||||||||
Total Other Financial Instruments
|
$
|
2,747,108
|
|
$
|
4,058,575
|
|
$
|
—
|
|
$
|
6,805,683
|
| ||||
|
| |||||||||||||||
aIncludes common and convertible preferred stocks and management investment companies as well as other equity investments.
bFor detailed categories, see the accompanying Consolidated Statement of Investments.
cIncludes securities determined to have no value at October 31, 2017.
A reconciliation of assets in which Level 3 inputs are used in determining fair value is presented when there are significant Level 3 financial instruments at the beginning and/or end of the period.
14. New Accounting Pronouncements
In March 2017, the Financial Accounting Standards Board (FASB) issued Accounting Standards Update (ASU) No. 2017-08, Receivables—Nonrefundable Fees and Other Costs (Subtopic 310-20): Premium Amortization on Purchased Callable Debt Securities. The amendments in the ASU shorten the amortization period for certain callable debt securities acquired at a premium, to be amortized to the earliest call date. The ASU does not require an accounting change for securities acquired at a discount, which continues to be amortized to maturity. The ASU is effective for fiscal years and interim periods within those fiscal years beginning after December 15, 2018. Management is currently evaluating the impact, if any, of applying this provision.
| franklintempleton.com | Semiannual Report | 57 | ||
FRANKLIN STRATEGIC SERIES
NOTES TO CONSOLIDATED FINANCIAL STATEMENTS (UNAUDITED)
Franklin Strategic Income Fund (continued)
15. Subsequent Events
The Fund has evaluated subsequent events through the issuance of the financial statements and determined that no events have occurred that require disclosure.
| 58 | Semiannual Report | franklintempleton.com | ||
FRANKLIN STRATEGIC SERIES
NOTES TO CONSOLIDATED FINANCIAL STATEMENTS (UNAUDITED)
Franklin Strategic Income Fund (continued)
Abbreviations
| Counterparty | Currency | Selected Portfolio | ||||||||
| BZWS | Barclays Bank PLC | BRL | Brazilian Real | ARM | Adjustable Rate Mortgage | |||||
| CITI | Citigroup, Inc. | EUR | Euro | CDO | Collateralized Debt Obligation | |||||
| DBAB | Deutsche Bank AG | GBP | British Pound | CLO | Collateralized Loan Obligation | |||||
| FBCO | Credit Suisse International | IDR | Indonesian Rupiah | CMT | Constant Maturity Treasury Index | |||||
| JPHQ | JP Morgan Chase & Co. | MXN | Mexican Peso | EDA | Economic Development Authority | |||||
| MYR | Malaysian Ringgit | FRN | Floating Rate Note | |||||||
| SEK | Swedish Krona | GDP | Gross Domestic Product | |||||||
| USD | United States Dollar | GO | General Obligation | |||||||
| HDC | Housing Development Corp. | |||||||||
| LIBOR | London InterBank Offered Rate | |||||||||
| MBS | Mortgage-Backed Security | |||||||||
| PIK | Payment-In-Kind | |||||||||
| SF | Single Family | |||||||||
| SFR | Single Family Revenue | |||||||||
| T-Note | Treasury Note | |||||||||
| VRI | Value Recovery Instruments | |||||||||
| Index | ||
| MCDX.NA.29 | MCDX North America Index |
| franklintempleton.com | Semiannual Report | 59 | ||
FRANKLIN STRATEGIC SERIES
FRANKLIN STRATEGIC INCOME FUND
Proxy Voting Policies and Procedures
The Fund’s investment manager has established Proxy Voting Policies and Procedures (Policies) that the Fund uses to determine how to vote proxies relating to portfolio securities. Shareholders may view the Fund’s complete Policies online at franklintempleton.com. Alternatively, shareholders may request copies of the Policies free of charge by calling the Proxy Group collect at (954) 527-7678 or by sending a written request to: Franklin Templeton Companies, LLC, 300 S.E. 2nd Street, Fort Lauderdale, FL 33301, Attention: Proxy Group. Copies of the Fund’s proxy voting records are also made available online at franklintempleton.com and posted on the US Securities and Exchange Commission’s website at sec.gov and reflect the most recent 12-month period ended June 30.
Quarterly Statement of Investments
The Trust, on behalf of the Fund, files a complete statement of investments with the US Securities and Exchange Commission for the first and third quarters for each fiscal year on Form N-Q. Shareholders may view the filed Form N-Q by visiting the Commission’s website at sec.gov. The filed form may also be viewed and copied at the Commission’s Public Reference Room in Washington, DC. Information regarding the operations of the Public Reference Room may be obtained by calling (800) SEC-0330.
| 60 | Semiannual Report | franklintempleton.com | ||
| Semiannual Report and Shareholder Letter Franklin Strategic Income Fund
Investment Manager Franklin Advisers, Inc.
Distributor Franklin Templeton Distributors, Inc. (800) DIAL BEN® / 342-5236 franklintempleton.com
Shareholder Services (800) 632-2301 |
Authorized for distribution only when accompanied or preceded by a summary prospectus and/or prospectus. Investors should carefully consider a fund’s investment goals, risks, charges and expenses before investing. A prospectus contains this and other information; please read it carefully before investing.
To help ensure we provide you with quality service, all calls to and from our service areas are monitored and/or recorded.
| © 2017 Franklin Templeton Investments. All rights reserved. | 194 S2017 12/17 |
| Item 2. | Code of Ethics. |
(a) The Registrant has adopted a code of ethics that applies to its principal executive officers and principal financial and accounting officer.
(c) N/A
(d) N/A
(f) Pursuant to Item 12(a)(1), the Registrant is attaching as an exhibit a copy of its code of ethics that applies to its principal executive officers and principal financial and accounting officer.
| Item 3. | Audit Committee Financial Expert. |
(a)(1) The Registrant has an audit committee financial expert serving on its audit committee.
(2) The audit committee financial expert is John B. Wilson and he is “independent” as defined under the relevant Securities and Exchange Commission Rules and Releases.
| Item 4. | Principal Accountant Fees and Services. N/A |
| Item 5. | Audit Committee of Listed Registrants. N/A |
| Item 6. | Schedule of Investments. N/A |
| Item 7. | Disclosure of Proxy Voting Policies and Procedures for Closed-End Management Investment Companies. N/A |
| Item 8. | Portfolio Managers of Closed-End Management Investment Companies. N/A |
| Item 9. | Purchases of Equity Securities by Closed-End Management Investment Company and Affiliated Purchasers. N/A |
| Item 10. | Submission of Matters to a Vote of Security Holders. |
There have been no changes to the procedures by which shareholders may recommend nominees to the Registrant’s Board of Trustees that would require disclosure herein.
| Item 11. | Controls and Procedures. |
(a) Evaluation of Disclosure Controls and Procedures. The Registrant maintains disclosure controls and procedures that are designed to
ensure that information required to be disclosed in the Registrant’s filings under the Securities Exchange Act of 1934 and the Investment Company Act of 1940 is recorded, processed, summarized and reported within the periods specified in the rules and forms of the Securities and Exchange Commission. Such information is accumulated and communicated to the Registrant’s management, including its principal executive officer and principal financial officer, as appropriate, to allow timely decisions regarding required disclosure. The Registrant’s management, including the principal executive officer and the principal financial officer, recognizes that any set of controls and procedures, no matter how well designed and operated, can provide only reasonable assurance of achieving the desired control objectives.
Within 90 days prior to the filing date of this Shareholder Report on Form N-CSR, the Registrant had carried out an evaluation, under the supervision and with the participation of the Registrant’s management, including the Registrant’s principal executive officer and the Registrant’s principal financial officer, of the effectiveness of the design and operation of the Registrant’s disclosure controls and procedures. Based on such evaluation, the Registrant’s principal executive officer and principal financial officer concluded that the Registrant’s disclosure controls and procedures are effective.
(b) Changes in Internal Controls. There have been no changes in the Registrant’s internal controls or in other factors that could materially affect the internal controls over financial reporting subsequent to the date of their evaluation in connection with the preparation of this Shareholder Report on Form N-CSR.
| Item 12. | Exhibits. |
(a) (1) Code of Ethics
(a) (2) Certifications pursuant to Section 302 of the Sarbanes-Oxley Act of 2002 of Matthew T. Hinkle, Chief Executive Officer - Finance and Administration, and Gaston Gardey, Chief Financial Officer and Chief Accounting Officer
(b) Certifications pursuant to Section 906 of the Sarbanes-Oxley Act of 2002 of Matthew T. Hinkle, Chief Executive Officer - Finance and Administration, and Gaston Gardey, Chief Financial Officer and Chief Accounting Officer
SIGNATURES
Pursuant to the requirements of the Securities Exchange Act of 1934 and the Investment Company Act of 1940, the registrant has duly caused this report to be signed on its behalf by the undersigned, thereunto duly authorized.
FRANKLIN STRATEGIC SERIES
By /s/ Matthew T. Hinkle
Matthew T. Hinkle
Chief Executive Officer –
Finance and Administration
Date December 27, 2017
Pursuant to the requirements of the Securities Exchange Act of 1934 and the Investment Company Act of 1940, this report has been signed below by the following persons on behalf of the registrant and in the capacities and on the dates indicated.
By /s/ Matthew T. Hinkle
Matthew T. Hinkle
Chief Executive Officer –
Finance and Administration
Date December 27, 2017
By /s/ Gaston Gardey
Gaston Gardey
Chief Financial Officer and
Chief Accounting Officer
Date December 27, 2017