UNITED STATES
SECURITIES AND EXCHANGE COMMISSION
Washington, DC 20549
FORMN-CSRS
CERTIFIED SHAREHOLDER REPORT OF REGISTERED
MANAGEMENT INVESTMENT COMPANIES
Investment Company Act file number811-06243
Franklin Strategic Series
(Exact name of registrant as specified in charter)
One Franklin Parkway, San Mateo, CA 94403-1906
(Address of principal executive offices) (Zip code)
Craig S. Tyle, One Franklin Parkway, San Mateo, CA 94403-1906
(Name and address of agent for service)
Registrant’s telephone number, including area code: 650312-2000
Date of fiscal year end: 4/30
Date of reporting period: 10/31/19
| Item 1. | Reports to Stockholders. |
| Franklin Growth Opportunities Fund |
| Franklin Small Cap Growth Fund | |||
Franklin Select U.S. Equity Fund | FranklinSmall-Mid Cap Growth Fund | |||||
Sign up for electronic delivery at franklintempleton.com/edelivery
Internet Delivery of Fund Reports Unless You Request Paper Copies: Effective January 1, 2021, as permitted by the SEC, paper copies of the Fund’s shareholder reports will no longer be sent by mail, unless you specifically request them from the Fund or your financial intermediary. Instead, the reports will be made available on a website, and you will be notified by mail each time a report is posted and provided with a website link to access the report.
If you already elected to receive shareholder reports electronically, you will not be affected by this change and you need not take any action. If you have not signed up for electronic delivery, we would encourage you to join fellow shareholders who have. You may elect to receive shareholder reports and other communications electronically from the Fund by calling (800)632-2301 or by contacting your financial intermediary.
You may elect to continue to receive paper copies of all your future shareholder reports free of charge by contacting your financial intermediary or, if you invest directly with a Fund, calling (800)632-2301 to let the Fund know of your request. Your election to receive reports in paper will apply to all funds held in your account.
SHAREHOLDER LETTER
Dear Shareholder:
During the six months ended October 31, 2019, the U.S. economy continued to grow, but at a more moderate pace due to concerns about trade and geopolitical stress.
The Standard & Poor’s® 500 Index (S&P 500®) recovered from heightened volatility in May and August 2019, reaching newall-time highs in October amid better-than-expected corporate earnings, investor optimism about a potential U.S.-China trade agreement and the U.S. Federal Reserve’s third successive rate cut. However, markets reflected concerns about tighter regulation of technology companies, U.S. political uncertainties, geopolitical tensions and the impact of trade disputes on global growth and corporate earnings. In this environment, U.S. stocks, as measured by the S&P 500, posted a positive total return for thesix-month period.
We are committed to our long-term perspective and disciplined investment approach as we conduct a rigorous, fundamental analysis of securities with a regular emphasis on investment risk management.
We believe active, professional investment management serves investors well. We also recognize the important role of financial advisors in today’s markets and encourage investors to continue to seek their advice. Amid changing markets and economic conditions, we are confident investors with a well-diversified portfolio and a patient, long-term outlook should be well positioned for the years ahead.
In addition, Franklin Strategic Series’ semiannual report includes more detail about prevailing conditions and a discussion about investment decisions during the period. Please remember all securities markets fluctuate, as do mutual fund share prices.
We thank you for investing with Franklin Templeton, welcome your questions and comments, and look forward to serving your future investment needs.
Sincerely, |
 |
Edward Perks, CFA |
President and Chief Executive Officer – |
Investment Management |
Franklin Strategic Series |
This letter reflects our analysis and opinions as of October 31, 2019, unless otherwise indicated. The information is not a complete analysis of every aspect of any market, country, industry, security or fund. Statements of fact are from sources considered reliable.
| CFA® is a trademark owned by CFA Institute. | ||||
Not FDIC Insured | May Lose Value | No Bank Guarantee
|
| franklintempleton.com | Not part of the semiannual report | 1 | ||
Contents
Semiannual Report | ||||
| 3 | ||||
| 4 | ||||
| 10 | ||||
| 16 | ||||
| 22 | ||||
| 28 | ||||
| 62 | ||||
| 68 | ||||
| 88 | ||||
| Visitfranklintempleton.comfor fund updates, to access your account, or to find helpful financial planning tools. |
2 | Semiannual Report | franklintempleton.com | ||
The U.S. economy expanded during the six months ended October 31, 2019. After moderating in 2019’s second quarter, the economy grew faster in the third quarter, aided by consumer spending, housing investment, government spending, inventory investment and exports. The manufacturing sector expanded during the period’s first half, but contracted in the second half. The services sector continued to expand throughout the period. The unemployment rate was 3.6% in April 2019, and though it varied slightly during the six months under review, it ended the period at 3.6%.1 The annual inflation rate, as measured by the Consumer Price Index, decreased from 2.0% in April 2019 to 1.8% at period-end.1
At its July 2019 meeting, the U.S. Federal Reserve (Fed) lowered its target range for the federal funds rate for the first time since December 2008, to 2.00%–2.25%, citing muted inflation pressures and the potential effects of global trade tensions on economic growth. Furthermore, the Fed ended its balance sheet normalization program earlier than previously indicated. The Fed further lowered the federal funds target rate range by 0.25% at its September and October meetings, to 1.50%–1.75%, reiterating the rationale cited at the July meeting.
U.S. equity markets overall rose during the period, benefiting from upbeat economic data and U.S. corporate earnings, the Fed’s interest-rate cuts and investor optimism about further monetary easing. However, markets reflected concerns about tighter regulation of technology companies, U.S. political uncertainties (including the impeachment inquiry into President Donald Trump), geopolitical tensions in certain regions, and the impact of U.S. trade disputes with China and other trading partners on global growth and corporate earnings. These concerns were partly alleviated at certain points during the period by occasional easing of trade tensions and optimism about a potential U.S.-China trade agreement. The broad U.S. stock market, as measured by the Standard & Poor’s 500 Index (S&P 500), recovered from heightened volatility in May and August 2019, reaching new all-time highs in October amid a number of better-than-expected corporate earnings reports, investor optimism about a potential phase one of the U.S.-China trade agreement and the Fed’s third successive rate cut.
Overall, the S&P 500 posted a +4.16% total return for the six-month period.2
The foregoing information reflects our analysis and opinions as of October 31, 2019. The information is not a complete analysis of every aspect of any market, country, industry, security or fund. Statements of fact are from sources considered reliable.
1. Source: Bureau of Labor Statistics.
2. Source: Morningstar.
See www.franklintempletondatasources.com for additional data provider information.
| franklintempleton.com | Semiannual Report | 3 | ||
Franklin Growth Opportunities Fund
This semiannual report for Franklin Growth Opportunities Fund covers the period ended October 31, 2019.
Your Fund’s Goal and Main Investments
The Fund seeks capital appreciation by investing, under normal conditions, predominantly in equity securities of companies demonstrating accelerating growth, increasing profitability, or above-average growth or growth potential as compared with the overall economy.
Performance Overview
The Fund’s Class A shares posted a +0.73% cumulative total return for the six months under review. In comparison, the Fund’s narrow benchmark, the Russell 3000® Growth Index, which measures performance of those Russell 3000® Index companies with relatively higherprice-to-book ratios and higher forecasted growth rates, posted a +4.05% total return.1 The Fund’s broad benchmark, the Standard & Poor’s 500 Index (S&P 500), which tracks the broad U.S. stock market, posted a +4.16% total return.1 You can find the Fund’s long-term performance data in the Performance Summary beginning on page 7.
Performance data represent past performance, which does not guarantee future results. Investment return and principal value will fluctuate, and you may have a gain or loss when you sell your shares. Current performance may differ from figures shown. For most recentmonth-end performance, go tofranklintempleton.comor call(800)342-5236.
Investment Strategy
We use fundamental,bottom-up research to seek companies meeting our criteria of growth potential, quality and valuation. In seeking sustainable growth characteristics, we look for companies we believe can produce sustainable earnings and cash flow growth, evaluating the long-term market opportunity and competitive structure of an industry to target leaders and emerging leaders. We define quality companies as those with strong and improving competitive positions in attractive markets. We also believe important attributes of quality are experienced and talented
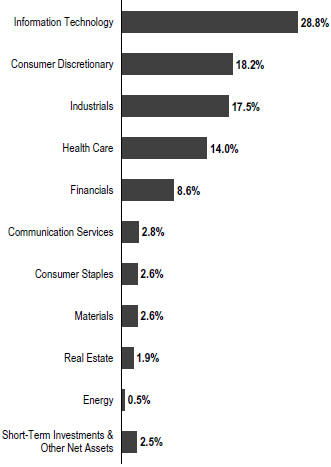
Portfolio Composition
Based on Total Net Assets as of 10/31/19
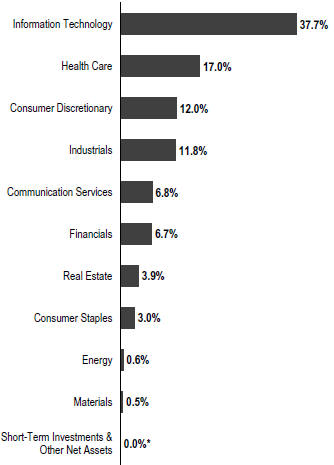
*Rounds to less than 0.1% of net assets.
management teams as well as financial strength reflected in the capital structure, gross and operating margins, free cash flow generation and returns on capital employed. Our valuation analysis includes a range of potential outcomes based on an assessment of multiple scenarios. In assessing value, we consider whether security prices fully reflect the balance of the sustainable growth opportunities relative to business and financial risks.
1. Source: Morningstar.
Frank Russell Company is the source and owner of the trademarks, service marks and copyrights related to the Russell Indexes. Russell® is a trademark of Frank Russell Company.
The indexes are unmanaged and include reinvestment of any income or distributions. They do not reflect any fees, expenses or sales charges. One cannot invest directly in an index, and an index is not representative of the Fund’s portfolio.
See www.franklintempletondatasources.com for additional data provider information.
The dollar value, number of shares or principal amount, and names of all portfolio holdings are listed in the Fund’s Statement of Investments (SOI).
The SOI begins on page 33.
4 | Semiannual Report | franklintempleton.com | ||
FRANKLIN GROWTH OPPORTUNITIES FUND
Manager’s Discussion
During the six months under review, key contributors to the Fund’s performance relative to the Russell 3000® Growth Index included stock selection in the health care, financials and real estate sectors.
Within health care, our investments in clinical stage biopharmaceutical firm Reata Pharmaceuticals, cancer-focused biopharmaceutical company Array BioPharma (not held atperiod-end), heart disease and critical care monitoring devices manufacturer Edwards Lifesciences and medical devices company Nevro benefited relative results. Reata Pharmaceuticals’ share price surged after the company announced positive results for a clinical trial for omaveloxolone, a treatment for neuromuscular disorder Friedreich’s ataxia. Array BioPharma was acquired by pharmaceuticals firm Pfizer (not a Fund holding) for a significant premium over the preannouncement stock closing price.
In the financials sector, our position in MarketAxess Holdings, which operates as a fixed-income electronic trading platform, aided relative results.
Within real estate, our investment in SBA Communications boosted relative results. The wireless communications company continued to generate strong operating results in its leasing and site development business amid 4G densification projects and early 5G deployment.
In contrast, key detractors from the Fund’s relative performance included stock selection in the information technology (IT), consumer discretionary and materials sectors.
Within IT, electronic products manufacturer Apple’s share price rose during the period, and our underweighted position hurt relative results. Other IT holdings hindered relative results as their share prices declined. These holdings included education technology firm 2U (not held atperiod-end), communications software and cloud-based platform company Twilio, programmable semiconductor devices manufacturer Xilinx and cloud-based enterprise workflow management provider ServiceNow. 2U’s share price declined as the company experienced broad challenges across its graduate- and short- course portfolios, including increased competition, regulatory uncertainty and delayed launches. Twilio’s shares were pressured by customer credits that affected second- and third-quarter 2019 revenues, as well as by weaker-than-expected fourth-quarter revenue and earnings guidance. We believe the company is well-positioned to leverage its leadership
| Top 10 Holdings | ||||
| 10/31/19 |
| Company Sector/Industry | % of Total Net Assets | |||
Amazon.com Inc. | 7.3% | |||
Consumer Discretionary | ||||
Microsoft Corp. | 5.7% | |||
Information Technology | ||||
Mastercard Inc. | 5.5% | |||
Information Technology | ||||
Visa Inc. | 4.4% | |||
Information Technology | ||||
Alphabet Inc. | 3.2% | |||
Communication Services | ||||
SBA Communications Corp. | 2.9% | |||
Real Estate | ||||
Apple Inc. | 2.8% | |||
Information Technology | ||||
ServiceNow Inc. | 2.6% | |||
Information Technology | ||||
CoStar Group Inc. | 2.4% | |||
Industrials | ||||
Adobe Inc. | 2.1% | |||
Information Technology | ||||
position with developers to become an importantbusiness-to-consumer communications platform.
In the consumer discretionary sector, our position ine-commerce and cloud computing services company Amazon.com hurt relative performance.
In the materials sector, our holding in specialty chemicals and carbon materials manufacturer Ingevity dampened relative results.
| franklintempleton.com | Semiannual Report | 5 | ||
FRANKLIN GROWTH OPPORTUNITIES FUND
Thank you for your continued participation in Franklin Growth Opportunities Fund. We look forward to serving your future investment needs.
 |
| |||
Grant Bowers Lead Portfolio Manager | ||||
 |
| |||
| Sara Araghi, CFA | ||||
| Portfolio Management Team | ||||


The foregoing information reflects our analysis, opinions and portfolio holdings as of October 31, 2019, the end of the reporting period. The way we implement our main investment strategies and the resulting portfolio holdings may change depending on factors such as market and economic conditions. These opinions may not be relied upon as investment advice or an offer for a particular security. The information is not a complete analysis of every aspect of any market, country, industry, security or the Fund. Statements of fact are from sources considered reliable, but the investment manager makes no representation or warranty as to their completeness or accuracy. Although historical performance is no guarantee of future results, these insights may help you understand our investment management philosophy.
6 | Semiannual Report | franklintempleton.com | ||
FRANKLIN GROWTH OPPORTUNITIES FUND
Performance Summary as of October 31, 2019
The performance table does not reflect any taxes that a shareholder would pay on Fund dividends, capital gain distributions, if any, or any realized gains on the sale of Fund shares. Total return reflects reinvestment of the Fund’s dividends and capital gain distributions, if any, and any unrealized gains or losses. Your dividend income will vary depending on dividends or interest paid by securities in the Fund’s portfolio, adjusted for operating expenses of each class. Capital gain distributions are net profits realized from the sale of portfolio securities.
Performance as of 10/31/191
Cumulative total return excludes sales charges. Average annual total return includes maximum sales charges. Sales charges will vary depending on the size of the investment and the class of share purchased. The maximum is 5.50% and the minimum is 0%.Class A:5.50% maximum initial sales charge;Advisor Class:no sales charges. For other share classes, visitfranklintempleton.com.
Share Class
| Cumulative Total Return2
| Average Annual Total Return3
| ||
| A4 | ||||
| 6-Month | +0.73% | -4.80% | ||
1-Year | +15.65% | +9.28% | ||
5-Year | +65.55% | +9.37% | ||
10-Year | +257.88% | +12.96% | ||
Advisor | ||||
6-Month | +0.86% | +0.86% | ||
1-Year | +15.90% | +15.90% | ||
5-Year | +67.69% | +10.89% | ||
10-Year | +267.74% | +13.91% | ||
Performance data represent past performance, which does not guarantee future results. Investment return and principal value will fluctuate, and you may have a gain or loss when you sell your shares. Current performance may differ from figures shown. For most recentmonth-end performance, go tofranklintempleton.comor call(800)342-5236.
See page 8 for Performance Summary footnotes.
| franklintempleton.com | Semiannual Report | 7 | ||
FRANKLIN GROWTH OPPORTUNITIES FUND
PERFORMANCE SUMMARY
Total Annual Operating Expenses5
Share Class
| With Fee Waiver
| Without Fee Waiver
| ||
A |
0.95% |
0.95% | ||
Advisor | 0.70% | 0.70% | ||
Each class of shares is available to certain eligible investors and has different annual fees and expenses, as described in the prospectus.
All investments involve risks, including possible loss of principal. Growth stock prices reflect projections of future earnings or revenues, and can, therefore, fall dramatically if the company fails to meet those projections. To the extent the Fund focuses on particular countries, regions, industries, sectors or types of investment from time to time, it may be subject to greater risks of adverse developments in such areas of focus than a fund that invests in a wider variety of countries, regions, industries, sectors or investments. Smaller, midsized and relatively new or unseasoned companies can be particularly sensitive to changing economic conditions, and their prospects for growth are less certain than those of larger, more established companies. Historically, these securities have experienced more price volatility than larger-company stocks, especially over the short term. The Fund’s prospectus also includes a description of the main investment risks.
1. The Fund has a fee waiver associated with any investment it makes in a Franklin Templeton money fund and/or other Franklin Templeton fund, contractually guaranteed through 8/31/20. Fund investment results reflect the fee waiver; without this waiver, the results would have been lower.
2. Cumulative total return represents the change in value of an investment over the periods indicated.
3. Average annual total return represents the average annual change in value of an investment over the periods indicated. Return for less than one year, if any, has not been annualized.
4. Prior to 9/10/18, these shares were offered at a higher initial sales charge of 5.75%, thus actual returns (with sales charges) would have differed. Average annual total returns (with sales charges) have been restated to reflect the current maximum initial sales charge of 5.50%.
5. Figures are as stated in the Fund’s current prospectus and may differ from the expense ratios disclosed in the Your Fund’s Expenses and Financial Highlights sections in this report. In periods of market volatility, assets may decline significantly, causing total annual Fund operating expenses to become higher than the figures shown.
8 | Semiannual Report | franklintempleton.com | ||
FRANKLIN GROWTH OPPORTUNITIES FUND
Your Fund’s Expenses
As a Fund shareholder, you can incur two types of costs: (1) transaction costs, including sales charges (loads) on Fund purchases and redemptions; and (2) ongoing Fund costs, including management fees, distribution and service(12b-1) fees, and other Fund expenses. All mutual funds have ongoing costs, sometimes referred to as operating expenses. The table below shows ongoing costs of investing in the Fund and can help you understand these costs and compare them with those of other mutual funds. The table assumes a $1,000 investment held for the six months indicated.
Actual Fund Expenses
The table below provides information about actual account values and actual expenses in the columns under the heading “Actual.” In these columns the Fund’s actual return, which includes the effect of Fund expenses, is used to calculate the “Ending Account Value” for each class of shares. You can estimate the expenses you paid during the period by following these steps (ofcourse, your account value and expenses will differ from those in this illustration):Divide your account value by $1,000 (ifyour account had an $8,600 value, then $8,600÷ $1,000 = 8.6). Then multiply the result by the number in the row for your class of shares under the headings “Actual” and “Expenses Paid During Period” (ifActual Expenses Paid During Period were $7.50, then 8.6 x $7.50 = $64.50). In this illustration, the actual expenses paid this period are $64.50.
Hypothetical Example for Comparison with Other Funds
Under the heading “Hypothetical” in the table, information is provided about hypothetical account values and hypothetical expenses based on the Fund’s actual expense ratio and an assumed rate of return of 5% per year before expenses, which is not the Fund’s actual return. This information may not be used to estimate the actual ending account balance or expenses you paid for the period, but it can help you compare ongoing costs of investing in the Fund with those of other funds. To do so, compare this 5% hypothetical example for the class of shares you hold with the 5% hypothetical examples that appear in the shareholder reports of other funds.
Please note that expenses shown in the table are meant to highlight ongoing costs and do not reflect any transactional costs. Therefore, information under the heading “Hypothetical” is useful in comparing ongoing costs only, and will not help you compare total costs of owning different funds. In addition, if transactional costs were included, your total costs would have been higher.
| Actual | Hypothetical | |||||||||||||||||
| (actual return after expenses) | (5% annual return before expenses) | |||||||||||||||||
| Share Class | Beginning Account Value 5/1/19 | Ending Account Value 10/31/19 | Expenses Paid During Period 5/1/19–10/31/191,2 | Ending Account Value 10/31/19 | Expenses Paid During Period 5/1/19–10/31/191,2 | Net Annualized Expense Ratio2 | ||||||||||||
| A | $1,000 | $1,007.30 | $4.79 | $1,020.36 | $4.82 | 0.95% | ||||||||||||
| C | $1,000 | $1,003.70 | $8.56 | $1,016.59 | $8.62 | 1.70% | ||||||||||||
| R | $1,000 | $1,006.10 | $6.05 | $1,019.10 | $6.09 | 1.20% | ||||||||||||
| R6 | $1,000 | $1,009.40 | $2.98 | $1,022.17 | $3.00 | 0.59% | ||||||||||||
| Advisor | $1,000 | $1,008.60 | $3.53 | $1,021.62 | $3.56 | 0.70% | ||||||||||||
1. Expenses are equal to the annualized expense ratio for thesix-month period as indicated above—in the far right column—multiplied by the simple average account value over the period indicated, and then multiplied by 184/366 to reflect theone-half year period.
2. Reflects expenses after fee waivers and expense reimbursements. Does not include acquired fund fees and expenses.
| franklintempleton.com | Semiannual Report | 9 | ||
Franklin Select U.S. Equity Fund
This semiannual report for Franklin Select U.S. Equity Fund covers the period ended October 31, 2019. As previously communicated, the Fund, a series of Franklin Strategic Series, will reorganize with and into Franklin Growth Fund, a series of Franklin Custodian Funds, on or about February 7, 2020, but may be delayed if unforeseen circumstances arise. Effective at the close of market on August 27, 2019, the Fund closed to new investors, with limited exceptions. Existing shareholders can continue to invest in the Fund. After the close of market on or about February 5, 2020, the Fund will not accept any additional purchases or exchanges. The Fund reserves the right to change this policy at any time.
Your Fund’s Goal and Main Investments
The Fund seeks capital appreciation by investing, under normal market conditions, at least 80% of its net assets in U.S. equity securities. The Fund invests primarily to predominantly in equity securities of large-capitalization companies, which are similar in size to those in the Standard & Poor’s 500 Index (S&P 500).
Performance Overview
The Fund’s Class A shares posted a +2.77% cumulative total return for the six months under review. In comparison, the S&P 500, which tracks the broad U.S. stock market, posted a +4.16% total return.1 You can find the Fund’s long-term performance data in the Performance Summary beginning on page 13.
Performance data represent past performance, which does not guarantee future results. Investment return and principal value will fluctuate, and you may have a gain or loss when you sell your shares. Current performance may differ from figures shown. For most recentmonth-end performance, go tofranklintempleton.comor call(800)342-5236.
Investment Strategy
We are research-driven,bottom-up fundamental investors seeking companies that exhibit a combination of growth potential, quality and reasonable valuation. We assess growth potential by considering companies that we believe
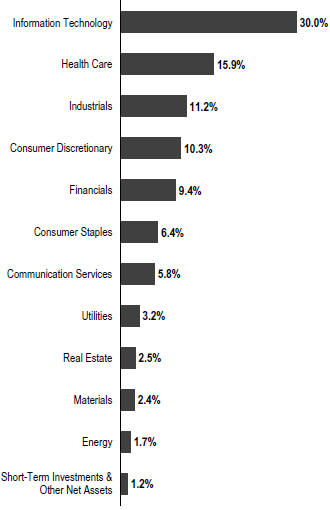
Portfolio Composition
Based on Total Net Assets as of 10/31/19
are positioned for growth in revenue, earnings or assets. In assessing valuation, we consider whether security prices fully reflect the balance of the long-term growth prospects relative to business and financial risks. We place a particular emphasis on quality and assessing downside risk, believing that important attributes of quality include experienced and talented management teams, favorable competitive positioning, and financial strength reflected in metrics including profitability, free cash flow generation and returns on capital employed. This quality analysis generally includes our assessment of the potential impacts of any material
1. Source: Morningstar.
The index is unmanaged and includes reinvestment of any income or distributions. It does not reflect any fees, expenses or sales charges. One cannot invest directly in an index, and an index is not representative of the Fund’s portfolio.
See www.franklintempletondatasources.com for additional data provider information.
The dollar value, number of shares or principal amount, and names of all portfolio holdings are listed in the Fund’s Statement of Investments (SOI).
The SOI begins on page 42.
10 | Semiannual Report | franklintempleton.com | ||
FRANKLIN SELECT U.S. EQUITY FUND
environmental, social and governance (ESG) factors on the long-term risk and return profile of a company. We generally use a team of analysts to help providein-depth industry expertise and use both qualitative and quantitative analysis to evaluate companies.
Manager’s Discussion
During the six months under review, key sector contributors to the Fund’s absolute performance included information technology (IT), health care and utilities.
Within IT, our investments in Netherlands-based carrier and cloud-neutral colocation data center services provider Interxion Holding, electronic products manufacturer Apple and semiconductor company Applied Materials boosted absolute performance. Interxion benefited from favorable colocation demand trends, driven largely by cloud and content platform providers. Nearperiod-end, the company announced its plan to merge with Digital Realty (not a Fund holding), pending approval by both companies’ shareholders.
In health care, U.K. pharmaceuticals firm AstraZeneca and medical technology products manufacturer Teleflex aided Fund performance. AstraZeneca reported robustsecond-and third-quarter 2019 earnings results and raised its sales guidance for two consecutive quarters, driving its shares to a record U.S. price. In our assessment, the company has a strong portfolio that is in the early stage of its life cycle, with adoption, indications and geographic expansion just beginning, and a pipeline that has several blockbuster candidates.
In the utilities sector, NextEra Energy, an electric power and energy infrastructure company, benefited from superior organic growth potential as well as modest value from expected investment opportunities related to future acquisitions. The company’s renewable energy goals and additional cost-cutting initiatives are slated to line up with a strengthenedearnings-per-share plan to drive growth.
In contrast, key sector detractors from the Fund’s absolute performance included energy, consumer discretionary and industrials.
Within energy, our holdings in oil and gas exploration and production company Concho Resources and natural gas producer Cabot Oil & Gas hurt absolute results. Concho Resources’ share price plunged after the company reported mixed second-quarter 2019 earnings results and provided a downbeatoil-production guidance for the remainder of 2019. We think the stock was oversold on the news. Concho still possesses a solid balance sheet and hedges with strong growth potential, in our view. The company reported decent
Top 10 Holdings
10/31/19
Company
| % of Total
| |||
Microsoft Corp. | 4.4% | |||
Information Technology
| ||||
Amazon.com Inc. | 4.2% | |||
Consumer Discretionary
| ||||
Alphabet Inc. | 3.4% | |||
Communication Services
| ||||
Mastercard Inc. | 3.2% | |||
Information Technology
| ||||
NextEra Energy Inc. | 3.2% | |||
Utilities
| ||||
Analog Devices Inc. | 2.9% | |||
Information Technology
| ||||
InterXion Holding NV | 2.7% | |||
Information Technology
| ||||
AstraZeneca PLC | 2.6% | |||
Health Care
| ||||
Apple Inc. | 2.6% | |||
Information Technology
| ||||
Verisk Analytics Inc. | 2.5% | |||
Industrials
| ||||
third-quarter results that we believe helped restore management’s credibility and give more credence to the company as a growth story with double-digit percentage oil volume growth and free cash flow potential in 2020. Cabot Oil & Gas reported solid second-quarter 2019 earnings results, but its shares declined due to a disappointing 2020 guidance. However, the company reported solid third-quarter results that, in our view, demonstrated its business model’s ability to generate free cash flow despite lower gas prices.
In consumer discretionary, our position ine-commerce and cloud computing services company Amazon.com hurt absolute results.
In the industrials sector, our position in Fortive, a diversified industrial conglomerate that designs, develops, manufactures and markets professional and engineered products, software and services, hindered Fund performance. Its shares declined after the company reported mixedsecond-and third-quarter 2019 results, with earnings exceeding consensus estimates and revenues missing estimates. In September, the company announced its intention to separate into two independent companies in the second half of 2020 by spinning off its transportation-related businesses, which include retail and commercial fueling, fleet management, and automotive service and repair solutions. We believe this
| franklintempleton.com | Semiannual Report | 11 | ||
FRANKLIN SELECT U.S. EQUITY FUND
separation makes a lot of sense, as it could potentially isolate the cyclicality of the retail fueling business.
Other key individual detractors from the Fund’s absolute performance included our holdings in research, development and medical device company ABIOMED and financial services firm Charles Schwab.
Thank you for your participation in Franklin Select U.S. Equity Fund. It has been a pleasure serving your investment needs.
 |  | |
Serena Perin Vinton, CFA Lead Portfolio Manager | ||
 |  | |
| Chris Anderson | ||
| Portfolio Management Team | ||
The foregoing information reflects our analysis, opinions and portfolio holdings as of October 31, 2019, the end of the reporting period. The way we implement our main investment strategies and the resulting portfolio holdings may change depending on factors such as market and economic conditions. These opinions may not be relied upon as investment advice or an offer for a particular security. The information is not a complete analysis of every aspect of any market, country, industry, security or the Fund. Statements of fact are from sources considered reliable, but the investment manager makes no representation or warranty as to their completeness or accuracy. Although historical performance is no guarantee of future results, these insights may help you understand our investment management philosophy.
12 | Semiannual Report | franklintempleton.com | ||
FRANKLIN SELECT U.S. EQUITY FUND
Performance Summary as of October 31, 2019
The performance table does not reflect any taxes that a shareholder would pay on Fund dividends, capital gain distributions, if any, or any realized gains on the sale of Fund shares. Total return reflects reinvestment of the Fund’s dividends and capital gain distributions, if any, and any unrealized gains or losses. Your dividend income will vary depending on dividends or interest paid by securities in the Fund’s portfolio, adjusted for operating expenses of each class. Capital gain distributions are net profits realized from the sale of portfolio securities.
Performance as of 10/31/191
Cumulative total return excludes sales charges. Average annual total return includes maximum sales charges. Sales charges will vary depending on the size of the investment and the class of share purchased. The maximum is 5.50% and the minimum is 0%.Class A:5.50% maximum initial sales charge;Advisor Class:no sales charges. For other share classes, visitfranklintempleton.com.
Share Class
| Cumulative Total Return2
| Average Annual Total Return3
| ||
| A4 | ||||
6-Month | +2.77% | -2.86% | ||
1-Year | +13.72% | +7.47% | ||
5-Year | +34.95% | +4.99% | ||
10-Year | +177.49% | +10.12% | ||
Advisor | ||||
6-Month | +2.90% | +2.90% | ||
1-Year | +14.08% | +14.08% | ||
5-Year | +36.73% | +6.46% | ||
10-Year | +185.09% | +11.04% | ||
Performance data represent past performance, which does not guarantee future results. Investment return and principal value will fluctuate, and you may have a gain or loss when you sell your shares. Current performance may differ from figures shown. For most recentmonth-end performance, go tofranklintempleton.comor call(800)342-5236.
See page 14 for Performance Summary footnotes.
| franklintempleton.com | Semiannual Report | 13 | ||
FRANKLIN SELECT U.S. EQUITY FUND
PERFORMANCE SUMMARY
Total Annual Operating Expenses5
| Share Class | With Fee Waiver | Without Fee Waiver | ||
A | 1.27% | 1.54% | ||
Advisor | 1.02% | 1.29% | ||
Each class of shares is available to certain eligible investors and has different annual fees and expenses, as described in the prospectus.
All investments involve risks, including possible loss of principal. To the extent the Fund focuses on particular countries, regions, industries, sectors or types of investment from time to time, it may be subject to greater risks of adverse developments in such areas of focus than a fund that invests in a wider variety of countries, regions, industries, sectors or investments. The Fund may have investments in both growth and value stocks, or in stocks with characteristics of both. Growth stock prices reflect projections of future earnings or revenues, and can, therefore, fall dramatically if the company fails to meet those projections. A value stock may not increase in price as anticipated by the investment manager if other investors fail to recognize the company’s value and bid up the price, the markets favor faster-growing companies, or the factors that the investment manager believes will increase the price of the security do not occur. Foreign securities involve special risks, including currency fluctuations and economic and political uncertainties. The Fund’s prospectus also includes a description of the main investment risks.
1. The Fund has an expense reduction and a fee waiver associated with any investments it makes in a Franklin Templeton money fund and/or other Franklin Templeton fund, contractually guaranteed through 8/31/20. Fund investment results reflect the expense reduction and fee waiver; without these reductions, the results would have been lower.
2. Cumulative total return represents the change in value of an investment over the periods indicated.
3. Average annual total return represents the average annual change in value of an investment over the periods indicated. Return for less than one year, if any, has not been annualized.
4. Prior to 9/10/18, these shares were offered at a higher initial sales charge of 5.75%, thus actual returns (with sales charges) would have differed. Average annual total returns (with sales charges) have been restated to reflect the current maximum initial sales charge of 5.50%.
5. Figures are as stated in the Fund’s current prospectus and may differ from the expense ratios disclosed in the Your Fund’s Expenses and Financial Highlights sections in this report. In periods of market volatility, assets may decline significantly, causing total annual Fund operating expenses to become higher than the figures shown.
14 | Semiannual Report | franklintempleton.com | ||
FRANKLIN SELECT U.S. EQUITY FUND
Your Fund’s Expenses
As a Fund shareholder, you can incur two types of costs: (1) transaction costs, including sales charges (loads) on Fund purchases and redemptions; and (2) ongoing Fund costs, including management fees, distribution and service(12b-1) fees, and other Fund expenses. All mutual funds have ongoing costs, sometimes referred to as operating expenses. The table below shows ongoing costs of investing in the Fund and can help you understand these costs and compare them with those of other mutual funds. The table assumes a $1,000 investment held for the six months indicated.
Actual Fund Expenses
The table below provides information about actual account values and actual expenses in the columns under the heading “Actual.” In these columns the Fund’s actual return, which includes the effect of Fund expenses, is used to calculate the “Ending Account Value” for each class of shares. You can estimate the expenses you paid during the period by following these steps(ofcourse, your account value and expenses will differ from those in this illustration):Divide your account value by $1,000(ifyour account had an $8,600 value, then $8,600÷ $1,000 = 8.6). Then multiply the result by the number in the row for your class of shares under the headings “Actual” and “Expenses Paid During Period”(ifActual Expenses Paid During Period were $7.50, then 8.6 x $7.50 = $64.50). In this illustration, the actual expenses paid this period are $64.50.
Hypothetical Example for Comparison with Other Funds
Under the heading “Hypothetical” in the table, information is provided about hypothetical account values and hypothetical expenses based on the Fund’s actual expense ratio and an assumed rate of return of 5% per year before expenses, which is not the Fund’s actual return. This information may not be used to estimate the actual ending account balance or expenses you paid for the period, but it can help you compare ongoing costs of investing in the Fund with those of other funds. To do so, compare this 5% hypothetical example for the class of shares you hold with the 5% hypothetical examples that appear in the shareholder reports of other funds.
Please note that expenses shown in the table are meant to highlight ongoing costs and do not reflect any transactional costs. Therefore, information under the heading “Hypothetical” is useful in comparing ongoing costs only, and will not help you compare total costs of owning different funds. In addition, if transactional costs were included, your total costs would have been higher.
| Actual | Hypothetical | |||||||||||||||||
| (actual return after expenses) | (5% annual return before expenses) | |||||||||||||||||
| Share Class | Beginning Account Value 5/1/19 | Ending Account Value 10/31/19 | Expenses Paid During Period 5/1/19–10/31/191,2 | Ending Account Value 10/31/19 | Expenses Paid During Period 5/1/19–10/31/191,2 | Net Annualized Expense Ratio2 | ||||||||||||
| A | $1,000 | $1,027.70 | $ 6.22 | $1,019.00 | $6.19 | 1.22% | ||||||||||||
| C | $1,000 | $1,023.60 | $10.02 | $1,015.23 | $9.98 | 1.97% | ||||||||||||
| R | $1,000 | $1,026.30 | $ 7.49 | $1,017.75 | $7.46 | 1.47% | ||||||||||||
| R6 | $1,000 | $1,029.50 | $ 4.39 | $1,020.81 | $4.37 | 0.86% | ||||||||||||
| Advisor | $1,000 | $1,029.00 | $ 4.95 | $1,020.26 | $4.93 | 0.97% | ||||||||||||
1. Expenses are equal to the annualized expense ratio for thesix-month period as indicated above—in the far right column—multiplied by the simple average account value over the period indicated, and then multiplied by 184/366 to reflect theone-half year period.
2. Reflects expenses after fee waivers and expense reimbursements. Does not include acquired fund fees and expenses.
| franklintempleton.com | Semiannual Report | 15 | ||
Franklin Small Cap Growth Fund
This semiannual report for Franklin Small Cap Growth Fund covers the period ended October 31, 2019.
Your Fund’s Goal and Main Investments
The Fund seeks long-term capital growth by investing, under normal market conditions, at least 80% of its net assets in the equity securities ofsmall-cap companies, which for this Fund are those with market capitalizations not exceeding $1.5 billion or that of the highest market capitalization in the Russell 2000® Index, whichever is greater, at the time of purchase.1
Performance Overview
The Fund’s Class A shares posted a +0.05% cumulative total return for the six months under review. In comparison, the Russell 2000® Growth Index, which measures performance of those Russell 2000® Index companies with relatively higherprice-to-book ratios and higher forecasted growth rates, posted a-1.73% total return.2 The Standard & Poor’s 500 Index (S&P 500), which tracks the broad U.S. stock market, posted a +4.16% total return.2 You can find the Fund’s long-term performance data in the Performance Summary beginning on page 19.
Performance data represent past performance, which does not guarantee future results. Investment return and principal value will fluctuate, and you may have a gain or loss when you sell your shares. Current performance may differ from figures shown. For most recentmonth-end performance, go tofranklintempleton.comor call(800)342-5236.
Investment Strategy
We use fundamental,bottom-up research to seek companies meeting our criteria of growth potential, quality and valuation. In seeking sustainable growth characteristics, we look for companies we believe can produce sustainable earnings and cash flow growth, evaluating the long-term market opportunity and competitive structure of an industry. We define quality companies as those with strong and improving competitive positions in attractive markets. We also believe important attributes of quality are experienced
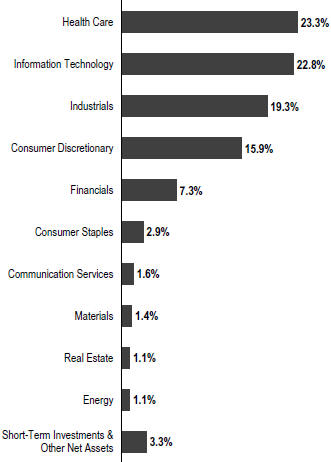
Portfolio Composition
Based on Total Net Assets as of 10/31/19
and talented management teams as well as financial strength reflected in the capital structure, gross and operating margins, free cash flow generation and returns on capital employed. Our valuation analysis includes a range of potential outcomes based on an assessment of multiple scenarios. In assessing value, we consider whether security prices fully reflect the balance of the sustainable growth opportunities relative to business and financial risks.
Manager’s Discussion
During the six months under review, key contributors to the Fund’s performance relative to the Russell 2000® Growth
1. The Russell 2000 Index is market capitalization weighted and measures performance of the 2,000 smallest companies in the Russell 3000 Index, which represent a small amount of the total market capitalization of the Russell 3000 Index.
2. Source: Morningstar.
The indexes are unmanaged and include reinvestment of any income or distributions. They do not reflect any fees, expenses or sales charges. One cannot invest directly in an index, and an index is not representative of the Fund’s portfolio.
See www.franklintempletondatasources.com for additional data provider information.
The dollar value, number of shares or principal amount, and names of all portfolio holdings are listed in the Fund’s Statement of Investments (SOI).
The SOI begins on page 49.
16 | Semiannual Report | franklintempleton.com | ||
FRANKLIN SMALL CAP GROWTH FUND
Index included stock selection and an underweighting in the health care sector and stock selection in the consumer discretionary and financials sectors.
Within health care, our investments in clinical stage biopharmaceutical firm Reata Pharmaceuticals, biotechnology company Iovance Biotherapeutics and cancer-focused biopharmaceutical company Array BioPharma (not held atperiod-end) boosted relative results. Reata Pharmaceuticals’ share price surged after the company announced positive results for a clinical trial for omaveloxolone, a treatment for neuromuscular disorder Friedreich’s ataxia. Iovance Biotherapeutics’ share price shot up following promising data from clinical studies of experimental treatments for cervical cancer and melanoma. Array BioPharma was acquired by pharmaceuticals firm Pfizer (not a Fund holding) for a significant premium over the preannouncement stock closing price.
In the consumer discretionary sector, our holdings in residential property construction and developer M/I Homes (not part of the index) and furniture manufacturer RH aided relative results.
Within financials, our position in PRA Group (not part of the index), which engages in the purchase, collection and management of portfolios of defaulted consumer receivables, enhanced relative returns.
In contrast, key detractors from the Fund’s relative performance included stock selection in the industrials and information technology (IT) sectors and an overweighting and stock selection in the energy sector.
Within industrials, infrastructure solutions provider Granite Construction’s share price declined after the company reported weaker-than-expected second- and third-quarter 2019 earnings results, due to charges from within its heavy civil business. Atperiod-end, we remain confident in the growth trajectory of the company’s other businesses and believe the company has enough liquidity to manage through the current challenges.
In the IT sector, our holdings in education technology firm 2U (not held atperiod-end; not part of the index), cloud-based internet security platform firm Zscaler and cloud-based technology learning platform company Pluralsight (not part of the index) hurt relative results. 2U’s share price declined as the company experienced broad challenges across its graduate- and short-course portfolios, including increased competition, regulatory uncertainty and delayed launches.
Top 10 Holdings
10/31/19
Company Sector/Industry
| % of Total Net Assets
| |||
Reata Pharmaceuticals Inc. | 2.0% | |||
Health Care
| ||||
Cubic Corp. | 1.8% | |||
Industrials
| ||||
Allegiant Travel Co. | 1.7% | |||
Industrials
| ||||
BWX Technologies Inc. | 1.6% | |||
Industrials
| ||||
M/I Homes Inc. | 1.6% | |||
Consumer Discretionary
| ||||
ManTech International Corp. | 1.6% | |||
Information Technology
| ||||
Kennametal Inc. | 1.5% | |||
Industrials
| ||||
Steven Madden Ltd. | 1.4% | |||
Consumer Discretionary
| ||||
Univar Solutions Inc. | 1.4% | |||
Industrials
| ||||
Mercury Systems Inc. | 1.4% | |||
Industrials
| ||||
In energy, our position in oil and gas exploration and production company Callon Petroleum (not part of the index) hindered relative results.
Other key individual detractors included our position in At Home Group (not held atperiod-end), which operates home decor superstores. At Home Group’s share price fell after the company reported weaker-than-expected second-quarter 2019 earnings results and lowered its fiscal-year 2019 guidance.
| franklintempleton.com | Semiannual Report | 17 | ||
FRANKLIN SMALL CAP GROWTH FUND
Thank you for your continued participation in Franklin Small Cap Growth Fund. We look forward to serving your future investment needs.
|  | |
Michael P. McCarthy, CFA Lead Portfolio Manager | ||
|  | |
| Bradley T. Carris, CFA | ||
| Portfolio Management Team | ||


The foregoing information reflects our analysis, opinions and portfolio holdings as of October 31, 2019, the end of the reporting period. The way we implement our main investment strategies and the resulting portfolio holdings may change depending on factors such as market and economic conditions. These opinions may not be relied upon as investment advice or an offer for a particular security. The information is not a complete analysis of every aspect of any market, country, industry, security or the Fund. Statements of fact are from sources considered reliable, but the investment manager makes no representation or warranty as to their completeness or accuracy. Although historical performance is no guarantee of future results, these insights may help you understand our investment management philosophy.
18 | Semiannual Report | franklintempleton.com | ||
FRANKLIN SMALL CAP GROWTH FUND
Performance Summary as of October 31, 2019
The performance table does not reflect any taxes that a shareholder would pay on Fund dividends, capital gain distributions, if any, or any realized gains on the sale of Fund shares. Total return reflects reinvestment of the Fund’s dividends and capital gain distributions, if any, and any unrealized gains or losses. Your dividend income will vary depending on dividends or interest paid by securities in the Fund’s portfolio, adjusted for operating expenses of each class. Capital gain distributions are net profits realized from the sale of portfolio securities.
Performance as of 10/31/191
Cumulative total return excludes sales charges. Average annual total return includes maximum sales charges. Sales charges will vary depending on the size of the investment and the class of share purchased. The maximum is 5.50% and the minimum is 0%.Class A:5.50% maximum initial sales charge;Advisor Class:no sales charges. For other share classes, visitfranklintempleton.com.
Share Class
| Cumulative Total Return2
| Average Annual Total Return3
| ||
A4 | ||||
6-Month | +0.05% | -5.46% | ||
1-Year | +12.64% | +6.45% | ||
5-Year | +56.52% | +8.15% | ||
10-Year | +304.16% | +14.34% | ||
Advisor | ||||
6-Month | +0.17% | +0.17% | ||
1-Year | +12.87% | +12.87% | ||
5-Year | +58.45% | +9.64% | ||
10-Year | +315.66% | +15.31% | ||
Performance data represent past performance, which does not guarantee future results. Investment return and principal value will fluctuate, and you may have a gain or loss when you sell your shares. Current performance may differ from figures shown. For most recentmonth-end performance, go tofranklintempleton.comor call(800)342-5236.
See page 20 for Performance Summary footnotes.
| franklintempleton.com | Semiannual Report | 19 | ||
FRANKLIN SMALL CAP GROWTH FUND
PERFORMANCE SUMMARY
Total Annual Operating Expenses5
| Share Class | With Fee Waiver | Without Fee Waiver | ||
A | 1.07% | 1.08% | ||
Advisor | 0.82% | 0.83% | ||
Each class of shares is available to certain eligible investors and has different annual fees and expenses, as described in the prospectus.
All investments involve risks, including possible loss of principal. Smaller, midsized and relatively new or unseasoned companies can be particularly sensitive to changing economic conditions, and their prospects for growth are less certain than those of larger, more established companies. Historically, these securities have experienced more price volatility than larger-company stocks, especially over the short term. Growth stock prices reflect projections of future earnings or revenues, and can, therefore, fall dramatically if the company fails to meet those projections. To the extent the Fund focuses on particular countries, regions, industries, sectors or types of investment from time to time, it may be subject to greater risks of adverse developments in such areas of focus than a fund that invests in a wider variety of countries, regions, industries, sectors or investments. From time to time, the trading market for a particular security or type of security in which the Fund invests may become less liquid or even illiquid. The Fund’s prospectus also includes a description of the main investment risks.
1. The Fund has a fee waiver associated with any investment it makes in a Franklin Templeton money fund and/or other Franklin Templeton fund, contractually guaranteed through 8/31/20. Fund investment results reflect the fee waiver; without this waiver, the results would have been lower.
2. Cumulative total return represents the change in value of an investment over the periods indicated.
3. Average annual total return represents the average annual change in value of an investment over the periods indicated. Return for less than one year, if any, has not been annualized.
4. Prior to 9/10/18, these shares were offered at a higher initial sales charge of 5.75%, thus actual returns (with sales charges) would have differed. Average annual total returns (with sales charges) have been restated to reflect the current maximum initial sales charge of 5.50%.
5. Figures are as stated in the Fund’s current prospectus and may differ from the expense ratios disclosed in the Your Fund’s Expenses and Financial Highlights sections in this report. In periods of market volatility, assets may decline significantly, causing total annual Fund operating expenses to become higher than the figures shown.
20 | Semiannual Report | franklintempleton.com | ||
FRANKLIN SMALL CAP GROWTH FUND
Your Fund’s Expenses
As a Fund shareholder, you can incur two types of costs: (1) transaction costs, including sales charges (loads) on Fund purchases and redemptions; and (2) ongoing Fund costs, including management fees, distribution and service(12b-1) fees, and other Fund expenses. All mutual funds have ongoing costs, sometimes referred to as operating expenses. The table below shows ongoing costs of investing in the Fund and can help you understand these costs and compare them with those of other mutual funds. The table assumes a $1,000 investment held for the six months indicated.
Actual Fund Expenses
The table below provides information about actual account values and actual expenses in the columns under the heading “Actual.” In these columns the Fund’s actual return, which includes the effect of Fund expenses, is used to calculate the “Ending Account Value” for each class of shares. You can estimate the expenses you paid during the period by following these steps(ofcourse, your account value and expenses will differ from those in this illustration):Divide your account value by $1,000(ifyour account had an $8,600 value, then $8,600÷ $1,000 = 8.6). Then multiply the result by the number in the row for your class of shares under the headings “Actual” and “Expenses Paid During Period”(ifActual Expenses Paid During Period were $7.50, then 8.6 x $7.50 = $64.50). In this illustration, the actual expenses paid this period are $64.50.
Hypothetical Example for Comparison with Other Funds
Under the heading “Hypothetical” in the table, information is provided about hypothetical account values and hypothetical expenses based on the Fund’s actual expense ratio and an assumed rate of return of 5% per year before expenses, which is not the Fund’s actual return. This information may not be used to estimate the actual ending account balance or expenses you paid for the period, but it can help you compare ongoing costs of investing in the Fund with those of other funds. To do so, compare this 5% hypothetical example for the class of shares you hold with the 5% hypothetical examples that appear in the shareholder reports of other funds.
Please note that expenses shown in the table are meant to highlight ongoing costs and do not reflect any transactional costs. Therefore, information under the heading “Hypothetical” is useful in comparing ongoing costs only, and will not help you compare total costs of owning different funds. In addition, if transactional costs were included, your total costs would have been higher.
| Actual | Hypothetical | |||||||||||||||||
| (actual return after expenses) | (5% annual return before expenses) | |||||||||||||||||
| Share Class | Beginning Account Value 5/1/19 | Ending Account Value 10/31/19 | Expenses Paid During Period 5/1/19–10/31/191,2 | Ending Account Value 10/31/19 | Expenses Paid During Period 5/1/19–10/31/191,2 | Net Annualized Expense Ratio2 | ||||||||||||
| A | $1,000 | $1,000.50 | $5.33 | $1,019.81 | $5.38 | 1.06% | ||||||||||||
| C | $1,000 | $ 997.10 | $9.09 | $1,016.04 | $9.17 | 1.81% | ||||||||||||
| R | $1,000 | $ 999.50 | $6.58 | $1,018.55 | $6.65 | 1.31% | ||||||||||||
| R6 | $1,000 | $1,002.50 | $3.22 | $1,021.92 | $3.25 | 0.64% | ||||||||||||
| Advisor | $1,000 | $1,001.70 | $4.08 | $1,021.06 | $4.12 | 0.81% | ||||||||||||
1. Expenses are equal to the annualized expense ratio for thesix-month period as indicated above—in the far right column—multiplied by the simple average account value over the period indicated, and then multiplied by 184/366 to reflect theone-half year period.
2. Reflects expenses after fee waivers and expense reimbursements. Does not include acquired fund fees and expenses.
| franklintempleton.com | Semiannual Report | 21 | ||
FranklinSmall-Mid Cap Growth Fund
This semiannual report for FranklinSmall-Mid Cap Growth Fund covers the period ended October 31, 2019.
Your Fund’s Goal and Main Investments
The Fund seeks long-term capital growth by investing, under normal market conditions, at least 80% of its net assets in the equity securities ofsmall-cap andmid-cap companies. The Fund definessmall-cap companies as those within the market capitalization range of companies in the Russell 2500™ Index at the time of purchase, andmid-cap companies as those within the market capitalization range of the Russell Midcap® Index, at the time of purchase.1
Performance Overview
The Fund’s Class A shares posted a-1.48% cumulative total return for the six months under review. In comparison, the Russell Midcap® Growth Index, which measures performance of those Russell Midcap® Index companies with relatively higherprice-to-book ratios and higher forecasted growth rates, posted a +2.04% total return.2 Also in comparison, the Standard & Poor’s 500 Index (S&P 500), which tracks the broad U.S. stock market, posted a +4.16% total return.2 You can find the Fund’s long-term performance data in the Performance Summary beginning on page 25.
Performance data represent past performance, which does not guarantee future results. Investment return and principal value will fluctuate, and you may have a gain or loss when you sell your shares. Current performance may differ from figures shown. For most recentmonth-end performance, go tofranklintempleton.comor call(800)342-5236.
Investment Strategy
We use fundamental,bottom-up research to seek companies meeting our criteria of growth potential, quality and valuation. In seeking sustainable growth characteristics, we look for companies we believe can produce sustainable earnings and cash flow growth, evaluating the long-term market opportunity and competitive structure of an industry to target leaders and emerging leaders. We define quality
Portfolio Composition
Based on Total Net Assets as of 10/31/19
companies as those with strong and improving competitive positions in attractive markets. We also believe important attributes of quality are experienced and talented management teams as well as financial strength reflected in the capital structure, gross and operating margins, free cash flow generation and returns on capital employed. Our valuation analysis includes a range of potential outcomes based on an assessment of multiple scenarios. In assessing value, we consider whether security prices fully reflect the balance of the sustainable growth opportunities relative to business and financial risks.
1. The Russell 2500 Index is market capitalization weighted and measures performance of the 2,500 smallest companies in the Russell 3000 Index, which represent a modest amount of the Russell 3000 Index’s total market capitalization. The Russell Midcap Index is market capitalization weighted and measures performance of the smallest companies in the Russell 1000 Index, which represent a modest amount of the Russell 1000 Index’s total market capitalization.
2. Source: Morningstar.
The indexes are unmanaged and include reinvestment of any income or distributions. They do not reflect any fees, expenses or sales charges. One cannot invest directly in an index, and an index is not representative of the Fund’s portfolio.
See www.franklintempletondatasources.com for additional data provider information.
The dollar value, number of shares or principal amount, and names of all portfolio holdings are listed in the Fund’s Statement of Investments (SOI).
The SOI begins on page 58.
22 | Semiannual Report | franklintempleton.com | ||
FRANKLINSMALL-MID CAP GROWTH FUND
Manager’s Discussion
During the six months under review, the information technology (IT) sector was the largest detractor from absolute performance, outweighing contributions posted by a majority of sectors represented in the Fund’s portfolio. Relative to the Russell Midcap® Growth Index, key detractors from the Fund’s performance included stock selection in the IT, consumer discretionary and industrials sectors.
In IT, 2U and New Relic (both not held atperiod-end) significantly detracted from relative performance. 2U provides online platforms for university-affiliated graduate degree programs as well as shorter, skills-building courses. Its share price declined as the company experienced broad challenges across its graduate- and short-course portfolios, including increased competition, regulatory uncertainty and delayed launches. Shares of New Relic, a cloud-based data storage and analytics company, declined following lower-than-expected sales figures for 2019’s second quarter. Management cited the launch of a new data analysis platform and a reorganization of its sales teams as reasons for the poor performance. Guidance for sales and cash flow for the remainder of its 2020 fiscal year also came in below expectations.
In consumer discretionary,non-profit postsecondary education services provider Grand Canyon Education hurt relative results.
In industrials, ride-sharing service Lyft was a relative detractor.
Elsewhere, medical device company ABIOMED (not held atperiod-end) also detracted from relative results as the company was forced to cut its guidance when a U.S. Food and Drug Administration letter issued in February 2019 incorrectly addressed the safety of the Impella PR heart pump.
In contrast, stock selection in financials, stock selection and an underweight in communication services, and stock selection in consumer staples contributed to relative performance.
In financials, electronic trading platform provider MarketAxess Holdings boosted relative results as the company benefited from the continued shift toward digitization of fixed-income trading. Increased uncertainty and volatility in the broader market drove an increase in trading activity, which also boosted the company’s share price. In particular, international trading volumes rose, as the number of global bonds with negative yields resulted in higher demand for U.S. bonds.
Top 10 Holdings
10/31/19
Company Sector/Industry
| % of Total Net Assets
| |||
CoStar Group Inc. | 2.0% | |||
Industrials
| ||||
SBA Communications Corp. | 1.9% | |||
Real Estate
| ||||
Verisk Analytics Inc. | 1.9% | |||
Industrials
| ||||
IDEXX Laboratories Inc. | 1.7% | |||
Health Care
| ||||
MSCI Inc. | 1.7% | |||
Financials
| ||||
Global Payments Inc. | 1.7% | |||
Information Technology
| ||||
MarketAxess Holdings Inc. | 1.6% | |||
Financials
| ||||
IDEX Corp. | 1.6% | |||
Industrials
| ||||
IAC/InterActiveCorp | 1.5% | |||
Communication Services
| ||||
GoDaddy Inc. | 1.5% | |||
Information Technology
| ||||
In communication services, the Fund’s lack of positions in several large, poorly-performing companies helped relative results.
In consumer staples, potato producer and processor Lamb Weston Holdings contributed to relative results.
Elsewhere,off-benchmark positions in clinical stage biopharmaceutical firm Reata Pharmaceuticals and cancer-focused biopharmaceutical company Array BioPharma (not held atperiod-end) also benefited relative performance. Reata Pharmaceuticals’ share price surged after the company announced positive results for a clinical trial for omaveloxolone, a treatment for neuromuscular disorder Friedreich’s ataxia. Array BioPharma was acquired by pharmaceuticals firm Pfizer (not a Fund holding) for a significant premium over the preannouncement stock closing price.
| franklintempleton.com | Semiannual Report | 23 | ||
FRANKLINSMALL-MID CAP GROWTH FUND
Thank you for your continued participation in FranklinSmall-Mid Cap Growth Fund. We look forward to serving your future investment needs.
 |  | |
| John P. Scandalios | ||
 |  | |
| Michael P. McCarthy, CFA | ||
| Portfolio Management Team | ||
The foregoing information reflects our analysis, opinions and portfolio holdings as of October 31, 2019, the end of the reporting period. The way we implement our main investment strategies and the resulting portfolio holdings may change depending on factors such as market and economic conditions. These opinions may not be relied upon as investment advice or an offer for a particular security. The information is not a complete analysis of every aspect of any market, country, industry, security or the Fund. Statements of fact are from sources considered reliable, but the investment manager makes no representation or warranty as to their completeness or accuracy. Although historical performance is no guarantee of future results, these insights may help you understand our investment management philosophy.
24 | Semiannual Report | franklintempleton.com | ||
FRANKLINSMALL-MID CAP GROWTH FUND
Performance Summary as of October 31, 2019
The performance table does not reflect any taxes that a shareholder would pay on Fund dividends, capital gain distributions, if any, or any realized gains on the sale of Fund shares. Total return reflects reinvestment of the Fund’s dividends and capital gain distributions, if any, and any unrealized gains or losses. Your dividend income will vary depending on dividends or interest paid by securities in the Fund’s portfolio, adjusted for operating expenses of each class. Capital gain distributions are net profits realized from the sale of portfolio securities.
Performance as of 10/31/191
Cumulative total return excludes sales charges. Average annual total return includes maximum sales charges. Sales charges will vary depending on the size of the investment and the class of share purchased. The maximum is 5.50% and the minimum is 0%.Class A:5.50% maximum initial sales charge;Advisor Class:no sales charges. For other share classes, visitfranklintempleton.com.
Share Class
| Cumulative Total Return2
| Average Annual Total Return3 | ||||
A4 | ||||||
6-Month | -1.48% | -6.89% | ||||
1-Year | +15.47% | +9.13% | ||||
5-Year | +49.31% | +7.13% | ||||
10-Year | +227.02% | +11.94% | ||||
Advisor | ||||||
6-Month | -1.36% | -1.36% | ||||
1-Year | +15.69% | +15.69% | ||||
5-Year | +51.12% | +8.61% | ||||
10-Year | +235.27% | +12.86% | ||||
Performance data represent past performance, which does not guarantee future results. Investment return and principal value will fluctuate, and you may have a gain or loss when you sell your shares. Current performance may differ from figures shown. For most recentmonth-end performance, go tofranklintempleton.comor call(800)342-5236.
See page 26 for Performance Summary footnotes.
| franklintempleton.com | Semiannual Report | 25 | ||
FRANKLINSMALL-MID CAP GROWTH FUND
PERFORMANCE SUMMARY
Total Annual Operating Expenses5
| Share Class | With Fee Waiver | Without Fee Waiver | ||
A | 0.91% | 0.92% | ||
Advisor | 0.66% | 0.67% | ||
Each class of shares is available to certain eligible investors and has different annual fees and expenses, as described in the prospectus.
All investments involve risks, including possible loss of principal. Growth stock prices reflect projections of future earnings or revenues, and can, therefore, fall dramatically if the company fails to meet those projections. Smaller, midsized and relatively new or unseasoned companies can be particularly sensitive to changing economic conditions, and their prospects for growth are less certain than those of larger, more established companies. Historically, these securities have experienced more price volatility than larger-company stocks, especially over the short term. To the extent the Fund focuses on particular countries, regions, industries, sectors or types of investment from time to time, it may be subject to greater risks of adverse developments in such areas of focus than a fund that invests in a wider variety of countries, regions, industries, sectors or investments. From time to time, the trading market for a particular security or type of security in which the Fund invests may become less liquid or even illiquid. The Fund’s prospectus also includes a description of the main investment risks.
1. The Fund has a fee waiver associated with any investment it makes in a Franklin Templeton money fund and/or other Franklin Templeton fund, contractually guaranteed through 8/31/20. Fund investment results reflect the expense reduction and fee waiver; without these reductions, the results would have been lower.
2. Cumulative total return represents the change in value of an investment over the periods indicated.
3. Average annual total return represents the average annual change in value of an investment over the periods indicated. Return for less than one year, if any, has not been annualized.
4. Prior to 9/10/18, these shares were offered at a higher initial sales charge of 5.75%, thus actual returns (with sales charges) would have differed. Average annual total returns (with sales charges) have been restated to reflect the current maximum initial sales charge of 5.50%.
5. Figures are as stated in the Fund’s current prospectus and may differ from the expense ratios disclosed in the Your Fund’s Expenses and Financial Highlights sections in this report. In periods of market volatility, assets may decline significantly, causing total annual Fund operating expenses to become higher than the figures shown.
26 | Semiannual Report | franklintempleton.com | ||
FRANKLINSMALL-MID CAP GROWTH FUND
Your Fund’s Expenses
As a Fund shareholder, you can incur two types of costs: (1) transaction costs, including sales charges (loads) on Fund purchases and redemptions; and (2) ongoing Fund costs, including management fees, distribution and service(12b-1) fees, and other Fund expenses. All mutual funds have ongoing costs, sometimes referred to as operating expenses. The table below shows ongoing costs of investing in the Fund and can help you understand these costs and compare them with those of other mutual funds. The table assumes a $1,000 investment held for the six months indicated.
Actual Fund Expenses
The table below provides information about actual account values and actual expenses in the columns under the heading “Actual.” In these columns the Fund’s actual return, which includes the effect of Fund expenses, is used to calculate the “Ending Account Value” for each class of shares. You can estimate the expenses you paid during the period by following these steps(ofcourse, your account value and expenses will differ from those in this illustration):Divide your account value by $1,000(ifyour account had an $8,600 value, then $8,600÷ $1,000 = 8.6). Then multiply the result by the number in the row for your class of shares under the headings “Actual” and “Expenses Paid During Period”(ifActual Expenses Paid During Period were $7.50, then 8.6 x $7.50 = $64.50). In this illustration, the actual expenses paid this period are $64.50.
Hypothetical Example for Comparison with Other Funds
Under the heading “Hypothetical” in the table, information is provided about hypothetical account values and hypothetical expenses based on the Fund’s actual expense ratio and an assumed rate of return of 5% per year before expenses, which is not the Fund’s actual return. This information may not be used to estimate the actual ending account balance or expenses you paid for the period, but it can help you compare ongoing costs of investing in the Fund with those of other funds. To do so, compare this 5% hypothetical example for the class of shares you hold with the 5% hypothetical examples that appear in the shareholder reports of other funds.
Please note that expenses shown in the table are meant to highlight ongoing costs and do not reflect any transactional costs. Therefore, information under the heading “Hypothetical” is useful in comparing ongoing costs only, and will not help you compare total costs of owning different funds. In addition, if transactional costs were included, your total costs would have been higher.
| Actual | Hypothetical | |||||||||||||||||
| (actual return after expenses) | (5% annual return before expenses) | |||||||||||||||||
| Share Class | Beginning Account Value 5/1/19 | Ending Account Value 10/31/19 | Expenses Paid During Period 5/1/19–10/31/191,2 | Ending Account Value 10/31/19 | Expenses Paid During Period 5/1/19–10/31/191,2 | Net Annualized Expense Ratio2 | ||||||||||||
| A | $1,000 | $985.20 | $4.39 | $1,020.71 | $4.47 | 0.88% | ||||||||||||
| C | $1,000 | $981.60 | $8.12 | $1,016.94 | $8.26 | 1.63% | ||||||||||||
| R | $1,000 | $984.00 | $5.59 | $1,019.51 | $5.69 | 1.12% | ||||||||||||
| R6 | $1,000 | $987.10 | $2.40 | $1,022.72 | $2.44 | 0.48% | ||||||||||||
| Advisor | $1,000 | $986.40 | $3.15 | $1,021.97 | $3.20 | 0.63% | ||||||||||||
1. Expenses are equal to the annualized expense ratio for thesix-month period as indicated above—in the far right column—multiplied by the simple average account value over the period indicated, and then multiplied by 184/366 to reflect theone-half year period.
2. Reflects expenses after fee waivers and expense reimbursements. Does not include acquired fund fees and expenses.
| franklintempleton.com | Semiannual Report | 27 | ||
FRANKLIN STRATEGIC SERIES
Franklin Growth Opportunities Fund
Six Months Ended (unaudited) | Year Ended April 30, | |||||||||||||||||||||||
| 2019 | 2018 | 2017 | 2016 | 2015 | ||||||||||||||||||||
Class A | ||||||||||||||||||||||||
Per share operating performance (for a share outstanding throughout the period) | ||||||||||||||||||||||||
Net asset value, beginning of period | $39.57 | $38.58 | $34.81 | $30.40 | $33.13 | $28.48 | ||||||||||||||||||
Income from investment operationsa: | ||||||||||||||||||||||||
Net investment income (loss)b | (0.07 | ) | (0.13 | ) | (0.10 | ) | (0.09 | ) | (0.19 | ) | (0.19 | ) | ||||||||||||
Net realized and unrealized gains (losses) | 0.36 | 5.29 | 7.03 | 5.14 | (1.88 | ) | 5.50 | |||||||||||||||||
Total from investment operations | 0.29 | 5.16 | 6.93 | 5.05 | (2.07 | ) | 5.31 | |||||||||||||||||
Less distributions from: | ||||||||||||||||||||||||
Net realized gains | — | (4.17 | ) | (3.16 | ) | (0.64 | ) | (0.66 | ) | (0.66 | ) | |||||||||||||
Net asset value, end of period | $39.86 | $39.57 | $38.58 | $34.81 | $30.40 | $33.13 | ||||||||||||||||||
Total returnc | 0.73% | 15.91% | 20.43% | 16.88% | (6.36)% | 18.87% | ||||||||||||||||||
Ratios to average net assetsd | ||||||||||||||||||||||||
Expenses before waiver and payments by affiliates | 0.95% | 0.94% | 1.02% | 1.05% | 1.11% | 1.18% | ||||||||||||||||||
Expenses net of waiver and payments by affiliates | 0.95% | e,f | 0.94% | e,f | 0.99% | e | 0.97% | e | 1.10% | 1.18% | f | |||||||||||||
Net investment income (loss) | (0.33)% | (0.32)% | (0.27)% | (0.30)% | (0.58)% | (0.59)% | ||||||||||||||||||
Supplemental data | ||||||||||||||||||||||||
Net assets, end of period (000’s) | $2,789,241 | $2,819,007 | $2,428,175 | $2,272,831 | $548,871 | $457,619 | ||||||||||||||||||
Portfolio turnover rate | 10.75% | 24.21% | 22.68% | 47.75% | 25.56% | 40.64% | ||||||||||||||||||
aThe amount shown for a share outstanding throughout the period may not correlate with the Statement of Operations for the period due to the timing of sales and repurchases of the Fund’s shares in relation to income earned and/or fluctuating fair value of the investments of the Fund.
bBased on average daily shares outstanding.
cTotal return does not reflect sales commissions or contingent deferred sales charges, if applicable, and is not annualized for periods less than one year.
dRatios are annualized for periods less than one year.
eBenefit of expense reduction rounds to less than 0.01%.
fBenefit of waiver and payments by affiliates rounds to less than 0.01%.
28 | Semiannual Report | The accompanying notes are an integral part of these financial statements. | franklintempleton.com | ||
FRANKLIN STRATEGIC SERIES
FINANCIAL HIGHLIGHTS
Franklin Growth Opportunities Fund(continued)
Six Months Ended (unaudited) | Year Ended April 30, | |||||||||||||||||||||||
| 2019 | 2018 | 2017 | 2016 | 2015 | ||||||||||||||||||||
Class C | ||||||||||||||||||||||||
Per share operating performance (for a share outstanding throughout the period) | ||||||||||||||||||||||||
Net asset value, beginning of period | $32.47 | $32.67 | $30.12 | $26.59 | $29.27 | $25.41 | ||||||||||||||||||
Income from investment operationsa: | ||||||||||||||||||||||||
Net investment income (loss)b | (0.18 | ) | (0.35 | ) | (0.33 | ) | (0.29 | ) | (0.37 | ) | (0.36 | ) | ||||||||||||
Net realized and unrealized gains (losses) | 0.30 | 4.32 | 6.04 | 4.46 | (1.65 | ) | 4.88 | |||||||||||||||||
Total from investment operations | 0.12 | 3.97 | 5.71 | 4.17 | (2.02 | ) | 4.52 | |||||||||||||||||
Less distributions from: | ||||||||||||||||||||||||
Net realized gains | — | (4.17 | ) | (3.16 | ) | (0.64 | ) | (0.66 | ) | (0.66 | ) | |||||||||||||
Net asset value, end of period | $32.59 | $32.47 | $32.67 | $30.12 | $26.59 | $29.27 | ||||||||||||||||||
Total returnc | 0.37% | 15.10% | 19.53% | 15.98% | (7.03)% | 18.04% | ||||||||||||||||||
Ratios to average net assetsd | ||||||||||||||||||||||||
Expenses before waiver and payments by affiliates | 1.70% | 1.69% | 1.77% | 1.80% | 1.85% | 1.88% | ||||||||||||||||||
Expenses net of waiver and payments by affiliates | 1.70% | e,f | 1.69% | e,f | 1.74% | e | 1.72% | e | 1.84% | 1.88% | f | |||||||||||||
Net investment income (loss) | (1.08)% | (1.07)% | (1.02)% | (1.05)% | (1.32)% | (1.29)% | ||||||||||||||||||
Supplemental data | ||||||||||||||||||||||||
Net assets, end of period (000’s) | $216,250 | $244,574 | $400,295 | $390,123 | $137,882 | $110,513 | ||||||||||||||||||
Portfolio turnover rate | 10.75% | 24.21% | 22.68% | 47.75% | 25.56% | 40.64% | ||||||||||||||||||
aThe amount shown for a share outstanding throughout the period may not correlate with the Statement of Operations for the period due to the timing of sales and repurchases of the Fund’s shares in relation to income earned and/or fluctuating fair value of the investments of the Fund.
bBased on average daily shares outstanding.
cTotal return does not reflect sales commissions or contingent deferred sales charges, if applicable, and is not annualized for periods less than one year.
dRatios are annualized for periods less than one year.
eBenefit of expense reduction rounds to less than 0.01%.
fBenefit of waiver and payments by affiliates rounds to less than 0.01%.
| franklintempleton.com | The accompanying notes are an integral part of these financial statements. | Semiannual Report | 29 | ||
FRANKLIN STRATEGIC SERIES
FINANCIAL HIGHLIGHTS
Franklin Growth Opportunities Fund(continued)
Six Months Ended (unaudited) | Year Ended April 30, | |||||||||||||||||||||||
| 2019 | 2018 | 2017 | 2016 | 2015 | ||||||||||||||||||||
Class R | ||||||||||||||||||||||||
Per share operating performance (for a share outstanding throughout the period) | ||||||||||||||||||||||||
Net asset value, beginning of period | $37.57 | $36.93 | $33.52 | $29.37 | $32.10 | $27.67 | ||||||||||||||||||
Income from investment operationsa: | ||||||||||||||||||||||||
Net investment income (loss)b | (0.11 | ) | (0.21 | ) | (0.18 | ) | (0.17 | ) | (0.26 | ) | (0.24 | ) | ||||||||||||
Net realized and unrealized gains (losses) | 0.34 | 5.02 | 6.75 | 4.96 | (1.81 | ) | 5.33 | |||||||||||||||||
Total from investment operations | 0.23 | 4.81 | 6.57 | 4.79 | (2.07 | ) | 5.09 | |||||||||||||||||
Less distributions from: | ||||||||||||||||||||||||
Net realized gains | — | (4.17 | ) | (3.16 | ) | (0.64 | ) | (0.66 | ) | (0.66 | ) | |||||||||||||
Net asset value, end of period | $37.80 | $37.57 | $36.93 | $33.52 | $29.37 | $32.10 | ||||||||||||||||||
Total returnc | 0.61% | 15.66% | 20.14% | 16.62% | (6.60)% | 18.63% | ||||||||||||||||||
Ratios to average net assetsd | ||||||||||||||||||||||||
Expenses before waiver and payments by affiliates | 1.20% | 1.19% | 1.27% | 1.30% | 1.35% | 1.38% | ||||||||||||||||||
Expenses net of waiver and payments by affiliates | 1.20% | e,f | 1.19% | e,f | 1.24% | e | 1.22% | e | 1.34% | 1.38% | f | |||||||||||||
Net investment income (loss) | (0.58)% | (0.57)% | (0.52)% | (0.55)% | (0.82)% | (0.79)% | ||||||||||||||||||
Supplemental data | ||||||||||||||||||||||||
Net assets, end of period (000’s) | $33,409 | $37,105 | $36,582 | $50,429 | $39,786 | $48,266 | ||||||||||||||||||
Portfolio turnover rate | 10.75% | 24.21 | % | 22.68% | 47.75% | 25.56% | 40.64% | |||||||||||||||||
aThe amount shown for a share outstanding throughout the period may not correlate with the Statement of Operations for the period due to the timing of sales and repurchases of the Fund’s shares in relation to income earned and/or fluctuating fair value of the investments of the Fund.
bBased on average daily shares outstanding.
cTotal return is not annualized for periods less than one year.
dRatios are annualized for periods less than one year.
eBenefit of expense reduction rounds to less than 0.01%.
fBenefit of waiver and payments by affiliates rounds to less than 0.01%.
30 | Semiannual Report | The accompanying notes are an integral part of these financial statements. | franklintempleton.com | ||
FRANKLIN STRATEGIC SERIES
FINANCIAL HIGHLIGHTS
Franklin Growth Opportunities Fund(continued)
Six Months Ended (unaudited) | Year Ended April 30, | |||||||||||||||||||||||
| 2019 | 2018 | 2017 | 2016 | 2015 | ||||||||||||||||||||
Class R6 | ||||||||||||||||||||||||
Per share operating performance (for a share outstanding throughout the period) | ||||||||||||||||||||||||
Net asset value, beginning of period | $43.42 | $41.78 | $37.30 | $32.39 | $35.09 | $29.98 | ||||||||||||||||||
Income from investment operationsa: | ||||||||||||||||||||||||
Net investment income (loss)b | 0.01 | 0.01 | 0.07 | 0.05 | (0.05 | ) | (0.03 | ) | ||||||||||||||||
Net realized and unrealized gains (losses) | 0.40 | 5.80 | 7.57 | 5.50 | (1.99 | ) | 5.80 | |||||||||||||||||
Total from investment operations | 0.41 | 5.81 | 7.64 | 5.55 | (2.04 | ) | 5.77 | |||||||||||||||||
Less distributions from: | ||||||||||||||||||||||||
Net realized gains | — | (4.17 | ) | (3.16 | ) | (0.64 | ) | (0.66 | ) | (0.66 | ) | |||||||||||||
Net asset value, end of period | $43.83 | $43.42 | $41.78 | $37.30 | $32.39 | $35.09 | ||||||||||||||||||
Total returnc | 0.94% | 16.26% | 20.98% | 17.42% | (5.94)% | 19.47% | ||||||||||||||||||
Ratios to average net assetsd | ||||||||||||||||||||||||
Expenses before waiver and payments by affiliates | 0.59% | 0.59% | 0.58% | 0.59% | 0.67% | 0.68% | ||||||||||||||||||
Expenses net of waiver and payments by affiliates | 0.59% | e,f | 0.58% | e | 0.55% | e | 0.51% | e | 0.66% | 0.68% | f | |||||||||||||
Net investment income (loss) | 0.03% | 0.04% | 0.17% | 0.16% | (0.14)% | (0.09)% | ||||||||||||||||||
Supplemental data | ||||||||||||||||||||||||
Net assets, end of period (000’s) | $384,159 | $418,174 | $369,688 | $291,825 | $235,620 | $246,911 | ||||||||||||||||||
Portfolio turnover rate | 10.75% | 24.21% | 22.68% | 47.75% | 25.56% | 40.64% | ||||||||||||||||||
aThe amount shown for a share outstanding throughout the period may not correlate with the Statement of Operations for the period due to the timing of sales and repurchases of the Fund’s shares in relation to income earned and/or fluctuating fair value of the investments of the Fund.
bBased on average daily shares outstanding.
cTotal return is not annualized for periods less than one year.
dRatios are annualized for periods less than one year.
eBenefit of expense reduction rounds to less than 0.01%.
fBenefit of waiver and payments by affiliates rounds to less than 0.01%.
| franklintempleton.com | The accompanying notes are an integral part of these financial statements. | Semiannual Report | 31 | ||
FRANKLIN STRATEGIC SERIES
FINANCIAL HIGHLIGHTS
Franklin Growth Opportunities Fund(continued)
Six Months Ended (unaudited) | Year Ended April 30, | |||||||||||||||||||||||
| 2019 | 2018 | 2017 | 2016 | 2015 | ||||||||||||||||||||
Advisor Class | ||||||||||||||||||||||||
Per share operating performance (for a share outstanding throughout the period) | ||||||||||||||||||||||||
Net asset value, beginning of period | $42.87 | $41.34 | $37.02 | $32.20 | $34.96 | $29.93 | ||||||||||||||||||
Income from investment operationsa: | ||||||||||||||||||||||||
Net investment income (loss)b | (0.02 | ) | (0.03 | ) | (0.01 | ) | (0.02 | ) | (0.11 | ) | (0.10 | ) | ||||||||||||
Net realized and unrealized gains (losses) | 0.39 | 5.73 | 7.49 | 5.48 | (1.99 | ) | 5.79 | |||||||||||||||||
Total from investment operations | 0.37 | 5.70 | 7.48 | 5.46 | (2.10 | ) | 5.69 | |||||||||||||||||
Less distributions from: | ||||||||||||||||||||||||
Net realized gains | — | (4.17 | ) | (3.16 | ) | (0.64 | ) | (0.66 | ) | (0.66 | ) | |||||||||||||
Net asset value, end of period | $43.24 | $42.87 | $41.34 | $37.02 | $32.20 | $34.96 | ||||||||||||||||||
Total returnc | 0.86% | 16.16% | 20.71% | 17.21% | (6.11)% | 19.23% | ||||||||||||||||||
Ratios to average net assetsd | ||||||||||||||||||||||||
Expenses before waiver and payments by affiliates | 0.70% | 0.69% | 0.77% | 0.80% | 0.85% | 0.88% | ||||||||||||||||||
Expenses net of waiver and payments by affiliates | 0.70% | e,f | 0.69% | e,f | 0.74% | e | 0.72% | e | 0.84% | 0.88% | f | |||||||||||||
Net investment income (loss) | (0.08)% | (0.07)% | (0.02)% | (0.05)% | (0.32)% | (0.29)% | ||||||||||||||||||
Supplemental data | ||||||||||||||||||||||||
Net assets, end of period (000’s) | $488,064 | $506,964 | $583,509 | $537,193 | $256,377 | $269,887 | ||||||||||||||||||
Portfolio turnover rate | 10.75% | 24.21% | 22.68% | 47.75% | 25.56% | 40.64% | ||||||||||||||||||
aThe amount shown for a share outstanding throughout the period may not correlate with the Statement of Operations for the period due to the timing of sales and repurchases of the Fund’s shares in relation to income earned and/or fluctuating fair value of the investments of the Fund.
bBased on average daily shares outstanding.
cTotal return is not annualized for periods less than one year.
dRatios are annualized for periods less than one year.
eBenefit of expense reduction rounds to less than 0.01%.
fBenefit of waiver and payments by affiliates rounds to less than 0.01%.
32 | Semiannual Report | The accompanying notes are an integral part of these financial statements. | franklintempleton.com | ||
FRANKLIN STRATEGIC SERIES
Statement of Investments, October 31, 2019 (unaudited)
Franklin Growth Opportunities Fund
| Country | Shares | Value | ||||||||||
Common Stocks 96.4% | ||||||||||||
Communication Services 6.7% | ||||||||||||
aAlphabet Inc., C | United States | 100,358 | $ | 126,462,119 | ||||||||
aFacebook Inc., A | United States | 151,743 | 29,081,546 | |||||||||
aLiberty Broadband Corp., C | United States | 356,818 | 42,129,501 | |||||||||
aNetflix Inc. | United States | 90,227 | 25,932,142 | |||||||||
aPinterest Inc., A | United States | 252,500 | 6,347,850 | |||||||||
The Walt Disney Co. | United States | 254,576 | 33,074,514 | |||||||||
|
| |||||||||||
| 263,027,672 | ||||||||||||
|
| |||||||||||
Consumer Discretionary 10.1% | ||||||||||||
aAmazon.com Inc. | United States | 159,953 | 284,182,097 | |||||||||
Aptiv PLC | United States | 295,903 | 26,498,114 | |||||||||
aChipotle Mexican Grill Inc. | United States | 18,164 | 14,134,498 | |||||||||
Levi Strauss & Co., A | United States | 833,386 | 14,850,939 | |||||||||
NIKE Inc., B | United States | 199,306 | 17,847,852 | |||||||||
a,bPeloton Interactive Inc. A | United States | 663,400 | 15,835,358 | |||||||||
aUnder Armour Inc., A | United States | 975,314 | 20,140,234 | |||||||||
|
| |||||||||||
| 393,489,092 | ||||||||||||
|
| |||||||||||
Consumer Staples 3.0% | ||||||||||||
Constellation Brands Inc., A | United States | 189,271 | 36,023,949 | |||||||||
Lamb Weston Holdings Inc. | United States | 558,234 | 43,564,581 | |||||||||
aMonster Beverage Corp. | United States | 352,068 | 19,761,577 | |||||||||
aNomad Foods Ltd. | United Kingdom | 959,344 | 18,716,802 | |||||||||
|
| |||||||||||
| 118,066,909 | ||||||||||||
|
| |||||||||||
Energy 0.6% | ||||||||||||
Diamondback Energy Inc. | United States | 274,301 | 23,524,054 | |||||||||
|
| |||||||||||
Financials 6.3% | ||||||||||||
The Charles Schwab Corp. | United States | 714,275 | 29,078,135 | |||||||||
Intercontinental Exchange Inc. | United States | 573,935 | 54,133,549 | |||||||||
MarketAxess Holdings Inc. | United States | 110,073 | 40,571,807 | |||||||||
MSCI Inc. | United States | 279,833 | 65,637,629 | |||||||||
S&P Global Inc. | United States | 227,424 | 58,673,118 | |||||||||
|
| |||||||||||
| 248,094,238 | ||||||||||||
|
| |||||||||||
Health Care 16.7% | ||||||||||||
AstraZeneca PLC, ADR | United Kingdom | 310,659 | 15,231,611 | |||||||||
aEdwards Lifesciences Corp. | United States | 288,115 | 68,680,854 | |||||||||
aElanco Animal Health Inc. | United States | 373,022 | 10,079,054 | |||||||||
aGuardant Health Inc. | United States | 259,017 | 18,001,682 | |||||||||
aGW Pharmaceuticals PLC, ADR | United Kingdom | 298,788 | 39,983,810 | |||||||||
aHeron Therapeutics Inc. | United States | 2,669,546 | 56,727,853 | |||||||||
aIDEXX Laboratories Inc. | United States | 120,554 | 34,359,096 | |||||||||
aIllumina Inc. | United States | 111,581 | 32,974,417 | |||||||||
aIntuitive Surgical Inc. | United States | 69,742 | 38,563,839 | |||||||||
aNevro Corp. | United States | 492,387 | 42,443,759 | |||||||||
aPTC Therapeutics Inc. | United States | 582,961 | 23,837,275 | |||||||||
aReata Pharmaceuticals Inc. | United States | 198,956 | 41,000,852 | |||||||||
aSage Therapeutics Inc. | United States | 189,601 | 25,719,376 | |||||||||
| franklintempleton.com | Semiannual Report | 33 | ||
FRANKLIN STRATEGIC SERIES
STATEMENT OF INVESTMENTS (UNAUDITED)
Franklin Growth Opportunities Fund(continued)
| Country | Shares | Value | ||||||||||
Common Stocks(continued) | ||||||||||||
Health Care(continued) | ||||||||||||
a,bSmileDirectClub Inc., A | United States | 947,498 | $ | 11,080,989 | ||||||||
UnitedHealth Group Inc. | United States | 309,579 | 78,230,613 | |||||||||
aVeeva Systems Inc. | United States | 396,044 | 56,170,921 | |||||||||
West Pharmaceutical Services Inc. | United States | 419,011 | 60,270,542 | |||||||||
|
| |||||||||||
| 653,356,543 | ||||||||||||
|
| |||||||||||
Industrials 11.0% | ||||||||||||
The Boeing Co. | United States | 98,253 | 33,397,177 | |||||||||
aCoStar Group Inc. | United States | 173,822 | 95,518,665 | |||||||||
Honeywell International Inc. | United States | 220,100 | 38,017,873 | |||||||||
aIHS Markit Ltd. | United States | 636,224 | 44,548,405 | |||||||||
Raytheon Co. | United States | 284,676 | 60,411,094 | |||||||||
Roper Technologies Inc. | United States | 128,568 | 43,322,273 | |||||||||
Stanley Black & Decker Inc. | United States | 170,015 | 25,728,370 | |||||||||
aUnivar Solutions Inc. | United States | 950,507 | 20,397,880 | |||||||||
Verisk Analytics Inc. | United States | 475,500 | 68,804,850 | |||||||||
|
| |||||||||||
| 430,146,587 | ||||||||||||
|
| |||||||||||
Information Technology 37.6% | ||||||||||||
aAdobe Inc. | United States | 289,002 | 80,322,326 | |||||||||
Analog Devices Inc. | United States | 288,071 | 30,717,011 | |||||||||
Apple Inc. | United States | 441,508 | 109,829,530 | |||||||||
aAutodesk Inc. | United States | 150,687 | 22,205,236 | |||||||||
aBlack Knight Inc. | United States | 328,967 | 21,119,681 | |||||||||
aCloudFlare Inc., A | United States | 538,600 | 9,070,024 | |||||||||
aFiserv Inc. | United States | 326,248 | 34,627,963 | |||||||||
aGuidewire Software Inc. | United States | 202,085 | 22,783,063 | |||||||||
aInterXion Holding NV | Netherlands | 563,175 | 49,683,299 | |||||||||
Intuit Inc. | United States | 73,846 | 19,015,345 | |||||||||
a,c,dLegalZoom.com Inc. | United States | 1,673,284 | 19,343,163 | |||||||||
Mastercard Inc., A | United States | 770,242 | 213,210,688 | |||||||||
Microsoft Corp. | United States | 1,566,958 | 224,654,768 | |||||||||
Monolithic Power Systems | United States | 238,216 | 35,713,343 | |||||||||
NVIDIA Corp. | United States | 172,870 | 34,750,327 | |||||||||
aPayPal Holdings Inc. | United States | 439,183 | 45,718,950 | |||||||||
aPluralsight Inc., A | United States | 462,013 | 8,353,195 | |||||||||
aPTC Inc. | United States | 295,541 | 19,774,648 | |||||||||
asalesforce.com Inc. | United States | 258,798 | 40,499,299 | |||||||||
aServiceNow Inc. | United States | 411,296 | 101,697,049 | |||||||||
aTwilio Inc., A | United States | 385,850 | 37,257,676 | |||||||||
aTyler Technologies Inc. | United States | 97,251 | 26,113,839 | |||||||||
Visa Inc., A | United States | 970,899 | 173,654,995 | |||||||||
aWorkday Inc., A | United States | 137,191 | 22,246,893 | |||||||||
Xilinx Inc. | United States | 327,669 | 29,732,685 | |||||||||
aZendesk Inc. | United States | 522,791 | 36,935,184 | |||||||||
|
| |||||||||||
| 1,469,030,180 | ||||||||||||
|
| |||||||||||
Materials 0.5% | ||||||||||||
aIngevity Corp. | United States | 230,041 | 19,371,753 | |||||||||
|
| |||||||||||
34 | Semiannual Report | franklintempleton.com | ||
FRANKLIN STRATEGIC SERIES
STATEMENT OF INVESTMENTS (UNAUDITED)
Franklin Growth Opportunities Fund(continued)
| Country | Shares | Value | ||||||||||
Common Stocks(continued) | ||||||||||||
Real Estate 3.9% | ||||||||||||
American Tower Corp. | United States | 173,495 | $ | 37,835,790 | ||||||||
SBA Communications Corp., A | United States | 472,242 | 113,645,037 | |||||||||
|
| |||||||||||
| 151,480,827 | ||||||||||||
|
| |||||||||||
Total Common Stocks (Cost $1,892,593,642) | 3,769,587,855 | |||||||||||
|
| |||||||||||
Preferred Stocks 3.6% | ||||||||||||
Communication Services 0.1% | ||||||||||||
a,c,dTanium Inc., pfd., G | United States | 805,800 | 5,565,263 | |||||||||
|
| |||||||||||
Consumer Discretionary 1.9% | ||||||||||||
a,c,dClearMotion Inc., pfd., C | United States | 2,610,594 | 9,016,731 | |||||||||
a,c,dClearMotion Inc., pfd., D | United States | 3,698,772 | 13,425,684 | |||||||||
a,c,dProterra Inc., pfd., 5, 144A | United States | 2,362,202 | 20,249,183 | |||||||||
a,c,dProterra Inc., pfd., 6, 144A | United States | 596,775 | 5,115,653 | |||||||||
a,c,dProterra Inc., pfd., 7 | United States | 780,667 | 6,692,005 | |||||||||
a,c,dProterra Inc., pfd., 8 | United States | 289,016 | 2,477,493 | |||||||||
a,c,dSweetgreen Inc., pfd., H | United States | 928,488 | 14,450,552 | |||||||||
a,c,dSweetgreen Inc., pfd., I | United States | 100,835 | 1,753,299 | |||||||||
|
| |||||||||||
| 73,180,600 | ||||||||||||
|
| |||||||||||
Financials 0.4% | ||||||||||||
a,c,dBill.com, pfd., H | United States | 1,624,999 | 15,820,859 | |||||||||
|
| |||||||||||
Health Care 0.3% | ||||||||||||
a,c,dTempus Labs Inc., pfd., F | United States | 504,854 | 12,499,983 | |||||||||
|
| |||||||||||
Industrials 0.8% | ||||||||||||
a,c,dOptoro Inc., pfd., E | United States | 509,182 | 12,614,393 | |||||||||
a,c,dWheels Up Partners LLC, pfd., D | United States | 5,028,735 | 17,297,043 | |||||||||
|
| |||||||||||
| 29,911,436 | ||||||||||||
|
| |||||||||||
Information Technology 0.1% | ||||||||||||
a,c,dGitLab Inc., pfd., E | United States | 201,294 | 3,749,986 | |||||||||
|
| |||||||||||
Total Preferred Stocks (Cost $112,896,675) | 140,728,127 | |||||||||||
|
| |||||||||||
Total Investments before Short Term Investments | 3,910,315,982 | |||||||||||
|
| |||||||||||
Short Term Investments 0.6% | ||||||||||||
Money Market Funds (Cost $8,229,451) 0.2% | ||||||||||||
e,fInstitutional Fiduciary Trust Money Market Portfolio, 1.56% | United States | 8,229,451 | 8,229,451 | |||||||||
|
| |||||||||||
| franklintempleton.com | Semiannual Report | 35 | ||
FRANKLIN STRATEGIC SERIES
STATEMENT OF INVESTMENTS (UNAUDITED)
Franklin Growth Opportunities Fund(continued)
| Country | Shares | Value | ||||||||||
Short Term Investments(continued) | ||||||||||||
g Investments from Cash Collateral Received for Loaned Securities | ||||||||||||
Money Market Funds 0.4% | ||||||||||||
e,fInstitutional Fiduciary Trust Money Market Portfolio, 1.56% | United States | 15,554,345 | $ | 15,554,345 | ||||||||
|
| |||||||||||
Total Investments (Cost $2,029,274,113) 100.6% | 3,934,099,778 | |||||||||||
Other Assets, less Liabilities (0.6)% | (22,976,318 | ) | ||||||||||
|
| |||||||||||
Net Assets 100.0% | $ | 3,911,123,460 | ||||||||||
|
| |||||||||||
See Abbreviations on page 87.
aNon-income producing.
bA portion or all of the security is on loan at October 31, 2019. See Note 1(c).
cFair valued using significant unobservable inputs. See Note 11 regarding fair value measurements.
dSee Note 7 regarding restricted securities.
eSee Note 3(f) regarding investments in affiliated management investment companies.
fThe rate shown is the annualizedseven-day effective yield at period end.
gSee Note 1(c) regarding securities on loan.
36 | Semiannual Report | The accompanying notes are an integral part of these financial statements. | franklintempleton.com | ||
FRANKLIN STRATEGIC SERIES
Financial Highlights
Franklin Select U.S. Equity Fund
Six Months Ended (unaudited) | Year Ended April 30, | |||||||||||||||||||||||
| 2019 | 2018 | 2017 | 2016 | 2015 | ||||||||||||||||||||
Class A | ||||||||||||||||||||||||
Per share operating performance (for a share outstanding throughout the period) | ||||||||||||||||||||||||
Net asset value, beginning of period | $15.51 | $16.32 | $15.20 | $13.12 | $15.29 | $13.38 | ||||||||||||||||||
Income from investment operationsa: | ||||||||||||||||||||||||
Net investment income (loss)b | (0.02 | ) | (0.04 | ) | (0.04 | ) | (0.01 | ) | 0.07 | c | (0.01 | ) | ||||||||||||
Net realized and unrealized gains (losses) | 0.45 | 1.41 | 1.16 | 2.09 | (1.83 | ) | 2.23 | |||||||||||||||||
Total from investment operations | 0.43 | 1.37 | 1.12 | 2.08 | (1.76 | ) | 2.22 | |||||||||||||||||
Less distributions from: | ||||||||||||||||||||||||
Net investment income | — | — | — | — | (0.06 | ) | — | |||||||||||||||||
Net realized gains | — | (2.18 | ) | — | — | (0.35 | ) | (0.31 | ) | |||||||||||||||
Total distributions | — | (2.18 | ) | — | — | (0.41 | ) | (0.31 | ) | |||||||||||||||
Net asset value, end of period | $15.94 | $15.51 | $16.32 | $15.20 | $13.12 | $15.29 | ||||||||||||||||||
Total returnd | 2.77% | 10.72% | 7.37% | 15.85% | (11.70)% | 16.84% | ||||||||||||||||||
Ratios to average net assetse | ||||||||||||||||||||||||
Expenses before waiver and payments by affiliates | 1.52% | 1.51% | 1.54% | 1.47% | 1.46% | 1.54% | ||||||||||||||||||
Expenses net of waiver and payments by affiliates | 1.22% | f | 1.23% | f | 1.25% | f | 1.24% | f | 1.25% | 1.28% | ||||||||||||||
Net investment income (loss) | (0.22)% | (0.22)% | (0.25)% | (0.04)% | 0.48% | c | (0.07)% | |||||||||||||||||
Supplemental data | ||||||||||||||||||||||||
Net assets, end of period (000’s) | $73,558 | $77,230 | $65,565 | $77,733 | $100,483 | $92,612 | ||||||||||||||||||
Portfolio turnover rate | —% | 4.79% | 93.43% | 17.45% | 35.56% | 25.55% | ||||||||||||||||||
aThe amount shown for a share outstanding throughout the period may not correlate with the Statement of Operations for the period due to the timing of sales and repurchases of the Fund’s shares in relation to income earned and/or fluctuating fair value of the investments of the Fund.
bBased on average daily shares outstanding.
cNet investment income per share includes approximately $0.06 per share related to income received in the form of special dividends in connection with certain Fund holdings. Excluding this amount, the ratio of net investment income to average net assets would have been 0.02%.
dTotal return does not reflect sales commissions or contingent deferred sales charges, if applicable, and is not annualized for periods less than one year.
eRatios are annualized for periods less than one year, except fornon-recurring expenses, if any.
fBenefit of expense reduction rounds to less than 0.01%.
| franklintempleton.com | The accompanying notes are an integral part of these financial statements. | Semiannual Report | 37 | ||
FRANKLIN STRATEGIC SERIES
FINANCIAL HIGHLIGHTS
Franklin Select U.S. Equity Fund(continued)
Six Months Ended (unaudited) | Year Ended April 30, | |||||||||||||||||||||||
| 2019 | 2018 | 2017 | 2016 | 2015 | ||||||||||||||||||||
Class C | ||||||||||||||||||||||||
Per share operating performance (for a share outstanding throughout the period) | ||||||||||||||||||||||||
Net asset value, beginning of period | $14.40 | $15.42 | $14.46 | $12.58 | $14.73 | $12.98 | ||||||||||||||||||
Income from investment operationsa: | ||||||||||||||||||||||||
Net investment income (loss)b | (0.07 | ) | (0.15 | ) | (0.15 | ) | (0.10 | ) | (0.04 | )c | (0.11 | ) | ||||||||||||
Net realized and unrealized gains (losses) | 0.41 | 1.31 | 1.11 | 1.98 | (1.76 | ) | 2.17 | |||||||||||||||||
Total from investment operations | 0.34 | 1.16 | 0.96 | 1.88 | (1.80 | ) | 2.06 | |||||||||||||||||
Less distributions from: | ||||||||||||||||||||||||
Net realized gains | — | (2.18 | ) | — | — | (0.35 | ) | (0.31 | ) | |||||||||||||||
Net asset value, end of period | $14.74 | $14.40 | $15.42 | $14.46 | $12.58 | $14.73 | ||||||||||||||||||
Total returnd | 2.36% | 9.95% | 6.64% | 14.94% | (12.31)% | 16.12% | ||||||||||||||||||
Ratios to average net assetse | ||||||||||||||||||||||||
Expenses before waiver and payments by affiliates | 2.27% | 2.26% | 2.29% | 2.21% | 2.20% | 2.24% | ||||||||||||||||||
Expenses net of waiver and payments by affiliates | 1.97% | f | 1.98% | f | 2.00% | f | 1.98% | f | 1.99% | 1.98% | ||||||||||||||
Net investment income (loss) | (0.97)% | (0.97)% | (1.00)% | (0.78)% | (0.26)% | c | (0.77)% | |||||||||||||||||
Supplemental data | ||||||||||||||||||||||||
Net assets, end of period (000’s) | $13,465 | $15,702 | $18,103 | $20,341 | $25,119 | $18,758 | ||||||||||||||||||
Portfolio turnover rate | —% | 4.79% | 93.43% | 17.45% | 35.56% | 25.55% | ||||||||||||||||||
aThe amount shown for a share outstanding throughout the period may not correlate with the Statement of Operations for the period due to the timing of sales and repurchases of the Fund’s shares in relation to income earned and/or fluctuating fair value of the investments of the Fund.
bBased on average daily shares outstanding.
cNet investment income per share includes approximately $0.06 per share related to income received in the form of special dividends in connection with certain Fund holdings. Excluding this amount, the ratio of net investment income to average net assets would have been (0.72)%.
dTotal return does not reflect sales commissions or contingent deferred sales charges, if applicable, and is not annualized for periods less than one year.
eRatios are annualized for periods less than one year, except fornon-recurring expenses, if any.
fBenefit of expense reduction rounds to less than 0.01%.
38 | Semiannual Report | The accompanying notes are an integral part of these financial statements. | franklintempleton.com | ||
FRANKLIN STRATEGIC SERIES
FINANCIAL HIGHLIGHTS
Franklin Select U.S. Equity Fund(continued)
Six Months Ended (unaudited) | Year Ended April 30, | |||||||||||||||||||||||
| 2019 | 2018 | 2017 | 2016 | 2015 | ||||||||||||||||||||
Class R | ||||||||||||||||||||||||
Per share operating performance (for a share outstanding throughout the period) | ||||||||||||||||||||||||
Net asset value, beginning of period | $15.21 | $16.08 | $15.01 | $12.98 | $15.15 | $13.28 | ||||||||||||||||||
Income from investment operationsa: | ||||||||||||||||||||||||
Net investment income (loss)b | (0.04 | ) | (0.08 | ) | (0.06 | ) | (0.03 | ) | 0.03 | c | (0.04 | ) | ||||||||||||
Net realized and unrealized gains (losses) | 0.44 | 1.39 | 1.13 | 2.06 | (1.81 | ) | 2.22 | |||||||||||||||||
Total from investment operations | 0.40 | 1.31 | 1.07 | 2.03 | (1.78 | ) | 2.18 | |||||||||||||||||
Less distributions from: | ||||||||||||||||||||||||
Net investment income | — | — | — | — | (0.04 | ) | — | |||||||||||||||||
Net realized gains | — | (2.18 | ) | — | — | (0.35 | ) | (0.31 | ) | |||||||||||||||
Total distributions | — | (2.18 | ) | — | — | (0.39 | ) | (0.31 | ) | |||||||||||||||
Net asset value, end of period | $15.61 | $15.21 | $16.08 | $15.01 | $12.98 | $15.15 | ||||||||||||||||||
Total returnd | 2.63% | 10.50% | 7.13% | 15.64% | (11.91)% | 16.66% | ||||||||||||||||||
Ratios to average net assetse | ||||||||||||||||||||||||
Expenses before waiver and payments by affiliates | 1.77% | 1.78% | 1.70% | 1.64% | 1.69% | 1.74% | ||||||||||||||||||
Expenses net of waiver and payments by affiliates | 1.47% | f | 1.50% | f | 1.41%f | 1.41% | f | 1.48% | 1.48% | |||||||||||||||
Net investment income (loss) | (0.47)% | (0.49)% | (0.41)% | (0.21)% | 0.25% | c | (0.27)% | |||||||||||||||||
Supplemental data | ||||||||||||||||||||||||
Net assets, end of period (000’s) | $149 | $144 | $137 | $166 | $273 | $169 | ||||||||||||||||||
Portfolio turnover rate | —% | 4.79% | 93.43% | 17.45% | 35.56% | 25.55% | ||||||||||||||||||
aThe amount shown for a share outstanding throughout the period may not correlate with the Statement of Operations for the period due to the timing of sales and repurchases of the Fund’s shares in relation to income earned and/or fluctuating fair value of the investments of the Fund.
bBased on average daily shares outstanding.
cNet investment income per share includes approximately $0.06 per share related to income received in the form of special dividends in connection with certain Fund holdings. Excluding this amount, the ratio of net investment income to average net assets would have been (0.21)%.
dTotal return is not annualized for periods less than one year.
eRatios are annualized for periods less than one year, except fornon-recurring expenses, if any.
fBenefit of expense reduction rounds to less than 0.01%.
| franklintempleton.com | The accompanying notes are an integral part of these financial statements. | Semiannual Report | 39 | ||
FRANKLIN STRATEGIC SERIES
FINANCIAL HIGHLIGHTS
Franklin Select U.S. Equity Fund(continued)
Six Months Ended (unaudited) | Year Ended April 30, | |||||||||||||||||||||||
| 2019 | 2018 | 2017 | 2016 | 2015 | ||||||||||||||||||||
Class R6 | ||||||||||||||||||||||||
Per share operating performance (for a share outstanding throughout the period) | ||||||||||||||||||||||||
Net asset value, beginning of period | $15.93 | $16.64 | $15.44 | $13.27 | $15.46 | $13.49 | ||||||||||||||||||
Income from investment operationsa: | ||||||||||||||||||||||||
Net investment incomeb | 0.01 | 0.02 | 0.11 | 0.05 | 0.12 | c | 0.05 | |||||||||||||||||
Net realized and unrealized gains (losses) | 0.46 | 1.45 | 1.09 | 2.12 | (1.85 | ) | 2.27 | |||||||||||||||||
Total from investment operations | 0.47 | 1.47 | 1.20 | 2.17 | (1.73 | ) | 2.32 | |||||||||||||||||
Less distributions from: | ||||||||||||||||||||||||
Net investment income | — | — | — | — | (0.11 | ) | (0.04 | ) | ||||||||||||||||
Net realized gains | — | (2.18 | ) | — | — | (0.35 | ) | (0.31 | ) | |||||||||||||||
Total distributions | — | (2.18 | ) | — | — | (0.46 | ) | (0.35 | ) | |||||||||||||||
Net asset value, end of period | $16.40 | $15.93 | $16.64 | $15.44 | $13.27 | $15.46 | ||||||||||||||||||
Total returnd | 2.95% | 11.13% | 7.77% | 16.35% | (11.32)% | 17.45% | ||||||||||||||||||
Ratios to average net assetse | ||||||||||||||||||||||||
Expenses before waiver and payments by affiliates | 1.21% | 1.22% | 1.12% | 1.06% | 1.04% | 1.09% | ||||||||||||||||||
Expenses net of waiver and payments by affiliates | 0.86% | f | 0.87% | f | 0.84% | f | 0.84% | f | 0.85% | 0.83% | ||||||||||||||
Net investment income | 0.14% | 0.14% | 0.16% | 0.36% | 0.88% | c | 0.38% | |||||||||||||||||
Supplemental data | ||||||||||||||||||||||||
Net assets, end of period (000’s) | $871 | $971 | $939 | $20,401 | $33,640 | $25,739 | ||||||||||||||||||
Portfolio turnover rate | —% | 4.79% | 93.43% | 17.45% | 35.56% | 25.55% | ||||||||||||||||||
aThe amount shown for a share outstanding throughout the period may not correlate with the Statement of Operations for the period due to the timing of sales and repurchases of the Fund’s shares in relation to income earned and/or fluctuating fair value of the investments of the Fund.
bBased on average daily shares outstanding.
cNet investment income per share includes approximately $0.06 per share related to income received in the form of special dividends in connection with certain Fund holdings. Excluding this amount, the ratio of net investment income to average net assets would have been 0.42%.
dTotal return is not annualized for periods less than one year.
eRatios are annualized for periods less than one year, except fornon-recurring expenses, if any.
fBenefit of expense reduction rounds to less than 0.01%.
40 | Semiannual Report | The accompanying notes are an integral part of these financial statements. | franklintempleton.com | ||
FRANKLIN STRATEGIC SERIES
FINANCIAL HIGHLIGHTS
Franklin Select U.S. Equity Fund(continued)
Six Months Ended (unaudited) | Year Ended April 30, | |||||||||||||||||||||||
| 2019 | 2018 | 2017 | 2016 | 2015 | ||||||||||||||||||||
Advisor Class | ||||||||||||||||||||||||
Per share operating performance (for a share outstanding throughout the period) | ||||||||||||||||||||||||
Net asset value, beginning of period | $15.84 | $16.57 | $15.39 | $13.25 | $15.44 | $13.48 | ||||||||||||||||||
Income from investment operationsa: | ||||||||||||||||||||||||
Net investment incomeb | — | c | 0.01 | — | c | 0.03 | 0.10 | d | 0.04 | |||||||||||||||
Net realized and unrealized gains (losses) | 0.46 | 1.44 | 1.18 | 2.11 | (1.85 | ) | 2.25 | |||||||||||||||||
Total from investment operations | 0.46 | 1.45 | 1.18 | 2.14 | (1.75 | ) | 2.29 | |||||||||||||||||
Less distributions from: | ||||||||||||||||||||||||
Net investment income | — | — | — | — | (0.09 | ) | (0.02 | ) | ||||||||||||||||
Net realized gains | — | (2.18 | ) | — | — | (0.35 | ) | (0.31 | ) | |||||||||||||||
Total distributions | — | (2.18 | ) | — | — | (0.44 | ) | (0.33 | ) | |||||||||||||||
Net asset value, end of period | $16.30 | $15.84 | $16.57 | $15.39 | $13.25 | $15.44 | ||||||||||||||||||
Total returne | 2.90% | 11.06% | 7.67% | 16.15% | (11.45)% | 17.25% | ||||||||||||||||||
Ratios to average net assetsf | ||||||||||||||||||||||||
Expenses before waiver and payments by affiliates | 1.27% | 1.26% | 1.29% | 1.22% | 1.20% | 1.24% | ||||||||||||||||||
Expenses net of waiver and payments by affiliates | 0.97% | g | 0.98% | g | 1.00% | g | 0.99% | g | 0.99% | 0.98% | ||||||||||||||
Net investment income | 0.03% | 0.03% | —% | h | 0.21% | 0.74% | d | 0.23% | ||||||||||||||||
Supplemental data | ||||||||||||||||||||||||
Net assets, end of period (000’s) | $13,085 | $28,668 | $10,450 | $13,077 | $10,736 | $9,914 | ||||||||||||||||||
Portfolio turnover rate | —% | 4.79% | 93.43% | 17.45% | 35.56% | 25.55% | ||||||||||||||||||
aThe amount shown for a share outstanding throughout the period may not correlate with the Statement of Operations for the period due to the timing of sales and repurchases of the Fund’s shares in relation to income earned and/or fluctuating fair value of the investments of the Fund.
bBased on average daily shares outstanding.
cAmount rounds to less than $0.01 per share.
dNet investment income per share includes approximately $0.06 per share related to income received in the form of special dividends in connection with certain Fund holdings. Excluding this amount, the ratio of net investment income to average net assets would have been 0.28%.
eTotal return is not annualized for periods less than one year.
fRatios are annualized for periods less than one year, except fornon-recurring expenses, if any.
gBenefit of expense reduction rounds to less than 0.01%.
hRounds to less than 0.01%.
| franklintempleton.com | The accompanying notes are an integral part of these financial statements. | Semiannual Report | 41 | ||
FRANKLIN STRATEGIC SERIES
Statement of Investments, October 31, 2019 (unaudited)
Franklin Select U.S. Equity Fund
| Country | Shares | Value | ||||||||||
Common Stocks 98.8% | ||||||||||||
Communication Services 5.8% | ||||||||||||
aAlphabet Inc., A | United States | 2,720 | $ | 3,423,936 | ||||||||
The Walt Disney Co. | United States | 18,570 | 2,412,614 | |||||||||
|
| |||||||||||
| 5,836,550 | ||||||||||||
|
| |||||||||||
Consumer Discretionary 10.3% | ||||||||||||
aAlibaba Group Holding Ltd., ADR | China | 13,610 | 2,404,479 | |||||||||
aAmazon.com Inc. | United States | 2,390 | 4,246,217 | |||||||||
Aptiv PLC | United States | 15,560 | 1,393,398 | |||||||||
NIKE Inc., B | United States | 26,420 | 2,365,911 | |||||||||
|
| |||||||||||
| 10,410,005 | ||||||||||||
|
| |||||||||||
Consumer Staples 6.4% | ||||||||||||
Constellation Brands Inc., A | United States | 8,000 | 1,522,640 | |||||||||
Estee Lauder Cos. Inc., A | United States | 9,220 | 1,717,410 | |||||||||
Lamb Weston Holdings Inc. | United States | 23,780 | 1,855,791 | |||||||||
aMonster Beverage Corp. | United States | 25,100 | 1,408,863 | |||||||||
|
| |||||||||||
| 6,504,704 | ||||||||||||
|
| |||||||||||
Energy 1.7% | ||||||||||||
Cabot Oil & Gas Corp., A | United States | 59,770 | 1,114,113 | |||||||||
Concho Resources Inc. | United States | 9,400 | 634,688 | |||||||||
|
| |||||||||||
| 1,748,801 | ||||||||||||
|
| |||||||||||
Financials 9.4% | ||||||||||||
BlackRock Inc. | United States | 5,270 | 2,433,159 | |||||||||
The Charles Schwab Corp. | United States | 51,960 | 2,115,292 | |||||||||
Intercontinental Exchange Inc. | United States | 26,160 | 2,467,411 | |||||||||
S&P Global Inc. | United States | 9,480 | 2,445,745 | |||||||||
|
| |||||||||||
| 9,461,607 | ||||||||||||
|
| |||||||||||
Health Care 15.9% | ||||||||||||
aABIOMED Inc. | United States | 4,310 | 894,670 | |||||||||
AstraZeneca PLC, ADR | United Kingdom | 53,230 | 2,609,867 | |||||||||
aIllumina Inc. | United States | 5,460 | 1,613,539 | |||||||||
aMettler-Toledo International Inc. | United States | 3,220 | 2,269,907 | |||||||||
Stryker Corp. | United States | 10,890 | 2,355,180 | |||||||||
Teleflex Inc. | United States | 6,950 | 2,414,500 | |||||||||
UnitedHealth Group Inc. | United States | 9,400 | 2,375,380 | |||||||||
aWaters Corp. | United States | 7,310 | 1,546,942 | |||||||||
|
| |||||||||||
| 16,079,985 | ||||||||||||
|
| |||||||||||
Industrials 11.2% | ||||||||||||
BWX Technologies Inc. | United States | 22,710 | 1,319,451 | |||||||||
FedEx Corp. | United States | 7,390 | 1,128,157 | |||||||||
Fortive Corp. | United States | 29,430 | 2,030,670 | |||||||||
Raytheon Co. | United States | 11,590 | 2,459,514 | |||||||||
Republic Services Inc. | United States | 21,200 | 1,855,212 | |||||||||
Verisk Analytics Inc. | United States | 17,790 | 2,574,213 | |||||||||
|
| |||||||||||
| 11,367,217 | ||||||||||||
|
| |||||||||||
42 | Semiannual Report | franklintempleton.com | ||
FRANKLIN STRATEGIC SERIES
STATEMENT OF INVESTMENTS (UNAUDITED)
Franklin Select U.S. Equity Fund(continued)
| Country | Shares | Value | ||||||||||
Common Stocks(continued) | ||||||||||||
Information Technology 30.0% | ||||||||||||
aAdyen NV | Netherlands | 376 | $ | 263,941 | ||||||||
Amphenol Corp., A | United States | 16,340 | 1,639,392 | |||||||||
Analog Devices Inc. | United States | 27,400 | 2,921,662 | |||||||||
Apple Inc. | United States | 10,370 | 2,579,641 | |||||||||
Applied Materials Inc. | United States | 47,430 | 2,573,552 | |||||||||
Cognex Corp. | United States | 28,430 | 1,463,861 | |||||||||
aInterXion Holding NV | Netherlands | 30,740 | 2,711,883 | |||||||||
Mastercard Inc., A | United States | 11,860 | 3,282,966 | |||||||||
Microsoft Corp. | United States | 31,130 | 4,463,108 | |||||||||
NVIDIA Corp. | United States | 9,440 | 1,897,629 | |||||||||
asalesforce.com Inc. | United States | 14,280 | 2,234,677 | |||||||||
aServiceNow Inc. | United States | 10,280 | 2,541,833 | |||||||||
aTyler Technologies Inc. | United States | 6,420 | 1,723,898 | |||||||||
|
| |||||||||||
| 30,298,043 | ||||||||||||
|
| |||||||||||
Materials 2.4% | ||||||||||||
Ecolab Inc. | United States | 12,660 | 2,431,606 | |||||||||
|
| |||||||||||
Real Estate 2.5% | ||||||||||||
SBA Communications Corp., A | United States | 10,630 | 2,558,110 | |||||||||
|
| |||||||||||
Utilities 3.2% | ||||||||||||
NextEra Energy Inc. | United States | 13,710 | 3,267,641 | |||||||||
|
| |||||||||||
Total Common Stocks (Cost $77,788,084) | 99,964,269 | |||||||||||
|
| |||||||||||
Short Term Investments (Cost $556,102) 0.6% | ||||||||||||
Money Market Funds 0.6% | ||||||||||||
b,cInstitutional Fiduciary Trust Money Market Portfolio, 1.56% | United States | 556,102 | 556,102 | |||||||||
|
| |||||||||||
Total Investments (Cost $78,344,186) 99.4% | 100,520,371 | |||||||||||
Other Assets, less Liabilities 0.6% | 607,072 | |||||||||||
|
| |||||||||||
Net Assets 100.0% | $ | 101,127,443 | ||||||||||
|
| |||||||||||
See Abbreviations on page 87.
aNon-income producing.
bSee Note 3(f) regarding investments in affiliated management investment companies.
cThe rate shown is the annualizedseven-day effective yield at period end.
| franklintempleton.com | The accompanying notes are an integral part of these financial statements. | Semiannual Report | 43 | ||
FRANKLIN STRATEGIC SERIES
Financial Highlights
Franklin Small Cap Growth Fund
Six Months Ended (unaudited) | Year Ended April 30, | |||||||||||||||||||||||
| 2019 | 2018 | 2017 | 2016 | 2015 | ||||||||||||||||||||
Class A | ||||||||||||||||||||||||
Per share operating performance (for a share outstanding throughout the period) | ||||||||||||||||||||||||
Net asset value, beginning of period | $21.46 | $23.01 | $19.60 | $16.37 | $18.83 | $18.20 | ||||||||||||||||||
Income from investment operationsa: | ||||||||||||||||||||||||
Net investment income (loss)b | (0.05 | ) | (0.15 | ) | (0.13 | ) | (0.11 | ) | (0.08 | ) | (0.12 | ) | ||||||||||||
Net realized and unrealized gains (losses) | 0.06 | 2.86 | 3.96 | 3.34 | (2.03 | ) | 1.57 | |||||||||||||||||
Total from investment operations | 0.01 | 2.71 | 3.83 | 3.23 | (2.11 | ) | 1.45 | |||||||||||||||||
Less distributions from: | ||||||||||||||||||||||||
Net realized gains | — | (4.26 | ) | (0.42 | ) | — | (0.35 | ) | (0.82 | ) | ||||||||||||||
Net asset value, end of period | $21.47 | $21.46 | $23.01 | $19.60 | $16.37 | $18.83 | ||||||||||||||||||
Total returnc | 0.05% | 16.06% | 19.71% | 19.73% | (11.28)% | 8.34% | ||||||||||||||||||
Ratios to average net assetsd | ||||||||||||||||||||||||
Expenses before waiver and payments by affiliates | 1.07% | 1.07% | 1.11% | 1.10% | 1.13% | 1.16% | ||||||||||||||||||
Expenses net of waiver and payments by affiliates | 1.06% | e | 1.06% | e | 1.10% | e | 1.08% | e | 1.11% | e | 1.16% | f | ||||||||||||
Net investment income (loss) | (0.51)% | (0.68)% | (0.61)% | (0.61)% | (0.44)% | (0.66)% | ||||||||||||||||||
Supplemental data | ||||||||||||||||||||||||
Net assets, end of period (000’s) | $722,016 | $713,442 | $665,251 | $719,752 | $792,072 | $1,164,218 | ||||||||||||||||||
Portfolio turnover rate | 14.53% | 42.10% | 29.82% | 29.93% | 43.99% | 30.15% | ||||||||||||||||||
aThe amount shown for a share outstanding throughout the period may not correlate with the Statement of Operations for the period due to the timing of sales and repurchases of the Fund’s shares in relation to income earned and/or fluctuating fair value of the investments of the Fund.
bBased on average daily shares outstanding.
cTotal return does not reflect sales commissions or contingent deferred sales charges, if applicable, and is not annualized for periods less than one year.
dRatios are annualized for periods less than one year.
eBenefit of expense reduction rounds to less than 0.01%.
fBenefit of waiver and payments by affiliates and expense reduction rounds to less than 0.01%.
44 | Semiannual Report | The accompanying notes are an integral part of these financial statements. | franklintempleton.com | ||
FRANKLIN STRATEGIC SERIES
FINANCIAL HIGHLIGHTS
Franklin Small Cap Growth Fund(continued)
Six Months Ended (unaudited) | Year Ended April 30, | |||||||||||||||||||||||
| 2019 | 2018 | 2017 | 2016 | 2015 | ||||||||||||||||||||
Class C | ||||||||||||||||||||||||
Per share operating performance (for a share outstanding throughout the period) | ||||||||||||||||||||||||
Net asset value, beginning of period | $17.15 | $19.41 | $16.71 | $14.07 | $16.36 | $16.03 | ||||||||||||||||||
Income from investment operationsa: | ||||||||||||||||||||||||
Net investment income (loss)b | (0.11 | ) | (0.28 | ) | (0.25 | ) | (0.21 | ) | (0.18 | ) | (0.22 | ) | ||||||||||||
Net realized and unrealized gains (losses) | 0.06 | 2.28 | 3.37 | 2.85 | (1.76 | ) | 1.37 | |||||||||||||||||
Total from investment operations | (0.05 | ) | 2.00 | 3.12 | 2.64 | (1.94 | ) | 1.15 | ||||||||||||||||
Less distributions from: | ||||||||||||||||||||||||
Net realized gains | — | (4.26 | ) | (0.42 | ) | — | (0.35 | ) | (0.82 | ) | ||||||||||||||
Net asset value, end of period | $17.10 | $17.15 | $19.41 | $16.71 | $14.07 | $16.36 | ||||||||||||||||||
Total returnc | (0.29)% | 15.31% | 18.79% | 18.76% | (11.95)% | 7.58% | ||||||||||||||||||
Ratios to average net assetsd | ||||||||||||||||||||||||
Expenses before waiver and payments by affiliates | 1.82% | 1.82% | 1.86% | 1.85% | 1.88% | 1.87% | ||||||||||||||||||
Expenses net of waiver and payments by affiliates | 1.81% | e | 1.81% | e | 1.85% | e | 1.83% | e | 1.86% | e | 1.87% | f | ||||||||||||
Net investment income (loss) | (1.26)% | (1.43)% | (1.36)% | (1.36)% | (1.19)% | (1.37)% | ||||||||||||||||||
Supplemental data | ||||||||||||||||||||||||
Net assets, end of period (000’s) | $80,254 | $90,513 | $132,116 | $142,539 | $157,175 | $225,105 | ||||||||||||||||||
Portfolio turnover rate | 14.53% | 42.10% | 29.82% | 29.93% | 43.99% | 30.15% | ||||||||||||||||||
aThe amount shown for a share outstanding throughout the period may not correlate with the Statement of Operations for the period due to the timing of sales and repurchases of the Fund’s shares in relation to income earned and/or fluctuating fair value of the investments of the Fund.
bBased on average daily shares outstanding.
cTotal return does not reflect sales commissions or contingent deferred sales charges, if applicable, and is not annualized for periods less than one year.
dRatios are annualized for periods less than one year.
eBenefit of expense reduction rounds to less than 0.01%.
fBenefit of waiver and payments by affiliates and expense reduction rounds to less than 0.01%.
| franklintempleton.com | The accompanying notes are an integral part of these financial statements. | Semiannual Report | 45 | ||
FRANKLIN STRATEGIC SERIES
FINANCIAL HIGHLIGHTS
Franklin Small Cap Growth Fund(continued)
Six Months Ended (unaudited) | Year Ended April 30, | |||||||||||||||||||||||
| 2019 | 2018 | 2017 | 2016 | 2015 | ||||||||||||||||||||
Class R | ||||||||||||||||||||||||
Per share operating performance (for a share outstanding throughout the period) | ||||||||||||||||||||||||
Net asset value, beginning of period | $20.15 | $21.93 | $18.74 | $15.70 | $18.11 | $17.57 | ||||||||||||||||||
Income from investment operationsa: | ||||||||||||||||||||||||
Net investment income (loss)b | (0.08 | ) | (0.20 | ) | (0.17 | ) | (0.15 | ) | (0.12 | ) | (0.16 | ) | ||||||||||||
Net realized and unrealized gains (losses) | 0.07 | 2.68 | 3.78 | 3.19 | (1.94 | ) | 1.52 | |||||||||||||||||
Total from investment operations | (0.01 | ) | 2.48 | 3.61 | 3.04 | (2.06 | ) | 1.36 | ||||||||||||||||
Less distributions from: | ||||||||||||||||||||||||
Net realized gains | — | (4.26 | ) | (0.42 | ) | — | (0.35 | ) | (0.82 | ) | ||||||||||||||
Net asset value, end of period | $20.14 | $20.15 | $21.93 | $18.74 | $15.70 | $18.11 | ||||||||||||||||||
Total returnc | (0.05)% | 15.78% | 19.37% | 19.36% | (11.46)% | 8.12% | ||||||||||||||||||
Ratios to average net assetsd | ||||||||||||||||||||||||
Expenses before waiver and payments by affiliates | 1.32% | 1.32% | 1.36% | 1.35% | 1.38% | 1.37% | ||||||||||||||||||
Expenses net of waiver and payments by affiliates | 1.31% | e | 1.31% | e | 1.35% | e | 1.33% | e | 1.36% | e | 1.37% | f | ||||||||||||
Net investment income (loss) | (0.76)% | (0.93)% | (0.86)% | (0.86)% | (0.69)% | (0.87)% | ||||||||||||||||||
Supplemental data | ||||||||||||||||||||||||
Net assets, end of period (000’s) | $64,848 | $74,634 | $71,398 | $79,995 | $79,929 | $92,455 | ||||||||||||||||||
Portfolio turnover rate | 14.53% | 42.10% | 29.82% | 29.93% | 43.99% | 30.15% | ||||||||||||||||||
aThe amount shown for a share outstanding throughout the period may not correlate with the Statement of Operations for the period due to the timing of sales and repurchases of the Fund’s shares in relation to income earned and/or fluctuating fair value of the investments of the Fund.
bBased on average daily shares outstanding.
cTotal return is not annualized for periods less than one year.
dRatios are annualized for periods less than one year.
eBenefit of expense reduction rounds to less than 0.01%.
fBenefit of waiver and payments by affiliates and expense reduction rounds to less than 0.01%.
46 | Semiannual Report | The accompanying notes are an integral part of these financial statements. | franklintempleton.com | ||
FRANKLIN STRATEGIC SERIES
FINANCIAL HIGHLIGHTS
Franklin Small Cap Growth Fund(continued)
Six Months Ended (unaudited) | Year Ended April 30, | |||||||||||||||||||||||
| 2019 | 2018 | 2017 | 2016 | 2015 | ||||||||||||||||||||
Class R6 | ||||||||||||||||||||||||
Per share operating performance (for a share outstanding throughout the period) | ||||||||||||||||||||||||
Net asset value, beginning of period | $23.73 | $24.88 | $21.06 | $17.52 | $20.02 | $19.21 | ||||||||||||||||||
Income from investment operationsa: | ||||||||||||||||||||||||
Net investment income (loss)b | (0.01 | ) | (0.07 | ) | (0.03 | ) | (0.03 | ) | 0.01 | (0.03 | ) | |||||||||||||
Net realized and unrealized gains (losses) | 0.07 | 3.18 | 4.27 | 3.57 | (2.16 | ) | 1.66 | |||||||||||||||||
Total from investment operations | 0.06 | 3.11 | 4.24 | 3.54 | (2.15 | ) | 1.63 | |||||||||||||||||
Less distributions from: | ||||||||||||||||||||||||
Net realized gains | — | (4.26 | ) | (0.42 | ) | — | (0.35 | ) | (0.82 | ) | ||||||||||||||
Net asset value, end of period | $23.79 | $23.73 | $24.88 | $21.06 | $17.52 | $20.02 | ||||||||||||||||||
Total returnc | 0.25% | 16.50% | 20.23% | 20.21% | (10.81)% | 8.91% | ||||||||||||||||||
Ratios to average net assetsd | ||||||||||||||||||||||||
Expenses before waiver and payments by affiliates | 0.67% | 0.67% | 0.65% | 0.63% | 0.63% | 0.66% | ||||||||||||||||||
Expenses net of waiver and payments by affiliates | 0.64% | e | 0.64% | e | 0.63% | e | 0.61% | e | 0.61% | e | 0.66% | f | ||||||||||||
Net investment income (loss) | (0.09)% | (0.26)% | (0.14)% | (0.14)% | 0.06% | (0.16)% | ||||||||||||||||||
Supplemental data | ||||||||||||||||||||||||
Net assets, end of period (000’s) | $1,080,672 | $1,084,442 | $935,509 | $858,972 | $846,724 | $844,293 | ||||||||||||||||||
Portfolio turnover rate | 14.53% | 42.10% | 29.82% | 29.93% | 43.99% | 30.15% | ||||||||||||||||||
aThe amount shown for a share outstanding throughout the period may not correlate with the Statement of Operations for the period due to the timing of sales and repurchases of the Fund’s shares in relation to income earned and/or fluctuating fair value of the investments of the Fund.
bBased on average daily shares outstanding.
cTotal return is not annualized for periods less than one year.
dRatios are annualized for periods less than one year.
eBenefit of expense reduction rounds to less than 0.01%.
fBenefit of waiver and payments by affiliates and expense reduction rounds to less than 0.01%.
| franklintempleton.com | The accompanying notes are an integral part of these financial statements. | Semiannual Report | 47 | ||
FRANKLIN STRATEGIC SERIES
FINANCIAL HIGHLIGHTS
Franklin Small Cap Growth Fund(continued)
Six Months Ended (unaudited) | Year Ended April 30, | |||||||||||||||||||||||
| 2019 | 2018 | 2017 | 2016 | 2015 | ||||||||||||||||||||
Advisor Class | ||||||||||||||||||||||||
Per share operating performance (for a share outstanding throughout the period) | ||||||||||||||||||||||||
Net asset value, beginning of period | $23.37 | $24.61 | $20.88 | $17.41 | $19.94 | $19.17 | ||||||||||||||||||
Income from investment operationsa: | ||||||||||||||||||||||||
Net investment income (loss)b | (0.03 | ) | (0.10 | ) | (0.08 | ) | (0.07 | ) | (0.04 | ) | (0.07 | ) | ||||||||||||
Net realized and unrealized gains (losses) | 0.07 | 3.12 | 4.23 | 3.54 | (2.14 | ) | 1.66 | |||||||||||||||||
Total from investment operations | 0.04 | 3.02 | 4.15 | 3.47 | (2.18 | ) | 1.59 | |||||||||||||||||
Less distributions from: | ||||||||||||||||||||||||
Net realized gains | — | (4.26 | ) | (0.42 | ) | — | (0.35 | ) | (0.82 | ) | ||||||||||||||
Net asset value, end of period | $23.41 | $23.37 | $24.61 | $20.88 | $17.41 | $19.94 | ||||||||||||||||||
Total returnc | 0.17% | 16.30% | 19.97% | 19.93% | (11.06)% | 8.65% | ||||||||||||||||||
Ratios to average net assetsd | ||||||||||||||||||||||||
Expenses before waiver and payments by affiliates | 0.82% | 0.82% | 0.86% | 0.85% | 0.88% | 0.87% | ||||||||||||||||||
Expenses net of waiver and payments by affiliates | 0.81% | e | 0.81% | e | 0.85% | e | 0.83% | e | 0.86% | e | 0.87% | f | ||||||||||||
Net investment income (loss) | (0.26)% | (0.43)% | (0.36)% | (0.36)% | (0.19)% | (0.37)% | ||||||||||||||||||
Supplemental data | ||||||||||||||||||||||||
Net assets, end of period (000’s) | $662,924 | $725,622 | $713,135 | $805,661 | $850,975 | $1,077,822 | ||||||||||||||||||
Portfolio turnover rate | 14.53% | 42.10% | 29.82% | 29.93% | 43.99% | 30.15% | ||||||||||||||||||
aThe amount shown for a share outstanding throughout the period may not correlate with the Statement of Operations for the period due to the timing of sales and repurchases of the Fund’s shares in relation to income earned and/or fluctuating fair value of the investments of the Fund.
bBased on average daily shares outstanding.
cTotal return is not annualized for periods less than one year.
dRatios are annualized for periods less than one year.
eBenefit of expense reduction rounds to less than 0.01%.
fBenefit of waiver and payments by affiliates and expense reduction rounds to less than 0.01%.
48 | Semiannual Report | The accompanying notes are an integral part of these financial statements. | franklintempleton.com | ||
FRANKLIN STRATEGIC SERIES
Statement of Investments, October 31, 2019 (unaudited)
Franklin Small Cap Growth Fund
| Country | Shares | Value | ||||||||||
Common Stocks 92.4% | ||||||||||||
Communication Services 1.6% | ||||||||||||
aIMAX Corp. | United States | 680,200 | $ | 14,522,270 | ||||||||
aYelp Inc. | United States | 764,700 | 26,389,797 | |||||||||
|
| |||||||||||
| 40,912,067 | ||||||||||||
|
| |||||||||||
Consumer Discretionary 13.1% | ||||||||||||
aBoot Barn Holdings Inc. | United States | 521,503 | 18,278,680 | |||||||||
Dave & Buster’s Entertainment Inc. | United States | 536,500 | 21,341,970 | |||||||||
a,b,cDraftKings Inc. | United States | 9,905,685 | 28,392,041 | |||||||||
aFive Below Inc. | United States | 175,500 | 21,956,805 | |||||||||
aGrand Canyon Education Inc. | United States | 212,900 | 19,578,284 | |||||||||
Lithia Motors Inc. | United States | 156,800 | 24,692,864 | |||||||||
aM/I Homes Inc. | United States | 949,376 | 41,943,432 | |||||||||
a,bPeloton Interactive Inc., B | United States | 1,038,769 | 23,577,076 | |||||||||
a,dThe RealReal Inc. | United States | 488,600 | 11,291,546 | |||||||||
a,dRevolve Group Inc. | United States | 360,600 | 7,486,056 | |||||||||
aRH | United States | 140,200 | 25,474,340 | |||||||||
a,eSportsman’s Warehouse Holdings Inc. | United States | 2,919,500 | 19,881,795 | |||||||||
Steven Madden Ltd. | United States | 902,450 | 37,162,891 | |||||||||
aTRI Pointe Group Inc. | United States | 590,700 | 9,297,618 | |||||||||
Wingstop Inc. | United States | 392,729 | 32,765,380 | |||||||||
|
| |||||||||||
| 343,120,778 | ||||||||||||
|
| |||||||||||
Consumer Staples 2.9% | ||||||||||||
aBellRing Brands Inc., A | United States | 290,500 | 5,075,035 | |||||||||
aGrocery Outlet Holding Corp. | United States | 621,300 | 19,819,470 | |||||||||
aHostess Brands Inc., A | United States | 1,007,600 | 12,877,128 | |||||||||
aNomad Foods Ltd. | United Kingdom | 937,100 | 18,282,821 | |||||||||
aThe Simply Good Foods Co. | United States | 804,800 | 19,749,792 | |||||||||
|
| |||||||||||
| 75,804,246 | ||||||||||||
|
| |||||||||||
Energy 1.1% | ||||||||||||
aCallon Petroleum Co. | United States | 3,498,500 | 13,294,300 | |||||||||
dLiberty Oilfield Services Inc., A | United States | 1,620,100 | 14,921,121 | |||||||||
|
| |||||||||||
| 28,215,421 | ||||||||||||
|
| |||||||||||
Financials 7.3% | ||||||||||||
Evercore Inc. | United States | 180,800 | 13,314,112 | |||||||||
FGL Holdings., A | United States | 1,464,200 | 13,221,726 | |||||||||
Houlihan Lokey Inc. | United States | 566,400 | 26,768,064 | |||||||||
LegacyTexas Financial Group Inc. | United States | 377,460 | 16,057,149 | |||||||||
aMetropolitan Bank Holding Corp. | United States | 318,661 | 13,683,303 | |||||||||
Pinnacle Financial Partners Inc. | United States | 586,304 | 34,486,401 | |||||||||
aPRA Group Inc. | United States | 506,500 | 17,185,545 | |||||||||
TCF Financial Corp. | United States | 653,223 | 25,861,099 | |||||||||
Western Alliance Bancorp | United States | 623,400 | 30,752,322 | |||||||||
|
| |||||||||||
| 191,329,721 | ||||||||||||
|
| |||||||||||
| franklintempleton.com | Semiannual Report | 49 | ||
FRANKLIN STRATEGIC SERIES
STATEMENT OF INVESTMENTS (UNAUDITED)
Franklin Small Cap Growth Fund(continued)
| Country | Shares | Value | ||||||||||
Common Stocks(continued) | ||||||||||||
Health Care 23.3% | ||||||||||||
aAllogene Therapeutics Inc. | United States | 161,782 | $ | 4,659,322 | ||||||||
aArgenx SE, ADR | Netherlands | 90,400 | 11,070,384 | |||||||||
aAscendis Pharma AS, ADR | Denmark | 178,900 | 19,782,762 | |||||||||
aCollegium Pharmaceutical Inc. | United States | 698,800 | 8,385,600 | |||||||||
aDeciphera Pharmaceuticals Inc. | United States | 431,500 | 19,132,710 | |||||||||
aEmergent BioSolutions Inc. | United States | 382,600 | 21,869,416 | |||||||||
aGlobal Blood Therapeutics Inc. | United States | 376,900 | 18,072,355 | |||||||||
aGW Pharmaceuticals PLC, ADR | United Kingdom | 230,700 | 30,872,274 | |||||||||
aHealthEquity Inc. | United States | 341,116 | 19,371,978 | |||||||||
aHeron Therapeutics Inc. | United States | 1,366,308 | 29,034,045 | |||||||||
aInspire Medical Systems Inc. | United States | 323,744 | 19,741,909 | |||||||||
aInteger Holdings Corp. | United States | 369,000 | 28,575,360 | |||||||||
aIovance Biotherapeutics Inc. | United States | 1,379,333 | 29,145,306 | |||||||||
aiRhythm Technologies Inc. | United States | 391,097 | 26,133,101 | |||||||||
a,dLivongo Health Inc. | United States | 697,500 | 15,059,025 | |||||||||
aNeogen Corp. | United States | 267,266 | 17,388,326 | |||||||||
aNeoGenomics Inc. | United States | 1,323,000 | 30,336,390 | |||||||||
aNeuronetics Inc. | United States | 380,300 | 3,388,473 | |||||||||
aNevro Corp. | United States | 281,100 | 24,230,820 | |||||||||
aOdonate Therapeutics Inc. | United States | 383,200 | 12,170,432 | |||||||||
aPenumbra Inc. | United States | 162,100 | 25,282,737 | |||||||||
aPfenex Inc. | United States | 1,364,631 | 12,581,898 | |||||||||
aPhreesia Inc. | United States | 463,300 | 13,727,579 | |||||||||
aPrecision BioSciences Inc. | United States | 262,000 | 1,700,380 | |||||||||
aPTC Therapeutics Inc. | United States | 864,500 | 35,349,405 | |||||||||
aReata Pharmaceuticals Inc. | United States | 249,974 | 51,514,642 | |||||||||
aRevance Therapeutics Inc. | United States | 1,053,592 | 16,499,251 | |||||||||
aSage Therapeutics Inc. | United States | 153,100 | 20,768,015 | |||||||||
aSmileDirectClub Inc., A | United States | 903,100 | 10,561,754 | |||||||||
a,dTherapeuticsMD Inc. | United States | 1,783,100 | 4,743,046 | |||||||||
aTivity Health Inc. | United States | 1,617,678 | 26,222,560 | |||||||||
|
| |||||||||||
| 607,371,255 | ||||||||||||
|
| |||||||||||
Industrials 18.3% | ||||||||||||
Allegiant Travel Co. | United States | 266,248 | 44,551,278 | |||||||||
Altra Industrial Motion Corp. | United States | 238,000 | 7,330,400 | |||||||||
aAxon Enterprise Inc. | United States | 351,300 | 17,961,969 | |||||||||
aBeacon Roofing Supply Inc. | United States | 870,866 | 27,031,681 | |||||||||
BWX Technologies Inc. | United States | 724,400 | 42,087,640 | |||||||||
Cubic Corp. | United States | 639,200 | 47,134,608 | |||||||||
Granite Construction Inc. | United States | 1,049,543 | 24,706,242 | |||||||||
Healthcare Services Group Inc. | United States | 673,600 | 16,408,896 | |||||||||
Kennametal Inc. | United States | 1,203,400 | 37,245,230 | |||||||||
Lindsay Corp. | United States | 139,421 | 13,162,737 | |||||||||
aMercury Systems Inc. | United States | 502,216 | 36,993,230 | |||||||||
Mobile Mini Inc. | United States | 265,800 | 9,999,396 | |||||||||
aSAIA Inc. | United States | 249,924 | 22,293,221 | |||||||||
aSpirit Airlines Inc. | United States | 770,300 | 28,932,468 | |||||||||
50 | Semiannual Report | franklintempleton.com | ||
FRANKLIN STRATEGIC SERIES
STATEMENT OF INVESTMENTS (UNAUDITED)
Franklin Small Cap Growth Fund(continued)
| Country | Shares | Value | ||||||||||
Common Stocks(continued) | ||||||||||||
Industrials(continued) | ||||||||||||
aUnivar Solutions Inc. | United States | 1,731,332 | $ | 37,154,385 | ||||||||
aUpwork Inc. | United States | 2,106,200 | 31,677,248 | |||||||||
US Ecology Inc. | United States | 540,576 | 33,640,044 | |||||||||
|
| |||||||||||
| 478,310,673 | ||||||||||||
|
| |||||||||||
Information Technology 22.3% | ||||||||||||
aAlteryx Inc. | United States | 312,400 | 28,584,600 | |||||||||
aCloudFlare Inc., A | United States | 1,160,515 | 19,543,072 | |||||||||
aEnvestnet Inc. | United States | 405,722 | 25,353,568 | |||||||||
aGuidewire Software Inc. | United States | 116,400 | 13,122,936 | |||||||||
aHubspot Inc. | United States | 165,229 | 25,627,018 | |||||||||
aInterXion Holding NV | Netherlands | 390,795 | 34,475,935 | |||||||||
aLattice Semiconductor Corp. | United States | 1,864,800 | 36,531,432 | |||||||||
a,b,cLegalZoom.com Inc. | United States | 1,431,280 | 16,545,597 | |||||||||
ManTech International Corp., A | United States | 515,000 | 40,777,700 | |||||||||
Monolithic Power Systems | United States | 179,700 | 26,940,624 | |||||||||
aOnto Innovation Inc. | United States | 887,800 | 28,587,160 | |||||||||
aPaylocity Holding Corp. | United States | 288,032 | 29,552,083 | |||||||||
aPluralsight Inc., A | United States | 1,134,200 | 20,506,336 | |||||||||
aPure Storage Inc., A | United States | 1,357,400 | 26,415,004 | |||||||||
aQ2 Holdings Inc. | United States | 247,000 | 17,658,030 | |||||||||
aSemtech Corp. | United States | 253,700 | 12,801,702 | |||||||||
aSilicon Laboratories Inc. | United States | 311,100 | 33,051,264 | |||||||||
aTwilio Inc., A | United States | 48,202 | 4,654,385 | |||||||||
aUSA Technologies Inc. | United States | 851,300 | 5,516,424 | |||||||||
aViaSat Inc. | United States | 421,283 | 29,001,122 | |||||||||
aViavi Solutions Inc. | United States | 1,920,800 | 30,655,968 | |||||||||
aWix.com Ltd. | Israel | 215,500 | 26,306,085 | |||||||||
aZendesk Inc. | United States | 350,914 | 24,792,074 | |||||||||
aZscaler Inc. | United States | 559,800 | 24,620,004 | |||||||||
|
| |||||||||||
| 581,620,123 | ||||||||||||
|
| |||||||||||
Materials 1.4% | ||||||||||||
aIngevity Corp. | United States | 429,329 | 36,153,795 | |||||||||
|
| |||||||||||
Real Estate 1.1% | ||||||||||||
Coresite Realty Corp. | United States | 244,600 | 28,740,500 | |||||||||
|
| |||||||||||
Total Common Stocks (Cost $1,785,991,136) | 2,411,578,579 | |||||||||||
|
| |||||||||||
Preferred Stocks 4.3% | ||||||||||||
Consumer Discretionary 2.8% | ||||||||||||
a,b,cClearMotion Inc., pfd., D | United States | 3,698,772 | 13,425,684 | |||||||||
a,b,cProterra Inc., pfd., 5, 144A | United States | 1,787,047 | 15,318,860 | |||||||||
a,b,cProterra Inc., pfd., 6, 144A | United States | 1,310,834 | 11,236,684 | |||||||||
a,b,cProterra Inc., pfd., 7 | United States | 536,367 | 4,597,826 | |||||||||
a,b,cRent the Runway Inc., pfd | United States | 596,471 | 13,788,135 | |||||||||
a,b,cSweetgreen Inc., pfd., H | United States | 383,435 | 5,967,603 | |||||||||
a,b,cSweetgreen Inc., pfd., I | United States | 41,641 | 724,046 | |||||||||
a,b,cTula eTechnology Inc. | United States | 361,111 | — | |||||||||
| franklintempleton.com | Semiannual Report | 51 | ||
FRANKLIN STRATEGIC SERIES
STATEMENT OF INVESTMENTS (UNAUDITED)
Franklin Small Cap Growth Fund(continued)
| Country | Shares | Value | ||||||||||
Preferred Stocks(continued) | ||||||||||||
Consumer Discretionary(continued) | ||||||||||||
a,b,cTula Technology Inc., E | United States | 3,611,111 | $ | 7,432,818 | ||||||||
|
| |||||||||||
| 72,491,656 | ||||||||||||
|
| |||||||||||
Industrials 1.0% | ||||||||||||
a,b,cOptoro Inc., pfd., E | United States | 508,130 | 12,588,330 | |||||||||
a,b,cWheels Up Partners LLC, pfd., D | United States | 4,310,344 | 14,826,036 | |||||||||
|
| |||||||||||
| 27,414,366 | ||||||||||||
|
| |||||||||||
Information Technology 0.5% | ||||||||||||
a,b,cSmule Inc., pfd., G, 144A | United States | 1,542,673 | 10,748,960 | |||||||||
a,b,cSmule Inc., pfd., H, 144A | United States | 352,675 | 2,790,260 | |||||||||
|
| |||||||||||
| 13,539,220 | ||||||||||||
|
| |||||||||||
Total Preferred Stocks (Cost $94,407,763) | 113,445,242 | |||||||||||
|
| |||||||||||
Total Investments before Short Term Investments | 2,525,023,821 | |||||||||||
|
| |||||||||||
Short Term Investments 5.1% | ||||||||||||
Money Market Funds (Cost $98,533,343) 3.8% | ||||||||||||
f,gInstitutional Fiduciary Trust Money Market Portfolio, 1.56% | United States | 98,533,343 | 98,533,343 | |||||||||
|
| |||||||||||
h Investments from Cash Collateral Received for Loaned Securities (Cost $35,405,075) 1.3% | ||||||||||||
Money Market Funds 1.3% | ||||||||||||
f,gInstitutional Fiduciary Trust Money Market Portfolio, 1.56% | United States | 35,405,075 | 35,405,075 | |||||||||
|
| |||||||||||
Total Investments (Cost $2,014,337,317) 101.8% | 2,658,962,239 | |||||||||||
Other Assets, less Liabilities (1.8)% | (48,246,691 | ) | ||||||||||
|
| |||||||||||
Net Assets 100.0% | $ | 2,610,715,548 | ||||||||||
|
| |||||||||||
See Abbreviations on page 87.
aNon-income producing.
bFair valued using significant unobservable inputs. See Note 11 regarding fair value measurements.
cSee Note 7 regarding restricted securities.
dA portion or all of the security is on loan at October 31, 2019. See Note 1(c).
eSee Note 8 regarding holdings of 5% voting securities.
fSee Note 3(f) regarding investments in affiliated management investment companies.
gThe rate shown is the annualizedseven-day effective yield at period end.
hSee Note 1(c) regarding securities on loan.
52 | Semiannual Report | The accompanying notes are an integral part of these financial statements. | franklintempleton.com | ||
FRANKLIN STRATEGIC SERIES
Financial Highlights
FranklinSmall-Mid Cap Growth Fund
Six Months Ended (unaudited) | Year Ended April 30, | |||||||||||||||||||||||
| 2019 | 2018 | 2017 | 2016 | 2015 | ||||||||||||||||||||
Class A | ||||||||||||||||||||||||
Per share operating performance (for a share outstanding throughout the period) | ||||||||||||||||||||||||
Net asset value, beginning of period | $37.17 | $36.07 | $34.35 | $31.84 | $38.38 | $40.42 | ||||||||||||||||||
Income from investment operationsa: | ||||||||||||||||||||||||
Net investment income (loss)b | (0.04 | ) | (0.09 | ) | (0.15 | ) | (0.11 | ) | (0.03 | )c | (0.14 | ) | ||||||||||||
Net realized and unrealized gains (losses) | (0.51 | ) | 5.33 | 4.97 | 4.73 | (3.37 | ) | 5.71 | ||||||||||||||||
Total from investment operations | (0.55 | ) | 5.24 | 4.82 | 4.62 | (3.40 | ) | 5.57 | ||||||||||||||||
Less distributions from: | ||||||||||||||||||||||||
Net realized gains | — | (4.14 | ) | (3.10 | ) | (2.11 | ) | (3.14 | ) | (7.61 | ) | |||||||||||||
Net asset value, end of period | $36.62 | $37.17 | $36.07 | $34.35 | $31.84 | $38.38 | ||||||||||||||||||
Total returnd | (1.48)% | 17.43% | 14.28% | 15.01% | (9.02)% | 15.78% | ||||||||||||||||||
Ratios to average net assetse | ||||||||||||||||||||||||
Expenses before waiver and payments by affiliates | 0.90% | 0.88% | 1.02% | 0.95% | 0.96% | 0.94% | ||||||||||||||||||
Expenses net of waiver and payments by affiliates | 0.88% | f | 0.87% | f | 1.00% | f | 0.94% | f | 0.95% | f | 0.94% | g | ||||||||||||
Net investment income (loss) | (0.23)% | (0.25)% | (0.41)% | (0.34)% | (0.08)% | c | (0.35)% | |||||||||||||||||
Supplemental data | ||||||||||||||||||||||||
Net assets, end of period (000’s) | $2,578,741 | $2,684,131 | $2,262,471 | $2,303,113 | $2,231,822 | $2,535,853 | ||||||||||||||||||
Portfolio turnover rate | 31.13% | 54.28% | 38.35% | 35.46% | 38.72% | 47.98% | ||||||||||||||||||
aThe amount shown for a share outstanding throughout the period may not correlate with the Statement of Operations for the period due to the timing of sales and repurchases of the Fund’s shares in relation to income earned and/or fluctuating fair value of the investments of the Fund.
bBased on average daily shares outstanding.
cNet investment income per share includes approximately $0.11 per share related to income received in the form of special dividends in connection with certain Fund holdings. Excluding this amount, the ratio of net investment income to average net assets would have been (0.38)%.
dTotal return does not reflect sales commissions or contingent deferred sales charges, if applicable, and is not annualized for periods less than one year.
eRatios are annualized for periods less than one year.
fBenefit of expense reduction rounds to less than 0.01%.
gBenefit of waiver and payments by affiliates rounds to less than 0.01%.
| franklintempleton.com | The accompanying notes are an integral part of these financial statements. | Semiannual Report | 53 | ||
FRANKLIN STRATEGIC SERIES
FINANCIAL HIGHLIGHTS
FranklinSmall-Mid Cap Growth Fund(continued)
Six Months Ended (unaudited) | Year Ended April 30, | |||||||||||||||||||||||
| 2019 | 2018 | 2017 | 2016 | 2015 | ||||||||||||||||||||
Class C | ||||||||||||||||||||||||
Per share operating performance (for a share outstanding throughout the period) | ||||||||||||||||||||||||
Net asset value, beginning of period | $24.98 | $25.84 | $25.59 | $24.40 | $30.43 | $33.78 | ||||||||||||||||||
Income from investment operationsa: | ||||||||||||||||||||||||
Net investment income (loss)b | (0.12 | ) | (0.26 | ) | (0.31 | ) | (0.27 | ) | (0.23 | )c | (0.36 | ) | ||||||||||||
Net realized and unrealized gains (losses) | (0.34 | ) | 3.54 | 3.66 | 3.57 | (2.66 | ) | 4.62 | ||||||||||||||||
Total from investment operations | (0.46 | ) | 3.28 | 3.35 | 3.30 | (2.89 | ) | 4.26 | ||||||||||||||||
Less distributions from: | ||||||||||||||||||||||||
Net realized gains | — | (4.14 | ) | (3.10 | ) | (2.11 | ) | (3.14 | ) | (7.61 | ) | |||||||||||||
Net asset value, end of period | $24.52 | $24.98 | $25.84 | $25.59 | $24.40 | $30.43 | ||||||||||||||||||
Total returnd | (1.84)% | 16.68% | 13.39% | 14.15% | (9.72)% | 14.96% | ||||||||||||||||||
Ratios to average net assetse | ||||||||||||||||||||||||
Expenses before waiver and payments by affiliates | 1.65% | 1.63% | 1.77% | 1.70% | 1.71% | 1.69% | ||||||||||||||||||
Expenses net of waiver and payments by affiliates | 1.63% | f | 1.62% | f | 1.75% | f | 1.69% | f | 1.70% | f | 1.69% | g | ||||||||||||
Net investment income (loss) | (0.98)% | (1.00)% | (1.16)% | (1.09)% | (0.83)% | c | (1.10)% | |||||||||||||||||
Supplemental data | ||||||||||||||||||||||||
Net assets, end of period (000’s) | $149,570 | $173,334 | $334,769 | $371,262 | $377,024 | $448,722 | ||||||||||||||||||
Portfolio turnover rate | 31.13% | 54.28% | 38.35% | 35.46% | 38.72% | 47.98% | ||||||||||||||||||
aThe amount shown for a share outstanding throughout the period may not correlate with the Statement of Operations for the period due to the timing of sales and repurchases of the Fund’s shares in relation to income earned and/or fluctuating fair value of the investments of the Fund.
bBased on average daily shares outstanding.
cNet investment income per share includes approximately $0.11 per share related to income received in the form of special dividends in connection with certain Fund holdings. Excluding this amount, the ratio of net investment income to average net assets would have been (1.13)%.
dTotal return does not reflect sales commissions or contingent deferred sales charges, if applicable, and is not annualized for periods less than one year.
eRatios are annualized for periods less than one year.
fBenefit of expense reduction rounds to less than 0.01%.
gBenefit of waiver and payments by affiliates rounds to less than 0.01%.
54 | Semiannual Report | The accompanying notes are an integral part of these financial statements. | franklintempleton.com | ||
FRANKLIN STRATEGIC SERIES
FINANCIAL HIGHLIGHTS
FranklinSmall-Mid Cap Growth Fund(continued)
Six Months Ended (unaudited) | Year Ended April 30, | |||||||||||||||||||||||
| 2019 | 2018 | 2017 | 2016 | 2015 | ||||||||||||||||||||
Class R | ||||||||||||||||||||||||
Per share operating performance (for a share outstanding throughout the period) | ||||||||||||||||||||||||
Net asset value, beginning of period | $33.66 | $33.15 | $31.87 | $29.75 | $36.18 | $38.61 | ||||||||||||||||||
Income from investment operationsa: | ||||||||||||||||||||||||
Net investment income (loss)b | (0.08 | ) | (0.16 | ) | (0.22 | ) | (0.18 | ) | (0.11 | )c | (0.23 | ) | ||||||||||||
Net realized and unrealized gains (losses) | (0.46 | ) | 4.81 | 4.60 | 4.41 | (3.18 | ) | 5.41 | ||||||||||||||||
Total from investment operations | (0.54 | ) | 4.65 | 4.38 | 4.23 | (3.29 | ) | 5.18 | ||||||||||||||||
Less distributions from: | ||||||||||||||||||||||||
Net realized gains | — | (4.14 | ) | (3.10 | ) | (2.11 | ) | (3.14 | ) | (7.61 | ) | |||||||||||||
Net asset value, end of period | $33.12 | $33.66 | $33.15 | $31.87 | $29.75 | $36.18 | ||||||||||||||||||
Total returnd | (1.60)% | 17.17% | 14.00% | 14.70% | (9.24)% | 15.52% | ||||||||||||||||||
Ratios to average net assetse | ||||||||||||||||||||||||
Expenses before waiver and payments by affiliates | 1.14% | 1.12% | 1.26% | 1.19% | 1.21% | 1.19% | ||||||||||||||||||
Expenses net of waiver and payments by affiliates | 1.12% | f | 1.11% | f | 1.24% | f | 1.18% | f | 1.20% | f | 1.19% | g | ||||||||||||
Net investment income (loss) | (0.47)% | (0.49)% | (0.65)% | (0.58)% | (0.33)%c | (0.60)% | ||||||||||||||||||
Supplemental data | ||||||||||||||||||||||||
Net assets, end of period (000’s) | $46,914 | $50,721 | $70,692 | $81,864 | $86,989 | $96,593 | ||||||||||||||||||
Portfolio turnover rate | 31.13% | 54.28% | 38.35% | 35.46% | 38.72% | 47.98% | ||||||||||||||||||
aThe amount shown for a share outstanding throughout the period may not correlate with the Statement of Operations for the period due to the timing of sales and repurchases of the Fund’s shares in relation to income earned and/or fluctuating fair value of the investments of the Fund.
bBased on average daily shares outstanding.
cNet investment income per share includes approximately $0.11 per share related to income received in the form of special dividends in connection with certain Fund holdings. Excluding this amount, the ratio of net investment income to average net assets would have been (0.63)%.
dTotal return is not annualized for periods less than one year.
eRatios are annualized for periods less than one year.
fBenefit of expense reduction rounds to less than 0.01%.
gBenefit of waiver and payments by affiliates rounds to less than 0.01%.
| franklintempleton.com | The accompanying notes are an integral part of these financial statements. | Semiannual Report | 55 | ||
FRANKLIN STRATEGIC SERIES
FINANCIAL HIGHLIGHTS
FranklinSmall-Mid Cap Growth Fund(continued)
Six Months Ended (unaudited) | Year Ended April 30, | |||||||||||||||||||||||
| 2019 | 2018 | 2017 | 2016 | 2015 | ||||||||||||||||||||
Class R6 | ||||||||||||||||||||||||
Per share operating performance (for a share outstanding throughout the period) | ||||||||||||||||||||||||
Net asset value, beginning of period | $41.83 | $39.91 | $37.51 | $34.43 | $41.04 | $42.53 | ||||||||||||||||||
Income from investment operationsa: | ||||||||||||||||||||||||
Net investment incomeb | 0.04 | 0.05 | 0.05 | 0.05 | 0.15 | c | 0.05 | |||||||||||||||||
Net realized and unrealized gains (losses) | (0.58 | ) | 6.01 | 5.45 | 5.14 | (3.62 | ) | 6.07 | ||||||||||||||||
Total from investment operations | (0.54 | ) | 6.06 | 5.50 | 5.19 | (3.47 | ) | 6.12 | ||||||||||||||||
Less distributions from: | ||||||||||||||||||||||||
Net realized gains | — | (4.14 | ) | (3.10 | ) | (2.11 | ) | (3.14 | ) | (7.61 | ) | |||||||||||||
Net asset value, end of period | $41.29 | $41.83 | $39.91 | $37.51 | $34.43 | $41.04 | ||||||||||||||||||
Total returnd | (1.29)% | 17.82% | 14.90% | 15.51% | (8.54)% | 16.32% | ||||||||||||||||||
Ratios to average net assetse | ||||||||||||||||||||||||
Expenses before waiver and payments by affiliates | 0.52% | 0.52% | 0.50% | 0.48% | 0.48% | 0.48% | ||||||||||||||||||
Expenses net of waiver and payments by affiliates | 0.48% | f | 0.49% | f | 0.47% | f | 0.47% | f | 0.47% | f | 0.48% | g | ||||||||||||
Net investment income | 0.17% | 0.13% | 0.12% | 0.13% | 0.40% | c | 0.11% | |||||||||||||||||
Supplemental data | ||||||||||||||||||||||||
Net assets, end of period (000’s) | $246,719 | $259,053 | $275,835 | $222,577 | $242,237 | $206,548 | ||||||||||||||||||
Portfolio turnover rate | 31.13% | 54.28% | 38.35% | 35.46% | 38.72% | 47.98% | ||||||||||||||||||
aThe amount shown for a share outstanding throughout the period may not correlate with the Statement of Operations for the period due to the timing of sales and repurchases of the Fund’s shares in relation to income earned and/or fluctuating fair value of the investments of the Fund.
bBased on average daily shares outstanding.
cNet investment income per share includes approximately $0.11 per share related to income received in the form of special dividends in connection with certain Fund holdings. Excluding this amount, the ratio of net investment income to average net assets would have been 0.10%.
dTotal return is not annualized for periods less than one year.
eRatios are annualized for periods less than one year.
fBenefit of expense reduction rounds to less than 0.01%.
gBenefit of waiver and payments by affiliates rounds to less than 0.01%.
56 | Semiannual Report | The accompanying notes are an integral part of these financial statements. | franklintempleton.com | ||
FRANKLIN STRATEGIC SERIES
FINANCIAL HIGHLIGHTS
FranklinSmall-Mid Cap Growth Fund(continued)
Six Months Ended (unaudited) | Year Ended April 30, | |||||||||||||||||||||||
| 2019 | 2018 | 2017 | 2016 | 2015 | ||||||||||||||||||||
Advisor Class | ||||||||||||||||||||||||
Per share operating performance (for a share outstanding throughout the period) | ||||||||||||||||||||||||
Net asset value, beginning of period | $41.09 | $39.33 | $37.11 | $34.15 | $40.83 | $42.44 | ||||||||||||||||||
Income from investment operationsa: | ||||||||||||||||||||||||
Net investment income (loss)b | 0.01 | 0.01 | (0.06 | ) | (0.03 | ) | 0.06 | c | (0.04 | ) | ||||||||||||||
Net realized and unrealized gains (losses) | (0.57 | ) | 5.89 | 5.38 | 5.10 | (3.60 | ) | 6.04 | ||||||||||||||||
Total from investment operations | (0.56 | ) | 5.90 | 5.32 | 5.07 | (3.54 | ) | 6.00 | ||||||||||||||||
Less distributions from: | ||||||||||||||||||||||||
Net realized gains | — | (4.14 | ) | (3.10 | ) | (2.11 | ) | (3.14 | ) | (7.61 | ) | |||||||||||||
Net asset value, end of period | $40.53 | $41.09 | $39.33 | $37.11 | $34.15 | $40.83 | ||||||||||||||||||
Total returnd | (1.36)% | 17.67% | 14.57% | 15.28% | (8.79)% | 16.09% | ||||||||||||||||||
Ratios to average net assetse | ||||||||||||||||||||||||
Expenses before waiver and payments by affiliates | 0.65% | 0.63% | 0.77% | 0.70% | 0.71% | 0.69% | ||||||||||||||||||
Expenses net of waiver and payments by affiliates | 0.63% | f | 0.62% | f | 0.75% | f | 0.69% | f | 0.70% | f | 0.69% | g | ||||||||||||
Net investment income (loss) | 0.02% | —% | h | (0.16)% | (0.09)% | 0.17% | c | (0.10)% | ||||||||||||||||
Supplemental data | ||||||||||||||||||||||||
Net assets, end of period (000’s) | $311,023 | $355,141 | $520,842 | $584,840 | $551,176 | $708,617 | ||||||||||||||||||
Portfolio turnover rate | 31.13% | 54.28% | 38.35% | 35.46% | 38.72% | 47.98% | ||||||||||||||||||
aThe amount shown for a share outstanding throughout the period may not correlate with the Statement of Operations for the period due to the timing of sales and repurchases of the Fund’s shares in relation to income earned and/or fluctuating fair value of the investments of the Fund.
bBased on average daily shares outstanding.
cNet investment income per share includes approximately $0.11 per share related to income received in the form of special dividends in connection with certain Fund holdings. Excluding this amount, the ratio of net investment income to average net assets would have been (0.13)%.
dTotal return is not annualized for periods less than one year.
eRatios are annualized for periods less than one year.
fBenefit of expense reduction rounds to less than 0.01%.
gBenefit of waiver and payments by affiliates rounds to less than 0.01%.
hRounds to less than 0.01%.
| franklintempleton.com | The accompanying notes are an integral part of these financial statements. | Semiannual Report | 57 | ||
FRANKLIN STRATEGIC SERIES
Statement of Investments, October 31, 2019 (unaudited)
FranklinSmall-Mid Cap Growth Fund
Shares
| Value
| |||||||
Common Stocks 96.6% | ||||||||
Communication Services 2.8% | ||||||||
aIAC/InterActiveCorp. | 226,000 | $ | 51,358,500 | |||||
aPinterest Inc., A | 842,000 | 21,167,880 | ||||||
aSpotify Technology SA | 159,500 | 23,015,850 | ||||||
|
| |||||||
| 95,542,230 | ||||||||
|
| |||||||
Consumer Discretionary 17.8% | ||||||||
Aptiv PLC | 190,000 | 17,014,500 | ||||||
aBurlington Stores Inc. | 218,000 | 41,893,060 | ||||||
aChipotle Mexican Grill Inc. | 34,300 | 26,690,888 | ||||||
Dollar General Corp. | 245,500 | 39,363,470 | ||||||
aDollar Tree Inc. | 215,000 | 23,736,000 | ||||||
Domino’s Pizza Inc. | 114,000 | 30,964,680 | ||||||
a,b,cDraftKings Inc. | 7,974,537 | 22,856,913 | ||||||
Expedia Group Inc. | 346,000 | 47,284,360 | ||||||
aFive Below Inc. | 200,000 | 25,022,000 | ||||||
aGrand Canyon Education Inc. | 243,000 | 22,346,280 | ||||||
Levi Strauss & Co., A | 1,200,000 | 21,384,000 | ||||||
MGM Resorts International | 1,073,000 | 30,580,500 | ||||||
aNVR Inc. | 9,100 | 33,092,969 | ||||||
aO’Reilly Automotive Inc. | 89,000 | 38,760,390 | ||||||
a,dPeloton Interactive Inc. A | 625,000 | 14,918,750 | ||||||
a,dRevolve Group Inc. | 360,000 | 7,473,600 | ||||||
Tractor Supply Co. | 438,500 | 41,666,270 | ||||||
aUlta Beauty Inc. | 136,500 | 31,824,975 | ||||||
aUnder Armour Inc., A | 575,500 | 11,884,075 | ||||||
Vail Resorts Inc. | 185,000 | 42,988,450 | ||||||
Wingstop Inc. | 254,000 | 21,191,220 | ||||||
|
| |||||||
| 592,937,350 | ||||||||
|
| |||||||
Consumer Staples 2.6% | ||||||||
aBellRing Brands Inc., A | 379,800 | 6,635,106 | ||||||
Church & Dwight Co. Inc. | 365,000 | 25,528,100 | ||||||
Lamb Weston Holdings Inc. | 410,000 | 31,996,400 | ||||||
McCormick & Co. Inc. | 140,000 | 22,496,600 | ||||||
|
| |||||||
| 86,656,206 | ||||||||
|
| |||||||
Energy 0.5% | ||||||||
Diamondback Energy Inc. | 200,000 | 17,152,000 | ||||||
|
| |||||||
Financials 8.1% | ||||||||
Ares Management Corp., A | 689,000 | 20,373,730 | ||||||
CBOE Global Markets Inc. | 331,000 | 38,114,650 | ||||||
MarketAxess Holdings Inc. | 148,500 | 54,735,615 | ||||||
MSCI Inc. | 237,500 | 55,708,000 | ||||||
SEI Investments Co. | 488,000 | 29,240,960 | ||||||
TCF Financial Corp. | 446,000 | 17,657,140 | ||||||
Tradeweb Markets Inc. | 685,500 | 28,619,625 | ||||||
Western Alliance Bancorp | 500,000 | 24,665,000 | ||||||
|
| |||||||
| 269,114,720 | ||||||||
|
| |||||||
58 | Semiannual Report | franklintempleton.com | ||
FRANKLIN STRATEGIC SERIES
STATEMENT OF INVESTMENTS (UNAUDITED)
FranklinSmall-Mid Cap Growth Fund(continued)
Shares
| Value
| |||||||
Common Stocks(continued) | ||||||||
Health Care 14.0% | ||||||||
aArgenx SE, ADR (Netherlands) | 73,000 | $ | 8,939,580 | |||||
aAvantor Inc. | 1,414,380 | 20,098,340 | ||||||
aDexCom Inc. | 230,414 | 35,539,055 | ||||||
aElanco Animal Health Inc. | 660,000 | 17,833,200 | ||||||
aGW Pharmaceuticals PLC, ADR (United Kingdom) | 144,700 | 19,363,754 | ||||||
aHealthEquity Inc. | 406,000 | 23,056,740 | ||||||
aHeron Therapeutics Inc. | 1,374,000 | 29,197,500 | ||||||
aIDEXX Laboratories Inc. | 198,500 | 56,574,485 | ||||||
aiRhythm Technologies Inc. | 199,450 | 13,327,249 | ||||||
a,dLivongo Health Inc. | 583,000 | 12,586,970 | ||||||
aMasimo Corp. | 102,500 | 14,943,475 | ||||||
aMettler-Toledo International Inc. | 66,000 | 46,526,040 | ||||||
aNeurocrine Biosciences Inc. | 190,042 | 18,907,278 | ||||||
aPenumbra Inc. | 181,247 | 28,269,095 | ||||||
aPTC Therapeutics Inc. | 320,000 | 13,084,800 | ||||||
aReata Pharmaceuticals Inc. | 230,500 | 47,501,440 | ||||||
aRevance Therapeutics Inc. | 575,000 | 9,004,500 | ||||||
aSage Therapeutics Inc. | 64,100 | 8,695,165 | ||||||
aSmileDirectClub Inc., A | 1,067,000 | 12,478,565 | ||||||
aVeeva Systems Inc. | 216,000 | 30,635,280 | ||||||
|
| |||||||
| 466,562,511 | ||||||||
|
| |||||||
Industrials 17.5% | ||||||||
BWX Technologies Inc. | 674,000 | 39,159,400 | ||||||
aCoStar Group Inc. | 120,800 | 66,382,016 | ||||||
Fortive Corp. | 579,500 | 39,985,500 | ||||||
IDEX Corp. | 333,500 | 51,869,255 | ||||||
aIHS Markit Ltd. | 251,915 | 17,639,088 | ||||||
L3Harris Technologies Inc. | 164,500 | 33,937,995 | ||||||
aLyft Inc., A | 417,500 | 17,301,200 | ||||||
aMercury Systems Inc. | 255,000 | 18,783,300 | ||||||
Old Dominion Freight Line Inc. | 103,455 | 18,837,086 | ||||||
Republic Services Inc. | 400,000 | 35,004,000 | ||||||
Rockwell Automation Inc. | 248,000 | 42,653,520 | ||||||
Roper Technologies Inc. | 124,630 | 41,995,325 | ||||||
Stanley Black & Decker Inc. | 202,500 | 30,644,325 | ||||||
TransUnion | 442,000 | 36,518,040 | ||||||
aUnivar Solutions Inc. | 543,795 | 11,669,841 | ||||||
aUpwork Inc. | 1,288,000 | 19,371,520 | ||||||
Verisk Analytics Inc. | 434,000 | 62,799,800 | ||||||
|
| |||||||
| 584,551,211 | ||||||||
|
| |||||||
Information Technology 28.8% | ||||||||
aAdvanced Micro Devices Inc. | 460,000 | 15,607,800 | ||||||
aAdyen NV (Netherlands) | 23,000 | 16,145,306 | ||||||
aAlteryx Inc. | 192,000 | 17,568,000 | ||||||
Amphenol Corp., A | 410,000 | 41,135,300 | ||||||
aANSYS Inc. | 151,000 | 33,242,650 | ||||||
| franklintempleton.com | Semiannual Report | 59 | ||
FRANKLIN STRATEGIC SERIES
STATEMENT OF INVESTMENTS (UNAUDITED)
FranklinSmall-Mid Cap Growth Fund(continued)
Shares
| Value
| |||||||
Common Stocks(continued) | ||||||||
Information Technology(continued) | ||||||||
aAtlassian Corp. PLC | 315,000 | $ | 38,048,850 | |||||
aBlack Knight Inc. | 748,000 | 48,021,600 | ||||||
aCloudFlare Inc., A | 784,400 | 13,209,296 | ||||||
aDocuSign Inc. | 707,000 | 46,796,330 | ||||||
aEPAM Systems Inc. | 163,000 | 28,681,480 | ||||||
aFiserv Inc. | 440,000 | 46,701,600 | ||||||
Global Payments Inc. | 328,500 | 55,575,630 | ||||||
aGoDaddy Inc., A | 776,800 | 50,515,304 | ||||||
aGuidewire Software Inc. | 321,000 | 36,189,540 | ||||||
KLA Corp. | 205,000 | 34,653,200 | ||||||
Lam Research Corp. | 71,000 | 19,243,840 | ||||||
aLattice Semiconductor Corp. | 848,335 | 16,618,883 | ||||||
Microchip Technology Inc. | 259,100 | 24,430,539 | ||||||
Monolithic Power Systems | 267,500 | 40,103,600 | ||||||
NXP Semiconductors NV (Netherlands) | 77,000 | 8,753,360 | ||||||
aOkta Inc., A | 23,000 | 2,508,610 | ||||||
aPaylocity Holding Corp. | 258,000 | 26,470,800 | ||||||
aPluralsight Inc., A | 865,000 | 15,639,200 | ||||||
aQ2 Holdings Inc. | 298,000 | 21,304,020 | ||||||
aSemtech Corp. | 75,963 | 3,833,093 | ||||||
aShopify Inc., A (Canada) | 44,000 | 13,797,080 | ||||||
aSilicon Laboratories Inc. | 98,000 | 10,411,520 | ||||||
aSquare Inc., A | 297,000 | 18,244,710 | ||||||
aSynopsys Inc. | 323,000 | 43,847,250 | ||||||
aTrimble Inc. | 523,000 | 20,836,320 | ||||||
aTwilio Inc., A | 375,000 | 36,210,000 | ||||||
aViaSat Inc. | 346,050 | 23,822,082 | ||||||
aWEX Inc. | 139,500 | 26,390,610 | ||||||
aWix.com Ltd. (Israel) | 123,000 | 15,014,610 | ||||||
Xilinx Inc. | 296,500 | 26,904,410 | ||||||
aZendesk Inc. | 317,000 | 22,396,050 | ||||||
|
| |||||||
| 958,872,473 | ||||||||
|
| |||||||
Materials 2.6% | ||||||||
Ball Corp. | 330,000 | 23,090,100 | ||||||
aIngevity Corp. | 356,780 | 30,044,444 | ||||||
Martin Marietta Materials Inc. | 124,500 | 32,607,795 | ||||||
|
| |||||||
| 85,742,339 | ||||||||
|
| |||||||
Real Estate 1.9% | ||||||||
SBA Communications Corp., A | 261,000 | 62,809,650 | ||||||
|
| |||||||
Total Common Stocks (Cost $2,452,216,254) | 3,219,940,690 | |||||||
|
| |||||||
Preferred Stocks 0.9% | ||||||||
Consumer Discretionary 0.4% | ||||||||
a,b,cProterra Inc., pfd., 5, 144A | 1,416,913 | 12,146,011 | ||||||
|
| |||||||
60 | Semiannual Report | franklintempleton.com | ||
FRANKLIN STRATEGIC SERIES
STATEMENT OF INVESTMENTS (UNAUDITED)
FranklinSmall-Mid Cap Growth Fund(continued)
Shares
| Value
| |||||||
Preferred Stocks(continued) | ||||||||
Financials 0.5% | ||||||||
a,b,cBill.com, pfd., H | 866,666 | $ | 8,437,790 | |||||
a,b,cPhononic Inc., pfd., F | 2,970,061 | 7,499,998 | ||||||
|
| |||||||
| 15,937,788 | ||||||||
|
| |||||||
Total Preferred Stocks (Cost $21,835,913) | 28,083,799 | |||||||
|
| |||||||
Total Investments before Short Term Investments (Cost $2,474,052,167) | 3,248,024,489 | |||||||
|
| |||||||
Short Term Investments 3.4% | ||||||||
Money Market Funds (Cost $81,736,824) 2.4% | ||||||||
e,fInstitutional Fiduciary Trust Money Market Portfolio, 1.56% | 81,736,824 | 81,736,824 | ||||||
|
| |||||||
gInvestments from Cash Collateral Received for Loaned Securities 1.0% | ||||||||
Money Market Funds (Cost $32,128,260) 1.0% | ||||||||
e,fInstitutional Fiduciary Trust Money Market Portfolio, 1.56% | 32,128,260 | 32,128,260 | ||||||
|
| |||||||
Total Investments (Cost $2,587,917,251) 100.9% | 3,361,889,573 | |||||||
Other Assets, less Liabilities (0.9)% | (28,921,672 | ) | ||||||
|
| |||||||
Net Assets 100.0% | $ | 3,332,967,901 | ||||||
|
| |||||||
See Abbreviations on page 87.
aNon-income producing.
bFair valued using significant unobservable inputs. See Note 11 regarding fair value measurements.
cSee Note 7 regarding restricted securities.
dA portion or all of the security is on loan at October 31, 2019. See Note 1(c).
eSee Note 3(f) regarding investments in affiliated management investment companies.
fThe rate shown is the annualizedseven-day effective yield at period end.
gSee Note 1(c) regarding securities on loan.
| franklintempleton.com | The accompanying notes are an integral part of these financial statements. | Semiannual Report | 61 | ||
FRANKLIN STRATEGIC SERIES
Statements of Assets and Liabilities
October 31, 2019 (unaudited)
| Franklin Growth Opportunities Fund | Franklin Select U.S. Equity Fund | Franklin Small Cap Growth Fund | Franklin Small-Mid Cap Growth Fund | |||||||||||||
Assets: | ||||||||||||||||
Investments in securities: | ||||||||||||||||
Cost - Unaffiliated issuers | $2,005,490,317 | $ 77,788,084 | $1,860,200,804 | $2,474,052,167 | ||||||||||||
Cost -Non-controlled affiliates (Note 3f and 8) | 23,783,796 | 556,102 | 154,136,513 | 113,865,084 | ||||||||||||
Value - Unaffiliated issuers+ | $3,910,315,982 | $ 99,964,269 | $2,505,142,026 | $3,248,024,489 | ||||||||||||
Value -Non-controlled affiliates (Note 3f and 8) | 23,783,796 | 556,102 | 153,820,213 | 113,865,084 | ||||||||||||
Receivables: | ||||||||||||||||
Investment securities sold | — | 873,114 | 19,829,191 | 24,039,059 | ||||||||||||
Capital shares sold | 1,232,496 | 4,915 | 10,440,950 | 1,879,651 | ||||||||||||
Dividends | 761,926 | 19,712 | 553,941 | 268,164 | ||||||||||||
Other assets | 1,180 | 33 | 781 | 1,069 | ||||||||||||
Total assets | 3,936,095,380 | 101,418,145 | 2,689,787,102 | 3,388,077,516 | ||||||||||||
Liabilities: | ||||||||||||||||
Payables: | ||||||||||||||||
Investment securities purchased | — | — | 28,146,728 | 16,322,693 | ||||||||||||
Capital shares redeemed | 6,064,989 | 147,516 | 13,273,796 | 3,393,644 | ||||||||||||
Management fees | 1,758,268 | 53,184 | 1,286,732 | 1,235,982 | ||||||||||||
Distribution fees | 780,488 | 27,141 | 243,103 | 691,340 | ||||||||||||
Transfer agent fees | 622,652 | 14,678 | 608,825 | 1,088,479 | ||||||||||||
Trustees’ fees and expenses | 5,167 | 86 | 3,836 | 5,006 | ||||||||||||
Professional fees | 15,616 | 23,800 | 6,901 | 20,323 | ||||||||||||
Payable upon return of securities loaned | 15,554,345 | — | 35,405,075 | 32,128,260 | ||||||||||||
Accrued expenses and other liabilities | 170,395 | 24,297 | 96,558 | 223,888 | ||||||||||||
Total liabilities | 24,971,920 | 290,702 | 79,071,554 | 55,109,615 | ||||||||||||
Net assets, at value | $3,911,123,460 | $101,127,443 | $2,610,715,548 | $3,332,967,901 | ||||||||||||
Net assets consist of: | ||||||||||||||||
Paid-in capital | $1,687,572,178 | $ 79,790,825 | $1,793,755,128 | $2,007,761,082 | ||||||||||||
Total distributable earnings (loss) | 2,223,551,282 | 21,336,618 | 816,960,420 | 1,325,206,819 | ||||||||||||
Net assets, at value | $3,911,123,460 | $101,127,443 | $2,610,715,548 | $3,332,967,901 | ||||||||||||
+Includes securities loaned | $ 15,302,503 | $ — | $ 34,191,901 | $ 31,423,386 | ||||||||||||
62 | Semiannual Report | The accompanying notes are an integral part of these financial statements. | franklintempleton.com | ||
FRANKLIN STRATEGIC SERIES
FINANCIAL STATEMENTS
Statements of Assets and Liabilities(continued)
October 31, 2019 (unaudited)
| Franklin Growth Opportunities Fund | Franklin Select U.S. Equity Fund | Franklin Small Cap Growth Fund | Franklin Small-Mid Cap Growth Fund | |||||||||||||
Class A: | ||||||||||||||||
Net assets, at value | $2,789,241,004 | $73,557,590 | $ 722,016,392 | $2,578,740,944 | ||||||||||||
Shares outstanding | 69,979,006 | 4,614,075 | 33,630,088 | 70,419,771 | ||||||||||||
Net asset value per sharea | $39.86 | $15.94 | $21.47 | $36.62 | ||||||||||||
Maximum offering price per share (net asset value per share ÷ 94.50%) | $42.18 | $16.87 | $22.72 | $38.75 | ||||||||||||
Class C: | ||||||||||||||||
Net assets, at value | $ 216,250,250 | $13,464,759 | $ 80,254,117 | $ 149,569,723 | ||||||||||||
Shares outstanding | 6,636,085 | 913,379 | 4,693,894 | 6,099,402 | ||||||||||||
Net asset value and maximum offering price per sharea | $32.59 | $14.74 | $17.10 | $24.52 | ||||||||||||
Class R: | ||||||||||||||||
Net assets, at value | $ 33,409,183 | $ 149,495 | $ 64,848,351 | $ 46,914,370 | ||||||||||||
Shares outstanding | 883,935 | 9,577 | 3,220,520 | 1,416,536 | ||||||||||||
Net asset value and maximum offering price per share | $37.80 | $15.61 | $20.14 | $33.12 | ||||||||||||
Class R6: | ||||||||||||||||
Net assets, at value | $ 384,159,012 | $ 870,705 | $1,080,672,325 | $ 246,719,463 | ||||||||||||
Shares outstanding | 8,765,396 | 53,085 | 45,424,713 | 5,974,927 | ||||||||||||
Net asset value and maximum offering price per share | $43.83 | $16.40 | $23.79 | $41.29 | ||||||||||||
Advisor Class: | ||||||||||||||||
Net assets, at value | $ 488,064,011 | $13,084,894 | $ 662,924,363 | $ 311,023,401 | ||||||||||||
Shares outstanding | 11,286,535 | 802,933 | 28,314,648 | 7,672,994 | ||||||||||||
Net asset value and maximum offering price per share | $43.24 | $16.30 | $23.41 | $40.53 | ||||||||||||
aRedemption price is equal to net asset value less contingent deferred sales charges, if applicable.
| franklintempleton.com | The accompanying notes are an integral part of these financial statements. | Semiannual Report | 63 | ||
FRANKLIN STRATEGIC SERIES
FINANCIAL STATEMENTS
Statements of Operations
for the six months ended October 31, 2019 (unaudited)
| Franklin Growth Opportunities Fund | Franklin Select U.S. | Franklin Small Cap | Franklin Small-Mid Cap Growth Fund | |||||||||||||
Investment income: | ||||||||||||||||
Dividends: (net of foreign taxes)* | ||||||||||||||||
Unaffiliated issuers | $ 10,350,472 | $ 506,975 | $ 5,764,735 | $ 9,430,972 | ||||||||||||
Non-controlled affiliates (Note 3f and 8) | 343,805 | 17,721 | 654,945 | 1,064,574 | ||||||||||||
Income from securities loaned: | ||||||||||||||||
Unaffiliated issuers (net of fees and rebates) | 1,433,117 | — | 557,207 | 573,653 | ||||||||||||
Non-controlled affiliates (Note 3f) | 109,633 | — | 252,375 | 231,172 | ||||||||||||
|
| |||||||||||||||
Total investment income | 12,237,027 | 524,696 | 7,229,262 | 11,300,371 | ||||||||||||
|
| |||||||||||||||
Expenses: | ||||||||||||||||
Management fees (Note 3a) | 10,794,057 | 499,378 | 8,083,077 | 7,876,363 | ||||||||||||
Distribution fees: (Note 3c) | ||||||||||||||||
Class A | 3,508,271 | 93,105 | 885,546 | 3,318,746 | ||||||||||||
Class C | 1,152,194 | 72,321 | 424,220 | 813,617 | ||||||||||||
Class R | 87,764 | 365 | 174,707 | 122,503 | ||||||||||||
Transfer agent fees: (Note 3e) | ||||||||||||||||
Class A | 1,948,730 | 52,039 | 656,039 | 2,203,177 | ||||||||||||
Class C | 159,993 | 10,105 | 78,572 | 135,009 | ||||||||||||
Class R | 24,481 | 102 | 64,721 | 41,224 | ||||||||||||
Class R6 | 51,318 | 380 | 197,445 | 53,536 | ||||||||||||
Advisor Class | 344,250 | 10,633 | 640,856 | 275,903 | ||||||||||||
Custodian fees (Note 4) | 17,907 | 662 | 17,014 | 14,061 | ||||||||||||
Reports to shareholders | 151,408 | 11,337 | 77,283 | 164,203 | ||||||||||||
Registration and filing fees | 83,587 | 43,054 | 58,458 | 91,992 | ||||||||||||
Professional fees | 35,807 | 23,685 | 32,133 | 33,155 | ||||||||||||
Trustees’ fees and expenses | 28,710 | 756 | 19,576 | 26,078 | ||||||||||||
Other | 35,729 | 25,183 | 25,978 | 32,170 | ||||||||||||
|
| |||||||||||||||
Total expenses | 18,424,206 | 843,105 | 11,435,625 | 15,201,737 | ||||||||||||
Expense reductions (Note 4) | (903 | ) | (5 | ) | (94 | ) | (201 | ) | ||||||||
Expenses waived/paid by affiliates (Note 3f and 3g) | (87,919 | ) | (156,228 | ) | (259,552 | ) | (267,409 | ) | ||||||||
|
| |||||||||||||||
Net expenses | 18,335,384 | 686,872 | 11,175,979 | 14,934,127 | ||||||||||||
|
| |||||||||||||||
Net investment income (loss) | (6,098,357 | ) | (162,176 | ) | (3,946,717 | ) | (3,633,756 | ) | ||||||||
|
| |||||||||||||||
Realized and unrealized gains (losses): | ||||||||||||||||
Net realized gain (loss) from: | ||||||||||||||||
Investments: | ||||||||||||||||
Unaffiliated issuers | 105,097,678 | (680,222 | ) | 52,396,134 | 146,751,603 | |||||||||||
Non-controlled affiliates (Note 3f and 8) | — | — | 5,793,115 | — | ||||||||||||
Foreign currency transactions | — | (13 | ) | 1,570 | (4,178 | ) | ||||||||||
|
| |||||||||||||||
Net realized gain (loss) | 105,097,678 | (680,235 | ) | 58,190,819 | 146,747,425 | |||||||||||
|
| |||||||||||||||
Net change in unrealized appreciation (depreciation) on: | ||||||||||||||||
Investments: | ||||||||||||||||
Unaffiliated issuers | (69,811,783 | ) | 3,158,071 | (53,261,189 | ) | (193,512,962 | ) | |||||||||
Non-controlled affiliates (Note 3f and 8) | — | — | 2,066,112 | — | ||||||||||||
|
| |||||||||||||||
64 | Semiannual Report | The accompanying notes are an integral part of these financial statements. | franklintempleton.com | ||
FRANKLIN STRATEGIC SERIES
FINANCIAL STATEMENTS
Statements of Operations(continued)
for the six months ended October 31, 2019 (unaudited)
| Franklin Growth Opportunities Fund | Franklin Select U.S. Equity Fund | Franklin Small Cap | Franklin Small-Mid Cap Growth Fund | |||||||||||||
Net change in unrealized appreciation (depreciation) | $ (69,811,783 | ) | $ 3,158,071 | $(51,195,077 | ) | $(193,512,962 | ) | |||||||||
Net realized and unrealized gain (loss) | 35,285,895 | 2,477,836 | 6,995,742 | (46,765,537 | ) | |||||||||||
Net increase (decrease) in net assets resulting from operations | $ 29,187,538 | $ 2,315,660 | $ 3,049,025 | $ (50,399,293 | ) | |||||||||||
*Foreign taxes withheld on dividends | $ 139 | $ 544 | $ — | $ 204 | ||||||||||||
| franklintempleton.com | The accompanying notes are an integral part of these financial statements. | Semiannual Report | 65 | ||
FRANKLIN STRATEGIC SERIES
FINANCIAL STATEMENTS
Statements of Changes in Net Assets
Franklin Growth Opportunities Fund | Franklin Select U.S. Equity Fund | |||||||||||||||
| Six Months Ended October 31, 2019 (unaudited) | Year Ended April 30, 2019 | Six Months Ended October 31, 2019 (unaudited) | Year Ended April 30, 2019 | |||||||||||||
Increase (decrease) in net assets: | ||||||||||||||||
Operations: | ||||||||||||||||
Net investment income (loss) | $ (6,098,357 | ) | $ (12,309,279 | ) | $ (162,176 | ) | $ (311,623 | ) | ||||||||
Net realized gain (loss) | 105,097,678 | 459,863,571 | (680,235 | ) | 515,616 | |||||||||||
Net change in unrealized appreciation (depreciation) | (69,811,783 | ) | 124,321,685 | 3,158,071 | 11,651,347 | |||||||||||
|
| |||||||||||||||
Net increase (decrease) in net assets resulting from operations | 29,187,538 | 571,875,977 | 2,315,660 | 11,855,340 | ||||||||||||
|
| |||||||||||||||
Distributions to shareholders: | ||||||||||||||||
Class A | — | (270,776,543 | ) | — | (9,068,158 | ) | ||||||||||
Class C | — | (29,467,299 | ) | — | (2,096,439 | ) | ||||||||||
Class R | — | (3,826,333 | ) | — | (17,405 | ) | ||||||||||
Class R6 | — | (36,746,123 | ) | — | (112,384 | ) | ||||||||||
Advisor Class | — | (56,405,582 | ) | — | (1,714,775 | ) | ||||||||||
|
| |||||||||||||||
Total distributions to shareholders | — | (397,221,880 | ) | — | (13,009,161 | ) | ||||||||||
|
| |||||||||||||||
Capital share transactions: (Note 2) | ||||||||||||||||
Class A | (50,453,322 | ) | 274,938,208 | (5,591,029 | ) | 13,281,422 | ||||||||||
Class C | (29,356,603 | ) | (164,852,400 | ) | (2,572,295 | ) | (1,890,912 | ) | ||||||||
Class R | (3,860,303 | ) | (765,911 | ) | 1,270 | 11,435 | ||||||||||
Class R6 | (37,186,352 | ) | 25,388,596 | (124,921 | ) | 44,676 | ||||||||||
Advisor Class | (23,030,893 | ) | (101,787,858 | ) | (15,616,499 | ) | 17,229,063 | |||||||||
|
| |||||||||||||||
Total capital share transactions | (143,887,473 | ) | 32,920,635 | (23,903,474 | ) | 28,675,684 | ||||||||||
|
| |||||||||||||||
Net increase (decrease) in net assets | (114,699,935 | ) | 207,574,732 | (21,587,814 | ) | 27,521,863 | ||||||||||
Net assets: | ||||||||||||||||
Beginning of period | 4,025,823,395 | 3,818,248,663 | 122,715,257 | 95,193,394 | ||||||||||||
|
| |||||||||||||||
End of period | $3,911,123,460 | $4,025,823,395 | $101,127,443 | $122,715,257 | ||||||||||||
|
| |||||||||||||||
66 | Semiannual Report | The accompanying notes are an integral part of these financial statements. | franklintempleton.com | ||
FRANKLIN STRATEGIC SERIES
FINANCIAL STATEMENTS
Statements of Changes in Net Assets(continued)
Franklin Small Cap Growth Fund | Franklin Small-Mid Cap Growth Fund | |||||||||||||||
| Six Months Ended October 31, 2019 (unaudited) | Year Ended April 30, 2019 | Six Months Ended October 31, 2019 (unaudited) | Year Ended April 30, 2019 | |||||||||||||
Increase (decrease) in net assets: | ||||||||||||||||
Operations: | ||||||||||||||||
Net investment income (loss) | $ (3,946,717 | ) | $ (12,755,804 | ) | $ (3,633,756 | ) | $ (8,359,866 | ) | ||||||||
Net realized gain (loss) | 58,190,819 | 359,902,029 | 146,747,425 | 651,025,562 | ||||||||||||
Net change in unrealized appreciation (depreciation) | (51,195,077 | ) | 33,288,454 | (193,512,962 | ) | (99,480,161 | ) | |||||||||
|
| |||||||||||||||
Net increase (decrease) in net assets resulting from operations | 3,049,025 | 380,434,679 | (50,399,293 | ) | 543,185,535 | |||||||||||
|
| |||||||||||||||
Distributions to shareholders: | ||||||||||||||||
Class A | — | (119,248,780 | ) | — | (273,591,265 | ) | ||||||||||
Class C | — | (19,107,819 | ) | — | (25,744,621 | ) | ||||||||||
Class R | — | (13,109,783 | ) | — | (8,327,251 | ) | ||||||||||
Class R6 | — | (158,804,029 | ) | — | (27,160,456 | ) | ||||||||||
Advisor Class | — | (120,036,837 | ) | — | (54,511,212 | ) | ||||||||||
|
| |||||||||||||||
Total distributions to shareholders | — | (430,307,248 | ) | — | (389,334,805 | ) | ||||||||||
|
| |||||||||||||||
Capital share transactions: (Note 2) | ||||||||||||||||
Class A | 7,981,838 | 66,793,851 | (65,055,581 | ) | 299,393,170 | |||||||||||
Class C | (9,846,989 | ) | (37,156,667 | ) | (20,925,731 | ) | (163,688,617 | ) | ||||||||
Class R | (9,385,704 | ) | 5,850,633 | (2,991,546 | ) | (20,982,789 | ) | |||||||||
Class R6 | (6,163,957 | ) | 156,516,510 | (8,872,230 | ) | (34,742,726 | ) | |||||||||
Advisor Class | (63,570,954 | ) | 29,111,361 | (41,167,310 | ) | (176,059,390 | ) | |||||||||
|
| |||||||||||||||
Total capital share transactions | (80,985,766 | ) | 221,115,688 | (139,012,398 | ) | (96,080,352 | ) | |||||||||
|
| |||||||||||||||
Net increase (decrease) in net assets | (77,936,741 | ) | 171,243,119 | (189,411,691 | ) | 57,770,378 | ||||||||||
Net assets: | ||||||||||||||||
Beginning of period | 2,688,652,289 | 2,517,409,170 | 3,522,379,592 | 3,464,609,214 | ||||||||||||
|
| |||||||||||||||
End of period | $2,610,715,548 | $2,688,652,289 | $3,332,967,901 | $3,522,379,592 | ||||||||||||
|
| |||||||||||||||
| franklintempleton.com | The accompanying notes are an integral part of these financial statements. | Semiannual Report | 67 | ||
FRANKLIN STRATEGIC SERIES
Notes to Financial Statements (unaudited)
1. Organization and Significant Accounting Policies
Franklin Strategic Series (Trust) is registered under the Investment Company Act of 1940 (1940 Act) as anopen-end management investment company, consisting of twelve separate funds, four of which are included in this report (Funds) and applies the specialized accounting and reporting guidance in U.S. Generally Accepted Accounting Principles (U.S. GAAP). The Funds offer five classes of shares: Class A, Class C, Class R, Class R6, and Advisor Class. Class C shares automatically convert to Class A shares after they have been held for 10 years. Each class of shares may differ by its initial sales load, contingent deferred sales charges, voting rights on matters affecting a single class, its exchange privilege and fees due to differing arrangements for distribution and transfer agent fees.
Franklin Select U.S. Equity Fund was closed to new investors with limited exceptions effective at the close of market August 27, 2019.
The following summarizes the Funds’ significant accounting policies.
a. Financial Instrument Valuation
The Funds’ investments in financial instruments are carried at fair value daily. Fair value is the price that would be received to sell an asset or paid to transfer a liability in an orderly transaction between market participants on the measurement date. The Funds calculate the net asset value (NAV) per share each business day as of 4 p.m. Eastern time or the regularly scheduled close of the New York Stock Exchange (NYSE), whichever is earlier. Under compliance policies and procedures approved by the Trust’s Board of Trustees (the Board), the Funds’ administrator has responsibility for oversight of valuation, including leading the cross-functional Valuation Committee (VC). The Funds may utilize independent pricing services, quotations from securities and financial instrument dealers, and other market sources to determine fair value.
Equity securities listed on an exchange or on the NASDAQ National Market System are valued at the last quoted sale price or the official closing price of the day, respectively. Foreign equity securities are valued as of the close of trading on the foreign stock exchange on which the security is primarily traded, or as of 4 p.m. Eastern time. The value is then converted into its U.S. dollar equivalent at the foreign exchange rate in effect at 4 p.m. Eastern time on the day that
the value of the security is determined.Over-the-counter (OTC) securities are valued within the range of the most recent quoted bid and ask prices. Securities that trade in multiple markets or on multiple exchanges are valued according to the broadest and most representative market. Certain equity securities are valued based upon fundamental characteristics or relationships to similar securities.
Investments inopen-end mutual funds are valued at the closing NAV.
The Funds have procedures to determine the fair value of financial instruments for which market prices are not reliable or readily available. Under these procedures, the Funds primarily employ a market-based approach which may use related or comparable assets or liabilities, recent transactions, market multiples, book values, and other relevant information for the investment to determine the fair value of the investment. An income-based valuation approach may also be used in which the anticipated future cash flows of the investment are discounted to calculate fair value. Discounts may also be applied due to the nature or duration of any restrictions on the disposition of the investments. Due to the inherent uncertainty of valuations of such investments, the fair values may differ significantly from the values that would have been used had an active market existed.
Trading in securities on foreign securities stock exchanges and OTC markets may be completed before 4 p.m. Eastern time. In addition, trading in certain foreign markets may not take place on every Funds’ business day. Occasionally, events occur between the time at which trading in a foreign security is completed and 4 p.m. Eastern time that might call into question the reliability of the value of a portfolio security held by the Fund. As a result, differences may arise between the value of the Funds’ portfolio securities as determined at the foreign market close and the latest indications of value at 4 p.m. Eastern time. In order to minimize the potential for these differences, the VC monitors price movements following the close of trading in foreign stock markets through a series of country specific market proxies (such as baskets of American Depositary Receipts, futures contracts and exchange traded funds). These price movements are measured against established trigger thresholds for each specific market proxy to assist in determining if an event has occurred that may call into question the reliability of the values of the foreign securities held by the Funds. If such an
68 | Semiannual Report | franklintempleton.com | ||
FRANKLIN STRATEGIC SERIES
NOTES TO FINANCIAL STATEMENTS (UNAUDITED)
event occurs, the securities may be valued using fair value procedures, which may include the use of independent pricing services.
When the last day of the reporting period is anon-business day, certain foreign markets may be open on those days that the Funds’ NAV is not calculated, which could result in differences between the value of the Funds’ portfolio securities on the last business day and the last calendar day of the reporting period. Any significant security valuation changes due to an open foreign market are adjusted and reflected by the Funds for financial reporting purposes.
b. Foreign Currency Translation
Portfolio securities and other assets and liabilities denominated in foreign currencies are translated into U.S. dollars based on the exchange rate of such currencies against U.S. dollars on the date of valuation. The Funds may enter into foreign currency exchange contracts to facilitate transactions denominated in a foreign currency. Purchases and sales of securities, income and expense items denominated in foreign currencies are translated into U.S. dollars at the exchange rate in effect on the transaction date. Portfolio securities and assets and liabilities denominated in foreign currencies contain risks that those currencies will decline in value relative to the U.S. dollar. Occasionally, events may impact the availability or reliability of foreign exchange rates used to convert the U.S. dollar equivalent value. If such an event occurs, the foreign exchange rate will be valued at fair value using procedures established and approved by the Board.
The Funds do not separately report the effect of changes in foreign exchange rates from changes in market prices on securities held. Such changes are included in net realized and unrealized gain or loss from investments in the Statements of Operations.
Realized foreign exchange gains or losses arise from sales of foreign currencies, currency gains or losses realized between the trade and settlement dates on securities transactions and the difference between the recorded amounts of dividends, interest, and foreign withholding taxes and the U.S. dollar equivalent of the amounts actually received or paid. Net unrealized foreign exchange gains and losses arise from changes in foreign exchange rates on foreign denominated assets and liabilities other than investments in securities held at the end of the reporting period.
c. Securities Lending
Certain or all Funds participate in an agency based securities lending program to earn additional income. The Fund receives cash collateral against the loaned securities in an amount equal to at least 102% of the fair value of the loaned securities. Collateral is maintained over the life of the loan in an amount not less than 100% of the fair value of loaned securities, as determined at the close of Fund business each day; any additional collateral required due to changes in security values is delivered to the Fund on the next business day. The collateral is deposited into a joint cash account with other funds and is used to invest in a money market fund managed by Franklin Advisers, Inc., an affiliate of the Funds and/or uninvested cash as included in due from custodian in the Statements of Assets and Liabilities. The Fund may receive income from the investment of cash collateral, in addition to lending fees and rebates paid by the borrower. Income from securities loaned, net of fees paid to the securities lending agent and/or third-party vendor, is reported separately in the Statements of Operations. The Fund bears the market risk with respect to the collateral investment, securities loaned, and the risk that the agent may default on its obligations to the Fund. If the borrower defaults on its obligation to return the securities loaned, the Fund has the right to repurchase the securities in the open market using the collateral received. The securities lending agent has agreed to indemnify the Fund in the event of default by a third party borrower. At October 31, 2019, Franklin Select U.S. Equity Fund had no securities on loan.
d. Income and Deferred Taxes
It is each Fund’s policy to qualify as a regulated investment company under the Internal Revenue Code. Each Fund intends to distribute to shareholders substantially all of its taxable income and net realized gains to relieve it from federal income and excise taxes. As a result, no provision for U.S. federal income taxes is required.
The Funds may be subject to foreign taxation related to income received, capital gains on the sale of securities and certain foreign currency transactions in the foreign jurisdictions in which the Funds invest. Foreign taxes, if any, are recorded based on the tax regulations and rates that exist in the foreign markets in which the Funds invest. When a capital gain tax is determined to apply, certain or all Funds record an estimated deferred tax liability in an amount that would be payable if the securities were disposed of on the valuation date.
| franklintempleton.com | Semiannual Report | 69 | ||
FRANKLIN STRATEGIC SERIES
NOTES TO FINANCIAL STATEMENTS (UNAUDITED)
1. Organization and Significant Accounting
Policies(continued)
d. Income and Deferred Taxes(continued)
Each Fund may recognize an income tax liability related to its uncertain tax positions under U.S. GAAP when the uncertain tax position has a less than 50% probability that it will be sustained upon examination by the tax authorities based on its technical merits. As of October 31, 2019, each Fund has determined that no tax liability is required in its financial statements related to uncertain tax positions for any open tax years (or expected to be taken in future tax years). Open tax years are those that remain subject to examination and are based on the statute of limitations in each jurisdiction in which the Fund invests.
e. Security Transactions, Investment Income, Expenses and Distributions
Security transactions are accounted for on trade date. Realized gains and losses on security transactions are determined on a specific identification basis. Interest income and estimated expenses are accrued daily. Dividend income is recorded on theex-dividend date except for certain dividends from securities where the dividend rate is not available. In such cases, the dividend is recorded as soon as the information is received by the Funds. Distributions to shareholders are recorded on theex-dividend date. Distributable earnings are determined according to income tax regulations (tax basis) and may differ from earnings recorded in accordance with U.S. GAAP. These differences may be permanent or temporary. Permanent differences are reclassified among capital accounts to reflect their tax character. These reclassifications have no impact on net assets or the results of operations. Temporary differences are not reclassified, as they may reverse in subsequent periods.
Common expenses incurred by the Trust are allocated among the Funds based on the ratio of net assets of each Fund to the combined net assets of the Trust or based on the ratio of number of shareholders of each Fund to the combined number of shareholders of the Trust. Fund specific expenses are charged directly to the Fund that incurred the expense.
Realized and unrealized gains and losses and net investment income, excluding class specific expenses, are allocated daily to each class of shares based upon the relative proportion of net assets of each class. Differences in per share distributions by class are generally due to differences in class specific expenses.
f. Accounting Estimates
The preparation of financial statements in accordance with U.S. GAAP requires management to make estimates and assumptions that affect the reported amounts of assets and liabilities at the date of the financial statements and the amounts of income and expenses during the reporting period. Actual results could differ from those estimates.
g. Guarantees and Indemnifications
Under the Trust’s organizational documents, its officers and trustees are indemnified by the Trust against certain liabilities arising out of the performance of their duties to the Trust. Additionally, in the normal course of business, the Trust, on behalf of the Funds, enters into contracts with service providers that contain general indemnification clauses. The Trust’s maximum exposure under these arrangements is unknown as this would involve future claims that may be made against the Trust that have not yet occurred. Currently, the Trust expects the risk of loss to be remote.
70 | Semiannual Report | franklintempleton.com | ||
FRANKLIN STRATEGIC SERIES
NOTES TO FINANCIAL STATEMENTS (UNAUDITED)
2. Shares of Beneficial Interest
At October 31, 2019, there were an unlimited number of shares authorized (without par value). Transactions in the Funds’ shares were as follows:
| Franklin Growth | Franklin Select U.S. | |||||||||||||||
| Opportunities Fund | Equity Fund | |||||||||||||||
| Shares | Amount | Shares | Amount | |||||||||||||
Class A Shares: | ||||||||||||||||
Six Months ended October 31, 2019 | ||||||||||||||||
Shares solda | 4,478,771 | $ | 177,356,470 | 249,217 | $ | 3,848,909 | ||||||||||
Shares redeemed | (5,749,177 | ) | (227,809,792 | ) | (613,604 | ) | (9,439,938 | ) | ||||||||
Net increase (decrease) | (1,270,406 | ) | $ | (50,453,322 | ) | (364,387 | ) | $ | (5,591,029 | ) | ||||||
Year ended April 30, 2019 | ||||||||||||||||
Shares solda | 11,527,502 | $ | 446,798,931 | 1,406,734 | $ | 21,698,694 | ||||||||||
Shares issued in reinvestment of distributions | 7,925,459 | 253,773,429 | 686,186 | 9,057,652 | ||||||||||||
Shares redeemed | (11,143,246 | ) | (425,634,152 | ) | (1,132,089 | ) | (17,474,924 | ) | ||||||||
Net increase (decrease) | 8,309,715 | $ | 274,938,208 | 960,831 | $ | 13,281,422 | ||||||||||
Class C Shares: | ||||||||||||||||
Six Months ended October 31, 2019 | ||||||||||||||||
Shares sold | 543,149 | $ | 17,667,935 | 71,337 | $ | 1,009,490 | ||||||||||
Shares redeemeda | (1,439,508 | ) | (47,024,538 | ) | (248,397 | ) | (3,581,785 | ) | ||||||||
Net increase (decrease) | (896,359 | ) | $ | (29,356,603 | ) | (177,060 | ) | $ | (2,572,295 | ) | ||||||
Year ended April 30, 2019 | ||||||||||||||||
Shares sold | 1,419,843 | $ | 46,769,565 | 246,596 | $ | 3,641,767 | ||||||||||
Shares issued in reinvestment of distributions | 1,096,405 | 28,890,280 | 169,618 | 2,082,903 | ||||||||||||
Shares redeemeda | (7,237,389 | ) | (240,512,245 | ) | (499,994 | ) | (7,615,582 | ) | ||||||||
Net increase (decrease) | (4,721,141 | ) | $ | (164,852,400 | ) | (83,780 | ) | $ | (1,890,912 | ) | ||||||
Class R Shares: | ||||||||||||||||
Six Months ended October 31, 2019 | ||||||||||||||||
Shares sold | 66,124 | $ | 2,476,833 | 88 | $ | 1,329 | ||||||||||
Shares redeemed | (169,936 | ) | (6,337,136 | ) | (4 | ) | (59 | ) | ||||||||
Net increase (decrease) | (103,812 | ) | $ | (3,860,303 | ) | 84 | $ | 1,270 | ||||||||
Year ended April 30, 2019 | ||||||||||||||||
Shares sold | 181,946 | $ | 6,761,234 | 435 | $ | 6,572 | ||||||||||
Shares issued in reinvestment of distributions | 123,799 | 3,767,199 | 1,344 | 17,405 | ||||||||||||
Shares redeemed | (308,476 | ) | (11,294,344 | ) | (776 | ) | (12,542 | ) | ||||||||
Net increase (decrease) | (2,731 | ) | $ | (765,911 | ) | 1,003 | $ | 11,435 | ||||||||
| franklintempleton.com | Semiannual Report | 71 | ||
FRANKLIN STRATEGIC SERIES
NOTES TO FINANCIAL STATEMENTS (UNAUDITED)
2. Shares of Beneficial Interest(continued)
| Franklin Growth | Franklin Select U.S. | |||||||||||||||
| Opportunities Fund | Equity Fund | |||||||||||||||
| Shares | Amount | Shares | Amount | |||||||||||||
Class R6 Shares: | ||||||||||||||||
Six Months ended October 31, 2019 | ||||||||||||||||
Shares sold | 488,440 | $ | 21,202,933 | 1,972 | $ | 31,751 | ||||||||||
Shares redeemed | (1,352,978 | ) | (58,389,285 | ) | (9,832 | ) | (156,672 | ) | ||||||||
Net increase (decrease) | (864,538 | ) | $ | (37,186,352 | ) | (7,860 | ) | $ | (124,921 | ) | ||||||
Year ended April 30, 2019 | ||||||||||||||||
Shares sold | 1,593,233 | $ | 65,447,277 | 14,436 | $ | 230,801 | ||||||||||
Shares issued in reinvestment of distributions | 798,910 | 28,041,731 | 8,300 | 112,384 | ||||||||||||
Shares redeemed | (1,611,469 | ) | (68,100,412 | ) | (18,245 | ) | (298,509 | ) | ||||||||
Net increase (decrease) | 780,674 | $ | 25,388,596 | 4,491 | $ | 44,676 | ||||||||||
Advisor Class Shares: | ||||||||||||||||
Six Months ended October 31, 2019 | ||||||||||||||||
Shares sold | 596,913 | $ | 25,555,047 | 103,100 | $ | 1,616,019 | ||||||||||
Shares redeemed | (1,135,649 | ) | (48,585,940 | ) | (1,110,371 | ) | (17,232,518 | ) | ||||||||
Net increase (decrease) | (538,736 | ) | $ | (23,030,893 | ) | (1,007,271 | ) | $ | (15,616,499 | ) | ||||||
Year ended April 30, 2019 | ||||||||||||||||
Shares sold | 4,826,217 | $ | 192,490,364 | 1,588,134 | $ | 23,675,471 | ||||||||||
Shares issued in reinvestment of distributions | 1,596,331 | 55,344,783 | 111,006 | 1,494,146 | ||||||||||||
Shares redeemed | (8,711,497 | ) | (349,623,005 | ) | (519,636 | ) | (7,940,554 | ) | ||||||||
Net increase (decrease) | (2,288,949 | ) | $ | (101,787,858 | ) | 1,179,504 | $ | 17,229,063 | ||||||||
| Franklin | ||||||||||||||||
| Franklin Small Cap | Small-Mid Cap | |||||||||||||||
| Growth Fund | Growth Fund | |||||||||||||||
| Shares | Amount | Shares | Amount | |||||||||||||
Class A Shares: | ||||||||||||||||
Six Months ended October 31, 2019 | ||||||||||||||||
Shares solda | 3,790,132 | $ | 79,722,081 | 4,478,136 | $ | 164,909,514 | ||||||||||
Shares redeemed | (3,406,646 | ) | (71,740,243 | ) | (6,277,331 | ) | (229,965,095 | ) | ||||||||
Net increase (decrease) | 383,486 | $ | 7,981,838 | (1,799,195 | ) | $ | (65,055,581 | ) | ||||||||
Year ended April 30, 2019 | ||||||||||||||||
Shares solda | 7,109,392 | $ | 159,713,318 | 14,858,754 | $ | 536,401,847 | ||||||||||
Shares issued in reinvestment of distributions | 6,425,425 | 111,866,657 | 8,741,011 | 259,433,312 | ||||||||||||
Shares redeemed | (9,200,387 | ) | (204,786,124 | ) | (14,104,259 | ) | (496,441,989 | ) | ||||||||
Net increase (decrease) | 4,334,430 | $ | 66,793,851 | 9,495,506 | $ | 299,393,170 | ||||||||||
72 | Semiannual Report | franklintempleton.com | ||
FRANKLIN STRATEGIC SERIES
NOTES TO FINANCIAL STATEMENTS (UNAUDITED)
| Franklin | ||||||||||||||||
| Franklin Small Cap | Small-Mid Cap | |||||||||||||||
| Growth Fund | Growth Fund | |||||||||||||||
| Shares | Amount | Shares | Amount | |||||||||||||
Class C Shares: | ||||||||||||||||
Six Months ended October 31, 2019 | ||||||||||||||||
Shares sold | 234,700 | $ | 3,955,261 | 372,826 | $ | 9,227,449 | ||||||||||
Shares redeemeda | (817,272 | ) | (13,802,250 | ) | (1,211,466 | ) | (30,153,180 | ) | ||||||||
Net increase (decrease) | (582,572 | ) | $ | (9,846,989 | ) | (838,640 | ) | $ | (20,925,731 | ) | ||||||
Year ended April 30, 2019 | ||||||||||||||||
Shares sold | 616,858 | $ | 10,919,327 | 1,512,688 | $ | 38,650,988 | ||||||||||
Shares issued in reinvestment of distributions | 1,309,694 | 18,270,229 | 1,265,311 | 25,318,892 | ||||||||||||
Shares redeemeda | (3,457,014 | ) | (66,346,223 | ) | (8,796,878 | ) | (227,658,497 | ) | ||||||||
Net increase (decrease) | (1,530,462 | ) | $ | (37,156,667 | ) | (6,018,879 | ) | $ | (163,688,617 | ) | ||||||
Class R Shares: | ||||||||||||||||
Six Months ended October 31, 2019 | ||||||||||||||||
Shares sold | 262,002 | $ | 5,179,252 | 124,681 | $ | 4,178,940 | ||||||||||
Shares redeemed | (745,014 | ) | (14,564,956 | ) | (215,218 | ) | (7,170,486 | ) | ||||||||
Net increase (decrease) | (483,012 | ) | $ | (9,385,704 | ) | (90,537 | ) | $ | (2,991,546 | ) | ||||||
Year ended April 30, 2019 | ||||||||||||||||
Shares sold | 1,090,360 | $ | 23,643,908 | 402,799 | $ | 13,332,859 | ||||||||||
Shares issued in reinvestment of distributions | 792,641 | 12,967,603 | 300,662 | 8,087,803 | ||||||||||||
Shares redeemed | (1,435,500 | ) | (30,760,878 | ) | (1,329,075 | ) | (42,403,451 | ) | ||||||||
Net increase (decrease) | 447,501 | $ | 5,850,633 | (625,614 | ) | $ | (20,982,789 | ) | ||||||||
Class R6 Shares: | ||||||||||||||||
Six Months ended October 31, 2019 | ||||||||||||||||
Shares sold | 5,141,698 | $ | 120,182,466 | 797,951 | $ | 33,141,813 | ||||||||||
Shares redeemed | (5,417,408 | ) | (126,346,423 | ) | (1,016,664 | ) | (42,014,043 | ) | ||||||||
Net increase (decrease) | (275,710 | ) | $ | (6,163,957 | ) | (218,713 | ) | $ | (8,872,230 | ) | ||||||
Year ended April 30, 2019 | ||||||||||||||||
Shares sold | 14,008,871 | $ | 340,717,317 | 2,051,263 | $ | 81,360,684 | ||||||||||
Shares issued in reinvestment of distributions | 7,029,042 | 135,098,188 | 733,010 | 24,453,238 | ||||||||||||
Shares redeemed | (12,935,223 | ) | (319,298,995 | ) | (3,502,497 | ) | (140,556,648 | ) | ||||||||
Net increase (decrease) | 8,102,690 | $ | 156,516,510 | (718,224 | ) | $ | (34,742,726 | ) | ||||||||
| franklintempleton.com | Semiannual Report | 73 | ||
FRANKLIN STRATEGIC SERIES
NOTES TO FINANCIAL STATEMENTS (UNAUDITED)
2. Shares of Beneficial Interest(continued)
| Franklin | ||||||||||||||||
| Franklin Small Cap | Small-Mid Cap | |||||||||||||||
| Growth Fund | Growth Fund | |||||||||||||||
| Shares | Amount | Shares | Amount | |||||||||||||
Advisor Class Shares: | ||||||||||||||||
Six Months ended October 31, 2019 | ||||||||||||||||
Shares sold | 1,885,752 | $ | 43,189,165 | 654,547 | $ | 26,636,485 | ||||||||||
Shares redeemed | (4,617,492 | ) | (106,760,119 | ) | (1,624,785 | ) | (67,803,795 | ) | ||||||||
Net increase (decrease) | (2,731,740 | ) | $ | (63,570,954 | ) | (970,238 | ) | $ | (41,167,310 | ) | ||||||
Year ended April 30, 2019 | ||||||||||||||||
Shares sold | 6,621,879 | $ | 160,225,038 | 3,117,800 | $ | 123,344,447 | ||||||||||
Shares issued in reinvestment of distributions | 5,738,085 | 108,679,322 | 1,592,925 | 52,232,005 | ||||||||||||
Shares redeemed | (10,287,992 | ) | (239,792,999 | ) | (9,309,703 | ) | (351,635,842 | ) | ||||||||
Net increase (decrease) | 2,071,972 | $ | 29,111,361 | (4,598,978 | ) | $ | (176,059,390 | ) | ||||||||
aMay include a portion of Class C shares that were automatically converted to Class A.
3. Transactions with Affiliates
Franklin Resources, Inc. is the holding company for various subsidiaries that together are referred to as Franklin Templeton. Certain officers and trustees of the Trust are also officers and/or directors of the following subsidiaries:
| Subsidiary | Affiliation | |
Franklin Advisers, Inc. (Advisers) | Investment manager | |
Franklin Templeton Services, LLC (FT Services) | Administrative manager | |
Franklin Templeton Distributors, Inc. (Distributors) | Principal underwriter | |
Franklin Templeton Investor Services, LLC (Investor Services) | Transfer agent | |
a. Management Fees
Franklin Growth Opportunities Fund pays an investment management fee to Advisers based on the average daily net assets of the Fund as follows:
| Annualized Fee Rate | Net Assets | |
0.700% | Up to and including $500 million | |
0.600% | Over $500 million, up to and including $1 billion | |
0.550% | Over $1 billion, up to and including $1.5 billion | |
0.500% | Over $1.5 billion, up to and including $6.5 billion | |
0.475% | Over $6.5 billion, up to and including $11.5 billion | |
0.450% | Over $11.5 billion, up to and including $16.5 billion | |
0.440% | Over $16.5 billion, up to and including $19 billion | |
0.430% | Over $19 billion, up to and including $21.5 billion | |
0.420% | In excess of $21.5 billion | |
74 | Semiannual Report | franklintempleton.com | ||
FRANKLIN STRATEGIC SERIES
NOTES TO FINANCIAL STATEMENTS (UNAUDITED)
Franklin Select U.S. Equity Fund pays an investment management fee to Advisers based on the average daily net assets of the Fund as follows:
| Annualized Fee Rate | Net Assets | |
0.950% | Up to and including $500 million | |
0.850% | Over $500 million, up to and including $1 billion | |
0.800% | Over $1 billion, up to and including $1.5 billion | |
0.750% | Over $1.5 billion, up to and including $6.5 billion | |
0.725% | Over $6.5 billion, up to and including $11.5 billion | |
0.700% | Over $11.5 billion, up to and including $16.5 billion | |
0.690% | Over $16.5 billion, up to and including $19 billion | |
0.680% | Over $19 billion, up to and including $21.5 billion | |
0.670% | In excess of $21.5 billion | |
Franklin Small Cap Growth Fund pays an investment management fee to Advisers based on the average daily net assets of the Fund as follows:
| Annualized Fee Rate | Net Assets | |
0.750% | Up to and including $500 million | |
0.650% | Over $500 million, up to and including $1 billion | |
0.600% | Over $1 billion, up to and including $1.5 billion | |
0.550% | Over $1.5 billion, up to and including $6.5 billion | |
0.525% | Over $6.5 billion, up to and including $11.5 billion | |
0.500% | Over $11.5 billion, up to and including $16.5 billion | |
0.490% | Over $16.5 billion, up to and including $19 billion | |
0.480% | Over $19 billion, up to and including $21.5 billion | |
0.470% | In excess of $21.5 billion | |
FranklinSmall-Mid Cap Growth Fund pays an investment management fee to Advisers based on the average daily net assets of the Fund as follows:
| Annualized Fee Rate | Net Assets | |
0.625% | Up to and including $100 million | |
0.500% | Over $100 million, up to and including $250 million | |
0.450% | Over $250 million, up to and including $7.5 billion | |
0.440% | Over $7.5 billion, up to and including $10 billion | |
0.430% | Over $10 billion, up to and including $12.5 billion | |
0.420% | Over $12.5 billion, up to and including $15 billion | |
0.400% | In excess of $15 billion | |
| franklintempleton.com | Semiannual Report | 75 | ||
FRANKLIN STRATEGIC SERIES
NOTES TO FINANCIAL STATEMENTS (UNAUDITED)
3. Transactions with Affiliates(continued)
a. Management Fees(continued)
For the period ended October 31, 2019, each Fund’s annualized gross effective investment management fee rate based on average daily net assets was as follows:
| Franklin Growth Opportunities Fund | Franklin Select U.S. Equity Fund | Franklin Small Cap Growth Fund | Franklin Small-Mid Cap Growth Fund | |||||||||||
| 0.544% | 0.950% | 0.617% | 0.457% | |||||||||||
b. Administrative Fees
Under an agreement with Advisers, FT Services provides administrative services to the Funds. The fee is paid by Advisers based on each of the Funds’ average daily net assets, and is not an additional expense of the Funds.
c. Distribution Fees
The Board has adopted distribution plans for each share class, with the exception of Class R6 and Advisor Class shares, pursuant to Rule12b-1 under the 1940 Act. Under the Funds’ Class A reimbursement distribution plans, the Funds reimburse Distributors for costs incurred in connection with the servicing, sale and distribution of each Fund’s shares up to the maximum annual plan rate. Under the Class A reimbursement distribution plans, costs exceeding the maximum for the current plan year cannot be reimbursed in subsequent periods. In addition, under the Funds’ Class C and R compensation distribution plans, the Funds pay Distributors for costs incurred in connection with the servicing, sale and distribution of each Fund’s shares up to the maximum annual plan rate for each class. The plan year, for purposes of monitoring compliance with the maximum annual plan rates, is February 1 through January 31 for each Fund.
The maximum annual plan rates, based on the average daily net assets, for each class, are as follows:
| Franklin Growth Opportunities Fund | Franklin Select U.S. Equity Fund | Franklin Small Cap Growth Fund | Franklin Small-Mid Cap Growth Fund | |||||||||||||
Reimbursement Plans: | ||||||||||||||||
Class A | 0.35% | 0.35% | 0.35% | 0.25% | ||||||||||||
Compensation Plans: | ||||||||||||||||
Class C | 1.00% | 1.00% | 1.00% | 1.00% | ||||||||||||
Class R | 0.50% | 0.50% | 0.50% | 0.50% | ||||||||||||
For Franklin Growth Opportunities Fund, Franklin Select U.S. Equity Fund and Franklin Small Cap Growth Fund, the Board has set the current rate at 0.25% per year for Class A shares until further notice and approval by the Board.
76 | Semiannual Report | franklintempleton.com | ||
FRANKLIN STRATEGIC SERIES
NOTES TO FINANCIAL STATEMENTS (UNAUDITED)
d. Sales Charges/Underwriting Agreements
Front-end sales charges and contingent deferred sales charges (CDSC) do not represent expenses of the Funds. These charges are deducted from the proceeds of sales of fund shares prior to investment or from redemption proceeds prior to remittance, as applicable. Distributors has advised the Funds of the following commission transactions related to the sales and redemptions of the Funds’ shares for the period:
| Franklin Growth Opportunities Fund | Franklin Select U.S. Equity Fund | Franklin Small Cap Growth Fund | Franklin Small-Mid Cap Growth Fund | |||||||||||||
Sales charges retained net of commissions paid to unaffiliated brokers/dealers | $159,651 | $3,774 | $78,194 | $183,746 | ||||||||||||
CDSC retained | $ 9,758 | $2,437 | $ 760 | $ 8,707 | ||||||||||||
e. Transfer Agent Fees
Each class of shares pays transfer agent fees to Investor Services for its performance of shareholder servicing obligations. The fees are based on an annualized asset based fee of 0.02% plus a transaction based fee. In addition, each class reimburses Investor Services for out of pocket expenses incurred and, except for Class R6, reimburses shareholder servicing fees paid to third parties. These fees are allocated daily based upon their relative proportion of such classes’ aggregate net assets. Class R6 pays Investor Services transfer agent fees specific to that class.
For the period ended October 31, 2019, the Funds paid transfer agent fees as noted in the Statements of Operations of which the following amounts were retained by Investor Services:
| Franklin Growth Opportunities Fund | Franklin Select U.S. Equity Fund | Franklin Small Cap Growth Fund | Franklin Small-Mid Cap Growth Fund | |||||||||||||
Transfer agent fees | $1,110,063 | $34,677 | $692,494 | $939,166 | ||||||||||||
f. Investments in Affiliated Management Investment Companies
Certain or all Funds invest in one or more affiliated management investment companies for purposes other than exercising a controlling influence over the management or policies. Management fees paid by the Funds are waived on assets invested in the affiliated management investment companies, as noted in the Statements of Operations, in an amount not to exceed the management and administrative fees paid directly or indirectly by each affiliate. During the period ended October 31, 2019, investments in affiliated management investment companies were as follows:
| Value at Beginning of Period | Purchases | Sales | Realized Gain (Loss) | Net Change in Unrealized Appreciation (Depreciation) | Value at End of Period | Number of Shares Held at End of Period | Investment Income | |||||||||||||||||||||||||
Franklin Growth Opportunities Fund |
| |||||||||||||||||||||||||||||||
Non-Controlled Affiliates | ||||||||||||||||||||||||||||||||
| Dividends | ||||||||||||||||||||||||||||||||
Institutional Fiduciary Trust Money Market Portfolio, 1.56% | $ 69,126,928 | $291,995,555 | $(352,893,032 | ) | $ — | $ — | $ 8,229,451 | 8,229,451 | $ 343,805 | |||||||||||||||||||||||
| franklintempleton.com | Semiannual Report | 77 | ||
FRANKLIN STRATEGIC SERIES
NOTES TO FINANCIAL STATEMENTS (UNAUDITED)
3. Transactions with Affiliates(continued)
f. Investments in Affiliated Management Investment Companies(continued)
| Value at Beginning of Period | Purchases | Sales | Realized Gain (Loss) | Net Change in Unrealized Appreciation (Depreciation) | Value at End of Period | Number of Shares Held at End of Period | Investment Income | |||||||||||||||||||||||||
Franklin Growth Opportunities Fund(continued) |
| |||||||||||||||||||||||||||||||
Non-Controlled Affiliates(continued) |
| |||||||||||||||||||||||||||||||
| Income from securities loaned | ||||||||||||||||||||||||||||||||
Institutional Fiduciary Trust Money Market Portfolio, 1.56% | $ | — | $ | 141,018,020 | $ | (125,463,675 | ) | $ — | $ — | $ | 15,554,345 | 15,554,345 | $ | 109,633 | ||||||||||||||||||
Total Affiliated Securities | $ | 69,126,928 | $ | 433,013,575 | $ | (478,356,707 | ) | $ — | $ — | $ | 23,783,796 | $ | 453,438 | |||||||||||||||||||
Franklin Select U.S. Equity Fund |
| |||||||||||||||||||||||||||||||
Non-Controlled Affiliates |
| |||||||||||||||||||||||||||||||
| Dividends | ||||||||||||||||||||||||||||||||
Institutional Fiduciary Trust Money Market Portfolio, 1.56% | $ | 7,161,073 | $ | 12,805,724 | $ | (19,410,695 | ) | $ — | $ — | $ | 556,102 | 556,102 | $ | 17,721 | ||||||||||||||||||
Franklin Small Cap Growth Fund |
| |||||||||||||||||||||||||||||||
Non-Controlled Affiliates |
| |||||||||||||||||||||||||||||||
| Dividends | ||||||||||||||||||||||||||||||||
Institutional Fiduciary Trust Money Market Portfolio, 1.56% | $ | 70,752,806 | $ | 243,732,332 | $ | (215,951,795 | ) | $ — | $ — | $ | 98,533,343 | 98,533,343 | $ | 654,945 | ||||||||||||||||||
| Income from securities loaned | ||||||||||||||||||||||||||||||||
Institutional Fiduciary Trust Money Market Portfolio, 1.56% | 18,262,684 | 209,249,557 | (192,107,166 | ) | — | — | 35,405,075 | 35,405,075 | 252,375 | |||||||||||||||||||||||
Total Affiliated Securities | $ | 89,015,490 | $ | 452,981,889 | $ | (408,058,961 | ) | $ — | $ — | $ | 133,938,418 | $ | 907,320 | |||||||||||||||||||
FranklinSmall-Mid Cap Growth Fund |
| |||||||||||||||||||||||||||||||
Non-Controlled Affiliates |
| |||||||||||||||||||||||||||||||
| Dividends | ||||||||||||||||||||||||||||||||
Institutional Fiduciary Trust Money Market Portfolio, 1.56% | $ | 124,157,073 | $ | 391,378,543 | $ | (433,798,792 | ) | $ — | $ — | $ | 81,736,824 | 81,736,824 | $ | 1,064,574 | ||||||||||||||||||
| Income from securities loaned | ||||||||||||||||||||||||||||||||
Institutional Fiduciary Trust Money Market Portfolio, 1.56% | 6,811,635 | 219,602,264 | (194,285,639 | ) | — | — | 32,128,260 | 32,128,260 | 231,172 | |||||||||||||||||||||||
Total Affiliated Securities | $ | 130,968,708 | $ | 610,980,807 | $ | (628,084,431 | ) | $ — | $ — | $ | 113,865,084 | $ | 1,295,746 | |||||||||||||||||||
78 | Semiannual Report | franklintempleton.com | ||
FRANKLIN STRATEGIC SERIES
NOTES TO FINANCIAL STATEMENTS (UNAUDITED)
g. Waiver and Expense Reimbursements
Advisers and Investor Services have contractually agreed in advance to waive or limit their respective fees and to assume as their own expense certain expenses otherwise payable by Franklin Select U.S. Equity Fund so that the expenses (excluding distribution fees and acquired fund fees and expenses) for Class A, Class C, Class R and Advisor Class of the Fund does not exceed 1.00%, and Class R6 does not exceed 0.89% based on the average net assets of each class (other than certainnon-routine expenses or costs, including those relating to litigation, indemnification, reorganizations, and liquidations) until August 31, 2020. Total expenses waived or paid are not subject to recapture subsequent to the Fund’s fiscal year end.
Prior to September 1, 2019, expenses (excluding certain fees and expenses as previously disclosed) for Franklin Select U.S. Equity Fund for Class R6 were limited to 0.88% based on the average net assets of the class.
For Franklin Growth Opportunities Fund, Franklin Small Cap Growth Fund and FranklinSmall-Mid Cap Growth Fund, Investor Services has contractually agreed in advance to waive or limit its fees so that the Class R6 transfer agent fees do not exceed 0.03%, 0.02% and 0.02%, respectively based on the average net assets of the class until August 31, 2020.
Prior to September 1, 2019, for Franklin Growth Opportunities Fund, Investor Services had voluntarily agreed in advance to waive or limit its fees so that the Class R6 transfer agent fees do not exceed 0.02% based on the average net assets of the class.
h. Interfund Transactions
FranklinSmall-Mid Cap Growth Fund engaged in purchases and sales of investments with funds or other accounts that have common investment managers (or affiliated investment managers), directors, trustees or officers. During the period ended October 31, 2019, these purchase and sale transactions aggregated $0 and $2,323,880, respectively.
4. Expense Offset Arrangement
The Funds have entered into an arrangement with their custodian whereby credits realized as a result of uninvested cash balances are used to reduce a portion of the Funds’ custodian expenses. During the period ended October 31, 2019, the custodian fees were reduced as noted in the Statements of Operations.
5. Income Taxes
For tax purposes, the Funds may elect to defer any portion of a post-October capital loss or late-year ordinary loss to the first day of the following fiscal year. At April 30, 2019, the deferred losses were as follows:
| Franklin Growth Opportunities Fund | Franklin Select U.S. Equity Fund | Franklin Small Cap Growth Fund | Franklin Small-Mid Cap Growth Fund | |||||||||||||
Late-year ordinary losses | $5,667,880 | $119,809 | $ — | $3,964,521 | ||||||||||||
| franklintempleton.com | Semiannual Report | 79 | ||
FRANKLIN STRATEGIC SERIES
NOTES TO FINANCIAL STATEMENTS (UNAUDITED)
5. Income Taxes(continued)
At October 31, 2019, the cost of investments and net unrealized appreciation (depreciation) for income tax purposes were as follows:
| Franklin Growth Opportunities Fund | Franklin Select U.S. | Franklin Small Cap | Franklin Small-Mid Cap Growth Fund | |||||||||||||
Cost of investments | $2,031,161,200 | $ | 78,345,384 | $ | 2,017,935,784 | $ | 2,589,710,556 | |||||||||
|
| |||||||||||||||
Unrealized appreciation | $1,972,066,696 | $ | 24,952,200 | $ | 796,507,273 | $ | 834,426,673 | |||||||||
Unrealized depreciation | (69,128,118 | ) | (2,777,213 | ) | (155,480,818 | ) | (62,247,656) | |||||||||
|
| |||||||||||||||
Net unrealized appreciation (depreciation) | $1,902,938,578 | $ | 22,174,987 | $ | 641,026,455 | $ | 772,179,017 | |||||||||
|
| |||||||||||||||
Differences between income and/or capital gains as determined on a book basis and a tax basis are primarily due to differing treatments of wash sales
6. Investment Transactions
Purchases and sales of investments (excluding short term securities) for the period ended October 31, 2019, were as follows:
| Franklin Growth Opportunities Fund | Franklin Select U.S. | Franklin Small Cap | Franklin Small-Mid Cap Growth Fund | |||||||||||||
Purchases | $419,866,733 | $ | — | $ | 368,992,206 | $ | 1,033,951,040 | |||||||||
Sales | $506,618,341 | $ | 17,878,764 | $ | 471,052,109 | $ | 1,152,600,396 | |||||||||
At October 31, 2019, in connection with securities lending transactions, certain or all Funds loaned investments and received cash collateral as follows:
Franklin Growth Opportunities Fund | Franklin Small Cap Growth Fund | Franklin Small-Mid Cap Growth Fund | ||||||||||
Securities lending transactionsa: | ||||||||||||
Equity investmentsb | $15,554,345 | $35,405,075 | $32,128,260 | |||||||||
aThe agreements can be terminated at any time.
bThe gross amount of recognized liability for such transactions is included in payable upon return of securities loaned in the Statements of Assets and Liabilities.
7. Restricted Securities
Certain or all Funds invest in securities that are restricted under the Securities Act of 1933 (1933 Act). Restricted securities are often purchased in private placement transactions, and cannot be sold without prior registration unless the sale is pursuant to an exemption under the 1933 Act. Disposal of these securities may require greater effort and expense, and prompt sale at an acceptable price may be difficult. The Funds may have registration rights for restricted securities. The issuer generally incurs all registration costs.
80 | Semiannual Report | franklintempleton.com | ||
FRANKLIN STRATEGIC SERIES
NOTES TO FINANCIAL STATEMENTS (UNAUDITED)
At October 31, 2019, investments in restricted securities, excluding securities exempt from registration under the 1933 Act, were as follows:
| Shares | Issuer | Acquisition Date | Cost | Value | ||||||||||||
Franklin Growth Opportunities Fund | ||||||||||||||||
| 1,624,999 | Bill.com, pfd., H | 12/21/18 | $ | 13,500,004 | $ | 15,820,859 | ||||||||||
| 2,610,594 | ClearMotion Inc., pfd., C | 11/06/17 | 5,500,000 | 9,016,731 | ||||||||||||
| 3,698,772 | ClearMotion Inc., pfd., D | 12/21/18 | 10,000,000 | 13,425,684 | ||||||||||||
| 201,294 | GitLab Inc., pfd., E | 9/11/19 | 3,749,986 | 3,749,986 | ||||||||||||
| 1,673,284 | LegalZoom.com Inc. | 7/20/18 | 16,479,337 | 19,343,163 | ||||||||||||
| 509,182 | Optoro Inc., pfd., E | 7/24/18 | 10,020,702 | 12,614,393 | ||||||||||||
| 2,362,202 | Proterra Inc., pfd., 5, 144A | 9/21/16 - 1/13/17 | 11,896,616 | 20,249,183 | ||||||||||||
| 596,775 | Proterra Inc., pfd., 6, 144A | 6/07/17 | 3,306,052 | 5,115,653 | ||||||||||||
| 780,667 | Proterra Inc., pfd., 7 | 5/21/18 - 9/18/18 | 5,094,960 | 6,692,005 | ||||||||||||
| 289,016 | Proterra Inc., pfd., 8 | 8/02/19 | 1,996,378 | 2,477,493 | ||||||||||||
| 928,488 | Sweetgreen Inc., pfd., H | 11/09/18 | 12,107,484 | 14,450,552 | ||||||||||||
| 100,835 | Sweetgreen Inc., pfd., I | 9/16/19 | 1,724,279 | 1,753,299 | ||||||||||||
| 805,800 | Tanium Inc., pfd., G | 9/14/15 | 4,000,233 | 5,565,263 | ||||||||||||
| 504,854 | Tempus Labs Inc., pfd., F | 5/29/19 | 12,499,983 | 12,499,983 | ||||||||||||
| 5,028,735 | Wheels Up Partners LLC, pfd., D | 5/16/19 - 8/02/19 | 17,499,998 | 17,297,043 | ||||||||||||
|
| |||||||||||||||
| Total Restricted Securities(Value is 4.1% of Net Assets) | $ | 129,376,012 | $ | 160,071,290 | ||||||||||||
|
| |||||||||||||||
Franklin Small Cap Growth Fund | ||||||||||||||||
| 3,698,772 | ClearMotion Inc., pfd., D | 12/21/18 | $ | 10,000,000 | $ | 13,425,684 | ||||||||||
| 9,905,685 | DraftKings Inc. | 8/07/15 - 3/02/17 | 26,627,302 | 28,392,041 | ||||||||||||
| 1,431,280 | LegalZoom.com Inc. | 7/20/18 | 14,095,961 | 16,545,597 | ||||||||||||
| 508,130 | Optoro Inc., pfd., E | 7/24/18 | 9,999,999 | 12,588,330 | ||||||||||||
| 1,787,047 | Proterra Inc., pfd., 5, 144A | 9/21/16 - 1/13/17 | 8,999,998 | 15,318,860 | ||||||||||||
| 1,310,834 | Proterra Inc., pfd., 6, 144A | 6/07/17 - 1/02/18 | 7,261,842 | 11,236,684 | ||||||||||||
| 536,367 | Proterra Inc., pfd., 7 | 5/21/18 | 3,500,556 | 4,597,826 | ||||||||||||
| 596,471 | Rent the Runway Inc., pfd | 3/21/19 | 13,333,328 | 13,788,135 | ||||||||||||
| 1,542,673 | Smule Inc., pfd., G, 144A | 5/31/16 | 11,099,995 | 10,748,960 | ||||||||||||
| 352,675 | Smule Inc., pfd., H, 144A | 4/27/17 | 2,999,995 | 2,790,260 | ||||||||||||
| 383,435 | Sweetgreen Inc., pfd., H | 11/09/18 | 4,999,992 | 5,967,603 | ||||||||||||
| 41,641 | Sweetgreen Inc., pfd., I | 9/16/19 | 712,061 | 724,046 | ||||||||||||
| 361,111 | Tula eTechnology Inc. | 11/01/18 | — | — | ||||||||||||
| 3,611,111 | Tula Technology Inc., E | 9/08/17 | 6,500,000 | 7,432,818 | ||||||||||||
| 4,310,344 | Wheels Up Partners LLC, pfd., D | 5/16/19 - 8/02/19 | 14,999,997 | 14,826,036 | ||||||||||||
|
| |||||||||||||||
| Total Restricted Securities(Value is 6.1% of Net Assets) | $ | 135,131,026 | $ | 158,382,880 | ||||||||||||
|
| |||||||||||||||
FranklinSmall-Mid Cap Growth Fund | ||||||||||||||||
| 866,666 | Bill.com, pfd., H | 12/21/18 | $ | 7,200,001 | $ | 8,437,790 | ||||||||||
| 7,974,537 | DraftKings Inc. | 8/07/15 - 3/02/17 | 21,380,303 | 22,856,913 | ||||||||||||
| 2,970,061 | Phononic Inc., pfd., F | 6/06/19 | 7,499,998 | 7,499,998 | ||||||||||||
| 1,416,913 | Proterra Inc., pfd., 5, 144A | 9/21/16 | 7,135,914 | 12,146,011 | ||||||||||||
|
| |||||||||||||||
| Total Restricted Securities(Value is 1.5% of Net Assets) | $ | 43,216,216 | $ | 50,940,712 | ||||||||||||
|
| |||||||||||||||
| franklintempleton.com | Semiannual Report | 81 | ||
FRANKLIN STRATEGIC SERIES
NOTES TO FINANCIAL STATEMENTS (UNAUDITED)
8. Holdings of 5% Voting Securities of Portfolio Companies
The 1940 Act defines “affiliated companies” to include investments in portfolio companies in which a fund owns 5% or more of the outstanding voting securities. During the period ended October 31, 2019, investments in “affiliated companies” were as follows:
| Name of Issuer | Value at Beginning of Period | Purchases | Sales | Realized Gain (Loss) | Net Change in Unrealized Appreciation (Depreciation) | Value at End of Period | Number of Shares Held at End of Period | Dividend Income | ||||||||||||||||||||||||
Franklin Small Cap Growth Fund | ||||||||||||||||||||||||||||||||
Non-Controlled Affiliates | ||||||||||||||||||||||||||||||||
The KeyW Holding Corp. | $ | 33,592,278 | $ — | $ | (33,325,672 | ) | $ | 7,901,967 | $(8,168,573) | $ | — | a | — | $ — | ||||||||||||||||||
Sportsman’s Warehouse Holdings Inc. | 16,003,372 | — | (4,247,410 | ) | (2,108,852 | ) | 10,234,685 | $ | 19,881,795 | 2,919,500 | — | |||||||||||||||||||||
|
|
|
| |||||||||||||||||||||||||||||
Total Affiliated Securities(Value is 0.8% of Net Assets) | $ | 49,595,650 | $ — | $ | (37,573,082 | ) | $ | 5,793,115 | $ 2,066,112 | $ | 19,881,795 | $ — | ||||||||||||||||||||
|
|
|
| |||||||||||||||||||||||||||||
aAs of October 31, 2019, no longer held by the fund.
9. Upcoming Acquisitions/Reorganizations
On July 17, 2019, the Board approved a proposal to reorganize Franklin Select U.S. Equity Fund with and into the Franklin Growth Fund, a series of Franklin Custodian Funds, subject to approval by the shareholders of Franklin Select U.S. Equity Fund.
10. Credit Facility
The Funds, together with other U.S. registered and foreign investment funds (collectively, Borrowers), managed by Franklin Templeton, are borrowers in a joint syndicated senior unsecured credit facility totaling $2 billion (Global Credit Facility) which matures on February 7, 2020. This Global Credit Facility provides a source of funds to the Borrowers for temporary and emergency purposes, including the ability to meet future unanticipated or unusually large redemption requests.
Under the terms of the Global Credit Facility, the Funds shall, in addition to interest charged on any borrowings made by the Funds and other costs incurred by the Funds, pay their share of fees and expenses incurred in connection with the implementation and maintenance of the Global Credit Facility, based upon their relative share of the aggregate net assets of all of the Borrowers, including an annual commitment fee of 0.15% based upon the unused portion of the Global Credit Facility. These fees are reflected in other expenses in the Statements of Operations. During the period ended October 31, 2019, the Funds did not use the Global Credit Facility.
11. Fair Value Measurements
The Funds follow a fair value hierarchy that distinguishes between market data obtained from independent sources (observable inputs) and the Funds’ own market assumptions (unobservable inputs). These inputs are used in determining the value of the Funds’ financial instruments and are summarized in the following fair value hierarchy:
| • | Level 1 – quoted prices in active markets for identical financial instruments |
| • | Level 2 – other significant observable inputs (including quoted prices for similar financial instruments, interest rates, prepayment speed, credit risk, etc.) |
82 | Semiannual Report | franklintempleton.com | ||
FRANKLIN STRATEGIC SERIES
NOTES TO FINANCIAL STATEMENTS (UNAUDITED)
| • | Level 3 – significant unobservable inputs (including the Funds’ own assumptions in determining the fair value of financial instruments) |
The input levels are not necessarily an indication of the risk or liquidity associated with financial instruments at that level.
A summary of inputs used as of October 31, 2019, in valuing the Funds’ assets carried at fair value, is as follows:
| Level 1 | Level 2 | Level 3 | Total | |||||||||||||
Franklin Growth Opportunities Fund | ||||||||||||||||
Assets: | ||||||||||||||||
Investments in Securities:a | ||||||||||||||||
Equity Investments:b | ||||||||||||||||
Communication Services | $ | 263,027,672 | $ | — | $ | 5,565,263 | $ | 268,592,935 | ||||||||
Consumer Discretionary | 393,489,092 | — | 73,180,600 | 466,669,692 | ||||||||||||
Financials | 248,094,238 | — | 15,820,859 | 263,915,097 | ||||||||||||
Health Care | 653,356,543 | — | 12,499,983 | 665,856,526 | ||||||||||||
Industrials | 430,146,587 | — | 29,911,436 | 460,058,023 | ||||||||||||
Information Technology | 1,449,687,017 | — | 23,093,149 | 1,472,780,166 | ||||||||||||
All Other Equity Investments | 312,443,543 | — | — | 312,443,543 | ||||||||||||
Short Term Investments | 23,783,796 | — | — | 23,783,796 | ||||||||||||
Total Investments in Securities | $ | 3,774,028,488 | $ | — | $ | 160,071,290 | $ | 3,934,099,778 | ||||||||
Franklin Select U.S. Equity Fund | ||||||||||||||||
Assets: | ||||||||||||||||
Investments in Securities:a | ||||||||||||||||
Equity Investments | $ | 99,964,269 | $ | — | $ | — | $ | 99,964,269 | ||||||||
Short Term Investments | 556,102 | — | — | 556,102 | ||||||||||||
Total Investments in Securities | $ | 100,520,371 | $ | — | $ | — | $ | 100,520,371 | ||||||||
Franklin Small Cap Growth Fund | ||||||||||||||||
Assets: | ||||||||||||||||
Investments in Securities:a | ||||||||||||||||
Equity Investments:b | ||||||||||||||||
Consumer Discretionary | $ | 291,151,661 | $ | — | $ | 124,460,773 | c | $ | 415,612,434 | |||||||
Industrials | 478,310,673 | — | 27,414,366 | 505,725,039 | ||||||||||||
Information Technology | 565,074,526 | — | 30,084,817 | 595,159,343 | ||||||||||||
All Other Equity Investments | 1,008,527,005 | — | — | 1,008,527,005 | ||||||||||||
Short Term Investments | 133,938,418 | — | — | 133,938,418 | ||||||||||||
Total Investments in Securities | $ | 2,477,002,283 | $ | — | $ | 181,959,956 | $ | 2,658,962,239 | ||||||||
FranklinSmall-Mid Cap Growth Fund | ||||||||||||||||
Assets: | ||||||||||||||||
Investments in Securities:a | ||||||||||||||||
Equity Investments:b | ||||||||||||||||
Consumer Discretionary | $ | 570,080,437 | $ | — | $ | 35,002,924 | $ | 605,083,361 | ||||||||
Financials | 269,114,720 | — | 15,937,788 | 285,052,508 | ||||||||||||
All Other Equity Investments | 2,357,888,620 | — | — | 2,357,888,620 | ||||||||||||
Short Term Investments | 113,865,084 | — | — | 113,865,084 | ||||||||||||
Total Investments in Securities | $ | 3,310,948,861 | $ | — | $ | 50,940,712 | $ | 3,361,889,573 | ||||||||
aFor detailed categories, see the accompanying Statement of Investments.
bIncludes common and preferred stocks.
cIncludes securities determined to have no value at October 31, 2019.
| franklintempleton.com | Semiannual Report | 83 | ||
FRANKLIN STRATEGIC SERIES
NOTES TO FINANCIAL STATEMENTS (UNAUDITED)
11. Fair Value Measurements(continued)
A reconciliation of assets in which Level 3 inputs are used in determining fair value is presented when there are significant Level 3 financial instruments at the beginning and/or end of the period. At October 31, 2019, the reconciliation of assets are as follows:
| Balance at Beginning of Period | Purchases | Sales | Transfer Into(Out of) Level 3 | Cost Basis Adjustments | Net Realized Gain (Loss) | Net Unrealized Appreciation (Depreciation) | Balance at End of Period | Net Change in Period End | ||||||||||||||||||||||||||||
Franklin Growth Opportunities Fund | ||||||||||||||||||||||||||||||||||||
Assets: | ||||||||||||||||||||||||||||||||||||
Investments in Securities: | ||||||||||||||||||||||||||||||||||||
Equity Investments:a | ||||||||||||||||||||||||||||||||||||
Communication Services | $ | 4,893,610 | $ | — | $— | $— | $— | $— | $ 671,653 | $ | 5,565,263 | $ 671,653 | ||||||||||||||||||||||||
Consumer Discretionary | 65,366,728 | 3,720,657 | — | — | — | — | 4,093,215 | 73,180,600 | 4,093,215 | |||||||||||||||||||||||||||
Financials | 14,395,754 | — | — | — | — | — | 1,425,105 | 15,820,859 | 1,425,105 | |||||||||||||||||||||||||||
Health Care | — | 12,499,983 | — | — | — | — | — | 12,499,983 | — | |||||||||||||||||||||||||||
Industrials | 12,168,487 | 17,499,998 | — | — | — | — | 242,951 | 29,911,436 | 242,951 | |||||||||||||||||||||||||||
Information Technology | 20,473,416 | 3,749,986 | — | — | — | — | (1,130,253 | ) | 23,093,149 | (1,130,253 | ) | |||||||||||||||||||||||||
Total Investments in Securities | $ | 117,297,995 | $ | 37,470,624 | $— | $— | $— | $— | $ 5,302,671 | $ | 160,071,290 | $ 5,302,671 | ||||||||||||||||||||||||
Franklin Small Cap Growth Fund | ||||||||||||||||||||||||||||||||||||
Assets: | ||||||||||||||||||||||||||||||||||||
Investments in Securities: | ||||||||||||||||||||||||||||||||||||
Equity Investments:a | ||||||||||||||||||||||||||||||||||||
Consumer Discretionary | $ | 119,996,881 | b | $ | 712,061 | $— | $— | $— | $— | $ 3,751,831 | $ | 124,460,773 | b | $ 3,751,831 | ||||||||||||||||||||||
Industrials | 12,143,346 | 14,999,997 | — | — | — | — | 271,023 | 27,414,366 | 271,023 | |||||||||||||||||||||||||||
Information Technology | 31,063,930 | — | — | — | — | — | (979,113 | ) | 30,084,817 | (979,113 | ) | |||||||||||||||||||||||||
Total Investments in Securities | $ | 163,204,157 | $ | 15,712,058 | $— | $— | $— | $— | $ 3,043,741 | $ | 181,959,956 | $ 3,043,741 | ||||||||||||||||||||||||
Franklin Small-Mid Cap Growth Fund | ||||||||||||||||||||||||||||||||||||
Assets: | ||||||||||||||||||||||||||||||||||||
Investments in Securities: | ||||||||||||||||||||||||||||||||||||
Equity Investments:a | ||||||||||||||||||||||||||||||||||||
Consumer Discretionary | $ | 33,865,637 | $ | — | $— | $— | $— | $— | $ 1,137,287 | $ | 35,002,924 | $ 1,137,287 | ||||||||||||||||||||||||
Financials | 7,677,734 | 7,499,998 | — | — | — | — | 760,056 | 15,937,788 | 760,056 | |||||||||||||||||||||||||||
Total Investments in Securities | $ | 41,543,371 | $ | 7,499,998 | $— | $— | $— | $— | $ 1,897,343 | $ | 50,940,712 | $ 1,897,343 | ||||||||||||||||||||||||
aIncludes common and preferred stocks.
bIncludes securities determined to have no value.
84 | Semiannual Report | franklintempleton.com | ||
FRANKLIN STRATEGIC SERIES
NOTES TO FINANCIAL STATEMENTS (UNAUDITED)
Significant unobservable valuation inputs for material Level 3 financial instruments and impact to fair value as a result of changes in unobservable valuation inputs as of October 31, 2019, are as follows:
| Description | Fair Value at End of Period | Valuation Technique | Unobservable Inputs | Amount/ Range (Weighted | Impact to Fair Value if Input Increasesb | |||||||||||||
Franklin Growth Opportunities Fund | ||||||||||||||||||
Assets: | ||||||||||||||||||
Investments in Securities: | ||||||||||||||||||
Equity Investments:c | ||||||||||||||||||
Communication Services | $5,565,263 | Discounted cash flow | NOPAT multiple | 19.4x | Increase | d | ||||||||||||
| Discount rate | 9.2% | Decrease | e | |||||||||||||||
| Discount for lack of marketability | 10.7% | Decrease | d | |||||||||||||||
Consumer Discretionary | 70,703,107 | Discounted cash flow | Forward EBITDA growth rate | 4.0% | Increase | e | ||||||||||||
| Free cash flow growth rate | 2.0% | Increase | d | |||||||||||||||
| Discount rate | | 10.3% - 14.3% (11.4%) |
| Decrease | e | |||||||||||||
| Discount for lack of marketability | | 3.3% - 19.0% (10.3%) |
| Decrease | d | |||||||||||||
| Terminal multiple | 32.5x | Increase | ||||||||||||||||
Financials | 15,820,859 | Market comparables | EV / revenue multiple | 10.9x | Increase | e | ||||||||||||
| Discount for lack of marketability | 7.3% | Decrease | d | |||||||||||||||
Industrials | 29,911,436 | Discounted cash flow | Discount rate | | 11.5% - 21.4% (15.7%) | | Decrease | d | ||||||||||
| Long term growth rate | | 3.0% - 5.0% (3.8%) |
| Increase | d | |||||||||||||
| Discount for lack of marketability | | 10.9% - 17.0% (14.4%) |
| Decrease | d | |||||||||||||
Information Technology | 19,343,163 | Discounted cash flow | Discount rate | 10.6% | Decrease | e | ||||||||||||
| Long term growth rate | 4.0% | Increase | e | |||||||||||||||
| Discount for lack of marketability | 10.7% | Decrease | d | |||||||||||||||
All Other Investmentsf | 18,727,462 | |||||||||||||||||
Total | $160,071,290 | |||||||||||||||||
Franklin Small Cap Growth Fund | ||||||||||||||||||
Assets: | ||||||||||||||||||
Investments in Securities: | ||||||||||||||||||
Equity Investments:c | ||||||||||||||||||
Consumer Discretionary | $124,460,773 | Discounted cash flow | Forward EBITDA growth rate | 4.0% | Increase | e | ||||||||||||
| Free cash flow growth rate | 2.0% | Increase | ||||||||||||||||
| 10.3% - 15.3% | ||||||||||||||||||
| Discount rate | (11.9%) | Decrease | e | |||||||||||||||
| Discount for lack of marketability | | 3.3% - 19.0% (9.1%) |
| Decrease | d | |||||||||||||
| Terminal multiple | 32.5x | Increase | ||||||||||||||||
| franklintempleton.com | Semiannual Report | 85 | ||
FRANKLIN STRATEGIC SERIES
NOTES TO FINANCIAL STATEMENTS (UNAUDITED)
11. Fair Value Measurements(continued)
| Description | Fair Value at End of Period | Valuation Technique | Unobservable Inputs | Amount/ Range (Weighted | Impact to Fair Value if Input Increasesb | |||||||||||
| Market comparables | EV / EBITDA multiple | 14.9x - 22.2x | Increase | |||||||||||||
| EV / revenue multiple | 12.3x | Increase | d | |||||||||||||
| Discount for lack of marketability | | 4.9% - 12.5% (9.0%) |
| Decrease | d | |||||||||||
Industrials | 27,414,366 | Discounted cash flow | Discount rate | | 11.5% - 21.4% (16.0%) |
| Decrease | e | ||||||||
| Long term growth rate | | 3.0% - 5.0% (3.9%) |
| Increase | d | |||||||||||
| Discount for lack of marketability | | 10.9% - 17.0% (14.2%) |
| Decrease | d | |||||||||||
Information Technology | 30,084,817 | Market comparables | EV / revenue multiple | 3.9x | Increase | d | ||||||||||
| Discount for lack of marketability | 7.3% | Decrease | d | |||||||||||||
| Discounted cash flow | Discount rate | 10.6% | Decrease | e | ||||||||||||
| Long term growth rate | 4.0% | Increase | e | |||||||||||||
| Discount for lack of marketability | 10.7% | Decrease | d | |||||||||||||
All Other Investmentsf | — g | |||||||||||||||
Total | $181,959,956 | |||||||||||||||
FranklinSmall-Mid Cap Growth Fund | ||||||||||||||||
Assets: | ||||||||||||||||
Investments in Securities: | ||||||||||||||||
Equity Investments:c | ||||||||||||||||
Consumer Discretionary | $35,002,924 | Discounted cash flow | Forward EBITDA growth rate | 4.0% | Increase | e | ||||||||||
| Discount rate | 10.3% | Decrease | e | |||||||||||||
| Discount for lack of marketability | 3.3% | Decrease | d | |||||||||||||
| Market comparables | Discount for lack of marketability | 11.4% | Decrease | d | ||||||||||||
Financials | 8,437,790 | Market comparables | EV / revenue multiple | 10.9x | Increase | e | ||||||||||
| Discount for lack of marketability | 7.3% | Decrease | d | |||||||||||||
All Other Investmentsf | 7,499,998 | |||||||||||||||
Total | $50,940,712 | |||||||||||||||
aWeighted based on the relative fair value of the financial instruments.
bRepresents the directional change in the fair value of the Level 3 financial instruments that would result from a significant and reasonable increase in the corresponding input. A significant and reasonable decrease in the input would have the opposite effect. Significant impacts, if any, to fair value and/or net assets have been indicated.
cIncludes common and preferred stocks.
dRepresents a significant impact to fair value but not net assets.
eRepresents a significant impact to fair value and net assets.
fIncludes financial instruments with values derived using private transaction prices ornon-public third party pricing information which is unobservable. May also include fair value of immaterial financial instruments developed using various valuation techniques and unobservable inputs.
gIncludes securities determined to have no value at October 31, 2019.
86 | Semiannual Report | franklintempleton.com | ||
FRANKLIN STRATEGIC SERIES
NOTES TO FINANCIAL STATEMENTS (UNAUDITED)
| Abbreviations | ||
EBITDA | Earnings before interest, taxes, depreciation and amortization | |
EV | Enterprise value | |
NOPAT | Net operating profit after tax | |
12. Subsequent Events
The Funds have evaluated subsequent events through the issuance of the financial statements and determined that no events have occurred that require disclosure.
| Abbreviations | ||
| Selected Portfolio | ||
| ADR American Depositary Receipt |
| franklintempleton.com | Semiannual Report | 87 | ||
FRANKLIN STRATEGIC SERIES
Proxy Voting Policies and Procedures
The Trust’s investment manager has established Proxy Voting Policies and Procedures (Policies) that the Trust uses to determine how to vote proxies relating to portfolio securities. Shareholders may view the Trust’s complete Policies online at franklintempleton.com. Alternatively, shareholders may request copies of the Policies free of charge by calling the Proxy Group collect at (954)527-7678 or by sending a written request to: Franklin Templeton Companies, LLC, 300 S.E. 2nd Street, Fort Lauderdale, FL 33301, Attention: Proxy Group. Copies of the Trust’s proxy voting records are also made available online at franklintempleton.com and posted on the U.S. Securities and Exchange Commission’s website at sec.gov and reflect the most recent12-month period ended June 30.
Quarterly Statement of Investments
The Trust files a complete statement of investments with the U.S. Securities and Exchange Commission for the first and third quarters for each fiscal year as an exhibit to its report on FormN-PORT. Shareholders may view the filed FormN-PORT by visiting the Commission’s website at sec.gov. The filed form may also be viewed and copied at the Commission’s Public Reference Room in Washington, DC. Information regarding the operations of the Public Reference Room may be obtained by calling(800) SEC-0330.
88 | Semiannual Report | franklintempleton.com | ||
Authorized for distribution only when accompanied or preceded by a summary prospectus and/or prospectus. Investors should carefully consider a fund’s investment goals, risks, charges and expenses before investing. A prospectus contains this and other information; please read it carefully before investing.
To help ensure we provide you with quality service, all calls to and from our service areas are monitored and/or recorded.
 | Semiannual Report and Shareholder Letter Franklin Strategic Series | |||||
| Investment Manager | Distributor | Shareholder Services | ||||
| Franklin Advisers, Inc. | Franklin Templeton Distributors, Inc. | (800)632-2301 | ||||
| (800) DIAL BEN®/342-5236 | ||||||
| franklintempleton.com | ||||||
| © 2019 Franklin Templeton Investments. All rights reserved. | FSS1 S 12/19 |
| Franklin Biotechnology Discovery Fund |
| Franklin Natural Resources Fund |
Sign up for electronic delivery at franklintempleton.com/edelivery
Internet Delivery of Fund Reports Unless You Request Paper Copies: Effective January 1, 2021, as permitted by the SEC, paper copies of the Fund’s shareholder reports will no longer be sent by mail, unless you specifically request them from the Fund or your financial intermediary. Instead, the reports will be made available on a website, and you will be notified by mail each time a report is posted and provided with a website link to access the report.
If you already elected to receive shareholder reports electronically, you will not be affected by this change and you need not take any action. If you have not signed up for electronic delivery, we would encourage you to join fellow shareholders who have. You may elect to receive shareholder reports and other communications electronically from the Fund by calling (800)632-2301 or by contacting your financial intermediary.
You may elect to continue to receive paper copies of all your future shareholder reports free of charge by contacting your financial intermediary or, if you invest directly with a Fund, calling (800)632-2301 to let the Fund know of your request. Your election to receive reports in paper will apply to all funds held in your account.
SHAREHOLDER LETTER
Dear Shareholder:
During the six months ended October 31, 2019, the U.S. economy continued to grow, but at a more moderate pace due to concerns about trade and geopolitical stress.
The Standard & Poor’s® 500 Index (S&P 500®) recovered from heightened volatility in May and August 2019, reaching newall-time highs in October amid better-than-expected corporate earnings, investor optimism about a potential U.S.-China trade agreement and the U.S. Federal Reserve’s third successive rate cut. However, markets reflected concerns about tighter regulation of technology companies, U.S. political uncertainties, geopolitical tensions and the impact of trade disputes on global growth and corporate earnings. In this environment, U.S. stocks, as measured by the S&P 500, posted a positive total return for thesix-month period.
We are committed to our long-term perspective and disciplined investment approach as we conduct a rigorous, fundamental analysis of securities with a regular emphasis on investment risk management.
We believe active, professional investment management serves investors well. We also recognize the important role of financial advisors in today’s markets and encourage investors to continue to seek their advice. Amid changing markets and economic conditions, we are confident investors with a well-diversified portfolio and a patient, long-term outlook should be well positioned for the years ahead.
In addition, Franklin Strategic Series’ semiannual report includes more detail about prevailing conditions and a discussion about investment decisions during the period. Please remember all securities markets fluctuate, as do mutual fund share prices.
We thank you for investing with Franklin Templeton, welcome your questions and comments, and look forward to serving your future investment needs.
Sincerely, |
 |
Edward Perks, CFA |
President and Chief Executive Officer – |
Investment Management |
Franklin Strategic Series |
This letter reflects our analysis and opinions as of October 31, 2019, unless otherwise indicated. The information is not a complete analysis of every aspect of any market, country, industry, security or fund. Statements of fact are from sources considered reliable.
| CFA® is a trademark owned by CFA Institute. | ||||
Not FDIC Insured | May Lose Value | No Bank Guarantee
|
| franklintempleton.com | Not part of the semiannual report | 1 | ||
Semiannual Report | ||||
| 3 | ||||
| 4 | ||||
| 10 | ||||
| 17 | ||||
| 31 | ||||
| 35 | ||||
| 46 | ||||
| Visitfranklintempleton.comfor fund updates, to access your account, or to find helpful financial planning tools. |
2 | Semiannual Report | franklintempleton.com | ||
SEMIANNUAL REPORT
The U.S. economy expanded during the six months ended October 31, 2019. After moderating in 2019’s second quarter, the economy grew faster in the third quarter, aided by consumer spending, housing investment, government spending, inventory investment and exports. The manufacturing sector expanded during the period’s first half, but contracted in the second half. The services sector continued to expand throughout the period. The unemployment rate was 3.6% in April 2019, and though it varied slightly during the six months under review, it ended the period at 3.6%.1 The annual inflation rate, as measured by the Consumer Price Index, decreased from 2.0% in April 2019 to 1.8% atperiod-end.1
At its July 2019 meeting, the U.S. Federal Reserve (Fed) lowered its target range for the federal funds rate for the first time since December 2008, to 2.00%–2.25%, citing muted inflation pressures and the potential effects of global trade tensions on economic growth. Furthermore, the Fed ended its balance sheet normalization program earlier than previously indicated. The Fed further lowered the federal funds target rate range by 0.25% at its September and October meetings, to 1.50%–1.75%, reiterating the rationale cited at the July meeting.
U.S. equity markets overall rose during the period, benefiting from upbeat economic data and U.S. corporate earnings, the Fed’s interest-rate cuts and investor optimism about further monetary easing. However, markets reflected concerns about tighter regulation of technology companies, U.S. political uncertainties (including the impeachment inquiry into President Donald Trump), geopolitical tensions in certain regions, and the impact of U.S. trade disputes with China and other trading partners on global growth and corporate earnings. These concerns were partly alleviated at certain points during the period by occasional easing of trade tensions and optimism about a potential U.S.-China trade agreement. The broad U.S. stock market, as measured by the Standard & Poor’s® 500 Index (S&P 500®), recovered from heightened volatility in May and August 2019, reaching newall-time highs in October amid a number of better-than-expected corporate earnings reports, investor optimism about a potential phase one of the U.S.-China trade agreement and the Fed’s third successive rate cut.
Overall, the S&P 500 posted a +4.16% total return for thesix-month period.2
The foregoing information reflects our analysis and opinions as of October 31, 2019. The information is not a complete analysis of every aspect of any market, country, industry, security or fund. Statements of fact are from sources considered reliable.
1. Bureau of Labor Statistics.
2. Morningstar.
See www.franklintempletondatasources.com for additional data provider information.
| franklintempleton.com | Semiannual Report | 3 | ||
Franklin Biotechnology Discovery Fund
This semiannual report for Franklin Biotechnology Discovery Fund covers the period ended October 31, 2019.
Your Fund’s Goal and Main Investments
The Fund seeks capital appreciation by investing at least 80% of its net assets in securities of biotechnology companies and discovery research firms located in the U.S. and other countries.
Performance Overview
The Fund’s Class A shares posted a +4.18% cumulative total return for the six months under review. In comparison, the NASDAQ Biotechnology Index®, which tracks U.S. and international-based biotechnology stocks, posted a +1.10% total return.1 Also in comparison, the Standard & Poor’s 500 Index (S&P 500), which is a broad measure of the U.S. stock market, posted a +4.16% total return.1 You can find the Fund’s long-term performance data in the Performance Summary beginning on page 7.
Performance data represent past performance, which does not guarantee future results. Investment return and principal value will fluctuate, and you may have a gain or loss when you sell your shares. Current performance may differ from figures shown. For most recentmonth-end performance, go tofranklintempleton.comor call(800)342-5236.
Investment Strategy
We are research-driven, fundamental investors, pursuing a growth strategy. Asbottom-up investors focusing primarily on individual securities, we choose companies that have identifiable drivers of future earnings growth and that present, in our opinion, the besttrade-off between potential earnings growth, business and financial risk, and valuation. Also, in seeking sustainable growth characteristics, we look for companies that we believe can produce sustainable earnings growth and cash flow growth or the potential to generate income. We rely on a team of analysts to help providein-depth industry expertise and use both qualitative and quantitative analysis to evaluate companies for distinct and sustainable competitive advantages likely to lead to growth in earnings and/or share price. Competitive
Portfolio Composition
Based on Total Net Assets as of 10/31/19
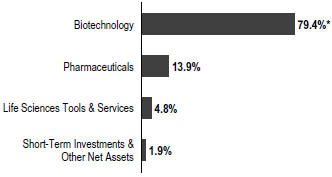
*Includes common, preferred stocks, escrows and litigation trusts as well as other equity interests.
advantages, such as a particular product niche, proven technology, sound financial position and strong management, are all factors we believe may contribute to strong growth potential.
Manager’s Discussion
During the six months under review, the biotechnology industry experienced some volatility. Please keep in mind that volatility is not uncommon in the biotechnology industry, and we seek to take advantage of short-term volatility by initiating positions or adding to existing holdings in companies we believe are undervalued.
Key contributors to the Fund’s absolute performance included Array BioPharma (not held atperiod-end), Reata Pharmaceuticals and Iovance Biotherapeutics.
Cancer-focused biopharmaceutical company Array BioPharma was acquired by pharmaceuticals firm Pfizer (not a Fund holding) for a significant premium over the preannouncement stock closing price.
Shares of Reata Pharmaceuticals, a clinical stage biopharmaceutical firm, surged after the company announced positive results for a clinical trial for omaveloxolone, a treatment for neuromuscular disorder Friedreich’s ataxia.
1. Source: Morningstar.
The indexes are unmanaged and include reinvestment of any income or distributions. They do not reflect any fees, expenses or sales charges. One cannot invest directly in an index, and an index is not representative of the Fund’s portfolio.
See www.franklintempletondatasources.com for additional data provider information.
The dollar value, number of shares or principal amount, and names of all portfolio holdings are listed in the Fund’s Statement of Investments (SOI).
The SOI begins on page 21.
4 | Semiannual Report | franklintempleton.com | ||
FRANKLIN BIOTECHNOLOGY DISCOVERY FUND
| Top 10 Holdings | ||||
| 10/31/19 | ||||
Company Sector/Industry | % of Total Net Assets | |||
Amgen Inc. | 8.1% | |||
Biotechnology | ||||
Vertex Pharmaceuticals Inc. | 6.8% | |||
Biotechnology | ||||
Gilead Sciences Inc. | 6.1% | |||
Biotechnology | ||||
Biogen Inc. | 5.2% | |||
Biotechnology | ||||
Illumina Inc. | 4.8% | |||
Life Sciences Tools & Services | ||||
Reata Pharmaceuticals Inc. | 4.6% | |||
Pharmaceuticals | ||||
GW Pharmaceuticals PLC | 4.3% | |||
Pharmaceuticals | ||||
Regeneron Pharmaceuticals Inc. | 4.1% | |||
Biotechnology | ||||
Iovance Biotherapeutics Inc. | 3.9% | |||
Biotechnology | ||||
Alexion Pharmaceuticals Inc. | 3.3% | |||
Biotechnology | ||||
Iovance Biotherapeutics’ share price shot up in 2019’s second quarter following promising data from clinical studies of experimental treatments for cervical cancer and melanoma. Some of those gains were reversed in the third quarter as investors moved out of small- andmid-capitalization stocks to large-capitalization stocks, which were perceived as more defensive.
In contrast, key detractors from the Fund’s absolute performance included Alexion Pharmaceuticals, GW Pharmaceuticals and Intercept Pharmaceuticals (not held atperiod-end).
Alexion Pharmaceuticals is a biopharmaceutical company that focuses on developing treatments for rare disorders. The company’s share price fell due to an August decision by regulators to review patents for Soliris, a blood disorder treatment. We believe that even if generic competitors to Soliris become available, the impact on sales of Ultomiris—the company’s next-generation blood disorder treatment—will be limited, and that the stock is still undervalued at current levels. However, we have reduced our position in the company as we expect the ongoing intellectual property rights proceedings to remain an overhang on its share price in the near term.
Shares of GW Pharmaceuticals, a cannabinoid-based drug developer, shed much of their value due to concerns about sales figures for its leading epilepsy treatment. This occurred despite broad regulatory approval and strong sales in Europe, and we believe the company suffered from general investor skepticism about new biotechnology products. We also believe investors mistakenly associated the company with the wider cannabis industry, which saw a general selloff in the third quarter.
Intercept Pharmaceuticals’ share price declined due to investor concerns about the commercial potential of Ocaliva, a treatment for a liver disease called PBC. After promising test trials, the drug is pending FDA approval to also treat a progressive liver disease known as NASH. While we believe the NASH market could be very large over time, Ocaliva’s position as the first drug approved for the disease could affect early sales as managed health care plans wrestle with coverage criteria and reimbursements. In the longer term, we think the drug’s side effect profile leaves it vulnerable to competition. As a result, we liquidated our position in the company prior to period end.
Thank you for your continued participation in Franklin Biotechnology Discovery Fund. We look forward to serving your future investment needs.
Sincerely,
 |
Evan McCulloch, CFA Lead Portfolio Manager | |||
Wendy Lam, Ph.D. Steven Kornfeld, CFA
Portfolio Management Team |

| franklintempleton.com | Semiannual Report | 5 | ||
FRANKLIN BIOTECHNOLOGY DISCOVERY FUND
The foregoing information reflects our analysis, opinions and portfolio holdings as of October 31, 2019, the end of the reporting period. The way we implement our main investment strategies and the resulting portfolio holdings may change depending on factors such as market and economic conditions. These opinions may not be relied upon as investment advice or an offer for a particular security. The information is not a complete analysis of every aspect of any market, country, industry, security or the Fund. Statements of fact are from sources considered reliable, but the investment manager makes no representation or warranty as to their completeness or accuracy. Although historical performance is no guarantee of future results, these insights may help you understand our investment management philosophy.
6 | Semiannual Report | franklintempleton.com | ||
FRANKLIN BIOTECHNOLOGY DISCOVERY FUND
Performance Summary as of October 31, 2019
The performance table does not reflect any taxes that a shareholder would pay on Fund dividends, capital gain distributions, if any, or any realized gains on the sale of Fund shares. Total return reflects reinvestment of the Fund’s dividends and capital gain distributions, if any, and any unrealized gains or losses. Your dividend income will vary depending on dividends or interest paid by securities in the Fund’s portfolio, adjusted for operating expenses of each class. Capital gain distributions are net profits realized from the sale of portfolio securities.
Performance as of 10/31/191
Cumulative total return excludes sales charges. Average annual total return includes maximum sales charges. Sales charges will vary depending on the size of the investment and the class of share purchased. The maximum is 5.50% and the minimum is 0%.Class A:5.50% maximum initial sales charge;Advisor Class:no sales charges. For other share classes, visitfranklintempleton.com.
Share Class
| Cumulative Total Return2
| Average Annual Total Return3
| ||
| A4 | ||||
6-Month | +4.18% | -1.55% | ||
1-Year | +7.75% | +1.82% | ||
5-Year | +6.44% | +0.12% | ||
10-Year | +314.51% | +14.63% | ||
Advisor | ||||
6-Month | +4.31% | +4.31% | ||
1-Year | +8.01% | +8.01% | ||
5-Year | +7.75% | +1.50% | ||
10-Year | +325.77% | +15.59% | ||
Performance data represent past performance, which does not guarantee future results. Investment return and principal value will fluctuate, and you may have a gain or loss when you sell your shares. Current performance may differ from figures shown. For most recentmonth-end performance, go tofranklintempleton.comor call(800)342-5236.
See page 8 for Performance Summary footnotes.
| franklintempleton.com | Semiannual Report | 7 | ||
FRANKLIN BIOTECHNOLOGY DISCOVERY FUND
PERFORMANCE SUMMARY
Total Annual Operating Expenses5
Share Class
| With Fee Waiver
| Without Fee Waiver
| ||
A | 1.02% | 1.04% | ||
Advisor | 0.77% | 0.79% | ||
Each class of shares is available to certain eligible investors and has different annual fees and expenses, as described in the prospectus.
All investments involve risks, including possible loss of principal. The Fund is a nondiversified fund that concentrates in a single sector, which involves risks such as patent considerations, product liability, government regulatory requirements, and regulatory approval for new drugs and medical products. Biotechnology companies often are small and/or relatively new. Smaller companies can be particularly sensitive to changes in economic conditions and have less certain growth prospects than larger, more established companies and can be volatile, especially over the short term. The Fund may also invest in foreign companies, which involve special risks, including currency fluctuations and political uncertainty. The Fund’s prospectus also includes a description of the main investment risks.
1. The Fund has a fee waiver associated with any investment it makes in a Franklin Templeton money fund and/or other Franklin Templeton fund, contractually guaranteed through 8/31/20. Fund investment results reflect the fee waiver; without this waiver, the results would have been lower.
2. Cumulative total return represents the change in value of an investment over the periods indicated.
3. Average annual total return represents the average annual change in value of an investment over the periods indicated. Return for less than one year, if any, has not been annualized.
4. Prior to 9/10/18, these shares were offered at a higher initial sales charge of 5.75%, thus actual returns (with sales charges) would have differed. Average annual total returns (with sales charges) have been restated to reflect the current maximum initial sales charge of 5.50%.
5. Figures are as stated in the Fund’s current prospectus and may differ from the expense ratios disclosed in the Your Fund’s Expenses and Financial Highlights sections in this report. In periods of market volatility, assets may decline significantly, causing total annual Fund operating expenses to become higher than the figures shown.
8 | Semiannual Report | franklintempleton.com | ||
FRANKLIN BIOTECHNOLOGY DISCOVERY FUND
Your Fund’s Expenses
As a Fund shareholder, you can incur two types of costs: (1) transaction costs, including sales charges (loads) on Fund purchases and redemptions; and (2) ongoing Fund costs, including management fees, distribution and service(12b-1) fees, and other Fund expenses. All mutual funds have ongoing costs, sometimes referred to as operating expenses. The table below shows ongoing costs of investing in the Fund and can help you understand these costs and compare them with those of other mutual funds. The table assumes a $1,000 investment held for the six months indicated.
Actual Fund Expenses
The table below provides information about actual account values and actual expenses in the columns under the heading “Actual.” In these columns the Fund’s actual return, which includes the effect of Fund expenses, is used to calculate the “Ending Account Value” for each class of shares. You can estimate the expenses you paid during the period by following these steps (ofcourse, your account value and expenses will differ from those in this illustration):Divide your account value by $1,000 (ifyour account had an $8,600 value, then $8,600÷ $1,000 = 8.6). Then multiply the result by the number in the row for your class of shares under the headings “Actual” and “Expenses Paid During Period” (ifActual Expenses Paid During Period were $7.50, then 8.6 x $7.50 = $64.50). In this illustration, the actual expenses paid this period are $64.50.
Hypothetical Example for Comparison with Other Funds
Under the heading “Hypothetical” in the table, information is provided about hypothetical account values and hypothetical expenses based on the Fund’s actual expense ratio and an assumed rate of return of 5% per year before expenses, which is not the Fund’s actual return. This information may not be used to estimate the actual ending account balance or expenses you paid for the period, but it can help you compare ongoing costs of investing in the Fund with those of other funds. To do so, compare this 5% hypothetical example for the class of shares you hold with the 5% hypothetical examples that appear in the shareholder reports of other funds.
Please note that expenses shown in the table are meant to highlight ongoing costs and do not reflect any transactional costs. Therefore, information under the heading “Hypothetical” is useful in comparing ongoing costs only, and will not help you compare total costs of owning different funds. In addition, if transactional costs were included, your total costs would have been higher.
| Actual | Hypothetical | |||||||||||||||||
| (actual return after expenses) | (5% annual return before expenses) | |||||||||||||||||
Share Class | Beginning Value 5/1/19 | Ending Value 10/31/19 | Expenses 5/1/19–10/31/191,2 | Ending Account Value 10/31/19 | Expenses Paid During Period 5/1/19–10/31/191, 2 | Net Annualized Expense Ratio2 | ||||||||||||
| A | $1,000 | $1,041.80 | $5.18 | $1,020.06 | $5.13 | 1.01% | ||||||||||||
| C | $1,000 | $1,037.80 | $9.02 | $1,016.29 | $8.92 | 1.76% | ||||||||||||
| R6 | $1,000 | $1,043.70 | $3.29 | $1,021.92 | $3.25 | 0.64% | ||||||||||||
| Advisor | $1,000 | $1,043.10 | $3.90 | $1,021.32 | $3.86 | 0.76% | ||||||||||||
1. Expenses are equal to the annualized expense ratio for thesix-month period as indicated above—in the far right column—multiplied by the simple average account value over the period indicated, and then multiplied by 184/366 to reflect theone-half year period.
2. Reflects expenses after fee waivers and expense reimbursements. Does not include acquired fund fees and expenses.
| franklintempleton.com | Semiannual Report | 9 | ||
Franklin Natural Resources Fund
This semiannual report for Franklin Natural Resources Fund covers the period ended October 31, 2019.
Your Fund’s Goal and Main Investments
The Fund seeks high total return (total return consists of capital appreciation and current dividend and interest income) by investing, under normal market conditions, at least 80% of its net assets in equity and debt securities of companies that own, produce, refine, process, transport or market natural resources, as well as those that provide related services.
Performance Overview
The Fund’s Class A shares posted a-17.26% cumulative total return for the six months under review. In comparison, the Standard & Poor’s (S&P®) North American Natural Resources Sector Index, which tracks companies involved in industries such as mining, energy, timber and forestry services, and the production of pulp and paper, posted a-7.36% total return.1 Also in comparison, the Standard & Poor’s 500 Index (S&P 500), which is a broad measure of the U.S. stock market, posted a +4.16% total return.1 Please note index performance information is provided for reference and we do not attempt to track any index but rather undertake investments on the basis of fundamental research. The Fund’s strategy, which focuses on companies with higher long-term growth potential, differs from the natural resources index’s large weighting in income-oriented companies that we believe typically provide more limited opportunities for growth. This difference may occasionally lead to wide performance discrepancies, especially in periods when investors focus on short-term safety and yield or, conversely, when investors focus more heavily on companies with stronger growth prospects and greater commodity price leverage. You can find the Fund’s long-term performance data in the Performance Summary beginning on page 14.
Performance data represent past performance, which does not guarantee future results. Investment return and principal value will fluctuate, and you may have a gain or loss when you sell your shares. Current performance may differ from
Geographic Composition
Based on Total Net Assets as of 10/31/19
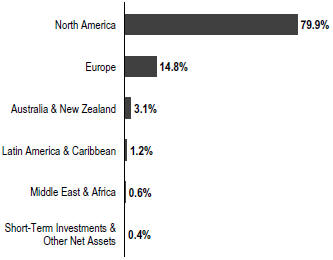
figures shown. For most recentmonth-end performance, go tofranklintempleton.comor call(800)342-5236.
Investment Strategy
We are research-driven, fundamental investors, pursuing a growth strategy. Asbottom-up investors focusing primarily on individual securities, we choose companies that have identifiable drivers of future earnings growth and that present, in our opinion, the besttrade-off between potential earnings growth, business and financial risk, and valuation. Also, in seeking sustainable growth characteristics, we look for companies that we believe can produce sustainable earnings growth and cash flow growth or the potential to generate income. We rely on a team of analysts to help providein-depth industry expertise and use both qualitative and quantitative analysis to evaluate companies for distinct and sustainable competitive advantages likely to lead to growth in earnings and/or share price. Competitive advantages, such as a particular product niche, proven technology, sound financial position and strong management, are all factors we believe may contribute to strong growth potential.
1. Source: Morningstar.
The indexes are unmanaged and include reinvestment of any income or distributions. They do not reflect any fees, expenses or sales charges. One cannot invest directly in an index, and an index is not representative of the Fund’s portfolio.
See www.franklintempletondatasources.com for additional data provider information.
The dollar value, number of shares or principal amount, and names of all portfolio holdings are listed in the Fund’s Statement of Investments (SOI).
The SOI begins on page 28.
10 | Semiannual Report | franklintempleton.com | ||
FRANKLIN NATURAL RESOURCES FUND
Sector Overview
Global commodity prices were mixed during the six months ended October 31, 2019, due to slower global industrial production, heightened U.S.-China trade tensions and geopolitical instability. Oil prices ended the period down despite several supply shocks, while precious metals prices increased as investors sought perceived safe-haven assets. The U.S. Federal Reserve’s three interest-rate cuts during the period helped limit the overall commodity decline.
Crude oil prices fell significantly during the period, as both the U.S. and global oil benchmarks—West Texas Intermediate and Brent crude oil, respectively—declined. Prices were driven down by the global economic slowdown amid the U.S.-China trade conflict, which led international organizations to reduce oil demand projections for 2019 and 2020. Rising U.S. oil production and inventory counterbalanced cuts by the Organization of the Petroleum Exporting Countries, drone attacks on Saudi oil facilities, U.S. sanctions on Iran and production drops in Venezuela and Libya.
U.S. natural gas prices rose slightly during the period. Record production levels in 2019’s second quarter and an inventory buildup in the third quarter drove prices down. Warm spring weather early in the period reduced demand for heating fuel, which further depressed prices. A weather-driven rebound in October reversed earlier declines, as a projected U.S. cold snap in November boosted demand for heating fuel. Rising exports and anticipated production cuts associated with a decline in naturalgas-focused drilling rigs also contributed to the price surge.
Metals advanced during the period, with the notable exception of copper. Gold prices hit asix-year high in 2019’s third quarter, as investors turned away from equities and bonds against a backdrop of slower global economic growth, political instability in the U.S. and U.K., and expectations of loosening monetary policy. Palladium prices also increased significantly. The metal, a key component in pollution-control devices for automobiles, benefited from increased demand driven by tighter emissions standards, particularly in China. Silver and platinum prices increased as well. Turning to industrial metals, copper prices declined during the period, hitting a multiyear low in the third quarter. Slower global manufacturing and construction activities drove the price decrease. Iron ore prices were volatile during the six months under review, though they ended the period slightly higher. Prices rose in the period’s first half due to lower inventory and higher Chinese steel production driven by government stimulus. However, those gains were significantly trimmed in
Portfolio Composition
Based on Total Net Assets as of 10/31/19
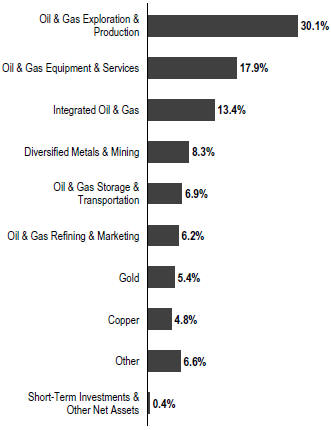
August as Chinese steel production declined in the face of U.S. tariff threats and increased supplies.
Manager’s Discussion
Natural resources equities broadly declined during the period due to slowing global economic growth, international trade conflicts—which included the imposition of tariffs—and declining demand. Energy companies were hit particularly hard, while gold mining companies benefited from rising gold prices as investors sought alternatives to equity markets and paper currency.
In this environment, overweightings and stock selection in oil and gas equipment and services as well as oil and gas exploration and production detracted from relative performance, as investors moved away from companies viewed as having higher exposure to weakening demand trends. This relative underperformance was magnified by a reduction of energy weightings in natural resources indexes. On an individual basis, the Fund’s largest relative detractors included large and, in our opinion, high-quality U.S.-based companies such as Superior Energy Services (not part of the index), Concho Resources and Callon Petroleum.
| franklintempleton.com | Semiannual Report | 11 | ||
FRANKLIN NATURAL RESOURCES FUND
Top 10 Holdings
10/31/19
| Company Sector/Industry | % of Total Net Assets | |||
Schlumberger Ltd. Oil & Gas Equipment & Services | 3.8% | |||
Diamondback Energy Inc. Oil & Gas Exploration & Production | 3.6% | |||
Concho Resources Inc. Oil & Gas Exploration & Production | 3.6% | |||
EOG Resources Inc. Oil & Gas Exploration & Production | 3.2% | |||
ConocoPhillips Oil & Gas Exploration & Production | 3.0% | |||
Occidental Petroleum Corp. Integrated Oil & Gas | 3.0% | |||
Halliburton Co. Oil & Gas Equipment & Services | 2.9% | |||
Pioneer Natural Resources Co. Oil & Gas Exploration & Production | 2.8% | |||
Cabot Oil & Gas Corp. Oil & Gas Exploration & Production | 2.8% | |||
Suncor Energy Inc. Integrated Oil & Gas | 2.7% | |||
An underweighted position in gold also detracted from relative performance. The sector’s biggest detractors included an underweighted position in Newmont Goldcorp, a U.S.-based mining company with global operations, and our lack of holdings in other well-performing companies.
Turning to contributors, an underweighting in integrated oil and gas—which suffered from similar dynamics to other energy industries—benefited relative results. Our underweighted position in Exxon Mobil was a significant contributor.
Anoff-benchmark exposure to packaged foods and meats also contributed to relative performance. Beyond Meat (not held atperiod-end), a leading American plant-based meats producer, is the Fund’s sole holding in the industry. The company’s stock surged following its initial public offering (IPO) in May. Despite the company reporting strong earnings in 2019’s second and third quarters, its share price declined in October afterpost-IPO trading restrictions were lifted, though it still ended the period up.
Elsewhere, overweighted positions in Canadian gold miners B2Gold and Alamos Gold (not part of the index) and Australian gold miner Newcrest Mining (not part of the index) benefited relative results.
Cash holdings were another relative contributor.
During the period, we chose to leave the Fund’s sector weightings relatively unchanged, while seeking to mitigate risk through a focus on large, relatively stable companies. We see several positive trends throughout the energy sector, including reduced capital investment, growing free cash flow and improving supply fundamentals. We believe the depressed valuations for energy equities, which approached multi-decade lows, are unsustainable in the long term and provide significant investment opportunities.
Thank you for your continued participation in Franklin Natural Resources Fund. We look forward to serving your future investment needs.
Sincerely,
 |
Frederick G. Fromm, CFA | |

 |
Matthew J. Adams, CFA | |
| Stephen M. Land, CFA | ||
| Portfolio Management Team | ||

12 | Semiannual Report | franklintempleton.com | ||
FRANKLIN NATURAL RESOURCES FUND
The foregoing information reflects our analysis, opinions and portfolio holdings as of October 31, 2019, the end of the reporting period. The way we implement our main investment strategies and the resulting portfolio holdings may change depending on factors such as market and economic conditions. These opinions may not be relied upon as investment advice or an offer for a particular security. The information is not a complete analysis of every aspect of any market, country, industry, security or the Fund. Statements of fact are from sources considered reliable, but the investment manager makes no representation or warranty as to their completeness or accuracy. Although historical performance is no guarantee of future results, these insights may help you understand our investment management philosophy.
| franklintempleton.com | Semiannual Report | 13 | ||
FRANKLIN NATURAL RESOURCES FUND
Performance Summary as of October 31, 2019
The performance table does not reflect any taxes that a shareholder would pay on Fund dividends, capital gain distributions, if any, or any realized gains on the sale of Fund shares. Total return reflects reinvestment of the Fund’s dividends and capital gain distributions, if any, and any unrealized gains or losses. Your dividend income will vary depending on dividends or interest paid by securities in the Fund’s portfolio, adjusted for operating expenses of each class. Capital gain distributions are net profits realized from the sale of portfolio securities.
Performance as of 10/31/191
Cumulative total return excludes sales charges. Average annual total return includes maximum sales charges. Sales charges will vary depending on the size of the investment and the class of share purchased. The maximum is 5.50% and the minimum is 0%.Class A:5.50% maximum initial sales charge;Advisor Class:no sales charges. For other share classes, visitfranklintempleton.com.
| Share Class | Cumulative Total Return2 | Average Annual Total Return3 | ||||||
A4 | ||||||||
6-Month | -17.26% | -21.80% | ||||||
1-Year | -17.62% | -22.15% | ||||||
5-Year | -37.44% | -9.98% | ||||||
10-Year | -25.84% | -3.49% | ||||||
Advisor | ||||||||
6-Month | -17.14% | -17.14% | ||||||
1-Year | -17.44% | -17.44% | ||||||
5-Year | -36.62% | -8.72% | ||||||
10-Year | -23.75% | -2.67% | ||||||
Performance data represent past performance, which does not guarantee future results. Investment return and principal value will fluctuate, and you may have a gain or loss when you sell your shares. Current performance may differ from figures shown. For most recentmonth-end performance, go tofranklintempleton.comor call(800)342-5236.
See page 15 for Performance Summary footnotes.
14 | Semiannual Report | franklintempleton.com | ||
FRANKLIN NATURAL RESOURCES FUND
PERFORMANCE SUMMARY
Total Annual Operating Expenses5
Share Class
| With Fee Waiver
| Without Fee Waiver
| ||
A
| 1.04%
| 1.04%
| ||
Advisor
| 0.79%
| 0.79%
| ||
Each class of shares is available to certain eligible investors and has different annual fees and expenses, as described in the prospectus.
All investments involve risks, including possible loss of principal. Investing in a fund concentrating in the natural resources sector involves special risks, including increased susceptibility to adverse economic and regulatory developments affecting the sector. Growth stock prices may fall dramatically if the company fails to meet projections of earnings or revenue; their prices may be more volatile than other securities, particularly over the short term. Smaller companies can be particularly sensitive to changes in economic conditions and have less certain growth prospects than larger, more established companies and can be volatile, especially over the short term. The Fund may also invest in foreign companies, which involve special risks, including currency fluctuations and political uncertainty. The Fund’s prospectus also includes a description of the main investment risks.
1. The Fund has a fee waiver associated with any investment it makes in a Franklin Templeton money fund and/or other Franklin Templeton fund, contractually guaranteed through 8/31/20. Fund investment results reflect the fee waiver; without this waiver, the results would have been lower.
2. Cumulative total return represents the change in value of an investment over the periods indicated.
3. Average annual total return represents the average annual change in value of an investment over the periods indicated. Return for less than one year, if any, has not been annualized.
4. Prior to 9/10/18, these shares were offered at a higher initial sales charge of 5.75%, thus actual returns (with sales charges) would have differed. Average annual total returns (with sales charges) have been restated to reflect the current maximum initial sales charge of 5.50%.
5. Figures are as stated in the Fund’s current prospectus and may differ from the expense ratios disclosed in the Your Fund’s Expenses and Financial Highlights sections in this report. In periods of market volatility, assets may decline significantly, causing total annual Fund operating expenses to become higher than the figures shown.
| franklintempleton.com | Semiannual Report | 15 | ||
FRANKLIN NATURAL RESOURCES FUND
Your Fund’s Expenses
As a Fund shareholder, you can incur two types of costs: (1) transaction costs, including sales charges (loads) on Fund purchases and redemptions; and (2) ongoing Fund costs, including management fees, distribution and service(12b-1) fees, and other Fund expenses. All mutual funds have ongoing costs, sometimes referred to as operating expenses. The table below shows ongoing costs of investing in the Fund and can help you understand these costs and compare them with those of other mutual funds. The table assumes a $1,000 investment held for the six months indicated.
Actual Fund Expenses
The table below provides information about actual account values and actual expenses in the columns under the heading “Actual.” In these columns the Fund’s actual return, which includes the effect of Fund expenses, is used to calculate the “Ending Account Value” for each class of shares. You can estimate the expenses you paid during the period by following these steps (ofcourse, your account value and expenses will differ from those in this illustration):Divide your account value by $1,000 (ifyour account had an $8,600 value, then $8,600÷ $1,000 = 8.6). Then multiply the result by the number in the row for your class of shares under the headings “Actual” and “Expenses Paid During Period” (ifActual Expenses Paid During Period were $7.50, then 8.6 x $7.50 = $64.50). In this illustration, the actual expenses paid this period are $64.50.
Hypothetical Example for Comparison with Other Funds
Under the heading “Hypothetical” in the table, information is provided about hypothetical account values and hypothetical expenses based on the Fund’s actual expense ratio and an assumed rate of return of 5% per year before expenses, which is not the Fund’s actual return. This information may not be used to estimate the actual ending account balance or expenses you paid for the period, but it can help you compare ongoing costs of investing in the Fund with those of other funds. To do so, compare this 5% hypothetical example for the class of shares you hold with the 5% hypothetical examples that appear in the shareholder reports of other funds.
Please note that expenses shown in the table are meant to highlight ongoing costs and do not reflect any transactional costs. Therefore, information under the heading “Hypothetical” is useful in comparing ongoing costs only, and will not help you compare total costs of owning different funds. In addition, if transactional costs were included, your total costs would have been higher.
| Actual (actual return after expenses) | Hypothetical (5% annual return before expenses) | |||||||||||
| Share Class | Beginning Account Value 5/1/19 | Ending Account Value 10/31/19 | Expenses Paid During Period 5/1/19–10/31/191, 2 | Ending Account | Expenses Paid During Period 5/1/19–10/31/191, 2 | Net Annualized Expense Ratio2 | ||||||
|
|
|
| |||||||||
| A | $1,000 | $827.40 | $5.10 | $1,019.56 | $5.63 | 1.11% | ||||||
| C | $1,000 | $824.70 | $8.53 | $1,015.79 | $9.42 | 1.86% | ||||||
| R6 | $1,000 | $829.50 | $2.94 | $1,021.92 | $3.25 | 0.64% | ||||||
| Advisor | $1,000 | $828.60 | $3.95 | $1,020.81 | $4.37 | 0.86% | ||||||
1. Expenses are equal to the annualized expense ratio for thesix-month period as indicated above—in the far right column—multiplied by the simple average account value over the period indicated, and then multiplied by 184/366 to reflect theone-half year period.
2. Reflects expenses after fee waivers and expense reimbursements. Does not include acquired fund fees and expenses.
16 | Semiannual Report | franklintempleton.com | ||
FRANKLIN STRATEGIC SERIES
Franklin Biotechnology Discovery Fund
Six Months Ended (unaudited) | Year Ended April 30, | |||||||||||||||||||||||
| 2019 | 2018 | 2017 | 2016 | 2015 | ||||||||||||||||||||
Class A | ||||||||||||||||||||||||
Per share operating performance (for a share outstanding throughout the period) | ||||||||||||||||||||||||
Net asset value, beginning of period | $138.85 | $146.14 | $147.22 | $128.19 | $182.30 | $129.27 | ||||||||||||||||||
Income from investment operationsa: | ||||||||||||||||||||||||
Net investment income (loss)b | (0.34 | ) | (0.99 | ) | (0.80 | ) | (0.79 | ) | (0.94 | ) | (1.09 | ) | ||||||||||||
Net realized and unrealized gains (losses) | 6.14 | (1.75 | ) | 3.32 | 25.75 | (39.39 | ) | 60.79 | ||||||||||||||||
Total from investment operations | 5.80 | (2.74 | ) | 2.52 | 24.96 | (40.33 | ) | 59.70 | ||||||||||||||||
Less distributions from: | ||||||||||||||||||||||||
Net investment income | — | — | — | (1.73 | ) | — | — | |||||||||||||||||
Net realized gains | — | (4.55 | ) | (3.60 | ) | (4.20 | ) | (13.78 | ) | (6.67 | ) | |||||||||||||
Total distributions | — | (4.55 | ) | (3.60 | ) | (5.93 | ) | (13.78 | ) | (6.67 | ) | |||||||||||||
Net asset value, end of period | $144.65 | $138.85 | $146.14 | $147.22 | $128.19 | $182.30 | ||||||||||||||||||
Total returnc | 4.18% | (1.60)% | 1.69% | 20.02% | (23.55)% | 46.81% | ||||||||||||||||||
Ratios to average net assetsd | ||||||||||||||||||||||||
Expenses before waiver and payments by affiliates | 1.03% | 1.02% | 1.05% | 1.04% | 0.99% | 1.00% | ||||||||||||||||||
Expenses net of waiver and payments by affiliatese | 1.01% | 1.00% | 1.03% | 1.02% | 0.98% | 1.00% | f | |||||||||||||||||
Net investment income (loss) | (0.48)% | (0.67)% | (0.53)% | (0.58)% | (0.56)% | (0.67)% | ||||||||||||||||||
Supplemental data | ||||||||||||||||||||||||
Net assets, end of period (000’s) | $886,021 | $924,611 | $1,081,883 | $1,176,687 | $1,074,903 | $1,601,906 | ||||||||||||||||||
Portfolio turnover rate | 18.29% | 28.62% | 26.95% | 34.12% | 22.13% | 41.43% | ||||||||||||||||||
aThe amount shown for a share outstanding throughout the period may not correlate with the Statement of Operations for the period due to the timing of sales and repurchases of the Fund’s shares in relation to income earned and/or fluctuating fair value of the investments of the Fund.
bBased on average daily shares outstanding.
cTotal return does not reflect sales commissions or contingent deferred sales charges, if applicable, and is not annualized for periods less than one year.
dRatios are annualized for periods less than one year.
eBenefit of expense reduction rounds to less than 0.01%.
fBenefit of waiver and payments by affiliates rounds to less than 0.01%.
| franklintempleton.com | The accompanying notes are an integral part of these financial statements. | Semiannual Report | 17 | ||
FRANKLIN STRATEGIC SERIES
FINANCIAL HIGHLIGHTS
Franklin Biotechnology Discovery Fund(continued)
Six Months Ended (unaudited) | Year Ended April 30, | |||||||||||||||||||||||
| 2019 | 2018 | 2017 | 2016 | 2015 | ||||||||||||||||||||
Class C | ||||||||||||||||||||||||
Per share operating performance (for a share outstanding throughout the period) | ||||||||||||||||||||||||
Net asset value, beginning of period | $133.51 | $141.75 | $143.98 | $125.99 | $180.67 | $129.11 | ||||||||||||||||||
Income from investment operationsa: | ||||||||||||||||||||||||
Net investment income (loss)b | (0.83 | ) | (2.03 | ) | (1.90 | ) | (1.81 | ) | (2.11 | ) | (2.38 | ) | ||||||||||||
Net realized and unrealized gains (losses) | 5.88 | (1.66 | ) | 3.27 | 25.29 | (38.79 | ) | 60.61 | ||||||||||||||||
Total from investment operations | 5.05 | (3.69 | ) | 1.37 | 23.48 | (40.90 | ) | 58.23 | ||||||||||||||||
Less distributions from: | ||||||||||||||||||||||||
Net investment income | — | — | — | (1.29 | ) | — | — | |||||||||||||||||
Net realized gains | — | (4.55 | ) | (3.60 | ) | (4.20 | ) | (13.78 | ) | (6.67 | ) | |||||||||||||
Total distributions | — | (4.55 | ) | (3.60 | ) | (5.49 | ) | (13.78 | ) | (6.67 | ) | |||||||||||||
Net asset value, end of period | $138.56 | $133.51 | $141.75 | $143.98 | $125.99 | $180.67 | ||||||||||||||||||
Total returnc | 3.78% | (2.33)% | 0.93% | 19.14% | (24.09)% | 45.76% | ||||||||||||||||||
Ratios to average net assetsd | ||||||||||||||||||||||||
Expenses before waiver and payments by affiliates | 1.78% | 1.77% | 1.80% | 1.79% | 1.71% | 1.75% | ||||||||||||||||||
Expenses net of waiver and payments by affiliatese | 1.76% | 1.75% | 1.78% | 1.77% | 1.70% | 1.75% | f | |||||||||||||||||
Net investment income (loss) | (1.23)% | (1.42)% | (1.28)% | (1.33)% | (1.28)% | (1.42)% | ||||||||||||||||||
Supplemental data | ||||||||||||||||||||||||
Net assets, end of period (000’s) | $43,847 | $46,508 | $58,433 | $53,935 | $17,562 | $23,051 | ||||||||||||||||||
Portfolio turnover rate | 18.29% | 28.62% | 26.95% | 34.12% | 22.13% | 41.43% | ||||||||||||||||||
aThe amount shown for a share outstanding throughout the period may not correlate with the Statement of Operations for the period due to the timing of sales and repurchases of the Fund’s shares in relation to income earned and/or fluctuating fair value of the investments of the Fund.
bBased on average daily shares outstanding.
cTotal return does not reflect sales commissions or contingent deferred sales charges, if applicable, and is not annualized for periods less than one year.
dRatios are annualized for periods less than one year.
eBenefit of expense reduction rounds to less than 0.01%.
fBenefit of waiver and payments by affiliates rounds to less than 0.01%.
18 | Semiannual Report | The accompanying notes are an integral part of these financial statements. | franklintempleton.com | ||
FRANKLIN STRATEGIC SERIES
FINANCIAL HIGHLIGHTS
Franklin Biotechnology Discovery Fund(continued)
Six Months Ended (unaudited) | Year Ended April 30, | |||||||||||||||||||||||
| 2019 | 2018 | 2017 | 2016 | 2015 | ||||||||||||||||||||
Class R6 | ||||||||||||||||||||||||
Per share operating performance (for a share outstanding throughout the period) | ||||||||||||||||||||||||
Net asset value, beginning of period | $143.83 | $150.65 | $151.03 | $131.37 | $185.75 | $131.09 | ||||||||||||||||||
Income from investment operationsa: | ||||||||||||||||||||||||
Net investment income (loss)b | (0.08 | ) | (0.46 | ) | (0.17 | ) | (0.25 | ) | (0.32 | ) | (0.45 | ) | ||||||||||||
Net realized and unrealized gains (losses) | 6.36 | (1.81 | ) | 3.39 | 26.41 | (40.28 | ) | 61.78 | ||||||||||||||||
Total from investment operations | 6.28 | (2.27 | ) | 3.22 | 26.16 | (40.60 | ) | 61.33 | ||||||||||||||||
Less distributions from: | ||||||||||||||||||||||||
Net investment income | — | — | — | (2.30 | ) | — | — | |||||||||||||||||
Net realized gains | — | (4.55 | ) | (3.60 | ) | (4.20 | ) | (13.78 | ) | (6.67 | ) | |||||||||||||
Total distributions | — | (4.55 | ) | (3.60 | ) | (6.50 | ) | (13.78 | ) | (6.67 | ) | |||||||||||||
Net asset value, end of period | $150.11 | $143.83 | $150.65 | $151.03 | $131.37 | $185.75 | ||||||||||||||||||
Total returnc | 4.37% | (1.24)% | 2.11% | 20.50% | (23.24)% | 47.40% | ||||||||||||||||||
Ratios to average net assetsd | ||||||||||||||||||||||||
Expenses before waiver and payments by affiliates | 0.73% | 0.70% | 0.65% | 0.63% | 0.60% | 0.60% | ||||||||||||||||||
Expenses net of waiver and payments by affiliatese | 0.64% | 0.63% | 0.61% | 0.61% | 0.59% | 0.60% | f | |||||||||||||||||
Net investment income (loss) | (0.11)% | (0.30)% | (0.11)% | (0.17)% | (0.17)% | (0.27)% | ||||||||||||||||||
Supplemental data | ||||||||||||||||||||||||
Net assets, end of period (000’s) | $5,313 | $6,164 | $8,307 | $8,891 | $5,568 | $76,436 | ||||||||||||||||||
Portfolio turnover rate | 18.29% | 28.62% | 26.95% | 34.12% | 22.13% | 41.43% | ||||||||||||||||||
aThe amount shown for a share outstanding throughout the period may not correlate with the Statement of Operations for the period due to the timing of sales and repurchases of the Fund’s shares in relation to income earned and/or fluctuating fair value of the investments of the Fund.
bBased on average daily shares outstanding.
cTotal return is not annualized for periods less than one year.
dRatios are annualized for periods less than one year.
eBenefit of expense reduction rounds to less than 0.01%.
fBenefit of waiver and payments by affiliates rounds to less than 0.01%.
| franklintempleton.com | The accompanying notes are an integral part of these financial statements. | Semiannual Report | 19 | ||
FRANKLIN STRATEGIC SERIES
FINANCIAL HIGHLIGHTS
Franklin Biotechnology Discovery Fund(continued)
Six Months Ended (unaudited) | Year Ended April 30, | |||||||||||||||||||||||
| 2019 | 2018 | 2017 | 2016 | 2015 | ||||||||||||||||||||
Advisor Class | ||||||||||||||||||||||||
Per share operating performance (for a share outstanding throughout the period) | ||||||||||||||||||||||||
Net asset value, beginning of period | $142.56 | $149.54 | $150.20 | $130.67 | $185.12 | $130.86 | ||||||||||||||||||
Income from investment operationsa: | ||||||||||||||||||||||||
Net investment income (loss)b | (0.17 | ) | (0.63 | ) | (0.45 | ) | (0.46 | ) | (0.55 | ) | (0.70 | ) | ||||||||||||
Net realized and unrealized gains (losses) | 6.31 | (1.80 | ) | 3.39 | 26.27 | (40.12 | ) | 61.63 | ||||||||||||||||
Total from investment operations | 6.14 | (2.43 | ) | 2.94 | 25.81 | (40.67 | ) | 60.93 | ||||||||||||||||
Less distributions from: | ||||||||||||||||||||||||
Net investment income | — | — | — | (2.08 | ) | — | — | |||||||||||||||||
Net realized gains | — | (4.55 | ) | (3.60 | ) | (4.20 | ) | (13.78 | ) | (6.67 | ) | |||||||||||||
Total distributions | — | (4.55 | ) | (3.60 | ) | (6.28 | ) | (13.78 | ) | (6.67 | ) | |||||||||||||
Net asset value, end of period | $148.70 | $142.56 | $149.54 | $150.20 | $130.67 | $185.12 | ||||||||||||||||||
Total returnc | 4.31% | (1.36)% | 1.94% | 20.32% | (23.36)% | 47.17% | ||||||||||||||||||
Ratios to average net assetsd | ||||||||||||||||||||||||
Expenses before waiver and payments by affiliates | 0.78% | 0.77% | 0.80% | 0.79% | 0.75% | 0.75% | ||||||||||||||||||
Expenses net of waiver and payments by affiliatese | 0.76% | 0.75% | 0.78% | 0.77% | 0.74% | 0.75% | f | |||||||||||||||||
Net investment income (loss) | (0.23)% | (0.42)% | (0.28)% | (0.33)% | (0.32)% | (0.42)% | ||||||||||||||||||
Supplemental data | ||||||||||||||||||||||||
Net assets, end of period (000’s) | $148,308 | $153,874 | $180,219 | $159,894 | $93,263 | $167,035 | ||||||||||||||||||
Portfolio turnover rate | 18.29% | 28.62% | 26.95% | 34.12% | 22.13% | 41.43% | ||||||||||||||||||
aThe amount shown for a share outstanding throughout the period may not correlate with the Statement of Operations for the period due to the timing of sales and repurchases of the Fund’s shares in relation to income earned and/or fluctuating fair value of the investments of the Fund.
bBased on average daily shares outstanding.
cTotal return is not annualized for periods less than one year.
dRatios are annualized for periods less than one year.
eBenefit of expense reduction rounds to less than 0.01%.
fBenefit of waiver and payments by affiliates rounds to less than 0.01%.
20 | Semiannual Report | The accompanying notes are an integral part of these financial statements. | franklintempleton.com | ||
FRANKLIN STRATEGIC SERIES
Statement of Investments, October 31, 2019 (unaudited)
Franklin Biotechnology Discovery Fund
| Country | Shares/ Warrants | Value | ||||||||||
Common Stocks and Other Equity Interests 97.9% | ||||||||||||
Biotechnology 79.2% | ||||||||||||
aAcadia Pharmaceuticals Inc. | United States | 294,600 | $ | 12,493,986 | ||||||||
aAcceleron Pharma Inc. | United States | 131,500 | 5,900,405 | |||||||||
aAlector Inc. | United States | 218,400 | 3,677,856 | |||||||||
aAlexion Pharmaceuticals Inc. | United States | 340,800 | 35,920,320 | |||||||||
a,bAllogene Therapeutics Inc., 144A | United States | 326,797 | 9,411,754 | |||||||||
aAlnylam Pharmaceuticals Inc. | United States | 77,200 | 6,696,328 | |||||||||
aAmarin Corp. PLC, ADR | Ireland | 162,300 | 2,664,966 | |||||||||
Amgen Inc. | United States | 411,800 | 87,816,350 | |||||||||
aAmicus Therapeutics Inc. | United States | 776,900 | 6,549,267 | |||||||||
aArgenx SE, ADR | Netherlands | 186,125 | 22,792,867 | |||||||||
aAscendis Pharma AS, ADR | Denmark | 257,700 | 28,496,466 | |||||||||
aAssembly Biosciences Inc. | United States | 186,900 | 3,085,719 | |||||||||
aAudentes Therapeutics Inc. | United States | 87,500 | 2,353,750 | |||||||||
a,cAurinia Pharmaceuticals Inc. | Canada | 536,900 | 2,609,334 | |||||||||
aBiogen Inc. | United States | 189,261 | 56,534,153 | |||||||||
aBioMarin Pharmaceutical Inc. | United States | 341,156 | 24,976,031 | |||||||||
aBluebird Bio Inc. | United States | 57,800 | 4,681,800 | |||||||||
a,cBridgebio Pharma Inc. | United States | 136,000 | 3,074,960 | |||||||||
a,cCRISPR Therapeutics AG | Switzerland | 166,314 | 8,377,236 | |||||||||
aDeciphera Pharmaceuticals Inc. | United States | 428,991 | 19,021,461 | |||||||||
aFate Therapeutics Inc. | United States | 912,346 | 13,639,573 | |||||||||
aG1 Therapeutics Inc. | United States | 398,426 | 8,454,600 | |||||||||
Gilead Sciences Inc. | United States | 1,042,000 | 66,385,820 | |||||||||
aGlobal Blood Therapeutics Inc. | United States | 434,500 | 20,834,275 | |||||||||
aGossamer Bio Inc. | United States | 242,900 | 4,997,667 | |||||||||
aHeron Therapeutics Inc. | United States | 1,657,077 | 35,212,886 | |||||||||
aHomology Medicines Inc. | United States | 138,400 | 1,817,192 | |||||||||
aImmunomedics Inc. | United States | 348,700 | 5,579,200 | |||||||||
aInsmed Inc. | United States | 260,200 | 4,837,118 | |||||||||
a,d,eIntarcia Therapeutics Inc., DD | United States | 80,195 | 634,441 | |||||||||
aIonis Pharmaceuticals Inc. | United States | 102,400 | 5,705,728 | |||||||||
aIovance Biotherapeutics Inc. | United States | 1,990,500 | 42,059,265 | |||||||||
aKalVista Pharmaceuticals Inc. | United States | 105,900 | 1,122,540 | |||||||||
aKezar Life Sciences Inc. | United States | 128,850 | 418,763 | |||||||||
a,cLogicBio Therapeutics Inc. | United States | 280,700 | 2,792,965 | |||||||||
aMinerva Neurosciences Inc. | United States | 492,400 | 2,333,976 | |||||||||
aMirati Therapeutics Inc. | United States | 123,851 | 11,664,287 | |||||||||
aMorphoSys AG, ADR | Germany | 275,700 | 7,504,554 | |||||||||
aNeurocrine Biosciences Inc. | United States | 326,800 | 32,513,332 | |||||||||
aPfenex Inc. | United States | 870,884 | 8,029,550 | |||||||||
aPortola Pharmaceuticals Inc. | United States | 558,200 | 16,137,562 | |||||||||
aPrecision BioSciences Inc. | United States | 125,040 | 811,510 | |||||||||
a,bPrecision BioSciences Inc., 144A | United States | 425,322 | 2,760,340 | |||||||||
aPrincipia Biopharma Inc. | United States | 92,600 | 3,269,706 | |||||||||
aPTC Therapeutics Inc. | United States | 704,200 | 28,794,738 | |||||||||
aRegeneron Pharmaceuticals Inc. | United States | 143,409 | 43,923,309 | |||||||||
aREGENXBIO Inc. | United States | 123,076 | 4,392,582 | |||||||||
| franklintempleton.com | Semiannual Report | 21 | ||
FRANKLIN STRATEGIC SERIES
STATEMENT OF INVESTMENTS (UNAUDITED)
Franklin Biotechnology Discovery Fund(continued)
| Country | Shares/ Warrants | Value | ||||||||||
Common Stocks and Other Equity Interests(continued) | ||||||||||||
Biotechnology(continued) | ||||||||||||
aRocket Pharmaceuticals Inc. | United States | 178,571 | $ | 2,596,422 | ||||||||
aSage Therapeutics Inc. | United States | 144,470 | 19,597,355 | |||||||||
aSarepta Therapeutics Inc. | United States | 65,400 | 5,432,124 | |||||||||
aSpringWorks Therapeutics Inc. | United States | 76,800 | 1,466,880 | |||||||||
aUltragenyx Pharmaceutical Inc. | United States | 66,100 | 2,653,254 | |||||||||
auniQure NV | Netherlands | 206,000 | 10,308,240 | |||||||||
aVertex Pharmaceuticals Inc. | United States | 377,000 | 73,695,960 | |||||||||
a,cViela Bio Inc. | United States | 151,600 | 3,297,300 | |||||||||
aXencor Inc. | United States | 178,132 | 6,093,896 | |||||||||
a,cZymeworks Inc. | Canada | 259,120 | 8,947,414 | |||||||||
|
| |||||||||||
| 857,851,333 | ||||||||||||
|
| |||||||||||
Life Sciences Tools & Services 4.8% | ||||||||||||
aIllumina Inc. | United States | 176,000 | 52,011,520 | |||||||||
|
| |||||||||||
Pharmaceuticals 13.9% | ||||||||||||
aAerie Pharmaceuticals Inc. | United States | 401,600 | 8,911,504 | |||||||||
a,cCara Therapeutics Inc. | United States | 227,000 | 4,712,520 | |||||||||
aCollegium Pharmaceutical Inc. | United States | 403,450 | 4,841,400 | |||||||||
aCymabay Therapeutics Inc. | United States | 438,356 | 1,968,218 | |||||||||
aDermira Inc. | United States | 538,268 | 3,601,013 | |||||||||
aGW Pharmaceuticals PLC, ADR | United Kingdom | 344,200 | 46,060,844 | |||||||||
a,cIterum Therapeutics PLC | United States | 33,648 | 90,850 | |||||||||
aMarinus Pharmaceuticals Inc. | United States | 201,856 | 236,172 | |||||||||
aOdonate Therapeutics Inc. | United States | 322,082 | 10,229,324 | |||||||||
a,cOptinose Inc. | United States | 230,300 | 1,800,946 | |||||||||
aReata Pharmaceuticals Inc. | United States | 242,600 | 49,995,008 | |||||||||
aRevance Therapeutics Inc. | United States | 647,300 | 10,136,718 | |||||||||
a,cTherapeuticsMD Inc. | United States | 2,847,040 | 7,573,126 | |||||||||
aTrevi Therapeutics Inc. | United States | 223,709 | 659,942 | |||||||||
|
| |||||||||||
| 150,817,585 | ||||||||||||
|
| |||||||||||
Total Common Stocks and Other Equity Interests | 1,060,680,438 | |||||||||||
|
| |||||||||||
Preferred Stocks (Cost $2,821,056) 0.1% | ||||||||||||
Biotechnology 0.1% | ||||||||||||
a,d,eMetacrine Inc., pfd., C | United States | 1,330,687 | 1,840,276 | |||||||||
|
| |||||||||||
Escrows and Litigation Trusts (Cost $2,090,611) 0.1% | ||||||||||||
a,dTrue North Therapeutics Inc., Escrow Account | United States | 759,880 | 934,769 | |||||||||
|
| |||||||||||
Total Investments before Short Term Investments | 1,063,455,483 | |||||||||||
|
| |||||||||||
22 | Semiannual Report | franklintempleton.com | ||
FRANKLIN STRATEGIC SERIES
STATEMENT OF INVESTMENTS (UNAUDITED)
Franklin Biotechnology Discovery Fund(continued)
| Country | Shares | Value | ||||||||||
Short Term Investments 3.6% | ||||||||||||
Money Market Funds (Cost $23,312,168) 2.2% | ||||||||||||
f,gInstitutional Fiduciary Trust Money Market Portfolio, 1.56% | United States | 23,312,168 | $ | 23,312,168 | ||||||||
|
| |||||||||||
hInvestments from Cash Collateral Received for Loaned Securities 1.4% | ||||||||||||
Money Market Funds (Cost $15,396,633) 1.4% | ||||||||||||
f,gInstitutional Fiduciary Trust Money Market Portfolio, 1.56% | United States | 15,396,633 | 15,396,633 | |||||||||
|
| |||||||||||
Total Investments (Cost $690,500,177) 101.7% | 1,102,164,284 | |||||||||||
Other Assets, less Liabilities (1.7)% | (18,675,497 | ) | ||||||||||
|
| |||||||||||
Net Assets 100.0% | $ | 1,083,488,787 | ||||||||||
|
| |||||||||||
See Abbreviations on page 45.
aNon-income producing.
bSecurity was purchased pursuant to Rule 144A under the Securities Act of 1933 and may be sold in transactions exempt from registration only to qualified institutional buyers or in a public offering registered under the Securities Act of 1933. At October 31, 2019, the aggregate value of these securities was $12,172,094, representing 1.1% of net assets.
cA portion or all of the security is on loan at October 31, 2019. See Note 1(c).
dFair valued using significant unobservable inputs. See Note 10 regarding fair value measurements.
eSee Note 8 regarding restricted securities.
fSee Note 3(f) regarding investments in affiliated management investment companies.
gThe rate shown is the annualizedseven-day effective yield at period end.
hSee Note 1(c) regarding securities on loan.
| franklintempleton.com | The accompanying notes are an integral part of these financial statements. | Semiannual Report | 23 | ||
FRANKLIN STRATEGIC SERIES
Financial Highlights
Franklin Natural Resources Fund
Six Months Ended (unaudited) | Year Ended April 30, | |||||||||||||||||||||||
| 2019 | 2018 | 2017 | 2016 | 2015 | ||||||||||||||||||||
Class A | ||||||||||||||||||||||||
Per share operating performance (for a share outstanding throughout the period) | ||||||||||||||||||||||||
Net asset value, beginning of period | $23.58 | $27.96 | $25.11 | $25.02 | $31.46 | $39.79 | ||||||||||||||||||
Income from investment operationsa: | ||||||||||||||||||||||||
Net investment incomeb | 0.17 | 0.31 | 0.39 | c | 0.20 | 0.29 | 0.23 | |||||||||||||||||
Net realized and unrealized gains (losses) | (4.24 | ) | (4.20 | ) | 2.77 | 0.17 | (6.55 | ) | (8.27 | ) | ||||||||||||||
Total from investment operations | (4.07 | ) | (3.89 | ) | 3.16 | 0.37 | (6.26 | ) | (8.04 | ) | ||||||||||||||
Less distributions from: | ||||||||||||||||||||||||
Net investment income | — | (0.49 | ) | (0.31 | ) | (0.28 | ) | (0.18 | ) | (0.29 | ) | |||||||||||||
Net asset value, end of period | $19.51 | $23.58 | $27.96 | $25.11 | $25.02 | $31.46 | ||||||||||||||||||
Total returnd | (17.26)% | (13.69)% | 12.74% | 1.37% | (19.80)% | (20.07)% | ||||||||||||||||||
Ratios to average net assetse | ||||||||||||||||||||||||
Expenses before waiver and payments by affiliates | 1.11% | 1.03% | 1.13% | 1.06% | 1.14% | 1.08% | ||||||||||||||||||
Expenses net of waiver and payments by affiliates | 1.11% | f,g | 1.03% | f,g | 1.13% | f,g | 1.05% | f | 1.13% | 1.08% | f,g | |||||||||||||
Net investment income | 1.61% | 1.21% | 1.56% | c | 0.79% | 1.22% | 0.67% | |||||||||||||||||
Supplemental data | ||||||||||||||||||||||||
Net assets, end of period (000’s) | $180,285 | $247,362 | $344,695 | $398,703 | $461,596 | $572,518 | ||||||||||||||||||
Portfolio turnover rate | 9.97% | 29.83% | 29.98% | 29.74% | 35.77% | 30.05% | ||||||||||||||||||
aThe amount shown for a share outstanding throughout the period may not correlate with the Statement of Operations for the period due to the timing of sales and repurchases of the Fund’s shares in relation to income earned and/or fluctuating fair value of the investments of the Fund.
bBased on average daily shares outstanding.
cNet investment income per share includes approximately $0.16 per share related to income received in the form of special dividends in connection with certain Fund holdings. Excluding this amount, the ratio of net investment income to average net assets would have been 0.91%.
dTotal return does not reflect sales commissions or contingent deferred sales charges, if applicable, and is not annualized for periods less than one year.
eRatios are annualized for periods less than one year.
fBenefit of expense reduction rounds to less than 0.01%.
gBenefit of waiver and payments by affiliates rounds to less than 0.01%.
24 | Semiannual Report | The accompanying notes are an integral part of these financial statements. | franklintempleton.com | ||
FRANKLIN STRATEGIC SERIES
FINANCIAL HIGHLIGHTS
Franklin Natural Resources Fund(continued)
Six Months Ended (unaudited) | Year Ended April 30, | |||||||||||||||||||||||
| 2019 | 2018 | 2017 | 2016 | 2015 | ||||||||||||||||||||
Class C | ||||||||||||||||||||||||
Per share operating performance (for a share outstanding throughout the period) | ||||||||||||||||||||||||
Net asset value, beginning of period | $22.82 | $27.17 | $24.28 | $24.25 | $30.46 | $38.39 | ||||||||||||||||||
Income from investment operationsa: | ||||||||||||||||||||||||
Net investment income (loss)b | 0.09 | 0.11 | 0.20 | c | 0.01 | 0.11 | (0.01 | ) | ||||||||||||||||
Net realized and unrealized gains (losses) | (4.09 | ) | (4.07 | ) | 2.69 | 0.15 | (6.31 | ) | (7.91 | ) | ||||||||||||||
Total from investment operations | (4.00 | ) | (3.96 | ) | 2.89 | 0.16 | (6.20 | ) | (7.92 | ) | ||||||||||||||
Less distributions from: | ||||||||||||||||||||||||
Net investment income | — | (0.39 | ) | — | (0.13 | ) | (0.01 | ) | (0.01 | ) | ||||||||||||||
Net asset value, end of period | $18.82 | $22.82 | $27.17 | $24.28 | $24.25 | $30.46 | ||||||||||||||||||
Total returnd | (17.53)% | (14.37)% | 11.90% | 0.63% | (20.37)% | (20.63)% | ||||||||||||||||||
Ratios to average net assetse | ||||||||||||||||||||||||
Expenses before waiver and payments by affiliates | 1.86% | 1.78% | 1.88% | 1.81% | 1.87% | 1.78% | ||||||||||||||||||
Expenses net of waiver and payments by affiliates | 1.86% | f,g | 1.78% | f,g | 1.88% | f,g | 1.80% | f | 1.86% | 1.78% | f,g | |||||||||||||
Net investment income (loss) | 0.86% | 0.46% | 0.81% | c | 0.04% | 0.49% | (0.03)% | |||||||||||||||||
Supplemental data | ||||||||||||||||||||||||
Net assets, end of period (000’s) | $34,729 | $49,620 | $83,814 | $96,835 | $107,724 | $123,735 | ||||||||||||||||||
Portfolio turnover rate | 9.97% | 29.83% | 29.98% | 29.74% | 35.77% | 30.05% | ||||||||||||||||||
aThe amount shown for a share outstanding throughout the period may not correlate with the Statement of Operations for the period due to the timing of sales and repurchases of the Fund’s shares in relation to income earned and/or fluctuating fair value of the investments of the Fund.
bBased on average daily shares outstanding.
cNet investment income per share includes approximately $0.16 per share related to income received in the form of special dividends in connection with certain Fund holdings. Excluding this amount, the ratio of net investment income to average net assets would have been 0.16%.
dTotal return does not reflect sales commissions or contingent deferred sales charges, if applicable, and is not annualized for periods less than one year.
eRatios are annualized for periods less than one year.
fBenefit of expense reduction rounds to less than 0.01%.
gBenefit of waiver and payments by affiliates rounds to less than 0.01%.
| franklintempleton.com | The accompanying notes are an integral part of these financial statements. | Semiannual Report | 25 | ||
FRANKLIN STRATEGIC SERIES
FINANCIAL HIGHLIGHTS
Franklin Natural Resources Fund(continued)
Six Months Ended (unaudited) | Year Ended April 30, | |||||||||||||||||||||||
| 2019 | 2018 | 2017 | 2016 | 2015 | ||||||||||||||||||||
Class R6 | ||||||||||||||||||||||||
Per share operating performance (for a share outstanding throughout the period) | ||||||||||||||||||||||||
Net asset value, beginning of period | $25.22 | $29.79 | $26.87 | $26.73 | $33.62 | $42.58 | ||||||||||||||||||
Income from investment operationsa: | ||||||||||||||||||||||||
Net investment incomeb | 0.28 | 0.45 | 0.57 | c | 0.47 | 0.51 | 0.46 | |||||||||||||||||
Net realized and unrealized gains (losses) | (4.58 | ) | (4.49 | ) | 2.95 | 0.04 | (7.06 | ) | (8.92 | ) | ||||||||||||||
Total from investment operations | (4.30 | ) | (4.04 | ) | 3.52 | 0.51 | (6.55 | ) | (8.46 | ) | ||||||||||||||
Less distributions from: | ||||||||||||||||||||||||
Net investment income | — | (0.53 | ) | (0.60 | ) | (0.37 | ) | (0.34 | ) | (0.50 | ) | |||||||||||||
Net asset value, end of period | $20.92 | $25.22 | $29.79 | $26.87 | $26.73 | $33.62 | ||||||||||||||||||
Total returnd | (17.05)% | (13.31)% | 13.37% | 1.89% | (19.31)% | (19.61)% | ||||||||||||||||||
Ratios to average net assetse | ||||||||||||||||||||||||
Expenses before waiver and payments by affiliates | 0.69% | 0.62% | 0.64% | 0.83% | 0.60% | 0.55% | ||||||||||||||||||
Expenses net of waiver and payments by affiliates | 0.64% | f | 0.59% | f | 0.57% | f | 0.54% | f | 0.55% | 0.54% | f | |||||||||||||
Net investment income | 2.08% | 1.65% | 2.12% | c | 1.30% | 1.80% | 1.21% | |||||||||||||||||
Supplemental data | ||||||||||||||||||||||||
Net assets, end of period (000’s) | $851 | $15,627 | $15,866 | $218 | $15 | $439 | ||||||||||||||||||
Portfolio turnover rate | 9.97% | 29.83% | 29.98% | 29.74% | 35.77% | 30.05% | ||||||||||||||||||
aThe amount shown for a share outstanding throughout the period may not correlate with the Statement of Operations for the period due to the timing of sales and repurchases of the Fund’s shares in relation to income earned and/or fluctuating fair value of the investments of the Fund.
bBased on average daily shares outstanding.
cNet investment income per share includes approximately $0.16 per share related to income received in the form of special dividends in connection with certain Fund holdings. Excluding this amount, the ratio of net investment income to average net assets would have been 1.47%.
dTotal return is not annualized for periods less than one year.
eRatios are annualized for periods less than one year.
fBenefit of expense reduction rounds to less than 0.01%.
26 | Semiannual Report | The accompanying notes are an integral part of these financial statements. | franklintempleton.com | ||
FRANKLIN STRATEGIC SERIES
FINANCIAL HIGHLIGHTS
Franklin Natural Resources Fund(continued)
Six Months Ended (unaudited) | Year Ended April 30, | |||||||||||||||||||||||
| 2019 | 2018 | 2017 | 2016 | 2015 | ||||||||||||||||||||
Advisor Class | ||||||||||||||||||||||||
Per share operating performance (for a share outstanding throughout the period) | ||||||||||||||||||||||||
Net asset value, beginning of period | $25.20 | $29.80 | $26.81 | $26.71 | $33.63 | $42.52 | ||||||||||||||||||
Income from investment operationsa: | ||||||||||||||||||||||||
Net investment incomeb | 0.21 | 0.40 | 0.49 | c | 0.29 | 0.36 | 0.35 | |||||||||||||||||
Net realized and unrealized gains (losses) | (4.53 | ) | (4.49 | ) | 2.95 | 0.17 | (7.00 | ) | (8.85 | ) | ||||||||||||||
Total from investment operations | (4.32 | ) | (4.09 | ) | 3.44 | 0.46 | (6.64 | ) | (8.50 | ) | ||||||||||||||
Less distributions from: | ||||||||||||||||||||||||
Net investment income | — | (0.51 | ) | (0.45 | ) | (0.36 | ) | (0.28 | ) | (0.39 | ) | |||||||||||||
Net asset value, end of period | $20.88 | $25.20 | $29.80 | $26.81 | $26.71 | $33.63 | ||||||||||||||||||
Total returnd | (17.14)% | (13.50)% | 13.04% | 1.64% | (19.60)% | (19.81)% | ||||||||||||||||||
Ratios to average net assetse | ||||||||||||||||||||||||
Expenses before waiver and payments by affiliates | 0.86% | 0.78% | 0.88% | 0.81% | 0.87% | 0.78% | ||||||||||||||||||
Expenses net of waiver and payments by affiliates | 0.86% | f,g | 0.78% | f,g | 0.88% | f,g | 0.80% | f | 0.86% | 0.78% | f,g | |||||||||||||
Net investment income | 1.86% | 1.46% | 1.81%c | 1.04% | 1.49% | 0.97% | ||||||||||||||||||
Supplemental data | ||||||||||||||||||||||||
Net assets, end of period (000’s) | $40,909 | $62,639 | $78,443 | $94,070 | $90,185 | $79,307 | ||||||||||||||||||
Portfolio turnover rate | 9.97% | 29.83% | 29.98% | 29.74% | 35.77% | 30.05% | ||||||||||||||||||
aThe amount shown for a share outstanding throughout the period may not correlate with the Statement of Operations for the period due to the timing of sales and repurchases of the Fund’s shares in relation to income earned and/or fluctuating fair value of the investments of the Fund.
bBased on average daily shares outstanding.
cNet investment income per share includes approximately $0.16 per share related to income received in the form of special dividends in connection with certain Fund holdings. Excluding this amount, the ratio of net investment income to average net assets would have been 1.16%.
dTotal return is not annualized for periods less than one year.
eRatios are annualized for periods less than one year.
fBenefit of expense reduction rounds to less than 0.01%.
gBenefit of waiver and payments by affiliates rounds to less than 0.01%.
| franklintempleton.com | The accompanying notes are an integral part of these financial statements. | Semiannual Report | 27 | ||
FRANKLIN STRATEGIC SERIES
Statement of Investments, October 31, 2019 (unaudited)
Franklin Natural Resources Fund
| Country | Shares | Value | ||||||||||
Common Stocks 99.6% | ||||||||||||
Aluminum 0.3% | ||||||||||||
aAlcoa Corp. | United States | 43,200 | $ | 898,128 | ||||||||
|
| |||||||||||
Commodity Chemicals 0.3% | ||||||||||||
Dow Inc. | United States | 16,000 | 807,840 | |||||||||
|
| |||||||||||
Copper 4.8% | ||||||||||||
Antofagasta PLC | United Kingdom | 354,400 | 3,981,380 | |||||||||
First Quantum Minerals Ltd. | Zambia | 190,000 | 1,606,305 | |||||||||
Freeport-McMoRan Inc. | United States | 314,500 | 3,088,390 | |||||||||
aImperial Metals Corp. | Canada | 364,500 | 503,904 | |||||||||
Lundin Mining Corp. | Chile | 400,300 | 2,022,024 | |||||||||
Sandfire Resources NL | Australia | 250,267 | 1,002,496 | |||||||||
|
| |||||||||||
| 12,204,499 | ||||||||||||
|
| |||||||||||
Diversified Chemicals 1.0% | ||||||||||||
BASF SE | Germany | 32,500 | 2,473,150 | |||||||||
|
| |||||||||||
Diversified Metals & Mining 8.3% | ||||||||||||
Anglo American PLC | United Kingdom | 107,500 | 2,759,594 | |||||||||
BHP Group PLC, ADR | United Kingdom | 119,100 | 5,052,222 | |||||||||
Glencore PLC | Switzerland | 1,394,100 | 4,201,629 | |||||||||
Hudbay Minerals Inc. | Canada | 181,400 | 658,634 | |||||||||
a,bNautilus Minerals Inc. | Canada | 3,895,831 | — | |||||||||
Nexa Resources SA | Peru | 100,000 | 1,069,000 | |||||||||
Rio Tinto PLC, ADR | Australia | 56,100 | 2,917,761 | |||||||||
South32 Ltd. | Australia | 829,300 | 1,457,990 | |||||||||
Teck Resources Ltd., B | Canada | 207,200 | 3,279,976 | |||||||||
|
| |||||||||||
| 21,396,806 | ||||||||||||
|
| |||||||||||
Fertilizers & Agricultural Chemicals 1.1% | ||||||||||||
Corteva Inc. | United States | 38,800 | 1,023,544 | |||||||||
Nutrien Ltd. | Canada | 38,600 | 1,844,694 | |||||||||
|
| |||||||||||
| 2,868,238 | ||||||||||||
|
| |||||||||||
Gold 5.4% | ||||||||||||
Agnico Eagle Mines Ltd. | Canada | 35,300 | 2,170,555 | |||||||||
Alamos Gold Inc., A | Canada | 337,000 | 1,835,389 | |||||||||
aB2Gold Corp. | Canada | 568,900 | 2,000,765 | |||||||||
Barrick Gold Corp. | Canada | 156,691 | 2,720,156 | |||||||||
aGuyana Goldfields Inc. | Canada | 1,122,300 | 451,818 | |||||||||
Newcrest Mining Ltd. | Australia | 84,000 | 1,812,702 | |||||||||
Newmont Goldcorp Corp. | United States | 51,215 | 2,034,772 | |||||||||
OceanaGold Corp. | Australia | 329,810 | 791,644 | |||||||||
|
| |||||||||||
| 13,817,801 | ||||||||||||
|
| |||||||||||
Integrated Oil & Gas 13.4% | ||||||||||||
Chevron Corp. | United States | 58,100 | 6,747,734 | |||||||||
Exxon Mobil Corp. | United States | 56,600 | 3,824,462 | |||||||||
Occidental Petroleum Corp. | United States | 186,900 | 7,569,450 | |||||||||
Royal Dutch Shell PLC, A, ADR | United Kingdom | 111,021 | 6,435,887 | |||||||||
Suncor Energy Inc. | Canada | 236,300 | 7,028,871 | |||||||||
28 | Semiannual Report | franklintempleton.com | ||
FRANKLIN STRATEGIC SERIES
STATEMENT OF INVESTMENTS (UNAUDITED)
Franklin Natural Resources Fund(continued)
| Country | Shares | Value | ||||||||||
Common Stocks(continued) | ||||||||||||
Integrated Oil & Gas(continued) | ||||||||||||
Total SA, B, ADR | France | 51,810 | $ | 2,726,760 | ||||||||
|
| |||||||||||
| 34,333,164 | ||||||||||||
|
| |||||||||||
Oil & Gas Drilling 1.1% | ||||||||||||
Patterson-UTI Energy Inc. | United States | 324,500 | 2,699,840 | |||||||||
|
| |||||||||||
Oil & Gas Equipment & Services 17.9% | ||||||||||||
aApergy Corp. | United States | 38,100 | 958,977 | |||||||||
Baker Hughes Co., A | United States | 292,100 | 6,250,940 | |||||||||
aCactus Inc. | United States | 46,500 | 1,381,980 | |||||||||
aDril-Quip Inc. | United States | 27,100 | 1,111,642 | |||||||||
Halliburton Co. | United States | 389,235 | 7,492,774 | |||||||||
Hunting PLC | United Kingdom | 116,500 | 593,115 | |||||||||
Liberty Oilfield Services Inc., A | United States | 211,500 | 1,947,915 | |||||||||
aNexTier Oilfield Solutions Inc. | United States | 130,160 | 562,291 | |||||||||
aNine Energy Service Inc. | United States | 102,650 | 579,973 | |||||||||
aOceaneering International Inc. | United States | 120,300 | 1,703,448 | |||||||||
aOil States International Inc. | United States | 253,166 | 3,612,679 | |||||||||
aProPetro Holding Corp. | United States | 47,500 | 368,125 | |||||||||
aRanger Energy Services Inc. | United States | 154,157 | 847,864 | |||||||||
Schlumberger Ltd. | United States | 297,047 | 9,710,466 | |||||||||
Schoeller-Bleckmann Oilfield Equipment AG | Austria | 22,600 | 1,290,536 | |||||||||
aSelect Energy Services Inc. | United States | 242,100 | 1,839,960 | |||||||||
aSuperior Energy Services Inc. | United States | 786,100 | 314,440 | |||||||||
TechnipFMC PLC | United Kingdom | 272,300 | 5,372,479 | |||||||||
|
| |||||||||||
| 45,939,604 | ||||||||||||
|
| |||||||||||
Oil & Gas Exploration & Production 30.1% | ||||||||||||
Cabot Oil & Gas Corp., A | United States | 379,800 | 7,079,472 | |||||||||
aCairn Energy PLC | United Kingdom | 1,259,500 | 2,901,019 | |||||||||
aCallon Petroleum Co. | United States | 1,078,400 | 4,097,920 | |||||||||
Canadian Natural Resources Ltd. | Canada | 244,000 | 6,155,139 | |||||||||
Concho Resources Inc. | United States | 136,100 | 9,189,472 | |||||||||
ConocoPhillips | United States | 141,500 | 7,810,800 | |||||||||
Diamondback Energy Inc. | United States | 107,600 | 9,227,776 | |||||||||
EOG Resources Inc. | United States | 118,200 | 8,192,442 | |||||||||
Hess Corp. | United States | 56,200 | 3,695,150 | |||||||||
aJagged Peak Energy Inc. | United States | 340,516 | 2,414,258 | |||||||||
Noble Energy Inc. | United States | 352,300 | 6,785,298 | |||||||||
Pioneer Natural Resources Co. | United States | 58,700 | 7,221,274 | |||||||||
aWPX Energy Inc. | United States | 250,000 | 2,495,000 | |||||||||
|
| |||||||||||
| 77,265,020 | ||||||||||||
|
| |||||||||||
Oil & Gas Refining & Marketing 6.2% | ||||||||||||
HollyFrontier Corp. | United States | 20,100 | 1,104,294 | |||||||||
Marathon Petroleum Corp. | United States | 89,000 | 5,691,550 | |||||||||
Phillips 66 | United States | 40,400 | 4,719,528 | |||||||||
Valero Energy Corp. | United States | 44,400 | 4,305,912 | |||||||||
|
| |||||||||||
| 15,821,284 | ||||||||||||
|
| |||||||||||
| franklintempleton.com | Semiannual Report | 29 | ||
FRANKLIN STRATEGIC SERIES
STATEMENT OF INVESTMENTS (UNAUDITED)
Franklin Natural Resources Fund(continued)
| Country | Shares | Value | ||||||||||
Common Stocks(continued) | ||||||||||||
Oil & Gas Storage & Transportation 6.9% | ||||||||||||
Enbridge Inc. | Canada | 55,447 | $ | 2,018,825 | ||||||||
Kinder Morgan Inc. | United States | 117,100 | 2,339,658 | |||||||||
ONEOK Inc. | United States | 34,500 | 2,409,135 | |||||||||
Targa Resources Corp. | United States | 124,500 | 4,840,560 | |||||||||
TC Energy Corp. | Canada | 50,600 | 2,546,698 | |||||||||
The Williams Cos. Inc. | United States | 162,300 | 3,620,913 | |||||||||
|
| |||||||||||
| 17,775,789 | ||||||||||||
|
| |||||||||||
Paper Packaging 0.7% | ||||||||||||
Packaging Corp. of America | United States | 16,900 | 1,849,874 | |||||||||
|
| |||||||||||
Pharmaceuticals 0.2% | ||||||||||||
aElanco Animal Health Inc. | United States | 17,600 | 475,552 | |||||||||
|
| |||||||||||
Specialty Chemicals 1.4% | ||||||||||||
Albemarle Corp. | United States | 41,700 | 2,532,859 | |||||||||
DuPont de Nemours Inc. | United States | 16,700 | 1,100,697 | |||||||||
|
| |||||||||||
| 3,633,556 | ||||||||||||
|
| |||||||||||
Trading Companies & Distributors 0.5% | ||||||||||||
aUnivar Solutions Inc. | United States | 65,000 | 1,394,900 | |||||||||
|
| |||||||||||
Total Common Stocks (Cost $263,632,325) | 255,655,045 | |||||||||||
|
| |||||||||||
Short Term Investments (Cost $1,613,452) 0.6% | ||||||||||||
Money Market Funds 0.6% | ||||||||||||
c,dInstitutional Fiduciary Trust Money Market Portfolio, 1.56% | United States | 1,613,452 | 1,613,452 | |||||||||
|
| |||||||||||
Total Investments (Cost $265,245,777) 100.2% | 257,268,497 | |||||||||||
Other Assets, less Liabilities (0.2)% | (493,848 | ) | ||||||||||
|
| |||||||||||
Net Assets 100.0% | $ | 256,774,649 | ||||||||||
|
| |||||||||||
See Abbreviations on page 45.
aNon-income producing.
bFair valued using significant unobservable inputs. See Note 10 regarding fair value measurements.
cSee Note 3(f) regarding investments in affiliated management investment companies.
dThe rate shown is the annualizedseven-day effective yield at period end.
30 | Semiannual Report | The accompanying notes are an integral part of these financial statements. | franklintempleton.com | ||
FRANKLIN STRATEGIC SERIES
Statements of Assets and Liabilities
October 31, 2019 (unaudited)
| Franklin Biotechnology Discovery Fund | Franklin Natural Resources Fund | |||||||
| ||||||||
Assets: | ||||||||
Investments in securities: | ||||||||
Cost - Unaffiliated issuers | $ 651,791,376 | $ 263,632,325 | ||||||
Cost -Non-controlled affiliates (Note 3f) | 38,708,801 | 1,613,452 | ||||||
|
| |||||||
Value - Unaffiliated issuers+ | $1,063,455,483 | $ 255,655,045 | ||||||
Value -Non-controlled affiliates (Note 3f) | 38,708,801 | 1,613,452 | ||||||
Receivables: | ||||||||
Investment securities sold ** | 133,396 | — | ||||||
Capital shares sold | 481,971 | 58,720 | ||||||
Dividends and interest | 161,715 | 301,832 | ||||||
Due from custodian | 105,000 | — | ||||||
Other assets | 372 | 120 | ||||||
|
| |||||||
Total assets | 1,103,046,738 | 257,629,169 | ||||||
|
| |||||||
Liabilities: | ||||||||
Payables: | ||||||||
Investment securities purchased | 1,524,785 | 93,896 | ||||||
Capital shares redeemed | 1,430,880 | 349,894 | ||||||
Management fees | 498,833 | 120,800 | ||||||
Distribution fees | 213,210 | 69,896 | ||||||
Transfer agent fees | 284,092 | 111,562 | ||||||
Trustees’ fees and expenses | 2,613 | 1,151 | ||||||
Reports to shareholders | 77,029 | 48,208 | ||||||
Funds advanced by custodian | — | 40,532 | ||||||
Payable upon return of securities loaned | 15,501,633 | — | ||||||
Accrued expenses and other liabilities | 24,876 | 18,581 | ||||||
|
| |||||||
Total liabilities | 19,557,951 | 854,520 | ||||||
|
| |||||||
Net assets, at value | $1,083,488,787 | $ 256,774,649 | ||||||
|
| |||||||
Net assets consist of: | ||||||||
Paid-in capital | $ 573,389,729 | $ 432,727,681 | ||||||
Total distributable earnings (loss) | 510,099,058 | (175,953,032 | ) | |||||
|
| |||||||
Net assets, at value | $1,083,488,787 | $ 256,774,649 | ||||||
|
| |||||||
+Includes securities loaned | $ 15,292,708 | $ — | ||||||
**Includes securities loaned | $ 50,537 | $ — | ||||||
| franklintempleton.com | The accompanying notes are an integral part of these financial statements. | Semiannual Report | 31 | ||
FRANKLIN STRATEGIC SERIES
FINANCIAL STATEMENTS
Statements of Assets and Liabilities(continued)
October 31, 2019 (unaudited)
| Franklin Biotechnology Discovery Fund | Franklin Natural Resources Fund | |||||||
| ||||||||
Class A: | ||||||||
Net assets, at value | $886,020,902 | $180,285,130 | ||||||
|
| |||||||
Shares outstanding | 6,125,289 | 9,238,828 | ||||||
|
| |||||||
Net asset value per sharea | $144.65 | $19.51 | ||||||
|
| |||||||
Maximum offering price per share (net asset value per share ÷ 94.50%) | $153.07 | $20.65 | ||||||
|
| |||||||
Class C: | ||||||||
Net assets, at value | $ 43,847,125 | $ 34,729,444 | ||||||
|
| |||||||
Shares outstanding | 316,450 | 1,845,555 | ||||||
|
| |||||||
Net asset value and maximum offering price per sharea | $138.56 | $18.82 | ||||||
|
| |||||||
Class R6: | ||||||||
Net assets, at value | $ 5,313,127 | $ 851,168 | ||||||
|
| |||||||
Shares outstanding | 35,394 | 40,687 | ||||||
|
| |||||||
Net asset value and maximum offering price per share | $150.11 | $20.92 | ||||||
|
| |||||||
Advisor Class: | ||||||||
Net assets, at value | $148,307,633 | $ 40,908,907 | ||||||
|
| |||||||
Shares outstanding | 997,332 | 1,958,902 | ||||||
|
| |||||||
Net asset value and maximum offering price per share | $148.70 | $ 20.88 | ||||||
|
| |||||||
aRedemption price is equal to net asset value less contingent deferred sales charges, if applicable.
32 | Semiannual Report | The accompanying notes are an integral part of these financial statements. | franklintempleton.com | ||
FRANKLIN STRATEGIC SERIES
FINANCIAL STATEMENTS
Statements of Operations
for the six months ended October 31, 2019 (unaudited)
| Franklin Biotechnology Discovery Fund | Franklin Natural Resources Fund | |||||||
| ||||||||
Investment income: | ||||||||
Dividends: (net of foreign taxes)* | ||||||||
Unaffiliated issuers | $ 1,845,134 | $ 4,073,139 | ||||||
Non-controlled affiliates (Note 3f) | 453,625 | 21,829 | ||||||
Income from securities loaned: | ||||||||
Unaffiliated issuers (net of fees and rebates) | 420,625 | 133,906 | ||||||
Non-controlled affiliates (Note 3f) | 213,728 | 2,928 | ||||||
|
| |||||||
Total investment income | 2,933,112 | 4,231,802 | ||||||
|
| |||||||
Expenses: | ||||||||
Management fees (Note 3a) | 3,314,035 | 826,289 | ||||||
Distribution fees: (Note 3c) | ||||||||
Class A | 1,135,412 | 261,425 | ||||||
Class C | 227,277 | 205,187 | ||||||
Transfer agent fees: (Note 3e) | ||||||||
Class A | 672,942 | 261,712 | ||||||
Class C | 33,667 | 51,342 | ||||||
Class R6 | 2,814 | 4,015 | ||||||
Advisor Class | 112,284 | 63,430 | ||||||
Custodian fees (Note 4) | 4,359 | 4,203 | ||||||
Reports to shareholders | 79,151 | 48,221 | ||||||
Registration and filing fees | 45,498 | 44,847 | ||||||
Professional fees | 28,884 | 24,230 | ||||||
Trustees’ fees and expenses | 9,658 | 3,291 | ||||||
Other | 15,013 | 8,737 | ||||||
|
| |||||||
Total expenses | 5,680,994 | 1,806,929 | ||||||
Expense reductions (Note 4) | (195 | ) | (212 | ) | ||||
Expenses waived/paid by affiliates (Note 3f and 3g) | (125,121 | ) | (6,821 | ) | ||||
|
| |||||||
Net expenses | 5,555,678 | 1,799,896 | ||||||
|
| |||||||
Net investment income (loss) | (2,622,566 | ) | 2,431,906 | |||||
|
| |||||||
Realized and unrealized gains (losses): | ||||||||
Net realized gain (loss) from: | ||||||||
Investments: | ||||||||
Unaffiliated issuers | 48,706,556 | (15,299,839 | ) | |||||
Foreign currency transactions | — | 4,013 | ||||||
|
| |||||||
Net realized gain (loss) | 48,706,556 | (15,295,826 | ) | |||||
|
| |||||||
Net change in unrealized appreciation (depreciation) on: | ||||||||
Investments: | ||||||||
Unaffiliated issuers | (1,673,793 | ) | (48,486,687 | ) | ||||
Translation of other assets and liabilities denominated in foreign currencies | — | (2,434 | ) | |||||
|
| |||||||
Net change in unrealized appreciation (depreciation) | (1,673,793 | ) | (48,489,121 | ) | ||||
|
| |||||||
Net realized and unrealized gain (loss) | 47,032,763 | (63,784,947 | ) | |||||
|
| |||||||
Net increase (decrease) in net assets resulting from operations | $44,410,197 | $(61,353,041 | ) | |||||
|
| |||||||
*Foreign taxes withheld on dividends | $ — | $ 169,490 | ||||||
| franklintempleton.com | The accompanying notes are an integral part of these financial statements. | Semiannual Report | 33 | ||
FRANKLIN STRATEGIC SERIES
FINANCIAL STATEMENTS
Statements of Changes in Net Assets
Franklin Biotechnology Discovery Fund | Franklin Natural Resources Fund | |||||||||||||||
|
| |||||||||||||||
| Six Months Ended October 31, 2019 (unaudited) | Year Ended April 30, 2019 | Six Months Ended October 31, 2019 (unaudited) | Year Ended April 30, 2019 | |||||||||||||
| ||||||||||||||||
Increase (decrease) in net assets: | ||||||||||||||||
Operations: | ||||||||||||||||
Net investment income (loss) | $ (2,622,566 | ) | $ (8,485,404 | ) | $ 2,431,906 | $ 5,068,646 | ||||||||||
Net realized gain (loss) | 48,706,556 | 59,100,885 | (15,295,826 | ) | 3,219,567 | |||||||||||
Net change in unrealized appreciation (depreciation) | (1,673,793 | ) | (69,695,618 | ) | (48,489,121 | ) | (76,614,204 | ) | ||||||||
|
| |||||||||||||||
Net increase (decrease) in net assets resulting from operations | 44,410,197 | (19,080,137 | ) | (61,353,041 | ) | (68,325,991 | ) | |||||||||
|
| |||||||||||||||
Distributions to shareholders: | ||||||||||||||||
Class A | — | (31,140,117 | ) | — | (5,445,964 | ) | ||||||||||
Class C | — | (1,654,793 | ) | — | (929,534 | ) | ||||||||||
Class R6 | — | (198,908 | ) | — | (313,292 | ) | ||||||||||
Advisor Class | — | (5,381,467 | ) | — | (1,289,908 | ) | ||||||||||
|
| |||||||||||||||
Total distributions to shareholders | — | (38,375,285 | ) | — | (7,978,698 | ) | ||||||||||
|
| |||||||||||||||
Capital share transactions: (Note 2) | ||||||||||||||||
Class A | (74,882,066 | ) | (112,026,697 | ) | (25,884,710 | ) | (46,670,690 | ) | ||||||||
Class C | (4,320,457 | ) | (9,069,507 | ) | (6,627,100 | ) | (22,834,504 | ) | ||||||||
Class R6 | (1,120,568 | ) | (1,820,119 | ) | (12,985,407 | ) | 2,159,944 | |||||||||
Advisor Class | (11,755,689 | ) | (17,313,109 | ) | (11,623,601 | ) | (3,919,165 | ) | ||||||||
|
| |||||||||||||||
Total capital share transactions | (92,078,780 | ) | (140,229,432 | ) | (57,120,818 | ) | (71,264,415 | ) | ||||||||
|
| |||||||||||||||
Net increase (decrease) in net assets | (47,668,583 | ) | (197,684,854 | ) | (118,473,859 | ) | (147,569,104 | ) | ||||||||
Net assets: | ||||||||||||||||
Beginning of period | 1,131,157,370 | 1,328,842,224 | 375,248,508 | 522,817,612 | ||||||||||||
|
| |||||||||||||||
End of period | $1,083,488,787 | $1,131,157,370 | $ 256,774,649 | $ 375,248,508 | ||||||||||||
|
| |||||||||||||||
34 | Semiannual Report | The accompanying notes are an integral part of these financial statements. | franklintempleton.com | ||
FRANKLIN STRATEGIC SERIES
Notes to Financial Statements (unaudited)
1. Organization and Significant Accounting Policies
Franklin Strategic Series (Trust) is registered under the Investment Company Act of 1940 (1940 Act) as anopen-end management investment company, consisting of twelve separate funds, two of which are included in this report (Funds) and applies the specialized accounting and reporting guidance in U.S. Generally Accepted Accounting Principles (U.S. GAAP). The Funds offer four classes of shares: Class A, Class C, Class R6 and Advisor Class. Class C shares automatically convert to Class A shares after they have been held for 10 years. Each class of shares may differ by its initial sales load, contingent deferred sales charges, voting rights on matters affecting a single class, its exchange privilege and fees due to differing arrangements for distribution and transfer agent fees.
The following summarizes the Funds’ significant accounting policies.
a. Financial Instrument Valuation
The Funds’ investments in financial instruments are carried at fair value daily. Fair value is the price that would be received to sell an asset or paid to transfer a liability in an orderly transaction between market participants on the measurement date. The Funds calculate the net asset value (NAV) per share each business day as of 4 p.m. Eastern time or the regularly scheduled close of the New York Stock Exchange (NYSE), whichever is earlier. Under compliance policies and procedures approved by the Trust’s Board of Trustees (the Board), the Funds’ administrator has responsibility for oversight of valuation, including leading the cross-functional Valuation Committee (VC). The Funds may utilize independent pricing services, quotations from securities and financial instrument dealers, and other market sources to determine fair value.
Equity securities listed on an exchange or on the NASDAQ National Market System are valued at the last quoted sale price or the official closing price of the day, respectively. Foreign equity securities are valued as of the close of trading on the foreign stock exchange on which the security is primarily traded, or as of 4 p.m. Eastern time. The value is then converted into its U.S. dollar equivalent at the foreign exchange rate in effect at 4 p.m. Eastern time on the day that the value of the security is determined.Over-the-counter (OTC) securities are valued within the range of the most recent quoted bid and ask prices. Securities that trade in multiple markets or on multiple exchanges are valued
according to the broadest and most representative market. Certain equity securities are valued based upon fundamental characteristics or relationships to similar securities.
Investments inopen-end mutual funds are valued at the closing NAV.
The Funds have procedures to determine the fair value of financial instruments for which market prices are not reliable or readily available. Under these procedures, the Funds primarily employ a market-based approach which may use related or comparable assets or liabilities, recent transactions, market multiples, book values, and other relevant information for the investment to determine the fair value of the investment. An income-based valuation approach may also be used in which the anticipated future cash flows of the investment are discounted to calculate fair value. Discounts may also be applied due to the nature or duration of any restrictions on the disposition of the investments. Due to the inherent uncertainty of valuations of such investments, the fair values may differ significantly from the values that would have been used had an active market existed.
Trading in securities on foreign securities stock exchanges and OTC markets may be completed before 4 p.m. Eastern time. In addition, trading in certain foreign markets may not take place on every Funds’ business day. Occasionally, events occur between the time at which trading in a foreign security is completed and 4 p.m. Eastern time that might call into question the reliability of the value of a portfolio security held by the Fund. As a result, differences may arise between the value of the Funds’ portfolio securities as determined at the foreign market close and the latest indications of value at 4 p.m. Eastern time. In order to minimize the potential for these differences, the VC monitors price movements following the close of trading in foreign stock markets through a series of country specific market proxies (such as baskets of American Depositary Receipts, futures contracts and exchange traded funds). These price movements are measured against established trigger thresholds for each specific market proxy to assist in determining if an event has occurred that may call into question the reliability of the values of the foreign securities held by the Funds. If such an event occurs, the securities may be valued using fair value procedures, which may include the use of independent pricing services.
| franklintempleton.com | Semiannual Report | 35 | ||
FRANKLIN STRATEGIC SERIES
NOTES TO FINANCIAL STATEMENTS (UNAUDITED)
1. Organization and Significant Accounting
Policies(continued)
a. Financial Instrument Valuation(continued)
When the last day of the reporting period is anon-business day, certain foreign markets may be open on those days that the Funds’ NAV is not calculated, which could result in differences between the value of the Funds’ portfolio securities on the last business day and the last calendar day of the reporting period. Any significant security valuation changes due to an open foreign market are adjusted and reflected by the Funds for financial reporting purposes.
b. Foreign Currency Translation
Portfolio securities and other assets and liabilities denominated in foreign currencies are translated into U.S. dollars based on the exchange rate of such currencies against U.S. dollars on the date of valuation. The Funds may enter into foreign currency exchange contracts to facilitate transactions denominated in a foreign currency. Purchases and sales of securities, income and expense items denominated in foreign currencies are translated into U.S. dollars at the exchange rate in effect on the transaction date. Portfolio securities and assets and liabilities denominated in foreign currencies contain risks that those currencies will decline in value relative to the U.S. dollar. Occasionally, events may impact the availability or reliability of foreign exchange rates used to convert the U.S. dollar equivalent value. If such an event occurs, the foreign exchange rate will be valued at fair value using procedures established and approved by the Board.
The Funds do not separately report the effect of changes in foreign exchange rates from changes in market prices on securities held. Such changes are included in net realized and unrealized gain or loss from investments in the Statements of Operations.
Realized foreign exchange gains or losses arise from sales of foreign currencies, currency gains or losses realized between the trade and settlement dates on securities transactions and the difference between the recorded amounts of dividends, interest, and foreign withholding taxes and the U.S. dollar equivalent of the amounts actually received or paid. Net unrealized foreign exchange gains and losses arise from changes in foreign exchange rates on foreign denominated assets and liabilities other than investments in securities held at the end of the reporting period.
c. Securities Lending
Certain or all Funds participate in an agency based securities lending program to earn additional income. The Fund receives cash collateral against the loaned securities in an amount equal to at least 102% of the fair value of the loaned securities. Collateral is maintained over the life of the loan in an amount not less than 100% of the fair value of loaned securities, as determined at the close of Fund business each day; any additional collateral required due to changes in security values is delivered to the Fund on the next business day. The collateral is deposited into a joint cash account with other funds and is used to invest in a money market fund managed by Franklin Advisers, Inc., an affiliate of the Funds. The Fund may receive income from the investment of cash collateral, in addition to lending fees and rebates paid by the borrower. Income from securities loaned, net of fees paid to the securities lending agent and/or third-party vendor, is reported separately in the Statements of Operations. The Fund bears the market risk with respect to the collateral investment, securities loaned, and the risk that the agent may default on its obligations to the Fund. If the borrower defaults on its obligation to return the securities loaned, the Fund has the right to repurchase the securities in the open market using the collateral received. The securities lending agent has agreed to indemnify the Fund in the event of default by a third party borrower. At October 31, 2019, the Franklin Natural Resources Fund had no securities on loan.
d. Income and Deferred Taxes
It is each Fund’s policy to qualify as a regulated investment company under the Internal Revenue Code. Each Fund intends to distribute to shareholders substantially all of its taxable income and net realized gains to relieve it from federal income and excise taxes. As a result, no provision for U.S. federal income taxes is required.
The Funds may be subject to foreign taxation related to income received, capital gains on the sale of securities and certain foreign currency transactions in the foreign jurisdictions in which the Funds invest. Foreign taxes, if any, are recorded based on the tax regulations and rates that exist in the foreign markets in which the Funds invest. When a capital gain tax is determined to apply, certain or all Funds record an estimated deferred tax liability in an amount that would be payable if the securities were disposed of on the valuation date.
36 | Semiannual Report | franklintempleton.com | ||
FRANKLIN STRATEGIC SERIES
NOTES TO FINANCIAL STATEMENTS (UNAUDITED)
Each Fund may recognize an income tax liability related to its uncertain tax positions under U.S. GAAP when the uncertain tax position has a less than 50% probability that it will be sustained upon examination by the tax authorities based on its technical merits. As of October 31, 2019, each Fund has determined that no tax liability is required in its financial statements related to uncertain tax positions for any open tax years (or expected to be taken in future tax years). Open tax years are those that remain subject to examination and are based on the statute of limitations in each jurisdiction in which the Fund invests.
e. Security Transactions, Investment Income, Expenses and Distributions
Security transactions are accounted for on trade date. Realized gains and losses on security transactions are determined on a specific identification basis. Interest income and estimated expenses are accrued daily. Dividend income is recorded on theex-dividend date except for certain dividends from securities where the dividend rate is not available. In such cases, the dividend is recorded as soon as the information is received by the Funds. Distributions to shareholders are recorded on theex-dividend date. Distributable earnings are determined according to income tax regulations (tax basis) and may differ from earnings recorded in accordance with U.S. GAAP. These differences may be permanent or temporary. Permanent differences are reclassified among capital accounts to reflect their tax character. These reclassifications have no impact on net assets or the results of operations. Temporary differences are not reclassified, as they may reverse in subsequent periods.
Common expenses incurred by the Trust are allocated among the Funds based on the ratio of net assets of each Fund to the combined net assets of the Trust or based on the ratio of
number of shareholders of each Fund to the combined number of shareholders of the Trust. Fund specific expenses are charged directly to the Fund that incurred the expense.
Realized and unrealized gains and losses and net investment income, excluding class specific expenses, are allocated daily to each class of shares based upon the relative proportion of net assets of each class. Differences in per share distributions by class are generally due to differences in class specific expenses.
f. Accounting Estimates
The preparation of financial statements in accordance with U.S. GAAP requires management to make estimates and assumptions that affect the reported amounts of assets and liabilities at the date of the financial statements and the amounts of income and expenses during the reporting period. Actual results could differ from those estimates.
g. Guarantees and Indemnifications
Under the Trust’s organizational documents, its officers and trustees are indemnified by the Trust against certain liabilities arising out of the performance of their duties to the Trust. Additionally, in the normal course of business, the Trust, on behalf of the Funds, enters into contracts with service providers that contain general indemnification clauses. The Trust’s maximum exposure under these arrangements is unknown as this would involve future claims that may be made against the Trust that have not yet occurred. Currently, the Trust expects the risk of loss to be remote.
| franklintempleton.com | Semiannual Report | 37 | ||
FRANKLIN STRATEGIC SERIES
NOTES TO FINANCIAL STATEMENTS (UNAUDITED)
2. Shares of Beneficial Interest
At October 31, 2019, there were an unlimited number of shares authorized (without par value). Transactions in the Funds’ shares were as follows:
| Franklin Biotechnology | Franklin Natural | |||||||||||||||
| Discovery Fund | Resources Fund | |||||||||||||||
| Shares | Amount | Shares | Amount | |||||||||||||
Class A Shares: | ||||||||||||||||
Six Months ended October 31, 2019 | ||||||||||||||||
Shares solda | 252,206 | $ | 35,453,133 | 407,740 | $ | 8,550,578 | ||||||||||
Shares redeemed | (786,082 | ) | (110,335,199 | ) | (1,660,730 | ) | (34,435,288 | ) | ||||||||
Net increase (decrease) | (533,876 | ) | $ | (74,882,066 | ) | (1,252,990 | ) | $ | (25,884,710 | ) | ||||||
Year ended April 30, 2019 | ||||||||||||||||
Shares solda | 721,089 | $ | 106,972,540 | 1,281,103 | $ | 32,532,375 | ||||||||||
Shares issued in reinvestment of distributions | 232,391 | 29,692,637 | 256,254 | 5,342,901 | ||||||||||||
Shares redeemed | (1,697,525 | ) | (248,691,874 | ) | (3,371,926 | ) | (84,545,966 | ) | ||||||||
Net increase (decrease) | (744,045 | ) | $ | (112,026,697 | ) | (1,834,569 | ) | $ | (46,670,690 | ) | ||||||
Class C Shares: | ||||||||||||||||
Six Months ended October 31, 2019 | ||||||||||||||||
Shares sold | 20,544 | $ | 2,774,311 | 62,788 | $ | 1,261,837 | ||||||||||
Shares redeemeda | (52,451 | ) | (7,094,768 | ) | (391,388 | ) | (7,888,937 | ) | ||||||||
Net increase (decrease) | (31,907 | ) | $ | (4,320,457 | ) | (328,600 | ) | $ | (6,627,100 | ) | ||||||
Year ended April 30, 2019 | ||||||||||||||||
Shares sold | 72,561 | $ | 10,442,091 | 324,962 | $ | 7,969,298 | ||||||||||
Shares issued in reinvestment of distributions | 13,364 | 1,646,340 | 45,232 | 915,493 | ||||||||||||
Shares redeemeda | (149,801 | ) | (21,157,938 | ) | (1,280,715 | ) | (31,719,295 | ) | ||||||||
Net increase (decrease) | (63,876 | ) | $ | (9,069,507 | ) | (910,521 | ) | $ | (22,834,504 | ) | ||||||
Class R6 Shares: | ||||||||||||||||
Six Months ended October 31, 2019 | ||||||||||||||||
Shares sold | 4,160 | $ | 619,233 | 65,340 | $ | 1,507,489 | ||||||||||
Shares redeemed | (11,626 | ) | (1,739,801 | ) | (644,389 | ) | (14,492,896 | ) | ||||||||
Net increase (decrease) | (7,466 | ) | $ | (1,120,568 | ) | (579,049 | ) | $ | (12,985,407 | ) | ||||||
Year ended April 30, 2019 | ||||||||||||||||
Shares sold | 14,632 | $ | 2,320,850 | 331,245 | $ | 8,552,092 | ||||||||||
Shares issued in reinvestment of distributions | 1,505 | 198,908 | 14,066 | 313,109 | ||||||||||||
Shares redeemed | (28,420 | ) | (4,339,877 | ) | (258,140 | ) | (6,705,257 | ) | ||||||||
Net increase (decrease) | (12,283 | ) | $ | (1,820,119 | ) | 87,171 | $ | 2,159,944 | ||||||||
38 | Semiannual Report | franklintempleton.com | ||
FRANKLIN STRATEGIC SERIES
NOTES TO FINANCIAL STATEMENTS (UNAUDITED)
| Franklin Biotechnology | Franklin Natural | |||||||||||||||
| Discovery Fund | Resources Fund | |||||||||||||||
| Shares | Amount | Shares | Amount | |||||||||||||
Advisor Class Shares: | ||||||||||||||||
Six Months ended October 31, 2019 | ||||||||||||||||
Shares sold | 89,153 | $ | 12,897,996 | 160,346 | $ | 3,587,475 | ||||||||||
Shares redeemed | (171,181 | ) | (24,653,685 | ) | (687,138 | ) | (15,211,076) | |||||||||
|
| |||||||||||||||
Net increase (decrease) | (82,028 | ) | $ | (11,755,689 | ) | (526,792 | ) | $ | (11,623,601) | |||||||
|
| |||||||||||||||
Year ended April 30, 2019 | ||||||||||||||||
Shares sold | 338,870 | $ | 52,338,943 | 757,766 | $ | 19,842,560 | ||||||||||
Shares issued in reinvestment of distributions | 36,842 | 4,828,793 | 57,021 | 1,269,854 | ||||||||||||
Shares redeemed | (501,477 | ) | (74,480,845 | ) | (961,445 | ) | (25,031,579) | |||||||||
|
| |||||||||||||||
Net increase (decrease) | (125,765 | ) | $ | (17,313,109 | ) | (146,658 | ) | $ | (3,919,165) | |||||||
|
| |||||||||||||||
aMay include a portion of Class C shares that were automatically converted to Class A.
3. Transactions with Affiliates
Franklin Resources, Inc. is the holding company for various subsidiaries that together are referred to as Franklin Templeton. Certain officers and trustees of the Trust are also officers and/or directors of the following subsidiaries:
| Subsidiary | Affiliation | |
Franklin Advisers, Inc. (Advisers) | Investment manager | |
Franklin Templeton Services, LLC (FT Services) | Administrative manager | |
Franklin Templeton Distributors, Inc. (Distributors) | Principal underwriter | |
Franklin Templeton Investor Services, LLC (Investor Services) | Transfer agent | |
a. Management Fees
Franklin Biotechnology Discovery Fund pays an investment management fee to Advisers based on the average daily net assets of the Fund as follows:
| Annualized Fee Rate | Net Assets | |
0.775% | Up to and including $100 million | |
0.650% | Over $100 million, up to and including $200 million | |
0.635% | Over $200 million, up to and including $250 million | |
0.585% | Over $250 million, up to and including $700 million | |
0.550% | Over $700 million, up to and including $1.2 billion | |
0.525% | Over $1.2 billion, up to and including $7.5 billion | |
0.515% | Over $7.5 billion, up to and including $10 billion | |
0.505% | Over $10 billion, up to and including $12.5 billion | |
0.495% | Over $12.5 billion, up to and including $15 billion | |
0.475% | In excess of $15 billion | |
| franklintempleton.com | Semiannual Report | 39 | ||
FRANKLIN STRATEGIC SERIES
NOTES TO FINANCIAL STATEMENTS (UNAUDITED)
3. Transactions with Affiliates(continued)
a. Management Fees(continued)
Franklin Natural Resources Fund pays an investment management fee to Advisers based on the average daily net assets of the Fund as follows:
| Annualized Fee Rate | Net Assets | |
0.625% | Up to and including $100 million | |
0.500% | Over $100 million, up to and including $250 million | |
0.450% | Over $250 million, up to and including $7.5 billion | |
0.440% | Over $7.5 billion, up to and including $10 billion | |
0.430% | Over $10 billion, up to and including $12.5 billion | |
0.420% | Over $12.5 billion, up to and including $15 billion | |
0.400% | In excess of $15 billion | |
For the period ended October 31, 2019, each Fund’s annualized gross effective investment management fee rate based on average daily net assets was as follows:
Franklin Biotechnology Discovery Fund | Franklin Natural Resources Fund | |||
0.598% | 0.532% | |||
b. Administrative Fees
Under an agreement with Advisers, FT Services provides administrative services to the Funds. The fee is paid by Advisers based on Funds’ average daily net assets, and is not an additional expense of the Funds.
c. Distribution Fees
The Board has adopted distribution plans for each share class, with the exception of Class R6 and Advisor Class shares, pursuant to Rule12b-1 under the 1940 Act. Under the Funds’ Class A reimbursement distribution plans, the Funds reimburse Distributors for costs incurred in connection with the servicing, sale and distribution of each Fund’s shares up to the maximum annual plan rate for each class. Under the Class A reimbursement distribution plans, costs exceeding the maximum for the current plan year cannot be reimbursed in subsequent periods. In addition, under the Funds’ Class C compensation distribution plans, the Funds pay Distributors for costs incurred in connection with the servicing, sale and distribution of each Fund’s shares up to the maximum annual plan rate for each class. The plan year, for purposes of monitoring compliance with the maximum annual plan rates, is February 1 through January 31 for each Fund.
The maximum annual plan rates, based on the average daily net assets, for each class, are as follows:
| Franklin Biotechnology Discovery Fund | Franklin Natural Resources Fund | |||||||
Reimbursement Plans: | ||||||||
Class A | 0.35% | 0.35% | ||||||
Class C | 1.00% | 1.00% | ||||||
The Board has set the current rate at 0.25% per year for Class A shares until further notice and approval by the Board.
40 | Semiannual Report | franklintempleton.com | ||
FRANKLIN STRATEGIC SERIES
NOTES TO FINANCIAL STATEMENTS (UNAUDITED)
d. Sales Charges/Underwriting Agreements
Front-end sales charges and contingent deferred sales charges (CDSC) do not represent expenses of the Funds. These charges are deducted from the proceeds of sales of fund shares prior to investment or from redemption proceeds prior to remittance, as applicable. Distributors has advised the Funds of the following commission transactions related to the sales and redemptions of the Funds’ shares for the period:
| Franklin Biotechnology Discovery Fund | Franklin Natural Resources Fund | |||||||
Sales charges retained net of commissions paid to unaffiliated brokers/dealers | $56,428 | $9,548 | ||||||
CDSC retained | $ 6,205 | $1,417 | ||||||
e. Transfer Agent Fees
Each class of shares pays transfer agent fees to Investor Services for its performance of shareholder servicing obligations. The fees are based on an annualized asset based fee of 0.02% plus a transaction based fee. In addition, each class reimburses Investor Services for out of pocket expenses incurred and, except for Class R6, reimburses shareholder servicing fees paid to third parties. These fees are allocated daily based upon their relative proportion of such classes’ aggregate net assets. Class R6 pays Investor Services transfer agent fees specific to that class.
For the period ended October 31, 2019, the Funds paid transfer agent fees as noted in the Statements of Operations of which the following amounts were retained by Investor Services:
| �� | Franklin Biotechnology Discovery Fund | Franklin Natural Resources Fund | ||||||
Transfer agent fees | $288,028 | $142,839 | ||||||
f. Investments in Affiliated Management Investment Companies
Certain or all Funds invest in one or more affiliated management investment companies for purposes other than exercising a controlling influence over the management or policies. Management fees paid by the Funds are waived on assets invested in the affiliated management investment companies, as noted in the Statements of Operations, in an amount not to exceed the management and administrative fees paid directly or indirectly by each affiliate. During the period ended October 31, 2019, investments in affiliated management investment companies were as follows:
| Value at Beginning of Period | Purchases | Sales | Realized Gain (Loss) | Net Change in Unrealized Appreciation (Depreciation) | Value at End of Period | Number of Shares Held at End of Period | Investment Income | |||||||||||||||||||||||||
Franklin Biotechnology Discovery Fund |
| |||||||||||||||||||||||||||||||
Non-Controlled Affiliates | ||||||||||||||||||||||||||||||||
| Dividends | ||||||||||||||||||||||||||||||||
Institutional Fiduciary Trust Money Market Portfolio, 1.56% | $27,393,876 | $190,860,151 | $(194,941,859 | ) | $ — | $ — | $23,312,168 | 23,312,168 | $ 453,625 | |||||||||||||||||||||||
| franklintempleton.com | Semiannual Report | 41 | ||
FRANKLIN STRATEGIC SERIES
NOTES TO FINANCIAL STATEMENTS (UNAUDITED)
3. Transactions with Affiliates(continued)
f. Investments in Affiliated Management Investment Companies(continued)
| Value at Beginning of Period | Purchases | Sales | Realized Gain (Loss) | Net Change in Unrealized Appreciation (Depreciation) | Value at End of Period | Number of Shares Held at End of Period | Investment Income | |||||||||||||||||||||||||
Franklin Biotechnology Discovery Fund(continued) |
| |||||||||||||||||||||||||||||||
Non-Controlled Affiliates(continued) |
| |||||||||||||||||||||||||||||||
| Income from securities loaned | ||||||||||||||||||||||||||||||||
Institutional Fiduciary Trust Money Market Portfolio, 1.56% | $27,827,675 | $ 75,478,978 | $ (87,910,020 | ) | $ — | $ — | $15,396,633 | 15,396,633 | $ 213,728 | |||||||||||||||||||||||
|
|
|
| |||||||||||||||||||||||||||||
Total Affiliated Securities | $55,221,551 | $266,339,129 | $(282,851,879 | ) | $ — | $ — | $38,708,801 | $ 667,353 | ||||||||||||||||||||||||
|
|
|
| |||||||||||||||||||||||||||||
Franklin Natural Resources Fund |
| |||||||||||||||||||||||||||||||
Non-Controlled Affiliates | ||||||||||||||||||||||||||||||||
| Dividends | ||||||||||||||||||||||||||||||||
Institutional Fiduciary Trust Money Market Portfolio, 1.56% | $ 788,220 | $ 37,414,334 | $ (36,589,102 | ) | $ — | $ — | $ 1,613,452 | 1,613,452 | $ 21,829 | |||||||||||||||||||||||
| Income from securities loaned | ||||||||||||||||||||||||||||||||
Institutional Fiduciary Trust Money Market Portfolio, 1.56% | — | 3,665,379 | (3,665,379 | ) | — | — | — | — | 2,928 | |||||||||||||||||||||||
|
| |||||||||||||||||||||||||||||||
Total Affiliated Securities | $ 788,220 | $ 41,079,713 | $ (40,254,481 | ) | $ — | $ — | $ 1,613,452 | $ 24,757 | ||||||||||||||||||||||||
|
|
|
| |||||||||||||||||||||||||||||
g. Waiver and Expense Reimbursements
Investor Services has contractually agreed in advance to waive or limit its fees so that the Class R6 transfer agent fees do not exceed 0.03% based on the average net assets of the class until August 31, 2020.
h. Interfund Transactions
Franklin Biotechnology Discovery Fund engaged in purchases and sales of investments with funds or other accounts that have common investment managers (or affiliated investment managers), directors, trustees or officers. During the period ended October 31, 2019, these purchase and sale transactions aggregated $1,025,328 and $0, respectively.
4. Expense Offset Arrangement
The Funds have entered into an arrangement with their custodian whereby credits realized as a result of uninvested cash balances are used to reduce a portion of the Funds’ custodian expenses. During the period ended October 31, 2019, the custodian fees were reduced as noted in the Statements of Operations.
5. Income Taxes
For tax purposes, capital losses may be carried over to offset future capital gains.
42 | Semiannual Report | franklintempleton.com | ||
FRANKLIN STRATEGIC SERIES
NOTES TO FINANCIAL STATEMENTS (UNAUDITED)
At April 30, 2019, the capital loss carryforwards were as follows:
| Franklin Natural Resources Fund | ||||
Capital loss carryforwards not subject to expiration: |
| |||
Short term | $ 10,086,801 | |||
Long term | 135,396,222 | |||
Total capital loss carryforwards | $145,483,023 | |||
For tax purposes, the Fund may elect to defer any portion of a post-October capital loss or late-year ordinary loss to the first day of the following fiscal year. At April 30, 2019, Franklin Biotechnology Discovery Fund deferred late-year ordinary losses of $2,803,664.
At October 31, 2019, the cost of investments and net unrealized appreciation (depreciation) for income tax purposes were as follows:
| Franklin Biotechnology Discovery Fund | Franklin Natural Resources Fund | |||||||
Cost of investments | $692,569,955 | $278,996,957 | ||||||
Unrealized appreciation | $453,212,759 | $ 39,688,733 | ||||||
Unrealized depreciation | (43,618,430 | ) | (61,417,193 | ) | ||||
Net unrealized appreciation (depreciation) | $409,594,329 | $(21,728,460 | ) | |||||
Differences between income and/or capital gains as determined on a book basis and a tax basis are primarily due to differing treatments of passive foreign investment company shares and wash sales.
6. Investment Transactions
Purchases and sales of investments (excluding short term securities) for the period ended October 31, 2019, were as follows:
| Franklin Biotechnology Discovery Fund | Franklin Natural Resources Fund | |||||||
Purchases | $193,039,203 | $30,804,398 | ||||||
Sales | $281,553,059 | $82,304,481 | ||||||
At October 31, 2019, in connection with securities lending transactions, certain or all Funds loaned investments and received cash collateral as follows:
| Franklin Biotechnology Discovery Fund | ||||
Securities lending transactionsa: | ||||
Equity Investmentsb | $15,501,633 | |||
aThe agreements can be terminated at any time.
bThe gross amount of recognized liability for such transactions is included in payable upon return of securities loaned in the Statements of Assets and Liabilities.
| franklintempleton.com | Semiannual Report | 43 | ||
FRANKLIN STRATEGIC SERIES
NOTES TO FINANCIAL STATEMENTS (UNAUDITED)
7. Concentration of Risk
Investing in foreign securities may include certain risks and considerations not typically associated with investing in U.S. securities, such as fluctuating currency values and changing local, regional and global economic, political and social conditions, which may result in greater market volatility. Current political and financial uncertainty surrounding the European Union may increase market volatility and the economic risk of investing in securities in Europe. In addition, certain foreign securities may not be as liquid as U.S. securities.
8. Restricted Securities
Certain or all Funds invest in securities that are restricted under the Securities Act of 1933 (1933 Act). Restricted securities are often purchased in private placement transactions, and cannot be sold without prior registration unless the sale is pursuant to an exemption under the 1933 Act. Disposal of these securities may require greater effort and expense, and prompt sale at an acceptable price may be difficult. The Funds may have registration rights for restricted securities. The issuer generally incurs all registration costs.
At October 31, 2019, investments in restricted securities, excluding securities exempt from registration under the 1933 Act were as follows:
| Shares | Issuer | Acquisition Date | Cost | Value | ||||||||||||
Franklin Biotechnology Discovery Fund | ||||||||||||||||
| 80,195 | Intarcia Therapeutics Inc., DD | 3/26/14 | $2,597,516 | $ 634,441 | ||||||||||||
| 1,330,687 | Metacrine Inc., pfd., C | 6/04/18 | 2,821,056 | 1,840,276 | ||||||||||||
| Total Restricted Securities(Value is 0.2% of Net Assets) | $5,418,572 | $2,474,717 | ||||||||||||||
9. Credit Facility
The Funds, together with other U.S. registered and foreign investment funds (collectively, Borrowers), managed by Franklin Templeton, are borrowers in a joint syndicated senior unsecured credit facility totaling $2 billion (Global Credit Facility) which matures on February 7, 2020. This Global Credit Facility provides a source of funds to the Borrowers for temporary and emergency purposes, including the ability to meet future unanticipated or unusually large redemption requests.
Under the terms of the Global Credit Facility, the Funds shall, in addition to interest charged on any borrowings made by the Funds and other costs incurred by the Funds, pay their share of fees and expenses incurred in connection with the implementation and maintenance of the Global Credit Facility, based upon their relative share of the aggregate net assets of all of the Borrowers, including an annual commitment fee of 0.15% based upon the unused portion of the Global Credit Facility. These fees are reflected in other expenses in the Statements of Operations. During the period ended October 31, 2019, the Funds did not use the Global Credit Facility.
10. Fair Value Measurements
The Funds follow a fair value hierarchy that distinguishes between market data obtained from independent sources (observable inputs) and the Funds’ own market assumptions (unobservable inputs). These inputs are used in determining the value of the Funds’ financial instruments and are summarized in the following fair value hierarchy:
| • | Level 1 – quoted prices in active markets for identical financial instruments |
44 | Semiannual Report | franklintempleton.com | ||
FRANKLIN STRATEGIC SERIES
NOTES TO FINANCIAL STATEMENTS (UNAUDITED)
| • | Level 2 – other significant observable inputs (including quoted prices for similar financial instruments, interest rates, prepayment speed, credit risk, etc.) |
| • | Level 3 – significant unobservable inputs (including the Funds’ own assumptions in determining the fair value of financial instruments) |
The input levels are not necessarily an indication of the risk or liquidity associated with financial instruments at that level.
A summary of inputs used as of October 31, 2019, in valuing the Funds’ assets carried at fair value, is as follows:
| Level 1 | Level 2 | Level 3 | Total | |||||||||||||
Franklin Biotechnology Discovery Fund | ||||||||||||||||
Assets: | ||||||||||||||||
Investments in Securities:a | ||||||||||||||||
Equity Investments:b | ||||||||||||||||
Biotechnology | $ | 857,216,892 | $ | — | $ | 2,474,717 | $ | 859,691,609 | ||||||||
All Other Equity Investments | 202,829,105 | — | — | 202,829,105 | ||||||||||||
Escrows and Litigation Trusts | — | — | 934,769 | 934,769 | ||||||||||||
Short Term Investments | 38,708,801 | — | — | 38,708,801 | ||||||||||||
Total Investments in Securities | $ | 1,098,754,798 | $ | — | $ | 3,409,486 | $ | 1,102,164,284 | ||||||||
Franklin Natural Resources Fund | ||||||||||||||||
Assets: | ||||||||||||||||
Investments in Securities:a | ||||||||||||||||
Equity Investments | $ | 255,655,045 | $ | — | $ | — | c | $ | 255,655,045 | |||||||
Short Term Investments | 1,613,452 | — | — | 1,613,452 | ||||||||||||
Total Investments in Securities | $ | 257,268,497 | $ | — | $ | — | $ | 257,268,497 | ||||||||
aFor detailed categories, see the accompanying Statement of Investments.
bIncludes common and preferred stocks as well as other equity interests.
cIncludes securities determined to have no value at October 31, 2019.
A reconciliation of assets in which Level 3 inputs are used in determining fair value is presented when there are significant Level 3 financial instruments at the beginning and/or end of the period.
11. Subsequent Events
The Funds have evaluated subsequent events through the issuance of the financial statements and determined that no events have occurred that require disclosure.
Abbreviations
Selected Portfolio
| ADR | American Depositary Receipt | |
| franklintempleton.com | Semiannual Report | 45 | ||
FRANKLIN STRATEGIC SERIES
Proxy Voting Policies and Procedures
The Trust’s investment manager has established Proxy Voting Policies and Procedures (Policies) that the Trust uses to determine how to vote proxies relating to portfolio securities. Shareholders may view the Trust’s complete Policies online at franklintempleton.com. Alternatively, shareholders may request copies of the Policies free of charge by calling the Proxy Group collect at (954)527-7678 or by sending a written request to: Franklin Templeton Companies, LLC, 300 S.E. 2nd Street, Fort Lauderdale, FL 33301, Attention: Proxy Group. Copies of the Trust’s proxy voting records are also made available online at franklintempleton.com and posted on the U.S. Securities and Exchange Commission’s website at sec.gov and reflect the most recent12-month period ended June 30.
Quarterly Statement of Investments
The Trust files a complete statement of investments with the U.S. Securities and Exchange Commission for the first and third quarters for each fiscal year as an exhibit to its report on FormN-PORT. Shareholders may view the filed FormN-PORT by visiting the Commission’s website at sec.gov. The filed form may also be viewed and copied at the Commission’s Public Reference Room in Washington, DC. Information regarding the operations of the Public Reference Room may be obtained by calling(800) SEC-0330.
46 | Semiannual Report | franklintempleton.com | ||
This page intentionally left blank.
This page intentionally left blank.
Authorized for distribution only when accompanied or preceded by a summary prospectus and/or prospectus. Investors should carefully consider a fund’s investment goals, risks, charges and expenses before investing. A prospectus contains this and other information; please read it carefully before investing.
To help ensure we provide you with quality service, all calls to and from our service areas are monitored and/or recorded.
|
Semiannual Report and Shareholder Letter | |||||
| Franklin Strategic Series | ||||||
Investment Manager | Distributor | Shareholder Services | ||||
| Franklin Advisers, Inc. | Franklin Templeton Distributors, Inc. | (800)632-2301 | ||||
| (800) DIAL BEN®/342-5236 | ||||||
| franklintempleton.com | ||||||
| © 2019 Franklin Templeton Investments. All rights reserved. | FSS2 S 12/19 |
Sign up for electronic delivery at franklintempleton.com/edelivery
Internet Delivery of Fund Reports Unless You Request Paper Copies: Effective January 1, 2021, as permitted by the SEC, paper copies of the Fund’s shareholder reports will no longer be sent by mail, unless you specifically request them from the Fund or your financial intermediary. Instead, the reports will be made available on a website, and you will be notified by mail each time a report is posted and provided with a website link to access the report.
If you already elected to receive shareholder reports electronically, you will not be affected by this change and you need not take any action. If you have not signed up for electronic delivery, we would encourage you to join fellow shareholders who have. You may elect to receive shareholder reports and other communications electronically from the Fund by calling (800)632-2301 or by contacting your financial intermediary.
You may elect to continue to receive paper copies of all your future shareholder reports free of charge by contacting your financial intermediary or, if you invest directly with a Fund, calling (800)632-2301 to let the Fund know of your request. Your election to receive reports in paper will apply to all funds held in your account.
SHAREHOLDER LETTER
Dear Shareholder:
During the six months ended October 31, 2019, the global economy expanded despite weakness in certain regions. Global stocks were aided by upbeat economic data in some other regions, encouraging corporate earnings reports and periods of optimism about a potential U.S.-China trade deal. Monetary policy easing by major central banks, including the U.S. Federal Reserve’s interest rate cuts in July, September and October, also buoyed global stocks. The European Central Bank left its benchmark interest rate unchanged and announced it would start a new bond-buying program in November. Global markets were pressured by trade tensions between the U.S. and its trading partners and other geopolitical risks. The U.S. dollar rose slightly against most currencies during the period. In this environment, global government bonds, as measured by the FTSE World Government Bond Index, posted a gain in U.S. dollar terms.
We are committed to our long-term perspective and disciplined investment approach as we conduct a rigorous, fundamental analysis of securities with a regular emphasis on investment risk management.
We believe active, professional investment management serves investors well. We also recognize the important role of financial advisors in today’s markets and encourage investors to continue to seek their advice. Amid changing markets and economic conditions, we are confident investors with a well-diversified portfolio and a patient, long-term outlook should be well positioned for the years ahead.
In addition, Franklin Flexible Alpha Bond Fund’s semiannual report includes more detail about prevailing conditions and a
discussion about investment decisions during the period. Please remember all securities markets fluctuate, as do mutual fund share prices.
As previously communicated, the Fund reorganized into Franklin Low Duration Total Return Fund on December 6, 2019. The Fund closed to new investors with limited exceptions on August 27, 2019, and was scheduled to close to all investors on December 4, 2019.
We thank you for investing with Franklin Templeton, welcome your questions and comments, and look forward to serving your investment needs in the years ahead.
Sincerely,

Edward Perks, CFA
President and Chief Executive Officer –
Investment Management
Franklin Strategic Series
This letter reflects our analysis and opinions as of October 31, 2019, unless otherwise indicated. The information is not a complete analysis of every aspect of any market, country, industry, security or fund. Statements of fact are from sources considered reliable.
CFA® is a trademark owned by CFA Institute.
Not FDIC Insured| May Lose Value| No Bank Guarantee
|
| franklintempleton.com | Not part of the semiannual report | 1 | ||
Semiannual Report | ||||
| 3 | ||||
| 7 | ||||
| 9 | ||||
| 10 | ||||
| 35 | ||||
| 40 | ||||
| 55 | ||||
| Visitfranklintempleton.comfor fund updates, to access your account, or to find helpful financial planning tools. |
2 | Semiannual Report | franklintempleton.com | ||
SEMIANNUAL REPORT
Franklin Flexible Alpha Bond Fund
This semiannual report for Franklin Flexible Alpha Bond Fund covers the period ended October 31, 2019. As previously communicated, the Fund reorganized into Franklin Low Duration Total Return Fund on December 6, 2019. The Fund closed to new investors with limited exceptions on August 27, 2019, and was scheduled to close to all investors on December 4, 2019.
Your Fund’s Goal and Main Investments
The Fund seeks to provide total return through a combination of current income and capital appreciation by investing at least 80% of its net assets in bonds and investments that provide exposure to bonds, including debt obligations of any credit quality, maturity or duration, all varieties of fixed income, variable rate and floating-rate debt securities and investments, money market instruments and derivatives. The Fund aims to provide attractive risk-adjusted total returns over a full market cycle. A full market cycle is a period of time that spans a full business and economic cycle, which may include periods of rising and declining interest rates.
What is duration?
Duration is a measure of a bond’s price sensitivity to interest-rate changes. In general, a portfolio of securities with a lower duration can be expected to be less sensitive to interest-rate changes than a portfolio with a higher duration.
|
Performance Overview
For the six months under review, the Fund’s Class A shares posted a +0.52% cumulative total return. In comparison, the LIBOR USD3-Month Rate Index posted a +1.15% total return.1 The index tracks the interest rate at which banks offer to lend to one another in the wholesale money markets in London and is used to set the cost of various variable-rate loans. You can find more of the Fund’s performance data in the Performance Summary beginning on page 7.
Performance data represent past performance, which does not guarantee future results. Investment return and principal
Sector Exposure*
10/31/19
| % of Total Net Assets | ||||
Residential Mortgage-Backed Securities | 28.1% | |||
Collateralized Loan Obligations | 26.3% | |||
International Bonds | 15.9% | |||
Investment-Grade Corporates | 8.2% | |||
Floating-Rate Loans | 6.6% | |||
Agency Mortgage-Backed Securities | 6.0% | |||
Treasury Inflation-Protected Securities | 5.8% | |||
Covered Bonds | 4.8% | |||
Commercial Mortgage-Backed Securities | 4.3% | |||
Municipal Bonds | 3.8% | |||
High-Yield Corporate Securities | 2.6% | |||
Currency Derivatives | 0.4% | |||
Interest-Rate Derivatives | -35.1% | |||
Cash & Cash Equivalents | 0.2% | |||
*Sector Exposure is intended to estimate the portfolio’s exposure to various sectors, including any hedged or increased exposure through certain derivatives held in the portfolio (or their underlying reference assets) and may not total 100% or may be negative due to rounding, use of any derivatives, unsettled trades or other factors. Interest-Rate Derivatives sector consists of Treasury, interest rate and other derivatives that are primarily used for duration management; a negative number indicates that the Fund is seeking to hedge interest-rate risk.
value will fluctuate, and you may have a gain or loss when you sell your shares. Current performance may differ from figures shown. For most recentmonth-end performance, go tofranklintempleton.comor call(800)342-5236.
Economic and Market Overview
The U.S. economy expanded during the six months ended October 31, 2019. After moderating in 2019’s second quarter, the economy grew faster in the third quarter, aided by consumer spending, housing investment, government spending, inventory investment and exports. The manufacturing sector expanded during the period’s first half, but contracted in the second half. The services sector continued to expand throughout the period. The unemployment rate was 3.6% in April 2019, and though it varied slightly during the six months under review, it ended the
1. Source: Bloomberg LP.
The index is unmanaged and includes reinvestment of any income or distributions. It does not reflect any fees, expenses or sales charges. One cannot invest directly in an index, and an index is not representative of the Fund’s portfolio.
The dollar value, number of shares or principal amount, and names of all portfolio holdings are listed in the Fund’s Statement of Investments (SOI).
The SOI begins on page 15.
| franklintempleton.com | Semiannual Report | 3 | ||
FRANKLIN FLEXIBLE ALPHA BOND FUND
period at 3.6%.2 The annual inflation rate, as measured by the Consumer Price Index, decreased from 2.0% in April 2019 to 1.8% atperiod-end.2
Dividend Distributions*
5/1/19–10/31/19
| Dividend per Share (cents) | ||||||||||||||||||||
| Month | Class A | Class C | Class R | Class R6 | Advisor Class | |||||||||||||||
May | 2.3337 | 2.0688 | 2.2012 | 3.0435 | 2.5775 | |||||||||||||||
June | 1.9848 | 1.7769 | 1.8671 | 2.7185 | 2.1801 | |||||||||||||||
July | 1.9774 | 1.7493 | 1.8267 | 2.8320 | 2.2032 | |||||||||||||||
August | 2.3025 | 1.9851 | 2.1046 | 2.6788 | 2.4943 | |||||||||||||||
September | 2.1769 | 1.8678 | 1.9872 | 2.4129 | 2.3609 | |||||||||||||||
October | 2.3005 | 1.9764 | 2.1138 | 2.7135 | 2.5094 | |||||||||||||||
Total | 13.0758 | 11.4243 | 12.1006 | 16.3992 | 14.3254 | |||||||||||||||
*The distribution amount is the sum of all estimatedtax-basis net investment income distributions for the period shown. A portion or all of the distribution may be reclassified as return of capital or short-term or long-term capital gains once final tax designations are known. Assumes shares were purchased and held for the entire accrual period. Since dividends accrue daily, your actual distributions will vary depending on the date you purchased your shares and any account activity. All Fund distributions will vary depending upon current market conditions, and past distributions are not indicative of future trends.
At its July 2019 meeting, the U.S. Federal Reserve (Fed) lowered its target range for the federal funds rate for the first time since December 2008, to 2.00%–2.25%, citing muted inflation pressures and the potential effects of global trade tensions on economic growth. Furthermore, the Fed ended its balance sheet normalization program earlier than previously indicated. The Fed further lowered the federal funds target rate range by 0.25% at its September and October meetings, to 1.50%–1.75%, reiterating the rationale cited at the July meeting.
The10-year Treasury yield, which moves inversely to its price, decreased during the period, falling to multi-year lows in 2019’s third quarter before recovering partially in October. U.S. political uncertainties (including the impeachment inquiry into President Donald Trump), geopolitical tensions in certain regions, U.S. trade disputes with China and other trading partners, slower domestic and global economic growth, and the Fed’s more accommodative monetary policy stance weighed on the Treasury yield at certain points during the period. However, several better-than-expected U.S. economic reports and periods of optimism about a potential U.S.-China trade agreement supported the yield. The10-year yield fell persistently below certain short-term yields during most of the period, but rose above all short-term
Treasury yields towardperiod-end amid investor optimism following the announcement of a potential phase one of the U.S.-China trade agreement. Overall, the10-year Treasury yield declined from 2.51% at the beginning of the period to 1.69% atperiod-end.
Currency Composition*
10/31/19
| % of Total Net Assets | ||||
North America | 99.3% | |||
U.S. Dollar | 100.1% | |||
Mexican Peso | 0.3% | |||
Canadian Dollar | -1.1% | |||
Asia | 1.1% | |||
Japanese Yen | 1.8% | |||
Indonesian Rupiah | 0.3% | |||
Chinese Yuan | 0.0% | ** | ||
South Korean Won | -0.2% | |||
Chinese Renminbi | -0.8% | |||
Latin America & Caribbean | 0.4% | |||
Colombian Peso | 0.2% | |||
Uruguayan Peso | 0.2% | |||
Dominican Peso | 0.0% | ** | ||
Europe | 0.3% | |||
Norwegian Krone | 0.9% | |||
Turkish Lira | 0.1% | |||
British Pound | 0.0% | ** | ||
Danish Krone | 0.0% | ** | ||
Euro | -0.2% | |||
Swedish Krona | -0.5% | |||
Middle East & Africa | 0.2% | |||
South African Rand | 0.2% | |||
Australia & New Zealand | -1.3% | |||
Australian Dollar | -1.3% | |||
*Currency Composition is intended to estimate the portfolio’s exposure to various currencies, including any hedged or increased exposure through certain derivatives held in the portfolio (or their underlying reference assets) and may not total 100% or may be negative due to rounding, use of any derivatives, unsettled trades or other factors.
**Rounds to less than 0.1%.
Investment Strategy
The Fund seeks to generate returns from various sources, other than solely from interest income, by allocating its portfolio across various risks (such as credit, currency and duration risks). In employing this strategy, the Fund has the
2. Source: Bureau of Labor Statistics.
See www.franklintempletondatasources.com for additional data provider information.
4 | Semiannual Report | franklintempleton.com | ||
FRANKLIN FLEXIBLE ALPHA BOND FUND
flexibility to invest across all debt asset classes without regard to country, sector, quality, maturity or duration and without reference to a benchmark index.
The Fund may engage in active and frequent trading as part of its investment strategies and, at any given time, may have a substantial amount of its assets invested in any class of debt securities, including, but not limited to: U.S. government and agency securities; foreign government and supranational debt securities; corporate bonds; corporate loans (and loan participations); collateralized debt and loan obligations; preferred securities; various types of mortgage-backed securities and other asset-backed securities (including covered bonds); municipal securities; and derivatives and other instruments with similar economic characteristics, or that provide exposure, to such debt securities.
Manager’s Discussion
Over thesix-month period, the Fund posted a positive total return and outperformed its benchmark on a gross basis. The Fund’s yield curve and duration positioning was the primary source of positive alpha, driven primarily by duration exposure in the U.S. as well as Australia. The Fund’s spread-sector exposure also enhanced results, driven primarily by the Fund’s allocation to collateralized loan obligations, covered bonds,non-dollar developed debt and basis-trade positions (taking opposing long and short positions in the two securities to profit from the convergence of their values). Additionally, the Fund’s active currency positioning also contributed to returns, driven primarily by our exposures to the Swedish krona, Australian dollar, Chinese yuan and Turkish lira. In contrast, the Fund’s exposure to U.S. Treasury Inflation-Protected Securities (TIPS),non-agency residential mortgage-backed securities (MBS) as well as high-yield corporate debt detracted from returns. Duration exposure in Europe as well as foreign currency exchange allocation to the Norwegian krone also weighed on performance.
What is the yield curve?
A yield curve is a line that plots the yield to maturity of bonds having equal credit quality against their maturity dates.
|
We continued to invest in a broad set of global fixed income sectors, with a goal of achieving more consistent positive alpha with a risk-diversified portfolio. In terms of portfolio changes, we increased our exposure to TIPS, fixed-rate agency MBS, investment-grade and high-yield corporate securities, sovereign emerging markets debt and taxable municipal bonds. In contrast, we reduced our exposure to senior secured floating-rate loans and collateralized loan
obligations. Other sectors remained relatively consistent over the period. Overall, portfolio duration was increased; however, we maintained relatively neutral exposures with a slightly negative stance in U.S. and positive duration in Australia, Canada, Europe and China. Although we made some slight changes to our currency positioning, the overall risk coming from currency remained a very small portion of the overall risk budget.
The Fund utilized derivatives, including credit default and currency swaps, currency forwards, futures, interest-rate swaps, total return swaps and inflation index swaps, principally as a tool for efficient portfolio management and to manage overall portfolio risk. These derivative transactions may provide the same, or similar, net long or short exposure to select currencies, interest rates, countries, duration or credit risks in a less expensive way than by directly purchasing securities. In those markets where portfolio securities are readily available, the cost difference in normal market conditions may be small. Overall, the portfolio continues to meet its risk-adjusted return target and remains in the lower end of our explicitly targeted risk range. Much of the Fund’s derivatives positioning was to hedge various risks in the portfolio and achieve the goal of a stable return profile.
What are swap agreements?
Swap agreements, such as interest-rate, currency and credit default swaps, are contracts between the Fund and another party (the swap counterparty). In a basic swap transaction, the Fund agrees with the swap counterparty to exchange the returns (or differentials in rates of return) earned or realized on a particular “notional amount” of underlying instruments. The notional amount is the set amount selected by the parties as the basis on which to calculate the obligations that they have agreed to exchange. The parties typically do not actually exchange the notional amount. Instead, they agree to exchange the returns that would be earned or realized if the notional amount were invested in given instruments or at given interest rates.
|
What is a currency forward contract?
A currency forward contract is an agreement between the Fund and a counterparty to buy or sell a foreign currency in exchange for another currency at a specific exchange rate on a future date. Currency forward contracts are privately traded in the interbank market, not on a centralized exchange.
|
| franklintempleton.com | Semiannual Report | 5 | ||
FRANKLIN FLEXIBLE ALPHA BOND FUND
What is a futures contract?
A futures contract is an agreement between the Fund and a counterparty made through a U.S. or foreign futures exchange to buy or sell an underlying instrument or asset at a specific price on a future date.
|
Thank you for your trust and participation in Franklin Flexible Alpha Bond Fund. It has been our privilege to serve you.
 |  | |
| David Yuen, CFA, FRM | ||
| Co-Lead Portfolio Manager | ||
 |  | |
Michael J. Materasso Co-Lead Portfolio Manager | ||
| Sonal Desai, Ph.D. | ||
| Portfolio Management Team | ||
The foregoing information reflects our analysis, opinions and portfolio holdings as of October 31, 2019, the end of the reporting period. The way we implement our main investment strategies and the resulting portfolio holdings may change depending on factors such as market and economic conditions. These opinions may not be relied upon as investment advice or an offer for a particular security. The information is not a complete analysis of every aspect of any market, country, industry, security or the Fund. Statements of fact are from sources considered reliable, but the investment manager makes no representation or warranty as to their completeness or accuracy. Although historical performance is no guarantee of future results, these insights may help you understand our investment management philosophy.
CFA® is a trademark owned by CFA Institute.
6 | Semiannual Report | franklintempleton.com | ||
FRANKLIN FLEXIBLE ALPHA BOND FUND
Performance Summary as of October 31, 2019
The performance tables do not reflect any taxes that a shareholder would pay on Fund dividends, capital gain distributions, if any, or any realized gains on the sale of Fund shares. Total return reflects reinvestment of the Fund’s dividends and capital gain distributions, if any, and any unrealized gains or losses. Your dividend income will vary depending on dividends or interest paid by securities in the Fund’s portfolio, adjusted for operating expenses of each class. Capital gain distributions are net profits realized from the sale of portfolio securities.
Performance as of 10/31/191
Cumulative total return excludes sales charges. Average annual total return includes maximum sales charges. Sales charges will vary depending on the size of the investment and the class of share purchased. The maximum is 3.75% and the minimum is 0%.Class A:3.75% maximum initial sales charge;Advisor Class:no sales charges. For other share classes, visitfranklintempleton.com.
| Share Class | | Cumulative Total Return | 2 | | Average Annual Total Return | 3 | ||
A4 | ||||||||
6-Month | +0.52% | -3.26% | ||||||
1-Year | +1.71% | -2.10% | ||||||
3-Year | +4.54% | +0.20% | ||||||
Since Inception (8/3/15) | +5.38% | +0.33% | ||||||
Advisor | ||||||||
6-Month | +0.76% | +0.76% | ||||||
1-Year | +2.06% | +2.06% | ||||||
3-Year | +5.15% | +1.69% | ||||||
Since Inception (8/3/15) | +6.03% | +1.39% | ||||||
| Distribution | 30-Day Standardized Yield6 | |||||||||||
| Share Class | Rate | 5 | (with fee waiver) | (without fee waiver) | ||||||||
A | 2.70% | 2.31% | 2.23% | |||||||||
Advisor | 3.06% | 2.69% | 2.60% | |||||||||
Performance data represent past performance, which does not guarantee future results. Investment return and principal value will fluctuate, and you may have a gain or loss when you sell your shares. Current performance may differ from figures shown. For most recentmonth-end performance, go tofranklintempleton.comor call(800)342-5236.
See page 8 for Performance Summary footnotes.
| franklintempleton.com | Semiannual Report | 7 | ||
FRANKLIN FLEXIBLE ALPHA BOND FUND
PERFORMANCE SUMMARY
Distributions(5/1/19–10/31/19)
| Share Class | Net Investment Income | |||
A | $0.130758 | |||
C | $0.114243 | |||
R | $0.121006 | |||
R6 | $0.163992 | |||
Advisor | $0.143254 | |||
Total Annual Operating Expenses7
| Share Class | With Fee Waiver | Without Fee Waiver | ||||||
A | 1.17% | 1.26% | ||||||
Advisor | 0.92% | 1.01% | ||||||
Each class of shares is available to certain eligible investors and has different annual fees and expenses, as described in the prospectus.
All investments involve risks, including possible loss of principal. Changes in the financial strength of a bond issuer or in a bond’s credit rating may affect its value. Interest rate movements and mortgage prepayments will affect the Fund’s share price and yield. During periods of declining interest rates, principal prepayments tend to increase as borrowers refinance their mortgages at lower rates; therefore the Fund may be forced to reinvest returned principal at lower interest rates, reducing income. Bond prices generally move in the opposite direction of interest rates. Thus, as the prices of bonds in the Fund adjust to a rise in interest rates, the Fund’s share price may decline. The Fund may be affected by issuers that fail to make interest payments and repay principal when due. The risks associated with higher-yielding, lower-rated securities (commonly called junk bonds) include higher risk of default and loss of principal. Derivatives, including currency management strategies, involve costs and can create economic leverage in the portfolio, which may result in significant volatility and cause the Fund to participate in losses (as well as enable gains) in an amount that exceeds the Fund’s initial investment. The Fund may not achieve the anticipated benefits, and may realize losses when a counterparty fails to perform as intended. The Fund’s prospectus also includes a description of the main investment risks.
1. The Fund has an expense reduction and a fee waiver associated with any investments it makes in a Franklin Templeton money fund and/or other Franklin Templeton fund, contractually guaranteed through 8/31/20. Fund investment results reflect the expense reduction and fee waiver; without these reductions, the results would have been lower.
2. Cumulative total return represents the change in value of an investment over the periods indicated.
3. Average annual total return represents the average annual change in value of an investment over the periods indicated. Return for less than one year, if any, has not been annualized.
4. Prior to 3/1/19, these shares were offered at a higher initial sales charge of 4.25%, thus actual returns (with sales charges) would have differed. Average annual total returns (with sales charges) have been restated to reflect the current maximum initial sales charge of 3.75%.
5. Distribution rate is based on an annualization of the sum of the respective class’s past 30 days’ daily distributions and the maximum offering price (NAV for Advisor Class) per share on 10/31/19.
6. The Fund’s30-day standardized yield is calculated over a trailing30-day period using the yield to maturity on bonds and/or the dividends accrued on stocks. It may not equal the Fund’s actual income distribution rate, which reflects the Fund’s past dividends paid to shareholders.
7. Figures are as stated in the Fund’s current prospectus and may differ from the expense ratios disclosed in the Your Fund’s Expenses and Financial Highlights sections in this report. In periods of market volatility, assets may decline significantly, causing total annual Fund operating expenses to become higher than the figures shown.
8 | Semiannual Report | franklintempleton.com | ||
FRANKLIN FLEXIBLE ALPHA BOND FUND
As a Fund shareholder, you can incur two types of costs: (1) transaction costs, including sales charges (loads) on Fund purchases and redemptions; and (2) ongoing Fund costs, including management fees, distribution and service(12b-1) fees, and other Fund expenses. All mutual funds have ongoing costs, sometimes referred to as operating expenses. The table below shows ongoing costs of investing in the Fund and can help you understand these costs and compare them with those of other mutual funds. The table assumes a $1,000 investment held for the six months indicated.
Actual Fund Expenses
The table below provides information about actual account values and actual expenses in the columns under the heading “Actual.” In these columns the Fund’s actual return, which includes the effect of Fund expenses, is used to calculate the “Ending Account Value” for each class of shares. You can estimate the expenses you paid during the period by following these steps (ofcourse, your account value and expenses will differ from those in this illustration):Divide your account value by $1,000 (ifyour account had an $8,600 value, then $8,600÷ $1,000 = 8.6). Then multiply the result by the number in the row for your class of shares under the headings “Actual” and “Expenses Paid During Period” (ifActual Expenses Paid During Period were $7.50, then 8.6 x $7.50 = $64.50). In this illustration, the actual expenses paid this period are $64.50.
Hypothetical Example for Comparison with Other Funds
Under the heading “Hypothetical” in the table, information is provided about hypothetical account values and hypothetical expenses based on the Fund’s actual expense ratio and an assumed rate of return of 5% per year before expenses, which is not the Fund’s actual return. This information may not be used to estimate the actual ending account balance or expenses you paid for the period, but it can help you compare ongoing costs of investing in the Fund with those of other funds. To do so, compare this 5% hypothetical example for the class of shares you hold with the 5% hypothetical examples that appear in the shareholder reports of other funds.
Please note that expenses shown in the table are meant to highlight ongoing costs and do not reflect any transactional costs. Therefore, information under the heading “Hypothetical” is useful in comparing ongoing costs only, and will not help you compare total costs of owning different funds. In addition, if transactional costs were included, your total costs would have been higher.
| Actual | Hypothetical | |||||||||||||||||
| (actual return after expenses) | (5% annual return before expenses) | |||||||||||||||||
| Expenses | Expenses | Net | ||||||||||||||||
| Beginning | Ending | Paid During | Ending | Paid During | Annualized | |||||||||||||
| Share | Account | Account | Period | Account | Period | Expense | ||||||||||||
| Class | Value 5/1/19 | Value 10/31/19 | 5/1/19–10/31/191, 2 | Value 10/31/19 | 5/1/19–10/31/191, 2 | Ratio2 | ||||||||||||
A | $1,000 | $1,005.20 | $5.54 | $1,019.61 | $5.58 | 1.10% | ||||||||||||
C | $1,000 | $1,004.60 | $7.56 | $1,017.60 | $7.61 | 1.50% | ||||||||||||
R | $1,000 | $1,005.30 | $6.80 | $1,018.35 | $6.85 | 1.35% | ||||||||||||
R6 | $1,000 | $1,009.70 | $3.03 | $1,022.12 | $3.05 | 0.60% | ||||||||||||
Advisor | $1,000 | $1,007.60 | $4.29 | $1,020.86 | $4.32 | 0.85% | ||||||||||||
1. Expenses are equal to the annualized expense ratio for thesix-month period as indicated above—in the far right column—multiplied by the simple average account value over the period indicated, and then multiplied by 184/366 to reflect theone-half year period.
2. Reflects expenses after fee waivers and expense reimbursements. Does not include acquired fund fees and expenses.
| franklintempleton.com | Semiannual Report | 9 | ||
FRANKLIN STRATEGIC SERIES
Franklin Flexible Alpha Bond Fund
| Six Months Ended | ||||||||||||||||||||
| October 31, 2019 | Year Ended April 30, | |||||||||||||||||||
| (unaudited) | 2019 | 2018 | 2017 | 2016a | ||||||||||||||||
| Class A | ||||||||||||||||||||
Per share operating performance | ||||||||||||||||||||
(for a share outstanding throughout the period) | ||||||||||||||||||||
Net asset value, beginning of period | $ 9.70 | $ | 9.79 | $ | 9.86 | $ | 9.88 | $ | 10.00 | |||||||||||
|
|
| ||||||||||||||||||
Income from investment operationsb: | ||||||||||||||||||||
Net investment income | 0.130 | 0.249 | c | 0.166 | c | 0.180 | 0.099 | |||||||||||||
Net realized and unrealized gains (losses) | (0.059 | ) | (0.080 | ) | (0.066 | ) | 0.017 | (0.123 | ) | |||||||||||
|
|
| ||||||||||||||||||
Total from investment operations | 0.071 | 0.169 | 0.100 | 0.197 | (0.024 | ) | ||||||||||||||
|
|
| ||||||||||||||||||
Less distributions from: | ||||||||||||||||||||
Net investment income | (0.131 | ) | (0.246 | ) | (0.160 | ) | (0.217 | ) | (0.096 | ) | ||||||||||
Net realized gains | — | (0.013 | ) | (0.010 | ) | — | — | |||||||||||||
|
|
| ||||||||||||||||||
Total distributions | (0.131 | ) | (0.259 | ) | (0.170 | ) | (0.217 | ) | (0.096 | ) | ||||||||||
|
|
| ||||||||||||||||||
Net asset value, end of period | $ 9.64 | $ | 9.70 | $ | 9.79 | $ | 9.86 | $ | 9.88 | |||||||||||
|
|
| ||||||||||||||||||
Total returnd | 0.52% | 1.76% | 1.02% | 2.22% | (0.34)% | |||||||||||||||
Ratios to average net assetse | ||||||||||||||||||||
Expenses before waiver and payments by affiliates | 1.15% | 1.19% | 0.97% | 3.17% | 3.47% | |||||||||||||||
Expenses net of waiver and payments by affiliatesf | 1.10% | 1.04% | 0.79% | 0.67% | 0.84% | |||||||||||||||
Net investment income | 2.84% | 2.60% | 1.80% | 1.83% | 1.37% | |||||||||||||||
Supplemental data | ||||||||||||||||||||
Net assets, end of period (000’s) | $1,817 | $1,458 | $1,132 | $10,443 | $10,200 | |||||||||||||||
Portfolio turnover rate | 45.40% | 24.74% | 48.04% | 90.37% | 40.12% | |||||||||||||||
Portfolio turnover rate excluding mortgage dollar rollsg | 39.25% | 24.00% | 19.40% | 57.79% | 30.05% | |||||||||||||||
aFor the period August 3, 2015 (commencement of operations) to April 30, 2016.
bThe amount shown for a share outstanding throughout the period may not correlate with the Statement of Operations for the period due to the timing of sales and repurchases of the Fund’s shares in relation to income earned and/or fluctuating fair value of the investments of the Fund.
cBased on average daily shares outstanding.
dTotal return does not reflect sales commissions or contingent deferred sales charges, if applicable, and is not annualized for periods less than one year.
eRatios are annualized for periods less than one year, except fornon-recurring expenses, if any.
fBenefit of expense reduction rounds to less than 0.01%.
gSee Note 1(f) regarding mortgage dollar rolls.
10 | Semiannual Report | The accompanying notes are an integral part of these financial statements. | franklintempleton.com | ||
FRANKLIN STRATEGIC SERIES
FINANCIAL HIGHLIGHTS
Franklin Flexible Alpha Bond Fund(continued)
| Six Months Ended | ||||||||||||||||||||
| October 31, 2019 | Year Ended April 30, | |||||||||||||||||||
| (unaudited) | 2019 | 2018 | 2017 | 2016a | ||||||||||||||||
| Class C | ||||||||||||||||||||
Per share operating performance | ||||||||||||||||||||
(for a share outstanding throughout the period) | ||||||||||||||||||||
Net asset value, beginning of period | $ 9.64 | $ | 9.73 | $ | 9.80 | $ | 9.86 | $ | 10.00 | |||||||||||
|
|
| ||||||||||||||||||
Income from investment operationsb: | ||||||||||||||||||||
Net investment income | 0.119 | 0.212 | c | 0.120 | 0.130 | 0.072 | ||||||||||||||
Net realized and unrealized gains (losses) | (0.065 | ) | (0.071 | ) | (0.062 | ) | (0.006 | ) | (0.131 | ) | ||||||||||
|
|
| ||||||||||||||||||
Total from investment operations | 0.054 | 0.141 | 0.058 | 0.124 | (0.059 | ) | ||||||||||||||
|
|
| ||||||||||||||||||
Less distributions from: | ||||||||||||||||||||
Net investment income | (0.114 | ) | (0.218 | ) | (0.118 | ) | (0.184 | ) | (0.081 | ) | ||||||||||
Net realized gains | — | (0.013 | ) | (0.010 | ) | — | — | |||||||||||||
|
|
| ||||||||||||||||||
Total distributions | (0.114 | ) | (0.231 | ) | (0.128 | ) | (0.184 | ) | (0.081 | ) | ||||||||||
|
|
| ||||||||||||||||||
Net asset value, end of period | $ 9.58 | $ | 9.64 | $ | 9.73 | $ | 9.80 | $ | 9.86 | |||||||||||
|
|
| ||||||||||||||||||
Total returnd | 0.46% | 1.58% | 0.49% | 1.47% | (0.69)% | |||||||||||||||
Ratios to average net assetse | ||||||||||||||||||||
Expenses before waiver and payments by affiliates | 1.55% | 1.55% | 1.58% | 3.88% | 3.98% | |||||||||||||||
Expenses net of waiver and payments by affiliatesf | 1.50% | 1.40% | 1.40% | 1.38% | 1.34% | |||||||||||||||
Net investment income | 2.44% | 2.24% | 1.19% | 1.12% | 0.87% | |||||||||||||||
Supplemental data | ||||||||||||||||||||
Net assets, end of period (000’s) | $379 | $368 | $279 | $245 | $204 | |||||||||||||||
Portfolio turnover rate | 45.40% | 24.74% | 48.04% | 90.37% | 40.12% | |||||||||||||||
Portfolio turnover rate excluding mortgage dollar rollsg | 39.25% | 24.00% | 19.40% | 57.79% | 30.05% | |||||||||||||||
aFor the period August 3, 2015 (commencement of operations) to April 30, 2016.
bThe amount shown for a share outstanding throughout the period may not correlate with the Statement of Operations for the period due to the timing of sales and repurchases of the Fund’s shares in relation to income earned and/or fluctuating fair value of the investments of the Fund.
cBased on average daily shares outstanding.
dTotal return does not reflect sales commissions or contingent deferred sales charges, if applicable, and is not annualized for periods less than one year.
eRatios are annualized for periods less than one year, except fornon-recurring expenses, if any.
fBenefit of expense reduction rounds to less than 0.01%.
gSee Note 1(f) regarding mortgage dollar rolls.
| franklintempleton.com | The accompanying notes are an integral part of these financial statements. | Semiannual Report �� | 11 | ||
FRANKLIN STRATEGIC SERIES
FINANCIAL HIGHLIGHTS
Franklin Flexible Alpha Bond Fund(continued)
| Six Months Ended | ||||||||||||||||||||
| October 31, 2019 | Year Ended April 30, | |||||||||||||||||||
| (unaudited) | 2019 | 2018 | 2017 | 2016a | ||||||||||||||||
| Class R | ||||||||||||||||||||
Per share operating performance | ||||||||||||||||||||
(for a share outstanding throughout the period) | ||||||||||||||||||||
Net asset value, beginning of period | $ 9.69 | $ | 9.78 | $ | 9.86 | $ | 9.86 | $ | 10.00 | |||||||||||
|
|
| ||||||||||||||||||
Income from investment operationsb: | ||||||||||||||||||||
Net investment income | 0.126 | 0.230 | c | 0.112 | 0.112 | 0.072 | ||||||||||||||
Net realized and unrealized gains (losses) | (0.065 | ) | (0.076 | ) | (0.058 | ) | 0.095 | (0.127 | ) | |||||||||||
|
|
| ||||||||||||||||||
Total from investment operations | 0.061 | 0.154 | 0.054 | 0.207 | (0.055 | ) | ||||||||||||||
|
|
| ||||||||||||||||||
Less distributions from: | ||||||||||||||||||||
Net investment income | (0.121 | ) | (0.231 | ) | (0.124 | ) | (0.207 | ) | (0.085 | ) | ||||||||||
Net realized gains | — | (0.013 | ) | (0.010 | ) | — | — | |||||||||||||
|
|
| ||||||||||||||||||
Total distributions | (0.121 | ) | (0.244 | ) | (0.134 | ) | (0.207 | ) | (0.085 | ) | ||||||||||
|
|
| ||||||||||||||||||
Net asset value, end of period | $ 9.63 | $ | 9.69 | $ | 9.78 | $ | 9.86 | $ | 9.86 | |||||||||||
|
|
| ||||||||||||||||||
Total returnd | 0.53% | 1.71% | 0.54% | 2.21% | (0.65)% | |||||||||||||||
Ratios to average net assetse | ||||||||||||||||||||
Expenses before waiver and payments by affiliates | 1.40% | 1.41% | 1.47% | 3.36% | 3.84% | |||||||||||||||
Expenses net of waiver and payments by affiliatesf | 1.35% | 1.26% | 1.29% | 0.86% | 1.22% | |||||||||||||||
Net investment income | 2.59% | 2.38% | 1.30% | 1.64% | 0.99% | |||||||||||||||
Supplemental data | ||||||||||||||||||||
Net assets, end of period (000’s) | $84 | $83 | $51 | $60 | $10 | |||||||||||||||
Portfolio turnover rate | 45.40% | 24.74% | 48.04% | 90.37% | 40.12% | |||||||||||||||
Portfolio turnover rate excluding mortgage dollar rollsg | 39.25% | 24.00% | 19.40% | 57.79% | 30.05% | |||||||||||||||
aFor the period August 3, 2015 (commencement of operations) to April 30, 2016.
bThe amount shown for a share outstanding throughout the period may not correlate with the Statement of Operations for the period due to the timing of sales and repurchases of the Fund’s shares in relation to income earned and/or fluctuating fair value of the investments of the Fund.
cBased on average daily shares outstanding.
dTotal return is not annualized for periods less than one year.
eRatios are annualized for periods less than one year, except fornon-recurring expenses, if any.
fBenefit of expense reduction rounds to less than 0.01%.
gSee Note 1(f) regarding mortgage dollar rolls.
12 | Semiannual Report | The accompanying notes are an integral part of these financial statements. | franklintempleton.com | ||
FRANKLIN STRATEGIC SERIES
FINANCIAL HIGHLIGHTS
Franklin Flexible Alpha Bond Fund(continued)
| Six Months Ended | ||||||||||||||||||||
| October 31, 2019 | Year Ended April 30, | |||||||||||||||||||
| (unaudited) | 2019 | 2018 | 2017 | 2016a | ||||||||||||||||
| Class R6 | ||||||||||||||||||||
Per share operating performance | ||||||||||||||||||||
(for a share outstanding throughout the period) | ||||||||||||||||||||
Net asset value, beginning of period | $ 9.71 | $ | 9.79 | $ | 9.86 | $ | 9.88 | $ | 10.00 | |||||||||||
|
|
| ||||||||||||||||||
Income from investment operationsb: | ||||||||||||||||||||
Net investment income | 0.171 | 0.296 | c | 0.204 | 0.177 | 0.108 | ||||||||||||||
Net realized and unrealized gains (losses) | (0.077 | ) | (0.086 | ) | (0.088 | ) | 0.022 | (0.124 | ) | |||||||||||
|
|
| ||||||||||||||||||
Total from investment operations | 0.094 | 0.210 | 0.116 | 0.199 | (0.016 | ) | ||||||||||||||
|
|
| ||||||||||||||||||
Less distributions from: | ||||||||||||||||||||
Net investment income | (0.164 | ) | (0.277 | ) | (0.176 | ) | (0.219 | ) | (0.104 | ) | ||||||||||
Net realized gains | — | (0.013 | ) | (0.010 | ) | — | — | |||||||||||||
|
|
| ||||||||||||||||||
Total distributions | (0.164 | ) | (0.290 | ) | (0.186 | ) | (0.219 | ) | (0.104 | ) | ||||||||||
|
|
| ||||||||||||||||||
Net asset value, end of period | $ 9.64 | $ | 9.71 | $ | 9.79 | $ | 9.86 | $ | 9.88 | |||||||||||
|
|
| ||||||||||||||||||
Total returnd | 0.97% | 2.30% | 1.18% | 2.03% | (0.15)% | |||||||||||||||
Ratios to average net assetse | ||||||||||||||||||||
Expenses before waiver and payments by affiliates | 0.65% | 0.65% | 0.86% | 5.23% | 3.72% | |||||||||||||||
Expenses net of waiver and payments by affiliatesf | 0.60% | 0.59% | 0.71% | 0.71% | 0.71% | |||||||||||||||
Net investment income | 3.34% | 3.05% | 1.88% | 1.79% | 1.50% | |||||||||||||||
Supplemental data | ||||||||||||||||||||
Net assets, end of period (000’s) | $403,212 | $504,875 | $210,808 | $10 | $10 | |||||||||||||||
Portfolio turnover rate | 45.40% | 24.74% | 48.04% | 90.37% | 40.12% | |||||||||||||||
Portfolio turnover rate excluding mortgage dollar rollsg | 39.25% | 24.00% | 19.40% | 57.79% | 30.05% | |||||||||||||||
aFor the period August 3, 2015 (commencement of operations) to April 30, 2016.
bThe amount shown for a share outstanding throughout the period may not correlate with the Statement of Operations for the period due to the timing of sales and repurchases of the Fund’s shares in relation to income earned and/or fluctuating fair value of the investments of the Fund.
cBased on average daily shares outstanding.
dTotal return is not annualized for periods less than one year.
eRatios are annualized for periods less than one year, except fornon-recurring expenses, if any.
fBenefit of expense reduction rounds to less than 0.01%.
gSee Note 1(f) regarding mortgage dollar rolls.
| franklintempleton.com | The accompanying notes are an integral part of these financial statements. | Semiannual Report | 13 | ||
FRANKLIN STRATEGIC SERIES
FINANCIAL HIGHLIGHTS
Franklin Flexible Alpha Bond Fund(continued)
| Six Months Ended | ||||||||||||||||||||
| October 31, 2019 | Year Ended April 30, | |||||||||||||||||||
| (unaudited) | 2019 | 2018 | 2017 | 2016a | ||||||||||||||||
| Advisor Class | ||||||||||||||||||||
Per share operating performance | ||||||||||||||||||||
(for a share outstanding throughout the period) | ||||||||||||||||||||
Net asset value, beginning of period | $ 9.70 | $ | 9.79 | $ | 9.85 | $ | 9.88 | $ | 10.00 | |||||||||||
|
|
| ||||||||||||||||||
Income from investment operationsb: | ||||||||||||||||||||
Net investment income | 0.150 | 0.275 | c | 0.194 | 0.166 | 0.107 | ||||||||||||||
Net realized and unrealized gains (losses) | (0.067 | ) | (0.074 | ) | (0.072 | ) | 0.023 | (0.129 | ) | |||||||||||
|
|
| ||||||||||||||||||
Total from investment operations | 0.083 | 0.201 | 0.122 | 0.189 | (0.022 | ) | ||||||||||||||
|
|
| ||||||||||||||||||
Less distributions from: | ||||||||||||||||||||
Net investment income | (0.143 | ) | (0.278 | ) | (0.172 | ) | (0.219 | ) | (0.098 | ) | ||||||||||
Net realized gains | — | (0.013 | ) | (0.010 | ) | — | — | |||||||||||||
|
|
| ||||||||||||||||||
Total distributions | (0.143 | ) | (0.291 | ) | (0.182 | ) | (0.219 | ) | (0.098 | ) | ||||||||||
|
|
| ||||||||||||||||||
Net asset value, end of period | $ 9.64 | $ | 9.70 | $ | 9.79 | $ | 9.85 | $ | 9.88 | |||||||||||
|
|
| ||||||||||||||||||
Total returnd | 0.76% | 2.20% | 1.14% | 2.13% | (0.31)% | |||||||||||||||
Ratios to average net assetse | ||||||||||||||||||||
Expenses before waiver and payments by affiliates | 0.90% | 0.90% | 0.93% | 3.22% | 3.34% | |||||||||||||||
Expenses net of waiver and payments by affiliatesf | 0.85% | 0.75% | 0.75% | 0.72% | 0.71% | |||||||||||||||
Net investment income | 3.09% | 2.89% | 1.84% | 1.78% | 1.50% | |||||||||||||||
Supplemental data | ||||||||||||||||||||
Net assets, end of period (000’s) | $436 | $433 | $425 | $232 | $344 | |||||||||||||||
Portfolio turnover rate | 45.40% | 24.74% | 48.04% | 90.37% | 40.12% | |||||||||||||||
Portfolio turnover rate excluding mortgage dollar rollsg | 39.25% | 24.00% | 19.40% | 57.79% | 30.05% | |||||||||||||||
aFor the period August 3, 2015 (commencement of operations) to April 30, 2016.
bThe amount shown for a share outstanding throughout the period may not correlate with the Statement of Operations for the period due to the timing of sales and repurchases of the Fund’s shares in relation to income earned and/or fluctuating fair value of the investments of the Fund.
cBased on average daily shares outstanding.
dTotal return is not annualized for periods less than one year.
eRatios are annualized for periods less than one year, except fornon-recurring expenses, if any.
fBenefit of expense reduction rounds to less than 0.01%.
gSee Note 1(f) regarding mortgage dollar rolls.
14 | Semiannual Report | The accompanying notes are an integral part of these financial statements. | franklintempleton.com | ||
FRANKLIN STRATEGIC SERIES
Statement of Investments, October 31, 2019 (unaudited)
Franklin Flexible Alpha Bond Fund
| Country | | Principal Amount | * | Value | ||||||||||||
Corporate Bonds 22.5% | ||||||||||||||||
Automobiles & Components 0.2% | ||||||||||||||||
Aptiv Corp., senior bond, 4.15%, 3/15/24 | United States | 900,000 | $ | 958,278 | ||||||||||||
|
| |||||||||||||||
Banks 6.6% | ||||||||||||||||
aBanca Monte dei Paschi di Siena SpA, | ||||||||||||||||
secured note, Reg S, 2.875%, 7/16/62 | Italy | 1,500,000 | EUR | 1,846,151 | ||||||||||||
secured note, Reg S, 2.125%, 11/26/63 | Italy | 2,000,000 | EUR | 2,418,417 | ||||||||||||
aBanca Popolare di Milano Scarl, | ||||||||||||||||
secured note, Reg S, 0.875%, 9/14/23 | Italy | 900,000 | EUR | 1,025,326 | ||||||||||||
secured note, Reg S, 0.625%, 6/08/24 | Italy | 2,800,000 | EUR | 3,164,874 | ||||||||||||
aBanco BPM SpA, secured note, Reg S, 0.75%, 3/31/23 | Italy | 1,700,000 | EUR | 1,926,564 | ||||||||||||
Bank of America Corp., | ||||||||||||||||
senior bond, 5.50%, 12/04/19 | United States | 75,000 | GBP | 97,523 | ||||||||||||
senior note, 3.55% to 3/05/23, FRN thereafter, 3/05/24 | United States | 1,400,000 | 1,459,801 | |||||||||||||
aBank of China Ltd., senior note, Reg S, 2.875%, 4/20/22 | China | 1,000,000 | 1,010,080 | |||||||||||||
Bank of Nova Scotia, secured note, 1.875%, 4/26/22 | Canada | 100,000 | 100,002 | |||||||||||||
aChina Construction Bank Corp., senior note, Reg S, 2.75%, 12/04/20 | China | 1,000,000 | 1,003,955 | |||||||||||||
Citigroup Inc., senior note, 2.65%, 10/26/20 | United States | 1,050,000 | 1,057,470 | |||||||||||||
HSBC Holdings PLC, | ||||||||||||||||
senior note, 4.30%, 3/08/26 | United Kingdom | 800,000 | 872,488 | |||||||||||||
senior note, 3.262% to 3/13/22, FRN thereafter, 3/13/23 | United Kingdom | 1,400,000 | 1,431,444 | |||||||||||||
Industrial & Commercial Bank of China Ltd., senior note, 2.452%, 10/20/21 | China | 1,900,000 | 1,901,396 | |||||||||||||
bKookmin Bank, secured note, 144A, 2.25%, 2/03/22 | South Korea | 1,800,000 | 1,798,663 | |||||||||||||
Realkredit Danmark A/S, secured bond, 1.00%, 4/01/27 | Denmark | 6,780,000 | DKK | 1,090,511 | ||||||||||||
Royal Bank of Canada, secured note, 2.10%, 10/14/21 | Canada | 100,000 | 100,271 | |||||||||||||
bThe Toronto-Dominion Bank, secured note, 144A, 2.25%, 3/15/22 | Canada | 200,000 | 201,238 | |||||||||||||
aTurkiye Vakiflar Bankasi TAO, secured note, Reg S, 2.375%, 11/04/22 | Turkey | 3,800,000 | EUR | 4,278,784 | ||||||||||||
|
| |||||||||||||||
| 26,784,958 | ||||||||||||||||
|
| |||||||||||||||
Consumer Durables & Apparel 0.0%† | ||||||||||||||||
KB Home, senior note, 8.00%, 3/15/20 | United States | 100,000 | 102,280 | |||||||||||||
|
| |||||||||||||||
Consumer Services 0.1% | ||||||||||||||||
bWynn Las Vegas LLC/Wynn Las Vegas Capital Corp., senior bond, 144A, 5.50%, 3/01/25 | United States | 525,000 | 559,125 | |||||||||||||
|
| |||||||||||||||
Diversified Financials 2.6% | ||||||||||||||||
Capital One Financial Corp., senior note, 3.05%, 3/09/22 | United States | 200,000 | 203,956 | |||||||||||||
cDeutsche Bank AG, senior note, FRN, 3.446%,(3-month USD LIBOR + 1.31%), 8/20/20 | Germany | 100,000 | 100,244 | |||||||||||||
bDexia Credit Local SA, senior note, 144A, 2.375%, 9/20/22 | France | 250,000 | 253,711 | |||||||||||||
The Goldman Sachs Group Inc., | ||||||||||||||||
senior note, 3.75%, 5/22/25 | United States | 1,000,000 | 1,061,584 | |||||||||||||
csenior note, FRN, 3.319%,(3-month USD LIBOR + 1.20%), 9/15/20 | United States | 500,000 | 504,166 | |||||||||||||
bICBCIL Finance Co. Ltd., senior note, 144A, 2.50%, 9/29/21 | China | 500,000 | 497,350 | |||||||||||||
Jyske Realkredit A/S, secured note, 1.00%, 4/01/26 | Denmark | 11,290,000 | DKK | 1,808,950 | ||||||||||||
Morgan Stanley, senior note, 3.70%, 10/23/24 | United States | 1,400,000 | 1,489,576 | |||||||||||||
Navient Corp., senior bond, 8.00%, 3/25/20 | United States | 4,660,000 | 4,770,675 | |||||||||||||
|
| |||||||||||||||
| 10,690,212 | ||||||||||||||||
|
| |||||||||||||||
| franklintempleton.com | Semiannual Report | 15 | ||
FRANKLIN STRATEGIC SERIES
STATEMENT OF INVESTMENTS (UNAUDITED)
Franklin Flexible Alpha Bond Fund(continued)
| Country | Principal Amount* | Value | ||||||||||
Corporate Bonds(continued) | ||||||||||||
Energy 2.4% | ||||||||||||
CNOOC Finance 2015 USA LLC, senior note, 3.50%, 5/05/25 | China | 1,700,000 | $ | 1,780,792 | ||||||||
bCNPC General Capital Ltd., senior note, 144A, 3.40%, 4/16/23 | China | 2,100,000 | 2,164,291 | |||||||||
Energy Transfer Operating LP, senior note, 7.50%, 10/15/20 | United States | 750,000 | 787,117 | |||||||||
Enterprise Products Operating LLC, senior note, 3.35%, 3/15/23 | United States | 850,000 | 880,963 | |||||||||
bHarvest Operations Corp., senior note, 144A, 4.20%, 6/01/23 | South Korea | 1,000,000 | 1,068,926 | |||||||||
Oceaneering International Inc., senior note, 4.65%, 11/15/24 | United States | 50,000 | 46,750 | |||||||||
bSinopec Group Overseas Development 2015 Ltd., | ||||||||||||
senior note, 144A, 2.50%, 4/28/20 | China | 1,800,000 | 1,802,331 | |||||||||
senior note, 144A, 3.25%, 4/28/25 | China | 1,000,000 | 1,035,225 | |||||||||
|
| |||||||||||
| 9,566,395 | ||||||||||||
|
| |||||||||||
Food, Beverage & Tobacco 0.5% | ||||||||||||
bImperial Brands Finance PLC, senior note, 144A, 4.25%, 7/21/25 | United Kingdom | 1,695,000 | 1,771,328 | |||||||||
Reynolds American Inc., senior note, 4.45%, 6/12/25 | United Kingdom | 100,000 | 107,410 | |||||||||
|
| |||||||||||
| 1,878,738 | ||||||||||||
|
| |||||||||||
Health Care Equipment & Services 0.7% | ||||||||||||
Anthem Inc., senior note, 2.95%, 12/01/22 | United States | 100,000 | 102,425 | |||||||||
Edwards Lifesciences Corp., senior note, 4.30%, 6/15/28 | United States | 300,000 | 338,853 | |||||||||
HCA Inc., senior note, 7.50%, 2/15/22 | United States | 2,050,000 | 2,279,600 | |||||||||
|
| |||||||||||
| 2,720,878 | ||||||||||||
|
| |||||||||||
Insurance 0.3% | ||||||||||||
bAthene Global Funding, secured note, 144A, 2.75%, 6/25/24 | United States | 1,100,000 | 1,112,870 | |||||||||
b Jackson National Life Global Funding, | ||||||||||||
secured note, 144A, 2.25%, 4/29/21 | United States | 50,000 | 50,279 | |||||||||
secured note, 144A, 2.10%, 10/25/21 | United States | 25,000 | 25,074 | |||||||||
|
| |||||||||||
| 1,188,223 | ||||||||||||
|
| |||||||||||
Materials 0.4% | ||||||||||||
bSABIC Capital II BV, senior note, 144A, 4.50%, 10/10/28 | Saudi Arabia | 400,000 | 444,474 | |||||||||
bSealed Air Corp., senior bond, 144A, 5.25%, 4/01/23 | United States | 950,000 | 1,018,875 | |||||||||
|
| |||||||||||
| 1,463,349 | ||||||||||||
|
| |||||||||||
Media & Entertainment 0.4% | ||||||||||||
Baidu Inc., senior note, 4.375%, 5/14/24 | China | 500,000 | 534,520 | |||||||||
bTencent Holdings Ltd., senior note, 144A, 2.985%, 1/19/23 | China | 1,200,000 | 1,220,586 | |||||||||
|
| |||||||||||
| 1,755,106 | ||||||||||||
|
| |||||||||||
Pharmaceuticals, Biotechnology & Life Sciences 0.3% | ||||||||||||
Allergan Funding SCS, senior bond, 3.80%, 3/15/25 | United States | 600,000 | 630,028 | |||||||||
bBayer U.S. Finance II LLC, senior note, 144A, 3.875%, 12/15/23 | Germany | 400,000 | 419,258 | |||||||||
|
| |||||||||||
| 1,049,286 | ||||||||||||
|
| |||||||||||
Real Estate 0.8% | ||||||||||||
American Tower Corp., senior bond, 3.375%, 10/15/26 | United States | 700,000 | 728,957 | |||||||||
aChina Overseas Finance Cayman VII Ltd., senior note, Reg S, 4.25%, 4/26/23 | China | 2,500,000 | 2,626,875 | |||||||||
|
| |||||||||||
| 3,355,832 | ||||||||||||
|
| |||||||||||
16 | Semiannual Report | franklintempleton.com | ||
FRANKLIN STRATEGIC SERIES
STATEMENT OF INVESTMENTS (UNAUDITED)
Franklin Flexible Alpha Bond Fund(continued)
| Country | Principal Amount* | Value | ||||||||||||||
Corporate Bonds(continued) | ||||||||||||||||
Retailing 0.3% | ||||||||||||||||
Alibaba Group Holding Ltd., senior note, 2.80%, 6/06/23 | China | 1,100,000 | $ | 1,115,136 | ||||||||||||
|
| |||||||||||||||
Semiconductors & Semiconductor Equipment 0.2% | ||||||||||||||||
Maxim Integrated Products Inc., senior note, 3.45%, 6/15/27 | United States | 800,000 | 823,786 | |||||||||||||
|
| |||||||||||||||
Telecommunication Services 1.2% | ||||||||||||||||
CenturyLink Inc., senior note, Series S, 6.45%, 6/15/21 | United States | 4,700,000 | 4,958,500 | |||||||||||||
|
| |||||||||||||||
Transportation 0.9% | ||||||||||||||||
American Airlines Pass Through Trust, first lien,2016-2, AA, 3.20%, 12/15/29 | United States | 43,850 | 45,455 | |||||||||||||
FedEx Corp., senior bond, 3.20%, 2/01/25 | United States | 850,000 | 883,627 | |||||||||||||
bKazakhstan Temir Zholy Finance BV, senior bond, 144A, 6.95%, 7/10/42 | Kazakhstan | 1,000,000 | 1,353,300 | |||||||||||||
bMexico City Airport Trust, senior secured bond, first lien, 144A, 5.50%, 7/31/47 | Mexico | 400,000 | 402,770 | |||||||||||||
a,dRZD Capital PLC, (Russian Railways), loan participation, senior bond, Reg S, 5.70%, 4/05/22 | Russia | 1,100,000 | 1,180,459 | |||||||||||||
|
| |||||||||||||||
| 3,865,611 | ||||||||||||||||
|
| |||||||||||||||
Utilities 4.6% | ||||||||||||||||
AES Corp., senior note, 4.00%, 3/15/21 | United States | 2,750,000 | 2,801,562 | |||||||||||||
aCGNPC International Ltd., senior note, Reg S, 3.75%, 12/11/27 | China | 2,100,000 | 2,229,612 | |||||||||||||
Dominion Energy Inc., senior bond, 2.85%, 8/15/26 | United States | 1,300,000 | 1,324,105 | |||||||||||||
Duke Energy Indiana Inc., senior secured bond, 3.75%, 7/15/20 | United States | 100,000 | 101,376 | |||||||||||||
b,eEDF SA, junior sub. bond, 144A, 5.625% to 1/22/24, FRN thereafter, Perpetual | France | 2,200,000 | 2,312,541 | |||||||||||||
bIsrael Electric Corp. Ltd., secured bond, 144A, 4.25%, 8/14/28 | Israel | 1,400,000 | 1,527,379 | |||||||||||||
bKorea East-West Power Co. Ltd., senior note, 144A, 3.875%, 7/19/23 | South Korea | 1,500,000 | 1,588,380 | |||||||||||||
The Southern Co., senior bond, 3.25%, 7/01/26 | United States | 850,000 | 887,477 | |||||||||||||
bState Grid Overseas Investment 2016 Ltd., senior note, 144A, 3.50%, 5/04/27 | China | 3,500,000 | 3,702,195 | |||||||||||||
bThree Gorges Finance I Cayman Islands Ltd., senior note, 144A, 3.70%, 6/10/25 | China | 2,100,000 | 2,228,100 | |||||||||||||
|
| |||||||||||||||
| 18,702,727 | ||||||||||||||||
|
| |||||||||||||||
Total Corporate Bonds (Cost $88,970,745) | 91,538,420 | |||||||||||||||
|
| |||||||||||||||
Foreign Government and Agency Securities 7.3% | ||||||||||||||||
bAngolan Government International Bond, senior note, 144A, 8.25%, 5/09/28 | Angola | 1,500,000 | 1,573,110 | |||||||||||||
aBanque Centrale de Tunisie International Bond, senior note, Reg S, 5.625%, 2/17/24 | Tunisia | 1,400,000 | EUR | 1,530,449 | ||||||||||||
bDominican Republic, senior note, 144A, 8.90%, 2/15/23 | Dominican Republic | 8,000,000 | DOP | 151,819 | ||||||||||||
bThe Export-Import Bank of China, senior note, 144A, 3.625%, 7/31/24 | China | 2,100,000 | 2,217,726 | |||||||||||||
bThe Export-Import Bank of India, senior note, 144A, 3.875%, 2/01/28 | India | 3,400,000 | 3,623,623 | |||||||||||||
The Export-Import Bank of Korea, senior note, 2.875%, 1/21/25 | South Korea | 2,000,000 | 2,076,130 | |||||||||||||
bGovernment of Belarus International Bond, senior note, 144A, 7.625%, 6/29/27 | Belarus | 200,000 | 230,250 | |||||||||||||
Government of Colombia, | ||||||||||||||||
senior bond, 9.85%, 6/28/27 | Colombia | 1,935,000,000 | COP | 719,777 | ||||||||||||
senior bond, 5.00%, 6/15/45 | Colombia | 1,200,000 | 1,400,712 | |||||||||||||
| franklintempleton.com | Semiannual Report | 17 | ||
FRANKLIN STRATEGIC SERIES
STATEMENT OF INVESTMENTS (UNAUDITED)
Franklin Flexible Alpha Bond Fund(continued)
| Country | Principal Amount* | Value | ||||||||||||||
Foreign Government and Agency Securities(continued) | ||||||||||||||||
bGovernment of Gabon, 144A, 6.375%, 12/12/24 | Gabon | 1,600,000 | $ | 1,597,464 | ||||||||||||
bGovernment of Indonesia, senior bond, 144A, 4.35%, 1/08/27 | Indonesia | 300,000 | 327,637 | |||||||||||||
bGovernment of Iraq, 144A, 5.80%, 1/15/28 | Iraq | 1,600,000 | 1,539,144 | |||||||||||||
bGovernment of Kazakhstan, senior bond, 144A, 4.875%, 10/14/44 | Kazakhstan | 1,100,000 | 1,341,373 | |||||||||||||
Government of Mexico, senior note, 4.15%, 3/28/27 | Mexico | 1,600,000 | 1,715,040 | |||||||||||||
Government of Peru, senior bond, 6.55%, 3/14/37 | Peru | 400,000 | 585,104 | |||||||||||||
bGovernment of Russia, senior note, 144A, 4.875%, 9/16/23 | Russia | 1,000,000 | 1,094,835 | |||||||||||||
Government of South Africa, senior bond, 7.00%, 2/28/31 | South Africa | 11,100,000 | ZAR | 612,882 | ||||||||||||
a,bGovernment of Spain, | ||||||||||||||||
senior bond, 144A, Reg S, 1.45%, 4/30/29 | Spain | 1,800,000 | EUR | 2,241,509 | ||||||||||||
senior bond, 144A, Reg S, 2.70%, 10/31/48 | Spain | 1,850,000 | EUR | 2,869,088 | ||||||||||||
bGovernment of Ukraine, senior bond, 144A, 7.375%, 9/25/32 | Ukraine | 800,000 | 838,012 | |||||||||||||
fGovernment of Uruguay, senior bond, Index Linked, 3.70%, 6/26/37 | Uruguay | 22,279,354 | UYU | 594,577 | ||||||||||||
The Korea Development Bank, senior note, 3.375%, 3/12/23 | South Korea | 600,000 | 624,753 | |||||||||||||
|
| |||||||||||||||
Total Foreign Government and Agency Securities | 29,505,014 | |||||||||||||||
|
| |||||||||||||||
U.S. Government and Agency Securities 3.2% | ||||||||||||||||
fU.S. Treasury Note, | ||||||||||||||||
Index Linked, 0.25%, 1/15/25 | United States | 1,451,478 | 1,456,608 | |||||||||||||
Index Linked, 0.375%, 7/15/25 | United States | 1,298,243 | 1,318,081 | |||||||||||||
Index Linked, 0.625%, 1/15/26 | United States | 3,131,246 | 3,214,222 | |||||||||||||
Index Linked, 0.125%, 7/15/26 | United States | 2,996,911 | 2,995,662 | |||||||||||||
Index Linked, 0.375%, 7/15/27 | United States | 4,027,434 | 4,098,045 | |||||||||||||
|
| |||||||||||||||
Total U.S. Government and Agency Securities | 13,082,618 | |||||||||||||||
|
| |||||||||||||||
Asset-Backed Securities and Commercial Mortgage-Backed | ||||||||||||||||
Banks 2.2% | ||||||||||||||||
b,gBX Commercial Mortgage Trust, | ||||||||||||||||
2018-IND, A, 144A, FRN, 2.515%, 11/15/35 | United States | 800,984 | 800,991 | |||||||||||||
2019-XL, A, 144A, FRN, 2.92%, 10/15/36 | United States | 3,850,000 | 3,859,788 | |||||||||||||
bBXP Trust,2017-GM, A, 144A, 3.379%, 6/13/39 | United States | 2,000,000 | 2,144,676 | |||||||||||||
b,hDBCG Mortgage Trust,2017-BBG, A, 144A, FRN, 2.614%,(1-month USD LIBOR + 0.70%), 6/15/34 | United States | 1,500,000 | 1,498,919 | |||||||||||||
b,gFREMF Mortgage Trust,2018-K72, B, 144A, FRN, 3.992%, 12/25/50 | United States | 450,000 | 485,396 | |||||||||||||
|
| |||||||||||||||
| 8,789,770 | ||||||||||||||||
|
| |||||||||||||||
Diversified Financials 58.0% | ||||||||||||||||
b,g,iAdagio CLO VIII DAC,VIII-A, B1, 144A, FRN, 1.65%, 4/15/32 | Ireland | 500,000 | EUR | 557,650 | ||||||||||||
b,hAlinea CLO Ltd.,2018-1A, B, 144A, FRN, 3.616%,(3-month USD LIBOR + 1.65%), 7/20/31 | United States | 2,300,000 | 2,255,495 | |||||||||||||
b,hAMMC CLO 21 Ltd.,2017-21A, C, 144A, FRN, 4.002%,(3-month USD LIBOR + 2.10%), 11/02/30 | United States | 400,000 | 382,676 | |||||||||||||
b,hAntares CLO Ltd.,2018-1A, B, 144A, FRN, 3.616%,(3-month USD LIBOR + 1.65%), 4/20/31 | United States | 600,000 | 584,748 | |||||||||||||
18 | Semiannual Report | franklintempleton.com | ||
FRANKLIN STRATEGIC SERIES
STATEMENT OF INVESTMENTS (UNAUDITED)
Franklin Flexible Alpha Bond Fund(continued)
| Country | Principal Amount* | Value | ||||||||||||||
Asset-Backed Securities and Commercial Mortgage-Backed Securities(continued) | ||||||||||||||||
Diversified Financials(continued) | ||||||||||||||||
b,g Ares European CLO VIII BV, | ||||||||||||||||
8A, AR, 144A, FRN, 0.92%, 4/17/32 | Netherlands | 2,600,000 | EUR | $ | 2,899,780 | |||||||||||
8A, BR, 144A, FRN, 1.60%, 4/17/32 | Netherlands | 700,000 | EUR | 780,710 | ||||||||||||
b,g ARES LII CLO Ltd., 2019-52A, D, 144A, FRN, 5.903%, 4/22/31 | United States | 851,852 | 840,139 | |||||||||||||
b,g,i Armada Euro CLO IV DAC, 4A, B, 144A, FRN, 1.70%, 7/15/33 | United Kingdom | 1,700,000 | EUR | 1,896,010 | ||||||||||||
b,g Atrium XII, 2012A, CR, 144A, FRN, 2.783%, 4/22/27 | United States | 7,000,000 | 6,982,710 | |||||||||||||
b,h Atrium XIII, | ||||||||||||||||
2013A, B, 144A, FRN, 3.434%, (3-month USD LIBOR + 1.50%), 11/21/30 | United States | 2,000,000 | 1,977,000 | |||||||||||||
2013A, C, 144A, FRN, 3.734%, (3-month USD LIBOR + 1.80%), 11/21/30 | United States | 600,000 | 572,400 | |||||||||||||
b,g Avoca CLO XVII Designated Activity Co., 17A, B1R, 144A, FRN, 1.70%, 10/15/32 | Ireland | 1,200,000 | EUR | 1,337,445 | ||||||||||||
b BAMLL Commercial Mortgage Securities Trust, | ||||||||||||||||
2012-PARK, A, 144A, 2.959%, 12/10/30 | United States | 100,000 | 102,924 | |||||||||||||
2015-200P, A, 144A, 3.218%, 4/14/33 | United States | 600,000 | 632,208 | |||||||||||||
Banc of America Commercial Mortgage Trust, 2015-UBS7, A4, 3.705%, 9/15/48 | United States | 100,000 | 107,509 | |||||||||||||
b,h Bellemeade Re Ltd., 2018-1A, M1B, 144A, FRN, 3.423%, (1-month USD LIBOR + 1.60%), 4/25/28 | United States | 1,171,183 | 1,172,908 | |||||||||||||
b,g,i Blackrock European CLO IX DAC, | ||||||||||||||||
9A, A, 144A, FRN, 0.90%, 12/15/32 | Ireland | 3,300,000 | EUR | 3,680,490 | ||||||||||||
9A, B, 144A, FRN, 1.55%, 12/15/32 | Ireland | 1,100,000 | EUR | 1,226,830 | ||||||||||||
b,g BlueMountain CLO Ltd., | ||||||||||||||||
2012-2A, BR2, 144A, FRN, 3.586%, 11/20/28 | United States | 918,083 | 913,713 | |||||||||||||
2012-2A, DR2, 144A, FRN, 5.036%, 11/20/28 | United States | 2,000,000 | 1,885,500 | |||||||||||||
b,g BlueMountain CLO XXIV Ltd., | ||||||||||||||||
2019-24A, A2, 144A, FRN, 3.566%, 4/20/31 | United States | 1,562,500 | 1,558,078 | |||||||||||||
2019-24A, D, 144A, FRN, 5.866%, 4/20/31 | United States | 1,000,000 | 989,720 | |||||||||||||
b,g,i BlueMountain EUR CLO, | ||||||||||||||||
5A, A, 144A, FRN, 0.91%, 1/15/33 | Ireland | 700,000 | EUR | 780,710 | ||||||||||||
5A, B, 144A, FRN, 1.55%, 1/15/33 | Ireland | 250,000 | EUR | 278,825 | ||||||||||||
b,h BlueMountain Fuji U.S. CLO II Ltd., 2017-2A, A1A, 144A, FRN, 3.166%, (3-month USD LIBOR + 1.20%), 10/20/30 | United States | 250,000 | 250,160 | |||||||||||||
b BRAVO Residential Funding Trust, 2019-1, A1C, 144A, 3.50%, 3/25/58 | United States | 1,143,519 | 1,164,986 | |||||||||||||
b,g Burnham Park CLO Ltd., | ||||||||||||||||
2016-1A, BR, 144A, FRN, 3.466%, 10/20/29 | United States | 3,000,000 | 2,968,830 | |||||||||||||
2016-1A, CR, 144A, FRN, 4.116%, 10/20/29 | United States | 2,000,000 | 1,942,360 | |||||||||||||
2016-1A, DR, 144A, FRN, 4.816%, 10/20/29 | United States | 2,000,000 | 1,913,160 | |||||||||||||
| franklintempleton.com | Semiannual Report | 19 | ||
FRANKLIN STRATEGIC SERIES
STATEMENT OF INVESTMENTS (UNAUDITED)
Franklin Flexible Alpha Bond Fund(continued)
| Country | Principal Amount* | Value | ||||||||||||||
Asset-Backed Securities and Commercial Mortgage-Backed Securities (continued) | ||||||||||||||||
Diversified Financials(continued) | ||||||||||||||||
b,gCarlyle Euro CLO DAC,2019-2A, A2A, 144A, FRN, 1.80%, 8/15/32 | Ireland | 2,700,000 | EUR | $ | 3,023,809 | |||||||||||
b,gCarlyle GMS Finance MM CLO LLC,2015-1A, A2R, 144A, FRN, 4.201%, 10/15/31 | United States | 800,000 | 793,560 | |||||||||||||
b,hCarlyle U.S. CLO Ltd., | ||||||||||||||||
2017-2A, B, 144A, FRN, 4.366%,(3-month USD LIBOR + 2.40%), 7/20/31 | United States | 60,000 | 58,557 | |||||||||||||
2017-4A, B, 144A, FRN, 3.851%,(3-month USD LIBOR + 1.85%), 1/15/30 | United States | 1,107,000 | 1,050,167 | |||||||||||||
2017-4A, C, 144A, FRN, 4.801%,(3-month USD LIBOR + 2.80%), 1/15/30 | United States | 400,000 | 366,000 | |||||||||||||
b,gCGRBS Commercial Mortgage Trust, 2013-VN05, C, 144A, FRN, 3.584%, 3/13/35 | United States | 450,000 | 476,517 | |||||||||||||
b,gCIM Trust, | ||||||||||||||||
2018-INV1, A4, 144A, FRN, 4.00%, 8/25/48 | United States | 1,033,200 | 1,081,212 | |||||||||||||
2019-INV1, A1, 144A, FRN, 4.00%, 2/25/49 | United States | 1,499,483 | 1,538,394 | |||||||||||||
b,gCole Park CLO Ltd.,2015-1A, BR, 144A, FRN, 3.566%, 10/20/28 | United States | 857,143 | 851,640 | |||||||||||||
b,gColumbia Cent CLO 27 Ltd.,2018-27A, A2A, 144A, FRN, 3.54%, 10/25/28 | United States | 769,231 | 762,908 | |||||||||||||
bCOMM Mortgage Trust, | ||||||||||||||||
g2014-277P, A, 144A, FRN, 3.732%, 8/10/49 | United States | 900,000 | 961,609 | |||||||||||||
2015-3BP, A, 144A, 3.178%, 2/10/35 | United States | 600,000 | 630,326 | |||||||||||||
gConseco Finance Securitizations Corp.,2002-2, M1, FRN, 7.424%, 3/01/33 | United States | 53,253 | 57,830 | |||||||||||||
Discover Card Execution Note Trust,2019-A3, A, 1.89%, 10/15/24 | United States | 1,520,000 | 1,523,077 | |||||||||||||
b,hDorchester Park CLO Ltd.,2015-1A, CR, 144A, FRN, 3.716%,(3-month USD LIBOR + 1.75%), 4/20/28 | United States | 1,350,000 | 1,323,513 | |||||||||||||
b,gDryden 38 Senior Loan Fund,2015-38A, CR, 144A, FRN, 4.001%, 7/15/30 | United States | 2,500,000 | 2,398,175 | |||||||||||||
b,gDryden 45 Senior Loan Fund,2016-45A, CR, 144A, FRN, 4.201%, 10/15/30 | United States | 1,250,000 | 1,230,237 | |||||||||||||
b,hDryden 49 Senior Loan Fund,2017-49A, C, 144A, FRN, 4.353%,(3-month USD LIBOR + 2.35%), 7/18/30 | United States | 60,000 | 58,529 | |||||||||||||
b,hDryden 64 CLO Ltd.,2018-64A, C, 144A, FRN, 3.753%,(3-month USD LIBOR + 1.75%), 4/18/31 | United States | 750,000 | 708,803 | |||||||||||||
b,gDunedin Park CLO DAC, | ||||||||||||||||
1A, A1, 144A, FRN, 1.07%, 10/22/32 | Ireland | 1,600,000 | EUR | 1,771,524 | ||||||||||||
1A, A2A, 144A, FRN, 1.75%, 10/22/32 | Ireland | 800,000 | EUR | 884,561 | ||||||||||||
b,gEleven Madison Trust 2015-11MD Mortgage Trust, 2015-11MD, A, 144A, FRN, 3.673%, 9/10/35 | United States | 2,005,000 | 2,146,360 | |||||||||||||
b,hEllington CLO III Ltd.,2018-3A, A1, 144A, FRN, 3.616%,(3-month USD LIBOR + 1.65%), 7/20/30 | United States | 500,000 | 497,625 | |||||||||||||
b,gEuro-Galaxy III CLO BV,2013-3A, B2ER, 144A, FRN, 1.50%, 1/17/31 | Netherlands | 250,000 | EUR | 278,335 | ||||||||||||
b,gEuro-Galaxy V CLO BV,2016-5A, BR, 144A, FRN, 1.60%, 11/10/30 | Netherlands | 1,400,000 | EUR | 1,561,420 | ||||||||||||
20 | Semiannual Report | franklintempleton.com | ||
FRANKLIN STRATEGIC SERIES
STATEMENT OF INVESTMENTS (UNAUDITED)
Franklin Flexible Alpha Bond Fund(continued)
| Country | Principal Amount* | Value | ||||||||||
Asset-Backed Securities and Commercial Mortgage-Backed Securities(continued) | ||||||||||||
Diversified Financials(continued) | ||||||||||||
FHLMC Structured Agency Credit Risk Debt Notes, | ||||||||||||
h2013-DN2, M2, FRN, 6.073%,(1-month USD LIBOR + 4.25%), 11/25/23 | United States | 2,225,437 | $ | 2,401,973 | ||||||||
h2014-DN1, M2, FRN, 4.023%,(1-month USD LIBOR + 2.20%), 2/25/24 | United States | 291,103 | 294,465 | |||||||||
h2014-DN2, M3, FRN, 5.423%,(1-month USD LIBOR + 3.60%), 4/25/24 | United States | 2,645,000 | 2,794,554 | |||||||||
h2014-DN3, M3, FRN, 5.823%,(1-month USD LIBOR + 4.00%), 8/25/24 | United States | 1,874,075 | 1,978,292 | |||||||||
h2014-DN4, M3, FRN, 6.373%,(1-month USD LIBOR + 4.55%), 10/25/24 | United States | 1,414,597 | 1,517,402 | |||||||||
h2014-HQ1, M3, FRN, 5.923%,(1-month USD LIBOR + 4.10%), 8/25/24 | United States | 839,911 | 887,810 | |||||||||
h2014-HQ2, M2, FRN, 4.023%,(1-month USD LIBOR + 2.20%), 9/25/24 | United States | 282,829 | 286,460 | |||||||||
h2014-HQ2, M3, FRN, 5.573%,(1-month USD LIBOR + 3.75%), 9/25/24 | United States | 2,500,000 | 2,702,093 | |||||||||
h2014-HQ3, M3, FRN, 6.573%,(1-month USD LIBOR + 4.75%), 10/25/24 | United States | 215,044 | 227,831 | |||||||||
h2015-DN1, M3, FRN, 5.973%,(1-month USD LIBOR + 4.15%), 1/25/25 | United States | 508,294 | 526,446 | |||||||||
h2015-DNA1, M2, FRN, 3.673%,(1-month USD LIBOR + 1.85%), 10/25/27 | United States | 131,419 | 132,447 | |||||||||
h2015-DNA1, M3, FRN, 5.123%,(1-month USD LIBOR + 3.30%), 10/25/27 | United States | 2,000,000 | 2,127,844 | |||||||||
h2015-DNA2, M2, FRN, 4.423%,(1-month USD LIBOR + 2.60%), 12/25/27 | United States | 46,357 | 46,549 | |||||||||
h2015-DNA3, M2, FRN, 4.673%,(1-month USD LIBOR + 2.85%), 4/25/28 | United States | 256,761 | 259,601 | |||||||||
h2015-DNA3, M3, FRN, 6.523%,(1-month USD LIBOR + 4.70%), 4/25/28 | United States | 2,500,000 | 2,759,254 | |||||||||
h2015-HQ1, M3, FRN, 5.623%,(1-month USD LIBOR + 3.80%), 3/25/25 | United States | 415,630 | 427,137 | |||||||||
h2015-HQ2, M3, FRN, 5.073%,(1-month USD LIBOR + 3.25%), 5/25/25 | United States | 1,500,000 | 1,568,548 | |||||||||
h2015-HQA2, M2, FRN, 4.623%,(1-month USD LIBOR + 2.80%), 5/25/28 | United States | 128,978 | 129,736 | |||||||||
h2015-HQA2, M3, FRN, 6.623%,(1-month USD LIBOR + 4.80%), 5/25/28 | United States | 2,000,000 | 2,140,135 | |||||||||
h2016-DNA1, M3, FRN, 7.373%,(1-month USD LIBOR + 5.55%), 7/25/28 | United States | 1,550,000 | 1,710,575 | |||||||||
h2016-DNA2, M3, FRN, 6.473%,(1-month USD LIBOR + 4.65%), 10/25/28 | United States | 3,552,363 | 3,810,686 | |||||||||
h2016-DNA3, M2, FRN, 3.823%,(1-month USD LIBOR + 2.00%), 12/25/28 | United States | 105,012 | 105,312 | |||||||||
h2016-HQA2, M2, FRN, 4.073%,(1-month USD LIBOR + 2.25%), 11/25/28 | United States | 213,857 | 214,956 | |||||||||
h2016-HQA2, M3, FRN, 6.973%,(1-month USD LIBOR + 5.15%), 11/25/28 | United States | 2,000,000 | 2,195,025 | |||||||||
| franklintempleton.com | Semiannual Report | 21 | ||
FRANKLIN STRATEGIC SERIES
STATEMENT OF INVESTMENTS (UNAUDITED)
Franklin Flexible Alpha Bond Fund(continued)
| Country | Principal Amount* | Value | ||||||||||
Asset-Backed Securities and Commercial Mortgage-Backed Securities (continued) | ||||||||||||
Diversified Financials(continued) | ||||||||||||
FHLMC Structured Agency Credit Risk Debt Notes,(continued) | ||||||||||||
h2016-HQA3, M2, FRN, 3.173%,(1-month USD LIBOR + 1.35%), 3/25/29 | United States | 1,670,561 | $ | 1,673,977 | ||||||||
h2016-HQA4, M2, FRN, 3.123%,(1-month USD LIBOR + 1.30%), 4/25/29 | United States | 513,413 | 515,217 | |||||||||
g2017-DNA1, M2, FRN, 5.073%, 7/25/29 | United States | 2,900,000 | 3,043,170 | |||||||||
g2017-DNA2, M2, FRN, 5.273%, 10/25/29 | United States | 3,000,000 | 3,188,891 | |||||||||
h2017-DNA3, M2, FRN, 4.323%,(1-month USD LIBOR + 2.50%), 3/25/30 | United States | 2,000,000 | 2,042,274 | |||||||||
g2017-HQA1, M2, FRN, 5.373%, 8/25/29 | United States | 2,350,000 | 2,463,930 | |||||||||
g2017-HQA3, M2, FRN, 4.173%, 4/25/30 | United States | 250,000 | 253,534 | |||||||||
b,hFlagship CLO VIII Ltd.,2014-8A, CRR, 144A, FRN, 3.801%,(3-month USD LIBOR + 1.80%), 1/16/26 | United States | 1,400,000 | 1,375,654 | |||||||||
b,gFlagstar Mortgage Trust,2018-6RR, 1A3, 144A, FRN, 4.00%, 10/25/48 | United States | 1,011,232 | 1,037,845 | |||||||||
FNMA Connecticut Avenue Securities, | ||||||||||||
h2013-C01, M2, FRN, 7.073%,(1-month USD LIBOR + 5.25%), 10/25/23 | United States | 2,643,970 | 2,914,803 | |||||||||
h2014-C01, M2, FRN, 6.223%,(1-month USD LIBOR + 4.40%), 1/25/24 | United States | 3,231,873 | 3,508,175 | |||||||||
h2014-C02, 1M2, FRN, 4.423%,(1-month USD LIBOR + 2.60%), 5/25/24 | United States | 1,724,540 | 1,794,222 | |||||||||
h2014-C02, 2M2, FRN, 4.423%,(1-month USD LIBOR + 2.60%), 5/25/24 | United States | 2,360,033 | 2,441,784 | |||||||||
h2014-C03, 1M2, FRN, 4.823%,(1-month USD LIBOR + 3.00%), 7/25/24 | United States | 1,148,765 | 1,207,175 | |||||||||
h2014-C03, 2M2, FRN, 4.723%,(1-month USD LIBOR + 2.90%), 7/25/24 | United States | 2,193,739 | 2,281,536 | |||||||||
h2014-C04, 1M1, FRN, 6.723%,(1-month USD LIBOR + 4.90%), 11/25/24 | United States | 2,696,277 | 2,939,353 | |||||||||
h2014-C04, 2M2, FRN, 6.823%,(1-month USD LIBOR + 5.00%), 11/25/24 | United States | 401,846 | 428,680 | |||||||||
h2015-C01, 1M2, FRN, 6.123%,(1-month USD LIBOR + 4.30%), 2/25/25 | United States | 26,868 | 28,462 | |||||||||
h2015-C01, 2M2, FRN, 6.373%,(1-month USD LIBOR + 4.55%), 2/25/25 | United States | 97,184 | 100,524 | |||||||||
h2015-C02, 1M2, FRN, 5.823%,(1-month USD LIBOR + 4.00%), 5/25/25 | United States | 395,328 | 417,207 | |||||||||
h2015-C02, 2M2, FRN, 5.823%,(1-month USD LIBOR + 4.00%), 5/25/25 | United States | 112,564 | 117,121 | |||||||||
h2015-C03, 1M2, FRN, 6.823%,(1-month USD LIBOR + 5.00%), 7/25/25 | United States | 2,336,814 | 2,524,556 | |||||||||
h2015-C03, 2M2, FRN, 6.823%,(1-month USD LIBOR + 5.00%), 7/25/25 | United States | 565,444 | 601,503 | |||||||||
h2016-C01, 1M2, FRN, 8.573%,(1-month USD LIBOR + 6.75%), 8/25/28 | United States | 2,285,044 | 2,529,857 | |||||||||
g2016-C02, 1M2, FRN, 7.823%, 9/25/28 | United States | 216,868 | 236,716 | |||||||||
g2016-C04, 1M2, FRN, 6.073%, 1/25/29 | United States | 2,000,000 | 2,113,697 | |||||||||
g2016-C05, 2M2, FRN, 6.273%, 1/25/29 | United States | 1,647,106 | 1,735,033 | |||||||||
g2016-C06, 1M2, FRN, 6.073%, 4/25/29 | United States | 460,000 | 489,562 | |||||||||
22 | Semiannual Report | franklintempleton.com | ||
FRANKLIN STRATEGIC SERIES
STATEMENT OF INVESTMENTS (UNAUDITED)
Franklin Flexible Alpha Bond Fund(continued)
| Country | Principal Amount* | Value | ||||||||||||||
Asset-Backed Securities and Commercial Mortgage-Backed | ||||||||||||||||
Diversified Financials(continued) | ||||||||||||||||
FNMA Connecticut Avenue Securities, (continued) | ||||||||||||||||
g2016-C07, 2M2, FRN, 6.173%, 5/25/29 | United States | 1,081,288 | $ | 1,136,317 | ||||||||||||
h2017-C01, 1B1, FRN, 7.573%,(1-month USD LIBOR + 5.75%), 7/25/29 | United States | 33,000 | 38,824 | |||||||||||||
h2017-C01, 1M2, FRN, 5.373%,(1-month USD LIBOR + 3.55%), 7/25/29 | United States | 890,000 | 932,664 | |||||||||||||
g2017-C02, 2M2, FRN, 5.473%, 9/25/29 | United States | 3,060,000 | 3,211,871 | |||||||||||||
g2017-C03, 1M2, FRN, 4.823%, 10/25/29 | United States | 2,780,000 | 2,895,937 | |||||||||||||
g2017-C03, 2M2, FRN, 4.673%, 11/25/29 | United States | 570,000 | 586,809 | |||||||||||||
g2017-C06, 1M2, FRN, 4.473%, 2/25/30 | United States | 390,000 | 398,605 | |||||||||||||
g2017-C07, 1M1, FRN, 2.473%, 5/25/30 | United States | 949,454 | 950,000 | |||||||||||||
h2018-C04, 2M1, FRN, 2.573%,(1-month USD LIBOR + 0.75%), 12/25/30 | United States | 335,226 | 335,396 | |||||||||||||
b,hGilbert Park CLO Ltd.,2017-1A, B, 144A, FRN, 3.601%,(3-month USD LIBOR + 1.60%), 10/15/30 | United States | 3,000,000 | 2,976,630 | |||||||||||||
GS Mortgage Securities Trust, | ||||||||||||||||
2016-GS3, A4, 2.85%, 10/10/49 | United States | 600,000 | 620,051 | |||||||||||||
2017-GS6, A3, 3.433%, 5/10/50 | United States | 2,000,000 | 2,145,313 | |||||||||||||
b,gJ.P. Morgan Chase Commercial Mortgage Securities Trust, 2016-NINE, A, 144A, FRN, 2.949%, 9/06/38 | United States | 600,000 | 619,746 | |||||||||||||
JPMBB Commercial Mortgage Securities Trust, | ||||||||||||||||
2015-C30, A5, 3.822%, 7/15/48 | United States | 1,500,000 | 1,626,467 | |||||||||||||
g2015-C30, AS, FRN, 4.226%, 7/15/48 | United States | 450,000 | 489,307 | |||||||||||||
2016-C1, A5, 3.576%, 3/15/49 | United States | 1,500,000 | 1,611,777 | |||||||||||||
g,jJPMDB Commercial Mortgage Securities Trust,2017-C5, XA, IO, FRN, 0.94%, 3/15/50 | United States | 188,645 | 10,550 | |||||||||||||
b,gLCM XXII Ltd., 22A, A2R, 144A, FRN, 3.416%, 10/20/28 | United States | 3,500,000 | 3,431,190 | |||||||||||||
b,hLong Point Park CLO Ltd., | ||||||||||||||||
2017-1A, A2, 144A, FRN, 3.377%,(3-month USD LIBOR + 1.375%), 1/17/30 | United States | 1,000,000 | 975,300 | |||||||||||||
2017-1A, B, 144A, FRN, 3.702%,(3-month USD LIBOR + 1.70%), 1/17/30 | United States | 1,000,000 | 954,350 | |||||||||||||
b,gMadison Park Euro Funding XIV DAC, 2014A, A1N, 144A, FRN, 1.12%, 7/15/32 | Ireland | 3,800,000 | EUR | 4,256,483 | ||||||||||||
b,gMadison Park Funding XIV Ltd., | ||||||||||||||||
2014-14A, BRR, 144A, FRN, 3.653%, 10/22/30 | United States | 1,500,000 | 1,489,485 | |||||||||||||
2014-14A, CRR, 144A, FRN, 4.153%, 10/22/30 | United States | 562,500 | 552,735 | |||||||||||||
b,gMadison Park Funding XXIX Ltd.,2018-29A, A2, 144A, FRN, 3.453%, 10/18/30 | United States | 1,468,182 | 1,452,311 | |||||||||||||
b,hMadison Park Funding XXVI Ltd.,2017-26A, AR, 144A, FRN, 3.128%,(3-month USD LIBOR + 1.20%), 7/29/30 | United States | 2,500,000 | 2,495,525 | |||||||||||||
b,gMadison Park Funding XXXI Ltd., | ||||||||||||||||
2018-31A, A2A, 144A, FRN, 3.434%, 1/23/31 | United States | 750,000 | 744,900 | |||||||||||||
2018-31A, B, 144A, FRN, 3.634%, 1/23/31 | United States | 3,000,000 | 2,979,660 | |||||||||||||
2018-31A, C, 144A, FRN, 4.084%, 1/23/31 | United States | 1,950,000 | 1,908,601 | |||||||||||||
| franklintempleton.com | Semiannual Report | 23 | ||
FRANKLIN STRATEGIC SERIES
STATEMENT OF INVESTMENTS (UNAUDITED)
Franklin Flexible Alpha Bond Fund(continued)
| Country | Principal Amount* | Value | ||||||||||||||
Asset-Backed Securities and Commercial Mortgage-Backed | ||||||||||||||||
Diversified Financials(continued) | ||||||||||||||||
b,gMill City Mortgage Loan Trust, | ||||||||||||||||
2017-1, A1, 144A, FRN, 2.75%, 11/25/58 | United States | 989,496 | $ | 998,069 | ||||||||||||
2018-1, A1, 144A, FRN, 3.25%, 5/25/62 | United States | 2,584,677 | 2,652,087 | |||||||||||||
2018-4, A1B, 144A, FRN, 3.50%, 4/25/66 | United States | 1,660,000 | 1,713,352 | |||||||||||||
bMorgan Stanley Capital I Trust, 2014-150E, A, 144A, 3.912%, 9/09/32 | United States | 450,000 | 481,781 | |||||||||||||
bNeuberger Berman Loan Advisers CLO Ltd., | ||||||||||||||||
h2017-26A, B, 144A, FRN, 3.503%,(3-month USD LIBOR + 1.50%), 10/18/30 | United States | 539,475 | 529,096 | |||||||||||||
g2019-32A, B, 144A, FRN, 3.816%, 1/19/32 | United States | 2,800,000 | 2,792,972 | |||||||||||||
b,hOctagon Investment Partners 33 Ltd., | ||||||||||||||||
2017-1A, A2, 144A, FRN, 3.466%,(3-month USD LIBOR + 1.50%), 1/20/31 | United States | 2,000,000 | 1,963,980 | |||||||||||||
2017-1A, B, 144A, FRN, 3.816%,(3-month USD LIBOR + 1.85%), 1/20/31 | United States | 500,000 | 477,280 | |||||||||||||
2017-1A, C, 144A, FRN, 4.716%,(3-month USD LIBOR + 2.75%), 1/20/31 | United States | 250,000 | 230,863 | |||||||||||||
b,hOctagon Investment Partners XXIII Ltd., | ||||||||||||||||
2015-1A, BR, 144A, FRN, 3.201%,(3-month USD LIBOR + 1.20%), 7/15/27 | United States | 1,200,000 | 1,179,936 | |||||||||||||
2015-1A, CR, 144A, FRN, 3.851%,(3-month USD LIBOR + 1.85%), 7/15/27 | United States | 2,000,000 | 1,970,580 | |||||||||||||
2015-1A, DR, 144A, FRN, 4.551%,(3-month USD LIBOR + 2.55%), 7/15/27 | United States | 300,000 | 292,137 | |||||||||||||
bProgress Residential Trust, 2018-SFR2, A, 144A, 3.712%, 8/17/35 | United States | 290,000 | 296,536 | |||||||||||||
b,hRadnor RE Ltd.,2018-1, M1, 144A, FRN, 3.223%,(1-month USD LIBOR + 1.40%), 3/25/28 | United States | 395,198 | 395,286 | |||||||||||||
b,gSequoia Mortgage Trust,2016-2, A4, 144A, FRN, 3.50%, 8/25/46 | United States | 1,683,240 | 1,720,829 | |||||||||||||
b,gSound Point Euro CLO II Funding DAC, | ||||||||||||||||
2A, A, 144A, FRN, 1.11%, 10/26/32 | Ireland | 1,600,000 | EUR | 1,788,842 | ||||||||||||
2A, B1, 144A, FRN, 1.85%, 10/26/32 | Ireland | 850,000 | EUR | 946,512 | ||||||||||||
b TCI-Flatiron CLO Ltd., | ||||||||||||||||
g2017-1A, A, 144A, FRN, 3.324%, 11/18/30 | United States | 2,000,000 | 1,995,860 | |||||||||||||
h2017-1A, B, 144A, FRN, 3.684%,(3-month USD LIBOR + 1.56%), 11/18/30 | United States | 2,000,000 | 1,953,120 | |||||||||||||
h2017-1A, C, 144A, FRN, 3.974%,(3-month USD LIBOR + 1.85%), 11/18/30 | United States | 1,200,000 | 1,133,880 | |||||||||||||
gThornburg Mortgage Securities Trust,2005-1, A3, FRN, 4.578%, 4/25/45 | United States | 17,416 | 17,594 | |||||||||||||
b Towd Point Mortgage Trust, | ||||||||||||||||
2015-1, AE, 144A, 3.00%, 10/25/53 | United States | 406,715 | 409,624 | |||||||||||||
g2015-2, 2A1, 144A, FRN, 3.75%, 11/25/57 | United States | 220,329 | 222,715 | |||||||||||||
g2016-3, A1, 144A, FRN, 2.25%, 4/25/56 | United States | 1,425,715 | 1,426,164 | |||||||||||||
g2016-4, A1, 144A, FRN, 2.25%, 7/25/56 | United States | 930,848 | 931,595 | |||||||||||||
g2016-5, A1, 144A, FRN, 2.50%, 10/25/56 | United States | 363,745 | 366,099 | |||||||||||||
g2017-1, A1, 144A, FRN, 2.75%, 10/25/56 | United States | 1,144,229 | 1,161,063 | |||||||||||||
g2017-2, A1, 144A, FRN, 2.75%, 4/25/57 | United States | 1,094,503 | 1,106,016 | |||||||||||||
g2017-4, A1, 144A, FRN, 2.75%, 6/25/57 | United States | 1,986,734 | 2,015,812 | |||||||||||||
h2017-5, A1, 144A, FRN, 2.423%,(1-month USD LIBOR + 0.60%), 2/25/57 | United States | 109,906 | 109,925 | |||||||||||||
24 | Semiannual Report | franklintempleton.com | ||
FRANKLIN STRATEGIC SERIES
STATEMENT OF INVESTMENTS (UNAUDITED)
Franklin Flexible Alpha Bond Fund(continued)
| Country | Principal Amount* | Value | ||||||||||||||
Asset-Backed Securities and Commercial Mortgage-Backed | ||||||||||||||||
Diversified Financials(continued) | ||||||||||||||||
bTowd Point Mortgage Trust, (continued)g2018-1, A1, 144A, FRN, 3.00%, 1/25/58 | United States | 508,383 | $ | 517,450 | ||||||||||||
g2018-2, A1, 144A, FRN, 3.25%, 3/25/58 | United States | 250,557 | 257,147 | |||||||||||||
g2018-4, A1, 144A, FRN, 3.00%, 6/25/58 | United States | 1,759,249 | 1,817,897 | |||||||||||||
g2018-5, A1A, 144A, FRN, 3.25%, 7/25/58 | United States | 549,286 | 565,501 | |||||||||||||
g2019-1, A1, 144A, FRN, 3.75%, 3/25/58 | United States | 2,302,716 | 2,434,142 | |||||||||||||
b,hVoya CLO Ltd., | ||||||||||||||||
2013-2A, A1R, 144A, FRN, 2.91%,(3-month USD LIBOR + 0.97%), 4/25/31 | United States | 7,300,000 | 7,227,876 | |||||||||||||
2014-1A, BR2, 144A, FRN, 3.903%,(3-month USD LIBOR + 1.90%), 4/18/31 | United States | 2,750,000 | 2,653,805 | |||||||||||||
b,gWells Fargo Mortgage Backed Securities,2018-1, A3, 144A, FRN, 3.50%, 7/25/47 | United States | 781,909 | 796,665 | |||||||||||||
b,hWest CLO Ltd.,2014-1A, A2R, 144A, FRN, 3.353%,(3-month USD LIBOR + 1.35%), 7/18/26 | United States | 170,000 | 169,638 | |||||||||||||
|
| |||||||||||||||
| 235,466,481 | ||||||||||||||||
|
| |||||||||||||||
Real Estate 0.2% | ||||||||||||||||
bAmerican Homes 4 Rent, 2014-SFR3, A, 144A, 3.678%, 12/17/36 | United States | 740,115 | 779,827 | |||||||||||||
|
| |||||||||||||||
Total Asset-Backed Securities and Commercial Mortgage-Backed Securities (Cost $247,624,963) | 245,036,078 | |||||||||||||||
|
| |||||||||||||||
Mortgage-Backed Securities 8.1% | ||||||||||||||||
Federal Home Loan Mortgage Corp. (FHLMC) Fixed Rate 4.1% | ||||||||||||||||
kFHLMC 15 Year, 2.50%, 10/01/34 | United States | 8,130,000 | 8,218,287 | |||||||||||||
kFHLMC 30 Year, 3.00%, 11/01/49 | United States | 8,100,000 | 8,231,625 | |||||||||||||
|
| |||||||||||||||
| 16,449,912 | ||||||||||||||||
|
| |||||||||||||||
Government National Mortgage Association (GNMA) Fixed Rate 4.0% | ||||||||||||||||
kGNMA II SF 30 Year, 3.50%, 10/01/49 | United States | 15,680,000 | 16,271,675 | |||||||||||||
|
| |||||||||||||||
Total Mortgage-Backed Securities (Cost $32,706,582) | 32,721,587 | |||||||||||||||
|
| |||||||||||||||
Municipal Bonds 0.2% | ||||||||||||||||
Cincinnati GO, Various Purpose, Improvement and Refunding, Series A, 5.00%, 12/01/25 | United States | 100,000 | 119,949 | |||||||||||||
Citizens Property Insurance Corp. Revenue, Coastal Account, senior secured, SeriesA-1, 5.00%, 6/01/22 | United States | 125,000 | 134,655 | |||||||||||||
Colorado State Board of Governors University Enterprise System | ||||||||||||||||
Revenue, Green Bonds, SeriesE-2, 5.00%, 3/01/25 | United States | 100,000 | 119,225 | |||||||||||||
Orlando Health Obligated Group, 3.777%, 10/01/28 | United States | 105,000 | 113,662 | |||||||||||||
Providence St. Joseph Health Obligated Group, 2.746%, 10/01/26 | United States | 15,000 | 15,367 | |||||||||||||
San Jose RDA Successor Agency Tax Allocation, Senior, Refunding, SeriesA-T, 3.226%, 8/01/27 | United States | 190,000 | 203,302 | |||||||||||||
Teays Valley Local School District GO, Pickaway Fairfield and Franklin Counties, Refunding, 4.00%, 12/01/26 | United States | 100,000 | 109,759 | |||||||||||||
Texas State GO, Transportation Commission Highway Improvement, Series A, 5.00%, 4/01/21 | United States | 5,000 | 5,272 | |||||||||||||
|
| |||||||||||||||
Total Municipal Bonds (Cost $774,687) | 821,191 | |||||||||||||||
|
| |||||||||||||||
| franklintempleton.com | Semiannual Report | 25 | ||
FRANKLIN STRATEGIC SERIES
STATEMENT OF INVESTMENTS (UNAUDITED)
Franklin Flexible Alpha Bond Fund(continued)
| Number of Contracts | Notional Amount* | Value | ||||||||||
Options Purchased 0.0%† | ||||||||||||
Puts -Over-the-Counter | ||||||||||||
Credit Default Swaptions 0.0%† | ||||||||||||
Buy Protection on CDX.NA.HY.32, Counterparty GSCO, Premium Rate 5.00%, December Strike Price $106.00, Expires 12/18/19 | 1 | 3,712,500 | $ | 14,590 | ||||||||
Buy Protection on CDX.NA.IG.32, Counterparty BZWS, Premium Rate 1.00%, November Strike Price $60.00, Expires 11/20/19 | 1 | 11,250,000 | 1,733 | |||||||||
|
| |||||||||||
Total Options Purchased (Cost $64,305) | 16,323 | |||||||||||
|
| |||||||||||
Total Investments before Short Term Investments | 412,721,231 | |||||||||||
|
| |||||||||||
| Country | Shares | |||||||||||
Short Term Investments (Cost $24,386,858) 6.0% | ||||||||||||
Money Market Funds 6.0% | ||||||||||||
l,mInstitutional Fiduciary Trust Money Market Portfolio, 1.56% | United States | 24,386,858 | 24,386,858 | |||||||||
|
| |||||||||||
Total Investments (Cost $436,048,783) 107.7% | 437,108,089 | |||||||||||
Options Written (0.0)%† | (3,465 | ) | ||||||||||
Other Assets, less Liabilities (7.7)% | (31,177,874 | ) | ||||||||||
|
| |||||||||||
Net Assets 100.0% | $ | 405,926,750 | ||||||||||
|
| |||||||||||
| Number of Contracts | Notional Amount* | |||||||||||
nOptions Written (0.0)%† | ||||||||||||
Puts -Over-the-Counter | ||||||||||||
Credit Default Swaptions (0.0)%† | ||||||||||||
Buy Protection on CDX.NA.HY.32, Counterparty GSCO, Premium Rate 5.00%, December Strike Price $102.50, Expires 12/18/19 | 1 | 3,712,500 | (3,364) | |||||||||
Buy Protection on CDX.NA.IG.32, Counterparty BZWS, Premium Rate 1.00%, November Strike Price $80.00, Expires 11/20/19 | 1 | 11,250,000 | (101) | |||||||||
|
| |||||||||||
Total Options Written (Premiums received $22,815) | $ | (3,465) | ||||||||||
|
| |||||||||||
26 | Semiannual Report | franklintempleton.com | ||
FRANKLIN STRATEGIC SERIES
STATEMENT OF INVESTMENTS (UNAUDITED)
Franklin Flexible Alpha Bond Fund(continued)
†Rounds to less than 0.1% of net assets.
*The principal/notional amount is stated in U.S. dollars unless otherwise indicated.
aSecurity was purchased pursuant to Regulation S under the Securities Act of 1933, which exempts from registration securities offered and sold outside of the United States. Such a security cannot be sold in the United States without either an effective registration statement filed pursuant to the Securities Act of 1933, or pursuant to an exemption from registration. At October 31, 2019, the aggregate value of these securities was $29,352,143, representing 7.2% of net assets.
bSecurity was purchased pursuant to Rule 144A under the Securities Act of 1933 and may be sold in transactions exempt from registration only to qualified institutional buyers or in a public offering registered under the Securities Act of 1933. At October 31, 2019, the aggregate value of these securities was $201,707,949, representing 49.7% of net assets.
cThe coupon rate shown represents the rate at period end.
dSee Note 1(e) regarding loan participation notes.
ePerpetual security with no stated maturity date.
fPrincipal amount of security is adjusted for inflation. See Note 1(h).
gAdjustable rate security with an interest rate that is not based on a published reference index and spread. The rate is based on the structure of the agreement and current market conditions. The coupon rate shown represents the rate at period end.
hThe coupon rate shown represents the rate inclusive of any caps or floors, if applicable, in effect at period end.
iSecurity purchased on a when-issued basis. See Note 1(c).
jInvestment in an interest-only security entitles holders to receive only the interest payment on the underlying instruments. The principal amount shown is the notional amount of the underlying instruments.
kSecurity purchased on ato-be-announced (TBA) basis. See Note 1(c).
lSee Note 3(f) regarding investments in affiliated management investment companies.
mThe rate shown is the annualizedseven-day effective yield at period end.
nSee Note 1(d) regarding written options.
At October 31, 2019, the Fund had the following futures contracts outstanding. See Note 1(d).
Futures Contracts
| Description | Type | Number of Contracts | Notional Amount* | Expiration Date | Value/ Unrealized Appreciation (Depreciation) | |||||||||||||||
Interest Rate Contracts | ||||||||||||||||||||
Australian 3 Yr. Bond | Long | 368 | $ | 29,270,834 | 12/16/19 | $ 44,518 | ||||||||||||||
Australian 10 Yr. Bond | Long | 125 | 12,565,999 | 12/16/19 | (152 | ) | ||||||||||||||
Canadian 10 Yr. Bond | Long | 185 | 19,960,046 | 12/18/19 | (499,303 | ) | ||||||||||||||
CME Ultra Long Term U.S. Treasury Bond | Short | 4 | 759,000 | 12/19/19 | (21,131 | ) | ||||||||||||||
Euro-BOBL | Short | 40 | 6,005,668 | 12/06/19 | 68,669 | |||||||||||||||
Euro-Bund | Short | 5 | 957,820 | 12/06/19 | 15,052 | |||||||||||||||
U.S. Treasury 2 Yr. Note | Short | 64 | 13,798,500 | 12/31/19 | 43,922 | |||||||||||||||
U.S. Treasury 5 Yr. Note | Short | 302 | 35,999,344 | 12/31/19 | 275,023 | |||||||||||||||
U.S. Treasury 10 Yr. Note | Short | 122 | 15,896,219 | 12/19/19 | 182,333 | |||||||||||||||
U.S. Treasury 30 Yr. Bond | Short | 45 | 7,261,875 | 12/19/19 | 196,811 | |||||||||||||||
Ultra 10 Yr. U.S. Treasury Note | Short | 103 | 14,637,265 | 12/19/19 | 211,034 | |||||||||||||||
|
| |||||||||||||||||||
Total Futures Contracts | $ 516,776 | |||||||||||||||||||
|
| |||||||||||||||||||
*As of period end.
| franklintempleton.com | Semiannual Report | 27 | ||
FRANKLIN STRATEGIC SERIES
STATEMENT OF INVESTMENTS (UNAUDITED)
Franklin Flexible Alpha Bond Fund(continued)
At October 31, 2019, the Fund had the following forward exchange contracts outstanding. See Note 1(d).
Forward Exchange Contracts
| Currency | Counterpartya | Type | Quantity | Contract Amount | Settlement Date | Unrealized Appreciation | Unrealized Depreciation | |||||||||||||||||||||
OTC Forward Exchange Contracts |
| |||||||||||||||||||||||||||
Euro | JPHQ | Sell | 300,000 | $ | 338,631 | 11/12/19 | $ | 3,782 | $ | — | ||||||||||||||||||
British Pound | JPHQ | Sell | 86,300 | 104,535 | 11/13/19 | — | (7,307 | ) | ||||||||||||||||||||
Indonesian Rupiah | JPHQ | Buy | 16,736,500,000 | 1,156,235 | 11/21/19 | 30,724 | — | |||||||||||||||||||||
South Korean Won | JPHQ | Sell | 1,000,000,000 | 825,941 | 11/21/19 | — | (29,070 | ) | ||||||||||||||||||||
Euro | DBAB | Buy | 100,000 | 117,270 | 12/13/19 | — | (5,397 | ) | ||||||||||||||||||||
Euro | DBAB | Sell | 800,000 | 934,000 | 12/13/19 | 39,015 | — | |||||||||||||||||||||
Australian Dollar | JPHQ | Sell | 6,400,000 | 4,318,624 | 1/09/20 | — | (102,003 | ) | ||||||||||||||||||||
Australian Dollar | JPHQ | Sell | 1,500,000 | 1,022,625 | 1/28/20 | — | (13,853 | ) | ||||||||||||||||||||
Japanese Yen | JPHQ | Buy | 670,700,000 | 6,348,436 | 1/29/20 | — | (99,037 | ) | ||||||||||||||||||||
Canadian Dollar | JPHQ | Sell | 1,600,000 | 1,205,573 | 1/30/20 | — | (10,327 | ) | ||||||||||||||||||||
Danish Krone | JPHQ | Sell | 20,016,977 | 3,017,092 | 1/30/20 | 7,359 | — | |||||||||||||||||||||
Euro | JPHQ | Sell | 8,242,501 | 9,304,525 | 1/30/20 | 52,586 | — | |||||||||||||||||||||
Mexican Peso | JPHQ | Buy | 25,008,000 | 1,237,928 | 1/30/20 | 43,834 | — | |||||||||||||||||||||
Mexican Peso | JPHQ | Sell | 25,008,000 | 1,288,176 | 1/30/20 | 6,414 | — | |||||||||||||||||||||
Norwegian Krone | JPHQ | Buy | 18,300,000 | 2,029,784 | 1/30/20 | — | (38,863 | ) | ||||||||||||||||||||
Chinese Yuan Renminbi | JPHQ | Sell | 27,800,000 | 3,906,069 | 2/24/20 | — | (26,014 | ) | ||||||||||||||||||||
Japanese Yen | JPHQ | Buy | 48,000,000 | 445,162 | 3/13/20 | 3,247 | — | |||||||||||||||||||||
Japanese Yen | JPHQ | Buy | 108,500,000 | 1,020,855 | 3/13/20 | — | (7,264 | ) | ||||||||||||||||||||
Canadian Dollar | JPHQ | Sell | 3,770,000 | 2,851,265 | 3/16/20 | — | (13,664 | ) | ||||||||||||||||||||
Euro | DBAB | Sell | 120,000 | 134,526 | 3/16/20 | — | (541 | ) | ||||||||||||||||||||
Euro | JPHQ | Sell | 8,820,429 | 9,863,623 | 3/16/20 | — | (64,297 | ) | ||||||||||||||||||||
Norwegian Krone | JPHQ | Buy | 26,600,000 | 2,970,407 | 3/16/20 | — | (76,834 | ) | ||||||||||||||||||||
Swedish Krona | JPHQ | Buy | 19,350,000 | 1,974,198 | 3/16/20 | 44,166 | — | |||||||||||||||||||||
Swedish Krona | JPHQ | Sell | 19,350,000 | 2,034,401 | 3/16/20 | 16,037 | — | |||||||||||||||||||||
Turkish Lira | JPHQ | Buy | 2,600,000 | 412,273 | 4/15/20 | 23,056 | — | |||||||||||||||||||||
|
| |||||||||||||||||||||||||||
Total Forward Exchange Contracts | $ | 270,220 | $ | (494,471 | ) | |||||||||||||||||||||||
|
| |||||||||||||||||||||||||||
Net unrealized appreciation (depreciation) |
| $ | (224,251 | ) | ||||||||||||||||||||||||
|
| |||||||||||||||||||||||||||
aMay be comprised of multiple contracts with the same counterparty, currency and settlement date.
At October 31, 2019, the Fund had the following credit default swap contracts outstanding. See Note 1(d).
Credit Default Swap Contracts
| Description | Periodic Payment Rate Received (Paid) | Payment Frequency | Counter- party | Maturity Date | Notional Amounta | Value | Unamortized Upfront Payments (Receipts) | Unrealized Appreciation (Depreciation) | Ratingb | |||||||||||||||||||||||||||
OTC Swap Contracts | ||||||||||||||||||||||||||||||||||||
Contracts to Buy Protectionc | ||||||||||||||||||||||||||||||||||||
Single Name | ||||||||||||||||||||||||||||||||||||
The AES Corp. | (5.00)% | Quarterly | CITI | 3/20/21 | $ | 2,750,000 | $ | (199,068 | ) | $ | (163,219 | ) | $ | (35,849 | ) | |||||||||||||||||||||
Ally Financial Inc. | (5.00)% | Quarterly | JPHQ | 12/20/24 | 2,600,000 | (534,960 | ) | (499,474 | ) | (35,486 | ) | |||||||||||||||||||||||||
American Airlines Group Inc. | (5.00)% | Quarterly | BZWS | 12/20/19 | 400,000 | (4,916 | ) | (2,283 | ) | (2,633 | ) | |||||||||||||||||||||||||
American Airlines Group Inc. | (5.00)% | Quarterly | CITI | 12/20/19 | 130,000 | (1,598 | ) | (733 | ) | (865 | ) | |||||||||||||||||||||||||
28 | Semiannual Report | franklintempleton.com | ||
FRANKLIN STRATEGIC SERIES
STATEMENT OF INVESTMENTS (UNAUDITED)
Franklin Flexible Alpha Bond Fund(continued)
Credit Default Swap Contracts(continued)
| Description | Periodic Payment Rate Received (Paid) | Payment Frequency | Counter- party | Maturity Date | Notional Amounta | Value | Unamortized Upfront Payments (Receipts) | Unrealized Appreciation (Depreciation) | Ratingb | |||||||||||||||||||||||||||
OTC Swap Contracts(continued) | ||||||||||||||||||||||||||||||||||||
Contracts to Buy Protectionc(continued) |
| |||||||||||||||||||||||||||||||||||
Single Name(continued) | ||||||||||||||||||||||||||||||||||||
Boyd Gaming Corp. | (5.00)% | Quarterly | BZWS | 6/20/22 | $ | 525,000 | $ | (67,519 | ) | $ | (52,231 | ) | $ | (15,288 | ) | |||||||||||||||||||||
Centurylink Inc. | (5.00)% | Quarterly | BZWS | 6/20/21 | 4,700,000 | (361,614 | ) | (182,308 | ) | (179,306 | ) | |||||||||||||||||||||||||
Energy Transfer LP | (5.00)% | Quarterly | MSCO | 12/20/20 | 750,000 | (45,652 | ) | (35,954 | ) | (9,698 | ) | |||||||||||||||||||||||||
Government of Italy | (1.00)% | Quarterly | BZWS | 6/20/23 | 700,000 | (10,810 | ) | 5,546 | (16,356 | ) | ||||||||||||||||||||||||||
Government of Turkey | (1.00)% | Quarterly | BZWS | 12/20/19 | 166,667 | (288 | ) | 1,066 | (1,354 | ) | ||||||||||||||||||||||||||
HCA Inc. | (5.00)% | Quarterly | FBCO | 3/20/22 | 2,050,000 | (243,938 | ) | (179,121 | ) | (64,817 | ) | |||||||||||||||||||||||||
KB Home | (5.00)% | Quarterly | JPHQ | 3/20/20 | 100,000 | (2,472 | ) | (1,374 | ) | (1,098 | ) | |||||||||||||||||||||||||
Nabors Industries Inc. | (1.00)% | Quarterly | CITI | 12/20/21 | 1,050,000 | 125,743 | 32,672 | 93,071 | ||||||||||||||||||||||||||||
Navient Corp. | (5.00)% | Quarterly | GSCO | 3/20/20 | 1,800,000 | (43,218 | ) | (27,294 | ) | (15,924 | ) | |||||||||||||||||||||||||
Navient Corp. | (5.00)% | Quarterly | JPHQ | 3/20/20 | 2,860,000 | (68,668 | ) | (43,393 | ) | (25,275 | ) | |||||||||||||||||||||||||
Contracts to Sell Protectionc,d | ||||||||||||||||||||||||||||||||||||
Single Name | ||||||||||||||||||||||||||||||||||||
American Tower Corp. | 1.00% | Quarterly | GSCO | 3/20/21 | 100,000 | 314 | (519 | ) | 833 | BBB- | ||||||||||||||||||||||||||
The Goldman Sachs Group Inc. | 1.00% | Quarterly | JPHQ | 12/20/24 | 2,600,000 | 52,113 | 46,031 | 6,082 | BBB+ | |||||||||||||||||||||||||||
Government of Argentina | 5.00% | Quarterly | CITI | 12/20/21 | 960,000 | (570,224 | ) | (551,942 | ) | (18,282 | ) | CCC- | ||||||||||||||||||||||||
Government of Indonesia | 1.00% | Quarterly | CITI | 12/20/24 | 1,025,000 | 12,926 | 6,895 | 6,031 | NR | |||||||||||||||||||||||||||
Government of Italy | 1.00% | Quarterly | BZWS | 6/20/23 | 700,000 | 3,553 | (24,319 | ) | 27,872 | NR | ||||||||||||||||||||||||||
Government of Russia | 1.00% | Quarterly | CITI | 12/20/24 | 620,000 | 7,921 | 6,318 | 1,603 | BBB- | |||||||||||||||||||||||||||
Government of Spain | 1.00% | Quarterly | CITI | 12/20/24 | 1,100,000 | 36,163 | 32,176 | 3,987 | NR | |||||||||||||||||||||||||||
Morgan Stanley | 1.00% | Quarterly | JPHQ | 12/20/24 | 2,600,000 | 56,512 | 50,521 | 5,991 | BBB+ | |||||||||||||||||||||||||||
Nabors Industries Inc. | 1.00% | Quarterly | CITI | 12/20/23 | 1,050,000 | (264,176 | ) | (130,022 | ) | (134,154 | ) | BB- | ||||||||||||||||||||||||
Sprint Communications Inc. | 5.00% | Quarterly | JPHQ | 9/20/20 | 12,000 | 551 | — | 551 | B | |||||||||||||||||||||||||||
Traded Index | ||||||||||||||||||||||||||||||||||||
eBNP Paribas Bespoke Bordeaux Index, Mezzanine Tranche7-10% | 2.10% | Quarterly | BNDP | 6/20/20 | 300,000 | 3,570 | — | 3,570 | | Non- Invest- ment Grade | | |||||||||||||||||||||||||
eBNP Paribas Bespoke Rodez Index, Mezzanine Tranche5-7% | 2.00% | Quarterly | BNDP | 12/20/20 | 500,000 | 4,148 | — | 4,148 | | Non- Invest- ment Grade | | |||||||||||||||||||||||||
eBNP Paribas Bespoke Rodez2 Index, Mezzanine Tranche5-7% | 3.20% | Quarterly | BNDP | 12/20/20 | 340,000 | 8,202 | — | 8,202 | | Non- Invest- ment Grade | | |||||||||||||||||||||||||
| franklintempleton.com | Semiannual Report | 29 | ||
FRANKLIN STRATEGIC SERIES
STATEMENT OF INVESTMENTS (UNAUDITED)
Franklin Flexible Alpha Bond Fund(continued)
Credit Default Swap Contracts(continued)
| Description | Periodic Payment Rate Received (Paid) | Payment Frequency | Counter- party | Maturity Date | Notional Amounta | Value | Unamortized Upfront Payments (Receipts) | Unrealized Appreciation (Depreciation) | Ratingb | |||||||||||||||||||||||||||
OTC Swap Contracts(continued) |
| |||||||||||||||||||||||||||||||||||
Contracts to Sell Protectionc,d(continued) |
| |||||||||||||||||||||||||||||||||||
Traded Index(continued) | ||||||||||||||||||||||||||||||||||||
eCitibank Bespoke Bogota Index, | ||||||||||||||||||||||||||||||||||||
Mezzanine Tranche7-10% | 1.35% | Quarterly | CITI | 6/20/20 | $ | 1,650,000 | $ | 8,162 | $ | — | $ | 8,162 | | Non- Invest- ment Grade | | |||||||||||||||||||||
eCitibank Bespoke Boulder Index, | ||||||||||||||||||||||||||||||||||||
Mezzanine Tranche5-10% | 1.18% | Quarterly | CITI | 12/20/19 | 3,000,000 | 4,528 | — | 4,528 | | Non- Invest- ment Grade | | |||||||||||||||||||||||||
eCitibank Bespoke Boulder Index, | ||||||||||||||||||||||||||||||||||||
Mezzanine Tranche5-15% | 1.24% | Quarterly | CITI | 12/20/19 | 1,600,000 | 3,934 | — | 3,934 | | Non- Invest- ment Grade | | |||||||||||||||||||||||||
eCitibank Bespoke Cambridge Index, | ||||||||||||||||||||||||||||||||||||
Equity Tranche0-3% | 0.00% | Quarterly | CITI | 12/20/19 | 407,500 | (36,391 | ) | (4,569 | ) | (31,822 | ) | | Non- Invest- ment Grade | | ||||||||||||||||||||||
eCitibank Bespoke Lima Index, | ||||||||||||||||||||||||||||||||||||
Mezzanine Tranche5-7% | 2.13% | Quarterly | CITI | 12/20/19 | 650,000 | 15 | — | 15 | | Non- Invest- ment Grade | | |||||||||||||||||||||||||
eCitibank Bespoke Palma Index, | ||||||||||||||||||||||||||||||||||||
Mezzanine Tranche5-7% | 2.30% | Quarterly | CITI | 6/20/21 | 710,000 | 10,077 | — | 10,077 | | Non- Invest- ment Grade | | |||||||||||||||||||||||||
eCitibank Bespoke Phoenix Index, | ||||||||||||||||||||||||||||||||||||
Mezzanine Tranche5-7% | 2.90% | Quarterly | CITI | 12/20/21 | 700,000 | 19,129 | — | 19,129 | | Non- Invest- ment Grade | | |||||||||||||||||||||||||
eCitibank Bespoke Singapore Index, | ||||||||||||||||||||||||||||||||||||
Equity Tranche0-3% | 0.00% | Quarterly | CITI | 6/20/20 | 770,000 | (81,561 | ) | (68,586 | ) | (12,975 | ) | | Non- Invest- ment Grade | | ||||||||||||||||||||||
eCitibank Bespoke Verona Index, | ||||||||||||||||||||||||||||||||||||
Equity Tranche0-3% | 0.00% | Quarterly | CITI | 12/20/19 | 12,225 | (169 | ) | (168 | ) | (1 | ) | | Non- Invest- ment Grade | | ||||||||||||||||||||||
30 | Semiannual Report | franklintempleton.com | ||
FRANKLIN STRATEGIC SERIES
STATEMENT OF INVESTMENTS (UNAUDITED)
Franklin Flexible Alpha Bond Fund(continued)
Credit Default Swap Contracts(continued)
| Description | Periodic Payment Rate Received (Paid) | Payment Frequency | Counter- party | Maturity Date | Notional Amounta | Value | Unamortized Upfront Payments (Receipts) | Unrealized Appreciation (Depreciation) | Ratingb | |||||||||||||||||||||||||||
OTC Swap Contracts(continued) |
| |||||||||||||||||||||||||||||||||||
Contracts to Sell Protectionc,d(continued) |
| |||||||||||||||||||||||||||||||||||
Traded Index(continued) | ||||||||||||||||||||||||||||||||||||
eCitibank Bespoke Verona Index, | ||||||||||||||||||||||||||||||||||||
Mezzanine Tranche7-15% | 0.40 | % | Quarterly | CITI | 12/20/19 | $ | 280,000 | $ 199 | $ | — | $ 199 | | Non- Invest- ment Grade | | ||||||||||||||||||||||
MCDX.NA.30 | 1.00 | % | Quarterly | CITI | 6/20/28 | 2,000,000 | 48,421 | 17,428 | 30,993 | | Invest- ment Grade | | ||||||||||||||||||||||||
MCDX.NA.31 | 1.00 | % | Quarterly | CITI | 12/20/23 | 12,200,000 | 216,373 | 104,112 | 112,261 | | Invest- ment Grade | | ||||||||||||||||||||||||
eMorgan Stanley Bespoke Pecan | ||||||||||||||||||||||||||||||||||||
5-10% | 3.98 | % | Quarterly | MSCO | 12/20/21 | 800,000 | 20,136 | — | 20,136 | | Non- Invest- ment Grade | | ||||||||||||||||||||||||
eMorgan Stanley Bespoke Pecan | ||||||||||||||||||||||||||||||||||||
5-10% | 4.10 | % | Quarterly | MSCO | 12/20/21 | 800,000 | 23,786 | — | 23,786 | | Non- Invest- ment Grade | | ||||||||||||||||||||||||
|
| |||||||||||||||||||||||||||||||||||
Total Credit Default Swap Contracts |
| $(1,870,766) | $ | (1,664,744 | ) | $ (206,022) | ||||||||||||||||||||||||||||||
|
| |||||||||||||||||||||||||||||||||||
aIn U.S. dollars unless otherwise indicated. For contracts to sell protection, the notional amount is equal to the maximum potential amount of the future payments and no recourse provisions have been entered into in association with the contracts.
bBased on Standard and Poor’s (S&P) Rating for single name swaps and internal ratings for index swaps. Internal ratings based on mapping into equivalent ratings from external vendors.
cPerformance triggers for settlement of contract include default, bankruptcy or restructuring for single name swaps, and failure to pay or bankruptcy of the underlying securities for traded index swaps.
dThe Fund enters contracts to sell protection to create a long credit position.
eRepresents a custom index comprised of a basket of underlying instruments.
At October 31, 2019, the Fund had the following cross-currency swap contracts outstanding. See Note 1(d).
Cross-Currency Swap Contracts
| Description | Payment Frequency | Coun- terparty | Maturity Date | Notional Amount | Value/ Unrealized Appreciation (Depreciation) | |||||||||||||||||||
OTC Swap Contracts | ||||||||||||||||||||||||
Receive Floating3-month USD LIBOR + 1.894% | Quarterly | 2,460,000 | USD | |||||||||||||||||||||
Pay Fixed 1.50% | Annual | CITI | 5/04/21 | 2,000,000 | EUR | $239,207 | ||||||||||||||||||
Receive Floating3-month USD LIBOR + 1.85% | Quarterly | 617,500 | USD | |||||||||||||||||||||
Pay Fixed 1.50% | Annual | CITI | 5/04/21 | 500,000 | EUR | 61,927 | ||||||||||||||||||
| franklintempleton.com | Semiannual Report | 31 | ||
FRANKLIN STRATEGIC SERIES
STATEMENT OF INVESTMENTS (UNAUDITED)
Franklin Flexible Alpha Bond Fund(continued)
Cross-Currency Swap Contracts(continued)
| Description | Payment Frequency | Coun- terparty | Maturity Date | Notional Amount | Value/ Unrealized Appreciation (Depreciation) | |||||||||||||||||||
OTC Swap Contracts(continued) | ||||||||||||||||||||||||
Receive Floating3-month USD LIBOR + 2.87% | Quarterly | 232,400 | USD | |||||||||||||||||||||
Pay Fixed 2.50% | Annual | CITI | 5/04/21 | 200,000 | EUR | $ 9,107 | ||||||||||||||||||
Receive Floating3-month USD LIBOR + 1.303% | Quarterly | 496,000 | USD | |||||||||||||||||||||
Pay Fixed 1.00% | Annual | JPHQ | 5/04/21 | 400,000 | EUR | 51,388 | ||||||||||||||||||
Receive Floating3-month USD LIBOR + 1.334% | Quarterly | 4,256,000 | USD | |||||||||||||||||||||
Pay Floating3-month EUR LIBOR + 1.12% | Quarterly | CITI | 7/10/21 | 3,800,000 | EUR | 26,330 | ||||||||||||||||||
Receive Floating3-month USD LIBOR + 1.81% | Quarterly | 1,568,000 | USD | |||||||||||||||||||||
Pay Floating3-month EUR LIBOR + 1.60% | Quarterly | CITI | 8/12/21 | 1,400,000 | EUR | 18,292 | ||||||||||||||||||
Receive Floating3-month USD LIBOR + 1.305% | Quarterly | 2,988,900 | USD | |||||||||||||||||||||
Pay Floating3-month EUR LIBOR + 1.11% | Quarterly | JPHQ | 8/20/21 | 2,700,000 | EUR | (6,248 | ) | |||||||||||||||||
Receive Floating3-month USD LIBOR + 1.31% | Quarterly | 2,719,500 | USD | |||||||||||||||||||||
Pay Floating3-month EUR LIBOR + 1.11% | Quarterly | CITI | 8/30/21 | 2,450,000 | EUR | 511 | ||||||||||||||||||
Receive Floating3-month USD LIBOR + 1.23% | Quarterly | 2,941,500 | USD | |||||||||||||||||||||
Pay Floating3-month EUR LIBOR + 1.07% | Quarterly | CITI | 9/17/21 | 2,650,000 | EUR | (4,916 | ) | |||||||||||||||||
Receive Floating3-month USD LIBOR + 1.25% | Quarterly | 5,550,000 | USD | |||||||||||||||||||||
Pay Floating3-month EUR LIBOR + 1.10% | Quarterly | CITI | 10/30/21 | 5,000,000 | EUR | (26,824 | ) | |||||||||||||||||
Receive Floating3-month USD LIBOR + 0.849% | Quarterly | 3,472,000 | USD | |||||||||||||||||||||
Pay Fixed 0.75% | Annual | DBAB | 9/14/22 | 2,800,000 | EUR | 328,921 | ||||||||||||||||||
|
| |||||||||||||||||||||||
Total Cross Currency Swap Contracts | $697,695 | |||||||||||||||||||||||
|
| |||||||||||||||||||||||
At October 31, 2019, the Fund had the following interest rate swap contracts outstanding. See Note 1(d).
Interest Rate Swap Contracts
| Description | Payment Frequency | Maturity Date | Notional Amount* | Value | Unamortized (Receipts) | Unrealized Appreciation (Depreciation) | ||||||||||||||||||||||
Centrally Cleared Swap Contracts | ||||||||||||||||||||||||||||
Receive Floating3-month USD LIBOR | Quarterly | |||||||||||||||||||||||||||
Pay Fixed 2.788% | Semi-Annual | 3/26/23 | 7,900,000 | $ | (343,646 | ) | $ | — | $ | (343,646 | ) | |||||||||||||||||
Receive Floating3-month USD LIBOR | Quarterly | |||||||||||||||||||||||||||
Pay Fixed 2.79% | Semi-Annual | 3/28/23 | 7,900,000 | (344,481 | ) | — | (344,481 | ) | ||||||||||||||||||||
Receive Floating3-month USD LIBOR | Quarterly | |||||||||||||||||||||||||||
Pay Fixed 2.713% | Semi-Annual | 3/29/23 | 4,700,000 | (190,817 | ) | — | (190,817 | ) | ||||||||||||||||||||
Receive Floating3-month USD LIBOR | Quarterly | |||||||||||||||||||||||||||
Pay Fixed 2.806% | Semi-Annual | 4/17/23 | 5,800,000 | (258,638 | ) | — | (258,638 | ) | ||||||||||||||||||||
Receive Fixed 2.773% | Quarterly | |||||||||||||||||||||||||||
Pay Floating3-month CNY CNRR | Quarterly | 8/23/24 | 17,000,000 | CNY | (36,253 | ) | — | (36,253 | ) | |||||||||||||||||||
Receive Fixed 2.765% | Quarterly | |||||||||||||||||||||||||||
Pay Floating3-month CNY CNRR | Quarterly | 8/26/24 | 13,700,000 | CNY | (29,920 | ) | — | (29,920 | ) | |||||||||||||||||||
Receive Fixed 2.79%. | Quarterly | |||||||||||||||||||||||||||
Pay Floating3-month CNY CNRR | Quarterly | 8/30/24 | 21,500,000 | CNY | (44,421 | ) | — | (44,421 | ) | |||||||||||||||||||
Receive Floating3-month USD LIBOR | Quarterly | |||||||||||||||||||||||||||
Pay Fixed 2.00% | Semi-Annual | 6/20/25 | 11,100,000 | (356,799 | ) | 507,813 | (864,612 | ) | ||||||||||||||||||||
Receive Floating3-month USD LIBOR | Quarterly | |||||||||||||||||||||||||||
Pay Fixed 3.082% | Semi-Annual | 9/28/25 | 8,000,000 | (725,310 | ) | — | (725,310 | ) | ||||||||||||||||||||
Receive Floating3-month USD LIBOR | Quarterly | |||||||||||||||||||||||||||
32 | Semiannual Report | franklintempleton.com | ||
FRANKLIN STRATEGIC SERIES
STATEMENT OF INVESTMENTS (UNAUDITED)
Franklin Flexible Alpha Bond Fund(continued)
Interest Rate Swap Contracts(continued)
| Description | Payment Frequency | Maturity Date | Notional Amount* | Value | Unamortized (Receipts) | Unrealized Appreciation (Depreciation) | ||||||||||||||||||||||
Centrally Cleared Swap Contracts(continued) | ||||||||||||||||||||||||||||
Pay Fixed 3.225% | Semi-Annual | 11/13/25 | 5,500,000 | $ (605,983 | ) | $ — | $ (605,983 | ) | ||||||||||||||||||||
|
| |||||||||||||||||||||||||||
Total Interest Rate Swap Contracts | $(2,936,268 | ) | $507,813 | $(3,444,081 | ) | |||||||||||||||||||||||
*In U.S. dollars unless otherwise indicated.
At October 31, 2019, the Fund had the following inflation index swap contracts outstanding. See Note 1(d).
Inflation Index Swap Contracts
| Description | Payment Frequency | Maturity Date | Notional Amount | Value/ Unrealized Appreciation (Depreciation) | ||||||||||||
Centrally Cleared Swap Contracts | ||||||||||||||||
Receive variable change inUSA-CPI-U | At maturity | |||||||||||||||
Pay Fixed 2.079% | At maturity | 9/18/24 | $ | 1,770,000 | $ (36,003 | ) | ||||||||||
Receive variable change inUSA-CPI-U | At maturity | |||||||||||||||
Pay Fixed 1.719% | At maturity | 8/14/26 | 2,050,000 | (10,074 | ) | |||||||||||
Receive variable change inUSA-CPI-U | At maturity | |||||||||||||||
Pay Fixed 2.35% | At maturity | 9/20/26 | 5,200,000 | (299,978 | ) | |||||||||||
Receive variable change inUSA-CPI-U | At maturity | |||||||||||||||
Pay Fixed 2.313% | At maturity | 6/01/28 | 1,400,000 | (85,792 | ) | |||||||||||
|
| |||||||||||||||
Total Inflation Index Swap Contracts | $ (431,847 | ) | ||||||||||||||
|
| |||||||||||||||
| franklintempleton.com | Semiannual Report | 33 | ||
FRANKLIN STRATEGIC SERIES
STATEMENT OF INVESTMENTS (UNAUDITED)
Franklin Flexible Alpha Bond Fund(continued)
At October 31, 2019, the Fund had the following total return swap contracts outstanding. See Note 1(d).
Total Return Swap Contracts
| Underlying Instruments | Financing Rate | Payment Frequency | Counter- party | Maturity Date | Notional Value* | Value/ Unrealized Appreciation (Depreciation) | ||||||||||||||||||||||
OTC Swap Contracts | ||||||||||||||||||||||||||||
Longa | ||||||||||||||||||||||||||||
Euribor 3 Month | 3-month EUR LIBOR | Quarterly | BNDP | 12/20/19 | 3,650,000 | EUR | $ (6,717 | ) | ||||||||||||||||||||
Euribor 3 Month | 3-month EUR LIBOR | Quarterly | CITI | 12/20/19 | 4,900,000 | EUR | (18,846 | ) | ||||||||||||||||||||
Markit iBoxx USD Liquid Leveraged Loan Index | 3-month USD LIBOR | Quarterly | JPHQ | 12/20/19 | 3,330,000 | 27,055 | ||||||||||||||||||||||
Markit iBoxx USD Liquid Leveraged Loan Index | 3-month USD LIBOR | Quarterly | MSCO | 12/20/19 | 900,000 | 12,810 | ||||||||||||||||||||||
Markit iBoxx USD Liquid Leveraged Loan Index | 3-month USD LIBOR | Quarterly | FBCO | 3/20/20 | 4,050,000 | 49,778 | ||||||||||||||||||||||
Markit iBoxx USD Liquid Leveraged Loan Index | 3-month USD LIBOR | Quarterly | GSCO | 3/20/20 | 6,600,000 | 108,727 | ||||||||||||||||||||||
Shortb | ||||||||||||||||||||||||||||
iBoxx USD Liquid Investment Grade Index | 3-month USD LIBOR | Quarterly | BNDP | 12/20/19 | 1,700,000 | (734 | ) | |||||||||||||||||||||
iBoxx USD Liquid Investment Grade Index | 3-month USD LIBOR | Quarterly | GSCO | 12/20/19 | 1,400,000 | 2,007 | ||||||||||||||||||||||
|
| |||||||||||||||||||||||||||
Total Total Return Swap Contracts | $174,080 | |||||||||||||||||||||||||||
|
| |||||||||||||||||||||||||||
*In U.S. dollars unless otherwise indicated.
aThe Fund receives the total return on the underlying instrument and pays a variable financing rate.
bThe Fund receives the variable financing rate and pays the total return on the underlying instrument.
See Note 8 regarding other derivative information.
See Abbreviations on page 54.
34 | Semiannual Report | The accompanying notes are an integral part of these financial statements. | franklintempleton.com | ||
FRANKLIN STRATEGIC SERIES
Statement of Assets and Liabilities
October 31, 2019 (unaudited)
Franklin Flexible Alpha Bond Fund
Assets: | ||||
Investments in securities: | ||||
Cost - Unaffiliated issuers | $411,661,925 | |||
Cost -Non-controlled affiliates (Note 3f) | 24,386,858 | |||
|
| |||
Value - Unaffiliated issuers | $412,721,231 | |||
Value -Non-controlled affiliates (Note 3f) | 24,386,858 | |||
Foreign currency, at value (cost $2,154,280) | 2,155,826 | |||
Receivables: | ||||
Investment securities sold | 5,097,604 | |||
Interest | 1,683,136 | |||
Deposits with brokers for: | ||||
OTC derivative contracts | 1,560,000 | |||
Futures contracts | 1,531,713 | |||
Centrally cleared swap contracts | 1,179,397 | |||
OTC swap contracts (upfront payments $302,489) | 302,765 | |||
Unrealized appreciation on OTC forward exchange contracts | 270,220 | |||
Unrealized appreciation on OTC swap contracts | 1,331,221 | |||
Other assets | 2,740 | |||
|
| |||
Total assets | 452,222,711 | |||
|
| |||
Liabilities: | ||||
Payables: | ||||
Investment securities purchased | 41,173,760 | |||
Capital shares redeemed | 463 | |||
Management fees | 160,943 | |||
Distribution fees | 641 | |||
Transfer agent fees | 7,442 | |||
Trustees’ fees and expenses | 173 | |||
Distributions to shareholders | 1,134,718 | |||
Variation margin on futures contracts | 455,381 | |||
Variation margin on centrally cleared swap contracts | 191,861 | |||
OTC swap contracts (upfront receipts $2,728,000) | 1,967,509 | |||
Options written, at value (premiums received $22,815) | 3,465 | |||
Unrealized depreciation on OTC forward exchange contracts | 494,471 | |||
Unrealized depreciation on OTC swap contracts | 665,468 | |||
Deferred tax | 201 | |||
Accrued expenses and other liabilities | 39,465 | |||
|
| |||
Total liabilities | 46,295,961 | |||
|
| |||
Net assets, at value | $405,926,750 | |||
|
| |||
Net assets consist of: | ||||
Paid-in capital | $412,216,402 | |||
Total distributable earnings (loss) | (6,289,652 | ) | ||
|
| |||
Net assets, at value | $405,926,750 | |||
|
| |||
| franklintempleton.com | The accompanying notes are an integral part of these financial statements. | Semiannual Report | 35 | ||
FRANKLIN STRATEGIC SERIES
FINANCIAL STATEMENTS
Statement of Assets and Liabilities(continued)
October 31, 2019(unaudited)
Franklin Flexible Alpha Bond Fund
Class A: | ||||
Net assets, at value | $ 1,816,689 | |||
|
| |||
Shares outstanding | 188,414 | |||
|
| |||
Net asset value per sharea | $9.64 | |||
|
| |||
Maximum offering price per share (net asset value per share ÷ 96.25%) | $10.02 | |||
|
| |||
Class C: | ||||
Net assets, at value | $ 378,693 | |||
|
| |||
Shares outstanding | 39,550 | |||
|
| |||
Net asset value and maximum offering price per sharea | $9.58 | |||
|
| |||
Class R: | ||||
Net assets, at value | $ 84,036 | |||
|
| |||
Shares outstanding | 8,728 | |||
|
| |||
Net asset value and maximum offering price per share | $9.63 | |||
|
| |||
Class R6: | ||||
Net assets, at value | $403,211,593 | |||
|
| |||
Shares outstanding | 41,816,072 | |||
|
| |||
Net asset value and maximum offering price per share | $9.64 | |||
|
| |||
Advisor Class: | ||||
Net assets, at value | $ 435,739 | |||
|
| |||
Shares outstanding | 45,212 | |||
|
| |||
Net asset value and maximum offering price per share | $9.64 | |||
|
| |||
aRedemption price is equal to net asset value less contingent deferred sales charges, if applicable.
36 | Semiannual Report | The accompanying notes are an integral part of these financial statements. | franklintempleton.com | ||
FRANKLIN STRATEGIC SERIES
FINANCIAL STATEMENTS
Statement of Operations
for the six months ended October 31, 2019 (unaudited)
Franklin Flexible Alpha Bond Fund
Investment income: | ||||
Dividends: | ||||
Unaffiliated issuers | $ 226,552 | |||
Non-controlled affiliates (Note 3f) | 311,907 | |||
Interest: (net of foreign taxes)~ | ||||
Unaffiliated issuers | 7,825,060 | |||
|
| |||
Total investment income | 8,363,519 | |||
|
| |||
Expenses: | ||||
Management fees (Note 3a) | 1,169,095 | |||
Distribution fees: (Note 3c) | ||||
Class A | 2,113 | |||
Class C | 1,325 | |||
Class R | 211 | |||
Transfer agent fees: (Note 3e) | ||||
Class A | 2,285 | |||
Class C | 552 | |||
Class R | 114 | |||
Class R6 | 42,266 | |||
Advisor Class | 593 | |||
Custodian fees (Note 4) | 4,305 | |||
Reports to shareholders | 2,607 | |||
Registration and filing fees | 61,686 | |||
Professional fees | 15,975 | |||
Trustees’ fees and expenses | 2,986 | |||
Other | 88,813 | |||
|
| |||
Total expenses | 1,394,926 | |||
Expense reductions (Note 4) | (2,867 | ) | ||
Expenses waived/paid by affiliates (Note 3f and 3g) | (110,008 | ) | ||
|
| |||
Net expenses | 1,282,051 | |||
|
| |||
Net investment income | 7,081,468 | |||
|
| |||
Realized and unrealized gains (losses): | ||||
Net realized gain (loss) from: | ||||
Investments: | ||||
Unaffiliated issuers | (1,406,747 | ) | ||
Written options | 61,560 | |||
Foreign currency transactions | 95,211 | |||
Forward exchange contracts | 765,573 | |||
Futures contracts | (3,066,248 | ) | ||
Swap contracts | 331,171 | |||
|
| |||
Net realized gain (loss) | (3,219,480 | ) | ||
|
| |||
Net change in unrealized appreciation (depreciation) on: | ||||
Investments: | ||||
Unaffiliated issuers | 3,043,916 | |||
Translation of other assets and liabilities denominated in foreign currencies | (89,507 | ) | ||
Forward exchange contracts | (413,852 | ) | ||
Written options | (8,005 | ) | ||
Futures contracts | 888,077 | |||
Swap contracts | (2,951,625 | ) | ||
Change in deferred taxes on unrealized appreciation | (201 | ) | ||
|
| |||
| franklintempleton.com | The accompanying notes are an integral part of these financial statements. | Semiannual Report | 37 | ||
FRANKLIN STRATEGIC SERIES
FINANCIAL STATEMENTS
Statement of Operations(continued)
for the six months ended October 31, 2019 (unaudited)
Franklin Flexible Alpha Bond Fund
Net change in unrealized appreciation (depreciation) | 468,803 | |||
|
| |||
Net realized and unrealized gain (loss) | (2,750,677 | ) | ||
|
| |||
Net increase (decrease) in net assets resulting from operations | $ 4,330,791 | |||
|
| |||
~Foreign taxes withheld on interest | $ | 82 |
38 | Semiannual Report | The accompanying notes are an integral part of these financial statements. | franklintempleton.com | ||
FRANKLIN STRATEGIC SERIES
FINANCIAL STATEMENTS
Statements of Changes in Net Assets
Franklin Flexible Alpha Bond Fund
Six Months Ended October 31, 2019 | Year Ended April 30, 2019 | |||||||
| ||||||||
Increase (decrease) in net assets: | ||||||||
Operations: | ||||||||
Net investment income | $ 7,081,468 | $ 11,868,025 | ||||||
Net realized gain (loss) | (3,219,480 | ) | (943,499 | ) | ||||
Net change in unrealized appreciation (depreciation) | 468,803 | (1,089,579 | ) | |||||
|
| |||||||
Net increase (decrease) in net assets resulting from operations | 4,330,791 | 9,834,947 | ||||||
|
| |||||||
Distributions to shareholders: | ||||||||
Class A | (22,712 | ) | (41,958 | ) | ||||
Class C | (4,799 | ) | (7,107 | ) | ||||
Class R | (1,047 | ) | (1,752 | ) | ||||
Class R6 | (7,093,897 | ) | (12,371,974 | ) | ||||
Advisor Class | (6,427 | ) | (11,924 | ) | ||||
|
| |||||||
Total distributions to shareholders | (7,128,882 | ) | (12,434,715 | ) | ||||
|
| |||||||
Capital share transactions: (Note 2) | ||||||||
Class A | 369,214 | 351,865 | ||||||
Class C | 13,213 | 91,704 | ||||||
Class R | 1,377 | 33,323 | ||||||
Class R6 | (98,880,977 | ) | 296,632,582 | |||||
Advisor Class | 5,229 | 11,647 | ||||||
|
| |||||||
Total capital share transactions | (98,491,944 | ) | 297,121,121 | |||||
|
| |||||||
Net increase (decrease) in net assets | (101,290,035 | ) | 294,521,353 | |||||
Net assets: | ||||||||
Beginning of period | 507,216,785 | 212,695,432 | ||||||
|
| |||||||
End of period | $405,926,750 | $507,216,785 | ||||||
|
| |||||||
| franklintempleton.com | The accompanying notes are an integral part of these financial statements. | Semiannual Report | 39 | ||
FRANKLIN STRATEGIC SERIES
Notes to Financial Statements (unaudited)
Franklin Flexible Alpha Bond Fund
1. Organization and Significant Accounting Policies
Franklin Strategic Series (Trust) is registered under the Investment Company Act of 1940 (1940 Act) as anopen-end management investment company, consisting of twelve separate funds and applies the specialized accounting and reporting guidance in U.S. Generally Accepted Accounting Principles (U.S. GAAP). Franklin Flexible Alpha Bond Fund (Fund) is included in this report. The Fund offers five classes of shares: Class A, Class C, Class R, Class R6 and Advisor Class. Class C shares automatically convert to Class A shares after they have been held for 10 years. Each class of shares may differ by its initial sales load, contingent deferred sales charges, voting rights on matters affecting a single class, its exchange privilege and fees due to differing arrangements for distribution and transfer agent fees.
The Fund closed to new investors with limited exceptions on August 27, 2019, and is scheduled to close to all investors on December 4, 2019.
The following summarizes the Fund’s significant accounting policies.
a. Financial Instrument Valuation
The Fund’s investments in financial instruments are carried at fair value daily. Fair value is the price that would be received to sell an asset or paid to transfer a liability in an orderly transaction between market participants on the measurement date. The Fund calculates the net asset value (NAV) per share each business day as of 4 p.m. Eastern time or the regularly scheduled close of the New York Stock Exchange (NYSE), whichever is earlier. Under compliance policies and procedures approved by the Trust’s Board of Trustees (the Board), the Fund’s administrator has responsibility for oversight of valuation, including leading the cross-functional Valuation Committee (VC). The Fund may utilize independent pricing services, quotations from securities and financial instrument dealers, and other market sources to determine fair value.
Debt securities generally trade in theover-the-counter (OTC) market rather than on a securities exchange. The Fund’s pricing services use multiple valuation techniques to determine fair value. In instances where sufficient market activity exists, the pricing services may utilize a market-based approach through which quotes from market makers are used to determine fair value. In instances where sufficient market activity may not exist or is limited, the pricing services also
utilize proprietary valuation models which may consider market characteristics such as benchmark yield curves, credit spreads, estimated default rates, anticipated market interest rate volatility, coupon rates, anticipated timing of principal repayments, underlying collateral, and other unique security features in order to estimate the relevant cash flows, which are then discounted to calculate the fair value. Securities denominated in a foreign currency are converted into their U.S. dollar equivalent at the foreign exchange rate in effect at 4 p.m. Eastern time on the date that the values of the foreign debt securities are determined. Derivative financial instruments listed on an exchange are valued at the official closing price of the day.
Investments inopen-end mutual funds are valued at the closing NAV.
Certain derivative financial instruments are centrally cleared or trade in the OTC market. The Fund’s pricing services use various techniques including industry standard option pricing models and proprietary discounted cash flow models to determine the fair value of those instruments. The Fund’s net benefit or obligation under the derivative contract, as measured by the fair value of the contract, is included in net assets.
The Fund has procedures to determine the fair value of financial instruments for which market prices are not reliable or readily available. Under these procedures, the Fund primarily employs a market-based approach which may use related or comparable assets or liabilities, recent transactions, market multiples, book values, and other relevant information for the investment to determine the fair value of the investment. An income-based valuation approach may also be used in which the anticipated future cash flows of the investment are discounted to calculate fair value. Discounts may also be applied due to the nature or duration of any restrictions on the disposition of the investments. Due to the inherent uncertainty of valuations of such investments, the fair values may differ significantly from the values that would have been used had an active market existed.
b. Foreign Currency Translation
Portfolio securities and other assets and liabilities denominated in foreign currencies are translated into U.S. dollars based on the exchange rate of such currencies against U.S. dollars on the date of valuation. The Fund may enter into foreign currency exchange contracts to facilitate transactions denominated in a foreign currency. Purchases
40 | Semiannual Report | franklintempleton.com | ||
FRANKLIN STRATEGIC SERIES
NOTES TO FINANCIAL STATEMENTS (UNAUDITED)
Franklin Flexible Alpha Bond Fund(continued)
and sales of securities, income and expense items denominated in foreign currencies are translated into U.S. dollars at the exchange rate in effect on the transaction date. Portfolio securities and assets and liabilities denominated in foreign currencies contain risks that those currencies will decline in value relative to the U.S. dollar. Occasionally, events may impact the availability or reliability of foreign exchange rates used to convert the U.S. dollar equivalent value. If such an event occurs, the foreign exchange rate will be valued at fair value using procedures established and approved by the Board.
The Fund does not separately report the effect of changes in foreign exchange rates from changes in market prices on securities held. Such changes are included in net realized and unrealized gain or loss from investments in the Statement of Operations.
Realized foreign exchange gains or losses arise from sales of foreign currencies, currency gains or losses realized between the trade and settlement dates on securities transactions and the difference between the recorded amounts of dividends, interest, and foreign withholding taxes and the U.S. dollar equivalent of the amounts actually received or paid. Net unrealized foreign exchange gains and losses arise from changes in foreign exchange rates on foreign denominated assets and liabilities other than investments in securities held at the end of the reporting period.
c. Securities Purchased on a When-Issued and TBA Basis
The Fund purchases securities on a when-issued andto-be-announced (TBA) basis, with payment and delivery scheduled for a future date. These transactions are subject to market fluctuations and are subject to the risk that the value at delivery may be more or less than the trade date purchase price. Although the Fund will generally purchase these securities with the intention of holding the securities, it may sell the securities before the settlement date. Sufficient assets have been segregated for these securities.
d. Derivative Financial Instruments
The Fund invested in derivative financial instruments in order to manage risk or gain exposure to various other investments or markets. Derivatives are financial contracts based on an underlying or notional amount, require no initial investment or an initial net investment that is smaller than would normally be required to have a similar response to changes in market
factors, and require or permit net settlement. Derivatives contain various risks including the potential inability of the counterparty to fulfill their obligations under the terms of the contract, the potential for an illiquid secondary market, and/or the potential for market movements which expose the Fund to gains or losses in excess of the amounts shown in the Statement of Assets and Liabilities. Realized gain and loss and unrealized appreciation and depreciation on these contracts for the period are included in the Statement of Operations.
Derivative counterparty credit risk is managed through a formal evaluation of the creditworthiness of all potential counterparties. The Fund attempts to reduce its exposure to counterparty credit risk on OTC derivatives, whenever possible, by entering into International Swaps and Derivatives Association (ISDA) master agreements with certain counterparties. These agreements contain various provisions, including but not limited to collateral requirements, events of default, or early termination. Termination events applicable to the counterparty include certain deteriorations in the credit quality of the counterparty. Termination events applicable to the Fund include failure of the Fund to maintain certain net asset levels and/or limit the decline in net assets over various periods of time. In the event of default or early termination, the ISDA master agreement gives thenon-defaulting party the right to net andclose-out all transactions traded, whether or not arising under the ISDA agreement, to one net amount payable by one counterparty to the other. However, absent an event of default or early termination, OTC derivative assets and liabilities are presented gross and not offset in the Statement of Assets and Liabilities. Early termination by the counterparty may result in an immediate payment by the Fund of any net liability owed to that counterparty under the ISDA agreement.
Collateral requirements differ by type of derivative. Collateral or initial margin requirements are set by the broker or exchange clearing house for exchange traded and centrally cleared derivatives. Initial margin deposited is held at the exchange and can be in the form of cash and/or securities. For OTC derivatives traded under an ISDA master agreement, posting of collateral is required by either the Fund or the applicable counterparty if the total net exposure of all OTC derivatives with the applicable counterparty exceeds the minimum transfer amount, which typically ranges from $100,000 to $250,000, and can vary depending on the counterparty and the type of the agreement. Generally, collateral is determined at the close of Fund business each
| franklintempleton.com | Semiannual Report | 41 | ||
FRANKLIN STRATEGIC SERIES
NOTES TO FINANCIAL STATEMENTS (UNAUDITED)
Franklin Flexible Alpha Bond Fund(continued)
1. Organization and Significant Accounting
Policies(continued)
d. Derivative Financial Instruments(continued)
day and any additional collateral required due to changes in derivative values may be delivered by the Fund or the counterparty the next business day, or within a few business days. Collateral pledged and/or received by the Fund for OTC derivatives, if any, is held in segregated accounts with the Fund’s custodian/counterparty broker and can be in the form of cash and/or securities. Unrestricted cash may be invested according to the Fund’s investment objectives. To the extent that the amounts due to the Fund from its counterparties are not subject to collateralization or are not fully collateralized, the Fund bears the risk of loss from counterpartynon-performance.
The Fund entered into exchange traded futures contracts primarily to manage and/or gain exposure to interest rate risk. A futures contract is an agreement between the Fund and a counterparty to buy or sell an asset at a specified price on a future date. Required initial margins are pledged by the Fund, and the daily change in fair value is accounted for as a variation margin payable or receivable in the Statement of Assets and Liabilities.
The Fund entered into OTC forward exchange contracts primarily to manage and/or gain exposure to certain foreign currencies. A forward exchange contract is an agreement between the Fund and a counterparty to buy or sell a foreign currency at a specific exchange rate on a future date.
The Fund entered into credit default swap contracts primarily to manage and/or gain exposure to credit risk. A credit default swap is an agreement between the Fund and a counterparty whereby the buyer of the contract receives credit protection and the seller of the contract guarantees the credit worthiness of a referenced debt obligation. These agreements may be privately negotiated in theover-the-counter market (OTC credit default swaps) or may be executed in a multilateral trade facility platform, such as a registered exchange (centrally cleared credit default swaps). The underlying referenced debt obligation may be a single issuer of corporate or sovereign debt, a credit index, a basket of issuers or indices, or a tranche of a credit index or basket of issuers or indices. In the event of a default of the underlying referenced debt obligation, the buyer is entitled to receive the notional amount of the credit default swap contract from the seller in exchange for the referenced debt obligation, a net settlement amount equal to the notional amount of the credit default swap less the recovery value of the referenced debt
obligation, or other agreed upon amount. For centrally cleared credit default swaps, required initial margins are pledged by the Fund, and the daily change in fair value is accounted for as a variation margin payable or receivable in the Statement of Assets and Liabilities. Over the term of the contract, the buyer pays the seller a periodic stream of payments, provided that no event of default has occurred. Such periodic payments are accrued daily as an unrealized appreciation or depreciation until the payments are made, at which time they are realized. Upfront payments and receipts are reflected in the Statement of Assets and Liabilities and represent compensating factors between stated terms of the credit default swap agreement and prevailing market conditions (credit spreads and other relevant factors). These upfront payments and receipts are amortized over the term of the contract as a realized gain or loss in the Statement of Operations.
The Fund entered into OTC cross currency swap contracts primarily to manage and/or gain exposure to interest rate risk and certain foreign currencies. A cross currency swap is an agreement between the Fund and a counterparty to exchange cash flows (determined using either a fixed or floating rate) based on the notional amounts of two different currencies. The notional amounts are typically determined based on the spot exchange rates at the opening of the contract. Cross currency swaps may require the exchange of notional amounts at the opening and/or closing of the contract. Over the term of the contract, contractually required payments to be paid and to be received are accrued daily and recorded as unrealized depreciation and appreciation until the payments are made, at which time they are realized. Upfront payments and receipts are reflected in the Statement of Assets and Liabilities and represent compensating factors between stated terms of the cross currency swap contract and prevailing market conditions (interest rate spreads and other relevant factors). These upfront payments and receipts are amortized over the term of the contract as a realized gain or loss in the Statement of Operations.
The Fund entered into inflation index swap contracts primarily to manage and/or gain exposure to inflation risk. An inflation index swap is an agreement between the Fund and a counterparty to exchange cash flows whereby one party makes payments based on the percentage change in an index that serves as a measure of inflation and the other party makes a regular payment based on a compounded
42 | Semiannual Report | franklintempleton.com | ||
FRANKLIN STRATEGIC SERIES
NOTES TO FINANCIAL STATEMENTS (UNAUDITED)
Franklin Flexible Alpha Bond Fund(continued)
fixed rate, applied to a notional amount. These agreements may be privately negotiated in theover-the-counter market (OTC inflation index swap) or may be executed on a registered exchange (centrally cleared inflation index swap). For centrally cleared inflation index swaps, required initial margins are pledged by the Fund, and the daily change in fair value is accounted for as a variation margin payable or receivable. Over the term of the contract, contractually required payments to be paid and to be received are accrued daily and recorded as unrealized depreciation and appreciation until the payments are made, at which time they are realized. Typically, an inflation index swap has payment obligations netted and exchanged upon maturity.
The Fund entered into interest rate swap contracts primarily to manage interest rate risk. An interest rate swap is an agreement between the Fund and a counterparty to exchange cash flows based on the difference between two interest rates, applied to a notional amount. These agreements may be privately negotiated in theover-the-counter market (OTC interest rate swaps) or may be executed on a registered exchange (centrally cleared interest rate swaps). For centrally cleared interest rate swaps, required initial margins are pledged by the Fund, and the daily change in fair value is accounted for as a variation margin payable or receivable in the Statement of Assets and Liabilities. Over the term of the contract, contractually required payments to be paid and to be received are accrued daily and recorded as unrealized depreciation and appreciation until the payments are made, at which time they are realized.
The Fund entered into OTC total return swap contracts primarily to manage and/or gain exposure to interest rate risk of an underlying instrument such as a stock, bond, index or basket of securities or indices. A total return swap is an agreement between the Fund and a counterparty to exchange a return linked to an underlying instrument for a floating or fixed rate payment, both based upon a notional amount. Over the term of the contract, contractually required payments to be paid or received are accrued daily and recorded as unrealized appreciation or depreciation until the payments are made, at which time they are recognized as realized gain or loss.
The Fund purchased or wrote OTC option contracts primarily to manage and/or gain exposure to interest rate, foreign exchange rate and credit risk. An option is a contract entitling the holder to purchase or sell a specific amount of shares or units of an asset or notional amount of a swap (swaption), at
a specified price. When an option is purchased or written, an amount equal to the premium paid or received is recorded as an asset or liability, respectively. Upon exercise of an option, the acquisition cost or sales proceeds of the underlying investment is adjusted by any premium received or paid. Upon expiration of an option, any premium received or paid is recorded as a realized gain or loss. Upon closing an option other than through expiration or exercise, the difference between the premium received or paid and the cost to close the position is recorded as a realized gain or loss.
See Note 8 regarding other derivative information.
e. Loan Participation Notes
The Fund invests in loan participation notes (Participations). Participations are loans originally issued to a borrower by one or more financial institutions (the Lender) and subsequently sold to other investors, such as the Fund. Participations typically result in the Fund having a contractual relationship only with the Lender and not with the borrower. The Fund has the right to receive from the Lender any payments of principal, interest and fees which the Lender received from the borrower. The Fund generally has no rights to either enforce compliance by the borrower with the terms of the loan agreement or to any collateral relating to the original loan. As a result, the Fund assumes the credit risk of both the borrower and the Lender that is selling the Participation. The Participations may also involve interest rate risk and liquidity risk, including the potential default or insolvency of the borrower and/or the Lender.
f. Mortgage Dollar Rolls
The Fund enters into mortgage dollar rolls, typically on a TBA basis. Mortgage dollar rolls are agreements between the Fund and a financial institution where the Fund sells (or buys) mortgage-backed securities for delivery on a specified date and simultaneously contracts to repurchase (or sell) substantially similar (same type, coupon, and maturity) securities at a future date and at a predetermined price. Gains or losses are realized on the initial sale, and the difference between the repurchase price and the sale price is recorded as an unrealized gain or loss to the Fund upon entering into the mortgage dollar roll. In addition, the Fund may invest the cash proceeds that are received from the initial sale. During the period between the sale and repurchase, the Fund is not entitled to principal and interest paid on the mortgage backed securities. Transactions in mortgage dollar rolls are accounted for as purchases and
| franklintempleton.com | Semiannual Report | 43 | ||
FRANKLIN STRATEGIC SERIES
NOTES TO FINANCIAL STATEMENTS (UNAUDITED)
Franklin Flexible Alpha Bond Fund(continued)
1. Organization and Significant Accounting
Policies (continued)
f. Mortgage Dollar Rolls(continued)
sales and may result in an increase to the Fund’s portfolio turnover rate. The risks of mortgage dollar roll transactions include the potential inability of the counterparty to fulfill its obligations.
g. Income and Deferred Taxes
It is the Fund’s policy to qualify as a regulated investment company under the Internal Revenue Code. The Fund intends to distribute to shareholders substantially all of its taxable income and net realized gains to relieve it from federal income and excise taxes. As a result, no provision for U.S. federal income taxes is required.
The Fund may be subject to foreign taxation related to income received, capital gains on the sale of securities and certain foreign currency transactions in the foreign jurisdictions in which it invests. Foreign taxes, if any, are recorded based on the tax regulations and rates that exist in the foreign markets in which the Fund invests. When a capital gain tax is determined to apply, the Fund records an estimated deferred tax liability in an amount that would be payable if the securities were disposed of on the valuation date.
The Fund may recognize an income tax liability related to its uncertain tax positions under U.S. GAAP when the uncertain tax position has a less than 50% probability that it will be sustained upon examination by the tax authorities based on its technical merits. As of October 31, 2019, the Fund has determined that no tax liability is required in its financial statements related to uncertain tax positions for any open tax years (or expected to be taken in future tax years). Open tax years are those that remain subject to examination and are based on the statute of limitations in each jurisdiction in which the Fund invests.
h. Security Transactions, Investment Income, Expenses and Distributions
Security transactions are accounted for on trade date. Realized gains and losses on security transactions are determined on a specific identification basis. Interest income and estimated expenses are accrued daily. Amortization of premium and accretion of discount on debt securities are included in interest income. Paydown gains and losses are
recorded as an adjustment to interest income. Dividend income is recorded on theex-dividend date. Dividends from net investment income are normally declared daily; these dividends may be reinvested or paid monthly to shareholders. Distributions from realized capital gains and other distributions, if any, are recorded on theex-dividend date. Distributable earnings are determined according to income tax regulations (tax basis) and may differ from earnings recorded in accordance with U.S. GAAP. These differences may be permanent or temporary. Permanent differences are reclassified among capital accounts to reflect their tax character. These reclassifications have no impact on net assets or the results of operations. Temporary differences are not reclassified, as they may reverse in subsequent periods.
Common expenses incurred by the Trust are allocated among the Funds based on the ratio of net assets of each Fund to the combined net assets of the Trust or based on the ratio of number of shareholders of each Fund to the combined number of shareholders of the Trust. Fund specific expenses are charged directly to the Fund that incurred the expense.
Net investment income, excluding class specific expenses, is allocated daily to each class of shares based upon the relative value of the settled shares of each class. Realized and unrealized gains and losses are allocated daily to each class of shares based upon the relative proportion of net assets of each class. Differences in per share distributions by class are generally due to differences in class specific expenses.
Inflation-indexed bonds are adjusted for inflation through periodic increases or decreases in the security’s interest accruals, face amount, or principal redemption value, by amounts corresponding to the rate of inflation as measured by an index. Any increase or decrease in the face amount or principal redemption value will be included as interest income in the Statement of Operations.
i. Accounting Estimates
The preparation of financial statements in accordance with U.S. GAAP requires management to make estimates and assumptions that affect the reported amounts of assets and liabilities at the date of the financial statements and the amounts of income and expenses during the reporting period. Actual results could differ from those estimates.
44 | Semiannual Report | franklintempleton.com | ||
FRANKLIN STRATEGIC SERIES
NOTES TO FINANCIAL STATEMENTS (UNAUDITED)
Franklin Flexible Alpha Bond Fund(continued)
j. Guarantees and Indemnifications
Under the Trust’s organizational documents, its officers and trustees are indemnified by the Trust against certain liabilities arising out of the performance of their duties to the Trust. Additionally, in the normal course of business, the Trust, on behalf of the Fund, enters into contracts with service
providers that contain general indemnification clauses. The Trust’s maximum exposure under these arrangements is unknown as this would involve future claims that may be made against the Trust that have not yet occurred. Currently, the Trust expects the risk of loss to be remote.
2. Shares of Beneficial Interest
At October 31, 2019, there were an unlimited number of shares authorized (without par value). Transactions in the Fund’s shares were as follows:
| Six Months Ended | Year Ended | |||||||||||||||
| October 31, 2019 | April 30, 2019 | |||||||||||||||
| Shares | Amount | Shares | Amount | |||||||||||||
Class A Shares: | ||||||||||||||||
Shares solda | 54,553 | $ | 527,949 | 146,054 | $ | 1,426,571 | ||||||||||
Shares issued in reinvestment of distributions | 2,332 | 22,574 | 4,309 | 41,654 | ||||||||||||
Shares redeemed | (18,720 | ) | (181,309 | ) | (115,764 | ) | (1,116,360 | ) | ||||||||
Net increase (decrease) | 38,165 | $ | 369,214 | 34,599 | $ | 351,865 | ||||||||||
Class C Shares: | ||||||||||||||||
Shares sold | 9,247 | $ | 89,057 | 21,517 | $ | 208,316 | ||||||||||
Shares issued in reinvestment of distributions | 498 | 4,783 | 735 | 7,066 | ||||||||||||
Shares redeemeda | (8,390 | ) | (80,627 | ) | (12,740 | ) | (123,678 | ) | ||||||||
Net increase (decrease) | 1,355 | $ | 13,213 | 9,512 | $ | 91,704 | ||||||||||
Class R Shares: | ||||||||||||||||
Shares sold | 34 | $ | 330 | 3,238 | $ | 31,606 | ||||||||||
Shares issued in reinvestment of distributions | 108 | 1,047 | 181 | 1,752 | ||||||||||||
Shares redeemed | — | — | (3 | ) | (35 | ) | ||||||||||
Net increase (decrease) | 142 | $ | 1,377 | 3,416 | $ | 33,323 | ||||||||||
Class R6 Shares: | ||||||||||||||||
Shares sold | — | $ | — | 31,582,771 | $ | 307,592,000 | ||||||||||
Shares issued in reinvestment of distributions | 24,324 | 236,429 | 29,382 | 284,707 | ||||||||||||
Shares redeemed | (10,197,264 | ) | (99,117,406 | ) | (1,157,235 | ) | (11,244,125 | ) | ||||||||
Net increase (decrease) | (10,172,940 | ) | $ | (98,880,977 | ) | 30,454,918 | $ | 296,632,582 | ||||||||
Advisor Class Shares: | ||||||||||||||||
Shares sold | 6,939 | $ | 67,450 | 4,301 | $ | 41,736 | ||||||||||
Shares issued in reinvestment of distributions | 664 | 6,427 | 1,232 | 11,923 | ||||||||||||
Shares redeemed | (7,063 | ) | (68,648 | ) | (4,298 | ) | (42,012 | ) | ||||||||
Net increase (decrease) | 540 | $ | 5,229 | 1,235 | $ | 11,647 | ||||||||||
aMay include a portion of Class C shares that were automatically converted to Class A.
| franklintempleton.com | Semiannual Report | 45 | ||
FRANKLIN STRATEGIC SERIES
NOTES TO FINANCIAL STATEMENTS (UNAUDITED)
Franklin Flexible Alpha Bond Fund(continued)
3. Transactions with Affiliates
Franklin Resources, Inc. is the holding company for various subsidiaries that together are referred to as Franklin Templeton. Certain officers and trustees of the Trust are also officers and/or directors of the following subsidiaries:
| Subsidiary | Affiliation | |||
| Franklin Advisers, Inc. (Advisers) | Investment manager | |||
| Franklin Templeton Institutional, LLC (FT Institutional) | Investment manager | |||
| Franklin Templeton Services, LLC (FT Services) | Administrative manager | |||
| Franklin Templeton Distributors, Inc. (Distributors) | Principal underwriter | |||
| Franklin Templeton Investor Services, LLC (Investor Services) | Transfer agent | |||
a. Management Fees
The Fund pays an investment management fee to Advisers based on the average daily net assets of the Fund as follows:
| Annualized Fee Rate | Net Assets | |||
| 0.550% | Up to and including $1 billion | |||
| 0.500% | Over $1 billion, up to and including $5 billion | |||
| 0.450% | Over $5 billion, up to and including $10 billion | |||
| 0.445% | Over $10 billion, up to and including $15 billion | |||
| 0.440% | Over $15 billion, up to and including $20 billion | |||
| 0.435% | In excess of $20 billion | |||
Under a subadvisory agreement, FT Instituitional, an affiliate of Advisers, provides subadvisory services to the Fund. The subadvisory fee is paid by Advisers based on the Fund’s average daily net assets, and is not an additional expense of the Fund.
b. Administrative Fees
Under an agreement with Advisers, FT Services provides administrative services to the Fund. The fee is paid by Advisers based on the Fund’s average daily net assets, and is not an additional expense of the Fund.
c. Distribution Fees
The Board has adopted distribution plans for each share class, with the exception of Class R6 and Advisor Class shares, pursuant to Rule12b-1 under the 1940 Act. Under the Fund’s Class A reimbursement distribution plan, the Fund reimburses Distributors for costs incurred in connection with the servicing, sale and distribution of the Fund’s shares up to the maximum annual plan rate. Under the Class A reimbursement distribution plan, costs exceeding the maximum for the current plan year cannot be reimbursed in subsequent periods. In addition, under the Fund’s Class C and R compensation distribution plans, the Fund pays Distributors for costs incurred in connection with the servicing, sale and distribution of the Fund’s shares up to the maximum annual plan rate for each class. The plan year, for purposes of monitoring compliance with the maximum annual plan rates, is February 1 through January 31.
46 | Semiannual Report | franklintempleton.com | ||
FRANKLIN STRATEGIC SERIES
NOTES TO FINANCIAL STATEMENTS (UNAUDITED)
Franklin Flexible Alpha Bond Fund(continued)
The maximum annual plan rates, based on the average daily net assets, for each class, are as follows:
Class A | 0.25 | % | ||
Class C | 0.65 | % | ||
Class R | 0.50 | % |
d. Sales Charges/Underwriting Agreements
Front-end sales charges and contingent deferred sales charges (CDSC) do not represent expenses of the Fund. These charges are deducted from the proceeds of sales of Fund shares prior to investment or from redemption proceeds prior to remittance, as applicable. Distributors has advised the Fund of the following commission transactions related to the sales and redemptions of the Fund’s shares for the period:
Sales charges retained net of commissions paid to unaffiliated brokers/dealers | $ | 12 | ||
CDSC retained | $ | 6 |
e. Transfer Agent Fees
Each class of shares pays transfer agent fees to Investor Services for its performance of shareholder servicing obligations. The fees are based on an annualized asset based fee of 0.02% plus a transaction based fee. In addition, each class reimburses Investor Services for out of pocket expenses incurred and, except for Class R6, reimburses shareholder servicing fees paid to third parties. These fees are allocated daily based upon their relative proportion of such classes’ aggregate net assets. Class R6 pays Investor Services transfer agent fees specific to that class.
For the period ended October 31, 2019, the Fund paid transfer agent fees of $45,810, of which $44,931 was retained by Investor Services.
f. Investments in Affiliated Management Investment Companies
The Fund invests in one or more affiliated management investment companies for purposes other than exercising a controlling influence over the management or policies. Management fees paid by the Fund are waived on assets invested in the affiliated management investment companies, as noted in the Statement of Operations, in an amount not to exceed the management and administrative fees paid directly or indirectly by each affiliate. During the period ended October 31, 2019, the Fund held investments in affiliated management investment companies as follows:
| Value at Beginning of Period | Purchases | Sales | Realized Gain (Loss) | Net Change in Unrealized Appreciation (Depreciation) | Value at End of Period | Number of Shares Held at End of Period | Dividend Income | |||||||||||||||||||||||||
Non-Controlled Affiliates | ||||||||||||||||||||||||||||||||
Institutional Fiduciary Trust Money Market Portfolio, 1.56% | $ | 77,861,898 | $ | 75,078,294 | $ | (128,553,334 | ) | $ — | $ — | $ | 24,386,858 | 24,386,858 | $ | 311,907 | ||||||||||||||||||
|
|
|
| |||||||||||||||||||||||||||||
g. Waiver and Expense Reimbursements
Advisers and Investor Services have contractually agreed in advance to waive or limit their respective fees and to assume as their own expense certain expenses otherwise payable by the Fund so that the expenses (excluding distribution fees, acquired fund fees and expenses and certainnon-routine expenses or costs, including those relating to litigation, indemnification,
| franklintempleton.com | Semiannual Report | 47 | ||
FRANKLIN STRATEGIC SERIES
NOTES TO FINANCIAL STATEMENTS (UNAUDITED)
Franklin Flexible Alpha Bond Fund(continued)
3. Transactions with Affiliates(continued)
g. Waiver and Expense Reimbursements(continued)
reorganizations, and liquidations) for Class A, Class C, Class R and Advisor Class of the Fund do not exceed 0.85% and for Class R6 do not exceed 0.56%, based on the average net assets of each class until August 31, 2020. Total expenses waived or paid are not subject to recapture subsequent to the Fund’s fiscal year end.
Prior to September 1, 2019, expenses (excluding certain fees and expenses as previously disclosed) for Class R6 were limited to 0.81% based on the average net assets of the class.
h. Other Affiliated Transactions
At October 31, 2019, Franklin Resources, Inc owned 99.3% of the Fund’s outstanding shares. Investment activities of this shareholder could have a material impact on the Fund.
4. Expense Offset Arrangement
The Fund has entered into an arrangement with its custodian whereby credits realized as a result of uninvested cash balances are used to reduce a portion of the Fund’s custodian expenses. During the period ended October 31, 2019, the custodian fees were reduced as noted in the Statement of Operations.
5. Income Taxes
For tax purposes, capital losses may be carried over to offset future capital gains.
At April 30, 2019, the capital loss carryforwards were as follows:
Capital loss carryforwards not subject to expiration: | ||||
Short term | $ | 1,069,279 | ||
Long term | 2,264,409 | |||
Total capital loss carryforwards | $ | 3,333,688 | ||
At October 31, 2019, the cost of investments and net unrealized appreciation (depreciation) for income tax purposes were as follows:
Cost of investments | $ | 436,048,166 | ||
Unrealized appreciation | $ | 10,564,527 | ||
Unrealized depreciation | (13,518,683 | ) | ||
Net unrealized appreciation (depreciation) | $ | (2,954,156 | ) | |
Differences between income and/or capital gains as determined on a book basis and a tax basis are primarily due to differing treatments of paydown losses, swaps and financial futures transactions.
6. Investment Transactions
Purchases and sales of investments (excluding short term securities) for the period ended October 31, 2019, aggregated $181,133,424 and $206,625,532, respectively.
48 | Semiannual Report | franklintempleton.com | ||
FRANKLIN STRATEGIC SERIES
NOTES TO FINANCIAL STATEMENTS (UNAUDITED)
Franklin Flexible Alpha Bond Fund(continued)
7. Credit Risk
At October 31, 2019, the Fund had 13.0% of its portfolio invested in high yield or other securities rated below investment grade and unrated securities, if any. These securities may be more sensitive to economic conditions causing greater price volatility and are potentially subject to a greater risk of loss due to default than higher rated securities.
8. Other Derivative Information
At October 31, 2019, investments in derivative contracts are reflected in the Statement of Assets and Liabilities as follows:
| Asset Derivatives | Liability Derivatives | |||||||||||||||
Derivative Contracts Not Accounted for as Hedging Instruments | Statement of Assets and Liabilities Location | Fair Value | Statement of Assets and Liabilities Location | Fair Value | ||||||||||||
Interest rate contracts | Variation margin on futures contracts | $ | 1,037,362 | a | Variation margin on futures contracts | $ | 520,586 | a | ||||||||
Variation margin on centrally cleared swap contracts | — | Variation margin on centrally cleared swap contracts | 3,444,081 | a | ||||||||||||
Unrealized appreciation on OTC swap contracts | 936,060 | Unrealized depreciation on OTC swap contracts | 64,285 | |||||||||||||
Foreign exchange contracts | Unrealized appreciation on OTC forward exchange contracts | 270,220 | Unrealized depreciation on OTC forward exchange contracts | 494,471 | ||||||||||||
Credit contracts | Investments in securities, at value | 16,323 | b | Options written, at value | 3,465 | |||||||||||
OTC swap contracts (upfront payments) | 302,765 | OTC swap contracts (upfront receipts) | 1,967,509 | |||||||||||||
Unrealized appreciation on OTC swap contracts | 395,161 | Unrealized depreciation on OTC swap contracts | 601,183 | |||||||||||||
Inflation contracts | Variation margin on centrally cleared swap contracts | — | Variation margin on centrally cleared swap contracts | 431,847 | a | |||||||||||
|
|
|
| |||||||||||||
Totals | $ | 2,957,891 | $ | 7,527,427 | ||||||||||||
|
|
|
| |||||||||||||
aThis amount reflects the cumulative appreciation (depreciation) of futures contracts and centrally cleared swap contracts as reported in the Statement of Investments. Only the variation margin receivable/payable at period end is separately reported within the Statement of Assets and Liabilities. Prior variation margin movements were recorded to cash upon receipt or payment.
bPurchased option contracts are included in investments in securities, at value in the Statement of Assets and Liabilities.
For the period ended October 31, 2019, the effect of derivative contracts in the Statement of Operations was as follows:
Derivative Contracts Not Accounted for as Hedging Instruments | Statement of Operations Location | Net Realized Gain (Loss) for the Period | Statement of Operations Location | Net Change in Unrealized Appreciation (Depreciation) for the Period | ||||||||
| Net realized gain (loss) from: | Net change in unrealized | |||||||||||
| appreciation (depreciation) on: | ||||||||||||
Interest rate contracts | Investments | $ | (14,431 | )a | Investments | $ | 92,440 | a | ||||
| Futures contracts | (3,066,248 | ) | Futures contracts | 888,077 | ||||||||
| Swap contracts | 734,194 | Swap contracts | (2,760,433 | ) | ||||||||
Foreign exchange contracts | Forward exchange contracts | 765,573 | Forward exchange contracts | (413,852 | ) | |||||||
| franklintempleton.com | Semiannual Report | 49 | ||
FRANKLIN STRATEGIC SERIES
NOTES TO FINANCIAL STATEMENTS (UNAUDITED)
Franklin Flexible Alpha Bond Fund(continued)
8. Other Derivative Information(continued)
Derivative Contracts Not Accounted for as Hedging Instruments | Statement of Operations Location | Net Realized Gain (Loss) for the Period | Statement of Operations Location | Net Change in Unrealized Appreciation (Depreciation) for the Period | ||||||||
| Net realized gain (loss) from: | Net change in unrealized | |||||||||||
| appreciation (depreciation) on: | ||||||||||||
Credit contracts | Investments | $ (381,854)a | Investments | $ | 57,743 | a | ||||||
| Written options | 61,560 | Written options | (8,005) | |||||||||
| Swap contracts | (402,992) | Swap contracts | 72,321 | |||||||||
Inflation contracts | Swap contracts | (31) | Swap contracts | (263,513) | ||||||||
|
|
|
| |||||||||
Totals | $(2,304,229) | $ | (2,335,222) | |||||||||
|
|
|
| |||||||||
aPurchased option contracts are included in net realized gain (loss) from investments and net change in unrealized appreciation (depreciation) on investments in the Statement of Operations.
For the period ended October 31, 2019, the average month end notional amount of futures contracts, options and swap contracts and the average month end contract value for forward exchange contracts were as follows:
Futures contracts | $ | 164,814,825 | ||
Options | 87,687,143 | |||
Swap contracts | 172,263,489 | |||
Forward exchange contracts | 46,682,805 |
At October 31, 2019, OTC derivative assets and liabilities are as follows:
Gross Amounts of Assets and Liabilities Presented | ||||||||
| Assetsa | Liabilitiesa | |||||||
Derivatives | ||||||||
Forward exchange contracts | $ 270,220 | $ 494,471 | ||||||
Options purchased | 16,323 | — | ||||||
Options written | — | 3,465 | ||||||
Swap contracts | 1,633,986 | 2,632,977 | ||||||
Total | $1,920,529 | $3,130,913 | ||||||
aAbsent an event of default or early termination, OTC derivative assets and liabilities are presented gross and not offset in the Statement of Assets and Liabilities.
50 | Semiannual Report | franklintempleton.com | ||
FRANKLIN STRATEGIC SERIES
NOTES TO FINANCIAL STATEMENTS (UNAUDITED)
Franklin Flexible Alpha Bond Fund(continued)
At October 31, 2019, OTC derivative assets, which may be offset against OTC derivative liabilities and collateral received from the counterparty, are as follows:
Amounts Not Offset in the Statement of Assets and Liabilities | ||||||||||||||||||||
Gross Amounts of | Financial Instruments Available for Offset | Financial Instruments Collateral Receiveda,b | Cash Collateral Received | Net Amount (Not less than zero) | ||||||||||||||||
Counterparty | ||||||||||||||||||||
BNDP | $ 15,920 | $ (7,451 | ) | $ — | $ — | $ 8,469 | ||||||||||||||
BZWS | 36,217 | (36,217 | ) | — | — | — | ||||||||||||||
CITI | 848,965 | (848,965 | ) | — | — | — | ||||||||||||||
DBAB | 367,936 | (5,938 | ) | (361,998 | ) | — | — | |||||||||||||
FBCO | 49,778 | (49,778 | ) | — | — | — | ||||||||||||||
GSCO | 126,157 | (47,101 | ) | — | — | 79,056 | ||||||||||||||
JPHQ | 418,824 | (418,824 | ) | — | — | — | ||||||||||||||
MSCO | 56,732 | (45,652 | ) | — | — | 11,080 | ||||||||||||||
|
| |||||||||||||||||||
Total | $1,920,529 | $(1,459,926 | ) | $(361,998 | ) | $ — | $98,605 | |||||||||||||
|
| |||||||||||||||||||
At October 31, 2019, OTC derivative liabilities, which may be offset against OTC derivative assets and collateral pledged to the counterparty, are as follows:
Amounts Not Offset in the Statement of Assets and Liabilities | ||||||||||||||||||||
Gross Amounts of | Financial Instruments Available for Offset | Financial Instruments Collateral Pledged | Cash Collateral Pledgedb | Net Amount (Not less than zero) | ||||||||||||||||
Counterparty | ||||||||||||||||||||
BNDP | $ 7,451 | $ (7,451 | ) | $ — | $ — | $ — | ||||||||||||||
BZWS | 476,179 | (36,217 | ) | — | (439,962 | ) | — | |||||||||||||
CITI | 1,203,773 | (848,965 | ) | — | (290,000 | ) | 64,808 | |||||||||||||
DBAB | 5,938 | (5,938 | ) | — | — | — | ||||||||||||||
FBCO | 243,938 | (49,778 | ) | — | (194,160 | ) | — | |||||||||||||
GSCO | 47,101 | (47,101 | ) | — | — | — | ||||||||||||||
JPHQ | 1,100,881 | (418,824 | ) | — | (590,000 | ) | 92,057 | |||||||||||||
MSCO | 45,652 | (45,652 | ) | — | — | — | ||||||||||||||
|
| |||||||||||||||||||
Total | $3,130,913 | $(1,459,926 | ) | $ — | $(1,514,122 | ) | $156,865 | |||||||||||||
|
| |||||||||||||||||||
aAt October 31, 2019, the Fund received U.S. Treasury Bonds and Notes as collateral for derivatives.
bIn some instances, the collateral amounts disclosed in the table above were adjusted due to the requirement to limit the collateral amounts to avoid the effect of overcollateralization. Actual collateral received and/or pledged may be more than the amounts disclosed herein.
See Note 1(d) regarding derivative financial instruments.
See Abbreviations on page 54.
| franklintempleton.com | Semiannual Report | 51 | ||
FRANKLIN STRATEGIC SERIES
NOTES TO FINANCIAL STATEMENTS (UNAUDITED)
Franklin Flexible Alpha Bond Fund(continued)
9. Credit Facility
The Fund, together with other U.S. registered and foreign investment funds (collectively, Borrowers), managed by Franklin Templeton, are borrowers in a joint syndicated senior unsecured credit facility totaling $2 billion (Global Credit Facility) which matures on February 7, 2020. This Global Credit Facility provides a source of funds to the Borrowers for temporary and emergency purposes, including the ability to meet future unanticipated or unusually large redemption requests.
Under the terms of the Global Credit Facility, the Fund shall, in addition to interest charged on any borrowings made by the Fund and other costs incurred by the Fund, pay its share of fees and expenses incurred in connection with the implementation and maintenance of the Global Credit Facility, based upon its relative share of the aggregate net assets of all of the Borrowers, including an annual commitment fee of 0.15% based upon the unused portion of the Global Credit Facility. These fees are reflected in other expenses in the Statement of Operations. During the period ended October 31, 2019, the Fund did not use the Global Credit Facility.
10. Fair Value Measurements
The Fund follows a fair value hierarchy that distinguishes between market data obtained from independent sources (observable inputs) and the Fund’s own market assumptions (unobservable inputs). These inputs are used in determining the value of the Fund’s financial instruments and are summarized in the following fair value hierarchy:
| • | Level 1 – quoted prices in active markets for identical financial instruments |
| • | Level 2 – other significant observable inputs (including quoted prices for similar financial instruments, interest rates, prepayment speed, credit risk, etc.) |
| • | Level 3 – significant unobservable inputs (including the Fund’s own assumptions in determining the fair value of financial instruments) |
The input levels are not necessarily an indication of the risk or liquidity associated with financial instruments at that level.
52 | Semiannual Report | franklintempleton.com | ||
FRANKLIN STRATEGIC SERIES
NOTES TO FINANCIAL STATEMENTS (UNAUDITED)
Franklin Flexible Alpha Bond Fund(continued)
A summary of inputs used as of October 31, 2019, in valuing the Fund’s assets and liabilities carried at fair value, is as follows:
| Level 1 | Level 2 | Level 3 | Total | |||||||||||||
Assets: | ||||||||||||||||
Investments in Securities:a | ||||||||||||||||
Corporate Bonds | $ | — | �� | $ | 91,538,420 | $ | — | $ | 91,538,420 | |||||||
Foreign Government and Agency Securities | — | 29,505,014 | — | 29,505,014 | ||||||||||||
U.S. Government and Agency Securities | — | 13,082,618 | — | 13,082,618 | ||||||||||||
Asset-Backed Securities and Commercial | ||||||||||||||||
Mortgage-Backed Securities | — | 245,036,078 | — | 245,036,078 | ||||||||||||
Mortgage-Backed Securities | — | 32,721,587 | — | 32,721,587 | ||||||||||||
Municipal Bonds | — | 821,191 | — | 821,191 | ||||||||||||
Options Purchased | — | 16,323 | — | 16,323 | ||||||||||||
Short Term Investments | 24,386,858 | — | — | 24,386,858 | ||||||||||||
Total Investments in Securities | $ | 24,386,858 | $ | 412,721,231 | $ | — | $ | 437,108,089 | ||||||||
Other Financial Instruments: | ||||||||||||||||
Futures Contracts | $ | 1,037,362 | $ | — | $ | — | $ | 1,037,362 | ||||||||
Forward Exchange Contracts | — | 270,220 | — | 270,220 | ||||||||||||
Swap Contracts | — | 1,331,221 | — | 1,331,221 | ||||||||||||
Total Other Financial Instruments | $ | 1,037,362 | $ | 1,601,441 | $ | — | $ | 2,638,803 | ||||||||
Liabilities: | ||||||||||||||||
Other Financial Instruments: | ||||||||||||||||
Options Written | $ | — | $ | 3,465 | $ | — | $ | 3,465 | ||||||||
Futures Contracts | 520,586 | — | — | 520,586 | ||||||||||||
Forward Exchange Contracts | — | 494,471 | — | 494,471 | ||||||||||||
Swap Contracts | — | 4,541,396 | — | 4,541,396 | ||||||||||||
Total Other Financial Instruments | $ | 520,586 | $ | 5,039,332 | $ | — | $ | 5,559,918 | ||||||||
aFor detailed categories, see the accompanying Statement of Investments.
11. Subsequent Events
The Fund has evaluated subsequent events through the issuance of the financial statements and determined that in addition to those events previously disclosed, the following subsequent event requires disclosure:
On December 6, 2019, Franklin Low Duration Total Return Fund (Surviving Fund), pursuant to a plan of reorganization approved on October 18, 2019, by shareholders of Franklin Flexible Alpha Bond Fund (Acquired Fund), a series of Franklin Strategic Series acquired 100% of the Acquired Fund’s net assets, primarily made up of investment securities, through atax-free exchange of shares of the Surviving Fund for the net assets of the Acquired Fund. Capital losses obtained by the Surviving Fund may be carried over to offset future capital gains, subject to certain limitations.
| franklintempleton.com | Semiannual Report | 53 | ||
FRANKLIN STRATEGIC SERIES
NOTES TO FINANCIAL STATEMENTS (UNAUDITED)
Franklin Flexible Alpha Bond Fund(continued)
Abbreviations
| Counterparty/Exchange | Currency | Selected Portfolio | ||||||||
| BNDP | BNP Paribas | COP | Colombian Peso | CLO | Collateralized Loan Obligation | |||||
| BZWS | Barclays Bank PLC | CNY | Chinese Renminbi | CNRR | China Reverse Repo Rate | |||||
| CITI | Citigroup, Inc. | DKK | Danish Krone | CPI | Consumer Price Index | |||||
| DBAB | Deutsche Bank AG | DOP | Dominican Peso | FNMA | Federal National Mortgage Association | |||||
| FBCO | Credit Suisse International | EUR | Euro | FRN | Floating Rate Note | |||||
| GSCO | The Goldman Sachs Group, Inc. | GBP | British Pound | GO | General Obligation | |||||
| JPHQ | JP Morgan Chase & Co. | USD | United States Dollar | IO | Interest Only | |||||
| MSCO | Morgan Stanley | UYU | Uruguayan Peso | LIBOR | London InterBank Offered Rate | |||||
| ZAR | South African Rand | RDA | Redevelopment Agency/Authority | |||||||
| SFR | Single Family Revenue | |||||||||
| Index | ||||
| CDX.NA.HY.Series number | CDX North America High Yield Index | |||
| CDX.NA.IG.Series number | CDX North America Investment Grade Index | |||
| MCDX.NA.Series number | MCDX North America Index | |||
54 | Semiannual Report | franklintempleton.com | ||
FRANKLIN STRATEGIC SERIES
FRANKLIN FLEXIBLE ALPHA BOND FUND
Proxy Voting Policies and Procedures
The Fund’s investment manager has established Proxy Voting Policies and Procedures (Policies) that the Fund uses to determine how to vote proxies relating to portfolio securities. Shareholders may view the Fund’s complete Policies online at franklintempleton.com. Alternatively, shareholders may request copies of the Policies free of charge by calling the Proxy Group collect at (954)527-7678 or by sending a written request to: Franklin Templeton Companies, LLC, 300 S.E. 2nd Street, Fort Lauderdale, FL 33301, Attention: Proxy Group. Copies of the Fund’s proxy voting records are also made available online at franklintempleton.com and posted on the U.S. Securities and Exchange Commission’s website at sec.gov and reflect the most recent12-month period ended June 30.
Quarterly Statement of Investments
The Trust, on behalf of the Fund, files a complete statement of investments with the U.S. Securities and Exchange Commission for the first and third quarters for each fiscal year as an exhibit to its report on FormN-PORT. Shareholders may view the filed FormN-PORT by visiting the Commission’s website at sec.gov. The filed form may also be viewed and copied at the Commission’s Public Reference Room in Washington, DC. Information regarding the operations of the Public Reference Room may be obtained by calling(800) SEC-0330.
| franklintempleton.com | Semiannual Report | 55 | ||
This page intentionally left blank.
Authorized for distribution only when accompanied or preceded by a summary prospectus and/or prospectus. Investors should carefully consider a fund’s investment goals, risks, charges and expenses before investing. A prospectus contains this and other information; please read it carefully before investing.
To help ensure we provide you with quality service, all calls to and from our service areas are monitored and/or recorded.
 | Semiannual Report and Shareholder Letter | |||||||
Franklin Flexible Alpha Bond Fund
| ||||||||
| Investment Manager | Subadvisor | Distributor | Shareholder Services | |||||
| Franklin Advisers, Inc. | Franklin Templeton Institutional, LLC | Franklin Templeton Distributors, Inc. (800) DIAL BEN®/ 342-5236 franklintempleton.com | (800)632-2301 | |||||
| © 2019 Franklin Templeton Investments. All rights reserved. | 953 S 12/19 |
Sign up for electronic delivery at franklintempleton.com/edelivery
Internet Delivery of Fund Reports Unless You Request Paper Copies: Effective January 1, 2021, as permitted by the SEC, paper copies of the Fund’s shareholder reports will no longer be sent by mail, unless you specifically request them from the Fund or your financial intermediary. Instead, the reports will be made available on a website, and you will be notified by mail each time a report is posted and provided with a website link to access the report.
If you already elected to receive shareholder reports electronically, you will not be affected by this change and you need not take any action. If you have not signed up for electronic delivery, we would encourage you to join fellow shareholders who have. You may elect to receive shareholder reports and other communications electronically from the Fund by calling (800)632-2301 or by contacting your financial intermediary.
You may elect to continue to receive paper copies of all your future shareholder reports free of charge by contacting your financial intermediary or, if you invest directly with a Fund, calling (800)632-2301 to let the Fund know of your request. Your election to receive reports in paper will apply to all funds held in your account.
SHAREHOLDER LETTER
Dear Shareholder:
During the six months ended October 31, 2019, the U.S. economy continued to grow, but at a more moderate pace due to concerns about trade and geopolitical stress.
The Standard & Poor’s® 500 Index (S&P 500®) recovered from heightened volatility in May and August 2019, reaching newall-time highs in October amid better-than-expected corporate earnings, investor optimism about a potential U.S.-China trade agreement and the U.S. Federal Reserve’s third successive rate cut. However, markets reflected concerns about tighter regulation of technology companies, U.S. political uncertainties, geopolitical tensions and the impact of trade disputes on global growth and corporate earnings. In this environment, investment-grade bonds, as measured by the Bloomberg Barclays U.S. Aggregate Bond Index, posted a positive total return for thesix-month period.
We are committed to our long-term perspective and disciplined investment approach as we conduct a rigorous, fundamental analysis of securities with a regular emphasis on investment risk management.
We believe active, professional investment management serves investors well. We also recognize the important role of financial advisors in today’s markets and encourage investors to continue to seek their advice. Amid changing markets and economic conditions, we are confident investors with a well-diversified portfolio and a patient, long-term outlook should be well positioned for the years ahead.
In addition, Franklin Strategic Income Fund’s semiannual report includes more detail about prevailing conditions and a discussion about investment decisions during the period. Please remember all securities markets fluctuate, as do mutual fund share prices.
We thank you for investing with Franklin Templeton, welcome your questions and comments, and look forward to serving your future investment needs.
Sincerely, |
 |
Edward Perks, CFA |
President and Chief Executive Officer – |
Investment Management |
Franklin Strategic Series |
This letter reflects our analysis and opinions as of October 31, 2019, unless otherwise indicated. The information is not a complete analysis of every aspect of any market, country, industry, security or fund. Statements of fact are from sources considered reliable.
| CFA® is a trademark owned by CFA Institute. | ||||
Not FDIC Insured | May Lose Value | No Bank Guarantee
|
| franklintempleton.com | Not part of the semiannual report | 1 | ||
Semiannual Report | ||||
| 3 | ||||
| �� | 7 | |||
| 9 | ||||
| Consolidated Financial Highlights and Consolidated Statement of Investments | 10 | |||
| 42 | ||||
| 47 | ||||
| 66 | ||||
| Visitfranklintempleton.comfor fund updates, to access your account, or to find helpful financial planning tools. |
2 | Semiannual Report | franklintempleton.com | ||
SEMIANNUAL REPORT
Franklin Strategic Income Fund
This semiannual report for Franklin Strategic Income Fund covers the period ended October 31, 2019.
Your Fund’s Goal and Main Investments
The Fund seeks a high level of current income, with capital appreciation over the long term as a secondary objective. The Fund uses an active asset allocation process and under normal market conditions invests at least 65% of its assets in U.S. and foreign debt securities, including those in emerging markets.
The Fund may invest in all varieties of fixed, variable and floating rate income securities, including bonds, U.S. and foreign government and agency securities, corporate loans (and loan participations), mortgage-backed securities and other asset-backed securities and convertible securities.
Performance Overview
The Fund’s Class A shares posted a +1.74% cumulative total return for the six months under review. In comparison, the Bloomberg Barclays U.S. Aggregate Bond Index, which represents the U.S. investment-grade fixed rate taxable bond market, posted a +5.71% total return.1 The Lipper Multi-Sector Income Funds Classification Average, which consists of funds chosen by Lipper that seek current income by allocating assets among different fixed income securities sectors, with a significant portion rated below investment grade, posted a +3.63% total return.2 You can find more of the Fund’s performance data in the Performance Summary beginning on page 7.
Performance data represent past performance, which does not guarantee future results. Investment return and principal value will fluctuate, and you may have a gain or loss when you sell your shares. Current performance may differ from figures shown. For most recentmonth-end performance, go tofranklintempleton.comor call(800)342-5236.
Economic and Market Overview
The U.S. economy expanded during the six months ended October 31, 2019. After moderating in 2019’s second quarter, the economy grew faster in the third quarter, aided by consumer spending, housing investment, government spending, inventory investment and exports. The manufacturing sector expanded during the period’s first half, but contracted in the second half. The services sector continued to expand throughout the period. The unemployment rate was 3.6% in April 2019, and though it varied slightly during the six months under review, it ended the period at 3.6%.3 The annual inflation rate, as measured by the Consumer Price Index, decreased from 2.0% in April 2019 to 1.8% atperiod-end.3
At its July 2019 meeting, the U.S. Federal Reserve (Fed) lowered its target range for the federal funds rate for the first time since December 2008, to 2.00%–2.25%, citing muted inflation pressures and the potential effects of global trade tensions on economic growth. Furthermore, the Fed ended its balance sheet normalization program earlier than previously indicated. The Fed further lowered the federal funds target rate range by 0.25% at its September and October meetings, to 1.50%–1.75%, reiterating the rationale cited at the July meeting.
The10-year Treasury yield, which moves inversely to its price, decreased during the period, falling to multi-year lows in 2019’s third quarter before recovering partially in October. U.S. political uncertainties (including the impeachment inquiry into President Donald Trump), geopolitical tensions in certain regions, U.S. trade disputes with China and other trading partners, slower domestic and global economic growth, and the Fed’s more accommodative monetary policy stance weighed on the Treasury yield at certain points during the period. However, several better-than-expected U.S. economic reports and periods of optimism about a potential U.S.-China trade agreement supported the yield. The
1. Source: Morningstar.
2. Source: Lipper, a Thomson Reuters Company. For thesix-month period ended 10/31/19, this category consisted of 331 funds. Lipper calculations do not include sales charges or expense subsidization by a fund’s manager. Fund performance relative to the average may have differed if these or other factors had been considered. The indexes are unmanaged and include reinvestment of any income or distributions. They do not reflect any fees, expenses or sales charges. One cannot invest directly in an index, and an index is not representative of the Fund’s portfolio.
3. Source: Bureau of Labor Statistics.
See www.franklintempletondatasources.com for additional data provider information.
The dollar value, number of shares or principal amount, and names of all portfolio holdings are listed in the Fund’s Consolidated Statement of Investments (SOI). The Consolidated SOI begins on page 15.
| franklintempleton.com | Semiannual Report | 3 | ||
FRANKLIN STRATEGIC INCOME FUND
10-year yield fell persistently below certain short-term yields during most of the period, but rose above all short-term Treasury yields towardperiod-end amid investor optimism following the announcement of a potential phase one of the U.S.-China trade agreement. Overall, the10-year Treasury yield declined from 2.51% at the beginning of the period to 1.69% atperiod-end.
| Portfolio Composition* | ||||
| Based on Consolidated Net Assets |
| 10/31/19 | ||||
Mortgage-Backed Securities | 22.3% | |||
High-Yield Corporate Bonds | 20.1% | |||
International Government & Agency Bonds | 19.0% | |||
Interest-Rate Derivatives | 12.8% | |||
Collateralized Loan Obligations | 11.4% | |||
Floating-Rate Loans | 10.4% | |||
Investment-Grade Corporate Bonds | 10.2% | |||
Treasury Inflation-Protected Securities | 3.9% | |||
Asset-Backed Securities | 2.3% | |||
U.S. Treasuries | 2.3% | |||
Municipal Bonds | 2.3% | |||
Commercial Mortgage-Backed Securities | 2.0% | |||
Marketplace Loans | 1.7% | |||
Other | 0.8% | |||
Covered Bonds | 0.1% | |||
Currency Derivatives | -0.1% | |||
Short-Term Investments & Other Net Assets | -0.3% | |||
*Notional exposure figures are intended to estimate the portfolio’s exposure, including any hedged or increased exposure through certain derivatives held in the portfolio (or their underlying reference assets). Portfolio breakdown percentages may not total 100% and may be negative due to rounding, use of any derivatives, unsettled trades or other factors. Interest-rate derivatives sector consists of Treasury, interest rate and other derivatives that are primarily used for duration management.
Investment Strategy
We use an active asset allocation strategy to try to achieve the Fund’s investment goals. We employ atop-down analysis of macroeconomic trends combined with abottom-up fundamental analysis of market sectors, industries and issuers to try to take advantage of varying sector reactions to economic events. We regularly enter into various currency-related transactions involving derivative instruments, including currency and cross currency forwards, currency swaps, currency and currency index futures contracts and currency options. We may also enter into interest-rate and credit-related transactions involving derivative instruments, including interest-rate, fixed income total return and credit default swaps and interest rate and/or bond futures contracts.
What is a currency forward contract?
A currency forward contract is an agreement between the Fund and a counterparty to buy or sell a foreign currency in exchange for another currency at a specific exchange rate on a future date. Currency forward contracts are privately traded in the interbank market, not on a centralized exchange.
|
What is a futures contract?
A futures contract is an agreement between the Fund and a counterparty made through a U.S. or foreign futures exchange to buy or sell an underlying instrument or asset at a specific price on a future date.
|
What are swap agreements?
Swap agreements, such as interest-rate, currency and credit default swaps, are contracts between the Fund and another party (the swap counterparty). In a basic swap transaction, the Fund agrees with the swap counterparty to exchange the returns (or differentials in rates of return) earned or realized on a particular “notional amount” of underlying instruments. The notional amount is the set amount selected by the parties as the basis on which to calculate the obligations that they have agreed to exchange. The parties typically do not actually exchange the notional amount. Instead, they agree to exchange the returns that would be earned or realized if the notional amount were invested in given instruments or at given interest rates.
|
What is an option?
An option is a contract to buy or sell a specific financial product known as the option’s underlying instrument at a specific price. The buyer of an option has the right, but not the obligation, to buy or sell the underlying instrument at or until a specified expiration date. Conversely, the seller (“writer”) of an option who opens a transaction is obligated to buy or sell the underlying instrument should the option holder exercise that right.
|
Manager’s Discussion
For global fixed income markets, the six months under review began the period with low levels of volatility but ended with volatility at multiyear highs as investors worried about a potential recession. Interest rates remained relatively low as the Fed lowered its rate three times during the period in July, September and October of 2019, citing muted inflation pressures and the potential effects of global trade tensions on economic growth. Outside the U.S., many major economies kept their interest rates unchanged.
4 | Semiannual Report | franklintempleton.com | ||
FRANKLIN STRATEGIC INCOME FUND
In this environment, most fixed income sectors posted positive total returns, but performance was mixed on a duration-matched basis.Non-agency residential mortgage-backed securities (RMBS) outpaced U.S. Treasuries, as did investment-grade corporate credit, commercial mortgage-backed securities (CMBS) and asset-backed securities. Treasury Inflation Protected-Securities (TIPS), high-yield corporate credit and emerging market bonds underperformed.
What is duration?
Duration is a measure of a bond’s price sensitivity to interest-rate changes. In general, a portfolio of securities with a lower duration can be expected to be less sensitive to interest-rate changes than a portfolio with a higher duration.
|
Dividend Distributions*
5/1/19–10/31/19
| Dividend per Share (cents) | ||||||||||||||||||||
| Month | Class A | Class C | Class R | Class R6 | Advisor Class | |||||||||||||||
May | 3.50 | 3.13 | 3.27 | 3.85 | 3.72 | |||||||||||||||
June | 3.50 | 3.21 | 3.32 | 3.78 | 3.68 | |||||||||||||||
July | 3.50 | 3.18 | 3.30 | 3.80 | 3.69 | |||||||||||||||
August | 3.39 | 3.02 | 3.16 | 3.74 | 3.61 | |||||||||||||||
September | 3.40 | 3.07 | 3.21 | 3.69 | 3.59 | |||||||||||||||
October | 3.35 | 3.03 | 3.15 | 3.67 | 3.56 | |||||||||||||||
Total | 20.64 | 18.64 | 19.41 | 22.53 | 21.85 | |||||||||||||||
*The distribution amount is the sum of all estimatedtax-basis net investment income distributions for the period shown. A portion or all of the distribution may be reclassified as return of capital or short-term or long-term capital gains once final tax designations are known. All Fund distributions will vary depending upon current market conditions, and past distributions are not indicative of future trends.
During the period, the Fund’s allocation to investment-grade corporate credit added to results.Non-dollar developed securities, marketplace loans, CMBS and sovereign developed securities also benefited returns. In contrast, our allocation to senior secured floating-rate loans, high-yield corporate credit, sovereign emerging markets securities and foreign currency detracted from performance.
What is the yield curve?
A yield curve is a line that plots the yield to maturity of bonds having equal credit quality against their maturity dates.
|
Our largest allocation remained in corporate credit inclusive of high-yield, collateralized loan obligations (CLOs), senior secured floating-rate loans and investment-grade corporate credit but we pared exposure in senior secured floating-rate loans, high-yield and investment-grade corporate credit
exposures over the period. We increased our allocation to sovereign emerging markets securities, CLOs, taxable municipal bonds, TIPS and RMBS.
Our foreign-currency exposure is held through a basket of shorts with major positions in the euro, Chinese renminbi, Australian dollar, Canadian dollar and South Korean won versus a basket of longs with major positions in the Japanese yen, Norwegian krone, Indonesian rupiah, Brazilian real and Uruguayan, Colombian and Mexican peso and other emerging-market currencies. Foreign currency exposure detracted overall from returns; performance gains mainly from our short Swedish krona, Australian dollar and euro positions were offset by negative returns mainly from Norwegian krone, Japanese yen, Brazilian real, South African rand, Uruguayan and Colombian peso positions.
Thank you for your continued participation in Franklin Strategic Income Fund. We look forward to serving your future investment needs.
 |  | |||
| Sonal Desai, Ph.D. | ||||
| Co-Lead Portfolio Manager | ||||
 |  | |||
| Patricia O’Connor, CFA | ||||
| Co-Lead Portfolio Manager | ||||
| William Chong, CFA, FRM | ||||
| Co-Lead Portfolio Manager | ||||
| David Yuen, CFA, FRM | ||||
| Co-Lead Portfolio Manager | ||||
| franklintempleton.com | Semiannual Report | 5 | ||
FRANKLIN STRATEGIC INCOME FUND
The foregoing information reflects our analysis, opinions and portfolio holdings as of October 31, 2019, the end of the reporting period. The way we implement our main investment strategies and the resulting portfolio holdings may change depending on factors such as market and economic conditions. These opinions may not be relied upon as investment advice or an offer for a particular security. The information is not a complete analysis of every aspect of any market, country, industry, security or the Fund. Statements of fact are from sources considered reliable, but the investment manager makes no representation or warranty as to their completeness or accuracy. Although historical performance is no guarantee of future results, these insights may help you understand our investment management philosophy.
6 | Semiannual Report | franklintempleton.com | ||
FRANKLIN STRATEGIC INCOME FUND
Performance Summary as of October 31, 2019
The performance tables do not reflect any taxes that a shareholder would pay on Fund dividends, capital gain distributions, if any, or any realized gains on the sale of Fund shares. Total return reflects reinvestment of the Fund’s dividends and capital gain distributions, if any, and any unrealized gains or losses. Your dividend income will vary depending on dividends or interest paid by securities in the Fund’s portfolio, adjusted for operating expenses of each class. Capital gain distributions are net profits realized from the sale of portfolio securities.
Performance as of 10/31/191
Cumulative total return excludes sales charges. Average annual total return includes maximum sales charges. Sales charges will vary depending on the size of the investment and the class of share purchased. The maximum is 3.75% and the minimum is 0%.Class A:3.75% maximum initial sales charge;Advisor Class:no sales charges. For other share classes, visitfranklintempleton.com.
Share Class
| Cumulative Total Return2
| Average Annual Total Return3
| ||
| A4 | ||||
6-Month | +1.74% | -2.04% | ||
1-Year | +5.90% | +1.90% | ||
5-Year | +11.39% | +1.40% | ||
10-Year | +55.49% | +4.12% | ||
Advisor | ||||
6-Month | +1.86% | +1.86% | ||
1-Year | +6.15% | +6.15% | ||
5-Year | +12.77% | +2.43% | ||
10-Year | +59.35% | +4.77% | ||
| Distribution | 30-Day Standardized Yield6 | |||||||||||
Share Class
| Rate5
| (with fee waiver)
| (without fee waiver)
| |||||||||
A | 4.20% | 3.94% | 3.91% | |||||||||
Advisor | 4.60% | 4.37% | 4.34% | |||||||||
Performance data represent past performance, which does not guarantee future results. Investment return and principal value will fluctuate, and you may have a gain or loss when you sell your shares. Current performance may differ from figures shown. For most recentmonth-end performance, go tofranklintempleton.comor call(800)342-5236.
See page 8 for Performance Summary footnotes.
| franklintempleton.com | Semiannual Report | 7 | ||
FRANKLIN STRATEGIC INCOME FUND
PERFORMANCE SUMMARY
Distributions(5/1/19–10/31/19)
Share Class
| Net Investment Income
| |||
A | $0.2064 | |||
C | $0.1864 | |||
R | $0.1941 | |||
R6 | $0.2253 | |||
Advisor | $0.2185 | |||
Total Annual Operating Expenses7
Share Class
| With Fee Waiver
| Without Fee Waiver
| ||
A | 0.89% | 0.94% | ||
Advisor | 0.64% | 0.69% | ||
Each class of shares is available to certain eligible investors and has different annual fees and expenses, as described in the prospectus.
All investments involve risks, including possible loss of principal. Bond prices generally move in the opposite direction of interest rates. Thus, as prices of bonds in the Fund adjust to a rise in interest rates, the Fund’s share price may decline. Changes in the financial strength of a bond issuer or in a bond’s credit rating may affect its value. High yields reflect the higher credit risks associated with certain lower rated securities held in the portfolio. Floating-rate loans and high-yield corporate bonds are rated below investment grade and are subject to greater risk of default, which could result in loss of principal—a risk that may be heightened in a slowing economy. The risks of foreign securities include currency fluctuations and political uncertainty. Investments in developing markets involve heightened risks related to the same factors, in addition to those associated with their relatively small size and lesser liquidity. Investing in derivative securities and the use of foreign currency techniques involve special risks as such may not achieve the anticipated benefits and/or may result in losses to the Fund. The Fund is actively managed but there is no guarantee that the manager’s investment decisions will produce the desired results. The Fund’s prospectus also includes a description of the main investment risks.
1. The Fund has a fee waiver associated with any investment it makes in a Franklin Templeton money fund and/or other Franklin Templeton fund, contractually guaranteed through 8/31/20. Fund investment results reflect the fee waiver; without this waiver, the results would have been lower.
2. Cumulative total return represents the change in value of an investment over the periods indicated.
3. Average annual total return represents the average annual change in value of an investment over the periods indicated. Return for less than one year, if any, has not been annualized.
4. Prior to 3/1/19, these shares were offered at a higher initial sales charge of 4.25%, thus actual returns (with sales charges) would have differed. Average annual total returns with sales charges have been restated to reflect the current maximum initial sales charge of 3.75%.
5. Distribution rate is based on the sum of the respective class’s dividend distributions over the past six months and the maximum offering price (NAV for Advisor Class) per share on 10/31/19.
6. The Fund’s30-day standardized yield is calculated over a trailing30-day period using the yield to maturity on bonds and/or the dividends accrued on stocks. It may not equal the Fund’s actual income distribution rate, which reflects the Fund’s past dividends paid to shareholders.
7. Figures are as stated in the Fund’s current prospectus and may differ from the expense ratios disclosed in the Your Fund’s Expenses and Consolidated Financial Highlights sections in this report. In periods of market volatility, assets may decline significantly, causing total annual Fund operating expenses to become higher than the figures shown.
8 | Semiannual Report | franklintempleton.com | ||
FRANKLIN STRATEGIC INCOME FUND
As a Fund shareholder, you can incur two types of costs: (1) transaction costs, including sales charges (loads) on Fund purchases and redemptions; and (2) ongoing Fund costs, including management fees, distribution and service(12b-1) fees, and other Fund expenses. All mutual funds have ongoing costs, sometimes referred to as operating expenses. The table below shows ongoing costs of investing in the Fund and can help you understand these costs and compare them with those of other mutual funds. The table assumes a $1,000 investment held for the six months indicated.
Actual Fund Expenses
The table below provides information about actual account values and actual expenses in the columns under the heading “Actual.” In these columns the Fund’s actual return, which includes the effect of Fund expenses, is used to calculate the “Ending Account Value” for each class of shares. You can estimate the expenses you paid during the period by following these steps (ofcourse, your account value and expenses will differ from those in this illustration):Divide your account value by $1,000 (ifyour account had an $8,600 value, then $8,600÷ $1,000 = 8.6). Then multiply the result by the number in the row for your class of shares under the headings “Actual” and “Expenses Paid During Period” (ifActual Expenses Paid During Period were $7.50, then 8.6 x $7.50 = $64.50). In this illustration, the actual expenses paid this period are $64.50.
Hypothetical Example for Comparison with Other Funds
Under the heading “Hypothetical” in the table, information is provided about hypothetical account values and hypothetical expenses based on the Fund’s actual expense ratio and an assumed rate of return of 5% per year before expenses, which is not the Fund’s actual return. This information may not be used to estimate the actual ending account balance or expenses you paid for the period, but it can help you compare ongoing costs of investing in the Fund with those of other funds. To do so, compare this 5% hypothetical example for the class of shares you hold with the 5% hypothetical examples that appear in the shareholder reports of other funds.
Please note that expenses shown in the table are meant to highlight ongoing costs and do not reflect any transactional costs. Therefore, information under the heading “Hypothetical” is useful in comparing ongoing costs only, and will not help you compare total costs of owning different funds. In addition, if transactional costs were included, your total costs would have been higher.
Actual | Hypothetical | |||||||||||||||||
| (actual return after expenses) | (5% annual return before expenses) | |||||||||||||||||
| Share Class | Beginning Account Value 5/1/19 | Ending Account Value 10/31/19 | Expenses Paid During Period 5/1/19–10/31/191, 2 | Ending Account Value 10/31/19 | Expenses Paid During Period 5/1/19–10/31/191, 2 | Net Annualized Expense Ratio2 | ||||||||||||
| A | $1,000 | $1,017.40 | $4.36 | $1,020.81 | $4.37 | 0.86% | ||||||||||||
| C | $1,000 | $1,015.30 | $6.38 | $1,018.80 | $6.39 | 1.26% | ||||||||||||
| R | $1,000 | $1,016.10 | $5.63 | $1,019.56 | $5.63 | 1.11% | ||||||||||||
| R6 | $1,000 | $1,019.30 | $2.39 | $1,022.77 | $2.39 | 0.47% | ||||||||||||
| Advisor | $1,000 | $1,018.60 | $3.10 | $1,022.07 | $3.10 | 0.61% | ||||||||||||
1. Expenses are equal to the annualized expense ratio for thesix-month period as indicated above—in the far right column—multiplied by the simple average account value over the period indicated, and then multiplied by 184/366 to reflect theone-half year period.
2. Reflects expenses after fee waivers and expense reimbursements. Does not include acquired fund fees and expenses.
| franklintempleton.com | Semiannual Report | 9 | ||
FRANKLIN STRATEGIC SERIES
Consolidated Financial Highlights
Franklin Strategic Income Fund
| Six Months Ended October 31, 2019 (unaudited) | Year Ended April 30, | |||||||||||||||||||||||
| 2019 | 2018 | 2017 | 2016 | 2015 | ||||||||||||||||||||
Class A | ||||||||||||||||||||||||
Per share operating performance (for a share outstanding throughout the period) | ||||||||||||||||||||||||
Net asset value, beginning of period | $ 9.61 | $ 9.61 | $ 9.84 | $ 9.32 | $10.04 | $10.57 | ||||||||||||||||||
|
| |||||||||||||||||||||||
Income from investment operationsa: | ||||||||||||||||||||||||
Net investment incomeb | 0.21 | 0.42 | 0.39 | 0.39 | 0.42 | 0.42 | ||||||||||||||||||
Net realized and unrealized gains (losses) | (0.04 | ) | — | c | (0.32 | ) | 0.30 | (0.74 | ) | (0.30) | ||||||||||||||
|
| |||||||||||||||||||||||
Total from investment operations | 0.17 | 0.42 | 0.07 | 0.69 | (0.32 | ) | 0.12 | |||||||||||||||||
|
| |||||||||||||||||||||||
Less distributions from: | ||||||||||||||||||||||||
Net investment income and net foreign currency gains | (0.21 | ) | (0.42 | ) | (0.30 | ) | (0.17 | ) | (0.40 | ) | (0.55) | |||||||||||||
Net realized gains | — | — | — | — | — | (0.10) | ||||||||||||||||||
|
| |||||||||||||||||||||||
Total distributions | (0.21 | ) | (0.42 | ) | (0.30 | ) | (0.17 | ) | (0.40 | ) | (0.65) | |||||||||||||
|
| |||||||||||||||||||||||
Net asset value, end of period | $ 9.57 | $ 9.61 | $ 9.61 | $ 9.84 | $ 9.32 | $10.04 | ||||||||||||||||||
|
| |||||||||||||||||||||||
Total returnd | 1.74% | 4.52% | 0.64% | 7.50% | (3.14)% | 1.16% | ||||||||||||||||||
Ratios to average net assetse | ||||||||||||||||||||||||
Expenses before waiver and payments by affiliates | 0.89% | 0.89% | 0.90% | 0.88% | 0.88% | 0.86% | ||||||||||||||||||
Expenses net of waiver and payments by affiliatesf | 0.86% | 0.84% | 0.85% | 0.82% | 0.84% | 0.85% | ||||||||||||||||||
Net investment income | 4.28% | 4.39% | 3.93% | 4.08% | 4.44% | 4.03% | ||||||||||||||||||
Supplemental data | ||||||||||||||||||||||||
Net assets, end of period (000’s) | $3,058,166 | $3,131,799 | $3,291,002 | $3,833,786 | $4,500,752 | $5,242,844 | ||||||||||||||||||
Portfolio turnover rate | 52.97% | 116.21% | g | 115.94% | 140.83% | 88.04% | 72.51% | |||||||||||||||||
Portfolio turnover rate excluding mortgage dollar rollsh | 43.95% | 39.01% | g | 47.40% | 87.33% | 48.33% | 49.36% | |||||||||||||||||
aThe amount shown for a share outstanding throughout the period may not correlate with the Consolidated Statement of Operations for the period due to the timing of sales and repurchases of the Fund’s shares in relation to income earned and/or fluctuating fair value of the investments of the Fund.
bBased on average daily shares outstanding.
cAmount rounds to less than $0.01 per share.
dTotal return does not reflect sales commissions or contingent deferred sales charges, if applicable, and is not annualized for periods less than one year.
eRatios are annualized for periods less than one year.
fBenefit of expense reduction rounds to less than 0.01%.
gExcludes the value of portfolio activity as a result ofin-kind transactions.
hSee Note 1(i) regarding mortgage dollar rolls.
10 | Semiannual Report | The accompanying notes are an integral part of these consolidated financial statements. | franklintempleton.com | ||
FRANKLIN STRATEGIC SERIES
CONSOLIDATED FINANCIAL HIGHLIGHTS
Franklin Strategic Income Fund(continued)
| Six Months Ended October 31, 2019 (unaudited) | Year Ended April 30, | |||||||||||||||||||||||
| 2019 | 2018 | 2017 | 2016 | 2015 | ||||||||||||||||||||
Class C | ||||||||||||||||||||||||
Per share operating performance (for a share outstanding throughout the period) | ||||||||||||||||||||||||
Net asset value, beginning of period | $ 9.61 | $ 9.60 | $ 9.84 | $ 9.31 | $10.04 | $10.57 | ||||||||||||||||||
|
| |||||||||||||||||||||||
Income from investment operationsa: | ||||||||||||||||||||||||
Net investment incomeb | 0.19 | 0.38 | 0.35 | 0.35 | 0.38 | 0.38 | ||||||||||||||||||
Net realized and unrealized gains (losses) | (0.04 | ) | 0.01 | (0.33 | ) | 0.31 | (0.75 | ) | (0.30) | |||||||||||||||
|
| |||||||||||||||||||||||
Total from investment operations | 0.15 | 0.39 | 0.02 | 0.66 | (0.37 | ) | 0.08 | |||||||||||||||||
|
| |||||||||||||||||||||||
Less distributions from: | ||||||||||||||||||||||||
Net investment income and net foreign currency gains | (0.19 | ) | (0.38 | ) | (0.26 | ) | (0.13 | ) | (0.36 | ) | (0.51) | |||||||||||||
Net realized gains | — | — | — | — | — | (0.10) | ||||||||||||||||||
|
| |||||||||||||||||||||||
Total distributions | (0.19 | ) | (0.38 | ) | (0.26 | ) | (0.13 | ) | (0.36 | ) | (0.61) | |||||||||||||
|
| |||||||||||||||||||||||
Net asset value, end of period | $ 9.57 | $ 9.61 | $ 9.60 | $ 9.84 | $ 9.31 | $10.04 | ||||||||||||||||||
|
| |||||||||||||||||||||||
Total returnc | 1.53% | 4.19% | 0.14% | 7.19% | (3.64)% | 0.76% | ||||||||||||||||||
Ratios to average net assetsd | ||||||||||||||||||||||||
Expenses before waiver and payments by affiliates | 1.29% | 1.29% | 1.30% | 1.28% | 1.28% | 1.26% | ||||||||||||||||||
Expenses net of waiver and payments by affiliatese | 1.26% | 1.24% | 1.25% | 1.22% | 1.24% | 1.25% | ||||||||||||||||||
Net investment income | 3.88% | 3.99% | 3.53% | 3.68% | 4.04% | 3.63% | ||||||||||||||||||
Supplemental data | ||||||||||||||||||||||||
Net assets, end of period (000’s) | $636,853 | $716,327 | $1,078,890 | $1,385,981 | $1,645,852 | $2,070,739 | ||||||||||||||||||
Portfolio turnover rate | 52.97% | 116.21% | f | 115.94% | 140.83% | 88.04% | 72.51% | |||||||||||||||||
Portfolio turnover rate excluding mortgage dollar rollsg | 43.95% | 39.01% | f | 47.40% | 87.33% | 48.33% | 49.36% | |||||||||||||||||
aThe amount shown for a share outstanding throughout the period may not correlate with the Consolidated Statement of Operations for the period due to the timing of sales and repurchases of the Fund’s shares in relation to income earned and/or fluctuating fair value of the investments of the Fund.
bBased on average daily shares outstanding.
cTotal return does not reflect sales commissions or contingent deferred sales charges, if applicable, and is not annualized for periods less than one year.
dRatios are annualized for periods less than one year.
eBenefit of expense reduction rounds to less than 0.01%.
fExcludes the value of portfolio activity as a result ofin-kind transactions.
gSee Note 1(i) regarding mortgage dollar rolls.
| franklintempleton.com | The accompanying notes are an integral part of these consolidated financial statements. | Semiannual Report | 11 | ||
FRANKLIN STRATEGIC SERIES
CONSOLIDATED FINANCIAL HIGHLIGHTS
Franklin Strategic Income Fund(continued)
| Six Months Ended October 31, 2019 (unaudited) | Year Ended April 30, | |||||||||||||||||||||||
| 2019 | 2018 | 2017 | 2016 | 2015 | ||||||||||||||||||||
Class R | ||||||||||||||||||||||||
Per share operating performance (for a share outstanding throughout the period) | ||||||||||||||||||||||||
Net asset value, beginning of period | $ 9.57 | $ 9.57 | $ 9.81 | $ 9.28 | $10.01 | $10.54 | ||||||||||||||||||
|
| |||||||||||||||||||||||
Income from investment operationsa: | ||||||||||||||||||||||||
Net investment incomeb | 0.19 | 0.39 | 0.36 | 0.37 | 0.39 | 0.39 | ||||||||||||||||||
Net realized and unrealized gains (losses) | (0.04 | ) | 0.01 | (0.33 | ) | 0.31 | (0.74 | ) | (0.29) | |||||||||||||||
|
| |||||||||||||||||||||||
Total from investment operations | 0.15 | 0.40 | 0.03 | 0.68 | (0.35 | ) | 0.10 | |||||||||||||||||
|
| |||||||||||||||||||||||
Less distributions from: | ||||||||||||||||||||||||
Net investment income and net foreign currency gains | (0.19 | ) | (0.40 | ) | (0.27 | ) | (0.15 | ) | (0.38 | ) | (0.53) | |||||||||||||
Net realized gains | — | — | — | — | — | (0.10) | ||||||||||||||||||
|
| |||||||||||||||||||||||
Total distributions | (0.19 | ) | (0.40 | ) | (0.27 | ) | (0.15 | ) | (0.38 | ) | (0.63) | |||||||||||||
|
| |||||||||||||||||||||||
Net asset value, end of period | $ 9.53 | $ 9.57 | $ 9.57 | $ 9.81 | $ 9.28 | $10.01 | ||||||||||||||||||
|
| |||||||||||||||||||||||
Total returnc | 1.61% | 4.28% | 0.29% | 7.38% | (3.50)% | 0.91% | ||||||||||||||||||
Ratios to average net assetsd | ||||||||||||||||||||||||
Expenses before waiver and payments by affiliates | 1.14% | 1.14% | 1.15% | 1.13% | 1.13% | 1.11% | ||||||||||||||||||
Expenses net of waiver and payments by affiliatese | 1.11% | 1.09% | 1.10% | 1.07% | 1.09% | 1.10% | ||||||||||||||||||
Net investment income | 4.03% | 4.14% | 3.68% | 3.83% | 4.19% | 3.78% | ||||||||||||||||||
Supplemental data | ||||||||||||||||||||||||
Net assets, end of period (000’s) | $77,290 | $85,458 | $105,692 | $146,552 | $181,671 | $223,758 | ||||||||||||||||||
Portfolio turnover rate | 52.97% | 116.21% | f | 115.94% | 140.83% | 88.04% | 72.51% | |||||||||||||||||
Portfolio turnover rate excluding mortgage dollar rollsg | 43.95% | 39.01% | f | 47.40% | 87.33% | 48.33% | 49.36% | |||||||||||||||||
aThe amount shown for a share outstanding throughout the period may not correlate with the Consolidated Statement of Operations for the period due to the timing of sales and repurchases of the Fund’s shares in relation to income earned and/or fluctuating fair value of the investments of the Fund.
bBased on average daily shares outstanding.
cTotal return is not annualized for periods less than one year.
dRatios are annualized for periods less than one year.
eBenefit of expense reduction rounds to less than 0.01%.
fExcludes the value of portfolio activity as a result ofin-kind transactions.
gSee Note 1(i) regarding mortgage dollar rolls.
12 | Semiannual Report | The accompanying notes are an integral part of these consolidated financial statements. | franklintempleton.com | ||
FRANKLIN STRATEGIC SERIES
CONSOLIDATED FINANCIAL HIGHLIGHTS
Franklin Strategic Income Fund(continued)
| Six Months Ended October 31, 2019 (unaudited) | Year Ended April 30, | |||||||||||||||||||||||
| 2019 | 2018 | 2017 | 2016 | 2015 | ||||||||||||||||||||
Class R6 | ||||||||||||||||||||||||
Per share operating performance (for a share outstanding throughout the period) | ||||||||||||||||||||||||
Net asset value, beginning of period | $ 9.63 | $ 9.62 | $ 9.86 | $ 9.33 | $10.05 | $10.58 | ||||||||||||||||||
|
| |||||||||||||||||||||||
Income from investment operationsa: | ||||||||||||||||||||||||
Net investment incomeb | 0.23 | 0.45 | 0.43 | 0.43 | 0.46 | 0.46 | ||||||||||||||||||
Net realized and unrealized gains (losses) | (0.05 | ) | 0.02 | (0.34 | ) | 0.31 | (0.74 | ) | (0.30) | |||||||||||||||
|
| |||||||||||||||||||||||
Total from investment operations | 0.18 | 0.47 | 0.09 | 0.74 | (0.28 | ) | 0.16 | |||||||||||||||||
|
| |||||||||||||||||||||||
Less distributions from: | ||||||||||||||||||||||||
Net investment income and net foreign currency gains | (0.23 | ) | (0.46 | ) | (0.33 | ) | (0.21 | ) | (0.44 | ) | (0.59) | |||||||||||||
Net realized gains | — | — | — | — | — | (0.10) | ||||||||||||||||||
|
| |||||||||||||||||||||||
Total distributions | (0.23 | ) | (0.46 | ) | (0.33 | ) | (0.21 | ) | (0.44 | ) | (0.69) | |||||||||||||
|
| |||||||||||||||||||||||
Net asset value, end of period | $ 9.58 | $ 9.63 | $ 9.62 | $ 9.86 | $ 9.33 | $10.05 | ||||||||||||||||||
|
| |||||||||||||||||||||||
Total returnc | 1.93% | 5.03% | 0.95% | 8.03% | (2.76)% | 1.54% | ||||||||||||||||||
Ratios to average net assetsd | ||||||||||||||||||||||||
Expenses before waiver and payments by affiliates | 0.51% | 0.51% | 0.50% | 0.48% | 0.49% | 0.48% | ||||||||||||||||||
Expenses net of waiver and payments by affiliatese | 0.47% | 0.45% | 0.45% | 0.42% | 0.45% | 0.47% | ||||||||||||||||||
Net investment income | 4.67% | 4.78% | 4.33% | 4.48% | 4.83% | 4.41% | ||||||||||||||||||
Supplemental data | ||||||||||||||||||||||||
Net assets, end of period (000’s) | $150,506 | $307,287 | $433,068 | $369,106 | $286,503 | $253,929 | ||||||||||||||||||
Portfolio turnover rate | 52.97% | 116.21% | f | 115.94% | 140.83% | 88.04% | 72.51% | |||||||||||||||||
Portfolio turnover rate excluding mortgage dollar rollsg | 43.95% | 39.01% | f | 47.40% | 87.33% | 48.33% | 49.36% | |||||||||||||||||
aThe amount shown for a share outstanding throughout the period may not correlate with the Consolidated Statement of Operations for the period due to the timing of sales and repurchases of the Fund’s shares in relation to income earned and/or fluctuating fair value of the investments of the Fund.
bBased on average daily shares outstanding.
cTotal return is not annualized for periods less than one year.
dRatios are annualized for periods less than one year.
eBenefit of expense reduction rounds to less than 0.01%.
fExcludes the value of portfolio activity as a result ofin-kind transactions.
gSee Note 1(i) regarding mortgage dollar rolls.
| franklintempleton.com | The accompanying notes are an integral part of these consolidated financial statements. | Semiannual Report | 13 | ||
FRANKLIN STRATEGIC SERIES
CONSOLIDATED FINANCIAL HIGHLIGHTS
Franklin Strategic Income Fund(continued)
| Six Months Ended October 31, 2019 (unaudited) | Year Ended April 30, | |||||||||||||||||||||||
| 2019 | 2018 | 2017 | 2016 | 2015 | ||||||||||||||||||||
Advisor Class | ||||||||||||||||||||||||
Per share operating performance (for a share outstanding throughout the period) | ||||||||||||||||||||||||
Net asset value, beginning of period | $ 9.62 | $ 9.62 | $ 9.85 | $ 9.33 | $10.05 | $10.58 | ||||||||||||||||||
|
| |||||||||||||||||||||||
Income from investment operationsa: | ||||||||||||||||||||||||
Net investment incomeb | 0.22 | 0.44 | 0.41 | 0.42 | 0.44 | 0.44 | ||||||||||||||||||
Net realized and unrealized gains (losses) | (0.04 | ) | — | c | (0.32 | ) | 0.30 | (0.74 | ) | (0.29) | ||||||||||||||
|
| |||||||||||||||||||||||
Total from investment operations | 0.18 | 0.44 | 0.09 | 0.72 | (0.30 | ) | 0.15 | |||||||||||||||||
|
| |||||||||||||||||||||||
Less distributions from: | ||||||||||||||||||||||||
Net investment income and net foreign currency gains | (0.22 | ) | (0.44 | ) | (0.32 | ) | (0.20 | ) | (0.42 | ) | (0.58) | |||||||||||||
Net realized gains | — | — | — | — | — | (0.10) | ||||||||||||||||||
|
| |||||||||||||||||||||||
Total distributions | (0.22 | ) | (0.44 | ) | (0.32 | ) | (0.20 | ) | (0.42 | ) | (0.68) | |||||||||||||
|
| |||||||||||||||||||||||
Net asset value, end of period | $ 9.58 | $ 9.62 | $ 9.62 | $ 9.85 | $ 9.33 | $10.05 | ||||||||||||||||||
|
| |||||||||||||||||||||||
Total returnd | 1.86% | 4.88% | 0.79% | 7.76% | (2.89)% | 1.41% | ||||||||||||||||||
Ratios to average net assetse | ||||||||||||||||||||||||
Expenses before waiver and payments by affiliates | 0.64% | 0.64% | 0.65% | 0.63% | 0.63% | 0.61% | ||||||||||||||||||
Expenses net of waiver and payments by affiliatesf | 0.61% | 0.59% | 0.60% | 0.57% | 0.59% | 0.60% | ||||||||||||||||||
Net investment income | 4.53% | 4.64% | 4.18% | 4.33% | 4.69% | 4.28% | ||||||||||||||||||
Supplemental data | ||||||||||||||||||||||||
Net assets, end of period (000’s) | $593,969 | $608,317 | $933,747 | $1,070,103 | $904,899 | $1,130,796 | ||||||||||||||||||
Portfolio turnover rate | 52.97% | 116.21% | g | 115.94% | 140.83% | 88.04% | 72.51% | |||||||||||||||||
Portfolio turnover rate excluding mortgage dollar rollsh | 43.95% | 39.01% | g | 47.40% | 87.33% | 48.33% | 49.36% | |||||||||||||||||
aThe amount shown for a share outstanding throughout the period may not correlate with the Consolidated Statement of Operations for the period due to the timing of sales and repurchases of the Fund’s shares in relation to income earned and/or fluctuating fair value of the investments of the Fund.
bBased on average daily shares outstanding.
cAmount rounds to less than $0.01 per share.
dTotal return is not annualized for periods less than one year.
eRatios are annualized for periods less than one year.
fBenefit of expense reduction rounds to less than 0.01%.
gExcludes the value of portfolio activity as a result ofin-kind transactions.
hSee Note 1(i) regarding mortgage dollar rolls.
14 | Semiannual Report | The accompanying notes are an integral part of these consolidated financial statements. | franklintempleton.com | ||
FRANKLIN STRATEGIC SERIES
Consolidated Statement of Investments, October 31, 2019 (unaudited)
Franklin Strategic Income Fund
| Country/ Organization | Shares/ Warrants | Value | ||||||||||||||
Common Stocks and Other Equity Interests 0.3% | ||||||||||||||||
Commercial & Professional Services 0.0%† | ||||||||||||||||
a,aa,bRemington Outdoor Co. Inc. | United States | 1,322,439 | $ | 1,322,439 | ||||||||||||
|
| |||||||||||||||
Consumer Services 0.0%† | ||||||||||||||||
a,b,cTurtle Bay Resort | United States | 5,579,939 | 122,759 | |||||||||||||
|
| |||||||||||||||
Energy 0.1% | ||||||||||||||||
Amplify Energy Corp. | United States | 5,288 | 38,338 | |||||||||||||
a,bAmplify Energy Corp., wts., 4/21/20 | United States | 50,712 | — | |||||||||||||
aBirch Permian Holdings Inc. | United States | 46,176 | 427,128 | |||||||||||||
aBirch Permian Holdings Inc. | United States | 359,948 | 3,284,525 | |||||||||||||
aChaparral Energy Inc., A | United States | 94,305 | 88,392 | |||||||||||||
a,dChaparral Energy Inc., A, 144A | United States | 3,418 | 3,204 | |||||||||||||
a,bHalcon Resources Corp. | United States | 2,215 | 44,015 | |||||||||||||
a,bHalcon Resources Corp., wts., 9/09/20 | United States | 75,770 | — | |||||||||||||
a,bHalcon Resources Corp., wts., A, 10/08/20 | United States | 10,639 | — | |||||||||||||
a,bHalcon Resources Corp., wts., B, 10/08/22 | United States | 13,300 | — | |||||||||||||
a,bHalcon Resources Corp., wts., C, 10/08/22 | United States | 17,100 | — | |||||||||||||
aRiviera Resources Inc. | United States | 84,462 | 1,101,384 | |||||||||||||
aRoan Resources Inc. | United States | 88,309 | 132,464 | |||||||||||||
|
| |||||||||||||||
| 5,119,450 | ||||||||||||||||
|
| |||||||||||||||
Materials 0.1% | ||||||||||||||||
a,b,eAppvion Operations Inc. | United States | 331,326 | 4,417,403 | |||||||||||||
aVerso Corp., A | United States | 38,905 | 569,569 | |||||||||||||
aVerso Corp., wts., 7/25/23 | United States | 4,095 | 7,166 | |||||||||||||
|
| |||||||||||||||
| 4,994,138 | ||||||||||||||||
|
| |||||||||||||||
Media & Entertainment 0.1% | ||||||||||||||||
aClear Channel Outdoor Holdings Inc. | United States | 285,564 | 665,364 | |||||||||||||
aiHeartMedia Inc., A | United States | 115,084 | 1,650,305 | |||||||||||||
a,biHeartMedia Inc., B | United States | 1,941 | 23,659 | |||||||||||||
aiHeartMedia Inc., wts., A, 5/01/39 | United States | 1 | 14 | |||||||||||||
|
| |||||||||||||||
| 2,339,342 | ||||||||||||||||
|
| |||||||||||||||
Retailing 0.0%† | ||||||||||||||||
a,b,eK2016470219 South Africa Ltd., A | South Africa | 125,940,079 | 83,322 | |||||||||||||
a,b,eK2016470219 South Africa Ltd., B | South Africa | 12,532,821 | 8,292 | |||||||||||||
|
| |||||||||||||||
| 91,614 | ||||||||||||||||
|
| |||||||||||||||
Software & Services 0.0%† | ||||||||||||||||
a,bWorkCapital BSD SARL, wts., 2/13/26 | Brazil | 6,000,000 | 750,000 | |||||||||||||
|
| |||||||||||||||
Total Common Stocks and Other Equity Interests (Cost $65,238,205) | 14,739,742 | |||||||||||||||
|
| |||||||||||||||
Management Investment Companies (Cost $152,217,419) 2.8% | ||||||||||||||||
Diversified Financials 2.8% | ||||||||||||||||
fFranklin Floating Rate Income Fund | United States | 15,243,687 | 126,065,295 | |||||||||||||
|
| |||||||||||||||
| franklintempleton.com | Semiannual Report | 15 | ||
FRANKLIN STRATEGIC SERIES
CONSOLIDATED STATEMENT OF INVESTMENTS (UNAUDITED)
Franklin Strategic Income Fund(continued)
| Country/ Organization | Principal Amount* | Value | ||||||||||||||
Corporate Bonds 30.6% | ||||||||||||||||
Banks 1.9% | ||||||||||||||||
dAkbank T.A.S., senior note, 144A, 5.125%, 3/31/25 | Turkey | 12,400,000 | $ | 11,867,296 | ||||||||||||
Bank of America Corp., | ||||||||||||||||
senior bond, 3.248%, 10/21/27 | United States | 5,000,000 | 5,208,183 | |||||||||||||
senior note, 3.50%, 4/19/26 | United States | 29,800,000 | 31,732,215 | |||||||||||||
Citigroup Inc., sub. bond, 5.50%, 9/13/25 | United States | 10,000,000 | 11,455,689 | |||||||||||||
Industrial & Commercial Bank of China Ltd., senior note, 3.538%, 11/08/27 | China | 8,500,000 | 8,883,477 | |||||||||||||
dIntesa Sanpaolo SpA, senior note, 144A, 6.50%, 2/24/21 | Italy | 1,400,000 | 1,469,433 | |||||||||||||
JPMorgan Chase & Co., sub. note, 3.875%, 9/10/24 | United States | 10,000,000 | 10,693,758 | |||||||||||||
gTurkiye Vakiflar Bankasi TAO, secured note, Reg S, 2.375%, 11/04/22 | Turkey | 3,900,000 | EUR | 4,391,384 | ||||||||||||
|
| |||||||||||||||
| 85,701,435 | ||||||||||||||||
|
| |||||||||||||||
Capital Goods 1.2% | ||||||||||||||||
dBeacon Roofing Supply Inc., senior note, 144A, 4.875%, 11/01/25 | United States | 12,000,000 | 11,835,600 | |||||||||||||
CNH Industrial NV, senior bond, 3.85%, 11/15/27 | United Kingdom | 6,600,000 | 6,888,915 | |||||||||||||
dHerc Holdings Inc., senior note, 144A, 5.50%, 7/15/27 | United States | 5,300,000 | 5,512,000 | |||||||||||||
Legrand France SA, senior bond, 8.50%, 2/15/25 | France | 200,000 | 260,435 | |||||||||||||
hOnsite Rental Group Operations Pty. Ltd., secured note, PIK, 6.10%, 10/26/23 | Australia | 4,655,176 | 4,306,038 | |||||||||||||
dTerex Corp., senior note, 144A, 5.625%, 2/01/25 | United States | 14,300,000 | 14,425,125 | |||||||||||||
dVertiv Group Corp., senior note, 144A, 9.25%, 10/15/24 | United States | 14,000,000 | 13,238,750 | |||||||||||||
|
| |||||||||||||||
| 56,466,863 | ||||||||||||||||
|
| |||||||||||||||
Commercial & Professional Services 0.7% | ||||||||||||||||
United Rentals North America Inc., senior bond, 5.875%, 9/15/26 | United States | 16,000,000 | 17,040,000 | |||||||||||||
dWest Corp., senior note, 144A, 8.50%, 10/15/25 | United States | 17,300,000 | 13,148,000 | |||||||||||||
|
| |||||||||||||||
| 30,188,000 | ||||||||||||||||
|
| |||||||||||||||
Consumer Durables & Apparel 0.7% | ||||||||||||||||
dHanesbrands Inc., senior bond, 144A, 4.875%, 5/15/26 | United States | 15,000,000 | 15,937,500 | |||||||||||||
KB Home, | ||||||||||||||||
senior bond, 7.50%, 9/15/22 | United States | 5,000,000 | 5,662,500 | |||||||||||||
senior note, 7.00%, 12/15/21 | United States | 8,000,000 | 8,630,000 | |||||||||||||
|
| |||||||||||||||
| 30,230,000 | ||||||||||||||||
|
| |||||||||||||||
Consumer Services 1.3% | ||||||||||||||||
d1011778 BC ULC/New Red Finance Inc., | ||||||||||||||||
secured note, second lien, 144A, 5.00%, 10/15/25 | Canada | 11,500,000 | 11,873,750 | |||||||||||||
senior secured note, first lien, 144A, 4.25%, 5/15/24 | Canada | 2,000,000 | 2,056,330 | |||||||||||||
dGolden Nugget Inc., senior note, 144A, 6.75%, 10/15/24 | United States | 13,200,000 | 13,630,320 | |||||||||||||
dKFC Holding Co./Pizza Hut Holdings LLC/Taco Bell of America LLC, | ||||||||||||||||
senior note, 144A, 5.00%, 6/01/24 | United States | 6,000,000 | 6,240,000 | |||||||||||||
senior note, 144A, 5.25%, 6/01/26 | United States | 9,100,000 | 9,646,000 | |||||||||||||
dWynn Las Vegas LLC/Wynn Las Vegas Capital Corp., senior bond, 144A, 5.50%, 3/01/25 | United States | 13,700,000 | 14,590,500 | |||||||||||||
|
| |||||||||||||||
| 58,036,900 | ||||||||||||||||
|
| |||||||||||||||
16 | Semiannual Report | franklintempleton.com | ||
FRANKLIN STRATEGIC SERIES
CONSOLIDATED STATEMENT OF INVESTMENTS (UNAUDITED)
Franklin Strategic Income Fund(continued)
| Country/ Organization | Principal Amount* | Value | ||||||||||||||
Corporate Bonds(continued) | ||||||||||||||||
Diversified Financials 2.3% | ||||||||||||||||
Capital One Financial Corp., senior note, 3.20%, 2/05/25 | United States | 11,900,000 | $ | 12,330,983 | ||||||||||||
iCia Securitizadora de Creditos Financeiros Vert-Fintech, senior secured note, FRN, 5.96%, (BZDIOVRA + 5.75%), 2/14/24 | Brazil | 5,306 | j | BRL | 1,366,622 | |||||||||||
The Goldman Sachs Group Inc., | ||||||||||||||||
senior note, 3.50%, 1/23/25 | United States | 23,000,000 | 24,057,872 | |||||||||||||
senior note, 3.75%, 2/25/26 | United States | 15,000,000 | 15,969,780 | |||||||||||||
Morgan Stanley, | ||||||||||||||||
senior bond, 3.591% to 7/22/27, FRN thereafter, 7/22/28 | United States | 10,000,000 | 10,578,159 | |||||||||||||
senior note, 3.875%, 1/27/26 | United States | 32,300,000 | 34,891,660 | |||||||||||||
Springleaf Finance Corp., senior note, 6.625%, 1/15/28 | United States | 5,700,000 | 6,327,000 | |||||||||||||
|
| |||||||||||||||
| 105,522,076 | ||||||||||||||||
|
| |||||||||||||||
Energy 3.5% | ||||||||||||||||
dAker BP ASA, senior note, 144A, 4.75%, 6/15/24 | Norway | 5,900,000 | 6,136,000 | |||||||||||||
dCalifornia Resources Corp., secured note, second lien, 144A, 8.00%, 12/15/22 | United States | 7,852,000 | 2,316,340 | |||||||||||||
Cheniere Corpus Christi Holdings LLC, | ||||||||||||||||
senior secured note, first lien, 7.00%, 6/30/24 | United States | 8,800,000 | 10,142,704 | |||||||||||||
senior secured note, first lien, 5.875%, 3/31/25 | United States | 8,200,000 | 9,112,988 | |||||||||||||
Cheniere Energy Partners LP, senior secured note, first lien, 5.25%, 10/01/25 | United States | 11,900,000 | 12,361,125 | |||||||||||||
CONSOL Energy Inc., senior note, 5.875%, 4/15/22 | United States | 11,076,000 | 10,868,325 | |||||||||||||
Ecopetrol SA, senior bond, 4.125%, 1/16/25 | Colombia | 8,200,000 | 8,626,400 | |||||||||||||
Energy Transfer Operating LP, | ||||||||||||||||
senior bond, 4.05%, 3/15/25 | United States | 1,300,000 | 1,364,926 | |||||||||||||
senior note, 7.50%, 10/15/20 | United States | 11,000,000 | 11,544,376 | |||||||||||||
d,hEnQuest PLC, senior note, 144A, PIK, 7.00%, 4/15/22 | United Kingdom | 9,955,122 | 7,998,592 | |||||||||||||
Exxon Mobil Corp., senior note, 2.222%, 3/01/21 | United States | 3,000,000 | 3,019,250 | |||||||||||||
d,kGaz Capital SA, (OJSC Gazprom), loan participation, senior note, 144A, 3.85%, 2/06/20 | Russia | 20,000,000 | 20,084,100 | |||||||||||||
Kinder Morgan Inc., | ||||||||||||||||
senior bond, 4.30%, 6/01/25 | United States | 9,000,000 | 9,743,174 | |||||||||||||
senior note, 3.15%, 1/15/23 | United States | 9,000,000 | 9,227,569 | |||||||||||||
Martin Midstream Partners LP/Martin Midstream Finance Corp., senior note, 7.25%, 2/15/21 | United States | 19,000,000 | 17,166,500 | |||||||||||||
Oceaneering International Inc., senior note, 4.65%, 11/15/24 | United States | 2,100,000 | 1,963,500 | |||||||||||||
lSanchez Energy Corp., senior note, 6.125%, 1/15/23 | United States | 6,000,000 | 300,000 | |||||||||||||
Sunoco LP/Sunoco Finance Corp., senior note, 4.875%, 1/15/23 | United States | 5,900,000 | 6,069,625 | |||||||||||||
lWeatherford International Ltd., | ||||||||||||||||
senior note, 7.75%, 6/15/21 | United States | 9,000,000 | 2,880,000 | |||||||||||||
senior note, 8.25%, 6/15/23 | United States | 7,000,000 | 2,170,000 | |||||||||||||
dWoodside Finance Ltd., senior note, 144A, 3.70%, 9/15/26 | Australia | 5,400,000 | 5,622,899 | |||||||||||||
|
| |||||||||||||||
| 158,718,393 | ||||||||||||||||
|
| |||||||||||||||
Food & Staples Retailing 0.5% | ||||||||||||||||
Walgreens Boots Alliance Inc., senior note, 3.80%, 11/18/24 | United States | 21,900,000 | 23,229,803 | |||||||||||||
|
| |||||||||||||||
| franklintempleton.com | Semiannual Report | 17 | ||
FRANKLIN STRATEGIC SERIES
CONSOLIDATED STATEMENT OF INVESTMENTS (UNAUDITED)
Franklin Strategic Income Fund(continued)
| Country/ Organization | Principal Amount* | Value | ||||||||||||||
Corporate Bonds(continued) | ||||||||||||||||
Food, Beverage & Tobacco 0.6% | ||||||||||||||||
Bunge Ltd. Finance Corp., senior note, 3.25%, 8/15/26 | United States | 2,000,000 | $ | 2,005,690 | ||||||||||||
dImperial Brands Finance PLC, senior note, 144A, 3.50%, 2/11/23 | United Kingdom | 20,400,000 | 20,861,825 | |||||||||||||
Reynolds American Inc., senior note, 4.45%, 6/12/25 | United Kingdom | 1,900,000 | 2,040,794 | |||||||||||||
|
| |||||||||||||||
| 24,908,309 | ||||||||||||||||
|
| |||||||||||||||
Health Care Equipment & Services 1.1% | ||||||||||||||||
Centene Corp., | ||||||||||||||||
senior note, 4.75%, 5/15/22 | United States | 2,000,000 | 2,050,000 | |||||||||||||
dsenior note, 144A, 5.375%, 6/01/26 | United States | 7,600,000 | 8,063,600 | |||||||||||||
CHS/Community Health Systems Inc., | ||||||||||||||||
senior note, 6.875%, 2/01/22 | United States | 7,223,000 | 5,615,882 | |||||||||||||
senior secured note, first lien, 6.25%, 3/31/23 | United States | 3,900,000 | 3,814,687 | |||||||||||||
CVS Health Corp., senior bond, 4.30%, 3/25/28 | United States | 5,800,000 | 6,301,243 | |||||||||||||
DaVita Inc., | ||||||||||||||||
senior bond, 5.125%, 7/15/24 | United States | 8,000,000 | 8,186,160 | |||||||||||||
senior bond, 5.00%, 5/01/25 | United States | 6,000,000 | 6,097,500 | |||||||||||||
Edwards Lifesciences Corp., senior note, 4.30%, 6/15/28 | United States | 1,957,000 | 2,210,448 | |||||||||||||
HCA Inc., senior bond, 5.875%, 2/15/26 | United States | 3,000,000 | 3,382,500 | |||||||||||||
dMEDNAX Inc., senior note, 144A, 6.25%, 1/15/27 | United States | 6,300,000 | 6,248,970 | |||||||||||||
|
| |||||||||||||||
| 51,970,990 | ||||||||||||||||
|
| |||||||||||||||
Materials 4.3% | ||||||||||||||||
hARD Finance SA, secured note, PIK, 7.125%, 9/15/23 | Luxembourg | 1,300,000 | 1,353,625 | |||||||||||||
dArdagh Packaging Finance PLC/Ardagh MP Holdings USA Inc., senior note, 144A, 6.00%, 2/15/25 | Luxembourg | 11,500,000 | 12,103,750 | |||||||||||||
dCemex SAB de CV, | ||||||||||||||||
senior secured bond, first lien, 144A, 5.70%, 1/11/25 | Mexico | 13,000,000 | 13,369,525 | |||||||||||||
senior secured bond, first lien, 144A, 6.125%, 5/05/25 | Mexico | 2,000,000 | 2,075,070 | |||||||||||||
gCNAC HK Finbridge Co. Ltd., senior note, Reg S, 4.875%, 3/14/25 | China | 7,800,000 | 8,465,964 | |||||||||||||
Crown Americas LLC/Crown Americas Capital Corp. VI, senior note, 4.75%, 2/01/26 | United States | 7,100,000 | 7,472,750 | |||||||||||||
dFirst Quantum Minerals Ltd., | ||||||||||||||||
senior note, 144A, 7.00%, 2/15/21 | Zambia | 2,144,000 | 2,158,740 | |||||||||||||
senior note, 144A, 7.25%, 4/01/23 | Zambia | 7,200,000 | 7,258,500 | |||||||||||||
dFMG Resources (August 2006) Pty. Ltd., | ||||||||||||||||
senior note, 144A, 5.125%, 3/15/23 | Australia | 3,600,000 | 3,757,500 | |||||||||||||
senior note, 144A, 5.125%, 5/15/24 | Australia | 7,700,000 | 8,085,000 | |||||||||||||
Freeport-McMoRan Inc., senior note, 4.55%, 11/14/24 | United States | 13,000,000 | 13,552,500 | |||||||||||||
dGlencore Funding LLC, | ||||||||||||||||
senior note, 144A, 4.125%, 5/30/23 | Switzerland | 5,000,000 | 5,238,364 | |||||||||||||
senior note, 144A, 4.625%, 4/29/24 | Switzerland | 2,500,000 | 2,674,590 | |||||||||||||
dMauser Packaging Solutions Holding Co., senior note, 144A, 7.25%, 4/15/25 | United States | 15,000,000 | 14,400,000 | |||||||||||||
dNew Gold Inc., senior note, 144A, 6.375%, 5/15/25 | Canada | 6,900,000 | 6,589,500 | |||||||||||||
dNorthwest Acquisitions ULC/Dominion Finco Inc., secured note, second lien, 144A, 7.125%, 11/01/22 | Canada | 3,800,000 | 1,909,500 | |||||||||||||
dNovelis Corp., senior bond, 144A, 5.875%, 9/30/26 | United States | 14,000,000 | 14,736,400 | |||||||||||||
18 | Semiannual Report | franklintempleton.com | ||
FRANKLIN STRATEGIC SERIES
CONSOLIDATED STATEMENT OF INVESTMENTS (UNAUDITED)
Franklin Strategic Income Fund(continued)
| Country/ Organization | Principal Amount* | Value | ||||||||||||||
Corporate Bonds(continued) | ||||||||||||||||
Materials(continued) | ||||||||||||||||
dOwens-Brockway Glass Container Inc., | ||||||||||||||||
senior note, 144A, 5.00%, 1/15/22 | United States | 6,000,000 | $ | 6,217,500 | ||||||||||||
senior note, 144A, 5.875%, 8/15/23 | United States | 10,000,000 | 10,600,000 | |||||||||||||
Reynolds Group Issuer Inc./Reynolds Group Issuer LLC/Reynolds Group Issuer Luxembourg SA, | ||||||||||||||||
senior secured note, first lien, 5.75%, 10/15/20 | United States | 5,427,003 | 5,452,510 | |||||||||||||
dsenior secured note, first lien, 144A, 5.125%, 7/15/23 | United States | 5,900,000 | 6,067,855 | |||||||||||||
d,isenior secured note, first lien, 144A, FRN, 5.501%,(3-month USD LIBOR + 3.50%), 7/15/21 | United States | 6,500,000 | 6,532,500 | |||||||||||||
dSABIC Capital II BV, senior note, 144A, 4.50%, 10/10/28 | Saudi Arabia | 5,500,000 | 6,111,517 | |||||||||||||
dSealed Air Corp., | ||||||||||||||||
senior bond, 144A, 5.125%, 12/01/24 | United States | 11,300,000 | 12,232,250 | |||||||||||||
senior note, 144A, 4.875%, 12/01/22 | United States | 4,000,000 | 4,250,000 | |||||||||||||
eSociedad Quimica y Minera de Chile SA, senior note, 144A, 3.625%, 4/03/23 | Chile | 1,500,000 | 1,539,750 | |||||||||||||
dSunCoke Energy Partners LP/SunCoke Energy Partners Finance Corp., senior note, 144A, 7.50%, 6/15/25 | United States | 12,000,000 | 10,260,000 | |||||||||||||
|
| |||||||||||||||
| 194,465,160 | ||||||||||||||||
|
| |||||||||||||||
Media & Entertainment 2.7% | ||||||||||||||||
dAltice Financing SA, secured bond, 144A, 7.50%, 5/15/26 | Luxembourg | 3,000,000 | 3,191,250 | |||||||||||||
CCO Holdings LLC/CCO Holdings Capital Corp., | ||||||||||||||||
senior bond, 5.25%, 9/30/22 | United States | 6,500,000 | 6,601,562 | |||||||||||||
dsenior bond, 144A, 5.375%, 5/01/25 | United States | 13,000,000 | 13,520,000 | |||||||||||||
dClear Channel Worldwide Holdings Inc., | ||||||||||||||||
first lien, senior secured note, 144A, 5.125%, 8/15/27 | United States | 6,400,000 | 6,677,952 | |||||||||||||
senior sub. note, 144A, 9.25%, 2/15/24 | United States | 1,362,000 | 1,500,754 | |||||||||||||
dCSC Holdings LLC, senior secured note, first lien, 144A, 5.50%, 5/15/26 | United States | 16,000,000 | 16,900,000 | |||||||||||||
dDiamond Sports Group LLC/Diamond Sports Finance Co., | ||||||||||||||||
first lien, 144A, 5.375%, 8/15/26 | United States | 4,300,000 | 4,498,875 | |||||||||||||
senior note, 144A, 6.625%, 8/15/27 | United States | 4,500,000 | 4,646,250 | |||||||||||||
DISH DBS Corp., | ||||||||||||||||
senior bond, 5.00%, 3/15/23 | United States | 6,000,000 | 6,067,500 | |||||||||||||
senior note, 5.875%, 11/15/24 | United States | 8,000,000 | 8,050,000 | |||||||||||||
iHeartCommunications Inc., | ||||||||||||||||
secured note, 6.375%, 5/01/26 | United States | 661,721 | 715,486 | |||||||||||||
senior note, 8.375%, 5/01/27 | United States | 1,199,371 | 1,292,322 | |||||||||||||
dLive Nation Entertainment Inc., senior note, 144A, 4.75%, 10/15/27 | United States | 4,400,000 | 4,598,440 | |||||||||||||
Netflix Inc., senior bond, 4.375%, 11/15/26 | United States | 11,800,000 | 12,039,540 | |||||||||||||
dNexstar Broadcasting Inc., senior note, 144A, 5.625%, 8/01/24 | United States | 15,000,000 | 15,688,200 | |||||||||||||
dUnivision Communications Inc., senior secured note, first lien, 144A, 5.125%, 2/15/25 | United States | 16,000,000 | 15,680,000 | |||||||||||||
|
| |||||||||||||||
| 121,668,131 | ||||||||||||||||
|
| |||||||||||||||
| franklintempleton.com | Semiannual Report | 19 | ||
FRANKLIN STRATEGIC SERIES
CONSOLIDATED STATEMENT OF INVESTMENTS (UNAUDITED)
Franklin Strategic Income Fund(continued)
| Country/ Organization | Principal Amount* | Value | ||||||||||||||
Corporate Bonds(continued) | ||||||||||||||||
Pharmaceuticals, Biotechnology & Life Sciences 1.6% | ||||||||||||||||
Allergan Funding SCS, senior bond, 3.80%, 3/15/25 | United States | 25,000,000 | $ | 26,251,150 | ||||||||||||
dBausch Health Cos. Inc., | ||||||||||||||||
senior bond, 144A, 6.125%, 4/15/25 | United States | 3,100,000 | 3,225,938 | |||||||||||||
senior note, 144A, 8.50%, 1/31/27 | United States | 5,000,000 | 5,637,500 | |||||||||||||
senior note, first lien, 144A, 7.00%, 3/15/24 | United States | 2,100,000 | 2,202,218 | |||||||||||||
dBayer U.S. Finance II LLC, senior bond, 144A, 4.375%, 12/15/28 | Germany | 11,700,000 | 12,702,005 | |||||||||||||
d,hEagle Holdings Co. II LLC, senior note, 144A, PIK, 7.625%, 5/15/22 | United States | 3,300,000 | 3,337,125 | |||||||||||||
dEndo DAC/Endo Finance LLC/Endo Finco Inc., | ||||||||||||||||
senior bond, 144A, 6.00%, 2/01/25 | United States | 11,000,000 | 7,067,500 | |||||||||||||
senior note, 144A, 6.00%, 7/15/23 | United States | 1,637,000 | 1,090,651 | |||||||||||||
dJaguar Holding Co. II/Pharmaceutical Product Development LLC, senior note, 144A, 6.375%, 8/01/23 | United States | 10,000,000 | 10,375,000 | |||||||||||||
|
| |||||||||||||||
| 71,889,087 | ||||||||||||||||
|
| |||||||||||||||
Real Estate 0.8% | ||||||||||||||||
American Tower Corp., senior bond, 3.375%, 10/15/26 | United States | 15,500,000 | 16,141,201 | |||||||||||||
gChina Overseas Finance Cayman VI Ltd., senior note, Reg S, 5.95%, 5/08/24 | China | 7,500,000 | 8,501,700 | |||||||||||||
MPT Operating Partnership LP/MPT Finance Corp., | ||||||||||||||||
senior bond, 5.25%, 8/01/26 | United States | 4,200,000 | 4,425,750 | |||||||||||||
senior bond, 5.00%, 10/15/27 | United States | 5,700,000 | 6,027,750 | |||||||||||||
|
| |||||||||||||||
| 35,096,401 | ||||||||||||||||
|
| |||||||||||||||
Retailing 0.1% | ||||||||||||||||
b,d,hK2016470219 South Africa Ltd., senior secured note, 144A, PIK, 3.00%, 12/31/22 | South Africa | 9,981,540 | 12,353 | |||||||||||||
b,d,hK2016470260 South Africa Ltd., senior secured note, 144A, PIK, 25.00%, 12/31/22 | South Africa | 2,371,531 | 10,946 | |||||||||||||
dParty City Holdings Inc., senior note, 144A, 6.625%, 8/01/26 | United States | 5,300,000 | 5,141,000 | |||||||||||||
|
| |||||||||||||||
| 5,164,299 | ||||||||||||||||
|
| |||||||||||||||
Semiconductors & Semiconductor Equipment 0.1% | ||||||||||||||||
Maxim Integrated Products Inc., senior note, 3.375%, 3/15/23 | United States | 1,800,000 | 1,853,167 | |||||||||||||
Qorvo Inc., senior note, 5.50%, 7/15/26 | United States | 2,600,000 | 2,781,948 | |||||||||||||
|
| |||||||||||||||
| 4,635,115 | ||||||||||||||||
|
| |||||||||||||||
Software & Services 0.2% | ||||||||||||||||
dSymantec Corp., senior note, 144A, 5.00%, 4/15/25 | United States | 9,500,000 | 9,743,079 | |||||||||||||
|
| |||||||||||||||
Technology Hardware & Equipment 0.5% | ||||||||||||||||
dCommScope Technologies LLC, senior bond, 144A, 6.00%, 6/15/25 | United States | 14,600,000 | 13,140,000 | |||||||||||||
dDell International LLC/EMC Corp., senior note, 144A, 7.125%, 6/15/24 | United States | 7,000,000 | 7,430,500 | |||||||||||||
|
| |||||||||||||||
| 20,570,500 | ||||||||||||||||
|
| |||||||||||||||
20 | Semiannual Report | franklintempleton.com | ||
FRANKLIN STRATEGIC SERIES
CONSOLIDATED STATEMENT OF INVESTMENTS (UNAUDITED)
Franklin Strategic Income Fund(continued)
| Country/ Organization | Principal Amount* | Value | ||||||||||||||
Corporate Bonds(continued) | ||||||||||||||||
Telecommunication Services 1.4% | ||||||||||||||||
AT&T Inc., senior note, 2.95%, 7/15/26 | United States | 14,800,000 | $ | 15,079,687 | ||||||||||||
dDigicel Group Two Ltd., | ||||||||||||||||
senior note, 144A, 8.25%, 9/30/22 | Bermuda | 2,427,000 | 627,938 | |||||||||||||
hsenior note, 144A, PIK, 9.125%, 4/01/24 | Bermuda | 3,042,961 | 562,948 | |||||||||||||
dDigicel Ltd., senior note, 144A, 6.00%, 4/15/21 | Bermuda | 10,000,000 | 7,562,500 | |||||||||||||
Sprint Communications Inc., | ||||||||||||||||
senior note, 6.00%, 11/15/22 | United States | 10,000,000 | 10,600,000 | |||||||||||||
dsenior note, 144A, 7.00%, 3/01/20 | United States | 5,000,000 | 5,075,000 | |||||||||||||
T-Mobile USA Inc., | ||||||||||||||||
senior bond, 6.50%, 1/15/24 | United States | 3,000,000 | 3,123,750 | |||||||||||||
senior bond, 6.375%, 3/01/25 | United States | 13,000,000 | 13,522,730 | |||||||||||||
senior note, 5.125%, 4/15/25 | United States | 6,000,000 | 6,256,800 | |||||||||||||
|
| |||||||||||||||
| 62,411,353 | ||||||||||||||||
|
| |||||||||||||||
Transportation 1.6% | ||||||||||||||||
d DAE Funding LLC, | ||||||||||||||||
senior note, 144A, 4.50%, 8/01/22 | United Arab Emirates | 2,000,000 | 2,040,000 | |||||||||||||
senior note, 144A, 5.00%, 8/01/24 | United Arab Emirates | 14,000,000 | 14,682,500 | |||||||||||||
dKazakhstan Temir Zholy Finance BV, senior bond, 144A, 6.95%, 7/10/42 | Kazakhstan | 18,100,000 | 24,494,730 | |||||||||||||
dMexico City Airport Trust, senior secured bond, first lien, 144A, 5.50%, 7/31/47 | Mexico | 12,718,000 | 12,806,072 | |||||||||||||
g,kRZD Capital PLC, (Russian Railways), loan participation, senior bond, Reg S, 5.70%, 4/05/22 | Russia | 17,600,000 | 18,887,352 | |||||||||||||
|
| |||||||||||||||
| 72,910,654 | ||||||||||||||||
|
| |||||||||||||||
Utilities 3.5% | ||||||||||||||||
Calpine Corp., | ||||||||||||||||
senior bond, 5.75%, 1/15/25 | United States | 9,000,000 | 9,258,750 | |||||||||||||
senior note, 5.375%, 1/15/23 | United States | 4,000,000 | 4,074,800 | |||||||||||||
Clearway Energy Operating LLC, senior note, 5.75%, 10/15/25 | United States | 12,800,000 | 13,184,000 | |||||||||||||
Dominion Energy Inc., senior bond, 2.85%, 8/15/26 | United States | 11,400,000 | 11,611,381 | |||||||||||||
d,m EDF SA, | ||||||||||||||||
junior sub. bond, 144A, 5.625% to 1/22/24, FRN thereafter, Perpetual | France | 5,000,000 | 5,255,775 | |||||||||||||
junior sub. note, 144A, 5.25% to 1/29/23, FRN thereafter, Perpetual | France | 25,000,000 | 25,914,000 | |||||||||||||
Exelon Corp., senior bond, 3.95%, 6/15/25 | United States | 8,500,000 | 9,215,223 | |||||||||||||
dInterGen NV, secured bond, 144A, 7.00%, 6/30/23 | Netherlands | 4,800,000 | 4,586,400 | |||||||||||||
dIsrael Electric Corp. Ltd., secured bond, 144A, 4.25%, 8/14/28 | Israel | 9,200,000 | 10,037,062 | |||||||||||||
The Southern Co., senior bond, 3.25%, 7/01/26 | United States | 24,200,000 | 25,266,991 | |||||||||||||
dState Grid Overseas Investment 2016 Ltd., senior note, 144A, 3.50%, 5/04/27 | China | 12,800,000 | 13,539,456 | |||||||||||||
d Talen Energy Supply LLC, | ||||||||||||||||
senior note, 144A, 10.50%, 1/15/26 | United States | 3,000,000 | 2,587,500 | |||||||||||||
senior secured note, 144A, 7.25%, 5/15/27 | United States | 10,800,000 | 10,827,000 | |||||||||||||
| franklintempleton.com | Semiannual Report | 21 | ||
FRANKLIN STRATEGIC SERIES
CONSOLIDATED STATEMENT OF INVESTMENTS (UNAUDITED)
Franklin Strategic Income Fund(continued)
| Country/ Organization | Principal Amount* | Value | ||||||||||||||
Corporate Bonds(continued) | ||||||||||||||||
Utilities(continued) | ||||||||||||||||
dThree Gorges Finance I Cayman Islands Ltd., senior note, 144A, 3.15%, 6/02/26 | China | 12,800,000 | $ | 13,225,728 | ||||||||||||
Virginia Electric & Power Co., senior bond, 6.35%, 11/30/37 | United States | 820,000 | 1,157,504 | |||||||||||||
|
| |||||||||||||||
| 159,741,570 | ||||||||||||||||
|
| |||||||||||||||
Total Corporate Bonds (Cost $1,392,458,413) | 1,383,268,118 | |||||||||||||||
|
| |||||||||||||||
i,nSenior Floating Rate Interests 5.8% | ||||||||||||||||
Automobiles & Components 0.0%† | ||||||||||||||||
Adient US LLC, | ||||||||||||||||
Initial Term Loans, 6.459%,(3-month USD LIBOR + 4.25%), 5/06/24 | United States | 180,000 | 176,175 | |||||||||||||
Initial Term Loans, 6.889%,(6-month USD LIBOR + 4.25%), 5/06/24 | United States | 538,200 | 526,763 | |||||||||||||
Thor Industries Inc., Initial USD Term Loans, 5.813%,(1-month USD LIBOR + 3.75%), 2/01/26 | United States | 1,884,415 | 1,840,838 | |||||||||||||
|
| |||||||||||||||
| 2,543,776 | ||||||||||||||||
|
| |||||||||||||||
Capital Goods 0.2% | ||||||||||||||||
Altra Industrial Motion Corp., Term Loan, 3.786%,(3-month USD LIBOR + 2.00%), 10/01/25 | United States | 692,214 | 691,128 | |||||||||||||
Doncasters U.S. Finance LLC, Second-Lien Term Loans, 10.354%,(3-month USD LIBOR + 8.25%), 10/09/20 | United States | 12,543,188 | 3,386,661 | |||||||||||||
Harsco Corp., Term LoanB-2, 4.063%,(1-month USD LIBOR + 2.25%), 12/10/24 | United States | 2,040,990 | 2,047,368 | |||||||||||||
Onsite Rental Group Operations Pty. Ltd., Term Loan, 6.323%,(1-month USD LIBOR + 4.50%), 10/25/22 | Australia | 3,404,855 | 3,362,294 | |||||||||||||
|
| |||||||||||||||
| 9,487,451 | ||||||||||||||||
|
| |||||||||||||||
Commercial & Professional Services 0.0%† | ||||||||||||||||
United Rentals North America Inc., Initial Term Loans, 3.536%,(1-month USD LIBOR + 1.75%), 10/31/25 | United States | 997,481 | 1,002,885 | |||||||||||||
Ventia Pty Ltd., Term B Loans, 5.604%,(3-month USD LIBOR + 3.50%), 5/21/26 | Australia | 829,952 | 832,027 | |||||||||||||
|
| |||||||||||||||
| 1,834,912 | ||||||||||||||||
|
| |||||||||||||||
Consumer Services 0.1% | ||||||||||||||||
Aristocrat Technologies Inc., TermB-3 Loans, 3.716%,(3-month USD LIBOR + 1.75%), 10/19/24 | United States | 1,408,412 | 1,413,474 | |||||||||||||
Avis Budget Car Rental LLC, Tranche B Term Loans, 3.79%,(1-month USD LIBOR + 2.00%), 2/13/25 | United States | 1,994,924 | 1,999,073 | |||||||||||||
Eldorado Resorts Inc., Initial Term Loan, 4.125% - 4.313%,(1-month USD LIBOR + 2.25%), 4/17/24 | United States | 3,215,110 | 3,214,412 | |||||||||||||
|
| |||||||||||||||
| 6,626,959 | ||||||||||||||||
|
| |||||||||||||||
Diversified Financials 0.0%† | ||||||||||||||||
Russell Investments U.S. Institutional Holdco Inc., Initial Term Loan, 5.036%,(1-month USD LIBOR + 3.25%), 6/01/23 | United States | 708,606 | 689,415 | |||||||||||||
|
| |||||||||||||||
22 | Semiannual Report | franklintempleton.com | ||
FRANKLIN STRATEGIC SERIES
CONSOLIDATED STATEMENT OF INVESTMENTS (UNAUDITED)
Franklin Strategic Income Fund(continued)
| Country/ Organization | Principal Amount* | Value | ||||||||||||||
i,nSenior Floating Rate Interests(continued) | ||||||||||||||||
Energy 2.2% | ||||||||||||||||
Fieldwood Energy LLC, Closing Date Loans, 7.177%,(3-month USD LIBOR + 5.25%), 4/11/22 | United States | 64,439,645 | $ | 52,131,673 | ||||||||||||
Utex Industries Inc., | ||||||||||||||||
First Lien Initial Term Loan, 5.786%,(1-month USD LIBOR + 4.00%), 5/21/21 | United States | 9,168,440 | 7,059,699 | |||||||||||||
Second Lien Initial Term Loan, 9.036%,(1-month USD LIBOR + 7.25%), 5/20/22 | United States | 955,410 | 506,367 | |||||||||||||
Wolverine Fuels Holding LLC, | ||||||||||||||||
First Lien Initial Term Loan, 7.874%,(3-month USD LIBOR + 5.75%), 8/14/20 | United States | 17,686,722 | 17,303,504 | |||||||||||||
Second Lien Initial Term Loan, 12.874%,(3-month USD LIBOR + 10.75%), 2/16/21 | United States | 22,488,412 | 21,270,282 | |||||||||||||
|
| |||||||||||||||
| 98,271,525 | ||||||||||||||||
|
| |||||||||||||||
Food, Beverage & Tobacco 0.4% | ||||||||||||||||
CSM Bakery Supplies LLC, Second Lien Term Loan, 9.78%,(3-month USD LIBOR + 7.75%), 7/03/21 | United States | 16,940,234 | 15,161,509 | |||||||||||||
JBS USA Lux SA, New Term Loans, 4.286%,(1-month USD LIBOR + 2.50%), 5/01/26 | United States | 997,494 | 1,002,244 | |||||||||||||
|
| |||||||||||||||
| 16,163,753 | ||||||||||||||||
|
| |||||||||||||||
Household & Personal Products 1.0% | ||||||||||||||||
b FGI Operating Co. LLC (Freedom Group), | ||||||||||||||||
hTerm Loan, PIK, 12.10%,(3-month USD LIBOR + 10.00%), 5/15/22 | United States | 15,064,735 | 14,699,084 | |||||||||||||
Term Loan FILO, 9.624% - 9.658%,(3-month USD LIBOR + 7.50%), 5/15/21 | United States | 28,662,305 | 28,606,339 | |||||||||||||
|
| |||||||||||||||
| 43,305,423 | ||||||||||||||||
|
| |||||||||||||||
Materials 0.4% | ||||||||||||||||
Appvion Operations, Inc., | ||||||||||||||||
Term Loan, 8.10%,(3-month USD LIBOR + 6.00%), 6/15/26 | United States | 442,850 | 447,279 | |||||||||||||
Term Loan, 8.22%,(6-month USD LIBOR + 6.00%), 6/15/26 | United States | 7,044,096 | 7,114,537 | |||||||||||||
Axalta Coating Systems U.S. Holdings Inc., TermB-3 Dollar Loan, 3.854%,(3-month USD LIBOR + 1.75%), 6/01/24 | United States | 2,183,006 | 2,183,290 | |||||||||||||
Chemours Co., TrancheB-2 US$ Term Loan, 3.54%,(1-month USD LIBOR + 1.75%), 4/03/25 | United States | 4,104,239 | 3,897,315 | |||||||||||||
Crown Americas LLC, Dollar Term B Loan, 3.997%,(1-month USD LIBOR + 2.00%), 4/03/25 | United States | 530,377 | 534,354 | |||||||||||||
Oxbow Carbon LLC, Tranche A Term Loan, 4.286%,(1-month USD LIBOR + 2.50%), 1/04/22 | United States | 3,172,129 | 3,156,269 | |||||||||||||
|
| |||||||||||||||
| 17,333,044 | ||||||||||||||||
|
| |||||||||||||||
Media & Entertainment 0.3% | ||||||||||||||||
Charter Communications Operating LLC, TermA-2 Loan, 3.55%,(1-month USD LIBOR + 1.50%), 3/31/23 | United States | 2,959,459 | 2,955,760 | |||||||||||||
CSC Holdings LLC, March 2017 Incremental Term Loans, 4.171%,(1-month USD LIBOR + 2.25%), 7/17/25 | United States | 997,442 | 994,013 | |||||||||||||
Diamond Sports Group LLC, Term Loan, 5.08%,(1-month USD LIBOR + 3.25%), 8/24/26 | United States | 3,000,000 | 3,018,375 | |||||||||||||
Gray Television Inc., Term C Loan, 4.511%,(1-month USD LIBOR + 2.50%), 1/02/26 | United States | 396,805 | 398,386 | |||||||||||||
| franklintempleton.com | Semiannual Report | 23 | ||
FRANKLIN STRATEGIC SERIES
CONSOLIDATED STATEMENT OF INVESTMENTS (UNAUDITED)
Franklin Strategic Income Fund(continued)
| Country/ Organization | Principal Amount* | Value | ||||||||||||||
i,nSenior Floating Rate Interests(continued) | ||||||||||||||||
Media & Entertainment(continued) | ||||||||||||||||
iHeartCommunications Inc., Term Loan, 6.032%,(1-month USD LIBOR + 4.00%), 5/04/26 | United States | 2,282,583 | $ | 2,293,277 | ||||||||||||
Lions Gate Capital Holdings LLC, Term A Loan, 3.536%,(1-month USD LIBOR + 1.75%), 3/22/23 | Canada | 2,478,119 | 2,419,263 | |||||||||||||
Nexstar Broadcasting Inc., TermB-4 Loan, 4.554%,(1-month USD LIBOR + 2.75%), 9/19/26 | United States | 997,625 | 1,003,112 | |||||||||||||
|
| |||||||||||||||
| 13,082,186 | ||||||||||||||||
|
| |||||||||||||||
Pharmaceuticals, Biotechnology & Life Sciences 0.2% | ||||||||||||||||
Grifols Worldwide Operations USA Inc., Tranche B Term Loan, 4.086%,(1-week USD LIBOR + 2.25%), 1/31/25 | United States | 6,741,681 | 6,759,587 | |||||||||||||
Syneos Health Inc., Initial Term B Loans, 3.786%,(1-month USD LIBOR + 2.00%), 8/01/24 | United States | 1,466,008 | 1,470,589 | |||||||||||||
|
| |||||||||||||||
| 8,230,176 | ||||||||||||||||
|
| |||||||||||||||
Retailing 0.1% | ||||||||||||||||
h99 Cents Only Stores, | ||||||||||||||||
First Lien Term Loan, PIK, 8.604%,(3-month USD LIBOR + 6.50%), 1/13/22 | United States | 2,642,070 | 2,173,103 | |||||||||||||
First Lien Term Loan, PIK, 8.535%,(6-month USD LIBOR + 6.50%), 1/13/22 | United States | 1,983,114 | 1,631,111 | |||||||||||||
|
| |||||||||||||||
| 3,804,214 | ||||||||||||||||
|
| |||||||||||||||
Semiconductors & Semiconductor Equipment 0.1% | ||||||||||||||||
MKS Instruments Inc., TrancheB-6 Term Loan, 3.536%,(1-month USD LIBOR + 1.75%), 2/02/26 | United States | 3,549,320 | 3,563,738 | |||||||||||||
ON Semiconductor Corp., 2019 Replacement TermB-4 Loans, 3.786%,(1-month USD LIBOR + 2.00%), 9/18/26 | United States | 2,000,000 | 2,011,522 | |||||||||||||
|
| |||||||||||||||
| 5,575,260 | ||||||||||||||||
|
| |||||||||||||||
Software & Services 0.5% | ||||||||||||||||
WEX Inc., TermB-3 Loan, 4.036%,(1-month USD LIBOR + 2.25%), 5/17/26 | United States | 1,844,081 | 1,853,302 | |||||||||||||
bWorkCapital BSD SARL, Loan, 18.176%,(3-month USD LIBOR + 16.00%), 2/11/22 | Luxembourg | 20,000,000 | 20,023,463 | |||||||||||||
|
| |||||||||||||||
| 21,876,765 | ||||||||||||||||
|
| |||||||||||||||
Telecommunication Services 0.2% | ||||||||||||||||
Global Tel*Link Corp., | ||||||||||||||||
First Lien Term Loan, 6.036%,(1-month USD LIBOR + 4.25%), 11/29/25 | United States | 997,488 | 873,799 | |||||||||||||
Second Lien Term Loan, 10.036%,(1-month USD LIBOR + 8.25%), 11/29/26 | United States | 545,755 | 521,196 | |||||||||||||
Securus Technologies Holdings Inc., | ||||||||||||||||
Initial Term Loan, 6.286%,(1-month USD LIBOR + 4.50%), 11/01/24 | United States | 2,487,342 | 1,975,658 | |||||||||||||
Second Lien Initial Loan, 10.036%,(1-month USD LIBOR + 8.25%), 11/01/25 | United States | 10,588,688 | 5,823,779 | |||||||||||||
|
| |||||||||||||||
| 9,194,432 | ||||||||||||||||
|
| |||||||||||||||
24 | Semiannual Report | franklintempleton.com | ||
FRANKLIN STRATEGIC SERIES
CONSOLIDATED STATEMENT OF INVESTMENTS (UNAUDITED)
Franklin Strategic Income Fund(continued)
| Country/ Organization | Principal Amount* | Value | ||||||||||||||
i,nSenior Floating Rate Interests(continued) | ||||||||||||||||
Transportation 0.1% | ||||||||||||||||
Air Canada, Term Loan, 3.805%,(1-month USD LIBOR + 2.00%), 10/06/23 | Canada | 407,413 | $ | 409,451 | ||||||||||||
Allegiant Travel Co., Class B Term Loans, 6.709%,(3-month USD LIBOR + 4.50%), 2/05/24 | United States | 2,901,565 | 2,912,446 | |||||||||||||
Hertz Corp., TrancheB-1 Term Loan, 4.54%,(1-month USD LIBOR + 2.75%), 6/30/23 | United States | 994,751 | 996,201 | |||||||||||||
|
| |||||||||||||||
| 4,318,098 | ||||||||||||||||
|
| |||||||||||||||
Utilities 0.0%† | ||||||||||||||||
EFS Cogen Holdings I LLC (Linden), | ||||||||||||||||
Term B Advance, 5.04%,(1-month USD LIBOR + 3.25%), 6/28/23 | United States | 282,435 | 281,994 | |||||||||||||
Term B Advance, 5.36%,(3-month USD LIBOR + 3.25%), 6/28/23 | United States | 697,512 | 696,422 | |||||||||||||
|
| |||||||||||||||
| 978,416 | ||||||||||||||||
|
| |||||||||||||||
Total Senior Floating Rate Interests (Cost $289,272,277) | 263,315,805 | |||||||||||||||
|
| |||||||||||||||
Foreign Government and Agency Securities 12.2% | ||||||||||||||||
dThe African Export-Import Bank, senior bond, 144A, 3.994%, 9/21/29 | Supranationalo | 8,600,000 | 8,724,571 | |||||||||||||
dAngolan Government International Bond, senior note, 144A, 8.25%, 5/09/28 | Angola | 26,800,000 | 28,106,232 | |||||||||||||
gBanque Centrale de Tunisie International Bond, senior note, Reg S, 5.625%, 2/17/24 | Tunisia | 25,700,000 | EUR | 28,094,677 | ||||||||||||
pBrazil Notas do Tesouro Nacional, Index Linked, 6.00%, 5/15/23 | Brazil | 19,500 | j | BRL | 18,073,278 | |||||||||||
dDominican Republic, senior note, 144A, 8.90%, 2/15/23 | Dominican Republic | 838,300,000 | DOP | 15,908,746 | ||||||||||||
dThe Export-Import Bank of India, senior note, 144A, 3.875%, 2/01/28 | India | 16,000,000 | 17,052,344 | |||||||||||||
dGovernment of Belarus International Bond, | ||||||||||||||||
senior bond, 144A, 6.20%, 2/28/30 | Belarus | 3,500,000 | 3,747,132 | |||||||||||||
senior note, 144A, 7.625%, 6/29/27 | Belarus | 7,500,000 | 8,634,375 | |||||||||||||
Government of China, 3.29%, 5/23/29 | China | 270,300,000 | CNY | 38,353,264 | ||||||||||||
Government of Colombia, | ||||||||||||||||
senior bond, 9.85%, 6/28/27 | Colombia | 55,750,000,000 | COP | 20,737,762 | ||||||||||||
senior bond, 5.00%, 6/15/45 | Colombia | 20,700,000 | 24,162,282 | |||||||||||||
dGovernment of Gabon, 144A, 6.375%, 12/12/24 | Gabon | 29,000,000 | 28,954,035 | |||||||||||||
Government of Indonesia, | ||||||||||||||||
senior bond, FR34, 12.80%, 6/15/21 | Indonesia | 129,210,000,000 | IDR | 10,184,371 | ||||||||||||
senior bond, FR39, 11.75%, 8/15/23 | Indonesia | 29,150,000,000 | IDR | 2,449,518 | ||||||||||||
senior bond, FR44, 10.00%, 9/15/24 | Indonesia | 8,340,000,000 | IDR | 679,760 | ||||||||||||
senior bond, FR56, 8.375%, 9/15/26 | Indonesia | 363,988,000,000 | IDR | 28,355,138 | ||||||||||||
dGovernment of Iraq, 144A, 5.80%, 1/15/28 | Iraq | 29,000,000 | 27,896,985 | |||||||||||||
dGovernment of Kazakhstan, senior bond, 144A, 4.875%, 10/14/44 | Kazakhstan | 19,300,000 | 23,534,999 | |||||||||||||
Government of Mexico, senior note, 4.15%, 3/28/27 | Mexico | 13,900,000 | 14,899,410 | |||||||||||||
Government of Peru, senior bond, 6.55%, 3/14/37 | Peru | 11,400,000 | 16,675,464 | |||||||||||||
| franklintempleton.com | Semiannual Report | 25 | ||
FRANKLIN STRATEGIC SERIES
CONSOLIDATED STATEMENT OF INVESTMENTS (UNAUDITED)
Franklin Strategic Income Fund(continued)
| Country/ Organization | Principal Amount* | Value | ||||||||||||||
Foreign Government and Agency Securities(continued) | ||||||||||||||||
dGovernment of Russia, senior note, 144A, 4.875%, 9/16/23 | Russia | 8,600,000 | $ | 9,415,581 | ||||||||||||
Government of South Africa, senior bond, 7.00%, 2/28/31 | South Africa | 365,000,000 | ZAR | 20,153,319 | ||||||||||||
d,gGovernment of Spain, | ||||||||||||||||
senior bond, 144A, Reg S, 1.45%, 4/30/29 | Spain | 17,300,000 | EUR | 21,543,391 | ||||||||||||
senior bond, 144A, Reg S, 2.70%, 10/31/48 | Spain | 35,600,000 | EUR | 55,210,551 | ||||||||||||
dGovernment of Ukraine, | ||||||||||||||||
144A, 7.75%, 9/01/22 | Ukraine | 2,200,000 | 2,344,320 | |||||||||||||
144A, 7.75%, 9/01/23 | Ukraine | 4,355,000 | 4,665,947 | |||||||||||||
144A, 7.75%, 9/01/24 | Ukraine | 4,355,000 | 4,676,181 | |||||||||||||
a,q144A, VRI, GDP Linked Security, 5/31/40 | Ukraine | 9,990,000 | 9,411,080 | |||||||||||||
senior bond, 144A, 7.375%, 9/25/32 | Ukraine | 6,000,000 | 6,285,090 | |||||||||||||
Government of Uruguay, | ||||||||||||||||
senior bond, 4.375%, 1/23/31 | Uruguay | 8,000,000 | 8,942,080 | |||||||||||||
rsenior bond, Index Linked, 3.70%, 6/26/37 | Uruguay | 835,347,737 | UYU | 22,293,211 | ||||||||||||
Nota do Tesouro Nacional, 10.00%, 1/01/23 | Brazil | 34,402 | j | BRL | 9,675,969 | |||||||||||
dPanama Notas del Tesoro, senior note, 144A, 3.75%, 4/17/26 | Panama | 8,200,000 | 8,511,600 | |||||||||||||
|
| |||||||||||||||
Total Foreign Government and Agency Securities | 548,352,663 | |||||||||||||||
|
| |||||||||||||||
U.S. Government and Agency Securities 6.2% | ||||||||||||||||
U.S. Treasury Bond, | ||||||||||||||||
7.125%, 2/15/23 | United States | 3,000,000 | 3,538,067 | |||||||||||||
6.25%, 8/15/23 | United States | 4,000,000 | 4,694,375 | |||||||||||||
6.875%, 8/15/25 | United States | 1,000,000 | 1,293,652 | |||||||||||||
5.25%, 2/15/29 | United States | 1,750,000 | 2,288,775 | |||||||||||||
U.S. Treasury Note, | ||||||||||||||||
3.125%, 11/15/28 | United States | 81,000,000 | 90,852,890 | |||||||||||||
rIndex Linked, 0.625%, 1/15/24 | United States | 25,234,651 | 25,656,744 | |||||||||||||
rIndex Linked, 0.125%, 7/15/24 | United States | 97,827,737 | 97,925,262 | |||||||||||||
rIndex Linked, 0.375%, 7/15/25 | United States | 34,295,255 | 34,819,321 | |||||||||||||
rIndex Linked, 0.375%, 7/15/27 | United States | 18,784,202 | 19,113,536 | |||||||||||||
|
| |||||||||||||||
Total U.S. Government and Agency Securities | 280,182,622 | |||||||||||||||
|
| |||||||||||||||
Asset-Backed Securities and Commercial Mortgage-Backed Securities 30.1% | ||||||||||||||||
Banks 0.4% | ||||||||||||||||
sCommercial Mortgage Trust,2006-GG7, AJ, FRN, 5.637%, 7/10/38 | United States | 5,333,000 | 4,941,858 | |||||||||||||
CSAIL Commercial Mortgage Trust,2015-C1, A4, 3.505%, 4/15/50 | United States | 10,050,000 | 10,657,941 | |||||||||||||
sCWABS Asset-Backed Certificates Trust,2005-11, AF4, FRN, 5.21%, 3/25/34 | United States | 1,629,592 | 1,648,209 | |||||||||||||
tMerrill Lynch Mortgage Investors Trust,2005-A6, 2A3, FRN, 2.203%,(1-month USD LIBOR + 0.38%), 8/25/35 | United States | 831,420 | 838,721 | |||||||||||||
|
| |||||||||||||||
| 18,086,729 | ||||||||||||||||
|
| |||||||||||||||
26 | Semiannual Report | franklintempleton.com | ||
FRANKLIN STRATEGIC SERIES
CONSOLIDATED STATEMENT OF INVESTMENTS (UNAUDITED)
Franklin Strategic Income Fund(continued)
| Country/ Organization | Principal Amount* | Value | ||||||||||||||
Asset-Backed Securities and Commercial Mortgage-Backed Securities(continued) | ||||||||||||||||
Diversified Financials 29.7% | ||||||||||||||||
tAmerican Express Credit Account Master Trust,2017-2, A, FRN, 2.364%,(1-month USD LIBOR + 0.45%), 9/16/24 | United States | 9,170,000 | $ | 9,215,936 | ||||||||||||
d,tAMMC CLO XI Ltd., | ||||||||||||||||
2012-11A, BR2, 144A, FRN, 3.536%,(3-month USD LIBOR + 1.60%), 4/30/31 | United States | 3,000,000 | 2,932,530 | |||||||||||||
2012-11A, CR2, 144A, FRN, 3.836%,(3-month USD LIBOR + 1.90%), 4/30/31 | United States | 1,000,000 | 941,690 | |||||||||||||
2012-11A, DR2, 144A, FRN, 4.786%,(3-month USD LIBOR + 2.85%), 4/30/31 | United States | 1,450,000 | 1,298,243 | |||||||||||||
d,tAntares CLO Ltd.,2018-1A, B, 144A, FRN, 3.616%,(3-month USD LIBOR + 1.65%), 4/20/31 | United States | 17,500,000 | 17,055,150 | |||||||||||||
d,tAres CLO Ltd.,2018-48A, D, 144A, FRN, 4.666%,(3-month USD LIBOR + 2.70%), 7/20/30 | United States | 3,550,000 | 3,274,875 | |||||||||||||
d,sARES L CLO Ltd.,2018-50A, B, 144A, FRN, 3.701%, 1/15/32 | United States | 15,700,000 | 15,475,333 | |||||||||||||
d,sARES LII CLO Ltd., | ||||||||||||||||
2019-52A, A2, 144A, FRN, 3.603%, 4/22/31 | United States | 2,522,358 | 2,516,077 | |||||||||||||
2019-52A, B, 144A, FRN, 3.803%, 4/22/31 | United States | 3,500,000 | 3,503,500 | |||||||||||||
2019-52A, C, 144A, FRN, 4.633%, 4/22/31 | United States | 1,000,000 | 995,020 | |||||||||||||
2019-52A, D, 144A, FRN, 5.903%, 4/22/31 | United States | 1,703,704 | 1,680,278 | |||||||||||||
d,tAres XLIII CLO Ltd.,2017-43A, A, 144A, FRN, 3.221%,(3-month USD LIBOR + 1.22%), 10/15/29 | United States | 3,870,000 | 3,875,495 | |||||||||||||
d,sAtrium XIV LLC, 14A, D, 144A, FRN, 4.951%, 8/23/30 | United States | 3,750,000 | 3,587,550 | |||||||||||||
Banc of America Commercial Mortgage Trust, | ||||||||||||||||
2015-UBS7, A3, 3.441%, 9/15/48 | United States | 10,920,000 | 11,575,335 | |||||||||||||
2015-UBS7, A4, 3.705%, 9/15/48 | United States | 12,450,000 | 13,384,853 | |||||||||||||
s2015-UBS7, B, FRN, 4.361%, 9/15/48 | United States | 6,740,000 | 7,316,574 | |||||||||||||
d,sBCAP LLC Trust,2009-RR1, 2A2, 144A, FRN, 4.94%, 5/26/35 | United States | 5,223,207 | 5,095,359 | |||||||||||||
d,sBCC Middle Market CLO LLC,2018-1A, A2, 144A, FRN, 4.116%, 10/20/30 | United States | 6,300,000 | 6,253,695 | |||||||||||||
dBetony CLO 2 Ltd., | ||||||||||||||||
s2018-1A, A1, 144A, FRN, 3.016%, 4/30/31 | United States | 15,300,000 | 15,169,338 | |||||||||||||
t2018-1A, C, 144A, FRN, 4.836%,(3-month USD LIBOR + 2.90%), 4/30/31 | United States | 4,000,000 | 3,623,720 | |||||||||||||
d,sBlueMountain CLO Ltd., | ||||||||||||||||
2012-2A, BR2, 144A, FRN, 3.586%, 11/20/28 | United States | 6,710,000 | 6,678,060 | |||||||||||||
2012-2A, CR2, 144A, FRN, 4.136%, 11/20/28 | United States | 2,730,000 | 2,666,910 | |||||||||||||
2014-2A, CR2, 144A, FRN, 4.166%, 10/20/30 | United States | 3,800,000 | 3,625,048 | |||||||||||||
2018-1A, D, 144A, FRN, 4.986%, 7/30/30 | United States | 5,000,000 | 4,589,250 | |||||||||||||
d,s,uBlueMountain EUR CLO, | ||||||||||||||||
5A, A, 144A, FRN, 0.91%, 1/15/33 | Ireland | 20,900,000 | EUR | 23,309,771 | ||||||||||||
5A, B, 144A, FRN, 1.55%, 1/15/33 | Ireland | 6,200,000 | EUR | 6,914,860 | ||||||||||||
d,tBlueMountain Fuji U.S. CLO II Ltd.,2017-2A, A1A, 144A, FRN, 3.166%,(3-month USD LIBOR + 1.20%), 10/20/30 | United States | 4,200,000 | 4,202,688 | |||||||||||||
d,tBlueMountain Fuji U.S. CLO III Ltd., | ||||||||||||||||
2017-3A, A2, 144A, FRN, 3.151%,(3-month USD LIBOR + 1.15%), 1/15/30 | United States | 4,600,000 | 4,496,500 | |||||||||||||
2017-3A, C, 144A, FRN, 3.701%,(3-month USD LIBOR + 1.70%), 1/15/30 | United States | 600,000 | 567,732 | |||||||||||||
| franklintempleton.com | Semiannual Report | 27 | ||
FRANKLIN STRATEGIC SERIES
CONSOLIDATED STATEMENT OF INVESTMENTS (UNAUDITED)
Franklin Strategic Income Fund(continued)
| Country/ Organization | Principal Amount* | Value | ||||||||||||||
Asset-Backed Securities and Commercial Mortgage-Backed | ||||||||||||||||
Diversified Financials(continued) | ||||||||||||||||
dBRAVO Residential Funding Trust,2019-1, A1C, 144A, 3.50%, 3/25/58 | United States | 10,804,901 | $ | 11,007,743 | ||||||||||||
d,sBurnham Park CLO Ltd., | ||||||||||||||||
2016-1A, BR, 144A, FRN, 3.466%, 10/20/29 | United States | 3,500,000 | 3,463,635 | |||||||||||||
2016-1A, CR, 144A, FRN, 4.116%, 10/20/29 | United States | 4,000,000 | 3,884,720 | |||||||||||||
d,sButtermilk Park CLO Ltd.,2018-1A, C, 144A, FRN, 4.101%, 10/15/31 | United States | 9,730,950 | 9,410,704 | |||||||||||||
tCapital One Multi-Asset Execution Trust, | ||||||||||||||||
2016-A2, A2, FRN, 2.551%,(1-month USD LIBOR + 0.63%), 2/15/24 | United States | 44,033,000 | 44,302,887 | |||||||||||||
2016-A7, A7, FRN, 2.431%,(1-month USD LIBOR + 0.51%), 9/16/24 | United States | 4,400,000 | 4,427,740 | |||||||||||||
d,tCarlyle Global Market Strategies CLO Ltd.,2014-4RA, C, 144A, FRN, 4.901%,(3-month USD LIBOR + 2.90%), 7/15/30 | United States | 3,000,000 | 2,690,670 | |||||||||||||
d,sCarlyle GMS Finance MM CLO LLC,2015-1A, A2R, 144A, FRN, 4.201%, 10/15/31 | United States | 12,000,000 | 11,903,400 | |||||||||||||
d,tCarlyle U.S. CLO Ltd.,2017-2A, A1B, 144A, FRN, 3.186%,(3-month USD LIBOR + 1.22%), 7/20/31 | United States | 8,500,000 | 8,500,255 | |||||||||||||
d,tCatamaran CLO Ltd.,2014-2A, BR, 144A, FRN, 4.953%,(3-month USD LIBOR + 2.95%), 10/18/26 | United States | 11,770,000 | 11,775,414 | |||||||||||||
d,sCGRBS Commercial Mortgage Trust, 2013-VN05, C, 144A, FRN, 3.584%, 3/13/35 | United States | 7,700,000 | 8,153,741 | |||||||||||||
d,sCIM Trust, | ||||||||||||||||
2019-INV1, A1, 144A, FRN, 4.00%, 2/25/49 | United States | 14,067,317 | 14,432,353 | |||||||||||||
2019-INV2, A3, 144A, FRN, 4.00%, 5/25/49 | United States | 17,857,951 | 18,673,020 | |||||||||||||
sCitibank Credit Card Issuance Trust, | ||||||||||||||||
2016-A3, A3, FRN, 2.48%, 12/07/23 | United States | 4,800,000 | 4,826,269 | |||||||||||||
2017-A7, A7, FRN, 2.348%, 8/08/24 | United States | 36,060,000 | 36,112,319 | |||||||||||||
d,sCole Park CLO Ltd.,2015-1A, BR, 144A, FRN, 3.566%, 10/20/28 | United States | 3,530,000 | 3,507,337 | |||||||||||||
d,sConsumer Loan Underlying Bond CLUB Certificate Issuer Trust I, | ||||||||||||||||
2018-14, PT, 144A, FRN, 9.459%, 9/16/41 | United States | 5,315,974 | 5,218,437 | |||||||||||||
2018-29, PT, 144A, FRN, 25.917%, 12/15/43 | United States | 2,385,591 | 1,973,324 | |||||||||||||
2019-26, PT, 144A, FRN, 20.442%, 8/15/44 | United States | 8,066,325 | 7,592,886 | |||||||||||||
2019-31, PT, 144A, FRN, 21.412%, 9/15/44 | United States | 7,284,495 | 6,808,026 | |||||||||||||
2019-37, PT, 144A, FRN, 20.088%, 10/17/44 | United States | 7,257,122 | 6,973,307 | |||||||||||||
2019-42, PT, 144A, FRN, 24.207%, 11/15/44 | United States | 7,577,604 | 7,286,316 | |||||||||||||
2019-S1, PT, 144A, FRN, 14.902%, 4/15/44 | United States | 7,203,375 | 6,325,383 | |||||||||||||
2019-S2, PT, 144A, FRN, 14.389%, 5/16/44 | United States | 5,130,082 | 4,689,474 | |||||||||||||
2019-S3, PT, 144A, FRN, 14.539%, 6/15/44 | United States | 5,931,262 | 5,534,463 | |||||||||||||
2019-S4, PT, 144A, FRN, 13.454%, 8/15/44 | United States | 6,712,272 | 6,265,039 | |||||||||||||
2019-S5, PT, 144A, FRN, 13.279%, 9/15/44 | United States | 6,211,248 | 5,695,440 | |||||||||||||
2019-S6, PT, 144A, FRN, 12.793%, 10/17/44 | United States | 5,787,144 | 5,403,167 | |||||||||||||
sDiscover Card Execution Note Trust,2017-A7, A7, FRN, 2.281%, 4/15/25 | United States | 5,360,000 | 5,356,204 | |||||||||||||
d,sDryden 38 Senior Loan Fund,2015-38A, CR, 144A, FRN, 4.001%, 7/15/30 | United States | 7,186,000 | 6,893,314 | |||||||||||||
2015-38A, DR, 144A, FRN, 5.001%, 7/15/30 | United States | 4,556,000 | 4,211,976 | |||||||||||||
28 | Semiannual Report | franklintempleton.com | ||
FRANKLIN STRATEGIC SERIES
CONSOLIDATED STATEMENT OF INVESTMENTS (UNAUDITED)
Franklin Strategic Income Fund(continued)
| Country/ Organization | Principal Amount* | Value | ||||||||||||||
Asset-Backed Securities and Commercial Mortgage-Backed Securities(continued) | ||||||||||||||||
Diversified Financials(continued) | ||||||||||||||||
d,tDryden 41 Senior Loan Fund,2015-41A, AR, 144A, FRN, 2.956%,(3-month USD LIBOR + 0.97%), 4/15/31 | United States | 9,850,000 | $ | 9,742,734 | ||||||||||||
d,tDryden 42 Senior Loan Fund,2016-42A, DR, 144A, FRN, 4.931%,(3-month USD LIBOR + 2.93%), 7/15/30 | United States | 8,400,000 | 7,649,628 | |||||||||||||
d,t Dryden 55 CLO Ltd., | ||||||||||||||||
2018-55A, A1, 144A, FRN, 3.021%,(3-month USD LIBOR + 1.02%), 4/15/31 | United States | 11,500,000 | 11,393,970 | |||||||||||||
2018-55A, D, 144A, FRN, 4.851%,(3-month USD LIBOR + 2.85%), 4/15/31 | United States | 3,000,000 | 2,724,090 | |||||||||||||
d,t Dryden 64 CLO Ltd., | ||||||||||||||||
2018-64A, A, 144A, FRN, 2.973%,(3-month USD LIBOR + 0.97%), 4/18/31 | United States | 5,070,000 | 5,010,580 | |||||||||||||
2018-64A, D, 144A, FRN, 4.653%,(3-month USD LIBOR + 2.65%), 4/18/31 | United States | 2,200,000 | 2,007,720 | |||||||||||||
d,sEaton Vance CLO Ltd., | ||||||||||||||||
2014-1RA, C, 144A, FRN, 4.101%, 7/15/30 | United States | 1,972,575 | 1,907,776 | |||||||||||||
2014-1RA, D, 144A, FRN, 5.051%, 7/15/30 | United States | 3,653,850 | 3,491,473 | |||||||||||||
d,sEleven Madison Trust 2015-11MD Mortgage Trust, 2015-11MD, A, 144A, FRN, 3.673%, 9/10/35 | United States | 14,920,000 | 15,971,918 | |||||||||||||
FHLMC Structured Agency Credit Risk Debt Notes, | ||||||||||||||||
t2013-DN2, M2, FRN, 6.073%,(1-month USD LIBOR + 4.25%), 11/25/23 | United States | 12,101,524 | 13,061,494 | |||||||||||||
t2014-DN1, M2, FRN, 4.023%,(1-month USD LIBOR + 2.20%), 2/25/24 | United States | 5,822,052 | 5,889,301 | |||||||||||||
t2014-DN2, M3, FRN, 5.423%,(1-month USD LIBOR + 3.60%), 4/25/24 | United States | 21,379,000 | 22,587,816 | |||||||||||||
t2014-DN3, M3, FRN, 5.823%,(1-month USD LIBOR + 4.00%), 8/25/24 | United States | 1,057,862 | 1,116,690 | |||||||||||||
t2014-DN4, M3, FRN, 6.373%,(1-month USD LIBOR + 4.55%), 10/25/24 | United States | 13,753,024 | 14,752,523 | |||||||||||||
t2014-HQ1, M3, FRN, 5.923%,(1-month USD LIBOR + 4.10%), 8/25/24 | United States | 3,074,073 | 3,249,385 | |||||||||||||
t2014-HQ2, M2, FRN, 4.023%,(1-month USD LIBOR + 2.20%), 9/25/24 | United States | 6,882,177 | 6,970,515 | |||||||||||||
t2014-HQ3, M3, FRN, 6.573%,(1-month USD LIBOR + 4.75%), 10/25/24 | United States | 6,088,430 | 6,450,475 | |||||||||||||
t2015-DNA1, M3, FRN, 5.123%,(1-month USD LIBOR + 3.30%), 10/25/27 | United States | 2,830,000 | 3,010,899 | |||||||||||||
t2015-DNA3, M3, FRN, 6.523%,(1-month USD LIBOR + 4.70%), 4/25/28 | United States | 18,411,581 | 20,320,895 | |||||||||||||
t2015-HQ1, M3, FRN, 5.623%,(1-month USD LIBOR + 3.80%), 3/25/25 | United States | 7,239,514 | 7,439,946 | |||||||||||||
t2015-HQA1, M3, FRN, 6.523%,(1-month USD LIBOR + 4.70%), 3/25/28 | United States | 18,830,000 | 19,950,969 | |||||||||||||
t2016-DNA2, M3, FRN, 6.473%,(1-month USD LIBOR + 4.65%), 10/25/28 | United States | 17,584,196 | 18,862,898 | |||||||||||||
s2017-DNA1, M2, FRN, 5.073%, 7/25/29 | United States | 7,300,000 | 7,660,394 | |||||||||||||
s2017-DNA2, M2, FRN, 5.273%, 10/25/29 | United States | 5,868,312 | 6,237,802 | |||||||||||||
| franklintempleton.com | Semiannual Report | 29 | ||
FRANKLIN STRATEGIC SERIES
CONSOLIDATED STATEMENT OF INVESTMENTS (UNAUDITED)
Franklin Strategic Income Fund(continued)
| Country/ Organization | Principal Amount* | Value | ||||||||||||||
Asset-Backed Securities and Commercial Mortgage-Backed Securities(continued) | ||||||||||||||||
Diversified Financials(continued) | ||||||||||||||||
FHLMC Structured Agency Credit Risk Debt Notes, (continued) | ||||||||||||||||
t2017-DNA3, M2, FRN, 4.323%,(1-month USD LIBOR + 2.50%), 3/25/30 | United States | 26,312,269 | $ | 26,868,426 | ||||||||||||
s2017-HQA1, M2, FRN, 5.373%, 8/25/29 | United States | 28,226,000 | 29,594,425 | |||||||||||||
d,t Flagship CLO VIII Ltd., | ||||||||||||||||
2014-8A, ARR, 144A, FRN, 2.851%,(3-month USD LIBOR + 0.85%), 1/16/26 | United States | 4,838,441 | 4,838,296 | |||||||||||||
2014-8A, DR, 144A, FRN, 5.051%,(3-month USD LIBOR + 3.05%), 1/16/26 | United States | 3,000,000 | 2,879,580 | |||||||||||||
FNMA Connecticut Avenue Securities, | ||||||||||||||||
t2013-C01, M2, FRN, 7.073%,(1-month USD LIBOR + 5.25%), 10/25/23 | United States | 14,863,521 | 16,386,049 | |||||||||||||
t2014-C01, M2, FRN, 6.223%,(1-month USD LIBOR + 4.40%), 1/25/24 | United States | 17,060,372 | 18,518,914 | |||||||||||||
t2014-C02, 1M2, FRN, 4.423%,(1-month USD LIBOR + 2.60%), 5/25/24 | United States | 13,807,687 | 14,365,603 | |||||||||||||
t2014-C03, 1M2, FRN, 4.823%,(1-month USD LIBOR + 3.00%), 7/25/24 | United States | 30,489,149 | 32,039,401 | |||||||||||||
t2014-C03, 2M2, FRN, 4.723%,(1-month USD LIBOR + 2.90%), 7/25/24 | United States | 3,903,526 | 4,059,751 | |||||||||||||
t2015-C01, 1M2, FRN, 6.123%,(1-month USD LIBOR + 4.30%), 2/25/25 | United States | 7,887,349 | 8,355,339 | |||||||||||||
t2015-C01, 2M2, FRN, 6.373%,(1-month USD LIBOR + 4.55%), 2/25/25 | United States | 9,726,017 | 10,060,237 | |||||||||||||
t2015-C02, 1M2, FRN, 5.823%,(1-month USD LIBOR + 4.00%), 5/25/25 | United States | 22,732,334 | 23,990,401 | |||||||||||||
t2015-C02, 2M2, FRN, 5.823%,(1-month USD LIBOR + 4.00%), 5/25/25 | United States | 11,163,113 | 11,615,056 | |||||||||||||
t2015-C03, 1M2, FRN, 6.823%,(1-month USD LIBOR + 5.00%), 7/25/25 | United States | 27,347,322 | 29,544,433 | |||||||||||||
t2015-C03, 2M2, FRN, 6.823%,(1-month USD LIBOR + 5.00%), 7/25/25 | United States | 13,868,546 | 14,752,951 | |||||||||||||
s2016-C02, 1M2, FRN, 7.823%, 9/25/28 | United States | 9,945,586 | 10,855,818 | |||||||||||||
s2016-C04, 1M2, FRN, 6.073%, 1/25/29 | United States | 9,910,000 | 10,473,370 | |||||||||||||
s2016-C05, 2M2, FRN, 6.273%, 1/25/29 | United States | 6,570,520 | 6,921,274 | |||||||||||||
s2016-C06, 1M2, FRN, 6.073%, 4/25/29 | United States | 2,220,000 | 2,362,670 | |||||||||||||
s2016-C07, 2M2, FRN, 6.173%, 5/25/29 | United States | 4,099,885 | 4,308,537 | |||||||||||||
t2017-C01, 1M2, FRN, 5.373%,(1-month USD LIBOR + 3.55%), 7/25/29 | United States | 22,910,000 | 24,008,237 | |||||||||||||
s2017-C03, 1M2, FRN, 4.823%, 10/25/29 | United States | 24,932,535 | 25,972,316 | |||||||||||||
s2017-C03, 2M2, FRN, 4.673%, 11/25/29 | United States | 5,225,499 | 5,379,594 | |||||||||||||
s2017-C05, 1M2, FRN, 4.023%, 1/25/30 | United States | 12,555,148 | 12,713,427 | |||||||||||||
d Galaxy XVIII CLO Ltd., | ||||||||||||||||
s2018-28A, A2, 144A, FRN, 3.071%, 7/15/31 | United States | 9,500,000 | 9,488,315 | |||||||||||||
t2018-28A, C, 144A, FRN, 3.951%,(3-month USD LIBOR + 1.95%), 7/15/31 | United States | 3,070,000 | 2,931,850 | |||||||||||||
30 | Semiannual Report | franklintempleton.com | ||
FRANKLIN STRATEGIC SERIES
CONSOLIDATED STATEMENT OF INVESTMENTS (UNAUDITED)
Franklin Strategic Income Fund(continued)
| Country/ Organization | Principal Amount* | Value | ||||||||||||||
Asset-Backed Securities and Commercial Mortgage-Backed Securities(continued) | ||||||||||||||||
Diversified Financials(continued) | ||||||||||||||||
d,sGalaxy XXV CLO Ltd.,2018-25A, D, 144A, FRN, 5.04%, 10/25/31 | United States | 4,734,850 | $ | 4,439,774 | ||||||||||||
d,sGalaxy XXVI CLO Ltd.,2018-26A, A, 144A, FRN, 3.35%, 11/22/31 | United States | 7,600,000 | 7,585,712 | |||||||||||||
d,t Galaxy XXVII CLO Ltd., | ||||||||||||||||
2018-27A, C, 144A, FRN, 3.968%,(3-month USD LIBOR + 1.80%), 5/16/31 | United States | 3,600,000 | 3,393,864 | |||||||||||||
2018-27A, C, 144A, FRN, 4.918%,(3-month USD LIBOR + 2.75%), 5/16/31 | United States | 5,750,000 | 5,143,145 | |||||||||||||
GS Mortgage Securities Trust, | ||||||||||||||||
s2016-GS3, B, FRN, 3.395%, 10/10/49 | United States | 8,037,000 | 8,356,726 | |||||||||||||
2017-GS6, B, 3.869%, 5/10/50 | United States | 7,700,000 | 8,245,891 | |||||||||||||
d,sHPS Loan Management Ltd.,2013A-18, C, 144A, FRN, 4.151%, 10/15/30 | United States | 4,950,000 | 4,767,197 | |||||||||||||
d,s LCM XVI LP, | ||||||||||||||||
2016A, A2R, 144A, FRN, 3.181%, 10/15/31 | United States | 7,655,557 | 7,634,121 | |||||||||||||
2016A, BR2, 144A, FRN, 3.751%, 10/15/31 | United States | 13,525,832 | 13,490,259 | |||||||||||||
d,s LCM XVII LP, | ||||||||||||||||
2017A, BRR, 144A, FRN, 3.601%, 10/15/31 | United States | 4,590,000 | 4,479,886 | |||||||||||||
2017A, CRR, 144A, FRN, 4.101%, 10/15/31 | United States | 4,240,000 | 4,048,903 | |||||||||||||
d,tLCM XVIII LP, 2018A, DR, 144A, FRN, 4.766%,(3-month USD LIBOR + 2.80%), 4/20/31 | United States | 6,860,000 | 6,151,568 | |||||||||||||
d,tLCM XXIV Ltd., 24A, A, 144A, FRN, 3.276%,(3-month USD LIBOR + 1.31%), 3/20/30 | United States | 4,300,000 | 4,299,054 | |||||||||||||
d,sMadison Park Euro Funding XIV DAC, 2014A, A1N, 144A, FRN, 1.12%, 7/15/32 | Ireland | 9,800,000 | EUR | 10,977,246 | ||||||||||||
d,tMadison Park Funding XXIII Ltd., | ||||||||||||||||
2017-23A, B, 144A, FRN, 3.636%,(3-month USD LIBOR + 1.70%), 7/27/30 | United States | 2,400,000 | 2,385,144 | |||||||||||||
2017-23A, C, 144A, FRN, 4.286%,(3-month USD LIBOR + 2.35%), 7/27/30 | United States | 5,000,000 | 4,917,650 | |||||||||||||
d,sMagnetite Ltd., 2015-14RA, A1, 144A, FRN, 3.123%, 10/18/31 | United States | 2,000,000 | 1,994,660 | |||||||||||||
d,sMill City Mortgage Loan Trust,2018-4, A1B, 144A, FRN, 3.50%, 4/25/66 | United States | 16,720,000 | 17,257,378 | |||||||||||||
t MortgageIT Trust, | ||||||||||||||||
2004-1, A2, FRN, 2.723%,(1-month USD LIBOR + 0.90%), 11/25/34 | United States | 1,618,376 | 1,640,612 | |||||||||||||
2005-5, A1, FRN, 2.343%,(1-month USD LIBOR + 0.26%), 12/25/35 | United States | 1,472,177 | 1,475,873 | |||||||||||||
d,sMountain View Funding CLO XIV Ltd., | ||||||||||||||||
2019-1A, A1, 144A, FRN, 3.441%, 4/15/29 | United States | 5,000,000 | 5,001,050 | |||||||||||||
2019-1A, C, 144A, FRN, 4.901%, 4/15/29 | United States | 4,500,000 | 4,505,490 | |||||||||||||
| franklintempleton.com | Semiannual Report | 31 | ||
FRANKLIN STRATEGIC SERIES
CONSOLIDATED STATEMENT OF INVESTMENTS (UNAUDITED)
Franklin Strategic Income Fund(continued)
| Country/ Organization | Principal Amount* | Value | ||||||||||||||
Asset-Backed Securities and Commercial Mortgage-Backed Securities(continued) | ||||||||||||||||
Diversified Financials(continued) | ||||||||||||||||
d,sNeuberger Berman CLO XVIII Ltd.,2014-18A, CR2, 144A, FRN, 4.966%, 10/21/30 | United States | 500,000 | $ | 451,250 | ||||||||||||
d,sNeuberger Berman CLO XXII Ltd.,2016-22A, CR, 144A, FRN, 4.202%, 10/17/30 | United States | 2,129,630 | 2,071,065 | |||||||||||||
d,tNZCG Funding Ltd.,2015-1A, A2R, 144A, FRN, 3.682%,(3-month USD LIBOR + 1.55%), 2/26/31 | United States | 15,500,000 | 15,195,580 | |||||||||||||
d,sOctagon Investment Partners 24 Ltd.,2015-1A, BS, 144A, FRN, 3.866%, 4/21/31 | United States | 4,485,000 | 4,482,444 | |||||||||||||
d,s Octagon Investment Partners 28 Ltd., | ||||||||||||||||
2016-1A, A2R, 144A, FRN, 3.386%, 10/24/30 | United States | 10,000,000 | 10,012,100 | |||||||||||||
2016-1A, BR, 144A, FRN, 3.736%, 10/24/30 | United States | 3,914,730 | 3,912,185 | |||||||||||||
d,tOctagon Investment Partners 30 Ltd., 144A, FRN, 3.286%,(3-month USD LIBOR + 1.32%), 3/17/30 | United States | 4,300,000 | 4,308,901 | |||||||||||||
d,tOctagon Investment Partners 36 Ltd.,2018-1A, A1, 144A, FRN, 2.971%,(3-month USD LIBOR + 0.97%), 4/15/31 | United States | 7,475,000 | 7,419,536 | |||||||||||||
d,tOctagon Investment Partners 37 Ltd.,2018-2A, C, 144A, FRN, 4.79%,(3-month USD LIBOR + 2.85%), 7/25/30 | United States | 4,000,000 | 3,624,160 | |||||||||||||
d,sOctagon Investment Partners 38 Ltd.,2018-1A, C, 144A, FRN, 4.916%, 7/20/30 | United States | 5,000,000 | 4,576,750 | |||||||||||||
d,tOctagon Investment Partners XVI Ltd.,2013-1A, DR, 144A, FRN, 5.002%,(3-month USD LIBOR + 3.00%), 7/17/30 | United States | 6,000,000 | 5,485,380 | |||||||||||||
d,t Octagon Investment Partners XXIII Ltd., | ||||||||||||||||
2015-1A, BR, 144A, FRN, 3.201%,(3-month USD LIBOR + 1.20%), 7/15/27 | United States | 4,590,000 | 4,513,255 | |||||||||||||
2015-1A, DR, 144A, FRN, 4.551%,(3-month USD LIBOR + 2.55%), 7/15/27 | United States | 6,400,000 | 6,232,256 | |||||||||||||
tOpteum Mortgage Acceptance Corp. Trust,2005-4, 1APT, FRN, 2.133%,(1-month USD LIBOR + 0.31%), 11/25/35 | United States | 1,680,613 | 1,693,821 | |||||||||||||
d,tRace Point IX CLO Ltd.,2015-9A, A1AR, 144A, FRN, 3.211%,(3-month USD LIBOR + 1.21%), 10/15/30 | United States | 3,600,000 | 3,591,072 | |||||||||||||
d,sStrata CLO I Ltd.,2018-1A, B, 144A, FRN, 4.201%, 1/15/31 | United States | 14,100,000 | 13,917,405 | |||||||||||||
tStructured Asset Securities Corp.,2005-2XS, 2A2, FRN, 3.532%,(1-month USD LIBOR + 1.50%), 2/25/35 | United States | 1,804,816 | 1,836,013 | |||||||||||||
sThornburg Mortgage Securities Trust,2005-1, A3, FRN, 4.578%, 4/25/45 | United States | 2,184,401 | 2,206,692 | |||||||||||||
d,sUpgrade Master Pass-Thru Trust,2019-PT1, A, 144A, FRN, 11.128%, 6/15/25 | United States | 3,606,486 | 3,605,047 | |||||||||||||
d Voya CLO Ltd., | ||||||||||||||||
s2013-2A, A2AR, 144A, FRN, 3.34%, 4/25/31 | United States | 2,200,000 | 2,142,734 | |||||||||||||
t2013-2A, BR, 144A, FRN, 3.79%,(3-month USD LIBOR + 1.85%), 4/25/31 | United States | 5,770,000 | 5,433,955 | |||||||||||||
t2014-1A, CR2, 144A, FRN, 4.803%,(3-month USD LIBOR + 2.80%), 4/18/31 | United States | 8,000,000 | 7,239,440 | |||||||||||||
s2015-2A, BR, 144A, FRN, 3.434%, 7/23/27 | United States | 9,290,000 | 9,223,948 | |||||||||||||
s2016-3A, A1R, 144A, FRN, 3.193%, 10/18/31 | United States | 10,000,000 | 9,986,100 | |||||||||||||
t2017-2A, B, 144A, FRN, 4.351%,(3-month USD LIBOR + 2.35%), 6/07/30 | United States | 19,200,000 | 18,764,544 | |||||||||||||
s2018-2A, A1, 144A, FRN, 3.001%, 7/15/31 | United States | 5,000,000 | 4,947,600 | |||||||||||||
32 | Semiannual Report | franklintempleton.com | ||
FRANKLIN STRATEGIC SERIES
CONSOLIDATED STATEMENT OF INVESTMENTS (UNAUDITED)
Franklin Strategic Income Fund(continued)
| Country/ Organization | Principal Amount* | Value | ||||||||||||||
Asset-Backed Securities and Commercial Mortgage-Backed Securities(continued) | ||||||||||||||||
Diversified Financials(continued) | ||||||||||||||||
d Voya CLO Ltd., (continued) | ||||||||||||||||
t2018-2A, D, 144A, FRN, 4.751%,(3-month USD LIBOR + 2.75%), 7/15/31 | United States | 2,900,000 | $ | 2,660,141 | ||||||||||||
sWells Fargo Mortgage Backed Securities Trust,2004-W, A9, FRN, 4.597%, 11/25/34 | United States | 850,582 | 891,982 | |||||||||||||
|
| |||||||||||||||
| 1,342,483,053 | ||||||||||||||||
|
| |||||||||||||||
Total Asset-Backed Securities and Commercial Mortgage-Backed Securities | 1,360,569,782 | |||||||||||||||
|
| |||||||||||||||
Mortgage-Backed Securities 9.4% | ||||||||||||||||
vFederal Home Loan Mortgage Corp. (FHLMC) Adjustable Rate 0.0%† | ||||||||||||||||
FHLMC, 4.93%, (US 1 Year CMTT-Note +/- MBS Margin), 1/01/33 | United States | 16,943 | 17,519 | |||||||||||||
|
| |||||||||||||||
Federal Home Loan Mortgage Corp. (FHLMC) Fixed Rate 6.6% | ||||||||||||||||
wFHLMC 30 Year, 2.50%, 11/01/49 | United States | 13,500,000 | 13,425,644 | |||||||||||||
wFHLMC 30 Year, 3.00%, 11/01/49 | United States | 51,300,000 | 52,133,625 | |||||||||||||
wFHLMC 30 Year, 3.50%, 11/01/49 | United States | 42,500,000 | 43,642,188 | |||||||||||||
wFHLMC 30 Year, 4.00%, 11/01/49 | United States | 58,450,000 | 60,651,750 | |||||||||||||
wFHLMC 30 Year, 4.50%, 11/01/49 | United States | 54,700,000 | 57,534,436 | |||||||||||||
FHLMC Gold 15 Year, 5.00%, 7/01/22 | United States | 33,447 | 34,587 | |||||||||||||
FHLMC Gold 30 Year, 3.50%, 12/01/47 | United States | 12,811,039 | 13,313,216 | |||||||||||||
FHLMC Gold 30 Year, 3.50%, 5/01/49 | United States | 53,806,224 | 55,328,846 | |||||||||||||
FHLMC Gold 30 Year, 4.50%, 10/01/40 | United States | 138,665 | 150,444 | |||||||||||||
FHLMC Gold 30 Year, 5.00%, 5/01/27 - 2/01/38 | United States | 1,057,131 | 1,154,542 | |||||||||||||
FHLMC Gold 30 Year, 5.50%, 6/01/33 - 6/01/36 | United States | 747,394 | 829,252 | |||||||||||||
FHLMC Gold 30 Year, 6.00%, 6/01/33 - 6/01/37 | United States | 263,282 | 296,515 | |||||||||||||
FHLMC Gold 30 Year, 6.50%, 10/01/21 - 6/01/36 | United States | 107,761 | 121,083 | |||||||||||||
FHLMC Gold 30 Year, 7.00%, 9/01/21 - 8/01/32 | United States | 20,282 | 21,208 | |||||||||||||
FHLMC Gold 30 Year, 7.50%, 1/01/26 - 1/01/31 | United States | 4,907 | 5,766 | |||||||||||||
FHLMC Gold 30 Year, 8.00%, 11/01/25 - 1/01/26 | United States | 67 | 67 | |||||||||||||
FHLMC Gold 30 Year, 9.00%, 12/01/24 | United States | 51 | 55 | |||||||||||||
|
| |||||||||||||||
| 298,643,224 | ||||||||||||||||
|
| |||||||||||||||
vFederal National Mortgage Association (FNMA) Adjustable Rate 0.0%† | ||||||||||||||||
FNMA, 4.493%, (US 1 Year CMTT-Note +/- MBS Margin), 12/01/34 | United States | 116,366 | 122,864 | |||||||||||||
|
| |||||||||||||||
Federal National Mortgage Association (FNMA) Fixed Rate 2.7% | ||||||||||||||||
FNMA 15 Year, 2.50%, 7/01/27 | United States | 234,579 | 237,704 | |||||||||||||
FNMA 15 Year, 4.50%, 3/01/20 | United States | 1,449 | 1,494 | |||||||||||||
FNMA 15 Year, 5.50%, 3/01/21 - 4/01/22 | United States | 20,800 | 20,970 | |||||||||||||
FNMA 30 Year, 3.00%, 9/01/48 | United States | 38,798,845 | 39,838,358 | |||||||||||||
FNMA 30 Year, 3.50%, 11/01/47 | United States | 13,325,469 | 13,828,671 | |||||||||||||
| franklintempleton.com | Semiannual Report | 33 | ||
FRANKLIN STRATEGIC SERIES
CONSOLIDATED STATEMENT OF INVESTMENTS (UNAUDITED)
Franklin Strategic Income Fund(continued)
| Country/ Organization | Principal Amount* | Value | ||||||||||||||
Mortgage-Backed Securities(continued) | ||||||||||||||||
Federal National Mortgage Association (FNMA) Fixed Rate(continued) | ||||||||||||||||
FNMA 30 Year, 3.50%, 6/01/49 | United States | 59,253,921 | $ | 60,809,165 | ||||||||||||
FNMA 30 Year, 4.50%, 3/01/28 - 2/01/41 | United States | 409,397 | 441,693 | |||||||||||||
FNMA 30 Year, 5.00%, 9/01/23 - 10/01/35 | United States | 1,074,842 | 1,173,561 | |||||||||||||
FNMA 30 Year, 5.50%, 9/01/33 - 12/01/35 | United States | 985,461 | 1,098,627 | |||||||||||||
FNMA 30 Year, 6.00%, 6/01/34 - 5/01/38 | United States | 2,133,354 | 2,417,441 | |||||||||||||
FNMA 30 Year, 6.50%, 3/01/28 - 10/01/37 | United States | 284,816 | 325,716 | |||||||||||||
FNMA 30 Year, 7.50%, 10/01/29. | United States | 4,811 | 5,627 | |||||||||||||
FNMA 30 Year, 8.00%, 1/01/25 - 5/01/26 | United States | 2,406 | 2,682 | |||||||||||||
|
| |||||||||||||||
| 120,201,709 | ||||||||||||||||
|
| |||||||||||||||
Government National Mortgage Association (GNMA) Fixed Rate 0.1% | ||||||||||||||||
GNMA I SF 30 Year, 5.00%, 6/15/34 - 7/15/34 | United States | 126,686 | 139,357 | |||||||||||||
GNMA I SF 30 Year, 5.50%, 2/15/33 - 6/15/36 | United States | 340,546 | 374,992 | |||||||||||||
GNMA I SF 30 Year, 6.00%, 8/15/36 | United States | 20,998 | 24,106 | |||||||||||||
GNMA I SF 30 Year, 6.50%, 2/15/29 - 3/15/32 | United States | 38,030 | 42,123 | |||||||||||||
GNMA I SF 30 Year, 7.00%, 11/15/27 - 5/15/28 | United States | 9,411 | 9,657 | |||||||||||||
GNMA I SF 30 Year, 7.50%, 9/15/23 - 5/15/27 | United States | 631 | 652 | |||||||||||||
GNMA I SF 30 Year, 8.00%, 2/15/25 - 9/15/27 | United States | 3,422 | 3,703 | |||||||||||||
GNMA I SF 30 Year, 8.50%, 8/15/24 | United States | 44 | 45 | |||||||||||||
GNMA I SF 30 Year, 9.00%, 1/15/25 | United States | 183 | 183 | |||||||||||||
GNMA I SF 30 Year, 9.50%, 6/15/25 | United States | 367 | 368 | |||||||||||||
GNMA II SF 30 Year, 4.50%, 5/20/49 | United States | 4,186,986 | 4,391,491 | |||||||||||||
GNMA II SF 30 Year, 5.00%, 9/20/33 - 11/20/33 | United States | 185,081 | 205,115 | |||||||||||||
GNMA II SF 30 Year, 5.50%, 6/20/34 | United States | 95,758 | 107,932 | |||||||||||||
GNMA II SF 30 Year, 6.00%, 11/20/34 | United States | 92,635 | 107,425 | |||||||||||||
GNMA II SF 30 Year, 6.50%, 7/20/28 - 12/20/31 | United States | 52,048 | 59,372 | |||||||||||||
GNMA II SF 30 Year, 7.50%, 4/20/32 | United States | 15,794 | 17,819 | |||||||||||||
|
| |||||||||||||||
| 5,484,340 | ||||||||||||||||
|
| |||||||||||||||
Total Mortgage-Backed Securities | 424,469,656 | |||||||||||||||
|
| |||||||||||||||
Municipal Bonds 1.9% | ||||||||||||||||
City of Austin Electric Utility System Revenue, Travis and Williamson Counties, Refunding, 6.262%, 11/15/32 | United States | 5,955,000 | 7,483,589 | |||||||||||||
uGreenville City School District GO, County of Darke, School Improvement, Refunding, 3.541%, 1/01/51 | United States | 7,335,000 | 7,335,953 | |||||||||||||
uHonolulu City and County Wastewater System Revenue, Second Bond Resolution, Refunding, Junior, 2.585%, 7/01/28 | United States | 1,180,000 | 1,192,001 | |||||||||||||
Kaiser Foundation Hospitals, 3.266%, 11/01/49 | | United States | | 9,825,000 | 10,031,339 | |||||||||||
New York State GO, Refunding, Series B, 3.20%, 2/15/39 | | United States | | 11,740,000 | 11,897,668 | |||||||||||
New York State Urban Development Corp. Sales Tax Revenue, Bidding Group 2, Series B, 2.97%, 3/15/34 | | United States | | 19,210,000 | 19,321,610 | |||||||||||
uOhio State Hospital Facility Revenue, Cleveland Clinic Health System Obligated Group, Refunding, Series G, 3.276%, 1/01/42 | United States | 1,975,000 | 2,029,569 | |||||||||||||
Orlando Health Obligated Group, 3.777%, 10/01/28 | United States | 3,870,000 | 4,189,238 | |||||||||||||
34 | Semiannual Report | franklintempleton.com | ||
FRANKLIN STRATEGIC SERIES
CONSOLIDATED STATEMENT OF INVESTMENTS (UNAUDITED)
Franklin Strategic Income Fund(continued)
| Country/ Organization | Principal Amount* | Value | ||||||||||||
Municipal Bonds(continued) | ||||||||||||||
uPennsylvania State Turnpike Commission Turnpike Revenue, Motor License Fund-Enhanced, Subordinate, Refunding, First Series, 3.579%, 12/01/43 | United States | 9,825,000 | $ | 9,930,226 | ||||||||||
RWJ Barnabas Health Inc., 3.477%, 7/01/49 | United States | 2,650,000 | 2,707,553 | |||||||||||
San Jose RDA Successor Agency Tax Allocation, Senior, Refunding, SeriesA-T, 3.25%, 8/01/29 | United States | 5,675,000 | 6,005,342 | |||||||||||
u Texas State University System Financing Revenue, | ||||||||||||||
Refunding, Serise B, 2.938%, 3/15/33 | United States | 2,315,000 | 2,356,739 | |||||||||||
Refunding, Serise B, 3.289%, 3/15/40 | United States | 1,965,000 | 1,982,213 | |||||||||||
|
| |||||||||||||
Total Municipal Bonds (Cost $84,864,411) | 86,463,040 | |||||||||||||
|
| |||||||||||||
| Shares/ Units | ||||||||||||||
Escrows and Litigation Trusts 0.0%† | ||||||||||||||
a,bClear Channel Communications Inc., Escrow Account | United States | 8,000,000 | — | |||||||||||
a,biHeartCommunications Inc., Escrow Account | United States | 3,100,000 | — | |||||||||||
a,bNewPage Corp., Litigation Trust | United States | 14,000,000 | — | |||||||||||
a,aa,b,eRemington Outdoor Co. Inc., Litigation Units | United States | 124,500 | — | |||||||||||
a,bT-Mobile USA Inc., Escrow Account | United States | 29,900,000 | — | |||||||||||
aVistra Energy Corp., Escrow Account | United States | 30,000,000 | 135,000 | |||||||||||
|
| |||||||||||||
Total Escrows and Litigation Trusts | 135,000 | |||||||||||||
|
| |||||||||||||
Total Investments before Short Term Investments | 4,487,561,723 | |||||||||||||
|
| |||||||||||||
| Shares | ||||||||||||||
Short Term Investments 3.7% | ||||||||||||||
Money Market Funds (Cost $58,779,273) 1.3% | ||||||||||||||
f,xInstitutional Fiduciary Trust Money Market Portfolio, 1.56% | United States | 58,779,273 | 58,779,273 | |||||||||||
|
| |||||||||||||
| franklintempleton.com | Semiannual Report | 35 | ||
FRANKLIN STRATEGIC SERIES
CONSOLIDATED STATEMENT OF INVESTMENTS (UNAUDITED)
Franklin Strategic Income Fund(continued)
| Country/ Organization | Principal Amount* | Value | ||||||||||||
Short Term Investments(continued) | ||||||||||||||
Repurchase Agreements (Cost $108,109,163) 2.4% | ||||||||||||||
yJoint Repurchase Agreement, 1.722%, 11/01/19 (Maturity Value $108,114,333) | ||||||||||||||
BNP Paribas Securities Corp. (Maturity Value $76,530,893) | ||||||||||||||
Deutsche Bank Securities Inc. (Maturity Value $18,828,111) | ||||||||||||||
HSBC Securities (USA) Inc. (Maturity Value $12,755,329) | ||||||||||||||
Collateralized by U.S. Government Agency Securities, | United States | 108,109,163 | $ | 108,109,163 | ||||||||||
|
| |||||||||||||
Total Investments (Cost $4,784,137,153) 103.0% | 4,654,450,159 | |||||||||||||
Other Assets, less Liabilities (3.0)% | (137,666,194 | ) | ||||||||||||
|
| |||||||||||||
Net Assets 100.0% | $ | 4,516,783,965 | ||||||||||||
|
| |||||||||||||
†Rounds to less than 0.1% of net assets.
*The principal amount is stated in U.S. dollars unless otherwise indicated.
aNon-income producing.
aaSee Note 10 regarding holdings of 5% voting securities.
bFair valued using significant unobservable inputs. See Note 12 regarding fair value measurements.
cThe security is owned by FT Holdings Corporation ll, a wholly-owned subsidiary of the Fund. See Note 1(h).
dSecurity was purchased pursuant to Rule 144A under the Securities Act of 1933 and may be sold in transactions exempt from registration only to qualified institutional buyers or in a public offering registered under the Securities Act of 1933. At October 31, 2019, the aggregate value of these securities was $1,664,808,595, representing 36.9% of net assets.
eSee Note 8 regarding restricted securities.
fSee Note 3(f) regarding investments in affiliated management investment companies.
gSecurity was purchased pursuant to Regulation S under the Securities Act of 1933, which exempts from registration securities offered and sold outside of the United States. Such a security cannot be sold in the United States without either an effective registration statement filed pursuant to the Securities Act of 1933, or pursuant to an exemption from registration. At October 31, 2019, the aggregate value of these securities was $145,095,019, representing 3.2% of net assets.
hIncome may be received in additional securities and/or cash.
iThe coupon rate shown represents the rate at period end.
jPrincipal amount is stated in 1,000 Brazilian Real Units.
kSee Note 1(g) regarding loan participation notes.
lSee Note 7 regarding defaulted securities.
mPerpetual security with no stated maturity date.
nSee Note 1(j) regarding senior floating rate interests.
oA supranational organization is an entity formed by two or more central governments through international treaties.
pRedemption price at maturity and coupon payment are adjusted for inflation. See Note 1(l).
qThe principal represents the notional amount. See Note 1(e) regarding value recovery instruments.
rPrincipal amount of security is adjusted for inflation. See Note 1(l).
sAdjustable rate security with an interest rate that is not based on a published reference index and spread. The rate is based on the structure of the agreement and current market conditions. The coupon rate shown represents the rate at period end.
tThe coupon rate shown represents the rate inclusive of any caps or floors, if applicable, in effect at period end.
uSecurity purchased on a when-issued basis. See Note 1(d).
vAdjustable Rate Mortgage-Backed Security (ARM); the rate shown is the effective rate at period end. ARM rates are not based on a published reference rate and spread, but instead pass-through weighted average interest income inclusive of any caps or floors, if applicable, from the underlying mortgage loans in which the majority of mortgages pay interest based on the index shown at their designated reset dates plus a spread, less the applicable servicing and guaranty fee (MBS margin).
wSecurity purchased on a to-be-announced (TBA) basis. See Note 1(d).
xThe rate shown is the annualized seven-day effective yield at period end.
ySee Note 1(c) regarding joint repurchase agreement.
zThe security was issued on a discount basis with no stated coupon rate.
36 | Semiannual Report | franklintempleton.com | ||
FRANKLIN STRATEGIC SERIES
CONSOLIDATED STATEMENT OF INVESTMENTS (UNAUDITED)
Franklin Strategic Income Fund(continued)
At October 31, 2019, the Fund had the following futures contracts outstanding. See Note 1(e).
Futures Contracts
| Description | Type | | Number of Contracts | | | Notional Amount | * | | Expiration Date | | | Value/ Unrealized Appreciation (Depreciation) | | |||||||
Interest Rate Contracts | ||||||||||||||||||||
Australian 10 Yr. Bond | Long | 110 | $ 11,058,079 | 12/16/19 | $ (53,865 | ) | ||||||||||||||
Canadian 10 Yr. Bond | Long | 155 | 16,723,281 | 12/18/19 | (19,764 | ) | ||||||||||||||
CME Ultra Long Term U.S. Treasury Bond | Short | 73 | 13,851,750 | 12/19/19 | (203,278 | ) | ||||||||||||||
CME Ultra Long Term U.S. Treasury Bond | Long | 320 | 60,720,000 | 12/19/19 | 431,962 | |||||||||||||||
U.S. Treasury 5 Yr. Note | Long | 1,374 | 163,785,094 | 12/31/19 | (40,742 | ) | ||||||||||||||
U.S. Treasury 10 Yr. Note | Long | 820 | 106,843,438 | 12/19/19 | (385,217 | ) | ||||||||||||||
U.S. Treasury 30 Yr. Bond | Long | 59 | 9,521,125 | 12/19/19 | (216,264 | ) | ||||||||||||||
Ultra 10 Yr. U.S. Treasury Note | Long | 436 | 61,959,688 | 12/19/19 | (882,816 | ) | ||||||||||||||
|
| |||||||||||||||||||
Total Futures Contracts | $(1,369,984 | ) | ||||||||||||||||||
|
| |||||||||||||||||||
*As of period end.
At October 31, 2019, the Fund had the following forward exchange contracts outstanding. See Note 1(e).
Forward Exchange Contracts
| Currency | Counterparty | a | Type | Quantity | | Contract Amount | | | Settlement Date | | | Unrealized Appreciation | | | Unrealized Depreciation | | ||||||||||||
OTC Forward Exchange Contracts |
| |||||||||||||||||||||||||||
Australian Dollar | JPHQ | Sell | 12,600,000 | $ 8,822,205 | 11/26/19 | $ 128,912 | $ — | |||||||||||||||||||||
Brazilian Real | JPHQ | Buy | 106,200,000 | 26,415,939 | 12/09/19 | — | (13,430 | ) | ||||||||||||||||||||
Brazilian Real | JPHQ | Sell | 111,260,000 | 27,296,430 | 12/09/19 | — | (364,051 | ) | ||||||||||||||||||||
Brazilian Real | JPHQ | Sell | 1,475,000 | 361,254 | 12/11/19 | — | (5,413 | ) | ||||||||||||||||||||
Brazilian Real | JPHQ | Sell | 22,200,000 | 5,437,277 | 12/13/19 | — | (80,859 | ) | ||||||||||||||||||||
Brazilian Real | JPHQ | Sell | 33,000,000 | 8,417,938 | 12/13/19 | 215,305 | — | |||||||||||||||||||||
Indonesian Rupiah | JPHQ | Buy | 46,000,000,000 | 3,255,946 | 12/13/19 | — | (4,809 | ) | ||||||||||||||||||||
Indonesian Rupiah | JPHQ | Sell | 230,000,000,000 | 15,691,090 | 12/13/19 | — | (564,590 | ) | ||||||||||||||||||||
South Korean Won | JPHQ | Sell | 18,600,000,000 | 15,898,115 | 12/16/19 | — | (15,497 | ) | ||||||||||||||||||||
Australian Dollar | JPHQ | Sell | 68,000,000 | 45,885,380 | 1/09/20 | — | (1,083,780 | ) | ||||||||||||||||||||
Canadian Dollar | JPHQ | Sell | 15,200,000 | 11,645,903 | 1/21/20 | 95,035 | — | |||||||||||||||||||||
Australian Dollar | DBAB | Sell | 3,000,000 | 2,109,900 | 1/28/20 | 36,944 | — | |||||||||||||||||||||
Australian Dollar | JPHQ | Sell | 26,100,000 | 17,756,770 | 1/28/20 | — | (277,944 | ) | ||||||||||||||||||||
Japanese Yen | JPHQ | Buy | 16,230,000,000 | 153,795,486 | 1/29/20 | — | (2,568,762 | ) | ||||||||||||||||||||
Canadian Dollar | JPHQ | Sell | 25,000,000 | 18,837,074 | 1/30/20 | — | (161,354 | ) | ||||||||||||||||||||
Euro | JPHQ | Sell | 102,596,949 | 115,676,091 | 1/30/20 | 514,348 | — | |||||||||||||||||||||
Mexican Peso | JPHQ | Buy | 323,700,000 | 16,710,202 | 1/30/20 | — | (119,258 | ) | ||||||||||||||||||||
Mexican Peso | JPHQ | Sell | 26,000,000 | 1,339,274 | 1/30/20 | 6,668 | — | |||||||||||||||||||||
Norwegian Krone | JPHQ | Buy | 257,400,000 | 28,611,233 | 1/30/20 | — | (607,779 | ) | ||||||||||||||||||||
Chinese Yuan Renminbi | JPHQ | Sell | 636,100,000 | 89,112,406 | 2/24/20 | — | (858,739 | ) | ||||||||||||||||||||
Japanese Yen | JPHQ | Buy | 750,000,000 | 6,955,651 | 3/13/20 | 50,735 | — | |||||||||||||||||||||
Japanese Yen | JPHQ | Buy | 3,700,000,000 | 34,812,553 | 3/13/20 | — | (247,714 | ) | ||||||||||||||||||||
Canadian Dollar | JPHQ | Sell | 3,000,000 | 2,293,999 | 3/16/20 | 14,214 | — | |||||||||||||||||||||
Canadian Dollar | JPHQ | Sell | 37,400,000 | 28,285,762 | 3/16/20 | — | (135,556 | ) | ||||||||||||||||||||
| franklintempleton.com | Semiannual Report | 37 | ||
FRANKLIN STRATEGIC SERIES
CONSOLIDATED STATEMENT OF INVESTMENTS (UNAUDITED)
Franklin Strategic Income Fund(continued)
Forward Exchange Contracts(continued)
| Currency | Counterpartya | Type | Quantity | Contract Amount | Settlement Date | Unrealized Appreciation | Unrealized Depreciation | |||||||||||||||||||||
OTC Forward Exchange Contracts(continued) |
| |||||||||||||||||||||||||||
Euro | JPHQ | Sell | 78,606,321 | $87,816,069 | 3/16/20 | $ — | $ (660,052 | ) | ||||||||||||||||||||
Norwegian Krone | JPHQ | Buy | 417,400,000 | 46,610,832 | 3/16/20 | — | (1,205,660 | ) | ||||||||||||||||||||
Swedish Krona | JPHQ | Buy | 294,000,000 | 29,995,562 | 3/16/20 | 671,051 | — | |||||||||||||||||||||
Swedish Krona | JPHQ | Sell | 294,000,000 | 30,910,276 | 3/16/20 | 243,664 | — | |||||||||||||||||||||
Turkish Lira | JPHQ | Buy | 62,000,000 | 9,831,127 | 4/15/20 | 549,790 | — | |||||||||||||||||||||
|
| |||||||||||||||||||||||||||
Total Forward Exchange Contracts | $ 2,526,666 | $ (8,975,247 | ) | |||||||||||||||||||||||||
|
| |||||||||||||||||||||||||||
Net unrealized appreciation (depreciation) |
| $ (6,448,581 | ) | |||||||||||||||||||||||||
|
| |||||||||||||||||||||||||||
aMay be comprised of multiple contracts with the same counterparty, currency and settlement date.
At October 31, 2019, the Fund had the following credit default swap contracts outstanding. See Note 1(e).
Credit Default Swap Contracts
| Description | Periodic (Paid) | Payment Frequency | Counter- party | Maturity Date | Notional Amounta | Value | Unamortized Upfront Payments (Receipts) | Unrealized Appreciation (Depreciation) | Ratingb | |||||||||||||||||||||||||||
Centrally Cleared Swap Contracts |
| |||||||||||||||||||||||||||||||||||
Contracts to Sell Protectionc,d |
| |||||||||||||||||||||||||||||||||||
Traded Index | ||||||||||||||||||||||||||||||||||||
CDX.EM.31 | 1.00% | Quarterly | 6/20/24 | $48,700,000 | $ (1,908,845 | ) | $ (1,187,473 | ) | $ (721,372 | ) | | Investment Grade | | |||||||||||||||||||||||
OTC Swap Contracts |
| |||||||||||||||||||||||||||||||||||
Contracts to Buy Protectionc |
| |||||||||||||||||||||||||||||||||||
Single Name | ||||||||||||||||||||||||||||||||||||
Ally Financial Inc. | (5.00 | )% | Quarterly | JPHQ | 12/20/24 | $19,800,000 | $ (4,073,924 | ) | $ (3,803,688 | ) | $ (270,236 | ) | ||||||||||||||||||||||||
Government of Italy | (1.00 | )% | Quarterly | BZWS | 6/20/23 | 14,200,000 | (219,289 | ) | 112,498 | (331,787 | ) | |||||||||||||||||||||||||
Government of Turkey | (1.00 | )% | Quarterly | BZWS | 12/20/19 | 9,100,000 | (15,698 | ) | 58,218 | (73,916 | ) | |||||||||||||||||||||||||
Contracts to Sell Protectionc,d |
| |||||||||||||||||||||||||||||||||||
Single Name | ||||||||||||||||||||||||||||||||||||
Government of Argentina | 5.00% | Quarterly | CITI | 12/20/21 | 48,600,000 | (28,867,642 | ) | (27,304,500 | ) | (1,563,142 | ) | CCC- | ||||||||||||||||||||||||
Government of Indonesia | 1.00% | Quarterly | CITI | 12/20/24 | 24,700,000 | 311,476 | 166,141 | 145,335 | NR | |||||||||||||||||||||||||||
Government of Italy | 1.00% | Quarterly | BZWS | 6/20/23 | 14,200,000 | 72,083 | (493,320 | ) | 565,403 | NR | ||||||||||||||||||||||||||
Government of Russia | 1.00% | Quarterly | CITI | 12/20/24 | 13,500,000 | 172,465 | 137,557 | 34,908 | BBB- | |||||||||||||||||||||||||||
Traded Index | ||||||||||||||||||||||||||||||||||||
eBNP Paribas Bespoke Bordeaux Index, Mezzanine Tranche7-10% | 2.10% | Quarterly | BNDP | 6/20/20 | 6,850,000 | 81,517 | — | 81,517 | | Non- Investment Grade | | |||||||||||||||||||||||||
38 | Semiannual Report | franklintempleton.com | ||
FRANKLIN STRATEGIC SERIES
CONSOLIDATED STATEMENT OF INVESTMENTS (UNAUDITED)
Franklin Strategic Income Fund(continued)
Credit Default Swap Contracts(continued)
| Description | | Periodic Payment Rate Received (Paid) |
| | Payment Frequency | | | Counter- party | | | Maturity Date | | | Notional Amount | a | Value | | Unamortized Upfront Payments (Receipts) | | | Unrealized Appreciation (Depreciation) | | Ratingb | |||||||||||||
OTC Swap Contracts(continued) |
| |||||||||||||||||||||||||||||||||||
Contracts to Sell Protectionc,d(continued) |
| |||||||||||||||||||||||||||||||||||
Traded Index(continued) |
| |||||||||||||||||||||||||||||||||||
eBNP Paribas Bespoke Rodez2 Index, Mezzanine Tranche5-7% | 3.20% | Quarterly | BNDP | 12/20/20 | $ 3,300,000 | $ 79,605 | $ — | $79,605 | Non- | |||||||||||||||||||||||||||
| | Investment Grade | | ||||||||||||||||||||||||||||||||||
eCitibank Bespoke Bogota Index, Mezzanine Tranche7-10% | 1.35% | Quarterly | CITI | 6/20/20 | 7,000,000 | 34,628 | — | 34,628 | Non- | |||||||||||||||||||||||||||
| | Investment Grade | | ||||||||||||||||||||||||||||||||||
eCitibank Bespoke Cambridge Index, Equity Tranche0-3% | 0.00% | Quarterly | CITI | 12/20/19 | 22,249,500 | (1,986,973 | ) | (249,483 | ) | (1,737,490 | ) | Non- | ||||||||||||||||||||||||
| | Investment Grade | | ||||||||||||||||||||||||||||||||||
eCitibank Bespoke Palma Index, Mezzanine Tranche5-7% | 2.30% | Quarterly | CITI | 6/20/21 | 6,700,000 | 95,093 | — | 95,093 | Non- | |||||||||||||||||||||||||||
| | Investment Grade | | ||||||||||||||||||||||||||||||||||
eCitibank Bespoke Phoenix Index, Mezzanine Tranche5-7% | 2.90% | Quarterly | CITI | 12/20/21 | 8,500,000 | 232,283 | — | 232,283 | Non- | |||||||||||||||||||||||||||
| | Investment Grade | | ||||||||||||||||||||||||||||||||||
eCitibank Bespoke Singapore Index, Equity Tranche0-3% | 0.00% | Quarterly | CITI | 6/20/20 | 7,000,000 | (741,459 | ) | (623,504 | ) | (117,955 | ) | Non- | ||||||||||||||||||||||||
| | Investment Grade | | ||||||||||||||||||||||||||||||||||
eCitibank Bespoke Sydney Index, Equity Tranche0-3% | 0.00% | Quarterly | CITI | 6/20/20 | 4,394,022 | (559,928 | ) | (446,816 | ) | (113,112 | ) | Non- | ||||||||||||||||||||||||
| | Investment Grade | | ||||||||||||||||||||||||||||||||||
eCitibank Bespoke Verona Index, Equity Tranche0-3% | 0.00% | Quarterly | CITI | 12/20/19 | 8,883,500 | (122,845 | ) | (122,273 | ) | (572 | ) | Non- | ||||||||||||||||||||||||
| | Investment Grade | | ||||||||||||||||||||||||||||||||||
eCitibank Bespoke Verona Index, Mezzanine Tranche7-15% | 0.40% | Quarterly | CITI | 12/20/19 | 31,000,000 | 22,032 | — | 22,032 | Non- | |||||||||||||||||||||||||||
| | Investment Grade | | ||||||||||||||||||||||||||||||||||
| franklintempleton.com | Semiannual Report | 39 | ||
FRANKLIN STRATEGIC SERIES
CONSOLIDATED STATEMENT OF INVESTMENTS (UNAUDITED)
Franklin Strategic Income Fund(continued)
Credit Default Swap Contracts(continued)
| Description | | Periodic Payment Rate Received (Paid) | | | Payment Frequency | | | Counter- party | | | Maturity Date | | | Notional Amount | a | Value | | Unamortized Upfront Payments (Receipts) | | | Unrealized Appreciation (Depreciation) | | Ratingb | |||||||||||||
OTC Swap Contracts(continued) |
| |||||||||||||||||||||||||||||||||||
Contracts to Sell Protectionc,d(continued) |
| |||||||||||||||||||||||||||||||||||
Traded Index(continued) |
| |||||||||||||||||||||||||||||||||||
MCDX.NA.31 | 1.00% | Quarterly | CITI | 12/20/23 | $23,060,000 | $ 408,980 | $ 193,265 | $215,715 | Investment | |||||||||||||||||||||||||||
| Grade | ||||||||||||||||||||||||||||||||||||
eMorgan Stanley Bespoke Pecan Index, Mezzanine Tranche5-10% | 3.98% | Quarterly | MSCO | 12/20/21 | 9,000,000 | 226,534 | — | 226,534 | Non- | |||||||||||||||||||||||||||
| | Investment Grade | | ||||||||||||||||||||||||||||||||||
eMorgan Stanley Bespoke Pecan Index, Mezzanine Tranche5-10% | 4.10% | Quarterly | MSCO | 12/20/21 | 9,000,000 | 267,594 | — | 267,594 | Non- | |||||||||||||||||||||||||||
| | Investment Grade | | ||||||||||||||||||||||||||||||||||
|
| |||||||||||||||||||||||||||||||||||
Total OTC Swap Contracts |
| $(34,583,468 | ) | $ (32,375,905 | ) | $(2,207,563 | ) | |||||||||||||||||||||||||||||
|
| |||||||||||||||||||||||||||||||||||
Total Credit Default Swap Contracts |
| $(36,492,313 | ) | $ (33,563,378 | ) | $(2,928,935 | ) | |||||||||||||||||||||||||||||
|
| |||||||||||||||||||||||||||||||||||
aFor contracts to sell protection, the notional amount is equal to the maximum potential amount of the future payments and no recourse provisions have been entered into in association with the contracts.
bBased on Standard and Poor’s (S&P) Rating for single name swaps and internal ratings for index swaps. Internal ratings based on mapping into equivalent ratings from external vendors.
cPerformance triggers for settlement of contract include default, bankruptcy or restructuring for single name swaps and failure to pay or bankruptcy of the underlying securities for traded index swaps.
dThe Fund enters contracts to sell protection to create a long credit position.
eRepresents a custom index comprised of a basket of underlying issuers.
At October 31, 2019, the Fund had the following cross-currency swap contracts outstanding. See Note 1(e).
Cross-Currency Swap Contracts
| Description | Payment Frequency | Counterparty | Maturity Date | Notional Amount | Value/ Unrealized Appreciation (Depreciation) | |||||||||||||||||||
OTC Swap Contracts | ||||||||||||||||||||||||
Receive Floating3-month USD LIBOR + 2.87% | Quarterly | 3,834,600 | USD | |||||||||||||||||||||
Pay Fixed 2.50% | Annual | CITI | 5/04/21 | 3,300,000 | EUR | $150,513 | ||||||||||||||||||
Receive Floating3-month USD LIBOR + 1.334% | Quarterly | 10,976,000 | USD | |||||||||||||||||||||
Pay Floating3-month EUR LIBOR + 1.12% | Quarterly | CITI | 7/10/21 | 9,800,000 | EUR | 67,904 | ||||||||||||||||||
|
| |||||||||||||||||||||||
Total Cross Currency Swap Contracts | $218,417 | |||||||||||||||||||||||
|
| |||||||||||||||||||||||
40 | Semiannual Report | franklintempleton.com | ||
FRANKLIN STRATEGIC SERIES
CONSOLIDATED STATEMENT OF INVESTMENTS (UNAUDITED)
Franklin Strategic Income Fund(continued)
At October 31, 2019, the Fund had the following interest rate swap contracts outstanding. See Note 1(e).
Interest Rate Swap Contracts
| Description | Payment Frequency | Maturity Date | Notional Amount* | Value/ Unrealized Appreciation (Depreciation) | ||||||||||||||||
Centrally Cleared Swap Contracts | ||||||||||||||||||||
Receive Fixed 2.773% | Quarterly | |||||||||||||||||||
Pay Floating3-month CNY CNRR | Quarterly | 8/23/24 | 196,750,000 | CNY | $ (417,535 | ) | ||||||||||||||
Receive Fixed 2.765% | Quarterly | |||||||||||||||||||
Pay Floating3-month CNY CNRR | Quarterly | 8/26/24 | 158,000,000 | CNY | (343,035 | ) | ||||||||||||||
Receive Fixed 2.79% | Quarterly | |||||||||||||||||||
Pay Floating3-month CNY CNRR | Quarterly | 8/30/24 | 236,250,000 | CNY | (486,188 | ) | ||||||||||||||
Receive Fixed 1.956% | Semi-Annual | |||||||||||||||||||
Pay Floating3-month CAD CABA | Semi-Annual | 7/17/29 | 55,000,000 | CAD | 483,118 | |||||||||||||||
Receive Fixed 1.232% | Semi-Annual | |||||||||||||||||||
Pay Floating3-month AUD BBSW | Semi-Annual | 9/06/29 | 55,000,000 | AUD | (136,758 | ) | ||||||||||||||
|
| |||||||||||||||||||
Total Interest Rate Swap Contracts | $ (900,398 | ) | ||||||||||||||||||
|
| |||||||||||||||||||
*In U.S. dollars unless otherwise indicated.
At October 31, 2019, the Fund had the following total return swap contracts outstanding. See Note 1(e).
Total Return Swap Contracts
| Underlying Instruments | Financing Rate | Payment Frequency | Counter- party | Maturity Date | Notional Value | Value/ Unrealized Appreciation (Depreciation) | ||||||||||||||||||
OTC Swap Contracts | ||||||||||||||||||||||||
Longa | ||||||||||||||||||||||||
Markit iBoxx USD Liquid Leveraged Loan Index | 3-month USD LIBOR | Quarterly | MSCO | 12/20/19 | $ | 23,600,000 | $ | 335,902 | ||||||||||||||||
Markit iBoxx USD Liquid Leveraged Loan Index | 3-month USD LIBOR | Quarterly | GSCO | 3/20/20 | 61,400,000 | 1,011,494 | ||||||||||||||||||
|
| |||||||||||||||||||||||
Total Total Return Swap Contracts | $ | 1,347,396 | ||||||||||||||||||||||
|
| |||||||||||||||||||||||
aThe Fund receives the total return on the underlying instrument and pays a variable financing rate.
See Note 9 regarding other derivative information.
See Abbreviations on page 65.
| franklintempleton.com | The accompanying notes are an integral part of these consolidated financial statements. | Semiannual Report | 41 | ||
FRANKLIN STRATEGIC SERIES
CONSOLIDATED FINANCIAL STATEMENTS
Consolidated Statement of Assets and Liabilities
October 31, 2019 (unaudited)
Franklin Strategic Income Fund
Assets: | ||||
Investments in securities: | ||||
Cost - Unaffiliated issuers | $4,463,345,189 | |||
Cost - Controlled affiliates (Note 3f and 10) | 152,217,419 | |||
Cost -Non-controlled affiliates (Note 3f and 10) | 60,465,382 | |||
Cost - Unaffiliated repurchase agreements | 108,109,163 | |||
|
| |||
Value - Unaffiliated issuers | $4,360,173,989 | |||
Value - Controlled affiliates (Note 3f and 10) | 126,065,295 | |||
Value -Non-controlled affiliates (Note 3f and 10) | 60,101,712 | |||
Value - Unaffiliated repurchase agreements | 108,109,163 | |||
Cash | 24,337,230 | |||
Restricted cash for OTC derivative contracts (Note 1f) | 1,340,000 | |||
Receivables: | ||||
Investment securities sold | 79,264,872 | |||
Capital shares sold | 3,206,777 | |||
Dividends and interest | 36,166,034 | |||
Deposits with brokers for: | ||||
OTC derivative contracts | 41,930,000 | |||
TBA transactions | 900,000 | |||
Futures contracts | 4,745,144 | |||
Centrally cleared swap contracts | 10,707,747 | |||
Variation margin on futures contracts | 3,123,799 | |||
Variation margin on centrally cleared swap contracts | 829,083 | |||
OTC swap contracts (upfront payments $1,259,100) | 667,679 | |||
Unrealized appreciation on OTC forward exchange contracts | 2,526,666 | |||
Unrealized appreciation on OTC swap contracts | 3,566,460 | |||
FT Subsidiary deferred tax benefit (Note 1h) | 402,876 | |||
Other assets | 2,555 | |||
|
| |||
Total assets | 4,868,167,081 | |||
|
| |||
Liabilities: | ||||
Payables: | ||||
Investment securities purchased | 290,711,101 | |||
Capital shares redeemed | 7,600,072 | |||
Management fees | 1,677,025 | |||
Distribution fees | 1,060,058 | |||
Transfer agent fees | 1,273,956 | |||
Trustees’ fees and expenses | 9,728 | |||
Distributions to shareholders | 891,449 | |||
Deposits from brokers for: | ||||
OTC derivative contracts | 1,340,000 | |||
OTC swap contracts (upfront receipts $40,626,762) | 33,043,584 | |||
Unrealized depreciation on OTC forward exchange contracts | 8,975,247 | |||
Unrealized depreciation on OTC swap contracts | 4,208,210 | |||
Deferred tax | 176,786 | |||
Accrued expenses and other liabilities | 415,900 | |||
|
| |||
Total liabilities | 351,383,116 | |||
|
| |||
Net assets, at value | $4,516,783,965 | |||
|
| |||
Net assets consist of: | ||||
Paid-in capital | $5,149,453,749 | |||
Total distributable earnings (loss) | (632,669,784 | ) | ||
|
| |||
Net assets, at value | $4,516,783,965 | |||
|
| |||
42 | Semiannual Report | The accompanying notes are an integral part of these consolidated financial statements. | franklintempleton.com | ||
FRANKLIN STRATEGIC SERIES
CONSOLIDATED FINANCIAL STATEMENTS
Consolidated Statement of Assets and Liabilities (continued)
October 31, 2019 (unaudited)
Franklin Strategic Income Fund
Class A: | ||||
Net assets, at value | $3,058,165,860 | |||
|
| |||
Shares outstanding | 319,591,711 | |||
|
| |||
Net asset value per sharea | $9.57 | |||
|
| |||
Maximum offering price per share (net asset value per share ÷ 96.25%) | $9.94 | |||
|
| |||
Class C: | ||||
Net assets, at value | $ 636,853,216 | |||
|
| |||
Shares outstanding | 66,556,353 | |||
|
| |||
Net asset value and maximum offering price per sharea | $9.57 | |||
|
| |||
Class R: | ||||
Net assets, at value | $ 77,289,870 | |||
|
| |||
Shares outstanding | 8,109,810 | |||
|
| |||
Net asset value and maximum offering price per share | $9.53 | |||
|
| |||
Class R6: | ||||
Net assets, at value | $ 150,506,116 | |||
|
| |||
Shares outstanding | 15,704,043 | |||
|
| |||
Net asset value and maximum offering price per share | $9.58 | |||
|
| |||
Advisor Class: | ||||
Net assets, at value | $ 593,968,903 | |||
|
| |||
Shares outstanding | 61,996,730 | |||
|
| |||
Net asset value and maximum offering price per share | $9.58 | |||
|
|
aRedemption price is equal to net asset value less contingent deferred sales charges, if applicable.
| franklintempleton.com | The accompanying notes are an integral part of these consolidated financial statements. | Semiannual Report | 43 | ||
FRANKLIN STRATEGIC SERIES
CONSOLIDATED FINANCIAL STATEMENTS
Consolidated Statement of Operations
for the six months ended October 31, 2019 (unaudited)
Franklin Strategic Income Fund
Investment income: | ||||
Dividends: (net of foreign taxes)* | ||||
Unaffiliated issuers | $ | 1,022 | ||
Controlled affiliates (Note 3f and 10) | 6,785,399 | |||
Non-controlled affiliates (Note 3f and 10) | 591,135 | |||
Interest: (net of foreign taxes)~ | ||||
Unaffiliated issuers | 116,482,770 | |||
|
| |||
Total investment income | 123,860,326 | |||
|
| |||
Expenses: | ||||
Management fees (Note 3a) | 10,989,820 | |||
Distribution fees: (Note 3c) | ||||
Class A | 3,961,962 | |||
Class C | 2,231,125 | |||
Class R | 205,568 | |||
Transfer agent fees: (Note 3e) | ||||
Class A | 2,495,147 | |||
Class C | 540,380 | |||
Class R | 64,732 | |||
Class R6 | 47,045 | |||
Advisor Class | 479,478 | |||
Custodian fees (Note 4) | 56,963 | |||
Reports to shareholders | 246,436 | |||
Registration and filing fees | 89,437 | |||
Professional fees | 44,013 | |||
Trustees’ fees and expenses | 39,635 | |||
Other | 61,431 | |||
|
| |||
Total expenses | 21,553,172 | |||
Expense reductions (Note 4) | (109,444 | ) | ||
Expenses waived/paid by affiliates (Note 3f and 3g) | (663,262 | ) | ||
|
| |||
Net expenses | 20,780,466 | |||
|
| |||
Net investment income | 103,079,860 | |||
|
| |||
Realized and unrealized gains (losses): | ||||
Net realized gain (loss) from: | ||||
Investments: | ||||
Unaffiliated issuers | (1,921,083 | ) | ||
Controlled affiliates (Note 3f and 10) | (10,939,400 | ) | ||
Foreign currency transactions | (185,479 | ) | ||
Forward exchange contracts | 8,502,886 | |||
Futures contracts | 32,221,068 | |||
Swap contracts | (26,029,749 | ) | ||
|
| |||
Net realized gain (loss) | 1,648,243 | |||
|
| |||
Net change in unrealized appreciation (depreciation) on: | ||||
Investments: | ||||
Unaffiliated issuers | (6,729,993 | ) | ||
Controlled affiliates (Note 3f and 10) | (2,136,187 | ) | ||
Non-controlled affiliates (Note 3f and 10) | (1,586,927 | ) | ||
Translation of other assets and liabilities denominated in foreign currencies | (106,030 | ) | ||
Forward exchange contracts | (9,767,148 | ) | ||
Futures contracts | (5,215,544 | ) | ||
Swap contracts | 3,108,805 | |||
44 | Semiannual Report | The accompanying notes are an integral part of these consolidated financial statements. | franklintempleton.com | ||
FRANKLIN STRATEGIC SERIES
CONSOLIDATED FINANCIAL STATEMENTS
Consolidated Statement of Operations(continued)
for the six months ended October 31, 2019 (unaudited)
Franklin Strategic Income Fund
Change in FT Subsidiary deferred tax benefit (Note 1h) | (129,138 | ) | ||
Change in deferred taxes on unrealized appreciation | (96,421 | ) | ||
|
| |||
Net change in unrealized appreciation (depreciation) | (22,658,583 | ) | ||
|
| |||
Net realized and unrealized gain (loss) | (21,010,340 | ) | ||
|
| |||
Net increase (decrease) in net assets resulting from operations | $ | 82,069,520 | ||
|
| |||
~Foreign taxes withheld on interest | $ | 211,623 | ||
| franklintempleton.com | The accompanying notes are an integral part of these consolidated financial statements. | Semiannual Report | 45 | ||
FRANKLIN STRATEGIC SERIES
CONSOLIDATED FINANCIAL STATEMENTS
Consolidated Statements of Changes in Net Assets
Franklin Strategic Income Fund
| Six Months Ended October 31, 2019 (unaudited) | Year Ended April 30, 2019 | |||||||
Increase (decrease) in net assets: | ||||||||
Operations: | ||||||||
Net investment income | $ | 103,079,860 | $ | 235,418,024 | ||||
Net realized gain (loss) | 1,648,243 | (61,378,232 | ) | |||||
Net change in unrealized appreciation (depreciation) | (22,658,583 | ) | 53,626,529 | |||||
|
| |||||||
Net increase (decrease) in net assets resulting from operations | 82,069,520 | 227,666,321 | ||||||
|
| |||||||
Distributions to shareholders: | ||||||||
Class A | (67,065,671 | ) | (138,743,800 | ) | ||||
Class C | (13,030,561 | ) | (34,243,715 | ) | ||||
Class R | (1,639,078 | ) | (3,918,092 | ) | ||||
Class R6 | (6,324,753 | ) | (18,669,569 | ) | ||||
Advisor Class | (13,620,484 | ) | (38,939,889 | ) | ||||
|
| |||||||
Total distributions to shareholders | (101,680,547 | ) | (234,515,065 | ) | ||||
|
| |||||||
Capital share transactions: (Note 2) | ||||||||
Class A | (59,388,478 | ) | (160,333,285 | ) | ||||
Class C | (76,854,488 | ) | (360,085,250 | ) | ||||
Class R | (7,835,095 | ) | (19,998,642 | ) | ||||
Class R6 | (156,912,811 | ) | (123,669,688 | ) | ||||
Advisor Class | (11,802,929 | ) | (322,273,887 | ) | ||||
|
| |||||||
Total capital share transactions | (312,793,801 | ) | (986,360,752 | ) | ||||
|
| |||||||
Net increase (decrease) in net assets | (332,404,828 | ) | (993,209,496 | ) | ||||
Net assets: | ||||||||
Beginning of period | 4,849,188,793 | 5,842,398,289 | ||||||
|
| |||||||
End of period | $ | 4,516,783,965 | $ | 4,849,188,793 | ||||
|
| |||||||
46 | Semiannual Report | The accompanying notes are an integral part of these consolidated financial statements. | franklintempleton.com | ||
FRANKLIN STRATEGIC SERIES
Notes to Consolidated Financial Statements (unaudited)
Franklin Strategic Income Fund
1. Organization and Significant Accounting Policies
Franklin Strategic Series (Trust) is registered under the Investment Company Act of 1940 (1940 Act) as anopen-end management investment company, consisting of twelve separate funds and applies the specialized accounting and reporting guidance in U.S. Generally Accepted Accounting Principles (U.S. GAAP). Franklin Strategic Income Fund (Fund) is included in this report. The Fund offers five classes of shares: Class A, Class C, Class R, Class R6, and Advisor Class. Class C shares automatically convert to Class A shares after they have been held for 10 years. Each class of shares may differ by its initial sales load, contingent deferred sales charges, voting rights on matters affecting a single class, its exchange privilege and fees due to differing arrangements for distribution and transfer agent fees.
The following summarizes the Fund’s significant accounting policies.
a. Financial Instrument Valuation
The Fund’s investments in financial instruments are carried at fair value daily. Fair value is the price that would be received to sell an asset or paid to transfer a liability in an orderly transaction between market participants on the measurement date. The Fund calculates the net asset value (NAV) per share each business day as of 4 p.m. Eastern time or the regularly scheduled close of the New York Stock Exchange (NYSE), whichever is earlier. Under compliance policies and procedures approved by the Trust’s Board of Trustees (the Board), the Fund’s administrator has responsibility for oversight of valuation, including leading the cross-functional Valuation Committee (VC). The Fund may utilize independent pricing services, quotations from securities and financial instrument dealers, and other market sources to determine fair value.
Equity securities and derivative financial instruments listed on an exchange or on the NASDAQ National Market System are valued at the last quoted sale price or the official closing price of the day, respectively. Foreign equity securities are valued as of the close of trading on the foreign stock exchange on which the security is primarily traded, or as of 4 p.m. Eastern time. The value is then converted into its U.S. dollar equivalent at the foreign exchange rate in effect at 4 p.m. Eastern time on the day that the value of the security is determined.Over-the-counter (OTC) securities are valued within the range of the most recent quoted bid and ask prices. Securities that trade in multiple markets or on multiple
exchanges are valued according to the broadest and most representative market. Certain equity securities are valued based upon fundamental characteristics or relationships to similar securities.
Debt securities generally trade in the OTC market rather than on a securities exchange. The Fund’s pricing services use multiple valuation techniques to determine fair value. In instances where sufficient market activity exists, the pricing services may utilize a market-based approach through which quotes from market makers are used to determine fair value. In instances where sufficient market activity may not exist or is limited, the pricing services also utilize proprietary valuation models which may consider market characteristics such as benchmark yield curves, credit spreads, estimated default rates, anticipated market interest rate volatility, coupon rates, anticipated timing of principal repayments, underlying collateral, and other unique security features in order to estimate the relevant cash flows, which are then discounted to calculate the fair value. Securities denominated in a foreign currency are converted into their U.S. dollar equivalent at the foreign exchange rate in effect at 4 p.m. Eastern time on the date that the values of the foreign debt securities are determined.
Investments inopen-end mutual funds are valued at the closing NAV. Investments in repurchase agreements are valued at cost, which approximates fair value.
Certain derivative financial instruments are centrally cleared or trade in the OTC market. The Fund’s pricing services use various techniques including industry standard option pricing models and proprietary discounted cash flow models to determine the fair value of those instruments. The Fund’s net benefit or obligation under the derivative contract, as measured by the fair value of the contract, is included in net assets.
The Fund has procedures to determine the fair value of financial instruments for which market prices are not reliable or readily available. Under these procedures, the Fund primarily employs a market-based approach which may use related or comparable assets or liabilities, recent transactions, market multiples, book values, and other relevant information for the investment to determine the fair value of the investment. An income-based valuation approach may also be used in which the anticipated future cash flows of the investment are discounted to calculate fair value. Discounts may also be applied due to the nature or duration of any
| franklintempleton.com | Semiannual Report | 47 | ||
FRANKLIN STRATEGIC SERIES
NOTES TO CONSOLIDATED FINANCIAL STATEMENTS (UNAUDITED)
Franklin Strategic Income Fund (continued)
1. Organization and Significant Accounting Policies(continued)
a. Financial Instrument Valuation(continued)
restrictions on the disposition of the investments. Due to the inherent uncertainty of valuations of such investments, the fair values may differ significantly from the values that would have been used had an active market existed.
Trading in securities on foreign securities stock exchanges and OTC markets may be completed before 4 p.m. Eastern time. In addition, trading in certain foreign markets may not take place on every Fund’s business day. Occasionally, events occur between the time at which trading in a foreign security is completed and 4 p.m. Eastern time that might call into question the reliability of the value of a portfolio security held by the Fund. As a result, differences may arise between the value of the Fund’s portfolio securities as determined at the foreign market close and the latest indications of value at 4 p.m. Eastern time. In order to minimize the potential for these differences, the VC monitors price movements following the close of trading in foreign stock markets through a series of country specific market proxies (such as baskets of American Depositary Receipts, futures contracts and exchange traded funds). These price movements are measured against established trigger thresholds for each specific market proxy to assist in determining if an event has occurred that may call into question the reliability of the values of the foreign securities held by the Fund. If such an event occurs, the securities may be valued using fair value procedures, which may include the use of independent pricing services.
When the last day of the reporting period is anon-business day, certain foreign markets may be open on those days that the Fund’s NAV is not calculated, which could result in differences between the value of the Fund’s portfolio securities on the last business day and the last calendar day of the reporting period. Any significant security valuation changes due to an open foreign market are adjusted and reflected by the Fund for financial reporting purposes.
b. Foreign Currency Translation
Portfolio securities and other assets and liabilities denominated in foreign currencies are translated into U.S. dollars based on the exchange rate of such currencies against U.S. dollars on the date of valuation. The Fund may enter into foreign currency exchange contracts to facilitate
transactions denominated in a foreign currency. Purchases and sales of securities, income and expense items denominated in foreign currencies are translated into U.S. dollars at the exchange rate in effect on the transaction date. Portfolio securities and assets and liabilities denominated in foreign currencies contain risks that those currencies will decline in value relative to the U.S. dollar. Occasionally, events may impact the availability or reliability of foreign exchange rates used to convert the U.S. dollar equivalent value. If such an event occurs, the foreign exchange rate will be valued at fair value using procedures established and approved by the Board.
The Fund does not separately report the effect of changes in foreign exchange rates from changes in market prices on securities held. Such changes are included in net realized and unrealized gain or loss from investments in the Consolidated Statement of Operations.
Realized foreign exchange gains or losses arise from sales of foreign currencies, currency gains or losses realized between the trade and settlement dates on securities transactions and the difference between the recorded amounts of dividends, interest, and foreign withholding taxes and the U.S. dollar equivalent of the amounts actually received or paid. Net unrealized foreign exchange gains and losses arise from changes in foreign exchange rates on foreign denominated assets and liabilities other than investments in securities held at the end of the reporting period.
c. Joint Repurchase Agreement
The Fund enters into a joint repurchase agreement whereby its uninvested cash balance is deposited into a joint cash account with other funds managed by the investment manager or an affiliate of the investment manager and is used to invest in one or more repurchase agreements. The value and face amount of the joint repurchase agreement are allocated to the funds based on theirpro-rata interest. A repurchase agreement is accounted for as a loan by the Fund to the seller, collateralized by securities which are delivered to the Fund’s custodian. The fair value, including accrued interest, of the initial collateralization is required to be at least 102% of the dollar amount invested by the funds, with the value of the underlying securities marked to market daily to maintain coverage of at least 100%. Repurchase agreements are subject to the terms of Master Repurchase Agreements (MRAs) with approved counterparties (sellers). The MRAs contain various provisions, including but not limited to events
48 | Semiannual Report | franklintempleton.com | ||
FRANKLIN STRATEGIC SERIES
NOTES TO CONSOLIDATED FINANCIAL STATEMENTS (UNAUDITED)
Franklin Strategic Income Fund(continued)
of default and maintenance of collateral for repurchase agreements. In the event of default by either the seller or the Fund, certain MRAs may permit thenon-defaulting party to net andclose-out all transactions, if any, traded under such agreements. The Fund may sell securities it holds as collateral and apply the proceeds towards the repurchase price and any other amounts owed by the seller to the Fund in the event of default by the seller. This could involve costs or delays in addition to a loss on the securities if their value falls below the repurchase price owed by the seller. The joint repurchase agreement held by the Fund at period end, as indicated in the Consolidated Statement of Investments, had been entered into on October 31, 2019.
d. Securities Purchased on a When-Issued and TBA Basis
The Fund purchases securities on a when-issued andto-be-announced (TBA) basis, with payment and delivery scheduled for a future date. These transactions are subject to market fluctuations and are subject to the risk that the value at delivery may be more or less than the trade date purchase price. Although the Fund will generally purchase these securities with the intention of holding the securities, it may sell the securities before the settlement date. Sufficient assets have been segregated for these securities and collateral has been pledged and/or received for open TBA trades.
e. Derivative Financial Instruments
The Fund invested in derivative financial instruments in order to manage risk or gain exposure to various other investments or markets. Derivatives are financial contracts based on an underlying or notional amount, require no initial investment or an initial net investment that is smaller than would normally be required to have a similar response to changes in market factors, and require or permit net settlement. Derivatives contain various risks including the potential inability of the counterparty to fulfill their obligations under the terms of the contract, the potential for an illiquid secondary market, and/or the potential for market movements which expose the Fund to gains or losses in excess of the amounts shown in the Consolidated Statement of Assets and Liabilities. Realized gain and loss and unrealized appreciation and depreciation on these contracts for the period are included in the Consolidated Statement of Operations.
Derivative counterparty credit risk is managed through a formal evaluation of the creditworthiness of all potential counterparties. The Fund attempts to reduce its exposure to counterparty credit risk on OTC derivatives, whenever possible, by entering into International Swaps and Derivatives Association (ISDA) master agreements with certain counterparties. These agreements contain various provisions, including but not limited to collateral requirements, events of default, or early termination. Termination events applicable to the counterparty include certain deteriorations in the credit quality of the counterparty. Termination events applicable to the Fund include failure of the Fund to maintain certain net asset levels and/or limit the decline in net assets over various periods of time. In the event of default or early termination, the ISDA master agreement gives thenon-defaulting party the right to net andclose-out all transactions traded, whether or not arising under the ISDA agreement, to one net amount payable by one counterparty to the other. However, absent an event of default or early termination, OTC derivative assets and liabilities are presented gross and not offset in the Consolidated Statement of Assets and Liabilities. Early termination by the counterparty may result in an immediate payment by the Fund of any net liability owed to that counterparty under the ISDA agreement.
Collateral requirements differ by type of derivative. Collateral or initial margin requirements are set by the broker or exchange clearing house for exchange traded and centrally cleared derivatives. Initial margin deposited is held at the exchange and can be in the form of cash and/or securities. For OTC derivatives traded under an ISDA master agreement, posting of collateral is required by either the Fund or the applicable counterparty if the total net exposure of all OTC derivatives with the applicable counterparty exceeds the minimum transfer amount, which typically ranges from $100,000 to $250,000, and can vary depending on the counterparty and the type of the agreement. Generally, collateral is determined at the close of Fund business each day and any additional collateral required due to changes in derivative values may be delivered by the Fund or the counterparty the next business day, or within a few business days. Collateral pledged and/or received by the Fund for OTC derivatives, if any, is held in segregated accounts with the Fund’s custodian/counterparty broker and can be in the form of cash and/or securities. Unrestricted cash may be invested according to the Fund’s investment objectives. To the extent that the amounts due to the Fund from its counterparties are
| franklintempleton.com | Semiannual Report | 49 | ||
FRANKLIN STRATEGIC SERIES
NOTES TO CONSOLIDATED FINANCIAL STATEMENTS (UNAUDITED)
Franklin Strategic Income Fund(continued)
1. Organization and Significant Accounting Policies(continued)
e. Derivative Financial Instruments(continued)
not subject to collateralization or are not fully collateralized, the Fund bears the risk of loss from counterpartynon-performance.
The Fund entered into exchange traded futures contracts primarily to manage and/or gain exposure to interest rate risk. A futures contract is an agreement between the Fund and a counterparty to buy or sell an asset at a specified price on a future date. Required initial margins are pledged by the Fund, and the daily change in fair value is accounted for as a variation margin payable or receivable in the Consolidated Statement of Assets and Liabilities.
The Fund entered into OTC forward exchange contracts primarily to manage and/or gain exposure to certain foreign currencies. A forward exchange contract is an agreement between the Fund and a counterparty to buy or sell a foreign currency at a specific exchange rate on a future date.
The Fund entered into credit default swap contracts primarily to manage and/or gain exposure to credit risk. A credit default swap is an agreement between the Fund and a counterparty whereby the buyer of the contract receives credit protection and the seller of the contract guarantees the credit worthiness of a referenced debt obligation. These agreements may be privately negotiated in theover-the-counter market (OTC credit default swaps) or may be executed in a multilateral trade facility platform, such as a registered exchange (centrally cleared credit default swaps). The underlying referenced debt obligation may be a single issuer of corporate or sovereign debt, a credit index, a basket of issuers or indices, or a tranche of a credit index or basket of issuers or indices. In the event of a default of the underlying referenced debt obligation, the buyer is entitled to receive the notional amount of the credit default swap contract from the seller in exchange for the referenced debt obligation, a net settlement amount equal to the notional amount of the credit default swap less the recovery value of the referenced debt obligation, or other agreed upon amount. For centrally cleared credit default swaps, required initial margins are pledged by the Fund, and the daily change in fair value is accounted for as a variation margin payable or receivable in the Consolidated Statement of Assets and Liabilities. Over the term of the contract, the buyer pays the seller a periodic stream of payments, provided that no event
of default has occurred. Such periodic payments are accrued daily as an unrealized appreciation or depreciation until the payments are made, at which time they are realized. Upfront payments and receipts are reflected in the Consolidated Statement of Assets and Liabilities and represent compensating factors between stated terms of the credit default swap agreement and prevailing market conditions (credit spreads and other relevant factors). These upfront payments and receipts are amortized over the term of the contract as a realized gain or loss in the Consolidated Statement of Operations.
The Fund entered into OTC cross currency swap contracts primarily to manage and/or gain exposure to interest rate risk and certain foreign currencies. A cross currency swap is an agreement between the Fund and a counterparty to exchange cash flows (determined using either a fixed or floating rate) based on the notional amounts of two different currencies. The notional amounts are typically determined based on the spot exchange rates at the opening of the contract. Cross currency swaps may require the exchange of notional amounts at the opening and/or closing of the contract. Over the term of the contract, contractually required payments to be paid and to be received are accrued daily and recorded as unrealized depreciation and appreciation until the payments are made, at which time they are realized. Upfront payments and receipts are reflected in the Consolidated Statement of Assets and Liabilities and represent compensating factors between stated terms of the cross currency swap contract and prevailing market conditions (interest rate spreads and other relevant factors). These upfront payments and receipts are amortized over the term of the contract as a realized gain or loss in the Consolidated Statement of Operations.
The Fund entered into interest rate swap contracts primarily to manage interest rate risk. An interest rate swap is an agreement between the Fund and a counterparty to exchange cash flows based on the difference between two interest rates, applied to a notional amount. These agreements may be privately negotiated in theover-the-counter market (OTC interest rate swaps) or may be executed on a registered exchange (centrally cleared interest rate swaps). For centrally cleared interest rate swaps, required initial margins are pledged by the Fund, and the daily change in fair value is accounted for as a variation margin payable or receivable in the Consolidated Statement of Assets and Liabilities. Over the term of the contract, contractually required payments to be paid and to be received are accrued
50 | Semiannual Report | franklintempleton.com | ||
FRANKLIN STRATEGIC SERIES
NOTES TO CONSOLIDATED FINANCIAL STATEMENTS (UNAUDITED)
Franklin Strategic Income Fund(continued)
daily and recorded as unrealized depreciation and appreciation until the payments are made, at which time they are realized.
The Fund entered into OTC total return swap contracts primarily to manage and/or gain exposure to interest rate risk of an underlying instrument such as a stock, bond, index or basket of securities or indices. A total return swap is an agreement between the Fund and a counterparty to exchange a return linked to an underlying instrument for a floating or fixed rate payment, both based upon a notional amount. Over the term of the contract, contractually required payments to be paid or received are accrued daily and recorded as unrealized appreciation or depreciation until the payments are made, at which time they are recognized as realized gain or loss.
The Fund invests in value recovery instruments (VRI) primarily to gain exposure to economic growth. Periodic payments from VRI are dependent on established benchmarks for underlying variables. VRI has a notional amount, which is used to calculate amounts of payments to holders. Payments are recorded upon receipt as realized gains in the Consolidated Statement of Operations. The risks of investing in VRI include growth risk, liquidity, and the potential loss of investment.
See Notes 9 regarding other derivative information.
f. Restricted Cash
At October 31, 2019, the Fund held restricted cash in connection with investments in certain derivative securities. Restricted cash is held in a segregated account with the Fund’s custodian and is reflected in the Consolidated Statement of Assets and Liabilities.
g. Loan Participation Notes
The Fund invests in loan participation notes (Participations). Participations are loans originally issued to a borrower by one or more financial institutions (the Lender) and subsequently sold to other investors, such as the Fund. Participations typically result in the Fund having a contractual relationship only with the Lender and not with the borrower. The Fund has the right to receive from the Lender any payments of principal, interest and fees which the Lender received from the borrower. The Fund generally has no rights to either enforce compliance by the borrower with the terms of the loan agreement or to any collateral relating to the original
loan. As a result, the Fund assumes the credit risk of both the borrower and the Lender that is selling the Participation. The Participations may also involve interest rate risk and liquidity risk, including the potential default or insolvency of the borrower and/or the Lender.
h. FT Holdings Corporation II (FT Subsidiary)
The Fund invests in certain financial instruments through its investment in FT Subsidiary. FT Subsidiary is a Delaware Corporation, is a wholly-owned subsidiary of the Fund, and is able to invest in certain financial instruments consistent with the investment objective of the Fund. At October 31, 2019, FT Subsidiary’s investment, Turtle Bay Resort, as well as any other assets and liabilities of FT Subsidiary are reflected in the Fund’s Consolidated Statement of Investments and Consolidated Statement of Assets and Liabilities.
At October 31, 2019, FT Subsidiary, which is a tax paying entity, recognized an unrealized loss on its Turtle Bay investment. An estimated deferred tax asset based on such unrealized loss is reflected as FT Subsidiary deferred tax benefit in the Consolidated Statement of Assets and Liabilities. The estimated benefit was calculated using a federal rate of 21%. When the Turtle Bay investment liquidates, the FT Subsidiary will recognize a capital loss which can be carried-back to offset prior year capital gains, resulting in a tax refund which will relieve the deferred tax asset.
The financial statements have been consolidated and include the accounts of the Fund and FT Subsidiary. All intercompany transactions and balances have been eliminated. At October 31, 2019, the net assets of FT Subsidiary were $18,481,933, representing less than 1% of the Fund’s consolidated net assets. The Fund’s investment in FT Subsidiary is limited to 25% of consolidated assets.
i. Mortgage Dollar Rolls
The Fund enters into mortgage dollar rolls, typically on a TBA basis. Mortgage dollar rolls are agreements between the Fund and a financial institution where the Fund sells (or buys) mortgage-backed securities for delivery on a specified date and simultaneously contracts to repurchase (or sell) substantially similar (same type, coupon, and maturity) securities at a future date and at a predetermined price. Gains or losses are realized on the initial sale, and the difference between the repurchase price and the sale price is recorded as an unrealized gain or loss to the Fund upon
| franklintempleton.com | Semiannual Report | 51 | ||
FRANKLIN STRATEGIC SERIES
NOTES TO CONSOLIDATED FINANCIAL STATEMENTS (UNAUDITED)
Franklin Strategic Income Fund(continued)
1. Organization and Significant Accounting Policies(continued)
i. Mortgage Dollar Rolls(continued)
entering into the mortgage dollar roll. In addition, the Fund may invest the cash proceeds that are received from the initial sale. During the period between the sale and repurchase, the Fund is not entitled to principal and interest paid on the mortgage backed securities. Transactions in mortgage dollar rolls are accounted for as purchases and sales and may result in an increase to the Fund’s portfolio turnover rate. The risks of mortgage dollar roll transactions include the potential inability of the counterparty to fulfill its obligations.
j. Senior Floating Rate Interests
The Fund invests in senior secured corporate loans that pay interest at rates which are periodically reset by reference to a base lending rate plus a spread. These base lending rates are generally the prime rate offered by a designated U.S. bank or the London InterBank Offered Rate (LIBOR). Senior secured corporate loans often require prepayment of principal from excess cash flows or at the discretion of the borrower. As a result, actual maturity may be substantially less than the stated maturity. Senior secured corporate loans in which the Fund invests are generally readily marketable, but may be subject to certain restrictions on resale. On July 27, 2017, the United Kingdom’s Financial Conduct Authority announced its intention to cease sustaining LIBOR after 2021. There remains uncertainty regarding the future utilization of LIBOR and the nature of any replacement rate. As such, the potential effect of a transition away from LIBOR on the Fund or the Fund’s investments that use or may use a floating rate based on LIBOR cannot yet be determined.
k. Income and Deferred Taxes
It is the Fund’s policy to qualify as a regulated investment company under the Internal Revenue Code. The Fund intends to distribute to shareholders substantially all of its taxable income and net realized gains to relieve it from federal income and excise taxes. As a result, no provision for U.S. federal income taxes is required.
The Fund may be subject to foreign taxation related to income received, capital gains on the sale of securities and certain foreign currency transactions in the foreign jurisdictions in which it invests. Foreign taxes, if any, are recorded based on the tax regulations and rates that exist in
the foreign markets in which the Fund invests. When a capital gain tax is determined to apply, the Fund records an estimated deferred tax liability in an amount that would be payable if the securities were disposed of on the valuation date.
The Fund may recognize an income tax liability related to its uncertain tax positions under U.S. GAAP when the uncertain tax position has a less than 50% probability that it will be sustained upon examination by the tax authorities based on its technical merits. As of October 31, 2019, the Fund has determined that no tax liability is required in its financial statements related to uncertain tax positions for any open tax years (or expected to be taken in future tax years). Open tax years are those that remain subject to examination and are based on the statute of limitations in each jurisdiction in which the Fund invests.
l. Security Transactions, Investment Income, Expenses and Distributions
Security transactions are accounted for on trade date. Realized gains and losses on security transactions are determined on a specific identification basis. Interest income and estimated expenses are accrued daily. Amortization of premium and accretion of discount on debt securities are included in interest income. Paydown gains and losses are recorded as an adjustment to interest income. Facility fees are recognized as income over the expected term of the loan. Dividend income is recorded on theex-dividend date except for certain dividends from securities where the dividend rate is not available. In such cases, the dividend is recorded as soon as the information is received by the Fund. Distributions to shareholders are recorded on theex-dividend date. Distributable earnings are determined according to income tax regulations (tax basis) and may differ from earnings recorded in accordance with U.S. GAAP. These differences may be permanent or temporary. Permanent differences are reclassified among capital accounts to reflect their tax character. These reclassifications have no impact on net assets or the results of operations. Temporary differences are not reclassified, as they may reverse in subsequent periods.
Common expenses incurred by the Trust are allocated among the Funds based on the ratio of net assets of each Fund to the combined net assets of the Trust or based on the ratio of number of shareholders of each Fund to the combined number of shareholders of the Trust. Fund specific expenses are charged directly to the Fund that incurred the expense.
52 | Semiannual Report | franklintempleton.com | ||
FRANKLIN STRATEGIC SERIES
NOTES TO CONSOLIDATED FINANCIAL STATEMENTS (UNAUDITED)
Franklin Strategic Income Fund(continued)
Realized and unrealized gains and losses and net investment income, excluding class specific expenses, are allocated daily to each class of shares based upon the relative proportion of net assets of each class. Differences in per share distributions by class are generally due to differences in class specific expenses.
Inflation-indexed bonds are adjusted for inflation through periodic increases or decreases in the security’s interest accruals, face amount, or principal redemption value, by amounts corresponding to the rate of inflation as measured by an index. Any increase or decrease in the face amount or principal redemption value will be included as interest income in the Consolidated Statement of Operations.
m. Accounting Estimates
The preparation of financial statements in accordance with U.S. GAAP requires management to make estimates and assumptions that affect the reported amounts of assets and
liabilities at the date of the financial statements and the amounts of income and expenses during the reporting period. Actual results could differ from those estimates.
n. Guarantees and Indemnifications
Under the Trust’s organizational documents, its officers and trustees are indemnified by the Trust against certain liabilities arising out of the performance of their duties to the Trust. Additionally, in the normal course of business, the Trust, on behalf of the Fund, enters into contracts with service providers that contain general indemnification clauses. The Trust’s maximum exposure under these arrangements is unknown as this would involve future claims that may be made against the Trust that have not yet occurred. Currently, the Trust expects the risk of loss to be remote.
2. Shares of Beneficial Interest
At October 31, 2019, there were an unlimited number of shares authorized (without par value). Transactions in the Fund’s shares were as follows:
| Six Months Ended | Year Ended | |||||||||||||||
| October 31, 2019 | April 30, 2019 | |||||||||||||||
| Shares | Amount | Shares | Amount | |||||||||||||
Class A Shares: | ||||||||||||||||
Shares solda | 27,232,491 | $ | 262,936,069 | 50,096,209 | $ | 476,428,245 | ||||||||||
Shares issued in reinvestment of distributions | 6,448,330 | 62,161,494 | 13,459,738 | 127,947,689 | ||||||||||||
Shares redeemed | (39,889,454 | ) | (384,486,041 | ) | (80,356,291 | ) | (764,709,219 | ) | ||||||||
Net increase (decrease) | (6,208,633 | ) | $ | (59,388,478 | ) | (16,800,344 | ) | $ | (160,333,285 | ) | ||||||
Class C Shares: | ||||||||||||||||
Shares sold | 3,491,163 | $ | 33,707,242 | 4,597,179 | $ | 43,711,512 | ||||||||||
Shares issued in reinvestment of distributions | 1,246,108 | 12,011,110 | 3,342,536 | 31,796,374 | ||||||||||||
Shares redeemeda | (12,706,695 | ) | (122,572,840 | ) | (45,752,627 | ) | (435,593,136 | ) | ||||||||
Net increase (decrease) | (7,969,424 | ) | $ | (76,854,488 | ) | (37,812,912 | ) | $ | (360,085,250 | ) | ||||||
Class R Shares: | ||||||||||||||||
Shares sold | 553,936 | $ | 5,327,740 | 1,437,455 | $ | 13,630,121 | ||||||||||
Shares issued in reinvestment of distributions | 168,887 | 1,621,363 | 405,340 | 3,838,586 | ||||||||||||
Shares redeemed | (1,538,695 | ) | (14,784,198 | ) | (3,962,132 | ) | (37,467,349 | ) | ||||||||
Net increase (decrease) | (815,872 | ) | $ | (7,835,095 | ) | (2,119,337 | ) | $ | (19,998,642 | ) | ||||||
| franklintempleton.com | Semiannual Report | 53 | ||
FRANKLIN STRATEGIC SERIES
NOTES TO CONSOLIDATED FINANCIAL STATEMENTS (UNAUDITED)
Franklin Strategic Income Fund(continued)
2. Shares of Beneficial Interest(continued)
| Six Months Ended | Year Ended | |||||||||||||||
| October 31, 2019 | April 30, 2019 | |||||||||||||||
| Shares | Amount | Shares | Amount | |||||||||||||
Class R6 Shares: | ||||||||||||||||
Shares sold | 3,030,290 | $ | 29,302,033 | 10,323,576 | $ | 98,464,071 | ||||||||||
Shares issued in reinvestment of distributions | 612,574 | 5,919,604 | 1,882,797 | 17,913,831 | ||||||||||||
Shares redeemed | (19,861,754 | ) | (192,134,448 | ) | (25,303,121 | ) | (240,047,590 | ) | ||||||||
Net increase (decrease) | (16,218,890 | ) | $ | (156,912,811 | ) | (13,096,748 | ) | $ | (123,669,688 | ) | ||||||
Advisor Class Shares: | ||||||||||||||||
Shares sold | 6,170,061 | $ | 59,613,722 | 18,952,628 | $ | 180,567,542 | ||||||||||
Shares issued in reinvestment of distributions | 1,331,661 | 12,850,411 | 3,899,671 | 37,096,165 | ||||||||||||
Shares redeemed | (8,713,443 | ) | (84,267,062 | ) | (56,752,457 | ) | (539,937,594 | ) | ||||||||
Net increase (decrease) | (1,211,721 | ) | $ | (11,802,929 | ) | (33,900,158 | ) | $ | (322,273,887 | ) | ||||||
aMay include a portion of Class C shares that were automatically converted to Class A.
3. Transactions with Affiliates
Franklin Resources, Inc. is the holding company for various subsidiaries that together are referred to as Franklin Templeton. Certain officers and trustees of the Trust are also officers and/or directors of the following subsidiaries:
| Subsidiary | Affiliation | |
Franklin Advisers, Inc. (Advisers) | Investment manager | |
Franklin Templeton Services, LLC (FT Services) | Administrative manager | |
Franklin Templeton Distributors, Inc. (Distributors) | Principal underwriter | |
Franklin Templeton Investor Services, LLC (Investor Services) | Transfer agent | |
a. Management Fees
The Fund pays an investment management fee to Advisers based on the average daily net assets of the Fund as follows:
| Annualized Fee Rate | Net Assets | |
0.625% | Up to and including $100 million | |
0.500% | Over $100 million, up to and including $250 million | |
0.450% | Over $250 million, up to and including $7.5 billion | |
0.440% | Over $7.5 billion, up to and including $10 billion | |
0.430% | Over $10 billion, up to and including $12.5 billion | |
0.420% | Over $12.5 billion, up to and including $15 billion | |
0.400% | Over $15 billion, up to and including $17.5 billion | |
0.380% | Over $17.5 billion, up to and including $20 billion | |
0.360% | Over $20 billion, up to and including $35 billion | |
0.355% | Over $35 billion, up to and including $50 billion | |
0.350% | In excess of $50 billion | |
54 | Semiannual Report | franklintempleton.com | ||
FRANKLIN STRATEGIC SERIES
NOTES TO CONSOLIDATED FINANCIAL STATEMENTS (UNAUDITED)
Franklin Strategic Income Fund(continued)
For the period ended October 31, 2019, the annualized gross effective investment management fee rate was 0.455% of the Fund’s average daily net assets.
b. Administrative Fees
Under an agreement with Advisers, FT Services provides administrative services to the Fund. The fee is paid by Advisers based on the Fund’s average daily net assets, and is not an additional expense of the Fund.
c. Distribution Fees
The Board has adopted distribution plans for each share class, with the exception of Class R6 and Advisor Class shares, pursuant to Rule12b-1 under the 1940 Act. Under the Fund’s Class A reimbursement distribution plan, the Fund reimburses Distributors for costs incurred in connection with the servicing, sale and distribution of the Fund’s shares up to the maximum annual plan rate. Under the Class A reimbursement distribution plan, costs exceeding the maximum for the current plan year cannot be reimbursed in subsequent periods. In addition, under the Fund’s Class C and R compensation distribution plans, the Fund pays Distributors for costs incurred in connection with the servicing, sale and distribution of the Fund’s shares up to the maximum annual plan rate for each class. The plan year, for purposes of monitoring compliance with the maximum annual plan rates, is February 1 through January 31.
The maximum annual plan rates, based on the average daily net assets, for each class, are as follows:
Class A | 0.25 | % | ||
Class C | 0.65 | % | ||
Class R | 0.50 | % |
d. Sales Charges/Underwriting Agreements
Front-end sales charges and contingent deferred sales charges (CDSC) do not represent expenses of the Fund. These charges are deducted from the proceeds of sales of Fund shares prior to investment or from redemption proceeds prior to remittance, as applicable. Distributors has advised the Fund of the following commission transactions related to the sales and redemptions of the Fund’s shares for the period:
Sales charges retained net of commissions paid to unaffiliated brokers/dealers | $ | 68,187 | ||
CDSC retained | $ | 14,020 |
e. Transfer Agent Fees
Each class of shares pays transfer agent fees to Investor Services for its performance of shareholder servicing obligations. The fees are based on an annualized asset based fee of 0.02% plus a transaction based fee. In addition, each class reimburses Investor Services for out of pocket expenses incurred and, except for Class R6, reimburses shareholder servicing fees paid to third parties. These fees are allocated daily based upon their relative proportion of such classes’ aggregate net assets. Class R6 pays Investor Services transfer agent fees specific to that class.
For the period ended October 31, 2019, the Fund paid transfer agent fees of $3,626,782, of which $1,445,182 was retained by Investor Services.
| franklintempleton.com | Semiannual Report | 55 | ||
FRANKLIN STRATEGIC SERIES
NOTES TO CONSOLIDATED FINANCIAL STATEMENTS (UNAUDITED)
Franklin Strategic Income Fund(continued)
3. Transactions with Affiliates(continued)
f. Investments in Affiliated Management Investment Companies
The Fund invests in one or more affiliated management investment companies for purposes other than exercising a controlling influence over the management or policies. Management fees paid by the Fund are waived on assets invested in the affiliated management investment companies, as noted in the Consolidated Statement of Operations, in an amount not to exceed the management and administrative fees paid directly or indirectly by each affiliate. During the period ended October 31, 2019, the Fund held investments in affiliated management investment companies as follows:
| Value at Beginning of Period | Purchases | Sales | Realized Gain (Loss) | Net Change in Unrealized Appreciation (Depreciation) | Value at End of Period | Number of Shares Held at End of Period | Dividend Income | |||||||||||||||||||||||||
Controlled Affiliates | ||||||||||||||||||||||||||||||||
Franklin Floating Rate Income Funda | $ | 194,101,482 | $ | — | $ | (54,960,600 | ) | $ | (10,939,400 | ) | $ | (2,136,187 | ) | $ | 126,065,295 | 15,243,687 | $ | 6,785,399 | ||||||||||||||
|
|
|
| |||||||||||||||||||||||||||||
Non-Controlled Affiliates | ||||||||||||||||||||||||||||||||
Institutional Fiduciary Trust Money Market Portfolio, 1.56% | 63,183,777 | 51,479,267 | (55,883,771 | ) | — | — | 58,779,273 | 58,779,273 | 591,135 | |||||||||||||||||||||||
|
|
|
| |||||||||||||||||||||||||||||
Total Affiliated Securities | $ | 257,285,259 | $ | 51,479,267 | $ | (110,844,371 | ) | $ | (10,939,400 | ) | $ | (2,136,187 | ) | $ | 184,844,568 | $ | 7,376,534 | |||||||||||||||
|
|
|
| |||||||||||||||||||||||||||||
aEffective May 31, 2019, Franklin Middle Tier Floating Rate Fund was renamed Franklin Floating Rate Income Fund.
g. Waiver and Expense Reimbursements
Investor Services has contractually agreed in advance to waive or limit its fees so that the Class R6 transfer agent fees do not exceed 0.03% based on the average net assets of the class until August 31, 2020.
Prior to September 1, 2019, the Class R6 transfer agent fees were limited to 0.02% based on the average net assets of the class.
4. Expense Offset Arrangement
The Fund has entered into an arrangement with its custodian whereby credits realized as a result of uninvested cash balances are used to reduce a portion of the Fund’s custodian expenses. During the period ended October 31, 2019, the custodian fees were reduced as noted in the Consolidated Statement of Operations.
5. Income Taxes
For tax purposes, capital losses may be carried over to offset future capital gains.
At April 30, 2019, the capital loss carryforwards were as follows:
Capital loss carryforwards not subject to expiration: | ||||
Short term | $ | 33,032,070 | ||
Long term | 441,662,444 | |||
|
| |||
Total capital loss carryforwards | $ | 474,694,514 | ||
|
| |||
56 | Semiannual Report | franklintempleton.com | ||
FRANKLIN STRATEGIC SERIES
NOTES TO CONSOLIDATED FINANCIAL STATEMENTS (UNAUDITED)
Franklin Strategic Income Fund(continued)
At October 31, 2019, the cost of investments and net unrealized appreciation (depreciation) for income tax purposes were as follows:
Cost of investments | $ | 4,781,112,776 | ||
|
| |||
Unrealized appreciation | $ | 96,524,884 | ||
Unrealized depreciation | (266,813,547) | |||
|
| |||
Net unrealized appreciation (depreciation) | $ | (170,288,663) | ||
|
| |||
Differences between income and/or capital gains as determined on a book basis and a tax basis are primarily due to differing treatments of paydown losses, bond discounts and premiums, swaps and financial futures transactions.
6. Investment Transactions
Purchases and sales of investments (excluding short term securities) for the period ended October 31, 2019, aggregated $2,575,195,636 and $2,983,127,411, respectively.
7. Credit Risk and Defaulted Securities
At October 31, 2019, the Fund had 33.6% of its portfolio invested in high yield, senior secured floating rate loans, or other securities rated below investment grade and unrated securities, if any. These securities may be more sensitive to economic conditions causing greater price volatility and are potentially subject to a greater risk of loss due to default than higher rated securities.
The Fund held defaulted securities and/or other securities for which the income has been deemed uncollectible. At October 31, 2019, the aggregate value of these securities was $5,350,000, representing 0.1% of the Fund’s net assets. The Fund discontinues accruing income on securities for which income has been deemed uncollectible and provides an estimate for losses on interest receivable. The securities have been identified in the accompanying Statement of Investments.
8. Restricted Securities
The Fund invests in securities that are restricted under the Securities Act of 1933 (1933 Act). Restricted securities are often purchased in private placement transactions, and cannot be sold without prior registration unless the sale is pursuant to an exemption under the 1933 Act. Disposal of these securities may require greater effort and expense, and prompt sale at an acceptable price may be difficult. The Fund may have registration rights for restricted securities. The issuer generally incurs all registration costs.
At October 31, 2019, investments in restricted securities, excluding securities exempt from registration under the 1933 Act were as follows:
| Principal Amount/ Shares/ Units | Issuer | Acquisition Date | Cost | Value | ||||||||||||
| 331,326 | aAppvion Operations Inc. | 4/12/19 | $ | 4,481,262 | $ | 4,417,403 | ||||||||||
| 125,940,079 | bK2016470219 South Africa Ltd., A | 2/08/13 - 2/01/17 | 977,122 | 83,322 | ||||||||||||
| 12,532,821 | bK2016470219 South Africa Ltd., B | 2/01/17 | 9,305 | 8,292 | ||||||||||||
| 124,500 | cRemington Outdoor Co. Inc., Litigation Units | 4/12/19 | — | — | ||||||||||||
| franklintempleton.com | Semiannual Report | 57 | ||
FRANKLIN STRATEGIC SERIES
NOTES TO CONSOLIDATED FINANCIAL STATEMENTS (UNAUDITED)
Franklin Strategic Income Fund(continued)
8. Restricted Securities(continued)
| Principal Amount/ Shares/ Units | Issuer | Acquisition Date | Cost | Value | ||||||||||||
| 1,500,000 | Sociedad Quimica y Minera de Chile SA, senior note, 144A, 3.625%, 4/03/23 | 8/28/17 | $ | 1,507,138 | $ | 1,539,750 | ||||||||||
|
| |||||||||||||||
| Total Restricted Securities(Value is 0.1% of Net Assets) | $ | 6,974,827 | $ | 6,048,767 | ||||||||||||
|
| |||||||||||||||
aThe Fund also invests in unrestricted securities or other investments in the issuer, valued at $7,561,816 as of October 31, 2019.
bThe Fund also invests in unrestricted securities or other investments in the issuer, valued at $23,299 as of October 31, 2019.
cThe Fund also invests in unrestricted securities or other investments in the issuer, valued at $1,322,439 as of October 31, 2019
9. Other Derivative Information
At October 31, 2019, investments in derivative contracts are reflected in the Consolidated Statement of Assets and Liabilities as follows:
Asset Derivatives | Liability Derivatives | |||||||||||
Derivative Contracts Not Accounted for as Hedging Instruments | Consolidated Statement of Assets and Liabilities Location | Fair Value | Consolidated Statement of Assets and Liabilities Location | Fair Value | ||||||||
| ||||||||||||
Interest rate contracts | Variation margin on futures contracts | $ | 431,962 | a | Variation margin on futures contracts | $ | 1,801,946 | a | ||||
Variation margin on centrally cleared swap contracts | 483,118 | a | Variation margin on centrally cleared swap contracts | 1,383,516 | a | |||||||
Unrealized appreciation on OTC swap contracts | 1,565,813 | Unrealized depreciation on OTC swap contracts | — | |||||||||
Foreign exchange contracts | Unrealized appreciation on OTC forward exchange contracts | 2,526,666 | Unrealized depreciation on OTC forward exchange contracts | 8,975,247 | ||||||||
Credit contracts | Variation margin on centrally cleared swap contracts | — | Variation margin on centrally cleared swap contracts | 721,372 | a | |||||||
OTC swap contracts (upfront payments) | 667,679 | OTC swap contracts (upfront receipts) | 33,043,584 | |||||||||
Unrealized appreciation on OTC swap contracts | 2,000,647 | Unrealized depreciation on OTC swap contracts | 4,208,210 | |||||||||
Value recovery instruments | Investments in securities, at value | 9,411,080 | b | |||||||||
|
|
|
| |||||||||
Totals | $ | 17,086,965 | $ | 50,133,875 | ||||||||
|
|
|
| |||||||||
aThis amount reflects the cumulative appreciation (depreciation) of futures contracts and centrally cleared swap contracts as reported in the Consolidated Statement of Investments. Only the variation margin receivable/payable at period end is separately reported within the Consolidated Statement of Assets and Liabilities. Prior variation margin movements were recorded to cash upon receipt or payment.
bVRI are included in investments in securities, at value in the Consolidated Statement of Assets and Liabilities.
58 | Semiannual Report | franklintempleton.com | ||
FRANKLIN STRATEGIC SERIES
NOTES TO CONSOLIDATED FINANCIAL STATEMENTS (UNAUDITED)
Franklin Strategic Income Fund(continued)
For the period ended October 31, 2019, the effect of derivative contracts in the Consolidated Statement of Operations was as follows:
Derivative Contracts Not Accounted for as Hedging Instruments | Consolidated Statement of Operations Location | Net Realized Gain (Loss) for the Period | Consolidated Statement of Operations Location | Net Change in Unrealized Appreciation (Depreciation) for the Period | ||||||||
| ||||||||||||
Net realized gain (loss) from: | Net change in unrealized appreciation (depreciation) on: | |||||||||||
Interest rate contracts | Futures contracts | $ | 32,221,068 | Futures contracts | $ | (5,215,544 | ) | |||||
Swap contracts | 8,458,265 | Swap contracts | (9,756,943 | ) | ||||||||
Foreign exchange contracts | Forward exchange contracts | 8,502,886 | Forward exchange contracts | (9,767,148 | ) | |||||||
Credit contracts | Swap contracts | (34,488,014 | ) | Swap contracts | 12,865,748 | |||||||
Value recovery instruments | Investments | — | Investments | 3,005,042 | a | |||||||
|
|
|
|
|
| |||||||
Totals | $ | 14,694,205 | $ | (8,868,845 | ) | |||||||
|
|
|
|
|
| |||||||
aVRI are included in net change in unrealized appreciation (depreciation) on investments in the Consolidated Statement of Operations.
For the period ended October 31, 2019, the average month end notional amount of futures contracts and swap contracts, the average month end contract value for forward exchange contracts and average month end fair value of VRI, were as follows:
Futures contracts | $ | 1,002,417,414 | ||
Swap contracts | 573,922,210 | |||
Forward exchange contracts | 641,327,870 | |||
VRI | 7,994,712 |
At October 31, 2019, the Fund’s OTC derivative assets and liabilities are as follows:
Gross Amounts of Assets and Liabilities Presented | ||||||||
| Assetsa | Liabilitiesa | |||||||
Derivatives | ||||||||
Forward exchange contracts | $2,526,666 | $ 8,975,247 | ||||||
Swap contracts | 4,234,139 | 37,251,794 | ||||||
Total | $6,760,805 | $46,227,041 | ||||||
aAbsent an event of default or early termination, OTC derivative assets and liabilities are presented gross and not offset in the Consolidated Statement of Assets and Liabilities.
| franklintempleton.com | Semiannual Report | 59 | ||
FRANKLIN STRATEGIC SERIES
NOTES TO CONSOLIDATED FINANCIAL STATEMENTS (UNAUDITED)
Franklin Strategic Income Fund(continued)
9. Other Derivative Information(continued)
At October 31, 2019, OTC derivative assets, which may be offset against OTC derivative liabilities and collateral received from the counterparty, are as follows:
Amounts Not Offset in the Consolidated Statement of Assets and Liabilities | ||||||||||||||||||||
Gross Amounts of Assets Presented in the Consolidated Statement of | Financial Instruments Available for Offset | Financial Instruments Collateral Receiveda,b | Cash Collateral Received | Net Amount (Not less than zero) | ||||||||||||||||
Counterparty | ||||||||||||||||||||
BNDP | $ 161,122 | $ — | $(161,122 | ) | $ — | $ — | ||||||||||||||
BZWS | 736,119 | (736,119 | ) | — | — | — | ||||||||||||||
CITI | 1,495,374 | (1,495,374 | ) | — | — | — | ||||||||||||||
DBAB | 36,944 | — | (36,944 | ) | — | — | ||||||||||||||
GSCO | 1,011,494 | — | — | (920,000 | ) | 91,494 | ||||||||||||||
JPHQ | 2,489,722 | (2,489,722 | ) | — | — | — | ||||||||||||||
MSCO | 830,030 | — | — | (420,000 | ) | 410,030 | ||||||||||||||
Total | $6,760,805 | $(4,721,215 | ) | $(198,066 | ) | $(1,340,000 | ) | $501,524 | ||||||||||||
At October 31, 2019, OTC derivative liabilities, which may be offset against OTC derivative assets and collateral pledged to the counterparty, are as follows:
|
| |||||||||||||||||||
Amounts Not Offset in the Consolidated Statement of Assets and Liabilities | ||||||||||||||||||||
Gross Amounts of Liabilities Presented in the Consolidated Statement of | Financial Instruments Available for Offset | Financial Instruments Collateral Pledged | Cash Collateral Pledgedb | Net Amount (Not less than zero) | ||||||||||||||||
Counterparty | ||||||||||||||||||||
BNDP | $ — | $ — | $ — | $ — | $ — | |||||||||||||||
BZWS | 899,023 | (736,119 | ) | — | (162,904 | ) | — | |||||||||||||
CITI | 32,278,847 | (1,495,374 | ) | — | (30,210,000 | ) | 573,473 | |||||||||||||
DBAB | — | — | — | — | — | |||||||||||||||
GSCO | — | — | — | — | — | |||||||||||||||
JPHQ | 13,049,171 | (2,489,722 | ) | — | (10,559,449 | ) | — | |||||||||||||
MSCO | — | — | — | — | — | |||||||||||||||
Total | $46,227,041 | $(4,721,215 | ) | $ — | $(40,932,353 | ) | $573,473 | |||||||||||||
aAt October 31, 2019, the Fund received U.S. Treasury Bonds and Notes as collateral for derivatives.
bIn some instances, the collateral amounts disclosed in the table above were adjusted due to the requirement to limit collateral amounts to avoid the effect of overcollateralization. Actual collateral received and/or pledged may be more than the amounts disclosed herein.
See Note 1(e) regarding derivative financial instruments.
See Abbreviations on page 65.
60 | Semiannual Report | franklintempleton.com | ||
FRANKLIN STRATEGIC SERIES
NOTES TO CONSOLIDATED FINANCIAL STATEMENTS (UNAUDITED)
Franklin Strategic Income Fund(continued)
10. Holdings of 5% Voting Securities of Portfolio Companies
The 1940 Act defines “affiliated companies” to include investments in portfolio companies in which a fund owns 5% or more of the outstanding voting securities. During the period ended October 31, 2019, investments in “affiliated companies” were as follows:
| Name of Issuer | Value at Beginning of Period | Purchases | Sales | Realized Gain (Loss) | Net Change in Unrealized Appreciation (Depreciation) | Value at End of | Number of of Period | Dividend Income | ||||||||||||||||||||||||
Non-Controlled Affiliates | ||||||||||||||||||||||||||||||||
Remington Outdoor Co. Inc. | $2,909,366 | $ — | $ — | $ — | $(1,586,927 | ) | $1,322,439 | 1,322,439 | $ — | |||||||||||||||||||||||
Remington Outdoor Co. Inc., Litigation Units | — | — | — | — | — | — | 124,500 | — | ||||||||||||||||||||||||
|
|
|
| |||||||||||||||||||||||||||||
Total Affiliated Securities(Value is —%† of Net Assets) | $2,909,366 | $ — | $ — | $ — | $(1,586,927 | ) | $1,322,439 | $ — | ||||||||||||||||||||||||
|
|
|
| |||||||||||||||||||||||||||||
†Rounds to less than 0.1% of net assets.
11. Credit Facility
The Fund, together with other U.S. registered and foreign investment funds (collectively, Borrowers), managed by Franklin Templeton, are borrowers in a joint syndicated senior unsecured credit facility totaling $2 billion (Global Credit Facility) which matures on February 7, 2020. This Global Credit Facility provides a source of funds to the Borrowers for temporary and emergency purposes, including the ability to meet future unanticipated or unusually large redemption requests.
Under the terms of the Global Credit Facility, the Fund shall, in addition to interest charged on any borrowings made by the Fund and other costs incurred by the Fund, pay its share of fees and expenses incurred in connection with the implementation and maintenance of the Global Credit Facility, based upon its relative share of the aggregate net assets of all of the Borrowers, including an annual commitment fee of 0.15% based upon the unused portion of the Global Credit Facility. These fees are reflected in other expenses in the Consolidated Statement of Operations. During the period ended October 31, 2019, the Fund did not use the Global Credit Facility.
12. Fair Value Measurements
The Fund follows a fair value hierarchy that distinguishes between market data obtained from independent sources (observable inputs) and the Fund’s own market assumptions (unobservable inputs). These inputs are used in determining the value of the Fund’s financial instruments and are summarized in the following fair value hierarchy:
| • | Level 1 – quoted prices in active markets for identical financial instruments |
| • | Level 2 – other significant observable inputs (including quoted prices for similar financial instruments, interest rates, prepayment speed, credit risk, etc.) |
| • | Level 3 – significant unobservable inputs (including the Fund’s own assumptions in determining the fair value of financial instruments) |
The input levels are not necessarily an indication of the risk or liquidity associated with financial instruments at that level.
| franklintempleton.com | Semiannual Report | 61 | ||
FRANKLIN STRATEGIC SERIES
NOTES TO CONSOLIDATED FINANCIAL STATEMENTS (UNAUDITED)
Franklin Strategic Income Fund(continued)
12. Fair Value Measurements(continued)
A summary of inputs used as of October 31, 2019, in valuing the Fund’s assets and liabilities carried at fair value, is as follows:
| Level 1 | Level 2 | Level 3 | Total | |||||||||||||
Assets: | ||||||||||||||||
Investments in Securities:a | ||||||||||||||||
Equity Investments:b | ||||||||||||||||
Commercial & Professional Services | $ | — | $ | — | $ | 1,322,439 | $ | 1,322,439 | ||||||||
Consumer Services | — | — | 122,759 | 122,759 | ||||||||||||
Energy | 1,363,782 | 3,711,653 | 44,015 | c | 5,119,450 | |||||||||||
Materials | 576,735 | — | 4,417,403 | 4,994,138 | ||||||||||||
Media & Entertainment | 2,315,683 | — | 23,659 | 2,339,342 | ||||||||||||
Retailing | — | — | 91,614 | 91,614 | ||||||||||||
Software & Services | — | — | 750,000 | 750,000 | ||||||||||||
All Other Equity Investments | 126,065,295 | — | — | 126,065,295 | ||||||||||||
Corporate Bonds: | ||||||||||||||||
Retailing | — | 5,141,000 | 23,299 | 5,164,299 | ||||||||||||
All Other Corporate Bonds | — | 1,378,103,819 | — | 1,378,103,819 | ||||||||||||
Senior Floating Rate Interests: | ||||||||||||||||
Household & Personal Products | — | — | 43,305,423 | 43,305,423 | ||||||||||||
Software & Services | — | 1,853,302 | 20,023,463 | 21,876,765 | ||||||||||||
All Other Senior Floating Rate Interests | — | 198,133,617 | — | 198,133,617 | ||||||||||||
Foreign Government and Agency Securities | — | 548,352,663 | — | 548,352,663 | ||||||||||||
U.S. Government and Agency Securities | — | 280,182,622 | — | 280,182,622 | ||||||||||||
Asset-Backed Securities and Commercial Mortgage-Backed Securities | — | 1,360,569,782 | — | 1,360,569,782 | ||||||||||||
Mortgage-Backed Securities | — | 424,469,656 | — | 424,469,656 | ||||||||||||
Municipal Bonds | — | 86,463,040 | — | 86,463,040 | ||||||||||||
Escrows and Litigation Trusts | — | 135,000 | — | c | 135,000 | |||||||||||
Short Term Investments | 58,779,273 | 108,109,163 | — | 166,888,436 | ||||||||||||
Total Investments in Securities | $ | 189,100,768 | $ | 4,395,225,317 | $ | 70,124,074 | $ | 4,654,450,159 | ||||||||
Other Financial Instruments: | ||||||||||||||||
Futures Contracts | $ | 431,962 | $ | — | $ | — | $ | 431,962 | ||||||||
Forward Exchange Contracts | — | 2,526,666 | — | 2,526,666 | ||||||||||||
Swap Contracts | — | 4,049,578 | — | 4,049,578 | ||||||||||||
Total Other Financial Instruments | $ | 431,962 | $ | 6,576,244 | $ | — | $ | 7,008,206 | ||||||||
62 | Semiannual Report | franklintempleton.com | ||
FRANKLIN STRATEGIC SERIES
NOTES TO CONSOLIDATED FINANCIAL STATEMENTS (UNAUDITED)
Franklin Strategic Income Fund(continued)
| Level 1 | Level 2 | Level 3 | Total | |||||||||||||
Liabilities: | ||||||||||||||||
Investments in Securities:a | ||||||||||||||||
Other Financial Instruments: | ||||||||||||||||
Futures Contracts | $ | 1,801,946 | $ | — | $ | — | $ | 1,801,946 | ||||||||
Forward Exchange Contracts | — | 8,975,247 | — | 8,975,247 | ||||||||||||
Swap Contracts | — | 6,313,098 | — | 6,313,098 | ||||||||||||
Total Other Financial Instruments | $ | 1,801,946 | $ | 15,288,345 | $ | — | $ | 17,090,291 | ||||||||
aFor detailed categories, see the accompanying Consolidated Statement of Investments.
bIncludes common stocks and management investment companies as well as other equity investments.
cIncludes securities determined to have no value at October 31, 2019.
A reconciliation of assets in which Level 3 inputs are used in determining fair value is presented when there are significant Level 3 financial instruments at the beginning and/or end of the period. At October 31, 2019, the reconciliation of assets is as follows:
| Balance at Beginning of Period | Purchases (Sales) | Transfer Level 3a | Transfer Out of Level 3b | Cost Basis Adjustmentsc | Net Realized Gain (Loss) | Net Unrealized Appreciation (Depreciation) | Balance at End of Period | Net Change in Unrealized Appreciation (Depreciation) on Assets Held at Period End | ||||||||||||||||||||||||||||
Assets: | ||||||||||||||||||||||||||||||||||||
Investments in Securities: | ||||||||||||||||||||||||||||||||||||
Equity Investments:d | ||||||||||||||||||||||||||||||||||||
Commercial & Professional Services | $ — | $ — | $1,322,439 | $— | $ — | $— | $ — | $ 1,322,439 | $ — | |||||||||||||||||||||||||||
Consumer Services | 122,759 | — | — | — | — | — | — | 122,759 | — | |||||||||||||||||||||||||||
Energy | 2 | — | 138,516 | e | — | — | — | (94,503 | ) | 44,015 | e | (94,503 | ) | |||||||||||||||||||||||
Materials | 4,615,489 | — | — | — | — | — | (198,086 | ) | 4,417,403 | (198,086 | ) | |||||||||||||||||||||||||
Media & Entertainment | — | 24,605 | — | — | — | — | (946 | ) | 23,659 | (946 | ) | |||||||||||||||||||||||||
Retailing | 96,878 | — | — | — | — | — | (5,264 | ) | 91,614 | (5,264 | ) | |||||||||||||||||||||||||
Software & Services | 750,000 | — | — | — | — | — | — | 750,000 | — | |||||||||||||||||||||||||||
Corporate Bonds: | ||||||||||||||||||||||||||||||||||||
Retailing | 90,006 | — | — | — | 8,097 | — | (74,804 | ) | 23,299 | (74,804 | ) | |||||||||||||||||||||||||
Senior Floating Rate Interests: | ||||||||||||||||||||||||||||||||||||
Household & Personal Products | 42,108,964 | — | — | — | 1,079,090 | — | 117,369 | 43,305,423 | 117,369 | |||||||||||||||||||||||||||
Software & Services | 19,883,394 | — | — | — | — | — | 140,069 | 20,023,463 | 140,069 | |||||||||||||||||||||||||||
Escrows and Litigation Trusts | — | e | — | — | — | — | — | — | — | e | — | |||||||||||||||||||||||||
|
| |||||||||||||||||||||||||||||||||||
Total Investments in Securities | $67,667,492 | $24,605 | $1,460,955 | $— | $1,087,187 | $— | $(116,165 | ) | $70,124,074 | $(116,165 | ) | |||||||||||||||||||||||||
|
| |||||||||||||||||||||||||||||||||||
aThe investments were transferred into Level 3 as a result of the unavailability of a quoted market price in an active market for identical securities and other significant observable valuation inputs. May include amounts related to a corporate action.
bThe investment was transferred out of Level 3 as a result of the availability of a quoted price in an active market for identical securities and other significant observable valuation inputs. May include amounts related to a corporate action.
cMay include accretion, amortization, partnership adjustments, and/or other cost basis adjustments.
dIncludes common stocks as well as other equity investments.
eIncludes securities determined to have no value.
| franklintempleton.com | Semiannual Report | 63 | ||
FRANKLIN STRATEGIC SERIES
NOTES TO CONSOLIDATED FINANCIAL STATEMENTS (UNAUDITED)
Franklin Strategic Income Fund(continued)
12. Fair Value Measurements(continued)
Significant unobservable valuation inputs for material Level 3 financial instruments and impact to fair value as a result of changes in unobservable valuation inputs as of October 31, 2019, are as follows:
| Description | Fair Value at End of Period | Valuation Technique | Unobservable Inputs | Amount/ Range (Weighted Averagea) | Impact to Fair Value if Input Increasesb | |||||||||
Assets: | ||||||||||||||
Investments in Securities: | ||||||||||||||
Senior Floating Rate Interests: | ||||||||||||||
Household & Personal Products | $ | 43,305,423 | Discounted cash flow | Free cash flow | $20.0 - $33.9 mil ($29.2) mil | Increase | c | |||||||
| Discount rate | 10.8% - 13.3% (11.7%) | Decrease | d | |||||||||||
Software & Services | $ | 20,023,463 | Discounted cash flow | Free cash flow | $26.6 mil | Increase | c | |||||||
| Discount rate | 19.0% | Increase | d | |||||||||||
All Other Investmentsf | 6,795,188 | f | ||||||||||||
Total | $ | 70,124,074 | f | |||||||||||
aWeighted based on the relative fair value of the financial instruments.
bRepresents the directional change in the fair value of the Level 3 financial instruments that would result from a significant and reasonable increase in the corresponding input. A significant and reasonable decrease in the input would have the opposite effect. Significant impacts, if any, to fair value and/or net assets have been indicated.
cRepresents a significant impact to fair value and net assets.
dRepresents a significant impact to fair value but not net assets.
eIncludes fair value of immaterial financial instruments developed using various valuation techniques and unobservable inputs. May also include financial instruments with values derived using private transaction prices ornon-public third party pricing information which is unobservable.
fIncludes securities determined to have no value at October 31, 2019.
13. Subsequent Events
The Fund has evaluated subsequent events through the issuance of the financial statements and determined that no events have occurred that require disclosure.
64 | Semiannual Report | franklintempleton.com | ||
FRANKLIN STRATEGIC SERIES
NOTES TO CONSOLIDATED FINANCIAL STATEMENTS (UNAUDITED)
Franklin Strategic Income Fund(continued)
Abbreviations
| ||||||||||
| Counterparty | Currency | Selected Portfolio | ||||||||
| BNDP | BNP Paribas | BRL | Brazilian Real | ARM | Adjustable Rate Mortgage | |||||
| BZWS | Barclays Bank PLC | CAD | Canadian Dollar | BBSW | Bank Bill Swap Rate | |||||
| CITI | Citigroup, Inc. | CNY | Chinese Yuan | BZDIOVRA | Brazil Cetip DI Interbank Deposit Rate | |||||
| DBAB | Deutsche Bank AG | COP | Colombian Peso | CABA | Canada Banker’s Acceptance | |||||
| GSCO | The Goldman Sachs Group, Inc. | DOP | Dominican Peso | CLO | Collateralized Loan Obligation | |||||
| JPHQ | JP Morgan Chase & Co. | EUR | Euro | CME | Chicago Mercantile Exchange | |||||
| MSCO | Morgan Stanley | IDR | Indonesian Rupiah | CMT | Constant Maturity Treasury Index | |||||
| USD | United States Dollar | CNRR | China Reverse Repo Rate | |||||||
| UYU | Uruguayan Peso | FRN | Floating Rate Note | |||||||
| ZAR | South African Rand | GDP | Gross Domestic Product | |||||||
| GO | General Obligation | |||||||||
| LIBOR | London InterBank Offered Rate | |||||||||
| MBS | Mortgage-Backed Security | |||||||||
| PIK | Payment-In-Kind | |||||||||
| RDA | Redevelopment Agency/Authority | |||||||||
| SF | Single Family | |||||||||
| T-Note | Treasury Note | |||||||||
| VRI | Value Recovery Instruments | |||||||||
| Index | ||
| CDX.EM.30 | CDX Emerging Markets Index | |
| MCDX.NA.31 | MCDX North America Index | |
| franklintempleton.com | Semiannual Report | 65 | ||
FRANKLIN STRATEGIC SERIES
FRANKLIN STRATEGIC INCOME FUND
Proxy Voting Policies and Procedures
The Fund’s investment manager has established Proxy Voting Policies and Procedures (Policies) that the Fund uses to determine how to vote proxies relating to portfolio securities. Shareholders may view the Fund’s complete Policies online at franklintempleton.com. Alternatively, shareholders may request copies of the Policies free of charge by calling the Proxy Group collect at (954)527-7678 or by sending a written request to: Franklin Templeton Companies, LLC, 300 S.E. 2nd Street, Fort Lauderdale, FL 33301, Attention: Proxy Group. Copies of the Fund’s proxy voting records are also made available online at franklintempleton.com and posted on the U.S. Securities and Exchange Commission’s website at sec.gov and reflect the most recent12-month period ended June 30.
Quarterly Statement of Investments
The Trust, on behalf of the Fund, files a complete statement of investments with the U.S. Securities and Exchange Commission for the first and third quarters for each fiscal year as an exhibit to its report on FormN-PORT. Shareholders may view the filed FormN-PORT by visiting the Commission’s website at sec.gov. The filed form may also be viewed and copied at the Commission’s Public Reference Room in Washington, DC. Information regarding the operations of the Public Reference Room may be obtained by calling(800) SEC-0330.
66 | Semiannual Report | franklintempleton.com | ||
This page intentionally left blank.
This page intentionally left blank.
Authorized for distribution only when accompanied or preceded by a summary prospectus and/or prospectus. Investors should carefully consider a fund’s investment goals, risks, charges and expenses before investing. A prospectus contains this and other information; please read it carefully before investing.
To help ensure we provide you with quality service, all calls to and from our service areas are monitored and/or recorded.
 | Semiannual Report and Shareholder Letter | |||||
| Franklin Strategic Income Fund | ||||||
| Investment Manager | Distributor | Shareholder Services | ||||
| Franklin Advisers, Inc. | Franklin Templeton Distributors, Inc. | (800)632-2301 | ||||
| (800) DIAL BEN®/342-5236 | ||||||
| franklintempleton.com | ||||||
| © 2019 Franklin Templeton Investments. All rights reserved. | 194 S 12/19 |
| Item 2. | Code of Ethics. |
(a) The Registrant has adopted a code of ethics that applies to its principal executive officers and principal financial and accounting officer.
(c) N/A
(d) N/A
(f) Pursuant to Item 13(a)(1), the Registrant is attaching as an exhibit a copy of its code of ethics that applies to its principal executive officers and principal financial and accounting officer.
| Item 3. | Audit Committee Financial Expert. |
(a)(1) The Registrant has an audit committee financial expert serving on its audit committee.
(2) The audit committee financial expert is Mary C. Choksi and she is “independent” as defined under the relevant Securities and Exchange Commission Rules and Releases.
| Item 4. | Principal Accountant Fees and Services. N/A |
| Item 5. | Audit Committee of Listed Registrants. N/A |
| Item 6. | Schedule of Investments. N/A |
| Item 7. | Disclosure of Proxy Voting Policies and Procedures forClosed-End Management Investment Companies. N/A |
| Item 8. | Portfolio Managers ofClosed-End Management Investment Companies. N/A |
| Item 9. | Purchases of Equity Securities byClosed-End Management Investment Company and Affiliated Purchasers. N/A |
| Item 10. | Submission of Matters to a Vote of Security Holders. |
There have been no changes to the procedures by which shareholders may recommend nominees to the Registrant’s Board of Trustees that would require disclosure herein.
| Item 11. | Controls and Procedures. |
(a)Evaluation of Disclosure Controls and Procedures. The Registrant maintains disclosure controls and procedures that are designed to provide reasonable assurance that information required to be disclosed in the Registrant’s filings under the Securities Exchange Act of 1934, as amended, and the Investment Company Act of 1940 is recorded, processed, summarized and reported within the periods specified in the rules and forms of the Securities and Exchange Commission. Such information is accumulated and communicated to the Registrant’s management, including its principal executive officer and principal financial officer, as appropriate, to allow timely decisions regarding required disclosure. The Registrant’s management, including the principal executive officer and the principal financial officer, recognizes that any set of controls and procedures, no matter how well designed and operated, can provide only reasonable assurance of achieving the desired control objectives.
Within 90 days prior to the filing date of this Shareholder Report on FormN-CSR, the Registrant had carried out an evaluation, under the supervision and with the participation of the Registrant’s management, including the Registrant’s principal executive officer and the Registrant’s principal financial officer, of the effectiveness of the design and operation of the Registrant’s disclosure controls and procedures. Based on such evaluation, the Registrant’s principal executive officer and principal financial officer concluded that the Registrant’s disclosure controls and procedures are effective.
(b)Changes in Internal Controls. There have been no changes in the Registrant’s internal control over financial reporting that occurred during the period covered by this report that has materially affected, or is reasonably likely to materially affect the internal control over financial reporting.
| Item 12. | Disclosure of Securities Lending Activities forClosed-End Management Investment Company. N/A |
| Item 13. | Exhibits. |
(a) (1) Code of Ethics
(a) (2) Certifications pursuant to Section 302 of the Sarbanes-Oxley Act of 2002 of Matthew T. Hinkle, Chief Executive Officer—Finance and Administration, and Gaston Gardey, Chief Financial Officer and Chief Accounting Officer
(b) Certifications pursuant to Section 906 of the Sarbanes-Oxley Act of 2002 of Matthew T. Hinkle, Chief Executive Officer—Finance and Administration, and Gaston Gardey, Chief Financial Officer and Chief Accounting Officer
SIGNATURES
Pursuant to the requirements of the Securities Exchange Act of 1934 and the Investment Company Act of 1940, the registrant has duly caused this report to be signed on its behalf by the undersigned, thereunto duly authorized.
FRANKLIN STRATEGIC SERIES
| By | S\MATTHEW T. HINKLE | |
| Matthew T. Hinkle | ||
| Chief Executive Officer – Finance and Administration | ||
| Date December 31, 2019 |
Pursuant to the requirements of the Securities Exchange Act of 1934 and the Investment Company Act of 1940, this report has been signed below by the following persons on behalf of the registrant and in the capacities and on the dates indicated.
| By | S\MATTHEW T. HINKLE | |
| Matthew T. Hinkle | ||
| Chief Executive Officer – Finance and Administration | ||
| Date December 31, 2019 |
| By | S\GASTON GARDEY | |
Gaston Gardey | ||
| Chief Financial Officer and Chief Accounting Officer | ||
Date December 31, 2019 |