Exhibit 99.2
Strategic Overview
Dynegy Inc.
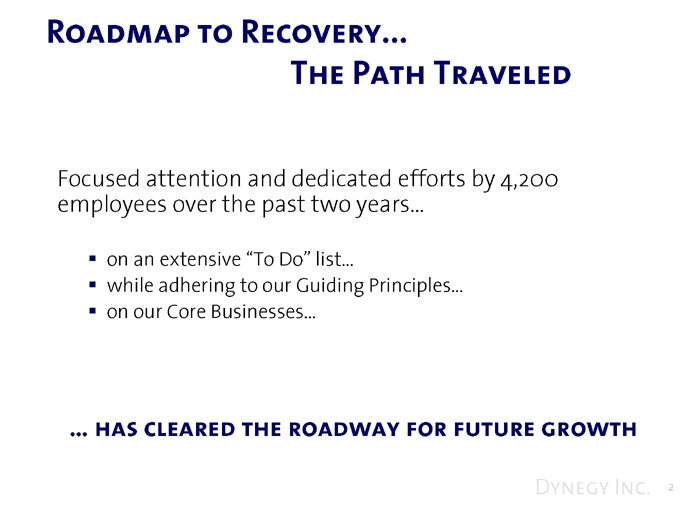
Roadmap to Recovery...
The Path Traveled
Focused attention and dedicated efforts by 4,200 employees over the past two years…
on an extensive “To Do” list… while adhering to our Guiding Principles… on our Core Businesses…
… has cleared the roadway for future growth
Dynegy Inc. 2

Roadmap to Recovery...
Dedicated efforts to attack an extended “to do” list
Established a game plan. . . Then we executed
Dynegy Inc. 3
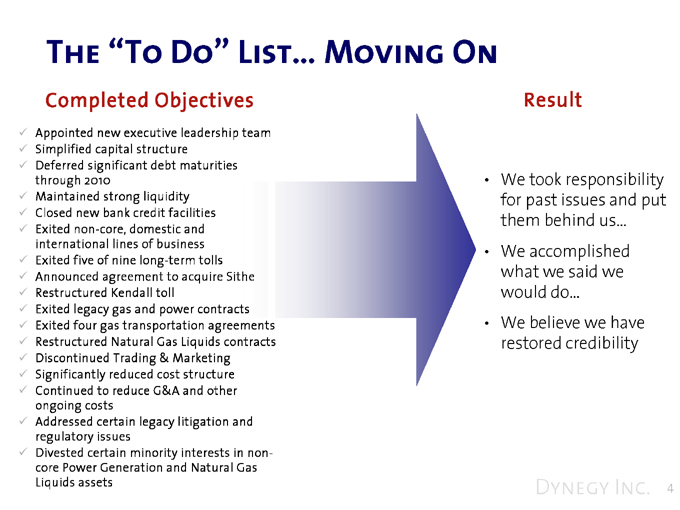
The “To Do” List… Moving On
Completed Objectives Result
Appointed new executive leadership team Simplified capital structure Deferred significant debt maturities through 2010 Maintained strong liquidity Closed new bank credit facilities Exited non-core, domestic and international lines of business Exited five of nine long-term tolls Announced agreement to acquire Sithe Restructured Kendall toll Exited legacy gas and power contracts Exited four gas transportation agreements Restructured Natural Gas Liquids contracts Discontinued Trading & Marketing Significantly reduced cost structure Continued to reduce G&A and other ongoing costs Addressed certain legacy litigation and regulatory issues Divested certain minority interests in non-core Power Generation and Natural Gas Liquids assets
We took responsibility for past issues and put them behind us… We accomplished what we said we would do… We believe we have restored credibility
Dynegy Inc. 4
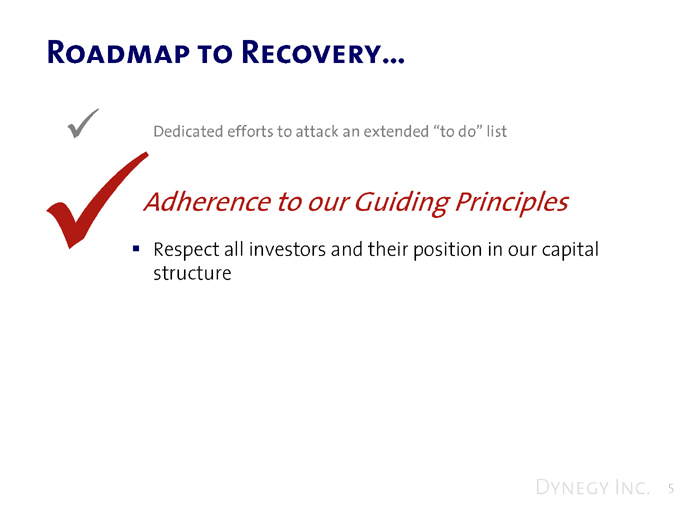
Roadmap to Recovery…
Dedicated efforts to attack an extended “to do” list
Adherence to our Guiding Principles
Respect all investors and their position in our capital structure
Dynegy Inc. 5
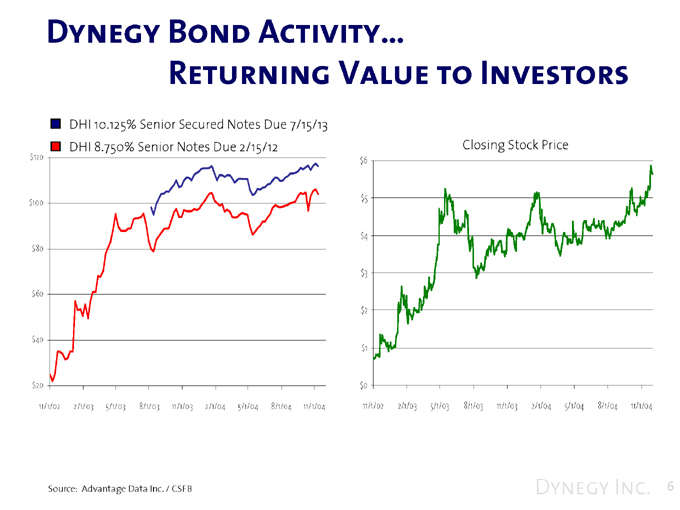
Dynegy Bond Activity…
Returning Value to Investors
DHI 10.125% Senior Secured Notes Due 7/15/13 DHI 8.750% Senior Notes Due 2/15/12
$120 $100 $80 $60 $40 $20
11/1/02 2/1/03 5/1/03 8/1/03 11/1/03 2/1/04 5/1/04 8/1/04 11/1/04
Closing Stock Price
$6 $5 $4 $3 $2 $1 $0
11/1/02 2/1/03 5/1/03 8/1/03 11/1/03 2/1/04 5/1/04 8/1/04 11/1/04
Source: Advantage Data Inc. / CSFB
Dynegy Inc. 6

Roadmap to Recovery…
Dedicated efforts to attack an extended “to do” list
Adherence to our Guiding Principles
Respect all investor rights and position in capital structure
Work to restore value to all investors
Extend debt maturities, creating a real option “runway”
Create a near term “synthetic investment grade” balance sheet
Dynegy Inc. 7
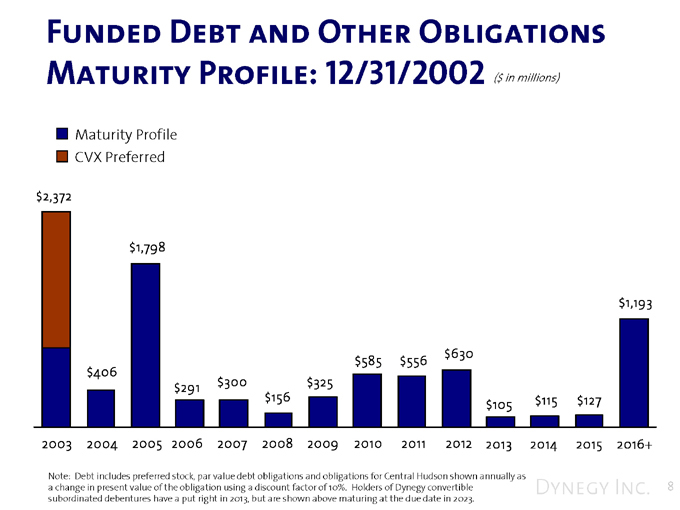
Funded Debt and Other Obligations Maturity Profile: 12/31/2002 ($ in millions)
Maturity Profile CVX Preferred
$2,372 $1,798 $1,193
$585 $556 $630 $406 $291 $300 $325 $156 $105 $115 $127
2003 2004 2005 2006 2007 2008 2009 2010 2011 2012 2013 2014 2015 2016+
Note: Debt includes preferred stock, par value debt obligations and obligations for Central Hudson shown annually as a change in present value of the obligation using a discount factor of 10%. Holders of Dynegy convertible subordinated debentures have a put right in 2013, but are shown above maturing at the due date in 2023.
Dynegy Inc. 8
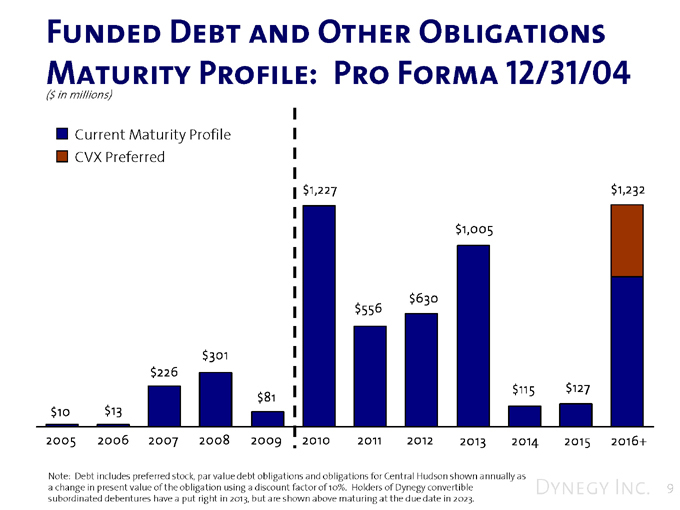
Funded Debt and Other Obligations Maturity Profile: Pro Forma 12/31/04
($ in millions)
Current Maturity Profile CVX Preferred
$301 $226 $81
$10 $13
$1,227
$630 $556
$1,232
$1,005
$115 $127
2005 2006 2007 2008 2009 2010 2011 2012 2013 2014 2015 2016+
Note: Debt includes preferred stock, par value debt obligations and obligations for Central Hudson shown annually as a change in present value of the obligation using a discount factor of 10%. Holders of Dynegy convertible subordinated debentures have a put right in 2013, but are shown above maturing at the due date in 2023.
Dynegy Inc. 9
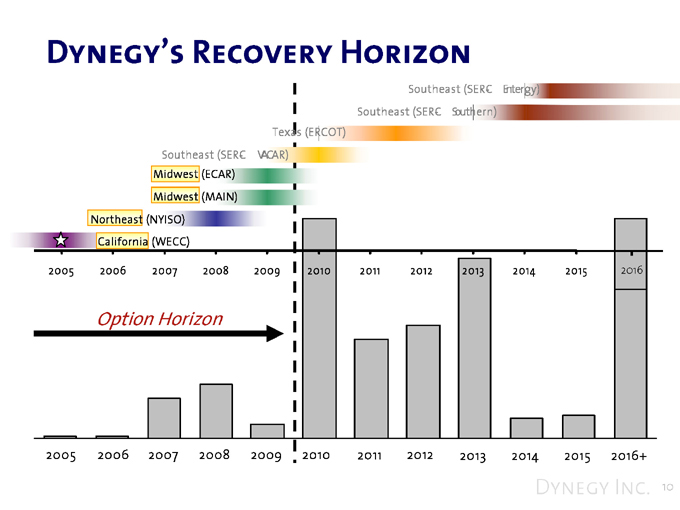
Dynegy’s Recovery Horizon
Southeast (SERC-Entergy) Southeast (SERC-Southern) Texas (ERCOT) Southeast (SERC-VACAR) Midwest (ECAR) Midwest (MAIN) Northeast (NYISO) California (WECC)
2005 2006 2007 2008 2009 2010 2011 2012 2013 2014 2015 2016
Option Horizon
2005 2006 2007 2008 2009 2010 2011 2012 2013 2014 2015 2016+
Dynegy Inc. 10
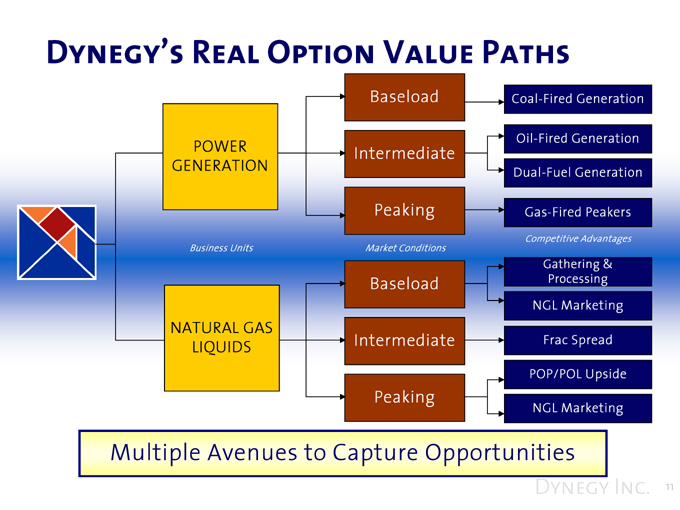
Dynegy’s Real Option Value Paths
Baseload Coal-Fired Generation POWER Oil-Fired Generation
Intermediate
GENERATION Dual-Fuel Generation Peaking Gas-Fired Peakers
Competitive Advantages Business Units Market Conditions
Gathering & Processing Baseload
NGL Marketing
NATURAL GAS
LIQUIDS Intermediate Frac Spread
POP/POL Upside
Peaking
NGL Marketing
Multiple Avenues to Capture Opportunities
Dynegy Inc. 11
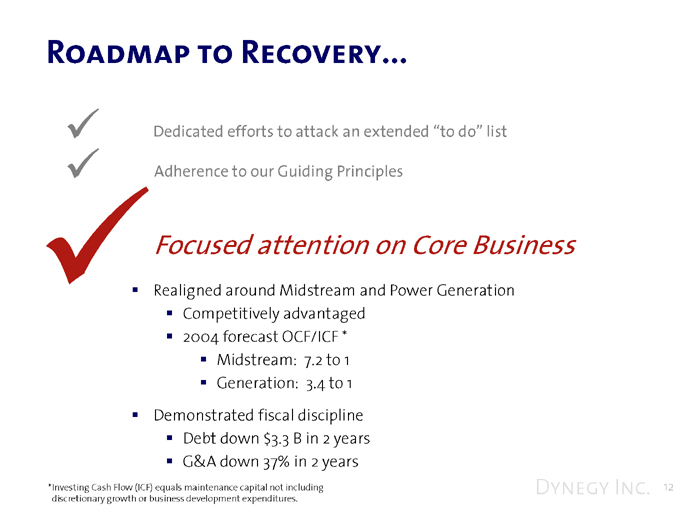
Roadmap to Recovery
Dedicated efforts to attack an extended “to do” list Adherence to our Guiding Principles
Focused attention on Core Business
Realigned around Midstream and Power Generation
Competitively advantaged 2004 forecast OCF/ICF *
Midstream: 7.2 to 1 Generation: 3.4 to 1
Demonstrated fiscal discipline
Debt down $3.3 B in 2 years G&A down 37% in 2 years
*Investing Cash Flow (ICF) equals maintenance capital not including discretionary growth or business development expenditures.
Dynegy Inc. 12
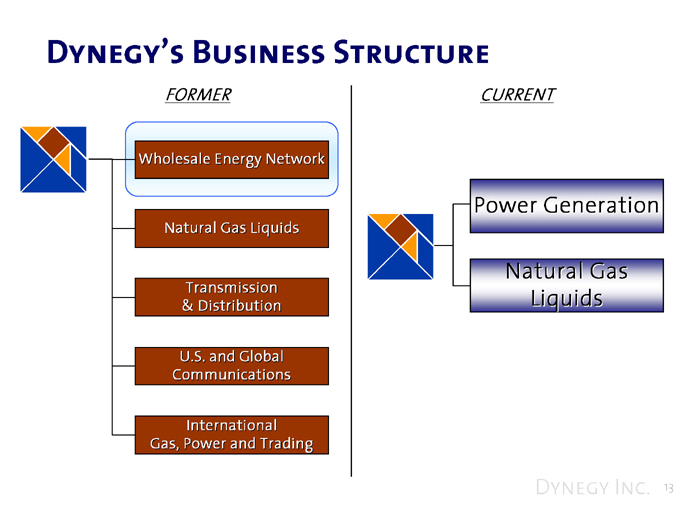
Dynegy’s Business Structure
FORMER CURRENT
Wholesale Energy Network
Power Generation
Natural Gas Liquids
Natural Gas Liquids
Transmission & Distribution
U.S. and Global Communications
International Gas, Power and Trading
Dynegy Inc. 13
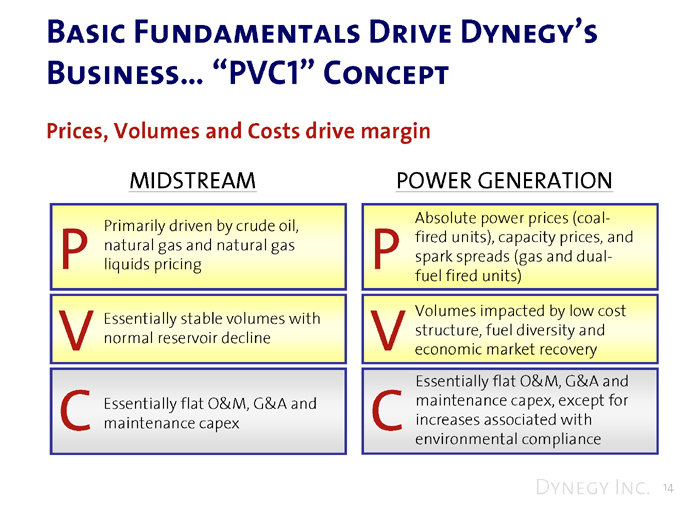
Basic Fundamentals Drive Dynegy’s Business… “PVC1” Concept
Prices, Volumes and Costs drive margin
MIDSTREAM
P Primarily driven by crude oil, natural gas and natural gas liquids pricing
V
C Essentially flat O&M, G&A and maintenance capex
POWER GENERATION
P Absolute power prices (coal-fired units), capacity prices, and spark spreads (gas and dual-fuel fired units)
V Volumes impacted by low cost structure, fuel diversity and economic market recovery
C Essentially flat O&M, G&A and maintenance capex, except for increases associated with environmental compliance
Dynegy Inc. 14
Accomplishments…
Clearing the Roadblocks for the Future
Dedicated efforts to attack an extended “To Do” list
Adherence to our Guiding Principles
Focused attention on Core Business
… The Road Ahead
Dynegy Inc. 15
What You Will See Today…
Midstream:
Providing Upside Today and Core Value Tomorrow
Longer-Term Cyclical Range Outlook
Power Generation:
Value Today from Baseload Generation
Tomorrow’s Market Recovery Drives Upside
Capital Structure Improvement Opportunities
Shifting the Emphasis to Our Common Stockholders
Cash Flow and Earnings Guidance for 2005
Recurring Business and GAAP Results
How to Model Dynegy
Individual Business Unit Drivers, Multiples and Values
Overall Enterprise Valuation Model. . . Your Inputs, Your Decision
Question & Answer Session
Dynegy Inc. 16