Exhibit 99.3
Upside Today…
And Core Value Tomorrow
Dynegy Analyst Day Steve Furbacher, EVP
Natural Gas Liquids
Dynegy Inc.
The Necessity of Midstream
… A Must Run Business
The Midstream business includes the gathering, processing and marketing of natural gas from a producer’s wellhead and ultimately delivering pipeline quality natural gas and saleable natural gas liquids to the wholesale market.
Gathering transports raw gas to processing and removes water
Processing extracts NGLs, water and contaminants, making pipeline quality natural gas and a mixed NGL stream
Fractionation splits mixed NGLs into specific NGL products for end-use sale
Marketing stores, transports and markets NGL products
Price, fees and volume are the primary margin drivers in the NGL business
Dynegy Inc. 2
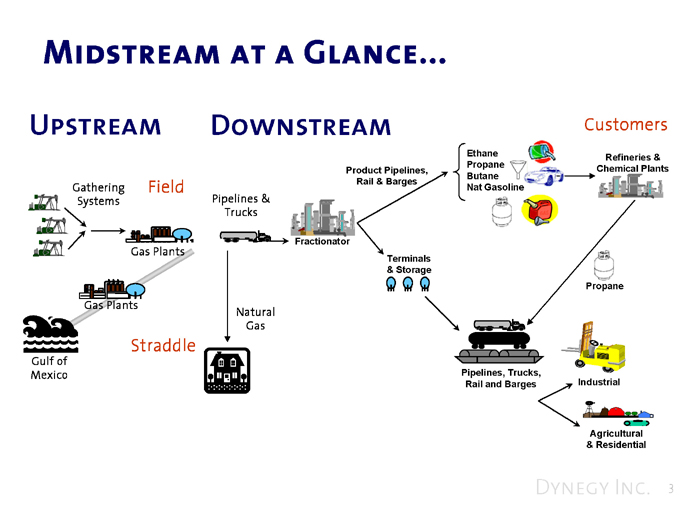
Midstream at a Glance
Upstream
Downstream
Gathering Systems
Field
Pipelines & Trucks
Product Pipelines, Rail & Barges
Ethane Propane Butane Nat Gasoline
Customers
Refineries & Chemical Plants
Gas Plants
Fractionator
Terminals & Storage
Propane
Gas Plants
Gulf of Mexico
Straddle
Natural Gas
Pipelines, Trucks, Rail and Barges
Industrial
Agricultural & Residential
Dynegy Inc. 3
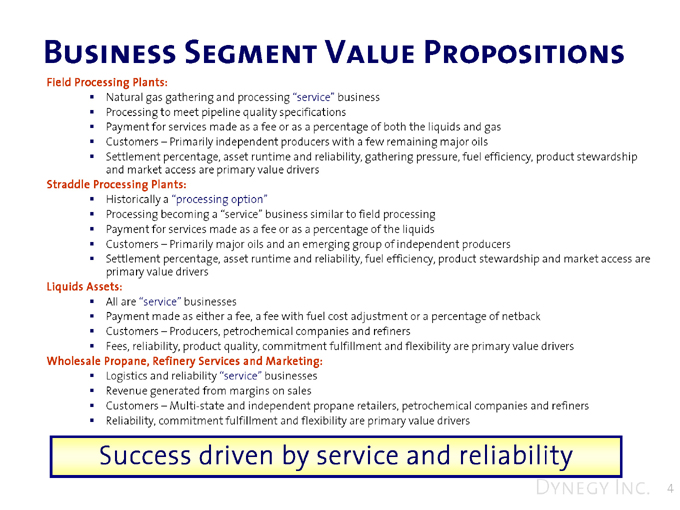
Business Segment Value Propositions
Field Processing Plants:
Natural gas gathering and processing “service” business Processing to meet pipeline quality specifications
Payment for services made as a fee or as a percentage of both the liquids and gas Customers – Primarily independent producers with a few remaining major oils
Settlement percentage, asset runtime and reliability, gathering pressure, fuel efficiency, product stewardship and market access are primary value drivers
Straddle Processing Plants:
Historically a “processing option”
Processing becoming a “service” business similar to field processing Payment for services made as a fee or as a percentage of the liquids
Customers – Primarily major oils and an emerging group of independent producers
Settlement percentage, asset runtime and reliability, fuel efficiency, product stewardship and market access are primary value drivers
Liquids Assets:
All are “service” businesses
Payment made as either a fee, a fee with fuel cost adjustment or a percentage of netback Customers – Producers, petrochemical companies and refiners Fees, reliability, product quality, commitment fulfillment and flexibility are primary value drivers
Wholesale Propane, Refinery Services and Marketing:
Revenue generated from margins on sales
Logistics and reliability “service” businesses
Customers – Multi-state and independent propane retailers, petrochemical companies and refiners Reliability, commitment fulfillment and flexibility are primary value drivers
Success driven by service and reliability
Dynegy Inc. 4
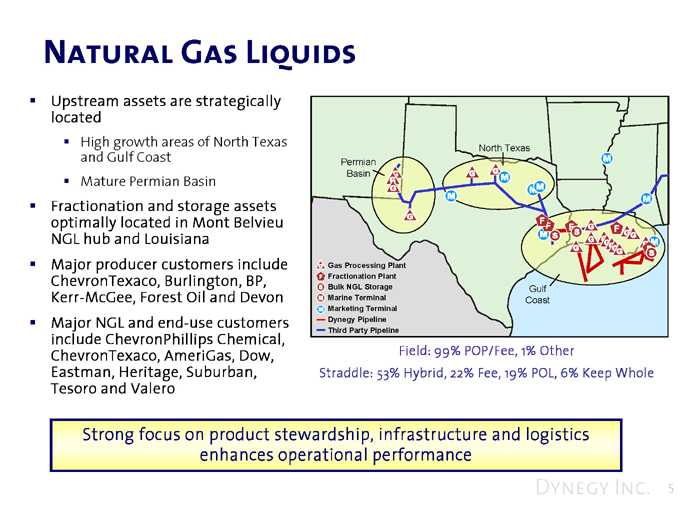
Natural Gas Liquids
Upstream assets are strategically located
High growth areas of North Texas and Gulf Coast Permian Mature Permian Basin Basin
Fractionation and storage assets optimally located in Mont Belvieu NGL hub and Louisiana
Major producer customers Gas Processing Plant
Fractionation Plant
include ChevronTexaco, Bulk NGL Storage Gulf Burlington, BP, Kerr-McGee, Marine Terminal Coast
Marketing Terminal
Forest Oil and Devon Dynegy Pipeline
Third Party Pipeline
Major NGL and end-use Field: 99% POP/Fee, 1% Other customers include Straddle: 53% Hybrid, 22% Fee, 19% POL, 6% Keep Whole
ChevronPhillips Chemical, ChevronTexaco, AmeriGas, Dow, Eastman, Heritage, Suburban, Tesoro and Valero
Strong focus on product stewardship, infrastructure and logistics enhances operational performance
Dynegy Inc. 5
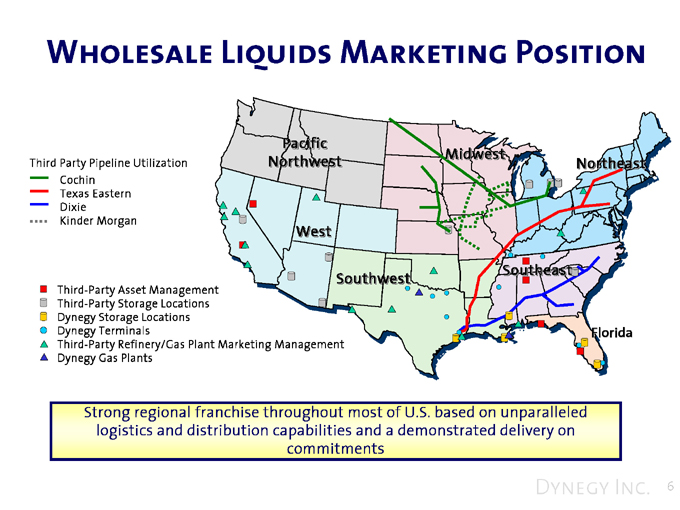
Wholesale Liquids Marketing Position
Pacific
Northwest Midwest
Third Party Pipeline Utilization Northeast Cochin Texas Eastern Dixie Kinder Morgan
West
Southwest Southeast
Third-Party Asset Management Third-Party Storage Locations Dynegy Storage Locations
Dynegy Terminals Florida Third-Party Refinery/Gas Plant Marketing Management Dynegy Gas Plants
Strong regional franchise throughout most of U.S. based on unparalleled logistics and distribution capabilities and a demonstrated delivery on commitments
Dynegy Inc. 6
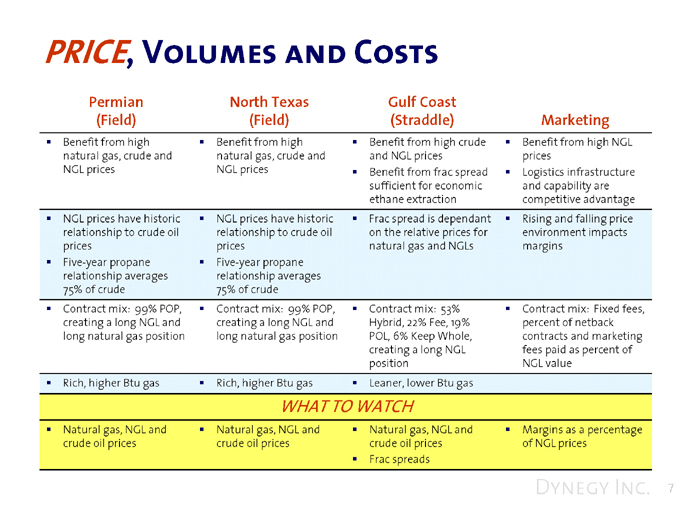
PRICE, Volumes and Costs
Permian (Field)
Benefit from high natural gas, crude and NGL prices
NGL prices have historic relationship to crude oil prices
Five-year propane relationship averages 75% of crude
Contract mix: 99% POP, creating a long NGL and long natural gas position
Rich, higher Btu gas
North Texas (Field)
Benefit from high natural gas, crude and NGL prices
NGL prices have historic relationship to crude oil prices
Five-year propane relationship averages 75% of crude
Contract mix: 99% POP, creating a long NGL and long natural gas position
Rich, higher Btu gas
Gulf Coast (Straddle)
Benefit from high crude and NGL prices
Benefit from frac spread sufficient for economic ethane extraction
Frac spread is dependant on the relative prices for natural gas and NGLs
Contract mix: 53% Hybrid, 22% Fee, 19% POL, 6% Keep Whole, creating a long NGL position
Leaner, lower Btu gas
Marketing
Benefit from high NGL prices
Logistics infrastructure and capability are competitive advantage
Rising and falling price environment impacts margins
Contract mix: Fixed fees, percent of netback contracts and marketing fees paid as percent of NGL value
WHAT TO WATCH
Natural gas, NGL and crude oil prices
Natural gas, NGL and crude oil prices
Natural gas, NGL and crude oil prices Frac spreads
Margins as a percentage of NGL prices
Dynegy Inc. 7
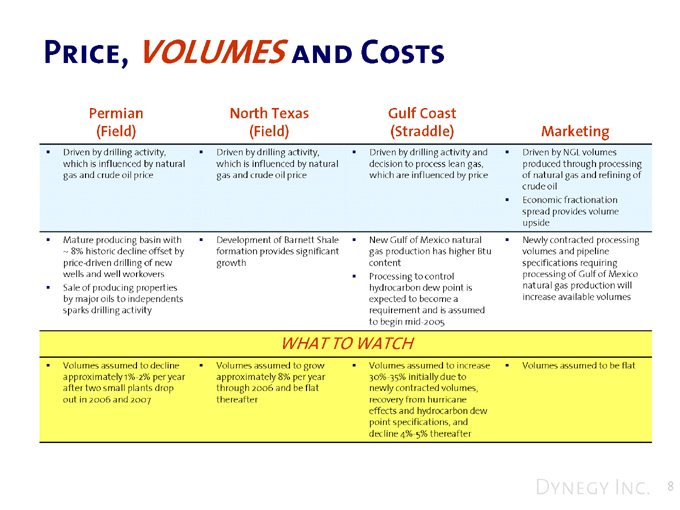
Price, VOLUMES and Costs
Driven by drilling activity, Driven by drilling activity, Driven by drilling activity and Driven by NGL volumes
which is influenced by natural which is influenced by natural decision to process lean gas, produced through processing
gas and crude oil price gas and crude oil price which are influenced by price of natural gas and refining of
crude oil
Economic fractionation
spread provides volume
upside
Mature producing basin with Development of Barnett Shale New Gulf of Mexico natural Newly contracted processing
~ 8% historic decline offset by formation provides significant gas production has higher Btu volumes and pipeline
price-driven drilling of new growth content specifications requiring
wells and well workovers Processing to control processing of Gulf of Mexico
Sale of producing properties hydrocarbon dew point is natural gas production will
by major oils to independents expected to become a increase available volumes
sparks drilling activity requirement and is assumed
to begin mid-2005
Volumes assumed to decline
Volumes assumed to grow
Volumes assumed to increase
Volumes assumed to be flat
approximately 1%-2% per year approximately 8% per year 30%-35% initially due to
after two small plants drop through 2006 and be flat newly contracted volumes,
out in 2006 and 2007 thereafter recovery from hurricane
effects and hydrocarbon dew
point specifications, and
decline 4%-5% thereafter
Dynegy Inc. 8
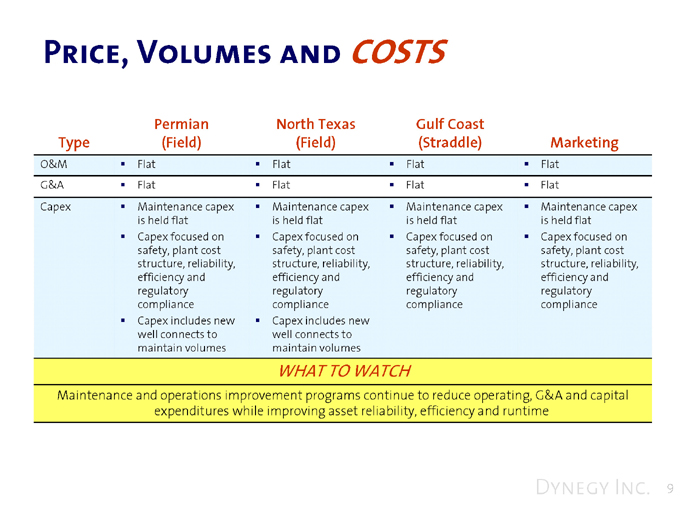
Price, Volumes and COSTS
Type
Permian (Field)
North Texas (Field)
Gulf Coast (Straddle)
Marketing
O&M Flat Flat Flat Flat
G&A Flat Flat Flat Flat
Capex
Maintenance capex is held flat
Capex focused on safety, plant cost structure, reliability, efficiency and regulatory compliance
Capex includes new well connects to maintain volumes
Maintenance capex is held flat
Capex focused on safety, plant cost structure, reliability, efficiency and regulatory compliance
Capex includes new well connects to maintain volumes
Maintenance capex is held flat
Capex focused on safety, plant cost structure, reliability, efficiency and regulatory compliance
Maintenance capex is held flat
Capex focused on safety, plant cost structure, reliability, efficiency and regulatory compliance
WHAT TO WATCH
Maintenance and operations improvement programs continue to reduce operating, G&A and capital expenditures while improving asset reliability, efficiency and runtime
Dynegy Inc. 9
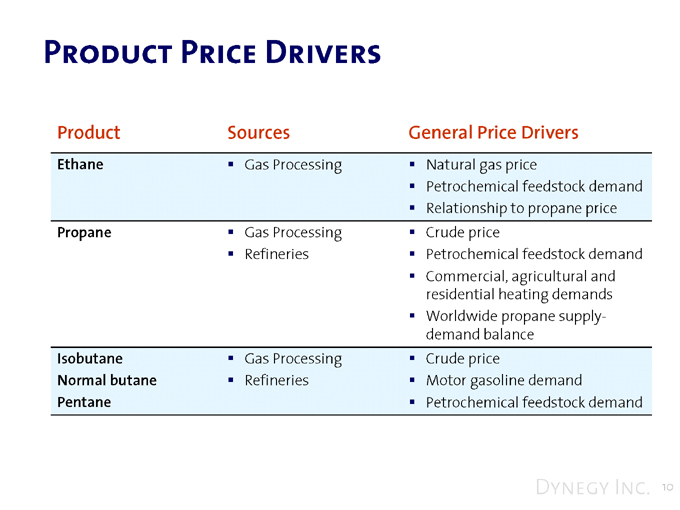
Product Price Drivers
Product Sources General Price Drivers
Ethane
Gas Processing
Natural gas price
Petrochemical feedstock demand Relationship to propane price
Propane
Gas Processing Refineries
Crude price
Petrochemical feedstock demand Commercial, agricultural and residential heating demands Worldwide propane supply-demand balance
Isobutane Normal butane Pentane
Gas Processing Refineries
Crude price
Motor gasoline demand
Petrochemical feedstock demand
Dynegy Inc. 10
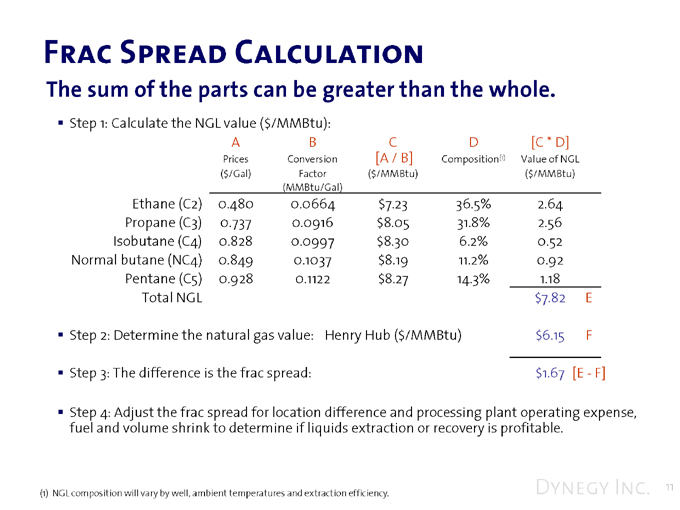
Frac Spread Calculation
The sum of the parts can be greater than the whole.
Step 1: Calculate the NGL value ($/MMBtu):
A
Prices
B Conversion Factor (MMBtu/Gal)
C [A / B]
D
Composition(1)
[C * D]
Value of NGL
Ethane (C2) 0.480 0.0664 $7.23 36.5% 2.64
Propane (C3) 0.737 0.0916 $8.05 31.8% 2.56
Isobutane (C4) 0.828 0.0997 $8.30 6.2% 0.52
Normal butane (NC4) 0.849 0.1037 $8.19 11.2% 0.92
Pentane (C5) 0.928 0.1122 $8.27 14.3% 1.18
Total NGL $7.82 E
Step 2: Determine the natural gas value: Henry Hub ($/MMBtu) $6.15 F
Step 3: The difference is the frac spread: $1.67 [E—F]
Step 4: Adjust the frac spread for location difference and processing plant operating expense, fuel and volume shrink to determine if liquids extraction or recovery is profitable.
(1) NGL composition will vary by well, ambient temperatures and extraction efficiency.
Dynegy Inc. 11
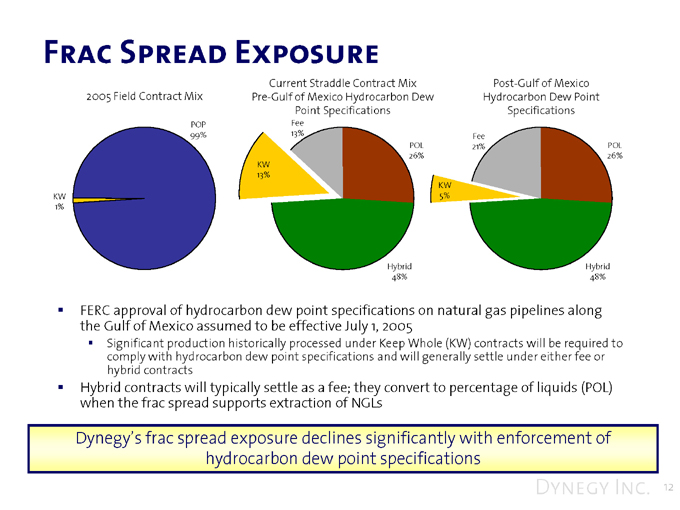
Frac Spread Exposure
Current Straddle Contract Mix Post-Gulf of Mexico 2005 Field Contract Mix Pre-Gulf of Mexico Hydrocarbon Dew Hydrocarbon Dew Point Point Specifications Specifications
POP Fee
99% 13% Fee
POL 21% POL 26% 26% KW
13%
KW KW 5% 1%
Hybrid Hybrid 48% 48%
FERC approval of hydrocarbon dew point specifications on natural gas pipelines along the Gulf of Mexico assumed to be effective July 1, 2005
Significant production historically processed under Keep Whole (KW) contracts will be required to comply with hydrocarbon dew point specifications and will generally settle under either fee or hybrid contracts
Hybrid contracts will typically settle as a fee; they convert to percentage of liquids (POL) when the frac spread supports extraction of NGLs
Dynegy’s frac spread exposure declines significantly with enforcement of hydrocarbon dew point specifications
Dynegy Inc. 12
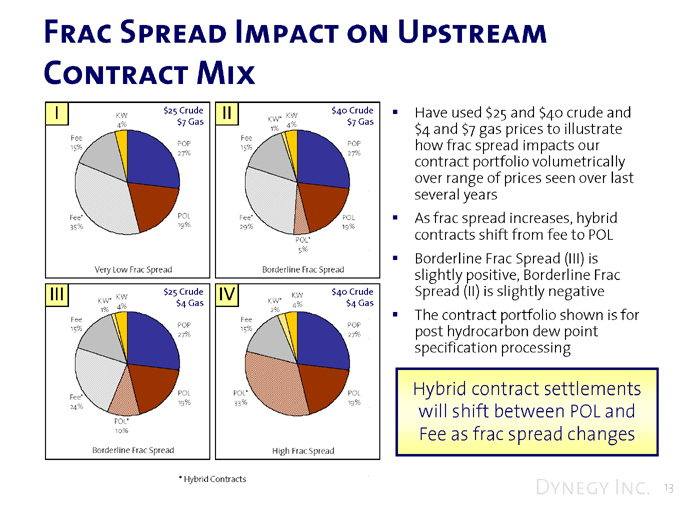
Frac Spread Impact on Upstream Contract Mix
I
II
KW KW* KW
4% 4% $7 Gas
1% Fee Fee
15% POP 15% POP
27% 27%
Fee* POL 35% 19%
Very Low Frac Spread Borderline Frac Spread
III KW $25 Crude IV KW $40 Crude KW* $4 Gas KW* 4% $4 Gas
1% 4% 2% Fee Fee
15% POP 15% POP
27% 27%
Fee* POL POL* POL 24% 19% 33% 19% POL* 10%
Borderline Frac Spread High Frac Spread
* Hybrid Contracts
Have used $25 and $40 crude and $4 and $7 gas prices to illustrate how frac spread impacts our contract portfolio volumetrically over range of prices seen over last several years As frac spread increases, hybrid contracts shift from fee to POL Borderline Frac Spread (III) is slightly positive, Borderline Frac Spread (II) is slightly negative The contract portfolio shown is for post hydrocarbon dew point specification processing
Hybrid contract settlements will shift between POL and Fee as frac spread changes
Dynegy Inc. 13
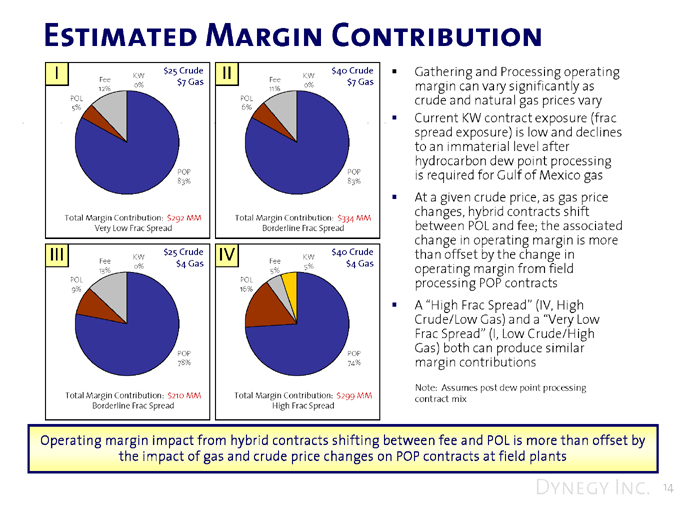
Estimated Margin Contribution
I II III IV
Fee KW Fee KW 12% 0% 11% 0% POL POL
5% 6%
POP POP 83% 83%
Total Margin Contribution: $292 MM Total Margin Contribution: $334 MM
Very Low Frac Spread Borderline Frac Spread
Fee KW Fee KW 13% 0% 5% 5% POL POL
9% 16%
POP POP 78% 74%
Total Margin Contribution: $210 MM Total Margin Contribution: $299 MM
Borderline Frac Spread High Frac Spread
Gathering and Processing operating margin can vary significantly as crude and natural gas prices vary Current KW contract exposure (frac spread exposure) is low and declines to an immaterial level after hydrocarbon dew point processing is required for Gulf of Mexico gas At a given crude price, as gas price changes, hybrid contracts shift between POL and fee; the associated change in operating margin is more than offset by the change in operating margin from field processing POP contracts A “High Frac Spread” (IV, High Crude/Low Gas) and a “Very Low Frac Spread” (I, Low Crude/High Gas) both can produce similar margin contributions
Note: Assumes post dew point processing contract mix
Operating margin impact from hybrid contracts shifting between fee and POL is more than offset by the impact of gas and crude price changes on POP contracts at field plants
Dynegy Inc. 14
Contract Portfolio and Frac Spread
Key ‘Takeaways’
Exposure to frac spread significantly mitigated under fee and hybrid settlement structure The pending FERC decision on hydrocarbon dew point specifications expected to reduce processors’ exposure to frac spread risk and increase straddle processing volumes The frac spread varies with natural gas price, NGL price and NGL content The economic frac spread varies by processing plant The major operating margin driver for Dynegy’s upstream processing business is the field processing POP contract mix
Dynegy Inc. 15
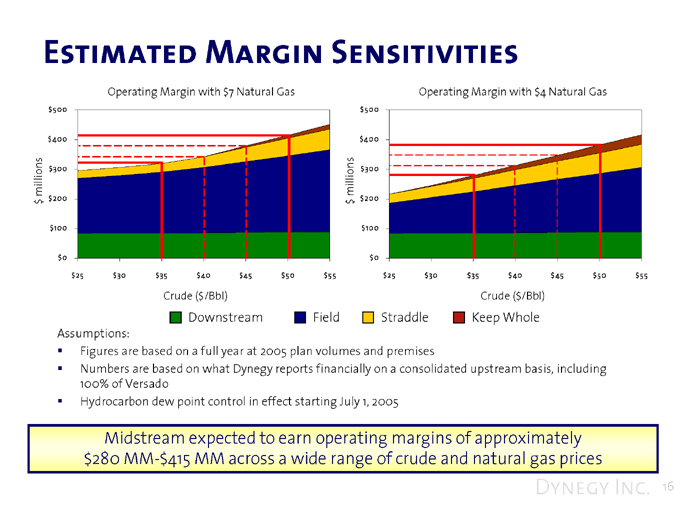
Estimated Margin Sensitivities
Operating Margin with $7 Natural Gas
$500 $400 $300 $200 $100 $0
$ millions
$25 $30 $35 $40 $45 $50 $55
Operating Margin with $4 Natural Gas
$500 $400 $300 $200 $100 $0
$ millions
$25 $30 $35 $40 $45 $50 $55
Crude ($/Bbl) Crude ($/Bbl)
Downstream Field Straddle Keep Whole
Assumptions:
Figures are based on a full year at 2005 plan volumes and premises
Numbers are based on what Dynegy reports financially on a consolidated upstream basis, including 100% of Versado Hydrocarbon dew point control in effect starting July 1, 2005
Midstream expected to earn operating margins of approximately $280 MM-$415 MM across a wide range of crude and natural gas prices
Dynegy Inc. 16
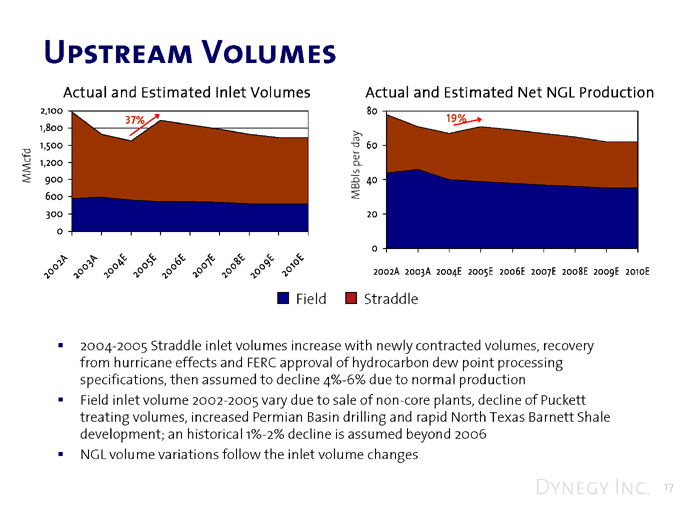
Upstream Volumes
Actual and Estimated Inlet Volumes
2,100 1,800 1,500 1,200 900 600 300 0
37%
MMcfd
2002A
2003A
2004A
2005A
2006A
2007A
2009A
2010A
Actual and Estimated Net NGL Production
MBbls per day
80 60 40 20 0
19%
2002A 2003A 2004E 2005E 2006E 2007E 2008E 2009E 2010E
Field Straddle
2004-2005 Straddle inlet volumes increase with newly contracted volumes, recovery from hurricane effects and FERC approval of hydrocarbon dew point processing specifications, then assumed to decline 4%-6% due to normal production Field inlet volume 2002-2005 vary due to sale of non-core plants, decline of Puckett treating volumes, increased Permian Basin drilling and rapid North Texas Barnett Shale development; an historical 1%-2% decline is assumed beyond 2006 NGL volume variations follow the inlet volume changes
Dynegy Inc. 17

Downstream Net Volumes
Actual and Estimated Volumes
MBbls per day
220 200 180 160 140 120 100
-18%
2002A 2003A 2004E 2005E 2006E 2007E 2008E 2009E 2010E
Fractionation
Actual and Estimated Volumes
MBbls per day
450 400 350 300 250 200 150 100 50 0
2002A 2003A 2004E 2005E 2006E 2007E 2008E 2009E 2010E
Refinery Svcs Wholesale Propane NGL Mktg
2002-2004 fractionation volumes vary due to NGL processing, frac spreads and curtailed trading of NGLs
2004-2005 fractionation decline due to loss of a large term contract in 3Q 2004, which is assumed to be replaced over the longer-term All other refinery services and wholesale volumes remain relatively flat
* Please see Appendix for more details.
Dynegy Inc. 18
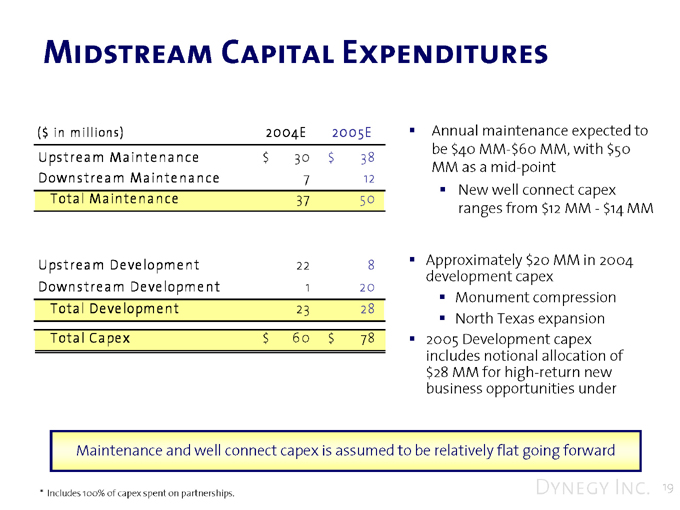
Midstream Capital Expenditures
($ in millions) 2004E 2005E Upstream Maintenance $30 $38 Downstream Maintenance 7 12 Total Maintenance 37 50
Upstream Development 22 8 Downstream Development 1 20 Total Development 23 28 Total Capex $60 $78
Annual maintenance expected to be $40 MM-$60 MM, with $50 MM as a mid-point New well connect capex ranges from $12 MM - $14 MM
Approximately $20 MM in 2004 development capex Monument compression North Texas expansion 2005 Development capex includes notional allocation of $28 MM for high-return new business opportunities under
Maintenance and well connect capex is assumed to be relatively flat going forward
* Includes 100% of capex spent on partnerships.
Dynegy Inc. 19
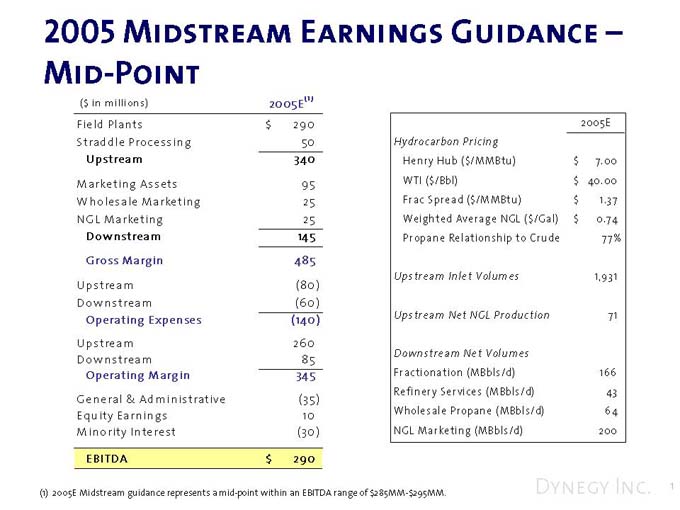
2005 Midstream Earnings Guidance –Mid-Point
($ in millions) 2005E(1)
Field Plants $290 Straddle Processing 50
Upstream 340 Marketing Assets 95 Wholesale Marketing 25 NGL Marketing 25
Downstream 145 Gross Margin 485 Upstream (80) Downstream (60)
Operating Expenses (140) Upstream 260 Downstream 85 Operating Margin 345 General & Administrative (35) Equity Earnings 10 Minority Interest (30) EBITDA $290
2005E
Hydrocarbon Pricing
Henry Hub ($/MMBtu) $7.00 WTI ($/Bbl) $40.00 Frac Spread ($/MMBtu) $1.37 Weighted Average NGL ($/Gal) $0.74 Propane Relationship to Crude 77%
Upstream Inlet Volumes 1,931
Upstream Net NGL Production 71
Downstream Net Volumes
Fractionation (MBbls/d) 166 Refinery Services (MBbls/d) 43 Wholesale Propane (MBbls/d) 64 NGL Marketing (MBbls/d) 200
(1) 2005E Midstream guidance represents a mid-point within an EBITDA range of $285MM-$295MM.
Dynegy Inc. 20
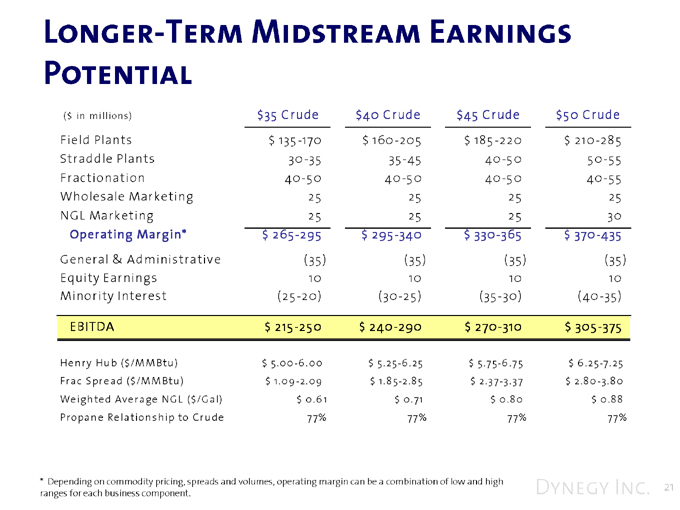
Longer-Term Midstream Earnings Potential
($ in millions) $35 Crude $40 Crude $45 Crude $50 Crude Field Plants $135-170 $160-205 $185-220 $210-285 Straddle Plants 30-35 35-45 40-50 50-55 Fractionation 40-50 40-50 40-50 40-55 Wholesale Marketing 25 25 25 25 NGL Marketing 25 25 25 30 Operating Margin* $265-295 $295-340 $330-365 $370-435 General & Administrative (35) (35) (35) (35) Equity Earnings 10 10 10 10 Minority Interest (25-20) (30-25) (35-30) (40-35) EBITDA $215-250 $240-290 $270-310 $305-375
Henry Hub ($/MMBtu ) $5.00-6.00 $5.25-6.25 $5.75-6.75 $6.25-7.25 Frac Spread ($/MM Btu) $1.09-2.09 $1.85-2.85 $2.37-3.37 $2.80-3.80 Weighted Average NGL ($/Gal) $0.61 $0.71 $0.80 $0.88 Propane Relationship to Crude 77% 77% 77% 77%
* Depending on commodity pricing, spreads and volumes, operating margin can be a combination of low and high ranges for each business component.
Dynegy Inc. 21
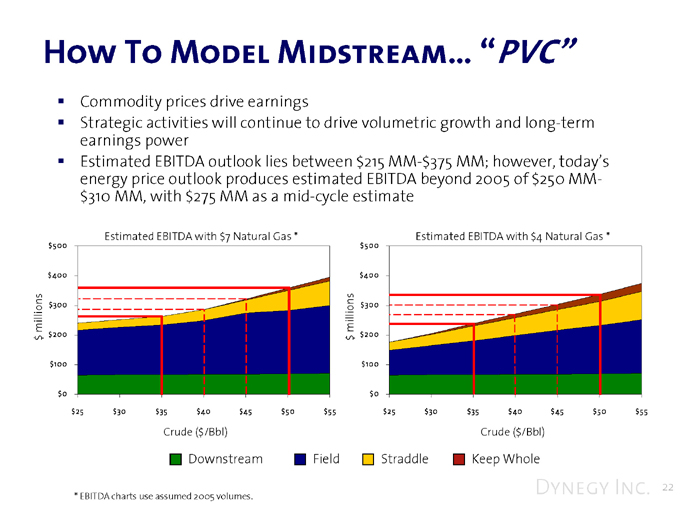
How To Model Midstream… “PVC”
Commodity prices drive earnings
Strategic activities will continue to drive volumetric growth and long-term earnings power Estimated EBITDA outlook lies between $215 MM-$375 MM; however, today’s energy price outlook produces estimated EBITDA beyond 2005 of $250 MM-$310 MM, with $275 MM as a mid-cycle estimate
Estimated EBITDA with $7 Natural Gas *
$ millions
$500 $400 $300 $200 $100 $0
$25 $30 $35 $40 $45 $50 $55
Crude ($/Bbl)
$ millions
Estimated EBITDA with $4 Natural Gas *
$500 $400 $300 $200 $100 $0
$25 $30 $35 $40 $45 $50 $55
Crude ($/Bbl)
Downstream
Field
Straddle Keep Whole
* EBITDA charts use assumed 2005 volumes.
Dynegy Inc. 22