Exhibit 99.4
Generation
Value Today…
And Upside Tomorrow
Dynegy Analyst Day Alec Dreyer, EVP
Generation
Dynegy Inc.
The Advantage of Dynegy Generation
… A diversified Power Play
A track record of operational excellence
Baseload, intermediate and peaking facilities well-positioned to provide a broad array of products at various demand levels Significant fuel diversity (coal, oil and natural gas) that provides a competitive advantage in an excess capacity market…and significant upside for the future
Power prices/spreads and volumes are the primary margin drivers for Dynegy Generation
Dynegy Inc. 2
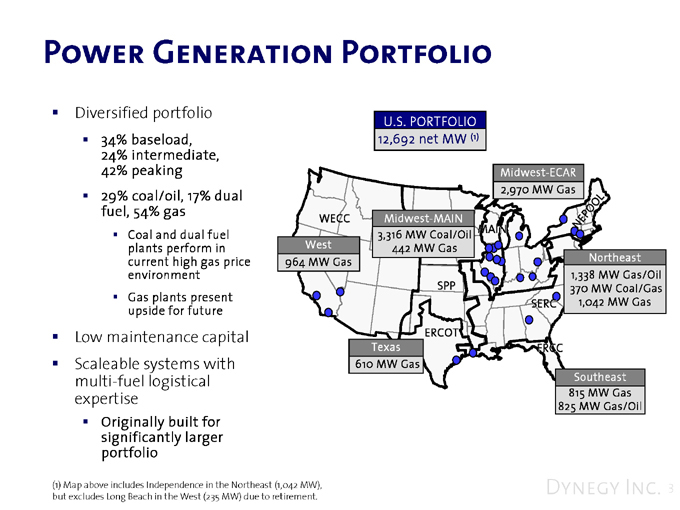
Power Generation Portfolio
Diversified portfolio
34% baseload, 24% intermediate, 42% peaking ??29% coal/oil, 17% dual fuel, 54% gas
Coal and dual fuel plants perform in current high gas price environment Gas plants present upside for future
Low maintenance capital Scaleable systems with multi-fuel logistical expertise
Originally built for significantly larger portfolio
U.S. PORTFOLIO 12,692 net MW (1)
Midwest-ECAR 2,970 MW Gas
NEPOOL
WECC Midwest-MAIN
MAIN 3,316 MW Coal/Oil 442 MW Gas SPP
West 964 MW Gas Northeast 1,338 MW Gas/Oil 370 MW Coal/Gas SERC 1,042 MW Gas ERCOT
Texas 610 MW Gas FRCC
Southeast 815 MW Gas 825 MW Gas/Oil
(1) Map above includes Independence in the Northeast (1,042 MW), but excludes Long Beach in the West (235 MW) due to retirement.
Dynegy Inc. 3
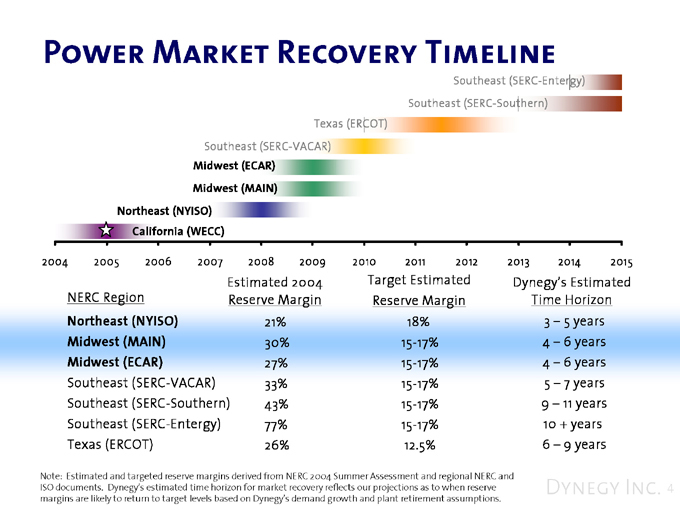
Power Market Recovery Timeline
Southeast (SERC-Entergy) Southeast (SERC-Southern) Texas (ERCOT) Southeast (SERC-VACAR)
Midwest (ECAR) Midwest (MAIN) Northeast (NYISO) California (WECC)
2004 2005 2006 2007 2008 2009 2010 2011 2012 2013 2014 2015
Estimated 2004 Target Estimated Dynegy’s Estimated NERC Region Reserve Margin Reserve Margin Time Horizon
Northeast (NYISO) 21% 18% 3 – 5 years
Midwest (MAIN) 30% 15-17% 4 – 6 years Midwest (ECAR) 27% 15-17% 4 – 6 years Southeast (SERC-VACAR) 33% 15-17% 5 – 7 years Southeast (SERC-Southern) 43% 15-17% 9 – 11 years Southeast (SERC-Entergy) 77% 15-17% 10 + years Texas (ERCOT) 26% 12.5% 6 – 9 years
Note: Estimated and targeted reserve margins derived from NERC 2004 Summer Assessment and regional NERC and ISO documents. Dynegy’s estimated time horizon for market recovery reflects our projections as to when reserve margins are likely to return to target levels based on Dynegy’s demand growth and plant retirement assumptions.
Dynegy Inc. 4
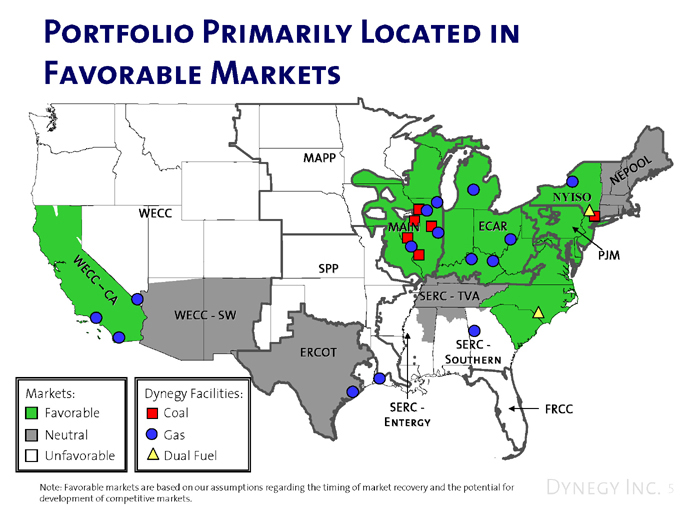
Portfolio Primarily Located in
Favorable Markets
MAPP
NEPOOL
NYISO
WECC
MAIN ECAR
WEEC – CA PJM SPP
SERC—TVA
WECC—SW
SERC—Southern ERCOT
SERC—Entergy FRCC
Markets: Dynegy Facilities:
Favorable
Neutral
Unfavorable
Coal
Gas
Dual Fuel
Note: Favorable markets are based on our assumptions regarding the timing of market recovery and the potential for development of competitive markets.
Dynegy Inc. 5
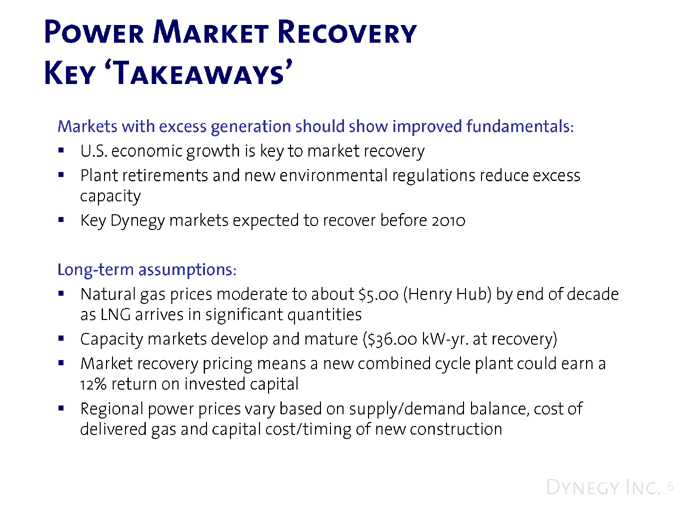
Power Market Recovery
Key ‘Takeaways’
Markets with excess generation should show improved fundamentals:
U.S. economic growth is key to market recovery
Plant retirements and new environmental regulations reduce excess capacity Key Dynegy markets expected to recover before 2010
Long-term assumptions:
Natural gas prices moderate to about $5.00 (Henry Hub) by end of decade as LNG arrives in significant quantities Capacity markets develop and mature ($36.00 kW-yr. at recovery) Market recovery pricing means a new combined cycle plant could earn a 12% return on invested capital Regional power prices vary based on supply/demand balance, cost of delivered gas and capital cost/timing of new construction
Dynegy Inc. 6
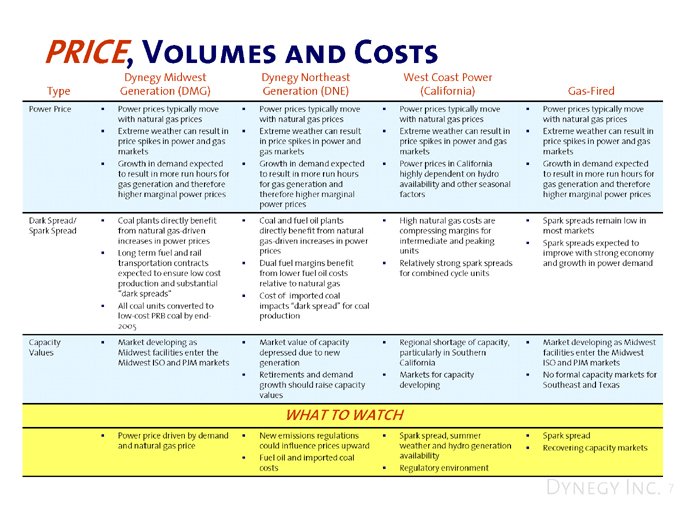
PRICE, Volumes and Costs
Type
Dynegy Midwest Generation (DMG)
Dynegy Northeast Generation (DNE)
West Coast Power (California)
Gas-Fired
Power Price
Power prices typically move with natural gas prices Extreme weather can result in price spikes in power and gas markets Growth in demand expected to result in more run hours for gas generation and therefore higher marginal power prices
Power prices typically move with natural gas prices Extreme weather can result in price spikes in power and gas markets Growth in demand expected to result in more run hours for gas generation and therefore higher marginal power prices
Power prices typically move with natural gas prices Extreme weather can result in price spikes in power and gas markets Power prices in California highly dependent on hydro availability and other seasonal factors
Power prices typically move with natural gas prices Extreme weather can result in price spikes in power and gas markets Growth in demand expected to result in more run hours for gas generation and therefore higher marginal power prices
Dark Spread/ Spark Spread
Coal plants directly benefit from natural gas-driven increases in power prices Long term fuel and rail transportation contracts expected to ensure low cost production and substantial “dark spreads” All coal units converted to low-cost PRB coal by end-2005
Coal and fuel oil plants directly benefit from natural gas-driven increases in power prices Dual fuel margins benefit from lower fuel oil costs relative to natural gas Cost of imported coal impacts “dark spread” for coal production
High natural gas costs are compressing margins for intermediate and peaking units Relatively strong spark spreads for combined cycle units
Spark spreads remain low in most markets Spark spreads expected to improve with strong economy and growth in power demand
Capacity Values
Market developing as Midwest facilities enter the Midwest ISO and PJM markets
Market value of capacity depressed due to new generation Retirements and demand growth should raise capacity values
Regional shortage of capacity, particularly in Southern California Markets for capacity developing
Market developing as Midwest facilities enter the Midwest ISO and PJM markets No formal capacity markets for Southeast and Texas
WHAT TO WATCH
Power price driven by demand and natural gas price
New emissions regulations could influence prices upward Fuel oil and imported coal costs
Spark spread, summer weather and hydro generation availability Regulatory environment
Spark spread
Recovering capacity markets
Dynegy Inc. 7
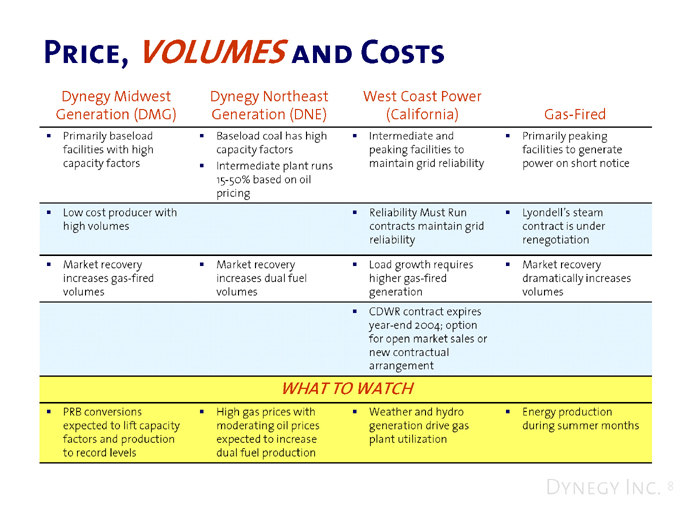
Price, VOLUMES and Costs
Dynegy Midwest Generation (DMG)
Dynegy Northeast Generation (DNE)
West Coast Power (California)
Gas-Fired
Primarily baseload facilities with high capacity factors
Baseload coal has high capacity factors Intermediate plant runs 15-50% based on oil pricing
Intermediate and peaking facilities to maintain grid reliability
Primarily peaking facilities to generate power on short notice
Low cost producer with high volumes
Reliability Must Run contracts maintain grid reliability
Lyondell’s steam contract is under renegotiation
Market recovery increases gas-fired volumes
Market recovery increases dual fuel volumes
Load growth requires higher gas-fired generation
Market recovery dramatically increases volumes
CDWR contract expires year-end 2004; option for open market sales or new contractual arrangement
WHAT TO WATCH
PRB conversions expected to lift capacity factors and production to record levels
High gas prices with moderating oil prices expected to increase dual fuel production
Weather and hydro generation drive gas plant utilization
Energy production during summer months
Dynegy Inc. 8
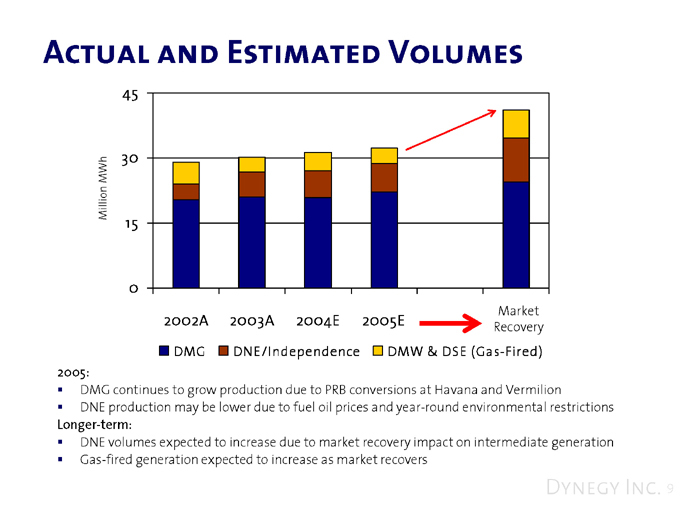
Actual and Estimated Volumes
Million MWh
45 30 15 0
Market
2002A 2003A 2004E 2005E Recovery
DMG DNE/Independence DMW & DSE (Gas-Fired)
2005:
DMG continues to grow production due to PRB conversions at Havana and Vermilion
DNE production may be lower due to fuel oil prices and year-round environmental restrictions
Longer-term:
DNE volumes expected to increase due to market recovery impact on intermediate generation Gas-fired generation expected to increase as market recovers
Dynegy Inc. 9
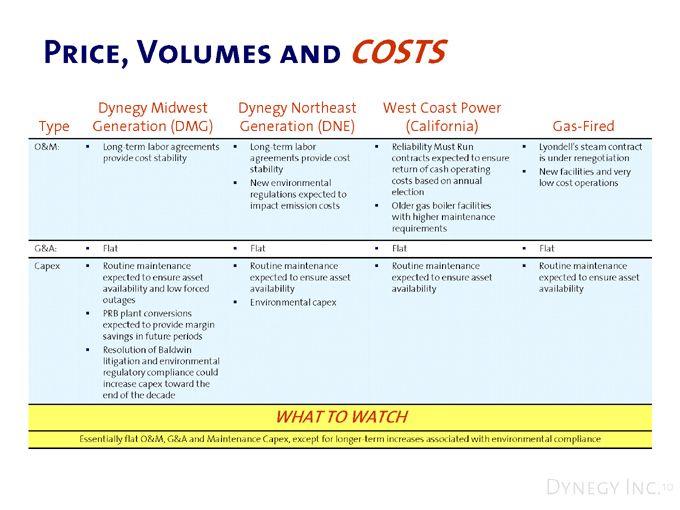
Price, Volumes and
COSTS
Type
Dynegy Midwest Generation (DMG)
Dynegy Northeast Generation (DNE)
West Coast Power (California)
Gas-Fired
O&M:
Long-term labor agreements provide cost stability
Long-term labor agreements provide cost stability New environmental regulations expected to impact emission costs
Reliability Must Run contracts expected to ensure return of cash operating costs based on annual election Older gas boiler facilities with higher maintenance requirements
Lyondell’s steam contract is under renegotiation New facilities and very low cost operations
G&A: Flat Flat Flat Flat Capex
Routine maintenance expected to ensure asset availability and low forced outages PRB plant conversions expected to provide margin savings in future periods Resolution of Baldwin litigation and environmental regulatory compliance could increase capex toward the end of the decade
Routine maintenance expected to ensure asset availability Environmental capex
Routine maintenance expected to ensure asset availability
Routine maintenance expected to ensure asset availability
WHAT TO WATCH
Essentially flat O&M, G&A and Maintenance Capex, except for longer-term increases associated with environmental compliance
Dynegy Inc.10
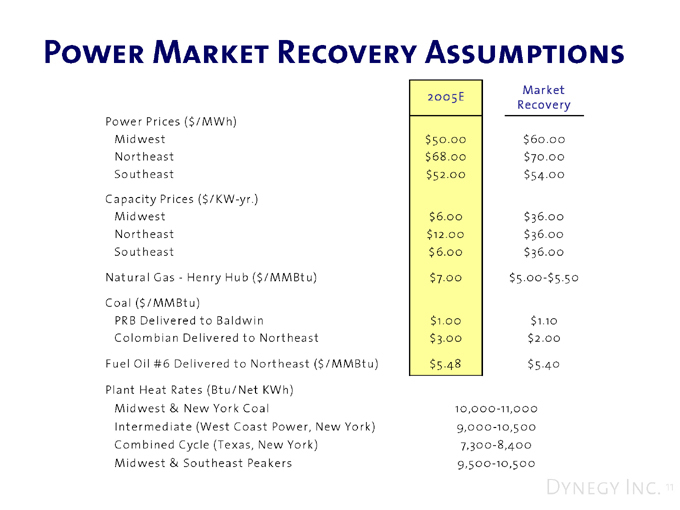
Power Market Recovery Assumptions
2005E Market Recovery Power Prices ($/MWh) Midwest $50.00 $60.00 Northeast $68.00 $70.00 Southeast $52.00 $54.00 Capacity Prices ($/KW-yr.) Midwest $6.00 $36.00 Northeast $12.00 $36.00 Southeast $6.00 $36.00 Natural Gas—Henry Hub ($/MMBtu) $7.00 $5.00-$5.50 Coal ($/MMBtu) PRB Delivered to Baldwin $1.00 $1.10 Colombian Delivered to Northeast $3.00 $2.00 Fuel Oil #6 Delivered to Northeast ($/MMBtu) $5.48 $5.40 Plant Heat Rates (Btu/Net KWh) Midwest & New York Coal 10,000-11,000 Intermediate (West Coast Power, New York) 9,000-10,500 Combined Cycle (Texas, New York) 7,300-8,400 Midwest & Southeast Peakers 9,500-10,500
Dynegy Inc. 11
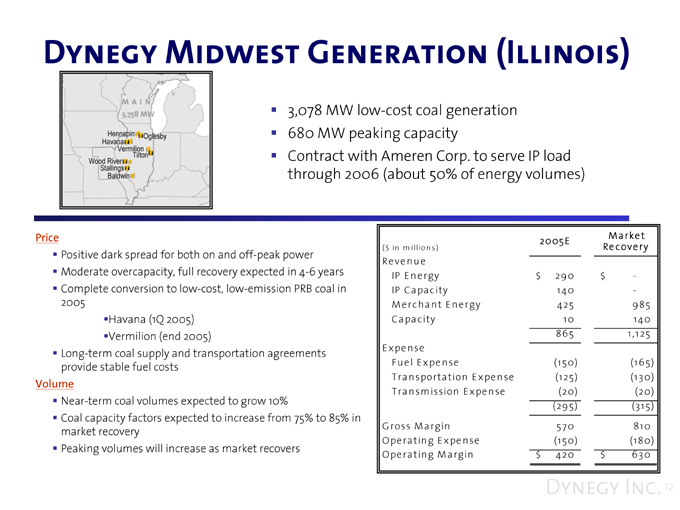
Dynegy Midwest Generation (Illinois)
Main 3,758 MW
Hennepin
Oglesby
Havana
Vermilion
Tilton
Wood River
Stallings
Baldwin
3,078 MW low-cost coal generation 680 MW peaking capacity
Contract with Ameren Corp. to serve IP load through 2006 (about 50% of energy volumes)
Price
Positive dark spread for both on and off-peak power Moderate overcapacity, full recovery expected in 4-6 years Complete conversion to low-cost, low-emission PRB coal in 2005 Havana (1Q 2005) Vermilion (end 2005) Long-term coal supply and transportation agreements provide stable fuel costs
Volume
Near-term coal volumes expected to grow 10%
Coal capacity factors expected to increase from 75% to 85% in market recovery Peaking volumes will increase as market recovers
2005E Market
($ in millions) Recovery
Revenue
IP Energy $290 $-
IP Capacity 140 -
Merchant Energy 425 985
Capacity 10 140
865 1,125
Expense
Fuel Expense (150) (165)
Transportation Expense (125) (130)
Transmission Expense (20) (20)
(295) (315)
Gross Margin 570 810
Operating Expense (150) (180)
Operating Margin $420 $630
Dynegy Inc. 12
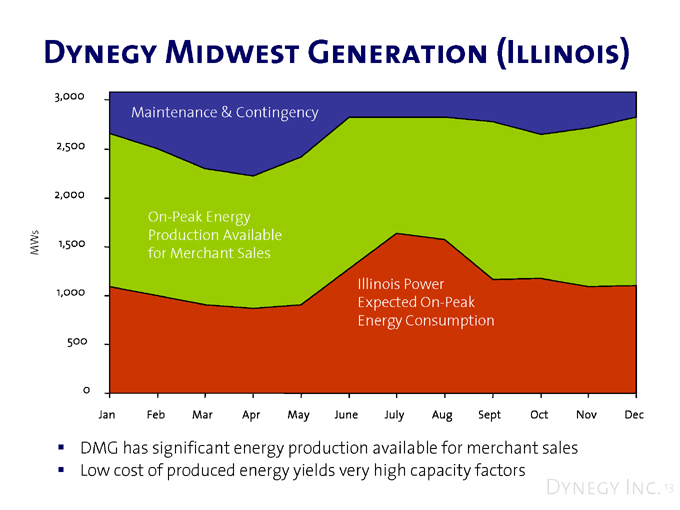
MWs
3,000 2,500 2,000 1,500 1,000 500 0
Maintenance & Contingency
On-Peak Energy Production Available for Merchant Sales
Illinois Power Expected On-Peak Energy Consumption
Jan Feb Mar Apr May June July Aug Sept Oct Nov Dec
DMG has significant energy production available for merchant sales Low cost of produced energy yields very high capacity factors
Dynegy Inc. 13
Dynegy Northeast (New York)
NY 2,750
ISO MW
Independence
Roseton
Danskammer
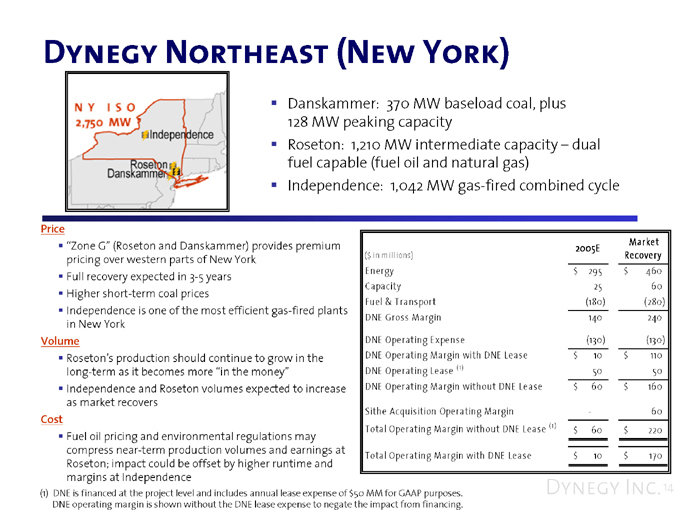
Danskammer: 370 MW baseload coal, plus 128 MW peaking capacity Roseton: 1,210 MW intermediate capacity – dual fuel capable (fuel oil and natural gas) Independence: 1,042 MW gas-fired combined cycle
Price
“Zone G” (Roseton and Danskammer) provides premium pricing over western parts of New York Full recovery expected in 3-5 years Higher short-term coal prices Independence is one of the most efficient gas-fired plants in New York
Volume
Roseton’s production should continue to grow in the long-term as it becomes more “in the money” Independence and Roseton volumes expected to increase as market recovers
Cost
Fuel oil pricing and environmental regulations may compress near-term production volumes and earnings at Roseton; impact could be offset by higher runtime and margins at Independence
(1) DNE is financed at the project level and includes annual lease expense of $50 MM for GAAP purposes.
DNE operating margin is shown without the DNE lease expense to negate the impact from financing.
2005E Market
($ in millions) Recovery
Energy $295 $460
Capacity 25 60
Fuel & Transport (180) (280)
DNE Gross Margin 140 240
DNE Operating Expense (130) (130)
DNE Operating Margin with DNE Lease $10 $110
DNE Operating Lease (1) 50 50
DNE Operating Margin without DNE Lease $60 $160
Sithe Acquisition Operating Margin - 60
Total Operating Margin without DNE Lease (1) $60 $220
Total Operating Margin with DNE Lease $10 $170
Dynegy Inc. 14
Dynegy Midwest (ECAR and MAIN)
Rocky Road
Renaissance
Bluegrass
Rolling Hills
Riverside
Foothills
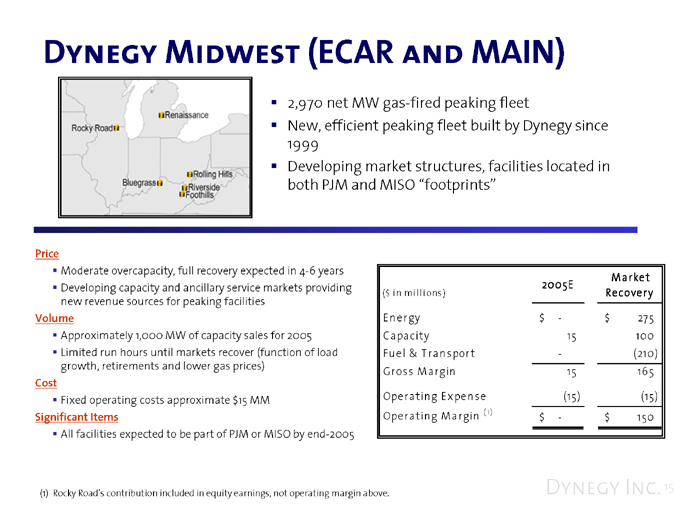
2,970 net MW gas-fired peaking fleet
New, efficient peaking fleet built by Dynegy since 1999 Developing market structures, facilities located in both PJM and MISO “footprints”
Price
Moderate overcapacity, full recovery expected in 4-6 years Developing capacity and ancillary service markets providing new revenue sources for peaking facilities
Volume
Approximately 1,000 MW of capacity sales for 2005 Limited run hours until markets recover (function of load growth, retirements and lower gas prices)
Cost
Fixed operating costs approximate $15 MM
Significant Items
All facilities expected to be part of PJM or MISO by end-2005
2005E Market
($ in millions) Recovery
Energy $- $275
Capacity 15 100
Fuel & Transport - (210)
Gross Margin 15 165
Operating Expense (15) (15)
Operating Margin (1) $- $150
(1) Rocky Road’s contribution included in equity earnings, not operating margin above.
Dynegy Inc. 15
Dynegy Southeast (SERC and ERCOT)
Rockingham
Heard County
Lyondell
Calcasieu
SERC 1,640 MW
ERCOT 610 MW
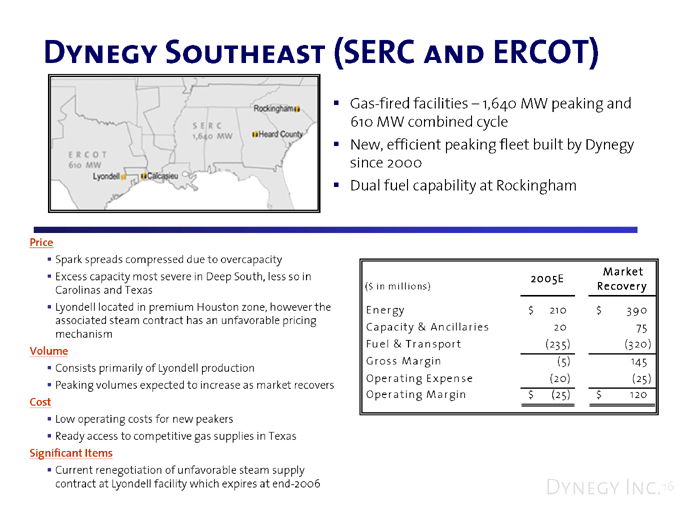
Gas-fired facilities – 1,640 MW peaking and 610 MW combined cycle New, efficient peaking fleet built by Dynegy since 2000 Dual fuel capability at Rockingham
Price
Spark spreads compressed due to overcapacity Excess capacity most severe in Deep South, less so in Carolinas and Texas Lyondell located in premium Houston zone, however the associated steam contract has an unfavorable pricing mechanism
Volume
Consists primarily of Lyondell production
Peaking volumes expected to increase as market recovers
Cost
Low operating costs for new peakers
Ready access to competitive gas supplies in Texas
Significant Items
Current renegotiation of unfavorable steam supply contract at Lyondell facility which expires at end-2006
2005E Market
($ in millions) Recovery
Energy $210 $390
Capacity & Ancillaries 20 75
Fuel & Transport (235) (320)
Gross Margin (5) 145
Operating Expense (20) (25)
Operating Margin $(25) $120
Dynegy Inc.16
Equity Earnings and Other
Black Mountain
El Segundo
Cabrillo I
Cabrillo II
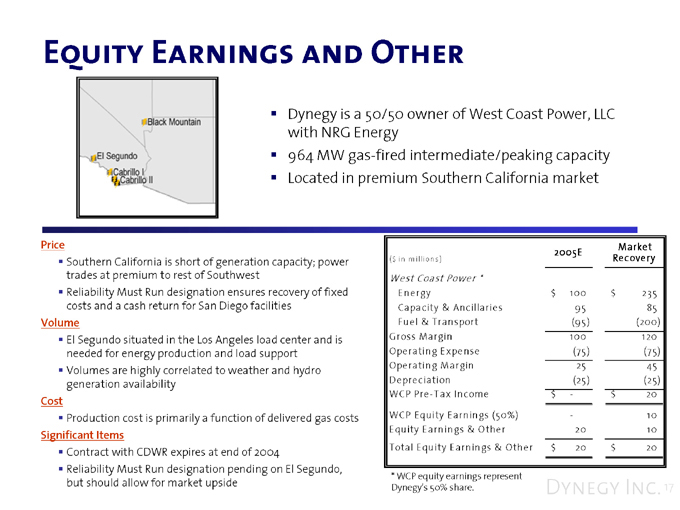
Dynegy is a 50/50 owner of West Coast Power, LLC with NRG Energy 964 MW gas-fired intermediate/peaking capacity Located in premium Southern California market
Price
Southern California is short of generation capacity; power trades at premium to rest of Southwest Reliability Must Run designation ensures recovery of fixed costs and a cash return for San Diego facilities
Volume
El Segundo situated in the Los Angeles load center and is needed for energy production and load support Volumes are highly correlated to weather and hydro generation availability
Cost
Production cost is primarily a function of delivered gas costs
Significant Items
Contract with CDWR expires at end of 2004
Reliability Must Run designation pending on El Segundo, but should allow for market upside
2005E Market
($ in millions) Recovery
West Coast Power *
Energy $100 $235
Capacity & Ancillaries 95 85
Fuel & Transport (95) (200)
Gross Margin 100 120
Operating Expense (75) (75)
Operating Margin 25 45
Depreciation (25) (25)
WCP Pre-Tax Income $- $20
WCP Equity Earnings (50%) - 10
Equity Earnings & Other 20 10
Total Equity Earnings & Other $20 $20
* WCP equity earnings represent Dynegy’s 50% share.
Dynegy Inc. 17
Generation Capital Expenditures
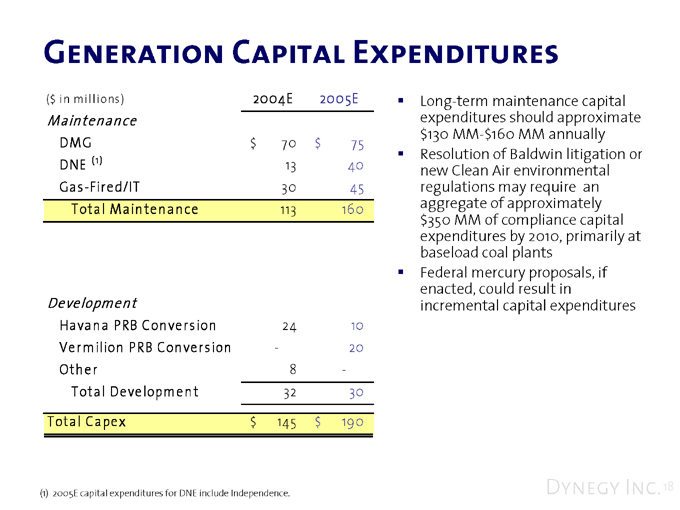
($ in millions ) 2004E 2005E
Maintenance
DMG $70 $75 DNE (1) 13 40 Gas-Fired/IT 30 45 Total Maintenance 113 160
Development
Havana PRB Conversion 24 10 Vermilion PRB Conversion - 20 Other 8 -Total Development 32 30 Total Capex $145 $190
Long-term maintenance capital expenditures should approximate $130 MM-$160 MM annually Resolution of Baldwin litigation or new Clean Air environmental regulations may require an aggregate of approximately $350 MM of compliance capital expenditures by 2010, primarily at baseload coal plants Federal mercury proposals, if enacted, could result in incremental capital expenditures
(1) 2005E capital expenditures for DNE include Independence.
Dynegy Inc. 18
2005 Generation Earnings Guidance –Mid-Point
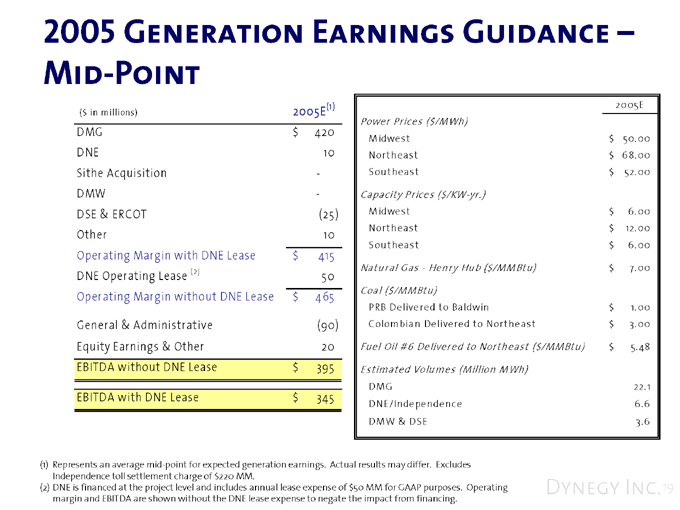
($ in millions) 2005E(1)
DMG $420 DNE 10 Sithe Acquisition -DMW -DSE & ERCOT (25) Other 10 Operating Margin with DNE Lease $415 DNE Operating Lease (2) 50 Operating Margin without DNE Lease $465 General & Administrative (90) Equity Earnings & Other 20 EBITDA without DNE Lease $395 EBITDA with DNE Lease $345
2005E
Power Prices ($/MWh)
Midwest $50.00
Northeast $68.00
Southeast $52.00
Capacity Prices ($/KW-yr.)
Midwest $6.00
Northeast $12.00
Southeast $6.00
Natural Gas - Henry Hub ($/MMBtu) $7.00
Coal ($/MMBtu)
PRB Delivered to Baldwin $1.00
Colombian Delivered to Northeast $3.00
Fuel Oil #6 Delivered to Northeast ($/MMBtu) $5.48
Estimated Volumes (Million MWh)
DMG 22.1
DNE/Independence 6.6
DMW & DSE 3.6
(1) Represents an average mid-point for expected generation earnings. Actual results may differ. Excludes Independence toll settlement charge of $220 MM.
(2) DNE is financed at the project level and includes annual lease expense of $50 MM for GAAP purposes. Operating margin and EBITDA are shown without the DNE lease expense to negate the impact from financing.
Dynegy Inc. 19
Longer-Term Generation Earnings
Potential
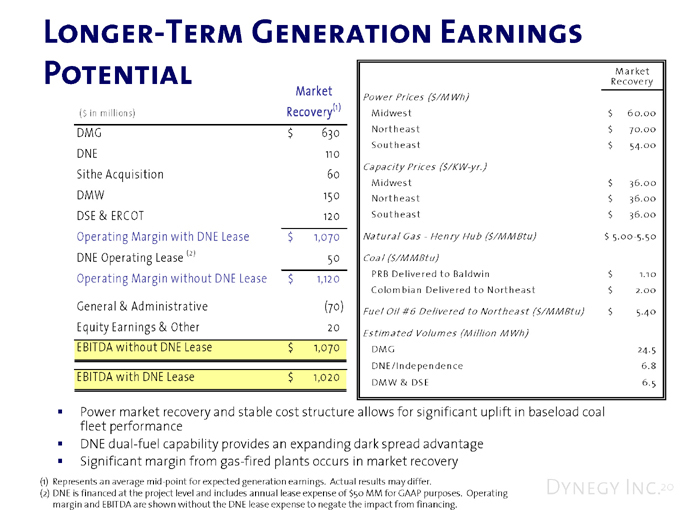
($ in millions)
Market Recovery(1 )
DMG
DNE
Sithe Acquisition
DMW
DSE & ERCOT
Operating Margin with DNE Lease DNE Operating Lease (2) Operating Margin without DNE Lease General & Administrative Equity Earnings & Other EBITDA without DNE Lease EBITDA with DNE Lease
$630
110
60
150
120
$1,070
50
$1,120
(70)
20
$1,070
$1,020
Power Prices ($/MWh)
Market Recovery
Midwest $60.00
Northeast $70.00
Southeast $54.00
Capacity Prices ($/KW-yr.)
Midwest $36.00
Northeast $36.00
Southeast $36.00
Natural Gas—Henry Hub ($/MMBtu) $5.00-5.50
Coal ($/MMBtu)
PRB Delivered to Baldwin $1.10
Colombian Delivered to Northeast $2.00
Fuel Oil #6 Delivered to Northeast ($/MMBtu) $5.40
Estimated Volumes (Million MWh)
DMG 24.5
DNE/Independence 6.8
DMW & DSE 6.5
Power market recovery and stable cost structure allows for significant uplift in baseload coal fleet performance DNE dual-fuel capability provides an expanding dark spread advantage Significant margin from gas-fired plants occurs in market recovery
(1) Represents an average mid-point for expected generation earnings. Actual results may differ.
(2) DNE is financed at the project level and includes annual lease expense of $50 MM for GAAP purposes. Operating margin and EBITDA are shown without the DNE lease expense to negate the impact from financing.
Dynegy Inc. 20
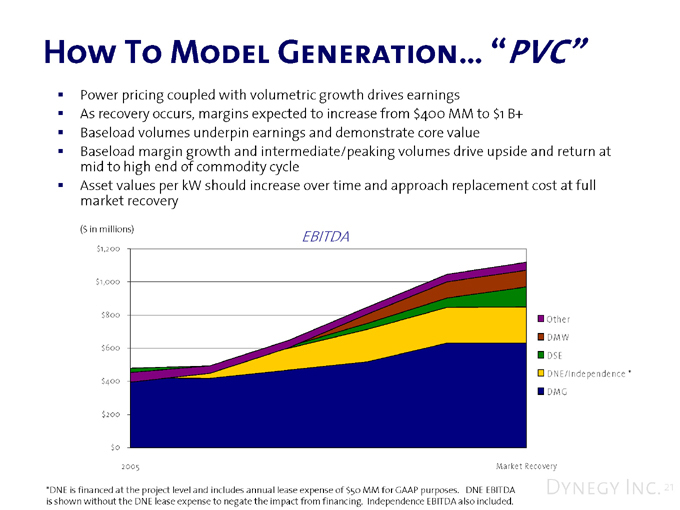
How To Model Generation… “PVC”
Power pricing coupled with volumetric growth drives earnings
As recovery occurs, margins expected to increase from $400 MM to $1 B+ Baseload volumes underpin earnings and demonstrate core value
Baseload margin growth and intermediate/peaking volumes drive upside and return at mid to high end of commodity cycle Asset values per kW should increase over time and approach replacement cost at full market recovery
($ in millions)
$1,200 $1,000 $800 $600 $400 $200
$0 2005
EBITDA
Other DMW DSE
DNE/Independence * DMG
Market Recovery
*DNE is financed at the project level and includes annual lease expense of $50 MM for GAAP purposes. DNE EBITDA is shown without the DNE lease expense to negate the impact from financing. Independence EBITDA also included.
Dynegy Inc. 21