Exhibit 99.6
Bruce Williamson
The Dynegy Value Proposition
Dynegy Inc.

Dynegy’s Directions
Guiding Principles
Self-restructure, accept responsibility and restore credibility Continue to work for all investors in capital structure
Business Strategy
Reposition capital structure to create real option horizon
Ability to capture upside in commodity-cyclical businesses
Financial Strategy
Maintain adequate liquidity, be fiscally disciplined and reduce debt Shift emphasis to the common shareholder
Dynegy Inc. 2
Dynegy Business Value
Metrics, Methodology & Mission
Dynegy Inc.
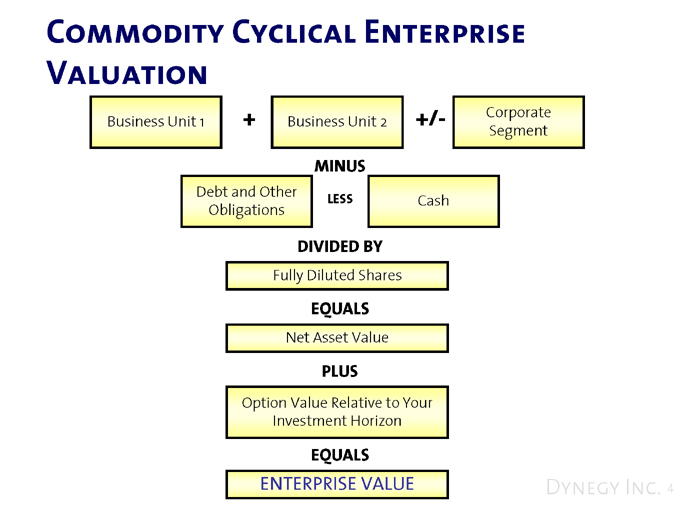
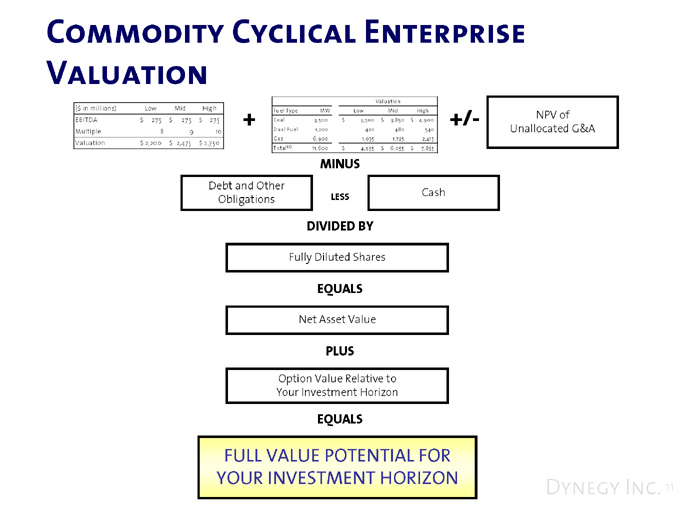
Commodity Cyclical Enterprise Valuation
Business Unit 1 + Business Unit 2 +/- Corporate Segment
MINUS
Debt and Other Obligations
LESS
Cash
DIVIDED BY
Fully Diluted Shares
EQUALS
Net Asset Value
PLUS
Option Value Relative to Your Investment Horizon
EQUALS
ENTERPRISE VALUE
Dynegy Inc. 4

Business Valuation Model: Midstream
Midstream is a commodity-cyclical business at or near the top of its range EBITDA expected to cycle between $250 MM and $325 MM
Valuation typically done on the basis of last 12 months EBITDA multiples Historical data suggests multiple range of 8-10 times
Transaction Value/LTM EBITDA
15.0x 10.0x 5.0x 0.0x
10.3x
9.6x 9.4x
8.3x 8.5x 7.7x
1999 2000 2001 2002 2003 2004
Number of Transactions 4 7 12 19 29 15
Dynegy Inc. 5
Source: JPMorgan
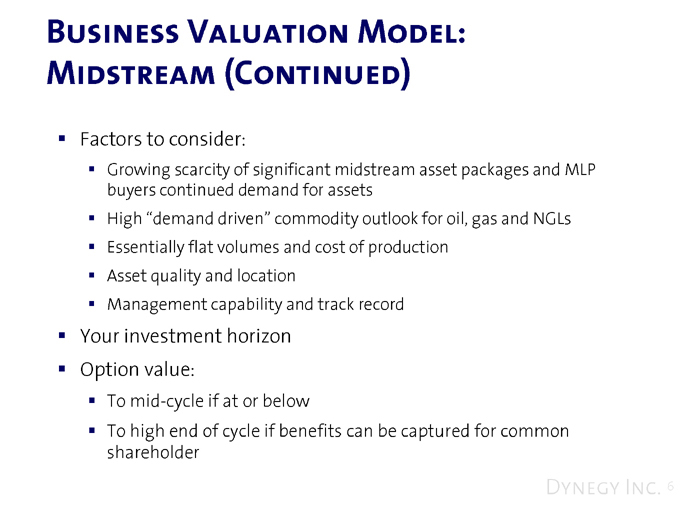
Business Valuation Model: Midstream (Continued)
Factors to consider:
Growing scarcity of significant midstream asset packages and MLP buyers continued demand for assets High “demand driven” commodity outlook for oil, gas and NGLs Essentially flat volumes and cost of production Asset quality and location Management capability and track record
Your investment horizon Option value:
To mid-cycle if at or below
To high end of cycle if benefits can be captured for common shareholder
Dynegy Inc. 6
Midstream Business Value: An Example Model
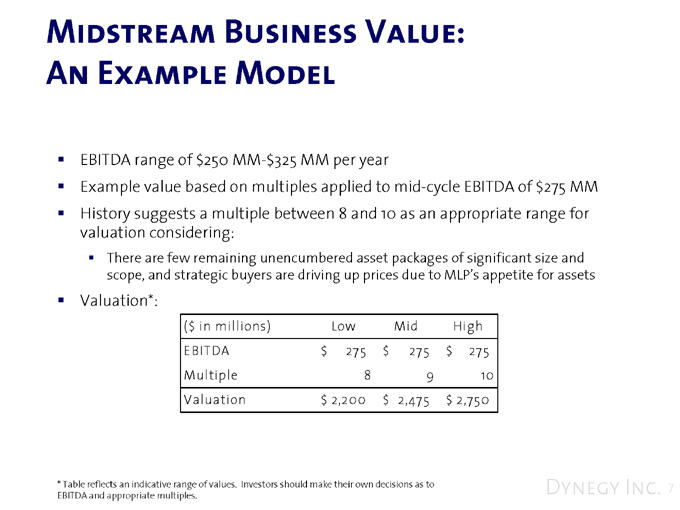
EBITDA range of $250 MM-$325 MM per year
Example value based on multiples applied to mid-cycle EBITDA of $275 MM History suggests a multiple between 8 and 10 as an appropriate range for valuation considering:
There are few remaining unencumbered asset packages of significant size and scope, and strategic buyers are driving up prices due to MLP’s appetite for assets
Valuation*:
($ in millions) Low Mid High
EBITDA $275 $275 $275
Multiple 8 9 10
Valuation $2,200 $2,475 $2,750
Table reflects an indicative range of values. Investors should make their own decisions as to EBITDA and appropriate multiples.
Dynegy Inc. 7
Business Valuation Model: Generation
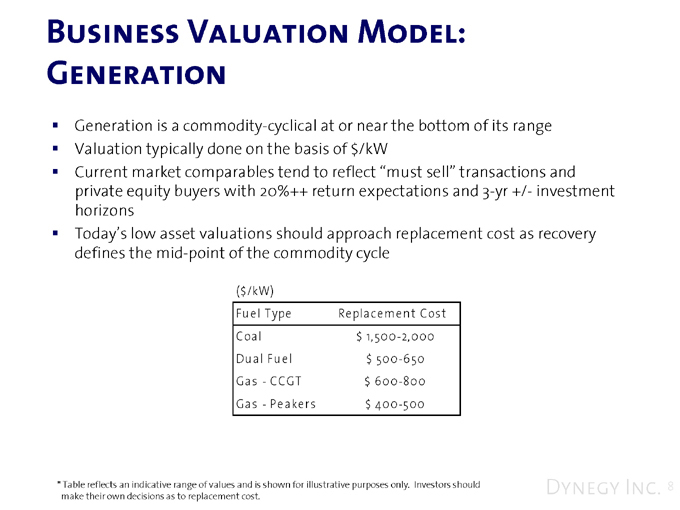
Generation is a commodity-cyclical at or near the bottom of its range Valuation typically done on the basis of $/kW Current market comparables tend to reflect “must sell” transactions and private equity buyers with 20%++ return expectations and 3-yr +/- investment horizons Today’s low asset valuations should approach replacement cost as recovery defines the mid-point of the commodity cycle
($/kW)
Fuel Type Replacement Cost Coal $1,500-2,000 Dual Fuel $500-650 Gas - CCGT $600-800 Gas - Peakers $400-500
Table reflects an indicative range of values and is shown for illustrative purposes only. Investors should make their own decisions as to replacement cost.
Dynegy Inc. 8
Business Valuation Model: Generation (Continued)
Factors to consider in evaluating cyclicality:
Volumes will vary with prevailing economic cycle and baseload volumes should provide core earning power Non-fuel costs generally flat Price recovery should significantly expand coal margins and add gas-fired earning power Portfolio diversity, quality and location relative to regional market recovery Management capabilities and track record
Your investment horizon
Most of our markets expected to fully recover in 4 to 6 years
Capital structure consistent with recovery horizon to capture upside
Option value
Commodity cyclicals that are below mid-cycle earnings should have an option value for recovery to mid-cycle or until significant debt is due (option term) Should also have option value to peak earning power if benefits can be captured for common shareholders You should evaluate and price this real option based on your investment horizon
Dynegy Inc. 9
Generation Business Value: An Example Model
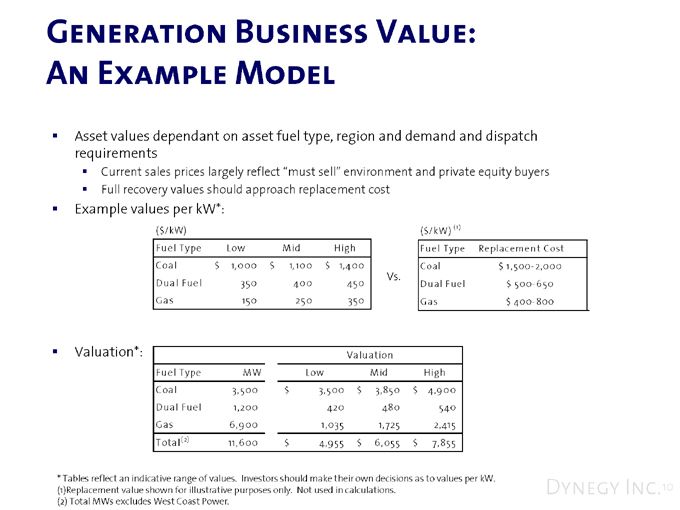
Asset values dependant on asset fuel type, region and demand and dispatch requirements
Current sales prices largely reflect “must sell” environment and private equity buyers Full recovery values should approach replacement cost
Example values per kW*:
($/kW)
Fuel Type Low Mid High
Coal $1,000 $1,100 $1,400
Dual Fuel 350 400 450
Gas 150 250 350
Vs.
($/kW) (1)
Fuel Type Replacement Cost
Coal $1,500- 2,000
Dual Fuel $500- 650
Gas $400- 800
Valuation*:
Valuation
Fuel Type MW Low Mid High
Coal 3,500 $3,500 $3,850 $4,9 00
Dual Fuel 1,200 420 480 540
Gas 6 ,9 00 1,035 1,725 2,415
Total(2) 11,6 00 $4,9 55 $6 ,055 $7,855
Tables reflect an indicative range of values. Investors should make their own decisions as to values per kW.
(1)Replacement value shown for illustrative purposes only. Not used in calculations. (2) Total MWs excludes West Coast Power.
Dynegy Inc.10
Commodity Cyclical Enterprise Valuation
($ in millions) Low Mid High
EBITDA $275 $275 $275
Multiple 8 9 10
Valuation $2,200 $2,475 $2,750
Valuation
Fuel Type MW L ow Mid High
Coal 3,500 $3,500 $3,850 $4,900
Dual Fuel 1,200 420 480 540
Gas 6,900 1,035 1,725 2,415
Total(2) 11,600 $4,955 $6,055 $7,855
NPV of Unallocated G&A
MINUS
Debt and Other
LESS Cash Obligations
DIVIDED BY
Fully Diluted Shares
EQUALS
Net Asset Value
PLUS
Option Value Relative to Your Investment Horizon
EQUALS
FULL VALUE POTENTIAL FOR YOUR INVESTMENT HORIZON
Dynegy Inc. 11
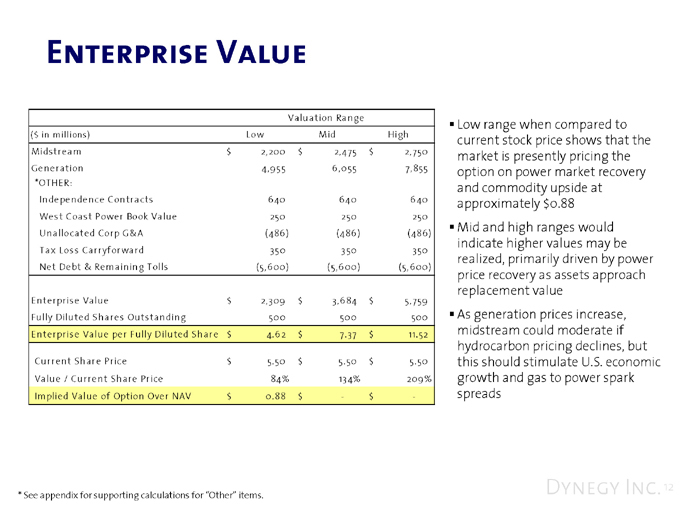
Enterprise Value
Valuation Range
($ in millions) Low Mid High
Midstream $2,200 $2,475 $2,750
Generation 4,955 6,055 7,855
*OTHER:
Independence Contracts 640 640 640
West Coast Power Book Value 250 250 250
Unallocated Corp G&A (486) (486) (486)
Tax Loss Carryforward 350 350 350
Net Debt & Remaining Tolls (5,600) (5,6 00) (5,6 00)
Enterprise Value $2,309 $3,684 $5,759
Fully Diluted Shares Outstanding 500 500 500
Enterprise Value per Fully Diluted Share $4.62 $7.37 $11.52
Current Share Price $5.50 $5.50 $5.50
Value/Current Share Price 84% 134% 209%
Implied Value of Option Over NAV $0.88 $- $-
Low range when compared to current stock price shows that the market is presently pricing the option on power market recovery and commodity upside at approximately $0.88 Mid and high ranges would indicate higher values may be realized, primarily driven by power price recovery as assets approach replacement value As generation prices increase, midstream could moderate if hydrocarbon pricing declines, but this should stimulate U.S. economic growth and gas to power spark spreads
See appendix for supporting calculations for “Other” items.
Dynegy Inc. 12

Sum-of-the-Parts Net Asset Value
(Eliminate Unallocated Corporate G&A)
Valuation Range
($ in millions) Low Mid High
Midstream $2,200 $2,475 $2,750
Generation 4,955 6,055 7,855
*OTHER:
Independence Contracts 640 640 640
West Coast Power Book Value 250 250 250
Unallocated Corp G&A - - -
Tax Loss Carryforward 350 350 350
Net Debt & Remaining Tolls (5,600) (5,600) (5,600)
Net Asset Value $2,795 $4,170 $6,245
Fully Diluted Shares Outstanding 500 500 500
Net Asset Value per Fully Diluted Share $5.59 $8.34 $12.49
Current Share Price $5.50 $5.50 $5.50
Value / Current Share Price 102% 152% 227%
Implied Value of Option Over NAV $- $- $-
Sum-of-the-parts value implies a free option on power market recovery and commodity upside Mid and high ranges would indicate higher values may be realized, primarily driven by power price recovery as assets approach replacement value As generation prices increase, midstream could moderate if hydrocarbon pricing declines, but this should stimulate U.S. economic growth and gas to power spark spreads
See appendix for supporting calculations for “Other” items.
Dynegy Inc. 13
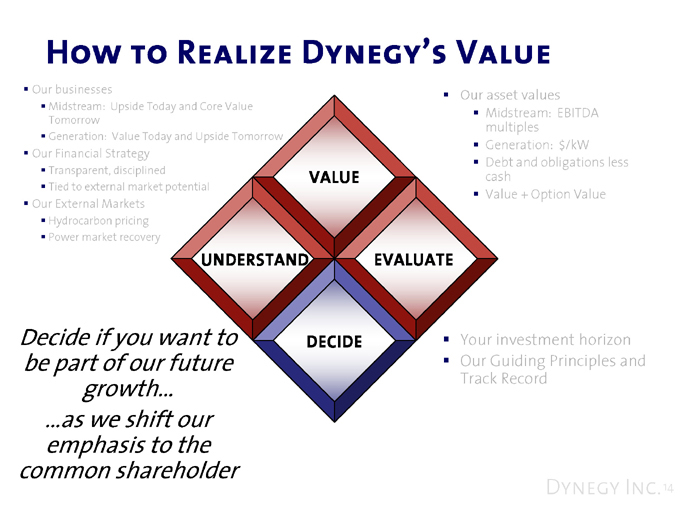
How to Realize Dynegy’s Value
Our businesses
Midstream: Upside Today and Core Value Tomorrow Generation: Value Today and Upside Tomorrow
Our Financial Strategy
Transparent, disciplined
Tied to external market potential
Our External Markets
Hydrocarbon pricing Power market recovery
VALUE
UNDERSTAND
DECIDE
EVALUATE
Decide if you want to be part of our future growth… …as we shift our emphasis to the common shareholder
Our asset values
Midstream: EBITDA multiples Generation: $/kW Debt and obligations less cash Value + Option Value
Your investment horizon Our Guiding Principles and Track Record
Dynegy Inc. 14