Table of Contents
UNITED STATES
SECURITIES AND EXCHANGE COMMISSION
Washington, D.C. 20549
FORM N-CSR
CERTIFIED SHAREHOLDER REPORT OF REGISTERED
MANAGEMENT INVESTMENT COMPANIES
Investment Company Act file number: 811-06431
| MANAGERS TRUST II |
(Exact name of registrant as specified in charter)
| 800 Connecticut Avenue, Norwalk, Connecticut 06854 |
(Address of principal executive offices) (Zip code)
Managers Investment Group LLC 800 Connecticut Avenue, Norwalk, Connecticut 06854 |
(Name and address of agent for service)
Registrant’s telephone number, including area code: (203) 299-3500
Date of fiscal year end: DECEMBER 31
Date of reporting period: JANUARY 1, 2010 – DECEMBER 31, 2010
(Annual Shareholder Report)
Table of Contents
| Item 1. | Reports to Shareholders |
Table of Contents
ANNUAL REPORT
Managers Trust II Funds
December 31, 2010
Managers AMG Chicago Equity Partners Mid-Cap Fund
Managers AMG Chicago Equity Partners Balanced Fund
Managers High Yield Fund
Managers Fixed Income Fund
Managers Short Duration Government Fund
Managers Intermediate Duration Govetx157832_rnment Fund
AR002-1210
Table of Contents
Table of Contents
| Managers Trust II Funds |
| Annual Report — December 31, 2010 |
Nothing contained herein is to be considered an offer, sale or solicitation of an offer to buy shares of any series of the Managers Family of Funds. Such offering is made only by Prospectus, which includes details as to offering price and other material information.
Table of Contents
Dear Shareholder:
Our foremost goal at Managers Investment Group (“MIG”) is to structure and manage mutual funds that will help our shareholders and clients successfully reach their investment goals and objectives.
Each of our Funds is geared to provide you with exposure to a specific asset class or style of investing. Investors tend to use our Funds as part of their broader portfolio in order to tailor their asset allocation to meet their individual needs. Most of our Funds, like those detailed in this report, are therefore designed to be building blocks.
At MIG, we have overall responsibility for the investment management and administration of the Funds. As a “manager of managers,” we work with external investment managers that make the day-to-day investment decisions in the Funds (the “Portfolio Managers”). We devote considerable resources to our disciplined process of identifying and selecting Portfolio Managers for the Funds. As a manager of managers, MIG performs many activities to monitor the ongoing investment, compliance, and administrative aspects of all of the Funds, which gives our shareholders added confidence in their investments.
Our parent company, Affiliated Managers Group (“AMG”), is a global asset management company with ownership interests in a diverse group of boutique investment management firms (its “Affiliates”). MIG has the unique opportunity to access the investment skills and acumen of some of AMG’s Affiliates. The set of our Funds managed by these proprietary firms also benefit from our activities to monitor the investment, compliance, and administrative aspects of the Funds.
Below is a brief overview of the securities markets and the performance results for the Funds. Following this letter, we also provide the Portfolio Managers’ discussion of their investment management approach, performance results, and market outlook.
The economic recovery that began in 2009 extended into 2010, thanks in part to a concerted effort by global governments to provide a framework conducive to growth and asset inflation. More specifically, government officials, especially those in the U.S., used monetary policy to keep interest rates low in order to entice corporations to spend and investors to allocate funds to risk-based assets. This accommodative monetary policy proved to be very successful in the short run as economies continued to recover and riskier assets appreciated substantially. That being said, the path higher was somewhat choppy as fears over sovereign debt and the potential for a double-dip recession weighed on the minds of investors. Fear turned into courage in the second half of the year as corporate earnings proved to be better than expected and a sovereign debt crisis was averted when European government officials agreed to provide the Irish government with an $89 billion rescue package. These events contributed to a strong year for credit sensitive fixed-income securities, especially those in the high-yield sector with the Barclays U.S. Capital Corporate High Yield Index gaining 15.12%. The risk trade was also in favor on the equity side of the ledger and benefited greatly from strong corporate earnings as well as the Federal Reserve’s plan to stimulate the U.S. economy via another round of quantitative easing (QE2). For the year, small-cap stocks posted the best results with the Russell 2000® Index rising 26.85%, closely followed by the performance of mid-cap stocks, as represented by the Russell MidCap® Index, which gained 25.48% for the year.
Against this backdrop, the Managers AMG Chicago Equity Partners Mid-Cap Fund, Managers AMG Chicago Equity Partners Balanced Fund, Managers High Yield Fund, Managers Fixed Income Fund, Managers Short Duration Government Fund and the Managers Intermediate Duration Government Fund (each a “Fund” and collectively the “Funds”), generated the following returns as detailed below:
Periods Ended 12/31/10 | 6 Months | 1 Year | 3 Years | 5 Years | 10 Years | Since Inception | Inception Date | |||||||||||||||||||||||
Managers AMG Chicago Equity Partners Mid-Cap Fund |
| |||||||||||||||||||||||||||||
-Class A | No Load | 30.97 | % | 28.06 | % | 0.96 | % | 2.43 | % | 4.42 | % | 9.62 | % | 1/2/1997 | ||||||||||||||||
-Class A | With Load | 23.48 | % | 20.68 | % | (1.01 | )% | 1.23 | % | 3.80 | % | 9.15 | % | 1/2/1997 | ||||||||||||||||
-Class B | No Load | 30.12 | % | 26.78 | % | 0.11 | % | 1.59 | % | 3.72 | % | 8.00 | % | 1/28/1998 | ||||||||||||||||
-Class B | With Load | 25.12 | % | 21.78 | % | (0.89 | )% | 1.21 | % | 3.72 | % | 8.00 | % | 1/28/1998 | ||||||||||||||||
-Class C | No Load | 30.18 | % | 26.71 | % | 0.10 | % | 1.55 | % | 3.71 | % | 7.43 | % | 2/19/1998 | ||||||||||||||||
-Class C | With Load | 29.18 | % | 25.71 | % | 0.10 | % | 1.55 | % | 3.71 | % | 7.43 | % | 2/19/1998 | ||||||||||||||||
-Institutional Class | 30.84 | % | 27.97 | % | 1.11 | % | 2.57 | % | 4.74 | % | 10.02 | % | 1/2/1997 | |||||||||||||||||
Russell Midcap® Index | 28.12 | % | 25.48 | % | 1.05 | % | 4.66 | % | 6.54 | % | 9.28 | % | ||||||||||||||||||
1
Table of Contents
Letter to Shareholders (continued)
Periods Ended 12/31/10 | 6 Months | 1 Year | 3 Years | 5 Years | 10 Years | Since Inception | Inception Date | |||||||||||||||||||||||||
Managers AMG Chicago Equity Partners Balanced Fund |
| |||||||||||||||||||||||||||||||
-Class A | No Load | 12.52 | % | 11.14 | % | 2.76 | % | 5.24 | % | 4.10 | % | 7.46 | % | 1/2/1997 | ||||||||||||||||||
-Class A | With Load | 6.03 | % | 4.76 | % | 0.76 | % | 4.01 | % | 3.49 | % | 7.01 | % | 1/2/1997 | ||||||||||||||||||
-Class B | No Load | 12.07 | % | 10.28 | % | 2.02 | % | 4.47 | % | 3.46 | % | 5.79 | % | 2/10/1998 | ||||||||||||||||||
-Class B | With Load | 7.07 | % | 5.28 | % | 1.05 | % | 4.13 | % | 3.46 | % | 5.79 | % | 2/10/1998 | ||||||||||||||||||
-Class C | No Load | 12.08 | % | 10.27 | % | 2.00 | % | 4.46 | % | 3.45 | % | 5.73 | % | 2/13/1998 | ||||||||||||||||||
-Class C | With Load | 11.08 | % | 9.27 | % | 2.00 | % | 4.46 | % | 3.45 | % | 5.73 | % | 2/13/1998 | ||||||||||||||||||
-Institutional Class | 12.65 | % | 11.42 | % | 3.03 | % | 5.50 | % | 4.49 | % | 7.90 | % | 1/2/1997 | |||||||||||||||||||
60% Russell 1000® Index/40% Barclays Capital U.S. Aggregate Bond Index |
| 14.52 | % | 12.72 | % | 2.11 | % | 4.74 | % | 4.09 | % | 6.57 | % | |||||||||||||||||||
Managers High Yield Fund | ||||||||||||||||||||||||||||||||
-Class A | No Load | 10.27 | % | 14.20 | % | 7.16 | % | 6.92 | % | 8.16 | % | 6.52 | % | 1/2/1998 | ||||||||||||||||||
-Class A | With Load | 5.64 | % | 9.29 | % | 5.60 | % | 5.99 | % | 7.69 | % | 6.17 | % | 1/2/1998 | ||||||||||||||||||
-Class B | No Load | 9.94 | % | 13.40 | % | 6.26 | % | 6.02 | % | 7.41 | % | 5.49 | % | 2/19/1998 | ||||||||||||||||||
-Class B | With Load | 4.94 | % | 8.40 | % | 5.42 | % | 5.73 | % | 7.41 | % | 5.49 | % | 2/19/1998 | ||||||||||||||||||
-Class C | No Load | 9.94 | % | 13.42 | % | 6.33 | % | 6.07 | % | 7.44 | % | 5.51 | % | 2/19/1998 | ||||||||||||||||||
-Class C | With Load | 8.94 | % | 12.42 | % | 6.33 | % | 6.07 | % | 7.44 | % | 5.51 | % | 2/19/1998 | ||||||||||||||||||
-Institutional Class | 10.49 | % | 14.58 | % | 7.54 | % | 7.24 | % | 8.58 | % | 6.61 | % | 3/2/1998 | |||||||||||||||||||
Barclays Capital U.S. Corporate High Yield Index |
| 10.15 | % | 15.12 | % | 10.38 | % | 8.91 | % | 8.88 | % | N/A | ||||||||||||||||||||
Managers Fixed Income Fund | ||||||||||||||||||||||||||||||||
-Class A | No Load | 4.24 | % | 10.04 | % | 6.66 | % | 6.52 | % | 6.50 | % | 6.50 | % | 1/2/1997 | ||||||||||||||||||
-Class A | With Load | (0.20 | )% | 5.39 | % | 5.12 | % | 5.60 | % | 6.04 | % | 6.17 | % | 1/2/1997 | ||||||||||||||||||
-Class B | No Load | 3.87 | % | 9.26 | % | 5.87 | % | 5.72 | % | 5.82 | % | 5.65 | % | 3/20/1998 | ||||||||||||||||||
-Class B | With Load | (1.13 | )% | 4.26 | % | 4.97 | % | 5.40 | % | 5.82 | % | 5.65 | % | 3/20/1998 | ||||||||||||||||||
-Class C | No Load | 3.85 | % | 9.22 | % | 5.84 | % | 5.72 | % | 5.82 | % | 5.74 | % | 3/5/1998 | ||||||||||||||||||
-Class C | With Load | 2.85 | % | 8.22 | % | 5.84 | % | 5.72 | % | 5.82 | % | 5.74 | % | 3/5/1998 | ||||||||||||||||||
-Institutional Class | 4.27 | % | 10.29 | % | 6.90 | % | 6.78 | % | 6.87 | % | 6.95 | % | 1/2/1997 | |||||||||||||||||||
Barclays Capital U.S. Aggregate Bond Index |
| 1.15 | % | 6.54 | % | 5.90 | % | 5.80 | % | 5.84 | % | 6.25 | % | |||||||||||||||||||
Managers Short Duration Government Fund |
| 0.78 | % | 1.58 | % | 2.26 | % | 3.25 | % | 3.52 | % | 4.32 | % | 3/31/1992 | ||||||||||||||||||
BofA Merrill Lynch Six-Month U.S. Treasury Bill Index |
| 0.19 | % | 0.36 | % | 1.50 | % | 2.97 | % | 2.78 | % | 3.86 | % | |||||||||||||||||||
Managers Intermediate Duration Government Fund |
| 1.49 | % | 7.30 | % | 6.74 | % | 6.24 | % | 5.69 | % | 6.57 | % | 3/31/1992 | ||||||||||||||||||
Citigroup Mortgage Index | 0.75 | % | 5.50 | % | 6.57 | % | 6.37 | % | 5.94 | % | 6.58 | % | ||||||||||||||||||||
For the year ended December 31, 2010, the Managers AMG Chicago Equity Partners Mid-Cap Fund (Institutional Class) returned 27.97%, versus the Russell Midcap® Index at 25.48%. The primary driver of the Fund’s outperformance was security selection in the consumer discretionary, health care, and technology sectors while selection from the financial and materials sectors detracted from performance.
For the year ended December 31, 2010, the Managers AMG Chicago Equity Partners Balanced Fund (Institutional Class) returned 11.42%, underperforming the 12.72% return for its hypothetical benchmark, which consists of 60% of the return of the Russell 1000® Index and 40% of the return of the Barclays Capital U.S. Aggregate Bond Index. The primary driver of the Fund’s underperformance was its underweight to equities
2
Table of Contents
Letter to Shareholders (continued)
relative to the benchmark. The team at Chicago Equity Partners moved to this allocation in mid-August, reflecting the continued economic uncertainty and slow-growth recovery scenario.
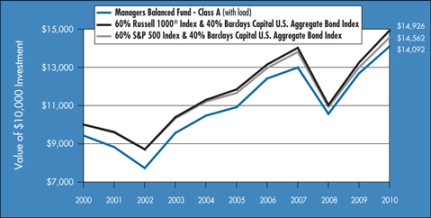
For the year ended December 31, 2010 the Managers High Yield Fund (Institutional Class) returned 14.58%, compared to 15.12% for the Barclays Capital U.S. Corporate High Yield Index. Performance was hindered by an underweight to the insurance sector and poor performance in the lodging, cable, and media sectors. This was partly offset by decent performance in the health care and telecommunications sectors.
For the year ended December 31, 2010, Managers Fixed Income Fund (Institutional Class) returned 10.29%, easily outpacing the 6.54% return for the Barclays Capital U.S. Aggregate Bond Index. The primary driver of the solid results was the Fund’s exposures to investment-grade and high-yield corporate bonds. The primary detractor from performance was the Fund’s cash allocation.
For the year ended December 31, 2010, the Managers Short Duration Government Fund returned 1.58%, outperforming its benchmark, the BofA Merrill Lynch Six-Month Treasury Bill Index, which returned 0.36%. The primary driver of the Fund’s outperformance for 2010 was its agency MBS exposure. The Fund’s yield-curve positioning detracted slightly from performance.
For the year ended December 31, 2010, the Managers Intermediate Duration Government Fund returned 7.30%, compared to 5.50% for its benchmark, the Citigroup Mortgage Index. Most of the Fund’s outperformance for 2010 was attributable to its exposure to agency and non-agency mortgage-backed securities. The Fund’s yield-curve positioning detracted slightly from performance.
The following report covers the one-year period ended December 31, 2010. Should you have any questions about this report, or if you’d like to receive a prospectus and additional information, including fees and expenses for these or any of the other Funds in our family, please feel free to contact us at 1-800-835-3879, or visit our Web site at www.managersinvest.com. As always, please read the prospectus carefully before you invest or send money.
If you are curious about how you can better diversify your investment program, visit the Knowledge Center on our Web site and view our articles in the investment strategies section. You can rest assured that under all market conditions our team is focused on delivering excellent investment management services for your benefit.
We thank you for your continued confidence and investment in The Managers Funds.
Respectfully,

John H. Streur
Senior Managing Partner
Managers Investment Group LLC
3
Table of Contents
| About Your Fund’s Expenses |
As a shareholder of a Fund, you may incur two types of costs: (1) transaction costs, which may include sales charges (loads) on purchase payments; redemption fees; and exchange fees; and (2) ongoing costs, including management fees; distribution (12b-1) fees; and other Fund expenses. This example is intended to help you understand your ongoing costs (in dollars) of investing in the Fund and to compare these costs with the ongoing costs of investing in other mutual funds. The example is based on $1,000 invested at the beginning of the period and held for the entire period as indicated below.
Actual Expenses
The first line of the following table provides information about the actual account values and actual expenses. You may use the information in this line, together with the amount you invested, to estimate the expenses that you paid over the period. Simply divide your account value by $1,000 (for example, an $8,600 account value divided by $1,000 = 8.6), then multiply the result by the number in the first line under the heading entitled “Expenses Paid During Period” to estimate the expenses you paid on your account during this period.
Hypothetical Example for Comparison Purposes
The second line of the following table provides information about hypothetical account values and hypothetical expenses based on the Fund’s actual expense ratio and an assumed annual rate of return of 5% before expenses, which is not the Fund’s actual return. The hypothetical account values and expenses may not be used to estimate the actual ending account balance or expenses you paid for the period. You may use this information to compare the ongoing costs of investing in the Fund and other funds by comparing this 5% hypothetical example with the 5% hypothetical examples that appear in the shareholder reports of other funds.
Please note that the expenses shown in the table are meant to highlight your ongoing costs only and do not reflect any transactional costs, such as sales charges (loads), redemption fees, or exchange fees. Therefore, the second line of the table is useful in comparing ongoing costs only, and will not help you determine the relative total costs of owning different funds.
Six Months Ended December 31, 2010 | Expense Ratio for the Period | Beginning Account Value 07/01/2010 | Ending Account Value 12/31/2010 | Expenses Paid During Period* | ||||||||||||
Managers AMG Chicago Equity Partners Mid-Cap Fund Class A | ||||||||||||||||
Based on Actual Fund Return | 1.24 | % | $ | 1,000 | $ | 1,310 | $ | 7.22 | ||||||||
Based on Hypothetical 5% Annual Return | 1.24 | % | $ | 1,000 | $ | 1,019 | $ | 6.31 | ||||||||
Managers AMG Chicago Equity Partners Mid-Cap Fund Class B | ||||||||||||||||
Based on Actual Fund Return | 1.99 | % | $ | 1,000 | $ | 1,301 | $ | 11.54 | ||||||||
Based on Hypothetical 5% Annual Return | 1.99 | % | $ | 1,000 | $ | 1,015 | $ | 10.11 | ||||||||
Managers AMG Chicago Equity Partners Mid-Cap Fund Class C | ||||||||||||||||
Based on Actual Fund Return | 1.99 | % | $ | 1,000 | $ | 1,302 | $ | 11.55 | ||||||||
Based on Hypothetical 5% Annual Return | 1.99 | % | $ | 1,000 | $ | 1,015 | $ | 10.11 | ||||||||
Managers AMG Chicago Equity Partners Mid-Cap Fund Institutional Class | ||||||||||||||||
Based on Actual Fund Return | 0.99 | % | $ | 1,000 | $ | 1,308 | $ | 5.76 | ||||||||
Based on Hypothetical 5% Annual Return | 0.99 | % | $ | 1,000 | $ | 1,020 | $ | 5.04 | ||||||||
Managers AMG Chicago Equity Partners Balanced Fund Class A | ||||||||||||||||
Based on Actual Fund Return | 1.25 | % | $ | 1,000 | $ | 1,125 | $ | 6.70 | ||||||||
Based on Hypothetical 5% Annual Return | 1.25 | % | $ | 1,000 | $ | 1,019 | $ | 6.36 | ||||||||
Managers AMG Chicago Equity Partners Balanced Fund Class B | ||||||||||||||||
Based on Actual Fund Return | 2.00 | % | $ | 1,000 | $ | 1,121 | $ | 10.69 | ||||||||
Based on Hypothetical 5% Annual Return | 2.00 | % | $ | 1,000 | $ | 1,015 | $ | 10.16 | ||||||||
Managers AMG Chicago Equity Partners Balanced Fund Class C | ||||||||||||||||
Based on Actual Fund Return | 2.00 | % | $ | 1,000 | $ | 1,121 | $ | 10.69 | ||||||||
Based on Hypothetical 5% Annual Return | 2.00 | % | $ | 1,000 | $ | 1,015 | $ | 10.16 | ||||||||
Managers AMG Chicago Equity Partners Balanced Fund Institutional Class | ||||||||||||||||
Based on Actual Fund Return | 1.00 | % | $ | 1,000 | $ | 1,127 | $ | 5.36 | ||||||||
Based on Hypothetical 5% Annual Return | 1.00 | % | $ | 1,000 | $ | 1,020 | $ | 5.09 | ||||||||
| * | Expenses are equal to the Fund’s annualized expense ratio multiplied by the average account value over the period, multiplied by the number of days in the most recent fiscal half-year (184), then divided by 365. |
4
Table of Contents
| About Your Fund’s Expenses (continued) |
Six Months Ended December 31, 2010 | Expense Ratio for the Period | Beginning Account Value 07/01/2010 | Ending Account Value 12/31/2010 | Expenses Paid During Period* | ||||||||||||
Managers High Yield Fund Class A | ||||||||||||||||
Based on Actual Fund Return | 1.15 | % | $ | 1,000 | $ | 1,103 | $ | 6.09 | ||||||||
Based on Hypothetical 5% Annual Return | 1.15 | % | $ | 1,000 | $ | 1,019 | $ | 5.85 | ||||||||
Managers High Yield Fund Class B | ||||||||||||||||
Based on Actual Fund Return | 1.90 | % | $ | 1,000 | $ | 1,099 | $ | 10.05 | ||||||||
Based on Hypothetical 5% Annual Return | 1.90 | % | $ | 1,000 | $ | 1,016 | $ | 9.65 | ||||||||
Managers High Yield Fund Class C | ||||||||||||||||
Based on Actual Fund Return | 1.90 | % | $ | 1,000 | $ | 1,099 | $ | 10.05 | ||||||||
Based on Hypothetical 5% Annual Return | 1.90 | % | $ | 1,000 | $ | 1,016 | $ | 9.65 | ||||||||
Managers High Yield Fund Institutional Class | ||||||||||||||||
Based on Actual Fund Return | 0.90 | % | $ | 1,000 | $ | 1,105 | $ | 4.77 | ||||||||
Based on Hypothetical 5% Annual Return | 0.90 | % | $ | 1,000 | $ | 1,021 | $ | 4.58 | ||||||||
Managers Fixed Income Fund Class A | ||||||||||||||||
Based on Actual Fund Return | 0.84 | % | $ | 1,000 | $ | 1,042 | $ | 4.32 | ||||||||
Based on Hypothetical 5% Annual Return | 0.84 | % | $ | 1,000 | $ | 1,021 | $ | 4.28 | ||||||||
Managers Fixed Income Fund Class B | ||||||||||||||||
Based on Actual Fund Return | 1.59 | % | $ | 1,000 | $ | 1,039 | $ | 8.17 | ||||||||
Based on Hypothetical 5% Annual Return | 1.59 | % | $ | 1,000 | $ | 1,017 | $ | 8.08 | ||||||||
Managers Fixed Income Fund Class C | ||||||||||||||||
Based on Actual Fund Return | 1.59 | % | $ | 1,000 | $ | 1,039 | $ | 8.17 | ||||||||
Based on Hypothetical 5% Annual Return | 1.59 | % | $ | 1,000 | $ | 1,017 | $ | 8.08 | ||||||||
Managers Fixed Income Fund Institutional Class | ||||||||||||||||
Based on Actual Fund Return | 0.59 | % | $ | 1,000 | $ | 1,043 | $ | 3.04 | ||||||||
Based on Hypothetical 5% Annual Return | 0.59 | % | $ | 1,000 | $ | 1,022 | $ | 3.01 | ||||||||
Managers Short Duration Government Fund | ||||||||||||||||
Based on Actual Fund Return | 0.81 | % | $ | 1,000 | $ | 1,008 | $ | 4.10 | ||||||||
Based on Hypothetical 5% Annual Return | 0.81 | % | $ | 1,000 | $ | 1,021 | $ | 4.13 | ||||||||
Managers Intermediate Duration Government Fund | ||||||||||||||||
Based on Actual Fund Return | 0.89 | % | $ | 1,000 | $ | 1,015 | $ | 4.52 | ||||||||
Based on Hypothetical 5% Annual Return | 0.89 | % | $ | 1,000 | $ | 1,021 | $ | 4.53 | ||||||||
| * | Expenses are equal to the Fund’s annualized expense ratio multiplied by the average account value over the period, multiplied by the number of days in the most recent fiscal half-year (184), then divided by 365. |
5
Table of Contents
| Managers AMG Chicago Equity Partners Mid-Cap Fund |
| Investment Manager’s Comments |
The Year in Review
For the year ended December 31, 2010, the Managers AMG Chicago Equity Partners Mid-Cap Fund’s Institutional Class returned 27.97%, versus the Russell Midcap® Index at 25.48%.
The economic news in the third and fourth quarters of 2010 was generally positive. Fears of a ‘double-dip’ recession receded, as the third quarter GDP growth number was 2.6%, which was a pick-up from the 1.7% reading in the prior three months. The general consensus is for a similar reading in the fourth quarter. Unemployment dropped from 9.8% to 9.4% in the latest reading, but this was due to equal parts increased jobs and a reduction in the workforce. The unemployment rate, which has been volatile, is based on a survey of only 60,000 households. It has generally been stronger than the more complete payroll survey of businesses, which showed an increase of 103,000 jobs in the same December release – a slight disappointment. While we may have seen the worst in terms of job losses, hiring levels remain weak. There was a rebound in the manufacturing economy, where the Institute for Supply Management new orders index ended December at a 60.9 reading, up from 51.1, at the end of the prior quarter (values above 50 indicate expansion). The personal savings rate fell slightly in the 4th quarter, as spending rose faster than disposable income. Ultimately, consumers will need to repair their financial net worth, which requires a long-term savings rate of 7% to 8%, according to most estimates. This is difficult to achieve with falling or flattening incomes combined with the massive hit to net worth from the decline in housing values, although the portfolio wealth effect from a resurgent stock market is a positive. The savings rate data is volatile for several reasons, but it appears the underlying trend right now is in the 5% to 6% range. A recent pick-up is real disposable income growth in the latest few months is the key to supporting higher spending levels and higher savings. The latest consumer confidence expectations reading of 71.9 from December 2010 is actually down from the 75.9 reading at the end of 2009. In general, the consumer remains cautious and nervous about prospects for job and income growth in the future, but spending appears to have picked up recently. Everyone will be watching to see if this spending is maintained.
Factor group performance in 2010 varied by quarter. Value has been particularly inconsistent, working in the first quarter, negative
in the second quarter, only to work very well in the third quarter. While value was the best factor group in the fourth quarter, it was driven mostly by the month of December, when the low-priced stocks (and P/B factor) rallied. Despite doing well in October and November, the momentum factors reversed in December, ending the quarter with a negative average.
After much variation throughout the year, all four factor groups ended 2010 with a positive average return. Security selection in consumer discretionary, energy, health care and technology was positive; selection from financials, materials, and consumer staples detracted from performance. Overall, we continue to see an improving environment. For the year the highest ranked stocks outperformed the lowest ranked stocks, but the spread between the two was narrower than the long term.
Looking Forward
Overall, our philosophy will not change based on short-term trends or conditions in the market. Our goal is to add value through security selection, while attempting to neutralize other risk factors, such as market timing and sector rotation, for which there is not adequate compensation by the market. We will continue to use our disciplined approach as we seek to provide added value at controlled levels of risk.
This commentary reflects the viewpoints of the portfolio manager, Chicago Equity Partners, as of January 21, 2011.
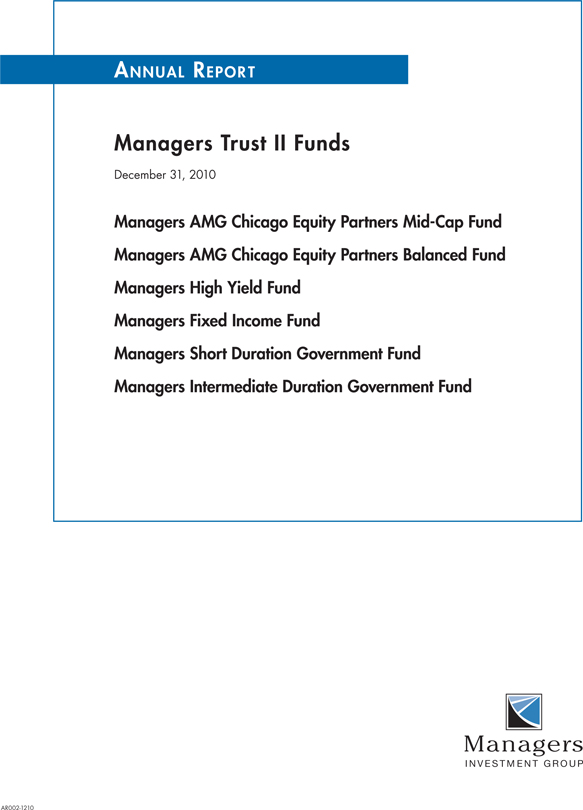
Cumulative Total Return Performance
Mid-Cap’s cumulative total return is based on the daily change in net asset value (NAV), and assumes that all dividends and distributions were reinvested. The Russell Midcap® Index measures the performance of the mid-cap segment of the U.S. equity universe. The Russell Midcap® Index is a subset of the Russell 1000® Index and measures the performance of the 800 smallest companies in the Russell 1000® Index, which represent approximately 27% of the total market capitalization of the Russell 1000® Index. The S&P Mid Cap 400 Index is the most widely used index for mid-size companies and covers approximately 7% of the U.S. equity market. Both indices assume reinvestment of dividends. Unlike the Fund, the indices are unmanaged, are not available for investment and do not incur expenses. This chart compares a hypothetical $10,000
6
Table of Contents
| Managers AMG Chicago Equity Partners Mid-Cap Fund |
| Investment Manager’s Comments (continued) |
Cumulative Total Return Performance (continued)
investment made in the Fund’s Class A Shares (with load) on December 31, 2000, with a $10,000 investment made in the Russell Midcap® Index and the S&P Mid Cap 400 Index for the same time periods. Performance for periods longer than one year is annualized. The graph and table do not reflect the deduction of taxes that a shareholder would pay on a Fund distribution or redemption of shares. Past performance is not indicative of future results. The listed returns for the Fund are net of expenses and the returns for the indices exclude expenses.
The table below shows the average annual total returns for the Managers AMG CEP Mid-Cap Fund, the Russell Midcap® Index and the S&P Mid Cap 400 Index from December 31, 2000 through December 31,2010.
Average Annual Total Returns1 | 1 Year | 5 Years | 10 Years | |||||||||||||
Managers AMG CEP Mid-Cap Fund2,3 | -Class A | No Load | 28.06 | % | 2.43 | % | 4.42 | % | ||||||||
| -Class A | With Load | 20.68 | % | 1.23 | % | 3.80 | % | |||||||||
| -Class B | No Load | 26.78 | % | 1.59 | % | 3.72 | % | |||||||||
| -Class B | With Load | 21.78 | % | 1.21 | % | 3.72 | % | |||||||||
| -Class C | No Load | 26.71 | % | 1.55 | % | 3.71 | % | |||||||||
| -Class C | With Load | 25.71 | % | 1.55 | % | 3.71 | % | |||||||||
| -Institutional Class | No Load | 27.97 | % | 2.57 | % | 4.74 | % | |||||||||
Russell Midcap® Index4 | 25.48 | % | 4.66 | % | 6.54 | % | ||||||||||
S&P Mid Cap 400 Index (former benchmark)5 | 26.64 | % | 5.73 | % | 7.16 | % | ||||||||||
The performance data shown represents past performance. Past performance is not a guarantee of future results. Current performance may be lower or higher than the performance data quoted. The investment return and the principal value of an investment will fluctuate so that an investor’s shares, when redeemed, may be worth more or less than their original cost. For performance information through the most recent month end please call (800) 835-3879 or visit our Web site at www.managersinvest.com.
Performance differences among the share classes are due to differences in sales charge structures and class expenses. Returns shown reflect maximum sales charge of 5.75% on Class A, as well as the applicable contingent deferred sales charge (CDSC) on both Class B and C shares. The Class B shares’ CDSC declines annually between years 1 through 6 according to the following schedule: 5, 4, 3, 3, 2, 1%. No sales charge is assessed after year six. Class C shares held for less than one year are subject to a 1% CDSC.
In choosing a Fund, investors should carefully consider the amount they plan to invest, their investment objectives, the Fund’s investment objectives, risks, charges and expenses before investing. For this and other information, please call (800) 835-3879 or visit www.managersinvest.com for a free prospectus. Read it carefully before investing or sending money. Distributed by Managers Distributors, Inc., member FINRA.
| 1 | Total return equals income yield plus share price change and assumes reinvestment of all dividends and capital gain distributions. Returns are net of fees and may reflect offsets of Fund expenses as described in the Prospectus. No adjustment has been made for taxes payable by shareholders on their reinvested dividends and capital gain distributions. Returns for periods greater than one year are annualized. The listed returns on the Fund are net of expenses and based on the published NAV as of December 31, 2010. All returns are in U.S. dollars($). |
| 2 | The Fund is subject to risks associated with investments in mid-capitalization companies, such as erratic earnings patterns, competitive conditions, limited earnings history, and a reliance on one or a limited number of products. |
| 3 | From time to time, the Fund’s advisor has waived its fees and/or absorbed Fund expenses, which has resulted in higher returns. |
| 4 | The Russell Midcap® Index measures the performance of the 800 smallest companies in the Russell 1000® Index. Unlike the Fund, the Russell Midcap® Index is unmanaged, is not available for investment, and does not incur expenses. |
| 5 | The S&P Mid Cap 400 Index is the most widely used index for mid-size companies and covers approximately 7% of the U.S. equities market. Unlike the Fund, the S&P Mid Cap 400 Index is unmanaged, is not available for investment and does not incur expenses. The S&P Mid Cap 400 Index is a proprietary data of Standard & Poor’s, a division of McGraw-Hill Companies, Inc. All rights reserved. On December 31, 2009, the Investment Manager changed the benchmark from the S&P Mid Cap 400 Index to the Russell Midcap® Index. |
The Russell Midcap® Index is a registered trademark of Russell Investments. Russell® is a trademark of Russell Investments.
Not FDIC insured, nor bank guaranteed. May lose value.
7
Table of Contents
| Managers AMG Chicago Equity Partners Mid-Cap Fund |
| Fund Snapshots |
| December 31, 2010 |
Portfolio Breakdown
Industry | Managers AMG CEP Mid-Cap Fund** | Russell Midcap® Index | S&P Mid Cap 400 Index | |||||||||
Financials | 18.9 | % | 18.8 | % | 19.8 | % | ||||||
Industrials | 18.1 | % | 13.1 | % | 16.2 | % | ||||||
Information Technology | 16.4 | % | 14.5 | % | 15.6 | % | ||||||
Consumer Discretionary | 11.7 | % | 15.2 | % | 14.3 | % | ||||||
Health Care | 10.6 | % | 9.0 | % | 11.1 | % | ||||||
Materials | 6.9 | % | 6.1 | % | 6.8 | % | ||||||
Utilities | 5.7 | % | 6.4 | % | 5.9 | % | ||||||
Energy | 5.3 | % | 8.8 | % | 5.9 | % | ||||||
Consumer Staples | 4.2 | % | 6.0 | % | 3.6 | % | ||||||
Telecommunication Services | 0.9 | % | 2.1 | % | 0.8 | % | ||||||
Other Assets and Liabilities | 1.3 | % | 0.0 | % | 0.0 | % | ||||||
| ** | As a percentage of net assets |
Top Ten Holdings
Top Ten Holdings | % of Net Assets | |||
Timken Co.* | 2.5 | % | ||
Cathay General Bancorp | 2.0 | |||
MICROS Systems, Inc. | 1.9 | |||
Factset Research Systems, Inc. | 1.7 | |||
Kennametal, Inc.* | 1.7 | |||
Anixter International, Inc. | 1.6 | |||
Atmel Corp. | 1.5 | |||
Oil States International, Inc. | 1.5 | |||
RenaissanceRe Holdings, Ltd.* | 1.4 | |||
Nationwide Health Properties, Inc. | 1.4 | |||
Top Ten as a Group | 17.2 | % | ||
| * | Top Ten Holding at June 30, 2010 |
Any sectors, industries, or securities discussed should not be perceived as investment recommendations. Mention of a specific security should not be considered a recommendation to buy or solicitation to sell that security. Specific securities mentioned in this report may have been sold from the Fund’s portfolio of investments by the time you receive this report.
8 |
Table of Contents
| Managers AMG Chicago Equity Partners Mid-Cap Fund |
| Schedule of Portfolio Investments |
| December 31, 2010 |
| Shares | Value | |||||||
Common Stocks - 98.7% | ||||||||
Consumer Discretionary - 11.7% | ||||||||
Advance Auto Parts, Inc. | 7,100 | $ | 469,665 | |||||
American Greetings Corp., Class A | 200 | 4,432 | ||||||
AnnTaylor Stores Corp.* | 4,300 | 117,777 | ||||||
Brinker International, Inc. | 16,100 | 336,168 | ||||||
Chipotle Mexican Grill, Inc.* | 1,100 | 233,926 | ||||||
Dana Holding Corp.* | 6,800 | 117,028 | ||||||
Dillard’s, Inc., Class A | 2,500 | 2 | 94,850 | |||||
Dollar Tree, Inc.* | 7,400 | 414,992 | ||||||
Fossil, Inc.* | 3,600 | 253,728 | ||||||
Gannett Co., Inc. | 7,900 | 119,211 | ||||||
Interpublic Group of Companies, Inc.* | 9,200 | 97,704 | ||||||
Liberty Global, Inc., Class A* | 5,300 | 2 | 187,514 | |||||
Polaris Industries, Inc. | 7,100 | 553,942 | ||||||
Signet Jewelers, Ltd.* | 1,900 | 82,460 | ||||||
Sotheby’s | 6,700 | 301,500 | ||||||
Timberland Co.* | 10,300 | 253,277 | ||||||
Tractor Supply Co. | 5,000 | 242,450 | ||||||
TRW Automotive Holdings Corp.* | 4,600 | 2 | 242,420 | |||||
Warnaco Group, Inc., The* | 2,000 | 110,140 | ||||||
Williams-Sonoma, Inc. | 14,600 | 521,074 | ||||||
Total Consumer Discretionary | 4,754,258 | |||||||
Consumer Staples - 4.2% | ||||||||
Alberto-Culver Co. | 2,900 | 107,416 | ||||||
Constellation Brands, Inc.* | 3,600 | 79,740 | ||||||
Corn Products International, Inc. | 9,300 | 427,800 | ||||||
Energizer Holdings, Inc.* | 1,800 | 131,220 | ||||||
Hansen Natural Corp.* | 3,500 | 182,980 | ||||||
Herbalife, Ltd. | 3,500 | 239,295 | ||||||
Hormel Foods Corp. | 5,000 | 256,300 | ||||||
McCormick & Co., Inc. | 3,800 | 176,814 | ||||||
Nu Skin Enterprises, Inc., Class A | 3,900 | 118,014 | ||||||
Total Consumer Staples | 1,719,579 | |||||||
Energy - 5.3% | ||||||||
Berry Petroleum Co., Class A | 3,300 | 144,210 | ||||||
Bill Barrett Corp.* | 4,600 | 189,198 | ||||||
Newfield Exploration Co.* | 1,100 | 79,321 | ||||||
Oil States International, Inc.* | 9,800 | 628,082 | ||||||
Patterson-UTI Energy, Inc. | 16,800 | 362,040 | ||||||
| Shares | Value | |||||||
Seacor Holdings, Inc.* | 900 | $ | 90,981 | |||||
Tesoro Corp. | 15,800 | 292,932 | ||||||
Whiting Petroleum Corp.* | 3,200 | 375,008 | ||||||
Total Energy | 2,161,772 | |||||||
Financials - 18.9% | ||||||||
Ares Capital Corp. | 6,300 | 103,824 | ||||||
Assurant, Inc. | 11,000 | 423,720 | ||||||
Cathay General Bancorp | 48,500 | 809,950 | ||||||
CBL & Associates Properties, Inc. | 11,400 | 199,500 | ||||||
Chimera Investment Corp. | 57,400 | 235,914 | ||||||
Commerce Bancshares, Inc. | 240 | 9,535 | ||||||
Commonwealth REIT | 14,700 | 374,997 | ||||||
Everest Re Group, Ltd. | 1,400 | 118,748 | ||||||
Federal Realty Investment Trust | 2,700 | 210,411 | ||||||
First American Financial Corp. | 6,106 | 91,224 | ||||||
Hospitality Properties Trust | 15,200 | 350,208 | ||||||
Huntington Bancshares, Inc. | 61,000 | 419,070 | ||||||
Janus Capital Group, Inc. | 11,300 | 146,561 | ||||||
Legg Mason, Inc. | 9,500 | 344,565 | ||||||
Liberty Property Trust | 7,900 | 252,168 | ||||||
MFA Financial, Inc. | 47,100 | 384,336 | ||||||
National Retail Properties, Inc. | 11,600 | 307,400 | ||||||
Nationwide Health Properties, Inc. | 15,400 | 560,252 | ||||||
Platinum Underwriter Holdings, Ltd. | 6,700 | 2 | 301,299 | |||||
Raymond James Financial, Inc. | 8,900 | 291,030 | ||||||
Rayonier, Inc. | 6,700 | 351,884 | ||||||
Realty Income Corp. | 6,500 | 2 | 222,300 | |||||
RenaissanceRe Holdings, Ltd. | 8,800 | 560,472 | ||||||
SVB Financial Group* | 1,200 | 63,660 | ||||||
Tanger Factory Outlet Centers, Inc. | 3,300 | 168,927 | ||||||
Trustmark Corp. | 11,900 | 295,596 | ||||||
Webster Financial Corp. | 5,800 | 114,260 | ||||||
Total Financials | 7,711,811 | |||||||
Health Care - 10.6% | ||||||||
AMERIGROUP Corp.* | 8,300 | 364,536 | ||||||
Cephalon, Inc.* | 4,100 | 253,052 | ||||||
Cooper Companies, Inc., The | 9,100 | 512,694 | ||||||
Coventry Health Care, Inc.* | 18,100 | 477,840 | ||||||
Health Net, Inc.* | 20,500 | 559,445 | ||||||
Hill-Rom Holdings, Inc. | 11,000 | 433,070 | ||||||
The accompanying notes are an integral part of these financial statements.
9
Table of Contents
| Managers AMG Chicago Equity Partners Mid-Cap Fund |
| Schedule of Portfolio Investments (continued) |
| Shares | Value | |||||||
Health Care - 10.6% (continued) |
| |||||||
Kindred Healthcare, Inc.* | 10,700 | $ | 196,559 | |||||
Kinetic Concepts, Inc.* | 2,600 | 108,888 | ||||||
Medicis Pharmaceutical Corp., Class A | 13,600 | 364,344 | ||||||
Mettler-Toledo International, Inc.* | 1,500 | 226,815 | ||||||
Owens & Minor, Inc. | 6,850 | 2 | 201,596 | |||||
Sirona Dental Systems, Inc.* | 2,600 | 108,628 | ||||||
Steris Corp. | 3,300 | 120,318 | ||||||
United Therapeutics Corp.* | 6,500 | 410,930 | ||||||
Total Health Care | 4,338,715 | |||||||
Industrials - 18.1% | ||||||||
Aecom Technology Corp.* | 16,900 | 472,693 | ||||||
AGCO Corp.* | 2,800 | 141,848 | ||||||
Alaska Airgroup, Inc.* | 4,000 | 226,760 | ||||||
Alexander & Baldwin, Inc. | 7,800 | 312,234 | ||||||
Baldor Electric Co. | 1,800 | 113,472 | ||||||
Bucyrus International, Inc. | 3,000 | 268,200 | ||||||
Chicago Bridge & Iron Co., N.V.* | 2,700 | 88,830 | ||||||
Corporate Executive Board Co. | 4,100 | 153,955 | ||||||
Crane Co. | 8,400 | 344,988 | ||||||
EMCOR Group, Inc.* | 10,200 | 295,596 | ||||||
Esterline Technologies Corp.* | 900 | 61,731 | ||||||
Gardner Denver, Inc. | 2,500 | 172,050 | ||||||
GATX Corp. | 8,200 | 289,296 | ||||||
Hexcel Corp.* | 2,800 | 50,652 | ||||||
Joy Global, Inc. | 1,400 | 121,450 | ||||||
KBR, Inc. | 16,300 | 496,661 | ||||||
Kennametal, Inc. | 17,400 | 686,604 | ||||||
Manpower, Inc. | 5,100 | 320,076 | ||||||
Nordson Corp. | 3,900 | 358,332 | ||||||
Oshkosh Truck Corp.* | 5,400 | 190,296 | ||||||
R.R. Donnelley & Sons Co. | 7,500 | 131,025 | ||||||
Snap-On, Inc. | 2,100 | 118,818 | ||||||
Timken Co. | 21,000 | 1,002,330 | ||||||
Toro Co., The | 5,000 | 308,200 | ||||||
Towers Watson & Co., Class A | 2,300 | 119,738 | ||||||
United Rentals, Inc.* | 15,100 | 343,525 | ||||||
URS Corp.* | 4,300 | 178,923 | ||||||
Total Industrials | 7,368,283 | |||||||
Information Technology - 16.4% | ||||||||
Acme Packet, Inc.* | 2,100 | 111,636 | ||||||
| Shares | Value | |||||||
Anixter International, Inc. | 10,700 | $ | 639,111 | |||||
Aruba Networks, Inc.* | 3,200 | 66,816 | ||||||
Atmel Corp.* | 51,000 | 628,320 | ||||||
Avnet, Inc.* | 8,500 | 280,755 | ||||||
CommScope, Inc.* | 3,300 | 103,026 | ||||||
Factset Research Systems, Inc. | 7,400 | 693,824 | ||||||
Gartner, Inc.* | 15,800 | 524,560 | ||||||
IAC/InterActiveCorp* | 3,400 | 97,580 | ||||||
International Rectifier Corp.* | 10,900 | 323,621 | ||||||
MICROS Systems, Inc.* | 18,100 | 793,866 | ||||||
NCR Corp.* | 8,000 | 122,960 | ||||||
NeuStar, Inc., Class A* | 5,200 | 135,460 | ||||||
Plantronics, Inc. | 4,900 | 182,378 | ||||||
RF Micro Devices, Inc.* | 8,400 | 61,740 | ||||||
Riverbed Technology, Inc.* | 8,400 | 295,428 | ||||||
Skyworks Solutions, Inc.* | 9,900 | 283,437 | ||||||
Solera Holdings, Inc. | 5,200 | 266,864 | ||||||
Tech Data Corp.* | 2,000 | 88,040 | ||||||
TIBCO Software, Inc.* | 16,200 | 319,302 | ||||||
ValueClick, Inc.* | 8,600 | 137,858 | ||||||
Veeco Instruments, Inc.* | 3,100 | 2 | 133,176 | |||||
VeriFone Holdings, Inc.* | 6,100 | 235,216 | ||||||
Zebra Technologies Corp.* | 4,400 | 167,156 | ||||||
Total Information Technology | 6,692,130 | |||||||
Materials - 6.9% | ||||||||
Cabot Corp. | 11,800 | 444,270 | ||||||
Cytec Industries, Inc. | 3,300 | 175,098 | ||||||
Domtar Corp. | 4,300 | 326,456 | ||||||
International Flavors & Fragrances, Inc. | 1,000 | 55,590 | ||||||
Lubrizol Corp. | 5,000 | 534,400 | ||||||
Reliance Steel & Aluminum Co. | 4,200 | 214,620 | ||||||
Rock-Tenn Co., Class A | 2,100 | 113,295 | ||||||
RPM International, Inc. | 4,600 | 101,660 | ||||||
Sonoco Products Co. | 11,100 | 373,737 | ||||||
Worthington Industries, Inc. | 24,700 | 454,480 | ||||||
Total Materials | 2,793,606 | |||||||
Telecommunication Services - 0.9% | ||||||||
MetroPCS Communications, Inc.* | 16,300 | 205,869 | ||||||
Telephone & Data Systems, Inc. | 4,500 | 164,475 | ||||||
Total Telecommunication Services | 370,344 | |||||||
The accompanying notes are an integral part of these financial statements.
10
Table of Contents
Managers AMG Chicago Equity Partners Mid-Cap Fund Schedule of Portfolio Investments (continued) |
| Shares | Value | |||||||
Utilities - 5.7% | ||||||||
AGL Resources, Inc. | 2,500 | $ | 89,625 | |||||
American Water Works Co., Inc. | 7,800 | 197,262 | ||||||
Energen Corp. | 3,600 | 173,736 | ||||||
Idacorp, Inc. | 9,300 | 343,914 | ||||||
Integrys Energy Group, Inc. | 6,200 | 300,762 | ||||||
NiSource, Inc. | 28,600 | 503,932 | ||||||
Northeast Utilities | 17,300 | 551,524 | ||||||
Pepco Holdings, Inc. | 4,300 | 78,475 | ||||||
Piedmont Natural Gas Co. | 2,600 | 2 | 72,696 | |||||
Total Utilities | 2,311,926 | |||||||
Total Common Stocks (cost $33,119,818) | 40,222,424 | |||||||
| Shares | Value | |||||||
Short-Term Investments - 2.7%1 |
| |||||||
BNY Institutional Cash Reserves Fund, Series B*3,4 | 159,721 | $ | 127,301 | |||||
BNY Mellon Overnight Government Fund, 0.23%3 | 607,000 | 607,000 | ||||||
Dreyfus Cash Management Fund, Institutional Class Shares, 0.14% | 343,668 | 343,668 | ||||||
Total Short-Term Investments - |
| 1,077,969 | ||||||
Total Investments - 101.4% - |
| 41,300,393 | ||||||
Other Assets, less Liabilities - (1.4)% | (556,886 | ) | ||||||
Net Assets - 100.0% | $ | 40,743,507 | ||||||
Note: Based on the approximate cost of investments of $34,580,971 for Federal income tax purposes at December 31, 2010, the aggregate gross unrealized appreciation and depreciation were $6,910,209 and $190,787, respectively, resulting in net unrealized appreciation of investments of $6,719,422.
| * | Non-income-producing security. |
| 1 | Yield shown for each investment company represents the December 31, 2010, seven-day average yield, which refers to the sum of the previous seven days’ dividends paid, expressed as an annual percentage. |
| 2 | Some or all of these shares were out on loan to various brokers as of December 31, 2010, amounting to $745,322, or 1.8% of net assets. |
| 3 | Collateral received from brokers for securities lending was invested in this short-term investment. |
| 4 | On September 12, 2008, The Bank of New York Mellon established a separate sleeve of the BNY Institutional Cash Reserves Fund (Series B) to hold certain Lehman Brothers floating rate notes. The Fund’s position in Series B is being fair valued daily. (See Note 7 in the Notes to Financial Statements.) |
The following table summarizes the inputs used to value the Fund’s net assets by the fair value hierarchy levels as of December 31, 2010: (See Note 1(a) in the Notes to Financial Statements.)
| Quoted Prices in Active Markets for Identical Investments Level 1 | Significant Other Observable Inputs Level 2 | Significant Unobservable Inputs Level 3 | Total | |||||||||||||
Investments in Securities | ||||||||||||||||
Common Stocks† | $ | 40,222,424 | — | — | $ | 40,222,424 | ||||||||||
Short-Term Investments | 950,668 | $ | 127,301 | — | 1,077,969 | |||||||||||
Total Investments in Securities | $ | 41,173,092 | $ | 127,301 | — | $ | 41,300,393 | |||||||||
| † | All common stocks held in the Fund are Level 1 securities. For a detailed break-out of common stocks by major industry classification, please refer to the Schedule of Portfolio Investments. |
As of December 31, 2010, the Fund had no significant transfers between Level 1 and Level 2 from the beginning of the reporting period.
Investments Definitions and Abbreviations:
REIT: Real Estate Investment Trust
The accompanying notes are an integral part of these financial statements.
11
Table of Contents
| Managers AMG Chicago Equity Partners Balanced Fund |
| Investment Manager’s Comments |
The Year in Review
For the year ended December 31, 2010, the Managers AMG Chicago Equity Partners Balanced Fund’s Institutional Class returned 11.42%, underperforming the 12.72% return for its hypothetical benchmark, which consists of 60% of the return of the Russell 1000® Index and 40% of the return of the Barclays Capital U.S. Aggregate Bond Index.
During the second half of the year, the Fund’s allocation was approximately 5% underweight to stocks, which was the main reason for the underperformance because equities posted double-digit gains during the last two quarters, while fixed income was slightly negative during the fourth quarter. We moved to this allocation in mid-August, reflecting the continued economic uncertainty and slow growth recovery scenario. As a result of the Fed’s actions and other positive news, the more cautious allocation erased the positive excess returns from both the equity and fixed portfolios over the one-year period.
The S&P 500 finished the year up 15%, posting a second year of double-digit gains as the market continues to recover from the financial crisis. Reaching that 15% return was no easy feat, however. The market had to digest several crisis (PIIGS, Gulf oil spill, flash crash) and mixed economic news (domestic and global) throughout the year. Recall that at the end of the second quarter, the S&P 500 was down almost 7%, and the words “double dip” were on the tip of everyone’s tongue. It wasn’t until the late August Fed meeting at Jackson Hole, Wyoming, that the market rallied, reflecting high expectations for Quantitative Easing 2.0 (QE2).
The equity portion of the Fund slightly outperformed its benchmark for the year. For the year, the highest ranked stocks outperformed the lowest ranked stocks, but the spread between the two was narrower than the long term. The performance of the quantitative factors (grouped by valuation, quality, momentum, and growth) that the Fund uses varied by quarter. Value has been particularly inconsistent, working in the first quarter, negative in the second quarter, only to work very well in the third quarter. While value was the best factor group in the fourth quarter, it was driven mostly by the month of December when the low-priced stocks (and P/B factor) rallied. Despite doing well in October and November, the momentum factors reversed in December, ending the quarter with a negative average.
After much variation throughout the year, all four factor groups ended 2010 with a positive average return. Security selection in consumer discretionary, consumer staples, and telecommunications was positive; selection from the industrial, health care, and utility sectors detracted from performance.
Overall, our philosophy will not change based on short-term trends or conditions in the market. Our goal is to add value through security selection, while attempting to neutralize other risk factors, such as market cap and sector rotation, for which there is not adequate compensation by the market.
The fixed-income market was characterized by two different sets of expectations in 2010. After remaining stable though the first quarter, interest rates declined dramatically in the second and third quarters as economic growth decelerated from 2009 levels. As the possibility of a double-dip recession emerged, investors globally became more risk averse. In addition to concerns over the U.S. economy, concern
developed over the credit worthiness of several European countries. In the fourth quarter, however, renewed optimism resulting from the Federal Reserve’s announcement of additional stimulus, in the form of QE2, caused interest rates to increase sharply. In spite of the change of direction in rates in the fourth quarter, fixed income returns finished the year at or above historical averages. Excess non-Treasury sectors remained strong in 2010. Quality spreads, curve slope, and rate volatility, likewise responded to the changing outlook throughout 2010. After declining dramatically in 2009 and early 2010, quality spreads increased mid-year, but resumed their decline into year end. The yield curve, after flattening early in 2010, resumed an upward slope after the Fed announced its desire to stimulate inflation. While reported year-over-year core CPI was at the lowest level in 50 years through November 2010, bond markets have increased the inflation premium in fixed income securities in spite of uncertainty over the effectiveness of QE2. The fixed income portion of the Fund outperformed over the one-year period.
Looking Forward
We have reduced our exposure to credit given concerns about 2011. In a post financial crisis environment, we believe the credit cycle will likely be shorter than in a normal post-recession period. Valuations are no longer compelling given the macroeconomic uncertainty. Agency debentures, agency mortgage-backed securities, and Treasuries were purchased with corporate sale proceeds. Reducing risk is prudent at this point in the recovery. Additionally, the portfolio is positioned to take advantage of the steep yield curve, while portfolio duration remains within + / -10% of the benchmark. As always, we will be diligent in monitoring exposures and will adjust the portfolio accordingly as we monitor the market conditions.
This commentary reflects the viewpoints of the portfolio manager, Chicago Equity Partners, as of January 21, 2011.
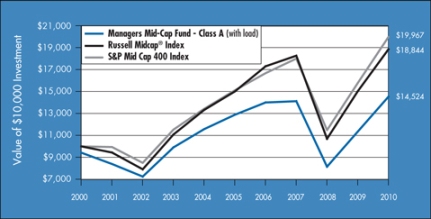
Cumulative Total Return Performance
The Fund’s cumulative total return is based on the daily change in net asset value (NAV), and assumes that all dividends and distributions were reinvested. The Barclays Capital U.S. Aggregate Bond Index is an index of the U.S. investment-grade fixed-rate bond market, including both government and corporate bonds. The Russell 1000® Index measures the performance of the large-cap segment of the U.S. equity universe. It is a subset of the Russell 3000® Index and includes approximately 1000 of the largest securities based on a combination of their market cap and current index membership. The Russell 1000® Index represents approximately 92% of the U.S. market. The S&P 500 Index is a capitalization-weighted index of 500 stocks. The S&P 500 Index is designed to measure performance of the broad domestic economy through changes in the aggregate market value of 500 stocks representing all major industries. Unlike the Fund, the Russell 1000® Index, the S&P 500 Index, and the Barclays Capital U.S. Aggregate Bond Index are unmanaged, are not available for investment, and do not incur expenses. The chart illustrates the performance of a hypothetical $10,000 investment made in the Fund’s Class A Shares (with load) on December 31, 2000, to a $10,000 investment made in the benchmarks for the same time periods. The graph and table do not reflect the deduction of taxes that a shareholder would pay on a Fund distribution or redemption of shares. Performance for periods longer than one year is annualized. The listed returns for the Fund
| 12 |
Table of Contents
| Managers AMG Chicago Equity Partners Balanced Fund |
| Investment Manager’s Comments (continued) |
Cumulative Total Return Performance (continued) |
are net of expenses and the returns for the indices exclude expenses. Total returns for the Fund would have been lower had certain expenses not been reduced.
The table below shows the average annual total returns for the Managers AMG CEP Balanced Fund, 60% Russell 1000® Index & 40% Barclays Capital U.S. Aggregate Bond Index, and 60% S&P 500 & 40% Barclays Capital U.S. Aggregate Bond Index from December 31, 2000 through December 31, 2010.
Average Annual Total Returns1 | 1 Year | 5 Years | 10 Years | |||||||||||||
Managers AMG CEP Balanced Fund2,3 | -Class A | No Load | 11.14 | % | 5.24 | % | 4.10 | % | ||||||||
| -Class A | With Load | 4.76 | % | 4.01 | % | 3.49 | % | |||||||||
| -Class B | No Load | 10.28 | % | 4.47 | % | 3.46 | % | |||||||||
| -Class B | With Load | 5.28 | % | 4.13 | % | 3.46 | % | |||||||||
| -Class C | No Load | 10.27 | % | 4.46 | % | 3.45 | % | |||||||||
| -Class C | With Load | 9.27 | % | 4.46 | % | 3.45 | % | |||||||||
| -Institutional Class | No Load | 11.42 | % | 5.50 | % | 4.49 | % | |||||||||
60% Russell 1000® Index & 40% Barclays Capital U.S. Aggregate Bond Index4,5 | 12.72 | % | 4.74 | % | 4.09 | % | ||||||||||
60% S&P 500 Index & 40% Barclays Capital U.S. Aggregate Bond Index (former benchmark)6 | 12.10 | % | 4.55 | % | 3.83 | % | ||||||||||
The performance data shown represents past performance. Past performance is not a guarantee of future results. Current performance may be lower or higher than the performance data quoted. The investment return and the principal value of an investment will fluctuate so that an investor’s shares, when redeemed, may be worth more or less than their original cost. For performance information through the most recent month end please call (800) 835-3879 or visit our Web site at www.managersinvest.com.
Performance differences among the share classes are due to differences in sales charge structures and class expenses. Returns shown reflect maximum sales charge of 5.75% on Class A, as well as the applicable contingent deferred sales charge (CDSC) on both Class B and C shares. The Class B shares’ CDSC declines annually between years 1 through 6 according to the following schedule: 5, 4, 3, 3, 2, 1%. No sales charge is assessed after year six. Class C shares held for less than one year are subject to a 1% CDSC.
In choosing a Fund, investors should carefully consider the amount they plan to invest, their investment objectives, the Fund’s investment objectives, risks, charges and expenses before investing. For this and other information, please call (800) 835-3879 or visit www.managersinvest.com for a
free prospectus. Read it carefully before investing or sending money. Distributed by Managers Distributors, Inc., member FINRA.
| 1 | Total return equals income yield plus share price change and assumes reinvestment of all dividends and capital gain distributions. Returns are net of fees and may reflect offsets of Fund expenses as described in the Prospectus. No adjustment has been made for taxes payable by shareholders on their reinvested dividends and capital gain distributions. Returns for periods greater than one year are annualized. The listed returns on the Fund are net of expenses and based on the published NAV as of December 31, 2010. All returns are in U.S. dollars($). |
| 2 | The Fund is subject to risks associated with investments in debt securities, such as default risk and fluctuations in the perception of the debtors’ ability to pay their creditors. |
| 3 | From time to time, the Fund’s advisor has waived its fees and/or absorbed Fund expenses, which has resulted in higher returns. |
| 4 | The Russell 1000® Index measures the performance of approximately 1,000 of the largest securities based on a combination of their market cap and current index membership. The Russell 1000 represents approximately 92% of the U.S. Market. Unlike the Fund, the Russell 1000® Index is unmanaged, is not available for investment, and does not incur expenses. |
| 5 | The Barclays Capital U.S. Aggregate Bond Index is an index of the U.S. investment-grade fixed-rate bond market, including both government and corporate bonds. Unlike the Fund, the Barclays Capital U.S. Aggregate Bond Index is unmanaged, is not available for investment, and does not incur expenses. |
| 6 | The Fund’s former benchmark was a combination of the S&P 500 Index and the Barclays Capital U.S. Aggregate Index. The S&P 500 Index is a capitalization-weighted index of 500 stocks. The S&P 500 Index is designed to measure performance of the broad domestic economy through changes in the aggregate market value of 500 stocks representing all major industries. The Barclays Capital U.S. Aggregate Bond Index is an index of the U.S. investment-grade fixed-rate bond market, including both government and corporate bonds. Unlike the Fund, the S&P 500 and the Barclays Capital U.S. Aggregate Bond Index is unmanaged, is not available for investment, and does not incur expenses. On December 31, 2009, the Investment Manager changed the benchmark from the S&P 500 Index and the Barclays Capital U.S. Aggregate Bond Index to the Russell 1000® Index. |
The Russell 1000® Index is a registered trademark of Russell Investments. Russell® is a trademark of Russell Investments.
Not FDIC insured, nor bank guaranteed. May lose value.
13
Table of Contents
| Managers AMG Chicago Equity Partners Balanced Fund |
| Fund Snapshots |
| December 31, 2010 |
Portfolio Breakdown
Industry | Managers AMG CEP Balanced Fund** | |||
U. S. Government and Agency Obligations | 31.3 | % | ||
Information Technology | 11.6 | % | ||
Financials | 10.0 | % | ||
Industrials | 9.9 | % | ||
Health Care | 6.4 | % | ||
Consumer Staples | 6.2 | % | ||
Energy | 6.2 | % | ||
Consumer Discretionary | 5.6 | % | ||
Mortgage-Backed Securities | 2.9 | % | ||
Materials | 2.7 | % | ||
Utilities | 2.4 | % | ||
Telecommunication Services | 1.6 | % | ||
Asset-Backed Securities | 0.2 | % | ||
Other Assets and Liabilities | 3.0 | % | ||
| ** | As a percentage of net assets |
Top Ten Holdings
Top Ten Holdings | % of Net Assets | |||
FHLMC, 1.625%, 09/26/12 | 1.9 | % | ||
Johnson & Johnson* | 1.7 | |||
FHLB, 4.000%, 09/06/13 | 1.6 | |||
U.S. Treasury, Principal Only Strip, 08/15/39 | 1.4 | |||
International Business Machines Corp. | 1.4 | |||
U.S. Treasury Notes, 2.250%, 05/31/14 | 1.4 | |||
Apple, Inc.* | 1.3 | |||
ConocoPhillips Co.* | 1.3 | |||
FNMA, 4.500%, 10/01/40 | 1.3 | |||
FNMA, 5.000%, 08/01/40 | 1.3 | |||
Top Ten as a Group | 14.6 | % | ||
| * | Top Ten Holding at June 30, 2010 |
Any sectors, industries, or securities discussed should not be perceived as investment recommendations. Mention of a specific security should not be considered a recommendation to buy or solicitation to sell that security. Specific securities mentioned in this report may have been sold from the Fund’s portfolio of investments by the time you receive this report.
14 |
Table of Contents
| Managers AMG Chicago Equity Partners Balanced Fund |
| Schedule of Portfolio Investments |
| December 31, 2010 |
Security Description | Shares | Value | ||||||
Common Stocks - 57.5% | ||||||||
Consumer Discretionary - 5.6% | ||||||||
Advance Auto Parts, Inc. | 500 | $ | 33,075 | |||||
Carmax, Inc.* | 1,400 | 44,632 | ||||||
Coach, Inc. | 500 | 27,655 | ||||||
Interpublic Group of Companies, Inc.* | 10,600 | 112,572 | ||||||
Liberty Global, Inc., Class A* | 3,500 | 2 | 123,830 | |||||
Macy’s, Inc. | 2,400 | 60,720 | ||||||
McDonald’s Corp. | 1,700 | 130,492 | ||||||
News Corp., Inc., Class A | 9,600 | 139,776 | ||||||
Ross Stores, Inc. | 1,500 | 94,875 | ||||||
Stanley Black & Decker, Inc. | 1,200 | 80,244 | ||||||
Starbucks Corp. | 4,500 | 144,585 | ||||||
TRW Automotive Holdings Corp.* | 1,100 | 2 | 57,970 | |||||
Total Consumer Discretionary | 1,050,426 | |||||||
Consumer Staples - 6.2% | ||||||||
Altria Group, Inc. | 3,120 | 76,815 | ||||||
Coca-Cola Co., The | 2,500 | 164,425 | ||||||
Coca-Cola Enterprises, Inc. | 1,900 | 47,557 | ||||||
Corn Products International, Inc. | 1,700 | 78,200 | ||||||
Estee Lauder Co., Class A | 2,300 | 185,610 | ||||||
Herbalife, Ltd. | 1,000 | 68,370 | ||||||
Hormel Foods Corp. | 1,400 | 71,764 | ||||||
Kroger Co., The | 2,100 | 46,956 | ||||||
Lorillard, Inc. | 1,300 | 106,678 | ||||||
McCormick & Co., Inc. | 2,000 | 93,060 | ||||||
Wal-Mart Stores, Inc. | 4,300 | 231,899 | ||||||
Total Consumer Staples | 1,171,334 | |||||||
Energy - 6.2% | ||||||||
Chevron Corp. | 1,500 | 136,875 | ||||||
ConocoPhillips Co. | 3,700 | 251,970 | ||||||
Devon Energy Corp. | 1,900 | 149,169 | ||||||
Exxon Mobil Corp. | 3,020 | 220,823 | ||||||
Halliburton Co. | 1,900 | 77,577 | ||||||
Oil States International, Inc.* | 1,800 | 115,362 | ||||||
Patterson-UTI Energy, Inc. | 4,100 | 88,355 | ||||||
Seacor Holdings, Inc.* | 200 | 20,218 | ||||||
Tesoro Corp. | 2,600 | 48,204 | ||||||
Valero Energy Corp. | 2,400 | 55,488 | ||||||
Total Energy | 1,164,041 | |||||||
The accompanying notes are an integral part of these financial statements. 15 |
Table of Contents
| Managers AMG Chicago Equity Partners Balanced Fund |
| Schedule of Portfolio Investments (continued) |
Security Description | Shares | Value | ||||||
Financials - 9.0% | ||||||||
American Express Co. | 600 | $ | 25,752 | |||||
American Financial Group, Inc. | 2,800 | 90,412 | ||||||
Annaly Capital Management, Inc. | 4,000 | 71,680 | ||||||
Berkshire Hathaway, Inc., Class B* | 800 | 64,088 | ||||||
Capital One Financial Corp. | 2,600 | 110,656 | ||||||
Citigroup, Inc.* | 38,000 | 179,740 | ||||||
Commonwealth REIT | 4,200 | 107,142 | ||||||
Discover Financial Services | 2,500 | 46,325 | ||||||
Goldman Sachs Group, Inc. | 545 | 91,647 | ||||||
JPMorgan Chase & Co. | 5,348 | 226,862 | ||||||
KeyCorp | 23,000 | 203,550 | ||||||
M&T Bank Corp. | 900 | 78,345 | ||||||
RenaissanceRe Holdings, Ltd. | 2,700 | 171,963 | ||||||
SL Green Realty Corp. | 900 | 60,759 | ||||||
SLM Corp.* | 3,800 | 47,842 | ||||||
Travelers Companies, Inc., The | 1,200 | 66,852 | ||||||
Wells Fargo & Co. | 1,500 | 46,485 | ||||||
Total Financials | 1,690,100 | |||||||
Health Care - 6.4% | ||||||||
AmerisourceBergen Corp. | 5,600 | 191,072 | ||||||
Amgen, Inc.* | 2,900 | 159,210 | ||||||
Biogen Idec, Inc.* | 700 | 46,935 | ||||||
CR Bard, Inc. | 1,200 | 110,124 | ||||||
Hill-Rom Holdings, Inc. | 1,400 | 55,118 | ||||||
Humana, Inc.* | 1,800 | 98,532 | ||||||
Johnson & Johnson | 5,100 | 315,435 | ||||||
Medco Health Solutions, Inc.* | 1,500 | 91,905 | ||||||
Pfizer, Inc. | 8,157 | 142,829 | ||||||
Total Health Care | 1,211,160 | |||||||
Industrials - 6.2% | ||||||||
Caterpillar, Inc. | 900 | 84,294 | ||||||
Chicago Bridge & Iron Co., N.V.* | 2,200 | 72,380 | ||||||
General Dynamics Corp. | 1,200 | 85,152 | ||||||
General Electric Co. | 9,300 | 170,097 | ||||||
Grainger (W.W.), Inc. | 1,000 | 138,110 | ||||||
KBR, Inc. | 1,500 | 45,705 | ||||||
Manpower, Inc. | 1,100 | 69,036 | ||||||
Northrop Grumman Corp. | 1,900 | 123,082 | ||||||
Timken Co. | 4,400 | 210,012 | ||||||
Union Pacific Corp. | 600 | 55,596 | ||||||
The accompanying notes are an integral part of these financial statements. 16 |
Table of Contents
| Managers AMG Chicago Equity Partners Balanced Fund |
| Schedule of Portfolio Investments (continued) |
Security Description | Shares | Value | ||||||
Industrials - 6.2% (continued) | ||||||||
United Continental Holdings, Inc.* | 2,000 | $ | 47,640 | |||||
United Parcel Service, Inc., Class B | 900 | 65,322 | ||||||
Total Industrials | 1,166,426 | |||||||
Information Technology - 11.6% | ||||||||
Accenture PLC, Class A | 3,700 | 179,413 | ||||||
Altera Corp. | 4,200 | 149,436 | ||||||
Apple, Inc.* | 790 | 254,822 | ||||||
Automatic Data Processing, Inc. | 900 | 41,652 | ||||||
Cognizant Technology Solutions Corp.* | 1,200 | 87,948 | ||||||
F5 Networks, Inc.* | 1,700 | 221,272 | ||||||
Google, Inc.* | 170 | 100,975 | ||||||
International Business Machines Corp. | 1,800 | 264,168 | ||||||
Intuit, Inc.* | 1,400 | 69,020 | ||||||
Jabil Circuit, Inc. | 3,000 | 60,270 | ||||||
Linear Technology Corp. | 4,000 | 138,360 | ||||||
Microsoft Corp. | 8,250 | 230,340 | ||||||
NetApp, Inc.* | 2,200 | 120,912 | ||||||
Oracle Corp. | 3,200 | 100,160 | ||||||
Tech Data Corp.* | 700 | 30,814 | ||||||
Visa, Inc., Class A | 1,900 | 133,722 | ||||||
Total Information Technology | 2,183,284 | |||||||
Materials - 2.7% | ||||||||
Alcoa, Inc. | 4,100 | 63,099 | ||||||
Cabot Corp. | 1,500 | 56,475 | ||||||
Domtar Corp. | 1,000 | 75,920 | ||||||
Freeport McMoRan Copper & Gold, Inc., Class B | 900 | 108,081 | ||||||
Lubrizol Corp. | 1,400 | 149,632 | ||||||
PPG Industries, Inc. | 700 | 58,849 | ||||||
Total Materials | 512,056 | |||||||
Telecommunication Services - 1.6% | ||||||||
American Tower Corp., Class A* | 400 | 20,656 | ||||||
AT&T, Inc. | 6,500 | 190,970 | ||||||
Verizon Communications, Inc. | 2,600 | 93,028 | ||||||
Total Telecommunication Services | 304,654 | |||||||
Utilities - 2.0% | ||||||||
Duke Energy Corp. | 9,600 | 170,976 | ||||||
Integrys Energy Group, Inc. | 1,800 | 87,318 | ||||||
NiSource, Inc. | 2,700 | 47,574 | ||||||
Pepco Holdings, Inc. | 3,900 | 71,175 | ||||||
Total Utilities | 377,043 | |||||||
Total Common Stocks (cost $8,996,145) | 10,830,524 | |||||||
The accompanying notes are an integral part of these financial statements. 17 |
Table of Contents
| Managers AMG Chicago Equity Partners Balanced Fund |
| Schedule of Portfolio Investments (continued) |
Security Description | Principal Amount | Value | ||||||
Corporate Bonds - 5.1% | ||||||||
Financials - 1.0% | ||||||||
American Express Co., 7.250%, 05/20/14 | $ | 50,000 | $ | 57,005 | ||||
Bank of America Corp., 5.750%, 12/01/17 | 15,000 | 15,632 | ||||||
Bank of America Funding Corp., 7.625%, 06/01/19 | 5,000 | 5,766 | ||||||
Citigroup, Inc. 8.500%, 05/22/19 | 15,000 | 18,651 | ||||||
Credit Suisse New York, Medium Term Notes, 5.000%, 05/15/13 | 40,000 | 43,075 | ||||||
General Electric Capital Corp., Global Medium Term Notes, Series A, 6.750%, 03/15/32 | 10,000 | 11,355 | ||||||
Goldman Sachs Group, Inc., 5.950%, 01/18/18 | 15,000 | 16,297 | ||||||
JPMorgan Chase & Co., 6.000%, 01/15/18 | 15,000 | 16,775 | ||||||
Morgan Stanley, 5.950%, 12/28/17 | 5,000 | 5,298 | ||||||
Morgan Stanley, Global Medium Term Notes, Series F, 5.625%, 09/23/19 | 5,000 | 5,107 | ||||||
Total Financials | 194,961 | |||||||
Industrials - 3.7% | ||||||||
Altria Group, Inc., 9.700%, 11/10/18 | 23,000 | 30,387 | ||||||
AT&T, Inc., 5.100%, 09/15/14 | 80,000 | 87,602 | ||||||
AT&T, Inc., 6.700%, 11/15/13 | 65,000 | 73,900 | ||||||
Coca-Cola Enterprises, Inc., 7.375%, 03/03/14 | 50,000 | 58,328 | ||||||
E.I. du Pont de Nemours & Company, 5.000%, 01/15/13 | 6,000 | 6,448 | ||||||
Hewlett-Packard Co., 4.500%, 03/01/13 | 55,000 | 58,900 | ||||||
Honeywell International, Inc., 4.250%, 03/01/13 | 55,000 | 2 | 58,852 | |||||
International Business Machines Corp., 5.600%, 11/30/39 | 20,000 | 21,872 | ||||||
Kellogg Co., 7.450%, 04/01/31 | 20,000 | 25,136 | ||||||
Kroger Co., The, 5.500%, 02/01/13 | 25,000 | 27,056 | ||||||
Kroger Co., The, 6.750%, 04/15/12 | 40,000 | 42,714 | ||||||
McDonald’s Corp., 4.300%, 03/01/13 | 40,000 | 42,664 | ||||||
McDonald’s Corp., 6.300%, 10/15/37 | 20,000 | 23,663 | ||||||
TransCanada Pipelines, Ltd., 4.875%, 01/15/15 | 45,000 | 49,150 | ||||||
United Parcel Service, Inc., 6.200%, 01/15/38 | 20,000 | 23,553 | ||||||
Wal-Mart Stores, Inc., 6.500%, 08/15/37 | 20,000 | 23,577 | ||||||
Wyeth, 5.250%, 03/15/13 | 40,000 | 43,758 | ||||||
Total Industrials | 697,560 | |||||||
Utilities - 0.4% | ||||||||
Florida Power & Light Co., 4.850%, 02/01/13 | 45,000 | 48,188 | ||||||
Georgia Power Co., Series 2010B, 5.400%, 06/01/40 | 20,000 | 20,277 | ||||||
Total Utilities | 68,465 | |||||||
Total Corporate Bonds (cost $899,865) | 960,986 | |||||||
Asset-Backed Securities - 0.2% | ||||||||
Harley-Davidson Motorcycle Trust 2006-2, Class A2, 5.350%, 03/15/13 (cost $33,407) | 33,431 | 33,782 | ||||||
Mortgage-Backed Securities - 2.9% | ||||||||
Bank of America Commercial Mortgage, Inc., Series 2005-6, Class A4, 5.195%, 09/10/474 | 96,000 | 103,227 | ||||||
CSFB Mortgage Securities Corp., Series 2005-C2, Class A3, 4.691%, 04/15/37 | 68,435 | 68,726 | ||||||
The accompanying notes are an integral part of these financial statements. 18 |
Table of Contents
| Managers AMG Chicago Equity Partners Balanced Fund |
| Schedule of Portfolio Investments (continued) |
Security Description | Principal Amount | Value | ||||||
Mortgage-Backed Securities - 2.9% (continued) | ||||||||
GE Capital Commercial Mortgage Corp., Series 2002-2A, Class A2, 4.970%, 08/11/36 | $ | 14,449 | $ | 14,832 | ||||
Greenwich Capital Commercial Funding Corp., Series 2005-GG5, Class A2, 5.117%, 04/10/37 | 108,320 | 109,161 | ||||||
Greenwich Capital Commercial Funding Corp., Series 2004-GG1, Class A7, 5.317%, 06/10/364 | 80,000 | 86,354 | ||||||
JP Morgan Chase Mortgage Securities Corp., Series 2002-C2, Class A2, 5.050%, 12/12/34 | 90,000 | 94,843 | ||||||
Wachovia Bank Commercial Mortgage Trust, Series 2005-C16, Class A4, 4.850%, 10/15/414 | 70,000 | 74,698 | ||||||
Total Mortgage-Backed Securities (cost $500,555) | 551,841 | |||||||
U.S. Government and Agency Obligations - 31.3% | ||||||||
Federal Home Loan Bank - 2.0% | ||||||||
FHLB, 4.000%, 09/06/13 | 280,000 | 301,712 | ||||||
FHLB, 5.375%, 05/18/16 | 65,000 | 74,660 | ||||||
Total Federal Home Loan Bank | 376,372 | |||||||
Federal Home Loan Mortgage Corporation - 6.7% | ||||||||
FHLMC, 1.625%, 09/26/12 | 350,000 | 356,301 | ||||||
FHLMC, 3.750%, 03/27/19 | 215,000 | 2 | 222,955 | |||||
FHLMC, 4.375%, 07/17/15 | 55,000 | 60,729 | ||||||
FHLMC, 4.500%, 01/15/14 to 11/01/24 | 216,480 | 236,145 | ||||||
FHLMC, 4.750%, 11/17/15 | 145,000 | 162,611 | ||||||
FHLMC, 5.000%, 12/01/20 | 64,218 | 68,412 | ||||||
FHLMC, 5.125%, 07/15/12 | 35,000 | 37,432 | ||||||
FHLMC, 6.000%, 01/01/38 | 63,588 | 68,959 | ||||||
FHLMC Gold Pool, 6.000%, 04/01/38 | 46,474 | 50,399 | ||||||
Total Federal Home Loan Mortgage Corporation | 1,263,943 | |||||||
Federal National Mortgage Association - 17.5% | ||||||||
FNMA, 2.875%, 12/11/13 | 45,000 | 2 | 47,338 | |||||
FNMA, 3.630%, 02/12/13 | 65,000 | 68,949 | ||||||
FNMA, 4.000%, 10/01/20 to 10/01/40 | 335,228 | 338,188 | ||||||
FNMA, 4.375%, 03/15/13 | 160,000 | 172,494 | ||||||
FNMA, 4.500%, 11/01/19 to 10/01/40 | 751,969 | 774,778 | ||||||
FNMA, 5.000%, 05/11/17 to 08/01/40 | 854,597 | 916,468 | ||||||
FNMA, 5.375%, 07/15/16 to 06/12/17 | 220,000 | 253,295 | ||||||
FNMA, 5.500%, 02/01/22 to 06/01/38 | 463,376 | 497,104 | ||||||
FNMA, 6.000%, 03/01/37 to 08/01/37 | 147,883 | 161,084 | ||||||
FNMA, 6.500%, 03/01/37 | 53,275 | 59,413 | ||||||
Total Federal National Mortgage Association | 3,289,111 | |||||||
United States Treasury Securities - 5.1% | ||||||||
U.S. Treasury Bonds, 3.500% 02/05/39 | 275,000 | 237,016 | ||||||
U.S. Treasury Notes, 2.250%, 05/31/14 | 250,000 | 258,652 | ||||||
U.S. Treasury Notes, 2.625%, 08/15/20 | 206,100 | 195,425 | ||||||
U.S. Treasury, Principal Only Strip, 08/15/39 | 1,000,000 | 270,314 | ||||||
Total United States Treasury Treasury Securities | 961,407 | |||||||
Total U.S. Government and Agency Obligations (cost $5,928,102) | 5,890,833 | |||||||
The accompanying notes are an integral part of these financial statements. 19 |
Table of Contents
| Managers AMG Chicago Equity Partners Balanced Fund |
| Schedule of Portfolio Investments (continued) |
Security Description | Shares | Value | ||||||
Short-Term Investments - 6.0%1 | ||||||||
BNY Institutional Cash Reserves Fund, Series B*3,5 | 28,392 | $ | 22,629 | |||||
BNY Mellon Overnight Government Fund, 0.23%3 | 344,000 | 344,000 | ||||||
Dreyfus Cash Management Fund, Institutional Class Shares, 0.14% | 771,247 | 771,247 | ||||||
Total Short-Term Investments (cost $1,143,639) | 1,137,876 | |||||||
Total Investments - 103.0% (cost $17,501,712) | 19,405,842 | |||||||
Other Assets, less Liabilities - (3.0)% | (570,248 | ) | ||||||
Net Assets - 100.0% | $ | 18,835,594 | ||||||
Note: Based on the approximate cost of investments of $17,567,700 for Federal income tax purposes at December 31, 2010, the aggregate gross unrealized appreciation and depreciation were $2,001,660 and $163,518, respectively, resulting in net unrealized appreciation of investments of $1,838,142.
| * | Non-income-producing security. |
| 1 | Yield shown for each investment company represents the December 31, 2010, seven-day average yield, which refers to the sum of the previous seven days’ dividends paid, expressed as an annual percentage. |
| 2 | Some or all of these securities were out on loan to various brokers as of December 31, 2010, amounting to a market value of $363,692, or 1.9% of net assets. |
| 3 | Collateral received from brokers for securities lending was invested in this short-term investment. |
| 4 | Variable Rate Security. The rate listed is as of December 31, 2010, and is periodically reset subject to terms and conditions set forth in the debenture. |
| 5 | On September 12, 2008, The Bank of New York Mellon established a separate sleeve of the BNY Institutional Cash Reserves Fund (Series B) to hold certain Lehman Brothers floating rate notes. The Fund’s position in Series B is being fair valued daily. (See Note 7 in the Notes to Financial Statements.) The following table summarizes the inputs used to value the Fund’s net assets by the fair value hierarchy levels as of December 31, 2010: (See Note 1(a) in the Notes to Financial Statements.) |
| Quoted Prices in Active Markets for Identical Investments Level 1 | Significant Other Observable Inputs Level 2 | Significant Unobservable Inputs Level 3 | Total | |||||||||||||
Investments in Securities | ||||||||||||||||
Common Stocks† | $ | 10,830,524 | — | — | $ | 10,830,524 | ||||||||||
Corporate Bonds†† | — | $ | 960,986 | — | 960,986 | |||||||||||
U.S. Government and Agency Obligations | ||||||||||||||||
Federal Home Loan Bank | — | 376,372 | — | 376,372 | ||||||||||||
Federal Home Loan Mortgage Corporation | — | 1,263,943 | — | 1,263,943 | ||||||||||||
Federal National Mortgage Association | — | 3,289,111 | — | 3,289,111 | ||||||||||||
United States Treasury Securities | — | 961,407 | — | 961,407 | ||||||||||||
Asset-Backed Securities | — | 33,782 | — | 33,782 | ||||||||||||
Mortgage-Backed Securities | — | 551,841 | — | 551,841 | ||||||||||||
Short-Term Investments | 1,115,247 | 22,629 | — | 1,137,876 | ||||||||||||
Total Investments in Securities | $ | 11,945,771 | $ | 7,460,071 | — | $ | 19,405,842 | |||||||||
| † | All common stocks held in the Fund are Level 1 securities. For a detailed break-out of common stocks by major industry classification, please refer to the Schedule of Portfolio Investments. |
| †† | All corporate bonds held in the Fund are Level 2 securities. For a detailed break-out of the corporate bonds by major industry classification, please refer to the Schedule of Portfolio Investments. |
As of December 31, 2010, the Fund had no significant transfers between Level 1 and Level 2 from the beginning of the reporting period.
Investments Definitions and Abbreviations:
| FHLB: | Federal Home Loan Bank | |
| FHLMC: | Federal Home Loan Mortgage Corp. | |
| FNMA: | Federal National Mortgage Association | |
| REIT: | Real Estate Investment Trust | |
The accompanying notes are an integral part of these financial statements. 20 |
Table of Contents
| Managers High Yield Fund |
| Investment Manager’s Comments |
The Year in Review
The Managers High Yield Fund (Institutional Class shares) returned 14.58% in 2010, compared with 15.12% for the Barclays Capital U.S. Corporate High Yield Index (the “Index”).
High-yield began the year on a strong note as it continued to build on the solid momentum of year-end 2009. Spreads were somewhat volatile in February before swiftly recovering and trending tighter through the end of April. In general, however, improving economic data, favorable technicals, strong capital market conditions, and lower default trends provided an encouraging backdrop to the high yield market through early April. By the end of April, high-yield bonds had posted 14-consecutive monthly gains and the year-to-date return was 7%. At the same time, the primary market was setting both weekly and monthly records. May ushered in a substantial correction as market volatility surged due to European sovereign concerns causing risk appetite levels to wane leading to a steady stream of large retail outflows and a sharp slowdown to the record pace of new issue activity in May and early June. Regulatory and economic uncertainty forced an equity sell-off during the second half of January 2010, which in turn pushed high-yield spreads wider. The high-yield market began the third quarter positively with solid corporate earnings reports, stronger capital market conditions, and declining default volumes. Weakening global economic conditions, however, weighed heavily on market sentiment during August before falling Treasury rates, rising equities, healthy demand, and dramatic improvements in capital market access rallied the market in September. Continued macroeconomic fears persisted, leading the Federal Reserve to announce a second round of quantitative easing in early-November. Despite some volatility in mid-November, which largely resulted from the Treasury curve backup and renewed macroeconomic risks from notable events in China and Ireland, the high-yield market finished the year strongly with a more stable macroeconomic environment, robust demand, unprecedented new issuance, and broader access to capital for high yield issuers. Overall, modest economic growth, improving corporate conditions, strong retail fund inflows, accommodative primary market conditions, and a sharp decline in default activity led to strong returns for high-yield credit in 2010.
Again in 2010, the lower end of the quality spectrum (i.e., CCC-rated bonds and distressed bonds) outperformed single-B and double-B rated credits for the year, illustrating the stronger desire for riskier assets. All sectors posted positive returns for a second-consecutive year, with life insurance, property and casualty insurance, and banking leading performance for the Barclays Capital U.S. High Yield Corporate Index in 2010. The lowest-performing sectors in the Index for the year were supermarkets, electric utilities, and health care.
Compared to the record high default volume and an upward spike in the default rate in 2009, default activity dramatically decreased in 2010. Only 44 companies defaulted during the year, affecting $19.8 billion in bonds and loans. The 12-month trailing par-weighted domestic default rate for high-yield bonds ended the year at 0.79%, well below the historical average of 4.3% and down drastically from 10.3% a year ago.
Increased demand for riskier assets helped to foster a robust new-issue market for high-yield bonds. High-yield issuers priced over $302 billion in 2010, exceeding last year’s record by more than $120 billion. High-yield mutual funds experienced inflows of $12.2 billion in 2010, compared to a record-setting $31.9 billion in inflows during 2009. Year-to-date redemptions, maturities, tenders and upgrades to investment grade totaled $174.2 billion versus $117.4 billion for the same period in 2009. These activities are important because they effectively create additional market demand for remaining issues.
Performance
The Fund underperformed its primary benchmark during 2010. Benchmarking fixed income funds is somewhat challenging because broad fixed income indexes do not incur trading costs, may invest in illiquid segments of the market that are not easily accessible, have no cash flows, and exclude fees. For the trailing 12-months, the Fund’s performance was hurt by its exposure to the media non-cable, media-cable, and insurance sectors. Performance was hindered by relative weightings in Ameristar Casinos, Wynn Las Vegas LLC, Virgin Media Finance, Windstream Corp., and Dex One Corp. Conversely, performance was aided by security selection in the health care, telecommunication, and chemicals sectors, with the largest contributions coming from Caesars Entertainment Operating Company, Vanguard Health Holdings, New Communications Holdings, Advanced Micro Devices, and GMAC.
Looking Forward
We expect that improvement in the economic environment will continue. Stronger issuer fundamentals, accommodating capital access, and robust demand will sustain a more conducive credit environment for high yield. Companies remain cautious, yet the broadening capital market access will further promote companies to refinance near-term debt maturities, thereby strengthening their balance sheets and ultimately lowering default outlooks. Corporate profitability should continue to build as revenue growth improves and margins hold. We believe that current valuations are attractive based on moderate gross domestic product growth, improved credit fundamentals, and low default risk. Accordingly, we expect spreads to tighten further as issuer fundamentals remain intact and moderate flows into the asset class continue. Again, we will rely on our individual security selection to be the primary driver of performance.
This commentary reflects the viewpoints of the Fund’s subadvisor, JPMorgan Asset Management as of January 24, 2011.
Cumulative Total Return Performance
High Yield’s cumulative total return is based on the daily change in net asset value (NAV), and assumes that all distributions were reinvested. The Barclays Capital U.S. Corporate High Yield Bond Index is a total return performance benchmark for fixed income securities having a maximum quality rating of Ba1 (as determined by Moody’s Investors Service). Unlike the Fund, the Barclays Capital U.S. Corporate High Yield Bond Index is unmanaged, is not available for investment, and does not incur expenses. The chart
21 |
Table of Contents
| Managers High Yield Fund |
| Investment Manager’s Comments (continued) |
Cumulative Total Return Performance (continued)
illustrates the performance of a hypothetical $10,000 investment made in the Fund’s Class A Shares (with load) on December 31, 2000 to a $10,000 investment made in the Barclays Capital U.S. Corporate High Yield Bond Index for the same time period. The graph and table do not reflect the deduction of taxes that a shareholder would pay on a Fund distribution or redemption of shares. Performance for periods longer than one year is annualized. The listed returns for the Fund are net of expenses and the returns for the index exclude expenses. Total returns for the Fund would have been lower had certain expenses not been reduced.
The table below shows the average annual total returns for the Managers High Yield Fund and the Barclays Capital U.S. Corporate High Yield Index from December 31, 2000 through December 31,2010.
Average Annual Total Returns1 | 1 Year | 5 Years | 10 Years | |||||||||||||
Managers High Yield Fund2,3 | -Class A | No Load | 14.20 | % | 6.92 | % | 8.16 | % | ||||||||
| -Class A | With Load | 9.29 | % | 5.99 | % | 7.69 | % | |||||||||
| -Class B | No Load | 13.40 | % | 6.02 | % | 7.41 | % | |||||||||
| -Class B | With Load | 8.40 | % | 5.73 | % | 7.41 | % | |||||||||
| -Class C | No Load | 13.42 | % | 6.07 | % | 7.44 | % | |||||||||
| -Class C | With Load | 12.42 | % | 6.07 | % | 7.44 | % | |||||||||
| -Institutional Class | No Load | 14.58 | % | 7.24 | % | 8.58 | % | |||||||||
Barclays Capital U.S. Corporate High Yield Bond Index4 | 15.12 | % | 8.91 | % | 8.88 | % | ||||||||||
The performance data shown represents past performance. Past performance is not a guarantee of future results. Current performance may be lower or higher than the performance data quoted. The investment return and the principal value of an investment will fluctuate so that an investor’s shares, when redeemed, may be worth more or less than their original cost. For performance information through the most recent month end please call (800) 835-3879 or visit our Web site at www.managersinvest.com.
Performance differences among the share classes are due to differences in sales charge structures and class expenses. Returns shown reflect maximum sales charge of 4.25% on Class A, as well as the applicable contingent deferred sales charge (CDSC) on both Class B and C shares. The Class B shares’ CDSC declines annually between years 1 through 6 according to the following schedule: 5, 4, 3, 3, 2, 1%. No sales charge is assessed after year six. Class C shares held for less than one year are subject to a 1% CDSC.
In choosing a Fund, investors should carefully consider the amount they plan to invest, their investment objectives, the Fund’s investment objectives, risks, charges and expenses before investing. For this and other information, please call (800) 835-3879 or visit www.managersinvest.com for a free prospectus. Read it carefully before investing or sending money. Distributed by Managers Distributors, Inc., member FINRA.
1 Total return equals income yield plus share price change and assumes reinvestment of all dividends and capital gain distributions. Returns are net of fees and may reflect offsets of Fund expenses as described in the Prospectus. No adjustment has been made for taxes payable by shareholders on their reinvested dividends and capital gain distributions. Returns for periods greater than one year are annualized. The listed returns on the Fund are net of expenses and based on the published NAV as of December 31, 2010. All returns are in U.S. dollars($). 2 The Fund is subject to the risks associated with investments in debt securities, such as default risk and fluctuations in the perception of the debtors’ ability to pay their creditors. 3 From time to time, the Fund’s advisor has waived its fees and/or absorbed Fund expenses, which has resulted in higher returns. 4 The Barclays Capital U.S. Corporate High Yield Bond Index is a total return performance benchmark for fixed income securities having a maximum quality rating of Ba1 (as determined by Moody’s Investors Service). Unlike the Fund, the Barclays Capital U.S. Corporate High Yield Bond Index is unmanaged, is not available for investment, and does not incur expenses.
Not FDIC insured, nor bank guaranteed. May lose value. |
22 |
Table of Contents
| Managers High Yield Fund |
| Fund Snapshots |
| December 31, 2010 |
Portfolio Breakdown
Industry | Managers High Yield Fund** | |||
Industrials | 83.7 | % | ||
Financials | 11.4 | % | ||
Utilities | 2.4 | % | ||
Materials | 0.2 | % | ||
Information Technology | 0.3 | % | ||
Consumer Discretionary | 0.1 | % | ||
Other Assets and Liabilities | 1.9 | % | ||
| ** | As a percentage of net assets |
Top Ten Holdings
Top Ten Holdings | % of Net Assets | |||
HCA, Inc., 9.625%, 11/15/16* | 2.8 | % | ||
GMAC, Inc., 6.750%, 12/01/14 | 1.5 | |||
Sprint Capital Corp., 8.750%, 03/15/32 | 1.3 | |||
Biomet, Inc., 10.375%, 10/15/17* | 1.3 | |||
Simmons Bedding Co., 11.250%, 07/15/15* | 1.3 | |||
Sungard Data Systems, Inc., 10.250%, 08/15/15* | 1.2 | |||
EchoStar DBS Corp., 7.750%, 05/31/15* | 1.1 | |||
Ford Motor Credit Co. LLC, 8.700%, 10/01/14 | 1.1 | |||
Intelsat Jackson Holdings, Ltd., 9.500%, 06/15/16* | 1.1 | |||
EchoStar Communications Corp., 7.125%, 02/01/16 | 1.0 | |||
Top Ten as a Group | 13.7 | % | ||
| * | Top Ten Holding at June 30, 2010 |
| Any sectors, industries, or securities discussed should not be perceived as investment recommendations. Mention of a specific security should not be considered a recommendation to buy or solicitation to sell that security. Specific securities mentioned in this report may have been sold from the Fund’s portfolio of investments by the time you receive this report. |
23 |
Table of Contents
| Managers High Yield Fund |
| Schedule of Portfolio Investments |
| December 31, 2010 |
Security Description | Principal Amount | Value | ||||||
Corporate Bonds - 97.5% | ||||||||
Financials - 11.4% | ||||||||
Alliance Laundry Systems LLC, Term Loan, Class B, 6.250%, 09/10/16, (04/06/11)4 | $ | 151,737 | $ | 153,697 | ||||
Ally Financial, Inc., 6.250%, 12/01/17 (a) | 85,000 | 85,106 | ||||||
Bank of America Corp., 8.000%, 12/29/496 | 90,000 | 90,823 | ||||||
Bumble Bee Acquisition Corp., 9.000%, 12/15/17 (a) | 50,000 | 52,250 | ||||||
Caesars Entertainment Operating Co., Inc., Term B-3 Loan, 3.288%, 01/28/15, (01/26/11)4 | 118,124 | 106,893 | ||||||
Caesars Entertainment Operating Co., Inc., Term B-3 Loan, 3.303%, 01/28/15, (03/31/11)4 | 170 | 154 | ||||||
CIT Group, Inc., 7.000%, 05/01/15 | 50,789 | 51,043 | ||||||
CIT Group, Inc., 7.000%, 05/01/16 | 322,983 | 325,002 | ||||||
CIT Group, Inc., 7.000%, 05/01/17 | 170,176 | 171,027 | ||||||
Citigroup Capital XXI, 8.300%, 12/21/576 | 85,000 | 88,825 | ||||||
Clear Channel Communications, Inc. Term Loan B, 3.911%, 01/29/16, (01/31/11)4 | 38,111 | 32,768 | ||||||
First Data Corp. Term Loan B-2, 3.011%, 09/24/14, (01/31/11)4 | 56,615 | 52,320 | ||||||
Ford Motor Credit Co. LLC, 7.000%, 04/15/15 | 110,000 | 118,317 | ||||||
Ford Motor Credit Co. LLC, 8.700%, 10/01/14 | 295,000 | 332,484 | ||||||
GMAC, Inc., 6.750%, 12/01/14 | 442,000 | 467,415 | ||||||
Host Hotels & Resorts, L.P., 6.375%, 03/15/15 | 130,000 | 132,600 | ||||||
Host Hotels & Resorts, L.P., 9.000%, 05/15/17 | 30,000 | 33,450 | ||||||
Ineos Holdings, Ltd., Term Loan, Class B-2, 7.501%, 12/16/13, (03/31/11)4 | 143,602 | 148,448 | ||||||
Ineos Holdings, Ltd., Term Loan, Class C-2, 8.001%, 12/16/14, (03/31/11)4 | 164,289 | 169,833 | ||||||
International Lease Finance Corp., 7.125%, 09/01/18 (a) | 25,000 | 26,688 | ||||||
International Lease Finance Corp., 8.250%, 12/15/20 | 40,000 | 41,250 | ||||||
International Lease Finance Corp., 8.625%, 09/15/15 (a) | 130,000 | 140,075 | ||||||
International Lease Finance Corp., 8.750%, 03/15/17 (a) | 160,000 | 172,000 | ||||||
Nuveen Investments, Inc., 2nd Lien Term Loan, 12.500%, 07/21/15 | 70,000 | 75,906 | ||||||
Pinafore LLC/Pinafore, Inc., 9.000%, 10/01/18 (a) | 55,000 | 59,675 | ||||||
Pinnacle Foods Finance LLC, 9.250%, 04/01/25 | 35,000 | 36,619 | ||||||
Texas Competitive Electric Holdings, Term Loan, Class B-2, 3.803%, 12/14/13, (01/10/11)4 | 92,775 | 71,864 | ||||||
Texas Competitive Electric Holdings, Term Loan, Class B-2, 3.803%, 10/10/14, (01/10/11)4 | 93,190 | 72,185 | ||||||
UCI Holdco, Inc., 9.250%, 12/15/13, (03/15/11)4 | 158,645 | 159,042 | ||||||
Vertafore, Inc., 2nd Lien Term Loan, 9.750%, 10/18/17, (03/29/11)4 | 45,000 | 45,478 | ||||||
Total Financials | 3,513,237 | |||||||
Industrials - 83.7% | ||||||||
ACCO Brands Corp., 7.625%, 08/15/15 | 65,000 | 65,325 | ||||||
ACCO Brands Corp., 10.625%, 03/15/15 | 115,000 | 129,950 | ||||||
Accellent, Inc., 8.375%, 02/01/17 | 20,000 | 20,600 | ||||||
Accellent, Inc., 10.000%, 11/01/17 (a) | 85,000 | 80,538 | ||||||
Aeroflex, Inc., 11.750%, 02/15/15 | 145,000 | 160,225 | ||||||
Aircastle, Ltd., 9.750%, 08/01/18 | 55,000 | 60,362 | ||||||
Alliant Techsystems, Inc., 6.750%, 04/01/16 | 120,000 | 124,950 | ||||||
The accompanying notes are an integral part of these financial statements. 24 |
Table of Contents
| Managers High Yield Fund |
| Schedule of Portfolio Investments (continued) |
Security Description | Principal Amount | Value | ||||||
Industrials - 83.7% (continued) | ||||||||
AMC Entertainment Holdings, Inc., 9.750%, 12/01/20 (a) | $ | 65,000 | $ | 67,925 | ||||
American Axle and Manufacturing, Inc., 7.875%, 03/01/17 | 95,000 | 97,731 | ||||||
American Tire Distributors, Inc., 9.750%, 06/01/17 (a) | 65,000 | 70,525 | ||||||
Amkor Technologies, Inc., 7.375%, 05/01/18 | 115,000 | 2 | 120,175 | |||||
Amsted Industries, Inc., 8.125%, 03/15/18 (a) | 60,000 | 63,975 | ||||||
Anadarko Petroleum Corp., 6.375%, 09/15/17 | 55,000 | 59,994 | ||||||
Arch Coal, Inc., 8.750%, 08/01/16 | 135,000 | 147,825 | ||||||
Ardagh Packaging Finance PLC, 9.125%, 10/15/20 (a) | 200,000 | 209,000 | ||||||
Ashland, Inc., 9.125%, 06/01/17 | 30,000 | 34,725 | ||||||
Ashtead Capital, Inc., 9.000%, 08/15/16 (a) | 70,000 | 73,325 | ||||||
Aspect Software, Inc., 10.625%, 05/15/17 (a) | 55,000 | 56,719 | ||||||
Associated Materials, Inc., 9.125%, 11/01/17 (a) | 75,000 | 78,562 | ||||||
Atkore International, Inc., 9.875%, 01/01/18 (a) | 30,000 | 31,350 | ||||||
Atlas Energy Operating Company LLC, 10.750%, 02/01/18 | 155,000 | 190,069 | ||||||
Avaya, Inc., 9.750%, 11/01/15 | 65,000 | 66,462 | ||||||
Avaya, Inc., 10.125%, 11/01/155 | 94,893 | 97,740 | ||||||
Avis Budget Car Rental LLC, 7.750%, 05/15/16 | 110,000 | 112,750 | ||||||
Avis Budget Car Rental LLC, 8.250%, 01/15/19 (a) | 45,000 | 45,675 | ||||||
Avis Budget Car Rental LLC, 9.625%, 03/15/18 | 40,000 | 2 | 43,300 | |||||
AWAS Aviation Capital, Ltd., 7.000%, 10/15/16 (a) | 100,000 | 99,625 | ||||||
B&G Foods, Inc., 7.625%, 01/15/18 | 30,000 | 31,650 | ||||||
Baldor Electric Co., 8.625%, 02/15/17 | 80,000 | 90,000 | ||||||
Bausch & Lomb, Inc., 9.875%, 11/01/15 | 65,000 | 69,875 | ||||||
BE Aerospace, Inc., 6.875%, 10/01/20 | 40,000 | 41,500 | ||||||
Belden, Inc., 9.250%, 06/15/19 | 75,000 | 82,594 | ||||||
Berry Plastics Corp., 9.750%, 01/15/21 (a) | 85,000 | 84,575 | ||||||
Biomet, Inc., 10.375%, 10/15/175 | 370,000 | 406,075 | ||||||
Bon-Ton Stores, Inc., The, 10.250%, 03/15/14 | 85,000 | 87,125 | ||||||
Boyd Gaming Corp., 7.125%, 02/01/16 | 50,000 | 2 | 45,125 | |||||
BreitBurn Energy, L.P., 8.625%, 10/15/20 (a) | 85,000 | 85,850 | ||||||
Brigham Exploration Co., 8.750%, 10/01/18 (a) | 70,000 | 75,950 | ||||||
Building Materials Corp. of America, 6.875%, 08/15/18 (a) | 85,000 | 84,575 | ||||||
Bumble Bee Foods LLC, 7.750%, 12/15/15 | 70,000 | 80,404 | ||||||
BWAY Holding Co., 10.000%, 06/15/18 (a) | 110,000 | 2 | 119,212 | |||||
Caesars Entertainment Inc., 10.000%, 12/15/18 | 107,000 | 98,172 | ||||||
Caesars Entertainment Inc., 11.250%, 06/01/17 | 185,000 | 209,050 | ||||||
Case New Holland, Inc., 7.875%, 12/01/17 (a) | 80,000 | 87,800 | ||||||
CCH II LLC & CCH II Capital Corp., 13.500%, 11/30/16 | 25,000 | 29,938 | ||||||
CCO Holdings LLC/CCO Holdings Capital Corp., 7.250%, 10/30/17 | 75,000 | 76,500 | ||||||
CCO Holdings LLC/CCO Holdings Capital Corp., 7.875%, 04/30/18 | 125,000 | 130,000 | ||||||
Central Garden & Pet Co., 8.250%, 03/01/18 | 85,000 | 86,488 | ||||||
The accompanying notes are an integral part of these financial statements. 25 |
Table of Contents
| Managers High Yield Fund |
| Schedule of Portfolio Investments (continued) |
Security Description | Principal Amount | Value | ||||||
Industrials - 83.7% (continued) | ||||||||
Cequel Communications Holdings I, LLC and Cequel Capital Corp., 8.625%, 11/15/17 (a) | $ | 190,000 | $ | 199,500 | ||||
Chemtura Corp., 7.875%, 09/01/18 (a) | 25,000 | 26,625 | ||||||
Chesapeake Energy Corp., 6.625%, 08/15/20 | 5,000 | 4,950 | ||||||
Chesapeake Energy Corp., 6.875%, 08/15/18 | 40,000 | 40,800 | ||||||
Chesapeake Energy Corp., 7.250%, 12/15/18 | 75,000 | 78,000 | ||||||
Chiquita Brands International, Inc., 8.875%, 12/01/15 | 165,000 | 169,228 | ||||||
Cincinnati Bell, Inc., 8.375%, 10/15/20 | 100,000 | 96,250 | ||||||
Citizens Communications Co., 6.625%, 03/15/15 | 90,000 | 94,500 | ||||||
Clean Harbors, Inc., 7.625%, 08/15/16 | 61,000 | 65,118 | ||||||
Clear Channel Worldwide Holdings, Inc., Series B, 9.250%, 12/15/17 | 250,000 | 275,000 | ||||||
Clearwater Paper Corp., 7.125%, 11/01/18 (a) | 5,000 | 5,188 | ||||||
Clearwater Paper Corp.,10.625%, 06/15/16 | 85,000 | 97,538 | ||||||
Clearwire Communications LLC, 12.000%, 12/01/15 (a) | 185,000 | 200,725 | ||||||
Clearwire Communications LLC/Clearwire Finance, Inc., 12.000%, 12/01/17 (a) | 25,000 | 2 | 25,938 | |||||
Cloud Peak Energy Resources LLC/ Cloud Peak Energy Finance Corp., 8.250%, 12/15/17 | 100,000 | 107,875 | ||||||
Community Health Systems, Inc., 8.875%, 07/15/15 | 155,000 | 163,138 | ||||||
Constellation Brands, Inc., 7.125%, 09/01/16 | 60,000 | 63,900 | ||||||
Constellation Brands, Inc., 8.375%, 12/15/14 | 90,000 | 98,775 | ||||||
Cooper Companies, Inc., 7.125%, 02/15/15 | 60,000 | 62,100 | ||||||
Cott Beverages USA, Inc., 8.125%, 09/01/18 | 20,000 | 21,650 | ||||||
Cricket Communications, Inc., 10.000%, 07/15/15 | 50,000 | 2 | 53,812 | |||||
Crosstex Energy, L.P., 8.875%, 02/15/18 | 115,000 | 123,769 | ||||||
DaVita, Inc., 6.375%, 11/01/18 | 10,000 | 9,975 | ||||||
DaVita, Inc., 6.625%, 11/01/20 | 10,000 | 9,925 | ||||||
Denbury Resources, Inc., 9.750%, 03/01/16 | 50,000 | 56,000 | ||||||
Digicel Group, Ltd., 10.500%, 04/15/18 (a) | 100,000 | 110,500 | ||||||
DineEquity, Inc., 9.500%, 10/30/18 (a) | 60,000 | 63,900 | ||||||
Diversey, Inc., 8.250%, 11/15/19 | 110,000 | 119,900 | ||||||
DJO Finance LLC, 10.875% 11/15/14 | 140,000 | 153,475 | ||||||
Dole Food Co., Inc., 8.000%, 10/01/16 (a) | 40,000 | 42,400 | ||||||
Dole Food Co., Inc., 13.875%, 03/15/14 | 36,000 | 44,190 | ||||||
Dunkin Finance Corp., 9.625%, 12/01/18 (a) | 35,000 | 35,525 | ||||||
Easton-Bell Sports, Inc., 9.750%, 12/01/16 | 145,000 | 159,862 | ||||||
EchoStar Communications Corp., 7.125%, 02/01/16 | 315,000 | 326,812 | ||||||
EchoStar DBS Corp., 7.750%, 05/31/15 | 325,000 | 346,938 | ||||||
El Paso Natural Gas Co., 7.250%, 06/01/18 | 65,000 | 69,908 | ||||||
EXCO Resources, Inc., 7.500%, 09/15/18 | 60,000 | 59,100 | ||||||
Fidelity National Information Services, Inc., 7.625%, 07/15/17 (a) | 15,000 | 15,862 | ||||||
Fidelity National Information Services, Inc., 7.875%, 07/15/20 (a) | 10,000 | 10,625 | ||||||
First Data Corp., 8.250%, 01/15/21 (a) | 118,000 | 2 | 113,870 | |||||
First Data Corp., 8.750%, 01/15/22 (a)5 | 120,000 | 2 | 116,700 | |||||
The accompanying notes are an integral part of these financial statements. 26 |
Table of Contents
| Managers High Yield Fund |
| Schedule of Portfolio Investments (continued) |
Security Description | Principal Amount | Value | ||||||
Industrials - 83.7% (continued) | ||||||||
First Data Corp., 8.875%, 08/15/20 (a) | $ | 85,000 | $ | 90,100 | ||||
First Data Corp., 10.550%, 09/24/155 | 2,737 | 2 | 2,607 | |||||
First Data Corp., 12.625%, 01/15/21 (a) | 240,000 | 2 | 230,400 | |||||
Forest Oil Corp., 7.250%, 06/15/19 | 25,000 | 25,500 | ||||||
Freescale Semiconductor, Inc., 9.250%, 04/15/18 (a) | 210,000 | 232,050 | ||||||
FTI Consulting, Inc., 6.750%, 10/01/20 (a) | 55,000 | 54,862 | ||||||
GCI, Inc., 8.625%, 11/15/19 | 150,000 | 2 | 163,125 | |||||
General Cable Corp., 7.125%, 04/01/17 | 105,000 | 108,675 | ||||||
Geo Group, Inc., The, 7.750%, 10/15/17 | 105,000 | 110,775 | ||||||
Georgia-Pacific Corp., 7.000%, 01/15/15 (a) | 28,000 | 29,190 | ||||||
Georgia-Pacific Corp., 8.250%, 05/01/16, (a) | 20,000 | 22,675 | ||||||
Giraffe Acquisition Corp., 9.125%, 12/01/18 (a) | 35,000 | 2 | 36,662 | |||||
Goodyear Tire & Rubber Co., The, 8.250%, 08/15/20 | 90,000 | 2 | 93,600 | |||||
Goodyear Tire & Rubber Co., The, 8.750%, 08/15/20 | 10,000 | 10,575 | ||||||
Goodyear Tire & Rubber Co., The, 10.500%, 05/15/16 | 45,000 | 2 | 51,525 | |||||
Graham Packaging Co., L.P., 8.250%, 01/01/17 | 90,000 | 94,050 | ||||||
Graham Packaging Co., L.P., 8.250%, 10/01/18 | 15,000 | 15,825 | ||||||
Graham Packaging Co., L.P./GPC Capital Corp. I, 9.875%, 10/15/14 | 105,000 | 109,200 | ||||||
Graphic Packaging International, Inc., 7.875%, 10/01/18 | 35,000 | 36,838 | ||||||
GWR Operating Partnership, L.L.L.P., 10.875%, 04/01/17 | 85,000 | 90,100 | ||||||
GXS Worldwide, Inc., 9.750%, 06/15/15 | 85,000 | 84,362 | ||||||
Hanesbrands, Inc., 8.000%, 12/15/16 | 105,000 | 113,138 | ||||||
HCA Holdings, Inc., 7.750%, 05/15/21 (a) | 105,000 | 2 | 105,262 | |||||
HCA, Inc., 9.625%, 11/15/165 | 823,000 | 883,696 | ||||||
Health Management Associates, Inc., 6.125%, 04/15/16 | 195,000 | 197,925 | ||||||
HealthSouth Corp., 7.250%, 10/01/18 | 50,000 | 51,125 | ||||||
HealthSouth Corp., 7.750%, 09/15/22 | 50,000 | 51,750 | ||||||
Hertz Corp., 7.500%, 10/15/18 (a) | 100,000 | 2 | 104,250 | |||||
Hertz Corp., 8.875%, 01/01/14 | 110,000 | 113,025 | ||||||
Hexion U.S. Finance Corp./Hexion Nova Scotia Finance ULC, 9.000%, 11/15/20 (a) | 50,000 | 53,000 | ||||||
Hillman Group, Inc., 10.875%, 06/01/18 | 60,000 | 66,150 | ||||||
Huntsman International LLC, 5.500%, 06/30/16 | 55,000 | 53,488 | ||||||
Huntsman International LLC, 7.375%, 01/01/15 | 50,000 | 51,375 | ||||||
Huntsman International LLC, 8.625%, 03/15/20 | 45,000 | 2 | 49,162 | |||||
Huntsman International LLC, 8.625%, 03/15/21 (a) | 25,000 | 27,125 | ||||||
Ineos Group Holdings PLC, 8.500%, 02/15/16 | 100,000 | 95,750 | ||||||
Inergy L.P./Inergy Finance Corp., 6.875%, 12/15/14 | 25,000 | 25,500 | ||||||
Inergy L.P./Inergy Finance Corp., 7.000%, 10/01/18 (a) | 70,000 | 70,875 | ||||||
Inergy L.P./Inergy Finance Corp., 8.250%, 03/01/16 | 25,000 | 26,188 | ||||||
Inergy L.P./Inergy Finance Corp., 8.750%, 03/01/15 | 30,000 | 32,100 | ||||||
Intelsat Bermuda, Ltd., 11.250%, 06/15/16 | 190,000 | 205,675 | ||||||
The accompanying notes are an integral part of these financial statements. 27 |
Table of Contents
| Managers High Yield Fund |
| Schedule of Portfolio Investments (continued) |
Security Description | Principal Amount | Value | ||||||
Industrials - 83.7% (continued) | ||||||||
Intelsat Jackson Holdings S.A., 7.250%, 10/15/20 (a) | $ | 75,000 | $ | 76,125 | ||||
Intelsat Jackson Holdings, Ltd., 9.500%, 06/15/16 | 310,000 | 328,600 | ||||||
Intelsat Subsidiary Holding Co., Ltd., 8.875%, 01/15/15 (a) | 35,000 | 35,962 | ||||||
Interactive Data Corp., 10.250%, 08/01/18 (a) | 105,000 | 113,925 | ||||||
Interline Brands, Inc., 7.000%, 11/15/18 (a) | 50,000 | 51,000 | ||||||
IPCS, Inc., 3.537%, 05/01/14, (02/01/11)4 | 147,764 | 142,592 | ||||||
Iron Mountain, Inc., 8.750%, 07/15/18 | 190,000 | 200,450 | ||||||
ITC Deltacom, Inc., 10.500%, 04/01/16 | 65,000 | 71,012 | ||||||
J.C. Penney Co., Inc., 7.950%, 04/01/17 | 45,000 | 49,275 | ||||||
Jarden Corp., 7.500%, 05/01/17 | 85,000 | 89,994 | ||||||
Jarden Corp., 8.000%, 05/01/16 | 100,000 | 109,375 | ||||||
JDA Software Group, Inc., 8.000%, 12/15/14 | 115,000 | 124,488 | ||||||
LBI Escrow Corp., 8.000%, 11/01/17 (a) | 100,000 | 110,875 | ||||||
Lear Corp., 7.875%, 03/15/18 | 15,000 | 16,125 | ||||||
Libbey Glass, Inc., 10.000%, 02/15/15 (a) | 95,000 | 102,600 | ||||||
Linn Energy LLC, 9.875%, 07/01/18 | 100,000 | 110,000 | ||||||
Linn Energy LLC/Linn Energy Finance Corp., 7.750%, 02/01/21 (a) | 40,000 | 41,200 | ||||||
Linn Energy LLC/Linn Energy Finance Corp., 11.750%, 05/15/17 | 15,000 | 17,250 | ||||||
Lucent Technologies, Inc., 6.450%, 03/15/29 | 140,000 | 111,300 | ||||||
Lyondell Chemical Co., 11.000%, 05/01/18 | 164,918 | 187,594 | ||||||
MagnaChip Semiconductor Corp., 10.500%, 04/15/18 | 125,000 | 132,500 | ||||||
Manitowoc Co., Inc., 8.500%, 11/01/20 | 70,000 | 74,725 | ||||||
Manitowoc Co., Inc., 9.500%, 02/15/18 | 55,000 | 2 | 60,500 | |||||
Marina District Finance Co., Inc., 9.500%, 10/15/15 (a) | 35,000 | 2 | 34,562 | |||||
Marina District Finance Co., Inc., 9.875%, 08/15/18 (a) | 125,000 | 2 | 123,750 | |||||
MarkWest Energy Partners LP, 8.750%, 04/15/18 | 120,000 | 130,500 | ||||||
Masco Corp., 7.125%, 03/15/20 | 20,000 | 20,958 | ||||||
MetroPCS Wireless, Inc., 7.875%, 09/01/18 | 140,000 | 145,950 | ||||||
MGM Mirage, Inc., 6.750%, 04/01/13 | 305,000 | 304,695 | ||||||
MGM Mirage, Inc., 6.875%, 04/01/16 | 40,000 | 2 | 35,850 | |||||
MGM Mirage, Inc., 9.000%, 03/15/20 (a) | 50,000 | 55,250 | ||||||
MGM Mirage, Inc., 11.125%, 11/15/17 | 160,000 | 184,800 | ||||||
Michael Foods, Inc., 9.750%, 07/15/18 (a) | 45,000 | 49,388 | ||||||
Michaels Stores, Inc., 7.750%, 11/01/18 (a) | 95,000 | 2 | 95,238 | |||||
Michaels Stores, Inc., 13.000%, 11/01/16 (b) | 40,000 | 39,800 | ||||||
Mueller Water Products, Inc., 8.750%, 09/01/20 | 40,000 | 44,400 | ||||||
Mylan, Inc., 7.625%, 07/15/17 (a) | 25,000 | 26,719 | ||||||
Mylan, Inc., 7.875%, 07/15/20 (a) | 115,000 | 124,488 | ||||||
Nalco Co., 6.625%, 01/15/19 (a) | 20,000 | 2 | 20,550 | |||||
Neiman Marcus Group, Inc., The, 9.000%, 10/15/155 | 114,897 | 2 | 120,929 | |||||
NewPage Corp., 11.375%, 12/31/14 | 50,000 | 47,250 | ||||||
The accompanying notes are an integral part of these financial statements. 28 |
Table of Contents
| Managers High Yield Fund |
| Schedule of Portfolio Investments (continued) |
Security Description | Principal Amount | Value | ||||||
Industrials - 83.7% (continued) | ||||||||
Nexstar Broadcasting, Inc., 8.875%, 04/15/17 (a) | $ | 75,000 | $ | 80,062 | ||||
Noranda Aluminium Acquisition Corp., 5.193%, 05/15/15, (05/15/11)5 | 203,822 | 185,223 | ||||||
Nova Chemicals Corp., 8.625%, 11/01/19 | 40,000 | 2 | 43,900 | |||||
Novelis, Inc., 8.375%, 12/15/17 (a) | 70,000 | 72,800 | ||||||
Novelis, Inc., 8.750%, 12/15/20 (a) | 90,000 | 93,825 | ||||||
NXP B.V./NXP Funding LLC, 9.500%, 10/15/15 | 75,000 | 80,438 | ||||||
NXP B.V./NXP Funding LLC, 9.750%, 08/01/18 (a) | 165,000 | 186,450 | ||||||
NXP B.V./NXP Funding LLC, 10.000%, 07/15/13 (a) | 75,000 | 84,375 | ||||||
OPTI Canada, Inc., 8.250%, 12/15/14 | 55,000 | 39,462 | ||||||
OPTI Canada, Inc., 9.000%, 12/15/12 (a) | 35,000 | 35,262 | ||||||
OPTI Canada, Inc., 9.750%, 08/15/13 (a) | 35,000 | 35,175 | ||||||
Oshkosh Corp., 8.250%, 03/01/17 | 45,000 | 49,162 | ||||||
P.H. Glatfelter Co., 7.125%, 05/01/16 | 115,000 | 119,744 | ||||||
Packaging Dynamics, Inc., 10.000%, 05/11/16 (a) | 160,000 | 165,000 | ||||||
PAETEC Holding Corp., 8.875%, 06/30/17 | 90,000 | 96,525 | ||||||
PAETEC Holding Corp., 9.500%, 07/15/15 | 45,000 | 2 | 46,800 | |||||
PAETEC Escrow Corp., 9.875%, 12/01/18 (a) | 100,000 | 103,250 | ||||||
Parker Drilling Co., 9.125%, 04/01/18 | 55,000 | 57,750 | ||||||
Petco Animal Supplies, Inc., 9.250%, 12/01/18 (a) | 75,000 | 79,406 | ||||||
Petrohawk Energy Corp., 7.250%, 08/15/18 | 20,000 | 20,300 | ||||||
Petrohawk Energy Corp., 7.875%, 06/01/15 | 170,000 | 177,862 | ||||||
Plains Exploration & Production Co., 7.000%, 03/15/17 | 70,000 | 72,275 | ||||||
Plains Exploration & Production Co., 7.750%, 06/15/15 | 25,000 | 26,188 | ||||||
PolyOne Corp., 7.375%, 09/15/20 | 50,000 | 2 | 51,938 | |||||
Polypore International, Inc., 7.500%, 11/15/17 (a) | 60,000 | 61,500 | ||||||
Reynolds Group Issuer, Inc., 8.500%, 05/15/18 (a) | 205,000 | 207,050 | ||||||
Quebecor Media, Inc., 7.750%, 03/15/16 | 250,000 | 259,375 | ||||||
Quebecor World, Escrow, 6.500%, 08/01/27* | 165,000 | 8,250 | ||||||
Qwest Communications International, Inc., 7.500%, 02/15/14 | 135,000 | 137,362 | ||||||
Radiation Therapy Services, Inc., 9.875%, 04/15/17 (a) | 80,000 | 80,200 | ||||||
RailAmerica, Inc., 9.250%, 07/01/17 | 73,000 | 80,575 | ||||||
Rain CII Carbon LLC/Rain CII Carbon Corp., 8.000%, 12/01/18 (a) | 30,000 | 2 | 30,900 | |||||
RBS Global, Inc./Rexnord LLC, 8.500%, 05/01/18 | 200,000 | 213,500 | ||||||
Reichhold Industries, Inc., 9.000%, 08/15/14 (a) | 235,000 | 208,562 | ||||||
Rental Service Corp., 9.500%, 12/01/14 | 105,000 | 110,775 | ||||||
Rite Aid Corp., 7.500%, 03/01/17 | 100,000 | 2 | 96,625 | |||||
Rite Aid Corp., 8.000%, 08/15/20 | 60,000 | 2 | 62,775 | |||||
Rite Aid Corp., 9.500%, 06/15/17 | 40,000 | 2 | 34,200 | |||||
Sally Holdings LLC, 9.250%, 11/15/14 | 40,000 | 42,200 | ||||||
SBA Telecommunications, Inc., 8.000%, 08/15/16 | 30,000 | 32,625 | ||||||
Scotts Miracle-Gro Co., The, 7.250%, 01/15/18 | 20,000 | 21,100 | ||||||
The accompanying notes are an integral part of these financial statements. 29 |
Table of Contents
| Managers High Yield Fund |
| Schedule of Portfolio Investments (continued) |
Security Description | Principal Amount | Value | ||||||
Industrials - 83.7% (continued) | ||||||||
Sealy Mattress Co., 8.250%, 06/15/14 | $ | 315,000 | $ | 323,663 | ||||
Sequa Corp., 11.750%, 12/01/15 (a) | 90,000 | 96,750 | ||||||
Service Corp. International, 6.750%, 04/01/15 | 175,000 | 180,250 | ||||||
Service Corp. International, 7.000%, 06/15/17 to 05/15/19 | 100,000 | 101,700 | ||||||
ServiceMaster Co., 10.750%, 07/15/15 (a)5 | 155,000 | 166,625 | ||||||
Simmons Bedding Co., 11.250%, 07/15/15 (a) | 365,000 | 396,025 | ||||||
Sinclair Television Group, Inc., 8.375%, 10/15/18 (a) | 10,000 | 10,375 | ||||||
Sinclair Television Group, Inc., 9.250%, 11/01/17 (a) | 75,000 | 81,562 | ||||||
Solo Cup Co., 8.500%, 02/15/14 | 50,000 | 2 | 45,250 | |||||
Solo Cup Co., 10.500%, 11/01/13 | 100,000 | 105,000 | ||||||
Spectrum Brands, Inc., 9.500%, 06/15/18 (a) | 55,000 | 60,500 | ||||||
Spectrum Brands, Inc., 12.000%, 08/28/195 | 186,327 | 208,919 | ||||||
Spirit AeroSystems, Inc., 7.500%, 10/01/17 | 90,000 | 94,050 | ||||||
Sprint Capital Corp., 6.900%, 05/01/19 | 110,000 | 109,175 | ||||||
Sprint Capital Corp., 8.750%, 03/15/32 | 415,000 | 421,225 | ||||||
SSI Investments II, Ltd./SSI Co-Issuer LLC, 11.125%, 06/01/18 | 100,000 | 109,000 | ||||||
Steinway Musical Instruments, Inc., 7.000%, 03/01/14 (a) | 200,000 | 202,500 | ||||||
Sun Media Corp., 7.625%, 02/15/13 | 5,000 | 5,038 | ||||||
SunGard Data Systems, Inc., 7.375%, 11/15/18 (a) | 50,000 | 50,500 | ||||||
SunGard Data Systems, Inc., 10.250%, 08/15/15 | 370,000 | 389,888 | ||||||
SUPERVALU, Inc., 8.000%, 05/01/16 | 265,000 | 2 | 255,062 | |||||
Surgical Care Affiliates, Inc., 8.875%, 07/15/15 (a)5 | 159,291 | 161,680 | ||||||
Syniverse Holdings, Inc., 9.125%, 01/15/19 (a) | 30,000 | 31,125 | ||||||
Tenet Healthcare Corp., 8.875%, 07/01/19 | 45,000 | 51,075 | ||||||
Tenet Healthcare Corp., 9.250%, 01/01/15 | 230,000 | 246,100 | ||||||
Terex Corp., 8.000%, 11/15/17 | 110,000 | 111,650 | ||||||
Travelport LLC, 4.921%, 09/01/14, (03/01/11)4 | 60,000 | 53,400 | ||||||
Travelport LLC, 9.000%, 03/01/16 | 40,000 | 38,950 | ||||||
Travelport LLC, 11.875%, 09/01/16 | 90,000 | 2 | 88,875 | |||||
Trinidad Drilling, Ltd., 7.875%, 01/15/19 (a) | 60,000 | 60,900 | ||||||
Triumph Group, Inc., 8.000%, 11/15/17 | 20,000 | 20,900 | ||||||
Triumph Group, Inc., 8.625%, 07/15/18 | 35,000 | 38,412 | ||||||
TRW Automotive, Inc., 7.250%, 03/15/17 (a) | 50,000 | 54,125 | ||||||
United Rentals North America, Inc., 8.375%, 09/15/20 | 25,000 | 25,562 | ||||||
United Rentals North America, Inc., 9.250%, 12/15/19 | 85,000 | 94,988 | ||||||
United Surgical Partners International, Inc., 8.875%, 05/01/17 | 15,000 | 15,525 | ||||||
United Surgical Partners International, Inc., 9.250%, 05/01/175 | 145,000 | 151,525 | ||||||
US Oncology, Inc., 9.125%, 08/15/17 | 170,000 | 210,376 | ||||||
Valeant Pharmaceuticals International, Inc., 6.750%, 10/01/17 (a) | 15,000 | 14,962 | ||||||
Valeant Pharmaceuticals International, Inc., 6.875%, 12/01/18 (a) | 150,000 | 149,626 | ||||||
Vertellus Specialties, Inc., 9.375%, 10/01/15 (a) | 75,000 | 79,688 | ||||||
The accompanying notes are an integral part of these financial statements. 30 |
Table of Contents
| Managers High Yield Fund |
| Schedule of Portfolio Investments (continued) |
Security Description | Principal Amount | Value | ||||||
Industrials - 83.7% (continued) | ||||||||
Visant Corp.,10.000%, 10/01/17 (a) | $ | 130,000 | $ | 138,450 | ||||
Wind Acquisition Finance, S.A., 11.750%, 07/15/17 (a) | 100,000 | 113,250 | ||||||
Windstream Corp., 8.125%, 09/01/18 | 40,000 | 42,200 | ||||||
Windstream Corp., 8.625%, 08/01/16 | 190,000 | 200,925 | ||||||
WMG Acquisition Corp., 9.500%, 06/15/16 | 75,000 | 80,812 | ||||||
Wynn Las Vegas LLC, 7.875%, 11/01/17 | 15,000 | 16,238 | ||||||
Wynn Las Vegas LLC/Wynn Las Vegas Capital Corp., 7.750%, 08/15/20 | 35,000 | 38,062 | ||||||
Yankee Acquisition Corp., Series B, 9.750%, 02/15/17 | 100,000 | 104,750 | ||||||
Zayo Group LLC, 10.250%, 03/15/17 | 105,000 | 115,500 | ||||||
Total Industrials | 26,136,939 | |||||||
Utilities - 2.4% | ||||||||
AES Corp., 9.750%, 04/15/16 | 125,000 | 140,312 | ||||||
Calpine Corp., 7.500%, 02/15/21 (a) | 60,000 | 59,400 | ||||||
Calpine Corp., 7.875%, 07/31/20 (a) | 65,000 | 66,138 | ||||||
Dynegy Holdings, Inc., 7.625%, 10/15/26 | 125,000 | 74,375 | ||||||
Dynegy Holdings, Inc., 7.750%, 06/01/19 | 50,000 | 2 | 33,625 | |||||
Energy Future Holdings Corp., 10.000%, 01/15/20 (a) | 70,000 | 2 | 72,364 | |||||
Energy Future Intermediate Holding Co. LLC, 10.000%, 12/01/20 | 96,000 | 99,482 | ||||||
NRG Energy, Inc., 7.375%, 02/01/16 | 145,000 | 2 | 148,988 | |||||
NRG Energy, Inc., 8.250%, 09/01/20 (a) | 55,000 | 56,650 | ||||||
Total Utilities | 751,334 | |||||||
Total Corporate Bonds (cost $28,294,208) | 30,401,510 | |||||||
Common Stocks - 0.6% | ||||||||
| Consumer Discretionary - 0.1% | Shares | |||||||
Dex One Corp.* | 3,380 | 25,215 | ||||||
Information Technology - 0.3% | ||||||||
Flextronics International, Ltd.* | 10,500 | 82,425 | ||||||
Materials - 0.2% | ||||||||
Huntsman Corp. | 5,000 | 78,051 | ||||||
Total Common Stocks (cost $455,793) | 185,691 | |||||||
Short-Term Investments - 9.1%1 | ||||||||
BNY Institutional Cash Reserves Fund, Series B*3,7 | 87,750 | 69,938 | ||||||
BNY Mellon Overnight Government Fund, 0.23%3 | 2,785,000 | 2,785,000 | ||||||
Total Short-Term Investments (cost $2,872,750) | 2,854,938 | |||||||
Total Investments - 107.2%(cost $31,622,751) | 33,442,139 | |||||||
Other Assets, less Liabilities - (7.2)% | (2,248,169 | ) | ||||||
Net Assets - 100.0% | $ | 31,193,970 | ||||||
The accompanying notes are an integral part of these financial statements. 31 |
Table of Contents
| Managers High Yield Fund |
| Notes to Schedule of Portfolio Investments |
Note: Based on the approximate cost of investments of $31,628,262 for Federal income tax purposes at December 31, 2010, the aggregate gross unrealized appreciation and depreciation were $2,243,166 and $429,289, respectively, resulting in net unrealized appreciation of investments of $1,813,877.
| * | Non-income-producing security. |
| (a) | Security exempt from registration under Rule 144A of the Securities Act of 1933. These securities may be resold in transactions exempt from registration, normally to qualified buyers. At December 31, 2010, the market value of these securities amounted to $8,683,428, or 27.8% of net assets. |
| (b) | Step Bond: A debt instrument with either deferred interest payments or an interest rate that resets at specific times during its term. |
| 1 | Yield shown for each investment company represents the December 31, 2010, seven-day average yield, which refers to the sum of the previous seven days’ dividends paid, expressed as an annual percentage. |
| 2 | Some or all of these securities were out on loan to various brokers as of December 31, 2010, amounting to a market value of $2,754,828, or 8.8% of net assets. |
| 3 | Collateral received from brokers for securities lending was invested in this short-term investment. |
| 4 | Floating Rate Security. The rate listed is as of December 31, 2010. Date in parentheses represents the securities next coupon rate reset. |
| 5 | Payment-in-kind security: A type of high yield debt instrument whose issuer has the option of making interest payments in either cash or additional debt securities. |
| 6 | Variable Rate Security. The rate listed is as of December 31, 2010, and is periodically reset subject to terms and conditions set forth in the debenture. |
| 7 | On September 12, 2008, The Bank of New York Mellon established a separate sleeve of the BNY Institutional Cash Reserves Fund (Series B) to hold certain Lehman Brothers floating rate notes. The Fund’s position in Series B is being fair valued daily. (See Note 7 in the Notes to Financial Statements.) |
The following table summarizes the inputs used to value the Fund’s net assets by the fair value hierarchy levels as of December 31, 2010: (See Note 1(a) in the Notes to Financial Statements.)
| Quoted Prices in Active Markets for Identical Investments Level 1 | Significant Other Observable Inputs Level 2 | Significant Unobservable Inputs Level 3 | Total | |||||||||||||
Investments in Securities |
| |||||||||||||||
Common Stocks† | $ | 185,691 | — | — | $ | 185,691 | ||||||||||
Corporate Bonds†† | — | $ | 30,401,510 | — | 30,401,510 | |||||||||||
Short-Term Investments | 2,785,000 | 69,938 | — | 2,854,938 | ||||||||||||
Total Investments in Securities | $ | 2,970,691 | $ | 30,471,448 | — | $ | 33,442,139 | |||||||||
| † | All common stocks held in the Fund are Level 1 securities. For a detailed break-out of common stocks by major industry classification, please refer to the Schedule of Portfolio Investments. |
| †† | All corporate bonds held in the Fund are Level 2 securities. For a detailed break-out of the corporate bonds by major industry classification, please refer to the Schedule of Portfolio Investments. |
As of December 31, 2010, the Fund had no significant transfers between Level 1 and Level 2 from the beginning of the reporting period.
The accompanying notes are an integral part of these financial statements. 32 |
Table of Contents
| Managers Fixed Income Fund |
| Investment Manager’s Comments |
The Year in Review
Managers Fixed Income Fund (Institutional Class) returned 10.29% for the 12 months ended December 31, 2010, easily outpacing the return of 6.54% for the Barclays Capital U.S. Aggregate Bond Index (“the Index”).
At the beginning of 2010, attention shifted from economic recovery to economic growth, as investors began to displace lingering economic pessimism with overdue optimism. The transition was far from smooth, however, as new concerns materialized and old ones resurfaced. Increased anxiety over sovereign debt solvency in Europe and China’s lending restrictions percolated through global credit markets, tempering investor sentiment early in the year. In the U.S., unsteady economic readings and regulatory reform risk led some market participants back into defensive mode, but these challenges failed to offset a persistent overall positive market tone, which led to a solid year for the fixed income markets. For the entire year, government and investment-grade sectors earned returns of 4% to 9% while high yield and emerging markets posted double-digit gains. The modest rise in yields and spread tightening forecast by our macro and sector teams suggest returns may be less generous in 2011.
The primary driver of the Fund’s performance relative to the Index during 2010 was its emphasis on corporate bonds and related underweight to U.S. Treasuries, the same two factors that led to strong results for the prior year. Spreads contracted substantially in 2009 and this pattern extended into 2010. The Fund benefited most from its exposure to U.S. investment-grade bonds. A sizeable portion of the Fund’s corporate exposure is invested in BBB-rated securities, the lowest and most credit-sensitive part of the investment-grade spectrum. As a group, BBB-rated securities performed very well during 2010 after posting exceptional returns in the prior year. Moving even further down on the credit spectrum, the Fund also benefited from its high yield exposure. The majority of the rest of the Fund’s solid results were attributable to its non-U.S. dollar denominated and convertible bonds.
Looking Forward
Bond returns may be more tempered in 2011 due in part to the current low level of yields and the possibility for rates to move higher. Low current yields as of December 31, 2010, are particularly problematic for government and investment-grade sectors. The 10-year Treasury could earn 3.3% in one year if rates are unchanged, but lose 1.8% if rates rise to just 4.0% (the peak in 2010). The corporate market offers more yield and we like that many company balance sheets are generally in good shape with strong cash balances and growing profits. We anticipate that economic trends will remain supportive of credit quality, allowing the
sector to earn higher returns than Treasurys, but we see the sector’s low 4.0% yield as capping its upside. In addition to shopping the investment-grade corporate market, we see the securitized sector as offering attractive opportunities. Many managers are underweight MBS due to the government’s involvement in the sector, but we see recent improvements in valuations as a chance to reduce those underweights. Selected securities in the non-agency markets have particular appeal.
The speculative-grade market yield of 7.4% also may limit the upside as the sector typically offers more generous yields. High yield bonds remain one of our favored sectors, though, as we believe the incremental income may shore up returns in an environment where yields may be at to rising. High yield loans, too, will become even more attractive when yield increases are more worrisome. Equity markets (and their proxies, convertible bonds) could earn higher returns than high yield in 2011 as investors reduce overweights to fixed income. But for those who prefer a potentially lower-volatility strategy with income, we believe the high yield market remains very attractive.
On the international front, we expect a continuation of China as a growth engine for the world, with faster growth and higher yields in developing countries than in developed nations. While we have a slight preference for U.S. Dollar over Euro or Yen, we are not enamored by any of them and continue to see emerging markets as having greater return potential. We see both Asia ex-Japan and Latin America as benefiting from China’s commodity demands. Our sovereign analysts are forecasting, for example, growth near 4% for commodity exporters like Australia and Brazil. This faster growth and higher yields continue to attract investor in flows, boosting the return potential for both the bonds and currencies.
This commentary reflects the viewpoints of the portfolio manager, Loomis, Sayles & Company, as of December 31, 2010, and are not intended as a forecast or guarantee of future results.
Cumulative Total Return Performance
Managers Fixed Income Fund’s cumulative total return is based on the daily change in net asset value (NAV), and assumes that all distributions were reinvested. The Barclays Capital U.S. Aggregate Bond Index is an index of the U.S. investment-grade fixed-rate bond market, including both government and corporate bonds. Unlike the Fund, the Barclays Capital U.S. Aggregate Bond Index is unmanaged, is not available for investment, and does not incur expenses. The chart illustrates the performance of a hypothetical $10,000 investment made in the Fund’s Class A Shares (with load) on December 31, 2000, with a $10,000 investment made in the Barclays Capital U.S. Aggregate Bond Index for the same time period. The graph and table do not reflect the deduction of taxes
33 |
Table of Contents
| Managers Fixed Income Fund |
| Investment Manager’s Comments (continued) |
Cumulative Total Return Performance (continued)
that a shareholder would pay on a Fund distribution or redemption of shares. Performance for periods longer than one year is annualized. The listed returns for the Fund are net of expenses and the returns for the index exclude expenses. Total returns for the Fund would have been lower had certain expenses not been reduced.
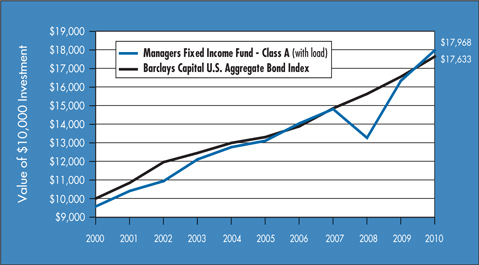
The table below shows the average annual total returns for the Managers Fixed Income Fund and the Barclays Capital U.S. Aggregate Bond Index from December 31, 2000 through December 31, 2010.
Average Annual Total Returns1 | 1 Year | 5 Years | 10 Years | |||||||||||||
Managers Fixed Income Fund2,3 | -Class A | No Load | 10.04 | % | 6.52 | % | 6.50 | % | ||||||||
| -Class A | With Load | 5.39 | % | 5.60 | % | 6.04 | % | |||||||||
| -Class B | No Load | 9.26 | % | 5.72 | % | 5.82 | % | |||||||||
| -Class B | With Load | 4.26 | % | 5.40 | % | 5.82 | % | |||||||||
| -Class C | No Load | 9.22 | % | 5.72 | % | 5.82 | % | |||||||||
| -Class C | With Load | 8.22 | % | 5.72 | % | 5.82 | % | |||||||||
| -Institutional Class | No Load | 10.29 | % | 6.78 | % | 6.87 | % | |||||||||
Barclays Capital U.S. Aggregate Bond Index4 | 6.54 | % | 5.80 | % | 5.84 | % | ||||||||||
The performance data shown represents past performance. Past performance is not a guarantee of future results. Current performance may be lower or higher than the performance data quoted. The investment return and the principal value of an investment will fluctuate so that an investor’s shares, when redeemed, may be worth more or less than their original cost. For performance information through the most recent month end please call (800) 835-3879 or visit our Web site at www.managersinvest.com.
Performance differences among the share classes are due to differences in sales charge structures and class expenses. Returns shown reflect maximum sales charge of 4.25% on Class A, as well as the applicable contingent deferred sales charge (CDSC) on both Class B and C shares. The Class B shares’ CDSC declines annually between years 1 through 6 according to the following schedule: 5, 4, 3, 3, 2, 1%. No sales charge is assessed after year six. Class C shares held for less than one year are subject to a 1% CDSC.
In choosing a Fund, investors should carefully consider the amount they plan to invest, their investment objectives, the Fund’s investment objectives, risks, charges and expenses before investing. For this and other information, please call (800) 835-3879 or visit www.managersinvest.com for a free prospectus. Read it carefully before investing or sending money. Distributed by Managers Distributors, Inc., member FINRA.
| 1 | Total return equals income yield plus share price change and assumes reinvestment of all dividends and capital gain distributions. Returns are net of fees and may reflect offsets of Fund expenses as described in the Prospectus. No adjustment has been made for taxes payable by shareholders on their reinvested dividends and capital gain distributions. Returns for periods greater than one year are annualized. The listed returns on the Fund are net of expenses and based on the published NAV as of December 31, 2010. All returns are in U.S. dollars($). |
| 2 | The Fund is subject to the risks associated with investments in debt securities, such as default risk and fluctuations in the perception of the debtors’ ability to pay its creditors. |
| 3 | From time to time, the Fund’s advisor has waived its fees and/or absorbed Fund expenses, which has resulted in higher returns. |
| 4 | The Barclays Capital U.S. Aggregate Bond Index is an index of the U.S. investment-grade, fixed-rate bond market, including both government and corporate bonds. Unlike the Fund, the Barclays Capital U.S. Aggregate Bond Index is unmanaged, is not available for investment, and does not incur expenses. |
Not FDIC insured, nor bank guaranteed. May lose value.
34 |
Table of Contents
| Managers Fixed Income Fund |
| Fund Snapshots |
| December 31, 2010 |
Portfolio Breakdown
Industry | Managers Fixed Income Fund** | |||
Industrials | 38.7 | % | ||
Financials | 21.0 | % | ||
U.S. Government and Agency Obligations | 12.8 | % | ||
Foreign Government Obligations | 8.2 | % | ||
Utilities | 7.7 | % | ||
Asset-Backed Securities | 5.3 | % | ||
Common Stocks | 2.9 | % | ||
Municipal Bonds | 1.1 | % | ||
Mortgage-Backed Securities | 0.6 | % | ||
Preferred Stocks | 0.5 | % | ||
Other Assets and Liabilities | 1.2 | % | ||
| ** | As a percentage of net assets |
Top Ten Holdings
Top Ten Holdings | % of Net Assets | |||
Ford Motor Co., 4.250%, 11/15/16 | 4.5 | % | ||
U.S. Treasury Notes, 3.125%, 05/15/19* | 4.1 | |||
Intel Corp. | 2.9 | |||
Canadian Government, 2.000%, 09/01/12* | 2.5 | |||
U.S. Treasury Notes, 3.875%, 11/15/40 | 2.0 | |||
Trinity Rail Leasing, L.P., Series 2010 1A, Class A, 5.194%, 10/16/40 | 2.0 | |||
Inter-American Development Bank, 6.000%, 12/15/17* | 1.9 | |||
Kinder Morgan Energy Partners, L.P., 5.950%, 02/15/18* | 1.7 | |||
Continental Airlines, Inc., Series 2010 B, 6.000%, 01/12/19 | 1.7 | |||
International Paper Co., 7.500%, 08/15/21* | 1.6 | |||
Top Ten as a Group | 24.9 | % | ||
| * | Top Ten Holding at June 30, 2010 |
Any sectors, industries, or securities discussed should not be perceived as investment recommendations. Mention of a specific security should not be considered a recommendation to buy or solicitation to sell that security. Specific securities mentioned in this report may have been sold from the Fund’s portfolio of investments by the time you receive this report.
35 |
Table of Contents
| Managers Fixed Income Fund |
| Schedule of Portfolio Investments |
| December 31, 2010 |
Security Description | Principal Amount | Value | ||||||
Corporate Bonds - 67.4% | ||||||||
Financials - 21.0% | ||||||||
AgriBank FCB, 9.125%, 07/15/196 | $ | 810,000 | $ | 963,419 | ||||
Alta Wind Holdings LLC, 7.000%, 06/30/35 (a) | 600,000 | 641,865 | ||||||
American General Finance Corp., Medium Term Notes, Series I, 4.875%, 07/15/12 | 200,000 | 189,250 | ||||||
American General Finance Corp., Medium Term Notes, Series J, 5.200%, 12/15/11 | 100,000 | 97,625 | ||||||
American General Finance Corp., Medium Term Notes, Series G, 5.375%, 10/01/12 | 400,000 | 380,000 | ||||||
American General Finance Corp., Medium Term Notes, Series I, 5.850%, 06/01/13 | 100,000 | 2 | 91,250 | |||||
American General Finance Corp., Medium Term Notes, Series J, 6.900%, 12/15/17 | 2,770,000 | 2,250,625 | ||||||
American International Group, Inc., Euro Medium Term Notes, 5.000%, 04/26/23 | 750,000 | 984,542 | ||||||
American International Group, Inc., Medium Term Notes, Series MP, 5.450%, 05/18/17 | 30,000 | 30,460 | ||||||
Associates Corp. of North America, 6.950%, 11/01/18 | 650,000 | 711,499 | ||||||
Bank of America Capital Trust VI, 5.625%, 03/08/35 | 295,000 | 250,551 | ||||||
Bear Stearns Companies, Inc., The, 4.650%, 07/02/18 | 480,000 | 493,726 | ||||||
Bear Stearns Companies, Inc., The, 5.300%, 10/30/15 | 25,000 | 27,158 | ||||||
Camden Property Trust, 5.700%, 05/15/17 | 255,000 | 269,453 | ||||||
Cantor Fitzgerald, L.P., 6.375%, 06/26/15 (a) | 910,000 | 920,982 | ||||||
Cantor Fitzgerald, L.P., 7.875%, 10/15/19 (a)6 | 700,000 | 722,014 | ||||||
Caterpillar Financial Services Corp., 6.125%, 02/17/14 | 615,000 | 691,903 | ||||||
Citigroup, Inc., 5.500%, 10/15/14 | 1,340,000 | 1,445,015 | ||||||
Citigroup, Inc., 5.850%, 12/11/34 | 75,000 | 73,447 | ||||||
Citigroup, Inc., 6.125%, 05/15/18 | 345,000 | 378,521 | ||||||
Citigroup, Inc., 6.125%, 08/25/36 | 935,000 | 898,748 | ||||||
Colonial Realty, L.P., 4.800%, 04/01/11 | 181,000 | 181,431 | ||||||
Crown Castle Towers LLC, 6.113%, 01/15/20 (a) | 850,000 | 888,372 | ||||||
Duke Realty, L.P., 5.950%, 02/15/17 | 35,000 | 36,498 | ||||||
ERAC USA Finance Co., 6.375%, 10/15/17 (a) | 240,000 | 266,802 | ||||||
ERAC USA Finance Co., 6.700%, 06/01/34 (a) | 65,000 | 67,559 | ||||||
ERAC USA Finance Co., 7.000%, 10/15/37 (a) | 925,000 | 999,191 | ||||||
ERP Operating, L.P., 5.125%, 03/15/16 | 15,000 | 16,201 | ||||||
ERP Operating, L.P., 5.750%, 06/15/17 | 70,000 | 76,802 | ||||||
GE Capital Australia Funding Pty., Ltd., Euro Medium Term Notes, 8.000%, 02/13/12 | AUD | 260,000 | 271,648 | |||||
General Electric Capital Corp., Global Medium Term Notes, Series A, 0.589%, 05/13/24, (01/18/11)4 | 180,000 | 151,598 | ||||||
Hanover Insurance Group, Inc., The, 7.500%, 03/01/20 | 465,000 | 490,808 | ||||||
Highwoods Realty, L.P., 5.850%, 03/15/17 | 30,000 | 30,925 | ||||||
Highwoods Realty, L.P., 7.500%, 04/15/18 | 350,000 | 391,190 | ||||||
International Lease Finance Corp., Medium Term Notes, Series R, 5.650%, 06/01/14 | 105,000 | 104,738 | ||||||
International Lease Finance Corp., 8.625%, 09/15/15 (a) | 10,000 | 10,775 | ||||||
iStar Financial, Inc., 0.803%, 10/01/12, (04/01/11)4,8 | 325,000 | 289,250 | ||||||
Lloyds TSB Bank PLC, 6.500%, 09/14/20 (a) | 1,255,000 | 1,156,651 | ||||||
Marsh & McLennan Companies, Inc., 5.375%, 07/15/14 | 410,000 | 436,508 | ||||||
Marsh & McLennan Companies, Inc., 5.875%, 08/01/33 | 1,230,000 | 1,128,040 | ||||||
The accompanying notes are an integral part of these financial statements. 36 |
Table of Contents
| Managers Fixed Income Fund |
| Schedule of Portfolio Investments (continued) |
Security Description | Principal Amount | Value | ||||||
Financials - 21.0% (continued) | ||||||||
MBIA Insurance Corp., 14.000%, 01/15/33 (a)5 | $ | 25,000 | 2 | $ | 13,812 | |||
Merrill Lynch & Co., Inc., Medium Term Notes, Series C, 6.050%, 06/01/34 | 1,100,000 | 1,029,648 | ||||||
Merrill Lynch & Co., Inc., 6.110%, 01/29/37 | 1,800,000 | 1,629,821 | ||||||
Metlife, Inc., 6.400%, 12/15/36 | 340,000 | 321,300 | ||||||
Morgan Stanley, 4.750%, 04/01/14 | 540,000 | 553,387 | ||||||
Morgan Stanley, 5.500%, 07/24/20 | 1,200,000 | 1,214,566 | ||||||
Morgan Stanley, 5.550%, 04/27/17 | 620,000 | 646,774 | ||||||
Morgan Stanley, 5.950%, 12/28/17 | 200,000 | 211,910 | ||||||
Morgan Stanley, 6.625%, 04/01/18 | 160,000 | 173,814 | ||||||
Morgan Stanley, Global Medium Term Notes, Series F, 5.500%, 01/26/20 | 200,000 | 201,962 | ||||||
Morgan Stanley, Global Medium Term Notes, Series F, 5.625%, 09/23/19 | 500,000 | 510,715 | ||||||
Mutual of Omaha Insurance Co., 6.800%, 06/15/36 (a) | 620,000 | 588,109 | ||||||
National City Bank of Indiana, 4.250%, 07/01/18 | 395,000 | 384,509 | ||||||
Penn Mutual Life Insurance Co., The, 7.625%, 06/15/40 (a) | 895,000 | 884,592 | ||||||
ProLogis Trust, 5.625%, 11/15/15 | 15,000 | 15,758 | ||||||
ProLogis Trust, 5.750%, 04/01/16 | 15,000 | 15,591 | ||||||
Simon Property Group, L.P., 5.250%, 12/01/16 | 25,000 | 27,005 | ||||||
Simon Property Group, L.P., 5.750%, 12/01/15 | 85,000 | 94,536 | ||||||
Simon Property Group, L.P., 5.875%, 03/01/17 | 40,000 | 43,966 | ||||||
Simon Property Group, L.P., 6.100%, 05/01/16 | 100,000 | 112,230 | ||||||
SLM Corp., 0.588%, 01/27/14, (01/25/11)4 | 135,000 | 121,688 | ||||||
SLM Corp., 5.000%, 10/01/13 | 10,000 | 10,032 | ||||||
SLM Corp., 5.375%, 01/15/13 | 20,000 | 20,409 | ||||||
SLM Corp., 8.450%, 06/15/18 | 845,000 | 879,469 | ||||||
Sovereign Bank, 5.125%, 03/15/13 | 335,000 | 339,236 | ||||||
Standard Chartered Bank, 6.400%, 09/29/17 (a) | 100,000 | 107,148 | ||||||
Standard Chartered PLC, 5.500%, 11/18/14 (a) | 750,000 | 813,534 | ||||||
WEA Finance LLC / WT Finance Australia, 6.750%, 09/02/19 (a) | AUD | 535,000 | 596,994 | |||||
Willis North America, Inc., 7.000%, 09/29/19 | 220,000 | 229,673 | ||||||
XL Capital PLC, 6.500%, 01/15/12 | 105,000 | 108,483 | ||||||
Total Financials | 31,407,711 | |||||||
Industrials - 38.7% | �� | |||||||
Alltel Corp., 7.875%, 07/01/32 | 210,000 | 269,087 | ||||||
Anadarko Petroleum Corp., 5.950%, 09/15/16 | 450,000 | 484,016 | ||||||
Anadarko Petroleum Corp., 6.450%, 09/15/36 | 395,000 | 395,199 | ||||||
Anheuser-Busch InBev Worldwide, Inc., 5.375%, 11/15/14 (a) | 975,000 | 1,075,152 | ||||||
AT&T Corp., 6.500%, 03/15/29 | 775,000 | 2 | 810,791 | |||||
Avnet, Inc., 6.000%, 09/01/15 | 720,000 | 770,915 | ||||||
Avnet, Inc., 6.625%, 09/15/16 | 140,000 | 154,919 | ||||||
Bell Atlantic Pennsylvania, Inc., 6.000%, 12/01/28 | 85,000 | 79,631 | ||||||
BellSouth Corp., 6.000%, 11/15/34 | 280,000 | 279,764 | ||||||
The accompanying notes are an integral part of these financial statements. 37 |
Table of Contents
| Managers Fixed Income Fund |
| Schedule of Portfolio Investments (continued) |
Security Description | Principal Amount | Value | ||||||
Industrials - 38.7% (continued) | ||||||||
Cardinal Health, Inc., 4.000%, 06/15/15 | $ | 320,000 | $ | 331,786 | ||||
CenturyTel, Series P, 7.600%, 09/15/39 | 605,000 | 611,561 | ||||||
Charter Communications Operating LLC, 8.000%, 04/30/12 | 245,000 | 258,475 | ||||||
Chevron Phillips Chemical Co. LLC, 8.250%, 06/15/19 (a) | 1,205,000 | 1,455,781 | ||||||
Choice Hotels International, Inc., 5.700%, 08/28/20 | 810,000 | 787,994 | ||||||
Ciena Corp., 0.875%, 06/15/178 | 180,000 | 148,500 | ||||||
CIGNA Corp., 6.150%, 11/15/36 | 240,000 | 248,740 | ||||||
Coca-Cola HBC Finance, B.V., 5.125%, 09/17/13 | 265,000 | 285,377 | ||||||
Comcast Corp., 5.650%, 06/15/35 | 150,000 | 146,194 | ||||||
Continental Airlines, Inc., 5.983%, 04/19/22 | 409,964 | 432,512 | ||||||
Continental Airlines, Inc., Series 2010 B, 6.000%, 01/12/19 | 2,500,000 | 2,500,000 | ||||||
Continental Airlines, Inc., Series B, 6.903%, 04/19/22 | 92,335 | 94,181 | ||||||
Continental Airlines, Inc., Series 00A1, 8.048%, 11/01/20 | 80,267 | 90,702 | ||||||
Corning, Inc., 6.850%, 03/01/29 | 600,000 | 665,418 | ||||||
Covidien International Finance, S.A., 6.000%, 10/15/17 | 295,000 | 335,744 | ||||||
Cummins Engine Co., Inc., 6.750%, 02/15/27 | 153,000 | 159,970 | ||||||
Cytec Industries, Inc., 6.000%, 10/01/15 | 80,000 | 87,721 | ||||||
Darden Restaurants, Inc., 6.000%, 08/15/35 | 170,000 | 161,113 | ||||||
Delta Air Lines, Inc. Pass Through Certificate, Series 2010-1A, 6.200%, 07/02/18 | 350,000 | 371,875 | ||||||
Delta Air Lines, Inc., 8.021%, 08/10/22 | 655,443 | 668,552 | ||||||
DP World, Ltd., 6.850%, 07/02/37 (a) | 1,720,000 | 1,590,818 | ||||||
Dun & Bradstreet Corp., The, 6.000%, 04/01/13 | 790,000 | 861,098 | ||||||
El Paso Corp., 6.950%, 06/01/28 | 165,000 | 153,296 | ||||||
Energy Transfer Partners, L.P., 6.125%, 02/15/17 | 65,000 | 71,545 | ||||||
Energy Transfer Partners, L.P., 6.625%, 10/15/36 | 145,000 | 153,345 | ||||||
Equifax, Inc., 7.000%, 07/01/37 | 228,000 | 249,055 | ||||||
Equitable Resources, Inc., 6.500%, 04/01/18 | 1,730,000 | 1,877,299 | ||||||
Express Scripts, Inc., 6.250%, 06/15/14 | 305,000 | 341,245 | ||||||
Express Scripts, Inc., 7.250%, 06/15/19 | 185,000 | 219,326 | ||||||
Ford Motor Co., 4.250%, 11/15/168 | 3,380,000 | 6,772,675 | ||||||
GATX Corp., 4.750%, 10/01/12 | 560,000 | 586,862 | ||||||
Georgia-Pacific Corp., 7.250%, 06/01/28 | 70,000 | 76,125 | ||||||
Hasbro, Inc., 6.600%, 07/15/28 | 165,000 | 169,584 | ||||||
HCA, Inc., 7.500%, 11/06/33 | 75,000 | 69,375 | ||||||
Intel Corp., 2.950%, 12/15/358 | 265,000 | 265,331 | ||||||
Intel Corp., 3.250%, 08/01/398 | 1,035,000 | 1,245,881 | ||||||
International Paper Co., 7.500%, 08/15/21 | 2,000,000 | 2,366,808 | ||||||
International Paper Co., 7.950%, 06/15/18 | 114,000 | 135,852 | ||||||
Intuit, Inc., 5.750%, 03/15/17 | 210,000 | 229,241 | ||||||
J.C. Penney Co., Inc., 5.750%, 02/15/18 | 25,000 | 24,750 | ||||||
J.C. Penney Co., Inc., 6.375%, 10/15/36 | 297,000 | 271,755 | ||||||
J.C. Penney Co., Inc., 7.625%, 03/01/97 | 25,000 | 22,312 | ||||||
The accompanying notes are an integral part of these financial statements. 38 |
Table of Contents
| Managers Fixed Income Fund |
| Schedule of Portfolio Investments (continued) |
Security Description | Principal Amount | Value | ||||||
Industrials - 38.7% (continued) | ||||||||
Kinder Morgan Energy Partners, L.P., 5.950%, 02/15/18 | $ | 2,335,000 | $ | 2,575,328 | ||||
Kinder Morgan Finance Co., 5.700%, 01/05/16 | 165,000 | 167,888 | ||||||
KLA Instruments Corp., 6.900%, 05/01/18 | 420,000 | 462,673 | ||||||
Kroger Co., The, 7.000%, 05/01/18 | 460,000 | 525,735 | ||||||
Macy’s Retail Holdings, Inc., 6.790%, 07/15/27 | 80,000 | 76,400 | ||||||
Macy’s Retail Holdings, Inc., 6.900%, 04/01/29 | 30,000 | 29,625 | ||||||
Marks & Spencer Group PLC, 7.125%, 12/01/37 (a) | 300,000 | 299,936 | ||||||
Masco Corp., 5.850%, 03/15/17 | 350,000 | 349,242 | ||||||
Masco Corp., 6.500%, 08/15/32 | 25,000 | 22,059 | ||||||
Masco Corp., 7.125%, 03/15/20 | 300,000 | 314,368 | ||||||
Masco Corp., 7.750%, 08/01/29 | 50,000 | 49,124 | ||||||
Medco Health Solutions, Inc., 7.250%, 08/15/13 | 420,000 | 477,348 | ||||||
Methanex Corp., 6.000%, 08/15/15 | 320,000 | 308,200 | ||||||
Missouri Pacfic Railroad Co., 5.000%, 01/01/456 | 200,000 | 144,886 | ||||||
Motorola, Inc., 6.500%, 09/01/25 | 15,000 | 15,463 | ||||||
Motorola, Inc., 6.500%, 11/15/28 | 70,000 | 2 | 69,077 | |||||
New England Telephone & Telegraph Co., 7.875%, 11/15/29 | 95,000 | 103,241 | ||||||
News America, Inc., 7.280%, 06/30/28 | 225,000 | 254,340 | ||||||
News America, Inc., 7.625%, 11/30/28 | 460,000 | 537,440 | ||||||
Nextel Communications, Inc., 5.950%, 03/15/14 | 710,000 | 701,125 | ||||||
Northwest Airlines, Inc., 8.028%, 11/01/17 | 336,017 | 347,777 | ||||||
Omnicare, Inc., 3.750%, 12/15/258 | 470,000 | 526,400 | ||||||
Owens & Minor, Inc., 6.350%, 04/15/166 | 125,000 | 127,403 | ||||||
Owens Corning, Inc., 6.500%, 12/01/16 | 210,000 | 222,688 | ||||||
Owens Corning, Inc., 7.000%, 12/01/36 | 385,000 | 397,871 | ||||||
PPG Industries, Inc., 6.650%, 03/15/18 | 1,935,000 | 2,228,750 | ||||||
Pulte Homes, Inc., 6.000%, 02/15/35 | 1,265,000 | 942,425 | ||||||
Pulte Homes, Inc., 6.375%, 05/15/33 | 465,000 | 353,400 | ||||||
Qantas Airways, Ltd., 6.050%, 04/15/16 (a) | 1,500,000 | 1,597,983 | ||||||
Qwest Corp., 6.875%, 09/15/33 | 20,000 | 19,750 | ||||||
Rowan Cos., Inc., 7.875%, 08/01/19 | 300,000 | 348,707 | ||||||
Safeway, Inc., 6.350%, 08/15/17 | 400,000 | 447,284 | ||||||
Samsung Electronics Co., Ltd., 7.700%, 10/01/27 (a) | 510,000 | 579,643 | ||||||
SBC Communications, Inc., 6.150%, 09/15/34 | 840,000 | 870,244 | ||||||
Sprint Capital Corp., 6.900%, 05/01/19 | 15,000 | 14,888 | ||||||
Sprint Capital Corp., 8.750%, 03/15/32 | 5,000 | 5,075 | ||||||
Telecom Italia Capital S.p.A., 6.000%, 09/30/34 | 40,000 | 33,288 | ||||||
Telecom Italia Capital S.p.A., 6.375%, 11/15/33 | 105,000 | 90,371 | ||||||
Tele-Communications, Inc., 9.800%, 02/01/12 | 350,000 | 381,050 | ||||||
Telefonica Emisiones SAU, 5.877%, 07/15/19 | 265,000 | 271,216 | ||||||
Texas Eastern Transmission, L.P., 7.000%, 07/15/32 | 255,000 | 294,934 | ||||||
TGT Pipeline LLC, 5.200%, 06/01/18 | 465,000 | 481,477 | ||||||
The accompanying notes are an integral part of these financial statements. 39 |
Table of Contents
| Managers Fixed Income Fund |
| Schedule of Portfolio Investments (continued) |
Security Description | Principal Amount | Value | ||||||
Industrials - 38.7% (continued) | ||||||||
Time Warner Cable, Inc., 6.750%, 07/01/18 | $ | 1,500,000 | $ | 1,751,145 | ||||
Time Warner, Inc., 6.625%, 05/15/29 | 270,000 | 298,964 | ||||||
Time Warner, Inc., 7.625%, 04/15/31 | 80,000 | 97,527 | ||||||
Time Warner, Inc., 7.700%, 05/01/32 | 685,000 | 838,569 | ||||||
Toll Brothers Finance Corp., 5.150%, 05/15/15 | 540,000 | 552,540 | ||||||
Toro Co., The, 6.625%, 05/01/376 | 365,000 | 335,321 | ||||||
V.F. Corp., 6.450%, 11/01/37 | 412,000 | 464,944 | ||||||
Verizon Maryland, Inc., 5.125%, 06/15/33 | 295,000 | 260,536 | ||||||
Verizon New England, Inc., 6.500%, 09/15/11 | 530,000 | 550,708 | ||||||
Verizon New York, Inc., Series B, 7.375%, 04/01/32 | 110,000 | 123,783 | ||||||
Viacom, Inc., 6.875%, 04/30/36 | 470,000 | 540,983 | ||||||
Western Union Co., 6.200%, 11/17/36 | 450,000 | 446,236 | ||||||
Western Union Co., The, 6.200%, 06/21/40 | 5,000 | 4,963 | ||||||
Weyerhaeuser Co., 6.875%, 12/15/33 | 660,000 | 620,968 | ||||||
Weyerhaeuser Co., 7.375%, 10/01/19 | 50,000 | 54,713 | ||||||
Weyerhaeuser Co., 7.375%, 03/15/32 | 90,000 | 91,224 | ||||||
Wyndham Worldwide Corp., 6.000%, 12/01/16 | 405,000 | 424,332 | ||||||
Wyndham Worldwide Corp., 7.375%, 03/01/20 | 460,000 | 506,552 | ||||||
Total Industrials | 57,945,378 | |||||||
Utilities - 7.7% | ||||||||
Abu Dhabi National Energy Co., 7.250%, 08/01/18 (a) | 1,040,000 | 1,155,298 | ||||||
Ameren Energy Generating Co., 7.000%, 04/15/18 | 1,200,000 | 2 | 1,184,540 | |||||
Ameren Illinois Co., 6.250%, 04/01/18 | 1,370,000 | 1,514,116 | ||||||
Bruce Mansfield Unit 12, 6.850%, 06/01/346 | 315,916 | 336,100 | ||||||
Cleveland Electric Illuminating Co., The, 5.950%, 12/15/36 | 695,000 | 666,133 | ||||||
Commonwealth Edison Co., 4.700%, 04/15/15 | 510,000 | 552,947 | ||||||
Empresa Nacional de Electricidad, 7.875%, 02/01/27 | 900,000 | 1,001,996 | ||||||
ITC Holdings Corp., 5.875%, 09/30/16 (a) | 225,000 | 251,845 | ||||||
ITC Holdings Corp., 6.375%, 09/30/36 (a) | 300,000 | 309,578 | ||||||
Korea Gas Corp., 6.000%, 07/15/14 (a) | 300,000 | 325,295 | ||||||
Nisource Finance Corp., 6.400%, 03/15/18 | 1,645,000 | 1,826,226 | ||||||
Nisource Finance Corp., 6.800%, 01/15/19 | 900,000 | 1,042,947 | ||||||
Southwestern Electric Power Co., 6.450%, 01/15/19 | 1,225,000 | 1,347,365 | ||||||
Total Utilities | 11,514,386 | |||||||
Total Corporate Bonds (cost $93,130,299) | 100,867,475 | |||||||
U.S. Government and Agency Obligations - 12.8% | ||||||||
Federal Home Loan Bank - 0.7% | ||||||||
FHLB, 1.875%, 06/21/13 | 1,040,000 | 1,064,880 | ||||||
Federal Home Loan Mortgage Corporation - 1.8% | ||||||||
FHLMC, 1.625%, 04/15/13 | 1,040,000 | 1,058,823 | ||||||
FHLMC, 2.125%, 09/21/12 | 1,560,000 | 1,600,607 | ||||||
Total Federal Home Loan Mortgage Corporation | 2,659,430 | |||||||
The accompanying notes are an integral part of these financial statements. 40 |
Table of Contents
| Managers Fixed Income Fund |
| Schedule of Portfolio Investments (continued) |
Security Description | Principal Amount | Value | ||||||||
Federal National Mortgage Association - 1.9% | ||||||||||
FNMA, 1.375%, 04/28/11 | $ | 2,080,000 | $ | 2,088,162 | ||||||
FNMA, 1.875%, 04/20/12 | 650,000 | 661,856 | ||||||||
Total Federal National Mortgage Association | 2,750,018 | |||||||||
United States Treasury Securities - 8.4% | ||||||||||
U.S. Treasury Inflation Indexed Notes, 2.000%, 01/15/14 | 520,771 | 559,584 | ||||||||
U.S. Treasury Notes, 1.000%, 08/31/11 | 1,970,000 | 1,980,236 | ||||||||
U.S. Treasury Notes, 3.125%, 05/15/19 | 6,000,000 | 6,064,218 | ||||||||
U.S. Treasury Notes, 3.875%, 11/15/40 | 3,080,000 | 3,030,431 | ||||||||
U.S. Treasury Notes, 4.750%, 05/15/14 | 835,000 | 932,787 | ||||||||
Total United States Treasury Securities | 12,567,256 | |||||||||
Total U.S. Government and Agency Obligations (cost $18,397,022) | 19,041,584 | |||||||||
Foreign Government Obligations - 8.2% | ||||||||||
Brazil, Republic of, 10.250%, 01/10/28 | BRL | 750,000 | 471,461 | |||||||
Canadian Government, 2.000%, 09/01/12 | CAD | 3,700,000 | 3,745,250 | |||||||
Canadian Government, 3.750%, 06/01/12 | CAD | 135,000 | 139,941 | |||||||
Canadian Government, 5.250%, 06/01/12 | CAD | 390,000 | 412,428 | |||||||
Inter-American Development Bank, 6.000%, 12/15/17 | NZD | 3,500,000 | 2,814,126 | |||||||
International Bank for Reconstruction & Development, Series GDIF, 1.430%, 03/05/14 | SGD | 1,000,000 | 782,505 | |||||||
Ireland Government Notes, 4.500%, 04/18/20 | EUR | 75,000 | 72,577 | |||||||
Ireland Government Notes, 5.000%, 10/18/20 | EUR | 25,000 | 24,524 | |||||||
Ireland Treasury Bonds, 4.500%, 10/18/18 | EUR | 275,000 | 280,814 | |||||||
Ireland Treasury Bonds, 5.400%, 03/13/25 | EUR | 125,000 | 119,626 | |||||||
Mexican Bonos, Series M10, 7.250%, 12/15/16 | MXN | 6,850,000 | 577,064 | |||||||
Mexican Fixed Rate Bonds, 8.000%, 12/07/23 | MXN | 3,500,000 | 303,976 | |||||||
Mexican Government, 9.000%, 12/20/12 | MXN | 5,950,000 | 516,903 | |||||||
New South Wales Treasury Corp., 6.000%, 05/01/12 | AUD | 995,000 | 1,027,906 | |||||||
New South Wales Treasury Corp., Series 12RG, 6.000%, 05/01/12 | AUD | 260,000 | 268,625 | |||||||
Portugal Obrigacoes do Tesouro, 3.850%, 04/15/21 | EUR | 50,000 | 52,477 | |||||||
Portugal Obrigacoes do Tesouro, 4.800%, 06/15/20 | EUR | 25,000 | 29,284 | |||||||
Queensland Treasury Corp., Series 11G, 6.000%, 06/14/11 | AUD | 665,000 | 682,468 | |||||||
Total Foreign Government Obligations (cost $11,110,137) | 12,321,955 | |||||||||
Municipal Bonds - 1.1% | ||||||||||
Buckeye Tobacco Settlement Financing Authority, Series 2007 A-2, 5.875%, 06/01/476 | 250,000 | 164,300 | ||||||||
California State, 4.500%, 08/01/27, (AMBAC Insured) | 45,000 | 39,398 | ||||||||
California State, 4.500%, 10/01/29 | 130,000 | 110,902 | ||||||||
California State, 4.500%, 08/01/30 | 30,000 | 25,520 | ||||||||
California State, 4.500%, 08/01/30, (AMBAC Insured) | 35,000 | 29,773 | ||||||||
California State, Variable Purpose Bond, 3.250%, 12/01/27, (National Insured) | 25,000 | 18,164 | ||||||||
California State, Variable Purpose Bond, 4.500%, 12/01/33, (AMBAC Insured) | 110,000 | 91,994 | ||||||||
Chicago Illinois O’Hare International Airport Revenue Bond, Series 2008 A, 4.500%, 01/01/38, (AGM Insured) | 15,000 | 12,709 | ||||||||
Eufaula Alabama, Series 2003 C, 4.000%, 08/15/12, (AMBAC Insured) | 175,000 | 175,710 | ||||||||
The accompanying notes are an integral part of these financial statements. 41 |
Table of Contents
| Managers Fixed Income Fund |
| Schedule of Portfolio Investments (continued) |
Security Description | Principal Amount | Value | ||||||
Municipal Bonds - 1.1% (continued) | ||||||||
Michigan Tobacco Settlement Financial Authority, Series 2006 A, 7.309%, 06/01/346 | $ | 390,000 | $ | 277,625 | ||||
San Jose California Redevelopment Agency Tax Allocation, Series 2006 C, 3.750%, 08/01/28, (BHAC Insured) | 15,000 | 11,686 | ||||||
San Jose California Redevelopment Agency Tax Allocation, Series 2006 C, 3.750%, 08/01/28, (National Insured) | 35,000 | 26,751 | ||||||
Virginia Tobacco Settlement Financing Corp., 6.706%, 06/01/466 | 1,055,000 | 659,628 | ||||||
Total Municipal Bonds (cost $2,251,637) | 1,644,160 | |||||||
Asset-Backed Securities - 5.3% | ||||||||
Centex Home Equity Loan, Series 2004-A, Class AF6, 4.270%, 01/25/345 | 247,720 | 249,867 | ||||||
Chase Issuance Trust, Series 2007-B1, Class B1, 0.510%, 04/15/19, (01/18/11)4 | 845,000 | 813,433 | ||||||
Chrysler Financial Lease Trust, Series 2010-A, Class B, 3.460%, 09/16/13 (a) | 640,000 | 640,648 | ||||||
Countrywide Home Loans, Series 2002-S1, Class A5, 6.460%, 11/25/16 (b) | 140,186 | 132,439 | ||||||
Marriott Vacation Club Owner Trust, Series 2009-2A, Class A, 4.809%, 07/20/31 (a) | 854,130 | 880,549 | ||||||
Merrill Auto Trust Securitization, Series 2008-1, Class B, 6.750%, 04/15/15 | 200,000 | 212,857 | ||||||
Sierra Receivables Funding Company, Series 2010-2A, Class A, 3.840%, 11/20/25 (a) | 1,522,849 | 1,526,273 | ||||||
Trinity Rail Leasing, L.P., Series 2010 1A, Class A, 5.194%, 10/16/40 (a) | 2,983,175 | 2,989,472 | ||||||
World Financial Network Credit Card Master Note Trust, Series 2010-A, 6.750%, 04/15/19 | 500,000 | 536,112 | ||||||
Total Asset-Backed Securities (cost $7,790,182) | 7,981,650 | |||||||
Mortgage-Backed Securities - 0.6% | ||||||||
Credit Suisse Mortgage Capital, Series 2007-C5, Class A4, 5.695%, 09/15/405 | 300,000 | 308,556 | ||||||
JP Morgan Chase Commercial Mortgage Securities Corp., Series 2007-LDPX, Class A3, 5.420%, 01/15/49 | 110,000 | 114,581 | ||||||
JP Morgan Chase Commercial Mortgage Securities Corp., Series 2007-LD11, Class A4, 5.817%, 06/15/49 5 | 220,000 | 230,557 | ||||||
LB-UBS Commercial Mortgage Trust, Series 2001-C3, Class A2, 6.365%, 12/15/28 | 295,102 | 298,764 | ||||||
Total Mortgage-Backed Securities (cost $642,729) | 952,458 | |||||||
| Common Stocks - 2.9% | Shares | |||||||
Information Technology | ||||||||
Intel Corp. (cost $4,461,584) | 204,750 | 4,305,892 | ||||||
Preferred Stocks - 0.5% | ||||||||
General Motors Co., Series 2010 B, 4.750%8 | 2,400 | 129,864 | ||||||
Newell Financial Trust I, 5.250%8 | 13,455 | 568,474 | ||||||
Total Preferred Stocks (cost $697,997) | 698,338 | |||||||
Short-Term Investments - 1.2%1 | ||||||||
BNY Institutional Cash Reserves Fund, Series B*3,7 | 247,573 | 197,321 | ||||||
BNY Mellon Overnight Government Fund, 0.23%3 | 1,264,000 | 1,264,000 | ||||||
Dreyfus Cash Management Fund, Institutional Class Shares, 0.14% | 301,535 | 301,535 | ||||||
Total Short-Term Investments (cost $1,813,108) | 1,762,856 | |||||||
Total Investments - 100.0% (cost $140,294,695) | 149,576,368 | |||||||
Other Assets, less Liabilities - (0.0)%# | (37,548 | ) | ||||||
Net Assets - 100.0% | $ | 149,538,820 | ||||||
The accompanying notes are an integral part of these financial statements. 42 |
Table of Contents
| Managers Fixed Income Fund |
| Notes to Schedules of Portfolio Investments |
Note: Based on the approximate cost of investments of $140,316,188 for Federal income tax purposes at December 31, 2010, the aggregate gross unrealized appreciation and depreciation were $11,256,713 and $1,996,533, respectively, resulting in net unrealized appreciation of investments of $9,260,180.
| # | Rounds to less than 0.01%. |
| (a) | Security exempt from registration under Rule 144A of the Securities Act of 1933. These securities may be resold in transactions exempt from registration, normally to qualified buyers. At December 31, 2010, the value of these securities amounted to $23,356,671, or 15.6% of net assets. |
| (b) | Step Bond: A debt instrument with either deferred interest payments or an interest rate that resets at specific times during its term. |
| 1 | Yield shown for each investment company represents its December 31, 2010, seven-day average yield, which refers to the sum of the previous seven days’ dividends paid, expressed as an annual percentage. |
| 2 | Some or all of these securities were out on loan to various brokers as of December 31, 2010, amounting to a market value of $1,461,845, or 1.0% of net assets. |
| 3 | Collateral received from brokers for securities lending was invested in this short-term investment. |
| 4 | Floating Rate Security. The rate listed is as of December 31, 2010. Date in parentheses represents the securities next coupon rate reset. |
| 5 | Variable Rate Security. The rate listed is as of December 31, 2010, and is periodically reset subject to terms and conditions set forth in the debenture. |
| 6 | Illiquid Security: A security not readily convertible into cash such as a stock, bond or commodity that is not actively traded and would be difficult to sell in a current sale. The Funds may not invest more than 15% of their net assets in illiquid securities. All securities are valued on the basis of valuations provided by dealers or independent pricing services. At December 31, 2010, the market value of these securities amounted to $3,730,696, or 2.5% of net assets. |
| 7 | On September 12, 2008, The Bank of New York Mellon established a separate sleeve of the BNY Institutional Cash Reserves Fund (Series B) to hold certain Lehman Brothers floating rate notes. The Fund’s position in Series B is being fair valued daily. (See Note 7 in the Notes to Financial Statements.) |
| 8 | Convertible Bond: A corporate bond, usually a junior debenture that can be converted, at the option of the holder, for a specific number of shares of the company’s preferred stock or common stock. At December 31, 2010, the market value of these bonds amounted to $9,946,375, or 6.7% of net assets. |
The following table summarizes the inputs used to value the Fund’s net assets by the fair value hierarchy levels as of December 31, 2010: (See Note 1(a) in the Notes to Financial Statements.)
| Quoted Prices in Active Markets for Identical Investments Level 1 | Significant Other Observable Inputs Level 2 | Significant Unobservable Inputs Level 3 | Total | |||||||||||||
Investments in Securities | ||||||||||||||||
Corporate Bonds† | — | $ | 100,867,475 | — | $ | 100,867,475 | ||||||||||
U.S. Government and Agency Obligations | — | 19,041,584 | — | 19,041,584 | ||||||||||||
Asset-Backed Securities | — | 7,981,650 | — | 7,981,650 | ||||||||||||
Mortgage-Backed Securities | — | 952,458 | — | 952,458 | ||||||||||||
Foreign Government Obligations | — | 12,321,955 | — | 12,321,955 | ||||||||||||
Municipal Bonds | — | 1,644,160 | — | 1,644,160 | ||||||||||||
Common Stocks | $ | 4,305,892 | — | — | 4,305,892 | |||||||||||
Preferred Stocks | — | 698,338 | — | 698,338 | ||||||||||||
Short-Term Investments | 1,565,535 | 197,321 | — | 1,762,856 | ||||||||||||
Total Investments in Securities | $ | 5,871,427 | $ | 143,704,941 | — | $ | 149,576,368 | |||||||||
| † | All corporate bonds held in the Fund are Level 2 securities. For a detailed break-out of the corporate bonds by major industry classification, please refer to the Schedule of Portfolio Investments. |
As of December 31, 2010, the Fund had no significant transfers between Level 1 and Level 2 from the beginning of the reporting period.
| Investments Definitions and Abbreviations: | ||||||
| AGM: | Assured Guaranty Municipal Corp. | GDIF: | Global Debt Insurance Facility | |||
| AMBAC: | American Municipal Bond Assurance Corp. | GNMA: | Government National Mortgage Association | |||
| BHAC: | Berkshire Hathaway Assurance Corp. | GSR: | Goldman Sachs REMIC | |||
| FGIC: | Federal Guaranty Insurance Corp. | National: | National Public Finance Guarantee Group | |||
| FHLB: | Federal Home Loan Bank | REIT: | Real Estate Investment Trust | |||
| FHLMC: | Federal Home Loan Mortgage Corp. | |||||
| FNMA: | Federal National Mortgage Association | |||||
Abbreviations have been used throughout the portfolios to indicate amounts shown in currencies or par values other than the U.S. dollar (USD):
| AUD: | Australian Dollar | MXN: | Mexican Peso | |||
| BRL: | Brazilian Real | NZD: | New Zealand Dollar | |||
| CAD: | Canadian Dollar | SGD: | Singapore Dollar | |||
| EUR: | Euro |
The accompanying notes are an integral part of these financial statements. 43 |
Table of Contents
| Managers Short Duration Government Fund |
| Investment Manager’s Comments |
The Managers Short Duration Government Bond Fund (“the Fund”) seeks to provide investors with a high level of current income, consistent with a low volatility of net asset value.
The Fund seeks to achieve its objective by matching the duration, or interest-rate risk, of a portfolio that invests exclusively in six-month U.S. Treasury securities on a constant maturity basis. Under normal circumstances, the Fund will invest at least 80% of its net assets, plus the amount of any borrowings for investment purposes, in debt securities issued by the U.S. government or its agencies and instrumentalities and synthetic instruments or derivatives having economic characteristics similar to such debt securities.
The Fund typically employs hedging techniques using instruments such as interest rate futures, options, floors, caps, and swaps, designed to reduce the interest-rate risk of their fixed-income securities. The Fund’s benchmark is the six-month Treasury bill.
The Portfolio Manager
Smith Breeden Associates, Inc.
Smith Breeden Associates, Inc. (“Smith Breeden”) is the subadvisor for the Fund. Smith Breeden, located at 280 South Mangum Street, Suite 301, Durham, NC, was founded in 1982. Smith Breeden is an investment management firm for a client base including corporate and public pension plans, central and supranational banks, endowments and foundations, private banks and financial institutions, insurance companies, and other institutional investors. Specializing in fixed income portfolios, the firm offers separate accounts, commingled funds, and serves as a subadvisor to ‘40 Act funds. As of December 31, 2010, Smith Breeden managed assets of approximately $6.4 billion.
Smith Breeden believes that innovative research provides critical insights into the fixed income market. The firm’s experienced investment professionals apply these research insights to the management of investment portfolios designed to achieve their clients’ objectives. The key tenets of this market-tested investment philosophy are:
| • | Over a market cycle, a portfolio of fixed income securities with wide risk-adjusted spreads produces an attractive total return in comparison to the market return. |
| • | The incremental return available from security selection and sector allocation, based on careful relative value analysis, quantitative research, and experienced market judgment, is more consistent than the incremental return from predicting the direction of interest rates or other macro-factor trading strategies. |
| • | Within the investment-grade fixed income market, the spread sectors, e.g., corporate bonds, mortgage-backed securities (MBS), commercial MBS (CMBS), and asset-backed securities (ABS), will tend to outperform Treasury securities over a market cycle. The corporate, mortgage, CMBS, and ABS sectors also offer the greatest active management opportunity for adding value through security selection. |
The portfolio management team at Smith Breeden specializes in analyzing and investing in mortgage securities. Through careful analysis and comparison of the characteristics of these securities, such as type of issuer, coupon, maturity, geographic structure, and prepayment rates, the portfolio manager seeks to structure a portfolio with similar risk characteristics to six-month U.S. Treasury securities and slightly higher returns. Because there is less certainty about the timing of principal payments to individual mortgage securities than for U.S. Treasury securities, they tend to carry a slightly higher yield. A properly structured portfolio of mortgage securities, however, can have a highly predictable cash flow while maintaining a yield advantage over Treasuries. Although the portfolio management team often purchases securities with maturities longer than six months, it does not attempt to increase returns by actively positioning the interest rate sensitivity of the Portfolio. Instead, the team typically manages the weighted average duration of the Portfolio so that it remains close to the Index.
The ideal investment exhibits many of the following traits:
| • | Yield advantage over Treasuries |
| • | Very high quality (Government or AAA) |
| • | Attractive value relative to other MBS opportunities |
The portfolio:
| • | Seeks to optimize return per unit of risk |
| • | Maintains minimal exposure to credit risk and interest rate risk |
| • | Consists of high-quality MBS, CMBS, and ABS securities |
| • | Will tend to have an interest-rate sensitivity similar to a six-month Treasury bill |
The investment team will make a sell decision when:
| • | They no longer view the bonds as attractive |
| • | They deem it necessary to reallocate the Portfolio |
| • | They need to maintain the Portfolio’s target duration |
The Year in Review
During the year ended December 31, 2010, the Fund returned 1.58%, while the BofA Merrill Lynch Six-Month U.S Treasury Bill Index returned 0.36%.
Economic conditions and the recovery in 2010 were largely shaped by the prior few years of historic market moves, a credit and liquidity crisis, and unprecedented government intervention. The prior year included high economic uncertainty, uncertain inflation expectations, constrained capital given restrictive risk management limits, and somewhat impaired liquidity. 2010 saw tightening across spread sectors, lower risk premia, improved liquidity, and lower market volatility as the markets continued healing.
44 |
Table of Contents
| Managers Short Duration Government Fund |
| Investment Manager’s Comments (continued) |
By the end of the first quarter of 2010, the Federal Reserve buying program of MBS was completed, culminating in purchases of $1.25 trillion. This program kept demand for MBS strong through most of 2009 and the early part of 2010 and mortgage rates lower than they otherwise would have been through a volatile period for the U.S. housing market and the overall economy. With the end to quantitative easing, the market had lost the volatility buffer provided not only by Federal Reserve buying, but also by the Fed’s assumption of massive amounts of prepayment risk via their MBS holdings.
Despite this, mortgage rates moved significantly lower during the second quarter. Demand remained strong as mortgages represented a high credit-quality security that offered a better yield than Treasury securities. With prepayments generally remaining mild and supply being light despite historically low rates, agency mortgages kept pace with a rally in Treasuries. It should be noted that one of the great technical supports for the agency MBS market in 2010 was the net negative supply primarily due to Government Sponsored Enterprise buyouts of delinquent loans.
As fears of a double dip in the economy emerged during the third quarter, both Treasury yields and mortgage rates again moved lower. Talk of a second round of quantitative easing surfaced toward the end of the quarter, which helped spur the bond market rally. Mortgage spreads widened in this rally as concerns emerged over increasing levels of prepayments and origination. Apart from agency MBS, spread sectors performed well during the quarter.
In the fourth quarter, interest rates backed up significantly as the market’s fear of a double dip in the economy gave way, and the market, buoyed by further quantitative easing (QE2) from the Federal Reserve, began to price in stronger growth expectations. The result was a very steep yield curve and a forward curve, which anticipates a less accommodative Federal Reserve in the coming quarters. This more optimistic outlook also spilled into fixed income spreads, where we now see tighter spread levels in virtually every market.
Most of the Fund outperformance for 2010 was attributed to agency MBS exposure. Agency adjustable-rate (ARMs), fixed-rate mortgages (FRMs), and Collateralized Mortgage Obligations (CMOs (considered by some to be mortgage derivatives)) were beneficiaries of lower realized volatility, hedging costs, and mortgage rates. A benign prepayment environment also helped the Fund’s very small exposure (2.7%) to mortgage derivatives. CMBS also outperformed as risk appetite continues to be strong for the asset class, especially as the commercial real estate market firms up. Supply in CMBS is almost non-existent, and market technicals continue to be supportive of tighter spreads.
The Fund’s Treasury Inflation-Protected Securities (TIPS) exposure was performance neutral for the year despite a strong fourth quarter where higher growth, an easy FOMC, and less deflation risk contributed to good TIPS performance. The portfolio remains positioned largely in the highest-quality securities. At year end, the Fund held no leverage.
Derivatives such as financial futures, options, and mortgage derivatives are used for portfolio duration and convexity risk management. Although we prefer to have the flexibility to use the largest array of instruments possible, derivatives are not crucial to our ability to add value.
Looking Forward
On December 31, portfolio duration closely approximated that of the six-month Treasury bill. In 2010, CMO (agency and non-agency), agency ARM, and ABS exposures were reduced by approximately
8.1%, 1.3%, and 0.3%, respectively, on a market-value basis within the portfolio. Cash and equivalents also decreased from 8.6% of the portfolio at year-end 2009 to 1.6% of capital at year-end 2010. The largest securitized sector increases were in 15-year agency FRMs and CMBS, which were increased from 15% and 5% of capital to nearly 30% and 9%, respectively. The Fund maintains a small allocation (1.8%) of TIPS. Given the supply changes and lack of backstop buyers, spread volatility in agency MBS will remain elevated, providing a good environment for active management. Security selection opportunities should also be high as prepayment levels are raised due to record low rates. We believe that high-quality spread assets held in the portfolio are likely to continue to experience positive performance, since spreads are still relatively generous by historical standards and technical conditions remain supportive.
This commentary reflects the viewpoints of Smith Breeden Associates, Inc., as of January 21, 2011.
Cumulative Total Return Performance
Managers Short Duration Government Fund’s cumulative total return is based on the daily change in net asset value (NAV), and assumes that all distributions were reinvested. The BofA Merrill Lynch Six-Month U.S. Treasury Bill Index is an unmanaged index that measures returns of six-month U.S. Treasury bills. Unlike the Fund, the BofA Merrill Lynch Six-Month U.S. Treasury Bill Index is unmanaged, is not available for investment, and does not incur expenses. The chart illustrates the performance of a hypothetical $10,000 investment made in the Fund on December 31, 2000 to a $10,000 investment made in the BofA Merrill Lynch Six-Month U.S. Treasury Bill Index for the same time periods. Figures include
45 |
Table of Contents
| Managers Short Duration Government Fund |
| Investment Manager’s Comments (continued) |
Cumulative Total Return Performance (continued)
reinvestment of capital gains and dividends. The listed returns for the Fund are net of expenses and the returns for the index exclude expenses. Total returns for the Fund would have been lower had certain expenses not been reduced.
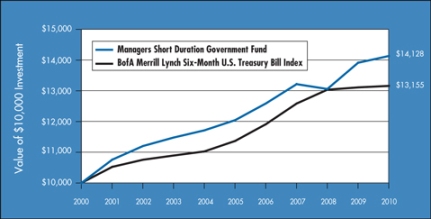
The table below shows the average annual total returns for the Managers Short Duration Government Fund and the BofA Merrill Lynch Six-Month U.S. Treasury Bill Index from December 31, 2000 through December 31, 2010.
Average Annual Total Returns1 | 1 Year | 5 Years | 10 Years | |||||||||
Managers Short Duration Government Fund2,3,4 | 1.58 | % | 3.25 | % | 3.52 | % | ||||||
BofA Merrill Lynch Six-Month U.S. Treasury Bill Index5 | 0.36 | % | 2.97 | % | 2.78 | % | ||||||
The performance data shown represents past performance. Past performance is not a guarantee of future results. Current performance may be lower or higher than the performance data quoted. The investment return and the principal value of an investment will fluctuate so that an investor’s shares, when redeemed, may be worth more or less than their original cost. For performance information through the most recent month end please call (800) 835-3879 or visit our Web site at www.managersinvest.com.
In choosing a Fund, investors should carefully consider the amount they plan to invest, their investment objectives, the Fund’s investment objectives, risks, charges and expenses before investing. For this and other information, please call (800) 835-3879 or visit www.managersinvest.com for a free prospectus. Read it carefully before investing or sending money. Distributed by Managers Distributors, Inc., member FINRA.
| 1 | Total return equals income yield plus share price change and assumes reinvestment of all dividends and capital gain distributions. Returns are net of fees and may reflect offsets of Fund expenses as described in the Prospectus. No adjustment has been made for taxes payable by shareholders on their reinvested dividends and capital gain distributions. Returns for periods greater than one year are annualized. The listed returns on the Fund are net of expenses and based on the published NAV as of December 31, 2010. All returns are in U.S. dollars($). |
| 2 | Changing interest rates may adversely affect the value of an investment. An increase in interest rates typically causes the value of bonds and other fixed income securities to fall. |
| 3 | The Fund may use derivative instruments for hedging purposes or as part of its investment strategy. There is a risk that a derivative intended as a hedge may not perform as expected. The main risk with derivatives is that some types can amplify a gain or loss, potentially earning or losing substantially more money than the actual cost of the derivative or that the counterparty may fail to honor its contract terms, causing a loss for the Fund. Use of these instruments may also involve certain costs and risks such as liquidity risk, interest rate risk, market risk, credit risk, management risk and the risk that a fund could not close out a position when it would be most advantageous to do so. |
| 4 | Many bonds have call provisions which allow the debtors to pay them back before maturity. This is especially true with mortgage securities, which can be paid back anytime. Typically debtors prepay their debt when it is to their advantage (when interest rates drop making a new loan at current rates more attractive), and thus likely to the disadvantage of bondholders, who may have to reinvest prepayment proceeds in securities with lower yields. Prepayment risk will vary depending on the provisions of the security and current interest rates relative to the interest rate of the debt. |
| 5 | The BofA Merrill Lynch Six-Month Treasury Bill Index is an unmanaged index that measures returns of six-month Treasury Bills. Unlike the Fund, the BofA Merrill Lynch Six-Month Treasury Bill Index is unmanaged, is not available for investment, and does not incur expenses. |
Not FDIC insured, nor bank guaranteed. May lose value.
46 |
Table of Contents
| Managers Short Duration Government Fund |
| Fund Snapshots |
| December 31, 2010 |
| Portfolio Breakdown | ||||
Portfolio Breakdown | Managers Short Duration Government Fund** | |||
U.S. Government and Agency Obligations | 89.0 | % | ||
Mortgage-Backed Securities | 8.9 | % | ||
Asset-Backed Securities | 0.3 | % | ||
Other Assets and Liabilities | 1.8 | % | ||
| ** | As a percentage of net assets |
Top Ten Holdings
Top Ten Holdings | % of Net Assets | |||
FNMA, 3.500%, TBA | 15.1 | % | ||
FHLMC Discount Notes, 0.077%, 02/07/11 | 4.8 | |||
FNMA, 2.710%, 11/01/34* | 2.3 | |||
U.S. Treasury Inflation Linked Notes, 2.375%, 01/15/25* | 1.8 | |||
FHLMC, Series 2638, Class OW, 4.500%, 10/15/27* | 1.7 | |||
FNMA, 4.855%, 02/01/36 | 1.4 | |||
LB-UBS Commercial Mortgage Trust, Series 2001-C3, Class A2, 6.365%, 12/15/28 | 1.2 | |||
FHLMC, Series 2939, Class DE, 4.750%, 04/15/25* | 1.2 | |||
FHLMC, Series 2764, Class TD, 5.000%, 02/15/29 | 1.2 | |||
FNMA, 5.000%, 10/01/19 | 1.1 | |||
Top Ten as a Group | 31.8 | % | ||
| * | Top Ten Holding at June 30, 2010 |
Any sectors, industries, or securities discussed should not be perceived as investment recommendations. Mention of a specific security should not be considered a recommendation to buy or solicitation to sell that security. Specific securities mentioned in this report may have been sold from the Fund’s portfolio of investments by the time you receive this report.
47 |
Table of Contents
| Managers Short Duration Government Fund |
| Schedule of Portfolio Investments |
| December 31, 2010 |
Security Description | Principal Amount | Value | ||||||
U.S. Government and Agency Obligations - 89.0% | ||||||||
Federal Home Loan Mortgage Corporation - 29.2% | ||||||||
FHLMC, 2.250%, 11/01/33, (11/01/11)4 | $ | 1,702,868 | $ | 1,779,959 | ||||
FHLMC, 2.396%, 10/01/28, (08/01/11)4 | 132,278 | 137,984 | ||||||
FHLMC, 2.482%, 12/01/33, (11/01/11)4 | 3,332,211 | 3,475,577 | ||||||
FHLMC, 2.484%, 10/01/33, (10/01/11)4 | 2,483,681 | 2,600,061 | ||||||
FHLMC, 2.493%, 10/01/33, (10/01/11)4 | 3,951,791 | 4,133,114 | ||||||
FHLMC, 2.570%, 09/01/35, (09/01/11)4,9 | 3,071,259 | 3,186,286 | ||||||
FHLMC, 2.655%, 07/01/34, (06/01/11)4,9 | 592,310 | 618,223 | ||||||
FHLMC, 2.742%, 02/01/23, (06/01/11)4 | 1,029,668 | 1,078,033 | ||||||
FHLMC, 2.946%, 09/01/33, (06/01/11)4,9 | 3,582,149 | 3,773,429 | ||||||
FHLMC, 2.984%, 06/01/35, (06/01/11)4,9 | 1,396,768 | 1,466,079 | ||||||
FHLMC, 3.455%, 12/01/35, (06/01/11)4 | 948,039 | 989,494 | ||||||
FHLMC, 4.500%, 07/01/189 | 3,086,667 | 3,258,362 | ||||||
FHLMC, 5.000%, 05/01/189 | 808,270 | 861,944 | ||||||
FHLMC, 5.000%, 07/15/256 | 36,266 | 36,251 | ||||||
FHLMC, 5.000%, 09/01/17 to 10/15/27 | 1,351,115 | 1,421,566 | ||||||
FHLMC, 5.500%, 11/01/199 | 3,801,865 | 4,100,668 | ||||||
FHLMC, 5.717%, 02/01/37, (02/01/12)4,9 | 2,099,193 | 2,224,320 | ||||||
FHLMC Gold Pool, 0.510%, 06/15/35, (01/15/11)4,9 | 3,277,813 | 3,277,375 | ||||||
FHLMC Gold Pool, 3.750%, 11/15/256,9 | 141,018 | 140,995 | ||||||
FHLMC Gold Pool, 5.000%, 05/01/189 | 724,470 | 772,579 | ||||||
FHLMC Gold Pool, 5.000%, 01/01/199 | 949,502 | 1,016,115 | ||||||
FHLMC Gold Pool, 5.000%, 04/01/19 to 08/01/19 | 698,710 | 746,227 | ||||||
FHLMC Gold Pool, 5.500%, 11/01/179 | 410,989 | 441,235 | ||||||
FHLMC Gold Pool, 5.500%, 12/01/17 to 09/01/19 | 732,081 | 790,751 | ||||||
FHLMC Gold Pool, 5.500%, 01/01/209 | 3,543,240 | 3,835,005 | ||||||
FHLMC Gold Pool, 7.000%, 06/01/17 | 1,592,428 | 1,726,187 | ||||||
FHLMC Gold Pool, 7.500%, 04/01/15 to 03/01/33 | 1,033,312 | 1,167,518 | ||||||
FHLMC REMICS, Series 2870, Class CN, 4.000%, 10/15/27 | 281,227 | 285,047 | ||||||
FHLMC REMICS, Series 2885, Class DE, 4.500%, 12/15/17 | 208,753 | 215,094 | ||||||
FHLMC REMICS, Series 2769, Class BX, 4.500%, 07/15/27 | 138,438 | 138,860 | ||||||
FHLMC Structured Pass Through Securities, Series T-51, Class 2A, 7.500%, 08/25/425 | 181,894 | 211,338 | ||||||
FHLMC, Series 2628, Class GQ, 3.140%, 11/15/17 | 1,082,295 | 1,110,110 | ||||||
FHLMC, Series 2836, Class P, 4.000%, 01/15/16 | 1,272,652 | 1,276,067 | ||||||
FHLMC, Series 2692, Class AB, 4.000%, 05/15/16 | 1,224,964 | 1,245,563 | ||||||
FHLMC, Series 2675, Class CB, 4.000%, 05/15/16 | 533,876 | 542,037 | ||||||
FHLMC, Series 2677, Class BA, 4.000%, 09/15/16 | 1,097,639 | 1,120,152 | ||||||
FHLMC, Series 2696, Class MD, 4.000%, 11/15/16 | 631,205 | 643,271 | ||||||
FHLMC, Series 2574, Class HW, 4.000%, 11/15/166 | 158,321 | 158,962 | ||||||
FHLMC, Series 2551, Class CH, 4.000%, 12/15/16 | 284,797 | 287,715 | ||||||
FHLMC, Series 2608, Class GJ, 4.000%, 03/15/17 | 386,830 | 392,458 | ||||||
The accompanying notes are an integral part of these financial statements. 48 |
Table of Contents
| Managers Short Duration Government Fund |
| Schedule of Portfolio Investments (continued) |
Security Description | Principal Amount | Value | ||||||
Federal Home Loan Mortgage Corporation - 29.2% (continued) | ||||||||
FHLMC, Series 2840, Class E, 4.250%, 08/15/126 | $ | 65,692 | $ | 65,686 | ||||
FHLMC, Series 3249, Class CJ, 4.250%, 01/15/29 | 1,048,220 | 1,059,455 | ||||||
FHLMC, Series 2561, Class EO, 4.500%, 09/15/169 | 510,617 | 513,236 | ||||||
FHLMC, Series 2760, Class EB, 4.500%, 09/15/16 | 1,777,866 | 1,803,818 | ||||||
FHLMC, Series 2574, Class TK, 4.500%, 11/15/166 | 315,384 | 316,827 | ||||||
FHLMC, Series 2582, Class BC, 4.500%, 04/15/17 | 624,974 | 636,875 | ||||||
FHLMC, Series 2688, Class DA, 4.500%, 02/15/20 | 878,156 | 887,218 | ||||||
FHLMC, Series 2776, Class OL, 4.500%, 11/15/27 | 531,924 | 537,497 | ||||||
FHLMC, Series 2561, Class BH, 4.500%, 05/15/17 | 1,177,094 | 1,208,221 | ||||||
FHLMC, Series 2664, Class GA, 4.500%, 01/15/18 | 704,145 | 715,122 | ||||||
FHLMC, Series 2697, Class LP, 4.500%, 10/15/19 | 134,134 | 135,025 | ||||||
FHLMC, Series 2844, Class PU, 4.500%, 06/15/27 | 1,154,866 | 1,168,238 | ||||||
FHLMC, Series 2857, Class BG, 4.500%, 08/15/27 | 2,681,098 | 2,709,639 | ||||||
FHLMC, Series 2638, Class OW, 4.500%, 10/15/27 | 6,350,501 | 6,399,813 | ||||||
FHLMC, Series 2760, Class PN, 4.500%, 11/15/27 | 1,560,778 | 1,579,270 | ||||||
FHLMC, Series 2725, Class PC, 4.500%, 05/15/28 | 144,074 | 144,025 | ||||||
FHLMC, Series 2939, Class DE, 4.750%, 04/15/25 | 4,476,216 | 4,576,816 | ||||||
FHLMC, Series 2877, Class MV, 4.750%, 12/15/28 | 973,525 | 993,519 | ||||||
FHLMC, Series 2707, Class PC, 5.000%, 02/15/17 | 630,576 | 632,467 | ||||||
FHLMC, Series 2657, Class DA, 5.000%, 10/15/20 | 332,658 | 335,737 | ||||||
FHLMC, Series 3062, Class HB, 5.000%, 03/15/25 | 40,493 | 40,500 | ||||||
FHLMC, Series 2726, Class PB, 5.000%, 04/15/26 | 957,889 | 967,708 | ||||||
FHLMC, Series 2753, Class PC, 5.000%, 05/15/26 | 412,346 | 412,859 | ||||||
FHLMC, Series 2866, Class WC, 5.000%, 01/15/27 | 1,438,736 | 1,445,601 | ||||||
FHLMC, Series 2764, Class UC, 5.000%, 05/15/27 | 2,204,179 | 2,226,642 | ||||||
FHLMC, Series 2844, Class PB, 5.000%, 06/15/27 | 1,354,284 | 1,370,762 | ||||||
FHLMC, Series 2907, Class HC, 5.000%, 06/15/27 | 2,445,885 | 2,500,518 | ||||||
FHLMC, Series 2780, Class LC, 5.000%, 07/15/27 | 1,368,537 | 1,384,836 | ||||||
FHLMC, Series 2893, Class PB, 5.000%, 12/15/27 | 2,897,522 | 2,929,146 | ||||||
FHLMC, Series 2783, Class PB, 5.000%, 01/15/28 | 1,465,093 | 1,487,531 | ||||||
FHLMC, Series 2684, Class PC, 5.000%, 05/15/28 | 2,036,785 | 2,044,986 | ||||||
FHLMC, Series 2881, Class TC, 5.000%, 06/15/28 | 1,760,149 | 1,795,311 | ||||||
FHLMC, Series 2649, Class OC, 5.000%, 07/15/28 | 623,161 | 632,991 | ||||||
FHLMC, Series 2827, Class TC, 5.000%, 10/15/28 | 427,834 | 435,041 | ||||||
FHLMC, Series 2764, Class TD, 5.000%, 02/15/29 | 4,369,000 | 4,541,228 | ||||||
FHLMC, Series 2960, Class NE, 5.000%, 08/15/31 | 2,527,874 | 2,552,561 | ||||||
FHLMC, Series 2558, Class UE, 5.500%, 05/15/22 | 790,508 | 823,350 | ||||||
FHLMC, Series 2429, Class HB, 6.500%, 12/15/23 | 502,388 | 558,323 | ||||||
Total Federal Home Loan Mortgage Corporation | 111,250,409 | |||||||
Federal National Mortgage Association - 52.1% | ||||||||
FNMA, 0.581%, 11/25/30, (01/25/11)4,9 | 2,017,366 | 2,019,443 | ||||||
The accompanying notes are an integral part of these financial statements. 49 |
Table of Contents
| Managers Short Duration Government Fund |
| Schedule of Portfolio Investments (continued) |
Security Description | Principal Amount | Value | ||||||
Federal National Mortgage Association - 52.1% (continued) | ||||||||
FNMA, 0.661%, 03/25/35, (01/25/11)4,9 | $ | 1,955,041 | $ | 1,947,928 | ||||
FNMA, 2.020%, 08/01/34, (04/01/11)4 | 776,706 | 801,653 | ||||||
FNMA, 2.044%, 01/01/35, (05/01/11)4 | 526,153 | 544,898 | ||||||
FNMA, 2.100%, 11/01/34, (04/01/11)4 | 808,280 | 838,995 | ||||||
FNMA, 2.107%, 01/01/24, (07/01/11)4 | 1,921,608 | 1,961,679 | ||||||
FNMA, 2.126%, 02/01/33, (03/01/11)4 | 2,913,046 | 3,014,763 | ||||||
FNMA, 2.141%, 01/01/35, (04/01/11)4 | 874,950 | 908,891 | ||||||
FNMA, 2.145%, 06/01/34, (05/01/11)4 | 2,029,817 | 2,118,280 | ||||||
FNMA, 2.200%, 09/01/34, (03/01/11)4 | 2,978,289 | 3,093,150 | ||||||
FNMA, 2.272%, 08/01/33, (02/01/11)4 | 947,343 | 982,270 | ||||||
FNMA, 2.279%, 08/01/33, (02/01/11) 4 | 604,786 | 627,198 | ||||||
FNMA, 2.496%, 05/01/33, (04/01/11)4 | 2,654,265 | 2,766,115 | ||||||
FNMA, 2.500%, 03/01/33, (01/01/11)4 | 1,140,995 | 1,190,118 | ||||||
FNMA, 2.524%, 04/01/35, (03/01/11)4 | 852,718 | 889,124 | ||||||
FNMA, 2.559%, 06/01/33, (05/01/11)4 | 1,087,601 | 1,136,458 | ||||||
FNMA, 2.561%, 01/01/26, (06/01/11)4 | 787,034 | 825,264 | ||||||
FNMA, 2.576%, 09/01/33, (09/01/11)4,9 | 1,053,977 | 1,090,621 | ||||||
FNMA, 2.586%, 01/01/25, (07/01/11)4 | 968,791 | 1,014,729 | ||||||
FNMA, 2.666%, 06/01/34, (06/01/11)4 | 3,102,609 | 3,245,659 | ||||||
FNMA, 2.700%, 08/01/34, (06/01/11)4 | 950,457 | 992,397 | ||||||
FNMA, 2.709%, 06/01/35, (06/01/11)4 | 453,207 | 472,429 | ||||||
FNMA, 2.710%, 11/01/34, (09/01/11)4 | 8,407,315 | 8,805,877 | ||||||
FNMA, 2.725%, 06/01/35, (06/01/11)4 | 409,315 | 427,307 | ||||||
FNMA, 2.948%, 01/01/33, (02/01/11)4 | 1,922,283 | 1,999,048 | ||||||
FNMA, 2.993%, 09/01/35, (08/01/11)4 | 1,693,289 | 1,773,213 | ||||||
FNMA, 3.024%, 02/01/37, (07/01/11)4 | 636,388 | 666,264 | ||||||
FNMA, 3.196%, 03/01/36, (06/01/11)4 | 2,270,344 | 2,394,048 | ||||||
FNMA, 3.236%, 03/01/36, (06/01/11)4 | 2,577,214 | 2,719,246 | ||||||
FNMA, 3.259%, 01/01/33, (07/01/11)4 | 71,728 | 74,906 | ||||||
FNMA, 3.500%, TBA | 57,000,000 | 57,391,876 | ||||||
FNMA, 3.533%. 01/01/36, (11/01/11)4 | 273,867 | 285,908 | ||||||
FNMA, 4.855%, 02/01/36, (10/01/11)4 | 5,144,895 | 5,390,123 | ||||||
FNMA, 5.000%, 09/01/199 | 655,844 | 696,117 | ||||||
FNMA, 5.000%, 03/01/18 to 10/01/24 | 7,261,486 | 7,774,352 | ||||||
FNMA, 5.002%, 01/01/36, (09/01/11)4 | 121,886 | 127,667 | ||||||
FNMA, 5.272%, 08/01/36, (06/01/11)4 | 465,667 | 489,312 | ||||||
FNMA, 5.307%, 06/01/37, (05/01/11)4 | 870,234 | 913,684 | ||||||
FNMA, 5.442%, 05/01/36, (05/01/11)4 | 381,926 | 401,449 | ||||||
FNMA, 5.500%, 10/01/17 to 12/25/26 | 11,403,545 | 12,267,208 | ||||||
FNMA, 5.500%, 11/01/189 | 1,087,618 | 1,170,038 | ||||||
FNMA, 5.795%, 09/01/37, (09/01/12)4 | 703,924 | 746,986 | ||||||
The accompanying notes are an integral part of these financial statements. 50 |
Table of Contents
| Managers Short Duration Government Fund |
| Schedule of Portfolio Investments (continued) |
Security Description | Principal Amount | Value | ||||||
Federal National Mortgage Association - 52.1% (continued) | ||||||||
FNMA, 6.000%, 03/01/17 to 10/01/23 | $ | 8,192,213 | $ | 8,925,147 | ||||
FNMA, 6.000%, 09/01/229 | 2,628,778 | 2,881,388 | ||||||
FNMA, 6.500%, 04/01/179 | 484,103 | 529,714 | ||||||
FNMA, 6.500%, 05/01/17 to 08/01/32 | 2,722,279 | 3,001,727 | ||||||
FNMA, 7.000%, 09/01/14 | 564,528 | 610,953 | ||||||
FNMA, 7.500%, 12/01/33 to 01/01/34 | 191,912 | 216,863 | ||||||
FNMA Grantor Trust, Series 2003-T4, Class A1, 0.481%, 09/26/33, (01/26/11)4 | 17,032 | 15,863 | ||||||
FNMA Grantor Trust, Series 2002-T5, Class A1, 0.501%, 05/25/32, (01/25/11)4 | 448,694 | 429,454 | ||||||
FNMA Grantor Trust, Series 2003-T2, Class A1, 0.541%, 03/25/33, (01/25/11)4 | 307,889 | 254,293 | ||||||
FNMA Grantor Trust Pass Through, Series 2004-T1, Class 1A2, 6.500%, 01/25/44 | 723,778 | 801,326 | ||||||
FNMA Pass Through Securities, Series 2002-33, Class A2, 7.500%, 06/25/32 | 112,727 | 131,846 | ||||||
FNMA Whole Loan, Series 2005-W2, Class A1, 0.461%, 05/25/35, (01/25/11)4,9 | 3,918,224 | 3,890,494 | ||||||
FNMA Whole Loan, Series 2003-W13, Class AV2, 0.541%, 10/25/33, (01/25/11)4,6 | 86,831 | 79,561 | ||||||
FNMA Whole Loan, Series 2004-W14, Class 1AF, 0.661%, 07/25/44, (01/25/11)4,9 | 3,628,339 | 3,626,542 | ||||||
FNMA Whole Loan, Series 2004-W5, Class F1, 0.711%, 02/25/47, (01/25/11)4 | 877,799 | 880,010 | ||||||
FNMA Whole Loan, Series 2002-W6, Class 2A, 7.324%, 06/25/425 | 1,702,824 | 1,968,984 | ||||||
FNMA Whole Loan, Series 2003-W1, Class 2A, 7.349%, 12/25/425 | 30,371 | 34,733 | ||||||
FNMA Whole Loan, Series 2002-W1, Class 2A, 7.365%, 02/25/425,9 | 525,526 | 604,355 | ||||||
FNMA Whole Loan, Series 2003-W4, Class 4A, 7.500%, 10/25/429 | 904,165 | 1,033,775 | ||||||
FNMA, Series 2007-25, Class FA, 0.661%, 04/25/37, (01/25/11)4 | 2,665,722 | 2,675,532 | ||||||
FNMA, Series 2003-15, Class CH, 4.000%, 02/25/17 | 359,479 | 363,493 | ||||||
FNMA, Series 2003-23, Class AB, 4.000%, 03/25/17 | 1,230,240 | 1,251,427 | ||||||
FNMA, Series 2003-23, Class AD, 4.500%, 03/25/17 | 642,155 | 654,942 | ||||||
FNMA, Series 2002-94, Class CA, 5.000%, 05/25/17 | 3,192,371 | 3,242,025 | ||||||
FNMA, Series 2003-5, Class EL, 5.000%, 08/25/22 | 1,810,229 | 1,895,427 | ||||||
FNMA, Series 1994-76, Class J, 5.000%, 04/25/24 | 766,525 | 817,268 | ||||||
FNMA, Series 2006-75, Class YA, 5.000%, 12/25/25 | 311,661 | 314,445 | ||||||
FNMA, Series 2004-90, Class PC, 5.000%, 03/25/27 | 2,103,413 | 2,117,145 | ||||||
FNMA, Series 2006-107, Class QA, 5.000%, 04/25/27 | 927,459 | 937,041 | ||||||
FNMA, Series 2882, Class YB, 5.000%, 10/15/27 | 984,298 | 998,441 | ||||||
FNMA, Series 2005-15, Class EA, 5.000%, 10/25/28 | 919,708 | 939,745 | ||||||
FNMA, Series 2003-81, Class MB, 5.000%, 05/25/29 | 2,704,476 | 2,746,239 | ||||||
FNMA, Series 2006-44, Class OA, 5.500%, 12/25/26 | 1,625,368 | 1,636,526 | ||||||
FNMA, Series 2006-57, Class PA, 5.500%, 08/25/27 | 937,579 | 944,860 | ||||||
FNMA, Series 2005-99, Class KC, 5.500%, 02/25/28 | 3,993,774 | 4,003,449 | ||||||
FNMA, Series 2006-48, Class TA, 5.500%, 04/25/28 | 952,416 | 966,018 | ||||||
FNMA, Series 2006-129, Class PA, 5.500%, 07/25/28 | 1,069,004 | 1,084,152 | ||||||
FNMA, Series 2005-118, Class MC, 6.000%, 01/25/32 | 1,310,406 | 1,313,621 | ||||||
FNMA, Series 1993-139, Class GA, 7.000%, 08/25/236,9 | 698,266 | 702,733 | ||||||
Total Federal National Mortgage Association | 198,518,248 | |||||||
The accompanying notes are an integral part of these financial statements. 51 |
Table of Contents
| Managers Short Duration Government Fund |
| Schedule of Portfolio Investments (continued) |
Security Description | Principal Amount | Value | ||||||
Government National Mortgage Association - 3.2% | ||||||||
GNMA, 1.875%, 03/20/37, (04/01/11)4 | $ | 495,701 | $ | 502,648 | ||||
GNMA, 2.500%, 07/20/35, (10/01/11)4,9 | 1,594,885 | 1,632,122 | ||||||
GNMA, 2.500%, 09/20/35, (10/01/11)4 | 1,280,689 | 1,310,590 | ||||||
GNMA, 2.625%, 07/20/18 to 09/20/35, (10/01/11)4 | 3,706,890 | 3,802,111 | ||||||
GNMA, 2.750%, 01/20/32, (04/01/11)4 | 140,756 | 144,547 | ||||||
GNMA, 2.750%, 10/20/34, (01/01/12)4 | 347,251 | 356,487 | ||||||
GNMA, 3.000%, 03/20/35, (04/01/11)4 | 89,670 | 92,197 | ||||||
GNMA, 3.000%, 06/20/35, (07/01/11)4 | 105,393 | 108,205 | ||||||
GNMA, 3.125%, 10/20/17, (01/01/12)4,9 | 53,917 | 55,493 | ||||||
GNMA, 3.125%, 11/20/17 to 11/20/27, (01/01/12)4 | 1,552,001 | 1,597,357 | ||||||
GNMA, 3.250%, 01/20/28, (04/01/11)4 | 69,633 | 71,763 | ||||||
GNMA, 3.375%, 03/20/21, (04/01/11)4 | 51,315 | 52,909 | ||||||
GNMA, 3.375%, 06/20/22, (07/01/11)4 | 97,393 | 100,450 | ||||||
GNMA, 3.375%, 04/20/24, (07/01/11)4,9 | 552,795 | 570,148 | ||||||
GNMA, 3.375%, 04/20/26 to 05/20/33, (07/01/11)4 | 217,671 | 224,503 | ||||||
GNMA, 3.375%, 05/20/27, (07/01/11)4,9 | 490,064 | 505,447 | ||||||
GNMA, 3.500%, 07/20/18, (10/01/11)4 | 64,215 | 66,142 | ||||||
GNMA, 3.500%, 02/20/34 | 226,067 | 229,629 | ||||||
GNMA, Series 2005-58, Class NJ, 4.500%, 08/20/35 | 575,422 | 590,046 | ||||||
GNMA, 9.500%, 12/15/17 | 9,490 | 10,640 | ||||||
Total Government National Mortgage Association | 12,023,434 | |||||||
Interest Only Strips - 2.5% | ||||||||
FHLMC, Series 2010-121, Class SB, 4.189%, 10/25/40, (01/25/11)4 | 1,685,315 | 161,158 | ||||||
FHLMC, Series 3721, Class SA, 4.240%, 09/15/40, (01/15/11)4 | 4,332,667 | 411,934 | ||||||
FHLMC, Series 3449, Class AI, 4.500%, 10/15/20 | 1,379,223 | 45,932 | ||||||
FHLMC, 4.500%, 09/15/35 | 261,559 | 45,081 | ||||||
FHLMC, Series 3685, Class EI, 5.000%, 03/15/19 | 5,237,610 | 535,830 | ||||||
FHLMC, Series 3659, Class IE, 5.000%, 03/15/19 | 2,193,777 | 255,503 | ||||||
FHLMC, Series 3731, Class IO, 5.000%, 07/15/19 | 2,413,919 | 242,208 | ||||||
FHLMC, 5.000%, 02/15/20 to 04/15/20 | 900,525 | 121,316 | ||||||
FHLMC, Series 2637, Class SI, 5.740%, 06/15/18, (01/15/11)4 | 573,455 | 54,322 | ||||||
FHLMC, Series 3560, Class KS, 6.140%, 11/15/36, (01/15/11)4 | 3,884,253 | 683,356 | ||||||
FHLMC, Series 3424, Class XI, 6.310%, 05/15/36, (01/15/11)4 | 1,252,964 | 200,895 | ||||||
FHLMC, Series 3153, Class JI, 6.360%, 05/15/36, (01/15/11)4 | 6,138,214 | 985,943 | ||||||
FHLMC, 6.440%, 11/15/18, (01/15/11)4 | 890,590 | 77,872 | ||||||
FHLMC, Series 2882, Class SJ, 6.440%, 10/15/34, (01/15/11)4 | 796,788 | 97,543 | ||||||
FHLMC, Series 2980, Class SL, 6.440%, 11/15/34, (01/15/11)4 | 1,070,749 | 159,216 | ||||||
FHLMC, Series 2922, Class SE, 6.490%, 02/15/35, (01/15/11)4 | 749,599 | 128,252 | ||||||
FHLMC, Series 2929, Class CS, 6.540%, 12/15/22, (01/15/11)4 | 342,593 | 15,116 | ||||||
FHLMC, Series 2530, Class QI, 6.740%, 01/15/32, (01/15/11)4 | 519,894 | 86,086 | ||||||
FHLMC, Series 2608, Class SJ, 6.840%, 03/15/17, (01/15/11)4 | 394,905 | 12,050 | ||||||
The accompanying notes are an integral part of these financial statements. 52 |
Table of Contents
| Managers Short Duration Government Fund |
| Schedule of Portfolio Investments (continued) |
Security Description | Principal Amount | Value | ||||||
Interest Only Strips - 2.5% (continued) | ||||||||
FHLMC, 6.840%, 11/15/30, (01/15/11)4 | $ | 289,363 | $ | 19,202 | ||||
FHLMC, Series 2644, Class ES, 6.890%, 02/15/18, (01/15/11)4 | 1,451,601 | 129,863 | ||||||
FHLMC, Series 2772, Class KS, 6.920%, 06/15/22, (01/15/11)4 | 361,849 | 22,825 | ||||||
FHLMC, Series 3489, Class SD, 7.540%, 06/15/32, (01/15/11)4 | 1,077,700 | 193,560 | ||||||
FHLMC, 8.000%, 06/01/316 | 262,149 | 65,292 | ||||||
FNMA, Series 2008-22, Class AI, 1.097%, 09/25/125 | 22,883,354 | 297,275 | ||||||
FNMA, Series 2010-95, Class DI, 4.500%, 11/25/20 | 3,119,568 | 275,871 | ||||||
FNMA, Series 2008 86, Class IO, 4.500%, 03/25/23 | 4,592,598 | 477,781 | ||||||
FNMA, Series 2010-105, Class IO, 5.000%, 08/25/20 | 2,211,360 | 267,440 | ||||||
FNMA, Series 2010-65, Class IO, 5.000%, 09/25/20 | 5,403,101 | 687,083 | ||||||
FNMA, 5.000%, 12/01/35 | 393,199 | 70,229 | ||||||
FNMA, Series 2003-48, Class SJ, 5.739%, 06/25/18, (01/25/11)4 | 730,968 | 68,161 | ||||||
FNMA, Series 2005-67, Class SM, 5.889%, 08/25/35, (01/25/11)4 | 538,332 | 69,403 | ||||||
FNMA, Series 2006-3, Class SA, 5.889%, 03/25/36, (01/25/11)4 | 1,225,815 | 177,169 | ||||||
FNMA, Series 2009-87, Class SX, 5.989%, 11/25/39, (01/25/11)4 | 2,670,544 | 335,640 | ||||||
FNMA, Series 2003-73, Class SM, 6.339%, 04/25/18, (01/25/11)4 | 772,482 | 81,506 | ||||||
FNMA, Series 2005-45, Class SR, 6.459%, 06/25/35, (01/25/11)4 | 1,139,966 | 151,936 | ||||||
FNMA, Series 2005-12, Class SC, 6.489%, 03/25/35, (01/25/11)4 | 845,049 | 118,451 | ||||||
FNMA, Series 2005-29, Class SC, 6.489%, 04/25/35, (01/25/11)4 | 1,508,009 | 182,302 | ||||||
FNMA, Series 2008-34, Class SM, 6.489%, 05/25/38, (01/25/11)4 | 2,340,745 | 339,414 | ||||||
FNMA, Series 2005-66, Class GS, 6.589%, 07/25/20, (01/25/11)4 | 540,514 | 71,414 | ||||||
FNMA, Series 2004-49, Class SQ, 6.789%, 07/25/34, (01/25/11)4 | 615,894 | 96,643 | ||||||
FNMA, Series 2004-64, Class SW, 6.789%, 08/25/34, (01/25/11)4 | 1,958,476 | 299,447 | ||||||
FNMA, Series 2003-67, Class TS, 6.839%, 08/25/17, (01/25/11)4 | 974,074 | 52,354 | ||||||
FNMA, Series 2004-51, Class SX, 6.859%, 07/25/34, (01/25/11)4 | 1,001,426 | 175,551 | ||||||
FNMA, Series 2006-101, Class SE, 6.989%, 10/25/36, (01/25/11)4 | 3,291,202 | 560,710 | ||||||
FNMA, 7.500%, 11/18/146 | 10,826 | 307 | ||||||
FNMA, 8.000%, 05/01/306 | 202,026 | 50,981 | ||||||
FNMA, 9.000%, 12/15/166 | 30,644 | 5,148 | ||||||
Total Interest Only Strips | 9,662,571 | |||||||
U.S. Treasury Notes - 2.0% | ||||||||
U.S. Treasury Inflation Linked Notes, 2.375%, 04/15/11 | 808,809 | 816,013 | ||||||
U.S. Treasury Inflation Linked Notes, 2.375%, 01/15/25 | 6,149,696 | 6,843,455 | ||||||
Total U.S. Treasury Notes | 7,659,468 | |||||||
Total U.S. Government and Agency Obligations (cost $336,974,796) | 339,114,130 | |||||||
Mortgage-Backed Securities - 8.9% | ||||||||
Bank of America Commercial Mortgage, Inc., Series 2005-2, Class A4, 4.783%, 07/10/435 | 1,774,185 | 1,840,808 | ||||||
Bank of America Commercial Mortgage, Inc., Series 2002-2, Class A3, 5.118%, 07/11/43 | 877,000 | 903,498 | ||||||
Bank of America Commercial Mortgage, Inc., Series 2002-PB2, Class A4, 6.186%, 06/11/35 | 570,976 | 591,183 | ||||||
Countrywide Home Loans, Inc., 0.761%, 02/25/35, (01/25/11)4,6,9 | 1,339,306 | 329,738 | ||||||
CS First Boston Mortgage Securities Corp., Series 2004-C5, Class A3, 4.500%, 11/15/37 | 1,000,000 | 1,014,813 | ||||||
Freddie Mac Multiclass Certificates, Series 3113, Class QA, 5.000%, 11/15/25 | 186,029 | 186,540 | ||||||
The accompanying notes are an integral part of these financial statements. 53 |
Table of Contents
| Managers Short Duration Government Fund |
| Schedule of Portfolio Investments (continued) |
Security Description | Principal Amount | Value | ||||||
Mortgage-Backed Securities - 8.9% (continued) | ||||||||
GE Capital Commercial Mortgage Corp., Series 2002-2A, Class A3, 5.349%, 08/11/36 | $ | 1,650,000 | $ | 1,726,297 | ||||
GE Capital Commercial Mortgage Corp., Series 2001-3, Class A2, 6.070%, 06/10/38 | 765,000 | 785,525 | ||||||
GE Capital Commercial Mortgage Corp., Series 2002-1A, Class A3, 6.269%, 12/10/35 | 1,532,085 | 1,596,085 | ||||||
GMAC Commercial Mortgage Securities, Inc., Series 2003 C3, Class A3, 4.646%, 04/10/40 | 755,063 | 784,026 | ||||||
Greenwich Capital Commercial Funding Corp., Class A2, Series 2005-GG3, 4.305%, 08/10/42 | 992,243 | 1,001,965 | ||||||
JP Morgan Chase Commercial Mortgage Securities Corp., Series 2004-CBX, Class A4, 4.529%, 01/12/37 | 1,310,000 | 1,331,714 | ||||||
JP Morgan Chase Commercial Mortgage Securities Corp., Series 2005 CB12, Class A3A1, 4.824%, 09/12/37 | 725,000 | 733,578 | ||||||
JP Morgan Chase Commercial Mortgage Securities Corp., Series 2005-LDP4, Class A3A1, 4.871%, 10/15/42 | 3,078,802 | 3,115,280 | ||||||
JP Morgan Chase Commercial Mortgage Securities Corp., Series 2006-LDP6, Class A3B, 5.559%, 04/15/435 | 2,892,000 | 2,946,569 | ||||||
JP Morgan Chase Commercial Mortgage Securities Corp., Series 2001-CIBC1, Class B, 6.446%, 03/15/33 | 1,464,249 | 1,462,913 | ||||||
JP Morgan Chase Commercial Mortgage Securities Corp., Series 2001-CIB3, Class A3, 6.465%, 11/15/35 | 1,196,729 | 1,228,717 | ||||||
LB-UBS Commercial Mortgage Trust, Series 2004-C8, Class A3, 4.435%, 12/15/29 | 2,145,000 | 2,169,803 | ||||||
LB-UBS Commercial Mortgage Trust, Series 2004-C8, Class A4, 4.510%, 12/15/29 | 1,037,500 | 1,056,846 | ||||||
LB-UBS Commercial Mortgage Trust, Series 2008-C8, Class A3, 4.830%, 11/15/27 | 801,750 | 820,259 | ||||||
LB-UBS Commercial Mortgage Trust, Series 2001-C3, Class A2, 6.365%, 12/15/28 | 4,680,146 | 4,737,805 | ||||||
LB-UBS Commercial Mortgage Trust, Series 2002-C1, Class A4, 6.462%, 03/15/31 | 979,633 | 1,022,544 | ||||||
Merrill Lynch Mortgage Trust, Series 2004-MKB1, Class A3, 4.892%, 02/12/42 | 2,000,000 | 2,040,303 | ||||||
Washington Mutual, Class 2A3, Series 2005-AR2, 0.611%, 01/25/45, (01/25/11)4 | 729,572 | 506,516 | ||||||
Total Mortgage-Backed Securities (cost $35,364,389) | 33,933,325 | |||||||
Asset-Backed Securities - 0.3% | ||||||||
First Franklin Mortgage Loan Asset Backed Certificates, Series 2005-FF10, Class A4, 0.581%, 11/25/35, (01/25/11)4 | 1,057,510 | 908,025 | ||||||
Structured Asset Investment Loan Trust, 0.801%, 12/25/34, (01/25/11)4,9 | 235,318 | 222,006 | ||||||
Total Asset-Backed Securities (cost $1,293,327) | 1,130,031 | |||||||
Short-Term Investments - 16.4% | ||||||||
U.S. Government and Agency Discount Notes - 5.6% | ||||||||
FHLMC Discount Notes, 0.033%, 01/11/113 | 1,125,000 | 1,124,988 | ||||||
FHLMC Discount Notes, 0.077%, 02/07/113,8 | 18,200,000 | 18,198,580 | ||||||
FHLMC Discount Notes, 0.099%, 03/15/113,8 | 400,000 | 399,921 | ||||||
FNMA Discount Notes, 0.030%, 01/12/113 | 1,475,000 | 1,474,981 | ||||||
FNMA Discount Notes, 0.221%, 09/12/113,8 | 100,000 | 99,846 | ||||||
Total U.S. Government and Agency Discount Notes | 21,298,316 | |||||||
| Other Investment Companies - 10.8%1 | Shares | |||||||
BNY Institutional Cash Reserves Fund, Series B*2,7 | 15,506 | 12,359 | ||||||
Dreyfus Cash Management Fund, Institutional Class Shares, 0.14% | 34,164,185 | 34,164,185 | ||||||
JPMorgan Liquid Assets Money Market Fund, Capital Shares, 0.14% | 7,030,328 | 7,030,328 | ||||||
Total Other Investment Companies | 41,206,872 | |||||||
Total Short-Term Investments (cost $62,506,721) | 62,505,188 | |||||||
Total Investments- 114.6% (cost $436,139,233) | 436,682,674 | |||||||
Other Assets, less Liabilities - (14.6)% | (55,756,416 | ) | ||||||
Net Assets - 100.0% | $ | 380,926,258 | ||||||
The accompanying notes are an integral part of these financial statements. 54 |
Table of Contents
| Managers Short Duration Government Fund |
| Notes to Schedule of Portfolio Investments |
Note: Based on the approximate cost of investments of $436,144,559 for Federal income tax purposes at December 31, 2010, the aggregate gross unrealized appreciation and depreciation were $4,444,040 and $3,905,925, respectively, resulting in net unrealized appreciation of investments of $538,115.
| 1 | Yield shown for each investment company represents its December 31, 2010, seven-day average yield, which refers to the sum of the previous seven days’ dividends paid, expressed as an annual percentage. |
| 2 | Collateral received from brokers for securities lending was invested in this short-term investment. |
| 3 | Percentage rate listed represents yield to maturity at December 31, 2010. |
| 4 | Floating Rate Security. The rate listed is as of December 31, 2010. Date in parentheses represents the securities next coupon rate reset. |
| 5 | Variable Rate Security. The rate listed is as of December 31, 2010, and is periodically reset subject to terms and conditions set forth in the debenture. |
| 6 | Illiquid Security: A security not readily convertible into cash such as a stock, bond or commodity that is not actively traded and would be difficult to sell in a current sale. The Funds may not invest more than 15% of their net assets in illiquid securities. All securities are valued on the basis of valuations provided by dealers or independent pricing services. At December 31, 2010, the market value of these securities amounted to $1,952,481, or 0.5% of net assets. |
| 7 | On September 12, 2008, The Bank of New York Mellon established a separate sleeve of the BNY Institutional Cash Reserves Fund (Series B) to hold certain Lehman Brothers floating rate notes. The Fund’s position in Series B is being fair valued daily. (See Note 7 in the Notes to Financial Statements.) |
| 8 | Security pledged to cover margin requirements for open futures positions at December 31, 2010. |
| 9 | All or part of the security has been segregated for delayed delivery transactions. |
The following table summarizes the inputs used to value the Fund’s net assets by the fair value hierarchy levels as of December 31, 2010: (See Note 1(a) in the Notes to Financial Statements.)
| Quoted Prices in Active Markets for Identical Investments Level 1 | Significant Other Observable Inputs Level 2 | Significant Unobservable Inputs Level 3 | Total | |||||||||||||
Investments in Securities | ||||||||||||||||
U.S. Government and Agency Obligations† | — | $ | 339,114,130 | — | $ | 339,114,130 | ||||||||||
Mortgage-Backed Securities | — | 33,933,325 | — | 33,933,325 | ||||||||||||
Asset-Backed Securities | — | 1,130,031 | — | 1,130,031 | ||||||||||||
Short-Term Investments: | ||||||||||||||||
U.S. Government and Agency Discount Notes | — | 21,298,316 | — | 21,298,316 | ||||||||||||
Other Investment Companies | $ | 41,194,513 | 12,359 | — | 41,206,872 | |||||||||||
Total Investments in Securities | $ | 41,194,513 | $ | 395,488,161 | — | $ | 436,682,674 | |||||||||
Derivatives‡ | ||||||||||||||||
Interest Rate Futures Contracts | $ | 135,027 | — | — | $ | 135,027 | ||||||||||
Total Derivatives | $ | 135,027 | — | — | $ | 135,027 | ||||||||||
| † | All U.S. Government and Agency Obligations held in the Fund are Level 2 securities. |
| ‡ | Derivative instruments, such as futures, forwards, options and swap contracts, are not reflected in the Schedule of Portfolio Investments and are valued at the unrealized appreciation/depreciation of the instrument. |
As of December 31, 2010, the Fund had no significant transfers between Level 1 and Level 2 from the beginning of the reporting period.
The following schedule shows the fair value of derivative instruments as of December 31, 2010:
Asset Derivatives | Liability Derivatives | |||||||||||||
Fund | Derivatives not accounted for as hedging | Statement of Assets and Liabilities Location | Fair Value | Statement of Assets and Liabilities Location | Fair Value | |||||||||
Short Duration | Interest rate futures contracts | Receivable for variation margin on futures | $ | 20,300 | Payable for variation margin on futures | $ | 231,522 | |||||||
The accompanying notes are an integral part of these financial statements. 55 |
Table of Contents
| Managers Short Duration Government Fund |
| Notes to Schedule of Portfolio Investments (continued) |
For the year ended December 31, 2010, the effect of derivative instruments on the Statement of Operations and the amount of realized gain/(loss) on derivatives recognized in income were as follows:
Fund | Derivatives not accounted for as hedging instruments | Amount | ||||
Short Duration | Interest rate futures contracts | ($ | 1,143,175 | ) | ||
The change in unrealized gain/(loss) on derivatives recognized in income were as follows: | ||||
Fund | Derivatives not accounted for as hedging instruments | Amount | ||||
Short Duration | Interest rate futures contracts | $ | 1,010,057 | |||
At December 31, 2010, the Fund had the following open futures contracts: (See Note 2 (a) in the Notes to Financial Statements.)
Type | Number of Contracts | Position | Expiration | Unrealized Gain/ (Loss) | ||||||||
2-Year U.S. Treasury Note | 76 | Long | March 2011 | ($10,878 | ) | |||||||
5-Year U.S. Treasury Note | 1 | Short | March 2011 | 2,271 | ||||||||
10-Year U.S. Treasury Note | 79 | Short | March 2011 | 316,419 | ||||||||
U.S. Treasury Long Bond | 24 | Short | March 2011 | 119,190 | ||||||||
5-Year Interest Rate Swap | 207 | Short | March 2011 | 127,170 | ||||||||
10-Year Interest Rate Swap | 136 | Short | March 2011 | 304,199 | ||||||||
3-Month Eurodollar | 43 | Short | March 2011 - March 2014 | (212,145 | ) | |||||||
3-Month Eurodollar | 39 | Short | June 2011 - June 2013 | (218,335 | ) | |||||||
3-Month Eurodollar | 1 | Long | September 2011 | 10,785 | ||||||||
3-Month Eurodollar | 19 | Short | September 2012 - September 2013 | (81,322 | ) | |||||||
3-Month Eurodollar | 38 | Short | December 2011 - December 2013 | (222,327 | ) | |||||||
Total | $135,027 | |||||||||||
Investments Definitions and Abbreviations: | ||
FHLMC: | Federal Home Loan Mortgage Corp. | |
FNMA: | Federal National Mortgage Association | |
GNMA: | Government National Mortgage Association | |
TBA: | To Be Announced | |
The accompanying notes are an integral part of these financial statements. 56 |
Table of Contents
| Managers Intermediate Duration Government Fund |
| Investment Manager’s Comments |
The Managers Intermediate Duration Government Fund’s objective is to achieve total return in excess of the total return of the major market indices for mortgage-backed securities.
The Managers Intermediate Duration Government Fund seeks to achieve its objective by matching the duration, or interest-rate risk, of a portfolio that invests exclusively in mortgage-backed securities, as weighted in the major market indices for mortgage-backed securities. These indices currently include the Citigroup Mortgage Index and the Barclays Capital Mortgage Index, each of which includes all outstanding government sponsored fixed-rate mortgage-backed securities, weighted in proportion to their current market capitalization. The duration of these indices is generally similar to that of intermediate-term U.S. Treasury notes, and typically will range between three and five years.
Under normal circumstances, the Fund will invest at least 80% of its assets in debt securities issued by the U.S. Government, its agencies and instrumentalities, and synthetic instruments or derivatives, or securities having economic characteristics similar to such debt securities. The Fund’s benchmark is the Citigroup Mortgage Index.
The Portfolio Manager
Smith Breeden Associates, Inc.
Smith Breeden Associates, Inc. (“Smith Breeden”) is the subadvisor for the Fund. Smith Breeden, located at 280 South Mangum Street, Suite 301, Durham, NC, was founded in 1982. Smith Breeden is an investment management firm for a client base including corporate and public pension plans, central and supranational banks, endowments and foundations, private banks and financial institutions, insurance companies, and other institutional investors. Specializing in fixed income portfolios, the firm offers separate accounts, commingled funds, and serves as a subadvisor to ‘40 Act funds. As of December 31, 2010, Smith Breeden managed assets of approximately $6.4 billion.
Smith Breeden believes that innovative research provides critical insights into the fixed-income market. The firm’s experienced investment professionals apply these research insights to the management of investment portfolios designed to achieve their clients’ objectives. The key tenets of this market-tested investment philosophy are:
| • | Over a market cycle, a portfolio of fixed income securities with wide risk-adjusted spreads produces an attractive total return in comparison to the market return. |
| • | The incremental return available from security selection and sector allocation, based on careful relative value analysis, quantitative research, and experienced market judgment, is more consistent than the incremental return from predicting the direction of interest rates or other macro-factor trading strategies. |
| • | Within the investment-grade fixed-income market, the spread sectors, e.g., corporate bonds, mortgage-backed securities (MBS), commercial MBS (CMBS), and asset-backed securities (ABS), will tend to outperform Treasury securities over a market cycle. The corporate, mortgage, CMBS, and ABS sectors also offer the greatest active management opportunity for adding value through security selection. |
The portfolio management team at Smith Breeden specializes in analyzing and investing in mortgage-backed securities. Through careful analysis and comparison of the characteristics of these securities, such as type of issuer, coupon, maturity, geographic structure, and historic and prospective prepayment rates, the team seeks to structure a portfolio that will outperform the Citigroup Mortgage Index. While the portfolio managers will purchase securities of any maturity or duration, they do not attempt to add value by actively positioning the interest-rate sensitivity of the portfolio. Instead, they typically manage the weighted average duration of the portfolio so that it is similar to that of the duration of the Citigroup Mortgage Index.
The ideal investment exhibits the following traits:
| • | Very high quality (AAA or Government) |
| • | Attractive value relative to other MBS opportunities |
The portfolio managers limit purchases to securities from the following asset classes:
| • | Securities issued directly or guaranteed by the U.S. Government or its agencies or instrumentalities |
| • | Mortgage-backed securities rated AAA by Standard & Poor’s Corporation (“S&P”) or Aaa by Moody’s Investors Service, Inc. (“Moody’s”) |
| • | Securities fully collateralized by assets in either of the above classes |
| • | Assets that would qualify as liquidity items under federal regulations (which may change from time to time) if held by a commercial bank or savings institution; and hedge instruments |
| • | Stripped mortgage-backed securities, which may only be used for risk management purposes |
57 |
Table of Contents
| Managers Intermediate Duration Government Fund |
| Investment Manager’s Comments (continued) |
The investment team will make a sell decision when:
| • | They no longer view the bonds as attractive |
| • | They need to maintain the portfolio’s target duration |
| • | They deem it necessary for portfolio allocation purposes |
The Year in Review
During the year ended December 31, 2010, the Fund returned 7.30%, compared to 5.50% for its benchmark, the Citigroup Mortgage Index (“Citi Mortgage”).
Economic conditions and the recovery in 2010 were largely shaped by the prior few years of historic market moves, a credit and liquidity crisis, and unprecedented government intervention. The prior year included high economic uncertainty, uncertain inflation expectations, constrained capital given restrictive risk-management limits, and somewhat impaired liquidity. 2010 saw tightening across spread sectors, lower risk premia, improved liquidity, and lower market volatility as the markets continued healing.
By the end of the first quarter of 2010, the Federal Reserve buying program of MBS was completed, culminating in purchases of $1.25 trillion. This program kept demand for MBS strong through most of 2009 and the early part of 2010 and mortgage rates lower than they otherwise would have been through a volatile period for the U.S. housing market and the overall economy. With the end to quantitative easing, the market had lost the volatility buffer provided not only by Federal Reserve buying, but also by the Fed’s assumption of massive amounts of prepayment risk via their MBS holdings.
Despite this, mortgage rates moved significantly lower during the second quarter. Demand remained strong as mortgages represented a high credit-quality security that offered a better yield than Treasury securities. With prepayments generally remaining mild and supply being light despite historically low rates, agency mortgages kept pace with a rally in Treasuries. It should be noted that one of the great technical supports for the agency MBS market in 2010 was the net negative supply primarily due to Government Sponsored Enterprise (GSE) buyouts of delinquent loans.
As fears of a double dip in the economy emerged during the third quarter, both Treasury yields and mortgage rates again moved lower. Talk of a second round of quantitative easing surfaced toward the end of the quarter, which helped spur the bond market rally. Mortgage spreads widened in this rally as concerns emerged over increasing levels of prepayments and origination. Apart from agency MBS, spread sectors performed well during the quarter.
In the fourth quarter, interest rates backed up significantly as the market’s fear of a double dip in the economy gave way, and the mar-
ket, buoyed by further quantitative easing (QE2) from the Federal Reserve, began to price in stronger growth expectations. The result was a very steep yield curve and a forward curve, which anticipates a less accommodative Federal Reserve in the coming quarters. This more optimistic outlook also spilled into fixed income spreads, where we now see tighter spread levels in virtually every market.
Most of the portfolio outperformance for 2010 was attributed to agency, non-agency MBS, and CMBS exposure. Agency adjustable-rate (ARMs), fixed-rate mortgages (FRMs), and Collateralized Mortgage Obligations (CMOs (considered by some to be mortgage derivatives)) were beneficiaries of lower realized volatility, hedging costs, and mortgage rates. A benign prepayment environment also helped the Fund’s very small exposure (2.8%) to mortgage derivatives. CMBS outperformed as risk appetite continues to be strong for the asset class, especially as the commercial real estate market firms up. Supply in CMBS is almost non-existent and market technicals continue to be supportive of tighter spreads.
Derivatives such as financial futures, options, and mortgage derivatives are used for portfolio duration and convexity risk management. Although we prefer to have the flexibility to use the largest array of instruments possible, derivatives are not crucial to our ability to add value.
Looking Forward
On December 31, 2010, the Fund held the bulk of its exposure in 15- and 30-year agency FRMs. In addition, 10% of capital was allocated to CMBS, which are not included in the Citigroup Mortgage Index. The total allocation to CMBS increased by 3% of capital during the year. We decreased the allocation to 15- and
30-year agency FRMs by approximately 8% during the year. The Fund also maintains a small allocation to ARMs, Interest-Only (IO) strips, CMOs, and Treasury Inflation Protected Securities (TIPS). We believe that high-quality spread assets that are held in the portfolio are likely to continue experiencing positive performance. Although spreads may tighten more slowly in 2011 as government intervention and stimulus efforts begin slowing or coming to an end, continued market demand for risk assets will keep a floor on prices across sectors.
This commentary reflects the viewpoints of Smith Breeden Associates, Inc., as of January 21, 2011.
Cumulative Total Return Performance
Managers Intermediate Duration Government Fund’s cumulative total return is based on the daily change in net asset value (NAV), and assumes that all distributions were reinvested. Unlike the Fund, the Citigroup Mortgage Index is unmanaged, is not available for investment, and does not incur expenses. The chart illustrates
58 |
Table of Contents
| Managers Intermediate Duration Government Fund |
| Investment Manager’s Comments (continued) |
Cumulative Total Return Performance (continued) |
the performance of a hypothetical $10,000 investment made in the Fund on December 31, 2000 to a $10,000 investment made in the Citigroup Mortgage Index for the same time periods. Figures include reinvestment of capital gains and dividends. The listed returns for the Fund are net of expenses and the returns for the index exclude expenses. Total returns for the Fund would have been lower had certain expenses not been reduced.
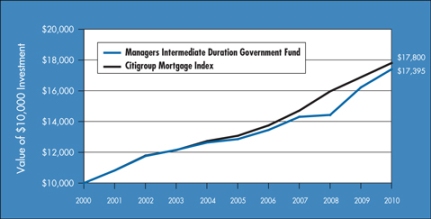
The table below shows the average annual total returns for the Managers Intermediate Duration Government Fund and the Citigroup Mortgage Index from December 31, 2000 through December 31, 2010.
Average Annual Total Returns1 | 1 Year | 5 Years | 10 Years | |||||||||
Managers Intermediate Duration Government Fund2,3,4,5 | 7.30 | % | 6.24 | % | 5.69 | % | ||||||
Citigroup Mortgage Index6 | 5.50 | % | 6.37 | % | 5.94 | % | ||||||
The performance data shown represents past performance. Past performance is not a guarantee of future results. Current performance may be lower or higher than the performance data quoted. The investment return and the principal value of an investment will fluctuate so that an investor’s shares, when redeemed, may be worth more or less than their original cost. For performance information through the most recent month end please call (800) 835-3879 or visit our Web site at www.managersinvest.com.
In choosing a Fund, investors should carefully consider the amount they plan to invest, their investment objectives, the Fund’s investment objectives, risks, charges and expenses before investing. For this and other information, please call (800) 835-3879 or visit www.managersinvest.com for a free prospectus. Read it carefully before investing or sending money. Distributed by Managers Distributors, Inc., member FINRA.
| 1 | Total return equals income yield plus share price change and assumes reinvestment of all dividends and capital gain distributions. Returns are net of fees and may reflect offsets of Fund expenses as described in the Prospectus. No adjustment has been made for taxes payable by shareholders on their reinvested dividends and capital gain distributions. Returns for periods greater than one year are annualized. The listed returns on the Fund are net of expenses and based on the published NAV as of December 31, 2010. All returns are in U.S. dollars($). |
| 2 | From time to time, the Fund’s advisor has waived its fees and/or absorbed Fund expenses, which has resulted in higher returns. |
| 3 | The Fund is subject to the risks associated with investments in debt securities, such as default risk and fluctuations in the perception of the debtors’ ability to pay their creditors. |
| 4 | The Fund may use derivative instruments for hedging purposes or as part of its investment strategy. There is a risk that a derivative intended as a hedge may not perform as expected. The main risk with derivatives is that some types can amplify a gain or loss, potentially earning or losing substantially more money than the actual cost of the derivative or that the counterparty may fail to honor its contract terms, causing a loss for the Fund. Use of these instruments may also involve certain costs and risks such as liquidity risk, interest rate risk, market risk, credit risk, management risk and the risk that a fund could not close out a position when it would be most advantageous to do so. |
| 5 | Many bonds have call provisions which allow the debtors to pay them back before maturity. This is especially true with mortgage securities, which can be paid back anytime. Typically debtors prepay their debt when it is to their advantage (when interest rates drop making a new loan at current rates more attractive), and thus likely to the disadvantage of bondholders, who may have to reinvest prepayment proceeds in securities with lower yields. Prepayment risk will vary depending on the provisions of the security and current interest rates relative to the interest rate of the debt. |
| 6 | The Citigroup Mortgage Index includes all outstanding government sponsored fixed-rate mortgage-backed securities, weighted in proportion to their current market capitalization. The Index reflects no deductions for fees, expenses, or taxes. Unlike the Fund, the Citigroup Mortgage Index is unmanaged, is not available for investment, and does not incur expenses. |
Not FDIC insured, nor bank guaranteed. May lose value.
59 |
Table of Contents
| Managers Intermediate Duration Government Fund |
| Fund Snapshots |
| December 31, 2010 |
Portfolio Breakdown
Portfolio Breakdown | Managers Intermediate Duration Government Fund** | |||
U.S. Government and Agency Obligations | 108.7 | % | ||
Mortgage-Backed Securities | 15.7 | % | ||
Other Assets and Liabilities | (24.4 | %) | ||
| ** | As a percentage of net assets |
Top Ten Holdings
Top Ten Holdings | % of Net Assets | |||
FNMA, 4.500%, TBA | 14.7 | % | ||
FNMA, 5.000%, TBA* | 9.6 | |||
FNMA, 3.500%, TBA | 6.6 | |||
FHLMC, 5.000%, TBA* | 4.8 | |||
FNMA, 6.000%, TBA* | 4.2 | |||
FHLMC, 5.500%, 01/13/35 | 4.2 | |||
FHLMC Gold Pool, 5.500%, 06/01/35* | 3.4 | |||
FHLMC, 5.624%, 01/01/36* | 3.3 | |||
GNMA, 5.500%, 10/15/39* | 2.5 | |||
FNMA, 4.500%, 10/01/40 | 2.5 | |||
Top Ten as a Group | 55.8 | % | ||
| * | Top Ten Holding at June 30, 2010 |
Any sectors, industries, or securities discussed should not be perceived as investment recommendations. Mention of a specific security should not be considered a recommendation to buy or solicitation to sell that security. Specific securities mentioned in this report may have been sold from the Fund’s portfolio of investments by the time you receive this report.
60 |
Table of Contents
| Managers Intermediate Duration Government Fund |
| Schedule of Portfolio Investments |
| December 31, 2010 |
Security Description | Principal Amount | Value | ||||||
U.S. Government and Agency Obligations - 108.7% | ||||||||
Federal Home Loan Mortgage Corporation - 36.8% | ||||||||
FHLMC, 2.474%, 11/01/33, (12/01/11)4 | $ | 1,809,353 | $ | 1,881,051 | ||||
FHLMC, 4.500%, 04/01/35 | 463,439 | 478,095 | ||||||
FHLMC, 5.000%, 05/01/18 | 243,999 | 260,202 | ||||||
FHLMC, 5.000%, 11/01/359 | 3,215,866 | 3,394,878 | ||||||
FHLMC, 5.000%, TBA | 7,000,000 | 7,341,250 | ||||||
FHLMC, 5.500%, 09/01/339 | 986,063 | 1,059,441 | ||||||
FHLMC, 5.500%, 05/01/349 | 828,916 | 894,122 | ||||||
FHLMC, 5.500%, 11/01/17 to 01/13/35 | 7,055,513 | 7,530,617 | ||||||
FHLMC, 5.624%, 01/01/36, (01/01/13)4 | 4,805,998 | 5,115,028 | ||||||
FHLMC, 5.717%, 02/01/37, (02/01/12)4 | 175,770 | 186,247 | ||||||
FHLMC, 6.000%, 02/01/22 to 03/01/22 | 845,077 | 922,282 | ||||||
FHLMC, 7.500%, 07/01/349 | 2,288,977 | 2,619,823 | ||||||
FHLMC Gold Pool, 3.750%, 11/15/256,9 | 94,662 | 94,647 | ||||||
FHLMC Gold Pool, 4.500%, 10/01/349 | 1,641,202 | 1,693,102 | ||||||
FHLMC Gold Pool, 4.500%, 04/01/359 | 2,516,979 | 2,595,000 | ||||||
FHLMC Gold Pool, 4.500%, 10/01/359 | 1,891,725 | 1,950,364 | ||||||
FHLMC Gold Pool, 4.500%, 11/01/359 | 1,611,101 | 1,661,042 | ||||||
FHLMC Gold Pool, 4.500%, 05/01/34 to 05/01/35 | 717,966 | 740,356 | ||||||
FHLMC Gold Pool, 5.000%, 10/01/18 to 08/01/19 | 430,673 | 459,328 | ||||||
FHLMC Gold Pool, 5.500%, 02/01/359 | 1,208,775 | 1,295,704 | ||||||
FHLMC Gold Pool, 5.500%, 06/01/359 | 4,802,374 | 5,152,241 | ||||||
FHLMC Gold Pool, 5.500%, 06/01/359 | 1,540,609 | 1,652,847 | ||||||
FHLMC Gold Pool, 5.500%, 12/01/389 | 1,014,629 | 1,084,426 | ||||||
FHLMC Gold Pool, 5.500%, 10/01/33 to 05/01/38 | 2,177,279 | 2,330,238 | ||||||
FHLMC Gold Pool, 6.000%, 09/01/17 to 05/01/22 | 3,544,377 | 3,870,511 | ||||||
FHLMC Structured Pass Through Securities, Series T-51, Class 2A, 7.500%, 08/25/425 | 254,651 | 295,873 | ||||||
Total Federal Home Loan Mortgage Corporation | 56,558,715 | |||||||
Federal National Mortgage Association - 57.8% | ||||||||
FNMA, 0.581%, 11/25/30, (01/25/11)4,9 | 2,017,366 | 2,019,443 | ||||||
FNMA, 0.661%, 03/25/35, (01/25/11)4,9 | 1,214,644 | 1,210,224 | ||||||
FNMA, 2.062%, 07/01/33, (06/01/11)4 | 543,425 | 561,322 | ||||||
FNMA, 2.145%, 06/01/34, (05/01/11)4,9 | 1,617,909 | 1,688,420 | ||||||
FNMA, 2.666%, 06/01/34, (06/01/11)4,9 | 1,864,668 | 1,950,642 | ||||||
FNMA, 2.700%, 08/01/34, (06/01/11)4 | 760,366 | 793,917 | ||||||
FNMA, 3.322%, 06/01/37, (05/01/11)4 | 691,627 | 726,159 | ||||||
FNMA, 3.500%, TBA | 10,000,000 | 10,068,750 | ||||||
FNMA, 4.500%, 10/01/40 to 11/01/40 | 6,183,887 | 6,353,351 | ||||||
FNMA, 4.500%, TBA | 22,000,000 | 22,580,932 | ||||||
FNMA, 5.000%, 01/01/209 | 1,845,364 | 1,984,055 | ||||||
FNMA, 5.000%, 06/01/18 to 03/01/36 | 4,065,672 | 4,295,514 | ||||||
The accompanying notes are an integral part of these financial statements. 61 |
Table of Contents
| Managers Intermediate Duration Government Fund |
| Schedule of Portfolio Investments (continued) |
Security Description | Principal Amount | Value | ||||||
Federal National Mortgage Association - 57.8% (continued) | ||||||||
FNMA, 5.000%, TBA | $ | 14,000,000 | $ | 14,717,500 | ||||
FNMA, 5.457%, 02/01/36, (02/01/11)4 | 177,876 | 185,480 | ||||||
FNMA, 5.500%, 01/01/199 | 452,713 | 487,021 | ||||||
FNMA, 5.500%, 11/01/349 | 1,453,029 | 1,563,947 | ||||||
FNMA, 5.500%, 03/01/17 to 07/01/38 | 5,350,919 | 5,772,313 | ||||||
FNMA, 5.500%, TBA | 2,100,000 | 2,246,671 | ||||||
FNMA, 6.000%, 08/01/17 | 221,510 | 241,619 | ||||||
FNMA, 6.000%, TBA | 6,000,000 | 6,521,250 | ||||||
FNMA, 6.500%, 11/01/28 to 07/01/32 | 433,324 | 482,975 | ||||||
FNMA, Series 1994-55, Class H, 7.000%, 03/25/249 | 2,021,246 | 2,255,339 | ||||||
FNMA Whole Loan, Series 2003-W4, Class 4A, 7.500%, 10/25/42 | 150,694 | 172,296 | ||||||
Total Federal National Mortgage Association | 88,879,140 | |||||||
Government National Mortgage Association - 10.9% | ||||||||
GNMA, 3.000%, 08/20/17, (10/01/11)4 | 31,844 | 32,667 | ||||||
GNMA, 3.000%, 08/20/18, (10/01/11)4 | 70,891 | 72,723 | ||||||
GNMA, 3.125%, 11/20/17, (01/01/12)4 | 203,609 | 209,559 | ||||||
GNMA, 3.125%, 12/20/17, (01/01/12)4 | 15,184 | 15,628 | ||||||
GNMA, 3.375%, 03/20/16, (04/01/11)4 | 18,609 | 19,187 | ||||||
GNMA, 3.375%, 06/20/16, (07/01/11)4 | 23,311 | 24,043 | ||||||
GNMA, 3.375%, 05/20/21, (07/01/11)4 | 35,659 | 36,778 | ||||||
GNMA, 4.500%, 09/15/40 | 995,666 | 1,035,071 | ||||||
GNMA, 4.500%, TBA | 2,300,000 | 2,387,687 | ||||||
GNMA, 5.000%, 09/15/39 to 12/15/39 | 7,540,680 | 8,056,195 | ||||||
GNMA, 5.500%, 10/15/39 to 11/15/39 | 4,422,461 | 4,828,062 | ||||||
GNMA, 7.500%, 09/15/28 to 11/15/31 | 25,529 | 29,512 | ||||||
Total Government National Mortgage Association | 16,747,112 | |||||||
Interest Only Strips - 2.7% | ||||||||
FHLMC, Series 2010-121, Class SB, 4.189%, 10/25/40, (01/25/11)4 | 741,320 | 74,205 | ||||||
FHLMC, Series 3721, Class SA, 4.240%, 09/15/40, (01/15/11)4 | 1,897,357 | 180,394 | ||||||
FHLMC, 4.500%, 09/15/35 | 512,655 | 88,359 | ||||||
FHLMC, 5.000%, 05/15/17 to 04/15/20 | 935,433 | 114,244 | ||||||
FHLMC, Series 3685, Class EI, 5.000%, 03/15/19 | 2,345,561 | 275,512 | ||||||
FHLMC, Series 3659, Class IE, 5.000%, 03/15/19 | 982,440 | 93,807 | ||||||
FHLMC, Series 3731, Class IO, 5.000%, 07/15/19 | 1,064,163 | 106,776 | ||||||
FHLMC, Series 2637, Class SI, 5.740%, 06/15/18, (01/15/11)4 | 439,004 | 41,586 | ||||||
FHLMC, 6.000%, 05/01/31 | 5,863 | 1,294 | ||||||
FHLMC, Series 3560, Class KS, 6.140%, 11/15/36, (01/15/11)4 | 1,338,566 | 235,493 | ||||||
FHLMC, Series 3424, Class XI, 6.310%, 05/15/36, (01/15/11)4 | 561,856 | 90,085 | ||||||
FHLMC, Series 3153, Class JI, 6.360%, 05/15/36, (01/15/11)4 | 1,065,251 | 145,004 | ||||||
FHLMC, 6.440%, 11/15/18, (01/15/11)4 | 707,904 | 61,899 | ||||||
FHLMC, Series 2882, Class SJ, 6.440%, 10/15/34, (01/15/11)4 | 1,767,064 | 216,324 | ||||||
FHLMC, Series 2980, Class SL, 6.440%, 11/15/34, (01/15/11)4 | 485,196 | 72,146 | ||||||
The accompanying notes are an integral part of these financial statements. 62 |
Table of Contents
| Managers Intermediate Duration Government Fund |
| Schedule of Portfolio Investments (continued) |
Security Description | Principal Amount | Value | ||||||
Interest Only Strips - 2.7% (continued) | ||||||||
FHLMC, Series 2922, Class SE, 6.490%, 02/15/35, (01/15/11)4 | $ | 332,557 | $ | 47,416 | ||||
FHLMC, Series 2608, Class SJ, 6.840%, 03/15/17, (01/15/11)4 | 604,633 | 18,450 | ||||||
FHLMC, 6.840%, 11/15/30, (01/15/11)4 | 117,637 | 7,806 | ||||||
FHLMC, Series 2644, Class ES, 6.890%, 02/15/18, (01/15/11)4 | 769,270 | 68,820 | ||||||
FHLMC, Series 2772, Class KS, 6.920%, 06/15/22, (01/15/11)4 | 277,011 | 17,474 | ||||||
FHLMC, 7.390%, 10/15/16, (01/15/11)4,6 | 26,886 | 216 | ||||||
FHLMC, Series 3489, Class SD, 7.540%, 06/15/32, (01/15/11)4 | 481,539 | 86,487 | ||||||
FHLMC, 7.640%, 06/15/31, (01/15/11)4 | 50,251 | 9,043 | ||||||
FNMA, 4.000%, 09/01/33 to 09/01/34 | 825,505 | 75,469 | ||||||
FNMA, Series 2010-95, Class DI, 4.500%, 11/25/20 | 1,394,240 | 123,296 | ||||||
FNMA, Series 2008-86, Class IO, 4.500%, 03/25/23 | 2,052,586 | 213,538 | ||||||
FNMA, 4.500%, 09/01/33 | 295,692 | 42,119 | ||||||
FNMA, Series 2010-65, Class IO, 5.000%, 09/25/20 | 2,334,810 | 296,905 | ||||||
FNMA, 5.000%, 05/01/34 to 12/01/35 | 1,305,781 | 224,820 | ||||||
FNMA, Series 2006-3, Class SA, 5.889%, 03/25/36, (01/25/11)4 | 529,646 | 76,550 | ||||||
FNMA, Series 2009-87, Class SX, 5.989%, 11/25/39, (01/25/11)4 | 1,193,256 | 149,972 | ||||||
FNMA, Series 2003-73, Class SM, 6.339%, 04/25/18, (01/25/11)4 | 591,368 | 62,396 | ||||||
FNMA, Series 2005-45, Class SR, 6.459%, 06/25/35, (01/25/11)4 | 505,743 | 67,406 | ||||||
FNMA, Series 2005-12, Class SC, 6.489%, 03/25/35, (01/25/11)4 | 375,629 | 52,652 | ||||||
FNMA, Series 2005-29, Class SC, 6.489%, 04/25/35, (01/25/11)4 | 811,372 | 98,086 | ||||||
FNMA, Series 2008-34, Class SM, 6.489%, 05/25/38, (01/25/11)4 | 1,040,473 | 150,872 | ||||||
FNMA, Series 2004-49, Class SQ, 6.789%, 07/25/34, (01/25/11)4 | 276,180 | 42,667 | ||||||
FNMA, Series 2004-64, Class SW, 6.789%, 08/25/34, (01/25/11)4 | 851,080 | 130,129 | ||||||
FNMA, Series 2003-67, Class TS, 6.839%, 08/25/17, (01/25/11)4 | 745,694 | 40,079 | ||||||
FNMA, Series 2004-51, Class SX, 6.859%, 07/25/34, (01/25/11)4 | 563,757 | 98,827 | ||||||
FNMA, Series 2006-101, Class SE, 6.989%, 10/25/36, (01/25/11)4 | 671,765 | 114,446 | ||||||
FNMA, 7.000%, 04/01/236 | 227,104 | 55,782 | ||||||
FNMA, 7.000%, 06/01/236 | 24,045 | 4,460 | ||||||
Total Interest Only Strips | 4,173,311 | |||||||
U.S. Treasury Notes - 0.5% | ||||||||
U.S. Treasury Inflation Linked Notes, 2.375%, 04/15/11 | 723,915 | 730,363 | ||||||
Total U.S. Government and Agency Obligations (cost $162,930,549) | 167,088,641 | |||||||
Mortgage-Backed Securities - 15.7% | ||||||||
American Home Mortgage Assets, Series 2005-1, Class 1A1, 3.073%, 11/25/35, (01/25/11)4 | 108,297 | 66,503 | ||||||
American Home Mortgage Investment Trust, 2.261%, 02/25/45, (02/01/11)4 | 744,586 | 662,548 | ||||||
American Home Mortgage Investment Trust, 2.457%, 04/25/44, (02/01/11)4 | 180,070 | 138,382 | ||||||
American Home Mortgage Investment Trust, 2.457%, 06/25/45, (02/01/11)4 | 96,577 | 88,084 | ||||||
American Home Loan Investment Trust, 2.457%, 06/25/45, (02/01/11)4 | 1,615,703 | 1,409,796 | ||||||
Banc of America Commercial Mortgage, Inc., Series 2006-6, Class A2, 5.309%, 10/10/45 | 1,592,772 | 1,622,129 | ||||||
Bank of America Funding Corp., Series 2004-B, Class 1A2, 2.997%, 12/20/345 | 206,417 | 139,677 | ||||||
Bear Stearns Alt-A Trust, Mortgage Pass-Through Certificates, Series 2005-3, 2.901%, 04/25/355 | 189,753 | 130,567 | ||||||
The accompanying notes are an integral part of these financial statements. 63 |
Table of Contents
| Managers Intermediate Duration Government Fund |
| Schedule of Portfolio Investments (continued) |
Security Description | Principal Amount | Value | ||||||
Mortgage-Backed Securities - 15.7% (continued) | ||||||||
Bear Stearns Commercial Mortgage Securities, Series 2005-PWR9, Class A3, 4.868%, 09/11/42 | $ | 1,000,000 | $ | 1,012,954 | ||||
Citigroup Commercial Mortgage Trust, Series 2008-C7, Class A3, 6.179%, 12/10/495 | 1,148,000 | 1,221,066 | ||||||
Citigroup/Deutsche Bank Commercial Mortgage Trust, Series 2006-CD3, Class A4, 5.658%, 10/15/48 | 2,000,000 | 2,078,021 | ||||||
Countrywide Alternative Loan Trust, 0.561%, 05/25/35, (01/25/11)4 | 719,382 | 644,240 | ||||||
Countrywide Home Loans, Inc., Series 2004-R2, Class 1AF1, 0.681%, 11/25/34, (01/25/11) (a)4,6 | 308,304 | 269,542 | ||||||
Countrywide Home Loans, Inc., Series 2005-HYB8, Class 1A1, 2.773%, 12/20/355 | 144,503 | 109,586 | ||||||
Countrywide Home Loans, Inc., Series 2005-HYB2, Class 1A4, 3.342%, 05/20/355 | 146,132 | 99,113 | ||||||
CS First Boston Mortgage Securities Corp., Series 2005-C3, Class A3, 4.645%, 07/15/37 | 2,000,000 | 2,062,314 | ||||||
CS First Boston Mortgage Securities Corp., Series 2002-CP5, Class A2, 4.940%, 12/15/35 | 1,000,000 | 1,049,598 | ||||||
GMAC Commercial Mortgage Securities, Inc., Series 2005 C1, Class A3, 4.538%, 05/10/43 | 850,263 | 849,759 | ||||||
Goldman Sachs Mortgage Loan Trust, Series 2005-RP2, Class 1AF, 0.611%, 03/25/35, (01/25/11) (a)4,6 | 304,395 | 255,779 | ||||||
GSR Mortgage Loan Trust, Series 2004-5, Class 1A3, 2.000%, 05/25/34, (02/01/11)4 | 77,466 | 62,004 | ||||||
Harborview Mortgage Loan Trust, 2.636%, 11/19/345 | 119,869 | 78,997 | ||||||
JPMorgan Chase Commercial Mortgage Securities Corp., Series 2004 CBX, Class A4, 4.529%, 01/12/37 | 350,000 | 355,801 | ||||||
JPMorgan Chase Commercial Mortgage Securities Corp., Series 2006-LDP6, Class A3B, 5.559%, 04/15/435 | 1,900,000 | 1,935,851 | ||||||
LB-UBS Commercial Mortgage Trust, Series 2004-C8, Class A3, 4.435%, 12/15/29 | 1,000,000 | 1,011,563 | ||||||
Master Alternative Loans Trust, 6.000%, 01/25/359 | 998,948 | 944,805 | ||||||
Morgan Stanley Mortgage Loan Trust, 6.031%, 08/25/355 | 1,463,055 | 1,282,511 | ||||||
Structured Asset Securities Corp., Series 2005-RF1, Class A, 0.611%, 03/25/35, (01/25/11) (a)4,6 | 362,627 | 299,539 | ||||||
Wachovia Bank Commercial Mortgage Trust, Series 2005 C19, Class A3, 4.566%, 05/15/44 | 309,028 | 312,854 | ||||||
Wachovia Bank Commercial Mortgage Trust, Series 2006-C28, Class A3, 5.679%, 10/15/48 | 2,206,000 | 2,293,192 | ||||||
Wells Fargo Mortgage Backed Securities Trust, Series 2007-16, Class 1A1, 6.000%, 12/28/37 | 1,531,915 | 1,585,291 | ||||||
Total Mortgage-Backed Securities (cost $22,874,038) | 24,072,066 | |||||||
Short-Term Investments - 22.7% | ||||||||
U.S. Government and Agency Discount Notes - 0.1% | ||||||||
FHLMC, Discount Notes, 0.038%, 01/19/113,8 | 150,000 | 149,997 | ||||||
| Other Investment Companies - 22.6%1 | Shares | |||||||
BNY Institutional Cash Reserves Fund, Series B*2,7 | 13,850 | 11,039 | ||||||
Dreyfus Cash Management Fund, Institutional Class Shares, 0.14% | 5,723,243 | 5,723,243 | ||||||
JPMorgan Liquid Assets Money Market Fund, Capital Shares, 0.14% | 29,040,181 | 29,040,181 | ||||||
Total Other Investment Companies | 34,774,463 | |||||||
Total Short-Term Investments (cost $34,927,254) | 34,924,460 | |||||||
Total Investments - 147.1% (cost $220,731,841) | 226,085,167 | |||||||
Other Assets, less Liabilities - (47.1)% | (72,440,871 | ) | ||||||
Net Assets -100.0% | $ | 153,644,296 | ||||||
The accompanying notes are an integral part of these financial statements. 64 |
Table of Contents
| Managers Intermediate Duration Government Fund |
| Notes to Schedule of Portfolio Investments |
Note: Based on the approximate cost of investments of $220,731,841 for Federal income tax purposes at December 31, 2010, the aggregate gross unrealized appreciation and depreciation were $7,156,150 and $1,802,824, respectively, resulting in net unrealized appreciation of investments of $5,353,326.
| (a) | Security exempt from registration under Rule 144A of the Securities Act of 1933. These securities may be resold in transactions exempt from registration, normally to qualified buyers. At December 31, 2010, the value of these securities amounted to $824,860, or 0.5% of net assets. |
| 1 | Yield shown for each investment company represents its December 31, 2010, seven-day average yield, which refers to the sum of the previous seven days’ dividends paid, expressed as an annual percentage. |
| 2 | Collateral received from brokers for securities lending was invested in this short-term investment. |
| 3 | Percentage rate listed represents yield to maturity at December 31, 2010. |
| 4 | Floating Rate Security. The rate listed is as of December 31, 2010. Date in parentheses represents the securities next coupon rate reset. |
| 5 | Variable Rate Security. The rate listed is as of December 31, 2010, and is periodically reset subject to terms and conditions set forth in the debenture. |
| 6 | Illiquid Security: A security not readily convertible into cash such as a stock, bond or commodity that is not actively traded and would be difficult to sell in a current sale. The Funds may not invest more than 15% of their net assets in illiquid securities. All securities are valued on the basis of valuations provided by dealers or independent pricing services. At December 31, 2010, the market value of these securities amounted to $979,965, or 0.6% of net assets. |
| 7 | On September 12, 2008, The Bank of New York Mellon established a separate sleeve of the BNY Institutional Cash Reserves Fund (Series B) to hold certain Lehman Brothers floating rate notes. The Fund’s position in Series B is being fair valued daily. (See Note 7 in the Notes to Financial Statements.) |
| 8 | Security pledged to cover margin requirements for open futures positions at December 31, 2010. |
| 9 | All or part of the security has been segregated for delayed delivery transactions. |
The following table summarizes the inputs used to value the Fund’s net assets by the fair value hierarchy levels as of December 31, 2010: (See Note 1(a) in the Notes to Financial Statements.)
| Quoted Prices in Active Markets for Identical Investments Level 1 | Significant Other Observable Inputs Level 2 | Significant Unobservable Inputs Level 3 | Total | |||||||||||||
Investments in Securities | ||||||||||||||||
U.S. Government and Agency Obligations† | — | $ | 167,088,641 | — | $ | 167,088,641 | ||||||||||
Mortgage-Backed Securites | — | 24,072,066 | — | 24,072,066 | ||||||||||||
Short-Term Investments: | ||||||||||||||||
U.S. Government and Agency Discount Notes | — | 149,997 | — | 149,997 | ||||||||||||
Other Investment Companies | $ | 34,763,424 | 11,039 | — | 34,774,463 | |||||||||||
Total Investments in Securities | $ | 34,763,424 | $ | 191,321,743 | — | $ | 226,085,167 | |||||||||
Derivatives‡ | ||||||||||||||||
Interest Rate Futures Contracts | ($ | 272,109 | ) | — | — | ($ | 272,109 | ) | ||||||||
Total Derivatives | ($ | 272,109 | ) | — | — | ($ | 272,109 | ) | ||||||||
| † | All U.S. Government and Agency Obligations held in the Fund are Level 2 securities. |
| ‡ | Derivative instruments, such as futures, forwards, options and swap contracts, are not reflected in the Schedule of Portfolio Investments and are valued at the unrealized appreciation/depreciation of the instrument. |
As of December 31, 2010, the Fund had no significant transfers between Level 1 and Level 2 from the beginning of the reporting period. The following schedule shows the fair value of derivative instruments as of December 31, 2010:
| Asset Derivatives | Liability Derivatives | |||||||||||||
Fund | Derivatives not accounted for as hedging instruments | Statement of Assets and Liabilities Location | Fair Value | Statement of Assets and Liabilities Location | Fair Value | |||||||||
Intermediate Duration | Interest rate futures contracts | Receivable for variation margin on futures | $ | 7,891 | Payable for variation margin on futures | $ | 16,387 | |||||||
The accompanying notes are an integral part of these financial statements. 65 |
Table of Contents
| Managers Intermediate Duration Government Fund |
| Notes to Schedule of Portfolio Investments (continued) |
For the year ended December 31, 2010, the effect of derivative instruments on the
Statement of Operations and the amount of realized gain/(loss) on derivatives recognized in income were as follows:
Fund | Derivatives not accounted for as hedging instruments | Amount | ||||
Intermediate Duration | Interest rate futures contracts | $ | 988,323 | |||
The change in unrealized gain/(loss) on derivatives recognized in income were as follows:
Fund | Derivatives not accounted for as hedging instruments | Amount | ||||
Intermediate Duration | Interest rate futures contracts | ($ | 347,733 | ) | ||
At December 31, 2010, the Fund had the following TBA forward sale commitments:
(See Note 1(k) in the Notes to Financial Statements.)
Fund | Principal Amount | Security | Current Liability | |||||||||
Intermediate Duration | ||||||||||||
| $ | 6,200,000 | FNMA, 4.500 | %, TBA | $ | 6,363,717 | |||||||
At December 31, 2010, the Fund had the following open futures contracts:
(See Note 2 (a) in the Notes to Financial Statements.)
Type | Number of Contracts | Position | Expiration | Unrealized Gain/(Loss) | ||||||||||||||||
2-Year U.S. Treasury Note | 8 | Short | March 2011 | $ | 1,105 | |||||||||||||||
5-Year U.S. Treasury Note | 13 | Long | March 2011 | (29,689 | ) | |||||||||||||||
10-Year U.S. Treasury Note | 1 | Long | March 2011 | (4,018 | ) | |||||||||||||||
U.S. Treasury Long Bond | 3 | Long | March 2011 | (14,914 | ) | |||||||||||||||
5-Year Interest Rate Swap | 21 | Short | March 2011 | 36,369 | ||||||||||||||||
3-Month Eurodollar | 12 | Short | March 2011 - March 2013 | (61,955 | ) | |||||||||||||||
3-Month Eurodollar | 12 | Short | June 2011 - June 2013 | (62,855 | ) | |||||||||||||||
3-Month Eurodollar | 12 | Short | September 2011 - September 2013 | (62,855 | ) | |||||||||||||||
3-Month Eurodollar | 14 | Short | December 2011 - December 2013 | (73,297 | ) | |||||||||||||||
Total | ($ | 272,109 | ) | |||||||||||||||||
| Investments Definitions and Abbreviations: | ||
FHLMC: | Federal Home Loan Mortgage Corp. | |
FNMA: | Federal National Mortgage Association | |
GNMA: | Government National Mortgage Association | |
GSR: | Goldman Sachs REMIC | |
TBA: | To Be Announced | |
The accompanying notes are an integral part of these financial statements. 66 |
Table of Contents
| Statements of Assets and Liabilities |
| December 31, 2010 |
| Managers AMG Chicago Equity Partners Mid-Cap Fund | Managers AMG Chicago Equity Partners Balanced Fund | Managers High Yield Fund | Managers Fixed Income Fund | |||||||||||||
Assets: | ||||||||||||||||
Investments at value* (including securities on loan valued at $745,322, $363,692, $2,754,828, and $1,461,845, respectively) | $ | 41,300,393 | $ | 19,405,842 | $ | 33,442,139 | $ | 149,576,368 | ||||||||
Foreign currency** | — | — | — | 17,713 | ||||||||||||
Receivable for investments sold | 168,036 | — | 119,212 | — | ||||||||||||
Receivable for Fund shares sold | 61,419 | 24,506 | 44,164 | 345,892 | ||||||||||||
Receivable from affiliate | 6,529 | 7,632 | 14,547 | 30,235 | ||||||||||||
Dividends, interest and other receivables | 45,820 | 62,949 | 567,274 | 1,757,164 | ||||||||||||
Prepaid expenses | 27,019 | 26,131 | 25,819 | 28,353 | ||||||||||||
Total assets | 41,609,216 | 19,527,060 | 34,213,155 | 151,755,725 | ||||||||||||
Liabilities: | ||||||||||||||||
Payable for Fund shares repurchased | 21,169 | 552 | 40,920 | 498,527 | ||||||||||||
Payable upon return of securities loaned | 766,721 | 372,392 | 2,872,750 | 1,511,573 | ||||||||||||
Payable for investments purchased | — | 258,916 | — | — | ||||||||||||
Payable to custodian | — | — | 8,029 | — | ||||||||||||
Accrued expenses: | ||||||||||||||||
Investment management and advisory fees | 24,103 | 10,907 | 18,562 | 56,982 | ||||||||||||
Administrative fees | 6,887 | 3,116 | 5,303 | 25,325 | ||||||||||||
Other | 46,829 | 45,583 | 73,621 | 124,498 | ||||||||||||
Total liabilities | 865,709 | 691,466 | 3,019,185 | 2,216,905 | ||||||||||||
Net Assets | $ | 40,743,507 | $ | 18,835,594 | $ | 31,193,970 | $ | 149,538,820 | ||||||||
Net Assets Represent: | ||||||||||||||||
Paid-in capital | $ | 44,861,522 | $ | 17,931,878 | $ | 33,762,389 | $ | 141,241,138 | ||||||||
Undistributed net investment income | 72,740 | 646 | 21,178 | 103,298 | ||||||||||||
Accumulated net realized loss from investments and foreign currency transactions | (11,260,941 | ) | (1,001,060 | ) | (4,408,985 | ) | (1,091,179 | ) | ||||||||
Net unrealized appreciation of investments and foreign currency translations | 7,070,186 | 1,904,130 | 1,819,388 | 9,285,563 | ||||||||||||
Net Assets | $ | 40,743,507 | $ | 18,835,594 | $ | 31,193,970 | $ | 149,538,820 | ||||||||
Class A Shares - Net Assets | $ | 7,590,093 | $ | 7,604,788 | $ | 21,729,621 | $ | 38,654,802 | ||||||||
Shares outstanding | 551,014 | 563,725 | 2,807,896 | 3,514,552 | ||||||||||||
Net asset value and redemption price per share | $ | 13.77 | $ | 13.49 | $ | 7.74 | $ | 11.00 | ||||||||
Offering price per share based on a maximum sales charge of 5.75% (NAV per share/(100% - 5.75%) | $ | 14.61 | $ | 14.31 | n/a | n/a | ||||||||||
Offering price per share based on a maximum sales charge of 4.25% (NAV per share/(100% - 4.25%) | n/a | n/a | $ | 8.08 | $ | 11.49 | ||||||||||
Class B Shares - Net Assets | $ | 261,136 | $ | 562,216 | $ | 693,012 | $ | 3,773,319 | ||||||||
Shares outstanding | 20,350 | 42,206 | 90,910 | 345,750 | ||||||||||||
Net asset value and offering price per share | $ | 12.83 | $ | 13.32 | $ | 7.62 | $ | 10.91 | ||||||||
Class C Shares - Net Assets | $ | 3,025,662 | $ | 2,805,309 | $ | 4,053,079 | $ | 45,363,045 | ||||||||
Shares outstanding | 236,158 | 209,272 | 531,464 | 4,132,099 | ||||||||||||
Net asset value and offering price per share | $ | 12.81 | $ | 13.41 | $ | 7.63 | $ | 10.98 | ||||||||
Institutional Class Shares - Net Assets | $ | 29,866,616 | $ | 7,863,281 | $ | 4,718,258 | $ | 61,747,654 | ||||||||
Shares outstanding | 2,062,646 | 578,082 | 603,544 | 5,597,461 | ||||||||||||
Net asset value, offering and redemption price per share | $ | 14.48 | $ | 13.60 | $ | 7.82 | $ | 11.03 | ||||||||
* Investments at cost | $ | 34,230,207 | $ | 17,501,712 | $ | 31,622,751 | $ | 140,294,695 | ||||||||
** Foreign currency at cost | — | — | — | $ | 17,713 | |||||||||||
The accompanying notes are an integral part of these financial statements. 67 |
Table of Contents
| Statements of Assets and Liabilities |
| December 31, 2010 |
| Managers Short Duration Government Fund | Managers Intermediate Duration Government Fund | |||||||
Assets: | ||||||||
Investments at value* | $ | 436,682,674 | $ | 226,085,167 | ||||
Receivable for delayed delivery investments sold | 533,158 | 6,353,796 | ||||||
Receivable for Fund shares sold | 1,198,456 | 233,011 | ||||||
Dividends, interest and other receivables | 1,419,244 | 688,570 | ||||||
Receivable for variation margin on futures | 20,300 | 7,891 | ||||||
Receivable from affiliate | 358 | 3,624 | ||||||
Prepaid expenses | 35,582 | 14,732 | ||||||
Total assets | 439,889,772 | 233,386,791 | ||||||
Liabilities: | ||||||||
Payable upon return of securities loaned | 15,506 | 13,850 | ||||||
Payable for delayed delivery investments purchased | 57,732,094 | 72,460,141 | ||||||
Payable for Fund shares repurchased | 652,309 | 692,227 | ||||||
Payable for TBA sale commitments | — | 6,363,717 | ||||||
Payable for variation margin on futures | 231,522 | 16,387 | ||||||
Accrued expenses: | ||||||||
Investment management and advisory fee payable | 229,263 | 92,919 | ||||||
Other | 102,820 | 103,254 | ||||||
Total liabilities | 58,963,514 | 79,742,495 | ||||||
Net Assets | $ | 380,926,258 | $ | 153,644,296 | ||||
Shares outstanding | 39,768,933 | 13,949,203 | ||||||
Net asset value, offering and redemption price per share | $ | 9.58 | $ | 11.01 | ||||
Net Assets Represent: | ||||||||
Paid-in capital | $ | 386,609,691 | $ | 148,821,489 | ||||
Undistributed net investment income | 155 | 26,057 | ||||||
Accumulated net realized loss from investments and futures contracts | (6,362,056 | ) | (254,922 | ) | ||||
Net unrealized appreciation of investments, futures contracts and TBA sale commitments | 678,468 | 5,051,672 | ||||||
Net Assets | $ | 380,926,258 | $ | 153,644,296 | ||||
*Investments at cost | $ | 436,139,233 | $ | 220,731,841 | ||||
The accompanying notes are an integral part of these financial statements. 68 |
Table of Contents
| Statements of Operations |
| For the year ended December 31, 2010 |
| Managers AMG Chicago Equity Partners Mid-Cap Fund | Managers AMG Chicago Equity Partners Balanced Fund | Managers High Yield Fund | Managers Fixed Income Fund | Managers Short Duration Government Fund | Managers Intermediate Duration Government Fund | |||||||||||||||||||
Investment Income: | ||||||||||||||||||||||||
Dividend income | $ | 641,314 | $ | 203,048 | $ | 4,868 | $ | 53,230 | $ | 63,677 | $ | 68,865 | ||||||||||||
Interest income | — | 291,917 | 2,935,872 | 7,208,009 | 7,822,996 | 6,053,774 | ||||||||||||||||||
Securities lending fees | 12,912 | 374 | 10,389 | 2,796 | 91 | — | ||||||||||||||||||
Total investment income | 654,226 | 495,339 | 2,951,129 | 7,264,035 | 7,886,764 | 6,122,639 | ||||||||||||||||||
Expenses: | ||||||||||||||||||||||||
Investment management and advisory fees | 256,964 | 124,691 | 224,397 | 658,465 | 2,513,934 | 1,161,863 | ||||||||||||||||||
Administrative fees | 73,418 | 35,626 | 64,113 | 292,651 | — | — | ||||||||||||||||||
Distribution Fees - Class A | 16,765 | 17,007 | 57,271 | 107,796 | — | — | ||||||||||||||||||
Distribution Fees - Class B | 3,520 | 6,162 | 8,057 | 35,684 | — | — | ||||||||||||||||||
Distribution Fees - Class C | 32,274 | 29,037 | 42,357 | 526,409 | — | — | ||||||||||||||||||
Registration fees | 48,522 | 47,830 | 56,786 | 53,634 | 64,092 | 40,842 | ||||||||||||||||||
Professional fees | 35,768 | 29,074 | 41,667 | 65,810 | 95,018 | 62,435 | ||||||||||||||||||
Custodian | 13,016 | 23,383 | 59,540 | 39,864 | 102,821 | 46,732 | ||||||||||||||||||
Transfer agent | 9,123 | 5,470 | 20,035 | 36,604 | 61,044 | 212,756 | ||||||||||||||||||
Reports to shareholders | 5,098 | 6,099 | 15,877 | 29,172 | 53,431 | 44,372 | ||||||||||||||||||
Trustees fees and expenses | 2,632 | 1,655 | 2,983 | 16,630 | 28,471 | 13,760 | ||||||||||||||||||
Miscellaneous | 3,923 | 2,759 | 4,505 | 9,472 | 18,256 | 10,305 | ||||||||||||||||||
Total expenses before offsets | 501,023 | 328,793 | 597,588 | 1,872,191 | 2,937,067 | 1,593,065 | ||||||||||||||||||
Expense reimbursements | (85,869 | ) | (98,345 | ) | (200,682 | ) | (338,740 | ) | — | (115,172 | ) | |||||||||||||
Expense reductions | (20,036 | ) | (4,788 | ) | (47 | ) | (241 | ) | (520 | ) | (242 | ) | ||||||||||||
Expense waivers | — | — | — | (1,861 | ) | (10,408 | ) | (13,097 | ) | |||||||||||||||
Net expenses | 395,118 | 225,660 | 396,859 | 1,531,349 | 2,926,139 | 1,464,554 | ||||||||||||||||||
Net investment income | 259,108 | 269,679 | 2,554,270 | 5,732,686 | 4,960,625 | 4,658,085 | ||||||||||||||||||
Net Realized and Unrealized Gain (Loss): | ||||||||||||||||||||||||
Net realized gain (loss) on investments | 5,949,208 | 1,761,338 | 1,025,889 | (203,562 | ) | 376,114 | 2,961,520 | |||||||||||||||||
Net realized gain (loss) on options and futures contracts | — | — | — | — | (1,143,175 | ) | 988,323 | |||||||||||||||||
Net realized loss on foreign currency transactions | — | — | — | (5,669 | ) | — | — | |||||||||||||||||
Net change in unrealized appreciation (depreciation) of investments | 2,895,240 | (153,247 | ) | 628,227 | 7,912,745 | 419,657 | 3,200,478 | |||||||||||||||||
Net change in unrealized appreciation (depreciation) of futures contracts | — | — | — | — | 1,010,057 | (347,733 | ) | |||||||||||||||||
Net change in unrealized appreciation of foreign currency translations | — | — | — | 5,281 | — | — | ||||||||||||||||||
Net realized and unrealized gain | 8,844,448 | 1,608,091 | 1,654,116 | 7,708,795 | 662,653 | 6,802,588 | ||||||||||||||||||
Net increase in net assets resulting from operations | $ | 9,103,556 | $ | 1,877,770 | $ | 4,208,386 | $ | 13,441,481 | $ | 5,623,278 | $ | 11,460,673 | ||||||||||||
The accompanying notes are an integral part of these financial statements. 69 |
Table of Contents
| Statements of Changes in Net Assets |
| For the year ended December 31, |
| Managers AMG Chicago Equity Partners Mid-Cap Fund | Managers AMG Chicago Equity Partners Balanced Fund | |||||||||||||||
| 2010 | 2009 | 2010 | 2009 | |||||||||||||
Increase (Decrease) in Net Assets From Operations: | ||||||||||||||||
Net investment income | $ | 259,108 | $ | 352,975 | $ | 269,679 | $ | 360,130 | ||||||||
Net realized gain (loss) on investments and foreign currency transactions | 5,949,208 | (4,735,306 | ) | 1,761,338 | (324,188 | ) | ||||||||||
Net change in unrealized appreciation (depreciation) of investments and foreign currency translations | 2,895,240 | 14,983,377 | (153,247 | ) | 3,834,541 | |||||||||||
Net increase in net assets resulting from operations | 9,103,556 | 10,601,046 | 1,877,770 | 3,870,483 | ||||||||||||
Distributions to Shareholders: | ||||||||||||||||
From net investment income: | ||||||||||||||||
Class A | (32,789 | ) | (49,401 | ) | (108,880 | ) | (174,382 | ) | ||||||||
Class B | — | — | (4,280 | ) | (13,932 | ) | ||||||||||
Class C | — | (1,778 | ) | (22,845 | ) | (32,235 | ) | |||||||||
Institutional Class | (197,349 | ) | (248,789 | ) | (136,824 | ) | (138,347 | ) | ||||||||
Return of capital: | ||||||||||||||||
Class A | — | — | — | — | ||||||||||||
Class B | — | — | — | — | ||||||||||||
Class C | — | — | — | — | ||||||||||||
Institutional Class | — | — | — | — | ||||||||||||
Total distributions to shareholders | (230,138 | ) | (299,968 | ) | (272,829 | ) | (358,896 | ) | ||||||||
From Capital Share Transactions: | ||||||||||||||||
Proceeds from sale of shares | 3,759,737 | 3,048,654 | 3,414,197 | 4,406,764 | ||||||||||||
Reinvestment of dividends and distributions | 211,777 | 270,979 | 204,143 | 200,915 | ||||||||||||
Cost of shares repurchased | (7,615,267 | ) | (9,422,753 | ) | (4,518,470 | ) | (11,346,529 | ) | ||||||||
Net decrease from capital share transactions | (3,643,753 | ) | (6,103,120 | ) | (900,130 | ) | (6,738,850 | ) | ||||||||
Total increase (decrease) in net assets | 5,229,665 | 4,197,958 | 704,811 | (3,227,263 | ) | |||||||||||
Net Assets: | ||||||||||||||||
Beginning of year | 35,513,842 | 31,315,884 | 18,130,783 | 21,358,046 | ||||||||||||
End of year | 40,743,507 | $ | 35,513,842 | $ | 18,835,594 | $ | 18,130,783 | |||||||||
End of year undistributed net investment income | $ | 72,740 | $ | 57,893 | $ | 646 | $ | 1,100 | ||||||||
The accompanying notes are an integral part of these financial statements. 70 |
Table of Contents
| Statements of Changes in Net Assets |
| For the year ended December 31, |
| Managers High Yield Fund | Managers Fixed Income Fund | |||||||||||||||
| 2010 | 2009 | 2010 | 2009 | |||||||||||||
Increase (Decrease) in Net Assets From Operations: | ||||||||||||||||
Net investment income | $ | 2,554,270 | $ | 3,022,671 | $ | 5,732,686 | $ | 6,415,578 | ||||||||
Net realized gain (loss) on investments and foreign currency transactions | 1,025,889 | (3,933,716 | ) | (209,231 | ) | (347,617 | ) | |||||||||
Net change in unrealized appreciation of investments and foreign currency translations | 628,227 | 14,623,076 | 7,918,026 | 20,379,847 | ||||||||||||
Net increase in net assets resulting from operations | 4,208,386 | 13,712,031 | 13,441,481 | 26,447,808 | ||||||||||||
Distributions to Shareholders: | ||||||||||||||||
From net investment income: | ||||||||||||||||
Class A | (1,845,390 | ) | (2,177,410 | ) | (1,816,800 | ) | (1,993,554 | ) | ||||||||
Class B | (57,140 | ) | (157,986 | ) | (124,108 | ) | (233,528 | ) | ||||||||
Class C | (309,306 | ) | (353,778 | ) | (1,815,282 | ) | (2,238,016 | ) | ||||||||
Institutional Class | (342,789 | ) | (322,893 | ) | (2,145,972 | ) | (1,699,098 | ) | ||||||||
Return of capital: | ||||||||||||||||
Class A | — | — | — | (67,729 | ) | |||||||||||
Class B | — | — | — | (6,757 | ) | |||||||||||
Class C | — | — | — | (96,278 | ) | |||||||||||
Institutional Class | — | — | — | (57,608 | ) | |||||||||||
Total distributions to shareholders | (2,554,625 | ) | (3,012,067 | ) | (5,902,162 | ) | (6,392,568 | ) | ||||||||
From Capital Share Transactions: | ||||||||||||||||
Proceeds from sale of shares | 6,148,030 | 22,442,475 | 54,457,609 | 47,864,130 | ||||||||||||
Reinvestment of dividends and distributions | 1,995,842 | 2,190,315 | 3,976,670 | 4,423,829 | ||||||||||||
Cost of shares repurchased | (16,508,471 | ) | (23,516,157 | ) | (53,494,943 | ) | (44,997,081 | ) | ||||||||
Net increase (decrease) from capital share transactions | (8,364,599 | ) | 1,116,633 | 4,939,336 | 7,290,878 | |||||||||||
Total increase (decrease) in net assets | (6,710,838 | ) | 11,816,597 | 12,478,655 | 27,346,118 | |||||||||||
Net Assets: | ||||||||||||||||
Beginning of year | 37,904,808 | 26,088,211 | 137,060,165 | 109,714,047 | ||||||||||||
End of year | $ | 31,193,970 | $ | 37,904,808 | $ | 149,538,820 | $ | 137,060,165 | ||||||||
End of year undistributed net investment income | $ | 21,178 | $ | 14,874 | $ | 103,298 | — | |||||||||
The accompanying notes are an integral part of these financial statements. 71 |
Table of Contents
| Statements of Changes in Net Assets |
| For the year ended December 31, |
| Managers Short Duration Government Fund | Managers Intermediate Duration Government Fund | |||||||||||||||
| 2010 | 2009 | 2010 | 2009 | |||||||||||||
Increase (Decrease) in Net Assets From Operations: | ||||||||||||||||
Net investment income | $ | 4,960,625 | $ | 6,458,920 | $ | 4,658,085 | $ | 6,484,248 | ||||||||
Net realized gain (loss) on investments and futures | (767,061 | ) | 1,386,051 | 3,949,843 | 4,377,340 | |||||||||||
Net change in unrealized appreciation of investments and futures | 1,429,714 | 8,560,257 | 2,852,745 | 8,789,067 | ||||||||||||
Net increase in net assets resulting from operations | 5,623,278 | 16,405,228 | 11,460,673 | 19,650,655 | ||||||||||||
Distributions to Shareholders: | ||||||||||||||||
From net investment income | (5,130,631 | ) | (6,294,858 | ) | (4,636,850 | ) | (6,508,347 | ) | ||||||||
From net realized gain on investments | — | — | (4,790,544 | ) | (1,431,402 | ) | ||||||||||
Total distributions to shareholders | (5,130,631 | ) | (6,294,858 | ) | (9,427,394 | ) | (7,939,749 | ) | ||||||||
From Capital Share Transactions: | ||||||||||||||||
Proceeds from sale of shares | 313,082,969 | 219,292,105 | 92,990,465 | 90,588,567 | ||||||||||||
Reinvestment of dividends and distributions | 4,896,319 | 6,090,797 | 8,373,360 | 7,193,562 | ||||||||||||
Cost of shares repurchased | (212,875,291 | ) | (203,712,138 | ) | (104,979,200 | ) | (124,447,216 | ) | ||||||||
Net increase (decrease) from capital share transactions | 105,103,997 | 21,670,764 | (3,615,375 | ) | (26,665,087 | ) | ||||||||||
Total increase (decrease) in net assets | 105,596,644 | 31,781,134 | (1,582,096 | ) | (14,954,181 | ) | ||||||||||
Net Assets: | ||||||||||||||||
Beginning of year | 275,329,614 | 243,548,480 | 155,226,392 | 170,180,573 | ||||||||||||
End of year | $ | 380,926,258 | $ | 275,329,614 | $ | 153,644,296 | $ | 155,226,392 | ||||||||
End of year undistributed net investment income | $ | 155 | $ | 170,161 | $ | 26,057 | $ | 6,062 | ||||||||
Share Transactions: | ||||||||||||||||
Sale of shares | 32,697,915 | 23,244,837 | 8,279,870 | 8,559,142 | ||||||||||||
Reinvestment of dividends and distributions | 511,626 | 647,394 | 757,008 | 674,455 | ||||||||||||
Shares repurchased | (22,230,366 | ) | (21,579,682 | ) | (9,332,613 | ) | (11,724,027 | ) | ||||||||
Net increase (decrease) in shares | 10,979,175 | 2,312,549 | (295,735 | ) | (2,490,430 | ) | ||||||||||
The accompanying notes are an integral part of these financial statements. 72 |
Table of Contents
| Financial Highlights |
| For a share outstanding throughout each year ended December 31, |
| Class A | ||||||||||||||||||||
Managers AMG Chicago Equity Partners Mid-Cap Fund | 2010 | 2009 | 2008 | 2007 | 2006 | |||||||||||||||
Net Asset Value, Beginning of Year | $ | 10.80 | $ | 7.82 | $ | 13.67 | $ | 14.60 | $ | 13.48 | ||||||||||
Income from Investment Operations: | ||||||||||||||||||||
Net investment income (loss) | 0.07 | 0.09 | 0.06 | (0.02 | )2 | 0.05 | ||||||||||||||
Net realized and unrealized gain (loss) on investments | 2.96 | 2.98 | (5.84 | ) | 0.17 | 2 | 1.11 | |||||||||||||
Total from investment operations | 3.03 | 3.07 | (5.78 | ) | 0.15 | 1.16 | ||||||||||||||
Less Distributions to Shareholders from: | ||||||||||||||||||||
Net investment income | (0.06 | ) | (0.09 | ) | (0.06 | ) | — | (0.04 | ) | |||||||||||
Net realized gain on investments | — | — | (0.01 | ) | (1.08 | ) | — | |||||||||||||
Total distributions to shareholders | (0.06 | ) | (0.09 | ) | (0.07 | ) | (1.08 | ) | (0.04 | ) | ||||||||||
Net Asset Value, End of Year | $ | 13.77 | $ | 10.80 | $ | 7.82 | $ | 13.67 | $ | 14.60 | ||||||||||
Total Return1 | 28.06 | % | 39.20 | % | (42.28 | )% | 0.84 | % | 8.69 | % | ||||||||||
Ratio of net expenses to average net assets | 1.19 | % | 1.19 | % | 1.18 | % | 1.21 | % | 1.23 | % | ||||||||||
Ratio of net investment income (loss) to average net assets1 | 0.60 | % | 1.15 | % | 0.57 | % | (0.10 | )% | 0.34 | % | ||||||||||
Portfolio turnover | 137 | % | 115 | % | 107 | % | 125 | % | 85 | % | ||||||||||
Net assets at end of year (000’s omitted) | $ | 7,590 | $ | 6,149 | $ | 3,863 | $ | 6,464 | $ | 9,178 | ||||||||||
Ratios absent expense offsets:3 | ||||||||||||||||||||
Ratio of total expenses to average net assets | 1.47 | % | 1.53 | % | 1.44 | % | 1.37 | % | 1.36 | % | ||||||||||
Ratio of net investment income (loss) to average net assets | 0.32 | % | 0.81 | % | 0.31 | % | (0.25 | )% | 0.22 | % | ||||||||||
| Class B | ||||||||||||||||||||
Managers AMG Chicago Equity Partners Mid-Cap Fund | 2010 | 2009 | 2008 | 2007 | 2006 | |||||||||||||||
Net Asset Value, Beginning of Year | $ | 10.13 | $ | 7.33 | $ | 12.80 | $ | 13.79 | $ | 12.82 | ||||||||||
Income from Investment Operations: | ||||||||||||||||||||
Net investment loss | (0.03 | )2 | (0.12 | ) | (0.06 | ) | (0.13 | )2 | (0.08 | ) | ||||||||||
Net realized and unrealized gain (loss) on investments | 2.73 | 2 | 2.92 | (5.40 | ) | 0.15 | 2 | 1.09 | ||||||||||||
Total from investment operations | 2.70 | 2.80 | (5.46 | ) | 0.02 | 1.01 | ||||||||||||||
Less Distributions to Shareholders from: | ||||||||||||||||||||
Net investment income | — | — | — | — | (0.04 | ) | ||||||||||||||
Net realized gain on investments | — | — | (0.01 | ) | (1.01 | ) | — | |||||||||||||
Total distributions to shareholders | — | — | (0.01 | ) | (1.01 | ) | (0.04 | ) | ||||||||||||
Net Asset Value, End of Year | $ | 12.83 | $ | 10.13 | $ | 7.33 | $ | 12.80 | $ | 13.79 | ||||||||||
Total Return1 | 26.65 | %4 | 38.20 | %4 | (42.67 | )% | (0.03 | )% | 7.88 | % | ||||||||||
Ratio of net expenses to average net assets | 1.94 | % | 1.94 | % | 1.94 | % | 1.96 | % | 1.98 | % | ||||||||||
Ratio of net investment income (loss) to average net assets1 | (0.23 | )% | 0.33 | % | (0.30 | )% | (0.86 | )% | (0.41 | )% | ||||||||||
Portfolio turnover | 137 | % | 115 | % | 107 | % | 125 | % | 85 | % | ||||||||||
Net assets at end of year (000’s omitted) | $ | 261 | $ | 621 | $ | 1,742 | $ | 6,909 | $ | 11,197 | ||||||||||
Ratios absent expense offsets:3 | ||||||||||||||||||||
Ratio of total expenses to average net assets | 2.22 | % | 2.27 | % | 2.20 | % | 2.12 | % | 2.11 | % | ||||||||||
Ratio of net investment income (loss) to average net assets | (0.51 | )% | 0.00 | %# | (0.56 | )% | (1.02 | )% | (0.59 | )% | ||||||||||
73 |
Table of Contents
| Financial Highlights |
| For a share outstanding throughout each year ended December 31, |
| Class C | ||||||||||||||||||||
Managers AMG Chicago Equity Partners Mid-Cap Fund | 2010 | 2009 | 2008 | 2007 | 2006 | |||||||||||||||
Net Asset Value, Beginning of Year | $ | 10.11 | $ | 7.32 | $ | 12.79 | $ | 13.80 | $ | 12.83 | ||||||||||
Income from Investment Operations: | ||||||||||||||||||||
Net investment income (loss) | (0.04 | ) | 0.02 | (0.03 | ) | (0.12 | )2 | (0.06 | ) | |||||||||||
Net realized and unrealized gain (loss) on investments | 2.74 | 2.77 | (5.43 | ) | 0.12 | 2 | 1.07 | |||||||||||||
Total from investment operations | 2.70 | 2.79 | (5.46 | ) | — | 1.01 | ||||||||||||||
Less Distributions to Shareholders from: | ||||||||||||||||||||
Net investment income | — | (0.00 | )# | — | — | (0.04 | ) | |||||||||||||
Net realized gain on investments | — | — | (0.01 | ) | (1.01 | ) | — | |||||||||||||
Total distributions to shareholders | — | (0.00 | )# | (0.01 | ) | (1.01 | ) | (0.04 | ) | |||||||||||
Net Asset Value, End of Year | $ | 12.81 | $ | 10.11 | $ | 7.32 | $ | 12.79 | $ | 13.80 | ||||||||||
Total Return1 | 26.71 | % | 38.18 | % | (42.71 | )% | (0.19 | )% | 7.87 | % | ||||||||||
Ratio of net expenses to average net assets | 1.94 | % | 1.94 | % | 1.94 | % | 1.96 | % | 1.98 | % | ||||||||||
Ratio of net investment income (loss) to average net assets1 | (0.18 | )% | 0.38 | % | (0.23 | )% | (0.85 | )% | (0.41 | )% | ||||||||||
Portfolio turnover | 137 | % | 115 | % | 107 | % | 125 | % | 85 | % | ||||||||||
Net assets at end of year (000’s omitted) | $ | 3,026 | $ | 3,669 | $ | 3,558 | $ | 8,651 | $ | 11,748 | ||||||||||
Ratios absent expense offsets:3 | ||||||||||||||||||||
Ratio of total expenses to average net assets | 2.22 | % | 2.28 | % | 2.19 | % | 2.12 | % | 2.11 | % | ||||||||||
Ratio of net investment income (loss) to average net assets | (0.46 | )% | 0.04 | % | (0.49 | )% | (1.02 | )% | (0.56 | )% | ||||||||||
| Institutional Class | ||||||||||||||||||||
Managers AMG Chicago Equity Partners Mid-Cap Fund | 2010 | 2009 | 2008 | 2007 | 2006 | |||||||||||||||
Net Asset Value, Beginning of Year | $ | 11.39 | $ | 8.24 | $ | 14.42 | $ | 15.41 | $ | 14.19 | ||||||||||
Income from Investment Operations: | ||||||||||||||||||||
Net investment income | 0.11 | 0.14 | 0.10 | 0.03 | 2 | 0.09 | ||||||||||||||
Net realized and unrealized gain (loss) on investments | 3.08 | 3.12 | (6.18 | ) | 0.11 | 2 | 1.17 | |||||||||||||
Total from investment operations | 3.19 | 3.26 | (6.08 | ) | 0.14 | 1.26 | ||||||||||||||
Less Distributions to Shareholders from: | ||||||||||||||||||||
Net investment income | (0.10 | ) | (0.11 | ) | (0.09 | ) | — | (0.04 | ) | |||||||||||
Net realized gain on investments | — | — | (0.01 | ) | (1.13 | ) | — | |||||||||||||
Total distributions to shareholders | (0.10 | ) | (0.11 | ) | (0.10 | ) | (1.13 | ) | (0.04 | ) | ||||||||||
Net Asset Value, End of Year | $ | 14.48 | $ | 11.39 | $ | 8.24 | $ | 14.42 | $ | 15.41 | ||||||||||
Total Return1 | 27.97 | % | 39.59 | % | (42.13 | )% | 0.78 | % | 8.96 | % | ||||||||||
Ratio of net expenses to average net assets | 0.94 | % | 0.94 | % | 0.94 | % | 0.96 | % | 0.98 | % | ||||||||||
Ratio of net investment income to average net assets1 | 0.84 | % | 1.39 | % | 0.77 | % | 0.16 | % | 0.59 | % | ||||||||||
Portfolio turnover | 137 | % | 115 | % | 107 | % | 125 | % | 85 | % | ||||||||||
Net assets at end of year (000’s omitted) | $ | 29,867 | $ | 25,075 | $ | 22,152 | $ | 51,029 | $ | 56,008 | ||||||||||
Ratios absent expense offsets:3 | ||||||||||||||||||||
Ratio of total expenses to average net assets | 1.22 | % | 1.28 | % | 1.19 | % | 1.12 | % | 1.11 | % | ||||||||||
Ratio of net investment income to average net assets | 0.56 | % | 1.05 | % | 0.51 | % | 0.01 | % | 0.47 | % | ||||||||||
74 |
Table of Contents
| Financial Highlights |
| For a share outstanding throughout each year ended December 31, |
| Class A | ||||||||||||||||||||
Managers AMG Chicago Equity Partners Balanced Fund | 2010 | 2009 | 2008 | 2007 | 2006 | |||||||||||||||
Net Asset Value, Beginning of Year | $ | 12.33 | $ | 10.45 | $ | 13.18 | $ | 12.86 | $ | 11.55 | ||||||||||
Income from Investment Operations: | ||||||||||||||||||||
Net investment income | 0.20 | 0.22 | 0.29 | 0.25 | 0.25 | |||||||||||||||
Net realized and unrealized gain (loss) on investments | 1.16 | 1.87 | (2.74 | ) | 0.34 | 1.32 | ||||||||||||||
Total from investment operations | 1.36 | 2.09 | (2.45 | ) | 0.59 | 1.57 | ||||||||||||||
Less Distributions to Shareholders from: | ||||||||||||||||||||
Net investment income | (0.20 | ) | (0.21 | ) | (0.27 | ) | (0.27 | ) | (0.26 | ) | ||||||||||
Return of capital | — | — | (0.01 | ) | — | — | ||||||||||||||
Total distributions to shareholders | (0.20 | ) | (0.21 | ) | (0.28 | ) | (0.27 | ) | (0.26 | ) | ||||||||||
Net Asset Value, End of Year | $ | 13.49 | $ | 12.33 | $ | 10.45 | $ | 13.18 | $ | 12.86 | ||||||||||
Total Return1 | 11.14 | % | 20.06 | % | (18.68 | )% | 4.63 | % | 13.73 | % | ||||||||||
Ratio of net expenses to average net assets | 1.22 | % | 1.23 | % | 1.17 | % | 1.23 | % | 1.23 | % | ||||||||||
Ratio of net investment income to average net assets1 | 1.56 | % | 1.77 | % | 2.53 | % | 1.93 | % | 2.05 | % | ||||||||||
Portfolio turnover | 97 | % | 114 | % | 99 | % | 206 | % | 66 | % | ||||||||||
Net assets at end of year (000’s omitted) | $ | 7,605 | $ | 6,933 | $ | 9,932 | $ | 2,076 | $ | 1,933 | ||||||||||
Ratios absent expense offsets:3 | ||||||||||||||||||||
Ratio of total expenses to average net assets | 1.80 | % | 1.76 | % | 1.68 | % | 1.78 | % | 1.81 | % | ||||||||||
Ratio of net investment income to average net assets | 0.98 | % | 1.24 | % | 2.03 | % | 1.38 | % | 1.49 | % | ||||||||||
| Class B | ||||||||||||||||||||
Managers AMG Chicago Equity Partners Balanced Fund | 2010 | 2009 | 2008 | 2007 | 2006 | |||||||||||||||
Net Asset Value, Beginning of Year | $ | 12.17 | $ | 10.29 | $ | 12.96 | $ | 12.64 | $ | 11.36 | ||||||||||
Income from Investment Operations: | ||||||||||||||||||||
Net investment income | 0.10 | 2 | 0.16 | 0.16 | 0.16 | 0.18 | ||||||||||||||
Net realized and unrealized gain (loss) on investments | 1.15 | 2 | 1.83 | (2.66 | ) | 0.33 | 1.29 | |||||||||||||
Total from investment operations | 1.25 | 1.99 | (2.50 | ) | 0.49 | 1.47 | ||||||||||||||
Less Distributions to Shareholders from: | ||||||||||||||||||||
Net investment income | (0.10 | ) | (0.11 | ) | (0.16 | ) | (0.17 | ) | (0.19 | ) | ||||||||||
Return of capital | — | — | (0.01 | ) | — | — | ||||||||||||||
Total distributions to shareholders | (0.10 | ) | (0.11 | ) | (0.17 | ) | (0.17 | ) | (0.19 | ) | ||||||||||
Net Asset Value, End of Year | $ | 13.33 | $ | 12.17 | $ | 10.29 | $ | 12.96 | $ | 12.64 | ||||||||||
Total Return1 | 10.28 | % | 19.42 | % | (19.38 | )% | 3.86 | % | 12.83 | % | ||||||||||
Ratio of net expenses to average net assets | 1.97 | % | 1.98 | % | 1.97 | % | 1.98 | % | 1.98 | % | ||||||||||
Ratio of net investment income to average net assets1 | 0.81 | % | 1.11 | % | 1.53 | % | 1.16 | % | 1.30 | % | ||||||||||
Portfolio turnover | 97 | % | 114 | % | 99 | % | 206 | % | 66 | % | ||||||||||
Net assets at end of year (000’s omitted) | $ | 562 | $ | 978 | $ | 2,434 | $ | 6,026 | $ | 8,485 | ||||||||||
Ratios absent expense offsets:3 | ||||||||||||||||||||
Ratio of total expenses to average net assets | 2.55 | % | 2.51 | % | 2.55 | % | 2.53 | % | 2.56 | % | ||||||||||
Ratio of net investment income to average net assets | 0.23 | % | 0.58 | % | 0.95 | % | 0.61 | % | 0.71 | % | ||||||||||
75 |
Table of Contents
| Financial Highlights |
| For a share outstanding throughout each year ended December 31, |
| Class C | ||||||||||||||||||||
Managers AMG Chicago Equity Partners Balanced Fund | 2010 | 2009 | 2008 | 2007 | 2006 | |||||||||||||||
Net Asset Value, Beginning of Year | $ | 12.25 | $ | 10.38 | $ | 13.08 | $ | 12.76 | $ | 11.46 | ||||||||||
Income from Investment Operations: | ||||||||||||||||||||
Net investment income | 0.11 | 0.12 | 0.18 | 0.16 | 0.16 | |||||||||||||||
Net realized and unrealized gain (loss) on investments | 1.15 | 1.88 | (2.70 | ) | 0.33 | 1.31 | ||||||||||||||
Total from investment operations | 1.26 | 2.00 | (2.52 | ) | 0.49 | 1.47 | ||||||||||||||
Less Distributions to Shareholders from: | ||||||||||||||||||||
Net investment income | (0.10 | ) | (0.13 | ) | (0.17 | ) | (0.17 | ) | (0.17 | ) | ||||||||||
Return of capital | — | — | (0.01 | ) | — | — | ||||||||||||||
Total distributions to shareholders | (0.10 | ) | (0.13 | ) | (0.18 | ) | (0.17 | ) | (0.17 | ) | ||||||||||
Net Asset Value, End of Year | $ | 13.41 | $ | 12.25 | $ | 10.38 | $ | 13.08 | $ | 12.76 | ||||||||||
Total Return1 | 10.35 | %4 | 19.33 | % | (19.36 | )% | 3.86 | % | 12.88 | % | ||||||||||
Ratio of net expenses to average net assets | 1.97 | % | 1.98 | % | 1.96 | % | 1.98 | % | 1.98 | % | ||||||||||
Ratio of net investment income to average net assets1 | 0.81 | % | 1.04 | % | 1.57 | % | 1.17 | % | 1.30 | % | ||||||||||
Portfolio turnover | 97 | % | 114 | % | 99 | % | 206 | % | 66 | % | ||||||||||
Net assets at end of year (000’s omitted) | $ | 2,805 | $ | 3,056 | $ | 2,926 | $ | 4,013 | $ | 4,479 | ||||||||||
Ratios absent expense offsets:3 | ||||||||||||||||||||
Ratio of total expenses to average net assets | 2.55 | % | 2.51 | % | 2.52 | % | 2.53 | % | 2.56 | % | ||||||||||
Ratio of net investment income to average net assets | 0.23 | % | 0.51 | % | 1.01 | % | 0.62 | % | 0.71 | % | ||||||||||
| Institutional Class | ||||||||||||||||||||
Managers AMG Chicago Equity Partners Balanced Fund | 2010 | 2009 | 2008 | 2007 | 2006 | |||||||||||||||
Net Asset Value, Beginning of Year | $ | 12.43 | $ | 10.54 | $ | 13.28 | $ | 12.96 | $ | 11.64 | ||||||||||
Income from Investment Operations: | ||||||||||||||||||||
Net investment income | 0.24 | 0.23 | 0.31 | 0.29 | 0.29 | |||||||||||||||
Net realized and unrealized gain (loss) on investments | 1.17 | 1.90 | (2.74 | ) | 0.34 | 1.32 | ||||||||||||||
Total from investment operations | 1.41 | 2.13 | (2.43 | ) | 0.63 | 1.61 | ||||||||||||||
Less Distributions to Shareholders from: | ||||||||||||||||||||
Net investment income | (0.24 | ) | (0.24 | ) | (0.30 | ) | (0.31 | ) | (0.29 | ) | ||||||||||
Return of capital | — | — | (0.01 | ) | — | — | ||||||||||||||
Total distributions to shareholders | (0.24 | ) | (0.24 | ) | (0.31 | ) | (0.31 | ) | (0.29 | ) | ||||||||||
Net Asset Value, End of Year | $ | 13.60 | $ | 12.43 | $ | 10.54 | $ | 13.28 | $ | 12.96 | ||||||||||
Total Return1 | 11.42 | % | 20.44 | % | (18.51 | )% | 4.87 | % | 13.98 | % | ||||||||||
Ratio of net expenses to average net assets | 0.97 | % | 0.98 | % | 0.96 | % | 0.98 | % | 0.98 | % | ||||||||||
Ratio of net investment income to average net assets1 | 1.81 | % | 2.03 | % | 2.58 | % | 2.18 | % | 2.30 | % | ||||||||||
Portfolio turnover | 97 | % | 114 | % | 99 | % | 206 | % | 66 | % | ||||||||||
Net assets at end of year (000’s omitted) | $ | 7,863 | $ | 7,164 | $ | 6,065 | $ | 7,754 | $ | 7,676 | ||||||||||
Ratios absent expense offsets:3 | ||||||||||||||||||||
Ratio of total expenses to average net assets | 1.55 | % | 1.51 | % | 1.52 | % | 1.53 | % | 1.56 | % | ||||||||||
Ratio of net investment income to average net assets | 1.23 | % | 1.50 | % | 2.02 | % | 1.63 | % | 1.73 | % | ||||||||||
76 |
Table of Contents
| Financial Highlights |
| For a share outstanding throughout each year ended December 31, |
| Class A | ||||||||||||||||||||
Managers High Yield Fund | 2010 | 2009 | 2008 | 2007 | 2006 | |||||||||||||||
Net Asset Value, Beginning of Year | $ | 7.35 | $ | 5.25 | $ | 8.23 | $ | 8.63 | $ | 8.30 | ||||||||||
Income from Investment Operations: | ||||||||||||||||||||
Net investment income | 0.61 | 0.60 | 0.64 | 0.59 | 0.55 | |||||||||||||||
Net realized and unrealized gain (loss) on investments | 0.39 | 2.10 | (2.99 | ) | (0.40 | ) | 0.33 | |||||||||||||
Total from investment operations | 1.00 | 2.70 | (2.35 | ) | 0.19 | 0.88 | ||||||||||||||
Less Distributions to Shareholders from: | ||||||||||||||||||||
Net investment income | (0.61 | ) | (0.60 | ) | (0.63 | ) | (0.59 | ) | (0.55 | ) | ||||||||||
Net Asset Value, End of Year | $ | 7.74 | $ | 7.35 | $ | 5.25 | $ | 8.23 | $ | 8.63 | ||||||||||
Total Return1 | 14.20 | % | 53.97 | %4 | (30.02 | )%4 | 2.25 | % | 11.07 | % | ||||||||||
Ratio of net expenses to average net assets | 1.15 | % | 1.15 | % | 1.15 | %7 | 1.15 | % | 1.15 | % | ||||||||||
Ratio of net investment income to average net assets1 | 8.06 | % | 9.33 | % | 8.57 | %7 | 6.92 | % | 6.65 | % | ||||||||||
Portfolio turnover | 60 | % | 56 | % | 41 | % | 51 | % | 65 | % | ||||||||||
Net assets at end of year (000’s omitted) | $ | 21,729 | $ | 28,450 | $ | 17,105 | $ | 24,151 | $ | 26,953 | ||||||||||
Ratios absent expense offsets:3 | ||||||||||||||||||||
Ratio of total expenses to average net assets | 1.78 | % | 1.68 | % | 1.70 | % | 1.55 | % | 1.54 | % | ||||||||||
Ratio of net investment income to average net assets | 7.43 | % | 8.80 | % | 8.01 | % | 6.52 | % | 6.26 | % | ||||||||||
| Class B | ||||||||||||||||||||
Managers High Yield Fund | 2010 | 2009 | 2008 | 2007 | 2006 | |||||||||||||||
Net Asset Value, Beginning of Year | $ | 7.24 | $ | 5.18 | $ | 8.13 | $ | 8.54 | $ | 8.22 | ||||||||||
Income from Investment Operations: | ||||||||||||||||||||
Net investment income | 0.54 | 2 | 0.58 | 0.56 | 0.54 | 0.50 | ||||||||||||||
Net realized and unrealized gain (loss) on investments | 0.38 | 2 | 2.02 | (2.94 | ) | (0.43 | ) | 0.31 | ||||||||||||
Total from investment operations | 0.92 | 2.60 | (2.38 | ) | 0.11 | 0.81 | ||||||||||||||
Less Distributions to Shareholders from: | ||||||||||||||||||||
Net investment income | (0.54 | ) | (0.54 | ) | (0.57 | ) | (0.52 | ) | (0.49 | ) | ||||||||||
Net Asset Value, End of Year | $ | 7.62 | $ | 7.24 | $ | 5.18 | $ | 8.13 | $ | 8.54 | ||||||||||
Total Return1 | 13.25 | %4 | 52.52 | %4 | (30.62 | )%4 | 1.30 | % | 10.21 | % | ||||||||||
Ratio of net expenses to average net assets | 1.90 | % | 1.90 | % | 1.90 | %7 | 1.90 | % | 1.90 | % | ||||||||||
Ratio of net investment income to average net assets1 | 7.35 | % | 8.90 | % | 7.80 | %7 | 6.14 | % | 5.88 | % | ||||||||||
Portfolio turnover | 60 | % | 56 | % | 41 | % | 51 | % | 65 | % | ||||||||||
Net assets at end of year (000’s omitted) | $ | 693 | $ | 1,309 | $ | 2,577 | $ | 6,536 | $ | 12,318 | ||||||||||
Ratios absent expense offsets:3 | ||||||||||||||||||||
Ratio of total expenses to average net assets | 2.53 | % | 2.42 | % | 2.45 | % | 2.30 | % | 2.28 | % | ||||||||||
Ratio of net investment income to average net assets | 6.72 | % | 8.38 | % | 7.25 | % | 5.74 | % | 5.50 | % | ||||||||||
77 |
Table of Contents
Financial Highlights For a share outstanding throughout each year ended December 31, |
| Class C | ||||||||||||||||||||
Managers High Yield Fund | 2010 | 2009 | 2008 | 2007 | 2006 | |||||||||||||||
Net Asset Value, Beginning of Year | $ | 7.24 | $ | 5.18 | $ | 8.12 | $ | 8.53 | $ | 8.21 | ||||||||||
Income from Investment Operations: | ||||||||||||||||||||
Net investment income | 0.54 | 0.54 | 0.57 | 0.53 | 0.49 | |||||||||||||||
Net realized and unrealized gain (loss) on investments | 0.39 | 2.06 | (2.94 | ) | (0.41 | ) | 0.32 | |||||||||||||
Total from investment operations | 0.93 | 2.60 | (2.37 | ) | 0.12 | 0.81 | ||||||||||||||
Less Distributions to Shareholders from: | ||||||||||||||||||||
Net investment income | (0.54 | ) | (0.54 | ) | (0.57 | ) | (0.53 | ) | (0.49 | ) | ||||||||||
Net Asset Value, End of Year | $ | 7.62 | $ | 7.24 | $ | 5.18 | $ | 8.12 | $ | 8.53 | ||||||||||
Total Return1 | 13.42 | % | 52.57 | %4 | (30.54 | )%4 | 1.32 | % | 10.24 | % | ||||||||||
Ratio of net expenses to average net assets | 1.90 | % | 1.90 | % | 1.90 | %7 | 1.90 | % | 1.90 | % | ||||||||||
Ratio of net investment income to average net assets1 | 7.29 | % | 8.68 | % | 7.91 | %7 | 6.18 | % | 5.89 | % | ||||||||||
Portfolio turnover | 60 | % | 56 | % | 41 | % | 51 | % | 65 | % | ||||||||||
Net assets at end of year (000’s omitted) | $ | 4,053 | $ | 4,488 | $ | 3,516 | $ | 6,186 | $ | 7,653 | ||||||||||
Ratios absent expense offsets:3 | ||||||||||||||||||||
Ratio of total expenses to average net assets | 2.53 | % | 2.43 | % | 2.46 | % | 2.30 | % | 2.29 | % | ||||||||||
Ratio of net investment income to average net assets | 6.66 | % | 8.15 | % | 7.36 | % | 5.78 | % | 5.50 | % | ||||||||||
| Institutional Class | ||||||||||||||||||||
Managers High Yield Fund | 2010 | 2009 | 2008 | 2007 | 2006 | |||||||||||||||
Net Asset Value, Beginning of Year | $ | 7.42 | $ | 5.29 | $ | 8.29 | $ | 8.70 | $ | 8.36 | ||||||||||
Income from Investment Operations: | ||||||||||||||||||||
Net investment income | 0.63 | 0.64 | 0.64 | 0.64 | 0.58 | |||||||||||||||
Net realized and unrealized gain (loss) on investments | 0.40 | 2.11 | (2.98 | ) | (0.43 | ) | 0.34 | |||||||||||||
Total from investment operations | 1.03 | 2.75 | (2.34 | ) | 0.21 | 0.92 | ||||||||||||||
Less Distributions to Shareholders from: | ||||||||||||||||||||
Net investment income | (0.63 | ) | (0.62 | ) | (0.66 | ) | (0.62 | ) | (0.58 | ) | ||||||||||
Net Asset Value, End of Year | $ | 7.82 | $ | 7.42 | $ | 5.29 | $ | 8.29 | $ | 8.70 | ||||||||||
Total Return1 | 14.58 | % | 54.64 | %4 | (29.80 | )%4 | 2.40 | % | 11.38 | % | ||||||||||
Ratio of net expenses to average net assets | 0.90 | % | 0.90 | % | 0.90 | %7 | 0.90 | % | 0.90 | % | ||||||||||
Ratio of net investment income to average net assets1 | 8.26 | % | 9.68 | % | 8.90 | %7 | 7.16 | % | 6.91 | % | ||||||||||
Portfolio turnover | 60 | % | 56 | % | 41 | % | 51 | % | 65 | % | ||||||||||
Net assets at end of year (000’s omitted) | $ | 4,718 | $ | 3,658 | $ | 2,890 | $ | 3,423 | $ | 7,053 | ||||||||||
Ratios absent expense offsets:3 | ||||||||||||||||||||
Ratio of total expenses to average net assets | 1.53 | % | 1.42 | % | 1.46 | % | 1.30 | % | 1.29 | % | ||||||||||
Ratio of net investment income to average net assets | 7.63 | % | 9.16 | % | 8.34 | % | 6.77 | % | 6.51 | % | ||||||||||
78 |
Table of Contents
| Financial Highlights |
| For a share outstanding throughout each year ended December 31, |
| Class A | ||||||||||||||||||||
Managers Fixed Income Fund | 2010 | 2009 | 2008 | 2007 | 2006 | |||||||||||||||
Net Asset Value, Beginning of Year | $ | 10.43 | $ | 8.93 | $ | 10.54 | $ | 10.55 | $ | 10.36 | ||||||||||
Income from Investment Operations: | ||||||||||||||||||||
Net investment income | 0.47 | 0.52 | 0.55 | 0.56 | 0.52 | |||||||||||||||
Net realized and unrealized gain (loss) on investments | 0.56 | 1.49 | (1.62 | ) | 0.01 | 0.19 | ||||||||||||||
Total from investment operations | 1.03 | 2.01 | (1.07 | ) | 0.57 | 0.71 | ||||||||||||||
Less Distributions to Shareholders from: | ||||||||||||||||||||
Net investment income | (0.46 | ) | (0.49 | ) | (0.54 | ) | (0.58 | ) | (0.52 | ) | ||||||||||
Return of capital | — | (0.02 | ) | — | — | — | ||||||||||||||
Total distributions to shareholders | (0.46 | ) | (0.51 | ) | (0.54 | ) | (0.58 | ) | (0.52 | ) | ||||||||||
Net Asset Value, End of Year | $ | 11.00 | $ | 10.43 | $ | 8.93 | $ | 10.54 | $ | 10.55 | ||||||||||
Total Return1 | 10.04 | % | 23.14 | % | (10.45 | )% | 5.53 | % | 7.10 | % | ||||||||||
Ratio of net expenses to average net assets | 0.84 | % | 0.84 | % | 0.84 | % | 0.82 | % | 0.74 | % | ||||||||||
Ratio of net investment income to average net assets1 | 4.13 | % | 5.30 | % | 5.72 | % | 5.12 | % | 4.98 | % | ||||||||||
Portfolio turnover | 23 | % | 42 | % | 16 | % | 17 | % | 55 | % | ||||||||||
Net assets at end of year (000’s omitted) | $ | 38,655 | $ | 40,625 | $ | 33,417 | $ | 24,122 | $ | 11,776 | ||||||||||
Ratios absent expense offsets:3 | ||||||||||||||||||||
Ratio of total expenses to average net assets | 1.07 | % | 1.08 | % | 1.08 | % | 1.12 | % | 1.15 | % | ||||||||||
Ratio of net investment income to average net assets | 3.90 | % | 5.06 | % | 5.48 | % | 4.84 | % | 4.60 | % | ||||||||||
| Class B | ||||||||||||||||||||
Managers Fixed Income Fund | 2010 | 2009 | 2008 | 2007 | 2006 | |||||||||||||||
Net Asset Value, Beginning of Year | $ | 10.35 | $ | 8.86 | $ | 10.47 | $ | 10.48 | $ | 10.30 | ||||||||||
Income from Investment Operations: | ||||||||||||||||||||
Net investment income | 0.40 | 0.49 | 0.48 | 0.51 | 0.43 | |||||||||||||||
Net realized and unrealized gain (loss) on investments | 0.54 | 1.43 | (1.62 | ) | (0.03 | ) | 0.19 | |||||||||||||
Total from investment operations | 0.94 | 1.92 | (1.14 | ) | 0.48 | 0.62 | ||||||||||||||
Less Distributions to Shareholders from: | ||||||||||||||||||||
Net investment income | (0.38 | ) | (0.41 | ) | (0.47 | ) | (0.49 | ) | (0.44 | ) | ||||||||||
Return of capital | — | (0.02 | ) | — | — | — | ||||||||||||||
Total distributions to shareholders | (0.38 | ) | (0.43 | ) | (0.47 | ) | (0.49 | ) | (0.44 | ) | ||||||||||
Net Asset Value, End of Year | $ | 10.91 | $ | 10.35 | $ | 8.86 | $ | 10.47 | $ | 10.48 | ||||||||||
Total Return1 | 9.16 | %4 | 22.22 | % | (11.13 | )% | 4.74 | % | 6.25 | % | ||||||||||
Ratio of net expenses to average net assets | 1.59 | % | 1.59 | % | 1.59 | % | 1.55 | % | 1.49 | % | ||||||||||
Ratio of net investment income to average net assets1 | 3.40 | % | 4.67 | % | 4.90 | % | 4.37 | % | 4.23 | % | ||||||||||
Portfolio turnover | 23 | % | 42 | % | 16 | % | 17 | % | 55 | % | ||||||||||
Net assets at end of year (000’s omitted) | $ | 3,773 | $ | 4,055 | $ | 6,349 | $ | 9,029 | $ | 13,089 | ||||||||||
Ratios absent expense offsets:3 | ||||||||||||||||||||
Ratio of total expenses to average net assets | 1.82 | % | 1.83 | % | 1.82 | % | 1.85 | % | 1.90 | % | ||||||||||
Ratio of net investment income to average net assets | 3.17 | % | 4.43 | % | 4.66 | % | 4.05 | % | 3.80 | % | ||||||||||
79 |
Table of Contents
| Financial Highlights |
| For a share outstanding throughout each year ended December 31, |
| Class C | ||||||||||||||||||||
Managers Fixed Income Fund | 2010 | 2009 | 2008 | 2007 | 2006 | |||||||||||||||
Net Asset Value, Beginning of Year | $ | 10.41 | $ | 8.92 | $ | 10.54 | $ | 10.55 | $ | 10.36 | ||||||||||
Income from Investment Operations: | ||||||||||||||||||||
Net investment income | 0.39 | 0.44 | 0.48 | 0.48 | 0.43 | |||||||||||||||
Net realized and unrealized gain (loss) on investments | 0.56 | 1.49 | (1.62 | ) | 0.01 | 0.20 | ||||||||||||||
Total from investment operations | 0.95 | 1.93 | (1.14 | ) | 0.49 | 0.63 | ||||||||||||||
Less Distributions to Shareholders from: | ||||||||||||||||||||
Net investment income | (0.38 | ) | (0.42 | ) | (0.48 | ) | (0.50 | ) | (0.44 | ) | ||||||||||
Return of capital | — | (0.02 | ) | — | — | — | ||||||||||||||
Total distributions to shareholders | (0.38 | ) | (0.44 | ) | (0.48 | ) | (0.50 | ) | (0.44 | ) | ||||||||||
Net Asset Value, End of Year | $ | 10.98 | $ | 10.41 | $ | 8.92 | $ | 10.54 | $ | 10.55 | ||||||||||
Total Return1 | 9.22 | % | 22.13 | % | (11.11 | )% | 4.75 | % | 6.31 | % | ||||||||||
Ratio of net expenses to average net assets | 1.59 | % | 1.59 | % | 1.59 | % | 1.56 | % | 1.49 | % | ||||||||||
Ratio of net investment income to average net assets1 | 3.39 | % | 4.53 | % | 4.96 | % | 4.38 | % | 4.23 | % | ||||||||||
Portfolio turnover | 23 | % | 42 | % | 16 | % | 17 | % | 55 | % | ||||||||||
Net assets at end of year (000’s omitted) | $ | 45,363 | $ | 57,658 | $ | 41,387 | $ | 32,154 | $ | 15,454 | ||||||||||
Ratios absent expense offsets:3 | ||||||||||||||||||||
Ratio of total expenses to average net assets | 1.82 | % | 1.83 | % | 1.83 | % | 1.86 | % | 1.90 | % | ||||||||||
Ratio of net investment income to average net assets | 3.16 | % | 4.29 | % | 4.73 | % | 4.08 | % | 3.82 | % | ||||||||||
| Institutional Class | ||||||||||||||||||||
Managers Fixed Income Fund | 2010 | 2009 | 2008 | 2007 | 2006 | |||||||||||||||
Net Asset Value, Beginning of Year | $ | 10.46 | $ | 8.96 | $ | 10.59 | $ | 10.59 | $ | 10.40 | ||||||||||
Income from Investment Operations: | ||||||||||||||||||||
Net investment income | 0.49 | 0.55 | 0.58 | 0.59 | 0.54 | |||||||||||||||
Net realized and unrealized gain (loss) on investments | 0.57 | 1.48 | (1.63 | ) | 0.01 | 0.19 | ||||||||||||||
Total from investment operations | 1.06 | 2.03 | (1.05 | ) | 0.60 | 0.73 | ||||||||||||||
Less Distributions to Shareholders from: | ||||||||||||||||||||
Net investment income | (0.49 | ) | (0.51 | ) | (0.58 | ) | (0.60 | ) | (0.54 | ) | ||||||||||
Return of capital | — | (0.02 | ) | — | — | — | ||||||||||||||
Total distributions to shareholders | (0.49 | ) | (0.53 | ) | (0.58 | ) | (0.60 | ) | (0.54 | ) | ||||||||||
Net Asset Value, End of Year | $ | 11.03 | $ | 10.46 | $ | 8.96 | $ | 10.59 | $ | 10.59 | ||||||||||
Total Return1 | 10.29 | % | 23.39 | % | (10.23 | )% | 5.84 | % | 7.34 | % | ||||||||||
Ratio of net expenses to average net assets | 0.59 | % | 0.59 | % | 0.59 | % | 0.56 | % | 0.49 | % | ||||||||||
Ratio of net investment income to average net assets1 | 4.34 | % | 5.55 | % | 5.93 | % | 5.37 | % | 5.23 | % | ||||||||||
Portfolio turnover | 23 | % | 42 | % | 16 | % | 17 | % | 55 | % | ||||||||||
Net assets at end of year (000’s omitted) | $ | 61,748 | $ | 34,723 | $ | 28,561 | $ | 33,412 | $ | 25,861 | ||||||||||
Ratios absent expense offsets:3 | ||||||||||||||||||||
Ratio of total expenses to average net assets | 0.82 | % | 0.83 | % | 0.83 | % | 0.86 | % | 0.90 | % | ||||||||||
Ratio of net investment income to average net assets | 4.11 | % | 5.31 | % | 5.69 | % | 5.07 | % | 4.82 | % | ||||||||||
80 |
Table of Contents
| Financial Highlights |
| For a share outstanding throughout each period |
| For the fiscal year ended March 31, | ||||||||||||||||||||||||
Short Duration Government Fund | For the year ended December 31, 2010 | For the year ended December 31, 2009 | For the year ended December 31, 2008 | For the period from April 1, 2007 to December 31, 2007 | 2007 | 2006 | ||||||||||||||||||
Net Asset Value, Beginning of Period | $ | 9.56 | $ | 9.20 | $ | 9.68 | $ | 9.68 | $ | 9.61 | $ | 9.66 | ||||||||||||
Income from Investment Operations: | ||||||||||||||||||||||||
Net investment income | 0.13 | 0.24 | 0.34 | 0.31 | 0.42 | 0.34 | ||||||||||||||||||
Net realized and unrealized gain (loss) on investments | 0.03 | 0.35 | (0.45 | ) | 0.01 | 0.06 | (0.05 | ) | ||||||||||||||||
Total from investment operations | 0.16 | 0.59 | (0.11 | ) | 0.32 | 0.48 | 0.29 | |||||||||||||||||
Less Distributions to Shareholders from: | ||||||||||||||||||||||||
Net investment income | (0.14 | ) | (0.23 | ) | (0.37 | ) | (0.32 | ) | (0.41 | ) | (0.34 | ) | ||||||||||||
Net Asset Value, End of Period | $ | 9.58 | $ | 9.56 | $ | 9.20 | $ | 9.68 | $ | 9.68 | $ | 9.61 | ||||||||||||
Total Return1 | 1.68 | %4 | 6.43 | %4 | (1.19 | )% | 3.41 | %8 | 5.05 | % | 3.00 | % | ||||||||||||
Ratio of net expenses to average net assets5 | 0.81 | % | 0.84 | % | 0.83 | % | 0.84 | %9 | 0.83 | % | 0.83 | % | ||||||||||||
Ratio of net investment income to average net assets1,5 | 1.38 | % | 2.43 | % | 3.88 | % | 4.49 | %9 | 4.15 | % | 3.41 | % | ||||||||||||
Portfolio turnover | 116 | % | 152 | % | 282 | % | 199 | %8 | 230 | % | 315 | % | ||||||||||||
Net assets at end of period (000’s omitted) | $ | 380,926 | $ | 275,330 | $ | 243,548 | $ | 235,117 | $ | 179,984 | $ | 206,523 | ||||||||||||
Ratios absent expense offsets:3 | ||||||||||||||||||||||||
Ratio of total expenses to average net assets | 0.82 | % | 0.84 | % | 0.84 | % | 1.22 | %9 | 1.36 | % | 1.08 | % | ||||||||||||
Ratio of net investment income to average net assets | 1.37 | % | 2.43 | % | 3.87 | % | 4.11 | %9 | 3.62 | % | 3.16 | % | ||||||||||||
81 |
Table of Contents
| Financial Highlights |
| For a share outstanding throughout each period |
| For the fiscal year ended March 31, | ||||||||||||||||||||||||
Intermediate Duration Government Fund | For the year ended December 31, 2010 | For the year ended December 31, 2009 | For the year ended December 31, 2008 | For the period from April 1, 2007 to December 31, 2007 | 2007 | 2006 | ||||||||||||||||||
Net Asset Value, Beginning of Period | $ | 10.90 | $ | 10.17 | $ | 10.67 | $ | 10.54 | $ | 10.37 | $ | 10.53 | ||||||||||||
Income from Investment Operations: | ||||||||||||||||||||||||
Net investment income | 0.32 | 0.41 | 0.45 | 0.37 | 0.47 | 0.37 | ||||||||||||||||||
Net realized and unrealized gain (loss) on investments | 0.46 | 0.83 | (0.37 | ) | 0.13 | 0.17 | (0.16 | ) | ||||||||||||||||
Total from investment operations | 0.78 | 1.24 | 0.08 | 0.50 | 0.64 | 0.21 | ||||||||||||||||||
Less Distributions to Shareholders from: | ||||||||||||||||||||||||
Net investment income | (0.32 | ) | (0.41 | ) | (0.45 | ) | (0.37 | ) | (0.47 | ) | (0.37 | ) | ||||||||||||
Net realized gain on investments | (0.35 | ) | (0.10 | ) | (0.13 | ) | — | — | — | |||||||||||||||
Total distributions to shareholders | (0.67 | ) | (0.51 | ) | (0.58 | ) | (0.37 | ) | (0.47 | ) | (0.37 | ) | ||||||||||||
Net Asset Value, End of Period | $ | 11.01 | $ | 10.90 | $ | 10.17 | $ | 10.67 | $ | 10.54 | $ | 10.37 | ||||||||||||
Total Return1 | 7.20 | %4 | 12.40 | % | 0.85 | % | 4.85 | %8 | 6.30 | % | 2.02 | % | ||||||||||||
Ratio of net expenses to average net assets6 | 0.89 | % | 0.89 | % | 0.89 | % | 0.83 | %9 | 0.87 | % | 0.88 | % | ||||||||||||
Ratio of net investment income to average net assets1,6 | 2.80 | % | 3.84 | % | 4.32 | % | 4.62 | %9 | 4.46 | % | 3.53 | % | ||||||||||||
Portfolio turnover | 409 | % | 370 | % | 429 | % | 240.00 | %8 | 445 | % | 672 | % | ||||||||||||
Net assets at end of period (000’s omitted) | $ | 153,644 | $ | 155,226 | $ | 170,181 | $ | 193,440 | $ | 182,771 | $ | 194,545 | ||||||||||||
Ratios absent expense offsets:3 | ||||||||||||||||||||||||
Ratio of total expenses to average net assets | 0.96 | % | 0.98 | % | 0.95 | % | 0.84 | %9 | 0.89 | % | 0.88 | % | ||||||||||||
Ratio of net investment income to average net assets | 2.73 | % | 3.75 | % | 4.26 | % | 4.61 | %9 | 4.44 | % | 3.53 | % | ||||||||||||
Notes to Financial Highlights
The following notes should be read in conjunction with the Financial Highlights of the Funds presented on the previous pages.
| # | Rounds to less than $0.01 or 0.01%. |
| 1 | Total returns and net investment income would have been lower had certain expenses not been reduced. (See Note 1(c) of Notes to Financial Statements.) |
| 2 | Per share numbers have been calculated using average shares. |
| 3 | Excludes the impact of expense reimbursements or fee waivers and expense reductions such as brokerage credits, but includes non-reimbursable expenses, if any, such as interest and taxes. (See Note 1(c) of Notes to Financial Statements.) |
| 4 | The total return is based on the Financial Statement Net Asset Values as shown. |
| 5 | Excludes interest expense for the years ended December 31, 2010, 2009, and 2008, the period ended December 31, 2007 and the fiscal years ended March 31, 2007 and 2006 of 0.00%, 0.00%, 0.00%, 0.38%, 0.53%, and 0.23%, respectively. (See Note 1(c) of Notes to Financial Statements.) |
| 6 | Excludes interest expense for the years ended December 31, 2010, 2009, and 2008, the period ended December 31, 2007 and the fiscal years ended March 31, 2007 and 2006 of 0.00%, 0.00%, 0.00%, 0.01%, 0.04%, and 0.00%, respectively. (See Note 1(c) of Notes to Financial Statements.) |
| 7 | Excludes interest expense for the year ended December 31, 2008 of 0.06%. |
| 8 | Not annualized. |
| 9 | Annualized. |
82 |
Table of Contents
| Notes to Financial Statements |
| December 31, 2010 |
| 1. | Summary of Significant Accounting Policies |
Managers Trust II (the “Trust”) is an open-end management investment company organized as a Massachusetts business trust and registered under the Investment Company Act of 1940, as amended (the “1940 Act”). Currently, the Trust is comprised of a number of different funds, each having distinct investment management objectives, strategies, risks and policies. Included in this report are: Managers AMG Chicago Equity Partners Mid-Cap Fund (“Mid-Cap”), Managers AMG Chicago Equity Partners Balanced Fund (“Balanced”), Managers High Yield Fund (“High Yield”), Managers Fixed Income Fund (“Fixed Income”), Managers Short Duration Government Fund (“Short Duration”), and Managers Intermediate Duration Government Fund (“Intermediate Duration”), collectively the “Funds.”
Mid-Cap, Balanced, High Yield, and Fixed Income each offer four classes of shares: Class A, Class B, Class C and Institutional Class. Sales of Class A shares may be subject to a front-end sales charge. Redemptions of Class A, Class B and Class C shares may be subject to a contingent-deferred sales charge (as a percentage of the original offering price or the net asset value at time of sale, whichever is less). Institutional Class shares are available, with no sales charge, to certain institutional investors and qualifying individual investors. Each class represents an interest in the same assets of the Fund and the classes are identical except for class specific expenses related to shareholder activity. Each class has equal voting privileges except that each class has exclusive voting rights with respect to its services and/or distribution plan. Please refer to a current prospectus for additional information on each share class.
The Funds’ financial statements are prepared in accordance with accounting principles generally accepted in the United States of America, which require management to make estimates and assumptions that affect the reported amounts of assets and liabilities and disclosure of contingent assets and liabilities at the date of the financial statements and the reported amounts of income and expenses during the reporting periods. Actual results could differ from those estimates and such differences may be material. The following is a summary of significant accounting policies followed by the Funds in the preparation of their financial statements:
| a. | Valuation of Investments |
Equity securities traded on a domestic or international securities exchange are valued at the last quoted sale price, or, lacking any sales, at the last quoted bid price. Over-the-counter securities are valued at the Nasdaq Official Closing Price, if one is available. Lacking any sales, over-the counter securities are valued at the last quoted bid price. The Funds’ investments are generally valued based on market quotations provided by third party pricing services approved by the Board of Trustees of the Funds. Under certain circumstances, the value of each Fund’s investment may be based on an evaluation of its fair value, pursuant to procedures established by and under the general supervision of the Board of Trustees of the Trust. Each Fund may use the fair value of a portfolio security to calculate its NAV when, for example, (1) market quotations are not readily available because a portfolio security is not traded in a public market or the principal market in which the security trades is closed, (2) trading in a portfolio security is suspended and has not resumed before the Fund calculates its NAV, (3) a significant event affecting the value of a
portfolio security is determined to have occurred between the time of the market quotation provided for a portfolio security and the time as of which the Fund calculates its NAV, (4) a security’s price has remained unchanged over a period of time (often referred to as a “stale price”), or (5) Managers Investment Group LLC (the “Investment Manager”) determines that a market quotation is inaccurate. Portfolio investments that trade primarily on foreign markets are priced based upon the market quotation of such securities as of the close of their respective principal markets, as adjusted to reflect the Investment Manager’s determination of the impact of events occurring subsequent to the close of such markets but prior to the time as of which the Funds calculate its NAV. In accordance with procedures approved by the Board of Trustees, the Investment Manager relies upon recommendations of a third-party fair valuation service in adjusting the prices of such foreign portfolio investments. The Funds may invest in securities that may be thinly traded. The Board of Trustees has adopted procedures to adjust prices when thinly traded securities are judged to be stale so that they reflect fair value. An investment valued on the basis of its fair value may be valued at a price higher or lower than available market quotations. An investment’s valuation may differ depending on the method used and the factors considered in determining value according to the Fund’s fair value procedures.
Fixed-income securities are valued based on valuations furnished by independent pricing services that utilize matrix systems, which reflect such factors as security prices, yields, maturities, and ratings, and are supplemented by dealer and exchange quotations. Futures contracts for which market quotations are readily available are valued at the settlement price as of the close of the futures exchange. Short-term investments having a remaining maturity of 60 days or less are valued at amortized cost, which approximates market value. Investments in other regulated investment companies are valued at their end of day net asset value per share except iShares or other ETF’s, which are valued the same as equity securities. Investments in certain mortgage-backed and stripped mortgage-backed securities, preferred stocks, convertible securities, derivatives and other debt securities not traded on an organized securities market are valued on the basis of valuations provided by dealers or by a pricing service which uses information with respect to transactions in such securities and various relationships between securities and yield to maturity in determining value. Securities (including derivatives) for which market quotations are not readily available are fair valued, as determined in good faith, and pursuant to procedures adopted by the Board of Trustees of the Trust. The values assigned to fair value investments are based on available information and do not necessarily represent amounts that might ultimately be realized, since such amounts depend on future developments inherent in long-term investments. Further, because of the inherent uncertainty of valuation, those estimated values may differ significantly from the values that would have been used had a ready market for the investments existed, and the differences could be material.
Generally Accepted Accounting Principles (GAAP) define fair value as the price that a Fund would receive to sell an asset or pay to transfer a liability in an orderly transaction between market participants at the measurement date. GAAP also establishes a framework for measuring fair value, and a three-level hierarchy for fair value measurements based upon the transparency of inputs to the valuation of an asset or liability. Inputs may be observable or unobservable and refer broadly to the assumptions that market participants
83 |
Table of Contents
| Notes to Financial Statements (continued) |
would use in pricing the asset or liability. Observable inputs reflect the assumptions market participants would use in pricing the asset or liability based on market data obtained from sources independent of the Funds. Unobservable inputs reflect the Funds’ own assumptions about the assumptions that market participants would use in pricing the asset or liability developed based on the best information available in the circumstances. Each investment is assigned a level based upon the observability of the inputs which are significant to the overall valuation.
The three-tier hierarchy of inputs is summarized below:
Level 1 – inputs are quoted prices in active markets for identical investments (e.g., equity securities, open-end investment companies, futures contracts, options contracts) Level 2 – other observable inputs (including, but not limited to: quoted prices for similar assets or liabilities in markets that are active, quoted prices for identical or similar assets or liabilities in markets that are not active, inputs other than quoted prices that are observable for the assets or liabilities (such as interest rates, yield curves, volatilities, prepayment speeds, loss severities, credit risks and default rates) or other market corroborated inputs) (e.g., debt securities, government securities, swap contracts, foreign currency exchange contracts, foreign securities utilizing international fair value pricing, broker-quoted securities, fair valued securities with observable inputs)
Level 3 – inputs are significant unobservable inputs (including the Fund’s own assumptions used to determine the fair value of investments) (e.g., fair valued securities with unobservable inputs) The inputs or methodologies used for valuing investments are not necessarily an indication of the risk associated with investing in those investments.
| b. | Security Transactions |
Security transactions are accounted for as of the trade date. Realized gains and losses on securities sold are determined on the basis of identified cost.
| c. | Investment Income and Expenses |
Dividend income is recorded on the ex-dividend date, except certain dividends from foreign securities where the ex-dividend date may have passed. These dividends are recorded as soon as the Trust is informed of the ex-dividend date. Dividend income on foreign securities is recorded net of any withholding tax. Interest income, which includes amortization of premium and accretion of discount on debt securities, is accrued as earned. Non-cash dividends included in dividend income, if any, are reported at the fair market value of the securities received. Other income and expenses are recorded on an accrual basis. Expenses that cannot be directly attributed to a fund are apportioned among the Funds in the Trust and in some cases other affiliated funds based upon their relative average net assets or number of shareholders. Investment income, realized and unrealized capital gains and losses, the common expenses of each Fund and certain Fund level expense reductions, if any, are allocated on a pro rata basis to each class based on the relative net
assets of each class to the total net assets of each Fund.
The following Funds had certain portfolio trades directed to various brokers who paid a portion of such Fund’s expenses. For the year ended December 31, 2010, under these arrangements, the amount by which the Funds’ expenses were reduced and the impact on the expense ratios were: Mid-Cap - $19,983 or 0.05%, and Balanced - $4,762 or 0.03%.
The Funds have a “balance credit” arrangement with The Bank of New York Mellon, the Funds’ custodian, whereby each Fund is credited with an interest factor equal to 0.75% below the effective 90-day T-Bill rate for account balances left uninvested overnight. If the T-Bill rate falls below 0.75%, no credits will be earned. These credits serve to reduce custody expenses that would otherwise be charged to each Fund. For the year ended December 31, 2010, the custodian expense was not reduced for any of the Funds.
Overdrafts will cause a reduction of any earnings credits, computed at 2% above the effective Federal Funds rate on the day of the overdraft. For the year ended December 31, 2010, overdraft fees and the impact on the expense ratios, if any, for Mid-Cap, Balanced, High Yield, Fixed Income, Short Duration, and Intermediate Duration equaled $0, $86, $182, $0, $0, and $0, respectively.
The Trust also has a balance credit arrangement with its Transfer Agent, BNY Mellon Investment Servicing (US) Inc., (formerly PNC Global Investment Servicing (U.S.) Inc.), whereby earnings credits are used to offset banking charges and other out-of-pocket expenses. For the year ended December 31, 2010, the transfer agent expense was reduced as follows: Mid-Cap - $53, Balanced - $26, High Yield - $47, Fixed Income - $241, Short Duration - $520, and Intermediate Duration - $242.
The Investment Manager has agreed to waive a portion of its management fee in consideration of shareholder servicing fees that it has received from JPMorgan Distribution Services, Inc., with respect to short-term cash investments each Fund may have made in the JPMor-gan Liquid Assets Money Market Fund – Capital Shares. For the year ended December 31, 2010, the management fee was reduced as follows: Mid-Cap - $0, Balanced - $0, High Yield - $0, Fixed Income - $1,861, Short Duration - $10,408, and Intermediate Duration - $13,097.
Total returns and net investment income for the Funds would have been lower had certain expenses not been offset. Total expenses before offsets exclude the impact of expense reimbursements or fee waivers and expense offsets such as brokerage recapture credits, but include non-reimburseable expenses, if any, such as interest and taxes, except in such cases where interest expense is disclosed separately.
| d. | Dividends and Distributions |
Dividends resulting from net investment income, if any, normally will be declared and paid annually for the Mid-Cap Fund, monthly for the Fixed Income, High Yield, Short Duration and Intermediate Duration and quarterly for the Balanced Fund. Distributions of capital gains, if any, will be made on an annual basis and when required for Federal excise tax purposes. Income and capital
84 |
Table of Contents
| Notes to Financial Statements (continued) |
gain distributions are determined in accordance with Federal income tax regulations, which may differ from generally accepted accounting principles. These differences are primarily due to differing treatments for losses deferred due to wash sales, REITS, equalization accounting for tax purposes, foreign currency, options, futures, and market discount transactions. Permanent book and tax basis differences, if any, relating to shareholder distributions will result in reclassifications to paid-in-capital. The tax character of distributions paid during the years ended December 31, 2010 and December 31, 2009 were as follows:
| Mid Cap | Balanced | High Yield | Fixed Income | |||||||||||||||||||||||||||||
| 2010 | 2009 | 2010 | 2009 | 2010 | 2009 | 2010 | 2009 | |||||||||||||||||||||||||
Distributions paid from: |
| |||||||||||||||||||||||||||||||
Ordinary income | $ | 230,138 | $ | 299,968 | $ | 272,829 | $ | 358,896 | $ | 2,554,625 | $ | 3,012,067 | $ | 5,902,162 | $ | 6,164,196 | ||||||||||||||||
Short-term capital gains | — | — | — | — | — | — | — | — | ||||||||||||||||||||||||
Long-term capital gains | — | — | — | — | — | — | — | — | ||||||||||||||||||||||||
Return of capital | — | — | — | — | — | — | — | 228,372 | ||||||||||||||||||||||||
Totals | $ | 230,138 | $ | 299,968 | $ | 272,829 | $ | 358,896 | $ | 2,554,625 | $ | 3,012,067 | $ | 5,902,162 | $ | 6,392,568 | ||||||||||||||||
As a % of distributions paid (unaudited): |
| |||||||||||||||||||||||||||||||
Qualified ordinary income | 100.00 | % | 100.00 | % | 66.71 | % | 75.22 | % | — | — | — | — | ||||||||||||||||||||
Ordinary income - dividends received deduction | 100.00 | % | 100.00 | % | 72.15 | % | 83.23 | % | — | — | — | — | ||||||||||||||||||||
| Short Duration | Intermediate Duration | |||||||||||||||||||
| 2010 | 2009 | 2010 | 2009 | |||||||||||||||||
Distributions paid from: | ||||||||||||||||||||
Ordinary income | $ | 5,130,631 | $ | 6,294,858 | $ | 4,638,090 | $ | 6,508,347 | ||||||||||||
Short-term capital gains | — | — | 4,338,776 | 1,431,402 | ||||||||||||||||
Long-term capital gains | — | — | 450,528 | — | ||||||||||||||||
Totals | $ | 5,130,631 | $ | 6,294,858 | $ | 9,427,394 | $ | 7,939,749 | ||||||||||||
As a % of distributions paid (unaudited): | ||||||||||||||||||||
Qualified ordinary income | — | — | — | — | ||||||||||||||||
Ordinary income - dividends received deduction | — | — | — | — | ||||||||||||||||
As of December 31, 2010, the components of distributable earnings (excluding unrealized appreciation/depreciation) on a tax basis consisted of:
| Mid Cap | Balanced | High Yield | Fixed Income | Short Duration | Intermediate Duration | |||||||||||||||||||
Capital loss carryforward | $ | 10,896,210 | $ | 934,426 | $ | 4,403,474 | $ | 1,069,686 | $ | 5,162,225 | — | |||||||||||||
Undistributed ordinary income | 58,773 | — | 21,178 | 103,298 | 155 | $ | 26,057 | |||||||||||||||||
Undistributed short-term capital gains | — | — | — | — | — | — | ||||||||||||||||||
Undistributed long-term capital gains | — | — | — | — | — | — | ||||||||||||||||||
85 |
Table of Contents
| Notes to Financial Statements (continued) |
| e. | Federal Taxes |
Each Fund intends to comply with the requirements under Subchapter M of the Internal Revenue Code of 1986, as amended, to distribute substantially all of its taxable income and gains to its shareholders and to meet certain diversification and income requirements with respect to investment companies. Therefore, no provision for Federal income or excise tax is included in the accompanying financial statements.
Additionally, based on each Fund’s understanding of the tax rules and rates related to income, gains and transactions for the foreign jurisdictions in which it invests, each Fund will provide for foreign taxes, and where appropriate, deferred foreign taxes.
Management has analyzed the Funds’ tax positions taken on federal income tax returns for all open tax years (tax years ended December
31, 2007-2010), and has concluded that no provision for federal income tax is required in the Funds’ financial statements. The Funds are not aware of any tax position for which it is reasonably possible that the total amounts of unrecognized tax benefits will change materially in the next twelve months.
| f. | Capital Stock |
The Trust’s Declaration of Trust authorizes for each series the issuance of an unlimited number of shares of beneficial interest, without par value. Each Fund records sales and repurchases of its capital stock on the trade date. Dividends and distributions to shareholders are recorded on the ex-dividend date. For the years ended December 31, 2010 and December 31, 2009, the capital stock transactions by class for Mid-Cap, Balanced, High Yield, and Fixed Income were:
| Mid-Cap | Balanced | |||||||||||||||||||||||||||||||
| 2010 | 2009 | 2010 | 2009 | |||||||||||||||||||||||||||||
| Shares | Amount | Shares | Amount | Shares | Amount | Shares | Amount | |||||||||||||||||||||||||
Class A: | ||||||||||||||||||||||||||||||||
Proceeds from sales | 152,527 | $ | 1,817,076 | 175,871 | $ | 1,573,981 | 153,940 | $ | 1,989,622 | 259,779 | $ | 2,845,086 | ||||||||||||||||||||
Reinvestment of distributions | 1,201 | 16,634 | 2,252 | 24,752 | 4,484 | 57,927 | 4,278 | 49,025 | ||||||||||||||||||||||||
Cost of shares repurchased | (171,982 | ) | (2,035,553 | ) | (102,802 | ) | (889,571 | ) | (156,920 | ) | (1,998,654 | ) | (651,802 | ) | (7,638,243 | ) | ||||||||||||||||
Net Increase (Decrease) - Class A | (18,254 | ) | ($201,843 | ) | 75,321 | $ | 709,162 | 1,504 | $ | 48,895 | (387,745 | ) | ($4,744,132 | ) | ||||||||||||||||||
Class B: | ||||||||||||||||||||||||||||||||
Proceeds from sales | 84 | $ | 935 | 168 | $ | 1,155 | 9,548 | $ | 123,057 | 23,140 | $ | 259,990 | ||||||||||||||||||||
Reinvestment of distributions | — | — | — | — | 235 | 3,014 | 614 | 6,744 | ||||||||||||||||||||||||
Cost of shares repurchased | (41,048 | ) | (441,806 | ) | (176,441 | ) | (1,444,034 | ) | (47,933 | ) | (597,986 | ) | (179,904 | ) | (1,952,017 | ) | ||||||||||||||||
Net Decrease - Class B | (40,964 | ) | ($440,871 | ) | (176,273 | ) | ($1,442,879 | ) | (38,150 | ) | ($471,915 | ) | (156,150 | ) | ($1,685,283 | ) | ||||||||||||||||
Class C: | ||||||||||||||||||||||||||||||||
Proceeds from sales | 6,516 | $ | 72,671 | 13,179 | $ | 106,965 | 27,751 | $ | 355,635 | 20,193 | $ | 221,969 | ||||||||||||||||||||
Reinvestment of distributions | — | — | 53 | 542 | 585 | 7,541 | 716 | 8,106 | ||||||||||||||||||||||||
Cost of shares repurchased | (133,269 | ) | (1,439,004 | ) | (136,234 | ) | (1,128,150 | ) | (68,533 | ) | (871,532 | ) | (53,253 | ) | (571,245 | ) | ||||||||||||||||
Net Decrease - Class C | (126,753 | ) | ($1,366,333 | ) | (123,002 | ) | ($1,020,643 | ) | (40,197 | ) | ($508,356 | ) | (32,344 | ) | ($341,170 | ) | ||||||||||||||||
Institutional Class: | ||||||||||||||||||||||||||||||||
Proceeds from sales | 149,279 | $ | 1,869,055 | 152,518 | $ | 1,366,553 | 73,672 | $ | 945,883 | 97,908 | $ | 1,079,719 | ||||||||||||||||||||
Reinvestment of distributions | 13,403 | 195,143 | 21,216 | 245,685 | 10,429 | 135,661 | 11,948 | 137,040 | ||||||||||||||||||||||||
Cost of shares repurchased | (301,849 | ) | (3,698,904 | ) | (659,517 | ) | (5,960,998 | ) | (82,243 | ) | (1,050,298 | ) | (109,145 | ) | (1,185,024 | ) | ||||||||||||||||
Net Increase (Decrease) - Institutional Class | (139,167 | ) | ($1,634,706 | ) | (485,783 | ) | ($4,348,760 | ) | 1,858 | $31,246 | 711 | $31,735 | ||||||||||||||||||||
86
|
Table of Contents
| Notes to Financial Statements (continued) |
| High Yield | Fixed Income | |||||||||||||||||||||||||||||||
| 2010 | 2009 | 2010 | 2009 | |||||||||||||||||||||||||||||
| Shares | Amount | Shares | Amount | Shares | Amount | Shares | Amount | |||||||||||||||||||||||||
Class A: | ||||||||||||||||||||||||||||||||
Proceeds from sales | 561,569 | $ | 4,207,687 | 2,670,648 | $ | 15,897,970 | 1,650,400 | $ | 17,834,800 | 2,132,956 | $ | 20,258,557 | ||||||||||||||||||||
Reinvestment of distributions | 197,078 | 1,473,915 | 266,725 | 1,670,573 | 104,383 | 1,132,260 | 141,825 | 1,362,744 | ||||||||||||||||||||||||
Cost of shares repurchased | (1,823,180 | ) | (13,579,835 | ) | (2,325,239 | ) | (13,838,087 | ) | (2,136,300 | ) | (23,308,029 | ) | (2,119,817 | ) | (20,513,025 | ) | ||||||||||||||||
Net Increase (Decrease) - Class A | (1,064,533 | ) | $ | (7,898,233 | ) | 612,134 | $ | 3,730,456 | (381,517 | ) | $ | (4,340,969 | ) | 154,964 | $ | 1,108,276 | ||||||||||||||||
Class B: | ||||||||||||||||||||||||||||||||
Proceeds from sales | 12,741 | $ | 93,537 | 15,442 | $ | 93,910 | 75,696 | $ | 826,667 | 78,959 | $ | 754,143 | ||||||||||||||||||||
Reinvestment of distributions | 4,785 | 35,193 | 12,989 | 77,355 | 6,279 | 67,622 | 11,848 | 112,028 | ||||||||||||||||||||||||
Cost of shares repurchased | (107,537 | ) | (782,312 | ) | (344,519 | ) | (2,060,740 | ) | (128,184 | ) | (1,363,867 | ) | (415,290 | ) | (4,008,505 | ) | ||||||||||||||||
Net Decrease - Class B | (90,011 | ) | $ | (653,582 | ) | (316,088 | ) | $ | (1,889,475 | ) | (46,209 | ) | $ | (469,578 | ) | (324,483 | ) | $ | (3,142,334 | ) | ||||||||||||
Class C: | ||||||||||||||||||||||||||||||||
Proceeds from sales | 54,946 | $ | 409,922 | 93,651 | $ | 514,827 | 399,093 | $ | 4,329,562 | 1,890,577 | $ | 17,735,537 | ||||||||||||||||||||
Reinvestment of distributions | 23,277 | 171,625 | 27,854 | 172,760 | 98,849 | 1,070,100 | 136,213 | 1,311,233 | ||||||||||||||||||||||||
Cost of shares repurchased | (166,548 | ) | (1,234,905 | ) | (180,948 | ) | (1,112,602 | ) | (1,905,917 | ) | (20,659,178 | ) | (1,127,609 | ) | (10,841,496 | ) | ||||||||||||||||
Net Increase (Decrease) - Class C | (88,325 | ) | $ | (653,358 | ) | (59,443 | ) | $ | (425,015 | ) | (1,407,975 | ) | $ | (15,259,516 | ) | 899,181 | $ | 8,205,274 | ||||||||||||||
Institutional Class: | ||||||||||||||||||||||||||||||||
Proceeds from sales | 189,264 | $ | 1,436,884 | 1,070,145 | $ | 5,935,768 | 2,862,678 | $ | 31,466,580 | 945,116 | $ | 9,115,892 | ||||||||||||||||||||
Reinvestment of distributions | 41,664 | 315,109 | 42,482 | 269,627 | 156,575 | 1,706,688 | 169,866 | 1,637,824 | ||||||||||||||||||||||||
Cost of shares repurchased | (120,296 | ) | (911,419 | ) | (1,165,972 | ) | (6,504,728 | ) | (742,062 | ) | (8,163,869 | ) | (982,160 | ) | (9,634,055 | ) | ||||||||||||||||
Net Increase (Decrease) - Institutional Class | 110,632 | $ | 840,574 | (53,345 | ) | $ | (299,333 | ) | 2,277,191 | $ | 25,009,399 | 132,822 | $ | 1,119,661 | ||||||||||||||||||
87 |
Table of Contents
| Notes to Financial Statements (continued) |
At December 31, 2010, certain unaffiliated shareholders of record, specifically omnibus accounts, individually or collectively held greater than 10% of the outstanding shares of the following Funds: Mid-Cap – two collectively own 85%; Balanced – two collectively own 66%; High Yield – three collectively own 53%; Fixed Income – two collectively own 30%; Short Duration – two collectively own 67%; Intermediate Duration – three collectively own 62%. Transactions by these shareholders may have a material impact on the Funds.
| g. | Capital Loss Carryovers |
As of December 31, 2010, the following Funds had accumulated net realized capital loss carryovers from securities transactions for Federal income tax purposes as shown in the following chart. These amounts may be used to offset realized capital gains, if any, through the expiration dates listed.
| Capital Loss Carryover Amount | Expires Dec. 31, | |||||||
Mid-Cap | ||||||||
| $ | 10,896,210 | 2017 | ||||||
Balanced | ||||||||
| $ | 934,426 | 2017 | ||||||
High Yield | ||||||||
| $ | 4,403,474 | 2017 | ||||||
Fixed Income | ||||||||
| $ | 616,984 | 2017 | ||||||
| 452,702 | 2018 | |||||||
Total | $ | 1,069,686 | �� | |||||
Short Duration | ||||||||
| $ | 1,210,911 | 2016 | ||||||
| 3,951,314 | 2017 | |||||||
Total | $ | 5,162,225 | ||||||
For the year ended December 31, 2010, the following Funds utilized capital loss carryovers: Mid-Cap - $5,902,212, Balanced - $1,681,674, High Yield - $999,707 and Short Duration - $806,171.
| h. | Reverse Repurchase Agreements |
A reverse repurchase agreement involves the sale of portfolio assets together with an agreement to repurchase the same or substantially the same assets later at a fixed price. An interest expense is charged
to the Fund for the duration of the sale. Additional assets are maintained in a segregated account with the custodian, and are marked to market daily. The segregated assets may consist of cash, U.S. Government securities, or other liquid securities at least equal in value to the obligations under the reverse repurchase agreements. In the event the buyer of securities under a reverse repurchase agreement files for bankruptcy or becomes insolvent, a fund’s use of the proceeds under the agreement may be restricted pending a determination by the other party, or its trustee or receiver, whether to enforce the obligation to repurchase the securities. For the year ended December 31, 2010, there were no reverse repurchase agreements, and therefore no interest expense.
| i. | Delayed Delivery Transactions and When-Issued Securities |
The Short Duration and Intermediate Duration Funds entered into securities on a delayed delivery or when-issued basis. Payment and delivery may take place after the customary settlement period for that security. The price of the underlying securities and the date when the securities will be delivered and paid for are fixed at the time the transaction is negotiated. During the time a delayed delivery sell is outstanding, the contract is marked to market daily and equivalent deliverable securities are held for the transaction. The value of the securities purchased on a delayed delivery or when-issued basis are identified as such in the Funds’ Schedules of Portfolio Investments. With respect to purchase commitments, the Funds identify securities as segregated in their records with a value at least equal to the amount of the commitment. The payables and receivables associated with the purchases and sales of delayed delivery securities having the same coupon, settlement date and broker are offset. Delayed delivery or when-issued securities that have been purchased from and sold to different brokers are reflected as both payables and receivables in the Funds’ Statement of Assets and Liabilities. Losses may arise due to changes in the value of the underlying securities or if the counterparty does not perform under the contract, or if the issuer does not issue the securities due to political, economic, or other factors.
| j. | Dollar Roll and Reverse Dollar Roll Agreements |
The Short Duration and Intermediate Duration Funds entered into dollar rolls in which they sell debt securities for delivery currently and simultaneously contract to repurchase similar, but not identical, securities at the same price or a lower price on an agreed date. The Funds receive compensation as consideration for entering into the commitment to repurchase. The compensation is the difference between the current sale price and the forward price for the future purchase (often referred to as the “drop”) as well as by the interest earned on the cash proceeds of the initial sale. The Funds may also be compensated by the receipt of a commitment fee. As the holder, the counterparty receives all principal and interest payments, including prepayments, made with respect to the similar security. Dollar rolls may be renewed with a new sale and repurchase price with a cash settlement made at renewal without physical delivery of the securities subject to the contract.
88 |
Table of Contents
| Notes to Financial Statements (continued) |
Certain risks may arise upon entering into dollar rolls from the potential inability of counterparties to meet the terms of their commitments. Additionally, the value of such securities may change adversely before the Funds are able to repurchase them. There can be no assurance that the Funds’ use of the cash that they receive from a dollar roll will provide a return that exceeds its cost.
| k. | Securities Transacted on a When Issued Basis |
The Short Duration and Intermediate Duration Funds entered into To Be Announced (“TBA”) sale commitments to hedge their portfolio positions or to sell mortgage-backed securities they own under delayed delivery arrangements. Proceeds of TBA sale commitments are not received until the contractual settlement date. During the time a TBA sale commitment is outstanding, equivalent deliverable securities, or an offsetting TBA purchase commitment deliverable on or before the sale commitment date, are held as “cover” for the transaction. Unsettled TBA sale commitments are valued at the current market value of the underlying securities, according to the procedures described under “Valuation of Investments,” in footnote 1a above. Each contract is marked-to-market daily and the change in market value is recorded by the Funds as an unrealized gain or loss. If the TBA sale commitment is closed through the acquisition of an offsetting purchase commitment, the Fund realizes a gain or loss. If the Fund delivers securities under the commitment, the Fund realizes a gain or a loss from the sale of the securities based upon the unit price established at the date the commitment was entered into.
| 2. | Derivative Instruments |
The following disclosures contain information on how and why the Funds use derivative instruments, the credit-risk and how derivative instruments affect the Funds’ financial position, results of operations and cash flows. The location and fair value amounts of these instruments on the Statements of Assets and Liabilities and the realized and changes in unrealized gains and losses on the Statements of Operations, each categorized by type of derivative contract, are included in a table in the Schedules of Portfolio Investments for the applicable funds. The derivative instruments outstanding as of period end as disclosed in the Statements of Assets and Liabilities and the realized and changes in unrealized gains and losses on derivative instruments during the period as disclosed in the Statement of Operations serve as indicators of the volume of derivative activity for the Funds.
| a. | Futures Contracts |
The Short Duration and Intermediate Duration Funds invest in interest rate futures contracts for risk management purposes in order to reduce the interest rate risk of fixed-income securities. The Funds are subject to interest rate risk in the normal course of pursuing their investment objectives. With futures, there is minimal counterparty credit risk to the Funds since futures are exchange traded and the exchange’s clearinghouse, as counterparty to all exchange traded futures, guarantees the futures against default. On entering into a futures contract, either cash or securities in an amount equal to a certain percentage of the contract value (initial margin) must be deposited with the futures broker. Subsequent payments (variation margin) are made or received each day. The variation margin
payments equal the daily changes in the contract value and are recorded as unrealized gains or losses. The Funds recognize a realized gain or loss when the contract is closed or expires equal to the difference between the value of the contract at the time it was opened and the value at the time it was closed. Futures are valued at their quoted daily settlement prices. The aggregate principal amounts of the contracts are not recorded in the financial statements. Fluctuations in the value of the contracts are recorded in the Statements of Assets and Liabilities as an asset (liability) and in the Statements of Operations as unrealized appreciation (depreciation) until the contracts are closed, when they are recorded as realized gains (losses) on futures.
Futures transactions involve additional costs and may result in losses. The effective use of futures depends on the Fund’s ability to close futures positions at times when the Fund’s portfolio managers deem it desirable to do so. The use of futures also involves the risk of imperfect correlation among movements in the values of the securities underlying the futures purchased and sold by the Funds, of the futures contracts themselves, and of the securities that are the subject of a hedge.
| b. | Assets Pledged to Cover Margin Requirements for Open Futures Positions |
The aggregate market value of assets pledged to cover margin requirements for the open futures positions at December 31, 2010 was:
Fund | Assets Pledged | |||
Short Duration | $ | 699,751 | ||
Intermediate Duration | 149,997 | |||
| c. | Stripped Securities |
The Short Duration and Intermediate Duration Funds invest in stripped securities (“STRIPS”), primarily interest-only strips for their hedging characteristics. Interest-only STRIPS will most likely move differently than typical fixed-income securities in relation to changes in interest rates. STRIPS are usually structured with two classes that receive different proportions of the interest and principal distributions from a pool of underlying assets. A common type of STRIP will have one class receiving all of the interest from the underlying assets (“interest-only” or “IO” class), while the other class will receive the entire principal (“principal only” or “PO” class). However, in some instances, one class will receive some of the interest and most of the principal while the other class will receive most of the interest and the remainder of the principal. STRIPS are unusually volatile in response to changes in interest rates. The yield to maturity on an IO class of STRIPS is extremely sensitive not only to changes in prevailing interest rates but also to the rate of principal payments (including prepayments) on the underlying assets. A rapid rate of principal prepayments may have a measurably adverse effect on a Fund’s yield to maturity to the extent it invests in IOs. Conversely, POs tend to increase in
89 |
Table of Contents
| Notes to Financial Statements (continued) |
value if prepayments are greater than anticipated and decline if prepayments are slower than anticipated. Thus, if the underlying assets experience greater than anticipated prepayments of principal, a Fund may fail to fully recover its initial investment in these securities, even if the STRIPS were rated of the highest credit quality by Standard & Poor’s Corporation or Moody’s. These risks are managed by investing in a variety of such securities and by using certain hedging techniques. In addition the secondary market for STRIPS may be less liquid than that of other mortgage-backed or asset-backed securities, potentially limiting a Fund’s ability to buy or sell those securities at any particular time.
| 3. | Commitments and Contingencies |
In the normal course of business, the Funds may enter into contracts and agreements that contain a variety of representations and warranties which provide general indemnifications. The maximum exposure to the Funds under these agreements is unknown, as this would involve future claims that may be made against the Funds that have not yet occurred. However, based on experience, the Funds expect the risks of loss to be remote.
| 4. | Foreign Currency Translation |
The books and records of the Funds are maintained in U.S. dollars. The value of investments, assets and liabilities denominated in currencies other than U.S. dollars are translated into U.S. dollars based upon current foreign exchange rates. Purchases and sales of foreign investments, income, and expenses are converted into U.S. dollars based on currency exchange rates prevailing on the respective dates of such transactions. Net realized and unrealized gain (loss) on foreign currency transactions represent: (1) foreign exchange gains and losses from the sale and holdings of foreign currencies; (2) gains and losses between trade date and settlement date on investment securities transactions and forward foreign currency exchange contracts; and (3) gains and losses from the difference between amounts of interest and dividends recorded and the amounts actually received.
In addition, the Funds do not isolate the net realized and unrealized gain or loss resulting from changes in exchange rates from the fluctuations resulting from changes in market prices of securities held. Such fluctuations are included with the net realized and unrealized gain or loss on investments.
| 5. | Agreements and Transactions with Affiliates |
The Trust has entered into an Investment Management Agreement under which the Investment Manager, an independently managed subsidiary of Affiliated Managers Group, Inc. (“AMG”), provides or oversees investment management services to the Funds. The Investment Manager selects subadvisors for each Fund (subject to Trustee approval), allocates assets among subadvisors and monitors the subadvisors’ investment programs and results. Each Fund’s
investment portfolio is managed by a portfolio manager who serves pursuant to Subadvisory Agreements with the Investment Manager.
Investment management fees are paid directly by each Fund to the Investment Manager based on average daily net assets. The annual investment management fee rates, as a percentage of average daily net assets for the year ended December 31, 2010, were as follows:
| Investment Management Fee | ||||
Mid-Cap | 0.70 | % | ||
Balanced | 0.70 | % | ||
High Yield | 0.70 | % | ||
Fixed Income | 0.45 | % | ||
Short Duration | 0.70 | % | ||
Intermediate Duration | 0.70 | % | ||
The Investment Manager has contractually agreed, through at least May 1, 2011 to waive fees and pay or reimburse expenses to the extent that the total operating expenses (exclusive of brokerage costs, interest, taxes, acquired fund fees and extraordinary expenses) exceed the following percentages of the following Funds’ average daily net assets:
Mid-Cap | Balanced | |||||||
1.24% | Class A | 1.25 | % | Class A | ||||
1.99% | Class B | 2.00 | % | Class B | ||||
1.99% | Class C | 2.00 | % | Class C | ||||
0.99% | Institutional Class | 1.00 | % | Inst. Class | ||||
High Yield | Fixed Income | |||||||
1.15% | Class A | 0.84 | % | Class A | ||||
1.90% | Class B | 1.59 | % | Class B | ||||
1.90% | Class C | 1.59 | % | Class C | ||||
0.90% | Institutional Class | 0.59 | % | Inst. Class | ||||
Intermediate Duration | Short Duration | |||||||
| 0.89% | n/a | |||||||
Each of Mid-Cap, Balanced, High Yield, Fixed Income, and Intermediate Duration is obligated to repay the Investment Manager such amounts waived, paid or reimbursed in future years provided that the repayment occurs within thirty-six (36) months after the waiver or reimbursement and that such repayment would not cause the Fund’s expenses in any such year to exceed the above percentages,
90 |
Table of Contents
| Notes to Financial Statements (continued) |
based on the Fund’s average daily net assets. For the year ended December 31, 2010, each Fund’s components of reimbursement are detailed in the following chart:
| Mid-Cap | Balanced | High Yield | ||||||||||
Reimbursement Available - 12/31/09 | $ | 305,458 | $ | 316,064 | $ | 525,904 | ||||||
Additional Reimbursements | 85,869 | 98,345 | 200,682 | |||||||||
Repayments | — | — | — | |||||||||
Expired Reimbursements | (110,934 | ) | (115,456 | ) | (184,970 | ) | ||||||
Reimbursement Available - 12/31/10 | $ | 280,393 | $ | 298,953 | $ | 541,616 | ||||||
| Fixed Income | Intermediate Duration | |||||||
Reimbursement Available - 12/31/09 | $ | 810,721 | $ | 252,944 | ||||
Additional Reimbursements | 338,740 | 115,172 | ||||||
Repayments | — | — | ||||||
Expired Reimbursements | (230,995 | ) | — | |||||
Reimbursement Available - 12/31/10 | $ | 918,466 | $ | 368,116 | ||||
Mid-Cap, Balanced, High Yield, and Fixed Income have entered into an Administration and Shareholder Servicing Agreement under which Managers Investment Group LLC serves as each Fund’s administrator (the “Administrator”) and is responsible for all aspects of managing the Funds’ operations, including administration and shareholder services to each Fund, its shareholders, and certain institutions, such as bank trust departments, broker-dealers and registered investment advisers, that advise or act as an intermediary with the Funds’ shareholders. During the year ended December 31, 2010, each of these Funds paid an Administration fee at the rate of 0.20% per annum of the Fund’s average daily net assets.
The aggregate annual retainer paid to each Independent Trustee is $65,000, plus $4,000 or $2,500 for each regular or special meeting attended, respectively. The Trustees’ fees and expenses are allocated among all of the Funds for which the Investment Manager serves as the advisor (the “Managers Funds”) based on the relative net assets of such Funds. The Independent Chairman of the Trusts receives an additional payment of $15,000 per year. The Chairman of the Audit Committee receives an additional payment of $5,000 per year. The “Trustees fees and expenses” shown in the financial statements represents the Funds’ allocated portion of the total fees and expenses paid by the Managers Funds.
The Funds are distributed by Managers Distributors, Inc. (the “Distributor” or “MDI”), a wholly-owned subsidiary of the Investment Manager. MDI serves as the principal underwriter for each Fund in the Trust. MDI is a registered broker-dealer and member of the Financial Industry Regulatory Authority, Inc. (“FINRA”). Shares of each Fund will be continuously offered and will be sold by brokers, dealers or other financial intermediaries who have executed selling agreements with the Distributor. MDI bears all the expenses of providing services pursuant to the Underwriting Agreement, including
the payment of the expenses relating to the distribution of Prospectuses for sales purposes and any advertising or sales literature. Certain Trustees and Officers of the Funds are Officers and/or Directors of the Investment Manager, AMG and/or the Distributor.
Mid-Cap, Balanced, High Yield, and Fixed Income have adopted a distribution and service plan with respect to Class A, Class B and Class C shares of each Fund (the “Plan”), in accordance with the requirements of Rule 12b-1 under the 1940 Act and the requirements of the applicable rules of the FINRA regarding asset-based sales charges. Pursuant to the Plan, each Fund may compensate MDI for its expenditures in financing any activity primarily intended to result in the sale of each such class of Fund shares and for maintenance and personal service provided to existing shareholders of that class. The Plan authorizes payments to MDI up to 0.25%, 1.00% and 1.00% annually of each Fund’s average daily net assets attributable to its Class A, Class B and Class C shares, respectively.
The Plan further provide for periodic payments by MDI to brokers, dealers and other financial intermediaries for providing shareholder services and for promotional and other sales related costs. The portion of payments by Class A, Class B or Class C shares of a Fund for shareholder servicing may not exceed an annual rate of 0.25% of the average daily net asset value of Fund shares of that class owned by clients of such broker, dealer or financial intermediary.
The following summarizes the total fees incurred under the Plan for Class A, Class B and Class C shares for the year ended December 31, 2010:
| Amount | ||||
Mid-Cap | $ | 52,559 | ||
Balanced | 52,206 | |||
High Yield | 107,685 | |||
Fixed Income | 669,889 | |||
On June 23, 2009, the Securities and Exchange Commission granted an exemptive order that permits the Funds to lend and borrow money for certain temporary purposes directly to and from other eligible Funds in the Managers Family of Funds (the “Fund Family”). Participation in this interfund lending program is voluntary for both borrowing and lending Funds, and an interfund loan is only made if it benefits each participating Fund. The Investment Manager administers the program according to procedures approved by the Funds’ Board of Trustees (the “Board”), and the Board monitors the operation of the program. An interfund loan must comply with certain conditions set out in the exemptive order, which are designed to assure fairness and protect all participating Funds. For the year ended December 31, 2010, the following Funds either borrowed from or lent to other Funds in the Fund family: High Yield borrowed varying amounts up to $2,081,574 for 24 days paying interest of $483; Fixed Income lent $1,030,486 for 6 days earning interest of $142. The interest amounts can be found in the Statement of Operations in interest income or as miscellaneous expense.
91 |
Table of Contents
| Notes to Financial Statements (continued) |
| 6. | Purchases and Sales of Securities |
Purchases and sales of securities (excluding short-term securities) for the year ended December 31, 2010, were as follows:
| Long-Term Securities (excluding U.S. Government Obligations) | U.S. Government Obligations | |||||||||||||||
Fund | Purchases | Sales | Purchases | Sales | ||||||||||||
Mid-Cap | $ | 48,961,205 | $ | 52,277,105 | n/a | n/a | ||||||||||
Balanced | 9,859,622 | 13,668,116 | $ | 6,902,743 | $ | 4,216,683 | ||||||||||
High Yield | 18,774,522 | 27,238,265 | n/a | n/a | ||||||||||||
Fixed Income | 33,452,204 | 22,335,508 | 6,399,947 | 8,430,934 | ||||||||||||
Short Duration | 38,389,106 | 23,009,289 | 473,421,575 | 362,518,748 | ||||||||||||
Intermediate Duration | 11,098,064 | 9,172,163 | 757,409,786 | 780,599,205 | ||||||||||||
| 7. | Portfolio Securities Loaned |
The Funds participate in a securities lending program offered by BNYM, providing for the lending of securities to qualified brokers. Securities lending fees include earnings of such temporary cash investments, plus or minus any rebate to a borrower. These earnings (after any rebate) are then divided between BNYM, as a fee for its services under the program, and the Fund, according to agreed-upon rates. Collateral on all securities loaned is accepted in cash and/or government securities and is maintained at a minimum level of 102% (105% in the case of certain foreign securities) of the market value, plus interest, if applicable, of investments on loan. It is the Funds’ policy to obtain additional collateral from or return excess collateral to the borrower by the end of the next business day, following the valuation date of the securities loaned. Therefore, the value of the collateral held may be temporarily less than the value of the securities on loan. Lending securities entails a risk of loss to the Funds if and to the extent that the market value of the securities loaned were to increase and the borrower did not increase the collateral accordingly, and the borrower fails to return the securities. The Funds bear the risk of any deficiency in the amount of the collateral available for return to the borrower due to any loss on the collateral invested. Collateral received in the form of cash is invested temporarily in the BNY Mellon Overnight Government Fund, formerly the BNY Institutional Cash Reserves Fund (the “ICRF”), or other short-term investments as defined in the Securities Lending Agreement with BNYM.
Effective August 2, 2010, the Trust, on behalf of each applicable Fund, has entered into an agreement with The Bank of New York Mellon and the Bank of New York Mellon Corporation (“BNYMC”) with respect to each Fund’s position in the BNY Institutional Cash Reserves Fund (the “ICRF”), pursuant to which (i) BNYMC will support the value of certain defaulted securities issued by Lehman Brothers Holdings, Inc. and held by ICRF, and (ii) if certain conditions are met, BNYMC will purchase the defaulted securities from each Fund in September 2011. Each applicable Fund is fair valuing
its position in the ICRF daily. Each Fund’s position, if any, in the separate sleeve of the ICRF is included in the3Schedule of Portfolio Investments and the unrealized loss on such investment is included in Net Unrealized Appreciation on the Statement of Assets and Liabilities and Statement of Operations.
| 8. | Risks Associated with Collateralized Mortgage Obligations (“CMOs”) |
The net asset value of the Short Duration and Intermediate Duration Funds may be sensitive to interest rate fluctuations because the Funds may hold several instruments, including CMOs and other derivatives, whose values can be significantly impacted by interest rate movements. CMOs are obligations collateralized by a portfolio of mortgages or mortgage-related securities. Payments of principal and interest on the mortgages are passed through to the holder of the CMOs on the same schedule as they are received, although certain classes of CMOs have priority over others with respect to the receipt of prepayments on the mortgages. Therefore, the investment in CMOs may be subject to a greater or lesser risk of prepayment than other types of mortgage-related securities. CMOs may have a fixed or variable rate of interest.
| 9. | Risks Associated with High Yield Securities (High Yield) |
Investing in high yield securities involves greater risks and considerations not typically associated with U.S. Government and other high quality/investment grade securities. High Yield securities are generally below investment grade securities and do not have an established retail secondary market. Economic downturns may disrupt the high yield market and impair the issuer’s ability to repay principal and interest. Also, an increase in interest rates would likely have an adverse impact on the value of such obligations and could cause the securities to become less liquid.
| 10. | Subsequent Events |
The Funds have determined that no additional material events or transactions occurred through the issuance date of the Funds’ financial statements, which require additional disclosure in or adjustment of the Funds’ financial statements.
92 |
Table of Contents
| Tax Information (continued) |
Tax Information (unaudited)
Each Fund hereby designates the maximum amount allowable of its net taxable income as qualified dividends as provided in the Jobs and Growth Tax Relief Reconciliation Act of 2003. The 2010 Form 1099-DIV you receive for each Fund will show the tax status of all distributions paid to you during the year.
Pursuant to section 852 of the Internal Revenue Code, Mid-Cap, Balanced, High Yield, Fixed Income, Short Duration, and Intermediate Duration hereby designate as a capital gain distribution with respect to the taxable year ended December 31, 2010, $0, $0, $0, $0, $0 and $450,528, respectively or, if subsequently determined to be different, the net capital gains of such year.
93 |
Table of Contents
| Report of Independent Registered Public Accounting Firm |
To the Board of Trustees of Managers Trust II and the Shareholders of Managers AMG Chicago Equity Partners Mid-Cap Fund, Managers AMG Chicago Equity Partners Balanced Fund, Managers High Yield Fund, Managers Fixed Income Fund, Managers Short Duration Government Fund and Managers Intermediate Duration Government Fund:
In our opinion, the accompanying statements of assets and liabilities, including the schedules of portfolio investments, and the related statements of operations and of changes in net assets and the financial highlights present fairly, in all material respects, the financial position of Managers AMG Chicago Equity Partners Mid-Cap Fund, Managers AMG Chicago Equity Partners Balanced Fund, Managers High Yield Fund, Managers Fixed Income Fund, Managers Short Duration Government Fund and Managers Intermediate Duration Government Fund (constituting Managers Trust II, hereafter referred to as the “Funds”) at December 31, 2010, the results of each of their operations for the year then ended, the changes in each of their net assets for each of the two years in the period then ended and the financial highlights for each of the periods indicated, in conformity with accounting principles generally accepted in the United States of America. These financial statements and financial highlights (hereafter referred to as “financial statements”) are the responsibility of the Funds’ management; our responsibility is to express an opinion on these financial statements based on our audits. We conducted our audits of these financial statements in accordance with the standards of the Public Company Accounting Oversight Board (United States). Those standards require that we plan and perform the audit to obtain reasonable assurance about whether the financial statements are free of material misstatement. An audit includes examining, on a test basis, evidence supporting the amounts and disclosures in the financial statements, assessing the accounting principles used and significant estimates made by management, and evaluating the overall financial statement presentation. We believe that our audits, which included confirmation of securities at December 31, 2010 by correspondence with the custodian and brokers, provide a reasonable basis for our opinion.
PricewaterhouseCoopers LLP
Philadelphia, Pennsylvania
February 24, 2011
94 |
Table of Contents
| Trustees and Officers |
The Trustees and Officers of the Trust, their business addresses, principal occupations for the past five years and dates of birth are listed below. The Trustees provide broad supervision over the affairs of the Trust and the Funds. The Trustees are experienced executives who meet periodically throughout the year to oversee the Funds’ activities, review contractual arrangements with companies that provide services to the Funds, and review the Funds’ performance. Unless otherwise noted, the address of each Trustee or Officer is the address of the Trust: 800 Connecticut Avenue, Norwalk, Connecticut 06854.
There is no stated term of office for Trustees. Trustees serve until their resignation, retirement or removal in accordance with the Trust’s organizational documents and policies adopted by the Board from time to time. The Chairman of the Trustees, President, Treasurer and Secretary of the Trust are elected by the Trustees annually. Other officers hold office at the pleasure of the Trustees.
Independent Trustees
The following Trustees are not “interested persons” of the Trust within the meaning of the 1940 Act:
Name, Date of Birth, Number of Funds Overseen in Fund Complex* | Principal Occupation(s) During Past | |
Jack W. Aber, 9/9/37 • Trustee since 2000 • Oversees 41 Funds in Fund Complex | Professor of Finance, Boston University School of Management (1972-Present); Trustee of Appleton Growth Fund (1 portfolio); Trustee of Third Avenue Trust (5 portfolios); Trustee of Third Avenue Variable Trust (1 portfolio); Trustee of Aston Funds (24 portfolios). | |
William E. Chapman, II, 9/23/41 • Independent Chairman • Trustee since 2000 • Oversees 41 Funds in Fund Complex | President and Owner, Longboat Retirement Planning Solutions (1998-Present); Hewitt Associates, LLC (part time) (provider of Retirement and Investment Education Seminars) (2002-2009); Trustee of Bowdoin College (2002-Present); Director of Harding, Loevner Funds, Inc. (6 portfolios); Trustee of Third Avenue Trust (5 portfolios); Trustee of Third Avenue Variable Trust (1 portfolio); Trustee of Aston Funds (24 portfolios). | |
Edward J. Kaier, 9/23/45 • Trustee since 2000 • Oversees 41 Funds in Fund Complex | Attorney at Law and Partner, Teeters Harvey Gilboy & Kaier LLP (2007-Present); Attorney at Law and Partner, Hepburn Willcox Hamilton & Putnam, LLP (1977-2007); Trustee of Third Avenue Trust (5 portfolios); Trustee of Third Avenue Variable Trust (1 portfolio); Trustee of Aston Funds (24 portfolios). | |
Steven J. Paggioli, 4/3/50 • Trustee since 2000 • Oversees 41 Funds in Fund Complex | Consultant (2001-Present); Formerly Executive Vice President and Director, The Wadsworth Group (1986- 2001); Executive Vice President, Secretary and Director, Investment Company Administration, LLC (1990-2001); Vice President, Secretary and Director, First Fund Distributors, Inc. (1991-2001); Trustee, Professionally Managed Portfolios (40 portfolios); Advisory Board Member, Sustainable Growth Advisors, LP; Independent Director, Chase Investment Counsel (2008 – Present); Trustee of Aston Funds (24 portfolios). | |
Eric Rakowski, 6/5/58 • Trustee since 2000 • Oversees 41 Funds in Fund Complex | Professor, University of California at Berkeley School of Law (1990-Present); Director of Harding, Loevner Funds, Inc. (6 portfolios); Trustee of Third Avenue Trust (5 portfolios); Trustee of Third Avenue Variable Trust (1 portfolio); Trustee of Aston Funds (24 portfolios). | |
Thomas R. Schneeweis, 5/10/47 • Trustee since 2000 • Oversees 41 Funds in Fund Complex | Professor of Finance, University of Massachusetts (1977-Present); Director, CISDM at the University of Massachusetts, (1996-Present); President, Alternative Investment Analytics, LLC, (formerly Schneeweis Partners, LLC) (2001-Present); Partner, S Capital Management, LLC (2007-Present); Partner, TRS Associates (1982-Present); Trustee of Aston Funds (24 portfolios). | |
| * | The Fund Complex consists of Managers AMG Funds, The Managers Funds, Managers Trust I and Managers Trust II. |
Interested Trustees
The following Trustees are “interested persons” of the Trust within the meaning of the 1940 Act. Mr. Dalton is an interested person by virtue of his positions with, and interest in securities of, Affiliated Managers Group, Inc. and his position with Managers Distributors, Inc. Mr. Streur is an interested person by virtue of his positions with Managers Investment Group LLC.
Name, Date of Birth, Number of Funds Overseen in Fund Complex* | Principal Occupation(s) During Past | |
Nathaniel Dalton, 9/29/66 • Trustee since 2008 • Oversees 41 Funds in Fund Complex | Executive Vice President and Chief Operating Officer, Affiliated Managers Group, Inc., (2006-Present); Executive Vice President, Affiliated Managers Group, Inc., (2002 -2006); Executive Vice President and General Counsel, Affiliated Managers Group, Inc. (2001-2002); Senior Vice President and General Counsel, Affiliated Managers Group, Inc. (1996-2001). Director, Managers Distributors, Inc. (2000-Present). | |
John H. Streur, 2/6/60 • Trustee since 2008 • President since 2008 • Oversees 41 Funds in Fund Complex | Senior Managing Partner, Managers Investment Group LLC (2006-Present); President, Managers Distributors, Inc. (2006-Present); Managing Partner, Managers Investment Group LLC (2005-2006); Chief Executive Officer, President and Chief Operating Officer, The Burridge Group LLC (1996-2004). | |
Officers
| ||
Name, Date of Birth, Position(s) Held with Fund and Length of Time Served | Principal Occupation(s) During Past | |
Christine C. Carsman, 4/2/52 • Secretary since 2004 • Chief Legal Officer since 2004 | Senior Vice President and Chief Regulatory Counsel, Affiliated Managers Group, Inc. (2004-Present); Secretary, The Managers Funds, Managers AMG Funds and Managers Trust I (2004-Present); Senior Counsel, Vice President and Director of Operational Risk Management and Compliance, Wellington Management Company, LLP (1995-2004); Deputy General Counsel, The Boston Company, Inc. (1993- 1995); Associate General Counsel, The Boston Company Advisors, Inc. (1991-1993); Associate, Sullivan & Worcester LLP (1987-1991). | |
Donald S. Rumery, 5/29/58 • Chief Financial Officer since 2007 • Treasurer since 2000 | Senior Vice President, Managers Investment Group LLC (2005-Present); Treasurer and Chief Financial Officer, Managers Distributors, Inc. (2000-Present); Treasurer, The Managers Funds (1995-Present); Treasurer, Managers AMG Funds (1999-Present); Treasurer, Managers Trust I (2000-Present); Chief Financial Officer, The Managers Funds, Managers AMG Funds and Managers Trust I (2007-Present); Vice President, The Managers Funds LLC, (1994-2004). | |
Keitha L. Kinne, 5/16/58 • Chief Operating Officer since 2007 | Managing Partner and Chief Operating Officer, Managers Investment Group LLC (2007-Present); Chief Investment Officer, Managers Investment Group LLC (2008-Present); Chief Operating Officer, The Managers Funds, Managers AMG Funds and Managers Trust I (2007-Present); Managing Director, Legg Mason & Co., LLC (2006-2007); Managing Director, Citigroup Asset Management (2004-2006). | |
David Kurzweil, 6/22/74 • Assistant Secretary since 2008 | Senior Vice President and Associate Counsel, Managers Investment Group LLC (2008-Present); Assistant Secretary, The Managers Funds, Managers AMG Funds and Managers Trust I (2008-Present); Counsel and Senior Vice President, Lazard Asset Management LLC (2003-2008). | |
John J. Ferencz, 3/09/62 • Chief Compliance Officer • Code of Ethics Reporting Officer • AML Compliance Officer • Sarbanes-Oxley Code of Ethics Compliance Officer since 2010 | Vice President, Legal and Compliance, Managers Investment Group LLC (2010-Present); Senior Compliance Analyst, Mutual Funds and Regulatory, GE Asset Management Incorporated (2005-2010). | |
95 |
Table of Contents
Investment Manager and Administrator
Managers Investment Group LLC
333 W. Wacker Drive
Suite 1200
Chicago, IL 60606
(800) 835-3879
Distributor
Managers Distributors, Inc.
333 W. Wacker Drive
Suite 1200
Chicago, IL 60606
(800) 835-3879
Custodian
The Bank of New York Mellon
2 Hanson Place
Brooklyn, New York 11217
Legal Counsel
Ropes & Gray LLP
Prudential Tower, 800 Boylston Street
Boston, Massachusetts 02199-3600
Transfer Agent
BNY Mellon Investment Servicing (US) Inc.*
Attn: Managers
P.O. Box 9769
Providence, Rhode Island 02940
(800) 548-4539
For Managers Choice Only
Managers
c/o BNY Mellon Investment Servicing (US) Inc.*
P.O. Box 9847
Providence, Rhode Island 02940-8047
(800) 358-7668
| * | Formerly PNC Global Investment Servicing (U.S.) Inc. |

Table of Contents
MANAGERS AND MANAGERS AMG FUNDS
EQUITY FUNDS | BALANCED FUNDS | |||
| CADENCE CAPITAL APPRECIATION | INTERNATIONAL EQUITY | CHICAGO EQUITY PARTNERS BALANCED | ||
| CADENCE FOCUSED GROWTH | AllianceBernstein L.P. | Chicago Equity Partners, LLC | ||
| CADENCE MID-CAP | Lazard Asset Management, LLC | ALTERNATIVE FUNDS | ||
| CADENCE EMERGING COMPANIES | Martin Currie Inc. | |||
| Cadence Capital Management, LLC | ||||
| REAL ESTATE SECURITIES | FQ GLOBAL ALTERNATIVES | |||
| CHICAGO EQUITY PARTNERS MID-CAP | Urdang Securities Management, Inc. | FQ GLOBAL ESSENTIALS | ||
| Chicago Equity Partners, LLC | First Quadrant, L.P. | |||
| RENAISSANCE LARGE CAP GROWTH | ||||
| EMERGING MARKETS EQUITY | Renaissance Group LLC | INCOME FUNDS | ||
| Rexiter Capital Management Limited Schroder Investment Management North America Inc. | SKYLINE SPECIAL EQUITIES | BOND (MANAGERS) | ||
| PORTFOLIO | FIXED INCOME | |||
| ESSEX SMALL/MICRO CAP GROWTH | Skyline Asset Management, L.P. | GLOBAL BOND | ||
| Essex Investment Management Co., LLC | Loomis, Sayles & Co., L.P. | |||
| SPECIAL EQUITY | ||||
| FQ TAX-MANAGED U.S. EQUITY | Ranger Investment Management, L.P. | BOND (MANAGERS PIMCO) | ||
| FQ U.S. EQUITY | Lord, Abbett & Co. LLC | Pacific Investment Management Co. LLC | ||
| First Quadrant, L.P. | Smith Asset Management Group, L.P. | CALIFORNIA INTERMEDIATE TAX- FREE | ||
| Federated MDTA LLC | Miller Tabak Asset Management LLC | |||
| FRONTIER SMALL CAP GROWTH | ||||
| Frontier Capital Management Company, LLC | SYSTEMATIC VALUE | GW&K MUNICIPAL BOND | ||
| SYSTEMATIC MID CAP VALUE | GW&K MUNICIPAL ENHANCED YIELD | |||
| GW&K SMALL CAP EQUITY | Systematic Financial Management, L.P. | Gannett Welsh & Kotler, LLC | ||
| Gannett Welsh & Kotler, LLC | ||||
| TIMESSQUARE MID CAP GROWTH | HIGH YIELD | |||
| INSTITUTIONAL MICRO-CAP | TIMESSQUARE SMALL CAP GROWTH | J.P. Morgan Investment Management LLC | ||
| MICRO-CAP | TSCM GROWTH EQUITY | |||
| Lord, Abbett & Co. LLC | TimesSquare Capital Management, LLC | INTERMEDIATE DURATION GOVERNMENT | ||
| WEDGE Capital Management L.L.P. | SHORT DURATION GOVERNMENT | |||
| Next Century Growth Investors LLC | TRILOGY GLOBAL EQUITY | Smith Breeden Associates, Inc. | ||
| RBC Global Asset Management (U.S.) Inc. | TRILOGY EMERGING MARKETS EQUITY | |||
| TRILOGY INTERNATIONAL SMALL CAP | ||||
Trilogy Global Advisors, L.P.
| ||||
This report is prepared for the Funds’ shareholders. It is authorized for distribution to prospective investors only when preceded or accompanied by an effective prospectus. To receive a free copy of the prospectus or Statement of Additional Information, which includes additional information about Fund Trustees, please contact us by calling 800.835.3879. Distributed by Managers Distributors, Inc., member FINRA.
A description of the policies and procedures each Fund uses to vote its proxies is available: (i) without charge, upon request, by calling 800.835.3879, or (ii) on the Securities and Exchange Commission’s (SEC) Web site at www. sec.gov. For information regarding each Fund’s proxy voting record for the 12-month period ended June 30, call 800.835.3879 or visit the SEC Web site at www.sec.gov.
The Funds file their complete schedule of portfolio holdings with the SEC for the first and third quarters of each fiscal year on Form N-Q. The Funds’ Forms N-Q are available on the SEC’s website at www.sec.gov. A Fund’s Forms N-Q may be reviewed and copied at the SEC’s Public Reference Room in Washington, DC. Information on the operation of the Public Reference Room may be obtained by calling 800.SEC.0330. To review a complete list of the Funds’ portfolio holdings, or to view the most recent quarterly holdings report, semiannual report, or annual report, please visit www.managersinvest.com.
|
| |||

www.managersinvest.com

Table of Contents
| Item 2. | CODE OF ETHICS |
Registrant has adopted a Code of Ethics. See attached Exhibit (a)(1).
| Item 3. | AUDIT COMMITTEE FINANCIAL EXPERT |
Registrant’s Board of Trustees has determined that independent Trustees Mr. Jack W. Aber and Mr. Steven J. Paggioli each qualify as the Audit Committee Financial Expert. Mr. Aber and Mr. Paggioli are “independent” as such term is defined in Form N-CSR.
| Item 4. | PRINCIPAL ACCOUNTANT FEES AND SERVICES |
The aggregate fees billed by PwC to the Fund for the Funds’ two most recent fiscal years for professional services rendered for audits of annual financial statements, or services that are normally provided in connection with statutory and regulatory filings or engagements (“Audit Fees”) were as follows:
| Fiscal 2010 | Fiscal 2009 | |||||||
Managers AMG Chicago Equity Partners Mid-Cap Fund | 20,014 | $ | 23,161 | |||||
Managers AMG Chicago Equity Partners Balanced Fund | 20,056 | $ | 21,101 | |||||
Managers High Yield Fund | 24,509 | $ | 25,786 | |||||
Managers Fixed Income Fund | 27,537 | $ | 28,971 | |||||
Managers Short Duration Government Fund | 25,638 | $ | 23,554 | |||||
Managers Intermediate Duration Government Fund | 25,638 | $ | 23,554 | |||||
All Funds in the Managers Complex Audited by PwC | 994,109 | $ | 850,498 | |||||
Audit-Related Fees
There were no fees billed by PwC to the Funds in its two recent fiscal years for services rendered for assurance and related services that are reasonably related to the performance of the audit or review of the Fund’s financial statements, but are not reported as Audit Fees (“Audit-Related Fees”).
For the Funds’ two most recent fiscal years, there were no Audit-Related Fees billed by PwC for engagements related directly to the operations and financial reporting of one or more Funds by a Fund Service Provider. A Fund Service Provider is (a) any investment adviser to the Fund (not including any Subadvisor whose role is primarily portfolio management and is subcontracted with or overseen by another investment adviser) or (b) any entity that provides ongoing services to the Fund and is controlling, controlled by or under common control with a Fund investment adviser described in (a).
Table of Contents
Tax Fees
The aggregate fees billed by PwC to the Funds for the two most recent fiscal years for professional services rendered for tax compliance, tax advice, and tax planning (“Tax Fees”) were as follows:
| Fiscal 2010 | Fiscal 2009 | |||||||
Managers AMG Chicago Equity Partners Mid-Cap Fund | 7,200 | $ | 5,800 | |||||
Managers AMG Chicago Equity Partners Balanced Fund | 7,200 | $ | 5,800 | |||||
Managers High Yield Fund | 7,200 | $ | 6,500 | |||||
Managers Fixed Income Fund | 7,200 | $ | 6,500 | |||||
Managers Short Duration Government Fund | 9,000 | $ | 9,050 | |||||
Managers Intermediate Duration Government Fund | 8,450 | $ | 9,050 | |||||
For the Funds’ two most recent fiscal years, Tax Fees billed by PwC for engagements by Fund Service Providers that related directly to the operations and financial reporting of the Funds were $0 for fiscal 2008 and $0 for fiscal 2007, respectively.
The services for which Tax Fees were charged comprise all services performed by professional staff in PwC’s tax division except those services related to the audit. Typically, this category would include fees for tax compliance, tax planning, and tax advice. Tax compliance, tax advice, and tax planning services include preparation of original and amended tax returns, claims for refund and tax payment-planning services, assistance with tax audits and appeals, tax advice related to mergers and acquisitions and requests for rulings or technical advice from taxing authorities.
All Other Fees
There were no other fees billed by PwC to the Funds for all other non-audit services (“Other Fees”) during the Funds’ two most recent fiscal years. During the same period, there were no Other Fees billed by PwC for engagements by Fund Service Providers that related directly to the operations and financial reporting of the Funds.
According to policies adopted by the Audit Committee, services provided by PwC to the Funds must be pre-approved by the Audit Committee. On an annual basis, the Audit Committee reviews and pre-approves various types of services that PwC may perform for the Funds without specific approval of each engagement, subject to specified budget limitations. As contemplated by the Sarbanes-Oxley Act of 2002 and related SEC rules, the Audit Committee also pre-approves non-audit services provided by PwC to any Fund Service Provider for any engagement that relates directly to the operations and financial reporting of the Funds. Any engagement that is not already pre-approved or that will exceed a pre-approved budget must be submitted to the Audit Committee for pre-approval. The Chairman of the Audit Committee is authorized on behalf of the Board of Trustees and the Audit Committee to approve the engagement of PwC to perform non-audit services subject to certain conditions, including notification to the Audit Committee of such pre-
Table of Contents
approval not later than the next meeting of the Audit Committee following the date of such pre-approval.
There were no other fees billed by PwC for non-audit services rendered to the Funds and to Fund Service Providers for the Funds’ two most recent fiscal years.
The Audit Committee has considered whether the provision of non-audit services by PwC to Fund Service Providers that were not required to be pre-approved by the Audit Committee is compatible with maintaining PwC’s independence in its audit of the Funds, taking into account representations from PwC, in accordance with Independence Standards Board Standard No. 1, regarding its independence from the Funds and its related entities.
The following table sets forth the non-audit services provided by PwC to the Funds and its service affiliates defined as the Funds’ investment advisor and any entity controlling, controlled by or under common control with Managers Investment Group LLC that provides ongoing services to the Funds (“Control Affiliates”) for the last two fiscal years.
| Audit-related fees A | Tax fees A | All other fees A | ||||||||||||||||||||||
| 2009 | 2008 | 2009 | 2008 | 2009 | 2008 | |||||||||||||||||||
Control Affiliates | $ | 580,765 | $ | 343,015 | $ | 467,485 | $ | 897,895 | $ | 0 | $ | 0 | ||||||||||||
| A | Aggregate amounts may reflect rounding. |
| Item 5. | AUDIT COMMITTEE OF LISTED REGISTRANTS |
Not applicable.
| Item 6. | SCHEDULE OF INVESTMENTS |
The schedule of investments in unaffiliated issuers as of the close of the reporting period is included as part of the shareholder report contained in Item 1 hereof.
| Item 7. | DISCLOSURE OF PROXY VOTING POLICIES AND PROCEDURES FOR CLOSED-END MANAGEMENT INVESTMENT COMPANIES |
Not applicable.
| Item 8. | PORTFOLIO MANAGERS OF CLOSED-END MANAGEMENT INVESTMENT COMPANIES |
Not applicable.
| Item 9. | PURCHASES OF EQUITY SECURITIES BY CLOSED-END MANAGEMENT INVESTMENT COMPANIES AND AFFILIATED PURCHASERS |
Not applicable.
| Item 10. | SUBMISSION OF MATTERS TO A VOTE OF SECURITY HOLDERS |
Not applicable.
| Item 11. | CONTROLS AND PROCEDURES |
Table of Contents
(a) The Registrant’s principal executive and principal financial officers have concluded, based on their evaluation of the registrant’s disclosure controls and procedures as of a date within 90 days of the filing of this report, that the Registrant’s disclosure controls and procedures are reasonably designed to ensure that information required to be disclosed by the Registrant on Form N-CSR is recorded, processed, summarized and reported within the required time periods and that information required to be disclosed by the registrant in the reports that it files or submits on Form N-CSR is accumulated and communicated to the Registrant’s management, including its principal executive and principal financial officers, as appropriate to allow timely decisions regarding required disclosure.
(b) There were no changes in the Registrant’s internal control over financial reporting during the Registrant’s fourth fiscal quarter of the period covered by this report that have materially affected, or are reasonably likely to affect, the internal control over financial reporting.
Table of Contents
| Item 12. | EXHIBITS |
| (a)(1) | Any Code of Ethics or amendments hereto. Filed herewith. | |
| (a)(2) | Certifications pursuant to Rule 30a-2(a) under the Investment Company Act of 1940 - Filed herewith. | |
(a)(3) | Not applicable. | |
| (b) | Certifications pursuant to Rule 30a-2(b) under the Investment Company Act of 1940 - Filed herewith. | |
Table of Contents
SIGNATURES
Pursuant to the requirements of the Securities Exchange Act of 1934 and the Investment Company Act of 1940, the registrant has duly caused this report to be signed on its behalf by the undersigned, thereunto duly authorized.
| MANAGERS TRUST II | ||
By: | /s/ John H. Streur | |
| John H. Streur, President | ||
Date: | March 9, 2011 | |
Pursuant to the requirements of the Securities Exchange Act of 1934 and the Investment Company Act of 1940, this report has been signed below by the following persons on behalf of the registrant and in the capacities and on the dates indicated.
By: | /s/ John H. Streur | |
| John H. Streur, President | ||
Date: | March 9, 2011 | |
By: | /s/ Donald S. Rumery | |
| Donald S. Rumery, Chief Financial Officer | ||
Date: | March 9, 2011 | |