UNITED STATES
SECURITIES AND EXCHANGE COMMISSION
Washington, D.C. 20549
FORM N-CSR
CERTIFIED SHAREHOLDER REPORT OF REGISTERED
MANAGEMENT INVESTMENT COMPANIES
Investment Company Act file number: 811-06431
MANAGERS TRUST II
(Exact name of registrant as specified in charter)
800 Connecticut Avenue, Norwalk, Connecticut 06854
(Address of principal executive offices) (Zip code)
Managers Investment Group LLC
800 Connecticut Avenue,
Norwalk, Connecticut 06854
(Name and address of agent for service)
Registrant’s telephone number, including area code: (203) 299-3500
Date of fiscal year end: DECEMBER 31
Date of reporting period: JANUARY 1, 2013 – DECEMBER 31, 2013
(Annual Shareholder Report)
| Item 1. | Reports to Shareholders |
AR070-1213
Managers Funds
Annual Report—December 31, 2013
| | | | |
TABLE OF CONTENTS | | Page | |
| |
LETTER TO SHAREHOLDERS | | | 2 | |
| |
ABOUT YOUR FUND’S EXPENSES | | | 3 | |
| |
PORTFOLIO MANAGER’S COMMENTS, FUND SNAPSHOTS, AND SCHEDULES OF PORTFOLIO INVESTMENTS | | | | |
| |
Managers Short Duration Government Fund | | | 4 | |
| |
Managers Intermediate Duration Government Fund | | | 16 | |
| |
NOTES TO SCHEDULES OF PORTFOLIO INVESTMENTS | | | 24 | |
| |
FINANCIAL STATEMENTS | | | | |
| |
Statement of Assets and Liabilities | | | 28 | |
Balance sheets, net asset value (NAV) per share computations and cumulative undistributed amounts | | | | |
| |
Statement of Operations | | | 29 | |
Detail of sources of income, expenses, and realized and unrealized gains (losses) during the year | | | | |
| |
Statements of Changes in Net Assets | | | 30 | |
Detail of changes in assets for the past two years | | | | |
| |
FINANCIAL HIGHLIGHTS | | | 31 | |
Historical net asset values per share, distributions, total returns, income and expense ratios, turnover ratios and net assets | | | | |
| |
NOTES TO FINANCIAL STATEMENTS | | | 33 | |
Accounting and distribution policies, details of agreements and transactions with Fund management and affiliates, and descriptions of certain investment risks | | | | |
| |
REPORT OF INDEPENDENT REGISTERED PUBLIC ACCOUNTING FIRM | | | 40 | |
| |
TRUSTEES AND OFFICERS | | | 41 | |
| |
ANNUAL RENEWAL OF INVESTMENT MANAGEMENT AND SUBADVISORY AGREEMENTS | | | 43 | |
Nothing contained herein is to be considered an offer, sale or solicitation of an offer to buy shares of any series of the Managers Family of Funds. Such offering is made only by Prospectus, which includes details as to offering price and other material information.
Letter to Shareholders
Dear Shareholder:
Thank you for your investment in The Managers Funds. Our foremost goal at Managers Investment Group (“MIG”) is to provide investment products and solutions that help our shareholders and clients successfully reach their investment goals and objectives. We do this by offering a broad selection of Funds managed by a collection of Affiliated Managers Group’s (“AMG”) Affiliate investment boutiques, along with a complementary series of open-architecture mutual funds.
The past year has been an exciting one for us at MIG. We were pleased to welcome the Brandywine Funds into the Managers Fund Family several months ago. We are excited to begin this new chapter in the 27-year history of the Brandywine Funds, while maintaining shareholders’ access to the same investment process that has guided the Brandywine Funds since their inception using the research-driven investment approach of Friess Associates.
We announced effective November 1, 2013, that the GW&K Small Cap Equity Fund would be closed to new investors with certain limited exceptions. The team at GW&K manages a total of $2.5 billion (as of December 31, 2013) in small-capitalization equities and closing the Fund to new investors allows the team to continue to execute on the investment process that has been effective for more than a decade. We also announced effective December 31, 2013, that Yacktman Fund and Yacktman Focused Fund will be closed to new investors with certain limited exceptions. The team at Yacktman Asset Management manages over $30 billion in U.S. equities and closing these Funds to new investors allows the team to continue to execute on the investment process that has been effective for more than two decades. We will continue to make decisions such as these that we believe are in the best interest of our shareholders.
Risky assets did well in 2013, with U.S. equity markets surpassing all-time highs. Ongoing global monetary easing, a low-yield environment, and healthy U.S. economic growth are supporting investor appetite for risk assets. Despite improving investor sentiment, risks remain, including uncertainty surrounding the Fed’s eventual exit from its ultra-accommodative monetary policy, ongoing fiscal headwinds in the U.S. and slower growth in Emerging Markets. Nevertheless, we are cautiously optimistic about the prospects for the upcoming year and we are confident that our Funds are well positioned to weather an uncertain economic environment.
We thank you for your continued confidence and investment in The Managers Funds. You can rest assured that under all market conditions our team is focused on delivering excellent investment management services for your benefit.
Respectfully,

Keitha Kinne
President
Managers Investment Group LLC
2
About Your Fund’s Expenses
As a shareholder of a Fund, you may incur two types of costs: (1) transaction costs, which may include sales charges (loads) on purchase payments; redemption fees; and exchange fees; and (2) ongoing costs, including management fees; distribution (12b-1) fees; and other Fund expenses. This example is intended to help you understand your ongoing costs (in dollars) of investing in the Fund and to compare these costs with the ongoing costs of investing in other mutual funds. The example is based on $1,000 invested at the beginning of the period and held for the entire period as indicated below.
Actual Expenses
The first line of the following table provides information about the actual account values and actual expenses. You may use the information in this line, together with the amount you invested, to estimate the expenses that you paid over the period. Simply divide your account value by $1,000 (for example, an $8,600 account value divided by $1,000 = 8.6), then multiply the result by the number in the first line under the heading entitled “Expenses Paid During Period” to estimate the expenses you paid on your account during this period.
Hypothetical Example for Comparison Purposes
The second line of the following table provides information about hypothetical account values and hypothetical expenses based on the Fund’s actual expense ratio and an assumed annual rate of return of 5% before expenses, which is not the Fund’s actual return. The hypothetical account values and expenses may not be used to estimate the actual ending account balance or expenses you paid for the period. You may use this information to compare the ongoing costs of investing in the Fund and other funds by comparing this 5% hypothetical example with the 5% hypothetical examples that appear in the shareholder reports of other funds.
Please note that the expenses shown in the table are meant to highlight your ongoing costs only and do not reflect any transactional costs, such as sales charges (loads), redemption fees, or exchange fees. Therefore, the second line of the table is useful in comparing ongoing costs only, and will not help you determine the relative total costs of owning different funds.
| | | | | | | | | | | | | | | | |
Six Months Ended
December 31, 2013 | | Expense
Ratio for
the Period | | | Beginning
Account
Value
07/01/13 | | | Ending
Account
Value
12/31/13 | | | Expenses
Paid During
the Period* | |
Managers Short Duration Government Fund | | | | | | | | | | | | | | | | |
Based on Actual Fund Return | | | 0.78 | % | | $ | 1,000 | | | $ | 1,006 | | | $ | 3.94 | |
Hypothetical (5% return before expenses) | | | 0.78 | % | | $ | 1,000 | | | $ | 1,021 | | | $ | 3.97 | |
| | | | |
Managers Intermediate Duration Government Fund | | | | | | | | | | | | | | | | |
Based on Actual Fund Return | | | 0.89 | % | | $ | 1,000 | | | $ | 1,010 | | | $ | 4.51 | |
Hypothetical (5% return before expenses) | | | 0.89 | % | | $ | 1,000 | | | $ | 1,021 | | | $ | 4.53 | |
| * | Expenses are equal to the Fund’s annualized expense ratio multiplied by the average account value over the period, multiplied by the number of days in the most recent half-year (184), then divided by 365. |
3
Managers Short Duration Government Fund
Portfolio Manager’s Comments
The Managers Short Duration Government Bond Fund (“the Fund”) seeks to provide investors with a high level of current income, consistent with a low volatility of net asset value.
The Fund seeks to achieve its objective by matching the duration, or interest-rate risk, of a portfolio that invests exclusively in six-month U.S. Treasury securities on a constant maturity basis. Under normal circumstances, the Fund will invest at least 80% of its net assets, plus the amount of any borrowings for investment purposes, in debt securities issued by the U.S. government or its agencies and instrumentalities and synthetic instruments or derivatives having economic characteristics similar to such debt securities.
The Fund typically employs hedging techniques using instruments such as interest rate futures, options, floors, caps and swaps, designed to reduce the interest-rate risk of their fixed-income securities. The Fund’s benchmark is the six-month U.S. Treasury bill.
THE PORTFOLIO MANAGER
Amundi Smith Breeden LLC
Effective September 30, 2013, Amundi Group indirectly acquired 100% ownership of Smith Breeden Associates, Inc. (“Smith Breeden”), the Fund’s subadvisor (the “Acquisition”). Pursuant to the Acquisition, Smith Breeden converted to a Delaware limited liability company named Amundi Smith Breeden LLC (“Amundi Smith Breeden”). Amundi Group is a leading European asset management firm with over $1 trillion in assets under management as of June 30, 2013. Amundi Smith Breeden remains the subadvisor for the Fund and is located at 280 South Mangum Street, Suite 301, Durham, NC and was founded in 1982. Amundi Smith Breeden is an investment management firm for a client base including corporate and public pension plans, central and supranational banks, endowments and foundations, private banks and financial institutions, insurance companies, and other institutional investors. Specializing in fixed income portfolios, the firm offers separate accounts, commingled funds, and serves as a subadvisor to ‘40 Act funds.
Amundi Smith Breeden believes that innovative research provides critical insights into the fixed income market. The firm’s experienced investment professionals apply these research insights to the management of investment portfolios designed to achieve their clients’ objectives. The key tenets of this market-tested investment philosophy are:
| | • | | Over a market cycle, a portfolio of fixed income securities with wide risk-adjusted spreads produces an attractive total return in comparison to the market return. |
| | • | | The incremental return available from security selection and sector allocation, based on careful relative value analysis, quantitative research and experienced market judgment, is more consistent than the incremental return from predicting the direction of interest rates or other macro-factor trading strategies. |
| | • | | Within the investment-grade fixed income market, the spread sectors, e.g., corporate bonds, mortgage-backed securities (MBS), commercial MBS (CMBS), and asset-backed securities (ABS), will tend to outperform Treasury securities over a market cycle. The corporate, mortgage, CMBS, and ABS sectors also offer the |
| | | greatest active management opportunity for adding value through security selection. |
The portfolio management team at Amundi Smith Breeden specializes in analyzing and investing in mortgage securities. Through careful analysis and comparison of the characteristics of these securities, such as type of issuer, coupon, maturity, geographic structure and prepayment rates, the portfolio manager seeks to structure a portfolio with similar risk characteristics to six-month U.S. Treasury securities and slightly higher returns. Because there is less certainty about the timing of principal payments to individual mortgage securities than for U.S. Treasury securities, they tend to carry a slightly higher yield. A properly structured portfolio of mortgage securities, however, can have a highly predictable cash flow while maintaining a yield advantage over treasuries. Although the portfolio management team often purchases securities with maturities longer than six months, it does not attempt to increase returns by actively positioning the interest rate sensitivity of the Portfolio. Instead, the team typically manages the weighted average duration of the Portfolio so that it remains close to the Index.
The ideal investment exhibits many of the following traits:
| | • | | Yield advantage over treasuries |
| | • | | Very high quality (Government or AAA) |
| | • | | Attractive value relative to other MBS opportunities |
The Portfolio:
| | • | | Seeks to optimize return per unit of risk |
| | • | | Maintains minimal exposure to credit risk and interest rate risk |
| | • | | Consists of high-quality MBS, CMBS, and ABS securities |
| | • | | Will tend to have an interest-rate sensitivity similar to a six-month Treasury bill |
The investment team will make a sell decision when:
| | • | | They no longer view the bonds as attractive |
| | • | | They deem it necessary to reallocate the Portfolio |
| | • | | They need to maintain the Portfolio’s target duration |
THE YEAR IN REVIEW
During the year ended December 31, 2013, the Fund returned 0.20%, while the Bank of America (BofA) Merrill Lynch 6-Month U.S Treasury Bill Index returned 0.18%.
This year saw the natural transition of belt-tightening shift away from the private sector and towards the public sector. The Federal Reserve (“the Fed”) became the primary source of uncertainty as market participants began re-pricing assets ahead of the expected tapering. By the end of the year, we saw the long end of the yield curve begin to move towards a reasonable level. However, by our estimation, rates in the three- to five-year portion of the curve are likely to rise as tapering progresses through 2014.
Heading into 2013, political and economic news had not been particularly positive; however, the recovery continued in textbook fashion. Agency mortgage-backed securities (MBS) began the first quarter under pressure as the Federal Open Market Committee (“FOMC”) released commentary regarding its third round of Quantitative Easing (“QE3”) with a more hawkish tone than
4
Managers Short Duration Government Fund
Portfolio Manager’s Comments (continued)
anticipated by the market. Lower coupon MBS continued to lag during the quarter as the market absorbed economic data and attempted to synthesize the various comments coming from members of the FOMC. MBS rallied into the end of the quarter as fears of an imminent end to QE3 waned. Agency MBS in sectors that the Fed is not purchasing performed well during the quarter, which allowed the Fund to outperform the index returns.
The second quarter began with some weak economic data, driving strong performance from production coupon mortgages as the market adjusted its expectations to reflect an extension of the Fed’s large scale asset purchase program. Higher coupon mortgages suffered from the rally in rates amid concerns about increased prepayment speeds. The MBS sector was punished significantly in the middle of the quarter as stronger employment data and talk of slowing purchases by several Fed members led expectations of reduced demand. In response, the market discounted mortgage prices significantly. By the end of the quarter, a higher and steeper yield curve drove MBS servicers and Real Estate Investment Trusts (“REITS”) to sell duration, further pressuring the agency MBS market. Relative value buyers did emerge at the end of the quarter to take advantage of the sell-off. Despite our bias towards MBS sectors that the FOMC was not purchasing, spreads throughout MBS widened, causing underperformance of the Fund for the second quarter.
MBS began July with significant volatility. MBS benefited as increased rates reduced the supply of new mortgages. However, demand for MBS from banks and REITS was also muted which left the Fed as the only major buyer of mortgages. As the quarter progressed, the production of new mortgages remained anemic. Demand from the Fed overwhelmed supply, helping mortgage performance. High rates led to lower prepayments, which also helped MBS performance through the middle of the third quarter. After months of QE3 tapering discussions, the Fed surprised the market in September by continuing its purchases at the same levels which led to significantly stronger performance from MBS into the end of the quarter. Mortgage spreads tightened upon this news which benefitted performance of the Fund.
MBS spreads continued to tighten into the fourth quarter, led by the lower coupon 30-year mortgages where the Fed continued to focus its purchases. Mortgage prepayments stayed low, despite lower mortgage rates as banks significantly cut their mortgage workforce, hampering their ability to process applications. By the middle of the quarter, concerns about tapering of QE3 weighed on mortgages. By the time the FOMC announced tapering, the market had effectively fully priced in the impact of tapering. Our bias towards non-FOMC purchased mortgages (i.e., higher coupon fixed-rate MBS, seasoned 15-year MBS, and adjustable rate mortgages (“ARMs”)) drove the outperformance for the quarter.
Most of the Portfolio outperformance for 2013 was attributable to our positioning in agency MBS (specifically, avoiding the parts of the market where the Fed was focused). Our positioning relative to the yield curve benefitted the portfolio. ARMs, fixed-rate mortgages (“FRMs”), and collateralized mortgage obligations (“CMOs”) all benefitted from the reduced production of mortgages and the slowdown in prepayments attributable to the higher interest rates in the latter half of the year.
Derivatives, such are financial futures, options, and mortgage derivatives, are used for portfolio duration and convexity risk management. We continue to find value in mortgage derivatives with beneficial underlying collateral characteristics.
At the end of the year, the Fund held the majority of its exposure in 15-year agency FRMs. We increased our exposure to 15-year agency FRMs by 12.8% during the year, while adding 2.2% of active exposure to Agency ARMs. We maintained our exposure to commercial mortgage-backed securities. The Fund also slightly reduced its small allocation to Interest-Only securities. We continue to see opportunities in high quality spread assets and remain positive on our 2014 outlook for the MBS sector.
Looking Forward
Amundi Smith Breeden believes that 2014 will pick up where 2013 left off. The short-term technicals for MBS remain positive. Even with tapering, the Fed is still purchasing more MBS than net new production. The real challenge will come in the second half of the year when the marginal buyer once again becomes private capital. Current large scale holders include the Government Sponsored Enterprises, banks, money managers, REITs, and overseas buyers. Excluding the agencies, all of these entities could buy mortgages under the right circumstances, but each has its own unique obstacles to overcome. We expect that money managers will buy, but will likely require wider spread levels than what the market is currently offering. On the other hand, prepayment rates should remain low through the year, and the additional carry that MBS provides will likely more than offset any spread widening. Despite some shorter-term headwinds, agency MBS continue to be an attractive asset class longer-term.
This commentary reflects the viewpoints of Amundi Smith Breeden as of December 31, 2013 and is not intended as a forecast or guarantee of future results.
Managers Short Duration Government Fund
Portfolio Manager’s Comments (continued)
CUMULATIVE TOTAL RETURN PERFORMANCE
Managers Short Duration Government Fund’s cumulative total return is based on the daily change in net asset value (NAV), and assumes that all distributions were reinvested. This graph compares a hypothetical $10,000 investment made in the Managers Short Duration Government Fund on December 31, 2003 to a $10,000 investment made in the BofA Merrill Lynch 6-Month U.S. Treasury Bill Index for the same time period. Performance for periods longer than one year is annualized. The graph and table do not reflect the deduction of taxes that a shareholder would pay on a Fund distribution or redemption of shares. The listed returns for the Fund are net of expenses and the returns for the index exclude expenses. Past performance is not indicative of future results. Total returns would have been lower had certain expenses not been reduced.

The table below shows the average annual total returns for the Managers Short Duration Government Fund and the BofA Merrill Lynch 6-Month U.S. Treasury Bill Index for the same time periods ended December 31, 2013.
| | | | | | | | | | | | |
| | | Average Annual Total Returns1 | |
| | | One Year | | | Five Years | | | Ten Years | |
Managers Short Duration Government Fund2,3,4,5 | | | 0.20 | % | | | 2.13 | % | | | 2.37 | % |
BofA Merrill Lynch 6-Month Treasury Bill Index6 | | | 0.18 | % | | | 0.31 | % | | | 1.97 | % |
The performance data shown represents past performance. Past performance is not a guarantee of future results. Current performance may be lower or higher than the performance data quoted. The investment return and principal value of an investment in the Fund will fluctuate so that an investor’s shares, when redeemed, may be worth more or less than their original cost. For performance information through the most recent month end, please call (800) 835-3879 or visit our Web site at www.managersinvest.com. Current net asset values, per share for each Fund are available on the Funds’ Web site at www.managersinvest.com.
Investors should carefully consider the Fund’s investment objectives, risks, charges, and expenses before investing. For this and other information, please call (800) 835-3879 or visit our Web site at www.managersinvest.com for a free prospectus. Read it carefully before investing or sending money. Funds are distributed by Managers Distributors, Inc., member FINRA.
| 1 | Total return equals income yield plus share price change and assumes reinvestment of all dividends and capital gain distributions. Returns are net of fees and may reflect offsets of Fund expenses as described in the Prospectus. No adjustment has been made for taxes payable by shareholders on their reinvested dividends and capital gain distributions. Returns for periods greater than one year are annualized. The listed returns on the Fund are net of expenses and based on the published NAV as of December 31, 2013. All returns are in U.S. dollars ($). |
| 2 | Changing interest rates may adversely affect the value of an investment. An increase in interest rates typically causes the value of bonds and other fixed-income securities to fall. |
| 3 | The Fund is subject to the risks associated with investments in debt securities, such as default risk and fluctuations in the perception of the debtors’ ability to pay their creditors. |
| 4 | The Fund may use derivative instruments for hedging purposes or as part of its investment strategy. There is a risk that a derivative intended as a hedge may not perform as expected. The main risks with derivatives is that some types can amplify a gain or loss, potentially earning or losing substantially more money than the actual cost of the derivative; or that the counterparty may fail to honor its contract terms, causing a loss for the Fund. Use of these instruments may also involve certain costs and risks such as liquidity risk, interest rate risk, market risk, credit risk, management risk and the risk that a fund could not close out a position when it would be most advantageous to do so. |
| 5 | Many bonds have call provisions which allow the debtors to pay them back before maturity. This is especially true with mortgage securities, which can be paid back anytime. Typically debtors prepay their debt when it is to their advantage (when interest rates drop making a new loan at current rates more attractive), and thus likely to the disadvantage of bondholders, who may have to reinvest prepayment proceeds in securities with lower yields. Prepayment risk will vary depending on the provisions of the security and current interest rates relative to the interest rate of the debt. |
| 6 | The BofA Merrill Lynch 6-Month U.S. Treasury Bill Index is an unmanaged index that measures returns of 6-month Treasury Bills. Unlike the Fund, the BofA Merrill Lynch 6-Month Treasury Bill Index is unmanaged, is not available for investment, and does not incur expenses. |
Not FDIC insured, nor bank guaranteed. May lose value.
6
Managers Short Duration Government Fund
Fund Snapshots
December 31, 2013
Portfolio Breakdown (unaudited)
| | | | |
Portfolio Breakdown | | Managers Short
Duration
Government Fund** | |
U.S. Government and Agency Obligations | | | 87.9 | % |
Mortgage-Backed Securities | | | 9.2 | % |
Asset-Backed Securities | | | 0.0 | %# |
Other Assets and Liabilities | | | 2.9 | % |
| ** | As a percentage of net assets. |
| # | Rounds to less than 0.1%. |
| | | | |
Rating | | Managers Short
Duration
Government Fund† | |
U.S. Treasury & Agency | | | 90.9 | % |
Aaa | | | 8.9 | % |
Aa | | | 0.0 | % |
A | | | 0.1 | % |
Baa | | | 0.0 | % |
Ba & lower | | | 0.1 | % |
| † | As a percentage of market value of fixed income securities. Chart does not include equity securities. |
Top Ten Holdings (unaudited)
| | | | |
Security Name | | % of
Net Assets | |
FHLMC Gold Pool, 3.500%, TBA 15yr | | | 3.7 | % |
U.S. Treasury Inflation Indexed Bonds, 0.375%, 07/15/23 | | | 2.0 | |
FNMA, 1.915%, 02/01/35* | | | 1.6 | |
FNMA, 2.485%, 11/01/34* | | | 1.3 | |
FHLMC Gold Pool, 4.500%, 10/01/24 | | | 1.3 | |
FNMA, 2.513%, 01/01/36* | | | 1.3 | |
FHLMC Gold Pool, 4.500%, 03/01/25 | | | 1.2 | |
FHLMC Gold Pool, 6.000%, 01/01/24 | | | 1.1 | |
FNMA, 6.000%, 11/01/22* | | | 1.0 | |
FNMA, 5.500%, 12/01/17* | | | 1.0 | |
| | | | |
Top Ten as a Group | | | 15.5 | % |
| | | | |
| * | Top Ten Holding at June 30, 2013 |
Any sectors, industries, or securities discussed should not be perceived as investment recommendations. Mention of a specific security should not be considered a recommendation to buy or solicitation to sell that security. Specific securities mentioned in this report may have been sold from the Fund’s portfolio of investments by the time you receive this report.
7
Managers Short Duration Government Fund
Schedule of Portfolio Investments
December 31, 2013
| | | | | | | | |
| | | Principal Amount | | | Value | |
Asset-Backed Securities—0.0%# | | | | | | | | |
Structured Asset Investment Loan Trust, Series 2004-BNC2, Class A5, 1.245%, 12/25/34 (01/27/14)1,2
(cost $186,993) | | $ | 186,650 | | | $ | 184,085 | |
Mortgage-Backed Securities—9.2% | | | | | | | | |
Bank of America Commercial Mortgage Trust, Series 2006-6, Class A2, 5.309%, 10/10/45 | | | 32,328 | | | | 32,398 | |
Bank of America Merrill Lynch Commercial Mortgage, Inc., | | | | | | | | |
Series 2004-6, Class A5, 4.811%, 12/10/42 | | | 3,540,000 | | | | 3,625,162 | |
Series 2005-6, Class A4, 5.184%, 09/10/473 | | | 2,351,000 | | | | 2,502,724 | |
Bear Stearns Commercial Mortgage Securities Trust, | | | | | | | | |
Series 2004-PWR3, Class A4, 4.715%, 02/11/41 | | | 63,928 | | | | 63,897 | |
Series 2004-PWR4, Class A3, 5.468%, 06/11/413 | | | 2,434,655 | | | | 2,448,574 | |
Series 2004-T14, Class A4, 5.200%, 01/12/413 | | | 323,452 | | | | 323,432 | |
Series 2004-T16, Class A6, 4.750%, 02/13/463 | | | 3,149,630 | | | | 3,217,268 | |
Series 2005-PWR7, Class A3, 5.116%, 02/11/413 | | | 1,375,000 | | | | 1,423,954 | |
Series 2006-PW11, Class A2, 5.391%, 03/11/393 | | | 989 | | | | 996 | |
Citigroup Commercial Mortgage Trust, Series 2005-C3, Class A4, 4.860%, 05/15/43 | | | 506,000 | | | | 523,379 | |
Commercial Mortgage Trust, Series 2004-LB3A, Class A5, 5.364%, 07/10/373 | | | 394,556 | | | | 397,035 | |
Countrywide Home Loan Mortgage Pass Through Trust, Series 2004-25, Class 2A4, 0.665%, 02/25/35 (01/27/14)1,2,4 | | | 724,474 | | | | 264,448 | |
Credit Suisse First Boston Mortgage Securities Corp., | | | | | | | | |
Series 2004-C2, Class A2, 5.416%, 05/15/363 | | | 1,389,734 | | | | 1,391,973 | |
Series 2004-C5, Class A3, 4.499%, 11/15/37 | | | 323,797 | | | | 323,263 | |
GE Capital Commercial Mortgage Corp., | | | | | | | | |
Series 2004-C2, Class A4, 4.893%, 03/10/40 | | | 223,745 | | | | 223,979 | |
Series 2004-C2, Class B, 4.983%, 03/10/403 | | | 2,275,000 | | | | 2,288,657 | |
GMAC Commercial Mortgage Securities, Inc., Series 2004-C1, Class A4, 4.908%, 03/10/38 | | | 494,751 | | | | 494,726 | |
Greenwich Capital Commercial Funding Corp., | | | | | | | | |
Series 2004-GG1, Class A7, 5.317%, 06/10/363 | | | 217,265 | | | | 218,405 | |
Series 2005-GG3, Class A3, 4.569%, 08/10/42 | | | 477,753 | | | | 477,347 | |
GS Mortgage Securities Corp. II, Series 2005-GG4, Class A4A, 4.751%, 07/10/395 | | | 2,352,198 | | | | 2,436,743 | |
JPMorgan Chase Commercial Mortgage Securities Corp., | | | | | | | | |
Series 2004-C2, Class A3, 5.250%, 05/15/413 | | | 798,024 | | | | 800,973 | |
Series 2004-C3, Class A5, 4.878%, 01/15/42 | | | 3,870,000 | | | | 3,972,950 | |
JPMorgan Chase Commercial Mortgage Securities Trust, | | | | | | | | |
Series 2004-PNC1, Class A4, 5.357%, 06/12/413 | | | 807,103 | | | | 817,192 | |
Series 2005-LDP1, Class A2, 4.625%, 03/15/46 | | | 720,183 | | | | 720,272 | |
LB-UBS Commercial Mortgage Trust, | | | | | | | | |
Series 2004-C6, Class A6, 5.020%, 08/15/293 | | | 560,874 | | | | 567,981 | |
Series 2004-C8, Class A6, 4.799%, 12/15/293 | | | 305,780 | | | | 310,968 | |
Merrill Lynch Mortgage Investors Trust, Series 1998-C1, Class A3, 6.720%, 11/15/263 | | | 1,296,117 | | | | 1,374,634 | |
Merrill Lynch Mortgage Trust, Series 2005-MKB2, Class A4, 5.204%, 09/12/423 | | | 2,500,000 | | | | 2,572,763 | |
Morgan Stanley Capital I Trust, Series 2005-HQ5, Class A4, 5.168%, 01/14/42 | | | 1,038,861 | | | | 1,064,343 | |
The accompanying notes are an integral part of these financial statements.
8
Managers Short Duration Government Fund
Schedule of Portfolio Investments (continued)
| | | | | | | | |
| | | Principal Amount | | | Value | |
Mortgage-Backed Securities—9.2% (continued) | | | | | | | | |
Wachovia Bank Commercial Mortgage Trust, | | | | | | | | |
Series 2005-C20, Class A7, 5.118%, 07/15/423 | | $ | 1,895,653 | | | $ | 1,997,672 | |
Series 2005-C22, Class A4, 5.289%, 12/15/443 | | | 1,505,000 | | | | 1,602,074 | |
WaMu Mortgage Pass Through Certificates, Series 2005-AR2, Class 2A3, 0.515%, 01/25/45 (01/25/14)1 | | | 508,716 | | | | 458,270 | |
Total Mortgage-Backed Securities (cost $40,017,925) | | | | | | | 38,938,452 | |
U.S. Government and Agency Obligations—87.9% | | | | | | | | |
Federal Home Loan Mortgage Corporation—37.8% | | | | | | | | |
FHLMC, | | | | | | | | |
2.007%, 09/01/35 (03/15/14)1,2 | | | 2,227,613 | | | | 2,334,761 | |
2.125%, 11/01/33 (03/15/14)1,2 | | | 1,106,296 | | | | 1,153,191 | |
2.340%, 10/01/28 (03/15/14)1 | | | 58,558 | | | | 61,228 | |
2.344%, 10/01/33 (03/15/14)1,2 | | | 1,458,014 | | | | 1,546,208 | |
2.350%, 10/01/33 to 11/01/33 (03/15/14)1,2 | | | 3,790,170 | | | | 4,025,055 | |
2.355%, 12/01/33 (03/15/14)1,2 | | | 2,058,957 | | | | 2,172,777 | |
2.357%, 07/01/34 (03/15/14)1,2 | | | 354,498 | | | | 368,219 | |
2.375%, 12/01/32 to 05/01/34 (03/15/14)1,2 | | | 3,997,918 | | | | 4,239,261 | |
2.380%, 03/01/34 (03/15/14)1,2 | | | 3,306,998 | | | | 3,491,802 | |
2.575%, 02/01/23 (03/15/14)1 | | | 393,739 | | | | 406,515 | |
2.591%, 09/01/33 (03/15/14)1,2 | | | 2,976,919 | | | | 3,155,656 | |
2.620%, 06/01/35 (03/15/14)1,2 | | | 898,535 | | | | 964,178 | |
3.029%, 02/01/37 (03/15/14)1,2 | | | 879,347 | | | | 926,233 | |
FHLMC Gold Pool, | | | | | | | | |
3.000%, TBA 15yr6 | | | 1,800,000 | | | | 1,833,328 | |
3.500%, TBA 15yr6 | | | 15,000,000 | | | | 15,637,500 | |
4.000%, 05/01/24 to 11/01/26 | | | 11,064,023 | | | | 11,700,111 | |
4.500%, 07/01/18 to 08/01/302 | | | 33,177,855 | | | | 35,544,672 | |
5.000%, 09/01/17 to 06/01/262 | | | 16,249,879 | | | | 17,293,484 | |
5.500%, 05/01/17 to 05/01/382 | | | 21,589,013 | | | | 23,247,765 | |
6.000%, 06/01/16 to 01/01/242 | | | 8,450,104 | | | | 9,128,887 | |
6.500%, 03/01/18 to 10/01/232 | | | 802,025 | | | | 869,800 | |
7.000%, 06/01/17 to 07/01/192 | | | 512,444 | | | | 539,762 | |
7.500%, 04/01/15 to 03/01/33 | | | 487,013 | | | | 559,668 | |
FHLMC REMICS, | | | | | | | | |
Series 2091, Class PG, 6.000%, 11/15/28 | | | 317,013 | | | | 353,099 | |
Series 2132, Class PE, 6.000%, 03/15/29 | | | 502,865 | | | | 558,000 | |
Series 2429, Class HB, 6.500%, 12/15/23 | | | 724,324 | | | | 808,985 | |
Series 2554, Class HA, 4.500%, 04/15/32 | | | 555,509 | | | | 565,584 | |
Series 2627, Class BM, 4.500%, 06/15/18 | | | 270,096 | | | | 285,503 | |
Series 2628, Class GQ, 3.140%, 11/15/17 | | | 47,942 | | | | 48,046 | |
Series 2631, Class PD, 4.500%, 06/15/18 | | | 90,730 | | | | 95,892 | |
Series 2635, Class DG, 4.500%, 01/15/18 | | | 126,138 | | | | 128,041 | |
Series 2654, Class OG, 5.000%, 02/15/32 | | | 91,666 | | | | 92,191 | |
The accompanying notes are an integral part of these financial statements.
9
Managers Short Duration Government Fund
Schedule of Portfolio Investments (continued)
| | | | | | | | |
| | | Principal Amount | | | Value | |
Federal Home Loan Mortgage Corporation—37.8% (continued) | | | | | | | | |
FHLMC REMICS, | | | | | | | | |
Series 2682, Class LC, 4.500%, 07/15/32 | | $ | 1,337,004 | | | $ | 1,388,845 | |
Series 2683, Class JB, 4.000%, 09/15/18 | | | 472,896 | | | | 492,267 | |
Series 2709, Class PE, 5.000%, 12/15/22 | | | 237,994 | | | | 245,045 | |
Series 2751, Class NE, 5.000%, 06/15/32 | | | 982,386 | | | | 985,855 | |
Series 2763, Class JD, 3.500%, 10/15/18 | | | 332,157 | | | | 340,127 | |
Series 2786, Class BC, 4.000%, 04/15/19 | | | 296,176 | | | | 312,830 | |
Series 2809, Class UC, 4.000%, 06/15/19 | | | 322,667 | | | | 339,929 | |
Series 2877, Class PA, 5.500%, 07/15/33 | | | 287,202 | | | | 302,936 | |
Series 2890, Class KC, 4.500%, 02/15/19 | | | 93,022 | | | | 93,568 | |
Series 2935, Class LM, 4.500%, 02/15/35 | | | 1,042,709 | | | | 1,104,772 | |
Series 2986, Class KL, 4.570%, 11/15/19 | | | 1,228,083 | | | | 1,243,506 | |
Series 3000, Class PB, 3.900%, 01/15/23 | | | 93,938 | | | | 96,043 | |
Series 3033, Class CI, 5.500%, 01/15/35 | | | 583,170 | | | | 612,515 | |
Series 3117, Class PL, 5.000%, 08/15/34 | | | 918,783 | | | | 937,162 | |
Series 3535, Class CA, 4.000%, 05/15/24 | | | 297,731 | | | | 312,574 | |
Series 3609, Class LA, 4.000%, 12/15/24 | | | 425,401 | | | | 449,743 | |
Series 3632, Class AG, 4.000%, 06/15/38 | | | 449,067 | | | | 471,665 | |
Series 3640, Class JA, 1.500%, 03/15/15 | | | 663,849 | | | | 666,074 | |
Series 3643, Class BX, 0.850%, 12/15/24 | | | 10,756 | | | | 10,753 | |
Series 3653, Class JK, 5.000%, 11/15/38 | | | 413,961 | | | | 450,429 | |
Series 3683, Class AD, 2.250%, 06/15/20 | | | 1,563,318 | | | | 1,587,078 | |
Series 3756, Class DA, 1.200%, 11/15/18 | | | 1,146,359 | | | | 1,152,163 | |
Series 3846, Class CK, 1.500%, 09/15/20 | | | 492,987 | | | | 500,327 | |
Series 3876, Class GA, 1.000%, 06/15/26 | | | 1,289,428 | | | | 1,300,357 | |
Total Federal Home Loan Mortgage Corporation | | | | | | | 159,531,965 | |
Federal National Mortgage Association—41.2% | | | | | | | | |
FNMA, | | | | | | | | |
1.874%, 08/01/34 (02/25/14)1 | | | 431,953 | | | | 452,631 | |
1.875%, 02/01/33 (02/25/14)1 | | | 1,764,435 | | | | 1,853,754 | |
1.895%, 01/01/24 (02/25/14)1,2 | | | 942,952 | | | | 961,973 | |
1.898%, 01/01/35 (02/25/14)1 | | | 1,122,621 | | | | 1,187,861 | |
1.915%, 02/01/35 (02/25/14)1 | | | 6,420,020 | | | | 6,781,921 | |
1.916%, 01/01/35 (02/25/14)1 | | | 1,851,586 | | | | 1,955,343 | |
1.925%, 05/01/34 to 03/01/36 (02/25/14)1 | | | 3,054,951 | | | | 3,230,085 | |
1.934%, 11/01/34 (02/25/14)1 | | | 649,858 | | | | 686,632 | |
1.935%, 08/01/33 (02/25/14)1 | | | 680,464 | | | | 717,629 | |
1.936%, 01/01/35 (02/25/14)1 | | | 3,737,300 | | | | 3,963,609 | |
1.964%, 10/01/34 (02/25/14)1 | | | 1,257,594 | | | | 1,329,639 | |
1.975%, 06/01/34 (02/25/14)1 | | | 1,204,427 | | | | 1,271,443 | |
2.050%, 09/01/33 (02/25/14)1,2 | | | 952,421 | | | | 990,036 | |
2.152%, 08/01/35 (02/25/14)1 | | | 671,722 | | | | 706,351 | |
2.165%, 02/01/36 (02/25/14)1 | | | 3,698,985 | | | | 3,946,262 | |
The accompanying notes are an integral part of these financial statements.
10
Managers Short Duration Government Fund
Schedule of Portfolio Investments (continued)
| | | | | | | | |
| | | Principal Amount | | | Value | |
Federal National Mortgage Association—41.2% (continued) | | | | | | | | |
FNMA, | | | | | | | | |
2.210%, 01/01/34 (02/25/14)1 | | $ | 884,671 | | | $ | 925,007 | |
2.211%, 12/01/33 (02/25/14)1 | | | 787,359 | | | | 841,979 | |
2.238%, 01/01/36 (02/25/14)1 | | | 94,028 | | | | 99,190 | |
2.244%, 05/01/33 (02/25/14)1 | | | 2,695,389 | | | | 2,844,974 | |
2.275%, 10/01/35 (02/25/14)1 | | | 2,032,273 | | | | 2,151,356 | |
2.296%, 07/01/34 (02/25/14)1 | | | 1,938,180 | | | | 2,050,468 | |
2.304%, 12/01/34 (02/25/14)1 | | | 3,347,454 | | | | 3,556,220 | |
2.308%, 09/01/33 (02/25/14)1 | | | 868,226 | | | | 915,963 | |
2.317%, 06/01/33 (02/25/14)1 | | | 560,510 | | | | 593,501 | |
2.320%, 01/01/33 to 03/01/33 (02/25/14)1 | | | 707,800 | | | | 751,487 | |
2.337%, 01/01/26 (02/25/14)1 | | | 382,109 | | | | 396,675 | |
2.340%, 02/01/37 (02/25/14)1 | | | 532,017 | | | | 567,016 | |
2.347%, 08/01/35 (02/25/14)1 | | | 1,834,844 | | | | 1,951,953 | |
2.359%, 03/01/34 (02/25/14)1 | | | 346,978 | | | | 369,177 | |
2.369%, 08/01/34 (02/25/14)1 | | | 461,696 | | | | 488,510 | |
2.370%, 01/01/25 to 05/01/34 (02/25/14)1 | | | 3,026,308 | | | | 3,207,929 | |
2.380%, 08/01/36 (02/25/14)1 | | | 269,751 | | | | 285,992 | |
2.427%, 12/01/34 to 09/01/37 (02/25/14)1 | | | 3,096,153 | | | | 3,283,592 | |
2.478%, 04/01/34 (02/25/14)1 | | | 758,551 | | | | 811,449 | |
2.480%, 06/01/35 (02/25/14)1 | | | 207,435 | | | | 219,806 | |
2.482%, 06/01/35 (02/25/14)1 | | | 227,821 | | | | 243,136 | |
2.485%, 11/01/34 (02/25/14)1 | | | 5,140,459 | | | | 5,492,402 | |
2.491%, 04/01/34 (02/25/14)1 | | | 902,597 | | | | 967,472 | |
2.505%, 05/01/36 (02/25/14)1 | | | 114,967 | | | | 121,237 | |
2.513%, 01/01/36 (02/25/14)1 | | | 4,968,354 | | | | 5,309,664 | |
2.559%, 01/01/36 (02/25/14)1 | | | 65,322 | | | | 69,549 | |
2.636%, 06/01/34 (02/25/14)1 | | | 3,212,042 | | | | 3,419,818 | |
2.669%, 01/01/33 (02/25/14)1 | | | 1,205,965 | | | | 1,281,444 | |
2.674%, 01/01/34 (02/25/14)1 | | | 2,782,782 | | | | 2,949,997 | |
3.000%, TBA 15yr6 | | | 3,000,000 | | | | 3,061,523 | |
3.500%, TBA 15yr6 | | | 400,000 | | | | 418,297 | |
4.000%, 10/01/21 to 12/01/26 | | | 720,389 | | | | 764,478 | |
4.000%, TBA 15yr6 | | | 1,000,000 | | | | 1,059,609 | |
4.500%, 04/01/19 to 11/01/29 | | | 6,204,706 | | | | 6,672,139 | |
5.000%, 03/01/18 to 03/01/252 | | | 13,783,364 | | | | 14,768,455 | |
5.500%, 10/01/17 to 07/01/262 | | | 23,963,323 | | | | 25,876,883 | |
6.000%, 03/01/17 to 07/01/252 | | | 12,594,093 | | | | 13,648,334 | |
6.500%, 04/01/17 to 08/01/322 | | | 1,290,656 | | | | 1,397,660 | |
7.000%, 09/01/14 to 11/01/22 | | | 3,477,699 | | | | 3,866,713 | |
7.500%, 08/01/33 to 09/01/33 | | | 108,502 | | | | 127,094 | |
The accompanying notes are an integral part of these financial statements.
11
Managers Short Duration Government Fund
Schedule of Portfolio Investments (continued)
| | | | | | | | |
| | | Principal Amount | | | Value | |
Federal National Mortgage Association—41.2% (continued) | | | | | | | | |
FNMA Grantor Trust, | | | | | | | | |
Series 2002-T5, Class A1, 0.405%, 05/25/32 (01/27/14)1 | | $ | 372,800 | | | $ | 366,291 | |
Series 2003-T4, Class 1A, 0.385%, 09/26/33 (01/27/14)1 | | | 15,014 | | | | 14,865 | |
FNMA REMICS, | | | | | | | | |
Series 1994-76, Class J, 5.000%, 04/25/24 | | | 307,515 | | | | 321,725 | |
Series 2001-63, Class FA, 0.715%, 12/18/31 (01/18/14)1,4 | | | 721,632 | | | | 726,818 | |
Series 2002-47, Class FD, 0.565%, 08/25/32 (01/25/14)1,4 | | | 695,134 | | | | 695,792 | |
Series 2002-56, Class UC, 5.500%, 09/25/17 | | | 532,069 | | | | 564,281 | |
Series 2002-74, Class FV, 0.615%, 11/25/32 (01/25/14)1 | | | 1,246,019 | | | | 1,247,679 | |
Series 2003-2, Class FA, 0.665%, 02/25/33 (01/25/14)1 | | | 706,929 | | | | 710,834 | |
Series 2003-3, Class HJ, 5.000%, 02/25/18 | | | 266,718 | | | | 283,298 | |
Series 2003-64, Class YA, 3.000%, 05/25/23 | | | 281,007 | | | | 288,693 | |
Series 2004-1, Class AC, 4.000%, 02/25/19 | | | 183,702 | | | | 192,943 | |
Series 2004-21, Class AE, 4.000%, 04/25/19 | | | 692,982 | | | | 729,164 | |
Series 2004-27, Class HB, 4.000%, 05/25/19 | | | 358,525 | | | | 378,604 | |
Series 2004-78, Class AC, 5.000%, 05/25/32 | | | 514,834 | | | | 524,611 | |
Series 2005-8, Class EB, 4.500%, 07/25/19 | | | 127,810 | | | | 128,191 | |
Series 2005-13, Class AF, 0.565%, 03/25/35 (01/25/14)1,2 | | | 1,109,568 | | | | 1,110,636 | |
Series 2005-19, Class PA, 5.500%, 07/25/34 | | | 222,652 | | | | 243,764 | |
Series 2005-29, Class TC, 5.000%, 04/25/35 | | | 187,247 | | | | 192,183 | |
Series 2005-51, Class ND, 5.500%, 11/25/33 | | | 462,140 | | | | 468,641 | |
Series 2005-58, Class EP, 5.500%, 07/25/35 | | | 545,681 | | | | 596,621 | |
Series 2005-68, Class PB, 5.750%, 07/25/35 | | | 142,573 | | | | 154,954 | |
Series 2005-68, Class PC, 5.500%, 07/25/35 | | | 491,298 | | | | 531,374 | |
Series 2005-93, Class HD, 4.500%, 11/25/19 | | | 28,064 | | | | 28,099 | |
Series 2005-100, Class GC, 5.000%, 12/25/34 | | | 1,026,048 | | | | 1,054,732 | |
Series 2006-18, Class PD, 5.500%, 08/25/34 | | | 193,987 | | | | 201,538 | |
Series 2007-56, Class FN, 0.535%, 06/25/37 (01/25/14)1 | | | 409,645 | | | | 408,620 | |
Series 2007-65, Class GB, 5.000%, 10/25/33 | | | 546,366 | | | | 555,195 | |
Series 2007-69, Class AB, 5.500%, 12/25/32 | | | 248,435 | | | | 256,717 | |
Series 2008-18, Class HD, 4.000%, 12/25/18 | | | 2,247,878 | | | | 2,354,980 | |
Series 2008-59, Class KB, 4.500%, 07/25/23 | | | 350,510 | | | | 372,263 | |
Series 2008-81, Class KA, 5.000%, 10/25/22 | | | 92,085 | | | | 94,136 | |
Series 2009-55, Class PC, 5.000%, 09/25/36 | | | 193,791 | | | | 195,994 | |
Series 2010-12, Class AC, 2.500%, 12/25/18 | | | 272,306 | | | | 279,455 | |
Series 2010-67, Class LP, 3.250%, 10/25/37 | | | 255,460 | | | | 257,692 | |
Series 2011-40, Class DK, 4.000%, 11/25/37 | | | 867,201 | | | | 885,556 | |
Series 2011-44, Class AG, 1.500%, 02/25/21 | | | 605,794 | | | | 605,854 | |
Series 2011-60, Class UC, 2.500%, 09/25/39 | | | 702,077 | | | | 713,722 | |
Series 2011-60, Class UE, 3.000%, 09/25/39 | | | 1,704,633 | | | | 1,751,659 | |
FNMA Whole Loan, | | | | | | | | |
Series 2003-W1, Class 2A, 6.716%, 12/25/423 | | | 22,930 | | | | 26,449 | |
Series 2003-W4, Class 4A, 7.085%, 10/25/422,3 | | | 608,904 | | | | 698,975 | |
Series 2003-W13, Class AV2, 0.445%, 10/25/33 (01/27/14)1,4 | | | 42,334 | | | | 40,351 | |
The accompanying notes are an integral part of these financial statements.
12
Managers Short Duration Government Fund
Schedule of Portfolio Investments (continued)
| | | | | | | | |
| | | Principal Amount | | | Value | |
Federal National Mortgage Association - 41.2% (continued) | | | | | | | | |
FNMA Whole Loan, | | | | | | | | |
Series 2004-W5, Class F1, 0.615%, 02/25/47 (01/25/14)1 | | $ | 608,148 | | | $ | 609,596 | |
Series 2004-W14, Class 1AF, 0.565%, 07/25/44 (01/25/14)1,2 | | | 2,456,075 | | | | 2,406,639 | |
Series 2005-W2, Class A1, 0.365%, 05/25/35 (01/25/14)1,2 | | | 2,098,124 | | | | 2,074,920 | |
Total Federal National Mortgage Association | | | | | | | 174,208,421 | |
Government National Mortgage Association - 3.7% | | | | | | | | |
GNMA, | | | | | | | | |
0.717%, 11/16/30 to 01/16/40 (01/16/14)1 | | | 2,448,513 | | | | 2,474,664 | |
1.625%, 12/20/21 to 03/20/37 (02/20/14)1,2 | | | 7,108,338 | | | | 7,377,440 | |
2.000%, 06/20/22 (02/20/14)1 | | | 65,707 | | | | 68,546 | |
2.500%, 07/20/18 to 08/20/21 (02/20/14)1 | | | 63,218 | | | | 66,003 | |
2.750%, 10/20/17 (02/20/14)1,2 | | | 22,954 | | | | 23,940 | |
3.000%, 11/20/17 to 03/20/21 (02/20/14)1 | | | 86,122 | | | | 89,969 | |
3.500%, 07/20/18 (02/20/14)1 | | | 28,138 | | | | 29,519 | |
4.000%, 09/15/18 | | | 442,076 | | | | 467,240 | |
4.500%, 04/15/18 to 07/15/24 | | | 2,617,856 | | | | 2,790,760 | |
5.000%, 06/20/19 to 04/20/20 | | | 572,778 | | | | 612,632 | |
5.500%, 03/15/17 to 06/15/18 | | | 1,548,616 | | | | 1,660,501 | |
9.500%, 12/15/17 | | | 3,895 | | | | 4,146 | |
Total Government National Mortgage Association | | | | | | | 15,665,360 | |
Interest Only Strips - 2.3% | | | | | | | | |
FHLMC, | | | | | | | | |
Series 215, Class IO, 8.000%, 06/15/314 | | | 154,665 | | | | 31,755 | |
Series 233, Class 5, 4.500%, 09/15/35 | | | 81,210 | | | | 13,970 | |
FHLMC REMICS, | | | | | | | | |
Series 2530, Class QI, 6.833%, 01/15/32 (01/15/14)1 | | | 208,690 | | | | 36,219 | |
Series 2637, Class SI, 5.833%, 06/15/18 (01/15/14)1 | | | 188,238 | | | | 13,481 | |
Series 2649, Class IM, 7.000%, 07/15/33 | | | 417,972 | | | | 103,031 | |
Series 2763, Class KS, 6.483%, 10/15/18 (01/15/14)1 | | | 407,474 | | | | 22,088 | |
Series 2877, Class GS, 6.533%, 11/15/18 (01/15/14)1,4 | | | 44,395 | | | | 327 | |
Series 2922, Class SE, 6.583%, 02/15/35 (01/15/14)1 | | | 373,644 | | | | 65,438 | |
Series 2934, Class HI, 5.000%, 02/15/20 | | | 137,869 | | | | 14,570 | |
Series 2934, Class KI, 5.000%, 02/15/20 | | | 90,005 | | | | 8,637 | |
Series 2965, Class SA, 5.883%, 05/15/32 (01/15/14)1 | | | 912,759 | | | | 141,521 | |
Series 2967, Class JI, 5.000%, 04/15/20 | | | 427,619 | | | | 44,793 | |
Series 2980, Class SL, 6.533%, 11/15/34 (01/15/14)1 | | | 485,892 | | | | 91,822 | |
Series 2981, Class SU, 7.633%, 05/15/30 (01/15/14)1 | | | 431,731 | | | | 80,547 | |
Series 3031, Class BI, 6.523%, 08/15/35 (01/15/14)1 | | | 1,162,202 | | | | 244,872 | |
Series 3065, Class DI, 6.453%, 04/15/35 (01/15/14)1 | | | 1,018,140 | | | | 211,893 | |
Series 3114, Class GI, 6.433%, 02/15/36 (01/15/14)1 | | | 1,748,904 | | | | 360,468 | |
Series 3308, Class S, 7.033%, 03/15/32 (01/15/14)1 | | | 852,034 | | | | 151,217 | |
Series 3424, Class XI, 6.403%, 05/15/36 (01/15/14)1 | | | 911,754 | | | | 165,284 | |
Series 3489, Class SD, 7.633%, 06/15/32 (01/15/14)1 | | | 457,893 | | | | 87,908 | |
Series 3606, Class SN, 6.083%, 12/15/39 (01/15/14)1 | | | 1,259,530 | | | | 185,829 | |
The accompanying notes are an integral part of these financial statements.
13
Managers Short Duration Government Fund
Schedule of Portfolio Investments (continued)
| | | | | | | | |
| | | Principal Amount | | | Value | |
Interest Only Strips - 2.3% (continued) | | | | | | | | |
FHLMC REMICS, | | | | | | | | |
Series 3685, Class EI, 5.000%, 03/15/19 | | $ | 1,492,089 | | | $ | 108,399 | |
Series 3731, Class IO, 5.000%, 07/15/19 | | | 696,054 | | | | 49,597 | |
Series 3882, Class AI, 5.000%, 06/15/26 | | | 321,247 | | | | 28,000 | |
Series 3995, Class KI, 3.500%, 02/15/27 | | | 1,410,905 | | | | 180,841 | |
FNMA, | | | | | | | | |
Series 92, Class 2, 9.000%, 12/15/164 | | | 10,344 | | | | 1,322 | |
Series 306, Class IO, 8.000%, 05/01/304 | | | 111,862 | | | | 22,792 | |
Series 365, Class 4, 5.000%, 04/01/36 | | | 117,048 | | | | 23,254 | |
FNMA REMICS, | | | | | | | | |
Series 2001-82, Class S, 7.665%, 05/25/28 (01/25/14)1,4 | | | 389,576 | | | | 89,221 | |
Series 2003-48, Class SJ, 5.835%, 06/25/18 (01/25/14)1 | | | 244,619 | | | | 17,940 | |
Series 2003-73, Class SM, 6.435%, 04/25/18 (01/25/14)1 | | | 225,184 | | | | 13,948 | |
Series 2004-49, Class SQ, 6.885%, 07/25/34 (01/25/14)1 | | | 304,779 | | | | 57,103 | |
Series 2004-51, Class SX, 6.955%, 07/25/34 (01/25/14)1 | | | 528,538 | | | | 103,863 | |
Series 2004-64, Class SW, 6.885%, 08/25/34 (01/25/14)1 | | | 1,370,510 | | | | 249,771 | |
Series 2004-66, Class SE, 6.335%, 09/25/34 (01/25/14)1 | | | 218,473 | | | | 36,945 | |
Series 2005-5, Class SD, 6.535%, 01/25/35 (01/25/14)1 | | | 425,362 | | | | 74,526 | |
Series 2005-12, Class SC, 6.585%, 03/25/35 (01/25/14)1 | | | 512,616 | | | | 89,659 | |
Series 2005-45, Class SR, 6.555%, 06/25/35 (01/25/14)1 | | | 1,197,633 | | | | 191,286 | |
Series 2005-65, Class KI, 6.835%, 08/25/35 (01/25/14)1 | | | 2,747,248 | | | | 511,465 | |
Series 2005-66, Class GS, 6.685%, 07/25/20 (01/25/14)1 | | | 239,379 | | | | 28,914 | |
Series 2005-67, Class SM, 5.985%, 08/25/35 (01/25/14)1 | | | 230,992 | | | | 34,608 | |
Series 2006-3, Class SA, 5.985%, 03/25/36 (01/25/14)1 | | | 545,147 | | | | 92,277 | |
Series 2007-75, Class JI, 6.380%, 08/25/37 (01/25/14)1 | | | 305,573 | | | | 47,866 | |
Series 2007-85, Class SI, 6.295%, 09/25/37 (01/25/14)1 | | | 589,440 | | | | 92,650 | |
Series 2008-86, Class IO, 4.500%, 03/25/23 | | | 1,429,137 | | | | 104,226 | |
Series 2008-87, Class AS, 7.485%, 07/25/33 (01/25/14)1 | | | 1,739,182 | | | | 304,516 | |
Series 2010-37, Class GI, 5.000%, 04/25/25 | | | 2,045,109 | | | | 138,251 | |
Series 2010-65, Class IO, 5.000%, 09/25/20 | | | 1,953,459 | | | | 166,551 | |
Series 2010-68, Class SJ, 6.385%, 07/25/40 (01/25/14)1 | | | 569,666 | | | | 97,973 | |
Series 2010-105, Class IO, 5.000%, 08/25/20 | | | 966,826 | | | | 92,173 | |
Series 2010-121, Class IO, 5.000%, 10/25/25 | | | 789,074 | | | | 64,577 | |
Series 2011-69, Class AI, 5.000%, 05/25/18 | | | 2,375,560 | | | | 164,844 | |
Series 2011-88, Class WI, 3.500%, 09/25/26 | | | 1,610,952 | | | | 224,384 | |
Series 2011-124, Class IC, 3.500%, 09/25/21 | | | 2,753,100 | | | | 217,548 | |
Series 2012-126, Class SJ, 4.835%, 11/25/42 (01/25/14)1 | | | 5,945,908 | | | | 930,784 | |
GNMA, | | | | | | | | |
Series 1999-40, Class TW, 6.836%, 02/17/29 (01/17/14)1 | | | 597,651 | | | | 110,763 | |
Series 2002-7, Class ST, 7.336%, 08/17/27 (01/17/14)1 | | | 521,254 | | | | 106,180 | |
Series 2011-32, Class KS, 11.767%, 06/16/34 (01/16/14)1 | | | 1,093,481 | | | | 267,802 | |
Series 2011-94, Class IS, 6.533%, 06/16/36 (01/16/14)1 | | | 775,692 | | | | 135,223 | |
Series 2011-146, Class EI, 5.000%, 11/16/41 | | | 464,259 | | | | 113,743 | |
The accompanying notes are an integral part of these financial statements.
14
Managers Short Duration Government Fund
Schedule of Portfolio Investments (continued)
| | | | | | | | |
| | | Principal Amount | | | Value | |
Interest Only Strips - 2.3% (continued) | | | | | | | | |
GNMA, | | | | | | | | |
Series 2011-157, Class SG, 6.433%, 12/20/41 (01/20/14)1 | | $ | 1,579,704 | | | $ | 364,681 | |
Series 2011-167, Class IO, 5.000%, 12/16/20 | | | 3,696,775 | | | | 299,854 | |
Series 2012-34, Class KS, 5.883%, 03/16/42 (01/16/14)1 | | | 3,904,833 | | | | 832,034 | |
Series 2012-69, Class QI, 4.000%, 03/16/41 | | | 2,077,843 | | | | 374,435 | |
Series 2012-96, Class IC, 3.000%, 08/20/27 | | | 1,280,530 | | | | 158,927 | |
Series 2012-101, Class AI, 3.500%, 08/20/27 | | | 1,101,767 | | | | 134,626 | |
Series 2012-103, Class IB, 3.500%, 04/20/40 | | | 1,463,789 | | | | 213,696 | |
Total Interest Only Strips | | | | | | | 9,839,708 | |
U.S. Government Obligations - 2.9% | | | | | | | | |
U.S. Treasury Inflation Indexed Bonds, 0.375%, 07/15/23 | | | 8,831,328 | | | | 8,517,401 | |
U.S. Treasury Inflation Linked Notes, 2.375%, 01/15/25 | | | 3,221,374 | | | | 3,702,818 | |
Total U.S. Government Obligations | | | | | | | 12,220,219 | |
Total U.S. Government and Agency Obligations (cost $365,848,451) | | | | | | | 371,465,673 | |
Short-Term Investments - 8.4% | | | | | | | | |
Repurchase Agreements - 0.5%7 | | | | | | | | |
Citigroup Global Markets, Inc., dated 12/31/13, due 01/02/14, 0.020%, total to be received $1,000,001 (collateralized by various U.S. Government Agency Obligations, 2.080% - 11.000%, 12/15/15 - 08/15/53, totaling $1,020,000) | | | 1,000,000 | | | | 1,000,000 | |
Mizuho Securities USA, Inc., dated 12/31/13, due 01/02/14, 0.020%, total to be received $876,614 (collateralized by various U.S. Government Agency Obligations, 0.000%—10.750%, 01/02/14 - 03/01/47, totaling $894,145) | | | 876,613 | | | | 876,613 | |
Total Repurchase Agreements | | | | | | | 1,876,613 | |
U.S. Government and Agency Discount Notes - 4.2% | | | | | | | | |
FHLMC, 0.08%, 02/11/148 | | | 2,300,000 | | | | 2,299,924 | |
FHLMC, 0.13%, 06/04/148 | | | 2,483,000 | | | | 2,482,156 | |
FNMA, 0.04%, 01/27/148 | | | 13,085,000 | | | | 13,084,817 | |
Total U.S. Government and Agency Discount Notes | | | | | | | 17,866,897 | |
U.S. Treasury Bills - 0.2% | | | | | | | | |
U.S. Treasury Bills, 0.04%, 04/17/148,9 | | | 1,000,000 | | | | 999,891 | |
| | |
| | | Shares | | | | |
Other Investment Companies - 3.5%10 | | | | | | | | |
Dreyfus Institutional Cash Advantage Fund, Institutional Class Shares, 0.06% | | | 14,523,557 | | | | 14,523,557 | |
Total Short-Term Investments
(cost $35,265,330) | | | | | | | 35,266,958 | |
Total Investments - 105.5% (cost $441,318,699) | | | | | | | 445,855,168 | |
Other Assets, less Liabilities - (5.5)% | | | | | | | (23,367,033 | ) |
Net Assets - 100.0% | | | | | | $ | 422,488,135 | |
The accompanying notes are an integral part of these financial statements.
15
Managers Intermediate Duration Government Fund
Portfolio Manager’s Comments
The Managers Intermediate Duration Government Fund’s objective is to achieve total return in excess of the total return of the major market indices for mortgage-backed securities.
The Managers Intermediate Duration Government Fund seeks to achieve its objective by matching the duration, or interest-rate risk, of a portfolio that invests exclusively in mortgage-backed securities, as weighted in the major market indices for mortgage-backed securities. These indices currently include the Citigroup Mortgage Index and the Barclays Capital Mortgage Index, each of which includes all outstanding government sponsored fixed-rate mortgage-backed securities, weighted in proportion to their current market capitalization. The duration of these indices is generally similar to that of intermediate-term U.S. Treasury notes, and typically will range between three and five years.
Under normal circumstances, the Fund will invest at least 80% of its assets in debt securities issued by the U.S. Government, its agencies and instrumentalities, and synthetic instruments or derivatives, or securities having economic characteristics similar to such debt securities. The Fund’s benchmark is the Citigroup Mortgage Index.
THE PORTFOLIO MANAGER
Amundi Smith Breeden LLC
Effective September 30, 2013, Amundi Group indirectly acquired 100% ownership of Smith Breeden Associates, Inc. (“Smith Breeden”), the Fund’s subadvisor (the “Acquisition”). Pursuant to the Acquisition, Smith Breeden converted to a Delaware limited liability company named Amundi Smith Breeden LLC (“Amundi Smith Breeden”). Amundi Group is a leading European asset management firm with over $1 trillion in assets under management as of June 30, 2013. Amundi Smith Breeden remains the subadvisor for the Fund and is located at 280 South Mangum Street, Suite 301, Durham, NC and was founded in 1982. Amundi Smith Breeden is an investment management firm for a client base including corporate and public pension plans, central and supranational banks, endowments and foundations, private banks and financial institutions, insurance companies, and other institutional investors. Specializing in fixed income portfolios, the firm offers separate accounts, commingled funds, and serves as a subadvisor to ‘40 Act funds.
Amundi Smith Breeden believes that innovative research provides critical insights into the fixed-income market. The firm’s experienced investment professionals apply these research insights to the management of investment portfolios designed to achieve their clients’ objectives. The key tenets of this market-tested investment philosophy are:
| | • | | Over a market cycle, a portfolio of fixed income securities with wide risk-adjusted spreads produces an attractive total return in comparison to the market return. |
| | • | | The incremental return available from security selection and sector allocation, based on careful relative value analysis, quantitative research, and experienced market judgment, is more consistent than the incremental return from predicting the direction of interest rates or other macro-factor trading strategies. |
| | • | | Within the investment-grade fixed-income market, the spread sectors, e.g., corporate bonds, mortgage-backed securities (MBS), commercial MBS (CMBS), and asset-backed securities (ABS), will tend to outperform Treasury securities over a market cycle. The corporate, mortgage, CMBS, and ABS sectors also offer the greatest active management opportunity for adding value through security selection. |
The portfolio management team at Amundi Smith Breeden specializes in analyzing and investing in mortgage-backed securities. Through careful analysis and comparison of the characteristics of these securities, such as type of issuer, coupon, maturity, geographic structure, and historic and prospective prepayment rates, the team seeks to structure a portfolio that will outperform the Citigroup Mortgage Index. While the portfolio managers will purchase securities of any maturity or duration, they do not attempt to add value by actively positioning the interest-rate sensitivity of the Portfolio. Instead, they typically manage the weighted average duration of the Portfolio so that it is similar to that of the duration of the Citigroup Mortgage Index.
The ideal investment exhibits the following traits:
| | • | | Very high quality (AAA or Government) |
| | • | | Attractive value relative to other MBS opportunities |
The portfolio managers limit purchases to securities from the following asset classes:
| | • | | Securities issued directly or guaranteed by the U.S. Government or its agencies or instrumentalities |
| | • | | Mortgage-backed securities rated AAA by Standard & Poor’s Corporation (“S&P”) or Aaa by Moody’s Investors Service, Inc. (“Moody’s”) |
| | • | | Securities fully collateralized by assets in either of the above classes |
| | • | | Assets that would qualify as liquidity items under federal regulations (which may change from time to time) if held by a commercial bank or savings institution; and hedge instruments |
| | • | | Stripped mortgage-backed securities, which may only be used for risk management purposes |
The investment team will make a sell decision when:
| | • | | They no longer view the bonds as attractive |
| | • | | They need to maintain the Portfolio’s target duration |
| | • | | They deem it necessary for Portfolio allocation purposes |
THE YEAR IN REVIEW
During the year ended December 31, 2013, the Fund returned (1.15)%, compared to (1.52)% for its benchmark, the Citigroup MortgageIndex.
This year saw the natural transition of belt-tightening shift away from the private sector and towards the public sector. The Federal Reserve became the primary source of uncertainty as market participants began re-pricing assets ahead of the expected tapering. By the end of the year, we saw the long end of the yield curve begin to move towards a reasonable level. However, by our estimation,
16
Managers Intermediate Duration Government Fund
Portfolio Manager’s Comments (continued)
rates in the three- to five-year portion of the curve are likely to rise as tapering progresses through 2014.
Heading into 2013, political and economic news had not been particularly positive; however, the recovery continued in textbook fashion. Agency mortgage-backed securities (“MBS”) began the first quarter under pressure as the Federal Open Market Committee (“FOMC”) released commentary regarding its third round of Quantitative Easing (“QE3”) with a more hawkish tone than the market had anticipated. Lower coupon MBS continued to lag during the quarter as the market continued to watch the economic data and attempted to synthesize the various comments from members of the FOMC. MBS rallied into the end of the quarter as fears of an imminent end to QE3 waned. Our tilt towards higher coupon MBS drove outperformance during the period. Portfolio exposures in non-agency MBS also contributed positively to performance.
The second quarter began with some weak economic data, and the market adjusted its expectations to reflect an extension of the Fed’s large scale asset purchase program. Higher coupon mortgages suffered from the rally in rates amid concerns on increased prepayment speeds. MBS was punished significantly in the middle of the quarter as stronger employment data and talk of slowing purchases by several Fed members led expectations of reduced demand. In response, the market discounted mortgage prices significantly. By the end of the quarter, higher and steeper yield curves drove mortgage servicers and Real Estate Investment Trusts (“REITS”) to sell duration, further pressuring the agency MBS market. Relative value buyers did emerge at the end of the quarter to take advantage of the sell-off. Once again, our bias towards coupons that the FOMC was not purchasing drove the outperformance for the Fund in the second quarter.
MBS began July with significant volatility. MBS benefited as increased rates reduced the supply of new mortgages. However, demand for MBS from banks and REITS was also muted which left the Fed as the only major buyer of mortgages. As the quarter progressed, the production of new mortgages remained anemic. Demand from the Fed overwhelmed supply, helping mortgage performance. High rates led to lower prepayments, which also helped MBS performance through the middle of the third quarter. After months of QE3 tapering discussions, the Fed surprised the market in September by maintaining its purchases at the same levels which led to significantly stronger performance from MBS into the end of the quarter. Our increased exposure to 15-year mortgages relative to 30-year mortgages over the quarter benefited the Fund.
MBS spreads continued to tighten into the fourth quarter, led by the lower coupon 30-year mortgages where the Fed continued to focus its purchases. Mortgage prepayments stayed low, despite lower mortgage rates as banks significantly cut their mortgage workforce, hampering their ability to process applications. By the middle of the quarter, concerns about tapering of QE3 weighed on mortgages. By the time the FOMC announced the beginning of tapering, the market had effectively fully priced in the impact of tapering. Our bias towards non-FOMC purchased mortgages (i.e., higher coupon fixed-rate MBS, seasoned 15-year MBS, and Collateralized Mortgage Obligations (“CMOs”)) drove the outperformance for the quarter.
Most of the Portfolio outperformance for 2013 was attributable to our security selection in agency MBS (specifically, avoiding the parts of the market where the Fed was focused). Our exposures to non-agency mortgages also benefited the Portfolio, as did our positioning relative to the yield curve. Adjustable-Rate Mortgages, Fixed-Rate Mortgages (“FRMs”) and CMOs all benefitted from the reduced production of mortgages and the slowdown in prepayments attributable to the higher interest rates in the latter half of the year.
Derivatives, such as financial futures, options, and mortgage derivatives, are used for portfolio duration and convexity risk management. We continue to find value in mortgage derivatives with beneficial underlying collateral characteristics.
At the end of the year, the Fund held the majority of its exposure in 15-year and 30-year agency FRMs. We increased the active exposure to 30-year agency FRMs by 19.6% during the year, while adding 5.5% of active exposure to 15-year agency FRMs. We decreased our active exposure to CMBS by 2.2%. The Fund also maintained its small allocation to Interest-Only strips and CMOs. We continue to see opportunities in high quality spread assets and are positive on our 2014 outlook for the MBS sector.
LOOKING FORWARD
Amundi Smith Breeden believes that 2014 will begin in very much the same way that 2013 ended. The short-term technicals for MBS remain positive. Even with tapering, the Fed is still purchasing more MBS than net new production. The real challenge will come in the second half of the year when the marginal buyer once again becomes private capital. Current large scale holders include the Government Sponsored Enterprises (GSEs), banks, money managers, REITs and overseas buyers. Excluding the agencies, all of these entities could buy mortgages under the right circumstances, but each has its own unique obstacles to overcome. We expect that money managers will buy, but will likely require wider spread levels than what the market is currently offering. On the other hand, prepayment rates should remain low through the year, and the additional carry that MBS provides will likely more than offset any spread widening. Despite some shorter-term headwinds, agency MBS continue to be an attractive asset class longer-term.
This commentary reflects the viewpoints of Amundi Smith Breeden LLC as of December 31, 2013 and is not intended as a forecast or guarantee of future results.
Managers Intermediate Duration Government Fund
Portfolio Manager’s Comments (continued)
CUMULATIVE TOTAL RETURN PERFORMANCE
Managers Intermediate Duration Government Fund’s cumulative total return is based on the daily change in net asset value (NAV), and assumes that all distributions were reinvested. The graph compares a hypothetical $10,000 investment made in the Managers Intermediate Duration Government Fund on December 31, 2003 to a $10,000 investment made in the Citigroup Mortgage Index for the same time period. Performance for periods longer than one year is annualized. The graph and table do not reflect the deduction of taxes that a shareholder would pay on a Fund distribution or redemption of shares. The listed returns for the Fund are net of expenses and the returns for the index exclude expenses. Past performance is not indicative of future results. Total returns would have been lower had certain expenses not been reduced.
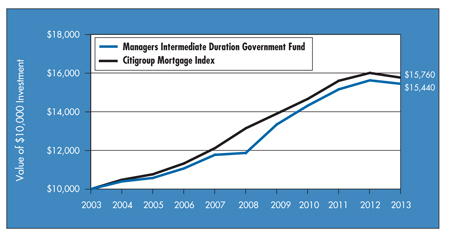
The table below shows the average annual total returns for the Managers Intermediate Duration Government Fund and the Citigroup Mortgage Index for the same time periods ended December 31, 2013.
| | | | | | | | | | | | |
| | | Average Annual Total Returns1 | |
| | | One
Year | | | Five
Years | | | Ten
Years | |
Managers Intermediate Duration Government Fund2,3,4,5,6 | | | (1.15 | )% | | | 5.40 | % | | | 4.44 | % |
Citigroup Mortgage Index7 | | | (1.52 | )% | | | 3.70 | % | | | 4.65 | % |
The performance data shown represents past performance. Past performance is not a guarantee of future results. Current performance may be lower or higher than the performance data quoted. The investment return and principal value of an investment in the Fund will fluctuate so that an investor’s shares, when redeemed, may be worth more or less than their original cost. For performance information through the most recent month end, please call (800) 835-3879 or visit our Web site at www.managersinvest.com. Current net asset values per share for each Fund are available on the Funds’ Web site at www.managersinvest.com.
Investors should carefully consider the Fund’s investment objectives, risks, charges, and expenses before investing. For this and other information, please call (800) 835-3879 or visit our Web site at www.managersinvest.com for a free prospectus. Read it carefully before investing or sending money. Funds are distributed by Managers Distributors, Inc., member FINRA.
| 1 | Total return equals income yield plus share price change and assumes reinvestment of all dividends and capital gain distributions. Returns are net of fees and may reflect offsets of Fund expenses as described in the Prospectus. No adjustment has been made for taxes payable by shareholders on their reinvested dividends and capital gain distributions. Returns for periods greater than one year are annualized. The listed returns on the Fund are net of expenses and based on the published NAV as of December 31, 2013. All returns are in U.S. dollars ($). |
| 2 | From time to time the Fund’s advisor has waived its fees and/or absorbed Fund expenses, which has resulted in higher returns. |
| 3 | Changing interest rates may adversely affect the value of an investment. An increase in interest rates typically casuses the value of bonds and other fixed-income securities to fall. |
| 4 | The Fund is subject to the risks associated with investments in debt securities, such as default risk, fluctuations in the debtor’s perceived ability to pay their creditors. |
| 5 | The Fund may use derivative instruments for hedging purposes or as part of its investment strategy. There is a risk that a derivative intended as a hedge may not perform as expected. The main risk with derivatives is that some types can amplify a gain or loss, potentially earning or losing substantially more money than the actual cost of the derivative or that the counterparty may fail to honor its contract terms, causing a loss for the Fund. Use of these instruments may also involve certain costs and risks such as liquidity risk, interest rate risk, market risk, credit risk, management risk and the risk that a fund could not close out a position when it would be most advantageous to do so. |
| 6 | Many bonds have call provisions which allow the debtors to pay them back before maturity. This is especially true with mortgage securities, which can be paid back anytime. Typically debtors prepay their debt when it is to their advantage (when interest rates drop making a new loan at current rates more attractive), and thus likely to the disadvantage of bondholders, who may have to reinvest prepayment proceeds in securities with lower yields. Prepayment risk will vary depending on the provisions of the security and current interest rates relative to the interest rate of the debt. |
| 7 | The Citigroup Mortgage Index includes all outstanding government sponsored fixed-rate mortgage-backed securities, weighted in proportion to their current market capitalization. The Index reflects no deductions for fees, expenses, or taxes. Unlike the Fund, the Citigroup Mortgage Index is unmanaged, is not available for investment, and does not incur expenses. |
Not FDIC insured, nor bank guaranteed. May lose value.
18
Managers Intermediate Duration Government Fund
Fund Snapshots
December 31, 2013
Portfolio Breakdown (unaudited)
| | | | |
Category | | Managers Intermediate
Duration
Government Fund** | |
U.S. Government and Agency Obligations | | | 129.4 | % |
Mortgage-Backed Securities | | | 5.7 | % |
Other Assets and Liabilities | | | (35.1 | )% |
| ** | As a percentage of net assets. |
| | | | |
Rating | | Managers Intermediate
Duration
Government Fund† | |
U.S. Treasury & Agency | | | 95.7 | % |
Aaa | | | 1.8 | % |
Aa | | | 0.0 | % |
A | | | 0.0 | % |
Baa | | | 0.5 | % |
Ba & lower | | | 2.0 | % |
| † | As a percentage of market value of fixed income securities. Chart does not include equity securities. |
Top Ten Holdings (unaudited)
| | | | |
Security Name | | % of Net Assets | |
FHLMC Gold Pool, 4.000%, TBA 30yr* | | | 20.3 | % |
FNMA, 3.500%, TBA 30yr* | | | 10.3 | |
FHLMC Gold Pool, 4.500%, TBA 30yr* | | | 5.1 | |
FNMA, 4.000%, TBA 15yr* | | | 3.9 | |
FHLMC Gold Pool, 3.500%, TBA 30yr* | | | 3.6 | |
FNMA, 4.000%, TBA 30yr* | | | 3.4 | |
FHLMC Gold Pool, 5.000%, 10/01/36* | | | 2.4 | |
FHLMC Gold Pool, 3.500%, 04/01/32* | | | 1.9 | |
FHLMC Gold Pool, 3.500%, TBA 15yr* | | | 1.9 | |
FNMA, 4.500%, 10/01/40* | | | 1.9 | |
Top Ten as a Group | | | 54.7 | % |
| | | | |
| * | Top Ten Holding at June 30, 2013 |
Any sectors, industries, or securities discussed should not be perceived as investment recommendations. Mention of a specific security should not be considered a recommendation to buy or solicitation to sell that security. Specific securities mentioned in this report may have been sold from the Fund’s portfolio of investments by the time you receive this report.
19
Managers Intermediate Duration Government Fund
Schedule of Portfolio Investments
December 31, 2013
| | | | | | | | |
| | | Principal Amount | | | Value | |
Mortgage-Backed Securities - 5.7% | | | | | | | | |
American Home Mortgage Assets LLC, Series 2005-1, Class 1A1, 2.571%, 11/25/35 (02/25/14)1 | | $ | 89,298 | | | $ | 70,538 | |
American Home Mortgage Investment Trust, | | | | | | | | |
Series 2004-1, Class 4A, 2.349%, 04/25/44 (02/25/14)1 | | | 138,550 | | | | 132,049 | |
Series 2005-1, Class 5A1, 2.349%, 06/25/45 (02/25/14)1 | | | 57,628 | | | | 55,965 | |
Series 2005-1, Class 6A, 2.349%, 06/25/45 (02/25/14)1 | | | 1,127,818 | | | | 1,050,204 | |
Bank of America Commercial Mortgage Trust, | | | | | | | | |
Series 2006-6, Class A2, 5.309%, 10/10/45 | | | 146,626 | | | | 146,946 | |
Series 2007-3, Class A2, 5.649%, 06/10/493 | | | 102,717 | | | | 102,616 | |
Bank of America Funding Corp., Series 2004-B, Class 1A2, 2.700%, 12/20/34 (02/20/14)1 | | | 133,334 | | | | 107,134 | |
Bear Stearns Alt-A Trust, Series 2005-3, Class 2A3, 2.557%, 04/25/35 (02/25/14)1 | | | 138,779 | | | | 118,313 | |
Bear Stearns Commercial Mortgage Securities Trust, | | | | | | | | |
Series 2005-PWR9, Class A3, 4.868%, 09/11/42 | | | 1,000,000 | | | | 1,005,678 | |
Series 2006-PW11, Class A2, 5.391%, 03/11/393 | | | 413 | | | | 416 | |
Citigroup/Deutsche Bank Commercial Mortgage Trust, Series 2006-CD3, Class A4, 5.658%, 10/15/48 | | | 951,026 | | | | 962,263 | |
Countrywide Alternative Loan Trust, Series 2005-J5, Class 1A1, 0.465%, 05/25/35 (01/25/14)1 | | | 44,327 | | | | 43,754 | |
Countrywide Home Loan Mortgage Pass Through Trust, | | | | | | | | |
Series 2004-R2, Class 1AF1, 0.585%, 11/25/34 (01/25/14) (a)1,4 | | | 174,210 | | | | 150,866 | |
Series 2005-HYB2, Class 1A4, 3.027%, 05/20/35 (02/20/14)1 | | | 108,868 | | | | 101,324 | |
Series 2005-HYB8, Class 1A1, 2.498%, 12/20/35 (02/20/14)1 | | | 113,386 | | | | 90,416 | |
Credit Suisse First Boston Mortgage Securities Corp., Series 2005-C3, Class A3, 4.645%, 07/15/37 | | | 243,087 | | | | 243,985 | |
GMAC Commercial Mortgage Securities, Inc., Series 2005-C1, Class A3, 4.538%, 05/10/43 | | | 16,645 | | | | 16,647 | |
GSMPS Mortgage Loan Trust, Series 2005-RP2, Class 1AF, 0.515%, 03/25/35 (01/25/14) (a)1,4 | | | 217,044 | | | | 183,986 | |
GSR Mortgage Loan Trust, Series 2004-5, Class 1A3, 1.883%, 05/25/34 (02/25/14)1 | | | 50,674 | | | | 45,780 | |
Harborview Mortgage Loan Trust, Series 2004-7, Class 2A2, 2.368%, 11/19/34 (02/19/14)1 | | | 84,968 | | | | 74,784 | |
JPMorgan Chase Commercial Mortgage Securities Trust, | | | | | | | | |
Series 2005-LDP1, Class A2, 4.625%, 03/15/46 | | | 15,699 | | | | 15,701 | |
Series 2006-LDP7, Class A3B, 5.863%, 04/15/453 | | | 686,514 | | | | 685,525 | |
Master Alternative Loans Trust, Series 2005-2, Class 2A1, 6.000%, 01/25/352 | | | 684,933 | | | | 693,478 | |
Morgan Stanley Mortgage Loan Trust, Series 2005-4, Class 2A1, 5.954%, 08/25/353 | | | 1,040,319 | | | | 1,008,292 | |
Structured Asset Securities Corp., Series 2005-RF1, Class A, 0.515%, 03/25/35 (01/25/14) (a)1,4 | | | 264,287 | | | | 221,941 | |
Wachovia Bank Commercial Mortgage Trust, Series 2006-C28, Class A2, 5.500%, 10/15/48 | | | 67,683 | | | | 68,147 | |
Wells Fargo Mortgage Backed Securities Trust, Series 2007-16, Class 1A1, 6.000%, 12/28/37 | | | 417,480 | | | | 434,378 | |
Total Mortgage-Backed Securities (cost $7,769,296) | | | | | | | 7,831,126 | |
U.S. Government and Agency Obligations - 129.4% | | | | | | | | |
Federal Home Loan Mortgage Corporation - 70.8% | | | | | | | | |
FHLMC, | | | | | | | | |
2.349%, 11/01/33 (03/15/14)1,2 | | | 1,197,679 | | | | 1,262,914 | |
2.496%, 01/01/36 (03/15/14)1 | | | 2,348,031 | | | | 2,492,741 | |
3.029%, 02/01/37 (03/15/14)1 | | | 73,630 | | | | 77,556 | |
FHLMC Gold Pool, | | | | | | | | |
3.000%, TBA 15yr6 | | | 900,000 | | | | 916,664 | |
3.500%, 04/01/32 to 05/01/432 | | | 10,354,030 | | | | 10,354,346 | |
3.500%, TBA 15yr6 | | | 2,500,000 | | | | 2,606,250 | |
The accompanying notes are an integral part of these financial statements.
20
Managers Intermediate Duration Government Fund
Schedule of Portfolio Investments (continued)
| | | | | | | | |
| | | Principal Amount | | | Value | |
Federal Home Loan Mortgage Corporation - 70.8% (continued) | | | | | | | | |
FHLMC Gold Pool, | | | | | | | | |
3.500%, TBA 30yr6 | | $ | 4,900,000 | | | $ | 4,861,719 | |
4.000%, 05/01/24 to 09/01/422 | | | 5,229,666 | | | | 5,424,000 | |
4.000%, TBA 30yr6 | | | 27,000,000 | | | | 27,727,734 | |
4.500%, 02/01/20 to 03/01/422 | | | 12,742,882 | | | | 13,561,085 | |
4.500%, TBA 30yr6 | | | 6,600,000 | | | | 6,983,367 | |
5.000%, 05/01/18 to 07/01/412 | | | 9,050,316 | | | | 9,748,746 | |
5.500%, 11/01/17 to 01/01/402 | | | 6,918,955 | | | | 7,549,361 | |
6.000%, 09/01/17 to 01/01/242 | | | 1,647,913 | | | | 1,793,808 | |
7.000%, 07/01/19 | | | 193,783 | | | | 208,880 | |
7.500%, 07/01/342 | | | 1,223,024 | | | | 1,391,013 | |
Total Federal Home Loan Mortgage Corporation | | | | | | | 96,960,184 | |
Federal National Mortgage Association - 47.0% | | | | | | | | |
FNMA, | | | | | | | | |
1.975%, 06/01/34 (02/25/14)1,2 | | | 960,014 | | | | 1,013,431 | |
2.369%, 08/01/34 (02/25/14)1 | | | 369,357 | | | | 390,808 | |
3.000%, TBA 15yr6 | | | 1,500,000 | | | | 1,530,762 | |
3.500%, 05/01/42 to 04/01/432 | | | 1,970,418 | | | | 1,961,050 | |
3.500%, TBA 15yr6 | | | 700,000 | | | | 732,020 | |
3.500%, TBA 30yr6 | | | 14,200,000 | | | | 14,105,703 | |
4.000%, 01/01/26 to 07/01/422 | | | 3,666,892 | | | | 3,794,054 | |
4.000%, TBA 15yr6 | | | 5,000,000 | | | | 5,298,047 | |
4.000%, TBA 30yr6 | | | 4,600,000 | | | | 4,735,125 | |
4.500%, 04/01/25 to 04/01/422 | | | 14,107,997 | | | | 14,976,178 | |
4.750%, 07/01/34 to 09/01/34 | | | 443,958 | | | | 477,127 | |
5.000%, 06/01/18 to 08/01/41 | | | 4,184,276 | | | | 4,548,662 | |
5.500%, 03/01/17 to 07/01/382 | | | 3,357,764 | | | | 3,655,129 | |
6.000%, 08/01/17 to 06/01/392 | | | 3,724,111 | | | | 4,077,036 | |
6.500%, 11/01/28 to 07/01/32 | | | 243,570 | | | | 266,370 | |
7.000%, 11/01/222 | | | 923,407 | | | | 1,027,672 | |
FNMA REMICS, | | | | | | | | |
Series 1994-55, Class H, 7.000%, 03/25/242 | | | 909,235 | | | | 1,016,904 | |
Series 2005-13, Class AF, 0.565%, 03/25/35 (01/25/14)1,2 | | | 595,228 | | | | 595,801 | |
FNMA Whole Loan, Series 2003-W4, Class 4A, 7.085%, 10/25/423 | | | 101,484 | | | | 116,496 | |
Total Federal National Mortgage Association | | | | | | | 64,318,375 | |
Government National Mortgage Association - 9.2% | | | | | | | | |
GNMA, | | | | | | | | |
2.000%, 05/20/21 (02/20/14)1 | | | 21,270 | | | | 22,188 | |
3.000%, 03/20/16 to 08/20/18 (02/20/14)1 | | | 158,947 | | | | 165,410 | |
4.500%, 06/15/39 to 05/15/41 | | | 1,893,773 | | | | 2,030,820 | |
5.000%, 09/15/39 to 10/20/412 | | | 7,003,783 | | | | 7,634,563 | |
5.500%, 10/15/39 to 11/15/392 | | | 2,481,791 | | | | 2,740,660 | |
7.500%, 09/15/28 to 11/15/31 | | | 23,341 | | | | 24,451 | |
Total Government National Mortgage Association | | | | | | | 12,618,092 | |
The accompanying notes are an integral part of these financial statements.
21
Managers Intermediate Duration Government Fund
Schedule of Portfolio Investments (continued)
| | | | | | | | |
| | | Principal Amount | | | Value | |
Interest Only Strips - 2.4% | | | | | | | | |
FHLMC, | | | | | | | | |
Series 212, Class IO, 6.000%, 05/01/314 | | $ | 2,247 | | | $ | 434 | |
Series 233, Class 5, 4.500%, 09/15/35 | | | 159,174 | | | | 27,381 | |
FHLMC REMICS, | | | | | | | | |
Series 2380, Class SI, 7.733%, 06/15/31 (01/15/14)1,4 | | | 19,301 | | | | 3,900 | |
Series 2637, Class SI, 5.833%, 06/15/18 (01/15/14)1 | | | 144,105 | | | | 10,321 | |
Series 2877, Class GS, 6.533%, 11/15/18 (01/15/14)1,4 | | | 35,288 | | | | 260 | |
Series 2922, Class SE, 6.583%, 02/15/35 (01/15/14)1 | | | 165,766 | | | | 29,031 | |
Series 2934, Class HI, 5.000%, 02/15/20 | | | 96,508 | | | | 10,199 | |
Series 2934, Class KI, 5.000%, 02/15/20 | | | 77,148 | | | | 7,404 | |
Series 2965, Class SA, 5.883%, 05/15/32 (01/15/14)1 | | | 368,626 | | | | 57,154 | |
Series 2967, Class JI, 5.000%, 04/15/20 | | | 181,717 | | | | 19,035 | |
Series 2980, Class SL, 6.533%, 11/15/34 (01/15/14)1 | | | 220,175 | | | | 41,608 | |
Series 3031, Class BI, 6.523%, 08/15/35 (01/15/14)1 | | | 380,187 | | | | 80,104 | |
Series 3065, Class DI, 6.453%, 04/15/35 (01/15/14)1 | | | 333,060 | | | | 69,316 | |
Series 3114, Class GI, 6.433%, 02/15/36 (01/15/14)1 | | | 283,885 | | | | 58,512 | |
Series 3308, Class S, 7.033%, 03/15/32 (01/15/14)1 | | | 375,607 | | | | 66,662 | |
Series 3424, Class XI, 6.403%, 05/15/36 (01/15/14)1 | | | 350,027 | | | | 63,453 | |
Series 3489, Class SD, 7.633%, 06/15/32 (01/15/14)1 | | | 204,597 | | | | 39,279 | |
Series 3606, Class SN, 6.083%, 12/15/39 (01/15/14)1 | | | 473,114 | | | | 69,803 | |
Series 3685, Class EI, 5.000%, 03/15/19 | | | 668,203 | | | | 48,545 | |
Series 3731, Class IO, 5.000%, 07/15/19 | | | 306,852 | | | | 21,865 | |
Series 3882, Class AI, 5.000%, 06/15/26 | | | 401,641 | | | | 35,007 | |
Series 3995, Class KI, 3.500%, 02/15/27 | | | 1,843,544 | | | | 236,295 | |
FNMA, | | | | | | | | |
Series 215, Class 2, 7.000%, 04/01/234 | | | 113,332 | | | | 21,710 | |
Series 222, Class 2, 7.000%, 06/01/234 | | | 11,216 | | | | 2,172 | |
Series 343, Class 2, 4.500%, 10/01/33 | | | 104,181 | | | | 17,696 | |
Series 343, Class 21, 4.000%, 09/01/18 | | | 170,214 | | | | 10,345 | |
Series 343, Class 22, 4.000%, 11/01/18 | | | 93,793 | | | | 5,867 | |
Series 351, Class 3, 5.000%, 04/01/34 | | | 126,661 | | | | 26,094 | |
Series 351, Class 4, 5.000%, 04/01/34 | | | 74,483 | | | | 14,972 | |
Series 351, Class 5, 5.000%, 04/01/34 | | | 63,059 | | | | 12,676 | |
Series 365, Class 4, 5.000%, 04/01/36 | | | 173,457 | | | | 34,461 | |
FNMA REMICS, | | | | | | | | |
Series 2003-73, Class SM, 6.435%, 04/25/18 (01/25/14)1 | | | 172,388 | | | | 10,677 | |
Series 2004-49, Class SQ, 6.885%, 07/25/34 (01/25/14)1 | | | 136,670 | | | | 25,606 | |
Series 2004-51, Class SX, 6.955%, 07/25/34 (01/25/14)1 | | | 210,596 | | | | 41,384 | |
Series 2004-64, Class SW, 6.885%, 08/25/34 (01/25/14)1 | | | 595,572 | | | | 108,541 | |
Series 2005-12, Class SC, 6.585%, 03/25/35 (01/25/14)1 | | | 227,861 | | | | 39,854 | |
Series 2005-45, Class SR, 6.555%, 06/25/35 (01/25/14)1 | | | 486,054 | | | | 77,632 | |
Series 2005-65, Class KI, 6.835%, 08/25/35 (01/25/14)1 | | | 1,101,499 | | | | 205,070 | |
Series 2005-89, Class S, 6.535%, 10/25/35 (01/25/14)1 | | | 1,111,799 | | | | 193,283 | |
Series 2006-3, Class SA, 5.985%, 03/25/36 (01/25/14)1 | | | 235,545 | | | | 39,871 | |
The accompanying notes are an integral part of these financial statements.
22
Managers Intermediate Duration Government Fund
Schedule of Portfolio Investments (continued)
| | | | | | | | |
| | | Principal Amount | | | Value | |
Interest Only Strips - 2.4% (continued) | | | | | | | | |
FNMA REMICS, | | | | | | | | |
Series 2007-75, Class JI, 6.380%, 08/25/37 (01/25/14)1 | | $ | 254,696 | | | $ | 39,897 | |
Series 2008-86, Class IO, 4.500%, 03/25/23 | | | 570,927 | | | | 41,637 | |
Series 2010-37, Class GI, 5.000%, 04/25/25 | | | 796,137 | | | | 53,820 | |
Series 2010-65, Class IO, 5.000%, 09/25/20 | | | 755,711 | | | | 64,432 | |
Series 2010-121, Class IO, 5.000%, 10/25/25 | | | 294,028 | | | | 24,063 | |
Series 2011-69, Class AI, 5.000%, 05/25/18 | | | 889,230 | | | | 61,705 | |
Series 2011-88, Class WI, 3.500%, 09/25/26 | | | 549,032 | | | | 76,473 | |
Series 2011-124, Class IC, 3.500%, 09/25/21 | | | 580,642 | | | | 45,882 | |
Series 2012-126, Class SJ, 4.835%, 11/25/42 (01/25/14)1 | | | 904,068 | | | | 141,525 | |
GNMA, | | | | | | | | |
Series 1999-40, Class TW, 6.836%, 02/17/29 (01/17/14)1 | | | 177,936 | | | | 32,977 | |
Series 2011-32, Class KS, 11.767%, 06/16/34 (01/16/14)1 | | | 450,094 | | | | 110,232 | |
Series 2011-94, Class IS, 6.533%, 06/16/36 (01/16/14)1 | | | 345,255 | | | | 60,187 | |
Series 2011-157, Class SG, 6.433%, 12/20/41 (01/20/14)1 | | | 1,290,654 | | | | 297,953 | |
Series 2011-167, Class IO, 5.000%, 12/16/20 | | | 627,695 | | | | 50,914 | |
Series 2012-34, Class KS, 5.883%, 03/16/42 (01/16/14)1 | | | 508,484 | | | | 108,347 | |
Series 2012-69, Class QI, 4.000%, 03/16/41 | | | 392,784 | | | | 70,781 | |
Series 2012-103, Class IB, 3.500%, 04/20/40 | | | 336,251 | | | | 49,089 | |
Total Interest Only Strips | | | | | | | 3,213,393 | |
Total U.S. Government and Agency Obligations (cost $176,301,935) | | | | | | | 177,110,044 | |
Short-Term Investments - 16.2% | | | | | | | | |
U.S. Treasury Bills - 0.1% | | | | | | | | |
U.S. Treasury Bills, 0.04%, 04/17/148,9 | | | 110,000 | | | | 109,988 | |
| | |
| | | Shares | | | | |
Other Investment Companies - 16.1%10 | | | | | | | | |
Dreyfus Institutional Cash Advantage Fund, Institutional Class Shares, 0.06% | | | 22,108,506 | | | | 22,108,506 | |
Total Short-Term Investments
(cost $22,218,485) | | | | | | | 22,218,494 | |
Total Investments - 151.3% (cost $206,289,716) | | | | | | | 207,159,664 | |
Other Assets, less Liabilities - (51.3)% | | | | | | | (70,244,398 | ) |
Net Assets - 100.0% | | | | | | $ | 136,915,266 | |
The accompanying notes are an integral part of these financial statements.
23
Notes to Schedules of Portfolio Investments
The following footnotes and abbreviations should be read in conjunction with each of the Schedules of Portfolio Investments previously presented in this report.
At December 31, 2013, the approximate cost of investments for Federal income tax purposes and the aggregate gross unrealized appreciation and/or depreciation based on tax cost were as follows:
| | | | | | | | | | | | | | | | |
Fund | | Cost | | | Appreciation | | | Depreciation | | | Net | |
Managers Short Duration Government Fund | | $ | 441,318,699 | | | $ | 6,595,262 | | | $ | (2,058,793 | ) | | $ | 4,536,469 | |
Managers Intermediate Duration Government Fund | | | 206,289,716 | | | | 3,383,213 | | | | (2,513,265 | ) | | | 869,948 | |
| # | Rounds to less than 0.1% |
| (a) | Security exempt from registration under Rule 144A of the Securities Act of 1933. This security may be resold in transactions exempt from registration, normally to qualified buyers. At December 31, 2013, the value of these securities amounted to the following: |
| | | | | | | | |
Fund | | Value | | | % of Net Assets | |
Managers Intermediate Duration Government Fund | | $ | 556,793 | | | | 0.4 | % |
| 1 | Floating Rate Security: The rate listed is as of December 31, 2013. Date in parentheses represents the security’s next coupon rate reset. |
| 2 | Some or all of these securities are segregated as collateral for delayed delivery agreements. At December 31, 2013, the value of these securities amounted to the following: |
| | | | | | | | |
Fund | | Value | | | % of Net Assets | |
Managers Short Duration Government Fund | | $ | 47,825,248 | | | | 11.3 | % |
Managers Intermediate Duration Government Fund | | | 58,434,142 | | | | 42.7 | % |
| 3 | Variable Rate Security: The rate listed is as of December 31, 2013 and is periodically reset subject to terms and conditions set forth in the debenture. |
| 4 | Illiquid Security: A security not readily convertible into cash such as a stock, bond or commodity that is not actively traded and would be difficult to sell in a timely sale. The Funds may not invest more than 15% of their net assets in illiquid securities. All illiquid securities are valued by an independent pricing agent. Illiquid securities market value at December 31, 2013, amounted to the following: |
| | | | | | | | |
Fund | | Value | | | % of Net Assets | |
Managers Short Duration Government Fund | | $ | 1,872,826 | | | | 0.4 | % |
Managers Intermediate Duration Government Fund | | | 585,269 | | | | 0.4 | % |
| 5 | Some or all of these shares were out on loan to various brokers as of December 31, 2013, amounting to the following: |
| | | | | | | | |
Fund | | Value | | | % of Net Assets | |
Managers Short Duration Government Fund | | $ | 1,851,489 | | | | 0.4 | % |
| 6 | TBA Securities are purchased/sold on a forward commitment basis with an approximate principal amount and no defined maturity date. The actual principal and maturity date will be determined upon settlement when the specific mortgage pools are assigned. |
| 7 | Collateral received from brokers for securities lending was invested in these short-term investments. |
| 8 | Represents yield to maturity at December 31, 2013. |
| 9 | Some or all of this security is held with brokers as collateral for futures contracts. The collateral market value at December 31, 2013, amounted to the following: |
| | | | | | | | |
Fund | | Value | | | % of Net Assets | |
Managers Short Duration Government Fund | | $ | 999,891 | | | | 0.2 | % |
Managers Intermediate Duration Government Fund | | | 79,991 | | | | 0.06 | % |
| 10 | Yield shown represents the December 31, 2013, seven-day average yield, which refers to the sum of the previous seven days’ dividends paid, expressed as an annual percentage. |
The accompanying notes are an integral part of these financial statements.
24
Notes to Schedules of Portfolio Investments (continued)
The following tables summarize the inputs used to value the Funds’ net assets by the fair value hierarchy levels as of December 31, 2013. (See Note 1(a) in the Notes to the Financial Statements.)
| | | | | | | | | | | | | | | | |
| | | Quoted Prices in Active
Markets for Identical
Investments
Level 1 | | | Significant Other
Observable Inputs
Level 2 | | | Significant
Unobservable Inputs
Level 3 | | | Total | |
Managers Short Duration Government | | | | | | | | | | | | | | | | |
Investments in Securities | | | | | | | | | | | | | | | | |
Asset-Backed Securities | | | — | | | $ | 184,085 | | | | — | | | $ | 184,085 | |
Mortgage-Backed Securities | | | — | | | | 38,938,452 | | | | — | | | | 38,938,452 | |
U.S. Government and Agency Obligations† | | | — | | | | 371,465,673 | | | | — | | | | 371,465,673 | |
Short-Term Investments | | | | | | | | | | | | | | | | |
Repurchase Agreements | | | — | | | | 1,876,613 | | | | — | | | | 1,876,613 | |
U.S. Government and Agency Discount Notes | | | — | | | | 17,866,897 | | | | — | | | | 17,866,897 | |
U.S. Treasury Bills | | | — | | | | 999,891 | | | | — | | | | 999,891 | |
Other Investment Companies | | $ | 14,523,557 | | | | — | | | | — | | | | 14,523,557 | |
| | | | | | | | | | | | | | | | |
Total Investments in Securities | | $ | 14,523,557 | | | $ | 431,331,611 | | | | — | | | $ | 445,855,168 | |
| | | | | | | | | | | | | | | | |
Financial Derivative Instruments-Assets†† | | | | | | | | | | | | | | | | |
Interest Rate Contracts | | $ | 752,498 | | | | — | | | | — | | | $ | 752,498 | |
| | | | | | | | | | | | | | | | |
Financial Derivative Instruments-Liabilities†† | | | | | | | | | | | | | | | | |
Interest Rate Contracts | | | (100,157 | ) | | | — | | | | — | | | | (100,157 | ) |
| | | | | | | | | | | | | | | | |
Total Financial Derivative Instruments | | $ | 652,341 | | | | — | | | | — | | | $ | 652,341 | |
| | | | | | | | | | | | | | | | |
| | | | |
| | | Quoted Prices in Active
Markets for Identical
Investments
Level 1 | | | Significant Other
Observable Inputs
Level 2 | | | Significant
Unobservable Inputs
Level 3 | | | Total | |
Managers Intermediate Duration Government Fund | | | | | | | | | | | | | | | | |
Investments in Securities | | | | | | | | | | | | | | | | |
Mortgage-Backed Securities | | | — | | | $ | 7,831,126 | | | | — | | | $ | 7,831,126 | |
U.S. Government and Agency Obligations† | | | — | | | | 177,110,044 | | | | — | | | | 177,110,044 | |
Short-Term Investments | | | | | | | | | | | | | | | | |
U.S. Treasury Bills | | | — | | | | 109,988 | | | | — | | | | 109,988 | |
Other Investment Companies | | $ | 22,108,506 | | | | — | | | | — | | | | 22,108,506 | |
| | | | | | | | | | | | | | | | |
Total Investments in Securities | | $ | 22,108,506 | | | $ | 185,051,158 | | | | — | | | $ | 207,159,664 | |
| | | | | | | | | | | | | | | | |
TBA Sale Commitments | | | — | | | $ | (1,440,387 | ) | | | — | | | $ | (1,440,387 | ) |
| | | | | | | | | | | | | | | | |
Financial Derivative Instruments-Assets†† | | | | | | | | | | | | | | | | |
Interest Rate Contracts | | $ | 54,756 | | | | — | | | | — | | | $ | 54,756 | |
| | | | | | | | | | | | | | | | |
Financial Derivative Instruments-Liabilities†† | | | | | | | | | | | | | | | | |
Interest Rate Contracts | | | (89,231 | ) | | | — | | | | — | | | | (89,231 | ) |
| | | | | | | | | | | | | | | | |
Total Financial Derivative Instruments | | $ | (34,475 | ) | | | — | | | | — | | | $ | (34,475 | ) |
| | | | | | | | | | | | | | | | |
| † | All U.S. government and agency obligations held in the Fund are Level 2 securities. For a detailed breakout of the U.S. government and agency obligations; by major industry or agency classification, please refer to the respective Schedule of Portfolio Investments. |
| †† | Derivative instruments, such as futures, are not reflected in the Schedule of Portfolio Investments and are valued at the unrealized appreciation/depreciation of the instrument. |
As of December 31, 2013, the Funds had no transfers between levels from the beginning of the reporting period.
The accompanying notes are an integral part of these financial statements.
25
Notes to Schedules of Portfolio Investments (continued)
The following schedule shows the fair value of derivative instruments at December 31, 2013:
| | | | | | | | | | | | | | |
| | | | | Asset Derivatives | | | Liability Derivatives | |
Fund | | Derivatives not accounted for as
hedging instruments | | Statement of Assets and Liabilities
Location | | Fair Value | | | Statement of Assets and Liabilities
Location | | Fair Value | |
Managers Short Duration Government Fund | | Interest rate contracts | | Receivable for variation margin1 | | $ | 121,625 | | | Payable for variation margin1 | | $ | (3,656 | ) |
| | | | | | | | | | | | | | |
| | | |
| | | | | Asset Derivatives | | | Liability Derivatives | |
Fund | | Derivatives not accounted for as
hedging instruments | | Statement of Assets and Liabilities
Location | | Fair Value | | | Statement of Assets and Liabilities
Location | | Fair Value | |
Managers Intermediate Duration Government Fund | | Interest rate contracts | | Receivable for variation margin1 | | $ | 13,891 | | | Payable for Variation margin1 | | $ | (6,672 | ) |
| | | | | | | | | | | | | | |
| 1 | Only current day’s variation margin is reported within the Statement of Assets and Liabilities. The variation margin is included in the open futures cumulative appreciation/ (depreciation) for Managers Short Duration Government Fund and Managers Intermediate Duration Government Fund of $652,341 and $(34,475), respectively as reported in the Notes to Schedule of Portfolio Investments. |
For the year ended December 31, 2013, the effect of derivative instruments on the Statement of Operations for the Funds and the amount of realized gain/(loss) and unrealized gain (loss) on derivatives recognized in income were as follows:
| | | | | | | | | | | | | | |
| | | | | Realized Gain (Loss) | | | Change in Unrealized Gain (Loss) | |
Fund | | Derivatives not accounted for as
hedging instruments | | Statement of Operations
Location | | Realized
Gain/(Loss) | | | Statement of Operations Location | | Change in Unrealized
Gain/(Loss) | |
Managers Short Duration Government Fund | | Interest rate contracts | | Net realized gain on futures contracts | | $ | 427,480 | | | Net change in unrealized appreciation(depreciation) of futures contracts | | $ | 717,794 | |
| | | | | | | | | | | | | | |
| | | |
| | | | | Realized Gain (Loss) | | | Change in Unrealized Gain (Loss) | |
Fund | | Derivatives not accounted for as
hedging instruments | | Statement of Operations
Location | | Realized
Gain/(Loss) | | | Statement of Operations Location | | Change in Unrealized
Gain/(Loss) | |
Managers Intermediate Duration Government Fund | | Interest rate contracts | | Net realized loss on futures contracts | | $ | (41,760 | ) | | Net change in unrealized appreciation(depreciation) of futures contracts | | $ | 147,324 | |
| | | | | | | | | | | | | | |
At December 31, 2013, the following Funds had TBA forward sale commitments: (See Note 1(i) in the Notes to Financial Statements.)
Managers Intermediate Duration Government Fund
| | | | | | | | | | | | | | | | |
Security | | Principal
Amount | | | Settlement
Date | | | Proceeds | | | Current
Liability | |
GNMA, 4.500%, TBA 30yr | | $ | 1,350,000 | | | | 1/21/14 | | | $ | 1,447,820 | | | $ | (1,440,387 | ) |
The accompanying notes are an integral part of these financial statements.
26
Notes to Schedules of Portfolio Investments (continued)
At December 31, 2013, the following Funds had open futures contracts: (See Note 7 in the Notes to Financial Statements.)
Managers Short Duration Government Fund
| | | | | | | | | | |
Type | | Number of Contracts | | Position | | Expiration Date | | Unrealized Gain/(Loss) | |
2-Year U.S. Treasury Note | | 35 | | Short | | 04/03/14 | | $ | 13,585 | |
3-Month Eurodollar | | 5 | | Short | | 03/17/14 | | | (40,950 | ) |
5-Year Interest Rate Swap | | 391 | | Short | | 03/19/14 | | | 421,625 | |
5-Year U.S. Treasury Note | | 39 | | Long | | 04/03/14 | | | (59,207 | ) |
10-Year Interest Rate Swap | | 105 | | Short | | 03/19/14 | | | 94,999 | |
10-Year U.S. Treasury Note | | 55 | | Short | | 03/31/14 | | | 123,613 | |
U.S. Treasury Long Bond | | 45 | | Short | | 03/31/14 | | | 98,676 | |
| | | | | | | | | | |
Total | | | | | | | | $ | 652,341 | |
| | | | | | | | | | |
Managers Intermediate Duration Government Fund
| | | | | | | | | | |
Type | | Number of Contracts | | Position | | Expiration Date | | Unrealized Gain/(Loss) | |
2-Year U.S. Treasury Note | | 5 | | Short | | 04/03/14 | | $ | 1,941 | |
5-Year Interest Rate Swap | | 23 | | Short | | 03/19/14 | | | 24,950 | |
5-Year U.S. Treasury Note | | 47 | | Long | | 04/03/14 | | | (71,352 | ) |
10-Year Interest Rate Swap | | 31 | | Short | | 03/19/14 | | | 27,865 | |
10-Year U.S. Treasury Note | | 5 | | Long | | 03/31/14 | | | (11,262 | ) |
U.S. Treasury Long Bond | | 3 | | Long | | 03/31/14 | | | (6,617 | ) |
| | | | | | | | | | |
Total | | | | | | | | $ | (34,475 | ) |
| | | | | | | | | | |
Investments Definitions and Abbreviations:
| | |
| FHLMC: | | Federal Home Loan Mortgage Corp. |
| FNMA: | | Federal National Mortgage Association |
| GMAC: | | General Motors Acceptance Corp. |
| GNMA: | | Government National Mortgage Association |
| GS: | | Goldman Sachs |
| GSMPS: | | Goldman Sachs Mortgage Participation Securities |
| GSR: | | Goldman Sachs REMIC |
| LB-UBS: | | Lehman Brothers-Union Bank of Switzerland |
| REMICS: | | Real Estate Mortgage Investment Conduits |
| TBA: | | To Be Announced |
The accompanying notes are an integral part of these financial statements.
27
Statement of Assets and Liabilities
December 31, 2013
| | | | | | | | |
| | | Managers
Short Duration
Government Fund | | | Managers
Intermediate
Duration
Government Fund | |
Assets: | | | | | | | | |
Investments at value* (including securities on loan valued at $1,851,489 and $0, respectively) | | $ | 445,855,168 | | | $ | 207,159,664 | |
Receivable for Fund shares sold | | | 1,691,867 | | | | 151,295 | |
Dividends, interest and other receivables | | | 1,457,336 | | | | 563,289 | |
Receivable for investments sold | | | 351,097 | | | | 19,441 | |
Receivable for delayed delivery instruments sold | | | — | | | | 1,451,195 | |
Receivable for variation margin | | | 121,625 | | | | 13,891 | |
Receivable from affiliate | | | — | | | | 5,375 | |
Prepaid expenses | | | 23,482 | | | | 10,744 | |
Total assets | | | 449,500,575 | | | | 209,374,894 | |
| | |
Liabilities: | | | | | | | | |
Payable for delayed delivery investments purchased | | | 22,087,719 | | | | 69,931,035 | |
Payable for investments purchased | | | 1,955,595 | | | | — | |
Payable upon return of securities loaned | | | 1,876,613 | | | | — | |
Payable for TBA sale commitments (proceeds receivable of $0 and $1,447,820, respectively) | | | — | | | | 1,440,387 | |
Payable for Fund shares repurchased | | | 758,086 | | | | 949,653 | |
Payable for variation margin | | | 3,656 | | | | 6,672 | |
Accrued expenses: | | | | | | | | |
Investment management and advisory fees | | | 254,143 | | | | 82,936 | |
Trustees fees and expenses | | | 906 | | | | 280 | |
Other | | | 75,722 | | | | 48,665 | |
Total liabilities | | | 27,012,440 | | | | 72,459,628 | |
| | |
Net Assets | | $ | 422,488,135 | | | $ | 136,915,266 | |
| | |
Net Assets Represent: | | | | | | | | |
Paid-in capital | | $ | 425,587,245 | | | $ | 138,440,036 | |
Accumulated net realized loss from investments and futures contracts | | | (8,287,920 | ) | | | (2,367,677 | ) |
Net unrealized appreciation of investments and futures contracts | | | 5,188,810 | | | | 842,907 | |
| | |
Net Assets | | $ | 422,488,135 | | | $ | 136,915,266 | |
Shares outstanding | | | 43,821,097 | | | | 12,865,770 | |
Net asset value, offering and redemption price per share | | $ | 9.64 | | | $ | 10.64 | |
* Investments at cost | | $ | 441,318,699 | | | $ | 206,289,716 | |
The accompanying notes are an integral part of these financial statements.
28
Statement of Operations
For the year ended December 31, 2013
| | | | | | | | |
| | | Managers
Short Duration
Government Fund | | | Managers
Intermediate
Duration
Government Fund | |
Investment Income: | | | | | | | | |
Interest income | | $ | 4,672,686 | | | $ | 4,068,588 | |
Dividend income | | | 7,980 | | | | 14,538 | |
Total investment income | | | 4,680,666 | | | | 4,083,126 | |
| | |
Expenses: | | | | | | | | |
Investment management and advisory fees | | | 3,072,747 | | | | 1,124,154 | |
Custodian | | | 117,819 | | | | 65,606 | |
Extraordinary expense | | | 84,186 | | | | 32,295 | |
Professional fees | | | 67,139 | | | | 37,100 | |
Registration fees | | | 48,746 | | | | 31,729 | |
Transfer agent | | | 33,553 | | | | 21,915 | |
Reports to shareholders | | | 28,887 | | | | 24,722 | |
Trustees fees and expenses | | | 16,411 | | | | 5,625 | |
Shareholder servicing fees | | | 3,293 | | | | 160,592 | |
Miscellaneous | | | 11,534 | | | | 4,977 | |
Total expenses before offsets | | | 3,484,315 | | | | 1,508,715 | |
Expense reimbursements | | | — | | | | (46,830 | ) |
Fee waivers | | | — | | | | (4,783 | ) |
Net expenses | | | 3,484,315 | | | | 1,457,102 | |
| | |
Net investment income | | | 1,196,351 | | | | 2,626,024 | |
| | |
Net Realized and Unrealized Gain (Loss): | | | | | | | | |
Net realized gain (loss) on investments | | | 412,643 | | | | (842,865 | ) |
Net realized gain (loss) on futures contracts | | | 427,480 | | | | (41,760 | ) |
Net change in unrealized appreciation (depreciation) of investments | | | (1,751,093 | ) | | | (4,055,868 | ) |
Net change in unrealized appreciation (depreciation) of futures contracts | | | 717,794 | | | | 147,324 | |
Net realized and unrealized loss | | | (193,176 | ) | | | (4,793,169 | ) |
| | |
Net increase (decrease) in net assets resulting from operations | | $ | 1,003,175 | | | $ | (2,167,145 | ) |
The accompanying notes are an integral part of these financial statements.
29
Statements of Changes in Net Assets
For the year ended December 31,
| | | | | | | | | | | | | | | | |
| | | Managers Short Duration
Government Fund | | | Managers Intermediate Duration
Government Fund | |
| | | 2013 | | | 2012 | | | 2013 | | | 2012 | |
Increase (Decrease) in Net Assets From Operations: | | | | | | | | | | | | | | | | |
Net investment income | | $ | 1,196,351 | | | $ | 3,253,295 | | | $ | 2,626,024 | | | $ | 3,500,598 | |
Net realized gain (loss) on investments and futures contracts | | | 840,123 | | | | (1,516,499 | ) | | | (884,625 | ) | | | 3,016,798 | |
Net change in unrealized appreciation (depreciation) of investments and futures contracts | | | (1,033,299 | ) | | | 4,683,729 | | | | (3,908,544 | ) | | | (612,254 | ) |
Net increase (decrease) in net assets resulting from operations | | | 1,003,175 | | | | 6,420,525 | | | | (2,167,145 | ) | | | 5,905,142 | |
| | | | |
Distributions to Shareholders: | | | | | | | | | | | | | | | | |
From net investment income | | | (1,317,291 | ) | | | (3,255,617 | ) | | | (2,636,843 | ) | | | (3,498,486 | ) |
From net realized gain on investments | | | — | | | | — | | | | (284,887 | ) | | | (4,353,483 | ) |
Total distributions to shareholders | | | (1,317,291 | ) | | | (3,255,617 | ) | | | (2,921,730 | ) | | | (7,851,969 | ) |
| | | | |
Capital Share Transactions: | | | | | | | | | | | | | | | | |
Proceeds from sale of shares | | | 233,972,051 | | | | 288,999,135 | | | | 35,405,674 | | | | 76,305,567 | |
Reinvestment of dividends | | | 1,133,602 | | | | 2,828,712 | | | | 2,542,117 | | | | 6,862,325 | |
Cost of shares repurchased | | | (278,718,075 | ) | | | (221,591,585 | ) | | | (81,842,141 | ) | | | (73,409,869 | ) |
Net increase (decrease) from capital share transactions | | | (43,612,422 | ) | | | 70,236,262 | | | | (43,894,350 | ) | | | 9,758,023 | |
| | | | |
Total increase (decrease) in net assets | | | (43,926,538 | ) | | | 73,401,170 | | | | (48,983,225 | ) | | | 7,811,196 | |
| | | | |
Net Assets: | | | | | | | | | | | | | | | | |
Beginning of year | | | 466,414,673 | | | | 393,013,503 | | | | 185,898,491 | | | | 178,087,295 | |
| | | | |
End of year | | $ | 422,488,135 | | | $ | 466,414,673 | | | $ | 136,915,266 | | | $ | 185,898,491 | |
End of year undistributed net investment income | | | — | | | | — | | | | — | | | $ | 2,112 | |
| | | | | | | | | | | | | | | | |
Share Transactions: | | | | | | | | | | | | | | | | |
Sale of shares | | | 24,337,342 | | | | 29,967,411 | | | | 3,274,081 | | | | 6,814,998 | |
Reinvested shares from dividends and distributions | | | 117,805 | | | | 293,690 | | | | 236,358 | | | | 620,611 | |
Shares repurchased | | | (28,975,521 | ) | | | (22,995,811 | ) | | | (7,582,303 | ) | | | (6,534,755 | ) |
Net increase (decrease) in shares | | | (4,520,374 | ) | | | 7,265,290 | | | | (4,071,864 | ) | | | 900,854 | |
The accompanying notes are an integral part of these financial statements.
30
Short Duration Government Fund
Financial Highlights
For a share outstanding throughout each year
| | | | | | | | | | | | | | | | | | | | |
| | | For the year ended December 31, | |
| | | 2013 | | | 2012 | | | 2011 | | | 2010 | | | 2009 | |
Net Asset Value, Beginning of Year | | $ | 9.65 | | | $ | 9.57 | | | $ | 9.58 | | | $ | 9.56 | | | $ | 9.20 | |
| | | | | |
Income from Investment Operations: | | | | | | | | | | | | | | | | | | | | |
Net investment income | | | 0.03 | 3 | | | 0.08 | 3 | | | 0.09 | | | | 0.13 | | | | 0.24 | |
Net realized and unrealized gain (loss) on investments | | | (0.01 | )3 | | | 0.08 | 3 | | | (0.01 | ) | | | 0.03 | | | | 0.35 | |
Total from investment operations | | | 0.02 | | | | 0.16 | | | | 0.08 | | | | 0.16 | | | | 0.59 | |
| | | | | |
Less Distributions to Shareholders from: | | | | | | | | | | | | | | | | | | | | |
Net investment income | | | (0.03 | ) | | | (0.08 | ) | | | (0.09 | ) | | | (0.14 | ) | | | (0.23 | ) |
| | | | | |
Net Asset Value, End of Year | | $ | 9.64 | | | $ | 9.65 | | | $ | 9.57 | | | $ | 9.58 | | | $ | 9.56 | |
Total Return1 | | | 0.20 | % | | | 1.64 | % | | | 0.80 | % | | | 1.68 | %4 | | | 6.43 | %4 |
Ratio of net expenses to average net assets (with offsets/reductions) | | | 0.79 | %5 | | | 0.81 | %6 | | | 0.82 | % | | | 0.81 | % | | | 0.84 | % |
Ratio of expenses to average net assets (with offsets) | | | 0.79 | %5 | | | 0.81 | %6 | | | 0.82 | % | | | 0.81 | % | | | 0.84 | % |
Ratio of total expenses to average net assets (without offsets/reductions)2 | | | 0.79 | %5 | | | 0.81 | %6 | | | 0.82 | % | | | 0.82 | % | | | 0.84 | % |
Ratio of net investment income to average net assets1 | | | 0.27 | %5 | | | 0.80 | %6 | | | 0.89 | % | | | 1.38 | % | | | 2.43 | % |
Portfolio turnover | | | 48 | % | | | 49 | % | | | 141 | % | | | 116 | % | | | 152 | % |
Net assets at end of year (000’s omitted) | | $ | 422,488 | | | $ | 466,415 | | | $ | 393,014 | | | $ | 380,926 | | | $ | 275,330 | |
| | | | | | | | | | | | | | | | | | | | |
31
Intermediate Duration Government Fund
Financial Highlights
For a share outstanding throughout each year
| | | | | | | | | | | | | | | | | | | | |
| | | For the year ended December 31, | |
| | | 2013 | | | 2012 | | | 2011 | | | 2010 | | | 2009 | |
Net Asset Value, Beginning of Year | | $ | 10.98 | | | $ | 11.10 | | | $ | 11.01 | | | $ | 10.90 | | | $ | 10.17 | |
| | | | | |
Income from Investment Operations: | | | | | | | | | | | | | | | | | | | | |
Net investment income | | | 0.18 | 3 | | | 0.20 | 3 | | | 0.30 | | | | 0.32 | | | | 0.41 | |
Net realized and unrealized gain (loss) on investments | | | (0.32 | )3 | | | 0.14 | 3 | | | 0.34 | | | | 0.46 | | | | 0.83 | |
Total from investment operations | | | (0.14 | ) | | | 0.34 | | | | 0.64 | | | | 0.78 | | | | 1.24 | |
| | | | | |
Less Distributions to Shareholders from: | | | | | | | | | | | | | | | | | | | | |
Net investment income | | | (0.18 | ) | | | (0.20 | ) | | | (0.30 | ) | | | (0.32 | ) | | | (0.41 | ) |
Net realized gain on investments | | | (0.02 | ) | | | (0.26 | ) | | | (0.25 | ) | | | (0.35 | ) | | | (0.10 | ) |
Total distributions to shareholders | | | (0.20 | ) | | | (0.46 | ) | | | (0.55 | ) | | | (0.67 | ) | | | (0.51 | ) |
| | | | | |
Net Asset Value, End of Year | | $ | 10.64 | | | $ | 10.98 | | | $ | 11.10 | | | $ | 11.01 | | | $ | 10.90 | |
Total Return1 | | | (1.25 | )%4 | | | 3.15 | %4 | | | 5.88 | %4 | | | 7.20 | %4 | | | 12.40 | % |
Ratio of net expenses to average net assets (with offsets/reductions) | | | 0.91 | %7 | | | 0.89 | %8 | | | 0.88 | % | | | 0.89 | % | | | 0.89 | % |
Ratio of expenses to average net assets (with offsets) | | | 0.91 | %7 | | | 0.89 | %8 | | | 0.88 | % | | | 0.89 | % | | | 0.89 | % |
Ratio of total expenses to average net assets (without offsets/reductions)2 | | | 0.94 | %7 | | | 0.92 | %8 | | | 0.94 | % | | | 0.96 | % | | | 0.98 | % |
Ratio of net investment income to average net assets1 | | | 1.64 | %7 | | | 1.81 | %8 | | | 2.64 | % | | | 2.80 | % | | | 3.84 | % |
Portfolio turnover | | | 29 | % | | | 21 | % | | | 453 | % | | | 409 | % | | | 370 | % |
Net assets at end of year (000’s omitted) | | $ | 136,915 | | | $ | 185,898 | | | $ | 178,087 | | | $ | 153,644 | | | $ | 155,226 | |
| | | | | | | | | | | | | | | | | | | | |
Notes to Financial Highlights
The following footnotes should be read in conjunction with the Financial Highlights of the Funds previously presented in this report.
| 1 | Total returns and net investment income would have been lower had certain expenses not been offset. |
| 2 | Excludes the impact of expense reimbursements or fee waivers and expense reductions such as brokerage credits, but includes expense repayments and non-reimbursable expenses, if any, such as interest, taxes and extraordinary expenses. |
| 3 | Per share numbers have been calculated using average shares. |
| 4 | The total return is based on the Financial Statement Net Asset Values as shown. |
| 5 | Includes non-routine extraordinary expenses amounting to 0.019% of average net assets. |
| 6 | Includes non-routine extraordinary expenses amounting to 0.005% of average net assets. |
| 7 | Includes non-routine extraordinary expenses amounting to 0.020% of average net assets. |
| 8 | Includes non-routine extraordinary expenses amounting to 0.004% of average net assets. |
32
Notes to Financial Statements
December 31, 2013
| 1. | Summary of Significant Accounting Policies |
Managers Trust II (the “Trust”) is an open-end management investment company organized as a Massachusetts business trust, and registered under the Investment Company Act of 1940, as amended (the “1940 Act”). Currently, the Trust consists of a number of different Funds, each having distinct investment management objectives, strategies, risks, and policies. Included in this report are two series of the Trust: Managers Short Duration Government Fund (“Short Duration”) and Managers Intermediate Duration Government Fund (“Intermediate Duration”), each a “Fund” and collectively the “Funds.”
The Funds’ financial statements are prepared in accordance with accounting principles generally accepted in the United States of America (“U.S. GAAP”), which require management to make estimates and assumptions that affect the reported amounts of assets and liabilities and disclosure of contingent assets and liabilities at the date of the financial statements and the reported amounts of income and expenses during the reporting period. Actual results could differ from those estimates and such differences could be material. The following is a summary of significant accounting policies followed by the Funds in the preparation of their financial statements:
| a. | Valuation of Investments |
Equity securities traded on a domestic securities exchange are valued at the last quoted sale price, or, lacking any sales, at the last quoted bid price. Equity securities primarily traded on an international securities exchange and equity securities traded on NASDAQ or in a U.S. or non-U.S. over-the-counter market are valued at the market’s official closing price, or, if there are no trades on the applicable date, at the last quoted bid price. In addition, if the applicable market does not offer an official closing price or if the official closing price is not representative of the overall market, equity securities primarily traded on an international securities exchange and equity securities traded in a non-U.S. over-the-counter market are valued at the last quoted sales price. The Funds’ investments are generally valued based on independent market quotations or prices or, if none, “evaluative” or other market based valuations provided by third-party pricing services approved by the Board of Trustees of the Funds (the “Board”).
Fixed-income securities are valued based on valuations furnished by independent pricing services that utilize matrix systems, which reflect such factors as security prices, yields, maturities, and ratings, and are supplemented by dealer and exchange quotations. Futures contracts for which market quotations are readily available are valued at the settlement price as of the close of the futures exchange. Debt obligations (other than short term debt obligations that have 60 days or less remaining until maturity) will be valued using the evaluated bid price or the mean price provided by an authorized pricing service. Short term debt obligations (debt obligations with maturities of one year or less at the time of issuance) that have 60 days or less remaining until maturity will be valued at amortized cost. Investments in other open-end regulated investment companies are valued at their end of day net asset value per share. Investments in certain mortgage-backed and stripped mortgage-backed securities, preferred stocks, convertible securities, derivatives and other debt securities not traded on an organized securities market are valued on the basis of valuations
provided by dealers or by a pricing service which uses information with respect to transactions in such securities and various relationships between such securities and yield to maturity in determining value.
Under certain circumstances, the value of certain Fund investments (including derivatives) may be based on an evaluation of fair value, pursuant to procedures established by and under the general supervision of the Board. The Pricing Committee is the committee formed by the Board to make fair value determinations for such investments. The Funds may use the fair value of a portfolio investment to calculate its net asset value (“NAV”) in the event that the market quotation, price or market based valuation for the portfolio investment is not deemed to be readily available or otherwise not determinable pursuant to the Board’s valuation procedures, if Managers Investment Group LLC (the “Investment Manager”) believes the quotation, price or market based valuation to be unreliable, or in certain other circumstances. When determining the fair value of an investment, the Pricing Committee seeks to determine the price that the Fund might reasonably expect to receive from a current sale of that investment in an arms-length transaction. Fair value determinations shall be based upon consideration of all available facts and information, including, but not limited to (i) attributes specific to the investment; (ii) fundamental analytical data and press releases relating to the investment and its issuer; and (iii) the value of other comparable securities or relevant financial instruments, including derivative securities, traded on other markets or among dealers. The values assigned to fair value investments are based on available information and do not necessarily represent amounts that might ultimately be realized in the future, since such amounts depend on future developments inherent in long-term investments. Because of the inherent uncertainty of valuation, those estimated values may differ significantly from the values that would have been used had a ready market for the investments existed, and the differences could be material. Board will be presented with a quarterly report showing as of the most recent quarter end, all outstanding securities fair valued by the Pricing Committee, including a comparison with the prior quarter end and the percentage of the Fund that the security represents at each quarter end.
Portfolio investments that trade primarily on foreign markets are priced based upon the market quotation of such securities as of the close of their respective principal markets. Under certain circumstances, on behalf of a fund that invests primarily in international securities, the Investment Manager or applicable subadvisor may adjust such prices based on its determination of the impact of events occurring subsequent to the close of such markets but prior to the time as of which the Fund calculates its NAV. The Board has also adopted a policy that securities held in a fund that invests primarily in international securities and certain foreign debt obligations held by a fund, in each case, that can be fair valued by the applicable fair value pricing service are fair valued on each business day without regard to a “trigger” (e.g., without regard to invoking fair value based upon a change in a U.S. equity securities index exceeding a pre-determined level). The Fund may invest in securities that may be thinly traded. The Board has adopted procedures to adjust prices of securities that are judged to be stale so that they reflect fair value. An investment valued on the basis of
Notes to Financial Statements (continued)
its fair value may be valued at a price higher or lower than available market quotations.
U.S. GAAP defines fair value as the price that a Fund would receive to sell an asset or pay to transfer a liability in an orderly transaction between market participants at the measurement date. U.S. GAAP also establishes a framework for measuring fair value, and a three-level hierarchy for fair value measurements based upon the transparency of inputs to the valuation of an asset or liability. Inputs may be observable or unobservable and refer broadly to the assumptions that market participants would use in pricing the asset or liability. Observable inputs reflect the assumptions market participants would use in pricing the asset or liability based on market data obtained from sources independent of the Funds. Unobservable inputs reflect the Funds’ own assumptions about the assumptions that market participants would use in pricing the asset or liability developed based on the best information available in the circumstances. Each investment is assigned a level based upon the observability of the inputs which are significant to the overall valuation.
The three-tier hierarchy of inputs is summarized below:
Level 1 – inputs are quoted prices in active markets for identical investments (e.g., equity securities, open-end investment companies, futures contracts, options contracts)
Level 2 – other observable inputs (including, but not limited to: quoted prices for similar assets or liabilities in markets that are active, quoted prices for identical or similar assets or liabilities in markets that are not active, inputs other than quoted prices that are observable for the assets or liabilities (such as interest rates, yield curves, volatilities, prepayment speeds, loss severities, credit risks and default rates) or other market corroborated inputs) (e.g., debt securities, government securities, swap contracts, foreign currency exchange contracts, foreign securities utilizing international fair value pricing, broker-quoted securities, fair valued securities with observable inputs)
Level 3 – inputs are significant unobservable inputs (including the Funds’ own assumptions used to determine the fair value of investments) (e.g., fair valued securities with unobservable inputs)
Changes in inputs or methodologies used for valuing investments may result in a transfer in or out of levels within the fair value hierarchy. The inputs or methodologies used for valuing investments are not necessarily an indication of the risk associated with investing in those investments.
Security transactions are accounted for as of trade date. Realized gains and losses on securities sold are determined on the basis of identified cost.
| c. | Investment Income and Expenses |
Dividend income is recorded on the ex-dividend date. Dividend and interest income on foreign securities is recorded gross of any withholding tax. Interest income, which includes amortization of premium and accretion of discount on debt securities, is accrued as earned. Non-cash dividends included in dividend income, if any, are reported at the fair market value of the securities received. Other income and expenses are recorded on an accrual basis. Expenses that cannot be directly attributed to a Fund are apportioned among the Funds in the Trust and in some cases other affiliated funds based upon their relative average net assets or number of shareholders.
The Funds have a “balance credit” arrangement with The Bank of New York Mellon (“BNYM”), the Funds’ custodian, whereby each Fund is credited with an interest factor equal to 0.75% below the effective 90-day T-Bill rate for account balances left uninvested overnight. If the T-Bill rate falls below 0.75%, no credits will be earned. These credits serve to reduce custody expenses that would otherwise be charged to each Fund. For the year ended December 31, 2013, the Funds’ custodian expense was not reduced.
Overdraft fees are computed at 1% above the effective Federal Funds rate on the day of the overdraft. Prior to January 1, 2013, the rate was 2% above the effective Federal Funds rate. For the year ended December 31, 2013, overdraft fees for Short Duration and Intermediate Duration equaled $0 and $220, respectively.
The Trust recently held a shareholder meeting at which shareholders were asked to approve a new Declaration of Trust for the Trust, amoung other proposals. The costs associated with this proxy were treated as “extraordinary expenses,” and, therefore, are excluded from the expense limitation agreement described in Note 2.
| d. | Dividends and Distributions |
Fund distributions resulting from either net investment income or realized net capital gains, if any, will normally be declared and paid at least annually in December, as described in the Fund’s prospectus. Distributions to shareholders are recorded on the ex- dividend date. Distributions are determined in accordance with Federal income tax regulations, which may differ from net investment income and net realized capital gains for financial statement purposes (U.S. GAAP). Differences may be permanent or temporary. Permanent differences are reclassified among capital accounts in the financial statements to reflect their tax character. Temporary differences arise when certain items of income, expense and gain or loss are recognized in different periods for financial statement and tax purposes; these differences will reverse at some time in the future. The most common differences are primarily due to differing treatments for losses deferred due to excise tax regulations and wash sales. Permanent book and tax basis differences, if any, relating to shareholder distributions will result in reclassifications to paid-in capital.
34
Notes to Financial Statements (continued)
The tax character of distributions paid during the years ended December 31, 2013 and December 31, 2012 were as follows:
| | | | | | | | | | | | | | | | |
| | | Short Duration | | | Intermediate Duration | |
| | | 2013 | | | 2012 | | | 2013 | | | 2012 | |
Distributions paid from: | | | | | | | | | | | | | | | | |
Ordinary income | | $ | 1,317,291 | | | $ | 3,255,617 | | | $ | 2,638,009 | | | $ | 3,498,486 | |
Short-term capital gains | | | — | | | | — | | | | 104,695 | | | | 2,936,108 | |
Long-term capital gains | | | — | | | | — | | | | 179,026 | | | | 1,417,375 | |
| | | | | | | | | | | | | | | | |
Total | | $ | 1,317,291 | | | $ | 3,255,617 | | | $ | 2,921,730 | | | $ | 7,851,969 | |
| | | | | | | | | | | | | | | | |
As of December 31, 2013, the components of distributable earnings (excluding unrealized appreciation/depreciation) on a tax basis consisted of:
| | | | | | | | |
| | | Short Duration | | | Intermediate Duration | |
Capital loss carryforward | | $ | 1,571,078 | | | $ | 195,154 | |
Undistributed ordinary income | | | — | | | | — | |
Undistributed short-term capital gains | | | — | | | | — | |
Undistributed long-term capital gains | | | — | | | | — | |
Post-October loss deferral | | | — | | | | 519,072 | |
Each Fund intends to comply with the requirements under Subchapter M of the Internal Revenue Code of 1986, as amended, and to distribute substantially all of its taxable income and gains to its shareholders and to meet certain diversification and income requirements with respect to investment companies. Therefore, no provision for Federal income or excise tax is included in the accompanying financial statements.
Additionally, based on each Fund’s understanding of the tax rules and rates related to income, gains and transactions for the foreign jurisdictions in which it invests, each Fund will provide for foreign taxes, and where appropriate, deferred foreign taxes.
Management has analyzed the Funds’ tax positions taken on federal income tax returns as of December 31, 2013 and all open tax years (generally, the three prior taxable years), and has concluded that no provision for federal income tax is required in the Funds’ financial statements. Additionally, the Funds are not aware of any tax position for which it is reasonably possible that the total amounts of unrecognized tax benefits will change materially in the next twelve months.
Net capital losses incurred in taxable years beginning after the enactment of the Regulated Investment Company Modernization Act of 2010, (post-enactment capital losses) may be carried forward for an unlimited time period. Such losses will be required to be utilized
prior to any loss carryovers incurred in pre-enactment taxable years, which generally expire eight years following the close of the taxable year in which they were incurred. As a result of this ordering rule, pre-enactment capital loss carryovers may be more likely to expire unused. Additionally, post-enactment capital losses that are carried forward retain their tax character as either short-term or long-term capital losses, unlike pre-enactment losses which are considered all short-term.
| f. | Capital Loss Carryovers and Deferrals |
As of December 31, 2013, the following Fund had accumulated net realized capital loss carryovers from securities transactions for Federal income tax purposes as shown in the following chart. These amounts may be used to offset future realized capital gains, if any, through the expiration dates listed or in the case of post-enactment losses, for an unlimited time period.
| | | | | | | | | | |
| | | Capital Loss Carryover Amounts | | | Expires |
Fund | | Short-Term | | | Long-Term | | | December 31, |
Short Duration | | | | | | | | | | |
(Pre-Enactment) | | $ | 1,571,078 | | | | — | | | 2017 |
| | | | | | | | | | |
Intermediate Duration | | | | | | | | | | |
(Post-Enactment) | | $ | 195,154 | | | | — | | | Unlimited |
| | | | | | | | | | |
For the year ended December 31, 2013, the following Fund utilized capital loss carryovers in the amount of:
| | | | | | | | |
| | | Capital Loss Carryover Utilized | |
Fund | | Short-Term | | | Long-Term | |
Short Duration | | $ | 760,040 | | | | — | |
The Trust’s Declaration of Trust authorizes for each series the issuance of an unlimited number of shares of beneficial interest, without par value. Each Fund records sales and repurchases of its capital stock on the trade date. The cost of securities contributed to the Funds in connection with the issuance of shares is based on the valuation of those securities in accordance with the Funds’ policy on investment valuation.
At December 31, 2013, certain unaffiliated shareholders of record, specifically omnibus accounts, individually or collectively held greater than 10% of the net assets of the Funds as follows: Short Duration – two collectively own 73%; Intermediate Duration – two collectively own 60%. Transactions by these shareholders may have a material impact on their respective Funds.
The Funds may enter into repurchase agreements provided that the value of the underlying collateral, including accrued interest, will equal or exceed the value of the repurchase agreement during the term of the agreement. The underlying collateral for all repurchase agreements is held in safekeeping by the Fund’s custodian or at the Federal Reserve Bank. If the seller defaults and the value of the collateral declines, or if bankruptcy proceedings commence with respect to the seller of the security, realization of the collateral by the Fund may be delayed or limited. At December 31, 2013, the
Notes to Financial Statements (continued)
market value of repurchase agreements outstanding for Short Duration and Intermediate Duration was $1,876,613 and $0, respectively.
| i. | Securities Transacted on a When Issued Basis |
The Funds may enter into To Be Announced (“TBA”) sale commitments to hedge its portfolio positions or to sell mortgage-backed securities it owns under delayed delivery arrangements. Proceeds of TBA sale commitments are not received until the contractual settlement date. During the time a TBA sale commitment is outstanding, equivalent deliverable securities, or an offsetting TBA purchase commitment deliverable on or before the sale commitment date, are held as “cover” for the transaction. Unsettled TBA sale commitments are valued at the current market value of the underlying securities according to the procedures described under “Valuation of Investments,” in footnote 1a above. Each contract is marked-to-market daily and the change in market value is recorded by the Funds as an unrealized gain or loss. If the TBA sale commitment is closed through the acquisition of an offsetting purchase commitment, the Funds realize a gain or loss. If the Funds deliver securities under the commitment, the Funds realize a gain or a loss from the sale of the securities based upon the unit price established at the date the commitment was entered into.
| j. | Delayed Delivery Transactions and When-Issued Securities |
The Funds may enter into securities transactions on a delayed delivery or when-issued basis. Payment and delivery may take place after the customary settlement period for that security. The price of the underlying securities and the date when the securities will be delivered and paid for are fixed at the time the transaction is negotiated. During the time a delayed delivery sell is outstanding, the contract is marked to market daily and equivalent deliverable securities are held for the transaction. The value of the securities purchased on a delayed delivery or when-issued basis are identified as such in the Funds’ Schedules of Portfolio Investments. With respect to purchase commitments, the Funds identify securities as segregated in their records with a value at least equal to the amount of the commitment. The payables and receivables associated with the purchases and sales of delayed delivery securities having the same coupon, settlement date and broker are offset. Delayed delivery or when-issued securities that have been purchased from and sold to different brokers are reflected as both payables and receivables in the Funds’ Statement of Assets and Liabilities. Losses may arise due to changes in the value of the underlying securities or if the counterparty does not perform under the contract, or if the issuer does not issue the securities due to political, economic, or other factors.
| 2. | Agreements and Transactions with Affiliates |
For each of the Funds, the Trust has entered into an investment management agreement under which the Investment Manager, a subsidiary of Affiliated Managers Group, Inc. (“AMG”), serves as investment manager to the Funds and is responsible for the Funds’ overall administration and operations. The Investment Manager selects subadvisors for the Funds (subject to Board approval) and monitors each subadvisor’s investment performance, security holdings and investment strategies. Each Fund’s investment portfolio is managed by one or more portfolio managers who serves pursuant to a subadvisory agreement with the Investment Manager.
Investment management fees are paid directly by the Funds to the Investment Manager based on average net assets. For the year December 31, 2013, the Funds’ investment management fees were paid at the following annual rate of each Fund’s respective average daily net assets:
| | | | |
Short Duration | | | 0.70 | % |
Intermediate Duration | | | 0.70 | % |
The Investment Manager has agreed to waive a portion of its management fee in consideration of shareholder servicing fees that it has received from JPMorgan Distribution Services, Inc., with respect to short-term cash investments each Fund has made in the JPMorgan Liquid Assets Money Market Fund, Capital Shares. For the year ended December 31, 2013, the management fee for Intermediate Duration was reduced by $4,783.
The Investment Manager has contractually agreed, through at least May 1, 2014, to waive management fees and/or reimburse Fund expenses in order to limit total annual Fund operating expenses after fee waiver and expense reimbursements (exclusive of taxes, interest (including interest incurred in connection with bank and custody overdrafts), brokerage commissions and other transaction costs, acquired fund fees and expenses and extraordinary expenses) to 0.89% of Intermediate Duration Fund’s average daily net assets subject to later reimbursement by the Fund in certain circumstances.
Intermediate Duration is obligated to repay the Investment Manager such amounts waived, paid or reimbursed in future years provided that the repayment occurs within thirty-six (36) months after the waiver or reimbursement and that such repayment would not cause the Fund’s total annual operating expenses after fee waiver and expense reimbursements in any such future year to exceed the Fund’s expense contractual expense limitation amount. For the year ended December 31, 2013, the Fund’s components of reimbursement available are detailed in the following chart:
| | | | |
| | | Intermediate Duration | |
Reimbursement Available - 12/31/12 | | $ | 235,999 | |
Additional Reimbursements | | | 46,830 | |
Repayments | | | — | |
Expired Reimbursements | | | (115,172 | ) |
| | | | |
Reimbursement Available - 12/31/13 | | $ | 167,657 | |
| | | | |
The aggregate annual retainer paid to each Independent Trustee of the Board is $105,000, plus $6,000 or $2,500 for each regular or special meeting attended, respectively. The Independent Chairman of the Trusts receives an additional payment of $25,000 per year. The Chairman of the Audit Committee receives an additional payment of $10,000 per year. The Trustees’ fees and expenses are allocated among all of the funds in the Trusts for which the Investment Manager serves as the advisor (the “Managers Funds”) based on the relative net assets of such Funds. The “Trustees fees and expenses” shown in the financial statements represents each Fund’s allocated portion of the total fees and expenses paid by the Managers Funds.
Prior to January 1, 2013, the annual retainer paid to each Independent Trustee of the Board was $80,000, plus $5,000 or
Notes to Financial Statements (continued)
$2,500 for each regular or special meeting attended, respectively. The Independent Chairman of the Trust formerly received an additional payment of $20,000 per year. The Chairman of the Audit Committee formerly received an additional payment of $8,000 per year.
The Funds are distributed by Managers Distributors, Inc. (the “Distributor” or “MDI”), a wholly-owned subsidiary of the Investment Manager. MDI serves as the distributor and underwriter for each Fund and is a registered broker-dealer and member of the Financial Industry Regulatory Authority, Inc. (“FINRA”). Shares of each Fund will be continuously offered and will be sold directly to prospective purchasers and through brokers, dealers or other financial intermediaries who have executed selling agreements with MDI. Subject to the compensation arrangement discussed below, generally MDI bears all or a portion of the expenses of providing services pursuant to the distribution agreement, including the payment of the expenses relating to the distribution of prospectuses for sales purposes and any advertising or sales literature. Certain Trustees and Officers of the Funds are Officers and/or Directors of the Investment Manager, AMG and/or the Distributor.
The Board has approved reimbursement payments to the Investment Manager for shareholder servicing expenses incurred (“shareholder servicing fees”). Shareholder servicing fees include payments to third parties such as a bank, broker-dealer, trust company of other financial intermediaries who provide shareholder recordkeeping, account servicing and other services. The Fund may reimburse the Investment Manager for actual amount incurred up to a maximum annual rate of the Fund’s average daily net asset value as shown in the table below. The impact on the annualized expense ratio for the year ended December 31, 2013, were as follows:
| | | | | | | | |
Fund | | Maximum Amount
Allowed | | | Actual Amount
Incurred | |
Short Duration | | | 0.100 | % | | | 0.001 | % |
Intermediate Duration | | | 0.100 | % | | | 0.100 | % |
The Securities and Exchange Commission granted an exemptive order that permits the Funds to lend and borrow money for certain temporary purposes directly to and from other eligible Managers Funds. Participation in this interfund lending program is voluntary for both borrowing and lending funds, and an interfund loan is only made if it benefits each participating fund. The Investment Manager administers the program according to procedures approved by the Board, and the Board monitors the operation of the program. An interfund loan must comply with certain conditions set out in the exemptive order, which are designed to assure fairness and protect all participating Funds. For the year ended December 31, 2013, the Funds neither borrowed from nor lent to other Managers Funds.
| 3. | Purchases and Sales of Securities |
Purchases and sales of securities (excluding short-term securities) for the year ended December 31, 2013, were as follows:
| | | | | | | | |
| | | Long-Term Securities
(excluding U.S. Government Obligations) | |
Fund | | Purchases | | | Sales | |
Short Duration | | $ | 10,074,476 | | | $ | 16,204,536 | |
Intermediate Duration | | | — | | | $ | 174,965 | |
| |
| | | U.S. Government Obligations | |
Fund | | Purchases | | | Sales | |
Short Duration | | $ | 193,692,197 | | | $ | 204,946,853 | |
Intermediate Duration | | $ | 89,001,076 | | | $ | 59,360,286 | |
| 4. | Portfolio Securities Loaned |
The Funds participate in a securities lending program offered by BNYM (the “Program”), providing for the lending of securities to qualified brokers. Securities lending income include earnings of such temporary cash investments, plus or minus any rebate to a borrower. These earnings (after any rebate) are then divided between BNYM, as a fee for its services under the program, and the Funds, according to agreed-upon rates. Collateral on all securities loaned is accepted in cash and is maintained at a minimum level of 102% (105% in the case of certain foreign securities) of the market value, plus interest, if applicable, of investments on loan. It is the Funds’ policy to obtain additional collateral from or return excess collateral to the borrower by the end of the next business day, following the valuation date of the securities loaned. Therefore, the value of the collateral held may be temporarily less than the value of the securities on loan. Lending securities entails a risk of loss to the Funds if and to the extent that the market value of the securities loaned were to increase and the borrower did not increase the collateral accordingly, and the borrower fails to return the securities. Under the terms of the Program, the Funds are indemnified for such losses by BNYM. Cash collateral is held in a separate account managed by BNYM, who is authorized to exclusively enter into overnight government repurchase agreements. BNYM bears the risk of any deficiency in the amount of the cash collateral available for return to the borrower due to any loss on the collateral invested.
| 5. | Commitments and Contingencies |
Under the Trust’s organizational documents, its trustees and officers are indemnified against certain liabilities arising out of the performance of their duties to the Trust. In addition, in the normal course of business, the Funds may enter into contracts and agreements that contain a variety of representations and warranties which provide general indemnifications. The maximum exposure to the Funds under these agreements is unknown, as this would involve future claims that may be made against the Funds that have not yet occurred. However, based on experience, the Funds have had no prior claims or losses and expect the risks of loss to be remote.
The following disclosures contain information on how and why the Funds use derivative instruments, the credit risk and how derivative instruments affect the Funds’ financial position, results of operations and cash flows. The location and fair value amounts of these instruments on the Statement of Assets and Liabilities and the realized and changes in unrealized gains and losses on the Statement of Operations, each categorized by type of derivative
Notes to Financial Statements (continued)
contract, are included in a table in the Notes to the Schedules of Portfolio Investments. For the year ended December 31, 2013, the average quarterly balances of derivative financial instruments outstanding were as follows:
| | | | | | | | |
| | | Short
Duration | | | Intermediate
Duration | |
Financial futures contracts: | | | | | | | | |
Average number of contracts purchased | | | 40 | | | | 55 | |
Average number of contracts sold | | | 435 | | | | 67 | |
Average notional value of contracts purchased | | $ | 4,863,250 | | | $ | 6,787,291 | |
Average notional value of contracts sold | | $ | 53,260,746 | | | $ | 9,062,697 | |
The Funds entered into futures contracts to achieve a desired level of investment, whether to accommodate portfolio turnover or cash flows from capital shares transactions. There are certain risks associated with futures contracts. Prices may not move as expected or the Fund may not be able to close out the contract when it desires to do so, resulting in losses.
On entering into a futures contract, either cash or securities in an amount equal to a certain percentage of the contract value (initial margin) must be deposited with the futures broker. Subsequent payments (variation margin) are made or received each day. The variation margin payments equal the daily changes in the contract value and are recorded as unrealized gains or losses. For OTC futures, daily variation margin is not required. The Funds recognize a realized gain or loss when the contract is closed or expires equal to the difference between the value of the contract at the time it was opened and the value at the time it was closed. Futures are valued at their quoted daily settlement prices. The aggregate principal amounts of the contracts are not recorded in the financial statements. Fluctuations in the value of the contracts are recorded in the Statement of Assets and Liabilities as an asset (liability) and in the Statement of Operations as unrealized appreciation (depreciation) until the contracts are closed, when they are recorded as realized gains (losses) on futures contracts.
| 8. | Risks Associated with Collateralized Mortgage Obligations (“CMOs”) |
The net asset values of the Funds may be sensitive to interest rate fluctuations because the Funds may hold several instruments, including CMOs and other derivatives, whose values can be significantly impacted by interest rate movements. CMOs are obligations collateralized by a portfolio of mortgages or mortgage- related securities. Payments of principal and interest on the mortgages are passed through to the holder of the CMOs on the same schedule as they are received, although certain classes of CMOs have priority over others with respect to the receipt of prepayments on the mortgages. Therefore, the investment in CMOs may be subject to a greater or lesser risk of prepayment than other types of mortgage-related securities. CMOs are subject to principal paydowns as a result of prepayments or refinancing of the underlying mortgage instruments. As a result, the average life may be substantially less than the original maturity. CMOs may have a fixed or variable rate of interest.
The Funds may enter into dollar rolls in which they sell debt securities for delivery currently and simultaneously contract to repurchase similar, but not identical, securities at the same price or a lower price on an agreed date. The Funds receive compensation as consideration for entering into the commitment to repurchase. The compensation is the difference between the current sale price and the repurchase price (often referred to as the “drop”) as well as the interest earned on the cash proceeds of the initial sale. The Funds may also be compensated by the receipt of a commitment fee. As the holder, the counterparty receives all principal and interest payments, including prepayments, made with respect to the similar security sold. Dollar rolls may be renewed with a new sale and repurchase price with a cash settlement made at renewal without physical delivery of the securities subject to the contract.
Certain risks may arise upon entering into dollar rolls from the potential inability of counterparties to meet the terms of their commitments. Additionally, the value of such securities may change adversely before the Funds are able to repurchase them. There can be no assurance that the Funds’ use of the cash that they receive from a dollar roll will provide a return that exceeds their cost.
Each of the Funds invests in stripped securities (“STRIPS”), primarily interest-only strips, for their hedging characteristics. Interest-only STRIPS will most likely move differently than typical fixed-income securities in relation to changes in interest rates. STRIPS are usually structured with two classes that receive different proportions of the interest and principal distributions from a pool of underlying assets. A common type of STRIP will have one class receiving all of the interest from the underlying assets (“interest-only” or “IO” class), while the other class will receive the entire principal (“principal only” or “PO” class). However, in some instances, one class will receive some of the interest and most of the principal while the other class will receive most of the interest and the remainder of the principal. STRIPS are unusually volatile in response to changes in interest rates. The yield to maturity on an IO class of STRIPS is extremely sensitive not only to changes in prevailing interest rates but also to the rate of principal payments (including prepayments) on the underlying assets. A rapid rate of principal prepayments may have a measurably adverse effect on a Funds’ yield to maturity to the extent it invests in IOs. Conversely, POs tend to increase in value if prepayments are greater than anticipated and decline if prepayments are slower than anticipated. Thus, if the underlying assets experience greater than anticipated prepayments of principal, a Fund may fail to fully recover its initial investment in these securities, even if the STRIPS were rated of the highest credit quality by Standard & Poor’s Corporation or Moody’s Investors Service, Inc. These risks are managed by investing in a variety of such securities and by using certain hedging techniques. In addition the secondary market for STRIPS may be less liquid than that of other mortgage-backed or asset-backed securities, potentially limiting a Fund’s ability to buy or sell those securities at any particular time.
Notes to Financial Statements (continued)
| 11. | Master Netting Agreement |
The Funds may enter into master netting agreements with their counterparties for the securities lending program and repurchase agreements, which provide the right, in the event of default (including bankruptcy or insolvency) for the non-defaulting party to liquidate the collateral and calculate net exposure to the defaulting party or request additional collateral. For financial reporting purposes, the Funds do not offset financial assets and financial liabilities that are subject to master netting agreements in the Statement of Assets and Liabilities. The following table is a summary of the Funds’ open securities lending and repurchase agreements which are subject to a master netting agreement as of December 31, 2013.
| | | | | | | | | | | | | | | | | | | | | | | | |
| | | Gross Amounts of
Recognized Assets | | | Gross Amounts
Offset in the
Statement of
Assets and
Liabilities | | | Net Amounts of
Assets Presented in
the Statement of
Assets and
Liabilities | | | Gross Amount Not Offset in the Statement
of Assets and Liabilities | | | | |
| Fund | | | | | Financial
Instruments | | | Cash Collateral
Received | | | Net Amount | |
Short Duration | | | | | | | | | | | | | | | | | | | | | | | | |
Securities lending | | $ | 1,851,489 | | | | — | | | $ | 1,851,489 | | | | — | | | $ | 1,851,489 | | | | — | |
Repurchase agreements | | | 1,876,613 | | | | — | | | | 1,876,613 | | | $ | 1,876,613 | | | | — | | | | — | |
| | | | | | | | | | | | | | | | | | | | | | | | |
Total | | $ | 3,728,102 | | | | — | | | $ | 3,728,102 | | | $ | 1,876,613 | | | $ | 1,851,489 | | | | — | |
| | | | | | | | | | | | | | | | | | | | | | | | |
On January 21, 2014, Affiliated Managers Group, Inc., a global asset management company, announced that the Funds’ Investment Manager and Administrator, Managers Investment Group LLC, will be rebranded as AMG Funds LLC. The rebranding is expected to become effective during the second quarter of 2014 once the appropriate regulatory filings have taken place.
Each Fund has determined that no other material events or transactions occurred through the issuance of the Fund’s financial statements, which require additional disclosure in or adjustment of the Fund’s financial statements.
Tax Information (unaudited)
Managers Short Duration Government Fund and Managers Intermediate Duration Government Fund each hereby designates the maximum amount allowable of its net taxable income as qualified dividends as provided in the Jobs and Growth Tax Relief Reconciliation Act of 2003. The 2013 Form 1099-DIV you receive for each Fund will show the tax status of all distributions paid to you during the calendar year.
Pursuant to section 852 of the Internal Revenue Code, Managers Short Duration Government Fund and Managers Intermediate Duration Government Fund each hereby designates $0 and $179,026, respectively, as a capital gain distribution with respect to the taxable year ended December 31, 2013, or if subsequently determined to be different, the net capital gains of such year.
Report of Independent Registered Public Accounting Firm
To the Board of Trustees of Managers Trust II and the Shareholders of Managers Short Duration Government Fund and Managers Intermediate Duration Government Fund:
In our opinion, the accompanying statements of assets and liabilities, including the schedules of portfolio investments, and the related statements of operations and of changes in net assets and the financial highlights present fairly, in all material respects, the financial position of Managers Short Duration Government Fund and Managers Intermediate Duration Government Fund (the “Funds”) at December 31, 2013, and the results of each of their operations, the changes in each of their net assets and the financial highlights for each of the periods indicated, in conformity with accounting principles generally accepted in the United States of America. These financial statements and financial highlights (hereafter referred to as “financial statements”) are the responsibility of the Funds’ management. Our responsibility is to express an opinion on these financial statements based on our audits. We conducted our audits of these financial statements in accordance with the standards of the Public Company Accounting Oversight Board (United States). Those standards require that we plan and perform the audit to obtain reasonable assurance about whether the financial statements are free of material misstatement. An audit includes examining, on a test basis, evidence supporting the amounts and disclosures in the financial statements, assessing the accounting principles used and significant estimates made by management, and evaluating the overall financial statement presentation. We believe that our audits, which included confirmation of securities at December 31, 2013 by correspondence with the custodian and brokers, and the application of alternative auditing procedures where securities purchased had not been received, provide a reasonable basis for our opinion.
PricewaterhouseCoopers LLP
Boston, Massachusetts
February 28, 2014
Trustees and Officers
The Trustees and Officers of the Trust, their business addresses, principal occupations for the past five years and dates of birth are listed below. The Trustees provide broad supervision over the affairs of the Trust and the Funds. The Trustees are experienced executives who meet periodically throughout the year to oversee the Funds’ activities, review contractual arrangements with companies that provide services to the Funds, and review the Funds’ performance. Unless otherwise noted, the address of each Trustee or Officer is the address of the Trust: 800 Connecticut Avenue, Norwalk, Connecticut 06854.
There is no stated term of office for Trustees. Trustees serve until their resignation, retirement or removal in accordance with the Trust’s organizational documents and policies adopted by the Board from time to time. The Chairman of the Trustees, President, Treasurer and Secretary of the Trust are elected by the Trustees annually. Other officers hold office at the pleasure of the Trustees.
Independent Trustees
The following Trustees are not “interested persons” of the Trust within the meaning of the 1940 Act:
| | |
Name, Date of Birth, Number of Funds Overseen in Fund Complex* | | Principal Occupation(s) During Past 5 Years and Other Directorships Held by Trustee |
Bruce B. Bingham, 12/1/48 • Trustee since 2012 • Oversees 39 Funds in Fund Complex | | Partner, Hamilton Partners (real estate development firm) (1987-Present). |
| |
William E. Chapman, II, 9/23/41 • Independent Chairman • Trustee since 2000 • Oversees 39 Funds in Fund Complex | | President and Owner, Longboat Retirement Planning Solutions (1998-Present); Hewitt Associates, LLC (part time) (provider of Retirement and Investment Education Seminars) (2002-2009); Trustee Emeritus of Bowdoin College (2013-Present); Trustee of Bowdoin College (2002-2013); Director of Harding, Loevner Funds, Inc. (6 portfolios); Trustee of Third Avenue Trust (5 portfolios); Trustee of Third Avenue Variable Trust (1 portfolio); Trustee of Aston Funds (23 portfolios). |
| |
Edward J. Kaier, 9/23/45 • Trustee since 2000 • Oversees 39 Funds in Fund Complex | | Attorney at Law and Partner, Teeters Harvey Marrone & Kaier LLP (2007-Present); Attorney at Law and Partner, Hepburn Willcox Hamilton & Putnam, LLP (1977-2007); Trustee of Third Avenue Trust (5 portfolios); Trustee of Third Avenue Variable Trust (1 portfolio); Trustee of Aston Funds (23 portfolios). |
| |
Kurt A. Keilhacker, 10/5/63 • Trustee since 2013 • Oversees 39 Funds in Fund Complex | | Managing Member, TechFund Capital (1997-Present); Managing Member, TechFund Europe (2000-Present); Trustee, Gordon College (2001-Present); Board Member, 6wind SA, (2002-Present); Managing Member, Clapham Partners I, LLC (2013-Present). |
| |
Steven J. Paggioli, 4/3/50 • Trustee since 2000 • Oversees 39 Funds in Fund Complex | | Independent Consultant (2002-Present); Formerly Executive Vice President and Director, The Wadsworth Group (1986-2001); Executive Vice President, Secretary and Director, Investment Company Adminis- tration, LLC (1990-2001); Vice President, Secretary and Director, First Fund Distributors, Inc. (1991-2001); Trustee, Professionally Managed Portfolios (45 portfolios); Advisory Board Member, Sustainable Growth Advisors, LP; Independent Director, Chase Investment Counsel (2008 – Present); Trustee of Aston Funds (23 portfolios). |
| |
Richard F. Powers III, 2/2/46 • Trustee since 2013 • Oversees 39 Funds in Fund Complex | | Adjunct Professor, Boston College (2011-Present); Director of Ameriprise Financial Inc. (2005-2009); President and CEO of Van Kampen Investments Inc. (1998-2003). |
| |
Eric Rakowski, 6/5/58 • Trustee since 2000 • Oversees 39 Funds in Fund Complex | | Professor, University of California at Berkeley School of Law (1990-Present); Director of Harding, Loevner Funds, Inc. (6 portfolios); Trustee of Third Avenue Trust (5 portfolios); Trustee of Third Avenue Variable Trust (1 portfolio); Trustee of Aston Funds (23 portfolios). |
| |
Victoria L. Sassine, 8/11/65 • Trustee since 2013 • Oversees 39 Funds in Fund Complex | | Lecturer, Babson College (2007 – Present) |
| | |
Name, Date of Birth, Number of Funds Overseen in Fund Complex* | | Principal Occupation(s) During Past 5 Years and Other Directorships Held by Trustee |
Thomas R. Schneeweis, 5/10/47 • Trustee since 2000 • Oversees 39 Funds in Fund Complex | | Professor Emeritus, University of Massachusetts (2013 - Present); Partner, S Capital Management, LLC (2007-Present); President, TRS Associates (1982-Present); Director, CISDM at the University of Massachusetts, (1996-2013); President, Alternative Investment Analytics, LLC, (formerly Schneeweis Partners, LLC) (2001-2013); Professor of Finance, University of Massachusetts (1977-2013); Partner, White Bear Partners, LLC (2007-2010); Partner, Northampton Capital Management, LLC (2004-2010); Trustee of Aston Funds (23 portfolios). |
| * | The Fund Complex consists of Managers AMG Funds, The Managers Funds, Managers Trust I and Managers Trust II. |
Interested Trustees
Each Trustee in the following table is an “interested person” of the Trust within the meaning of the 1940 Act. Ms. Carsman is an interested person of the Trust within the meaning of the 1940 Act by virtue of her position with, and interest in securities of, AMG, and her former position as Chief Legal Officer of the Trust.
| | |
Name, Date of Birth, Number of Funds Overseen in Fund Complex* | | Principal Occupation(s) During Past 5 Years and Other Directorships Held by Trustee |
Christine C. Carsman, 4/2/52 • Trustee since 2011 • Oversees 39 Funds in Fund Complex | | Senior Vice President and Deputy General Counsel, Affiliated Managers Group, Inc. (2011-Present); Senior Vice President and Chief Regulatory Counsel, Affiliated Managers Group, Inc. (2007-2011); Vice President and Chief Regulatory Counsel, Affiliated Managers Group, Inc. (2004-2007); Secretary and Chief Legal Officer, Managers AMG Funds, The Managers Funds, Managers Trust I and Managers Trust II (2004-2011); Senior Counsel, Vice President and Director of Operational Risk Management and Compliance, Wellington Management Company, LLP (1995-2004). |
| |
Officers | | |
| |
Name, Date of Birth, Position(s) Held with Fund and Length of Time Served | | Principal Occupation(s) During Past 5 Years |
Keitha L. Kinne, 5/16/58 • President since 2012 • Chief Operating Officer since 2007 | | Managing Partner and Chief Operating Officer, Managers Investment Group LLC (2007-Present); Chief Investment Officer, Managers Investment Group LLC (2008-Present); President, Managers Distributors, Inc. (2012-Present; Chief Operating Officer, The Managers Funds, Managers AMG Funds and Managers Trust I (2007-Present); Managing Director, Legg Mason & Co., LLC (2006-2007); Managing Director, Citigroup Asset Management (2004-2006). |
| |
Lewis Collins, 2/22/66 • Secretary since 2011 • Chief Legal Officer since 2011 | | Senior Vice President and Senior Counsel, Affiliated Managers Group, Inc. (2010-Present); Vice President and Senior Counsel, Affiliated Managers Group, Inc. (2006-2010); Senior Counsel, Affiliated Managers Group, Inc. (2002-2006); Attorney, Ropes & Gray LLP (1998-2002). |
Trustees and Officers
| | |
Name, Date of Birth,
Position(s) Held with Fund
and Length of Time Served | | Principal Occupation(s) During Past 5 Years |
Donald S. Rumery, 5/29/58 • Chief Financial Officer since 2007 • Treasurer since 2000 | | Senior Vice President, Managers Investment Group LLC (2005-Present); Treasurer, The Managers Funds (1995-Present); Treasurer, Managers AMG Funds (1999-Present); Treasurer, Managers Trust I (2000-Present); Chief Financial Officer, The Managers Funds, Managers AMG Funds and Managers Trust I (2007-Present); Treasurer and Chief Financial Officer, Managers Distributors, Inc. (2000-2012); Vice President, The Managers Funds LLC, (1994-2004). |
| |
John J. Ferencz, 3/9/62 • Chief Compliance Officer since 2010 | | Vice President, Legal and Compliance, Managers Investment Group LLC (2010-Present); Senior Compliance Analyst, Mutual Funds and Regulatory, GE Asset Management Incorporated (2005-2010). |
| | |
Name, Date of Birth,
Position(s) Held with Fund
and Length of Time Served | | Principal Occupation(s) During Past 5 Years |
Michael S. Ponder, 9/12/73 • Assistant Secretary since 2011 | | Senior Vice President and Counsel, Managers Investment Group LLC (2011-Present); Attorney, DeNovo Legal (2009-2010); Vice President, Credit Suisse (2007-2009); Associate, Willkie Farr & Gallagher LLP (2006-2007). |
| |
Matthew B. Wallace, 11/24/80 • Anti-Money Laundering Compliance Officer since 2012 | | Assistant Vice President, Legal and Compliance, Managers Investment Group LLC (2014-Present); Senior Associate, Legal and Compliance, Managers Investment Group LLC (2012-Present); Associate, Legal and Compliance, Managers Investment Group LLC (2010-2012); Compliance Specialist, Calamos Advisors LLC (2007-2010). |
Annual Renewal of Investment Management and Subadvisory Agreements
On September 19-20, 2013, the Board of Trustees (the “Board” or the “Trustees”), including a majority of the Trustees who are not “interested persons” of Managers Trust II (the “Independent Trustees”), approved new subadvisory agreements between Managers Investment Group LLC (“Managers” or the “Investment Manager”) and Amundi Smith Breeden LLC (“Amundi Smith Breeden”) (the “New Subadvisory Agreements”) relating to Managers Short Duration Government Fund and Managers Intermediate Duration Government Fund (each a “Fund”). The New Subadvisory Agreements were presented for approval because the former subadvisory agreements between Managers and Smith Breeden Associates, Inc. (“Smith Breeden Associates”) relating to the Funds (the “Former Subadvisory Agreements”) were expected to terminate in connection with Amundi Group’s indirect acquisition of 100% ownership of Smith Breeden Associates on September 30, 2013 (the “Acquisition”). Pursuant to the Acquisition, Smith Breeden Associates converted to a Delaware limited liability company named Amundi Smith Breeden LLC. For purposes of this disclosure, “Smith Breeden” shall refer to Smith Breeden Associates for periods prior to the Acquisition and Amundi Smith Breeden for periods after the Acquisition.
The Independent Trustees were separately represented by independent counsel in connection with their consideration of the approval of each New Subadvisory Agreement. In considering the New Subadvisory Agreements, the Trustees considered the information relating to the Funds and Smith Breeden provided to them in connection with their September 19-20, 2013, meeting, and also considered generally the information relating to the Funds and Smith Breeden provided to them in connection with their meeting on June 20-21, 2013, which was the meeting in which the Trustees considered and approved the renewal of the Former Subadvisory Agreements for an additional one year period. In connection with the June 20-21, 2013, meeting, the information provided to the Trustees relating to each Fund included comparative performance, fee and expense information for an appropriate peer group of similar mutual funds (each a “Peer Group”), performance information for relevant benchmark indices (each a “Fund Benchmark”) and, with respect to Smith Breeden, comparative performance information for an appropriate peer group of managed accounts. The Trustees also considered the other information provided to them on a periodic basis throughout the year, including at their meeting on June 20-21, 2013, regarding the nature, extent and quality of services provided by Smith Breeden under the Former Subadvisory Agreements. Prior to voting, the Independent Trustees met with their independent legal counsel in a private session at which no representatives of management were present.
Nature, extent and quality of services.
In considering, at their June 20-21, 2013, meeting, the nature, extent and quality of the services provided by Smith Breeden, the Trustees reviewed information relating to Smith Breeden’s financial condition, operations and personnel and the investment philosophy, strategies and techniques (the “Investment Strategy”)
used in managing each Fund. Among other things, the Trustees reviewed biographical information on portfolio management and other professional staff, information regarding Smith Breeden’s organizational and management structure and Smith Breeden’s brokerage policies and practices. The Trustees considered specific information provided regarding the experience of the individuals at Smith Breeden with portfolio management responsibility for each Fund, including the information set forth in each Fund’s prospectus and statement of additional information. In the course of their deliberations at such meeting, the Trustees evaluated, among other things: (a) the services rendered by Smith Breeden in the past; (b) the qualifications and experience of Smith Breeden’s personnel; and (c) Smith Breeden’s compliance program. The Trustees also considered Smith Breeden’s risk management processes. The Trustees also took into account, at their September 19-20, 2013, meeting, the financial condition of Smith Breeden with respect to its ability to provide the same level of services under the New Subadvisory Agreements as under the Former Subadvisory Agreements.
The Trustees, at their September 19-20, 2013, meeting, reviewed information relating to the Acquisition and the role of current Smith Breeden personnel under each New Subadvisory Agreement following the Acquisition and noted that the role of such personnel would be identical. The Trustees considered the investment philosophy, strategies and techniques that are intended to be used by Smith Breeden in managing each Fund. Among other things, the Trustees reviewed updated biographical information on portfolio management and other professional staff, information regarding Smith Breeden’s organizational and management structure and Smith Breeden’s brokerage policies and practices. The Trustees considered specific information provided regarding the experience of the individuals at Smith Breeden with portfolio management responsibility for each Fund, including the information set forth in each Fund’s prospectus and statement of additional information. In this regard, the Trustees observed that Smith Breeden has extensive experience managing fixed income assets. The Trustees noted that Smith Breeden has served as investment adviser or subadvisor to the Funds since the Funds commenced operations in 1992 and that the same personnel would continue to serve as portfolio managers to the Funds.
Performance.
Among other information relating to the Managers Short Duration Government Fund’s performance, the Trustees noted, at their June 20-21, 2013, meeting, that the Fund’s performance for the 1-year, 3-year, 5-year and 10-year periods ended March 31, 2013, was below, below, above and above, respectively, the median performance of the Peer Group and above the performance of the Fund Benchmark, the BofA Merrill Lynch 6-Month T-Bill Index, for each such time period. The Trustees took into account management’s discussion of the Fund’s performance, both at their June 20-21, 2013, meeting and at their September 19-20, 2013, meeting. At their June 20-21, 2013, meeting, the Trustees took into account the reasons for the Fund’s recent underperformance
Annual Renewal of Investment Management and Subadvisory Agreements (continued)
relative to the Peer Group and the fact that the Fund outperformed the Fund Benchmark for all relevant time periods. At such meeting, the Trustees also considered Smith Breeden’s performance as compared to an appropriate peer group of managed accounts and also considered the gross performance of the Fund as compared to Smith Breeden’s relevant performance composite that utilizes the same investment strategy and approach and noted that the Board reviews on a quarterly basis detailed information about both the Fund’s performance results and portfolio composition, as well as Smith Breeden’s Investment Strategy. At their September 19-20, 2013, meeting, the Trustees also considered more recent performance information, and noted that although the Fund’s performance was below the performance of the Fund Benchmark for the period from January 1, 2013, through June 30, 2013, the Fund’s performance is being addressed and the prospects for adequate future performance supported the approval of the New Subadvisory Agreement for the Fund.
Among other information relating to the Managers Intermediate Duration Government Fund’s performance, the Trustees noted, at their June 20-21, 2013 meeting, that the Fund’s performance for the 1-year, 3-year, 5-year and 10-year periods ended March 31, 2013, was below, above, above and above, respectively, the median performance of the Peer Group and above, above, above and below, respectively, the performance of the Fund Benchmark, the Citigroup Mortgage Index. The Trustees took into account management’s discussion of the Fund’s performance, both at their June
20-21, 2013, meeting and at their September 19-20, 2013, meeting. At their June 20-21, 2013, meeting, the Trustees took into account the Fund’s more recent improved performance relative to the Fund Benchmark and the fact that the Fund performed well relative to the Peer Group for the 3-year,
5-year and 10-year periods, ranking in the top quintile relative to its Peer Group for the 5-year and 10-year periods. At such meeting, the Trustees also considered Smith Breeden’s performance as compared to an appropriate peer group of managed accounts and also considered the gross performance of the Fund as compared to Smith Breeden’s relevant performance composite that utilizes the same investment strategy and approach and noted that the Board reviews on a quarterly basis detailed information about both the Fund’s performance results and portfolio composition, as well as Smith Breeden’s Investment Strategy. At their September
19-20, 2013, meeting, the Trustees also considered more recent performance information, noting that the Fund’s performance was above the performance of the Fund Benchmark for the period from January 1, 2013, through June 30, 2013.
Subadvisory Fees and Profitability.
The Trustees noted that the Investment Manager, and not the Fund, is responsible for paying the fees charged by Smith Breeden. In considering the reasonableness of the subadvisory fee, the Trustees relied on the ability of Managers to negotiate the terms of each New Subadvisory Agreement at arm’s length as part of the manager-of-managers structure, noting that Managers is not affiliated with Smith Breeden.
In addition, the Trustees considered other potential benefits of the subadvisory relationship to Smith Breeden, including, among others, the indirect benefits that Smith Breeden may receive from its relationship with a Fund, including any so-called “fallout benefits” to Smith Breeden, such as reputational value derived from Smith Breeden serving as subadvisor to the Fund. In addition, the Trustees noted that the subadvisory fees are paid by the Investment Manager out of its advisory fee. As a consequence of all of the foregoing, the cost of services to be provided by Smith Breeden and the profitability to Smith Breeden of its relationship with a Fund were not material factors in the Trustees’ deliberations. For similar reasons, the Trustees did not consider potential economies of scale in the management of a Fund by Smith Breeden to be a material factor in their deliberations at this time. Taking into account all of the foregoing, the Trustees concluded that, in light of the nature, extent and quality of the services provided to-date by Smith Breeden, and the other considerations noted above with respect to Smith Breeden, each Fund’s subadvisory fees are reasonable.
* * * * *
After consideration of the foregoing, the Trustees also reached the following conclusions (in addition to the conclusions discussed above) regarding each New Subadvisory Agreement: (a) Smith Breeden has demonstrated that it possesses the capability and resources to perform the duties required of it under each New Subadvisory Agreement; (b) Smith Breeden’s Investment Strategy is appropriate for pursuing the applicable Fund’s investment objectives; and (c) Smith Breeden maintains appropriate compliance programs.
Based on all of the above-mentioned factors and related conclusions, with no single factor or conclusion being determinative and with each Trustee not necessarily attributing the same weight to each factor, the Trustees concluded that approval of each New Subadvisory Agreement would be in the best interests of the applicable Fund and its shareholders. Accordingly, on September 19-20, 2013, the Trustees, including a majority of the Independent Trustees, voted to approve the New Subadvisory Agreement for each Fund.
Proxy Results
A special meeting of shareholders of Managers Trust II was held on July 2, 2013. With respect to the proposals to amend certain “fundamental” investment restrictions of the Funds, the meeting was adjourned to August, 20, 2013, September 27, 2013, October 22, 2013, and October 30, 2013 for Managers Intermediate Duration Government Fund. On July 2, 2013, the proposals to amend and restate the declaration of trust did not pass. The proposals and results of the votes are summarized below.
| | | | | | | | |
| | | All Funds in Trust | |
| Managers Trust II | | For | | | Withheld | |
| Election of Directors | | (rounded to the nearest share) | |
Bruce Bingham | | | 51,163,690 | | | | 1,110,767 | |
William E. Chapman, II | | | 50,980,897 | | | | 1,293,559 | |
Edward J. Kaier | | | 51,119,439 | | | | 1,155,018 | |
Steven J. Paggioli | | | 51,094,012 | | | | 1,180,444 | |
Erik Rakowski | | | 51,025,723 | | | | 1,248,733 | |
Thomas R. Schneeweis | | | 51,078,988 | | | | 1,195,468 | |
Christine C. Carsman | | | 51,055,532 | | | | 1,218,924 | |
Kurt Keilhacker | | | 51,140,167 | | | | 1,134,290 | |
Richard F. Powers III | | | 51,049,048 | | | | 1,225,408 | |
Victoria Sassine | | | 51,068,192 | | | | 1,206,264 | |
| | | | | | | | | | | | | | | | |
| | | Managers Short Duration Government Fund | |
| | | For | | | Against | | | Abstain | | | Broker
Non-Votes | |
| To amend “fundamental” restrictions of the Funds with respect to: | | (rounded to the nearest share) | |
Issuance of Senior Securities | | | 24,533,826 | | | | 282,760 | | | | 385,675 | | | | 8,226,777 | |
Borrowing | | | 24,389,449 | | | | 419,125 | | | | 393,686 | | | | 8,226,777 | |
Lending | | | 24,403,168 | | | | 412,433 | | | | 386,660 | | | | 8,226,777 | |
The Underwriting of Securities | | | 24,430,911 | | | | 377,569 | | | | 393,781 | | | | 8,226,777 | |
Purchasing and Selling Commodities | | | 24,380,064 | | | | 425,371 | | | | 396,828 | | | | 8,226,777 | |
Purchasing and Selling Real Estate | | | 24,468,835 | | | | 346,421 | | | | 387,006 | | | | 8,226,777 | |
Diversification of Investments | | | 24,569,807 | | | | 254,532 | | | | 377,924 | | | | 8,226,777 | |
Concentrating Investments in a Particular Industry | | | 24,417,473 | | | | 388,940 | | | | 395,850 | | | | 8,226,777 | |
Short Sales | | | 24,412,391 | | | | 384,787 | | | | 405,084 | | | | 8,226,777 | |
Investing for Control | | | 24,490,604 | | | | 307,492 | | | | 404,166 | | | | 8,226,777 | |
Securities Issued by Other Investment Companies | | | 24,498,908 | | | | 310,045 | | | | 393,310 | | | | 8,226,777 | |
Margin Transactions | | | 24,425,344 | | | | 380,863 | | | | 396,056 | | | | 8,226,777 | |
Oil, Gas and Mineral Programs | | | 24,467,992 | | | | 320,550 | | | | 413,719 | | | | 8,226,777 | |
Investing in New Issuers | | | 24,499,411 | | | | 298,158 | | | | 404,694 | | | | 8,226,777 | |
Proxy Results (continued)
| | | | | | | | | | | | | | | | |
| | | Managers Intermediate Duration Government Fund | |
| | | For | | | Against | | | Abstain | | | Broker Non-Votes | |
To amend “fundamental” restrictions of the Funds with respect to: | | (rounded to the nearest share) | |
Issuance of Senior Securities | | | 7,960,967 | | | | 303,336 | | | | 527,690 | | | | 2,926,818 | |
Borrowing | | | 7,869,424 | | | | 378,657 | | | | 533,912 | | | | 2,926,818 | |
Lending | | | 7,854,339 | | | | 398,045 | | | | 529,609 | | | | 2,926,818 | |
The Underwriting of Securities | | | 7,952,477 | | | | 287,382 | | | | 542,134 | | | | 2,926,818 | |
Purchasing and Selling Commodities | | | 7,924,002 | | | | 333,257 | | | | 524,734 | | | | 2,926,818 | |
Purchasing and Selling Real Estate | | | 7,901,658 | | | | 339,533 | | | | 540,803 | | | | 2,926,818 | |
Diversification of Investments | | | 8,033,173 | | | | 243,525 | | | | 505,295 | | | | 2,926,818 | |
Concentrating Investments in a Particular Industry | | | 7,799,474 | | | | 416,861 | | | | 565,658 | | | | 2,926,818 | |
Short Sales | | | 7,839,321 | | | | 381,183 | | | | 561,489 | | | | 2,926,818 | |
Investing for Control | | | 7,942,891 | | | | 284,348 | | | | 554,754 | | | | 2,926,818 | |
Securities Issued by Other Investment Companies | | | 7,891,010 | | | | 334,728 | | | | 556,255 | | | | 2,926,818 | |
Margin Transactions | | | 7,839,369 | | | | 385,442 | | | | 557,183 | | | | 2,926,818 | |
Oil, Gas and Mineral Programs | | | 7,969,231 | | | | 249,252 | | | | 563,510 | | | | 2,926,818 | |
Investing in New Issuers | | | 7,937,700 | | | | 294,771 | | | | 549,522 | | | | 2,926,818 | |
| |
| | | Managers Short Duration Government Fund | |
| | | For | | | Against | | | Abstain | | | Broker Non-Votes | |
To amend and restate the Agreement and Declaration of the Trust relating to: | | (rounded to the nearest share) | |
Declaration of Trust Amendment Procedures | | | 26,799,049 | | | | 250,778 | | | | 435,710 | | | | 8,141,928 | |
Merger, Consolidation, Sale of Assets and Termination of Trust, Series or Classes | | | 25,440,680 | | | | 1,600,018 | | | | 444,838 | | | | 8,141,928 | |
Other Changes | | | 25,496,172 | | | | 1,597,786 | | | | 391,580 | | | | 8,141,928 | |
| |
| | | Managers Intermediate Duration Government Fund | |
| | | For | | | Against | | | Abstain | | | Broker Non-Votes | |
To amend and restate the Agreement and Declaration of the Trust relating to: | | (rounded to the nearest share) | |
Declaration of Trust Amendment Procedures | | | 4,626,731 | | | | 133,661 | | | | 332,257 | | | | 3,934,136 | |
Merger, Consolidation, Sale of Assets and Termination of Trust, Series or Classes | | | 4,566,047 | | | | 193,561 | | | | 333,041 | | | | 3,934,136 | |
Other Changes | | | 4,608,988 | | | | 183,135 | | | | 300,527 | | | | 3,934,136 | |
| |
| | | All Funds in Trust | |
| | | For | | | Against | | | Abstain | | | Broker Non-Votes | |
To amend and restate the Agreement and Declaration of the Trust relating to: | | (rounded to the nearest share) | |
Declaration of Trust Amendment Procedures | | | 36,921,178 | | | | 523,561 | | | | 1,110,168 | | | | 13,719,549 | |
Merger, Consolidation, Sale of Assets and Termination of Trust, Series or Classes | | | 35,494,400 | | | | 1,925,115 | | | | 1,135,392 | | | | 13,719,549 | |
Other Changes | | | 35,581,474 | | | | 1,926,523 | | | | 1,046,912 | | | | 13,719,549 | |
46
THIS PAGE INTENTIONALLY LEFT BLANK
THIS PAGE INTENTIONALLY LEFT BLANK
Investment Manager and Administrator
Managers Investment Group LLC
800 Connecticut Avenue
Norwalk, CT 06854
(800) 835-3879
Distributor
Managers Distributors, Inc.
800 Connecticut Avenue
Norwalk, CT 06854
(800) 835-3879
Custodian
The Bank of New York Mellon
2 Hanson Place
Brooklyn, NY 11217
Legal Counsel
Ropes & Gray LLP
Prudential Tower, 800 Boylston Street
Boston, MA 02199-3600
Transfer Agent
BNY Mellon Investment Servicing (US) Inc.
Attn: Managers
P.O. Box 9769
Providence, RI 02940
(800) 548-4539
For ManagersChoiceTM Only
Managers
c/o BNY Mellon Investment Servicing (US) Inc.
P.O. Box 9847
Providence, RI 02940-8047
(800) 358-7668

MANAGERS FUNDS
| | | | |
EQUITY FUNDS | | BALANCED FUNDS |
BRANDYWINE BRANDYWINE BLUE BRANDYWINE ADVISORS MIDCAP GROWTH Friess Associates, LLC CADENCE CAPITAL APPRECIATION CADENCE MID-CAP CADENCE EMERGING COMPANIES Cadence Capital Management, LLC ESSEX SMALL/MICRO CAP GROWTH Essex Investment Management Co., LLC FQ TAX-MANAGED U.S. EQUITY FQ U.S. EQUITY First Quadrant, L.P. FRONTIER SMALL CAP GROWTH Frontier Capital Management Company, LLC GW&K SMALL CAP EQUITY Gannett Welsh & Kotler, LLC MICRO-CAP Lord, Abbett & Co. LLC WEDGE Capital Management L.L.P. Next Century Growth Investors LLC RBC Global Asset Management (U.S.) Inc. REAL ESTATE SECURITIES CenterSquare Investment Management, Inc. | | RENAISSANCE LARGE CAP GROWTH Renaissance Group LLC SKYLINE SPECIAL EQUITIES PORTFOLIO Skyline Asset Management, L.P. SPECIAL EQUITY Ranger Investment Management, L.P. Lord, Abbett & Co. LLC Smith Asset Management Group, L.P. Federated MDTA LLC SYSTEMATIC VALUE SYSTEMATIC MID CAP VALUE Systematic Financial Management, L.P. TIMESSQUARE INTERNATIONAL SMALL CAP TIMESSQUARE MID CAP GROWTH TIMESSQUARE SMALL CAP GROWTH TSCM GROWTH EQUITY TimesSquare Capital Management, LLC TRILOGY GLOBAL EQUITY TRILOGY EMERGING MARKETS EQUITY TRILOGY INTERNATIONAL SMALL CAP Trilogy Global Advisors, L.P. YACKTMAN YACKTMAN FOCUSED Yacktman Asset Management LP | | CHICAGO EQUITY PARTNERS BALANCED Chicago Equity Partners, LLC ALTERNATIVE FUNDS FQ GLOBAL ALTERNATIVES FQ GLOBAL ESSENTIALS First Quadrant, L.P. INCOME FUNDS BOND (MANAGERS) GLOBAL INCOME OPPORTUNITY Loomis, Sayles & Co., L.P. BOND (MANAGERS PIMCO) Pacific Investment Management Co. LLC GW&K FIXED INCOME GW&K MUNICIPAL BOND GW&K MUNICIPAL ENHANCED YIELD Gannett Welsh & Kotler, LLC HIGH YIELD J.P. Morgan Investment Management LLC INTERMEDIATE DURATION GOVERNMENT SHORT DURATION GOVERNMENT Amundi Smith Breeden LLC |
| | |
| | |
| | |
| | |
| | |
| | |
| | |
| | |
| | |
| | |
| | |
| | |
| | |
| | |
| | |
| | |
| | |
| | |
| | |
| | |
| | |
| | |
| | |
| | |
| | |
| | |
| | |
| | |
| | |
| | |
| | |
| | |
| | |
| | |
| | |
| | |
This report is prepared for the Funds’ shareholders. It is authorized for distribution to prospective investors only when preceded or accompanied by an effective prospectus. To receive a free copy of the prospectus or Statement of Additional Information, which includes additional information about Fund Trustees, please contact us by calling 800.835.3879. Distributed by Managers Distributors, Inc., member FINRA. Current net asset value per share for each Fund are available on the Funds’ Web site at www.managersinvest.com. A description of the policies and procedures each Fund uses to vote its proxies is available: (i) without charge, upon request, by calling 800.835.3879, or (ii) on the Securities and Exchange Commission’s (SEC) Web site at www. sec.gov. For information regarding each Fund’s proxy voting record for the 12-month period ended June 30, call 800.835.3879 or visit the SEC Web site at www.sec.gov. The Funds file their complete schedule of portfolio holdings with the SEC for the first and third quarters of each fiscal year on Form N-Q. The Funds’ Forms N-Q are available on the SEC’s website at www.sec.gov. A Fund’s Forms N-Q may be reviewed and copied at the SEC’s Public Reference Room in Washington, DC. Information on the operation of the Public Reference Room may be obtained by calling 800.SEC.0330. To review a complete list of the Funds’ portfolio holdings, or to view the most recent quarterly holdings report, semiannual report, or annual report, please visit www.managersinvest.com. | | 
|

| | | | |
AR002-1213
Managers Funds
Annual Report—December 31, 2013
| | | | |
TABLE OF CONTENTS | | Page | |
| |
LETTER TO SHAREHOLDERS | | | 2 | |
| |
ABOUT YOUR FUND’S EXPENSES | | | 3 | |
| |
PORTFOLIO MANAGER’S COMMENTS, FUND SNAPSHOTS, AND SCHEDULES OF PORTFOLIO INVESTMENTS | | | | |
| |
Managers AMG Chicago Equity Partners Balanced Fund | | | 4 | |
| |
Managers High Yield Fund | | | 15 | |
| |
Managers AMG GW&K Fixed Income Fund | | | 31 | |
| |
NOTES TO SCHEDULES OF PORTFOLIO INVESTMENTS | | | 37 | |
| |
FINANCIAL STATEMENTS | | | | |
| |
Statement of Assets and Liabilities | | | 40 | |
Balance sheets, net asset value (NAV) per share computations and cumulative undistributed amounts | | | | |
| |
Statement of Operations | | | 42 | |
Detail of sources of income, expenses, and realized and unrealized gains (losses) during the year | | | | |
| |
Statements of Changes in Net Assets | | | 43 | |
Detail of changes in assets for the past two years | | | | |
| |
FINANCIAL HIGHLIGHTS | | | 45 | |
Historical net asset values per share, distributions, total returns, income and expense ratios, turnover ratios and net assets | | | | |
| |
NOTES TO FINANCIAL HIGHLIGHTS | | | 50 | |
| |
NOTES TO FINANCIAL STATEMENTS | | | 51 | |
Accounting and distribution policies, details of agreements and transactions with Fund management and affiliates, and descriptions of certain investment risks | | | | |
| |
REPORT OF INDEPENDENT REGISTERED PUBLIC ACCOUNTING FIRM | | | 60 | |
| |
TRUSTEES AND OFFICERS | | | 61 | |
Nothing contained herein is to be considered an offer, sale or solicitation of an offer to buy shares of any series of the Managers Family of Funds. Such offering is made only by Prospectus, which includes details as to offering price and other material information.
Letter to Shareholders
Dear Shareholder:
Thank you for your investment in The Managers Funds. Our foremost goal at Managers Investment Group (“MIG”) is to provide investment products and solutions that help our shareholders and clients successfully reach their investment goals and objectives. We do this by offering a broad selection of Funds managed by a collection of Affiliated Managers Group’s (“AMG”) Affiliate investment boutiques, along with a complementary series of open-architecture mutual funds.
The past year has been an exciting one for us at MIG. We were pleased to welcome the Brandywine Funds into the Managers Fund Family several months ago. We are excited to begin this new chapter in the 27-year history of the Brandywine Funds, while maintaining shareholders’ access to the same investment process that has guided the Brandywine Funds since their inception using the research-driven investment approach of Friess Associates.
We announced effective November 1, 2013, that the GW&K Small Cap Equity Fund would be closed to new investors with certain limited exceptions. The team at GW&K manages a total of $2.5 billion (as of December 31, 2013) in small-capitalization equities and closing the Fund to new investors allows the team to continue to execute on the investment process that has been effective for more than a decade. We also announced effective December 31, 2013, that Yacktman Fund and Yacktman Focused Fund will be closed to new investors with certain limited exceptions. The team at Yacktman Asset Management manages over $30 billion in U.S. equities and closing these Funds to new investors allows the team to continue to execute on the investment process that has been effective for more than two decades. We will continue to make decisions such as these that we believe are in the best interest of our shareholders.
Risky assets did well in 2013, with U.S. equity markets surpassing all-time highs. Ongoing global monetary easing, a low-yield environment, and healthy U.S. economic growth are supporting investor appetite for risk assets. Despite improving investor sentiment, risks remain, including uncertainty surrounding the Fed’s eventual exit from its ultra-accommodative monetary policy, ongoing fiscal headwinds in the U.S. and slower growth in Emerging Markets. Nevertheless, we are cautiously optimistic about the prospects for the upcoming year and we are confident that our Funds are well positioned to weather an uncertain economic environment.
We thank you for your continued confidence and investment in The Managers Funds. You can rest assured that under all market conditions our team is focused on delivering excellent investment management services for your benefit.
Respectfully,

Keitha Kinne
President
The Managers Funds
2
About Your Fund’s Expenses
As a shareholder of a Fund, you may incur two types of costs: (1) transaction costs, which may include sales charges (loads) on purchase payments; redemption fees; and exchange fees; and (2) ongoing costs, including management fees; distribution (12b-1) fees; and other Fund expenses. This example is intended to help you understand your ongoing costs (in dollars) of investing in the Fund and to compare these costs with the ongoing costs of investing in other mutual funds. The example is based on $1,000 invested at the beginning of the period and held for the entire period as indicated below.
Actual Expenses
The first line of the following table provides information about the actual account values and actual expenses. You may use the information in this line, together with the amount you invested, to estimate the expenses that you paid over the period. Simply divide your account value by $1,000 (for example, an $8,600 account value divided by $1,000 = 8.6), then multiply the result by the number in the first line under the heading entitled “Expenses Paid During Period” to estimate the expenses you paid on your account during this period.
Hypothetical Example for Comparison Purposes
The second line of the following table provides information about hypothetical account values and hypothetical expenses based on the Fund’s actual expense ratio and an assumed annual rate of return of 5% before expenses, which is not the Fund’s actual return. The hypothetical account values and expenses may not be used to estimate the actual ending account balance or expenses you paid for the period. You may use this information to compare the ongoing costs of investing in the Fund and other funds by comparing this 5% hypothetical example with the 5% hypothetical examples that appear in the shareholder reports of other funds.
Please note that the expenses shown in the table are meant to highlight your ongoing costs only and do not reflect any transactional costs, such as sales charges (loads), redemption fees, or exchange fees. Therefore, the second line of the table is useful in comparing ongoing costs only, and will not help you determine the relative total costs of owning different funds.
| | | | | | | | | | | | | | | | |
Six Months Ended December 31, 2013 | | Expense
Ratio
for the
Period | | | Beginning
Account
Value
07/01/13 | | | Ending
Account
Value
12/31/13 | | | Expenses
Paid
During
the Period* | |
Managers AMG Chicago Equity Partners Balanced Fund | | | | | | | | | | | | | | | | |
Investor Class | | | | | | | | | | | | | | | | |
Based on Actual Fund Return | | | 1.09 | % | | $ | 1,000 | | | $ | 1,097 | | | $ | 5.76 | |
Hypothetical (5% return before expenses) | | | 1.09 | % | | $ | 1,000 | | | $ | 1,020 | | | $ | 5.55 | |
| | | | | | | | | | | | | | | | |
Service Class | | | | | | | | | | | | | | | | |
Based on Actual Fund Return | | | 0.91 | % | | $ | 1,000 | | | $ | 1,099 | | | $ | 4.81 | |
Hypothetical (5% return before expenses) | | | 0.91 | % | | $ | 1,000 | | | $ | 1,021 | | | $ | 4.63 | |
| | | | | | | | | | | | | | | | |
Institutional Class | | | | | | | | | | | | | | | | |
Based on Actual Fund Return | | | 0.84 | % | | $ | 1,000 | | | $ | 1,099 | | | $ | 4.45 | |
Hypothetical (5% return before expenses) | | | 0.84 | % | | $ | 1,000 | | | $ | 1,021 | | | $ | 4.29 | |
| | | | | | | | | | | | | | | | |
Managers High Yield Fund | | | | | | | | | | | | | | | | |
Investor Class | | | | | | | | | | | | | | | | |
Based on Actual Fund Return | | | 1.15 | % | | $ | 1,000 | | | $ | 1,053 | | | $ | 5.95 | |
Hypothetical (5% return before expenses) | | | 1.15 | % | | $ | 1,000 | | | $ | 1,019 | | | $ | 5.85 | |
| | | | | | | | | | | | | | | | |
Institutional Class | | | | | | | | | | | | | | | | |
Based on Actual Fund Return | | | 0.90 | % | | $ | 1,000 | | | $ | 1,055 | | | $ | 4.66 | |
Hypothetical (5% return before expenses) | | | 0.90 | % | | $ | 1,000 | | | $ | 1,021 | | | $ | 4.58 | |
| | | | | | | | | | | | | | | | |
Managers AMG GW&K Fixed Income Fund | | | | | | | | | | | | | | | | |
Investor Class | | | | | | | | | | | | | | | | |
Based on Actual Fund Return | | | 0.84 | % | | $ | 1,000 | | | $ | 1,023 | | | $ | 4.28 | |
Hypothetical (5% return before expenses) | | | 0.84 | % | | $ | 1,000 | | | $ | 1,021 | | | $ | 4.28 | |
| | | | | | | | | | | | | | | | |
Service Class | | | | | | | | | | | | | | | | |
Based on Actual Fund Return | | | 0.67 | % | | $ | 1,000 | | | $ | 1,023 | | | $ | 3.42 | |
Hypothetical (5% return before expenses) | | | 0.67 | % | | $ | 1,000 | | | $ | 1,022 | | | $ | 3.41 | |
| | | | | | | | | | | | | | | | |
Class C | | | | | | | | | | | | | | | | |
Based on Actual Fund Return | | | 1.59 | % | | $ | 1,000 | | | $ | 1,019 | | | $ | 8.09 | |
Hypothetical (5% return before expenses) | | | 1.59 | % | | $ | 1,000 | | | $ | 1,017 | | | $ | 8.08 | |
| | | | | | | | | | | | | | | | |
Institutional Class | | | | | | | | | | | | | | | | |
Based on Actual Fund Return | | | 0.59 | % | | $ | 1,000 | | | $ | 1,024 | | | $ | 3.01 | |
Hypothetical (5% return before expenses) | | | 0.59 | % | | $ | 1,000 | | | $ | 1,022 | | | $ | 3.01 | |
| | | | | | | | | | | | | | | | |
| * | Expenses are equal to the Fund’s annualized expense ratio multiplied by the average account value over the period, multiplied by the number of days in the period (184), then divided by 365. |
3
Managers AMG Chicago Equity Partners Balanced Fund
Portfolio Manager’s Comments
THE YEAR IN REVIEW
For the year ended December 31, 2013, the Managers AMG Chicago Equity Partners Balanced Fund (Institutional Share Class) returned 17.45%, compared to the 17.95% return for its benchmark, which consists of 60% of the return of the Russell 1000® Index and 40% of the return of the Barclays U.S. Aggregate Bond Index. The equity portion of the Fund outperformed the equity index while the fixed income sleeve underperformed which led to the Fund’s overall underperformance versus the blended benchmark. Throughout the year, the Portfolio’s allocation was neutral and in the fourth quarter the Fund moved to a 5% overweight to equities.
EQUITY
The strong 4th quarter rally helped the U.S. stock market finish the year up over 30%, with the S&P 500® Index posting its best return since 1997 and outperforming all other asset classes. The S&P 500 was positive all four quarters in 2013, starting and finishing with similar double digit (10.5%) quarters. The year started with a defensive rally, but changed leadership in May when the Fed first suggested tapering in 2013. Since that time, cyclical stocks have generally outperformed. For the year, small cap stocks outperformed large cap stocks, growth beat value and volatility remained low. The market will likely focus closely on the U.S. economy in 2014 as the Fed continues to taper their asset purchase program and the economy and market are forced to stand on their own.
Regarding stock selection, year-to-date, the overall universe showed good discrimination between top and bottom ranked stocks, but the sectors had mixed performance. The model was inverse in TMT (technology, media and telecom) and energy, but performed well in non-cyclicals, cyclicals and financials on average in 2013. As a result, security selection in technology and energy hindered performance for the year. In the 4th quarter and for the year, value, quality and growth factors were on average positive, and momentum factors underperformed. The defensive rally in the first four months of the year rewarded cheap, quality stocks and we saw our value and quality factors work well during this time. After the Fed spoke in May, the best performing stocks were those that didn’t work well the first four months of the year, especially in technology, and momentum factors underperformed. Quality gave way to growth in the fourth quarter while value made a comeback as the market rose another 10% in the fourth quarter.
FIXED INCOME
Investment grade fixed income markets experienced their share of volatility in 2013. Uncertainty peaked in the second quarter when initial discussions of possible “Tapering” occurred. December, the fourth quarter, and the calendar year were characterized by higher rates and tighter spreads. The lone exception was U.S. Agency debentures, where spreads declined in December and the fourth quarter, but were modestly wider for the year. The interest rate increase resulted in negative total returns across all investment grade sectors for the year. Due to spread tightening and yield advantage all non-Treasury sectors, except U.S. Agencies, had positive excess returns in 2013.
Treasury rates for 10-year maturities were higher by 127 basis points for the year and the option adjusted spread for investment
grade corporate bonds measured by the Barclays Corporate Index declined by 27 basis points for the year. The best performing sector of the corporate market by quality rating was “BBB,” which declined 34 basis points. The financial sector was the best performing sector of the corporate market, where spreads declined by 45 basis points in 2013. The Agency MBS sector of the market had tighter spreads as well, declining 15 basis points.
Throughout the year, investor confidence was bolstered by Quantitative Easing (“QE”). One exception was the second quarter when the Federal Reserve hinted it “may” be on the verge of reducing the pace of Treasury and Agency MBS purchases. After assuring markets that the level of QE would decline only if macroeconomic measures demonstrated sufficient strength, investors were once again inclined to add risk to portfolios. In December, as a result of improvement in housing and labor markets, accompanied by stable to falling inflation, the Federal Reserve commenced their exit move by reducing the rate of monthly purchases by $10 billion to $75 billion per month, and reiterating that short term rates would be maintained at near-zero levels for the next several years. Federal Reserve board members also expressed concern about financial asset speculation as a result of low rates and substantial liquidity.
In 2013, the fixed income portion of the Fund was defensively positioned. Focusing on higher quality, lower beta sectors and issuers of the investment grade market resulted in underperformance versus the benchmark. A combination of weak fundamentals and historically high valuations, especially in riskier asset types, prompted this strategic positioning. In our view, investors are not being adequately compensated for the risk they are assuming in this market environment. While several fundamental factors have shown improvement, financial asset valuations have continued to rise. As a result, the divergence between fundamentals and valuations persists in fixed income. We remain vigilant against adding risk to the fixed income portion of the fund without sufficient compensation. We continue to believe our positioning is prudent, is in-line with our stated objectives, and will benefit our clients over a complete market cycle.
This commentary reflects the viewpoints of the portfolio manager, Chicago Equity Partners, as of December 31, 2013 and is not intended as a forecast or guarantee of future results.
CUMULATIVE TOTAL RETURN PERFORMANCE
The Managers AMG Chicago Equity Partners Balanced Fund’s (“Managers AMG CEP Balanced Fund”) cumulative total return is based on the daily change in net asset value (NAV), and assumes that all dividends and distributions were reinvested. The chart compares a hypothetical $10,000 investment made in the Fund’s Investor Class shares on December 31, 2003 to a $10,000 investment made in the benchmarks for the same time period. Performance for periods longer than one year is annualized. The graph and table do not reflect the deduction of taxes that a shareholder would pay on a Fund distribution or redemption of shares. The listed returns for the Fund are net of expenses and the returns for the indices exclude expenses. Past performance is not indicative of future results. Total returns for the Fund would have been lower had certain expenses not been reduced.
Managers AMG Chicago Equity Partners Balanced Fund
Portfolio Manager’s Comments (continued)
CUMULATIVE TOTAL RETURN PERFORMANCE (continued)
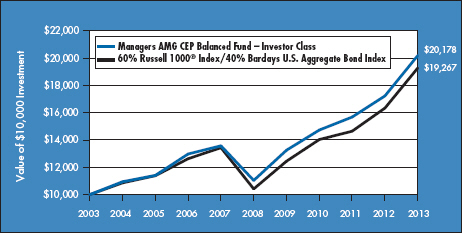
The table below shows the average annual total returns for the Managers AMG CEP Balanced Fund, the Russell 1000® Index and the Barclays U.S. Aggregate Bond Index for the same time periods ended December 31, 2013.
| | | | | | | | | | | | | | | | | | | | |
| | | Average Annual Total Returns1 | |
| | | One
Year | | | Five
Years | | | Ten
Years | | | Since
Inception | | | Inception
Date | |
Managers AMG CEP Balanced Fund2,3,4,5 | | | | | | | | | | | | | | | | | | | | |
Investor Class | | | 17.14 | % | | | 12.82 | % | | | 7.27 | % | | | 8.09 | % | | | 01/02/97 | |
Service Class | | | 17.54 | % | | | — | | | | — | | | | 15.60 | % | | | 11/30/12 | |
Institutional Class | | | 17.45 | % | | | 13.12 | % | | | 7.58 | % | | | 8.50 | % | | | 01/02/97 | |
60% Russell 1000®Index6/40% Barclays U.S. Aggregate Index7 | | | 17.95 | % | | | 13.09 | % | | | 6.78 | % | | | 7.55 | % | | | 01/02/97 | † |
The performance data shown represents past performance. Past performance is not a guarantee of future results. Current performance may be lower or higher than the performance data quoted. The investment return and principal value of an investment in the Fund will fluctuate so that an investor’s shares, when redeemed, may be worth more or less than their original cost. For performance information through the most recent month end, please call (800) 835-3879 or visit our Web site at www.managersinvest.com. Current net assets values per share for each Fund are available on the Funds’ Web site at www.managersinvest.com.
Investors should carefully consider the Fund’s investment objectives, risks, charges and expenses before investing. For this and other information, please call (800) 835-3879 or visit our Web site at www.managersinvest.com for a free prospectus. Read it carefully before investing or sending money. Funds are distributed by Managers Distributors, Inc., member FINRA.
| † | Date reflects inception date of the Fund, not the index. |
| 1 | Total return equals income yield plus share price change and assumes reinvestment of all dividends and capital gain distributions. Returns are net of fees and may reflect offsets of Fund expenses as described in the Prospectus. No adjustment has been made for taxes payable by shareholders on their reinvested dividends and capital gain distributions. Returns for periods greater than one year are annualized. The listed returns on the Fund are net of expenses and based on the published NAV as of December 31, 2013. All returns are in U.S. dollars ($). |
| 2 | From time to time, the Fund’s advisor has waived its fees and/or absorbed Fund expenses, which has resulted in higher returns. |
| 3 | Changing interest rates may adversely affect the value of an investment. An increase in interest rates typically causes the value of bonds and other fixed income securities to fall. The Fund is subject to the risks associated with investments in debt securities, such as default risk and fluctuations in the perception of the debtor’s ability to pay its creditors. Investments in foreign securities, even though publicly traded in the United States, may involve risks which are in addition to those inherent in domestic investments. |
| 4 | The Fund invests in large-capitalization companies that may underperform other stock funds (such as funds that focus on small- and medium-capitalization companies) when stocks of large-capitalization companies are out of favor. |
| 5 | The Fund invests in value stocks, which may perform differently from the market as a whole and may be undervalued by the market for a long period of time. Value stocks may underperform growth stocks during the given periods. |
| 6 | The Russell 1000® Index measures the performance of approximately 1,000 of the largest securities based on a combination of their market cap and current index membership. The Russell 1000® represents approximately 92% of the U.S. market. The Russell 1000® Index is unmanaged, is not available for investment, and does not incur expenses. |
| 7 | The Barclays U.S. Aggregate Bond Index is an index of the U.S. investment grade fixed-rate bond market, including both government and corporate bonds. The Barclays U.S. Aggregate Bond Index is unmanaged, is not available for investment, and does not incur expenses. |
The Russell 1000® Index is a registered trademark of Russell Investments. Russell® is a trademark of Russell Investments.
Not FDIC insured, nor bank guaranteed. May lose value.
5
Managers AMG Chicago Equity Partners Balanced Fund
Fund Snapshots
December 31, 2013
Portfolio Breakdown (unaudited)
| | | | |
Sector | | Managers AMG
Chicago Equity Partners
Balanced Fund** | |
U.S. Government and Agency Obligations | | | 31.9 | % |
Information Technology | | | 13.3 | % |
Consumer Discretionary | | | 10.5 | % |
Financials | | | 9.2 | % |
Health Care | | | 8.2 | % |
Industrials | | | 8.0 | % |
Consumer Staples | | | 5.8 | % |
Energy | | | 5.2 | % |
Materials | | | 2.6 | % |
Utilities | | | 2.0 | % |
Telecommunication Services | | | 1.5 | % |
Other Assets and Liabilities | | | 1.8 | % |
| ** | As a percentage of net assets |
Top Ten Holdings (unaudited)
| | | | |
Security Name | | % of
Net Assets | |
U.S. Treasury Notes, 0.750%, 03/31/18* | | | 2.3 | % |
U.S. Treasury Notes, 3.125%, 05/15/21 | | | 2.2 | |
FHLMC, 4.750%, 11/17/15* | | | 1.9 | |
U.S. Treasury Notes, 2.625%, 08/15/20* | | | 1.9 | |
FHLMC, 2.500%, 05/27/16* | | | 1.7 | |
U.S. Treasury Bonds, 4.750%, 02/15/41* | | | 1.6 | |
FNMA 5.000%, 05/11/17 | | | 1.5 | |
Exxon Mobil Corp.* | | | 1.3 | |
U.S. Treasury Notes, 0.250%, 09/15/15 | | | 1.2 | |
Microsoft Corp. | | | 1.2 | |
Top Ten as a Group | | | 16.8 | % |
| | | | |
| * | Top Ten Holding at June 30, 2013 |
Because a fund’s strategy may result in multiple investments in particular sectors of the economy, its performance may depend on the performance of those sectors and may fluctuate more widely than investments diversified across more sectors. For additional information on these and other risk considerations, please see the Fund’s prospectus.
Any sectors, industries, or securities discussed should not be perceived as investment recommendations. Mention of a specific security should not be considered a recommendation to buy or solicitation to sell that security. Specific securities mentioned in this report may have been sold from the Fund’s portfolio of investments by the time you receive this report.
6
Managers AMG Chicago Equity Partners Balanced Fund
Schedule of Portfolio Investments
December 31, 2013
| | | | | | | | |
| | | Shares | | | Value | |
Common Stocks - 64.4% | | | | | | | | |
| | |
Consumer Discretionary - 10.5% | | | | | | | | |
Amazon.com, Inc.* | | | 680 | | | $ | 271,177 | |
Bally Technologies, Inc.* | | | 2,900 | | | | 227,505 | |
Best Buy Co., Inc. | | | 6,600 | | | | 263,208 | |
Cablevision Systems Corp. | | | 8,350 | | | | 149,716 | |
CarMax, Inc.* | | | 800 | | | | 37,616 | |
CBS Corp., Class B | | | 3,575 | | | | 227,870 | |
Comcast Corp., Class A | | | 3,250 | | | | 168,886 | |
Domino’s Pizza, Inc. | | | 2,800 | | | | 195,020 | |
GameStop Corp., Class A | | | 900 | | | | 44,334 | |
The Gap, Inc. | | | 6,825 | | | | 266,721 | |
Gentex Corp. | | | 2,800 | | | | 92,372 | |
Hanesbrands, Inc. | | | 2,650 | | | | 186,216 | |
The Home Depot, Inc. | | | 5,925 | | | | 487,864 | |
Hyatt Hotels Corp., Class A* | | | 900 | | | | 44,514 | |
Las Vegas Sands Corp. | | | 3,000 | | | | 236,610 | |
Liberty Interactive Corp., Class A* | | | 2,900 | | | | 85,115 | |
Lowe’s Cos., Inc. | | | 4,600 | | | | 227,930 | |
Michael Kors Holdings, Ltd.* | | | 3,825 | | | | 310,552 | |
Netflix, Inc.* | | | 1,035 | | | | 381,056 | |
Newell Rubbermaid, Inc. | | | 3,650 | | | | 118,296 | |
Polaris Industries, Inc. | | | 655 | | | | 95,394 | |
priceline.com, Inc.* | | | 395 | | | | 459,148 | |
PulteGroup, Inc. | | | 2,700 | | | | 54,999 | |
Staples, Inc. | | | 2,700 | | | | 42,903 | |
Target Corp. | | | 1,350 | | | | 85,414 | |
Thor Industries, Inc. | | | 1,200 | | | | 66,276 | |
Total Consumer Discretionary | | | | | | | 4,826,712 | |
| | |
Consumer Staples - 5.8% | | | | | | | | |
Altria Group, Inc. | | | 2,275 | | | | 87,337 | |
Archer-Daniels-Midland Co. | | | 6,150 | | | | 266,910 | |
Brown-Forman Corp., Class B | | | 1,775 | | | | 134,137 | |
The Coca-Cola Co. | | | 8,375 | | | | 345,971 | |
Coca-Cola Enterprises, Inc. | | | 475 | | | | 20,962 | |
Constellation Brands, Inc., Class A* | | | 4,100 | | | | 288,558 | |
Costco Wholesale Corp. | | | 500 | | | | 59,505 | |
Green Mountain Coffee Roasters, Inc. | | | 3,150 | | | | 238,077 | |
The Hershey Co. | | | 1,700 | | | | 165,291 | |
The JM Smucker Co. | | | 500 | | | | 51,810 | |
The Kroger Co. | | | 1,025 | | | | 40,518 | |
Mead Johnson Nutrition Co. | | | 400 | | | | 33,504 | |
Nu Skin Enterprises, Inc., Class A | | | 2,825 | | | | 390,472 | |
The accompanying notes are an integral part of these financial statements.
7
Managers AMG Chicago Equity Partners Balanced Fund
Schedule of Portfolio Investments (continued)
| | | | | | | | |
| | | Shares | | | Value | |
Consumer Staples - 5.8% (continued) | | | | | | | | |
PepsiCo, Inc. | | | 200 | | | $ | 16,588 | |
Philip Morris International, Inc. | | | 325 | | | | 28,317 | |
Pinnacle Foods, Inc. | | | 2,000 | | | | 54,920 | |
The Procter & Gamble Co. | | | 995 | | | | 81,003 | |
Reynolds American, Inc. | | | 5,425 | | | | 271,196 | |
Safeway, Inc. | | | 2,600 | | | | 84,682 | |
Total Consumer Staples | | | | | | | 2,659,758 | |
| | |
Energy - 5.2% | | | | | | | | |
Anadarko Petroleum Corp. | | | 2,175 | | | | 172,521 | |
Baker Hughes, Inc. | | | 700 | | | | 38,682 | |
Cheniere Energy, Inc.* | | | 2,925 | | | | 126,126 | |
Chesapeake Energy Corp. | | | 2,225 | | | | 60,386 | |
Chevron Corp. | | | 1,550 | | | | 193,610 | |
Diamond Offshore Drilling, Inc. | | | 850 | | | | 48,382 | |
Dril-Quip, Inc.* | | | 1,145 | | | | 125,870 | |
EOG Resources, Inc. | | | 350 | | | | 58,744 | |
EQT Corp. | | | 325 | | | | 29,178 | |
Exxon Mobil Corp. | | | 5,770 | | | | 583,926 | |
Noble Energy, Inc. | | | 1,025 | | | | 69,813 | |
Oasis Petroleum, Inc.* | | | 2,625 | | | | 123,296 | |
Occidental Petroleum Corp. | | | 475 | | | | 45,172 | |
Patterson-UTI Energy, Inc. | | | 1,100 | | | | 27,852 | |
Phillips 66 | | | 825 | | | | 63,632 | |
RPC, Inc.1 | | | 4,700 | | | | 83,895 | |
Schlumberger, Ltd. | | | 1,800 | | | | 162,198 | |
SM Energy Co. | | | 3,050 | | | | 253,486 | |
Ultra Petroleum Corp.*,1 | | | 4,550 | | | | 98,508 | |
Total Energy | | | | | | | 2,365,277 | |
| | |
Financials - 8.9% | | | | | | | | |
The Allstate Corp. | | | 1,850 | | | | 100,899 | |
American International Group, Inc. | | | 2,200 | | | | 112,310 | |
Aspen Insurance Holdings, Ltd. | | | 1,000 | | | | 41,310 | |
Axis Capital Holdings, Ltd. | | | 500 | | | | 23,785 | |
Bank of America Corp. | | | 14,900 | | | | 231,993 | |
Capitol Federal Financial, Inc. | | | 2,700 | | | | 32,697 | |
The Chubb Corp. | | | 600 | | | | 57,978 | |
CME Group, Inc. | | | 1,600 | | | | 125,536 | |
Comerica, Inc. | | | 2,900 | | | | 137,866 | |
Endurance Specialty Holdings, Ltd. | | | 800 | | | | 46,936 | |
Everest Re Group, Ltd. | | | 550 | | | | 85,728 | |
Extra Space Storage, Inc. | | | 3,125 | | | | 131,656 | |
Fidelity National Financial, Inc., Class A | | | 1,925 | | | | 62,466 | |
First Horizon National Corp. | | | 3,450 | | | | 40,192 | |
The Goldman Sachs Group, Inc. | | | 300 | | | | 53,178 | |
The accompanying notes are an integral part of these financial statements.
8
Managers AMG Chicago Equity Partners Balanced Fund
Schedule of Portfolio Investments (continued)
| | | | | | | | |
| | | Shares | | | Value | |
Financials - 8.9% (continued) | | | | | | | | |
JPMorgan Chase & Co. | | | 4,423 | | | $ | 258,657 | |
Legg Mason, Inc. | | | 2,100 | | | | 91,308 | |
Lincoln National Corp. | | | 875 | | | | 45,168 | |
M&T Bank Corp. | | | 125 | | | | 14,552 | |
Mack-Cali Realty Corp. | | | 1,500 | | | | 32,220 | |
McGraw-Hill Financial, Inc. | | | 1,900 | | | | 148,580 | |
Moody’s Corp. | | | 1,650 | | | | 129,475 | |
Piedmont Office Realty Trust, Inc., Class A1 | | | 1,900 | | | | 31,388 | |
The Progressive Corp. | | | 1,100 | | | | 29,997 | |
Public Storage | | | 1,000 | | | | 150,520 | |
SLM Corp. | | | 3,200 | | | | 84,096 | |
Spirit Realty Capital, Inc. | | | 6,700 | | | | 65,861 | |
State Street Corp. | | | 1,900 | | | | 139,441 | |
SunTrust Banks, Inc. | | | 4,675 | | | | 172,087 | |
The Travelers Cos., Inc. | | | 3,450 | | | | 312,363 | |
US Bancorp | | | 2,300 | | | | 92,920 | |
Waddell & Reed Financial, Inc., Class A | | | 4,900 | | | | 319,088 | |
Wells Fargo & Co. | | | 3,725 | | | | 169,115 | |
Weyerhaeuser Co. | | | 11,350 | | | | 358,320 | |
XL Group PLC | | | 4,850 | | | | 154,424 | |
Total Financials | | | | | | | 4,084,110 | |
| | |
Health Care - 8.2% | | | | | | | | |
AbbVie, Inc. | | | 2,150 | | | | 113,542 | |
Actavis PLC* | | | 1,240 | | | | 208,320 | |
Aetna, Inc. | | | 2,325 | | | | 159,472 | |
Alexion Pharmaceuticals, Inc.* | | | 825 | | | | 109,774 | |
AmerisourceBergen Corp. | | | 2,000 | | | | 140,620 | |
Amgen, Inc. | | | 2,383 | | | | 272,043 | |
Boston Scientific Corp.* | | | 4,900 | | | | 58,898 | |
The Cooper Cos., Inc. | | | 450 | | | | 55,728 | |
Cubist Pharmaceuticals, Inc.* | | | 500 | | | | 34,435 | |
Eli Lilly & Co. | | | 300 | | | | 15,300 | |
Illumina, Inc.* | | | 1,600 | | | | 176,992 | |
Jazz Pharmaceuticals PLC* | | | 1,875 | | | | 237,300 | |
Johnson & Johnson | | | 3,550 | | | | 325,144 | |
McKesson Corp. | | | 1,100 | | | | 177,540 | |
Medtronic, Inc. | | | 3,500 | | | | 200,865 | |
Merck & Co., Inc. | | | 350 | | | | 17,517 | |
Mylan, Inc.* | | | 4,325 | | | | 187,705 | |
Patterson Cos., Inc. | | | 2,625 | | | | 108,150 | |
Pfizer, Inc. | | | 10,857 | | | | 332,550 | |
Regeneron Pharmaceuticals, Inc.* | | | 1,450 | | | | 399,098 | |
ResMed, Inc.1 | | | 4,845 | | | | 228,103 | |
The accompanying notes are an integral part of these financial statements.
9
Managers AMG Chicago Equity Partners Balanced Fund
Schedule of Portfolio Investments (continued)
| | | | | | | | |
| | | Shares | | | Value | |
Health Care - 8.2% (continued) | | | | | | | | |
Salix Pharmaceuticals, Ltd.* | | | 225 | | | $ | 20,236 | |
Stryker Corp. | | | 1,500 | | | | 112,710 | |
United Therapeutics Corp.* | | | 450 | | | | 50,886 | |
Total Health Care | | | | | | | 3,742,928 | |
| | |
Industrials - 6.8% | | | | | | | | |
A. O. Smith Corp. | | | 2,400 | | | | 129,456 | |
AECOM Technology Corp.* | | | 1,200 | | | | 35,316 | |
AMERCO* | | | 400 | | | | 95,136 | |
B/E Aerospace, Inc.* | | | 675 | | | | 58,745 | |
Colfax Corp.* | | | 1,975 | | | | 125,788 | |
Con-way, Inc. | | | 1,400 | | | | 55,594 | |
Crane Co. | | | 1,350 | | | | 90,788 | |
Delta Air Lines, Inc. | | | 12,800 | | | | 351,616 | |
Exelis, Inc. | | | 700 | | | | 13,342 | |
Fluor Corp. | | | 500 | | | | 40,145 | |
General Dynamics Corp. | | | 450 | | | | 42,998 | |
General Electric Co. | | | 3,600 | | | | 100,908 | |
Graco, Inc. | | | 1,200 | | | | 93,744 | |
Hexcel Corp.* | | | 1,200 | | | | 53,628 | |
Honeywell International, Inc. | | | 800 | | | | 73,096 | |
Huntington Ingalls Industries, Inc. | | | 1,650 | | | | 148,516 | |
IDEX Corp. | | | 1,000 | | | | 73,850 | |
Illinois Tool Works, Inc. | | | 700 | | | | 58,856 | |
ITT Corp. | | | 6,000 | | | | 260,520 | |
Kirby Corp.* | | | 400 | | | | 39,700 | |
Norfolk Southern Corp. | | | 1,800 | | | | 167,094 | |
Northrop Grumman Corp. | | | 3,000 | | | | 343,830 | |
Pall Corp. | | | 900 | | | | 76,815 | |
Quanta Services, Inc.* | | | 400 | | | | 12,624 | |
Rockwell Automation, Inc. | | | 1,225 | | | | 144,746 | |
RR Donnelley & Sons Co. | | | 750 | | | | 15,210 | |
SPX Corp. | | | 1,800 | | | | 179,298 | |
Union Pacific Corp. | | | 1,075 | | | | 180,600 | |
United Technologies Corp. | | | 500 | | | | 56,900 | |
Total Industrials | | | | | | | 3,118,859 | |
| | |
Information Technology - 13.3% | | | | | | | | |
Akamai Technologies, Inc.* | | | 1,700 | | | | 80,206 | |
ANSYS, Inc.* | | | 1,650 | | | | 143,880 | |
AOL, Inc.* | | | 2,800 | | | | 130,536 | |
Apple, Inc. | | | 790 | | | | 443,277 | |
Avago Technologies, Ltd. | | | 2,600 | | | | 137,514 | |
Booz Allen Hamilton Holding Corp. | | | 3,050 | | | | 58,407 | |
Broadridge Financial Solutions, Inc. | | | 2,800 | | | | 110,656 | |
The accompanying notes are an integral part of these financial statements.
10
Managers AMG Chicago Equity Partners Balanced Fund
Schedule of Portfolio Investments (continued)
| | | | | | | | |
| | | Shares | | | Value | |
Information Technology - 13.3% (continued) | | | | | | | | |
Brocade Communications Systems, Inc.* | | | 16,100 | | | $ | 142,807 | |
Cisco Systems, Inc. | | | 5,625 | | | | 126,281 | |
Computer Sciences Corp. | | | 2,500 | | | | 139,700 | |
DST Systems, Inc. | | | 500 | | | | 45,370 | |
Electronic Arts, Inc.* | | | 12,025 | | | | 275,854 | |
Facebook, Inc., Class A* | | | 6,800 | | | | 371,688 | |
First Solar, Inc.* | | | 2,075 | | | | 113,378 | |
FleetCor Technologies, Inc.* | | | 2,370 | | | | 277,693 | |
Google, Inc., Class A* | | | 400 | | | | 448,284 | |
Harris Corp. | | | 2,100 | | | | 146,601 | |
Hewlett-Packard Co. | | | 6,900 | | | | 193,062 | |
International Business Machines Corp. | | | 490 | | | | 91,909 | |
International Rectifier Corp.* | | | 2,200 | | | | 57,354 | |
Intuit, Inc. | | | 200 | | | | 15,264 | |
Jack Henry & Associates, Inc. | | | 2,250 | | | | 133,222 | |
Linear Technology Corp. | | | 1,000 | | | | 45,550 | |
LinkedIn Corp., Class A* | | | 710 | | | | 153,949 | |
Microchip Technology, Inc.1 | | | 1,000 | | | | 44,750 | |
Microsoft Corp. | | | 14,400 | | | | 538,992 | |
NCR Corp.* | | | 8,825 | | | | 300,580 | |
Pandora Media, Inc.* | | | 2,450 | | | | 65,170 | |
SanDisk Corp. | | | 3,600 | | | | 253,944 | |
Stratasys, Ltd.* | | | 2,220 | | | | 299,034 | |
Visa, Inc., Class A | | | 1,425 | | | | 317,319 | |
Western Digital Corp. | | | 1,000 | | | | 83,900 | |
Workday, Inc., Class A* | | | 1,850 | | | | 153,846 | |
Xerox Corp. | | | 1,500 | | | | 18,255 | |
Xilinx, Inc. | | | 3,200 | | | | 146,944 | |
Total Information Technology | | | | | | | 6,105,176 | |
| | |
Materials - 2.6% | | | | | | | | |
Alcoa, Inc. | | | 1,700 | | | | 18,071 | |
Avery Dennison Corp. | | | 600 | | | | 30,114 | |
E.I. du Pont de Nemours & Co. | | | 400 | | | | 25,988 | |
Greif, Inc. | | | 500 | | | | 26,200 | |
LyondellBasell Industries N.V., Class A | | | 1,600 | | | | 128,448 | |
Monsanto Co. | | | 1,300 | | | | 151,515 | |
Packaging Corp. of America | | | 5,100 | | | | 322,728 | |
PPG Industries, Inc. | | | 525 | | | | 99,572 | |
United States Steel Corp. | | | 500 | | | | 14,750 | |
Westlake Chemical Corp. | | | 2,550 | | | | 311,278 | |
WR Grace & Co.* | | | 600 | | | | 59,322 | |
Total Materials | | | | | | | 1,187,986 | |
| | |
Telecommunication Services - 1.5% | | | | | | | | |
AT&T, Inc. | | | 6,700 | | | | 235,572 | |
The accompanying notes are an integral part of these financial statements.
11
Managers AMG Chicago Equity Partners Balanced Fund
Schedule of Portfolio Investments (continued)
| | | | | | | | |
| | | Shares | | | Value | |
Telecommunication Services - 1.5% (continued) | | | | | | | | |
Level 3 Communications, Inc.* | | | 2,200 | | | $ | 72,974 | |
Verizon Communications, Inc. | | | 7,725 | | | | 379,606 | |
Total Telecommunication Services | | | | | | | 688,152 | |
| | |
Utilities - 1.6% | | | | | | | | |
Ameren Corp. | | | 5,550 | | | | 200,688 | |
American Water Works Co, Inc. | | | 5,675 | | | | 239,825 | |
CenterPoint Energy, Inc. | | | 2,850 | | | | 66,063 | |
Public Service Enterprise Group, Inc. | | | 3,150 | | | | 100,926 | |
Questar Corp. | | | 3,825 | | | | 87,937 | |
Vectren Corp. | | | 1,425 | | | | 50,588 | |
Total Utilities | | | | | | | 746,027 | |
| | |
Total Common Stocks (cost $24,710,918) | | | | | | | 29,524,985 | |
| | |
| | | Principal Amount | | | | |
Corporate Bonds and Notes - 1.9% | | | | | | | | |
| | |
Financials - 0.3% | | | | | | | | |
American Express Co., 7.250%, 05/20/14 | | $ | 40,000 | | | | 41,056 | |
General Electric Capital Corp., MTN, Series A, 6.750%, 03/15/32 | | | 25,000 | | | | 31,045 | |
US Bank N.A., Series Y, 4.950%, 10/30/14 | | | 55,000 | | | | 57,104 | |
Total Financials | | | | | | | 129,205 | |
| | |
Industrials - 1.2% | | | | | | | | |
Altria Group, Inc., 9.700%, 11/10/18 | | | 5,000 | | | | 6,579 | |
AT&T, Inc., 5.100%, 09/15/14 | | | 60,000 | | | | 61,923 | |
ConocoPhillips, 4.600%, 01/15/15 | | | 115,000 | | | | 119,904 | |
International Business Machines Corp., 4.000%, 06/20/42 | | | 61,000 | | | | 54,689 | |
McDonald’s Corp., Series MTN, 6.300%, 10/15/37 | | | 15,000 | | | | 18,340 | |
PepsiCo, Inc., 2.500%, 05/10/16 | | | 65,000 | | | | 67,478 | |
Pfizer, Inc., 6.200%, 03/15/19 | | | 45,000 | | | | 53,405 | |
United Parcel Service, Inc., 6.200%, 01/15/38 | | | 45,000 | | | | 54,882 | |
Verizon Communications, Inc., 3.000%, 04/01/16 | | | 80,000 | | | | 83,470 | |
Wal-Mart Stores, Inc., 6.500%, 08/15/37 | | | 30,000 | | | | 37,653 | |
Total Industrials | | | | | | | 558,323 | |
| | |
Utilities - 0.4% | | | | | | | | |
Consolidated Edison Co. of New York, Inc., Series 08-B, 6.750%, 04/01/38 | | | 45,000 | | | | 56,958 | |
Dominion Resources, Inc., 4.450%, 03/15/21 | | | 25,000 | | | | 26,547 | |
Georgia Power Co., 5.400%, 06/01/40 | | | 15,000 | | | | 15,716 | |
TransCanada PipeLines, Ltd., | | | | | | | | |
3.800%, 10/01/20 | | | 20,000 | | | | 20,733 | |
4.875%, 01/15/15 | | | 40,000 | | | | 41,847 | |
Total Utilities | | | | | | | 161,801 | |
| | |
Total Corporate Bonds and Notes (cost $839,629) | | | | | | | 849,329 | |
The accompanying notes are an integral part of these financial statements.
12
Managers AMG Chicago Equity Partners Balanced Fund
Schedule of Portfolio Investments (continued)
| | | | | | | | |
| | | Principal Amount | | | Value | |
U.S. Government and Agency Obligations - 31.9% | | | | | | | | |
| | |
Federal Home Loan Banks - 0.4% | | | | | | | | |
FHLB, 5.375%, 05/18/16 | | $ | 165,000 | | | $ | 183,807 | |
| | |
Federal Home Loan Mortgage Corporation - 6.2% | | | | | | | | |
FHLMC, | | | | | | | | |
2.500%, 05/27/16 | | | 760,000 | | | | 795,877 | |
3.000%, 03/01/43 | | | 278,136 | | | | 264,350 | |
3.500%, 03/01/42 | | | 151,369 | | | | 150,645 | |
3.750%, 03/27/19 | | | 230,000 | | | | 250,993 | |
4.500%, 11/01/24 to 11/01/39 | | | 310,795 | | | | 329,838 | |
4.750%, 11/17/15 | | | 780,000 | | | | 843,454 | |
5.000%, 12/01/20 | | | 19,882 | | | | 21,145 | |
5.500%, 04/01/38 | | | 72,055 | | | | 78,666 | |
6.000%, 01/01/38 to 06/01/38 | | | 80,395 | | | | 88,830 | |
Total Federal Home Loan Mortgage Corporation | | | | | | | 2,823,798 | |
| | |
Federal National Mortgage Association - 12.6% | | | | | | | | |
FNMA, | | | | | | | | |
0.375%, 12/21/151 | | | 355,000 | | | | 354,631 | |
1.250%, 01/30/17 | | | 200,000 | | | | 202,559 | |
2.500%, 02/01/23 to 04/01/23 | | | 546,999 | | | | 558,640 | |
3.000%, 08/01/22 to 05/01/43 | | | 746,212 | | | | 724,643 | |
3.500%, 09/01/25 to 07/01/43 | | | 1,056,535 | | | | 1,076,373 | |
4.000%, 08/01/19 to 12/01/41 | | | 496,111 | | | | 518,367 | |
4.500%, 11/01/19 to 05/01/41 | | | 453,577 | | | | 481,963 | |
5.000%, 05/11/17 to 08/01/41 | | | 968,021 | | | | 1,080,687 | |
5.375%, 07/15/16 to 06/12/17 | | | 485,000 | | | | 550,852 | |
5.500%, 02/01/22 to 06/01/38 | | | 127,988 | | | | 140,745 | |
6.000%, 03/01/37 to 06/01/38 | | | 56,724 | | | | 63,286 | |
6.500%, 03/01/37 | | | 13,834 | | | | 15,386 | |
Total Federal National Mortgage Association | | | | | | | 5,768,132 | |
| | |
U.S. Treasury Obligations - 12.7% | | | | | | | | |
U.S. Treasury Bonds, | | | | | | | | |
3.500%, 02/15/39 | | | 200,000 | | | | 188,406 | |
4.750%, 02/15/41 | | | 655,000 | | | | 753,864 | |
6.250%, 05/15/30 | | | 375,000 | | | | 501,064 | |
The accompanying notes are an integral part of these financial statements.
13
Managers AMG Chicago Equity Partners Balanced Fund
Schedule of Portfolio Investments (continued)
| | | | | | | | |
| | | Principal Amount | | | Value | |
U.S. Treasury Obligations - 12.7% (continued) | | | | | | | | |
U.S. Treasury Notes, | | | | | | | | |
0.250%, 09/15/15 | | $ | 545,000 | | | $ | 544,596 | |
0.750%, 03/31/18 | | | 1,100,000 | | | | 1,068,891 | |
1.000%, 03/31/17 | | | 380,000 | | | | 380,891 | |
2.125%, 02/29/16 | | | 220,000 | | | | 228,061 | |
2.500%, 08/15/23 | | | 325,000 | | | | 312,140 | |
2.625%, 08/15/20 | | | 825,000 | | | | 842,016 | |
3.125%, 05/15/21 | | | 980,000 | | | | 1,021,803 | |
Total U.S. Treasury Obligations | | | | | | | 5,841,732 | |
| | |
Total U.S. Government and Agency Obligations (cost $14,806,672) | | | | | | | 14,617,469 | |
| | |
Short-Term Investments - 3.8% | | | | | | | | |
| | |
Repurchase Agreements - 1.4%2 | | | | | | | | |
Morgan Stanley & Co., LLC, dated 12/31/13, due 01/02/14, 0.030%, total to be received $662,193 (collateralized by various U.S. Government Agency Obligations, 1.372% - 8.500%, 05/01/17 - 12/01/44, totaling $675,436) | | | 662,192 | | | | 662,192 | |
| | |
| | | Shares | | | | |
Other Investment Companies - 2.4%3 | | | | | | | | |
Dreyfus Institutional Cash Advantage Fund, Institutional Class Shares, 0.06% | | | 1,103,321 | | | | 1,103,321 | |
Total Short-Term Investments | | | | | | | | |
(cost $1,765,513) | | | | | | | 1,765,513 | |
| | |
Total Investments - 102.0% (cost $42,122,732) | | | | | | | 46,757,296 | |
| | |
Other Assets, less Liabilities - (2.0)% | | | | | | | (902,645 | ) |
| | |
Net Assets - 100.0% | | | | | | $ | 45,854,651 | |
The accompanying notes are an integral part of these financial statements.
14
Managers High Yield Fund
Portfolio Manager’s Comments
THE YEAR IN REVIEW
The Managers High Yield Fund (Institutional Class Shares) returned 6.47% for the year ended December 31, 2013, compared with 7.44% for the Barclays Capital U.S. Corporate High Yield Index (the “Index”).
Despite fluid developments with monetary and fiscal policy, coupled with persistent interest rate pressure, steadily improving macro fundamentals and wide spreads relative to low defaults produced coupon-type returns for high-yield bonds in 2013. Overall, the asset class outperformed Treasuries, investment-grade and emerging market bonds in 2013. Ultimately, investors’ desire for yield and the support of positive corporate fundamentals continued to drive interest in the asset class. Both spreads and yields ultimately tightened considerably during the period. At December 31, high-yield spreads (as measured by the Barclays Capital U.S. Corporate High Yield Bond Index) were 428 basis points (bps), 111 bps tighter for the 12-month period. For the same period, yields fell from 6.13% (at December 31, 2012) to 5.64%.
Riskier CCC-rated bonds outperformed again in 2013 as CCCs returned 13.82%, while single-Bs returned 7.27% and double-Bs returned 5.05%. All sectors provided positive returns with technology, consumer products and building materials leading performance for the year. The lowest-performing sectors for the year were pipelines, retailers and media cable.
For the second consecutive year, the high-yield primary market set a record for new issue volume. High-yield issuers priced a total of approximately $400 billion, nearly a 9% increase over last year’s total. Importantly, despite the pickup in issuance, new-issue quality remained conservative overall, despite the increase in lower-quality issuance during the second half of the year. Refinancing activities continue to dominate the use of proceeds and lower-rated issuance remains well below levels seen prior to the last default cycle.
Retail demand for high-yield bonds weakened in 2013, as rising interest rates and volatility due to uncertainty about monetary and fiscal policy outweighed strong fundamentals and very low default rates. Specifically, high-yield mutual fund flows totaled a net outflow of $4.1 billion in 2013 compared with $29 billion of inflows last year.
Default activity in 2013 was benign, as both default volume and the high-yield default rate reached six-year lows. The trailing 12-month par-weighted high-yield default rate decreased to 0.66%, its lowest level since December 2007. Record capital market conditions have been an important driver of low defaults as issuers continue to refinance at lower rates and extend debt maturity profiles. Default activity is expected to remain low with a forecasted sub-2% default rate through 2015, considerably below historical averages.
The Fund underperformed the benchmark during the year. In addition to the negative impact of cash, underperformance was driven by security selection in the telecommunication, consumer services and media non-cable sectors. The largest detractors came from relative weightings in Sprint Corporation, Springleaf Finance Corporation, DISH DBS Corporation, ArcelorMittal and Reichhold Industries. Alternatively, relative contributions from security selection in the technology, health care and natural gas sectors
enhanced performance. Specifically, relative weightings in Reynolds Group, Radiation Therapy Services, Inc., First Data Corp., Marina District Finance Co. and Accellent, Inc. improved results for the year.
Compared to the benchmark at quarter-end, the Fund was overweight in health care, technology and consumer products due to our view of the relative value opportunities within those sectors. The Fund was underweight in metals and mining, electric utilities and oil field services because we have not found these sectors compelling due to challenging fundamental outlooks or rich valuations.
MARKET OUTLOOK
In 2014, we expect improving growth in the U.S. and modestly positive growth globally. We anticipate that corporate earnings will strengthen in 2014 and corporate balance sheets will remain healthy and supportive of valuations. Given attractive financing rates, companies continue to refinance and extend debt-maturity profiles. Mergers-and-acquisition activity, which has been generally constructive for high-yield companies, should accelerate in 2014. Default rates are forecasted to remain below 2% through 2015. We expect tapering to continue throughout 2014 as the U.S. economic data improves, pushing Treasury rates gradually higher throughout the year. Although high yield has shown low or negative correlation with rates historically, given the current spread levels and relative low absolute yields combined with the continued tapering of quantitative easing and associated further rate rises, we believe high yield will be more positively correlated. We also expect the re-emergence of spread and performance volatility around technical pressures resulting from retail fund flows. Importantly, we expect high yield to continue to exhibit strong relative performance versus most other fixed income assets in 2014 as we forecast low single-digit returns for the broader high-yield market. We will continue to utilize our bottom-up, individual security selection investment process to capitalize on dislocations in value and market opportunities.
This commentary reflects the viewpoints of the Fund’s subadvisor, JP Morgan Asset Management as of 12/31/13 and is not intended as a forecast or guarantee of future results.
CUMULATIVE TOTAL RETURN PERFORMANCE
Managers High Yield Fund’s cumulative total return is based on the daily change in net asset value (NAV), and assumes that all distributions were reinvested. The chart compares a hypothetical $10,000 investment made in the Fund’s Investor Class shares (formerly Class A shares of the Fund, which were renamed Investor Class shares as of December 1, 2012) on December 31, 2003 to a $10,000 investment made in the Barclays U.S. Corporate High Yield Bond Index for the same time period. Performance for periods longer than one year is annualized. The graph and table do not reflect the deduction of taxes that a shareholder would pay on a Fund distribution or redemption of shares. The listed returns for the Fund are net of expenses and the returns for the index exclude expenses. Past performance is not indicative of future results. Total returns for the Fund would have been lower had certain expenses not been reduced.
Managers High Yield Fund
Portfolio Manager’s Comments (continued)
CUMULATIVE TOTAL RETURN PERFORMANCE (continued)
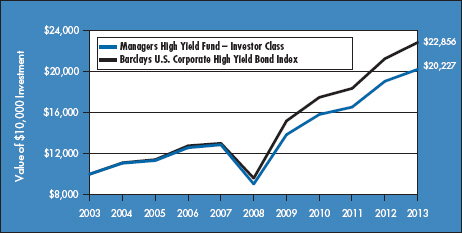
The table below shows the average annual total returns for the Managers High Yield Fund and the Barclays U.S. Corporate High Yield Bond Index for the same time periods ended December 31, 2013.
| | | | | | | | | | | | |
| | | Average Annual Total Returns1 | |
| | | One Year | | | Five Years | | | Ten Years | |
Managers High Yield Fund2,3,4 | | | | | | | | | | | | |
Investor Class | | | 6.08 | % | | | 17.49 | % | | | 7.30 | % |
Institutional Class | | | 6.47 | % | | | 17.87 | % | | | 7.64 | % |
Barclays U.S. Corporate High Yield Bond Index5 | | | 7.44 | % | | | 18.93 | % | | | 8.62 | % |
The performance data shown represents past performance. Past performance is not a guarantee of future results. Current performance may be lower or higher than the performance data quoted. The investment return and principal value of an investment in the Fund will fluctuate so that an investor’s shares, when redeemed, may be worth more or less than their original cost. For performance information through the most recent month end please call (800) 835-3879 or visit our Web site at www.managersinvest.com. Current net assets values per share for each Fund are available on the Funds’ Web site at www.managersinvest.com.
Investors should carefully consider the Fund’s investment objectives, risks, charges and expenses before investing. For this and other information, please call (800) 835-3879 or visit our Web site at www.managersinvest.com for a free prospectus. Read it carefully before investing or sending money. Funds are distributed by Managers Distributors, Inc., member FINRA.
| 1 | Total return equals income yield plus share price change and assumes reinvestment of all dividends and capital gain distributions. Returns are net of fees and may reflect offsets of Fund expenses as described in the Prospectus. No adjustment has been made for taxes payable by shareholders on their reinvested dividends and capital gain distributions. Returns for periods greater than one year are annualized. The listed returns on the Fund are net of expenses and based on the published NAV as of December 31, 2013. All returns are in U.S. dollars ($). |
| 2 | From time to time, the Fund’s advisor has waived its fees and/or absorbed Fund expenses, which has resulted in higher returns |
| 3 | Fixed income funds are subject to risks associated with investments in debt securities, such as default risk and fluctuations in the perception of the debtors’ ability to pay their creditors. Changing interest rates may adversely affect the value of a fixed income investment. An increase in interest rates typically causes the value of bonds and other fixed income securities to fall. |
| 4 | The Fund holds securities in which the issuer of the security may default or otherwise be unable to honor a financial obligation. The Fund holds securities rated below investment grade that are especially susceptible to this risk. These issuers may be involved in bankruptcy proceedings, reorganizations, or financial restructurings, and are not as strong financially as higher-rated issuers. |
| 5 | The Barclays U.S. Corporate High Yield Bond Index is a total return performance benchmark for fixed income securities having a maximum quality rating of Ba1 (as determined by Moody’s Investors Service, Inc.). Unlike the Fund, the Barclays U.S. Corporate High Yield Bond Index is unmanaged, is not available for investment, and does not incur expenses. |
Not FDIC insured, nor bank guaranteed. May lose value.
Managers High Yield Fund
Fund Snapshots
December 31, 2013
Portfolio Breakdown (unaudited)
| | | | |
Sector | | Managers High
Yield Fund** | |
Industrials | | | 86.3 | % |
Financials | | | 6.7 | % |
Utilities | | | 0.7 | % |
Bank Loan Obligations | | | 1.2 | % |
Materials | | | 0.0 | %# |
Other Assets and Liabilities | | | 5.1 | % |
| ** | As a percentage of net assets |
| # | Rounds to less than 0.1% |
| | | | |
Rating | | Managers High
Yield Fund† | |
Baa | | | 2.5 | % |
Ba | | | 37.1 | % |
B | | | 46.3 | % |
Caa | | | 11.4 | % |
Not Rated | | | 2.7 | % |
| † | As a percentage of market value of fixed income securities. Chart does not include equity securities. |
Top Ten Holdings (unaudited)
| | | | |
Security Name | | % of
Net Assets | |
Sprint Capital Corp., 8.750%, 03/15/32* | | | 1.6 | % |
HCA, Inc., 7.500%, 02/15/22* | | | 1.5 | |
Reynolds Group Issuer, Inc. / Reynolds Group Issuer LLC / Reynolds Group Issuer Lu, 9.000%, 04/15/19* | | | 1.1 | |
International Lease Finance Corp., 8.750%, 03/15/17* | | | 0.9 | |
Ally Financial, Inc., 6.250%, 12/01/17* | | | 0.9 | |
First Data Corp., 8.750%, 01/15/22* | | | 0.9 | |
Intelsat Jackson Holdings SA, 7.250%, 10/15/20* | | | 0.9 | |
DISH DBS Corp., 7.875%, 09/01/19* | | | 0.8 | |
Caesars Entertainment Operating Co., Inc., 9.000%, 02/15/20 | | | 0.8 | |
HCA Holdings, Inc., 7.750%, 05/15/21* | | | 0.7 | |
| | | | |
Top Ten as a Group | | | 10.1 | % |
| | | | |
| * | Top Ten Holding at June 30, 2013 |
Because a fund’s strategy may result in multiple investments in particular sectors of the economy, its performance may depend on the performance of those sectors and may fluctuate more widely than investments diversified across more sectors. For additional information on these and other risk considerations, please see the Fund’s prospectus.
Any sectors, industries, or securities discussed should not be perceived as investment recommendations. Mention of a specific security should not be considered a recommendation to buy or solicitation to sell that security. Specific securities mentioned in this report may have been sold from the Fund’s portfolio of investments by the time you receive this report.
Managers High Yield Fund
Schedule of Portfolio Investments
December 31, 2013
| | | | | | | | |
| | | Principal Amount | | | Value | |
Bank Loan Obligations - 1.2% | | | | | | | | |
Caesars Entertainment Operating Co., Inc., Extended B-6 Term Loan, 5.488%, 01/28/18 (01/27/14)4 | | $ | 70,221 | | | $ | 67,187 | |
Clear Channel Communications, Inc., Term Loan, Class B, 3.819%, 01/29/16 (01/31/14)4 | | | 11,841 | | | | 11,502 | |
Clear Channel Communications, Inc.,Term Loan D, 6.919%, 01/23/19 (01/31/14)4 | | | 34,927 | | | | 33,443 | |
Integra Telecom Holdings, Term Loan, | | | | | | | | |
5.250%, 02/22/19 (01/31/13)4 | | | 65,000 | | | | 65,926 | |
5.250%, 02/22/19 (03/31/14)4 | | | 64,025 | | | | 64,937 | |
SUPERVALU, Inc. , Term Loan B, 5.000%, 03/21/19 (03/31/14)4 | | | 103,861 | | | | 105,051 | |
Vertafore, Inc., 2nd Lien Term Loan, 9.750%, 10/27/17 (03/31/14)4 | | | 45,000 | | | | 45,889 | |
Total Bank Loan Obligations (cost $370,326) | | | | | | | 393,935 | |
| | |
| | | Shares | | | | |
Common Stocks - 0.0%# | | | | | | | | |
LyondellBasell Industries N.V., Class A (Materials) (cost $0) | | | 3 | | | | 241 | |
| | |
| | | Principal Amount | | | | |
Corporate Bonds and Notes - 93.7% | | | | | | | | |
Financials - 6.7% | | | | | | | | |
Ally Financial, Inc., | | | | | | | | |
2.926%, 07/18/16 (01/21/14)4 | | $ | 50,000 | | | | 51,143 | |
4.750%, 09/10/18 | | | 40,000 | | | | 42,000 | |
5.500%, 02/15/17 | | | 60,000 | | | | 65,250 | |
6.250%, 12/01/17 | | | 285,000 | | | | 318,844 | |
7.500%, 09/15/20 | | | 90,000 | | | | 105,188 | |
Bank of America Corp., Series K, 8.000%, 07/29/495 | | | 145,000 | | | | 161,417 | |
Chinos Intermediate Holdings A, Inc., (7.500% Cash or 8.500% PIK),
7.500%, 05/01/19 (a)6 | | | 45,000 | | | | 46,125 | |
CIT Group, Inc., | | | | | | | | |
4.250%, 08/15/17 | | | 95,000 | | | | 99,275 | |
5.250%, 03/15/18 | | | 110,000 | | | | 118,388 | |
5.500%, 02/15/19 (a) | | | 55,000 | | | | 59,262 | |
Corrections Corp. of America, | | | | | | | | |
4.125%, 04/01/20 | | | 65,000 | | | | 64,025 | |
4.625%, 05/01/23 | | | 15,000 | | | | 14,213 | |
General Motors Financial Co., Inc., | | | | | | | | |
2.750%, 05/15/16 (a) | | | 30,000 | | | | 30,450 | |
3.250%, 05/15/18 (a) | | | 15,000 | | | | 15,038 | |
4.250%, 05/15/23 (a) | | | 30,000 | | | | 28,612 | |
International Lease Finance Corp., | | | | | | | | |
5.875%, 04/01/19 | | | 160,000 | | | | 171,200 | |
6.250%, 05/15/19 | | | 80,000 | | | | 87,000 | |
8.750%, 03/15/17 (b) | | | 270,000 | | | | 319,275 | |
Nuveen Investments, Inc., 9.500%, 10/15/20 (a) | | | 80,000 | | | | 80,600 | |
The accompanying notes are an integral part of these financial statements.
18
Managers High Yield Fund
Schedule of Portfolio Investments (continued)
| | | | | | | | |
| | | Principal Amount | | | Value | |
Financials - 6.7% (continued) | | | | | | | | |
Realogy Corp., | | | | | | | | |
7.625%, 01/15/20 (a) | | $ | 65,000 | | | $ | 73,288 | |
7.875%, 02/15/19 (a) | | | 110,000 | | | | 121,275 | |
Serta Simmons Holdings LLC, 8.125%, 10/01/20 (a) | | | 180,000 | | | | 196,650 | |
Vanguard Natural Resources LLC/VNR Finance Corp., 7.875%, 04/01/20 | | | 60,000 | | | | 63,300 | |
Total Financials | | | | | | | 2,331,818 | |
| | |
Industrials - 86.3% | | | | | | | | |
Academy, Ltd. / Academy Finance Corp., 9.250%, 08/01/19 (a) | | | 60,000 | | | | 66,600 | |
Accellent, Inc., | | | | | | | | |
8.375%, 02/01/17 | | | 80,000 | | | | 84,000 | |
10.000%, 11/01/17 | | | 85,000 | | | | 88,188 | |
Access Midstream Partners, L.P. / ACMP Finance Corp., | | | | | | | | |
4.875%, 05/15/23 | | | 40,000 | | | | 38,800 | |
5.875%, 04/15/21 | | | 20,000 | | | | 21,400 | |
6.125%, 07/15/22 | | | 50,000 | | | | 53,750 | |
ACCO Brands Corp., 6.750%, 04/30/20 | | | 155,000 | | | | 153,838 | |
ACI Worldwide, Inc., 6.375%, 08/15/20 (a) | | | 50,000 | | | | 52,375 | |
Activision Blizzard, Inc., | | | | | | | | |
5.625%, 09/15/21 (a) | | | 20,000 | | | | 20,750 | |
6.125%, 09/15/23 (a) | | | 10,000 | | | | 10,450 | |
The ADT Corp., | | | | | | | | |
3.500%, 07/15/22 | | | 10,000 | | | | 8,720 | |
6.250%, 10/15/21 (a) | | | 45,000 | | | | 47,306 | |
Aircastle, Ltd., | | | | | | | | |
4.625%, 12/15/18 | | | 40,000 | | | | 40,400 | |
6.750%, 04/15/17 | | | 15,000 | | | | 16,800 | |
7.625%, 04/15/20 | | | 35,000 | | | | 39,463 | |
9.750%, 08/01/18 | | | 75,000 | | | | 82,125 | |
Alcatel-Lucent USA, Inc., 6.450%, 03/15/29 | | | 40,000 | | | | 35,600 | |
Alere, Inc., 6.500%, 06/15/20 | | | 20,000 | | | | 20,550 | |
Allegion US Holding Co., Inc., Series N, 5.750%, 10/01/21 (a) | | | 30,000 | | | | 31,350 | |
Alliant Techsystems, Inc., 5.250%, 10/01/21 (a) | | | 35,000 | | | | 35,262 | |
Allison Transmission, Inc., 7.125%, 05/15/19 (a) | | | 105,000 | | | | 113,662 | |
AMC Entertainment, Inc., | | | | | | | | |
8.750%, 06/01/19 | | | 40,000 | | | | 42,950 | |
9.750%, 12/01/20 | | | 115,000 | | | | 132,106 | |
American Axle & Manufacturing, Inc., | | | | | | | | |
6.250%, 03/15/21 | | | 25,000 | | | | 26,688 | |
7.750%, 11/15/19 | | | 75,000 | | | | 85,688 | |
American Tire Distributors, Inc., 9.750%, 06/01/17 | | | 55,000 | | | | 58,575 | |
Amkor Technology, Inc., | | | | | | | | |
6.375%, 10/01/22 | | | 10,000 | | | | 10,325 | |
6.625%, 06/01/21 | | | 35,000 | | | | 36,488 | |
7.375%, 05/01/18 | | | 25,000 | | | | 26,500 | |
The accompanying notes are an integral part of these financial statements.
19
Managers High Yield Fund
Schedule of Portfolio Investments (continued)
| | | | | | | | |
| | | Principal Amount | | | Value | |
Industrials - 86.3% (continued) | | | | | | | | |
Amsted Industries, Inc., 8.125%, 03/15/18 (a) | | $ | 30,000 | | | $ | 31,688 | |
Anixter, Inc., 5.625%, 05/01/19 | | | 35,000 | | | | 36,969 | |
Antero Resources Finance Corp., 5.375%, 11/01/21 (a) | | | 40,000 | | | | 40,425 | |
Arch Coal, Inc., | | | | | | | | |
7.000%, 06/15/191 | | | 35,000 | | | | 28,000 | |
7.250%, 06/15/21 | | | 95,000 | | | | 73,150 | |
8.000%, 01/15/19 (a)1 | | | 20,000 | | | | 20,000 | |
Ardagh Packaging Finance PLC, 9.125%, 10/15/20 (a) | | | 200,000 | | | | 220,000 | |
Armored Autogroup, Inc., 9.250%, 11/01/18 | | | 55,000 | | | | 53,212 | |
Ashland, Inc., 4.750%, 08/15/22 (b) | | | 120,000 | | | | 114,600 | |
Ashtead Capital, Inc., 6.500%, 07/15/22 (a) | | | 35,000 | | | | 37,494 | |
Aspect Software, Inc., 10.625%, 05/15/17 | | | 55,000 | | | | 55,688 | |
Associated Materials LLC / AMH New Finance, Inc., 9.125%, 11/01/17 | | | 40,000 | | | | 42,900 | |
Atkore International, Inc., 9.875%, 01/01/18 | | | 80,000 | | | | 86,400 | |
Audatex North America, Inc., 6.000%, 06/15/21 (a) | | | 70,000 | | | | 73,675 | |
Avaya, Inc., 7.000%, 04/01/19 (a) | | | 105,000 | | | | 103,425 | |
Avis Budget Car Rental LLC / Avis Budget Finance, Inc., | | | | | | | | |
4.875%, 11/15/17 | | | 5,000 | | | | 5,275 | |
5.500%, 04/01/23 | | | 50,000 | | | | 48,688 | |
8.250%, 01/15/19 | | | 155,000 | | | | 169,725 | |
B&G Foods, Inc., 4.625%, 06/01/21 | | | 25,000 | | | | 24,062 | |
BC Mountain LLC / BC Mountain Finance, Inc., 7.000%, 02/01/21 (a) | | | 15,000 | | | | 15,225 | |
Belden, Inc., 5.500%, 09/01/22 (a) | | | 85,000 | | | | 83,725 | |
Berry Petroleum Co., 6.375%, 09/15/22 | | | 40,000 | | | | 40,900 | |
Biomet, Inc., 6.500%, 08/01/20 | | | 165,000 | | | | 174,075 | |
Blackboard, Inc., 7.750%, 11/15/19 (a) | | | 50,000 | | | | 49,875 | |
BMC Software Finance, Inc., 8.125%, 07/15/21 (a) | | | 35,000 | | | | 36,225 | |
BOE Intermediate Holding Corp., (9.000% Cash or 9.750% PIK), 9.000%, 11/01/17 (a)6 | | | 26,137 | | | | 27,379 | |
BOE Merger Corp., (9.500% Cash or 10.250% PIK), 9.500%, 11/01/17 (a)6 | | | 35,000 | | | | 37,362 | |
Bombardier, Inc., | | | | | | | | |
6.125%, 01/15/23 (a) | | | 70,000 | | | | 69,825 | |
7.750%, 03/15/20 (a) | | | 40,000 | | | | 45,600 | |
BreitBurn Energy Partners, L.P. / BreitBurn Finance Corp., | | | | | | | | |
7.875%, 04/15/22 | | | 95,000 | | | | 99,275 | |
8.625%, 10/15/20 | | | 70,000 | | | | 75,600 | |
Building Materials Corp. of America, | | | | | | | | |
6.750%, 05/01/21 (a) | | | 65,000 | | | | 70,525 | |
6.875%, 08/15/18 (a) | | | 30,000 | | | | 32,025 | |
Bumble Bee Holding, Inc., 9.000%, 12/15/17 (a) | | | 116,000 | | | | 127,600 | |
BWAY Holding Co., 10.000%, 06/15/18 | | | 75,000 | | | | 81,562 | |
The accompanying notes are an integral part of these financial statements.
20
Managers High Yield Fund
Schedule of Portfolio Investments (continued)
| | | | | | | | |
| | | Principal Amount | | | Value | |
Industrials - 86.3% (continued) | | | | | | | | |
Caesars Entertainment Operating Co., Inc., | | | | | | | | |
8.500%, 02/15/20 | | $ | 95,000 | | | $ | 91,734 | |
9.000%, 02/15/20 | | | 265,000 | | | | 259,038 | |
10.000%, 12/15/18 | | | 57,000 | | | | 27,645 | |
11.250%, 06/01/17 | | | 115,000 | | | | 117,300 | |
Caesars Entertainment Resort Properties LLC / Caesars Entertainment Resort Properties, 8.000%, 10/01/20 (a)1 | | | 75,000 | | | | 78,375 | |
Case New Holland, Inc., 7.875%, 12/01/17 | | | 35,000 | | | | 41,475 | |
CCO Holdings LLC / CCO Holdings Capital Corp., | | | | | | | | |
5.250%, 03/15/21 (a) | | | 35,000 | | | | 33,600 | |
5.250%, 09/30/22 | | | 95,000 | | | | 89,181 | |
7.000%, 01/15/19 | | | 145,000 | | | | 153,156 | |
7.375%, 06/01/20 | | | 20,000 | | | | 21,750 | |
CDW LLC / CDW Finance Corp., | | | | | | | | |
8.000%, 12/15/18 (b) | | | 13,000 | | | | 14,235 | |
8.500%, 04/01/19 | | | 170,000 | | | | 188,700 | |
Central Garden and Pet Co., 8.250%, 03/01/18 | | | 165,000 | | | | 161,288 | |
CenturyLink, Inc., | | | | | | | | |
Series T, 5.800%, 03/15/22 | | | 210,000 | | | | 208,425 | |
Series V, 5.625%, 04/01/20 | | | 45,000 | | | | 46,012 | |
Series W, 6.750%, 12/01/23 | | | 45,000 | | | | 45,788 | |
CEVA Group PLC, 8.375%, 12/01/17 (a) | | | 150,000 | | | | 157,500 | |
Chesapeake Energy Corp., | | | | | | | | |
6.125%, 02/15/21 | | | 25,000 | | | | 26,938 | |
6.625%, 08/15/20 | | | 75,000 | | | | 84,188 | |
6.875%, 11/15/20 | | | 15,000 | | | | 17,025 | |
Chiquita Brands International, Inc. / Chiquita Brands LLC, 7.875%, 02/01/21 (a) | | | 70,000 | | | | 75,950 | |
Chrysler Group LLC / CG Co.-Issuer, Inc., 8.250%, 06/15/21 | | | 200,000 | | | | 228,500 | |
Cinemark USA, Inc., | | | | | | | | |
4.875%, 06/01/23 | | | 25,000 | | | | 23,625 | |
7.375%, 06/15/21 | | | 55,000 | | | | 61,050 | |
Claire’s Stores, Inc., | | | | | | | | |
8.875%, 03/15/19 | | | 70,000 | | | | 72,450 | |
9.000%, 03/15/19 (a) | | | 145,000 | | | | 158,050 | |
Clean Harbors, Inc., 5.250%, 08/01/20 | | | 75,000 | | | | 77,625 | |
Clear Channel Communications, Inc., 9.000%, 03/01/21 | | | 115,000 | | | | 116,725 | |
Clear Channel Worldwide Holdings, Inc., | | | | | | | | |
6.500%, 11/15/22 | | | 85,000 | | | | 86,594 | |
Series A, 7.625%, 03/15/20 | | | 5,000 | | | | 5,225 | |
Series B, 6.500%, 11/15/22 | | | 240,000 | | | | 246,300 | |
Series B, 7.625%, 03/15/20 | | | 105,000 | | | | 110,906 | |
CNH Capital LLC, 6.250%, 11/01/16 | | | 50,000 | | | | 55,438 | |
Cogent Communications Group, Inc., 8.375%, 02/15/18 (a) | | | 55,000 | | | | 59,950 | |
CommScope, Inc., 8.250%, 01/15/19 (a) | | | 73,000 | | | | 80,391 | |
The accompanying notes are an integral part of these financial statements.
21
Managers High Yield Fund
Schedule of Portfolio Investments (continued)
| | | | | | | | |
| | | Principal Amount | | | Value | |
Industrials - 86.3% (continued) | | | | | | | | |
Constellation Brands, Inc., 3.750%, 05/01/21 | | $ | 20,000 | | | $ | 18,850 | |
Crestwood Midstream Partners, L.P. / Crestwood Midstream Finance Corp., 6.125%, 03/01/22 (a) | | | 40,000 | | | | 41,200 | |
Crosstex Energy, L.P. / Crosstex Energy Finance Corp., 8.875%, 02/15/18 | | | 145,000 | | | | 152,612 | |
Crown Castle International Corp., 5.250%, 01/15/23 | | | 75,000 | | | | 73,875 | |
CSC Holdings LLC, 8.625%, 02/15/19 | | | 125,000 | | | | 147,188 | |
Dana Holding Corp., | | | | | | | | |
5.375%, 09/15/21 | | | 45,000 | | | | 45,394 | |
6.000%, 09/15/23 | | | 15,000 | | | | 15,112 | |
6.500%, 02/15/19 | | | 85,000 | | | | 90,738 | |
DaVita HealthCare Partners, Inc., 6.625%, 11/01/20 | | | 85,000 | | | | 91,588 | |
Del Monte Corp., 7.625%, 02/15/19 | | | 170,000 | | | | 177,012 | |
Denali Borrower LLC / Denali Finance Corp., 5.625%, 10/15/20 (a) | | | 100,000 | | | | 99,375 | |
Denbury Resources, Inc., | | | | | | | | |
4.625%, 07/15/23 | | | 45,000 | | | | 40,838 | |
8.250%, 02/15/20 | | | 40,000 | | | | 44,250 | |
DISH DBS Corp., | | | | | | | | |
5.125%, 05/01/20 | | | 40,000 | | | | 40,200 | |
5.875%, 07/15/22 | | | 135,000 | | | | 135,675 | |
6.750%, 06/01/21 | | | 125,000 | | | | 133,125 | |
7.875%, 09/01/19 | | | 240,000 | | | | 275,400 | |
DJO Finance LLC / DJO Finance Corp., | | | | | | | | |
7.750%, 04/15/18 | | | 135,000 | | | | 138,038 | |
8.750%, 03/15/18 | | | 45,000 | | | | 49,612 | |
9.875%, 04/15/18 | | | 20,000 | | | | 21,600 | |
Eagle Midco, Inc., 9.000%, 06/15/18 (a) | | | 30,000 | | | | 31,425 | |
Easton-Bell Sports, Inc., 9.750%, 12/01/161 | | | 145,000 | | | | 152,070 | |
El Paso LLC, 7.250%, 06/01/18 | | | 75,000 | | | | 85,998 | |
EP Energy LLC / EP Energy Finance, Inc., 9.375%, 05/01/20 | | | 125,000 | | | | 144,844 | |
EP Energy LLC / Everest Acquisition Finance, Inc., | | | | | | | | |
6.875%, 05/01/19 | | | 55,000 | | | | 59,469 | |
7.750%, 09/01/22 | | | 60,000 | | | | 67,500 | |
Epicor Software Corp., 8.625%, 05/01/19 | | | 100,000 | | | | 109,000 | |
EV Energy Partners, L.P. / EV Energy Finance Corp., 8.000%, 04/15/19 | | | 125,000 | | | | 126,250 | |
FGI Operating Co. LLC / FGI Finance, Inc., 7.875%, 05/01/20 | | | 75,000 | | | | 80,625 | |
First Data Corp., | | | | | | | | |
6.750%, 11/01/20 (a) | | | 55,000 | | | | 57,475 | |
7.375%, 06/15/19 (a) | | | 35,000 | | | | 37,450 | |
8.250%, 01/15/21 (a) | | | 30,000 | | | | 32,063 | |
8.875%, 08/15/20 (a) | | | 165,000 | | | | 183,356 | |
12.625%, 01/15/21 | | | 160,000 | | | | 188,600 | |
First Data Corp., (8.750% Cash or 10.000% PIK), 8.750%, 01/15/22 (a)6 | | | 290,000 | | | | 311,025 | |
The accompanying notes are an integral part of these financial statements.
22
Managers High Yield Fund
Schedule of Portfolio Investments (continued)
| | | | | | | | |
| | | Principal Amount | | | Value | |
Industrials - 86.3% (continued) | | | | | | | | |
FMG Resources August 2006 Pty, Ltd., | | | | | | | | |
6.875%, 02/01/18 (a)1 | | $ | 60,000 | | | $ | 63,300 | |
8.250%, 11/01/19 (a)1 | | | 115,000 | | | | 129,519 | |
Fresenius Medical Care US Finance II, Inc., 5.625%, 07/31/19 (a) | | | 50,000 | | | | 54,250 | |
Gardner Denver, Inc., 6.875%, 08/15/21 (a)1 | | | 30,000 | | | | 30,075 | |
GCI, Inc., | | | | | | | | |
6.750%, 06/01/21 | | | 55,000 | | | | 52,938 | |
8.625%, 11/15/19 | | | 70,000 | | | | 74,725 | |
GenCorp, Inc., 7.125%, 03/15/21 | | | 125,000 | | | | 134,375 | |
General Cable Corp., 6.500%, 10/01/22 (a) (b) | | | 90,000 | | | | 88,650 | |
General Motors Co., 4.875%, 10/02/23 (a) | | | 215,000 | | | | 218,762 | |
The Geo Group, Inc., | | | | | | | | |
5.875%, 01/15/22 (a) | | | 60,000 | | | | 59,775 | |
6.625%, 02/15/21 | | | 100,000 | | | | 106,250 | |
The Goodyear Tire & Rubber Co., | | | | | | | | |
6.500%, 03/01/21 | | | 40,000 | | | | 42,600 | |
8.250%, 08/15/20 | | | 80,000 | | | | 89,800 | |
8.750%, 08/15/20 | | | 10,000 | | | | 11,750 | |
Great Lakes Dredge & Dock Corp., 7.375%, 02/01/19 | | | 105,000 | | | | 110,250 | |
Griffon Corp., 7.125%, 04/01/18 | | | 70,000 | | | | 74,550 | |
Gymboree Corp., 9.125%, 12/01/181 | | | 80,000 | | | | 74,100 | |
H&E Equipment Services, Inc., 7.000%, 09/01/22 | | | 45,000 | | | | 49,275 | |
Halcon Resources Corp., | | | | | | | | |
8.875%, 05/15/21 | | | 120,000 | | | | 121,800 | |
9.250%, 02/15/22 (a) | | | 25,000 | | | | 25,562 | |
9.750%, 07/15/20 (a) | | | 15,000 | | | | 15,694 | |
Hanesbrands, Inc., 6.375%, 12/15/20 | | | 90,000 | | | | 98,775 | |
Hawk Acquisition Sub, Inc., 4.250%, 10/15/20 (a) | | | 150,000 | | | | 145,500 | |
HCA Holdings, Inc., | | | | | | | | |
6.250%, 02/15/21 | | | 45,000 | | | | 47,194 | |
7.750%, 05/15/21 | | | 235,000 | | | | 257,325 | |
HCA, Inc., | | | | | | | | |
6.500%, 02/15/20 | | | 25,000 | | | | 27,531 | |
7.500%, 02/15/22 | | | 475,000 | | | | 522,500 | |
HD Supply, Inc., | | | | | | | | |
8.125%, 04/15/19 | | | 120,000 | | | | 134,250 | |
11.000%, 04/15/20 | | | 45,000 | | | | 53,550 | |
11.500%, 07/15/20 | | | 70,000 | | | | 83,738 | |
Healthcare Technology Intermediate, Inc., (7.375% Cash or 8.125% PIK), 7.375%, 09/01/18 (a)6 | | | 20,000 | | | | 20,900 | |
HealthSouth Corp., | | | | | | | | |
5.750%, 11/01/24 | | | 25,000 | | | | 24,812 | |
7.750%, 09/15/22 | | | 44,000 | | | | 48,400 | |
8.125%, 02/15/20 | | | 50,000 | | | | 55,062 | |
The accompanying notes are an integral part of these financial statements.
23
Managers High Yield Fund
Schedule of Portfolio Investments (continued)
| | | | | | | | |
| | | Principal Amount | | | Value | |
Industrials - 86.3% (continued) | | | | | | | | |
The Hertz Corp., | | | | | | | | |
5.875%, 10/15/20 | | $ | 40,000 | | | $ | 41,650 | |
7.500%, 10/15/18 | | | 135,000 | | | | 146,138 | |
Hexion US Finance Corp., 6.625%, 04/15/20 | | | 110,000 | | | | 113,300 | |
Hexion US Finance Corp. / Hexion Nova Scotia Finance ULC, | | | | | | | | |
8.875%, 02/01/18 | | | 90,000 | | | | 93,938 | |
9.000%, 11/15/201 | | | 50,000 | | | | 50,125 | |
Hiland Partners, L.P. / Hiland Partners Finance Corp., 7.250%, 10/01/20 (a) | | | 55,000 | | | | 59,262 | |
The Hillman Group, Inc., 10.875%, 06/01/18 | | | 90,000 | | | | 97,650 | |
Hilton Worldwide Finance LLC / Hilton Worldwide Finance Corp., 5.625%, 10/15/21 (a) | | | 50,000 | | | | 51,969 | |
Hologic, Inc., 6.250%, 08/01/20 | | | 100,000 | | | | 106,000 | |
Hughes Satellite Systems Corp., 6.500%, 06/15/19 | | | 60,000 | | | | 65,250 | |
Huntsman International LLC, | | | | | | | | |
4.875%, 11/15/20 | | | 70,000 | | | | 69,300 | |
8.625%, 03/15/20 | | | 45,000 | | | | 50,006 | |
8.625%, 03/15/21 | | | 25,000 | | | | 28,375 | |
IMS Health, Inc., 6.000%, 11/01/20 (a) | | | 75,000 | | | | 79,875 | |
Ineos Finance PLC, 8.375%, 02/15/19 (a) | | | 200,000 | | | | 223,250 | |
Infor US, Inc., | | | | | | | | |
9.375%, 04/01/19 | | | 85,000 | | | | 96,050 | |
11.500%, 07/15/18 | | | 65,000 | | | | 75,237 | |
Intelsat Jackson Holdings SA, | | | | | | | | |
6.625%, 12/15/22 | | | 80,000 | | | | 82,800 | |
7.250%, 10/15/20 | | | 275,000 | | | | 302,156 | |
7.500%, 04/01/21 | | | 35,000 | | | | 38,763 | |
Intelsat Luxembourg SA, 7.750%, 06/01/21 (a) | | | 115,000 | | | | 123,769 | |
Interactive Data Corp., 10.250%, 08/01/18 | | | 95,000 | | | | 105,060 | |
Interline Brands, Inc., 7.500%, 11/15/18 (b) | | | 65,000 | | | | 69,062 | |
Interline Brands, Inc., (10.000% Cash or 10.750% PIK), 10.000%, 11/15/186 | | | 25,000 | | | | 27,438 | |
inVentiv Health, Inc., | | | | | | | | |
9.000%, 01/15/18 (a) | | | 75,000 | | | | 78,750 | |
11.000%, 08/15/18 (a) (b) | | | 80,000 | | | | 71,062 | |
Iron Mountain, Inc., 6.000%, 08/15/23 | | | 70,000 | | | | 72,100 | |
Isle of Capri Casinos, Inc., 5.875%, 03/15/21 | | | 95,000 | | | | 93,812 | |
J. Crew Group, Inc., 8.125%, 03/01/19 | | | 40,000 | | | | 42,200 | |
J.C. Penney Corp., Inc., | | | | | | | | |
5.750%, 02/15/18 | | | 35,000 | | | | 29,050 | |
6.375%, 10/15/36 | | | 60,000 | | | | 45,150 | |
7.950%, 04/01/17 | | | 15,000 | | | | 13,162 | |
Jack Cooper Finance Co., 9.250%, 06/01/20 (a) | | | 20,000 | | | | 21,625 | |
Jack Cooper Holdings Corp., 9.250%, 06/01/20 (a) | | | 50,000 | | | | 54,062 | |
James River Coal Co., 7.875%, 04/01/19 | | | 35,000 | | | | 9,625 | |
Jarden Corp., 7.500%, 01/15/20 | | | 100,000 | | | | 108,500 | |
Kinetic Concepts, Inc. / KCI USA, Inc., 10.500%, 11/01/18 (b) | | | 150,000 | | | | 173,250 | |
The accompanying notes are an integral part of these financial statements.
24
Managers High Yield Fund
Schedule of Portfolio Investments (continued)
| | | | | | | | |
| | | Principal Amount | | | Value | |
Industrials - 86.3% (continued) | | | | | | | | |
Kodiak Oil & Gas Corp., | | | | | | | | |
5.500%, 01/15/21 | | $ | 10,000 | | | $ | 10,025 | |
5.500%, 02/01/22 | | | 10,000 | | | | 10,000 | |
8.125%, 12/01/19 | | | 90,000 | | | | 100,350 | |
L Brands, Inc., 6.625%, 04/01/21 | | | 90,000 | | | | 99,225 | |
Legacy Reserves, L.P. / Legacy Reserves Finance Corp., 8.000%, 12/01/20 (a) | | | 70,000 | | | | 73,150 | |
Level 3 Financing, Inc., | | | | | | | | |
8.125%, 07/01/19 | | | 80,000 | | | | 88,200 | |
8.625%, 07/15/20 | | | 65,000 | | | | 73,125 | |
Libbey Glass, Inc., 6.875%, 05/15/20 | | | 52,000 | | | | 56,420 | |
Linn Energy LLC/Linn Energy Finance Corp., | | | | | | | | |
7.000%, 11/01/19 (a) (b) | | | 50,000 | | | | 50,750 | |
7.750%, 02/01/21 | | | 155,000 | | | | 164,688 | |
LSB Industries, Inc., 7.750%, 08/01/19 (a) | | | 85,000 | | | | 89,675 | |
Magnachip Semiconductor Corp., 6.625%, 07/15/21 | | | 70,000 | | | | 71,575 | |
The Manitowoc Co., Inc., 8.500%, 11/01/20 | | | 100,000 | | | | 114,000 | |
ManTech International Corp., 7.250%, 04/15/18 | | | 50,000 | | | | 52,750 | |
Marina District Finance Co., Inc., 9.875%, 08/15/18 | | | 125,000 | | | | 135,781 | |
MarkWest Energy Partners, L.P. / MarkWest Energy Finance Corp., 5.500%, 02/15/23 | | | 70,000 | | | | 70,875 | |
McGraw-Hill Global Education Holdings LLC / McGraw-Hill Global Education Finance, 9.750%, 04/01/21 (a) | | | 35,000 | | | | 38,850 | |
MEG Energy Corp., | | | | | | | | |
6.375%, 01/30/23 (a) | | | 45,000 | | | | 45,506 | |
7.000%, 03/31/24 (a) | | | 60,000 | | | | 60,900 | |
Memorial Production Partners, L.P. / Memorial Production Finance Corp., | | | | | | | | |
7.625%, 05/01/21 (a) | | | 15,000 | | | | 15,488 | |
7.625%, 05/01/21 | | | 40,000 | | | | 41,300 | |
MetroPCS Wireless, Inc., | | | | | | | | |
6.250%, 04/01/21 (a) | | | 45,000 | | | | 46,856 | |
7.875%, 09/01/18 | | | 5,000 | | | | 5,381 | |
MGM Resorts International, | | | | | | | | |
5.250%, 03/31/20 | | | 90,000 | | | | 89,550 | |
6.750%, 10/01/20 | | | 145,000 | | | | 155,512 | |
7.750%, 03/15/22 | | | 85,000 | | | | 95,412 | |
8.625%, 02/01/19 | | | 170,000 | | | | 200,175 | |
Michaels FinCo Holdings LLC / Michaels FinCo, Inc., (7.500% Cash or 8.250% PIK), 7.500%, 08/01/18 (a)6 | | | 40,000 | | | | 41,800 | |
Michaels Stores, Inc., 7.750%, 11/01/18 | | | 135,000 | | | | 147,150 | |
Midstates Petroleum Co., Inc. / Midstates Petroleum Co. LLC, | | | | | | | | |
9.250%, 06/01/21 | | | 40,000 | | | | 42,000 | |
10.750%, 10/01/20 | | | 50,000 | | | | 54,625 | |
Mueller Water Products, Inc., 8.750%, 09/01/20 | | | 30,000 | | | | 33,750 | |
Neiman Marcus Group, Ltd., Inc., 8.000%, 10/15/21 (a) | | | 30,000 | | | | 31,500 | |
Neiman Marcus Group, Ltd., Inc. (8.750% Cash or 9.500% PIK), 8.750%, 10/15/21 (a)6 | | | 20,000 | | | | 21,050 | |
Nexeo Solutions LLC / Nexeo Solutions Finance Corp., 8.375%, 03/01/18 | | | 75,000 | | | | 74,813 | |
Nexstar Broadcasting, Inc., 6.875%, 11/15/20 | | | 85,000 | | | | 91,375 | |
The accompanying notes are an integral part of these financial statements.
25
Managers High Yield Fund
Schedule of Portfolio Investments (continued)
| | | | | | | | |
| | | Principal Amount | | | Value | |
Industrials - 86.3% (continued) | | | | | | | | |
The Nielsen Co. Luxembourg SARL, 5.500%, 10/01/21 (a) | | $ | 30,000 | | | $ | 30,525 | |
Nielsen Finance LLC / Nielsen Finance Co., 4.500%, 10/01/20 | | | 20,000 | | | | 19,550 | |
NII International Telecom SCA, 7.875%, 08/15/19 (a) | | | 40,000 | | | | 30,400 | |
Noranda Aluminum Acquisition Corp., 11.000%, 06/01/19 (a) | | | 35,000 | | | | 29,925 | |
Novelis, Inc., | | | | | | | | |
8.375%, 12/15/17 | | | 65,000 | | | | 69,509 | |
8.750%, 12/15/20 | | | 25,000 | | | | 27,938 | |
NXP, B.V. / NXP Funding LLC, 5.750%, 02/15/21 (a) | | | 200,000 | | | | 210,000 | |
Oasis Petroleum, Inc., 6.875%, 03/15/22 (a) | | | 50,000 | | | | 53,250 | |
Oshkosh Corp., 8.500%, 03/01/20 | | | 35,000 | | | | 38,850 | |
Packaging Dynamics Corp., 8.750%, 02/01/16 (a) | | | 50,000 | | | | 51,531 | |
PAETEC Holding Corp., 9.875%, 12/01/18 | | | 95,000 | | | | 106,638 | |
Party City Holdings, Inc., 8.875%, 08/01/20 | | | 130,000 | | | | 146,250 | |
PC Nextco Holdings LLC / PC Nextco Finance, Inc., (8.750% Cash or 9.500% PIK), 8.750%, 08/15/19 (a)6 | | | 30,000 | | | | 30,938 | |
Peabody Energy Corp., | | | | | | | | |
6.000%, 11/15/18 | | | 35,000 | | | | 37,450 | |
6.250%, 11/15/211 | | | 70,000 | | | | 71,050 | |
Petco Animal Supplies, Inc., 9.250%, 12/01/18 (a) | | | 80,000 | | | | 86,200 | |
Plains Exploration & Production Co., | | | | | | | | |
6.500%, 11/15/20 | | | 145,000 | | | | 160,206 | |
6.875%, 02/15/23 | | | 75,000 | | | | 84,000 | |
PNK Finance Corp., 6.375%, 08/01/21 (a) | | | 20,000 | | | | 20,550 | |
Polymer Group, Inc., 7.750%, 02/01/19 | | | 105,000 | | | | 112,481 | |
PolyOne Corp., 7.375%, 09/15/20 | | | 70,000 | | | | 77,612 | |
Polypore International, Inc., 7.500%, 11/15/17 | | | 45,000 | | | | 47,672 | |
Post Holdings, Inc., | | | | | | | | |
6.750%, 12/01/21 (a) | | | 20,000 | | | | 20,750 | |
7.375%, 02/15/22 (a) | | | 10,000 | | | | 10,750 | |
7.375%, 02/15/22 | | | 125,000 | | | | 134,375 | |
QR Energy, L.P. / QRE Finance Corp., 9.250%, 08/01/20 | | | 60,000 | | | | 62,400 | |
Quebecor Media, Inc., 5.750%, 01/15/23 | | | 80,000 | | | | 77,800 | |
Quebecor World, Escrow, 0.000%, 08/01/277 | | | 165,000 | | | | 1,856 | |
Radiation Therapy Services, Inc., | | | | | | | | |
8.875%, 01/15/17 | | | 60,000 | | | | 60,900 | |
9.875%, 04/15/17 | | | 90,000 | | | | 79,650 | |
Radio Systems Corp., 8.375%, 11/01/19 (a) | | | 65,000 | | | | 71,500 | |
Rain CII Carbon LLC / CII Carbon Corp., 8.000%, 12/01/18 (a) | | | 30,000 | | | | 31,200 | |
Regency Energy Partners, L.P. / Regency Energy Finance Corp., 5.500%, 04/15/23 | | | 45,000 | | | | 44,100 | |
Reichhold Industries, Inc., (9.000% Cash or 11.000% PIK), 9.000%, 05/08/17 (a)6 | | | 143,172 | | | | 83,756 | |
Rentech Nitrogen Partners, L.P. / Rentech Nitrogen Finance Corp., 6.500%, 04/15/21 (a) | | | 40,000 | | | | 38,800 | |
Reynolds Group Issuer, Inc. / Reynolds Group Issuer LLC / Reynolds Group Issuer Lu, | | | | | | | | |
5.750%, 10/15/20 | | | 145,000 | | | | 148,625 | |
9.000%, 04/15/19 | | | 355,000 | | | | 382,513 | |
9.875%, 08/15/19 | | | 100,000 | | | | 111,750 | |
The accompanying notes are an integral part of these financial statements.
26
Managers High Yield Fund
Schedule of Portfolio Investments (continued)
| | | | | | | | |
| | | Principal Amount | | | Value | |
Industrials - 86.3% (continued) | | | | | | | | |
RHP Hotel Properties, L.P. / RHP Finance Corp., 5.000%, 04/15/21 | | $ | 25,000 | | | $ | 24,812 | |
Rite Aid Corp., 9.250%, 03/15/20 | | | 35,000 | | | | 40,338 | |
RKI Exploration & Production LLC / RKI Finance Corp., 8.500%, 08/01/21 (a) | | | 55,000 | | | | 58,162 | |
Rockwood Specialties Group, Inc., 4.625%, 10/15/20 | | | 40,000 | | | | 41,050 | |
RR Donnelley & Sons Co., 7.000%, 02/15/22 | | | 15,000 | | | | 16,200 | |
RSI Home Products, Inc., 6.875%, 03/01/18 (a) | | | 30,000 | | | | 31,575 | |
Sabine Pass Liquefaction LLC, 5.625%, 02/01/21 (a) | | | 100,000 | | | | 98,250 | |
Sabre, Inc., 8.500%, 05/15/19 (a) | | | 180,000 | | | | 200,475 | |
Sally Holdings LLC / Sally Capital, Inc., | | | | | | | | |
5.500%, 11/01/23 | | | 20,000 | | | | 19,900 | |
5.750%, 06/01/22 | | | 35,000 | | | | 36,575 | |
6.875%, 11/15/19 | | | 75,000 | | | | 83,250 | |
Samson Investment Co., 10.500%, 02/15/20 (a) (b) | | | 40,000 | | | | 43,800 | |
SandRidge Energy, Inc., | | | | | | | | |
7.500%, 03/15/21 | | | 30,000 | | | | 31,575 | |
8.125%, 10/15/22 | | | 45,000 | | | | 47,925 | |
SBA Telecommunications, Inc., | | | | | | | | |
5.750%, 07/15/20 | | | 45,000 | | | | 47,025 | |
8.250%, 08/15/19 | | | 44,000 | | | | 47,410 | |
Schaeffler Finance, B.V., 8.500%, 02/15/19 (a) | | | 200,000 | | | | 226,000 | |
The Scotts Miracle-Gro Co., 6.625%, 12/15/20 | | | 60,000 | | | | 64,950 | |
Sealed Air Corp., | | | | | | | | |
6.500%, 12/01/20 (a) | | | 30,000 | | | | 32,400 | |
8.375%, 09/15/21 (a) | | | 85,000 | | | | 96,900 | |
Sensata Technologies, B.V., 6.500%, 05/15/19 (a) | | | 135,000 | | | | 145,462 | |
Service Corp. International, | | | | | | | | |
5.375%, 01/15/22 (a) | | | 10,000 | | | | 10,175 | |
7.000%, 06/15/17 | | | 60,000 | | | | 67,500 | |
7.000%, 05/15/19 | | | 50,000 | | | | 53,750 | |
7.500%, 04/01/27 | | | 60,000 | | | | 63,600 | |
ServiceMaster Co., 7.000%, 08/15/20 | | | 60,000 | | | | 59,775 | |
Sinclair Television Group, Inc., | | | | | | | | |
5.375%, 04/01/21 | | | 90,000 | | | | 89,100 | |
6.125%, 10/01/22 | | | 35,000 | | | | 35,525 | |
Sirius XM Holdings, Inc., | | | | | | | | |
4.250%, 05/15/20 (a) | | | 100,000 | | | | 94,750 | |
4.625%, 05/15/23 (a) | | | 10,000 | | | | 9,075 | |
5.750%, 08/01/21 (a)1 | | | 60,000 | | | | 60,900 | |
Spectrum Brands Escrow Corp., | | | | | | | | |
6.375%, 11/15/20 (a) | | | 25,000 | | | | 26,750 | |
6.625%, 11/15/22 (a) | | | 25,000 | | | | 26,656 | |
Spectrum Brands, Inc., 6.750%, 03/15/20 | | | 35,000 | | | | 37,844 | |
Sprint Capital Corp., 8.750%, 03/15/32 | | | 495,000 | | | | 533,362 | |
The accompanying notes are an integral part of these financial statements.
27
Managers High Yield Fund
Schedule of Portfolio Investments (continued)
| | | | | | | | |
| | | Principal Amount | | | Value | |
Industrials - 86.3% (continued) | | | | | | | | |
Sprint Communications, Inc., | | | | | | | | |
7.000%, 03/01/20 (a) | | $ | 30,000 | | | $ | 33,600 | |
9.000%, 11/15/18 (a) | | | 180,000 | | | | 217,350 | |
Sprint Corp., | | | | | | | | |
7.125%, 06/15/24 (a) | | | 35,000 | | | | 35,613 | |
7.250%, 09/15/21 (a) | | | 40,000 | | | | 43,100 | |
7.875%, 09/15/23 (a) | | | 80,000 | | | | 86,200 | |
SSI Investments II, Ltd. / SSI Co-Issuer LLC, 11.125%, 06/01/18 | | | 100,000 | | | | 109,000 | |
SunEdison, Inc., 7.750%, 04/01/19 | | | 85,000 | | | | 91,375 | |
SunGard Data Systems, Inc., | | | | | | | | |
6.625%, 11/01/19 | | | 80,000 | | | | 84,400 | |
7.375%, 11/15/18 | | | 75,000 | | | | 79,594 | |
7.625%, 11/15/20 | | | 20,000 | | | | 21,900 | |
Tekni-Plex, Inc., 9.750%, 06/01/19 (a) | | | 27,000 | | | | 30,780 | |
Tempur Sealy International, Inc., 6.875%, 12/15/20 | | | 45,000 | | | | 49,275 | |
Tenet Healthcare Corp., | | | | | | | | |
4.750%, 06/01/20 | | | 100,000 | | | | 98,250 | |
6.000%, 10/01/20 (a) | | | 90,000 | | | | 94,106 | |
8.000%, 08/01/20 | | | 205,000 | | | | 223,194 | |
8.125%, 04/01/22 | | | 80,000 | | | | 86,400 | |
Terex Corp., | | | | | | | | |
6.000%, 05/15/21 | | | 100,000 | | | | 103,875 | |
6.500%, 04/01/20 | | | 60,000 | | | | 64,500 | |
Tervita Corp., 8.000%, 11/15/18 (a) | | | 65,000 | | | | 67,438 | |
Tesoro Logistics, L.P. / Tesoro Logistics Finance Corp., | | | | | | | | |
5.875%, 10/01/20 (a) | | | 30,000 | | | | 30,825 | |
5.875%, 10/01/20 | | | 55,000 | | | | 56,512 | |
6.125%, 10/15/21 | | | 30,000 | | | | 31,050 | |
T-Mobile USA, Inc., | | | | | | | | |
6.633%, 04/28/21 | | | 45,000 | | | | 47,531 | |
6.731%, 04/28/22 | | | 115,000 | | | | 120,319 | |
Trinidad Drilling, Ltd., 7.875%, 01/15/19 (a) | | | 70,000 | | | | 74,725 | |
Trinseo Materials Operating SCA / Trinseo Materials Finance, Inc., 8.750%, 02/01/19 (a) | | | 80,000 | | | | 83,000 | |
Triumph Group, Inc., 4.875%, 04/01/21 | | | 50,000 | | | | 48,750 | |
tw telecom holdings, Inc., 5.375%, 10/01/22 (a) | | | 40,000 | | | | 39,400 | |
UCI International, Inc., 8.625%, 02/15/19 | | | 110,000 | | | | 110,550 | |
United Rentals North America, Inc., | | | | | | | | |
7.375%, 05/15/20 | | | 50,000 | | | | 55,687 | |
7.625%, 04/15/22 | | | 25,000 | | | | 27,906 | |
8.250%, 02/01/21 | | | 135,000 | | | | 152,887 | |
8.375%, 09/15/201 | | | 15,000 | | | | 16,800 | |
9.250%, 12/15/19 | | | 85,000 | | | | 95,200 | |
United Surgical Partners International, Inc., 9.000%, 04/01/20 | | | 90,000 | | | | 101,250 | |
UPCB Finance III, Ltd., 6.625%, 07/01/20 (a) | | | 150,000 | | | | 160,125 | |
The accompanying notes are an integral part of these financial statements.
28
Managers High Yield Fund
Schedule of Portfolio Investments (continued)
| | | | | | | | |
| | | Principal Amount | | | Value | |
Industrials - 86.3% (continued) | | | | | | | | |
UPCB Finance VI, Ltd., 6.875%, 01/15/22 (a) | | $ | 150,000 | | | $ | 160,125 | |
Vail Resorts, Inc., 6.500%, 05/01/19 | | | 130,000 | | | | 138,450 | |
Valeant Pharmaceuticals International, | | | | | | | | |
6.750%, 08/15/21 (a) | | | 100,000 | | | | 106,500 | |
7.000%, 10/01/20 (a) | | | 55,000 | | | | 59,537 | |
7.250%, 07/15/22 (a) | | | 170,000 | | | | 183,812 | |
7.500%, 07/15/21 (a) | | | 130,000 | | | | 143,325 | |
Videotron, Ltd., 5.000%, 07/15/22 | | | 20,000 | | | | 19,650 | |
Virgin Media Secured Finance PLC, 5.375%, 04/15/21 (a) | | | 200,000 | | | | 201,000 | |
Visteon Corp., 6.750%, 04/15/19 | | | 82,000 | | | | 87,535 | |
Vulcan Materials Co., | | | | | | | | |
7.000%, 06/15/18 | | | 10,000 | | | | 11,425 | |
7.500%, 06/15/21 | | | 65,000 | | | | 74,425 | |
Watco Cos LLC / Watco Finance Corp., 6.375%, 04/01/23 (a) | | | 40,000 | | | | 39,800 | |
WESCO Distribution, Inc., 5.375%, 12/15/21 (a) | | | 15,000 | | | | 15,037 | |
Whiting Petroleum Corp., 5.750%, 03/15/21 | | | 150,000 | | | | 155,625 | |
The William Carter Co., 5.250%, 08/15/21 (a) | | | 15,000 | | | | 15,300 | |
Wind Acquisition Finance SA, 7.250%, 02/15/18 (a) | | | 200,000 | | | | 211,500 | |
Windstream Corp., | | | | | | | | |
6.375%, 08/01/23 | | | 55,000 | | | | 51,700 | |
7.500%, 04/01/23 | | | 100,000 | | | | 101,000 | |
7.750%, 10/15/20 | | | 15,000 | | | | 15,994 | |
7.750%, 10/01/21 | | | 95,000 | | | | 101,175 | |
WMG Acquisition Corp., | | | | | | | | |
6.000%, 01/15/21 (a) | | | 31,000 | | | | 32,356 | |
11.500%, 10/01/18 | | | 35,000 | | | | 40,425 | |
Zayo Group LLC / Zayo Capital, Inc., 8.125%, 01/01/20 | | | 60,000 | | | | 66,000 | |
Total Industrials | | | | | | | 29,793,926 | |
| | |
Utilities - 0.7% | | | | | | | | |
The AES Corp., | | | | | | | | |
7.375%, 07/01/21 | | | 5,000 | | | | 5,662 | |
8.000%, 06/01/20 | | | 40,000 | | | | 47,000 | |
Calpine Corp., 7.500%, 02/15/21 (a) | | | 67,000 | | | | 73,449 | |
NRG Energy, Inc., | | | | | | | | |
7.625%, 01/15/18 | | | 40,000 | | | | 45,800 | |
7.875%, 05/15/21 | | | 20,000 | | | | 22,250 | |
8.250%, 09/01/20 | | | 30,000 | | | | 33,375 | |
Total Utilities | | | | | | | 227,536 | |
| | |
Total Corporate Bonds and Notes (cost $31,040,792) | | | | | | | 32,353,280 | |
The accompanying notes are an integral part of these financial statements.
29
Managers High Yield Fund
Schedule of Portfolio Investments (continued)
| | | | | | | | |
| | | Principal Amount | | | Value | |
Short-Term Investments - 5.1% | | | | | | | | |
| | |
Repurchase Agreements - 1.6%2 | | | | | | | | |
Morgan Stanley & Co., LLC, dated 12/31/13, due 01/02/14, 0.030%, total to be received $558,955 (collarteralized by various U.S. Government Agency Obligations, 1.372% - 8.500%, 05/01/17 - 12/01/44, totaling $570,133) | | $ | 558,954 | | | $ | 558,954 | |
| | |
| | | Shares | | | | |
Other Investment Companies - 3.5%3 | | | | | | | | |
Dreyfus Institutional Cash Advantage Fund, Institutional Class Shares, 0.06% | | | 1,198,514 | | | | 1,198,514 | |
Total Short-Term Investments
(cost $1,757,468) | | | | | | | 1,757,468 | |
| | |
Total Investments - 100.0% (cost $33,168,586) | | | | | | | 34,504,924 | |
| | |
Other Assets, less Liabilities - 0.0% | | | | | | | 11,694 | |
| | |
Net Assets - 100.0% | | | | | | $ | 34,516,618 | |
The accompanying notes are an integral part of these financial statements.
30
Managers AMG GW&K Fixed Income Fund
Portfolio Manager’s Comments
THE YEAR IN REVIEW
Managers AMG GW&K Fixed Income Fund (Institutional Class) returned 0.46% for the year ended December 31, 2013, outpacing the return of (2.02)% for the Barclays U.S. Aggregate Bond Index (“the Index”).
Looking back at 2013, remarks by the Fed had the most visible impact on the fixed income markets. Treasury yields were relatively range-bound for the first four months of the year before rising aggressively throughout the summer as the Fed appeared to signal that tapering was imminent. In the process, 10-year yields touched multi-year highs. The increase in yields was temporarily interrupted by both the Fed’s decision to refrain from tapering in September and the ensuing fiscal drama stemming from the government shutdown in October. However, a quick resolution to the political standoff and the encouraging economic data in the last two months of the year affirmed the outlook for the economy and put tapering back on the table. The rest is history.
Through December, every sector of the taxable bond market had negative returns except high yield. The sharp rise in interest rates drove a negative return for the Index of (2.02)%, its worst annual showing since 1999. In a year of many records, this represented only the third calendar year since the inception of the Index in 1976 that total returns were negative. The curve steepened, with front-end yields ending the year relatively close to where they started, but with 10-year and 30-year yields at their highs for the year. On a total return basis, two-year Treasuries returned 0.30%, while the long bond lost (15.03)%. Investment grade corporate bonds were also hurt by higher yields and lost (1.53)%, though the rally in spreads during the fourth quarter allowed excess returns to finish at a respectable 2.86%. Despite temporary underperformance during the dramatic rate backup from June until September, the high yield market delivered a welcomed positive total return in 2013, as the flow of central bank money and relatively low interest rates pushed investors into higher yielding assets. The sector ended the year with a coupon-like total return of 7.44%, as spreads tightened 129 basis points. Excess returns for high yield finished at 9.23%. Mortgage-backed securities, arguably the most sensitive to quantitative easing, took the rumors and announcement of tapering in stride. Spreads were 16 basis points tighter on the year, driving total and excess returns of -1.41% and 0.98%, respectively.
LOOKINGFORWARD
In 2014, we expect to see slightly higher rates and modestly tighter spreads based upon a steady winding down of the Fed’s massive quantitative easing program, an adequately improving economy, and low defaults. A major caveat for the market will be whether the Fed’s “qualitative” approach to strengthening rate guidance will be sufficient to anchor rates as quantitative easing tapering begins. Any string of economic data that surprises to the upside could cause the market to re-price expectations quickly.
We remain approximately one-half year underweight duration relative to our benchmarks. While we expect rates to grind marginally higher next year, we believe we are approaching the
upper bound for the 10-year Treasury (3.25%-3.50%) given the tenuous nature of this recovery, the lack of inflationary pressures, and the Fed’s commitment to keep rates lower for longer.
Against this backdrop, the carry trade environment will persist, and credit should perform well. We remain overweight the intermediate part of the curve and continue to favor credit risk over duration risk. While we recognize that return opportunities from here are limited in corporate bonds, excess returns should be better than the alternatives. Fundamentals are solid and valuations are not yet at extreme levels. Higher yields will keep flows coming into the sector with institutional buyers offsetting retail outflows. We expect modest spread tightening as the economy continues to improve. In our opinion, the risks to corporate bonds would come from an unexpected monetary tightening, a spike in default rates or sharply higher interest rates. None of these are likely in 2014.
In high grade corporates, we continue to focus on some of the widest spread industrial sectors, which should benefit the most from stronger global growth. Within the high yield sector, we remain invested in the higher quality BB/B-rated segment of the market. The limited interest rate sensitivity and low embedded default risk inherent to single-B rated bonds make them particularly attractive in an environment of heightened macro risks and the ongoing quest for income.
We continue to be relatively neutral in mortgage-backed securities. As interest rates rise, our primary concern shifts from prepayment risk to extension risk. We continue to emphasize higher-coupon, seasoned, specified-pools that should help protect us from any serious duration spikes. MBS performance has been dominated by uncertainty arising from QE3 exit strategies, GSE reform, and FHFA leadership changes. Spreads could come under pressure as we transition to a new regime where money managers become the marginal buyer as the Fed moves to the sidelines. We may look to go underweight mortgage-backed securities in 2014.
This commentary reflects the viewpoints of the portfolio manager, GW&K Investment Management, as of December 31, 2013 and is not intended as a forecast or guarantee of future results
CUMULATIVE TOTAL RETURN PERFORMANCE
Managers AMG GW&K Fixed Income Fund’s cumulative total return is based on the daily change in net asset value (NAV), and assumes that all distributions were reinvested. The chart compares a hypothetical $10,000 investment made in the Fund’s Investor Class shares on December 31, 2003, with a $10,000 investment made in the Barclays U.S. Aggregate Bond Index for the same time period. Performance for periods longer than one year is annualized. The graph and table do not reflect the deduction of taxes that a shareholder would pay on a Fund distribution or redemption of shares. The listed returns for the Fund are net of expenses and the returns for the index exclude expenses. Past performance is not indicative of future results. Total returns for the Fund would have been lower had certain expenses not been reduced.
Managers AMG GW&K Fixed Income Fund
Portfolio Manager’s Comments (continued)
CUMULATIVE TOTAL RETURN PERFORMANCE (continued)
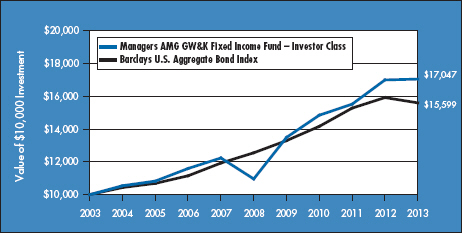
The table below shows the average annual total returns for the Managers AMG GW&K Fixed Income Fund and the Barclays U.S. Aggregate Bond Index for the same time periods ended December 31, 2013.
| | | | | | | | | | | | | | | | | | | | |
| | | Average Annual Total Returns1 | |
| | | One Year | | | Five Years | | | Ten Years | | | Since Inception | | | Inception Date | |
Managers AMG GW&K Fixed Income Fund2,3,4,5,6 | | | | | |
Investor Class | | | 0.29 | % | | | 9.24 | % | | | 5.48 | % | | | 6.18 | % | | | 01/02/97 | |
Service Class | | | 0.41 | % | | | — | | | | — | | | | 0.62 | % | | | 11/30/12 | |
Class C7 | | | (0.59 | )% | | | 8.40 | % | | | 4.70 | % | | | 5.39 | % | | | 03/05/98 | |
Institutional Class | | | 0.46 | % | | | 9.50 | % | | | 5.76 | % | | | 6.60 | % | | | 01/02/97 | |
Barclays U.S. Aggregate Bond Index8 | | | (2.02 | )% | | | 4.44 | % | | | 4.55 | % | | | 5.72 | % | | | 01/02/97 | † |
The performance data shown represents past performance. Past performance is not a guarantee of future results. Current performance may be lower or higher than the performance data quoted. The investment return and principal value of an investment in the Fund will fluctuate so that an investor’s shares, when redeemed, may be worth more or less than their original cost. For performance information through the most recent month end please call (800) 835-3879 or visit our Web site at www.managersinvest.com. Current net asset values per share for each Fund are available on the Funds Web site at www.managersinvest.com.
Investors should carefully consider the Fund’s investment objectives, risks, charges and expenses before investing. For this and other information, please call (800) 835-3879 or visit our Web site at www.managersinvest.com for a free prospectus. Read it carefully before investing or sending money. Funds are distributed by Managers Distributors, Inc., member FINRA.
| † | Date reflects inception date of the Fund, not the index. |
| 1 | Total return equals income yield plus share price change and assumes reinvestment of all dividends and capital gain distributions. Returns are net of fees and may reflect offsets of Fund expenses as described in the Prospectus. No adjustment has been made for taxes payable by shareholders on their reinvested dividends and capital gain distributions. Returns for periods greater than one year are annualized. The listed returns on the Fund are net of expenses and based on the published NAV as of December 31, 2013. All returns are in U.S. dollars ($). |
| 2 | From time to time, the Fund’s advisor has waived its fees and/or absorbed Fund expenses, which has resulted in higher returns. |
| 3 | Fixed income funds are subject to the risks associated with investments in debt securities, such as default risk and fluctuations in the perception of the debtor’s ability to pay its creditors. |
| 4 | High Yield bonds (also known as “junk bonds”) are subject to additional risks such as the risk of default. |
| 5 | Changing interest rates may adversely affect the value of a fixed income investment. An increase in interest rates typically causes the value of bonds and other fixed income securities to fall. |
| 6 | Market risk associated with equity securities may become more pronounced for the Fund. |
| 7 | Closed to new investments. |
| 8 | The Barclays U.S. Aggregate Bond Index is an index of the U.S. investment grade, fixed-rate bond market, including both government and corporate bonds. Unlike the Fund, the Barclays U.S. Aggregate Bond Index is unmanaged, is not available for investment, and does not incur expenses. |
Not FDIC insured, nor bank guaranteed. May lose value.
Managers AMG GW&K Fixed Income Fund
Fund Snapshots
December 31, 2013
Portfolio Breakdown (unaudited)
| | | | |
Sector | | Managers AMG
GW&K Fixed
Income Fund** | |
Industrials | | | 45.5 | % |
U.S. Government and Agency Obligations | | | 27.2 | % |
Financials | | | 16.5 | % |
Municipal Bonds | | | 6.7 | % |
Other Assets and Liabilities | | | 4.1 | % |
| ** | As a percentage of net assets |
| | | | |
Rating | | Managers AMG
GW&K Fixed
Income Fund† | |
U.S. Treasury | | | 0.6 | % |
U.S. Agency | | | 27.8 | % |
Aa | | | 3.4 | % |
A | | | 13.7 | % |
Baa | | | 36.8 | % |
Ba | | | 11.8 | % |
B | | | 5.9 | % |
| † | As a percentage of market value of fixed income securities. Chart does not include equity securities. |
Top Ten Holdings (unaudited)
| | | | |
Security Name | | % of
Net Assets | |
FNMA, 5.500%, 02/01/39* | | | 5.1 | % |
FHLMC Gold Pool, 5.000%, 10/01/36* | | | 4.6 | |
FNMA, 4.500%, 05/01/39* | | | 3.7 | |
FNMA, 6.000%, 06/01/36* | | | 3.3 | |
FNMA, 5.500%, 05/01/25* | | | 2.2 | |
American Tower Corp., 7.250%, 05/15/19* | | | 2.1 | |
FNMA, 6.000%, 10/01/39 | | | 2.1 | |
Weyerhaeuser Co. | | | 2.0 | |
The Williams Cos, Inc. | | | 2.0 | |
FHLMC Gold Pool, 5.000%, 06/01/26* | | | 2.0 | |
Top Ten as a Group | | | 29.1 | % |
| | | | |
| * | Top Ten Holding at June 30, 2013 |
Because a fund’s strategy may result in multiple investments in particular sectors of the economy, its performance may depend on the performance of those sectors and may fluctuate more widely than investments diversified across more sectors. For additional information on these and other risk considerations, please see the Fund’s prospectus.
Any sectors, industries, or securities discussed should not be perceived as investment recommendations. Mention of a specific security should not be considered a recommendation to buy or solicitation to sell that security. Specific securities mentioned in this report may have been sold from the Fund’s portfolio of investments by the time you receive this report.
Managers AMG GW&K Fixed Income Fund
Schedule of Portfolio Investments
December 31, 2013
| | | | | | | | |
| | | Principal Amount | | | Value | |
Corporate Bonds and Notes - 62.0% | | | | | | | | |
Financials - 16.5% | | | | | | | | |
American Tower Corp., 7.250%, 05/15/19 | | $ | 2,020,000 | | | $ | 2,386,382 | |
Associates Corp. of North America, 6.950%, 11/01/18 | | | 1,000,000 | | | | 1,191,057 | |
Bank of America Corp., Series M, 8.125%, 12/29/495 | | | 1,000,000 | | | | 1,123,953 | |
General Electric Capital Corp., Series GMTN, 6.000%, 08/07/19 | | | 1,000,000 | | | | 1,174,733 | |
General Motors Financial Co., Inc., 4.250%, 05/15/23 (a) | | | 1,000,000 | | | | 953,750 | |
The Goldman Sachs Group, Inc., 6.125%, 02/15/33 | | | 1,970,000 | | | | 2,222,416 | |
International Lease Finance Corp., 8.250%, 12/15/20 | | | 900,000 | | | | 1,055,250 | |
JPMorgan Chase & Co., Series 1, 7.900%, 04/29/495 | | | 1,525,000 | | | | 1,682,862 | |
Morgan Stanley, Series GMTN, 5.500%, 07/28/21 | | | 1,000,000 | | | | 1,119,208 | |
The PNC Financial Services Group, Inc., 6.750%, 07/29/495 | | | 1,700,000 | | | | 1,776,461 | |
Wells Fargo & Co., Series K, 7.980%, 03/29/495 | | | 1,500,000 | | | | 1,680,000 | |
Weyerhaeuser Co., 8.500%, 01/15/25 | | | 1,825,000 | | | | 2,329,189 | |
Total Financials | | | | | | | 18,695,261 | |
Industrials - 45.5% | | | | | | | | |
American Axle & Manufacturing, Inc., 6.625%, 10/15/22 | | | 600,000 | | | | 634,500 | |
ArcelorMittal, 10.350%, 06/01/19 (b) | | | 830,000 | | | | 1,054,100 | |
AutoNation, Inc., 6.750%, 04/15/18 | | | 450,000 | | | | 523,125 | |
Boston Scientific Corp., 6.000%, 01/15/20 | | | 975,000 | | | | 1,120,768 | |
Calumet Specialty Products Partners, L.P. / Calumet Finance Corp., 7.625%,
01/15/22 (a) | | | 600,000 | | | | 607,500 | |
CBS Corp., 8.875%, 05/15/19 | | | 930,000 | | | | 1,190,355 | |
CenturyLink, Inc., Series S, 6.450%, 06/15/21 | | | 1,055,000 | | | | 1,102,475 | |
CF Industries, Inc., 7.125%, 05/01/20 | | | 1,860,000 | | | | 2,183,024 | |
Chesapeake Energy Corp., 6.125%, 02/15/21 | | | 1,080,000 | | | | 1,163,700 | |
Chrysler Group LLC / CG Co-Issuer, Inc., 8.000%, 06/15/19 | | | 650,000 | | | | 721,500 | |
Comcast Corp., 7.050%, 03/15/33 | | | 1,000,000 | | | | 1,213,255 | |
Continental Resources, Inc., 5.000%, 09/15/22 | | | 600,000 | | | | 624,000 | |
CRH America, Inc., 8.125%, 07/15/18 | | | 1,000,000 | | | | 1,226,117 | |
DIRECTV Holdings LLC / DIRECTV Financing Co., Inc., 5.200%, 03/15/20 | | | 2,000,000 | | | | 2,180,846 | |
Domtar Corp., 10.750%, 06/01/17 | | | 960,000 | | | | 1,199,080 | |
Energy Transfer Equity, L.P., 7.500%, 10/15/20 | | | 1,020,000 | | | | 1,150,050 | |
Ford Motor Co., 7.450%, 07/16/31 | | | 990,000 | | | | 1,215,615 | |
Freeport-McMoRan Copper & Gold, Inc., 3.550%, 03/01/22 | | | 850,000 | | | | 809,250 | |
Frontier Communications Corp., 8.500%, 04/15/20 | | | 700,000 | | | | 787,500 | |
The Gap, Inc., 5.950%, 04/12/21 | | | 1,095,000 | | | | 1,211,750 | |
Georgia-Pacific LLC, 8.000%, 01/15/24 | | | 945,000 | | | | 1,218,475 | |
Hornbeck Offshore Services, Inc., 5.875%, 04/01/20 | | | 950,000 | | | | 985,625 | |
Host Hotels & Resorts, L.P., 4.750%, 03/01/23 | | | 1,180,000 | | | | 1,190,161 | |
Huntsman International LLC, 8.625%, 03/15/21 | | | 1,000,000 | | | | 1,135,000 | |
International Paper Co., 7.500%, 08/15/21 | | | 990,000 | | | | 1,215,460 | |
L-3 Communications Corp., 4.950%, 02/15/21 | | | 1,610,000 | | | | 1,686,496 | |
Lear Corp., 4.750%, 01/15/23 (a) | | | 1,000,000 | | | | 942,500 | |
|
The accompanying notes are an integral part of these financial statements. 34 |
Managers AMG GW&K Fixed Income Fund
Schedule of Portfolio Investments (continued)
| | | | | | | | |
| | | Principal Amount | | | Value | |
Industrials - 45.5% (continued) | | | | | | | | |
Lubrizol Corp., 8.875%, 02/01/19 | | $ | 915,000 | | | $ | 1,188,409 | |
The Mosaic Co., 4.250%, 11/15/23 | | | 1,200,000 | | | | 1,187,480 | |
NuStar Logistics, L.P., 6.750%, 02/01/21 | | | 280,000 | | | | 290,337 | |
Offshore Group Investment, Ltd., 7.500%, 11/01/191 | | | 500,000 | | | | 546,250 | |
Owens Corning, 4.200%, 12/15/22 | | | 1,000,000 | | | | 956,684 | |
Plains Exploration & Production Co., 6.750%, 02/01/22 | | | 425,000 | | | | 468,474 | |
QVC, Inc., 5.125%, 07/02/22 | | | 1,000,000 | | | | 990,792 | |
Rio Tinto Finance USA, Ltd., 9.000%, 05/01/19 | | | 1,290,000 | | | | 1,686,118 | |
The Ryland Group, Inc., 6.625%, 05/01/20 | | | 1,000,000 | | | | 1,062,500 | |
Teck Resources, Ltd., 6.125%, 10/01/35 | | | 1,740,000 | | | | 1,720,260 | |
Teekay Corp., 8.500%, 01/15/20 | | | 1,100,000 | | | | 1,194,875 | |
Thompson Creek Metals Co., Inc., 9.750%, 12/01/171 | | | 525,000 | | | | 580,125 | |
T-Mobile USA, Inc., 6.633%, 04/28/21 | | | 250,000 | | | | 264,063 | |
Trinidad Drilling, Ltd., 7.875%, 01/15/19 (a) | | | 1,000,000 | | | | 1,067,500 | |
United Continental Holdings, Inc., 6.375%, 06/01/181 | | | 1,000,000 | | | | 1,047,500 | |
United Rentals North America, Inc., 8.250%, 02/01/21 | | | 750,000 | | | | 849,375 | |
Valero Energy Corp., 9.375%, 03/15/19 | | | 965,000 | | | | 1,245,014 | |
Verizon Communications, Inc., 5.150%, 09/15/23 | | | 1,000,000 | | | | 1,075,754 | |
Weatherford International, Ltd./Bermuda, 9.625%, 03/01/19 | | | 1,305,000 | | | | 1,678,528 | |
The Williams Cos, Inc., 8.750%, 03/15/32 | | | 1,945,000 | | | | 2,276,342 | |
Total Industrials | | | | | | | 51,668,607 | |
Total Corporate Bonds and Notes (cost $71,789,327) | | | | | | | 70,363,868 | |
Municipal Bonds - 6.7% | | | | | | | | |
California State General Obligation, Build America Bonds, 7.550%, 04/01/39 | | | 1,700,000 | | | | 2,200,599 | |
Illinois State General Obligation, 5.365%, 03/01/17 | | | 1,700,000 | | | | 1,850,331 | |
JobsOhio Beverage System, Series B, 3.985%, 01/01/29 | | | 1,445,000 | | | | 1,333,749 | |
Metropolitan Transportation Authority NY Revenue, Build America Bonds, 6.668%, 11/15/39 | | | 885,000 | | | | 1,035,769 | |
New Jersey Economic Development Authority, 7.425%, 02/15/29 (National Insured)8 | | | 1,000,000 | | | | 1,207,400 | |
Total Municipal Bonds (cost $8,232,918) | | | | | | | 7,627,848 | |
| | |
U.S. Government and Agency Obligations - 27.2% | | | | | | | | |
Federal Home Loan Mortgage Corporation - 6.6% | | | | | | | | |
FHLMC Gold Pool, 5.000%, 06/01/26 to 10/01/36 | | | 6,953,461 | | | | 7,474,548 | |
Federal National Mortgage Association - 20.1% | | | | | | | | |
FNMA, | | | | | | | | |
4.500%, 05/01/39 | | | 3,946,050 | | | | 4,195,399 | |
5.000%, 08/01/35 | | | 1,881,221 | | | | 2,045,357 | |
5.500%, 05/01/25 to 02/01/39 | | | 9,454,690 | | | | 10,403,571 | |
6.000%, 06/01/36 to 10/01/39 | | | 5,498,318 | | | | 6,121,284 | |
Total Federal National Mortgage Association | | | | | | | 22,765,611 | |
U.S. Treasury Obligations - 0.5% | | | | | | | | |
United States Treasury Notes, 3.500%, 05/15/20 | | | 550,000 | | | | 593,506 | |
Total U.S. Government and Agency Obligations (cost $30,834,621) | | | | | | | 30,833,665 | |
|
The accompanying notes are an integral part of these financial statements. 35 |
Managers AMG GW&K Fixed Income Fund
Schedule of Portfolio Investments (continued)
| | | | | | | | |
| | | Principal Amount | | | Value | |
Short-Term Investments - 5.3% | | | | | | | | |
Repurchase Agreements - 1.0%2 | | | | | | | | |
Citigroup Global Markets Inc., dated 12/31/13, due 01/02/14, 0.020%, total to be received $1,000,001 (collateralized by various U.S. Government Agency Obligations, 2.080% - 11.000%, 12/15/15 - 08/15/53, totaling $1,020,000) | | $ | 1,000,000 | | | $ | 1,000,000 | |
RBC Capital Markets LLC, dated 12/31/13, due 01/02/14, 0.001%, total to be received $132,284 (collateralized by various U.S. Government Agency Obligations, 0.000% - 2.500%, 01/23/14 - 08/15/23, totaling $134,930) | | | 132,284 | | | | 132,284 | |
Total Repurchase Agreements | | | | | | | 1,132,284 | |
| | |
| | | Shares | | | | |
Other Investment Companies - 4.3%3 | | | | | | | | |
Dreyfus Institutional Cash Advantage Fund, Institutional Class Shares, 0.06% | | | 4,909,078 | | | | 4,909,078 | |
Total Short-Term Investments
(cost $6,041,362) | | | | | | | 6,041,362 | |
Total Investments - 101.2% (cost $116,898,228) | | | | | | | 114,866,743 | |
Other Assets, less Liabilities - (1.2)% | | | | | | | (1,320,211 | ) |
Net Assets - 100.0% | | | | | | $ | 113,546,532 | |
|
The accompanying notes are an integral part of these financial statements. 36 |
Notes to Schedules of Portfolio Investments
The following footnotes and abbreviations should be read in conjunction with each of the Schedules of Portfolio Investments previously presented in this report.
At December 31, 2013, the approximate cost of investments for Federal income tax purposes and the aggregate gross unrealized appreciation and/or depreciation based on tax cost were as follows:
| | | | | | | | | | | | | | | | |
Fund | | Cost | | | Appreciation | | | Depreciation | | | Net | |
Managers AMG Chicago Equity Partners Balanced Fund | | $ | 42,214,825 | | | $ | 4,935,606 | | | $ | (393,135 | ) | | $ | 4,542,471 | |
Managers High Yield Fund | | | 33,169,816 | | | | 1,575,964 | | | | (240,856 | ) | | | 1,335,108 | |
Managers AMG GW&K Fixed Income Fund | | | 116,899,147 | | | | 866,028 | | | | (2,898,432 | ) | | | (2,032,404 | ) |
| * | Non-income producing security. |
| # | Rounds to less than 0.1%. |
| (a) | Security exempt from registration under Rule 144A of the Securities Act of 1933. These securities may be resold in transactions exempt from registration, normally to qualified buyers. At December 31, 2013, the value of these securities amounted to the following: |
| | | | | | | | |
Fund | | Market Value | | | % of Net Assets | |
Managers High Yield Fund | | $ | 9,918,857 | | | | 28.7 | % |
Managers AMG GW&K Fixed Income Fund | | | 3,571,250 | | | | 3.1 | % |
| (b) | Step Bond: A debt instrument with either deferred interest payments or an interest rate that resets at specific times during its term. |
| 1 | Some or all of these shares were out on loan to various brokers as of December 31, 2013, amounting to the following: |
| | | | | | | | |
Fund | | Market Value | | | % of Net Assets | |
Managers AMG Chicago Equity Partners Balanced Fund | | $ | 646,539 | | | | 1.4 | % |
Managers High Yield Fund | | | 540,893 | | | | 1.6 | % |
Managers AMG GW&K Fixed Income Fund | | | 1,089,253 | | | | 1.0 | % |
| 2 | Collateral received from brokers for securities lending was invested in these short-term investments. |
| 3 | Yield shown represents the December 31, 2013, seven-day average yield, which refers to the sum of the previous seven days’ dividends paid, expressed as an annual percentage. |
| 4 | Floating Rate Security: The rate listed is as of December 31, 2013. Date in parentheses represents the security’s next coupon rate reset. |
| 5 | Variable Rate Security: The rate listed is as of December 31, 2013, and is periodically reset subject to terms and conditions set forth in the debenture. |
| 6 | Payment-in-Kind Security: The security may pay interest/dividends in additional par/shares and/or in cash. Rates shown are the current rate and possible payment rates. |
| 7 | Security is in default. Issuer has failed to make a timely payment of either principal or interest or has failed to comply with some provision of the bond indenture. |
| 8 | Securities in the portfolio backed by insurance of financial institutions and financial guaranty assurance agencies at December 31, 2013, amounted to the following: |
| | | | | | | | |
Fund | | Market Value | | | % of Net Assets | |
Managers AMG GW&K Fixed Income Fund | | $ | 1,207,400 | | | | 1.1 | % |
The accompanying notes are an integral part of these financial statements.
37
Notes to Schedules of Portfolio Investments (continued)
The following tables summarize the inputs used to value the Funds’ net assets by the fair value hierarchy levels as of December 31, 2013: (See Note 1(a) in the Notes to the Financial Statements.)
| | | | | | | | | | | | | | | | |
| | | Quoted Prices in Active
Markets for Identical
Investments
Level 1 | | | Significant Other
Observable Inputs
Level 2 | | | Significant
Unobservable Inputs
Level 3 | | | Total | |
Managers AMG Chicago Equity Partners Balanced Fund | | | | | | | | | |
Investments in Securities | | | | | | | | | | | | | | | | |
Common Stocks† | | $ | 29,524,985 | | | | — | | | | — | | | $ | 29,524,985 | |
Corporate Bonds and Notes†† | | | — | | | $ | 849,329 | | | | — | | | | 849,329 | |
U.S. Government and Agency Obligations†† | | | — | | | | 14,617,469 | | | | — | | | | 14,617,469 | |
Short-Term Investments | | | | | | | | | | | | | | | | |
Repurchase Agreements | | | — | | | | 662,192 | | | | — | | | | 662,192 | |
Other Investment Companies | | | 1,103,321 | | | | — | | | | — | | | | 1,103,321 | |
| | | | | | | | | | | | | | | | |
Total Investments in Securities | | $ | 30,628,306 | | | $ | 16,128,990 | | | | — | | | $ | 46,757,296 | |
| | | | | | | | | | | | | | | | |
| | | | |
| | | Quoted Prices in Active
Markets for Identical
Investments
Level 1 | | | Significant Other
Observable Inputs
Level 2 | | | Significant
Unobservable Inputs
Level 3 | | | Total | |
Managers High Yield Fund | | | | | | | | | |
Investments in Securities | | | | | | | | | | | | | | | | |
Bank Loan Obligations | | | — | | | $ | 393,935 | | | | — | | | $ | 393,935 | |
Common Stocks† | | $ | 241 | | | | — | | | | — | | | | 241 | |
Corporate Bonds and Notes†† | | | — | | | | 32,353,280 | | | | — | | | | 32,353,280 | |
Short-Term Investments | | | | | | | | | | | | | | | | |
Repurchase Agreements | | | — | | | | 558,954 | | | | — | | | | 558,954 | |
Other Investment Companies | | | 1,198,514 | | | | — | | | | — | | | | 1,198,514 | |
| | | | | | | | | | | | | | | | |
Total Investments in Securities | | $ | 1,198,755 | | | $ | 33,306,169 | | | | — | | | $ | 34,504,924 | |
| | | | | | | | | | | | | | | | |
| | | | |
| | | Quoted Prices in Active
Markets for Identical
Investments
Level 1 | | | Significant Other
Observable Inputs
Level 2 | | | Significant
Unobservable Inputs
Level 3 | | | Total | |
Managers AMG GW&K Fixed Income Fund | | | | | | | | | |
Investments in Securities | | | | | | | | | | | | | | | | |
Corporate Bonds and Notes†† | | | — | | | $ | 70,363,868 | | | | — | | | $ | 70,363,868 | |
Municipal Bonds | | | — | | | | 7,627,848 | | | | — | | | | 7,627,848 | |
U.S. Government and Agency Obligations†† | | | — | | | | 30,833,665 | | | | — | | | | 30,833,665 | |
Short-Term Investments | | | | | | | | | | | | | | | | |
Repurchase Agreements | | | — | | | | 1,132,284 | | | | — | | | | 1,132,284 | |
Other Investment Companies | | $ | 4,909,078 | | | | — | | | | — | | | | 4,909,078 | |
| | | | | | | | | | | | | | | | |
Total Investments in Securities | | $ | 4,909,078 | | | $ | 109,957,665 | | | | — | | | $ | 114,866,743 | |
| | | | | | | | | | | | | | | | |
| † | All common stocks held in the Fund are level 1 securities. For a detailed breakout of the common stocks by major industry classification, please refer to the respective Schedule of Portfolio Investments. |
| †† | All corporate bonds and notes; U.S. government and agency obligations; held in the Fund are level 2 securities. For a detailed breakout of the corporate bonds and notes; U.S. government and agency obligations; by major industry or agency classification, please refer to the respective Schedule of Portfolio Investments. |
The accompanying notes are an integral part of these financial statements.
38
Notes to Schedules of Portfolio Investments (continued)
As of December 31, 2013, the Funds had no transfers between levels from the beginning of the reporting period.
| | | | | | | | |
| Investments Definitions and Abbreviations: |
| | | | |
| FHLB | | Federal Home Loan Bank | | | | GMTN: | | Global Medium-Term Notes |
| FHLMC: | | Federal Home Loan Mortgage Corp. | | | | MTN: | | Medium-Term Notes |
| FNMA: | | Federal National Mortgage Association | | | | | | |
The accompanying notes are an integral part of these financial statements.
39
Statement of Assets and Liabilities
December 31, 2013
| | | | | | | | | | | | |
| | | Managers AMG
Chicago Equity
Partners
Balanced Fund | | | Managers
High Yield
Fund | | | Managers AMG
GW&K Fixed
Income Fund | |
Assets: | | | | | | | | | | | | |
Investments at value* (including securities on loan valued at $646,539, $540,893,and $1,089,253, respectively) | | $ | 46,757,296 | | | $ | 34,504,924 | | | $ | 114,866,743 | |
Dividends, interest and other receivables | | | 110,486 | | | | 621,963 | | | | 1,481,831 | |
Receivable for Fund shares sold | | | 24,691 | | | | 96,228 | | | | 430,856 | |
Receivable from affiliate | | | 23,891 | | | | 18,950 | | | | 26,780 | |
Receivable for investments sold | | | — | | | | 37,219 | | | | — | |
Prepaid expenses | | | 24,412 | | | | 19,851 | | | | 30,459 | |
Total assets | | | 46,940,776 | | | | 35,299,135 | | | | 116,836,669 | |
Liabilities: | | | | | | | | | | | | |
Payable upon return of securities loaned | | | 662,192 | | | | 558,954 | | | | 1,132,284 | |
Payable for investments purchased | | | 349,198 | | | | — | | | | — | |
Payable for Fund shares repurchased | | | 6,119 | | | | 154,864 | | | | 2,037,332 | |
Accrued expenses: | | | | | | | | | | | | |
Investment advisory and management fees | | | 26,970 | | | | 20,520 | | | | 44,063 | |
Administrative fees | | | 7,706 | | | | 5,863 | | | | 19,584 | |
Distribution fees - Investor Class | | | 6,990 | | | | 6,748 | | | | 7,067 | |
Distribution fees - Class C | | | — | | | | — | | | | 18,843 | |
Trustees fees and expenses | | | 46 | | | | 79 | | | | 167 | |
Other | | | 26,904 | | | | 35,489 | | | | 30,797 | |
Total liabilities | | | 1,086,125 | | | | 782,517 | | | | 3,290,137 | |
| | | |
Net Assets | | $ | 45,854,651 | | | $ | 34,516,618 | | | $ | 113,546,532 | |
| | | |
Net Assets Represent: | | | | | | | | | | | | |
Paid-in capital | | $ | 40,557,900 | | | $ | 35,741,739 | | | $ | 115,908,073 | |
Undistributed net investment income | | | 15,697 | | | | 6,409 | | | | 51,441 | |
Accumulated net realized gain (loss) from investments and foreign currency transactions | | | 646,490 | | | | (2,567,868 | ) | | | (381,497 | ) |
Net unrealized appreciation (depreciation) of investments and foreign currency translations | | | 4,634,564 | | | | 1,336,338 | | | | (2,031,485 | ) |
Net Assets | | $ | 45,854,651 | | | $ | 34,516,618 | | | $ | 113,546,532 | |
* Investments at cost | | $ | 42,122,732 | | | $ | 33,168,586 | | | $ | 116,898,228 | |
The accompanying notes are an integral part of these financial statements.
40
Statement of Assets and Liabilities
December 31, 2013 (continued)
| | | | | | | | | | | | |
| | | Managers AMG
Chicago Equity
Partners
Balanced Fund | | | Managers
High Yield
Fund | | | Managers AMG
GW&K Fixed
Income Fund | |
Investor Class Shares: | | | | | | | | | | | | |
Net Assets | | $ | 33,151,482 | | | $ | 31,751,305 | | | $ | 32,009,292 | |
Shares outstanding | | | 2,191,343 | | | | 3,922,385 | | | | 3,214,889 | |
Net asset value, offering and redemption price per share | | $ | 15.13 | | | $ | 8.09 | | | $ | 9.96 | |
Service Class Shares: | | | | | | | | | | | | |
Net Assets | | $ | 1,580,781 | | | | n/a | | | $ | 1,562,532 | |
Shares outstanding | | | 103,620 | | | | n/a | | | | 156,383 | |
Net asset value, offering and redemption price per share | | $ | 15.26 | | | | n/a | | | $ | 9.99 | |
Class C Shares: | | | | | | | | | | | | |
Net Assets | | | n/a | | | | n/a | | | $ | 20,793,179 | |
Shares outstanding | | | n/a | | | | n/a | | | | 2,091,584 | |
Net asset value, offering and redemption price per share | | | n/a | | | | n/a | | | $ | 9.94 | |
Institutional Class Shares: | | | | | | | | | | | | |
Net Assets | | $ | 11,122,388 | | | $ | 2,765,313 | | | $ | 59,181,529 | |
Shares outstanding | | | 729,001 | | | | 337,978 | | | | 5,924,246 | |
Net asset value, offering and redemption price per share | | $ | 15.26 | | | $ | 8.18 | | | $ | 9.99 | |
The accompanying notes are an integral part of these financial statements.
41
Statement of Operations
For the year ended December 31, 2013
| | | | | | | | | | | | |
| | | Managers AMG
Chicago Equity
Partners
Balanced Fund | | | Managers
High Yield
Fund | | | Managers AMG
GW&K Fixed
Income Fund | |
Investment Income: | | | | | | | | | | | | |
Dividend income | | $ | 433,446 | 1 | | $ | 1,430 | | | $ | 2,785 | |
Interest income | | | 276,857 | | | | 2,355,692 | | | | 3,935,681 | |
Securities lending income | | | 5,244 | | | | 11,241 | | | | 5,282 | |
Foreign withholding tax | | | (141 | ) | | | (1,082 | ) | | | (8,257 | ) |
Total investment income | | | 715,406 | | | | 2,367,281 | | | | 3,935,491 | |
Expenses: | | | | | | | | | | | | |
Investment advisory and management fees | | | 291,183 | | | | 239,185 | | | | 590,849 | |
Administrative fees | | | 83,195 | | | | 68,339 | | | | 262,601 | |
Distribution fees - Investor Class | | | 75,371 | | | | 78,784 | | | | 92,688 | |
Distribution fees - Class C | | | — | | | | — | | | | 274,959 | |
Shareholder servicing fees - Service Class | | | 670 | | | | — | | | | 1,092 | |
Registration fees | | | 51,015 | | | | 35,551 | | | | 69,166 | |
Professional fees | | | 37,252 | | | | 60,544 | | | | 54,617 | |
Custodian | | | 28,508 | | | | 53,573 | | | | 19,036 | |
Reports to shareholders | | | 27,015 | | | | 13,955 | | | | 45,403 | |
Transfer agent | | | 8,330 | | | | 13,030 | | | | 13,010 | |
Extraordinary expense | | | 7,829 | | | | 7,002 | | | | 26,667 | |
Trustees fees and expenses | | | 1,586 | | | | 1,279 | | | | 4,608 | |
Miscellaneous | | | 2,876 | | | | 1,786 | | | | 5,667 | |
Total expenses before offsets | | | 614,830 | | | | 573,028 | | | | 1,460,363 | |
Expense reimbursements | | | (181,502 | ) | | | (179,573 | ) | | | (290,204 | ) |
Expense reductions | | | (4,396 | ) | | | — | | | | — | |
Net expenses | | | 428,932 | | | | 393,455 | | | | 1,170,159 | |
| | | |
Net investment income | | | 286,474 | | | | 1,973,826 | | | | 2,765,332 | |
Net Realized and Unrealized Gain (Loss): | | | | | | | | | | | | |
Net realized gain (loss) on investments | | | 3,326,313 | | | | 652,164 | | | | (381,497 | ) |
Net change in unrealized appreciation (depreciation) of investments | | | 2,891,892 | | | | (514,120 | ) | | | (2,241,302 | ) |
Net realized and unrealized gain (loss) | | | 6,218,205 | | | | 138,044 | | | | (2,622,799 | ) |
| | | |
Net increase in net assets resulting from operations | | $ | 6,504,679 | | | $ | 2,111,870 | | | $ | 142,533 | |
| 1 | Includes non-recurring dividends of $29,419. |
The accompanying notes are an integral part of these financial statements.
42
Statements of Changes in Net Assets
For the year ended December 31,
| | | | | | | | | | | | | | | | |
| | | Managers AMG Chicago Equity
Partners Balanced Fund | | | Managers High Yield
Fund | |
| | | 2013 | | | 2012 | | | 2013 | | | 2012 | |
Increase (Decrease) in Net Assets From Operations: | | | | | | | | | | | | | | | | |
Net investment income | | $ | 286,474 | | | $ | 437,483 | | | $ | 1,973,826 | | | $ | 2,047,204 | |
Net realized gain on investments | | | 3,326,313 | | | | 2,805,172 | | | | 652,164 | | | | 540,791 | |
Net change in unrealized appreciation (depreciation) of investments | | | 2,891,892 | | | | (14,941 | ) | | | (514,120 | ) | | | 1,657,826 | |
Net increase in net assets resulting from operations | | | 6,504,679 | | | | 3,227,714 | | | | 2,111,870 | | | | 4,245,821 | |
Distributions to Shareholders: | | | | | | | | | | | | | | | | |
From net investment income: | | | | | | | | | | | | | | | | |
Investor Class | | | (167,010 | ) | | | (294,226 | ) | | | (1,812,211 | ) | | | (1,738,220 | ) |
Service Class | | | (8,752 | ) | | | (43 | ) | | | — | | | | — | |
Class C | | | — | | | | (15,502 | )2 | | | — | | | | (146,925 | )2 |
Institutional Class | | | (85,363 | ) | | | (137,356 | ) | | | (159,039 | ) | | | (167,867 | ) |
From net realized gain on investments: | | | | | | | | | | | | | | | | |
Investor Class | | | (2,826,451 | ) | | | (1,192,459 | ) | | | — | | | | — | |
Service Class | | | (134,245 | ) | | | (454 | ) | | | — | | | | — | |
Institutional Class | | | (940,368 | ) | | | (445,138 | ) | | | — | | | | — | |
Total distributions to shareholders | | | (4,162,189 | ) | | | (2,085,178 | ) | | | (1,971,250 | ) | | | (2,053,012 | ) |
Capital Share Transactions:1 | | | | | | | | | | | | | | | | |
Net increase (decrease) from capital share transactions | | | 7,853,945 | | | | 5,577,982 | | | | 1,020,739 | | | | (1,009,695 | ) |
| | | | |
Total increase in net assets | | | 10,196,435 | | | | 6,720,518 | | | | 1,161,359 | | | | 1,183,114 | |
Net Assets: | | | | | | | | | | | | | | | | |
Beginning of year | | | 35,658,216 | | | | 28,937,698 | | | | 33,355,259 | | | | 32,172,145 | |
End of year | | $ | 45,854,651 | | | $ | 35,658,216 | | | $ | 34,516,618 | | | $ | 33,355,259 | |
End of year undistributed net investment income | | $ | 15,697 | | | $ | 2,142 | | | $ | 6,409 | | | | — | |
| | | | | | | | | | | | | | | | |
| 1 | See Note 1(g) of the Notes to Financial Statements. |
| 2 | The amounts disclosed above were incurred prior to the closing of C shares and/or the conversion to Investor shares. |
The accompanying notes are an integral part of these financial statements.
43
Statements of Changes in Net Assets
For the year ended December 31,
| | | | | | | | |
| | | Managers AMG
GW&K Fixed Income Fund | |
| | | 2013 | | | 2012 | |
Increase (Decrease) in Net Assets From Operations: | | | | | | | | |
Net investment income | | $ | 2,765,332 | | | $ | 5,437,210 | |
Net realized gain (loss) on investments | | | (381,497 | ) | | | 12,841,299 | |
Net change in unrealized appreciation (depreciation) of investments | | | (2,241,302 | ) | | | (5,702,087 | ) |
Net increase in net assets resulting from operations | | | 142,533 | | | | 12,576,422 | |
Distributions to Shareholders: | | | | | | | | |
From net investment income: | | | | | | | | |
Investor Class | | | (871,265 | ) | | | (1,771,132 | ) |
Service Class | | | (35,602 | ) | | | (44 | ) |
Class C | | | (431,792 | ) | | | (1,169,612 | ) |
Institutional Class | | | (1,669,013 | ) | | | (2,895,211 | ) |
From net realized gain on investments: | | | | | | | | |
Investor Class | | | (3,162,412 | ) | | | (400,733 | ) |
Service Class | | | (150,429 | ) | | | (96 | ) |
Class C | | | (2,099,367 | ) | | | (320,362 | ) |
Institutional Class | | | (5,438,306 | ) | | | (568,638 | ) |
Total distributions to shareholders | | | (13,858,186 | ) | | | (7,125,828 | ) |
Capital Share Transactions:1 | | | | | | | | |
Net decrease from capital share transactions | | | (13,118,777 | ) | | | (2,137,640 | ) |
| | |
Total increase (decrease) in net assets | | | (26,834,430 | ) | | | 3,312,954 | |
Net Assets: | | | | | | | | |
Beginning of year | | | 140,380,962 | | | | 137,068,008 | |
End of year | | $ | 113,546,532 | | | $ | 140,380,962 | |
End of year undistributed net investment income | | $ | 51,441 | | | $ | 294,174 | |
| | | | | | | | |
| 1 | See Note 1(g) of the Notes to Financial Statements. |
The accompanying notes are an integral part of these financial statements.
44
Managers AMG Chicago Equity Partners Balanced Fund
Financial Highlights
For a share outstanding throughout each period
| | | | | | | | | | | | | | | | | | | | |
| | | For the year ended December 31, | |
Investor Class | | 2013 | | | 2012 | | | 2011 | | | 2010 | | | 2009 | |
Net Asset Value, Beginning of Year | | $ | 14.19 | | | $ | 13.70 | | | $ | 13.49 | | | $ | 12.33 | | | $ | 10.45 | |
Income from Investment Operations: | | | | | | | | | | | | | | | | | | | | |
Net investment income | | | 0.10 | 3,14 | | | 0.18 | 3 | | | 0.18 | 3 | | | 0.20 | | | | 0.22 | |
Net realized and unrealized gain (loss) on investments | | | 2.33 | 3 | | | 1.16 | 3 | | | 0.69 | 3 | | | 1.16 | | | | 1.87 | |
Total from investment operations | | | 2.43 | | | | 1.34 | | | | 0.87 | | | | 1.36 | | | | 2.09 | |
Less Distributions to Shareholders from: | | | | | | | | | | | | | | | | | | | | |
Net investment income | | | (0.09 | ) | | | (0.17 | ) | | | (0.18 | ) | | | (0.20 | ) | | | (0.21 | ) |
Net realized gain on investments | | | (1.40 | ) | | | (0.68 | ) | | | (0.48 | ) | | | — | | | | — | |
Total distributions to shareholders | | | (1.49 | ) | | | (0.85 | ) | | | (0.66 | ) | | | (0.20 | ) | | | (0.21 | ) |
Net Asset Value, End of Year | | $ | 15.13 | | | $ | 14.19 | | | $ | 13.70 | | | $ | 13.49 | | | $ | 12.33 | |
Total Return1 | | | 17.14 | % | | | 9.86 | % | | | 6.45 | % | | | 11.14 | % | | | 20.06 | % |
Ratio of net expenses to average net assets with (offsets/reductions) | | | 1.10 | %4 | | | 1.17 | %5,6 | | | 1.24 | % | | | 1.22 | % | | | 1.23 | % |
Ratio of expenses to average net assets (with offsets) | | | 1.11 | %4 | | | 1.18 | %5 | | | 1.25 | % | | | 1.25 | % | | | 1.25 | % |
Ratio of total expenses to average net assets (without offsets/reductions)2 | | | 1.55 | %4 | | | 1.52 | %5 | | | 1.70 | % | | | 1.80 | % | | | 1.76 | % |
Ratio of net investment income to average net assets1 | | | 0.62 | %4 | | | 1.21 | %5 | | | 1.27 | % | | | 1.56 | % | | | 1.77 | % |
Portfolio turnover | | | 90 | % | | | 110 | % | | | 94 | % | | | 97 | % | | | 114 | % |
Net assets at end of year (000’s omitted) | | $ | 33,151 | | | $ | 26,047 | | | $ | 17,519 | | | $ | 7,605 | | | $ | 6,933 | |
| | | | | | | | | | | | | | | | | | | | |
| | | | | | | | |
Service Class | | For the year ended
December 31, 2013 | | | For the period ended
December 1, 2012
through
December 31, 2012** | |
Net Asset Value, Beginning of Period | | $ | 14.30 | | | $ | 15.11 | |
Income from Investment Operations: | | | | | | | | |
Net investment income3 | | | 0.13 | 14 | | | 0.02 | |
Net realized and unrealized gain (loss) on investments3 | | | 2.36 | | | | (0.08 | ) |
Total from investment operations | | | 2.49 | | | | (0.06 | ) |
Less Distributions to Shareholders from: | | | | | | | | |
Net investment income | | | (0.12 | ) | | | (0.06 | ) |
Net realized gain on investments | | | (1.41 | ) | | | (0.69 | ) |
Total distributions to shareholders | | | (1.53 | ) | | | (0.75 | ) |
Net Asset Value, End of Period | | $ | 15.26 | | | $ | 14.30 | |
Total Return1 | | | 17.45 | %7 | | | (0.36 | )%7,12 |
Ratio of net expenses to average net assets (with offsets/reductions) | | | 0.92 | %4 | | | 0.82 | %5,6,13 |
Ratio of expenses to average net assets (with offsets) | | | 0.93 | %4 | | | 0.83 | %5,13 |
Ratio of total expenses to average net assets (without offsets/reductions)2 | | | 1.39 | %4 | | | 1.62 | %5,13 |
Ratio of net investment income to average net assets1 | | | 0.83 | %4 | | | 1.90 | %5,13 |
Portfolio turnover | | | 90 | % | | | 110 | % |
Net assets at end of period (000’s omitted) | | $ | 1,581 | | | $ | 9 | |
| | | | | | | | |
45
Managers AMG Chicago Equity Partners Balanced Fund
Financial Highlights
For a share outstanding throughout each year
| | | | | | | | | | | | | | | | | | | | |
| | | For the year ended December 31, | |
Institutional Class | | 2013 | | | 2012 | | | 2011 | | | 2010 | | | 2009 | |
Net Asset Value, Beginning of Year | | $ | 14.31 | | | $ | 13.82 | | | $ | 13.60 | | | $ | 12.43 | | | $ | 10.54 | |
Income from Investment Operations: | | | | | | | | | | | | | | | | | | | | |
Net investment income | | | 0.14 | 3,14 | | | 0.21 | 3 | | | 0.21 | 3 | | | 0.24 | | | | 0.23 | |
Net realized and unrealized gain (loss) on investments | | | 2.35 | 3 | | | 1.18 | 3 | | | 0.71 | 3 | | | 1.17 | | | | 1.90 | |
Total from investment operations | | | 2.49 | | | | 1.39 | | | | 0.92 | | | | 1.41 | | | | 2.13 | |
Less Distributions to Shareholders from: | | | | | | | | | | | | | | | | | | | | |
Net investment income | | | (0.13 | ) | | | (0.21 | ) | | | (0.22 | ) | | | (0.24 | ) | | | (0.24 | ) |
Net realized gain on investments | | | (1.41 | ) | | | (0.69 | ) | | | (0.48 | ) | | | — | | | | — | |
Total distributions to shareholders | | | (1.54 | ) | | | (0.90 | ) | | | (0.70 | ) | | | (0.24 | ) | | | (0.24 | ) |
Net Asset Value, End of Year | | $ | 15.26 | | | $ | 14.31 | | | $ | 13.82 | | | $ | 13.60 | | | $ | 12.43 | |
Total Return1 | | | 17.45 | % | | | 10.09 | % | | | 6.77 | % | | | 11.42 | % | | | 20.44 | % |
Ratio of net expenses to average net assets (with offsets/reductions) | | | 0.85 | %4 | | | 0.92 | %5,6 | | | 0.99 | % | | | 0.97 | % | | | 0.98 | % |
Ratio of expenses to average net assets (with offsets) | | | 0.86 | %4 | | | 0.93 | %5 | | | 1.00 | % | | | 1.00 | % | | | 1.00 | % |
Ratio of total expenses to average net assets (without offsets/reductions)2 | | | 1.30 | %4 | | | 1.27 | %5 | | | 1.45 | % | | | 1.55 | % | | | 1.51 | % |
Ratio of net investment income to average net assets1 | | | 0.88 | %4 | | | 1.46 | %5 | | | 1.52 | % | | | 1.81 | % | | | 2.03 | % |
Portfolio turnover | | | 90 | % | | | 110 | % | | | 94 | % | | | 97 | % | | | 114 | % |
Net assets at end of year (000’s omitted) | | $ | 11,122 | | | $ | 9,601 | | | $ | 8,885 | | | $ | 7,863 | | | $ | 7,164 | |
| | | | | | | | | | | | | | | | | | | | |
46
Managers High Yield Fund
Financial Highlights
For a share outstanding throughout each year
| | | | | | | | | | | | | | | | | | | | |
| | | For the year ended December 31, | |
Investor Class | | 2013 | | | 2012 | | | 2011 | | | 2010 | | | 2009 | |
Net Asset Value, Beginning of Year | | $ | 8.07 | | | $ | 7.51 | | | $ | 7.74 | | | $ | 7.35 | | | $ | 5.25 | |
Income from Investment Operations: | | | | | | | | | | | | | | | | | | | | |
Net investment income | | | 0.47 | 3 | | | 0.54 | 3 | | | 0.56 | 3 | | | 0.61 | | | | 0.60 | |
Net realized and unrealized gain (loss) on investments | | | 0.02 | 3 | | | 0.56 | 3 | | | (0.22 | )3 | | | 0.39 | | | | 2.10 | |
Total from investment operations | | | 0.49 | | | | 1.10 | | | | 0.34 | | | | 1.00 | | | | 2.70 | |
Less Distributions to Shareholders from: | | | | | | | | | | | | | | | | | | | | |
Net investment income | | | (0.47 | ) | | | (0.54 | ) | | | (0.57 | ) | | | (0.61 | ) | | | (0.60 | ) |
Net Asset Value, End of Year | | $ | 8.09 | | | $ | 8.07 | | | $ | 7.51 | | | $ | 7.74 | | | $ | 7.35 | |
Total Return1 | | | 6.21 | %7 | | | 15.12 | %7 | | | 4.54 | % | | | 14.20 | % | | | 53.97 | %7 |
Ratio of net expenses to average net assets (with offsets/reductions) | | | 1.17 | %8 | | | 1.15 | %9 | | | 1.15 | % | | | 1.15 | % | | | 1.15 | % |
Ratio of expenses to average net assets (with offsets) | | | 1.17 | %8 | | | 1.15 | %9 | | | 1.15 | % | | | 1.15 | % | | | 1.15 | % |
Ratio of total expenses to average net assets (without offsets/reductions)2 | | | 1.70 | %8 | | | 1.73 | %9 | | | 1.69 | % | | | 1.78 | % | | | 1.68 | % |
Ratio of net investment income to average net assets1 | | | 5.76 | %8 | | | 6.87 | %9 | | | 7.35 | % | | | 8.06 | % | | | 9.33 | % |
Portfolio turnover | | | 39 | % | | | 48 | % | | | 48 | % | | | 60 | % | | | 56 | % |
Net assets at end of year (000’s omitted) | | $ | 31,751 | | | $ | 30,817 | | | $ | 23,957 | | | $ | 21,729 | | | $ | 28,450 | |
| | | | | | | | | | | | | | | | | | | | |
| |
| | | For the year ended December 31, | |
Institutional Class | | 2013 | | | 2012 | | | 2011 | | | 2010 | | | 2009 | |
Net Asset Value, Beginning of Year | | $ | 8.16 | | | $ | 7.59 | | | $ | 7.82 | | | $ | 7.42 | | | $ | 5.29 | |
Income from Investment Operations: | | | | | | | | | | | | | | | | | | | | |
Net investment income | | | 0.49 | 3 | | | 0.56 | 3 | | | 0.59 | 3 | | | 0.63 | | | | 0.64 | |
Net realized and unrealized gain (loss) on investments | | | 0.02 | 3 | | | 0.58 | 3 | | | (0.22 | )3 | | | 0.40 | | | | 2.11 | |
Total from investment operations | | | 0.51 | | | | 1.14 | | | | 0.37 | | | | 1.03 | | | | 2.75 | |
Less Distributions to Shareholders from: | | | | | | | | | | | | | | | | | | | | |
Net investment income | | | (0.49 | ) | | | (0.57 | ) | | | (0.60 | ) | | | (0.63 | ) | | | (0.62 | ) |
Net Asset Value, End of Year | | $ | 8.18 | | | $ | 8.16 | | | $ | 7.59 | | | $ | 7.82 | | | $ | 7.42 | |
Total Return1 | | | 6.47 | % | | | 15.46 | % | | | 4.83 | % | | | 14.58 | %7 | | | 54.64 | %7 |
Ratio of net expenses to average net assets (with offsets/reductions) | | | 0.92 | %8 | | | 0.90 | %9 | | | 0.90 | % | | | 0.90 | % | | | 0.90 | % |
Ratio of expenses to average net assets (with offsets) | | | 0.92 | %8 | | | 0.90 | %9 | | | 0.90 | % | | | 0.90 | % | | | 0.90 | % |
Ratio of total expenses to average net assets (without offsets/reductions)2 | | | 1.45 | %8 | | | 1.48 | %9 | | | 1.44 | % | | | 1.53 | % | | | 1.42 | % |
Ratio of net investment income to average net assets1 | | | 6.01 | %8 | | | 7.12 | %9 | | | 7.60 | % | | | 8.26 | % | | | 9.68 | % |
Portfolio turnover | | | 39 | % | | | 48 | % | | | 48 | % | | | 60 | % | | | 56 | % |
Net assets at end of year (000’s omitted) | | $ | 2,765 | | | $ | 2,538 | | | $ | 5,247 | | | $ | 4,718 | | | $ | 3,658 | |
| | | | | | | | | | | | | | | | | | | | |
47
Managers AMG GW&K Fixed Income Fund
Financial Highlights
For a share outstanding throughout each period
| | | | | | | | | | | | | | | | | | | | |
| | | For the year ended December 31, | |
Investor Class | | 2013 | | | 2012 | | | 2011 | | | 2010 | | | 2009 | |
Net Asset Value, Beginning of Year | | $ | 11.24 | | | $ | 10.81 | | | $ | 11.00 | | | $ | 10.43 | | | $ | 8.93 | |
Income from Investment Operations: | | | | | | | | | | | | | | | | | | | | |
Net investment income | | | 0.24 | 3 | | | 0.44 | 3 | | | 0.46 | 3 | | | 0.47 | | | | 0.52 | |
Net realized and unrealized gain (loss) on investments | | | (0.21 | )3 | | | 0.58 | 3 | | | 0.03 | 3 | | | 0.56 | | | | 1.49 | |
Total from investment operations | | | 0.03 | | | | 1.02 | | | | 0.49 | | | | 1.03 | | | | 2.01 | |
Less Distributions to Shareholders from: | | | | | | | | | | | | | | | | | | | | |
Net investment income | | | (0.26 | ) | | | (0.48 | ) | | | (0.51 | ) | | | (0.46 | ) | | | (0.49 | ) |
Net realized gain on investments | | | (1.05 | ) | | | (0.11 | ) | | | (0.17 | ) | | | — | | | | (0.02 | ) |
Total distributions to shareholders | | | (1.31 | ) | | | (0.59 | ) | | | (0.68 | ) | | | (0.46 | ) | | | (0.51 | ) |
Net Asset Value, End of Year | | $ | 9.96 | | | $ | 11.24 | | | $ | 10.81 | | | $ | 11.00 | | | $ | 10.43 | |
Total Return1 | | | 0.29 | % | | | 9.53 | % | | | 4.53 | % | | | 10.04 | % | | | 23.14 | % |
Ratio of net expenses to average net assets (with offsets/reductions) | | | 0.86 | %10 | | | 0.84 | %11 | | | 0.84 | % | | | 0.84 | % | | | 0.84 | % |
Ratio of expenses to average net assets (with offsets) | | | 0.86 | %10 | | | 0.84 | %11 | | | 0.84 | % | | | 0.84 | % | | | 0.84 | % |
Ratio of total expenses to average net assets (without offsets/reductions)2 | | | 1.08 | %10 | | | 1.04 | %11 | | | 1.05 | % | | | 1.07 | % | | | 1.08 | % |
Ratio of net investment income to average net assets1 | | | 2.14 | %10 | | | 3.92 | %11 | | | 4.18 | % | | | 4.13 | % | | | 5.30 | % |
Portfolio turnover | | | 43 | % | | | 110 | % | | | 28 | % | | | 23 | % | | | 42 | % |
Net assets at end of year (000’s omitted) | | $ | 32,009 | | | $ | 41,772 | | | $ | 35,647 | | | $ | 38,655 | | | $ | 40,625 | |
| | | | | | | | | | | | | | | | | | | | |
| | | | | | | | |
Service Class | | For the year ended
December 31, 2013 | | | For the period ended
December 1, 2012
through
December 31, 2012** | |
Net Asset Value, Beginning of Period | | $ | 11.28 | | | $ | 11.41 | |
Income from Investment Operations: | | | | | | | | |
Net investment income3 | | | 0.26 | | | | 0.02 | |
Net realized and unrealized gain (loss) on investments3 | | | (0.22 | ) | | | 0.01 | |
Total from investment operations | | | 0.04 | | | | 0.03 | |
Less Distributions to Shareholders from: | | | | | | | | |
Net investment income | | | (0.28 | ) | | | (0.05 | ) |
Net realized gain on investments | | | (1.05 | ) | | | (0.11 | ) |
Total distributions to shareholders | | | (1.33 | ) | | | (0.16 | ) |
Net Asset Value, End of Period | | $ | 9.99 | | | $ | 11.28 | |
Total Return1 | | | 0.41 | % | | | 0.26 | %12 |
Ratio of net expenses to average net assets (with offsets/reductions) | | | 0.69 | %10 | | | 0.64 | %11,13 |
Ratio of expenses to average net assets (with offsets) | | | 0.69 | %10 | | | 0.64 | %11,13 |
Ratio of total expenses to average net assets (without offsets/reductions)2 | | | 0.91 | %10 | | | 0.90 | %11,13 |
Ratio of net investment income to average net assets1 | | | 2.31 | %10 | | | 2.07 | %11,13 |
Portfolio turnover | | | 43 | % | | | 110 | % |
Net assets at end of period (000’s omitted) | | $ | 1,563 | | | $ | 10 | |
| | | | | | | | |
48
Managers AMG GW&K Fixed Income Fund
Financial Highlights
For a share outstanding throughout each year
| | | | | | | | | | | | | | | | | | | | |
| | | For the year ended December 31, | |
Class C | | 2013 | | | 2012†† | | | 2011 | | | 2010 | | | 2009 | |
Net Asset Value, Beginning of Year | | $ | 11.22 | | | $ | 10.79 | | | $ | 10.98 | | | $ | 10.41 | | | $ | 8.92 | |
Income from Investment Operations: | | | | | | | | | | | | | | | | | | | | |
Net investment income | | | 0.15 | 3 | | | 0.36 | 3 | | | 0.38 | 3 | | | 0.39 | | | | 0.44 | |
Net realized and unrealized gain (loss) on investments | | | (0.20 | )3 | | | 0.57 | 3 | | | 0.02 | 3 | | | 0.56 | | | | 1.49 | |
Total from investment operations | | | (0.05 | ) | | | 0.93 | | | | 0.40 | | | | 0.95 | | | | 1.93 | |
Less Distributions to Shareholders from: | | | | | | | | | | | | | | | | | | | | |
Net investment income | | | (0.18 | ) | | | (0.39 | ) | | | (0.42 | ) | | | (0.38 | ) | | | (0.42 | ) |
Net realized gain on investments | | | (1.05 | ) | | | (0.11 | ) | | | (0.17 | ) | | | — | | | | (0.02 | ) |
Total distributions to shareholders | | | (1.23 | ) | | | (0.50 | ) | | | (0.59 | ) | | | (0.38 | ) | | | (0.44 | ) |
Net Asset Value, End of Year | | $ | 9.94 | | | $ | 11.22 | | | $ | 10.79 | | | $ | 10.98 | | | $ | 10.41 | |
Total Return1 | | | (0.50 | )%7 | | | 8.72 | %7 | | | 3.73 | % | | | 9.22 | % | | | 22.13 | % |
Ratio of net expenses to average net assets (with offsets/reductions) | | | 1.61 | %10 | | | 1.59 | %11 | | | 1.59 | % | | | 1.59 | % | | | 1.59 | % |
Ratio of expenses to average net assets (with offsets) | | | 1.61 | %10 | | | 1.59 | %11 | | | 1.59 | % | | | 1.59 | % | | | 1.59 | % |
Ratio of total expenses to average net assets (without offsets/reductions)2 | | | 1.83 | %10 | | | 1.79 | %11 | | | 1.80 | % | | | 1.82 | % | | | 1.83 | % |
Ratio of net investment income to average net assets1 | | | 1.38 | %10 | | | 3.18 | %11 | | | 3.42 | % | | | 3.39 | % | | | 4.53 | % |
Portfolio turnover | | | 43 | % | | | 110 | % | | | 28 | % | | | 23 | % | | | 42 | % |
Net assets at end of year (000’s omitted) | | $ | 20,793 | | | $ | 33,026 | | | $ | 33,615 | | | $ | 45,363 | | | $ | 57,658 | |
| | | | | | | | | | | | | | | | | | | | |
| | | | | | | | | | | | | | | | | | | | |
| | | For the year ended December 31, | |
Institutional Class | | 2013 | | | 2012 | | | 2011 | | | 2010 | | | 2009 | |
Net Asset Value, Beginning of Year | | $ | 11.28 | | | $ | 10.84 | | | $ | 11.03 | | | $ | 10.46 | | | $ | 8.96 | |
Income from Investment Operations: | | | | | | | | | | | | | | | | | | | | |
Net investment income | | | 0.27 | 3 | | | 0.47 | 3 | | | 0.49 | 3 | | | 0.49 | | | | 0.55 | |
Net realized and unrealized gain (loss) on investments | | | (0.22 | )3 | | | 0.58 | 3 | | | 0.02 | 3 | | | 0.57 | | | | 1.48 | |
Total from investment operations | | | 0.05 | | | | 1.05 | | | | 0.51 | | | | 1.06 | | | | 2.03 | |
Less Distributions to Shareholders from: | | | | | | | | | | | | | | | | | | | | |
Net investment income | | | (0.29 | ) | | | (0.50 | ) | | | (0.53 | ) | | | (0.49 | ) | | | (0.51 | ) |
Net realized gain on investments | | | (1.05 | ) | | | (0.11 | ) | | | (0.17 | ) | | | — | | | | (0.02 | ) |
Total distributions to shareholders | | | (1.34 | ) | | | (0.61 | ) | | | (0.70 | ) | | | (0.49 | ) | | | (0.53 | ) |
Net Asset Value, End of Year | | $ | 9.99 | | | $ | 11.28 | | | $ | 10.84 | | | $ | 11.03 | | | $ | 10.46 | |
Total Return1 | | | 0.46 | % | | | 9.89 | % | | | 4.79 | % | | | 10.29 | % | | | 23.39 | % |
Ratio of net expenses to average net assets (with offsets/reductions) | | | 0.61 | %10 | | | 0.59 | %11 | | | 0.59 | % | | | 0.59 | % | | | 0.59 | % |
Ratio of expenses to average net assets (with offsets) | | | 0.61 | %10 | | | 0.59 | %11 | | | 0.59 | % | | | 0.59 | % | | | 0.59 | % |
Ratio of total expenses to average net assets (without offsets/reductions)2 | | | 0.83 | %10 | | | 0.79 | %11 | | | 0.80 | % | | | 0.82 | % | | | 0.83 | % |
Ratio of net investment income to average net assets1 | | | 2.39 | %10 | | | 4.21 | %11 | | | 4.41 | % | | | 4.34 | % | | | 5.55 | % |
Portfolio turnover | | | 43 | % | | | 110 | % | | | 28 | % | | | 23 | % | | | 42 | % |
Net assets at end of year (000’s omitted) | | $ | 59,182 | | | $ | 65,573 | | | $ | 64,573 | | | $ | 61,748 | | | $ | 34,723 | |
| | | | | | | | | | | | | | | | | | | | |
49
Notes to Financial Highlights
The following footnotes should be read in conjunction with the Financial Highlights of the Funds previously presented in this report.
| | ** | Commenced operations on December 1, 2012 |
| | †† | Closed to new investments. |
| | 1 | Total returns and net investment income would have been lower had certain expenses not been offset. |
| | 2 | Excludes the impact of expense reimbursements or fee waivers and expense reductions such as brokerage credits, but includes expense repayments and non-reimbursable expenses, if any, such as interest, taxes and extraordinary expenses. |
| | 3 | Per share numbers have been calculated using average shares. |
| | 4 | Includes non-routine extraordinary expenses amounting to 0.019%, 0.014% and 0.019% of average net assets for the Investor Class, Service Class and Institutional Class, respectively. |
| | 5 | Includes non-routine extraordinary expenses amounting to 0.005%, 0.005% and 0.004% of average net assets for the Investor Class, Service Class and Institutional Class, respectively. |
| | 6 | Effective July 1, 2012, the Fund’s expense cap was reduced to 0.84% from 1.00%. The expense ratio shown reflects the weighted average expense ratio for the full year ended December 31, 2012. |
| | 7 | The total return is based on the Financial Statement Net Asset Values as shown. |
| | 8 | Includes non-routine extraordinary expenses amounting to 0.020% and 0.021% of average net assets for the Investor Class and Institutional Class, respectively. |
| | 9 | Includes non-routine extraordinary expenses amounting to 0.005% and 0.004% of average net assets for the Investor Class and Institutional Class, respectively. |
| | 10 | Includes non-routine extraordinary expenses amounting to 0.021%, 0.016%, 0.021% and 0.020% of average net assets for the Investor Class, Service Class, Class C and Institutional Class, respectively. |
| | 11 | Includes non-routine extraordinary expenses amounting to 0.004%, 0.005%, 0.004% and 0.004% of average net assets for the Investor Class, Service Class, Class C and Institutional Class, respectively. |
| | 14 | Includes non-recurring dividends. Without these dividends, net investment income per share would have been $0.09, $0.12, and $0.13 for Managers AMG Chicago Equity Partners Balanced Fund’s Investor Class, Service Class, and Institutional Class shares, respectively. |
50
Notes to Financial Statements
December 31, 2013
| 1. | Summary of Significant Accounting Policies |
Managers Trust II (the “Trust”) is an open-end management investment company organized as a Massachusetts business trust and registered under the Investment Company Act of 1940, as amended (the “1940 Act”). Currently, the Trust consists of a number of different Funds, each having distinct investment management objectives, strategies, risks, and policies. Included in this report are Managers AMG Chicago Equity Partners Balanced Fund (“Balanced”), Managers High Yield Fund (“High Yield”) and Managers AMG GW&K Fixed Income Fund, (“Fixed Income”), each a “Fund” and collectively the “Funds.” High Yield will deduct a 2.00% redemption fee from the proceeds of any redemption (including a redemption by exchange) of shares if the redemption occurs within 30 days of the purchase of those shares. For the year ended December 31, 2013, High Yield had redemption fees amounting to $1,038.
Effective December 1, 2012, Class A shares of the Balanced, High Yield and Fixed Income Funds were renamed Investor Class shares. Additionally, Balanced and Fixed Income Funds established one additional share class: Service Class shares. On November 30, 2012 at the close of business, all outstanding Class C shares of the Balanced, and High Yield Funds were automatically converted to a number of full and/or fractional Investor Class shares equal in value to the shareholder Class C shares of each respective Fund. On November 30, 2012 at the close of business, all outstanding Class B shares of the Fixed Income Fund were automatically converted to a number of full and/or fractional Investor Class shares equal in value to the shareholder Class B shares.
Effective December 1, 2012, Class C shares of Fixed Income were closed to all new investors and will no longer be available for purchase by existing shareholders, including purchase by exchange, except for purchases made by automatic reinvestment of dividends and capital gains pursuant to the Fund’s automatic reinvestment plan. Shareholders who redeem Class C shares of the Fund will continue to be subject to the deferred sales charges described in the Prospectus.
Balanced and Fixed Income each offer three classes of shares: Investor, Service and Institutional Class. High Yield has two classes of shares: Investor and Institutional Class. Each class represents an interest in the same assets of the Fund. Although all share classes generally have identical voting rights, each share class votes separately when required by law. Different share classes may pay different distribution amounts to the extent the net asset value per share and/or the expenses of such share classes differ. Each share class has its own expense structure. Please refer to a current prospectus for additional information on each share class.
The Funds’ financial statements are prepared in accordance with accounting principles generally accepted in the United States of America (“U.S. GAAP”), which require management to make estimates and assumptions that affect the reported amounts of assets and liabilities and disclosure of contingent assets and liabilities at the date of the financial statements and the reported amounts of income and expenses during the reporting period. Actual results could differ from those estimates and such differences could be material. The following is a summary of significant accounting policies followed by the Funds in the preparation of their financial statements:
| a. | Valuation of Investments |
Equity securities traded on a domestic securities exchange are valued at the last quoted sale price, or, lacking any sales, at the last quoted bid price. Equity securities primarily traded on an international securities exchange and equity securities traded on NASDAQ or in a U.S. or non-U.S. over-the-counter market are valued at the market’s official closing price, or, if there are no trades on the applicable date, at the last quoted bid price. In addition, if the applicable market does not offer an official closing price or if the official closing price is not representative of the overall market, equity securities primarily traded on an international securities exchange and equity securities traded in a non-U.S. over-the-counter market are valued at the last quoted sales price. The Funds investments are generally valued based on independent market quotations or prices or, if none, “evaluative” or other market based valuations provided by third-party pricing services approved by the Board of Trustees of the Funds (the “Board”).
Fixed-income securities are valued based on valuations furnished by independent pricing services that utilize matrix systems, which reflect such factors as security prices, yields, maturities, and ratings, and are supplemented by dealer and exchange quotations. Debt obligations (other than short term debt obligations that have 60 days or less remaining until maturity) will be valued using the evaluated bid price or the mean price provided by an authorized pricing service. Short term debt obligations (debt obligations with maturities of one year or less at the time of issuance) that have 60 days or less remaining until maturity will be valued at amortized cost.
Under certain circumstances, the value of certain Fund investments (including derivatives) may be based on an evaluation of fair value, pursuant to procedures established by and under the general supervision of the Board. The Pricing Committee is the committee formed by the Board to make fair value determinations for such investments. The Fund may use the fair value of a portfolio investment to calculate its net asset value (“NAV”) in the event that the market quotation, price or market based valuation for the portfolio investment is not deemed to be readily available or otherwise not determinable pursuant to the Board’s valuation procedures, if Managers Investment Group LLC (the “Investment Manager”) believes the quotation, price or market based valuation to be unreliable, or in certain other circumstances. When determining the fair value of an investment, the Pricing Committee seeks to determine the price that the Fund might reasonably expect to receive from a current sale of that investment in an arms-length transaction. Fair value determinations shall be based upon consideration of all available facts and information, including, but not limited to (i) attributes specific to the investment; (ii) fundamental analytical data and press releases relating to the investment and its issuer; and (iii) the value of other comparable securities or relevant financial instruments, including derivative securities, traded on other markets or among dealers.
The values assigned to fair value investments are based on available information and do not necessarily represent amounts that might ultimately be realized in the future, since such amounts depend on future developments inherent in long-term investments. Because of the inherent uncertainty of valuation, those estimated values may differ significantly from the values that would have been used had a
Notes to Financial Statements (continued)
ready market for the investments existed, and the differences could be material. The Board will be presented with a quarterly report showing as of the most recent quarter end, all outstanding securities fair valued by the Pricing Committee, including a comparison with the prior quarter end and the percentage of the Fund that the security represents at each quarter end.
Portfolio investments that trade primarily on foreign markets are priced based upon the market quotation of such securities as of the close of their respective principal markets. Under certain circumstances, on behalf of a fund that invests primarily in international securities, the Investment Manager or applicable subadvisor may adjust such prices based on its determination of the impact of events occurring subsequent to the close of such markets but prior to the time as of which each Fund calculates its NAV. The Board has also adopted a policy that securities held in a fund that invests primarily in international securities and certain foreign debt obligations held by a fund, in each case, that can be fair valued by the applicable fair value pricing service are fair valued on each business day without regard to a “trigger” (e.g., without regard to invoking fair value based upon a change in a U.S. equity securities index exceeding a pre-determined level). The Funds may invest in securities that may be thinly traded. The Board has adopted procedures to adjust prices of securities that are judged to be stale so that they reflect fair value. An investment valued on the basis of its fair value may be valued at a price higher or lower than available market quotations.
U.S. GAAP defines fair value as the price that a Fund would receive to sell an asset or pay to transfer a liability in an orderly transaction between market participants at the measurement date. U.S. GAAP also establishes a framework for measuring fair value, and a three level hierarchy for fair value measurements based upon the transparency of inputs to the valuation of an asset or liability. Inputs may be observable or unobservable and refer broadly to the assumptions that market participants would use in pricing the asset or liability. Observable inputs reflect the assumptions market participants would use in pricing the asset or liability based on market data obtained from sources independent of the Funds. Unobservable inputs reflect the Funds’ own assumptions about the assumptions that market participants would use in pricing the asset or liability developed based on the best information available in the circumstances. Each investment is assigned a level based upon the observability of the inputs which are significant to the overall valuation.
The three-tier hierarchy of inputs is summarized below:
Level 1 – inputs are quoted prices in active markets for identical investments (e.g., equity securities, open-end investment companies)
Level 2 – other observable inputs (including, but not limited to: quoted prices for similar assets or liabilities in markets that are active, quoted prices for identical or similar assets or liabilities in markets that are not active, inputs other than quoted prices that are observable for the assets or liabilities (such as interest rates, yield curves, volatilities, prepayment speeds, loss severities, credit risks and default rates) or other market corroborated inputs) (e.g., debt securities, government securities, foreign currency exchange
contracts, foreign securities utilizing international fair value pricing, broker-quoted securities, fair valued securities with observable inputs)
Level 3 – inputs are significant unobservable inputs (including the Fund’s own assumptions used to determine the fair value of investments) (e.g., fair valued securities with unobservable inputs)
Changes in inputs or methodologies used for valuing investments may result in a transfer in or out of levels within the fair value hierarchy. The inputs or methodologies used for valuing investments are not necessarily an indication of the risk associated with investing in those investments.
Security transactions are accounted for as of trade date. Realized gains and losses on securities sold are determined on the basis of identified cost.
| c. | Investment Income and Expenses |
Dividend income is recorded on the ex-dividend date. Dividend and interest income on foreign securities is recorded gross of any withholding tax. Interest income, which includes amortization of premium and accretion of discount on debt securities, is accrued as earned. Non-cash dividends included in dividend income, if any, are reported at the fair market value of the securities received. Other income and expenses are recorded on an accrual basis. Expenses that cannot be directly attributed to a Fund are apportioned among the Funds in the Trust and in some cases other affiliated funds based upon their relative average net assets or number of shareholders. Investment income, realized and unrealized capital gains and losses, the common expenses of each Fund, and certain Fund level expense reductions, if any, are allocated on a pro-rata basis to each class based on the relative net assets of each class to the total net assets of each Fund.
Balanced had certain portfolio trades directed to various brokers, under a brokerage recapture program, which paid a portion of the Fund’s expenses. For the year ended December 31, 2013, the amount by which the Fund’s expenses were reduced and the impact on the expense ratios, if any, was $4,396 or 0.01%.
The Funds have a “balance credit” arrangement with The Bank of New York Mellon (“BNYM”), the Funds’ custodian, whereby each Fund is credited with an interest factor equal to 0.75% below the effective 90-day T-Bill rate for account balances left uninvested overnight. If the T-Bill rate falls below 0.75%, no credits will be earned. These credits serve to reduce custody expenses that would otherwise be charged to each Fund. For the year ended December 31, 2013, the Funds’ custodian expense was not reduced.
Overdraft fees are computed at 1% above the effective Federal Funds rate on the day of the overdraft. Prior to January 1, 2013, the rate was 2% above the effective Federal Funds rate. For the year ended December 31, 2013, overdraft fees for Balanced and High Yield equaled $22 and $41, respectively.
The Trust recently held a shareholder meeting at which shareholders were asked to approve a new Declaration of Trust for the Trust, among other proposals. The costs associated with this proxy were treated as “extraordinary expenses,” and, therefore, are excluded from the expense limitation agreement described in Note 2.
Notes to Financial Statements (continued)
| d. | Dividends and Distributions |
Each Funds’ distributions resulting from either net investment income or realized net capital gains, if any, will normally be declared and paid at least monthly for Fixed Income and High Yield, and quarterly for Balanced, as described in the each Fund’s prospectus. Distributions to shareholders are recorded on the ex-dividend date. Distributions are determined in accordance with Federal income tax regulations, which may differ from net investment income and net realized capital gains for financial statement purposes (U.S. GAAP). Differences may be permanent or
temporary. Permanent differences are reclassified among capital accounts in the financial statements to reflect their tax character. Temporary differences arise when certain items of income, expense and gain or loss are recognized in different periods for financial statement and tax purposes; these differences will reverse at some time in the future. The most common differences are due to differing treatments for losses deferred due to wash sales, REITS, foreign currency, and market discount transactions. Permanent book and tax basis differences, if any, relating to shareholder distributions will result in reclassifications to paid-in capital.
The tax character of distributions paid during the years ended December 31, 2013 and December 31, 2012 were as follows:
| | | | | | | | | | | | | | | | | | | | | | | | |
| | | Balanced | | | High Yield | | | Fixed Income | |
| | | 2013 | | | 2012 | | | 2013 | | | 2012 | | | 2013 | | | 2012 | |
Distributions paid from: | | | | | | | | | | | | | | | | | | | | | | | | |
Ordinary income | | $ | 261,125 | | | $ | 435,372 | | | $ | 1,971,250 | | | $ | 2,053,012 | | | $ | 3,008,950 | | | $ | 5,835,999 | |
Short-term capital gains | | | 1,954,176 | | | | 291,196 | | | | — | | | | — | | | | 501,201 | | | | 16,794 | |
Long-term capital gains | | | 1,946,888 | | | | 1,358,610 | | | | — | | | | — | | | | 10,348,035 | | | | 1,273,035 | |
| | | | | | | | | | | | | | | | | | | | | | | | |
Total | | $ | 4,162,189 | | | $ | 2,085,178 | | | $ | 1,971,250 | | | $ | 2,053,012 | | | $ | 13,858,186 | | | $ | 7,125,828 | |
| | | | | | | | | | | | | | | | | | | | | | | | |
As of December 31, 2013, the components of distributable earnings (excluding unrealized appreciation/depreciation) on a tax basis consisted of:
| | | | | | | | | | | | |
| | | Balanced | | | High Yield | | | Fixed Income | |
Capital loss carryforward | | | — | | | $ | 2,566,638 | | | $ | 296,482 | |
Undistributed ordinary income | | $ | 13,536 | | | | 6,409 | | | | 51,441 | |
Undistributed short-term capital gains | | | 164,645 | | | | — | | | | — | |
Undistributed long-term capital gains | | | 576,099 | | | | — | | | | — | |
Post-October loss deferral | | | — | | | | — | | | | 84,096 | |
Each Fund intends to comply with the requirements under Subchapter M of the Internal Revenue Code of 1986, as amended, and to distribute substantially all of its taxable income and gains to its shareholders and to meet certain diversification and income requirements with respect to investment companies. Therefore, no provision for Federal income or excise tax is included in the accompanying financial statements.
Additionally, based on each Fund’s understanding of the tax rules and rates related to income, gains and transactions for the foreign jurisdictions in which it invests, each Funds’ will provide for foreign taxes, and where appropriate, deferred foreign taxes.
Management has analyzed the Funds’ tax positions taken on federal income tax returns as of December 31, 2013 and all open tax years (generally, the three prior taxable years), and has concluded that no provision for federal income tax is required in the Funds’ financial statements. Additionally, the Funds are not aware of any tax position for which it is reasonably possible that the total amounts of unrecognized tax benefits will change materially in the next twelve months.
Net capital losses incurred in taxable years beginning after the enactment of the Regulated Investment Company Modernization Act of 2010 (post-enactment capital losses) may be carried forward for an unlimited time period. Such losses incurred will be required to be utilized prior to any loss carryovers incurred in pre-enactment taxable years, which generally expire eight years following the close of the taxable year in which they were incurred. As a result of this ordering rule, pre-enactment capital loss carryovers may be more likely to expire unused. Additionally, post-enactment capital losses that are carried forward will retain their tax character as either short-term or long-term capital losses, unlike pre-enactment losses which are considered all short-term.
| f. | Capital Loss Carryovers and Deferrals |
As of December 31, 2013, the following Funds had accumulated net realized capital loss carryovers from securities transactions for Federal income tax purposes as shown in the following chart. These amounts may be used to offset future realized capital gains, if any, through the expiration dates listed or in the case of post-enactment losses, for an unlimited time period.
53
Notes to Financial Statements (continued)
| | | | | | | | |
| | | Capital Loss Carryover
Amounts | | Expires |
Fund | | Short-Term | | | Long-Term | | December 31, |
Balanced | | | | | | | | |
(Post-Enactment) | | | — | | | — | | |
| | | | | | | | |
High Yield | | | | | | | | |
(Pre-Enactment) | | $ | 2,566,638 | | | — | | 2017 |
| | | | | | | | |
Fixed Income | | | | | | | | |
(Post-Enactment) | | $ | 296,482 | | | — | | Unlimited |
| | | | | | | | |
For the year ended December 31, 2013, the following Funds utilized capital loss carryovers in the amount of:
| | | | | | | | |
| | | Capital Loss Carryover Utilized | |
| | | Short-Term | | | Long-Term | |
Balanced | | | — | | | | — | |
High Yield | | $ | 647,926 | | | | — | |
Fixed Income | | | — | | | | — | |
The Trust’s Declaration of Trust authorizes for each series the issuance of an unlimited number of shares of beneficial interest, without par value. Each Fund records sales and repurchases of its capital stock on the trade date. The cost of securities contributed to the Funds in connection with the issuance of shares is based on the valuation of those securities in accordance with the Funds’ policy on investment valuation.
For the years ended December 31, 2013 and December 31, 2012, the capital stock transactions by class for Balanced, High Yield, and Fixed Income were:
| | | | | | | | | | | | | | | | | | | | | | | | | | | | | | | | |
| | | Balanced | | | High Yield | |
| | | 2013 | | | 2012 | | | 2013 | | | 2012 | |
| | | Shares | | | Amount | | | Shares | | | Amount | | | Shares | | | Amount | | | Shares | | | Amount | |
Investor Class: | | | | | | | | | | | | | | | | | | | | | | | | | | | | | | | | |
Proceeds from sale of shares† | | | 862,843 | | | $ | 13,221,782 | | | | 1,298,034 | | | $ | 19,007,524 | | | | 1,119,812 | | | $ | 9,011,674 | | | | 1,324,130 | | | $ | 10,466,494 | |
Reinvestment of distributions | | | 151,722 | | | | 2,293,355 | | | | 55,303 | | | | 783,378 | | | | 188,996 | | | | 1,525,171 | | | | 182,953 | | | | 1,433,603 | |
Cost of shares repurchased | | | (659,229 | ) | | | (10,107,175 | ) | | | (795,780 | ) | | | (11,779,865 | ) | | | (1,203,338 | ) | | | (9,731,843 | ) | | | (879,360 | ) | | | (6,852,197 | ) |
| | | | | | | | | | | | | | | | | | | | | | | | | | | | | | | | |
Net increase | | | 355,336 | | | $ | 5,407,962 | | | | 557,557 | 1 | | $ | 8,011,037 | 1 | | | 105,470 | | | $ | 805,002 | | | | 627,723 | 1 | | $ | 5,047,900 | 1 |
| | | | | | | | | | | | | | | | | | | | | | | | | | | | | | | | |
Service Class: | | | | | | | | | | | | | | | | | | | | | | | | | | | | | | | | |
Proceeds from sale of shares | | | 139,347 | | | $ | 2,145,144 | | | | 662 | | | $ | 10,000 | | | | — | | | | — | | | | — | | | | — | |
Reinvestment of distributions | | | 2,844 | | | | 43,379 | | | | 35 | | | | 497 | | | | — | | | | — | | | | — | | | | — | |
Cost of shares repurchased | | | (39,268 | ) | | | (602,180 | ) | | | — | | | | — | | | | — | | | | — | | | | — | | | | — | |
| | | | | | | | | | | | | | | | | | | | | | | | | | | | | | | | |
Net increase | | | 102,923 | | | $ | 1,586,343 | | | | 697 | 2 | | $ | 10,497 | 2 | | | — | | | | — | | | | — | | | | — | |
| | | | | | | | | | | | | | | | | | | | | | | | | | | | | | | | |
Class C: | | | | | | | | | | | | | | | | | | | | | | | | | | | | | | | | |
Proceeds from sale of shares | | | — | | | | — | | | | 278,363 | | | $ | 4,045,328 | | | | — | | | | — | | | | 34,188 | | | $ | 263,193 | |
Reinvestment of distributions | | | — | | | | — | | | | 313 | | | | 4,619 | | | | — | | | | — | | | | 12,626 | | | | 97,097 | |
Cost of shares repurchased | | | — | | | | — | | | | (464,632 | ) | | | (6,881,020 | ) | | | — | | | | — | | | | (447,833 | ) | | | (3,503,391 | ) |
| | | | | | | | | | | | | | | | | | | | | | | | | | | | | | | | |
Net decrease | | | — | | | | — | | | | (185,956 | )3 | | $ | (2,831,073 | )3 | | | — | | | | — | | | | (401,019 | )3 | | $ | (3,143,101 | )3 |
| | | | | | | | | | | | | | | | | | | | | | | | | | | | | | | | |
Institutional Class: | | | | | | | | | | | | | | | | | | | | | | | | | | | | | | | | |
Proceeds from sale of shares | | | 133,480 | | | $ | 2,051,173 | | | | 203,895 | | | $ | 2,978,828 | | | | 83,390 | | | $ | 681,130 | | | | 85,065 | | | $ | 669,760 | |
Reinvestment of distributions | | | 66,455 | | | | 1,013,186 | | | | 40,168 | | | | 575,365 | | | | 17,401 | | | | 141,883 | | | | 18,704 | | | | 148,010 | |
Cost of shares repurchased | | | (141,969 | ) | | | (2,204,719 | ) | | | (216,030 | ) | | | (3,166,672 | ) | | | (73,870 | ) | | | (607,276 | ) | | | (484,301 | ) | | | (3,732,264 | ) |
| | | | | | | | | | | | | | | | | | | | | | | | | | | | | | | | |
Net increase (decrease) | | | 57,966 | | | $ | 859,640 | | | | 28,033 | | | $ | 387,521 | | | | 26,921 | | | $ | 215,737 | | | | (380,532 | ) | | $ | (2,914,494 | ) |
| | | | | | | | | | | | | | | | | | | | | | | | | | | | | | | | |
| † | For the year ended December 31, 2012, 409,598 shares and $6,135,903 are included due to the conversion of Class C shares into Investor Class shares for Balanced and 313,604 shares and $2,509,713 are included due to the conversion of Class C shares into Investor Class shares for High Yield. |
| 1 | Effective December 1, 2012, all Class A shares were renamed Investor Class shares. |
| 2 | Commenced operations on December 1, 2012. |
| 3 | Effective December 1, 2012, all Class C shares converted to Investor Class shares. |
54
Notes to Financial Statements (continued)
| | | | | | | | | | | | | | | | |
| | | Fixed Income | |
| | | 2013 | | | 2012 | |
| | | Shares | | | Amount | | | Shares | | | Amount | |
Investor Class: | | | | | | | | | | | | | | | | |
Proceeds from sale of shares† | | | 976,849 | | | $ | 10,764,860 | | | | 1,133,166 | | | $ | 12,743,800 | |
Reinvestment of distributions | | | 281,916 | | | | 2,854,535 | | | | 114,841 | | | | 1,287,693 | |
Cost of shares repurchased | | | (1,759,013 | ) | | | (19,409,076 | ) | | | (831,087 | ) | | | (9,359,763 | ) |
| | | | | | | | | | | | | | | | |
Net increase (decrease) | | | (500,248 | ) | | $ | (5,789,681 | ) | | | 416,920 | 1 | | $ | 4,671,730 | 1 |
| | | | | | | | | | | | | | | | |
Service Class: | | | | | | | | | | | | | | | | |
Proceeds from sale of shares | | | 199,754 | | | $ | 2,248,555 | | | | 877 | | | $ | 10,000 | |
Reinvestment of distributions | | | 10,089 | | | | 102,030 | | | | 12 | | | | 140 | |
Cost of shares repurchased | | | (54,349 | ) | | | (600,286 | ) | | | — | | | | — | |
| | | | | | | | | | | | | | | | |
Net increase | | | 155,494 | | | $ | 1,750,299 | | | | 889 | 2 | | $ | 10,140 | 2 |
| | | | | | | | | | | | | | | | |
Class B: | | | | | | | | | | | | | | | | |
Proceeds from sale of shares | | | — | | | | — | | | | 2,268 | | | $ | 25,299 | |
Reinvestment of distributions | | | — | | | | — | | | | 4,350 | | | | 48,360 | |
Cost of shares repurchased | | | — | | | | — | | | | (308,045 | ) | | | (3,467,737 | ) |
| | | | | | | | | | | | | | | | |
Net decrease | | | — | | | | — | | | | (301,427 | )3 | | $ | (3,394,078 | )3 |
| | | | | | | | | | | | | | | | |
Class C: | | | | | | | | | | | | | | | | |
Proceeds from sale of shares | | | 46,320 | | | $ | 467,259 | | | | 414,299 | | | $ | 4,657,294 | |
Reinvestment of distributions | | | 174,351 | | | | 1,758,814 | | | | 90,235 | | | | 1,009,759 | |
Cost of shares repurchased | | | (1,071,521 | ) | | | (11,716,267 | ) | | | (677,615 | ) | | | (7,595,940 | ) |
| | | | | | | | | | | | | | | | |
Net decrease | | | (850,850 | ) | | $ | (9,490,194 | ) | | | (173,081 | )4 | | $ | (1,928,887 | )4 |
| | | | | | | | | | | | | | | | |
Institutional Class: | | | | | | | | | | | | | | | | |
Proceeds from sale of shares | | | 2,594,935 | | | $ | 28,487,585 | | | | 1,965,175 | | | $ | 22,161,321 | |
Reinvestment of distributions | | | 656,806 | | | | 6,694,001 | | | | 237,467 | | | | 2,671,220 | |
Cost of shares repurchased | | | (3,141,725 | ) | | | (34,770,787 | ) | | | (2,344,687 | ) | | | (26,329,086 | ) |
| | | | | | | | | | | | | | | | |
Net increase (decrease) | | | 110,016 | | | $ | 410,799 | | | | (142,045 | ) | | $ | (1,496,545 | ) |
| | | | | | | | | | | | | | | | |
| † | For the year ended December 31, 2012, 265,965 shares and $3,026,608 are included due to the conversion of Class B shares into Investor Class shares. |
| 1 | Effective December 1, 2012, all Class A shares were renamed Investor Class shares. |
| 2 | Commenced operations on December 1, 2012. |
| 3 | Effective December 1, 2012, Class B shares converted to Investor Class shares. |
| 4 | Effective December 1, 2012, shares are no longer available for purchase. |
At December 31, 2013, certain unaffiliated shareholders of record, specifically omnibus accounts, individually or collectively held greater than 10% of the net assets of the Funds as follows: Balanced – three collectively owned 54%; High Yield – one collectively owned 46%; Fixed Income – four collectively owned 65%. Transactions by these shareholders may have a material impact on their respective Funds.
The Funds may enter into repurchase agreements provided that the value of the underlying collateral, including accrued interest, will equal or exceed the value of the repurchase agreement during the term of the agreement. The underlying collateral for all repurchase agreements is held in safekeeping by the Fund’s custodian or at the Federal Reserve Bank. If the seller defaults and the value of the collateral declines, or if bankruptcy proceedings commence with respect to the seller of the security, realization of the collateral by the Fund may be delayed or limited. At December 31, 2013, the market value of repurchase agreements outstanding for Balanced,
High Yield and Fixed Income was $662,192, $558,954 and $1,132,284, respectively.
| i. | Foreign Currency Translation |
The books and records of the Funds are maintained in U.S. dollars. The value of investments, assets and liabilities denominated in currencies other than U.S. dollars are translated into U.S. dollars based upon current foreign exchange rates. Purchases and sales of foreign investments, income and expenses are converted into U.S. dollars based on currency exchange rates prevailing on the respective dates of such transactions. Net realized and unrealized gain (loss) on foreign currency transactions represent: (1) foreign exchange gains and losses from the sale and holdings of foreign currencies; (2) gains and losses between trade date and settlement date on investment securities transactions; and (3) gains and losses from the difference between amounts of interest and dividends recorded and the amounts actually received.
55
Notes to Financial Statements (continued)
The Funds do not isolate the net realized and unrealized gain or loss resulting from changes in exchange rates from the fluctuations in market prices of securities held. Such fluctuations are included with the net realized and unrealized gain or loss on investments.
The Funds invest in securities of foreign entities and in instruments denominated in foreign currencies which involve risks not typically associated with investments in domestic securities. Non-domestic securities carry special risks, such as exposure to currency fluctuations, less developed or less efficient trading markets, political instability, a lack of company information, differing auditing and legal standards, and, potentially, less liquidity.
Realized gains in certain countries may be subject to foreign taxes at the Fund level, at rates ranging from approximately 10% to 15%. The Funds would pay such foreign taxes on net realized gains at the appropriate rate for each jurisdiction.
| 2. | Agreements and Transactions with Affiliates |
For each of the Funds, the Trust has entered into an investment advisory agreement under which the Investment Manager, a subsidiary of Affiliated Managers Group, Inc. (“AMG”), serves as investment manager to the Funds and is responsible for the Funds’ overall administration and operations. The Investment Manager selects subadvisors for the Funds (subject to Board approval) and monitors each subadvisor’s investment performance, security holdings and investment strategies. Each Fund’s investment portfolio is managed by one or more portfolio managers who serve pursuant to a subadvisory agreement with the Investment Manager. Balanced is managed by Chicago Equity Partners, LLC (“CEP”). Fixed Income is managed by Gannett Welsh & Kotler, LLC (“GW&K”). AMG indirectly owns a majority interest in CEP and GW&K.
Investment management fees are paid directly by the Fund to the Investment Manager based on average daily net assets. For the year ended December 31, 2013, the Funds’ investment management fee were paid at the following annual rate of each Funds’ respective average daily net assets:
| | | | |
Balanced | | | 0.70 | % |
High Yield | | | 0.70 | % |
Fixed Income | | | 0.45 | % |
The Investment Manager has contractually agreed, through May 1, 2014, to waive management fees and pay or reimburse Fund expenses in order to limit total annual Fund operating expenses after fee waiver and expense reimbursements (exclusive of taxes, interest (including interest incurred in connection with bank and custody overdrafts), shareholder servicing fees, distribution and service (12b-1) fees, brokerage commission and other transaction costs, acquired fund fees and expenses and extraordinary expenses) of High Yield and Fixed Income to 0.90% and 0.59%, respectively, of each Fund’s average daily net assets subject to later reimbursement by the Funds in certain circumstances.
Effective July 1, 2012, Managers Investment Group LLC has contractually agreed through May 1, 2014, to waive management fees and/or reimburse Fund expenses in order to limit the Balanced Fund’s total annual operating expenses after fee waiver and expense
reimbursements (exclusive of taxes, interest (including interest incurred in connection with bank and custody overdrafts), shareholder servicing fees, distribution and service (12b-1) fees, brokerage commissions and other transaction costs, acquired fund fees and expenses, and extraordinary expenses) to 0.84% of average daily net assets. Immediately prior to July 1, 2012, the Fund had a contractual expense limitation of 1.00%.
Each Fund is obligated to repay the Investment Manager such amounts waived, paid or reimbursed in future years provided that the repayment occurs within thirty-six (36) months after the waiver or reimbursement and that such repayment would not cause that Fund’s total annual operating expenses after fee waiver and expense reimbursements in any such future year to exceed that Fund’s respective expense contractual expense limitation amount. For the year ended December 31, 2013, each Fund’s components of reimbursement available are detailed in the following chart:
| | | | | | | | | | | | |
| | | Balanced | | | High Yield | | | Fixed
Income | |
Reimbursement Available - 12/31/12 | | $ | 319,188 | | | $ | 537,581 | | | $ | 910,183 | |
Additional Reimbursements | | | 181,502 | | | | 179,573 | | | | 290,204 | |
Expired Reimbursements | | | (98,345 | ) | | | (200,682 | ) | | | (338,740 | ) |
| | | | | | | | | | | | |
Reimbursement Available - 12/31/13 | | $ | 402,345 | | | $ | 516,472 | | | $ | 861,647 | |
| | | | | | | | | | | | |
Each Fund has entered into an Administration and Shareholder Servicing Agreement under which the Investment Manager serves as the Funds’ administrator (the “Administrator”) and is responsible for all aspects of managing the Funds’ operations, including administration and shareholder services to each Fund, its shareholders, and certain institutions, such as bank trust departments, broker-dealers and registered investment advisers, that advise or act as an intermediary with the Funds’ shareholders. The Funds pay a fee to the Administrator at the rate of 0.20% per annum of each Fund’s average daily net assets for this service.
The aggregate annual retainer paid to each Independent Trustee of the Board is $105,000, plus $6,000 or $2,500 for each regular or special meeting attended, respectively. The Independent Chairman of the Trust receives an additional payment of $25,000 per year. The Chairman of the Audit Committee receives an additional payment of $10,000 per year. The Trustees’ fees and expenses are allocated among all of the funds in the Trusts for which the Investment Manager serves as the advisor (the “Managers Funds”) based on the relative net assets of such Funds. The “Trustees fees and expenses” shown in the financial statements represents each Fund’s allocated portion of the total fees and expenses paid by the Managers Funds.
Prior to January 1, 2013, the annual retainer paid to each Independent Trustee of the Board was $80,000, plus $5,000 or $2,500 for each regular or special meeting attended, respectively. The Independent Chairman of the Trust formerly received an additional payment of $20,000 per year. The Chairman of the Audit Committee formerly received an additional payment of $8,000 per year.
The Funds are distributed by Managers Distributors, Inc. (the “Distributor” or “MDI”), a wholly-owned subsidiary of the Investment Manager. MDI serves as the distributor and underwriter
Notes to Financial Statements (continued)
for each Fund and is a registered broker-dealer and member of the Financial Industry Regulatory Authority, Inc. (“FINRA”). Shares of each Fund will be continuously offered and will be sold directly to prospective purchasers and through brokers, dealers or other financial intermediaries who have executed selling agreements with MDI. Subject to the compensation arrangement discussed below, generally MDI bears all or a portion of the expenses of providing services pursuant to the distribution agreement, including the payment of the expenses relating to the distribution of prospectuses for sales purposes and any advertising or sales literature. Certain Trustees and Officers of the Funds are Officers and/or Directors of the Investment Manager, AMG and/or the Distributor.
The Trust has adopted a distribution and service plan (the “Plan”) with respect to the Investor Class, and Class C shares in accordance with the requirements of Rule 12b-1 under the 1940 Act and the requirements of the applicable rules of FINRA regarding asset-based sales charges. Pursuant to the Plan, each Fund may make payments to the Distributor for its expenditures in financing any activity primarily intended to result in the sale of each such class of the Fund’s shares and for maintenance and personal service provided to existing shareholders of that class. The Plan authorizes payments to the Distributor up to 0.25% annually of each Fund’s average daily net assets attributable to the Investor Class shares and 1.00% annually of each Fund’s average daily net assets attributable to Class C shares.
For the Balanced and Fixed Income Service Classes, the Board has approved reimbursement payments to the Investment Manager for shareholder servicing expenses incurred (“shareholder servicing fees”). Shareholder servicing fees include payments to third parties such as a bank, broker-dealer, trust company or other financial intermediaries who provide shareholder recordkeeping, account servicing and other services. The Service Class shares may reimburse the Investment Manager for the actual amount incurred up to a maximum annual rate of each Class’s average daily net assets as shown in the table below.
The impact on the annualized expense ratios for the year ended December 31, 2013, were as follows:
| | | | | | | | |
Fund | | Maximum Amount
Allowed | | | Actual Amount
Incurred | |
Balanced | | | | | | | | |
Service Class | | | 0.10 | % | | | 0.07 | % |
Fixed Income | | | | | | | | |
Service Class | | | 0.10 | % | | | 0.08 | % |
The Securities and Exchange Commission granted an exemptive order that permits the Funds to lend and borrow money for certain temporary purposes directly to and from other eligible Managers Funds. Participation in this interfund lending program is voluntary for both borrowing and lending funds, and an interfund loan is only made if it benefits each participating fund. The Investment Manager administers the program according to procedures approved by the Board, and the Board monitors the operation of the program. An interfund loan must comply with certain conditions set out in the exemptive order, which are designed to assure fairness and protect all participating Funds. For the year ended December 31, 2013, the
following Funds either borrowed from or lent to other Managers Funds: Fixed Income lent $4,200,178, for three days earning interest of $195. The interest amount is included in the Statement of Operations as interest income. For the year ended December 31, 2013, Balanced and High Yield neither borrowed from nor lent to other Managers Funds.
| 3. | Purchases and Sales of Securities |
Purchases and sales of securities (excluding short-term securities) for the year ended December 31, 2013, were as follows:
| | | | | | | | |
| | | Long-Term Securities
(excluding U.S. Government Obligations) | |
Fund | | Purchases | | | Sales | |
Balanced | | $ | 21,249,265 | | | $ | 26,102,905 | |
High Yield | | | 14,593,073 | | | | 12,466,411 | |
Fixed Income | | | 43,425,538 | | | | 47,162,386 | |
| |
| | | U.S. Government Obligations | |
Fund | | Purchases | | | Sales | |
Balanced | | $ | 20,021,066 | | | $ | 10,459,274 | |
High Yield | | | n/a | | | | n/a | |
Fixed Income | | | 9,869,451 | | | | 19,062,092 | |
| 4. | Portfolio Securities Loaned |
The Funds participate in a securities lending program offered by BNYM (the “Program”), providing for the lending of securities to qualified brokers. Securities lending income includes earnings of such temporary cash investments, plus or minus any rebate to a borrower. These earnings (after any rebate) are then divided between BNYM, as a fee for its services under the program, and the Funds, according to agreed-upon rates. Collateral on all securities loaned is accepted in cash and is maintained at a minimum level of 102% (105% in the case of certain foreign securities) of the market value, plus interest, if applicable, of investments on loan. It is the Funds’ policy to obtain additional collateral from or return excess collateral to the borrower by the end of the next business day, following the valuation date of the securities loaned. Therefore, the value of the collateral held may be temporarily less than the value of the securities on loan. Lending securities entails a risk of loss to the Funds if and to the extent that the market value of the securities loaned were to increase and the borrower did not increase the collateral accordingly, and the borrower fails to return the securities. Under the terms of the Program, the Funds are indemnified for such losses by BNYM. Cash collateral is held in a separate account managed by BNYM, who is authorized to exclusively enter into overnight government repurchase agreements. BNYM bears the risk of any deficiency in the amount of the cash collateral available for return to the borrower due to any loss on the collateral invested.
Notes to Financial Statements (continued)
| 5. | Commitments and Contingencies |
Under the Trust’s organizational documents, its trustees and officers are indemnified against certain liabilities arising out of the performance of their duties to the Trust. In addition, in the normal course of business, the Funds may enter into contracts and agreements that contain a variety of representations and warranties, which provide general indemnifications. The maximum exposure to the Funds under these arrangements is unknown, as this would involve future claims that may be made against a Fund that have not yet occurred. However, based on experience, the Funds have had no prior claims or losses and expect the risks of loss to be remote.
| 6. | Risks Associated with High Yield Securities |
Investing in high yield securities involves greater risks and considerations not typically associated with U.S. Government and other high quality/investment grade securities. High Yield securities are generally below investment grade securities and do not have an established retail secondary market. Economic downturns may disrupt the high yield market and impair the issuer’s ability to repay principal and interest. Also, an increase in interest rates would likely have an adverse impact on the value of such obligations and could cause the securities to become less liquid.
| 7. | Master Netting Agreements |
The Funds may enter into master netting agreements with their counterparties for the securities lending program and repurchase agreements, which provide the right, in the event of default (including bankruptcy or insolvency) for the non-defaulting party to liquidate the collateral and calculate net exposure to the defaulting party or request additional collateral. For financial reporting purposes, the Funds do not offset financial assets and financial liabilities that are subject to master netting agreements in the Statementof Assets and Liabilities. The following table is a summary of the Funds’ open securities lending and repurchase agreements which are subject to a master netting agreement as of December 31, 2013:
| | | | | | | | | | | | | | | | | | | | | | | | |
| | | Gross Amounts of
Recognized Assets | | | Gross Amounts
Offset in the
Statement of
Assets and
Liabilities | | | Net Amounts of
Assets Presented in
the Statement of
Assets and
Liabilities | | | Gross Amount Not Offset in the Statement
of Assets and Liabilities | | | Net Amount | |
| Fund | | | | | Financial
Instruments | | | Cash Collateral
Received | | |
Balanced | | | | | | | | | | | | | | | | | | | | | | | | |
Securities lending | | $ | 646,539 | | | | — | | | $ | 646,539 | | | | — | | | $ | 646,539 | | | | — | |
Repurchase agreements | | | 662,192 | | | | — | | | | 662,192 | | | $ | 662,192 | | | | — | | | | — | |
| | | | | | | | | | | | | | | | | | | | | | | | |
Total | | $ | 1,308,731 | | | | — | | | $ | 1,308,731 | | | $ | 662,192 | | | $ | 646,539 | | | | — | |
| | | | | | | | | | | | | | | | | | | | | | | | |
High Yield | | | | | | | | | | | | | | | | | | | | | | | | |
Securities lending | | $ | 540,893 | | | | — | | | $ | 540,893 | | | | — | | | $ | 540,893 | | | | — | |
Repurchase agreements | | | 558,954 | | | | — | | | | 558,954 | | | $ | 558,954 | | | | — | | | | — | |
| | | | | | | | | | | | | | | | | | | | | | | | |
Total | | $ | 1,099,847 | | | | — | | | $ | 1,099,847 | | | $ | 558,954 | | | $ | 540,893 | | | | — | |
| | | | | | | | | | | | | | | | | | | | | | | | |
Fixed Income | | | | | | | | | | | | | | | | | | | | | | | | |
Securities lending | | $ | 1,089,253 | | | | — | | | $ | 1,089,253 | | | | — | | | $ | 1,089,253 | | | | — | |
Repurchase agreements | | | 1,132,284 | | | | — | | | | 1,132,284 | | | $ | 1,132,284 | | | | — | | | | — | |
| | | | | | | | | | | | | | | | | | | | | | | | |
Total | | $ | 2,221,537 | | | | — | | | $ | 2,221,537 | | | $ | 1,132,284 | | | $ | 1,089,253 | | | | — | |
| | | | | | | | | | | | | | | | | | | | | | | | |
On January 21, 2014, Affiliated Managers Group, Inc., a global asset management company, announced that the Funds’ Investment Manager and Administrator, Managers Investment Group LLC, will be rebranded as AMG Funds LLC. The rebranding is expected to become effective during the second quarter of 2014 once the appropriate regulatory filings have taken place.
Each Fund has determined that no other material events or transactions occurred through the issuance date of the Funds’ financial statements, which require additional disclosure in or adjustment of the Funds’ financial statements.
58
Notes to Financial Statements (continued)
Tax Information (unaudited)
Managers AMG Chicago Equity Partners Balanced Fund, Managers High Yield Fund and Managers AMG GW&K Fixed Income Fund each hereby designates the maximum amount allowable of its net taxable income as qualified dividends as provided in the Jobs and Growth Tax Relief Reconciliation Act of 2003. The 2012 Form 1099-DIV you receive for each Fund will show the tax status of all distributions paid to you during the year.
The percentage of Qualified Dividend Income (“QDI”) and the Dividends-Received Deduction (“DRD”) for distributions paid is as follows:
| | | | | | | | |
| | | 2013 | | | 2012 | |
Balanced | | | | | | | | |
Ordinary Income - QDI | | | 100.00 | % | | | 66.41 | % |
Ordinary Income - DRD | | | 22.35 | % | | | 69.32 | % |
| | |
High Yield | | | | | | | | |
Ordinary Income - QDI | | | — | | | | — | |
Ordinary Income - DRD | | | — | | | | — | |
| | |
Fixed Income | | | | | | | | |
Ordinary Income - QDI | | | 5.43 | % | | | 9.87 | % |
Ordinary Income - DRD | | | 4.70 | % | | | 8.95 | % |
Pursuant to section 852 of the Internal Revenue Code, Managers AMG Chicago Equity Partners Balanced Fund, Managers High Yield Fund and Managers AMG GW&K Fixed Income Fund each hereby designates $1,946,888, $0 and $10,348,035, respectively, as a capital gain distribution with respect to the taxable year ended December 31, 2013, or if subsequently determined to be different, the net capital gains of such year.
59
Report of Independent Registered Public Accounting Firm
To the Board of Trustees of The Managers Trust II and the Shareholders of Managers AMG Chicago Equity Partners Balanced Fund, Managers High Yield Fund and Managers AMG GW&K Fixed Income Fund:
In our opinion, the accompanying statements of assets and liabilities, including the schedules of portfolio investments, and the related statements of operations and of changes in net assets and the financial highlights present fairly, in all material respects, the financial position of Managers AMG Chicago Equity Partners Balanced Fund, Managers High Yield Fund, and Managers AMG GW&K Fixed Income Fund (the “Funds”) at December 31, 2013, and the results of each of their operations, the changes in each of their net assets and the financial highlights for each of the periods indicated, in conformity with accounting principles generally accepted in the United States of America. These financial statements and financial highlights (hereafter referred to as “financial statements”) are the responsibility of the Funds’ management. Our responsibility is to express an opinion on these financial statements based on our audits. We conducted our audits of these financial statements in accordance with the standards of the Public Company Accounting Oversight Board (United States). Those standards require that we plan and perform the audit to obtain reasonable assurance about whether the financial statements are free of material misstatement. An audit includes examining, on a test basis, evidence supporting the amounts and disclosures in the financial statements, assessing the accounting principles used and significant estimates made by management, and evaluating the overall financial statement presentation. We believe that our audits, which included confirmation of securities at December 31, 2013 by correspondence with the custodian, agent banks and brokers and the application of alternative auditing procedures where securities purchased had not been received, provide a reasonable basis for our opinion.
PricewaterhouseCoopers LLP
Boston, Massachusetts
February 28, 2014
60
Trustees and Officers
The Trustees and Officers of the Trust, their business addresses, principal occupations for the past five years and dates of birth are listed below. The Trustees provide broad supervision over the affairs of the Trust and the Funds. The Trustees are experienced executives who meet periodically throughout the year to oversee the Funds’ activities, review contractual arrangements with companies that provide services to the Funds, and review the Funds’ performance. Unless otherwise noted, the address of each Trustee or Officer is the address of the Trust: 800 Connecticut Avenue, Norwalk, Connecticut 06854.
There is no stated term of office for Trustees. Trustees serve until their resignation, retirement or removal in accordance with the Trust’s organizational documents and policies adopted by the Board from time to time. The Chairman of the Trustees, President, Treasurer and Secretary of the Trust are elected by the Trustees annually. Other officers hold office at the pleasure of the Trustees.
Independent Trustees
The following Trustees are not “interested persons” of the Trust within the meaning of the 1940 Act:
| | |
Name, Date of Birth, Number of Funds Overseen in Fund Complex* | | Principal Occupation(s) During Past 5 Years and Other Directorships Held by Trustee |
Bruce B. Bingham, 12/1/48 • Trustee since 2012 • Oversees 39 Funds in Fund Complex | | Partner, Hamilton Partners (real estate development firm) (1987-Present). |
| |
William E. Chapman, II, 9/23/41 • Independent Chairman • Trustee since 2000 • Oversees 39 Funds in Fund Complex | | President and Owner, Longboat Retirement Planning Solutions (1998-Present); Hewitt Associates, LLC (part time) (provider of Retirement and Investment Education Seminars) (2002-2009); Trustee Emeritus of Bowdoin College (2013-Present); Trustee of Bowdoin College (2002-2013); Director of Harding, Loevner Funds, Inc. (6 portfolios); Trustee of Third Avenue Trust (5 portfolios); Trustee of Third Avenue Variable Trust (1 portfolio); Trustee of Aston Funds (23 portfolios). |
| |
Edward J. Kaier, 9/23/45 • Trustee since 2000 • Oversees 39 Funds in Fund Complex | | Attorney at Law and Partner, Teeters Harvey Marrone & Kaier LLP (2007-Present); Attorney at Law and Partner, Hepburn Willcox Hamilton & Putnam, LLP (1977-2007); Trustee of Third Avenue Trust (5 portfolios); Trustee of Third Avenue Variable Trust (1 portfolio); Trustee of Aston Funds (23 portfolios). |
| |
Steven J. Paggioli, 4/3/50 • Trustee since 2000 • Oversees 39 Funds in Fund Complex | | Independent Consultant (2002-Present); Formerly Executive Vice President and Director, The Wadsworth Group (1986-2001); Executive Vice President, Secretary and Director, Investment Company Adminis- tration, LLC (1990-2001); Vice President, Secretary and Director, First Fund Distributors, Inc. (1991-2001); Trustee, Professionally Managed Portfolios (45 portfolios); Advisory Board Member, Sustainable Growth Advisors, LP; Independent Director, Chase Investment Counsel (2008 – Present); Trustee of Aston Funds (23 portfolios). |
| |
Richard F. Powers III, 2/2/46 • Trustee since 2013 • Oversees 39 Funds in Fund Complex | | Adjunct Professor, Boston College (2011-Present); Director of Ameriprise Financial Inc. (2005-2009); President and CEO of Van Kampen Investments Inc. (1998-2003). |
| |
Eric Rakowski, 6/5/58 • Trustee since 2000 • Oversees 39 Funds in Fund Complex | | Professor, University of California at Berkeley School of Law (1990-Present); Director of Harding, Loevner Funds, Inc. (6 portfolios); Trustee of Third Avenue Trust (5 portfolios); Trustee of Third Avenue Variable Trust (1 portfolio); Trustee of Aston Funds (23 portfolios). |
| |
Victoria L. Sassine, 8/11/65 • Trustee since 2013 • Oversees 39 Funds in Fund Complex | | Lecturer, Babson College (2007 – Present) |
| | |
Name, Date of Birth, Number of Funds Overseen in Fund Complex* | | Principal Occupation(s) During Past 5 Years and Other Directorships Held by Trustee |
Thomas R. Schneeweis, 5/10/47 • Trustee since 2000 • Oversees 39 Funds in Fund Complex | | Professor Emeritus, University of Massachusetts (2013 - Present); Partner, S Capital Management, LLC (2007-Present); President, TRS Associates (1982-Present); Director, CISDM at the University of Massachusetts, (1996-2013); President, Alternative Investment Analytics, LLC, (formerly Schneeweis Partners, LLC) (2001-2013); Professor of Finance, University of Massachusetts (1977-2013); Partner, White Bear Partners, LLC (2007-2010); Partner, Northampton Capital Management, LLC (2004-2010); Trustee of Aston Funds (23 portfolios). |
| * | The Fund Complex consists of Managers AMG Funds, The Managers Funds, Managers Trust I and Managers Trust II. |
Interested Trustees
Each Trustee in the following table is an “interested person” of the Trust within the meaning of the 1940 Act. Ms. Carsman is an interested person of the Trust within the meaning of the 1940 Act by virtue of her position with, and interest in securities of, AMG, and her former position as Chief Legal Officer of the Trust.
| | |
Name, Date of Birth, Number of Funds Overseen in Fund Complex* | | Principal Occupation(s) During Past 5 Years and Other Directorships Held by Trustee |
Christine C. Carsman, 4/2/52 • Trustee since 2011 • Oversees 39 Funds in Fund Complex | | Senior Vice President and Deputy General Counsel, Affiliated Managers Group, Inc. (2011-Present); Senior Vice President and Chief Regulatory Counsel, Affiliated Managers Group, Inc. (2007-2011); Vice President and Chief Regulatory Counsel, Affiliated Managers Group, Inc. (2004-2007); Secretary and Chief Legal Officer, Managers AMG Funds, The Managers Funds, Managers Trust I and Managers Trust II (2004-2011); Senior Counsel, Vice President and Director of Operational Risk Management and Compliance, Wellington Management Company, LLP (1995-2004). |
| |
Officers | | |
| |
Name, Date of Birth, Position(s) Held with Fund and Length of Time Served | | Principal Occupation(s) During Past 5 Years |
Keitha L. Kinne, 5/16/58 • President since 2012 • Chief Operating Officer since 2007 | | Managing Partner and Chief Operating Officer, Managers Investment Group LLC (2007-Present); Chief Investment Officer, Managers Investment Group LLC (2008-Present); President, Managers Distributors, Inc. (2012-Present; Chief Operating Officer, The Managers Funds, Managers AMG Funds and Managers Trust I (2007-Present); Managing Director, Legg Mason & Co., LLC (2006-2007); Managing Director, Citigroup Asset Management (2004-2006). |
| |
Lewis Collins, 2/22/66 • Secretary since 2011 • Chief Legal Officer since 2011 | | Senior Vice President and Senior Counsel, Affiliated Managers Group, Inc. (2010-Present); Vice President and Senior Counsel, Affiliated Managers Group, Inc. (2006-2010); Senior Counsel, Affiliated Managers Group, Inc. (2002-2006); Attorney, Ropes & Gray LLP (1998-2002). |
Trustees and Officers
| | |
Name, Date of Birth,
Position(s) Held with Fund
and Length of Time Served | | Principal Occupation(s) During Past 5 Years |
Donald S. Rumery, 5/29/58 • Chief Financial Officer since 2007 • Treasurer since 2000 | | Senior Vice President, Managers Investment Group LLC (2005-Present); Treasurer, The Managers Funds (1995-Present); Treasurer, Managers AMG Funds (1999-Present); Treasurer, Managers Trust I (2000-Present); Chief Financial Officer, The Managers Funds, Managers AMG Funds and Managers Trust I (2007-Present); Treasurer and Chief Financial Officer, Managers Distributors, Inc. (2000-2012); Vice President, The Managers Funds LLC, (1994-2004). |
| |
John J. Ferencz, 3/9/62 • Chief Compliance Officer since 2010 | | Vice President, Legal and Compliance, Managers Investment Group LLC (2010-Present); Senior Compliance Analyst, Mutual Funds and Regulatory, GE Asset Management Incorporated (2005-2010). |
| | |
Name, Date of Birth,
Position(s) Held with Fund
and Length of Time Served | | Principal Occupation(s) During Past 5 Years |
Michael S. Ponder, 9/12/73 • Assistant Secretary since 2011 | | Senior Vice President and Counsel, Managers Investment Group LLC (2011-Present); Attorney, DeNovo Legal (2009-2010); Vice President, Credit Suisse (2007-2009); Associate, Willkie Farr & Gallagher LLP (2006-2007). |
| |
Matthew B. Wallace, 11/24/80 • Anti-Money Laundering Compliance Officer since 2012 | | Assistant Vice President, Legal and Compliance, Managers Investment Group LLC (2014-Present); Senior Associate, Legal and Compliance, Managers Investment Group LLC (2012-Present); Associate, Legal and Compliance, Managers Investment Group LLC (2010-2012); Compliance Specialist, Calamos Advisors LLC (2007-2010). |
PROXY RESULTS
A special meeting of shareholders of Managers Trust II was held on July 2, 2013. With respect to the proposals to amend certain “fundamental” investment restrictions of the Funds, the meeting was adjourned to August, 20, 2013 and September 27, 2013 for Managers High Yield Fund and Managers AMG GW&K Fixed Income Fund. On July 2, 2013, the proposals to amend and restate the declaration of trust did not pass. The proposals and results of the votes are summarized below.
| | | | | | | | |
| | | All Funds in Trust | |
| Managers Trust II Funds | | For | | | Withheld | |
| Election of Directors | | (rounded to the nearest share) | |
Bruce Bingham | | | 51,163,690 | | | | 1,110,767 | |
William E. Chapman, II | | | 50,980,897 | | | | 1,293,559 | |
Edward J. Kaier | | | 51,119,439 | | | | 1,155,018 | |
Steven J. Paggioli | | | 51,094,012 | | | | 1,180,444 | |
Erik Rakowski | | | 51,025,723 | | | | 1,248,733 | |
Thomas R. Schneeweis | | | 51,078,988 | | | | 1,195,468 | |
Christine C. Carsman | | | 51,055,532 | | | | 1,218,924 | |
Kurt Keilhacker | | | 51,140,167 | | | | 1,134,290 | |
Richard F. Powers III | | | 51,049,048 | | | | 1,225,408 | |
Victoria Sassine | | | 51,068,192 | | | | 1,206,264 | |
| | | | | | | | | | | | | | | | |
| | | Managers AMG Chicago Equity Partners Balanced Fund | |
| | | For | | | Against | | | Abstain | | | Broker Non-Votes | |
| To amend “fundamental” restrictions of the Funds with respect to: | | (rounded to the nearest share) | |
Issuance of Senior Securities | | | 363,017 | | | | 30,709 | | | | 79,597 | | | | 317,142 | |
Borrowing | | | 355,098 | | | | 39,227 | | | | 78,998 | | | | 317,142 | |
Lending | | | 359,951 | | | | 39,150 | | | | 75,222 | | | | 317,142 | |
The Underwriting of Securities | | | 362,868 | | | | 37,469 | | | | 72,987 | | | | 317,142 | |
Purchasing and Selling Commodities | | | 370,841 | | | | 29,939 | | | | 72,543 | | | | 317,142 | |
Purchasing and Selling Real Estate | | | 368,805 | | | | 33,446 | | | | 71,072 | | | | 317,142 | |
Diversification of Investments | | | 374,790 | | | | 21,943 | | | | 76,590 | | | | 317,142 | |
Concentrating Investments in a Particular Industry | | | 357,721 | | | | 40,005 | | | | 75,597 | | | | 317,142 | |
PROXY RESULTS (continued)
| | | | | | | | | | | | | | | | |
| | | Managers High Yield Fund | |
| | | For | | | Against | | | Abstain | | | Broker Non-Votes | |
| To amend “fundamental” restrictions of the Funds with respect to: | | (rounded to the nearest share) | |
Issuance of Senior Securities | | | 2,384,390 | | | | 51,162 | | | | 188,986 | | | | 273,939 | |
Borrowing | | | 2,371,383 | | | | 63,662 | | | | 189,493 | | | | 273,939 | |
Lending | | | 2,375,990 | | | | 48,288 | | | | 200,260 | | | | 273,939 | |
The Underwriting of Securities | | | 2,368,051 | | | | 54,202 | | | | 202,285 | | | | 273,939 | |
Purchasing and Selling Commodities | | | 2,378,428 | | | | 61,452 | | | | 184,659 | | | | 273,939 | |
Purchasing and Selling Real Estate | | | 2,387,775 | | | | 51,189 | | | | 185,574 | | | | 273,939 | |
Diversification of Investments | | | 2,399,562 | | | | 41,345 | | | | 183,631 | | | | 273,939 | |
Concentrating Investments in a Particular Industry | | | 2,366,033 | | | | 63,830 | | | | 194,675 | | | | 273,939 | |
| |
| | | Managers AMG GW&K Fixed Income Fund | |
| | | For | | | Against | | | Abstain | | | Broker Non-Votes | |
| To amend “fundamental” restrictions of the Funds with respect to: | | (rounded to the nearest share) | |
Issuance of Senior Securities | | | 6,681,334 | | | | 150,481 | | | | 194,014 | | | | 852,362 | |
Borrowing | | | 6,685,324 | | | | 129,015 | | | | 211,491 | | | | 852,362 | |
Lending | | | 6,694,243 | | | | 111,819 | | | | 219,768 | | | | 852,362 | |
The Underwriting of Securities | | | 2,368,051 | | | | 54,202 | | | | 202,285 | | | | 852,362 | |
Purchasing and Selling Commodities | | | 2,378,428 | | | | 61,452 | | | | 184,659 | | | | 852,362 | |
Purchasing and Selling Real Estate | | | 2,287,775 | | | | 51,189 | | | | 185,574 | | | | 852,362 | |
Diversification of Investments | | | 6,756,283 | | | | 89,059 | | | | 180,487 | | | | 852,362 | |
Concentrating Investments in a Particular Industry | | | 6,687,230 | | | | 144,388 | | | | 194,212 | | | | 852,362 | |
PROXY RESULTS (continued)
| | | | | | | | | | | | | | | | |
| | | Managers AMG Chicago Equity Partners Balanced Fund | |
| | | For | | | Against | | | Abstain | | | Broker Non-Votes | |
| To amend and restate the Agreement and Declaration of the Trust relating to: | | (rounded to the nearest share) | |
Declaration of Trust Amendment Procedures | | | 361,941 | | | | 32,671 | | | | 78,711 | | | | 317,142 | |
Merger, Consolidation, Sale of Assets and Termination of Trust, Series or Classes | | | 363,000 | | | | 31,613 | | | | 78,711 | | | | 317,142 | |
Other Changes | | | 361,641 | | | | 30,996 | | | | 80,686 | | | | 317,142 | |
| |
| | | Managers High Yield Fund | |
| | | For | | | Against | | | Abstain | | | Broker Non-Votes | |
| To amend and restate the Agreement and Declaration of the Trust relating to: | | (rounded to the nearest share) | |
Declaration of Trust Amendment Procedures | | | 1,779,731 | | | | 28,296 | | | | 136,804 | | | | 330,717 | |
Merger, Consolidation, Sale of Assets and Termination of Trust, Series or Classes | | | 1,767,893 | | | | 28,424 | | | | 148,513 | | | | 330,717 | |
Other Changes | | | 1,765,601 | | | | 37,091 | | | | 142,138 | | | | 330,717 | |
| |
| | | Managers AMG GW&K Fixed Income Fund | |
| | | For | | | Against | | | Abstain | | | Broker Non-Votes | |
| To amend and restate the Agreement and Declaration of the Trust relating to: | | (rounded to the nearest share) | |
Declaration of Trust Amendment Procedures | | | 3,353,725 | | | | 78,156 | | | | 126,688 | | | | 955,626 | |
Merger, Consolidation, Sale of Assets and Termination of Trust, Series or Classes | | | 3,356,781 | | | | 71,499 | | | | 130,289 | | | | 955,626 | |
Other Changes | | | 3,349,072 | | | | 77,516 | | | | 131,981 | | | | 955,626 | |
| |
| | | All Funds in Trust | |
| | | For | | | Against | | | Abstain | | | Broker Non-Votes | |
| To amend and restate the Agreement and Declaration of the Trust relating to: | | (rounded to the nearest share) | |
Declaration of Trust Amendment Procedures | | | 36,921,178 | | | | 523,561 | | | | 1,110,168 | | | | 13,719,549 | |
Merger, Consolidation, Sale of Assets and Termination of Trust, Series or Classes | | | 35,494,400 | | | | 1,925,115 | | | | 1,135,392 | | | | 13,719,549 | |
Other Changes | | | 35,581,474 | | | | 1,926,523 | | | | 1,046,912 | | | | 13,719,549 | |
THIS PAGE INTENTIONALLY LEFT BLANK
THIS PAGE INTENTIONALLY LEFT BLANK
THIS PAGE INTENTIONALLY LEFT BLANK
Investment Manager and Administrator
Managers Investment Group LLC
800 Connecticut Avenue
Norwalk, CT 06854
(800) 835-3879
Distributor
Managers Distributors, Inc.
800 Connecticut Avenue
Norwalk, CT 06854
(800) 835-3879
Custodian
The Bank of New York Mellon
2 Hanson Place
Brooklyn, NY 11217
Legal Counsel
Ropes & Gray LLP
Prudential Tower, 800 Boylston Street
Boston, MA 02199-3600
Transfer Agent
BNY Mellon Investment Servicing (US) Inc.
Attn: Managers
P.O. Box 9769
Providence, RI 02940
(800) 548-4539
For ManagersChoiceTM Only
Managers
c/o BNY Mellon Investment Servicing (US) Inc.
P.O. Box 9847
Providence, RI 02940-8047
(800) 358-7668
MANAGERS FUNDS
| | | | |
EQUITY FUNDS | | BALANCED FUNDS |
BRANDYWINE BRANDYWINE BLUE BRANDYWINE ADVISORS MIDCAP GROWTH Friess Associates, LLC CADENCE CAPITAL APPRECIATION CADENCE MID-CAP CADENCE EMERGING COMPANIES Cadence Capital Management, LLC ESSEX SMALL/MICRO CAP GROWTH Essex Investment Management Co., LLC FQ TAX-MANAGED U.S. EQUITY FQ U.S. EQUITY First Quadrant, L.P. FRONTIER SMALL CAP GROWTH Frontier Capital Management Company, LLC GW&K SMALL CAP EQUITY Gannett Welsh & Kotler, LLC MICRO-CAP Lord, Abbett & Co. LLC WEDGE Capital Management L.L.P. Next Century Growth Investors LLC RBC Global Asset Management (U.S.) Inc. REAL ESTATE SECURITIES CenterSquare Investment Management, Inc. | | RENAISSANCE LARGE CAP GROWTH Renaissance Group LLC SKYLINE SPECIAL EQUITIES PORTFOLIO Skyline Asset Management, L.P. SPECIAL EQUITY Ranger Investment Management, L.P. Lord, Abbett & Co. LLC Smith Asset Management Group, L.P. Federated MDTA LLC SYSTEMATIC VALUE SYSTEMATIC MID CAP VALUE Systematic Financial Management, L.P. TIMESSQUARE INTERNATIONAL SMALL CAP TIMESSQUARE MID CAP GROWTH TIMESSQUARE SMALL CAP GROWTH TSCM GROWTH EQUITY TimesSquare Capital Management, LLC TRILOGY GLOBAL EQUITY TRILOGY EMERGING MARKETS EQUITY TRILOGY INTERNATIONAL SMALL CAP Trilogy Global Advisors, L.P. YACKTMAN YACKTMAN FOCUSED Yacktman Asset Management LP | | CHICAGO EQUITY PARTNERS BALANCED Chicago Equity Partners, LLC ALTERNATIVE FUNDS FQ GLOBAL ALTERNATIVES FQ GLOBAL ESSENTIALS First Quadrant, L.P. INCOME FUNDS BOND (MANAGERS) GLOBAL INCOME OPPORTUNITY Loomis, Sayles & Co., L.P. BOND (MANAGERS PIMCO) Pacific Investment Management Co. LLC GW&K FIXED INCOME GW&K MUNICIPAL BOND GW&K MUNICIPAL ENHANCED YIELD Gannett Welsh & Kotler, LLC HIGH YIELD J.P. Morgan Investment Management LLC INTERMEDIATE DURATION GOVERNMENT SHORT DURATION GOVERNMENT Amundi Smith Breeden LLC |
This report is prepared for the Funds’ shareholders. It is authorized for distribution to prospective investors only when preceded or accompanied by an effective prospectus. To receive a free copy of the prospectus or Statement of Additional Information, which includes additional information about Fund Trustees, please contact us by calling 800.835.3879. Distributed by Managers Distributors, Inc., member FINRA. Current net asset value per share for each Fund are available on the Funds’ Web site at www.managersinvest.com. A description of the policies and procedures each Fund uses to vote its proxies is available: (i) without charge, upon request, by calling 800.835.3879, or (ii) on the Securities and Exchange Commission’s (SEC) Web site at www. sec.gov. For information regarding each Fund’s proxy voting record for the 12-month period ended June 30, call 800.835.3879 or visit the SEC Web site at www.sec.gov. The Funds file their complete schedule of portfolio holdings with the SEC for the first and third quarters of each fiscal year on Form N-Q. The Funds’ Forms N-Q are available on the SEC’s website at www.sec.gov. A Fund’s Forms N-Q may be reviewed and copied at the SEC’s Public Reference Room in Washington, DC. Information on the operation of the Public Reference Room may be obtained by calling 800.SEC.0330. To review a complete list of the Funds’ portfolio holdings, or to view the most recent quarterly holdings report, semiannual report, or annual report, please visit www.managersinvest.com. | |
|
| | | | |
Registrant has adopted a Code of Ethics. See attached Exhibit (a)(1).
| Item 3. | AUDIT COMMITTEE FINANCIAL EXPERT |
Registrant’s Board of Trustees has determined that independent Trustee Mr. Steven J. Paggioli qualifies as the Audit Committee Financial Expert. Mr. Paggioli is “independent” as such term is defined in Form N-CSR.
| Item 4. | PRINCIPAL ACCOUNTANT FEES AND SERVICES |
The aggregate fees billed by the Funds’ independent registered public accounting firm, PricewaterhouseCoopers LLP (“PwC”), to the Funds for the Funds’ two most recent fiscal years for professional services rendered for audits of annual financial statements, or services that are normally provided in connection with statutory and regulatory filings or engagements (“Audit Fees”) were as follows:
| | | | | | | | |
Fund - Trust II | | Fiscal
2013 | | | Fiscal
2012 | |
Managers AMG GW&K Fixed Income Fund | | $ | 31,170 | | | $ | 29,603 | |
Managers AMG Chicago Equity Partners Balanced Fund | | $ | 28,826 | | | $ | 23,583 | |
Managers High Yield Fund | | $ | 21,170 | | | $ | 17,747 | |
Managers Short Duration Government Fund | | $ | 35,470 | | | $ | 28,037 | |
Managers Intermediate Duration Government Fund | | $ | 30,470 | | | $ | 27,468 | |
There were no fees billed by PwC to the Funds in its two recent fiscal years for services rendered for assurance and related services that are reasonably related to the performance of the audit or review of the Fund’s financial statements, but are not reported as Audit Fees (“Audit-Related Fees”).
For the Funds’ two most recent fiscal years, there were no Audit-Related Fees billed by PwC for engagements related directly to the operations and financial reporting of one or more Funds by a Fund Service Provider. A Fund Service Provider is (a) any investment adviser to the Fund (not including any Subadvisor whose role is primarily portfolio management and is subcontracted with or overseen by another investment adviser) or (b) any entity that provides ongoing services to the Fund and is controlling, controlled by or under common control with a Fund investment adviser described in (a).
The aggregate fees billed by PwC to the Funds for the two most recent fiscal years for professional services rendered for tax compliance, tax advice, and tax planning (“Tax Fees”) were as follows:
| | | | | | | | |
Fund - Trust II | | Fiscal
2013 | | | Fiscal
2012 | |
Managers AMG GW&K Fixed Income Fund | | $ | 8,830 | | | $ | 7,000 | |
Managers AMG Chicago Equity Partners Balanced Fund | | $ | 6,885 | | | $ | 9,000 | |
Managers High Yield Fund | | $ | 8,830 | | | $ | 9,500 | |
Managers Short Duration Government Fund | | $ | 9,530 | | | $ | 9,000 | |
Managers Intermediate Duration Government Fund | | $ | 9,530 | | | $ | 9,000 | |
For the Funds’ two most recent fiscal years, Tax Fees billed by PwC for engagements by Fund Service Providers that related directly to the operations and financial reporting of the Funds were $0 for fiscal 2013 and $0 for fiscal 2012, respectively.
The services for which Tax Fees were charged comprise all services performed by professional staff in PwC’s tax division except those services related to the audit. Typically, this category would include fees for tax compliance, tax planning, and tax advice. Tax compliance, tax advice, and tax planning services include preparation of original and amended tax returns, claims for refund and tax payment-planning services, assistance with tax audits and appeals, tax advice related to mergers and acquisitions and requests for rulings or technical advice from taxing authorities.
There were no other fees billed by PwC to the Funds for all other non-audit services (“Other Fees”) during the Funds’ two most recent fiscal years. During the same period, there were no Other Fees billed by PwC for engagements by Fund Service Providers that related directly to the operations and financial reporting of the Funds.
(e) (1) According to policies adopted by the Audit Committee, services provided by PwC to the Funds must be pre-approved by the Audit Committee. On an annual basis, the Audit Committee reviews and pre-approves various types of services that PwC may perform for the Funds without specific approval of each engagement, subject to specified budget limitations. As contemplated by the Sarbanes-Oxley Act of 2002 and related SEC rules, the Audit Committee also pre-approves non-audit services provided by PwC to any Fund Service Provider for any engagement that relates directly to the operations and financial reporting of the Funds. Any engagement that is not already pre-approved or that will exceed a pre-approved budget must be submitted to the Audit Committee for pre-approval. The Chairman of the Audit Committee is authorized on behalf of the Board of Trustees and the Audit Committee to approve the engagement of PwC to perform non-audit services subject to certain conditions, including notification to the Audit Committee of such pre-approval not later than the next meeting of the Audit Committee following the date of such pre-approval.
(e)(2) None.
(f) Not applicable.
(g) The aggregate fees billed by PwC in 2013 and 2012 for non-audit services rendered to the Funds and Fund Service Providers were $109,605 and $109,500, respectively. For the fiscal year ended October 31, 2013, this amount reflects the amounts disclosed above in Item 4(b),(c),(d), plus $66,000 in fees billed to the Fund Service Providers for non-audit services that did not relate directly to the operations and financial reporting of the Funds. For the fiscal year ended October 31, 2012, this amount reflects the amounts disclosed above in Item 4(b),(c),(d), plus $66,000 in fees billed to the Fund Service Providers for non-audit services that did not relate directly to the operations and financial reporting of the Funds.
(h) The Trust’s Audit Committee has considered whether the provision of non-audit services by registrant’s independent registered public accounting firm to the registrant’s investment advisor, and any entity controlling, controlled, or under common control with the investment advisor that provided ongoing services to the registrant that were not pre-approved by the Committee (because such services did not relate directly to the operations and financial reporting of the registrant) was compatible with maintaining the independence of the independent registered public accounting firm.
| Item 5. | AUDIT COMMITTEE OF LISTED REGISTRANTS |
Not applicable.
| Item 6. | SCHEDULE OF INVESTMENTS |
The schedule of investments in unaffiliated issuers as of the close of the reporting period is included as part of the shareholder report contained in Item 1 hereof.
| Item 7. | DISCLOSURE OF PROXY VOTING POLICIES AND PROCEDURES FOR CLOSED-END MANAGEMENT INVESTMENT COMPANIES |
Not applicable.
| Item 8. | PORTFOLIO MANAGERS OF CLOSED-END MANAGEMENT INVESTMENT COMPANIES |
Not applicable.
| Item 9. | PURCHASES OF EQUITY SECURITIES BY CLOSED-END MANAGEMENT INVESTMENT COMPANIES AND AFFILIATED PURCHASERS |
Not applicable.
| Item 10. | SUBMISSION OF MATTERS TO A VOTE OF SECURITY HOLDERS |
Not applicable.
| Item 11. | CONTROLS AND PROCEDURES |
(a) The Registrant’s principal executive and principal financial officers have concluded, based on their evaluation of the
registrant’s disclosure controls and procedures as of a date within 90 days of the filing of this report, that the Registrant’s disclosure controls and procedures are reasonably designed to ensure that information required to be disclosed by the Registrant on Form N-CSR is recorded, processed, summarized and reported within the required time periods and that information required to be disclosed by the registrant in the reports that it files or submits on Form N-CSR is accumulated and communicated to the Registrant’s management, including its principal executive and principal financial officers, as appropriate to allow timely decisions regarding required disclosure.
(b) There were no changes in the Registrant’s internal control over financial reporting during the Registrant’s fourth fiscal quarter of the period covered by this report that have materially affected, or are reasonably likely to affect, the internal control over financial reporting.
| | |
| Item 12. | | EXHIBITS |
| |
| (a)(1) | | Any Code of Ethics or amendments hereto. Filed herewith. |
| |
| (a)(2) | | Certifications pursuant to Rule 30a-2(a) under the Investment Company Act of 1940 - Filed herewith. |
| |
| (a)(3) | | Not applicable. |
| |
| (b) | | Certifications pursuant to Rule 30a-2(b) under the Investment Company Act of 1940 - Filed herewith. |
SIGNATURES
Pursuant to the requirements of the Securities Exchange Act of 1934 and the Investment Company Act of 1940, the registrant has duly caused this report to be signed on its behalf by the undersigned, thereunto duly authorized.
MANAGERS TRUST II
| | |
By: | | /s/ Keitha L. Kinne |
| | Keitha L. Kinne, President |
Date: March 7, 2014
Pursuant to the requirements of the Securities Exchange Act of 1934 and the Investment Company Act of 1940, this report has been signed below by the following persons on behalf of the registrant and in the capacities and on the dates indicated.
| | |
By: | | /s/ Keitha L. Kinne |
| | Keitha L. Kinne, President |
Date: March 7, 2014
| | |
By: | | /s/ Donald S. Rumery |
| | Donald S. Rumery, Chief Financial Officer |
Date: March 7, 2014