UNITED STATES
SECURITIES AND EXCHANGE COMMISSION
Washington, D.C. 20549
FORM N-CSR
CERTIFIED SHAREHOLDER REPORT OF REGISTERED
MANAGEMENT INVESTMENT COMPANIES
Investment Company Act file number: 811-06431
AMG Funds II
(Exact name of registrant as specified in charter)
800 Connecticut Avenue, Norwalk, Connecticut 06854
(Address of principal executive offices) (Zip code)
AMG Funds LLC
800 Connecticut Avenue, Norwalk, Connecticut 06854
(Name and address of agent for service)
Registrant’s telephone number, including area code: (203) 299-3500
Date of fiscal year end: DECEMBER 31
Date of reporting period: JANUARY 1, 2014 – DECEMBER 31, 2014
(Annual Shareholder Report)
| Item 1. | Reports to Shareholders |
| | | | |
 | | | | ANNUAL REPORT |
AMG Funds
December 31, 2014
AMG Chicago Equity Partners Balanced Fund
Investor Class: MBEAX | Service Class: MBESX | Institutional Class: MBEYX
AMG Managers High Yield Fund
Investor Class: MHHAX | Institutional Class: MHHYX |
AMG Managers Intermediate Duration Government Fund: MGIDX
AMG Managers Short Duration Government Fund: MGSDX
| | | | |
www.amgfunds.com | | | | AR002-1214 |
AMG Funds
Annual Report—December 31, 2014
| | | | |
TABLE OF CONTENTS | | PAGE | |
LETTER TO SHAREHOLDERS | | | 2 | |
| |
ABOUT YOUR FUND’S EXPENSES | | | 3 | |
| |
PORTFOLIO MANAGER’S COMMENTS, FUND SNAPSHOTS, AND SCHEDULES OF PORTFOLIO INVESTMENTS | | | | |
| |
AMG Chicago Equity Partners Balanced Fund | | | 4 | |
| |
AMG Managers High Yield Fund | | | 15 | |
| |
AMG Managers Intermediate Duration Government Fund | | | 34 | |
| |
AMG Managers Short Duration Government Fund | | | 41 | |
| |
NOTES TO SCHEDULES OF PORTFOLIO INVESTMENTS | | | 52 | |
| |
FINANCIAL STATEMENTS | | | | |
| |
Statement of Assets and Liabilities | | | 59 | |
Balance sheets, net asset value (NAV) per share computations and cumulative undistributed amounts | | | | |
| |
Statement of Operations | | | 62 | |
Detail of sources of income, expenses, and realized and unrealized gains (losses) during the year | | | | |
| |
Statements of Changes in Net Assets | | | 63 | |
Detail of changes in assets for the past two years | | | | |
| |
Statements of Changes in Net Assets | | | 64 | |
Detail of changes in assets for the past two years | | | | |
| |
Financial Highlights | | | 65 | |
Historical net asset values per share, distributions, total returns, income and expense ratios, turnover ratios and net assets | | | | |
| |
Notes to Financial Statements | | | 70 | |
Accounting and distribution policies, details of agreements and transactions with Fund management and affiliates, and descriptions of certain investment risks | | | | |
| |
REPORT OF INDEPENDENT REGISTERED PUBLIC ACCOUNTING FIRM | | | 79 | |
| |
TRUSTEES AND OFFICERS | | | 80 | |
Nothing contained herein is to be considered an offer, sale or solicitation of an offer to buy shares of any series of the AMG Fund Family of mutual funds. Such offering is made only by Prospectus, which includes details as to offering price and other material information.
| | | | |
| | | | Letter to Shareholders |
DEAR SHAREHOLDER:
The year ended December 31, 2014, was another period of strong equity returns. The S&P 500 Index, a widely followed barometer of the U.S. equity market, rose more than 13% during the past 12 months. International stocks, by comparison, had negative performance, as measured by the MSCI ACWI ex US Index (in U.S. Dollar terms). The first quarter of 2014 marked the five-year anniversary of the equity bull market. Despite a few bouts of volatility and persistent doubts about the strength of the economic recovery since the beginning of the bull market, the S&P 500 Index had a cumulative gain (through December 31, 2014) of 244% (including reinvestment of dividends) since the market bottom on March 9, 2009.
Meanwhile, the Barclays U.S. Aggregate Bond Index, a broad U.S. bond market benchmark, returned 6% during 2014. Bond markets have also performed strongly during this period, to the surprise of many, despite the unwinding of the U.S. Federal Reserve’s bond-buying program known as QE3.
In 2014, Managers Investment Group was rebranded as AMG Funds. Our new name helps align our fund family more closely with our parent company, Affiliated Managers Group (“AMG”). While the names of funds branded under AMG changed slightly, the ticker symbols remain the same. There was no change to the legal or ownership structure of the funds and the name change will have no impact on their management.
Our foremost goal at AMG Funds is to provide investment products and solutions that help our shareholders and clients successfully reach their long-term investment goals. We do this by partnering with many of AMG’s affiliate investment boutiques to offer a distinctive array of actively managed, return-oriented funds. In addition, we oversee and distribute a number of complementary mutual funds sub-advised by unaffiliated investment managers. We thank you for your continued confidence and investment in AMG Funds. You can rest assured that, under all market conditions, our team is focused on delivering excellent investment management services for your benefit.
Respectfully,

Jeffery Cerutti
President
AMG Funds
| | | | | | | | | | | | | | |
Average Annual Total Returns | | Periods ended December 31, 2014 | |
Stocks: | | | | 1 Year | | | 3 Years | | | 5 Years | |
Large Caps | | (S&P 500 Index) | | | 13.69 | % | | | 20.41 | % | | | 15.45 | % |
Small Caps | | (Russell 2000® Index) | | | 4.89 | % | | | 19.21 | % | | | 15.55 | % |
International | | (MSCI All Country World ex USA Index) | | | (3.87 | )% | | | 8.99 | % | | | 4.43 | % |
Bonds: | | | | | | | | | | | | | | |
Investment Grade | | (Barclays U.S. Aggregate Bond Index) | | | 5.97 | % | | | 2.66 | % | | | 4.45 | % |
High Yield | | (Barclays U.S. High Yield Bond Index) | | | 2.45 | % | | | 8.43 | % | | | 9.03 | % |
Tax-exempt | | (Barclays Municipal Bond Index) | | | 9.05 | % | | | 4.30 | % | | | 5.16 | % |
Treasury Bills | | BofA Merrill Lynch 6-month U.S. Treasury Bill | | | 0.12 | % | | | 0.16 | % | | | 0.22 | % |
2
About Your Fund’s Expenses
As a shareholder of a Fund, you may incur two types of costs: (1) transaction costs, which may include sales charges (loads) on purchase payments; redemption fees; and exchange fees; and (2) ongoing costs, including management fees; distribution (12b-1) fees; and other Fund expenses. This example is intended to help you understand your ongoing costs (in dollars) of investing in the Fund and to compare these costs with the ongoing costs of investing in other mutual funds. The example is based on $1,000 invested at the beginning of the period and held for the entire period as indicated below.
ACTUAL EXPENSES
The first line of the following table provides information about the actual account values and actual expenses. You may use the information in this line, together with the amount you invested, to estimate the expenses that you paid over the period. Simply divide your account value by $1,000 (for example, an $8,600 account value divided by $1,000 = 8.6), then multiply the result by the number in the first line under the heading entitled “Expenses Paid During Period” to estimate the expenses you paid on your account during this period.
HYPOTHETICAL EXAMPLE FOR COMPARISON PURPOSES
The second line of the following table provides information about hypothetical account values and hypothetical expenses based on the Fund’s actual expense ratio and an assumed annual rate of return of 5% before expenses, which is not the Fund’s actual return. The hypothetical account values and expenses may not be used to estimate the actual ending account balance or expenses you paid for the period. You may use this information to compare the ongoing costs of investing in the Fund and other funds by comparing this 5% hypothetical example with the 5% hypothetical examples that appear in the shareholder reports of other funds.
Please note that the expenses shown in the table are meant to highlight your ongoing costs only and do not reflect any transactional costs, such as sales charges (loads), redemption fees, or exchange fees. Therefore, the second line of the table is useful in comparing ongoing costs only, and will not help you determine the relative total costs of owning different funds.
| | | | | | | | | | | | | | | | |
| Six Months Ended December 31, 2014 | | Expense
Ratio for
the Period | | | Beginning
Account Value
7/01/14 | | | Ending
Account Value
12/31/14 | | | Expenses
Paid During
the Period* | |
AMG Chicago Equity Partners Balanced Fund | | | | | | | | | |
Investor Class | | | | | | | | | | | | | | | | |
Based on Actual Fund Return | | | 1.09 | % | | $ | 1,000 | | | $ | 1,032 | | | $ | 5.58 | |
Hypothetical (5% return before expenses) | | | 1.09 | % | | $ | 1,000 | | | $ | 1,020 | | | $ | 5.55 | |
Service Class | | | | | | | | | | | | | | | | |
Based on Actual Fund Return | | | 0.83 | % | | $ | 1,000 | | | $ | 1,034 | | | $ | 4.27 | |
Hypothetical (5% return before expenses) | | | 0.83 | % | | $ | 1,000 | | | $ | 1,021 | | | $ | 4.25 | |
Institutional Class | | | | | | | | | | | | | | | | |
Based on Actual Fund Return | | | 0.84 | % | | $ | 1,000 | | | $ | 1,033 | | | $ | 4.30 | |
Hypothetical (5% return before expenses) | | | 0.84 | % | | $ | 1,000 | | | $ | 1,021 | | | $ | 4.28 | |
AMG Managers High Yield Fund | | | | | | | | | | | | | | | | |
Investor Class | | | | | | | | | | | | | | | | |
Based on Actual Fund Return | | | 1.15 | % | | $ | 1,000 | | | $ | 977 | | | $ | 5.73 | |
Hypothetical (5% return before expenses) | | | 1.15 | % | | $ | 1,000 | | | $ | 1,019 | | | $ | 5.85 | |
Institutional Class | | | | | | | | | | | | | | | | |
Based on Actual Fund Return | | | 0.90 | % | | $ | 1,000 | | | $ | 978 | | | $ | 4.49 | |
Hypothetical (5% return before expenses) | | | 0.90 | % | | $ | 1,000 | | | $ | 1,021 | | | $ | 4.58 | |
AMG Managers Intermediate Duration Government Fund | | | | | | | | | | | | | | | | |
Based on Actual Fund Return | | | 0.89 | % | | $ | 1,000 | | | $ | 1,019 | | | $ | 4.53 | |
Hypothetical (5% return before expenses) | | | 0.89 | % | | $ | 1,000 | | | $ | 1,021 | | | $ | 4.53 | |
AMG Managers Short Duration Government Fund | | | | | | | | | | | | | | | | |
Based on Actual Fund Return | | | 0.81 | % | | $ | 1,000 | | | $ | 1,001 | | | $ | 4.09 | |
Hypothetical (5% return before expenses) | | | 0.81 | % | | $ | 1,000 | | | $ | 1,021 | | | $ | 4.13 | |
| * | Expenses are equal to the Fund’s annualized expense ratio multiplied by the average account value over the period, multiplied by the number of days in the most recent half-year (184), then divided by 365. |
3
AMG Chicago Equity Partners Balanced Fund
Portfolio Manager’s Comments
THE YEAR IN REVIEW
For the year ended December 31, 2014, the AMG Chicago Equity Partners Balanced Fund (Institutional Share Class) returned 10.0%, compared to the 10.5% return for its benchmark, which consists of 60% of the return of the Russell 1000® Index and 40% of the return of the Barclays U.S. Aggregate Bond Index. Both the equity and fixed income portions of the Fund performed roughly in-line with their respective benchmarks. Throughout the year, the portfolio’s allocation remained at a 5% overweight to equities, an allocation decision that was implemented in December of 2013. This overweight was a benefit to the Fund throughout the year, as equities outpaced fixed-income performance.
The dramatic collapse in the price of oil during the final quarter of 2014 dominated headlines. After peaking at over $100 a barrel in June, oil prices fell by half, ending the year closer to $50 a barrel. Price declines accelerated during the final three months, driven by a combination of continued strong production to an already oversupplied market and by OPEC’s surprise decision to not support prices by reigning in production. According to the U.S. Energy Information Administration, U.S. production increased to 8.6 million barrels a day, the highest in nearly 30 years. The average U.S. household is forecast to spend about $550 less on gasoline in 2015 vs. 2014 based on their current projections. While this windfall is a positive for consumers, there will also be a negative impact on the earnings of energy companies and those impacted by the expected reduction in capital expenditures. The magnitude and breadth of this impact has created a new source of increased uncertainty.
EQUITY
U.S. equity markets paused in the first quarter of 2014 after posting very strong returns in 2013. The second quarter started with a pull-back in some of the highest momentum industries (biotech, internet and software services), which was reflected in poor momentum factor performance early on and strong performance from the value factors. In the third quarter, the spread between large- and small-cap performance (8%) was one of the widest quarterly spreads in
favor of large-cap stocks in the last 20 years. Increased volatility returned to the equity markets at the start of the fourth quarter, as the combination of heightened Ebola fears, global economic growth concerns and whether weak oil prices indicated something more sinister spooked investors. However, the early October losses of over 5% were quickly erased, and the market proceeded to record a number of record closing highs on its way to a tenth consecutive positive quarter. The Russell 1000® Index gained 13.2% for the year. Once again, the combination of solid earnings, improving economic conditions and an accommodative U.S. Federal Reserve (the Fed) supported the move higher.
The model’s stock-selection forecasts were mixed for the year. Over the year, there was a positive spread between the top and bottom ranked quintiles, but the last quarter had the least amount of information. Throughout the year there was positive breadth of factor contribution, with each of the four groups contributing, but each factor group had inconsistencies throughout the year. The equity portion of the Fund had excess returns in the first three quarters and negative excess return in the fourth quarter.
Our research has shown that constructing a well-diversified portfolio of companies with attractive valuation ratios, quality balance sheets and positive growth and moment expectations, built through a disciplined, risk controlled process, delivers consistent excess returns. Overall, our philosophy will not change based on short-term trends or conditions in the market. We will continue to use our disciplined approach to provide added value at controlled levels of risk.
FIXED INCOME
Two of the most significant developments in the fixed-income markets recently were the continued widening of corporate spreads that began in late June of this year and a substantial flattening of the yield curve, with short rates modestly increasing and long maturities declining in yield.
Investment-grade corporate spreads, as measured by the Barclays Corporate Index, increased over each of the final five months of 2014. The last time the Barclays Corporate Index had five
consecutive months of negative excess returns was in the second half of 2008. Throughout this period, “BBB” rated issuers experienced the most significant increase. The industrial sector increased most, driven by substantially higher spreads in the energy space as a result of the dramatic decline in the price of crude oil. While the full impact of cheaper oil remains uncertain, the high concentration of energy issuers in the “BBB” and high-yield sectors of the debt markets became a source of concern to investors.
The Treasury yield curve “twisted” rather significantly in the fourth quarter, as the short end of the curve responded to the possible increase in overnight rates by the Fed sometime in 2015. Longer maturities remained focused on the uncertain and irregular growth of both domestic and overseas economies. Europe, Japan, China and Russia all experienced declines in economic growth rates, and continue to battle against deflationary influences. Historically, weakness in these large economies has impacted the United States. As a result, in spite of the completion of the third round of quantitative easing, the yield on the 30-year Treasury declined by 121 basis points in 2014.
The fixed-income position in the Fund benefitted from these developments in the last half of the year. Our emphasis on higher quality, lower risk sectors and issuers within our benchmarks resulted in positive performance in the third and fourth quarters. Our underweight to the corporate sector and emphasis on high-quality government bonds did not help in the first half of the year but contributed to the positive excess returns for the second half of the year. Against a backdrop of the end to Quantitative Easing by the Fed, ongoing geopolitical risks and uncertainty regarding global economic growth, we are anticipating higher levels of volatility, and further re-pricing of riskier sectors of the capital markets. Therefore, the fixed-income portion of the portfolio remains defensively positioned in this environment. We continue to believe our positioning is prudent and in-line with our stated objectives, and will benefit our clients.
This commentary reflects the viewpoints of the portfolio manager, Chicago Equity Partners LLC, as of December 31, 2014 and is not intended as a forecast or guarantee of future results.
AMG Chicago Equity Partners Balanced Fund
Portfolio Manager’s Comments (continued)
CUMULATIVE TOTAL RETURN PERFORMANCE
The AMG Chicago Equity Partners Balanced Fund’s cumulative total return is based on the daily change in net asset value (NAV), and assumes that all dividends and distributions were reinvested. The graph compares a hypothetical $10,000 investment made in the Fund’s Investor Class shares on December 31, 2004 to a $10,000 investment made in the benchmarks for the same time period. The graph and table do not reflect the deduction of taxes that a shareholder would pay on a Fund distribution or redemption of shares. The listed returns for the Fund are net of expenses and the returns for the indices exclude expenses. Total returns for the Fund would have been lower had certain expenses not been reduced.

The table below shows the average annual total returns for the AMG Chicago Equity Partners Balanced Fund, the Russell 1000® Index and the Barclays U.S. Aggregate Bond Index for the same time periods ended December 31, 2014.
| | | | | | | | | | | | | | | | | | | | |
| Average Annual Total Returns1 | | One
Year | | | Five
Years | | | Ten
Years | | | Since
Inception | | | Inception
Date | |
AMG Chicago Equity Partners Balanced Fund 2,3,4,5 | | | | | | | | | | | | | | | | | | | | |
Investor Class | | | 9.69 | % | | | 10.80 | % | | | 7.30 | % | | | 8.18 | % | | | 01/02/97 | |
Service Class | | | 9.93 | % | | | — | | | | — | | | | 12.84 | % | | | 11/30/12 | |
Institutional Class | | | 9.97 | % | | | 11.09 | % | | | 7.57 | % | | | 8.58 | % | | | 01/02/97 | |
60% Russell 1000® Index6/40% Barclays U.S. Aggregate Bond Index7 | | | 10.49 | % | | | 11.45 | % | | | 7.26 | % | | | 7.71 | % | | | 01/02/97 | † |
The performance data shown represents past performance. Past performance is not a guarantee of future results. Current performance may be lower or higher than the performance data quoted. The investment return and principal value of an investment in the Fund will fluctuate so that an investor’s shares, when redeemed, may be worth more or less than their original cost.
Investors should carefully consider the Fund’s investment objectives, risks, charges and expenses before investing. For performance information through the most recent month end, current net asset values per share for the Fund and other information, please call (800) 835-3879 or visit our website at www.amgfunds.com for a free prospectus. Read it carefully before investing or sending money.
Distributed by AMG Distributors, Inc., member FINRA/SIPC.
| † | Date reflects inception date of the Fund, not the index. |
| 1 | Total return equals income yield plus share price change and assumes reinvestment of all dividends and capital gain distributions. Returns are net of fees and may reflect offsets of Fund expenses as described in the prospectus. No adjustment has been made for taxes payable by shareholders on their reinvested dividends and capital gain distributions. Returns for periods greater than one year are annualized. The listed returns on the Fund are net of expenses and based on the published NAV as of December 31, 2014. All returns are in U.S. dollars ($). |
| 2 | From time to time, the Fund’s advisor has waived its fees and/or absorbed Fund expenses, which has resulted in higher returns. |
| 3 | Changing interest rates may adversely affect the value of an investment. An increase in interest rates typically causes the value of bonds and other fixed income securities to fall. The Fund is subject to the risks associated with investments in debt securities, such as default risk and fluctuations in the perception of the debtor’s ability to pay its creditors. Investments in foreign securities, even though publicly traded in the United States, may involve risks which are in addition to those inherent in domestic investments. |
| 4 | The Fund invests in large-capitalization companies that may underperform other stock funds (such as funds that focus on small- and medium-capitalization companies) when stocks of large-capitalization companies are out of favor. |
| 5 | The Fund invests in value stocks, which may perform differently from the market as a whole and may be undervalued by the market for a long period of time. Value stocks may underperform growth stocks during the given periods. |
| 6 | The Russell 1000® Index measures the performance of approximately 1,000 of the largest securities based on a combination of their market cap and current index membership. The Russell 1000® represents approximately 92% of the U.S. market. The Russell 1000® Index is unmanaged, is not available for investment, and does not incur expenses. |
| 7 | The Barclays U.S. Aggregate Bond Index is an index of the U.S. investment grade fixed-rate bond market, including both government and corporate bonds. The Barclays U.S. Aggregate Bond Index is unmanaged, is not available for investment, and does not incur expenses. |
The Russell 1000® Index is a registered trademark of Russell Investments. Russell® is a trademark of Russell Investments.
Not FDIC insured, nor bank guaranteed. May lose value.
5
AMG Chicago Equity Partners Balanced Fund
Fund Snapshots (unaudited)
December 31, 2014
PORTFOLIO BREAKDOWN
| | | | |
Sector | | AMG
Chicago Equity Partners
Balanced Fund** | |
U.S. Government and Agency Obligations | | | 30.7 | % |
Information Technology | | | 13.5 | % |
Industrials | | | 10.1 | % |
Financials | | | 9.6 | % |
Consumer Discretionary | | | 9.0 | % |
Health Care | | | 8.9 | % |
Consumer Staples | | | 4.9 | % |
Energy | | | 3.9 | % |
Materials | | | 2.6 | % |
Utilities | | | 1.8 | % |
Telecommunication Services | | | 1.3 | % |
Other Assets and Liabilities | | | 3.7 | % |
| ** | As a percentage of net assets. |
TOP TEN HOLDINGS
| | | | |
Security Name | | % of Net Assets | |
U.S. Treasury Notes, 2.500%, 05/15/24 | | | 3.3 | % |
U.S. Treasury Notes, 0.750%, 03/31/18 | | | 2.6 | |
Apple, Inc.* | | | 2.5 | |
U.S. Treasury Notes, 2.625%, 08/15/20 | | | 1.9 | |
U.S. Treasury Bonds, 2.750%, 08/15/42 | | | 1.7 | |
U.S. Treasury Notes, 0.625%, 08/31/17* | | | 1.5 | |
U.S. Treasury Notes, 3.125%, 05/15/21 | | | 1.5 | |
U.S. Treasury Notes, 0.875%, 04/15/17* | | | 1.4 | |
Facebook, Inc., Class A* | | | 1.2 | |
FHLMC, 2.500%, 05/27/16* | | | 1.2 | |
| | | | |
Top Ten as a Group | | | 18.8 | % |
| | | | |
| * | Top Ten Holding as of June 30, 2014. |
Because a fund’s strategy may result in multiple investments in particular sectors of the economy, its performance may depend on the performance of those sectors and may fluctuate more widely than investments diversified across more sectors. For additional information on these and other risk considerations, please see the Fund’s prospectus.
Any sectors, industries, or securities discussed should not be perceived as investment recommendations. Mention of a specific security should not be considered a recommendation to buy or solicitation to sell that security. Specific securities mentioned in this report may have been sold from the Fund’s portfolio of investments by the time you receive this report.
6
AMG Chicago Equity Partners Balanced Fund
Schedule of Portfolio Investments
December 31, 2014
| | | | | | | | |
| | | Shares | | | Value | |
Common Stocks - 62.7% | | | | | | | | |
Consumer Discretionary - 9.0% | | | | | | | | |
Advance Auto Parts, Inc. | | | 1,280 | | | $ | 203,878 | |
Asbury Automotive Group, Inc.* | | | 275 | | | | 20,878 | |
Barnes & Noble, Inc.* | | | 320 | | | | 7,430 | |
Best Buy Co., Inc. | | | 2,330 | | | | 90,823 | |
Big Lots, Inc. | | | 1,975 | | | | 79,039 | |
BJ’s Restaurants, Inc.* | | | 60 | | | | 3,013 | |
Brown Shoe Co., Inc. | | | 340 | | | | 10,931 | |
Brunswick Corp. | | | 125 | | | | 6,407 | |
Buffalo Wild Wings, Inc.* | | | 40 | | | | 7,215 | |
Build-A-Bear Workshop, Inc.* | | | 825 | | | | 16,582 | |
Burlington Stores, Inc.* | | | 140 | | | | 6,616 | |
Cablevision Systems Corp., Class A1 | | | 10,240 | | | | 211,354 | |
Capella Education Co. | | | 40 | | | | 3,078 | |
The Cato Corp., Class A | | | 120 | | | | 5,062 | |
Chipotle Mexican Grill, Inc.* | | | 660 | | | | 451,777 | |
Choice Hotels International, Inc. | | | 800 | | | | 44,816 | |
Comcast Corp., Class A | | | 8,900 | | | | 516,289 | |
Cooper Tire & Rubber Co. | | | 80 | | | | 2,772 | |
Core-Mark Holding Co., Inc. | | | 20 | | | | 1,239 | |
Cracker Barrel Old Country Store, Inc. | | | 75 | | | | 10,557 | |
Dana Holding Corp. | | | 110 | | | | 2,391 | |
DineEquity, Inc. | | | 20 | | | | 2,073 | |
Domino’s Pizza, Inc. | | | 2,690 | | | | 253,317 | |
Entercom Communications Corp., Class A* | | | 70 | | | | 851 | |
Eros International PLC* | | | 115 | | | | 2,433 | |
Expedia, Inc. | | | 2,070 | | | | 176,695 | |
Fiesta Restaurant Group, Inc.* | | | 130 | | | | 7,904 | |
Foot Locker, Inc. | | | 3,890 | | | | 218,540 | |
Grand Canyon Education, Inc.* | | | 130 | | | | 6,066 | |
Group 1 Automotive, Inc. | | | 40 | | | | 3,585 | |
Hanesbrands, Inc. | | | 2,630 | | | | 293,561 | |
The Home Depot, Inc. | | | 2,425 | | | | 254,552 | |
HSN, Inc. | | | 230 | | | | 17,480 | |
Jack in the Box, Inc. | | | 185 | | | | 14,793 | |
JAKKS Pacific, Inc.* | | | 55 | | | | 374 | |
Johnson Controls, Inc. | | | 2,090 | | | | 101,031 | |
Lear Corp. | | | 700 | | | | 68,656 | |
Liberty Ventures, Series A* | | | 400 | | | | 15,088 | |
Live Nation Entertainment, Inc.* | | | 275 | | | | 7,180 | |
Lowe’s Cos., Inc. | | | 4,250 | | | | 292,400 | |
Marriott International Inc., Class A | | | 1,525 | | | | 118,996 | |
Marriott Vacations Worldwide Corp. | | | 150 | | | | 11,181 | |
Michael Kors Holdings, Ltd.* | | | 1,370 | | | | 102,887 | |
| | | | | | | | |
| | | Shares | | | Value | |
Motorcar Parts of America, Inc.* | | | 25 | | | $ | 777 | |
Nautilus, Inc.* | | | 550 | | | | 8,349 | |
Newell Rubbermaid, Inc. | | | 4,050 | | | | 154,265 | |
News Corp., Class A* | | | 1,000 | | | | 15,690 | |
NIKE, Inc., Class B | | | 2,400 | | | | 230,760 | |
Nutrisystem, Inc. | | | 230 | | | | 4,497 | |
O’Reilly Automotive, Inc.* | | | 1,030 | | | | 198,399 | |
Overstock.com, Inc.*1 | | | 320 | | | | 7,766 | |
Penske Automotive Group, Inc. | | | 40 | | | | 1,963 | |
Perry Ellis International, Inc.* | | | 100 | | | | 2,593 | |
The Priceline Group, Inc.* | | | 85 | | | | 96,918 | |
Restaurant Brands International LP, UIT* | | | 38 | | | | 1,421 | |
Restaurant Brands International, Inc.* | | | 3,742 | | | | 146,095 | |
Select Comfort Corp.* | | | 240 | | | | 6,487 | |
Signet Jewelers, Ltd. | | | 500 | | | | 65,785 | |
Skechers U.S.A., Inc., Class A* | | | 270 | | | | 14,918 | |
Staples, Inc. | | | 5,495 | | | | 99,569 | |
Starwood Hotels & Resorts Worldwide, Inc. | | | 1,060 | | | | 85,934 | |
Strayer Education, Inc.* | | | 70 | | | | 5,200 | |
Target Corp. | | | 1,375 | | | | 104,376 | |
Tenneco, Inc.* | | | 170 | | | | 9,624 | |
Tiffany & Co. | | | 2,720 | | | | 290,659 | |
Time Warner, Inc. | | | 1,730 | | | | 147,777 | |
Time, Inc. | | | 160 | | | | 3,938 | |
Tower International, Inc.* | | | 400 | | | | 10,220 | |
Universal Electronics, Inc.* | | | 310 | | | | 20,159 | |
The Walt Disney Co. | | | 8,210 | | | | 773,300 | |
Total Consumer Discretionary | | | | | | | 6,179,229 | |
Consumer Staples - 4.9% | | | | | | | | |
Altria Group, Inc. | | | 3,905 | | | | 192,399 | |
Archer-Daniels-Midland Co. | | | 4,255 | | | | 221,260 | |
Avon Products, Inc. | | | 6,615 | | | | 62,115 | |
Bunge, Ltd. | | | 280 | | | | 25,455 | |
Casey’s General Stores, Inc. | | | 100 | | | | 9,032 | |
Central Garden and Pet Co., Class A* | | | 370 | | | | 3,533 | |
The Clorox Co. | | | 750 | | | | 78,157 | |
The Coca-Cola Co. | | | 1,275 | | | | 53,830 | |
ConAgra Foods, Inc. | | | 600 | | | | 21,768 | |
Constellation Brands, Inc., Class A* | | | 4,395 | | | | 431,457 | |
CVS Health Corp. | | | 1,150 | | | | 110,756 | |
Dean Foods Co. | | | 220 | | | | 4,264 | |
Dr Pepper Snapple Group, Inc. | | | 3,320 | | | | 237,978 | |
Fresh Del Monte Produce, Inc. | | | 180 | | | | 6,039 | |
Hormel Foods Corp. | | | 1,050 | | | | 54,705 | |
Ingles Markets, Inc., Class A | | | 10 | | | | 371 | |
|
The accompanying notes are an integral part of these financial statements. 7 |
AMG Chicago Equity Partners Balanced Fund
Schedule of Portfolio Investments (continued)
| | | | | | | | |
| | | Shares | | | Value | |
Consumer Staples - 4.9% (continued) | | | | | | | | |
Keurig Green Mountain, Inc. | | | 575 | | | $ | 76,127 | |
Kimberly-Clark Corp. | | | 550 | | | | 63,547 | |
The Kroger Co. | | | 3,185 | | | | 204,509 | |
Mead Johnson Nutrition Co. | | | 1,900 | | | | 191,026 | |
Monster Beverage Corp.* | | | 1,000 | | | | 108,350 | |
National Beverage Corp.* | | | 100 | | | | 2,262 | |
The Pantry, Inc.* | | | 435 | | | | 16,121 | |
PepsiCo, Inc. | | | 1,400 | | | | 132,384 | |
Philip Morris International, Inc. | | | 965 | | | | 78,599 | |
Pilgrim’s Pride Corp.*1 | | | 8,170 | | | | 267,894 | |
The Procter & Gamble Co. | | | 2,110 | | | | 192,200 | |
Reynolds American, Inc. | | | 3,000 | | | | 192,810 | |
Sanderson Farms, Inc. | | | 70 | | | | 5,882 | |
SUPERVALU, Inc.* | | | 250 | | | | 2,425 | |
USANA Health Sciences, Inc.* | | | 30 | | | | 3,078 | |
Walgreens Boots Alliance, Inc. | | | 1,300 | | | | 99,060 | |
The WhiteWave Foods Co.* | | | 5,680 | | | | 198,743 | |
Total Consumer Staples | | | | | | | 3,348,136 | |
Energy - 3.9% | | | | | | | | |
Abraxas Petroleum Corp.* | | | 580 | | | | 1,705 | |
Adams Resources & Energy, Inc. | | | 40 | | | | 1,998 | |
Alon USA Energy, Inc. | | | 110 | | | | 1,394 | |
Anadarko Petroleum Corp. | | | 1,215 | | | | 100,237 | |
Baker Hughes, Inc. | | | 500 | | | | 28,035 | |
Carrizo Oil & Gas, Inc.* | | | 45 | | | | 1,872 | |
Cheniere Energy, Inc.* | | | 4,600 | | | | 323,840 | |
Chevron Corp. | | | 2,005 | | | | 224,921 | |
Clayton Williams Energy, Inc.* | | | 55 | | | | 3,509 | |
ConocoPhillips | | | 2,140 | | | | 147,788 | |
Delek US Holdings, Inc. | | | 300 | | | | 8,184 | |
Diamondback Energy, Inc.* | | | 25 | | | | 1,495 | |
EQT Corp. | | | 795 | | | | 60,182 | |
Exxon Mobil Corp. | | | 5,625 | | | | 520,031 | |
FMC Technologies, Inc.* | | | 3,425 | | | | 160,427 | |
Gastar Exploration, Inc.* | | | 470 | | | | 1,133 | |
Gulf Island Fabrication, Inc. | | | 355 | | | | 6,883 | |
Helix Energy Solutions Group, Inc.* | | | 200 | | | | 4,340 | |
Hess Corp. | | | 810 | | | | 59,794 | |
Matrix Service Co.* | | | 130 | | | | 2,902 | |
National Oilwell Varco, Inc. | | | 930 | | | | 60,943 | |
Newpark Resources, Inc.* | | | 580 | | | | 5,533 | |
Occidental Petroleum Corp. | | | 695 | | | | 56,024 | |
Oil States International, Inc.* | | | 700 | | | | 34,230 | |
Pacific Ethanol, Inc.* | | | 965 | | | | 9,968 | |
| | | | | | | | |
| | | Shares | | | Value | |
Patterson-UTI Energy, Inc. | | | 11,045 | | | $ | 183,237 | |
Phillips 66 | | | 1,235 | | | | 88,550 | |
REX American Resources Corp.* | | | 100 | | | | 6,197 | |
Schlumberger, Ltd. | | | 1,265 | | | | 108,044 | |
Southwestern Energy Co.* | | | 5,950 | | | | 162,376 | |
Teekay Tankers, Ltd.,
Class A1 | | | 2,980 | | | | 15,079 | |
Tesoro Corp. | | | 1,900 | | | | 141,265 | |
Triangle Petroleum Corp.*1 | | | 430 | | | | 2,055 | |
US Silica Holdings, Inc.1 | | | 290 | | | | 7,450 | |
Valero Energy Corp. | | | 2,600 | | | | 128,700 | |
Western Refining, Inc. | | | 40 | | | | 1,511 | |
Total Energy | | | | | | | 2,671,832 | |
Financials - 8.7% | | | | | | | | |
Aflac, Inc. | | | 800 | | | | 48,872 | |
AG Mortgage Investment Trust, Inc. | | | 575 | | | | 10,678 | |
Allied World Assurance Co. Holdings AG | | | 1,500 | | | | 56,880 | |
The Allstate Corp. | | | 1,340 | | | | 94,135 | |
American Assets Trust, Inc. | | | 95 | | | | 3,782 | |
American Capital Agency Corp. | | | 2,175 | | | | 47,480 | |
American Capital Mortgage Investment Corp. | | | 160 | | | | 3,014 | |
American International Group, Inc. | | | 2,200 | | | | 123,222 | |
Ameriprise Financial, Inc. | | | 310 | | | | 40,997 | |
AmTrust Financial Services, Inc. | | | 150 | | | | 8,437 | |
Annaly Capital Management, Inc. | | | 1,690 | | | | 18,269 | |
Anworth Mortgage Asset Corp. | | | 1,430 | | | | 7,507 | |
Apollo Residential Mortgage, Inc. | | | 60 | | | | 946 | |
Aspen Insurance Holdings, Ltd. | | | 2,200 | | | | 96,294 | |
Associated Banc-Corp. | | | 4,390 | | | | 81,786 | |
Associated Estates Realty Corp. | | | 230 | | | | 5,338 | |
Axis Capital Holdings, Ltd. | | | 770 | | | | 39,339 | |
BancFirst Corp. | | | 160 | | | | 10,142 | |
Banco Latinoamericano de Comercio Exterior, S.A. | | | 110 | | | | 3,311 | |
Bank of America Corp. | | | 14,750 | | | | 263,877 | |
Bank of the Ozarks, Inc. | | | 170 | | | | 6,446 | |
Berkshire Hathaway, Inc., Class B* | | | 1,000 | | | | 150,150 | |
BofI Holding, Inc.* | | | 50 | | | | 3,890 | |
Boston Private Financial Holdings, Inc. | | | 215 | | | | 2,896 | |
Brixmor Property Group, Inc. | | | 4,490 | | | | 111,532 | |
Capstead Mortgage Corp.1 | | | 140 | | | | 1,719 | |
Cathay General Bancorp | | | 330 | | | | 8,445 | |
Cedar Realty Trust, Inc. | | | 360 | | | | 2,642 | |
Chimera Investment Corp. | | | 22,500 | | | | 71,550 | |
The Chubb Corp. | | | 680 | | | | 70,360 | |
Citigroup, Inc. | | | 400 | | | | 21,644 | |
The accompanying notes are an integral part of these financial statements.
8
AMG Chicago Equity Partners Balanced Fund
Schedule of Portfolio Investments (continued)
| | | | | | | | |
| | | Shares | | | Value | |
Financials - 8.7% (continued) | | | | | | | | |
CME Group, Inc. | | | 1,665 | | | $ | 147,602 | |
Comerica, Inc. | | | 3,710 | | | | 173,776 | |
Commerce Bancshares, Inc. | | | 630 | | | | 27,399 | |
Cullen/Frost Bankers, Inc. | | | 1,040 | | | | 73,466 | |
CyrusOne, Inc. | | | 40 | | | | 1,102 | |
CYS Investments, Inc. | | | 610 | | | | 5,319 | |
DiamondRock Hospitality Co. | | | 630 | | | | 9,368 | |
Equity Lifestyle Properties, Inc. | | | 3,225 | | | | 166,249 | |
Everest Re Group, Ltd. | | | 425 | | | | 72,378 | |
Extra Space Storage, Inc. | | | 4,210 | | | | 246,874 | |
FelCor Lodging Trust, Inc. | | | 180 | | | | 1,948 | |
First American Financial Corp. | | | 280 | | | | 9,492 | |
First Defiance Financial Corp. | | | 90 | | | | 3,065 | |
First Financial Bancorp | | | 80 | | | | 1,487 | |
First Horizon National Corp. | | | 3,550 | | | | 48,209 | |
First Interstate BancSystem, Inc., Class A | | | 160 | | | | 4,451 | |
First Merchants Corp. | | | 110 | | | | 2,503 | |
First NBC Bank Holding Co.* | | | 165 | | | | 5,808 | |
The Geo Group, Inc. | | | 320 | | | | 12,915 | |
The Goldman Sachs Group, Inc. | | | 570 | | | | 110,483 | |
Great Southern Bancorp, Inc. | | | 250 | | | | 9,918 | |
Hallmark Financial Services, Inc.* | | | 810 | | | | 9,793 | |
Hersha Hospitality Trust | | | 2,400 | | | | 16,872 | |
HFF, Inc., Class A | | | 480 | | | | 17,242 | |
Highwoods Properties, Inc. | | | 230 | | | | 10,184 | |
Hudson Pacific Properties, Inc. | | | 315 | | | | 9,469 | |
Intercontinental Exchange, Inc. | | | 1,000 | | | | 219,290 | |
JPMorgan Chase & Co. | | | 3,548 | | | | 222,034 | |
KeyCorp | | | 3,000 | | | | 41,700 | |
LaSalle Hotel Properties | | | 455 | | | | 18,414 | |
Lazard, Ltd., Class A* | | | 3,120 | | | | 156,094 | |
Legg Mason, Inc. | | | 1,785 | | | | 95,265 | |
Lincoln National Corp. | | | 1,815 | | | | 104,671 | |
M&T Bank Corp. | | | 325 | | | | 40,827 | |
Mack-Cali Realty Corp. | | | 5,750 | | | | 109,595 | |
MainSource Financial Group, Inc. | | | 20 | | | | 418 | |
Marcus & Millichap, Inc.* | | | 345 | | | | 11,471 | |
MBIA, Inc.* | | | 8,310 | | | | 79,277 | |
McGraw Hill Financial, Inc. | | | 2,040 | | | | 181,519 | |
Meridian Bancorp, Inc.* | | | 210 | | | | 2,356 | |
Metro Bancorp, Inc.* | | | 290 | | | | 7,517 | |
MFA Financial, Inc. | | | 2,290 | | | | 18,297 | |
MGIC Investment Corp.* | | | 1,155 | | | | 10,765 | |
Morgan Stanley | | | 1,900 | | | | 73,720 | |
| | | | | | | | |
| | | Shares | | | Value | |
Nelnet, Inc., Class A | | | 50 | | | $ | 2,317 | |
New Residential Investment Corp. | | | 680 | | | | 8,684 | |
Northern Trust Corp. | | | 1,090 | | | | 73,466 | |
Northrim BanCorp, Inc. | | | 50 | | | | 1,312 | |
The Phoenix Cos., Inc.* | | | 40 | | | | 2,755 | |
Physicians Realty Trust | | | 145 | | | | 2,407 | |
Piedmont Office Realty Trust, Inc., Class A1 | | | 6,690 | | | | 126,040 | |
Piper Jaffray Cos.* | | | 190 | | | | 11,037 | |
Potlatch Corp. | | | 360 | | | | 15,073 | |
Preferred Bank | | | 210 | | | | 5,857 | |
PrivateBancorp, Inc. | | | 360 | | | | 12,024 | |
The Progressive Corp. | | | 1,820 | | | | 49,122 | |
Public Storage | | | 1,160 | | | | 214,426 | |
Reinsurance Group of America, Inc. | | | 1,210 | | | | 106,020 | |
S&T Bancorp, Inc. | | | 240 | | | | 7,154 | |
Signature Bank* | | | 1,195 | | | | 150,522 | |
Simon Property Group, Inc. | | | 1,260 | | | | 229,459 | |
Sovran Self Storage, Inc. | | | 160 | | | | 13,955 | |
Square 1 Financial, Inc.,
Class A* | | | 60 | | | | 1,482 | |
State Bank Financial Corp. | | | 60 | | | | 1,199 | |
State Street Corp. | | | 1,670 | | | | 131,095 | |
Suffolk Bancorp | | | 40 | | | | 908 | |
Sunstone Hotel Investors, Inc. | | | 260 | | | | 4,293 | |
SunTrust Banks, Inc. | | | 2,185 | | | | 91,552 | |
TD Ameritrade Holding Corp. | | | 2,530 | | | | 90,523 | |
The Travelers Cos., Inc. | | | 1,445 | | | | 152,953 | |
Universal Insurance Holdings, Inc. | | | 1,160 | | | | 23,722 | |
Univest Corp. of Pennsylvania | | | 70 | | | | 1,417 | |
US Bancorp | | | 2,945 | | | | 132,378 | |
Wells Fargo & Co. | | | 4,770 | | | | 261,491 | |
WesBanco, Inc. | | | 200 | | | | 6,960 | |
West Bancorporation, Inc. | | | 50 | | | | 851 | |
Western Alliance Bancorp* | | | 160 | | | | 4,448 | |
WisdomTree Investments, Inc.1 | | | 1,120 | | | | 17,556 | |
Total Financials | | | | | | | 5,960,640 | |
Health Care - 8.9% | | | | | | | | |
Abaxis, Inc. | | | 100 | | | | 5,683 | |
AbbVie, Inc. | | | 6,805 | | | | 445,319 | |
Acorda Therapeutics, Inc.* | | | 140 | | | | 5,722 | |
Aetna, Inc. | | | 725 | | | | 64,402 | |
Affymetrix, Inc.* | | | 90 | | | | 888 | |
Agios Pharmaceuticals, Inc.*1 | | | 45 | | | | 5,042 | |
Alexion Pharmaceuticals, Inc.* | | | 2,590 | | | | 479,228 | |
AmerisourceBergen Corp. | | | 200 | | | | 18,032 | |
Amgen, Inc. | | | 1,000 | | | | 159,290 | |
The accompanying notes are an integral part of these financial statements.
9
AMG Chicago Equity Partners Balanced Fund
Schedule of Portfolio Investments (continued)
| | | | | | | | |
| | | Shares | | | Value | |
Health Care - 8.9% (continued) | | | | | | | | |
Anacor Pharmaceuticals, Inc.* | | | 130 | | | $ | 4,192 | |
AngioDynamics, Inc.* | | | 165 | | | | 3,137 | |
Anika Therapeutics, Inc.* | | | 160 | | | | 6,518 | |
Anthem, Inc. | | | 1,355 | | | | 170,283 | |
Avanir Pharmaceuticals, Inc.* | | | 280 | | | | 4,746 | |
Biogen Idec, Inc.* | | | 290 | | | | 98,440 | |
Bristol-Myers Squibb Co. | | | 4,400 | | | | 259,732 | |
Brookdale Senior Living, Inc.* | | | 3,875 | | | | 142,096 | |
Celgene Corp.* | | | 1,600 | | | | 178,976 | |
Centene Corp.* | | | 230 | | | | 23,885 | |
Cepheid, Inc.* | | | 310 | | | | 16,783 | |
Chemed Corp.1 | | | 45 | | | | 4,755 | |
Covidien PLC | | | 1,245 | | | | 127,339 | |
CR Bard, Inc. | | | 555 | | | | 92,474 | |
Depomed, Inc.* | | | 900 | | | | 14,499 | |
Dyax Corp.* | | | 1,915 | | | | 26,925 | |
Edwards Lifesciences Corp.* | | | 1,510 | | | | 192,344 | |
Emergent Biosolutions, Inc.* | | | 40 | | | | 1,089 | |
The Ensign Group, Inc. | | | 25 | | | | 1,110 | |
Gilead Sciences, Inc.* | | | 5,005 | | | | 471,771 | |
Greatbatch, Inc.* | | | 85 | | | | 4,191 | |
HCA Holdings, Inc.* | | | 1,600 | | | | 117,424 | |
Health Net, Inc.* | | | 2,390 | | | | 127,937 | |
HealthSouth Corp. | | | 360 | | | | 13,846 | |
ICU Medical, Inc.* | | | 75 | | | | 6,143 | |
Illumina, Inc.* | | | 1,800 | | | | 332,244 | |
Impax Laboratories, Inc.* | | | 120 | | | | 3,802 | |
Intuitive Surgical, Inc.* | | | 730 | | | | 386,126 | |
Isis Pharmaceuticals, Inc.*1 | | | 415 | | | | 25,622 | |
Johnson & Johnson | | | 2,625 | | | | 274,496 | |
Lannett Co., Inc.* | | | 280 | | | | 12,006 | |
Ligand Pharmaceuticals, Inc.*1 | | | 300 | | | | 15,963 | |
Magellan Health, Inc.* | | | 30 | | | | 1,801 | |
Mallinckrodt PLC* | | | 3,170 | | | | 313,925 | |
McKesson Corp. | | | 1,350 | | | | 280,233 | |
Medivation, Inc.* | | | 1,230 | | | | 122,520 | |
Medtronic, Inc. | | | 2,565 | | | | 185,193 | |
Merck & Co., Inc. | | | 1,305 | | | | 74,111 | |
Merrimack Pharmaceuticals, Inc.*1 | | | 3,420 | | | | 38,646 | |
Natus Medical, Inc.* | | | 550 | | | | 19,822 | |
NPS Pharmaceuticals, Inc.* | | | 225 | | | | 8,048 | |
NuVasive, Inc.* | | | 115 | | | | 5,423 | |
Omeros Corp.* | | | 935 | | | | 23,169 | |
Owens & Minor, Inc. | | | 60 | | | | 2,107 | |
| | | | | | | | |
| | | Shares | | | Value | |
Pacira Pharmaceuticals, Inc.* | | | 145 | | | $ | 12,856 | |
PAREXEL International Corp.* | | | 200 | | | | 11,112 | |
Pfizer, Inc. | | | 11,057 | | | | 344,426 | |
Pharmacyclics, Inc.*1 | | | 600 | | | | 73,356 | |
POZEN, Inc.* | | | 580 | | | | 4,640 | |
Raptor Pharmaceutical Corp.*1 | | | 270 | | | | 2,840 | |
Sequenom, Inc.* | | | 5,555 | | | | 20,554 | |
STERIS Corp. | | | 170 | | | | 11,025 | |
Triple-S Management Corp., Class B* | | | 360 | | | | 8,608 | |
United Therapeutics Corp.* | | | 460 | | | | 59,565 | |
Universal Health Services, Inc., Class B | | | 1,225 | | | | 136,294 | |
Zeltiq Aesthetics, Inc.* | | | 190 | | | | 5,303 | |
Total Health Care | | | | | | | 6,110,077 | |
Industrials - 8.4% | | | | | | | | |
AAON, Inc. | | | 370 | | | | 8,284 | |
AAR Corp. | | | 70 | | | | 1,945 | |
ABM Industries, Inc. | | | 90 | | | | 2,578 | |
ACCO Brands Corp.* | | | 970 | | | | 8,740 | |
Accuride Corp.* | | | 1,850 | | | | 8,029 | |
Alaska Air Group, Inc. | | | 1,670 | | | | 99,799 | |
Allison Transmission Holdings, Inc. | | | 5,725 | | | | 194,077 | |
American Woodmark Corp.* | | | 70 | | | | 2,831 | |
ArcBest Corp. | | | 165 | | | | 7,651 | |
Argan, Inc. | | | 400 | | | | 13,456 | |
Avis Budget Group, Inc.* | | | 4,495 | | | | 298,153 | |
Blount International, Inc.* | | | 1,170 | | | | 20,557 | |
Brady Corp., Class A | | | 40 | | | | 1,094 | |
Carlisle Cos., Inc. | | | 1,060 | | | | 95,654 | |
Caterpillar, Inc. | | | 1,880 | | | | 172,076 | |
CH Robinson Worldwide, Inc. | | | 300 | | | | 22,467 | |
Con-way, Inc. | | | 810 | | | | 39,836 | |
Copa Holdings, S.A., Class A | | | 400 | | | | 41,456 | |
CRA International, Inc.* | | | 90 | | | | 2,729 | |
Deluxe Corp. | | | 270 | | | | 16,808 | |
Douglas Dynamics, Inc. | | | 380 | | | | 8,143 | |
EMCOR Group, Inc. | | | 40 | | | | 1,780 | |
Esterline Technologies Corp.* | | | 15 | | | | 1,645 | |
Exelis, Inc. | | | 2,900 | | | | 50,837 | |
Federal Signal Corp. | | | 970 | | | | 14,977 | |
Fluor Corp. | | | 270 | | | | 16,370 | |
FreightCar America, Inc. | | | 330 | | | | 8,682 | |
General Dynamics Corp. | | | 1,090 | | | | 150,006 | |
General Electric Co. | | | 7,330 | | | | 185,229 | |
The Greenbrier Cos., Inc.1 | | | 340 | | | | 18,268 | |
H&E Equipment Services, Inc. | | | 70 | | | | 1,966 | |
The accompanying notes are an integral part of these financial statements.
10
AMG Chicago Equity Partners Balanced Fund
Schedule of Portfolio Investments (continued)
| | | | | | | | |
| | | Shares | | | Value | |
Industrials - 8.4% (continued) | | | | | | | | |
Harsco Corp. | | | 3,010 | | | $ | 56,859 | |
HNI Corp. | | | 470 | | | | 23,998 | |
Huntington Ingalls Industries, Inc. | | | 2,370 | | | | 266,530 | |
Hurco Cos., Inc. | | | 80 | | | | 2,727 | |
Hyster-Yale Materials Handling, Inc. | | | 20 | | | | 1,464 | |
Illinois Tool Works, Inc. | | | 1,600 | | | | 151,520 | |
Ingersoll-Rand PLC | | | 500 | | | | 31,695 | |
Insperity, Inc. | | | 50 | | | | 1,695 | |
ITT Corp. | | | 8,070 | | | | 326,512 | |
JetBlue Airways Corp.*1 | | | 580 | | | | 9,199 | |
John Bean Technologies Corp. | | | 50 | | | | 1,643 | |
Joy Global, Inc. | | | 790 | | | | 36,751 | |
Kforce, Inc. | | | 910 | | | | 21,958 | |
Kimball International, Inc., Class B | | | 305 | | | | 2,782 | |
Kirby Corp.* | | | 950 | | | | 76,703 | |
Knight Transportation, Inc. | | | 220 | | | | 7,405 | |
Korn/Ferry International* | | | 70 | | | | 2,013 | |
Landstar System, Inc. | | | 730 | | | | 52,947 | |
Lockheed Martin Corp. | | | 990 | | | | 190,644 | |
Meritor, Inc.* | | | 940 | | | | 14,241 | |
The Middleby Corp.* | | | 1,600 | | | | 158,560 | |
Moog, Inc., Class A* | | | 150 | | | | 11,105 | |
Mueller Industries, Inc. | | | 50 | | | | 1,707 | |
MYR Group, Inc.* | | | 115 | | | | 3,151 | |
Northrop Grumman Corp. | | | 490 | | | | 72,221 | |
Old Dominion Freight Line, Inc.* | | | 1,400 | | | | 108,696 | |
Orbital Sciences Corp.* | | | 50 | | | | 1,345 | |
PAM Transportation Services, Inc.* | | | 175 | | | | 9,072 | |
Pitney Bowes, Inc. | | | 16,015 | | | | 390,286 | |
Polypore International, Inc.* | | | 435 | | | | 20,467 | |
Rockwell Automation, Inc. | | | 445 | | | | 49,484 | |
Rush Enterprises, Inc.,
Class A* | | | 95 | | | | 3,045 | |
SkyWest, Inc. | | | 115 | | | | 1,527 | |
Snap-on,, Inc. | | | 800 | | | | 109,392 | |
Southwest Airlines Co. | | | 7,380 | | | | 312,322 | |
Spirit AeroSystems Holdings, Inc., Class A* | | | 9,010 | | | | 387,790 | |
Spirit Airlines, Inc.* | | | 30 | | | | 2,267 | |
SPX Corp. | | | 1,490 | | | | 128,021 | |
Standex International Corp. | | | 115 | | | | 8,885 | |
Steelcase, Inc., Class A | | | 630 | | | | 11,309 | |
Sun Hydraulics Corp. | | | 55 | | | | 2,166 | |
Teledyne Technologies, Inc.* | | | 165 | | | | 16,952 | |
TransDigm Group, Inc. | | | 2,010 | | | | 394,664 | |
Trex Co., Inc.* | | | 160 | | | | 6,813 | |
| | | | | | | | |
| | | Shares | | | Value | |
Trinity Industries, Inc. | | | 5,405 | | | $ | 151,394 | |
Tutor Perini Corp.* | | | 355 | | | | 8,545 | |
Tyco International PLC | | | 2,125 | | | | 93,203 | |
Union Pacific Corp. | | | 2,350 | | | | 279,956 | |
United Rentals, Inc.* | | | 2,310 | | | | 235,643 | |
West Corp. | | | 390 | | | | 12,870 | |
Total Industrials | | | | | | | 5,788,267 | |
Information Technology - 13.5% | | | | | | | | |
Actua Corp.* | | | 75 | | | | 1,385 | |
Akamai Technologies, Inc.* | | | 3,010 | | | | 189,510 | |
Alpha & Omega Semiconductor, Ltd.* | | | 520 | | | | 4,602 | |
Amphenol Corp., Class A | | | 2,400 | | | | 129,144 | |
Apple, Inc. | | | 15,375 | | | | 1,697,092 | |
Applied Materials, Inc. | | | 2,960 | | | | 73,763 | |
Applied Micro Circuits Corp.* | | | 630 | | | | 4,108 | |
Arista Networks, Inc.*1 | | | 3,075 | | | | 186,837 | |
ARRIS Group, Inc.* | | | 300 | | | | 9,057 | |
Aspen Technology, Inc.* | | | 700 | | | | 24,514 | |
Barracuda Networks, Inc.* | | | 190 | | | | 6,810 | |
Bel Fuse, Inc., Class B | | | 35 | | | | 957 | |
Blackbaud, Inc. | | | 180 | | | | 7,787 | |
Blackhawk Network Holdings, Inc., Class B* | | | 607 | | | | 22,878 | |
Booz Allen Hamilton Holding Corp. | | | 7,875 | | | | 208,924 | |
Broadcom Corp., Class A | | | 1,100 | | | | 47,663 | |
Broadridge Financial Solutions, Inc. | | | 2,625 | | | | 121,222 | |
Brocade Communications Systems, Inc. | | | 7,190 | | | | 85,130 | |
Cabot Microelectronics Corp.* | | | 25 | | | | 1,183 | |
CACI International, Inc., Class A* | | | 40 | | | | 3,447 | |
CDW Corp. | | | 1,500 | | | | 52,755 | |
Cognizant Technology Solutions Corp., Class A* | | | 1,775 | | | | 93,471 | |
Comtech Telecommunications Corp. | | | 10 | | | | 315 | |
Cypress Semiconductor Corp.1 | | | 630 | | | | 8,996 | |
DST Systems, Inc. | | | 570 | | | | 53,666 | |
Electronic Arts, Inc.* | | | 14,915 | | | | 701,229 | |
Entropic Communications, Inc.* | | | 270 | | | | 683 | |
Envestnet, Inc.* | | | 100 | | | | 4,914 | |
EPAM Systems, Inc.* | | | 315 | | | | 15,041 | |
ePlus, Inc.* | | | 170 | | | | 12,867 | |
Euronet Worldwide, Inc.* | | | 460 | | | | 25,254 | |
F5 Networks, Inc.* | | | 1,510 | | | | 197,002 | |
Facebook, Inc., Class A* | | | 10,755 | | | | 839,105 | |
Fairchild Semiconductor International, Inc.* | | | 555 | | | | 9,368 | |
FleetCor Technologies, Inc.* | | | 3,015 | | | | 448,361 | |
Gartner, Inc.* | | | 400 | | | | 33,684 | |
Global Payments, Inc. | | | 1,050 | | | | 84,767 | |
The accompanying notes are an integral part of these financial statements.
11
AMG Chicago Equity Partners Balanced Fund
Schedule of Portfolio Investments (continued)
| | | | | | | | |
| | | Shares | | | Value | |
Information Technology - 13.5% (continued) | | | | | | | | |
Google, Inc., Class A* | | | 420 | | | $ | 222,877 | |
Google, Inc., Class C* | | | 400 | | | | 210,560 | |
Harris Corp. | | | 340 | | | | 24,419 | |
Hewlett-Packard Co. | | | 3,900 | | | | 156,507 | |
Integrated Device Technology, Inc.* | | | 130 | | | | 2,548 | |
InterDigital, Inc. | | | 440 | | | | 23,276 | |
International Rectifier Corp.* | | | 1,910 | | | | 76,209 | |
Intuit, Inc. | | | 390 | | | | 35,954 | |
Jabil Circuit, Inc. | | | 2,475 | | | | 54,029 | |
Leidos Holdings, Inc. | | | 975 | | | | 42,432 | |
LogMeln, Inc.* | | | 490 | | | | 24,177 | |
Manhattan Associates, Inc.* | | | 575 | | | | 23,414 | |
ManTech International Corp., Class A | | | 50 | | | | 1,512 | |
MAXIMUS, Inc. | | | 175 | | | | 9,597 | |
Methode Electronics, Inc. | | | 230 | | | | 8,397 | |
Microchip Technology, Inc.1 | | | 3,745 | | | | 168,937 | |
Microsoft Corp. | | | 14,665 | | | | 681,189 | |
MicroStrategy, Inc., Class A* | | | 30 | | | | 4,872 | |
Palo Alto Networks, Inc. | | | 1,600 | | | | 196,112 | |
Pandora Media, Inc.* | | | 8,670 | | | | 154,586 | |
Polycom, Inc.* | | | 4,035 | | | | 54,473 | |
Power Integrations, Inc. | | | 130 | | | | 6,726 | |
QLogic Corp.* | | | 50 | | | | 666 | |
QUALCOMM, Inc. | | | 990 | | | | 73,587 | |
Quantum Corp.* | | | 2,910 | | | | 5,122 | |
Rambus, Inc.* | | | 270 | | | | 2,994 | |
RF Micro Devices, Inc.*1 | | | 1,135 | | | | 18,830 | |
Rofin-Sinar Technologies, Inc.* | | | 90 | | | | 2,589 | |
Rogers Corp.* | | | 20 | | | | 1,629 | |
Ruckus Wireless, Inc.* | | | 450 | | | | 5,409 | |
SanDisk Corp. | | | 2,065 | | | | 202,329 | |
Sanmina Corp.* | | | 690 | | | | 16,236 | |
Science Applications International Corp. | | | 80 | | | | 3,962 | |
Semtech Corp.* | | | 170 | | | | 4,687 | |
SolarWinds, Inc.* | | | 2,175 | | | | 108,380 | |
SS&C Technologies Holdings, Inc. | | | 30 | | | | 1,755 | |
Super Micro Computer, Inc.* | | | 80 | | | | 2,790 | |
Synaptics, Inc.* | | | 35 | | | | 2,409 | |
Syntel, Inc.* | | | 200 | | | | 8,996 | |
Tableau Software, Inc.,
Class A* | | | 2,990 | | | | 253,432 | |
Take-Two Interactive Software, Inc.* | | | 1,170 | | | | 32,795 | |
TeleCommunication Systems, Inc., Class A* | | | 620 | | | | 1,934 | |
Tessera Technologies, Inc. | | | 815 | | | | 29,144 | |
Texas Instruments, Inc. | | | 2,070 | | | | 110,673 | |
| | | | | | | | |
| | | Shares | | | Value | |
Tyler Technologies, Inc.* | | | 30 | | | $ | 3,283 | |
VASCO Data Security International, Inc.*1 | | | 885 | | | | 24,966 | |
VeriSign, Inc.*1 | | | 2,190 | | | | 124,830 | |
Visa, Inc., Class A | | | 295 | | | | 77,349 | |
Western Digital Corp. | | | 610 | | | | 67,527 | |
Xerox Corp. | | | 2,090 | | | | 28,967 | |
Xilinx, Inc. | | | 4,200 | | | | 181,818 | |
Yelp, Inc.* | | | 4,875 | | | | 266,809 | |
Total Information Technology | | | | | | | 9,256,191 | |
Materials - 2.6% | | | | | | | | |
A. Schulman, Inc. | | | 160 | | | | 6,485 | |
Albemarle Corp. | | | 2,280 | | | | 137,096 | |
Avery Dennison Corp. | | | 1,130 | | | | 58,624 | |
Ball Corp. | | | 1,905 | | | | 129,864 | |
Boise Cascade Co.* | | | 320 | | | | 11,888 | |
Celanese Corp., Series A | | | 1,000 | | | | 59,960 | |
Century Aluminum Co.* | | | 440 | | | | 10,736 | |
Clearwater Paper Corp.* | | | 160 | | | | 10,968 | |
Commercial Metals Co. | | | 280 | | | | 4,561 | |
The Dow Chemical Co. | | | 825 | | | | 37,628 | |
Ferro Corp.* | | | 1,130 | | | | 14,645 | |
Graphic Packaging Holding Co.* | | | 280 | | | | 3,814 | |
International Flavors & Fragrances, Inc. | | | 1,300 | | | | 131,768 | |
Kronos Worldwide, Inc. | | | 40 | | | | 521 | |
LyondellBasell Industries N.V., Class A | | | 2,850 | | | | 226,262 | |
Minerals Technologies, Inc. | | | 15 | | | | 1,042 | |
Newmont Mining Corp. | | | 2,350 | | | | 44,415 | |
Olin Corp. | | | 140 | | | | 3,188 | |
Packaging Corp. of America | | | 1,300 | | | | 101,465 | |
Platform Specialty Products Corp.* | | | 3,425 | | | | 79,529 | |
PolyOne Corp. | | | 230 | | | | 8,719 | |
PPG Industries, Inc. | | | 680 | | | | 157,182 | |
Quaker Chemical Corp. | | | 70 | | | | 6,443 | |
Resolute Forest Products, Inc.* | | | 20 | | | | 352 | |
Rockwood Holdings, Inc. | | | 650 | | | | 51,220 | |
Sealed Air Corp. | | | 1,875 | | | | 79,556 | |
The Sherwin-Williams Co. | | | 1,000 | | | | 263,040 | |
Sigma-Aldrich Corp. | | | 200 | | | | 27,454 | |
Trecora Resources* | | | 480 | | | | 7,056 | |
UFP Technologies, Inc.* | | | 40 | | | | 983 | |
United States Steel Corp. | | | 3,620 | | | | 96,799 | |
Worthington Industries, Inc. | | | 130 | | | | 3,912 | |
Total Materials | | | | | | | 1,777,175 | |
The accompanying notes are an integral part of these financial statements.
12
AMG Chicago Equity Partners Balanced Fund
Schedule of Portfolio Investments (continued)
| | | | | | | | |
| | | Shares | | | Value | |
Telecommunication Services - 1.3% | | | | | | | | |
AT&T, Inc. | | | 5,080 | | | $ | 170,637 | |
Atlantic Tele-Network, Inc. | | | 20 | | | | 1,352 | |
Frontier Communications Corp. | | | 11,430 | | | | 76,238 | |
Inteliquent, Inc. | | | 710 | | | | 13,937 | |
Intelsat, S.A.* | | | 700 | | | | 12,152 | |
Level 3 Communications, Inc.* | | | 4,400 | | | | 217,272 | |
SBA Communications Corp., Class A* | | | 990 | | | | 109,652 | |
Verizon Communications, Inc. | | | 5,170 | | | | 241,853 | |
Windstream Holdings, Inc.1 | | | 6,425 | | | | 52,942 | |
Total Telecommunication Services | | | | | | | 896,035 | |
Utilities - 1.5% | | | | | | | | |
Ameren Corp. | | | 3,110 | | | | 143,464 | |
American States Water Co. | | | 30 | | | | 1,130 | |
American Water Works Co, Inc. | | | 4,165 | | | | 221,994 | |
Avista Corp. | | | 60 | | | | 2,121 | |
Black Hills Corp. | | | 70 | | | | 3,713 | |
Calpine Corp.* | | | 1,670 | | | | 36,957 | |
CenterPoint Energy, Inc. | | | 5,255 | | | | 123,125 | |
Chesapeake Utilities Corp. | | | 10 | | | | 497 | |
Dynegy, Inc.* | | | 280 | | | | 8,498 | |
The Empire District Electric Co. | | | 130 | | | | 3,866 | |
IDACORP, Inc. | | | 130 | | | | 8,605 | |
New Jersey Resources Corp. | | | 245 | | | | 14,994 | |
Portland General Electric Co. | | | 60 | | | | 2,270 | |
Public Service Enterprise Group, Inc. | | | 4,520 | | | | 187,173 | |
Questar Corp. | | | 4,890 | | | | 123,619 | |
Vectren Corp. | | | 3,945 | | | | 182,377 | |
WGL Holdings, Inc. | | | 90 | | | | 4,916 | |
Total Utilities | | | | | | | 1,069,319 | |
Total Common Stocks
(cost $39,499,843) | | | | | | | 43,056,901 | |
| | |
| | | Principal | | | | |
| | | Amount | | | | |
Corporate Bonds and Notes - 2.9% | | | | | | | | |
Financials - 0.9% | | | | | | | | |
American Express Credit Corp., Series MTN, 2.750%, 09/15/15 | | $ | 90,000 | | | | 91,404 | |
General Electric Capital Corp., | | | | | | | | |
2.900%, 01/09/17 | | | 80,000 | | | | 82,827 | |
MTN, 1.000%, 01/08/16 | | | 60,000 | | | | 60,233 | |
MTN, Series A, 6.750%, 03/15/32 | | | 35,000 | | | | 47,941 | |
| | | | | | | | |
| | | Principal Amount | | | Value | |
US Bancorp, MTN, 2.200%, 04/25/19 | | $ | 85,000 | | | $ | 85,474 | |
Wells Fargo & Co., | | | | | | | | |
1.250%, 07/20/16 | | | 100,000 | | | | 100,370 | |
MTN, 1.400%, 09/08/171 | | | 125,000 | | | | 124,948 | |
Total Financials | | | | | | | 593,197 | |
Industrials - 1.5% | | | | | | | | |
Altria Group, Inc., 9.700%, 11/10/18 | | | 5,000 | | | | 6,354 | |
Burlington Northern, Santa Fe LLC, 4.700%, 10/01/19 | | | 30,000 | | | | 33,198 | |
Caterpillar Financial Services Corp., | | | | | | | | |
MTN, 1.000%, 11/25/16 | | | 65,000 | | | | 65,080 | |
MTN, 2.250%, 12/01/19 | | | 95,000 | | | | 95,214 | |
Colgate-Palmolive Co., MTN, 1.750%, 03/15/19 | | | 55,000 | | | | 54,677 | |
Exxon Mobil Corp., 0.921%, 03/15/17 | | | 75,000 | | | | 74,943 | |
International Business Machines Corp., 4.000%, 06/20/42 | | | 76,000 | | | | 75,992 | |
Johnson & Johnson, 0.700%, 11/28/16 | | | 90,000 | | | | 89,985 | |
McDonald’s Corp., MTN, 6.300%, 10/15/37 | | | 25,000 | | | | 32,777 | |
Medtronic, Inc., 0.875%, 02/27/17 | | | 45,000 | | | | 44,804 | |
PepsiCo, Inc., 2.500%, 05/10/161 | | | 85,000 | | | | 86,870 | |
Pfizer, Inc., 6.200%, 03/15/19 | | | 55,000 | | | | 64,046 | |
Union Pacific Corp., 3.646%, 02/15/24 | | | 110,000 | | | | 116,646 | |
United Parcel Service, Inc., 6.200%, 01/15/38 | | | 50,000 | | | | 66,720 | |
Wal-Mart Stores, Inc., 6.500%, 08/15/37 | | | 45,000 | | | | 62,129 | |
The Walt Disney Co., 1.350%, 08/16/16 | | | 60,000 | | | | 60,588 | |
Total Industrials | | | | | | | 1,030,023 | |
Telecommunication Services - 0.2% | | | | | | | | |
Verizon Communications, Inc., 2.625%, 02/21/20 | | | 108,000 | | | | 106,892 | |
Utilities - 0.3% | | | | | | | | |
Consolidated Edison Co. of New York, Inc., Series 08-B, 6.750%, 04/01/38 | | | 55,000 | | | | 76,850 | |
Dominion Resources, Inc., 4.450%, 03/15/21 | | | 35,000 | | | | 37,973 | |
Georgia Power Co., 5.400%, 06/01/40 | | | 25,000 | | | | 30,411 | |
TransCanada PipeLines, Ltd., 3.800%, 10/01/20 | | | 80,000 | | | | 82,363 | |
Total Utilities | | | | | | | 227,597 | |
Total Corporate Bonds and Notes
(cost $1,922,293) | | | | | | | 1,957,709 | |
The accompanying notes are an integral part of these financial statements.
13
AMG Chicago Equity Partners Balanced Fund
Schedule of Portfolio Investments (continued)
| | | | | | | | |
| | | Principal Amount | | | Value | |
U.S. Government and Agency Obligations - 30.7% | | | | | | | | |
Federal Home Loan Mortgage Corporation - 5.9% | | | | | | | | |
FHLMC, | | | | | | | | |
2.500%, 05/27/16 | | $ | 780,000 | | | $ | 802,214 | |
3.750%, 03/27/19 | | | 640,000 | | | | 696,821 | |
FHLMC Gold Pool, | | | | | | | | |
2.500%, 07/01/28 | | | 91,647 | | | | 93,438 | |
3.000%, 01/01/29 to 07/01/43 | | | 606,106 | | | | 620,475 | |
3.500%, 03/01/42 to 11/01/44 | | | 629,535 | | | | 655,598 | |
4.000%, 02/01/44 to 11/01/44 | | | 720,368 | | | | 769,031 | |
4.500%, 02/01/39 to 11/01/39 | | | 302,785 | | | | 328,342 | |
5.500%, 04/01/38 to 01/01/39 | | | 98,549 | | | | 110,777 | |
Total Federal Home Loan Mortgage Corporation | | | | | | | 4,076,696 | |
Federal National Mortgage Association - 8.3% | | | | | | | | |
FNMA, | | | | | | | | |
0.375%, 12/21/15 | | | 725,000 | | | | 725,274 | |
2.500%, 04/01/28 | | | 228,153 | | | | 232,850 | |
3.000%, 03/01/42 to 08/01/43 | | | 837,954 | | | | 849,307 | |
3.500%, 09/01/26 to 07/01/43 | | | 705,868 | | | | 739,207 | |
4.000%, 12/01/21 to 12/01/41 | | | 465,359 | | | | 497,520 | |
4.500%, 07/01/39 to 05/01/41 | | | 455,064 | | | | 494,676 | |
5.000%, 05/11/17 to 08/01/41 | | | 1,114,368 | | | | 1,226,379 | |
5.375%, 07/15/16 to 06/12/17 | | | 750,000 | | | | 818,882 | |
5.500%, 02/01/35 to 06/01/38 | | | 88,167 | | | | 98,720 | |
Total Federal National Mortgage Association | | | | | | | 5,682,815 | |
U.S. Treasury Obligations - 16.5% | | | | | | | | |
U.S. Treasury Bonds, | | | | | | | | |
2.750%, 08/15/42 | | | 1,165,000 | | | | 1,164,818 | |
4.750%, 02/15/41 | | | 565,000 | | | | 789,632 | |
U.S. Treasury Notes, | | | | | | | | |
0.625%, 12/15/16 to 08/31/17 | | | 1,575,000 | | | | 1,564,915 | |
0.750%, 12/31/17 to 03/31/18 | | | 2,070,000 | | | | 2,039,636 | |
0.875%, 04/15/17 | | | 980,000 | | | | 981,378 | |
| | | | | | | | |
| | | Principal Amount | | | Value | |
U.S. Treasury Notes, | | | | | | | | |
2.250%, 11/15/24 | | $ | 235,000 | | | $ | 236,616 | |
2.500%, 05/15/24 | | | 2,180,000 | | | | 2,245,910 | |
2.625%, 08/15/20 | | | 1,235,000 | | | | 1,289,803 | |
3.125%, 05/15/21 | | | 950,000 | | | | 1,019,543 | |
Total U.S. Treasury Obligations | | | | | | | 11,332,251 | |
Total U.S. Government and Agency Obligations
(cost $20,730,330) | | | | | | | 21,091,762 | |
Short-Term Investments - 7.2% | | | | | | | | |
Repurchase Agreements - 1.6%2 | | | | | | | | |
Cantor Fitzgerald Securities, Inc., dated 12/31/14 due 01/02/15, 0.090%, total to be received $750,004 (collateralized by various U.S. Government Agency Obligations, 0.000% - 10.500%, 01/01/15 - 11/20/64, totaling $765,000) | | | 750,000 | | | | 750,000 | |
Citigroup Global Markets, Inc., dated 12/31/14, due 01/02/15, 0.080%, total to be received $230,479 (collateralized by various U.S. Government Agency Obligations, 1.375% - 8.000%, 12/15/17 - 07/15/51, totaling $235,088) | | | 230,478 | | | | 230,478 | |
Nomura Securities International, Inc., dated 12/31/14, due 01/02/15, 0.080%, total to be received $112,146 (collateralized by various U.S. Government Agency Obligations, 0.000% - 8.875%, 01/07/15 -11/20/64 totaling $114,388) | | | 112,145 | | | | 112,145 | |
Total Repurchase Agreements | | | | | | | 1,092,623 | |
| | |
| | | Shares | | | | |
Other Investment Companies - 5.6%3 | | | | | | | | |
Dreyfus Institutional Cash Advantage Fund, Institutional Class Shares, 0.06% | | | 3,853,370 | | | | 3,853,370 | |
Total Short-Term Investments
(cost $4,945,993) | | | | | | | 4,945,993 | |
Total Investments - 103.5%
(cost $67,098,459) | | | | | | | 71,052,365 | |
Other Assets, less Liabilities - (3.5)% | | | | | | | (2,419,247 | ) |
Net Assets - 100.0% | | | | | | $ | 68,633,118 | |
The accompanying notes are an integral part of these financial statements.
14
AMG Managers High Yield Fund
Portfolio Manager’s Comments
THE YEAR IN REVIEW
The AMG Managers High Yield Fund (Institutional Class Shares) (the “Fund”) returned 2.16% for the year ended December 31, 2014, compared with 2.45% for the Barclays U.S. Corporate High Yield Bond Index (the “Index”).
MARKET RECAP
The high-yield market ended 2014 with lower-than-expected returns resulting from global growth concerns and the return of volatility that intensified into year-end with the significant declines in oil prices. Despite experiencing a few setbacks early in the year, with weak first-quarter economic reports and the emerging market crises, high-yield spreads tightened going into late June. Investor sentiment diminished early in the third quarter, however, as global growth concerns re-emerged and resulting volatility pressured the high-yield market into the year-end. At December 31, high-yield spreads (as measured by the Index) were 483 basis points (bps), 101 bps wider than 12 months ago. For the same period, yields on the Index rose from 5.64% (at December 31, 2013) to 6.61%.
Higher-quality bonds outperformed dramatically, as double-B’s returned 5.37%, besting the returns of single-Bs, 1.47%, and CCC’s, -1.11%. Sector-return dispersion continued as more cyclical sectors unperformed. Oil field services returned the worst, (16.08)%, while banking performed the best at 8.43%. Big and liquid names underperformed (as measured by the Barclays Very Liquid Index), posting a return of 2.10%, trailing the broader high-yield market by 35 bps.
While the pace of new high-yield issuance in 2014 lagged slightly compared to 2012 and 2013, total supply of $356 billion reflects robust issuance activity and the third-largest year on record. While new issue activity continues to be led by refinancing, a broader use of proceeds will begin to increase in the coming year. With declining risk appetites and rising market volatility, full-year outflows for U.S. high-yield mutual funds totaled a record $20.6 billion.
Defaults (ex-TXU Energy) increased, primarily due to one large default in December, and were at 1.63% on a trailing 12-month par-weighted basis and are expected to be 2.0-2.5% through 2015, still below historical averages. We view sub-$60 oil into later 2016 as problematic for low-tier energy but would perhaps raise defaults only 1-2%.
PERFORMANCE AND POSITIONING
In addition to the negative impact of cash, the Fund underperformed its benchmark for the year due to security selection in the banking, retail and electric utilities sectors. The largest detractors came from relative weightings in the Gymboree Corp., SandRidge Energy, Inc., Royal Bank of Scotland Group, Arch Coal, Inc. and Caesars Entertainment Operating Co. Alternatively, relative contributions from security selection in the oil field services, independent energy and health care sectors enhanced annual performance. Specifically, relative weightings in Samson Investment Company, Alpha Natural Resources, HCA, Cliffs Natural Resources and Walter Energy improved results for the year.
Compared to the benchmark at year end, the Fund was overweight in technology, consumer products and health care, due to our view of the relative value opportunities within those sectors. The Fund was underweight in banking/financials, metals and mining and electric utilities because we have not found these sectors compelling, due to challenging fundamental outlooks or rich valuations. Relative to the benchmark at quarter end, the Fund’s spread was equivalent while the Fund’s yield was tighter. The duration of the Fund remains short of the benchmark.
MARKET OUTLOOK
U.S. economic momentum improved as 2014 progressed and we anticipate corporate earnings will continue to strengthen and remain supportive of high-yield fundamentals as we enter 2015. Growth outside of the U.S. remains sluggish and could continue to impact risk asset performance. Default rates are expected to come off historic lows and are forecasted to be 2.0-2.5% through
2015, well below long-term averages. The recent decline in oil prices, if sustained, will negatively impact credit fundamentals for the energy sector and could impact the default experience. As mentioned above, we view sub-$60 oil into later 2016 as problematic for low-tier energy, but would perhaps raise defaults only 1-2%. For the vast majority of the high-yield market, the decline in oil is a benefit to either end demand or cost inputs and should help sustain healthy fundamentals. We expect new issue activity to remain robust and be led by refinancing; however, we expect mergers-and-acquisition activity and general corporate purpose financings to continue to increase. More broadly, management actions are consistent with late mid-cycle behavior. As central bank policies develop, and if global growth concerns continue, episodes of volatility will persist while increasing dispersion of returns among individual issuers and sectors. Spread and performance volatility may also continue around technical pressures resulting from retail fund flows. With the recent widening and current spread levels north of 500 bps, high-yield has historically exhibited less rate sensitivity relative to other fixed-income asset classes. Excess returns are expected to be strong in 2015. Our base-case scenario is for high-yield to return 5-7% as coupon return and modest spread-tightening are offset by default experience and the eventual rise in rates. We believe our current portfolio positioning and our fundamental research and bottom-up-oriented style should allow us to take advantage of market opportunities.
This commentary reflects the viewpoints of the Fund’s subadvisor, JP Morgan Asset Management as of December 31, 2014 and is not intended as a forecast or guarantee of future results.
15
AMG Managers High Yield Fund
Portfolio Manager’s Comments (continued)
CUMULATIVE TOTAL RETURN PERFORMANCE
AMG Managers High Yield Fund’s cumulative total return is based on the daily change in net asset value (NAV), and assumes that all dividends and distributions were reinvested. The graph compares a hypothetical $10,000 investment made in the Fund’s Investor Class shares (formerly Class A shares of the Fund, which were renamed Investor Class shares as of December 1, 2012) on December 31, 2004 to a $10,000 investment made in the Barclays U.S. Corporate High Yield Bond Index for the same time period. The graph and table do not reflect the deduction of taxes that a shareholder would pay on a Fund distribution or redemption of shares. The listed returns for the Fund are net of expenses and the returns for the index exclude expenses. Total returns for the Fund would have been lower had certain expenses not been reduced.
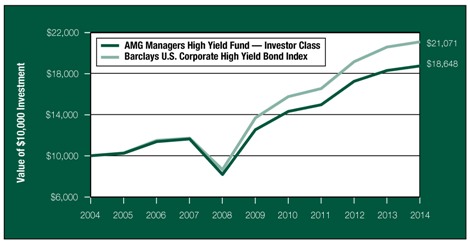
The table below shows the average annual total returns for the AMG Managers High Yield Fund and the Barclays U.S. Corporate High Yield Bond Index for the same time periods ended December 31, 2014.
| | | | | | | | | | | | |
| Average Annual Total Returns1 | | One
Year | | | Five
Years | | | Ten
Years | |
AMG Managers High Yield Fund 2,3,4,5 | | | | | | | | | | | | |
Investor Class | | | 1.99 | % | | | 8.28 | % | | | 6.43 | % |
Institutional Class | | | 2.16 | % | | | 8.57 | % | | | 6.72 | % |
Barclays U.S. Corporate High Yield Bond Index6 | | | 2.45 | % | | | 9.03 | % | | | 7.74 | % |
The performance data shown represents past performance. Past performance is not a guarantee of future results. Current performance may be lower or higher than the performance data quoted. The investment return and principal value of an investment in the Fund will fluctuate so that an investor’s shares, when redeemed, may be worth more or less than their original cost.
Investors should carefully consider the Fund’s investment objectives, risks, charges and expenses before investing. For performance information through the most recent month end, current net asset values per share for the Fund and other information, please call (800) 835-3879 or visit our website at www.amgfunds.com for a free prospectus. Read it carefully before investing or sending money.
Distributed by AMG Distributors, Inc., member FINRA/SIPC.
| 1 | Total return equals income yield plus share price change and assumes reinvestment of all dividends and capital gain distributions. Returns are net of fees and may reflect offsets of Fund expenses as described in the prospectus. No adjustment has been made for taxes payable by shareholders on their reinvested dividends and capital gain distributions. Returns for periods greater than one year are annualized. The listed returns on the Fund are net of expenses and based on the published NAV as of December 31, 2014. All returns are in U.S. dollars ($). |
| 2 | From time to time, the Fund’s advisor has waived its fees and/or absorbed Fund expenses, which has resulted in higher returns. |
| 3 | Fixed income funds are subject to risks associated with investments in debt securities, such as default risk and fluctuations in the perception of the debtors’ ability to pay their creditors. Changing interest rates may adversely affect the value of a fixed income investment. An increase in interest rates typically causes the value of bonds and other fixed income securities to fall. |
| 4 | The Fund holds securities in which the issuer of the security may default or otherwise be unable to honor a financial obligation. The Fund holds securities rated below investment grade that are especially susceptible to this risk. These issuers may be involved in bankruptcy proceedings, reorganizations, or financial restructurings, and are not as strong financially as higher-rated issuers. |
| 5 | A short term redemption fee of 2% will be charged on shares held for less than 90 days. |
| 6 | The Barclays U.S. Corporate High Yield Bond Index is a total return performance benchmark for fixed income securities having a maximum quality rating of Ba1 (as determined by Moody’s Investors Service, Inc.). Unlike the Fund, the Barclays U.S. Corporate High Yield Bond Index is unmanaged, is not available for investment, and does not incur expenses. |
Not FDIC insured, nor bank guaranteed. May lose value.
16
AMG Managers High Yield Fund
Fund Snapshots (unaudited)
December 31, 2014
PORTFOLIO BREAKDOWN
| | | | |
Sector | | AMG Managers
High Yield Fund** | |
Industrials | | | 83.8 | % |
Financials | | | 5.6 | % |
Floating Rate Senior Loan | | | | |
Interests | | | 5.6 | % |
Utilities | | | 1.2 | % |
Other Assets and Liabilities | | | 3.8 | % |
** As a percentage of net assets. | |
| |
Rating | | AMG Managers
High Yield Fund† | |
Baa | | | 1.0 | % |
Ba | | | 40.5 | % |
B | | | 41.2 | % |
Caa | | | 10.9 | % |
Not Rated | | | 6.4 | % |
| † | As a percentage of market value of fixed-income securities. |
TOP TEN HOLDINGS
| | | | |
Security Name | | %of
Net Assets | |
HCA, Inc., 7.500%, 02/15/22* | | | 1.6 | % |
Sprint Corp., 7.875%, 09/15/23* | | | 1.2 | |
Chrysler Group LLC / CG Co-Issuer, Inc., 8.250%, 06/15/21* | | | 1.2 | |
Sprint Capital Corp., 8.750%, 03/15/32* | | | 1.0 | |
Intelsat Jackson Holdings SA, 7.250%, 10/15/20* | | | 1.0 | |
Reynolds Group Issuer, Inc. / Reynolds Group Issuer LLC / Reynolds Group Issuer Lu, 9.875%, 08/15/19 | | | 0.9 | |
HCA Holdings, Inc., 7.750%, 05/15/21* | | | 0.9 | |
DISH DBS Corp., 6.750%, 06/01/21 | | | 0.9 | |
First Data Corp., 8.750%, 01/15/22* | | | 0.8 | |
International Lease Finance Corp., 5.875%, 04/01/19 | | | 0.8 | |
| | | | |
Top Ten as a Group | | | 10.3 | % |
| | | | |
| * | Top Ten Holding as of June 30, 2014. |
Credit quality ratings shown above reflect the highest rating assigned by either Standard & Poor’s (“S&P”) or Moody’s Investors Service, Inc. (“Moody’s”). These rating agencies are independent, nationally recognized statistical rating organizations and are widely used. Investment grade ratings are credit ratings of BBB/Baa or higher. Below investment grade ratings are credit ratings of BB/Ba or lower. Investments designated N/R are not rated by either rating agency. Unrated investments do not necessarily indicate low credit quality. Credit quality ratings are subject to change.
Because a fund’s strategy may result in multiple investments in particular sectors of the economy, its performance may depend on the performance of those sectors and may fluctuate more widely than investments diversified across more sectors. For additional information on these and other risk considerations, please see the Fund’s prospectus.
Any sectors, industries, or securities discussed should not be perceived as investment recommendations. Mention of a specific security should not be considered a recommendation to buy or solicitation to sell that security. Specific securities mentioned in this report may have been sold from the Fund’s portfolio of investments by the time you receive this report.
17
AMG Managers High Yield Fund
Schedule of Portfolio Investments
December 31, 2014
| | | | | | | | |
| . | | Principal Amount | | | Value | |
Floating Rate Senior Loan Interests - 5.6%4 | | | | | | | | |
Academy, LTD., Initial Term Loan, | | | | | | | | |
3.167%, 08/03/18 (01/23/15) | | $ | 33,841 | | | $ | 33,450 | |
4.500%, 08/03/18 (01/30/15) | | | 65,398 | | | | 64,641 | |
Accellent, Inc., Initial Term Loan (First Lien), 4.500%, 03/12/21 (03/12/15) | | | 99,250 | | | | 97,017 | |
Alliance Laundry Systems LLC, Term Loan (First Lien), 4.250%, 12/10/18 (01/05/15) | | | 96,404 | | | | 95,561 | |
American Energy - Marcelus, LLC, Initial Loan (First Lien), 5.250%, 08/04/20 (02/04/15) | | | 65,000 | | | | 57,525 | |
Bway Intermediate Company, Inc., Initial Term Loan, | | | | | | | | |
5.500%, 08/14/20 (02/26/15) | | | 62,011 | | | | 61,759 | |
6.750%, 08/14/20 (04/08/15) | | | 2,664 | | | | 2,653 | |
CD&R Millennium Holdco. 6 S.A.R.L. (Mauser Holdings), Initial Dollar Term Loan (First Lien), 4.500%, 07/31/21 (01/30/15) | | | 64,838 | | | | 64,027 | |
CD&R Millennium Holdco. 6 S.A.R.L. (Mauser Holdings), Initial Term Loan (Second Lien), 8.250%, 07/31/22 (01/30/15) | | | 70,000 | | | | 68,250 | |
Charter Communications Operating LLC (AKA CCO Holdings), Term G Loan, 4.250%, 08/21/21 (01/15/15) | | | 170,000 | | | | 171,074 | |
Clear Channel Communications, Inc., Term Loan D, 6.919%, 01/30/19 (01/30/15) | | | 34,927 | | | | 32,995 | |
Diamond Foods, Loan, 4.250%, 08/20/18 (01/30/15) | | | 99,499 | | | | 98,794 | |
Evergreen Skills LUX S.A R.L., Initial Term Loan (First Lien), 5.750%, 04/28/21 (01/28/15) | | | 99,750 | | | | 98,104 | |
Evergreen Skills LUX S.A R.L., Initial Term Loan (Second Lien), 9.250%, 04/28/22 (01/28/15) | | | 100,000 | | | | 94,750 | |
Grifols Worldwide Operations Limited, U.S. Tranche B Term Loan, 3.169%, 02/27/21 (01/30/15) | | | 99,250 | | | | 98,059 | |
The Hillman Group, Inc., Initial Term Loan, 4.500%, 06/30/21 (03/31/15) | | | 99,500 | | | | 98,505 | |
Integra Telecom Holdings, Inc., Term Loan, 5.250%, 02/22/19 (01/30/15) | | | 127,725 | | | | 125,011 | |
Interline Brands, 1st Lien Term Loan, 4.000%, 03/17/21 (03/17/15) | | | 79,599 | | | | 76,912 | |
Neiman Marcus Group, Inc.., Other Term Loan, | | | | | | | | |
4.250%, 10/25/20 (03/06/15) | | | 198,496 | | | | 194,719 | |
4.250%, 10/25/20 (01/30/15) | | | 501 | | | | 492 | |
New Albertsons, Inc., Term B Loan, 4.750%, 06/27/21 (03/23/15) | | | 99,750 | | | | 98,472 | |
Ortho-Clinical Diagnostics Holdings Luxembourg S.A.R.L., Initial Term Loan, 4.750%, 06/30/21 (03/27/15) | | | 99,499 | | | | 98,069 | |
Steinway Musical Instruments, Inc., 1st Lien Term Loan, 4.750%, 09/19/19 (01/30/15) | | | 99,497 | | | | 99,249 | |
Varsity Brands, Term Loan B, 5.000%, 12/10/21 (03/10/15)5 | | | 95,000 | | | | 94,881 | |
Vertaforce, Inc., 2nd Lien Term Loan, 9.750%, 10/29/17 (03/30/15) | | | 45,000 | | | | 45,262 | |
Wilton Brands LLC (FKA Wilton Brands Inc.), Tranche B Loan, | | | | | | | | |
7.500%, 08/30/18 (02/27/15)5 | | | 73,955 | | | | 69,641 | |
7.500%, 08/30/18 (01/30/15)5 | | | 1,056 | | | | 995 | |
Total Floating Rate Senior Loan Interests
(cost $2,169,765) | | | | | | | 2,140,867 | |
The accompanying notes are an integral part of these financial statements.
18
AMG Managers High Yield Fund
Schedule of Portfolio Investments (continued)
| | | | | | | | |
| | | Principal Amount | | | Value | |
Corporate Bonds and Notes - 90.6% | | | | | | | | |
Financials - 5.6% | | | | | | | | |
Ally Financial, Inc., | | | | | | | | |
2.911%, 07/18/16 (01/20/15)4 | | $ | 40,000 | | | $ | 39,824 | |
3.500%, 01/27/19 | | | 75,000 | | | | 74,287 | |
4.750%, 09/10/18 | | | 40,000 | | | | 41,500 | |
6.250%, 12/01/17 | | | 145,000 | | | | 156,962 | |
7.500%, 09/15/20 | | | 108,000 | | | | 126,900 | |
Bank of America Corp., Series K, 8.000%, 07/29/496 | | | 145,000 | | | | 156,419 | |
Chinos Intermediate Holdings A, Inc., (7.500% Cash or 8.500% PIK), 7.750%,
05/01/19 (a)7 | | | 45,000 | | | | 39,937 | |
CIT Group, Inc., | | | | | | | | |
3.875%, 02/19/19 | | | 100,000 | | | | 100,000 | |
5.250%, 03/15/18 | | | 110,000 | | | | 114,950 | |
5.500%, 02/15/19 (a) | | | 80,000 | | | | 84,650 | |
Cogent Communications Finance, Inc., 5.625%, 04/15/21 (a) | | | 85,000 | | | | 83,512 | |
Corrections Corp. of America, | | | | | | | | |
4.125%, 04/01/20 | | | 90,000 | | | | 87,975 | |
4.625%, 05/01/23 | | | 130,000 | | | | 125,775 | |
General Motors Financial Co., Inc., | | | | | | | | |
3.250%, 05/15/18 | | | 15,000 | | | | 15,056 | |
4.250%, 05/15/23 | | | 30,000 | | | | 30,672 | |
International Lease Finance Corp., | | | | | | | | |
4.625%, 04/15/21 | | | 60,000 | | | | 61,163 | |
5.875%, 04/01/19 | | | 285,000 | | | | 307,800 | |
6.250%, 05/15/19 | | | 130,000 | | | | 142,350 | |
Realogy Group LLC, 7.625%, 01/15/20 (a) | | | 65,000 | | | | 69,875 | |
Realogy Group LLC / Realogy Co-Issuer Corp., 5.250%, 12/01/21 (a) | | | 20,000 | | | | 19,525 | |
Serta Simmons Holdings LLC, 8.125%, 10/01/20 (a) | | | 195,000 | | | | 207,188 | |
Vanguard Natural Resources LLC/VNR Finance Corp., 7.875%, 04/01/20 | | | 50,000 | | | | 43,388 | |
Total Financials | | | | | | | 2,129,708 | |
Industrials - 83.8% | | | | | | | | |
1011778 BC ULC / New Red Finance, Inc., 6.000%, 04/01/22 (a) | | | 40,000 | | | | 41,200 | |
21st Century Oncology, Inc., | | | | | | | | |
8.875%, 01/15/17 | | | 60,000 | | | | 60,750 | |
9.875%, 04/15/17 | | | 55,000 | | | | 51,425 | |
Academy, Ltd. / Academy Finance Corp., 9.250%, 08/01/19 (a) | | | 60,000 | | | | 63,300 | |
The accompanying notes are an integral part of these financial statements.
19
AMG Managers High Yield Fund
Schedule of Portfolio Investments (continued)
| | | | | | | | |
| | | Principal Amount | | | Value | |
Industrials - 83.8% (continued) | | | | | | | | |
Access Midstream Partners, L.P. / ACMP Finance Corp., | | | | | | | | |
4.875%, 05/15/23 | | $ | 40,000 | | | $ | 40,800 | |
5.875%, 04/15/21 | | | 20,000 | | | | 20,950 | |
6.125%, 07/15/22 | | | 60,000 | | | | 64,050 | |
ACCO Brands Corp., 6.750%, 04/30/20 | | | 120,000 | | | | 126,180 | |
ACI Worldwide, Inc., 6.375%, 08/15/20 (a) | | | 50,000 | | | | 52,437 | |
The ADT Corp., | | | | | | | | |
3.500%, 07/15/22 | | | 75,000 | | | | 64,125 | |
6.250%, 10/15/211 | | | 85,000 | | | | 87,550 | |
AECOM Technology Corp., | | | | | | | | |
5.750%, 10/15/22 (a) | | | 20,000 | | | | 20,500 | |
5.875%, 10/15/24 (a) | | | 25,000 | | | | 25,625 | |
Aircastle, Ltd., | | | | | | | | |
4.625%, 12/15/18 | | | 40,000 | | | | 40,300 | |
7.625%, 04/15/20 | | | 70,000 | | | | 77,875 | |
Alcatel-Lucent USA, Inc., 8.875%, 01/01/20 (a) | | | 200,000 | | | | 218,500 | |
Alere, Inc., 6.500%, 06/15/20 | | | 20,000 | | | | 20,250 | |
Allegion US Holding Co., Inc., 5.750%, 10/01/21 | | | 30,000 | | | | 31,875 | |
Alliant Techsystems, Inc., 5.250%, 10/01/21 (a) | | | 60,000 | | | | 60,750 | |
Allison Transmission, Inc., 7.125%, 05/15/19 (a) | | | 125,000 | | | | 131,406 | |
Altice, S.A., 7.750%, 05/15/22 (a) | | | 200,000 | | | | 200,875 | |
AMC Entertainment, Inc., 9.750%, 12/01/20 | | | 120,000 | | | | 131,100 | |
American Axle & Manufacturing, Inc., | | | | | | | | |
6.250%, 03/15/21 | | | 25,000 | | | | 26,375 | |
7.750%, 11/15/19 | | | 60,000 | | | | 67,500 | |
American Energy-Permian Basin LLC / AEPB Finance Corp., | | | | | | | | |
7.125%, 11/01/20 (a)1 | | | 20,000 | | | | 14,900 | |
7.375%, 11/01/21 (a)1 | | | 40,000 | | | | 29,600 | |
Amkor Technology, Inc., | | | | | | | | |
6.375%, 10/01/22 | | | 110,000 | | | | 106,700 | |
6.625%, 06/01/21 | | | 55,000 | | | | 54,725 | |
Anixter, Inc., 5.625%, 05/01/19 | | | 35,000 | | | | 37,100 | |
Antero Resources Corp., 5.125%, 12/01/22 (a) | | | 15,000 | | | | 14,212 | |
Antero Resources Finance Corp., | | | | | | | | |
5.375%, 11/01/21 | | | 40,000 | | | | 38,850 | |
6.000%, 12/01/20 | | | 15,000 | | | | 15,037 | |
Apex Tool Group LLC, 7.000%, 02/01/21 (a) | | | 15,000 | | | | 12,900 | |
The accompanying notes are an integral part of these financial statements.
20
AMG Managers High Yield Fund
Schedule of Portfolio Investments (continued)
| | | | | | | | |
| | | Principal Amount | | | Value | |
Industrials - 83.8% (continued) | | | | | | | | |
Arch Coal, Inc., | | | | | | | | |
7.000%, 06/15/19 | | $ | 35,000 | | | $ | 10,675 | |
7.250%, 06/15/21 | | | 95,000 | | | | 28,144 | |
8.000%, 01/15/19 (a)1 | | | 20,000 | | | | 11,200 | |
Ardagh Packaging Finance PLC, 9.125%, 10/15/20 (a) | | | 200,000 | | | | 214,000 | |
Armored Autogroup, Inc., 9.250%, 11/01/18 | | | 90,000 | | | | 90,000 | |
Ashland, Inc., 4.750%, 08/15/22 (b) | | | 195,000 | | | | 195,975 | |
Ashtead Capital, Inc., 6.500%, 07/15/22 (a) | | | 35,000 | | | | 37,362 | |
Aspect Software, Inc., 10.625%, 05/15/17 | | | 80,000 | | | | 76,000 | |
Associated Materials LLC / AMH New Finance, Inc., 9.125%, 11/01/17 | | | 40,000 | | | | 33,200 | |
Atwood Oceanics, Inc., 6.500%, 02/01/20 | | | 100,000 | | | | 92,000 | |
Audatex North America, Inc., 6.000%, 06/15/21 (a) | | | 165,000 | | | | 170,775 | |
Avaya, Inc., 7.000%, 04/01/19 (a) | | | 115,000 | | | | 112,700 | |
Avis Budget Car Rental LLC / Avis Budget Finance, Inc., | | | | | | | | |
4.875%, 11/15/17 | | | 5,000 | | | | 5,175 | |
5.125%, 06/01/22 (a) | | | 10,000 | | | | 10,125 | |
5.500%, 04/01/23 (a) | | | 110,000 | | | | 112,750 | |
B&G Foods, Inc., 4.625%, 06/01/21 | | | 55,000 | | | | 53,892 | |
Belden, Inc., 5.500%, 09/01/22 (a) | | | 85,000 | | | | 84,787 | |
Berry Petroleum Co., 6.375%, 09/15/22 | | | 40,000 | | | | 30,600 | |
Big Heart Pet Brands, 7.625%, 02/15/19 | | | 186,000 | | | | 183,210 | |
Biomet, Inc., 6.500%, 08/01/20 | | | 230,000 | | | | 246,675 | |
Blackboard, Inc., 7.750%, 11/15/19 (a) | | | 95,000 | | | | 95,712 | |
Blue Racer Midstream LLC / Blue Racer Finance Corp., 6.125%, 11/15/22 (a) | | | 40,000 | | | | 38,700 | |
Bombardier, Inc., | | | | | | | | |
6.125%, 01/15/23 (a)1 | | | 85,000 | | | | 86,912 | |
7.750%, 03/15/20 (a) | | | 40,000 | | | | 43,600 | |
BreitBurn Energy Partners, L.P. / BreitBurn Finance Corp., | | | | | | | | |
7.875%, 04/15/22 | | | 40,000 | | | | 31,100 | |
8.625%, 10/15/20 | | | 70,000 | | | | 60,550 | |
Building Materials Corp. of America, 6.750%, 05/01/21 (a) | | | 65,000 | | | | 68,900 | |
Bumble Bee Holding, Inc., 9.000%, 12/15/17 (a) | | | 110,000 | | | | 115,665 | |
Caesars Entertainment Operating Co., Inc., | | | | | | | | |
8.500%, 02/15/201 | | | 125,000 | | | | 95,000 | |
9.000%, 02/15/201 | | | 380,000 | | | | 283,100 | |
10.000%, 12/15/189 | | | 57,000 | | | | 9,120 | |
11.250%, 06/01/17 | | | 115,000 | | | | 84,870 | |
California Resources Corp., 6.000%, 11/15/24 (a)1 | | | 95,000 | | | | 80,750 | |
Case New Holland Industrial, Inc., 7.875%, 12/01/17 | | | 35,000 | | | | 38,675 | |
The accompanying notes are an integral part of these financial statements.
21
AMG Managers High Yield Fund
Schedule of Portfolio Investments (continued)
| | | | | | | | |
| | | Principal Amount | | | Value | |
Industrials - 83.8% (continued) | | | | | | | | |
CBS Outdoor Americas Capital LLC / CBS Outdoor Americas Capital Corp., | | | | | | | | |
5.250%, 02/15/22 (a)1 | | $ | 20,000 | | | $ | 20,200 | |
5.875%, 03/15/25 (a)1 | | | 20,000 | | | | 20,200 | |
CCO Holdings LLC / CCO Holdings Capital Corp., | | | | | | | | |
5.250%, 03/15/21 | | | 180,000 | | | | 182,025 | |
6.625%, 01/31/22 | | | 30,000 | | | | 31,987 | |
7.375%, 06/01/20 | | | 75,000 | | | | 79,687 | |
CCOH Safari LLC, | | | | | | | | |
5.500%, 12/01/22 | | | 50,000 | | | | 50,875 | |
5.750%, 12/01/24 | | | 65,000 | | | | 65,894 | |
CDW LLC / CDW Finance Corp., 8.500%, 04/01/19 | | | 21,000 | | | | 22,234 | |
Central Garden and Pet Co., 8.250%, 03/01/181 | | | 160,000 | | | | 162,000 | |
CenturyLink, Inc., | | | | | | | | |
Series T, 5.800%, 03/15/22 | | | 145,000 | | | | 151,162 | |
Series W, 6.750%, 12/01/231 | | | 130,000 | | | | 142,837 | |
Cequel Communications Holdings I LLC / Cequel Capital Corp., 5.125%, 12/15/21 (a) | | | 50,000 | | | | 48,750 | |
CEVA Group PLC, 7.000%, 03/01/21 (a)1 | | | 75,000 | | | | 72,750 | |
Chesapeake Energy Corp., | | | | | | | | |
4.875%, 04/15/221 | | | 50,000 | | | | 48,875 | |
6.125%, 02/15/21 | | | 25,000 | | | | 26,375 | |
6.625%, 08/15/20 | | | 100,000 | | | | 106,750 | |
6.875%, 11/15/20 | | | 15,000 | | | | 16,200 | |
Chiquita Brands International, Inc. / Chiquita Brands LLC, 7.875%, 02/01/21 | | | 96,000 | | | | 103,560 | |
Chrysler Group LLC / CG Co-Issuer, Inc., 8.250%, 06/15/21 | | | 400,000 | | | | 445,000 | |
Cinemark USA, Inc., | | | | | | | | |
4.875%, 06/01/23 | | | 25,000 | | | | 23,750 | |
7.375%, 06/15/21 | | | 115,000 | | | | 123,050 | |
Claire’s Stores, Inc., | | | | | | | | |
8.875%, 03/15/19 | | | 70,000 | | | | 57,050 | |
9.000%, 03/15/19 (a) | | | 145,000 | | | | 143,550 | |
Clean Harbors, Inc., 5.250%, 08/01/20 | | | 110,000 | | | | 111,100 | |
Clear Channel Worldwide Holdings, Inc., | | | | | | | | |
6.500%, 11/15/22 | | | 85,000 | | | | 86,912 | |
Series A, 7.625%, 03/15/20 | | | 5,000 | | | | 5,212 | |
Series B, 6.500%, 11/15/22 | | | 295,000 | | | | 305,325 | |
Series B, 7.625%, 03/15/20 | | | 155,000 | | | | 163,912 | |
CNH Industrial Capital LLC, 3.625%, 04/15/18 | | | 50,000 | | | | 49,500 | |
Cogent Communications Holdings, Inc., 8.375%, 02/15/18 (a) | | | 55,000 | | | | 57,750 | |
The accompanying notes are an integral part of these financial statements.
22
AMG Managers High Yield Fund
Schedule of Portfolio Investments (continued)
| | | | | | | | |
| | | Principal Amount | | | Value | |
Industrials - 83.8% (continued) | | | | | | | | |
CommScope, Inc., | | | | | | | | |
5.000%, 06/15/21 (a) | | $ | 10,000 | | | $ | 9,900 | |
5.500%, 06/15/24 (a) | | | 10,000 | | | | 9,900 | |
Compressco Partners L.P. / Compressco Finance, Inc., 7.250%, 08/15/22 (a) | | | 20,000 | | | | 17,400 | |
CONSOL Energy, Inc., 5.875%, 04/15/22 (a) | | | 40,000 | | | | 37,400 | |
Crown Castle International Corp., 5.250%, 01/15/23 | | | 80,000 | | | | 82,000 | |
Dana Holding Corp., | | | | | | | | |
5.375%, 09/15/21 | | | 35,000 | | | | 36,137 | |
5.500%, 12/15/24 | | | 55,000 | | | | 55,825 | |
6.000%, 09/15/23 | | | 40,000 | | | | 42,000 | |
6.750%, 02/15/21 | | | 45,000 | | | | 47,812 | |
DaVita HealthCare Partners, Inc., 6.625%, 11/01/20 | | | 38,000 | | | | 40,019 | |
Denali Borrower LLC / Denali Finance Corp., 5.625%, 10/15/20 (a) | | | 100,000 | | | | 104,300 | |
Denbury Resources, Inc., | | | | | | | | |
4.625%, 07/15/23 | | | 55,000 | | | | 47,987 | |
5.500%, 05/01/22 | | | 95,000 | | | | 87,400 | |
DISH DBS Corp., | | | | | | | | |
5.125%, 05/01/20 | | | 40,000 | | | | 40,400 | |
5.875%, 07/15/22 | | | 170,000 | | | | 174,675 | |
5.875%, 11/15/24 (a) | | | 65,000 | | | | 65,487 | |
6.750%, 06/01/21 | | | 305,000 | | | | 328,637 | |
7.875%, 09/01/19 | | | 65,000 | | | | 73,937 | |
DJO Finance LLC / DJO Finance Corp., | | | | | | | | |
7.750%, 04/15/18 | | | 135,000 | | | | 131,625 | |
8.750%, 03/15/18 | | | 45,000 | | | | 47,025 | |
9.875%, 04/15/18 | | | 20,000 | | | | 20,400 | |
DreamWorks Animation SKG, Inc., 6.875%, 08/15/20 (a) | | | 35,000 | | | | 36,050 | |
Eagle Midco, Inc., 9.000%, 06/15/18 (a) | | | 30,000 | | | | 30,825 | |
Entegris, Inc., 6.000%, 04/01/22 (a) | | | 25,000 | | | | 25,437 | |
EP Energy LLC / Everest Acquisition Finance, Inc., | | | | | | | | |
7.750%, 09/01/22 | | | 85,000 | | | | 79,900 | |
9.375%, 05/01/201 | | | 200,000 | | | | 203,000 | |
Epicor Software Corp., 8.625%, 05/01/19 | | | 100,000 | | | | 105,500 | |
Equinix, Inc., | | | | | | | | |
5.375%, 01/01/22 | | | 25,000 | | | | 25,360 | |
5.750%, 01/01/25 | | | 20,000 | | | | 20,275 | |
EV Energy Partners, L.P. / EV Energy Finance Corp., 8.000%, 04/15/19 | | | 125,000 | | | | 106,875 | |
FGI Operating Co. LLC / FGI Finance, Inc., 7.875%, 05/01/20 | | | 110,000 | | | | 99,550 | |
The accompanying notes are an integral part of these financial statements.
23
AMG Managers High Yield Fund
Schedule of Portfolio Investments (continued)
| | | | | | | | |
| | | Principal Amount | | | Value | |
Industrials - 83.8% (continued) | | | | | | | | |
First Data Corp., | | | | | | | | |
6.750%, 11/01/20 (a) | | $ | 37,000 | | | $ | 39,590 | |
7.375%, 06/15/19 (a) | | | 85,000 | | | | 89,675 | |
8.250%, 01/15/21 (a) | | | 180,000 | | | | 193,500 | |
8.875%, 08/15/20 (a) | | | 165,000 | | | | 177,375 | |
12.625%, 01/15/21 | | | 155,000 | | | | 184,450 | |
First Data Corp., (8.750% Cash or 10.000% PIK), 8.750%, 01/15/22 (a)7 | | | 290,000 | | | | 313,200 | |
FMG Resources August 2006 Pty, Ltd., | | | | | | | | |
6.875%, 02/01/18 (a)1 | | | 20,000 | | | | 18,200 | |
8.250%, 11/01/19 (a)1 | | | 155,000 | | | | 141,631 | |
Frontier Communications Corp., | | | | | | | | |
6.250%, 09/15/211 | | | 20,000 | | | | 20,150 | |
6.875%, 01/15/25 | | | 35,000 | | | | 35,087 | |
7.125%, 01/15/23 | | | 10,000 | | | | 10,225 | |
Gannett Co., Inc., | | | | | | | | |
4.875%, 09/15/21 (a) | | | 15,000 | | | | 14,925 | |
5.500%, 09/15/24 (a) | | | 15,000 | | | | 15,075 | |
Gardner Denver, Inc., 6.875%, 08/15/21 (a)1 | | | 30,000 | | | | 28,950 | |
GCI, Inc., | | | | | | | | |
6.750%, 06/01/21 | | | 90,000 | | | | 88,706 | |
8.625%, 11/15/19 | | | 95,000 | | | | 99,987 | |
GenCorp, Inc., 7.125%, 03/15/21 | | | 125,000 | | | | 131,537 | |
General Cable Corp., 5.750%, 10/01/22 (b) | | | 90,000 | | | | 66,150 | |
General Motors Co., 4.875%, 10/02/23 | | | 185,000 | | | | 198,875 | |
The Geo Group, Inc., | | | | | | | | |
5.875%, 01/15/22 | | | 60,000 | | | | 61,800 | |
6.625%, 02/15/21 | | | 100,000 | | | | 105,250 | |
The Goodyear Tire & Rubber Co., | | | | | | | | |
6.500%, 03/01/21 | | | 40,000 | | | | 42,600 | |
8.250%, 08/15/20 | | | 80,000 | | | | 85,200 | |
8.750%, 08/15/20 | | | 65,000 | | | | 75,562 | |
Great Lakes Dredge & Dock Corp., 7.375%, 02/01/19 | | | 120,000 | | | | 123,000 | |
Gymboree Corp., 9.125%, 12/01/18 | | | 80,000 | | | | 31,200 | |
H&E Equipment Services, Inc., 7.000%, 09/01/22 | | | 40,000 | | | | 41,350 | |
Halcon Resources Corp., | | | | | | | | |
8.875%, 05/15/211 | | | 160,000 | | | | 121,200 | |
9.250%, 02/15/22 | | | 25,000 | | | | 18,562 | |
9.750%, 07/15/20 | | | 15,000 | | | | 11,325 | |
Hanesbrands, Inc., 6.375%, 12/15/20 | | | 50,000 | | | | 53,250 | |
The accompanying notes are an integral part of these financial statements.
24
AMG Managers High Yield Fund
Schedule of Portfolio Investments (continued)
| | | | | | | | |
| | | Principal Amount | | | Value | |
Industrials - 83.8% (continued) | | | | | | | | |
HCA Holdings, Inc., | | | | | | | | |
6.250%, 02/15/21 | | $ | 30,000 | | | $ | 32,025 | |
7.750%, 05/15/21 | | | 320,000 | | | | 341,600 | |
HCA, Inc., | | | | | | | | |
5.250%, 04/15/25 | | | 65,000 | | | | 68,006 | |
6.500%, 02/15/20 | | | 25,000 | | | | 28,075 | |
7.500%, 02/15/22 | | | 535,000 | | | | 612,575 | |
HD Supply, Inc., | | | | | | | | |
5.250%, 12/15/21 (a) | | | 70,000 | | | | 71,400 | |
11.000%, 04/15/20 | | | 45,000 | | | | 51,525 | |
11.500%, 07/15/20 | | | 70,000 | | | | 80,500 | |
HealthSouth Corp., | | | | | | | | |
5.750%, 11/01/24 | | | 25,000 | | | | 26,125 | |
7.750%, 09/15/22 | | | 42,000 | | | | 44,730 | |
Hearthside Group Holdings LLC / Hearthside Finance Co., 6.500%, 05/01/22 (a) | | | 5,000 | | | | 4,900 | |
The Hertz Corp., | | | | | | | | |
5.875%, 10/15/20 | | | 80,000 | | | | 81,000 | |
6.250%, 10/15/22 | | | 75,000 | | | | 76,125 | |
7.375%, 01/15/211 | | | 40,000 | | | | 42,200 | |
7.500%, 10/15/18 | | | 55,000 | | | | 57,200 | |
Hexion US Finance Corp., 6.625%, 04/15/20 | | | 215,000 | | | | 211,775 | |
Hexion US Finance Corp. / Hexion Nova Scotia Finance ULC, | | | | | | | | |
8.875%, 02/01/18 | | | 80,000 | | | | 71,400 | |
9.000%, 11/15/20 | | | 40,000 | | | | 29,000 | |
Hiland Partners, L.P. / Hiland Partners Finance Corp., 7.250%, 10/01/20 (a) | | | 55,000 | | | | 52,525 | |
The Hillman Group, Inc., 6.375%, 07/15/22 (a) | | | 50,000 | | | | 48,250 | |
Hilton Worldwide Finance LLC / Hilton Worldwide Finance Corp., 5.625%, 10/15/21 | | | 40,000 | | | | 42,000 | |
HJ Heinz Co., 4.250%, 10/15/20 | | | 60,000 | | | | 60,750 | |
Hologic, Inc., 6.250%, 08/01/20 | | | 115,000 | | | | 120,175 | |
Hughes Satellite Systems Corp., 6.500%, 06/15/19 | | | 60,000 | | | | 64,650 | |
Huntington Ingalls Industries, Inc., 5.000%, 12/15/21 (a) | | | 35,000 | | | | 35,656 | |
Huntsman International LLC, | | | | | | | | |
4.875%, 11/15/20 | | | 165,000 | | | | 164,588 | |
8.625%, 03/15/21 | | | 25,000 | | | | 26,938 | |
iHeartCommunications, Inc., 9.000%, 03/01/21 | | | 115,000 | | | | 113,131 | |
IMS Health, Inc., 6.000%, 11/01/20 (a) | | | 75,000 | | | | 77,437 | |
Ineos Finance PLC, | | | | | | | | |
7.500%, 05/01/20 (a) | | | 70,000 | | | | 73,762 | |
8.375%, 02/15/19 (a) | | | 200,000 | | | | 213,250 | |
Infinity Acquisition LLC / Infinity Acquisition Finance Corp., 7.250%, 08/01/22 (a) | | | 40,000 | | | | 36,400 | |
The accompanying notes are an integral part of these financial statements.
25
AMG Managers High Yield Fund
Schedule of Portfolio Investments (continued)
| | | | | | | | |
| | | Principal Amount | | | Value | |
Industrials - 83.8% (continued) | | | | | | | | |
Infor Software Parent LLC / Infor Software Parent, Inc., (7.125% Cash or 7.875% PIK), 7.125%, 05/01/21 (a)1,7 | | $ | 115,000 | | | $ | 113,275 | |
Infor US, Inc., | | | | | | | | |
9.375%, 04/01/19 | | | 85,000 | | | | 91,269 | |
11.500%, 07/15/18 | | | 65,000 | | | | 71,175 | |
Intelsat Jackson Holdings SA, | | | | | | | | |
5.500%, 08/01/23 | | | 45,000 | | | | 44,894 | |
6.625%, 12/15/221 | | | 55,000 | | | | 56,788 | |
7.250%, 10/15/20 | | | 355,000 | | | | 375,856 | |
7.500%, 04/01/21 | | | 120,000 | | | | 128,850 | |
Intelsat Luxembourg, S.A., 7.750%, 06/01/21 | | | 110,000 | | | | 110,688 | |
Interline Brands, Inc., (10.000% Cash or 10.750% PIK), 10.000%, 11/15/187 | | | 15,000 | | | | 15,750 | |
inVentiv Health, Inc., | | | | | | | | |
9.000%, 01/15/18 (a) | | | 75,000 | | | | 76,875 | |
11.000%, 08/15/18 (a), (b) | | | 35,000 | | | | 30,593 | |
inVentiv Health, Inc., (10.000% Cash or 12.000% PIK), 10.000%, 08/15/18 (a)7 | | | 45,000 | | | | 42,525 | |
Iron Mountain, Inc., 6.000%, 08/15/23 | | | 70,000 | | | | 73,150 | |
Isle of Capri Casinos, Inc., 5.875%, 03/15/21 | | | 45,000 | | | | 45,900 | |
J.C. Penney Corp., Inc., | | | | | | | | |
5.750%, 02/15/181 | | | 35,000 | | | | 30,625 | |
6.375%, 10/15/36 | | | 60,000 | | | | 39,450 | |
Jack Cooper Holdings Corp., 9.250%, 06/01/20 (a) | | | 80,000 | | | | 83,600 | |
Jarden Corp., 6.125%, 11/15/22 | | | 90,000 | | | | 94,275 | |
JCH Parent, Inc., (10.500% Cash or 11.250% PIK), 10.500%, 03/15/19 (a)7 | | | 30,000 | | | | 27,900 | |
Kindred Escrow Corp. II, | | | | | | | | |
8.000%, 01/15/20 (a) | | | 70,000 | | | | 74,725 | |
8.750%, 01/15/23 (a)1 | | | 15,000 | | | | 16,219 | |
Kinetic Concepts, Inc. / KCI USA, Inc., 10.500%, 11/01/18 (b) | | | 150,000 | | | | 163,500 | |
KLX, Inc., 5.875%, 12/01/22 (a) | | | 70,000 | | | | 70,875 | |
Kodiak Oil & Gas Corp., | | | | | | | | |
5.500%, 01/15/21 | | | 10,000 | | | | 10,075 | |
5.500%, 02/01/22 | | | 10,000 | | | | 10,075 | |
8.125%, 12/01/191 | | | 90,000 | | | | 92,025 | |
Kratos Defense & Security Solutions, Inc., 7.000%, 05/15/19 | | | 90,000 | | | | 76,950 | |
L Brands, Inc., 6.625%, 04/01/21 | | | 120,000 | | | | 135,600 | |
Laredo Petroleum, Inc., | | | | | | | | |
5.625%, 01/15/22 | | | 35,000 | | | | 30,800 | |
7.375%, 05/01/22 | | | 40,000 | | | | 37,600 | |
The accompanying notes are an integral part of these financial statements.
26
AMG Managers High Yield Fund
Schedule of Portfolio Investments (continued)
| | | | | | | | |
| | | Principal Amount | | | Value | |
Industrials - 83.8% (continued) | | | | | | | | |
Legacy Reserves L.P. / Legacy Reserves Finance Corp., | | | | | | | | |
6.625%, 12/01/21 (a)1 | | $ | 40,000 | | | $ | 33,000 | |
8.000%, 12/01/20 | | | 70,000 | | | | 58,450 | |
Level 3 Communications, Inc., 5.750%, 12/01/22 (a) | | | 60,000 | | | | 60,675 | |
Level 3 Financing, Inc., | | | | | | | | |
8.125%, 07/01/19 | | | 80,000 | | | | 85,400 | |
8.625%, 07/15/20 | | | 65,000 | | | | 70,444 | |
Lightstream Resources, Ltd., 8.625%, 02/01/20 (a) | | | 30,000 | | | | 21,150 | |
Linn Energy LLC / Linn Energy Finance Corp., | | | | | | | | |
6.250%, 11/01/19 (b) | | | 50,000 | | | | 42,750 | |
7.750%, 02/01/21 | | | 145,000 | | | | 122,888 | |
Linn Energy LLC/Linn Energy Finance Corp., 8.625%, 04/15/20 | | | 10,000 | | | | 8,750 | |
LSB Industries, Inc., 7.750%, 08/01/19 | | | 85,000 | | | | 88,825 | |
Magnachip Semiconductor Corp., 6.625%, 07/15/21 | | | 105,000 | | | | 95,813 | |
The Manitowoc Co., Inc., 8.500%, 11/01/20 | | | 100,000 | | | | 108,500 | |
Marina District Finance Co., Inc., 9.875%, 08/15/18 | | | 125,000 | | | | 131,406 | |
MarkWest Energy Partners, L.P. / MarkWest Energy Finance Corp., | | | | | | | | |
5.500%, 02/15/23 | | | 85,000 | | | | 86,488 | |
6.500%, 08/15/211 | | | 25,000 | | | | 25,875 | |
McGraw-Hill Global Education Holdings LLC / McGraw-Hill Global Education Finance, 9.750%, 04/01/21 (b) | | | 55,000 | | | | 61,050 | |
MEG Energy Corp., | | | | | | | | |
6.375%, 01/30/23 (a) | | | 80,000 | | | | 71,800 | |
6.500%, 03/15/21 (a) | | | 40,000 | | | | 36,700 | |
7.000%, 03/31/24 (a) | | | 90,000 | | | | 81,900 | |
Memorial Production Partners, L.P. / Memorial Production Finance Corp., | | | | | | | | |
6.875%, 08/01/22 (a) | | | 50,000 | | | | 38,250 | |
7.625%, 05/01/21 | | | 80,000 | | | | 64,400 | |
MGM Resorts International, | | | | | | | | |
5.250%, 03/31/201 | | | 280,000 | | | | 278,600 | |
6.000%, 03/15/23 | | | 100,000 | | | | 101,000 | |
6.750%, 10/01/20 | | | 125,000 | | | | 131,563 | |
7.750%, 03/15/22 | | | 90,000 | | | | 99,900 | |
8.625%, 02/01/19 | | | 5,000 | | | | 5,694 | |
Michaels FinCo Holdings LLC / Michaels FinCo, Inc., (7.500% Cash or 8.250% PIK), 7.500%, 08/01/18 (a)7 | | | 6,000 | | | | 6,135 | |
Michaels Stores, Inc., 5.875%, 12/15/20 (a) | | | 25,000 | | | | 25,375 | |
Micron Technology, Inc., 5.875%, 02/15/22 (a) | | | 60,000 | | | | 63,150 | |
Midstates Petroleum Co., Inc. / Midstates Petroleum Co. LLC, | | | | | | | | |
9.250%, 06/01/21 | | | 40,000 | | | | 20,400 | |
10.750%, 10/01/20 | | | 45,000 | | | | 24,300 | |
Neiman Marcus Group, Ltd., Inc., 8.000%, 10/15/21 (a) | | | 40,000 | | | | 42,500 | |
The accompanying notes are an integral part of these financial statements.
27
AMG Managers High Yield Fund
Schedule of Portfolio Investments (continued)
| | | | | | | | |
| | | Principal Amount | | | Value | |
Industrials - 83.8% (continued) | | | | | | | | |
Neiman Marcus Group, Ltd., Inc. (8.750% Cash or 9.500% PIK), 8.750%, 10/15/21 (a)7 | | $ | 65,000 | | | $ | 69,225 | |
Nexeo Solutions LLC / Nexeo Solutions Finance Corp., 8.375%, 03/01/18 | | | 75,000 | | | | 73,125 | |
Nexstar Broadcasting, Inc., 6.875%, 11/15/20 | | | 120,000 | | | | 125,100 | |
The Nielsen Co. Luxembourg SARL, 5.500%, 10/01/21 (a) | | | 50,000 | | | | 51,250 | |
Nielsen Finance LLC / Nielsen Finance Co., 5.000%, 04/15/22 (a) | | | 70,000 | | | | 70,700 | |
Noranda Aluminum Acquisition Corp., 11.000%, 06/01/19 | | | 35,000 | | | | 34,563 | |
Novelis, Inc., 8.375%, 12/15/17 | | | 65,000 | | | | 67,519 | |
Numericable Group, S.A., 6.000%, 05/15/22 (a) | | | 200,000 | | | | 201,350 | |
NXP, B.V. / NXP Funding LLC, 5.750%, 02/15/21 (a) | | | 200,000 | | | | 211,000 | |
Oasis Petroleum, Inc., 6.875%, 03/15/221 | | | 70,000 | | | | 64,050 | |
Omnicare, Inc., | | | | | | | | |
4.750%, 12/01/22 | | | 10,000 | | | | 10,175 | |
5.000%, 12/01/24 | | | 5,000 | | | | 5,150 | |
Oshkosh Corp., | | | | | | | | |
5.375%, 03/01/221 | | | 5,000 | | | | 5,125 | |
8.500%, 03/01/20 | | | 35,000 | | | | 36,838 | |
Packaging Dynamics Corp., 8.750%, 02/01/16 (a) | | | 42,000 | | | | 42,210 | |
PAETEC Holding Corp., 9.875%, 12/01/18 | | | 85,000 | | | | 89,548 | |
Party City Holdings, Inc., 8.875%, 08/01/20 | | | 130,000 | | | | 139,425 | |
PC Nextco Holdings LLC / PC Nextco Finance, Inc., 8.750%, 08/15/19 | | | 30,000 | | | | 30,300 | |
Peabody Energy Corp., | | | | | | | | |
6.250%, 11/15/211 | | | 85,000 | | | | 72,994 | |
6.500%, 09/15/201 | | | 15,000 | | | | 13,088 | |
Petco Animal Supplies, Inc., 9.250%, 12/01/18 (a) | | | 110,000 | | | | 115,500 | |
Polymer Group, Inc., 7.750%, 02/01/19 | | | 103,000 | | | | 107,249 | |
PolyOne Corp., 7.375%, 09/15/20 | | | 70,000 | | | | 74,725 | |
Post Holdings, Inc., | | | | | | | | |
6.000%, 12/15/22 (a) | | | 25,000 | | | | 23,531 | |
6.750%, 12/01/21 (a) | | | 50,000 | | | | 48,625 | |
7.375%, 02/15/22 | | | 150,000 | | | | 150,375 | |
Quebecor Media, Inc., 5.750%, 01/15/23 | | | 180,000 | | | | 184,950 | |
Quebecor World, Escrow, 6.500%, 08/01/279 | | | 165,000 | | | | 722 | |
Qwest Capital Funding, Inc., 7.750%, 02/15/31 | | | 65,000 | | | | 66,300 | |
Radio Systems Corp., 8.375%, 11/01/19 (a) | | | 85,000 | | | | 91,375 | |
Rain CII Carbon LLC / CII Carbon Corp., 8.000%, 12/01/18 (a) | | | 30,000 | | | | 30,450 | |
Regal Entertainment Group, 5.750%, 03/15/22 | | | 40,000 | | | | 38,400 | |
The accompanying notes are an integral part of these financial statements.
28
AMG Managers High Yield Fund
Schedule of Portfolio Investments (continued)
| | | | | | | | |
| | | Principal Amount | | | Value | |
Industrials - 83.8% (continued) | | | | | | | | |
Regency Energy Partners, L.P. / Regency Energy Finance Corp., | | | | | | | | |
5.000%, 10/01/22 | | $ | 35,000 | | | $ | 33,250 | |
5.500%, 04/15/23 | | | 45,000 | | | | 43,650 | |
5.750%, 09/01/20 | | | 5,000 | | | | 5,038 | |
5.875%, 03/01/22 | | | 20,000 | | | | 20,050 | |
Reichhold Holdings International B.V., 12.000%, 02/27/158 | | | 75,000 | | | | 72,750 | |
Reichhold Industries, Inc., (9.000% Cash or 11.000% PIK), 9.000%, 05/08/17 (a)8,9 | | | 151,046 | | | | 86,851 | |
Reichhold, Inc., 12.000%, 02/27/158 | | | 35,000 | | | | 33,950 | |
Rentech Nitrogen Partners, L.P. / Rentech Nitrogen Finance Corp., 6.500%, 04/15/21 (a) | | | 60,000 | | | | 53,700 | |
Reynolds Group Issuer, Inc. / Reynolds Group Issuer LLC / Reynolds Group Issuer Lu, | | | | | | | | |
5.750%, 10/15/20 | | | 145,000 | | | | 149,350 | |
9.000%, 04/15/19 | | | 230,000 | | | | 239,200 | |
9.875%, 08/15/19 | | | 325,000 | | | | 346,125 | |
RHP Hotel Properties, L.P. / RHP Finance Corp., 5.000%, 04/15/21 | | | 135,000 | | | | 135,000 | |
Rite Aid Corp., 9.250%, 03/15/20 | | | 35,000 | | | | 38,281 | |
RKI Exploration & Production LLC / RKI Finance Corp., 8.500%, 08/01/21 (a) | | | 55,000 | | | | 44,688 | |
RSI Home Products, Inc., 6.875%, 03/01/18 (a) | | | 65,000 | | | | 68,250 | |
RSP Permian, Inc., 6.625%, 10/01/22 (a) | | | 15,000 | | | | 14,025 | |
Sabine Pass Liquefaction LLC, | | | | | | | | |
5.750%, 05/15/24 | | | 100,000 | | | | 98,625 | |
6.250%, 03/15/22 | | | 100,000 | | | | 101,875 | |
Sabre GLBL, Inc., 8.500%, 05/15/19 (a) | | | 114,000 | | | | 122,408 | |
Sally Holdings LLC / Sally Capital, Inc., | | | | | | | | |
5.500%, 11/01/23 | | | 20,000 | | | | 20,950 | |
5.750%, 06/01/22 | | | 35,000 | | | | 36,838 | |
6.875%, 11/15/19 | | | 75,000 | | | | 80,063 | |
Sanchez Energy Corp., 6.125%, 01/15/23 (a) | | | 45,000 | | | | 37,913 | |
SandRidge Energy, Inc., | | | | | | | | |
7.500%, 03/15/21 | | | 70,000 | | | | 45,150 | |
8.125%, 10/15/22 | | | 95,000 | | | | 60,325 | |
SBA Telecommunications, Inc., 5.750%, 07/15/20 | | | 45,000 | | | | 46,026 | |
The Scotts Miracle-Gro Co., 6.625%, 12/15/20 | | | 60,000 | | | | 63,450 | |
Sealed Air Corp., | | | | | | | | |
6.500%, 12/01/20 (a) | | | 30,000 | | | | 33,000 | |
8.375%, 09/15/21 (a)1 | | | 95,000 | | | | 106,638 | |
Sensata Technologies BV, | | | | | | | | |
5.625%, 11/01/24 (a) | | | 15,000 | | | | 15,591 | |
6.500%, 05/15/19 (a) | | | 25,000 | | | | 26,063 | |
The accompanying notes are an integral part of these financial statements.
29
AMG Managers High Yield Fund
Schedule of Portfolio Investments (continued)
| | | | | | | | |
| | | Principal Amount | | | Value | |
Industrials - 83.8% (continued) | | | | | | | | |
Service Corp. International, | | | | | | | | |
7.000%, 06/15/17 | | $ | 60,000 | | | $ | 64,800 | |
7.500%, 04/01/27 | | | 115,000 | | | | 129,950 | |
Service Corp. International/US, 5.375%, 05/15/24 | | | 40,000 | | | | 41,000 | |
The ServiceMaster Co., | | | | | | | | |
7.000%, 08/15/20 | | | 43,000 | | | | 44,720 | |
8.000%, 02/15/20 | | | 20,000 | | | | 21,150 | |
Sinclair Television Group, Inc., | | | | | | | | |
5.375%, 04/01/21 | | | 85,000 | | | | 84,788 | |
6.125%, 10/01/22 | | | 40,000 | | | | 40,900 | |
Sirius XM Radio, Inc., | | | | | | | | |
4.250%, 05/15/20 (a) | | | 75,000 | | | | 74,063 | |
4.625%, 05/15/23 (a) | | | 10,000 | | | | 9,400 | |
5.750%, 08/01/21 (a)1 | | | 95,000 | | | | 97,613 | |
6.000%, 07/15/24 (a) | | | 30,000 | | | | 30,825 | |
SM Energy Co., 6.125%, 11/15/22 (a) | | | 20,000 | | | | 18,850 | |
Spectrum Brands, Inc., | | | | | | | | |
6.375%, 11/15/20 | | | 35,000 | | | | 36,663 | |
6.625%, 11/15/22 | | | 25,000 | | | | 26,563 | |
6.750%, 03/15/20 | | | 110,000 | | | | 115,225 | |
Sprint Capital Corp., | | | | | | | | |
6.875%, 11/15/28 | | | 10,000 | | | | 8,850 | |
8.750%, 03/15/32 | | | 395,000 | | | | 384,138 | |
Sprint Communications, Inc., 9.000%, 11/15/18 (a) | | | 100,000 | | | | 113,990 | |
Sprint Corp., | | | | | | | | |
7.250%, 09/15/21 | | | 80,000 | | | | 79,700 | |
7.875%, 09/15/23 | | | 455,000 | | | | 451,451 | |
SunGard Data Systems, Inc., | | | | | | | | |
6.625%, 11/01/19 | | | 55,000 | | | | 55,825 | |
7.375%, 11/15/18 | | | 37,000 | | | | 38,526 | |
7.625%, 11/15/20 | | | 30,000 | | | | 31,950 | |
Targa Resources Partners LP / Targa Resources Partners Finance Corp., 4.125%,
11/15/19 (a) | | | 20,000 | | | | 19,350 | |
Tekni-Plex, Inc., 9.750%, 06/01/19 (a) | | | 10,000 | | | | 10,900 | |
Telecom Italia S.P.A., 5.303%, 05/30/24 (a) | | | 200,000 | | | | 203,250 | |
Tempur Sealy International, Inc., 6.875%, 12/15/20 | | | 45,000 | | | | 48,038 | |
Tenet Healthcare Corp., | | | | | | | | |
4.750%, 06/01/20 | | | 100,000 | | | | 102,000 | |
6.000%, 10/01/20 | | | 150,000 | | | | 161,450 | |
8.000%, 08/01/20 | | | 205,000 | | | | 216,788 | |
8.125%, 04/01/22 | | | 155,000 | | | | 173,600 | |
The accompanying notes are an integral part of these financial statements.
30
AMG Managers High Yield Fund
Schedule of Portfolio Investments (continued)
| | | | | | | | |
| | | Principal Amount | | | Value | |
Industrials - 83.8% (continued) | | | | | | | | |
Terex Corp., | | | | | | | | |
6.000%, 05/15/21 | | $ | 120,000 | | | $ | 123,000 | |
6.500%, 04/01/20 | | | 60,000 | | | | 62,400 | |
Tesoro Logistics L.P. / Tesoro Logistics Finance Corp., | | | | | | | | |
5.500%, 10/15/19 (a) | | | 20,000 | | | | 19,900 | |
5.875%, 10/01/20 | | | 93,000 | | | | 93,698 | |
6.125%, 10/15/21 | | | 45,000 | | | | 45,113 | |
6.250%, 10/15/22 (a) | | | 20,000 | | | | 20,050 | |
Time, Inc., 5.750%, 04/15/22 (a) | | | 80,000 | | | | 77,600 | |
T-Mobile USA, Inc., | | | | | | | | |
6.633%, 04/28/21 | | | 45,000 | | | | 46,350 | |
6.731%, 04/28/22 | | | 210,000 | | | | 217,088 | |
Trinidad Drilling, Ltd., 7.875%, 01/15/19 (a) | | | 90,000 | | | | 84,150 | |
Trinseo Materials Operating SCA / Trinseo Materials Finance, Inc., 8.750%, 02/01/19 | | | 92,000 | | | | 93,725 | |
Triumph Group, Inc., 4.875%, 04/01/21 | | | 80,000 | | | | 79,400 | |
UCI International, Inc., 8.625%, 02/15/19 | | | 110,000 | | | | 105,600 | |
Ultra Petroleum Corp., 6.125%, 10/01/24 (a)1 | | | 50,000 | | | | 43,250 | |
United Rentals North America, Inc., | | | | | | | | |
7.375%, 05/15/20 | | | 50,000 | | | | 54,250 | |
7.625%, 04/15/22 | | | 100,000 | | | | 110,450 | |
8.250%, 02/01/21 | | | 195,000 | | | | 213,525 | |
United States Cellular Corp., 6.700%, 12/15/33 | | | 40,000 | | | | 39,489 | |
United Surgical Partners International, Inc., 9.000%, 04/01/20 | | | 100,000 | | | | 107,875 | |
UPCB Finance III, Ltd., 6.625%, 07/01/20 (a) | | | 150,000 | | | | 157,875 | |
UPCB Finance VI, Ltd., 6.875%, 01/15/22 (a) | | | 150,000 | | | | 163,875 | |
Vail Resorts, Inc., 6.500%, 05/01/19 | | | 80,000 | | | | 82,950 | |
Valeant Pharmaceuticals International, | | | | | | | | |
6.750%, 08/15/21 (a) | | | 100,000 | | | | 104,875 | |
7.000%, 10/01/20 (a) | | | 55,000 | | | | 58,300 | |
7.250%, 07/15/22 (a) | | | 180,000 | | | | 192,600 | |
7.500%, 07/15/21 (a) | | | 280,000 | | | | 303,450 | |
Videotron, Ltd., 5.000%, 07/15/22 | | | 20,000 | | | | 20,450 | |
Virgin Media Secured Finance PLC, 5.375%, 04/15/21 (a) | | | 200,000 | | | | 207,500 | |
Vulcan Materials Co., 7.500%, 06/15/21 | | | 65,000 | | | | 76,050 | |
Watco Cos. LLC / Watco Finance Corp., 6.375%, 04/01/23 (a) | | | 55,000 | | | | 54,725 | |
Whiting Petroleum Corp., 5.750%, 03/15/21 | | | 210,000 | | | | 195,300 | |
The accompanying notes are an integral part of these financial statements.
31
AMG Managers High Yield Fund
Schedule of Portfolio Investments (continued)
| | | | | | | | |
| | | Principal Amount | | | Value | |
Industrials - 83.8% (continued) | | | | | | | | |
Windstream Corp., | | | | | | | | |
7.500%, 04/01/23 | | $ | 130,000 | | | $ | 130,000 | |
7.750%, 10/01/21 | | | 120,000 | | | | 123,000 | |
WMG Acquisition Corp., | | | | | | | | |
5.625%, 04/15/22 (a) | | | 20,000 | | | | 19,450 | |
6.000%, 01/15/21 (a) | | | 56,000 | | | | 56,280 | |
WPX Energy, Inc., 5.250%, 09/15/24 | | | 25,000 | | | | 23,375 | |
WR Grace & Co., | | | | | | | | |
5.125%, 10/01/21 (a) | | | 20,000 | | | | 20,550 | |
5.625%, 10/01/24 (a) | | | 10,000 | | | | 10,462 | |
Zayo Group LLC / Zayo Capital, Inc., 8.125%, 01/01/20 | | | 50,000 | | | | 53,187 | |
Zebra Technologies Corp., 7.250%, 10/15/22 (a) | | | 130,000 | | | | 136,825 | |
Total Industrials | | | | | | | 31,689,722 | |
Utilities - 1.2% | | | | | | | | |
The AES Corp., | | | | | | | | |
3.234%, 06/01/19 (03/01/15)4 | | | 35,000 | | | | 34,212 | |
4.875%, 05/15/23 | | | 25,000 | | | | 24,937 | |
7.375%, 07/01/21 | | | 125,000 | | | | 141,875 | |
8.000%, 06/01/20 | | | 15,000 | | | | 17,212 | |
Dynegy Finance I, Inc. / Dynegy Finance II, Inc., | | | | | | | | |
7.375%, 11/01/22 (a) | | | 80,000 | | | | 81,500 | |
7.625%, 11/01/24 (a) | | | 40,000 | | | | 40,850 | |
NRG Energy, Inc., | | | | | | | | |
6.250%, 07/15/22 | | | 40,000 | | | | 41,100 | |
7.875%, 05/15/21 | | | 45,000 | | | | 48,713 | |
8.250%, 09/01/20 | | | 30,000 | | | | 32,175 | |
Total Utilities | | | | | | | 462,574 | |
Total Corporate Bonds and Notes
(cost $34,654,402) | | | | | | | 34,282,004 | |
Short-Term Investments - 8.5% | | | | | | | | |
Repurchase Agreements - 5.5%2 | | | | | | | | |
Cantor Fitzgerald Securities, Inc., dated 12/31/14 due 01/02/15, 0.090%, total to be received $1,000,005 (collateralized by various U.S. Government Agency Obligations, 0.000% - 10.500%, 01/01/15 - 11/20/64, totaling $1,020,000) | | | 1,000,000 | | | | 1,000,000 | |
Daiwa Capital Markets America, dated 12/31/14, due 01/02/15, 0.120%, total to be received $64,987 (collateralized by various U.S. Government Agency Obligations, 0.000% - 6.500%, 06/01/17 - 03/01/48, totaling $66,287) | | | 64,987 | | | | 64,987 | |
Nomura Securities International, Inc., dated 12/31/14, due 01/02/15, 0.080%, total to be received $1,000,004 (collateralized by various U.S. Government Agency Obligations, 0.000% - 8.875%, 01/07/15 -11/20/64 totaling $1,020,000) | | | 1,000,000 | | | | 1,000,000 | |
Total Repurchase Agreements | | | | | | | 2,064,987 | |
The accompanying notes are an integral part of these financial statements.
32
AMG Managers High Yield Fund
Schedule of Portfolio Investments (continued)
| | | | | | | | |
| | | Shares | | | Value | |
Other Investment Companies - 3.0%3 | | | | | | | | |
Dreyfus Institutional Cash Advantage Fund, Institutional Class Shares, 0.06%10 | | | 1,138,985 | | | $ | 1,138,985 | |
Total Short-Term Investments
(cost 3,203,972) | | | | | | | 3,203,972 | |
Total Investments - 104.7%
(cost $40,028,139) | | | | | | | 39,626,843 | |
Other Assets, less Liabilities - (4.7)% | | | | | | | (1,786,878 | ) |
Net Assets - 100.0% | | | | | | $ | 37,839,965 | |
The accompanying notes are an integral part of these financial statements.
33
AMG Managers Intermediate Duration Government Fund
Portfolio Manager’s Comments
THE YEAR IN REVIEW
During the year ended December 31, 2014, the AMG Managers Intermediate Duration Government Fund (the Fund) returned 6.64%, compared to 6.12% for its benchmark, the Citigroup Mortgage Index.
During 2014, we witnessed the initial attempts to transition to a more normal market environment. Despite the Federal Reserve’s (the Fed’s) successful withdrawal from the third round of quantitative easing (QE3), longer-term interest rates declined significantly throughout the year. By the end of the year, however, rates on the shorter end of the curve began to rise in anticipation of Fed tightening.
Agency mortgage-backed securities (MBS) were off to a scorching start to begin 2014 as spreads tightened significantly within the sector. This action occurred despite the Fed’s move to begin its tapering of QE3 at a rate of roughly $10 billion per month. The reduction in monthly demand from the Fed was more than offset by the reduction in supply driven by higher interest rates.
The start of the second quarter brought some turbulence in global capital markets, as the rebound in economic activity after the cold winter brought uncertainty about monetary policy to the forefront. While intermediate rates remained firm, longer rates rallied as investors looked for safe assets due to the combination of uncertainty about Russia, low relative rates in Europe and the general consensus that some short covering was occurring due to significant short positions by most of the active management community. The lack of volatility in intermediate rates was supportive for agency MBS.
Market participants began the third quarter with a rush for the exits, as years of rising prices and falling volatility had “packed the theater” by encouraging the accumulation of risk positions. At the same time, many of the theater’s exit doors had been blocked by considerable reductions in the number and risk tolerance of market intermediaries. Agency MBS faced some headwinds as lower interest rates drove increased
supply while the Fed continued its stable path of tapering. Spreads leaked wider as gross MBS production rose to $80 billion per month, which was $30 billion per month higher than the previous quarter.
Shifting economic and financial forces wrought havoc in global markets to begin the fourth quarter. While there was no specific catalyst, it felt as though market participants finally realized that the uncertainty regarding future monetary policy actions as QE3 ended should be reflected in lower prices. The market also struggled to digest the many other important market developments, including redoubled monetary stimulus from the Bank of Japan, growing asset purchases by the European Central Bank (ECB), gathering economic weakness in China and Europe, plummeting inflation pricing, increasing strength in the U.S. Dollar and the sharp decline in oil prices. Agency MBS felt pressure initially from the sharp rally in rates, as concerns rose over a potential increase in prepayment rates and a pick-up in implied volatilities. The concerns, however, were short-lived, as spreads returned back to their starting point within a few weeks.
Most of the Fund outperformance for 2014 was attributable to our positioning in agency MBS, specifically avoiding those parts of the market where the Fed was most active. Higher coupon fixed-rate mortgages (FRMs), adjustable-rate mortgages (ARMS), and front-pay tranches from collateral mortgage obligations (CMOs) all benefited from the reduced production of mortgages and the slower prepayment environment. Additionally, the holdings in both agency and non-agency ARMs, as well as non-agency FRMs, also moderately benefitted the Fund.
We reduced the leverage in the portfolio during the course of the year. While the vast majority of the Fund assets were invested in 30-year agency FRMs (89%), this still represented a decrease of 6% market weight from the beginning of the year. Similarly, the market weight of agency ARMs in the portfolio was reduced by slightly over half. We
continue to view MBS as an attractive alternative to Treasuries due to the additional spread offered.
LOOKING FORWARD
As we enter 2015, Amundi Smith Breeden believes that agency MBS offer spreads that are modestly tight to historical standards and are largely supported by a combination of low-volatility and prepayment rates, as well as the continued re-investment of paydowns on the existing Fed portfolio of agency MBS. The Fed currently owns one-third of outstanding agency FRMs, and that portfolio size is being maintained for now. All three of these supports bear watching, although we feel a significant rise in prepayment rates is unlikely. The current level of volatility is certainly worth watching as we may be emerging from a period in which monetary policy was extremely market-friendly, due to the clarity with which moves were projected. The view over the next few years, however, is much less clear, and the expectations of the timing and pace of rate increases vary greatly, even amongst Fed members. This confusion may drive increased volatility as we enter 2015, as the market tries to estimate the future direction of rates.
Finally, we will be monitoring for any indication from the Fed regarding potential changes to its current re-investment program, which we expect to continue unchanged well into late 2015, barring any changes in economic momentum. We expect agency MBS to moderately widen to levels that would be somewhat cheap historically over the next year or two as the Fed begins to shrink its balance sheet and volatility increases. The carry benefit that MBS offer versus Treasuries, however, is likely to offset any spread widening, making it an attractive asset class. The increased volatility should also benefit investors who are approaching the asset class through prudent active management.
This commentary reflects the viewpoints of Amundi Smith Breeden LLC as of December 31, 2014 and is not intended as a forecast or guarantee of future results.
34
AMG Managers Intermediate Duration Government Fund
Portfolio Manager’s Comments (continued)
CUMULATIVE TOTAL RETURN PERFORMANCE
AMG Managers Intermediate Duration Government Fund’s cumulative total return is based on the daily change in net asset value (NAV), and assumes that all dividends and distributions were reinvested. The graph compares a hypothetical $10,000 investment made in the AMG Managers Intermediate Duration Government Fund on December 31, 2004 to a $10,000 investment made in the Citigroup Mortgage Index for the same time period. The graph and table do not reflect the deduction of taxes that a shareholder would pay on a Fund distribution or redemption of shares. The listed returns for the Fund are net of expenses and the returns for the index exclude expenses. Total returns would have been lower had certain expenses not been reduced.
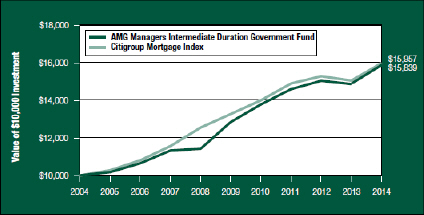
The table below shows the average annual total returns for the AMG Managers Intermediate Duration Government Fund and the Citigroup Mortgage Index for the same time periods ended December 31, 2014.
| | | | | | | | | | | | |
| Average Annual Total Returns1 | | One
Year | | | Five
Years | | | Ten
Years | |
AMG Managers Intermediate
Duration Government Fund 2,3,4,5 | | | 6.64 | % | | | 4.30 | % | | | 4.71 | % |
Citigroup Mortgage Index6 | | | 6.12 | % | | | 3.77 | % | | | 4.78 | % |
The performance data shown represents past performance. Past performance is not a guarantee of future results. Current performance may be lower or higher than the performance data quoted. The investment return and principal value of an investment in the Fund will fluctuate so that an investor’s shares, when redeemed, may be worth more or less than their original cost.
Investors should carefully consider the Fund’s investment objectives, risks, charges, and expenses before investing. For performance information through the most recent month end, current net asset values per share for the Fund and other information, please call (800) 835-3879 or visit our website at www.amgfunds.com for a free prospectus. Read it carefully before investing or sending money.
Distributed by AMG Distributors, Inc., member FINRA/SIPC.
| 1 | Total return equals income yield plus share price change and assumes reinvestment of all dividends and capital gain distributions. Returns are net of fees and may reflect offsets of Fund expenses as described in the prospectus. No adjustment has been made for taxes payable by shareholders on their reinvested dividends and capital gain distributions. Returns for periods greater than one year are annualized. The listed returns on the Fund are net of expenses and based on the published NAV as of December 31, 2014. All returns are in
U.S. dollars ($). |
| 2 | From time to time the Fund’s advisor has waived its fees and/or absorbed Fund expenses, which has resulted in higher returns. |
| 3 | The Fund is subject to the risks associated with investments in debt securities, such as default risk, fluctuations in the debtor’s perceived ability to pay its creditors and changing interest rate risk. An increase in interest rates typically causes the value of bonds and other fixed-income securities to fall. |
| 4 | The Fund may use derivative instruments for hedging purposes or as part of its investment strategy. There is a risk that a derivative intended as a hedge may not perform as expected. The main risk with derivatives is that some types can amplify a gain or loss, potentially earning or losing substantially more money than the actual cost of the derivative; or that the counterparty may fail to honor its contract terms, causing a loss for the Fund. Use of these instruments may also involve certain costs and risks such as liquidity risk, interest rate risk, market risk, credit risk, management risk and the risk that a fund could not close out a position when it would be most advantageous to do so. |
| 5 | Many bonds have call provisions which allow the debtors to pay them back before maturity. This is especially true with mortgage securities, which can be paid back anytime. Typically debtors prepay their debt when it is to their advantage (when interest rates drop making a new loan at current rates more attractive), and thus likely to the disadvantage of bondholders, who may have to reinvest prepayment proceeds in securities with lower yields. Prepayment risk will vary depending on the provisions of the security and current interest rates relative to the interest rate of the debt. |
| 6 | The Citigroup Mortgage Index includes all outstanding government sponsored fixed-rate mortgage-backed securities, weighted in proportion to their current market capitalization. The Index reflects no deductions for fees, expenses, or taxes. Unlike the Fund, the Citigroup Mortgage Index is unmanaged, is not available for investment, and does not incur expenses. |
Not FDIC insured, nor bank guaranteed. May lose value.
35
AMG Managers Intermediate Duration Government Fund
Fund Snapshots (unaudited)
December 31, 2014
PORTFOLIO BREAKDOWN
| | | | |
Category | | AMG Managers
Intermediate
Duration
Government Fund** | |
U.S. Government and Agency Obligations | | | 109.0 | % |
Mortgage-Backed Securities | | | 2.7 | % |
Other Assets and Liabilities | | | (11.7 | )% |
| ** | As a percentage of net assets. |
| | | | |
Rating | | AMG Managers
Intermediate
Duration
Government
Fund† | |
U.S. Government and Agency Obligations | | | 97.5 | % |
Aaa | | | 0.6 | % |
Aa | | | 0.0 | % |
A | | | 0.0 | % |
Baa | | | 0.4 | % |
Ba & lower | | | 1.5 | % |
| † | As a percentage of market value of fixed-income securities. |
TOP TEN HOLDINGS
| | | | |
Security Name | | % of
Net Assets | |
FHLMC Gold Pool, 4.000%, TBA 30yr* | | | 14.9 | % |
FNMA, 3.500%, TBA 30yr* | | | 13.6 | |
FNMA, 4.500%, TBA 30yr* | | | 8.3 | |
FNMA, 4.000%, TBA 30yr* | | | 7.1 | |
GNMA, 4.000%, TBA 30yr | | | 5.5 | |
FNMA, 3.000%, TBA 15yr* | | | 3.8 | |
FHLMC Gold Pool, 3.500%, TBA 30yr* | | | 2.9 | |
FHLMC Gold Pool, 5.000%, 10/01/36* | | | 1.6 | |
FHLMC Gold Pool, 3.500%, 04/01/32* | | | 1.4 | |
FHLMC Gold Pool, 3.500%, 01/01/43 | | | 1.3 | |
| | | | |
Top Ten as a Group | | | 60.4 | % |
| | | | |
| * | Top Ten Holding as of June 30, 2014. |
Credit quality ratings shown above reflect the highest rating assigned by either Standard & Poor’s (“S&P”) or Moody’s Investors Service, Inc. (“Moody’s”). These rating agencies are independent, nationally recognized statistical rating organizations and are widely used. Investment grade ratings are credit ratings of BBB/Baa or higher. Below investment grade ratings are credit ratings of BB/Ba or lower. Investments designated N/R are not rated by either rating agency. Unrated investments do not necessarily indicate low credit quality. Credit quality ratings are subject to change.
Because a fund’s strategy may result in multiple investments in particular sectors of the economy, its performance may depend on the performance of those sectors and may fluctuate more widely than investments diversified across more sectors. For additional information on these and other risk considerations, please see the Fund’s prospectus.
Any sectors, industries, or securities discussed should not be perceived as investment recommendations. Mention of a specific security should not be considered a recommendation to buy or solicitation to sell that security. Specific securities mentioned in this report may have been sold from the Fund’s portfolio of investments by the time you receive this report.
36
AMG Managers Intermediate Duration Government Fund
Schedule of Portfolio Investments
December 31, 2014
| | | | | | | | |
| | | Principal Amount | | | Value | |
Mortgage-Backed Securities - 2.7% | | | | | | | | |
American Home Mortgage Assets Trust, Series 2005-1, Class 1A1, 2.446%, 11/25/35 (02/25/15)4 | | $ | 86,407 | | | $ | 75,807 | |
American Home Mortgage Investment Trust, | | | | | | | | |
Series 2004-1, Class 4A, 2.332%, 04/25/44 (02/25/15)4 | | | 130,135 | | | | 123,170 | |
Series 2005-1, Class 5A1, 2.326%, 06/25/45 (02/25/15)4 | | | 54,130 | | | | 53,536 | |
Series 2005-1, Class 6A, 2.326%, 06/25/45 (02/25/15)4 | | | 995,602 | | | | 969,884 | |
Bank of America Commercial Mortgage Trust, Series 2006-6, Class A2, 5.309%, 10/10/45 | | | 127,222 | | | | 127,268 | |
Bank of America Funding Corp., Series 2004-B, Class 1A2, 2.669%, 12/20/34 (02/20/15)4 | | | 125,727 | | | | 105,182 | |
Bear Stearns Alt-A Trust, Series 2005-3, Class 2A3, 2.638%, 04/25/35 (02/25/15)4 | | | 124,493 | | | | 108,181 | |
Countrywide Home Loan Mortgage Pass Through Trust, | | | | | | | | |
Series 2005-HYB2, Class 1A4, 2.744%, 05/20/35 (02/20/15)4 | | | 98,897 | | | | 92,509 | |
Series 2005-HYB8, Class 1A1, 2.470%, 12/20/35 (02/20/15)4 | | | 108,559 | | | | 88,904 | |
Countrywide Home Loan reperforming loan REMIC Trust, Series 2004-R2, Class 1AF1, 0.590%, 11/25/34 (01/25/15) (a)4,8 | | | 141,623 | | | | 124,450 | |
GSMPS Mortgage Loan Trust, Series 2005-RP2, Class 1AF, 0.520%, 03/25/35 (01/25/15) (a)4,8 | | | 192,739 | | | | 168,480 | |
GSR Mortgage Loan Trust, Series 2004-5, Class 1A3, 1.890%, 05/25/34 (02/25/15)4 | | | 40,738 | | | | 37,479 | |
Harborview Mortgage Loan Trust, Series 2004-7, Class 2A2, 2.258%, 11/19/34 (02/19/15)4 | | | 75,274 | | | | 69,871 | |
JPMorgan Chase Commercial Mortgage Securities Trust, Series 2006-LDP7, Class A3B, 5.865%, 04/15/456 | | | 589,945 | | | | 588,969 | |
Master Alternative Loans Trust, Series 2005-2, Class 2A1, 6.000%, 01/25/3510 | | | 600,888 | | | | 620,752 | |
Morgan Stanley Mortgage Loan Trust, Series 2005-4, Class 2A1, 5.913%, 08/25/356 | | | 902,362 | | | | 892,148 | |
Structured Asset Securities Corp., Series 2005-RF1, Class A, 0.520%, 03/25/35 (01/25/15) (a)4,8 | | | 232,108 | | | | 194,744 | |
Wells Fargo Mortgage Backed Securities Trust, Series 2007-16, Class 1A1, 6.000%, 12/28/37 | | | 282,262 | | | | 291,074 | |
Total Mortgage-Backed Securities (cost $4,934,614) | | | | | | | 4,732,408 | |
U.S. Government and Agency Obligations - 109.0% | | | | | | | | |
Federal Home Loan Mortgage Corporation - 41.3% | | | | | | | | |
FHLMC, | | | | | | | | |
2.349%, 11/01/33 (03/15/15)4,10 | | | 983,383 | | | | 1,048,936 | |
2.470%, 01/01/36 (03/15/15)4,10 | | | 2,136,299 | | | | 2,286,263 | |
2.797%, 02/01/37 (03/15/15)4 | | | 68,810 | | | | 73,895 | |
FHLMC Gold Pool, | | | | | | | | |
3.500%, 04/01/32 to 01/01/4410 | | | 13,167,001 | | | | 13,755,932 | |
3.500%, TBA 30yr,5,11 | | | 4,900,000 | | | | 5,082,601 | |
4.000%, 05/01/24 to 09/01/4210 | | | 5,293,323 | | | | 5,656,926 | |
4.000%, TBA 30yr,5,11 | | | 24,400,000 | | | | 25,964,190 | |
4.500%, 02/01/20 to 09/01/4110 | | | 3,977,357 | | | | 4,308,048 | |
5.000%, 05/01/18 to 07/01/4110 | | | 5,846,599 | | | | 6,434,939 | |
5.500%, 11/01/17 to 01/01/4010 | | | 4,280,240 | | | | 4,781,370 | |
6.000%, 09/01/17 to 01/01/2410 | | | 1,185,744 | | | | 1,297,553 | |
7.000%, 07/01/19 | | | 134,601 | | | | 143,539 | |
7.500%, 07/01/3410 | | | 1,004,953 | | | | 1,176,262 | |
Total Federal Home Loan Mortgage Corporation | | | | | | | 72,010,454 | |
The accompanying notes are an integral part of these financial statements.
37
AMG Managers Intermediate Duration Government Fund
Schedule of Portfolio Investments (continued)
| | | | | | | | |
| | | Principal Amount | | | Value | |
Federal National Mortgage Association - 52.4% | | | | | | | | |
FNMA, | | | | | | | | |
1.975%, 06/01/34 (02/25/15)4,10 | | $ | 783,573 | | | $ | 830,807 | |
2.150%, 08/01/34 (02/25/15)4 | | | 317,594 | | | | 337,689 | |
3.000%, 05/01/43 to 06/01/43 | | | 2,678,687 | | | | 2,713,474 | |
3.000%, TBA 15yr,5,11 | | | 6,300,000 | | | | 6,548,309 | |
3.500%, 05/01/42 to 04/01/4310 | | | 1,715,342 | | | | 1,794,673 | |
3.500%, TBA 30yr,5,11 | | | 22,800,000 | | | | 23,712,510 | |
4.000%, 01/01/26 to 11/01/4410 | | | 4,935,825 | | | | 5,277,425 | |
4.000%, TBA 30yr,5,11 | | | 11,600,000 | | | | 12,358,817 | |
4.500%, 04/01/25 to 04/01/4210 | | | 10,739,616 | | | | 11,679,332 | |
4.500%, TBA 30yr,5,11 | | | 13,300,000 | | | | 14,436,735 | |
4.750%, 07/01/34 to 09/01/34 | | | 369,656 | | | | 407,185 | |
5.000%, 06/01/18 to 06/01/41 | | | 1,560,720 | | | | 1,720,005 | |
5.500%, 03/01/17 to 08/01/4110 | | | 3,655,109 | | | | 4,078,222 | |
6.000%, 08/01/17 to 06/01/3910 | | | 2,764,815 | | | | 3,048,772 | |
6.500%, 11/01/28 to 07/01/32 | | | 227,520 | | | | 249,489 | |
7.000%, 11/01/2210 | | | 651,532 | | | | 714,235 | |
FNMA REMICS, | | | | | | | | |
Series 1994-55, Class H, 7.000%, 03/25/2410 | | | 715,298 | | | | 789,810 | |
Series 2005-13, Class AF, 0.570%, 03/25/35 (01/25/15)4,10 | | | 393,480 | | | | 396,965 | |
FNMA Whole Loan, Series 2003-W4, Class 4A, 7.017%, 10/25/426 | | | 84,954 | | | | 97,249 | |
Total Federal National Mortgage Association | | | | | | | 91,191,703 | |
Government National Mortgage Association - 14.0% | | | | | | | | |
GNMA, | | | | | | | | |
2.000%, 05/20/21 (02/20/15)4 | | | 16,690 | | | | 17,363 | |
3.000%, 03/20/16 to 08/20/18 (02/20/15)4 | | | 101,317 | | | | 104,195 | |
3.500%, 08/15/43 | | | 1,172,475 | | | | 1,241,617 | |
3.500%, TBA 30yr,5,11 | | | 1,000,000 | | | | 1,049,687 | |
4.000%, 06/20/43 to 11/15/445,10 | | | 2,344,298 | | | | 2,538,757 | |
4.000%, TBA 30yr,5,11 | | | 8,900,000 | | | | 9,542,364 | |
4.500%, 06/15/39 to 05/15/4110 | | | 993,090 | | | | 1,094,392 | |
5.000%, 09/15/39 to 10/20/4110 | | | 5,816,187 | | | | 6,469,180 | |
5.500%, 10/15/39 to 11/15/3910 | | | 2,015,787 | | | | 2,270,291 | |
7.500%, 09/15/28 to 11/15/31 | | | 22,495 | | | | 23,552 | |
Total Government National Mortgage Association | | | | | | | 24,351,398 | |
Interest Only Strips - 1.3% | | | | | | | | |
FHLMC, | | | | | | | | |
Series 212, Class IO, 6.000%, 05/01/318 | | | 1,779 | | | | 392 | |
Series 233, Class 5, 4.500%, 09/15/35 | | | 120,360 | | | | 19,566 | |
The accompanying notes are an integral part of these financial statements.
38
AMG Managers Intermediate Duration Government Fund
Schedule of Portfolio Investments (continued)
| | | | | | | | |
| | | Principal Amount | | | Value | |
Interest Only Strips - 1.3% (continued) | | | | | | | | |
FHLMC REMICS, | | | | | | | | |
Series 2380, Class SI, 7.739%, 06/15/31 (01/15/15)4,8 | | $ | 14,798 | | | $ | 3,343 | |
Series 2922, Class SE, 6.589%, 02/15/35 (01/15/15)4 | | | 134,672 | | | | 26,494 | |
Series 2934, Class HI, 5.000%, 02/15/20 | | | 70,094 | | | | 6,183 | |
Series 2934, Class KI, 5.000%, 02/15/20 | | | 54,795 | | | | 4,638 | |
Series 2965, Class SA, 5.889%, 05/15/32 (01/15/15)4 | | | 292,019 | | | | 46,879 | |
Series 2967, Class JI, 5.000%, 04/15/20 | | | 126,562 | | | | 10,978 | |
Series 2980, Class SL, 6.539%, 11/15/34 (01/15/15)4 | | | 178,788 | | | | 43,403 | |
Series 3031, Class BI, 6.529%, 08/15/35 (01/15/15)4 | | | 339,793 | | | | 60,909 | |
Series 3065, Class DI, 6.459%, 04/15/35 (01/15/15)4 | | | 300,240 | | | | 50,082 | |
Series 3114, Class GI, 6.439%, 02/15/36 (01/15/15)4 | | | 248,443 | | | | 46,782 | |
Series 3308, Class S, 7.039%, 03/15/32 (01/15/15)4 | | | 286,411 | | | | 55,631 | |
Series 3424, Class XI, 6.409%, 05/15/36 (01/15/15)4 | | | 281,810 | | | | 43,689 | |
Series 3489, Class SD, 7.639%, 06/15/32 (01/15/15)4 | | | 162,182 | | | | 34,133 | |
Series 3606, Class SN, 6.089%, 12/15/39 (01/15/15)4 | | | 385,193 | | | | 60,720 | |
Series 3685, Class EI, 5.000%, 03/15/19 | | | 410,359 | | | | 23,162 | |
Series 3731, Class IO, 5.000%, 07/15/19 | | | 191,449 | | | | 11,542 | |
Series 3882, Class AI, 5.000%, 06/15/26 | | | 276,741 | | | | 20,866 | |
FNMA, | | | | | | | | |
Series 215, Class 2, 7.000%, 04/25/238 | | | 90,113 | | | | 18,131 | |
Series 222, Class 2, 7.000%, 06/25/238 | | | 8,774 | | | | 1,762 | |
Series 343, Class 2, 4.500%, 10/25/33 | | | 84,450 | | | | 14,999 | |
Series 343, Class 21, 4.000%, 09/25/18 | | | 111,745 | | | | 6,057 | |
Series 343, Class 22, 4.000%, 11/25/18 | | | 60,246 | | | | 3,264 | |
Series 351, Class 3, 5.000%, 04/25/34 | | | 97,336 | | | | 18,460 | |
Series 351, Class 4, 5.000%, 04/25/34 | | | 57,346 | | | | 10,733 | |
Series 351, Class 5, 5.000%, 04/25/34 | | | 48,423 | | | | 9,063 | |
Series 365, Class 4, 5.000%, 04/25/36 | | | 131,484 | | | | 23,663 | |
FNMA REMICS, | | | | | | | | |
Series 2003-73, Class SM, 6.431%, 04/25/18 (01/25/15)4 | | | 82,341 | | | | 2,702 | |
Series 2004-49, Class SQ, 6.881%, 07/25/34 (01/25/15)4 | | | 113,169 | | | | 22,113 | |
Series 2004-51, Class SX, 6.951%, 07/25/34 (01/25/15)4 | | | 163,566 | | | | 33,588 | |
Series 2004-64, Class SW, 6.881%, 08/25/34 (01/25/15)4 | | | 475,378 | | | | 97,378 | |
Series 2005-12, Class SC, 6.581%, 03/25/35 (01/25/15)4 | | | 184,608 | | | | 30,192 | |
Series 2005-45, Class SR, 6.551%, 06/25/35 (01/25/15)4 | | | 386,344 | | | | 77,021 | |
Series 2005-65, Class KI, 6.831%, 08/25/35 (01/25/15)4,10 | | | 883,782 | | | | 175,280 | |
Series 2005-89, Class S, 6.531%, 10/25/35 (01/25/15)4 | | | 887,294 | | | | 169,815 | |
Series 2006-3, Class SA, 5.981%, 03/25/36 (01/25/15)4 | | | 187,781 | | | | 33,588 | |
Series 2007-75, Class JI, 6.376%, 08/25/37 (01/25/15)4 | | | 193,834 | | | | 30,888 | |
Series 2008-86, Class IO, 4.500%, 03/25/23 | | | 361,851 | | | | 21,077 | |
The accompanying notes are an integral part of these financial statements.
39
AMG Managers Intermediate Duration Government Fund
Schedule of Portfolio Investments (continued)
| | | | | | | | |
| | | Principal Amount | | | Value | |
Interest Only Strips - 1.3% (continued) | | | | | | | | |
FNMA REMICS, | | | | | | | | |
Series 2010-37, Class GI, 5.000%, 04/25/25 | | $ | 461,714 | | | $ | 23,654 | |
Series 2010-65, Class IO, 5.000%, 09/25/20 | | | 519,450 | | | | 38,417 | |
Series 2010-121, Class IO, 5.000%, 10/25/25 | | | 197,121 | | | | 13,722 | |
Series 2011-69, Class AI, 5.000%, 05/25/18 | | | 537,036 | | | | 29,572 | |
Series 2011-88, Class WI, 3.500%, 09/25/26 | | | 457,823 | | | | 57,062 | |
Series 2011-124, Class IC, 3.500%, 09/25/21 | | | 435,319 | | | | 32,463 | |
Series 2012-126, Class SJ, 4.831%, 11/25/42 (01/25/15)4 | | | 827,179 | | | | 129,053 | |
GNMA, | | | | | | | | |
Series 2011-32, Class KS, 11.778%, 06/16/34 (01/16/15)4 | | | 353,207 | | | | 74,448 | |
Series 2011-94, Class IS, 6.539%, 06/16/36 (01/16/15)4 | | | 300,178 | | | | 48,407 | |
Series 2011-157, Class SG, 6.435%, 12/20/41 (01/20/15)4 | | | 1,135,754 | | | | 263,150 | |
Series 2011-167, Class IO, 5.000%, 12/16/20 | | | 415,672 | | | | 27,810 | |
Series 2012-34, Class KS, 5.889%, 03/16/42 (01/16/15)4 | | | 462,911 | | | | 101,722 | |
Series 2012-69, Class QI, 4.000%, 03/16/41 | | | 340,151 | | | | 60,330 | |
Series 2012-103, Class IB, 3.500%, 04/20/40 | | | 296,533 | | | | 42,078 | |
Total Interest Only Strips | | | | | | | 2,311,054 | |
Total U.S. Government and Agency Obligations (cost $186,488,076) | | | | | | | 189,864,609 | |
| | |
Short-Term Investments - 45.4% | | | | | | | | |
U.S. Treasury Bills - 0.1% | | | | | | | | |
U.S. Treasury Bill, 0.04%, 04/02/1512,13 | | | 90,000 | | | | 89,991 | |
| | |
| | | Shares | | | | |
Other Investment Companies - 45.3%3 | | | | | | | | |
Dreyfus Institutional Cash Advantage Fund, Institutional Class Shares, 0.06%10 | | | 58,876,539 | | | | 58,876,539 | |
JPMorgan Liquid Assets Money Market Fund, Capital Shares, 0.07%10 | | | 20,009,126 | | | | 20,009,126 | |
Total Other Investment Companies | | | | | | | 78,885,665 | |
Total Short-Term Investments
(cost $78,975,656) | | | | | | | 78,975,656 | |
Total Investments - 157.1%
(cost $270,398,346) | | | | | | | 273,572,673 | |
Other Assets, less Liabilities - (57.1)% | | | | | | | (99,435,051 | ) |
Net Assets - 100.0% | | | | | | $ | 174,137,622 | |
The accompanying notes are an integral part of these financial statements.
40
AMG Managers Short Duration Government Fund
Portfolio Manager’s Comments
THE YEAR IN REVIEW
During the year ended December 31, 2014, the AMG Managers Short Duration Government Fund (the Fund) returned 0.60%, while the BofA Merrill Lynch Six-Month U.S. Treasury Bill Index returned 0.12%.
During 2014, we witnessed the initial attempts to transition to a more normal market environment. Despite the U.S. Federal Reserve’s (the Fed) successful withdrawal from the third round of quantitative easing (QE3), longer-term interest rates declined significantly throughout the year. By the end of the year, however, rates on the shorter end of the curve began to rise in anticipation of Fed tightening.
Agency mortgage-backed securities (MBS) were off to a scorching start to begin 2014, as spreads tightened significantly within the sector. This action occurred despite the Fed’s move to begin its tapering of QE3 at a rate of roughly $10 billion per month. The reduction in monthly demand from the Fed was more than offset by the reduction in supply driven by higher interest rates.
The start of the second quarter brought some turbulence in global capital markets, as the rebound in economic activity after the cold winter brought uncertainty about monetary policy to the forefront. While intermediate rates remained firm, longer rates rallied as investors looked for safe assets due to the combination of uncertainty about Russia, low relative rates in Europe and the general consensus that some short covering was occurring due to significant short positions by most of the active management community. The lack of volatility in intermediate rates was supportive for agency MBS.
Market participants began the third quarter with a rush for the exits, as years of rising prices and falling volatility had “packed the theater” by encouraging the accumulation of risk positions. At the same time, many of the theater’s exit doors had been blocked by considerable reductions in the number and risk tolerance of market intermediaries.
Agency MBS faced some headwinds as lower interest rates drove increased supply while the Fed continued its stable path of tapering. Spreads leaked wider as gross MBS production rose to $80 billion per month, which was $30 billion per month higher than the previous quarter.
Shifting economic and financial forces wrought havoc in global markets to begin the fourth quarter. While there was no specific catalyst, it felt as though market participants finally realized that the uncertainty regarding future monetary policy actions as QE3 ended should be reflected in lower prices. The market also struggled to digest the many other important market developments, including redoubled monetary stimulus from the Bank of Japan, growing asset purchases by the European Central Bank, gathering economic weakness in China and Europe, plummeting inflation pricing, increasing strength in the U.S. Dollar and the sharp decline in oil prices. Agency MBS felt pressure initially from the sharp rally in rates, as concerns rose over a potential increase in prepayment rates and a pick-up in implied volatilities. The concerns, however, were short-lived, as spreads returned back to their starting point within a few weeks.
Most of the Fund outperformance for 2014 was attributable to our positioning in agency MBS, specifically avoiding those parts of the market where the Fed was most active. Higher-coupon fixed-rate mortgages (FRMs), adjustable-rate mortgages (ARMS) and front-pay tranches from collateral mortgage obligations (CMOs) all benefited from the reduced production of mortgages and the slower prepayment environment.
At the end of the year, while the Fund held the majority of its exposure in 15-year agency FRMs, we reduced the portfolio concentration to this sector by almost half over the course of the year to end at 24% of the portfolio market weight. We added 8% to the market weighting in 30-year FRMs while maintaining the exposures to agency ARMs and CMOs at relatively constant levels. We continue to view MBS as an
attractive alternative to Treasuries due to the additional spread offered.
LOOKING FORWARD
As we enter 2015, Amundi Smith Breeden believes that agency MBS offer spreads that are modestly tight to historical standards and are largely supported by a combination of low volatility and prepayment rates, as well as the continued re-investment of paydowns on the existing Fed portfolio of agency MBS. The Fed currently owns one-third of outstanding agency FRMs, and that portfolio size is being maintained for now. All three of these supports bear watching, although we feel a significant rise in prepayment rates is unlikely. The current level of volatility is certainly worth watching, as we may be emerging from a period in which monetary policy was extremely market-friendly due to the clarity with which moves were projected. The view over the next few years, however, is much less clear, and the expectations of the timing and pace of rate increases vary greatly, even amongst Fed members. This confusion may drive increased volatility entering 2015, as the market tries to estimate the future direction of rates.
Finally, we will be monitoring for any indication from the Fed regarding potential changes to its current re-investment program, which we expect to continue as is well into late 2015, barring any shifts in economic momentum. We expect agency MBS to moderately widen to levels that would be somewhat cheap historically over the next year or two as the Fed begins to shrink its balance sheet and volatility increases. The carry benefit that MBS offer versus Treasuries, however, is likely to offset any spread widening, making it an attractive asset class. The increased volatility should also benefit investors who are approaching the asset class through prudent active management.
This commentary reflects the viewpoints of Amundi Smith Breeden LLC as of December 31, 2014 and is not intended as a forecast or guarantee of future results.
41
AMG Managers Short Duration Government Fund
Portfolio Manager’s Comments (continued)
CUMULATIVE TOTAL RETURN PERFORMANCE
AMG Managers Short Duration Government Fund’s cumulative total return is based on the daily change in net asset value (NAV), and assumes that all dividends and distributions were reinvested. This graph compares a hypothetical $10,000 investment made in the AMG Managers Short Duration Government Fund on December 31, 2004 to a $10,000 investment made in the BofA Merrill Lynch 6-Month U.S. Treasury Bill Index for the same time period. The graph and table do not reflect the deduction of taxes that a shareholder would pay on a Fund distribution or redemption of shares. The listed returns for the Fund are net of expenses and the returns for the index exclude expenses. Total returns would have been lower had certain expenses not been reduced.
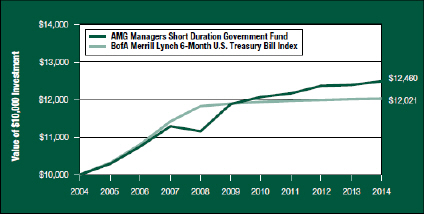
The table below shows the average annual total returns for the AMG Managers Short Duration Government Fund and the BofA Merrill Lynch 6-Month U.S. Treasury Bill Index for the same time periods ended December 31, 2014.
| | | | | | | | | | | | |
| Average Annual Total Returns1 | | One
Year | | | Five
Years | | | Ten
Years | |
AMG Managers Short Duration
Government Fund 2,3,4,5 | | | 0.60 | % | | | 0.96 | % | | | 2.22 | % |
BofA Merrill Lynch 6-Month U.S.
Treasury Bill Index6 | | | 0.12 | % | | | 0.22 | % | | | 1.86 | % |
The performance data shown represents past performance. Past performance is not a guarantee of future results. Current performance may be lower or higher than the performance data quoted. The investment return and principal value of an investment in the Fund will fluctuate so that an investor’s shares, when redeemed, may be worth more or less than their original cost.
Investors should carefully consider the Fund’s investment objectives, risks, charges, and expenses before investing. For performance information through the most recent month end, current net asset values per share for the Fund and other information, please call (800) 835-3879 or visit our website at www.amgfunds.com for a free prospectus. Read it carefully before investing or sending money.
Distributed by AMG Distributors, Inc., member FINRA/SIPC.
| 1 | Total return equals income yield plus share price change and assumes reinvestment of all dividends and capital gain distributions. Returns are net of fees and may reflect offsets of Fund expenses as described in the prospectus. No adjustment has been made for taxes payable by shareholders on their reinvested dividends and capital gain distributions. Returns for periods greater than one year are annualized. The listed returns on the Fund are net of expenses and based on the published NAV as of December 31, 2014. All returns are in U.S. dollars ($). |
| 2 | From time to time the Fund’s advisor has waived its fees and/or absorbed Fund expenses, which has resulted in higher returns. |
| 3 | The Fund is subject to the risks associated with investments in debt securities, such as default risk and fluctuations in the perception of the debtors’ ability to pay its creditors and changing interest rate risk. An increase in interest rates typically causes the value of bonds and other fixed-income securities to fall. |
| 4 | The Fund may use derivative instruments for hedging purposes or as part of its investment strategy. There is a risk that a derivative intended as a hedge may not perform as expected. The main risks with derivatives is that some types can amplify a gain or loss, potentially earning or losing substantially more money than the actual cost of the derivative; or that the counterparty may fail to honor its contract terms, causing a loss for the Fund. Use of these instruments may also involve certain costs and risks such as liquidity risk, interest rate risk, market risk, credit risk, management risk and the risk that a fund could not close out a position when it would be most advantageous to do so. |
| 5 | Many bonds have call provisions which allow the debtors to pay them back before maturity. This is especially true with mortgage securities, which can be paid back anytime. Typically debtors prepay their debt when it is to their advantage (when interest rates drop making a new loan at current rates more attractive), and thus likely to the disadvantage of bondholders, who may have to reinvest prepayment proceeds in securities with lower yields. Prepayment risk will vary depending on the provisions of the security and current interest rates relative to the interest rate of the debt. |
| 6 | The BofA Merrill Lynch 6-Month U.S. Treasury Bill Index is an unmanaged index that measures returns of 6-month Treasury Bills. Unlike the Fund, the BofA Merrill Lynch 6-Month Treasury Bill Index is unmanaged, is not available for investment, and does not incur expenses. |
Not FDIC insured, nor bank guaranteed. May lose value.
42
AMG Managers Short Duration Government Fund
Fund Snapshots (unaudited)
December 31, 2014
PORTFOLIO BREAKDOWN
| | | | |
Category | | AMG Managers
Short Duration
Government Fund** | |
U.S. Government and Agency Obligations | | | 74.7 | % |
Asset-Backed Securities | | | 9.6 | % |
Mortgage-Backed Securities | | | 4.2 | % |
Other Assets and Liabilities | | | 11.5 | % |
| ** | As a percentage of net assets. |
| | | | |
Rating | | AMG Managers
Short Duration
Government Fund† | |
U.S. Government and Agency Obligations | | | 85.6 | % |
Aaa | | | 14.2 | % |
Aa | | | 0.0 | % |
A | | | 0.1 | % |
Baa | | | 0.0 | % |
Ba & lower | | | 0.1 | % |
| † | As a percentage of market value of fixed-income securities. |
TOP TEN HOLDINGS
| | | | |
Security Name | | % of Net Assets | |
Chase Issuance Trust, Series 2013-A9, Class A, 0.581%, 11/16/20 | | | 3.1 | % |
U.S. Treasury Inflation Indexed Bonds, 0.375%, 07/15/23* | | | 2.3 | |
FHLMC REMICS, Series 3990, Class GF, 0.561%, 03/15/41 | | | 2.3 | |
FNMA REMICS, Series 2011-115, Class FK, 0.540%, 10/25/39 | | | 2.2 | |
FNMA, 3.500%, TBA 15yr | | | 1.6 | |
FHLMC Gold Pool, 5.500%, 12/01/24* | | | 1.6 | |
FNMA, 2.295%, 04/01/37 | | | 1.5 | |
FNMA, 6.500%, 12/01/28* | | | 1.3 | |
FNMA, 5.500%, 08/01/41 | | | 1.3 | |
FHLMC Gold Pool, 5.500%, 01/01/39* | | | 1.3 | |
| | | | |
Top Ten as a Group | | | 18.5 | % |
| | | | |
| * | Top Ten Holding as of June 30, 2014. |
Credit quality ratings shown above reflect the highest rating assigned by either Standard & Poor’s (“S&P”) or Moody’s Investors Service, Inc. (“Moody’s”). These rating agencies are independent, nationally recognized statistical rating organizations and are widely used. Investment grade ratings are credit ratings of BBB/Baa or higher. Below investment grade ratings are credit ratings of BB/Ba or lower. Investments designated N/R are not rated by either rating agency. Unrated investments do not necessarily indicate low credit quality. Credit quality ratings are subject to change.
Because a fund’s strategy may result in multiple investments in particular sectors of the economy, its performance may depend on the performance of those sectors and may fluctuate more widely than investments diversified across more sectors. For additional information on these and other risk considerations, please see the Fund’s prospectus.
Any sectors, industries, or securities discussed should not be perceived as investment recommendations. Mention of a specific security should not be considered a recommendation to buy or solicitation to sell that security. Specific securities mentioned in this report may have been sold from the Fund’s portfolio of investments by the time you receive this report.
43
AMG Managers Short Duration Government Fund
Schedule of Portfolio Investments
December 31, 2014
| | | | | | | | |
| | | Principal Amount | | | Value | |
Asset-Backed Securities - 9.6% | | | | | | | | |
AmeriCredit Automobile Receivables Trust, | | | | | | | | |
Series 2011-1, Class D, 4.260%, 02/08/17 | | $ | 3,420,000 | | | $ | 3,464,556 | |
Series 2011-2, Class D, 4.000%, 05/08/17 | | | 3,900,000 | | | | 3,959,682 | |
Series 2011-3, Class D, 4.040%, 07/10/17 | | | 4,095,000 | | | | 4,168,575 | |
Series 2012-1, Class C, 2.670%, 01/08/18 | | | 400,000 | | | | 404,894 | |
Chase Issuance Trust, | | | | | | | | |
Series 2013-A9, Class A, 0.581%, 11/16/20 (01/15/15)4 | | | 11,724,000 | | | | 11,746,791 | |
Series 2014-A5, Class A5, 0.531%, 04/15/21 (01/15/15)4 | | | 1,284,000 | | | | 1,279,746 | |
Citibank Credit Card Issuance Trust, | | | | | | | | |
Series 2013-A12, Class A12, 0.462%, 11/07/18 (02/09/15)4 | | | 4,000,000 | | | | 3,995,688 | |
Series 2013-A7, Class A7, 0.596%, 09/10/20 (02/10/15)4 | | | 1,121,000 | | | | 1,120,751 | |
Discover Card Execution Note Trust, | | | | | | | | |
Series 2014-A1, Class A1, 0.591%, 07/15/21 (01/15/15)4 | | | 1,080,000 | | | | 1,082,337 | |
Series 2014-A2, Class A2, 0.432%, 08/15/19 (02/17/15)4 | | | 1,500,000 | | | | 1,496,544 | |
Santander Drive Auto Receivables Trust, Series 2011-1, Class D, 4.010%, 02/15/17 | | | 4,161,000 | | | | 4,230,426 | |
Structured Asset Investment Loan Trust, Series 2004-BNC2, Class A5, 1.250%, 12/25/34 (01/26/15)4 | | | 87,913 | | | | 87,393 | |
Total Asset-Backed Securities (cost $37,113,624) | | | | | | | 37,037,383 | |
Mortgage-Backed Securities - 4.2% | | | | | | | | |
Bank of America Commercial Mortgage Trust, Series 2006-6, Class A2, 5.309%, 10/10/45 | | | 28,050 | | | | 28,060 | |
Bank of America Merrill Lynch Commercial Mortgage, Inc., Series 2005-6, Class A4, 5.152%, 09/10/476 | | | 2,536,753 | | | | 2,589,081 | |
Bear Stearns Commercial Mortgage Securities Trust, | | | | | | | | |
Series 2004-PWR4, Class A3, 5.468%, 06/11/416 | | | 105,652 | | | | 105,628 | |
Series 2005-PWR7, Class A3, 5.116%, 02/11/416 | | | 507,952 | | | | 507,962 | |
Series 2006-T22, Class A4, 5.575%, 04/12/386 | | | 1,667,451 | | | | 1,729,199 | |
CD Commercial Mortgage Trust, Series 2005-CD1, Class A4, 5.226%, 07/15/446 | | | 561,550 | | | | 570,623 | |
Citigroup Commercial Mortgage Trust, Series 2005-C3, Class A4, 4.860%, 05/15/43 | | | 22,673 | | | | 22,649 | |
Commercial Mortgage Trust, Series 2005-C6, Class A5A, 5.116%, 06/10/446 | | | 518,069 | | | | 523,593 | |
Countrywide Home Loan Mortgage Pass Through Trust, Series 2004-25, Class 2A4, 0.670%, 02/25/35 (01/26/15)4,8 | | | 544,104 | | | | 216,898 | |
GS Mortgage Securities Corp. II, Series 2005-GG4, Class A4A, 4.751%, 07/10/39 | | | 1,693,102 | | | | 1,694,736 | |
LB-UBS Commercial Mortgage Trust, Series 2005-C5, Class A4, 4.954%, 09/15/30 | | | 1,208,142 | | | | 1,214,171 | |
Merrill Lynch Mortgage Investors Trust, Series 1998-C1, Class A3, 6.720%, 11/15/266 | | | 837,738 | | | | 873,961 | |
Merrill Lynch Mortgage Trust, Series 2005-MKB2, Class A4, 5.204%, 09/12/426 | | | 919,680 | | | | 919,387 | |
Morgan Stanley Capital I Trust, Series 2006-HQ8, Class A4, 5.412%, 03/12/446 | | | 1,691,049 | | | | 1,733,494 | |
Wachovia Bank Commercial Mortgage Trust, | | | | | | | | |
Series 2005-C20, Class A7, 5.118%, 07/15/426 | | | 1,696,377 | | | | 1,710,473 | |
Series 2005-C22, Class A4, 5.269%, 12/15/446 | | | 1,358,667 | | | | 1,387,674 | |
WaMu Mortgage Pass Through Certificates, Series 2005-AR2, Class 2A3, 0.520%, 01/25/45 (01/25/15)4 | | | 456,617 | | | | 420,453 | |
| | |
Total Mortgage-Backed Securities (cost $17,247,155) | | | | | | | 16,248,042 | |
The accompanying notes are an integral part of these financial statements.
44
AMG Managers Short Duration Government Fund
Schedule of Portfolio Investments (continued)
| | | | | | | | |
| | | Principal Amount | | | Value | |
U.S. Government and Agency Obligations - 74.7% | | | | | | | | |
| | |
Federal Home Loan Mortgage Corporation - 28.5% | | | | | | | | |
FHLMC, | | | | | | | | |
1.875%, 09/01/35 (03/15/15)4 | | $ | 2,010,680 | | | $ | 2,113,130 | |
2.125%, 11/01/33 (03/15/15)4 | | | 962,618 | | | | 1,017,550 | |
2.344%, 10/01/33 (03/15/15)4 | | | 1,303,108 | | | | 1,385,058 | |
2.350%, 10/01/33 to 11/01/33 (03/15/15)4 | | | 3,148,408 | | | | 3,353,038 | |
2.355%, 12/01/33 (03/15/15)4 | | | 1,815,043 | | | | 1,937,005 | |
2.357%, 07/01/34 (03/15/15)4 | | | 288,727 | | | | 308,375 | |
2.365%, 09/01/33 (03/15/15)4 | | | 2,350,410 | | | | 2,511,346 | |
2.375%, 12/01/32 to 05/01/34 (03/15/15)4 | | | 6,253,627 | | | | 6,665,160 | |
2.392%, 10/01/28 (03/15/15)4 | | | 46,267 | | | | 48,824 | |
2.554%, 02/01/23 (03/15/15)4 | | | 290,108 | | | | 308,816 | |
2.621%, 06/01/35 (03/15/15)4 | | | 712,745 | | | | 766,015 | |
2.797%, 02/01/37 (03/15/15)4 | | | 821,784 | | | | 882,510 | |
FHLMC Gold Pool, | | | | | | | | |
4.000%, 05/01/24 to 11/01/26 | | | 8,778,009 | | | | 9,379,349 | |
4.500%, 05/01/19 to 07/01/26 | | | 5,777,093 | | | | 6,159,309 | |
5.000%, 09/01/17 to 04/01/23 | | | 8,463,756 | | | | 8,974,655 | |
5.500%, 05/01/17 to 08/01/40 | | | 23,657,393 | | | | 26,147,164 | |
6.000%, 06/01/16 to 01/01/24 | | | 7,068,581 | | | | 7,682,502 | |
6.500%, 03/01/18 to 10/01/23 | | | 510,931 | | | | 548,916 | |
7.000%, 06/01/17 to 07/01/19 | | | 239,031 | | | | 250,892 | |
7.500%, 04/01/15 to 03/01/33 | | | 371,141 | | | | 435,147 | |
FHLMC REMICS, | | | | | | | | |
Series 2091, Class PG, 6.000%, 11/15/28 | | | 246,075 | | | | 270,715 | |
Series 2132, Class PE, 6.000%, 03/15/29 | | | 406,485 | | | | 445,854 | |
Series 2427, Class LW, 6.000%, 03/15/17 | | | 575,379 | | | | 597,310 | |
Series 2429, Class HB, 6.500%, 12/15/23 | | | 622,021 | | | | 701,690 | |
Series 2541, Class ED, 5.000%, 12/15/17 | | | 2,247,936 | | | | 2,351,923 | |
Series 2554, Class HA, 4.500%, 04/15/32 | | | 56,712 | | | | 56,752 | |
Series 2627, Class BM, 4.500%, 06/15/18 | | | 170,576 | | | | 177,907 | |
Series 2631, Class PD, 4.500%, 06/15/18 | | | 57,861 | | | | 60,601 | |
Series 2645, Class BY, 4.500%, 07/15/18 | | | 1,956,307 | | | | 2,040,176 | |
Series 2682, Class LC, 4.500%, 07/15/32 | | | 821,729 | | | | 847,036 | |
Series 2683, Class JB, 4.000%, 09/15/18 | | | 302,829 | | | | 314,649 | |
Series 2709, Class PE, 5.000%, 12/15/22 | | | 327,503 | | | | 332,367 | |
Series 2763, Class JD, 3.500%, 10/15/18 | | | 146,825 | | | | 148,239 | |
Series 2786, Class BC, 4.000%, 04/15/19 | | | 200,283 | | | | 209,681 | |
Series 2809, Class UC, 4.000%, 06/15/19 | | | 213,346 | | | | 221,869 | |
The accompanying notes are an integral part of these financial statements.
45
AMG Managers Short Duration Government Fund
Schedule of Portfolio Investments (continued)
| | | | | | | | |
| | | Principal Amount | | | Value | |
Federal Home Loan Mortgage Corporation - 28.5% (continued) | | | | | | | | |
FHLMC REMICS, | | | | | | | | |
Series 2877, Class PA, 5.500%, 07/15/33 | | $ | 192,581 | | | $ | 204,265 | |
Series 2882, Class UM, 4.500%, 08/15/19 | | | 616,603 | | | | 624,043 | |
Series 2935, Class LM, 4.500%, 02/15/35 | | | 656,865 | | | | 684,711 | |
Series 3000, Class PB, 3.900%, 01/15/23 | | | 21,933 | | | | 22,048 | |
Series 3013, Class GA, 5.000%, 06/15/34 | | | 428,192 | | | | 435,566 | |
Series 3033, Class CI, 5.500%, 01/15/35 | | | 377,406 | | | | 398,032 | |
Series 3117, Class PL, 5.000%, 08/15/34 | | | 309,847 | | | | 312,691 | |
Series 3535, Class CA, 4.000%, 05/15/24 | | | 192,586 | | | | 200,353 | |
Series 3609, Class LA, 4.000%, 12/15/24 | | | 631,308 | | | | 660,259 | |
Series 3632, Class AG, 4.000%, 06/15/38 | | | 350,032 | | | | 366,772 | |
Series 3640, Class JA, 1.500%, 03/15/15 | | | 47,280 | | | | 47,276 | |
Series 3653, Class JK, 5.000%, 11/15/38 | | | 329,115 | | | | 351,983 | |
Series 3659, Class EJ, 3.000%, 06/15/18 | | | 4,327,648 | | | | 4,434,212 | |
Series 3683, Class AD, 2.250%, 06/15/20 | | | 954,289 | | | | 963,888 | |
Series 3756, Class DA, 1.200%, 11/15/18 | | | 762,798 | | | | 764,832 | |
Series 3818, Class UA, 1.350%, 02/15/17 | | | 234,428 | | | | 235,742 | |
Series 3827, Class CA, 1.500%, 04/15/17 | | | 252,831 | | | | 254,143 | |
Series 3846, Class CK, 1.500%, 09/15/20 | | | 278,970 | | | | 281,288 | |
Series 3990, Class GF, 0.561%, 03/15/41 (01/15/15)4 | | | 8,763,009 | | | | 8,855,493 | |
| | |
Total Federal Home Loan Mortgage Corporation | | | | | | | 109,749,127 | |
Federal National Mortgage Association - 37.7% | | | | | | | | |
FNMA, | | | | | | | | |
1.850%, 08/01/34 (02/25/15)4 | | | 338,538 | | | | 356,952 | |
1.875%, 02/01/33 (02/25/15)4 | | | 1,456,450 | | | | 1,537,473 | |
1.890%, 01/01/24 (02/25/15)4 | | | 686,955 | | | | 700,972 | |
1.925%, 09/01/33 to 03/01/36 (02/25/15)4 | | | 2,024,330 | | | | 2,142,300 | |
1.930%, 08/01/35 (02/25/15)4 | | | 563,764 | | | | 598,881 | |
1.935%, 08/01/33 (02/25/15)4 | | | 530,732 | | | | 562,343 | |
1.975%, 06/01/34 (02/25/15)4 | | | 983,065 | | | | 1,042,325 | |
2.020%, 02/01/36 (02/25/15)4 | | | 3,321,595 | | | | 3,518,995 | |
2.127%, 10/01/35 (02/25/15)4 | | | 1,718,764 | | | | 1,828,895 | |
2.150%, 01/01/34 to 08/01/34 (02/25/15)4 | | | 1,157,421 | | | | 1,225,028 | |
2.176%, 01/01/36 to 08/01/36 (02/25/15)4 | | | 316,962 | | | | 338,505 | |
2.192%, 12/01/33 (02/25/15)4 | | | 678,594 | | | | 723,271 | |
2.193%, 03/01/34 (02/25/15)4 | | | 297,181 | | | | 315,055 | |
2.195%, 01/01/33 (02/25/15)4 | | | 33,535 | | | | 34,372 | |
2.201%, 07/01/34 (02/25/15)4 | | | 1,687,445 | | | | 1,801,230 | |
2.243%, 05/01/33 (02/25/15)4 | | | 2,104,099 | | | | 2,239,738 | |
2.250%, 03/01/33 (02/25/15)4 | | | 482,852 | | | | 514,011 | |
The accompanying notes are an integral part of these financial statements.
46
AMG Managers Short Duration Government Fund
Schedule of Portfolio Investments (continued)
| | | | | | | | |
| | | Principal Amount | | | Value | |
Federal National Mortgage Association - 37.7% (continued) | | | | | | | | |
FNMA, | | | | | | | | |
2.270%, 09/01/37 (02/25/15)4 | | $ | 242,566 | | | $ | 262,205 | |
2.278%, 09/01/33 (02/25/15)4 | | | 671,967 | | | | 715,619 | |
2.295%, 04/01/37 (02/25/15)4 | | | 5,497,019 | | | | 5,871,271 | |
2.300%, 02/01/37 (02/25/15)4 | | | 515,046 | | | | 550,143 | |
2.306%, 12/01/34 (02/25/15)4 | | | 2,876,293 | | | | 3,077,469 | |
2.316%, 06/01/33 (02/25/15)4 | | | 476,984 | | | | 508,598 | |
2.329%, 01/01/26 (02/25/15)4 | | | 291,026 | | | | 302,321 | |
2.348%, 08/01/35 (02/25/15)4 | | | 1,630,854 | | | | 1,744,321 | |
2.355%, 01/01/25 to 05/01/36 (02/25/15)4 | | | 881,551 | | | | 930,710 | |
2.371%, 05/01/34 (02/25/15)4 | | | 2,108,061 | | | | 2,256,197 | |
2.383%, 06/01/34 (02/25/15)4 | | | 2,685,694 | | | | 2,868,024 | |
2.402%, 01/01/36 (02/25/15)4 | | | 54,665 | | | | 58,655 | |
2.425%, 01/01/34 (02/25/15)4 | | | 2,342,273 | | | | 2,512,684 | |
2.428%, 12/01/34 (02/25/15)4 | | | 2,502,698 | | | | 2,685,311 | |
2.435%, 01/01/33 (02/25/15)4 | | | 1,065,138 | | | | 1,142,783 | |
2.457%, 04/01/34 (02/25/15)4 | | | 652,140 | | | | 700,369 | |
2.473%, 04/01/34 (02/25/15)4 | | | 793,842 | | | | 852,276 | |
2.485%, 11/01/34 (02/25/15)4 | | | 4,280,597 | | | | 4,578,774 | |
2.505%, 01/01/36 (02/25/15)4 | | | 4,330,120 | | | | 4,651,963 | |
3.500%, TBA 15yr,5,11 | | | 6,000,000 | | | | 6,338,437 | |
4.000%, 10/01/21 to 12/01/26 | | | 599,293 | | | | 639,593 | |
4.500%, 10/01/19 to 06/01/26 | | | 2,915,222 | | | | 3,140,468 | |
5.000%, 03/01/18 to 09/01/25 | | | 12,266,873 | | | | 13,187,154 | |
5.500%, 10/01/17 to 08/01/41 | | | 19,336,865 | | | | 21,546,126 | |
6.000%, 03/01/17 to 07/01/25 | | | 9,255,642 | | | | 10,025,130 | |
6.500%, 04/01/17 to 08/01/32 | | | 5,163,890 | | | | 5,877,683 | |
7.000%, 11/01/22 | | | 2,428,413 | | | | 2,662,123 | |
7.500%, 08/01/33 to 09/01/33 | | | 83,684 | | | | 97,678 | |
FNMA Grantor Trust, | | | | | | | | |
Series 2002-T5, Class A1, 0.410%, 05/25/32 (01/26/15)4 | | | 321,850 | | | | 316,865 | |
Series 2003-T4, Class 1A, 0.390%, 09/26/33 (01/26/15)4 | | | 14,530 | | | | 14,395 | |
FNMA REMICS, | | | | | | | | |
Series 1994-31, Class ZC, 6.500%, 02/25/24 | | | 608,205 | | | | 682,493 | |
Series 1994-76, Class J, 5.000%, 04/25/24 | | | 207,853 | | | | 217,450 | |
Series 2001-63, Class FA, 0.712%, 12/18/31 (01/18/15)4 | | | 575,409 | | | | 584,085 | |
Series 2001-76, Class UD, 5.500%, 01/25/17 | | | 688,255 | | | | 713,999 | |
Series 2002-47, Class FD, 0.570%, 08/25/32 (01/25/15)4 | | | 604,859 | | | | 610,832 | |
Series 2002-56, Class UC, 5.500%, 09/25/17 | | | 294,078 | | | | 306,931 | |
Series 2002-74, Class FV, 0.620%, 11/25/32 (01/25/15)4 | | | 1,041,774 | | | | 1,052,812 | |
The accompanying notes are an integral part of these financial statements.
47
AMG Managers Short Duration Government Fund
Schedule of Portfolio Investments (continued)
| | | | | | | | |
| | | Principal Amount | | | Value | |
Federal National Mortgage Association - 37.7% (continued) | | | | | | | | |
FNMA REMICS, | | | | | | | | |
Series 2003-2, Class FA, 0.670%, 02/25/33 (01/25/15)4 | | $ | 538,229 | | | $ | 544,493 | |
Series 2003-3, Class HJ, 5.000%, 02/25/18 | | | 165,811 | | | | 173,547 | |
Series 2003-64, Class YA, 3.000%, 05/25/23 | | | 167,246 | | | | 170,589 | |
Series 2004-1, Class AC, 4.000%, 02/25/19 | | | 111,018 | | | | 114,994 | |
Series 2004-21, Class AE, 4.000%, 04/25/19 | | | 503,575 | | | | 523,634 | |
Series 2004-27, Class HB, 4.000%, 05/25/19 | | | 243,900 | | | | 253,508 | |
Series 2004-53, Class NC, 5.500%, 07/25/24 | | | 353,555 | | | | 385,473 | |
Series 2004-78, Class AC, 5.000%, 05/25/32 | | | 96,186 | | | | 96,383 | |
Series 2005-13, Class AF, 0.570%, 03/25/35 (01/25/15)4 | | | 733,487 | | | | 739,984 | |
Series 2005-19, Class PA, 5.500%, 07/25/34 | | | 166,017 | | | | 180,344 | |
Series 2005-29, Class TC, 5.000%, 04/25/35 | | | 76,792 | | | | 77,505 | |
Series 2005-58, Class EP, 5.500%, 07/25/35 | | | 404,623 | | | | 443,520 | |
Series 2005-68, Class PB, 5.750%, 07/25/35 | | | 90,255 | | | | 97,052 | |
Series 2005-68, Class PC, 5.500%, 07/25/35 | | | 321,906 | | | | 344,724 | |
Series 2005-100, Class GC, 5.000%, 12/25/34 | | | 507,742 | | | | 519,152 | |
Series 2006-18, Class PD, 5.500%, 08/25/34 | | | 108,589 | | | | 112,188 | |
Series 2007-56, Class FK, 0.540%, 06/25/37 to 10/25/39 (01/25/15)4 | | | 8,653,172 | | | | 8,730,266 | |
Series 2007-65, Class GB, 5.000%, 10/25/33 | | | 49,843 | | | | 49,828 | |
Series 2007-69, Class AB, 5.500%, 12/25/32 | | | 100,723 | | | | 101,986 | |
Series 2008-59, Class KB, 4.500%, 07/25/23 | | | 232,843 | | | | 243,797 | |
Series 2008-81, Class KA, 5.000%, 10/25/22 | | | 14,714 | | | | 14,750 | |
Series 2010-12, Class AC, 2.500%, 12/25/18 | | | 321,323 | | | | 327,656 | |
Series 2011-40, Class DK, 4.000%, 11/25/37 | | | 279,562 | | | | 281,353 | |
Series 2011-60, Class UC, 2.500%, 09/25/39 | | | 534,926 | | | | 545,136 | |
Series 2011-60, Class UE, 3.000%, 09/25/39 | | | 1,298,794 | | | | 1,336,536 | |
FNMA Whole Loan, | | | | | | | | |
Series 2003-W1, Class 2A, 6.552%, 12/25/426 | | | 20,650 | | | | 23,747 | |
Series 2003-W4, Class 4A, 7.017%, 10/25/426 | | | 509,725 | | | | 583,495 | |
Series 2003-W13, Class AV2, 0.450%, 10/25/33 (01/26/15)4,8 | | | 36,639 | | | | 35,190 | |
Series 2004-W5, Class F1, 0.620%, 02/25/47 (01/25/15)4 | | | 538,038 | | | | 541,437 | |
Series 2004-W14, Class 1AF, 0.570%, 07/25/44 (01/25/15)4 | | | 2,161,615 | | | | 2,124,649 | |
Series 2005-W2, Class A1, 0.370%, 05/25/35 (01/25/15)4 | | | 1,720,082 | | | | 1,706,323 | |
Total Federal National Mortgage Association | | | | | | | 145,187,532 | |
Government National Mortgage Association - 3.2% | | | | | | | | |
GNMA, | | | | | | | | |
1.625%, 12/20/21 to 03/20/37 (02/20/15)4 | | | 6,225,412 | | | | 6,480,570 | |
2.000%, 06/20/22 (02/20/15)4 | | | 55,857 | | | | 59,502 | |
2.500%, 07/20/18 to 08/20/21 (02/20/15)4 | | | 51,819 | | | | 53,777 | |
The accompanying notes are an integral part of these financial statements.
48
AMG Managers Short Duration Government Fund
Schedule of Portfolio Investments (continued)
| | | | | | | | |
| | | Principal Amount | | | Value | |
Government National Mortgage Association - 3.2% (continued) | | | | | | | | |
GNMA, | | | | | | | | |
2.750%, 10/20/17 (02/20/15)4 | | $ | 15,912 | | | $ | 16,341 | |
3.000%, 11/20/17 to 03/20/21 (02/20/15)4 | | | 63,771 | | | | 66,152 | |
3.500%, 07/20/18 (02/20/15)4 | | | 20,378 | | | | 21,106 | |
4.000%, 09/15/18 | | | 278,564 | | | | 296,063 | |
4.500%, 04/15/18 to 07/15/24 | | | 1,768,767 | | | | 1,854,174 | |
5.000%, 06/20/19 to 04/20/20 | | | 425,136 | | | | 453,851 | |
5.500%, 03/15/17 to 06/15/18 | | | 897,390 | | | | 946,394 | |
9.500%, 12/15/17 | | | 2,201 | | | | 2,334 | |
Series 2000-36, 0.711%, 11/16/30 (01/16/15)4 | | | 654,010 | | | | 659,382 | |
Series 2010-2, 0.711%, 01/16/40 (01/16/15)4 | | | 1,308,972 | | | | 1,325,142 | |
Total Government National Mortgage Association | | | | | | | 12,234,788 | |
Interest Only Strips - 2.0% | | | | | | | | |
FHLMC, | | | | | | | | |
Series 215, Class IO, 8.000%, 06/15/318 | | | 123,243 | | | | 23,834 | |
Series 233, Class 5, 4.500%, 09/15/35 | | | 61,407 | | | | 9,983 | |
FHLMC REMICS, | | | | | | | | |
Series 2649, Class IM, 7.000%, 07/15/33 | | | 418,926 | | | | 100,333 | |
Series 2763, Class KS, 6.489%, 10/15/18 (01/15/15)4 | | | 180,117 | | | | 5,020 | |
Series 2922, Class SE, 6.589%, 02/15/35 (01/15/15)4 | | | 303,557 | | | | 59,719 | |
Series 2934, Class HI, 5.000%, 02/15/20 | | | 100,134 | | | | 8,833 | |
Series 2934, Class KI, 5.000%, 02/15/20 | | | 63,926 | | | | 5,411 | |
Series 2965, Class SA, 5.889%, 05/15/32 (01/15/15)4 | | | 723,072 | | | | 116,077 | |
Series 2967, Class JI, 5.000%, 04/15/20 | | | 297,828 | | | | 25,834 | |
Series 2980, Class SL, 6.539%, 11/15/34 (01/15/15)4 | | | 394,557 | | | | 95,783 | |
Series 2981, Class SU, 7.639%, 05/15/30 (01/15/15)4 | | | 353,838 | | | | 92,158 | |
Series 3031, Class BI, 6.529%, 08/15/35 (01/15/15)4 | | | 1,038,723 | | | | 186,195 | |
Series 3065, Class DI, 6.459%, 04/15/35 (01/15/15)4 | | | 917,810 | | | | 153,096 | |
Series 3114, Class GI, 6.439%, 02/15/36 (01/15/15)4 | | | 1,530,560 | | | | 288,205 | |
Series 3308, Class S, 7.039%, 03/15/32 (01/15/15)4 | | | 649,701 | | | | 126,195 | |
Series 3424, Class XI, 6.409%, 05/15/36 (01/15/15)4 | | | 734,062 | | | | 113,801 | |
Series 3489, Class SD, 7.639%, 06/15/32 (01/15/15)4 | | | 362,969 | | | | 76,390 | |
Series 3606, Class SN, 6.089%, 12/15/39 (01/15/15)4 | | | 1,025,465 | | | | 161,650 | |
Series 3685, Class EI, 5.000%, 03/15/19 | | | 916,327 | | | | 51,721 | |
Series 3731, Class IO, 5.000%, 07/15/19 | | | 434,278 | | | | 26,181 | |
Series 3882, Class AI, 5.000%, 06/15/26 | | | 221,348 | | | | 16,689 | |
FNMA, | | | | | | | | |
Series 92, Class 2, 9.000%, 12/25/168 | | | 5,565 | | | | 346 | |
Series 306, Class IO, 8.000%, 05/25/308 | | | 97,275 | | | | 21,639 | |
Series 365, Class 4, 5.000%, 04/25/36 | | | 88,725 | | | | 15,968 | |
The accompanying notes are an integral part of these financial statements.
49
AMG Managers Short Duration Government Fund
Schedule of Portfolio Investments (continued)
| | | | | | | | |
| | | Principal Amount | | | Value | |
Interest Only Strips - 2.0% (continued) | | | | | | | | |
FNMA REMICS, | | | | | | | | |
Series 2001-82, Class S, 7.661%, 05/25/28 (01/25/15)4,8 | | $ | 302,079 | | | $ | 71,348 | |
Series 2003-48, Class SJ, 5.831%, 06/25/18 (01/25/15)4 | | | 141,298 | | | | 7,295 | |
Series 2003-73, Class SM, 6.431%, 04/25/18 (01/25/15)4 | | | 107,559 | | | | 3,529 | |
Series 2004-49, Class SQ, 6.881%, 07/25/34 (01/25/15)4 | | | 252,371 | | | | 49,314 | |
Series 2004-51, Class SX, 6.951%, 07/25/34 (01/25/15)4 | | | 410,505 | | | | 84,298 | |
Series 2004-64, Class SW, 6.881%, 08/25/34 (01/25/15)4 | | | 1,093,924 | | | | 224,084 | |
Series 2004-66, Class SE, 6.331%, 09/25/34 (01/25/15)4 | | | 178,516 | | | | 33,316 | |
Series 2005-5, Class SD, 6.531%, 01/25/35 (01/25/15)4 | | | 329,738 | | | | 58,500 | |
Series 2005-12, Class SC, 6.581%, 03/25/35 (01/25/15)4 | | | 415,310 | | | | 67,922 | |
Series 2005-45, Class SR, 6.551%, 06/25/35 (01/25/15)4 | | | 951,948 | | | | 189,780 | |
Series 2005-65, Class KI, 6.831%, 08/25/35 (01/25/15)4 | | | 2,204,239 | | | | 437,166 | |
Series 2005-66, Class GS, 6.681%, 07/25/20 (01/25/15)4 | | | 166,995 | | | | 17,642 | |
Series 2006-3, Class SA, 5.981%, 03/25/36 (01/25/15)4 | | | 434,602 | | | | 77,737 | |
Series 2007-75, Class JI, 6.376%, 08/25/37 (01/25/15)4 | | | 232,553 | | | | 37,058 | |
Series 2007-85, Class SI, 6.291%, 09/25/37 (01/25/15)4 | | | 477,503 | | | | 85,265 | |
Series 2008-86, Class IO, 4.500%, 03/25/23 | | | 905,782 | | | | 52,760 | |
Series 2008-87, Class AS, 7.481%, 07/25/33 (01/25/15)4 | | | 1,341,145 | | | | 291,563 | |
Series 2010-37, Class GI, 5.000%, 04/25/25 | | | 1,186,046 | | | | 60,763 | |
Series 2010-65, Class IO, 5.000%, 09/25/20 | | | 1,342,741 | | | | 99,305 | |
Series 2010-68, Class SJ, 6.381%, 07/25/40 (01/25/15)4 | | | 473,216 | | | | 92,760 | |
Series 2010-105, Class IO, 5.000%, 08/25/20 | | | 680,253 | | | | 56,426 | |
Series 2010-121, Class IO, 5.000%, 10/25/25 | | | 529,008 | | | | 36,824 | |
Series 2011-69, Class AI, 5.000%, 05/25/18 | | | 1,434,681 | | | | 79,001 | |
Series 2011-88, Class WI, 3.500%, 09/25/26 | | | 1,343,328 | | | | 167,430 | |
Series 2011-124, Class IC, 3.500%, 09/25/21 | | | 2,064,052 | | | | 153,921 | |
Series 2012-126, Class SJ, 4.831%, 11/25/42 (01/25/15)4 | | | 5,440,223 | | | | 848,762 | |
GNMA, | | | | | | | | |
Series 2011-32, Class KS, 11.778%, 06/16/34 (01/16/15)4 | | | 858,100 | | | | 180,867 | |
Series 2011-94, Class IS, 6.539%, 06/16/36 (01/16/15)4 | | | 674,416 | | | | 108,758 | |
Series 2011-146, Class EI, 5.000%, 11/16/41 | | | 400,909 | | | | 100,451 | |
Series 2011-157, Class SG, 6.435%, 12/20/41 (01/20/15)4 | | | 1,390,112 | | | | 322,084 | |
Series 2011-167, Class IO, 5.000%, 12/16/20 | | | 2,448,079 | | | | 163,787 | |
Series 2012-34, Class KS, 5.889%, 03/16/42 (01/16/15)4 | | | 3,554,864 | | | | 781,162 | |
Series 2012-69, Class QI, 4.000%, 03/16/41 | | | 1,799,412 | | | | 319,148 | |
Series 2012-96, Class IC, 3.000%, 08/20/27 | | | 1,111,370 | | | | 121,543 | |
Series 2012-101, Class AI, 3.500%, 08/20/27 | | | 850,544 | | | | 126,763 | |
Series 2012-103, Class IB, 3.500%, 04/20/40 | | | 1,290,886 | | | | 183,177 | |
Total Interest Only Strips | | | | | | | 7,572,570 | |
The accompanying notes are an integral part of these financial statements.
50
AMG Managers Short Duration Government Fund
Schedule of Portfolio Investments (continued)
| | | | | | | | |
| | | Principal Amount | | | Value | |
U.S. Government Obligations - 3.3% | | | | | | | | |
U.S. Treasury Inflation Indexed Bonds, 0.375%, 07/15/23 | | $ | 8,978,288 | | | $ | 8,876,582 | |
U.S. Treasury Inflation Protected Securities, 2.375%, 01/15/27 | | | 3,214,220 | | | | 3,846,769 | |
Total U.S. Government Obligations | | | | | | | 12,723,351 | |
Total U.S. Government and Agency Obligations (cost $280,431,968) | | | | | | | 287,467,368 | |
| | |
Short-Term Investments - 9.1% | | | | | | | | |
U.S. Government and Agency Discount Notes - 7.6% | | | | | | | | |
FHLMC, 0.15%, 06/16/1510,12 | | | 7,134,000 | | | | 7,130,733 | |
FHLMC, 0.14%, 08/25/1512 | | | 8,000,000 | | | | 7,993,104 | |
FHLMC, 0.18%, 10/20/1512 | | | 2,000,000 | | | | 1,997,398 | |
FNMA, 0.10%, 05/01/1512 | | | 10,000,000 | | | | 9,996,990 | |
FNMA, 0.18%, 10/01/1512 | | | 2,000,000 | | | | 1,997,568 | |
Total U.S. Government and Agency Discount Notes | | | | | | | 29,115,793 | |
U.S. Treasury Bills - 0.2% | | | | | | | | |
U.S. Treasury Bill, 0.04%, 04/02/1512,13 | | | 830,000 | | | | 829,917 | |
| | |
| | | Shares | | | | |
Other Investment Companies - 1.3%3 | | | | | | | | |
Dreyfus Institutional Cash Advantage Fund, Institutional Class Shares, 0.06%10 | | | 5,137,426 | | | | 5,137,426 | |
Total Short-Term Investments
(cost $35,079,642) | | | | | | | 35,083,136 | |
Total Investments - 97.6% (cost $369,872,389) | | | | | | | 375,835,929 | |
Other Assets, less Liabilities - 2.4% | | | | | | | 9,410,430 | |
Net Assets - 100.0% | | | | | | $ | 385,246,359 | |
The accompanying notes are an integral part of these financial statements.
51
Notes to Schedules of Portfolio Investments
The following footnotes and abbreviations should be read in conjunction with each of the Schedules of Portfolio Investments previously presented in this report.
At December 31, 2014, the approximate cost of investments for federal income tax purposes and the aggregate gross unrealized appreciation and/or depreciation based on tax cost were as follows:
| | | | | | | | | | | | | | | | |
| Fund | | Cost | | | Appreciation | | | Depreciation | | | Net | |
AMG Chicago Equity Partners Balanced Fund | | $ | 67,229,157 | | | $ | 5,168,870 | | | $ | (1,345,662 | ) | | $ | 3,823,208 | |
AMG Managers High Yield Fund | | | 40,029,534 | | | | 813,635 | | | | (1,216,326 | ) | | | (402,691 | ) |
AMG Managers Intermediate Duration Government Fund | | | 272,725,023 | | | | 4,047,000 | | | | (3,199,350 | ) | | | 847,650 | |
AMG Managers Short Duration Government Fund | | | 377,398,554 | | | | 7,370,877 | | | | (8,933,502 | ) | | | (1,562,625 | ) |
| * | Non-income producing security. |
| (a) | Security exempt from registration under Rule 144A of the Securities Act of 1933. This security may be resold in transactions exempt from registration, normally to qualified buyers. At December 31, 2014, the value of these securities amounted to the following: |
| | | | | | | | |
| Fund | | Value | | | % of Net Assets | |
AMG Managers High Yield Fund | | $ | 9,931,363 | | | | 26.2 | % |
AMG Managers Intermediate Duration Government Fund | | | 487,674 | | | | 0.3 | % |
| (b) | Step Bond: A debt instrument with either deferred interest or an interest rate that resets at specific times during its term. |
| 1 | Some or all of these shares were out on loan to various brokers as of December 31, 2014, amounting to the following: |
| | | | | | | | |
| Fund | | Value | | | % of Net Assets | |
AMG Chicago Equity Partners Balanced Fund | | $ | 1,056,983 | | | | 1.5 | % |
AMG Managers High Yield Fund | | | 1,986,847 | | | | 5.3 | % |
| 2 | Collateral received from brokers for securities lending was invested in these short-term investments. |
| 3 | Yield shown represents the December 31, 2014, seven-day average yield, which refers to the sum of the previous seven days’ dividends paid, expressed as an annual percentage. |
| 4 | Floating Rate Security: The rate listed is as of December 31, 2014. Date in parentheses represents the security’s next coupon rate reset. |
| 5 | All or part of the security is delayed delivery transactions. The market value of delayed delivery securities at December 31, 2014, amounted to the following: |
| | | | | | | | |
| Fund | | Value | | | % of Net
Assets | |
AMG Managers High Yield Fund | | $ | 165,517 | | | | 0.4 | % |
AMG Managers Intermediate Duration Government Fund | | | 99,692,486 | | | | 57.2 | % |
AMG Managers Short Duration Government Fund | | | 6,338,437 | | | | 1.6 | % |
| 6 | Variable Rate Security: The rate listed is as of December 31, 2014 and is periodically reset subject to terms and conditions set forth in the debenture. |
| 7 | Payment-in-Kind Security: The security may pay interest/dividends in additional par/shares and/or in cash. Rates shown are the current rate and possible payment rates. |
| 8 | Illiquid Security: A security not readily convertible into cash such as a stock, bond or commodity that is not actively traded and would be difficult to sell in a timely sale. The Funds may not invest more than 15% of their net assets in illiquid securities. All illiquid securities are valued by an independent pricing agent. Illiquid securities market value at December 31, 2014, amounted to the following: |
| | | | | | | | |
| Fund | | Value | | | % of Net
Assets | |
AMG Managers High Yield | | $ | 193,551 | | | | 0.5 | % |
AMG Managers Intermediate Duration Government Fund | | | 511,302 | | | | 0.3 | % |
AMG Managers Short Duration Government Fund | | | 369,255 | | | | 0.1 | % |
| 9 | Security is in default. Issuer has failed to make a timely payment of either principal or interest or has failed to comply with some provision of the bond indenture. |
The accompanying notes are an integral part of these financial statements.
52
Notes to Schedules of Portfolio Investments (continued)
| 10 | Some or all of these securities are segregated as collateral for delayed delivery agreements. At December 31, 2014, the value of these securities amounted to the following: |
| | | | | | | | |
| Fund | | Value | | | % of Net Assets | |
AMG Managers High Yield Fund | | $ | 165,517 | | | | 0.4 | % |
AMG Managers Intermediate Duration Government Fund | | | 130,113,295 | | | | 74.7 | % |
AMG Managers Short Duration Government Fund | | | 6,338,437 | | | | 1.6 | % |
| 11 | TBA Securities are purchased/sold on a forward commitment basis with an approximate principal amount and no defined maturity date. The actual principal and maturity date will be determined upon settlement when the specific mortgage pools are assigned. |
| 12 | Represents yield to maturity at December 31, 2014. |
| 13 | Some or all of this security is held with brokers as collateral for futures contracts. The collateral market value at December 31, 2014, amounted to the following: |
| | | | | | | | |
| Fund | | Value | | | % of Net Assets | |
AMG Managers Intermediate Duration Government Fund | | $ | 89,991 | | | | 0.1 | % |
AMG Managers Short Duration Government Fund | | | 829,917 | | | | 0.2 | % |
The following tables summarize the inputs used to value the Funds’ net assets by the fair value hierarchy levels as of December 31, 2014: (See Note 1(a) in the Notes to the Financial Statements.)
| | | | | | | | | | | | | | | | |
| | | Quoted Prices in Active
Markets for Identical
Investments Level 1 | | | Significant Other
Observable Inputs Level 2 | | | Significant
Unobservable
Inputs Level 3 | | | Total | |
AMG Chicago Equity Partners Balanced Fund | | | | | | | | | | | | | | | | |
Investments in Securities | | | | | | | | | | | | | | | | |
Common Stocks† | | $ | 43,056,901 | | | | — | | | | — | | | $ | 43,056,901 | |
Corporate Bonds and Notes†† | | | — | | | $ | 1,957,709 | | | | — | | | | 1,957,709 | |
U.S. Government and Agency Obligations†† | | | — | | | | 21,091,762 | | | | — | | | | 21,091,762 | |
Short-Term Investments | | | | | | | | | | | | | | | | |
Repurchase Agreements | | | — | | | | 1,092,623 | | | | — | | | | 1,092,623 | |
Other Investment Companies | | | 3,853,370 | | | | — | | | | — | | | | 3,853,370 | |
| | | | | | | | | | | | | | | | |
Total Investments in Securities | | $ | 46,910,271 | | | $ | 24,142,094 | | | | — | | | $ | 71,052,365 | |
| | | | | | | | | | | | | | | | |
| | | | |
| | | Quoted Prices in Active
Markets for Identical
Investments Level 1 | | | Significant Other
Observable Inputs Level 2 | | | Significant
Unobservable
Inputs Level 3 | | | Total | |
AMG Managers High Yield Fund | | | | | | | | | | | | | | | | |
Investments in Securities | | | | | | | | | | | | | | | | |
Floating Rate Senior Loan Interests | | | — | | | $ | 1,866,201 | | | $ | 274,666 | | | $ | 2,140,867 | |
Corporate Bonds and Notes†† | | | — | | | | 34,282,004 | | | | — | | | | 34,282,004 | |
Short-Term Investments | | | | | | | | | | | | | | | | |
Repurchase Agreements | | | — | | | | 2,064,987 | | | | — | | | | 2,064,987 | |
Other Investment Companies | | $ | 1,138,985 | | | | — | | | | — | | | | 1,138,985 | |
| | | | | | | | | | | | | | | | |
Total Investments in Securities | | $ | 1,138,985 | | | $ | 38,213,192 | | | $ | 274,666 | | | $ | 39,626,843 | |
| | | | | | | | | | | | | | | | |
The accompanying notes are an integral part of these financial statements.
53
Notes to Schedules of Portfolio Investments (continued)
The following table below is a reconciliation of investments in which significant unobservable inputs (Level 3) were used in determining fair value at December 31, 2014:
| | | | |
| AMG Managers High Yield Fund | | Floating Rate
Senior Loan | |
Balance as of December 31, 2013 | | | — | |
Accrued discounts (premiums) | | $ | (56 | ) |
Realized gain (loss) | | | (5 | ) |
Change in unrealized appreciation (depreciation) | | | (5,069 | ) |
Purchases | | | 280,948 | |
Sales | | | (1,152 | ) |
Transfers in to Level 3 | | | — | |
Transfers out of Level 3 | | | — | |
Balance as of December 31, 2014 | | $ | 274,666 | |
Net change in unrealized appreciation/depreciation on investments still held at December 31, 2014 | | $ | (5,069 | ) |
The Fund’s investments that are categorized as Level 3 were valued utilizing third party pricing information without adjustment. Such valuations are based on unobservable inputs. A significant change in third party information inputs could result in a significantly lower or higher value of such Level 3 investment.
| | | | | | | | | | | | | | | | |
| | | Quoted Prices
in Active
Markets for
Identical
Investments
Level 1 | | | Significant
Other
Observable
Inputs Level 2 | | | Significant
Unobservable
Inputs
Level 3 | | | Total | |
AMG Managers Intermediate Duration Government Fund | | | | | | | | | | | | | | | | |
Investments in Securities | | | | | | | | | | | | | | | | |
Mortgage-Backed Securities | | | — | | | $ | 4,732,408 | | | | — | | | $ | 4,732,408 | |
U.S. Government and Agency Obligations†† | | | — | | | | 189,864,609 | | | | — | | | | 189,864,609 | |
Short-Term Investments | | | | | | | | | | | | | | | | |
U.S. Treasury Bills | | | — | | | | 89,991 | | | | — | | | | 89,991 | |
Other Investment Companies | | $ | 78,885,665 | | | | — | | | | — | | | | 78,885,665 | |
| | | | | | | | | | | | | | | | |
Total Investments in Securities | | $ | 78,885,665 | | | $ | 194,687,008 | | | | — | | | $ | 273,572,673 | |
| | | | | | | | | | | | | | | | |
TBA Sale Commitments | | | — | | | $ | (6,338,325 | ) | | | — | | | $ | (6,338,325 | ) |
| | | | | | | | | | | | | | | | |
Financial Derivative Instruments-Assets††† | | | | | | | | | | | | | | | | |
Interest Rate Contracts | | $ | 82,499 | | | | — | | | | — | | | $ | 82,499 | |
| | | | | | | | | | | | | | | | |
Financial Derivative Instruments-Liabilities††† | | | | | | | | | | | | | | | | |
Interest Rate Contracts | | | (111,958 | ) | | | — | | | | — | | | | (111,958 | ) |
| | | | | | | | | | | | | | | | |
Total Financial Derivative Instruments | | $ | (29,459 | ) | | | — | | | | — | | | $ | (29,459 | ) |
| | | | | | | | | | | | | | | | |
The accompanying notes are an integral part of these financial statements.
54
Notes to Schedules of Portfolio Investments (continued)
| | | | | | | | | | | | | | | | |
| | | Quoted Prices
in Active
Markets for
Identical
Investments
Level 1 | | | Significant
Other
Observable
Inputs Level 2 | | | Significant
Unobservable
Inputs
Level 3 | | | Total | |
AMG Managers Short Duration Government Fund | | | | | | | | | | | | | | | | |
Investments in Securities | | | | | | | | | | | | | | | | |
Asset-Backed Securities | | | — | | | $ | 37,037,383 | | | | — | | | $ | 37,037,383 | |
Mortgage-Backed Securities | | | — | | | | 16,248,042 | | | | — | | | | 16,248,042 | |
U.S. Government and Agency Obligations†† | | | — | | | | 287,467,368 | | | | — | | | | 287,467,368 | |
Short-Term Investments | | | | | | | | | | | | | | | | |
U.S. Government and Agency Discount Notes | | | — | | | | 29,115,793 | | | | — | | | | 29,115,793 | |
U.S. Treasury Bills | | | — | | | | 829,917 | | | | — | | | | 829,917 | |
Other Investment Companies | | $ | 5,137,426 | | | | — | | | | — | | | | 5,137,426 | |
| | | | | | | | | | | | | | | | |
Total Investments in Securities | | $ | 5,137,426 | | | $ | 370,698,503 | | | | — | | | $ | 375,835,929 | |
| | | | | | | | | | | | | | | | |
Financial Derivative Instruments-Assets††† | | | | | | | | | | | | | | | | |
Interest Rate Contracts | | $ | 10,303 | | | | — | | | | — | | | $ | 10,303 | |
| | | | | | | | | | | | | | | | |
Financial Derivative Instruments-Liabilities††† | | | | | | | | | | | | | | | | |
Interest Rate Contracts | | | (366,166 | ) | | | — | | | | — | | | | (366,166 | ) |
| | | | | | | | | | | | | | | | |
Total Financial Derivative Instruments | | $ | (355,863 | ) | | | — | | | | — | | | ($ | 355,863 | ) |
| | | | | | | | | | | | | | | | |
| † | All common stocks held in the Fund are level 1 securities. For a detailed breakout of the common stocks, please refer to the respective Schedule of Portfolio Investments. |
| †† | All corporate bonds and notes and U.S. government and agency obligations held in the Fund are Level 2 securities. For a detailed breakout of the corporate bonds and notes and U.S. government and agency obligations; by major industry or agency classification, please refer to the respective Schedule of Portfolio Investments. |
| ††† | Derivative instruments, such as futures, are not reflected in the Schedule of Portfolio Investments and are valued at the unrealized appreciation/depreciation of the instrument. |
As of December 31, 2014, the Funds had no transfers between levels from the beginning of the reporting period.
The accompanying notes are an integral part of these financial statements.
55
Notes to Schedules of Portfolio Investments (continued)
The following schedule shows the fair value of derivative instruments at December 31, 2014:
| | | | | | | | | | | | | | |
| | | | | Asset Derivatives | | | Liability Derivatives | |
| Fund | | Derivatives not accounted for as hedging instruments | | Statement of Assets and Liabilities Location | | Fair Value | | | Statement of Assets and Liabilities Location | | Fair Value | |
AMG Managers Intermediate Duration Government Fund | | | | | | | | | | |
| | Interest rate contracts | | Receivable for variation margin1 | | $ | 1,938 | | | Payable for variation margin1 | | $ | 7,188 | |
| | | | | | | | | | | | | | |
| | | |
| | | | | Asset Derivatives | | | Liability Derivatives | |
| Fund | | Derivatives not accounted for as hedging instruments | | Statement of Assets and Liabilities Location | | Fair Value | | | Statement of Assets and Liabilities Location | | Fair Value | |
AMG Managers Short Duration Government Fund | | | | | | | | | | |
| | Interest rate contracts | | Receivable for variation margin1 | | $ | 3,281 | | | Payable for variation margin1 | | $ | 77,438 | |
| | | | | | | | | | | | | | |
| 1 | Only current day’s variation margin is reported within the Statement of Assets and Liabilities. The variation margin is included in the open futures cumulative appreciation/ (depreciation) for AMG Managers Intermediate Duration Government Fund and AMG Managers Short Duration Government Fund of $(29,459) and $(355,863), respectively, as reported in the Notes to Schedule of Portfolio Investments. |
For the year ended December 31, 2014, the effect of derivative instruments on the Statement of Operations for the Funds and the amount of realized gain/(loss) and unrealized gain (loss) on derivatives recognized in income were as follows:
| | | | | | | | | | | | | | |
| | | | | Realized Gain (Loss) | | | Change in Unrealized Gain (Loss) | |
| Fund | | Derivatives not accounted for as hedging instruments | | Statement of Operations Location | | Realized
Gain/(Loss) | | | Statement of Operations Location | | Change in Unrealized
Gain/(Loss) | |
AMG Managers Intermediate Duration Government Fund | | | | | | | | | | |
| | Interest rate contracts | | Net realized loss on futures contracts | | $ | (319,055 | ) | | Net change in unrealized appreciation- (depreciation) of futures contracts | | $ | 5,016 | |
| | | | | | | | | | | | | | |
| | | |
| | | | | Realized Gain (Loss) | | | Change in Unrealized Gain (Loss) | |
| Fund | | Derivatives not accounted for as hedging instruments | | Statement of Operations Location | | Realized Gain/(Loss) | | | Statement of Operations Location | | Change in Unrealized Gain/(Loss) | |
AMG Managers Short Duration Government Fund | | | | | | | | | | |
| | Interest rate contracts | | Net realized loss on futures contracts | | $ | (2,253,715 | ) | | Net change in unrealized appreciation- (depreciation) of futures contracts | | $ | (1,008,204 | ) |
| | | | | | | | | | | | | | |
The accompanying notes are an integral part of these financial statements.
56
Notes to Schedules of Portfolio Investments (continued)
At December 31, 2014, the following Fund had TBA forward sale commitments:
(See Note 1(I) in the Notes to Financial Statements.)
AMG Managers Intermediate Duration Government Fund
| | | | | | | | | | | | | | | | |
| Security | | Principal
Amount | | | Settlement
Date | | | | Current
Liability | | | Proceeds | |
FNMA, 3.500, TBA 30yr | | $ | 1,200,000 | | | 1/14/15 | | | | $ | 1,250,906 | | | $ | (1,247,063 | ) |
FNMA, 4.000, TBA 30yr | | | 3,800,000 | | | 1/14/15 | | | | | 4,055,565 | | | | (4,046,406 | ) |
GNMA, 4.000, TBA 30yr | | | 650,000 | | | 1/21/15 | | | | | 710,201 | | | | (709,211 | ) |
GNMA, 4.500, TBA 30yr | | | 300,000 | | | 1/21/15 | | | | | 321,653 | | | | (321,000 | ) |
| | | | | | | | | | | | | | | | |
| | | | | | | | Totals | | $ | 6,338,325 | | | $ | (6,323,680 | ) |
| | | | | | | | | | | | | | | | |
At December 31, 2014, the following Funds had open futures contracts:
(See Note 7 in the Notes to Financial Statements.)
AMG Managers Intermediate Duration Government Fund
| | | | | | | | | | | | |
| Type | | Number of Contracts | | Position | | Expiration Date | | | | Unrealized
Gain/(Loss) | |
2-Year U.S. Treasury Note | | 5 | | Short | | 04/06/15 | | | | $ | 1,472 | |
5-Year Interest Rate Swap | | 23 | | Short | | 03/18/15 | | | | | 70,380 | |
5-Year U.S. Treasury Note | | 2 | | Short | | 04/06/15 | | | | | 89 | |
10-Year Interest Rate Swap | | 33 | | Short | | 03/18/15 | | | | | (111,958 | ) |
10-Year U.S. Treasury Note | | 5 | | Long | | 03/31/15 | | | | | 1,472 | |
U.S. Treasury Long Bond | | 3 | | Long | | 03/31/15 | | | | | 9,086 | |
| | | | | | | | | | | | |
| | | | | | | | Total | | $ | (29,459 | ) |
| | | | | | | | | | | | |
AMG Managers Short Duration Government Fund
| | | | | | | | | | | | |
| Type | | Number of Contracts | | Position | | Expiration Date | | | | Unrealized
Gain/(Loss) | |
2-Year U.S. Treasury Note | | 35 | | Short | | 04/06/15 | | | | $ | 10,303 | |
5-Year Interest Rate Swap | | 399 | | Short | | 03/18/15 | | | | | (149,084 | ) |
5-Year U.S. Treasury Note | | 21 | | Long | | 04/06/15 | | | | | (1,201 | ) |
10-Year Interest Rate Swap | | 53 | | Short | | 03/18/15 | | | | | (52,991 | ) |
10-Year U.S. Treasury Note | | 55 | | Short | | 03/31/15 | | | | | (16,895 | ) |
U.S. Treasury Long Bond | | 48 | | Short | | 03/31/15 | | | | | (145,995 | ) |
| | | | | | | | | | | | |
| | | | | | | | Total | | $ | (355,863 | ) |
| | | | | | | | | | | | |
The accompanying notes are an integral part of these financial statements.
57
Notes to Schedules of Portfolio Investments (continued)
INVESTMENTS DEFINITIONS AND ABBREVIATIONS:
| | |
FHLMC: | | Federal Home Loan Mortgage Corp. |
FNMA: | | Federal National Mortgage Association |
GNMA: | | Government National Mortgage Association |
GS: | | Goldman Sachs |
GSMPS: | | Goldman Sachs Mortgage Participation Securities |
GSR: | | Goldman Sachs REMIC |
| | |
IO: | | Interest Only |
LB-UBS: | | Lehman Brothers-Union Bank of Switzerland |
MTN: | | Medium-Term Notes |
PLC: | | Public Limited Company |
REMICS: | | Real Estate Mortgage Investment Conduits |
TBA: | | To Be Announced |
UIT: | | Unit Investment Trust |
The accompanying notes are an integral part of these financial statements.
58
Statement of Assets and Liabilities
December 31, 2014
| | | | | | | | |
| | | AMG
Chicago Equity
Partners
Balanced Fund | | | AMG Managers
High Yield
Fund | |
Assets: | | | | | | | | |
Investments at value* (including securities on loan valued at $1,056,983 and $1,986,847, respectively) | | $ | 71,052,365 | | | $ | 39,626,843 | |
Receivable for Fund shares sold | | | 2,276,144 | | | | 47,952 | |
Dividends, interest and other receivables | | | 160,425 | | | | 666,462 | |
Receivable from affiliate | | | 27,541 | | | | 27,867 | |
Receivable for investments sold | | | 780 | | | | 45,587 | |
Prepaid expenses | | | 14,193 | | | | 8,222 | |
Total assets | | | 73,531,448 | | | | 40,422,933 | |
Liabilities: | | | | | | | | |
Payable for investments purchased | | | 3,025,115 | | | | 310,741 | |
Payable upon return of securities loaned | | | 1,092,623 | | | | 2,064,987 | |
Payable for Fund shares repurchased | | | 666,607 | | | | 78,872 | |
Accrued expenses: | | | | | | | | |
Investment advisory and management fees | | | 38,376 | | | | 22,299 | |
Administrative fees | | | 10,964 | | | | 6,371 | |
Distribution fees - Investor Class | | | 9,021 | | | | 7,302 | |
Trustees fees and expenses | | | 599 | | | | 363 | |
Other | | | 55,025 | | | | 92,033 | |
Total liabilities | | | 4,898,330 | | | | 2,582,968 | |
| | |
Net Assets | | $ | 68,633,118 | | | $ | 37,839,965 | |
Net Assets Represent: | | | | | | | | |
Paid-in capital | | $ | 64,112,055 | | | $ | 40,340,036 | |
Undistributed net investment income | | | 7,856 | | | | 7,556 | |
Accumulated net realized gain (loss) from investments | | | 559,301 | | | | (2,106,331 | ) |
Net unrealized appreciation (depreciation) of investments | | | 3,953,906 | | | | (401,296 | ) |
Net Assets | | $ | 68,633,118 | | | $ | 37,839,965 | |
* Investments at cost | | $ | 67,098,459 | | | $ | 40,028,139 | |
The accompanying notes are an integral part of these financial statements.
59
Statement of Assets and Liabilities (continued)
| | | | | | | | |
| | | AMG
Chicago Equity
Partners
Balanced Fund | | | AMG
Managers
High Yield
Fund | |
Investor Class Shares: | | | | | | | | |
Net Assets | | $ | 41,750,530 | | | $ | 34,709,173 | |
Shares outstanding | | | 2,766,122 | | | | 4,428,792 | |
Net asset value, offering and redemption price per share | | $ | 15.09 | | | $ | 7.84 | |
Service Class Shares: | | | | | | | | |
Net Assets | | $ | 14,481,215 | | | | n/a | |
Shares outstanding | | | 951,030 | | | | n/a | |
Net asset value, offering and redemption price per share | | $ | 15.23 | | | | n/a | |
Institutional Class Shares: | | | | | | | | |
Net Assets | | $ | 12,401,373 | | | $ | 3,130,792 | |
Shares outstanding | | | 814,722 | | | | 395,298 | |
Net asset value, offering and redemption price per share | | $ | 15.22 | | | $ | 7.92 | |
The accompanying notes are an integral part of these financial statements.
60
Statement of Assets and Liabilities (continued)
| | | | | | | | |
| | | AMG Managers
Intermediate
Duration
Government Fund | | | AMG Managers
Short Duration
Government Fund | |
Assets: | | | | | | | | |
Investments at value* | | $ | 273,572,673 | | | $ | 375,835,929 | |
Receivable for delayed delivery instruments sold | | | 72,017,066 | | | | — | |
Receivable for Fund shares sold | | | 622,472 | | | | 2,304,015 | |
Dividends, interest and other receivables | | | 498,678 | | | | 1,109,924 | |
Receivable from affiliate | | | 11,789 | | | | — | |
Receivable for investments sold and paydowns | | | 9,574 | | | | 15,175,640 | |
Receivable for variation margin | | | 1,938 | | | | 3,281 | |
Prepaid expenses | | | 5,083 | | | | 8,458 | |
Total assets | | | 346,739,273 | | | | 394,437,247 | |
Liabilities: | | | | | | | | |
Payable for delayed delivery investments purchased | | | 163,876,721 | | | | 6,344,833 | |
Payable for TBA sale commitments (proceeds receivable of $6,323,680 and $0, respectively) | | | 6,338,325 | | | | — | |
Payable for investments purchased | | | 997,397 | | | | — | |
Payable for Fund shares repurchased | | | 904,735 | | | | 2,384,524 | |
Payable for collateral | | | 257,277 | | | | — | |
Payable for variation margin | | | 7,188 | | | | 77,438 | |
Accrued expenses: | | | | | | | | |
Investment management and advisory fees | | | 100,663 | | | | 233,978 | |
Shareholder servicing fees | | | 14,380 | | | | 1,079 | |
Trustees fees and expenses | | | 1,509 | | | | 4,517 | |
Other | | | 103,456 | | | | 144,519 | |
Total liabilities | | | 172,601,651 | | | | 9,190,888 | |
| | |
Net Assets | | $ | 174,137,622 | | | $ | 385,246,359 | |
Net Assets Represent: | | | | | | | | |
Paid-in capital | | $ | 172,201,435 | | | $ | 387,961,728 | |
Undistributed net investment income | | | 3,101 | | | | — | |
Accumulated net realized loss from investments and futures contracts | | | (1,197,137 | ) | | | (8,323,046 | ) |
Net unrealized appreciation of investments and futures contracts | | | 3,130,223 | | | | 5,607,677 | |
Net Assets | | $ | 174,137,622 | | | $ | 385,246,359 | |
Shares outstanding | | | 15,894,423 | | | | 39,933,892 | |
Net asset value, offering and redemption price per share | | $ | 10.96 | | | $ | 9.65 | |
* Investments at cost | | $ | 270,398,346 | | | $ | 369,872,389 | |
The accompanying notes are an integral part of these financial statements.
61
Statement of Operations
For the year ended December 31, 2014
| | | | | | | | | | | | | | | | |
| | | AMG
Chicago Equity
Partners
Balanced Fund | | | AMG
Managers
High Yield
Fund | | | AMG Managers
Intermediate
Duration
Government Fund | | | AMG Managers
Short Duration
Government Fund | |
Investment Income: | | | | | | | | | | | | | | | | |
Dividend income | | $ | 608,149 | | | $ | 1,038 | | | $ | 26,155 | | | $ | 8,968 | |
Interest income | | | 396,289 | | | | 2,358,683 | | | | 3,424,913 | | | | 5,257,133 | |
Securities lending income | | | 8,164 | | | | 10,018 | | | | — | | | | 429 | |
Foreign withholding tax | | | — | | | | (325 | ) | | | — | | | | — | |
Total investment income | | | 1,012,602 | | | | 2,369,414 | | | | 3,451,068 | | | | 5,266,530 | |
Expenses: | | | | | | | | | | | | | | | | |
Investment management and advisory fees | | | 398,704 | | | | 264,612 | | | | 997,949 | | | | 2,910,872 | |
Administrative fees | | | 113,915 | | | | 75,603 | | | | — | | | | — | |
Distribution fees - Investor Class | | | 93,566 | | | | 86,787 | | | | — | | | | — | |
Shareholder servicing fees - Service Class | | | 3,283 | | | | — | | | | — | | | | — | |
Shareholder servicing fees | | | — | | | | — | | | | 142,564 | | | | 3,770 | |
Registration fees | | | 48,825 | | | | 36,036 | | | | 29,662 | | | | 64,675 | |
Professional fees | | | 34,856 | | | | 60,924 | | | | 71,368 | | | | 85,621 | |
Custodian fees | | | 27,760 | | | | 64,159 | | | | 65,876 | | | | 130,302 | |
Reports to shareholders | | | 17,158 | | | | 19,676 | | | | 32,239 | | | | 58,183 | |
Transfer agent fees | | | 10,142 | | | | 12,751 | | | | 11,930 | | | | 28,154 | |
Trustees fees and expenses | | | 2,341 | | | | 1,486 | | | | 5,651 | | | | 16,801 | |
Miscellaneous | | | 3,162 | | | | 2,247 | | | | 3,774 | | | | 18,077 | |
Total expenses before offsets | | | 753,712 | | | | 624,281 | | | | 1,361,013 | | | | 3,316,455 | |
Expense reimbursements | | | (178,166 | ) | | | (197,131 | ) | | | (91,438 | ) | | | — | |
Expense reductions | | | (8,374 | ) | | | — | | | | — | | | | — | |
Fee waivers | | | — | | | | — | | | | (8,459 | ) | | | — | |
Net expenses | | | 567,172 | | | | 427,150 | | | | 1,261,116 | | | | 3,316,455 | |
| | | | |
Net investment income | | | 445,430 | | | | 1,942,264 | | | | 2,189,952 | | | | 1,950,075 | |
Net Realized and Unrealized Gain (Loss): | | | | | | | | | | | | | | | | |
Net realized gain on investments | | | 5,348,407 | | | | 463,758 | | | | 4,957,008 | | | | 2,218,589 | |
Net realized loss on futures contracts | | | — | | | | — | | | | (319,055 | ) | | | (2,253,715 | ) |
Net change in unrealized appreciation (depreciation) of investments | | | (680,658 | ) | | | (1,737,634 | ) | | | 2,282,300 | | | | 1,427,071 | |
Net change in unrealized appreciation (depreciation) of futures contracts | | | — | | | | — | | | | 5,016 | | | | (1,008,204 | ) |
Net realized and unrealized gain (loss) | | | 4,667,749 | | | | (1,273,876 | ) | | | 6,925,269 | | | | 383,741 | |
| | | | |
Net increase in net assets resulting from operations | | $ | 5,113,179 | | | $ | 668,388 | | | $ | 9,115,221 | | | $ | 2,333,816 | |
The accompanying notes are an integral part of these financial statements.
62
Statements of Changes in Net Assets
For the years ended December 31,
| | | | | | | | | | | | | | | | |
| | | AMG Chicago Equity
Partners Balanced Fund | | | AMG Managers High Yield
Fund | |
| | | 2014 | | | 2013 | | | 2014 | | | 2013 | |
Increase (Decrease) in Net Assets From Operations: | | | | | | | | | | | | | | | | |
Net investment income | | $ | 445,430 | | | $ | 286,474 | | | $ | 1,942,264 | | | $ | 1,973,826 | |
Net realized gain on investments | | | 5,348,407 | | | | 3,326,313 | | | | 463,758 | | | | 652,164 | |
Net change in unrealized appreciation (depreciation) of investments | | | (680,658 | ) | | | 2,891,892 | | | | (1,737,634 | ) | | | (514,120 | ) |
Net increase in net assets resulting from operations | | | 5,113,179 | | | | 6,504,679 | | | | 668,388 | | | | 2,111,870 | |
Distributions to Shareholders: | | | | | | | | | | | | | | | | |
From net investment income: | | | | | | | | | | | | | | | | |
Investor Class | | | (255,532 | ) | | | (167,010 | ) | | | (1,776,356 | ) | | | (1,812,211 | ) |
Service Class | | | (67,831 | ) | | | (8,752 | ) | | | — | | | | — | |
Institutional Class | | | (108,580 | ) | | | (85,363 | ) | | | (166,982 | ) | | | (159,039 | ) |
From net realized gain on investments: | | | | | | | | | | | | | | | | |
Investor Class | | | (3,590,785 | ) | | | (2,826,451 | ) | | | — | | | | — | |
Service Class | | | (810,554 | ) | | | (134,245 | ) | | | — | | | | — | |
Institutional Class | | | (1,055,585 | ) | | | (940,368 | ) | | | — | | | | — | |
Total distributions to shareholders | | | (5,888,867 | ) | | | (4,162,189 | ) | | | (1,943,338 | ) | | | (1,971,250 | ) |
Capital Share Transactions:1 | | | | | | | | | | | | | | | | |
Net increase from capital share transactions | | | 23,554,155 | | | | 7,853,945 | | | | 4,598,297 | | | | 1,020,739 | |
| | | | |
Total increase in net assets | | | 22,778,467 | | | | 10,196,435 | | | | 3,323,347 | | | | 1,161,359 | |
Net Assets: | | | | | | | | | | | | | | | | |
Beginning of year | | | 45,854,651 | | | | 35,658,216 | | | | 34,516,618 | | | | 33,355,259 | |
End of year | | $ | 68,633,118 | | | $ | 45,854,651 | | | $ | 37,839,965 | | | $ | 34,516,618 | |
End of year undistributed net investment income | | $ | 7,856 | | | $ | 15,697 | | | $ | 7,556 | | | $ | 6,409 | |
| | | | | | | | | | | | | | | | |
| 1 | See Note 1(g) of the Notes to Financial Statements. |
The accompanying notes are an integral part of these financial statements.
63
Statements of Changes in Net Assets (continued)
For the years ended December 31,
| | | | | | | | | | | | | | | | |
| | | AMG Managers Intermediate Duration
Government Fund | | | AMG Managers Short Duration
Government Fund | |
| | | 2014 | | | 2013 | | | 2014 | | | 2013 | |
Increase (Decrease) in Net Assets From Operations: | | | | | | | | | | | | | | | | |
Net investment income | | $ | 2,189,952 | | | $ | 2,626,024 | | | $ | 1,950,075 | | | $ | 1,196,351 | |
Net realized gain (loss) on investments and futures contracts | | | 4,637,953 | | | | (884,625 | ) | | | (35,126 | ) | | | 840,123 | |
Net change in unrealized appreciation (depreciation) of investments and futures contracts | | | 2,287,316 | | | | (3,908,544 | ) | | | 418,867 | | | | (1,033,299 | ) |
Net increase (decrease) in net assets resulting from operations | | | 9,115,221 | | | | (2,167,145 | ) | | | 2,333,816 | | | | 1,003,175 | |
Distributions to Shareholders: | | | | | | | | | | | | | | | | |
From net investment income | | | (2,186,725 | ) | | | (2,636,843 | ) | | | (2,078,120 | ) | | | (1,317,291 | ) |
From net realized gain on investments | | | (3,467,539 | ) | | | (284,887 | ) | | | — | | | | — | |
Total distributions to shareholders | | | (5,654,264 | ) | | | (2,921,730 | ) | | | (2,078,120 | ) | | | (1,317,291 | ) |
Capital Share Transactions: | | | | | | | | | | | | | | | | |
Proceeds from sale of shares | | | 63,567,920 | | | | 35,405,674 | | | | 160,549,746 | | | | 233,972,051 | |
Reinvestment of dividends and distributions | | | 5,096,002 | | | | 2,542,117 | | | | 1,907,063 | | | | 1,133,602 | |
Cost of shares repurchased | | | (34,902,523 | ) | | | (81,842,141 | ) | | | (199,954,281 | ) | | | (278,718,075 | ) |
Net increase (decrease) from capital share transactions | | | 33,761,399 | | | | (43,894,350 | ) | | | (37,497,472 | ) | | | (43,612,422 | ) |
| | | | |
Total increase (decrease) in net assets | | | 37,222,356 | | | | (48,983,225 | ) | | | (37,241,776 | ) | | | (43,926,538 | ) |
Net Assets: | | | | | | | | | | | | | | | | |
Beginning of year | | | 136,915,266 | | | | 185,898,491 | | | | 422,488,135 | | | | 466,414,673 | |
End of year | | $ | 174,137,622 | | | $ | 136,915,266 | | | $ | 385,246,359 | | | $ | 422,488,135 | |
End of year undistributed net investment income | | $ | 3,101 | | | | — | | | | — | | | | — | |
| | | | | | | | | | | | | | | | |
Capital Share Transactions: | | | | | | | | | | | | | | | | |
Sale of shares | | | 5,754,077 | | | | 3,274,081 | | | | 16,610,106 | | | | 24,337,342 | |
Reinvested shares from dividends and distributions | | | 465,823 | | | | 236,358 | | | | 197,427 | | | | 117,805 | |
Shares repurchased | | | (3,191,247 | ) | | | (7,582,303 | ) | | | (20,694,738 | ) | | | (28,975,521 | ) |
Net increase (decrease) in shares | | | 3,028,653 | | | | (4,071,864 | ) | | | (3,887,205 | ) | | | (4,520,374 | ) |
The accompanying notes are an integral part of these financial statements.
64
AMG Chicago Equity Partners Balanced Fund
Financial Highlights
For a share outstanding throughout each period
| | | | | | | | | | | | | | | | | | | | |
| | | For the years ended December 31, | |
| Investor Class | | 2014 | | | 2013 | | | 2012 | | | 2011 | | | 2010 | |
Net Asset Value, Beginning of Year | | $ | 15.13 | | | $ | 14.19 | | | $ | 13.70 | | | $ | 13.49 | | | $ | 12.33 | |
Income from Investment Operations: | | | | | | | | | | | | | | | | | | | | |
Net investment income | | | 0.11 | 3 | | | 0.10 | 3,4 | | | 0.18 | 3 | | | 0.18 | 3 | | | 0.20 | |
Net realized and unrealized gain on investments | | | 1.37 | 3 | | | 2.33 | 3 | | | 1.16 | 3 | | | 0.69 | 3 | | | 1.16 | |
Total from investment operations | | | 1.48 | | | | 2.43 | | | | 1.34 | | | | 0.87 | | | | 1.36 | |
Less Distributions to Shareholders from: | | | | | | | | | | | | | | | | | | | | |
Net investment income | | | (0.11 | ) | | | (0.09 | ) | | | (0.17 | ) | | | (0.18 | ) | | | (0.20 | ) |
Net realized gain on investments | | | (1.41 | ) | | | (1.40 | ) | | | (0.68 | ) | | | (0.48 | ) | | | — | |
Total distributions to shareholders | | | (1.52 | ) | | | (1.49 | ) | | | (0.85 | ) | | | (0.66 | ) | | | (0.20 | ) |
Net Asset Value, End of Year | | $ | 15.09 | | | $ | 15.13 | | | $ | 14.19 | | | $ | 13.70 | | | $ | 13.49 | |
Total Return1 | | | 9.69 | % | | | 17.14 | % | | | 9.86 | % | | | 6.45 | % | | | 11.14 | % |
Ratio of net expenses to average net assets (with offsets/reductions) | | | 1.07 | % | | | 1.10 | %5 | | | 1.17 | %6,7 | | | 1.24 | % | | | 1.22 | % |
Ratio of expenses to average net assets (with offsets) | | | 1.09 | % | | | 1.11 | %5 | | | 1.18 | %6 | | | 1.25 | % | | | 1.25 | % |
Ratio of total expenses to average net assets (without offsets/reductions)2 | | | 1.40 | % | | | 1.55 | %5 | | | 1.52 | %6 | | | 1.70 | % | | | 1.80 | % |
Ratio of net investment income to average net assets1 | | | 0.70 | % | | | 0.62 | %5 | | | 1.21 | %6 | | | 1.27 | % | | | 1.56 | % |
Portfolio turnover | | | 92 | % | | | 90 | % | | | 110 | % | | | 94 | % | | | 97 | % |
Net assets at end of year (000’s omitted) | | $ | 41,751 | | | $ | 33,151 | | | $ | 26,047 | | | $ | 17,519 | | | $ | 7,605 | |
| | | | | | | | | | | | | | | | | | | | |
| | | | | | | | | | | | |
| | | For the years ended
December 31, | | | For the period ended
December 1, 2012
through
December 31, 2012* | |
| Service Class | | 2014 | | | 2013 | | |
Net Asset Value, Beginning of Period | | $ | 15.26 | | | $ | 14.30 | | | $ | 15.11 | |
Income from Investment Operations: | | | | | | | | | | | | |
Net investment income3 | | | 0.15 | | | | 0.13 | 4 | | | 0.02 | |
Net realized and unrealized gain (loss) on investments3 | | | 1.37 | | | | 2.36 | | | | (0.08 | ) |
Total from investment operations | | | 1.52 | | | | 2.49 | | | | (0.06 | ) |
Less Distributions to Shareholders from: | | | | | | | | | | | | |
Net investment income | | | (0.13 | ) | | | (0.12 | ) | | | (0.06 | ) |
Net realized gain on investments | | | (1.42 | ) | | | (1.41 | ) | | | (0.69 | ) |
Total distributions to shareholders | | | (1.55 | ) | | | (1.53 | ) | | | (0.75 | ) |
Net Asset Value, End of Period | | $ | 15.23 | | | $ | 15.26 | | | $ | 14.30 | |
Total Return1 | | | 9.93 | % | | | 17.45 | %8 | | | (0.36 | )%8,15 |
Ratio of net expenses to average net assets (with offsets/reductions) | | | 0.86 | % | | | 0.92 | %5 | | | 0.82 | %6,16 |
Ratio of expenses to average net assets (with offsets) | | | 0.88 | % | | | 0.93 | %5 | | | 0.83 | %6,16 |
Ratio of total expenses to average net assets (without offsets/reductions)2 | | | 1.20 | % | | | 1.39 | %5 | | | 1.62 | %6,16 |
Ratio of net investment income to average net assets1 | | | 0.91 | % | | | 0.83 | %5 | | | 1.90 | %6,16 |
Portfolio turnover | | | 92 | % | | | 90 | % | | | 110 | % |
Net assets at end of period (000’s omitted) | | $ | 14,481 | | | $ | 1,581 | | | $ | 9 | |
| | | | | | | | | | | | |
65
AMG Chicago Equity Partners Balanced Fund
Financial Highlights
For a share outstanding throughout each year
| | | | | | | | | | | | | | | | | | | | |
| | | For the years ended December 31, | |
| Institutional Class | | 2014 | | | 2013 | | | 2012 | | | 2011 | | | 2010 | |
Net Asset Value, Beginning of Year | | $ | 15.26 | | | $ | 14.31 | | | $ | 13.82 | | | $ | 13.60 | | | $ | 12.43 | |
Income from Investment Operations: | | | | | | | | | | | | | | | | | | | | |
Net investment income | | | 0.15 | 3 | | | 0.14 | 3,4 | | | 0.21 | 3 | | | 0.21 | 3 | | | 0.24 | |
Net realized and unrealized gain on investments | | | 1.38 | 3 | | | 2.35 | 3 | | | 1.18 | 3 | | | 0.71 | 3 | | | 1.17 | |
Total from investment operations | | | 1.53 | | | | 2.49 | | | | 1.39 | | | | 0.92 | | | | 1.41 | |
Less Distributions to Shareholders from: | | | | | | | | | | | | | | | | | | | | |
Net investment income | | | (0.15 | ) | | | (0.13 | ) | | | (0.21 | ) | | | (0.22 | ) | | | (0.24 | ) |
Net realized gain on investments | | | (1.42 | ) | | | (1.41 | ) | | | (0.69 | ) | | | (0.48 | ) | | | — | |
Total distributions to shareholders | | | (1.57 | ) | | | (1.54 | ) | | | (0.90 | ) | | | (0.70 | ) | | | (0.24 | ) |
Net Asset Value, End of Year | | $ | 15.22 | | | $ | 15.26 | | | $ | 14.31 | | | $ | 13.82 | | | $ | 13.60 | |
Total Return1 | | | 9.97 | % | | | 17.45 | % | | | 10.09 | % | | | 6.77 | % | | | 11.42 | % |
Ratio of net expenses to average net assets (with offsets/reductions) | | | 0.82 | % | | | 0.85 | %5 | | | 0.92 | %6,7 | | | 0.99 | % | | | 0.97 | % |
Ratio of expenses to average net assets (with offsets) | | | 0.84 | % | | | 0.86 | %5 | | | 0.93 | %6 | | | 1.00 | % | | | 1.00 | % |
Ratio of total expenses to average net assets (without offsets/reductions)2 | | | 1.15 | % | | | 1.30 | %5 | | | 1.27 | %6 | | | 1.45 | % | | | 1.55 | % |
Ratio of net investment income to average net assets1 | | | 0.95 | % | | | 0.88 | %5 | | | 1.46 | %6 | | | 1.52 | % | | | 1.81 | % |
Portfolio turnover | | | 92 | % | | | 90 | % | | | 110 | % | | | 94 | % | | | 97 | % |
Net assets at end of year (000’s omitted) | | $ | 12,401 | | | $ | 11,122 | | | $ | 9,601 | | | $ | 8,885 | | | $ | 7,863 | |
| | | | | | | | | | | | | | | | | | | | |
66
AMG Managers High Yield Fund
Financial Highlights
For a share outstanding throughout each year
| | | | | | | | | | | | | | | | | | | | |
| | | For the years ended December 31, | |
| Investor Class | | 2014 | | | 2013 | | | 2012 | | | 2011 | | | 2010 | |
Net Asset Value, Beginning of Year | | $ | 8.09 | | | $ | 8.07 | | | $ | 7.51 | | | $ | 7.74 | | | $ | 7.35 | |
Income from Investment Operations: | | | | | | | | | | | | | | | | | | | | |
Net investment income | | | 0.42 | 3 | | | 0.47 | 3 | | | 0.54 | 3 | | | 0.56 | 3 | | | 0.61 | |
Net realized and unrealized gain (loss) on investments | | | (0.26 | )3 | | | 0.02 | 3 | | | 0.56 | 3 | | | (0.22 | )3 | | | 0.39 | |
Total from investment operations | | | 0.16 | | | | 0.49 | | | | 1.10 | | | | 0.34 | | | | 1.00 | |
Less Distributions to Shareholders from: | | | | | | | | | | | | | | | | | | | | |
Net investment income | | | (0.41 | ) | | | (0.47 | ) | | | (0.54 | ) | | | (0.57 | ) | | | (0.61 | ) |
Net Asset Value, End of Year | | $ | 7.84 | | | $ | 8.09 | | | $ | 8.07 | | | $ | 7.51 | | | $ | 7.74 | |
Total Return1 | | | 1.99 | % | | | 6.21 | %8 | | | 15.12 | %8 | | | 4.54 | % | | | 14.20 | % |
Ratio of net expenses to average net assets (with offsets/reductions) | | | 1.15 | % | | | 1.17 | %9 | | | 1.15 | %10 | | | 1.15 | % | | | 1.15 | % |
Ratio of expenses to average net assets (with offsets) | | | 1.15 | % | | | 1.17 | %9 | | | 1.15 | %10 | | | 1.15 | % | | | 1.15 | % |
Ratio of total expenses to average net assets (without offsets/reductions)2 | | | 1.67 | % | | | 1.70 | %9 | | | 1.73 | %10 | | | 1.69 | % | | | 1.78 | % |
Ratio of net investment income to average net assets1 | | | 5.12 | % | | | 5.76 | %9 | | | 6.87 | %10 | | | 7.35 | % | | | 8.06 | % |
Portfolio turnover | | | 40 | % | | | 39 | % | | | 48 | % | | | 48 | % | | | 60 | % |
Net assets at end of year (000’s omitted) | | $ | 34,709 | | | $ | 31,751 | | | $ | 30,817 | | | $ | 23,957 | | | $ | 21,729 | |
| | | | | | | | | | | | | | | | | | | | |
| |
| | | For the years ended December 31, | |
| Institutional Class | | 2014 | | | 2013 | | | 2012 | | | 2011 | | | 2010 | |
Net Asset Value, Beginning of Year | | $ | 8.18 | | | $ | 8.16 | | | $ | 7.59 | | | $ | 7.82 | | | $ | 7.42 | |
Income from Investment Operations: | | | | | | | | | | | | | | | | | | | | |
Net investment income | | | 0.44 | 3 | | | 0.49 | 3 | | | 0.56 | 3 | | | 0.59 | 3 | | | 0.63 | |
Net realized and unrealized gain (loss) on investments | | | (0.26 | )3 | | | 0.02 | 3 | | | 0.58 | 3 | | | (0.22 | )3 | | | 0.40 | |
Total from investment operations | | | 0.18 | | | | 0.51 | | | | 1.14 | | | | 0.37 | | | | 1.03 | |
Less Distributions to Shareholders from: | | | | | | | | | | | | | | | | | | | | |
Net investment income | | | (0.44 | ) | | | (0.49 | ) | | | (0.57 | ) | | | (0.60 | ) | | | (0.63 | ) |
Net Asset Value, End of Year | | $ | 7.92 | | | $ | 8.18 | | | $ | 8.16 | | | $ | 7.59 | | | $ | 7.82 | |
Total Return1 | | | 2.16 | % | | | 6.47 | % | | | 15.46 | % | | | 4.83 | % | | | 14.58 | %8 |
Ratio of net expenses to average net assets (with offsets/reductions) | | | 0.90 | % | | | 0.92 | %9 | | | 0.90 | %10 | | | 0.90 | % | | | 0.90 | % |
Ratio of expenses to average net assets (with offsets) | | | 0.90 | % | | | 0.92 | %9 | | | 0.90 | %10 | | | 0.90 | % | | | 0.90 | % |
Ratio of total expenses to average net assets (without offsets/reductions)2 | | | 1.42 | % | | | 1.45 | %9 | | | 1.48 | %10 | | | 1.44 | % | | | 1.53 | % |
Ratio of net investment income to average net assets1 | | | 5.37 | % | | | 6.01 | %9 | | | 7.12 | %10 | | | 7.60 | % | | | 8.26 | % |
Portfolio turnover | | | 40 | % | | | 39 | % | | | 48 | % | | | 48 | % | | | 60 | % |
Net assets at end of year (000’s omitted) | | $ | 3,131 | | | $ | 2,765 | | | $ | 2,538 | | | $ | 5,247 | | | $ | 4,718 | |
| | | | | | | | | | | | | | | | | | | | |
67
AMG Managers Intermediate Duration Government Fund
Financial Highlights
For a share outstanding throughout each year
| | | | | | | | | | | | | | | | | | | | |
| | | For the years ended December 31, | |
| | | 2014 | | | 2013 | | | 2012 | | | 2011 | | | 2010 | |
Net Asset Value, Beginning of Year | | $ | 10.64 | | | $ | 10.98 | | | $ | 11.10 | | | $ | 11.01 | | | $ | 10.90 | |
Income from Investment Operations: | | | | | | | | | | | | | | | | | | | | |
Net investment income | | | 0.17 | 3 | | | 0.18 | 3 | | | 0.20 | 3 | | | 0.30 | | | | 0.32 | |
Net realized and unrealized gain (loss) on investments | | | 0.54 | 3 | | | (0.32 | )3 | | | 0.14 | 3 | | | 0.34 | | | | 0.46 | |
Total from investment operations | | | 0.71 | | | | (0.14 | ) | | | 0.34 | | | | 0.64 | | | | 0.78 | |
Less Distributions to Shareholders from: | | | | | | | | | | | | | | | | | | | | |
Net investment income | | | (0.17 | ) | | | (0.18 | ) | | | (0.20 | ) | | | (0.30 | ) | | | (0.32 | ) |
Net realized gain on investments | | | (0.22 | ) | | | (0.02 | ) | | | (0.26 | ) | | | (0.25 | ) | | | (0.35 | ) |
Total distributions to shareholders | | | (0.39 | ) | | | (0.20 | ) | | | (0.46 | ) | | | (0.55 | ) | | | (0.67 | ) |
Net Asset Value, End of Year | | $ | 10.96 | | | $ | 10.64 | | | $ | 10.98 | | | $ | 11.10 | | | $ | 11.01 | |
Total Return1 | | | 6.73 | %8 | | | (1.25 | )%8 | | | 3.15 | %8 | | | 5.88 | %8 | | | 7.20 | %8 |
Ratio of net expenses to average net assets (with offsets/reductions) | | | 0.89 | % | | | 0.91 | %11 | | | 0.89 | %12 | | | 0.88 | % | | | 0.89 | % |
Ratio of expenses to average net assets (with offsets) | | | 0.89 | % | | | 0.91 | %11 | | | 0.89 | %12 | | | 0.88 | % | | | 0.89 | % |
Ratio of total expenses to average net assets (without offsets/reductions)2 | | | 0.96 | % | | | 0.94 | %11 | | | 0.92 | %12 | | | 0.94 | % | | | 0.96 | % |
Ratio of net investment income to average net assets1 | | | 1.54 | % | | | 1.64 | %11 | | | 1.81 | %12 | | | 2.64 | % | | | 2.80 | % |
Portfolio turnover | | | 11 | % | | | 29 | % | | | 21 | % | | | 453 | % | | | 409 | % |
Net assets at end of year (000’s omitted) | | $ | 174,138 | | | $ | 136,915 | | | $ | 185,898 | | | $ | 178,087 | | | $ | 153,644 | |
| | | | | | | | | | | | | | | | | | | | |
68
AMG Managers Short Duration Government Fund
Financial Highlights
For a share outstanding throughout each year
| | | | | | | | | | | | | | | | | | | | |
| | | For the years ended December 31, | |
| | | 2014 | | | 2013 | | | 2012 | | | 2011 | | | 2010 | |
Net Asset Value, Beginning of Year | | $ | 9.64 | | | $ | 9.65 | | | $ | 9.57 | | | $ | 9.58 | | | $ | 9.56 | |
Income from Investment Operations: | | | | | | | | | | | | | | | | | | | | |
Net investment income | | | 0.053 | | | | 0.033 | | | | 0.083 | | | | 0.09 | | | | 0.13 | |
Net realized and unrealized gain (loss) on investments | | | 0.013 | | | | (0.01 | )3 | | | 0.083 | | | | (0.01 | ) | | | 0.03 | |
Total from investment operations | | | 0.06 | | | | 0.02 | | | | 0.16 | | | | 0.08 | | | | 0.16 | |
Less Distributions to Shareholders from: | | | | | | | | | | | | | | | | | | | | |
Net investment income | | | (0.05 | ) | | | (0.03 | ) | | | (0.08 | ) | | | (0.09 | ) | | | (0.14 | ) |
Net Asset Value, End of Year | | $ | 9.65 | | | $ | 9.64 | | | $ | 9.65 | | | $ | 9.57 | | | $ | 9.58 | |
Total Return1 | | | 0.60 | % | | | 0.20 | % | | | 1.64 | % | | | 0.80 | % | | | 1.68 | %8 |
Ratio of net expenses to average net assets (with offsets/reductions) | | | 0.80 | % | | | 0.79 | %13 | | | 0.81 | %14 | | | 0.82 | % | | | 0.81 | % |
Ratio of expenses to average net assets (with offsets) | | | 0.80 | % | | | 0.79 | %13 | | | 0.81 | %14 | | | 0.82 | % | | | 0.81 | % |
Ratio of total expenses to average net assets (without offsets/reductions)2 | | | 0.80 | % | | | 0.79 | %13 | | | 0.81 | %14 | | | 0.82 | % | | | 0.82 | % |
Ratio of net investment income to average net assets1 | | | 0.47 | % | | | 0.27 | %13 | | | 0.80 | %14 | | | 0.89 | % | | | 1.38 | % |
Portfolio turnover | | | 41 | % | | | 48 | % | | | 49 | % | | | 141 | % | | | 116 | % |
Net assets at end of year (000’s omitted) | | $ | 385,246 | | | $ | 422,488 | | | $ | 466,415 | | | $ | 393,014 | | | $ | 380,926 | |
| | | | | | | | | | | | | | | | | | | | |
Notes to Financial Highlights
| * | Commenced operations on December 1, 2012. |
| 1 | Total returns and net investment income would have been lower had certain expenses not been offset. |
| 2 | Excludes the impact of expense reimbursements or fee waivers and expense reductions such as brokerage credits, but includes expense repayments and non-reimbursable expenses, if any, such as interest, taxes and extraordinary expenses. |
| 3 | Per share numbers have been calculated using average shares. |
| 4 | Includes non-recurring dividends. Without these dividends, net investment income per share would have been $0.09, $0.12, and $0.13 for AMG Chicago Equity Partners Balanced Fund’s Investor Class, Service Class, and Institutional Class shares, respectively. |
| 5 | Includes non-routine extraordinary expenses amounting to 0.019%, 0.014% and 0.019% of average net assets for the Investor Class, Service Class and Institutional Class, respectively. |
| 6 | Includes non-routine extraordinary expenses amounting to 0.005%, 0.005% and 0.004% of average net assets for the Investor Class, Service Class and Institutional Class, respectively. |
| 7 | Effective July 1, 2012, the Fund’s expense cap was reduced to 0.84% from 1.00%. The expense ratio shown reflects the weighted average expense ratio for the full year ended December 31, 2012. |
| 8 | The total return is based on the Financial Statement Net Asset Values as shown in the Financial Highlights. |
| 9 | Includes non-routine extraordinary expenses amounting to 0.020% and 0.021% of average net assets for the Investor Class and Institutional Class, respectively. |
| 10 | Includes non-routine extraordinary expenses amounting to 0.005% and 0.004% of average net assets for the Investor Class and Institutional Class, respectively. |
| 11 | Includes non-routine extraordinary expenses amounting to 0.020% of average net assets. |
| 12 | Includes non-routine extraordinary expenses amounting to 0.004% of average net assets. |
| 13 | Includes non-routine extraordinary expenses amounting to 0.019% of average net assets. |
| 14 | Includes non-routine extraordinary expenses amounting to 0.005% of average net assets. |
69
Notes to Financial Statements
December 31, 2014
1. SUMMARY OF SIGNIFICANT ACCOUNTING POLICIES
AMG Funds II (formerly Managers Trust II) (the “Trust”) is an open-end management investment company organized as a Massachusetts business trust, and registered under the Investment Company Act of 1940, as amended (the “1940 Act”). Currently, the Trust consists of a number of different funds, each having distinct investment management objectives, strategies, risks, and policies. Included in this report are AMG Chicago Equity Partners Balanced Fund (“Balanced”) (formerly Managers AMG Chicago Equity Partners Balanced Fund), AMG Managers High Yield Fund (“High Yield”) (formerly Managers High Yield Fund), AMG Managers Intermediate Duration Government Fund (“Intermediate Duration”) (formerly Managers Intermediate Duration Government Fund) and AMG Managers Short Duration Government Fund (“Short Duration”) (formerly Managers Short Duration Government Fund), each a “Fund” and collectively the “Funds.” High Yield will deduct a 2.00% redemption fee from the proceeds of any redemption (including a redemption by exchange) of shares if the redemption occurs within 90 days of the purchase of those shares. For the year ended December 31, 2014, High Yield had redemption fees amounting to $2,588.
Balanced offers three classes of shares: Investor, Service and Institutional Class. High Yield offers two classes of shares: Investor and Institutional Class. Each class represents an interest in the same assets of the Fund. Although all share classes generally have identical voting rights, each share class votes separately when required by law. Different share classes may pay different distribution amounts to the extent the net asset value per share and/or the expenses of such share classes differ. Each share class has its own expense structure. Please refer to a current prospectus for additional information on each share class.
The Funds’ financial statements are prepared in accordance with accounting principles generally accepted in the United States of America (“U.S. GAAP”), which require management to make estimates and assumptions that affect the reported amounts of assets and liabilities and disclosure of contingent assets and liabilities at the date of the financial statements and the reported amounts of income and expenses during the reporting period. Actual results could differ from those estimates and such differences could be material. The following is a summary of significant accounting policies followed by the Funds in the preparation of their financial statements:
a. VALUATION OF INVESTMENTS
Equity securities traded on a domestic or international securities exchange are valued at the last quoted sale price, or, lacking any sales, at the last quoted bid price. Equity securities primarily traded on an international securities exchange and equity securities traded on NASDAQ or in a U.S. or non-U.S. over-the-counter market are valued at the market’s official closing price, or, if there are no trades on the applicable date, at the last quoted bid price. In addition, if the applicable market does not offer an official closing price or if the official closing price is not representative of the overall market, equity securities primarily traded on an international securities exchange and equity securities traded in a non-U.S. over-the-counter market are valued at the last quoted sales price. The Funds’ investments are generally valued based on independent market quotations or prices or, if none, “evaluative” or other market based valuations provided by third-party pricing services approved by the Board of Trustees of the Funds (the “Board”).
Fixed-income securities are valued based on valuations furnished by independent pricing services that utilize matrix systems, which reflect such factors as security prices, yields, maturities, and ratings, and are supplemented by dealer and exchange quotations. Debt obligations (other than short-term debt obligations that have 60 days or less remaining until maturity) will be valued using the evaluated bid price or the mean price provided by an authorized pricing service. Futures contracts for which market quotations are readily available are valued at the settlement price as of the close of the futures exchange. Short term debt obligations (debt obligations with maturities of one year or less at the time of issuance) that have 60 days or less remaining until maturity will be valued at amortized cost. Investments in other open-end regulated investment companies are valued at their end of day net asset value per share. Investments in certain mortgage-backed and stripped mortgage-backed securities, preferred stocks, convertible securities, derivatives and other debt securities not traded on an organized securities market are valued on the basis of valuations provided by dealers or by a pricing service which uses information with respect to transactions in such securities and various relationships between such securities and yield to maturity in determining value.
Under certain circumstances, the value of certain Fund investments (including derivatives) may be based on an evaluation of fair value, pursuant to procedures established by and under the general supervision of the Board. The Pricing Committee is the committee formed by the Board to make fair value determinations for such investments. Each Fund may use the fair value of a portfolio investment to calculate its net asset value (“NAV”) in the event that the market quotation, price or market based valuation for the portfolio investment is not deemed to be readily available or otherwise not determinable pursuant to the Board’s valuation procedures, if AMG Funds LLC (formerly Managers Investment Group LLC) (the “Investment Manager”) believes the quotation, price or market based valuation to be unreliable, or in certain other circumstances. When determining the fair value of an investment, the Pricing Committee seeks to determine the price that the Fund might reasonably expect to receive from a current sale of that investment in an arms-length transaction. Fair value determinations shall be based upon consideration of all available facts and information, including, but not limited to (i) attributes specific to the investment; (ii) fundamental analytical data and press releases relating to the investment and its issuer; and (iii) the value of other comparable securities or relevant financial instruments, including derivative securities, traded on other markets or among dealers.
The values assigned to fair value investments are based on available information and do not necessarily represent amounts that might ultimately be realized in the future, since such amounts depend on future developments inherent in long-term investments. Because of the inherent uncertainty of valuation, those estimated values may differ significantly from the values that would have been used had a ready market for the investments existed, and the differences could be material. The Board will be presented with a quarterly report showing, as of the most recent quarter end, all outstanding securities fair valued by the Pricing Committee, including a comparison with the prior quarter end and the percentage of the Fund that the security represents at each quarter end.
Portfolio investments that trade primarily on foreign markets are priced based upon the market quotation of such securities as of the close of their respective
70
Notes to Financial Statements (continued)
principal markets. Under certain circumstances, on behalf of a fund that invests in international securities, the Investment Manager or applicable subadvisor may recommend an adjustment of such prices based on its determination of the impact of events occurring subsequent to the close of such markets but prior to the time as of which each Fund calculates its NAV. The Board has also adopted a policy that securities held in a fund that invests in international securities and certain foreign debt obligations held by a fund, in each case, that can be fair valued by the applicable fair value pricing service are fair valued on each business day without regard to a “trigger” (e.g., without regard to invoking fair value based upon a change in a U.S. equity securities index exceeding a pre-determined level). The Funds may invest in securities that may be thinly traded. The Board has adopted procedures to adjust prices of securities that are judged to be stale so that they reflect fair value. An investment valued on the basis of its fair value may be valued at a price higher or lower than available market quotations.
U.S. GAAP defines fair value as the price that a fund would receive to sell an asset or pay to transfer a liability in an orderly transaction between market participants at the measurement date. U.S. GAAP also establishes a framework for measuring fair value, and a three-level hierarchy for fair value measurements based upon the transparency of inputs to the valuation of an asset or liability. Inputs may be observable or unobservable and refer broadly to the assumptions that market participants would use in pricing the asset or liability. Observable inputs reflect the assumptions market participants would use in pricing the asset or liability based on market data obtained from sources independent of the Funds. Unobservable inputs reflect the Funds’ own assumptions about the assumptions that market participants would use in pricing the asset or liability developed based on the best information available in the circumstances. Each investment is assigned a level based upon the observability of the inputs which are significant to the overall valuation.
The three-tier hierarchy of inputs is summarized below:
Level 1 – inputs are quoted prices in active markets for identical investments (e.g., equity securities, open-end investment companies, futures contracts, options contracts)
Level 2 – other observable inputs (including, but not limited to: quoted prices for similar assets or liabilities in markets that are active, quoted prices for identical or similar assets or liabilities in markets that are not active, inputs other than quoted prices that are observable for the assets or liabilities (such as interest rates, yield curves, volatilities, prepayment speeds, loss severities, credit risks and default rates) or other market corroborated inputs) (e.g., debt securities, government securities, swap contracts, foreign currency exchange contracts, foreign securities utilizing international fair value pricing, broker-quoted securities, fair valued securities with observable inputs)
Level 3 – inputs are significant unobservable inputs (including the Funds’ own assumptions used to determine the fair value of investments) (e.g., fair valued securities with unobservable inputs)
Changes in inputs or methodologies used for valuing investments may result in a transfer in or out of levels within the fair value hierarchy. The inputs or
methodologies used for valuing investments may not necessarily be an indication of the risk associated with investing in those investments.
b. SECURITY TRANSACTIONS
Security transactions are accounted for as of trade date. Realized gains and losses on securities sold are determined on the basis of identified cost.
c. INVESTMENT INCOME AND EXPENSES
Dividend income is recorded on the ex-dividend date. Dividend and interest income on foreign securities is recorded gross of any withholding tax. Interest income, which includes amortization of premium and accretion of discount on debt securities, is accrued as earned. Non-cash dividends included in dividend income, if any, are reported at the fair market value of the securities received. Other income and expenses are recorded on an accrual basis. Expenses that cannot be directly attributed to a Fund are apportioned among the Funds in the Trust and in some cases other affiliated funds based upon their relative average net assets or number of shareholders. Investment income, realized and unrealized capital gains and losses, the common expenses of each Fund, and certain Fund level expense reductions, if any, are allocated on a pro-rata basis to each class based on the relative net assets of each class to the total net assets of each Fund.
Balanced had certain portfolio trades directed to various brokers, under a brokerage recapture program, which paid a portion of the Fund’s expenses. For the year ended December 31, 2014, the amount by which the Fund’s expenses were reduced and the impact on the expense ratios, if any, was $8,374 or 0.002%.
The Funds have a “balance credit” arrangement with The Bank of New York Mellon (“BNYM”), the Funds’ custodian, whereby each Fund is credited with an interest factor equal to 0.75% below the effective 90-day T-Bill rate for account balances left uninvested overnight. If the T-Bill rate falls below 0.75%, no credits will be earned. These credits serve to reduce custodian expenses that would otherwise be charged to each Fund. For the year ended December 31, 2014, the Funds’ custodian expense was not reduced.
Overdraft fees are computed at 1% above the effective Federal Funds rate on the day of the overdraft. For the year ended December 31, 2014, the Funds did not incur overdraft fees.
d. DIVIDENDS AND DISTRIBUTIONS
Fund distributions resulting from either net investment income or realized net capital gains, if any, will normally be declared and paid at least annually in December, as described in the Funds’ prospectus. Distributions to shareholders are recorded on the ex-dividend date. Distributions are determined in accordance with federal income tax regulations, which may differ from net investment income and net realized capital gains for financial statement purposes (U.S. GAAP). Differences may be permanent or temporary. Permanent differences are reclassified among capital accounts in the financial statements to reflect their tax character. Temporary differences arise when certain items of income, expense and gain or loss are recognized in different periods for
71
Notes to Financial Statements (continued)
financial statement and tax purposes; these differences will reverse at some time in the future. The differences are due to differing treatments for losses deferred due to excise tax regulations, wash sales, futures and tax straddles.
Permanent book and tax basis differences, if any, relating to shareholder distributions will result in reclassifications to paid-in capital.
The tax character of distributions paid during the years ended December 31, 2014 and December 31, 2013 were as follows:
| | | | | | | | | | | | | | | | | | | | | | | | | | | | | | | | |
| | | Balanced | | | High Yield | | | Intermediate Duration | | | Short Duration | |
| | | 2014 | | | 2013 | | | 2014 | | | 2013 | | | 2014 | | | 2013 | | | 2014 | | | 2013 | |
Distributions paid from: | | | | | | | | | | | | | | | | | | | | | | | | | |
Ordinary income | | $ | 431,943 | | | $ | 261,125 | | | $ | 1,943,338 | | | $ | 2,053,012 | | | $ | 2,186,725 | | | $ | 2,638,009 | | | $ | 1,950,075 | | | $ | 1,317,291 | |
Short-term capital gains | | | 1,411,082 | | | | 1,954,176 | | | | — | | | | — | | | | 3,286,678 | | | | 104,695 | | | | — | | | | — | |
Long-term capital gains | | | 4,045,842 | | | | 1,946,888 | | | | — | | | | — | | | | 180,861 | | | | 179,026 | | | | — | | | | — | |
| | | | | | | | | | | | | | | | | | | | | | | | | | | | | | | | |
Total | | $ | 5,888,867 | | | $ | 4,162,189 | | | $ | 1,943,338 | | | $ | 2,053,012 | | | $ | 5,654,264 | | | $ | 2,921,730 | | | $ | 1,950,075 | | | $ | 1,317,291 | |
| | | | | | | | | | | | | | | | | | | | | | | | | | | | | | | | |
As of December 31, 2014, the components of distributable earnings (excluding unrealized appreciation/depreciation) on a tax basis consisted of:
| | | | | | | | | | | | | | | | |
| | | Balanced | | | High Yield | | | Intermediate Duration | | | Short Duration | |
Capital loss carryforward | | | — | | | $ | 2,105,202 | | | | — | | | $ | 584,645 | |
Undistributed ordinary income | | $ | 7,856 | | | | 7,822 | | | $ | 3,101 | | | | — | |
Undistributed short-term capital gains | | | 20,376 | | | | — | | | | 922,364 | | | | — | |
Undistributed long-term capital gains | | | 669,623 | | | | — | | | | 177,717 | | | | — | |
Late-year loss deferral | | | — | | | | — | | | | — | | | | 568,100 | |
e. FEDERAL TAXES
Each Fund intends to comply with the requirements under Subchapter M of the Internal Revenue Code of 1986, as amended, to distribute substantially all of its taxable income and gains to its shareholders and to meet certain diversification and income requirements with respect to investment companies. Therefore, no provision for federal income or excise tax is included in the accompanying financial statements.
Additionally, based on each Fund’s understanding of the tax rules and rates related to income, gains and transactions for the foreign jurisdictions in which it invests, each Fund will provide for foreign taxes, and where appropriate, deferred foreign taxes.
Management has analyzed the Funds’ tax positions taken on federal income tax returns as of December 31, 2014 and all open tax years (generally, the three prior taxable years), and has concluded that no provision for federal income tax is required in the Funds’ financial statements. Additionally, the Funds are not aware of any tax position for which it is reasonably possible that the total amounts of unrecognized tax benefits will change materially in the next twelve months.
Net capital losses incurred in taxable years beginning after the enactment of the Regulated Investment Company Modernization Act of 2010, may be carried forward for an unlimited time period. Such losses will be required to be utilized prior to any loss carryovers incurred in pre-enactment taxable years, which generally expire eight years following the close of the taxable year in which they were incurred. As a result of this ordering rule, pre-enactment capital loss carryovers may be more likely to expire unused. Additionally, post-enactment
capital losses that are carried forward retain their tax character as either short-term or long-term capital losses, unlike pre-enactment losses which are considered all short-term.
f. CAPITAL LOSS CARRYOVERS AND DEFERRALS
As of December 31, 2014, the following Funds had accumulated net realized capital loss carryovers from securities transactions for federal income tax purposes as shown in the following chart. These amounts may be used to offset future realized capital gains, if any, through the expiration dates listed or in the case of post-enactment losses, for an unlimited time period.
| | | | | | | | | | | | |
| | | Capital Loss
Carryover Amounts | | | | |
| Fund | | Short-Term | | | Long-Term | | | Expires
December 31, | |
Balanced | | | | | | | | | | | | |
(Pre-Enactment) | | | — | | | | — | | | | | |
High Yield | | | | | | | | | | | | |
(Pre-Enactment) | | $ | 2,105,202 | | | | — | | | | 2017 | |
Intermediate Duration | | | | | | | | | | | | |
(Pre-Enactment) | | | — | | | | — | | | | | |
Short Duration | | | | | | | | | | | | |
(Post-Enactment) | | $ | 584,645 | | | | — | | | | N/A | |
72
Notes to Financial Statements (continued)
For the year ended December 31, 2014, the following Funds utilized capital loss carryovers in the amount of:
| | | | | | | | |
| | | Capital Loss Carryover Utilized | |
| Fund | | Short-Term | | | Long-Term | |
Balanced | | | — | | | | — | |
High Yield | | $ | 461,436 | | | | — | |
Intermediate Duration | | | 193,265 | | | | — | |
Short Duration | | | 986,434 | | | | — | |
g. CAPITAL STOCK
The Trust’s Declaration of Trust authorizes for each series the issuance of an unlimited number of shares of beneficial interest, without par value. Each Fund records sales and repurchases of its capital stock on the trade date. The cost of securities contributed to the Funds in connection with the issuance of shares is based on the valuation of those securities in accordance with the Funds’ policy on investment valuation.
For the year ended December 31, 2014 and December 31, 2013, the capital stock transactions by class for Balanced and High Yield were:
| | | | | | | | | | | | | | | | | | | | | | | | | | | | | | | | |
| | | Balanced | | | High Yield | |
| | | 2014 | | | 2013 | | | 2014 | | | 2013 | |
| | | Shares | | | Amount | | | Shares | | | Amount | | | Shares | | | Amount | | | Shares | | | Amount | |
Investor Class: | | | | | | | | | | | | | | | | | | | | | | | | | | | | | | | | |
Proceeds from sale of shares | | | 1,202,988 | | | $ | 19,138,905 | | | | 862,843 | | | $ | 13,221,782 | | | | 1,152,505 | | | $ | 9,370,757 | | | | 1,119,812 | | | $ | 9,011,674 | |
Reinvestment of distributions | | | 208,257 | | | | 3,173,093 | | | | 151,722 | | | | 2,293,355 | | | | 195,308 | | | | 1,581,726 | | | | 188,996 | | | | 1,525,171 | |
Cost of shares repurchased | | | (836,466 | ) | | | (13,186,170 | ) | | | (659,229 | ) | | | (10,107,175 | ) | | | (841,406 | ) | | | (6,824,466 | ) | | | (1,203,338 | ) | | | (9,731,843 | ) |
| | | | | | | | | | | | | | | | | | | | | | | | | | | | | | | | |
Net increase | | | 574,779 | | | $ | 9,125,828 | | | | 355,336 | | | $ | 5,407,962 | | | | 506,407 | | | $ | 4,128,017 | | | | 105,470 | | | $ | 805,002 | |
| | | | | | | | | | | | | | | | | | | | | | | | | | | | | | | | |
Service Class: | | | | | | | | | | | | | | | | | | | | | | | | | | | | | | | | |
Proceeds from sale of shares | | | 1,334,849 | | | $ | 20,991,730 | | | | 139,347 | | | $ | 2,145,144 | | | | — | | | | — | | | | — | | | | — | |
Reinvestment of distributions | | | 9,184 | | | | 142,301 | | | | 2,844 | | | | 43,379 | | | | — | | | | — | | | | — | | | | — | |
Cost of shares repurchased | | | (496,623 | ) | | | (8,023,723 | ) | | | (39,268 | ) | | | (602,180 | ) | | | — | | | | — | | | | — | | | | — | |
| | | | | | | | | | | | | | | | | | | | | | | | | | | | | | | | |
Net increase | | | 847,410 | | | $ | 13,110,308 | | | | 102,923 | | | $ | 1,586,343 | | | | — | | | | — | | | | — | | | | — | |
| | | | | | | | | | | | | | | | | | | | | | | | | | | | | | | | |
Institutional Class: | | | | | | | | | | | | | | | | | | | | | | | | | | | | | | | | |
Proceeds from sale of shares | | | 131,007 | | | $ | 2,098,590 | | | | 133,480 | | | $ | 2,051,173 | | | | 109,032 | | | $ | 896,735 | | | | 83,390 | | | $ | 681,130 | |
Reinvestment of distributions | | | 75,120 | | | | 1,155,376 | | | | 66,455 | | | | 1,013,186 | | | | 18,929 | | | | 154,888 | | | | 17,401 | | | | 141,883 | |
Cost of shares repurchased | | | (120,406 | ) | | | (1,935,947 | ) | | | (141,969 | ) | | | (2,204,719 | ) | | | (70,641 | ) | | | (581,343 | ) | | | (73,870 | ) | | | (607,276 | ) |
| | | | | | | | | | | | | | | | | | | | | | | | | | | | | | | | |
Net increase | | | 85,721 | | | $ | 1,318,019 | | | | 57,966 | | | $ | 859,640 | | | | 57,320 | | | $ | 470,280 | | | | 26,921 | | | $ | 215,737 | |
| | | | | | | | | | | | | | | | | | | | | | | | | | | | | | | | |
At December 31, 2014, certain unaffiliated shareholders of record, specifically omnibus accounts, individually or collectively held greater than 10% of the net assets of the Funds as follows: Balanced - three collectively own 50%; Intermediate Duration – two collectively own 62%; Short Duration two collectively own 67%. Transactions by these shareholders may have a material impact on their respective Funds.
h. REPURCHASE AGREEMENTS
The Funds may enter into repurchase agreements provided that the value of the underlying collateral, including accrued interest, will equal or exceed the value of the repurchase agreement during the term of the agreement. The underlying collateral for all repurchase agreements is held in safekeeping by the Fund’s custodian or at the Federal Reserve Bank. If the seller defaults and the value of the collateral declines, or if bankruptcy proceedings commence with respect to the seller of the security, realization of the collateral by the Fund may be delayed or limited. At December 31, 2014, the market value of repurchase agreements outstanding for Balanced, High Yield, Intermediate Duration and Short Duration was $1,092,623, $2,064,987, $0 and $0, respectively.
i. FOREIGN CURRENCY TRANSLATION
The books and records of the Funds are maintained in U.S. dollars. The value of investments, assets and liabilities denominated in currencies other than U.S.
dollars are translated into U.S. dollars based upon current foreign exchange rates. Purchases and sales of foreign investments, income and expenses are converted into U.S. dollars based on currency exchange rates prevailing on the respective dates of such transactions. Net realized and unrealized gain (loss) on foreign currency transactions represent: (1) foreign exchange gains and losses from the sale and holdings of foreign currencies; (2) gains and losses between trade date and settlement date on investment securities transactions; and (3) gains and losses from the difference between amounts of interest and dividends recorded and the amounts actually received.
The Funds do not isolate the net realized and unrealized gain or loss resulting from changes in exchange rates from the fluctuations in market prices of securities held. Such fluctuations are included with the net realized and unrealized gain or loss on investments.
73
Notes to Financial Statements (continued)
j. FOREIGN SECURITIES
The Funds invest in securities of foreign entities and in instruments denominated in foreign currencies which involve risks not typically associated with investments in domestic securities. Non-domestic securities carry special risks, such as exposure to currency fluctuations, less developed or less efficient trading markets, political instability, a lack of company information, differing auditing and legal standards, and, potentially, less liquidity.
Realized gains in certain countries may be subject to foreign taxes at the Fund level, at rates ranging from approximately 10% to 15%. The Funds would pay such foreign taxes at the appropriate rate for each jurisdiction.
k. SECURITIES TRANSACTED ON A WHEN ISSUED BASIS
The Funds may enter into To Be Announced (“TBA”) sale commitments to hedge their portfolio positions or to sell mortgage-backed securities it owns under delayed delivery arrangements. Proceeds of TBA sale commitments are not received until the contractual settlement date. During the time a TBA sale commitment is outstanding, equivalent deliverable securities, or an offsetting TBA purchase commitment deliverable on or before the sale commitment date, are held as “cover” for the transaction. Unsettled TBA sale commitments are valued at the current market value of the underlying securities according to the procedures described under “Valuation of Investments,” in footnote 1a above. Each contract is marked-to-market daily and the change in market value is recorded by the Funds as an unrealized gain or loss. If the TBA sale commitment is closed through the acquisition of an offsetting purchase commitment, the Funds realize a gain or loss. If the Funds deliver securities under the commitment, the Funds realize a gain or a loss from the sale of the securities based upon the unit price established at the date the commitment was entered into.
l. DELAYED DELIVERY TRANSACTIONS AND WHEN-ISSUED SECURITIES
The Funds may enter into securities transactions on a delayed delivery or when issued basis. Payment and delivery may take place after the customary settlement period for that security. The price of the underlying securities and the date when the securities will be delivered and paid for are fixed at the time the transaction is negotiated. During the time a delayed delivery sell is outstanding, the contract is marked to market daily and equivalent deliverable securities are held for the transaction. The value of the securities purchased on a delayed delivery or when-issued basis are identified as such in the Funds’ Schedules of Portfolio Investments. With respect to purchase commitments, the Funds identify securities as segregated in their records with a value at least equal to the amount of the commitment. The payables and receivables associated with the purchases and sales of delayed delivery securities having the same coupon, settlement date and broker are offset. Delayed delivery or when-issued securities that have been purchased from and sold to different brokers are reflected as both payables and receivables in the Funds’ Statement of Assets and Liabilities. Losses may arise due to changes in the value of the underlying securities or if the counterparty does not perform under the contract, or if the issuer does not issue the securities due to political, economic, or other factors.
2. AGREEMENTS AND TRANSACTIONS WITH AFFILIATES
For each of the Funds, the Trust has entered into an investment advisory agreement under which the Investment Manager, a subsidiary and the U.S.
retail distribution arm of Affiliated Managers Group, Inc. (“AMG”), serves as investment manager to the Funds and is responsible for the Funds’ overall administration and operations. The Investment Manager selects one or more subadvisors for the Funds (subject to Board approval) and monitors each subadvisor’s investment performance, security holdings and investment strategies. Each Fund’s investment portfolio is managed by one or more portfolio managers who serve pursuant to a subadvisory agreement with the Investment Manager. The investment portfolio of Balanced is managed by Chicago Equity Partners, LLC (“CEP”). AMG indirectly owns a majority interest in CEP.
Investment management fees are paid directly by the Funds to the Investment Manager based on average daily net assets. For the year ended December 31, 2014, the Funds’ investment management fees were paid at the following annual rate of each Fund’s respective average daily net assets:
| | | | |
Balanced | | | 0.70 | % |
High Yield | | | 0.70 | % |
Intermediate Duration | | | 0.70 | % |
Short Duration | | | 0.70 | % |
The Investment Manager has contractually agreed, through at least May 1, 2015, to waive management fees (but not below zero) and/or reimburse Fund expenses in order to limit total annual Fund operating expenses after fee waiver and expense reimbursements (exclusive of taxes, interest (including interest incurred in connection with bank and custody overdrafts), shareholder servicing, distribution and service (12b-1) fees, brokerage commissions and other transaction costs, acquired fund fees and expenses and extraordinary expenses) of Balanced and High Yield to 0.84% and 0.90%, respectively, of each Fund’s average daily net assets subject to later reimbursement by the Funds in certain circumstances.
The Investment Manager has contractually agreed, through at least May 1, 2015, to waive management fees (but not below zero) and/or reimburse Fund expenses in order to limit total annual Fund operating expenses after fee waiver and expense reimbursements (exclusive of taxes, interest (Including interest incurred in connection with bank and custody overdrafts), brokerage commissions and other transaction costs, acquired fund fees and expenses and extraordinary expenses) to 0.89% of Intermediate Duration Fund’s average daily net assets subject to later reimbursement by the Fund in certain circumstances.
The contractual expense limitation may only be terminated in the event the Investment Manager ceases to be the investment manager of the Fund or by mutual agreement between the Investment Manager and the AMG Funds II Board of Trustees; provided, however, that no such termination shall affect the obligation (including the amount of the obligation) of the Trust, on behalf of the Fund, to repay amounts previously paid, waived or reimbursed by the Investment Manager with respect to periods prior to the date of such termination.
Each Fund is obligated to repay the Investment Manager such amounts waived, paid or reimbursed in future years provided that the repayment occurs within thirty-six (36) months after the waiver or reimbursement and that such repayment would not cause the Fund’s total annual operating expenses after fee
74
Notes to Financial Statements (continued)
waiver and expense reimbursements in any such future year to exceed that Fund’s contractual expense limitation amount. For the year ended December 31, 2014, each Fund’s components of reimbursement available are detailed in the following chart:
| | | | | | | | | | | | |
| | | Balanced | | | High Yield | | | Intermediate Duration | |
Reimbursement Available - 12/31/13 | | $ | 402,345 | | | $ | 516,472 | | | $ | 167,657 | |
Additional Reimbursements | | | 178,166 | | | | 197,131 | | | | 91,438 | |
Expired Reimbursements | | | (94,572 | ) | | | (168,401 | ) | | | (75,733 | ) |
| | | | | | | | | | | | |
Reimbursement Available - 12/31/14 | | $ | 485,939 | | | $ | 545,202 | | | $ | 183,362 | |
| | | | | | | | | | | | |
The Investment Manager has agreed to waive a portion of its management fee in consideration of shareholder servicing fees that it has received from JPMorgan Distribution Services, Inc., with respect to short-term cash investments each Fund may have made in the JPMorgan Liquid Assets Money Market Fund, Capital Shares. For the year ended December 31, 2014, the management fee for Intermediate Duration was reduced by $8,459.
Balanced and High Yield have entered into an Administration and Shareholder Servicing Agreement under which the Investment Manager serves as Funds’ administrator (the “Administrator”) and is responsible for all aspects of managing the Funds’ operations, including administration and shareholder services to each Fund, its shareholders, and certain institutions, such as bank trust departments, broker-dealers and registered investment advisers, that advise or act as an intermediary with the Funds’ shareholders. The Funds pay a fee to the Administrator at the rate of 0.20% per annum of each Fund’s average daily net assets for this service.
The aggregate annual retainer paid to each Independent Trustee of the Board is $130,000, plus $7,000 or $2,500 for each regular or special meeting attended, respectively. The Independent Chairman of the Trusts receives an additional payment of $35,000 per year. The Chairman of the Audit Committee receives an additional payment of $15,000 per year. The Trustees’ fees and expenses are allocated among all of the Funds in the Trusts for which the Investment Manager serves as the advisor based on the relative net assets of such Funds. The “Trustees fees and expenses” shown in the financial statements represents each Fund’s allocated portion of the total fees and expenses paid by the AMG Funds family of mutual funds (“AMG Funds family”).
Prior to January 1. 2014, the aggregate annual retainer paid to each Independent Trustee of the Board was $105,000, plus $6,000 or $2,500 for each regular or special meeting attended, respectively. The Independent Chairman of the Trusts formerly received an additional payment of $25,000 per year. The Chairman of the Audit Committee formerly received an additional payment of $10,000 per year.
The Funds are distributed by AMG Distributors, Inc. (formerly Managers Distributors, Inc.) (the “Distributor”), a wholly-owned subsidiary of the Investment Manager. The Distributor serves as the distributor and underwriter for each Fund and is a registered broker-dealer and member of the Financial Industry Regulatory Authority, Inc. (“FINRA”). Shares of each Fund will be continuously offered and will be sold directly to prospective purchasers and through brokers, dealers or other financial intermediaries who have executed selling agreements with the Distributor. Subject to the compensation arrangement discussed below, generally the Distributor bears all or a portion of the expenses of providing services pursuant to the distribution agreement, including the payment of the expenses relating to the distribution of prospectuses for sales purposes and any advertising or sales literature. Certain Trustees and Officers of the Funds are Officers and/or Directors of the Investment Manager, AMG and/or the Distributor.
The Trust has adopted a distribution and service plan (the “Plan”) with respect to the Investor Class shares in accordance with the requirements of Rule 12b-1 under the 1940 Act and the requirements of the applicable rules of FINRA regarding asset based sales charges. Pursuant to the Plan, Balanced and High Yield may make payments to the Distributor for their expenditures in financing any activity primarily intended to result in the sale of each such class of the Fund’s shares and for maintenance and personal service provided to existing shareholders of that class. The Plan authorizes payments to the Distributor up to 0.25% annually of each Fund’s average daily net assets attributable to the Investor Class shares.
For Balanced, Intermediate Duration and Short Duration, the Board has approved reimbursement payments to the Investment Manager for shareholder servicing expenses (“shareholder servicing fees”) incurred. Shareholder servicing fees include payments to third parties such as a bank, broker-dealer, trust company or other financial intermediaries who provide shareholder recordkeeping, account servicing and other services. For Balanced, the Service Class shares may reimburse the Investment Manager for the actual amount incurred up to a maximum annual rate of each Class’s average daily net assets as shown in the table below. For Intermediate Duration and Short Duration, the Fund may reimburse the Investment Manager for the actual amount incurred up to a maximum annual rate of the Fund’s average daily net asset value. The impact on the annualized expense ratio for the year ended December 31, 2014, was as follows:
| | | | | | | | |
| Fund | | Maximum Amount Allowed | | | Actual Amount Incurred | |
Balanced-Service Class | | | 0.100 | % | | | 0.040 | % |
Intermediate Duration | | | 0.100 | % | | | 0.100 | % |
Short Duration | | | 0.100 | % | | | 0.001 | % |
The Securities and Exchange Commission granted an exemptive order that permits the Funds to lend and borrow money for certain temporary purposes directly to and from other eligible Funds in the AMG Funds family. Participation in this interfund lending program is voluntary for both the borrowing and lending Funds, and an interfund loan is only made if it benefits each participating Fund. The Investment Manager administers the program according to procedures approved by the Board, and the Board monitors the operation of the program. An interfund loan must comply with certain conditions set out in the exemptive
75
Notes to Financial Statements (continued)
order, which are designed to assure fairness and protect all participating Funds. For the year ended December 31, 2014, the following Funds either borrowed from or lent to other Funds in the AMG Funds family: Balanced borrowed varying amounts not exceeding $1,623,618 for four days paying interest of $87. The interest amount is included in the Statement of Operations as miscellaneous expense. Balanced lent $1,198,048 for three days earning interest of $60 and High Yield lent $1,442,962 for eight days earning interest of $91. The interest amount is included in the Statement of Operations as interest income. The Intermediate Duration and Short Duration Funds do not participate in the interfund lending program. At December 31, 2014, the Funds had no interfund loans outstanding.
3. PURCHASES AND SALES OF SECURITIES
Purchases and sales of securities (excluding short-term securities) for the year ended December 31, 2014, were as follows:
| | | | | | | | |
| | | Long-Term Securities | |
| | | (excluding U.S. Government | |
| | | Obligations) | |
| Fund | | Purchases | | | Sales | |
Balanced | | $ | 48,782,591 | | | $ | 38,300,365 | |
High Yield | | | 16,319,474 | | | | 14,347,670 | |
Intermediate Duration | | | — | | | | 3,598,305 | |
Short Duration | | | 44,779,408 | | | | 29,314,661 | |
| |
| | | U.S. Government Obligations | |
| Fund | | Purchases | | | Sales | |
Balanced | | $ | 19,628,689 | | | $ | 13,567,865 | |
High Yield | | | — | | | | — | |
Intermediate Duration | | | 19,381,389 | | | | 2,080,444,099 | |
Short Duration | | | 108,343,586 | | | | 169,016,067 | |
4. PORTFOLIO SECURITIES LOANED
The Funds participate in a securities lending program offered by BNYM (the “Program”), providing for the lending of securities to qualified brokers. Securities lending income include earnings of such temporary cash investments, plus or minus any rebate to a borrower. These earnings (after any rebate) are then divided between BNYM, as a fee for its services under the Program, and the Funds, according to agreed-upon rates. Collateral on all securities loaned is accepted in cash and is maintained at a minimum level of 102% (105% in the case of certain foreign securities) of the market value, plus interest, if applicable, of investments on loan. It is the Funds’ policy to obtain additional collateral from or return excess collateral to the borrower by the end of the next business day, following the valuation date of the securities loaned. Therefore, the value of the collateral held may be temporarily less than the value of the securities on loan. Lending securities entails a risk of loss to the Funds if and to the extent that the market value of the securities loaned were to increase and the borrower did not increase the collateral accordingly, and the borrower fails to return the securities. Under the terms of the Program, the Funds are indemnified for such losses by BNYM. Cash collateral is held in a separate account managed by BNYM, who is authorized to exclusively enter into overnight government repurchase agreements. BNYM bears the risk of any
deficiency in the amount of the cash collateral available for return to the borrower due to any loss on the collateral invested.
At December 31, 2014, the value of the securities loaned and cash collateral received, were as follows:
| | | | | | | | |
| | | Securities | | | Cash Collateral | |
| Fund | | Loaned | | | Received | |
Balanced | | | $1,056,983 | | | | $1,092,623 | |
High Yield | | | 1,986,847 | | | | 2,064,987 | |
5. COMMITMENTS AND CONTINGENCIES
Under the Trust’s organizational documents, its trustees and officers are indemnified against certain liabilities arising out of the performance of their duties to the Trust. In addition, in the normal course of business, the Funds may enter into contracts and agreements that contain a variety of representations and warranties which provide general indemnifications. The maximum exposure to the Funds under these arrangements is unknown, as this would involve future claims that may be made against the Funds that have not yet occurred. However, based on experience, the Funds had no prior claims or losses and expect the risks of loss to be remote.
6. RISKS ASSOCIATED WITH HIGH YIELD SECURITIES
Investing in high yield securities involves greater risks and considerations not typically associated with U.S. Government and other high quality/investment grade securities. High yield securities are generally below investment grade securities and do not have an established retail secondary market. Economic downturns may disrupt the high yield market and impair the issuer’s ability to repay principal and interest. Also, an increase in interest rates would likely have an adverse impact on the value of such obligations and could cause the securities to become less liquid.
7. DERIVATIVE INSTRUMENTS
The following disclosures contain information on how and why the Funds use derivative instruments, the credit risk and how derivative instruments affect the Funds’ financial position, results of operations and cash flows. The location and fair value amounts of these instruments on the Statement of Assets and Liabilities and the realized and changes in unrealized gains and losses on the Statement of Operations, each categorized by type of derivative contract, are included in a table in the Notes to the Schedules of Portfolio Investments. For the year ended December 31, 2014, the average quarterly balances of derivative financial instruments outstanding were as follows:
| | | | | | | | |
| | | Intermediate | | | Short | |
| | | Duration | | | Duration | |
Financial futures contracts: | | | | | | | | |
Average number of contracts purchased | | | 17 | | | | 28 | |
Average number of contracts sold | | | 61 | | | | 606 | |
Average notional value of contracts purchased | | $ | 2,153,406 | | | $ | 3,285,023 | |
Average notional value of contracts sold | | $ | 6,879,534 | | | $ | 68,356,438 | |
8. FUTURES CONTRACTS
The Funds entered into futures contracts to achieve a desired level of investment, whether to accommodate portfolio turnover or cash flows from
76
Notes to Financial Statements (continued)
capital shares transactions. There are certain risks associated with futures contracts. Prices may not move as expected or the Fund may not be able to close out the contract when it desires to do so, resulting in losses.
On entering into a futures contract, either cash or securities in an amount equal to a certain percentage of the contract value (initial margin) must be deposited with the futures broker. Subsequent payments (variation margin) are made or received each day. The variation margin payments equal the daily changes in the contract value and are recorded as unrealized gains or losses. For OTC futures, daily variation margin is not required. The Funds recognize a realized gain or loss when the contract is closed or expires equal to the difference between the value of the contract at the time it was opened and the value at the time it was closed. Futures are valued at their quoted daily settlement prices. The aggregate principal amounts of the contracts are not recorded in the financial statements. Fluctuations in the value of the contracts are recorded in the Statement of Assets and Liabilities as an asset (liability) and in the Statement of Operations as unrealized appreciation (depreciation) until the contracts are closed, when they are recorded as realized gains (losses) on futures contracts.
9. RISKS ASSOCIATED WITH COLLATERALIZED MORTGAGE OBLIGATIONS (“CMOs”)
The net asset values of the Funds may be sensitive to interest rate fluctuations because the Funds may hold several instruments, including CMOs and other derivatives, whose values can be significantly impacted by interest rate movements. CMOs are obligations collateralized by a portfolio of mortgages or mortgage-related securities. Payments of principal and interest on the mortgages are passed through to the holder of the CMOs on the same schedule as they are received, although certain classes of CMOs have priority over others with respect to the receipt of prepayments on the mortgages. Therefore, the investment in CMOs may be subject to a greater or lesser risk of prepayment than other types of mortgage-related securities. CMOs are subject to principal paydowns as a result of prepayments or refinancing of the underlying mortgage instruments. As a result, the average life may be substantially less than the original maturity. CMOs may have a fixed or variable rate of interest.
10. DOLLAR ROLL AGREEMENTS
The Funds may enter into dollar rolls in which they sell debt securities for delivery currently and simultaneously contract to repurchase similar, but not identical, securities at the same price or a lower price on an agreed date. The Funds receive compensation as consideration for entering into the commitment to repurchase. The compensation is the difference between the current sale price and the repurchase price (often referred to as the “drop”) as well as the interest earned on the cash proceeds of the initial sale. The Funds may also be compensated by the receipt of a commitment fee. As the holder, the counterparty receives all principal and interest payments, including prepayments, made with respect to the similar security sold. Dollar rolls may be renewed with a new sale and repurchase price with a cash settlement made at renewal without physical delivery of the securities subject to the contract.
Certain risks may arise upon entering into dollar rolls from the potential inability of counterparties to meet the terms of their commitments. Additionally, the value of such securities may change adversely before the Funds are able to
repurchase them. There can be no assurance that the Funds’ use of the cash that they receive from a dollar roll will provide a return that exceeds their cost.
11. STRIPPED SECURITIES
The Funds invest in stripped securities (“STRIPS”), primarily interest-only strips, for their hedging characteristics. Interest-only STRIPS will most likely move differently than typical fixed-income securities in relation to changes in interest rates. STRIPS are usually structured with two classes that receive different proportions of the interest and principal distributions from a pool of underlying assets. A common type of STRIP will have one class receiving all of the interest from the underlying assets (“interest-only” or “IO” class), while the other class will receive the entire principal (“principal only” or “PO” class). However, in some instances, one class will receive some of the interest and most of the principal while the other class will receive most of the interest and the remainder of the principal. STRIPS are unusually volatile in response to changes in interest rates. The yield to maturity on an IO class of STRIPS is extremely sensitive not only to changes in prevailing interest rates but also to the rate of principal payments (including prepayments) on the underlying assets. A rapid rate of principal prepayments may have a measurably adverse effect on a Funds’ yield to maturity to the extent it invests in IOs. Conversely, POs tend to increase in value if prepayments are greater than anticipated and decline if prepayments are slower than anticipated. Thus, if the underlying assets experience greater than anticipated repayments of principal, a Fund may fail to fully recover its initial investment in these securities, even if the STRIPS were rated of the highest credit quality by Standard & Poor’s Corporation or Moody’s Investors Service, Inc. These risks are managed by investing in a variety of such securities and by using certain hedging techniques. In addition the secondary market for STRIPS may be less liquid than that of other mortgage-backed or asset-backed securities, potentially limiting a Fund’s ability to buy or sell those securities at any particular time.
12. MASTER NETTING AGREEMENTS
The Funds may enter into master netting agreements with their counterparties for the securities lending program and repurchase agreements, which provide the right, in the event of default (including bankruptcy or insolvency) for the non-defaulting party to liquidate the collateral and calculate net exposure to the defaulting party or request additional collateral. For financial reporting purposes, the Funds do not offset financial assets and financial liabilities that are subject to master netting agreements in the Statement of Assets and Liabilities. For securities lending transactions, see Note 4.
77
Notes to Financial Statements (continued)
The following table is a summary of the Funds’ open repurchase agreements that are subject to a master netting agreement as of December 31, 2014:
| | | | | | | | | | | | | | | | |
| | | Net Amounts of
Assets Presented
in the Statement of Assets and
Liabilities | | | Gross Amount Not Offset in the
Statement of Assets and Liabilities | | | Net Amount | |
| Fund | | | Financial
Instruments | | | Cash Collateral
Received | | |
Balanced | | | | | | | | | | | | | | | | |
Cantor Fitzgerald Securities, Inc. | | $ | 750,000 | | | $ | 750,000 | | | | — | | | | — | |
Citigroup Global Markets, Inc. | | | 230,478 | | | | 230,478 | | | | — | | | | — | |
Nomura Securities International, Inc. | | | 112,145 | | | | 112,145 | | | | — | | | | — | |
| | | | | | | | | | | | | | | | |
Total | | $ | 1,092,623 | | | $ | 1,092,623 | | | | — | | | | — | |
| | | | | | | | | | | | | | | | |
High Yield | | | | | | | | | | | | | | | | |
Cantor Fitzgerald Securities | | $ | 1,000,000 | | | $ | 1,000,000 | | | | — | | | | — | |
Daiwa Capital Markets America | | | 64,987 | | | | 64,987 | | | | — | | | | — | |
Nomura Securities International, Inc. | | | 1,000,000 | | | | 1,000,000 | | | | — | | | | — | |
| | | | | | | | | | | | | | | | |
Total | | $ | 2,064,987 | | | $ | 2,064,987 | | | | — | | | | — | |
| | | | | | | | | | | | | | | | |
13. SUBSEQUENT EVENTS
Each Fund has determined that no material events or transactions occurred through the issuance of the Funds’ financial statements, which require additional disclosure in or adjustment of the Funds’ financial statements.
TAX INFORMATION (unaudited)
The AMG Chicago Equity Partners Balanced, AMG Managers High Yield, AMG Managers Intermediate Duration Government and AMG Managers Short Duration Government Funds each hereby designates the maximum amount allowable of its net taxable income as qualified dividends as provided in the Jobs and Growth Tax Relief Reconciliation Act of 2003. The 2014 Form 1099-DIV you receive for each Fund will show the tax status of all distributions paid to you during the year.
Pursuant to section 852 of the Internal Revenue Code, AMG Chicago Equity Partners Balanced, AMG Managers High Yield, AMG Managers Intermediate Duration Government and AMG Managers Short Duration Government Funds each hereby designates $4,045,842, $0, $180,861 and $0, respectively, as a capital gain distribution with respect to the taxable year ended December 31, 2014, or if subsequently determined to be different, the net capital gains of such fiscal year.
78
Report of Independent Registered Public Accounting Firm
TO THE BOARD OF TRUSTEES OF AMG FUNDS II AND THE SHAREHOLDERS OF AMG CHICAGO EQUITY PARTNERS BALANCED FUND, AMG MANAGERS HIGH YIELD FUND, AMG MANAGERS INTERMEDIATE DURATION GOVERNMENT FUND AND AMG MANAGERS SHORT DURATION GOVERNMENT FUND:
In our opinion, the accompanying statements of assets and liabilities, including the schedules of portfolio investments, and the related statements of operations and of changes in net assets and the financial highlights present fairly, in all material respects, the financial positions of AMG Chicago Equity Partners Balanced Fund (formerly, Managers AMG Chicago Equity Partners Balanced Fund), AMG Managers High Yield Fund (formerly, Managers High Yield Fund), AMG Managers Intermediate Duration Government Fund (formerly, Managers Intermediate Duration Government Fund), and AMG Managers Short Duration Government Fund (formerly, Managers Short Duration Government Fund) (the “Funds”) at December 31, 2014, and the results of each of their operations, the changes in each of their net assets and the financial highlights for each of the periods indicated, in conformity with accounting principles generally accepted in the United States of America. These financial statements and financial highlights (hereafter referred to as “financial statements”) are the responsibility of the Funds’ management. Our responsibility is to express an opinion on these financial statements based on our audits. We conducted our audits of these financial statements in accordance with the standards of the Public Company Accounting Oversight Board (United States). Those standards require that we plan and perform the audit to obtain reasonable assurance about whether the financial statements are free of material misstatement. An audit includes examining, on a test basis, evidence supporting the amounts and disclosures in the financial statements, assessing the accounting principles used and significant estimates made by management, and evaluating the overall financial statement presentation. We believe that our audits, which included confirmation of securities at December 31, 2014 by correspondence with the custodian, brokers and transfer agent, and the application of alternative auditing procedures where securities purchased had not been received, provide a reasonable basis for our opinion.
PricewaterhouseCoopers LLP
Boston, Massachusetts
February 26, 2015
79
AMG Funds
Trustees and Officers
The Trustees and Officers of the Trust, their business addresses, principal occupations for the past five years and dates of birth are listed below. The Trustees provide broad supervision over the affairs of the Trust and the Funds. The Trustees are experienced executives who meet periodically throughout the year to oversee the Funds’ activities, review contractual arrangements with
companies that provide services to the Funds, and review the Funds’ performance. Unless otherwise noted, the address of each Trustee or Officer is the address of the Trust: 800 Connecticut Avenue, Norwalk, Connecticut 06854.
There is no stated term of office for Trustees. Trustees serve until their resignation, retirement or removal in accordance with the Trust’s
organizational documents and policies adopted by the Board from time to time. The Chairman of the Trustees, President, Treasurer and Secretary of the Trust are elected by the Trustees annually. Other officers hold office at the pleasure of the Trustees.
Independent Trustees
The following Trustees are not “interested persons” of the Trust within the meaning of the 1940 Act:
| | | | |
Number of Funds
Overseen in Fund Complex | | Name, Date of Birth, Principal Occupation(s) During Past 5 Years and Other Directorships Held by Trustee |
| • | | Trustee since 2012 | | Bruce B. Bingham, 12/1/48 |
| • | | Oversees 44 Funds in
Fund Complex | | Partner, Hamilton Partners (real estate development firm) (1987-Present); Trustee of Aston Funds (27 portfolios) (2014-Present); Director of The Yacktman Funds (2000-2012). |
| | |
| • | | Independent Chairman | | William E. Chapman, II, 9/23/41 |
| • • | | Trustee since 2000
Oversees 44 Funds in
Fund Complex | | President and Owner, Longboat Retirement Planning Solutions (1998-Present); Hewitt Associates, LLC (part time) (provider of Retirement and Investment Education Seminars) (2002-2009); Trustee Emeritus of Bowdoin College (2013-Present); Trustee of Bowdoin College (2002-2013); Director of Harding, Loevner Funds, Inc. (6 portfolios); Trustee of Third Avenue Trust (5 portfolios); Trustee of Third Avenue Variable Trust (1 portfolio); Trustee of Aston Funds (27 portfolios) (2010-Present). |
| | |
| • | | Trustee since 2000 | | Edward J. Kaier, 9/23/45 |
| • | | Oversees 44 Funds in
Fund Complex | | Attorney at Law and Partner, Teeters Harvey Marrone & Kaier LLP (2007-Present); Attorney at Law and Partner, Hepburn Willcox Hamilton & Putnam, LLP (1977-2007); Trustee of Third Avenue Trust (5 portfolios); Trustee of Third Avenue Variable Trust (1 portfolio); Trustee of Aston Funds (27 portfolios) (2010-Present). |
| | |
| • | | Trustee since 2013 | | Kurt A. Keilhacker, 10/5/63 |
| • | | Oversees 46 Funds in
Fund Complex | | Managing Member, TechFund Capital (1997-Present); Managing Member, TechFund Europe (2000-Present); Trustee, Gordon College (2001-Present); Board Member, 6wind SA, (2002-Present); Managing Member, Clapham Partners I, LLC (2013-Present); Trustee of Aston Funds (27 portfolios) (2014-Present). |
| | |
| • | | Trustee since 2000 | | Steven J. Paggioli, 4/3/50 |
| • | | Oversees 44 Funds in
Fund Complex | | Independent Consultant (2002-Present); Formerly Executive Vice President and Director, The Wadsworth Group (1986-2001); Executive Vice President, Secretary and Director, Investment Company Administration, LLC (1990-2001); Vice President, Secretary and Director, First Fund Distributors, Inc. (1991-2001); Trustee, Professionally Managed Portfolios (43 portfolios); Advisory Board Member, Sustainable Growth Advisors, LP; Independent Director, Chase Investment Counsel (2008 – Present); Trustee of Aston Funds (27 portfolios) (2010-Present). |
| | |
| • | | Trustee since 2013 | | Richard F. Powers III, 2/2/46 |
| • | | Oversees 44 Funds in
Fund Complex | | Adjunct Professor, Boston College (2011-Present); Trustee of Aston Funds (27 portfolios) (2014-Present); President and CEO of Van Kampen Investments Inc. (1998-2003). |
| | |
| • | | Trustee since 2000 | | Eric Rakowski, 6/5/58 |
| • | | Oversees 46 Funds in
Fund Complex | | Professor, University of California at Berkeley School of Law (1990-Present); Director of Harding, Loevner Funds, Inc. (6 portfolios); Trustee of Third Avenue Trust (5 portfolios); Trustee of Third Avenue Variable Trust (1 portfolio); Trustee of Aston Funds (27 portfolios) (2010-Present). |
| | |
| • | | Trustee since 2013 | | Victoria L. Sassine, 8/11/65 |
| • | | Oversees 46 Funds in
Fund Complex | | Lecturer, Babson College (2007 – Present); Trustee of Aston Funds (27 portfolios) (2014-Present). |
| | |
| • | | Trustee since 2000 | | Thomas R. Schneeweis, 5/10/47 |
| • | | Oversees 44 Funds in
Fund Complex | | Professor Emeritus, University of Massachusetts (2013 - Present); Partner, S Capital Management, LLC (2007-Present); President, TRS Associates (1982-Present); Director, CISDM at the University of Massachusetts, (1996-2013); President, Alternative Investment Analytics, LLC, (formerly Schneeweis Partners, LLC) (2001-2013); Professor of Finance, University of Massachusetts (1977-2013); Partner, White Bear Partners, LLC (2007-2010); Partner, Northampton Capital Management, LLC (2004-2010); Trustee of Aston Funds (27 portfolios) (2010-Present). |
80
AMG Funds
Trustees and Officers (continued)
Interested Trustees
Each Trustee in the following table is an “interested person” of the Trust within the meaning of the 1940 Act. Ms. Carsman is an interested person of the Trust within the meaning of the 1940 Act by virtue of her position with, and interest in securities of, AMG, and her former position as Chief Legal Officer of the Trust.
| | | | |
Number of Funds
Overseen in Fund Complex | | Name, Date of Birth, Principal Occupation(s) During Past 5 Years and Other Directorships Held by Trustee |
| • | | Trustee since 2011 | | Christine C. Carsman, 4/2/52 |
| • | | Oversees 46 Funds in Fund
Complex | | Senior Vice President and Deputy General Counsel, Affiliated Managers Group, Inc. (2011-Present); Trustee of Aston Funds (27 portfolios) (2014-Present); Senior Vice President and Chief Regulatory Counsel, Affiliated Managers Group, Inc. (2007-2011); Vice President and Chief Regulatory Counsel, Affiliated Managers Group, Inc. (2004-2007); Secretary and Chief Legal Officer, AMG Funds, AMG Funds I, AMG Funds II and AMG Funds III (2004-2011); Senior Counsel, Vice President and Director of Operational Risk Management and Compliance, Wellington Management Company, LLP (1995-2004). |
| |
| Officers | | |
| |
Position(s) Held with Fund
and Length of Time Served | | Name, Date of Birth, Principal Occupation(s) During Past 5 Years |
| • | | President since 2014 | | Jeffrey T. Cerutti, 2/7/68 |
| • | | Principal Executive Officer
since 2014 | | Chief Executive Officer, AMG Funds LLC (2014-Present); Director, President and Principal, AMG Distributors, Inc. (2014-Present); President, VP Distributors, (2011-2014); Executive Vice President, Head of Distribution, Virtus Investment Partners, Inc. (2010-2014); Managing Director, Head of Sales, UBS Global Asset Management (2001-2010). |
| | |
| • | | Chief Operating Officer
since 2007 | | Keitha L. Kinne, 5/16/58 Chief Operating Officer, AMG Funds LLC (2007-Present); Chief Investment Officer, AMG Funds LLC (2008-Present); Chief Operating Officer, AMG Distributors, Inc. (2007-Present); Managing Partner, AMG Funds LLC (2007-2014); President, AMG Funds (2012-2014); President, AMG Distributors, Inc. (2012-2014); Managing Director, Legg Mason & Co., LLC (2006-2007); Managing Director, Citigroup Asset Management (2004-2006). |
| | |
| • | | Secretary since 2011 | | Lewis Collins, 2/22/66 |
| • | | Chief Legal Officer
since 2011 | | Senior Vice President and Senior Counsel, Affiliated Managers Group, Inc. (2010-Present); Vice President and Senior Counsel, Affiliated Managers Group, Inc. (2006-2010); Senior Counsel, Affiliated Managers Group, Inc. (2002-2006); Attorney, Ropes & Gray LLP (1998-2002). |
| | |
| • | | Chief Financial | | Donald S. Rumery, 5/29/58 |
| | Officer since 2007 | | Senior Vice President, Director of Mutual Funds Services, AMG Funds LLC (2005-Present); Treasurer, AMG Funds III (1995-Present); Treasurer, AMG Funds |
| • | | Treasurer since 1999 | | (1999-Present); Treasurer, AMG Funds I (2000-Present); Chief Financial Officer, AMG Funds, AMG Funds I, and AMG Funds III (2007-Present); Treasurer and Chief |
| • | | Principal Financial Officer
since 1999 | | Financial Officer, AMG Distributors, Inc. (2000-2012); Vice President, AMG Funds LLC, (1994-2004). |
| | |
| • | | Assistant Treasurer | | John C. Ball, 1/9/76 |
| | since 2014 | | Vice President, Assistant Treasurer, AMG Funds LLC (2014-Present); Vice President, State Street Corp. (2010-2014); Vice President, State Street International |
| | | | (Ireland) Limited (2007-2010). |
| | |
| • | | Chief Compliance Officer | | John J. Ferencz, 3/9/62 |
| | since 2010 | | Vice President, Chief Compliance Officer - AMG Family of Funds, AMG Funds LLC (2010-Present); Code of Ethics Reporting Officer and Sarbanes Oxley Code of Ethics Compliance Officer, AMG Funds, AMG Funds I, AMG Funds II and AMG Funds III (2010-Present); Senior Compliance Analyst, Mutual Funds and Regulatory, GE Asset Management Incorporated (2005-2010). |
| | |
| • | | Assistant Secretary | | Michael S. Ponder, 9/12/73 |
| | since 2011 | | Senior Vice President, Counsel, AMG Funds LLC (2011-Present); Attorney, DeNovo Legal (2009-2010); Vice President, Credit Suisse (2007-2009); Associate, Willkie |
| | | | Farr & Gallagher LLP (2006-2007). |
| | |
| • | | Anti-Money Laundering | | Patrick J. Spellman, 3/15/74 |
| | Compliance Officer
since 2014 | | Senior Vice President, Chief Compliance Officer, AMG Funds LLC (2011-Present); Chief Compliance Officer, AMG Distributors, Inc., (2010-Present); Compliance Manager, Legal and Compliance, Affiliated Managers Group, Inc. (2005-2011). |
81
THIS PAGE INTENTIONALLY LEFT BLANK
THIS PAGE INTENTIONALLY LEFT BLANK
THIS PAGE INTENTIONALLY LEFT BLANK

INVESTMENT MANAGER AND
ADMINISTRATOR
AMG Funds LLC
800 Connecticut Avenue
Norwalk, CT 06854
(800) 835-3879
DISTRIBUTOR
AMG Distributors, Inc.
800 Connecticut Avenue
Norwalk, CT 06854
(800) 835-3879
CUSTODIAN
The Bank of New York Mellon
2 Hanson Place
Brooklyn, NY 11217
LEGAL COUNSEL
Ropes & Gray LLP
Prudential Tower, 800 Boylston Street
Boston, MA 02199-3600
TRANSFER AGENT
BNY Mellon Investment Servicing (US) Inc.
Attn: AMG Funds
P.O. Box 9769
Providence, RI 02940
(800) 548-4539
FOR MANAGERSCHOICETM ONLY
AMG Funds
c/o BNY Mellon Investment Servicing (US) Inc.
P.O. Box 9847
Providence, Rhode Island 02940-8047
(800) 358-7668
This report is prepared for the Funds’ shareholders. It is authorized for distribution to prospective investors only when preceded or accompanied by an effective prospectus. To receive a free copy of the prospectus or Statement of Additional Information, which includes additional information about Fund Trustees, please contact us by calling 800.835.3879. Distributed by AMG Distributors, Inc., member FINRA/SIPC.
Current net asset values per share for each Fund are available on the Funds’ website at www.amgfunds.com.
A description of the policies and procedures each Fund uses to vote its proxies is available: (i) without charge, upon request, by calling 800.835.3879, or (ii) on the Securities and Exchange Commission’s (SEC) Web site at www.sec.gov. For information regarding each Fund’s proxy voting record for the 12-month period ended June 30, call 800.835.3879 or visit the SEC Web site at www.sec.gov.
The Funds file their complete schedule of portfolio holdings with the SEC for the first and third quarters of each fiscal year on Form N-Q. The Funds’ Forms N-Q are available on the SEC’s website at www.sec.gov. A Fund’s Forms N-Q may be reviewed and copied at the SEC’s Public Reference Room in Washington, DC. Information on the operation of the Public Reference Room may be obtained by calling
1-800-SEC-0330. To review a complete list of the Funds’ portfolio holdings, or to view the most recent quarterly holdings report, semiannual report, or annual report, please visit www.amgfunds.com.
www.amgfunds.com |
AFFILIATE SUBADVISED FUNDS
ALTERNATIVE FUNDS
AMG FQ Global Alternatives
First Quadrant, L.P.
BALANCED FUNDS
AMG Chicago Equity Partners Balanced
Chicago Equity Partners, LLC
AMG FQ Global Risk-Balanced
(formerly Managers AMG FQ Global Essentials)
First Quadrant, L.P.
EQUITY FUNDS
AMG Chicago Equity Partners Small Cap Value Fund
Chicago Equity Partners, LLC
AMG FQ Tax-Managed U.S. Equity
AMG FQ U.S. Equity
First Quadrant, L.P.
AMG Frontier Small Cap Growth
Frontier Capital Management Company, LLC
AMG GW&K Small Cap Core
(formerly GW&K Small Cap Equity)
Gannett Welsh & Kotler, LLC
AMG Renaissance International Equity
AMG Renaissance Large Cap Growth
The Renaissance Group LLC
AMG SouthernSun Small Cap
AMG SouthernSun U.S. Equity
SouthernSun Asset Management, LLC
AMG Systematic Large Cap Value
(formerly Systematic Value)
AMG Systematic Mid Cap Value
Systematic Financial Management, L.P.
AMG TimesSquare All Cap Growth
(formerly Managers AMG TSCM Growth Equity)
AMG TimesSquare International Small Cap
AMG TimesSquare Mid Cap Growth
AMG TimesSquare Small Cap Growth
TimesSquare Capital Management, LLC
AMG Trilogy Emerging Markets Equity
AMG Trilogy Global Equity
AMG Trilogy International Small Cap
Trilogy Global Advisors, L.P.
AMG Yacktman Focused
AMG Yacktman
Yacktman Asset Management LP
FIXED INCOME FUNDS
AMG GW&K Enhanced Core Bond
(formerly Managers AMG GW&K Fixed Income)
AMG GW&K Municipal Bond
AMG GW&K Municipal Enhanced Yield
Gannett Welsh & Kotler, LLC
OPEN-ARCHITECTURE FUNDS
EQUITY FUNDS
AMG Managers Brandywine Advisors Mid Cap Growth
AMG Managers Brandywine Blue
AMG Managers Brandywine
Friess Associates, LLC
AMG Managers Cadence Capital Appreciation
AMG Managers Cadence Emerging Companies
AMG Managers Cadence Mid-Cap
Cadence Capital Management, LLC
AMG Managers Emerging Opportunities
(formerly Managers Micro-Cap)
Lord, Abbett & Co. LLC
WEDGE Capital Management L.L.P.
Next Century Growth Investors LLC
RBC Global Asset Management (U.S.) Inc.
AMG Managers Essex Small/Micro Cap Growth
Essex Investment Management Co., LLC
AMG Managers Real Estate Securities
CenterSquare Investment Management, Inc.
AMG Managers Skyline Special Equities
(formerly Skyline Special Equities Portfolio)
Skyline Asset Management, L.P.
AMG Managers Special Equity
Ranger Investment Management, L.P.
Lord, Abbett & Co. LLC
Smith Asset Management Group, L.P.
Federated MDTA LLC
FIXED INCOME FUNDS
AMG Managers Bond
AMG Managers Global Income Opportunity
Loomis, Sayles & Co., L.P.
AMG Managers High Yield
J.P. Morgan Investment Management Inc.
AMG Managers Intermediate Duration Government
AMG Managers Short Duration Government
Amundi Smith Breeden LLC
AMG Managers Total Return Bond
(formerly Managers PIMCO Bond)
Pacific Investment Management Co. LLC
| | | | |
 | | | | | www.amgfunds.com |
| | | |
| | |
| |

| | ANNUAL REPORT |
AMG Funds
December 31, 2014

| | | | | | |
| AMG GW&K Enhanced Core Bond Fund | | |
| (formerly Managers AMG GW&K Fixed Income Fund) | | |
| Investor Class: MFDAX | | Service Class: MFDSX | | Class C: MFDCX | | |
| Institutional Class: MFDYX | | | | | | |
| |
| AMG GW&K Municipal Bond Fund | | |
| Investor Class: GWMTX | | Service Class: GWMSX | | Institutional Class: GWMIX | | |
| |
| AMG GW&K Municipal Enhanced Yield Fund | | |
| Investor Class: GWMNX | | Service Class: GWMRX | | Institutional Class: GWMEX | | |
| |
| AMG GW&K Small Cap Core Fund | | |
| (formerly GW&K Small Cap Equity Fund) | | |
| Investor Class: GWETX | | Service Class: GWESX | | Institutional Class: GWEIX | | |
| | | | |
| www.amgfunds.com | | | | AR020-1214 |
AMG Funds
Annual Report—December 31, 2014
| | | | |
TABLE OF CONTENTS | | PAGE | |
LETTER TO SHAREHOLDERS | | | 2 | |
| |
ABOUT YOUR FUND’S EXPENSES | | | 3 | |
| |
PORTFOLIO MANAGER’S COMMENTS, FUND SNAPSHOTS, AND SCHEDULES OF PORTFOLIO INVESTMENTS | | | | |
| |
AMG GW&K Enhanced Core Bond Fund | | | 4 | |
| |
AMG GW&K Municipal Bond Fund | | | 10 | |
| |
AMG GW&K Municipal Enhanced Yield Fund | | | 20 | |
| |
AMG GW&K Small Cap Core Fund | | | 27 | |
| |
NOTES TO SCHEDULES OF PORTFOLIO INVESTMENTS | | | 32 | |
| |
FINANCIAL STATEMENTS | | | | |
| |
Statement of Assets and Liabilities | | | 35 | |
Balance sheets, net asset value (NAV) per share computations and cumulative undistributed amounts | | | | |
| |
Statement of Operations | | | 36 | |
Detail of sources of income, expenses, and realized and unrealized gains (losses) during the year | | | | |
| |
Statements of Changes in Net Assets | | | 37 | |
Detail of changes in assets for the past two years | | | | |
| |
Financial Highlights | | | 39 | |
Historical net asset values per share, distributions, total returns, income and expense ratios, turnover ratios and net assets | | | | |
| |
Notes to Financial Highlights | | | 47 | |
| |
Notes to Financial Statements | | | 48 | |
Accounting and distribution policies, details of agreements and transactions with Fund management and affiliates, and descriptions of certain investment risks | | | | |
| |
REPORT OF INDEPENDENT REGISTERED PUBLIC ACCOUNTING FIRM | | | 56 | |
| |
TRUSTEES AND OFFICERS | | | 57 | |
Nothing contained herein is to be considered an offer, sale or solicitation of an offer to buy shares of any series of the AMG Fund family of mutual funds. Such offering is made only by Prospectus, which includes details as to offering price and other material information.
| | |
| |
| | Letter to Shareholders |
DEAR SHAREHOLDER:
The year ended December 31, 2014, was another period of strong equity returns. The S&P 500 Index, a widely followed barometer of the U.S. equity market, rose more than 13% during the past 12 months. International stocks, by comparison, had negative performance, as measured by the MSCI ACWI ex US Index (in U.S. Dollar terms). The first quarter of 2014 marked the five-year anniversary of the equity bull market. Despite a few bouts of volatility and persistent doubts about the strength of the economic recovery since the beginning of the bull market, the S&P 500 Index had a cumulative gain (through December 31, 2014) of 244% (including reinvestment of dividends) since the market bottom on March 9, 2009.
Meanwhile, the Barclays U.S. Aggregate Bond Index, a broad U.S. bond market benchmark, returned 6% during 2014. Bond markets have also performed strongly during this period, to the surprise of many, despite the unwinding of the U.S. Federal Reserve’s bond-buying program known as QE3.
In 2014, Managers Investment Group was rebranded as AMG Funds. Our new name helps align our fund family more closely with our parent company, Affiliated Managers Group (“AMG”). While the names of funds branded under AMG changed slightly, the ticker symbols remain the same. There was no change to the legal or ownership structure of the funds and the name change will have no impact on their management.
Our foremost goal at AMG Funds is to provide investment products and solutions that help our shareholders and clients successfully reach their long-term investment goals. We do this by partnering with many of AMG’s affiliate investment boutiques to offer a distinctive array of actively managed, return-oriented funds. In addition, we oversee and distribute a number of complementary mutual funds sub-advised by unaffiliated investment managers. We thank you for your continued confidence and investment in AMG Funds. You can rest assured that, under all market conditions, our team is focused on delivering excellent investment management services for your benefit.
Respectfully,
Jeffery Cerutti
President
AMG Funds
| | | | | | | | | | | | | | |
| Average Annual Total Returns | | Periods ended
December 31, 2014 | |
| Stocks: | | | | 1 Year | | | 3 Years | | | 5 Years | |
Large Caps | | (S&P 500 Index) | | | 13.69 | % | | | 20.41 | % | | | 15.45 | % |
Small Caps | | (Russell 2000® Index) | | | 4.89 | % | | | 19.21 | % | | | 15.55 | % |
International | | (MSCI All Country World ex USA Index) | | | (3.87 | )% | | | 8.99 | % | | | 4.43 | % |
Bonds: | | | | | | | | | | | | | | |
Investment Grade | | (Barclays U.S. Aggregate Bond Index) | | | 5.97 | % | | | 2.66 | % | | | 4.45 | % |
High Yield | | (Barclays U.S. High Yield Bond Index) | | | 2.45 | % | | | 8.43 | % | | | 9.03 | % |
Tax-exempt | | (Barclays Municipal Bond Index) | | | 9.05 | % | | | 4.30 | % | | | 5.16 | % |
Treasury Bills | | (BofA Merrill Lynch 6-month U.S. Treasury Bill) | | | 0.12 | % | | | 0.16 | % | | | 0.22 | % |
2
About Your Fund’s Expenses
As a shareholder of a Fund, you may incur two types of costs: (1) transaction costs, which may include sales charges (loads) on purchase payments; redemption fees; and exchange fees; and (2) ongoing costs, including management fees; distribution (12b-1) fees; and other Fund expenses. This example is intended to help you understand your ongoing costs (in dollars) of investing in the Fund and to compare these costs with the ongoing costs of investing in other mutual funds. The example is based on $1,000 invested at the beginning of the period and held for the entire period as indicated below.
ACTUAL EXPENSES
The first line of the following table provides information about the actual account values and actual expenses. You may use the information in this line, together with the amount you invested, to estimate the expenses that you paid over the period. Simply divide your account value by $1,000 (for example, an $8,600 account value divided by $1,000 = 8.6), then multiply the result by the number in the first line under the heading entitled “Expenses Paid During Period” to estimate the expenses you paid on your account during this period.
HYPOTHETICAL EXAMPLE FOR COMPARISON PURPOSES
The second line of the following table provides information about hypothetical account values and hypothetical expenses based on the Fund’s actual expense ratio and an assumed annual rate of return of 5% before expenses, which is not the Fund’s actual return. The hypothetical account values and expenses may not be used to estimate the actual ending account balance or expenses you paid for the period. You may use this information to compare the ongoing costs of investing in the Fund and other funds by comparing this 5% hypothetical example with the 5% hypothetical examples that appear in the shareholder reports of other funds.
Please note that the expenses shown in the table are meant to highlight your ongoing costs only and do not reflect any transactional costs, such as sales charges (loads), redemption fees, or exchange fees. Therefore, the second line of the table is useful in comparing ongoing costs only, and will not help you determine the relative total costs of owning different funds.
| | | | | | | | | | | | | | | | |
| Year Ended December 31, 2014 | | Expense
Ratio for
the Period | | | Beginning
Account Value
7/01/14 | | | Ending
Account Value
12/31/14 | | | Expenses
Paid During
the Period* | |
AMG GW&K Enhanced Core Bond Fund | |
Investor Class | | | | | | | | | | | | | | | | |
Based on Actual Fund Return | | | 0.84 | % | | $ | 1,000 | | | $ | 1,000 | | | $ | 4.23 | |
Hypothetical (5% return before expenses) | | | 0.84 | % | | $ | 1,000 | | | $ | 1,021 | | | $ | 4.28 | |
Service Class | | | | | | | | | | | | | | | | |
Based on Actual Fund Return | | | 0.62 | % | | $ | 1,000 | | | $ | 1,001 | | | $ | 3.13 | |
Hypothetical (5% return before expenses) | | | 0.62 | % | | $ | 1,000 | | | $ | 1,022 | | | $ | 3.16 | |
Class C | | | | | | | | | | | | | | | | |
Based on Actual Fund Return | | | 1.59 | % | | $ | 1,000 | | | $ | 996 | | | $ | 8.00 | |
Hypothetical (5% return before expenses) | | | 1.59 | % | | $ | 1,000 | | | $ | 1,017 | | | $ | 8.08 | |
Institutional Class | | | | | | | | | | | | | | | | |
Based on Actual Fund Return | | | 0.59 | % | | $ | 1,000 | | | $ | 1,001 | | | $ | 2.98 | |
Hypothetical (5% return before expenses) | | | 0.59 | % | | $ | 1,000 | | | $ | 1,022 | | | $ | 3.01 | |
AMG GW&K Municipal Bond Fund | |
Investor Class | | | | | | | | | | | | | | | | |
Based on Actual Fund Return | | | 0.87 | % | | $ | 1,000 | | | $ | 1,021 | | | $ | 4.43 | |
Hypothetical (5% return before expenses) | | | 0.87 | % | | $ | 1,000 | | | $ | 1,021 | | | $ | 4.43 | |
Service Class | | | | | | | | | | | | | | | | |
Based on Actual Fund Return | | | 0.50 | % | | $ | 1,000 | | | $ | 1,023 | | | $ | 2.55 | |
Hypothetical (5% return before expenses) | | | 0.50 | % | | $ | 1,000 | | | $ | 1,023 | | | $ | 2.55 | |
Institutional Class | | | | | | | | | | | | | | | | |
Based on Actual Fund Return | | | 0.34 | % | | $ | 1,000 | | | $ | 1,024 | | | $ | 1.73 | |
Hypothetical (5% return before expenses) | | | 0.34 | % | | $ | 1,000 | | | $ | 1,024 | | | $ | 1.73 | |
AMG GW&K Municipal Enhanced Yield Fund | |
Investor Class | | | | | | | | | | | | | | | | |
Based on Actual Fund Return | | | 1.03 | % | | $ | 1,000 | | | $ | 1,050 | | | $ | 5.32 | |
Hypothetical (5% return before expenses) | | | 1.03 | % | | $ | 1,000 | | | $ | 1,020 | | | $ | 5.24 | |
Service Class | | | | | | | | | | | | | | | | |
Based on Actual Fund Return | | | 0.68 | % | | $ | 1,000 | | | $ | 1,051 | | | $ | 3.52 | |
Hypothetical (5% return before expenses) | | | 0.68 | % | | $ | 1,000 | | | $ | 1,022 | | | $ | 3.47 | |
Institutional Class | | | | | | | | | | | | | | | | |
Based on Actual Fund Return | | | 0.64 | % | | $ | 1,000 | | | $ | 1,051 | | | $ | 3.31 | |
Hypothetical (5% return before expenses) | | | 0.64 | % | | $ | 1,000 | | | $ | 1,022 | | | $ | 3.26 | |
AMG GW&K Small Cap Core Fund | |
Investor Class | | | | | | | | | | | | | | | | |
Based on Actual Fund Return | | | 1.45 | % | | $ | 1,000 | | | $ | 1,017 | | | $ | 7.37 | |
Hypothetical (5% return before expenses) | | | 1.45 | % | | $ | 1,000 | | | $ | 1,018 | | | $ | 7.37 | |
Service Class | | | | | | | | | | | | | | | | |
Based on Actual Fund Return | | | 1.10 | % | | $ | 1,000 | | | $ | 1,019 | | | $ | 5.60 | |
Hypothetical (5% return before expenses) | | | 1.10 | % | | $ | 1,000 | | | $ | 1,020 | | | $ | 5.60 | |
Institutional Class | | | | | | | | | | | | | | | | |
Based on Actual Fund Return | | | 0.95 | % | | $ | 1,000 | | | $ | 1,020 | | | $ | 4.84 | |
Hypothetical (5% return before expenses) | | | 0.95 | % | | $ | 1,000 | | | $ | 1,020 | | | $ | 4.84 | |
| * | Expenses are equal to the Fund’s annualized expense ratio multiplied by the average account value over the period, multiplied by the number of days in the most recent fiscal half-year (184), then divided by 365. |
3
AMG GW&K Enhanced Core Bond Fund
Portfolio Manager’s Comments
THE YEAR IN REVIEW
AMG GW&K Enhanced Core Bond Fund Institutional Class (the Fund) returned 5.85% for the year ended December 31, 2014, compared to the return of 5.97% for the Barclays U.S. Aggregate Bond Index. Please note that this Fund has multiple share classes. Performance for all classes can be found on the Fund’s performance page at www.amgfunds.com
Fixed-income markets saw mixed performance in the fourth quarter amid concerns about anemic global growth, the rising threat of deflation and the implications of falling energy prices after a strong first nine months to the year for bonds. The end of the year offered economic data in the U.S. that contained further evidence that a meaningful domestic recovery is finally taking hold, with GDP growing at its fastest pace in more than ten years. The U.S. has stood apart from the rest of the world with respect to monetary policy. The U.S. Federal Reserve (the Fed) brought QE3 to an end towards the end of 2014 and adopted increasingly hawkish language, while the European Central Bank and Bank of Japan ramped up asset purchases and hinted at further easing. And so, interest rates extended their year-long rally on the back of both a flight-to-quality and demand for the relative attractiveness of U.S. debt, ultimately ending the year near historic lows.
We expect the recent uptick in volatility to persist in 2015. Despite a U.S. economy that continues to show strength, the impending rate hike from the Fed and the implications of falling energy prices will ensure that uncertainty persists in both the interest rate and credit markets. We also anticipate further flattening of the yield curve as we approach the first rate hike. Additionally, the unique strength of the U.S., amid a global economy characterized by the threat of deflation, slow growth, and geopolitical uncertainty, will continue to limit upside in rates, as the U.S. offers both safety and attractive valuations. Finally, we remain constructive on high-quality spread product, which we expect to benefit from improving economic fundamentals in the U.S. and a worldwide search for yield.
Within the Fund, duration and curve positioning remain essentially neutral-weight. We believe there is room for further bear flattening given the impact of impending Fed action and expectations of low inflation, but to a large extent we think this story has already been priced in. We maintain our preference for intermediate maturities, which offer carry and roll that more than offset the risk of rising rates at that part of the curve.
We continue to see value in corporate bonds relative to Treasuries, particularly following recent spread widening, given that profitability remains near peak levels and balance sheets remain solid. Corporates also provide a defensive hedge in a rising rate environment. Within investment grade, we still prefer BBB-rated credits for the incremental spread over A-rated credits for acceptable levels of additional risk. We also continue to favor the more cyclical sectors, which should benefit from the ongoing U.S. recovery and which offer the best reward for careful security selection.
We remain overweight high-yield as well. While we recognize that a prolonged decline in oil prices could lead to an increase in the overall default rate over the next several years, credit fundamentals more broadly remain strong and support a benign default outlook outside of the energy space. High-yield spreads reached their highest level in more than two years during the quarter and remain 160 basis points above their recent lows, offering not only carry and the potential for spread compression, but also protection against rising rates. We remain neutral on mortgages, despite limited room for spread compression, because they offer downside protection in a rising rate environment, as well as a defensive alternative to credit markets.
This commentary reflects the viewpoints of the portfolio manager, Gannett Welsh & Kotler, LLC as of December 31, 2014 and is not intended as a forecast or guarantee of future results
4
AMG GW&K Enhanced Core Bond Fund
Portfolio Manager’s Comments (continued)
CUMULATIVE TOTAL RETURN PERFORMANCE
AMG GW&K Enhanced Core Bond Fund’s cumulative total return is based on the daily change in net asset value (NAV), and assumes that all distributions were reinvested. The chart compares a hypothetical $10,000 investment made in the Fund’s Investor Class shares on December 31, 2004, with a $10,000 investment made in the Barclays U.S. Aggregate Bond Index for the same time period. The graph and table do not reflect the deduction of taxes that a shareholder would pay on a Fund distribution or redemption of shares. The listed returns for the Fund are net of expenses and the returns for the index exclude expenses. Total returns for the Fund would have been lower had certain expenses not been reduced.
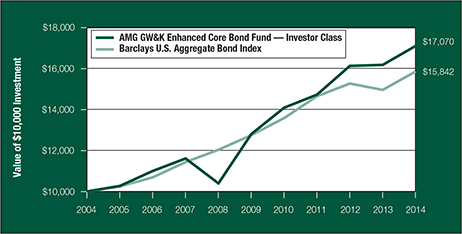
The table below shows the average annual total returns for the AMG GW&K Enhanced Core Bond Fund and the Barclays U.S. Aggregate Bond Index for the same time periods ended December 31, 2014.
| | | | | | | | | | | | | | | | | | | | |
| Average Annual Total Returns1 | | One
Year | | | Five
Years | | | Ten
Years | | | Since
Inception | | | Inception
Date | |
AMG GW&K Enhanced Core Bond Fund2,3,4,5 | | | | | | | | | | | | | | | | | | | | |
Investor Class | | | 5.58 | % | | | 5.93 | % | | | 5.49 | % | | | 6.15 | % | | | 01/02/97 | |
Service Class | | | 5.84 | % | | | — | | | | — | | | | 3.09 | % | | | 11/30/12 | |
Class C6 | | | 4.79 | % | | | 5.13 | % | | | 4.70 | % | | | 5.36 | % | | | 03/05/98 | |
Institutional Class | | | 5.85 | % | | | 6.19 | % | | | 5.75 | % | | | 6.56 | % | | | 01/02/97 | |
Barclays U.S. Aggregate Bond Index7 | | | 5.97 | % | | | 4.45 | % | | | 4.71 | % | | | 5.73 | % | | | 01/02/97 | † |
The performance data shown represents past performance. Past performance is not a guarantee of future results. Current performance may be lower or higher than the performance data quoted. The investment return and principal value of an investment in the Fund will fluctuate so that an investor’s shares, when redeemed, may be worth more or less than their original cost.
Investors should carefully consider the Fund’s investment objectives, risks, charges and expenses before investing. For performance information through the most recent month end, current net asset values per share for the Fund and other information, please call (800) 835-3879 or visit our website at www.amgfunds.com for a free prospectus. Read it carefully before investing or sending money.
Funds are distributed by AMG Distributors, Inc., member FINRA/SIPC.
| † | Date reflects inception date of the Fund, not the index. |
| 1 | Total return equals income yield plus share price change and assumes reinvestment of all dividends and capital gain distributions. Returns are net of fees and may reflect offsets of Fund expenses as described in the prospectus. No adjustment has been made for taxes payable by shareholders on their reinvested dividends and capital gain distributions. Returns for periods greater than one year are annualized. The listed returns on the Fund are net of expenses and based on the published NAV as of December 31, 2014. All returns are in U.S. dollars ($). |
| 2 | From time to time, the Fund’s advisor has waived its fees and/or absorbed Fund expenses, which has resulted in higher returns. |
| 3 | Fixed income funds are subject to the risks associated with investments in debt securities, such as default risk and fluctuations in the perception of the debtor’s ability to pay its creditors. |
| 4 | High Yield bonds (also known as “junk bonds”) are subject to additional risks such as the risk of default. |
| 5 | Changing interest rates may adversely affect the value of a fixed income investment. An increase in interest rates typically causes the value of bonds and other fixed income securities to fall. |
| 6 | Closed to new investments. |
| 7 | The Barclays U.S. Aggregate Bond Index is an index of the U.S. investment grade, fixed-rate bond market, including both government and corporate bonds. Unlike the Fund, the Barclays U.S. Aggregate Bond Index is unmanaged, is not available for investment, and does not incur expenses. |
Not FDIC insured, nor bank guaranteed. May lose value.
5
AMG GW&K Enhanced Core Bond Fund
Fund Snapshots (unaudited)
December 31, 2014
PORTFOLIO BREAKDOWN
| | | | |
Sector | | AMG GW&K Enhanced
Core Bond Fund** | |
Industrials | | | 43.8 | % |
U.S. Government and Agency Obligations | | | 30.1 | % |
Financials | | | 15.6 | % |
Municipal Bonds | | | 6.4 | % |
Other Assets and Liabilities | | | 4.1 | % |
| ** | As a percentage of net assets. |
| | | | |
Rating | | AMG GW&K Enhanced
Core Bond Fund† | |
U.S. Government and Agency Obligations | | | 31.4 | % |
Aa | | | 6.3 | % |
A | | | 9.8 | % |
Baa | | | 34.8 | % |
Ba | | | 14.3 | % |
B | | | 3.4 | % |
| † | As a percentage of market value of fixed-income securities. |
TOP TEN HOLDINGS
| | | | |
Security Name | | % of Net Assets | |
FNMA, 5.500%, 02/01/39 | | | 4.9 | % |
FNMA, 4.500%, 05/01/39* | | | 4.4 | |
FHLMC Gold Pool,
5.000%, 10/01/36* | | | 3.9 | |
United States Treasury Notes, 6.250%, 08/15/23* | | | 2.5 | |
Starwood Hotels & Resorts Worldwide, Inc.,
4.500%, 10/01/34 | | | 2.2 | |
FNMA, 6.000%, 06/01/36* | | | 2.1 | |
FNMA, 5.500%, 05/01/25* | | | 2.1 | |
FNMA, 6.000%, 10/01/39* | | | 2.1 | |
California State General Obligation, Build America Bonds,
7.550%, 04/01/39 | | | 2.1 | |
The Goldman Sachs Group, Inc., 6.130%, 02/15/33 | | | 2.0 | |
| | | | |
Top Ten as a Group | | | 28.3 | % |
| | | | |
| * | Top Ten Holding as of June 30, 2014. |
Credit quality ratings shown above reflect the highest rating assigned by either Standard & Poor’s (“S&P”) or Moody’s Investors Service, Inc. (“Moody’s”). These rating agencies are independent, nationally recognized statistical rating organizations and are widely used. Investment grade ratings are credit ratings of BBB/Baa or higher. Below investment grade ratings are credit ratings of BB/Ba or lower. Investments designated N/R are not rated by either rating agency. Unrated investments do not necessarily indicate low credit quality. Credit quality ratings are subject to change.
Because a fund’s strategy may result in multiple investments in particular sectors of the economy, its performance may depend on the performance of those sectors and may fluctuate more widely than investments diversified across more sectors For additional information on these and other risk considerations, please see the Fund’s prospectus.
Any sectors, industries, or securities discussed should not be perceived as investment recommendations. Mention of a specific security should not be considered a recommendation to buy or solicitation to sell that security. Specific securities mentioned in this report may have been sold from the Fund’s portfolio of investments by the time you receive this report.
6
AMG GW&K Enhanced Core Bond Fund
Schedule of Portfolio Investments
December 31, 2014
| | | | | | | | |
| | | Principal Amount | | | Value | |
Corporate Bonds and Notes - 59.4% | | | | | | | | |
Financials - 15.6% | | | | | | | | |
Ally Financial, Inc., 8.000%, 03/15/20 | | $ | 550,000 | | | $ | 650,375 | |
American Tower Corp., | | | | | | | | |
5.050%, 09/01/20 | | | 355,000 | | | | 385,630 | |
7.250%, 05/15/19 | | | 1,120,000 | | | | 1,309,116 | |
Associates Corp. of North America, 6.950%, 11/01/18 | | | 725,000 | | | | 847,516 | |
Bank of America Corp., Series M, 8.125%, 12/29/491 | | | 520,000 | | | | 563,550 | |
General Electric Capital Corp., Series GMTN, 6.000%, 08/07/19 | | | 775,000 | | | | 902,378 | |
The Goldman Sachs Group, Inc., 6.125%, 02/15/33 | | | 1,445,000 | | | | 1,776,318 | |
International Lease Finance Corp., 8.250%, 12/15/20 | | | 550,000 | | | | 664,125 | |
JPMorgan Chase & Co., Series 1, 7.900%, 04/29/491 | | | 1,195,000 | | | | 1,292,154 | |
Morgan Stanley, Series GMTN, 5.500%, 07/28/21 | | | 750,000 | | | | 852,348 | |
The PNC Financial Services Group, Inc., 6.750%, 07/29/491,2 | | | 1,165,000 | | | | 1,284,413 | |
Wells Fargo & Co., Series K, 7.980%, 03/29/491 | | | 1,215,000 | | | | 1,347,131 | |
Weyerhaeuser Co., 8.500%, 01/15/25 | | | 1,340,000 | | | | 1,773,911 | |
Total Financials | | | | | | | 13,648,965 | |
Industrials - 43.8% | | | | | | | | |
Alcoa, Inc., 5.125%, 10/01/24 | | | 855,000 | | | | 907,812 | |
American Axle & Manufacturing, Inc., 6.625%, 10/15/22 | | | 600,000 | | | | 639,000 | |
ArcelorMittal, 10.350%, 06/01/19 (b) | | | 530,000 | | | | 641,963 | |
Burlington Northern Santa Fe LLC, 6.150%, 05/01/37 | | | 1,335,000 | | | | 1,762,993 | |
Calumet Specialty Products Partners L.P. / Calumet Finance Corp., 7.625%, 01/15/22 | | | 600,000 | | | | 558,000 | |
CBS Corp., 3.375%, 03/01/22 | | | 850,000 | | | | 855,011 | |
CenturyLink, Inc., Series S, 6.450%, 06/15/21 | | | 605,000 | | | | 651,888 | |
CF Industries, Inc., 7.125%, 05/01/20 | | | 1,435,000 | | | | 1,711,545 | |
Chesapeake Energy Corp., 6.125%, 02/15/21 | | | 615,000 | | | | 648,825 | |
Cimarex Energy Co., 4.375%, 06/01/242 | | | 500,000 | | | | 478,750 | |
Cloud Peak Energy Resources LLC / Cloud Peak Energy Finance Corp., 6.375%, 03/15/24 | | | 500,000 | | | | 467,500 | |
Comcast Corp., 7.050%, 03/15/33 | | | 660,000 | | | | 920,946 | |
CONSOL Energy, Inc., 5.875%, 04/15/22 (a) | | | 500,000 | | | | 467,500 | |
DIRECTV Holdings LLC / DIRECTV Financing Co., Inc., | | | | | | | | |
5.000%, 03/01/21 | | | 550,000 | | | | 600,573 | |
5.200%, 03/15/20 | | | 1,000,000 | | | | 1,107,017 | |
Energy Transfer Equity, L.P., 7.500%, 10/15/20 | | | 570,000 | | | | 635,550 | |
Ford Motor Co., 7.450%, 07/16/31 | | | 670,000 | | | | 911,989 | |
Freeport-McMoran Oil & Gas LLC/FCX Oil & Gas Inc., 6.750%, 02/01/22 | | | 765,000 | | | | 843,413 | |
Frontier Communications Corp., 8.500%, 04/15/20 | | | 565,000 | | | | 632,800 | |
General Motors Co., 6.250%, 10/02/43 | | | 750,000 | | | | 899,700 | |
The accompanying notes are an integral part of these financial statements.
7
AMG GW&K Enhanced Core Bond Fund
Schedule of Portfolio Investments (continued)
| | | | | | | | |
| | | Principal Amount | | | Value | |
Industrials - 43.8% (continued) | | | | | | | | |
Georgia-Pacific LLC, 8.000%, 01/15/24 | | $ | 645,000 | | | $ | 858,857 | |
Hornbeck Offshore Services, Inc., 5.875%, 04/01/20 | | | 600,000 | | | | 537,000 | |
Host Hotels & Resorts, L.P., Series C, 4.750%, 03/01/23 | | | 815,000 | | | | 867,490 | |
International Paper Co., 7.500%, 08/15/21 | | | 675,000 | | | | 842,567 | |
L-3 Communications Corp., 4.950%, 02/15/21 | | | 1,185,000 | | | | 1,289,671 | |
Lear Corp., | | | | | | | | |
4.750%, 01/15/23 | | | 600,000 | | | | 601,500 | |
5.375%, 03/15/24 | | | 350,000 | | | | 359,625 | |
The Mosaic Co., 4.250%, 11/15/23 | | | 840,000 | | | | 888,003 | |
NuStar Logistics, L.P., 6.750%, 02/01/21 | | | 450,000 | | | | 477,060 | |
Offshore Group Investment, Ltd., 7.500%, 11/01/19 | | | 500,000 | | | | 375,000 | |
Owens Corning, 4.200%, 12/15/22 | | | 855,000 | | | | 869,140 | |
Peabody Energy Corp., 6.250%, 11/15/212 | | | 850,000 | | | | 729,938 | |
QVC, Inc., 5.125%, 07/02/22 | | | 830,000 | | | | 874,865 | |
The Ryland Group, Inc., 6.625%, 05/01/20 | | | 650,000 | | | | 692,250 | |
Sprint Corp., 7.875%, 09/15/23 | | | 600,000 | | | | 595,320 | |
Starwood Hotels & Resorts Worldwide, Inc., 4.500%, 10/01/34 | | | 1,900,000 | | | | 1,944,086 | |
Teck Resources, Ltd., 6.125%, 10/01/35 | | | 1,200,000 | | | | 1,097,395 | |
Teekay Corp., 8.500%, 01/15/20 | | | 600,000 | | | | 670,320 | |
Thompson Creek Metals Co., Inc., 9.750%, 12/01/172 | | | 525,000 | | | | 548,625 | |
Time, Inc., 5.750%, 04/15/22 (a) | | | 750,000 | | | | 727,500 | |
T-Mobile USA, Inc., 6.633%, 04/28/21 | | | 280,000 | | | | 288,400 | |
Tyson Foods, Inc., 4.875%, 08/15/34 | | | 845,000 | | | | 929,890 | |
United Continental Holdings, Inc., 6.375%, 06/01/18 | | | 550,000 | | | | 583,000 | |
Verizon Communications, Inc., 5.150%, 09/15/23 | | | 780,000 | | | | 861,911 | |
Viacom, Inc., 6.875%, 04/30/36 | | | 675,000 | | | | 859,456 | |
Weatherford International, Ltd./Bermuda, 9.625%, 03/01/19 | | | 968,000 | | | | 1,149,130 | |
The Williams Cos., Inc., 8.750%, 03/15/32 | | | 1,360,000 | | | | 1,590,970 | |
Total Industrials | | | | | | | 38,451,744 | |
Total Corporate Bonds and Notes (cost $52,247,422) | | | | | | | 52,100,709 | |
Municipal Bonds - 6.4% | | | | | | | | |
California State General Obligation, Build America Bonds, 7.550%, 04/01/39 | | | 1,175,000 | | | | 1,814,423 | |
Illinois State General Obligation, 5.365%, 03/01/17 | | | 1,150,000 | | | | 1,233,663 | |
JobsOhio Beverage System, Series B, 3.985%, 01/01/29 | | | 745,000 | | | | 773,057 | |
Metropolitan Transportation Authority NY Revenue, Build America Bonds, 6.668%, 11/15/39 | | | 685,000 | | | | 936,059 | |
New Jersey Economic Development Authority, Series A, 7.425%, 02/15/29 (National Insured)3 | | | 685,000 | | | | 873,724 | |
Total Municipal Bonds (cost $5,446,055) | | | | | | | 5,630,926 | |
The accompanying notes are an integral part of these financial statements.
8
AMG GW&K Enhanced Core Bond Fund
Schedule of Portfolio Investments (continued)
| | | | | | | | |
| | | Principal Amount | | | Value | |
U.S. Government and Agency Obligations - 30.1% | | | | | | | | |
Federal Home Loan Mortgage Corporation - 6.6% | | | | | | | | |
FHLMC Gold Pool, | | | | | | | | |
4.500%, 10/01/39 | | $ | 845,157 | | | $ | 916,491 | |
5.000%, 06/01/26 to 10/01/36 | | | 4,441,148 | | | | 4,863,682 | |
Total Federal Home Loan Mortgage Corporation | | | | | | | 5,780,173 | |
Federal National Mortgage Association - 20.6% | | | | | | | | |
FNMA, | | | | | | | | |
4.000%, 02/01/26 | | | 499,809 | | | | 537,467 | |
4.500%, 05/01/39 | | | 3,546,077 | | | | 3,880,373 | |
5.000%, 08/01/35 | | | 1,438,964 | | | | 1,594,243 | |
5.500%, 05/01/25 to 02/01/39 | | | 7,011,802 | | | | 7,825,077 | |
6.000%, 02/01/23 to 10/01/39 | | | 3,736,535 | | | | 4,252,022 | |
Total Federal National Mortgage Association | | | | | | | 18,089,182 | |
U.S. Treasury Obligations - 2.9% | | | | | | | | |
United States Treasury Notes, | | | | | | | | |
3.500%, 05/15/20 | | | 350,000 | | | | 381,856 | |
6.250%, 08/15/23 | | | 1,646,000 | | | | 2,191,751 | |
Total U.S. Treasury Obligations | | | | | | | 2,573,607 | |
Total U.S. Government and Agency Obligations (cost $25,852,016) | | | | | | | 26,442,962 | |
Short-Term Investments - 5.8% | | | | | | | | |
Repurchase Agreements - 2.6%4 | | | | | | | | |
Cantor Fitzgerald Securities, Inc., dated 12/31/14 due 01/02/15, 0.090%, total to be received $1,000,005 (collateralized by various U.S. Government Agency Obligations, 0.000% - 10.500%, 01/01/15 - 11/20/64, totaling $1,020,000) | | | 1,000,000 | | | | 1,000,000 | |
Daiwa Capital Markets America, dated 12/31/14, due 01/02/15, 0.120%, total to be received $316,215 (collateralized by various U.S. Government Agency Obligations, 0.000% - 6.500%, 06/01/17 - 03/01/48, totaling $322,537) | | | 316,213 | | | | 316,213 | |
Nomura Securities International, Inc., dated 12/31/14, due 01/02/15, 0.080%, total to be received $1,000,004 (collateralized by various U.S. Government Agency Obligations, 0.000% - 8.875%, 01/07/15 -11/20/64 totaling $1,020,000) | | | 1,000,000 | | | | 1,000,000 | |
Total Repurchase Agreements | | | | | | | 2,316,213 | |
| | |
| | | Shares | | | | |
Other Investment Companies - 3.2%5 | | | | | | | | |
Dreyfus Institutional Cash Advantage Fund, Institutional Class Shares, 0.06% | | | 2,793,853 | | | | 2,793,853 | |
Total Short-Term Investments
(cost $5,110,066) | | | | | | | 5,110,066 | |
Total Investments - 101.7% (cost $88,655,559) | | | | | | | 89,284,663 | |
Other Assets, less Liabilities - (1.7)% | | | | | | | (1,465,232 | ) |
Net Assets - 100.0% | | | | | | $ | 87,819,431 | |
The accompanying notes are an integral part of these financial statements.
9
AMG GW&K Municipal Bond Fund
Portfolio Manager’s Comments
THE YEAR IN REVIEW
For the year ended December 31, 2014, the AMG GW&K Municipal Bond Fund Institutional Class (the Fund) returned 7.80%, underperforming its benchmark, the Barclays Capital Municipal Bond 10-Year Index (the Index), which returned 8.72%. Please note that this Fund has multiple share classes. Performance for all classes can be found on the Fund’s performance page at www.amgfunds.com.
Municipals posted mixed returns in the final months of 2014–the long-end rallied hard amid signs of a deepening global slowdown, while the short-end barely broke even, held back by the prospect of U.S Federal Reserve (the Fed) rate hikes in 2015. The results continued a year-long trend that rewarded duration risk and punished those who sought to hide in shorter maturities. Throughout 2014, results in the municipal bond market were driven mainly by broader events, the behavior of municipal yields simply mirroring the massive flattening of the Treasury curve. Short rates drifted higher as nonfarm payrolls continued to expand and U.S. GDP growth rebounded in the second half of the year from a weather-induced contraction in the first quarter. Meanwhile, with growth and inflation still uncomfortably low in Europe and Japan, global capital poured into U.S. government securities, looking for an alternative to the depressed yields available on other high-quality sovereign bonds. In the waning months of the year, Fund flows were positive every week and new deals were taken down easily, with many oversubscribed, upsized and re-priced higher during order periods. Investors mostly dismissed the high profile cases of Puerto Rico and Detroit as isolated incidents. Even in the few bankruptcy cases where pensioners fared as well as or better than bondholders, negotiated settlement, rather than legal precedent, was the deciding factor.
Looking ahead, the broader markets will be hyper-focused on Fed policy. As investors try to decipher the maddening language of forward guidance, volatility is likely to increase. The fourth quarter gave us a taste of that. In this environment, municipals should offer a relative haven, one that has historically avoided the sharp swings of the Treasury market. Credit fundamentals in the municipal bond space remain solid. Tax revenues have been on the upswing for five years at the same time the states have implemented austerity measures that have modestly shrunk the level of municipal debt outstanding. Rainy day funds have been replenished and states are benefiting from the national recovery that typically trickles down with a lag. Technicals in the market are favorable as well. The fourth-quarter surge in supply is giving way to the typically slow issuance months of January and February. Pent-up demand promises to curtail any yield spike, as many investors lie in wait to leg in at more attractive levels. And yields versus Treasuries are historically cheap, particularly in the 10-year range and out longer, where nominal yields even surpass their taxable counterparts. Entering the potentially choppy waters of 2015, much of what makes municipals so secure and predictable, from the steady tax-free income stream, to the miniscule default rates, to the domestic nature of the purchasing base, should reassure those looking for a portfolio anchor.
Throughout the year, our trading activity centered on selling five-year maturities and reinvesting in 10-year bonds. With the yield curve historically steep through the majority of the year, these swaps provided a significant pickup in carry from both higher-yield and increased roll potential. Additionally, the sale prices of the shorter maturities were still at substantial
premiums, gains that were set to drop sharply toward par as the bonds aged further. Meanwhile, the 10-year part of the curve performed particularly well in the bull-flattening scenario that continued to play out in the fourth quarter. As rates declined over the course of the year, however, we allowed overall duration to drift modestly lower. While any bonds shorter than the benchmark proved a drag on performance in 2014, we still maintain a healthy exposure to such positions as a hedge against rising interest rates heading into the new year.
Away from structural considerations, we deliberately upgraded credit quality toward the latter half of 2014, as investors chased yield in a declining rate environment. As spreads tightened during the year, the risk/reward calculus changed, prompting us to shed risk that we believe will become more vulnerable to re-pricing going forward. This included the tax-backed debt of certain states, a number of fully-valued hospitals and the enterprise systems of weaker local governments that trade richer than their fundamentals.
The Fund underperformed the benchmark for the year. An overweight to bonds shorter than the index was a performance negative, as longer bonds outperformed. An underweight to single-A and BBB-rated bonds was also a performance drag, as spreads tightened on most lower-quality sectors.
This commentary reflects the viewpoints of Gannett Welsh & Kotler, LLC as of December 31, 2014 and is not intended as a forecast or guarantee of future results.
10
AMG GW&K Municipal Bond Fund
Portfolio Manager’s Comments (continued)
CUMULATIVE TOTAL RETURN PERFORMANCE
AMG GW&K Municipal Bond Fund’s cumulative total return is based on the daily change in net asset value (NAV), and assumes that all dividends and distributions were reinvested. The chart compares a hypothetical $10,000 investment made in AMG GW&K Municipal Bond Fund - Service Class on June 30, 2009, to a $10,000 investment made in the Barclays 10-Year Municipal Bond Index for the same time period. The graph and table do not reflect the deduction of taxes that a shareholder would pay on a Fund distribution or redemption of shares. The listed returns for the Fund are net of expenses and the returns for the index exclude expenses. Total returns would have been lower had certain expenses not been reduced.
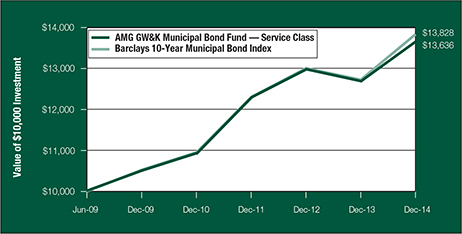
The table below shows the average annual total returns for the AMG GW&K Municipal Bond Fund and the Barclays 10-Year Municipal Bond Index for the same time periods ended December 31, 2014.
| | | | | | | | | | | | | | | | |
| Average Annual Total Returns1 | | One
Year | | | Five
Years | | | Since
Inception | | | Inception
Date | |
AMG GW&K Municipal Bond Fund2,3,4 | | | | | | | | | | | | | | | | |
Investor Class | | | 7.39 | % | | | 5.13 | % | | | 5.54 | % | | | 6/30/09 | |
Service Class | | | 7.62 | % | | | 5.39 | % | | | 5.80 | % | | | 6/30/09 | |
Institutional Class | | | 7.80 | % | | | 5.58 | % | | | 6.07 | % | | | 6/30/09 | |
Barclays 10-Year Municipal Bond Index5 | | | 8.72 | % | | | 5.61 | % | | | 6.07 | % | | | 6/30/09 | † |
The performance data shown represents past performance. Past performance is not a guarantee of future results. Current performance may be lower or higher than the performance data quoted. The investment return and principal value of an investment in the Fund will fluctuate so that an investor’s shares, when redeemed, may be worth more or less than their original cost.
Investors should carefully consider the Fund’s investment objectives, risks, charges and expenses before investing. For performance information through the most recent month end, current net asset values per share for the Fund and other information, please call (800) 835-3879 or visit our website at www.amgfunds.com for a free prospectus. Read it carefully before investing or sending money.
Funds are distributed by AMG Distributors, Inc., member FINRA/SIPC.
| † | Date reflects the inception date of the Fund, not the index. |
| 1 | Total return equals income yield plus share price change and assumes reinvestment of all dividends and capital gain distributions. Returns are net of fees and may reflect offsets of Fund expenses as described in the prospectus. No |
| | adjustment has been made for taxes payable by shareholders on their reinvested dividends and capital gain distributions. Returns for periods greater than one year are annualized. The listed returns on the Fund are net of expenses and based on the published NAV as of December 31, 2014. All returns are in U.S. dollars ($). |
| 2 | From time to time, the Fund’s advisor has waived its fees and/or absorbed Fund expenses, which has resulted in higher returns. |
| 3 | The Fund is subject to the risks associated with investments in debt securities, such as default risk and fluctuations in the perception of the debtor’s ability to pay its creditors. Changing interest rates may adversely affect the value of an investment. An increase in interest rates typically causes the value of bonds and other fixed income securities to fall. Issuer of bonds may not be able to meet interest of principal payments when the bonds come due. Factors unique to the municipal bond market may negatively affect the value in municipal bonds. |
| 4 | Investment income may be subject to certain state and local taxes, and depending on your tax status, the federal alternative minimum tax. Capital gains are not exempt from federal income tax. |
| 5 | The Barclays 10-Year Municipal Bond Index is the 10 year (8-12) component of the Municipal bond index. It is a rules-based, market-value-weighted Index engineered for the tax-exempt bond market. The Index tracks general obligation bonds, revenue bonds, insured bonds, and pre-refunded bonds rated Baa3/BBB or higher by at least two of the ratings agencies: Moody’s, S&P, Fitch. Unlike the Fund, the Barclays 10-Year Municipal Bond Index is unmanaged, is not available for investment and does not incur expenses. |
Not FDIC insured, nor bank guaranteed. May lose value.
11
AMG GW&K Municipal Bond Fund
Fund Snapshots (unaudited)
December 31, 2014
PORTFOLIO BREAKDOWN
| | | | |
Sector | | AMG GW&K Municipal
Bond Fund** | |
Transportation | | | 23.2 | % |
General Obligation | | | 23.6 | % |
Utilities | | | 18.7 | % |
Education | | | 11.7 | % |
Public Services | | | 7.7 | % |
Healthcare | | | 3.3 | % |
Lease/Rent | | | 2.5 | % |
Tax | | | 2.4 | % |
Industrial Development | | | 1.5 | % |
Certificate of Participation | | | 1.4 | % |
Other | | | 1.0 | % |
Recreation | | | 0.2 | % |
Other Assets and Liabilities | | | 2.8 | % |
| ** | As a percentage of net assets. |
| | | | |
Rating | | AMG GW&K Municipal
Bond Fund** | |
Aaa | | | 26.2 | % |
Aa | | | 55.1 | % |
A | | | 18.2 | % |
Baa | | | 0.5 | % |
| *** | As a percentage of market value of fixed-income securities. |
TOP TEN HOLDINGS
| | | | |
Security Name | | % of Net Assets | |
Massachusetts State Department of Taxation & Finance, Series F, 5.000%, 11/01/24 | | | 2.4 | % |
New York State Thruway Authority, General Revenue Junior Indebtedness, Series A,
5.000%, 05/01/19* | | | 2.3 | |
Texas Transportation Commission State Highway Fund, 5.000%, 04/01/23* | | | 2.1 | |
Houston Utility System Revenue, Series C, 5.000%, 05/15/24* | | | 1.8 | |
North Carolina State Limited Obligation, Series C, 5.000%, 05/01/23 | | | 1.6 | |
Florida State Board of Education, Series D, 5.000%, 06/01/24* | | | 1.5 | |
California State Tax Exempt General Obligation,
5.000%, 10/01/23 | | | 1.5 | |
Regional Transportation District County COPS, Series A, 5.000%, 06/01/24* | | | 1.4 | |
Texas State A&M University, Series A, 5.000%, 05/15/22 | | | 1.3 | |
North Texas Tollway Authority Revenue, Special Projects System, Series D, 5.000%, 09/01/27 | | | 1.3 | |
| | | | |
Top Ten as a Group | | | 17.2 | % |
| | | | |
| * | Top Ten Holding as of June 30, 2014. |
Credit quality ratings shown above reflect the highest rating assigned by either Standard & Poor’s (“S&P”) or Moody’s Investors Service, Inc. (“Moody’s”). These rating agencies are independent, nationally recognized statistical rating organizations and are widely used. Investment grade ratings are credit ratings of BBB/Baa or higher. Below investment grade ratings are credit ratings of BB/Ba or lower. Investments designated N/R are not rated by either rating agency. Unrated investments do not necessarily indicate low credit quality. Credit quality ratings are subject to change.
Because a fund’s strategy may result in multiple investments in particular sectors of the economy, its performance may depend on the performance of those sectors and may fluctuate more widely than investments diversified across more sectors. For additional information on these and other risk considerations, please see the Fund’s prospectus.
Any sectors, industries, or securities discussed should not be perceived as investment recommendations. Mention of a specific security should not be considered a recommendation to buy or solicitation to sell that security. Specific securities mentioned in this report may have been sold from the Fund’s portfolio of investments by the time you receive this report.
12
AMG GW&K Municipal Bond Fund
Fund Snapshots (continued)
December 31, 2014
| | | | |
STATE BREAKDOWN | |
State | | % of Net Assets | |
Texas | | | 15.4 | % |
New York | | | 15.3 | % |
Washington | | | 6.7 | % |
California | | | 6.6 | % |
Florida | | | 5.1 | % |
Ohio | | | 5.1 | % |
New Jersey | | | 5.0 | % |
Massachusetts | | | 4.5 | % |
District of Columbia | | | 4.4 | % |
Illinois | | | 4.0 | % |
Wisconsin | | | 3.5 | % |
Arizona | | | 3.4 | % |
North Carolina | | | 2.9 | % |
Virginia | | | 2.4 | % |
Kentucky | | | 2.1 | % |
Colorado | | | 2.0 | % |
South Carolina | | | 1.9 | % |
Michigan | | | 1.6 | % |
Pennsylvania | | | 1.4 | % |
Minnesota | | | 0.8 | % |
Indiana | | | 0.7 | % |
Mississippi | | | 0.6 | % |
Nebraska | | | 0.5 | % |
Oklahoma | | | 0.5 | % |
Georgia | | | 0.3 | % |
New Mexico | | | 0.3 | % |
Iowa | | | 0.2 | % |
Oregon | | | 0.2 | % |
Other Assets and Liabilities | | | 2.6 | % |
| | | | |
| | | 100.0 | % |
| | | | |
13
AMG GW&K Municipal Bond Fund
Schedule of Portfolio Investments
December 31, 2014
| | | | | | | | |
| | | Principal Amount | | | Value | |
Municipal Bonds - 97.4% | | | | | | | | |
Arizona - 3.4% | | | | | | | | |
Arizona Health Facilities Authority, Scottsdale Lincoln Hospital Revenue, 5.000%, 12/01/26 | | $ | 2,560,000 | | | $ | 3,010,176 | |
Arizona Transportation Board, Subordinated Highway Revenue, Series 2011 A,
5.000%, 07/01/22 | | | 2,380,000 | | | | 2,825,036 | |
Arizona Transportation Board, Subordinated Highway Revenue, Series 2013 A,
5.000%, 07/01/21 | | | 1,575,000 | | | | 1,881,164 | |
Arizona Transportation Board, Subordinated Highway Revenue, Series 2013 A,
5.000%, 07/01/22 | | | 4,120,000 | | | | 5,007,324 | |
Arizona Water Infrastructure Finance Authority Revenue, Series A, 5.000%, 10/01/21 | | | 3,020,000 | | | | 3,651,693 | |
Phoenix Civic Improvement Corp. Senior Lien Wastewater System Revenue, Series 2008, 5.500%, 07/01/20 | | | 1,045,000 | | | | 1,203,380 | |
Total Arizona | | | | | | | 17,578,773 | |
California - 6.6% | | | | | | | | |
California State Health Facilities Financing Authority Revenue, Saint Joseph Health System, Series A, 5.000%, 07/01/27 | | | 1,375,000 | | | | 1,646,837 | |
California State Public Works Board Lease Revenue, California State Prison Project, Series 2011 C, 5.250%, 10/01/22 | | | 1,000,000 | | | | 1,210,140 | |
California State Public Works Board Lease Revenue, Correctional Facility Improvements,
Series A, 5.000%, 09/01/25 | | | 5,000,000 | | | | 6,032,650 | |
California State Tax Exempt General Obligation, 5.000%, 02/01/23 | | | 2,165,000 | | | | 2,606,985 | |
California State Tax Exempt General Obligation, 5.000%, 10/01/23 | | | 6,150,000 | | | | 7,539,039 | |
California State Tax Exempt General Obligation, 5.000%, 09/01/25 | | | 1,750,000 | | | | 1,997,485 | |
California State Tax Exempt General Obligation, 5.250%, 09/01/23 | | | 1,740,000 | | | | 2,112,325 | |
Los Angeles Department of Water & Power, Power Systems, Series B, 5.000%, 07/01/26 | | | 1,000,000 | | | | 1,215,350 | |
Los Angeles Unified School District General Obligation, Series KRY, 5.250%, 07/01/28 | | | 2,100,000 | | | | 2,505,909 | |
Southern California Public Power Authority, Southern Transmission Project, Series 2008 B, 6.000%, 07/01/27 | | | 1,175,000 | | | | 1,377,547 | |
University of California, Limited Project Revenue, Series G, 5.000%, 05/15/25 | | | 4,700,000 | | | | 5,603,481 | |
Total California | | | | | | | 33,847,748 | |
Colorado - 2.0% | | | | | | | | |
Denver City & County Co. Airport Revenue, Series B, 5.000%, 11/15/24 | | | 2,750,000 | | | | 3,281,135 | |
Regional Transportation District County COPS, Series A, 5.000%, 06/01/24 | | | 6,000,000 | | | | 7,205,880 | |
Total Colorado | | | | | | | 10,487,015 | |
District of Columbia - 4.4% | | | | | | | | |
District of Columbia Public Improvements General Obligation, Series A, 5.000%, 06/01/20 | | | 3,030,000 | | | | 3,559,432 | |
District of Columbia Public Improvements General Obligation, Series A, 5.000%, 06/01/27 | | | 5,500,000 | | | | 6,559,135 | |
District of Columbia Water & Sewer Authority Public Utility Revenue, Sub Lien, Series C, 5.000%, 10/01/21 | | | 5,000,000 | | | | 5,996,550 | |
District of Columbia Water & Sewer Authority Public Utility Revenue, Sub Lien, Series C, 5.000%, 10/01/24 | | | 5,475,000 | | | | 6,564,196 | |
Total District of Columbia | | | | | | | 22,679,313 | |
Florida - 5.1% | | | | | | | | |
Florida State Board of Education Capital Outlay, Series 2008 C, 5.000%, 06/01/20 | | | 2,845,000 | | | | 3,304,581 | |
Florida State Board of Education Capital Outlay, Series 2011 C, 5.000%, 06/01/22 | | | 3,655,000 | | | | 4,376,387 | |
Florida State Board of Education, Series D, 5.000%, 06/01/24 | | | 6,565,000 | | | | 7,751,624 | |
Florida State Department of Transportation, Series B, 5.000%, 07/01/24 | | | 1,800,000 | | | | 2,151,126 | |
Florida State Turnpike Authority Revenue, Department of Transportation, Series A,
5.000%, 07/01/20 | | | 3,750,000 | | | | 4,419,262 | |
The accompanying notes are an integral part of these financial statements.
14
AMG GW&K Municipal Bond Fund
Schedule of Portfolio Investments (continued)
| | | | | | | | |
| | | Principal Amount | | | Value | |
Florida - 5.1% (continued) | | | | | | | | |
JEA Water and Sewer System Revenue, Series 2012 A, 5.000%, 10/01/24 | | $ | 1,670,000 | | | $ | 1,949,508 | |
Reedy Creek Improvement District, Utility Revenue, Series 1, 5.000%, 10/01/25 | | | 2,000,000 | | | | 2,367,740 | |
Total Florida | | | | | | | 26,320,228 | |
Georgia - 0.3% | | | | | | | | |
Atlanta Department of Aviation FAC Charge Revenue, Series A, 5.000%, 01/01/25 | | | 1,500,000 | | | | 1,800,135 | |
Illinois - 4.0% | | | | | | | | |
Illinois State Finance Authority Revenue, University of Chicago, Series A, 5.000%, 10/01/23 | | | 5,000,000 | | | | 6,067,150 | |
Illinois State Miscellaneous Revenue, 5.000%, 02/01/24 | | | 1,030,000 | | | | 1,152,549 | |
Illinois State Miscellaneous Revenue, 5.000%, 02/01/25 | | | 2,000,000 | | | | 2,216,600 | |
Illinois State Sales Tax Revenue, Build Illinois, Junior Obligation, 5.000%, 06/15/23 | | | 3,570,000 | | | | 4,308,740 | |
Illinois State Toll Highway Authority, 5.000%, 12/01/20 | | | 2,500,000 | | | | 2,973,825 | |
Illinois State Toll Highway Authority, Series A, 5.000%, 12/01/22 | | | 1,115,000 | | | | 1,345,705 | |
Metropolitan Pier and Exposition Authority Revenue, McCormick Place Expansion Project, Series 2012 B, 5.000%, 12/15/22 | | | 2,055,000 | | | | 2,452,334 | |
Total Illinois | | | | | | | 20,516,903 | |
Indiana - 0.7% | | | | | | | | |
Indiana University Student Fee Revenue, Series W-2, 5.000%, 08/01/236 | | | 2,750,000 | | | | 3,374,855 | |
Iowa - 0.2% | | | | | | | | |
Iowa Special Obligation, Prison Infrastructure Fund, Series 2010, 5.000%, 06/15/21 | | | 665,000 | | | | 784,660 | |
Kentucky - 2.1% | | | | | | | | |
Kentucky Infrastructure Authority, Wastewater & Drinking Water, Series A, 5.000%, 02/01/22 | | | 3,270,000 | | | | 3,821,420 | |
Kentucky State Asset/Liability Commission Agency Fund Revenue, Project NTS-Federal Highway Trust 1st, Series A, 5.250%, 09/01/22 | | | 1,600,000 | | | | 1,933,168 | |
Kentucky State Asset/Liability Commission Agency Fund Revenue, Project NTS-Federal Highway Trust 1st, Series A, 5.250%, 09/01/24 | | | 1,515,000 | | | | 1,843,891 | |
Kentucky Turnpike Authority Revenue, Revitalization Projects, Series A, 5.000%, 07/01/23 | | | 2,750,000 | | | | 3,093,695 | |
Total Kentucky | | | | | | | 10,692,174 | |
Massachusetts - 4.5% | | | | | | | | |
Massachusetts State Bay Transportation Authority Sales Tax Revenue, Series 2004 C, 5.500%, 07/01/23 | | | 1,750,000 | | | | 2,216,497 | |
Massachusetts State Department of Taxation & Finance, Series F, 5.000%, 11/01/24 | | | 10,000,000 | | | | 12,177,500 | |
Massachusetts State Development Finance Agency Revenue, Boston College, Series S, 5.000%, 07/01/23 | | | 2,895,000 | | | | 3,549,502 | |
Massachusetts State Health & Educational Facilities Authority Revenue, Northeastern University, Series 2008 T-1, 5.000%, 10/01/24 | | | 1,655,000 | | | | 1,934,182 | |
Massachusetts State School Building Authority Sales Tax Revenue, Series 2012 A, 5.000%, 08/15/21 | | | 2,710,000 | | | | 3,272,352 | |
Total Massachusetts | | | | | | | 23,150,033 | |
Michigan - 1.6% | | | | | | | | |
Michigan Finance Authority Revenue, Unemployment Obligation, Series 2012 B, 5.000%, 07/01/20 | | | 1,965,000 | | | | 2,278,044 | |
Michigan Finance Authority Revenue, Unemployment Obligation, Series 2012 B, 5.000%, 07/01/22 | | | 4,475,000 | | | | 4,771,379 | |
Michigan Strategic Fund Limited Obligation Revenue, Cadillac Place Office Building Project, Series 2011, 5.250%, 10/15/23 | | | 1,000,000 | | | | 1,183,370 | |
Total Michigan | | | | | | | 8,232,793 | |
The accompanying notes are an integral part of these financial statements.
15
AMG GW&K Municipal Bond Fund
Schedule of Portfolio Investments (continued)
| | | | | | | | |
| | | Principal Amount | | | Value | |
Minnesota - 0.8% | | | | | | | | |
Minnesota State General Obligation, Series D, 5.000%, 08/01/21 | | $ | 3,325,000 | | | $ | 3,942,586 | |
Mississippi - 0.6% | | | | | | | | |
Mississippi Development Bank Special Obligation, Madison County Highway Project, Series C, 5.000%, 01/01/22 | | | 2,585,000 | | | | 3,064,207 | |
Nebraska - 0.5% | | | | | | | | |
Nebraska Public Power District Revenue, Series 2012 B, 5.000%, 01/01/20 | | | 2,020,000 | | | | 2,351,038 | |
New Jersey - 5.0% | | | | | | | | |
New Jersey Economic Development Authority Lease Revenue, Rutgers University, 5.000%, 06/15/23 | | | 1,375,000 | | | | 1,681,969 | |
New Jersey Economic Development Authority, Schools Facilities Construction, Series 2013 NN, 5.000%, 03/01/21 | | | 1,910,000 | | | | 2,179,520 | |
New Jersey Economic Development Authority, Schools Facilities Construction, Series II, 5.000%, 03/01/22 | | | 2,000,000 | | | | 2,275,020 | |
New Jersey Economic Development Authority, Schools Facilities Construction, Series NN, 5.000%, 03/01/26 | | | 2,625,000 | | | | 2,949,581 | |
New Jersey Economic Development Authority, Tobacco and Liquor Tax Revenue, 5.000%, 06/15/20 | | | 2,000,000 | | | | 2,295,640 | |
New Jersey State Turnpike Authority Revenue, Series 2012 B, 5.000%, 01/01/24 | | | 2,755,000 | | | | 3,281,563 | |
New Jersey State Turnpike Authority Revenue, Series A, 5.000%, 01/01/24 | | | 1,900,000 | | | | 2,250,949 | |
New Jersey Transportation Trust Fund Authority, Series 2003 B, 5.250%, 12/15/19 | | | 1,290,000 | | | | 1,482,391 | |
New Jersey Transportation Trust Fund Authority, Series 2011 A, 5.250%, 06/15/24 | | | 1,165,000 | | | | 1,355,256 | |
New Jersey Transportation Trust Fund Authority, Series 2011 B, 5.250%, 06/15/23 | | | 1,550,000 | | | | 1,810,168 | |
Rutgers The State University of New Jersey, Series J, 5.000%, 05/01/24 | | | 3,325,000 | | | | 4,034,788 | |
Total New Jersey | | | | | | | 25,596,845 | |
New Mexico - 0.3% | | | | | | | | |
New Mexico Finance Authority, Transportation Revenue, Sub Lien, Series A-2, 5.000%, 12/15/20 | | | 1,520,000 | | | | 1,794,786 | |
New York - 15.3% | | | | | | | | |
Long Island Power Authority, Series 2012 B, 5.000%, 09/01/23 | | | 1,510,000 | | | | 1,759,965 | |
Metropolitan Transportation Authority Dedicated Tax Fund, Series A, 5.250%, 11/15/26 | | | 2,090,000 | | | | 2,547,814 | |
Metropolitan Transportation Authority Revenue, Series 2012 A, 5.000%, 11/15/23 | | | 2,315,000 | | | | 2,789,644 | |
New York City General Obligation, Series 2008 B-1, 5.250%, 09/01/20 | | | 3,200,000 | | | | 3,660,544 | |
New York City General Obligation, Series 2013 H, 5.000%, 08/01/25 | | | 2,070,000 | | | | 2,481,061 | |
New York City General Obligation, Series E, 5.250%, 08/01/22 | | | 3,000,000 | | | | 3,655,770 | |
New York City General Obligation, Series I, 5.000%, 08/01/24 | | | 3,490,000 | | | | 4,170,585 | |
New York City Health & Hospital Corp., 5.000%, 02/15/23 | | | 1,020,000 | | | | 1,221,797 | |
New York State Dormitory Authority Revenue, Personal Income Tax Revenue, Series A, 5.000%, 03/15/24 | | | 5,000,000 | | | | 6,173,200 | |
New York State Dormitory Authority Revenue, State University Dormitory Facilities Issue, Series 2011 A, 5.000%, 07/01/21 | | | 1,165,000 | | | | 1,385,185 | |
New York State Dormitory Authority Revenue, State University Facilities, Series A, 5.000%, 07/01/22 | | | 4,180,000 | | | | 5,015,666 | |
New York State Dormitory Authority, Personal Income Tax Revenue, Series A, 5.000%, 02/15/25 | | | 5,000,000 | | | | 6,094,350 | |
New York State Dormitory Authority, Personal Income Tax Revenue, Series C, 5.000%, 03/15/22 | | | 4,635,000 | | | | 5,485,291 | |
New York State Environmental Facilities Corp., New York City Municipal Water Finance Authority Project, Series C, 5.000%, 06/15/20 | | | 4,195,000 | | | | 4,622,303 | |
New York State Environmental Facilities Corp., New York City Municipal Water Finance Authority Project, Series F, 5.000%, 06/15/21 | | | 1,000,000 | | | | 1,128,820 | |
New York State Thruway Authority, General Revenue Junior Indebtedness, Series A, 5.000%, 05/01/19 | | | 10,285,000 | | | | 11,775,605 | |
New York State Thruway Authority, Personal Income Tax Revenue, Series A, 5.000%, 03/15/24 | | | 2,500,000 | | | | 3,024,100 | |
The accompanying notes are an integral part of these financial statements.
16
AMG GW&K Municipal Bond Fund
Schedule of Portfolio Investments (continued)
| | | | | | | | |
| | | Principal Amount | | | Value | |
New York - 15.3% (continued) | | | | | | | | |
New York State Thruway Authority, Series 2012 I, 5.000%, 01/01/21 | | $ | 2,780,000 | �� | | $ | 3,275,785 | |
New York State Urban Development Corp. Revenue, State Personal Income Tax, Series A, 5.000%, 03/15/23 | | | 2,600,000 | | | | 3,068,650 | |
Triborough Bridge & Tunnel Authority Revenue, Series 2013 A, 5.000%, 11/15/22 | | | 1,520,000 | | | | 1,831,646 | |
Utility Debt Securitization Authority, Series TE, 5.000%, 12/15/28 | | | 3,200,000 | | | | 3,900,448 | |
Total New York | | | | | | | 79,068,229 | |
North Carolina - 2.9% | | | | | | | | |
North Carolina Eastern Municipal Power Agency, Series 2012 D, 5.000%, 01/01/237 | | | 3,000,000 | | | | 3,506,910 | |
North Carolina State Limited Obligation, Series A, 5.000%, 05/01/22 | | | 3,000,000 | | | | 3,616,680 | |
North Carolina State Limited Obligation, Series C, 5.000%, 05/01/23 | | | 6,575,000 | | | | 8,000,920 | |
Total North Carolina | | | | | | | 15,124,510 | |
Ohio - 5.1% | | | | | | | | |
American Municipal Power, Inc., 5.000%, 02/15/23 | | | 2,500,000 | | | | 2,931,300 | |
Cleveland Department of Public Utilities Division of Water, Series A, 5.000%, 01/01/22 | | | 3,010,000 | | | | 3,593,850 | |
Miami University, General Receipts Revenue, Series 2011, 5.000%, 09/01/22 | | | 1,000,000 | | | | 1,182,560 | |
Ohio State Adult Correctional Building Fund Project, Series 2013, 5.000%, 10/01/21 | | | 2,200,000 | | | | 2,613,930 | |
Ohio State General Obligation, Common Schools, Series A, 5.000%, 09/15/23 | | | 4,100,000 | | | | 5,043,656 | |
Ohio State General Obligation, Series 2012 A, 5.000%, 09/15/21 | | | 1,685,000 | | | | 2,029,347 | |
Ohio State General Obligation, Series R, 5.000%, 05/01/21 | | | 5,000,000 | | | | 5,991,200 | |
Ohio State University, Series A, 5.000%, 12/01/20 | | | 2,570,000 | | | | 2,992,302 | |
Total Ohio | | | | | | | 26,378,145 | |
Oklahoma - 0.5% | | | | | | | | |
Oklahoma Capital Improvement Authority, Series A, 5.000%, 07/01/22 | | | 2,025,000 | | | | 2,437,614 | |
Oregon - 0.2% | | | | | | | | |
Tri-County Metro Transportation District of Capital Grant Receipt Revenue, Series 2011 A, 5.000%, 10/01/19 | | | 1,030,000 | | | | 1,193,173 | |
Pennsylvania - 1.4% | | | | | | | | |
Monroeville Finance Authority, University of Pittsburgh Medical Center, 5.000%, 02/15/22 | | | 1,330,000 | | | | 1,587,302 | |
Pennsylvania Economic Development Financing Authority Revenue, Series 2012 B, 5.000%, 07/01/21 | | | 2,245,000 | | | | 2,507,126 | |
Pennsylvania Economic Development Financing Authority Revenue, Series B, 5.000%, 07/01/22 | | | 1,690,000 | | | | 1,801,675 | |
Saint Mary Hospital Authority Health System Revenue, Catholic Health East, Series A, 5.000%, 11/15/26 | | | 1,100,000 | | | | 1,263,240 | |
Total Pennsylvania | | | | | | | 7,159,343 | |
South Carolina - 1.9% | | | | | | | | |
Florence County Hospital Revenue, McLeod Regional Medical Center Project, 5.000%, 11/01/28 | | | 2,720,000 | | | | 3,227,960 | |
South Carolina Transportation Infrastructure Bank, Series 2012 A, 5.000%, 10/01/21 | | | 2,415,000 | | | | 2,856,027 | |
South Carolina Transportation Infrastructure Bank, Series B, 5.000%, 10/01/21 | | | 3,145,000 | | | | 3,719,340 | |
Total South Carolina | | | | | | | 9,803,327 | |
The accompanying notes are an integral part of these financial statements.
17
AMG GW&K Municipal Bond Fund
Schedule of Portfolio Investments (continued)
| | | | | | | | |
| | | Principal Amount | | | Value | |
Texas - 15.4% | | | | | | | | |
Austin Water & Wastewater System Revenue, Series A, 5.000%, 11/15/22 | | $ | 2,780,000 | | | $ | 3,372,362 | |
City Public Service Board of San Antonio TX, Series A, 5.250%, 02/01/24 | | | 2,320,000 | | | | 2,686,050 | |
Cypress-Fairbanks Independent School District, Series C, 5.000%, 02/15/23 | | | 5,000,000 | | | | 6,109,150 | |
Harris County Cultural Education Facilities Finance Corp., Memorial Herman Health System, Series A, 5.000%, 12/01/25 | | | 2,800,000 | | | | 3,380,608 | |
Houston Utility System Revenue, Series C, 5.000%, 05/15/24 | | | 7,410,000 | | | | 9,170,097 | |
North Texas Municipal Water District, Water Utility Improvement, 5.250%, 09/01/23 | | | 3,000,000 | | | | 3,671,340 | |
North Texas Tollway Authority Revenue, Special Projects System, 1st Tier, Series A, 5.000%, 01/01/25 | | | 5,240,000 | | | | 6,255,879 | |
North Texas Tollway Authority Revenue, Special Projects System, Series D, 5.250%, 09/01/27 | | | 5,695,000 | | | | 6,846,358 | |
San Antonio Electric & Gas Revenue, Series A, 5.250%, 02/01/25 | | | 5,000,000 | | | | 5,778,150 | |
Texas State A&M University, Permanent University Fund, Series A, 5.000%, 07/01/23 | | | 1,550,000 | | | | 1,882,615 | |
Texas State A&M University, Series A, 5.000%, 05/15/22 | | | 5,730,000 | | | | 6,966,248 | |
Texas State A&M University, Series B, 5.000%, 05/15/21 | | | 4,040,000 | | | | 4,853,656 | |
Texas Transportation Commission Fund, Series A, 5.000%, 04/01/27 | | | 5,000,000 | | | | 5,961,150 | |
Texas Transportation Commission State Highway Fund, 5.000%, 04/01/23 | | | 8,850,000 | | | | 10,894,350 | |
Texas Transportation Commission State Highway Fund, First Tier, 5.000%, 04/01/21 | | | 1,350,000 | | | | 1,474,767 | |
Total Texas | | | | | | | 79,302,780 | |
Virginia - 2.4% | | | | | | | | |
Richmond Public Utility Revenue, Series A, 5.000%, 01/15/25 | | | 3,700,000 | | | | 4,467,380 | |
Virginia College Building Authority, Educational Facilities Authority Revenue, 21ST Century College & Equipment Programs, Series B, 5.000%, 02/01/23 | | | 2,360,000 | | | | 2,834,879 | |
Virginia Public Building Authority, Public Facilities Revenue, Series B, 5.000%, 08/01/24 | | | 2,310,000 | | | | 2,681,286 | |
Virginia State College Building Authority, 21st Century Equipment Program, 5.000%, 09/01/23 | | | 1,910,000 | | | | 2,301,149 | |
Total Virginia | | | | | | | 12,284,694 | |
Washington - 6.7% | | | | | | | | |
Energy Northwest Washington Electric Revenue, Columbia Generating Station, Series 2012 A, 5.000%, 07/01/21 | | | 1,910,000 | | | | 2,298,131 | |
Energy Northwest Washington Electric Revenue, Columbia Generating Station, Series A, 5.000%, 07/01/21 | | | 3,250,000 | | | | 3,901,592 | |
King County Sewer Revenue, Series B, 5.000%, 01/01/24 | | | 5,175,000 | | | | 6,065,876 | |
Port of Seattle Revenue, Series 2012 A, 5.000%, 08/01/23 | | | 3,055,000 | | | | 3,655,460 | |
Spokane Public Facilities District, Series B, 5.000%, 12/01/20 | | | 1,000,000 | | | | 1,160,190 | |
Tacoma Electric System Revenue, Series A, 5.000%, 01/01/20 | | | 2,725,000 | | | | 3,182,964 | |
Washington Health Care Facilities Authority Revenue, Providence Health Services, Series 2012 A, 5.000%, 10/01/21 | | | 1,510,000 | | | | 1,792,023 | |
Washington State Federal Highway Grant, Senior 520 Corridor Program, 5.000%, 09/01/207 | | | 3,695,000 | | | | 4,334,235 | |
Washington State General Obligation, Motor Fuel Tax Revenue, Series 2012 E, 5.000%, 02/01/21 | | | 3,000,000 | | | | 3,574,320 | |
Washington State General Obligation, Series 2010 A, 5.000%, 08/01/20 | | | 3,850,000 | | | | 4,500,458 | |
Total Washington | | | | | | | 34,465,249 | |
Wisconsin - 3.5% | | | | | | | | |
Wisconsin State Department of Transportation Revenue, Series 1, 5.000%, 07/01/26 | | | 2,220,000 | | | | 2,547,561 | |
Wisconsin State Department of Transportation, Series 1, 5.000%, 07/01/21 | | | 4,385,000 | | | | 5,091,862 | |
Wisconsin State General Obligation, Series 1, 5.000%, 05/01/20 | | | 3,745,000 | | | | 4,402,173 | |
The accompanying notes are an integral part of these financial statements.
18
AMG GW&K Municipal Bond Fund
Schedule of Portfolio Investments (continued)
| | | | | | | | |
| | | Principal Amount | | | Value | |
Wisconsin - 3.5% (continued) | | | | | | | | |
Wisconsin State General Obligation, Series 2, 5.000%, 05/01/23 | | $ | 1,995,000 | | | $ | 2,402,080 | |
Wisconsin State General Obligation, Series 2, 5.000%, 05/01/24 | | | 3,170,000 | | | | 3,797,755 | |
Total Wisconsin | | | | | | | 18,241,431 | |
Total Municipal Bonds (cost $489,211,524) | | | | | | | 501,672,587 | |
| | |
| | | Shares | | | | |
Other Investment Companies - 1.6%5 | | | | | | | | |
Fidelity Institutional Money Market Tax Exempt Portfolio, Institutional Class, 0.01%
(cost $8,311,900) | | | 8,311,900 | | | | 8,311,900 | |
Total Investments - 99.0% (cost $497,523,424) | | | | | | | 509,984,487 | |
Other Assets, less Liabilities - 1.0% | | | | | | | 5,320,852 | |
Net Assets - 100.0% | | | | | | $ | 515,305,339 | |
The accompanying notes are an integral part of these financial statements.
19
AMG GW&K Municipal Enhanced Yield Fund
Portfolio Manager’s Comments
THE YEAR IN REVIEW
For the year ended December 31, 2014, the AMG GW&K Municipal Enhanced Yield Fund Institutional Class (the Fund) returned 17.45%, outperforming the Barclays U.S. Municipal Bond BAA Index, which returned 14.47%. Please note that this Fund has multiple share classes. Performance for all classes can be found on the Fund’s performance page at www.amgfunds.com
Municipals posted mixed returns in the final months of 2014: the long-end rallied hard amid signs of a deepening global slowdown, while the short-end barely broke even, held back by the prospect of U.S Federal Reserve (the Fed) rate hikes in 2015. The results continued a year-long trend that rewarded duration risk and punished those who sought to hide in shorter maturities. Throughout 2014, results in the municipal bond market were driven mainly by broader events, the behavior of municipal yields simply mirroring the massive flattening of the Treasury curve. Short rates drifted higher as nonfarm payrolls continued to expand and U.S. GDP growth rebounded in the second half of the year from a weather-induced contraction in the first quarter. Meanwhile, with growth and inflation still uncomfortably low in Europe and Japan, global capital poured into U.S. government securities, looking for an alternative to the depressed yields available on other high-quality sovereign bonds. In the waning months of the year, Fund flows were positive every week and new deals were taken down easily, with many oversubscribed, upsized and re-priced higher during order periods. Investors mostly dismissed the high profile cases of Puerto Rico and Detroit as isolated incidents. Even in the few bankruptcy cases where pensioners fared as well as or better than bondholders, negotiated settlement, rather than legal precedent, was the deciding factor.
Looking ahead, the broader markets will be hyper-focused on Fed policy. As investors try to decipher the maddening language of forward guidance, volatility is likely to increase. The fourth quarter gave us a taste of that. In this environment, municipals should offer a relative haven, one that
has historically avoided the sharp swings of the Treasury market. Credit fundamentals in the municipal bond space remain solid. Tax revenues have been on the upswing for five years at the same time the states have implemented austerity measures that have modestly shrunk the level of municipal debt outstanding. Rainy day funds have been replenished and states are benefiting from the national recovery that typically trickles down with a lag. Technicals in the market are favorable as well. The fourth-quarter surge in supply is giving way to the typically slow issuance months of January and February. Pent-up demand promises to curtail any yield spike, as many investors lie in wait to leg in at more attractive levels. And yields versus Treasuries are historically cheap, particularly in the 10-year range and out longer, where nominal yields even surpass their taxable counterparts. Entering the potentially choppy waters of 2015, much of what makes municipals so secure and predictable, from the steady tax-free income stream, to the miniscule default rates, to the domestic nature of the purchasing base, should reassure those looking for a portfolio anchor.
The Fund outperformed the benchmark for the year. Strong returns from single-A and BBB-rated holdings aided performance. An overweight to longer maturities was also a positive, as the long end was the best performing part of the curve for the year.
This commentary reflects the viewpoints of the Gannett Welsh & Kotler, LLC as of December 31, 2014 and is not intended as a forecast or guarantee of future results.
20
AMG GW&K Municipal Enhanced Yield Fund
Portfolio Manager’s Comments (continued)
CUMULATIVE TOTAL RETURN PERFORMANCE
AMG GW&K Municipal Enhanced Yield Fund’s cumulative total return is based on the daily change in net asset value (NAV), and assumes that all dividends and distributions were reinvested. The chart compares a hypothetical $10,000 investment made in AMG GW&K Municipal Enhanced Yield Fund - Institutional Class on December 30, 2005, to a $10,000 investment made in the Barclays U.S. Municipal Bond BAA Index for the same time period. The graph and table do not reflect the deduction of taxes that a shareholder would pay on a Fund distribution or redemption of shares. The listed returns for the Fund are net of expenses and the returns for the index exclude expenses. Total returns would have been lower had certain expenses not been reduced.
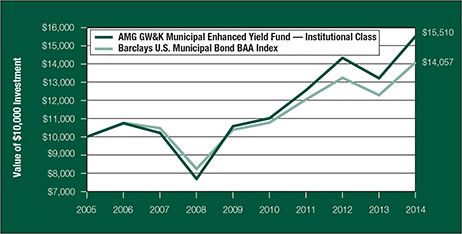
The table below shows the average annual total returns for the AMG GW&K Municipal Enhanced Yield Fund and the Barclays U.S. Municipal Bond BAA Index for the same time periods ended December 31, 2014.
| | | | | | | | | | | | | | | | |
| Average Annual Total Returns1 | | One
Year | | | Five
Years | | | Since
Inception | | | Inception
Date | |
AMG GW&K Municipal Enhanced Yield
Fund 2,3,4,5,6 | | | | | | | | | |
Investor Class | | | 17.14 | % | | | 7.55 | % | | | 8.74 | % | | | 7/27/09 | |
Service Class | | | 17.39 | % | | | 7.80 | % | | | 8.99 | % | | | 7/27/09 | |
Institutional Class | | | 17.45 | % | | | 7.96 | % | | | 5.00 | % | | | 12/30/05 | |
Barclays U.S. Municipal Bond BAA Index7 | | | 14.47 | % | | | 6.25 | % | | | 3.86 | % | | | 12/30/05 | † |
The performance data shown represents past performance. Past performance is not a guarantee of future results. Current performance may be lower or higher than the performance data quoted. The investment return and principal value of an investment in the Fund will fluctuate so that an investor’s shares, when redeemed, may be worth more or less than their original cost.
Investors should carefully consider the Fund’s investment objectives, risks, charges and expenses before investing. For performance information through the most recent month end, current net asset values per share for the Fund and other information, please call (800) 835-3879 or visit our website at www.amgfunds.com for a free prospectus. Read it carefully before investing or sending money.
Funds are distributed by AMG Distributors, Inc., member FINRA/SIPC.
| † | Date reflects the inception date of the Fund, not the index. |
| 1 | Total return equals income yield plus share price change and assumes reinvestment of all dividends and capital gain distributions. Returns are net of fees and may reflect offsets of Fund expenses as described in the prospectus. No adjustment has been made for taxes payable by shareholders on their reinvested dividends and capital gain distributions. Returns for periods greater than one year are annualized. The listed returns on the Fund are net of expenses and based on the published NAV as of December 31, 2014. All returns are in U.S. dollars ($). |
| 2 | From time to time, the Fund’s advisor has waived its fees and/or absorbed Fund expenses, which has resulted in higher returns. |
| 3 | The performance shown includes that of the predecessor Fund, the BNY Hamilton Municipal Enhanced Yield Fund, a series of BNY Hamilton Funds, Inc., which was reorganized into the GW&K Municipal Enhanced Yield Fund, a series of AMG Funds, as of the close of business on November 7, 2008. |
| 4 | Issuer of bonds may not be able to meet interest or principal payments when the bonds come due. High yield bonds (also known as “junk bonds”) are subject to increased risks such as the risk of default. The use of leverage in a Fund’s strategy can magnify relatively small market movements into relatively larger losses for the Fund. Factors unique to the municipal bond market may negatively affect the value in municipal bonds. |
| 5 | Investment income may be subject to certain state and local taxes, and depending on your tax status, the federal alternative minimum tax. Capital gains are not exempt from federal income tax. |
| 6 | The Fund is subject to the risks associated with investments in debt securities, such as default risk and fluctuations in the perception of the debtor’s ability to pay its creditors. |
| 7 | The Barclays U.S. Municipal Bond BAA Index is a subset of the Barclays Capital Municipal Bond Index with an index rating of Baa1, Baa2, or Baa3. The Barclays Capital Municipal Bond Index is a rules-based, market-value-weighted index engineered for the long-term, tax-exempt bond market. Unlike the Fund, the Barclays U.S. Municipal Bond Index is unmanaged, is not available for investment and does not incur expenses. |
Not FDIC insured, nor bank guaranteed. May lose value.
21
AMG GW&K Municipal Enhanced Yield Fund
Fund Snapshots (unaudited)
December 31, 2014
PORTFOLIO BREAKDOWN
| | | | |
Sector | | AMG GW&K Municipal
Enhanced Yield
Fund** | |
Transportation | | | 26.6 | % |
Healthcare | | | 25.5 | % |
Utilities | | | 14.5 | % |
Industrial Development | | | 11.1 | % |
Education | | | 6.2 | % |
Public Services | | | 3.3 | % |
General Obligation | | | 2.8 | % |
Other | | | 0.8 | % |
Tax | | | 2.1 | % |
State and Non-State Appropriated | | | | |
Tobacco | | | 1.9 | % |
Certificate of Participation | | | 1.6 | % |
Recreation | | | 1.5 | % |
Other Assets and Liabilities | | | 2.1 | % |
| ** | As a percentage of net assets. |
| | | | |
Rating | | AMG GW&K Municipal
Enhanced Yield
Fund** | |
Aaa | | | 2.1 | % |
Aa | | | 3.8 | % |
A | | | 45.8 | % |
Baa | | | 46.2 | % |
Ba & lower | | | 2.1 | % |
| *** | As a percentage of market value of fixed-income securities. |
TOP TEN HOLDINGS
| | | | |
Security Name | | % of Net Assets | |
New Jersey Economic Development Authority, Industrial Revenue, Private Activity - The Goethals Bridge Replacement Project, 5.375%, 01/01/43* | | | 3.1 | % |
New Jersey State Turnpike Authority, Highway Improvements, Series A, 5.000%, 01/01/43 | | | 2.8 | |
Saint John the Baptist Parish Revenue, Marathon Oil Corp. Project, Series 2007 A, 5.125%, 06/01/37* | | | 2.8 | |
Long Island New York Power Authority, Electric Light & Power Improvements, Series A, 5.000%, 09/01/39 | | | 2.5 | |
Chattanooga-Hamilton County Hospital Authority, 5.000%, 10/01/44 | | | 2.4 | |
West Virginia Hospital Finance Authority, West Virginia United Health Systems Obligation Group, Series A, 5.500%, 06/01/44 | | | 2.3 | |
Route 460 Funding Corp. Toll Road Revenue, Series 2012 A, 5.125%, 07/01/49* | | | 2.3 | |
Miami Beach Health Facilities Authority, Mt. Sinai Medical Center, 5.000%, 11/15/29 | | | 2.3 | |
Metropolitan Transportation Authority, Series A, 5.000%, 11/15/43* | | | 2.2 | |
Louisiana Local Government Environmental Facilities and Community Development Authority Hospital Revenue, Series 2010 A, 5.875%, 10/01/40 | | | 2.2 | |
| | | | |
Top Ten as a Group | | | 24.9 | % |
| | | | |
| * | Top Ten Holding as of June 30, 2014. |
Credit quality ratings shown above reflect the highest rating assigned by either Standard & Poor’s (“S&P”) or Moody’s Investors Service, Inc. (“Moody’s”). These rating agencies are independent, nationally recognized statistical rating organizations and are widely used. Investment grade ratings are credit ratings of BBB/Baa or higher. Below investment grade ratings are credit ratings of BB/Ba or lower. Investments designated N/R are not rated by either rating agency. Unrated investments do not necessarily indicate low credit quality. Credit quality ratings are subject to change.
Because a fund’s strategy may result in multiple investments in particular sectors of the economy, its performance may depend on the performance of those sectors and may fluctuate more widely than investments diversified across more sectors. For additional information on these and other risk considerations, please see the Fund’s prospectus.
Any sectors, industries, or securities discussed should not be perceived as investment recommendations. Mention of a specific security should not be considered a recommendation to buy or solicitation to sell that security. Specific securities mentioned in this report may have been sold from the Fund’s portfolio of investments by the time you receive this report.
22
AMG GW&K Municipal Enhanced Yield Fund
Fund Snapshots (continued)
December 31, 2014
| | | | |
STATE BREAKDOWN | |
State | | % of Net Assets | |
New Jersey | | | 13.3 | % |
Texas | | | 10.5 | % |
New York | | | 8.9 | % |
Illinois | | | 6.8 | % |
Florida | | | 6.5 | % |
Louisiana | | | 5.0 | % |
Massachusetts | | | 4.9 | % |
California | | | 4.8 | % |
Indiana | | | 4.5 | % |
Pennsylvania | | | 4.5 | % |
West Virginia | | | 4.1 | % |
Virginia | | | 4.0 | % |
District of Columbia | | | 3.7 | % |
Tennessee | | | 2.4 | % |
Michigan | | | 2.2 | % |
Virgin Islands | | | 2.2 | % |
Nebraska | | | 2.1 | % |
Colorado | | | 2.0 | % |
Arizona | | | 1.7 | % |
New Hampshire | | | 1.7 | % |
Ohio | | | 1.6 | % |
Kentucky | | | 0.5 | % |
Other Assets and Liabilities | | | 2.1 | % |
| | | | |
| | | 100.0 | % |
| | | | |
23
AMG GW&K Municipal Enhanced Yield Fund
Schedule of Portfolio Investments
December 31, 2014
| | | | | | | | |
| | | Principal Amount | | | Value | |
Municipal Bonds - 97.9% | | | | | | | | |
Arizona - 1.7% | | | | | | | | |
Arizona Health Facilities Authority, Scottsdale Lincoln Hospital Revenue, 5.000%, 12/01/42 | | $ | 3,800,000 | | | $ | 4,256,532 | |
California - 4.8% | | | | | | | | |
California Municipal Finance Authority Certificate, Community Hospitals of Central California, 5.500%, 02/01/39 | | | 1,805,000 | | | | 1,986,060 | |
California Statewide Communities Development Authority Student Housing Revenue, University of California Irvine Campus Apartments Project, Series 2011, 5.375%, 05/15/38 | | | 1,735,000 | | | | 1,942,003 | |
M-S-R Energy Authority, Natural Gas Revenue, Series A, 7.000%, 11/01/34 | | | 1,275,000 | | | | 1,817,003 | |
M-S-R Energy Authority, Natural Gas Revenue, Series C, 6.500%, 11/01/39 | | | 3,075,000 | | | | 4,181,908 | |
Sacramento County Public Facilities Financing Corporation COPS, 5.750%, 02/01/30 | | | 1,935,000 | | | | 2,135,582 | |
Total California | | | | | | | 12,062,556 | |
Colorado - 2.0% | | | | | | | | |
Public Authority for Colorado Energy Natural Gas Purchase Revenue, Series 2008, 6.500%, 11/15/38 | | | 3,730,000 | | | | 5,119,276 | |
District of Columbia - 3.7% | | | | | | | | |
District of Columbia Ballpark Revenue, Series 2006 B-1, 5.000%, 02/01/31 (National Insured)3 | | | 3,735,000 | | | | 3,857,769 | |
Metropolitan Washington Airports Authority Dulles Toll Road Revenue, Dulles Metrorail and Capital Improvement Project, Series A, 5.000%, 10/01/53 | | | 5,000,000 | | | | 5,353,350 | |
Total District of Columbia | | | | | | | 9,211,119 | |
Florida - 6.5% | | | | | | | | |
Alachua County Health Facilities Authority, Shands Teaching Hospital & Clinics, 5.000%, 12/01/44 | | | 3,000,000 | | | | 3,381,809 | |
Martin County Health Facilities Authority, Martin Memorial Medical Center, 5.500%, 11/15/42 | | | 4,120,000 | | | | 4,541,764 | |
Miami Beach Health Facilities Authority, Mt. Sinai Medical Center, 5.000%, 11/15/29 | | | 4,945,000 | | | | 5,654,954 | |
Seminole Tribe Special Obligation Revenue, Series 2007 A, 5.250%, 10/01/27 (a) | | | 50,000 | | | | 53,081 | |
Seminole Tribe Special Obligation Revenue, Series 2007 A, 5.500%, 10/01/24 (a) | | | 2,500,000 | | | | 2,715,025 | |
Total Florida | | | | | | | 16,346,633 | |
Illinois - 6.8% | | | | | | | | |
Illinois State General Obligation, 5.000%, 02/01/39 | | | 3,765,000 | | | | 3,987,210 | |
Illinois State General Obligation, 5.500%, 07/01/38 | | | 2,845,000 | | | | 3,166,826 | |
Metropolitan Pier and Exposition Authority Revenue, McCormick Place Expansion Project, Series 2012 A, 5.000%, 06/15/42 | | | 4,785,000 | | | | 5,192,778 | |
Railsplitter Tobacco Settlement Authority Revenue, 6.000%, 06/01/28 | | | 4,025,000 | | | | 4,736,338 | |
Total Illinois | | | | | | | 17,083,152 | |
Indiana - 4.5% | | | | | | | | |
Indiana State Finance Authority Hospital Revenue, Community Health Network, Series 2012 A, 5.000%, 05/01/42 | | | 5,000,000 | | | | 5,480,300 | |
Indiana State Finance Authority Revenue, AMT-I-69 Development Partners LLC, 5.000%, 09/01/46 | | | 4,000,000 | | | | 4,245,080 | |
Indiana State Finance Authority Revenue, AMT-I-69 Development Partners LLC, 5.250%, 09/01/40 | | | 1,350,000 | | | | 1,473,781 | |
Total Indiana | | | | | | | 11,199,161 | |
Kentucky - 0.5% | | | | | | | | |
Owen County Waterworks System Revenue, American Water Co. Project, Series 2009 A, 6.250%, 06/01/39 | | | 995,000 | | | | 1,138,897 | |
Louisiana - 5.0% | | | | | | | | |
Louisiana Local Government Environmental Facilities and Community Development Authority Hospital Revenue, Series 2010 A, 5.875%, 10/01/40 | | | 4,820,000 | | | | 5,575,246 | |
The accompanying notes are an integral part of these financial statements.
24
AMG GW&K Municipal Enhanced Yield Fund
Schedule of Portfolio Investments (continued)
| | | | | | | | |
| | | Principal Amount | | | Value | |
Louisiana - 5.0% (continued) | | | | | | | | |
Saint John the Baptist Parish Revenue, Marathon Oil Corp. Project, Series 2007 A, 5.125%, 06/01/37 | | $ | 6,500,000 | | | $ | 6,882,850 | |
Total Louisiana | | | | | | | 12,458,096 | |
Massachusetts - 4.9% | | | | | | | | |
Massachusetts Development Finance Agency Revenue, Cap Cod Healthcare Obligation, 5.250%, 11/15/41 | | | 3,140,000 | | | | 3,517,208 | |
Massachusetts Development Finance Agency Revenue, Covanta Energy Project, Series 2012 B, 4.875%, 11/01/42 (a) | | | 5,000,000 | | | | 5,077,950 | |
Massachusetts Health and Educational Facilities Authority Revenue, Suffolk University, Series 2009 A, 5.750%, 07/01/39 | | | 3,360,000 | | | | 3,725,770 | |
Total Massachusetts | | | | | | | 12,320,928 | |
Michigan - 2.2% | | | | | | | | |
Michigan State Hospital Finance Authority Revenue, Henry Ford Health System, Series 2009, 5.750%, 11/15/39 | | | 4,765,000 | | | | 5,441,058 | |
Nebraska - 2.1% | | | | | | | | |
Central Plains Energy Project, Natural Gas Revenue, 5.000%, 09/01/42 | | | 5,000,000 | | | | 5,374,350 | |
New Hampshire - 1.7% | | | | | | | | |
New Hampshire Health and Education Facilities Authority, Southern New Hampshire University, 5.000%, 01/01/42 | | | 4,000,000 | | | | 4,177,200 | |
New Jersey - 13.3% | | | | | | | | |
New Jersey Economic Development Authority, Industrial Revenue, Private Activity - The Goethals Bridge Replacement Project, 5.375%, 01/01/43 | | | 7,005,000 | | | | 7,670,685 | |
New Jersey Economic Development Authority, School Facilities Construction, Series UU, 5.000%, 06/15/40 | | | 3,000,000 | | | | 3,258,480 | |
New Jersey Economic Development Authority, Tobacco and Liquor Tax Revenue, 5.000%, 06/15/28 | | | 995,000 | | | | 1,099,565 | |
New Jersey Economic Development Authority, Tobacco and Liquor Tax Revenue, 5.000%, 06/15/29 | | | 1,000,000 | | | | 1,098,880 | |
New Jersey Economic Development Authority, UMM Energy Partners, Series 2012 A, 5.125%, 06/15/43 | | | 4,450,000 | | | | 4,701,870 | |
New Jersey Health Care Facilities Financing Authority Revenue and Refunding, Barnabas Health Issue, Series 2011 A, 5.625%, 07/01/32 | | | 4,095,000 | | | | 4,803,271 | |
New Jersey State Turnpike Authority, Highway Improvements, Series A, 5.000%, 01/01/43 | | | 6,230,000 | | | | 6,905,644 | |
New Jersey Transportation Trust Fund Authority, Series A, 5.000%, 06/15/42 | | | 3,500,000 | | | | 3,748,850 | |
Total New Jersey | | | | | | | 33,287,245 | |
New York - 8.9% | | | | | | | | |
Chautauqua County Industrial Development Agency Exempt Facility Revenue, NRG Dunkirk Power Project, Series 2009, 5.875%, 04/01/42 | | | 4,000,000 | | | | 4,447,480 | |
Long Island Power Authority, Electric Light & Power Improvements, Series A, 5.000%, 09/01/39 | | | 5,695,000 | | | | 6,404,312 | |
Long Island Power Authority, Electric Light & Power Improvements, Series A, 5.000%, 09/01/44 | | | 3,390,000 | | | | 3,785,681 | |
Metropolitan Transportation Authority, Series A, 5.000%, 11/15/43 | | | 5,000,000 | | | | 5,596,900 | |
Port Authority of New York and New Jersey Special Project, JFK International Air Terminal LLC Project, Series 2010, 6.000%, 12/01/42 | | | 1,850,000 | | | | 2,141,634 | |
Total New York | | | | | | | 22,376,007 | |
Ohio - 1.6% | | | | | | | | |
Butler County Hospital Facilities Revenue, UC Health, Series 2010, 5.500%, 11/01/40 | | | 3,635,000 | | | | 4,065,311 | |
Pennsylvania - 4.5% | | | | | | | | |
Lycoming County Authority Health System Revenue, Susquehanna Health System Project, Series 2009 A, 5.750%, 07/01/39 | | | 5,000,000 | | | | 5,396,500 | |
The accompanying notes are an integral part of these financial statements.
25
AMG GW&K Municipal Enhanced Yield Fund
Schedule of Portfolio Investments (continued)
| | | | | | | | |
| | | Principal Amount | | | Value | |
Pennsylvania - 4.5% (continued) | | | | | | | | |
Pennsylvania Higher Educational Facilities Authority, La Salle University, 5.000%, 05/01/42 | | $ | 4,000,000 | | | $ | 4,268,880 | |
Philadelphia Gas Works Revenue, Ninth Series, 5.250%, 08/01/40 | | | 1,415,000 | | | | 1,605,091 | |
Total Pennsylvania | | | | | | | 11,270,471 | |
Tennessee - 2.4% | | | | | | | | |
Chattanooga-Hamilton County Hospital Authority, 5.000%, 10/01/44 | | | 5,630,000 | | | | 6,108,381 | |
Texas - 10.5% | | | | | | | | |
Central Texas Regional Mobility Authority Senior Lien Revenue, Series 2011, 6.000%, 01/01/41 | | | 3,420,000 | | | | 3,941,926 | |
Central Texas Regional Mobility Authority Senior Lien Revenue, Series A, 5.000%, 01/01/43 | | | 2,950,000 | | | | 3,221,577 | |
Fort Bend County Industrial Development Corp. Industrial Revenue, Series 2012 A, 4.750%, 05/01/38 | | | 2,155,000 | | | | 2,236,093 | |
Grand Parkway Transportation Corp. 1st Tier Toll Revenue, Series A, 5.500%, 04/01/53 | | | 3,870,000 | | | | 4,276,195 | |
North Texas Tollway Authority Revenue, First Tier, Series B, 5.000%, 01/01/42 | | | 3,750,000 | | | | 4,120,313 | |
North Texas Tollway Authority Revenue, Second Tier, Series B, 5.000%, 01/01/31 | | | 3,500,000 | | | | 3,985,695 | |
Texas Municipal Gas Acquisition & Supply Corp. Gas Supply Revenue, Senior Lien Series 2008 A, 6.250%, 12/15/26 | | | 3,705,000 | | | | 4,614,281 | |
Total Texas | | | | | | | 26,396,080 | |
Virgin Islands - 2.2% | | | | | | | | |
Virgin Islands Public Finance Authority Matching Fund Loan Notes, Series 2012 A, 5.000%, 10/01/32 | | | 5,000,000 | | | | 5,430,050 | |
Virginia - 4.0% | | | | | | | | |
Chesapeake City Expressway Toll Road Revenue, Series 2012 A, 5.000%, 07/15/47 | | | 4,000,000 | | | | 4,268,400 | |
Route 460 Funding Corp. Toll Road Revenue, Series 2012 A, 5.125%, 07/01/49 | | | 5,315,000 | | | | 5,725,796 | |
Total Virginia | | | | | | | 9,994,196 | |
West Virginia - 4.1% | | | | | | | | |
West Virginia Economic Development Revenue, Appalachian Power Co. Amos Project, Series 2010 A, 5.375%, 12/01/381 | | | 4,060,000 | | | | 4,478,586 | |
West Virginia Hospital Finance Authority, West Virginia United Health Systems Obligation Group, Series A, 5.500%, 06/01/44 | | | 5,000,000 | | | | 5,749,850 | |
Total West Virginia | | | | | | | 10,228,436 | |
Total Municipal Bonds (cost $233,060,471) | | | | | | | 245,345,135 | |
| | |
| | | Shares | | | | |
Other Investment Companies - 0.8%5 | | | | | | | | |
Fidelity Institutional Money Market Tax Exempt Portfolio, Institutional Class, 0.01% (cost $1,985,941) | | | 1,985,941 | | | | 1,985,941 | |
Total Investments - 98.7% (cost $235,046,412) | | | | | | | 247,331,076 | |
Other Assets, less Liabilities - 1.3% | | | | | | | 3,216,136 | |
Net Assets - 100.0% | | | | | | $ | 250,547,212 | |
The accompanying notes are an integral part of these financial statements.
26
AMG GW&K Small Cap Core Fund
Portfolio Manager’s Comments
THE YEAR IN REVIEW
For the year ended December 31, 2014, the AMG GW&K Small Cap Core Fund Investor Class (the Fund) returned 1.53%, underperforming the Russell 2000® Index, which returned 4.89%. Please note that this Fund has multiple share classes. Performance for all classes can be found on the Fund’s performance page at www.amgfunds.com.
Nearly anyone who has flown commercially recalls a bout of turbulence during a flight. Some of these are minor and just rattle the nerves. Some last longer and inspire pledges to never fly again. Moviegoers may remember the scene from Almost Famous which hilariously depicted an episode of turbulence that led to some life changing confessions. But nearly every experience with turbulence ends as it did in the movie, with a safe landing and happy ending. In other words, turbulence is uncomfortable, but a fairly typical event.
The same is true in the investing world. Investors do not wish for turbulence, but it is more common than uncommon. The U.S. Federal Reserve (the Fed) and other central banks around the world have been intervening in markets ever since the 2008 financial crisis, to lower short-term interest rates and push investors out on the risk curve. Lower volatility for risk assets has been a byproduct. Investors who took the hint early have been paid out handsomely, as most U.S. equity indices have posted 15% or better annualized five-year returns. However, recent economic performance in the U.S. brings us closer to the time when the Fed will begin to normalize its monetary policy, and more turbulent events will almost assuredly result. We would argue this process has already begun, with commodity price drops and wide dispersion in industry performance in 2014. It is our opinion that the coming year is likely to see a bit more volatility and turbulence, but just like air travel, this is common and doesn’t mean we should change our destination or mode of transport. U.S. small-cap stocks can still offer good returns, although the types of stocks that will outperform will likely change.
For the U.S. small-cap market, a very strong Russell 2000® Index fourth-quarter return of 9.7% helped save what had been a disappointing
2014. The index ended the full year up 4.9%. Looking deeper into small-cap performance, we saw a second year where quality factor performance was not a key determinant of returns. For example, several lower-quality factors like high beta and high EPS variation underperformed. However, several others outperformed, such as stocks with no return-on-investment (ROE) measure. Returns by long-term debt levels and ROE within the small-cap market were quite mixed for 2014, and overall we consider the environment mixed to a slight positive for higher-quality names.
The real action within the index, for 2014, was at the industry and sector level. For the year, the theme of lower rates and lower fuel prices also drove sector and industry performance. Utilities, health care and consumer staples were the best performers, with energy (-36.0%) and materials (-4.2%) being the only sectors to finish with meaningful declines. The best industry groups were REITs, semiconductors, airlines, biotech, pharma and container and packaging. Biotech has outperformed in four of the last five years, as have several others in this group, another trend to watch for potential change in 2015. Mean reversion is a powerful force. Lester Bangs (played memorably by Philip Seymour Hoffman), the infamous rock critic and mentor in Almost Famous, said it best, “you’ll meet them all again on their long journey to the middle.”
For the year, the attribution trends mirrored those seen during the fourth quarter. Energy, industrials and materials were our best performers. Energy actually generated absolute positive returns in the exploration and production space, which is difficult to pull off in an industry down nearly 35%. Materials had all five names generating positive returns in a negative sector, while industrials performance was buoyed by Heartland Express, Inc. (a truckload carrier), which finished the year up 38%. Consumer staples, utilities and financials were also each slightly additive. On the flip side, health care, technology and consumer discretionary were negative contributors. Health care cost our Fund the greatest stress, on a combination of weaker stock selection, with four names down more than 20%, including Hanger, Inc. (HGR), Air Methods Corporation (AIRM), IPC Healthcare, Inc. (IPCM) and Medidata Solutions,
Inc. (MDSO), and a lack of exposure to strong performing buyouts. Technology and consumer discretionary each had a few misses on the stock selection side, most of which occurred earlier in the year.
As we enter 2015, the macro investing picture appears to have several competing jet streams that could bring about quite a different investing environment than we have seen over the past few years. International economies appear to be slowing, certainly in the emerging economies but also in the core of Europe. At the same time, the U.S. economy appears to be growing at a (dare we say) sustainable pace, with some benefit still to come over the next few quarters to the consumer and companies with petroleum-linked input costs from the significant decline in energy prices. This puts the Fed in the difficult position of needing to approach normalization of monetary policy, while investors become more concerned with global growth. What happens next? The most likely answer is turbulence, a phenomenon that is actually quite common, both in aviation and investing. Risk assets would seem to be poised for greater volatility during this period. Just as it is prudent to have one’s seat belt fastened on an airplane, it is prudent to have a small-cap vehicle that can perform well in more volatile market conditions and focuses up the quality spectrum. Our Fund has always been focused on high-quality businesses, run by long-term oriented, skillful managers with track records of delivering sustainable growth and above-average returns in various business conditions. We buy these with an eye on valuation relative to its peers, history and growth prospects over a three-to-five year period. We believe this fundamentally-driven approach will work well for the environment most likely to develop in 2015, as the themes that worked so well in 2014 revert to the middle.
This commentary reflects the viewpoints of Gannett Welsh & Kotler, LLC as of December 31, 2014 and is not intended as a forecast or guarantee of future results.
27
AMG GW&K Small Cap Core Fund
Portfolio Manager’s Comments (continued)
CUMULATIVE TOTAL RETURN PERFORMANCE
AMG GW&K Small Cap Core Fund’s cumulative total return is based on the daily change in net asset value (NAV) and assumes that all dividends and distributions were reinvested. The chart compares a hypothetical $10,000 investment made in AMG GW&K Small Cap Core Fund - Investor Class on December 31, 2004, to a $10,000 investment made in the Russell 2000® Index for the same time period. The graph and table do not reflect the deduction of taxes that a shareholder would pay on a Fund distribution or redemption of shares. The listed returns for the Fund are net of expenses and the returns for the index exclude expenses. Total returns would have been lower had certain expenses not been reduced.
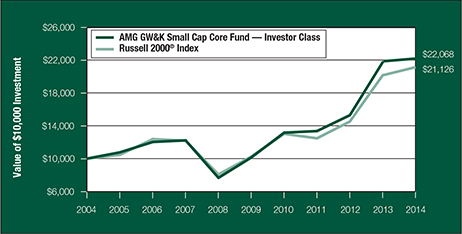
The table below shows the average annual total returns for the AMG GW&K Small Cap Core Fund and the Russell 2000® Index for the same time periods ended December 31, 2014.
| | | | | | | | | | | | | | | | | | | | |
| Average Annual Total Returns1 | | One
Year | | | Five
Years | | | Ten
Years | | | Since
Inception | | | Inception
date | |
AMG GW&K Small Cap Core Fund 2,3,4 | | | | | | | | | | | | | | | | | | | | |
Investor Class | | | 1.53 | % | | | 16.84 | % | | | 8.24 | % | | | 8.20 | % | | | 12/10/96 | |
Service Class | | | 1.86 | % | | | 17.10 | % | | | — | | | | 18.37 | % | | | 7/27/09 | |
Institutional Class | | | 2.04 | % | | | 17.34 | % | | | — | | | | 18.60 | % | | | 7/27/09 | |
Russell 2000® Index5 | | | 4.89 | % | | | 15.55 | % | | | 7.77 | % | | | 8.31 | % | | | 12/10/96 | † |
The performance data shown represents past performance. Past performance is not a guarantee of future results. Current performance may be lower or higher than the performance data quoted. The investment return and principal value of an investment in the Fund will fluctuate so that an investor’s shares, when redeemed, may be worth more or less than their original cost.
Investors should carefully consider the Fund’s investment objectives, risks, charges and expenses before investing. For performance information through the most recent month end, current net asset values per share for the Fund and other information, please call (800) 835-3879 or visit our website at www.amgfunds.com for a free prospectus. Read it carefully before investing or sending money.
Funds are distributed by AMG Distributors, Inc., member FINRA/SIPC.
| † | Date reflects the inception date of the Fund, not the index. |
| 1 | Total return equals income yield plus share price change and assumes reinvestment of all dividends and capital gain distributions. Returns are net of fees and may reflect offsets of Fund expenses as described in the prospectus. No adjustment has been made for taxes payable by shareholders on their reinvested dividends and capital gain distributions. Returns for periods greater than one year are annualized. The listed returns on the Fund are net of expenses and based on the published NAV as of December 31, 2014. All returns are in U.S. dollars ($). |
| 2 | From time to time, the Fund’s advisor has waived its fees and/or absorbed Fund expenses, which has resulted in higher returns. |
| 3 | The Fund inception dates and returns for all periods prior to November 7, 2008 reflects performance of the predecessor Fund, The BNY Hamilton Multi-Cap Equity Fund, a series of BNY Hamilton Funds, Inc. |
| 4 | The Fund is subject to risks associated with investments in small-capitalization companies, such as erratic earnings patterns, competitive conditions, limited earnings history, and a reliance on one or a limited number of products. |
| 5 | The Russell 2000® Index is composed of the 2,000 smallest stocks in the Russell 3000® Index and is widely regarded in the industry as the premier measure of small-cap stock performance. The Russell 3000® Index is composed of the 3,000 largest U.S. companies as measured by market capitalization, and represents about 98% of the U.S. stock market. The Russell 2000® Index and the Russell 3000® Index are unmanaged, are not available for investment, and do not incur expenses. |
The Russell 2000® Index and Russell 3000® Index are registered trademarks of Russell Investments. Russell® is a trademark of Russell Investments.
Not FDIC insured, nor bank guaranteed. May lose value.
28
AMG GW&K Small Cap Core Fund
Fund Snapshots (unaudited)
December 31, 2014
| | | | | | | | |
| PORTFOLIO BREAKDOWN | |
| | |
Sector | | AMG GW&K
Small Cap
Core Fund** | | | Russell 2000®
Index | |
Financials | | | 20.9 | % | | | 24.2 | % |
Industrials | | | 19.0 | % | | | 13.8 | % |
Information Technology | | | 17.6 | % | | | 17.9 | % |
Consumer Discretionary | | | 13.6 | % | | | 13.7 | % |
Health Care | | | 13.2 | % | | | 14.8 | % |
Materials | | | 5.9 | % | | | 4.5 | % |
Energy | | | 3.4 | % | | | 3.4 | % |
Utilities | | | 2.9 | % | | | 3.6 | % |
Consumer Staples | | | 1.1 | % | | | 3.3 | % |
Telecommunications Services | | | 0.0 | % | | | 0.8 | % |
Other Assets and Liabilities | | | 2.4 | % | | | 0.0 | % |
| ** | As a percentage of net assets. |
| | | | |
| TOP TEN HOLDINGS | |
| |
Security Name | | % of Net Assets | |
Tyler Technologies, Inc. | | | 2.3 | % |
Grand Canyon Education, Inc. | | | 2.3 | |
MarketAxess Holdings, Inc. | | | 2.2 | |
FEI Co. | | | 2.2 | |
West Pharmaceutical Services, Inc. | | | 2.1 | |
Texas Roadhouse, Inc. | | | 2.0 | |
Heartland Express, Inc. | | | 2.0 | |
NorthWestern Corp. | | | 2.0 | |
Cognex Corp. | | | 1.9 | |
Pebblebrook Hotel Trust | | | 1.8 | |
| | | | |
Top Ten as a Group | | | 20.8 | % |
| | | | |
Because a fund’s strategy may result in multiple investments in particular sectors of the economy, its performance may depend on the performance of those sectors and may fluctuate more widely than investments diversified across more sectors. For additional information on these and other risk considerations, please see the Fund’s prospectus.
Any sectors, industries, or securities discussed should not be perceived as investment recommendations. Mention of a specific security should not be considered a recommendation to buy or solicitation to sell that security. Specific securities mentioned in this report may have been sold from the Fund’s portfolio of investments by the time you receive this report.
29
AMG GW&K Small Cap Core Fund
Schedule of Portfolio Investments
December 31, 2014
| | | | | | | | |
| | | Shares | | | Value | |
Common Stocks - 97.6% | | | | | | | | |
Consumer Discretionary - 13.6% | | | | | |
Grand Canyon Education, Inc.* | | | 182,450 | | | $ | 8,513,117 | |
Group 1 Automotive, Inc. | | | 74,548 | | | | 6,680,992 | |
Hibbett Sports, Inc.*,2 | | | 102,675 | | | | 4,972,550 | |
Monro Muffler Brake, Inc.2 | | | 46,875 | | | | 2,709,375 | |
Oxford Industries, Inc. | | | 51,279 | | | | 2,831,114 | |
Pier 1 Imports, Inc. | | | 181,500 | | | | 2,795,100 | |
The Ryland Group, Inc. | | | 145,450 | | | | 5,608,552 | |
Texas Roadhouse, Inc. | | | 225,110 | | | | 7,599,714 | |
Tumi Holdings, Inc.* | | | 231,931 | | | | 5,503,723 | |
Tupperware Brands Corp.2 | | | 56,647 | | | | 3,568,761 | |
Total Consumer Discretionary | | | | | | | 50,782,998 | |
Consumer Staples - 1.1% | | | | | | | | |
WD-40 Co. | | | 47,621 | | | | 4,051,595 | |
Energy - 3.4% | | | | | | | | |
Dril-Quip, Inc.* | | | 56,081 | | | | 4,303,095 | |
Forum Energy Technologies, Inc.* | | | 194,149 | | | | 4,024,709 | |
Matador Resources Co.*,2 | | | 218,448 | | | | 4,419,203 | |
Total Energy | | | | | | | 12,747,007 | |
Financials - 20.9% | | | | | | | | |
American Campus Communities, Inc. | | | 137,865 | | | | 5,702,096 | |
AMERISAFE, Inc. | | | 68,796 | | | | 2,914,199 | |
Cohen & Steers, Inc.2 | | | 132,405 | | | | 5,571,602 | |
Glacier Bancorp, Inc. | | | 227,490 | | | | 6,317,397 | |
Iberiabank Corp. | | | 90,387 | | | | 5,861,597 | |
MarketAxess Holdings, Inc. | | | 114,336 | | | | 8,199,035 | |
National Health Investors, Inc. | | | 75,385 | | | | 5,273,935 | |
Pebblebrook Hotel Trust | | | 148,435 | | | | 6,773,089 | |
PRA Group, Inc.* | | | 102,054 | | | | 5,911,988 | |
ProAssurance Corp. | | | 102,855 | | | | 4,643,903 | |
STAG Industrial, Inc. | | | 195,465 | | | | 4,788,892 | |
Stifel Financial Corp.* | | | 128,890 | | | | 6,575,968 | |
Texas Capital Bancshares, Inc.* | | | 101,885 | | | | 5,535,412 | |
ViewPoint Financial Group, Inc.* | | | 176,698 | | | | 4,214,247 | |
Total Financials | | | | | | | 78,283,360 | |
Health Care - 13.2% | | | | | | | | |
Air Methods Corp.*,2 | | | 78,945 | | | | 3,475,948 | |
Analogic Corp. | | | 49,249 | | | | 4,166,958 | |
Cantel Medical Corp. | | | 75,902 | | | | 3,283,521 | |
| | | | | | | | |
| | | Shares | | | Value | |
Cepheid, Inc.* | | | 75,270 | | | $ | 4,075,118 | |
Globus Medical, Inc., Class A* | | | 218,001 | | | | 5,181,884 | |
HMS Holdings Corp.*,2 | | | 112,715 | | | | 2,382,795 | |
ICU Medical, Inc.* | | | 71,585 | | | | 5,862,811 | |
IPC Healthcare, Inc.* | | | 87,460 | | | | 4,013,539 | |
Medidata Solutions, Inc.* | | | 78,770 | | | | 3,761,267 | |
MWI Veterinary Supply, Inc.* | | | 30,548 | | | | 5,190,411 | |
West Pharmaceutical Services, Inc. | | | 147,210 | | | | 7,837,460 | |
Total Health Care | | | | | | | 49,231,712 | |
Industrials - 19.0% | | | | | | | | |
CLARCOR, Inc. | | | 95,879 | | | | 6,389,377 | |
The Corporate Executive Board Co. | | | 91,377 | | | | 6,627,574 | |
Healthcare Services Group, Inc. | | | 181,425 | | | | 5,611,475 | |
Heartland Express, Inc. | | | 278,740 | | | | 7,528,767 | |
HEICO Corp.2 | | | 47,867 | | | | 2,891,167 | |
The Middleby Corp.* | | | 62,844 | | | | 6,227,840 | |
Mobile Mini, Inc. | | | 114,320 | | | | 4,631,103 | |
Primoris Services Corp. | | | 163,432 | | | | 3,798,160 | |
Proto Labs, Inc.*,2 | | | 70,383 | | | | 4,726,922 | |
RBC Bearings, Inc. | | | 70,667 | | | | 4,560,142 | |
Ritchie Bros. Auctioneers, Inc.2 | | | 208,211 | | | | 5,598,794 | |
The Toro Co. | | | 89,143 | | | | 5,688,215 | |
Universal Forest Products, Inc. | | | 71,830 | | | | 3,821,356 | |
US Ecology, Inc. | | | 77,460 | | | | 3,107,695 | |
Total Industrials | | | | | | | 71,208,587 | |
Information Technology - 17.6% | | | | | |
Blackbaud, Inc. | | | 135,110 | | | | 5,844,859 | |
Cardtronics, Inc.* | | | 100,620 | | | | 3,881,920 | |
Cavium, Inc.*,2 | | | 90,610 | | | | 5,601,510 | |
Cognex Corp.* | | | 174,320 | | | | 7,204,646 | |
CoStar Group, Inc.* | | | 21,085 | | | | 3,871,839 | |
EPAM Systems, Inc.* | | | 72,825 | | | | 3,477,394 | |
FEI Co. | | | 89,394 | | | | 8,076,748 | |
LogMeln, Inc.* | | | 80,306 | | | | 3,962,298 | |
Power Integrations, Inc. | | | 98,508 | | | | 5,096,804 | |
PROS Holdings, Inc.* | | | 38,480 | | | | 1,057,430 | |
Rofin-Sinar Technologies, Inc.* | | | 100,232 | | | | 2,883,675 | |
SciQuest, Inc.* | | | 151,450 | | | | 2,188,452 | |
Solera Holdings, Inc. | | | 77,066 | | | | 3,944,238 | |
The accompanying notes are an integral part of these financial statements.
30
AMG GW&K Small Cap Core Fund
Schedule of Portfolio Investments (continued)
| | | | | | | | |
| | | Shares | | | Value | |
Information Technology - 17.6% (continued) | |
Tyler Technologies, Inc.* | | | 79,706 | | | $ | 8,723,025 | |
Total Information Technology | | | | | | | 65,814,838 | |
Materials - 5.9% | | | | | | | | |
Balchem Corp. | | | 65,485 | | | | 4,363,920 | |
Compass Minerals International, Inc. | | | 44,229 | | | | 3,840,404 | |
Flotek Industries, Inc.* | | | 142,750 | | | | 2,673,707 | |
KapStone Paper and Packaging Corp. | | | 174,440 | | | | 5,112,836 | |
Silgan Holdings, Inc. | | | 112,865 | | | | 6,049,564 | |
Total Materials | | | | | | | 22,040,431 | |
Utilities - 2.9% | | | | | | | | |
Cleco Corp. | | | 64,250 | | | | 3,504,195 | |
NorthWestern Corp. | | | 130,162 | | | | 7,364,566 | |
Total Utilities | | | | | | | 10,868,761 | |
Total Common Stocks (cost $308,618,334) | | | | | | | 365,029,289 | |
| | |
| | | Principal
Amount | | | | |
Short-Term Investments - 5.5% | |
Repurchase Agreements - 3.4%4 | | | | | |
Cantor Fitzgerald Securities, Inc., dated 12/31/14 due 01/02/15, 0.090%, total to be received $3,041,321 (collateralized by various U.S. Government Agency Obligations, 0.000% - 10.500%, 01/01/15 - 11/20/64, totaling $3,102,132) | | $ | 3,041,306 | | | | 3,041,306 | |
Citigroup Global Markets, Inc., dated 12/31/14, due 01/02/15, 0.080%, total to be received $640,244 (collateralized by various U.S. Government Agency Obligations, 1.375% - 8.000%, 12/15/17 - 07/15/51, totaling $653,046) | | | 640,241 | | | | 640,241 | |
Daiwa Capital Markets America, dated 12/31/14, due 01/02/15, 0.120%, total to be received $3,041,326 (collateralized by various U.S. Government Agency Obligations, 0.000% - 6.500%, 06/01/17 - 03/01/48, totaling $3,102,132) | | | 3,041,306 | | | | 3,041,306 | |
| | | | | | | | |
| | | Principal Amount | | | Value | |
Nomura Securities International, Inc., dated 12/31/14, due 01/02/15, 0.080%, total to be received $3,041,320 (collateralized by various U.S. Government Agency Obligations, 0.000% - 8.875%, 01/07/15 -11/20/64 totaling $3,102,132) | | $ | 3,041,306 | | | $ | 3,041,306 | |
State of Wisconsin Investment Board, dated 12/31/14, due 01/02/15, 0.150%, total to be received $3,041,331 (collateralized by various U.S. Government Agency Obligations, 0.125% - 2.500%, 04/15/16 - 02/15/42, totaling $3,102,437) | | | 3,041,306 | | | | 3,041,306 | |
Total Repurchase
Agreements | | | | | | | 12,805,465 | |
| | |
| | | Shares | | | | |
Other Investment Companies - 2.1%5 | |
Dreyfus Institutional Cash Advantage Fund, Institutional Class Shares, 0.06% | | | 7,952,088 | | | | 7,952,088 | |
Total Short-Term Investments
(cost $20,757,553) | | | | 20,757,553 | |
Total Investments - 103.1%
(cost $329,375,887) | | | | 385,786,842 | |
Other Assets, less Liabilities - (3.1)% | | | | (11,685,117 | ) |
Net Assets - 100.0% | | | $ | 374,101,725 | |
The accompanying notes are an integral part of these financial statements.
31
Notes to Schedules of Portfolio Investments
The following footnotes and abbreviations should be read in conjunction with each of the Schedules of Portfolio Investments previously presented in this report.
At December 31, 2014, the approximate cost of investments for federal income tax purposes and the aggregate gross unrealized appreciation and/or depreciation based on tax cost were:
| | | | | | | | | | | | | | | | |
| Fund | | Cost | | | Appreciation | | | Depreciation | | | Net | |
AMG GW&K Enhanced Core Bond Fund | | $ | 88,655,793 | | | $ | 2,009,587 | | | $ | (1,380,717 | ) | | $ | 628,870 | |
AMG GW&K Municipal Bond Fund | | | 497,523,424 | | | | 12,883,278 | | | | (422,215 | ) | | | 12,461,063 | |
AMG GW&K Municipal Enhanced Yield Fund | | | 235,127,484 | | | | 12,284,693 | | | | (81,101 | ) | | | 12,203,592 | |
AMG GW&K Small Cap Core Fund | | | 329,348,995 | | | | 66,510,862 | | | | (10,073,015 | ) | | | 56,437,847 | |
| * | Non-income producing security. |
| (a) | Security exempt from registration under Rule 144A of the Securities Act of 1933. This security may be resold in transactions exempt from registration, normally to qualified buyers. At December 31, 2014, the value of these securities amounted to the following: |
| | | | | | | | |
| Fund | | Market Value | | | % of Net Assets | |
AMG GW&K Enhanced Core Bond Fund | | $ | 1,195,000 | | | | 1.4 | % |
AMG GW&K Municipal Enhanced Yield Fund | | | 7,846,056 | | | | 3.1 | % |
| (b) | Step Bond: A debt instrument with either deferred interest payments or an interest rate that resets at specific times during its term. |
| 1 | Variable Rate Security. The rate listed is as of December 31, 2014, and is periodically reset subject to terms and conditions set forth in the debenture. |
| 2 | Some or all of these shares were out on loan to various brokers as of December 31, 2014, amounting to: |
| | | | | | | | |
| Fund | | Market Value | | | % of Net Assets | |
AMG GW&K Enhanced Core Bond Fund | | $ | 2,219,278 | | | | 2.5 | % |
AMG GW&K Small Cap Core Fund | | | 12,399,511 | | | | 3.3 | % |
| 3 | Securities in the portfolio backed by insurance of financial institutions and financial guaranty assurance agencies. At December 31, 2014, the value of these securities amounted to the following: |
| | | | | | | | |
| Fund | | Market Value | | | % of Net Assets | |
AMG GW&K Enhanced Core Bond Fund | | $ | 873,724 | | | | 1.0 | % |
AMG GW&K Municipal Enhanced Yield Fund | | | 3,857,769 | | | | 1.5 | % |
| 4 | Collateral received from brokers for securities lending was invested in these short-term investments. |
| 5 | Yield shown represents the December 31, 2014, seven-day average yield, which refers to the sum of the previous seven days’ dividends paid, expressed as an annual percentage. |
| 6 | All or part of the security is delayed delivery transaction. The market value of delayed delivery securities at December 31, 2014, amounted to the following: |
| | | | | | | | |
| Fund | | Market Value | | | % of Net Assets | |
AMG GW&K Municipal Bond Fund | | $ | 3,374,855 | | | | 0.7 | % |
| 7 | Some of the theses securities are segregated as collateral for delayed delivery transactions. At December 31, 2014, the value of theses securities amounted to the following: |
| | | | | | | | |
| Fund | | Market Value | | | % of Net Assets | |
AMG GW&K Municipal Bond Fund | | $ | 7,154,940 | | | | 1.4 | % |
The accompanying notes are an integral part of these financial statements.
32
Notes to Schedules of Portfolio Investments (continued)
The following tables summarize the inputs used to value the Funds’ net assets by the fair value hierarchy levels as of December 31, 2014: (See Note 1(a) in the Notes to the Financial Statements.)
| | | | | | | | | | | | | | | | |
| | | Quoted Prices in Active
Markets for Identical
Investments
Level 1 | | | Significant Other
Observable Inputs
Level 2 | | | Significant Unobservable
Inputs
Level 3 | | | Total | |
AMG GW&K Enhanced Core Bond Fund | | | | | | | | | | | | | | | | |
Investments in Securities | | | | | | | | | | | | | | | | |
Corporate Bonds and Notes† | | | — | | | $ | 52,100,709 | | | | — | | | $ | 52,100,709 | |
Municipal Bonds†† | | | — | | | | 5,630,926 | | | | — | | | | 5,630,926 | |
U.S. Government and Agency Obligations† | | | — | | | | 26,442,962 | | | | — | | | | 26,442,962 | |
Short-Term Investments | | | | | | | | | | | | | | | | |
Repurchase Agreements | | | — | | | | 2,316,213 | | | | — | | | | 2,316,213 | |
Other Investment Companies | | $ | 2,793,853 | | | | — | | | | — | | | | 2,793,853 | |
| | | | | | | | | | | | | | | | |
Total Investments in Securities | | $ | 2,793,853 | | | $ | 86,490,810 | | | | — | | | $ | 89,284,663 | |
| | | | | | | | | | | | | | | | |
| | | | |
| | | Quoted Prices in Active
Markets for Identical
Investments
Level 1 | | | Significant Other
Observable Inputs
Level 2 | | | Significant Unobservable
Inputs
Level 3 | | | Total | |
AMG GW&K Municipal Bond Fund | | | | | | | | | | | | | | | | |
Investments in Securities | | | | | | | | | | | | | | | | |
Municipal Bonds†† | | | — | | | $ | 501,672,587 | | | | — | | | $ | 501,672,587 | |
Other Investment Companies | | $ | 8,311,900 | | | | — | | | | — | | | | 8,311,900 | |
| | | | | | | | | | | | | | | | |
Total Investments in Securities | | $ | 8,311,900 | | | $ | 501,672,587 | | | | — | | | $ | 509,984,487 | |
| | | | | | | | | | | | | | | | |
| | | | |
| | | Quoted Prices in Active
Markets for Identical
Investments
Level 1 | | | Significant Other
Observable Inputs
Level 2 | | | Significant Unobservable
Inputs
Level 3 | | | Total | |
AMG GW&K Municipal Enhanced Yield Fund | | | | | | | | | | | | | | | | |
Investments in Securities | | | | | | | | | | | | | | | | |
Municipal Bonds†† | | | — | | | $ | 245,345,135 | | | | — | | | $ | 245,345,135 | |
Other Investment Companies | | $ | 1,985,941 | | | | — | | | | — | | | | 1,985,941 | |
| | | | | | | | | | | | | | | | |
Total Investments in Securities | | $ | 1,985,941 | | | $ | 245,345,135 | | | | — | | | $ | 247,331,076 | |
| | | | | | | | | | | | | | | | |
The accompanying notes are an integral part of these financial statements.
33
Notes to Schedules of Portfolio Investments (continued)
| | | | | | | | | | | | | | | | |
| | | Quoted Prices in Active
Markets for Identical
Investments
Level 1 | | | Significant Other
Observable Inputs
Level 2 | | | Significant Unobservable
Inputs
Level 3 | | | Total | |
AMG GW&K Small Cap Core Fund | | | | | | | | | | | | | | | | |
Investments in Securities | | | | | | | | | | | | | | | | |
Common Stocks††† | | $ | 365,029,289 | | | | — | | | | — | | | $ | 365,029,289 | |
Short-Term Investments | | | | | | | | | | | | | | | | |
Repurchase Agreements | | | — | | | $ | 12,805,465 | | | | — | | | | 12,805,465 | |
Other Investment Companies | | | 7,952,088 | | | | — | | | | — | | | | 7,952,088 | |
| | | | | | | | | | | | | | | | |
Total Investments in Securities | | $ | 372,981,377 | | | $ | 12,805,465 | | | | — | | | $ | 385,786,842 | |
| | | | | | | | | | | | | | | | |
| † | All corporate bonds and notes and U.S. government and agency obligations held in the Fund are level 2 securities. For a detailed breakout of the corporate bonds and notes and U.S. government and agency obligations by major industry or agency classification, please refer to the respective Schedule of Portfolio Investments. |
| †† | All municipal bonds held in the Fund are Level 2 securities. For a detailed breakout of the bonds by major classification, please refer to the respective Schedule of Portfolio Investments. |
| ††† | All common stocks held in the Funds are Level 1 securities. For a detailed breakout of the common stocks by major industry classification, please refer to the respective Schedule of Portfolio Investments. |
As of December 31, 2014, the Funds had no transfers between levels from the beginning of the reporting period.
INVESTMENTS DEFINITIONS AND ABBREVIATIONS:
| | |
COPS: | | Certificates of Participation |
FGIC: | | Financial Guaranty Insurance Company |
FHLMC: | | Federal Home Loan Mortgage Corp. |
FNMA: | | Federal National Mortgage Association |
GMTN: | | Global Medium-Term Notes |
National: | | National Public Finance Guarantee Corp. |
The accompanying notes are an integral part of these financial statements.
34
Statement of Assets and Liabilities
December 31, 2014
| | | | | | | | | | | | | | | | |
| | | AMG GW&K
Enhanced Core
Bond Fund | | | AMG GW&K
Municipal Bond
Fund | | | AMG GW&K
Municipal
Enhanced Yield
Fund | | | AMG GW&K
Small Cap
Core Fund | |
Assets: | | | | | | | | | | | | | | | | |
Investments at value* (including securities on loan valued at $2,219,278, $0, $0 and $12,399,511, respectively) | | $ | 89,284,663 | | | $ | 509,984,487 | | | $ | 247,331,076 | | | $ | 385,786,842 | |
Receivable for investments sold | | | — | | | | 2,747,469 | | | | 2,473,424 | | | | 95,708 | |
Receivable for Fund shares sold | | | 188,870 | | | | 9,356,131 | | | | 779,586 | | | | 1,445,421 | |
Dividends, interest and other receivables | | | 1,092,025 | | | | 6,151,509 | | | | 2,896,325 | | | | 641,450 | |
Receivable from affiliate | | | 22,029 | | | | 150,838 | | | | 38,294 | | | | 53,137 | |
Prepaid expenses | | | 14,254 | | | | 15,647 | | | | 9,718 | | | | 16,358 | |
Total assets | | | 90,601,841 | | | | 528,406,081 | | | | 253,528,423 | | | | 388,038,916 | |
Liabilities: | | | | | | | | | | | | | | | | |
Payable upon return of securities loaned | | | 2,316,213 | | | | — | | | | — | | | | 12,805,465 | |
Payable for investments purchased | | | — | | | | 9,789,848 | | | | — | | | | — | |
Payable for Fund shares repurchased | | | 337,408 | | | | 2,937,429 | | | | 2,769,294 | | | | 721,115 | |
Accrued expenses: | | | | | | | | | | | | | | | | |
Investment advisory and management fees | | | 33,585 | | | | 149,203 | | | | 106,281 | | | | 236,960 | |
Administrative fees | | | 14,927 | | | | 106,573 | | | | 33,980 | | | | 78,987 | |
Shareholder service fees - Investor Class | | | — | | | | 18,962 | | | | 4,002 | | | | 18,968 | |
Shareholder service fees - Service Class | | | — | | | | 4,241 | | | | — | | | | 5,816 | |
Distribution fees - Investor Class | | | 5,934 | | | | 4,952 | | | | 1,927 | | | | 8,296 | |
Distribution fees - Class C | | | 13,660 | | | | — | | | | — | | | | — | |
Trustees fees and expenses | | | 1,038 | | | | 4,538 | | | | 2,265 | | | | 3,498 | |
Other | | | 59,645 | | | | 84,996 | | | | 63,462 | | | | 58,086 | |
Total liabilities | | | 2,782,410 | | | | 13,100,742 | | | | 2,981,211 | | | | 13,937,191 | |
Net Assets | | $ | 87,819,431 | | | $ | 515,305,339 | | | $ | 250,547,212 | | | $ | 374,101,725 | |
Net Assets Represent: | | | | | | | | | | | | | | | | |
Paid-in capital | | $ | 87,463,758 | | | $ | 500,932,348 | | | $ | 239,309,631 | | | $ | 313,642,426 | |
Undistributed net investment income | | | 21,912 | | | | — | | | | 4,329 | | | | 10,337 | |
Accumulated net realized gain (loss) from investments | | | (295,343 | ) | | | 1,911,928 | | | | (1,051,412 | ) | | | 4,038,007 | |
Net unrealized appreciation of investments | | | 629,104 | | | | 12,461,063 | | | | 12,284,664 | | | | 56,410,955 | |
Net Assets | | $ | 87,819,431 | | | $ | 515,305,339 | | | $ | 250,547,212 | | | $ | 374,101,725 | |
Investor Class: | | | | | | | | | | | | | | | | |
Net Assets | | $ | 27,444,047 | | | $ | 23,571,817 | | | $ | 8,506,557 | | | $ | 37,994,847 | |
Shares outstanding | | | 2,685,654 | | | | 2,030,537 | | | | 837,653 | | | | 1,624,259 | |
Net asset value, offering and redemption price per share | | $ | 10.22 | | | $ | 11.61 | | | $ | 10.16 | | | $ | 23.39 | |
Service Class: | | | | | | | | | | | | | | | | |
Net Assets | | $ | 2,480,156 | | | $ | 98,152,415 | | | $ | 15,756,846 | | | $ | 44,805,785 | |
Shares outstanding | | | 241,829 | | | | 8,436,546 | | | | 1,550,584 | | | | 1,904,109 | |
Net asset value, offering and redemption price per share | | $ | 10.26 | | | $ | 11.63 | | | $ | 10.16 | | | $ | 23.53 | |
Class C Shares: | | | | | | | | | | | | | | | | |
Net Assets | | $ | 15,927,462 | | | | n/a | | | | n/a | | | | n/a | |
Shares outstanding | | | 1,561,126 | | | | n/a | | | | n/a | | | | n/a | |
Net asset value, offering and redemption price per share | | $ | 10.20 | | | | n/a | | | | n/a | | | | n/a | |
Institutional Class: | | | | | | | | | | | | | | | | |
Net Assets | | $ | 41,967,766 | | | $ | 393,581,107 | | | $ | 226,283,809 | | | $ | 291,301,093 | |
Shares outstanding | | | 4,093,980 | | | | 33,721,021 | | | | 22,305,065 | | | | 12,339,416 | |
Net asset value, offering and redemption price per share | | $ | 10.25 | | | $ | 11.67 | | | $ | 10.14 | | | $ | 23.61 | |
* Investments at cost | | $ | 88,655,559 | | | $ | 497,523,424 | | | $ | 235,046,412 | | | $ | 329,375,887 | |
The accompanying notes are an integral part of these financial statements.
35
Statement of Operations
For the year ended December 31, 2014
| | | | | | | | | | | | | | | | |
| | | AMG GW&K
Enhanced Core
Bond Fund | | | AMG GW&K
Municipal
Bond Fund | | | AMG GW&K
Municipal
Enhanced Yield
Fund | | | AMG GW&K
Small Cap
Core Fund | |
Investment Income: | | | | | | | | | | | | | | | | |
Interest income | | $ | 3,280,667 | | | $ | 9,513,095 | | | $ | 10,707,192 | | | $ | 289 | |
Dividend income | | | 1,686 | | | | 1,077 | | | | 418 | | | | 3,924,844 | 1 |
Securities lending income | | | 10,236 | | | | — | | | | — | | | | 71,827 | |
Foreign withholding tax | | | — | | | | — | | | | — | | | | (15,152 | ) |
Total investment income | | | 3,292,589 | | | | 9,514,172 | | | | 10,707,610 | | | | 3,981,808 | |
Expenses: | | | | | | | | | | | | | | | | |
Investment advisory and management fees | | | 405,752 | | | | 1,422,570 | | | | 1,198,447 | | | | 2,424,518 | |
Administrative fees | | | 180,334 | | | | 1,016,122 | | | | 599,223 | | | | 808,172 | |
Distribution fees - Investor Class | | | 68,244 | | | | 69,273 | | | | 25,048 | | | | 130,287 | |
Distribution fees - Class C | | | 183,179 | | | | — | | | | — | | | | — | |
Shareholder servicing fees - Investor Class | | | — | | | | 58,203 | | | | 11,398 | | | | 112,868 | |
Shareholder servicing fees - Service Class | | | 1,079 | | | | 128,878 | | | | 8,011 | | | | 52,379 | |
Professional fees | | | 52,795 | | | | 52,334 | | | | 52,467 | | | | 53,135 | |
Registration fees | | | 57,954 | | | | 79,317 | | | | 66,644 | | | | 56,391 | |
Custodian | | | 15,865 | | | | 49,050 | | | | 22,734 | | | | 23,880 | |
Transfer agent | | | 9,634 | | | | 25,671 | | | | 11,269 | | | | 22,974 | |
Reports to shareholders | | | 30,678 | | | | 24,966 | | | | 16,531 | | | | 40,940 | |
Trustees fees and expenses | | | 3,851 | | | | 16,356 | | | | 9,507 | | | | 13,342 | |
Miscellaneous | | | 4,721 | | | | 8,602 | | | | 6,589 | | | | 7,174 | |
Total expenses before offsets | | | 1,014,086 | | | | 2,951,342 | | | | 2,027,868 | | | | 3,746,060 | |
Fee waivers | | | — | | | | — | | | | (216,037 | ) | | | — | |
Expense reimbursements | | | (229,007 | ) | | | (1,312,291 | ) | | | (232,205 | ) | | | (378,846 | ) |
Net expenses | | | 785,079 | | | | 1,639,051 | | | | 1,579,626 | | | | 3,367,214 | |
Net investment income | | | 2,507,510 | | | | 7,875,121 | | | | 9,127,984 | | | | 614,594 | |
Net Realized and Unrealized Gain (Loss): | | | | | | | | | | | | | | | | |
Net realized gain on investments | | | 87,523 | | | | 3,462,649 | | | | 3,771,712 | | | | 22,646,725 | |
Net change in unrealized appreciation (depreciation) of investments | | | 2,660,589 | | | | 16,538,759 | | | | 25,123,728 | | | | (14,926,183 | ) |
Net realized and unrealized gain | | | 2,748,112 | | | | 20,001,408 | | | | 28,895,440 | | | | 7,720,542 | |
Net increase in net assets resulting from operations | | $ | 5,255,622 | | | $ | 27,876,529 | | | $ | 38,023,424 | | | $ | 8,335,136 | |
| 1 | Includes non-recurring dividends of $640,330. |
The accompanying notes are an integral part of these financial statements.
36
Statements of Changes in Net Assets
For the years ended December 31,
| | | | | | | | | | | | | | | | |
| | | AMG GW&K Enhanced
Core Bond Fund | | | AMG GW&K Municipal
Bond Fund | |
| | | 2014 | | | 2013 | | | 2014 | | | 2013 | |
Increase (Decrease) in Net Assets From Operations: | | | | | | | | | | | | | | | | |
Net investment income | | $ | 2,507,510 | | | $ | 2,765,332 | | | $ | 7,875,121 | | | $ | 4,612,084 | |
Net realized gain (loss) on investments | | | 87,523 | | | | (381,497 | ) | | | 3,462,649 | | | | 657,968 | |
Net change in unrealized appreciation (depreciation) of investments | | | 2,660,589 | | | | (2,241,302 | ) | | | 16,538,759 | | | | (10,012,903 | ) |
Net increase (decrease) in net assets resulting from operations | | | 5,255,622 | | | | 142,533 | | | | 27,876,529 | | | | (4,742,851 | ) |
Distributions to Shareholders: | | | | | | | | | | | | | | | | |
From net investment income: | | | | | | | | | | | | | | | | |
Investor Class | | | (769,523 | ) | | | (871,265 | ) | | | (432,266 | ) | | | (403,081 | ) |
Service Class | | | (57,198 | ) | | | (35,602 | ) | | | (1,339,974 | ) | | | (769,786 | ) |
Class C | | | (381,610 | ) | | | (431,792 | ) | | | — | | | | — | |
Institutional Class | | | (1,330,077 | ) | | | (1,669,013 | ) | | | (6,154,942 | ) | | | (3,400,461 | ) |
From net realized gain on investments: | | | | | | | | | | | | | | | | |
Investor Class | | | — | | | | (3,162,412 | ) | | | (79,952 | ) | | | (109,207 | ) |
Service Class | | | — | | | | (150,429 | ) | | | (330,497 | ) | | | (216,679 | ) |
Class C | | | — | | | | (2,099,367 | ) | | | — | | | | — | |
Institutional Class | | | — | | | | (5,438,306 | ) | | | (1,316,968 | ) | | | (787,354 | ) |
Total distributions to shareholders | | | (2,538,408 | ) | | | (13,858,186 | ) | | | (9,654,599 | ) | | | (5,686,568 | ) |
Capital Share Transactions:1 | | | | | | | | | | | | | | | | |
Net increase (decrease) from capital share transactions | | | (28,444,315 | ) | | | (13,118,777 | ) | | | 210,693,581 | | | | 117,040,476 | |
Total increase (decrease) in net assets | | | (25,727,101 | ) | | | (26,834,430 | ) | | | 228,915,511 | | | | 106,611,057 | |
Net Assets: | | | | | | | | | | | | | | | | |
Beginning of year | | | 113,546,532 | | | | 140,380,962 | | | | 286,389,828 | | | | 179,778,771 | |
End of year | | $ | 87,819,431 | | | $ | 113,546,532 | | | $ | 515,305,339 | | | $ | 286,389,828 | |
End of year undistributed net investment income (loss) | | $ | 21,912 | | | $ | 51,441 | | | | — | | | $ | 38,756 | |
| | | | | | | | | | | | | | | | |
| 1 | See Note 1(g) of the Notes to Financial Statements. |
The accompanying notes are an integral part of these financial statements.
37
Statements of Changes in Net Assets (continued)
For the years ended December 31,
| | | | | | | | | | | | | | | | |
| | | AMG GW&K Municipal
Enhanced Yield Fund | | | AMG GW&K Small
Cap Core Fund | |
| | | 2014 | | | 2013 | | | 2014 | | | 2013 | |
Increase (Decrease) in Net Assets From Operations: | | | | | | | | | | | | | | | | |
Net investment income (loss) | | $ | 9,127,984 | | | $ | 11,669,177 | | | $ | 614,594 | | | $ | (68,908 | ) |
Net realized gain (loss) on investments | | | 3,771,712 | | | | (4,821,153 | ) | | | 22,646,725 | | | | 11,109,017 | |
Net change in unrealized appreciation (depreciation) of investments | | | 25,123,728 | | | | (32,073,071 | ) | | | (14,926,183 | ) | | | 56,941,446 | |
Net increase (decrease) in net assets resulting from operations | | | 38,023,424 | | | | (25,225,047 | ) | | | 8,335,136 | | | | 67,981,555 | |
Distributions to Shareholders: | | | | | | | | | | | | | | | | |
From net investment income: | | | | | | | | | | | | | | | | |
Investor Class | | | (345,685 | ) | | | (621,586 | ) | | | — | | | | — | |
Service Class | | | (377,198 | ) | | | (210,911 | ) | | | (20,176 | ) | | | — | |
Institutional Class | | | (8,402,809 | ) | | | (10,832,659 | ) | | | (460,718 | ) | | | — | |
From net realized gain on investments: | | | | | | | | | | | | | | | | |
Investor Class | | | — | | | | (63,080 | ) | | | (2,104,505 | ) | | | (2,426,685 | ) |
Service Class | | | — | | | | (39,281 | ) | | | (2,494,630 | ) | | | (1,256,478 | ) |
Institutional Class | | | — | | | | (1,529,874 | ) | | | (15,829,282 | ) | | | (6,070,507 | ) |
Total distributions to shareholders | | | (9,125,692 | ) | | | (13,297,391 | ) | | | (20,909,311 | ) | | | (9,753,670 | ) |
Capital Share Transactions:1 | | | | | | | | | | | | | | | | |
Net increase (decrease) from capital share transactions | | | 7,236,539 | | | | (69,861,782 | ) | | | 111,993,583 | | | | 112,022,616 | |
Total increase (decrease) in net assets | | | 36,134,271 | | | | (108,384,220 | ) | | | 99,419,408 | | | | 170,250,501 | |
Net Assets: | | | | | | | | | | | | | | | | |
Beginning of year | | | 214,412,941 | | | | 322,797,161 | | | | 274,682,317 | | | | 104,431,816 | |
End of year | | $ | 250,547,212 | | | $ | 214,412,941 | | | $ | 374,101,725 | | | $ | 274,682,317 | |
End of year undistributed net investment income | | $ | 4,329 | | | $ | 2,018 | | | $ | 10,337 | | | | — | |
| | | | | | | | | | | | | | | | |
| 1 | See Note 1(g) of the Notes to Financial Statements. |
The accompanying notes are an integral part of these financial statements.
38
AMG GW&K Enhanced Core Bond Fund
Financial Highlights
For a share outstanding throughout each period
| | | | | | | | | | | | | | | | | | | | |
| | | For the years ended December 31, | |
| Investor Class | | 2014 | | | 2013 | | | 2012 | | | 2011 | | | 2010 | |
Net Asset Value, Beginning of Year | | $ | 9.96 | | | $ | 11.24 | | | $ | 10.81 | | | $ | 11.00 | | | $ | 10.43 | |
Income from Investment Operations: | | | | | | | | | | | | | | | | | | | | |
Net investment income | | | 0.29 | 3 | | | 0.24 | 3 | | | 0.44 | 3 | | | 0.46 | 3 | | | 0.47 | |
Net realized and unrealized gain (loss) on investments | | | 0.26 | 3 | | | (0.21 | )3 | | | 0.58 | 3 | | | 0.03 | 3 | | | 0.56 | |
Total from investment operations | | | 0.55 | | | | 0.03 | | | | 1.02 | | | | 0.49 | | | | 1.03 | |
Less Distributions to Shareholders from: | | | | | | | | | | | | | | | | | | | | |
Net investment income | | | (0.29 | ) | | | (0.26 | ) | | | (0.48 | ) | | | (0.51 | ) | | | (0.46 | ) |
Net realized gain on investments | | | — | | | | (1.05 | ) | | | (0.11 | ) | | | (0.17 | ) | | | — | |
Total distributions to shareholders | | | (0.29 | ) | | | (1.31 | ) | | | (0.59 | ) | | | (0.68 | ) | | | (0.46 | ) |
Net Asset Value, End of Year | | $ | 10.22 | | | $ | 9.96 | | | $ | 11.24 | | | $ | 10.81 | | | $ | 11.00 | |
Total Return1 | | | 5.58 | % | | | 0.29 | % | | | 9.53 | % | | | 4.53 | % | | | 10.04 | % |
Ratio of net expenses to average net assets (with offsets/reductions) | | | 0.84 | % | | | 0.86 | %4 | | | 0.84 | %5 | | | 0.84 | % | | | 0.84 | % |
Ratio of expenses to average net assets (with offsets) | | | 0.84 | % | | | 0.86 | %4 | | | 0.84 | %5 | | | 0.84 | % | | | 0.84 | % |
Ratio of total expenses to average net assets (without offsets/reductions)2 | | | 1.09 | % | | | 1.08 | %4 | | | 1.04 | %5 | | | 1.05 | % | | | 1.07 | % |
Ratio of net investment income to average net assets1 | | | 2.82 | % | | | 2.14 | %4 | | | 3.92 | %5 | | | 4.18 | % | | | 4.13 | % |
Portfolio turnover | | | 22 | % | | | 43 | % | | | 110 | % | | | 28 | % | | | 23 | % |
Net assets at end of year (000’s omitted) | | $ | 27,444 | | | $ | 32,009 | | | $ | 41,772 | | | $ | 35,647 | | | $ | 38,655 | |
| | | | | | | | | | | | | | | | | | | | |
| | | | | | | | | | | | |
| | | For the years ended
December 31, | | | For the period from
December 1, 2012
through
December 31, 2012* | |
| Service Class | | 2014 | | | 2013 | | |
Net Asset Value, Beginning of Period | | $ | 9.99 | | | $ | 11.28 | | | $ | 11.41 | |
Income from Investment Operations: | | | | | | | | | | | | |
Net investment income3 | | | 0.31 | | | | 0.26 | | | | 0.02 | |
Net realized and unrealized gain (loss) on investments3 | | | 0.27 | | | | (0.22 | ) | | | 0.01 | |
Total from investment operations | | | 0.58 | | | | 0.04 | | | | 0.03 | |
Less Distributions to Shareholders from: | | | | | | | | | | | | |
Net investment income | | | (0.31 | ) | | | (0.28 | ) | | | (0.05 | ) |
Net realized gain on investments | | | — | | | | (1.05 | ) | | | (0.11 | ) |
Total distributions to shareholders | | | (0.31 | ) | | | (1.33 | ) | | | (0.16 | ) |
Net Asset Value, End of Period | | $ | 10.26 | | | $ | 9.99 | | | $ | 11.28 | |
Total Return1 | | | 5.84 | % | | | 0.41 | % | | | 0.26 | %17 |
Ratio of net expenses to average net assets (with offsets/reductions) | | | 0.65 | % | | | 0.69 | %4 | | | 0.64 | %5,18 |
Ratio of expenses to average net assets (with offsets) | | | 0.65 | % | | | 0.69 | %4 | | | 0.64 | %5,18 |
Ratio of total expenses to average net assets (without offsets/reductions)2 | | | 0.90 | % | | | 0.91 | %4 | | | 0.90 | %5,18 |
Ratio of net investment income to average net assets1 | | | 3.00 | % | | | 2.31 | %4 | | | 2.07 | %5,18 |
Portfolio turnover | | | 22 | % | | | 43 | % | | | 110 | % |
Net assets at end of period (000’s omitted) | | $ | 2,480 | | | $ | 1,563 | | | $ | 10 | |
| | | | | | | | | | | | |
39
AMG GW&K Enhanced Core Bond Fund
Financial Highlights
For a share outstanding throughout each year
| | | | | | | | | | | | | | | | | | | | |
| | | For the years ended December 31, | |
| Class C | | 2014 | | | 2013 | | | 2012†† | | | 2011 | | | 2010 | |
Net Asset Value, Beginning of Year | | $ | 9.94 | | | $ | 11.22 | | | $ | 10.79 | | | $ | 10.98 | | | $ | 10.41 | |
Income from Investment Operations: | | | | | | | | | | | | | | | | | | | | |
Net investment income | | | 0.21 | 3 | | | 0.15 | 3 | | | 0.36 | 3 | | | 0.38 | 3 | | | 0.39 | |
Net realized and unrealized gain (loss) on investments | | | 0.26 | 3 | | | (0.20 | )3 | | | 0.57 | 3 | | | 0.02 | 3 | | | 0.56 | |
Total from investment operations | | | 0.47 | | | | (0.05 | ) | | | 0.93 | | | | 0.40 | | | | 0.95 | |
Less Distributions to Shareholders from: | | | | | | | | | | | | | | | | | | | | |
Net investment income | | | (0.21 | ) | | | (0.18 | ) | | | (0.39 | ) | | | (0.42 | ) | | | (0.38 | ) |
Net realized gain on investments | | | — | | | | (1.05 | ) | | | (0.11 | ) | | | (0.17 | ) | | | — | |
Total distributions to shareholders | | | (0.21 | ) | | | (1.23 | ) | | | (0.50 | ) | | | (0.59 | ) | | | (0.38 | ) |
Net Asset Value, End of Year | | $ | 10.20 | | | $ | 9.94 | | | $ | 11.22 | | | $ | 10.79 | | | $ | 10.98 | |
Total Return1 | | | 4.79 | % | | | (0.50 | )%6 | | | 8.72 | %6 | | | 3.73 | % | | | 9.22 | % |
Ratio of net expenses to average net assets (with offsets/reductions) | | | 1.59 | % | | | 1.61 | %4 | | | 1.59 | %5 | | | 1.59 | % | | | 1.59 | % |
Ratio of expenses to average net assets (with offsets) | | | 1.59 | % | | | 1.61 | %4 | | | 1.59 | %5 | | | 1.59 | % | | | 1.59 | % |
Ratio of total expenses to average net assets (without offsets/reductions)2 | | | 1.84 | % | | | 1.83 | %4 | | | 1.79 | %5 | | | 1.80 | % | | | 1.82 | % |
Ratio of net investment income to average net assets1 | | | 2.07 | % | | | 1.38 | %4 | | | 3.18 | %5 | | | 3.42 | % | | | 3.39 | % |
Portfolio turnover | | | 22 | % | | | 43 | % | | | 110 | % | | | 28 | % | | | 23 | % |
Net assets at end of year (000’s omitted) | | $ | 15,927 | | | $ | 20,793 | | | $ | 33,026 | | | $ | 33,615 | | | $ | 45,363 | |
| | | | | | | | | | | | | | | | | | | | |
| | | | | | | | | | | | | | | | | | | | |
| | | For the years ended December 31, | |
| Institutional Class | | 2014 | | | 2013 | | | 2012 | | | 2011 | | | 2010 | |
Net Asset Value, Beginning of Year | | $ | 9.99 | | | $ | 11.28 | | | $ | 10.84 | | | $ | 11.03 | | | $ | 10.46 | |
Income from Investment Operations: | | | | | | | | | | | | | | | | | | | | |
Net investment income | | | 0.31 | 3 | | | 0.27 | 3 | | | 0.47 | 3 | | | 0.49 | 3 | | | 0.49 | |
Net realized and unrealized gain (loss) on investments | | | 0.27 | 3 | | | (0.22 | )3 | | | 0.58 | 3 | | | 0.02 | 3 | | | 0.57 | |
Total from investment operations | | | 0.58 | | | | 0.05 | | | | 1.05 | | | | 0.51 | | | | 1.06 | |
Less Distributions to Shareholders from: | | | | | | | | | | | | | | | | | | | | |
Net investment income | | | (0.32 | ) | | | (0.29 | ) | | | (0.50 | ) | | | (0.53 | ) | | | (0.49 | ) |
Net realized gain on investments | | | — | | | | (1.05 | ) | | | (0.11 | ) | | | (0.17 | ) | | | — | |
Total distributions to shareholders | | | (0.32 | ) | | | (1.34 | ) | | | (0.61 | ) | | | (0.70 | ) | | | (0.49 | ) |
Net Asset Value, End of Year | | $ | 10.25 | | | $ | 9.99 | | | $ | 11.28 | | | $ | 10.84 | | | $ | 11.03 | |
Total Return1 | | | 5.85 | % | | | 0.46 | % | | | 9.89 | % | | | 4.79 | % | | | 10.29 | % |
Ratio of net expenses to average net assets (with offsets/reductions) | | | 0.59 | % | | | 0.61 | %4 | | | 0.59 | %5 | | | 0.59 | % | | | 0.59 | % |
Ratio of expenses to average net assets (with offsets) | | | 0.59 | % | | | 0.61 | %4 | | | 0.59 | %5 | | | 0.59 | % | | | 0.59 | % |
Ratio of total expenses to average net assets (without offsets/reductions)2 | | | 0.84 | % | | | 0.83 | %4 | | | 0.79 | %5 | | | 0.80 | % | | | 0.82 | % |
Ratio of net investment income to average net assets1 | | | 3.05 | % | | | 2.39 | %4 | | | 4.21 | %5 | | | 4.41 | % | | | 4.34 | % |
Portfolio turnover | | | 22 | % | | | 43 | % | | | 110 | % | | | 28 | % | | | 23 | % |
Net assets at end of year (000’s omitted) | | $ | 41,968 | | | $ | 59,182 | | | $ | 65,573 | | | $ | 64,573 | | | $ | 61,748 | |
| | | | | | | | | | | | | | | | | | | | |
40
AMG GW&K Municipal Bond Fund
Financial Highlights
For a share outstanding throughout each year
| | | | | | | | | | | | | | | | | | | | |
| | | For the years ended December 31, | |
| Investor Class | | 2014 | | | 2013 | | | 2012 | | | 2011 | | | 2010 | |
Net Asset Value, Beginning of Year | | $ | 11.02 | | | $ | 11.52 | | | $ | 11.21 | | | $ | 10.29 | | | $ | 10.27 | |
Income from Investment Operations: | | | | | | | | | | | | | | | | | | | | |
Net investment income3 | | | 0.18 | | | | 0.18 | | | | 0.20 | | | | 0.27 | | | | 0.31 | |
Net realized and unrealized gain (loss) on investments3 | | | 0.63 | | | | (0.47 | ) | | | 0.38 | | | | 0.97 | | | | 0.09 | |
Total from investment operations | | | 0.81 | | | | (0.29 | ) | | | 0.58 | | | | 1.24 | | | | 0.40 | |
Distributions to Shareholders from: | | | | | | | | | | | | | | | | | | | | |
Net investment income | | | (0.18 | ) | | | (0.17 | ) | | | (0.19 | ) | | | (0.27 | ) | | | (0.31 | ) |
Net realized gain on investments | | | (0.04 | ) | | | (0.04 | ) | | | (0.08 | ) | | | (0.05 | ) | | | (0.07 | ) |
Total distributions to shareholders | | | (0.22 | ) | | | (0.21 | ) | | | (0.27 | ) | | | (0.32 | ) | | | (0.38 | ) |
Net Asset Value, End of Year | | $ | 11.61 | | | $ | 11.02 | | | $ | 11.52 | | | $ | 11.21 | | | $ | 10.29 | |
Total Return1 | | | 7.39 | % | | | (2.51 | )%6 | | | 5.27 | %6 | | | 12.16 | % | | | 3.89 | % |
Ratio of net expenses to average net assets (with offsets/reductions) | | | 0.80 | % | | | 0.81 | %7 | | | 0.80 | %8 | | | 0.81 | % | | | 0.75 | % |
Ratio of expenses to average net assets (with offsets) | | | 0.80 | % | | | 0.81 | %7 | | | 0.80 | %8 | | | 0.81 | % | | | 0.75 | % |
Ratio of total expenses to average net assets (without offsets/reductions)2 | | | 1.12 | % | | | 1.17 | %7 | | | 1.18 | %8 | | | 1.34 | % | | | 1.45 | % |
Ratio of net investment income to average net assets1 | | | 1.55 | % | | | 1.56 | %7 | | | 1.71 | %8 | | | 2.46 | % | | | 2.91 | % |
Portfolio turnover | | | 31 | % | | | 28 | % | | | 39 | % | | | 26 | % | | | 22 | % |
Net assets at end of year (000’s omitted) | | $ | 23,572 | | | $ | 28,655 | | | $ | 22,726 | | | $ | 8,777 | | | $ | 2,856 | |
| | | | | | | | | | | | | | | | | | | | |
| |
| | | For the years ended December 31, | |
| Service Class | | 2014 | | | 2013 | | | 2012 | | | 2011 | | | 2010 | |
Net Asset Value, Beginning of Year | | $ | 11.04 | | | $ | 11.54 | | | $ | 11.23 | | | $ | 10.30 | | | $ | 10.28 | |
Income from Investment Operations: | | | | | | | | | | | | | | | | | | | | |
Net investment income3 | | | 0.21 | | | | 0.21 | | | | 0.23 | | | | 0.30 | | | | 0.33 | |
Net realized and unrealized gain (loss) on investments3 | | | 0.63 | | | | (0.47 | ) | | | 0.38 | | | | 0.97 | | | | 0.09 | |
Total from investment operations | | | 0.84 | | | | (0.26 | ) | | | 0.61 | | | | 1.27 | | | | 0.42 | |
Distributions to Shareholders from: | | | | | | | | | | | | | | | | | | | | |
Net investment income | | | (0.21 | ) | | | (0.20 | ) | | | (0.22 | ) | | | (0.29 | ) | | | (0.33 | ) |
Net realized gain on investments | | | (0.04 | ) | | | (0.04 | ) | | | (0.08 | ) | | | (0.05 | ) | | | (0.07 | ) |
Total distributions to shareholders | | | (0.25 | ) | | | (0.24 | ) | | | (0.30 | ) | | | (0.34 | ) | | | (0.40 | ) |
Net Asset Value, End of Year | | $ | 11.63 | | | $ | 11.04 | | | $ | 11.54 | | | $ | 11.23 | | | $ | 10.30 | |
Total Return1 | | | 7.62 | % | | | (2.24 | )% | | | 5.53 | % | | | 12.52 | % | | | 4.05 | % |
Ratio of net expenses to average net assets (with offsets/reductions) | | | 0.52 | % | | | 0.53 | %7 | | | 0.55 | %8 | | | 0.54 | % | | | 0.55 | % |
Ratio of expenses to average net assets (with offsets) | | | 0.52 | % | | | 0.53 | %7 | | | 0.55 | %8 | | | 0.54 | % | | | 0.55 | % |
Ratio of total expenses to average net assets (without offsets/reductions)2 | | | 0.84 | % | | | 0.89 | %7 | | | 0.93 | %8 | | | 1.09 | % | | | 1.25 | % |
Ratio of net investment income to average net assets1 | | | 1.82 | % | | | 1.84 | %7 | | | 1.97 | %8 | | | 2.80 | % | | | 3.13 | % |
Portfolio turnover | | | 31 | % | | | 28 | % | | | 39 | % | | | 26 | % | | | 22 | % |
Net assets at end of year (000’s omitted) | | $ | 98,152 | | | $ | 53,024 | | | $ | 35,444 | | | $ | 22,705 | | | $ | 15,032 | |
| | | | | | | | | | | | | | | | | | | | |
41
AMG GW&K Municipal Bond Fund
Financial Highlights
For a share outstanding throughout each year
| | | | | | | | | | | | | | | | | | | | |
| | | For the years ended December 31, | |
| Institutional Class | | 2014 | | | 2013 | | | 2012 | | | 2011 | | | 2010 | |
Net Asset Value, Beginning of Year | | $ | 11.08 | | | $ | 11.58 | | | $ | 11.26 | | | $ | 10.33 | | | $ | 10.31 | |
Income from Investment Operations: | | | | | | | | | | | | | | | | | | | | |
Net investment income3 | | | 0.23 | | | | 0.23 | | | | 0.25 | | | | 0.30 | | | | 0.35 | |
Net realized and unrealized gain (loss) on investments3 | | | 0.63 | | | | (0.47 | ) | | | 0.40 | | | | 0.99 | | | | 0.09 | |
Total from investment operations | | | 0.86 | | | | (0.24 | ) | | | 0.65 | | | | 1.29 | | | | 0.44 | |
Distributions to Shareholders from: | | | | | | | | | | | | | | | | | | | | |
Net investment income | | | (0.23 | ) | | | (0.22 | ) | | | (0.25 | ) | | | (0.31 | ) | | | (0.35 | ) |
Net realized gain on investments | | | (0.04 | ) | | | (0.04 | ) | | | (0.08 | ) | | | (0.05 | ) | | | (0.07 | ) |
Total distributions to shareholders | | | (0.27 | ) | | | (0.26 | ) | | | (0.33 | ) | | | (0.36 | ) | | | (0.42 | ) |
Net Asset Value, End of Year | | $ | 11.67 | | | $ | 11.08 | | | $ | 11.58 | | | $ | 11.26 | | | $ | 10.33 | |
Total Return1 | | | 7.80 | % | | | (2.02 | )% | | | 5.80 | %6 | | | 12.71 | %6 | | | 4.27 | %6 |
Ratio of net expenses to average net assets (with offsets/reductions) | | | 0.34 | % | | | 0.36 | %7 | | | 0.35 | %8 | | | 0.34 | % | | | 0.34 | % |
Ratio of expenses to average net assets (with offsets) | | | 0.34 | % | | | 0.36 | %7 | | | 0.35 | %8 | | | 0.34 | % | | | 0.34 | % |
Ratio of total expenses to average net assets (without offsets/reductions)2 | | | 0.66 | % | | | 0.72 | %7 | | | 0.73 | %8 | | | 0.83 | % | | | 1.04 | % |
Ratio of net investment income to average net assets1 | | | 2.00 | % | | | 2.01 | %7 | | | 2.15 | %8 | | | 2.79 | % | | | 3.31 | % |
Portfolio turnover | | | 31 | % | | | 28 | % | | | 39 | % | | | 26 | % | | | 22 | % |
Net assets at end of year (000’s omitted) | | $ | 393,581 | | | $ | 204,711 | | | $ | 121,609 | | | $ | 32,019 | | | $ | 1,180 | |
| | | | | | | | | | | | | | | | | | | | |
42
AMG GW&K Municipal Enhanced Yield Fund
Financial Highlights
For a share outstanding throughout each year
| | | | | | | | | | | | | | | | | | | | |
| | | For the years ended December 31, | |
| Investor Class | | 2014 | | | 2013 | | | 2012 | | | 2011 | | | 2010 | |
Net Asset Value, Beginning of Year | | $ | 8.98 | | | $ | 10.24 | | | $ | 9.55 | | | $ | 8.79 | | | $ | 8.81 | |
Income from Investment Operations: | | | | | | | | | | | | | | | | | | | | |
Net investment income | | | 0.34 | 3 | | | 0.35 | 3 | | | 0.36 | 3 | | | 0.37 | 3 | | | 0.37 | |
Net realized and unrealized gain (loss) on investments | | | 1.18 | 3 | | | (1.18 | )3 | | | 0.93 | 3 | | | 0.78 | 3 | | | (0.03 | ) |
Total from investment operations | | | 1.52 | | | | (0.83 | ) | | | 1.29 | | | | 1.15 | | | | 0.34 | |
Distributions to Shareholders from: | | | | | | | | | | | | | | | | | | | | |
Net investment income | | | (0.34 | ) | | | (0.36 | ) | | | (0.36 | ) | | | (0.37 | ) | | | (0.36 | ) |
Net realized gain on investments | | | — | | | | (0.07 | ) | | | (0.24 | ) | | | (0.02 | ) | | | — | |
Total distributions to shareholders | | | (0.34 | ) | | | (0.43 | ) | | | (0.60 | ) | | | (0.39 | ) | | | (0.36 | ) |
Net Asset Value, End of Year | | $ | 10.16 | | | $ | 8.98 | | | $ | 10.24 | | | $ | 9.55 | | | $ | 8.79 | |
Total Return1 | | | 17.14 | % | | | (8.27 | )%6 | | | 13.69 | %6 | | | 13.48 | % | | | 3.81 | % |
Ratio of net expenses to average net assets (with offsets/reductions) | | | 1.00 | % | | | 1.12 | %9 | | | 1.07 | %10 | | | 1.17 | %11 | | | 1.27 | % |
Ratio of expenses to average net assets (with offsets) | | | 1.00 | % | | | 1.12 | %9 | | | 1.07 | %10 | | | 1.17 | %11 | | | 1.27 | % |
Ratio of total expenses to average net assets (without offsets/reductions)2 | | | 1.19 | % | | | 1.30 | %9 | | | 1.27 | %10 | | | 1.40 | % | | | 1.57 | % |
Ratio of net investment income to average net assets1 | | | 3.46 | % | | | 3.58 | %9 | | | 3.53 | %10 | | | 4.02 | % | | | 4.10 | % |
Portfolio turnover | | | 83 | % | | | 52 | % | | | 70 | % | | | 31 | % | | | 50 | % |
Net assets at end of year (000’s omitted) | | $ | 8,507 | | | $ | 8,030 | | | $ | 21,413 | | | $ | 5,689 | | | $ | 557 | |
| | | | | | | | | | | | | | | | | | | | |
| |
| | | For the years ended December 31, | |
| Service Class | | 2014 | | | 2013 | | | 2012 | | | 2011 | | | 2010 | |
Net Asset Value, Beginning of Year | | $ | 8.98 | | | $ | 10.23 | | | $ | 9.54 | | | $ | 8.79 | | | $ | 8.81 | |
Income from Investment Operations: | | | | | | | | | | | | | | | | | | | | |
Net investment income | | | 0.36 | 3 | | | 0.38 | 3 | | | 0.38 | 3 | | | 0.40 | 3 | | | 0.39 | |
Net realized and unrealized gain (loss) on investments | | | 1.18 | 3 | | | (1.18 | )3 | | | 0.93 | 3 | | | 0.77 | 3 | | | (0.02 | ) |
Total from investment operations | | | 1.54 | | | | (0.80 | ) | | | 1.31 | | | | 1.17 | | | | 0.37 | |
Distributions to Shareholders from: | | | | | | | | | | | | | | | | | | | | |
Net investment income | | | (0.36 | ) | | | (0.38 | ) | | | (0.38 | ) | | | (0.40 | ) | | | (0.39 | ) |
Net realized gain on investments | | | — | | | | (0.07 | ) | | | (0.24 | ) | | | (0.02 | ) | | | — | |
Total distributions to shareholders | | | (0.36 | ) | | | (0.45 | ) | | | (0.62 | ) | | | (0.42 | ) | | | (0.39 | ) |
Net Asset Value, End of Year | | $ | 10.16 | | | $ | 8.98 | | | $ | 10.23 | | | $ | 9.54 | | | $ | 8.79 | |
Total Return1 | | | 17.39 | % | | | (7.95 | )% | | | 13.90 | % | | | 13.65 | % | | | 4.09 | % |
Ratio of net expenses to average net assets (with offsets/reductions) | | | 0.72 | % | | | 0.78 | %9 | | | 0.86 | %10 | | | 0.94 | %11 | | | 1.01 | % |
Ratio of expenses to average net assets (with offsets) | | | 0.72 | % | | | 0.78 | %9 | | | 0.86 | %10 | | | 0.94 | %11 | | | 1.01 | % |
Ratio of total expenses to average net assets (without offsets/reductions)2 | | | 0.91 | % | | | 0.96 | %9 | | | 1.06 | %10 | | | 1.16 | % | | | 1.31 | % |
Ratio of net investment income to average net assets1 | | | 3.68 | % | | | 3.99 | %9 | | | 3.74 | %10 | | | 4.48 | % | | | 4.36 | % |
Portfolio turnover | | | 83 | % | | | 52 | % | | | 70 | % | | | 31 | % | | | 50 | % |
Net assets at end of year (000’s omitted) | | $ | 15,757 | | | $ | 5,222 | | | $ | 6,401 | | | $ | 2,145 | | | $ | 1,181 | |
| | | | | | | | | | | | | | | | | | | | |
43
AMG GW&K Municipal Enhanced Yield Fund
Financial Highlights
For a share outstanding throughout each year
| | | | | | | | | | | | | | | | | | | | |
| | | For the years ended December 31, | |
| Institutional Class | | 2014 | | | 2013 | | | 2012 | | | 2011 | | | 2010 | |
Net Asset Value, Beginning of Year | | $ | 8.97 | | | $ | 10.22 | | | $ | 9.53 | | | $ | 8.78 | | | $ | 8.81 | |
Income from Investment Operations: | | | | | | | | | | | | | | | | | | | | |
Net investment income | | | 0.37 | 3 | | | 0.39 | 3 | | | 0.40 | 3 | | | 0.41 | 3 | | | 0.40 | |
Net realized and unrealized gain (loss) on investments | | | 1.17 | 3 | | | (1.17 | )3 | | | 0.93 | 3 | | | 0.78 | 3 | | | (0.03 | ) |
Total from investment operations | | | 1.54 | | | | (0.78 | ) | | | 1.33 | | | | 1.19 | | | | 0.37 | |
Distributions to Shareholders from: | | | | | | | | | | | | | | | | | | | | |
Net investment income | | | (0.37 | ) | | | (0.40 | ) | | | (0.40 | ) | | | (0.42 | ) | | | (0.40 | ) |
Net realized gain on investments | | | — | | | | (0.07 | ) | | | (0.24 | ) | | | (0.02 | ) | | | — | |
Total distributions to shareholders | | | (0.37 | ) | | | (0.47 | ) | | | (0.64 | ) | | | (0.44 | ) | | | (0.40 | ) |
Net Asset Value, End of Year | | $ | 10.14 | | | $ | 8.97 | | | $ | 10.22 | | | $ | 9.53 | | | $ | 8.78 | |
Total Return1 | | | 17.45 | % | | | (7.80 | )% | | | 14.13 | %6 | | | 13.94 | % | | | 4.15 | % |
Ratio of net expenses to average net assets (with offsets/reductions) | | | 0.64 | % | | | 0.66 | %9 | | | 0.65 | %10 | | | 0.69 | %11 | | | 0.79 | % |
Ratio of expenses to average net assets (with offsets) | | | 0.64 | % | | | 0.66 | %9 | | | 0.65 | %10 | | | 0.69 | %11 | | | 0.79 | % |
Ratio of total expenses to average net assets (without offsets/reductions)2 | | | 0.83 | % | | | 0.84 | %9 | | | 0.85 | %10 | | | 0.91 | % | | | 1.09 | % |
Ratio of net investment income to average net assets1 | | | 3.83 | % | | | 4.08 | %9 | | | 3.96 | %10 | | | 4.69 | % | | | 4.58 | % |
Portfolio turnover | | | 83 | % | | | 52 | % | | | 70 | % | | | 31 | % | | | 50 | % |
Net assets at end of year (000’s omitted) | | $ | 226,284 | | | $ | 201,161 | | | $ | 294,983 | | | $ | 138,250 | | | $ | 48,079 | |
| | | | | | | | | | | | | | | | | | | | |
44
AMG GW&K Small Cap Core Fund
Financial Highlights
For a share outstanding throughout each year
| | | | | | | | | | | | | | | | | | | | |
| | | For the years ended December 31, | |
| Investor Class | | 2014 | | | 2013 | | | 2012 | | | 2011 | | | 2010 | |
Net Asset Value, Beginning of Year | | $ | 24.34 | | | $ | 17.72 | | | $ | 15.87 | | | $ | 15.64 | | | $ | 12.05 | |
Income from Investment Operations: | | | | | | | | | | | | | | | | | | | | |
Net investment income (loss)3 | | | (0.07 | )19 | | | (0.07 | )13 | | | 0.14 | 14 | | | (0.02 | ) | | | 0.01 | |
Net realized and unrealized gain on investments3 | | | 0.46 | | | | 7.56 | | | | 2.15 | | | | 0.25 | | | | 3.58 | |
Total from investment operations | | | 0.39 | | | | 7.49 | | | | 2.29 | | | | 0.23 | | | | 3.59 | |
Distributions to Shareholders from: | | | | | | | | | | | | | | | | | | | | |
Net investment income | | | — | | | | — | | | | (0.08 | ) | | | — | | | | 0.00 | 12 |
Net realized gain on investments | | | (1.34 | ) | | | (0.87 | ) | | | (0.36 | ) | | | — | | | | — | |
Total distributions to shareholders | | | (1.34 | ) | | | (0.87 | ) | | | (0.44 | ) | | | (0.00 | )12 | | | — | |
Net Asset Value, End of Year | | $ | 23.39 | | | $ | 24.34 | | | $ | 17.72 | | | $ | 15.87 | | | $ | 15.64 | |
Total Return1 | | | 1.53 | % | | | 42.26 | % | | | 14.45 | % | | | 1.47 | % | | | 29.81 | % |
Ratio of net expenses to average net assets (with offsets/reductions) | | | 1.42 | % | | | 1.37 | %15 | | | 1.41 | %16 | | | 1.39 | % | | | 1.42 | % |
Ratio of expenses to average net assets (with offsets) | | | 1.42 | % | | | 1.37 | %15 | | | 1.41 | %16 | | | 1.39 | % | | | 1.42 | % |
Ratio of total expenses to average net assets (without offsets/reductions)2 | | | 1.53 | % | | | 1.50 | %15 | | | 1.62 | %16 | | | 1.71 | % | | | 1.84 | % |
Ratio of net investment income (loss) to average net assets1 | | | (0.28 | )% | | | (0.32 | )%15 | | | 0.78 | %16 | | | (0.14 | )% | | | 0.07 | % |
Portfolio turnover | | | 26 | % | | | 19 | % | | | 14 | % | | | 25 | % | | | 19 | % |
Net assets at end of year (000’s omitted) | | $ | 37,995 | | | $ | 69,992 | | | $ | 14,707 | | | $ | 3,349 | | | $ | 1,914 | |
| | | | | | | | | | | | | | | | | | | | |
| |
| | | For the years ended December 31, | |
| Service Class | | 2014 | | | 2013 | | | 2012 | | | 2011 | | | 2010 | |
Net Asset Value, Beginning of Year | | $ | 24.42 | | | $ | 17.73 | | | $ | 15.85 | | | $ | 15.59 | | | $ | 12.01 | |
Income from Investment Operations: | | | | | | | | | | | | | | | | | | | | |
Net investment income (loss)3 | | | 0.04 | 19 | | | (0.02 | )13 | | | 0.06 | 14 | | | 0.01 | | | | 0.04 | |
Net realized and unrealized gain on investments3 | | | 0.43 | | | | 7.58 | | | | 2.26 | | | | 0.25 | | | | 3.56 | |
Total from investment operations | | | 0.47 | | | | 7.56 | | | | 2.32 | | | | 0.26 | | | | 3.60 | |
Distributions to Shareholders from: | | | | | | | | | | | | | | | | | | | | |
Net investment income | | | (0.01 | ) | | | — | | | | (0.08 | ) | | | — | | | | (0.02 | ) |
Net realized gain on investments | | | (1.35 | ) | | | (0.87 | ) | | | (0.36 | ) | | | — | | | | — | |
Total distributions to shareholders | | | (1.36 | ) | | | (0.87 | ) | | | (0.44 | ) | | | — | | | | (0.02 | ) |
Net Asset Value, End of Year | | $ | 23.53 | | | $ | 24.42 | | | $ | 17.73 | | | $ | 15.85 | | | $ | 15.59 | |
Total Return1 | | | 1.86 | % | | | 42.64 | %6 | | | 14.67 | %6 | | | 1.67 | %6 | | | 30.01 | %6 |
Ratio of net expenses to average net assets (with offsets/reductions) | | | 1.10 | % | | | 1.13 | %15 | | | 1.20 | %16 | | | 1.20 | % | | | 1.20 | % |
Ratio of expenses to average net assets (with offsets) | | | 1.10 | % | | | 1.13 | %15 | | | 1.20 | %16 | | | 1.20 | % | | | 1.20 | % |
Ratio of total expenses to average net assets (without offsets/reductions)2 | | | 1.22 | % | | | 1.26 | %15 | | | 1.41 | %16 | | | 1.52 | % | | | 1.62 | % |
Ratio of net investment income (loss) to average net assets1 | | | 0.16 | % | | | (0.09 | )%15 | | | 0.44 | %16 | | | 0.04 | % | | | 0.30 | % |
Portfolio turnover | | | 26 | % | | | 19 | % | | | 14 | % | | | 25 | % | | | 19 | % |
Net assets at end of year (000’s omitted) | | $ | 44,806 | | | $ | 35,836 | | | $ | 13,052 | | | $ | 19,007 | | | $ | 18,788 | |
| | | | | | | | | | | | | | | | | | | | |
45
AMG GW&K Small Cap Core Fund
Financial Highlights
For a share outstanding throughout each year
| | | | | | | | | | | | | | | | | | | | |
| | | For the years ended December 31, | |
| Institutional Class | | 2014 | | | 2013 | | | 2012 | | | 2011 | | | 2010 | |
Net Asset Value, Beginning of Year | | $ | 24.49 | | | $ | 17.76 | | | $ | 15.87 | | | $ | 15.59 | | | $ | 12.01 | |
Income from Investment Operations: | | | | | | | | | | | | | | | | | | | | |
Net investment income3 | | | 0.07 | 19 | | | 0.02 | 13 | | | 0.14 | 14 | | | 0.05 | | | | 0.07 | |
Net realized and unrealized gain on investments3 | | | 0.44 | | | | 7.58 | | | | 2.23 | | | | 0.25 | | | | 3.57 | |
Total from investment operations | | | 0.51 | | | | 7.60 | | | | 2.37 | | | | 0.30 | | | | 3.64 | |
Distributions to Shareholders from: | | | | | | | | | | | | | | | | | | | | |
Net investment income | | | (0.04 | ) | | | — | | | | (0.12 | ) | | | (0.02 | ) | | | (0.06 | ) |
Net realized gain on investments | | | (1.35 | ) | | | (0.87 | ) | | | (0.36 | ) | | | — | | | | — | |
Total distributions to shareholders | | | (1.39 | ) | | | (0.87 | ) | | | (0.48 | ) | | | (0.02 | ) | | | (0.06 | ) |
Net Asset Value, End of Year | | $ | 23.61 | | | $ | 24.49 | | | $ | 17.76 | | | $ | 15.87 | | | $ | 15.59 | |
Total Return1 | | | 2.04 | % | | | 42.81 | %6 | | | 14.97 | %6 | | | 1.90 | % | | | 30.28 | % |
Ratio of net expenses to average net assets (with offsets/reductions) | | | 0.95 | % | | | 0.97 | %15 | | | 0.96 | %16 | | | 0.95 | % | | | 0.95 | % |
Ratio of expenses to average net assets (with offsets) | | | 0.95 | % | | | 0.97 | %15 | | | 0.96 | %16 | | | 0.95 | % | | | 0.95 | % |
Ratio of total expenses to average net assets (without offsets/reductions)2 | | | 1.07 | % | | | 1.10 | %15 | | | 1.17 | %16 | | | 1.27 | % | | | 1.37 | % |
Ratio of net investment income to average net assets1 | | | 0.30 | % | | | 0.07 | %15 | | | 0.84 | %16 | | | 0.30 | % | | | 0.55 | % |
Portfolio turnover | | | 26 | % | | | 19 | % | | | 14 | % | | | 25 | % | | | 19 | % |
Net assets at end of year (000’s omitted) | | $ | 291,301 | | | $ | 168,854 | | | $ | 76,673 | | | $ | 40,425 | | | $ | 17,941 | |
| | | | | | | | | | | | | | | | | | | | |
46
Notes to Financial Highlights
The following footnotes should be read in conjunction with the Financial Highlights of the Funds previously presented in this report.
| * | Commenced operations on December 1, 2012. |
| †† | Effective December 1, 2012, Class C shares were closed to all new investors. |
| 1 | Total returns and net investment income would have been lower had certain expenses not been offset. |
| 2 | Excludes the impact of expense reimbursement and expense offsets such as brokerage credits, but includes non-reimbursable expenses, if any, such as interest, taxes and extraordinary expenses. |
| 3 | Per share numbers have been calculated using average shares. |
| 4 | Includes non-routine extraordinary expenses amounting to 0.021%, 0.016%, 0.021% and 0.020% of average net assets for the Investor Class, Service Class, Class C and Institutional Class, respectively. |
| 5 | Includes non-routine extraordinary expenses amounting to 0.004%, 0.005%, 0.004% and 0.004% of average net assets for the Investor Class, Service Class, Class C and Institutional Class, respectively. |
| 6 | The Total Return is based on the Financial Statement Net Asset Values as shown in the Financial Highlights. |
| 7 | Includes non-routine extraordinary expenses amounting to 0.021%, 0.020% and 0.020% of average net assets for the Investor Class, Service Class and Institutional Class, respectively. |
| 8 | Includes non-routine extraordinary expenses amounting to 0.005%, 0.005% and 0.005% of average net assets for the Investor Class, Service Class and Institutional Class, respectively. |
| 9 | Includes non-routine extraordinary expenses amounting to 0.024%, 0.022% and 0.023% of average net assets for the Investor Class, Service Class and Institutional Class, respectively. |
| 10 | Includes non-routine extraordinary expenses amounting to 0.006%, 0.005% and 0.005% of average net assets for the Investor Class, Service Class and Institutional Class, respectively. |
| 11 | Effective July 1, 2011, the Fund’s expense cap was reduced to 0.64% from 0.79%. The expense ratio shown reflects the weighted average expense ratio for the full year ended December 31, 2011. |
| 12 | Rounds to less than $0.01 or 0.00%. |
| 13 | Includes non-recurring dividends. Without these dividends net investment income per share would have been $(0.09), $(0.04) and $0.00 for the Investor Class, Service Class and Institutional Class, respectively. |
| 14 | Includes non-recurring dividends. Without these dividends net investment income per share would have been $0.03, $(0.05) and $0.03 for the Investor Class, Service Class and Institutional Class, respectively. |
| 15 | Includes non-routine extraordinary expenses amounting to 0.015%, 0.017% and 0.018% of average net assets for the Investor Class, Service Class and Institutional Class, respectively. |
| 16 | Includes non-routine extraordinary expenses amounting to 0.008%, 0.004% and 0.005% of average net assets for the Investor Class, Service Class and Institutional Class, respectively. |
| 19 | Includes non-recurring dividends. Without these dividends, net investment income per share would have been $(0.11), $(0.00), and $0.03 for AMG GW&K Small Cap Core Fund’s Investor Class, Service Class, and Institutional Class shares, respectively. |
47
Notes to Financial Statements
December 31, 2014
1. SUMMARY OF SIGNIFICANT ACCOUNTING POLICIES
AMG Funds (formerly Managers AMG Funds) and AMG Funds II (formerly Managers Trust II) (the “Trusts”) are open-end management investment companies, organized as Massachusetts business trusts, and registered under the Investment Company Act of 1940, as amended (the “1940 Act”). Currently, the Trusts consist of a number of different funds, each having distinct investment management objectives, strategies, risks, and policies. Included in this report are AMG Funds II: AMG GW&K Enhanced Core Bond Fund (“Enhanced Core Bond”) (formerly Managers AMG GW&K Fixed Income Fund) and AMG Funds: AMG GW&K Municipal Bond Fund (“Municipal Bond”) (formerly GW&K Municipal Bond Fund), AMG GW&K Municipal Enhanced Yield Fund (“Municipal Enhanced”) (formerly GW&K Municipal Enhanced Yield Fund) and AMG GW&K Small Cap Core Fund (“Small Cap Core”) (formerly GW&K Small Cap Equity Fund), each a “Fund” and collectively the “Funds.”
Each Fund offers three classes of shares: Investor Class, Service Class and Institutional Class. Each class represents an interest in the same assets of the Fund. Although all share classes generally have identical voting rights, each share class votes separately when required by law. Different share classes may pay different distribution amounts to the extent the net asset value per share and/or the expenses of such share classes differ. Each share class has its own expense structure. Please refer to a current prospectus for additional information on each share class.
Effective December 1, 2012, Class C shares of Enhanced Core Bond were closed to all new investors and will no longer be available for purchase by existing shareholders, including purchase by exchange, except for purchases made by automatic reinvestment of dividends and capital gains pursuant to the Fund’s automatic reinvestment plan. Shareholders who redeem Class C shares of the Fund will continue to be subject to the deferred sales charges described in the prospectus.
Effective November 1, 2013, Small Cap Core was closed to new investors. Please refer to a current prospectus for additional information.
The Funds’ financial statements are prepared in accordance with accounting principles generally accepted in the United States of America (“U.S. GAAP”), which require management to make estimates and assumptions that affect the reported amounts of assets and liabilities and disclosure of contingent assets and liabilities at the date of the financial statements and the reported amounts of income and expenses during the reporting period. Actual results could differ from those estimates and such differences could be material. The following is a summary of significant accounting policies followed by the Funds in the preparation of their financial statements:
a. VALUATION OF INVESTMENTS
Equity securities traded on a domestic or international securities exchange are valued at the last quoted sale price, or, lacking any sales, at the last quoted bid price. Equity securities primarily traded on an international securities exchange and equity securities traded on NASDAQ or in a U.S. or non-U.S. over-the-counter market are valued at the market’s official closing price, or, if there are no trades on the applicable date, at the last quoted bid price. In addition, if the applicable market does not offer an official closing price or if the official closing price is not representative of the overall market, equity securities primarily
traded on an international securities exchange and equity securities traded in a non-U.S. over-the-counter market are valued at the last quoted sales price. The Funds’ investments are generally valued based on independent market quotations or prices or, if none, “evaluative” or other market based valuations provided by third-party pricing services approved by the Board of Trustees of the Funds (the “Board”).
Fixed-income securities are valued based on valuations furnished by independent pricing services that utilize matrix systems, which reflect such factors as security prices, yields, maturities, and ratings, and are supplemented by dealer and exchange quotations. Debt obligations (other than short term debt obligations that have 60 days or less remaining until maturity) will be valued using the evaluated bid price or the mean price provided by an authorized pricing service. Short-term debt obligations (debt obligations with maturities of one year or less at the time of issuance) that have 60 days or less remaining until maturity will be valued at amortized cost. Investments in other open-end regulated investment companies are valued at their end of day net asset value per share. Investments in certain mortgage-backed and stripped mortgage-backed securities, preferred stocks, convertible securities, derivatives and other debt securities not traded on an organized securities market are valued on the basis of valuations provided by dealers or by a pricing service which uses information with respect to transactions in such securities and various relationships between such securities and yield to maturity in determining value.
Under certain circumstances, the value of certain Fund investments (including derivatives) may be based on an evaluation of fair value, pursuant to procedures established by and under the general supervision of the Board. The Pricing Committee is the committee formed by the Board to make fair value determinations for such investments. Each Fund may use the fair value of a portfolio investment to calculate its net asset value (“NAV”) in the event that the market quotation, price or market based valuation for the portfolio investment is not deemed to be readily available or otherwise not determinable pursuant to the Board’s valuation procedures, if AMG Funds LLC (formerly Managers Investment Group LLC) (the “Investment Manager”) believes the quotation, price or market based valuation to be unreliable, or in certain other circumstances. When determining the fair value of an investment, the Pricing Committee seeks to determine the price that the Fund might reasonably expect to receive from a current sale of that investment in an arms-length transaction. Fair value determinations shall be based upon consideration of all available facts and information, including, but not limited to (i) attributes specific to the investment; (ii) fundamental analytical data and press releases relating to the investment and its issuer; and (iii) the value of other comparable securities or relevant financial instruments, including derivative securities, traded on other markets or among dealers.
The values assigned to fair value investments are based on available information and do not necessarily represent amounts that might ultimately be realized in the future, since such amounts depend on future developments inherent in long-term investments. Because of the inherent uncertainty of valuation, those estimated values may differ significantly from the values that would have been used had a ready market for the investments existed, and the differences could be material. The Board will be presented with a quarterly report showing as of the most recent quarter end, all outstanding securities fair
Notes to Financial Statements (continued)
valued by the Pricing Committee, including a comparison with the prior quarter end and the percentage of the Fund that the security represents at each quarter end.
Portfolio investments that trade primarily on foreign markets are priced based upon the market quotation of such securities as of the close of their respective principal markets. Under certain circumstances, on behalf of a fund that invests in international securities, the Investment Manager or applicable subadvisor may recommend an adjustment of such prices based on its determination of the impact of events occurring subsequent to the close of such markets but prior to the time as of which each Fund calculates its NAV. The Board has also adopted a policy that securities held in a fund that invests in international securities and certain foreign debt obligations held by a fund, in each case, that can be fair valued by the applicable fair value pricing service are fair valued on each business day without regard to a “trigger” (e.g., without regard to invoking fair value based upon a change in a U.S. equity securities index exceeding a pre-determined level). The Funds may invest in securities that may be thinly traded. The Board has adopted procedures to adjust prices of securities that are judged to be stale so that they reflect fair value. An investment valued on the basis of its fair value may be valued at a price higher or lower than available market quotations.
U.S. GAAP defines fair value as the price that a fund would receive to sell an asset or pay to transfer a liability in an orderly transaction between market participants at the measurement date. U.S. GAAP also establishes a framework for measuring fair value, and a three-level hierarchy for fair value measurements based upon the transparency of inputs to the valuation of an asset or liability. Inputs may be observable or unobservable and refer broadly to the assumptions that market participants would use in pricing the asset or liability. Observable inputs reflect the assumptions market participants would use in pricing the asset or liability based on market data obtained from sources independent of the Funds. Unobservable inputs reflect the Funds’ own assumptions about the assumptions that market participants would use in pricing the asset or liability developed based on the best information available in the circumstances. Each investment is assigned a level based upon the observability of the inputs which are significant to the overall valuation.
The three-tier hierarchy of inputs is summarized below:
Level 1 – inputs are quoted prices in active markets for identical investments (e.g., equity securities, open-end investment companies)
Level 2 – other observable inputs (including, but not limited to: quoted prices for similar assets or liabilities in markets that are active, quoted prices for identical or similar assets or liabilities in markets that are not active, inputs other than quoted prices that are observable for the assets or liabilities (such as interest rates, yield curves, volatilities, prepayment speeds, loss severities, credit risks and default rates) or other market corroborated inputs) (e.g., debt securities, government securities, foreign currency exchange contracts, foreign securities utilizing international fair value pricing, broker-quoted securities, fair valued securities with observable inputs)
Level 3 – inputs are significant unobservable inputs (including the Fund’s own assumptions used to determine the fair value of investments) (e.g., fair valued securities with unobservable inputs)
Changes in inputs or methodologies used for valuing investments may result in a transfer in or out of levels within the fair value hierarchy. The inputs or methodologies used for valuing investments may not necessarily be an indication of the risk associated with investing in those investments.
b. SECURITY TRANSACTIONS
Security transactions are accounted for as of trade date. Realized gains and losses on securities sold are determined on the basis of identified cost.
c. INVESTMENT INCOME AND EXPENSES
Dividend income is recorded on the ex-dividend date. Dividend and interest income on foreign securities is recorded gross of any withholding tax. Interest income, which includes amortization of premium and accretion of discount on debt securities, is accrued as earned. Non-cash dividends included in dividend income, if any, are reported at the fair market value of the securities received. Distributions received in excess of income from return of capital including real estate investment trusts (REITs) are recorded as a reduction of the cost of the related investment and/or as a realized gain. If the Fund no longer owns the applicable securities, any distributions received in excess of income are recorded as an adjustment to realized gain. Other income and expenses are recorded on an accrual basis. Expenses that cannot be directly attributed to a Fund are apportioned among the Funds in the AMG Trust and in some cases other affiliated funds based upon their relative average net assets or number of shareholders. Investment income, realized and unrealized capital gains and losses, the common expenses of each Fund, and certain Fund level expense reductions, if any, are allocated on a pro-rata basis to each class based on the relative net assets of each class to the total net assets of each Fund.
The Funds have a “balance credit” arrangement with The Bank of New York Mellon (“BNYM”), the Funds’ custodian, whereby each Fund is credited with an interest factor equal to 0.75% below the effective 90-day T-Bill rate for account balances left uninvested overnight. If the T-Bill rate falls below 0.75%, no credits will be earned. These credits serve to reduce custodian expenses that would otherwise be charged to each Fund. For the year ended December 31, 2014, the Funds’ custodian expense was not reduced.
Overdraft fees are computed at 1% above the effective Federal Funds rate on the day of the overdraft. For the year ended December 31, 2014, overdraft fees for Enhanced Core Bond, Municipal Bond, Municipal Enhanced and Small Cap Core equaled $17, $116, $193 and $9, respectively.
d. DIVIDENDS AND DISTRIBUTIONS
Fund distributions resulting from either net investment income or realized net capital gains, if any, will normally be declared and paid at least annually in December, as described in the Funds’ prospectus. Distributions to shareholders are recorded on the ex-dividend date. Distributions are determined in accordance with federal income tax regulations, which may differ from net investment income and net realized capital gains for financial statement purposes (U.S. GAAP). Differences may be permanent or temporary. Permanent differences are reclassified among capital accounts in the financial statements
Notes to Financial Statements (continued)
to reflect their tax character. Temporary differences arise when certain items of income, expense and gain or loss are recognized in different periods for financial statement and tax purposes; these differences will reverse at some time in the future. The differences are due to differing treatments for losses
deferred due to excise tax regulations and wash sales. Permanent book and tax basis differences, if any, relating to shareholder distributions will result in reclassifications to paid-in capital.
The tax character of distributions paid during the years ended December 31, 2014 and December 31, 2013 were as follows:
| | | | | | | | | | | | | | | | | | | | | | | | | | | | | | | | |
| | | Enhanced Core Bond | | | Municipal Bond** | | | Municipal Enhanced* | | | Small Cap Core | |
| | | 2014 | | | 2013 | | | 2014 | | | 2013 | | | 2014 | | | 2013 | | | 2014 | | | 2013 | |
Distributions paid from: | | | | | | | | | | | | | | | | | | | | | | | | | | | | | | | | |
Ordinary income | | $ | 2,538,408 | | | $ | 3,008,950 | | | $ | 7,913,906 | | | $ | 4,573,328 | | | $ | 9,125,692 | | | $ | 11,667,159 | | | $ | 480,894 | | | | — | |
Short-term capital gains | | | — | | | | 501,201 | | | | 675,428 | | | | 598,145 | | | | — | | | | 16,251 | | | | 2,885,197 | | | $ | 789,311 | |
Long-term capital gains | | | — | | | | 10,348,035 | | | | 1,065,265 | | | | 515,095 | | | | — | | | | 1,613,981 | | | | 17,543,220 | | | | 8,964,359 | |
| | | | | | | | | | | | | | | | | | | | | | | | | | | | | | | | |
| | $ | 2,538,408 | | | $ | 13,858,186 | | | $ | 9,654,599 | | | $ | 5,686,568 | | | $ | 9,125,692 | | | $ | 13,297,391 | | | $ | 20,909,311 | | | $ | 9,753,670 | |
| | | | | | | | | | | | | | | | | | | | | | | | | | | | | | | | |
| * | The ordinary income distributions paid by Municipal Enhanced which were tax-exempt for the periods 2014 and 2013 were $9,107,195 and $11,652,099, respectively. |
| ** | The ordinary income distributions paid by Municipal Bond which were tax-exempt for the periods 2014 and 2013 were $7,912,223 and $4,571,626, respectively. |
As of December 31, 2014, the components of distributable earnings (excluding unrealized appreciation/depreciation) on a tax basis consisted of:
| | | | | | | | | | | | | | | | |
| | | Enhanced Core Bond | | | Municipal Bond | | | Municipal Enhanced | | | Small Cap Equity | |
Capital loss carryforward | | $ | 295,109 | | | | — | | | $ | 970,340 | | | | — | |
Undistributed ordinary income | | | 21,912 | | | $ | 265,406 | | | | 4,329 | | | $ | 10,337 | |
Undistributed short-term capital gains | | | — | | | | — | | | | — | | | | — | |
Undistributed long-term capital gains | | | — | | | | 1,646,522 | | | | — | | | | 4,393,512 | |
Post-October loss deferral | | | — | | | | — | | | | — | | | | 382,397 | |
e. FEDERAL TAXES
Each Fund intends to comply with the requirements under Subchapter M of the Internal Revenue Code of 1986, as amended, and, to distribute substantially all of its taxable income and gains to its shareholders and to meet certain diversification and income requirements with respect to investment companies. Therefore, no provision for federal income or excise tax is included in the accompanying financial statements.
Additionally, based on Small Cap Core’s understanding of the tax rules and rates related to income, gains and transactions for the foreign jurisdictions in which it invests, the Fund will provide for foreign taxes, and where appropriate, deferred foreign taxes.
Management has analyzed the Funds’ tax positions taken on federal income tax returns as of December 31, 2014, and for all open tax years (generally, the three prior taxable years), and has concluded that no provision for federal income tax is required in the Funds’ financial statements. Additionally, the Funds are not aware of any tax position for which it is reasonably possible that the total amounts of unrecognized tax benefits will change materially in the next twelve months.
Net capital losses incurred in taxable years beginning after the enactment of the Regulated Investment Company Modernization Act of 2010, may be carried
forward for an unlimited time period. Such losses will be required to be utilized prior to any loss carryovers incurred in pre-enactment taxable years, which generally expire eight years following the close of the taxable year in which they were incurred. As a result of this ordering rule, pre-enactment capital loss carryovers may be more likely to expire unused. Additionally, post-enactment capital losses that are carried forward retain their tax character as either short-term or long-term capital losses, unlike pre-enactment losses which are considered all short-term.
f. CAPITAL LOSS CARRYOVERS AND DEFERRALS
As of December 31, 2014, the following Funds had accumulated net realized capital loss carryovers from securities transactions for federal income tax purposes as shown in the following chart. These amounts may be used to offset future realized capital gains for an unlimited time period.
Notes to Financial Statements (continued)
| | | | | | | | | | | | |
| | | Capital Loss | | | | |
| | | Carryover Amounts | | | | |
| Fund | | Short-Term | | | Long-Term | | | Expires | |
Enhanced Core Bond | | | | | | | | | | | | |
(Post-Enactment) | | $ | 295,109 | | | | — | | | | Unlimited | |
Municipal Bond | | | | | | | | | | | | |
(Post-Enactment) | | | — | | | | — | | | | Unlimited | |
Municipal Enhanced | | | | | | | | | | | | |
(Post-Enactment) | | $ | 970,340 | | | | — | | | | Unlimited | |
Small Cap Core | | | | | | | | | | | | |
(Post-Enactment) | | | — | | | | — | | | | Unlimited | |
g. CAPITAL STOCK
The Trusts’ Declarations of Trust authorize for each series the issuance of an unlimited number of shares of beneficial interest, without par value. Each Fund records sales and repurchases of its capital stock on the trade date. The cost of securities contributed to the Funds in connection with the issuance of shares is based on the valuation of those securities in accordance with the Funds’ policy on investment valuation.
For the year ended December 31, 2014 and December 31, 2013, the capital stock transactions by class for Enhanced Core Bond, Municipal Bond, Municipal Enhanced and Small Cap Core were as follows:
| | | | | | | | | | | | | | | | | | | | | | | | | | | | | | | | |
| | | Enhanced Core Bond | | | Municipal Bond | |
| | | 2014 | | | 2013 | | | 2014 | | | 2013 | |
| | | Shares | | | Amount | | | Shares | | | Amount | | | Shares | | | Amount | | | Shares | | | Amount | |
Investor Class: | | | | | | | | | | | | | | | | | | | | | | | | | | | | | | | | |
Proceeds from sale of shares | | | 1,105,135 | | | $ | 11,355,152 | | | | 976,849 | | | $ | 10,764,860 | | | | 1,313,946 | | | $ | 15,060,926 | | | | 1,822,098 | | | $ | 20,569,840 | |
Reinvestment of distributions | | | 48,652 | | | | 497,882 | | | | 281,916 | | | | 2,854,535 | | | | 43,890 | | | | 504,129 | | | | 45,135 | | | | 504,499 | |
Cost of shares repurchased | | | (1,683,022 | ) | | | (17,154,959 | ) | | | (1,759,013 | ) | | | (19,409,076 | ) | | | (1,926,523 | ) | | | (22,140,073 | ) | | | (1,239,936 | ) | | | (13,875,025 | ) |
| | | | | | | | | | | | | | | | | | | | | | | | | | | | | | | | |
Net increase (decrease) | | | (529,235 | ) | | $ | (5,301,925 | ) | | | (500,248 | ) | | $ | (5,789,681 | ) | | | (568,687 | ) | | $ | (6,575,018 | ) | | | 627,297 | | | $ | 7,199,314 | |
| | | | | | | | | | | | | | | | | | | | | | | | | | | | | | | | |
Service Class: | | | | | | | | | | | | | | | | | | | | | | | | | | | | | | | | |
Proceeds from sale of shares | | | 109,002 | | | $ | 1,126,759 | | | | 199,754 | | | $ | 2,248,555 | | | | 5,554,498 | | | $ | 63,929,297 | | | | 3,367,067 | | | $ | 37,890,398 | |
Reinvestment of distributions | | | 3,830 | | | | 39,381 | | | | 10,089 | | | | 102,030 | | | | 88,317 | | | | 1,018,649 | | | | 57,053 | | | | 637,451 | |
Cost of shares repurchased | | | (27,386 | ) | | | (280,334 | ) | | | (54,349 | ) | | | (600,286 | ) | | | (2,008,633 | ) | | | (22,996,704 | ) | | | (1,693,082 | ) | | | (18,946,361 | ) |
| | | | | | | | | | | | | | | | | | | | | | | | | | | | | | | | |
Net increase | | | 85,446 | | | $ | 885,806 | | | | 155,494 | | | $ | 1,750,299 | | | | 3,634,182 | | | $ | 41,951,242 | | | | 1,731,038 | | | $ | 19,581,488 | |
| | | | | | | | | | | | | | | | | | | | | | | | | | | | | | | | |
Class C: | | | | | | | | | | | | | | | | | | | | | | | | | | | | | | | | |
Proceeds from sale of shares | | | 7,687 | | | $ | 78,568 | | | | 46,320 | | | $ | 467,259 | | | | — | | | | — | | | | — | | | | — | |
Reinvestment of distributions | | | 25,851 | | | | 264,164 | | | | 174,351 | | | | 1,758,814 | | | | — | | | | — | | | | — | | | | — | |
Cost of shares repurchased | | | (563,996 | ) | | | (5,763,405 | ) | | | (1,071,521 | ) | | | (11,716,267 | ) | | | — | | | | — | | | | — | | | | — | |
| | | | | | | | | | | | | | | | | | | | | | | | | | | | | | | | |
Net decrease | | | (530,458 | ) | | $ | (5,420,673 | ) | | | (850,850 | ) | | $ | (9,490,194 | ) | | | — | | | | — | | | | — | | | | — | |
| | | | | | | | | | | | | | | | | | | | | | | | | | | | | | | | |
Institutional Class: | | | | | | | | | | | | | | | | | | | | | | | | | | | | | | | | |
Proceeds from sale of shares | | | 1,334,860 | | | $ | 13,732,720 | | | | 2,594,935 | | | $ | 28,487,585 | | | | 20,955,711 | | | $ | 241,281,689 | | | | 15,047,219 | | | $ | 169,526,811 | |
Reinvestment of distributions | | | 124,781 | | | | 1,280,372 | | | | 656,806 | | | | 6,694,001 | | | | 640,309 | | | | 7,411,371 | | | | 367,179 | | | | 4,121,663 | |
Cost of shares repurchased | | | (3,289,907 | ) | | | (33,620,615 | ) | | | (3,141,725 | ) | | | (34,770,787 | ) | | | (6,356,590 | ) | | | (73,375,703 | ) | | | (7,432,814 | ) | | | (83,388,800 | ) |
| | | | | | | | | | | | | | | | | | | | | | | | | | | | | | | | |
Net increase (decrease) | | | (1,830,266 | ) | | $ | (18,607,523 | ) | | | 110,016 | | | $ | 410,799 | | | | 15,239,430 | | | $ | 175,317,357 | | | | 7,981,584 | | | $ | 90,259,674 | |
| | | | | | | | | | | | | | | | | | | | | | | | | | | | | | | | |
51
Notes to Financial Statements (continued)
| | | | | | | | | | | | | | | | | | | | | | | | | | | | | | | | |
| | | Municipal Enhanced | | | Small Cap Core | |
| | | 2014 | | | 2013 | | | 2014 | | | 2013 | |
| | | Shares | | | Amount | | | Shares | | | Amount | | | Shares | | | Amount | | | Shares | | | Amount | |
Investor Class: | | | | | | | | | | | | | | | | | | | | | | | | | | | | | | | | |
Proceeds from sale of shares | | | 1,818,662 | | | $ | 17,853,038 | | | | 1,278,527 | | | $ | 12,816,750 | | | | 634,821 | | | $ | 15,177,787 | | | | 2,728,282 | | | $ | 57,807,003 | |
Reinvestment of distributions | | | 35,200 | | | | 344,366 | | | | 70,944 | | | | 684,564 | | | | 83,102 | | | | 1,964,534 | | | | 95,850 | | | | 2,332,983 | |
Cost of shares repurchased | | | (1,910,370 | ) | | | (18,841,404 | ) | | | (2,546,069 | ) | | | (24,684,293 | ) | | | (1,969,034 | ) | | | (47,032,493 | ) | | | (778,821 | ) | | | (17,203,313 | ) |
| | | | | | | | | | | | | | | | | | | | | | | | | | | | | | | | |
Net increase (decrease) | | | (56,508 | ) | | $ | (644,000 | ) | | | (1,196,598 | ) | | $ | (11,182,979 | ) | | | (1,251,111 | ) | | $ | (29,890,172 | ) | | | 2,045,311 | | | $ | 42,936,673 | |
| | | | | | | | | | | | | | | | | | | | | | | | | | | | | | | | |
Service Class: | | | | | | | | | | | | | | | | | | | | | | | | | | | | | | | | |
Proceeds from sale of shares | | | 2,041,597 | | | $ | 20,091,308 | | | | 399,979 | | | $ | 3,813,904 | | | | 623,346 | | | $ | 15,141,794 | | | | 845,272 | | | $ | 18,202,654 | |
Reinvestment of distributions | | | 38,258 | | | | 377,147 | | | | 26,690 | | | | 250,192 | | | | 70,148 | | | | 1,667,423 | | | | 28,040 | | | | 684,732 | |
Cost of shares repurchased | | | (1,110,705 | ) | | | (10,961,898 | ) | | | (471,070 | ) | | | (4,572,489 | ) | | | (256,726 | ) | | | (6,139,546 | ) | | | (142,092 | ) | | | (3,162,147 | ) |
| | | | | | | | | | | | | | | | | | | | | | | | | | | | | | | | |
Net increase (decrease) | | | 969,150 | | | $ | 9,506,557 | | | | (44,401 | ) | | $ | (508,393 | ) | | | 436,768 | | | $ | 10,669,671 | | | | 731,220 | | | $ | 15,725,239 | |
| | | | | | | | | | | | | | | | | | | | | | | | | | | | | | | | |
Institutional Class: | | | | | | | | | | | | | | | | | | | | | | | | | | | | | | | | |
Proceeds from sale of shares | | | 5,027,817 | | | $ | 48,928,368 | | | | 8,512,856 | | | $ | 81,871,318 | | | | 6,496,214 | | | $ | 156,385,059 | | | | 3,803,655 | | | $ | 80,451,528 | |
Reinvestment of distributions | | | 646,628 | | | | 6,307,190 | | | | 892,864 | | | | 8,414,657 | | | | 629,895 | | | | 15,022,999 | | | | 208,697 | | | | 5,110,997 | |
Cost of shares repurchased | | | (5,796,894 | ) | | | (56,861,576 | ) | | | (15,835,719 | ) | | | (148,456,385 | ) | | | (1,681,058 | ) | | | (40,193,974 | ) | | | (1,436,301 | ) | | | (32,201,821 | ) |
| | | | | | | | | | | | | | | | | | | | | | | | | | | | | | | | |
Net increase (decrease) | | | (122,449 | ) | | $ | (1,626,018 | ) | | | (6,429,999 | ) | | $ | (58,170,410 | ) | | | 5,445,051 | | | $ | 131,214,084 | | | | 2,576,051 | | | $ | 53,360,704 | |
| | | | | | | | | | | | | | | | | | | | | | | | | | | | | | | | |
At December 31, 2014, certain unaffiliated shareholders of record, specifically omnibus accounts, individually or collectively held greater than 10% of the net assets of the Funds as follows: Enhanced Core Bond - three collectively own 57%; Municipal Bond - two collectively own 64%; Municipal Enhanced - two collectively own 80%; Small Cap Core - three collectively own 55%. Transactions by these shareholders may have a material impact on their respective Funds.
h. REPURCHASE AGREEMENTS
The Funds may enter into repurchase agreements provided that the value of the underlying collateral, including accrued interest, will equal or exceed the value of the repurchase agreement during the term of the agreement. The underlying collateral for all repurchase agreements is held in safekeeping by the Fund’s custodian or at the Federal Reserve Bank. If the seller defaults and the value of the collateral declines, or if bankruptcy proceedings commence with respect to the seller of the security, realization of the collateral by the Fund may be delayed or limited. At December 31, 2014, the market value of repurchase agreements outstanding for Enhanced Core Bond and Small Cap Core was $2,316,213 and $12,805,465, respectively.
i. DELAYED DELIVERY TRANSACTIONS AND WHEN-ISSUED SECURITIES
The Funds may enter into securities transactions on a delayed delivery or when issued basis. Payment and delivery may take place after the customary settlement period for that security. The price of the underlying securities and the date when the securities will be delivered and paid for are fixed at the time the transaction is negotiated. During the time a delayed delivery sell is outstanding, the contract is marked to market daily and equivalent deliverable securities are held for the transaction. The value of the securities purchased on a delayed delivery or when-issued basis are identified as such in the Funds’ Schedules of
Portfolio Investments. With respect to purchase commitments, the Funds identify securities as segregated in their records with a value at least equal to the amount of the commitment. The payables and receivables associated with the purchases and sales of delayed delivery securities having the same coupon, settlement date and broker are offset. Delayed delivery or when-issued securities that have been purchased from and sold to different brokers are reflected as both payables and receivables in the Funds’ Statement of Assets and Liabilities. Losses may arise due to changes in the value of the underlying securities or if the counterparty does not perform under the contract, or if the issuer does not issue the securities due to political, economic, or other factors.
2. AGREEMENTS AND TRANSACTIONS WITH AFFILIATES
For each of the Funds, the Trust has entered into an investment advisory agreement under which the Investment Manager, a subsidiary and the U.S. retail distribution arm of Affiliated Managers Group, Inc. (“AMG”), serves as Investment Manager to the Funds and is responsible for the Funds’ overall administration and operations. The Investment Manager selects one or more subadvisors for the Funds (subject to Board approval) and monitors each subadvisor’s investment performance, security holdings and investment strategies. Each Fund’s investment portfolio is managed by Gannett Welsh & Kotler, LLC (“GW&K”), who serves pursuant to a subadvisory agreement with the Investment Manager. AMG indirectly owns a majority interest in GW&K.
Investment management fees are paid directly by the Funds to the Investment Manager based on average daily net assets. For the year ended December 31, 2014, the Funds’ investment management fees were paid at the following annual rate of each Fund’s respective average daily net assets:
52
Notes to Financial Statements (continued)
| | | | |
Enhanced Core Bond | | | 0.45 | % |
Municipal Bond | | | 0.35 | % |
Municipal Enhanced | | | 0.50 | % |
Small Cap Core | | | 0.75 | % |
The Investment Manager has contractually agreed, through at least May 1, 2015, to waive management fees (but not below zero) and/or reimburse Fund expenses in order to limit total annual Fund operating expenses after fee waiver and expense reimbursements (exclusive of taxes, interest (including interest incurred in connection with bank and custody overdrafts), shareholder servicing fees, distribution and service (12b-1) fees, brokerage commissions and other transaction costs, acquired fund fees and expenses and extraordinary expenses) of Enhanced Core Bond, Municipal Bond, Municipal Enhanced and Small Cap Core to 0.59%, 0.34%, 0.64% and 0.95%, respectively, of each Fund’s average daily net assets subject to later reimbursement by the Funds in certain circumstances. The contractual expense limitation may only be terminated in the event the Investment Manager or a successor ceases to be the Investment Manager of the Fund or a successor fund, by mutual agreement of the Investment Manager and the Trusts’ Board of Trustees, or in the event of the Fund’s liquidation unless the Fund is reorganized or is a party to a merger in which the surviving entity is successor to the accounting and performance information of the Fund.
Each Fund is obligated to repay the Investment Manager such amounts waived, paid, or reimbursed in future years provided that the repayment occurs within thirty-six (36) months after the waiver or reimbursement and that such repayment would not cause the Fund’s total annual operating expenses after fee waiver and expense reimbursements in any such future year to exceed that Fund’s contractual expense limitation amount. For the year ended December 31, 2014, each Fund’s components of reimbursement available are detailed in the following chart:
| | | | | | | | |
| | | Enhanced | | | Municipal | |
| | | Core Bond | | | Bond | |
Reimbursement Available - 12/31/13 | | $ | 861,647 | | | $ | 1,546,047 | |
Additional Reimbursements | | | 229,007 | | | | 1,312,291 | |
Expired Reimbursements | | | (291,775 | ) | | | (198,531 | ) |
| | | | | | | | |
Reimbursement Available - 12/31/14 | | $ | 798,879 | | | $ | 2,659,807 | |
| | | | | | | | |
| | |
| | | Municipal
Enhanced | | | Small Cap Core | |
Reimbursement Available - 12/31/13 | | $ | 702,996 | | | $ | 586,195 | |
Additional Reimbursements | | | 232,205 | | | | 378,846 | |
Expired Reimbursements | | | (182,324 | ) | | | (158,683 | ) |
| | | | | | | | |
Reimbursement Available - 12/31/14 | | $ | 752,877 | | | $ | 806,358 | |
| | | | | | | | |
Each Fund has entered into an Administration and Shareholder Servicing Agreement under which the Investment Manager serves as the Funds’ administrator (the “Administrator”) and is responsible for all aspects of managing the Funds’ operations, including administration and shareholder services to each Fund, its shareholders, and certain institutions, such as bank
trust departments, broker-dealers and registered investment advisers, that advise or act as intermediary with the Funds’ shareholders. The Funds pay a fee to the Administrator at the rate of 0.25% per annum of each Fund’s average daily net assets for this service. The Administrator for Municipal Enhanced is voluntarily waiving a portion of its administration fee on 90% of the Fund’s net assets. The waiver, which may be modified or terminated at any time, amounts to 0.10% on the first $250 million of the Fund’s net assets and 0.15% on the remaining net assets. For the year ended December 31, 2014, the amount waived was $216,037 or 0.09%.
The aggregate annual retainer paid to each Independent Trustee of the Board is $130,000, plus $7,000 or $2,500 for each regular or special meeting attended, respectively. The Independent Chairman of the Trusts receives an additional payment of $35,000 per year. The Chairman of the Audit Committee receives an additional payment of $15,000 per year. The Trustees’ fees and expenses are allocated among all of the Funds in the Trusts for which the Investment Manager serves as the advisor based on the relative net assets of such Funds. The “Trustees fees and expenses” shown in the financial statements represents each Fund’s allocated portion of the total fees and expenses paid by the AMG Funds family of mutual funds (“AMG Funds family”).
Prior to January 1, 2014, the aggregate annual retainer paid to each Independent Trustee of the Board was $105,000, plus $6,000 or $2,500 for each regular or special meeting attended, respectively. The Independent Chairman of the Trusts formerly received an additional payment of $25,000 per year. The Chairman of the Audit Committee formerly received an additional payment of $10,000 per year.
The Funds are distributed by AMG Distributors, Inc. (formerly Managers Distributors, Inc.) (the “Distributor”), a wholly-owned subsidiary of the Investment Manager. The Distributor serves as the distributor and underwriter for each Fund and is a registered broker-dealer and member of the Financial Industry Regulatory Authority, Inc. (“FINRA”). Shares of each Fund will be continuously offered and will be sold directly to prospective purchasers and through brokers, dealers or other financial intermediaries who have executed selling agreements with the Distributor. Subject to the compensation arrangement discussed below, generally the Distributor bears all or a portion of the expenses of providing services pursuant to the distribution agreement, including the payment of the expenses relating to the distribution of prospectuses for sales purposes and any advertising or sales literature. Certain Trustees and Officers of the Funds are Officers and/or Directors of the Investment Manager, AMG and/or the Distributor.
The Trusts have adopted a distribution and service plan (the “Plan”) with respect to the Investor Class shares of each Fund and Class C shares of Enhanced Core Bond, in accordance with the requirements of Rule 12b-1 under the 1940 Act and the requirements of the applicable rules of FINRA regarding asset-based sales charges. Pursuant to the Plan, each Fund may make payments to the Distributor for its expenditures in financing any activity primarily intended to result in the sale of each such class of the Fund’s shares and for maintenance and personal service provided to existing shareholders of that class. The Plan authorizes payments to the Distributors of up to 0.25% and 1.00% annually of each Fund’s average daily net assets attributable to the Investor Class and Class C shares, respectively.
Notes to Financial Statements (continued)
For Enhanced Core Bond’s Service Class and for each of the Investor and Service Classes of Municipal Bond, Municipal Enhanced and Small Cap Core, the Board has approved reimbursement payments to the Investment Manager for shareholder servicing expenses (“shareholder servicing fees”) incurred. Shareholder servicing fees include payments to third parties such as a bank, broker-dealer, trust company or other financial intermediaries who provide shareholder recordkeeping, account servicing and other services. The Investor and Service Class shares may reimburse the Investment Manager for the actual amount incurred up to a maximum annual rate of each Class’s average daily net assets as shown in the table below.
The impact on the annualized expense ratios for the year ended December 31, 2014, were as follows:
| | | | | | | | |
| | | Maximum | | | Actual | |
| Fund | | Amount
Allowed | | | Amount
Incurred | |
Enhanced Core Bond | | | | | | | | |
Service Class | | | 0.10 | % | | | 0.06 | % |
Municipal Bond | | | | | | | | |
Investor Class | | | 0.25 | % | | | 0.21 | % |
Service Class | | | 0.25 | % | | | 0.18 | % |
Municipal Enhanced | | | | | | | | |
Investor Class | | | 0.25 | % | | | 0.11 | % |
Service Class | | | 0.25 | % | | | 0.08 | % |
Small Cap Core | | | | | | | | |
Investor Class | | | 0.25 | % | | | 0.22 | % |
Service Class | | | 0.25 | % | | | 0.15 | % |
The Securities and Exchange Commission granted an exemptive order that permits the Funds to lend and borrow money for certain temporary purposes directly to and from other eligible Funds in the AMG Funds family. Participation in this interfund lending program is voluntary for both the borrowing and lending funds, and an interfund loan is only made if it benefits each participating Fund. The Investment Manager administers the program according to procedures approved by the Board, and the Board monitors the operation of the program. An interfund loan must comply with certain conditions set out in the exemptive order, which are designed to assure fairness and protect all participating Funds. For the year ended December 31, 2014, the following Funds either borrowed from or lent to other Funds in the AMG Funds family: Small Cap Core borrowed varying amounts not exceeding $4,863,765, for four days paying interest of $162. The interest amount is included in the Statement of Operations as miscellaneous expense. Small Cap Core lent $6,334,762, for three days earning interest of $289 and Enhanced Core Bond lent $1,019,303 for five days earning interest of $86. The interest amount is included in the Statement of Operations as interest income. For the year ended December 31, 2014, Municipal Enhanced and Municipal Bond neither borrowed from nor lent to other Funds in the AMG Funds family. At December 31, 2014, the Funds had no interfund loans outstanding.
3. PURCHASES AND SALES OF SECURITIES
Purchases and sales of securities (excluding short-term securities and U.S. Government obligations) for the year ended December 31, 2014, were as follows:
| | | | | | | | |
| | | Long-Term Securities excluding (U.S. | |
| | | Government Obligations) | |
| Fund | | Purchases | | | Sales | |
Enhanced Core Bond | | $ | 16,722,128 | | | $ | 38,407,338 | |
Municipal Bond | | | 327,489,282 | | | | 122,001,642 | |
Municipal Enhanced | | | 198,539,892 | | | | 192,499,890 | |
Small Cap Core | | | 165,831,246 | | | | 81,493,914 | |
| |
| | | U.S. Government Obligations | |
| Fund | | Purchases | | | Sales | |
Enhanced Core Bond | | $ | 4,488,270 | | | $ | 9,298,711 | |
4. PORTFOLIO SECURITIES LOANED
The Funds participate in a securities lending program offered by BNYM (the “Program”), providing for the lending of securities to qualified brokers. Securities lending income includes earnings of such temporary cash investments, plus or minus any rebate to a borrower. These earnings (after any rebate) are then divided between BNYM, as a fee for its services under the Program, and the Funds, according to agreed-upon rates. Collateral received on all securities loaned is accepted in cash and is maintained at a minimum level of 102% (105% in the case of certain foreign securities) of the market value, plus interest, if applicable, of investments on loan. It is the Funds’ policy to obtain additional collateral from or return excess collateral to the borrower by the end of the next business day, following the valuation date of the securities loaned. Therefore, the value of the collateral held may be temporarily less than the value of the securities on loan. Lending securities entails a risk of loss to the Funds if and to the extent that the market value of the securities loaned were to increase and the borrower did not increase the collateral accordingly, and the borrower fails to return the securities. Under the terms of the Program, the Funds are indemnified for such losses by BNYM. Cash collateral is held in a separate account managed by BNYM, who is authorized to exclusively enter into overnight government repurchase agreements. BNYM bears the risk of any deficiency in the amount of the cash collateral available for return to the borrower due to any loss on the collateral invested.
At December 31, 2014, the value of the securities loaned and cash collateral received, were as follows:
| | | | | | | | |
| | | Securities | | | Cash Collateral | |
| Fund | | Loaned | | | Received | |
Enhanced Core Bond | | $ | 2,219,278 | | | $ | 2,316,213 | |
Small Cap Core | | | 12,399,511 | | | | 12,805,465 | |
5. COMMITMENTS AND CONTINGENCIES
Under each Trusts’ organizational documents, its trustees and officers are indemnified against certain liabilities arising out of the performance of their duties to the Trusts. In addition, in the normal course of business, the Funds may enter into contracts and agreements that contain a variety of
54
Notes to Financial Statements (continued)
representations and warranties, which provide general indemnifications. The maximum exposure to the Funds under these arrangements is unknown, as this would involve future claims that may be made against a Fund that have not yet occurred. However, based on experience, the Funds had no prior claims or losses and expect the risks of loss to be remote.
6. MASTER NETTING AGREEMENTS
The Funds may enter into master netting agreements with their counterparties for the securities lending program and repurchase agreements, which provide
the right, in the event of default (including bankruptcy or insolvency) for the non-defaulting party to liquidate the collateral and calculate net exposure to the defaulting party or request additional collateral. For financial reporting purposes, the Funds do not offset financial assets and financial liabilities that are subject to master netting agreements in the Statement of Assets and Liabilities. For security lending transactions, see Note 4.
The following table is a summary of the Funds’ open repurchase agreements which are subject to a master netting agreement as of December 31, 2014:
| | | | | | | | | | | | | | | | |
| | | Net Amounts of
Assets Presented in the Statement
of Assets and
Liabilities | | | Gross Amount Not Offset in the
Statement of Assets and Liabilities | | | | |
| | | | Financial
Instruments | | | Cash Collateral
Received | | | Net Amount | |
Enhanced Core Bond | | | | | | | | | | | | | | | | |
Cantor Fitzgerald Securities, Inc. | | $ | 1,000,000 | | | $ | 1,000,000 | | | | — | | | | — | |
Daiwa Capital Markets America | | | 316,213 | | | | 316,213 | | | | — | | | | — | |
Nomura Securities International, Inc. | | | 1,000,000 | | | | 1,000,000 | | | | — | | | | — | |
| | | | | | | | | | | | | | | | |
Total | | $ | 2,316,213 | | | $ | 2,316,213 | | | | — | | | | — | |
| | | | | | | | | | | | | | | | |
Small Cap Core | | | | | | | | | | | | | | | | |
Cantor Fitzgerald Securities, Inc. | | $ | 3,041,306 | | | $ | 3,041,306 | | | | — | | | | — | |
Citigroup Global Markets, Inc. | | | 640,241 | | | | 640,241 | | | | — | | | | — | |
Daiwa Capital Markets America | | | 3,041,306 | | | | 3,041,306 | | | | — | | | | — | |
Nomura Securities International, Inc. | | | 3,041,306 | | | | 3,041,306 | | | | — | | | | — | |
State of Wisconsin Investment Board | | | 3,041,306 | | | | 3,041,306 | | | | — | | | | — | |
| | | | | | | | | | | | | | | | |
Total | | $ | 12,805,465 | | | $ | 12,805,465 | | | | — | | | | — | |
| | | | | | | | | | | | | | | | |
7. SUBSEQUENT EVENTS
Each Fund has determined that no material events or transactions occurred through the issuance date of the Funds’ financial statements which require additional disclosure in or adjustment of the Funds’ financial statements.
TAX INFORMATION (unaudited)
The AMG GW&K Enhanced Core Bond, AMG GW&K Municipal Bond, AMG GW&K Municipal Enhanced Yield Fund and AMG GW&K Small Cap Core Funds each hereby designates the maximum amount allowable of its net taxable income as qualified dividends as provided in the Jobs and Growth Tax Relief Reconciliation Act of 2003. The 2014 Form 1099-DIV you receive for each Fund will show the tax status of all distributions paid to you during the year.
Pursuant to section 852 of the Internal Revenue Code, AMG GW&K Enhanced Core Bond, AMG GW&K Municipal Bond, AMG GW&K Municipal Enhanced Yield Fund and AMG GW&K Small Cap Core Funds each hereby designates $0, $1,065,265, $0 and $17,543,220, respectively, as a capital gain distribution with respect to the taxable year ended December 31, 2014, or if subsequently determined to be different, the net capital gains of such fiscal year.
55
Report of Independent Registered Public Accounting Firm
TO THE BOARD OF TRUSTEES OF AMG FUNDS II AND THE SHAREHOLDERS OF AMG GW&K ENHANCED CORE BOND FUND, AS WELL AS THE BOARD OF TRUSTEES OF AMG FUNDS AND THE SHAREHOLDERS OF AMG GW&K MUNICIPAL BOND FUND, AMG GW&K MUNICIPAL ENHANCED YIELD FUND, AND AMG GW&K SMALL CAP CORE FUND:
In our opinion, the accompanying statements of assets and liabilities, including the schedules of portfolio investments, and the related statements of operations and of changes in net assets and the financial highlights present fairly, in all material respects, the financial positions of AMG GW&K Enhanced Core Bond Fund (formerly, Managers AMG GW&K Fixed Income Fund), AMG GW&K Municipal Bond Fund (formerly, GW&K Municipal Bond Fund), AMG GW&K Municipal Enhanced Yield Fund (formerly, GW&K Municipal Enhanced Yield Fund), and AMG GW&K Small Cap Core Fund (formerly, GW&K Small Cap Equity Fund) (the “Funds”) at December 31, 2014, and the results of each of their operations, the changes in each of their net assets and the financial highlights for each of the periods indicated, in conformity with accounting principles generally accepted in the United States of America. These financial statements and financial highlights (hereafter referred to as “financial statements”) are the responsibility of the Funds’ management. Our responsibility is to express an opinion on these financial statements based on our audits. We conducted our audits of these financial statements in accordance with the standards of the Public Company Accounting Oversight Board (United States). Those standards require that we plan and perform the audit to obtain reasonable assurance about whether the financial statements are free of material misstatement. An audit includes examining, on a test basis, evidence supporting the amounts and disclosures in the financial statements, assessing the accounting principles used and significant estimates made by management, and evaluating the overall financial statement presentation. We believe that our audits, which included confirmation of securities at December 31, 2014 by correspondence with the custodian, brokers and transfer agent, and the application of alternative auditing procedures where securities purchased had not been received, provide a reasonable basis for our opinion.
PricewaterhouseCoopers LLP
Boston, Massachusetts
February 26, 2015
56
AMG Funds
Trustees and Officers
The Trustees and Officers of the Trust, their business addresses, principal occupations for the past five years and dates of birth are listed below. The Trustees provide broad supervision over the affairs of the Trust and the Funds. The Trustees are experienced executives who meet periodically throughout the year to oversee the Funds’ activities, review contractual arrangements with
companies that provide services to the Funds, and review the Funds’ performance. Unless otherwise noted, the address of each Trustee or Officer is the address of the Trust: 800 Connecticut Avenue, Norwalk, Connecticut 06854.
There is no stated term of office for Trustees. Trustees serve until their resignation, retirement or removal in accordance with the Trust’s
organizational documents and policies adopted by the Board from time to time. The Chairman of the Trustees, President, Treasurer and Secretary of the Trust are elected by the Trustees annually. Other officers hold office at the pleasure of the Trustees.
Independent Trustees
The following Trustees are not “interested persons” of the Trust within the meaning of the 1940 Act:
| | |
Number of Funds Overseen in Fund Complex | | Name, Date of Birth, Principal Occupation(s) During Past 5 Years and Other Directorships Held by Trustee |
• Trustee since 2012 | | Bruce B. Bingham, 12/1/48 |
• Oversees 44 Funds in Fund Complex | | Partner, Hamilton Partners (real estate development firm) (1987-Present); Trustee of Aston Funds (27 portfolios) (2014-Present); Director of The Yacktman Funds (2000-2012). |
| |
• Independent Chairman | | William E. Chapman, II, 9/23/41 |
• Trustee since 1999 - AMG Funds • Trustee since 2000 - AMG Funds II • Oversees 44 Funds in Fund Complex | | President and Owner, Longboat Retirement Planning Solutions (1998-Present); Hewitt Associates, LLC (part time) (provider of Retirement and Investment Education Seminars) (2002-2009); Trustee Emeritus of Bowdoin College (2013-Present), Trustee of Bowdoin College (2002-2013); Director of Harding, Loevner Funds, Inc. (6 portfolios); Trustee of Third Avenue Trust (5 portfolios); Trustee of Third Avenue Variable Trust (1 portfolio); Trustee of Aston Funds (27 portfolios) (2010-Present). |
| |
• Trustee since 1999 - AMG Funds • Trustee since 2000 - AMG Funds II • Oversees 44 Funds in Fund Complex | | Edward J. Kaier, 9/23/45 Attorney at Law and Partner, Teeters Harvey Marrone & Kaier LLP (2007-Present); Attorney at Law and Partner, Hepburn Willcox Hamilton & Putnam, LLP (1977-2007); Trustee of Third Avenue Trust (5 portfolios); Trustee of Third Avenue Variable Trust (1 portfolio); Trustee of Aston Funds (27 portfolios) (2010-Present). |
| |
• Trustee since 2013 | | Kurt A. Keilhacker, 10/5/63 |
• Oversees 46 Funds in Fund Complex | | Managing Member, TechFund Capital (1997-Present); Managing Member, TechFund Europe (2000-Present); Trustee, Gordon College (2001-Present); Board Member, 6wind SA, (2002-Present); Managing Member, Clapham Partners I, LLC (2013-Present); Trustee of Aston Funds (27 portfolios) (2014-Present). |
| |
• Trustee since 2004 - AMG Funds • Trustee since 2000 - AMG Funds II • Oversees 44 Funds in Fund Complex | | Steven J. Paggioli, 4/3/50 Independent Consultant (2002-Present); Formerly Executive Vice President and Director, The Wadsworth Group (1986-2001); Executive Vice President, Secretary and Director, Investment Company Administration, LLC (1990-2001); Vice President, Secretary and Director, First Fund Distributors, Inc. (1991-2001); Trustee, Professionally Managed Portfolios (43 portfolios); Advisory Board Member, Sustainable Growth Advisors, LP; Independent Director, Chase Investment Counsel (2008 – Present); Trustee of Aston Funds (27 portfolios) (2010-Present). |
| |
• Trustee since 2013 | | Richard F. Powers III, 2/2/46 |
• Oversees 44 Funds in Fund Complex | | Adjunct Professor, Boston College (2011-Present); Trustee of Aston Funds (27 portfolios) (2014-Present); President and CEO of Van Kampen Investments Inc. (1998-2003). |
| |
• Trustee since 1999 - AMG Funds • Trustee since 2000 - AMG Funds II • Oversees 46 Funds in Fund Complex | | Eric Rakowski, 6/5/58 Professor, University of California at Berkeley School of Law (1990-Present); Director of Harding, Loevner Funds, Inc. (6 portfolios); Trustee of Third Avenue Trust (5 portfolios); Trustee of Third Avenue Variable Trust (1 portfolio); Trustee of Aston Funds (27 portfolios) (2010-Present). |
| |
• Trustee since 2013 | | Victoria L. Sassine, 8/11/65 |
• Oversees 46 Funds in Fund Complex | | Lecturer, Babson College (2007 – Present); Trustee of Aston Funds (27 portfolios) (2014-Present). |
| |
• Trustee since 2004 - AMG Funds • Trustee since 2000 - AMG Funds II • Oversees 44 Funds in Fund Complex | | Thomas R. Schneeweis, 5/10/47 Professor Emeritus, University of Massachusetts (2013 - Present); Partner, S Capital Management, LLC (2007-Present); President, TRS Associates (1982-Present); Director, CISDM at the University of Massachusetts, (1996-2013); President, Alternative Investment Analytics, LLC, (formerly Schneeweis Partners, LLC) (2001-2013); Professor of Finance, University of Massachusetts (1977-2013); Partner, White Bear Partners, LLC (2007-2010); Partner, Northampton Capital Management, LLC (2004-2010); Trustee of Aston Funds (27 portfolios) (2010-Present). |
57
AMG Funds
Trustees and Officers (continued)
Interested Trustees
Each Trustee in the following table is an “interested person” of the Trust within the meaning of the 1940 Act. Ms. Carsman is an interested person of the Trust within the meaning of the 1940 Act by virtue of her position with, and interest in securities of, AMG, and her former position as Chief Legal Officer of the Trust.
| | |
Number of Funds Overseen in Fund Complex | | Name, Date of Birth, Principal Occupation(s) During Past 5 Years and Other Directorships Held by Trustee |
• Trustee since 2011 | | Christine C. Carsman, 4/2/52 |
• Oversees 46 Funds in Fund Complex | | Senior Vice President and Deputy General Counsel, Affiliated Managers Group, Inc. (2011-Present); Trustee of Aston Funds (27 portfolios) (2014-Present); Senior Vice President and Chief Regulatory Counsel, Affiliated Managers Group, Inc. (2007-2011); Vice President and Chief Regulatory Counsel, Affiliated Managers Group, Inc. (2004-2007); Secretary and Chief Legal Officer, AMG Funds, AMG Funds I, AMG Funds II and AMG Funds III (2004-2011); Senior Counsel, Vice President and Director of Operational Risk Management and Compliance, Wellington Management Company, LLP (1995-2004). |
| |
| Officers | | |
| |
Position(s) Held with Fund and Length of Time Served | | Name, Date of Birth, Principal Occupation(s) During Past 5 Years |
• President since 2014 | | Jeffrey T. Cerutti, 2/7/68 |
• Principal Executive Officer since 2014 | | Chief Executive Officer, AMG Funds LLC (2014-Present); Director, President and Principal, AMG Distributors, Inc. (2014-Present); President, VP Distributors, (2011-2014); Executive Vice President, Head of Distribution, Virtus Investment Partners, Inc. (2010-2014); Managing Director, Head of Sales, UBS Global Asset Management (2001-2010). |
| |
• Chief Operating Officer since 2007 | | Keitha L. Kinne, 5/16/58 Chief Operating Officer, AMG Funds LLC (2007-Present); Chief Investment Officer, AMG Funds LLC (2008-Present); Chief Operating Officer, AMG Distributors, Inc. (2007-Present); Managing Partner, AMG Funds LLC (2007-2014); President, AMG Funds (2012-2014); President, AMG Distributors, Inc. (2012-2014); Managing Director, Legg Mason & Co., LLC (2006-2007); Managing Director, Citigroup Asset Management (2004-2006). |
| |
• Secretary since 2011 | | Lewis Collins, 2/22/66 |
• Chief Legal Officer since 2011 | | Senior Vice President and Senior Counsel, Affiliated Managers Group, Inc. (2010-Present); Vice President and Senior Counsel, Affiliated Managers Group, Inc. (2006-2010); Senior Counsel, Affiliated Managers Group, Inc. (2002-2006); Attorney, Ropes & Gray LLP (1998-2002). |
| |
• Chief Financial Officer since 2007 • Treasurer since 1999 • Principal Financial Officer since 1999 | | Donald S. Rumery, 5/29/58 Senior Vice President, Director of Mutual Funds Services, AMG Funds LLC (2005-Present); Treasurer, AMG Funds III (1995-Present); Treasurer, AMG Funds (1999-Present); Treasurer, AMG Funds I and AMG Funds II (2000-Present); Chief Financial Officer, AMG Funds, AMG Funds I, AMG Funds II and AMG Funds III (2007-Present); Treasurer and Chief Financial Officer, AMG Distributors, Inc. (2000-2012); Vice President, AMG Funds LLC, (1994-2004). |
| |
• Assistant Treasurer since 2014 | | John C. Ball, 1/9/76 Vice President, Assistant Treasurer, AMG Funds LLC (2014-Present); Vice President, State Street Corp. (2010-2014); Vice President, State Street International (Ireland) Limited (2007-2010). |
| |
• Chief Compliance Officer since 2010 | | John J. Ferencz, 3/9/62 Vice President, Chief Compliance Officer - AMG Family of Funds, AMG Funds LLC (2010-Present); Code of Ethics Reporting Officer and Sarbanes Oxley Code of Ethics Compliance Officer, AMG Funds, AMG Funds I, AMG Funds II and AMG Funds III (2010-Present); Senior Compliance Analyst, Mutual Funds and Regulatory, GE Asset Management Incorporated (2005-2010). |
| |
• Assistant Secretary since 2011 | | Michael S. Ponder, 9/12/73 Senior Vice President Counsel, AMG Funds LLC (2011-Present); Attorney, DeNovo Legal (2009-2010); Vice President, Credit Suisse (2007-2009); Associate, Willkie Farr & Gallagher LLP (2006-2007). |
| |
• Anti-Money Laundering | | Patrick J. Spellman, 3/15/74 |
Compliance Officer since 2014 | | Senior Vice President, Chief Compliance Officer, AMG Funds LLC (2011-Present); Chief Compliance Officer, AMG Distributors, Inc., (2010-Present); Compliance Manager, Legal and Compliance, Affiliated Managers Group, Inc. (2005-2011). |
58
THIS PAGE INTENTIONALLY LEFT BLANK
THIS PAGE INTENTIONALLY LEFT BLANK
INVESTMENT MANAGER AND ADMINISTRATOR
AMG Funds LLC
800 Connecticut Avenue
Norwalk, CT 06854
(800) 835-3879
DISTRIBUTOR
AMG Distributors, Inc.
800 Connecticut Avenue
Norwalk, CT 06854
(800) 835-3879
SUBADVISOR
Gannett Welsh & Kotler, LLC
222 Berkeley St.
Boston, MA 02116
CUSTODIAN
The Bank of New York Mellon
2 Hanson Place
Brooklyn, NY 11217
LEGAL COUNSEL
Ropes & Gray LLP
Prudential Tower, 800 Boylston Street
Boston, MA 02199-3600
TRANSFER AGENT
BNY Mellon Investment Servicing (US) Inc.
Attn: AMG Funds
P.O. Box 9769
Providence, RI 02940
(800) 548-4539
FOR MANAGERSCHOICETM ONLY
AMG Funds
c/o BNY Mellon Investment Servicing (US) Inc.
P.O. Box 9847
Providence, Rhode Island 02940-8047
(800) 358-7668
This report is prepared for the Funds’ shareholders. It is authorized for distribution to prospective investors only when preceded or accompanied by an effective prospectus. To receive a free copy of the prospectus or Statement of Additional Information, which includes additional information about Fund Trustees, please contact us by calling 800.835.3879. Distributed by AMG Distributors, Inc., member FINRA/SIPC.
Current net asset values per share for each Fund are available on the Funds’ website at www.amgfunds.com.
A description of the policies and procedures each Fund uses to vote its proxies is available: (i) without charge, upon request, by calling 800.835.3879, or (ii) on the Securities and Exchange Commission’s (SEC) website at www.sec.gov. For information regarding each Fund’s proxy voting record for the 12-month period ended June 30, call 800.835.3879 or visit the SEC website at www.sec.gov.
Each Fund files its complete schedule of portfolio holdings with the SEC for the first and third quarters of each fiscal year on Form N-Q. The Funds’ Forms N-Q are available on the SEC’s website at www.sec.gov. A Fund’s Forms N-Q may be reviewed and copied at the SEC’s Public Reference Room in Washington, DC. Information on the operation of the Public Reference Room may be obtained by calling 1-800-SEC-0330. To review a complete list of the Funds’ portfolio holdings, or to view the most recent quarterly holdings report, semiannual report, or annual report, please visit www.amgfunds.com.
www.amgfunds.com
AFFILIATE SUBADVISED FUNDS
ALTERNATIVE FUNDS
AMG FQ Global Alternatives
First Quadrant, L.P.
BALANCED FUNDS
AMG Chicago Equity Partners Balanced
Chicago Equity Partners, LLC
AMG FQ Global Risk-Balanced
(formerly Managers AMG FQ Global Essentials)
First Quadrant, L.P.
EQUITY FUNDS
AMG Chicago Equity Partners Small Cap Value Fund
Chicago Equity Partners, LLC
AMG FQ Tax-Managed U.S. Equity
AMG FQ U.S. Equity
First Quadrant, L.P.
AMG Frontier Small Cap Growth
Frontier Capital Management Company, LLC
AMG GW&K Small Cap Core
(formerly GW&K Small Cap Equity)
Gannett Welsh & Kotler, LLC
AMG Renaissance International Equity
AMG Renaissance Large Cap Growth
The Renaissance Group LLC
AMG SouthernSun Small Cap
AMG SouthernSun U.S. Equity
SouthernSun Asset Management, LLC
AMG Systematic Large Cap Value
(formerly Systematic Value)
AMG Systematic Mid Cap Value
Systematic Financial Management, L.P.
AMG TimesSquare All Cap Growth
(formerly Managers AMG TSCM Growth Equity)
AMG TimesSquare International Small Cap
AMG TimesSquare Mid Cap Growth
AMG TimesSquare Small Cap Growth
TimesSquare Capital Management, LLC
AMG Trilogy Emerging Markets
Equity
AMG Trilogy Global Equity
AMG Trilogy International Small Cap
Trilogy Global Advisors, L.P.
AMG Yacktman Focused
AMG Yacktman
Yacktman Asset Management LP
FIXED INCOME FUNDS
AMG GW&K Enhanced Core Bond
(formerly Managers AMG GW&K Fixed Income)
AMG GW&K Municipal Bond
AMG GW&K Municipal Enhanced Yield
Gannett Welsh & Kotler, LLC
OPEN-ARCHITECTURE FUNDS
EQUITY FUNDS
AMG Managers Brandywine Advisors Mid Cap Growth
AMG Managers Brandywine Blue
AMG Managers Brandywine
Friess Associates, LLC
AMG Managers Cadence Capital Appreciation
AMG Managers Cadence Emerging Companies
AMG Managers Cadence Mid Cap
Cadence Capital Management, LLC
AMG Managers Emerging
Opportunities
(formerly Managers Micro-Cap)
Lord, Abbett & Co. LLC
WEDGE Capital Management L.L.P.
Next Century Growth Investors LLC
RBC Global Asset Management (U.S.) Inc.
AMG Managers Essex Small/Micro
Cap Growth
Essex Investment Management Co., LLC
AMG Managers Real Estate
Securities
CenterSquare Investment Management, Inc.
AMG Managers Skyline Special
Equities
(formerly Skyline Special Equities Portfolio)
Skyline Asset Management, L.P.
AMG Managers Special Equity
Ranger Investment Management, L.P.
Lord, Abbett & Co. LLC
Smith Asset Management Group, L.P.
Federated MDTA LLC
FIXED INCOME FUNDS
AMG Managers Bond
AMG Managers Global Income Opportunity
Loomis, Sayles & Co., L.P.
AMG Managers High Yield
J.P. Morgan Investment Management Inc.
AMG Managers Intermediate Duration Government
AMG Managers Short Duration
Government
Amundi Smith Breeden LLC
AMG Managers Total Return Bond
(formerly Managers PIMCO Bond)
Pacific Investment Management Co. LLC
| | |
 | | www.amgfunds.com |
Item 2. CODE OF ETHICS
Registrant has adopted a Code of Ethics. See attached Exhibit (a)(1).
Item 3. AUDIT COMMITTEE FINANCIAL EXPERT
Registrant’s Board of Trustees has determined that independent Trustee Mr. Steven J. Paggioli qualifies as an Audit Committee Financial Expert. Mr. Paggioli is “independent” as such term is defined in Form N-CSR.
Item 4. PRINCIPAL ACCOUNTANT FEES AND SERVICES
(a) Audit Fees
The aggregate fees billed by the Funds’ independent registered public accounting firm, PricewaterhouseCoopers LLP (“PwC”), to the Funds for the Funds’ two most recent fiscal years for professional services rendered for audits of annual financial statements, or services that are normally provided in connection with statutory and regulatory filings or engagements (“Audit Fees”) were as follows:
| | | | | | | | |
Fund - AMG FUNDS II | | Fiscal 2014 | | | Fiscal 2013 | |
AMG GW&K Enhanced Core Bond Fund | | $ | 41,097 | | | $ | 31,170 | |
AMG Chicago Equity Partners Balanced Fund | | $ | 26,100 | | | $ | 28,826 | |
AMG Managers High Yield Fund | | $ | 50,909 | | | $ | 21,170 | |
AMG Managers Short Duration Government Fund | | $ | 44,896 | | | $ | 35,470 | |
AMG Managers Intermediate Duration Government Fund | | $ | 52,186 | | | $ | 30,470 | |
(b) Audit-Related Fees
There were no fees billed by PwC to the Funds in its two recent fiscal years for services rendered for assurance and related services that are reasonably related to the performance of the audit or review of the Fund’s financial statements, but are not reported as Audit Fees (“Audit-Related Fees”).
For the Funds’ two most recent fiscal years, there were no Audit-Related Fees billed by PwC for engagements related directly to the operations and financial reporting of one or more Funds by a Fund Service Provider. A Fund Service Provider is (a) any investment adviser to the Fund (not including any Subadvisor whose role is primarily portfolio management and is subcontracted with or overseen by another investment adviser) or (b) any entity that provides ongoing services to the Fund and is controlling, controlled by or under common control with a Fund investment adviser described in (a).
(c) Tax Fees
The aggregate fees billed by PwC to the Funds for the two most recent fiscal years for professional services rendered for tax compliance, tax advice, and tax planning (“Tax Fees”) were as follows:
| | | | | | | | |
Fund - AMG FUNDS II | | Fiscal 2014 | | | Fiscal 2013 | |
AMG GW&K Enhanced Core Bond Fund | | $ | 8,830 | | | $ | 8,830 | |
AMG Chicago Equity Partners Balanced Fund | | $ | 6,885 | | | $ | 6,885 | |
AMG Managers High Yield Fund | | $ | 8,830 | | | $ | 8,830 | |
AMG Managers Short Duration Government Fund | | $ | 9,530 | | | $ | 9,530 | |
AMG Managers Intermediate Duration Government Fund | | $ | 9,530 | | | $ | 9,530 | |
For the Funds’ two most recent fiscal years, Tax Fees billed by PwC for engagements by Fund Service Providers that related directly to the operations and financial reporting of the Funds were $0 for fiscal 2014 and $0 for fiscal 2013, respectively.
The services for which Tax Fees were charged comprise all services performed by professional staff in PwC’s tax division except those services related to the audit. Typically, this category would include fees for tax compliance, tax planning, and tax advice. Tax compliance, tax advice, and tax planning services include preparation of original and amended tax returns, claims for refund and tax payment-planning services, assistance with tax audits and appeals, tax advice related to mergers and acquisitions and requests for rulings or technical advice from taxing authorities.
(d) All Other Fees
There were no other fees billed by PwC to the Funds for all other non-audit services (“Other Fees”) during the Funds’ two most recent fiscal years. During the same period, there were no Other Fees billed by PwC for engagements by Fund Service Providers that related directly to the operations and financial reporting of the Funds.
(e) (1) According to policies adopted by the Audit Committee, services provided by PwC to the Funds must be pre-approved by the Audit Committee. On an annual basis, the Audit Committee reviews and pre-approves various types of services that PwC may perform for the Funds without specific approval of each engagement, subject to specified budget limitations. As contemplated by the Sarbanes-Oxley Act of 2002 and related SEC rules, the Audit Committee also pre-approves non-audit services provided by PwC to any Fund Service Provider for any engagement that relates directly to the operations and financial reporting of the Funds. Any engagement that is not already pre-approved or that will exceed a pre-approved budget must be submitted to the Audit Committee for pre-approval. The Chairman of the Audit Committee is authorized on behalf of the Board of Trustees and the Audit Committee to approve the engagement of PwC to perform non-audit services subject to certain conditions, including notification to the Audit Committee of such pre-approval not later than the next meeting of the Audit Committee following the date of such pre-approval.
(e)(2) None.
(f) Not applicable.
(g) The aggregate fees billed by PwC in 2014 and 2013 for non-audit services rendered to the Funds and Fund Service Providers were $109,605 and $109,500, respectively. For the fiscal year ended December 31, 2014, this amount reflects the amounts disclosed above in Item 4(b),(c),(d), plus $0 in fees billed to the Fund Service Providers for non-audit services that did not relate directly to the operations and financial reporting of the Funds. For the fiscal year ended December 31, 2013, this amount reflects the amounts disclosed above in Item 4(b),(c),(d), plus $0 in fees billed to the Fund Service Providers for non-audit services that did not relate directly to the operations and financial reporting of the Funds.
(h) The Trust’s Audit Committee has considered whether the provision of non-audit services by registrant’s independent registered public accounting firm to the registrant’s investment advisor, and any entity controlling, controlled, or under common control with the investment advisor that provided ongoing services to the registrant that were not pre-approved by the Committee (because such services did not relate directly to the operations and financial reporting of the registrant) was compatible with maintaining the independence of the independent registered public accounting firm.
Item 5. AUDIT COMMITTEE OF LISTED REGISTRANTS
Not applicable.
Item 6. SCHEDULE OF INVESTMENTS
The schedule of investments in unaffiliated issuers as of the close of the reporting period is included as part of the shareholder report contained in Item 1 hereof.
Item 7. DISCLOSURE OF PROXY VOTING POLICIES AND PROCEDURES FOR CLOSED-END MANAGEMENT INVESTMENT COMPANIES
Not applicable.
Item 8. PORTFOLIO MANAGERS OF CLOSED-END MANAGEMENT INVESTMENT COMPANIES
Not applicable.
Item 9. PURCHASES OF EQUITY SECURITIES BY CLOSED-END MANAGEMENT INVESTMENT COMPANIES AND AFFILIATED PURCHASERS
Not applicable.
Item 10. SUBMISSION OF MATTERS TO A VOTE OF SECURITY HOLDERS
Not applicable.
Item 11. CONTROLS AND PROCEDURES
(a) The Registrant’s principal executive and principal financial officers have concluded, based on their evaluation of the registrant’s disclosure controls and procedures as of a date within 90 days of the filing of this report, that the Registrant’s disclosure
controls and procedures are reasonably designed to ensure that information required to be disclosed by the Registrant on Form N-CSR is recorded, processed, summarized and reported within the required time periods and that information required to be disclosed by the registrant in the reports that it files or submits on Form N-CSR is accumulated and communicated to the Registrant’s management, including its principal executive and principal financial officers, as appropriate to allow timely decisions regarding required disclosure.
(b) There were no changes in the Registrant’s internal control over financial reporting during the Registrant’s fourth fiscal quarter of the period covered by this report that have materially affected, or are reasonably likely to affect, the internal control over financial reporting.
Item 12. EXHIBITS
| | |
| (a)(1) | | Any Code of Ethics or amendments hereto. Filed herewith. |
| |
| (a)(2) | | Certifications pursuant to Rule 30a-2(a) under the Investment Company Act of 1940 - Filed herewith. |
| |
| (a)(3) | | Not applicable. |
| |
| (b) | | Certifications pursuant to Rule 30a-2(b) under the Investment Company Act of 1940 - Filed herewith. |
SIGNATURES
Pursuant to the requirements of the Securities Exchange Act of 1934 and the Investment Company Act of 1940, the registrant has duly caused this report to be signed on its behalf by the undersigned, thereunto duly authorized.
| | |
| AMG FUNDS II |
| |
| By: | | /s/ Jeffrey T. Cerutti |
| | Jeffrey T. Cerutti, Principal Executive Officer |
| |
| Date: | | March 10, 2015 |
Pursuant to the requirements of the Securities Exchange Act of 1934 and the Investment Company Act of 1940, this report has been signed below by the following persons on behalf of the registrant and in the capacities and on the dates indicated.
| | |
| By: | | /s/ Jeffrey T. Cerutti |
| | Jeffrey T. Cerutti, Principal Executive Officer |
| |
| Date: | | March 10, 2015 |
| |
| By: | | /s/ Donald S. Rumery |
| | Donald S. Rumery, Principal Financial Officer |
| |
| Date: | | March 10, 2015 |