Table of Contents
UNITED STATES
SECURITIES AND EXCHANGE COMMISSION
Washington, D.C. 20549
FORM N-CSR
CERTIFIED SHAREHOLDER REPORT OF REGISTERED
MANAGEMENT INVESTMENT COMPANIES
Investment Company Act file number: 811-06431
AMG Funds II
(Exact name of registrant as specified in charter)
600 Steamboat Road, Suite 300, Greenwich, Connecticut 06830
(Address of principal executive offices) (Zip code)
AMG Funds LLC
600 Steamboat Road, Suite 300, Greenwich, Connecticut 06830
(Name and address of agent for service)
Registrant’s telephone number, including area code: (203) 299-3500
Date of fiscal year end: DECEMBER 31
Date of reporting period: JANUARY 1, 2016 – DECEMBER 31, 2016
(Annual Shareholder Report)
Table of Contents
Item 1. Reports to Shareholders
Table of Contents
 | ANNUAL REPORT |
AMG Funds
December 31, 2016

AMG GW&K Enhanced Core Bond Fund
Class N: MFDAX | Class S: MFDSX | Class C: MFDCX
Class I: MFDYX
AMG GW&K Municipal Bond Fund
Class N: GWMTX | Class S: GWMSX | Class I: GWMIX
AMG GW&K Municipal Enhanced Yield Fund
Class N: GWMNX | Class S: GWMRX | Class I: GWMEX
AMG GW&K Small Cap Core Fund
Class N: GWETX | Class S: GWESX | Class I: GWEIX
AMG GW&K Small Cap Growth Fund
Class I: GWGIX
| www.amgfunds.com | | AR020-1216 |
Table of Contents
Table of Contents
AMG Funds
Annual Report—December 31, 2016
| PAGE | ||||
| 2 | ||||
| 3 | ||||
PORTFOLIO MANAGER’S COMMENTS, FUND SNAPSHOTS, AND SCHEDULES OF PORTFOLIO INVESTMENTS | ||||
| 5 | ||||
| 11 | ||||
| 20 | ||||
| 27 | ||||
| 33 | ||||
NOTES TO SCHEDULES OF PORTFOLIO INVESTMENTS | 39 | |||
FINANCIAL STATEMENTS | ||||
Statement of Assets and Liabilities Balance sheets, net asset value (NAV) per share computations and cumulative undistributed amounts |
| 42
|
| |
| 44 | ||||
Detail of sources of income, expenses, and realized and unrealized gains (losses) during the fiscal year | ||||
| 45 | ||||
Detail of changes in assets for the past two fiscal years | ||||
| 47 | ||||
Historical net asset values per share, distributions, total returns, income and expense ratios, turnover ratios and net assets | ||||
| 56 | ||||
| 57 | ||||
Accounting and distribution policies, details of agreements and transactions with Fund management and affiliates, and descriptions of certain investment risks | ||||
| 67 | ||||
| 68 | ||||
Nothing contained herein is to be considered an offer, sale or solicitation of an offer to buy shares of any series of the AMG Fund family of mutual funds. Such offering is made only by prospectus, which includes details as to offering price and other material information.
Table of Contents
| Letter to Shareholders |
DEAR SHAREHOLDER:
While the year got off to a rocky start, overall U.S. equity investors enjoyed strong positive returns for 2016. The S&P 500 Index, a widely-followed barometer of the U.S. equity market, returned 12.0% during the prior twelve months. Small cap investors were also rewarded with a return of 21.3% for the small cap Russell 2000® Index.
After the market’s initial stumble, investors had to balance a number of noteworthy events, including the U.K.’s planned exit from the European Union (“Brexit”), a contentious U.S. presidential election and the U.S. Federal Reserve’s second rate increase of 25 basis points to 0.50%-0.75%. Following the surprise election of Donald Trump as the 45th President of the United States, investors witnessed a rally in pro-cyclical sectors as the new administration’s plans for tax reform and increased fiscal spending drove anticipation of stronger future economic growth. Along with higher equity prices, long-term interest rates rose and the U.S. Dollar strengthened. Commodity prices collapsed, but then rebounded on indications of an increase in U.S. infrastructure spending and a small uptick in China’s third-quarter Gross Domestic Product (GDP). Oil prices also experienced volatility as they continued their fall from 2015, bottoming in February and subsequently recovering more than 100%. This recovery lent some much needed support to the beleaguered energy industry, which ended the year with the highest returns of any sector in the S&P 500 Index. In total, all sectors but the health care sector were positive for 2016; however, there was significant dispersion in performance across sectors. Energy, telecommunication services and financials returned 27%, 23% and 21%, respectively, while companies within the consumer staples, real estate and health care sectors returned 5%, 4% and (3)%, respectively. Internationally, stocks lagged their U.S. counterparts, returning 4.5%, as measured by the MSCI ACWI ex USA (in U.S. Dollar terms).
The Bloomberg Barclays U.S. Aggregate Bond Index, a broad U.S. bond market benchmark, returned 2.7% for the year ended December 31, 2016. Over the course of the year, interest rates and credit spreads gyrated at times, putting pressure on bond prices. While stocks finished strong, bond prices were less fortunate, as rising interest rates caused yields to rise and bond prices to fall. The 10-year U.S. Treasury note’s yield started the year at 2.24%, bottomed at 1.37% in July, and ended the year much higher at 2.45%. High yield, on the other hand, was very strong, as investor risk appetite improved and spreads tightened 470 basis points. The Bloomberg Barclays U.S. Corporate High Yield Bond Index ended the year with a healthy 17.1% return.
We are excited to announce as of October 1, 2016, the AMG Funds family of mutual funds fully integrated the former Aston Funds. AMG Funds and Aston Funds shareholders will now have access to the differentiated solutions of AMG Funds, which represents a single point of access to one of the largest line-ups of boutique managers and products in the world.
AMG Funds appreciates the privilege of providing investment tools to you and your clients. Our foremost goal at AMG Funds is to provide investment solutions that help our shareholders successfully reach their long-term investment goals. By partnering with AMG’s affiliated investment boutiques, AMG Funds provides access to a distinctive array of actively-managed return-oriented investment strategies. Additionally, we oversee and distribute a number of complementary open-architecture mutual funds subadvised by unaffiliated investment managers. We thank you for your continued confidence and investment in AMG Funds. You can rest assured that under all market conditions our team is focused on delivering excellent investment management services for your benefit.
Respectfully,

Jeffery Cerutti
President
AMG Funds
Average Annual Total Returns | Periods ended December 31, 2016 | |||||||||||||
Stocks: | 1 Year | 3 Years | 5 Years | |||||||||||
Large Caps | (S&P 500 Index) | 11.96 | % | 8.87 | % | 14.66 | % | |||||||
Small Caps | (Russell 2000® Index) | 21.31 | % | 6.74 | % | 14.46 | % | |||||||
International | (MSCI All Country World ex-USA Index) | 4.50 | % | (1.78 | )% | 5.00 | % | |||||||
Bonds: | ||||||||||||||
Investment Grade | (Bloomberg Barclays U.S. Aggregate Bond Index) | 2.65 | % | 3.03 | % | 2.23 | % | |||||||
High Yield | (Bloomberg Barclays U.S. Corporate High Yield Index) | 17.13 | % | 4.66 | % | 7.36 | % | |||||||
Tax-exempt | (Bloomberg Barclays Municipal Bond Index) | 0.25 | % | 4.14 | % | 3.28 | % | |||||||
Treasury Bills | (BofA Merrill Lynch 6 month U.S. Treasury Bill) | 0.67 | % | 0.34 | % | 0.27 | % | |||||||
| 2 |
Table of Contents
As a shareholder of a Fund, you may incur two types of costs: (1) transaction costs, which may include sales charges (loads) on purchase payments; redemption fees; and exchange fees; and (2) ongoing costs, including management fees; distribution (12b-1) fees; and other Fund expenses. This example is intended to help you understand your ongoing costs (in dollars) of investing in the Fund and to compare these costs with the ongoing costs of investing in other mutual funds. The example is based on $1,000 invested at the beginning of the period and held for the entire period as indicated below.
ACTUAL EXPENSES
The first line of the following table provides information about the actual account values and actual expenses. You may use the information in this line, together with the amount you invested, to estimate the expenses that you paid over the period. Simply divide your account value by $1,000 (for example, an $8,600 account value divided by $1,000 = 8.6), then multiply the result by the number in the first line under the heading entitled “Expenses Paid During Period” to estimate the expenses you paid on your account during this period.
HYPOTHETICAL EXAMPLE FOR COMPARISON PURPOSES
The second line of the following table provides information about hypothetical account values and hypothetical expenses based on the Fund’s actual expense ratio and an assumed annual rate of return of 5% before expenses, which is not the Fund’s actual return. The hypothetical account values and expenses may not be used to estimate the actual ending account balance or expenses you paid for the period. You may use this information to compare the ongoing costs of investing in the Fund and other funds by comparing this 5% hypothetical example with the 5% hypothetical examples that appear in the shareholder reports of other funds.
Please note that the expenses shown in the table are meant to highlight your ongoing costs only and do not reflect any transactional costs, such as sales charges (loads), redemption fees, or exchange fees. Therefore, the second line of the table is useful in comparing ongoing costs only, and will not help you determine the relative total costs of owning different funds.
| Six Months Ended December 31, 2016 | Expense Ratio for the Period | Beginning Account Value 07/01/16 | Ending Account Value 12/31/16 | Expenses Paid During the Period* | ||||||||||||
AMG GW&K Enhanced Core Bond Fund |
| |||||||||||||||
Class N | ||||||||||||||||
Based on Actual Fund Return | 0.84 | % | $ | 1,000 | $ | 980 | $ | 4.18 | ||||||||
Hypothetical (5% return before expenses) | 0.84 | % | $ | 1,000 | $ | 1,021 | $ | 4.27 | ||||||||
Class S | ||||||||||||||||
Based on Actual Fund Return | 0.69 | % | $ | 1,000 | $ | 980 | $ | 3.43 | ||||||||
Hypothetical (5% return before expenses) | 0.69 | % | $ | 1,000 | $ | 1,022 | $ | 3.51 | ||||||||
Class C | ||||||||||||||||
Based on Actual Fund Return | 1.59 | % | $ | 1,000 | $ | 976 | $ | 7.90 | ||||||||
Hypothetical (5% return before expenses) | 1.59 | % | $ | 1,000 | $ | 1,017 | $ | 8.06 | ||||||||
Class I | ||||||||||||||||
Based on Actual Fund Return | 0.59 | % | $ | 1,000 | $ | 982 | $ | 2.94 | ||||||||
Hypothetical (5% return before expenses) | 0.59 | % | $ | 1,000 | $ | 1,022 | $ | 3.00 | ||||||||
AMG GW&K Municipal Bond Fund |
| |||||||||||||||
Class N | ||||||||||||||||
Based on Actual Fund Return | 0.65 | % | $ | 1,000 | $ | 955 | $ | 3.19 | ||||||||
Hypothetical (5% return before expenses) | 0.65 | % | $ | 1,000 | $ | 1,022 | $ | 3.30 | ||||||||
Class S | ||||||||||||||||
Based on Actual Fund Return | 0.49 | % | $ | 1,000 | $ | 957 | $ | 2.41 | ||||||||
Hypothetical (5% return before expenses) | 0.49 | % | $ | 1,000 | $ | 1,023 | $ | 2.49 | ||||||||
Class I | ||||||||||||||||
Based on Actual Fund Return | 0.34 | % | $ | 1,000 | $ | 957 | $ | 1.67 | ||||||||
Hypothetical (5% return before expenses) | 0.34 | % | $ | 1,000 | $ | 1,023 | $ | 1.73 | ||||||||
AMG GW&K Municipal Enhanced Yield Fund |
| |||||||||||||||
Class N | ||||||||||||||||
Based on Actual Fund Return | 1.14 | % | $ | 1,000 | $ | 927 | $ | 5.52 | ||||||||
Hypothetical (5% return before expenses) | 1.14 | % | $ | 1,000 | $ | 1,019 | $ | 5.79 | ||||||||
Class S | ||||||||||||||||
Based on Actual Fund Return | 0.74 | % | $ | 1,000 | $ | 929 | $ | 3.59 | ||||||||
Hypothetical (5% return before expenses) | 0.74 | % | $ | 1,000 | $ | 1,021 | $ | 3.76 | ||||||||
Class I | ||||||||||||||||
Based on Actual Fund Return | 0.64 | % | $ | 1,000 | $ | 930 | $ | 3.11 | ||||||||
Hypothetical (5% return before expenses) | 0.64 | % | $ | 1,000 | $ | 1,022 | $ | 3.25 | ||||||||
AMG GW&K Small Cap Core Fund |
| |||||||||||||||
Class N | ||||||||||||||||
Based on Actual Fund Return | 1.34 | % | $ | 1,000 | $ | 1,105 | $ | 7.09 | ||||||||
Hypothetical (5% return before expenses) | 1.34 | % | $ | 1,000 | $ | 1,018 | $ | 6.80 | ||||||||
Class S | ||||||||||||||||
Based on Actual Fund Return | 1.09 | % | $ | 1,000 | $ | 1,107 | $ | 5.77 | ||||||||
Hypothetical (5% return before expenses) | 1.09 | % | $ | 1,000 | $ | 1,020 | $ | 5.53 | ||||||||
Class I | ||||||||||||||||
Based on Actual Fund Return | 0.95 | % | $ | 1,000 | $ | 1,108 | $ | 5.03 | ||||||||
Hypothetical (5% return before expenses) | 0.95 | % | $ | 1,000 | $ | 1,020 | $ | 4.82 | ||||||||
3 |
Table of Contents
About Your Fund’s Expenses
(continued)
| Six Months Ended December 31, 2016 | Expense Ratio for the Period | Beginning Account Value 07/01/16 | Ending Account Value 12/31/16 | Expenses Paid During the Period* | ||||||||||||
AMG GW&K Small Cap Growth Fund |
| |||||||||||||||
Class I | ||||||||||||||||
Based on Actual Fund Return | 0.95 | % | $ | 1,000 | $ | 1,102 | $ | 5.02 | ||||||||
Hypothetical (5% return before expenses) | 0.95 | % | $ | 1,000 | $ | 1,020 | $ | 4.82 | ||||||||
| * | Expenses are equal to the Fund’s annualized expense ratio multiplied by the average account value over the period,multiplied by the number of days in the most recent fiscal half-year (184), then divided by 366. |
4
Table of Contents
AMG GW&K Enhanced Core Bond Fund
Portfolio Manager’s Comments (unaudited)
THE YEAR IN REVIEW
AMG GW&K Enhanced Core Bond Fund (Class N)1 (the “Fund”) returned 3.2% for the year ended December 31, 2016, compared to the return of 2.7% for the Bloomberg Barclays U.S. Aggregate Bond Index (the “Index”).
BACKGROUND
Fixed-income markets experienced a stark departure from the status quo in the fourth quarter. The unexpected outcome of the U.S. election, OPEC’s decision to cut crude production and hawkish commentary from the U.S. Federal Reserve (the Fed) prompted a major reappraisal of the narrative that dominated trading through the first three quarters of the year. All at once, long-held assumptions about growth, inflation, taxes and regulation were called into question and investors responded by sending interest rates sharply higher. Notably, this dramatic move simply brought rates back to approximately where they began the year, suggesting more of a return to normal than an outright panic.
MARKET
The taxable bond market saw its worst quarterly performance in more than 35 years, with the Index posting a return of (3.0%) in the fourth quarter of 2016. Treasuries led the way, losing (3.8%) as yields bounced sharply from near-record lows to their highest levels in more than two years. Yields at the front end of the curve rose in response to signals from the Fed that it could accelerate the pace of rate hikes in 2017, sending two-year yields up 43 basis points to a seven-year high. Meanwhile, intermediate and long rates increased in response to post-election expectations of aggressive fiscal stimulus, with the 30-year rising 75 basis points. This resulted in a significant steepening of the yield curve, as the two-year/30-year spread widened 32 basis points and reversed most of its year-to-date flattening.
Investment-grade corporates declined (2.8%), outperforming Treasuries due to 15 basis points of spread tightening. The same appetite for risk that pushed equity indices to record levels drove strong performance in credit as well. BBB-rated bonds fared the best, tightening 21 basis points, as investor focus shifted toward the more industrial and cyclical corners of the market. High-yield corporate bonds also benefited from investor
optimism, reaching their tightest level in more than two years and posting the only positive return in the taxable market (1.8%). Here too, the lower end of the quality spectrum outperformed, as CCCs returned 4.7% on the back of strong returns from the energy (5.8%) and basic materials (2.88%) sectors. Mortgage-backed securities were a relative outperformer as well (2.0%), owing, in large part, to their shorter duration and ongoing technical support from Fed reinvestments. Government-related bonds (3.1%) performed in line with the broader market.
PERFORMANCE ATTRIBUTION
The moderate yield curve steepening throughout the year was a minimal detractor to performance, as the Fund was just slightly longer in duration than the benchmark. Any detraction to performance from the yield curve, however, was mitigated by our overweight allocation to spread product. Investment-grade corporates and taxable municipals were strong contributors to the allocation effect, while our out-of-benchmark allocation to high-yield corporates earned us performance at the security-selection level.
OUTLOOK
Looking ahead, 2017 promises to resolve much of the uncertainty that has arisen in the closing months of 2016. The policy specifics of the Trump administration’s planned fiscal stimulus are likely to emerge early in the year, with significant implications for economic growth, corporate profits and inflation. Proposed changes to trade agreements, tax policy and government regulation should also have meaningful economic impact. At the same time, much of this anticipated benefit could be mitigated by an accelerated pace of Fed rate hikes. Higher costs of financing and a stronger U.S. Dollar could offset the intended advantages of lower taxes, looser regulation and increased government spending. Given these somewhat countervailing forces, we expect moves in intermediate and long maturities to be subdued. The Fund is positioned with duration slightly longer than the benchmark due to our overweight to intermediate maturities rather than a particular preference for the long end. We believe this part of the curve offers the most attractive potential returns, due to the carry and roll available for the assumed interest-rate exposure.
Positive economic data and strong corporate earnings have driven demand for corporate credit and brought spreads to their tightest level in two years. The commodity price decline that caused a selloff earlier in the year reversed sharply in recent months, driving outsized returns in many of the worst-performing sectors over the last two years. Additionally, expectations of a more relaxed regulatory environment helped drive performance in the financial sector. The default rate in the high-yield market was 5.1% in 2016, though removing energy and natural resources issuers brings that down to 2.4%.2
Despite the high degree of uncertainty heading into 2017, we believe corporate credit is likely to outperform under most scenarios. Credit fundamentals remain sound, earnings growth is steady and corporations have ready access to capital. Furthermore, the global search for yield continues to favor high-quality corporate bonds, suggesting the potential for further spread compression, as well as limited room for widening in the event of a selloff. That said, we continue to avoid lower-quality industrials and commodity-linked sectors where sentiment is prone to rapid reversals. Our view toward the high-yield market is neutral because we believe solid credit fundamentals are being fairly priced at current spread levels. We believe the outlook for the mortgage market remains favorable, given the protection it offers against higher rates at the front end. The sector should also benefit from positive technical dynamics provided by the Fed’s ongoing asset purchases.
| 1 | Prior to October 1, 2016, the Fund’s Class N shares were known as Investor Shares. |
| 2 | Standard & Poors |
This commentary reflects the viewpoints of the portfolio manager, GW&K Investment Management, LLC as of December 31, 2016, and is not intended as a forecast or guarantee of future results, and is subject to change without notice.
| 5 |
Table of Contents
AMG GW&K Enhanced Core Bond Fund
Portfolio Manager’s Comments (continued)
CUMULATIVE TOTAL RETURN PERFORMANCE
AMG GW&K Enhanced Core Bond Fund’s cumulative total return is based on the daily change in net asset value (NAV), and assumes that all distributions were reinvested. The graph compares a hypothetical $10,000 investment made in the AMG GW&K Enhanced Core Bond Fund Class N (formally Investor Class) shares on December 31, 2006, with a $10,000 investment made in the Bloomberg Barclays U.S. Aggregate Bond Index for the same time period. The graph and table do not reflect the deduction of taxes that a shareholder would pay on a Fund distribution or redemption of shares. The listed returns for the Fund are net of expenses and the returns for the index exclude expenses. Total returns for the Fund would have been lower had certain expenses not been reduced.
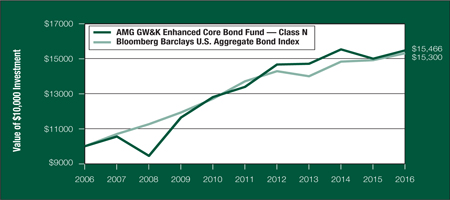
The table below shows the average annual total returns for the AMG GW&K Enhanced Core Bond Fund and the Bloomberg Barclays U.S. Aggregate Bond Index for the same time periods ended December 31, 2016.
| Average Annual Total Returns1 | One Year | Five Years | Ten Years | Since Inception | Inception Date | |||||||||||||||
AMG GW&K Enhanced Core Bond Fund 2,3,4,5,6 | ||||||||||||||||||||
Class N7 | 3.15 | % | 2.94 | % | 4.46 | % | 5.50 | % | 01/02/97 | |||||||||||
Class S7 | 3.31 | % | — | — | 1.54 | % | 11/30/12 | |||||||||||||
Class C7,8 | 2.40 | % | 2.16 | % | 3.67 | % | 4.67 | % | 03/05/98 | |||||||||||
Class I7 | 3.41 | % | 3.19 | % | 4.72 | % | 5.89 | % | 01/02/97 | |||||||||||
Bloomberg Barclays U.S. Aggregate Bond Index9 | 2.65 | % | 2.23 | % | 4.34 | % | 5.31 | % | 01/02/97 | † | ||||||||||
The performance data shown represents past performance. Past performance is not a guarantee of future results. Current performance may be lower or higher than the performance data quoted. The investment return and principal value of an investment will fluctuate so that an investor’s shares, when redeemed, may be worth more or less than their original cost.
Investors should carefully consider the Fund’s investment objectives, risks, charges and expenses before investing. For performance information through the most recent month end, current net asset values per share for the Fund and other information, please call (800) 835-3879 or visit our website at www.amgfunds.com for a free prospectus. Read it carefully before investing or sending money.
Funds are distributed by AMG Distributors, Inc., member FINRA/SIPC.
| † | Date reflects the inception date of the Fund, not the index. |
| 1 | Total return equals income yield plus share price change and assumes reinvestment of all dividends and capital gain distributions. Returns are net of fees and may reflect offsets of Fund expenses as described in the prospectus. No adjustment has been made for taxes payable by shareholders on their reinvested dividends and capital gain distributions. Returns for periods greater than one year are annualized. The listed returns on the Fund are net of expenses and based on the published NAV as of December 31, 2016. All returns are in U.S. dollars ($). |
| 2 | From time to time, the Fund’s advisor has waived its fees and/or absorbed Fund expenses, which has resulted in higher returns. |
| 3 | The Fund is subject to the risks associated with investments in debt securities, such as default risk and fluctuations in the perception of the debtor’s ability to pay its creditors. Changing interest rates may adversely affect the value of an investment. An increase in interest rates typically causes the value of bonds and other fixed income securities to fall. |
| 4 | To the extent that the Fund invests in asset-backed or mortgage-backed securities, its exposure to prepayment and extension risks may be greater than investments in other fixed income securities. |
| 5 | High-yield bonds (also known as “junk bonds”) may be subject to greater levels of interest rate, credit, and liquidity risk than investments in higher rated securities. These securities are considered predominantly speculative with respect to the issuer’s continuing ability to make principal and interest payments. The issuers of the Fund’s holdings may be involved in bankruptcy proceedings, reorganizations, or financial restructurings, and are not as strong financially as higher-rated issuers. |
| 6 | Investments in international securities are subject to certain risks of overseas investing including currency fluctuations and changes in political and economic conditions, which could result in significant market fluctuations. These risks are magnified in emerging markets. |
| 7 | Effective October 1, 2016, the Investor Class, Service Class and Institutional Class were renamed Class N, Class S and Class I, respectively. |
| 8 | Closed to new investments. |
| 9 | The Bloomberg Barclays U.S. Aggregate Bond Index is an index of the U.S. investment-grade fixed-rate bond market, including both government and corporate bonds. Effective August 24, 2016, the Barclays indices were renamed Bloomberg Barclays indices. Unlike the Fund, the Bloomberg Barclays U.S. Aggregate Bond Index is unmanaged, is not available for investment and does not incur expenses. |
Not FDIC insured, nor bank guaranteed. May lose value.
6
Table of Contents
AMG GW&K Enhanced Core Bond Fund
Fund Snapshots (unaudited)
December 31, 2016
PORTFOLIO BREAKDOWN
Sector | AMG GW&K Enhanced Core Bond Fund* | |||
U.S. Government and Agency Obligations | 36.0 | % | ||
Industrials | 35.0 | % | ||
Financials | 16.2 | % | ||
Municipal Bonds | 6.7 | % | ||
Other Assets and Liabilities | 6.1 | % | ||
| * | As a percentage of net assets. |
Rating | AMG GW&K Enhanced Core Bond Fund** | |||
U.S. Government and Agency Obligations | 38.3 | % | ||
Aaa | 1.0 | % | ||
Aa | 8.6 | % | ||
A | 7.0 | % | ||
Baa | 32.0 | % | ||
Ba | 12.1 | % | ||
B | 1.0 | % | ||
| ** | As a percentage of market value of fixed-income securities. |
TOP TEN HOLDINGS
Security Name | % of Net Assets | |||
FNMA, 4.000%, 10/01/43*** | 3.6 | % | ||
United States Treasury Bond, 6.250%, 08/15/23*** | 2.9 | |||
United States Treasury Notes, 2.000%, 11/30/22*** | 2.9 | |||
FNMA, 4.500%, 04/01/41*** | 2.5 | |||
FNMA, 4.500%, 05/01/39*** | 2.1 | |||
Citigroup, Inc., 2.050%, 12/07/18 | 2.0 | |||
California State General Obligation, School Improvements, 7.550%, 04/01/39*** | 1.9 | |||
FHLMC Gold Pool, 5.000%, 10/01/36*** | 1.7 | |||
FNMA, 3.500%, 02/01/46 | 1.7 | |||
Weyerhaeuser Co., 8.500%, 01/15/25 | 1.6 | |||
|
| |||
Top Ten as a Group | 22.9 | % | ||
|
| |||
| *** | Top Ten Holdings as of June 30, 2016. |
Credit quality ratings shown above reflect the highest rating assigned by either Standard & Poor’s (“S&P”) or Moody’s Investors Service, Inc. (“Moody’s”). These rating agencies are independent, nationally recognized statistical rating organizations and are widely used. Investment grade ratings are credit ratings of BBB/Baa or higher. Below investment grade ratings are credit ratings of BB/Ba or lower. Investments designated N/R are not rated by either rating agency. Unrated investments do not necessarily indicate low credit quality. Credit quality ratings are subject to change.
Because a fund’s strategy may result in multiple investments in particular sectors of the economy, its performance may depend on the performance of those sectors and may fluctuate more widely than investments diversified across more sectors. For additional information on these and other risk considerations, please see the Fund’s prospectus.
Any sectors, industries, or securities discussed should not be perceived as investment recommendations. Mention of a specific security should not be considered a recommendation to buy or solicitation to sell that security. Specific securities mentioned in this report may have been sold from the Fund’s portfolio of investments by the time you receive this report.
7
Table of Contents
AMG GW&K Enhanced Core Bond Fund
Schedule of Portfolio Investments
December 31, 2016
| Principal Amount | Value | |||||||
Corporate Bonds and Notes—51.2% | ||||||||
Financials—16.2% | ||||||||
Ally Financial, Inc., | ||||||||
5.125%, 09/30/241 | $ | 499,000 | $ | 508,980 | ||||
8.000%, 03/15/20 | 650,000 | 737,750 | ||||||
American Tower Corp., 4.400%, 02/15/26 | 1,097,000 | 1,123,021 | ||||||
Bank of America Corp., MTN, 3.875%, 08/01/25 | 1,654,000 | 1,684,892 | ||||||
Citigroup, Inc., 2.050%, 12/07/18 | 2,301,000 | 2,301,822 | ||||||
Crown Castle International Corp., 5.250%, 01/15/23 | 1,030,000 | 1,112,400 | ||||||
The Goldman Sachs Group, Inc., 6.125%, 02/15/33 | 946,000 | 1,146,448 | ||||||
Host Hotels & Resorts, L.P., Series C, 4.750%, 03/01/23 | 1,077,000 | 1,123,209 | ||||||
International Lease Finance Corp., 8.250%, 12/15/20 | 1,124,000 | 1,312,270 | ||||||
JPMorgan Chase & Co., Series S, 6.750%, 01/29/491,2,3 | 1,050,000 | 1,132,688 | ||||||
Morgan Stanley, GMTN, 5.500%, 07/28/21 | 997,000 | 1,105,936 | ||||||
National Rural Utilities Cooperative Finance Corp., MTN, 3.250%, 11/01/25 | 1,088,000 | 1,104,652 | ||||||
Northern Trust Corp., Series D, 4.600%, 12/29/492,3 | 1,113,000 | 1,061,524 | ||||||
Wells Fargo & Co., Series U, 5.875%, 12/29/492,3 | 1,069,000 | 1,123,679 | ||||||
Weyerhaeuser Co., 8.500%, 01/15/25 | 1,413,000 | 1,829,860 | ||||||
Total Financials | 18,409,131 | |||||||
Industrials—35.0% | ||||||||
American Airlines Group, Inc., 6.125%, 06/01/18 | 616,000 | 644,490 | ||||||
Automatic Data Processing, Inc., 3.375%, 09/15/25 | 1,586,000 | 1,628,099 | ||||||
Ball Corp., 5.250%, 07/01/25 | 1,116,000 | 1,170,405 | ||||||
Burlington Northern Santa Fe LLC, 6.150%, 05/01/37 | 1,342,000 | 1,717,251 | ||||||
CCO Holdings LLC / CCO Holdings Capital Corp., | ||||||||
5.125%, 02/15/23 | 1,130,000 | 1,163,900 | ||||||
5.750%, 01/15/24 | 25,000 | 26,187 | ||||||
CDW LLC / CDW Finance Corp., 5.500%, 12/01/24 | 1,126,000 | 1,156,965 | ||||||
Cedar Fair LP / Canada’s Wonderland Co. / Magnum Management Corp., 5.375%, 06/01/24 | 1,084,000 | 1,121,940 | ||||||
Comcast Corp., 7.050%, 03/15/33 | 835,000 | 1,122,762 | ||||||
CSX Corp., 2.600%, 11/01/26 | 1,203,000 | 1,128,554 | ||||||
CVS Health Corp., 5.125%, 07/20/45 | 956,000 | 1,069,555 | ||||||
General Motors Co., 6.250%, 10/02/43 | 1,039,000 | 1,152,501 | ||||||
Georgia-Pacific LLC, 8.000%, 01/15/24 | 876,000 | 1,119,659 | ||||||
The Goodyear Tire & Rubber Co., 5.000%, 05/31/26 | 1,135,000 | 1,132,662 | ||||||
Hanesbrands, Inc., 4.625%, 05/15/24 (a) | 925,000 | 901,875 | ||||||
HCA, Inc., 5.000%, 03/15/24 | 1,429,000 | 1,473,656 | ||||||
International Paper Co., 3.000%, 02/15/27 | 1,183,000 | 1,118,487 | ||||||
Lennar Corp., 4.750%, 11/15/22 | 1,157,000 | 1,191,710 | ||||||
Masco Corp., Series, 4.375%, 04/01/26 | 1,143,000 | 1,160,145 | ||||||
The accompanying notes are an integral part of these financial statements.
8
Table of Contents
AMG GW&K Enhanced Core Bond Fund
Schedule of Portfolio Investments (continued)
| Principal Amount | Value | |||||||
Industrials—35.0% (continued) | ||||||||
McDonald’s Corp., MTN, 3.700%, 01/30/26 | $ | 1,072,000 | $ | 1,093,445 | ||||
Microsoft Corp., 3.750%, 02/12/45 | 1,146,000 | 1,077,389 | ||||||
Molson Coors Brewing Co., 3.000%, 07/15/26 | 1,159,000 | 1,097,856 | ||||||
Newell Brands, Inc., 3.850%, 04/01/23 | 1,632,000 | 1,695,173 | ||||||
Omnicom Group, Inc., 3.600%, 04/15/26 | 1,111,000 | 1,101,675 | ||||||
Owens Corning, 4.200%, 12/15/22 | 1,100,000 | 1,143,831 | ||||||
Reynolds Group Issuer, Inc., 5.125%, 07/15/23 (a) | 1,000,000 | 1,022,500 | ||||||
Sirius XM Radio, Inc., 5.375%, 07/15/26 (a) | 1,000,000 | 980,000 | ||||||
Southwest Airlines Co., 3.000%, 11/15/26 | 1,325,000 | 1,251,512 | ||||||
Steel Dynamics, Inc., 5.000%, 12/15/26 (a)1 | 1,000,000 | 998,750 | ||||||
T-Mobile USA, Inc., 6.500%, 01/15/26 | 1,080,000 | 1,170,450 | ||||||
Tyson Foods, Inc., 4.875%, 08/15/34 | 1,047,000 | 1,070,029 | ||||||
Under Armour, Inc., 3.250%, 06/15/26 | 1,155,000 | 1,092,997 | ||||||
Verizon Communications, Inc., 4.400%, 11/01/34 | 1,105,000 | 1,093,958 | ||||||
Vulcan Materials Co., 4.500%, 04/01/25 | 803,000 | 843,150 | ||||||
Walgreens Boots Alliance, Inc., 3.100%, 06/01/23 | 1,680,000 | 1,671,304 | ||||||
Total Industrials | 39,604,822 | |||||||
Total Corporate Bonds and Notes (cost $58,455,468) | 58,013,953 | |||||||
Municipal Bonds—6.7% | ||||||||
California State General Obligation, School Improvements, 7.550%, 04/01/39 | 1,445,000 | 2,139,539 | ||||||
JobsOhio Beverage System, Series B, 3.985%, 01/01/29 | 1,190,000 | 1,260,127 | ||||||
Los Angeles Unified School District, School Improvements, 5.750%, 07/01/34 | 1,100,000 | 1,359,622 | ||||||
Los Angeles Unified School District, School Improvements, 6.758%, 07/01/34 | 345,000 | 463,335 | ||||||
Metropolitan Transportation Authority Revenue, Transit Improvements, 6.668%, 11/15/39 | 965,000 | 1,280,690 | ||||||
New Jersey Economic Development Authority, Pension Funding, Series A, 7.425%, 02/15/29 (National Insured)4 | 923,000 | 1,100,484 | ||||||
Total Municipal Bonds (cost $7,545,046) | 7,603,797 | |||||||
U.S. Government and Agency Obligations—36.0% | ||||||||
Federal Home Loan Mortgage Corporation—3.4% | ||||||||
FHLMC Gold Pool, | ||||||||
4.500%, 09/01/26 to 10/01/39 | 1,189,328 | 1,266,860 | ||||||
5.000%, 06/01/26 to 10/01/36 | 2,342,567 | 2,537,774 | ||||||
Total Federal Home Loan Mortgage Corporation | 3,804,634 | |||||||
Federal National Mortgage Association—26.8% | ||||||||
FNMA, | ||||||||
3.500%, 11/01/42 to 03/01/46 | 5,456,389 | 5,615,437 | ||||||
4.000%, 09/01/25 to 10/01/44 | 11,265,569 | 11,909,323 | ||||||
4.500%, 05/01/39 to 09/01/42 | 7,136,407 | 7,716,337 | ||||||
5.000%, 08/01/35 | 846,347 | 925,085 | ||||||
5.500%, 05/01/25 to 04/01/40 | 2,089,350 | 2,308,696 | ||||||
The accompanying notes are an integral part of these financial statements.
9
Table of Contents
AMG GW&K Enhanced Core Bond Fund
Schedule of Portfolio Investments (continued)
| Principal Amount | Value | |||||||
Federal National Mortgage Association—26.8% (continued) | ||||||||
FNMA, | ||||||||
6.000%, 02/01/23 to 10/01/39 | $ | 1,698,589 | $ | 1,920,573 | ||||
Total Federal National Mortgage Association | 30,395,451 | |||||||
U.S. Treasury Obligations—5.8% | ||||||||
United States Treasury Bonds, 6.250%, 08/15/23 | 2,639,000 | 3,300,091 | ||||||
United States Treasury Notes, 2.000%, 11/30/22 | 3,316,000 | 3,294,174 | ||||||
Total U.S. Treasury Obligations | 6,594,265 | |||||||
Total U.S. Government and Agency Obligations (cost $41,190,830) | 40,794,350 | |||||||
Short-Term Investments—6.3% | ||||||||
Repurchase Agreements—1.7%5 | ||||||||
Daiwa Capital Markets America, dated 12/30/16, due 01/03/17, 0.520% total to be received $1,000,058 (collateralized by various U.S. Government Agency Obligations, 0.000% - 6.500%, 03/02/17 - 02/01/49, totaling $1,020,000) | 1,000,000 | 1,000,000 | ||||||
Nomura Securities International, Inc., dated 12/30/16, due 01/03/17, 0.500% total to be received $888,968 (collateralized by various U.S. Government Agency Obligations, 0.000% - 9.500%, 01/15/17 - 08/20/66, totaling $906,697) | 888,919 | 888,919 | ||||||
Total Repurchase Agreements | 1,888,919 | |||||||
| Shares | ||||||||
Other Investment Companies—4.6%6 | ||||||||
Dreyfus Government Cash Management Fund, Institutional Class Shares, 0.45% | 5,203,078 | 5,203,078 | ||||||
Total Short-Term Investments (cost $7,091,997) | 7,091,997 | |||||||
Total Investments—100.2% (cost $114,283,341) | 113,504,097 | |||||||
Other Assets, less Liabilities—(0.2)% | (238,251 | ) | ||||||
Net Assets—100.0% | $ | 113,265,846 | ||||||
The accompanying notes are an integral part of these financial statements.
10
Table of Contents
Portfolio Manager’s Comments (unaudited)
THE YEAR IN REVIEW
For the year ended December 31, 2016, the AMG GW&K Municipal Bond Fund (Class S)1 (the “Fund”) returned (0.8%), underperforming its benchmark, the Bloomberg Barclays 10-Year Municipal Bond Index (the “Index”), which returned (0.1%).
MARKET
Municipal bonds suffered their worst quarter of performance since 1994, essentially wiping out all their gains from the previous nine months. Ten-year tax-exempt yields soared 80 basis points over the quarter to finish the year at 2.31%, 100 basis points above their summer lows2. The results of the November election caught the markets by surprise and shifted sentiment dramatically. The Republican sweep brushed away long-held assumptions of sluggish growth amid continued Washington gridlock and the market seemed to immediately price in the successful passage of steep tax cuts, heavy infrastructure spending and more business-friendly regulation. Oil prices rose to cyclical highs and stock markets set a series of new record levels. Inflation expectations moved sharply higher and the yield on the 10-year U.S. Treasury note hit a two-year high of 2.64%2. In December, after the unemployment rate declined to its lowest reading since 2007, the U.S. Federal Reserve finally raised rates and signaled a marginally faster pace of tightening for 2017, giving the economy an important vote of confidence. Treasuries rallied back in the final two weeks of December to close the year at 2.45% as the equity rally ran out of steam.
Municipals followed the path of Treasuries over the quarter but exhibited greater volatility. The post-election selloff was far more acute as retail investors reacted poorly to their first losses in years. Mutual funds, which had just seen 54 consecutive weeks of inflows, were suddenly inundated with redemption requests. During the week ended November 16, investors withdrew $3.1 billion, the most in over three years. The outflows continued into year-end at a pace of nearly $2 billion a week3. Prior to the election, dealer inventories were sagging under the weight of three successive months of record issuance. Instead of absorbing bonds, they were adding to the selling pressure in an effort to shed exposure to a falling market. As issuance slowed in mid-November, a lack of price transparency emerged, forcing prices to adjust with little guidance. Municipal bonds underperformed significantly. The 10-year municipal bond/Treasury ratio, which began November at 95%, peaked at 107%, similar to the panic selling experience back in 2013’s Taper Tantrum2. Ultimately, however, municipal bonds cheapened enough to entice crossover buyers to step in with other value-seeking investors to support the market, and municipals rallied back hard to end the year on firmer footing. After peaking at 2.58%, its highest level since January 2014, the yield on the 10-year municipal bond fell 30 basis points in four trading days and eventually closed the year at 2.31%, nearly 40 basis points higher than where it began in January.
Heading into 2017, it appears like the municipal bond market has essentially stabilized. Ratios
versus Treasuries begin the year near more normal levels as the demand side recognized the value offered by November’s dislocation. But uncertainty still looms in the coming year. Few details have emerged on potential tax reform and infrastructure spending, leaving the market to speculate on possible outcomes. Long dormant fears of inflation have shown signs of resurfacing, adding to investor caution. Extreme proposals regarding the municipal bond tax-exemption will undoubtedly get voiced from one corner or another, but we do not expect a major overhaul to the primary funding vehicle of the nation’s infrastructure for the last 100+ years. We also don’t expect a supply boom anytime soon. The Trump Administration’s infrastructure plan appears to be based on harnessing private versus public investment, and the rise in interest rates has already slowed the biggest source of issuance this year: refunding deals. Average expectations for issuance are in the $380 billion range, a 15% drop-off from 2016’s record-breaking year4. While the market is in a much more attractive position for investors heading into 2017, with rates higher and relative value ratios still historically cheap, we could be in for a volatile stretch. Of course, volatility suits our style of active management and we look forward to seeking to take advantage of market fluctuations in 2017.
The Fund underperformed the Bloomberg Barclays 10-Year Municipal Bond Index in 2016. Our overweight to shorter maturities (5-7 years) was a negative. A lower yield relative to the Index due to our higher quality was also a performance detractor. On the positive side, a duration extension trade post-election aided performance as rates subsequently declined.
11
Table of Contents
AMG GW&K Municipal Bond Fund
Portfolio Manager’s Comments (continued)
FUND PORTFOLIO
The post-election selloff sent yields to three-year highs and pushed the market to oversold conditions with municipal bond/Treasury ratios exceeding 100% across the curve. We reacted to this opportunity as we always do — by buying aggressively, extending duration and locking in higher rates. We focused our purchases on the 10-15-year part of the curve where we executed trades at average yields of 3.0%, or 5.3% on a taxable-equivalent basis. The proceeds for the trade came from five-year maturities, an area of the curve in high demand because it had performed well on a relative basis. We picked up approximately 140 basis points in yield between the buy and the sell and also positioned for better curve and credit roll down.
We never claim to know the direction of rates ahead of time, but when they move meaningfully in one direction or the other, we shift our allocation along the curve. As rates have declined over the past few years to a historic low in July, we incrementally moved our duration in and increased our allocation to maturities shorter than the benchmark. This not only provided us with greater protection from rising rates, but also equipped us with more flexibility to push out duration if the opportunity arose. As such, when rates shot up post-election, we knew exactly what our response should be: buy into the selloff. And, if rates rise again, we will extend duration further. We have seen, time and again, how this approach has maximized returns over the long run.
| 1 | Prior to October 1, 2016, the Fund’s Class S shares were known as Service Shares. |
| 2 | FactSet |
| 3 | Bloomberg and Lipper U.S. Fund Flows |
| 4 | Bloomberg |
This commentary reflects the viewpoints of the portfolio manager, GW&K Investment Management, LLC as of December 31, 2016, and is not intended as a forecast or guarantee of future results, and is subject to change without notice.
12
Table of Contents
AMG GW&K Municipal Bond Fund
Portfolio Manager’s Comments (continued)
CUMULATIVE TOTAL RETURN PERFORMANCE
AMG GW&K Municipal Bond Fund’s cumulative total return is based on the daily change in net asset value (NAV), and assumes that all dividends and distributions were reinvested. The graph compares a hypothetical $10,000 investment made in AMG GW&K Municipal Bond Fund Class S (formally Service Class) on June 30, 2009, to a $10,000 investment made in the Bloomberg Barclays 10-Year Municipal Bond Index for the same time period. The graph and table do not reflect the deduction of taxes that a shareholder would pay on a Fund distribution or redemption of shares. The listed returns for the Fund are net of expenses and the returns for the index exclude expenses. Total returns would have been lower had certain expenses not been reduced.
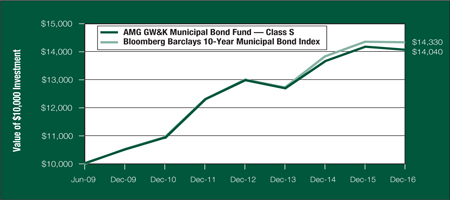
The table below shows the average annual total returns for the AMG GW&K Municipal Bond Fund and the Bloomberg Barclays 10-Year Municipal Bond Index for the same time periods ended December 31, 2016.
| Average Annual Total Returns1 | One Year | Five Years | Since Inception | Inception Date | ||||||||||||
AMG GW&K Municipal Bond Fund 2,3,4,5 | ||||||||||||||||
Class N6 | (1.05 | )% | 2.42 | % | 4.35 | % | 6/30/09 | |||||||||
Class S6 | (0.77 | )% | 2.71 | % | 4.63 | % | 6/30/09 | |||||||||
Class I6 | (0.70 | )% | 2.88 | % | 4.86 | % | 6/30/09 | |||||||||
Bloomberg Barclays 10-Year Municipal Bond Index7 | (0.12 | )% | 3.10 | % | 4.91 | % | 6/30/09 | † | ||||||||
The performance data shown represents past performance. Past performance is not a guarantee of future results. Current performance may be lower or higher than the performance data quoted. The investment return and principal value of an investment will fluctuate so that an investor’s shares, when redeemed, may be worth more or less than their original cost.
Investors should carefully consider the Fund’s investment objectives, risks, charges and expenses before investing. For performance information through the most recent month end, current net asset values per share for the Fund and other information, please call (800) 835-3879 or visit our website at www.amgfunds.com for a free prospectus. Read it carefully before investing or sending money.
Funds are distributed by AMG Distributors, Inc., member FINRA/SIPC.
| † | Date reflects the inception date of the Fund, not the index. |
| 1 | Total return equals income yield plus share price change and assumes reinvestment of all dividends and capital gain distributions. Returns are net of fees and may reflect offsets of Fund expenses as described in the prospectus. No adjustment has been made for taxes payable by shareholders on their reinvested dividends and capital gain distributions. Returns for periods greater than one year are annualized. The listed returns on the Fund are net of expenses and based on the published NAV as of December 31, 2016. All returns are in U.S. dollars ($). |
| 2 | From time to time, the Fund’s advisor has waived its fees and/or absorbed Fund expenses, which has resulted in higher returns. |
| 3 | The Fund is subject to the risks associated with investments in debt securities, such as default risk and fluctuations in the perception of the debtor’s ability to pay its creditors. Changing interest rates may adversely affect the value of an investment. An increase in interest rates typically causes the value of bonds and other fixed income securities to fall. |
| 4 | Factors unique to the municipal bond market may negatively affect the value in municipal bonds. |
| 5 | Investment income may be subject to certain state and local taxes, and depending on your tax status, the federal alternative minimum tax. Capital gains are not exempt from federal income tax. |
| 6 | Effective October 1, 2016, the Investor class, Service class and Institutional Class were renamed Class N, Class S and Class I, respectively. |
| 7 | The Bloomberg Barclays 10-Year Municipal Bond Index is the 10 Year (8-12) component of the Municipal Bond index. It is a rulesbased,market-value-weighted index engineered for the tax-exempt bond market. The Index tracks general obligation bonds, revenue bonds, insured bonds, and prerefunded bonds rated Baa3/BBB- or higher by at least two of the ratings agencies: Moody’s, S&P, Fitch. Effective August 24, 2016, the Barclays indices were renamed Bloomberg Barclays indices. Unlike the Fund, the Bloomberg Barclays 10-Year Municipal Bond Index is unmanaged, is not available for investment and does not incur expenses. |
Not FDIC insured, nor bank guaranteed. May lose value.
13
Table of Contents
AMG GW&K Municipal Bond Fund
Fund Snapshots (unaudited)
December 31, 2016
PORTFOLIO BREAKDOWN
Sector | AMG GW&K Municipal Bond Fund* | |||
General Obligation | 33.8 | % | ||
Transportation | 18.9 | % | ||
Utilities | 16.9 | % | ||
Public Services | 9.5 | % | ||
Education | 7.1 | % | ||
Healthcare | 6.7 | % | ||
Certificate of Participation | 1.3 | % | ||
Industrial Development | 1.3 | % | ||
Tax | 1.2 | % | ||
Other | 0.9 | % | ||
Other Assets & Liabilities | 2.4 | % | ||
| * | As a percentage of net assets. |
Rating | AMG GW&K Municipal Bond Fund** | |||
Aaa | 34.2 | % | ||
Aa | 55.2 | % | ||
A | 9.3 | % | ||
Baa | 1.3 | % | ||
| ** | As a percentage of market value of fixed-income securities. |
TOP TEN HOLDINGS
Security Name | % of Net Assets | |||
Maryland State, General Obligation, University and College Improvements, Series B, 5.000%, 08/01/23*** | 2.5 | % | ||
Arizona Water Infrastructure Finance Authority,Water Quality Revenue, Series A, 5.000%, 10/01/26*** | 1.9 | |||
Commonwealth of Virginia, Series B, 5.000%, 06/01/22*** | 1.6 | |||
State of Michigan, 5.000%, 03/15/27 | 1.6 | |||
State of Washington, Water Utility Improvements Revenue, Series C, 5.000%, 08/01/25*** | 1.5 | |||
Illinois State Finance Authority Revenue, Clean Water Initiative Revenue, 5.000%, 07/01/27 | 1.4 | |||
New York City General Obligation, Series I, 5.000%, 08/01/24*** | 1.4 | |||
Texas Transportation Commission Fund, Series A, 5.000%, 04/01/27*** | 1.4 | |||
Missouri Highway & Transportation Commission, Fuel Sales Tax Revenue, Series A, 5.000%, 05/01/22*** | 1.3 | |||
Missouri Highway & Transportation Commission, Fuel Sales Tax Revenue, Series B, 5.000%, 05/01/23 | 1.3 | |||
|
| |||
Top Ten as a Group | 15.9 | % | ||
|
| |||
| *** | Top Ten Holdings as of June 30, 2016. |
Credit quality ratings shown above reflect the highest rating assigned by either Standard & Poor’s (“S&P”) or Moody’s Investors Service, Inc. (“Moody’s”). These rating agencies are independent, nationally recognized statistical rating organizations and are widely used. Investment grade ratings are credit ratings of BBB/Baa or higher. Below investment grade ratings are credit ratings of BB/Ba or lower. Investments designated N/R are not rated by either rating agency. Unrated investments do not necessarily indicate low credit quality. Credit quality ratings are subject to change.
Because a fund’s strategy may result in multiple investments in particular sectors of the economy, its performance may depend on the performance of those sectors and may fluctuate more widely than investments diversified across more sectors. For additional information on these and other risk considerations, please see the Fund’s prospectus.
Any sectors, industries, or securities discussed should not be perceived as investment recommendations. Mention of a specific security should not be considered a recommendation to buy or solicitation to sell that security. Specific securities mentioned in this report may have been sold from the Fund’s portfolio of investments by the time you receive this report.
14
Table of Contents
AMG GW&K Municipal Bond Fund
Schedule of Portfolio Investments
December 31, 2016
| Principal Amount | Value | |||||||
Municipal Bonds—99.2% | ||||||||
Arizona—4.0% | ||||||||
Arizona School Facilities Board COPS, Series A, 5.000%, 09/01/21 | $ | 5,100,000 | $ | 5,779,218 | ||||
Arizona Transportation Board, Subordinated Highway Revenue, Series 2013 A, 5.000%, 07/01/22 | 4,355,000 | 5,021,184 | ||||||
Arizona Water Infrastructure Finance Authority, Water Quality Revenue, Series A, 5.000%, 10/01/26 | 15,000,000 | 17,949,600 | ||||||
City of Phoenix Civic Improvement Corp., Water Utility Improvements, Series A, 5.000%, 07/01/21 | 4,110,000 | 4,464,323 | ||||||
Phoenix Civic Improvement Corp., Water Utility Improvements, Series A, 5.000%, 07/01/22 | 3,650,000 | 3,964,666 | ||||||
Total Arizona | 37,178,991 | |||||||
California—4.9% | ||||||||
California State Tax Exempt General Obligation, 5.000%, 03/01/24 | 5,000,000 | 5,911,200 | ||||||
California State University, Series A, 5.000%, 11/01/29 | 4,525,000 | 5,278,594 | ||||||
State of California, 5.000%, 09/01/22 | 6,040,000 | 6,986,770 | ||||||
State of California, 5.000%, 09/01/25 | 10,000,000 | 12,029,500 | ||||||
State of California, 5.000%, 09/01/29 | 5,010,000 | 5,964,706 | ||||||
State of California, Series C, 5.000%, 09/01/26 | 7,700,000 | 9,196,264 | ||||||
Total California | 45,367,034 | |||||||
Colorado—1.5% | ||||||||
City & County of Denver CO. Airport System Revenue, Series A, 5.000%, 11/15/23 | 6,000,000 | 6,997,800 | ||||||
Regional Transportation District County COPS, Series A, 5.000%, 06/01/24 | 6,000,000 | 6,810,420 | ||||||
Total Colorado | 13,808,220 | |||||||
Connecticut—0.7% | ||||||||
State of Connecticut Special Tax Revenue, Transit Infrastructure, 5.000%, 08/01/24 | 5,340,000 | 6,207,697 | ||||||
District of Columbia—2.6% | ||||||||
District of Columbia Water & Sewer Authority Public Utility Revenue, Sub Lien, Series C, 5.000%, 10/01/21 | 5,100,000 | 5,813,082 | ||||||
District of Columbia Water & Sewer Authority Public Utility Revenue, Sub Lien, Series C, 5.000%, 10/01/24 | 5,475,000 | 6,348,317 | ||||||
District of Columbia, Series A, 5.000%, 06/01/24 | 5,000,000 | 5,936,800 | ||||||
District of Columbia, Series A, 5.000%, 06/01/30 | 5,010,000 | 5,947,622 | ||||||
Total District of Columbia | 24,045,821 | |||||||
Florida—3.8% | ||||||||
Florida State Board of Education, Series D, 5.000%, 06/01/24 | 6,565,000 | 7,406,239 | ||||||
Orange County Health Facilities Authority, Series A, 5.000%, 10/01/31 | 4,165,000 | 4,658,386 | ||||||
State of Florida, Capital Outlay, Series B, 5.000%, 06/01/27 | 9,145,000 | 10,783,235 | ||||||
State of Florida, Department of Transportation, Fuel Sales Tax Revenue, Series B, 5.000%, 07/01/26 | 5,780,000 | 6,574,172 | ||||||
Tampa Bay Water, 5.500%, 10/01/22 (National Insured)4 | 4,775,000 | 5,685,258 | ||||||
Total Florida | 35,107,290 | |||||||
Georgia—3.3% | ||||||||
Atlanta Water & Wastewater Revenue, 5.000%, 11/01/25 | 5,100,000 | 6,107,505 | ||||||
Georgia State University & College Improvements, Series A, 5.000%, 02/01/26 | 5,520,000 | 6,639,235 | ||||||
Georgia State University & College Improvements, Series A, 5.000%, 07/01/27 | 5,450,000 | 6,314,370 | ||||||
The accompanying notes are an integral part of these financial statements.
15
Table of Contents
AMG GW&K Municipal Bond Fund
Schedule of Portfolio Investments (continued)
| Principal Amount | Value | |||||||
Georgia—3.3% (continued) | ||||||||
Georgia State University & College Improvements, Series A—Tranche 2, 5.000%, 07/01/24 | $ | 5,000,000 | $ | 5,829,800 | ||||
State of Georgia, Series C, 5.000%, 09/01/23 | 5,000,000 | 5,865,400 | ||||||
Total Georgia | 30,756,310 | |||||||
Idaho—0.7% | ||||||||
Idaho Housing & Finance Association, 5.000%, 07/15/23 | 5,770,000 | 6,671,389 | ||||||
Illinois—4.8% | ||||||||
Chicago O’Hare International Airport, Series B, 5.000%, 01/01/28 | 10,570,000 | 12,005,512 | ||||||
Illinois State Finance Authority Revenue, Clean Water Initiative Revenue, 5.000%, 07/01/27 | 11,000,000 | 12,930,500 | ||||||
Illinois State Finance Authority Revenue, University of Chicago, Series A, 5.000%, 10/01/23 | 5,000,000 | 5,817,800 | ||||||
Illinois State Toll Highway Authority, Series A, 5.000%, 12/01/22 | 3,590,000 | 4,113,781 | ||||||
Illinois State Toll Highway Authority, Series A, 5.000%, 12/01/31 | 8,060,000 | 9,104,898 | ||||||
Total Illinois | 43,972,491 | |||||||
Indiana—0.6% | ||||||||
Indiana Finance Authority, Indiana University Health Revenue, Series A, 5.000%, 12/01/23 | 5,115,000 | 5,960,100 | ||||||
Iowa—0.5% | ||||||||
State of Iowa, Series A, 5.000%, 06/01/25 | 4,000,000 | 4,773,880 | ||||||
Kentucky—0.6% | ||||||||
Louisville/Jefferson County Metropolitan Government, Norton Healthcare Inc., Series A, 5.000%, 10/01/29 | 5,000,000 | 5,614,200 | ||||||
Maryland—3.8% | ||||||||
Maryland State, General Obligation, University and College Improvements, Series B, 5.000%, 08/01/23 | 20,000,000 | 23,125,800 | ||||||
University System of Maryland, University & College Improvements, Series A, 5.000%, 04/01/23 | 5,475,000 | 6,398,742 | ||||||
University System of Maryland, University & College Improvements, Series A, 5.000%, 04/01/24 | 5,075,000 | 6,013,469 | ||||||
Total Maryland | 35,538,011 | |||||||
Massachusetts—7.2% | ||||||||
Commonwealth of Massachusetts, Public Improvements, Series B, 5.000%, 08/01/22 | 5,000,000 | 5,602,700 | ||||||
Commonwealth of Massachusetts, Series A, 5.000%, 07/01/25 | 7,500,000 | 9,040,650 | ||||||
Commonwealth of Massachusetts, Series B, 5.000%, 07/01/23 | 5,000,000 | 5,875,300 | ||||||
Massachusetts Clean Water Trust, 5.000%, 08/01/25 | 4,940,000 | 5,369,385 | ||||||
Massachusetts School Building Authority, 5.000%, 08/15/25 | 5,025,000 | 5,772,368 | ||||||
Massachusetts State Department of Taxation and Finance, Series F, 5.000%, 11/01/24 | 10,000,000 | 11,569,300 | ||||||
Massachusetts State Development Finance Agency, Boston College, Series S, 5.000%, 07/01/23 | 5,700,000 | 6,713,004 | ||||||
Massachusetts Water Resources Authority, Series C, 5.000%, 08/01/24 | 10,000,000 | 11,318,500 | ||||||
Massachusetts Water Resources Authority, Series C, 5.000%, 08/01/26 | 4,025,000 | 4,880,675 | ||||||
Total Massachusetts | 66,141,882 | |||||||
Michigan—4.2% | ||||||||
Michigan Finance Authority, Henry Ford Health System, 5.000%, 11/15/29 | 10,000,000 | 11,179,500 | ||||||
Michigan State Building Authority Revenue, Series I, 5.000%, 04/15/27 | 5,700,000 | 6,592,848 | ||||||
Michigan State, Environmental Program, Series A, 5.000%, 12/01/22 | 5,000,000 | 5,822,450 | ||||||
The accompanying notes are an integral part of these financial statements.
16
Table of Contents
AMG GW&K Municipal Bond Fund
Schedule of Portfolio Investments (continued)
| Principal Amount | Value | |||||||
Michigan—4.2% (continued) | ||||||||
State of Michigan, 5.000%, 03/15/27 | $ | 12,600,000 | $ | 14,969,304 | ||||
Total Michigan | 38,564,102 | |||||||
Minnesota—2.6% | ||||||||
Minneapolis-St Paul Metropolitan Airports Commission, Series A, 5.000%, 01/01/25 | 5,000,000 | 5,920,000 | ||||||
Minnesota State General Obligation, Series D, 5.000%, 08/01/22 | 10,200,000 | 11,858,418 | ||||||
Minnesota State Public Facilities Authority, Series A, 5.000%, 03/01/22 | 5,085,000 | 5,852,835 | ||||||
Total Minnesota | 23,631,253 | |||||||
Missouri—3.4% | ||||||||
Missouri Highway & Transportation Commission, Fuel Sales Tax Revenue, Series A, 5.000%, 05/01/22 | 10,720,000 | 12,400,253 | ||||||
Missouri Highway & Transportation Commission, Fuel Sales Tax Revenue, Series B, 5.000%, 05/01/23 | 10,330,000 | 12,148,183 | ||||||
University of Missouri, Series A, 5.000%, 11/01/26 | 5,495,000 | 6,573,119 | ||||||
Total Missouri | 31,121,555 | |||||||
New Jersey—1.7% | ||||||||
New Jersey Health Care Facilities Financing Authority, RWJ Barnabas Health Obligation, 5.000%, 07/01/29 | 6,415,000 | 7,286,029 | ||||||
New Jersey State Turnpike Authority Revenue, Series 2012 B, 5.000%, 01/01/24 | 2,790,000 | 3,204,148 | ||||||
New Jersey State Turnpike Authority Revenue, Series A, 5.000%, 01/01/24 | 4,925,000 | 5,590,663 | ||||||
Total New Jersey | 16,080,840 | |||||||
New York—12.7% | ||||||||
Metropolitan Transportation Authority, Fuel Sales Tax Revenue, Series A, 5.000%, 11/15/24 | 5,000,000 | 5,957,700 | ||||||
Metropolitan Transportation Authority, Transit Revenue, Series C, 5.000%, 11/15/21 | 5,185,000 | 5,876,316 | ||||||
Metropolitan Transportation Authority, Transit Revenue, Series F, 5.000%, 11/15/24 | 4,950,000 | 5,646,712 | ||||||
New York City General Obligation, Series C, 5.000%, 08/01/24 | 5,000,000 | 5,891,350 | ||||||
New York City General Obligation, Series G, 5.000%, 08/01/23 | 5,000,000 | 5,828,950 | ||||||
New York City General Obligation, Series I, 5.000%, 08/01/24 | 11,485,000 | 13,059,249 | ||||||
New York City Transitional Finance Authority, Future Tax Secured Revenue, Series B, 5.000%, 02/01/24 | 5,015,000 | 5,592,176 | ||||||
New York City Transitional Finance Authority, Future Tax Secured Revenue, Series C, 5.000%, 11/01/23 | 5,000,000 | 5,899,600 | ||||||
New York City Transitional Finance Authority, Future Tax Secured Revenue, Series D, 5.000%, 11/01/22 | 5,115,000 | 5,656,116 | ||||||
New York City Water & Sewer System Revenue, Series FF, 5.000%, 06/15/25 | 7,555,000 | 8,316,317 | ||||||
New York City Water & Sewer System Revenue, Series FF, 5.000%, 06/15/30 | 5,470,000 | 6,396,235 | ||||||
New York State Dormitory Authority, Series A, 5.000%, 12/15/25 | 8,425,000 | 9,752,948 | ||||||
New York State Dormitory Authority, Series A, 5.000%, 12/15/27 | 5,630,000 | 6,500,454 | ||||||
New York State Dormitory Authority, Series D, 5.000%, 02/15/27 | 11,145,000 | 13,074,235 | ||||||
New York State Dormitory Authority, Series E, 5.000%, 03/15/32 | 6,150,000 | 7,125,759 | ||||||
New York State Urban Development Corp., Personal Income Tax Revenue, 5.000%, 03/15/24 | 5,505,000 | 6,525,297 | ||||||
Total New York | 117,099,414 | |||||||
North Carolina—3.8% | ||||||||
The Charlotte-Mecklenburg Hospital Authority, Carolinas Healthcare System, 5.000%, 01/15/25 | 10,000,000 | 11,776,300 | ||||||
North Carolina Municipal Power Agency No. 1, Electric, Power and Light Revenue, Series A, 5.000%, 01/01/27 | 5,025,000 | 5,959,600 | ||||||
North Carolina State Limited Obligation, Series A, 5.000%, 06/01/26 | 8,945,000 | 11,019,614 | ||||||
The accompanying notes are an integral part of these financial statements.
17
Table of Contents
AMG GW&K Municipal Bond Fund
Schedule of Portfolio Investments (continued)
| Principal Amount | Value | |||||||
North Carolina—3.8% (continued) | ||||||||
North Carolina State Limited Obligation, Series C, 5.000%, 05/01/23 | $ | 5,020,000 | $ | 5,874,304 | ||||
Total North Carolina | 34,629,818 | |||||||
Ohio—3.8% | ||||||||
Ohio State General Obligation, Series A, 5.000%, 09/15/22 | 10,000,000 | 11,600,900 | ||||||
Ohio State General Obligation, University & College Improvements, Series C, 5.000%, 11/01/26 | 5,000,000 | 5,942,050 | ||||||
Ohio Water Development Authority, Water Pollution Control Loan Fund, 5.000%, 06/01/23 | 5,000,000 | 5,890,950 | ||||||
Ohio Water Development Authority, Water Pollution Control Loan Fund, Series 2015A, 5.000%, 06/01/25 | 10,025,000 | 12,099,874 | ||||||
Total Ohio | 35,533,774 | |||||||
Oklahoma—1.0% | ||||||||
Grand River Dam Authority, Series A, 5.000%, 06/01/28 | 7,820,000 | 9,247,072 | ||||||
Pennsylvania—0.9% | ||||||||
Lancaster County Hospital Authority, University of Pennsylvania Health Revenue, 5.000%, 08/15/26 | 6,730,000 | 8,007,354 | ||||||
Tennessee—0.6% | ||||||||
State of Tennessee Fuel Sales Tax Revenue, Series B, 5.000%, 09/01/26 | 5,000,000 | 5,989,100 | ||||||
Texas—11.5% | ||||||||
Central Texas Turnpike System Transportation Commission, Series C, 5.000%, 08/15/31 | 11,075,000 | 12,045,059 | ||||||
City of Austin TX Water & Wastewater System Revenue, Series A, 5.000%, 11/15/22 | 7,790,000 | 9,020,197 | ||||||
City of San Antonio TX Electric & Gas Systems Revenue, 5.000%, 02/01/26 | 9,275,000 | 11,129,907 | ||||||
Humble Independent School District, Series B, 5.000%, 02/15/23 | 5,550,000 | 6,461,532 | ||||||
Metropolitan Transit Authority of Harris County, Series A, 5.000%, 11/01/24 | 5,000,000 | 5,898,500 | ||||||
North Texas Tollway Authority Revenue, Special Projects System, 1st Tier, Series A, 5.000%, 01/01/25 | 6,320,000 | 7,296,693 | ||||||
North Texas Tollway Authority Revenue, Special Projects System, Series D, 5.250%, 09/01/27 | 10,265,000 | 11,750,551 | ||||||
North Texas Tollway Authority, Series A, 5.000%, 01/01/26 | 7,695,000 | 8,841,786 | ||||||
Plano Independent School District, Series A, 5.000%, 02/15/22 | 6,290,000 | 7,215,511 | ||||||
State of Texas, Transportation Commission Highway Improvements Revenue, 5.000%, 04/01/25 | 5,000,000 | 5,712,950 | ||||||
Texas Transportation Commission Fund, Series A, 5.000%, 04/01/27 | 11,000,000 | 12,509,970 | ||||||
The University of Texas System Financing Revenue, Series B, 5.000%, 08/15/22 | 6,865,000 | 7,952,828 | ||||||
Total Texas | 105,835,484 | |||||||
Virginia—3.6% | ||||||||
Commonwealth of Virginia, Series B, 5.000%, 06/01/22 | 12,980,000 | 15,073,804 | ||||||
Virginia College Building Authority, Series B, 5.000%, 09/01/23 | 5,350,000 | 6,258,162 | ||||||
Virginia Public Building Authority, Series B, 5.000%, 08/01/25 | 9,750,000 | 11,745,240 | ||||||
Total Virginia | 33,077,206 | |||||||
Washington—8.3% | ||||||||
City of Seattle WA Municipal Light & Power Revenue, Series B, 5.000%, 02/01/23 | 4,495,000 | 4,925,801 | ||||||
County of King WA Sewer Revenue, Series B, 5.000%, 01/01/24 | 3,085,000 | 3,421,851 | ||||||
Energy Northwest Electric Revenue, Bonneville Power, 5.000%, 07/01/25 | 10,050,000 | 12,080,200 | ||||||
State of Washington School Improvements, Series C, 5.000%, 02/01/28 | 5,925,000 | 7,046,425 | ||||||
State of Washington, Series R-2015C, 5.000%, 07/01/28 | 10,000,000 | 11,689,800 | ||||||
The accompanying notes are an integral part of these financial statements.
18
Table of Contents
AMG GW&K Municipal Bond Fund
Schedule of Portfolio Investments (continued)
| Principal Amount | Value | |||||||
Washington—8.3% (continued) | ||||||||
State of Washington, Water Utility Improvements Revenue, Series C, 5.000%, 08/01/25 | $ | 11,925,000 | $ | 13,680,360 | ||||
University of Washington, University & College Improvements Revenue, Series A, 5.000%, 12/01/32 | 5,760,000 | 6,800,256 | ||||||
University of Washington, University & College Improvements Revenue, Series C, 5.000%, 07/01/27 | 7,270,000 | 8,371,114 | ||||||
Washington Health Care Facilities Authority Multicare Health System, Series B, 5.000%, 08/15/23 | 3,940,000 | 4,554,876 | ||||||
Washington Health Care Facilities Authority Providence Health & Services, Series A, 5.000%, 10/01/26 | 3,425,000 | 3,872,168 | ||||||
Total Washington | 76,442,851 | |||||||
Wisconsin—2.1% | ||||||||
Wisconsin State Revenue, Department of Transportation, Series 1, 5.000%, 07/01/25 | 3,005,000 | 3,485,590 | ||||||
Wisconsin State Revenue, Department of Transportation, Series A, 5.000%, 07/01/22 | 5,000,000 | 5,776,050 | ||||||
Wisconsin State Revenue, Department of Transportation, Series A, 5.000%, 07/01/24 | 5,000,000 | 5,939,000 | ||||||
Wisconsin State, Series 2, 5.000%, 05/01/24 | 3,420,000 | 3,905,743 | ||||||
Total Wisconsin | 19,106,383 | |||||||
Total Municipal Bonds (cost $936,531,047) | 915,509,522 | |||||||
| Shares | ||||||||
Short-Term Investments—1.3% | ||||||||
Dreyfus Government Cash Management Fund, Institutional Class Shares, 0.45%6 | 11,698,278 | 11,698,278 | ||||||
Total Investments—100.5% (cost $948,229,325) | 927,207,800 | |||||||
Other Assets, less Liabilities—(0.5)% | (4,286,759 | ) | ||||||
Net Assets—100.0% | $ | 922,921,041 | ||||||
The accompanying notes are an integral part of these financial statements.
19
Table of Contents
AMG GW&K Municipal Enhanced Yield Fund
Portfolio Manager’s Comments (unaudited)
THE YEAR IN REVIEW
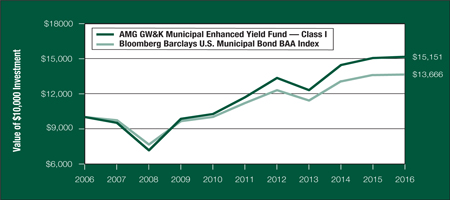
For the year ended December 31, 2016, the AMG GW&K Municipal Enhanced Yield Fund (Class I)1 (the “Fund”) returned 0.7%, modestly outperforming the Bloomberg Barclays U.S. Municipal Bond BAA Index, which returned 0.4%.
Municipal bonds suffered their worst quarter of performance since 1994, essentially wiping out all their gains from the previous nine months. Ten-year tax-exempt yields soared 80 basis points over the quarter to finish the year at 2.31%, 100 basis points above their summer lows2. The results of the November election caught the markets by surprise and shifted sentiment dramatically. The Republican sweep brushed away long-held assumptions of sluggish growth amid continued Washington gridlock and the market seemed to immediately price in the successful passage of steep tax cuts, heavy infrastructure spending and more business-friendly regulation. Oil prices rose to cyclical highs and stock markets set a series of new record levels. Inflation expectations moved sharply higher and the yield on the 10-year U.S. Treasury note hit a two-year high of 2.64%2.In December, after the unemployment rate declined to its lowest reading since 2007, the U.S. Federal Reserve finally raised rates and signaled a marginally faster pace of tightening for 2017, giving the economy an important vote of confidence. Treasuries rallied back in the final two weeks of December to close the year at 2.45% as the equity rally ran out of steam.
Municipals followed the path of Treasuries over the quarter but exhibited greater volatility. The post-election selloff was far more acute, as retail investors reacted poorly to their first losses in years. Mutual funds, which had just seen 54 consecutive weeks of inflows, were suddenly inundated with redemption requests. During the week ended November 16, investors withdrew $3.1 billion, the most in over three years. The outflows continued into year-end at a pace of nearly $2 billion a week3. Prior to the election, dealer inventories were sagging under the weight of three successive months of record issuance. Instead of absorbing bonds, they were adding to the selling pressure in an effort to shed exposure to a falling market. As issuance slowed in mid-November, a lack of price transparency emerged, forcing prices to adjust with little guidance. Municipal bonds underperformed significantly. The 10-year municipal bond/Treasury ratio, which began November at 95%, peaked at 107%, similar to the panic selling experience back in 2013’s Taper Tantrum2. Ultimately, however, municipal bonds cheapened enough to entice crossover buyers to step in with other value-seeking investors to support the market, and municipals rallied back hard to end the year on firmer footing. After peaking at 2.58%, its highest level since January 2014, the yield on the 10-year municipal bond fell 30 basis points in four trading days and eventually closed the year at 2.31%, nearly 40 basis points higher than where it began in January.
Heading into 2017, it appears like the municipal bond market has essentially stabilized. Ratios versus Treasuries begin the year near more normal levels as the demand side recognized the value offered by November’s dislocation. But uncertainty still looms in the coming year. Few details have emerged on potential tax reform and infrastructure spending, leaving the market to speculate on possible outcomes. Long-dormant fears of inflation have shown signs of resurfacing, adding to investor caution. Extreme proposals regarding the municipal bond tax-exemption will undoubtedly get voiced from one corner or another, but we do not expect a major overhaul to the primary funding vehicle of the nation’s infrastructure for the last 100+ years. We also don’t expect a supply boom anytime soon. The Trump Administration’s infrastructure plan appears to be based on harnessing private versus public investment, and the rise in interest rates has already slowed the biggest source of issuance this year: refunding deals. Average expectations for issuance are in the $380 billion range, a 15% drop-off from 2016’s record-breaking year. While the market is in a much more attractive position for investors heading into 2017,4 with rates higher and relative-value ratios still historically cheap, we could be in for a volatile stretch. Of course, volatility suits our style of active management and we look forward to seeking to take advantage of market fluctuations in 2017.
20
Table of Contents
AMG GW&K Municipal Enhanced Yield Fund
Portfolio Manager’s Comments (continued)
INVESTMENT STRATEGY
We remain active on the long end of the yield curve in the Fund, with over 80% invested in maturities greater than 20 years. The volume was primarily focused on relative value trading as opposed to curve trades that you would see more in an intermediate strategy, as the yield curve is relatively flat in the 25-30 years. We continue to avoid local general obligation bonds and focus on the hospital and transportation sectors.
PERFORMANCE
The Fund slightly outperformed the Bloomberg Barclays U.S. Municipal Bond BAA Index in the fourth quarter and outperformed for the year. An overweight to longer maturities detracted from performance as rates increased during the quarter. This is in contrast to the first half of 2016, where our duration overweight benefited our performance. Potential fiscal policy changes,
increased inflation expectations and technical selling pressure steepened the municipal yield curve with the two-to-thirty-year maturity spread widening +24 basis points. The Fund benefited from higher overall credit quality as credit spreads widened in the quarter. The Fund has approximately 40% of its holdings in A-rated credits, several of which performed better than BBB-rated bonds in the Index during the quarter.
| 1 | Prior to October 1, 2016, the Fund’s Class I shares were known as Institutional Shares. |
| 2 | FactSet |
| 3 | Bloomberg and Lipper U.S. Fund Flows |
| 4 | Bloomberg |
This commentary reflects the viewpoints of the portfolio manager, GW&K Investment Management, LLC as of December 31, 2016 and is not intended as a forecast or guarantee of future results, and is subject to change without notice.
CUMULATIVE TOTAL RETURN PERFORMANCE
AMG GW&K Municipal Enhanced Yield Fund’s cumulative total return is based on the daily change in net asset value (NAV), and assumes that all dividends and distributions were reinvested. The graph compares a hypothetical $10,000 investment made in AMG GW&K Municipal Enhanced Yield Fund Class I (formally Institutional Class) on December 31, 2006, to a $10,000 investment made in the Bloomberg Barclays U.S. Municipal Bond BAA Index for the same time period. The graph and table do not reflect the deduction of taxes that a shareholder would pay on a Fund distribution or redemption of shares.
21
Table of Contents
AMG GW&K Municipal Enhanced Yield Fund
Portfolio Manager’s Comments (continued)
CUMULATIVE TOTAL RETURN PERFORMANCE (continued)
The listed returns for the Fund are net of expenses and the returns for the index exclude expenses. Total returns would have been lower had certain expenses not been reduced.
The table below shows the average annual total returns for the AMG GW&K Municipal Enhanced Yield Fund and the Bloomberg Barclays U.S. Municipal Bond BAA Index for the same time periods ended December 31, 2016.
| One | Five | Ten | Since | Inception | ||||||||||||||||
| Average Annual Total Returns1 | Year | Years | Years | Inception | Date | |||||||||||||||
AMG GW&K Municipal Enhanced Yield Fund 2,3,4,5,6,7,8,9 | ||||||||||||||||||||
Class N10 | 0.10 | % | 4.84 | % | — | 6.83 | % | 7/27/09 | ||||||||||||
Class S10 | 0.55 | % | 5.19 | % | — | 7.15 | % | 7/27/09 | ||||||||||||
Class I10 | 0.70 | % | 5.33 | % | 4.25 | % | 4.53 | % | 12/30/05 | |||||||||||
Bloomberg Barclays U.S. Municipal Bond BAA Index11 | 0.35 | % | 4.07 | % | 3.17 | % | 3.57 | % | 12/30/05 | † | ||||||||||
The performance data shown represents past performance. Past performance is not a guarantee of future results. Current performance may be lower or higher than the performance data quoted. The investment return and principal value of an investment will fluctuate so that an investor’s shares, when redeemed, may be worth more or less than their original cost.
Investors should carefully consider the Fund’s investment objectives, risks, charges and expenses before investing. For performance information through the most recent month end, current net asset values per share for the Fund and other information, please call (800) 835-3879 or visit our website at www.amgfunds.com for a free prospectus. Read it carefully before investing or sending money.
Funds are distributed by AMG Distributors, Inc., member FINRA/SIPC.
| † | Date reflects the inception date of the Fund, not the index. |
| 1 | Total return equals income yield plus share price change and assumes reinvestment of all dividends and capital gain distributions. Returns are net of fees and may reflect offsets of Fund expenses as described in the prospectus. No adjustment has been made for taxes payable by shareholders on their reinvested dividends and capital gain distributions. Returns for periods greater than one year are annualized. The listed returns on the Fund are net of expenses and based on the published NAV as of December 31, 2016. All returns are in U.S. dollars ($). |
| 2 | From time to time, the Fund’s advisor has waived its fees and/or absorbed Fund expenses, which has resulted in higher returns. |
| 3 | The Fund is subject to the risks associated with investments in debt securities, such as default risk and fluctuations in the perception of the debtor’s ability to pay its creditors. Changing interest rates may adversely affect the value of an investment. An increase in interest rates typically causes the value of bonds and other fixed income securities to fall. |
| 4 | The Fund may invest in derivatives such as options and futures; the complexity and rapidly changing structure of derivatives markets may increase the possibility of market losses. |
| 5 | High-yield bonds (also known as “junk bonds”) may be subject to greater levels of interest rate, credit, and liquidity risk than investments in higher rated securities. These securities are considered predominantly speculative with respect to the issuer’s continuing ability to make principal and interest payments. The issuers of the Fund’s holdings may be involved in bankruptcy proceedings, reorganizations, or financial restructurings, and are not as strong financially as higher-rated issuers. |
| 6 | The use of leverage in a Fund’s strategy, such as futures and forward commitment transactions, can magnify relatively small market movements into relatively larger losses for the Fund. |
| 7 | Factors unique to the municipal bond market may negatively affect the value in municipal bonds. |
| 8 | Investment income may be subject to certain state and local taxes, and depending on your tax status, the federal alternative minimum tax. Capital gains are not exempt from federal income tax. |
| 9 | The performance shown includes that of the predecessor Fund, the BNY Hamilton Municipal Enhanced Yield Fund, a series of BNY Hamilton Funds, Inc., which was reorganized into the GW&K Municipal Enhanced Yield Fund, a series of AMG Funds, as of the close of business on November 7, 2008. |
| 10 | Effective October 1, 2016, the Investor Class, Service Class and Institutional Class were renamed Class N, Class S and Class I, respectively. |
| 11 | The Bloomberg Barclays U.S. Municipal Bond BAA Index is a subset of the Bloomberg Barclays U.S. Municipal Bond Index with an index rating of Baa1, Baa2, or Baa3. The Bloomberg Barclays U.S. Municipal Bond Index is a rules-based, market-value-weighted index engineered for the long-term, tax-exempt bond market. Effective August 24, 2016, the Barclays indices were renamed Bloomberg Barclays indices. Unlike the Fund, the Bloomberg Barclays U.S. Municipal Bond BAA Index is unmanaged, is not available for investment and does not incur expenses. |
Not FDIC insured, nor bank guaranteed. May lose value.
22
Table of Contents
AMG GW&K Municipal Enhanced Yield Fund
Fund Snapshots (unaudited)
December 31, 2016
PORTFOLIO BREAKDOWN
Sector | AMG GW&K Municipal Enhanced Yield Fund* | |||
Healthcare | 29.8 | % | ||
Transportation | 28.0 | % | ||
Utilities | 8.5 | % | ||
Education | 7.5 | % | ||
Other | 5.7 | % | ||
State and Non-State Appropriated Tobacco | 4.9 | % | ||
Tax | 4.9 | % | ||
General Obligation | 3.3 | % | ||
Industrial Development | 3.1 | % | ||
Recreation | 3.0 | % | ||
Lease/Rent | 0.8 | % | ||
Other Assets & Liabilities | 0.5 | % | ||
| * | As a percentage of net assets. |
Rating | AMG GW&K Municipal Enhanced Yield Fund** | |||
Aa | 4.2 | % | ||
A | 40.5 | % | ||
BBB | 55.3 | % | ||
| ** | As a percentage of market value of fixed-income securities. |
TOP TEN HOLDINGS
Security Name | %of Net Assets | |||
Central Texas Turnpike System, Series C, 5.000%, 08/15/42*** | 4.3 | % | ||
New York Transportation Development Corp., Laguardia Airport Terminal B, 5.000%, 07/01/46*** | 3.8 | |||
Louisville/Jefferson County Metropolitan Government, Norton Healthcare Inc., 5.000%, 10/01/33 | 3.5 | |||
Alachua County Health Facilities Authority, Shands Teaching Hospital & Clinics, 5.000%, 12/01/44*** | 3.2 | |||
Brooklyn Arena Local Development Corp., Barclays Center Project, Series A, 5.000%, 07/15/42 | 3.0 | |||
New Jersey Health Care Facilities Financing Authority, RWJ Barnabas Health Obligation, 5.000%, 07/01/43 | 2.8 | |||
Michigan Finance Authority, Henry Ford Health System, 5.000%, 11/15/41 | 2.7 | |||
Miami Beach Health Facilities Authority, Mt. Sinai Medical Center, 5.000%, 11/15/39*** | 2.7 | |||
New Jersey Economic Development Authority, Series XX, 5.000%, 06/15/22 | 2.7 | |||
West Virginia Hospital Finance Authority,West Virginia United Health Systems Obligation Group, Series A, 5.500%, 06/01/44 | 2.6 | |||
|
| |||
Top Ten as a Group | 31.3 | % | ||
|
| |||
| *** | Top Ten Holdings as of June 30, 2016. |
Credit quality ratings shown above reflect the highest rating assigned by either Standard & Poor’s (“S&P”) or Moody’s Investors Service, Inc. (“Moody’s”). These rating agencies are independent, nationally recognized statistical rating organizations and are widely used. Investment grade ratings are credit ratings of BBB/Baa or higher. Below investment grade ratings are credit ratings of BB/Ba or lower. Investments designated N/R are not rated by either rating agency. Unrated investments do not necessarily indicate low credit quality. Credit quality ratings are subject to change.
Because a fund’s strategy may result in multiple investments in particular sectors of the economy, its performance may depend on the performance of those sectors and may fluctuate more widely than investments diversified across more sectors. For additional information on these and other risk considerations, please see the Fund’s prospectus.
Any sectors, industries, or securities discussed should not be perceived as investment recommendations. Mention of a specific security should not be considered a recommendation to buy or solicitation to sell that security. Specific securities mentioned in this report may have been sold from the Fund’s portfolio of investments by the time you receive this report.
23
Table of Contents
AMG GW&K Municipal Enhanced Yield Fund
Schedule of Portfolio Investments
December 31, 2016
| Principal Amount | Value | |||||||
Municipal Bonds—99.6% | ||||||||
California—2.2% | ||||||||
M-S-R Energy Authority, Natural Gas Revenue, Series C, 6.500%, 11/01/39 | $ | 3,635,000 | $ | 4,777,444 | ||||
Colorado—1.7% | ||||||||
Public Authority for Colorado Energy Natural Gas Purchase Revenue, Series 2008, 6.500%, 11/15/38 | 2,805,000 | 3,673,737 | ||||||
Florida—12.3% | ||||||||
Alachua County Health Facilities Authority, Shands Teaching Hospital & Clinics, 5.000%, 12/01/44 | 6,520,000 | 6,967,076 | ||||||
County of Miami-Dade FL Aviation Revenue, 5.000%, 10/01/41 | 4,095,000 | 4,583,656 | ||||||
Martin County Health Facilities Authority, Martin Memorial Medical Center, 5.500%, 11/15/42 | 4,430,000 | 4,771,376 | ||||||
Miami Beach Health Facilities Authority, Mt. Sinai Medical Center, 5.000%, 11/15/39 | 5,605,000 | 5,856,496 | ||||||
Orange County Health Facilities Authority, Orlando Health Inc., Series A, 5.000%, 10/01/39 | 4,065,000 | 4,427,639 | ||||||
Total Florida | 26,606,243 | |||||||
Georgia—0.5% | ||||||||
City of Atlanta GA Water & Wastewater Revenue, 5.000%, 11/01/40 | 1,000,000 | 1,126,660 | ||||||
Illinois—13.8% | ||||||||
Chicago O’Hare International Airport, Refunding General Senior Lien, Series B, 5.000%, 01/01/41 | 3,800,000 | 4,180,912 | ||||||
Chicago O’Hare International Airport, Senior Lien, Series D, 5.250%, 01/01/427 | 2,500,000 | 2,820,750 | ||||||
Illinois State General Obligation, 5.000%, 02/01/39 | 3,930,000 | 3,757,787 | ||||||
Illinois State General Obligation, 5.500%, 07/01/38 | 3,245,000 | 3,296,239 | ||||||
Metropolitan Pier and Exposition Authority Revenue, McCormick Place Expansion Project, Series 2012 A, 5.000%, 06/15/42 | 4,990,000 | 5,058,662 | ||||||
Metropolitan Pier and Exposition Authority Revenue, McCormick Place Expansion Project, Series B, 5.000%, 06/15/52 | 5,405,000 | 5,453,537 | ||||||
Railsplitter Tobacco Settlement Authority Revenue, 6.000%, 06/01/28 | 4,550,000 | 5,177,718 | ||||||
Total Illinois | 29,745,605 | |||||||
Kentucky—3.6% | ||||||||
Louisville/Jefferson County Metropolitan Government, Norton Healthcare Inc., 5.000%, 10/01/33 | 7,000,000 | 7,660,100 | ||||||
Louisiana—2.8% | ||||||||
Louisiana Public Facilities Authority, Lease Provident Group-Flagship Property, 5.000%, 07/01/46 | 1,700,000 | 1,828,962 | ||||||
Louisiana Public Facilities Authority, Ochsner Clinic Foundation Project, 5.000%, 05/15/47 | 4,035,000 | 4,313,254 | ||||||
Total Louisiana | 6,142,216 | |||||||
Massachusetts—4.7% | ||||||||
Massachusetts Development Finance Agency, UMass Boston Student Housing, 5.000%, 10/01/41 | 2,250,000 | 2,335,972 | ||||||
Massachusetts Development Finance Agency, UMass Boston Student Housing, 5.000%, 10/01/48 | 5,000,000 | 5,163,150 | ||||||
Massachusetts Health and Educational Facilities Authority Revenue, Suffolk University, Series 2009 A, 5.750%, 07/01/39 | 2,535,000 | 2,688,469 | ||||||
Total Massachusetts | 10,187,591 | |||||||
Michigan—3.8% | ||||||||
Michigan Finance Authority, Henry Ford Health System, 5.000%, 11/15/41 | 5,500,000 | 5,874,880 | ||||||
Michigan Finance Authority, Trinity Health Corp., Series 2016, 5.000%, 12/01/45 | 2,205,000 | 2,403,428 | ||||||
Total Michigan | 8,278,308 | |||||||
Nebraska—2.5% | ||||||||
Central Plains Energy Project, Natural Gas Revenue, 5.000%, 09/01/42 | 5,000,000 | 5,284,300 | ||||||
The accompanying notes are an integral part of these financial statements.
24
Table of Contents
AMG GW&K Municipal Enhanced Yield Fund
Schedule of Portfolio Investments (continued)
| Principal Amount | Value | |||||||
New Jersey—12.2% | ||||||||
New Jersey Economic Development Authority, School Facilities Construction, 5.000%, 03/01/25 | $ | 4,350,000 | $ | 4,539,181 | ||||
New Jersey Economic Development Authority, Series XX, 5.000%, 06/15/22 | 5,425,000 | 5,728,691 | ||||||
New Jersey Economic Development Authority, Tobacco and Liquor Tax Revenue, 5.000%, 06/15/28 | 1,075,000 | 1,131,943 | ||||||
New Jersey Economic Development Authority, Tobacco and Liquor Tax Revenue, 5.000%, 06/15/29 | 1,000,000 | 1,047,970 | ||||||
New Jersey Economic Development Authority, UMM Energy Partners, Series 2012 A, 5.125%, 06/15/43 | 4,450,000 | 4,602,412 | ||||||
New Jersey Health Care Facilities Financing Authority, RWJ Barnabas Health Obligation, 5.000%, 07/01/43 | 5,605,000 | 6,085,461 | ||||||
New Jersey Transportation Trust Fund Authority, Federal Highway Reimbursement Notes, 5.000%, 06/15/27 | 2,000,000 | 2,167,440 | ||||||
New Jersey Transportation Trust Fund Authority, Federal Highway Reimbursement Notes, 5.000%, 06/15/28 | 1,000,000 | 1,077,990 | ||||||
Total New Jersey | 26,381,088 | |||||||
New York—9.2% | ||||||||
Brooklyn Arena Local Development Corp., Barclays Center Project, Series A, 5.000%, 07/15/42 | 6,000,000 | 6,419,880 | ||||||
New York State Dormitory Authority, The New School Project, Series A, 5.000%, 07/01/46 | 3,000,000 | 3,291,660 | ||||||
New York Transportation Development Corp., Laguardia Airport Terminal B, 5.000%, 07/01/46 | 8,000,000 | 8,306,000 | ||||||
Port Authority of New York and New Jersey Special Project, JFK International Air Terminal LLC Project, Series 2010, 6.000%, | ||||||||
12/01/42 | 1,580,000 | 1,790,804 | ||||||
Total New York | 19,808,344 | |||||||
Oregon—2.5% | ||||||||
Oregon State Facilities Authority, Legacy Health Project, Series A, 5.000%, 06/01/46 | 4,950,000 | 5,399,559 | ||||||
Rhode Island—2.5% | ||||||||
Tobacco Settlement Financing Corp., Series A, 5.000%, 06/01/35 | 2,000,000 | 2,084,900 | ||||||
Tobacco Settlement Financing Corp., Series A, 5.000%, 06/01/40 | 3,250,000 | 3,362,548 | ||||||
Total Rhode Island | 5,447,448 | |||||||
Texas—16.4% | ||||||||
Central Texas Regional Mobility Authority, 5.000%, 01/01/40 | 4,600,000 | 4,937,272 | ||||||
Central Texas Regional Mobility Authority, 5.000%, 01/01/46 | 3,700,000 | 3,948,233 | ||||||
Central Texas Turnpike System, Series C, 5.000%, 08/15/42 | 8,770,000 | 9,251,912 | ||||||
Grand Parkway Transportation Corp., 1st Tier Toll Revenue, Series A, 5.500%, 04/01/53 | 3,925,000 | 4,171,804 | ||||||
New Hope Cultural Education Facilities Corp., College Station Project, Series A, 5.000%, 07/01/47 | 4,650,000 | 4,766,343 | ||||||
Texas Municipal Gas Acquisition & Supply Corp., Gas Supply Revenue, Senior Lien Series 2008 D, 6.250%, 12/15/26 | 2,950,000 | 3,463,624 | ||||||
Texas Private Activity Bond Surface Transportation Corp., Senior Lien-Blueridge Transport, 5.000%, 12/31/40 | 1,500,000 | 1,583,310 | ||||||
Texas Private Activity Bond Surface Transportation Corp., Senior Lien-Blueridge Transport, 5.000%, 12/31/45 | 3,000,000 | 3,155,190 | ||||||
Total Texas | 35,277,688 | |||||||
Virginia—3.9% | ||||||||
Chesapeake Bay Bridge & Tunnel District, First Tier General Resolution Revenue, 5.000%, 07/01/46 | 5,000,000 | 5,387,450 | ||||||
Chesapeake City Expressway Toll Road Revenue, Series 2012 A, 5.000%, 07/15/47 | 3,010,000 | 3,129,166 | ||||||
Total Virginia | 8,516,616 | |||||||
West Virginia—2.6% | ||||||||
West Virginia Hospital Finance Authority, West Virginia United Health Systems Obligation Group, Series A, 5.500%, 06/01/44 | 5,000,000 | 5,611,900 | ||||||
The accompanying notes are an integral part of these financial statements.
25
Table of Contents
AMG GW&K Municipal Enhanced Yield Fund
Schedule of Portfolio Investments (continued)
| Principal Amount | Value | |||||||
Wisconsin—2.4% | ||||||||
Wisconsin Health & Educational Facilities Authority, ProHealth Care Obligation Group, 5.000%, 08/15/39 | $ | 4,635,000 | $ | 5,092,614 | ||||
Total Municipal Bonds (cost $219,523,735) | 215,017,461 | |||||||
| Shares | ||||||||
Short-Term Investments—0.8% | ||||||||
Dreyfus Government Cash Management Fund, Institutional Class Shares, 0.45%6 | 1,739,600 | 1,739,600 | ||||||
Total Investments—100.4%8 (cost $221,263,335) | 216,757,061 | |||||||
Other Assets, less Liabilities—(0.4)% | (963,985 | ) | ||||||
Net Assets—100.0% | $ | 215,793,076 | ||||||
The accompanying notes are an integral part of these financial statements.
26
Table of Contents
Portfolio Manager’s Comments (unaudited)
THE YEAR IN REVIEW
For the year ended December 31, 2016, the AMG GW&K Small Cap Core Fund (Class N)1 (the “Fund”) returned 17.4%, underperforming the Russell 2000® Index, which returned 21.3%.
A wise man once said about the stock market: “Don’t you know this is all about psychology?” In this case, we are quoting our Chief Investment Officer during one of our recent Investment Policy meetings. But sometimes, when you spend all day immersed in company-level financials, industry data and macroeconomic statistics, it is easy to forget the large role that psychology or, said differently, sentiment, plays in determining equity returns. In the fourth quarter of 2016, we experienced one of those periods where sentiment changed dramatically. The surprising nature of the catalyst for this change, the election victory by Donald Trump and the Republican sweep of Congress, added to the intensity of the sentiment shift. Investors moved from positioning for a Washington and macroeconomic status quo (or perhaps even a tilt in the Senate towards Democrats) to a political landscape dominated by the Republican ticket. Making the situation even more interesting is the lack of a clear ideology for President-elect Trump. This blank slate permitted investors to imagine the most positive outcomes this newly-elected leader might be able to accomplish. And dream they have, driving equity prices up on hope of lower taxes, lower regulation and beneficial infrastructure spending which would drive overall higher growth rates for both the economy and corporate profits. This sounds like Nirvana, not the Washington or economic landscape we have come to know well over the last eight years.
With their higher domestic exposure and risk profile, it is no wonder that the Russell 2000® Index popped by 8.8% during the fourth quarter. This narrative for a market rally was set up by the preceding two and a half years, when corporate profits stalled and small cap stocks had mostly stagnated. This was compounded by a macro overlay where investors were obsessed with safety and embraced the idea that low rates and low growth were here to stay. Markets became unbalanced by the midpoint of 2016, as too many
investors pushed this safety and low-growth trade, while avoiding cyclical growth at all costs. Thus, while the election was the spark that started the fire, the dry kindling and crumpled newspaper were already in the fireplace. The rally raged strongest in value stocks, with the Russell 2000® Value Index gaining 14.1% compared to the meager 3.6% for the Russell 2000® Growth Index for the fourth quarter. Even more impressive was the full-year outperformance by the Value Index, which exceeded the Growth Index by over 20%. In the fourth quarter, Investors focused on low valuation, cyclical exposure and potential beneficiaries of inflation. Companies that have lacked pricing power have been laggards through most of this cycle, but Trump’s expected policies could be inflationary and a rising tide should lift all boats. The Fund’s focus on companies with pricing power, as well as the growth tilt in the Fund, hurt our relative performance, as we finished the quarter up 4.8%. For the year, the Fund finished up 17.4%. While this sounds great in absolute terms, performance trailed the Russell 2000® Index. We were disappointed to lag the Index over both periods, particularly given the strong relative start to the year.
Looking a little more closely at the performance within the small cap market, we saw very strong fourth-quarter returns from financials, energy, industrials and materials. To be sure, the OPEC agreement in November to curtail oil production boosted the energy and related industries, while the other leaders during the quarter were driven by expectations of changes to tax, regulatory and infrastructure spending policy from the Trump/ Republican agenda. Over the full year, sector leadership came from the same characters with only a change in order: materials 47.2%, financials 35.6%, industrials 32.2% and energy 28.3%. The lagging sectors for the quarter included the only negative return group, health care, as well as real estate, information technology and utilities. While health care suffered due to uncertainty over the status of the Affordable Care Act and potential pressure on drug pricing from the new administration, all of the sectors mentioned above lack the cyclical exposure or higher incumbent tax rates that would benefit from the perceived new environment. For all of 2016, health care was
easily the worst performer, offering a negative return (7.5%), while consumer discretionary 12.7% also lagged the benchmark.
In the small cap universe, Value was the leading factor group. Stocks in the two lowest-valuation price/earnings (P/E) quintile groups significantly outperformed their higher P/E counterparts during the quarter. Additionally, the smallest market cap quintile also outperformed, likely due to lower valuation parameters and the exchange-traded funds (ETF) impact from investors looking to quickly gain small cap exposure. Other factor designations were mixed and showed a slightly-higher quality bias. We believe the very weak performance by biotech (10.4%) is skewing this performance in favor of high-quality factors, as most biotech stocks fall into lower-quality categories. For the full year, smaller cap, lower-valuation and higher-leverage stocks outperformed, but the quality factors were again skewed by biotech (20.3%). Generally speaking, high-quality stocks did better in the first and fourth quarters and fared worse in both the second and third quarters.
For the full year, a significant part of the underperformance came from our cash allocation. In retrospect, we were too slow to redeploy the proceeds from profit taking and merger and acquisition (M&A) take-outs during the year, which was a drag during the second-half rally. Two sectors were responsible for most of the remaining damage. In materials, our underexposure to highly cyclical and commodity-driven stocks in industries such as metals and mining 80.4% and chemicals 48.7% weighed heavily on relative performance. From a stock selection standpoint, Flotek Industries (FTK) finished the year down (18%) on both fundamental and energy-related challenges. Silgan Holdings (SLGN), a low beta2 container producer, was also down slightly for the full year. In information technology, difficulty in the semiconductors and software industries dulled strong performance from other industries. The semi group had large gains in the Index 43.7% and none of our three holdings kept up. In software, all of our holdings performed in line or below the Index components, although none suffered a major earnings disappointment. In both
| 27 |
Table of Contents
AMG GW&K Small Cap Core Fund
Portfolio Manager’s Comments (continued)
of these groups, an untimely sell during the year added to the discomfort. Health care and consumer discretionary were our two best stock selection performers during the year.
It is difficult to conclude any investment report at this time without coming back to the election. As we noted at the opening, there are two drivers of the stock market: fundamentals and psychology or sentiment. The most shocking thing about the market psychology over the past three months is how investors have wholeheartedly embraced the potentially positive takeaways from this past election without really acknowledging any potential risks or challenges. This goes not only for stock investors, but participants in fixed-income and currency markets as well. We saw very dramatic moves up in both long-term Treasury rates and the U.S. Dollar during the fourth quarter. It seems, as we alluded to in the small cap factor discussion, that the set-up going into the fourth quarter was every bit as important as the actual catalyst event in setting these market moves in motion. Investors had become too complacent about rates staying low and stable growth and income stocks
outperforming, which caused an imbalance and opening for change. The narrative around the Trump and Republican victories pushed the markets over the edge. The question is…now what? It seems to us that while the economy is strengthening, a strong U.S. Dollar will likely offset this impact on corporate earnings overall in 2017. Will psychology and sentiment continue to exude optimism about earnings potential for 2018 and beyond in the face of pressure on 2017 estimates? Our best guess is that the small cap market will provide investors with opportunities in the coming year, as it usually does, after compounding at nearly 14.5% annually over the past five years. We are pleased that the Fund has kept up during these years of positive performance, as our approach is built to capture as much upside as possible but also protect against the downside. Our hope is that the upside will continue in 2017, but we will continue to build
a Fund portfolio that we believe will provide protection from potential downside should it emerge.
| 1 | Prior to October 1, 2016, the Fund’s Class N shares were known as Investor Shares. |
| 2 | A stock with lower volatility than the overall market. |
This commentary reflects the viewpoints of the portfolio manager, GW&K Investment Management, LLC as of December 31, 2016 and is not intended as a forecast or guarantee of future results, and is subject to change without notice.
28
Table of Contents
AMG GW&K Small Cap Core Fund
Portfolio Manager’s Comments (continued)
CUMULATIVE TOTAL RETURN PERFORMANCE
AMG GW&K Small Cap Core Fund’s cumulative total return is based on the daily change in net asset value (NAV) and assumes that all dividends and distributions were reinvested. The graph compares a hypothetical $10,000 investment made in AMG GW&K Small Cap Core Fund Class N (formally Investor Class) on December 31, 2006, to a $10,000 investment made in the Russell 2000® Index for the same time period. The graph and table do not reflect the deduction of taxes that a shareholder would pay on a Fund distribution or redemption of shares. The listed returns for the Fund are net of expenses and the returns for the index exclude expenses. Total returns would have been lower had certain expenses not been reduced.
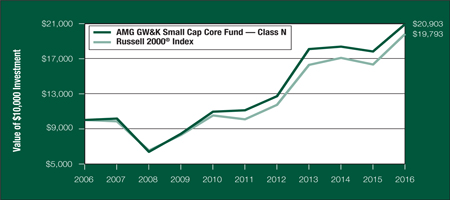
The table below shows the average annual total returns for the AMG GW&K Small Cap Core Fund and the Russell 2000® Index for the same time periods ended December 31, 2016.
| Average Annual Total Returns1 | One Year | Five Years | Ten Years | Since Inception | Inception date | |||||||||||||||
AMG GW&K Small Cap Core Fund 2,3,4 | ||||||||||||||||||||
Class N5 | 17.44 | % | 13.49 | % | 7.65 | % | 8.05 | % | 12/10/96 | |||||||||||
Class S5 | 17.75 | % | 13.79 | % | — | 15.20 | % | 7/27/09 | ||||||||||||
Class I5 | 17.90 | % | 13.97 | % | — | 15.40 | % | 7/27/09 | ||||||||||||
Russell 2000® Index6 | 21.31 | % | 14.46 | % | 7.07 | % | 8.24 | % | 12/10/96 | † | ||||||||||
The performance data shown represents past performance. Past performance is not a guarantee of future results. Current performance may be lower or higher than the performance data quoted. The investment return and principal value of an investment will fluctuate so that an investor’s shares, when redeemed, may be worth more or less than their original cost.
Investors should carefully consider the Fund’s investment objectives, risks, charges and expenses before investing. For performance information through the most recent month end, current net asset values per share for the Fund and other information, please call (800) 835-3879 or visit our website at www.amgfunds.com for a free prospectus. Read it carefully before investing or sending money.
Funds are distributed by AMG Distributors, Inc., member FINRA/SIPC.
| † | Date reflects the inception date of the Fund, not the index. |
| 1 | Total return equals income yield plus share price change and assumes reinvestment of all dividends and capital gain distributions. Returns are net of fees and may reflect offsets of Fund expenses as described in the prospectus. No adjustment has been made for taxes payable by shareholders on their reinvested dividends and capital gain distributions. Returns for periods greater than one year are annualized. The listed returns on the Fund are net of expenses and based on the published NAV as of December 31, 2016. All returns are in U.S. dollars ($). |
| 2 | From time to time, the Fund’s advisor has waived its fees and/or absorbed Fund expenses, which has resulted in higher returns. |
| 3 | The Fund inception dates and returns for all periods beginning prior to November 7, 2008 reflects performance of the predecessor Fund, The BNY Hamilton Multi-Cap Equity Fund, a series of BNY Hamilton Funds, Inc. |
| 4 | The Fund is subject to risks associated with investments in small-capitalization companies, such as erratic earnings patterns, competitive conditions, limited earnings history, and a reliance on one or a limited number of products. |
| 5 | Effective October 1, 2016, the Investor Class, Service Class and Institutional Class were renamed Class N, Class S and Class I, respectively. |
| 6 | The Russell 2000® Index is composed of the 2,000 smallest stocks in the Russell 3000® Index and is widely regarded in the industry as the premier measure of small-cap stock performance. Unlike the Fund, the Russell 2000® Index is unmanaged, is not available for investment and does not incur expenses. |
The Russell Indices are trademarks of the London Stock Exchange Group companies.
Not FDIC insured, nor bank guaranteed. May lose value.
29
Table of Contents
AMG GW&K Small Cap Core Fund
Fund Snapshots (unaudited)
December 31, 2016
PORTFOLIO BREAKDOWN
Sector | AMG GW&K Small Cap Core Fund* | Russell 2000® Index | ||||||
Financials | 17.4 | % | 19.9 | % | ||||
Industrials | 17.2 | % | 14.6 | % | ||||
Information Technology | 16.3 | % | 16.9 | % | ||||
Health Care | 14.7 | % | 12.2 | % | ||||
Consumer Discretionary | 13.7 | % | 12.6 | % | ||||
Real Estate | 7.3 | % | 7.9 | % | ||||
Materials | 4.2 | % | 4.9 | % | ||||
Energy | 3.5 | % | 3.8 | % | ||||
Utilities | 2.9 | % | 3.5 | % | ||||
Consumer Staples | 1.1 | % | 3.0 | % | ||||
Telecommunication Services | 0.0 | % | 0.7 | % | ||||
Other Assets and Liabilities | 1.7 | % | 0.0 | % | ||||
| * | As a percentage of net assets. |
TOP TEN HOLDINGS
| % of | ||||
Security Name | Net Assets | |||
West Pharmaceutical Services, Inc.** | 2.6 | % | ||
LogMeln, Inc.** | 2.5 | |||
Grand Canyon Education, Inc.** | 2.4 | |||
MarketAxess Holdings, Inc.** | 2.3 | |||
ICU Medical, Inc.** | 2.2 | |||
Texas Roadhouse, Inc.** | 2.1 | |||
Lithia Motors, Inc., Class A | 2.0 | |||
Matador Resources Co. | 1.9 | |||
Cathay General Bancorp | 1.8 | |||
Texas Capital Bancshares, Inc. | 1.8 | |||
|
| |||
Top Ten as a Group | 21.6 | % | ||
|
| |||
| ** | Top Ten Holdings as of June 30, 2016. |
Because a fund’s strategy may result in multiple investments in particular sectors of the economy, its performance may depend on the performance of those sectors and may fluctuate more widely than investments diversified across more sectors. For additional information on these and other risk considerations, please see the Fund’s prospectus.
Any sectors, industries, or securities discussed should not be perceived as investment recommendations. Mention of a specific security should not be considered a recommendation to buy or solicitation to sell that security. Specific securities mentioned in this report may have been sold from the Fund’s portfolio of investments by the time you receive this report.
30
Table of Contents
AMG GW&K Small Cap Core Fund
Schedule of Portfolio Investments
December 31, 2016
| Shares | Value | |||||||
Common Stocks—98.3% | ||||||||
Consumer Discretionary—13.7% |
| |||||||
CalAtlantic Group, Inc.1 | 142,708 | $ | 4,853,499 | |||||
Five Below, Inc.*,1 | 131,706 | 5,262,972 | ||||||
Grand Canyon Education, Inc.* | 171,126 | 10,002,315 | ||||||
Helen of Troy, Ltd.* | 37,408 | 3,159,106 | ||||||
Hibbett Sports, Inc.*,1 | 97,271 | 3,628,208 | ||||||
Lithia Motors, Inc., Class A | 87,465 | 8,469,236 | ||||||
Monro Muffler Brake, Inc. | 44,820 | 2,563,704 | ||||||
Oxford Industries, Inc. | 64,254 | 3,863,593 | ||||||
Texas Roadhouse, Inc. | 184,975 | 8,923,194 | ||||||
Tupperware Brands Corp.1 | 66,349 | 3,491,284 | ||||||
Wolverine World Wide, Inc. | 157,135 | 3,449,113 | ||||||
Total Consumer Discretionary | 57,666,224 | |||||||
Consumer Staples—1.1% | ||||||||
Amplify Snack Brands, Inc.*,1 | 152,027 | 1,339,358 | ||||||
WD-40 Co. | 26,862 | 3,140,168 | ||||||
Total Consumer Staples | 4,479,526 | |||||||
Energy—3.5% | ||||||||
Dril-Quip, Inc.* | 52,980 | 3,181,449 | ||||||
Forum Energy Technologies, Inc.* | 183,680 | 4,040,960 | ||||||
Matador Resources Co.*,1 | 300,600 | 7,743,456 | ||||||
Total Energy | 14,965,865 | |||||||
Financials—17.4% | ||||||||
Ameris Bancorp | 122,177 | 5,326,917 | ||||||
AMERISAFE, Inc. | 87,276 | 5,441,659 | ||||||
Cathay General Bancorp | 199,289 | 7,578,961 | ||||||
Cohen & Steers, Inc. | 124,916 | 4,197,178 | ||||||
Glacier Bancorp, Inc. | 109,227 | 3,957,294 | ||||||
IBERIABANK Corp. | 62,884 | 5,266,535 | ||||||
MarketAxess Holdings, Inc. | 66,014 | 9,698,777 | ||||||
PRA Group, Inc.* | 71,109 | 2,780,362 | ||||||
ProAssurance Corp. | 96,290 | 5,411,498 | ||||||
Stifel Financial Corp.* | 121,911 | 6,089,454 | ||||||
Texas Capital Bancshares, Inc.* | 96,337 | 7,552,821 | ||||||
United Bankshares Inc.1 | 69,214 | 3,201,148 | ||||||
Webster Financial Corp. | 127,267 | 6,908,053 | ||||||
Total Financials | 73,410,657 | |||||||
Health Care—14.7% | ||||||||
Analogic Corp. | 25,888 | 2,147,410 | ||||||
| Shares | Value | |||||||
Cantel Medical Corp. | 71,371 | $ | 5,620,466 | |||||
Catalent, Inc.* | 181,889 | 4,903,727 | ||||||
Cotiviti Holdings, Inc.*,1 | 88,527 | 3,045,329 | ||||||
Diplomat Pharmacy, Inc.*,1 | 141,319 | 1,780,619 | ||||||
Globus Medical, Inc., Class A* | 231,841 | 5,751,975 | ||||||
ICU Medical, Inc.* | 64,183 | 9,457,365 | ||||||
Impax Laboratories, Inc.* | 124,372 | 1,647,929 | ||||||
INC Research Holdings, Inc., Class A* | 137,715 | 7,243,809 | ||||||
Medidata Solutions, Inc.* | 103,872 | 5,159,322 | ||||||
West Pharmaceutical Services, Inc. | 127,174 | 10,788,170 | ||||||
Wright Medical Group N.V.*,1 | 200,141 | 4,599,240 | ||||||
Total Health Care | 62,145,361 | |||||||
Industrials—17.2% | ||||||||
Alamo Group, Inc. | 34,820 | 2,649,802 | ||||||
CEB, Inc. | 86,445 | 5,238,567 | ||||||
CLARCOR, Inc. | 90,830 | 7,490,750 | ||||||
Healthcare Services Group, Inc. | 150,958 | 5,913,025 | ||||||
Heartland Express, Inc.1 | 263,856 | 5,372,108 | ||||||
HEICO Corp. | 76,190 | 5,878,058 | ||||||
HEICO Corp., Class A | 57,330 | 3,892,707 | ||||||
Mobile Mini, Inc. | 107,616 | 3,255,384 | ||||||
Primoris Services Corp. | 206,142 | 4,695,915 | ||||||
RBC Bearings, Inc.* | 56,077 | 5,204,506 | ||||||
Ritchie Bros. Auctioneers, Inc. | 196,104 | 6,667,536 | ||||||
The Toro Co. | 100,408 | 5,617,828 | ||||||
Universal Forest Products, Inc. | 67,271 | 6,873,751 | ||||||
US Ecology, Inc. | 73,187 | 3,597,141 | ||||||
Total Industrials | 72,347,078 | |||||||
Information Technology—16.3% |
| |||||||
Blackbaud, Inc. | 85,403 | 5,465,792 | ||||||
Callidus Software, Inc.* | 194,291 | 3,264,089 | ||||||
Cardtronics PLC, Class A* | 95,894 | 5,232,936 | ||||||
Cognex Corp. | 110,617 | 7,037,454 | ||||||
EPAM Systems, Inc.*,1 | 68,709 | 4,418,676 | ||||||
ExlService Holdings, Inc.* | 81,775 | 4,124,731 | ||||||
HubSpot, Inc.* | 104,484 | 4,910,748 | ||||||
LogMeln, Inc.1 | 110,233 | 10,642,996 | ||||||
MACOM Technology Solutions Holdings, Inc.*,1 | 115,862 | 5,362,093 | ||||||
Power Integrations, Inc. | 84,245 | 5,716,023 | ||||||
Proofpoint, Inc.*,1 | 42,776 | 3,022,124 | ||||||
The accompanying notes are an integral part of these financial statements.
31
Table of Contents
AMG GW&K Small Cap Core Fund
Schedule of Portfolio Investments (continued)
| Shares | Value | |||||||
Information Technology—16.3% |
| |||||||
Rogers Corp.* | 24,919 | $ | 1,914,028 | |||||
Tyler Technologies, Inc.* | 52,338 | 7,472,296 | ||||||
Total Information Technology | 68,583,986 | |||||||
Materials—4.2% | ||||||||
Balchem Corp. | 63,834 | 5,356,949 | ||||||
Compass Minerals International, Inc.1 | 42,085 | 3,297,360 | ||||||
Flotek Industries, Inc.* | 197,087 | 1,850,647 | ||||||
KapStone Paper and Packaging Corp. | 166,308 | 3,667,091 | ||||||
Silgan Holdings, Inc. | 71,611 | 3,665,051 | ||||||
Total Materials | 17,837,098 | |||||||
Real Estate—7.3% | ||||||||
American Campus Communities, Inc. | 103,667 | 5,159,507 | ||||||
Education Realty Trust, Inc. | 148,001 | 6,260,442 | ||||||
National Health Investors, Inc. | 71,340 | 5,291,288 | ||||||
Pebblebrook Hotel Trust1 | 113,633 | 3,380,582 | ||||||
STAG Industrial, Inc. | 216,921 | 5,177,904 | ||||||
Sun Communities, Inc. | 73,032 | 5,594,982 | ||||||
Total Real Estate | 30,864,705 | |||||||
Utilities—2.9% | ||||||||
IDACORP, Inc. | 66,012 | 5,317,267 | ||||||
NorthWestern Corp. | 121,184 | 6,891,734 | ||||||
Total Utilities | 12,209,001 | |||||||
Total Common Stocks | 414,509,501 | |||||||
| Principal Amount | ||||||||
Short-Term Investments—8.0% |
| |||||||
Repurchase Agreements—6.3%5 |
| |||||||
Citigroup Global Markets, Inc., dated 12/30/16,due 01/03/17, 0.530% total to be received $6,314,092 (collateralized by various U.S. Government Agency Obligations, 2.000%—8.500%, 12/01/17—01/01/47, totaling $6,439,994) | $ | 6,313,720 | 6,313,720 | |||||
| Principal Amount | Value | |||||||
Daiwa Capital Markets America, dated 12/30/16, due 01/03/17, 0.520% total to be received $6,314,085 (collateralized by various U.S. Government Agency Obligations, 0.000%—6.500%, 03/02/17—02/01/49, totaling $6,439,994) | $ | 6,313,720 | $ | 6,313,720 | ||||
Merrill Lynch Pierce Fenner & Smith, Inc., dated 12/30/16, due 01/03/17, 0.500% total to be received $1,328,827 (collateralized by various U.S. Government Agency Obligations, 0.685%—2.000%, 10/31/18—11/30/22, totaling $1,355,328) | 1,328,753 | 1,328,753 | ||||||
Nomura Securities International, Inc., dated 12/30/16, due 01/03/17, 0.500% total to be received $6,314,071 (collateralized by various U.S. Government Agency Obligations, 0.000%—9.500%, 01/15/17—08/20/66, totaling $6,439,995) | 6,313,720 | 6,313,720 | ||||||
State of Wisconsin Investment Board, dated 12/30/16, due 01/03/17, 0.650% total to be received $6,314,176 (collateralized by various U.S. Government Agency Obligations, 0.125%—3.875%, 04/15/18—02/15/46, totaling $6,474,145) | 6,313,720 | 6,313,720 | ||||||
Total Repurchase Agreements | 26,583,633 | |||||||
| Shares | ||||||||
Other Investment Companies—1.7%6 |
| |||||||
Dreyfus Government Cash Management Fund, Institutional Class Shares, 0.45% | 7,085,094 | 7,085,094 | ||||||
Total Short-Term Investments | 33,668,727 | |||||||
Total Investments—106.3% | 448,178,228 | |||||||
Other Assets, less Liabilities—(6.3)% | (26,756,921 | ) | ||||||
Net Assets—100.0% | $ | 421,421,307 | ||||||
The accompanying notes are an integral part of these financial statements.
32
Table of Contents
AMG GW&K Small Cap Growth Fund
Portfolio Manager’s Comments (unaudited)
THE YEAR IN REVIEW
For the year ended December 31, 2016, the AMG GW&K Small Cap Growth Fund (Class I)1 (the Fund) returned 9.7%, underperforming the Russell 2000® Growth Index, which returned 11.3%.
A wise man once said about the stock market: “Don’t you know this is all about psychology?” In this case, we are quoting our Chief Investment Officer during one of our recent Investment Policy meetings. But sometimes, when you spend all day immersed in company level financials, industry data and macroeconomic statistics, it is easy to forget the large role that psychology or, said differently, sentiment, plays in determining equity returns. In the fourth quarter of 2016, we experienced one of those periods where sentiment changed dramatically. The surprising nature of the catalyst for this change, the election victory by Donald Trump and the Republican sweep of Congress, added to the intensity of the sentiment shift. Investors moved from positioning for a Washington and macroeconomic status quo (or perhaps even a tilt in the Senate towards Democrats) to a political landscape dominated by the Republican ticket. Making the situation even more interesting is the lack of a clear ideology for President-elect Trump. This blank slate permitted investors to imagine the most positive outcomes this newly-elected leader might be able to accomplish. And dream they have, driving equity prices up on hope of lower taxes, lower regulation and beneficial infrastructure spending, which would drive overall higher growth rates for both the economy and corporate profits. This sounds like Nirvana, not the Washington or economic landscape we have come to know well over the last eight years.
Given its high domestic exposure and risk profile, it is no wonder that the Russell 2000® Growth Index popped 10.2% from the election through the end of the year. While the election served as a catalyst, the narrative for a market rally had been set up by the preceding two and a half years, as corporate profits stalled and small cap growth stocks had mostly vacillated. This was compounded by a macro overlay where investors were obsessed with safety and embraced the idea that low rates and
low growth were here to stay. The result was too much emphasis on safety and low-growth trades, while avoiding cyclical growth at all costs. Furthermore, stocks had pulled back considerably heading into the election, as the Russell 2000® Growth Index sat 7.3% off its recent high. Thus, while the election was the spark that started the fire, the dry kindling and crumpled newspaper were already in the fireplace. This fire left U.S. small cap growth stocks with returns of 3.6% and 11.3% for the fourth quarter and the year, respectively. These results compare favorably with the large cap brethren as seen by the quarterly and annual returns for the Russell 1000® Growth Index of 1.0% and 7.1%, respectively. However, they pale in comparison to the move in the Russell 2000® Value Index, which posted a gain of 14.1% in the fourth quarter and 31.7% for the year. It is worth noting that this disconnect between growth and value stocks in the U.S. small cap market was quite the outlier compared to recent years. The Russell 2000® Growth Index has not lagged its value counterpart by this much in over a decade. The aftermath of the dot.com bubble, namely 2001, was the last time growth stocks were trampled this badly. In fact, that was the last year that either benchmark has gotten the best of the other by more than 2,000 basis points.
Despite the yawning gap in performance, the U.S. small cap benchmarks for growth and value had some notable commonalities. The best performing sector for both benchmarks during the fourth quarter was financials, and they also shared the same worst performing sector, health care. The financials sector averaged 5.5% of the Growth Index and returned 19.7%. The financials sector within the Value Index was bigger on both counts, averaging 29.3% of the benchmark and returning 25.5%. At the other end of the spectrum, health care constituted 21.8% of the Russell 2000® Growth Index and declined (7.2%). In contrast, the health care sector was 4.5% of the Russell 2000® Value Index and posted a loss of (1.7%). Both indices also shared some style preferences during the fourth quarter. Specifically, stocks with low price/earnings (P/E) and profitable companies were in vogue. In sum, the two benchmarks had much in common as to what did work and what
did not work, but the Growth Index had relatively less of the former and relatively more of the latter, which contributed significantly to the divergence in outcomes for the two benchmarks.
To return our focus exclusively to growth stocks, the financials sector was the clear leader of the Russell 2000® Growth Index in the fourth quarter, but other areas also posted strong gains. Industrials took the runner-up prize to financials. The next best performing meaningful sectors were consumer discretionary, materials and energy, which were tightly grouped, with returns between 7% and 8%. A common thread across these top performers is that they generally have cyclical exposure and would be potential beneficiaries of inflation. Even within consumer discretionary, over half of the return in this sector came from the hotels, restaurants and leisure industry, which would welcome a boost in food costs. In total, the strength in the quarter was broad based, as all sectors save health care finished comfortably in the green. Health care was the only sector to deliver negative returns, declining (7.2%). Within this sector, the biotechnology and pharmaceuticals industries led the way lower with declines of (12.2%) and (11.7%), respectively. The underperformance of the biopharma complex was likely due to mean reversion combined with fears of an unfriendly administration. However, these industries were far from the only culprits for health care’s poor showing. In total, all six industries in the health care sector lagged the benchmark and five of the six finished in the red. Perhaps not surprisingly, the potential for changes on the legislative front left many investors feeling unsettled about the broader health care landscape.
The story for the full year was similar, in many respects, to that of the fourth quarter. The materials sector took the top prize in 2016, with a return of 28.9%. The energy and industrials sectors were a nose behind, posting gains of 28.7% and 28.6%, respectively. Financials was the only other sector to clear the 20% threshold, posting a return of 21.0%. These sectors could be notable winners if some of the president-elect’s foremost initiatives come to pass; most notably, a
| 33 |
Table of Contents
AMG GW&K Small Cap Growth Fund
Portfolio Manager’s Comments (continued)
reduction in the corporate tax rate, an easing of the regulatory environment and a sizable infrastructure bill. As for the laggards in 2016, the health care sector brought up the rear, just as it did in the fourth quarter, as the only sector to net a loss for the year. The health care sector actually outperformed in the second and third quarters, but that was not enough to overcome losses at the start and end of the year. The result was an overall decline for the sector of (9.7%) for the year.
To drill down on the Fund’s performance versus the benchmark, our relative results for both the quarter and the year were led by the consumer discretionary sector. This group had a number of winners, with a total of four stocks returning at least 20% in the quarter and nine for the year as a whole. Grand Canyon Education Inc. (LOPE) topped the list in the fourth quarter on the back of strong earnings and anticipation of a more amenable regulatory environment. Grand Canyon was a strong performer for the full year, but it ceded the top spot in consumer discretionary in 2016 to Burlington Stores Inc. (BURL) which came close to doubling. Burlington’s stock performance was driven by generally good quarterly reports and investors’ increasing appreciation for the company’s ability to withstand encroachment by e-commerce threats. Beyond consumer discretionary, the financials sector was a notable contributor for both the quarter and the year due to our overweight position in the sector along with some strong stock picks. As to the latter, the biggest contributor in the sector for both the quarter and the year was Texas Capital Bancshares Inc. (TCBI), which benefits from a steeper yield curve and higher oil prices.
On the other side of the ledger, the industrials and consumer staples sectors were the biggest detractors to relative performance during the fourth quarter. The industrials weakness was a combination of allocation and selection effects. On the allocation front, industrials was one of the strongest sectors in the benchmark on the heels of the election, and we suffered from an underweight position. As for stock selection, the primary detractors were Proto Labs Inc. (PRLB) and Ritchie Bros. Auctioneers Inc. (RBA). Proto Labs was hit by a meaningful guidance reduction on its last earnings call, which led us to question our thesis and subsequently exit our position. Ritchie Bros.
Auctioneers pulled back in late December in reaction to disappointing auction proceeds after a period of significant outperformance for the stock. In consumer staples, the weakness can be blamed on Amplify Snack Brands Inc. (BETR), which was hurt by poor quarterly results not long after announcing a sizable strategic acquisition. For the year, the most significant detractors were the information technology and consumer staples sectors. The weakness in information technology can be attributed to our software and semiconductor holdings, within which two stocks stood out, Tyler Technologies, Inc. (TYL) and Cavium Inc. (CAVM). Similar to Amplify Snack Brands, Tyler Technologies’s execution was disappointing on the heels of a large acquisition. Tyler has been a significant holding for a number of years and we continue to have confidence in the company’s long-term prospects. We cannot say we retained the same confidence in Cavium after they announced an acquisition that significantly changed our view of the company and led us to sell our position. In consumer staples, Smart & Final Stores Inc. (SFS) combined with Amplify Snack Brands to weigh on results in this sector. Food deflation and competitive concerns appeared to be the main reasons for the stock’s underperformance. The changing competitive dynamics were especially troubling for us and led to a sale of Smart & Final Stores.
It is difficult to conclude any investment report at this time without coming back to the election. As we noted at the opening, there are two drivers of the stock market: fundamentals and psychology or sentiment. The most shocking thing about the market psychology over the past three months is how investors have wholeheartedly embraced the potentially positive takeaways from this past election without really acknowledging any potential risks or challenges. This goes not only for stock investors, but participants in fixed-income and currency markets, as well. We saw very dramatic moves up in both long-term Treasury rates and the U.S. Dollar during the quarter. The question is…now what? It seems to us that while the economy is strengthening, a strong U.S. Dollar may partially offset this impact on corporate earnings overall in 2017. Will psychology and sentiment continue to exude optimism about earnings potential for 2018 and beyond, if 2017 estimates do not move
sharply higher? Our best guess is that the small cap growth market will provide investors with opportunities in the coming year, as it usually does, after compounding at nearly 13.7% annually over the past five years. Our hope is that the upside will continue in 2017, but we will continue to build a Fund portfolio that we believe will provide protection from potential downside should it emerge.
| 1 | Prior to October 1, 2016, the Fund’s Class I shares were known as Institutional Shares. |
This commentary reflects the viewpoints of the portfolio manager, GW&K Investment Management, LLC as of December 31, 2016 and is not intended as a forecast or guarantee of future results, and is subject to change without notice.
| 34 |
Table of Contents
AMG GW&K Small Cap Growth Fund
Portfolio Manager’s Comments (continued)
CUMULATIVE TOTAL RETURN PERFORMANCE
AMG GW&K Small Cap Growth Fund’s cumulative total return is based on the daily change in net asset value (NAV) and assumes that all dividends and distributions were reinvested. The graph compares a hypothetical $10,000 investment made in AMG GW&K Small Cap Growth Fund Class I (formerly Institutional Class) on June 30, 2015, to a $10,000 investment made in the Russell 2000® Growth Index for the same time period. The graph and table do not reflect the deduction of taxes that a shareholder would pay on a Fund distribution or redemption of shares. The listed returns for the Fund are net of expenses and the returns for the index exclude expenses. Total returns would have been lower had certain expenses not been reduced.
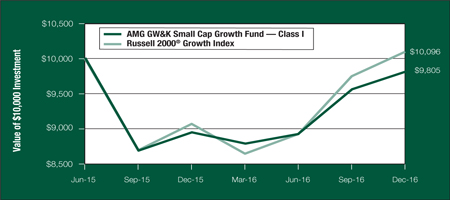
The table below shows the average annual total returns for the AMG GW&K Small Cap Growth Fund and the Russell 2000® Growth Index for the same time periods ended December 31, 2016.
| One | Since | Inception | ||||||||||
| Average Annual Total Returns1 | Year | Inception | Date | |||||||||
AMG GW&K Small Cap Growth Fund 2,3,4 | ||||||||||||
Class I5 | 9.68 | % | (1.30 | )% | 6/30/15 | |||||||
Russell 2000® Growth Index6 | 11.32 | % | 0.64 | % | 6/30/15 | † | ||||||
The performance data shown represents past performance. Past performance is not a guarantee of future results. Current performance may be lower or higher than the performance data quoted. The investment return and principal value of an investment will fluctuate so that an investor’s shares, when redeemed, may be worth more or less than their original cost.
Investors should carefully consider the Fund’s investment objectives, risks, charges and expenses before investing. For performance information through the most recent month end, current net asset values per share for the Fund and other information, please call (800) 835-3879 or visit our website at www.amgfunds.com for a free prospectus. Read it carefully before investing or sending money.
Funds are distributed by AMG Distributors, Inc., member FINRA/SIPC.
| † | Date reflects the inception date of the Fund, not the index |
| 1 | Total return equals income yield plus share price change and assumes reinvestment of all dividends and capital gain distributions. Returns are net of fees and may reflect offsets of Fund expenses as described in the prospectus. No adjustment has been made for taxes payable by shareholders on their reinvested dividends and capital gain distributions. Returns for periods greater than one year are annualized. The listed returns on the Fund are net of expenses and based on the published NAV as of December 31, 2016. All returns are in U.S. dollars ($). |
| 2 | From time to time, the Fund’s advisor has waived its fees and/or absorbed Fund expenses, which has resulted in higher returns. |
| 3 | The Fund is subject to risks associated with investments in small-capitalization companies, such as erratic earnings patterns, competitive conditions, limited earnings history, and a reliance on one or a limited number of products. |
| 4 | The Fund invests in growth stocks, which may be more sensitive to market movements because their prices tend to reflect future investor expectations rather than just current profits. Growth stocks may underperform value stocks during any given period. |
| 5 | Effective October 1, 2016, the Institutional Class was renamed Class I. |
| 6 | The Russell 2000® Growth Index measures the performance of the Russell 2,000 companies with higher price-to-book ratios and higher forecasted growth values. Unlike the Fund, the Russell 2000® Growth Index is unmanaged, is not available for investment and does not incur expenses. |
The Russell Indices are trademarks of the London Stock Exchange Group companies.
Not FDIC insured, nor bank guaranteed. May lose value.
35
Table of Contents
AMG GW&K Small Cap Growth Fund
Fund Snapshots (unaudited)
December 31, 2016
PORTFOLIO BREAKDOWN
Sector | AMG GW&K Small Cap Growth Fund* | Russell 2000® Growth Index | ||||||
Information Technology | 26.4 | % | 24.2 | % | ||||
Health Care | 20.0 | % | 20.9 | % | ||||
Consumer Discretionary | 18.1 | % | 15.4 | % | ||||
Industrials | 14.8 | % | 16.8 | % | ||||
Financials | 10.0 | % | 5.7 | % | ||||
Materials | 3.8 | % | 5.2 | % | ||||
Real Estate | 2.9 | % | 5.5 | % | ||||
Consumer Staples | 1.8 | % | 3.1 | % | ||||
Energy | 1.3 | % | 1.6 | % | ||||
Telecommunication Services | 0.0 | % | 0.8 | % | ||||
Utilities | 0.0 | % | 0.8 | % | ||||
Other Assets and Liabilities | 0.9 | % | 0.0 | % | ||||
| * | As a percentage of net assets. |
TOP TEN HOLDINGS
| % of | ||||
Security Name | Net Assets | |||
Grand Canyon Education, Inc.** | 3.4 | % | ||
WageWorks, Inc.** | 2.5 | |||
Burlington Stores, Inc.** | 2.5 | |||
LogMeln, Inc. | 2.4 | |||
Power Integrations, Inc.** | 2.4 | |||
MarketAxess Holdings, Inc.** | 2.3 | |||
Balchem Corp. | 2.2 | |||
Ritchie Bros. Auctioneers, Inc.** | 2.1 | |||
Pool Corp.** | 2.1 | |||
Dave & Buster’s Entertainment, Inc. | 2.0 | |||
|
| |||
Top Ten as a Group | 23.9 | % | ||
|
| |||
| ** | Top Ten Holdings as of June 30, 2016. |
Because a fund’s strategy may result in multiple investments in particular sectors of the economy, its performance may depend on the performance of those sectors and may fluctuate more widely than investments diversified across more sectors. For additional information on these and other risk considerations, please see the Fund’s prospectus.
Any sectors, industries, or securities discussed should not be perceived as investment recommendations. Mention of a specific security should not be considered a recommendation to buy or solicitation to sell that security. Specific securities mentioned in this report may have been sold from the Fund’s portfolio of investments by the time you receive this report.
36
Table of Contents
AMG GW&K Small Cap Growth Fund
Schedule of Portfolio Investments
December 31, 2016
| Shares | Value | |||||||
Common Stocks—99.1% | ||||||||
Consumer Discretionary—18.1% | ||||||||
Build-A-Bear Workshop, Inc.* | 1,605 | $ | 22,069 | |||||
Burlington Stores, Inc.* | 645 | 54,664 | ||||||
Chuy’s Holdings, Inc.* | 1,144 | 37,123 | ||||||
Dave & Buster’s Entertainment, Inc.* | 802 | 45,153 | ||||||
Five Below, Inc.* | 1,015 | 40,559 | ||||||
Fox Factory Holding Corp.* | 1,150 | 31,913 | ||||||
Grand Canyon Education, Inc.* | 1,285 | 75,108 | ||||||
Hibbett Sports, Inc.*,1 | 505 | 18,836 | ||||||
Oxford Industries, Inc. | 425 | 25,555 | ||||||
Pool Corp. | 455 | 47,475 | ||||||
Vitamin Shoppe, Inc.* | 280 | 6,650 | ||||||
Total Consumer Discretionary | 405,105 | |||||||
Consumer Staples—1.8% | ||||||||
Amplify Snack Brands, Inc.*,1 | 1,345 | 11,849 | ||||||
PriceSmart, Inc. | 330 | 27,555 | ||||||
Total Consumer Staples | 39,404 | |||||||
Energy—1.3% | ||||||||
Matador Resources Co.*,1 | 1,145 | 29,495 | ||||||
Financials—10.0% | ||||||||
Encore Capital Group, Inc.* | 785 | 22,490 | ||||||
Greenhill & Co., Inc. | 385 | 10,664 | ||||||
Heritage Insurance Holdings, Inc. | 970 | 15,200 | ||||||
MarketAxess Holdings, Inc. | 345 | 50,687 | ||||||
Pinnacle Financial Partners, Inc. | 399 | 27,651 | ||||||
PrivateBancorp, Inc. | 785 | 42,539 | ||||||
Stifel Financial Corp.* | 440 | 21,978 | ||||||
Texas Capital Bancshares, Inc.* | 395 | 30,968 | ||||||
Total Financials | 222,177 | |||||||
Health Care—20.0% | ||||||||
ABIOMED, Inc.* | 205 | 23,099 | ||||||
Acadia Healthcare Co., Inc.*,1 | 550 | 18,205 | ||||||
Amicus Therapeutics, Inc.*,1 | 3,310 | 16,451 | ||||||
Bruker Corp. | 715 | 15,144 | ||||||
Catalent, Inc.* | 1,140 | 30,734 | ||||||
Cotiviti Holdings, Inc.*,1 | 872 | 29,997 | ||||||
DBV Technologies, S.A., Sponsored ADR* | 855 | 30,036 | ||||||
Endologix, Inc.* | 1,350 | 7,722 | ||||||
Globus Medical, Inc., Class A* | 1,205 | 29,896 | ||||||
ICU Medical, Inc.* | 230 | 33,890 | ||||||
| Shares | Value | |||||||
Impax Laboratories, Inc.* | 730 | $ | 9,672 | |||||
INC Research Holdings, Inc., Class A* | 730 | 38,398 | ||||||
Inotek Pharmaceuticals Corp.*,1 | 2,520 | 15,372 | ||||||
Medidata Solutions, Inc.* | 735 | 36,507 | ||||||
Neurocrine Biosciences, Inc.* | 715 | 27,670 | ||||||
Retrophin, Inc.* | 1,115 | 21,107 | ||||||
West Pharmaceutical Services, Inc. | 370 | 31,387 | ||||||
Wright Medical Group N.V.* | 1,370 | 31,483 | ||||||
Total Health Care | 446,770 | |||||||
Industrials—14.8% | ||||||||
CEB, Inc. | 430 | 26,058 | ||||||
Exponent, Inc. | 445 | 26,834 | ||||||
Graco, Inc. | 365 | 30,328 | ||||||
HEICO Corp. | 545 | 42,047 | ||||||
Knight Transportation, Inc. | 670 | 22,144 | ||||||
Ritchie Bros. Auctioneers, Inc. | 1,405 | 47,770 | ||||||
SiteOne Landscape Supply, Inc.* | 935 | 32,473 | ||||||
Thermon Group Holdings, Inc.* | 630 | 12,027 | ||||||
WageWorks, Inc.* | 755 | 54,738 | ||||||
Woodward, Inc. | 525 | 36,251 | ||||||
Total Industrials | 330,670 | |||||||
Information Technology—26.4% | ||||||||
Blackbaud, Inc. | 475 | 30,400 | ||||||
Bottomline Technologies, Inc.* | 725 | 18,140 | ||||||
Cabot Microelectronics Corp. | 370 | 23,373 | ||||||
Callidus Software, Inc.* | 1,340 | 22,512 | ||||||
Cardtronics PLC, Class A* | 550 | 30,014 | ||||||
Cognex Corp. | 504 | 32,064 | ||||||
CyberArk Software, Ltd.* | 420 | 19,110 | ||||||
EPAM Systems, Inc.*,1 | 570 | 36,657 | ||||||
ExlService Holdings, Inc.* | 431 | 21,740 | ||||||
Forrester Research, Inc. | 865 | 37,152 | ||||||
HubSpot, Inc.* | 645 | 30,315 | ||||||
Intralinks Holdings, Inc.*,1 | 1,195 | 16,156 | ||||||
LogMeln, Inc. | 560 | 54,068 | ||||||
MACOM Technology Solutions Holdings, Inc.*,1 | 635 | 29,388 | ||||||
MAXIMUS, Inc. | 370 | 20,642 | ||||||
Mimecast, Ltd.* | 755 | 13,514 | ||||||
Power Integrations, Inc. | 775 | 52,584 | ||||||
Tyler Technologies, Inc.* | 285 | 40,689 | ||||||
VeriFone Systems, Inc.* | 950 | 16,844 | ||||||
The accompanying notes are an integral part of these financial statements.
37
Table of Contents
AMG GW&K Small Cap Growth Fund
Schedule of Portfolio Investments (continued)
| Shares | Value | |||||||
Information Technology—26.4% (continued) | ||||||||
Xactly Corp.* | 1,634 | $ | 17,975 | |||||
Zebra Technologies Corp., Class A* | 300 | 25,728 | ||||||
Total Information Technology | 589,065 | |||||||
Materials—3.8% | ||||||||
Balchem Corp. | 595 | 49,932 | ||||||
Flotek Industries, Inc.* | 1,160 | 10,892 | ||||||
KapStone Paper and Packaging Corp. | 1,045 | 23,042 | ||||||
Total Materials | 83,866 | |||||||
Real Estate—2.9% | ||||||||
STAG Industrial, Inc. | 1,270 | 30,315 | ||||||
Sun Communities, Inc. | 455 | 34,858 | ||||||
Total Real Estate | 65,173 | |||||||
Total Common Stocks (cost $1,980,195) | 2,211,725 | |||||||
| Principal Amount | Value | |||||||
Short-Term Investments—9.2% | ||||||||
Repurchase Agreements—6.8%5 |
| |||||||
Citigroup Global Markets, Inc., dated 12/30/16, due 01/03/17, 0.510% total to be received $151,684 (collateralized by various U.S. Government Agency Obligations, 0.125%—1.750%, 04/15/20—01/15/28, totaling $154,709) | $ | 151,675 | $ | 151,675 | ||||
| Shares | ||||||||
Other Investment Companies—2.4%6 | ||||||||
Dreyfus Government Cash Management Fund, Institutional Class Shares, 0.45% | 53,964 | 53,964 | ||||||
Total Short-Term Investments | 205,639 | |||||||
Total Investments—108.3% | 2,417,364 | |||||||
Other Assets, less Liabilities—(8.3)% | (186,272 | ) | ||||||
Net Assets—100.0% | $ | 2,231,092 | ||||||
The accompanying notes are an integral part of these financial statements.
38
Table of Contents
Notes to Schedules of Portfolio Investments
The following footnotes should be read in conjunction with each of the Schedules of Portfolio Investments previously presented in this report.
At December 31, 2016, the approximate cost of investments and the aggregate gross unrealized appreciation and depreciation based on federal income tax were as follows:
| Fund | Cost | Appreciation | Depreciation | Net | ||||||||||||
AMG GW&K Enhanced Core Bond Fund | $ | 114,283,906 | $ | 739,296 | $ | (1,519,105 | ) | $ | (779,809 | ) | ||||||
AMG GW&K Municipal Bond Fund | 948,229,332 | 2,475,577 | (23,497,109 | ) | (21,021,532 | ) | ||||||||||
AMG GW&K Municipal Enhanced Yield Fund | 221,425,423 | 2,610,932 | (7,279,294 | ) | (4,668,362 | ) | ||||||||||
AMG GW&K Small Cap Core Fund | 366,356,038 | 102,981,910 | (21,159,720 | ) | 81,822,190 | |||||||||||
AMG GW&K Small Cap Growth Fund | 2,243,064 | 341,488 | (167,189 | ) | 174,299 | |||||||||||
| * | Non-income producing security. |
| (a) | Security exempt from registration under Rule 144A of the Securities Act of 1933. This security may be resold in transactions exempt from registration, normally to qualified buyers. At December 31, 2016, the value of these securities amounted to the following: |
| Fund | Market Value | % of Net Assets | ||||||
AMG GW&K Enhanced Core Bond Fund | $ | 3,903,125 | 3.4 | % | ||||
| 1 | Some or all of these securities were out on loan to various brokers as of December 31, 2016, amounting to the following: |
| Fund | Market Value | % of Net Assets | ||||||
AMG GW&K Enhanced Core Bond Fund | $ | 1,822,235 | 1.6 | % | ||||
AMG GW&K Small Cap Core Fund | 25,772,801 | 6.1 | % | |||||
AMG GW&K Small Cap Growth Fund | 146,315 | 6.6 | % | |||||
| 2 | Variable Rate Security. The rate listed is as of December 31, 2016, and is periodically reset subject to terms and conditions set forth in the debenture. |
| 3 | Perpetuity Bond. The date shown is the final call date. |
| 4 | Securities in the portfolio backed by insurance of financial institutions and financial guaranty assurance agencies. At December 31, 2016, the value of these securities amounted to the following: |
| Fund | Market Value | % of Net Assets | ||||||
AMG GW&K Enhanced Core Bond Fund | $ | 1,100,484 | 1.0 | % | ||||
AMG GW&K Municipal Bond Fund | 5,685,258 | 0.6 | % | |||||
| 5 | Collateral received from brokers for securities lending was invested in these joint repurchase agreements. |
| 6 | Yield shown represents the December 31, 2016, seven-day average yield, which refers to the sum of the previous seven days’ dividends paid, expressed as an annual percentage. |
| 7 | All or part of the security is delayed delivery transaction. The market value for delayed delivery security at December 31, 2016, amounted to the following: |
| Fund | Market Value | % of Net Assets | ||||||
AMG GW&K Municipal Enhanced Yield Fund | $ | 2,820,750 | 1.3 | % | ||||
| 8 | Securities are available for collateral in connection with purchases on a delayed delivery basis. |
The accompanying notes are an integral part of these financial statements.
39
Table of Contents
Notes to Schedules of Portfolio Investments (continued)
The following tables summarize the inputs used to value the Funds’ investments by the fair value hierarchy levels as of December 31, 2016: (See Note 1(a) in the Notes to the Financial Statements.)
Quoted Prices in Active Markets for Identical Investments Level 1 | Significant Other Level 2 | Significant Unobservable Inputs Level 3 | Total | |||||||||||||
AMG GW&K Enhanced Core Bond Fund | ||||||||||||||||
Investments in Securities | ||||||||||||||||
Corporate Bonds and Notes† | — | $ | 58,013,953 | — | $ | 58,013,953 | ||||||||||
Municipal Bonds†† | — | 7,603,797 | — | 7,603,797 | ||||||||||||
U.S. Government and Agency Obligations† | — | 40,794,350 | — | 40,794,350 | ||||||||||||
Short-Term Investments | ||||||||||||||||
Repurchase Agreements | — | 1,888,919 | — | 1,888,919 | ||||||||||||
Other Investment Companies | $ | 5,203,078 | — | — | 5,203,078 | |||||||||||
|
|
|
|
|
|
|
| |||||||||
Total Investments in Securities | $ | 5,203,078 | $ | 108,301,019 | — | $ | 113,504,097 | |||||||||
|
|
|
|
|
|
|
| |||||||||
Quoted Prices in Active Markets for Identical Level 1 | Significant Other Observable Inputs Level 2 | Significant Unobservable Inputs Level 3 | Total | |||||||||||||
AMG GW&K Municipal Bond Fund | ||||||||||||||||
Investments in Securities | ||||||||||||||||
Municipal Bonds†† | — | $ | 915,509,522 | — | $ | 915,509,522 | ||||||||||
Short-Term Investments | $ | 11,698,278 | — | — | $ | 11,698,278 | ||||||||||
|
|
|
|
|
|
|
| |||||||||
Total Investments in Securities | $ | 11,698,278 | $ | 915,509,522 | — | $ | 927,207,800 | |||||||||
|
|
|
|
|
|
|
| |||||||||
Quoted Prices in Active Markets for Identical Level 1 | Significant Other Observable Inputs Level 2 | Significant Unobservable Inputs Level 3 | Total | |||||||||||||
AMG GW&K Municipal Enhanced Yield Fund | ||||||||||||||||
Investments in Securities | ||||||||||||||||
Municipal Bonds†† | — | $ | 215,017,461 | — | $ | 215,017,461 | ||||||||||
Short-Term Investments | $ | 1,739,600 | — | — | $ | 1,739,600 | ||||||||||
|
|
|
|
|
|
|
| |||||||||
Total Investments in Securities | $ | 1,739,600 | $ | 215,017,461 | — | $ | 216,757,061 | |||||||||
|
|
|
|
|
|
|
| |||||||||
The accompanying notes are an integral part of these financial statements.
40
Table of Contents
Notes to Schedules of Portfolio Investments (continued)
Quoted Prices in Active Markets for Identical Level 1 | Significant Other Observable Inputs Level 2 | Significant Unobservable Inputs Level 3 | Total | |||||||||||||
AMG GW&K Small Cap Core Fund | ||||||||||||||||
Investments in Securities | ||||||||||||||||
Common Stocks††† | $ | 414,509,501 | — | — | $ | 414,509,501 | ||||||||||
Short-Term Investments | ||||||||||||||||
Repurchase Agreements | — | $ | 26,583,633 | — | $ | 26,583,633 | ||||||||||
Other Investment Companies | $ | 7,085,094 | — | — | 7,085,094 | |||||||||||
|
|
|
|
|
|
|
| |||||||||
Total Investments in Securities | $ | 421,594,595 | $ | 26,583,633 | — | $ | 448,178,228 | |||||||||
|
|
|
|
|
|
|
| |||||||||
Quoted Prices in Active Level 1 | Significant Other Observable Inputs Level 2 | Significant Unobservable Inputs Level 3 | Total | |||||||||||||
AMG GW&K Small Cap Growth Fund | ||||||||||||||||
Investments in Securities | ||||||||||||||||
Common Stocks††† | $ | 2,211,725 | — | — | $ | 2,211,725 | ||||||||||
Short-Term Investments | ||||||||||||||||
Repurchase Agreements | — | $ | 151,675 | — | $ | 151,675 | ||||||||||
Other Investment Companies | $ | 53,964 | — | — | 53,964 | |||||||||||
|
|
|
|
|
|
|
| |||||||||
Total Investments in Securities | $ | 2,265,689 | $ | 151,675 | — | $ | 2,417,364 | |||||||||
|
|
|
|
|
|
|
| |||||||||
| † | All corporate bonds and notes and U.S. government and agency obligations held in the Funds are level 2 securities. For a detailed breakout of the corporate bonds and notes and U.S. government and agency obligations by major industry or agency classification, please refer to the respective Schedule of Portfolio Investments. |
| †† | All municipal bonds held in the Funds are Level 2 securities. For a detailed breakout of the bonds by major classification, please refer to the respective Schedule of Portfolio Investments. |
| ††† | All common stocks held in the Funds are Level 1 securities. For a detailed breakout of the common stocks by major industry classification, please refer to the respective Schedule of Portfolio Investments. |
As of December 31, 2016, the Funds had no transfers between levels from the beginning of the reporting period.
INVESTMENTS DEFINITIONS AND ABBREVIATIONS:
ADR: ADR after the name of a holding stands for American Depositary Receipt, representing ownership of foreign securities on deposit with a domestic custodian bank. The value of an ADR security is determined or significantly influenced by trading on exchanges not located in the United States or Canada. Sponsored ADRs are initiated by the underlying foreign company.
| COPS: | Certificates of Participation | |
| FHLMC: | Federal Home Loan Mortgage Corporation | |
| FNMA: | Federal National Mortgage Association | |
| GMTN: | Global Medium-Term Notes | |
| MTN: | Medium-Term Notes | |
| PLC: | Public Limited Company | |
| National Insured: | National Public Finance Guarantee Corp. |
The accompanying notes are an integral part of these financial statements.
41
Table of Contents
Statement of Assets and Liabilities
December 31, 2016
| AMG GW&K Enhanced Core Bond Fund# | AMG GW&K Municipal Bond Fund# | AMG GW&K Municipal Enhanced Yield Fund# | AMG GW&K Small Cap Core Fund# | AMG GW&K Small Cap Growth Fund# | ||||||||||||||||
Assets: | ||||||||||||||||||||
Investments at value* (including securities on loan valued at $1,822,235, $0, $0, $25,772,801 and $146,315, respectively) | $ | 113,504,097 | $ | 927,207,800 | $ | 216,757,061 | $ | 448,178,228 | $ | 2,417,364 | ||||||||||
Receivable for Fund shares sold | 830,491 | 19,016,829 | 1,290,827 | 642,378 | — | |||||||||||||||
Dividends, interest and other receivables | 1,066,645 | 11,529,112 | 2,309,830 | 844,532 | 987 | |||||||||||||||
Receivable from affiliate | 62,565 | 99,188 | 35,646 | 14,853 | 13,345 | |||||||||||||||
Prepaid expenses | 36,013 | 36,301 | 31,544 | 28,222 | 9,655 | |||||||||||||||
Total assets | 115,499,811 | 957,889,230 | 220,424,908 | 449,708,213 | 2,441,351 | |||||||||||||||
Liabilities: | ||||||||||||||||||||
Payable upon return of securities loaned | 1,888,919 | — | — | 26,583,633 | 151,675 | |||||||||||||||
Payable for investments purchased | — | — | — | 874,136 | 7,588 | |||||||||||||||
Payable for delayed delivery investments purchased | — | — | 2,729,125 | — | — | |||||||||||||||
Payable for Fund shares repurchased | 182,712 | 34,508,256 | 1,708,017 | 411,954 | — | |||||||||||||||
Payable to Affiliate | — | — | — | — | 12,623 | |||||||||||||||
Accrued expenses: | ||||||||||||||||||||
Investment advisory and management fees | 45,629 | 170,067 | 94,784 | 270,830 | 1,392 | |||||||||||||||
Administrative fees | 15,209 | 121,991 | 28,435 | 54,166 | 278 | |||||||||||||||
Shareholder service fees—Class N | — | 2,904 | 908 | 2,837 | — | |||||||||||||||
Shareholder service fees—Class S | 3,149 | 26,811 | 4,240 | 5,704 | — | |||||||||||||||
Distribution fees—Class N | 3,463 | 6,865 | 908 | 7,792 | — | |||||||||||||||
Distribution fees—Class C | 6,695 | — | — | — | — | |||||||||||||||
Professional fees | 43,459 | 40,142 | 34,696 | 27,787 | 24,652 | |||||||||||||||
Trustees fees and expenses | 78 | 529 | 141 | 196 | 1 | |||||||||||||||
Other | 44,652 | 90,624 | 30,578 | 47,871 | 12,050 | |||||||||||||||
Total liabilities | 2,233,965 | 34,968,189 | 4,631,832 | 28,286,906 | 210,259 | |||||||||||||||
Net Assets | $ | 113,265,846 | $ | 922,921,041 | $ | 215,793,076 | $ | 421,421,307 | $ | 2,231,092 | ||||||||||
* Investments at cost | $ | 114,283,341 | $ | 948,229,325 | $ | 221,263,335 | $ | 366,263,449 | $ | 2,185,834 | ||||||||||
| # | Effective October 1, 2016, the Funds’ share classes were renamed or redesignated as described in Note 1 of the Notes to the Financial Statements. |
The accompanying notes are an integral part of these financial statements.
42
Table of Contents
Statement of Assets and Liabilities (continued)
| AMG GW&K Enhanced Core Bond Fund# | AMG GW&K Municipal Bond Fund# | AMG GW&K Municipal Enhanced Yield Fund# | AMG GW&K Small Cap Core Fund# | AMG GW&K Small Cap Growth Fund# | ||||||||||||||||
Net Assets Represent: | ||||||||||||||||||||
Paid-in capital | $ | 118,625,906 | $ | 945,309,410 | $ | 222,727,043 | $ | 340,271,262 | $ | 2,058,357 | ||||||||||
Undistributed net investment income | 9,070 | — | — | — | — | |||||||||||||||
Accumulated net realized loss from investments | (4,589,886 | ) | (1,366,844 | ) | (2,427,693 | ) | (764,734 | ) | (58,795 | ) | ||||||||||
Net unrealized appreciation (depreciation) of investments | (779,244 | ) | (21,021,525 | ) | (4,506,274 | ) | 81,914,779 | 231,530 | ||||||||||||
Net Assets | $ | 113,265,846 | $ | 922,921,041 | $ | 215,793,076 | $ | 421,421,307 | $ | 2,231,092 | ||||||||||
Class N: | ||||||||||||||||||||
Net Assets | $ | 16,115,222 | $ | 31,406,458 | $ | 4,184,299 | $ | 35,760,404 | n/a | |||||||||||
Shares outstanding | 1,666,966 | 2,790,665 | 444,922 | 1,455,377 | n/a | |||||||||||||||
Net asset value, offering and redemption price per share | $ | 9.67 | $ | 11.25 | $ | 9.40 | $ | 24.57 | n/a | |||||||||||
Class S: | ||||||||||||||||||||
Net Assets | $ | 37,951,844 | $ | 163,149,394 | $ | 16,415,435 | $ | 17,689,174 | n/a | |||||||||||
Shares outstanding | 3,910,973 | 14,469,779 | 1,744,409 | 713,877 | n/a | |||||||||||||||
Net asset value, offering and redemption price per share | $ | 9.70 | $ | 11.28 | $ | 9.41 | $ | 24.78 | n/a | |||||||||||
Class C: | ||||||||||||||||||||
Net Assets | $ | 7,841,902 | n/a | n/a | n/a | n/a | ||||||||||||||
Shares outstanding | 811,792 | n/a | n/a | n/a | n/a | |||||||||||||||
Net asset value, offering and redemption price per share | $ | 9.66 | n/a | n/a | n/a | n/a | ||||||||||||||
Class I: | ||||||||||||||||||||
Net Assets | $ | 51,356,878 | $ | 728,365,189 | $ | 195,193,342 | $ | 367,971,729 | $ | 2,231,092 | ||||||||||
Shares outstanding | 5,295,792 | 64,391,388 | 20,775,707 | 14,814,672 | 227,735 | |||||||||||||||
Net asset value, offering and redemption price per share | $ | 9.70 | $ | 11.31 | $ | 9.40 | $ | 24.84 | $ | 9.80 | ||||||||||
| # | Effective October 1, 2016, the Funds’ share classes were renamed or redesignated as described in Note 1 of the Notes to the Financial Statements. |
The accompanying notes are an integral part of these financial statements.
43
Table of Contents
For the year ended December 31, 2016
| AMG GW&K Enhanced Core Bond Fund# | AMG GW&K Municipal Bond Fund# | AMG GW&K Municipal Enhanced Yield Fund# | AMG GW&K Small Cap Core Fund# | AMG GW&K Small Cap Growth Fund# | ||||||||||||||||
Investment Income: | ||||||||||||||||||||
Interest income | $ | 3,655,621 | $ | 17,077,382 | $ | 8,790,688 | $ | 521 | — | |||||||||||
Dividend income | 1,529 | 13,071 | 3,227 | 5,184,990 | 1 | $ | 9,472 | |||||||||||||
Securities lending income | 6,224 | — | — | 89,815 | 346 | |||||||||||||||
Miscellaneous income | 1,706 | — | — | — | — | |||||||||||||||
Foreign withholding tax | — | — | — | (16,374 | ) | (117 | ) | |||||||||||||
Total investment income | 3,665,080 | 17,090,453 | 8,793,915 | 5,258,952 | 9,701 | |||||||||||||||
Expenses: | ||||||||||||||||||||
Investment advisory and management fees | 532,161 | 2,983,587 | 1,246,410 | 2,904,313 | 12,743 | |||||||||||||||
Administrative fees | 220,615 | 2,133,320 | 561,668 | 865,041 | 3,730 | |||||||||||||||
Distribution fees—Class N | 45,948 | 81,371 | 14,842 | 87,786 | — | |||||||||||||||
Distribution fees—Class C | 96,699 | — | — | — | — | |||||||||||||||
Shareholder servicing fees—Class N | — | 38,386 | 14,842 | 49,869 | — | |||||||||||||||
Shareholder servicing fees—Class S | 32,243 | 248,404 | 13,565 | 38,479 | — | |||||||||||||||
Professional fees | 55,254 | 106,576 | 53,883 | 56,414 | 28,332 | |||||||||||||||
Registration fees | 49,628 | 52,839 | 44,897 | 38,613 | 16,221 | |||||||||||||||
Transfer agent fees | 34,810 | 46,129 | 14,882 | 22,395 | 332 | |||||||||||||||
Custodian fees | 23,341 | 78,344 | 25,127 | 26,072 | 5,874 | |||||||||||||||
Reports to shareholders | 17,700 | 36,730 | 13,800 | 38,599 | 8,758 | |||||||||||||||
Trustees fees and expenses | 8,275 | 69,934 | 18,855 | 29,608 | 111 | |||||||||||||||
Miscellaneous | 6,067 | 29,942 | 8,682 | 12,245 | 2,126 | |||||||||||||||
Total expenses before offsets | 1,122,741 | 5,905,562 | 2,031,453 | 4,169,434 | 78,227 | |||||||||||||||
Fee waivers | — | — | (170,667 | ) | — | — | ||||||||||||||
Expense reimbursements | (249,870 | ) | (2,293,974 | ) | (222,096 | ) | (314,503 | ) | (62,087 | ) | ||||||||||
Expense reductions | — | — | — | (18,738 | ) | — | ||||||||||||||
Net expenses | 872,871 | 3,611,588 | 1,638,690 | 3,836,193 | 16,140 | |||||||||||||||
Net investment income (loss) | 2,792,209 | 13,478,865 | 7,155,225 | 1,422,759 | (6,439 | ) | ||||||||||||||
Net Realized and Unrealized Gain (loss): | ||||||||||||||||||||
Net realized gain (loss) on investments | 837,864 | 11,765,887 | 6,721,972 | 14,201,155 | (28,503 | ) | ||||||||||||||
Net change in unrealized appreciation (depreciation) of investments | (777,068 | ) | (37,153,635 | ) | (13,050,976 | ) | 49,509,033 | 252,237 | ||||||||||||
Net realized and unrealized gain (loss) | 60,796 | (25,387,748 | ) | (6,329,004 | ) | 63,710,188 | 223,734 | |||||||||||||
Net increase (decrease) in net assets resulting from operations | $ | 2,853,005 | $ | (11,908,883 | ) | $ | 826,221 | $ | 65,132,947 | $ | 217,295 | |||||||||
| # | Effective October 1, 2016, the Funds’ share classes were renamed or redesignated as described in Note 1 of the Notes to the Financial Statements. |
| 1 | Includes non-recurring dividend of $976,975. |
The accompanying notes are an integral part of these financial statements.
44
Table of Contents
Statements of Changes in Net Assets
For the years ended December 31,
| AMG GW&K Enhanced Core Bond Fund | AMG GW&K Municipal Bond Fund | |||||||||||||||
| 2016# | 2015 | 2016# | 2015 | |||||||||||||
Increase (Decrease) in Net Assets Resulting From Operations: | ||||||||||||||||
Net investment income | $ | 2,792,209 | $ | 2,589,414 | $ | 13,478,865 | $ | 11,879,981 | ||||||||
Net realized gain (loss) on investments | 837,864 | (5,132,363 | ) | 11,765,887 | 12,154,764 | |||||||||||
Net change in unrealized appreciation (depreciation) of investments | (777,068 | ) | (631,280 | ) | (37,153,635 | ) | 3,671,047 | |||||||||
Net increase (decrease) in net assets resulting from operations | 2,853,005 | (3,174,229 | ) | (11,908,883 | ) | 27,705,792 | ||||||||||
Distributions to Shareholders: | ||||||||||||||||
From net investment income: | ||||||||||||||||
Class N | (414,745 | ) | (757,792 | ) | (337,669 | ) | (307,554 | ) | ||||||||
Class S | (777,513 | ) | (121,235 | ) | (2,154,034 | ) | (1,760,792 | ) | ||||||||
Class C | (137,712 | ) | (284,731 | ) | — | — | ||||||||||
Class I | (1,453,169 | ) | (1,459,487 | ) | (11,028,510 | ) | (9,837,254 | ) | ||||||||
From net realized gain on investments: | ||||||||||||||||
Class N | — | — | (579,320 | ) | (345,596 | ) | ||||||||||
Class S | — | — | (3,103,417 | ) | (1,606,917 | ) | ||||||||||
Class C | — | — | — | — | ||||||||||||
Class I | — | — | (13,370,506 | ) | (8,166,806 | ) | ||||||||||
Total distributions to shareholders | (2,783,139 | ) | (2,623,245 | ) | (30,573,456 | ) | (22,024,919 | ) | ||||||||
Capital Share Transactions:1 | ||||||||||||||||
Net increase from capital share transactions | 27,097,678 | 4,076,345 | 153,597,847 | 290,819,321 | ||||||||||||
Total increase (decrease) in net assets | 27,167,544 | (1,721,129 | ) | 111,115,508 | 296,500,194 | |||||||||||
Net Assets: | ||||||||||||||||
Beginning of year | 86,098,302 | 87,819,431 | 811,805,533 | 515,305,339 | ||||||||||||
End of year | $ | 113,265,846 | $ | 86,098,302 | $ | 922,921,041 | $ | 811,805,533 | ||||||||
End of year undistributed net investment income | $ | 9,070 | — | — | — | |||||||||||
|
|
|
|
|
|
|
| |||||||||
| # | Effective October 1, 2016, the Funds’ share classes were renamed or redesignated as described in Note 1 of the Notes to the Financial Statements. |
| 1 | See Note 1(g) of the Notes to Financial Statements. |
The accompanying notes are an integral part of these financial statements.
45
Table of Contents
Statements of Changes in Net Assets (continued)
For the year ended December 31,
| AMG GW&K Municipal Enhanced Yield Fund | AMG GW&K Small Cap Core Fund | AMG GW&K Small Cap Growth Fund* | ||||||||||||||||||||||
| 2016# | 2015 | 2016# | 2015 | 2016# | 2015 | |||||||||||||||||||
Increase (Decrease) in Net Assets Resulting From Operations: | ||||||||||||||||||||||||
Net investment income (loss) | $ | 7,155,225 | $ | 7,963,038 | $ | 1,422,759 | $ | 433,600 | $ | (6,439 | ) | $ | (1,792 | ) | ||||||||||
Net realized gain (loss) on investments | 6,721,972 | 4,973,058 | 14,201,155 | 13,481,106 | (28,503 | ) | (23,431 | ) | ||||||||||||||||
Net change in unrealized appreciation (depreciation) of investments | (13,050,976 | ) | (3,739,962 | ) | 49,509,033 | (24,005,209 | ) | 252,237 | (20,707 | ) | ||||||||||||||
Net increase (decrease) in net assets resulting from operations | 826,221 | 9,196,134 | 65,132,947 | (10,090,503 | ) | 217,295 | (45,930 | ) | ||||||||||||||||
Distributions to Shareholders: | ||||||||||||||||||||||||
From net investment income: | ||||||||||||||||||||||||
Class N | (141,532 | ) | (139,414 | ) | — | — | — | — | ||||||||||||||||
Class S | (483,507 | ) | (562,790 | ) | (32,695 | ) | (33,789 | ) | — | — | ||||||||||||||
Class I | (6,534,101 | ) | (7,264,910 | ) | (1,399,673 | ) | (710,270 | ) | (1,135 | ) | — | |||||||||||||
From net realized gain on investments: | ||||||||||||||||||||||||
Class N | (189,462 | ) | (71,420 | ) | (1,490,651 | ) | (1,421,265 | ) | — | — | ||||||||||||||
Class S | (751,847 | ) | (208,173 | ) | (721,953 | ) | (1,479,651 | ) | — | — | ||||||||||||||
Class I | (9,105,322 | ) | (2,744,562 | ) | (15,063,218 | ) | (12,008,340 | ) | — | — | ||||||||||||||
Total distributions to shareholders | (17,205,771 | ) | (10,991,269 | ) | (18,708,190 | ) | (15,653,315 | ) | (1,135 | ) | — | |||||||||||||
Capital Share Transactions:1 | ||||||||||||||||||||||||
Net increase (decrease) from capital share transactions | (1,420,098 | ) | (15,159,353 | ) | 185,281 | 26,453,362 | 841,781 | 1,219,081 | ||||||||||||||||
Total increase (decrease) in net assets | (17,799,648 | ) | (16,954,488 | ) | 46,610,038 | 709,544 | 1,057,941 | 1,173,151 | ||||||||||||||||
Net Assets: | ||||||||||||||||||||||||
Beginning of year | 233,592,724 | 250,547,212 | 374,811,269 | 374,101,725 | 1,173,151 | — | ||||||||||||||||||
End of year | $ | 215,793,076 | $ | 233,592,724 | $ | 421,421,307 | $ | 374,811,269 | $ | 2,231,092 | $ | 1,173,151 | ||||||||||||
End of year undistributed net investment income | — | $ | 253 | — | — | — | — | |||||||||||||||||
|
|
|
|
|
|
|
|
|
|
|
| |||||||||||||
| * | Commencement of operations was on June 30, 2015. |
| # | Effective October 1, 2016, the Funds’ share classes were renamed or redesignated as described in Note 1 of the Notes to the Financial Statements. |
| 1 | See Note 1(g) of the Notes to Financial Statements. |
The accompanying notes are an integral part of these financial statements.
46
Table of Contents
AMG GW&K Enhanced Core Bond Fund
For a share outstanding throughout each period
| For the years ended December 31, | ||||||||||||||||||||
| Class N | 2016# | 2015 | 2014 | 2013 | 2012 | |||||||||||||||
Net Asset Value, Beginning of Year | $ | 9.58 | $ | 10.22 | $ | 9.96 | $ | 11.24 | $ | 10.81 | ||||||||||
Income from Investment Operations: | ||||||||||||||||||||
Net investment income1,2 | 0.22 | 0.29 | 0.29 | 0.24 | 0.44 | |||||||||||||||
Net realized and unrealized gain (loss) on investments | 0.09 | (0.64 | ) | 0.26 | (0.21 | ) | 0.58 | |||||||||||||
Total income (loss) from investment operations | 0.31 | (0.35 | ) | 0.55 | 0.03 | 1.02 | ||||||||||||||
Less Distributions to Shareholders from: | ||||||||||||||||||||
Net investment income | (0.22 | ) | (0.29 | ) | (0.29 | ) | (0.26 | ) | (0.48 | ) | ||||||||||
Net realized gain on investments | — | — | — | (1.05 | ) | (0.11 | ) | |||||||||||||
Total distributions to shareholders | (0.22 | ) | (0.29 | ) | (0.29 | ) | (1.31 | ) | (0.59 | ) | ||||||||||
Net Asset Value, End of Year | $ | 9.67 | $ | 9.58 | $ | 10.22 | $ | 9.96 | $ | 11.24 | ||||||||||
Total Return2 | 3.26 | %4 | (3.51 | )%4 | 5.58 | % | 0.29 | % | 9.53 | % | ||||||||||
Ratio of net expenses to average net assets (with offsets/reductions) | 0.84 | % | 0.84 | % | 0.84 | % | 0.86 | %5 | 0.84 | %6 | ||||||||||
Ratio of expenses to average net assets (with offsets) | 0.84 | % | 0.84 | % | 0.84 | % | 0.86 | %5 | 0.84 | %6 | ||||||||||
Ratio of total expenses to average net assets (without offsets/reductions)3 | 1.05 | % | 1.07 | % | 1.09 | % | 1.08 | %5 | 1.04 | %6 | ||||||||||
Ratio of net investment income to average net assets2 | 2.27 | % | 2.87 | % | 2.82 | % | 2.14 | %5 | 3.92 | %6 | ||||||||||
Portfolio turnover | 88 | % | 57 | % | 22 | % | 43 | % | 110 | % | ||||||||||
Net assets at end of year (000’s omitted) | $ | 16,115 | $ | 20,203 | $ | 27,444 | $ | 32,009 | $ | 41,772 | ||||||||||
|
|
|
|
|
|
|
|
|
| |||||||||||
| For the years ended December 31, | For the period from December 1, 2012 through | |||||||||||||||||||
| Class S | 2016# | 2015 | 2014 | 2013 | December 31, 2012* | |||||||||||||||
Net Asset Value, Beginning of Period | $ | 9.62 | $ | 10.26 | $ | 9.99 | $ | 11.28 | $ | 11.41 | ||||||||||
Income from Investment Operations: | ||||||||||||||||||||
Net investment income1,2 | 0.24 | 0.30 | 0.31 | 0.26 | 0.02 | |||||||||||||||
Net realized and unrealized gain (loss) on investments | 0.08 | (0.63 | ) | 0.27 | (0.22 | ) | 0.01 | |||||||||||||
Total income (loss) from investment operations | 0.32 | (0.33 | ) | 0.58 | 0.04 | 0.03 | ||||||||||||||
Less Distributions to Shareholders from: | ||||||||||||||||||||
Net investment income | (0.24 | ) | (0.31 | ) | (0.31 | ) | (0.28 | ) | (0.05 | ) | ||||||||||
Net realized gain on investments | — | — | — | (1.05 | ) | (0.11 | ) | |||||||||||||
Total distributions to shareholders | (0.24 | ) | (0.31 | ) | (0.31 | ) | (1.33 | ) | (0.16 | ) | ||||||||||
Net Asset Value, End of Period | $ | 9.70 | $ | 9.62 | $ | 10.26 | $ | 9.99 | $ | 11.28 | ||||||||||
Total Return2 | 3.31 | % | (3.30 | )% | 5.84 | % | 0.41 | % | 0.26 | %18 | ||||||||||
Ratio of net expenses to average net assets (with offsets/reductions) | 0.69 | % | 0.67 | % | 0.65 | % | 0.69 | %5 | 0.64 | %6,19 | ||||||||||
Ratio of expenses to average net assets (with offsets) | 0.69 | % | 0.67 | % | 0.65 | % | 0.69 | %5 | 0.64 | %6,19 | ||||||||||
Ratio of total expenses to average net assets (without offsets/reductions)3 | 0.90 | % | 0.90 | % | 0.90 | % | 0.91 | %5 | 0.90 | %6,19 | ||||||||||
Ratio of net investment income to average net assets2 | 2.39 | % | 2.96 | % | 3.00 | % | 2.31 | %5 | 2.07 | %6,19 | ||||||||||
Portfolio turnover | 88 | % | 57 | % | 22 | % | 43 | % | 110 | % | ||||||||||
Net assets at end of period (000’s omitted) | $ | 37,952 | $ | 7,463 | $ | 2,480 | $ | 1,563 | $ | 10 | ||||||||||
|
|
|
|
|
|
|
|
|
| |||||||||||
47
Table of Contents
AMG GW&K Enhanced Core Bond Fund
Financial Highlights
For a share outstanding throughout each year
| For the years ended December 31, | ||||||||||||||||||||
| Class C | 2016 | 2015 | 2014 | 2013 | 2012†† | |||||||||||||||
Net Asset Value, Beginning of Year | $ | 9.57 | $ | 10.20 | $ | 9.94 | $ | 11.22 | $ | 10.79 | ||||||||||
Income from Investment Operations: | ||||||||||||||||||||
Net investment income1,2 | 0.15 | 0.21 | 0.21 | 0.15 | 0.36 | |||||||||||||||
Net realized and unrealized gain (loss) on investments | 0.08 | (0.63 | ) | 0.26 | (0.20 | ) | 0.57 | |||||||||||||
Total income (loss) from investment operations | 0.23 | (0.42 | ) | 0.47 | (0.05 | ) | 0.93 | |||||||||||||
Less Distributions to Shareholders from: | ||||||||||||||||||||
Net investment income | (0.14 | ) | (0.21 | ) | (0.21 | ) | (0.18 | ) | (0.39 | ) | ||||||||||
Net realized gain on investments | — | — | — | (1.05 | ) | (0.11 | ) | |||||||||||||
Total distributions to shareholders | (0.14 | ) | (0.21 | ) | (0.21 | ) | (1.23 | ) | (0.50 | ) | ||||||||||
Net Asset Value, End of Year | $ | 9.66 | $ | 9.57 | $ | 10.20 | $ | 9.94 | $ | 11.22 | ||||||||||
Total Return2 | 2.40 | % | (4.15 | )%4 | 4.79 | % | (0.50 | )%4 | 8.72 | %4 | ||||||||||
Ratio of net expenses to average net assets (with offsets/reductions) | 1.59 | % | 1.59 | % | 1.59 | % | 1.61 | %5 | 1.59 | %6 | ||||||||||
Ratio of expenses to average net assets (with offsets) | 1.59 | % | 1.59 | % | 1.59 | % | 1.61 | %5 | 1.59 | %6 | ||||||||||
Ratio of total expenses to average net assets (without offsets/reductions)3 | 1.80 | % | 1.82 | % | 1.84 | % | 1.83 | %5 | 1.79 | %6 | ||||||||||
Ratio of net investment income to average net assets2 | 1.53 | % | 2.12 | % | 2.07 | % | 1.38 | %5 | 3.18 | %6 | ||||||||||
Portfolio turnover | 88 | % | 57 | % | 22 | % | 43 | % | 110 | % | ||||||||||
Net assets at end of year (000’s omitted) | $ | 7,842 | $ | 11,031 | $ | 15,927 | $ | 20,793 | $ | 33,026 | ||||||||||
|
|
|
|
|
|
|
|
|
| |||||||||||
| For the years ended December 31, | ||||||||||||||||||||
| Class I | 2016# | 2015 | 2014 | 2013 | 2012 | |||||||||||||||
Net Asset Value, Beginning of Year | $ | 9.61 | $ | 10.25 | $ | 9.99 | $ | 11.28 | $ | 10.84 | ||||||||||
Income from Investment Operations: | ||||||||||||||||||||
Net investment income1,2 | 0.25 | 0.31 | 0.31 | 0.27 | 0.47 | |||||||||||||||
Net realized and unrealized gain (loss) on investments | 0.09 | (0.63 | ) | 0.27 | (0.22 | ) | 0.58 | |||||||||||||
Total income (loss) from investment operations | 0.34 | (0.32 | ) | 0.58 | 0.05 | 1.05 | ||||||||||||||
Less Distributions to Shareholders from: | ||||||||||||||||||||
Net investment income | (0.25 | ) | (0.32 | ) | (0.32 | ) | (0.29 | ) | (0.50 | ) | ||||||||||
Net realized gain on investments | — | — | — | (1.05 | ) | (0.11 | ) | |||||||||||||
Total distributions to shareholders | (0.25 | ) | (0.32 | ) | (0.32 | ) | (1.34 | ) | (0.61 | ) | ||||||||||
Net Asset Value, End of Year | $ | 9.70 | $ | 9.61 | $ | 10.25 | $ | 9.99 | $ | 11.28 | ||||||||||
Total Return2 | 3.52 | %4 | (3.15 | )% | 5.85 | % | 0.46 | % | 9.89 | % | ||||||||||
Ratio of net expenses to average net assets (with offsets/reductions) | 0.59 | % | 0.59 | % | 0.59 | % | 0.61 | %5 | 0.59 | %6 | ||||||||||
Ratio of expenses to average net assets (with offsets) | 0.59 | % | 0.59 | % | 0.59 | % | 0.61 | %5 | 0.59 | %6 | ||||||||||
Ratio of total expenses to average net assets (without offsets/reductions)3 | 0.80 | % | 0.82 | % | 0.84 | % | 0.83 | %5 | 0.79 | %6 | ||||||||||
Ratio of net investment income to average net assets2 | 2.51 | % | 3.10 | % | 3.05 | % | 2.39 | %5 | 4.21 | %6 | ||||||||||
Portfolio turnover | 88 | % | 57 | % | 22 | % | 43 | % | 110 | % | ||||||||||
Net assets at end of year (000’s omitted) | $ | 51,357 | $ | 47,402 | $ | 41,968 | $ | 59,182 | $ | 65,573 | ||||||||||
|
|
|
|
|
|
|
|
|
| |||||||||||
48
Table of Contents
AMG GW&K Municipal Bond Fund
Financial Highlights
For a share outstanding throughout each year
| For the years ended December 31, | ||||||||||||||||||||
| Class N | 2016# | 2015 | 2014 | 2013 | 2012 | |||||||||||||||
Net Asset Value, Beginning of Year | $ | 11.70 | $ | 11.61 | $ | 11.02 | $ | 11.52 | $ | 11.21 | ||||||||||
Income from Investment Operations: | ||||||||||||||||||||
Net investment income1,2 | 0.13 | 0.15 | 0.18 | 0.18 | 0.20 | |||||||||||||||
Net realized and unrealized gain (loss) on investments | (0.25 | ) | 0.24 | 0.63 | (0.47 | ) | 0.38 | |||||||||||||
Total income (loss) from investment operations | (0.12 | ) | 0.39 | 0.81 | (0.29 | ) | 0.58 | |||||||||||||
Less Distributions to Shareholders from: | ||||||||||||||||||||
Net investment income | (0.12 | ) | (0.15 | ) | (0.18 | ) | (0.17 | ) | (0.19 | ) | ||||||||||
Net realized gain on investments | (0.21 | ) | (0.15 | ) | (0.04 | ) | (0.04 | ) | (0.08 | ) | ||||||||||
Total distributions to shareholders | (0.33 | ) | (0.30 | ) | (0.22 | ) | (0.21 | ) | (0.27 | ) | ||||||||||
Net Asset Value, End of Year | $ | 11.25 | $ | 11.70 | $ | 11.61 | $ | 11.02 | $ | 11.52 | ||||||||||
Total Return2 | (1.05 | )% | 3.36 | % | 7.39 | % | (2.51 | )%4 | 5.27 | %4 | ||||||||||
Ratio of net expenses to average net assets (with offsets/reductions) | 0.71 | % | 0.82 | % | 0.80 | % | 0.81 | %7 | 0.80 | %8 | ||||||||||
Ratio of expenses to average net assets (with offsets) | 0.71 | % | 0.82 | % | 0.80 | % | 0.81 | %7 | 0.80 | %8 | ||||||||||
Ratio of total expenses to average net assets (without offsets/reductions)3 | 0.95 | % | 1.13 | % | 1.12 | % | 1.17 | %7 | 1.18 | %8 | ||||||||||
Ratio of net investment income to average net assets2 | 1.08 | % | 1.28 | % | 1.55 | % | 1.56 | %7 | 1.71 | %8 | ||||||||||
Portfolio turnover | 66 | % | 78 | % | 31 | % | 28 | % | 39 | % | ||||||||||
Net assets at end of year (000’s omitted) | $ | 31,406 | $ | 27,362 | $ | 23,572 | $ | 28,655 | $ | 22,726 | ||||||||||
|
|
|
|
|
|
|
|
|
| |||||||||||
| For the years ended December 31, | ||||||||||||||||||||
| Class S | 2016# | 2015 | 2014 | 2013 | 2012 | |||||||||||||||
Net Asset Value, Beginning of Year | $ | 11.73 | $ | 11.63 | $ | 11.04 | $ | 11.54 | $ | 11.23 | ||||||||||
Income from Investment Operations: | ||||||||||||||||||||
Net investment income1,2 | 0.15 | 0.19 | 0.21 | 0.21 | 0.23 | |||||||||||||||
Net realized and unrealized gain (loss) on investments | (0.23 | ) | 0.24 | 0.63 | (0.47 | ) | 0.38 | |||||||||||||
Total income (loss) from investment operations | (0.08 | ) | 0.43 | 0.84 | (0.26 | ) | 0.61 | |||||||||||||
Less Distributions to Shareholders from: | ||||||||||||||||||||
Net investment income | (0.16 | ) | (0.18 | ) | (0.21 | ) | (0.20 | ) | (0.22 | ) | ||||||||||
Net realized gain on investments | (0.21 | ) | (0.15 | ) | (0.04 | ) | (0.04 | ) | (0.08 | ) | ||||||||||
Total distributions to shareholders | (0.37 | ) | (0.33 | ) | (0.25 | ) | (0.24 | ) | (0.30 | ) | ||||||||||
Net Asset Value, End of Year | $ | 11.28 | $ | 11.73 | $ | 11.63 | $ | 11.04 | $ | 11.54 | ||||||||||
Total Return2 | (0.77 | )% | 3.77 | % | 7.62 | % | (2.24 | )% | 5.53 | % | ||||||||||
Ratio of net expenses to average net assets (with offsets/reductions) | 0.49 | % | 0.51 | % | 0.52 | % | 0.53 | %7 | 0.55 | %8 | ||||||||||
Ratio of expenses to average net assets (with offsets) | 0.49 | % | 0.51 | % | 0.52 | % | 0.53 | %7 | 0.55 | %8 | ||||||||||
Ratio of total expenses to average net assets (without offsets/reductions)3 | 0.73 | % | 0.82 | % | 0.84 | % | 0.89 | %7 | 0.93 | %8 | ||||||||||
Ratio of net investment income to average net assets2 | 1.31 | % | 1.59 | % | 1.82 | % | 1.84 | %7 | 1.97 | %8 | ||||||||||
Portfolio turnover | 66 | % | 78 | % | 31 | % | 28 | % | 39 | % | ||||||||||
Net assets at end of year (000’s omitted) | $ | 163,149 | $ | 128,684 | $ | 98,152 | $ | 53,024 | $ | 35,444 | ||||||||||
|
|
|
|
|
|
|
|
|
| |||||||||||
49
Table of Contents
AMG GW&K Municipal Bond Fund
Financial Highlights
For a share outstanding throughout each year
| For the years ended December 31, | ||||||||||||||||||||
| Class I | 2016# | 2015 | 2014 | 2013 | 2012 | |||||||||||||||
Net Asset Value, Beginning of Year | $ | 11.77 | $ | 11.67 | $ | 11.08 | $ | 11.58 | $ | 11.26 | ||||||||||
Income from Investment Operations: | ||||||||||||||||||||
Net investment income1,2 | 0.17 | 0.21 | 0.23 | 0.23 | 0.25 | |||||||||||||||
Net realized and unrealized gain (loss) on investments | (0.25 | ) | 0.24 | 0.63 | (0.47 | ) | 0.40 | |||||||||||||
Total income (loss) from investment operations | (0.08 | ) | 0.45 | 0.86 | (0.24 | ) | 0.65 | |||||||||||||
Less Distributions to Shareholders from: | ||||||||||||||||||||
Net investment income | (0.17 | ) | (0.20 | ) | (0.23 | ) | (0.22 | ) | (0.25 | ) | ||||||||||
Net realized gain on investments | (0.21 | ) | (0.15 | ) | (0.04 | ) | (0.04 | ) | (0.08 | ) | ||||||||||
Total distributions to shareholders | (0.38 | ) | (0.35 | ) | (0.27 | ) | (0.26 | ) | (0.33 | ) | ||||||||||
Net Asset Value, End of Year | $ | 11.31 | $ | 11.77 | $ | 11.67 | $ | 11.08 | $ | 11.58 | ||||||||||
Total Return2 | (0.70 | )% | 3.94 | % | 7.80 | % | (2.02 | )% | 5.80 | %4 | ||||||||||
Ratio of net expenses to average net assets (with offsets/reductions) | 0.34 | % | 0.34 | % | 0.34 | % | 0.36 | %7 | 0.35 | %8 | ||||||||||
Ratio of expenses to average net assets (with offsets) | 0.34 | % | 0.34 | % | 0.34 | % | 0.36 | %7 | 0.35 | %8 | ||||||||||
Ratio of total expenses to average net assets (without offsets/reductions)3 | 0.58 | % | 0.65 | % | 0.66 | % | 0.72 | %7 | 0.73 | %8 | ||||||||||
Ratio of net investment income to average net assets2 | 1.45 | % | 1.76 | % | 2.00 | % | 2.01 | %7 | 2.15 | %8 | ||||||||||
Portfolio turnover | 66 | % | 78 | % | 31 | % | 28 | % | 39 | % | ||||||||||
Net assets at end of year (000’s omitted) | $ | 728,365 | $ | 655,760 | $ | 393,581 | $ | 204,711 | $ | 121,609 | ||||||||||
|
|
|
|
|
|
|
|
|
| |||||||||||
50
Table of Contents
AMG GW&K Municipal Enhanced Yield Fund
Financial Highlights
For a share outstanding throughout each year
| For the years ended December 31, | ||||||||||||||||||||
| Class N | 2016# | 2015 | 2014 | 2013 | 2012 | |||||||||||||||
Net Asset Value, Beginning of Year | $ | 10.08 | $ | 10.16 | $ | 8.98 | $ | 10.24 | $ | 9.55 | ||||||||||
Income from Investment Operations: | ||||||||||||||||||||
Net investment income1,2 | 0.25 | 0.30 | 0.34 | 0.35 | 0.36 | |||||||||||||||
Net realized and unrealized gain (loss) on investments | (0.23 | ) | 0.05 | 1.18 | (1.18 | ) | 0.93 | |||||||||||||
Total income (loss) from investment operations | 0.02 | 0.35 | 1.52 | (0.83 | ) | 1.29 | ||||||||||||||
Less Distributions to Shareholders from: | ||||||||||||||||||||
Net investment income | (0.25 | ) | (0.30 | ) | (0.34 | ) | (0.36 | ) | (0.36 | ) | ||||||||||
Net realized gain on investments | (0.45 | ) | (0.13 | ) | — | (0.07 | ) | (0.24 | ) | |||||||||||
Total distributions to shareholders | (0.70 | ) | (0.43 | ) | (0.34 | ) | (0.43 | ) | (0.60 | ) | ||||||||||
Net Asset Value, End of Year | $ | 9.40 | $ | 10.08 | $ | 10.16 | $ | 8.98 | $ | 10.24 | ||||||||||
Total Return2 | 0.10 | % | 3.57 | % | 17.14 | % | (8.27 | )%4 | 13.69 | %4 | ||||||||||
Ratio of net expenses to average net assets (with offsets/reductions) | 1.14 | % | 1.07 | % | 1.00 | % | 1.12 | %9 | 1.07 | %10 | ||||||||||
Ratio of expenses to average net assets (with offsets) | 1.14 | % | 1.07 | % | 1.00 | % | 1.12 | %9 | 1.07 | %10 | ||||||||||
Ratio of total expenses to average net assets (without offsets/reductions)3 | 1.30 | % | 1.25 | % | 1.19 | % | 1.30 | %9 | 1.27 | %10 | ||||||||||
Ratio of net investment income to average net assets2 | 2.38 | % | 2.98 | % | 3.46 | % | 3.58 | %9 | 3.53 | %10 | ||||||||||
Portfolio turnover | 172 | % | 120 | % | 83 | % | 52 | % | 70 | % | ||||||||||
Net assets at end of year (000’s omitted) | $ | 4,184 | $ | 5,500 | $ | 8,507 | $ | 8,030 | $ | 21,413 | ||||||||||
|
|
|
|
|
|
|
|
|
| |||||||||||
| For the years ended December 31, | ||||||||||||||||||||
| Class S | 2016# | 2015 | 2014 | 2013 | 2012 | |||||||||||||||
Net Asset Value, Beginning of Year | $ | 10.09 | $ | 10.16 | $ | 8.98 | $ | 10.23 | $ | 9.54 | ||||||||||
Income from Investment Operations: | ||||||||||||||||||||
Net investment income1,2 | 0.29 | 0.34 | 0.36 | 0.38 | 0.38 | |||||||||||||||
Net realized and unrealized gain (loss) on investments | (0.22 | ) | 0.06 | 1.18 | (1.18 | ) | 0.93 | |||||||||||||
Total income (loss) from investment operations | 0.07 | 0.40 | 1.54 | (0.80 | ) | 1.31 | ||||||||||||||
Less Distributions to Shareholders from: | ||||||||||||||||||||
Net investment income | (0.30 | ) | (0.34 | ) | (0.36 | ) | (0.38 | ) | (0.38 | ) | ||||||||||
Net realized gain on investments | (0.45 | ) | (0.13 | ) | — | (0.07 | ) | (0.24 | ) | |||||||||||
Total distributions to shareholders | (0.75 | ) | (0.47 | ) | (0.36 | ) | (0.45 | ) | (0.62 | ) | ||||||||||
Net Asset Value, End of Year | $ | 9.41 | $ | 10.09 | $ | 10.16 | $ | 8.98 | $ | 10.23 | ||||||||||
Total Return2 | 0.55 | % | 4.07 | % | 17.39 | % | (7.95 | )% | 13.90 | % | ||||||||||
Ratio of net expenses to average net assets (with offsets/reductions) | 0.72 | % | 0.71 | % | 0.72 | % | 0.78 | %9 | 0.86 | %10 | ||||||||||
Ratio of expenses to average net assets (with offsets) | 0.72 | % | 0.71 | % | 0.72 | % | 0.78 | %9 | 0.86 | %10 | ||||||||||
Ratio of total expenses to average net assets (without offsets/reductions)3 | 0.88 | % | 0.89 | % | 0.91 | % | 0.96 | %9 | 1.06 | %10 | ||||||||||
Ratio of net investment income to average net assets2 | 2.81 | % | 3.35 | % | 3.68 | % | 3.99 | %9 | 3.74 | %10 | ||||||||||
Portfolio turnover | 172 | % | 120 | % | 83 | % | 52 | % | 70 | % | ||||||||||
Net assets at end of year (000’s omitted) | $ | 16,415 | $ | 16,036 | $ | 15,757 | $ | 5,222 | $ | 6,401 | ||||||||||
|
|
|
|
|
|
|
|
|
| |||||||||||
51
Table of Contents
AMG GW&K Municipal Enhanced Yield Fund
Financial Highlights
For a share outstanding throughout each year
| For the years ended December 31, | ||||||||||||||||||||
| Class I | 2016# | 2015 | 2014 | 2013 | 2012 | |||||||||||||||
Net Asset Value, Beginning of Year | $ | 10.07 | $ | 10.14 | $ | 8.97 | $ | 10.22 | $ | 9.53 | ||||||||||
Income from Investment Operations: | ||||||||||||||||||||
Net investment income1,2 | 0.30 | 0.34 | 0.37 | 0.39 | 0.40 | |||||||||||||||
Net realized and unrealized gain (loss) on investments | (0.22 | ) | 0.07 | 1.17 | (1.17 | ) | 0.93 | |||||||||||||
Total income (loss) from investment operations | 0.08 | 0.41 | 1.54 | (0.78 | ) | 1.33 | ||||||||||||||
Less Distributions to Shareholders from: | ||||||||||||||||||||
Net investment income | (0.30 | ) | (0.35 | ) | (0.37 | ) | (0.40 | ) | (0.40 | ) | ||||||||||
Net realized gain on investments | (0.45 | ) | (0.13 | ) | — | (0.07 | ) | (0.24 | ) | |||||||||||
Total distributions to shareholders | (0.75 | ) | (0.48 | ) | (0.37 | ) | (0.47 | ) | (0.64 | ) | ||||||||||
Net Asset Value, End of Year | $ | 9.40 | $ | 10.07 | $ | 10.14 | $ | 8.97 | $ | 10.22 | ||||||||||
Total Return2 | 0.70 | % | 4.15 | % | 17.45 | % | (7.80 | )% | 14.13 | %4 | ||||||||||
Ratio of net expenses to average net assets (with offsets/reductions) | 0.64 | % | 0.64 | % | 0.64 | % | 0.66 | %9 | 0.65 | %10 | ||||||||||
Ratio of expenses to average net assets (with offsets) | 0.64 | % | 0.64 | % | 0.64 | % | 0.66 | %9 | 0.65 | %10 | ||||||||||
Ratio of total expenses to average net assets (without offsets/reductions)3 | 0.80 | % | 0.82 | % | 0.83 | % | 0.84 | %9 | 0.85 | %10 | ||||||||||
Ratio of net investment income to average net assets2 | 2.89 | % | 3.42 | % | 3.83 | % | 4.08 | %9 | 3.96 | %10 | ||||||||||
Portfolio turnover | 172 | % | 120 | % | 83 | % | 52 | % | 70 | % | ||||||||||
Net assets at end of year (000’s omitted) | $ | 195,193 | $ | 212,057 | $ | 226,284 | $ | 201,161 | $ | 294,983 | ||||||||||
|
|
|
|
|
|
|
|
|
| |||||||||||
52
Table of Contents
AMG GW&K Small Cap Core Fund
Financial Highlights
For a share outstanding throughout each year
| For the years ended December 31, | ||||||||||||||||||||
| Class N | 2016# | 2015 | 2014 | 2013 | 2012 | |||||||||||||||
Net Asset Value, Beginning of Year | $ | 21.80 | $ | 23.39 | $ | 24.34 | $ | 17.72 | $ | 15.87 | ||||||||||
Income from Investment Operations: | ||||||||||||||||||||
Net investment income (loss)1,2 | 0.00 | ##,11 | (0.06 | )12 | (0.07 | )13 | (0.07 | )14 | 0.14 | 15 | ||||||||||
Net realized and unrealized gain (loss) on investments | 3.81 | (0.64 | ) | 0.46 | 7.56 | 2.15 | ||||||||||||||
Total income (loss) from investment operations | 3.81 | (0.70 | ) | 0.39 | 7.49 | 2.29 | ||||||||||||||
Less Distributions to Shareholders from: | ||||||||||||||||||||
Net investment income | — | — | — | — | (0.08 | ) | ||||||||||||||
Net realized gain on investments | (1.04 | ) | (0.89 | ) | (1.34 | ) | (0.87 | ) | (0.36 | ) | ||||||||||
Total distributions to shareholders | (1.04 | ) | (0.89 | ) | (1.34 | ) | (0.87 | ) | (0.44 | ) | ||||||||||
Net Asset Value, End of Year | $ | 24.57 | $ | 21.80 | $ | 23.39 | $ | 24.34 | $ | 17.72 | ||||||||||
Total Return2 | 17.44 | % | (3.02 | )% | 1.53 | % | 42.26 | % | 14.45 | % | ||||||||||
Ratio of net expenses to average net assets (with offsets/reductions) | 1.33 | % | 1.35 | % | 1.42 | % | 1.37 | %16 | 1.41 | %17 | ||||||||||
Ratio of expenses to average net assets (with offsets) | 1.33 | % | 1.35 | % | 1.42 | % | 1.37 | %16 | 1.41 | %17 | ||||||||||
Ratio of total expenses to average net assets (without offsets/reductions)3 | 1.42 | % | 1.46 | % | 1.53 | % | 1.50 | %16 | 1.62 | %17 | ||||||||||
Ratio of net investment income (loss) to average net assets2 | 0.01 | % | (0.24 | )% | (0.28 | )% | (0.32 | )%16 | 0.78 | %17 | ||||||||||
Portfolio turnover | 19 | % | 16 | % | 26 | % | 19 | % | 14 | % | ||||||||||
Net assets at end of year (000’s omitted) | $ | 35,760 | $ | 35,691 | $ | 37,995 | $ | 69,992 | $ | 14,707 | ||||||||||
|
|
|
|
|
|
|
|
|
| |||||||||||
| For the years ended December 31, | ||||||||||||||||||||
| Class S | 2016# | 2015 | 2014 | 2013 | 2012 | |||||||||||||||
Net Asset Value, Beginning of Year | $ | 21.97 | $ | 23.53 | $ | 24.42 | $ | 17.73 | $ | 15.85 | ||||||||||
Income from Investment Operations: | ||||||||||||||||||||
Net investment income (loss)1,2 | 0.04 | 11 | 0.01 | 12 | 0.04 | 13 | (0.02 | )14 | 0.06 | 15 | ||||||||||
Net realized and unrealized gain (loss) on investments | 3.87 | (0.65 | ) | 0.43 | 7.58 | 2.26 | ||||||||||||||
Total income (loss) from investment operations | 3.91 | (0.64 | ) | 0.47 | 7.56 | 2.32 | ||||||||||||||
Less Distributions to Shareholders from: | ||||||||||||||||||||
Net investment income | (0.05 | ) | (0.02 | ) | (0.01 | ) | — | (0.08 | ) | |||||||||||
Net realized gain on investments | (1.05 | ) | (0.90 | ) | (1.35 | ) | (0.87 | ) | (0.36 | ) | ||||||||||
Total distributions to shareholders | (1.10 | ) | (0.92 | ) | (1.36 | ) | (0.87 | ) | (0.44 | ) | ||||||||||
Net Asset Value, End of Year | $ | 24.78 | $ | 21.97 | $ | 23.53 | $ | 24.42 | $ | 17.73 | ||||||||||
Total Return2 | 17.75 | % | (2.75 | )% | 1.86 | % | 42.64 | %4 | 14.67 | %4 | ||||||||||
Ratio of net expenses to average net assets (with offsets/reductions) | 1.06 | % | 1.07 | % | 1.10 | % | 1.13 | %16 | 1.20 | %17 | ||||||||||
Ratio of expenses to average net assets (with offsets) | 1.06 | % | 1.07 | % | 1.10 | % | 1.13 | %16 | 1.20 | %17 | ||||||||||
Ratio of total expenses to average net assets (without offsets/reductions)3 | 1.16 | % | 1.18 | % | 1.22 | % | 1.26 | %16 | 1.41 | %17 | ||||||||||
Ratio of net investment income (loss) to average net assets2 | 0.16 | % | 0.03 | % | 0.16 | % | (0.09 | )%16 | 0.44 | %17 | ||||||||||
Portfolio turnover | 19 | % | 16 | % | 26 | % | 19 | % | 14 | % | ||||||||||
Net assets at end of year (000’s omitted) | $ | 17,689 | $ | 36,739 | $ | 44,806 | $ | 35,836 | $ | 13,052 | ||||||||||
|
|
|
|
|
|
|
|
|
| |||||||||||
53
Table of Contents
AMG GW&K Small Cap Core Fund
Financial Highlights
For a share outstanding throughout each year
| For the years ended December 31, | ||||||||||||||||||||
| Class I | 2016# | 2015 | 2014 | 2013 | 2012 | |||||||||||||||
Net Asset Value, Beginning of Year | $ | 22.04 | $ | 23.61 | $ | 24.49 | $ | 17.76 | $ | 15.87 | ||||||||||
Income from Investment Operations: | ||||||||||||||||||||
Net investment income1,2 | 0.10 | 11 | 0.04 | 12 | 0.07 | 13 | 0.02 | 14 | 0.14 | 15 | ||||||||||
Net realized and unrealized gain (loss) on investments | 3.86 | (0.65 | ) | 0.44 | 7.58 | 2.23 | ||||||||||||||
Total income (loss) from investment operations | 3.96 | (0.61 | ) | 0.51 | 7.60 | 2.37 | ||||||||||||||
Less Distributions to Shareholders from: | ||||||||||||||||||||
Net investment income | (0.10 | ) | (0.05 | ) | (0.04 | ) | — | (0.12 | ) | |||||||||||
Net realized gain on investments | (1.06 | ) | (0.91 | ) | (1.35 | ) | (0.87 | ) | (0.36 | ) | ||||||||||
Total distributions to shareholders | (1.16 | ) | (0.96 | ) | (1.39 | ) | (0.87 | ) | (0.48 | ) | ||||||||||
Net Asset Value, End of Year | $ | 24.84 | $ | 22.04 | $ | 23.61 | $ | 24.49 | $ | 17.76 | ||||||||||
Total Return2 | 17.90 | % | (2.63 | )% | 2.04 | % | 42.81 | %4 | 14.97 | %4 | ||||||||||
Ratio of net expenses to average net assets (with offsets/reductions) | 0.94 | % | 0.95 | % | 0.95 | % | 0.97 | %16 | 0.96 | %17 | ||||||||||
Ratio of expenses to average net assets (with offsets) | 0.94 | % | 0.95 | % | 0.95 | % | 0.97 | %16 | 0.96 | %17 | ||||||||||
Ratio of total expenses to average net assets (without offsets/reductions)3 | 1.03 | % | 1.06 | % | 1.07 | % | 1.10 | %16 | 1.17 | %17 | ||||||||||
Ratio of net investment income to average net assets2 | 0.43 | % | 0.17 | % | 0.30 | % | 0.07 | %16 | 0.84 | %17 | ||||||||||
Portfolio turnover | 19 | % | 16 | % | 26 | % | 19 | % | 14 | % | ||||||||||
Net assets at end of year (000’s omitted) | $ | 367,972 | $ | 302,381 | $ | 291,301 | $ | 168,854 | $ | 76,673 | ||||||||||
|
|
|
|
|
|
|
|
|
| |||||||||||
54
Table of Contents
AMG GW&K Small Cap Growth Fund
Financial Highlights
For a share outstanding throughout each period
| For the year ended December 31, | For the period from through December 31, 2015** | |||||||
| Class I | 2016# | |||||||
Net Asset Value, Beginning of Period | $ | 8.95 | $ | 10.00 | ||||
Income from Investment Operations: | ||||||||
Net investment loss1,2 | (0.03 | ) | (0.02 | ) | ||||
Net realized and unrealized gain (loss) on investments | 0.89 | (1.03 | ) | |||||
Total income (loss) from investment operations | 0.86 | (1.05 | ) | |||||
Less Distributions to Shareholders from: | ||||||||
Net investment income | (0.01 | ) | — | |||||
Net Asset Value, End of Period | $ | 9.80 | $ | 8.95 | ||||
Total Return2 | 9.55 | %4 | (10.50 | )%18 | ||||
Ratio of net expenses to average net assets (with offsets/reductions) | 0.95 | % | 0.95 | %19 | ||||
Ratio of expenses to average net assets (with offsets) | 0.95 | % | 0.95 | %19 | ||||
Ratio of total expenses to average net assets (without offsets/reductions)3 | 4.60 | % | 11.39 | %19 | ||||
Ratio of net investment loss to average net assets2 | (0.38 | )% | (0.39 | )%19 | ||||
Portfolio turnover | 48 | % | 41 | %18 | ||||
Net assets at end of period (000’s omitted) | $ | 2,231 | $ | 1,173 | ||||
|
|
|
| |||||
55
Table of Contents
The following footnotes should be read in conjunction with the Financial Highlights of the Funds previously presented in this report.
| # | Effective October 1, 2016, the Investor Class, Service Class and Institutional Class of AMG GW&K Enhanced Core Bond Fund, AMG GW&K Municipal Bond Fund, AMG GW&K Municipal Enhanced Yield Fund and AMG GW&K Small Cap Core Fund were renamed Class N, Class S and Class I, respectively, and the Institutional Class of AMG GW&K Small Cap Growth Fund was renamed Class I. |
| ## | Rounds to less than $0.01 per share. |
| * | Commencement of operations was December 1, 2012. |
| ** | Commencement of operations was June 30, 2015. |
| †† | Effective December 1, 2012, Class C shares were closed to all new investors. |
| 1 | Per share numbers have been calculated using average shares. |
| 2 | Total returns and net investment income would have been lower had certain expenses not been offset. |
| 3 | Excludes the impact of expense reimbursements or fee waiver and expense reductions such as brokerage credits, but includes non-reimbursable expenses, if any, such as interest, taxes and extraordinary expenses. (See Notes 1(c) and 2 in the Notes to Financial Statements). |
| 4 | The Total Return is based on the Financial Statement Net Asset Values as shown in the Financial Highlights. |
| 5 | Includes non-routine extraordinary expenses amounting to 0.021%, 0.016%, 0.021% and 0.020% of average net assets for the Class N, Class S, Class C and Class l, respectively. |
| 6 | Includes non-routine extraordinary expenses amounting to 0.004%, 0.005%, 0.004% and 0.004% of average net assets for the Class N, Class S, Class C and Class l, respectively. |
| 7 | Includes non-routine extraordinary expenses amounting to 0.021%, 0.020% and 0.020% of average net assets for the Class N, Class S and Class l, respectively. |
| 8 | Includes non-routine extraordinary expenses amounting to 0.005%, 0.005% and 0.005% of average net assets for the Class N, Class S and Class l, respectively. |
| 9 | Includes non-routine extraordinary expenses amounting to 0.024%, 0.022% and 0.023% of average net assets for the Class N, Class S and Class l, respectively. |
| 10 | Includes non-routine extraordinary expenses amounting to 0.006%, 0.005% and 0.005% of average net assets for the Class N, Class S and Class l, respectively. |
| 11 | Includes non-recurring dividends. Without these dividends, net investment income per share would have been $(0.06), $(0.02) and $0.04 for the Class N, Class S and Class l, respectively. |
| 12 | Includes non-recurring dividends. Without these dividends, net investment income per share would have been $(0.05), $0.01 and $0.05 for the Class N, Class S and Class l, respectively. |
| 13 | Includes non-recurring dividends. Without these dividends, net investment income per share would have been $(0.11), $(0.00), and $0.03 for AMG GW&K Small Cap Core Fund’s Class N, Class S and Class l shares, respectively. |
| 14 | Includes non-recurring dividends. Without these dividends, net investment income per share would have been $(0.09), $(0.04) and $0.00 for the Class N, Class S and Class l respectively. |
| 15 | Includes non-recurring dividends. Without these dividends, net investment income per share would have been $0.03, $(0.05) and $0.03 for the Class N, Class S and Class l, respectively. |
| 16 | Includes non-routine extraordinary expenses amounting to 0.015%, 0.017% and 0.018% of average net assets for the Class N, Class S and Class l, respectively. |
| 17 | Includes non-routine extraordinary expenses amounting to 0.008%, 0.004% and 0.005% of average net assets for the Class N, Class S and Class l, respectively. |
| 18 | Not annualized. |
| 19 | Annualized. |
56
Table of Contents
December 31, 2016
1.SUMMARY OF SIGNIFICANT ACCOUNTING POLICIES
AMG Funds and AMG Funds II (the “Trusts”) are open-end management investment companies, organized as Massachusetts business trusts and registered under the Investment Company Act of 1940, as amended (the “1940 Act”). Currently, the Trusts consist of a number of different funds, each having distinct investment management objectives, strategies, risks, and policies. Included in this report are AMG Funds: AMG GW&K Municipal Bond Fund (“Municipal Bond”), AMG GW&K Municipal Enhanced Yield Fund (“Municipal Enhanced”), AMG GW&K Small Cap Core Fund (“Small Cap Core”) and AMG GW&K Small Cap Growth Fund (“Small Cap Growth”) and AMG Funds II: AMG GW&K Enhanced Core Bond Fund (“Enhanced Core Bond”), each a “Fund” and collectively, the “Funds.”
Each Fund offers different classes of shares, which, effective October 1, 2016 were renamed. Enhanced Core Bond, Municipal Bond, Municipal Enhanced and Small Cap Core previously offered Investor Class shares, Service Class shares, and Institutional Class shares which were renamed to Class N, Class S and Class I, respectively; Small Cap Growth previously offered Institutional Class shares which were renamed Class I. Additionally, Enhanced Core Bond offers Class C shares. Small Cap Growth commenced operations on June 30, 2015.
Each class represents an interest in the same assets of the respective Fund. Although all share classes generally have identical voting rights, each share class votes separately when required by law. Different share classes may pay different distribution amounts to the extent the net asset value per share and/or the expenses of such share classes differ. Each share class has its own expense structure. Please refer to a current prospectus for additional information on each share class.
Effective December 1, 2012, Class C shares of Enhanced Core Bond were closed to all new investors and will no longer be available for purchase by existing shareholders. Shareholders who redeem Class C shares of the Fund will continue to be subject to the deferred sales charges described in the prospectus. Effective November 1, 2013, Small Cap Core was closed to new investors. Please refer to Enhanced Core Bond’s and Small Cap Core’s current prospectus for additional information.
The Funds’ financial statements are prepared in accordance with accounting principles generally accepted in the United States of America (“U.S. GAAP”), including accounting and reporting guidance pursuant to Accounting Standards Codification Topic 946 applicable to investment companies. U.S. GAAP requires management to make estimates and assumptions that affect the reported amounts of assets and liabilities and disclosure of contingent assets and liabilities at the date of the financial statements and the reported amounts of income and expenses during the reporting period. Actual results could differ from those estimates and such differences could be material. The following is a summary of significant accounting policies followed by the Funds in the preparation of their financial statements:
a. VALUATION OF INVESTMENTS
Equity securities traded on a national securities exchange or reported on the NASDAQ national market system (“NMS”) are valued at the last quoted sales price on the primary exchange or, if applicable, the NASDAQ official closing price or the official closing price of the relevant exchange or, lacking any sales,
at the last quoted bid price or the mean between the last quoted bid and ask prices (the “exchange mean price”). Equity securities traded in the over-the-counter market (other than NMS securities) are valued at the exchange mean price. Foreign equity securities (securities principally traded in markets other than U.S. markets) are valued at the official closing price on the primary exchange or, for markets that either do not offer an official closing price or where the official closing price may not be representative of the overall market, the last quoted sale price.
Fixed income securities purchased with a remaining maturity exceeding 60 days are valued at the evaluated bid price or the mean price provided by an authorized pricing service or, if an evaluated price is not available, by reference to other securities which are considered comparable in credit rating, interest rate, due date and other features (generally referred to as “matrix pricing”) or other similar pricing methodologies. Investments in certain mortgage-backed and stripped mortgage-backed securities, preferred stocks, convertible securities, derivatives and other debt securities not traded on an organized securities market are valued on the basis of valuations provided by dealers or by a pricing service which uses information with respect to transactions in such securities and various relationships between such securities and yield to maturity in determining value.
Fixed income securities purchased with a remaining maturity of 60 days or less are valued at amortized cost, provided that the amortized cost value is approximately the same as the fair value of the security valued without the use of amortized cost. Investments in other open-end regulated investment companies are valued at their end of day net asset value per share.
The Funds’ portfolio investments are generally valued based on independent market quotations or prices or, if none, “evaluative” or other market based valuations provided by third-party pricing services approved by the Board of Trustees of the Trusts (the “Board”). Under certain circumstances, the value of certain Fund portfolio investments (including derivatives) may be based on an evaluation of fair value, pursuant to procedures established by and under the general supervision of the Board. The Valuation Committee, which is comprised of the Independent Trustees of the Board, and the Pricing Committee, which is comprised of representatives from AMG Funds LLC (the “Investment Manager”) are the committees appointed by the Board to make fair value determinations. Each Fund may use the fair value of a portfolio investment to calculate its net asset value (“NAV”) in the event that the market quotation, price or market based valuation for the portfolio investment is not readily available or otherwise not determinable pursuant to the Board’s valuation procedures, if the Investment Manager for the Pricing Committee believes the quotation, price or market based valuation to be unreliable, or in certain other circumstances. When determining the fair value of an investment, the Pricing Committee and, if required under the Trust’s securities valuation procedures, the Valuation Committee, seeks to determine the price that the Fund might reasonably expect to receive from current sale of that portfolio investment in an arms-length transaction. Fair value determinations shall be based upon consideration of all available facts and information, including, but not limited to (i) attributes specific to the investment; (ii) fundamental and analytical data relating to the investment; and (iii) the value of other comparable securities or relevant financial instruments, including derivative securities, traded on other markets or among dealers.
| 57 |
Table of Contents
Notes to Financial Statements (continued)
The values assigned to fair value portfolio investments are based on available information and do not necessarily represent amounts that might ultimately be realized in the future, since such amounts depend on future developments inherent in long-term investments. Because of the inherent uncertainty of valuation, those estimated values may differ significantly from the values that would have been used had a ready market for the investments existed, and the differences could be material. The Board will be presented with a quarterly report showing as of the most recent quarter end, all outstanding securities fair valued by the Fund, including a comparison with the prior quarter end and the percentage of the Fund that the security represents at each quarter end.
With respect to foreign equity securities and certain foreign fixed income securities, the Board has adopted a policy that securities held in a Fund that can be fair valued by the applicable fair value pricing service are fair valued on each business day provided that each individual price exceeds a pre-established confidence level.
U.S. GAAP defines fair value as the price that a fund would receive to sell an asset or pay to transfer a liability in an orderly transaction between market participants at the measurement date. U.S. GAAP also establishes a framework for measuring fair value, and a three-level hierarchy for fair value measurements based upon the transparency of inputs to the valuation of an asset or liability. Inputs may be observable or unobservable and refer broadly to the assumptions that market participants would use in pricing the asset or liability. Observable inputs reflect the assumptions market participants would use in pricing the asset or liability based on market data obtained from sources independent of the Funds. Unobservable inputs reflect the Funds’ own assumptions about the assumptions that market participants would use in pricing the asset or liability developed based on the best information available in the circumstances. Each investment is assigned a level based upon the observability of the inputs which are significant to the overall valuation.
The three-tier hierarchy of inputs is summarized below:
Level 1 – inputs are quoted prices in active markets for identical investments (e.g., equity securities, open-end investment companies)
Level 2 – other observable inputs (including, but not limited to: quoted prices for similar assets or liabilities in markets that are active, quoted prices for identical or similar assets or liabilities in markets that are not active, inputs other than quoted prices that are observable for the assets or liabilities (such as interest rates, yield curves, volatilities, prepayment speeds, loss severities, credit risks and default rates) or other market corroborated inputs) (e.g., debt securities, government securities, foreign currency exchange contracts, foreign securities utilizing international fair value pricing, broker-quoted securities, fair valued securities with observable inputs)
Level 3 – inputs are significant unobservable inputs (including the Fund’s own assumptions used to determine the fair value of investments) (e.g., fair valued securities with unobservable inputs)
Changes in inputs or methodologies used for valuing investments may result in a transfer in or out of levels within the fair value hierarchy. The inputs or methodologies used for valuing investments may not necessarily be an indication of the risk associated with investing in those investments. Transfers
between different levels of the fair value disclosure hierarchy are deemed to have occurred as of the beginning of the reporting period.
b. SECURITY TRANSACTIONS
Security transactions are accounted for as of trade date. Realized gains and losses on securities sold are determined on the basis of identified cost.
c. INVESTMENT INCOME AND EXPENSES
Dividend income is recorded on the ex-dividend date. Dividends from foreign securities are recorded as soon as the Trust becomes aware of the ex-dividend date. Interest income, which includes amortization of premium and accretion of discount on debt securities, is accrued as earned. Dividend and interest income on foreign securities is recorded gross of any withholding tax. Non-cash dividends included in dividend income, if any, are reported at the fair market value of the securities received. Distributions received in excess of income from return of capital including real estate investment trusts (REITs) are recorded as a reduction of the cost of the related investment and/or as a realized gain. If the Fund no longer owns the applicable securities, any distributions received in excess of income are recorded as an adjustment to realized gain. Other income and expenses are recorded on an accrual basis. Expenses that cannot be directly attributed to a Fund are apportioned among the funds in the Trusts and other trusts within AMG Funds family of mutual funds (collectively the “AMG Funds family”) based upon their relative average net assets or number of shareholders. Investment income, realized and unrealized gains and losses, the common expenses of each Fund, and certain Fund level expense reductions, if any, are allocated on a pro-rata basis to each class based on the relative net assets of each class to the total net assets of each Fund.
Small Cap Core and Small Cap Growth had certain portfolio trades directed to various brokers under a brokerage recapture program. Credits received from the brokerage recapture program are earned and paid on a monthly basis, and are recorded as expense offsets, which serve to reduce the Fund’s overall expense ratio. For the year ended December 31, 2016, the impact on the expense ratios, if any, was $18,738 and $1, respectively, both less than 0.01%.
d. DIVIDENDS AND DISTRIBUTIONS
Fund distributions resulting from either net investment income or realized net capital gains, if any, will normally be declared and paid at least annually in December, as described in the Funds’ prospectus. Distributions to shareholders are recorded on the ex-dividend date. Distributions are determined in accordance with federal income tax regulations, which may differ from net investment income and net realized capital gains for financial statement purposes (U.S. GAAP). Differences may be permanent or temporary. Permanent differences are reclassified among capital accounts in the financial statements to reflect their tax character. Permanent book and tax basis differences, if any, relating to shareholder distributions will result in reclassifications to paid-in capital. Temporary differences arise when certain items of income, expense and gain or loss are recognized in different periods for financial statement and tax purposes; these differences will reverse at some time in the future. Permanent differences are due to redesignation of dividends paid by the fund. Temporary differences are due to differences between book and tax treatment of losses for excise tax purposes and wash sales.
58 |
Table of Contents
Notes to Financial Statements (continued)
The tax character of distributions paid during the years ended December 31, 2016 and December 31, 2015 were as follows:
| Enhanced Core Bond | Municipal Bond* | Municipal Enhanced** | Small Cap Core | Small Cap Growth | ||||||||||||||||||||||||||||||||
| Distributions paid from: | 2016 | 2015 | 2016 | 2015 | 2016 | 2015 | 2016 | 2015 | 2016 | |||||||||||||||||||||||||||
Ordinary income | $ | 2,783,139 | $ | 2,623,245 | $ | 13,518,971 | $ | 11,879,981 | $ | 7,158,615 | $ | 7,967,114 | $ | 1,432,368 | $ | 648,345 | $ | 764 | ||||||||||||||||||
Short-term capital gains | — | — | 10,894,944 | 2,721,008 | 5,596,273 | 267,207 | — | 986,775 | 371 | |||||||||||||||||||||||||||
Long-term capital gains | — | — | 6,159,541 | 7,423,930 | 4,450,883 | 2,756,948 | 17,275,822 | 14,018,195 | — | |||||||||||||||||||||||||||
|
|
|
|
|
|
|
|
|
|
|
|
|
|
|
|
|
| |||||||||||||||||||
| $ | 2,783,139 | $ | 2,623,245 | $ | 30,573,456 | $ | 22,024,919 | $ | 17,205,771 | $ | 10,991,269 | $ | 18,708,190 | $ | 15,653,315 | $ | 1,135 | |||||||||||||||||||
|
|
|
|
|
|
|
|
|
|
|
|
|
|
|
|
|
| |||||||||||||||||||
| * | The ordinary income distributions paid by Municipal Bond which were tax-exempt for the periods 2016 and 2015 were $13,518,971 and $11,879,981, respectively. |
| ** | The ordinary income distributions paid by Municipal Enhanced which were tax-exempt for the periods 2016 and 2015 were $7,153,068 and $7,948,240, respectively. |
As of December 31, 2016, the components of distributable earnings (excluding unrealized appreciation/depreciation) on a tax basis consisted of:
| Enhanced Core Bond | Municipal Bond | Municipal Enhanced | Small Cap Core | Small Cap Growth | ||||||||||||||||
Capital loss carryforward | $ | 4,225,768 | — | — | — | — | ||||||||||||||
Undistributed ordinary income | 9,070 | — | — | — | — | |||||||||||||||
Undistributed short-term capital gains | — | — | — | — | — | |||||||||||||||
Undistributed long-term capital gains | — | — | — | — | — | |||||||||||||||
Late year loss deferral | 363,553 | $ | 1,366,837 | $ | 2,265,605 | $ | 672,144 | $ | 1,565 | |||||||||||
e. FEDERAL TAXES
Each Fund currently qualifies as an investment company and intends to comply with the requirements under Subchapter M of the Internal Revenue Code of 1986, as amended, to distribute substantially all of its taxable income and gains to its shareholders and to meet certain diversification and income requirements with respect to investment companies. Therefore, no provision for federal income or excise tax is included in the accompanying financial statements.
Additionally, based on Small Cap Core’s and Small Cap Growth’s understanding of the tax rules and rates related to income, gains and transactions for the foreign jurisdictions in which it invests, Small Cap Core and Small Cap Growth will provide for foreign taxes, and where appropriate, deferred foreign taxes.
Management has analyzed the Funds’ tax positions taken on federal income tax returns as of December 31, 2016, and for all open tax years (generally, the three prior taxable years), and has concluded that no provision for federal income tax is required in the Funds’ financial statements. Additionally, Management is not aware of any tax position for which it is reasonably possible that the total amounts of unrecognized tax benefits will change materially in the next twelve months.
Net capital losses incurred may be carried forward for an unlimited time period, and retain their tax character as either short-term or long-term capital losses.
f. CAPITAL LOSS CARRYOVERS AND DEFERRALS
As of December 31, 2016, the following Funds had accumulated net realized capital loss carryovers from securities transactions for federal income tax purposes as shown in the following chart. These amounts may be used to offset future realized capital gains for an unlimited time period.
| Capital Loss Carryover Amounts | ||||||||
| Fund | Short-Term | Long-Term | ||||||
Enhanced Core Bond | $ | 807,428 | $ | 3,418,340 | ||||
As of December 31, 2016, Municipal Bond, Municipal Enhanced, Small Cap Core and Small Cap Growth had no accumulated net realized capital loss carryovers from securities transactions for federal income tax purposes. Should Municipal Bond, Municipal Enhanced, Small Cap Core and Small Cap Growth incur net capital losses for the year ended December 31, 2017, such amounts may be used to offset future realized capital gains, for an unlimited time period.
g. CAPITAL STOCK
The Trusts’ Declarations of Trust authorize for each Fund the issuance of an unlimited number of shares of beneficial interest, without par value. Each Fund records sales and repurchases of its capital stock on the trade date. The cost of securities contributed to the Funds in connection with the issuance of shares is based on the valuation of those securities in accordance with the Funds’ policy on investment valuation.
59 |
Table of Contents
Notes to Financial Statements (continued)
For the years ended December 31, 2016 and 2015, the capital stock transactions by class for the Funds were as follows:
| Enhanced Core Bond | Municipal Bond | |||||||||||||||||||||||||||||||
| 2016 | 2015 | 2016 | 2015 | |||||||||||||||||||||||||||||
| Shares | Amount | Shares | Amount | Shares | Amount | Shares | Amount | |||||||||||||||||||||||||
Class N: | ||||||||||||||||||||||||||||||||
Proceeds from sale of shares | 385,257 | $ | 3,795,029 | 745,685 | $ | 7,581,134 | 1,647,974 | $ | 19,577,982 | 1,539,109 | $ | 17,987,833 | ||||||||||||||||||||
Reinvestment of distributions | 27,286 | 268,301 | 53,402 | 536,159 | 75,000 | 856,921 | 54,114 | 632,448 | ||||||||||||||||||||||||
Cost of shares repurchased | (853,785 | ) | (8,384,944 | ) | (1,376,533 | ) | (13,764,481 | ) | (1,270,324 | ) | (14,901,658 | ) | (1,285,745 | ) | (14,916,621 | ) | ||||||||||||||||
|
|
|
|
|
|
|
|
|
|
|
|
|
|
|
| |||||||||||||||||
Net increase (decrease) | (441,242 | ) | $ | (4,321,614 | ) | (577,446 | ) | $ | (5,647,188 | ) | 452,650 | $ | 5,533,245 | 307,478 | $ | 3,703,660 | ||||||||||||||||
|
|
|
|
|
|
|
|
|
|
|
|
|
|
|
| |||||||||||||||||
Class S: | ||||||||||||||||||||||||||||||||
Proceeds from sale of shares | 3,892,108 | $ | 38,388,245 | 590,618 | $ | 5,851,078 | 10,232,475 | $ | 121,026,163 | 5,825,773 | $ | 68,099,858 | ||||||||||||||||||||
Reinvestment of distributions | 77,281 | 766,271 | 10,485 | 104,238 | 291,662 | 3,354,153 | 192,521 | 2,255,691 | ||||||||||||||||||||||||
Cost of shares repurchased | (834,296 | ) | (8,310,804 | ) | (67,052 | ) | (669,781 | ) | (7,024,704 | ) | (81,937,500 | ) | (3,484,494 | ) | (40,798,939 | ) | ||||||||||||||||
|
|
|
|
|
|
|
|
|
|
|
|
|
|
|
| |||||||||||||||||
Net increase | 3,135,093 | $ | 30,843,712 | 534,051 | $ | 5,285,535 | 3,499,433 | $ | 42,442,816 | 2,533,800 | $ | 29,556,610 | ||||||||||||||||||||
|
|
|
|
|
|
|
|
|
|
|
|
|
|
|
| |||||||||||||||||
Class C: | ||||||||||||||||||||||||||||||||
Proceeds from sale of shares | 2,517 | $ | 24,694 | 5,337 | $ | 53,505 | — | — | — | — | ||||||||||||||||||||||
Reinvestment of distributions | 9,536 | 93,552 | 19,802 | 198,380 | — | — | — | — | ||||||||||||||||||||||||
Cost of shares repurchased | (353,217 | ) | (3,475,625 | ) | (433,309 | ) | (4,362,382 | ) | — | — | — | — | ||||||||||||||||||||
|
|
|
|
|
|
|
|
|
|
|
|
|
|
|
| |||||||||||||||||
Net decrease | (341,164 | ) | $ | (3,357,379 | ) | (408,170 | ) | $ | (4,110,497 | ) | — | — | — | — | ||||||||||||||||||
|
|
|
|
|
|
|
|
|
|
|
|
|
|
|
| |||||||||||||||||
Class I: | ||||||||||||||||||||||||||||||||
Proceeds from sale of shares | 2,391,953 | $ | 23,618,757 | 1,630,862 | $ | 16,511,994 | 32,007,506 | $ | 379,279,837 | 33,123,648 | $ | 388,149,326 | ||||||||||||||||||||
Reinvestment of distributions | 145,492 | 1,436,923 | 143,327 | 1,438,083 | 2,035,999 | 23,482,851 | 1,438,936 | 16,900,334 | ||||||||||||||||||||||||
Cost of shares repurchased | (2,172,562 | ) | (21,122,721 | ) | (937,260 | ) | (9,401,582 | ) | (25,376,090 | ) | (297,140,902 | ) | (12,559,632 | ) | (147,490,609 | ) | ||||||||||||||||
|
|
|
|
|
|
|
|
|
|
|
|
|
|
|
| |||||||||||||||||
Net increase | 364,883 | $ | 3,932,959 | 836,929 | $ | 8,548,495 | 8,667,415 | $ | 105,621,786 | 22,002,952 | $ | 257,559,051 | ||||||||||||||||||||
|
|
|
|
|
|
|
|
|
|
|
|
|
|
|
| |||||||||||||||||
60
Table of Contents
Notes to Financial Statements (continued)
| Municipal Enhanced | Small Cap Core | |||||||||||||||||||||||||||||||
| 2016 | 2015 | 2016 | 2015 | |||||||||||||||||||||||||||||
| Shares | Amount | Shares | Amount | Shares | Amount | Shares | Amount | |||||||||||||||||||||||||
Class N: | ||||||||||||||||||||||||||||||||
Proceeds from sale of shares | 569,848 | $ | 5,963,684 | 765,332 | $ | 7,817,267 | 171,093 | $ | 3,879,355 | 344,200 | $ | 8,072,293 | ||||||||||||||||||||
Reinvestment of distributions | 33,790 | 329,552 | 20,792 | 210,164 | 55,106 | 1,367,178 | 60,630 | 1,336,887 | ||||||||||||||||||||||||
Cost of shares repurchased | (704,478 | ) | (7,269,369 | ) | (1,078,015 | ) | (11,024,996 | ) | (407,888 | ) | (9,392,744 | ) | (392,023 | ) | (9,181,256 | ) | ||||||||||||||||
|
|
|
|
|
|
|
|
|
|
|
|
|
|
|
| |||||||||||||||||
Net increase (decrease) | (100,840 | ) | $ | (976,133 | ) | (291,891 | ) | $ | (2,997,565 | ) | (181,689 | ) | $ | (4,146,211 | ) | 12,807 | $ | 227,924 | ||||||||||||||
|
|
|
|
|
|
|
|
|
|
|
|
|
|
|
| |||||||||||||||||
Class S: | ||||||||||||||||||||||||||||||||
Proceeds from sale of shares | 1,219,602 | $ | 12,565,944 | 1,115,492 | $ | 11,383,413 | 86,671 | $ | 2,032,563 | 162,317 | $ | 3,848,812 | ||||||||||||||||||||
Reinvestment of distributions | 127,122 | 1,234,918 | 76,444 | 770,964 | 29,980 | 750,402 | 35,688 | 792,991 | ||||||||||||||||||||||||
Cost of shares repurchased | (1,192,382 | ) | (12,156,404 | ) | (1,152,453 | ) | (11,693,012 | ) | (1,074,660 | ) | (25,613,152 | ) | (430,228 | ) | (10,436,822 | ) | ||||||||||||||||
|
|
|
|
|
|
|
|
|
|
|
|
|
|
|
| |||||||||||||||||
Net increase (decrease) | 154,342 | $ | 1,644,458 | 39,483 | $ | 461,365 | (958,009 | ) | $ | (22,830,187 | ) | (232,223 | ) | $ | (5,795,019 | ) | ||||||||||||||||
|
|
|
|
|
|
|
|
|
|
|
|
|
|
|
| |||||||||||||||||
Class I: | ||||||||||||||||||||||||||||||||
Proceeds from sale of shares | 6,118,953 | $ | 63,716,957 | 5,680,203 | $ | 57,465,629 | 2,961,740 | $ | 68,702,616 | 2,374,100 | $ | 56,191,800 | ||||||||||||||||||||
Reinvestment of distributions | 835,430 | 8,132,689 | 587,901 | 5,926,350 | 613,419 | 15,384,553 | 538,090 | 11,994,017 | ||||||||||||||||||||||||
Cost of shares repurchased | (7,243,382 | ) | (73,938,069 | ) | (7,508,463 | ) | (76,015,132 | ) | (2,480,898 | ) | (56,925,490 | ) | (1,531,195 | ) | (36,165,360 | ) | ||||||||||||||||
|
|
|
|
|
|
|
|
|
|
|
|
|
|
|
| |||||||||||||||||
Net increase (decrease) | (288,999 | ) | $ | (2,088,423 | ) | (1,240,359 | ) | $ | (12,623,153 | ) | 1,094,261 | $ | 27,161,679 | 1,380,995 | $ | 32,020,457 | ||||||||||||||||
|
|
|
|
|
|
|
|
|
|
|
|
|
|
|
| |||||||||||||||||
| Small Cap Growth | ||||||||||||||||
| 2016 | 2015 | |||||||||||||||
| Shares | Amount | Shares | Amount | |||||||||||||
Class I: | ||||||||||||||||
Proceeds from sale of shares | 148,293 | $ | 1,303,687 | 159,184 | $ | 1,476,468 | ||||||||||
Reinvestment of distributions | 114 | 1,126 | — | — | ||||||||||||
Cost of shares repurchased | (51,818 | ) | (463,032 | ) | (28,038 | ) | (257,387 | ) | ||||||||
|
|
|
|
|
|
|
| |||||||||
Net increase | 96,589 | $ | 841,781 | 131,146 | $ | 1,219,081 | ||||||||||
|
|
|
|
|
|
|
| |||||||||
At December 31, 2016, certain unaffiliated shareholders of record, including omnibus accounts, individually or collectively held greater than 10% of the net assets of the Funds as follows: Enhanced Core Bond—two collectively own 38%; Municipal Bond—two collectively own 68%; Municipal Enhanced—two collectively own 80%; Small Cap Core—three collectively own 65% and Small Cap Growth—two collectively own 89%. Transactions by these shareholders may have a material impact on their respective Fund.
h. REPURCHASE AGREEMENTS AND JOINT REPURCHASE AGREEMENTS
The Funds may enter into repurchase agreements for temporary cash management purposes provided that the value of the underlying collateral, including accrued interest, will equal or exceed the value of the repurchase agreement during the term of the agreement. The underlying collateral for all repurchase agreements is held in safekeeping by the Fund’s custodian or at the Federal Reserve Bank. If the seller defaults and the value of the collateral declines, or if bankruptcy proceedings commence with respect to the seller of the security, realization of the collateral by the Funds may be delayed or limited.
Additionally, the Funds may enter into joint repurchase agreements for reinvestment of cash collateral on securities lending transactions under the securities lending program offered by The Bank of New York Mellon (“BNYM”) (the “Program”), provided that the value of the underlying collateral, including accrued interest, will equal or exceed the value of the joint repurchase agreement during the term of the agreement. The Funds participate on a pro rata basis with other clients of BNYM in its share of the underlying collateral under such joint repurchase agreements and in its share of proceeds from any repurchase or other disposition of the underlying collateral. The underlying collateral for joint repurchase agreements is held in safekeeping by the Funds’ custodian or at the Federal Reserve Bank. If the seller defaults and the value of the collateral declines, or if bankruptcy proceedings commence with respect to the seller of the security, realization of the collateral by the Funds may be delayed or limited. Pursuant to the Program, the Funds are indemnified for such losses by BNYM.
61
Table of Contents
Notes to Financial Statements (continued)
At December 31, 2016, the market value of repurchase agreements or joint repurchase agreements outstanding for Enhanced Core Bond, Small Cap Core and Small Cap Growth were $1,888,919, $26,583,633 and $151,675, respectively.
i. DELAYED DELIVERY TRANSACTIONS AND WHEN-ISSUED SECURITIES
The Funds may enter into securities transactions on a delayed delivery or when issued basis. Payment and delivery may take place after the customary settlement period for that security. The price of the underlying securities and the date when the securities will be delivered and paid for are fixed at the time the transaction is negotiated. During the time a delayed delivery sell is outstanding, the contract is marked to market daily and equivalent deliverable securities are held for the transaction. The value of the securities purchased on a delayed delivery or when-issued basis are identified as such in the Funds’ Schedules of Portfolio Investments. With respect to purchase commitments, the Funds identify securities as segregated in their records with a value at least equal to the amount of the commitment. Losses may arise due to changes in the value of the underlying securities or if the counterparty does not perform under the contract, or if the issuer does not issue the securities due to political, economic, or other factors.
2. AGREEMENTS AND TRANSACTIONS WITH AFFILIATES
For each of the Funds, the Trusts have entered into an investment advisory agreement under which the Investment Manager, a subsidiary and the U.S. retail distribution arm of Affiliated Managers Group, Inc. (“AMG”), serves as investment manager to the Funds and is responsible for the Funds’ overall administration and operations. The Investment Manager selects one or more subadvisors for the Funds (subject to Board approval) and monitors each subadvisor’s investment performance, security holdings and investment strategies. Each Fund’s investment portfolio is managed by GW&K Investment Management, LLC, (“GW&K”) who serves pursuant to a subadvisory agreement with the Investment Manager. AMG indirectly owns a majority interest in GW&K.
Investment management fees are paid directly by the Funds to the Investment Manager based on average daily net assets. For the year ended December 31, 2016, the Funds’ investment management fees were paid at the following annual rate of each Fund’s respective average daily net assets:
Enhanced Core Bond | 0.45 | % | ||
Municipal Bond* | ||||
on first $25 million | 0.35 | % | ||
on next $25 million | 0.30 | % | ||
on next $50 million | 0.25 | % | ||
on balance over $100 million | 0.20 | % | ||
Municipal Enhanced | 0.50 | % | ||
Small Cap Core | 0.75 | % | ||
Small Cap Growth | 0.75 | % |
| * | Effective October 1, 2016, Municipal Bond changed to a tiered management fee structure. Prior to October 1, 2016, the annual rate for Municipal Bond’s investment management fee was 0.35% of the Fund’s average daily net assets. |
The Investment Manager has contractually agreed, through at least May 1, 2017, to waive management fees and/or reimburse fund expenses in order to limit total annual Fund operating expenses after fee waiver and expense reimbursements (exclusive of taxes, interest (including interest incurred in connection with bank and custody overdrafts), shareholder servicing fees, distribution and service (12b-1) fees, brokerage commissions and other transaction costs, acquired fund fees and expenses and extraordinary expenses) of Enhanced Core Bond, Municipal Bond, Municipal Enhanced, Small Cap Core and Small Cap Growth to 0.59%, 0.34%, 0.64%, 0.95% and 0.95%, respectively, of each Fund’s average daily net assets subject to later reimbursement by the Funds in certain circumstances. The contractual expense limitation may only be terminated in the event the Investment Manager or a successor ceases to be the investment manager of the Fund or a successor fund, by mutual agreement between the Investment Manager and the Board, or in the event of the Fund’s liquidation unless the Fund is reorganized or is a party to a merger in which the surviving entity is successor to the accounting and performance information of the Fund.
Each Fund is obligated to repay the Investment Manager such amounts waived, paid, or reimbursed in future years provided that the repayment occurs within thirty-six (36) months after the waiver or reimbursement and that such repayment would not cause the Fund’s total annual operating expenses after fee waiver and expense reimbursements in any such future year to exceed that Funds’ contractual expense limitation amount.
For the year ended December 31, 2016, each Fund’s expiration of reimbursement is as follows:
| Expiration Period | Enhanced Core Bond | Municipal Bond | ||||||
Less than 1 year | $ | 229,007 | $ | 1,312,291 | ||||
Within 2 years | 208,328 | 2,123,295 | ||||||
Within 3 years | 249,870 | 2,293,974 | ||||||
|
|
|
| |||||
Total Amount Subject to Reimbursement | $ | 687,205 | $ | 5,729,560 | ||||
|
|
|
| |||||
| Expiration Period | Municipal Enhanced | Small Cap Core | ||||||
Less than 1 year | $ | 232,205 | $ | 378,845 | ||||
Within 2 years | 205,861 | 405,914 | ||||||
Within 3 years | 222,096 | 314,503 | ||||||
|
|
|
| |||||
Total Amount Subject to Reimbursement | $ | 660,162 | $ | 1,099,262 | ||||
|
|
|
| |||||
| Expiration Period | Small Cap Growth | |||
Less than 1 year | — | |||
Within 2 years | $ | 48,523 | ||
Within 3 years | 57,742 | |||
|
| |||
Total Amount Subject to Reimbursement | $ | 106,265 | ||
|
| |||
The Trusts, on behalf of the Funds, have entered into an amended and restated Administration Agreement under which the Investment Manager serves as the Funds’ administrator (the “Administrator”) and is responsible for all non-portfolio
62
Table of Contents
Notes to Financial Statements (continued)
management aspects of managing the Funds’ operations, including administration and shareholder services to each Fund as further described in each Fund’s prospectus. Effective October 1, 2016, each Fund pays a fee to the Administrator at the rate of 0.15% per annum of the Fund’s average daily net assets for this service. Prior to October 1, 2016, Enhanced Core Bond, Municipal Bond, Municipal Enhanced, Small Cap Core and Small Cap Growth paid an administration fee under a similar contract at an annual rate of 0.20%, 0.25%, 0.25%, 0.25% and 0.25%, respectively, of each Fund’s average daily net assets.
The Administrator for Municipal Enhanced is voluntarily waiving a portion of its administration fee on 90% of the Fund’s net assets. The waiver, which may be modified or terminated at any time, amounts to 0.10% on the first $250 million of the Fund’s net assets and 0.15% on the remaining net assets. For the year ended December 31, 2016, the amount waived was $170,667 or 0.08%. Effective October 1, 2016, the administration fee waiver was discontinued.
The Funds are distributed by AMG Distributors, Inc. (the “Distributor”), a wholly owned subsidiary of the Investment Manager. The Distributor serves as the distributor and underwriter for each Fund and is a registered broker-dealer and member of the Financial Industry Regulatory Authority, Inc. (“FINRA”). Shares of each Fund will be continuously offered and will be sold directly to prospective purchasers and through brokers, dealers or other financial intermediaries who have executed selling agreements with the Distributor. Subject to the compensation arrangement discussed below, generally the Distributor bears all or a portion of the expenses of providing services pursuant to the distribution agreement, including the payment of the expenses relating to the distribution of prospectuses for sales purposes and any advertising or sales literature.
The Trusts have adopted a distribution and service plan (the “Plan”) with respect to the Class N shares of each Fund and Class C shares of Enhanced Core Bond, in accordance with the requirements of Rule 12b-1 under the 1940 Act and the requirements of the applicable rules of FINRA regarding asset based sales charges. Pursuant to the Plan, each Fund may make payments to the Distributor for its expenditures in financing any activity primarily intended to result in the sale of each such class of the Fund’s shares and for maintenance and personal service provided to existing shareholders of that class. The Plan authorizes payments to the Distributors up to 0.25% and 1.00% annually of each Fund’s average daily net assets attributable to Class N and Class C shares, respectively. The Plan further provides for periodic payments by the Trust or the Distributor to brokers, dealers and other financial intermediaries for providing shareholder services and for promotional and other sales related costs. The portion of payments made under the plan by Class C shares or Class N shares for shareholder servicing may not exceed an annual rate of 0.25% of the average daily net asset value of each Fund’s shares of that class owned by clients of such broker, dealer or financial intermediary.
For Enhanced Core Bond’s Class S shares and for each of the Class N and Class S shares of Municipal Bond, Municipal Enhanced and Small Cap Core, the Board has approved reimbursement payments to the Investment Manager for shareholder servicing expenses (“shareholder servicing fees”) incurred. Shareholder servicing fees include payments to financial intermediaries such as broker-dealers (including fund supermarket platforms), banks, and trust companies who provide shareholder recordkeeping, account servicing and other
services. The Class N and Class S shares may reimburse the Investment Manager for the actual amount incurred up to a maximum annual rate of each Class’s average daily net assets as shown in the table below.
The impact on the annualized expense ratios for the year ended December 31, 2016, were as follows:
| Fund | Maximum Amount Approved | Actual Amount Incurred | ||||||
Enhanced Core Bond | ||||||||
Class S | 0.10 | % | 0.10 | % | ||||
Municipal Bond | ||||||||
Class N | 0.25 | % | 0.12 | % | ||||
Class S* | 0.25 | % | 0.15 | % | ||||
Municipal Enhanced | ||||||||
Class N | 0.25 | % | 0.25 | % | ||||
Class S* | 0.25 | % | 0.08 | % | ||||
Small Cap Core | ||||||||
Class N | 0.25 | % | 0.14 | % | ||||
Class S* | 0.25 | % | 0.12 | % | ||||
| * | Effective October 1, 2016, the maximum annual rate was decreased to 0.15% from 0.25%. |
The Board provides supervision of the affairs of the Trusts, other trusts within the AMG Funds family and other affiliated funds. The Trustees of the Trusts who are not affiliated with an Investment Manager receive an annual retainer and per meeting fees for regular, special and telephonic meetings, and they are reimbursed for out-of-pocket expenses incurred while carrying out their duties as Board members. The Chairman of the Board and the Audit Committee Chair receive additional annual retainers. Certain Trustees and Officers of the Funds are Officers and/or Directors of the Investment Manager, AMG and/or the Distributor.
The Securities and Exchange Commission granted an exemptive order that permits the funds to lend and borrow money for certain temporary purposes directly to and from other eligible funds in the AMG Funds family. Participation in this interfund lending program is voluntary for both the borrowing and lending funds, and an interfund loan is only made if it benefits each participating Fund. The Administrator administers the program according to procedures approved by the Board, and the Board monitors the operation of the program. An interfund loan must comply with certain conditions set out in the exemptive order, which are designed to assure fairness and protect all participating funds. For the year ended December 31, 2016, the following Funds either borrowed from or lent to other Funds in the AMG Funds family: Enhanced Core Bond lent a maximum of $1,581,285 for 3 days earning interest in the amount of $109, and Small Cap Core lent a maximum of $2,796,955 for 11 days earning interest in the amount of $521. The interest amount is included in the Statement of Operations as interest income. Enhanced Core Bond borrowed $8,027,111 for one day paying interest of $234, and Municipal Bond borrowed a maximum of $6,022,988 for 8 days paying interest of $736. The interest expense amount is included in the Statement of Operations as miscellaneous expense. For the year ended
63 |
Table of Contents
Notes to Financial Statements (continued)
December 31, 2016, Municipal Enhanced Yield and Small Cap Growth neither borrowed from nor lent to other Funds in the AMG Funds family. At December 31, 2016, the Funds had no interfund loans outstanding.
The Investment Manager paid the initial state registration fees in the amount of $12,623 on behalf of Small Cap Growth. This balance is reflected as a Payable to Affiliate on the Statement of Assets and Liabilities.
3. PURCHASES AND SALES OF SECURITIES
Purchases and sales of securities (excluding short-term securities) for the year ended December 31, 2016, were as follows:
| Long-Term Securities (excluding U.S. Government Obligations) | ||||||||
| Fund | Purchases | Sales | ||||||
Enhanced Core Bond | $ | 90,766,795 | $ | 70,171,548 | ||||
Municipal Bond | 771,202,823 | 599,672,749 | ||||||
Municipal Enhanced | 415,322,292 | 422,090,105 | ||||||
Small Cap Core | 73,420,435 | 86,831,451 | ||||||
Small Cap Growth | 1,634,387 | 806,769 | ||||||
| U.S. Government Obligations | ||||||||
| Fund | Purchases | Sales | ||||||
Enhanced Core Bond | $ | 33,802,795 | $ | 28,284,236 | ||||
4. PORTFOLIO SECURITIES LOANED
The Funds participate in the Program providing for the lending of securities to qualified brokers. Securities lending income includes earnings of such temporary cash investments, plus or minus any rebate to a borrower. These earnings (after any rebate) are then divided between BNYM, as a fee for its services under the Program, and the Funds, according to agreed-upon rates. Collateral on all securities loaned is accepted in cash and is maintained at a minimum level of 102% (105% in the case of certain foreign securities) of the market value, plus interest, if applicable, of investments on loan. It is the Funds’ policy to obtain additional collateral from or return excess collateral to the borrower by the end of the next business day, following the valuation date of the securities loaned. Therefore, the value of the collateral held may be temporarily less than the value of the securities on loan. Lending securities entails a risk of loss to the Funds if and to the extent that the market value of the securities loaned were to increase and the borrower did not increase the collateral accordingly, and the borrower fails to return the securities. Under the terms of the Program, the Funds are indemnified for such losses by BNYM. Cash collateral is held in a separate omnibus account managed by BNYM, who is authorized to exclusively enter into joint overnight government repurchase agreements. BNYM bears the risk of any deficiency in the amount of the cash collateral available for return to the borrower due to any loss on the collateral invested.
At December 31, 2016, the value of the securities loaned and cash collateral received, were as follows:
| Fund | Securities Loaned | Cash Collateral Received | ||||||
Enhanced Core Bond | $ | 1,822,235 | $ | 1,888,919 | ||||
Small Cap Core | 25,772,801 | 26,583,633 | ||||||
Small Cap Growth | 146,315 | 151,675 | ||||||
5. COMMITMENTS AND CONTINGENCIES
Under each Trust’s organizational documents, its trustees and officers are indemnified against certain liabilities arising out of the performance of their duties to the Trusts. In addition, in the normal course of business, the Funds may enter into contracts and agreements that contain a variety of representations and warranties, which provide general indemnifications. The maximum exposure to the Funds under these arrangements is unknown, as this would involve future claims that may be made against a Fund that have not yet occurred. However, based on experience, the Funds had no prior claims or losses and expect the risks of loss to be remote.
6. MASTER NETTING AGREEMENTS
The Funds may enter into master netting agreements with their counterparties for the securities lending program and repurchase agreements, which provide the right, in the event of default (including bankruptcy or insolvency) for the non-defaulting party to liquidate the collateral and calculate net exposure to the defaulting party or request additional collateral. For financial reporting purposes, the Funds do not offset financial assets and financial liabilities that are subject to master netting agreements in the Statement of Assets and Liabilities. For security lending transactions, see Note 4.
64
Table of Contents
Notes to Financial Statements (continued)
The following table is a summary of the Funds’ open repurchase agreements that are subject to a master netting agreement as of December 31, 2016:
Net Amounts of Assets Presented in the Statement | Gross Amount Not Offset in the Statement of Assets and Liabilities | |||||||||||||||
| Financial Instruments Collateral | Cash Collateral Received | Net Amount | ||||||||||||||
Enhanced Core Bond | ||||||||||||||||
Daiwa Capital Markets America | $ | 1,000,000 | $ | 1,000,000 | — | — | ||||||||||
Nomura Securities International, Inc. | 888,919 | 888,919 | — | — | ||||||||||||
|
|
|
|
|
|
|
| |||||||||
Totals | $ | 1,888,919 | $ | 1,888,919 | — | — | ||||||||||
|
|
|
|
|
|
|
| |||||||||
Small Cap Core | ||||||||||||||||
Citigroup Global Markets, Inc. | $ | 6,313,720 | $ | 6,313,720 | — | — | ||||||||||
Daiwa Capital Markets America | 6,313,720 | 6,313,720 | — | — | ||||||||||||
Merrill Lynch Pierce Fenner & Smith, Inc. | 1,328,753 | 1,328,753 | — | — | ||||||||||||
Nomura Securities International, Inc. | 6,313,720 | 6,313,720 | — | — | ||||||||||||
State of Wisconsin Investment Board | 6,313,720 | 6,313,720 | — | — | ||||||||||||
|
|
|
|
|
|
|
| |||||||||
Totals | $ | 26,583,633 | $ | 26,583,633 | — | — | ||||||||||
|
|
|
|
|
|
|
| |||||||||
Small Cap Growth | ||||||||||||||||
Citigroup Global Markets, Inc. | $ | 151,675 | $ | 151,675 | — | — | ||||||||||
|
|
|
|
|
|
|
| |||||||||
7. REGULATORY UPDATES
On October 13, 2016, the SEC amended existing rules intended to modernize reporting and disclosure of information. These amendments relate to Regulation S-X which sets forth the form and content of financial statements. At this time, management is evaluating the implications of adopting these amendments and their impact on the financial statements and accompanying notes.
8. SUBSEQUENT EVENTS
The Funds have determined that no material events or transactions occurred through the issuance date of the Funds’ financial statements, which require an additional disclosure in or adjustment of the Funds’ financial statements except for the following: Effective February 27, 2017, the name of Small Cap Growth will be changed to AMG GW&K Small/Mid Cap Fund and related changes to the Fund’s principal investment strategies will take effect. Effective February 27, 2017, the management fee for Small Cap Growth will be reduced from 0.75% to 0.65%, the contractual expense limitation amount will be reduced from 0.95% to 0.85%, the contractual expense limitation term will be extended to May 1, 2018, and Class N Shares and I Shares will be authorized to pay up to 0.15% and 0.10%, respectively, in shareholder servicing fees. Effective February 27, 2017, the Enhanced Core Bond will rename existing Class I Shares to Class Z Shares and then rename Class S Shares to Class I Shares; Municipal Enhanced Yield and Small Cap Core will issue new Class Z Shares and Small Cap Growth will issue new Class N and Class Z Shares. Effective
February 27, 2017, the management fee for Enhanced Core Bond will be reduced from 0.45% to 0.30%, the contractual expense limitation amount will be reduced from 0.59% to 0.48%, and the contractual expense limitation term will be extended to May 1, 2018. Effective February 27, 2017, shareholder servicing fees paid by Class N Shares of the Municipal Bond will decrease from up to 0.25% to up to 0.15% and Class I Shares of the Fund will be authorized to pay up to 0.05% in shareholder servicing fees. Effective February 27, 2017, the management fee for Muni Enhanced Yield will be reduced from 0.50% to 0.45%, the contractual expense limitation amount will be reduced from 0.64% to 0.59%, the contractual expense limitation term will be extended to May 1, 2018, the maximum shareholder servicing fees paid by Class N Shares of Muni Enhanced Yield will decrease from up to 0.25% to up to 0.15% and Class I Shares of the Fund will be authorized to pay up to 0.05% in shareholder servicing fees. Effective February 27, 2017 the management fee for the Small Cap Core will be reduced from 0.75% to 0.70%, the contractual expense limitation amount will be reduced from 0.95% to 0.90%, the contractual expense limitation term will be extended to May 1, 2018, the maximum shareholder servicing fees paid by Class N Shares of the Fund will decrease from up to 0.25% to up to 0.15% and Class I Shares of the Fund will be authorized to pay up to 0.05% in shareholder servicing fees. Effective June 23, 2017, Municipal Bond, Municipal Enhanced Yield and Small Cap Core Class S Shares will be converted to Class I Shares.
65
Table of Contents
Notes to Financial Statements (continued)
TAX INFORMATION (unaudited)
The AMG GW&K Enhanced Core Bond Fund, AMG GW&K Municipal Bond Fund, AMG GW&K Municipal Enhanced Yield Fund, AMG GW&K Small Cap Core Fund and AMG GW&K Small Cap Growth Fund each hereby designates the maximum amount allowable of its net taxable income as qualified dividends as provided in the Jobs and Growth Tax Relief Reconciliation Act of 2003. The 2016 Form 1099-DIV you receive for each Fund will show the tax status of all distributions paid to you during the year.
Pursuant to section 852 of the Internal Revenue Code, AMG GW&K Enhanced Core Bond Fund, AMG GW&K Municipal Bond Fund, AMG GW&K Municipal Enhanced Yield Fund, AMG GW&K Small Cap Core Fund and AMG GW&K Small Cap Growth Fund each hereby designates $0, $6,159,541, $4,450,883, $17,275,822 and $0, respectively, as a capital gain distribution with respect to the taxable year ended December 31, 2016, or if subsequently determined to be different, the net capital gains of such fiscal year.
66
Table of Contents
Report of Independent Registered Public Accounting Firm
TO THE BOARD OF TRUSTEES OF AMG FUNDS AND AMG FUNDS II AND THE SHAREHOLDERS OF AMG GW&K ENHANCED CORE BOND FUND, AMG GW&K MUNICIPAL BOND FUND, AMG GW&K MUNICIPAL ENHANCED YIELD FUND, AMG GW&K SMALL CAP CORE FUND AND AMG GW&K SMALL CAP GROWTH FUND:
In our opinion, the accompanying statements of assets and liabilities, including the schedules of portfolio investments, and the related statements of operations and of changes in net assets and the financial highlights present fairly, in all material respects, the financial position of AMG GW&K Enhanced Core Bond Fund, AMG GW&K Municipal Bond Fund, AMG GW&K Municipal Enhanced Yield Fund, AMG GW&K Small Cap Core Fund, and AMG GW&K Small Cap Growth Fund (the “Funds”) as of December 31 2016, the results of each of their operations, the changes in each of their net assets and the financial highlights for each of the periods indicated, in conformity with accounting principles generally accepted in the United States of America. These financial statements and financial highlights (hereafter referred to as “financial statements”) are the responsibility of the Funds’ management. Our responsibility is to express an opinion on these financial statements based on our audits. We conducted our audits of these financial statements in accordance with the standards of the Public Company Accounting Oversight Board (United States). Those standards require that we plan and perform the audit to obtain reasonable assurance about whether the financial statements are free of material misstatement. An audit includes examining, on a test basis, evidence supporting the amounts and disclosures in the financial statements, assessing the accounting principles used and significant estimates made by management, and evaluating the overall financial statement presentation. We believe that our audits, which included confirmation of securities as of December 31, 2016 by correspondence with the custodian and brokers, and the application of alternative auditing procedures where securities purchased had not been received, provide a reasonable basis for our opinion.
PricewaterhouseCoopers LLP
Boston, Massachusetts
February 28, 2017
67
Table of Contents
AMG Funds
The Trustees and Officers of the Trust, their business addresses, principal occupations for the past five years and ages are listed below. The Trustees provide broad supervision over the affairs of the Trust and the Funds. The Trustees are experienced executives who meet periodically throughout the year to oversee the Funds’ activities, review contractual arrangements with
companies that provide services to the Funds, and review the Funds’ performance. Unless otherwise noted, the address of each Trustee or Officer is the address of the Trust: 600 Steamboat Road, Suite 300, Greenwich, Connecticut 06830.
There is no stated term of office for Trustees. Trustees serve until their
resignation, retirement or removal in accordance with the Trust’s
organizational documents and policies adopted by the Board from time to time. The Chairman of the Trustees, President, Treasurer and Secretary of the Trust are elected by the Trustees annually. Other officers hold office at the pleasure of the Trustees.
Independent Trustees
The following Trustees are not “interested persons” of the Trust within the meaning of the 1940 Act:
Number of Funds Overseen in Fund Complex | Name, Age, Principal Occupation(s) During Past 5 Years and Other Directorships Held by Trustee | |
• Trustee since 2012 | Bruce B. Bingham, 68 | |
• Oversees 67 Funds in Fund Complex | Partner, Hamilton Partners (real estate development firm) (1987-Present); Director of The Yacktman Funds (2000-2012). | |
• Trustee since 1999—AMG Funds | Edward J. Kaier, 71 | |
• Trustee since 2000—AMG Funds II • Oversees 67 Funds in Fund Complex | Attorney at Law and Partner, Teeters Harvey Marrone & Kaier LLP (2007-Present); Attorney at Law and Partner, Hepburn Willcox Hamilton & Putnam, LLP (1977-2007); Trustee of Third Avenue Trust (5 portfolios); Trustee of Third Avenue Variable Trust (1 portfolio). | |
• Trustee since 2013 | Kurt A. Keilhacker, 53 | |
• Oversees 69 Funds in Fund Complex | Managing Member, TechFund Capital (1997-Present); Managing Member, TechFund Europe (2000-Present); Board Member, 6wind SA, (2002-Present); Managing Member, Elementum Ventures (2013-Present); Trustee, Gordon College (2001-2016). | |
• Trustee since 2004—AMG Funds | Steven J. Paggioli, 66 | |
• Trustee since 2000—AMG Funds II • Oversees 67 Funds in Fund Complex | Independent Consultant (2002-Present); Formerly Executive Vice President and Director, The Wadsworth Group (1986-2001); Executive Vice President, Secretary and Director, Investment Company Administration, LLC (1990-2001); Vice President, Secretary and Director, First Fund Distributors, Inc. (1991-2001); Trustee, Professionally Managed Portfolios (32 portfolios); Advisory Board Member, Sustainable Growth Advisors, LP; Independent Director, Chase Investment Counsel (2008–Present). | |
• Trustee since 2013 | Richard F. Powers III, 71 | |
• Oversees 67 Funds in Fund Complex | Adjunct Professor, Boston College (2010-2013); President and CEO of Van Kampen Investments Inc. (1998-2003). | |
• Independent Chairman | Eric Rakowski, 58 | |
• Trustee since 1999—AMG Funds • Trustee since 2000—AMG Funds II • Oversees 69 Funds in Fund Complex | Professor, University of California at Berkeley School of Law (1990-Present); Director of Harding, Loevner Funds, Inc. (9 portfolios); Trustee of Third Avenue Trust (5 portfolios); Trustee of Third Avenue Variable Trust (1 portfolio). | |
• Trustee since 2013 | Victoria L. Sassine, 51 | |
• Oversees 69 Funds in Fund Complex | Lecturer, Babson College (2007 – Present). | |
• Trustee since 2004—AMG Funds | Thomas R. Schneeweis, 69 | |
• Trustee since 2000—AMG Funds II • Oversees 67 Funds in Fund Complex | Professor Emeritus, University of Massachusetts (2013-Present); Partner, S Capital Wealth Advisors (2015-Present); President, TRS Associates (1982-Present); Board Member, Chartered Alternative Investment Association (“CAIA”) (2002-Present); Director, CAIA Foundation (Education) (2010-Present); Director, Institute for Global Asset and Risk Management (Education) (2010-Present); Partner, S Capital Management, LLC (2007-2015); Director, CISDM at the University of Massachusetts, (1996-2013); President, Alternative Investment Analytics, LLC, (formerly Schneeweis Partners, LLC) (2001-2013); Professor of Finance, University of Massachusetts (1977-2013). | |
Interested Trustees
Each Trustee in the following table is an “interested person” of the Trust within the meaning of the 1940 Act. Ms. Carsman is an interested person of the Trust within the meaning of the 1940 Act by virtue of her position with, and interest in securities of AMG.
Number of Funds Overseen in Fund | Name, Age, Principal Occupation(s) During Past 5 Years and Other Directorships Held by Trustee | |
• Trustee since 2011 | Christine C. Carsman, 64 | |
• Oversees 69 Funds in Fund Complex | Executive Vice President, Deputy General Counsel and Chief Regulatory Counsel, Affiliated Managers Group, Inc. (2017-Present); Senior Vice President and Deputy General Counsel, Affiliated Managers Group, Inc. (2011-2016); Senior Vice President and Chief Regulatory Counsel, Affiliated Managers Group, Inc. (2007-2011); Vice President and Chief Regulatory Counsel, Affiliated Managers Group, Inc. (2004-2007); Secretary and Chief Legal Officer, AMG Funds, AMG Funds I, AMG Funds II and AMG Funds III (2004-2011); Senior Counsel, Vice President and Director of Operational Risk Management and Compliance, Wellington Management Company, LLP (1995-2004). |
68
Table of Contents
AMG Funds
Trustees and Officers (continued)
Officers
| ||
Position(s) Held with Fund and | Name, Age, Principal Occupation(s) During Past 5 Years | |
• President since 2014 | Jeffrey T. Cerutti, 49 | |
• Principal Executive Officer since 2014 Chief Executive Officer since 2016 | Chief Executive Officer, AMG Funds LLC (2014-Present); Director, President and Principal, AMG Distributors, Inc. (2014-Present); President and Principal Executive Officer, AMG Funds, AMG Funds I, AMG Funds II and AMG Funds III (2014-Present); Chief Executive Officer, President and Principal Executive Officer, AMG Funds IV, (2015-Present); Chief Executive Officer, AMG Funds, AMG Funds I, AMG Funds II and AMG Funds III (2016-Present); Chief Executive Officer, Aston Asset Management, LLC (2016); President, VP Distributors, (2011-2014); Executive Vice President, Head of Distribution, Virtus Investment Partners, Inc. (2010-2014); Managing Director, Head of Sales, UBS Global Asset Management (2001-2010). | |
• Chief Operating Officer since 2007 | Keitha L. Kinne, 58 Chief Operating Officer, AMG Funds LLC (2007-Present); Chief Investment Officer, AMG Funds LLC (2008-Present); Chief Operating Officer, AMG Distributors, Inc. (2007-Present); Chief Operating Officer, AMG Funds, AMG Funds I, AMG Funds II, and AMG Funds III (2007-Present); Chief Operating Officer, AMG Funds IV, (2016-Present); Chief Operating Officer and Chief Investment Officer, Aston Asset Management, LLC (2016); President and Principal Executive Officer, AMG Funds, AMG Funds I, AMG Funds II and AMG Funds III (2012-2014); Managing Partner, AMG Funds LLC (2007-2014); President, AMG Funds (2012-2014); President, AMG Distributors, Inc. (2012-2014); Managing Director, Legg Mason & Co., LLC (2006-2007); Managing Director, Citigroup Asset Management (2004-2006). | |
• Secretary since 2015 | Mark J. Duggan, 52 | |
• Chief Legal Officer since 2015 | Senior Vice President and Senior Counsel, AMG Funds LLC (2015-Present); Secretary and Chief Legal Officer, AMG Funds, AMG Funds I, AMG Funds II and AMG Funds III (2015-Present); Secretary and Chief Legal Officer, AMG Funds IV, (2015-Present); Attorney, K&L Gates, LLP (2009-2015). | |
• Chief Financial Officer since 2007 • AMG Funds Treasurer since 1999 • AMG Funds II Treasurer since 2000 • Principal Financial Officer since 2008 | Donald S. Rumery, 58 Senior Vice President, Director of Mutual Funds Services, AMG Funds LLC (2005-Present); Principal Financial Officer, AMG Funds, AMG Funds I, AMG Funds II and AMG Funds III (2008-Present); Treasurer, Chief Financial Officer, Principal Financial Officer and Principal Accounting Officer, AMG Funds IV, (2016-Present); Treasurer, AMG Funds, (1999-Present); Treasurer, AMG Funds III (1995-Present); Treasurer, (AMG Funds I and AMG Funds II (2000-Present); Chief Financial Officer, AMG Funds, AMG Funds I, AMG Funds II and AMG Funds III (2007-Present); Treasurer and Chief Financial Officer, AMG Distributors, Inc. (2000-2012); Vice President, AMG Funds LLC, (1994-2004). | |
• Chief Compliance Officer since 2016 | Gerald F. Dillenburg, 50 Chief Compliance Officer and Sarbanes Oxley Code of Ethics Compliance Officer, AMG Funds, AMG Funds I, AMG Funds II and AMG Funds III (2016-Present); Chief Compliance Officer, AMG Funds IV (1996-Present); Sarbanes-Oxley Code of Ethics Compliance Officer, AMG Funds IV (2016-Present); Chief Compliance Officer, Aston Asset Management, LLC (2006-2016); Chief Operating Officer, Aston Funds (2003-2016); Secretary, Aston Funds (1996-2015); Chief Financial Officer, Aston Funds (1997-2010); Chief Financial Officer, Aston Asset Management, LLC (2006-2010); Treasurer, Aston Funds (1996-2010). | |
• Anti-Money Laundering Compliance Officer since 2014 | Patrick J. Spellman, 42 Senior Vice President, Chief Compliance Officer, AMG Funds LLC (2011-Present); Chief Compliance Officer, AMG Distributors, Inc., (2010-Present); Anti-Money Laundering Compliance Officer, AMG Funds, AMG Funds I, AMG Funds II, and AMG Funds III (2014-Present); Anti-Money Laundering Officer, AMG Funds IV, (2016-Present); Compliance Manager, Legal and Compliance, Affiliated Managers Group, Inc. (2005-2011). | |
• Assistant Secretary since 2016 | Maureen A. Meredith, 31 Vice President, Counsel, AMG Funds LLC (2015-Present); Assistant Secretary, AMG Funds, AMG Funds I, AMG Funds II, AMG Funds III and AMG Funds IV (2016-Present); Associate, Ropes & Gray LLP (2011-2015); Law Fellow, Massachusetts Appleseed Center for Law and Justice (2010-2011). | |
• Assistant Secretary since 2016 | Diana M. Podgorny, 37 Vice President, Counsel, AMG Funds LLC (2016-Present); Assistant Secretary, AMG Funds, AMG Funds I, AMG Funds II and AMG Funds III (2016-Present); Assistant Secretary, AMG Funds IV (2010-Present); Vice President, Counsel, Aston Asset Management, LLC (2010-2016). | |
• Assistant Secretary since 2016 | Marc Peirce, 54 Vice President, Compliance Officer, AMG Funds LLC (2016-Present); Assistant Secretary, AMG Funds IV (2001-Present); Assistant Secretary, AMG Funds, AMG Funds I, AMG Funds II and AMG Funds III (2016-Present); Vice President, Aston Asset Management, LLC (1998-2016); Assistant Chief Compliance Officer, Aston Asset Management, LLC (2006-2016). | |
69
Table of Contents
THIS PAGE INTENTIONALLY LEFT BLANK
Table of Contents
THIS PAGE INTENTIONALLY LEFT BLANK
Table of Contents
THIS PAGE INTENTIONALLY LEFT BLANK
Table of Contents
INVESTMENT MANAGER AND ADMINISTRATOR
AMG Funds LLC
600 Steamboat Road Suite 300
Greenwich, CT 06830
(800) 835-3879
DISTRIBUTOR
AMG Distributors, Inc.
600 Steamboat Road, Suite 300
Greenwich, CT 06830
(800) 835-3879
SUBADVISOR
GW&K Investment Management, LLC
222 Berkeley St.
Boston, MA 02116
CUSTODIAN
The Bank of New York Mellon
2 Hanson Place
Brooklyn, NY 11217
LEGAL COUNSEL
Ropes & Gray LLP
Prudential Tower, 800 Boylston Street
Boston, MA 02199-3600
TRANSFER AGENT
BNY Mellon Investment Servicing (US) Inc.
Attn: AMG Funds
P.O. Box 9769 Providence, RI 02940
(800) 548-4539
FOR MANAGERSCHOICETM ONLY
AMG Funds
c/o BNY Mellon Investment Servicing (US) Inc.
P.O. Box 9847
Providence, RI 02940-8047
(800) 358-7668
This report is prepared for the Funds’ shareholders. It is authorized for distribution to prospective investors only when preceded or accompanied by an effective prospectus. To receive a free copy of the prospectus or Statement of Additional Information, which includes additional information about Fund Trustees, please contact us by calling 800.835.3879. Distributed by AMG Distributors, Inc., member FINRA/SIPC.
Current net asset values per share for each Fund are available on the Funds’ website at www.amgfunds.com.
A description of the policies and procedures each Fund uses to vote its proxies is available: (i) without charge, upon request, by calling 800.835.3879, or (ii) on the Securities and Exchange Commission’s (SEC) website at www.sec.gov. For information regarding each Fund’s proxy voting record for the 12-month period ended June 30, call 800.835.3879 or visit the SEC website at www.sec.gov.
Each Fund files its complete schedule of portfolio holdings with the SEC for the first and third quarters of each fiscal year on Form N-Q. The Funds’ Forms N-Q are available on the SEC’s website at www.sec.gov. A Fund’s Forms N-Q may be reviewed and copied at the SEC’s Public Reference Room in Washington, DC. Information on the operation of the Public Reference Room may be obtained by calling 1-800-SEC-0330. To review a complete list of the Funds’ portfolio holdings, or to view the most recent quarterly holdings report, semiannual report, or annual report, please visit www.amgfunds.com.
| www.amgfunds.com | |
Table of Contents
AFFILIATE SUBADVISED FUNDS
BALANCED FUNDS
AMG Chicago Equity Partners Balanced
Chicago Equity Partners, LLC
AMG FQ Global Risk-Balanced
First Quadrant, L.P.
EQUITY FUNDS
AMG Chicago Equity Partners Small Cap Value
Chicago Equity Partners, LLC
AMG FQ Tax-Managed U.S. Equity
AMG FQ U.S. Equity
First Quadrant, L.P.
AMG Frontier Small Cap Growth
Frontier Capital Management Company, LLC
AMG GW&K Small Cap Core
AMG GW&K Small Cap Growth
AMG GW&K U.S. Small Cap Growth
GW&K Investment Management, LLC
AMG Renaissance International Equity
AMG Renaissance Large Cap Growth
The Renaissance Group LLC
AMG River Road Dividend All Cap Value
AMG River Road Dividend All Cap Value II
AMG River Road Focused Absolute Value
AMG River Road Long-Short
AMG River Road Select Value
AMG River Road Small Cap Value
River Road Asset Management, LLC
AMG SouthernSun Small Cap
AMG SouthernSun Global Opportunities
AMG SouthernSun U.S. Equity
SouthernSun Asset Management, LLC
AMG Systematic Large Cap Value
AMG Systematic Mid Cap Value
Systematic Financial Management, L.P.
AMG TimesSquare All Cap Growth
AMG TimesSquare Emerging Markets Small Cap
AMG TimesSquare International Small Cap
AMG TimesSquare Mid Cap Growth
AMG TimesSquare Small Cap Growth
TimesSquare Capital Management, LLC
AMG Trilogy Emerging Markets Equity
AMG Trilogy Emerging Wealth Equity
AMG Trilogy Global Equity
AMG Trilogy International Small Cap
Trilogy Global Advisors, L.P.
AMG Yacktman
AMG Yacktman Focused
AMG Yacktman Focused Fund—Security Selection Only
AMG Yacktman Special Opportunities
Yacktman Asset Management LP
FIXED INCOME FUNDS
AMG GW&K Core Bond
AMG GW&K Enhanced Core Bond
AMG GW&K Municipal Bond
AMG GW&K Municipal Enhanced Yield
GW&K Investment Management, LLC
OPEN-ARCHITECTURE FUNDS
ALTERNATIVE FUNDS
AMG Managers Lake Partners LASSO Alternative
Lake Partners, Inc.
BALANCED FUNDS
AMG Managers Montag & Caldwell Balanced
Montag & Caldwell, LLC
EQUITY FUNDS
AMG Managers Brandywine
AMG Managers Brandywine Advisors Mid Cap Growth
AMG Managers Brandywine Blue
Friess Associates, LLC
AMG Managers Cadence Capital Appreciation
AMG Managers Cadence Emerging Companies
AMG Managers Cadence Mid Cap
Cadence Capital Management, LLC
AMG Managers CenterSquare Real Estate
CenterSquare Investment Management, Inc.
AMG Managers Emerging Opportunities
Lord, Abbett & Co. LLC
WEDGE Capital Management L.L.P.
Next Century Growth Investors LLC
RBC Global Asset Management (U.S.) Inc.
AMG Managers Essex Small/Micro Cap Growth
Essex Investment Management Co., LLC
AMG Managers Fairpointe Focused Equity
AMG Managers Fairpointe Mid Cap
Fairpointe Capital LLC
AMG Managers Guardian Capital Global Dividend
Guardian Capital LP
AMG Managers LMCG Small Cap Growth
LMCG Investments, LLC
AMG Managers Montag & Caldwell Growth
AMG Managers Montag & Caldwell Mid Cap Growth
Montag & Caldwell, LLC
AMG Managers Pictet International
Pictet Asset Management Limited
AMG Managers Silvercrest Small Cap
Silvercrest Asset Management Group LLC
AMG Managers Skyline Special Equities
Skyline Asset Management, L.P.
AMG Managers Special Equity
Ranger Investment Management, L.P.
Lord, Abbett & Co. LLC
Smith Asset Management Group, L.P.
Federated MDTA LLC
AMG Managers Value Partners Asia Dividend
Value Partners Hong Kong Limited
FIXED INCOME FUNDS
AMG Managers Amundi Intermediate Government
AMG Managers Amundi Short Duration Government
Amundi Smith Breeden LLC
AMG Managers Doubleline Core Plus Bond
DoubleLine Capital LP
AMG Managers Global Income Opportunity
AMG Managers Loomis Sayles Bond
Loomis, Sayles & Co., L.P.
AMG Managers High Yield
J.P. Morgan Investment Management Inc.
AR020-1216 | | www.amgfunds.com |
Table of Contents
 | ANNUAL REPORT |
AMG Funds
December 31, 2016
AMG Chicago Equity Partners Balanced Fund
Class N: MBEAX | Class I: MBESX | Class Z: MBEYX
AMG Chicago Equity Partners Small Cap Value Fund
Class N: CESVX | Class I: CESSX | Class Z: CESIX
AMG Managers High Yield Fund
Class N: MHHAX | Class I: MHHYX |
AMG Managers Amundi Intermediate Government Fund
(formerly AMG Managers Intermediate Duration Government Fund)
Class S: MGIDX |
AMG Managers Amundi Short Duration Government Fund
(formerly AMG Managers Short Duration Government Fund)
Class S: MGSDX |
| www.amgfunds.com | | AR002-1216 |
Table of Contents
Table of Contents
AMG Funds
Annual Report—December 31, 2016
| PAGE | ||||
| 2 | ||||
| 3 | ||||
PORTFOLIO MANAGER’S COMMENTS, FUND SNAPSHOTS, AND SCHEDULES OF PORTFOLIO INVESTMENTS | ||||
| 4 | ||||
| 17 | ||||
| 24 | ||||
| 40 | ||||
| 49 | ||||
| 59 | ||||
FINANCIAL STATEMENTS | ||||
| 66 | ||||
Balance sheets, net asset value (NAV) per share computations and cumulative undistributed amounts | ||||
| 69 | ||||
Detail of sources of income, expenses, and realized and unrealized gains (losses) during the year | ||||
| 70 | ||||
Detail of changes in assets for the past two years | ||||
| 72 | ||||
Historical net asset values per share, distributions, total returns, income and expense ratios, turnover ratios and net assets | ||||
| 79 | ||||
Accounting and distribution policies, details of agreements and transactions with Fund management and affiliates, and descriptions of certain investment risks | ||||
| 89 | ||||
| 90 | ||||
Nothing contained herein is to be considered an offer, sale or solicitation of an offer to buy shares of any series of the AMG Fund family of mutual funds. Such offering is made only by prospectus, which includes details as to offering price and other material information.
Table of Contents
| | Letter to Shareholders |
DEAR SHAREHOLDER:
While the year got off to a rocky start, overall U.S. equity investors enjoyed strong positive returns for 2016. The S&P 500 Index, a widely-followed barometer of the U.S. equity market, returned 12.0% during the prior twelve months. Small cap investors were also rewarded with a return of 21.3% for the small cap Russell 2000® Index.
After the market’s initial stumble, investors had to balance a number of noteworthy events, including the U.K.’s planned exit from the European Union (“Brexit”), a contentious U.S. presidential election and the U.S. Federal Reserve’s second rate increase of 25 basis points to 0.50%-0.75%. Following the surprise election of Donald Trump as the 45th President of the United States, investors witnessed a rally in pro-cyclical sectors as the new administration’s plans for tax reform and increased fiscal spending drove anticipation of stronger future economic growth. Along with higher equity prices, long-term interest rates rose and the U.S. Dollar strengthened. Commodity prices collapsed, but then rebounded on indications of an increase in U.S. infrastructure spending and a small uptick in China’s third-quarter Gross Domestic Product (GDP). Oil prices also experienced volatility as they continued their fall from 2015, bottoming in February and subsequently recovering more than 100%. This recovery lent some much needed support to the beleaguered energy industry, which ended the year with the highest returns of any sector in the S&P 500 Index. In total, all sectors but the health care sector were positive for 2016; however, there was significant dispersion in performance across sectors. Energy, telecommunication services and financials returned 27%, 23% and 21%, respectively, while companies within the consumer staples, real estate and health care sectors returned 5%, 4% and (3)%, respectively. Internationally, stocks lagged their U.S. counterparts, returning 4.5%, as measured by the MSCI ACWI ex USA (in U.S. Dollar terms).
The Bloomberg Barclays U.S. Aggregate Bond Index, a broad U.S. bond market benchmark, returned 2.7% for the year ended December 31, 2016. Over the course of the year, interest rates and credit spreads gyrated at times, putting pressure on bond prices. While stocks finished strong, bond prices were less fortunate, as rising interest rates caused yields to rise and bond prices to fall. The 10-year U.S. Treasury note’s yield started the year at 2.24%, bottomed at 1.37% in July, and ended the year much higher at 2.45%. High yield, on the other hand, was very strong, as investor risk appetite improved and spreads tightened 470 basis points. The Bloomberg Barclays U.S. Corporate High Yield Bond Index ended the year with a healthy 17.1% return.
We are excited to announce as of October 1, 2016, the AMG Funds family of mutual funds fully integrated the former Aston Funds. AMG Funds and Aston Funds shareholders will now have access to the differentiated solutions of AMG Funds, which represents a single point of access to one of the largest line-ups of boutique managers and products in the world.
AMG Funds appreciates the privilege of providing investment tools to you and your clients. Our foremost goal at AMG Funds is to provide investment solutions that help our shareholders successfully reach their long-term investment goals. By partnering with AMG’s affiliated investment boutiques, AMG Funds provides access to a distinctive array of actively-managed return-oriented investment strategies. Additionally, we oversee and distribute a number of complementary open-architecture mutual funds subadvised by unaffiliated investment managers. We thank you for your continued confidence and investment in AMG Funds. You can rest assured that under all market conditions our team is focused on delivering excellent investment management services for your benefit.
Respectfully,

Jeffery Cerutti
President
AMG Funds
Average Annual Total Returns | Periods ended December 31, 2016 | |||||||||||||
Stocks: | 1 Year | 3 Years | 5 Years | |||||||||||
Large Caps | (S&P 500 Index) | 11.96 | % | 8.87 | % | 14.66 | % | |||||||
Small Caps | (Russell 2000® Index) | 21.31 | % | 6.74 | % | 14.46 | % | |||||||
| (MSCI All Country World | ||||||||||||||
International | ex-USA Index) | 4.50 | % | (1.78 | )% | 5.00 | % | |||||||
Bonds: | ||||||||||||||
| (Bloomberg Barclays U.S. | ||||||||||||||
Investment Grade | Aggregate Bond Index) | 2.65 | % | 3.03 | % | 2.23 | % | |||||||
| (Bloomberg Barclays U.S. | ||||||||||||||
High Yield | Corporate High Yield Index) | 17.13 | % | 4.66 | % | 7.36 | % | |||||||
| (Bloomberg Barclays | ||||||||||||||
Tax-exempt | Municipal Bond Index) | 0.25 | % | 4.14 | % | 3.28 | % | |||||||
| (BofA Merrill Lynch 6 month | ||||||||||||||
Treasury Bills | U.S. Treasury Bill) | 0.67 | % | 0.34 | % | 0.27 | % | |||||||
2
Table of Contents
As a shareholder of a Fund, you may incur two types of costs: (1) transaction costs, which may include sales charges (loads) on purchase payments; redemption fees; and exchange fees; and (2) ongoing costs, including management fees; distribution (12b-1) fees; and other Fund expenses. This example is intended to help you understand your ongoing costs (in dollars) of investing in the Fund and to compare these costs with the ongoing costs of investing in other mutual funds. The example is based on $1,000 invested at the beginning of the period and held for the entire period as indicated below.
ACTUAL EXPENSES
The first line of the following table provides information about the actual account values and actual expenses. You may use the information in this line, together with the amount you invested, to estimate the expenses that you paid over the period. Simply divide your account value by $1,000 (for example, an $8,600 account value divided by $1,000 = 8.6), then multiply the result by the number in the first line under the heading entitled “Expenses Paid During Period” to estimate the expenses you paid on your account during this period.
HYPOTHETICAL EXAMPLE FOR COMPARISON PURPOSES
The second line of the following table provides information about hypothetical account values and hypothetical expenses based on the Fund’s actual expense ratio and an assumed annual rate of return of 5% before expenses, which is not the Fund’s actual return. The hypothetical account values and expenses may not be used to estimate the actual ending account balance or expenses you paid for the period. You may use this information to compare the ongoing costs of investing in the Fund and other funds by comparing this 5% hypothetical example with the 5% hypothetical examples that appear in the shareholder reports of other funds.
Please note that the expenses shown in the table are meant to highlight your ongoing costs only and do not reflect any transactional costs, such as sales charges (loads), redemption fees, or exchange fees. Therefore, the second line of the table is useful in comparing ongoing costs only, and will not help you determine the relative total costs of owning different funds.
| Beginning | Ending | |||||||||||||||
| Expense | Account | Account | Expenses | |||||||||||||
| Ratio for | Value | Value | Paid During | |||||||||||||
Six Months Ended December 31, 2016 | the Period | 7/01/16 | 12/31/16 | the Period* | ||||||||||||
AMG Chicago Equity Partners Balanced Fund | ||||||||||||||||
Class N | ||||||||||||||||
Based on Actual Fund Return | 1.09 | % | $ | 1,000 | $ | 1,026 | $ | 5.55 | ||||||||
Hypothetical (5% return before expenses) | 1.09 | % | $ | 1,000 | $ | 1,020 | $ | 5.53 | ||||||||
Class I | ||||||||||||||||
Based on Actual Fund Return | 0.94 | % | $ | 1,000 | $ | 1,027 | $ | 4.79 | ||||||||
Hypothetical (5% return before expenses) | 0.94 | % | $ | 1,000 | $ | 1,020 | $ | 4.77 | ||||||||
Class Z | ||||||||||||||||
Based on Actual Fund Return | 0.84 | % | $ | 1,000 | $ | 1,028 | $ | 4.28 | ||||||||
Hypothetical (5% return before expenses) | 0.84 | % | $ | 1,000 | $ | 1,021 | $ | 4.27 | ||||||||
AMG Chicago Equity Partners Small Cap Value Fund | ||||||||||||||||
Class N | ||||||||||||||||
Based on Actual Fund Return | 1.35 | % | $ | 1,000 | $ | 1,237 | $ | 7.59 | ||||||||
Hypothetical (5% return before expenses) | 1.35 | % | $ | 1,000 | $ | 1,018 | $ | 6.85 | ||||||||
Class I | ||||||||||||||||
Based on Actual Fund Return | 1.05 | % | $ | 1,000 | $ | 1,240 | $ | 5.91 | ||||||||
Hypothetical (5% return before expenses) | 1.05 | % | $ | 1,000 | $ | 1,020 | $ | 5.33 | ||||||||
Class Z | ||||||||||||||||
Based on Actual Fund Return | 0.95 | % | $ | 1,000 | $ | 1,241 | $ | 5.35 | ||||||||
Hypothetical (5% return before expenses) | 0.95 | % | $ | 1,000 | $ | 1,020 | $ | 4.82 | ||||||||
AMG Managers High Yield Fund | ||||||||||||||||
Class N | ||||||||||||||||
Based on Actual Fund Return | 1.15 | % | $ | 1,000 | $ | 1,070 | $ | 5.98 | ||||||||
Hypothetical (5% return before expenses) | 1.15 | % | $ | 1,000 | $ | 1,019 | $ | 5.84 | ||||||||
Class I | ||||||||||||||||
Based on Actual Fund Return | 0.90 | % | $ | 1,000 | $ | 1,072 | $ | 4.69 | ||||||||
Hypothetical (5% return before expenses) | 0.90 | % | $ | 1,000 | $ | 1,021 | $ | 4.57 | ||||||||
AMG Managers Amundi Intermediate Government Fund | ||||||||||||||||
Class S | ||||||||||||||||
Based on Actual Fund Return | 0.88 | % | $ | 1,000 | $ | 987 | $ | 4.40 | ||||||||
Hypothetical (5% return before expenses) | 0.88 | % | $ | 1,000 | $ | 1,021 | $ | 4.47 | ||||||||
AMG Managers Amundi Short Duration Government Fund | ||||||||||||||||
Class S | ||||||||||||||||
Based on Actual Fund Return | 0.80 | % | $ | 1,000 | $ | 1,006 | $ | 4.03 | ||||||||
Hypothetical (5% return before expenses) | 0.80 | % | $ | 1,000 | $ | 1,021 | $ | 4.06 | ||||||||
| * | Expenses are equal to the Fund’s annualized expense ratio multiplied by the average account value over the period, multiplied by the number of days in the most recent half-year (184), then divided by 366. |
3
Table of Contents
AMG Chicago Equity Partners Balanced Fund
Portfolio Manager’s Comments (unaudited)
THE YEAR IN REVIEW
For the year ended December 31, 2016, the AMG Chicago Equity Partners Balanced Fund (Class N)1 (the “Fund”) returned 4.6%, compared to the 8.5% return for its benchmark, which consists of 60% of the return of the Russell 1000® Index and 40% of the return of the Bloomberg Barclays U.S. Aggregate Bond Index.
The portfolio is managed to emphasize stock selection while also using our proprietary models to adjust size, style and allocation exposures. The Fund experienced underperformance in both equities and fixed income. For the equity portion, the preference for growth over value hurt performance on average, while the modest small-cap exposure helped. However, the stock selection model was mixed over the year — weaker early on with improvement toward the end of the year. The fixed-income portion of the Fund underperformed as a result of an underweight to corporate bonds, as well as an emphasis on higher-quality issuers. More detailed attribution follows.
EQUITY
2016 was a year of reversals, with preferences shifting every couple of months. Recession concerns earlier in the year eased as economic data improved and oil prices stabilized. Continued accommodative U.S. Federal Reserve (the “Fed”) policy prolonged the low-rate environment until late in fourth quarter, resulting in some investors reaching for yield for the first six months of the year and supporting the risk-on trade. In the third quarter, the bond proxy stocks pulled back, and the cheap, high beta stocks performed well in the cyclical and technology sectors. In the fourth quarter, all eyes were on the election and the Fed. The surprise Trump victory resulted in strong equity markets, with sector performance driven by the perceived winners and losers of Trump policy. The Fed behaved as expected in the quarter, finally raising rates 0.25%, and corporate earnings turned the corner as third-quarter numbers came in positive after five consecutive quarters of negative earnings growth.
U.S. stocks outperformed other asset classes in 2016. Small cap stocks strongly outpaced their large and mid-cap counterparts for the year. Value had a strong year despite a weaker third quarter, outperforming growth by 20% in small cap stocks (as measured by the Russell 2000® Growth and Russell 2000® Value Indexes) and 10% in large cap (as measured by the Russell 1000® Growth and Russell 1000® Value Indexes). Financials and energy sectors performed well and health care performed the worst. Despite volatility (CBOE Volatility Index — VIX) spiking around the election, it finished the year down (23)%. Over the last 12 months, the value and quality factor groups performed the best, while the growth factor group was mixed and the momentum factor group was generally weak across sectors. The stock selection model had challenges during parts of the year, and top-ranked stocks underperformed in non cyclicals, cyclicals and energy. The stock selection model improved in the fourth quarter, as investors preferred not only cheap stocks, but those with good quality and strong growth expectations. The portfolio’s tilt toward growth negatively impacted performance, while the small cap exposure helped performance for most of the year. Overall, the equity portion of the Fund underperformed its benchmark for the year. While it has been a challenging year for the stock selection model and active management in general, we saw improvement in the fourth quarter. It has been our experience that the market rewards a broad set of fundamental factors more often than not. This is why we stick to our disciplined process at all times, even during market environments such as these. Historically, we have been rewarded for doing so, as we have seen outperformance in periods following weakness.
Our research has shown that constructing a well-diversified portfolio of companies with attractive valuation ratios, quality balance sheets and positive growth and momentum expectations, built through a disciplined, risk-controlled process, delivers consistent excess returns. Overall, our philosophy will not change based on short-term trends or conditions in the market. We will
continue to use our disciplined approach to provide added value at controlled levels of risk.
FIXED INCOME
For the calendar year, interest rates rose modestly and corporate spreads declined. However, within 2016, both rates and spreads experienced significant volatility. Some of the most significant influences on rates and spreads included Fed policy, economic fundamentals, “Brexit” and the U.S. presidential election. The tone of the market for risk assets started the year quite negative but finished the year with cautious optimism. The federal funds rate increase in December 2015 and declines in earnings and revenue growth had resulted in a meaningful “risk-off” trade for most of 2015 and early 2016. The market volatility resulted in an abrupt change in tone from Fed officials, indicating a much slower pace for future rate increases. This policy shift occurred in early February 2016 and from that point on, risk sectors of the market performed very well. However, as mentioned above, the Fed raised rates in December 2016, signaling a policy shift from easing to tightening.
Throughout 2016, the fixed-income portfolio favored government securities and higher-quality corporate bonds. A combination of weak fundamentals, rich valuations, an increase in lending standards and a significant shift in Fed policy reinforced our conviction that portfolio risk should be at the lower end of our range. Our outlook continues to be for wider spreads for corporate bonds, which we believe should provide near-term outperformance and longer-term opportunities. An environment that includes improving fundamentals and better compensation for taking risk would result in an increase in our exposure to corporate bonds. In our view, current circumstances support our strategy of maintaining a high-quality bias to fixed-income portfolios. We will continue to monitor inputs to our investment process for indications of improving conditions and opportunity. We continue to believe our positioning is prudent and in-line with our stated objectives.
4
Table of Contents
AMG Chicago Equity Partners Balanced Fund
Portfolio Manager’s Comments (continued)
| 1 | Prior to October 1, 2016, the Fund’s Class N shares were known as Investor Shares. |
This commentary reflects the viewpoints of the portfolio manager, Chicago Equity Partners, LLC, as of December 31, 2016 and is not intended as a forecast or guarantee of future results and are subject to change without notice.
CUMULATIVE TOTAL RETURN PERFORMANCE
The AMG Chicago Equity Partners Balanced Fund’s cumulative total return is based on the daily change in net asset value (NAV), and
assumes that all dividends and distributions were reinvested. The graph compares a hypothetical $10,000 investment made in the AMG Chicago Equity Partners Balanced Fund’s Class N (formerly Investor Class) shares on December 31, 2006 to a $10,000 investment made in the benchmarks for the same time period. The graph and table do not
reflect the deduction of taxes that a shareholder would pay on a Fund distribution or redemption of shares. The listed returns for the Fund are net of expenses and the returns for the indices exclude expenses. Total returns for the Fund would have been lower had certain expenses not been reduced.
5
Table of Contents
AMG Chicago Equity Partners Balanced Fund
Portfolio Manager’s Comments (continued)
CUMULATIVE TOTAL RETURN PERFORMANCE (continued)

The table below shows the average annual total returns for the AMG Chicago Equity Partners Balanced Fund, the Russell 1000® Index and the Bloomberg Barclays U.S. Aggregate Bond Index for the same time periods ended December 31, 2016.
| One | Five | Ten | Since | Inception | ||||||||||||||||
| Average Annual Total Returns1 | Year | Years | Years | Inception | Date | |||||||||||||||
AMG Chicago Equity Partners Balanced Fund 2,3,4,5,6,7 | ||||||||||||||||||||
Class N8 | 4.59 | % | 8.57 | % | 6.19 | % | 7.69 | % | 01/02/97 | |||||||||||
Class I8 | 4.79 | % | — | — | 8.18 | % | 11/30/12 | |||||||||||||
Class Z8 | 4.82 | % | 8.83 | % | 6.46 | % | 8.07 | % | 01/02/97 | |||||||||||
60% Russell 1000® Index9/40% Bloomberg Barclays U.S. Aggregate Bond Index10 | 8.47 | % | 9.80 | % | 6.63 | % | 7.41 | % | 01/02/97 | † | ||||||||||
Bloomberg Barclays U.S. Aggregate Bond Index10 | 2.65 | % | 2.23 | % | 4.34 | % | 5.31 | % | 01/02/97 | † | ||||||||||
Russell 1000® Index9 | 12.05 | % | 14.69 | % | 7.08 | % | 7.90 | % | 01/02/97 | † | ||||||||||
The performance data shown represents past performance. Past performance is not a guarantee of future results. Current performance may be lower or higher than the performance data quoted. The investment return and principal value of an investment will fluctuate so that an investor’s shares, when redeemed, may be worth more or less than their original cost.
Investors should carefully consider the Fund’s investment objectives, risks, charges and expenses before investing. For performance information through the most recent month end, current net asset values per share for the Fund and other information, please call (800) 835-3879 or visit our website at www.amgfunds.com for a free prospectus. Read it carefully before investing or sending money.
Distributed by AMG Distributors, Inc., member FINRA/SIPC.
| † | Date reflects inception date of the Fund, not the index. |
| 1 | Total return equals income yield plus share price change and assumes reinvestment of all dividends and capital gain distributions. Returns are net of fees and may reflect offsets of Fund expenses as described in the prospectus. No adjustment has been made for taxes payable by shareholders on their reinvested dividends and capital gain distributions. Returns for periods greater than one year are annualized. The listed returns on the Fund are net of expenses and based on the published NAV as of December 31, 2016. All returns are in U.S. dollars ($). |
| 2 | From time to time, the Fund’s advisor has waived its fees and/or absorbed Fund expenses, which has resulted in higher returns. |
| 3 | To the extent that the Fund invests in asset-backed or mortgage-backed securities, its exposure to prepayment and extension risks may be greater than investments in other fixed income securities. |
| 4 | The Fund is subject to the risks associated with investments in debt securities, such as default risk and fluctuations in the perception of the debtor’s ability to pay its creditors. Changing interest rates may adversely affect the value of an investment. |
| An increase in interest rates typically causes the value of bonds and other fixed income securities to fall. |
| 5 | Investments in international securities are subject to certain risks of overseas investing including currency fluctuations and changes in political and economic conditions, which could result in significant market fluctuations. These risks are magnified in emerging markets. |
| 6 | The Fund is subject to risks associated with investments in mid-capitalization companies such as greater price volatility, lower trading volume, and less liquidity than the stocks of larger, more established companies. |
| 7 | The Fund invests in value stocks, which may perform differently from the market as a whole and may be undervalued by the market for a long period of time. |
| 8 | Effective October 1, 2016, the Investor Class, Service Class and Institutional Class of AMG Chicago Equity Partners Balanced Fund were renamed Class N, Class I and Class Z, respectively. |
| 9 | The Russell 1000® Index measures the performance of approximately 1,000 of the largest securities based on a combination of their market cap and current index membership. The Russell 1000® represents approximately 92% of the U.S. market. The Russell 1000® Index is unmanaged, is not available for investment, and does not incur expenses. |
| 10 | The Bloomberg Barclays U.S. Aggregate Bond Index represents securities that are SEC-registered, taxable, and dollar denominated. The index covers the U.S. investment grade fixed rate bond market, with index components for government and corporate securities, mortgage pass-through securities, and asset-backed securities. The Bloomberg Barclays U.S. Aggregate Bond Index is unmanaged, is not available for investment, and does not incur expenses. |
The Russell 1000® Index is a trademark of the London Stock Exchange Group companies.
Not FDIC insured, nor bank guaranteed. May lose value.
6
Table of Contents
AMG Chicago Equity Partners Balanced Fund
Fund Snapshots (unaudited)
December 31, 2016
PORTFOLIO BREAKDOWN
| AMG Chicago Equity Partners | ||||
Sector | Balanced Fund* | |||
U.S. Government and Agency Obligations | 32.7 | % | ||
Information Technology | 14.9 | % | ||
Industrials | 10.1 | % | ||
Consumer Discretionary | 9.3 | % | ||
Health Care | 8.6 | % | ||
Financials | 8.6 | % | ||
Consumer Staples | 4.7 | % | ||
Energy | 2.8 | % | ||
Real Estate | 2.2 | % | ||
Materials | 1.9 | % | ||
Utilities | 1.9 | % | ||
Telecommunication Services | 1.7 | % | ||
Other Assets and Liabilities | 0.6 | % | ||
| * | As a percentage of net assets. |
TOP TEN HOLDINGS
| %of | ||||
Security Name | Net Assets | |||
U.S. Treasury Bonds, 2.750%, 08/15/42** | 2.5 | % | ||
U.S. Treasury Notes, 2.25%, 11/15/24** | 2.0 | % | ||
U.S. Treasury Notes, 2.500%, 05/15/24** | 2.0 | % | ||
Apple, Inc. | 1.6 | % | ||
U.S. Treasury Notes, 1.875%, 11/30/21** | 1.6 | % | ||
Alphabet, Inc., Class A | 1.6 | % | ||
U.S. Treasury Notes, 1.375%, 05/31/20 | 1.5 | % | ||
Facebook, Inc., Class A | 1.5 | % | ||
FHLMC Gold Pool, 3.500%, 01/01/46** | 1.4 | % | ||
Microsoft Corp. | 1.2 | % | ||
|
| |||
Top Ten as a Group | 16.9 | % | ||
|
| |||
| ** | Top Ten Holdings as of June 30, 2016. |
Because a fund’s strategy may result in multiple investments in particular sectors of the economy, its performance may depend on the performance of those sectors and may fluctuate more widely than investments diversified across more sectors. For additional information on these and other risk considerations, please see the Fund’s prospectus.
Any sectors, industries, or securities discussed should not be perceived as investment recommendations. Mention of a specific security should not be considered a recommendation to buy or solicitation to sell that security. Specific securities mentioned in this report may have been sold from the Fund’s portfolio of investments by the time you receive this report.
7
Table of Contents
AMG Chicago Equity Partners Balanced Fund
Schedule of Portfolio Investments
December 31, 2016
| Shares | Value | |||||||
Common Stocks—61.8% | ||||||||
Consumer Discretionary—9.3% | ||||||||
Amazon.com, Inc.* | 2,120 | $ | 1,589,724 | |||||
AMC Entertainment Holdings, Inc., Class A1 | 160 | 5,384 | ||||||
American Axle & Manufacturing Holdings, Inc.* | 1,180 | 22,774 | ||||||
American Eagle Outfitters, Inc. | 1,805 | 27,382 | ||||||
America’s Car-Mart, Inc.* | 190 | 8,313 | ||||||
Asbury Automotive Group, Inc.* | 540 | 33,318 | ||||||
Beazer Homes USA, Inc.* | 2,100 | 27,930 | ||||||
Big 5 Sporting Goods Corp. | 1,570 | 27,240 | ||||||
Big Lots, Inc.1 | 2,380 | 119,500 | ||||||
Bloomin’ Brands, Inc. | 790 | 14,244 | ||||||
Boyd Gaming Corp.* | 1,040 | 20,977 | ||||||
Burlington Stores, Inc.* | 7,770 | 658,508 | ||||||
Cable One, Inc. | 750 | 466,298 | ||||||
CBS Corp., Class B | 18,040 | 1,147,705 | ||||||
Charter Communications, Inc., Class A* | 2,450 | 705,404 | ||||||
The Cheesecake Factory, Inc. | 350 | 20,958 | ||||||
Chico’s FAS, Inc. | 1,620 | 23,312 | ||||||
The Children’s Place, Inc. | 250 | 25,238 | ||||||
Choice Hotels International, Inc. | 3,220 | 180,481 | ||||||
Comcast Corp., Class A | 9,550 | 659,428 | ||||||
Cooper-Standard Holding, Inc.* | 190 | 19,642 | ||||||
Darden Restaurants, Inc. | 2,780 | 202,162 | ||||||
Dave & Buster’s Entertainment, Inc.* | 250 | 14,075 | ||||||
Dollar Tree, Inc.* | 1,390 | 107,280 | ||||||
Domino’s Pizza, Inc. | 3,610 | 574,856 | ||||||
The Finish Line, Inc., Class A1 | 950 | 17,870 | ||||||
Francesca’s Holdings Corp.* | 720 | 12,982 | ||||||
Genuine Parts Co. | 670 | 64,012 | ||||||
Hasbro, Inc. | 2,370 | 184,362 | ||||||
The Home Depot, Inc. | 9,260 | 1,241,581 | ||||||
ILG, Inc. | 795 | 14,445 | ||||||
International Game Technology PLC | 1,600 | 40,832 | ||||||
The Interpublic Group of Cos., Inc. | 10,690 | 250,253 | ||||||
Intrawest Resorts Holdings, Inc.* | 1,020 | 18,207 | ||||||
Johnson Outdoors, Inc., Class A | 170 | 6,747 | ||||||
Las Vegas Sands Corp. | 4,870 | 260,107 | ||||||
La-Z-Boy, Inc. | 290 | 9,004 | ||||||
LifeLock, Inc.* | 190 | 4,545 | ||||||
Lowe’s Cos., Inc. | 3,210 | 228,295 | ||||||
Lululemon Athletica, Inc.* | 3,600 | 233,964 | ||||||
Malibu Boats, Inc., Class A* | 630 | 12,020 | ||||||
Marriott Vacations Worldwide Corp. | 260 | 22,061 | ||||||
Mattel, Inc. | 1,850 | 50,968 | ||||||
MCBC Holdings, Inc. | 1,780 | 25,952 | ||||||
| Shares | Value | |||||||
McDonald’s Corp. | 2,790 | $ | 339,599 | |||||
MGM Resorts International* | 15,230 | 439,081 | ||||||
Michael Kors Holdings, Ltd.* | 2,240 | 96,275 | ||||||
Murphy USA, Inc.* | 1,930 | 118,637 | ||||||
NACCO Industries, Inc., Class A | 280 | 25,354 | ||||||
Nordstrom, Inc. | 2,440 | 116,949 | ||||||
Omnicom Group, Inc. | 2,300 | 195,753 | ||||||
O’Reilly Automotive, Inc.* | 1,120 | 311,819 | ||||||
Papa John’s International, Inc. | 240 | 20,539 | ||||||
Perry Ellis International, Inc.* | 640 | 15,942 | ||||||
Pool Corp. | 6,400 | 667,776 | ||||||
Ralph Lauren Corp. | 450 | 40,644 | ||||||
Regal Entertainment Group, Class A1 | 26,530 | 546,518 | ||||||
Ross Stores, Inc. | 3,930 | 257,808 | ||||||
Scripps Networks Interactive, Inc., Class A | 1,660 | 118,474 | ||||||
Sirius XM Holdings, Inc.1 | 56,800 | 252,760 | ||||||
Strayer Education, Inc.* | 130 | 10,482 | ||||||
Target Corp. | 5,155 | 372,346 | ||||||
Tenneco, Inc.* | 1,150 | 71,840 | ||||||
Tile Shop Holdings, Inc.* | 645 | 12,610 | ||||||
Tower International, Inc. | 430 | 12,190 | ||||||
Tribune Media Co., Class A | 1,330 | 46,523 | ||||||
Tupperware Brands Corp. | 15,050 | 791,931 | ||||||
Ulta Salon Cosmetics & Fragrance, Inc.* | 1,640 | 418,102 | ||||||
Urban Outfitters, Inc.* | 5,440 | 154,931 | ||||||
Vail Resorts, Inc. | 3,280 | 529,097 | ||||||
VF Corp. | 2,590 | 138,176 | ||||||
Visteon Corp. | 4,790 | 384,829 | ||||||
The Walt Disney Co. | 1,075 | 112,036 | ||||||
Whirlpool Corp. | 470 | 85,432 | ||||||
Wolverine World Wide, Inc. | 1,170 | 25,682 | ||||||
World Wrestling Entertainment, Inc., Class A | 1,290 | 23,736 | ||||||
Total Consumer Discretionary | 16,154,211 | |||||||
Consumer Staples—4.7% | ||||||||
Altria Group, Inc. | 14,845 | 1,003,819 | ||||||
Archer-Daniels-Midland Co. | 2,180 | 99,517 | ||||||
Avon Products, Inc.* | 720 | 3,629 | ||||||
Blue Buffalo Pet Products, Inc.* | 7,340 | 176,454 | ||||||
Brown-Forman Corp., Class B | 3,100 | 139,252 | ||||||
Central Garden and Pet Co., Class A* | 400 | 12,360 | ||||||
The Coca-Cola Co. | 2,050 | 84,993 | ||||||
Colgate-Palmolive Co. | 1,220 | 79,837 | ||||||
ConAgra Brands, Inc. | 5,140 | 203,287 | ||||||
Constellation Brands, Inc., Class A | 1,160 | 177,840 | ||||||
CVS Health Corp. | 1,480 | 116,787 | ||||||
Darling Ingredients, Inc.* | 950 | 12,264 | ||||||
The accompanying notes are an integral part of these financial statements.
8
Table of Contents
AMG Chicago Equity Partners Balanced Fund
Schedule of Portfolio Investments (continued)
| Shares | Value | |||||||
Consumer Staples—4.7% (continued) | ||||||||
Dean Foods Co. | 685 | $ | 14,919 | |||||
Dr. Pepper Snapple Group, Inc. | 5,820 | 527,699 | ||||||
Energizer Holdings, Inc. | 1,830 | 81,636 | ||||||
Fresh Del Monte Produce, Inc. | 790 | 47,898 | ||||||
Hormel Foods Corp. | 6,030 | 209,904 | ||||||
Ingredion, Inc. | 4,530 | 566,069 | ||||||
The JM Smucker Co. | 1,850 | 236,911 | ||||||
Lamb Weston Holdings, Inc.* | 3,230 | 122,256 | ||||||
Lancaster Colony Corp. | 215 | 30,399 | ||||||
Medifast, Inc. | 550 | 22,896 | ||||||
Mondelez International, Inc., Class A | 3,820 | 169,341 | ||||||
National Beverage Corp. | 425 | 21,709 | ||||||
Natural Health Trends Corp. | 860 | 21,371 | ||||||
Nu Skin Enterprises, Inc., Class A | 1,010 | 48,258 | ||||||
PepsiCo, Inc. | 13,420 | 1,404,135 | ||||||
Philip Morris International, Inc. | 6,570 | 601,089 | ||||||
Post Holdings, Inc.*,1 | 1,200 | 96,468 | ||||||
The Procter & Gamble Co. | 7,210 | 606,217 | ||||||
Reynolds American, Inc. | 1,140 | 63,886 | ||||||
Sanderson Farms, Inc. | 50 | 4,712 | ||||||
SpartanNash Co. | 1,055 | 41,715 | ||||||
Sysco Corp. | 5,870 | 325,022 | ||||||
Tyson Foods, Inc., Class A | 4,980 | 307,166 | ||||||
Universal Corp. | 450 | 28,688 | ||||||
Walgreens Boots Alliance, Inc. | 2,490 | 206,072 | ||||||
Wal-Mart Stores, Inc. | 3,850 | 266,112 | ||||||
Total Consumer Staples | 8,182,587 | |||||||
Energy—2.8% | ||||||||
Anadarko Petroleum Corp. | 2,020 | 140,855 | ||||||
Apache Corp. | 5,210 | 330,679 | ||||||
Baker Hughes, Inc. | 2,810 | 182,566 | ||||||
Cabot Oil & Gas Corp. | 4,870 | 113,763 | ||||||
Carrizo Oil & Gas, Inc.* | 500 | 18,675 | ||||||
Chevron Corp. | 6,455 | 759,754 | ||||||
Cimarex Energy Co. | 1,560 | 212,004 | ||||||
ConocoPhillips | 3,840 | 192,538 | ||||||
CONSOL Energy, Inc. | 3,810 | 69,456 | ||||||
Denbury Resources, Inc.* | 810 | 2,981 | ||||||
Devon Energy Corp. | 6,790 | 310,099 | ||||||
Diamond Offshore Drilling, Inc.*,1 | 3,940 | 69,738 | ||||||
EOG Resources, Inc. | 540 | 54,594 | ||||||
EQT Corp. | 780 | 51,012 | ||||||
Evolution Petroleum Corp. | 610 | 6,100 | ||||||
Exxon Mobil Corp. | 11,095 | 1,001,435 | ||||||
Fairmount Santrol Holdings, Inc.* | 3,270 | 38,553 | ||||||
| Shares | Value | |||||||
Green Plains, Inc. | 550 | $ | 15,318 | |||||
Jones Energy, Inc., Class A* | 1,350 | 6,750 | ||||||
Matrix Service Co.* | 740 | 16,798 | ||||||
McDermott International, Inc.* | 8,880 | 65,623 | ||||||
Nabors Industries, Ltd. | 16,440 | 269,616 | ||||||
National Oilwell Varco, Inc. | 3,300 | 123,552 | ||||||
Navios Maritime Acquisition Corp. | 3,960 | 6,732 | ||||||
Noble Corp. PLC | 11,020 | 65,238 | ||||||
Noble Energy, Inc. | 1,720 | 65,463 | ||||||
Oasis Petroleum, Inc.* | 1,810 | 27,403 | ||||||
Occidental Petroleum Corp. | 2,520 | 179,500 | ||||||
Oceaneering International, Inc. | 2,310 | 65,165 | ||||||
Pacific Ethanol, Inc.* | 1,690 | 16,055 | ||||||
Parsley Energy, Inc., Class A* | 5,710 | 201,220 | ||||||
RPC, Inc.1 | 2,830 | 56,062 | ||||||
RSP Permian, Inc.* | 530 | 23,649 | ||||||
Sanchez Energy Corp.*,1 | 2,200 | 19,866 | ||||||
Valero Energy Corp. | 1,510 | 103,163 | ||||||
Total Energy | 4,881,975 | |||||||
Financials—7.0% | ||||||||
Access National Corp.1 | 420 | 11,659 | ||||||
Aflac, Inc. | 5,040 | 350,784 | ||||||
AG Mortgage Investment Trust, Inc. | 1,880 | 32,167 | ||||||
AGNC Investment Corp. | 4,710 | 85,392 | ||||||
The Allstate Corp. | 5,160 | 382,459 | ||||||
Ambac Financial Group, Inc.* | 440 | 9,900 | ||||||
American International Group, Inc. | 1,520 | 99,271 | ||||||
Ameriprise Financial, Inc. | 970 | 107,612 | ||||||
Argo Group International Holdings, Ltd. | 90 | 5,931 | ||||||
ARMOUR Residential REIT, Inc.1 | 3,210 | 69,625 | ||||||
Arrow Financial Corp. | 123 | 4,982 | ||||||
Aspen Insurance Holdings, Ltd. | 4,210 | 231,550 | ||||||
Associated Banc-Corp. | 7,100 | 175,370 | ||||||
Assurant, Inc. | 490 | 45,501 | ||||||
Assured Guaranty, Ltd. | 6,240 | 235,685 | ||||||
Axis Capital Holdings, Ltd. | 3,510 | 229,098 | ||||||
BancFirst Corp. | 40 | 3,722 | ||||||
Bank of America Corp. | 32,260 | 712,962 | ||||||
Berkshire Hathaway, Inc., Class B* | 2,520 | 410,710 | ||||||
Brown & Brown, Inc. | 9,110 | 408,675 | ||||||
Camden National Corp. | 550 | 24,448 | ||||||
Capital Bank Financial Corp., Class A | 139 | 5,456 | ||||||
Carolina Financial Corp. | 540 | 16,627 | ||||||
CenterState Banks, Inc. | 1,480 | 37,252 | ||||||
Central Valley Community Bancorp | 230 | 4,591 | ||||||
The Charles Schwab Corp. | 5,090 | 200,902 | ||||||
The accompanying notes are an integral part of these financial statements.
9
Table of Contents
AMG Chicago Equity Partners Balanced Fund
Schedule of Portfolio Investments (continued)
| Shares | Value | |||||||
Financials—7.0% (continued) | ||||||||
Chemical Financial Corp. | 220 | $ | 11,917 | |||||
Citizens Financial Group, Inc. | 2,950 | 105,108 | ||||||
CME Group, Inc. | 675 | 77,861 | ||||||
Columbia Banking System, Inc. | 230 | 10,276 | ||||||
Comerica, Inc. | 4,550 | 309,900 | ||||||
Commerce Bancshares, Inc. | 3,851 | 222,626 | ||||||
Community Bank System, Inc. | 350 | 21,626 | ||||||
Cullen/Frost Bankers, Inc.1 | 800 | 70,584 | ||||||
CYS Investments, Inc.1 | 1,260 | 9,740 | ||||||
Discover Financial Services | 2,980 | 214,828 | ||||||
Eaton Vance Corp. | 6,620 | 277,246 | ||||||
Enova International, Inc.* | 2,225 | 27,924 | ||||||
Erie Indemnity Co., Class A | 3,310 | 372,210 | ||||||
Essent Group, Ltd.* | 1,805 | 58,428 | ||||||
Evercore Partners, Inc., Class A | 560 | 38,472 | ||||||
Everest Re Group, Ltd. | 355 | 76,822 | ||||||
Farmers National Banc Corp. | 320 | 4,544 | ||||||
Federal Agricultural Mortgage Corp., Class C | 300 | 17,181 | ||||||
Fifth Third Bancorp | 5,560 | 149,953 | ||||||
First American Financial Corp. | 845 | 30,952 | ||||||
First Community Bancshares, Inc. | 130 | 3,918 | ||||||
First Financial Bancorp | 450 | 12,802 | ||||||
First Financial Corp | 695 | 36,696 | ||||||
First Interstate BancSystem, Inc., Class A1 | 800 | 34,040 | ||||||
First Republic Bank/CA | 1,740 | 160,324 | ||||||
Flagstar Bancorp, Inc.* | 120 | 3,233 | ||||||
Franklin Resources, Inc. | 4,030 | 159,507 | ||||||
Fulton Financial Corp. | 1,140 | 21,432 | ||||||
The Goldman Sachs Group, Inc. | 610 | 146,064 | ||||||
Hancock Holding Co. | 815 | 35,126 | ||||||
Hilltop Holdings, Inc. | 2,700 | 80,460 | ||||||
Huntington Bancshares, Inc. | 1 | 13 | ||||||
Impac Mortgage Holdings, Inc.* | 560 | 7,851 | ||||||
Independent Bank Corp./MA | 970 | 68,336 | ||||||
Independent Bank Corp./MI | 700 | 15,190 | ||||||
INTL. FCStone, Inc.* | 820 | 32,472 | ||||||
Invesco, Ltd. | 3,150 | 95,571 | ||||||
JPMorgan Chase & Co. | 11,208 | 967,138 | ||||||
KeyCorp | 6,803 | 124,291 | ||||||
Lazard, Ltd., Class A | 1,590 | 65,333 | ||||||
Lincoln National Corp. | 6,690 | 443,346 | ||||||
MarketAxess Holdings, Inc. | 2,000 | 293,840 | ||||||
Marlin Business Services Corp. | 130 | 2,717 | ||||||
Meta Financial Group, Inc. | 860 | 88,494 | ||||||
MFA Financial, Inc. | 7,470 | 56,996 | ||||||
| Shares | Value | |||||||
MGIC Investment Corp.* | 1,780 | $ | 18,138 | |||||
Morningstar, Inc. | 550 | 40,458 | ||||||
MSCI, Inc. | 1,140 | 89,809 | ||||||
MTGE Investment Corp. | 540 | 8,478 | ||||||
Nasdaq, Inc. | 1,160 | 77,859 | ||||||
Navient Corp. | 2,730 | 44,854 | ||||||
New Residential Investment Corp. | 1,220 | 19,178 | ||||||
Northern Trust Corp. | 6,760 | 601,978 | ||||||
Old Second Bancorp, Inc. | 370 | 4,088 | ||||||
PennyMac Financial Services, Inc., Class A* | 2,090 | 34,798 | ||||||
PennyMac Mortgage Investment Trust | 560 | 9,167 | ||||||
Piper Jaffray Cos.* | 550 | 39,875 | ||||||
Preferred Bank | 440 | 23,065 | ||||||
Primerica, Inc. | 1,310 | 90,586 | ||||||
PrivateBancorp, Inc. | 220 | 11,922 | ||||||
Prudential Financial, Inc. | 1,770 | 184,186 | ||||||
QCR Holdings, Inc. | 150 | 6,495 | ||||||
Radian Group, Inc. | 1,570 | 28,229 | ||||||
Regional Management Corp.* | 430 | 11,300 | ||||||
Regions Financial Corp. | 10,530 | 151,211 | ||||||
Sandy Spring Bancorp, Inc. | 620 | 24,794 | ||||||
ServisFirst Bancshares, Inc.1 | 1,960 | 73,382 | ||||||
Southern National Bancorp of Virginia, Inc. | 140 | 2,288 | ||||||
State Bank Financial Corp. | 570 | 15,310 | ||||||
State Street Corp. | 1,380 | 107,254 | ||||||
Stock Yards Bancorp, Inc. | 160 | 7,512 | ||||||
SunTrust Banks, Inc. | 5,715 | 313,468 | ||||||
T. Rowe Price Group, Inc. | 570 | 42,898 | ||||||
TD Ameritrade Holding Corp. | 3,270 | 142,572 | ||||||
Torchmark Corp. | 1,480 | 109,165 | ||||||
The Travelers Cos., Inc. | 665 | 81,409 | ||||||
UMB Financial Corp. | 1,310 | 101,027 | ||||||
Universal Insurance Holdings, Inc. | 3,795 | 107,778 | ||||||
US Bancorp | 6,565 | 337,244 | ||||||
Walker & Dunlop, Inc.* | 860 | 26,832 | ||||||
Wells Fargo & Co. | 4,120 | 227,053 | ||||||
Wintrust Financial Corp. | 440 | 31,931 | ||||||
Total Financials | 12,213,310 | |||||||
Health Care—8.6% | ||||||||
AbbVie, Inc. | 4,900 | 306,838 | ||||||
Aetna, Inc. | 415 | 51,464 | ||||||
Agenus, Inc.*,1 | 1,550 | 6,386 | ||||||
Align Technology, Inc.* | 2,290 | 220,138 | ||||||
Allergan PLC* | 1,520 | 319,215 | ||||||
Amgen, Inc. | 10,590 | 1,548,364 | ||||||
Amphastar Pharmaceuticals, Inc.*,1 | 2,890 | 53,234 | ||||||
The accompanying notes are an integral part of these financial statements.
10
Table of Contents
AMG Chicago Equity Partners Balanced Fund
Schedule of Portfolio Investments (continued)
| Shares | Value | |||||||
Health Care—8.6% (continued) | ||||||||
ANI Pharmaceuticals, Inc.* | 510 | $ | 30,916 | |||||
ARIAD Pharmaceuticals, Inc.*,1 | 3,450 | 42,918 | ||||||
Array BioPharma, Inc.* | 5,715 | 50,235 | ||||||
Baxter International, Inc. | 26,248 | 1,163,836 | ||||||
BioSpecifics Technologies Corp.* | 60 | 3,342 | ||||||
Bristol-Myers Squibb Co. | 20,570 | 1,202,111 | ||||||
Bruker Corp. | 4,100 | 86,838 | ||||||
Cardiovascular Systems, Inc.* | 810 | 19,610 | ||||||
Catalent, Inc.* | 1,265 | 34,104 | ||||||
Clovis Oncology, Inc.*,1 | 400 | 17,768 | ||||||
Coherus Biosciences, Inc.* | 1,250 | 35,188 | ||||||
Corcept Therapeutics, Inc.*,1 | 2,575 | 18,694 | ||||||
CR Bard, Inc. | 3,210 | 721,159 | ||||||
Danaher Corp. | 4,020 | 312,917 | ||||||
Exelixis, Inc.* | 1,510 | 22,514 | ||||||
Express Scripts Holding Co.* | 8,020 | 551,696 | ||||||
Halozyme Therapeutics, Inc.*,1 | 6,145 | 60,713 | ||||||
Halyard Health, Inc.* | 820 | 30,324 | ||||||
HMS Holdings Corp.* | 715 | 12,984 | ||||||
Humana, Inc. | 1,190 | 242,796 | ||||||
ICU Medical, Inc.* | 530 | 78,096 | ||||||
IDEXX Laboratories, Inc.* | 2,360 | 276,757 | ||||||
Immunomedics, Inc.* | 5,020 | 18,423 | ||||||
INC Research Holdings, Inc., Class A* | 1,240 | 65,224 | ||||||
Incyte Corp.* | 7,460 | 748,014 | ||||||
Innoviva, Inc.*,1 | 3,730 | 39,911 | ||||||
Intuitive Surgical, Inc.* | 900 | 570,753 | ||||||
Ironwood Pharmaceuticals, Inc.* | 3,375 | 51,604 | ||||||
Johnson & Johnson | 10,225 | 1,178,022 | ||||||
Magellan Health, Inc.* | 900 | 67,725 | ||||||
Masimo Corp.* | 925 | 62,345 | ||||||
McKesson Corp. | 230 | 32,304 | ||||||
Merck & Co., Inc. | 11,805 | 694,960 | ||||||
Molina Healthcare, Inc.* | 220 | 11,937 | ||||||
Mylan N.V.* | 3,720 | 141,918 | ||||||
NxStage Medical, Inc.* | 990 | 25,948 | ||||||
OraSure Technologies, Inc.* | 1,740 | 15,277 | ||||||
Pfizer, Inc. | 3,367 | 109,360 | ||||||
PRA Health Sciences, Inc.* | 430 | 23,702 | ||||||
Quest Diagnostics, Inc. | 890 | 81,791 | ||||||
Quintiles IMS Holdings, Inc.* | 9,700 | 737,685 | ||||||
United Therapeutics Corp.*,1 | 4,700 | 674,121 | ||||||
UnitedHealth Group, Inc. | 6,680 | 1,069,067 | ||||||
Vertex Pharmaceuticals, Inc.* | 600 | 44,202 | ||||||
WellCare Health Plans, Inc.* | 4,225 | 579,163 | ||||||
| Shares | Value | |||||||
Zoetis, Inc. | 9,210 | $ | 493,011 | |||||
Total Health Care | 15,057,622 | |||||||
Industrials—7.4% | ||||||||
A. O. Smith Corp. | 7,240 | 342,814 | ||||||
AAR Corp. | 540 | 17,847 | ||||||
ABM Industries, Inc. | 575 | 23,483 | ||||||
Acacia Research Corp.* | 980 | 6,370 | ||||||
ACCO Brands Corp.* | 2,370 | 30,929 | ||||||
American Outdoor Brands Corp.*,1 | 1,090 | 22,977 | ||||||
Applied Industrial Technologies, Inc. | 370 | 21,978 | ||||||
Argan, Inc. | 300 | 21,165 | ||||||
Astec Industries, Inc. | 320 | 21,587 | ||||||
Avis Budget Group, Inc.* | 6,210 | 227,783 | ||||||
BLUE BIRD Corp.* | 1,150 | 17,768 | ||||||
Brady Corp., Class A | 400 | 15,020 | ||||||
The Brink’s Co. | 540 | 22,275 | ||||||
Carlisle Cos., Inc. | 2,470 | 272,416 | ||||||
Chart Industries, Inc.* | 370 | 13,327 | ||||||
Chicago Bridge & Iron Co., N.V. | 6,370 | 202,248 | ||||||
Cintas Corp. | 6,060 | 700,294 | ||||||
Copa Holdings, S.A., Class A1 | 950 | 86,288 | ||||||
Copart, Inc.* | 3,680 | 203,909 | ||||||
Costamare, Inc. | 4,160 | 23,296 | ||||||
Cummins, Inc. | 1,530 | 209,105 | ||||||
Deere & Co. | 2,780 | 286,451 | ||||||
Deluxe Corp. | 375 | 26,854 | ||||||
DigitalGlobe, Inc.* | 1,390 | 39,824 | ||||||
Ducommun, Inc.* | 370 | 9,457 | ||||||
EMCOR Group, Inc. | 310 | 21,936 | ||||||
Energy Recovery, Inc.*,1 | 1,825 | 18,889 | ||||||
Equifax, Inc. | 1,980 | 234,095 | ||||||
FedEx Corp. | 3,730 | 694,526 | ||||||
GATX Corp.1 | 3,650 | 224,767 | ||||||
Generac Holdings, Inc.* | 670 | 27,296 | ||||||
General Dynamics Corp. | 2,900 | 500,714 | ||||||
General Electric Co. | 16,110 | 509,076 | ||||||
Gibraltar Industries, Inc.* | 520 | 21,658 | ||||||
Hawaiian Holdings, Inc.* | 1,240 | 70,680 | ||||||
HEICO Corp. | 4,990 | 384,978 | ||||||
HNI Corp. | 910 | 50,887 | ||||||
Illinois Tool Works, Inc. | 5,660 | 693,124 | ||||||
Insperity, Inc. | 880 | 62,436 | ||||||
Kennametal, Inc. | 2,800 | 87,528 | ||||||
Knoll, Inc. | 1,160 | 32,399 | ||||||
L-3 Communications Holdings, Inc. | 2,480 | 377,233 | ||||||
Landstar System, Inc. | 4,200 | 358,260 | ||||||
The accompanying notes are an integral part of these financial statements.
11
Table of Contents
AMG Chicago Equity Partners Balanced Fund
Schedule of Portfolio Investments (continued)
| Shares | Value | |||||||
Industrials—7.4% (continued) | ||||||||
Lydall, Inc.* | 255 | $ | 15,772 | |||||
MasTec, Inc.* | 1,495 | 57,184 | ||||||
MRC Global, Inc.* | 1,085 | 21,982 | ||||||
Mueller Water Products, Inc., Class A | 1,415 | 18,834 | ||||||
Nordson Corp. | 2,120 | 237,546 | ||||||
Northrop Grumman Corp. | 2,110 | 490,744 | ||||||
Old Dominion Freight Line, Inc.* | 5,200 | 446,108 | ||||||
PACCAR, Inc. | 990 | 63,261 | ||||||
Parker Hannifin Corp. | 2,300 | 322,000 | ||||||
Quad/Graphics, Inc. | 1,695 | 45,562 | ||||||
Quanta Services, Inc.* | 9,550 | 332,818 | ||||||
Rockwell Automation, Inc. | 6,415 | 862,176 | ||||||
SkyWest, Inc. | 840 | 30,618 | ||||||
Spirit AeroSystems Holdings, Inc., Class A | 1,920 | 112,032 | ||||||
Stanley Black & Decker, Inc. | 670 | 76,842 | ||||||
Supreme Industries, Inc., Class A | 745 | 11,696 | ||||||
Swift Transportation Co.*,1 | 1,180 | 28,745 | ||||||
Tetra Tech, Inc. | 250 | 10,788 | ||||||
TransDigm Group, Inc. | 1,320 | 328,627 | ||||||
TransUnion* | 4,790 | 148,155 | ||||||
Trex Co., Inc.* | 875 | 56,350 | ||||||
Tutor Perini Corp.* | 1,590 | 44,520 | ||||||
United Rentals, Inc.* | 2,140 | 225,941 | ||||||
United Technologies Corp. | 2,580 | 282,820 | ||||||
Valmont Industries, Inc. | 690 | 97,221 | ||||||
Vectrus, Inc.* | 780 | 18,603 | ||||||
Wabash National Corp. | 3,600 | 56,952 | ||||||
Waste Management, Inc. | 16,030 | 1,136,687 | ||||||
West Corp. | 950 | 23,522 | ||||||
YRC Worldwide, Inc.*,1 | 1,970 | 26,162 | ||||||
Total Industrials | 12,866,215 | |||||||
Information Technology—14.9% | ||||||||
3D Systems Corp.*,1 | 3,880 | 51,565 | ||||||
Accenture PLC, Class A | 6,040 | 707,465 | ||||||
Activision Blizzard, Inc. | 11,630 | 419,959 | ||||||
Advanced Energy Industries, Inc.* | 840 | 45,990 | ||||||
Advanced Micro Devices, Inc.* | 9,580 | 108,637 | ||||||
Alarm.com Holdings, Inc.* | 2,070 | 57,608 | ||||||
Alpha & Omega Semiconductor, Ltd.* | 220 | 4,679 | ||||||
Alphabet, Inc., Class A* | 3,445 | 2,729,990 | ||||||
Alphabet, Inc., Class C* | 250 | 192,955 | ||||||
Amdocs, Ltd. | 1,880 | 109,510 | ||||||
Amphenol Corp., Class A | 9,530 | 640,416 | ||||||
Apple, Inc. | 24,640 | 2,853,805 | ||||||
Autodesk, Inc.* | 4,790 | 354,508 | ||||||
| Shares | Value | |||||||
Automatic Data Processing, Inc. | 1,040 | $ | 106,891 | |||||
Barracuda Networks, Inc.* | 340 | 7,286 | ||||||
Black Box Corp. | 710 | 10,828 | ||||||
Black Knight Financial Services, Inc., Class A*,1 | 2,920 | 110,376 | ||||||
Cardtronics PLC, Class A* | 495 | 27,012 | ||||||
Care.com, Inc.* | 1,545 | 13,241 | ||||||
CDK Global, Inc. | 9,530 | 568,846 | ||||||
ChannelAdvisor Corp.* | 1,250 | 17,938 | ||||||
Cirrus Logic, Inc.* | 290 | 16,397 | ||||||
Cisco Systems, Inc. | 8,290 | 250,524 | ||||||
Citrix Systems, Inc.* | 8,880 | 793,073 | ||||||
CommScope Holding Co., Inc.* | 11,510 | 428,172 | ||||||
CommVault Systems, Inc.* | 555 | 28,527 | ||||||
Convergys Corp. | 370 | 9,087 | ||||||
CoreLogic, Inc.* | 11,750 | 432,752 | ||||||
Corning, Inc. | 6,310 | 153,144 | ||||||
CSG Systems International, Inc. | 690 | 33,396 | ||||||
DST Systems, Inc. | 950 | 101,792 | ||||||
Ebix, Inc.1 | 715 | 40,791 | ||||||
Electronic Arts, Inc.* | 6,535 | 514,697 | ||||||
ePlus, Inc.* | 440 | 50,688 | ||||||
Exar Corp.* | 410 | 4,420 | ||||||
Fabrinet* | 330 | 13,299 | ||||||
Facebook, Inc., Class A* | 22,210 | 2,555,260 | ||||||
Finisar Corp.* | 1,020 | 30,875 | ||||||
Gigamon, Inc.* | 270 | 12,298 | ||||||
The Hackett Group, Inc. | 1,090 | 19,249 | ||||||
HP, Inc. | 3,350 | 49,714 | ||||||
Insight Enterprises, Inc.* | 390 | 15,772 | ||||||
InterDigital, Inc. | 755 | 68,969 | ||||||
InvenSense, Inc.*,1 | 570 | 7,290 | ||||||
Itron, Inc.* | 820 | 51,537 | ||||||
KLA-Tencor Corp. | 4,190 | 329,669 | ||||||
Knowles Corp.*,1 | 610 | 10,193 | ||||||
Leidos Holdings, Inc. | 7,240 | 370,254 | ||||||
Liquidity Services, Inc.* | 1,820 | 17,745 | ||||||
Manhattan Associates, Inc.* | 910 | 48,257 | ||||||
ManTech International Corp., Class A | 310 | 13,098 | ||||||
MasterCard, Inc., Class A | 7,580 | 782,635 | ||||||
Maxim Integrated Products, Inc. | 10,600 | 408,842 | ||||||
Mentor Graphics Corp. | 430 | 15,863 | ||||||
Microsemi Corp.* | 390 | 21,048 | ||||||
Microsoft Corp. | 33,240 | 2,065,534 | ||||||
NCR Corp.* | 36,310 | 1,472,734 | ||||||
NETGEAR, Inc.* | 990 | 53,806 | ||||||
NIC, Inc. | 480 | 11,472 | ||||||
The accompanying notes are an integral part of these financial statements.
12
Table of Contents
AMG Chicago Equity Partners Balanced Fund
Schedule of Portfolio Investments (continued)
| Shares | Value | |||||||
Information Technology—14.9% (continued) | ||||||||
NVIDIA Corp. | 4,600 | $ | 491,004 | |||||
Paycom Software, Inc.*,1 | 890 | 40,486 | ||||||
Plexus Corp.* | 580 | 31,343 | ||||||
Power Integrations, Inc. | 95 | 6,446 | ||||||
Proofpoint, Inc.* | 320 | 22,608 | ||||||
Red Hat, Inc.* | 880 | 61,336 | ||||||
RetailMeNot, Inc.* | 420 | 3,906 | ||||||
Sanmina Corp.* | 700 | 25,655 | ||||||
Science Applications International Corp. | 320 | 27,136 | ||||||
Semtech Corp.* | 830 | 26,186 | ||||||
Shutterstock, Inc.*,1 | 60 | 2,851 | ||||||
Square, Inc., Class A* | 27,720 | 377,824 | ||||||
Super Micro Computer, Inc.* | 230 | 6,452 | ||||||
Symantec Corp. | 38,750 | 925,738 | ||||||
SYNNEX Corp. | 80 | 9,682 | ||||||
Take-Two Interactive Software, Inc.* | 1,110 | 54,712 | ||||||
TE Connectivity, Ltd. | 6,890 | 477,339 | ||||||
Tech Data Corp.* | 85 | 7,198 | ||||||
Texas Instruments, Inc. | 12,960 | 945,691 | ||||||
TrueCar, Inc.*,1 | 1,040 | 13,000 | ||||||
TTM Technologies, Inc.* | 5,380 | 73,329 | ||||||
Vantiv, Inc., Class A* | 1,740 | 103,739 | ||||||
Varonis Systems, Inc.* | 590 | 15,812 | ||||||
Viavi Solutions, Inc.* | 30,150 | 246,627 | ||||||
Visa, Inc., Class A | 3,990 | 311,300 | ||||||
Vishay Intertechnology, Inc. | 1,130 | 18,306 | ||||||
VMware, Inc., Class A*,1 | 1,170 | 92,114 | ||||||
WEX, Inc.* | 1,900 | 212,040 | ||||||
Xactly Corp.* | 2,320 | 25,520 | ||||||
Xilinx, Inc. | 5,040 | 304,265 | ||||||
Yelp, Inc.* | 14,820 | 565,087 | ||||||
Total Information Technology | 25,967,110 | |||||||
Materials—1.9% | ||||||||
Air Products & Chemicals, Inc. | 1,810 | 260,314 | ||||||
AK Steel Holding Corp.* | 4,455 | 45,486 | ||||||
Berry Plastics Group, Inc.* | 12,610 | 614,485 | ||||||
Cabot Corp. | 8,500 | 429,590 | ||||||
The Chemours Co. | 2,550 | 56,330 | ||||||
Cliffs Natural Resources, Inc.* | 1,060 | 8,915 | ||||||
The Dow Chemical Co. | 5,840 | 334,165 | ||||||
E.I. du Pont de Nemours & Co. | 10,130 | 743,542 | ||||||
FMC Corp. | 7,250 | 410,060 | ||||||
Greif, Inc., Class A | 730 | 37,456 | ||||||
Kronos Worldwide, Inc. | 1,160 | 13,850 | ||||||
| Shares | Value | |||||||
Louisiana-Pacific Corp.* | 465 | $ | 8,802 | |||||
Nucor Corp. | 2,850 | 169,632 | ||||||
Rayonier Advanced Materials, Inc.1 | 1,340 | 20,716 | ||||||
Ryerson Holding Corp.* | 1,620 | 21,627 | ||||||
Steel Dynamics, Inc. | 1,420 | 50,524 | ||||||
SunCoke Energy, Inc.* | 1,890 | 21,433 | ||||||
Trinseo, S.A. | 1,335 | 79,166 | ||||||
Worthington Industries, Inc. | 540 | 25,618 | ||||||
Total Materials | 3,351,711 | |||||||
Real Estate—2.2% | ||||||||
American Tower Corp. | 4,470 | 472,390 | ||||||
Ashford Hospitality Trust, Inc. | 2,940 | 22,814 | ||||||
Boston Properties, Inc. | 1,280 | 160,998 | ||||||
Camden Property Trust | 1,020 | 85,751 | ||||||
CBL & Associates Properties, Inc. | 5,110 | 58,765 | ||||||
Columbia Property Trust, Inc. | 6,030 | 130,248 | ||||||
Corporate Office Properties Trust | 4,180 | 130,500 | ||||||
DCT Industrial Trust, Inc. | 460 | 22,025 | ||||||
Digital Realty Trust, Inc.1 | 4,370 | 429,396 | ||||||
EastGroup Properties, Inc. | 650 | 47,996 | ||||||
Equity Lifestyle Properties, Inc. | 6,560 | 472,987 | ||||||
Equity Residential | 6,640 | 427,350 | ||||||
Extra Space Storage, Inc. | 4,410 | 340,628 | ||||||
Four Corners Property Trust, Inc. | 2,785 | 57,148 | ||||||
Highwoods Properties, Inc. | 755 | 38,513 | ||||||
Hudson Pacific Properties, Inc. | 1,005 | 34,954 | ||||||
Lexington Realty Trust | 4,430 | 47,844 | ||||||
The Macerich Co. | 1,740 | 123,262 | ||||||
National Storage Affiliates Trust | 1,820 | 40,167 | ||||||
Piedmont Office Realty Trust, Inc., Class A | 13,300 | 278,103 | ||||||
PS Business Parks, Inc. | 360 | 41,947 | ||||||
Realty Income Corp. | 740 | 42,535 | ||||||
Ryman Hospitality Properties, Inc. | 325 | 20,478 | ||||||
Senior Housing Properties Trust | 3,500 | 66,255 | ||||||
Simon Property Group, Inc. | 200 | 35,534 | ||||||
Summit Hotel Properties, Inc. | 3,710 | 59,471 | ||||||
Tanger Factory Outlet Centers, Inc. | 2,120 | 75,854 | ||||||
Washington Real Estate Investment Trust | 690 | 22,556 | ||||||
Total Real Estate | 3,786,469 | |||||||
Telecommunication Services—1.5% | ||||||||
AT&T, Inc. | 12,480 | 530,774 | ||||||
CenturyLink, Inc. | 10,920 | 259,678 | ||||||
IDT Corp., Class B | 2,945 | 54,600 | ||||||
Sprint Corp.*,1 | 8,280 | 69,718 | ||||||
T-Mobile US, Inc.* | 1,960 | 112,720 | ||||||
The accompanying notes are an integral part of these financial statements.
13
Table of Contents
AMG Chicago Equity Partners Balanced Fund
Schedule of Portfolio Investments (continued)
| Shares | Value | |||||||
Telecommunication Services—1.5% (continued) | ||||||||
Verizon Communications, Inc. | 20,830 | $ | 1,111,905 | |||||
Zayo Group Holdings, Inc.* | 13,770 | 452,482 | ||||||
Total Telecommunication Services | 2,591,877 | |||||||
Utilities—1.5% | ||||||||
American Water Works Co., Inc. | 3,905 | 282,565 | ||||||
Atmos Energy Corp. | 4,560 | 338,124 | ||||||
Avista Corp. | 300 | 11,996 | ||||||
CenterPoint Energy, Inc. | 8,355 | 205,866 | ||||||
Chesapeake Utilities Corp. | 200 | 13,390 | ||||||
Connecticut Water Service, Inc. | 280 | 15,638 | ||||||
Consolidated Edison, Inc. | 2,240 | 165,043 | ||||||
Duke Energy Corp. | 2,130 | 165,331 | ||||||
Edison International | 2,790 | 200,852 | ||||||
Eversource Energy | 1,770 | 97,757 | ||||||
IDACORP, Inc. | 230 | 18,526 | ||||||
Middlesex Water Co. | 225 | 9,662 | ||||||
Northwest Natural Gas Co. | 330 | 19,734 | ||||||
OGE Energy Corp. | 3,240 | 108,378 | ||||||
ONE Gas, Inc. | 40 | 2,558 | ||||||
Ormat Technologies, Inc. | 955 | 51,207 | ||||||
Otter Tail Corp. | 710 | 28,968 | ||||||
Pinnacle West Capital Corp. | 2,340 | 182,590 | ||||||
PPL Corp. | 7,870 | 267,974 | ||||||
SJW Group | 1,050 | 58,779 | ||||||
Vectren Corp. | 4,495 | 234,414 | ||||||
WGL Holdings, Inc. | 430 | 32,800 | ||||||
Xcel Energy, Inc. | 1,150 | 46,805 | ||||||
Total Utilities | 2,558,957 | |||||||
Total Common Stocks | 107,612,044 | |||||||
Rights—0.0%# | ||||||||
DYAX Corp. (Healthcare)*,15 | 670 | 7 | ||||||
| Principal Amount | ||||||||
Corporate Bonds and Notes—4.9% | ||||||||
Financials—1.6% | ||||||||
Bank of America Corp., Series MTN, 2.503%, 10/21/22 | $ | 270,000 | 261,473 | |||||
Bank of Montreal, Series MTN, 2.100%, 12/12/19 | 185,000 | 185,078 | ||||||
The Goldman Sachs Group, Inc., 2.350%, 11/15/21 | 320,000 | 311,253 | ||||||
JPMorgan Chase & Co., Series MTN, 2.295%, 08/15/21 | 330,000 | 324,097 | ||||||
| Principal Amount | Value | |||||||
Morgan Stanley, Series MTN, 2.625%, 11/17/21 | $ | 295,000 | $ | 291,779 | ||||
The Toronto-Dominion Bank, Series MTN, 2.250%, 11/05/19 | 70,000 | 70,445 | ||||||
US Bancorp, MTN, 2.200%, 04/25/19 | 175,000 | 176,551 | ||||||
Visa, Inc., 2.200%, 12/14/20 | 220,000 | 220,806 | ||||||
Wells Fargo & Co., | ||||||||
2.500%, 03/04/21 | 545,000 | 541,280 | ||||||
MTN, 1.400%, 09/08/171 | 305,000 | 304,672 | ||||||
Total Financials | 2,687,434 | |||||||
Industrials—2.7% | ||||||||
3M Co., Series MTN, 2.000%, 06/26/22 | 130,000 | 127,530 | ||||||
Altria Group, Inc., 2.625%, 01/14/20 | 200,000 | 202,422 | ||||||
The Boeing Co., 2.350%, 10/30/21 | 254,000 | 255,662 | ||||||
Burlington Northern Santa Fe LLC, 4.700%, 10/01/19 | 65,000 | 69,930 | ||||||
Cisco Systems, Inc., 1.400%, 02/28/18 | 200,000 | 200,377 | ||||||
Colgate-Palmolive Co., MTN, 1.750%, 03/15/19 | 105,000 | 105,430 | ||||||
Dr. Pepper Snapple Group, Inc., 3.130%, 12/15/23 | 120,000 | 120,214 | ||||||
Exxon Mobil Corp., 1.708%, 03/01/19 | 95,000 | 95,235 | ||||||
Ford Motor Co., 4.346%, 12/08/26 | 120,000 | 121,498 | ||||||
General Electric Co., | ||||||||
2.900%, 01/09/17 | 115,000 | 115,041 | ||||||
5.250%, 12/06/17 | 340,000 | 352,266 | ||||||
MTN, Series A, 6.750%, 03/15/32 | 45,000 | 59,994 | ||||||
The Home Depot, Inc., 2.250%, 09/10/18 | 210,000 | 212,889 | ||||||
Johnson & Johnson, 5.150%, 07/15/18 | 90,000 | 95,171 | ||||||
Lockheed Martin Corp., 1.850%, 11/23/18 | 70,000 | 70,311 | ||||||
McDonald’s Corp., | ||||||||
MTN, 5.350%, 03/01/18 | 195,000 | 203,272 | ||||||
MTN, 6.300%, 10/15/37 | 135,000 | 170,146 | ||||||
Medtronic, Inc., 0.875%, 02/27/17 | 45,000 | 44,975 | ||||||
PepsiCo, Inc., Series 1, 1.000%, 10/13/17 | 135,000 | 134,926 | ||||||
Pfizer, Inc., 1.700%, 12/15/19 | 230,000 | 229,882 | ||||||
Philip Morris International, Inc., 1.625%, 03/20/171 | 330,000 | 330,019 | ||||||
Tyson Foods, Inc., 2.650%, 08/15/19 | 200,000 | 202,029 | ||||||
Union Pacific Corp., 3.646%, 02/15/24 | 155,000 | 161,963 | ||||||
United Parcel Service, Inc., 6.200%, 01/15/38 | 210,000 | 276,800 | ||||||
Verizon Communications, Inc., 2.625%, 02/21/20 | 388,000 | 392,015 | ||||||
The accompanying notes are an integral part of these financial statements.
14
Table of Contents
AMG Chicago Equity Partners Balanced Fund
Schedule of Portfolio Investments (continued)
| Principal Amount | Value | |||||||
Industrials—2.7% (continued) | ||||||||
Wal-Mart Stores, Inc., 6.500%, 08/15/37 | $ | 245,000 | $ | 332,658 | ||||
Total Industrials | 4,682,655 | |||||||
Telecommunication Services—0.2% | ||||||||
AT&T, Inc., 5.200%, 03/15/20 | 345,000 | 371,169 | ||||||
Utilities—0.4% | ||||||||
BP Capital Markets PLC, 1.676%, 05/03/19 | 225,000 | 223,485 | ||||||
Consolidated Edison Co. of New York, Inc., | 105,000 | 142,384 | ||||||
Dominion Resources, Inc., 4.450%, 03/15/21 | 75,000 | 80,214 | ||||||
Georgia Power Co., 5.400%, 06/01/40 | 65,000 | 74,435 | ||||||
Shell International Finance BV, 1.875%, 05/10/21 | 130,000 | 127,182 | ||||||
TransCanada PipeLines, Ltd., 3.800%, 10/01/20 | 100,000 | 104,433 | ||||||
Total Utilities | 752,133 | |||||||
Total Corporate Bonds and Notes | 8,493,391 | |||||||
U.S. Government and Agency Obligations—32.7% | ||||||||
Federal Home Loan Mortgage Corporation—11.7% | ||||||||
FHLMC, 1.375%, 05/01/20 1 | 165,000 | 163,800 | ||||||
FHLMC Gold Pool, | ||||||||
2.500%, 07/01/28 to 09/01/46 | 1,482,784 | 1,452,199 | ||||||
3.000%, 01/01/29 to 09/01/46 | 4,736,181 | 4,762,617 | ||||||
3.500%, 03/01/42 to 03/01/46 | 6,196,559 | 6,353,027 | ||||||
4.000%, 08/01/43 to 11/01/45 | 5,073,003 | 5,333,002 | ||||||
4.500%, 02/01/39 to 04/01/44 | 1,147,520 | 1,233,573 | ||||||
5.000%, 07/01/35 to 07/01/41 | 915,052 | 998,640 | ||||||
5.500%, 04/01/38 to 01/01/39 | 54,744 | 61,256 | ||||||
Total Federal Home Loan Mortgage Corporation | 20,358,114 | |||||||
Federal National Mortgage Association—3.7% | ||||||||
FNMA, | ||||||||
0.875%, 03/28/18 | 200,000 | 199,623 | ||||||
1.000%, 10/24/19 | 350,000 | 345,304 | ||||||
1.375%, 10/07/21 | 170,000 | 165,501 | ||||||
| Principal Amount | Value | |||||||
1.875%, 02/19/19 1 | $ | 440,000 | $ | 445,499 | ||||
2.000%, 01/01/30 | 63,802 | 62,208 | ||||||
2.500%, 04/01/28 to 05/01/43 | 1,218,076 | 1,173,165 | ||||||
2.625%, 09/06/24 | 305,000 | 308,272 | ||||||
3.000%, 03/01/42 to 08/01/43 | 647,050 | 646,984 | ||||||
3.500%, 11/01/25 to 07/01/43 | 606,726 | 628,217 | ||||||
4.000%, 12/01/21 to 11/01/44 | 702,909 | 740,526 | ||||||
4.500%, 06/01/39 to 09/01/43 | 953,583 | 1,027,387 | ||||||
5.000%, 09/01/33 to 10/01/41 | 392,867 | 429,812 | ||||||
5.500%, 02/01/35 to 05/01/39 | 194,891 | 217,537 | ||||||
Total Federal National Mortgage Association |
| 6,390,035 | ||||||
U.S. Treasury Obligations—17.3% | ||||||||
U.S. Treasury Bonds, | ||||||||
2.750%, 08/15/42 | 4,600,000 | 4,347,092 | ||||||
3.000%, 11/15/45 | 1,105,000 | 1,090,151 | ||||||
3.125%, 11/15/41 | 670,000 | 680,168 | ||||||
U.S. Treasury Notes, | ||||||||
0.875%, 07/15/18 to 07/31/19 | 2,635,000 | 2,615,303 | ||||||
1.000%, 09/30/19 to 11/30/19 | 1,445,000 | 1,429,023 | ||||||
1.125%, 07/31/21 | 1,200,000 | 1,160,132 | ||||||
1.375%, 05/31/20 to 08/31/20 | 3,705,000 | 3,678,085 | ||||||
1.500%, 02/28/19 to 01/31/22 | 2,755,000 | 2,722,817 | ||||||
1.625%, 07/31/20 to 05/15/26 | 1,215,000 | 1,201,354 | ||||||
1.875%, 11/30/21 | 2,860,000 | 2,852,570 | ||||||
2.250%, 11/15/24 to 11/15/25 | 5,070,000 | 5,029,508 | ||||||
2.500%, 05/15/24 | 3,350,000 | 3,400,709 | ||||||
Total U.S. Treasury Obligations | 30,206,912 | |||||||
Total U.S. Government and Agency Obligations (cost $58,189,133) | 56,955,061 | |||||||
The accompanying notes are an integral part of these financial statements.
15
Table of Contents
AMG Chicago Equity Partners Balanced Fund
Schedule of Portfolio Investments (continued)
| Principal Amount | Value | |||||||
Short-Term Investments—2.3% | ||||||||
Repurchase Agreements—1.8%2 | ||||||||
Citigroup Global Markets, Inc., dated 12/30/16,due 01/03/17, 0.530% total to be received $1,000,059 (collateralized by various U.S. Government Agency Obligations, 2.000% - 8.500%, 12/01/17 - 01/01/47, totaling $1,020,000) | $ | 1,000,000 | $ | 1,000,000 | ||||
Daiwa Capital Markets America, dated 12/30/16, due 01/03/17, 0.520% total to be received $1,000,058 (collateralized by various U.S. Government Agency Obligations, 0.000% - 6.500%, 03/02/17 - 02/01/49,totaling $1,020,000) | 1,000,000 | 1,000,000 | ||||||
Merrill Lynch Pierce Fenner & Smith, Inc., dated 12/30/16, due 01/03/17, 0.500% total to be received $216,376 (collateralized by various U.S. Government Agency Obligations, 0.685% - 2.000%, 10/31/18 - 11/30/22, totaling $220,691) | 216,364 | 216,364 | ||||||
Nomura Securities International, Inc., dated 12/30/16, due 01/03/17, 0.500% total to be received $1,000,056 (collateralized by various U.S. Government Agency Obligations, 0.000% - 9.500%, 01/15/17 - 08/20/66,totaling $1,020,000) | 1,000,000 | 1,000,000 | ||||||
Total Repurchase Agreements | 3,216,364 | |||||||
| Shares | Value | |||||||
Other Investment Companies—0.5%3 | ||||||||
Dreyfus Government Cash Management Fund, Institutional Class Shares, 0.45% | 900,145 | $ | 900,145 | |||||
Total Short-Term Investments | 4,116,509 | |||||||
Total Investments—101.7% | 177,177,012 | |||||||
Other Assets, less Liabilities—(1.7)% | (2,989,582 | ) | ||||||
Net Assets—100.0% | $ | 174,187,430 | ||||||
The accompanying notes are an integral part of these financial statements.
16
Table of Contents
AMG Chicago Equity Partners Small Cap Value Fund
Portfolio Manager’s Comments (unaudited)
THE YEAR IN REVIEW
For the year ended December 31, 2016, the AMG Chicago Equity Partners Small Cap Value (Class I)1 (the “Fund”) returned 29.3%, compared to the 31.7% return for its benchmark, the Russell 2000® Value Index.
The portfolio is managed to emphasize stock selection while neutralizing size, style and sector exposure. The Fund consists of a well-diversified portfolio of companies with attractive valuation ratios, quality balance sheets and positive growth and momentum expectations built through a disciplined, risk-controlled process, with the goal of delivering consistent excess returns.
MARKET ENVIRONMENT
Unpredictable 2016 (Increased Interest Rates, New President Elect and Positive Corporate Earnings)
2016 was a year of reversals, with preferences shifting every couple of months. Recession concerns earlier in the year eased as economic data improved and oil prices stabilized. Continued accommodative U.S Federal Reserve (the “Fed”) policy prolonged the low-rate environment until late in the fourth quarter, resulting in some investors reaching for yield for the first six months of the year and supporting the risk-on trade. In the third quarter, the bond proxy stocks pulled back, and the cheap, high beta stocks performed well in the cyclical and technology sectors. In the fourth quarter, all eyes were on the election and the Fed. The surprise Trump victory resulted in strong
equity markets, with sector performance driven by the perceived winners and losers of Trump policy. The Fed behaved as expected in the quarter, finally raising rates 0.25%, and corporate earnings turned the corner as third quarter numbers came in positive after five consecutive quarters of negative earnings growth.
PERFORMANCE DISCUSSION
U.S. Stocks Were Up in the Year — Led by Small Cap and Value Stocks, While Stock Selection was Weak Most of 2016
U.S. stocks outperformed other asset classes in 2016. Small cap stocks strongly outpaced their large and mid-cap counterparts for the year. Value had a strong year despite a weaker third quarter, outperforming growth by 20% in small cap stocks (as measured by the Russell 2000® Growth and Russell 2000® Value Indexes) and 10% in large cap (as measured by the Russell 1000® Growth and Russell 1000® Value Indexes). Financials and energy sectors performed well and health care performed the worst. Despite volatility (CBOE Volatility Index — VIX) spiking around the election, it finished the year down (23)%. Over the last 12 months, the value factor group performed best, while the quality and growth factor groups were mixed and the momentum factor group was generally weak across all sectors. The top-ranked stocks underperformed in cyclicals and financials, but performed well in the other sectors. While it has been a challenging year for the stock selection model and active management in general, we saw improvement in the fourth quarter. It has been our experience that the market rewards a broad set of fundamental factors more often than not. This is why we stick to our disciplined process at all times, even during market environments such as these. Historically, we have been rewarded for doing so, as we have seen outperformance in periods following weakness.
OUTLOOK
Our research has shown that constructing a well-diversified portfolio of companies with attractive valuation ratios, quality balance sheets and positive growth and momentum expectations, built through a disciplined, risk-controlled process, delivers consistent excess returns. Overall, our philosophy will not change based on short-term trends or conditions in the market. We will continue to use our disciplined approach to provide added value at controlled levels of risk.
| 1 | Prior to October 1, 2016, the Fund’s Class I shares were known as Service Shares. |
This commentary reflects the viewpoints of the portfolio manager, Chicago Equity Partners, LLC, as of December 31, 2016 and is not intended as a forecast or guarantee of future results and are subject to change without notice.
17
Table of Contents
AMG Chicago Equity Partners Small Cap Value Fund
Portfolio Manager’s Comments (continued)
CUMULATIVE TOTAL RETURN PERFORMANCE
The AMG Chicago Equity Partners Small Cap Value Fund’s cumulative total return is based on the daily change in net asset value (NAV), and assumes that all dividends and distributions were reinvested. The graph compares a hypothetical $10,000 investment made in the AMG Chicago Equity Partners Small Cap Value Fund’s Class I (formerly Service Class ) shares on December 31, 2014 to a $10,000 investment made in the benchmark for the same time period. The graph and table do not reflect the deduction of taxes that a shareholder would pay on a Fund distribution or redemption of shares. The listed returns for the Fund are net of expenses and the returns for the indices exclude expenses. Total returns for the Fund would have been lower had certain expenses not been reduced.

The table below shows the average annual total returns for the AMG Chicago Equity Partners Small Cap Value Fund and the Russell 2000® Value Index for the same time periods ended December 31, 2016.
| One | Since | Inception | ||||||||||
| Average Annual Total Returns1 | Year | Inception | Date | |||||||||
AMG Chicago Equity Partners Small Cap Value Fund 2,3,4,5,6,7 |
| |||||||||||
Class N8 | 29.00 | % | 10.06 | % | 12/31/14 | |||||||
Class I8 | 29.34 | % | 10.40 | % | 12/31/14 | |||||||
Class Z8 | 29.49 | % | 10.51 | % | 12/31/14 | |||||||
Russell 2000® Value Index9 | 31.74 | % | 10.42 | % | 12/31/14 | † | ||||||
The performance data shown represents past performance. Past performance is not a guarantee of future results. Current performance may be lower or higher than the performance data quoted. The investment return and principal value of an investment will fluctuate so that an investor’s shares, when redeemed, may be worth more or less than their original cost.
Investors should carefully consider the Fund’s investment objectives, risks, charges and expenses before investing. For performance information through the most recent month end, current net asset values per share for the Fund and other information, please call (800) 835-3879 or visit our website at www.amgfunds.com for a free prospectus. Read it carefully before investing or sending money.
Distributed by AMG Distributors, Inc., member FINRA/SIPC.
| † | Date reflects inception date of the Fund, not the index. |
| 1 | Total return equals income yield plus share price change and assumes reinvestment of all dividends and capital gain distributions. Returns are net of fees and may reflect offsets of Fund expenses as described in the prospectus. No adjustment has been made for taxes payable by shareholders on their reinvested dividends and capital gain distributions. Returns for periods greater than one year are annualized. The listed returns on the Fund are net of expenses and based on the published NAV as of December 31, 2016. All returns are in U.S. dollars ($). |
| 2 | From time to time, the Fund’s advisor has waived its fees and/or absorbed Fund expenses, which has resulted in higher returns. |
| 3 | The Fund is subject to risks associated with investments in small-capitalization companies, such as erratic earnings patterns, competitive conditions, limited earnings history and a reliance on one or a limited number of products. |
| 4 | Investments in international securities are subject to certain risks of overseas investing including currency fluctuations and changes in political and economic conditions, which could result in significant market fluctuations. |
| 5 | The Fund is subject to the risks associated with investments in emerging markets, such as erratic earnings patterns, economic and political instability, changing exchange controls, limitations on repatriation of foreign capital and changes in local governmental attitudes toward private investment, possibly leading to nationalization or confiscation of investor assets. |
| 6 | The Fund is subject to special risk considerations similar to those associated with the direct ownership of real estate. Real estate valuations may be subject to factors such as changing general and local economic, financial, competitive, and environmental conditions. |
| 7 | The Fund invests in value stocks, which may perform differently from the market as a whole and may be undervalued by the market for a long period of time. |
| 8 | Effective October 1, 2016, the Investor Class, Service Class and Institutional Class of AMG Chicago Equity Partners Small Cap Value Fund were renamed Class N, Class I and Class Z, respectively. |
| 9 | The Russell 2000® Value Index is an unmanaged, market-value weighted, value-oriented index comprised of small stocks that have relatively low price-to-book ratios and lower forecasted growth values. Unlike the Fund, the Russell 2000® Value Index is unmanaged, is not available for investment and does not incur expenses. |
The Russell 2000® Value Index is a trademark of the London Stock Exchange Group companies.
Not FDIC insured, nor bank guaranteed. May lose value.
18
Table of Contents
AMG Chicago Equity Partners Small Cap Value Fund
Fund Snapshots (unaudited)
December 31, 2016
PORTFOLIO BREAKDOWN
Sector | AMG Chicago Equity Partners Small Cap Value Fund* | Russell 2000® Value Index | ||||||
Financials | 36.1 | % | 32.6 | % | ||||
Industrials | 16.0 | % | 12.6 | % | ||||
Information Technology | 10.9 | % | 10.4 | % | ||||
Real Estate | 9.3 | % | 10.1 | % | ||||
Consumer Discretionary | 7.9 | % | 10.0 | % | ||||
Utilities | 6.8 | % | 6.0 | % | ||||
Energy | 6.0 | % | 5.9 | % | ||||
Materials | 5.3 | % | 4.6 | % | ||||
Health Care | 4.9 | % | 4.3 | % | ||||
Consumer Staples | 3.1 | % | 2.8 | % | ||||
Telecommunication Services | 0.6 | % | 0.7 | % | ||||
Other Assets and Liabilities | (6.9 | )% | 0.0 | % | ||||
| * | As a percentage of net assets. |
TOP TEN HOLDINGS
| % of | ||||
Security Name | Net Assets | |||
UMB Financial Corp.** | 1.9 | % | ||
Lexington Realty Trust | 1.7 | % | ||
Hudson Pacific Properties, Inc. | 1.6 | % | ||
Universal Insurance Holdings, Inc. | 1.5 | % | ||
McDermott International, Inc.** | 1.4 | % | ||
Hilltop Holdings, Inc. | 1.4 | % | ||
CenterState Banks, Inc. | 1.3 | % | ||
Hancock Holding Co. | 1.2 | % | ||
Meta Financial Group, Inc. | 1.2 | % | ||
Piper Jaffray Cos. | 1.2 | % | ||
|
| |||
Top Ten as a Group | 14.4 | % | ||
|
| |||
| ** | Top Ten Holdings as of June 30, 2016. |
Because a fund’s strategy may result in multiple investments in particular sectors of the economy, its performance may depend on the performance of those sectors and may fluctuate more widely than investments diversified across more sectors. For additional information on these and other risk considerations, please see the Fund’s prospectus.
Any sectors, industries, or securities discussed should not be perceived as investment recommendations. Mention of a specific security should not be considered a recommendation to buy or solicitation to sell that security. Specific securities mentioned in this report may have been sold from the Fund’s portfolio of investments by the time you receive this report.
19
Table of Contents
AMG Chicago Equity Partners Small Cap Value Fund
Schedule of Portfolio Investments
December 31, 2016
| Shares | Value | |||||||
Common Stocks—106.9% | ||||||||
Consumer Discretionary—7.9% | ||||||||
AMC Entertainment Holdings, Inc., Class A | 910 | $ | 30,621 | |||||
America’s Car-Mart, Inc.* | 800 | 35,000 | ||||||
Big 5 Sporting Goods Corp. | 6,060 | 105,141 | ||||||
Capella Education Co. | 320 | 28,096 | ||||||
Chico’s FAS, Inc. | 5,340 | 76,843 | ||||||
The Children’s Place, Inc. | 420 | 42,399 | ||||||
Cooper-Standard Holding, Inc.* | 820 | 84,772 | ||||||
Cracker Barrel Old Country Store, Inc.1 | 320 | 53,434 | ||||||
Dana, Inc. | 2,500 | 47,450 | ||||||
The Finish Line, Inc., Class A1 | 1,890 | 35,551 | ||||||
ILG, Inc. | 1,050 | 19,078 | ||||||
Intrawest Resorts Holdings, Inc.* | 1,470 | 26,240 | ||||||
Johnson Outdoors, Inc., Class A | 750 | 29,768 | ||||||
Marriott Vacations Worldwide Corp. | 630 | 53,456 | ||||||
NACCO Industries, Inc., Class A | 480 | 43,464 | ||||||
Office Depot, Inc. | 7,890 | 35,663 | ||||||
Perry Ellis International, Inc.* | 2,950 | 73,484 | ||||||
Sonic Automotive, Inc., Class A | 4,240 | 97,096 | ||||||
Tower International, Inc. | 1,080 | 30,618 | ||||||
Weyco Group, Inc. | 410 | 12,833 | ||||||
Wolverine World Wide, Inc. | 2,520 | 55,314 | ||||||
Total Consumer Discretionary | 1,016,321 | |||||||
Consumer Staples—3.1% | ||||||||
Avon Products, Inc.* | 3,730 | 18,799 | ||||||
Central Garden and Pet Co., Class A* | 1,730 | 53,457 | ||||||
Dean Foods Co. | 1,560 | 33,977 | ||||||
Fresh Del Monte Produce, Inc. | 1,035 | 62,752 | ||||||
Ingles Markets, Inc., Class A | 10 | 481 | ||||||
Nature’s Sunshine Products, Inc. | 490 | 7,350 | ||||||
Sanderson Farms, Inc. | 590 | 55,602 | ||||||
SpartanNash Co. | 2,880 | 113,875 | ||||||
Universal Corp. | 810 | 51,638 | ||||||
Total Consumer Staples | 397,931 | |||||||
Energy—6.0% | ||||||||
Denbury Resources, Inc.* | 8,590 | 31,611 | ||||||
Fairmount Santrol Holdings, Inc.* | 6,010 | 70,858 | ||||||
Green Plains, Inc. | 540 | 15,039 | ||||||
Jones Energy, Inc., Class A* | 6,770 | 33,850 | ||||||
Matrix Service Co.* | 1,250 | 28,375 | ||||||
McDermott International, Inc.* | 25,050 | 185,120 | ||||||
Navios Maritime Acquisition Corp. | 19,790 | 33,643 | ||||||
Oasis Petroleum, Inc.* | 8,190 | 123,997 | ||||||
| Shares | Value | |||||||
Pacific Ethanol, Inc.* | 8,260 | $ | 78,470 | |||||
RSP Permian, Inc.* | 1,710 | 76,300 | ||||||
Sanchez Energy Corp.*,1 | 7,030 | 63,481 | ||||||
Unit Corp.* | 1,030 | 27,676 | ||||||
Total Energy | 768,420 | |||||||
Financials—36.1% | ||||||||
Access National Corp.1 | 880 | 24,429 | ||||||
AG Mortgage Investment Trust, Inc. | 4,780 | 81,786 | ||||||
Ambac Financial Group, Inc.* | 700 | 15,750 | ||||||
Apollo Commercial Real Estate Finance, Inc. | 4 | 65 | ||||||
Argo Group International Holdings, Ltd. | 450 | 29,655 | ||||||
ARMOUR Residential REIT, Inc.1 | 5,870 | 127,320 | ||||||
Arrow Financial Corp. | 463 | 18,751 | ||||||
Ashford Hospitality Trust, Inc. | 13,590 | 105,458 | ||||||
BancFirst Corp. | 190 | 17,679 | ||||||
Camden National Corp. | 1,520 | 67,564 | ||||||
Capital Bank Financial Corp., Class A | 212 | 8,321 | ||||||
Carolina Financial Corp. | 880 | 27,095 | ||||||
CenterState Banks, Inc. | 6,750 | 169,897 | ||||||
Central Valley Community Bancorp | 1,210 | 24,152 | ||||||
Columbia Banking System, Inc. | 3,280 | 146,550 | ||||||
Community Bank System, Inc. | 1,700 | 105,043 | ||||||
CYS Investments, Inc. | 3,000 | 23,190 | ||||||
Enova International, Inc.* | 5,860 | 73,543 | ||||||
Farmers Capital Bank Corp. | 470 | 19,763 | ||||||
Farmers National Banc Corp. | 1,710 | 24,282 | ||||||
Federal Agricultural Mortgage Corp., Class C | 1,450 | 83,041 | ||||||
Fifth Street Asset Management, Inc.1 | 1,250 | 8,375 | ||||||
First American Financial Corp. | 3,950 | 144,688 | ||||||
First Community Bancshares, Inc. | 700 | 21,098 | ||||||
First Financial Bancorp | 2,050 | 58,322 | ||||||
First Financial Corp. | 850 | 44,880 | ||||||
First Interstate BancSystem, Inc., Class A | 1,840 | 78,292 | ||||||
Fulton Financial Corp. | 5,560 | 104,528 | ||||||
Genworth Financial, Inc., Class A* | 17,252 | 65,730 | ||||||
Hancock Holding Co. | 3,680 | 158,608 | ||||||
Hilltop Holdings, Inc. | 6,060 | 180,588 | ||||||
Impac Mortgage Holdings, Inc.* | 850 | 11,917 | ||||||
Independent Bank Corp./MA | 1,430 | 100,744 | ||||||
Independent Bank Corp./MI | 2,620 | 56,854 | ||||||
INTL. FCStone, Inc.* | 2,690 | 106,524 | ||||||
Lakeland Financial Corp. | 1,160 | 54,938 | ||||||
Macatawa Bank Corp. | 1,950 | 20,300 | ||||||
Marlin Business Services Corp. | 640 | 13,376 | ||||||
The accompanying notes are an integral part of these financial statements.
20
Table of Contents
AMG Chicago Equity Partners Small Cap Value Fund
Schedule of Portfolio Investments (continued)
| Shares | Value | |||||||
Financials—36.1% (continued) | ||||||||
MBT Financial Corp. | 960 | $ | 10,896 | |||||
Meta Financial Group, Inc. | 1,510 | 155,379 | ||||||
MGIC Investment Corp.* | 8,370 | 85,290 | ||||||
MTGE Investment Corp. | 3,310 | 51,967 | ||||||
New Residential Investment Corp. | 3,085 | 48,496 | ||||||
Old Second Bancorp, Inc. | 1,640 | 18,122 | ||||||
Owens Realty Mortgage, Inc. | 670 | 12,408 | ||||||
PennyMac Financial Services, Inc., Class A* | 4,020 | 66,933 | ||||||
PennyMac Mortgage Investment Trust | 2,860 | 46,818 | ||||||
Piper Jaffray Cos.* | 2,120 | 153,700 | ||||||
Preferred Bank | 2,040 | 106,937 | ||||||
Primerica, Inc. | 1,660 | 114,789 | ||||||
PrivateBancorp, Inc. | 1,080 | 58,525 | ||||||
Radian Group, Inc. | 5,710 | 102,666 | ||||||
Regional Management Corp.* | 2,090 | 54,925 | ||||||
S&T Bancorp, Inc. | 1,420 | 55,437 | ||||||
Safety Insurance Group, Inc. | 180 | 13,266 | ||||||
Sandy Spring Bancorp, Inc. | 1,550 | 61,984 | ||||||
State Bank Financial Corp. | 2,620 | 70,373 | ||||||
Stock Yards Bancorp, Inc. | 800 | 37,560 | ||||||
Texas Capital Bancshares, Inc.* | 1,180 | 92,512 | ||||||
Third Point Reinsurance, Ltd.* | 1,610 | 18,596 | ||||||
UMB Financial Corp. | 3,190 | 246,013 | ||||||
Union Bankshares Corp. | 1,890 | 67,549 | ||||||
Universal Insurance Holdings, Inc. | 6,990 | 198,516 | ||||||
Walker & Dunlop, Inc.* | 4,040 | 126,048 | ||||||
Wintrust Financial Corp. | 2,050 | 148,768 | ||||||
Total Financials | 4,647,569 | |||||||
Health Care—4.9% | ||||||||
Agenus, Inc.*,1 | 7,260 | 29,911 | ||||||
Aratana Therapeutics, Inc.*,1 | 950 | 6,821 | ||||||
ARIAD Pharmaceuticals, Inc.*,1 | 4,110 | 51,128 | ||||||
Array BioPharma, Inc.*,1 | 13,240 | 116,380 | ||||||
Exelixis, Inc.*,1 | 3,070 | 45,774 | ||||||
Halyard Health, Inc.* | 3,820 | 141,264 | ||||||
ICU Medical, Inc.* | 230 | 33,890 | ||||||
Immunomedics, Inc.* | 3,290 | 12,074 | ||||||
Innoviva, Inc.*,1 | 2,020 | 21,614 | ||||||
Magellan Health, Inc.* | 2,040 | 153,510 | ||||||
Owens & Minor, Inc. | 340 | 11,999 | ||||||
Triple-S Management Corp., Class B* | 230 | 4,761 | ||||||
Total Health Care | 629,126 | |||||||
| Shares | Value | |||||||
Industrials—16.0% | ||||||||
AAR Corp. | 1,380 | $ | 45,609 | |||||
ABM Industries, Inc. | 2,615 | 106,797 | ||||||
Acacia Research Corp.* | 4,970 | 32,305 | ||||||
ACCO Brands Corp.* | 9,820 | 128,151 | ||||||
Applied Industrial Technologies, Inc. | 810 | 48,114 | ||||||
ArcBest Corp. | 10 | 276 | ||||||
Astec Industries, Inc. | 1,460 | 98,492 | ||||||
Bel Fuse, Inc., Class B | 1,170 | 36,153 | ||||||
BLUE BIRD Corp.* | 3,000 | 46,350 | ||||||
Chart Industries, Inc.* | 1,780 | 64,116 | ||||||
Costamare, Inc. | 8,960 | 50,176 | ||||||
Deluxe Corp. | 750 | 53,707 | ||||||
DigitalGlobe, Inc.* | 3,800 | 108,870 | ||||||
Ducommun, Inc.* | 1,410 | 36,040 | ||||||
EMCOR Group, Inc. | 2,010 | 142,228 | ||||||
EnerSys | 500 | 39,050 | ||||||
GATX Corp.1 | 1,640 | 100,991 | ||||||
Gibraltar Industries, Inc.* | 1,990 | 82,884 | ||||||
The Greenbrier Cos., Inc.1 | 500 | 20,775 | ||||||
Kelly Services, Inc., Class A | 500 | 11,460 | ||||||
Kennametal, Inc. | 1,910 | 59,707 | ||||||
MasTec, Inc.* | 1,000 | 38,250 | ||||||
MRC Global, Inc.* | 2,420 | 49,029 | ||||||
Navigant Consulting, Inc.* | 630 | 16,493 | ||||||
Quad/Graphics, Inc. | 3,050 | 81,984 | ||||||
SkyWest, Inc. | 3,950 | 143,978 | ||||||
Tetra Tech, Inc. | 1,030 | 44,444 | ||||||
Tutor Perini Corp.* | 1,310 | 36,680 | ||||||
Universal Forest Products, Inc. | 295 | 30,143 | ||||||
Vectrus, Inc.* | 810 | 19,318 | ||||||
Wabash National Corp. | 8,580 | 135,736 | ||||||
West Corp. | 1,470 | 36,397 | ||||||
YRC Worldwide, Inc.* | 8,180 | 108,630 | ||||||
Total Industrials | 2,053,333 | |||||||
Information Technology—10.9% | ||||||||
Advanced Energy Industries, Inc.* | 910 | 49,822 | ||||||
Advanced Micro Devices, Inc.* | 10,360 | 117,482 | ||||||
Alpha & Omega Semiconductor, Ltd.* | 440 | 9,359 | ||||||
Amkor Technology, Inc.* | 2,150 | 22,682 | ||||||
Black Box Corp. | 1,480 | 22,570 | ||||||
Care.com, Inc.* | 1,660 | 14,226 | ||||||
ChannelAdvisor Corp.* | 2,800 | 40,180 | ||||||
The accompanying notes are an integral part of these financial statements.
21
Table of Contents
AMG Chicago Equity Partners Small Cap Value Fund
Schedule of Portfolio Investments (continued)
| Shares | Value | |||||||
Information Technology—10.9% (continued) |
| |||||||
Comtech Telecommunications Corp. | 10 | $ | 118 | |||||
Convergys Corp. | 1,110 | 27,262 | ||||||
ePlus, Inc.* | 790 | 91,008 | ||||||
Finisar Corp.* | 4,160 | 125,923 | ||||||
Insight Enterprises, Inc.* | 2,290 | 92,608 | ||||||
Intersil Corp., Class A | 1,870 | 41,701 | ||||||
InvenSense, Inc.* | 1,280 | 16,371 | ||||||
Liquidity Services, Inc.* | 3,220 | 31,395 | ||||||
ManTech International Corp., Class A | 630 | 26,618 | ||||||
Mentor Graphics Corp. | 1,380 | 50,908 | ||||||
MicroStrategy, Inc., Class A* | 370 | 73,038 | ||||||
MKS Instruments, Inc. | 620 | 36,828 | ||||||
NETGEAR, Inc.* | 560 | 30,436 | ||||||
Plexus Corp.* | 1,400 | 75,656 | ||||||
Progress Software Corp. | 370 | 11,814 | ||||||
RetailMeNot, Inc.* | 2,180 | 20,274 | ||||||
Sanmina Corp.* | 1,470 | 53,876 | ||||||
Super Micro Computer, Inc.* | 1,330 | 37,306 | ||||||
SYNNEX Corp. | 390 | 47,198 | ||||||
Tech Data Corp.* | 430 | 36,412 | ||||||
TTM Technologies, Inc.* | 10,640 | 145,023 | ||||||
Vishay Intertechnology, Inc. | 2,980 | 48,276 | ||||||
Zedge, Inc., Class B* | 1 | 3 | ||||||
Total Information Technology | 1,396,373 | |||||||
Materials—5.3% | ||||||||
AK Steel Holding Corp.*,1 | 13,140 | 134,159 | ||||||
The Chemours Co. | 4,930 | 108,904 | ||||||
Cliffs Natural Resources, Inc.*,1 | 1,570 | 13,204 | ||||||
Commercial Metals Co. | 660 | 14,375 | ||||||
Greif, Inc., Class A | 2,170 | 111,343 | ||||||
Koppers Holdings, Inc.* | 200 | 8,060 | ||||||
Kronos Worldwide, Inc. | 2,800 | 33,432 | ||||||
Olympic Steel, Inc. | 1,430 | 34,649 | ||||||
Rayonier Advanced Materials, Inc. | 1,200 | 18,552 | ||||||
Ryerson Holding Corp.*,1 | 3,650 | 48,728 | ||||||
Schnitzer Steel Industries, Inc., Class A | 600 | 15,420 | ||||||
| Shares | Value | |||||||
Schweitzer-Mauduit International, Inc. | 220 | $ | 10,017 | |||||
Stepan Co. | 585 | 47,666 | ||||||
SunCoke Energy, Inc.* | 7,610 | 86,297 | ||||||
Total Materials | 684,806 | |||||||
Real Estate—9.3% | ||||||||
CBL & Associates Properties, Inc. | 5,380 | 61,870 | ||||||
DCT Industrial Trust, Inc. | 2,070 | 99,112 | ||||||
Four Corners Property Trust, Inc. | 4,650 | 95,418 | ||||||
Highwoods Properties, Inc. | 2,560 | 130,586 | ||||||
Hudson Pacific Properties, Inc. | 5,750 | 199,985 | ||||||
Lexington Realty Trust | 20,660 | 223,137 | ||||||
Mack-Cali Realty Corp. | 1,820 | 52,816 | ||||||
National Storage Affiliates Trust | 3,900 | 86,073 | ||||||
PS Business Parks, Inc. | 265 | 30,878 | ||||||
RE/MAX Holdings, Inc., Class A | 1,130 | 63,280 | ||||||
Summit Hotel Properties, Inc. | 5,690 | 91,211 | ||||||
Tier REIT, Inc. | 1,480 | 25,737 | ||||||
Washington Real Estate Investment Trust | 1,200 | 39,228 | ||||||
Total Real Estate | 1,199,331 | |||||||
Telecommunication Services—0.6% | ||||||||
IDT Corp., Class B | 4,440 | 82,318 | ||||||
Utilities—6.8% | ||||||||
ALLETE, Inc. | 220 | 14,122 | ||||||
Avista Corp. | 760 | 30,392 | ||||||
Chesapeake Utilities Corp. | 940 | 62,933 | ||||||
Connecticut Water Service, Inc. | 1,030 | 57,525 | ||||||
IDACORP, Inc. | 1,130 | 91,022 | ||||||
Middlesex Water Co. | 710 | 30,487 | ||||||
Northwest Natural Gas Co. | 1,480 | 88,504 | ||||||
ONE Gas, Inc. | 200 | 12,792 | ||||||
Ormat Technologies, Inc. | 2,380 | 127,616 | ||||||
Otter Tail Corp. | 1,910 | 77,928 | ||||||
SJW Group | 2,440 | 136,591 | ||||||
WGL Holdings, Inc. | 1,950 | 148,746 | ||||||
Total Utilities | 878,658 | |||||||
Total Common Stocks | 13,754,186 | |||||||
The accompanying notes are an integral part of these financial statements.
22
Table of Contents
AMG Chicago Equity Partners Small Cap Value Fund
Schedule of Portfolio Investments (continued)
| Principal Amount | Value | |||||||
Short-Term Investments—5.1% |
| |||||||
Repurchase Agreements—4.3%2 |
| |||||||
HSBC Securities USA, Inc., dated 12/30/16, due 01/03/17, 0.450% total to be received $557,608 (collateralized by various U.S. Government Agency Obligations, 0.875% - 3.000%, 05/15/17 - 05/15/46, totaling $568,732) | $ | 557,580 | $ | 557,580 | ||||
| Shares | Value | |||||||
Other Investment Companies—0.8%3 |
| |||||||
Dreyfus Government Cash Management Fund, Institutional Class Shares, 0.45% | 104,513 | $ | 104,513 | |||||
Total Short-Term Investments | 662,093 | |||||||
Total Investments—112.0% | 14,416,279 | |||||||
Other Assets, less Liabilities—(12.0)% | (1,548,214 | ) | ||||||
Net Assets—100.0% | $ | 12,868,065 | ||||||
The accompanying notes are an integral part of these financial statements.
23
Table of Contents
Portfolio Manager’s Comments (unaudited)
THE YEAR IN REVIEW
The AMG Managers High Yield Fund (Class N)1 (the “Fund”) returned 15.3% for the year ended December 31, 2016, compared with 17.1% for the Bloomberg Barclays U.S. Corporate High Yield Bond Index (the “Index”).
MARKET ENVIRONMENT
2016 was the strongest year for high yield since 2009. Total returns were down 5.1% (as measured by the BofA Merrill Lynch US High Yield Master II Constrained Index) through February 11. However, as oil bounced and global growth concerns faded, high yield rallied for the remainder of the year and finished emphatically with a 17.5% return. Commodity market volatility continued to impact the broader high-yield market throughout the year, as did the build-up and results of both the Brexit referendum and U.S. general election. The surprising election results in November and resulting pro-growth policy expectations contributed to the most significant rate sell-off since the 2013 “Taper Tantrum.” The post-election, pro-growth narrative continued to drive markets into year-end as credit dramatically outperformed duration. The Federal Open Market Committee raised the federal funds rate target by 25 basis points (bps) and signaled multiple rate hikes in 2017, which also contributed to the continued rate sell-off.
Relative to the five-year U.S. Treasury note, high yield generated nearly 1700 bps of excess return and dramatically outperformed all of the major asset classes for the year: Emerging Markets (BoA Merrill Lynch Emerging Markets Corporate Index), 9.6%; high-grade credit (BoA Merrill Lynch U.S. Corporate Index), 6.0%; U.S. Aggregate (BofA Merrill Lynch US Corporate Government & Mortgage Index), 2.6%; and five-year Treasuries (BofA Merrill Lynch Current US Treasury Index), 0.6%. High yield also outperformed the S&P 500 Index, up 11.96%, after lagging for the past four years. High-yield spreads tightened dramatically, (274) bps for the 12-month period, closing at 421 bps. For the same period, yields dropped from 8.76% at December 31, 2015, to 6.13% at December 31, 2016.
Beta significantly outperformed on the year, with CCCs returning 37.7%; Bs, 16.7%; and BBs, 13.4%. All sectors posted positive returns in 2016 with steel 48.3%, metals and mining 43.8% and energy 38.4% as the best-performing sectors and health care 4.1%, banks 4.3% and hotels 5.6% as the worst-performing sectors. Periods of volatility resulted in performance dispersion among sectors on the year. Big and liquid names (as measured by the Bloomberg Barclays Very Liquid Index) underperformed slightly for the year, returning 16.7%, and trailed the broader high-yield market by 84 bps.
High-yield bond new issuance totaled $286 billion for 2016, down a modest 2% from last year’s tally2. Issuers tended to be higher quality overall and refinancing purposes were the dominant use of proceeds, accounting for 58% of the activity in the year 2. Despite periods of volatility, secondary market technicals were generally supportive, with $6.9 billion of inflows reported for U.S. high-yield mutual funds in the year2.
As expected, the trailing 12-month default rate moved higher in 2016 due, in large part, to activity within commodities, which accounted for over 80% of default activity in 20163 .As the commodity backdrop steadily improved, however, overall default volume declined. As of December 31, the trailing 12-month default rate was 3.32%, up from 1.80% one year ago. Excluding energy and metals and mining, the default rate dropped to 0.68%.
PERFORMANCE REVIEW
The Fund underperformed its benchmark during the year. Underweight positioning in both metals and mining and oil field services, coupled with security selection within the transportation services sectors, detracted from performance for the year. Specifically, relative weightings in Softbank Group Corporation (Sprint), Caesars Entertainment, Whiting Petroleum and Denbury Resources hindered annual results. Alternatively, relative contributions from security selection in the telecommunications, independent energy and gaming sectors enhanced performance for the
year. The largest contributors came from relative weightings in Valeant Pharmaceuticals, Jack Cooper Enterprises, Aspect Software and Intelsat SA.
Compared to the benchmark at year-end, the Fund was overweight in technology, gaming and health care due to our view of the relative value opportunities within those sectors. The Fund was underweight in metals and mining, banking/ financials and oil field services because we have not found these sectors compelling due to challenging fundamental outlooks or rich valuations. Relative to the benchmark at December 31, the Fund’s yield and spread are greater than those of the benchmark, while duration of the Fund is lower.
MARKET OUTLOOK
U.S. growth is likely to improve from trend-like levels due to expectation of tax reform, less regulation and fiscal spending. We expect the majority of high-yield issuers to maintain reasonable fundamentals as earnings growth has turned positive. We believe broader market high-yield spreads are fair-to-slightly-attractive relative to current and expected defaults, and we expect defaults to move lower in 2017 to 2-3%. However, commodity market volatility will likely continue to impact the broader high-yield market performance. We expect episodes of volatility will persist as central bank policies develop, potential challenges to the Euro continue and post-election policy direction evolves. While retail fund flows have been volatile, heightened rate concerns post-election have made high yield a more attractive asset class and a net beneficiary of demand. We would expect credit to be a relative outperformer versus duration if the inflation and growth narrative continues to take hold of the financial markets. New issue supply has been better quality, while refinancing activity continues to be the largest use of proceeds. The quality of the calendar could deteriorate if risk asset demand increases and investor discipline deteriorates due to overly optimistic post-election growth expectations. High-yield spreads have the ability to partially absorb a gradual, modest rise in rates and therefore we see
24
Table of Contents
AMG Managers High Yield Fund
Portfolio Manager’s Comments (continued)
potential for modest spread tightening in either a rising or stable rate environment. We believe our current Fund portfolio positioning and our fundamental research, bottom-up oriented style should allow us to take advantage of market opportunities.
| 1 | Prior to October 1, 2016, the Fund’s Class N shares were known as Investor Shares. |
| 2 | JPMorgan Chase & Co; AMG Data Services |
| 3 | JPMorgan Chase & Co and Moody’s Investor Services |
This commentary reflects the viewpoints of the Fund’s portfolio manager, JP Morgan Asset Management as of December 31, 2016 and is not intended as a forecast or guarantee of future results and are subject to change without notice.
CUMULATIVE TOTAL RETURN PERFORMANCE
AMG Managers High Yield Fund’s cumulative total return is based on the daily change in net asset value (NAV), and assumes that all dividends and distributions were reinvested. The graph compares a hypothetical $10,000 investment made in the
AMG Managers High Yield Fund’s Class N (formerly Investor Class) shares on December 31, 2006 to a $10,000 investment made in the Bloomberg Barclays U.S. Corporate High Yield Bond Index for the same time period. The graph and table do not reflect the deduction of taxes that a shareholder would pay on a Fund distribution or redemption of shares. The listed returns for the Fund are net of expenses and the returns for the index exclude expenses. Total returns for the Fund would have been lower had certain expenses not been reduced.
The accompanying notes are an integral part of these financial statements.
25
Table of Contents
AMG Managers High Yield Fund
Portfolio Manager’s Comments (continued)
CUMULATIVE TOTAL RETURN PERFORMANCE (continued)
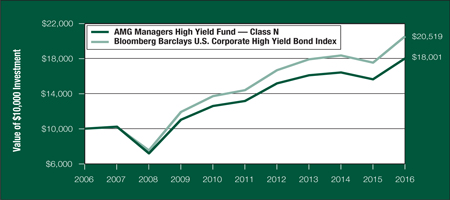
The table below shows the average annual total returns for the AMG Managers High Yield Fund and the Bloomberg Barclays U.S. Corporate High Yield Bond Index for the same time periods ended December 31, 2016.
| One | Five | Ten | ||||||||||
| Average Annual Total Returns1 | Year | Years | Years | |||||||||
AMG Managers High Yield Fund 2,3,4,5,6,7,8,9 |
| |||||||||||
Class N10 | 15.25 | % | 6.48 | % | 6.06 | % | ||||||
Class I10 | 15.60 | % | 6.74 | % | 6.35 | % | ||||||
Bloomberg Barclays U.S. Corporate High Yield Bond Index11 | 17.13 | % | 7.36 | % | 7.45 | % | ||||||
The performance data shown represents past performance. Past performance is not a guarantee of future results. Current performance may be lower or higher than the performance data quoted. The investment return and principal value of an investment will fluctuate so that an investor’s shares, when redeemed, may be worth more or less than their original cost.
Investors should carefully consider the Fund’s investment objectives, risks, charges and expenses before investing. For performance information through the most recent month end, current net asset values per share for the Fund and other information, please call (800) 835-3879 or visit our website at www.amgfunds.com for a free prospectus. Read it carefully before investing or sending money.
Distributed by AMG Distributors, Inc., member FINRA/SIPC.
| 1 | Total return equals income yield plus share price change and assumes reinvestment of all dividends and capital gain distributions. Returns are net of fees and may reflect offsets of Fund expenses as described in the prospectus. No adjustment has been made for taxes payable by shareholders on their reinvested dividends and capital gain distributions. Returns for periods greater than one year are annualized. The listed returns on the Fund are net of expenses and based on the published NAV as of December 31, 2016. All returns are in U.S. dollars ($). |
| 2 | From time to time, the Fund’s advisor has waived its fees and/or absorbed Fund expenses, which has resulted in higher returns. |
| 3 | A short term redemption fee of 2% will be charged on shares held for less than 90 days. |
| 4 | The fund is subject to risks associated with investments in debt securities, such as default risk and fluctuations in the perception of the debtors’ ability to pay their creditors. Changing interest rates may adversely affect the value of an investment. An increase in interest rates typically causes the value of bonds and other fixed income securities to fall. |
| 5 | High-yield bonds (also known as “junk bonds”) may be subject to greater levels of interest rate, credit, and liquidity risk than investments in higher rated securities. These securities are considered predominantly speculative with respect to the issuer’s continuing ability to make principal and interest payments. The issuers of the Fund’s holdings may be involved in bankruptcy proceedings, reorganizations, or financial restructurings, and are not as strong financially as higher-rated issuers. |
| 6 | Investments in international securities are subject to certain risks of overseas investing including currency fluctuations and changes in political and economic conditions, which could result in significant market fluctuations. These risks are magnified in emerging markets. |
| 7 | To the extent that the Fund invests in asset-backed or mortgage-backed securities, its exposure to prepayment and extension risks may be greater than investments in other fixed income securities. |
| 8 | The Fund is subject to currency risk resulting from fluctuations in exchange rates that may affect the total loss or gain on a non-U.S. Dollar investment when converted back to U.S. Dollars. |
| 9 | The Fund may invest in derivatives such as options and futures; the complexity and rapidly changing structure of derivatives markets may increase the possibility of market losses. |
| 10 | Effective October 1, 2016, the Investor Class and Institutional Class of AMG Managers High Yield Fund were renamed Class N and Class I, respectively. |
| 11 | The Bloomberg Barclays U.S. Corporate High Yield Bond Index is a total return performance benchmark for USD-denominated, high yield, fixed-rate corporate bonds having a maximum quality rating of Ba1 (as determined by the middle of the Moody’s, Fitch, and S&P ratings). Unlike the fund, the Bloomberg Barclays U.S. Corporate High Yield Bond Index is unmanaged is not available for investment, and does not incur expenses. |
Not FDIC insured, nor bank guaranteed. May lose value.
26
Table of Contents
AMG Managers High Yield Fund
Fund Snapshots (unaudited)
December 31, 2016
PORTFOLIO BREAKDOWN
| AMG Managers | ||||
Sector | High Yield Fund* | |||
Industrials | 87.0 | % | ||
Financials | 5.1 | % | ||
Floating Rate Senior Loan Interests | 3.3 | % | ||
Utilities | 1.2 | % | ||
Other Assets and Liabilities | 3.4 | % | ||
| * | As a percentage of net assets. |
| AMG Managers | ||||
Rating | High Yield Fund*** | |||
Baa | 4.4 | % | ||
Ba | 36.7 | % | ||
B | 43.7 | % | ||
Caa & lower | 13.8 | % | ||
N/R | 1.4 | % | ||
| *** | As a percentage of market value of preferred and fixed-income securities. |
TOP TEN HOLDINGS
| % of | ||||
Security Name | Net Assets | |||
Sprint Capital Corp., 8.750%, 03/15/32** | 1.6 | % | ||
Sprint Corp., 7.875%, 09/15/23** | 1.6 | |||
First Data Corp., 5.750%, 01/15/24** | 1.5 | |||
Caesars Entertainment Operating Co., Inc., 9.000%, 02/15/20** | 1.3 | |||
DISH DBS Corp., 5.875%, 11/15/24 | 1.2 | |||
CCO Holdings LLC / CCO Holdings Capital Corp., 5.750%, 02/15/26** | 1.1 | |||
Tenet Healthcare Corp. 8.125%, 04/01/22 | 1.1 | |||
Intelsat Jackson Holdings S.A. 7.250%, 10/15/20 | 1.1 | |||
Neptune Finco Corp., 10.875%, 10/15/25** | 1.0 | |||
Valeant Pharmaceuticals International, Inc., 7.500%, 07/15/21** | 1.0 | |||
|
| |||
Top Ten as a Group | 12.5 | % | ||
|
| |||
| ** | Top Ten Holdings as of June 30, 2016. |
Credit quality ratings shown above reflect the highest rating assigned by either Standard & Poor’s (“S&P”) or Moody’s Investors Service, Inc. (“Moody’s”). These rating agencies are independent, nationally recognized statistical rating organizations and are widely used. Investment grade ratings are credit ratings of BBB/Baa or higher. Below investment grade ratings are credit ratings of BB/Ba or lower. Investments designated N/R are not rated by either rating agency. Unrated investments do not necessarily indicate low credit quality. Credit quality ratings are subject to change.
Because a fund’s strategy may result in multiple investments in particular sectors of the economy, its performance may depend on the performance of those sectors and may fluctuate more widely than investments diversified across more sectors. For additional information on these and other risk considerations, please see the Fund’s prospectus.
Any sectors, industries, or securities discussed should not be perceived as investment recommendations. Mention of a specific security should not be considered a recommendation to buy or solicitation to sell that security. Specific securities mentioned in this report may have been sold from the Fund’s portfolio of investments by the time you receive this report.
27
Table of Contents
AMG Managers High Yield Fund
Schedule of Portfolio Investments
December 31, 2016
| Principal Amount | Value | |||||||
Corporate Bonds and Notes—92.6% | ||||||||
Financials - 5.1% | ||||||||
Aircastle, Ltd., 5.000%, 04/01/23 | $ | 70,000 | $ | 71,575 | ||||
Ally Financial, Inc., | ||||||||
4.250%, 04/15/21 | 65,000 | 65,772 | ||||||
4.625%, 05/19/22 | 80,000 | 81,100 | ||||||
4.625%, 03/30/25 | 95,000 | 93,931 | ||||||
5.750%, 11/20/25 | 40,000 | 40,050 | ||||||
Bank of America Corp., Series K, 8.000%, 07/29/494,5 | 165,000 | 169,744 | ||||||
Care Capital Properties LP, 5.125%, 08/15/26 (a) | 30,000 | 29,278 | ||||||
Chinos Intermediate Holdings A, Inc., (7.750% Cash or 8.500% PIK), 7.750%, 05/01/19 (a)6 | 65,208 | 27,061 | ||||||
Citigroup, Inc., | ||||||||
Series N, 5.800%, 11/29/494,5 | 5,000 | 5,050 | ||||||
Series O, 5.875%, 12/29/491,4,5 | 5,000 | 5,056 | ||||||
Cogent Communications Finance, Inc., 5.625%, 04/15/21 (a) | 90,000 | 91,125 | ||||||
Communications Sales & Leasing, Inc. / CSL Capital LLC, 8.250%, 10/15/23 | 100,000 | 106,500 | ||||||
Corrections Corp. of America, 4.625%, 05/01/23 | 110,000 | 108,900 | ||||||
Dana Financing Luxembourg Sarl, 6.500%, 06/01/26 (a) | 20,000 | 20,950 | ||||||
Diamond 1 Finance Corp. / Diamond 2 Finance Corp., | ||||||||
5.450%, 06/15/23 (a) | 45,000 | 47,797 | ||||||
6.020%, 06/15/26 (a) | 40,000 | 43,409 | ||||||
Equinix, Inc., | ||||||||
5.375%, 01/01/22 | 15,000 | 15,825 | ||||||
5.750%, 01/01/25 | 5,000 | 5,250 | ||||||
5.875%, 01/15/26 | 50,000 | 52,750 | ||||||
ESH Hospitality, Inc., 5.250%, 05/01/25 (a) | 20,000 | 19,950 | ||||||
MGM Growth Properties Operating Partnership LP / MGP Finance Co-Issuer, Inc., 4.500%, 09/01/26 (a) | 25,000 | 24,125 | ||||||
Newfield Exploration Co., 5.750%, 01/30/22 | 65,000 | 68,819 | ||||||
Total Financials | 1,194,017 | |||||||
Industrials—86.3% | ||||||||
1011778 BC ULC / New Red Finance, Inc., 6.000%, 04/01/22 (a) | 60,000 | 62,850 | ||||||
21st Century Oncology, Inc., 11.000%, 05/01/23 (a)4,7 | 65,406 | 44,803 | ||||||
ACCO Brands Corp., | ||||||||
5.250%, 12/15/24 (a) | 20,000 | 20,188 | ||||||
6.750%, 04/30/20 | 60,000 | 63,150 | ||||||
Adient Global Holdings, Ltd., 4.875%, 08/15/26 (a) | 35,000 | 34,388 | ||||||
The ADT Corp., 3.500%, 07/15/22 | 80,000 | 76,600 | ||||||
AdvancePierre Foods Holdings, Inc., 5.500%, 12/15/24 (a) | 10,000 | 10,119 | ||||||
AECOM, | ||||||||
5.750%, 10/15/22 | 20,000 | 21,240 | ||||||
The accompanying notes are an integral part of these financial statements.
28
Table of Contents
AMG Managers High Yield Fund
Schedule of Portfolio Investments (continued)
| Principal Amount | Value | |||||||
Industrials—86.3% (continued) | ||||||||
5.875%, 10/15/24 | $ | 25,000 | $ | 26,815 | ||||
Air Medical Merger Sub Corp., 6.375%, 05/15/23 (a) | 70,000 | 67,550 | ||||||
Alberta Energy Co., Ltd., | ||||||||
7.375%, 11/01/31 | 5,000 | 5,768 | ||||||
8.125%, 09/15/30 | 10,000 | 12,067 | ||||||
Alere, Inc., | ||||||||
6.375%, 07/01/23 (a) | 30,000 | 29,962 | ||||||
6.500%, 06/15/20 | 20,000 | 19,800 | ||||||
Allegion PLC, 5.875%, 09/15/23 | 15,000 | 15,975 | ||||||
Alta Mesa Holdings LP / Alta Mesa Finance Services Corp., 7.875%, 12/15/24 (a) | 20,000 | 20,800 | ||||||
Altice Luxembourg, S.A., 7.750%, 05/15/22 (a) | 200,000 | 214,000 | ||||||
AMC Entertainment Holdings, Inc., | ||||||||
5.750%, 06/15/25 | 75,000 | 77,063 | ||||||
5.875%, 11/15/26 (a) | 10,000 | 10,250 | ||||||
AMC Networks, Inc., 5.000%, 04/01/24 | 40,000 | 40,350 | ||||||
American Axle & Manufacturing, Inc., | ||||||||
6.250%, 03/15/21 | 25,000 | 25,875 | ||||||
6.625%, 10/15/22 | 55,000 | 56,991 | ||||||
Amkor Technology, Inc., | ||||||||
6.375%, 10/01/22 | 85,000 | 88,931 | ||||||
6.625%, 06/01/21 | 60,000 | 61,875 | ||||||
Anixter, Inc., 5.500%, 03/01/23 | 80,000 | 83,300 | ||||||
Antero Midstream Partners LP / Antero Midstream Finance Corp., 5.375%, 09/15/24 (a) | 25,000 | 25,375 | ||||||
Antero Resources Corp., | ||||||||
5.125%, 12/01/22 | 35,000 | 35,525 | ||||||
5.375%, 11/01/21 | 25,000 | 25,656 | ||||||
6.000%, 12/01/20 | 15,000 | 15,451 | ||||||
Apex Tool Group LLC, 7.000%, 02/01/21 (a) | 30,000 | 27,000 | ||||||
Arconic, Inc., 5.900%, 02/01/27 | 10,000 | 10,475 | ||||||
Argos Merger Sub, Inc., 7.125%, 03/15/23 (a) | 145,000 | 148,262 | ||||||
Ashland, Inc., | ||||||||
4.750%, 08/15/22 (b) | 60,000 | 62,475 | ||||||
6.875%, 05/15/43 | 50,000 | 51,875 | ||||||
Avaya, Inc., 7.000%, 04/01/19 (a) | 45,000 | 39,600 | ||||||
Avis Budget Car Rental LLC / Avis Budget Finance, Inc., | ||||||||
5.125%, 06/01/22 (a)1 | 30,000 | 29,512 | ||||||
5.500%, 04/01/23 | 60,000 | 59,175 | ||||||
6.375%, 04/01/24 (a) | 40,000 | 40,150 | ||||||
Belden, Inc., 5.500%, 09/01/22 (a) | 85,000 | 87,975 | ||||||
Blue Racer Midstream LLC / Blue Racer Finance Corp., 6.125%, 11/15/22 (a) | 80,000 | 80,400 | ||||||
The accompanying notes are an integral part of these financial statements.
29
Table of Contents
AMG Managers High Yield Fund
Schedule of Portfolio Investments (continued)
| Principal Amount | Value | |||||||
Industrials—86.3% (continued) | ||||||||
Boardwalk Pipelines L.P., 5.950%, 06/01/26 | $ | 15,000 | $ | 16,323 | ||||
Boise Cascade Co., 5.625%, 09/01/24 (a) | 10,000 | 9,975 | ||||||
Bombardier, Inc., 7.500%, 03/15/25 (a) | 105,000 | 104,267 | ||||||
Boyd Gaming Corp., 6.375%, 04/01/26 (a) | 20,000 | 21,640 | ||||||
Caesars Entertainment Operating Co., Inc., | ||||||||
8.500%, 02/15/208 | 122,949 | 129,096 | ||||||
9.000%, 02/15/208 | 290,149 | 301,755 | ||||||
11.250%, 06/01/178 | 113,152 | 115,698 | ||||||
Carrizo Oil & Gas, Inc., 6.250%, 04/15/23 | 20,000 | 20,600 | ||||||
CBS Radio, Inc., 7.250%, 11/01/24 (a) | 15,000 | 15,788 | ||||||
CCO Holdings LLC / CCO Holdings Capital Corp., | ||||||||
5.375%, 05/01/25 (a) | 30,000 | 30,975 | ||||||
5.500%, 05/01/26 (a) | 25,000 | 25,562 | ||||||
5.750%, 02/15/26 (a) | 255,000 | 264,562 | ||||||
5.875%, 04/01/24 (a) | 90,000 | 96,300 | ||||||
Central Garden & Pet Co., 6.125%, 11/15/23 | 45,000 | 47,700 | ||||||
CenturyLink, Inc., Series W, 6.750%, 12/01/23 | 105,000 | 107,756 | ||||||
The Chemours Co., | ||||||||
6.625%, 05/15/23 | 50,000 | 49,750 | ||||||
7.000%, 05/15/25 | 20,000 | 19,800 | ||||||
Cheniere Corpus Christi Holdings LLC, 5.875%, 03/31/25 (a) | 30,000 | 30,722 | ||||||
Chesapeake Energy Corp., | ||||||||
6.875%, 11/15/20 | 15,000 | 15,075 | ||||||
8.000%, 12/15/22 (a) | 102,000 | 110,415 | ||||||
8.000%, 01/15/25 (a) | 40,000 | 40,950 | ||||||
Cinemark USA, Inc., 4.875%, 06/01/23 | 45,000 | 45,788 | ||||||
Claire’s Stores, Inc., 9.000%, 03/15/19 (a) | 145,000 | 73,950 | ||||||
Clean Harbors, Inc., 5.125%, 06/01/21 | 25,000 | 25,630 | ||||||
Clear Channel Worldwide Holdings, Inc., | ||||||||
Series A, 6.500%, 11/15/22 | 85,000 | 85,425 | ||||||
Series B, 6.500%, 11/15/22 | 225,000 | 231,188 | ||||||
Series A, 7.625%, 03/15/20 | 55,000 | 53,075 | ||||||
Series B, 7.625%, 03/15/20 | 115,000 | 115,359 | ||||||
CNH Industrial Capital LLC, 4.875%, 04/01/21 | 55,000 | 57,338 | ||||||
Cogent Communications Group, Inc., 5.375%, 03/01/22 (a) | 70,000 | 72,625 | ||||||
CommScope Technologies Finance LLC, 6.000%, 06/15/25 (a) | 85,000 | 90,525 | ||||||
CommScope, Inc., 5.500%, 06/15/24 (a) | 35,000 | 36,356 | ||||||
Communications Sales & Leasing, Inc. / CSL Capital LLC, 7.125%, 12/15/24 (a) | 15,000 | 15,188 | ||||||
Continental Resources, Inc., 4.500%, 04/15/23 | 75,000 | 73,875 | ||||||
Cooper-Standard Automotive, Inc., 5.625%, 11/15/26 (a) | 25,000 | 24,781 | ||||||
The accompanying notes are an integral part of these financial statements.
30
Table of Contents
AMG Managers High Yield Fund
Schedule of Portfolio Investments (continued)
| Principal Amount | Value | |||||||
Industrials - 86.3% (continued) | ||||||||
Crestwood Midstream Partners L.P. / Crestwood Midstream Finance Corp., | ||||||||
6.125%, 03/01/22 | $ | 10,000 | $ | 10,300 | ||||
6.250%, 04/01/23 (b) | 35,000 | 35,875 | ||||||
CSI Compressco L.P. / Compressco Finance, Inc., 7.250%, 08/15/22 | 20,000 | 19,000 | ||||||
Dana Holding Corp., | ||||||||
5.500%, 12/15/24 | 35,000 | 35,875 | ||||||
6.000%, 09/15/23 | 95,000 | 99,631 | ||||||
DaVita HealthCare Partners, Inc., 5.000%, 05/01/25 | 70,000 | 69,038 | ||||||
Denbury Resources, Inc., | ||||||||
4.625%, 07/15/23 | 50,000 | 40,375 | ||||||
5.500%, 05/01/22 | 40,000 | 35,100 | ||||||
DISH DBS Corp., | ||||||||
5.000%, 03/15/23 | 150,000 | 149,625 | ||||||
5.875%, 07/15/22 | 125,000 | 131,875 | ||||||
5.875%, 11/15/24 | 265,000 | 273,679 | ||||||
DJO Finco, Inc. / DJO Finance LLC / DJO Finance Corp., 8.125%, 06/15/21 (a) | 155,000 | 135,238 | ||||||
Encana Corp., | ||||||||
6.625%, 08/15/37 | 25,000 | 27,019 | ||||||
7.200%, 11/01/31 | 15,000 | 16,873 | ||||||
Energizer Holdings, Inc., 5.500%, 06/15/25 (a) | 65,000 | 65,325 | ||||||
EnLink Midstream Partners L.P., 4.400%, 04/01/24 | 45,000 | 44,780 | ||||||
Entegris, Inc., 6.000%, 04/01/22 (a) | 90,000 | 93,938 | ||||||
EP Energy LLC / Everest Acquisition Finance, Inc., | ||||||||
7.750%, 09/01/22 | 40,000 | 32,600 | ||||||
8.000%, 11/29/24 (a) | 15,000 | 16,196 | ||||||
9.375%, 05/01/20 | 105,000 | 97,321 | ||||||
FGI Operating Co. LLC / FGI Finance, Inc., 7.875%, 05/01/20 | 70,000 | 59,850 | ||||||
First Data Corp., | ||||||||
5.375%, 08/15/23 (a) | 57,000 | 59,280 | ||||||
5.750%, 01/15/24 (a) | 335,000 | 346,936 | ||||||
7.000%, 12/01/23 (a) | 23,000 | 24,552 | ||||||
Freeport-McMoRan, Inc., | ||||||||
3.875%, 03/15/23 | 10,000 | 9,225 | ||||||
4.550%, 11/14/24 | 15,000 | 14,138 | ||||||
Frontier Communications Corp., | ||||||||
6.875%, 01/15/25 | 40,000 | 34,050 | ||||||
10.500%, 09/15/22 | 5,000 | 5,275 | ||||||
11.000%, 09/15/25 | 140,000 | 145,075 | ||||||
Gardner Denver, Inc., 6.875%, 08/15/21 (a) | 40,000 | 40,000 | ||||||
Gates Global LLC / Gates Global Co., 6.000%, 07/15/22 (a) | 40,000 | 39,320 | ||||||
The accompanying notes are an integral part of these financial statements.
31
Table of Contents
AMG Managers High Yield Fund
Schedule of Portfolio Investments (continued)
| Principal Amount | Value | |||||||
Industrials - 86.3% (continued) | ||||||||
GCI, Inc., 6.750%, 06/01/21 | $ | 50,000 | $ | 51,500 | ||||
GCP Applied Technologies, Inc., 9.500%, 02/01/23 (a) | 35,000 | 40,250 | ||||||
General Cable Corp., 5.750%, 10/01/22 (b) | 85,000 | 82,875 | ||||||
The Geo Group, Inc., | ||||||||
5.875%, 01/15/22 | 95,000 | 96,662 | ||||||
6.000%, 04/15/26 | 25,000 | 24,688 | ||||||
The Goodyear Tire & Rubber Co., | ||||||||
5.000%, 05/31/26 | 10,000 | 9,979 | ||||||
5.125%, 11/15/23 | 25,000 | 25,875 | ||||||
Great Lakes Dredge & Dock Corp., 7.375%, 02/01/19 | 80,000 | 79,600 | ||||||
Gulfport Energy Corp., 6.000%, 10/15/24 (a) | 10,000 | 10,225 | ||||||
H&E Equipment Services, Inc., 7.000%, 09/01/22 | 90,000 | 95,175 | ||||||
Halcon Resources Corp., 8.625%, 02/01/20 (a) | 20,000 | 20,900 | ||||||
Hanesbrands, Inc., 4.625%, 05/15/24 (a) | 25,000 | 24,375 | ||||||
HCA, Inc., | ||||||||
5.250%, 06/15/26 | 45,000 | 46,631 | ||||||
5.375%, 02/01/25 | 230,000 | 230,862 | ||||||
5.875%, 02/15/26 | 210,000 | 216,825 | ||||||
7.500%, 02/15/22 | 205,000 | 233,188 | ||||||
HD Supply, Inc., 5.750%, 04/15/24 (a) | 55,000 | 58,201 | ||||||
HealthSouth Corp., | ||||||||
5.750%, 11/01/24 | 30,000 | 30,525 | ||||||
5.750%, 09/15/25 | 55,000 | 55,000 | ||||||
Herc Rentals, Inc., 7.750%, 06/01/24 (a) | 95,000 | 100,344 | ||||||
The Hertz Corp., | ||||||||
5.500%, 10/15/24 (a) | 35,000 | 30,756 | ||||||
6.250%, 10/15/22 | 100,000 | 94,250 | ||||||
7.375%, 01/15/21 | 80,000 | 80,600 | ||||||
Hexion, Inc., | ||||||||
6.625%, 04/15/20 | 145,000 | 129,050 | ||||||
8.875%, 02/01/18 | 55,000 | 55,000 | ||||||
The Hillman Group, Inc., 6.375%, 07/15/22 (a) | 80,000 | 75,600 | ||||||
Hill-Rom Holdings, Inc., 5.750%, 09/01/23 (a) | 55,000 | 57,062 | ||||||
Hilton Domestic Operating Co., Inc., 4.250%, 09/01/24 (a) | 10,000 | 9,750 | ||||||
Hilton Grand Vacations Borrower LLC/Hilton Grand Vacations Borrower, Inc., 6.125%, 12/01/24 (a) | 10,000 | 10,438 | ||||||
HRG Group, Inc., 7.750%, 01/15/22 | 40,000 | 41,900 | ||||||
Hughes Satellite Systems Corp., 6.625%, 08/01/26 (a) | 10,000 | 10,075 | ||||||
Huntsman International LLC, 5.125%, 11/15/22 | 95,000 | 97,375 | ||||||
iHeartCommunications, Inc., 9.000%, 03/01/21 | 105,000 | 78,094 | ||||||
Inception Merger Sub, Inc. / Rackspace Hosting, Inc., 8.625%, 11/15/24 (a) | 40,000 | 42,438 | ||||||
The accompanying notes are an integral part of these financial statements.
32
Table of Contents
AMG Managers High Yield Fund
Schedule of Portfolio Investments (continued)
| Principal Amount | Value | |||||||
Industrials - 86.3% (continued) | ||||||||
INEOS Group Holdings, S.A., 5.625%, 08/01/24 (a) | $ | 200,000 | $ | 199,000 | ||||
Infinity Acquisition LLC / Infinity Acquisition Finance Corp., 7.250%, 08/01/22 (a) | 60,000 | 50,850 | ||||||
Infor Software Parent LLC / Infor Software Parent, Inc., (7.125% Cash or 7.875% PIK), 7.125%, 05/01/21 (a)6 | 85,000 | 87,975 | ||||||
Infor US, Inc., 6.500%, 05/15/22 | 145,000 | 151,888 | ||||||
Informatica LLC, 7.125%, 07/15/23 (a) | 90,000 | 86,400 | ||||||
Intelsat Jackson Holdings S.A., | ||||||||
5.500%, 08/01/23 | 110,000 | 74,668 | ||||||
7.250%, 04/01/19 | 40,000 | 33,800 | ||||||
7.250%, 10/15/20 | 315,000 | 245,700 | ||||||
7.500%, 04/01/21 | 35,000 | 26,862 | ||||||
International Game Technology PLC, 6.500%, 02/15/25 (a) | 200,000 | 215,500 | ||||||
Interval Acquisition Corp., 5.625%, 04/15/23 | 65,000 | 66,625 | ||||||
inVentiv Group Holdings Inc/inVentiv Health Inc/inVentiv Health Clinical, Inc., 7.500%, 10/01/24 (a) | 40,000 | 42,096 | ||||||
inVentiv Health, Inc., 9.000%, 01/15/18 (a) | 105,000 | 105,215 | ||||||
J.C. Penney Corp., Inc., 6.375%, 10/15/36 | 40,000 | 33,850 | ||||||
Jack Cooper Holdings Corp., 9.250%, 06/01/20 (b)7 | 120,000 | 52,500 | ||||||
Jack Ohio Finance LLC / Jack Ohio Finance 1 Corp., 6.750%, 11/15/21 (a) | 45,000 | 45,675 | ||||||
James Hardie International Finance, Ltd., 5.875%, 02/15/23 (a) | 20,000 | 20,800 | ||||||
Kindred Healthcare, Inc., 8.750%, 01/15/23 | 95,000 | 89,181 | ||||||
Kinetic Concepts, Inc. / KCI USA, Inc., | ||||||||
7.875%, 02/15/21 (a) | 30,000 | 32,625 | ||||||
9.625%, 10/01/21 (a) | 125,000 | 132,812 | ||||||
KLX, Inc., 5.875%, 12/01/22 (a) | 90,000 | 93,038 | ||||||
Kratos Defense & Security Solutions, Inc., 7.000%, 05/15/19 | 49,000 | 47,652 | ||||||
L Brands, Inc., 6.750%, 07/01/36 | 45,000 | 45,788 | ||||||
Level 3 Communications, Inc., 5.750%, 12/01/22 | 60,000 | 61,800 | ||||||
Level 3 Financing, Inc., 5.375%, 05/01/25 | 95,000 | 97,138 | ||||||
Live Nation Entertainment, Inc., 4.875%, 11/01/24 (a) | 10,000 | 10,050 | ||||||
LSB Industries, Inc., 8.500%, 08/01/19 (b) | 96,000 | 88,800 | ||||||
LTF Merger Sub, Inc., 8.500%, 06/15/23 (a) | 70,000 | 72,800 | ||||||
Magnachip Semiconductor Corp., 6.625%, 07/15/21 (b) | 95,000 | 82,650 | ||||||
Mallinckrodt International Finance, S.A. / Mallinckrodt CB LLC, | ||||||||
5.500%, 04/15/25 (a) | 35,000 | 31,500 | ||||||
5.625%, 10/15/23 (a) | 30,000 | 28,125 | ||||||
5.750%, 08/01/22 (a) | 25,000 | 24,188 | ||||||
MEG Energy Corp., | ||||||||
6.375%, 01/30/23 (a) | 25,000 | 22,375 | ||||||
7.000%, 03/31/24 (a) | 135,000 | 122,850 | ||||||
MGM Growth Properties Operating Partnership L.P. / MGP Escrow Co-Issuer, Inc., 5.625%, 05/01/24 (a) | 10,000 | 10,500 | ||||||
The accompanying notes are an integral part of these financial statements.
33
Table of Contents
AMG Managers High Yield Fund
Schedule of Portfolio Investments (continued)
| Principal Amount | Value | |||||||
Industrials - 86.3% (continued) | ||||||||
MGM Resorts International, | ||||||||
6.000%, 03/15/23 | $ | 95,000 | $ | 102,838 | ||||
7.750%, 03/15/22 | 180,000 | 207,450 | ||||||
Micron Technology, Inc., | ||||||||
5.250%, 01/15/24 (a) | 100,000 | 100,000 | ||||||
7.500%, 09/15/23 (a) | 30,000 | 33,300 | ||||||
Microsemi Corp., 9.125%, 04/15/23 (a) | 75,000 | 87,750 | ||||||
Midcontinent Communications & Midcontinent Finance Corp., 6.875%, 08/15/23 (a) | 70,000 | 74,900 | ||||||
MPLX L.P., | ||||||||
4.875%, 06/01/25 | 95,000 | 97,838 | ||||||
5.500%, 02/15/23 | 35,000 | 36,418 | ||||||
Nabors Industries, Inc., 5.500%, 01/15/23 (a) | 10,000 | 10,438 | ||||||
Neiman Marcus Group, Ltd. LLC, 8.000%, 10/15/21 (a) | 25,000 | 18,688 | ||||||
Neiman Marcus Group, Ltd. LLC (8.750% Cash or 9.500% PIK), 8.750%, 10/15/21 (a)1,6 | 80,000 | 57,000 | ||||||
Neptune Finco Corp., 10.875%, 10/15/25 (a) | 200,000 | 238,500 | ||||||
Nielsen Finance LLC / Nielsen Finance Co., 5.000%, 04/15/22 (a) | 65,000 | 66,462 | ||||||
Noranda Aluminum Acquisition Corp., 11.000%, 06/01/198 | 35,000 | 2 | ||||||
Novelis Corp., | ||||||||
5.875%, 09/30/26 (a) | 20,000 | 20,250 | ||||||
6.250%, 08/15/24 (a) | 20,000 | 21,250 | ||||||
Oasis Petroleum, Inc., | ||||||||
6.500%, 11/01/21 | 60,000 | 61,425 | ||||||
6.875%, 03/15/22 | 40,000 | 41,200 | ||||||
6.875%, 01/15/23 | 25,000 | 25,750 | ||||||
Omega US Sub LLC, 8.750%, 07/15/23 (a) | 75,000 | 78,750 | ||||||
Oshkosh Corp., 5.375%, 03/01/25 | 20,000 | 20,500 | ||||||
Parsley Energy LLC / Parsley Finance Corp., 6.250%, 06/01/24 (a) | 5,000 | 5,286 | ||||||
Post Holdings, Inc., 7.750%, 03/15/24 (a) | 100,000 | 111,500 | ||||||
Quebecor Media, Inc., 5.750%, 01/15/23 | 170,000 | 177,012 | ||||||
Quebecor World, Escrow, 6.500%, 08/01/27*,7 | 165,000 | 16 | ||||||
Qwest Capital Funding, Inc., 7.750%, 02/15/31 | 65,000 | 59,475 | ||||||
Radio Systems Corp., 8.375%, 11/01/19 (a) | 105,000 | 109,528 | ||||||
Regal Entertainment Group, | ||||||||
5.750%, 03/15/22 | 20,000 | 21,000 | ||||||
5.750%, 06/15/23 | 40,000 | 41,038 | ||||||
Regency Energy Partners, L.P. / Regency Energy Finance Corp., 5.500%, 04/15/23 | 45,000 | 46,688 | ||||||
Reichhold Holdings International B.V. PIK, | ||||||||
12.000%, 03/31/187 | 87,678 | 87,678 | ||||||
15.000%, 03/31/187 | 56,456 | 56,456 | ||||||
Reichhold LLC, 12.000%, 03/31/187 | 35,000 | 35,000 | ||||||
The accompanying notes are an integral part of these financial statements.
34
Table of Contents
AMG Managers High Yield Fund
Schedule of Portfolio Investments (continued)
| Principal Amount | Value | |||||||
Industrials - 86.3% (continued) | ||||||||
Reynolds Group Issuer, Inc. / Reynolds Group Issuer LLC / Reynolds Group Issuer Lu, | ||||||||
5.750%, 10/15/20 | $ | 95,000 | $ | 98,088 | ||||
7.000%, 07/15/24 (a) | 20,000 | 21,300 | ||||||
Rite Aid Corp., 6.125%, 04/01/23 (a) | 80,000 | 86,300 | ||||||
Riverbed Technology, Inc., 8.875%, 03/01/23 (a) | 75,000 | 79,500 | ||||||
RSI Home Products, Inc., 6.500%, 03/15/23 (a) | 105,000 | 110,250 | ||||||
RSP Permian, Inc., | ||||||||
5.250%, 01/15/25 (a) | 15,000 | 15,112 | ||||||
6.625%, 10/01/22 | 15,000 | 15,938 | ||||||
Sabine Pass Liquefaction LLC, | ||||||||
5.625%, 04/15/23 (b) | 100,000 | 106,750 | ||||||
5.750%, 05/15/24 | 100,000 | 107,750 | ||||||
Sabre GLBL, Inc., | ||||||||
5.250%, 11/15/23 (a) | 35,000 | 36,115 | ||||||
5.375%, 04/15/23 (a) | 45,000 | 46,125 | ||||||
Sanchez Energy Corp., 6.125%, 01/15/23 | 35,000 | 33,425 | ||||||
SBA Communications Corp., 4.875%, 09/01/24 (a) | 50,000 | 49,500 | ||||||
The Scotts Miracle-Gro Co., | ||||||||
5.250%, 12/15/26 (a) | 15,000 | 15,038 | ||||||
6.000%, 10/15/23 (a) | 50,000 | 53,125 | ||||||
Sensata Technologies BV, 4.875%, 10/15/23 (a) | 115,000 | 118,019 | ||||||
Service Corp. International, 7.500%, 04/01/27 | 115,000 | 133,975 | ||||||
Sinclair Television Group, Inc., | ||||||||
5.125%, 02/15/27 (a) | 15,000 | 14,325 | ||||||
6.125%, 10/01/22 | 105,000 | 109,988 | ||||||
Sirius XM Radio, Inc., | ||||||||
5.375%, 04/15/25 (a) | 130,000 | 129,675 | ||||||
6.000%, 07/15/24 (a) | 80,000 | 83,800 | ||||||
Six Flags Entertainment Corp., 4.875%, 07/31/24 (a) | 20,000 | 19,800 | ||||||
SM Energy Co., | ||||||||
5.625%, 06/01/25 | 30,000 | 29,100 | ||||||
6.125%, 11/15/22 | 10,000 | 10,175 | ||||||
6.500%, 01/01/23 | 10,000 | 10,212 | ||||||
Southwestern Energy Co., | ||||||||
4.100%, 03/15/22 | 5,000 | 4,749 | ||||||
6.700%, 01/23/25 (b) | 30,000 | 30,825 | ||||||
Sprint Capital Corp., | ||||||||
6.875%, 11/15/28 | 15,000 | 14,850 | ||||||
8.750%, 03/15/32 | 340,000 | 374,850 | ||||||
The accompanying notes are an integral part of these financial statements.
35
Table of Contents
AMG Managers High Yield Fund
Schedule of Portfolio Investments (continued)
| Principal Amount | Value | |||||||
Industrials - 86.3% (continued) | ||||||||
Sprint Corp., | ||||||||
7.625%, 02/15/25 | $ | 100,000 | $ | 105,375 | ||||
7.875%, 09/15/23 | 340,000 | 363,800 | ||||||
SPX FLOW, Inc., | ||||||||
5.625%, 08/15/24 (a) | 15,000 | 15,150 | ||||||
5.875%, 08/15/26 (a) | 20,000 | 20,050 | ||||||
Targa Resources Partners LP / Targa Resources Partners Finance Corp., | ||||||||
5.125%, 02/01/25 (a) | 15,000 | 14,944 | ||||||
6.750%, 03/15/24 | 55,000 | 59,262 | ||||||
TEGNA, Inc., | ||||||||
4.875%, 09/15/21 (a) | 15,000 | 15,300 | ||||||
5.500%, 09/15/24 (a) | 45,000 | 45,619 | ||||||
Tempur Sealy International, Inc., 5.625%, 10/15/23 | 90,000 | 93,375 | ||||||
Tenet Healthcare Corp., | ||||||||
6.750%, 06/15/23 | 180,000 | 159,300 | ||||||
7.500%, 01/01/22 (a) | 10,000 | 10,450 | ||||||
8.125%, 04/01/22 | 270,000 | 256,095 | ||||||
Tenneco, Inc., 5.000%, 07/15/26 | 5,000 | 4,919 | ||||||
Terex Corp., 6.000%, 05/15/21 | 135,000 | 138,544 | ||||||
Tesoro Logistics L.P. / Tesoro Logistics Finance Corp., | ||||||||
5.250%, 01/15/25 | 20,000 | 20,500 | ||||||
5.875%, 10/01/20 | 58,000 | 59,885 | ||||||
6.125%, 10/15/21 | 25,000 | 26,312 | ||||||
6.250%, 10/15/22 | 20,000 | 21,300 | ||||||
6.375%, 05/01/24 | 20,000 | 21,500 | ||||||
Time, Inc., 5.750%, 04/15/22 (a) | 80,000 | 83,200 | ||||||
T-Mobile USA, Inc., | ||||||||
6.500%, 01/15/26 | 65,000 | 70,444 | ||||||
6.731%, 04/28/22 | 175,000 | 183,312 | ||||||
TransDigm, Inc., 6.500%, 05/15/25 | 80,000 | 84,100 | ||||||
Triumph Group, Inc., 4.875%, 04/01/21 | 80,000 | 75,440 | ||||||
UCI International LLC, 8.625%, 02/15/197,8 | 115,000 | 24,150 | ||||||
United Rentals North America, Inc., | ||||||||
5.500%, 05/15/27 | 30,000 | 29,812 | ||||||
5.750%, 11/15/24 | 65,000 | 68,575 | ||||||
5.875%, 09/15/26 | 75,000 | 77,531 | ||||||
United States Cellular Corp., 6.700%, 12/15/33 | 65,000 | 64,675 | ||||||
Valeant Pharmaceuticals International, Inc., | ||||||||
5.875%, 05/15/23 (a) | 210,000 | 159,600 | ||||||
The accompanying notes are an integral part of these financial statements.
36
Table of Contents
AMG Managers High Yield Fund
Schedule of Portfolio Investments (continued)
| Principal Amount | Value | |||||||
Industrials—86.3% (continued) | ||||||||
6.125%, 04/15/25 (a) | $ | 60,000 | $ | 45,300 | ||||
7.250%, 07/15/22 (a) | 130,000 | 106,925 | ||||||
7.500%, 07/15/21 (a) | 280,000 | 238,350 | ||||||
Valvoline, Inc., 5.500%, 07/15/24 (a) | 5,000 | 5,188 | ||||||
Versum Materials, Inc., 5.500%, 09/30/24 (a) | 20,000 | 20,500 | ||||||
Vista Outdoor, Inc., 5.875%, 10/01/23 | 85,000 | 89,410 | ||||||
Western Digital Corp., | ||||||||
7.375%, 04/01/23 (a) | 65,000 | 71,662 | ||||||
10.500%, 04/01/24 (a) | 120,000 | 142,200 | ||||||
Whiting Petroleum Corp., | ||||||||
5.750%, 03/15/21 | 40,000 | 40,034 | ||||||
6.250%, 04/01/23 | 90,000 | 90,450 | ||||||
Williams Partners, L.P. / ACMP Finance Corp., 6.125%, 07/15/22 | 60,000 | 61,887 | ||||||
Windstream Services LLC, | ||||||||
6.375%, 08/01/23 | 30,000 | 26,925 | ||||||
7.500%, 06/01/22 | 90,000 | 88,650 | ||||||
7.500%, 04/01/23 | 15,000 | 14,512 | ||||||
7.750%, 10/01/21 | 140,000 | 144,620 | ||||||
WMG Acquisition Corp., | ||||||||
4.875%, 11/01/24 (a) | 10,000 | 10,000 | ||||||
5.625%, 04/15/22 (a) | 18,000 | 18,698 | ||||||
WPX Energy, Inc., | ||||||||
5.250%, 09/15/24 | 10,000 | 9,750 | ||||||
6.000%, 01/15/22 | 15,000 | 15,450 | ||||||
8.250%, 08/01/23 | 50,000 | 56,125 | ||||||
WR Grace & Co., 5.625%, 10/01/24 (a) | 10,000 | 10,538 | ||||||
Wynn Las Vegas LLC / Wynn Las Vegas Capital Corp., 5.500%, 03/01/25 (a) | 150,000 | 149,175 | ||||||
XPO Logistics, Inc., | ||||||||
6.125%, 09/01/23 (a) | 15,000 | 15,731 | ||||||
6.500%, 06/15/22 (a) | 80,000 | 84,300 | ||||||
Zayo Group LLC / Zayo Capital, Inc., | ||||||||
6.000%, 04/01/23 | 50,000 | 52,250 | ||||||
6.375%, 05/15/25 | 60,000 | 62,925 | ||||||
Zebra Technologies Corp., 7.250%, 10/15/22 | 120,000 | 131,100 | ||||||
Total Industrials | 19,977,355 | |||||||
Utilities—1.2% | ||||||||
AES Corp, 6.000%, 05/15/26 | 15,000 | 15,300 | ||||||
AmeriGas Partners LP / AmeriGas Finance Corp., 5.500%, 05/20/25 | 30,000 | 30,412 | ||||||
Dynegy, Inc., | ||||||||
7.375%, 11/01/22 | 90,000 | 86,400 | ||||||
The accompanying notes are an integral part of these financial statements.
37
Table of Contents
AMG Managers High Yield Fund
Schedule of Portfolio Investments (continued)
| Principal Amount | Value | |||||||
Utilities—1.2% (continued) | ||||||||
7.625%, 11/01/241 | $ | 45,000 | $ | 41,738 | ||||
8.000%, 01/15/25 (a) | 25,000 | 23,562 | ||||||
NRG Energy, Inc., | ||||||||
6.250%, 07/15/22 | 40,000 | 40,300 | ||||||
6.625%, 01/15/27 (a) | 35,000 | 33,250 | ||||||
7.875%, 05/15/21 | 4,000 | 4,190 | ||||||
Total Utilities | 275,152 | |||||||
Total Corporate Bonds and Notes (cost $21,575,580) | 21,446,524 | |||||||
Floating Rate Senior Loan Interests—3.3%9 | ||||||||
21st Century Oncology Holdings, Inc., 1st Lien Senior Secured Term Loan B, 7.125%, 04/30/22 (03/31/17)7 | 98,500 | 91,112 | ||||||
Clear Channel Communications, Inc., Term Loan D, 7.520%, 01/30/19 (01/30/17) | 34,927 | 28,495 | ||||||
Evergreen Skills LUX S.A R.L., Initial Term Loan (First Lien), 5.837%, 04/28/21 (01/31/17) | 97,750 | 89,624 | ||||||
Evergreen Skills LUX S.A R.L., Initial Term Loan (Second Lien), 9.337%, 04/28/22 (01/31/17) | 50,000 | 37,697 | ||||||
Gardner Denver, Inc., Initial Dollar Term Loan, | ||||||||
4.250%, 07/30/20 (01/31/17) | 1,978 | 1,960 | ||||||
4.568%, 07/30/20 (03/31/17) | 58,022 | 57,515 | ||||||
The Hillman Group, Inc., Initial Term Loan, 4.500%, 06/30/21 (03/31/17) | 97,500 | 98,089 | ||||||
Neiman Marcus Group, Inc., Other Term Loan, 4.250%, 10/25/20 (01/06/17) | 101,016 | 88,389 | ||||||
Ortho-Clinical Diagnostics Holdings Luxembourg S.A.R.L., Initial Term Loan, 4.750%, 06/30/21 (03/31/17) | 97,500 | 97,027 | ||||||
Steinway Musical Instruments, Inc., 1st Lien Term Loan, 4.750%, 09/19/19 (01/31/17) | 96,632 | 93,250 | ||||||
Wilton Brands LLC (FKA Wilton Brands, Inc.), 8.500%, 08/30/18 (02/28/17) | 95,102 | 90,506 | ||||||
Total Floating Rate Senior Loan Interests (cost $823,652) | 773,664 | |||||||
| Shares | ||||||||
Common Stocks—0.7% | ||||||||
Industrials—0.7% | ||||||||
Halcon Resources Corp.* | 5,513 | 51,494 | ||||||
Quad/Graphics, Inc. | 1 | 26 | ||||||
Reichhold Cayman Equity*,7 | 148 | 97,532 | ||||||
Total Industrials | 149,052 | |||||||
Total Common Stocks (cost $116,262) | 149,052 | |||||||
Warrants—0.0% | ||||||||
Industrials—0.0% | ||||||||
Jack Cooper Enterprises, 03/26/27*,7 | ||||||||
(cost $1,203) | 176 | — | ||||||
The accompanying notes are an integral part of these financial statements.
38
Table of Contents
AMG Managers High Yield Fund
Schedule of Portfolio Investments (continued)
| Principal Amount | Value | |||||||
Short-Term Investments—2.8% | ||||||||
Repurchase Agreements—0.4%2 | ||||||||
Daiwa Capital Markets America, dated 12/30/16, due 01/03/17, 0.520% total to be received $77,194 (collateralized by various U.S. Government Agency Obligations, 0.000%—6.500%, 03/02/17—02/01/49, totaling $78,734) | $ | 77,190 | $ | 77,190 | ||||
| Shares | ||||||||
Other Investment Companies—2.4%3 | ||||||||
Dreyfus Government Cash Management Fund, Institutional Class Shares, 0.45% | 558,938 | 558,938 | ||||||
Total Short-Term Investments | 636,128 | |||||||
Total Investments—99.4% | 23,005,368 | |||||||
Other Assets, less Liabilities—0.6% | 146,823 | |||||||
Net Assets—100.0% | $ | 23,152,191 | ||||||
The accompanying notes are an integral part of these financial statements.
39
Table of Contents
AMG Managers Amundi Intermediate Government Fund
Portfolio Manager’s Comments (unaudited)
THE YEAR IN REVIEW
During the year ended December 31, 2016, the AMG Managers Amundi Intermediate Government Fund1 Class S2 (the “Fund”) returned 1.4%, while the Citigroup Mortgage Index returned 1.6%.
2016 included a number of notable events. Expectations for a U.S. Federal Reserve (the “Fed”) rate hike early in the year proved to be premature, as market pricing of inflation decreased by the end of the first quarter. The surprising vote for “Brexit” highlighted the transition of uncertainty towards the political realm. This theme of political uncertainty persisted into November, as the Republican party won the U.S. presidential election, along with the majority of the House and Senate, leading market participants to shift their focus from the Fed and monetary policy to the fiscal policy of the new administration. By the end of the year, markets generally reacted positively, with increases in growth expectations.
Agency mortgage-backed securities (“MBS”) experienced a difficult environment to begin the first quarter, as intermediate-term Treasuries rallied. The FNMA par coupon had a difficult time keeping up with the move in Treasury rates, but was still 45 basis points lower during the quarter. Interest-rate volatility increased as pressure in credit sectors created fluctuations in the pricing of Treasury securities. Agency MBS spreads widened to the swap curve in the first part of the quarter, but tightened during March, to end the quarter slightly wider than where they started.
Agency MBS did well for much of the second quarter, but had some trouble keeping pace with Treasury securities in late June. Agency MBS weathered the immediate aftermath of Brexit relatively well. Initially, we saw spreads widen in light of the yield drop, but the market remained orderly and trading volumes were heavy. The drop in rates elevated prepayment risks, which led us to focus on securities with attractive collateral characteristics that would exhibit lower prepayment rates.
September was a solid month for Agency MBS, as interest rates stabilized well above the lows observed earlier in the third quarter. Higher coupon MBS led the way, but the support of the Fed repurchase activity drove solid performance in
production coupons as well. The ease in interest rates during the quarter comforted investors that prepayment rates would remain relatively constrained, which ushered certain buyers back into the market. While prepayment rates increased after the bond rally in the summer, prepayment levels remained well below the levels seen at the peaks in 2012/2013, despite similar mortgage rates, due to the fact that most borrowers who were inclined to refinance had already done so.
Agency MBS continued to struggle through the early part of December, but a bond rally near the end of the year helped to calm duration extension fears. The post-election move in rates was significant, but largely just offset the Brexit rally that occurred earlier in the year. Overall, the asset class performed reasonably well, given the large rate moves during the year.
The Fund slightly underperformed the benchmark for the year. The Fund’s position in Agency FRMs (Fixed-Rate MBS) contributed modestly to performance. Specifically, the Fund remained underweight in lower coupon MBS and generally overweight in middle to higher coupon MBS relative to the benchmark. The Fund also maintained a slight underweight to GNMA MBS versus the benchmark over the same time period. Despite this, the Fund still modestly underperformed its benchmark for the year on a net of fees basis.
During 2016, 30-year Agency FRMs continued to account for the majority of the Fund’s exposure, at 95% of capital. We almost doubled exposure to 15-year Agency FRMs to 7% by year-end, and significantly reduced CMBS exposure from over 5% to less than 2%. Additionally, we increased Consumer ABS exposure modestly to 7%, while maintaining ~1.5% of the Fund’s exposure within Agency CMOs.
LOOKING FORWARD
We enter 2017 with a neutral view on MBS. Spreads seem reasonable relative to historical levels, but the outlook is more opaque than it was a year ago. Our primary concern is a potential shift in Fed policy, which could be a result of the Federal Open Market Committee (“FOMC”) reacting to more aggressive fiscal policy or from a likely more hawkish composition as the new
administration makes appointments. At this time, two empty Board of Governor’s seats need to be filled. This composition shift, in conjunction with recent market expectations of a higher-growth and higher-inflationary environment, may result in the Fed removing monetary accommodations at a rate faster than previously expected.
We believe the higher level of short-term rates likely in such a scenario is not necessarily a negative for agency MBS. The more immediate impact would come from an adjustment in the size of the Fed’s balance sheet. The Fed owns $2.4 trillion Treasury bonds and $1.74 trillion Agency MBS, which it has maintained at a stable level since October 2014 by reinvesting pay-downs in both markets. The Fed has stated it will continue the current reinvestment policy until sometime after short-rates have “normalized.” An earlier normalization of rates would likely also result in an earlier adjustment to the reinvestment policy. However, a number of factors might mitigate this risk of additional supply, including:
| • | A gradual decrease in investment activity beginning in 2018 or later |
| • | The market’s recent ability to absorb substantial supply in an orderly manner |
| • | The potential for a simultaneous tapering of Treasuries and MBS, which would mitigate the impact on MBS spreads |
We believe fundamentals for MBS are more positive. With rates well off the lows from earlier in the year, prepayment rates should drop sharply in the coming months, fully reversing the move from earlier in 2016. Additionally, the premia for pools with more attractive collateral characteristics have decreased, and specified pools may offer protection against wider generic mortgage spreads. We view this as an opportunity to buy cheap convexity, which should benefit from any uptick in volatility.
All this considered, we expect to see MBS spreads widen marginally over the course of 2017. However, the additional carry offered by MBS should more than offset the effect of wider spreads. With that, we would expect to see modest outperformance of MBS relative to similar-duration
40
Table of Contents
AMG Managers Amundi Intermediate Government Fund
Portfolio Manager’s Comments (continued)
Treasuries. Additional volatility should provide a good environment for active management to capitalize on market mispricing.
| 1 | Prior to October 1, 2016, the Fund was known as AMG Managers Intermediate Duration Government Fund. |
| 2 | Effective October 1, 2016, the shares of the Fund were reclassified and redesignated as Class S shares. |
This commentary reflects the viewpoints of the portfolio manager, Amundi Smith Breeden LLC as
of December 31, 2016, and is not intended as a forecast or guarantee of future results and are subject to change without notice.
CUMULATIVE TOTAL RETURN PERFORMANCE
AMG Managers Amundi Intermediate Government Fund’s (formerly AMG Managers Intermediate Duration Government Fund) cumulative total return is based on the daily change in net asset value (NAV), and assumes that all dividends and distributions were reinvested. The graph compares
a hypothetical $10,000 investment made in the AMG Managers Amundi Intermediate Government Fund’s Class S on December 31, 2006 to a $10,000 investment made in the benchmarks for the same time period. The graph and table do not reflect the deduction of taxes that a shareholder would pay on a Fund distribution or redemption of shares. The listed returns for the Fund are net of expenses and the returns for the index exclude expenses. Total returns would have been lower had certain expenses not been reduced.
41
Table of Contents
AMG Managers Amundi Intermediate Government Fund
Portfolio Manager’s Comments (continued)
CUMULATIVE TOTAL RETURN PERFORMANCE (continued)
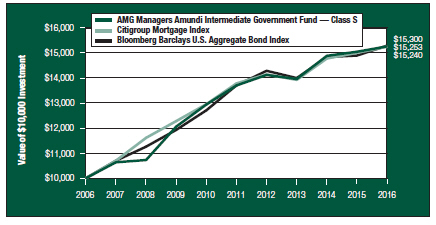
The table below shows the average annual total returns for the AMG Managers Amundi Intermediate Government Fund, Bloomberg Barclays U.S. Aggregate Bond Index and the Citigroup Mortgage Index for the same time periods ended December 31, 2016.
| One | Five | Ten | ||||||||||
| Average Annual Total Returns1 | Year | Years | Years | |||||||||
AMG Managers Amundi Intermediate Government Fund 2,3,4,5,6,7 | ||||||||||||
Class S8 | 1.42 | % | 2.18 | % | 4.31 | % | ||||||
Bloomberg Barclays U.S. Aggregate Bond Index9 | 2.65 | % | 2.23 | % | 4.34 | % | ||||||
Citigroup Mortgage Index10 | 1.59 | % | 2.04 | % | 4.30 | % | ||||||
The performance data shown represents past performance. Past performance is not a guarantee of future results. Current performance may be lower or higher than the performance data quoted. The investment return and principal value of an investment will fluctuate so that an investor’s shares, when redeemed, may be worth more or less than their original cost.
Investors should carefully consider the Fund’s investment objectives, risks, charges, and expenses before investing. For performance information through the most recent month end, current net asset values per share for the Fund and other information, please call (800) 835-3879 or visit our website at www.amgfunds.com for a free prospectus. Read it carefully before investing or sending money.
Distributed by AMG Distributors, Inc., member FINRA/SIPC.
| 1 | Total return equals income yield plus share price change and assumes reinvestment of all dividends and capital gain distributions. Returns are net of fees and may reflect offsets of Fund expenses as described in the prospectus. No adjustment has been made for taxes payable by shareholders on their reinvested dividends and capital gain distributions. Returns for periods greater than one year are annualized. The listed returns on the Fund are net of expenses and based on the published NAV as of December 31, 2016. All returns are in U.S. dollars ($). |
| 2 | From time to time the Fund’s advisor has waived its fees and/or absorbed Fund expenses, which has resulted in higher returns. |
| 3 | The Fund is subject to the risks associated with investments in debt securities, such as default risk and fluctuations in the perception of the debtor’s ability to pay its creditors. Changing interest rates may adversely affect the value of an investment. An increase in interest rates typically causes the value of bonds and other fixed income securities to fall. |
| 4 | To the extent that the Fund invests in asset- backed or mortgage-backed securities, its exposure to prepayment and extension risks may be greater than investments in other fixed income securities. |
| 5 | The Fund may invest in derivatives such as options and futures; the complexity and rapidly changing structure of derivatives markets may increase the possibility of market losses. |
| 6 | Many bonds have call provisions which allow the debtors to pay them back before maturity. This is especially true with mortgage securities, which can be paid back anytime. Typically debtors prepay their debt when it is to their advantage (when interest rates drop making a new loan at current rates more attractive), and thus likely to the disadvantage of bondholders, who may have to reinvest prepayment proceeds in securities with lower yields. Prepayment risk will vary depending on the provisions of the security and current interest rates relative to the interest rate of the debt. |
| 7 | Obligations of certain government agencies are not backed by the full faith and credit of the U.S. government. If one of these agencies defaulted on a loan, there is no guarantee that the U.S. government would provide financial support. Additionally, debt securities of the U.S. government may be affected by changing interest rates and subject to prepayment risk. |
| 8 | Effective October 1, 2016, the shares of the AMG Managers Amundi Intermediate Government Fund were reclassified and redesignated as Class S shares. |
| 9 | The Bloomberg Barclays U.S. Aggregate Bond Index is an index of the U.S. investment-grade fixed-rate bond market, including both government and corporate bonds. Unlike the Fund, the Bloomberg Barclays U.S. Aggregate Bond Index is unmanaged, is not available for investment, and does not incur expenses. |
| 10 | The Citigroup Mortgage Index includes all outstanding government sponsored fixed-rate mortgage-backed securities, weighted in proportion to their current market capitalization. The Index reflects no deductions for fees, expenses, or taxes. Unlike the Fund, the Citigroup Mortgage Index is unmanaged, is not available for investment, and does not incur expenses. |
Not FDIC insured, nor bank guaranteed. May lose value.
42
Table of Contents
AMG Managers Amundi Intermediate Government Fund
Fund Snapshots (unaudited)
December 31, 2016
PORTFOLIO BREAKDOWN
Category | AMG Managers Amundi Intermediate Government Fund* | |||
U.S. Government and Agency Obligations | 118.8 | % | ||
Asset-Backed Securities | 6.7 | % | ||
Mortgage-Backed Securities | 2.4 | % | ||
TBA Forward Sale Commitments | (10.8 | )% | ||
Other Assets and Liabilities | (17.1 | )% | ||
| * | As a percentage of net assets. |
Rating | AMG Managers Amundi Intermediate Government Fund*** | |||
U.S. Government and Agency Obligations | 92.9 | % | ||
Aaa | 6.8 | % | ||
Aa | 0.0 | %# | ||
Baa | 0.1 | % | ||
Ba & lower | 0.2 | % | ||
| *** | As a percentage of market value of fixed-income securities. |
| # | Less than 0.05%. |
TOP TEN HOLDINGS
Security Name | % of Net Assets | |||
FNMA, 3.500%, TBA 30 Years | 9.7 | % | ||
FHLMC Gold Pool, 4.000%, TBA 30 Years | 9.6 | |||
FNMA, 3.000%, TBA 30 Years | 6.4 | |||
FHLMC Gold Pool, 3.500%, TBA 30 Years | 6.0 | |||
FNMA, 4.000%, TBA 30 Years | 4.7 | |||
FNMA, 4.500%, TBA 30 Years | 4.6 | |||
FNMA, 3.000%, TBA 30 Years | 4.5 | |||
FNMA, 2.500%, TBA 30 Years | 3.3 | |||
FNMA, 4.000%, 09/01/55 | 1.8 | |||
Progress Residential Trust, Series 2015-SFR2, Class A, 2.740%, | ||||
06/12/32** | 1.8 | |||
|
| |||
Top Ten as a Group | 52.4 | % | ||
|
| |||
| ** | Top Ten Holdings as of June 30, 2016. |
Credit quality ratings shown above reflect the highest rating assigned by either Standard & Poor’s (“S&P”) or Moody’s Investors Service, Inc. (“Moody’s”). These rating agencies are independent, nationally recognized statistical rating organizations and are widely used. Investment grade ratings are credit ratings of BBB/Baa or higher. Below investment grade ratings are credit ratings of BB/Ba or lower. Investments designated N/R are not rated by either rating agency. Unrated investments do not necessarily indicate low credit quality. Credit quality ratings are subject to change.
Because a fund’s strategy may result in multiple investments in particular sectors of the economy, its performance may depend on the performance of those sectors and may fluctuate more widely than investments diversified across more sectors. For additional information on these and other risk considerations, please see the Fund’s prospectus.
Any sectors, industries, or securities discussed should not be perceived as investment recommendations. Mention of a specific security should not be considered a recommendation to buy or solicitation to sell that security. Specific securities mentioned in this report may have been sold from the Fund’s portfolio of investments by the time you receive this report.
43
Table of Contents
AMG Managers Amundi Intermediate Government Fund
Schedule of Portfolio Investments
December 31, 2016
| Principal Amount | Value | |||||||
Asset-Backed Securities—6.7% | ||||||||
American Homes 4 Rent, Series 2014-SFR1, Class A, 1.736%, 06/17/31 (01/17/17) (a)9,10 | $ | 1,135,483 | $ | 1,131,456 | ||||
Colony American Homes, | ||||||||
Series 2014-1A, Class A, 2.136%, 05/17/31 (01/17/17) (a)9 | 1,527,051 | 1,525,701 | ||||||
Series 2014-2A, Class A, 1.705%, 07/17/31 (01/17/17) (a)9 | 1,775,804 | 1,761,214 | ||||||
Invitation Homes Trust, | ||||||||
Series 2013-SFR1, Class A, 1.886%, 12/17/30 (01/17/17) (a)9,10 | 1,953,270 | 1,953,296 | ||||||
Series 2014-SFR1, Class A, 1.736%, 06/17/31 (01/17/17) (a)9 | 97,092 | 96,740 | ||||||
Progress Residential Trust, Series 2015-SFR2, Class A, 2.740%, 06/12/32 (a)10 | 2,970,740 | 2,943,564 | ||||||
SWAY Residential Trust, Series 2014-1, Class A, 2.036%, 01/17/32 (01/17/17) (a)9 | 1,653,284 | 1,654,356 | ||||||
Total Asset-Backed Securities (cost $11,055,003) | 11,066,327 | |||||||
Mortgage-Backed Securities—2.4% | ||||||||
American Home Mortgage Assets Trust, Series 2005-1, Class 1A1, 3.416%, 11/25/35 (02/25/17)9 | 59,786 | 51,001 | ||||||
American Home Mortgage Investment Trust, | ||||||||
Series 2004-1, Class 4A, 3.293%, 04/25/44 (02/25/17)9 | 99,993 | 92,954 | ||||||
Series 2005-1, Class 5A1, 3.278%, 06/25/45 (02/25/17)9 | 18,331 | 18,200 | ||||||
Banc of America Funding Trust, Series 2004-B, Class 1A2, 2.981%, 12/20/344 | 65,282 | 60,308 | ||||||
Bear Stearns Commercial Mortgage Securities Trust, Series 2007-PW16, Class A4, 5.711%, 06/11/404,10 | 1,426,332 | 1,427,790 | ||||||
GSMPS Mortgage Loan Trust, Series 2005-RP2, Class 1AF, 1.106%, 03/25/35 | 152,727 | 135,040 | ||||||
GSR Mortgage Loan Trust, Series 2004-5, Class 1A3, 2.530%, 05/25/34 (02/25/17)9 | 29,422 | 28,243 | ||||||
Harborview Mortgage Loan Trust, Series 2004-7, Class 2A2, 2.880%, 11/19/344 | 56,817 | 52,302 | ||||||
Morgan Stanley Capital I Trust, Series 2007-T27, Class A4, 5.643%, 06/11/424 | 1,738,798 | 1,758,483 | ||||||
Reperforming Loan REMIC Trust, Series 2004-R2, Class 1AF1, 1.176%, 11/25/34 (01/25/17) (a)7,9 | 87,363 | 75,735 | ||||||
Structured Asset Securities Corp., Series 2005-RF1, Class A, 1.106%, 03/25/35 | 179,130 | 150,200 | ||||||
Wells Fargo Mortgage Backed Securities Trust, Series 2007-16, Class 1A1, 6.000%, 12/28/37 | 134,768 | 139,358 | ||||||
Total Mortgage-Backed Securities (cost $4,179,187) | 3,989,614 | |||||||
U.S. Government and Agency Obligations—118.8% | ||||||||
Federal Home Loan Mortgage Corporation—29.2% | ||||||||
FHLMC, 2.802%, 11/01/33 (3/15/17)9,10 | 592,162 | 628,781 | ||||||
FHLMC Gold Pool, | ||||||||
3.000%, 06/01/45 | 1,628,054 | 1,621,698 | ||||||
3.500%, 04/01/32 to 05/01/4310 | 6,495,423 | 6,702,262 | ||||||
3.500%, TBA 30 years11,12 | 9,700,000 | 9,932,246 | ||||||
4.000%, 09/01/31 to 07/01/4410 | 4,909,794 | 5,179,555 | ||||||
4.000%, TBA 30 years11,12 | 15,200,000 | 15,946,046 | ||||||
4.500%, 02/01/20 to 09/01/4110 | 2,002,390 | 2,148,281 | ||||||
5.000%, 05/01/18 to 06/01/4110 | 2,649,260 | 2,888,319 | ||||||
5.500%, 11/01/17 to 01/01/3910 | 2,163,346 | 2,403,150 | ||||||
6.000%, 09/01/17 to 01/01/24 | 246,685 | 263,451 | ||||||
7.000%, 07/01/19 | 59,187 | 61,336 | ||||||
The accompanying notes are an integral part of these financial statements.
44
Table of Contents
AMG Managers Amundi Intermediate Government Fund
Schedule of Portfolio Investments (continued)
| Principal Amount | Value | |||||||
Federal Home Loan Mortgage Corporation—29.2% (continued) | ||||||||
FHLMC Gold Pool, | ||||||||
7.500%, 07/01/3410 | $ | 688,246 | $ | 817,613 | ||||
Total Federal Home Loan Mortgage Corporation | 48,592,738 | |||||||
Federal National Mortgage Association—63.1% | ||||||||
FNMA, | ||||||||
2.500%, 02/01/43 | 722,349 | 690,942 | ||||||
2.500%, TBA 30 years11,12 | 5,400,000 | 5,408,543 | ||||||
2.694%, 06/01/34 (2/25/17)9,10 | 512,445 | 530,451 | ||||||
2.842%, 08/01/34 (2/25/17)9 | 231,663 | 245,556 | ||||||
3.000%, 04/01/45 | 179,500 | 179,171 | ||||||
3.000%, TBA 30 years11,12 | 10,700,000 | 10,613,436 | ||||||
3.000%, TBA 30 years11,12 | 7,500,000 | 7,450,604 | ||||||
3.500%, 05/01/42 to 11/01/4610 | 14,322,655 | 14,731,653 | ||||||
3.500%, TBA 30 years11,12 | 15,810,000 | 16,204,015 | ||||||
3.500%, TBA 30 years11,12 | 1,400,000 | 1,432,730 | ||||||
4.000%, 01/01/26 to 09/01/5510 | 13,607,995 | 14,364,530 | ||||||
4.000%, TBA 30 years11,12 | 2,600,000 | 2,733,402 | ||||||
4.000%, TBA 30 years11,12 | 7,500,000 | 7,874,268 | ||||||
4.500%, 11/01/26 to 06/01/4610 | 5,899,814 | 6,362,987 | ||||||
4.500%, TBA 30 years11,12 | 7,200,000 | 7,735,359 | ||||||
4.750%, 07/01/34 to 09/01/34 | 235,948 | 257,044 | ||||||
5.000%, 06/01/18 to 08/01/40 | 2,446,417 | 2,704,640 | ||||||
5.500%, 03/01/17 to 08/01/4110 | 2,742,954 | 3,063,844 | ||||||
6.000%, 08/01/17 to 06/01/3910 | 1,093,443 | 1,204,911 | ||||||
6.500%, 07/01/32 | 61,686 | 63,041 | ||||||
7.000%, 11/01/2210 | 302,872 | 324,860 | ||||||
FNMA REMICS, | ||||||||
Series 1994-55, Class H, 7.000%, 03/25/2410 | 428,108 | 465,864 | ||||||
Series 2005-13, Class AF, 1.156%, 03/25/35 (1/25/17)9,10 | 253,762 | 253,290 | ||||||
FNMA REMICS Whole Loan, Series 2003-W4, Class 4A, 6.790%, 10/25/424 | 59,344 | 68,262 | ||||||
Total Federal National Mortgage Association | 104,963,403 | |||||||
Government National Mortgage Association—25.4% | ||||||||
GNMA, | ||||||||
3.000%, 11/15/42 to 06/20/45 | 3,744,210 | 3,797,393 | ||||||
3.000%, TBA 30 years11,12 | 2,000,000 | 2,025,039 | ||||||
3.500%, 08/15/43 to 11/20/4510 | 9,125,546 | 9,539,876 | ||||||
4.000%, 06/20/43 to 12/20/4610 | 11,836,642 | 12,716,893 | ||||||
4.000%, TBA 30 years11,12 | 1,300,000 | 1,380,234 | ||||||
4.000%, TBA 30 years11,12 | 700,000 | 743,381 | ||||||
The accompanying notes are an integral part of these financial statements.
45
Table of Contents
AMG Managers Amundi Intermediate Government Fund
Schedule of Portfolio Investments (continued)
| Principal Amount | Value | |||||||
Government National Mortgage Association—25.4% (continued) | ||||||||
GNMA, | ||||||||
4.500%, 05/15/39 to 02/15/4610 | $ | 5,368,496 | $ | 5,847,085 | ||||
5.000%, 12/15/35 to 12/15/4510 | 4,565,691 | 5,050,466 | ||||||
5.500%, 10/15/39 to 11/15/3910 | 1,050,449 | 1,185,725 | ||||||
7.500%, 09/15/28 to 11/15/31 | 20,580 | 21,374 | ||||||
Total Government National Mortgage Association | 42,307,466 | |||||||
Interest Only Strips—1.1% | ||||||||
FHLMC, Series 212, Class IO, 6.000%, 05/01/317 | 1,082 | 235 | ||||||
FHLMC REMICS, | ||||||||
Series 2380, Class SI, 7.196%, 06/15/31 (1/15/17)7,9 | 9,494 | 2,111 | ||||||
Series 2922, Class SE, 6.046%, 02/15/35 (1/15/17)9 | 94,260 | 18,630 | ||||||
Series 2934, Class HI, 5.000%, 02/15/20 | 28,173 | 1,490 | ||||||
Series 2934, Class KI, 5.000%, 02/15/20 | 19,403 | 949 | ||||||
Series 2965, Class SA, 5.346%, 05/15/32 (1/15/17)9 | 181,250 | 26,277 | ||||||
Series 2967, Class JI, 5.000%, 04/15/20 | 53,826 | 2,951 | ||||||
Series 2980, Class SL, 5.996%, 11/15/34 (1/15/17)9 | 128,317 | 31,258 | ||||||
Series 3065, Class DI, 5.916%, 04/15/35 (1/15/17)9 | 243,652 | 46,045 | ||||||
Series 3308, Class S, 6.496%, 03/15/32 (1/15/17)9 | 176,998 | 35,321 | ||||||
Series 3424, Class XI, 5.866%, 05/15/36 (1/15/17)9 | 209,021 | 37,304 | ||||||
Series 3489, Class SD, 7.096%, 06/15/32 (1/15/17)9 | 102,338 | 21,391 | ||||||
Series 3685, Class EI, 5.000%, 03/15/19 | 84,513 | 1,827 | ||||||
Series 3731, Class IO, 5.000%, 07/15/19 | 43,021 | 1,003 | ||||||
Series 3882, Class AI, 5.000%, 06/15/26 | 97,690 | 4,252 | ||||||
Series 4395, Class TI, 4.000%, 05/15/26 | 651,305 | 68,321 | ||||||
FNMA, | ||||||||
Series 222, Class 2, 7.000%, 06/25/237 | 5,511 | 919 | ||||||
Series 343, Class 21, 4.000%, 09/25/187 | 28,901 | 980 | ||||||
Series 343, Class 22, 4.000%, 11/25/187 | 15,795 | 538 | ||||||
Series 351, Class 3, 5.000%, 04/25/34 | 57,417 | 10,121 | ||||||
Series 351, Class 4, 5.000%, 04/25/34 | 33,374 | 6,050 | ||||||
Series 351, Class 5, 5.000%, 04/25/34 | 27,932 | 5,063 | ||||||
FNMA REMICS, | ||||||||
Series 2004-49, Class SQ, 6.294%, 07/25/34 (1/25/17)9 | 81,142 | 14,765 | ||||||
Series 2004-51, Class SX, 6.364%, 07/25/34 (1/25/17)9 | 103,567 | 20,538 | ||||||
Series 2004-64, Class SW, 6.294%, 08/25/34 (1/25/17)9 | 323,142 | 61,921 | ||||||
Series 2005-12, Class SC, 5.994%, 03/25/35 (1/25/17)9 | 142,772 | 25,260 | ||||||
Series 2005-45, Class SR, 5.964%, 06/25/35 (1/25/17)9 | 258,255 | 48,130 | ||||||
Series 2005-65, Class KI, 6.244%, 08/25/35 (1/25/17)9,10 | 591,893 | 113,136 | ||||||
Series 2005-89, Class S, 5.944%, 10/25/35 (1/25/17)9 | 593,072 | 106,824 | ||||||
Series 2006-3, Class SA, 5.394%, 03/25/36 (1/25/17)9 | 122,721 | 20,255 | ||||||
The accompanying notes are an integral part of these financial statements.
46
Table of Contents
AMG Managers Amundi Intermediate Government Fund
Schedule of Portfolio Investments (continued)
| Principal Amount | Value | |||||||
Interest Only Strips—1.1% (continued) | ||||||||
FNMA REMICS, | ||||||||
Series 2007-75, Class JI, 5.789%, 08/25/37 (1/25/17)9 | $ | 118,254 | $ | 21,571 | ||||
Series 2008-86, Class IO, 4.500%, 03/25/23 | 94,485 | 2,872 | ||||||
Series 2009-31, Class PI, 5.000%, 11/25/38 | 741,573 | 118,942 | ||||||
Series 2010-121, Class IO, 5.000%, 10/25/25 | 61,219 | 2,181 | ||||||
Series 2010-37, Class GI, 5.000%, 04/25/257 | 59,708 | 1,390 | ||||||
Series 2010-65, Class IO, 5.000%, 09/25/20 | 190,942 | 9,127 | ||||||
Series 2011-124, Class IC, 3.500%, 09/25/21 | 204,451 | 8,871 | ||||||
Series 2011-69, Class AI, 5.000%, 05/25/18 | 92,731 | 1,630 | ||||||
Series 2011-88, Class WI, 3.500%, 09/25/26 | 270,085 | 28,595 | ||||||
Series 2012-126, Class SJ, 4.244%, 11/25/42 (1/25/17)9 | 618,828 | 100,502 | ||||||
GNMA, | ||||||||
Series 2011-157, Class SG, 5.861%, 12/20/41 (1/20/17)9 | 805,568 | 182,271 | ||||||
Series 2011-167, Class IO, 5.000%, 12/16/20 | 115,876 | 3,802 | ||||||
Series 2011-32, Class KS, 10.685%, 06/16/34 (1/16/17)9 | 189,609 | 25,691 | ||||||
Series 2011-94, Class IS, 5.993%, 06/16/36 (1/16/17)9 | 195,933 | 26,930 | ||||||
Series 2012-103, Class IB, 3.500%, 04/20/40 | 207,328 | 23,800 | ||||||
Series 2012-140, Class IC, 3.500%, 11/20/42 | 560,784 | 113,887 | ||||||
Series 2012-34, Class KS, 5.343%, 03/16/42 (1/16/17)9 | 377,540 | 94,842 | ||||||
Series 2012-69, Class QI, 4.000%, 03/16/41 | 249,335 | 39,222 | ||||||
Series 2014-173, Class AI, 4.000%, 11/20/38 | 290,294 | 26,491 | ||||||
Series 2016-108, Class QI, 4.000%, 08/20/46 | 287,824 | 74,066 | ||||||
Series 2016-145, Class UI, 3.500%, 10/20/46 | 488,971 | 101,593 | ||||||
Series 2016-46, Class JI, 4.500%, 04/20/46 | 279,739 | 62,294 | ||||||
Series 2016-81, Class IO, 4.000%, 06/20/46 | 497,895 | 96,587 | ||||||
Total Interest Only Strips | 1,901,022 | |||||||
Total U.S. Government and Agency Obligations (cost $196,668,661) | 197,764,629 | |||||||
The accompanying notes are an integral part of these financial statements.
47
Table of Contents
AMG Managers Amundi Intermediate Government Fund
Schedule of Portfolio Investments (continued)
| Principal Amount | Value | |||||||
Short-Term Investments—27.7% | ||||||||
U.S. Treasury Bills—0.1% | ||||||||
U. S. Treasury Bills, 0.11%, 03/02/1713,14 | $ | 110,000 | $ | 109,914 | ||||
| Shares | ||||||||
Other Investment Companies—27.6%3 | ||||||||
Dreyfus Government Cash Management Fund, Institutional Class Shares, 0.45%10 | 16,891,550 | 16,891,550 | ||||||
JPMorgan U.S. Government Money Market Fund, Capital Shares, 0.44%10 | 29,134,433 | 29,134,433 | ||||||
Total Other Investment Companies | 46,025,983 | |||||||
Total Short-Term Investments | 46,135,897 | |||||||
Total Investments—155.6% (cost $258,038,753) | 258,956,467 | |||||||
Other Assets, less Liabilities—(55.6)% | (92,545,640 | ) | ||||||
Net Assets—100.0% | $ | 166,410,827 | ||||||
The accompanying notes are an integral part of these financial statements.
48
Table of Contents
AMG Managers Amundi Short Duration Government Fund
Portfolio Manager’s Comments (unaudited)
THE YEAR IN REVIEW
During the year ended December 31, 2016, the AMG Managers Amundi Short Duration Government Fund1 Class S2 (the “Fund”) returned 1.1%, while the BofA Merrill Lynch 6-Month U.S. Treasury Bill Index returned 0.7%.
2016 included a number of notable events. Expectations for a U.S. Federal Reserve (the “Fed”) rate hike early in the year proved to be premature, as market pricing of inflation decreased by the end of the first quarter. The surprising vote for “Brexit” highlighted the transition of uncertainty towards the political realm. This theme of political uncertainty persisted into November, as the Republican party won the U.S. presidential election, along with the majority of the House and Senate, leading market participants to shift their focus from the Fed and monetary policy to the fiscal policy of the new administration. By the end of the year, markets generally reacted positively with increases in growth expectations.
Agency mortgage-backed securities (“MBS”) experienced a difficult environment to begin the first quarter, as intermediate-term Treasuries rallied. The FNMA par coupon had a difficult time keeping up with the move in Treasury rates, but was still 45 basis points lower during the quarter. Interest-rate volatility increased as pressure in credit sectors created fluctuations in the pricing of Treasury securities. Agency MBS spreads widened to the swap curve in the first part of the quarter, but tightened during March, to end the quarter slightly wider than where they started.
Agency MBS did well for much of the second quarter, but had some trouble keeping pace with Treasury securities in late June. Agency MBS weathered the immediate aftermath of Brexit relatively well. Initially, we saw spreads widen in light of the yield drop, but the market remained orderly and trading volumes were heavy. The drop in rates elevated prepayment risks, which led us to focus on securities with attractive collateral characteristics that would exhibit lower prepayment rates.
September was a solid month for Agency MBS as interest rates stabilized well above the lows observed earlier in the third quarter. Higher coupon
MBS led the way, but the support of the Fed repurchase activity drove solid performance in production coupons as well. The ease in interest rates during the quarter comforted investors that prepayment rates would remain relatively constrained, which ushered certain buyers back into the market. While prepayment rates increased after the bond rally in the summer, prepayment levels remained well below the levels seen at the peaks in 2012/2013, despite similar mortgage rates, due to the fact that most borrowers who were inclined to refinance had already done so.
Agency MBS continued to struggle through the early part of December, but a bond rally near the end of the year helped to calm duration-extension fears. The post-election move in rates was significant, but largely just offset the Brexit rally that occurred earlier in the year. Overall, the asset class performed reasonably well, given the large rate moves during the year.
Most of the Fund’s outperformance for 2016 was attributable to positioning in Agency fixed-rate MBS (“FRM’s”). Specifically, the Fund was positioned relatively conservatively, with asset purchases focused primarily in sectors in which the Fed was not involved. For most of the year, we added positions in collateralized mortgage obligations (“CMO’s”) and seasoned 15-year and 30-year fixed-rate mortgages at attractive spread levels. Agency CMOs were the second-largest contributor to outperformance for the year, contributing positively to excess returns for three of the four quarters. The Fund’s positioning in Agency Interest-Only (“IO’s”), Agency Adjustable-rate mortgages (“ARM’s”), commercial mortgage-backed securities (“CMBS”), Consumer asset-backed securities (“ABS”) and Treasury inflation-protected securities (“TIPS”) all moderately contributed to the positive performance for the year.
At the end of the year, 30-year Agency FRMs were the largest component of the Fund, increasing from 19% to 33% during the year. We decreased our exposure to 15-year Agency FRMs by 10%, to end the year with 14% weighting in the sector. We moderately increased our holdings in Agency ARMs to 19%. Additionally, we completely removed the modest remaining CMBS holdings by
the end the year. We continue to view Agency MBS as an attractive alternative to Treasuries due to the additional spread offered.
LOOKING FORWARD
We enter 2017 with a neutral view on MBS. Spreads seem reasonable relative to historical levels, but the outlook is more opaque than it was a year ago. Our primary concern is a potential shift in Fed policy, which could be a result of the Federal Open Market Committee (“FOMC”) reacting to more aggressive fiscal policy or from a likely more hawkish composition as the new administration makes appointments. At this time, two empty Board of Governor’s seats need to be filled. This composition shift, in conjunction with recent market expectations of a higher-growth and higher-inflationary environment, may result in the Fed removing monetary accommodations at a rate faster than previously expected.
We believe the higher level of short-term rates likely in such a scenario is not necessarily a negative for agency MBS. The more immediate impact would come from an adjustment in the size of the Fed’s balance sheet. The Fed owns $2.4 trillion Treasury bonds and $1.74 trillion Agency MBS, which it has maintained at a stable level since October 2014, by reinvesting pay-downs in both markets. The Fed has stated it will continue the current reinvestment policy until sometime after short-rates have “normalized.” An earlier normalization of rates would likely also result in an earlier adjustment to the reinvestment policy. However, a number of factors might mitigate this risk of additional supply, including:
| • | A gradual decrease in investment activity beginning in 2018 or later |
| • | The market’s recent ability to absorb substantial supply in an orderly manner |
| • | And the potential for a simultaneous tapering of Treasuries and MBS, which would mitigate the impact on MBS spreads |
We believe fundamentals for MBS are more positive. With rates well off the lows from earlier in the year, prepayment rates should drop sharply in the coming months, fully reversing the move from
49
Table of Contents
AMG Managers Amundi Short Duration Government Fund
Portfolio Manager’s Comments (continued)
earlier in 2016. Additionally, the premia for pools with more attractive collateral characteristics have decreased, and specified pools may offer protection against wider generic mortgage spreads. We view this as an opportunity to buy cheap convexity, which should benefit from any uptick in volatility.
All this considered, we expect to see MBS spreads widen marginally over the course of 2017. However, the additional carry offered by MBS should more than offset the effect of wider spreads. With that, we would expect to see modest outperformance of MBS relative to similar-duration Treasuries. Additional volatility should provide a good environment for active management to capitalize on market mispricing.
| 1 | Prior to October 1, 2016, the Fund was known as AMG Managers Short Duration Government Fund. |
| 2 | Effective October 1, 2016, the shares of the Fund were reclassified and redesignated as Class S shares. |
This commentary reflects the viewpoints of the portfolio manager, Amundi Smith Breeden LLC, as of December 31, 2016 and is not intended as a forecast or guarantee of future results and are subject to change without notice.
CUMULATIVE TOTAL RETURN PERFORMANCE
AMG Managers Amundi Short Duration Government Fund’s (formerly AMG Managers Short Duration Government Fund) cumulative total
return is based on the daily change in net asset value (NAV), and assumes that all dividends and distributions were reinvested. This graph compares a hypothetical $10,000 investment made in the AMG Managers Amundi Short Duration Government Fund’s Class S on December 31, 2006 to a $10,000 investment made in the BofA Merrill Lynch 6-Month U.S. Treasury Bill Index for the same time period. The graph and table do not reflect the deduction of taxes that a shareholder would pay on a Fund distribution or redemption of shares. The listed returns for the Fund are net of expenses and the returns for the index exclude expenses. Total returns would have been lower had certain expenses not been reduced.
50
Table of Contents
AMG Managers Amundi Short Duration Government Fund
Portfolio Manager’s Comments (continued)
CUMULATIVE TOTAL RETURN PERFORMANCE (continued)
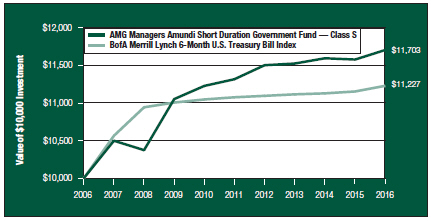
The table below shows the average annual total returns for the AMG Managers Amundi Short Duration Government Fund and the BofA Merrill Lynch 6-Month U.S. T- Bill Index for the same time periods ended December 31, 2016.
| One | Five | Ten | ||||||||||
| Average Annual Total Returns1 | Year | Years | Years | |||||||||
AMG Managers Amundi Short Duration Government Fund 2,3,4,5,6,7 | ||||||||||||
Class S 8 | 1.10 | % | 0.68 | % | 1.59 | % | ||||||
BofA Merrill Lynch 6-Month U.S. T-Bill Index9 | 0.67 | % | 0.27 | % | 1.16 | % | ||||||
The performance data shown represents past performance. Past performance is not a guarantee of future results. Current performance may be lower or higher than the performance data quoted. The investment return and principal value of an investment will fluctuate so that an investor’s shares, when redeemed, may be worth more or less than their original cost.
Investors should carefully consider the Fund’s investment objectives, risks, charges, and expenses before investing. For performance information through the most recent month end, current net asset values per share for the Fund and other information, please call (800) 835-3879 or visit our website at www.amgfunds.com for a free prospectus. Read it carefully before investing or sending money.
Distributed by AMG Distributors, Inc., member FINRA/SIPC.
| 1 | Total return equals income yield plus share price change and assumes reinvestment of all dividends and capital gain distributions. Returns are net of fees and may reflect offsets of Fund expenses as described in the prospectus. No adjustment has been made for taxes payable by shareholders on their reinvested dividends and capital gain distributions. Returns for periods greater than one year are annualized. The listed returns on the Fund are net of expenses and based on the published NAV as of December 31, 2016. All returns are in U.S. dollars ($). |
| 2 | From time to time the Fund’s advisor has waived its fees and/or absorbed Fund expenses, which has resulted in higher returns. |
| 3 | The Fund is subject to the risks associated with investments in debt securities, such as default risk and fluctuations in the perception of the debtors’ ability to pay its creditors. Changing interest rates may adversely affect the value of an investment. An increase in interest rates typically causes the value of bonds and other fixed-income securities to fall. |
| 4 | The Fund may invest in derivatives such as options and futures; the complexity and rapidly changing structure of derivatives markets may increase the possibility of market losses. |
| 5 | Many bonds have call provisions which allow the debtors to pay them back before maturity. This is especially true with mortgage securities, which can be paid back anytime. Typically debtors prepay their debt when it is to their advantage (when interest rates drop making a new loan at current rates more attractive), and thus likely to the disadvantage of bondholders, who may have to reinvest prepayment proceeds in securities with lower yields. Prepayment risk will vary depending on the provisions of the security and current interest rates relative to the interest rate of the debt. |
| 6 | To the extent that the Fund invests in asset- backed or mortgage-backed securities, its exposure to prepayment and extension risks may be greater than investments in other fixed income securities. |
| 7 | Obligations of certain government agencies are not backed by the full faith and credit of the U.S. government. If one of these agencies defaulted on a loan, there is no guarantee that the U.S. government would provide financial support. Additionally, debt securities of the U.S. government may be affected by changing interest rates and subject to prepayment risk. |
| 8 | Effective October 1, 2016, the shares of the AMG Managers Amundi Short Duration Government Fund were reclassified and redesignated as Class S shares. |
| 9 | The BofA Merrill Lynch 6-Month U.S. T-Bill Index is an unmanaged index that measures returns of six-month Treasury Bills. Unlike the Fund, the BofA Merrill Lynch 6-Month T-Bill Index is unmanaged, is not available for investment, and does not incur expenses. |
Not FDIC insured, nor bank guaranteed. May lose value.
51
Table of Contents
AMG Managers Amundi Short Duration Government Fund
Fund Snapshots (unaudited)
December 31, 2016
PORTFOLIO BREAKDOWN
Category | AMG Managers Amundi Short Duration Government Fund* | |||
U.S. Government and Agency Obligations | 80.9 | % | ||
Asset-Backed Securities | 10.5 | % | ||
TBA Forward Sale Commitments | (2.6 | )% | ||
Other Assets and Liabilities | 11.2 | % | ||
| * | As a percentage of net assets. |
Rating | AMG Managers Amundi Short Duration Government Fund*** | |||
U.S. Government and Agency Obligations | 88.5 | % | ||
Aaa | 11.5 | % | ||
| *** | As a percentage of market value of fixed-income securities. |
TOP TEN HOLDINGS
Security Name | % of Net Assets | |||
FHLB, 0.02%, 01/06/17 | 6.6 | % | ||
FNMA, 3.500%, 11/01/30** | 4.0 | |||
GNMA, 6.000%, 01/15/36** | 3.1 | |||
FNMA, 3.000%, TBA 15 years | 2.5 | |||
FNMA, 5.500%, 05/01/34** | 2.2 | |||
FNMA, 4.000%, 02/01/41** | 2.2 | |||
FNMA, 2.811%, 04/01/37** | 2.1 | |||
FNMA, 4.500%, 04/01/35** | 2.1 | |||
FHLMC Gold Pool, 4.000%,12/01/44 | 1.9 | |||
FNMA, 5.500%, 08/01/41** | 1.8 | |||
|
| |||
Top Ten as a Group | 28.5 | % | ||
|
| |||
| ** | Top Ten Holdings as of June 30, 2016. |
Credit quality ratings shown above reflect the highest rating assigned by either Standard & Poor’s (“S&P”) or Moody’s Investors Service, Inc. (“Moody’s”). These rating agencies are independent, nationally recognized statistical rating organizations and are widely used. Investment grade ratings are credit ratings of BBB/Baa or higher. Below investment grade ratings are credit ratings of BB/Ba or lower. Investments designated N/R are not rated by either rating agency. Unrated investments do not necessarily indicate low credit quality. Credit quality ratings are subject to change.
Because a fund’s strategy may result in multiple investments in particular sectors of the economy, its performance may depend on the performance of those sectors and may fluctuate more widely than investments diversified across more sectors. For additional information on these and other risk considerations, please see the Fund’s prospectus.
Any sectors, industries, or securities discussed should not be perceived as investment recommendations. Mention of a specific security should not be considered a recommendation to buy or solicitation to sell that security. Specific securities mentioned in this report may have been sold from the Fund’s portfolio of investments by the time you receive this report.
52
Table of Contents
AMG Managers Amundi Short Duration Government Fund
Schedule of Portfolio Investments
December 31, 2016
| Principal Amount | Value | |||||||
Asset-Backed Securities—10.5% | ||||||||
American Homes 4 Rent, Series 2014-SFR1, Class A, 1.736%, 06/17/31 (01/17/17) (a)9 | $ | 1,653,263 | $ | 1,647,400 | ||||
AMSR Trust, Series 2016-SFR1, Class A, 2.136%, 11/17/33 (01/17/17) (a)9 | 3,200,000 | 3,200,145 | ||||||
Capital Auto Receivables Asset Trust, Series 2013-4, Class D, 3.220%, 05/20/19 | 1,080,000 | 1,094,193 | ||||||
Colony American Homes, | ||||||||
Series 2014-1A, Class A, 2.136%, 05/17/31 (01/17/17) (a)9 | 3,430,064 | �� | 3,427,031 | |||||
Series 2014-2A, Class A, 1.705%, 07/17/31 (01/17/17) (a)9 | 1,694,292 | 1,680,371 | ||||||
Drive Auto Receivables Trust, | ||||||||
Series 2015-AA, Class C, 3.060%, 05/17/21 (a) | 1,335,000 | 1,348,119 | ||||||
Series 2015-BA, Class C, 2.760%, 07/15/21 (a) | 365,000 | 367,326 | ||||||
Series 2015-DA, Class B, 2.590%, 12/16/19 (a) | 474,922 | 476,525 | ||||||
Invitation Homes Trust, | ||||||||
Series 2013-SFR1, Class A, 1.886%, 12/17/30 (01/17/17) (a)9 | 987,450 | 987,463 | ||||||
Series 2014-SFR1, Class A, 1.736%, 06/17/31 (01/17/17) (a)9 | 970,924 | 967,397 | ||||||
Santander Drive Auto Receivables Trust, | ||||||||
Series 2012-4, Class D, 3.500%, 06/15/18 | 2,625,903 | 2,630,681 | ||||||
Series 2012-6, Class D, 2.520%, 09/17/18 | 3,032,725 | 3,036,755 | ||||||
Series 2013-4, Class D, 3.920%, 01/15/20 | 1,290,000 | 1,317,395 | ||||||
Series 2014-1, Class C, 2.360%, 04/15/20 | 258,195 | 259,286 | ||||||
SWAY Residential Trust, Series 2014-1, Class A, 2.036%, 01/17/32 (01/17/17) (a)9 | 2,142,421 | 2,143,811 | ||||||
Total Asset-Backed Securities (cost $24,554,532) | 24,583,898 | |||||||
U.S. Government and Agency Obligations—80.9% | ||||||||
Federal Home Loan Mortgage Corporation—20.7% | ||||||||
FHLMC, | ||||||||
2.550%, 11/01/33 (03/15/17)9 | 716,518 | 748,682 | ||||||
2.725%, 11/01/33 (03/15/17)9 | 743,568 | 791,705 | ||||||
2.725%, 10/01/33 (03/15/17)9 | 742,791 | 779,500 | ||||||
2.728%, 05/01/34 (03/15/17)9 | 1,537,943 | 1,625,049 | ||||||
2.737%, 10/01/33 (03/15/17)9 | 1,270,925 | 1,339,537 | ||||||
2.740%, 10/01/28 (03/15/17)9 | 24,637 | 26,002 | ||||||
2.786%, 04/01/34 (03/15/17)9 | 496,185 | 523,208 | ||||||
2.802%, 12/01/33 (03/15/17)9 | 1,204,425 | 1,267,344 | ||||||
2.881%, 03/01/34 (03/15/17)9 | 2,023,385 | 2,132,650 | ||||||
2.999%, 02/01/23 (03/15/17)9 | 107,188 | 112,440 | ||||||
3.001%, 09/01/33 (03/15/17)9 | 1,583,304 | 1,673,193 | ||||||
3.091%, 06/01/35 (03/15/17)9 | 537,069 | 569,410 | ||||||
3.272%, 05/01/35 (03/15/17)9 | 861,547 | 916,953 | ||||||
FHLMC Gold Pool, | ||||||||
3.000%, 04/01/31 | 2,783,924 | 2,861,681 | ||||||
4.000%, 12/01/44 | 4,178,909 | 4,393,747 | ||||||
The accompanying notes are an integral part of these financial statements.
53
Table of Contents
AMG Managers Amundi Short Duration Government Fund
Schedule of Portfolio Investments (continued)
| Principal Amount | Value | |||||||
Federal Home Loan Mortgage Corporation—20.7% (continued) | ||||||||
FHLMC Gold Pool, | ||||||||
4.500%, 05/01/19 to 03/01/42 | $ | 11,826,840 | $ | 12,681,141 | ||||
5.000%, 10/01/18 to 02/01/38 | 3,023,191 | 3,244,915 | ||||||
5.500%, 12/01/32 to 08/01/40 | 6,610,799 | 7,418,046 | ||||||
6.000%, 02/01/22 to 01/01/24 | 2,951,546 | 3,161,627 | ||||||
6.500%, 03/01/18 to 10/01/23 | 170,138 | 180,651 | ||||||
7.000%, 06/01/17 to 07/01/19 | 54,507 | 56,334 | ||||||
7.500%, 04/01/29 to 03/01/33 | 210,813 | 244,723 | ||||||
FHLMC REMICS, | ||||||||
Series 2427, Class LW, 6.000%, 03/15/17 | 6,689 | 6,752 | ||||||
Series 2627, Class BM, 4.500%, 06/15/18 | 42,215 | 42,933 | ||||||
Series 2631, Class PD, 4.500%, 06/15/18 | 14,270 | 14,533 | ||||||
Series 2668, Class AZ, 4.000%, 09/15/18 | 256,177 | 259,506 | ||||||
Series 2683, Class JB, 4.000%, 09/15/18 | 161,237 | 163,114 | ||||||
Series 2786, Class BC, 4.000%, 04/15/19 | 67,133 | 68,597 | ||||||
Series 2809, Class UC, 4.000%, 06/15/19 | 70,196 | 71,517 | ||||||
Series 2877, Class PA, 5.500%, 07/15/33 | 57,538 | 58,594 | ||||||
Series 2935, Class LM, 4.500%, 02/15/35 | 157,019 | 158,697 | ||||||
Series 3033, Class CI, 5.500%, 01/15/35 | 97,980 | 99,751 | ||||||
Series 3535, Class CA, 4.000%, 05/15/24 | 49,709 | 50,475 | ||||||
Series 3609, Class LA, 4.000%, 12/15/24 | 212,047 | 216,582 | ||||||
Series 3632, Class AG, 4.000%, 06/15/38 | 170,102 | 175,132 | ||||||
Series 3653, Class JK, 5.000%, 11/15/38 | 162,998 | 170,857 | ||||||
Series 3756, Class DA, 1.200%, 11/15/18 | 197,312 | 197,029 | ||||||
Series 3798, Class BD, 2.500%, 06/15/24 | 30,808 | 30,796 | ||||||
Series 3818, Class UA, 1.350%, 02/15/17 | 486 | 486 | ||||||
Series 3827, Class CA, 1.500%, 04/15/17 | 2,830 | 2,830 | ||||||
Series 3846, Class CK, 1.500%, 09/15/20 | 26,090 | 26,085 | ||||||
Total Federal Home Loan Mortgage Corporation | 48,562,804 | |||||||
Federal National Mortgage Association—52.7% | ||||||||
FNMA, | ||||||||
2.414%, 01/01/34 (2/25/17)9 | 690,104 | 725,182 | ||||||
2.433%, 02/01/33 (2/25/17)9 | 854,517 | 889,380 | ||||||
2.527%, 08/01/33 (2/25/17)9 | 373,681 | 389,784 | ||||||
2.585%, 09/01/33 (2/25/17)9 | 257,603 | 270,613 | ||||||
2.636%, 03/01/34 (2/25/17)9 | 199,283 | 209,731 | ||||||
2.647%, 05/01/33 (2/25/17)9 | 1,279,174 | 1,343,728 | ||||||
2.675%, 09/01/33 (2/25/17)9 | 837,621 | 887,708 | ||||||
2.694%, 06/01/34 (2/25/17)9 | 642,910 | 665,500 | ||||||
2.721%, 12/01/34 (2/25/17)9 | 2,004,113 | 2,122,972 | ||||||
The accompanying notes are an integral part of these financial statements.
54
Table of Contents
AMG Managers Amundi Short Duration Government Fund
Schedule of Portfolio Investments (continued)
| Principal Amount | Value | |||||||
Federal National Mortgage Association—52.7% (continued) | ||||||||
FNMA, | ||||||||
2.757%, 01/01/36 (2/25/17)9 | $ | 38,428 | $ | 40,719 | ||||
2.783%, 01/01/33 (2/25/17)9 | 916,449 | 965,588 | ||||||
2.791%, 01/01/34 (2/25/17)9 | 1,431,388 | �� | 1,510,389 | |||||
2.802%, 06/01/33 (2/25/17)9 | 289,679 | 304,463 | ||||||
2.814%, 04/01/37 (2/25/17)9,10 | 4,758,338 | 5,019,351 | ||||||
2.823%, 05/01/34 (2/25/17)9 | 1,621,715 | 1,712,199 | ||||||
2.842%, 08/01/34 (2/25/17)9 | 289,579 | 306,944 | ||||||
2.869%, 04/01/34 (2/25/17)9 | 440,858 | 466,932 | ||||||
2.869%, 12/01/34 (2/25/17)9 | 1,883,340 | 1,989,358 | ||||||
2.872%, 10/01/35 (2/25/17)9 | 1,191,367 | 1,250,394 | ||||||
2.872%, 11/01/34 (2/25/17)9 | 2,673,237 | 2,834,003 | ||||||
2.911%, 04/01/34 (2/25/17)9 | 501,286 | 530,456 | ||||||
2.911%, 01/01/36 (2/25/17)9 | 2,991,420 | 3,173,029 | ||||||
2.962%, 07/01/34 (2/25/17)9 | 1,104,114 | 1,168,105 | ||||||
2.980%, 06/01/35 (2/25/17)9 | 105,384 | 112,156 | ||||||
3.000%, TBA 15 years11,12 | 5,700,000 | 5,849,180 | ||||||
3.047%, 06/01/34 (2/25/17)9 | 1,798,176 | 1,895,975 | ||||||
3.070%, 08/01/35 (2/25/17)9 | 1,171,254 | 1,238,436 | ||||||
3.077%, 12/01/33 (2/25/17)9 | 424,612 | 443,467 | ||||||
3.500%, 11/01/3010 | 8,846,409 | 9,316,317 | ||||||
4.000%, 10/01/21 to 06/01/42 | 6,775,470 | 7,158,472 | ||||||
4.500%, 10/01/19 to 02/01/41 | 16,259,043 | 17,590,441 | ||||||
4.500%, TBA 30 years11,12 | 2,300,000 | 2,471,017 | ||||||
5.000%, 10/01/19 to 01/01/41 | 14,829,061 | 16,087,755 | ||||||
5.500%, 05/01/34 to 08/01/41 | 11,456,865 | 13,019,724 | ||||||
6.000%, 09/01/21 to 08/01/37 | 6,406,922 | 7,117,299 | ||||||
6.500%, 04/01/17 to 08/01/32 | 3,093,043 | 3,545,481 | ||||||
7.000%, 11/01/22 | 1,128,874 | 1,210,830 | ||||||
7.500%, 08/01/33 to 09/01/33 | 58,185 | 70,470 | ||||||
FNMA Grantor Trust, | ||||||||
Series 2002-T5, Class A1, 0.996%, 05/25/32 (01/25/17)9 | 208,471 | 204,508 | ||||||
Series 2003-T4, Class 1A, 0.976%, 09/26/33 (01/26/17)9 | 13,709 | 13,624 | ||||||
FNMA REMICS, | ||||||||
Series 1994-31, Class ZC, 6.500%, 02/25/24 | 368,435 | 401,984 | ||||||
Series 1994-76, Class J, 5.000%, 04/25/24 | 73,964 | 75,414 | ||||||
Series 2001-63, Class FA, 1.286%, 12/18/31 (01/18/17)9 | 390,334 | 396,493 | ||||||
Series 2002-47, Class FD, 1.156%, 08/25/32 (01/25/17)9 | 422,410 | 422,737 | ||||||
Series 2002-56, Class UC, 5.500%, 09/25/17 | 20,593 | 20,801 | ||||||
Series 2003-2, Class FA, 1.256%, 02/25/33 (01/25/17)9 | 336,897 | 338,486 | ||||||
The accompanying notes are an integral part of these financial statements.
55
Table of Contents
AMG Managers Amundi Short Duration Government Fund
Schedule of Portfolio Investments (continued)
| Principal Amount | Value | |||||||
Federal National Mortgage Association—52.7% (continued) | ||||||||
FNMA REMICS, | ||||||||
Series 2003-3, Class HJ, 5.000%, 02/25/18 | $ | 32,784 | $ | 33,244 | ||||
Series 2003-64, Class YA, 3.000%, 05/25/23 | 17,369 | 17,402 | ||||||
Series 2004-1, Class AC, 4.000%, 02/25/19 | 24,517 | 24,813 | ||||||
Series 2004-21, Class AE, 4.000%, 04/25/19 | 145,966 | 148,002 | ||||||
Series 2004-27, Class HB, 4.000%, 05/25/19 | 82,955 | 84,679 | ||||||
Series 2004-53, Class NC, 5.500%, 07/25/24 | 286,351 | 308,383 | ||||||
Series 2005-13, Class AF, 1.156%, 03/25/35 (01/25/17)9 | 473,039 | 472,159 | ||||||
Series 2005-19, Class PA, 5.500%, 07/25/34 | 152,308 | 160,723 | ||||||
Series 2005-58, Class EP, 5.500%, 07/25/35 | 220,957 | 239,500 | ||||||
Series 2005-68, Class PB, 5.750%, 07/25/35 | 32,740 | 34,356 | ||||||
Series 2005-68, Class PC, 5.500%, 07/25/35 | 205,809 | 216,053 | ||||||
Series 2007-56, Class FN, 1.126%, 06/25/37 (01/25/17)9 | 183,536 | 182,552 | ||||||
Series 2008-59, Class KB, 4.500%, 07/25/23 | 71,802 | 73,733 | ||||||
Series 2010-12, Class AC, 2.500%, 12/25/18 | 82,710 | 83,198 | ||||||
Series 2011-60, Class UC, 2.500%, 09/25/39 | 249,232 | 251,411 | ||||||
FNMA REMICS Whole Loan, | ||||||||
Series 2003-W1, Class 2A, 6.211%, 12/25/424 | 16,735 | 18,739 | ||||||
Series 2003-W13, Class AV2, 1.036%, 10/25/33 (01/25/17)7,9 | 13,194 | 13,148 | ||||||
Series 2003-W4, Class 4A, 6.790%, 10/25/424 | 356,066 | 409,573 | ||||||
Series 2004-W14, Class 1AF, 1.156%, 07/25/44 (01/25/17)9 | 1,671,154 | 1,609,691 | ||||||
Series 2004-W5, Class F1, 1.206%, 02/25/47 (01/25/17)9 | 397,009 | 392,264 | ||||||
Series 2005-W2, Class A1, 0.956%, 05/25/35 (01/25/17)9 | 977,974 | 968,818 | ||||||
Total Federal National Mortgage Association | 123,520,036 | |||||||
Government National Mortgage Association—3.8% | ||||||||
GNMA, | ||||||||
4.000%, 09/15/18 | 87,651 | 89,823 | ||||||
5.000%, 01/15/46 | 1,365,035 | 1,501,709 | ||||||
6.000%, 01/15/3610 | 6,259,966 | 7,300,943 | ||||||
9.500%, 12/15/17 | 152 | 153 | ||||||
Total Government National Mortgage Association | 8,892,628 | |||||||
Interest Only Strips—2.1% | ||||||||
FHLMC REMICS, | ||||||||
Series 2922, Class SE, 6.046%, 02/15/35 (01/15/17)9 | 212,467 | 41,992 | ||||||
Series 2934, Class HI, 5.000%, 02/15/20 | 40,246 | 2,128 | ||||||
Series 2934, Class KI, 5.000%, 02/15/20 | 22,636 | 1,107 | ||||||
Series 2965, Class SA, 5.346%, 05/15/32 (01/15/17)9 | 448,795 | 65,064 | ||||||
Series 2967, Class JI, 5.000%, 04/15/20 | 126,665 | 6,944 | ||||||
Series 2980, Class SL, 5.996%, 11/15/34 (01/15/17)9 | 283,175 | 68,981 | ||||||
The accompanying notes are an integral part of these financial statements.
56
Table of Contents
AMG Managers Amundi Short Duration Government Fund
Schedule of Portfolio Investments (continued)
| Principal Amount | Value | |||||||
Interest Only Strips—2.1% (continued) | ||||||||
FHLMC REMICS, | ||||||||
Series 2981, Class SU, 7.096%, 05/15/30 (01/15/17)9 | $ | 219,859 | $ | 39,554 | ||||
Series 3065, Class DI, 5.916%, 04/15/35 (01/15/17)9 | 744,825 | 140,757 | ||||||
Series 3308, Class S, 6.496%, 03/15/32 (01/15/17)9 | 401,506 | 80,124 | ||||||
Series 3424, Class XI, 5.866%, 05/15/36 (01/15/17)9 | 544,460 | 97,170 | ||||||
Series 3489, Class SD, 7.096%, 06/15/32 (01/15/17)9 | 229,036 | 47,873 | ||||||
Series 3685, Class EI, 5.000%, 03/15/19 | 188,717 | 4,079 | ||||||
Series 3731, Class IO, 5.000%, 07/15/19 | 97,587 | 2,274 | ||||||
Series 3882, Class AI, 5.000%, 06/15/26 | 78,136 | 3,401 | ||||||
Series 4395, Class TI, 4.000%, 05/15/26 | 757,073 | 79,416 | ||||||
FNMA, Series 306, Class IO, 8.000%, 05/25/307 | 65,957 | 18,603 | ||||||
FNMA REMICS, | ||||||||
Series 2003-48, Class SJ, 5.244%, 06/25/18 (01/25/17)7,9 | 7,506 | 63 | ||||||
Series 2004-49, Class SQ, 6.294%, 07/25/34 (01/25/17)9 | 180,949 | 32,926 | ||||||
Series 2004-51, Class SX, 6.364%, 07/25/34 (01/25/17)9 | 259,924 | 51,544 | ||||||
Series 2004-64, Class SW, 6.294%, 08/25/34 (01/25/17)9 | 743,602 | 142,491 | ||||||
Series 2004-66, Class SE, 5.744%, 09/25/34 (01/25/17)9 | 119,883 | 21,292 | ||||||
Series 2005-12, Class SC, 5.984%, 03/25/35 (01/25/17)9 | 272,790 | 48,264 | ||||||
Series 2005-45, Class SR, 5.964%, 06/25/35 (01/25/17)9 | 636,337 | 118,593 | ||||||
Series 2005-5, Class SD, 5.944%, 01/25/35 (01/25/17)9 | 199,540 | 34,862 | ||||||
Series 2005-65, Class KI, 6.244%, 08/25/35 (01/25/17)9 | 1,476,240 | 282,174 | ||||||
Series 2005-66, Class GS, 6.094%, 07/25/20 (01/25/17)9 | 69,390 | 4,328 | ||||||
Series 2006-3, Class SA, 5.394%, 03/25/36 (01/25/17)9 | 284,026 | 46,878 | ||||||
Series 2007-75, Class JI, 5.789%, 08/25/37 (01/25/17)9 | 141,876 | 25,880 | ||||||
Series 2007-85, Class SI, 5.704%, 09/25/37 (01/25/17)9 | 300,026 | 54,465 | ||||||
Series 2008-86, Class IO, 4.500%, 03/25/23 | 236,514 | 7,190 | ||||||
Series 2008-87, Class AS, 6.894%, 07/25/33 (01/25/17)9 | 846,592 | 174,923 | ||||||
Series 2009-31, Class PI, 5.000%, 11/25/38 | 862,711 | 138,372 | ||||||
Series 2010-105, Class IO, 5.000%, 08/25/20 | 271,125 | 13,811 | ||||||
Series 2010-121, Class IO, 5.000%, 10/25/25 | 164,291 | 5,853 | ||||||
Series 2010-37, Class GI, 5.000%, 04/25/257 | 153,377 | 3,571 | ||||||
Series 2010-65, Class IO, 5.000%, 09/25/20 | 493,571 | 23,593 | ||||||
Series 2010-68, Class SJ, 5.794%, 07/25/40 (01/25/17)9 | 326,807 | 64,378 | ||||||
Series 2011-124, Class IC, 3.500%, 09/25/21 | 969,397 | 42,062 | ||||||
Series 2011-69, Class AI, 5.000%, 05/25/18 | 247,728 | 4,351 | ||||||
Series 2011-88, Class WI, 3.500%, 09/25/26 | 792,475 | 83,902 | ||||||
Series 2012-126, Class SJ, 4.244%, 11/25/42 (01/25/17)9 | 4,069,929 | 660,985 | ||||||
GNMA, | ||||||||
Series 2011-157, Class SG, 5.861%, 12/20/41 (01/20/17)9 | 1,066,782 | 241,374 | ||||||
Series 2011-167, Class IO, 5.000%, 12/16/20 | 682,447 | 22,394 | ||||||
The accompanying notes are an integral part of these financial statements.
57
Table of Contents
AMG Managers Amundi Short Duration Government Fund
Schedule of Portfolio Investments (continued)
| Principal Amount | Value | |||||||
Interest Only Strips—2.1% (continued) | ||||||||
GNMA, | ||||||||
Series 2011-32, Class KS, 10.685%, 06/16/34 (01/16/17)9 | $ | 460,645 | $ | 62,416 | ||||
Series 2011-94, Class IS, 5.993%, 06/16/36 (01/16/17)9 | 440,206 | 60,505 | ||||||
Series 2012-101, Class AI, 3.500%, 08/20/27 | 477,291 | 54,547 | ||||||
Series 2012-103, Class IB, 3.500%, 04/20/40 | 902,555 | 103,608 | ||||||
Series 2012-140, Class IC, 3.500%, 11/20/42 | 704,650 | 143,104 | ||||||
Series 2012-34, Class KS, 5.343%, 03/16/42 (01/16/17)9 | 2,899,266 | 728,326 | ||||||
Series 2012-69, Class QI, 4.000%, 03/16/41 | 1,318,991 | 207,487 | ||||||
Series 2012-96, Class IC, 3.000%, 08/20/27 | 782,138 | 79,872 | ||||||
Series 2013-5, Class BI, 3.500%, 01/20/43 | 293,095 | 57,870 | ||||||
Series 2014-173, Class AI, 4.000%, 11/20/38 | 275,707 | 25,160 | ||||||
Series 2016-108, Class QI, 4.000%, 08/20/46 | 328,275 | 84,475 | ||||||
Series 2016-145, Class UI, 3.500%, 10/20/46 | 584,299 | 121,399 | ||||||
Series 2016-46, Class JI, 4.500%, 04/20/46 | 316,556 | 70,493 | ||||||
Series 2016-81, Class IO, 4.000%, 06/20/46 | 566,237 | 109,845 | ||||||
Total Interest Only Strips | 4,959,093 | |||||||
U.S. Government Obligations—1.6% | ||||||||
U.S. Treasury Inflation Indexed Bonds, 2.375%, 01/15/27 | 3,272,369 | 3,833,420 | ||||||
Total U.S. Government and Agency Obligations (cost $188,305,517) | 189,767,981 | |||||||
Short-Term Investments—10.5% | ||||||||
U.S. Government and Agency Discount Notes—8.3% | ||||||||
FHLB, 0.02%, 01/06/1713 | 15,500,000 | 15,499,504 | ||||||
FHLB, 0.11%, 01/18/1713 | 4,000,000 | 3,999,368 | ||||||
Total U.S. Government and Agency Discount Notes | 19,498,872 | |||||||
U.S. Treasury Bills—0.3% | ||||||||
U. S. Treasury Bills, 0.11%, 03/02/1713,14 | 780,000 | 779,392 | ||||||
| Shares | ||||||||
Other Investment Companies—1.9%3 | ||||||||
Dreyfus Government Cash Management Fund, Institutional Class Shares, 0.45% | 4,466,683 | 4,466,683 | ||||||
Total Short-Term Investments (cost $24,744,480) | 24,744,947 | |||||||
Total Investments—101.9% (cost $237,604,529) | 239,096,826 | |||||||
Other Assets, less Liabilities—(1.9)% | (4,527,938 | ) | ||||||
Net Assets—100.0% | $ | 234,568,888 | ||||||
The accompanying notes are an integral part of these financial statements.
58
Table of Contents
Notes to Schedules of Portfolio Investments
The following footnotes should be read in conjunction with each of the Schedules of Portfolio Investments previously presented in this report.
At December 31, 2016, the approximate cost of investments and the aggregate gross unrealized appreciation and depreciation for federal income tax were as follows:
| Fund | Cost | Appreciation | Depreciation | Net | ||||||||||||
AMG Chicago Equity Partners Balanced Fund | $ | 169,865,789 | $ | 10,238,113 | $ | (2,926,890 | ) | $ | 7,311,223 | |||||||
AMG Chicago Equity Partners Small Cap Value Fund | 12,325,764 | 2,311,393 | (220,878 | ) | 2,090,515 | |||||||||||
AMG Managers High Yield Fund | 23,241,550 | 857,557 | (1,093,739 | ) | (236,182 | ) | ||||||||||
AMG Managers Amundi Intermediate Government Fund | 258,434,276 | 2,665,065 | (2,142,874 | ) | 522,191 | |||||||||||
AMG Managers Amundi Short Duration Government Fund | 237,612,127 | 4,870,862 | (3,386,163 | ) | 1,484,699 | |||||||||||
| * | Non-income producing security. |
| # | Less than 0.05%. |
| (a) | Security exempt from registration under Rule 144A of the Securities Act of 1933. This security may be resold in transactions exempt from registration, normally to qualified buyers. At December 31, 2016, the value of these securities amounted to the following: |
| Fund | Market Value | % of Net Assets | ||||||
AMG Managers High Yield Fund | $ | 8,358,311 | 36.1 | % | ||||
AMG Managers Amundi Intermediate Government Fund | 11,427,302 | 6.9 | % | |||||
AMG Managers Amundi Short Duration Government Fund | 16,245,588 | 6.9 | % | |||||
| (b) | Step Bond: A debt instrument with either deferred interest payments or an interest rate that resets at specific times during its term. |
| 1 | Some or all of these securities were out on loan to various brokers as of December 31, 2016, amounting to the following: |
| Fund | Market Value | % of Net Assets | ||||||
AMG Chicago Equity Partners Balanced Fund | $ | 3,119,717 | 1.8 | % | ||||
AMG Chicago Equity Partners Small Cap Value Fund | 536,303 | 4.2 | % | |||||
AMG Managers High Yield Fund | 73,484 | 0.3 | % | |||||
| 2 | Collateral received from brokers for securities lending was invested in these joint repurchase agreements. |
| 3 | Yield shown represents the December 31, 2016, seven-day average yield, which refers to the sum of the previous seven days’ dividends paid, expressed as an annual percentage. |
| 4 | Variable Rate Security: The rate listed is as of December 31, 2016, and is periodically reset subject to terms and conditions set forth in the debenture. |
| 5 | Perpetuity Bond. The date shown is the final call date. |
| 6 | Payment-in-Kind Security: The security may pay interest/dividends in additional par/shares and/or in cash. Rates shown are the current rate and possible payment rates. |
| 7 | Illiquid Security: A security not readily convertible into cash such as a stock, bond or commodity that is not actively traded and would be difficult to sell in a timely sale. The Funds may not invest more than 15% of their net assets in illiquid securities. The market value of illiquid securities at December 31, 2016, amounted to the following: |
| Fund | Market Value | % of Net Assets | ||||||
AMG Managers High Yield Fund | $ | 489,247 | 2.1 | % | ||||
AMG Managers Amundi Intermediate Government Fund | 367,148 | 0.2 | % | |||||
AMG Managers Amundi Short Duration Government Fund | 35,385 | 0.0 | %# | |||||
| 8 | Security is in default. Issuer has failed to make a timely payment of either principal or interest or has failed to comply with some provision of the bond indenture. |
| 9 | Floating Rate Security: The rate listed is as of December 31, 2016. Date in parentheses represents the security’s next coupon rate reset. |
The accompanying notes are an integral part of these financial statements.
59
Table of Contents
Notes to Schedules of Portfolio Investments (continued)
| 10 | Some or all of these securities are segregated as collateral for delayed delivery agreements. At December 31, 2016, the value of these securities amounted to the following: |
| Fund | Market Value | % of Net Assets | ||||||
AMG Managers Amundi Intermediate Government Fund | $ | 92,518,509 | 55.6 | % | ||||
AMG Managers Amundi Short Duration Government Fund | 21,636,611 | 9.2 | % | |||||
| 11 | All or part of the security is delayed delivery transaction. The market value for delayed delivery securities at December 31, 2016, amounted to the following: |
| Fund | Market Value | % of Net Assets | ||||||
AMG Managers Amundi Intermediate Government Fund | $ | 92,518,509 | 55.6 | % | ||||
AMG Managers Amundi Short Duration Government Fund | 8,320,197 | 3.5 | % | |||||
| 12 | TBA Securities are purchased/sold on a forward commitment basis with an approximate principal amount and no defined maturity date. The actual principal and maturity date will be determined upon settlement when the specific mortgage pools are assigned. |
| 13 | Represents yield to maturity at December 31, 2016. |
| 14 | Some or all of this security is held as collateral for futures contracts. The market value of collateral at December 31, 2016, amounted to the following: |
| Fund | Market Value | % of Net Assets | ||||||
AMG Managers Amundi Intermediate Government Fund | $ | 109,914 | 0.1 | % | ||||
AMG Managers Amundi Short Duration Government Fund | 779,392 | 0.3 | % | |||||
| 15 | This security is restricted and not available for re-sale. The security was received as part of a corporate action on January 22, 2016. |
The following tables summarize the inputs used to value the Funds’ investments by the fair value hierarchy levels as of December 31, 2016: (See Note 1(a) in the Notes to the Financial Statements.)
Quoted Prices in Active Markets Level 1 | Significant Other Observable Inputs Level 2 | Significant Unobservable Inputs Level 3 | Total | |||||||||||||
AMG Chicago Equity Partners Balanced Fund |
| |||||||||||||||
Investments in Securities | ||||||||||||||||
Common Stocks† | $ | 107,612,044 | — | — | $ | 107,612,044 | ||||||||||
Rights | — | — | $ | 7 | 7 | |||||||||||
Corporate Bonds and Notes†† | — | $ | 8,493,391 | — | 8,493,391 | |||||||||||
U.S. Government and Agency Obligations†† | — | 56,955,061 | — | 56,955,061 | ||||||||||||
Short-Term Investments | ||||||||||||||||
Repurchase Agreements | — | 3,216,364 | — | 3,216,364 | ||||||||||||
Other Investment Companies | 900,145 | — | — | 900,145 | ||||||||||||
|
|
|
|
|
|
|
| |||||||||
Total Investments in Securities | $ | 108,512,189 | $ | 68,664,816 | $ | 7 | $ | 177,177,012 | ||||||||
|
|
|
|
|
|
|
| |||||||||
At December 31, 2016, the Level 3 securities are Rights received as a result of a corporate action.
The accompanying notes are an integral part of these financial statements.
60
Table of Contents
Notes to Schedules of Portfolio Investments (continued)
Quoted Prices in Active Markets Level 1 | Significant Other Observable Inputs Level 2 | Significant Unobservable Inputs Level 3 | Total | |||||||||||||
AMG Chicago Equity Partners Small Cap Value Fund | ||||||||||||||||
Investments in Securities | ||||||||||||||||
Common Stocks† | $ | 13,754,186 | — | — | $ | 13,754,186 | ||||||||||
Short-Term Investments | ||||||||||||||||
Repurchase Agreements | — | $ | 557,580 | — | 557,580 | |||||||||||
Other Investment Companies | 104,513 | — | — | 104,513 | ||||||||||||
|
|
|
|
|
|
|
| |||||||||
Total Investments in Securities | $ | 13,858,699 | $ | 557,580 | — | $ | 14,416,279 | |||||||||
|
|
|
|
|
|
|
| |||||||||
Quoted Prices in Active Markets Level 1 | Significant Other Observable Inputs Level 2 | Significant Unobservable Inputs Level 3 | Total | |||||||||||||
AMG Managers High Yield Fund | ||||||||||||||||
Investments in Securities | ||||||||||||||||
Corporate Bonds and Notes | ||||||||||||||||
Industrials | — | $ | 19,798,205 | $ | 179,150 | $ | 19,977,355 | |||||||||
Financials | — | 1,194,017 | — | 1,194,017 | ||||||||||||
Utilities | — | 275,152 | — | 275,152 | ||||||||||||
Floating Rate Senior Loan Interests | — | 400,707 | 372,957 | 773,664 | ||||||||||||
Common Stocks | ||||||||||||||||
Industrials | $ | 51,520 | — | 97,532 | 149,052 | |||||||||||
Warrants | — | — | — | — | ||||||||||||
Short-Term Investments | ||||||||||||||||
Repurchase Agreements | — | 77,190 | — | 77,190 | ||||||||||||
Other Investment Companies | 558,938 | — | — | 558,938 | ||||||||||||
|
|
|
|
|
|
|
| |||||||||
Total Investments in Securities | $ | 610,458 | $ | 21,745,271 | $ | 649,639 | $ | 23,005,368 | ||||||||
|
|
|
|
|
|
|
| |||||||||
The following table below is a reconciliation of investments in which significant unobservable inputs (Level 3) were used in determining fair value at December 31, 2016:
| AMG Managers High Yield Fund | Common Stock | Corporate Bond | Floating Rate Senior Loan Interests* | Total | ||||||||||||
Balance as of December 31, 2015 | $ | 81,252 | $ | 170,713 | $ | 700,083 | $ | 952,048 | ||||||||
Accrued discounts (premiums) | — | 1,137 | 1,343 | 2,480 | ||||||||||||
Realized gain (loss) | — | — | 1,595 | 1,595 | ||||||||||||
Change in unrealized appreciation (depreciation) | 16,280 | (1,554 | ) | 5,799 | 20,525 | |||||||||||
Purchases | — | 8,854 | 2,063 | 10,917 | ||||||||||||
Sales | — | — | (36,399 | ) | (36,399 | ) | ||||||||||
Transfers in to Level 3 | — | — | — | — | ||||||||||||
Transfers out of Level 3 | — | — | (301,527 | ) | (301,527 | ) | ||||||||||
Balance as of December 31, 2016 | $ | 97,532 | $ | 179,150 | $ | 372,957 | $ | 649,639 | ||||||||
Net change in unrealized appreciation (depreciation) on investments still held at December 31, 2016 | $ | 16,280 | $ | (1,554 | ) | $ | 5,799 | $ | 20,525 | |||||||
| * | The Fund transferred certain investments out of Level 3 due to increased liquidity and increased visibility into pricing inputs of the third party pricing vendor. |
The accompanying notes are an integral part of these financial statements.
61
Table of Contents
Notes to Schedules of Portfolio Investments (continued)
The following table summarizes the quantitative inputs and assumptions used for items categorized in Level 3 of the fair value hierarchy as of December 31, 2016. The table below is not intended to be all-inclusive, but rather provides information on the significant Level 3 inputs as they relate to the Fund’s fair value measurements:
| Quantitative Information about Level 3 Fair Value Measurements | ||||||||||||||||||
| Fair Value as of December 31, 2016 | Valuation Technique(s) | Unobservable Inputs | Range | Average | ||||||||||||||
AMG Managers High Yield Fund | ||||||||||||||||||
Common Stocks | $ | 97,532 | Enterprise Value | EV Multiple, Discount | 7.9-9.3 | 8.7 | ||||||||||||
Corporate Bonds | 179,134 | Enterprise Value | EV Multiple, Discount | 7.9-9.3 | 8.7 | |||||||||||||
Corporate Bonds | 16 | Broker Quote | Price | n/a | n/a | |||||||||||||
Floating Rate Senior Loan Interests | 372,957 | Unadjusted Price from Pricing Service | Price | n/a | n/a | |||||||||||||
|
| |||||||||||||||||
Total | $ | 649,639 | ||||||||||||||||
|
| |||||||||||||||||
Quoted Prices in Active Markets Level 1 | Significant Other Observable Inputs Level 2 | Significant Unobservable Inputs Level 3 | Total | |||||||||||||
AMG Managers Amundi Intermediate Government Fund | ||||||||||||||||
Investments in Securities | ||||||||||||||||
Asset-Backed Securities | — | $ | 11,066,327 | — | $ | 11,066,327 | ||||||||||
Mortgage-Backed Securities | — | 3,989,614 | — | 3,989,614 | ||||||||||||
U.S. Government and Agency Obligations†† | — | 197,764,629 | — | 197,764,629 | ||||||||||||
Short-Term Investments | ||||||||||||||||
U.S. Treasury Bills | — | 109,914 | — | 109,914 | ||||||||||||
Other Investment Companies | $ | 46,025,983 | — | — | 46,025,983 | |||||||||||
|
|
|
|
|
|
|
| |||||||||
Total Investments in Securities | $ | 46,025,983 | $ | 212,930,484 | — | $ | 258,956,467 | |||||||||
|
|
|
|
|
|
|
| |||||||||
TBA Sale Commitments | $ | (17,988,984 | ) | — | $ | (17,988,984 | ) | |||||||||
|
|
|
|
|
|
|
| |||||||||
Financial Derivative Instruments-Assets††† | ||||||||||||||||
Futures contracts | $ | 33,161 | — | — | $ | 33,161 | ||||||||||
|
|
|
|
|
|
|
| |||||||||
Financial Derivative Instruments-Liabilities††† | ||||||||||||||||
Futures contracts | (6,770 | ) | — | — | (6,770 | ) | ||||||||||
|
|
|
|
|
|
|
| |||||||||
Total Financial Derivative Instruments | $ | 26,391 | — | — | $ | 26,391 | ||||||||||
|
|
|
|
|
|
|
| |||||||||
The accompanying notes are an integral part of these financial statements.
62
Table of Contents
Notes to Schedules of Portfolio Investments (continued)
Quoted Prices in Active Markets Level 1 | Significant Other Observable Inputs Level 2 | Significant Unobservable Inputs Level 3 | Total | |||||||||||||
AMG Managers Amundi Short Duration Government Fund | ||||||||||||||||
Investments in Securities | ||||||||||||||||
Asset-Backed Securities | — | $ | 24,583,898 | — | $ | 24,583,898 | ||||||||||
U.S. Government and Agency Obligations†† | — | 189,767,981 | — | 189,767,981 | ||||||||||||
Short-Term Investments | ||||||||||||||||
U.S. Government and Agency Discount Notes | — | 19,498,872 | — | 19,498,872 | ||||||||||||
U.S. Treasury Bills | — | 779,392 | — | 779,392 | ||||||||||||
Other Investment Companies | $ | 4,466,683 | — | — | 4,466,683 | |||||||||||
|
|
|
|
|
|
|
| |||||||||
Total Investments in Securities | $ | 4,466,683 | $ | 234,630,143 | — | $ | 239,096,826 | |||||||||
|
|
|
|
|
|
|
| |||||||||
TBA Sale Commitments | — | $ | (6,022,785 | ) | — | $ | (6,022,785 | ) | ||||||||
|
|
|
|
|
|
|
| |||||||||
Financial Derivative Instruments-Assets††† | ||||||||||||||||
Futures | $ | 300,274 | — | — | $ | 300,274 | ||||||||||
|
|
|
|
|
|
|
| |||||||||
Financial Derivative Instruments-Liabilities††† | ||||||||||||||||
Futures | (34,182 | ) | — | — | (34,182 | ) | ||||||||||
|
|
|
|
|
|
|
| |||||||||
Total Financial Derivative Instruments | $ | 266,092 | — | — | $ | 266,092 | ||||||||||
|
|
|
|
|
|
|
| |||||||||
| † | All common stocks held in the Funds are Level 1 securities. For a detailed breakout of these securities, please refer to the respective Schedule of Portfolio Investments. |
| †† | All corporate bonds and notes and U.S. government and agency obligations held in the Funds are Level 2 securities. For a detailed breakout of the corporate bonds and notes and U.S. government and agency obligations; by major industry or agency classification, please refer to the respective Schedule of Portfolio Investments. |
| ††† | Derivative instruments, such as futures, are not reflected in the Schedule of Portfolio Investments and are valued at the unrealized appreciation/depreciation of the instrument. |
As of December 31, 2016, the Funds had no significant transfers between Levels 1 and 2 from the beginning of the reporting period.
The accompanying notes are an integral part of these financial statements.
63
Table of Contents
Notes to Schedules of Portfolio Investments (continued)
The following schedule shows the value of derivative instruments at December 31, 2016:
| Asset Derivatives | Liability Derivatives | |||||||||||||||||||
| Fund | Derivatives not accounted for as hedging instruments | Statement of Assets and Liabilities Location | Fair Value | Statement of Assets and Liabilities Location | Fair Value | |||||||||||||||
AMG Managers Amundi Intermediate Government Fund |
| |||||||||||||||||||
| Interest rate contracts | Receivable for variation margin | 1 | $ | 2,969 | Payable for variation margin | 1 | $ | 21,273 | ||||||||||||
|
|
|
| |||||||||||||||||
| Asset Derivatives | Liability Derivatives | |||||||||||||||||||
| Fund | Derivatives not accounted for as hedging instruments | Statement of Assets and Liabilities Location | Fair Value | Statement of Assets and Liabilities Location | Fair Value | |||||||||||||||
AMG Managers Amundi Short Duration Government Fund |
| |||||||||||||||||||
| Interest rate contracts | Receivable for variation margin | 1 | $ | 16,844 | Payable for variation margin | 1 | $ | 124,102 | ||||||||||||
|
|
|
| |||||||||||||||||
| 1 | Only current day’s variation margin is reported within the Statement of Assets and Liabilities. The variation margin is included in the open futures cumulative appreciation for AMG Managers Amundi Intermediate Government Fund and AMG Managers Amundi Short Duration Government Fund of $26,391 and $266,092, respectively, as reported in the Notes to Schedules of Portfolio Investments. |
For the year ended December 31, 2016, the effect of derivative instruments on the Statement of Operations for the Funds and the amount of realized gain/(loss) and change in unrealized gain (loss) on derivatives recognized in income was as follows:
| Realized Gain (Loss) | Change in Unrealized Gain (Loss) | |||||||||||||||||
| Fund | Derivatives not accounted for as hedging instruments | Statement of Operations Location | Realized Gain/ (Loss) | Statement of Operations Location | Change in Unrealized Gain/ (Loss) | |||||||||||||
AMG Managers Amundi Intermediate Government Fund |
| |||||||||||||||||
| Interest rate contracts | | Net realized loss on futures contracts | | $(41,571) | | Net change in unrealized appreciation (depreciation) of futures contracts | | $40,411 | ||||||||||
|
|
|
| |||||||||||||||
| Realized Gain (Loss) | Change in Unrealized Gain (Loss) | |||||||||||||||||
| Fund | Derivatives not accounted for as hedging instruments | Statement of Operations Location | Realized Gain/ (Loss) | Statement of Operations Location | Change in Unrealized Gain/ (Loss) | |||||||||||||
AMG Managers Amundi Short Duration Government Fund |
| |||||||||||||||||
| Interest rate contracts | Net realized loss on futures contracts | $(1,174,913) | | Net change in unrealized appreciation (depreciation) of futures contracts | | $246,395 | ||||||||||||
|
|
|
| |||||||||||||||
At December 31, 2016, the following Funds had TBA forward sale commitments:
(See Note 1(i) in the Notes to Financial Statements.)
AMG Managers Amundi Intermediate Government Fund | ||||||||||||||||||||
| Security | Principal Amount | Settlement Date | Current Liability | Proceeds | ||||||||||||||||
FNMA, 3.000%, TBA 30 years | $ | 500,000 | 01/18/17 | $ | 496,707 | $ | (490,859 | ) | ||||||||||||
FNMA, 3.500%, TBA 30 years | 14,400,000 | 01/18/17 | 14,758,875 | (14,776,063 | ) | |||||||||||||||
FNMA, 4.000%, TBA 30 years | 2,600,000 | 01/18/17 | 2,733,402 | (2,727,156 | ) | |||||||||||||||
|
|
|
| |||||||||||||||||
| Totals | $ | 17,988,984 | $ | (17,994,078 | ) | |||||||||||||||
|
|
|
| |||||||||||||||||
The accompanying notes are an integral part of these financial statements.
64
Table of Contents
Notes to Schedules of Portfolio Investments (continued)
AMG Managers Amundi Short Duration Government Fund | ||||||||||||||||||||
| Security | Principal Amount | Settlement Date | Current Liability | Proceeds | ||||||||||||||||
FHLMC Gold Pool, 3.000%, TBA 15 years | $ | 2,800,000 | 01/23/17 | $ | 2,873,078 | $ | (2,872,625 | ) | ||||||||||||
FNMA, 4.000%, TBA 30 years | 3,000,000 | 02/13/17 | 3,149,707 | (3,126,094 | ) | |||||||||||||||
|
|
|
| |||||||||||||||||
| Totals | $ | 6,022,785 | $ | (5,998,719 | ) | |||||||||||||||
|
|
|
| |||||||||||||||||
At December 31, 2016, the following Funds had open futures contracts:
(See Note 8 in the Notes to Financial Statements.)
AMG Managers Amundi Intermediate Government Fund | ||||||||||||||||
| Type | Number of Contracts | Position | Expiration Date | Unrealized Gain/(Loss) | ||||||||||||
10-Year Interest Rate Swap | 36 | Short | 03/15/17 | $ | 20,199 | |||||||||||
10-Year U.S. Treasury Note | 3 | Long | 03/22/17 | (2,093 | ) | |||||||||||
2-Year U.S. Treasury Note | 3 | Short | 03/31/17 | 414 | ||||||||||||
5-Year Interest Rate Swap | 23 | Short | 03/15/17 | 10,724 | ||||||||||||
5-Year U.S. Treasury Note | 5 | Short | 03/31/17 | 1,824 | ||||||||||||
U.S. Ultra Bond CBT Mar 17 | 2 | Long | 03/31/17 | (4,677 | ) | |||||||||||
|
| |||||||||||||||
| Total | $ | 26,391 | ||||||||||||||
|
| |||||||||||||||
AMG Managers Amundi Short Duration Government Fund | ||||||||||||||||
| Type | Number of Contracts | Position | Expiration Date | Unrealized Gain/(Loss) | ||||||||||||
10-Year Interest Rate Swap | 35 | Short | 03/15/17 | $ | 19,647 | |||||||||||
10-Year U.S. Treasury Note | 49 | Long | 03/22/17 | (34,182 | ) | |||||||||||
2-Year U.S. Treasury Note | 192 | Short | 03/31/17 | 26,521 | ||||||||||||
5-Year Interest Rate Swap | 418 | Short | 03/15/17 | 195,736 | ||||||||||||
5-Year U.S. Treasury Note | 7 | Short | 03/31/17 | 2,553 | ||||||||||||
U.S. Ultra Bond CBT Mar 17 | 24 | Short | 03/31/17 | 55,817 | ||||||||||||
|
| |||||||||||||||
| Total | $ | 266,092 | ||||||||||||||
|
| |||||||||||||||
INVESTMENTS DEFINITIONS AND ABBREVIATIONS:
FHLB: | Federal Home Loan Bank | |
FHLMC: | Federal Home Loan Mortgage Corporation | |
FNMA: | Federal National Mortgage Association | |
GNMA: | Government National Mortgage Association | |
GSMPS: | Goldman Sachs Mortgage Participation Securities | |
GSR: | Goldman Sachs REMIC |
MTN: | Medium-Term Notes | |
PIK: | Payment-in-Kind | |
PLC: | Public Limited Company | |
REIT: | Real Estate Investment Trust | |
REMICS: | Real Estate Mortgage Investment Conduits | |
TBA: | To Be Announced |
The accompanying notes are an integral part of these financial statements.
65
Table of Contents
Statement of Assets and Liabilities
December 31, 2016
| AMG Chicago Equity Partners Balanced Fund# | AMG Chicago Equity Partners Small Cap Value Fund# | AMG Managers High Yield Fund# | ||||||||||
Assets: | ||||||||||||
Investments at value* (including securities on loan valued at $3,119,717, $536,303 and $73,484, respectively) | $ | 177,177,012 | $ | 14,416,279 | $ | 23,005,368 | ||||||
Receivable for investments sold | 379,415 | 21,811 | — | |||||||||
Receivable for Fund shares sold | 364,893 | 130,303 | 34,104 | |||||||||
Dividends, interest and other receivables | 425,862 | 24,003 | 396,980 | |||||||||
Receivable from affiliate | 26,562 | 25,102 | 13,034 | |||||||||
Prepaid expenses | 39,546 | 28,953 | 21,110 | |||||||||
Total assets | 178,413,290 | 14,646,451 | 23,470,596 | |||||||||
Liabilities: | ||||||||||||
Payable for investments purchased | 518,225 | 62,044 | — | |||||||||
Payable upon return of securities loaned | 3,216,364 | 557,580 | 77,190 | |||||||||
Payable for Fund shares repurchased | 268,028 | 1,058,198 | 132,724 | |||||||||
Payable to affiliate | — | 47,346 | — | |||||||||
Accrued expenses: | ||||||||||||
Investment advisory and management fees | 88,361 | 7,215 | 10,795 | |||||||||
Administrative fees | 22,090 | 1,746 | 2,944 | |||||||||
Distribution fees—Class N | 19,814 | 4 | 4,344 | |||||||||
Shareholder servicing fees—Class N | — | 3 | — | |||||||||
Shareholder servicing fees—Class I | 6,312 | — | — | |||||||||
Professional fees | 32,519 | 23,698 | 49,107 | |||||||||
Trustees fees and expenses | 70 | 4 | 13 | |||||||||
Other | 54,077 | 20,548 | 41,288 | |||||||||
Total liabilities | 4,225,860 | 1,778,386 | 318,405 | |||||||||
Net Assets | $ | 174,187,430 | $ | 12,868,065 | $ | 23,152,191 | ||||||
Net Assets Represent: | ||||||||||||
Paid-in capital | $ | 165,839,526 | $ | 11,039,966 | $ | 26,841,946 | ||||||
Undistributed (Distributions in excess of) net investment income | (570 | ) | — | 6,083 | ||||||||
Accumulated net realized gain (loss) from investments | 826,294 | (266,743 | ) | (3,548,381 | ) | |||||||
Net unrealized appreciation (depreciation) of investments | 7,522,180 | 2,094,842 | (147,457 | ) | ||||||||
Net Assets | $ | 174,187,430 | $ | 12,868,065 | $ | 23,152,191 | ||||||
* Investments at cost | $ | 169,654,832 | $ | 12,321,437 | $ | 23,152,825 | ||||||
| # | Effective October 1, 2016, the Funds’ share classes were renamed or redesignated as described in Note 1 of the Notes to the Financial Statements. |
The accompanying notes are an integral part of these financial statements.
66
Table of Contents
Statement of Assets and Liabilities (continued)
| AMG Chicago Equity Partners Balanced Fund# | AMG Chicago Equity Partners Small Cap Value Fund# | AMG Managers High Yield Fund# | ||||||||||
Class N Shares: | ||||||||||||
Net Assets | $ | 92,501,773 | $ | 30,210 | $ | 20,414,883 | ||||||
Shares outstanding | 5,987,244 | 2,514 | 2,651,947 | |||||||||
Net asset value, offering and redemption price per share | $ | 15.45 | $ | 12.02 | $ | 7.70 | ||||||
Class I Shares: | ||||||||||||
Net Assets | $ | 75,889,740 | $ | 10,887,940 | $ | 2,737,308 | ||||||
Shares outstanding | 4,868,671 | 908,409 | 351,992 | |||||||||
Net asset value, offering and redemption price per share | $ | 15.59 | $ | 11.99 | $ | 7.78 | ||||||
Class Z Shares: | ||||||||||||
Net Assets | $ | 5,795,917 | $ | 1,949,915 | n/a | |||||||
Shares outstanding | 371,921 | 162,644 | n/a | |||||||||
Net asset value, offering and redemption price per share | $ | 15.58 | $ | 11.99 | n/a | |||||||
| # | Effective October 1, 2016, the Funds’ share classes were renamed or redesignated as described in Note 1 of the Notes to the Financial Statements. |
The accompanying notes are an integral part of these financial statements.
67
Table of Contents
Statement of Assets and Liabilities (continued)
| AMG Managers Amundi Intermediate Government Fund# | AMG Managers Amundi Short Duration Government Fund# | |||||||
Assets: | ||||||||
Investments at value* | $ | 258,956,467 | $ | 239,096,826 | ||||
Receivable for delayed delivery investments sold | 76,385,335 | 11,626,945 | ||||||
Receivable for Fund shares sold | 698,541 | 3,651,995 | ||||||
Dividends, interest and other receivables | 546,465 | 732,654 | ||||||
Cash collateral | 277,594 | — | ||||||
Receivable for paydowns | 39,405 | 310,197 | ||||||
Receivable from affiliate | 39,373 | — | ||||||
Receivable for variation margin | 2,969 | 16,844 | ||||||
Prepaid expenses | 17,172 | 16,563 | ||||||
Total assets | 336,963,321 | 255,452,024 | ||||||
Liabilities: | ||||||||
Payable for delayed delivery investments purchased | 151,627,823 | 13,959,618 | ||||||
TBA sale commitments at value (proceeds receivable of $17,994,078 and $5,998,719, respectively) | 17,988,984 | 6,022,785 | ||||||
Payable for Fund shares repurchased | 621,771 | 490,032 | ||||||
Payable for investments purchased | 9,555 | — | ||||||
Payable for variation margin | 21,273 | 124,102 | ||||||
Accrued expenses: | ||||||||
Investment advisory and management fees | 70,419 | 81,480 | ||||||
Administrative fees | 22,006 | 30,555 | ||||||
Shareholder servicing fees- Class S | 37,230 | 30,555 | ||||||
Professional fees | 44,865 | 44,389 | ||||||
Trustees fees and expenses | 64 | 87 | ||||||
Other | 108,504 | 99,533 | ||||||
Total liabilities | 170,552,494 | 20,883,136 | ||||||
Net Assets | $ | 166,410,827 | $ | 234,568,888 | ||||
Net Assets Represent: | ||||||||
Paid-in capital | $ | 169,341,307 | $ | 238,140,883 | ||||
Undistributed net investment income | 380,109 | 2,457,695 | ||||||
Accumulated net realized loss from investments and futures contracts | (4,259,788 | ) | (7,764,013 | ) | ||||
Net unrealized appreciation of investments and futures contracts | 949,199 | 1,734,323 | ||||||
Net Assets | $ | 166,410,827 | $ | 234,568,888 | ||||
Shares outstanding—Class S | 15,628,238 | 24,363,794 | ||||||
Net asset value, offering and redemption price per share—Class S | $ | 10.65 | $ | 9.63 | ||||
| * Investments at cost | $ | 258,038,753 | $ | 237,604,529 | ||||
| # | Effective October 1, 2016, the Funds’ share classes were renamed or redesignated as described in Note 1 of the Notes to the Financial Statements. |
The accompanying notes are an integral part of these financial statements.
68
Table of Contents
For the year ended December 31, 2016
| AMG Chicago Equity Partners Balanced Fund# | AMG Chicago Equity Partners Small Cap Value Fund# | AMG Managers High Yield Fund# | AMG Managers Amundi Intermediate Government Fund# | AMG Managers Amundi Short Duration Government Fund# | ||||||||||||||||
Investment Income: | ||||||||||||||||||||
Dividend income | $ | 2,110,352 | 1 | $ | 236,004 | $ | 319 | $ | 30,388 | $ | 4,315 | |||||||||
Interest income | 1,355,108 | — | 1,717,235 | 4,205,951 | 6,871,092 | |||||||||||||||
Securities lending income | 27,560 | 6,330 | 17,555 | — | 13 | |||||||||||||||
Foreign withholding tax | (134 | ) | — | — | — | — | ||||||||||||||
Total investment income | 3,492,886 | 242,334 | 1,735,109 | 4,236,339 | 6,875,420 | |||||||||||||||
Expenses: | ||||||||||||||||||||
Investment advisory and management fees | 1,168,740 | 74,796 | 171,512 | 1,249,771 | 1,750,403 | |||||||||||||||
Administrative fees | 324,515 | 26,988 | 48,563 | 67,679 | 90,969 | |||||||||||||||
Distribution fees—Class N | 244,334 | 36 | 58,131 | — | — | |||||||||||||||
Shareholder servicing fees—Class N | — | 22 | — | — | — | |||||||||||||||
Shareholder servicing fees—Class I | 70,559 | 11,944 | — | — | — | |||||||||||||||
Shareholder servicing fees—Class S | — | — | — | 215,279 | 93,709 | |||||||||||||||
Custodian fees | 65,633 | 16,501 | 47,807 | 75,200 | 73,872 | |||||||||||||||
Registration fees | 57,750 | 43,334 | 31,483 | 26,074 | 25,050 | |||||||||||||||
Professional fees | 47,188 | 25,206 | 60,530 | 64,811 | 70,988 | |||||||||||||||
Transfer agent fees | 24,942 | 9,228 | 14,427 | 31,110 | 10,592 | |||||||||||||||
Reports to shareholders | 23,889 | 10,132 | 12,976 | 37,802 | 63,926 | |||||||||||||||
Trustees fees and expenses | 12,876 | 947 | 2,101 | 14,975 | 24,064 | |||||||||||||||
Miscellaneous | 6,484 | 1,977 | 2,107 | 6,710 | 11,207 | |||||||||||||||
Repayment for prior reimbursements | — | — | — | 7,240 | — | |||||||||||||||
Total expenses before offsets/reductions | 2,046,910 | 221,111 | 449,637 | 1,796,651 | 2,214,780 | |||||||||||||||
Expense reimbursements | (276,286 | ) | (94,463 | ) | (159,030 | ) | (81,422 | ) | — | |||||||||||
Expense reductions | (22,618 | ) | (1,751 | ) | — | — | — | |||||||||||||
Fee waivers | — | — | — | (17,543 | ) | — | ||||||||||||||
Net expenses | 1,748,006 | 124,897 | 290,607 | 1,697,686 | 2,214,780 | |||||||||||||||
Net investment income | 1,744,880 | 117,437 | 1,444,502 | 2,538,653 | 4,660,640 | |||||||||||||||
Net Realized and Unrealized Gain (Loss): | ||||||||||||||||||||
Net realized gain (loss) on investments | 1,942,643 | 735,967 | (1,386,126 | ) | 1,085,806 | 2,597,106 | ||||||||||||||
Net realized loss on futures contracts | — | — | — | (41,571 | ) | (1,174,913 | ) | |||||||||||||
Net change in unrealized appreciation (depreciation) of investments | 5,002,573 | 2,288,175 | 3,516,250 | (618,085 | ) | (3,503,247 | ) | |||||||||||||
Net change in unrealized appreciation of futures contracts | — | — | — | 40,411 | 246,395 | |||||||||||||||
Net realized and unrealized gain (loss) | 6,945,216 | 3,024,142 | 2,130,124 | 466,561 | (1,834,659 | ) | ||||||||||||||
Net increase in net assets resulting from operations | $ | 8,690,096 | $ | 3,141,579 | $ | 3,574,626 | $ | 3,005,214 | $ | 2,825,981 | ||||||||||
| # | Effective October 1, 2016, the Funds’ share classes were renamed or redesignated as described in Note 1 of the Notes to the Financial Statements. |
| 1 | Includes non-recurring dividends of $202,768. |
The accompanying notes are an integral part of these financial statements.
69
Table of Contents
Statements of Changes in Net Assets
For the years ended December 31,
| AMG Chicago Equity Partners Balanced Fund | AMG Chicago Equity Small Cap Value Fund* | AMG Managers High Yield Fund | ||||||||||||||||||||||
| 2016# | 2015 | 2016# | 2015 | 2016# | 2015 | |||||||||||||||||||
Increase (Decrease) in Net Assets Resulting From Operations: | ||||||||||||||||||||||||
Net investment income | $ | 1,744,880 | $ | 681,498 | $ | 117,437 | $ | 97,792 | $ | 1,444,502 | $ | 1,890,731 | ||||||||||||
Net realized gain (loss) on investments | 1,942,643 | 2,473,703 | 735,967 | (999,755 | ) | (1,386,126 | ) | (45,820 | ) | |||||||||||||||
Net change in unrealized appreciation (depreciation) of investments | 5,002,573 | (1,434,299 | ) | 2,288,175 | (193,333 | ) | 3,516,250 | (3,262,411 | ) | |||||||||||||||
Net increase (decrease) in net assets resulting from operations | 8,690,096 | 1,720,902 | 3,141,579 | (1,095,296 | ) | 3,574,626 | (1,417,500 | ) | ||||||||||||||||
Distributions to Shareholders: | ||||||||||||||||||||||||
From net investment income: | ||||||||||||||||||||||||
Class N | (899,880 | ) | (520,943 | ) | (217 | ) | — | (1,310,115 | ) | (1,716,173 | ) | |||||||||||||
Class I | (784,679 | ) | (326,230 | ) | (102,530 | ) | (87,485 | ) | (151,435 | ) | (169,087 | ) | ||||||||||||
Class Z | (62,513 | ) | (45,707 | ) | (19,183 | ) | (14,054 | ) | — | — | ||||||||||||||
From net realized gain on investments: | ||||||||||||||||||||||||
Class N | (70,151 | ) | (2,381,784 | ) | — | — | — | — | ||||||||||||||||
Class I | (57,353 | ) | (1,556,354 | ) | — | — | — | — | ||||||||||||||||
Class Z | (4,375 | ) | (43,342 | ) | — | — | — | — | ||||||||||||||||
Total distributions to shareholders | (1,878,951 | ) | (4,874,360 | ) | (121,930 | ) | (101,539 | ) | (1,461,550 | ) | (1,885,260 | ) | ||||||||||||
Capital Share Transactions:1 | ||||||||||||||||||||||||
Net increase (decrease) from capital share transactions | 10,393,262 | 91,503,363 | (2,861,768 | ) | 13,907,019 | (8,405,321 | ) | (5,092,769 | ) | |||||||||||||||
Total increase (decrease) in net assets | 17,204,407 | 88,349,905 | 157,881 | 12,710,184 | (6,292,245 | ) | (8,395,529 | ) | ||||||||||||||||
Net Assets: | ||||||||||||||||||||||||
Beginning of year | 156,983,023 | 68,633,118 | 12,710,184 | — | 29,444,436 | 37,839,965 | ||||||||||||||||||
End of year | $ | 174,187,430 | $ | 156,983,023 | $ | 12,868,065 | $ | 12,710,184 | $ | 23,152,191 | $ | 29,444,436 | ||||||||||||
End of year undistributed (distributions in excess of) net investment income | $ | (570 | ) | $ | (11,114 | ) | — | — | $ | 6,083 | $ | 24,681 | ||||||||||||
|
|
|
|
|
|
|
|
|
|
|
| |||||||||||||
| * | Commencement of operations was on January 2, 2015. |
| 1 | See Note 1(g) of the Notes to Financial Statements. |
| # | Effective October 1, 2016, the Funds’ share classes were renamed as described in Note 1 of the Notes to the Financial Statements. |
The accompanying notes are an integral part of these financial statements.
70
Table of Contents
Statements of Changes in Net Assets (continued)
For the year ended December 31,
| AMG Managers Amundi Intermediate Government Fund | AMG Managers Amundi Short Duration Government Fund | |||||||||||||||
| 2016# | 2015 | 2016# | 2015 | |||||||||||||
Increase (Decrease) in Net Assets Resulting From Operations: | ||||||||||||||||
Net investment income | $ | 2,538,653 | $ | 1,878,230 | $ | 4,660,640 | $ | 941,736 | ||||||||
Net realized gain (loss) on investments and futures contracts | 1,044,235 | 1,637,304 | 1,422,193 | (862,542 | ) | |||||||||||
Net change in unrealized appreciation (depreciation) of investments and futures contracts | (577,674 | ) | (1,603,350 | ) | (3,256,852 | ) | (616,502 | ) | ||||||||
Net increase (decrease) in net assets resulting from operations | 3,005,214 | 1,912,184 | 2,825,981 | (537,308 | ) | |||||||||||
Distributions to Shareholders: | ||||||||||||||||
From net investment income | (2,324,161 | ) | (1,715,923 | ) | (2,527,449 | ) | (613,266 | ) | ||||||||
From net realized gain on investments | (2,763,558 | ) | (2,980,423 | ) | — | — | ||||||||||
Total distributions to shareholders | (5,087,719 | ) | (4,696,346 | ) | (2,527,449 | ) | (613,266 | ) | ||||||||
Capital Share Transactions—Class S: | ||||||||||||||||
Proceeds from sale of shares | 66,129,198 | 80,828,756 | 103,879,750 | 247,057,885 | ||||||||||||
Reinvestment of dividends and distributions | 4,630,731 | 4,309,750 | 2,135,935 | 544,398 | ||||||||||||
Cost of shares repurchased | (94,306,073 | ) | (64,452,490 | ) | (267,051,584 | ) | (236,391,813 | ) | ||||||||
Net increase (decrease) from capital share transactions | (23,546,144 | ) | 20,686,016 | (161,035,899 | ) | 11,210,470 | ||||||||||
Total increase (decrease) in net assets | (25,628,649 | ) | 17,901,854 | (160,737,367 | ) | 10,059,896 | ||||||||||
Net Assets: | ||||||||||||||||
Beginning of year | 192,039,476 | 174,137,622 | 395,306,255 | 385,246,359 | ||||||||||||
End of year | $ | 166,410,827 | $ | 192,039,476 | $ | 234,568,888 | $ | 395,306,255 | ||||||||
End of year undistributed net investment income | $ | 380,109 | $ | 165,617 | $ | 2,457,695 | $ | 324,504 | ||||||||
Share Transactions—Class S: | ||||||||||||||||
Sale of shares | 6,031,612 | 7,332,604 | 10,777,736 | 25,577,569 | ||||||||||||
Reinvested shares from dividends and distributions | 431,895 | 396,581 | 221,824 | 56,336 | ||||||||||||
Shares repurchased | (8,607,228 | ) | (5,851,649 | ) | (27,722,955 | ) | (24,480,608 | ) | ||||||||
Net increase (decrease) in shares | (2,143,721 | ) | 1,877,536 | (16,723,395 | ) | 1,153,297 | ||||||||||
| # | Effective October 1, 2016, the Funds’ share classes were renamed or redesignated as described in Note 1 of the Notes to the Financial Statements. |
The accompanying notes are an integral part of these financial statements.
71
Table of Contents
AMG Chicago Equity Partners Balanced Fund
For a share outstanding throughout each period
| For the years ended December 31, | ||||||||||||||||||||
| Class N | 2016# | 2015 | 2014 | 2013 | 2012 | |||||||||||||||
Net Asset Value, Beginning of Year | $ | 14.92 | $ | 15.09 | $ | 15.13 | $ | 14.19 | $ | 13.70 | ||||||||||
Income from Investment Operations: | ||||||||||||||||||||
Net investment income1,2 | 0.14 | 18 | 0.10 | 3 | 0.11 | 0.10 | 4 | 0.18 | ||||||||||||
Net realized and unrealized gain on investments | 0.54 | 0.23 | 1.37 | 2.33 | 1.16 | |||||||||||||||
Total income from investment operations | 0.68 | 0.33 | 1.48 | 2.43 | 1.34 | |||||||||||||||
Less Distributions to Shareholders from: | ||||||||||||||||||||
Net investment income | (0.14 | ) | (0.11 | ) | (0.11 | ) | (0.09 | ) | (0.17 | ) | ||||||||||
Net realized gain on investments | (0.01 | ) | (0.39 | ) | (1.41 | ) | (1.40 | ) | (0.68 | ) | ||||||||||
Total distributions to shareholders | (0.15 | ) | (0.50 | ) | (1.52 | ) | (1.49 | ) | (0.85 | ) | ||||||||||
Net Asset Value, End of Year | $ | 15.45 | $ | 14.92 | $ | 15.09 | $ | 15.13 | $ | 14.19 | ||||||||||
Total Return1 | 4.59 | % | 2.19 | % | 9.69 | % | 17.14 | % | 9.86 | % | ||||||||||
Ratio of net expenses to average net assets (with offsets/reductions) | 1.08 | % | 1.08 | % | 1.07 | % | 1.10 | %5 | 1.17 | %6,7 | ||||||||||
Ratio of expenses to average net assets (with offsets) | 1.09 | % | 1.09 | % | 1.09 | % | 1.11 | %5 | 1.18 | %6 | ||||||||||
Ratio of total expenses to average net assets (without offsets/reductions)8 | 1.25 | % | 1.36 | % | 1.40 | % | 1.55 | %5 | 1.52 | %6 | ||||||||||
Ratio of net investment income to average net assets1 | 0.94 | % | 0.64 | % | 0.70 | % | 0.62 | %5 | 1.21 | %6 | ||||||||||
Portfolio turnover | 119 | % | 105 | % | 92 | % | 90 | % | 110 | % | ||||||||||
Net assets at end of Year (000’s omitted) | $ | 92,502 | $ | 94,476 | $ | 41,751 | $ | 33,151 | $ | 26,047 | ||||||||||
|
|
|
|
|
|
|
|
|
| |||||||||||
| For the years ended December 31, | For the period ended December 31, 2012* | |||||||||||||||||||
| Class I | 2016# | 2015 | 2014 | 2013 | ||||||||||||||||
Net Asset Value, Beginning of Period | $ | 15.05 | $ | 15.23 | $ | 15.26 | $ | 14.30 | $ | 15.11 | ||||||||||
Income from Investment Operations: | ||||||||||||||||||||
Net investment income1,2 | 0.17 | 18 | 0.12 | 3 | 0.15 | 0.13 | 4 | 0.02 | ||||||||||||
Net realized and unrealized gain (loss) on investments | 0.54 | 0.23 | 1.37 | 2.36 | (0.08 | ) | ||||||||||||||
Total income (loss) from investment operations | 0.71 | 0.35 | 1.52 | 2.49 | (0.06 | ) | ||||||||||||||
Less Distributions to Shareholders from: | ||||||||||||||||||||
Net investment income | (0.16 | ) | (0.14 | ) | (0.13 | ) | (0.12 | ) | (0.06 | ) | ||||||||||
Net realized gain on investments | (0.01 | ) | (0.39 | ) | (1.42 | ) | (1.41 | ) | (0.69 | ) | ||||||||||
Total distributions to shareholders | (0.17 | ) | (0.53 | ) | (1.55 | ) | (1.53 | ) | (0.75 | ) | ||||||||||
Net Asset Value, End of Period | $ | 15.59 | $ | 15.05 | $ | 15.23 | $ | 15.26 | $ | 14.30 | ||||||||||
Total Return1 | 4.79 | % | 2.29 | % | 9.93 | % | 17.45 | %9 | (0.36 | )%9,10 | ||||||||||
Ratio of net expenses to average net assets (with offsets/reductions) | 0.93 | % | 0.93 | % | 0.86 | % | 0.92 | %5 | 0.82 | %6,11 | ||||||||||
Ratio of expenses to average net assets (with offsets) | 0.94 | % | 0.94 | % | 0.88 | % | 0.93 | %5 | 0.83 | %6,11 | ||||||||||
Ratio of total expenses to average net assets (without offsets/reductions)8 | 1.10 | % | 1.21 | % | 1.20 | % | 1.39 | %5 | 1.62 | %6,11 | ||||||||||
Ratio of net investment income to average net assets1 | 1.09 | % | 0.80 | % | 0.91 | % | 0.83 | %5 | 1.90 | %6,11 | ||||||||||
Portfolio turnover | 119 | % | 105 | % | 92 | % | 90 | % | 110 | %10 | ||||||||||
Net assets at end of period (000’s omitted) | $ | 75,890 | $ | 60,798 | $ | 14,481 | $ | 1,581 | $ | 9 | ||||||||||
|
|
|
|
|
|
|
|
|
| |||||||||||
The accompanying notes are an integral part of these financial statements.
72
Table of Contents
AMG Chicago Equity Partners Balanced Fund
Financial Highlights
For a share outstanding throughout each year
| For the years ended December 31, | ||||||||||||||||||||
| Class Z | 2016# | 2015 | 2014 | 2013 | 2012 | |||||||||||||||
Net Asset Value, Beginning of Year | $ | 15.05 | $ | 15.22 | $ | 15.26 | $ | 14.31 | $ | 13.82 | ||||||||||
Income from Investment Operations: | ||||||||||||||||||||
Net investment income1,2 | 0.18 | 18 | 0.14 | 3 | 0.15 | 0.14 | 4 | 0.21 | ||||||||||||
Net realized and unrealized gain on investments | 0.54 | 0.23 | 1.38 | 2.35 | 1.18 | |||||||||||||||
Total income from investment operations | 0.72 | 0.37 | 1.53 | 2.49 | 1.39 | |||||||||||||||
Less Distributions to Shareholders from: | ||||||||||||||||||||
Net investment income | (0.18 | ) | (0.15 | ) | (0.15 | ) | (0.13 | ) | (0.21 | ) | ||||||||||
Net realized gain on investments | (0.01 | ) | (0.39 | ) | (1.42 | ) | (1.41 | ) | (0.69 | ) | ||||||||||
Total distributions to shareholders | (0.19 | ) | (0.54 | ) | (1.57 | ) | (1.54 | ) | (0.90 | ) | ||||||||||
Net Asset Value, End of Year | $ | 15.58 | $ | 15.05 | $ | 15.22 | $ | 15.26 | $ | 14.31 | ||||||||||
Total Return1 | 4.82 | % | 2.44 | % | 9.97 | % | 17.45 | % | 10.09 | % | ||||||||||
Ratio of net expenses to average net assets (with offsets/reductions) | 0.83 | % | 0.83 | % | 0.82 | % | 0.85 | %5 | 0.92 | %6,7 | ||||||||||
Ratio of expenses to average net assets (with offsets) | 0.84 | % | 0.84 | % | 0.84 | % | 0.86 | %5 | 0.93 | %6 | ||||||||||
Ratio of total expenses to average net assets (without offsets/reductions)8 | 1.00 | % | 1.09 | % | 1.15 | % | 1.30 | %5 | 1.27 | %6 | ||||||||||
Ratio of net investment income to average net assets1 | 1.20 | % | 0.89 | % | 0.95 | % | 0.88 | %5 | 1.46 | %6 | ||||||||||
Portfolio turnover | 119 | % | 105 | % | 92 | % | 90 | % | 110 | % | ||||||||||
Net assets at end of year (000’s omitted) | $ | 5,796 | $ | 1,709 | $ | 12,401 | $ | 11,122 | $ | 9,601 | ||||||||||
|
|
|
|
|
|
|
|
|
| |||||||||||
The accompanying notes are an integral part of these financial statements.
73
Table of Contents
AMG Chicago Equity Partners Small Cap Value Fund
Financial Highlights
For a share outstanding throughout each period
| For the year ended December 31, | ||||||||
| Class N | 2016# | For the period ended December 31, 2015** | ||||||
Net Asset Value, Beginning of Period | $ | 9.39 | $ | 10.00 | ||||
Income from Investment Operations: | ||||||||
Net investment Income (loss)1,2 | 0.08 | (0.08 | )3 | |||||
Net realized and unrealized gain (loss) on investments | 2.64 | (0.53 | ) | |||||
Total income (loss) from investment operations | 2.72 | (0.61 | ) | |||||
Less Distributions to Shareholders from: | ||||||||
Net investment income | (0.09 | ) | — | |||||
Net Asset Value, End of Period | $ | 12.02 | $ | 9.39 | ||||
Total Return1 | 29.00 | % | (6.10 | )%10 | ||||
Ratio of net expenses to average net assets (with offsets/reductions) | 1.33 | % | 1.32 | %11 | ||||
Ratio of expenses to average net assets (with offsets) | 1.34 | % | 1.35 | %11 | ||||
Ratio of total expenses to average net assets (without offsets/reductions)8 | 2.26 | % | 2.34 | %11 | ||||
Ratio of net investment income (loss) to average net assets1 | 0.77 | % | (0.77 | )%11 | ||||
Portfolio turnover | 146 | % | 138 | %10 | ||||
Net assets at end of period (000’s omitted) | $ | 30 | $ | 16 | ||||
|
|
|
| |||||
| For the year ended December 31, | ||||||||
| Class I | 2016# | For the period ended December 31, 2015** | ||||||
Net Asset Value, Beginning of Period | $ | 9.35 | $ | 10.00 | ||||
Income from Investment Operations: | ||||||||
Net investment income1,2 | 0.09 | 0.10 | 3 | |||||
Net realized and unrealized gain (loss) on investments | 2.65 | (0.68 | ) | |||||
Total income (loss) from investment operations | 2.74 | (0.58 | ) | |||||
Less Distributions to Shareholders from: | ||||||||
Net investment income | (0.10 | ) | (0.07 | ) | ||||
Net Asset Value, End of Period | $ | 11.99 | $ | 9.35 | ||||
Total Return1 | 29.34 | % | (5.77 | )%10 | ||||
Ratio of net expenses to average net assets (with offsets/reductions) | 1.06 | % | 1.03 | %11 | ||||
Ratio of expenses to average net assets (with offsets) | 1.07 | % | 1.06 | %11 | ||||
Ratio of total expenses to average net assets (without offsets/reductions)8 | 1.85 | % | 1.85 | %11 | ||||
Ratio of net investment income to average net assets1 | 0.96 | % | 0.98 | %11 | ||||
Portfolio turnover | 146 | % | 138 | %10 | ||||
Net assets at end of period (000’s omitted) | $ | 10,888 | $ | 11,085 | ||||
|
|
|
| |||||
The accompanying notes are an integral part of these financial statements.
74
Table of Contents
AMG Chicago Equity Partners Small Cap Value Fund
Financial Highlights
For a share outstanding throughout each period
| For the year ended December 31, | ||||||||
| Class Z | 2016# | For the period ended December 31, 2015** | ||||||
Net Asset Value, Beginning of Period | $ | 9.35 | $ | 10.00 | ||||
Income from Investment Operations: | ||||||||
Net investment income1,2 | 0.11 | 0.11 | 3 | |||||
Net realized and unrealized gain (loss) on investments | 2.65 | (0.68 | ) | |||||
Total income (loss) from investment operations | 2.76 | (0.57 | ) | |||||
Less Distributions to Shareholders from: | ||||||||
Net investment income | (0.12 | ) | (0.08 | ) | ||||
Net Asset Value, End of Period | $ | 11.99 | $ | 9.35 | ||||
Total Return1 | 29.49 | % | (5.69 | )%10 | ||||
Ratio of net expenses to average net assets (with offsets/reductions) | 0.92 | % | 0.92 | %11 | ||||
Ratio of expenses to average net assets (with offsets) | 0.93 | % | 0.95 | %11 | ||||
Ratio of total expenses to average net assets (without offsets/reductions)8 | 1.71 | % | 3.06 | %11 | ||||
Ratio of net investment income to average net assets1 | 1.04 | % | 1.07 | %11 | ||||
Portfolio turnover | 146 | % | 138 | %10 | ||||
Net assets at end of period (000’s omitted) | $ | 1,950 | $ | 1,609 | ||||
|
|
|
| |||||
The accompanying notes are an integral part of these financial statements.
75
Table of Contents
AMG Managers High Yield Fund
Financial Highlights
For a share outstanding throughout each year
| For the years ended December 31, | ||||||||||||||||||||
| Class N | 2016# | 2015 | 2014 | 2013 | 2012 | |||||||||||||||
Net Asset Value, Beginning of Year | $ | 7.07 | $ | 7.84 | $ | 8.09 | $ | 8.07 | $ | 7.51 | ||||||||||
Income from Investment Operations: | ||||||||||||||||||||
Net investment income1,2 | 0.41 | 0.42 | 0.42 | 0.47 | 0.54 | |||||||||||||||
Net realized and unrealized gain (loss) on investments | 0.64 | (0.77 | ) | (0.26 | ) | 0.02 | 0.56 | |||||||||||||
Total income (loss) from investment operations | 1.05 | (0.35 | ) | 0.16 | 0.49 | 1.10 | ||||||||||||||
Less Distributions to Shareholders from: | ||||||||||||||||||||
Net investment income | (0.42 | ) | (0.42 | ) | (0.41 | ) | (0.47 | ) | (0.54 | ) | ||||||||||
Net Asset Value, End of Year | $ | 7.70 | $ | 7.07 | $ | 7.84 | $ | 8.09 | $ | 8.07 | ||||||||||
Total Return1 | 15.25 | % | (4.77 | )% | 1.99 | % | 6.21 | %9 | 15.12 | %9 | ||||||||||
Ratio of net expenses to average net assets (with offsets/reductions) | 1.15 | % | 1.15 | % | 1.15 | % | 1.17 | %12 | 1.15 | %13 | ||||||||||
Ratio of expenses to average net assets (with offsets) | 1.15 | % | 1.15 | % | 1.15 | % | 1.17 | %12 | 1.15 | %13 | ||||||||||
Ratio of total expenses to average net assets (without offsets/reductions)8 | 1.77 | % | 1.68 | % | 1.67 | % | 1.70 | %12 | 1.73 | %13 | ||||||||||
Ratio of net investment income to average net assets1 | 5.57 | % | 5.41 | % | 5.12 | % | 5.76 | %12 | 6.87 | %13 | ||||||||||
Portfolio turnover | 31 | % | 42 | % | 40 | % | 39 | % | 48 | % | ||||||||||
Net assets at end of year (000’s omitted) | $ | 20,415 | $ | 27,020 | $ | 34,709 | $ | 31,751 | $ | 30,817 | ||||||||||
|
|
|
|
|
|
|
|
|
| |||||||||||
| For the years ended December 31, | ||||||||||||||||||||
| Class I | 2016# | 2015 | 2014 | 2013 | 2012 | |||||||||||||||
Net Asset Value, Beginning of Year | $ | 7.14 | $ | 7.92 | $ | 8.18 | $ | 8.16 | $ | 7.59 | ||||||||||
Income from Investment Operations: | ||||||||||||||||||||
Net investment income1,2 | 0.43 | 0.44 | 0.44 | 0.49 | 0.56 | |||||||||||||||
Net realized and unrealized gain (loss) on investments | 0.65 | (0.78 | ) | (0.26 | ) | 0.02 | 0.58 | |||||||||||||
Total income (loss) from investment operations | 1.08 | (0.34 | ) | 0.18 | 0.51 | 1.14 | ||||||||||||||
Less Distributions to Shareholders from: | ||||||||||||||||||||
Net investment income | (0.44 | ) | (0.44 | ) | (0.44 | ) | (0.49 | ) | (0.57 | ) | ||||||||||
Net Asset Value, End of Year | $ | 7.78 | $ | 7.14 | $ | 7.92 | $ | 8.18 | $ | 8.16 | ||||||||||
Total Return1 | 15.60 | % | (4.56 | )% | 2.16 | % | 6.47 | % | 15.46 | % | ||||||||||
Ratio of net expenses to average net assets (with offsets/reductions) | 0.90 | % | 0.90 | % | 0.90 | % | 0.92 | %12 | 0.90 | %13 | ||||||||||
Ratio of expenses to average net assets (with offsets) | 0.90 | % | 0.90 | % | 0.90 | % | 0.92 | %12 | 0.90 | %13 | ||||||||||
Ratio of total expenses to average net assets (without offsets/reductions)8 | 1.52 | % | 1.43 | % | 1.42 | % | 1.45 | %12 | 1.48 | %13 | ||||||||||
Ratio of net investment income to average net assets1 | 5.80 | % | 5.65 | % | 5.37 | % | 6.01 | %12 | 7.12 | %13 | ||||||||||
Portfolio turnover | 31 | % | 42 | % | 40 | % | 39 | % | 48 | % | ||||||||||
Net assets at end of year (000’s omitted) | $ | 2,737 | $ | 2,424 | $ | 3,131 | $ | 2,765 | $ | 2,538 | ||||||||||
|
|
|
|
|
|
|
|
|
| |||||||||||
The accompanying notes are an integral part of these financial statements.
76
Table of Contents
AMG Managers Amundi Intermediate Government Fund
Financial Highlights
For a share outstanding throughout each year
| For the years ended December 31, | ||||||||||||||||||||
| Class S | 2016# | 2015 | 2014 | 2013 | 2012 | |||||||||||||||
Net Asset Value, Beginning of Year | $ | 10.81 | $ | 10.96 | $ | 10.64 | $ | 10.98 | $ | 11.10 | ||||||||||
Income from Investment Operations: | ||||||||||||||||||||
Net investment income1,2 | 0.14 | 0.11 | 0.17 | 0.18 | 0.20 | |||||||||||||||
Net realized and unrealized gain (loss) on investments | 0.01 | 0.01 | 0.54 | (0.32 | ) | 0.14 | ||||||||||||||
Total income (loss) from investment operations | 0.15 | 0.12 | 0.71 | (0.14 | ) | 0.34 | ||||||||||||||
Less Distributions to Shareholders from: | ||||||||||||||||||||
Net investment income | (0.13 | ) | (0.10 | ) | (0.17 | ) | (0.18 | ) | (0.20 | ) | ||||||||||
Net realized gain on investments | (0.18 | ) | (0.17 | ) | (0.22 | ) | (0.02 | ) | (0.26 | ) | ||||||||||
Total distributions to shareholders | (0.31 | ) | (0.27 | ) | (0.39 | ) | (0.20 | ) | (0.46 | ) | ||||||||||
Net Asset Value, End of Year | $ | 10.65 | $ | 10.81 | $ | 10.96 | $ | 10.64 | $ | 10.98 | ||||||||||
Total Return1 | 1.42 | % | 1.09 | %9 | 6.73 | %9 | (1.25 | )%9 | 3.15 | %9 | ||||||||||
Ratio of net expenses to average net assets (with offsets/reductions) | 0.88 | % | 0.88 | % | 0.89 | % | 0.91 | %14 | 0.89 | %15 | ||||||||||
Ratio of expenses to average net assets (with offsets) | 0.88 | % | 0.88 | % | 0.89 | % | 0.91 | %14 | 0.89 | %15 | ||||||||||
Ratio of total expenses to average net assets (without offsets/reductions)8 | 0.93 | % | 0.92 | % | 0.96 | % | 0.94 | %14 | 0.92 | %15 | ||||||||||
Ratio of net investment income to average net assets1 | 1.32 | % | 0.99 | % | 1.54 | % | 1.64 | %14 | 1.81 | %15 | ||||||||||
Portfolio turnover | 17 | % | 21 | % | 11 | % | 29 | % | 21 | % | ||||||||||
Net assets at end of year (000’s omitted) | $ | 166,411 | $ | 192,039 | $ | 174,138 | $ | 136,915 | $ | 185,898 | ||||||||||
|
|
|
|
|
|
|
|
|
| |||||||||||
The accompanying notes are an integral part of these financial statements.
77
Table of Contents
AMG Managers Amundi Short Duration Government Fund
Financial Highlights
For a share outstanding throughout each year
| For the years ended December 31, | ||||||||||||||||||||
| Class S | 2016# | 2015 | 2014 | 2013 | 2012 | |||||||||||||||
Net Asset Value, Beginning of Year | $ | 9.62 | $ | 9.65 | $ | 9.64 | $ | 9.65 | $ | 9.57 | ||||||||||
Income from Investment Operations: | ||||||||||||||||||||
Net investment income1,2 | 0.16 | 0.02 | 0.05 | 0.03 | 0.08 | |||||||||||||||
Net realized and unrealized gain (loss) on investments | (0.05 | ) | (0.03 | ) | 0.01 | (0.01 | ) | 0.08 | ||||||||||||
Total income (loss) from investment operations | 0.11 | (0.01 | ) | 0.06 | 0.02 | 0.16 | ||||||||||||||
Less Distributions to Shareholders from: | ||||||||||||||||||||
Net investment income | (0.10 | ) | (0.02 | ) | (0.05 | ) | (0.03 | ) | (0.08 | ) | ||||||||||
Net Asset Value, End of Year | $ | 9.63 | $ | 9.62 | $ | 9.65 | $ | 9.64 | $ | 9.65 | ||||||||||
Total Return1 | 1.10 | % | (0.15 | )% | 0.60 | % | 0.20 | % | 1.64 | % | ||||||||||
Ratio of net expenses to average net assets (with offsets/reductions) | 0.80 | % | 0.79 | % | 0.80 | % | 0.79 | %16 | 0.81 | %17 | ||||||||||
Ratio of expenses to average net assets (with offsets) | 0.80 | % | 0.79 | % | 0.80 | % | 0.79 | %16 | 0.81 | %17 | ||||||||||
Ratio of total expenses to average net assets (without offsets/reductions)8 | 0.80 | % | 0.79 | % | 0.80 | % | 0.79 | %16 | 0.81 | %17 | ||||||||||
Ratio of net investment income to average net assets1 | 1.69 | % | 0.25 | % | 0.47 | % | 0.27 | %16 | 0.80 | %17 | ||||||||||
Portfolio turnover | 37 | % | 51 | % | 41 | % | 48 | % | 49 | % | ||||||||||
Net assets at end of year (000’s omitted) | $ | 234,569 | $ | 395,306 | $ | 385,246 | $ | 422,488 | $ | 466,415 | ||||||||||
|
|
|
|
|
|
|
|
|
| |||||||||||
Notes to Financial Highlights
| # | Effective October 1, 2016, the Investor Class, Service Class and Institutional Class of AMG Chicago Equity Partners Balanced Fund and AMG Chicago Equity Partners Small Cap Value Fund were renamed Class N, Class I and Class Z, respectively; the Investor Class and Institutional Class of AMG Managers High Yield Fund were renamed Class N and Class I, respectively, and the shares of AMG Managers Amundi Intermediate Government Fund and AMG Amundi Short Duration Government Fund were reclassified and redesignated as Class S shares. |
| * | Commencement of operations was December 1, 2012. |
| ** | Commencement of operations was January 2, 2015. |
| 1 | Total returns and net investment income would have been lower had certain expenses not been offset. |
| 2 | Per share numbers have been calculated using average shares. |
| 3 | Includes non-recurring dividends. Without these dividends, net investment income per share would have been $0.09, $0.11, and $0.13 for AMG Chicago Equity Partners Balanced Fund’s Class N, Class I and Class Z shares, respectively, and net investment income (loss) per share would have been $(0.09), $0.09, and $0.10 for AMG Chicago Equity Partners Small Cap Value Fund’s Class N, Class I and Class Z shares, respectively. |
| 4 | Includes non-recurring dividends. Without these dividends, net investment income per share would have been $0.09, $0.12, and $0.13 for AMG Chicago Equity Partners Balanced Fund’s Class N, Class I, and Class Z shares, respectively. |
| 5 | Includes non-routine extraordinary expenses amounting to 0.019%, 0.014% and 0.019% of average net assets for the Class N, Class I and Class Z, respectively. |
| 6 | Includes non-routine extraordinary expenses amounting to 0.005%, 0.005% and 0.004% of average net assets for the Class N, Class I and Class Z, respectively. |
| 7 | Effective July 1, 2012, the Fund’s expense cap was reduced to 0.84% from 1.00%. The expense ratio shown reflects the weighted average expense ratio for the full year ended December 31, 2012. |
| 8 | Excludes the impact of expense reimbursements or fee waivers and expense reductions such as brokerage credits, but includes expense repayments and non-reimbursable expenses, if any, such as interest, taxes and extraordinary expenses. (See Notes 1(c) and 2 in the Notes to Financial Statements.) |
| 9 | The total return is based on the Financial Statement Net Asset Values as shown in the Financial Highlights. |
| 10 | Not annualized. |
| 11 | Annualized. |
| 12 | Includes non-routine extraordinary expenses amounting to 0.020% and 0.021% of average net assets for the Class N and Class I, respectively. |
| 13 | Includes non-routine extraordinary expenses amounting to 0.005% and 0.004% of average net assets for the Class N and Class I, respectively. |
| 14 | Includes non-routine extraordinary expenses amounting to 0.020% of average net assets. |
| 15 | Includes non-routine extraordinary expenses amounting to 0.004% of average net assets. |
| 16 | Includes non-routine extraordinary expenses amounting to 0.019% of average net assets. |
| 17 | Includes non-routine extraordinary expenses amounting to 0.005% of average net assets. |
| 18 | Includes non-recurring dividends. Without these dividends, net investment income per share would have been $0.12, $0.15, and $0.16 for AMG Chicago Equity Partners Balanced Fund’s Class N, Class I, and Class Z shares, respectively. |
The accompanying notes are an integral part of these financial statements.
78
Table of Contents
December 31, 2016
1. SUMMARY OF SIGNIFICANT ACCOUNTING POLICIES
AMG Funds and AMG Funds II (the “Trusts”) are open-end management investment companies, organized as a Massachusetts business trusts and registered under the Investment Company Act of 1940, as amended (the “1940 Act”). Currently, the Trusts consist of a number of different funds, each having distinct investment management objectives, strategies, risks, and policies. Included in this report are AMG Funds: AMG Chicago Equity Partners Small Cap Value Fund (“Small Cap Value”) and AMG Funds II: AMG Chicago Equity Partners Balanced Fund (“Balanced”), AMG Managers High Yield Fund (“High Yield”), AMG Managers Amundi Intermediate Government Fund (“Intermediate Government”) (formerly AMG Managers Intermediate Duration Government Fund) and AMG Managers Amundi Short Duration Government Fund (“Short Duration”) (formerly AMG Managers Short Duration Government Fund), each a “Fund” and collectively the “Funds.” High Yield will deduct a 2.00% redemption fee from the proceeds of any redemption (including a redemption by exchange) of shares if the redemption occurs within 90 days of the purchase of those shares. For the year ended December 31, 2016, High Yield had redemption fees amounting to $3,038. These amounts are netted against the cost of shares repurchased in the Statements of Changes in Net Assets.
The Small Cap Value Fund had an inception date of December 31, 2014. The Fund’s commencement of operations was on January 2, 2015.
Each Fund offers different classes of shares, which, effective October 1, 2016, were renamed or redesignated. Both Balanced and Small Cap Value previously offered Investor Class shares, Service Class shares, and Institutional Class shares which were renamed to Class N, Class I and Class Z, respectively; High Yield previously offered Investor Class shares and Institutional Class shares which were renamed to Class N and Class I, respectively; and Intermediate Government and Short Duration shares were reclassified and redesignated Class S. Although all share classes generally have identical voting rights, each share class votes separately when required by law. Different share classes may pay different distribution amounts to the extent the net asset value per share and/or the expenses of such share classes differ. Each share class has its own expense structure. Please refer to a current prospectus for additional information on each share class.
The Funds’ financial statements are prepared in accordance with accounting principles generally accepted in the United States of America (“U.S. GAAP”), including accounting and reporting guidance pursuant to Accounting Standards Codification Topic 946 applicable to investment companies. U.S. GAAP requires management to make estimates and assumptions that affect the reported amounts of assets and liabilities and disclosure of contingent assets and liabilities at the date of the financial statements and the reported amounts of income and expenses during the reporting period. Actual results could differ from those estimates and such differences could be material. The following is a summary of significant accounting policies followed by the Funds in the preparation of their financial statements:
a. VALUATION OF INVESTMENTS
Equity securities traded on a national securities exchange or reported on the NASDAQ national market system (“NMS”) are valued at the last quoted sales price on the primary exchange or, if applicable, the NASDAQ official closing price or the official closing price of the relevant exchange or, lacking any sales,
at the last quoted bid price or the mean between the last quoted bid and ask prices (the “exchange mean price”). Equity securities traded in the over-the-counter market (other than NMS securities) are valued at the exchange mean price. Foreign equity securities (securities principally traded in markets other than U.S. markets) are valued at the official closing price on the primary exchange or, for markets that either do not offer an official closing price or where the official closing price may not be representative of the overall market, the last quoted sale price.
Fixed income securities purchased with a remaining maturity exceeding 60 days are valued at the evaluated bid price or the mean price provided by an authorized pricing service or, if an evaluated price is not available, by reference to other securities which are considered comparable in credit rating, interest rate, due date and other features (generally referred to as “matrix pricing”) or other similar pricing methodologies. Investments in certain mortgage-backed and stripped mortgage-backed securities, preferred stocks, convertible securities, derivatives and other debt securities not traded on an organized securities market are valued on the basis of valuations provided by dealers or by a pricing service which uses information with respect to transactions in such securities and various relationships between such securities and yield to maturity in determining value.
Fixed income securities purchased with a remaining maturity of 60 days or less are valued at amortized cost, provided that the amortized cost value is approximately the same as the fair value of the security valued without the use of amortized cost. Investments in other open-end regulated investment companies are valued at their end of day net asset value per share.
Futures contracts for which market quotations are readily available are valued at the settlement price as of the close of the futures exchange.
The Funds’ portfolio investments are generally valued based on independent market quotations or prices or, if none, “evaluative” or other market based valuations provided by third-party pricing services approved by the Board of Trustees of the Trusts (the “Board”). Under certain circumstances, the value of certain Fund portfolio investments (including derivatives) may be based on an evaluation of fair value, pursuant to procedures established by and under the general supervision of the Board. The Valuation Committee, which is comprised of the Independent Trustees of the Board, and the Pricing Committee, which is comprised of representatives from AMG Funds LLC (the “Investment Manager”) are the committees appointed by the Board to make fair value determinations. Each Fund may use the fair value of a portfolio investment to calculate its net asset value (“NAV”) in the event that the market quotation, price or market based valuation for the portfolio investment is not readily available or otherwise not determinable pursuant to the Board’s valuation procedures, if the Investment Manager or the Pricing Committee believes the quotation, price or market based valuation to be unreliable, or in certain other circumstances. When determining the fair value of an investment, the Pricing Committee and, if required under the Trusts’ securities valuation procedures, the Valuation Committee, seeks to determine the price that the Fund might reasonably expect to receive from current sale of that portfolio investment in an arms-length transaction. Fair value determinations shall be based upon consideration of all available facts and information, including, but not limited to (i) attributes specific to the investment; (ii) fundamental and analytical data relating to the
79 |
Table of Contents
Notes to Financial Statements (continued)
investment; and (iii) the value of other comparable securities or relevant financial instruments, including derivative securities, traded on other markets or among dealers.
The values assigned to fair value portfolio investments are based on available information and do not necessarily represent amounts that might ultimately be realized in the future, since such amounts depend on future developments inherent in long-term investments. Because of the inherent uncertainty of valuation, those estimated values may differ significantly from the values that would have been used had a ready market for the investments existed, and the differences could be material. The Board will be presented with a quarterly report showing as of the most recent quarter end, all outstanding securities fair valued by the Fund, including a comparison with the prior quarter end and the percentage of the Fund that the security represents at each quarter end.
With respect to foreign equity securities and certain foreign fixed income securities, the Board has adopted a policy that securities held in a Fund that can be fair valued by the applicable fair value pricing service are fair valued on each business day provided that each individual price exceeds a pre-established confidence level.
U.S. GAAP defines fair value as the price that a fund would receive to sell an asset or pay to transfer a liability in an orderly transaction between market participants at the measurement date. U.S. GAAP also establishes a framework for measuring fair value, and a three-level hierarchy for fair value measurements based upon the transparency of inputs to the valuation of an asset or liability. Inputs may be observable or unobservable and refer broadly to the assumptions that market participants would use in pricing the asset or liability. Observable inputs reflect the assumptions market participants would use in pricing the asset or liability based on market data obtained from sources independent of the Funds. Unobservable inputs reflect the Funds’ own assumptions about the assumptions that market participants would use in pricing the asset or liability developed based on the best information available in the circumstances. Each investment is assigned a level based upon the observability of the inputs which are significant to the overall valuation.
The three-tier hierarchy of inputs is summarized below:
Level 1 – inputs are quoted prices in active markets for identical investments (e.g., equity securities, open-end investment companies, futures contracts)
Level 2 – other observable inputs (including, but not limited to: quoted prices for similar assets or liabilities in markets that are active, quoted prices for identical or similar assets or liabilities in markets that are not active, inputs other than quoted prices that are observable for the assets or liabilities (such as interest rates, yield curves, volatilities, prepayment speeds, loss severities, credit risks and default rates) or other market corroborated inputs) (e.g., debt securities, government securities, foreign currency exchange contracts, foreign securities utilizing international fair value pricing, broker-quoted securities, fair valued securities with observable inputs)
Level 3 – inputs are significant unobservable inputs (including the Funds’ own assumptions used to determine the fair value of investments) (e.g., fair valued securities with unobservable inputs)
Changes in inputs or methodologies used for valuing investments may result in a transfer in or out of levels within the fair value hierarchy. The inputs or methodologies used for valuing investments may not necessarily be an indication of the risk associated with investing in those investments. Transfers between different levels of the fair value disclosure hierarchy are deemed to have occurred as of the beginning of the reporting period.
b. SECURITY TRANSACTIONS
Security transactions are accounted for as of trade date. Realized gains and losses on securities sold are determined on the basis of identified cost.
c. INVESTMENT INCOME AND EXPENSES
Dividend income is recorded on the ex-dividend date. Interest income, which includes amortization of premium and accretion of discount on debt securities, is accrued as earned. Dividend and interest income on foreign securities is recorded gross of any withholding tax. Non-cash dividends included in dividend income, if any, are reported at the fair market value of the securities received. Upon notification from issuers, distributions received from a real estate investment trust (“REIT”) may be redesignated as a reduction of cost of investments and/or realized gain. Other income and expenses are recorded on an accrual basis. Expenses that cannot be directly attributed to a Fund are apportioned among the funds in the Trust and other trusts within the AMG Funds family of mutual funds (collectively, the “AMG Funds family”) based upon their relative average net assets or number of shareholders. Investment income, realized and unrealized capital gains and losses, the common expenses of each Fund, and certain Fund level expense reductions, if any, are allocated on a pro-rata basis to each class based on the relative net assets of each class to the total net assets of each Fund.
The following Funds had certain portfolio trades directed to various brokers, under a brokerage recapture program, which paid a portion of such Fund’s expenses. For the year ended December 31, 2016, the amount by which the fund’s expenses were reduced and the impact on the expense ratios, if any, were as follows: Balanced—$22,618 or 0.01%, Small Cap Value—$1,751 or 0.01%.
d. DIVIDENDS AND DISTRIBUTIONS
Fund distributions resulting from either net investment income or realized net capital gains, if any, will normally be declared and paid at least annually in December, as described in the Funds’ prospectus. Distributions to shareholders are recorded on the ex-dividend date. Distributions are determined in accordance with federal income tax regulations, which may differ from net investment income and net realized capital gains for financial statement purposes (U.S. GAAP). Differences may be permanent or temporary. Permanent differences are reclassified among capital accounts in the financial statements to reflect their tax character. Permanent book and tax basis differences, if any, relating to shareholder distributions will result in reclassifications to paid-in capital. Temporary differences arise when certain items of income, expense and gain or loss are recognized in different periods for financial statement and tax purposes; these differences will reverse at some time in the future. Temporary differences are due to differences between book and tax treatment of losses for excise tax purposes, wash sales, futures and tax straddles.
80
Table of Contents
Notes to Financial Statements (continued)
The tax character of distributions paid during the years ended December 31, 2016 and December 31, 2015 were as follows:
| Balanced | Small Cap Value | High Yield | Intermediate Government | Short Duration | ||||||||||||||||||||||||||||||||||||
Distributions paid from: | 2016 | 2015 | 2016 | 2015 | 2016 | 2015 | 2016 | 2015 | 2016 | 2015 | ||||||||||||||||||||||||||||||
Ordinary income | $ | 1,747,072 | $ | 891,722 | $ | 121,930 | $ | 101,539 | $ | 1,461,550 | $ | 1,885,260 | $ | 5,087,719 | $ | 1,715,923 | $ | 2,527,449 | $ | 613,266 | ||||||||||||||||||||
Short-term capital gains | — | 428,523 | — | — | — | — | — | 2,802,915 | — | — | ||||||||||||||||||||||||||||||
Long-term capital gains | 131,879 | 3,554,115 | — | — | — | — | — | 177,508 | — | — | ||||||||||||||||||||||||||||||
|
|
|
|
|
|
|
|
|
|
|
|
|
|
|
|
|
|
|
| |||||||||||||||||||||
Total | $ | 1,878,951 | $ | 4,874,360 | $ | 121,930 | $ | 101,539 | $ | 1,461,550 | $ | 1,885,260 | $ | 5,087,719 | $ | 4,696,346 | $ | 2,527,449 | $ | 613,266 | ||||||||||||||||||||
|
|
|
|
|
|
|
|
|
|
|
|
|
|
|
|
|
|
|
| |||||||||||||||||||||
As of December 31, 2016, the components of distributable earnings (excluding unrealized appreciation/depreciation) on a tax basis consisted of:
| Balanced | Small Cap Value | High Yield | Intermediate Government | Short Duration | ||||||||||||||||
Capital loss carryforward | — | $ | 262,416 | $ | 3,396,497 | — | $ | 4,760,539 | ||||||||||||
Undistributed ordinary income | $ | 16,665 | — | 6,083 | $ | 380,109 | 2,457,695 | |||||||||||||
Undistributed short-term capital gains | — | — | — | — | — | |||||||||||||||
Undistributed long-term capital gains | 1,037,251 | — | — | — | — | |||||||||||||||
Late-year loss deferral | — | — | 63,159 | 1,800,126 | — | |||||||||||||||
e. FEDERAL TAXES
Each Fund currently qualifies as an investment company and intends to comply with the requirements under Subchapter M of the Internal Revenue Code of 1986, as amended, to distribute substantially all of its taxable income and gains to its shareholders and to meet certain diversification and income requirements with respect to investment companies. Therefore, no provision for federal income or excise tax is included in the accompanying financial statements.
Additionally, based on each Fund’s understanding of the tax rules and rates related to income, gains and transactions for the foreign jurisdictions in which it invests, each Fund will provide for foreign taxes, and where appropriate, deferred foreign taxes.
Management has analyzed the Funds’ tax positions taken on federal income tax returns as of December 31, 2016, and all open tax years (generally, the three prior taxable years), and has concluded that no provision for federal income tax is required in the Funds’ financial statements. Additionally, Management is not aware of any tax position for which it is reasonably possible that the total amounts of unrecognized tax benefits will change materially in the next twelve months.
Net capital losses incurred in taxable years beginning after the enactment of the Regulated Investment Company Modernization Act of 2010, may be carried forward for an unlimited time period. Such losses will be required to be utilized prior to any loss carryovers incurred in pre-enactment taxable years, which generally expire eight years following the close of the taxable year in which they were incurred. As a result of this ordering rule, pre-enactment capital loss carryovers may be more likely to expire unused. Additionally, post-enactment capital losses that are carried forward retain their tax character as either short-term or long-term capital losses, unlike pre-enactment losses which are considered all short-term.
f. CAPITAL LOSS CARRYOVERS AND DEFERRALS
As of December 31, 2016, the following Funds had accumulated net realized capital loss carryovers from securities transactions for federal income tax purposes as shown in the following chart. These amounts may be used to offset future realized capital gains, if any, through the expiration dates listed or in the case of post-enactment losses, for an unlimited time period.
| Capital Loss Carryover Amounts | ||||||||||||
| Fund | Short-Term | Long-Term | Expires December 31, | |||||||||
Small Cap Value | ||||||||||||
(Post-Enactment) | $ | 262,416 | — | Unlimited | ||||||||
High Yield | ||||||||||||
(Pre-Enactment) | $ | 1,914,719 | — | 2017 | ||||||||
(Post-Enactment) | — | $ | 1,481,778 | Unlimited | ||||||||
Short Duration | ||||||||||||
(Pre-Enactment) | $ | 585,044 | — | 2017 | ||||||||
(Post-Enactment) | — | $ | 4,175,495 | Unlimited | ||||||||
Balanced and Intermediate Government had no accumulated net realized capital loss carryovers from securities transactions for federal income tax purposes. Should Balanced and Intermediate Government incur net capital losses for the year ended December 31, 2017, such amounts may be used to offset future realized capital gains, for an unlimited time period.
For the year ended December 31, 2016, the following Funds utilized capital loss carryovers in the amount of:
81
Table of Contents
Notes to Financial Statements (continued)
| Capital Loss Carryover Utilized | ||||||||
| Fund | Short-Term | Long-Term | ||||||
Balanced | — | — | ||||||
Small Cap Value | $ | 155,698 | — | |||||
High Yield | — | — | ||||||
Intermediate Government | — | — | ||||||
Short Duration | 2,329 | — | ||||||
g. CAPITAL STOCK
The Trusts’ Declaration of Trust authorizes for each Fund the issuance of an unlimited number of shares of beneficial interest, without par value. Each Fund records sales and repurchases of its capital stock on the trade date. The cost of securities contributed to the Funds in connection with the issuance of shares is based on the valuation of those securities in accordance with the Funds’ policy on investment valuation.
For the years ended December 31, 2016 and 2015, the capital stock transactions by class for Balanced, Small Cap Value and High Yield were as follows:
| Balanced | Small Cap* | |||||||||||||||||||||||||||||||
| 2016 | 2015 | 2016 | 2015 | |||||||||||||||||||||||||||||
| Shares | Amount | Shares | Amount | Shares | Amount | Shares | Amount | |||||||||||||||||||||||||
Class N: | ||||||||||||||||||||||||||||||||
Proceeds from sale of shares | 3,377,841 | $ | 49,948,934 | 4,917,700 | $ | 75,876,816 | 1,549 | $ | 18,593 | 1,181,275 | $ | 12,083,124 | ||||||||||||||||||||
Reinvestment of distributions | 53,953 | 817,953 | 169,057 | 2,540,619 | 17 | 207 | — | — | ||||||||||||||||||||||||
Cost of shares repurchased | (3,777,688 | ) | (56,409,174 | ) | (1,519,741 | ) | (23,301,123 | ) | (783 | ) | (7,962 | ) | (1,179,544 | ) | (12,193,236 | ) | ||||||||||||||||
|
|
|
|
|
|
|
|
|
|
|
|
|
|
|
| |||||||||||||||||
Net increase (decrease) | (345,894 | ) | $ | (5,642,287 | ) | 3,567,016 | $ | 55,116,312 | 783 | $ | 10,838 | 1,731 | $ | (110,112 | ) | |||||||||||||||||
|
|
|
|
|
|
|
|
|
|
|
|
|
|
|
| |||||||||||||||||
Class I: | ||||||||||||||||||||||||||||||||
Proceeds from sale of shares | 2,263,148 | $ | 34,028,928 | 3,649,007 | $ | 56,053,664 | 181,690 | $ | 1,853,567 | 1,308,993 | $ | 13,485,730 | ||||||||||||||||||||
Reinvestment of distributions | 19,571 | 299,586 | 32,172 | 487,073 | 8,418 | 102,527 | 9,228 | 87,485 | ||||||||||||||||||||||||
Cost of shares repurchased | (1,453,335 | ) | (22,061,566 | ) | (592,922 | ) | (9,069,021 | ) | (467,369 | ) | (4,771,305 | ) | (132,551 | ) | (1,308,615 | ) | ||||||||||||||||
|
|
|
|
|
|
|
|
|
|
|
|
|
|
|
| |||||||||||||||||
Net increase (decrease) | 829,384 | $ | 12,266,948 | 3,088,257 | $ | 47,471,716 | (277,261 | ) | $ | (2,815,211 | ) | 1,185,670 | $ | 12,264,600 | ||||||||||||||||||
|
|
|
|
|
|
|
|
|
|
|
|
|
|
|
| |||||||||||||||||
Class Z: | ||||||||||||||||||||||||||||||||
Proceeds from sale of shares | 323,484 | $ | 4,749,655 | 113,841 | $ | 1,780,500 | 43,104 | $ | 418,513 | 185,788 | $ | 1,891,574 | ||||||||||||||||||||
Reinvestment of distributions | 4,203 | 64,334 | 5,616 | 86,077 | 1,575 | 19,183 | 1,481 | 14,055 | ||||||||||||||||||||||||
Cost of shares repurchased | (69,342 | ) | (1,045,388 | ) | (820,603 | ) | (12,951,242 | ) | (54,112 | ) | (495,091 | ) | (15,192 | ) | (153,098 | ) | ||||||||||||||||
|
|
|
|
|
|
|
|
|
|
|
|
|
|
|
| |||||||||||||||||
Net increase (decrease) | 258,345 | $ | 3,768,601 | (701,146 | ) | $ | (11,084,665 | ) | (9,433 | ) | $ | (57,395 | ) | 172,077 | $ | 1,752,531 | ||||||||||||||||
|
|
|
|
|
|
|
|
|
|
|
|
|
|
|
| |||||||||||||||||
| High Yield | ||||||||||||||||
| 2016 | 2015 | |||||||||||||||
| Shares | Amount | Shares | Amount | |||||||||||||
Class N: | ||||||||||||||||
Proceeds from sale of shares | 830,859 | $ | 6,112,155 | 458,232 | $ | 3,548,190 | ||||||||||
Reinvestment of distributions | 149,970 | 1,099,393 | 201,329 | 1,540,515 | ||||||||||||
Cost of shares repurchased | (2,153,177 | ) | (15,707,254 | ) | (1,264,058 | ) | (9,754,397 | ) | ||||||||
|
|
|
|
|
|
|
| |||||||||
Net decrease | (1,172,348 | ) | $ | (8,495,706 | ) | (604,497 | ) | $ | (4,665,692 | ) | ||||||
|
|
|
|
|
|
|
| |||||||||
Class I: | ||||||||||||||||
Proceeds from sale of shares | 53,750 | $ | 395,644 | 64,450 | $ | 499,391 | ||||||||||
Reinvestment of distributions | 19,182 | 142,757 | 20,559 | 159,183 | ||||||||||||
Cost of shares repurchased | (60,457 | ) | (448,016 | ) | (140,790 | ) | (1,085,651 | ) | ||||||||
|
|
|
|
|
|
|
| |||||||||
Net increase (decrease) | 12,475 | $ | 90,385 | (55,781 | ) | $ | (427,077 | ) | ||||||||
|
|
|
|
|
|
|
| |||||||||
| * | Commencement of operations was on January 2, 2015, and included an initial subscription from the Investment Manager. |
82
Table of Contents
Notes to Financial Statements (continued)
At December 31, 2016, certain unaffiliated shareholders of record, including omnibus accounts, individually or collectively held greater than 10% of the net assets of the Funds as follows: Balanced—two own 41%; High Yield—one owns 15%; Intermediate Government—two own 45%; Short Duration—two own 57%. Transactions by these shareholders may have a material impact on their respective Fund.
h. REPURCHASE AGREEMENTS AND JOINT REPURCHASE AGREEMENTS
The Funds may enter into repurchase agreements for temporary cash management purposes provided that the value of the underlying collateral, including accrued interest, will equal or exceed the value of the repurchase agreement during the term of the agreement. The underlying collateral for all repurchase agreements is held in safekeeping by the Funds’ custodian or at the Federal Reserve Bank. If the seller defaults and the value of the collateral declines, or if bankruptcy proceedings commence with respect to the seller of the security, realization of the collateral by the Funds may be delayed or limited.
Additionally, the Funds may enter into joint repurchase agreements for reinvestment of cash collateral on securities lending transactions under the securities lending program offered by The Bank of New York Mellon (“BNYM”) (the “Program”), provided that the value of the underlying collateral, including accrued interest, will equal or exceed the value of the joint repurchase agreement during the term of the agreement. The Funds participate on a pro rata basis with other clients of BNYM in its share of the underlying collateral under such joint repurchase agreements and in its share of proceeds from any repurchase or other disposition of the underlying collateral. The underlying collateral for joint repurchase agreements is held in safekeeping by the Funds’ custodian or at the Federal Reserve Bank. If the seller defaults and the value of the collateral declines, or if bankruptcy proceedings commence with respect to the seller of the security, realization of the collateral by the Funds may be delayed or limited. Pursuant to the Program, the Funds are indemnified for such losses by BNYM.
At December 31, 2016, the market value of repurchase agreements or joint repurchase agreements outstanding for Balanced, Small Cap Value and High Yield were $3,216,364, $557,580, and $77,190, respectively.
i. SECURITIES TRANSACTED ON A WHEN ISSUED BASIS
All Funds except Small Cap Value may enter into To-Be-Announced (“TBA”) sale commitments to hedge their portfolio positions or to sell mortgage-backed securities they own under delayed delivery arrangements. Proceeds of TBA sale commitments are not received until the contractual settlement date. During the time a TBA sale commitment is outstanding, equivalent deliverable securities, with the same counterparty, or an offsetting TBA purchase commitment deliverable on or before the sale commitment date, are held as “cover” for the transaction. Unsettled TBA sale commitments are valued at the current market value of the underlying securities according to the procedures described under “Valuation of Investments,” in footnote 1a above.
Each contract is marked-to-market daily and the change in market value is recorded by the Funds as an unrealized gain or loss. If the TBA sale commitment is closed through the acquisition of an offsetting purchase
commitment, the Funds realize a gain or loss. If the Funds deliver securities under the commitment, the Funds realize a gain or a loss from the sale of the securities based upon the unit price established at the date the commitment was entered into.
j. DELAYED DELIVERY TRANSACTIONS AND WHEN-ISSUED SECURITIES
All Funds except Small Cap Value may enter into securities transactions on a delayed delivery or when issued basis. Payment and delivery may take place after the customary settlement period for that security. The price of the underlying securities and the date when the securities will be delivered and paid for are fixed at the time the transaction is negotiated. During the time a delayed delivery sell is outstanding, the contract is marked to market daily and equivalent deliverable securities are held for the transaction. The value of the securities purchased on a delayed delivery or when-issued basis are identified as such in the Funds’ Schedules of Portfolio Investments. With respect to purchase commitments, the Funds identify securities as segregated in their records with a value at least equal to the amount of the commitment. Delayed delivery or when-issued securities that have been purchased from and sold to different brokers are reflected as an investment in securities and a forward sale commitment in the Funds’ Statement of Assets and Liabilities. For financial reporting purposes, the Funds do not offset the receivable and payable for delayed delivery investments purchased and sold on TBA commitments. Losses may arise due to changes in the value of the underlying securities or if the counterparty does not perform under the contract, or if the issuer does not issue the securities due to political, economic, or other factors.
2. AGREEMENTS AND TRANSACTIONS WITH AFFILIATES
For each of the Funds, the Trusts have entered into an investment advisory agreement under which the Investment Manager, a subsidiary and the U.S. retail distribution arm of Affiliated Managers Group, Inc. (“AMG”), serves as investment manager to the Funds and is responsible for the Funds’ overall administration and operations. The Investment Manager selects one or more subadvisors for the Funds (subject to Board approval) and monitors each subadvisor’s investment performance, security holdings and investment strategies. Each Fund’s investment portfolio is managed by one or more portfolio managers who serve pursuant to a subadvisory agreement with the Investment Manager. The investment portfolio of Balanced and Small Cap Value are managed by Chicago Equity Partners, LLC (“CEP”). AMG indirectly owns a majority interest in CEP.
Investment management fees are paid directly by the Funds to the Investment Manager based on average daily net assets. Effective October 1, 2016, the Funds’ investment management fees are paid at the following annual rate of each Fund’s respective average daily net assets:
Balanced | 0.60 | % | ||
Small Cap Value | 0.62 | % | ||
High Yield | 0.55 | % | ||
Intermediate Government | 0.48 | % | ||
Short Duration | 0.40 | % |
83
Table of Contents
Notes to Financial Statements (continued)
Prior to October 1, 2016, the annual rate for the investment management fees was 0.70%, 0.62%, 0.70%, 0.70% and 0.70% of each Fund’s average daily net assets of Balanced, Small Cap Value, High Yield, Intermediate Government and Short Duration, respectively.
The Investment Manager has contractually agreed, through at least May 1, 2017, to waive management fees and/or reimburse fund expenses in order to limit total annual Fund operating expenses after fee waiver and expense reimbursements (exclusive of taxes, interest (including interest incurred in connection with bank and custody overdrafts), shareholder servicing fees, distribution and service (12b-1) fees, brokerage commissions and other transaction costs, acquired fund fees and expenses and extraordinary expenses) of Balanced, Small Cap Value and High Yield to 0.84%, 0.95% and 0.90%, respectively, of each Fund’s average daily net assets subject to later reimbursement by the Funds in certain circumstances.
The Investment Manager has contractually agreed, through at least May 1, 2017, to waive management fees and/or reimburse Fund expenses in order to limit total annual fund operating expenses after fee waiver and expense reimbursements (exclusive of taxes, interest (including interest incurred in connection with bank and custody overdrafts), brokerage commissions and other transaction costs, acquired fund fees and expenses and extraordinary expenses) to 0.89% of Intermediate Government’s average daily net assets subject to later reimbursement by the Fund in certain circumstances.
The contractual expense limitation may only be terminated in the event the Investment Manager or a successor ceases to be the investment manager of the Fund or a successor fund, by mutual agreement between the Investment Manager and the Board, or in the event of the Fund’s liquidation unless the Fund is reorganized or is a party to a merger in which the surviving entity is successor to the accounting and performance information of the Fund.
Each Fund is obligated to repay the Investment Manager such amounts waived, paid or reimbursed in future years provided that the repayment occurs within thirty-six (36) months after the waiver or reimbursement and that such repayment would not cause the Fund’s total annual operating expenses after fee waiver and expense reimbursements in any such future year to exceed that Fund’s contractual expense limitation amount.
At December 31, 2016, the Funds’ expiration of reimbursement are as follows:
| Expiration Period | Balanced | Small Cap Value | ||||||
Less than 1 year | $ | 178,167 | — | |||||
Within 2 years | 256,154 | $ | 100,095 | |||||
Within 3 years | 276,286 | 94,463 | ||||||
|
|
|
| |||||
Total Amount Subject to Reimbursement | $ | 710,607 | $ | 194,558 | ||||
|
|
|
| |||||
| Expiration Period | High Yield | Intermediate Government | ||||||
Less than 1 year | $ | 197,131 | $ | 89,573 | ||||
Within 2 years | 185,686 | 58,801 | ||||||
Within 3 years | 159,030 | 81,422 | ||||||
|
|
|
| |||||
Total Amount Subject to Reimbursement | $ | 541,847 | $ | 229,796 | ||||
|
|
|
| |||||
The Investment Manager has agreed to waive a portion of its management fee in consideration of shareholder servicing fees that it has received from JPMorgan Distribution Services, Inc., with respect to short-term cash investments each Fund may have made in the JPMorgan Money Market Funds. For the year ended December 31, 2016, the investment management fee for Intermediate Government was reduced by $17,543.
The Trusts, on behalf of the Funds, has entered into an amended and restated Administration Agreement under which the Investment Manager serves as the Funds’ administrator (the “Administrator”) and is responsible for all non-portfolio management aspects of managing the Funds’ operations, including administration and shareholder services to each Fund as further described in each Fund’s prospectus. Effective October 1, 2016, each Fund pays a fee to the Administrator at the rate of 0.15% per annum of the Fund’s average daily net assets for this service. Prior to October 1, 2016, Balanced, Small Cap Value and High Yield paid an administration fee under a similar contract at an annual rate of 0.20%, 0.25%, 0.20%, respectively, of each Fund’s average daily net assets while Intermediate Government and Short Duration did not pay an administration fee.
The Funds are distributed by AMG Distributors, Inc. (the “Distributor”), a wholly-owned subsidiary of the Investment Manager. The Distributor serves as the distributor and underwriter for each Fund and is a registered broker-dealer and member of the Financial Industry Regulatory Authority, Inc. (“FINRA”). Shares of each Fund will be continuously offered and will be sold directly to prospective purchasers and through brokers, dealers or other financial intermediaries who have executed selling agreements with the Distributor. Generally the Distributor bears all or a portion of the expenses of providing services pursuant to the distribution agreement, including the payment of the expenses relating to the distribution of prospectuses for sales purposes and any advertising or sales literature.
The Trusts have adopted a distribution and service plan (the “Plan”) with respect to the Class N shares in accordance with the requirements of Rule 12b-1 under the 1940 Act and the requirements of the applicable rules of FINRA regarding asset based sales charges. Pursuant to the Plan, Balanced, Small Cap Value and High Yield may make payments to the Distributor for their expenditures in financing any activity primarily intended to result in the sale of each such class of the Fund’s shares and for maintenance and personal service provided to existing shareholders of that class. The Plan authorizes payments to the Distributor of 0.25% annually of each Fund’s average daily net assets attributable to the Class N shares.
For Class N of Small Cap Value, Class I of Balanced and Small Cap Value, and Class S of Intermediate Government and Short Duration, the Board has approved reimbursement payments to the Investment Manager for shareholder
84
Table of Contents
Notes to Financial Statements (continued)
servicing expenses (“shareholder servicing fees”) for the actual amount incurred up to a maximum annual rate of each Class’s average daily net assets.
Shareholder servicing fees include payments to financial intermediaries such as broker-dealers (including fund supermarket platforms), banks, and trust companies who provide shareholder recordkeeping, account servicing and other services.
The impact on the annualized expense ratios for the year ended December 31, 2016, was as follows:
| Fund | Maximum Amount Approved | Actual Amount Incurred | ||||||
Balanced-Class I | 0.100 | % | 0.100 | % | ||||
Small Cap Value-Class I | 0.150 | % | 0.115 | % | ||||
Small Cap Value-Class N | 0.150 | % | 0.150 | % | ||||
Intermediate Government- | 0.150 | % | 0.112 | % | ||||
Short Duration-Class S* | 0.150 | % | 0.034 | % | ||||
| * | Effective October 1, 2016, the maximum annual rate was increased to 0.15% from 0.10%. |
The Board provides supervision of the affairs of the Trusts and other trusts within the AMG Funds family. The Trustees of the Trusts who are not affiliated with an Investment Manager receive an annual retainer and per meeting fees for regular, special and telephonic meetings, and they are reimbursed for out-of-pocket expenses incurred while carrying out their duties as Board members. The Chairman of the Board and the Audit Committee Chair receive additional annual retainers. Certain Trustees and Officers of the Funds are Officers and/or Directors of the Investment Manager, AMG and/or the Distributor.
The Securities and Exchange Commission (the “SEC”) granted an exemptive order that permits the Funds to lend and borrow money for certain temporary purposes directly to and from other eligible funds in the AMG Funds family. Participation in this interfund lending program is voluntary for both the borrowing and lending funds, and an interfund loan is only made if it benefits each participating fund. The Administrator manages the program according to procedures approved by the Board, and the Board monitors the operation of the program. An interfund loan must comply with certain conditions set out in the exemptive order, which are designed to assure fairness and protect all participating funds. For the year ended December 31, 2016, Intermediate Government lent varying amounts not exceeding $8,207,111 for four days earning interest of $348. The interest amount is included in the Statement of Operations as interest income. For the year ended December 31, 2016, Balanced, Small Cap Value, High Yield and Short Duration neither borrowed from nor lent to other funds in the AMG Funds family. At December 31, 2016, the Funds had no interfund loans outstanding.
3. PURCHASES AND SALES OF SECURITIES
Purchases and sales of securities (excluding short-term securities and U.S. Government Obligations) for the year ended December 31, 2016, were as follows:
| Long-Term Securities | ||||||||
| Fund | Purchases | Sales | ||||||
Balanced | $ | 155,622,291 | $ | 150,269,439 | ||||
Small Cap Value | 17,723,238 | 19,640,896 | ||||||
High Yield | 7,584,627 | 15,926,457 | ||||||
Intermediate Government | 11,920,063 | 21,453,760 | ||||||
Short Duration | 18,080,204 | 38,414,444 | ||||||
| U.S. Government Obligations | ||||||||
| Fund | Purchases | Sales | ||||||
Balanced | $ | 60,338,339 | $ | 54,234,322 | ||||
Intermediate Government | 26,099,707 | 42,994,163 | ||||||
Short Duration | 77,057,682 | 186,238,794 | ||||||
4. PORTFOLIO SECURITIES LOANED
The Funds participate in the Program providing for the lending of securities to qualified brokers. Securities lending income includes earnings of such temporary cash investments, plus or minus any rebate to a borrower. These earnings (after any rebate) are then divided between BNYM, as a fee for its services under the Program, and the Funds, according to agreed-upon rates. Collateral on all securities loaned is accepted in cash and is maintained at a minimum level of 102% (105% in the case of certain foreign securities) of the market value, plus interest, if applicable, of investments on loan. It is the Funds’ policy to obtain additional collateral from or return excess collateral to the borrower by the end of the next business day, following the valuation date of the securities loaned. Therefore, the value of the collateral held may be temporarily less than the value of the securities on loan. Lending securities entails a risk of loss to the Funds if and to the extent that the market value of the securities loaned were to increase and the borrower did not increase the collateral accordingly, and the borrower fails to return the securities. Under the terms of the Program, the Funds are indemnified for such losses by BNYM. Cash collateral is held in a separate omnibus account managed by BNYM, who is authorized to exclusively enter into joint overnight government repurchase agreements. BNYM bears the risk of any deficiency in the amount of the cash collateral available for return to the borrower due to any loss on the collateral invested.
At December 31, 2016, the value of the securities loaned and cash collateral received, were as follows:
| Fund | Securities Loaned | Cash Collateral Received | ||||||
Balanced | $ | 3,119,717 | $ | 3,216,364 | ||||
Small Cap Value | 536,303 | 557,580 | ||||||
High Yield | 73,484 | 77,190 | ||||||
5. COMMITMENTS AND CONTINGENCIES
Under the Trusts’ organizational documents, its trustees and officers are indemnified against certain liabilities arising out of the performance of their duties to the Trusts. In addition, in the normal course of business, the Funds may enter into contracts and agreements that contain a variety of representations and warranties which provide general indemnifications. The
85
Table of Contents
Notes to Financial Statements (continued)
maximum exposure to the Funds under these arrangements is unknown, as this would involve future claims that may be made against a Fund that have not yet occurred. However, based on experience, the Funds had no prior claims or losses and expect the risks of loss to be remote.
6. RISKS ASSOCIATED WITH HIGH YIELD SECURITIES
Investing in high yield securities involves greater risks and considerations not typically associated with U.S. Government and other high quality/investment grade securities. High yield securities are generally below investment grade securities and do not have an established retail secondary market. Economic downturns may disrupt the high yield market and impair the issuer’s ability to repay principal and interest. Also, an increase in interest rates would likely have an adverse impact on the value of such obligations and could cause the securities to become less liquid.
7. DERIVATIVE INSTRUMENTS
The following disclosures contain information on how and why certain Funds use derivative instruments, the credit risk and how derivative instruments affect the Funds’ financial position, results of operations and cash flows. The location and fair value amounts of these instruments on the Statement of Assets and Liabilities, and the realized gains and losses and changes in unrealized gains and losses on the Statement of Operations, each categorized by type of derivative contract, are included in a table in the Notes to the Schedules of Portfolio Investments. For the year ended December 31, 2016, the average quarterly balances of derivative financial instruments outstanding were as follows:
| Intermediate Government | Short Duration | |||||||
Financial futures contracts: | ||||||||
Average number of contracts purchased | 5 | 32 | ||||||
Average number of contracts sold | 65 | 654 | ||||||
Average notional value of contracts purchased | $ | 781,862 | $ | 4,096,934 | ||||
Average notional value of contracts sold | $ | 7,057,717 | $ | 87,400,960 | ||||
8. FUTURES CONTRACTS
A Fund may enter into futures contracts to achieve a desired level of investment, whether to accommodate portfolio turnover or cash flows from capital shares transactions. There are certain risks associated with futures contracts. Prices may not move as expected or the Fund may not be able to close out the contract when it desires to do so, resulting in losses.
On entering into a futures contract, either cash or securities in an amount equal to a certain percentage of the contract value (initial margin) must be deposited with the futures broker. Variation margin payments are made or received each day. The variation margin payments equal the daily changes in the contract value and are recorded as unrealized gains or losses. For over-the-counter (“OTC”) futures, daily variation margin payments are not required. The Funds recognize a realized gain or loss when the contract is closed or expires equal to the difference between the value of the contract at the time it was opened and the value at the time it was closed. Futures are valued at their quoted daily settlement prices. The aggregate principal amounts of the contracts are not recorded in the financial statements. Fluctuations in the value of the contracts are recorded in the Statement of Assets and Liabilities as an asset (liability) and
in the Statement of Operations as unrealized appreciation (depreciation) until the contracts are closed, when they are recorded as realized gains (losses) on futures contracts.
9. RISKS ASSOCIATED WITH COLLATERALIZED MORTGAGE
OBLIGATIONS (“CMOs”)
The net asset values of a fund may be sensitive to interest rate fluctuations because a fund may hold several instruments, including CMOs and other derivatives, whose values can be significantly impacted by interest rate movements. CMOs are obligations collateralized by a portfolio of mortgages or mortgage-related securities. Payments of principal and interest on the mortgages are passed through to the holder of the CMOs on the same schedule as they are received, although certain classes of CMOs have priority over others with respect to the receipt of prepayments on the mortgages. Therefore, the investment in CMOs may be subject to a greater or lesser risk of prepayment than other types of mortgage-related securities. CMOs are subject to principal paydowns as a result of prepayments or refinancing of the underlying mortgage instruments. As a result, the average life may be substantially less than the original maturity. CMOs may have a fixed or variable rate of interest.
10. DOLLAR ROLL AGREEMENTS
All Funds except Small Cap Value may enter into dollar rolls in which they sell debt securities for delivery currently and simultaneously contract to repurchase similar, but not identical, securities at the same price or a lower price on an agreed date. The Funds receive compensation as consideration for entering into the commitment to repurchase. The compensation is the difference between the current sale price and the repurchase price (often referred to as the “drop”) as well as the interest earned on the cash proceeds of the initial sale. The Funds may also be compensated by the receipt of a commitment fee. As the holder, the counterparty receives all principal and interest payments, including prepayments, made with respect to the similar security sold. Dollar rolls may be renewed with a new sale and repurchase price with a cash settlement made at renewal without physical delivery of the securities subject to the contract.
Certain risks may arise upon entering into dollar rolls from the potential inability of counterparties to meet the terms of their commitments. Additionally, the value of such securities may change adversely before the Funds are able to repurchase them. There can be no assurance that the Funds’ use of the cash that they receive from a dollar roll will provide a return that exceeds their cost.
11. STRIPPED SECURITIES
High Yield, Intermediate Government and Short Duration may invest in stripped securities (“STRIPS”) for hedging purposes to protect the Fund’s portfolio against interest rate fluctuations. Interest-only STRIPS will most likely move differently than typical fixed-income securities in relation to changes in interest rates. STRIPS are usually structured with two classes that receive different proportions of the interest and principal distributions from a pool of underlying assets. A common type of STRIP will have one class receiving all of the interest from the underlying assets (“interest-only” or “IO” class), while the other class will receive the entire principal (“principal only” or “PO” class). However, in some instances, one class will receive some of the interest and most of the principal while the other class will receive most of the interest and the remainder of the principal. STRIPS are unusually volatile in response to changes in interest rates. The yield to maturity on an IO class of STRIPS is extremely sensitive not only to
86
Table of Contents
Notes to Financial Statements (continued)
changes in prevailing interest rates but also to the rate of principal payments (including prepayments) on the underlying assets. A rapid rate of principal prepayments may have a measurably adverse effect on a Funds’ yield to maturity to the extent it invests in IOs. Conversely, POs tend to increase in value if prepayments are greater than anticipated and decline if prepayments are slower than anticipated. Thus, if the underlying assets experience greater than anticipated repayments of principal, a Fund may fail to fully recover its initial investment in these securities, even if the STRIPS were rated of the highest credit quality by Standard & Poor’s Corporation or Moody’s Investors Service, Inc. These risks are managed by investing in a variety of such securities and by using certain hedging techniques. In addition the secondary market for STRIPS may be less liquid than that of other mortgage-backed or asset-backed
securities, potentially limiting a Fund’s ability to buy or sell those securities at any particular time.
12. MASTER NETTING AGREEMENTS
The Funds may enter into master netting agreements with their counterparties for the securities lending program and repurchase agreements, which provide the right, in the event of default (including bankruptcy or insolvency) for the non-defaulting party to liquidate the collateral and calculate net exposure to the defaulting party or request additional collateral. For financial reporting purposes, the Funds do not offset financial assets and financial liabilities that are subject to master netting agreements in the Statement of Assets and Liabilities. For securities lending transactions, see Note 4.
The following table is a summary of the Funds’ open repurchase agreements that are subject to a master netting agreement as of December 31, 2016:
| Gross Amount Not Offset in the Statement of Assets and Liabilities | ||||||||||||||||
| Fund | Net Amounts of Assets Assets and Liabilities | Financial Instruments Collateral | Cash Collateral Received | Net Amount | ||||||||||||
Balanced | ||||||||||||||||
Citigroup Global Markets, Inc. | $ | 1,000,000 | $ | 1,000,000 | — | — | ||||||||||
Daiwa Capital Markets America | 1,000,000 | 1,000,000 | — | — | ||||||||||||
Merrill Lynch Pierce Fenner & Smith, Inc. | 216,364 | 216,364 | — | — | ||||||||||||
Nomura Securities International, Inc. | 1,000,000 | 1,000,000 | — | — | ||||||||||||
|
|
|
|
|
|
|
| |||||||||
Totals | $ | 3,216,364 | $ | 3,216,364 | — | — | ||||||||||
|
|
|
|
|
|
|
| |||||||||
Small Cap Value | ||||||||||||||||
HSBC Securities USA, Inc. | $ | 557,580 | $ | 557,580 | — | — | ||||||||||
|
|
|
|
|
|
|
| |||||||||
High Yield | ||||||||||||||||
Daiwa Capital Markets America | $ | 77,190 | $ | 77,190 | — | — | ||||||||||
|
|
|
|
|
|
|
| |||||||||
13. REGULATORY UPDATES
On October 13, 2016, the SEC amended existing rules intended to modernize reporting and disclosure of information. These amendments relate to Regulation S-X, which sets forth the form and content of financial statements. At this time, management is evaluating the implications of adopting these amendments and their impact on the financial statements and accompanying notes.
14. SUBSEQUENT EVENTS
The Funds have determined that no material events or transactions occurred through the issuance date of the Funds’ financial statements, which require an additional disclosure in or adjustment of the Funds’ financial statements except for the following: Effective February 27, 2017, Intermediate Government and Short Duration will rename existing Class S shares to Class N shares, and will issue new Class I and Class Z shares. Additionally, the new Class I shares may reimburse the Investment Manager for the actual amount of Shareholder Servicing fees incurred up to a maximum annual rate of 0.05% of Class I’s average daily net assets. The Investment Manager will also contractually agree, through at least May 1, 2018, to waive management fees and/or reimburse Fund expenses in order limit total annual Fund operating expenses (exclusive of certain items) for Intermediate Government to 0.74% of the average daily net assets of such Fund. Also effective February 27, 2017, the Investment Manager will contractually agree, through May 1, 2018, to waive 0.05% and 0.11% of the investment management fee, which may not be recouped, for Intermediate Government and Short Duration, respectively. Please refer to the Funds’ prospectus for further details.
87
Table of Contents
Notes to Financial Statements (continued)
TAX INFORMATION (unaudited)
The AMG Chicago Equity Partners Balanced Fund, AMG Chicago Equity Partners Small Cap Value Fund, AMG Managers High Yield Fund, AMG Managers Amundi Intermediate Government Fund and AMG Managers Amundi Short Duration Government Fund each hereby designates the maximum amount allowable of its net taxable income as qualified dividends as provided in the Jobs and Growth Tax Relief Reconciliation Act of 2003. The 2016 Form 1099-DIV you receive for each Fund will show the tax status of all distributions paid to you during the year.
Pursuant to section 852 of the Internal Revenue Code, AMG Chicago Equity Partners Balanced Fund, AMG Chicago Equity Partners Small Cap Value Fund, AMG Managers High Yield Fund, AMG Managers Amundi Intermediate Government Fund and AMG Managers Amundi Short Duration Government Fund each hereby designates $131,879, $0, $0, $0 and $0, respectively, as a capital gain distribution with respect to the taxable year ended December 31, 2016, or if subsequently determined to be different, the net capital gains of such fiscal year.
88
Table of Contents
Report of Independent Registered Public Accounting Firm
TO THE BOARDS OF TRUSTEES OF AMG FUNDS AND AMG FUNDS II AND THE SHAREHOLDERS OF AMG CHICAGO EQUITY PARTNERS BALANCED FUND, AMG CHICAGO EQUITY PARTNERS SMALL CAP VALUE FUND, AMG MANAGERS HIGH YIELD FUND, AMG MANAGERS AMUNDI INTERMEDIATE GOVERNMENT FUND (FORMERLY AMG MANAGERS INTERMEDIATE DURATION GOVERNMENT FUND) AND AMG MANAGERS AMUNDI SHORT DURATION GOVERNMENT FUND (FORMERLY AMG MANAGERS SHORT DURATION GOVERNMENT FUND):
In our opinion, the accompanying statements of assets and liabilities, including the schedules of portfolio investments, and the related statements of operations and of changes in net assets and the financial highlights present fairly, in all material respects, the financial position of AMG Chicago Equity Partners Balanced Fund, AMG Chicago Equity Partners Small Cap Value Fund, AMG Managers High Yield Fund, AMG Managers Amundi Intermediate Government Fund (formerly AMG Managers Intermediate Duration Government Fund), and AMG Managers Amundi Short Duration Government Fund (formerly AMG Managers Short Duration Government Fund) (the “Funds”) as of December 31, 2016, and the results of each of their operations, the changes in each of their net assets and the financial highlights for each of the periods indicated, in conformity with accounting principles generally accepted in the United States of America. These financial statements and financial highlights (hereafter referred to as “financial statements”) are the responsibility of the Funds’ management. Our responsibility is to express an opinion on these financial statements based on our audits. We conducted our audits of these financial statements in accordance with the standards of the Public Company Accounting Oversight Board (United States). Those standards require that we plan and perform the audit to obtain reasonable assurance about whether the financial statements are free of material misstatement. An audit includes examining, on a test basis, evidence supporting the amounts and disclosures in the financial statements, assessing the accounting principles used and significant estimates made by management, and evaluating the overall financial statement presentation. We believe that our audits, which included confirmation of securities as of December 31, 2016 by correspondence with the custodian, brokers, and transfer agent, and the application of alternative auditing procedures where securities purchased had not been received, provide a reasonable basis for our opinion.
PricewaterhouseCoopers LLP
Boston, Massachusetts
February 28, 2017
89
Table of Contents
AMG Funds
The Trustees and Officers of the Trust, their business addresses, principal occupations for the past five years and ages are listed below. The Trustees provide broad supervision over the affairs of the Trust and the Funds. The Trustees are experienced executives who meet periodically throughout the year to oversee the Funds’ activities, review contractual arrangements with
companies that provide services to the Funds, and review the Funds’ performance. Unless otherwise noted, the address of each Trustee or Officer is the address of the Trust: 600 Steamboat Road, Suite 300, Greenwich, Connecticut 06830.
There is no stated term of office for Trustees. Trustees serve until their resignation, retirement or removal in accordance with the Trust’s
organizational documents and policies adopted by the Board from time to time. The Chairman of the Trustees, President, Treasurer and Secretary of the Trust are elected by the Trustees annually. Other officers hold office at the pleasure of the Trustees.
Independent Trustees
The following Trustees are not “interested persons” of the Trust within the meaning of the 1940 Act:
Number of Funds Overseen in Fund Complex | Name, Age, Principal Occupation(s) During Past 5 Years and Other Directorships Held by Trustee | |
• Trustee since 2012 • Oversees 67 Funds in Fund Complex | Bruce B. Bingham, 68 Partner, Hamilton Partners (real estate development firm) (1987-Present); Director of The Yacktman Funds (2000-2012). | |
• Trustee since 1999—AMG • Funds Trustee since 2000—AMG Funds II • Oversees 67 Funds in Fund Complex | Edward J. Kaier, 71 Attorney at Law and Partner, Teeters Harvey Marrone & Kaier LLP (2007-Present); Attorney at Law and Partner, Hepburn Willcox Hamilton & Putnam, LLP (1977-2007); Trustee of Third Avenue Trust (5 portfolios); Trustee of Third Avenue Variable Trust (1 portfolio). | |
• Trustee since 2013 • Oversees 69 Funds in Fund Complex | Kurt A. Keilhacker, 53 Managing Member, TechFund Capital (1997-Present); Managing Member, TechFund Europe (2000-Present); Board Member, 6wind SA, (2002-Present); Managing Member, Elementum Ventures (2013-Present); Trustee, Gordon College (2001-2016). | |
• Trustee since 2004—AMG Funds • Trustee since 2000—AMG Funds II • Oversees 67 Funds in Fund Complex | Steven J. Paggioli, 66 Independent Consultant (2002-Present); Formerly Executive Vice President and Director, The Wadsworth Group (1986-2001); Executive Vice President, Secretary and Director, Investment Company Administration, LLC (1990-2001); Vice President, Secretary and Director, First Fund Distributors, Inc. (1991-2001); Trustee, Professionally Managed Portfolios (32 portfolios); Advisory Board Member, Sustainable Growth Advisors, LP; Independent Director, Chase Investment Counsel (2008–Present). | |
• Trustee since 2013 • Oversees 67 Funds in Fund Complex | Richard F. Powers III, 71 Adjunct Professor, Boston College (2010-2013); President and CEO of Van Kampen Investments Inc. (1998-2003). | |
• Independent Chairman • Trustee since 1999—AMG Funds • Trustee since 2000—AMG Funds II • Oversees 69 Funds in Fund Complex | Eric Rakowski, 58 Professor, University of California at Berkeley School of Law (1990-Present); Director of Harding, Loevner Funds, Inc. (9 portfolios); Trustee of Third Avenue Trust (5 portfolios); Trustee of Third Avenue Variable Trust (1 portfolio). | |
• Trustee since 2013 • Oversees 69 Funds in Fund Complex | Victoria L. Sassine, 51 Lecturer, Babson College (2007 – Present). | |
• Trustee since 2004—AMG Funds • Trustee since 2000—AMG Funds II • Oversees 67 Funds in Fund Complex | Thomas R. Schneeweis, 69 Professor Emeritus, University of Massachusetts (2013-Present); Partner, S Capital Wealth Advisors (2015-Present); President, TRS Associates (1982-Present); Board Member, Chartered Alternative Investment Association (“CAIA”) (2002-Present); Director, CAIA Foundation (Education) (2010-Present); Director, Institute for Global Asset and Risk Management (Education) (2010-Present); Partner, S Capital Management, LLC (2007-2015); Director, CISDM at the University of Massachusetts, (1996-2013); President, Alternative Investment Analytics, LLC, (formerly Schneeweis Partners, LLC) (2001-2013); Professor of Finance, University of Massachusetts (1977-2013). | |
| Interested Trustees | ||
| Each Trustee in the following table is an “interested person” of the Trust with in the meaning of the 1940 Act. Ms. Carsman is an interested person of the Trust withinthe meaning of the 1940 Act by virtue of her position with, and interest in securities of, AMG. | ||
Number of Funds Overseen in Fund Complex | Name, Age, Principal Occupation(s) During Past 5 Years and Other Directorships Held by Trustee | |
• Trustee since 2011 • Oversees 69 Funds in Fund Complex | Christine C. Carsman, 64 Executive Vice President, Deputy General Counsel and Chief Regulatory Counsel, Affiliated Managers Group, Inc. (2017-Present); Senior Vice President and Deputy General Counsel, Affiliated Managers Group, Inc. (2011-2016); Senior Vice President and Chief Regulatory Counsel, Affiliated Managers Group, Inc. (2007-2011); Vice President and Chief Regulatory Counsel, Affiliated Managers Group, Inc. (2004-2007); Secretary and Chief Legal Officer, AMG Funds, AMG Funds I, AMG Funds II and AMG Funds III (2004-2011); Senior Counsel, Vice President and Director of Operational Risk Management and Compliance, Wellington Management Company, LLP (1995-2004). | |
90
Table of Contents
AMG Funds
Trustees and Officers (continued)
| Officers | ||
Position(s) Held with Fund and Length of Time Served | Name, Age, Principal Occupation(s) During Past 5 Years | |
• President since 2014 • Principal Executive Officer since 2014 • Chief Executive Officer since 2016 | Jeffrey T. Cerutti, 49 Chief Executive Officer, AMG Funds LLC (2014-Present); Director, President and Principal, AMG Distributors, Inc. (2014-Present); President and Principal Executive Officer, AMG Funds, AMG Funds I, AMG Funds II and AMG Funds III (2014-Present); Chief Executive Officer, President and Principal Executive Officer, AMG Funds IV, (2015-Present); Chief Executive Officer, AMG Funds, AMG Funds I, AMG Funds II and AMG Funds III (2016-Present); Chief Executive Officer, Aston Asset Management, LLC (2016); President, VP Distributors, (2011-2014); Executive Vice President, Head of Distribution, Virtus Investment Partners, Inc. (2010-2014); Managing Director, Head of Sales, UBS Global Asset Management (2001-2010). | |
• Chief Operating Officer since 2007 | Keitha L. Kinne, 58 Chief Operating Officer, AMG Funds LLC (2007-Present); Chief Investment Officer, AMG Funds LLC (2008-Present); Chief Operating Officer, AMG Distributors, Inc. (2007-Present); Chief Operating Officer, AMG Funds, AMG Funds I, AMG Funds II, and AMG Funds III (2007-Present); Chief Operating Officer, AMG Funds IV, (2016-Present); Chief Operating Officer and Chief Investment Officer, Aston Asset Management, LLC (2016); President and Principal Executive Officer, AMG Funds, AMG Funds I, AMG Funds II and AMG Funds III (2012-2014); Managing Partner, AMG Funds LLC (2007-2014); President, AMG Funds (2012-2014); President, AMG Distributors, Inc. (2012-2014); Managing Director, Legg Mason & Co., LLC (2006-2007); Managing Director, Citigroup Asset Management (2004-2006). | |
• Secretary since 2015 • Chief Legal Officer since 2015 | Mark J. Duggan, 52 Senior Vice President and Senior Counsel, AMG Funds LLC (2015-Present); Secretary and Chief Legal Officer, AMG Funds, AMG Funds I, AMG Funds II and AMG Funds III (2015-Present); Secretary and Chief Legal Officer, AMG Funds IV, (2015-Present); Attorney, K&L Gates, LLP (2009-2015). | |
• Chief Financial Officer since 2007 • AMG Funds Treasurer since 1999 • AMG Funds II Treasurer since 2000 • Principal Financial Officer since 2008 | Donald S. Rumery, 58 Senior Vice President, Director of Mutual Funds Services, AMG Funds LLC (2005-Present); Principal Financial Officer, AMG Funds, AMG Funds I, AMG Funds II and AMG Funds III (2008-Present); Treasurer, Chief Financial Officer, Principal Financial Officer and Principal Accounting Officer, AMG Funds IV, (2016-Present); Treasurer, AMG Funds, (1999-Present); Treasurer, AMG Funds III (1995-Present); Treasurer, (AMG Funds I and AMG Funds II (2000-Present); Chief Financial Officer, AMG Funds, AMG Funds I, AMG Funds II and AMG Funds III (2007-Present); Treasurer and Chief Financial Officer, AMG Distributors, Inc. (2000-2012); Vice President, AMG Funds LLC, (1994-2004). | |
• Chief Compliance Officer since 2016 | Gerald F. Dillenburg, 50 Chief Compliance Officer and Sarbanes Oxley Code of Ethics Compliance Officer, AMG Funds, AMG Funds I, AMG Funds II and AMG Funds III (2016-Present); Chief Compliance Officer, AMG Funds IV (1996-Present); Sarbanes-Oxley Code of Ethics Compliance Officer, AMG Funds IV (2016-Present); Chief Compliance Officer, Aston Asset Management, LLC (2006-2016); Chief Operating Officer, Aston Funds (2003-2016); Secretary, Aston Funds (1996-2015); Chief Financial Officer, Aston Funds (1997-2010); Chief Financial Officer, Aston Asset Management, LLC (2006-2010); Treasurer, Aston Funds (1996-2010). | |
• Anti-Money Laundering Compliance Officer since 2014 | Patrick J. Spellman, 42 Senior Vice President, Chief Compliance Officer, AMG Funds LLC (2011-Present); Chief Compliance Officer, AMG Distributors, Inc., (2010-Present); Anti-Money Laundering Compliance Officer, AMG Funds, AMG Funds I, AMG Funds II, and AMG Funds III (2014-Present); Anti-Money Laundering Officer, AMG Funds IV, (2016-Present); Compliance Manager, Legal and Compliance, Affiliated Managers Group, Inc. (2005-2011). | |
• Assistant Secretary since 2016 | Maureen A. Meredith, 31 Vice President, Counsel, AMG Funds LLC (2015-Present); Assistant Secretary, AMG Funds, AMG Funds I, AMG Funds II, AMG Funds III and AMG Funds IV (2016-Present); Associate, Ropes & Gray LLP (2011-2015); Law Fellow, Massachusetts Appleseed Center for Law and Justice (2010-2011). | |
• Assistant Secretary since 2016 | Diana M. Podgorny, 37 Vice President, Counsel, AMG Funds LLC (2016-Present); Assistant Secretary, AMG Funds, AMG Funds I, AMG Funds II and AMG Funds III (2016-Present); Assistant Secretary, AMG Funds IV (2010-Present); Vice President, Counsel, Aston Asset Management, LLC (2010-2016). | |
• Assistant Secretary since 2016 | Marc Peirce, 54 Vice President, Compliance Officer, AMG Funds LLC (2016-Present); Assistant Secretary, AMG Funds IV (2001-Present); Assistant Secretary, AMG Funds, AMG Funds I, AMG Funds II and AMG Funds III (2016-Present); Vice President, Aston Asset Management, LLC (1998-2016); | |
91
Table of Contents
THIS PAGE INTENTIONALLY LEFT BLANK
Table of Contents
INVESTMENT MANAGER AND
ADMINISTRATOR
AMG Funds LLC
600 Steamboat Road, Suite 300
Greenwich, CT 06830
(800) 835-3879
DISTRIBUTOR
AMG Distributors, Inc.
600 Steamboat Road, Suite 300
Greenwich, CT 06830
(800) 835-3879
CUSTODIAN
The Bank of New York Mellon
2 Hanson Place
Brooklyn, NY 11217
LEGAL COUNSEL
Ropes & Gray LLP
Prudential Tower, 800 Boylston Street
Boston, MA 02199-3600
TRANSFER AGENT
BNY Mellon Investment Servicing (US) Inc.
Attn: AMG Funds
P.O. Box 9769
Providence, RI 02940
(800) 548-4539
FOR MANAGERSCHOICETM ONLY
AMG Funds
c/o BNY Mellon Investment Servicing (US) Inc.
P.O. Box 9847
Providence, Rhode Island 02940-8047
(800) 358-7668
This report is prepared for the Funds’ shareholders. It is authorized for distribution to prospective investors only when preceded or accompanied by an effective prospectus. To receive a free copy of the prospectus or Statement of Additional Information, which includes additional information about Fund Trustees, please contact us by calling 800.835.3879. Distributed by AMG Distributors, Inc., member FINRA/SIPC.
Current net asset values per share for each Fund are available on the Funds’ website at www.amgfunds.com.
A description of the policies and procedures each Fund uses to vote its proxies is available: (i) without charge, upon request, by calling 800.835.3879, or (ii) on the Securities and Exchange Commission’s (SEC) website at www.sec.gov. For information regarding each Fund’s proxy voting record for the 12-month period ended June 30, call 800.835.3879 or visit the SEC website at www.sec.gov.
Each Fund files its complete schedule of portfolio holdings with the SEC for the first and third quarters of each fiscal year on Form N-Q. The Funds’ Forms N-Q are available on the SEC’s website at www.sec.gov. A Fund’s Forms N-Q may be reviewed and copied at the SEC’s Public Reference Room in Washington, DC. Information on the operation of the Public Reference Room may be obtained by calling 1-800-SEC-0330. To review a complete list of the Funds’ portfolio holdings, or to view the most recent quarterly holdings report, semiannual report, or annual report, please visit www.amgfunds.com.
www.amgfunds.com |
Table of Contents

AFFILIATE SUBADVISED FUNDS
BALANCED FUNDS
AMG Chicago Equity Partners Balanced
Chicago Equity Partners, LLC
AMG FQ Global Risk-Balanced
First Quadrant, L.P.
EQUITY FUNDS
AMG Chicago Equity Partners Small Cap Value
Chicago Equity Partners, LLC
AMG FQ Tax-Managed U.S. Equity
AMG FQ U.S. Equity
First Quadrant, L.P.
AMG Frontier Small Cap Growth
Frontier Capital Management Company, LLC
AMG GW&K Small Cap Core
AMG GW&K Small Cap Growth
AMG GW&K U.S. Small Cap Growth
GW&K Investment Management, LLC
AMG Renaissance International Equity
AMG Renaissance Large Cap Growth
The Renaissance Group LLC
AMG River Road Dividend All Cap Value
AMG River Road Dividend All Cap Value II
AMG River Road Focused Absolute Value
AMG River Road Long-Short
AMG River Road Select Value
AMG River Road Small Cap Value
River Road Asset Management, LLC
AMG SouthernSun Small Cap
AMG SouthernSun Global Opportunities
AMG SouthernSun U.S. Equity
SouthernSun Asset Management, LLC
AMG Systematic Large Cap Value
AMG Systematic Mid Cap Value
Systematic Financial Management, L.P.
AMG TimesSquare All Cap Growth
AMG TimesSquare Emerging Markets
Small Cap
AMG TimesSquare International Small Cap
AMG TimesSquare Mid Cap Growth
AMG TimesSquare Small Cap Growth
TimesSquare Capital Management, LLC
AMG Trilogy Emerging Markets Equity
AMG Trilogy Emerging Wealth Equity
AMG Trilogy Global Equity
AMG Trilogy International Small Cap
Trilogy Global Advisors, L.P.
AMG Yacktman
AMG Yacktman Focused
AMG Yacktman Focused Fund - Security Selection Only
AMG Yacktman Special Opportunities
Yacktman Asset Management LP
FIXED INCOME FUNDS
AMG GW&K Core Bond
AMG GW&K Enhanced Core Bond
AMG GW&K Municipal Bond
AMG GW&K Municipal Enhanced Yield
GW&K Investment Management, LLC
OPEN-ARCHITECTURE FUNDS
ALTERNATIVE FUNDS
AMG Managers Lake Partners LASSO
Alternative
Lake Partners, Inc.
BALANCED FUNDS
AMG Managers Montag & Caldwell
Balanced
Montag & Caldwell, LLC
EQUITY FUNDS
AMG Managers Brandywine
AMG Managers Brandywine Advisors Mid Cap Growth
AMG Managers Brandywine Blue
Friess Associates, LLC
AMG Managers Cadence Capital
Appreciation
AMG Managers Cadence Emerging
Companies
AMG Managers Cadence Mid Cap
Cadence Capital Management, LLC
AMG Managers CenterSquare Real Estate
CenterSquare Investment Management,
Inc.
AMG Managers Emerging Opportunities
Lord, Abbett & Co. LLC
WEDGE Capital Management L.L.P.
Next Century Growth Investors LLC
RBC Global Asset Management (U.S.) Inc.
AMG Managers Essex Small/Micro Cap
Growth
Essex Investment Management Co., LLC
AMG Managers Fairpointe Focused
Equity
AMG Managers Fairpointe Mid Cap
Fairpointe Capital LLC
AMG Managers Guardian Capital
Global Dividend
Guardian Capital LP
AMG Managers LMCG Small Cap Growth
LMCG Investments, LLC
AMG Managers Montag & Caldwell
Growth
AMG Managers Montag & Caldwell Mid Cap Growth
Montag & Caldwell, LLC
AMG Managers Pictet International
Pictet Asset Management Limited
AMG Managers Silvercrest Small Cap
Silvercrest Asset Management Group
LLC
AMG Managers Skyline Special Equities
Skyline Asset Management, L.P.
AMG Managers Special Equity
Ranger Investment Management, L.P.
Lord, Abbett & Co. LLC
Smith Asset Management Group, L.P.
Federated MDTA LLC
AMG Managers Value Partners Asia Dividend
Value Partners Hong Kong Limited
FIXED INCOME FUNDS
AMG Managers Amundi Intermediate
Government
AMG Managers Amundi Short Duration
Government
Amundi Smith Breeden LLC
AMG Managers Doubleline Core Plus Bond
DoubleLine Capital LP
AMG Managers Global Income Opportunity
AMG Managers Loomis Sayles Bond
Loomis, Sayles & Co., L.P.
AMG Managers High Yield
J.P. Morgan Investment Management
Inc.

Table of Contents
Item 2. CODE OF ETHICS
Registrant has adopted a Code of Ethics. See attached Exhibit (a)(1).
Item 3. AUDIT COMMITTEE FINANCIAL EXPERT
Registrant’s Board of Trustees has determined that independent Trustee Mr. Steven J. Paggioli qualifies as an Audit Committee Financial Expert. Mr. Paggioli is “independent” as such term is defined in Form N-CSR.
Item 4. PRINCIPAL ACCOUNTANT FEES AND SERVICES
| (a) | Audit Fees |
The aggregate fees billed by the Funds’ independent registered public accounting firm, PricewaterhouseCoopers LLP (“PwC”), to the Funds for the Funds’ two most recent fiscal years for professional services rendered for audits of annual financial statements, or services that are normally provided in connection with statutory and regulatory filings or engagements (“Audit Fees”) were as follows:
Fund - AMG FUNDS II | Fiscal 2016 | Fiscal 2015 | ||||||
AMG GW&K Enhanced Core Bond Fund | $ | 37,846 | $ | 41,633 | ||||
AMG Chicago Equity Partners Balanced Fund | $ | 27,540 | $ | 32,237 | ||||
AMG Managers High Yield Fund | $ | 46,084 | $ | 46,662 | ||||
AMG Managers Amundi Short Duration Government Fund | $ | 41,233 | $ | 45,939 | ||||
AMG Managers Amundi Intermediate Government Fund | $ | 41,219 | $ | 42,072 | ||||
(b) Audit-Related Fees
There were no fees billed by PwC to the Funds in its two recent fiscal years for services rendered for assurance and related services that are reasonably related to the performance of the audit or review of the Fund’s financial statements, but are not reported as Audit Fees (“Audit-Related Fees”).
For the Funds’ two most recent fiscal years, there were no Audit-Related Fees billed by PwC for engagements related directly to the operations and financial reporting of one or more Funds by a Fund Service Provider. A Fund Service Provider is (a) any investment adviser to the Fund (not including any Subadvisor whose role is primarily portfolio management and is subcontracted with or overseen by another investment adviser) or (b) any entity that provides ongoing services to the Fund and is controlling, controlled by or under common control with a Fund investment adviser described in (a).
Table of Contents
(c) Tax Fees
The aggregate fees billed by PwC to the Funds for the two most recent fiscal years for professional services rendered for tax compliance, tax advice, and tax planning (“Tax Fees”) were as follows:
Fund - AMG FUNDS II | Fiscal 2016 | Fiscal 2015 | ||||||
AMG GW&K Enhanced Core Bond Fund | $ | 9,425 | $ | 9,240 | ||||
AMG Chicago Equity Partners Balanced Fund | $ | 7,369 | $ | 7,225 | ||||
AMG Managers High Yield Fund | $ | 9,425 | $ | 9,240 | ||||
AMG Managers Amundi Short Duration Government Fund | $ | 10,159 | $ | 9,960 | ||||
AMG Managers Amundi Intermediate Government Fund | $ | 10,159 | $ | 9,960 | ||||
For the Funds’ two most recent fiscal years, Tax Fees billed by PwC for engagements by Fund Service Providers that related directly to the operations and financial reporting of the Funds were $0 for fiscal 2016 and $0 for fiscal 2015, respectively.
The services for which Tax Fees were charged comprise all services performed by professional staff in PwC’s tax division except those services related to the audit. Typically, this category would include fees for tax compliance, tax planning, and tax advice. Tax compliance, tax advice, and tax planning services include preparation of original and amended tax returns, claims for refund and tax payment-planning services, assistance with tax audits and appeals, tax advice related to mergers and acquisitions and requests for rulings or technical advice from taxing authorities.
(d) All Other Fees
There were no other fees billed by PwC to the Funds for all other non-audit services (“Other Fees”) during the Funds’ two most recent fiscal years. During the same period, there were no Other Fees billed by PwC for engagements by Fund Service Providers that related directly to the operations and financial reporting of the Funds.
(e) (1) According to policies adopted by the Audit Committee, services provided by PwC to the Funds must be pre-approved by the Audit Committee. On an annual basis, the Audit Committee reviews and pre-approves various types of services that PwC may perform for the Funds without specific approval of each engagement, subject to specified budget limitations. As contemplated by the Sarbanes-Oxley Act of 2002 and related SEC rules, the Audit Committee also pre-approves non-audit services provided by PwC to any Fund Service Provider for any engagement that relates directly to the operations and financial reporting of the Funds. Any engagement that is not already pre-approved or that will exceed a pre-approved budget must be submitted to the Audit Committee for pre-approval. The Chairman of the Audit Committee is authorized on behalf of the Board of Trustees and the Audit Committee to approve the engagement of PwC to perform non-audit services subject to certain conditions, including notification to the Audit Committee of such pre-approval not later than the next meeting of the Audit Committee following the date of such pre-approval.
Table of Contents
(e)(2) None.
(f) Not applicable.
(g) The aggregate fees billed by PwC in 2016 and 2015 for non-audit services rendered to the Funds and Fund Service Providers were $78,937 and $111,625, respectively. For the fiscal years ended December 31, 2016, this amount reflects the amounts disclosed above in Item 4(b),(c),(d), plus $32,400 in fees billed to the Fund Service Providers for non-audit services that did not relate directly to the operations and financial reporting of the Funds. For the fiscal year ended December 31, 2015, this amount reflects the amounts disclosed above in Item 4(b),(c),(d), plus $66,000 in fees billed to the Fund Service Providers for non-audit services that did not relate directly to the operations and financial reporting of the Funds.
(h) The Trust’s Audit Committee has considered whether the provision of non-audit services by registrant’s independent registered public accounting firm to the registrant’s investment advisor, and any entity controlling, controlled, or under common control with the investment advisor that provided ongoing services to the registrant that were not pre-approved by the Committee (because such services did not relate directly to the operations and financial reporting of the registrant) was compatible with maintaining the independence of the independent registered public accounting firm.
Item 5. AUDIT COMMITTEE OF LISTED REGISTRANTS
Not applicable.
Item 6. SCHEDULE OF INVESTMENTS
The schedule of investments in unaffiliated issuers as of the close of the reporting period is included as part of the shareholder report contained in Item 1 hereof.
Item 7. DISCLOSURE OF PROXY VOTING POLICIES AND PROCEDURES FOR CLOSED-END MANAGEMENT INVESTMENT COMPANIES
Not applicable.
Item 8. PORTFOLIO MANAGERS OF CLOSED-END MANAGEMENT INVESTMENT COMPANIES
Not applicable.
Item 9. PURCHASES OF EQUITY SECURITIES BY CLOSED-END MANAGEMENT INVESTMENT COMPANIES AND AFFILIATED PURCHASERS
Not applicable.
Item 10. SUBMISSION OF MATTERS TO A VOTE OF SECURITY HOLDERS
Not applicable.
Table of Contents
Item 11. CONTROLS AND PROCEDURES
(a) The Registrant’s principal executive and principal financial officers have concluded, based on their evaluation of the registrant’s disclosure controls and procedures as of a date within 90 days of the filing of this report, that the Registrant’s disclosure controls and procedures are reasonably designed to ensure that information required to be disclosed by the Registrant on Form N-CSR is recorded, processed, summarized and reported within the required time periods and that information required to be disclosed by the registrant in the reports that it files or submits on Form N-CSR is accumulated and communicated to the Registrant’s management, including its principal executive and principal financial officers, as appropriate to allow timely decisions regarding required disclosure.
(b) There were no changes in the Registrant’s internal control over financial reporting during the Registrant’s fourth fiscal quarter of the period covered by this report that have materially affected, or are reasonably likely to affect, the internal control over financial reporting.
Table of Contents
Item 12. EXHIBITS
| (a)(1) | Any Code of Ethics or amendments hereto. Filed herewith. | |
| (a)(2) | Certifications pursuant to Rule 30a-2(a) under the Investment Company Act of 1940—Filed herewith. | |
| (a)(3) | Not applicable. | |
| (b) | Certifications pursuant to Rule 30a-2(b) under the Investment Company Act of 1940—Filed herewith. | |
Table of Contents
SIGNATURES
Pursuant to the requirements of the Securities Exchange Act of 1934 and the Investment Company Act of 1940, the registrant has duly caused this report to be signed on its behalf by the undersigned, thereunto duly authorized.
AMG FUNDS II
| By: | /s/ Jeffrey T. Cerutti | |
| Jeffrey T. Cerutti, Principal Executive Officer |
Date: March 10, 2017
Pursuant to the requirements of the Securities Exchange Act of 1934 and the Investment Company Act of 1940, this report has been signed below by the following persons on behalf of the registrant and in the capacities and on the dates indicated.
| By: | /s/ Jeffrey T. Cerutti | |
| Jeffrey T. Cerutti, Principal Executive Officer |
Date: March 10, 2017
| By: | /s/ Donald S. Rumery | |
| Donald S. Rumery, Principal Financial Officer |
Date: March 10, 2017