UNITED STATES
SECURITIES AND EXCHANGE COMMISSION
Washington, D.C. 20549
FORM N-CSR
CERTIFIED SHAREHOLDER REPORT OF REGISTERED
MANAGEMENT INVESTMENT COMPANIES
Investment Company Act file number: 811-06431
AMG Funds II
(Exact name of registrant as specified in charter)
600 Steamboat Road, Suite 300, Greenwich, Connecticut 06830
(Address of principal executive offices) (Zip code)
AMG Funds LLC
600 Steamboat Road, Suite 300, Greenwich, Connecticut 06830
(Name and address of agent for service)
Registrant’s telephone number, including area code: (203) 299-3500
Date of fiscal year end: DECEMBER 31
Date of reporting period: JANUARY 1, 2015 – DECEMBER 31, 2015
(Annual Shareholder Report)
Item 1. Reports to Shareholders
| | | | |
 | | | | ANNUAL REPORT |
AMG Funds
December 31, 2015

AMG GW&K Enhanced Core Bond Fund
Investor Class: MFDAX | Service Class: MFDSX | Class C: MFDCX
Institutional Class: MFDYX
AMG GW&K Municipal Bond Fund
Investor Class: GWMTX | Service Class: GWMSX | Institutional Class: GWMIX
AMG GW&K Municipal Enhanced Yield Fund
Investor Class: GWMNX | Service Class: GWMRX | Institutional Class: GWMEX
AMG GW&K Small Cap Core Fund
Investor Class: GWETX | Service Class: GWESX | Institutional Class: GWEIX
AMG GW&K Small Cap Growth Fund
Institutional Class: GWGIX
| | |
| www.amgfunds.com | | | AR020-1215 |
|
AMG Funds Annual Report—December 31, 2015 |
| | | | |
TABLE OF CONTENTS | | PAGE | |
LETTER TO SHAREHOLDERS | | | 2 | |
| |
ABOUT YOUR FUND’S EXPENSES | | | 3 | |
| |
PORTFOLIO MANAGER’S COMMENTS, FUND SNAPSHOTS, AND SCHEDULES OF PORTFOLIO INVESTMENTS | | | | |
AMG GW&K Enhanced Core Bond Fund | | | 5 | |
AMG GW&K Municipal Bond Fund | | | 11 | |
AMG GW&K Municipal Enhanced Yield Fund | | | 20 | |
AMG GW&K Small Cap Core Fund | | | 27 | |
AMG GW&K Small Cap Growth Fund | | | 33 | |
| |
NOTES TO SCHEDULES OF PORTFOLIO INVESTMENTS | | | 39 | |
| |
FINANCIAL STATEMENTS | | | | |
| |
Statement of Assets and Liabilities | | | 42 | |
Balance sheets, net asset value (NAV) per share computations and cumulative undistributed amounts | | | | |
| |
Statement of Operations | | | 44 | |
Detail of sources of income, expenses, and realized and unrealized gains (losses) during the year | | | | |
| |
Statements of Changes in Net Assets | | | 45 | |
Detail of changes in assets for the past two years | | | | |
| |
Financial Highlights | | | 47 | |
Historical net asset values per share, distributions, total returns, income and expense ratios, turnover ratios and net assets | | | | |
| |
Notes to Financial Highlights | | | 56 | |
| |
Notes to Financial Statements | | | 57 | |
Accounting and distribution policies, details of agreements and transactions with Fund management and affiliates, and descriptions of certain investment risks | | | | |
| |
REPORT OF INDEPENDENT REGISTERED PUBLIC ACCOUNTING FIRM | | | 66 | |
| |
TRUSTEES AND OFFICERS | | | 67 | |
Nothing contained herein is to be considered an offer, sale or solicitation of an offer to buy shares of any series of the AMG Fund family of mutual funds. Such offering is made only by prospectus, which includes details as to offering price and other material information.
| | | | |
| | | | Letter to Shareholders |
DEAR SHAREHOLDER:
Overall, U.S. equity investors achieved modest positive returns for the year ended December 31, 2015, although the second half of the year was characterized by a notable increase in volatility. The S&P 500 Index, a widely followed barometer of the U.S. equity market, returned 1.4% during the past twelve months. However, the U.S. equity market did experience its first correction in four years in August, losing just over 10% of its value in a little more than a week. Fortunately, those losses were almost entirely recovered by the end of the period. Investors had to process the first rate increase from the U.S. Federal Reserve +0.25% in nearly six years, a continued slowing of growth in China and the implications for global economic growth and the impact of commodity prices falling to lows not seen since 2009. During the year, there was significant dispersion in performance across sectors, with consumer discretionary and health care stocks returning 6% while companies within the energy sector fell (23)%. Meanwhile, international stocks fell during the prior year, returning (5.7)%, as measured by the MSCI ACWI ex USA (in U.S. Dollar terms). International investment returns in U.S. Dollar terms were negatively impacted by continued strengthening in the U.S. Dollar.
The Barclays U.S. Aggregate Index, a broad U.S. bond market benchmark, returned 0.6% for the year ended December 31, 2015. Interest rates rose modestly during 2015, providing some pressure on bond prices. Investors’ appetite for risk declined during the second half of 2015, reflected in the (4.5)% decline in the Barclays U.S. Corporate High Yield Index.
Our foremost goal at AMG Funds is to provide investment solutions that help our shareholders successfully reach their long-term investment goals. By partnering with AMG’s affiliated investment boutiques, AMG Funds provides access to a distinctive array of actively-managed, return-oriented investment strategies. Additionally, we oversee and distribute a number of complementary open-architecture mutual funds subadvised by unaffiliated investment managers. We thank you for your continued confidence and investment in AMG Funds. You can rest assured that under all market conditions our team is focused on delivering excellent investment management services for your benefit.
Respectfully,

Jeffery Cerutti
President
AMG Funds
| | | | | | | | | | | | | | |
Average Annual Total Returns | | Periods ended December 31, 2015 | |
| | | 1 Year | | | 3 Years | | | 5 Years | |
| Stocks: | | | | | | | | | | | | | | |
Large Caps | | (S&P 500 Index) | | | 1.38 | % | | | 15.13 | % | | | 12.57 | % |
Small Caps | | (Russell 2000® Index) | | | (4.41 | )% | | | 11.65 | % | | | 9.19 | % |
International | | (MSCI All Country World Index ex US Index) | | | (5.66 | )% | | | 1.50 | % | | | 1.06 | % |
Bonds: | | | | | | | | | | | | | | |
Investment Grade | | (Barclays U.S. Aggregate Bond Index) | | | 0.55 | % | | | 1.44 | % | | | 3.25 | % |
High Yield | | (Barclays U.S. Corporate High Yield Bond Index) | | | (4.47 | )% | | | 1.69 | % | | | 5.04 | % |
Tax-exempt | | (Barclays Municipal Bond Index) | | | 3.30 | % | | | 3.16 | % | | | 5.35 | % |
Treasury Bills | | (BofA Merrill Lynch 6-month U.S. Treasury Bill Index) | | | 0.22 | % | | | 0.17 | % | | | 0.19 | % |
2
About Your Fund’s Expenses
As a shareholder of a Fund, you may incur two types of costs: (1) transaction costs, which may include sales charges (loads) on purchase payments; redemption fees; and exchange fees; and (2) ongoing costs, including management fees; distribution (12b-1) fees; and other Fund expenses. This example is intended to help you understand your ongoing costs (in dollars) of investing in the Fund and to compare these costs with the ongoing costs of investing in other mutual funds. The example is based on $1,000 invested at the beginning of the period and held for the entire period as indicated below.
ACTUAL EXPENSES
The first line of the following table provides information about the actual account values and actual expenses. You may use the information in this line, together with the amount you invested, to estimate the expenses that you paid over the period. Simply divide your account value by $1,000 (for example, an $8,600 account value divided by $1,000 = 8.6), then multiply the result by the number in the first line under the heading entitled “Expenses Paid During Period” to estimate the expenses you paid on your account during this period.
HYPOTHETICAL EXAMPLE FOR COMPARISON PURPOSES
The second line of the following table provides information about hypothetical account values and hypothetical expenses based on the Fund’s actual expense ratio and an assumed annual rate of return of 5% before expenses, which is not the Fund’s actual return. The hypothetical account values and expenses may not be used to estimate the actual ending account balance or expenses you paid for the period. You may use this information to compare the ongoing costs of investing in the Fund and other funds by comparing this 5% hypothetical example with the 5% hypothetical examples that appear in the shareholder reports of other funds.
Please note that the expenses shown in the table are meant to highlight your ongoing costs only and do not reflect any transactional costs, such as sales charges (loads), redemption fees, or exchange fees. Therefore, the second line of the table is useful in comparing ongoing costs only, and will not help you determine the relative total costs of owning different funds.
| | | | | | | | | | | | | | | | |
| Six Months Ended December 31, 2015 | | Expense
Ratio for
the Period | | | Beginning
Account Value
07/01/15 | | | Ending Account Value 12/31/15 | | | Expenses
Paid During
the Period* | |
AMG GW&K Enhanced Core Bond Fund | |
Investor Class | | | | | | | | | | | | | | | | |
Based on Actual Fund Return | | | 0.84 | % | | $ | 1,000 | | | $ | 972 | | | $ | 4.17 | |
Hypothetical (5% return before expenses) | | | 0.84 | % | | $ | 1,000 | | | $ | 1,021 | | | $ | 4.28 | |
Service Class | | | | | | | | | | | | | | | | |
Based on Actual Fund Return | | | 0.69 | % | | $ | 1,000 | | | $ | 972 | | | $ | 3.43 | |
Hypothetical (5% return before expenses) | | | 0.69 | % | | $ | 1,000 | | | $ | 1,022 | | | $ | 3.52 | |
Class C | | | | | | | | | | | | | | | | |
Based on Actual Fund Return | | | 1.59 | % | | $ | 1,000 | | | $ | 968 | | | $ | 7.89 | |
Hypothetical (5% return before expenses) | | | 1.59 | % | | $ | 1,000 | | | $ | 1,017 | | | $ | 8.08 | |
Institutional Class | | | | | | | | | | | | | | | | |
Based on Actual Fund Return | | | 0.59 | % | | $ | 1,000 | | | $ | 973 | | | $ | 2.93 | |
Hypothetical (5% return before expenses) | | | 0.59 | % | | $ | 1,000 | | | $ | 1,022 | | | $ | 3.01 | |
AMG GW&K Municipal Bond Fund | |
Investor Class | | | | | | | | | | | | | | | | |
Based on Actual Fund Return | | | 0.83 | % | | $ | 1,000 | | | $ | 1,034 | | | $ | 4.26 | |
Hypothetical (5% return before expenses) | | | 0.83 | % | | $ | 1,000 | | | $ | 1,021 | | | $ | 4.23 | |
Service Class | | | | | | | | | | | | | | | | |
Based on Actual Fund Return | | | 0.51 | % | | $ | 1,000 | | | $ | 1,037 | | | $ | 2.62 | |
Hypothetical (5% return before expenses) | | | 0.51 | % | | $ | 1,000 | | | $ | 1,023 | | | $ | 2.60 | |
Institutional Class | | | | | | | | | | | | | | | | |
Based on Actual Fund Return | | | 0.34 | % | | $ | 1,000 | | | $ | 1,038 | | | $ | 1.75 | |
Hypothetical (5% return before expenses) | | | 0.34 | % | | $ | 1,000 | | | $ | 1,024 | | | $ | 1.73 | |
AMG GW&K Municipal Enhanced Yield Fund | |
Investor Class | | | | | | | | | | | | | | | | |
Based on Actual Fund Return | | | 1.14 | % | | $ | 1,000 | | | $ | 1,044 | | | $ | 5.87 | |
Hypothetical (5% return before expenses) | | | 1.14 | % | | $ | 1,000 | | | $ | 1,019 | | | $ | 5.80 | |
Service Class | | | | | | | | | | | | | | | | |
Based on Actual Fund Return | | | 0.70 | % | | $ | 1,000 | | | $ | 1,046 | | | $ | 3.61 | |
Hypothetical (5% return before expenses) | | | 0.70 | % | | $ | 1,000 | | | $ | 1,022 | | | $ | 3.57 | |
Institutional Class | | | | | | | | | | | | | | | | |
Based on Actual Fund Return | | | 0.64 | % | | $ | 1,000 | | | $ | 1,046 | | | $ | 3.30 | |
Hypothetical (5% return before expenses) | | | 0.64 | % | | $ | 1,000 | | | $ | 1,022 | | | $ | 3.26 | |
AMG GW&K Small Cap Core Fund | | | | | |
Investor Class | | | | | | | | | | | | | | | | |
Based on Actual Fund Return | | | 1.33 | % | | $ | 1,000 | | | $ | 936 | | | $ | 6.49 | |
Hypothetical (5% return before expenses) | | | 1.33 | % | | $ | 1,000 | | | $ | 1,019 | | | $ | 6.77 | |
Service Class | | | | | | | | | | | | | | | | |
Based on Actual Fund Return | | | 1.05 | % | | $ | 1,000 | | | $ | 937 | | | $ | 5.13 | |
Hypothetical (5% return before expenses) | | | 1.05 | % | | $ | 1,000 | | | $ | 1,020 | | | $ | 5.35 | |
Institutional Class | | | | | | | | | | | | | | | | |
Based on Actual Fund Return | | | 0.95 | % | | $ | 1,000 | | | $ | 938 | | | $ | 4.64 | |
Hypothetical (5% return before expenses) | | | 0.95 | % | | $ | 1,000 | | | $ | 1,020 | | | $ | 4.84 | |
About Your Fund’s Expenses
| | | | | | | | | | | | | | | | |
| Six Months Ended December 31, 2015 | | Expense
Ratio for
the Period | | | Beginning
Account Value
07/01/15 | | | Ending
Account Value
12/31/15 | | | Expenses
Paid During
the Period* | |
AMG GW&K Small Cap Growth Fund | |
Institutional Class | | | | | | | | | | | | | | | | |
Based on Actual Fund Return | | | 0.95 | % | | $ | 1,000 | | | $ | 894 | | | $ | 4.54 | |
Hypothetical (5% return before expenses) | | | 0.95 | % | | $ | 1,000 | | | $ | 1,020 | | | $ | 4.84 | |
| * | Expenses are equal to the Fund’s annualized expense ratio multiplied by the average account value over the period, multiplied by the number of days in the most recent fiscal half-year (184), then divided by 365. |
4
AMG GW&K Enhanced Core Bond Fund
Portfolio Manager’s Comments (unaudited)
THE YEAR IN REVIEW
AMG GW&K Enhanced Core Bond Fund (Investor Class) (the “Fund”) returned (3.41%) for the year ended December 31, 2015, compared to the return of 0.55% for the Barclays U.S. Aggregate Bond Index.
The end of the year was challenged by the same general themes that plagued the taxable bond market throughout 2015. Investors grappled with a combination of an imminent U.S. Federal Reserve (the “Fed”) lift-off, an uncertain global growth outlook as China’s economy continued to slow, a stronger U.S. Dollar, plummeting oil prices and an unyielding commodity related sell-off. After months of back and forth, the Federal Open Market Committee finally raised rates for the first tightening of monetary policy in nearly a decade, mollifying one source of angst for investors. The market greeted the hike as affirming a benign economic outlook for the U.S. economy. But for the year, the Fed’s actions took a back seat to the commodity price decline and credit-related issues. This divide can be seen by the breakeven performance in the Barclays U.S. Aggregate Index versus a -4.5% loss in the U.S. high-yield market in the last several months of the year. The market ended the year with very little movement in the intermediate part of the curve, and slightly higher rates on the short end relative to the long end. This flattening of the yield curve left the 2/30yr Treasury spread close to its lowest level in 12 months.
Heading into 2016, many of the challenges that weighed on the market last year remain. The theme of relative domestic strength and global weakness should remain prevalent throughout the first half of the year. U.S. monetary policy divergence with the rest of the world is likely to be an important influence on both the bond market and the economy. Fed activity may produce an elevated level of volatility, but we do not expect interest rates to increase meaningfully. A low inflationary environment, moderate economic growth and a cautious approach from the Fed should all contribute to keeping rates in the intermediate and long end of the curve fairly
subdued. We maintain a relatively neutral duration and continue to prefer the intermediate part of the curve given the attractive carry and roll for the interest-rate risk assumed.
Despite a healthy economy, the fundamental and technical backdrop for corporate credit is challenging. Investors are particularly concerned about low market liquidity and redemption risk. Furthermore, the fortunes for large portions of the corporate bond market remain hostage to the bursting of the commodity cycle and slowing global growth. Defaults in the high-yield segment are expected to rise from 2.8% this year to 3.8% next year, driven by the energy sector, which could see its default rate approach 10%.
As we enter 2016, the big question on investors’ minds is whether there will be a broader contagion from the commodity rout. While developments in the credit markets bear close monitoring, we do not see a case for a more far-reaching credit crunch. The primary market remains open to most issuers and banks are sanguine about credit quality. However, given these challenges, we believe managing the risks and rebalancing portfolios accordingly will be the key for successful investing in the New Year. Along these lines, we continued to reduce our exposure to commodity prices and global growth within the Fund. The proceeds were invested into higher-quality mortgage-backed securities, taxable municipals and defensive investment-grade credits. We remain overweight investment grade corporates, which should outperform Treasuries in a moderate growth climate. The risk/return for this segment improved markedly throughout the course of the year as spreads widened amid record new issuance. We are slightly underweight the high-yield market. While we see attractive valuation in some sectors, weak technicals and challenging fundamentals will continue to weigh on the market. The outlook for the mortgage sector remains favorable due to solid technicals. We remain biased toward higher premium mortgage-backed securities because they should provide solid excess returns in a part of the curve that is susceptible to higher rates next year.
This commentary reflects the viewpoints of the portfolio manager, GW&K Investment Management, LLC as of December 31, 2015 and is not intended as a forecast or guarantee of future results.
5
AMG GW&K Enhanced Core Bond Fund
Portfolio Manager’s Comments (continued)
CUMULATIVE TOTAL RETURN PERFORMANCE
AMG GW&K Enhanced Core Bond Fund’s cumulative total return is based on the daily change in net asset value (NAV), and assumes that all distributions were reinvested. The chart compares a hypothetical $10,000 investment made in the AMG Enhanced Core Bond Fund—Investor Class shares on December 31, 2005, with a $10,000 investment made in the Barclays U.S. Aggregate Bond Index for the same time period. The graph and table do not reflect the deduction of taxes that a shareholder would pay on a Fund distribution or redemption of shares. The listed returns for the Fund are net of expenses and the returns for the index exclude expenses. Total returns for the Fund would have been lower had certain expenses not been reduced.
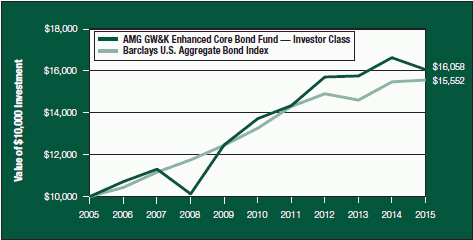
The table below shows the average annual total returns for the AMG GW&K Enhanced Core Bond Fund and the Barclays U.S. Aggregate Bond Index for the same time periods ended December 31, 2015.
| | | | | | | | | | | | | | | | | | | | |
| Average Annual Total Returns1 | | One
Year | | | Five
Years | | | Ten
Years | | | Since
Inception | | | Inception
Date | |
AMG GW&K Enhanced Core Bond Fund 2,3,4,5 | | | | | | | | | | | | | | | | | | | | |
Investor Class | | | (3.41 | )% | | | 3.21 | % | | | 4.85 | % | | | 5.62 | % | | | 01/02/97 | |
Service Class | | | (3.30 | )% | | | — | | | | — | | | | 0.98 | % | | | 11/30/12 | |
Class C6 | | | (4.14 | )% | | | 2.42 | % | | | 4.06 | % | | | 4.80 | % | | | 03/05/98 | |
Institutional Class | | | (3.15 | )% | | | 3.47 | % | | | 5.11 | % | | | 6.02 | % | | | 01/02/97 | |
Barclays U.S. Aggregate Bond Index7 | | | 0.55 | % | | | 3.25 | % | | | 4.51 | % | | | 5.45 | % | | | 01/02/97 | † |
The performance data shown represents past performance. Past performance is not a guarantee of future results. Current performance may be lower or higher than the performance data quoted. The investment return and principal value of an investment in the Fund will fluctuate so that an investor’s shares, when redeemed, may be worth more or less than their original cost.
Investors should carefully consider the Fund’s investment objectives, risks, charges and expenses before investing. For performance information through the most recent month end, current net asset values per share for the Fund and other information, please call (800) 835-3879 or visit our website at www.amgfunds.com for a free prospectus. Read it carefully before investing or sending money.
Funds are distributed by AMG Distributors, Inc., member FINRA/SIPC.
| † | Date reflects the inception date of the Fund, not the index. |
| 1 | Total return equals income yield plus share price change and assumes reinvestment of all dividends and capital gain distributions. Returns are net of fees and may reflect offsets of Fund expenses as described in the prospectus. No adjustment has been made for taxes payable by shareholders on their reinvested dividends and capital gain distributions. Returns for periods greater than one year are annualized. The listed returns on the Fund are net of expenses and based on the published NAV as of December 31, 2015. All returns are in U.S. dollars ($). |
| 2 | From time to time, the Fund’s advisor has waived its fees and/or absorbed Fund expenses, which has resulted in higher returns. |
| 3 | Fixed income funds are subject to the risks associated with investments in debt securities, such as default risk and fluctuations in the perception of the debtor’s ability to pay its creditors. |
| 4 | Issuer of bonds may not be able to meet interest or principal payments when the bonds come due. High yield bonds (also known as “junk bonds”) are subject to additional risks such as the risk of default. The use of leverage in a Fund’s strategy can magnify relatively small market movements into relatively larger looses for the Fund. Factors unique to the municipal bond market may negatively affect the value in municipal bonds. |
| 5 | Changing interest rates may adversely affect the value of a fixed income investment. An increase in interest rates typically causes the value of bonds and other fixed income securities to fall. |
| 6 | Closed to new investments. |
| 7 | The Barclays U.S. Aggregate Bond Index is an index of the U.S. investment-grade, fixed-rate bond market, including both government and corporate bonds. Unlike the Fund, the Barclays U.S. Aggregate Bond Index is unmanaged, is not available for investment, and does not incur expenses. |
Not FDIC insured, nor bank guaranteed. May lose value.
6
AMG GW&K Enhanced Core Bond Fund
Fund Snapshots (unaudited)
December 31, 2015
PORTFOLIO BREAKDOWN
| | | | |
Sector | | AMG GW&K Enhanced
Core Bond Fund** | |
U.S. Government and Agency Obligations | | | 42.6 | % |
Industrials | | | 31.5 | % |
Financials | | | 14.1 | % |
Municipal Bonds | | | 6.6 | % |
Other Assets and Liabilities | | | 5.2 | % |
| ** | As a percentage of net assets. |
| | | | |
Rating | | AMG GW&K Enhanced
Core Bond Fund*** | |
U.S. Government and Agency Obligations | | | 44.9 | % |
Aaa | | | 2.1 | % |
Aa | | | 9.1 | % |
A | | | 10.6 | % |
Baa | | | 22.8 | % |
Ba | | | 8.8 | % |
B | | | 1.7 | % |
| *** | As a percentage of market value of fixed-income securities. |
TOP TEN HOLDINGS
| | | | |
Security Name | | % of
Net Assets | |
United States Treasury Bond, 6.250%, 08/15/23* | | | 6.9 | % |
FNMA, 5.500%, 02/01/39* | | | 3.8 | |
FNMA, 4.500%, 05/01/39* | | | 3.7 | |
FHLMC Gold Pool, 5.000%, 10/01/36* | | | 3.0 | |
Microsoft Corp., 2.650%, 11/03/22 | | | 2.0 | |
Burlington Northern Santa Fe LLC, 6.150%, 05/01/37* | | | 2.0 | |
Weyerhaeuser Co., 8.500%, 01/15/25* | | | 2.0 | |
The Goldman Sachs Group, Inc., 6.125%, 02/15/33* | | | 2.0 | |
California State General Obligation, School Improvements, | | | | |
7.550%, 04/01/39* | | | 2.0 | |
CF Industries, Inc., 7.125%, 05/01/20* | | | 1.9 | |
| | | | |
Top Ten as a Group | | | 29.3 | % |
| | | | |
| * | Top Ten Holdings as of June 30, 2015. |
Credit quality ratings shown above reflect the highest rating assigned by either Standard & Poor’s (“S&P”) or Moody’s Investors Service, Inc. (“Moody’s”). These rating agencies are independent, nationally recognized statistical rating organizations and are widely used. Investment grade ratings are credit ratings of BBB/Baa or higher. Below investment grade ratings are credit ratings of BB/Ba or lower. Investments designated N/R are not rated by either rating agency. Unrated investments do not necessarily indicate low credit quality. Credit quality ratings are subject to change.
Because a fund’s strategy may result in multiple investments in particular sectors of the economy, its performance may depend on the performance of those sectors and may fluctuate more widely than investments diversified across more sectors For additional information on these and other risk considerations, please see the Fund’s prospectus.
Any sectors, industries, or securities discussed should not be perceived as investment recommendations. Mention of a specific security should not be considered a recommendation to buy or solicitation to sell that security. Specific securities mentioned in this report may have been sold from the Fund’s portfolio of investments by the time you receive this report.
7
AMG GW&K Enhanced Core Bond Fund
Schedule of Portfolio Investments
December 31, 2015
| | | | | | | | |
| | | Principal Amount | | | Value | |
Corporate Bonds and Notes—45.6% | | | | | | | | |
Financials—14.1% | | | | | | | | |
Ally Financial, Inc., 8.000%, 03/15/20 | | $ | 775,000 | | | $ | 885,438 | |
Crown Castle International Corp., 5.250%, 01/15/23 | | | 865,000 | | | | 912,575 | |
General Electric Capital Corp., GMTN, 6.000%, 08/07/19 | | | 775,000 | | | | 878,381 | |
The Goldman Sachs Group, Inc., 6.125%, 02/15/33 | | | 1,465,000 | | | | 1,720,919 | |
Host Hotels & Resorts, L.P., Series C, 4.750%, 03/01/231 | | | 815,000 | | | | 843,572 | |
International Lease Finance Corp., 8.250%, 12/15/20 | | | 700,000 | | | | 829,500 | |
JPMorgan Chase & Co., Series S, 6.750%, 01/29/492 | | | 799,000 | | | | 871,909 | |
Morgan Stanley, GMTN, 5.500%, 07/28/21 | | | 750,000 | | | | 841,296 | |
National Rural Utilities Cooperative Finance Corp., MTN, 3.250%, 11/01/25 | | | 875,000 | | | | 872,422 | |
Visa, Inc., 3.150%, 12/14/25 | | | 860,000 | | | | 862,135 | |
Wells Fargo & Co., Series U, 5.875%, 12/29/492 | | | 839,000 | | | | 884,096 | |
Weyerhaeuser Co., 8.500%, 01/15/25 | | | 1,340,000 | | | | 1,722,327 | |
Total Financials | | | | | | | 12,124,570 | |
Industrials—31.5% | | | | | | | | |
AbbVie, Inc., 3.200%, 11/06/22 | | | 930,000 | | | | 916,823 | |
Actavis Funding SCS, 3.800%, 03/15/25 | | | 1,000,000 | | | | 996,808 | |
American Axle & Manufacturing, Inc., 6.625%, 10/15/22 | | | 1,295,000 | | | | 1,359,750 | |
Automatic Data Processing, Inc., 3.375%, 09/15/25 | | | 846,000 | | | | 863,473 | |
Ball Corp., 5.250%, 07/01/25 | | | 575,000 | | | | 590,094 | |
BorgWarner, Inc., 3.375%, 03/15/25 | | | 1,000,000 | | | | 945,888 | |
Burlington Northern Santa Fe LLC, 6.150%, 05/01/37 | | | 1,465,000 | | | | 1,722,814 | |
CalAtlantic Group, Inc., 6.625%, 05/01/20 | | | 850,000 | | | | 930,750 | |
CF Industries, Inc., 7.125%, 05/01/20 | | | 1,435,000 | | | | 1,620,798 | |
CHS/Community Health Systems, Inc., 5.125%, 08/01/21 | | | 445,000 | | | | 445,000 | |
Comcast Corp., 7.050%, 03/15/33 | | | 660,000 | | | | 852,921 | |
CVS Health Corp., 4.875%, 07/20/35 | | | 1,030,000 | | | | 1,066,780 | |
Ford Motor Co., 7.450%, 07/16/31 | | | 670,000 | | | | 828,825 | |
Frontier Communications Corp., 8.875%, 09/15/20 (a) | | | 500,000 | | | | 507,500 | |
General Motors Co., 6.250%, 10/02/43 | | | 1,000,000 | | | | 1,060,106 | |
Georgia-Pacific LLC, 8.000%, 01/15/24 | | | 668,000 | | | | 846,069 | |
HCA, Inc., 5.000%, 03/15/24 | | | 1,360,000 | | | | 1,360,000 | |
International Paper Co., 3.800%, 01/15/261 | | | 935,000 | | | | 923,107 | |
Lear Corp., 5.375%, 03/15/24 | | | 450,000 | | | | 464,625 | |
McDonald’s Corp., MTN, 3.700%, 01/30/26 | | | 867,000 | | | | 868,097 | |
Microsoft Corp., 2.650%, 11/03/22 | | | 1,741,000 | | | | 1,740,859 | |
Owens Corning, 4.200%, 12/15/22 | | | 855,000 | | | | 856,775 | |
QVC, Inc., 5.125%, 07/02/22 | | | 830,000 | | | | 828,485 | |
The accompanying notes are an integral part of these financial statements.
8
AMG GW&K Enhanced Core Bond Fund
Schedule of Portfolio Investments (continued)
| | | | | | | | |
| | | Principal Amount | | | Value | |
Industrials—31.5% (continued) | | | | | | | | |
T-Mobile USA, Inc., 6.250%, 04/01/21 | | $ | 1,000,000 | | | $ | 1,032,500 | |
Tyson Foods, Inc., 4.875%, 08/15/34 | | | 845,000 | | | | 865,018 | |
United Rentals North America, Inc., 6.125%, 06/15/23 | | | 1,000,000 | | | | 1,027,500 | |
Verizon Communications, Inc., 5.150%, 09/15/23 | | | 830,000 | | | | 913,902 | |
Viacom, Inc., 6.875%, 04/30/36 | | | 675,000 | | | | 670,468 | |
Total Industrials | | | | | | | 27,105,735 | |
Total Corporate Bonds and Notes (cost $39,542,359) | | | | | | | 39,230,305 | |
Municipal Bonds—6.6% | | | | | | | | |
California State General Obligation, School Improvements, 7.550%, 04/01/39 | | | 1,175,000 | | | | 1,707,874 | |
JobsOhio Beverage System, Series B, 3.985%, 01/01/29 | | | 880,000 | | | | 915,922 | |
Los Angeles Unified School District, School Improvements, 5.750%, 07/01/34 | | | 1,100,000 | | | | 1,325,291 | |
Metropolitan Transportation Authority Revenue, Build America Bonds, 6.668%, 11/15/39 | | | 685,000 | | | | 895,699 | |
New Jersey Economic Development Authority, Pension Funding, Series A, 7.425%, 02/15/29 (National Insured)3 | | | 770,000 | | | | 879,902 | |
Total Municipal Bonds (cost $5,771,959) | | | | | | | 5,724,688 | |
U.S. Government and Agency Obligations—42.6% | | | | | | | | |
Federal Home Loan Banks—1.3% | | | | | | | | |
FHLB, 2.125%, 05/27/21 | | | 1,160,000 | | | | 1,162,022 | |
Federal Home Loan Mortgage Corporation—5.0% | | | | | | | | |
FHLMC Gold Pool, | | | | | | | | |
4.500%, 10/01/39 | | | 682,022 | | | | 735,995 | |
5.000%, 06/01/26 to 10/01/36 | | | 3,254,989 | | | | 3,546,679 | |
Total Federal Home Loan Mortgage Corporation | | | | | | | 4,282,674 | |
Federal National Mortgage Association—26.2% | | | | | | | | |
FNMA, | | | | | | | | |
4.000%, 02/01/26 to 01/01/42 | | | 4,354,744 | | | | 4,629,273 | |
4.500%, 05/01/39 to 09/01/42 | | | 4,597,049 | | | | 5,008,642 | |
5.000%, 08/01/35 | | | 1,092,668 | | | | 1,206,075 | |
5.500%, 05/01/25 to 04/01/40 | | | 6,744,313 | | | | 7,556,122 | |
6.000%, 02/01/23 to 10/01/40 | | | 3,652,341 | | | | 4,135,095 | |
Total Federal National Mortgage Association | | | | | | | 22,535,207 | |
U.S. Treasury Obligations—10.1% | | | | | | | | |
United States Treasury Bonds, | | | | | | | | |
3.500%, 02/15/39 | | | 738,000 | | | | 816,585 | |
6.250%, 08/15/23 | | | 4,598,000 | | | | 5,937,705 | |
United States Treasury Notes, | | | | | | | | |
2.250%, 11/15/24 | | | 1,469,000 | | | | 1,468,483 | |
3.500%, 05/15/20 | | | 426,000 | | | | 458,108 | |
Total U.S. Treasury Obligations | | | | | | | 8,680,881 | |
Total U.S. Government and Agency Obligations (cost $36,303,635) | | | | | | | 36,660,784 | |
The accompanying notes are an integral part of these financial statements.
9
AMG GW&K Enhanced Core Bond Fund
Schedule of Portfolio Investments (continued)
| | | | | | | | |
| | | Principal Amount | | | Value | |
Short-Term Investments—5.9% | | | | | | | | |
Repurchase Agreements—1.6%4 | | | | | | | | |
Cantor Fitzgerald Securities, Inc., dated 12/31/15, due 01/04/16, 0.340%, total to be received $1,000,038 (collateralized by various U.S. Government Obligations, 0.000% - 10.500%, 01/15/16 - 09/01/49, totaling $1,020,000) | | $ | 1,000,000 | | | $ | 1,000,000 | |
Daiwa Capital Markets America, dated 12/31/15, due 01/04/16, 0.350%, total to be received $376,595 (collateralized by various U.S. Government Agency Obligations, 0.000% - 7.500%, 01/21/16 - 02/01/49, totaling $384,112) | | | 376,580 | | | | 376,580 | |
Total Repurchase Agreements | | | | | | | 1,376,580 | |
| | | Shares | | | | |
Other Investment Companies—4.3%5 | | | | | | | | |
Dreyfus Institutional Cash Advantage Fund, Institutional Class Shares, 0.26% | | | 3,704,959 | | | | 3,704,959 | |
Total Short-Term Investments | | | | | | | | |
(cost $5,081,539) | | | | | | | 5,081,539 | |
Total Investments—100.7% (cost $86,699,492) | | | | | | | 86,697,316 | |
Other Assets, less Liabilities—(0.7)% | | | | | | | (599,014 | ) |
Net Assets—100.0% | | | | | | $ | 86,098,302 | |
The accompanying notes are an integral part of these financial statements.
10
AMG GW&K Municipal Bond Fund
Portfolio Manager’s Comments (unaudited)
THE YEAR IN REVIEW
For the year ended December 31, 2015, the AMG GW&K Municipal Bond Fund (Service Class) (the “Fund”) returned 3.77%, outperforming its benchmark, the Barclays 10-Year Municipal Bond Index (the Index), which returned 3.76%.
Municipal bonds posted surprisingly strong results late in 2015, defying the broader sell-off in other fixed-income markets. While Treasuries struggled with a U.S. Federal Reserve (the “Fed”) that turned decisively toward a year-end rate hike, municipal bonds were boosted by a steep decline in new issue volume, which coincided with a seasonal acceleration in coupon and reinvestment demand. Tax-exempt supply fell -24% from the fourth quarter of last year, driven by a 45% plunge in refunding transactions. The dropoff was a product of the major spike in refinancing activity in the first half of the year when borrowers were looking to get ahead of rising rates. Meanwhile, flows into tax-exempt funds were positive every week of the final quarter of 2015 and surged into year end, a welcome turnaround from the negative flows seen throughout the second and third quarters. These technical dynamics led to steady gains in an environment that was otherwise unfavorable towards bonds.
Recall that early in the fourth quarter of 2015, odds of a year-end rate hike were still under 30% due to slowing employment growth and the Fed’s hesitation to raise rates in the face of “recent global economic and financial developments.” It wasn’t until the October 28 Federal Open Market Committee meeting that sentiment flipped. Although rates were kept unchanged at that meeting, policy makers removed reference to global contagion and put a December liftoff squarely on the table. The following week, payrolls rebounded and the odds shot up to over 70%. When the hike finally came in mid-December, the first in nearly ten years, the market was well prepared and seemed relieved to get the uncertainty out of the way. Short Treasury rates moved higher by 40 basis points over the quarter. The longer end of the Treasury curve was up by half as much, held back by a deepening slump in
commodity prices and the Fed’s emphasis on “gradual” rate increases going forward.
With tax-exempt yields hovering near and even higher than Treasury yields in late September, the stage was set for municipal bonds to outperform heading into year end. In fact, the ten-year municipal/Treasury ratio ended December at 85%, down a full 15 percentage points from October 1, the largest quarterly drop since 2011. Municipal bonds also benefited from a solid fundamental backdrop. State and local revenues continued to strengthen throughout the year, helped by steady employment growth, a surge in personal income tax collections and a recovery in the housing market. The troubles in Puerto Rico, which included the island’s first payment default and endless restructuring talks with creditors, bond insurers and even the U.S. Congress, never spilled over to the general market, unsurprising given the unique nature of the territory’s financial crisis. For the year, the Fund outperformed the benchmark with an overweight to bonds longer than the Index (3-4 years) the biggest contributor.
Looking ahead, we expect municipals to hold up well in what could be a choppy 2016. The challenges facing the space should be manageable. Pension funding will continue to test the financial discipline of the states, and in places like Illinois and New Jersey, we expect the situations to get worse before they get better. But unfunded liabilities have been on the mend recently and accounting reforms should prove useful in forcing the hands of reluctant officials to move toward better funding schemes. Relative valuations begin the year just below historical averages, but in periods of rising rates we would expect ratios to test their long-term lows. And while the national recovery is now almost seven years in length, most state and local governments have spent that time wisely, reining in spending, paring back debt and building a cushion against any turn in the cycle. Still, with the financial markets focused on Fed policy, commodity weakness and global turmoil, we can expect volatility to carry over into the new year. We stand ready to take advantage of any opportunities that
emerge, whether related to duration positioning, liquidity disruptions or credit developments.
We enter 2016 with a duration modestly shorter than the benchmark. With inflation expectations near six-year lows and the world finally concerned about the threat of deflation, we could see some near-term opportunities to capture higher yields on even the smallest reversal in sentiment. And yet, waiting around for rates to rise is not a strategy, so we have been careful not to shed too much duration. Also, with liquidity becoming an increasing concern for dealers, regulators and market participants, our long-standing emphasis on large, widely-held credits and our deep experience with trading during all market conditions should give us a welcome edge. The Fund remains well diversified in terms of credit, structure and curve exposure.
This commentary reflects the viewpoints of GW&K Investment Management, LLC as of December 31, 2015 and is not intended as a forecast or guarantee of future results.
11
AMG GW&K Municipal Bond Fund
Portfolio Manager’s Comments (continued)
CUMULATIVE TOTAL RETURN PERFORMANCE
AMG GW&K Municipal Bond Fund’s cumulative total return is based on the daily change in net asset value (NAV), and assumes that all dividends and distributions were reinvested. The chart compares a hypothetical $10,000 investment made in AMG GW&K Municipal Bond Fund—Service Class on June 30, 2009, to a $10,000 investment made in the Barclays 10-Year Municipal Bond Index for the same time period. The graph and table do not reflect the deduction of taxes that a shareholder would pay on a Fund distribution or redemption of shares. The listed returns for the Fund are net of expenses and the returns for the index exclude expenses. Total returns would have been lower had certain expenses not been reduced.
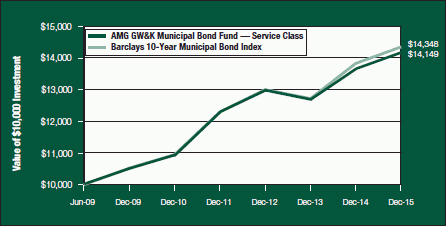
The table below shows the average annual total returns for the AMG GW&K Municipal Bond Fund and the Barclays 10-Year Municipal Bond Index for the same time periods ended December 31, 2015.
| | | | | | | | | | | | | | | | |
| | | One | | | Five | | | Since | | | Inception | |
| Average Annual Total Returns1 | | Year | | | Years | | | Inception | | | Date | |
AMG GW&K Municipal Bond Fund 2,3,4,5,6 | | | | | | | | | | | | | | | | |
Investor Class | | | 3.36 | % | | | 5.02 | % | | | 5.20 | % | | | 6/30/09 | |
Service Class | | | 3.77 | % | | | 5.33 | % | | | 5.48 | % | | | 6/30/09 | |
Institutional Class | | | 3.94 | % | | | 5.54 | % | | | 5.74 | % | | | 6/30/09 | |
Barclays 10-Year Municipal Bond Index7 | | | 3.76 | % | | | 5.55 | % | | | 5.71 | % | | | 6/30/09 | † |
The performance data shown represents past performance. Past performance is not a guarantee of future results. Current performance may be lower or higher than the performance data quoted. The investment return and principal value of an investment in the Fund will fluctuate so that an investor’s shares, when redeemed, may be worth more or less than their original cost.
Investors should carefully consider the Fund’s investment objectives, risks, charges and expenses before investing. For performance information through the most recent month end, current net asset values per share for the Fund and other information, please call (800) 835-3879 or visit our website at www.amgfunds.com for a free prospectus. Read it carefully before investing or sending money.
Funds are distributed by AMG Distributors, Inc., member FINRA/SIPC.
| † | Date reflects the inception date of the Fund, not the index. |
| 1 | Total return equals income yield plus share price change and assumes reinvestment of all dividends and capital gain distributions. Returns are net of fees and may reflect offsets of Fund expenses as described in the prospectus. No |
| | adjustment has been made for taxes payable by shareholders on their reinvested dividends and capital gain distributions. Returns for periods greater than one year are annualized. The listed returns on the Fund are net of expenses and based on the published NAV as of December 31, 2015. All returns are in U.S. dollars ($). |
| 2 | From time to time, the Fund’s advisor has waived its fees and/or absorbed Fund expenses, which has resulted in higher returns. |
| 3 | The Fund is subject to the risks associated with investments in debt securities, such as default risk and fluctuations in the perception of the debtor’s ability to pay its creditors. |
| 4 | Changing interest rates may adversely affect the value of an investment. An increase in interest rates typically causes the value of bonds and other fixed income securities to fall. |
| 5 | Issuer of bonds may not be able to meet interest of principal payments when the bonds come due. Factors unique to the municipal bond market may negatively affect the value in municipal bonds. |
| 6 | Investment income may be subject to certain state and local taxes, and depending on your tax status, the federal alternative minimum tax. Capital gains are not exempt from federal income tax. |
| 7 | The Barclays 10-Year Municipal Bond Index is the 10 year (8-12) component of the Municipal bond index. It is a rules-based, market-value-weighted index engineered for the tax-exempt bond market. The Index tracks general obligation bonds, revenue bonds, insured bonds, and pre-refunded bonds rated Baa3/BBB- or higher by at least two of the ratings agencies: Moody’s, S&P, Fitch. Unlike the Fund, the Barclays 10-Year Municipal Bond Index is unmanaged, is not available for investment and does not incur expenses. |
Not FDIC insured, nor bank guaranteed. May lose value.
12
AMG GW&K Municipal Bond Fund
Fund Snapshots (unaudited)
December 31, 2015
PORTFOLIO BREAKDOWN
| | | | |
| | | AMG GW&K Municipal | |
Sector | | Bond Fund** | |
General Obligation | | | 30.1 | % |
Transportation | | | 20.5 | % |
Utilities | | | 18.6 | % |
Public Services | | | 9.6 | % |
Education | | | 8.2 | % |
Cash | | | 3.4 | % |
Tax | | | 3.4 | % |
Industrial Development | | | 2.3 | % |
Lease/Rent | | | 2.2 | % |
Certificate of Participation | | | 1.6 | % |
Healthcare | | | 1.3 | % |
State and Non-State Appropriated Tobacco | | | 0.0 | % |
Other Assets and Liabilities | | | (1.2 | )% |
| ** | As a percentage of net assets. |
| | | | |
| | | AMG GW&K Municipal | |
Rating | | Bond Fund*** | |
Aaa | | | 29.8 | % |
Aa | | | 57.0 | % |
A | | | 11.3 | % |
Baa | | | 1.9 | % |
| *** | As a percentage of market value of fixed-income securities. |
TOP TEN HOLDINGS
| | | | |
| | | % of | |
Security Name | | Net Assets | |
Maryland State, General Obligation, University and College Improvements, Series B, 5.000%, 08/01/23 | | | 3.0 | % |
Arizona Water Infrastructure Finance Authority, Water Quality Revenue, Series A, 5.000%, 10/01/26 | | | 2.3 | |
New York City Transitional Finance Authority, Future Tax Secured Revenue, Series C, 5.000%, 11/01/23 | | | 2.0 | |
Minnesota State General Obligation, Series D, 5.000%, 08/01/24 | | | 1.9 | |
Ohio Water Development Authority, Water Pollution Control Loan Fund, 5.000%, 06/01/23* | | | 1.9 | |
Minnesota State General Obligation, Series D, 5.000%, 08/01/22 | | | 1.9 | |
Ohio State General Obligation, Series A, 5.000%, 09/15/22* | | | 1.8 | |
New York City General Obligation, Series I, 5.000%, 08/01/24 | | | 1.6 | |
University of California, College and University Revenue, Series I, 5.000%, 05/15/26 | | | 1.5 | |
Los Angeles Unified School District General Obligation, Series A, 5.000%, 07/01/23 | | | 1.5 | |
| | | | |
Top Ten as a Group | | | 19.4 | % |
| | | | |
| * | Top Ten Holdings as of June 30, 2015. |
Credit quality ratings shown above reflect the highest rating assigned by either Standard & Poor’s (“S&P”) or Moody’s Investors Service, Inc. (“Moody’s”). These rating agencies are independent, nationally recognized statistical rating organizations and are widely used. Investment grade ratings are credit ratings of BBB/Baa or higher. Below investment grade ratings are credit ratings of BB/Ba or lower. Investments designated N/R are not rated by either rating agency. Unrated investments do not necessarily indicate low credit quality. Credit quality ratings are subject to change.
Because a fund’s strategy may result in multiple investments in particular sectors of the economy, its performance may depend on the performance of those sectors and may fluctuate more widely than investments diversified across more sectors. For additional information on these and other risk considerations, please see the Fund’s prospectus.
Any sectors, industries, or securities discussed should not be perceived as investment recommendations. Mention of a specific security should not be considered a recommendation to buy or solicitation to sell that security. Specific securities mentioned in this report may have been sold from the Fund’s portfolio of investments by the time you receive this report.
13
AMG GW&K Municipal Bond Fund
Fund Snapshots (continued)
December 31, 2015
STATE BREAKDOWN
| | | | |
| | | % of | |
State | | Net Assets | |
Texas | | | 12.2 | % |
New York | | | 11.0 | % |
Ohio | | | 7.8 | % |
California | | | 6.0 | % |
Washington | | | 5.8 | % |
Wisconsin | | | 5.8 | % |
Illinois | | | 5.1 | % |
Massachusetts | | | 4.6 | % |
Arizona | | | 4.5 | % |
Georgia | | | 4.0 | % |
Minnesota | | | 3.8 | % |
North Carolina | | | 3.5 | % |
Missouri | | | 3.0 | % |
Maryland | | | 3.0 | % |
| | | | |
| | | % of | |
State | | Net Assets | |
Florida | | | 2.8 | % |
District of Columbia | | | 2.6 | % |
New Jersey | | | 2.5 | % |
Virginia | | | 1.9 | % |
Pennsylvania | | | 1.7 | % |
Oregon | | | 1.3 | % |
Connecticut | | | 1.3 | % |
Colorado | | | 0.9 | % |
Michigan | | | 0.9 | % |
Idaho | | | 0.8 | % |
Kentucky | | | 0.4 | % |
Other Assets and Liabilities | | | 2.8 | % |
| | | | |
| | | 100 | % |
| | | | |
14
AMG GW&K Municipal Bond Fund
Schedule of Portfolio Investments
December 31, 2015
| | | | | | | | |
| | | Principal Amount | | | Value | |
Municipal Bonds—97.2% | | | | | | | | |
Arizona—4.5% | | | | | | | | |
Arizona Health Facilities Authority, Scottsdale Lincoln Hospital Revenue, 5.000%, 12/01/26 | | $ | 2,560,000 | | | $ | 3,029,786 | |
Arizona School Facilities Board COPS, Series A, 5.000%, 09/01/21 | | | 5,000,000 | | | | 5,894,450 | |
Arizona Transportation Board, Subordinated Highway Revenue, Series 2013 A, 5.000%, 07/01/22 | | | 4,255,000 | | | | 5,125,488 | |
Arizona Water Infrastructure Finance Authority, Water Quality Revenue, Series A, 5.000%, 10/01/26 | | | 15,000,000 | | | | 18,644,400 | |
Phoenix Civic Improvement Corp., Water Utility Improvements, Series A, 5.000%, 07/01/22 | | | 3,650,000 | | | | 4,173,300 | |
Total Arizona | | | | | | | 36,867,424 | |
California—6.0% | | | | | | | | |
California State Public Works Board, Series F, 5.000%, 05/01/25 | | | 6,000,000 | | | | 7,482,900 | |
California State Public Works Board, Series H, 5.000%, 12/01/26 | | | 8,500,000 | | | | 10,538,895 | |
California State Tax Exempt General Obligation, 5.000%, 03/01/24 | | | 5,000,000 | | | | 6,195,250 | |
Los Angeles Unified School District General Obligation, Series A, 5.000%, 07/01/23 | | | 10,000,000 | | | | 12,334,200 | |
University of California, College and University Revenue, Series I, 5.000%, 05/15/26 | | | 10,000,000 | | | | 12,471,200 | |
Total California | | | | | | | 49,022,445 | |
Colorado—0.9% | | | | | | | | |
Regional Transportation District County COPS, Series A, 5.000%, 06/01/24 | | | 6,000,000 | | | | 7,182,540 | |
Connecticut—1.3% | | | | | | | | |
State of Connecticut Special Tax Revenue, Series A, 5.000%, 08/01/24 | | | 3,400,000 | | | | 4,169,556 | |
State of Connecticut Special Tax Revenue, Transit Infrastructure, 5.000%, 08/01/24 | | | 5,340,000 | | | | 6,548,656 | |
Total Connecticut | | | | | | | 10,718,212 | |
District of Columbia—2.6% | | | | | | | | |
District of Columbia Water & Sewer Authority Public Utility Revenue, Sub Lien, Series C, 5.000%, 10/01/21 | | | 5,000,000 | | | | 5,955,250 | |
District of Columbia Water & Sewer Authority Public Utility Revenue, Sub Lien, Series C, 5.000%, 10/01/24 | | | 5,475,000 | | | | 6,543,227 | |
District of Columbia, Series A, 5.000%, 06/01/24 | | | 7,250,000 | | | | 8,968,685 | |
Total District of Columbia | | | | | | | 21,467,162 | |
Florida—2.8% | | | | | | | | |
Florida State Board of Education, Series D, 5.000%, 06/01/24 | | | 6,565,000 | | | | 7,764,294 | |
Miami-Dade Water & Sewer System Revenue, 5.000%, 10/01/24 | | | 5,000,000 | | | | 6,133,750 | |
Miami-Dade Water & Sewer System Revenue, 5.000%, 10/01/25 | | | 5,085,000 | | | | 6,296,349 | |
Reedy Creek Improvement District, Utility Revenue, Series 1, 5.000%, 10/01/25 | | | 2,000,000 | | | | 2,372,840 | |
Total Florida | | | | | | | 22,567,233 | |
Georgia—4.0% | | | | | | | | |
Atlanta Water & Wastewater Revenue, 5.000%, 11/01/25 | | | 8,730,000 | | | | 10,854,184 | |
Georgia State University & College Improvements, Series A, 5.000%, 02/01/26 | | | 4,230,000 | | | | 5,309,665 | |
Georgia State University & College Improvements, Series A—Tranche 2, 5.000%, 07/01/24 | | | 5,000,000 | | | | 6,039,950 | |
Georgia State, Series E-2, 5.000%, 09/01/21 | | | 8,385,000 | | | | 10,045,146 | |
Total Georgia | | | | | | | 32,248,945 | |
Idaho—0.8% | | | | | | | | |
Idaho Housing & Finance Association, 5.000%, 07/15/23 | | | 5,770,000 | | | | 6,836,411 | |
The accompanying notes are an integral part of these financial statements.
15
AMG GW&K Municipal Bond Fund
Schedule of Portfolio Investments (continued)
| | | | | | | | |
| | | Principal Amount | | | Value | |
Illinois—5.1% | | | | | | | | |
Chicago O’Hare International Airport, Series B, 5.000%, 01/01/28 | | $ | 10,500,000 | | | $ | 12,323,955 | |
Illinois State Finance Authority Revenue, University of Chicago, Series A, 5.000%, 10/01/23 | | | 5,105,000 | | | | 6,181,185 | |
Illinois State Toll Highway Authority, Series A, 5.000%, 12/01/22 | | | 3,590,000 | | | | 4,283,660 | |
Illinois State Toll Highway Authority, Series A, 5.000%, 12/01/316 | | | 7,295,000 | | | | 8,660,989 | |
Metropolitan Pier and Exposition Authority Revenue, McCormick Place Expansion Project, Series 2012 B, 5.000%, 12/15/22 | | | 2,095,000 | | | | 2,415,305 | |
Metropolitan Pier and Exposition Authority Revenue, McCormick Place Expansion Project, Series A, 5.500%, 06/15/29 (National Insured)3 | | | 6,170,000 | | | | 7,341,375 | |
Total Illinois | | | | | | | 41,206,469 | |
Kentucky—0.4% | | | | | | | | |
Kentucky Turnpike Authority Revenue, Revitalization Projects, Series A, 5.000%, 07/01/23 | | | 2,750,000 | | | | 3,017,300 | |
Maryland—3.0% | | | | | | | | |
Maryland State, General Obligation, University and College Improvements, Series B, 5.000%, 08/01/23 | | | 20,000,000 | | | | 24,224,200 | |
Massachusetts—4.6% | | | | | | | | |
Massachusetts School Building Authority, 5.000%, 08/15/25 | | | 5,000,000 | | | | 6,013,300 | |
Massachusetts State Department of Taxation and Finance, Series F, 5.000%, 11/01/24 | | | 10,000,000 | | | | 12,152,100 | |
Massachusetts State Development Finance Agency, Boston College, Series P, 5.000%, 07/01/21 | | | 3,090,000 | | | | 3,278,984 | |
Massachusetts State Development Finance Agency, Boston College, Series S, 5.000%, 07/01/23 | | | 5,645,000 | | | | 6,918,117 | |
Massachusetts State Development Finance Agency, Lahey Clinic Obligations, Series F, 5.000%, 08/15/45 | | | 2,560,000 | | | | 2,897,741 | |
University of Massachusetts Building Authority, Series 2, 5.000%, 11/01/21 | | | 5,000,000 | | | | 5,971,650 | |
Total Massachusetts | | | | | | | 37,231,892 | |
Michigan—0.9% | | | | | | | | |
Michigan State Building Authority Revenue, Series I, 5.000%, 04/15/27 | | | 5,700,000 | | | | 6,906,804 | |
Minnesota—3.8% | | | | | | | | |
Minnesota State General Obligation, Series D, 5.000%, 08/01/22 | | | 12,500,000 | | | | 15,201,000 | |
Minnesota State General Obligation, Series D, 5.000%, 08/01/24 | | | 12,555,000 | | | | 15,720,743 | |
Total Minnesota | | | | | | | 30,921,743 | |
Missouri—3.0% | | | | | | | | |
Missouri Highway & Transportation Commission: Fuel Sales Tax Revenue, Series A, 5.000%, 05/01/22 | | | 10,000,000 | | | | 12,115,900 | |
Missouri Highway & Transportation Commission: Fuel Sales Tax Revenue, Series A, 5.000%, 05/01/23 | | | 10,000,000 | | | | 12,285,100 | |
Total Missouri | | | | | | | 24,401,000 | |
New Jersey—2.5% | | | | | | | | |
New Jersey Economic Development Authority, Schools Facilities Construction, Series 2013 NN, 5.000%, 03/01/21 | | | 1,935,000 | | | | 2,115,516 | |
New Jersey Economic Development Authority, Schools Facilities Construction, Series II, 5.000%, 03/01/22 | | | 2,175,000 | | | | 2,388,172 | |
New Jersey Economic Development Authority, Schools Facilities Construction, Series NN, 5.000%, 03/01/26 | | | 2,640,000 | | | | 2,864,189 | |
New Jersey Economic Development Authority, Tobacco and Liquor Tax Revenue, 5.000%, 06/15/20 | | | 2,000,000 | | | | 2,186,900 | |
New Jersey State Turnpike Authority Revenue, Series 2012 B, 5.000%, 01/01/24 | | | 2,790,000 | | | | 3,323,169 | |
New Jersey State Turnpike Authority Revenue, Series A, 5.000%, 01/01/24 | | | 4,925,000 | | | | 5,869,073 | |
New Jersey Transportation Trust Fund Authority, Series 2011 A, 5.250%, 06/15/24 | | | 1,165,000 | | | | 1,275,465 | |
Total New Jersey | | | | | | | 20,022,484 | |
The accompanying notes are an integral part of these financial statements.
16
AMG GW&K Municipal Bond Fund
Schedule of Portfolio Investments (continued)
| | | | | | | | |
| | | Principal Amount | | | Value | |
New York—11.0% | | | | | | | | |
Metropolitan Transportation Authority, Transit Revenue, Series C, 5.000%, 11/15/21 | | $ | 5,185,000 | | | $ | 6,144,692 | |
New York City General Obligation, Series G, 5.000%, 08/01/23 | | | 5,000,000 | | | | 6,099,750 | |
New York City General Obligation, Series I, 5.000%, 08/01/24 | | | 10,760,000 | | | | 12,928,570 | |
New York City Transitional Finance Authority, Future Tax Secured Revenue, Series C, 5.000%, 11/01/23 | | | 13,425,000 | | | | 16,490,196 | |
New York City Transitional Finance Authority, Future Tax Secured Revenue, Series D, 5.000%, 11/01/22 | | | 5,115,000 | | | | 5,905,012 | |
New York City Water & Sewer System Revenue, Series FF, 5.000%, 06/15/25 | | | 6,910,000 | | | | 7,967,921 | |
New York State Dormitory Authority, Personal Income Tax Revenue, Series A, 5.000%, 02/15/25 | | | 5,000,000 | | | | 6,100,800 | |
New York State Dormitory Authority, Sales Tax Revenue, Series A, 5.000%, 03/15/21 | | | 10,000,000 | | | | 11,796,400 | |
New York State Thruway Authority, General Revenue, Junior Indebtedness, Series A, 5.000%, 05/01/19 | | | 5,000,000 | | | | 5,607,700 | |
New York State Urban Development Corp., General Revenue, Series A, 5.000%, 01/01/21 | | | 8,900,000 | | | | 10,190,055 | |
Total New York | | | | | | | 89,231,096 | |
North Carolina—3.5% | | | | | | | | |
North Carolina Limited Obligation, Series C, 5.000%, 05/01/24 | | | 8,375,000 | | | | 10,363,979 | |
North Carolina Municipal Power Agency No 1, Electric, Power and Light Revenue, Series A, 5.000%, 01/01/27 | | | 5,025,000 | | | | 6,134,068 | |
North Carolina State Grant Anticipation Revenue, 5.000%, 03/01/23 | | | 3,275,000 | | | | 3,873,998 | |
North Carolina State Limited Obligation, Series C, 5.000%, 05/01/23 | | | 6,575,000 | | | | 8,062,199 | |
Total North Carolina | | | | | | | 28,434,244 | |
Ohio—7.8% | | | | | | | | |
Ohio State General Obligation, Common Schools, Series B, 5.000%, 03/15/25 | | | 5,000,000 | | | | 5,939,150 | |
Ohio State General Obligation, Series A, 5.000%, 09/15/22 | | | 12,140,000 | | | | 14,749,129 | |
Ohio State General Obligation, Series R, 5.000%, 05/01/21 | | | 5,215,000 | | | | 6,179,931 | |
Ohio State General Obligation, University & College Improvements, Series C, 5.000%, 11/01/26 | | | 8,545,000 | | | | 10,550,853 | |
Ohio Water Development Authority, Water Pollution Control Loan Fund, 5.000%, 06/01/23 | | | 12,500,000 | | | | 15,387,000 | |
Ohio Water Development Authority, Water Pollution Control Loan Fund, Series 2015A, 5.000%, 06/01/256 | | | 8,000,000 | | | | 10,090,720 | |
Total Ohio | | | | | | | 62,896,783 | |
Oregon—1.3% | | | | | | | | |
Oregon State Lottery Revenue, Series C, 5.000%, 04/01/22 | | | 4,000,000 | | | | 4,835,720 | |
Oregon State Lottery Revenue, Series D, 5.000%, 04/01/21 | | | 5,000,000 | | | | 5,930,650 | |
Total Oregon | | | | | | | 10,766,370 | |
Pennsylvania—1.7% | | | | | | | | |
Pennsylvania Economic Development Financing Authority Revenue, Series 2012 B, 5.000%, 07/01/21 | | | 5,740,000 | | | | 6,189,212 | |
Philadelphia Gas Works Co., Natural Gas Revenue, 5.000%, 08/01/24 | | | 6,400,000 | | | | 7,643,520 | |
Total Pennsylvania | | | | | | | 13,832,732 | |
Texas—12.2% | | | | | | | | |
Central Texas Turnpike System Transportation Commission, Series C, 5.000%, 08/15/31 | | | 9,000,000 | | | | 10,283,040 | |
City of Austin TX Water & Wastewater System Revenue, Series A, 5.000%, 11/15/22 | | | 7,790,000 | | | | 9,436,183 | |
City of Dallas TX Waterworks & Sewer System Revenue, Series A, 5.000%, 10/01/22 | | | 5,000,000 | | | | 6,056,500 | |
City Public Service Board of San Antonio TX, Series A, 5.250%, 02/01/24 | | | 2,320,000 | | | | 2,597,820 | |
Cypress-Fairbanks Independent School District, Series C, 5.000%, 02/15/23 | | | 5,000,000 | | | | 6,089,100 | |
The accompanying notes are an integral part of these financial statements.
17
AMG GW&K Municipal Bond Fund
Schedule of Portfolio Investments (continued)
| | | | | | | | |
| | | Principal Amount | | | Value | |
Texas—12.2% (continued) | | | | | | | | |
Houston Combined Utility System Revenue, 1st Lien, Series C, 5.000%, 05/15/21 | | $ | 5,850,000 | | | $ | 6,900,309 | |
North Texas Tollway Authority Revenue, Special Projects System, 1st Tier, Series A, 5.000%, 01/01/25 | | | 5,260,000 | | | | 6,324,729 | |
North Texas Tollway Authority Revenue, Special Projects System, Series D, 5.250%, 09/01/27 | | | 10,165,000 | | | | 12,071,649 | |
San Antonio Electric & Gas Revenue, Series A, 5.250%, 02/01/25 | | | 5,075,000 | | | | 5,681,107 | |
Spring Branch Independent School District, Series A, 5.000%, 02/01/21 | | | 8,650,000 | | | | 10,159,425 | |
Texas State A&M University, Series A, 5.000%, 05/15/22 | | | 5,730,000 | | | | 6,899,378 | |
Texas Transportation Commission Fund, Series A, 5.000%, 04/01/27 | | | 5,000,000 | | | | 5,946,200 | |
Texas Transportation Commission State Highway Fund, Series A, 5.000%, 04/01/23 | | | 5,000,000 | | | | 6,118,850 | |
The University of Texas System Financing Revenue, Series A, 5.000%, 08/15/22 | | | 4,185,000 | | | | 4,797,014 | |
Total Texas | | | | | | | 99,361,304 | |
Virginia—1.9% | | | | | | | | |
Virginia College Building Authority, 21st Century College & Equipment, 5.000%, 02/01/21 | | | 5,000,000 | | | | 5,888,600 | |
Virginia College Building Authority, Series B, 5.000%, 09/01/23 | | | 5,350,000 | | | | 6,568,676 | |
Virginia Public Building Authority, Correctional Facilities Revenue, Series B, 5.000%, 08/01/24 | | | 2,320,000 | | | | 2,629,720 | |
Total Virginia | | | | | | | 15,086,996 | |
Washington—5.8% | | | | | | | | |
City of Seattle WA Municipal Light & Power Revenue, Series A, 5.000%, 02/01/23 | | | 2,175,000 | | | | 2,525,632 | |
City of Seattle WA Municipal Light & Power Revenue, Series B, 5.000%, 02/01/23 | | | 5,565,000 | | | | 6,378,492 | |
Energy Northwest Washington Electric Revenue, Columbia Generating Station, Series A, 5.000%, 07/01/21 | | | 5,035,000 | | | | 5,983,091 | |
King County Sewer Revenue, Series B, 5.000%, 01/01/24 | | | 5,175,000 | | | | 6,042,020 | |
Washington Health Care Facilities Authority Multicare Health System, Series B, 5.000%, 08/15/23 | | | 3,940,000 | | | | 4,736,432 | |
Washington State General Obligation, Miscellaneous Revenue, Series R-2015C, 5.000%, 07/01/21 | | | 5,515,000 | | | | 6,553,474 | |
Washington State General Obligation, Motor Vehicle Fuel Tax, Series C, 5.000%, 02/01/24 | | | 5,335,000 | | | | 6,584,777 | |
Washington State Generation Obligation, Series 2016A, 5.000%, 07/01/21 | | | 7,250,000 | | | | 8,615,175 | |
Total Washington | | | | | | | 47,419,093 | |
Wisconsin—5.8% | | | | | | | | |
Wisconsin State Revenue, Department of Transportation, Series 1, 5.000%, 07/01/21 | | | 5,000,000 | | | | 5,953,150 | |
Wisconsin State Revenue, Department of Transportation, Series 1, 5.000%, 07/01/25 | | | 3,005,000 | | | | 3,645,185 | |
Wisconsin State Revenue, Department of Transportation, Series A, 5.000%, 07/01/22 | | | 9,805,000 | | | | 11,864,736 | |
Wisconsin State Revenue, Department of Transportation, Series A, 5.000%, 07/01/24 | | | 6,085,000 | | | | 7,567,732 | |
Wisconsin State, Series 2, 5.000%, 05/01/24 | | | 3,170,000 | | | | 3,813,161 | |
Wisconsin State, Series 4, 5.000%, 05/01/25 | | | 6,015,000 | | | | 7,461,728 | |
Wisconsin State, Series A, 5.000%, 05/01/23 | | | 6,000,000 | | | | 7,076,400 | |
Total Wisconsin | | | | | | | 47,382,092 | |
Total Municipal Bonds (cost $773,120,864) | | | | | | | 789,252,974 | |
The accompanying notes are an integral part of these financial statements.
18
AMG GW&K Municipal Bond Fund
Schedule of Portfolio Investments (continued)
| | | | | | | | |
| | | Shares | | | Value | |
Other Investment Companies—3.4%5 | | | | | | | | |
Fidelity Institutional Money Market Tax Exempt Portfolio, Institutional Class, 0.01%7 (cost $27,361,706) | | | 27,361,706 | | | $ | 27,361,706 | |
Total Investments—100.6% (cost $800,482,570) | | | | | | | 816,614,680 | |
Other Assets, less Liabilities—(0.6)% | | | | | | | (4,809,147 | ) |
Net Assets—100.0% | | | | | | $ | 811,805,533 | |
The accompanying notes are an integral part of these financial statements.
19
AMG GW&K Municipal Enhanced Yield Fund
Portfolio Manager’s Comments (unaudited)
THE YEAR IN REVIEW
For the year ended December 31, 2015, the AMG GW&K Municipal Enhanced Yield Fund (Institutional Class) (the “Fund”) returned 4.15%, modestly underperforming the Barclays U.S. Municipal Bond BAA Index, which returned 4.25%.
Municipal bonds posted surprisingly strong results late in 2015, defying the broader sell-off in other fixed-income markets. While Treasuries struggled with a U.S. Federal reserve (the “Fed”) that turned decisively toward a year-end rate hike, municipal bonds were boosted by a steep decline in new issue volume, which coincided with a seasonal acceleration in coupon and reinvestment demand. Tax-exempt supply fell -24% from the fourth quarter of last year, driven by a 45% plunge in refunding transactions. The drop-off was a product of the major spike in refinancing activity in the first half of the year when borrowers were looking to get ahead of rising rates. Meanwhile, flows into tax-exempt funds were positive every week of the final quarter of 2015 and surged into year end, a welcome turnaround from the negative flows seen throughout the second and third quarters. These technical dynamics led to steady gains in an environment that was otherwise unfavorable towards bonds.
Recall that early in the fourth quarter of 2015, odds of a year-end rate hike were still under 30% due to slowing employment growth and the Fed’s hesitation to raise rates in the face of “recent global economic and financial developments.” It wasn’t until the October 28 Federal Open Market Committee meeting that sentiment flipped. Although rates were kept unchanged at that meeting, policy makers removed reference to global contagion and put a December lift-off squarely on the table. The following week, payrolls rebounded and the odds shot up to over 70%. When the hike finally came in mid-December, the first in nearly ten years, the market was well prepared and seemed relieved to get the uncertainty out of the way. Short Treasury rates moved higher by 40 basis points over the quarter. The longer end of the Treasury curve was up by half as much, held back by a deepening slump in
commodity prices and the Fed’s emphasis on “gradual” rate increases going forward.
With tax-exempt yields hovering near and even higher than Treasury yields in late September, the stage was set for municipal bonds to outperform heading into year end. In fact, the ten-year municipal/Treasury ratio ended December at 85%, down a full 15 percentage points from October 1, the largest quarterly drop since 2011. Municipal bonds also benefited from a solid fundamental backdrop. State and local revenues continued to strengthen throughout the year, helped by steady employment growth, a surge in personal income tax collections and a recovery in the housing market. The troubles in Puerto Rico, which included the island’s first payment default and endless restructuring talks with creditors, bond insurers and even the U.S. Congress, never spilled over to the general market, unsurprising given the unique nature of the territory’s financial crisis.
For the year, the Fund performed in line with the benchmark. An overweight to longer maturities aided performance as rates declined on the long end. An underweight to zero coupon bonds and bonds that were recently pre-refunded detracted from performance.
Looking ahead, we expect municipals to hold up well in what could be a choppy 2016. The challenges facing the space should be manageable. Pension funding will continue to test the financial discipline of the states, and in places like Illinois and New Jersey, we expect the situations to get worse before they get better. But unfunded liabilities have been on the mend recently and accounting reforms should prove useful in forcing the hands of reluctant officials to move toward better funding schemes. Relative valuations begin the year just below historical averages, but in periods of rising rates we would expect ratios to test their long-term lows. And while the national recovery is now almost seven years in length, most state and local governments have spent that time wisely, reining in spending, paring back debt and building a cushion against any turn in the cycle. Still, with the financial
markets focused on Fed policy, commodity weakness and global turmoil, we can expect volatility to carry over into the New Year. We stand ready to take advantage of any opportunities that emerge, whether related to duration positioning, liquidity disruptions or credit developments.
We enter 2016 with a duration modestly shorter than the benchmark. With inflation expectations near six-year lows and the world finally concerned about the threat of deflation, we could see some near-term opportunities to capture higher yields on even the smallest reversal in sentiment. And yet, waiting around for rates to rise is not a strategy, so we have been careful not to shed too much duration. Also, with liquidity becoming an increasing concern for dealers, regulators and market participants, our long-standing emphasis on large, widely-held credits and our deep experience with trading during all market conditions should give us a welcome edge. The Fund remains well diversified in terms of credit, structure and curve exposure.
This commentary reflects the viewpoints of the GW&K Investment Management, LLC as of December 31, 2015 and is not intended as a forecast or guarantee of future results.
20
AMG GW&K Municipal Enhanced Yield Fund
Portfolio Manager’s Comments (continued)
CUMULATIVE TOTAL RETURN PERFORMANCE
AMG GW&K Municipal Enhanced Yield Fund’s cumulative total return is based on the daily change in net asset value (NAV), and assumes that all dividends and distributions were reinvested. The chart compares a hypothetical $10,000 investment made in AMG GW&K Municipal Enhanced Yield Fund—Institutional Class on December 31, 2005, to a $10,000 investment made in the Barclays U.S. Municipal Bond BAA Index for the same time period. The graph and table do not reflect the deduction of taxes that a shareholder would pay on a Fund distribution or redemption of shares. The listed returns for the Fund are net of expenses and the returns for the index exclude expenses. Total returns would have been lower had certain expenses not been reduced.
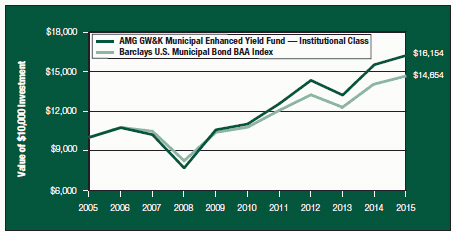
The table below shows the average annual total returns for the AMG GW&K Municipal Enhanced Yield Fund and the Barclays U.S. Municipal Bond BAA Index for the same time periods ended December 31, 2015.
| | | | | | | | | | | | | | | | | | | | |
| Average Annual Total Returns1 | | One
Year | | | Five
Years | | | Ten
Years | | | Since
Inception | | | Inception
Date | |
AMG GW&K Municipal Enhanced Yield
Fund 2,3,4,5,6,7,8,9,10 | | | | | | | | | | | | | | | | | | | | |
Investor Class | | | 3.57 | % | | | 7.50 | % | | | — | | | | 7.92 | % | | | 7/27/09 | |
Service Class | | | 4.07 | % | | | 7.80 | % | | | — | | | | 8.21 | % | | | 7/27/09 | |
Institutional Class | | | 4.15 | % | | | 7.96 | % | | | 4.92 | % | | | 4.92 | % | | | 12/30/05 | |
Barclays U.S. Municipal Bond BAA Index11 | | | 4.25 | % | | | 6.35 | % | | | 3.90 | % | | | 3.90 | % | | | 12/30/05 | † |
The performance data shown represents past performance. Past performance is not a guarantee of future results. Current performance may be lower or higher than the performance data quoted. The investment return and principal value of an investment in the Fund will fluctuate so that an investor’s shares, when redeemed, may be worth more or less than their original cost.
Investors should carefully consider the Fund’s investment objectives, risks, charges and expenses before investing. For performance information through the most recent month end, current net asset values per share for the Fund and other information, please call (800) 835-3879 or visit our website at www.amgfunds.com for a free prospectus. Read it carefully before investing or sending money.
Funds are distributed by AMG Distributors, Inc., member FINRA/SIPC.
| † | Date reflects the inception date of the Fund, not the index. |
| 1 | Total return equals income yield plus share price change and assumes reinvestment of all dividends and capital gain distributions. Returns are net of fees and may reflect offsets of Fund expenses as described in the prospectus. No adjustment has been made for taxes payable by shareholders on their reinvested dividends and capital gain distributions. Returns for periods greater than one year are annualized. The listed returns on the Fund are net of expenses and based on the published NAV as of December 31, 2015. All returns are in U.S. dollars ($). |
| 2 | From time to time, the Fund’s advisor has waived its fees and/or absorbed Fund expenses, which has resulted in higher returns. |
| 3 | The Fund is subject to the risks associated with investments in debt securities, such as default risk and fluctuations in the perception of the debtor’s ability to pay its creditors |
| 4 | Issuer of bonds may not be able to meet interest or principal payments when the bonds come due. |
| 5 | High yield bonds (also known as “junk bonds”) are subject to increased risks such as the risk of default. |
| 6 | The use of leverage in a Fund’s strategy can magnify relatively small market movements into relatively larger losses for the Fund. |
| 7 | Factors unique to the municipal bond market may negatively affect the value in municipal bonds. |
| 8 | Changing interest rates may adversely affect the value of a fixed income investment. An increase in interest rates typically causes the value of bonds and other fixed income securities to fall. |
| 9 | Investment income may be subject to certain state and local taxes, and depending on your tax status, the federal alternative minimum tax. Capital gains are not exempt from federal income tax. |
| 10 | The performance shown includes that of the predecessor Fund, the BNY Hamilton Municipal Enhanced Yield Fund, a series of BNY Hamilton Funds, Inc., which was reorganized into the GW&K Municipal Enhanced Yield Fund, a series of AMG Funds, as of the close of business on November 7, 2008. |
| 11 | The Barclays U.S. Municipal Bond BAA Index is a subset of the Barclays Capital Municipal Bond Index with an index rating of Baa1, Baa2, or Baa3. The Barclays Capital Municipal Bond Index is a rules-based, market-value-weighted index engineered for the long-term, tax-exempt bond market. Unlike the Fund, the Barclays U.S. Municipal Bond Index is unmanaged, is not available for investment and does not incur expenses. |
Not FDIC insured, nor bank guaranteed. May lose value.
21
AMG GW&K Municipal Enhanced Yield Fund
Fund Snapshots (unaudited)
December 31, 2015
PORTFOLIO BREAKDOWN
| | | | |
| | | AMG GW&K Municipal | |
Sector | | Enhanced Yield Fund** | |
Healthcare | | | 30.6 | % |
Transportation | | | 27.5 | % |
Utilities | | | 14.3 | % |
Education | | | 5.9 | % |
Industrial Development | | | 4.9 | % |
State and Non-State Appropriated Tobacco | | | 4.5 | % |
Tax | | | 4.3 | % |
General Obligation | | | 3.0 | % |
Other | | | 2.2 | % |
Public Services | | | 1.5 | % |
Cash | | | 0.2 | % |
Other Assets and Liabilities | | | 1.1 | % |
| ** | As a percentage of net assets. |
| | | | |
| | | AMG GW&K Municipal | |
Rating | | Enhanced Yield Fund*** | |
Aa | | | 6.6 | % |
A | | | 45.6 | % |
BBB | | | 47.8 | % |
| *** | As a percentage of market value of fixed-income securities. |
TOP TEN HOLDINGS
| | | | |
| | | % of | |
Security Name | | Net Assets | |
Massachusetts Development Finance Agency, Lahey Clinic Obligations, Series F, 5.000%, 08/15/45 | | | 3.7 | % |
Central Texas Turnpike System, Series C, 5.000%, 08/15/42* | | | 3.3 | |
New Jersey Turnpike Authority, Series E. 5.000%, 01/01/45 | | | 3.0 | |
Louisiana Local Government Environmental Facilities and Community Development Authority Hospital Revenue, Series 2010 A, 5.880%, 10/01/40* | | | 2.6 | |
Atlanta Water & Wastewater Revenue, 5.000%, 11/01/40 | | | 2.6 | |
Miami Beach Health Facilities Authority, Mt. Sinai Medical Center, 5.000%, 11/15/39* | | | 2.5 | |
Wisconsin Health & Educational Facilities Authority, ProHealth Care Obligation Group, 5.000%, 08/15/39 | | | 2.5 | |
Pennsylvania Economic Development Financing Authority, PA Bridges FINCO LP, 5.000%, 06/30/42* | | | 2.5 | |
Metropolitan Transportation Authority, 5.000%, 11/15/40 | | | 2.5 | |
University of Kansas Hospital Authority, Kansas University Health System, 5.000%, 09/01/45 | | | 2.4 | |
| | | | |
Top Ten as a Group | | | 27.6 | % |
| | | | |
| * | Top Ten Holdings as of June 30, 2015. |
Credit quality ratings shown above reflect the highest rating assigned by either Standard & Poor’s (“S&P”) or Moody’s Investors Service, Inc. (“Moody’s”). These rating agencies are independent, nationally recognized statistical rating organizations and are widely used. Investment grade ratings are credit ratings of BBB/Baa or higher. Below investment grade ratings are credit ratings of BB/Ba or lower. Investments designated N/R are not rated by either rating agency. Unrated investments do not necessarily indicate low credit quality. Credit quality ratings are subject to change.
Because a fund’s strategy may result in multiple investments in particular sectors of the economy, its performance may depend on the performance of those sectors and may fluctuate more widely than investments diversified across more sectors. For additional information on these and other risk considerations, please see the Fund’s prospectus.
Any sectors, industries, or securities discussed should not be perceived as investment recommendations. Mention of a specific security should not be considered a recommendation to buy or solicitation to sell that security. Specific securities mentioned in this report may have been sold from the Fund’s portfolio of investments by the time you receive this report.
22
AMG GW&K Municipal Enhanced Yield Fund
Fund Snapshots (continued)
December 31, 2015
STATE BREAKDOWN
| | | | |
| | | % of | |
State | | Net Assets | |
Texas | | | 13.3 | % |
Illinois | | | 12.2 | % |
New Jersey | | | 10.6 | % |
Florida | | | 8.4 | % |
New York | | | 6.6 | % |
Massachusetts | | | 5.5 | % |
Louisiana | | | 4.6 | % |
Pennsylvania | | | 4.5 | % |
District of Columbia | | | 4.3 | % |
Michigan | | | 2.7 | % |
Georgia | | | 2.6 | % |
Wisconsin | | | 2.5 | % |
Kansas | | | 2.4 | % |
West Virginia | | | 2.4 | % |
| | | | |
| | | % of | |
State | | Net Assets | |
Rhode Island | | | 2.4 | % |
Nebraska | | | 2.3 | % |
California | | | 2.2 | % |
Colorado | | | 2.2 | % |
Kentucky | | | 2.0 | % |
Virginia | | | 1.8 | % |
New Hampshire | | | 1.8 | % |
Tennessee | | | 1.2 | % |
Other Assets and Liabilities | | | 1.5 | % |
| | | | |
| | | 100 | % |
| | | | |
23
AMG GW&K Municipal Enhanced Yield Fund
Schedule of Portfolio Investments
December 31, 2015
| | | | | | | | |
| | | Principal Amount | | | Value | |
Municipal Bonds—98.5% | | | | | | | | |
California—2.2% | | | | | | | | |
M-S-R Energy Authority, Natural Gas Revenue, Series C, 6.500%, 11/01/39 | | $ | 3,635,000 | | | $ | 5,106,557 | |
Colorado—2.2% | | | | | | | | |
Public Authority for Colorado Energy Natural Gas Purchase Revenue, Series 2008, 6.500%, 11/15/38 | | | 3,760,000 | | | | 5,069,871 | |
District of Columbia—4.3% | | | | | | | | |
District of Columbia Hospital Revenue, Children’s Hospital, 5.000%, 07/15/44 | | | 5,000,000 | | | | 5,674,750 | |
Metropolitan Washington Airports Authority Dulles Toll Road Revenue, Dulles Metrorail and Capital Improvement Project, Series A, 5.000%, 10/01/53 | | | 4,195,000 | | | | 4,483,952 | |
Total District of Columbia | | | | | | | 10,158,702 | |
Florida—8.4% | | | | | | | | |
Alachua County Health Facilities Authority, Shands Teaching Hospital & Clinics, 5.000%, 12/01/44 | | | 5,075,000 | | | | 5,583,515 | |
Martin County Health Facilities Authority, Martin Memorial Medical Center, 5.500%, 11/15/42 | | | 4,410,000 | | | | 4,883,149 | |
Miami Beach Health Facilities Authority, Mt. Sinai Medical Center, 5.000%, 11/15/39 | | | 5,355,000 | | | | 5,859,548 | |
Tampa Revenue, University of Tampa, 5.000%, 04/01/45 | | | 3,000,000 | | | | 3,241,620 | |
Total Florida | | | | | | | 19,567,832 | |
Georgia—2.6% | | | | | | | | |
Atlanta Water & Wastewater Revenue, 5.000%, 11/01/40 | | | 5,245,000 | | | | 6,064,426 | |
Illinois—12.2% | | | | | | | | |
Chicago O’Hare International Airport, Series C, 5.000%, 01/01/46 | | | 2,250,000 | | | | 2,446,763 | |
Chicago O’Hare International Airport, Series D, 5.000%, 01/01/46 | | | 3,820,000 | | | | 4,242,950 | |
Illinois State General Obligation, 5.000%, 02/01/39 | | | 3,740,000 | | | | 3,911,591 | |
Illinois State General Obligation, 5.500%, 07/01/38 | | | 2,785,000 | | | | 3,015,487 | |
Metropolitan Pier and Exposition Authority Revenue, McCormick Place Expansion Project, Series 2012 A, 5.000%, 06/15/42 | | | 4,785,000 | | | | 4,979,797 | |
Metropolitan Pier and Exposition Authority Revenue, McCormick Place Expansion Project, Series B, 5.000%, 06/15/52 | | | 4,865,000 | | | | 5,027,053 | |
Railsplitter Tobacco Settlement Authority Revenue, 6.000%, 06/01/28 | | | 4,150,000 | | | | 4,905,010 | |
Total Illinois | | | | | | | 28,528,651 | |
Kansas—2.4% | | | | | | | | |
University of Kansas Hospital Authority, Kansas University Health System, 5.000%, 09/01/45 | | | 5,080,000 | | | | 5,721,553 | |
Kentucky—2.0% | | | | | | | | |
Kentucky Economic Development Finance Authority, Telecommunications Revenue, 5.000%, 07/01/40 | | | 1,250,000 | | | | 1,349,912 | |
Kentucky Economic Development Finance Authority, Telecommunications Revenue, 5.000%, 01/01/45 | | | 3,085,000 | | | | 3,313,938 | |
Total Kentucky | | | | | | | 4,663,850 | |
Louisiana—4.6% | | | | | | | | |
Louisiana Local Government Environmental Facilities and Community Development Authority Hospital Revenue, Series 2010 A, 5.875%, 10/01/40 | | | 5,260,000 | | | | 6,117,012 | |
Louisiana Public Facilities Authority, Ochsner Clinic Foundation Project, 5.000%, 05/15/47 | | | 4,235,000 | | | | 4,552,413 | |
Total Louisiana | | | | | | | 10,669,425 | |
Massachusetts—5.5% | | | | | | | | |
Massachusetts Development Finance Agency, Lahey Clinic Obligations, Series F, 5.000%, 08/15/45 | | | 7,735,000 | | | | 8,755,479 | |
The accompanying notes are an integral part of these financial statements.
24
AMG GW&K Municipal Enhanced Yield Fund
Schedule of Portfolio Investments (continued)
| | | | | | | | |
| | | Principal Amount | | | Value | |
Massachusetts—5.5% (continued) | | | | | | | | |
Massachusetts Health and Educational Facilities Authority Revenue, Suffolk University, Series 2009 A, 5.750%, 07/01/39 | | $ | 3,760,000 | | | $ | 4,177,473 | |
Total Massachusetts | | | | | | | 12,932,952 | |
Michigan—2.7% | | | | | | | | |
Michigan State Building Authority Revenue, Facilities Program, Series I, 5.000%, 10/15/45 | | | 3,000,000 | | | | 3,409,590 | |
Michigan State Hospital Finance Authority Revenue, Henry Ford Health System, Series 2009, 5.750%, 11/15/39 | | | 2,495,000 | | | | 2,838,686 | |
Total Michigan | | | | | | | 6,248,276 | |
Nebraska—2.3% | | | | | | | | |
Central Plains Energy Project, Natural Gas Revenue, 5.000%, 09/01/42 | | | 5,010,000 | | | | 5,396,872 | |
New Hampshire—1.8% | | | | | | | | |
New Hampshire Health and Education Facilities Authority, Southern New Hampshire University, 5.000%, 01/01/42 | | | 4,000,000 | | | | 4,152,800 | |
New Jersey—10.6% | | | | | | | | |
New Jersey Economic Development Authority, School Improvements Revenue, Series WW, 5.250%, 06/15/40 | | | 2,000,000 | | | | 2,083,040 | |
New Jersey Economic Development Authority, Tobacco and Liquor Tax Revenue, 5.000%, 06/15/28 | | | 1,020,000 | | | | 1,087,534 | |
New Jersey Economic Development Authority, Tobacco and Liquor Tax Revenue, 5.000%, 06/15/29 | | | 1,000,000 | | | | 1,060,930 | |
New Jersey Economic Development Authority, UMM Energy Partners, Series 2012 A, 5.125%, 06/15/43 | | | 4,450,000 | | | | 4,672,411 | |
New Jersey Health Care Facilities Financing Authority Revenue and Refunding, Barnabas Health Issue, Series 2011 A, 5.625%, 07/01/32 | | | 2,000,000 | | | | 2,325,220 | |
New Jersey Transportation Trust Fund Authority, Series A, 5.000%, 06/15/42 | | | 3,275,000 | | | | 3,427,091 | |
New Jersey Transportation Trust Fund Authority, Series AA, 5.000%, 06/15/45 | | | 1,700,000 | | | | 1,775,395 | |
New Jersey Transportation Trust Fund Authority, Series AA, 5.250%, 06/15/41 | | | 1,250,000 | | | | 1,344,338 | |
New Jersey Turnpike Authority, Series E, 5.000%, 01/01/45 | | | 6,205,000 | | | | 7,034,981 | |
Total New Jersey | | | | | | | 24,810,940 | |
New York—6.6% | | | | | | | | |
Long Island Power Authority, Electric Light & Power Improvements, Series A, 5.000%, 09/01/44 | | | 2,820,000 | | | | 3,173,656 | |
Long Island Power Authority, Series B, 5.000%, 09/01/45 | | | 4,210,000 | | | | 4,760,163 | |
Metropolitan Transportation Authority, 5.000%, 11/15/40 | | | 5,000,000 | | | | 5,727,050 | |
Port Authority of New York and New Jersey Special Project, JFK International Air Terminal LLC Project, Series 2010, 6.000%, 12/01/42 | | | 1,565,000 | | | | 1,823,303 | |
Total New York | | | | | | | 15,484,172 | |
Pennsylvania—4.5% | | | | | | | | |
Lycoming County Authority Health System Revenue, Susquehanna Health System Project, Series 2009 A, 5.750%, 07/01/39 | | | 4,330,000 | | | | 4,675,144 | |
Pennsylvania Economic Development Financing Authority, PA Bridges FINCO LP, 5.000%, 06/30/42 | | | 5,250,000 | | | | 5,733,578 | |
Total Pennsylvania | | | | | | | 10,408,722 | |
Rhode Island—2.4% | | | | | | | | |
Tobacco Settlement Financing Corp., Series A, 5.000%, 06/01/35 | | | 2,000,000 | | | | 2,123,160 | |
Tobacco Settlement Financing Corp., Series A, 5.000%, 06/01/40 | | | 3,325,000 | | | | 3,477,119 | |
Total Rhode Island | | | | | | | 5,600,279 | |
Tennessee—1.2% | | | | | | | | |
Chattanooga-Hamilton County Hospital Authority, 5.000%, 10/01/44 | | | 2,675,000 | | | | 2,876,561 | |
The accompanying notes are an integral part of these financial statements.
25
AMG GW&K Municipal Enhanced Yield Fund
Schedule of Portfolio Investments (continued)
| | | | | | | | |
| | | Principal Amount | | | Value | |
Texas—13.3% | | | | | | | | |
Central Texas Regional Mobility Authority Senior Lien Revenue, Series 2011, 6.000%, 01/01/41 | | $ | 3,505,000 | | | $ | 4,083,851 | |
Central Texas Regional Mobility Authority Senior Lien Revenue, Series A, 5.000%, 01/01/43 | | | 1,500,000 | | | | 1,612,380 | |
Central Texas Turnpike System, Series C, 5.000%, 08/15/42 | | | 7,000,000 | | | | 7,785,330 | |
Grand Parkway Transportation Corp. 1st Tier Toll Revenue, Series A, 5.500%, 04/01/53 | | | 3,780,000 | | | | 4,156,450 | |
New Hope Cultural Education Facilities Corp., College Station Project, Series A, 5.000%, 07/01/47 | | | 4,950,000 | | | | 5,104,638 | |
North Texas Tollway Authority, Highway Tolls Revenue, Series B, 5.000%, 01/01/40 | | | 3,900,000 | | | | 4,349,280 | |
Texas Municipal Gas Acquisition & Supply Corp. Gas Supply Revenue, Senior Lien Series 2008 D, 6.250%, 12/15/26 | | | 3,130,000 | | | | 3,861,825 | |
Total Texas | | | | | | | 30,953,754 | |
Virginia—1.8% | | | | | | | | |
Chesapeake City Expressway Toll Road Revenue, Series 2012 A, 5.000%, 07/15/47 | | | 4,000,000 | | | | 4,253,640 | |
West Virginia—2.4% | | | | | | | | |
West Virginia Hospital Finance Authority, West Virginia United Health Systems Obligation Group, Series A, 5.500%, 06/01/44 | | | 5,000,000 | | | | 5,667,950 | |
Wisconsin—2.5% | | | | | | | | |
Wisconsin Health & Educational Facilities Authority, ProHealth Care Obligation Group, 5.000%, 08/15/39 | | | 5,240,000 | | | | 5,826,670 | |
Total Municipal Bonds (cost $221,619,753) | | | | | | | 230,164,455 | |
| | |
| | | Shares | | | | |
Other Investment Companies—0.3%5 | | | | | | | | |
Fidelity Institutional Money Market Tax Exempt Portfolio, Institutional Class, 0.01%
(cost $549,037) | | | 549,037 | | | | 549,037 | |
Total Investments—98.8% (cost $222,168,790) | | | | | | | 230,713,492 | |
Other Assets, less Liabilities—1.2% | | | | | | | 2,879,232 | |
Net Assets—100.0% | | | | | | $ | 233,592,724 | |
The accompanying notes are an integral part of these financial statements.
26
AMG GW&K Small Cap Core Fund
Portfolio Manager’s Comments (unaudited)
THE YEAR IN REVIEW
For the year ended December 31, 2015, the AMG GW&K Small Cap Core Fund (Investor Class) (the “Fund”) returned (3.02)%, outperforming the Russell 2000® Index, which returned (4.41)%.
It is hard to determine what Americans wasted more time contemplating in 2015: 1) the potential improper inflation of footballs, 2) the presidential prospects of Donald Trump, or 3) whether the U.S. Federal Reserve (the “Fed”) would raise the fed funds rate target. While the final outcomes for items one and two have amazingly still not been resolved, we can at least stop debating whether the Fed will begin normalizing monetary policy. The investment community’s hyper-focus on the Fed and potential lift-off had a widespread impact on the results of many asset classes. Treasury rates in general climbed during 2015, as did the U.S. Dollar (USD). Commodities dropped and financial conditions tightened a bit in asset classes like Emerging Markets and U.S. High Yield. While the potential for a higher U.S. fed funds rate of course wasn’t responsible alone for all the asset class results referenced here, the persistent focus on it in the investment world certainly played a factor. This constriction was also felt in the U.S. small-cap market, as evidenced by the disappointing (4.41)% return from the Russell 2000® Index for the year. The fourth quarter performance helped to somewhat reduce the damage, with a 3.59% increase. During the course of the calendar year, small caps experienced lower sales and earnings growth than previously expected. Top- and bottom-line growth was closer to low-single-digit growth instead of high-single-digit or low-double-digit expectations to start the year. While growth in the U.S. was slow and steady in many sectors, companies with exposure to export markets (higher USD, slower demand growth) and commodity prices or energy infrastructure saw much greater sales and earnings pressure. This left small-cap investors looking for a place to hide, generating narrow stock market performance and some periods of high volatility. Volatility spiked in late summer, as investors questioned some of the more crowded investment theses. We
will get more into what 2016 might hold for U.S. small-cap investors in the conclusion, but unfortunately,
like the inflation of footballs and hot air coming from Donald Trump, we don’t see an immediate and clean ending to the story line over the next few months.
To help explain how the year progressed for U.S. small-cap investors, it might be best to start with the sector that created some of the biggest headlines: health care. In particular, the biotech and pharmaceutical industries have led the market for several years now. Biopharma as a group is somewhat sheltered to all the earnings bogeymen we worried about in 2015. They are nearly completely uncorrelated with currency strength or weakness in Emerging Markets or commodities. In fact, the vast majority of these stocks in the U.S. small-cap universe have no earnings and no prospect for earnings over the next several years. Combine this with a more accommodative FDA, Obamacare, a good pricing backdrop and a strong funding environment (aided by low rates), and investors became very enamored with these stocks and their long-term potential. Biotech on its own (at +6% of the benchmark) accounted for over one third of the Index performance in the first half of the year. In the third quarter, this narrow momentum group collapsed over 23%, driven lower by political rhetoric concerning drug inflation, the woes of Valeant and the weight of the group’s vertical ascension. The biopharma space rebounded in the fourth quarter somewhat to finish the year ahead of the benchmark once again, but it is fair to say the cracks in the foundation are now visible. We expect more volatility and weakness in the group, particularly the more speculative names, as we progress through 2016.
Information technology and utilities were other solid performers in the Index for 2015. While investors were attracted to the yield and low-earnings volatility in utilities, they also bid up prices in software, services and semiconductor industries within technology. The strength in health care and information technology helped push the Russell 2000® Growth Index ahead of Russell 2000® Value Index by 600 basis points during the year. The three-year cumulative advantage for the Russell 2000® Growth Index is now at 500 basis points annualized, as investors have sought out dependable earnings growth in a shifting global
macro environment and underachieving cyclical growth. While we have expected this to shift, we have thus far been early in this prediction. On the negative side of sector Russell 2000® Growth Index performance, energy continued to be a falling knife, losing (39.3)% for the year. The forces of supply (excessive) and demand (anemic) continued to pressure prices of both oil and natural gas, although this price mechanism will eventually correct matters. We think we will see a change in perception in these markets in 2016, with greater price stability a result. Price weakness also manifested itself in the consumer discretionary, industrials and materials sectors in 2015, although the first two groups acted a bit better in the quarter. Looking at small-cap index style factors, investors clearly flirted with lower-quality stocks in the quarter, although higher-quality stocks outperformed over the full year. A mirror image of the performance of the biopharma group, high quality stocks were only in favor in the third quarter, but the powerful impact in this quarter outweighed the other three quarters, combined.
The relative performance of the Fund reflected this swing in quality preference, as it outperformed for the year but lagged later in the year when low quality outperformed. For 2015, the higher quality environment for small cap stocks likely aided our relative results by 80-85 basis points, with stock selection driving the remaining outperformance. Energy and information technology were our two best performing sectors. While the Index portion of information technology was up about 3%, our Fund held four stocks that were up over 35% and another that was up nearly 20%. In energy, the Fund was down just over half as much as the Index, helped mainly by our lone E&P holding. This Permian and Eagle Ford Basin-focused producer declined only (2)% compared to the (39.3)% drop in the sector due to a solid balance sheet and good execution. The industrials sector was another positive contributor, as domestic-focused companies offset those with greater international exposure. Financials and health care were our weaker relative performers for the year. In health care, it will be no surprise that the biopharma groups featured prominently, while three holdings
AMG GW&K Small Cap Core Fund
Portfolio Manager’s Comments (continued)
also contributed to the woes. However, these were offset by good selection as well, and our allocation within the sector accounted for the weaker results. In financials, our stock selection in the bank, capital markets and REITs industries was subpar. Fortunately, this was partially made up for by three great performers among the insurance and diversified holdings of the Fund. This is a sector we look to improve upon in 2016.
We started 2015 with expectations for an improving domestic macro-economic environment and small-cap earnings growth in the high single-digit neighborhood. While we didn’t see a lot of potential for valuation improvement, we thought multiples were reasonable given the interest rate, inflation and earnings backdrop. We also laughed upon hearing of a potential Trump presidential run, assuming it was either a publicity stunt or would end in a dramatic flameout. The New England Patriots football deflation story also sounded rather absurd and we assumed it would end within a news cycle. So our record last year was far from perfect, to say the least. This year, we are assuming mid-single-digit earnings growth as some of the USD strength cycles through and commodity-oriented sectors become less bad, especially in the second half of the year. Employment growth in the U.S. remains very good and our belief is that the consumer is healthy and the pace of household formation is improving. Since the small-cap market went down a bit over the last 12 months, valuations are about the same, if not a touch better, at 17-18 times earnings. The negatives to watch include some weak signals within the transport markets, the growth path for China and other emerging economies and how capital markets respond to the likely continuation of Fed policy actions. While the narrow market performance in the first half of 2015 has corrected somewhat, it may not be complete and corrections can become overly harsh. We will hopefully utilize these opportunities as they materialize, and reposition the Fund to seek to maximize the three-to-five year capital appreciation potential. While we may be early in our analysis, see Trump and the footballs, we believe our long-term disciplined approach will continue to deliver good relative performance.
This commentary reflects the viewpoints of GW&K Investment Management, LLC as of December 31,
2015 and is not intended as a forecast or guarantee of future results.
AMG GW&K Small Cap Core Fund
Portfolio Manager’s Comments (continued)
CUMULATIVE TOTAL RETURN PERFORMANCE
AMG GW&K Small Cap Core Fund’s cumulative total return is based on the daily change in net asset value (NAV) and assumes that all dividends and distributions were reinvested. The chart compares a hypothetical $10,000 investment made in AMG GW&K Small Cap Core Fund—Investor Class on December 31, 2005, to a $10,000 investment made in the Russell 2000® Index for the same time period. The graph and table do not reflect the deduction of taxes that a shareholder would pay on a Fund distribution or redemption of shares. The listed returns for the Fund are net of expenses and the returns for the index exclude expenses. Total returns would have been lower had certain expenses not been reduced.
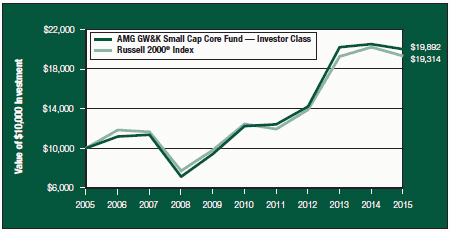
The table below shows the average annual total returns for the AMG GW&K Small Cap Core Fund and the Russell 2000® Index for the same time periods ended December 31, 2015.
| | | | | | | | | | | | | | | | | | | | |
| | | One | | | Five | | | Ten | | | Since | | | Inception | |
| Average Annual Total Returns1 | | Year | | | Years | | | Years | | | Inception | | | date | |
AMG GW&K Small Cap Core Fund 2,3,4 | | | | | | | | | | | | | | | | | | | | |
Investor Class | | | (3.02 | )% | | | 10.22 | % | | | 7.12 | % | | | 7.58 | % | | | 12/10/96 | |
Service Class | | | (2.75 | )% | | | 10.48 | % | | | — | | | | 14.81 | % | | | 7/27/09 | |
Institutional Class | | | (2.63 | )% | | | 10.70 | % | | | — | | | | 15.02 | % | | | 7/27/09 | |
Russell 2000® Index5 | | | (4.41 | )% | | | 9.19 | % | | | 6.80 | % | | | 7.60 | % | | | 12/10/96 | † |
The performance data shown represents past performance. Past performance is not a guarantee of future results. Current performance may be lower or higher than the performance data quoted. The investment return and principal value of an investment in the Fund will fluctuate so that an investor’s shares, when redeemed, may be worth more or less than their original cost.
Investors should carefully consider the Fund’s investment objectives, risks, charges and expenses before investing. For performance information through the most recent month end, current net asset values per share for the Fund and other information, please call (800) 835-3879 or visit our website at www.amgfunds.com for a free prospectus. Read it carefully before investing or sending money.
Funds are distributed by AMG Distributors, Inc., member FINRA/SIPC.
| † | Date reflects the inception date of the Fund, not the index. |
| 1 | Total return equals income yield plus share price change and assumes reinvestment of all dividends and capital gain distributions. Returns are net of fees and may reflect offsets of Fund expenses as described in the prospectus. No adjustment has been made for taxes payable by shareholders on their reinvested dividends and capital gain distributions. Returns for periods greater than one year are annualized. The listed returns on the Fund are net of expenses and based on the published NAV as of December 31, 2015. All returns are in U.S. dollars ($). |
| 2 | From time to time, the Fund’s advisor has waived its fees and/or absorbed Fund expenses, which has resulted in higher returns. |
| 3 | The Fund inception dates and returns for all periods beginning prior to November 7, 2008 reflects performance of the predecessor Fund, The BNY Hamilton Multi-Cap Equity Fund, a series of BNY Hamilton Funds, Inc. |
| 4 | The Fund is subject to risks associated with investments in small-capitalization companies, such as erratic earnings patterns, competitive conditions, limited earnings history, and a reliance on one or a limited number of products. |
| 5 | The Russell 2000® Index is composed of the 2,000 smallest stocks in the Russell 3000® Index and is widely regarded in the industry as the premier measure of small-cap stock performance. The Russell 3000® Index is composed of the 3,000 largest U.S. companies as measured by market capitalization, and represents about 98% of the U.S. stock market. The Russell 2000® Index and the Russell 3000® Index are unmanaged, are not available for investment, and do not incur expenses. |
The Russell Indices are trademarks of the London Stock Exchange Group companies.
Not FDIC insured, nor bank guaranteed. May lose value.
29
AMG GW&K Small Cap Core Fund
Fund Snapshots (unaudited)
December 31, 2015
PORTFOLIO BREAKDOWN
| | | | | | | | |
Sector | | AMG GW&K Small
Cap Core Fund** | | | Russell 2000®
Index | |
Financials | | | 22.3 | % | | | 25.6 | % |
Information Technology | | | 18.0 | % | | | 18.0 | % |
Industrials | | | 16.4 | % | | | 12.1 | % |
Health Care | | | 15.4 | % | | | 16.5 | % |
Consumer Discretionary | | | 13.8 | % | | | 13.5 | % |
Materials | | | 4.7 | % | | | 3.6 | % |
Utilities | | | 2.7 | % | | | 3.7 | % |
Energy | | | 2.7 | % | | | 2.8 | % |
Consumer Staples | | | 1.3 | % | | | 3.4 | % |
Telecommunication Services | | | 0.0 | % | | | 0.8 | % |
Other Assets and Liabilities | | | 2.7 | % | | | 0.0 | % |
| ** | As a percentage of net assets. |
TOP TEN HOLDINGS
| | | | |
| | | % of | |
Security Name | | Net Assets | |
MarketAxess Holdings, Inc.* | | | 2.7 | % |
Tyler Technologies, Inc.* | | | 2.5 | |
West Pharmaceutical Services, Inc.* | | | 2.3 | |
Grand Canyon Education, Inc.* | | | 2.1 | |
Texas Roadhouse, Inc.* | | | 2.1 | |
ICU Medical, Inc. | | | 2.0 | |
Blackbaud, Inc. | | | 1.9 | |
FEI Co.* | | | 1.9 | |
NorthWestern Corp. | | | 1.8 | |
Lithia Motors, Inc., Class A* | | | 1.8 | |
| | | | |
Top Ten as a Group | | | 21.1 | % |
| | | | |
| * | Top Ten Holdings as of June 30, 2015. |
Because a fund’s strategy may result in multiple investments in particular sectors of the economy, its performance may depend on the performance of those sectors and may fluctuate more widely than investments diversified across more sectors. For additional information on these and other risk considerations, please see the Fund’s prospectus.
Any sectors, industries, or securities discussed should not be perceived as investment recommendations. Mention of a specific security should not be considered a recommendation to buy or solicitation to sell that security. Specific securities mentioned in this report may have been sold from the Fund’s portfolio of investments by the time you receive this report.
30
AMG GW&K Small Cap Core Fund
Schedule of Portfolio Investments
December 31, 2015
| | | | | | | | |
| | | Shares | | | Value | |
Common Stocks—97.3% | | | | | | | | |
Consumer Discretionary—13.8% | | | | | | | | |
CalAtlantic Group, Inc. | | | 145,747 | | | $ | 5,526,726 | |
Five Below, Inc.*,2 | | | 132,530 | | | | 4,254,213 | |
Grand Canyon Education, Inc.* | | | 200,055 | | | | 8,026,207 | |
Hibbett Sports, Inc.*,2 | | | 102,800 | | | | 3,108,672 | |
Lithia Motors, Inc., Class A | | | 64,245 | | | | 6,853,014 | |
Monro Muffler Brake, Inc. | | | 47,425 | | | | 3,140,483 | |
Oxford Industries, Inc. | | | 67,779 | | | | 4,325,656 | |
Pier 1 Imports, Inc.2 | | | 183,650 | | | | 934,778 | |
Texas Roadhouse, Inc. | | | 220,960 | | | | 7,903,739 | |
Tumi Holdings, Inc.* | | | 234,781 | | | | 3,904,408 | |
Tupperware Brands Corp.2 | | | 68,872 | | | | 3,832,727 | |
Total Consumer Discretionary | | | | | | | 51,810,623 | |
Consumer Staples—1.3% | | | | | | | | |
WD-40 Co. | | | 47,596 | | | | 4,695,345 | |
Energy—2.7% | | | | | | | | |
Dril-Quip, Inc.* | | | 56,056 | | | | 3,320,197 | |
Forum Energy Technologies, Inc.*,2 | | | 194,049 | | | | 2,417,851 | |
Matador Resources Co.*,2 | | | 218,448 | | | | 4,318,717 | |
Total Energy | | | | | | | 10,056,765 | |
Financials—22.3% | | | | | | | | |
American Campus Communities, Inc. | | | 106,215 | | | | 4,390,928 | |
AMERISAFE, Inc. | | | 85,751 | | | | 4,364,726 | |
Cathay General Bancorp | | | 159,020 | | | | 4,982,097 | |
Cohen & Steers, Inc. | | | 131,655 | | | | 4,012,844 | |
Education Realty Trust, Inc. | | | 151,597 | | | | 5,742,494 | |
Glacier Bancorp, Inc. | | | 225,890 | | | | 5,992,862 | |
Iberiabank Corp. | | | 63,087 | | | | 3,474,201 | |
MarketAxess Holdings, Inc. | | | 89,061 | | | | 9,938,317 | |
National Health Investors, Inc. | | | 75,485 | | | | 4,594,772 | |
Pebblebrook Hotel Trust | | | 116,073 | | | | 3,252,365 | |
PRA Group, Inc.* | | | 120,579 | | | | 4,182,886 | |
ProAssurance Corp. | | | 102,880 | | | | 4,992,766 | |
STAG Industrial, Inc. | | | 219,105 | | | | 4,042,487 | |
Stifel Financial Corp.* | | | 127,340 | | | | 5,394,122 | |
Sun Communities, Inc. | | | 75,300 | | | | 5,160,309 | |
Texas Capital Bancshares, Inc.* | | | 101,785 | | | | 5,030,215 | |
| | | | | | | | |
| | | Shares | | | Value | |
Webster Financial Corp. | | | 113,310 | | | $ | 4,213,999 | |
Total Financials | | | | | | | 83,762,390 | |
Health Care—15.4% | | | | | | | | |
Air Methods Corp.* | | | 79,920 | | | | 3,351,046 | |
Analogic Corp. | | | 49,224 | | | | 4,065,902 | |
Cantel Medical Corp. | | | 75,702 | | | | 4,704,122 | |
Catalent, Inc.* | | | 179,934 | | | | 4,503,748 | |
Diplomat Pharmacy, Inc.*,2 | | | 142,349 | | | | 4,871,183 | |
Globus Medical, Inc., Class A* | | | 216,501 | | | | 6,023,058 | |
ICU Medical, Inc.* | | | 65,225 | | | | 7,356,075 | |
Medidata Solutions, Inc.* | | | 108,595 | | | | 5,352,648 | |
Team Health Holdings, Inc.* | | | 101,831 | | | | 4,469,363 | |
West Pharmaceutical Services, Inc. | | | 143,960 | | | | 8,669,271 | |
Wright Medical Group, Inc* | | | 185,440 | | | | 4,483,939 | |
Total Health Care | | | | | | | 57,850,355 | |
Industrials—16.4% | | | | | | | | |
CEB, Inc. | | | 89,477 | | | | 5,492,993 | |
CLARCOR, Inc. | | | 95,004 | | | | 4,719,799 | |
Healthcare Services Group, Inc. | | | 155,625 | | | | 5,426,644 | |
Heartland Express, Inc.2 | | | 277,240 | | | | 4,718,625 | |
HEICO Corp. | | | 76,296 | | | | 4,147,451 | |
HEICO Corp., Class A | | | 27,799 | | | | 1,367,711 | |
Mobile Mini, Inc. | | | 114,470 | | | | 3,563,451 | |
Primoris Services Corp. | | | 209,127 | | | | 4,607,068 | |
Proto Labs, Inc.*,2 | | | 70,533 | | | | 4,492,247 | |
RBC Bearings, Inc.* | | | 57,042 | | | | 3,684,343 | |
Ritchie Bros. Auctioneers, Inc.2 | | | 208,361 | | | | 5,023,584 | |
The Toro Co. | | | 88,293 | | | | 6,451,570 | |
Universal Forest Products, Inc. | | | 71,680 | | | | 4,900,762 | |
US Ecology, Inc. | | | 77,385 | | | | 2,819,909 | |
Total Industrials | | | | | | | 61,416,157 | |
Information Technology—18.0% | | | | | | | | |
Aspen Technology, Inc.* | | | 99,260 | | | | 3,748,058 | |
Blackbaud, Inc. | | | 107,733 | | | | 7,095,295 | |
Cardtronics, Inc.* | | | 101,845 | | | | 3,427,084 | |
Cavium, Inc.* | | | 89,885 | | | | 5,906,343 | |
Cognex Corp. | | | 171,270 | | | | 5,783,788 | |
EPAM Systems, Inc.* | | | 72,775 | | | | 5,721,570 | |
The accompanying notes are an integral part of these financial statements.
31
AMG GW&K Small Cap Core Fund
Schedule of Portfolio Investments (continued)
| | | | | | | | |
| | | Shares | | | Value | |
Information Technology—18.0% (continued) | | | | | | | | |
FEI Co. | | | 88,569 | | | $ | 7,066,920 | |
LogMeln, Inc.* | | | 81,281 | | | | 5,453,955 | |
Power Integrations, Inc. | | | 99,733 | | | | 4,850,016 | |
Rofin-Sinar Technologies, Inc.* | | | 101,782 | | | | 2,725,722 | |
SciQuest, Inc.* | | | 153,250 | | | | 1,987,652 | |
Solera Holdings, Inc. | | | 76,066 | | | | 4,170,699 | |
Tyler Technologies, Inc.* | | | 54,331 | | | | 9,470,980 | |
Total Information Technology | | | | | | | 67,408,082 | |
Materials—4.7% | | | | | | | | |
Balchem Corp. | | | 66,285 | | | | 4,030,128 | |
Compass Minerals International, Inc. | | | 44,154 | | | | 3,323,472 | |
Flotek Industries, Inc.*,2 | | | 190,837 | | | | 2,183,175 | |
KapStone Paper and Packaging Corp. | | | 175,040 | | | | 3,954,154 | |
Silgan Holdings, Inc. | | | 73,308 | | | | 3,938,106 | |
Total Materials | | | | | | | 17,429,035 | |
Utilities—2.7% | | | | | | | | |
Cleco Corp. | | | 64,250 | | | | 3,354,492 | |
NorthWestern Corp. | | | 127,312 | | | | 6,906,676 | |
Total Utilities | | | | | | | 10,261,168 | |
Total Common Stocks (cost $332,284,174) | | | | | | | 364,689,920 | |
| | |
| | | Principal
Amount | | | | |
Short-Term Investments—7.7% | | | | | | | | |
Repurchase Agreements—5.4%4 | | | | | | | | |
BNP Paribas Securities Corp., dated 12/31/15,due 01/04/16, 0.300%, total to be received $4,809,384 (collateralized by various U.S. Government Agency Obligations, 0.000%—5.500%, 06/06/16—05/04/37, totaling $4,905,408) | | $ | 4,809,224 | | | | 4,809,224 | |
| | | | | | | | |
| | | Principal
Amount | | | Value | |
Cantor Fitzgerald Securities, Inc., dated 12/31/15, due 01/04/16, 0.340%, total to be received $4,809,406 (collateralized by various U.S. Government Obligations, 0.000%—10.500%, 01/15/16—09/01/49, totaling $4,905,409) | | $ | 4,809,224 | | | $ | 4,809,224 | |
Daiwa Capital Markets America, dated 12/31/15, due 01/04/16, 0.350%, total to be received $4,809,411 (collateralized by various U.S. Government Agency Obligations, 0.000%—7.500%, 01/21/16—02/01/49, totaling $4,905,409) | | | 4,809,224 | | | | 4,809,224 | |
Nomura Securities International, Inc., dated 12/31/15, due 01/04/16, 0.330%, total to be received $3,842,782 (collateralized by various U.S. Government Agency Obligations, 0.000%—10.500%, 01/15/16—12/20/65, totaling $3,919,494) | | | 3,842,641 | | | | 3,842,641 | |
State of Wisconsin Investment Board, dated 12/31/15, due 01/04/16, 0.410%, total to be received $1,978,954 (collateralized by various U.S. Government Agency Obligations, 0.125%—2.500%, 01/15/17—02/15/42, totaling $2,019,895) | | | 1,978,864 | | | | 1,978,864 | |
Total Repurchase Agreements | | | | | | | 20,249,177 | |
| | |
| | | Shares | | | | |
Other Investment Companies—2.3%5 | | | | | | | | |
Dreyfus Institutional Cash Advantage Fund, Institutional Class Shares, 0.26% | | | 8,698,017 | | | | 8,698,017 | |
Total Short-Term Investments
(cost $28,947,194) | | | | | | | 28,947,194 | |
Total Investments—105.0%
(cost $361,231,368) | | | | | | | 393,637,114 | |
Other Assets, less Liabilities—(5.0)% | | | | | | | (18,825,845 | ) |
Net Assets—100.0% | | | | | | $ | 374,811,269 | |
The accompanying notes are an integral part of these financial statements.
32
AMG GW&K Small Cap Growth Fund
Portfolio Manager’s Comments (unaudited)
THE YEAR IN REVIEW
For the six month period ended December 31, 2015, the AMG GW&K Small Cap Growth Fund (Institutional Class) (the “Fund”) returned (10.60)%, underperforming the Russell 2000® Growth Index, which returned (9.31)%.
It is hard to determine what Americans wasted more time contemplating in 2015: 1) the potential improper inflation of footballs, 2) the presidential prospects of Donald Trump, or 3) whether the U.S. Federal Reserve (the Fed) would raise the fed funds rate target. While the final outcomes for items one and two have amazingly still not been resolved, we can at least stop debating whether the Fed will begin normalizing monetary policy. The investment community’s hyper-focus on the Fed and potential liftoff had a widespread impact on the results of many asset classes. Treasury rates in general climbed during 2015, as did the U.S. Dollar (USD). Commodities dropped and financial conditions tightened a bit in asset classes like Emerging Markets and U.S. High Yield. Of course, the potential for a higher U.S. fed funds rate wasn’t the only thing responsible for all the asset class results referenced here; however, the persistent focus on it in the investment world certainly played a factor. This constriction was also felt in the U.S. small-cap market, as evidenced by the disappointing (9.31)% return from the Russell 2000® Growth Index for the year. The fourth-quarter performance helped to reduce the damage somewhat, with a 4.32% increase. During the course of the calendar year, small caps experienced lower sales and earnings growth than previously expected. Top- and bottom-line growth was closer to low-single-digit growth instead of high-single-digit or low-double-digit expectations to start the year. While growth in the U.S. was slow and steady in many sectors, companies with exposure to export markets (higher USD, slower demand growth) and commodity prices or energy infrastructure saw much greater sales and earnings pressure. This left small-cap investors looking for a place to hide, generating narrow stock market performance and some periods of high volatility. Volatility spiked in late summer, as investors questioned some of the more crowded investment theses. We will get more into what 2016 might hold for U.S. small-cap investors in the conclusion but, unfortunately, like the inflation
of footballs and hot air coming from Donald Trump, we don’t see an immediate and clean ending to the story line over the next few months.
To help explain how the year progressed for U.S. small-cap investors, it might be best to start with the sector that created some of the biggest headlines: health care. In particular, the biotech and pharmaceutical industries have led the market for several years now. Biopharma as a group is somewhat sheltered to all the earnings bogeymen we worried about in 2015. They are nearly completely uncorrelated with currency strength or weakness in Emerging Markets or commodities. In fact, the vast majority of these stocks in the U.S. small-cap universe have no earnings and no prospect for earnings over the next several years. Combine this with a more accommodative FDA, Obamacare, a good pricing backdrop and a strong funding environment (aided by low rates), and investors became very enamored with these stocks and their long-term potential. Biotech on its own (at +6% of the benchmark) accounted for over one-third of the Index performance in the first half of the year. In the third quarter, this narrow momentum group collapsed over 23%, driven lower by political rhetoric concerning drug inflation, the woes of Valeant and the weight of the group’s vertical ascension. The biopharma space rebounded in the fourth quarter somewhat to finish the year ahead of the benchmark once again, but it is fair to say the cracks in the foundation are now visible. We expect more volatility and weakness in the group, particularly the more speculative names, as we progress through 2016.
Information technology and utilities were other solid performers in the Index for 2015. While investors were attracted to the yield and low-earnings volatility in utilities, they also bid up prices in software, services and semiconductor industries within technology. The strength in health care and information technology helped push the Russell 2000® Growth Index ahead of Russell 2000® Value Index by 600 basis points during the year. The three-year cumulative advantage for the Russell 2000® Growth Index is now at 500 basis points annualized, as investors have sought out dependable earnings growth in a shifting global macro environment and underachieving cyclical growth. While we have expected this to shift, we
have thus far been early in this prediction. On the negative side of sector Russell 2000® Growth Index performance, energy continued to be a falling knife, losing (39.3)% for the year. The forces of supply (excessive) and demand (anemic) continued to pressure prices of both oil and natural gas, although this price mechanism will eventually correct matters. We think we will see a change in perception in these markets in 2016, with greater price stability a result. Price weakness also manifested itself in the consumer discretionary, industrials and materials sectors in 2015, although the first two groups acted a bit better in the quarter. Looking at small-cap index style factors, investors clearly flirted with lower-quality stocks in the quarter, although higher-quality stocks outperformed over the full year. A mirror image of the performance of the biopharma group, high-quality stocks were only in favor in the third quarter, but the powerful impact in this quarter outweighed the other three quarters, combined.
The Fund launched midway through the year on June 30, 2015. During the last six months of the year, the Fund underperformed the benchmark, primarily driven by holdings within the consumer staples and financials sectors. In financials, our stock selection in the bank, capital markets and REITs industries was subpar. Fortunately, this was partially made up for by a great performer among the diversified financial services industry within the Fund. Overall, this is a sector we look to improve upon in 2016. Performance lagged later in the year, when low quality outperformed its higher quality counterparts.
The year began with expectations for an improving domestic macro-economic environment and small-cap earnings growth in the high single-digit neighborhood. While we didn’t see a lot of potential for valuation improvement, we thought multiples were reasonable given the interest rate, inflation and earnings backdrop. We also laughed upon hearing of a potential Trump presidential run, assuming it was either a publicity stunt or would end in a dramatic flameout. The New England Patriots football deflation story also sounded rather absurd and we assumed it would end within a news cycle. So our record last year was far from perfect, to say the least. This year, we are
AMG GW&K Small Cap Growth Fund
Portfolio Manager’s Comments (continued)
assuming mid-single-digit earnings growth as some of the USD strength cycles through and commodity-oriented sectors improve somewhat, especially in the second half of the year. Employment growth in the U.S. remains very good and our belief is that the consumer is healthy and the pace of household formation is improving. The negatives to watch include some weak signals within the transport markets, the growth path for China and other emerging economies and how capital markets respond to the likely continuation of Fed policy actions. We will hopefully utilize these opportunities as they materialize, and reposition the Fund to maximize the three-to-five-year capital appreciation potential. While we may be early in our analysis- see Trump and the footballs-we believe our long-term, disciplined approach will deliver good relative performance.
This commentary reflects the viewpoints of GW&K Investment Management, LLC as of December 31, 2015 and is not intended as a forecast or guarantee of future results.
34
AMG GW&K Small Cap Growth Fund
Portfolio Manager’s Comments (continued)
CUMULATIVE TOTAL RETURN PERFORMANCE
AMG GW&K Small Cap Growth Fund’s cumulative total return is based on the daily change in net asset value (NAV) and assumes that all dividends and distributions were reinvested. The chart compares a hypothetical $10,000 investment made in AMG GW&K Small Cap Growth Fund—Institutional Class on June 30, 2015, to a $10,000 investment made in the Russell 2000® Growth Index for the same time period. The graph and table do not reflect the deduction of taxes that a shareholder would pay on a Fund distribution or redemption of shares. The listed returns for the Fund are net of expenses and the returns for the index exclude expenses. Total returns would have been lower had certain expenses not been reduced.
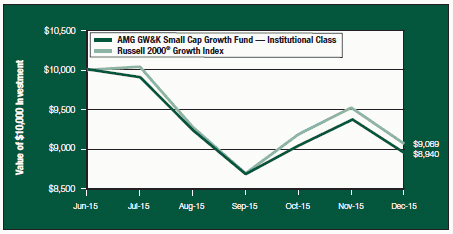
The table below shows the average annual total returns for the AMG GW&K Small Cap Growth Fund and the Russell 2000® Growth Index for the same time periods ended December 31, 2015.
| | | | | | | | |
| | | Since | | | Inception | |
| Average Annual Total Returns1 | | Inception | | | Date | |
AMG GW&K Small Cap Growth Fund 2,3,4 | | | | | | | | |
Institutional Class | | | (10.60 | )% | | | 6/30/15 | |
Russell 2000® Growth Index5 | | | (9.31 | )% | | | 6/30/15 | † |
The performance data shown represents past performance. Past performance is not a guarantee of future results. Current performance may be lower or higher than the performance data quoted. The investment return and principal value of an investment in the Fund will fluctuate so that an investor’s shares, when redeemed, may be worth more or less than their original cost.
Investors should carefully consider the Fund’s investment objectives, risks, charges and expenses before investing. For performance information through the most recent month end, current net asset values per share for the Fund and other information, please call (800) 835-3879 or visit our website at www.amgfunds.com for a free prospectus. Read it carefully before investing or sending money.
Funds are distributed by AMG Distributors, Inc., member FINRA/SIPC.
| † | Date reflects the inception date of the Fund, not the index |
| 1 | Total return equals income yield plus share price change and assumes reinvestment of all dividends and capital gain distributions. Returns are net of fees and may reflect offsets of Fund expenses as described in the prospectus. No adjustment has been made for taxes payable by shareholders on their reinvested dividends and capital gain distributions. Returns for periods greater than one year are annualized. The listed returns on the Fund are net of expenses and based on the published NAV as of December 31, 2015. All returns are in U.S. dollars ($). |
| 2 | From time to time, the Fund’s advisor has waived its fees and/or absorbed Fund expenses, which has resulted in higher returns. |
| 3 | The Fund is subject to risks associated with investments in small-capitalization companies, such as erratic earnings patterns, competitive conditions, limited earnings history, and a reliance on one or a limited number of products. |
| 4 | The Fund invests in growth stocks, which may be more sensitive to market movements because their prices tend to reflect future investor expectations rather than just current profits. Growth stocks may underperform value stocks during any given period. |
| 5 | The Russell 2000® Growth Index measures the performance of the Russell 2,000 companies with higher price-to-book ratios and higher forecasted growth values. Unlike the Fund, the Russell 2000® Growth Index is unmanaged, is not available for investment and does not incur expenses. |
The Russell Indices are trademarks of the London Stock Exchange Group companies.
Not FDIC insured, nor bank guaranteed. May lose value.
35
AMG GW&K Small Cap Growth Fund
Fund Snapshots (unaudited)
December 31, 2015
PORTFOLIO BREAKDOWN
| | | | | | | | |
| | | AMG GW&K Small | | | Russell 2000® | |
Sector | | Cap Growth Fund** | | | Growth Index | |
Health Care | | | 27.1 | % | | | 28.2 | % |
Information Technology | | | 24.6 | % | | | 25.0 | % |
Consumer Discretionary | | | 15.0 | % | | | 16.7 | % |
Industrials | | | 14.2 | % | | | 12.6 | % |
Financials | | | 10.8 | % | | | 7.8 | % |
Materials | | | 3.6 | % | | | 4.1 | % |
Consumer Staples | | | 2.6 | % | | | 3.5 | % |
Energy | | | 1.1 | % | | | 1.2 | % |
Utilities | | | 0.0 | % | | | 0.1 | % |
Telecommunication Services | | | 0.0 | % | | | 0.8 | % |
Other Assets and Liabilities | | | 1.0 | % | | | 0.0 | % |
| ** | As a percentage of net assets. |
TOP TEN HOLDINGS
| | | | |
| | | % of | |
Security Name | | Net Assets | |
Grand Canyon Education, Inc. | | | 2.6 | % |
MarketAxess Holdings, Inc. | | | 2.4 | |
EPAM Systems, Inc. | | | 2.1 | |
Tyler Technologies, Inc. | | | 2.0 | |
Pool Corp. | | | 1.9 | |
Power Integrations, Inc. | | | 1.9 | |
Align Technology, Inc. | | | 1.9 | |
Medidata Solutions, Inc. | | | 1.8 | |
Balchem Corp. | | | 1.8 | |
Exponent, Inc. | | | 1.7 | |
| | | | |
Top Ten as a Group | | | 20.1 | % |
| | | | |
Because a fund’s strategy may result in multiple investments in particular sectors of the economy, its performance may depend on the performance of those sectors and may fluctuate more widely than investments diversified across more sectors. For additional information on these and other risk considerations, please see the Fund’s prospectus.
Any sectors, industries, or securities discussed should not be perceived as investment recommendations. Mention of a specific security should not be considered a recommendation to buy or solicitation to sell that security. Specific securities mentioned in this report may have been sold from the Fund’s portfolio of investments by the time you receive this report.
36
AMG GW&K Small Cap Growth Fund
Schedule of Portfolio Investments
December 31, 2015
| | | | | | | | |
| | | Shares | | | Value | |
Common Stocks—99.0% | | | | | | | | |
Consumer Discretionary—15.0% | | | | | | | | |
BJ’s Restaurants, Inc.* | | | 395 | | | $ | 17,171 | |
Build-A-Bear Workshop, Inc.* | | | 980 | | | | 11,995 | |
Burlington Stores, Inc.* | | | 400 | | | | 17,160 | |
Chuy’s Holdings, Inc.* | | | 515 | | | | 16,140 | |
Five Below, Inc.* | | | 615 | | | | 19,741 | |
Grand Canyon Education, Inc.* | | | 760 | | | | 30,491 | |
Hibbett Sports, Inc.* | | | 315 | | | | 9,526 | |
Oxford Industries, Inc. | | | 245 | | | | 15,636 | |
Pool Corp. | | | 275 | | | | 22,214 | |
Tumi Holdings, Inc.* | | | 580 | | | | 9,645 | |
Vitamin Shoppe, Inc.* | | | 170 | | | | 5,559 | |
Total Consumer Discretionary | | | | | | | 175,278 | |
Consumer Staples—2.6% | | | | | | | | |
PriceSmart, Inc. | | | 200 | | | | 16,598 | |
Smart & Final Stores, Inc.* | | | 760 | | | | 13,840 | |
Total Consumer Staples | | | | | | | 30,438 | |
Energy—1.1% | | | | | | | | |
Matador Resources Co.*,2 | | | 645 | | | | 12,752 | |
Financials—10.8% | | | | | | | | |
Encore Capital Group, Inc.*,2 | | | 460 | | | | 13,377 | |
Greenhill & Co., Inc. | | | 220 | | | | 6,294 | |
Heritage Insurance Holdings, Inc. | | | 580 | | | | 12,656 | |
MarketAxess Holdings, Inc. | | | 250 | | | | 27,898 | |
PrivateBancorp, Inc. | | | 435 | | | | 17,844 | |
STAG Industrial, Inc. | | | 795 | | | | 14,668 | |
Stifel Financial Corp.* | | | 245 | | | | 10,378 | |
Sun Communities, Inc. | | | 185 | | | | 12,678 | |
Texas Capital Bancshares, Inc.* | | | 220 | | | | 10,872 | |
Total Financials | | | | | | | 126,665 | |
Health Care—27.1% | | | | | | | | |
ABIOMED, Inc.* | | | 205 | | | | 18,507 | |
Acadia Healthcare Co., Inc.* | | | 300 | | | | 18,738 | |
Air Methods Corp.* | | | 375 | | | | 15,724 | |
Align Technology, Inc.* | | | 330 | | | | 21,730 | |
Amicus Therapeutics, Inc.*,2 | | | 1,860 | | | | 18,042 | |
Bruker Corp.* | | | 505 | | | | 12,256 | |
Catalent, Inc.* | | | 510 | | | | 12,765 | |
DBV Technologies, S.A.* | | | 345 | | | | 12,527 | |
Dynavax Technologies Corp.* | | | 635 | | | | 15,342 | |
| | | | | | | | |
| | | Shares | | | Value | |
Emergent BioSolutions, Inc.* | | | 440 | | | $ | 17,604 | |
Endologix, Inc.*,2 | | | 825 | | | | 8,167 | |
Globus Medical, Inc., Class A* | | | 730 | | | | 20,309 | |
ICU Medical, Inc.* | | | 140 | | | | 15,789 | |
Impax Laboratories, Inc.* | | | 380 | | | | 16,249 | |
Inotek Pharmaceuticals Corp.* | | | 1,445 | | | | 16,372 | |
Medidata Solutions, Inc.* | | | 440 | | | | 21,688 | |
Retrophin, Inc.* | | | 380 | | | | 7,330 | |
Team Health Holdings, Inc.* | | | 320 | | | | 14,045 | |
West Pharmaceutical Services, Inc. | | | 260 | | | | 15,657 | |
Wright Medical Group N.V.* | | | 795 | | | | 19,223 | |
Total Health Care | | | | | | | 318,064 | |
Industrials—14.2% | | | | | | | | |
CEB, Inc. | | | 250 | | | | 15,347 | |
Exponent, Inc. | | | 410 | | | | 20,479 | |
The Gorman-Rupp Co. | | | 330 | | | | 8,821 | |
Graco, Inc. | | | 205 | | | | 14,774 | |
HEICO Corp. | | | 330 | | | | 17,939 | |
Knight Transportation, Inc. | | | 400 | | | | 9,692 | |
Mobile Mini, Inc. | | | 320 | | | | 9,962 | |
Proto Labs, Inc.* | | | 285 | | | | 18,152 | |
Ritchie Bros. Auctioneers, Inc. | | | 830 | | | | 20,011 | |
Thermon Group Holdings, Inc.* | | | 365 | | | | 6,176 | |
WageWorks, Inc.* | | | 275 | | | | 12,477 | |
Woodward, Inc. | | | 265 | | | | 13,160 | |
Total Industrials | | | | | | | 166,990 | |
Information Technology—24.6% | | | | | | | | |
Blackbaud, Inc. | | | 285 | | | | 18,770 | |
Bottomline Technologies, Inc.* | | | 425 | | | | 12,635 | |
Cabot Microelectronics Corp.* | | | 220 | | | | 9,632 | |
Cardtronics, Inc.* | | | 320 | | | | 10,768 | |
Cavium, Inc.* | | | 245 | | | | 16,099 | |
Cognex Corp. | | | 605 | | | | 20,431 | |
comScore, Inc.*,2 | | | 420 | | | | 17,283 | |
Electronics For Imaging, Inc.* | | | 245 | | | | 11,451 | |
EPAM Systems, Inc.* | | | 310 | | | | 24,372 | |
FEI Co. | | | 215 | | | | 17,155 | |
Forrester Research, Inc. | | | 495 | | | | 14,098 | |
Infoblox, Inc.* | | | 650 | | | | 11,953 | |
Interactive Intelligence Group, Inc.* | | | 330 | | | | 10,369 | |
IntraLinks Holdings, Inc.* | | | 695 | | | | 6,304 | |
The accompanying notes are an integral part of these financial statements.
37
AMG GW&K Small Cap Growth Fund
Schedule of Portfolio Investments (continued)
| | | | | | | | |
| | | Shares | | | Value | |
Information Technology—24.6% (continued) | | | | | | | | |
LogMeln, Inc.* | | | 260 | | | $ | 17,446 | |
Power Integrations, Inc. | | | 455 | | | | 22,127 | |
Super Micro Computer, Inc.* | | | 380 | | | | 9,314 | |
Tyler Technologies, Inc.* | | | 135 | | | | 23,533 | |
VeriFone Systems, Inc.* | | | 545 | | | | 15,271 | |
Total Information Technology | | | | | | | 289,011 | |
Materials—3.6% | | | | | | | | |
Balchem Corp. | | | 355 | | | | 21,584 | |
Flotek Industries, Inc.*,2 | | | 660 | | | | 7,550 | |
KapStone Paper and Packaging Corp. | | | 580 | | | | 13,102 | |
Total Materials | | | | | | | 42,236 | |
Total Common Stocks (cost $1,182,141) | | | | | | | 1,161,434 | |
| | | | | | | | |
| | | Principal
Amount | | | Value | |
Short-Term Investments—7.8% | | | | | | | | |
Repurchase Agreements—4.9%4 | | | | | | | | |
Royal Bank of Scotland PLC, dated 12/31/15,due 01/04/16, 0.300%, total to be received $57,237 (collateralized by various U.S. Government Agency Obligations, 0.074% — 3.250%, 07/31/16—11/15/23, totaling $58,380) | | $ | 57,235 | | | $ | 57,235 | |
| | |
| | | Shares | | | | |
Other Investment Companies—2.9%5 | | | | | | | | |
Dreyfus Institutional Cash Advantage Fund, Institutional Class Shares, 0.26% | | | 34,745 | | | | 34,745 | |
Total Short-Term Investments
(cost $91,980) | | | | | | | 91,980 | |
Total Investments—106.8%
(cost $1,274,121) | | | | | | | 1,253,414 | |
Other Assets, less Liabilities—(6.8)% | | | | | | | (80,263 | ) |
Net Assets—100.0% | | | | | | $ | 1,173,151 | |
The accompanying notes are an integral part of these financial statements.
38
Notes to Schedules of Portfolio Investments
The following footnotes should be read in conjunction with each of the Schedules of Portfolio Investments previously presented in this report.
At December 31, 2015, the approximate cost of investments for federal income tax purposes and the aggregate gross unrealized appreciation and depreciation based on tax cost were:
| | | | | | | | | | | | | | | | |
| Fund | | Cost | | | Appreciation | | | Depreciation | | | Net | |
AMG GW&K Enhanced Core Bond Fund | | $ | 86,699,492 | | | $ | 930,213 | | | $ | (932,389 | ) | | $ | (2,176 | ) |
AMG GW&K Municipal Bond Fund | | | 800,482,570 | | | | 16,283,277 | | | | (151,167 | ) | | | 16,132,110 | |
AMG GW&K Municipal Enhanced Yield Fund | | | 222,393,989 | | | | 8,657,493 | | | | (337,990 | ) | | | 8,319,503 | |
AMG GW&K Small Cap Core Fund | | | 361,282,419 | | | | 60,230,525 | | | | (27,875,830 | ) | | | 32,354,695 | |
AMG GW&K Small Cap Growth Fund | | | 1,299,715 | | | | 48,463 | | | | (94,764 | ) | | | (46,301 | ) |
| * | Non-income producing security. |
| (a) | Security exempt from registration under Rule 144A of the Securities Act of 1933. This security may be resold in transactions exempt from registration, normally to qualified buyers. At December 31, 2015, the value of these securities amounted to the following: |
| | | | | | | | |
| Fund | | Market Value | | | % of Net Assets | |
AMG GW&K Enhanced Core Bond Fund | | $ | 507,500 | | | | 0.6 | % |
| 1 | Variable Rate Security. The rate listed is as of December 31, 2015, and is periodically reset subject to terms and conditions set forth in the debenture. |
| 2 | Some or all of these shares or principal amount were out on loan to various brokers as of December 31, 2015, amounting to the following: |
| | | | | | | | |
| Fund | | Market Value | | | % of Net Assets | |
AMG GW&K Enhanced Core Bond Fund | | $ | 1,325,009 | | | | 1.5 | % |
AMG GW&K Small Cap Core Fund | | | 19,402,890 | | | | 5.2 | % |
AMG GW&K Small Cap Growth Fund | | | 55,118 | | | | 4.7 | % |
| 3 | Securities in the portfolio backed by insurance of financial institutions and financial guaranty assurance agencies. At December 31, 2015, the value of these securities amounted to the following: |
| | | | | | | | |
| Fund | | Market Value | | | % of Net Assets | |
AMG GW&K Enhanced Core Bond Fund | | $ | 879,902 | | | | 1.0 | % |
AMG GW&K Municipal Bond Fund | | | 7,341,375 | | | | 0.9 | % |
| 4 | Collateral received from brokers for securities lending was invested in these joint repurchase agreements. |
| 5 | Yield shown represents the December 31, 2015, seven-day average yield, which refers to the sum of the previous seven days’ dividends paid, expressed as an annual percentage. |
| 6 | All or part of the security is delayed delivery transaction. The market value of delayed delivery securities at December 31, 2015, amounted to the following: |
| | | | | | | | |
| Fund | | Market Value | | | % of Net Assets | |
AMG GW&K Municipal Bond Fund | | $ | 18,751,709 | | | | 2.3 | % |
| 7 | Some or all of these securities are segregated as collateral for delayed delivery transactions. At December 31, 2015, the value of these securities amounted to the following: |
| | | | | | | | |
| Fund | | Market Value | | | % of Net Assets | |
AMG GW&K Municipal Bond Fund | | $ | 18,751,709 | | | | 2.3 | % |
The accompanying notes are an integral part of these financial statements.
39
Notes to Schedules of Portfolio Investments (continued)
The following tables summarize the inputs used to value the Funds’ investments by the fair value hierarchy levels as of December 31, 2015: (See Note 1(a) in the Notes to the Financial Statements.)
| | | | | | | | | | | | | | | | |
| | | Quoted Prices in Active Markets
for Identical Investments Level 1 | | | Significant Other
Observable Inputs Level 2 | | | Significant
Unobservable Inputs Level 3 | | | Total | |
AMG GW&K Enhanced Core Bond Fund | | | | | | | | | | | | | | | | |
Investments in Securities | | | | | | | | | | | | | | | | |
Corporate Bonds and Notes† | | | — | | | $ | 39,230,305 | | | | — | | | $ | 39,230,305 | |
Municipal Bonds†† | | | — | | | | 5,724,688 | | | | — | | | | 5,724,688 | |
U.S. Government and Agency Obligations† | | | — | | | | 36,660,784 | | | | — | | | | 36,660,784 | |
Short-Term Investments | | | | | | | | | | | | | | | | |
Repurchase Agreements | | | — | | | | 1,376,580 | | | | — | | | | 1,376,580 | |
Other Investment Companies | | $ | 3,704,959 | | | | — | | | | — | | | | 3,704,959 | |
| | | | | | | | | | | | | | | | |
Total Investments in Securities | | $ | 3,704,959 | | | $ | 82,992,357 | | | | — | | | $ | 86,697,316 | |
| | | | | | | | | | | | | | | | |
| | | | |
| | | Quoted Prices in Active Markets
for Identical Investments
Level 1 | | | Significant Other
Observable Inputs
Level 2 | | | Significant
Unobservable Inputs
Level 3 | | | Total | |
AMG GW&K Municipal Bond Fund | | | | | | | | | | | | | | | | |
Investments in Securities | | | | | | | | | | | | | | | | |
Municipal Bonds†† | | | — | | | $ | 789,252,974 | | | | — | | | $ | 789,252,974 | |
Other Investment Companies | | $ | 27,361,706 | | | | — | | | | — | | | | 27,361,706 | |
| | | | | | | | | | | | | | | | |
Total Investments in Securities | | $ | 27,361,706 | | | $ | 789,252,974 | | | | — | | | $ | 816,614,680 | |
| | | | | | | | | | | | | | | | |
| | | | |
| | | Quoted Prices in Active Markets
for Identical Investments
Level 1 | | | Significant Other
Observable Inputs
Level 2 | | | Significant
Unobservable Inputs
Level 3 | | | Total | |
AMG GW&K Municipal Enhanced Yield Fund | | | | | | | | | | | | | | | | |
Investments in Securities | | | | | | | | | | | | | | | | |
Municipal Bonds†† | | | — | | | $ | 230,164,455 | | | | — | | | $ | 230,164,455 | |
Other Investment Companies | | $ | 549,037 | | | | — | | | | — | | | | 549,037 | |
| | �� | | | | | | | | | | | | | | |
Total Investments in Securities | | $ | 549,037 | | | $ | 230,164,455 | | | | — | | | $ | 230,713,492 | |
| | | | | | | | | | | | | | | | |
The accompanying notes are an integral part of these financial statements.
40
Notes to Schedules of Portfolio Investments (continued)
| | | | | | | | | | | | | | | | |
| | | Quoted Prices in Active Markets
for Identical Investments
Level 1 | | | Significant Other
Observable Inputs
Level 2 | | | Significant
Unobservable Inputs
Level 3 | | | Total | |
AMG GW&K Small Cap Core Fund | | | | | | | | | | | | | | | | |
Investments in Securities | | | | | | | | | | | | | | | | |
Common Stocks††† | | $ | 364,689,920 | | | | — | | | | — | | | $ | 364,689,920 | |
Short-Term Investments | | | | | | | | | | | | | | | | |
Repurchase Agreements | | | — | | | $ | 20,249,177 | | | | — | | | | 20,249,177 | |
Other Investment Companies | | | 8,698,017 | | | | — | | | | — | | | | 8,698,017 | |
| | | | | | | | | | | | | | | | |
Total Investments in Securities | | $ | 373,387,937 | | | $ | 20,249,177 | | | | — | | | $ | 393,637,114 | |
| | | | | | | | | | | | | | | | |
| | | | |
| | | Quoted Prices in Active Markets
for Identical Investments
Level 1 | | | Significant Other
Observable Inputs
Level 2 | | | Significant
Unobservable Inputs
Level 3 | | | Total | |
AMG GW&K Small Cap Growth Fund | | | | | | | | | | | | | | | | |
Investments in Securities | | | | | | | | | | | | | | | | |
Common Stocks††† | | $ | 1,161,434 | | | | — | | | | — | | | $ | 1,161,434 | |
Short-Term Investments | | | | | | | | | | | | | | | | |
Repurchase Agreements | | | — | | | $ | 57,235 | | | | — | | | | 57,235 | |
Other Investment Companies | | | 34,745 | | | | — | | | | — | | | | 34,745 | |
| | | | | | | | | | | | | | | | |
Total Investments in Securities | | $ | 1,196,179 | | | $ | 57,235 | | | | — | | | $ | 1,253,414 | |
| | | | | | | | | | | | | | | | |
| † | All corporate bonds and notes and U.S. government and agency obligations held in the Funds are level 2 securities. For a detailed breakout of the corporate bonds and notes and U.S. government and agency obligations by major industry or agency classification, please refer to the respective Funds’ Schedule of Portfolio Investments. |
| †† | All municipal bonds held in the Funds are Level 2 securities. For a detailed breakout of the bonds by major classification, please refer to the respective Fund’s Schedule of Portfolio Investments. |
| ††† | All common stocks held in the Funds are Level 1 securities. For a detailed breakout of the common stocks by major industry classification, please refer to the respective Fund’s Schedule of Portfolio Investments. |
As of December 31, 2015, the Funds had no transfers between levels from the beginning of the reporting period.
| | |
| INVESTMENTS DEFINITIONS AND ABBREVIATIONS: |
| |
| COPS: | | Certificates of Participation |
| FHLB: | | Federal Home Loan Bank |
| FHLMC: | | Federal Home Loan Mortgage Corporation |
| FNMA: | | Federal National Mortgage Association |
| GMTN: | | Global Medium-Term Notes |
| MTN: | | Medium-Term Notes |
| National Insured: | | National Public Finance Guarantee Corp. |
The accompanying notes are an integral part of these financial statements.
41
Statement of Assets and Liabilities
December 31, 2015
| | | | | | | | | | | | | | | | | | | | |
| | | AMG GW&K
Enhanced Core
Bond Fund | | | AMG GW&K
Municipal Bond
Fund | | | AMG GW&K
Municipal
Enhanced Yield
Fund | | | AMG GW&K
Small Cap
Core Fund | | | AMG GW&K
Small Cap
Growth Fund | |
Assets: | | | | | | | | | | | | | | | | | | | | |
Investments at value* (including securities on loan valued at $1,325,009, $0, $0, $19,402,890 and $55,118, respectively) | | $ | 86,697,316 | | | $ | 816,614,680 | | | $ | 230,713,492 | | | $ | 393,637,114 | | | $ | 1,253,414 | |
Receivable for investments sold | | | — | | | | — | | | | 53,855 | | | | 1,819,405 | | | | 9,505 | |
Receivable from affiliate for interfund lending | | | — | | | | — | | | | — | | | | 2,796,955 | | | | — | |
Receivable for Fund shares sold | | | 56,898 | | | | 8,315,377 | | | | 646,714 | | | | 678,989 | | | | — | |
Dividends, interest and other receivables | | | 903,897 | | | | 9,095,723 | | | | 2,456,573 | | | | 474,263 | | | | 466 | |
Receivable from affiliate | | | 21,874 | | | | 241,093 | | | | 40,552 | | | | 46,048 | | | | 7,736 | |
Prepaid expenses | | | 22,864 | | | | 19,128 | | | | 19,829 | | | | 16,578 | | | | 1,092 | |
Total assets | | | 87,702,849 | | | | 834,286,001 | | | | 233,931,015 | | | | 399,469,352 | | | | 1,272,213 | |
Liabilities: | | | | | | | | | | | | | | | | | | | | |
Payable upon return of securities loaned | | | 1,376,580 | | | | — | | | | — | | | | 20,249,177 | | | | 57,235 | |
Payable for investments purchased | | | — | | | | — | | | | — | | | | 2,908,344 | | | | 3,554 | |
Payable for delayed delivery investments purchased | | | — | | | | 18,552,104 | | | | — | | | | — | | | | — | |
Payable for Fund shares repurchased | | | 107,399 | | | | 3,398,068 | | | | 134,119 | | | | 1,110,183 | | | | — | |
Payable to Affiliate | | | — | | | | — | | | | — | | | | — | | | | 12,623 | |
Accrued expenses: | | | | | | | | | | | | | | | | | | | | |
Investment advisory and management fees | | | 33,208 | | | | 237,076 | | | | 98,384 | | | | 242,222 | | | | 755 | |
Administrative fees | | | 14,759 | | | | 169,340 | | | | 49,192 | | | | 80,741 | | | | 252 | |
Shareholder service fees—Investor Class | | | — | | | | 4,087 | | | | 1,109 | | | | — | | | | — | |
Shareholder service fees—Service Class | | | 1,282 | | | | 17,300 | | | | — | | | | — | | | | — | |
Distribution fees—Investor Class | | | 4,365 | | | | 5,688 | | | | 1,042 | | | | 7,765 | | | | — | |
Distribution fees—Class C | | | 9,533 | | | | — | | | | — | | | | — | | | | — | |
Professional Fees | | | 42,955 | | | | 43,287 | | | | 35,357 | | | | 28,076 | | | | 19,431 | |
Trustees fees and expenses | | | 60 | | | | 463 | | | | 173 | | | | 260 | | | | 6 | |
Other | | | 14,406 | | | | 53,055 | | | | 18,915 | | | | 31,315 | | | | 5,206 | |
Total liabilities | | | 1,604,547 | | | | 22,480,468 | | | | 338,291 | | | | 24,658,083 | | | | 99,062 | |
Net Assets | | $ | 86,098,302 | | | $ | 811,805,533 | | | $ | 233,592,724 | | | $ | 374,811,269 | | | $ | 1,173,151 | |
* Investments at cost | | $ | 86,699,492 | | | $ | 800,482,570 | | | $ | 222,168,790 | | | $ | 361,231,368 | | | $ | 1,274,121 | |
The accompanying notes are an integral part of these financial statements.
42
Statement of Assets and Liabilities
| | | | | | | | | | | | | | | | | | | | |
| | | AMG GW&K
Enhanced Core
Bond Fund | | | AMG GW&K
Municipal Bond
Fund | | | AMG GW&K
Municipal
Enhanced Yield
Fund | | | AMG GW&K
Small Cap
Core Fund | | | AMG GW&K
Small Cap
Growth Fund | |
Net Assets Represent: | | | | | | | | | | | | | | | | | | | | |
Paid-in capital | | $ | 91,528,228 | | | $ | 791,751,669 | | | $ | 224,150,278 | | | $ | 340,095,788 | | | $ | 1,219,081 | |
Undistributed net investment income | | | — | | | | — | | | | 253 | | | | — | | | | — | |
Accumulated net realized gain (loss) from investments | | | (5,427,750 | ) | | | 3,921,754 | | | | 897,491 | | | | 2,309,735 | | | | (25,223 | ) |
Net unrealized appreciation (depreciation) of investments | | | (2,176 | ) | | | 16,132,110 | | | | 8,544,702 | | | | 32,405,746 | | | | (20,707 | ) |
Net Assets | | $ | 86,098,302 | | | $ | 811,805,533 | | | $ | 233,592,724 | | | $ | 374,811,269 | | | $ | 1,173,151 | |
Investor Class: | | | | | | | | | | | | | | | | | | | | |
Net Assets | | $ | 20,203,009 | | | $ | 27,361,832 | | | $ | 5,499,772 | | | $ | 35,691,178 | | | | n/a | |
Shares outstanding | | | 2,108,208 | | | | 2,338,015 | | | | 545,762 | | | | 1,637,066 | | | | n/a | |
Net asset value, offering and redemption price per share | | $ | 9.58 | | | $ | 11.70 | | | $ | 10.08 | | | $ | 21.80 | | | | n/a | |
Service Class: | | | | | | | | | | | | | | | | | | | | |
Net Assets | | $ | 7,462,654 | | | $ | 128,683,897 | | | $ | 16,035,829 | | | $ | 36,738,620 | | | | n/a | |
Shares outstanding | | | 775,880 | | | | 10,970,346 | | | | 1,590,067 | | | | 1,671,886 | | | | n/a | |
Net asset value, offering and redemption price per share | | $ | 9.62 | | | $ | 11.73 | | | $ | 10.09 | | | $ | 21.97 | | | | n/a | |
Class C Shares: | | | | | | | | | | | | | | | | | | | | |
Net Assets | | $ | 11,030,833 | | | | n/a | | | | n/a | | | | n/a | | | | n/a | |
Shares outstanding | | | 1,152,956 | | | | n/a | | | | n/a | | | | n/a | | | | n/a | |
Net asset value, offering and redemption price per share | | $ | 9.57 | | | | n/a | | | | n/a | | | | n/a | | | | n/a | |
Institutional Class: | | | | | | | | | | | | | | | | | | | | |
Net Assets | | $ | 47,401,806 | | | $ | 655,759,804 | | | $ | 212,057,123 | | | $ | 302,381,471 | | | $ | 1,173,151 | |
Shares outstanding | | | 4,930,909 | | | | 55,723,973 | | | | 21,064,706 | | | | 13,720,411 | | | | 131,146 | |
Net asset value, offering and redemption price per share | | $ | 9.61 | | | $ | 11.77 | | | $ | 10.07 | | | $ | 22.04 | | | $ | 8.95 | |
The accompanying notes are an integral part of these financial statements.
43
Statement of Operations
For the year ended December 31, 2015
| | | | | | | | | | | | | | | | | | | | |
| | | AMG GW&K
Enhanced Core
Bond Fund | | | AMG GW&K
Municipal
Bond Fund | | | AMG GW&K
Municipal
Enhanced
Yield Fund | | | AMG GW&K
Small Cap
Core Fund | | | AMG GW&K
Small Cap
Growth Fund* | |
Investment Income: | | | | | | | | | | | | | | | | | | | | |
Interest income | | $ | 3,313,475 | | | $ | 14,530,825 | | | $ | 9,492,469 | | | $ | 231 | | | | — | |
Dividend income | | | 2,494 | | | | 2,331 | | | | 562 | | | | 4,188,022 | 1 | | $ | 2,599 | |
Securities lending income | | | 6,169 | | | | — | | | | — | | | | 51,801 | | | | 44 | |
Foreign withholding tax | | | — | | | | — | | | | — | | | | (18,581 | ) | | | (44 | ) |
Total investment income | | | 3,322,138 | | | | 14,533,156 | | | | 9,493,031 | | | | 4,221,473 | | | | 2,599 | |
Expenses: | | | | | | | | | | | | | | | | | | | | |
Investment advisory and management fees | | | 404,389 | | | | 2,418,498 | | | | 1,169,998 | | | | 2,832,778 | | | | 3,466 | |
Administrative fees | | | 179,729 | | | | 1,727,497 | | | | 584,999 | | | | 944,260 | | | | 1,155 | |
Distribution fees—Investor Class | | | 65,755 | | | | 61,116 | | | | 11,870 | | | | 93,191 | | | | — | |
Distribution fees—Class C | | | 133,713 | | | | — | | | | — | | | | — | | | | — | |
Shareholder servicing fees—Investor Class | | | — | | | | 55,623 | | | | 8,539 | | | | 57,466 | | | | — | |
Shareholder servicing fees—Service Class | | | 2,986 | | | | 186,521 | | | | 11,524 | | | | 49,167 | | | | — | |
Professional fees | | | 55,564 | | | | 84,615 | | | | 51,204 | | | | 52,083 | | | | 21,671 | |
Registration fees | | | 53,318 | | | | 63,914 | | | | 48,563 | | | | 46,516 | | | | 12,715 | |
Custodian | | | 18,513 | | | | 64,191 | | | | 25,996 | | | | 23,593 | | | | 4,400 | |
Reports to shareholders | | | 9,953 | | | | 31,094 | | | | 5,290 | | | | 47,058 | | | | 9,032 | |
Transfer agent | | | 8,157 | | | | 33,981 | | | | 9,520 | | | | 17,733 | | | | 147 | |
Trustees fees and expenses | | | 5,140 | | | | 39,518 | | | | 14,354 | | | | 22,541 | | | | 22 | |
Miscellaneous | | | 3,835 | | | | 9,902 | | | | 5,780 | | | | 7,571 | | | | 306 | |
Total expenses before offsets | | | 941,052 | | | | 4,776,470 | | | | 1,947,637 | | | | 4,193,957 | | | | 52,914 | |
Fee waivers | | | — | | | | — | | | | (211,783 | ) | | | — | | | | — | |
Expense reimbursements | | | (208,328 | ) | | | (2,123,295 | ) | | | (205,861 | ) | | | (405,914 | ) | | | (48,523 | ) |
Expense reductions | | | — | | | | — | | | | — | | | | (170 | ) | | | — | |
Net expenses | | | 732,724 | | | | 2,653,175 | | | | 1,529,993 | | | | 3,787,873 | | | | 4,391 | |
Net investment income (loss) | | | 2,589,414 | | | | 11,879,981 | | | | 7,963,038 | | | | 433,600 | | | | (1,792 | ) |
Net Realized and Unrealized Gain (Loss): | | | | | | | | | | | | | | | | | | | | |
Net realized gain (loss) on investments | | | (5,132,363 | ) | | | 12,154,764 | | | | 4,973,058 | | | | 13,481,106 | | | | (23,431 | ) |
Net change in unrealized appreciation (depreciation) of investments | | | (631,280 | ) | | | 3,671,047 | | | | (3,739,962 | ) | | | (24,005,209 | ) | | | (20,707 | ) |
Net realized and unrealized gain (loss) | | | (5,763,643 | ) | | | 15,825,811 | | | | 1,233,096 | | | | (10,524,103 | ) | | | (44,138 | ) |
Net increase (decrease) in net assets resulting from operations | | $ | (3,174,229 | ) | | $ | 27,705,792 | | | $ | 9,196,134 | | | $ | (10,090,503 | ) | | $ | (45,930 | ) |
| * | Commencement of operations was on June 30, 2015. |
| 1 | Includes non-recurring dividends of $490,133. |
The accompanying notes are an integral part of these financial statements.
44
Statements of Changes in Net Assets
For the years ended December 31,
| | | | | | | | | | | | | | | | |
| | | AMG GW&K Enhanced
Core Bond Fund | | | AMG GW&K Municipal
Bond Fund | |
| | | 2015 | | | 2014 | | | 2015 | | | 2014 | |
Increase (Decrease) in Net Assets Resulting From Operations: | | | | | | | | | | | | | | | | |
Net investment income | | $ | 2,589,414 | | | $ | 2,507,510 | | | $ | 11,879,981 | | | $ | 7,875,121 | |
Net realized gain (loss) on investments | | | (5,132,363 | ) | | | 87,523 | | | | 12,154,764 | | | | 3,462,649 | |
Net change in unrealized appreciation (depreciation) of investments | | | (631,280 | ) | | | 2,660,589 | | | | 3,671,047 | | | | 16,538,759 | |
Net increase (decrease) in net assets resulting from operations | | | (3,174,229 | ) | | | 5,255,622 | | | | 27,705,792 | | | | 27,876,529 | |
Distributions to Shareholders: | | | | | | | | | | | | | | | | |
From net investment income: | | | | | | | | | | | | | | | | |
Investor Class | | | (757,792 | ) | | | (769,523 | ) | | | (307,554 | ) | | | (432,266 | ) |
Service Class | | | (121,235 | ) | | | (57,198 | ) | | | (1,760,792 | ) | | | (1,339,974 | ) |
Class C | | | (284,731 | ) | | | (381,610 | ) | | | — | | | | — | |
Institutional Class | | | (1,459,487 | ) | | | (1,330,077 | ) | | | (9,837,254 | ) | | | (6,154,942 | ) |
From net realized gain on investments: | | | | | | | | | | | | | | | | |
Investor Class | | | — | | | | — | | | | (345,596 | ) | | | (79,952 | ) |
Service Class | | | — | | | | — | | | | (1,606,917 | ) | | | (330,497 | ) |
Class C | | | — | | | | — | | | | — | | | | — | |
Institutional Class | | | — | | | | — | | | | (8,166,806 | ) | | | (1,316,968 | ) |
Total distributions to shareholders | | | (2,623,245 | ) | | | (2,538,408 | ) | | | (22,024,919 | ) | | | (9,654,599 | ) |
Capital Share Transactions:1 | | | | | | | | | | | | | | | | |
Net increase (decrease) from capital share transactions | | | 4,076,345 | | | | (28,444,315 | ) | | | 290,819,321 | | | | 210,693,581 | |
Total increase (decrease) in net assets | | | (1,721,129 | ) | | | (25,727,101 | ) | | | 296,500,194 | | | | 228,915,511 | |
Net Assets: | | | | | | | | | | | | | | | | |
Beginning of year | | | 87,819,431 | | | | 113,546,532 | | | | 515,305,339 | | | | 286,389,828 | |
End of year | | $ | 86,098,302 | | | $ | 87,819,431 | | | $ | 811,805,533 | | | $ | 515,305,339 | |
End of year undistributed net investment income | | | — | | | $ | 21,912 | | | | — | | | | — | |
| | | | | | | | | | | | | | | | |
| 1 | See Note 1(g) of the Notes to Financial Statements. |
The accompanying notes are an integral part of these financial statements.
45
Statements of Changes in Net Assets (continued)
For the periods ended December 31,
| | | | | | | | | | | | | | | | | | | | |
| | | AMG GW&K Municipal
Enhanced Yield Fund | | | AMG GW&K Small
Cap Core Fund | | | AMG GW&K Small
Cap Growth Fund* | |
| | | 2015 | | | 2014 | | | 2015 | | | 2014 | | | 2015 | |
Increase (Decrease) in Net Assets Resulting From Operations: | | | | | | | | | | | | | | | | | | | | |
Net investment income (loss) | | $ | 7,963,038 | | | $ | 9,127,984 | | | $ | 433,600 | | | $ | 614,594 | | | $ | (1,792 | ) |
Net realized gain (loss) on investments | | | 4,973,058 | | | | 3,771,712 | | | | 13,481,106 | | | | 22,646,725 | | | | (23,431 | ) |
Net change in unrealized appreciation (depreciation) of investments | | | (3,739,962 | ) | | | 25,123,728 | | | | (24,005,209 | ) | | | (14,926,183 | ) | | | (20,707 | ) |
Net increase (decrease) in net assets resulting from operations | | | 9,196,134 | | | | 38,023,424 | | | | (10,090,503 | ) | | | 8,335,136 | | | | (45,930 | ) |
Distributions to Shareholders: | | | | | | | | | | | | | | | | | | | | |
From net investment income: | | | | | | | | | | | | | | | | | | | | |
Investor Class | | | (139,414 | ) | | | (345,685 | ) | | | — | | | | — | | | | — | |
Service Class | | | (562,790 | ) | | | (377,198 | ) | | | (33,789 | ) | | | (20,176 | ) | | | — | |
Institutional Class | | | (7,264,910 | ) | | | (8,402,809 | ) | | | (710,270 | ) | | | (460,718 | ) | | | — | |
From net realized gain on investments: | | | | | | | | | | | | | | | | | | | | |
Investor Class | | | (71,420 | ) | | | — | | | | (1,421,265 | ) | | | (2,104,505 | ) | | | — | |
Service Class | | | (208,173 | ) | | | — | | | | (1,479,651 | ) | | | (2,494,630 | ) | | | — | |
Institutional Class | | | (2,744,562 | ) | | | — | | | | (12,008,340 | ) | | | (15,829,282 | ) | | | — | |
Total distributions to shareholders | | | (10,991,269 | ) | | | (9,125,692 | ) | | | (15,653,315 | ) | | | (20,909,311 | ) | | | — | |
Capital Share Transactions:1 | | | | | | | | | | | | | | | | | | | | |
Net increase (decrease) from capital share transactions | | | (15,159,353 | ) | | | 7,236,539 | | | | 26,453,362 | | | | 111,993,583 | | | | 1,219,081 | |
Total increase (decrease) in net assets | | | (16,954,488 | ) | | | 36,134,271 | | | | 709,544 | | | | 99,419,408 | | | | 1,173,151 | |
Net Assets: | | | | | | | | | | | | | | | | | | | | |
Beginning of period | | | 250,547,212 | | | | 214,412,941 | | | | 374,101,725 | | | | 274,682,317 | | | | — | |
End of period | | $ | 233,592,724 | | | $ | 250,547,212 | | | $ | 374,811,269 | | | $ | 374,101,725 | | | $ | 1,173,151 | |
End of period undistributed net investment income | | $ | 253 | | | $ | 4,329 | | | | — | | | $ | 10,337 | | | | — | |
| | | | | | | | | | | | | | | | | | | | |
| * | Commencement of operations was on June 30, 2015. |
| 1 | See Note 1(g) of the Notes to Financial Statements. |
The accompanying notes are an integral part of these financial statements.
46
AMG GW&K Enhanced Core Bond Fund
Financial Highlights
For a share outstanding throughout each period
| | | | | | | | | | | | | | | | | | | | |
| | | For the years ended December 31, | |
| Investor Class | | 2015 | | | 2014 | | | 2013 | | | 2012 | | | 2011 | |
Net Asset Value, Beginning of Year | | $ | 10.22 | | | $ | 9.96 | | | $ | 11.24 | | | $ | 10.81 | | | $ | 11.00 | |
Income from Investment Operations: | | | | | | | | | | | | | | | | | | | | |
Net investment income1,2 | | | 0.29 | | | | 0.29 | | | | 0.24 | | | | 0.44 | | | | 0.46 | |
Net realized and unrealized gain (loss) on investments | | | (0.64 | ) | | | 0.26 | | | | (0.21 | ) | | | 0.58 | | | | 0.03 | |
Total from investment operations | | | (0.35 | ) | | | 0.55 | | | | 0.03 | | | | 1.02 | | | | 0.49 | |
Less Distributions to Shareholders from: | | | | | | | | | | | | | | | | | | | | |
Net investment income | | | (0.29 | ) | | | (0.29 | ) | | | (0.26 | ) | | | (0.48 | ) | | | (0.51 | ) |
Net realized gain on investments | | | — | | | | — | | | | (1.05 | ) | | | (0.11 | ) | | | (0.17 | ) |
Total distributions to shareholders | | | (0.29 | ) | | | (0.29 | ) | | | (1.31 | ) | | | (0.59 | ) | | | (0.68 | ) |
Net Asset Value, End of Year | | $ | 9.58 | | | $ | 10.22 | | | $ | 9.96 | | | $ | 11.24 | | | $ | 10.81 | |
Total Return2 | | | (3.51 | )%6 | | | 5.58 | % | | | 0.29 | % | | | 9.53 | % | | | 4.53 | % |
Ratio of net expenses to average net assets (with offsets/reductions) | | | 0.84 | % | | | 0.84 | % | | | 0.86 | %4 | | | 0.84 | %5 | | | 0.84 | % |
Ratio of expenses to average net assets (with offsets) | | | 0.84 | % | | | 0.84 | % | | | 0.86 | %4 | | | 0.84 | %5 | | | 0.84 | % |
Ratio of total expenses to average net assets (without offsets/reductions)3 | | | 1.07 | % | | | 1.09 | % | | | 1.08 | %4 | | | 1.04 | %5 | | | 1.05 | % |
Ratio of net investment income to average net assets2 | | | 2.87 | % | | | 2.82 | % | | | 2.14 | %4 | | | 3.92 | %5 | | | 4.18 | % |
Portfolio turnover | | | 57 | % | | | 22 | % | | | 43 | % | | | 110 | % | | | 28 | % |
Net assets at end of year (000’s omitted) | | $ | 20,203 | | | $ | 27,444 | | | $ | 32,009 | | | $ | 41,772 | | | $ | 35,647 | |
| | | | | | | | | | | | | | | | | | | | |
| | | | | | | | | | | | | | | | |
| | | For the years ended
December 31, | | | For the period from
December 1, 2012 through | |
| Service Class | | 2015 | | | 2014 | | | 2013 | | | December 31, 2012* | |
Net Asset Value, Beginning of Period | | $ | 10.26 | | | $ | 9.99 | | | $ | 11.28 | | | $ | 11.41 | |
Income from Investment Operations: | | | | | | | | | | | | | | | | |
Net investment income1,2 | | | 0.30 | | | | 0.31 | | | | 0.26 | | | | 0.02 | |
Net realized and unrealized gain (loss) on investments | | | (0.63 | ) | | | 0.27 | | | | (0.22 | ) | | | 0.01 | |
Total from investment operations | | | (0.33 | ) | | | 0.58 | | | | 0.04 | | | | 0.03 | |
Less Distributions to Shareholders from: | | | | | | | | | | | | | | | | |
Net investment income | | | (0.31 | ) | | | (0.31 | ) | | | (0.28 | ) | | | (0.05 | ) |
Net realized gain on investments | | | — | | | | — | | | | (1.05 | ) | | | (0.11 | ) |
Total distributions to shareholders | | | (0.31 | ) | | | (0.31 | ) | | | (1.33 | ) | | | (0.16 | ) |
Net Asset Value, End of Period | | $ | 9.62 | | | $ | 10.26 | | | $ | 9.99 | | | $ | 11.28 | |
Total Return2 | | | (3.30 | )% | | | 5.84 | % | | | 0.41 | % | | | 0.26 | %17 |
Ratio of net expenses to average net assets (with offsets/reductions) | | | 0.67 | % | | | 0.65 | % | | | 0.69 | %4 | | | 0.64 | %5,18 |
Ratio of expenses to average net assets (with offsets) | | | 0.67 | % | | | 0.65 | % | | | 0.69 | %4 | | | 0.64 | %5,18 |
Ratio of total expenses to average net assets (without offsets/reductions)3 | | | 0.90 | % | | | 0.90 | % | | | 0.91 | %4 | | | 0.90 | %5,18 |
Ratio of net investment income to average net assets2 | | | 2.96 | % | | | 3.00 | % | | | 2.31 | %4 | | | 2.07 | %5,18 |
Portfolio turnover | | | 57 | % | | | 22 | % | | | 43 | % | | | 110 | % |
Net assets at end of period (000’s omitted) | | $ | 7,463 | | | $ | 2,480 | | | $ | 1,563 | | | $ | 10 | |
| | | | | | | | | | | | | | | | |
47
AMG GW&K Enhanced Core Bond Fund
Financial Highlights
For a share outstanding throughout each year
| | | | | | | | | | | | | | | | | | | | |
| | | For the years ended December 31, | |
| Class C | | 2015 | | | 2014 | | | 2013 | | | 2012†† | | | 2011 | |
Net Asset Value, Beginning of Year | | $ | 10.20 | | | $ | 9.94 | | | $ | 11.22 | | | $ | 10.79 | | | $ | 10.98 | |
Income from Investment Operations: | | | | | | | | | | | | | | | | | | | | |
Net investment income1,2 | | | 0.21 | | | | 0.21 | | | | 0.15 | | | | 0.36 | | | | 0.38 | |
Net realized and unrealized gain (loss) on investments | | | (0.63 | ) | | | 0.26 | | | | (0.20 | ) | | | 0.57 | | | | 0.02 | |
Total from investment operations | | | (0.42 | ) | | | 0.47 | | | | (0.05 | ) | | | 0.93 | | | | 0.40 | |
Less Distributions to Shareholders from: | | | | | | | | | | | | | | | | | | | | |
Net investment income | | | (0.21 | ) | | | (0.21 | ) | | | (0.18 | ) | | | (0.39 | ) | | | (0.42 | ) |
Net realized gain on investments | | | — | | | | — | | | | (1.05 | ) | | | (0.11 | ) | | | (0.17 | ) |
Total distributions to shareholders | | | (0.21 | ) | | | (0.21 | ) | | | (1.23 | ) | | | (0.50 | ) | | | (0.59 | ) |
Net Asset Value, End of Year | | $ | 9.57 | | | $ | 10.20 | | | $ | 9.94 | | | $ | 11.22 | | | $ | 10.79 | |
Total Return2 | | | (4.15 | )%6 | | | 4.79 | % | | | (0.50 | )%6 | | | 8.72 | %6 | | | 3.73 | % |
Ratio of net expenses to average net assets (with offsets/reductions) | | | 1.59 | % | | | 1.59 | % | | | 1.61 | %4 | | | 1.59 | %5 | | | 1.59 | % |
Ratio of expenses to average net assets (with offsets) | | | 1.59 | % | | | 1.59 | % | | | 1.61 | %4 | | | 1.59 | %5 | | | 1.59 | % |
Ratio of total expenses to average net assets (without offsets/reductions)3 | | | 1.82 | % | | | 1.84 | % | | | 1.83 | %4 | | | 1.79 | %5 | | | 1.80 | % |
Ratio of net investment income to average net assets2 | | | 2.12 | % | | | 2.07 | % | | | 1.38 | %4 | | | 3.18 | %5 | | | 3.42 | % |
Portfolio turnover | | | 57 | % | | | 22 | % | | | 43 | % | | | 110 | % | | | 28 | % |
Net assets at end of year (000’s omitted) | | $ | 11,031 | | | $ | 15,927 | | | $ | 20,793 | | | $ | 33,026 | | | $ | 33,615 | |
| | | | | | | | | | | | | | | | | | | | |
| |
| | | For the years ended December 31, | |
| Institutional Class | | 2015 | | | 2014 | | | 2013 | | | 2012 | | | 2011 | |
Net Asset Value, Beginning of Year | | $ | 10.25 | | | $ | 9.99 | | | $ | 11.28 | | | $ | 10.84 | | | $ | 11.03 | |
Income from Investment Operations: | | | | | | | | | | | | | | | | | | | | |
Net investment income1,2 | | | 0.31 | | | | 0.31 | | | | 0.27 | | | | 0.47 | | | | 0.49 | |
Net realized and unrealized gain (loss) on investments | | | (0.63 | ) | | | 0.27 | | | | (0.22 | ) | | | 0.58 | | | | 0.02 | |
Total from investment operations | | | (0.32 | ) | | | 0.58 | | | | 0.05 | | | | 1.05 | | | | 0.51 | |
Less Distributions to Shareholders from: | | | | | | | | | | | | | | | | | | | | |
Net investment income | | | (0.32 | ) | | | (0.32 | ) | | | (0.29 | ) | | | (0.50 | ) | | | (0.53 | ) |
Net realized gain on investments | | | — | | | | — | | | | (1.05 | ) | | | (0.11 | ) | | | (0.17 | ) |
Total distributions to shareholders | | | (0.32 | ) | | | (0.32 | ) | | | (1.34 | ) | | | (0.61 | ) | | | (0.70 | ) |
Net Asset Value, End of Year | | $ | 9.61 | | | $ | 10.25 | | | $ | 9.99 | | | $ | 11.28 | | | $ | 10.84 | |
Total Return2 | | | (3.15 | )% | | | 5.85 | % | | | 0.46 | % | | | 9.89 | % | | | 4.79 | % |
Ratio of net expenses to average net assets (with offsets/reductions) | | | 0.59 | % | | | 0.59 | % | | | 0.61 | %4 | | | 0.59 | %5 | | | 0.59 | % |
Ratio of expenses to average net assets (with offsets) | | | 0.59 | % | | | 0.59 | % | | | 0.61 | %4 | | | 0.59 | %5 | | | 0.59 | % |
Ratio of total expenses to average net assets (without offsets/reductions)3 | | | 0.82 | % | | | 0.84 | % | | | 0.83 | %4 | | | 0.79 | %5 | | | 0.80 | % |
Ratio of net investment income to average net assets2 | | | 3.10 | % | | | 3.05 | % | | | 2.39 | %4 | | | 4.21 | %5 | | | 4.41 | % |
Portfolio turnover | | | 57 | % | | | 22 | % | | | 43 | % | | | 110 | % | | | 28 | % |
Net assets at end of year (000’s omitted) | | $ | 47,402 | | | $ | 41,968 | | | $ | 59,182 | | | $ | 65,573 | | | $ | 64,573 | |
| | | | | | | | | | | | | | | | | | | | |
48
AMG GW&K Municipal Bond Fund
Financial Highlights
For a share outstanding throughout each year
| | | | | | | | | | | | | | | | | | | | |
| | | For the years ended December 31, | |
| Investor Class | | 2015 | | | 2014 | | | 2013 | | | 2012 | | | 2011 | |
Net Asset Value, Beginning of Year | | $ | 11.61 | | | $ | 11.02 | | | $ | 11.52 | | | $ | 11.21 | | | $ | 10.29 | |
Income from Investment Operations: | | | | | | | | | | | | | | | | | | | | |
Net investment income1,2 | | | 0.15 | | | | 0.18 | | | | 0.18 | | | | 0.20 | | | | 0.27 | |
Net realized and unrealized gain (loss) on investments | | | 0.24 | | | | 0.63 | | | | (0.47 | ) | | | 0.38 | | | | 0.97 | |
Total from investment operations | | | 0.39 | | | | 0.81 | | | | (0.29 | ) | | | 0.58 | | | | 1.24 | |
Less Distributions to Shareholders from: | | | | | | | | | | | | | | | | | | | | |
Net investment income | | | (0.15 | ) | | | (0.18 | ) | | | (0.17 | ) | | | (0.19 | ) | | | (0.27 | ) |
Net realized gain on investments | | | (0.15 | ) | | | (0.04 | ) | | | (0.04 | ) | | | (0.08 | ) | | | (0.05 | ) |
Total distributions to shareholders | | | (0.30 | ) | | | (0.22 | ) | | | (0.21 | ) | | | (0.27 | ) | | | (0.32 | ) |
Net Asset Value, End of Year | | $ | 11.70 | | | $ | 11.61 | | | $ | 11.02 | | | $ | 11.52 | | | $ | 11.21 | |
Total Return2 | | | 3.36 | % | | | 7.39 | % | | | (2.51 | )%6 | | | 5.27 | %6 | | | 12.16 | % |
Ratio of net expenses to average net assets (with offsets/reductions) | | | 0.82 | % | | | 0.80 | % | | | 0.81 | %7 | | | 0.80 | %8 | | | 0.81 | % |
Ratio of expenses to average net assets (with offsets) | | | 0.82 | % | | | 0.80 | % | | | 0.81 | %7 | | | 0.80 | %8 | | | 0.81 | % |
Ratio of total expenses to average net assets (without offsets/reductions)3 | | | 1.13 | % | | | 1.12 | % | | | 1.17 | %7 | | | 1.18 | %8 | | | 1.34 | % |
Ratio of net investment income to average net assets2 | | | 1.28 | % | | | 1.55 | % | | | 1.56 | %7 | | | 1.71 | %8 | | | 2.46 | % |
Portfolio turnover | | | 78 | % | | | 31 | % | | | 28 | % | | | 39 | % | | | 26 | % |
Net assets at end of year (000’s omitted) | | $ | 27,362 | | | $ | 23,572 | | | $ | 28,655 | | | $ | 22,726 | | | $ | 8,777 | |
| | | | | | | | | | | | | | | | | | | | |
| |
| | | For the years ended December 31, | |
| Service Class | | 2015 | | | 2014 | | | 2013 | | | 2012 | | | 2011 | |
Net Asset Value, Beginning of Year | | $ | 11.63 | | | $ | 11.04 | | | $ | 11.54 | | | $ | 11.23 | | | $ | 10.30 | |
Income from Investment Operations: | | | | | | | | | | | | | | | | | | | | |
Net investment income1,2 | | | 0.19 | | | | 0.21 | | | | 0.21 | | | | 0.23 | | | | 0.30 | |
Net realized and unrealized gain (loss) on investments | | | 0.24 | | | | 0.63 | | | | (0.47 | ) | | | 0.38 | | | | 0.97 | |
Total from investment operations | | | 0.43 | | | | 0.84 | | | | (0.26 | ) | | | 0.61 | | | | 1.27 | |
Less Distributions to Shareholders from: | | | | | | | | | | | | | | | | | | | | |
Net investment income | | | (0.18 | ) | | | (0.21 | ) | | | (0.20 | ) | | | (0.22 | ) | | | (0.29 | ) |
Net realized gain on investments | | | (0.15 | ) | | | (0.04 | ) | | | (0.04 | ) | | | (0.08 | ) | | | (0.05 | ) |
Total distributions to shareholders | | | (0.33 | ) | | | (0.25 | ) | | | (0.24 | ) | | | (0.30 | ) | | | (0.34 | ) |
Net Asset Value, End of Year | | $ | 11.73 | | | $ | 11.63 | | | $ | 11.04 | | | $ | 11.54 | | | $ | 11.23 | |
Total Return2 | | | 3.77 | % | | | 7.62 | % | | | (2.24 | )% | | | 5.53 | % | | | 12.52 | % |
Ratio of net expenses to average net assets (with offsets/reductions) | | | 0.51 | % | | | 0.52 | % | | | 0.53 | %7 | | | 0.55 | %8 | | | 0.54 | % |
Ratio of expenses to average net assets (with offsets) | | | 0.51 | % | | | 0.52 | % | | | 0.53 | %7 | | | 0.55 | %8 | | | 0.54 | % |
Ratio of total expenses to average net assets (without offsets/reductions)3 | | | 0.82 | % | | | 0.84 | % | | | 0.89 | %7 | | | 0.93 | %8 | | | 1.09 | % |
Ratio of net investment loss to average net assets2 | | | 1.59 | % | | | 1.82 | % | | | 1.84 | %7 | | | 1.97 | %8 | | | 2.80 | % |
Portfolio turnover | | | 78 | % | | | 31 | % | | | 28 | % | | | 39 | % | | | 26 | % |
Net assets at end of year (000’s omitted) | | $ | 128,684 | | | $ | 98,152 | | | $ | 53,024 | | | $ | 35,444 | | | $ | 22,705 | |
| | | | | | | | | | | | | | | | | | | | |
49
AMG GW&K Municipal Bond Fund
Financial Highlights
For a share outstanding throughout each year
| | | | | | | | | | | | | | | | | | | | |
| | | For the years ended December 31, | |
| Institutional Class | | 2015 | | | 2014 | | | 2013 | | | 2012 | | | 2011 | |
Net Asset Value, Beginning of Year | | $ | 11.67 | | | $ | 11.08 | | | $ | 11.58 | | | $ | 11.26 | | | $ | 10.33 | |
Income from Investment Operations: | | | | | | | | | | | | | | | | | | | | |
Net investment income1,2 | | | 0.21 | | | | 0.23 | | | | 0.23 | | | | 0.25 | | | | 0.30 | |
Net realized and unrealized gain (loss) on investments | | | 0.24 | | | | 0.63 | | | | (0.47 | ) | | | 0.40 | | | | 0.99 | |
Total income (loss) from investment operations | | | 0.45 | | | | 0.86 | | | | (0.24 | ) | | | 0.65 | | | | 1.29 | |
Less Distributions to Shareholders from: | | | | | | | | | | | | | | | | | | | | |
Net investment income | | | (0.20 | ) | | | (0.23 | ) | | | (0.22 | ) | | | (0.25 | ) | | | (0.31 | ) |
Net realized gain on investments | | | (0.15 | ) | | | (0.04 | ) | | | (0.04 | ) | | | (0.08 | ) | | | (0.05 | ) |
Total distributions to shareholders | | | (0.35 | ) | | | (0.27 | ) | | | (0.26 | ) | | | (0.33 | ) | | | (0.36 | ) |
Net Asset Value, End of Year | | $ | 11.77 | | | $ | 11.67 | | | $ | 11.08 | | | $ | 11.58 | | | $ | 11.26 | |
Total Return2 | | | 3.94 | % | | | 7.80 | % | | | (2.02 | )% | | | 5.80 | %6 | | | 12.71 | %6 |
Ratio of net expenses to average net assets (with offsets/reductions) | | | 0.34 | % | | | 0.34 | % | | | 0.36 | %7 | | | 0.35 | %8 | | | 0.34 | % |
Ratio of expenses to average net assets (with offsets) | | | 0.34 | % | | | 0.34 | % | | | 0.36 | %7 | | | 0.35 | %8 | | | 0.34 | % |
Ratio of total expenses to average net assets (without offsets/reductions)3 | | | 0.65 | % | | | 0.66 | % | | | 0.72 | %7 | | | 0.73 | %8 | | | 0.83 | % |
Ratio of net investment income to average net assets2 | | | 1.76 | % | | | 2.00 | % | | | 2.01 | %7 | | | 2.15 | %8 | | | 2.79 | % |
Portfolio turnover | | | 78 | % | | | 31 | % | | | 28 | % | | | 39 | % | | | 26 | % |
Net assets at end of year (000’s omitted) | | $ | 655,760 | | | $ | 393,581 | | | $ | 204,711 | | | $ | 121,609 | | | $ | 32,019 | |
| | | | | | | | | | | | | | | | | | | | |
50
AMG GW&K Municipal Enhanced Yield Fund
Financial Highlights
For a share outstanding throughout each year
| | | | | | | | | | | | | | | | | | | | |
| | | For the years ended December 31, | |
| Investor Class | | 2015 | | | 2014 | | | 2013 | | | 2012 | | | 2011 | |
Net Asset Value, Beginning of Year | | $ | 10.16 | | | $ | 8.98 | | | $ | 10.24 | | | $ | 9.55 | | | $ | 8.79 | |
Income from Investment Operations: | | | | | | | | | | | | | | | | | | | | |
Net investment income1,2 | | | 0.30 | | | | 0.34 | | | | 0.35 | | | | 0.36 | | | | 0.37 | |
Net realized and unrealized gain (loss) on investments | | | 0.05 | | | | 1.18 | | | | (1.18 | ) | | | 0.93 | | | | 0.78 | |
Total from investment operations | | | 0.35 | | | | 1.52 | | | | (0.83 | ) | | | 1.29 | | | | 1.15 | |
Less Distributions to Shareholders from: | | | | | | | | | | | | | | | | | | | | |
Net investment income | | | (0.30 | ) | | | (0.34 | ) | | | (0.36 | ) | | | (0.36 | ) | | | (0.37 | ) |
Net realized gain on investments | | | (0.13 | ) | | | — | | | | (0.07 | ) | | | (0.24 | ) | | | (0.02 | ) |
Total distributions to shareholders | | | (0.43 | ) | | | (0.34 | ) | | | (0.43 | ) | | | (0.60 | ) | | | (0.39 | ) |
Net Asset Value, End of Year | | $ | 10.08 | | | $ | 10.16 | | | $ | 8.98 | | | $ | 10.24 | | | $ | 9.55 | |
Total Return2 | | | 3.57 | % | | | 17.14 | % | | | (8.27 | )%6 | | | 13.69 | %6 | | | 13.48 | % |
Ratio of net expenses to average net assets (with offsets/reductions) | | | 1.07 | % | | | 1.00 | % | | | 1.12 | %9 | | | 1.07 | %10 | | | 1.17 | %11 |
Ratio of expenses to average net assets (with offsets) | | | 1.07 | % | | | 1.00 | % | | | 1.12 | %9 | | | 1.07 | %10 | | | 1.17 | %11 |
Ratio of total expenses to average net assets (without offsets/reductions)3 | | | 1.25 | % | | | 1.19 | % | | | 1.30 | %9 | | | 1.27 | %10 | | | 1.40 | % |
Ratio of net investment income to average net assets2 | | | 2.98 | % | | | 3.46 | % | | | 3.58 | %9 | | | 3.53 | %10 | | | 4.02 | % |
Portfolio turnover | | | 120 | % | | | 83 | % | | | 52 | % | | | 70 | % | | | 31 | % |
Net assets at end of year (000’s omitted) | | $ | 5,500 | | | $ | 8,507 | | | $ | 8,030 | | | $ | 21,413 | | | $ | 5,689 | |
| | | | | | | | | | | | | | | | | | | | |
| |
| | | For the years ended December 31, | |
| Service Class | | 2015 | | | 2014 | | | 2013 | | | 2012 | | | 2011 | |
Net Asset Value, Beginning of Year | | $ | 10.16 | | | $ | 8.98 | | | $ | 10.23 | | | $ | 9.54 | | | $ | 8.79 | |
Income from Investment Operations: | | | | | | | | | | | | | | | | | | | | |
Net investment income1,2 | | | 0.34 | | | | 0.36 | | | | 0.38 | | | | 0.38 | | | | 0.40 | |
Net realized and unrealized gain (loss) on investments | | | 0.06 | | | | 1.18 | | | | (1.18 | ) | | | 0.93 | | | | 0.77 | |
Total from investment operations | | | 0.40 | | | | 1.54 | | | | (0.80 | ) | | | 1.31 | | | | 1.17 | |
Less Distributions to Shareholders from: | | | | | | | | | | | | | | | | | | | | |
Net investment income | | | (0.34 | ) | | | (0.36 | ) | | | (0.38 | ) | | | (0.38 | ) | | | (0.40 | ) |
Net realized gain on investments | | | (0.13 | ) | | | — | | | | (0.07 | ) | | | (0.24 | ) | | | (0.02 | ) |
Total distributions to shareholders | | | (0.47 | ) | | | (0.36 | ) | | | (0.45 | ) | | | (0.62 | ) | | | (0.42 | ) |
Net Asset Value, End of Year | | $ | 10.09 | | | $ | 10.16 | | | $ | 8.98 | | | $ | 10.23 | | | $ | 9.54 | |
Total Return2 | | | 4.07 | % | | | 17.39 | % | | | (7.95 | )% | | | 13.90 | % | | | 13.65 | % |
Ratio of net expenses to average net assets (with offsets/reductions) | | | 0.71 | % | | | 0.72 | % | | | 0.78 | %9 | | | 0.86 | %10 | | | 0.94 | %11 |
Ratio of expenses to average net assets (with offsets) | | | 0.71 | % | | | 0.72 | % | | | 0.78 | %9 | | | 0.86 | %10 | | | 0.94 | %11 |
Ratio of total expenses to average net assets (without offsets/reductions)3 | | �� | 0.89 | % | | | 0.91 | % | | | 0.96 | %9 | | | 1.06 | %10 | | | 1.16 | % |
Ratio of net investment income to average net assets2 | | | 3.35 | % | | | 3.68 | % | | | 3.99 | %9 | | | 3.74 | %10 | | | 4.48 | % |
Portfolio turnover | | | 120 | % | | | 83 | % | | | 52 | % | | | 70 | % | | | 31 | % |
Net assets at end of year (000’s omitted) | | $ | 16,036 | | | $ | 15,757 | | | $ | 5,222 | | | $ | 6,401 | | | $ | 2,145 | |
| | | | | | | | | | | | | | | | | | | | |
51
AMG GW&K Municipal Enhanced Yield Fund
Financial Highlights
For a share outstanding throughout each year
| | | | | | | | | | | | | | | | | | | | |
| | | For the years ended December 31, | |
| Institutional Class | | 2015 | | | 2014 | | | 2013 | | | 2012 | | | 2011 | |
Net Asset Value, Beginning of Year | | $ | 10.14 | | | $ | 8.97 | | | $ | 10.22 | | | $ | 9.53 | | | $ | 8.78 | |
Income from Investment Operations: | | | | | | | | | | | | | | | | | | | | |
Net investment income1,2 | | | 0.34 | | | | 0.37 | | | | 0.39 | | | | 0.40 | | | | 0.41 | |
Net realized and unrealized gain (loss) on investments | | | 0.07 | | | | 1.17 | | | | (1.17 | ) | | | 0.93 | | | | 0.78 | |
Total from investment operations | | | 0.41 | | | | 1.54 | | | | (0.78 | ) | | | 1.33 | | | | 1.19 | |
Less Distributions to Shareholders from: | | | | | | | | | | | | | | | | | | | | |
Net investment income | | | (0.35 | ) | | | (0.37 | ) | | | (0.40 | ) | | | (0.40 | ) | | | (0.42 | ) |
Net realized gain on investments | | | (0.13 | ) | | | — | | | | (0.07 | ) | | | (0.24 | ) | | | (0.02 | ) |
Total distributions to shareholders | | | (0.48 | ) | | | (0.37 | ) | | | (0.47 | ) | | | (0.64 | ) | | | (0.44 | ) |
Net Asset Value, End of Year | | $ | 10.07 | | | $ | 10.14 | | | $ | 8.97 | | | $ | 10.22 | | | $ | 9.53 | |
Total Return2 | | | 4.15 | % | | | 17.45 | % | | | (7.80 | )% | | | 14.13 | %6 | | | 13.94 | % |
Ratio of net expenses to average net assets (with offsets/reductions) | | | 0.64 | % | | | 0.64 | % | | | 0.66 | %9 | | | 0.65 | %10 | | | 0.69 | %11 |
Ratio of expenses to average net assets (with offsets) | | | 0.64 | % | | | 0.64 | % | | | 0.66 | %9 | | | 0.65 | %10 | | | 0.69 | %11 |
Ratio of total expenses to average net assets (without offsets/reductions)3 | | | 0.82 | % | | | 0.83 | % | | | 0.84 | %9 | | | 0.85 | %10 | | | 0.91 | % |
Ratio of net investment income to average net assets2 | | | 3.42 | % | | | 3.83 | % | | | 4.08 | %9 | | | 3.96 | %10 | | | 4.69 | % |
Portfolio turnover | | | 120 | % | | | 83 | % | | | 52 | % | | | 70 | % | | | 31 | % |
Net assets at end of year (000’s omitted) | | $ | 212,057 | | | $ | 226,284 | | | $ | 201,161 | | | $ | 294,983 | | | $ | 138,250 | |
52
AMG GW&K Small Cap Core Fund
Financial Highlights
For a share outstanding throughout each year
| | | | | | | | | | | | | | | | | | | | |
| | | For the years ended December 31, | |
| Investor Class | | 2015 | | | 2014 | | | 2013 | | | 2012 | | | 2011 | |
Net Asset Value, Beginning of Year | | $ | 23.39 | | | $ | 24.34 | | | $ | 17.72 | | | $ | 15.87 | | | $ | 15.64 | |
Income from Investment Operations: | | | | | | | | | | | | | | | | | | | | |
Net investment income (loss)1,2 | | | (0.06 | )19 | | | (0.07 | )12 | | | (0.07 | )13 | | | 0.14 | 14 | | | (0.02 | ) |
Net realized and unrealized gain (loss) on investments | | | (0.64 | ) | | | 0.46 | | | | 7.56 | | | | 2.15 | | | | 0.25 | |
Total from investment operations | | | (0.70 | ) | | | 0.39 | | | | 7.49 | | | | 2.29 | | | | 0.23 | |
Less Distributions to Shareholders from: | | | | | | | | | | | | | | | | | | | | |
Net investment income | | | — | | | | — | | | | — | | | | (0.08 | ) | | | — | |
Net realized gain on investments | | | (0.89 | ) | | | (1.34 | ) | | | (0.87 | ) | | | (0.36 | ) | | | — | |
Total distributions to shareholders | | | (0.89 | ) | | | (1.34 | ) | | | (0.87 | ) | | | (0.44 | ) | | | — | |
Net Asset Value, End of Year | | $ | 21.80 | | | $ | 23.39 | | | $ | 24.34 | | | $ | 17.72 | | | $ | 15.87 | |
Total Return2 | | | (3.02 | )% | | | 1.53 | % | | | 42.26 | % | | | 14.45 | % | | | 1.47 | % |
Ratio of net expenses to average net assets (with offsets/reductions) | | | 1.35 | % | | | 1.42 | % | | | 1.37 | %15 | | | 1.41 | %16 | | | 1.39 | % |
Ratio of expenses to average net assets (with offsets) | | | 1.35 | % | | | 1.42 | % | | | 1.37 | %15 | | | 1.41 | %16 | | | 1.39 | % |
Ratio of total expenses to average net assets (without offsets/reductions)3 | | | 1.46 | % | | | 1.53 | % | | | 1.50 | %15 | | | 1.62 | %16 | | | 1.71 | % |
Ratio of net investment income (loss) to average net assets2 | | | (0.24 | )% | | | (0.28 | )% | | | (0.32 | )%15 | | | 0.78 | %16 | | | (0.14 | )% |
Portfolio turnover | | | 16 | % | | | 26 | % | | | 19 | % | | | 14 | % | | | 25 | % |
Net assets at end of year (000’s omitted) | | $ | 35,691 | | | $ | 37,995 | | | $ | 69,992 | | | $ | 14,707 | | | $ | 3,349 | |
| | | | | | | | | | | | | | | | | | | | |
| |
| | | For the years ended December 31, | |
| Service Class | | 2015 | | | 2014 | | | 2013 | | | 2012 | | | 2011 | |
Net Asset Value, Beginning of Year | | $ | 23.53 | | | $ | 24.42 | | | $ | 17.73 | | | $ | 15.85 | | | $ | 15.59 | |
Income from Investment Operations: | | | | | | | | | | | | | | | | | | | | |
Net investment income (loss)1,2 | | | 0.01 | 19 | | | 0.04 | 12 | | | (0.02 | )13 | | | 0.06 | 14 | | | 0.01 | |
Net realized and unrealized gain (loss) on investments | | | (0.65 | ) | | | 0.43 | | | | 7.58 | | | | 2.26 | | | | 0.25 | |
Total income from investment operations | | | (0.64 | ) | | | 0.47 | | | | 7.56 | | | | 2.32 | | | | 0.26 | |
Less Distributions to Shareholders from: | | | | | | | | | | | | | | | | | | | | |
Net investment income | | | (0.02 | ) | | | (0.01 | ) | | | — | | | | (0.08 | ) | | | — | |
Net realized gain on investments | | | (0.90 | ) | | | (1.35 | ) | | | (0.87 | ) | | | (0.36 | ) | | | — | |
Total distributions to shareholders | | | (0.92 | ) | | | (1.36 | ) | | | (0.87 | ) | | | (0.44 | ) | | | — | |
Net Asset Value, End of Year | | $ | 21.97 | | | $ | 23.53 | | | $ | 24.42 | | | $ | 17.73 | | | $ | 15.85 | |
Total Return2 | | | (2.75 | )% | | | 1.86 | % | | | 42.64 | %6 | | | 14.67 | %6 | | | 1.67 | %6 |
Ratio of net expenses to average net assets (with offsets/reductions) | | | 1.07 | % | | | 1.10 | % | | | 1.13 | %15 | | | 1.20 | %16 | | | 1.20 | % |
Ratio of expenses to average net assets (with offsets) | | | 1.07 | % | | | 1.10 | % | | | 1.13 | %15 | | | 1.20 | %16 | | | 1.20 | % |
Ratio of total expenses to average net assets (without offsets/reductions)3 | | | 1.18 | % | | | 1.22 | % | | | 1.26 | %15 | | | 1.41 | %16 | | | 1.52 | % |
Ratio of net investment income (loss) to average net assets2 | | | 0.03 | % | | | 0.16 | % | | | (0.09 | )%15 | | | 0.44 | %16 | | | 0.04 | % |
Portfolio turnover | | | 16 | % | | | 26 | % | | | 19 | % | | | 14 | % | | | 25 | % |
Net assets at end of year (000’s omitted) | | $ | 36,739 | | | $ | 44,806 | | | $ | 35,836 | | | $ | 13,052 | | | $ | 19,007 | |
| | | | | | | | | | | | | | | | | | | | |
53
AMG GW&K Small Cap Core Fund
Financial Highlights
For a share outstanding throughout each year
| | | | | | | | | | | | | | | | | | | | |
| | | For the years ended December 31, | |
| Institutional Class | | 2015 | | | 2014 | | | 2013 | | | 2012 | | | 2011 | |
Net Asset Value, Beginning of Year | | $ | 23.61 | | | $ | 24.49 | | | $ | 17.76 | | | $ | 15.87 | | | $ | 15.59 | |
Income from Investment Operations: | | | | | | | | | | | | | | | | | | | | |
Net investment income1,2 | | | 0.04 | 19 | | | 0.07 | 12 | | | 0.02 | 13 | | | 0.14 | 14 | | | 0.05 | |
Net realized and unrealized gain (loss) on investments | | | (0.65 | ) | | | 0.44 | | | | 7.58 | | | | 2.23 | | | | 0.25 | |
Total from investment operations | | | (0.61 | ) | | | 0.51 | | | | 7.60 | | | | 2.37 | | | | 0.30 | |
Less Distributions to Shareholders from: | | | | | | | | | | | | | | | | | | | | |
Net investment income | | | (0.05 | ) | | | (0.04 | ) | | | — | | | | (0.12 | ) | | | (0.02 | ) |
Net realized gain on investments | | | (0.91 | ) | | | (1.35 | ) | | | (0.87 | ) | | | (0.36 | ) | | | — | |
Total distributions to shareholders | | | (0.96 | ) | | | (1.39 | ) | | | (0.87 | ) | | | (0.48 | ) | | | (0.02 | ) |
Net Asset Value, End of Year | | $ | 22.04 | | | $ | 23.61 | | | $ | 24.49 | | | $ | 17.76 | | | $ | 15.87 | |
Total Return2 | | | (2.63 | )% | | | 2.04 | % | | | 42.81 | %6 | | | 14.97 | %6 | | | 1.90 | % |
Ratio of net expenses to average net assets (with offsets/reductions) | | | 0.95 | % | | | 0.95 | % | | | 0.97 | %15 | | | 0.96 | %16 | | | 0.95 | % |
Ratio of expenses to average net assets (with offsets) | | | 0.95 | % | | | 0.95 | % | | | 0.97 | %15 | | | 0.96 | %16 | | | 0.95 | % |
Ratio of total expenses to average net assets (without offsets/reductions)3 | | | 1.06 | % | | | 1.07 | % | | | 1.10 | %15 | | | 1.17 | %16 | | | 1.27 | % |
Ratio of net investment income to average net assets2 | | | 0.17 | % | | | 0.30 | % | | | 0.07 | %15 | | | 0.84 | %16 | | | 0.30 | % |
Portfolio turnover | | | 16 | % | | | 26 | % | | | 19 | % | | | 14 | % | | | 25 | % |
Net assets at end of year (000’s omitted) | | $ | 302,381 | | | $ | 291,301 | | | $ | 168,854 | | | $ | 76,673 | | | $ | 40,425 | |
| | | | | | | | | | | | | | | | | | | | |
54
AMG GW&K Small Cap Growth Fund
Financial Highlights
For a share outstanding throughout each period
| | | | |
| Institutional Class | | For the period
from June 30, 2015
through
December 31, 2015** | |
Net Asset Value, Beginning of Period | | $ | 10.00 | |
Income from Investment Operations: | | | | |
Net investment loss1,2 | | | (0.02 | ) |
Net realized and unrealized loss on investments | | | (1.03 | ) |
Total from investment operations | | | (1.05 | ) |
Net Asset Value, End of Period | | $ | 8.95 | |
Total Return2 | | | (10.50 | )%17 |
Ratio of net expenses to average net assets (with offsets/reductions) | | | 0.95 | %18 |
Ratio of expenses to average net assets (with offsets) | | | 0.95 | %18 |
Ratio of total expenses to average net assets (without offsets/reductions)3 | | | 11.39 | %18 |
Ratio of net investment loss to average net assets2 | | | (0.39 | )%18 |
Portfolio turnover | | | 41 | %17 |
Net assets at end of period (000’s omitted) | | $ | 1,173 | |
| | | | |
55
Notes to Financial Highlights
The following footnotes should be read in conjunction with the Financial Highlights of the Funds previously presented in this report.
| * | Commencement of operations was December 1, 2012. |
| ** | Commencement of operations was June 30, 2015. |
| †† | Effective December 1, 2012, Class C shares were closed to all new investors. |
| 1 | Per share numbers have been calculated using average shares. |
| 2 | Total returns and net investment income would have been lower had certain expenses not been offset. |
| 3 | Excludes the impact of expense reimbursements or fee waiver and expense reductions such as brokerage credits, but includes non-reimbursable expenses, if any, such as interest, taxes and extraordinary expenses. (See Notes 1(c) and 2 in the Notes to Financial Statements.) |
| 4 | Includes non-routine extraordinary expenses amounting to 0.021%, 0.016%, 0.021% and 0.020% of average net assets for the Investor Class, Service Class, Class C and Institutional Class, respectively. |
| 5 | Includes non-routine extraordinary expenses amounting to 0.004%, 0.005%, 0.004% and 0.004% of average net assets for the Investor Class, Service Class, Class C and Institutional Class, respectively. |
| 6 | The Total Return is based on the Financial Statement Net Asset Values as shown in the Financial Highlights. |
| 7 | Includes non-routine extraordinary expenses amounting to 0.021%, 0.020% and 0.020% of average net assets for the Investor Class, Service Class and Institutional Class, respectively. |
| 8 | Includes non-routine extraordinary expenses amounting to 0.005%, 0.005% and 0.005% of average net assets for the Investor Class, Service Class and Institutional Class, respectively. |
| 9 | Includes non-routine extraordinary expenses amounting to 0.024%, 0.022% and 0.023% of average net assets for the Investor Class, Service Class and Institutional Class, respectively. |
| 10 | Includes non-routine extraordinary expenses amounting to 0.006%, 0.005% and 0.005% of average net assets for the Investor Class, Service Class and Institutional Class, respectively. |
| 11 | Effective July 1, 2011, the Fund’s expense cap was reduced to 0.64% from 0.79%. The expense ratio shown reflects the weighted average expense ratio for the full year ended December 31, 2011. |
| 12 | Includes non-recurring dividends. Without these dividends, net investment income per share would have been $(0.11), $(0.00), and $0.03 for AMG GW&K Small Cap Core Fund’s Investor Class, Service Class, and Institutional Class shares, respectively. |
| 13 | Includes non-recurring dividends. Without these dividends, net investment income per share would have been $(0.09), $(0.04) and $0.00 for the Investor Class, Service Class and Institutional Class, respectively. |
| 14 | Includes non-recurring dividends. Without these dividends, net investment income per share would have been $0.03, $(0.05) and $0.03 for the Investor Class, Service Class and Institutional Class, respectively. |
| 15 | Includes non-routine extraordinary expenses amounting to 0.015%, 0.017% and 0.018% of average net assets for the Investor Class, Service Class and Institutional Class, respectively. |
| 16 | Includes non-routine extraordinary expenses amounting to 0.008%, 0.004% and 0.005% of average net assets for the Investor Class, Service Class and Institutional Class, respectively. |
| 19 | Includes non-recurring dividends. Without these dividends, net investment income per share would have been $(0.05), $0.01 and $0.05 for the Investor Class, Service Class and Institutional Class, respectively. |
56
|
Notes to Financial Statements December 31, 2015 |
1.SUMMARY OF SIGNIFICANT ACCOUNTING POLICIES
AMG Funds and AMG Funds II (the “Trusts”) are open-end management investment companies, organized as Massachusetts business trusts, and registered under the Investment Company Act of 1940, as amended (the “1940 Act”). Currently, the Trusts consist of a number of different funds, each having distinct investment management objectives, strategies, risks, and policies. Included in this report are AMG Funds: AMG GW&K Municipal Bond Fund (“Municipal Bond”), AMG GW&K Municipal Enhanced Yield Fund (“Municipal Enhanced”), AMG GW&K Small Cap Core Fund (“Small Cap Core”) and AMG GW&K Small Cap Growth Fund (“Small Cap Growth”) and AMG Funds II: AMG GW&K Enhanced Core Bond Fund (“Enhanced Core Bond”), each a “Fund” and collectively, the “Funds.”
Each Fund has established the following classes of shares: Investor Class, Service Class and Institutional Class. Currently, Enhanced Core Bond, Municipal Bond, Municipal Enhanced and Small Cap Core offer Investor Class, Service Class and Institutional Class Shares. Small Cap Growth offers Institutional Class shares only. Additionally, Enhanced Core Bond established and offers Class C shares. The Small Cap Growth Fund commenced operations on June 30, 2015.
Each class represents an interest in the same assets of the Fund. Although all share classes generally have identical voting rights, each share class votes separately when required by law. Different share classes may pay different distribution amounts to the extent the net asset value per share and/or the expenses of such share classes differ. Each share class has its own expense structure. Please refer to a current prospectus for additional information on each share class.
Effective December 1, 2012, Class C shares of Enhanced Core Bond were closed to all new investors and will no longer be available for purchase by existing shareholders. Shareholders who redeem Class C shares of the Fund will continue to be subject to the deferred sales charges described in the prospectus. Effective November 1, 2013, Small Cap Core was closed to new investors. Please refer to Enhanced Core Bond’s and Small Cap Core’s current prospectus for additional information.
The Funds’ financial statements are prepared in accordance with accounting principles generally accepted in the United States of America (“U.S. GAAP”), which require management to make estimates and assumptions that affect the reported amounts of assets and liabilities and disclosure of contingent assets and liabilities at the date of the financial statements and the reported amounts of income and expenses during the reporting period. Actual results could differ from those estimates and such differences could be material. The following is a summary of significant accounting policies followed by the Funds in the preparation of their financial statements:
a. VALUATION OF INVESTMENTS
Equity securities, traded on a national securities exchange or reported on the NASDAQ national market system (“NMS”) are valued at the last quoted sales price on the primary exchange or, if applicable, the NASDAQ official closing price or the official closing price of the relevant exchange or, lacking any sales, at the last quoted bid price or the mean between the last quoted bid and ask prices (the “exchange mean price”). Equity securities traded in the over-the-counter market (other than NMS securities) are valued at the exchange mean
price. Foreign equity securities (securities principally traded in markets other than U.S. markets) are valued at the official closing price on the primary exchange or, for markets that either do not offer an official closing price or where the official closing price may not be representative of the overall market, the last quoted sale price.
Fixed income securities purchased with a remaining maturity exceeding 60 days are valued at the evaluated mean price provided by an authorized pricing service or, if an evaluated price is not available, by reference to other securities which are considered comparable in credit rating, interest rate, due date and other features (generally referred to as “matrix pricing”) or other similar pricing methodologies. Investments in certain mortgage-backed and stripped mortgage-backed securities, preferred stocks, convertible securities, derivatives and other debt securities not traded on an organized securities market are valued on the basis of valuations provided by dealers or by a pricing service which uses information with respect to transactions in such securities and various relationships between such securities and yield to maturity in determining value.
Fixed income securities purchased with a remaining maturity of 60 days or less are valued at amortized cost, provided that the amortized cost value is approximately the same as the fair value of the security valued without the use of amortized cost. Investments in other open-end regulated investment companies are valued at their end of day net asset value per share.
The Funds’ portfolio investments are generally valued based on independent market quotations or prices or, if none, “evaluative” or other market based valuations provided by third-party pricing services approved by the Board of Trustees of the Trust (the “Board”). Under certain circumstances, the value of certain Fund portfolio investments (including derivatives) may be based on an evaluation of fair value, pursuant to procedures established by and under the general supervision of the Board. The Valuation Committee, which is comprised of the Independent Trustees of the Board, and the Pricing Committee, which is comprised of representatives from AMG Funds LLC (the “Investment Manager”) are the committees appointed by the Board to make fair value determinations. Each Fund may use the fair value of a portfolio investment to calculate its net asset value (“NAV”) in the event that the market quotation, price or market based valuation for the portfolio investment is not readily available or otherwise not determinable pursuant to the Board’s valuation procedures, if the Investment Manager for the Pricing Committee believes the quotation, price or market based valuation to be unreliable, or in certain other circumstances. When determining the fair value of an investment, the Pricing Committee and, if required under the Trust’s securities valuation procedures, the Valuation Committee, seeks to determine the price that the Fund might reasonably expect to receive from current sale of that portfolio investment in an arms-length transaction. Fair value determinations shall be based upon consideration of all available facts and information, including, but not limited to (i) attributes specific to the investment; (ii) fundamental and analytical data relating to the investment; and (iii) the value of other comparable securities or relevant financial instruments, including derivative securities, traded on other markets or among dealers.
The values assigned to fair value investments are based on available information and do not necessarily represent amounts that might ultimately be
57
Notes to Financial Statements (continued)
realized in the future, since such amounts depend on future developments inherent in long-term investments. Because of the inherent uncertainty of valuation, those estimated values may differ significantly from the values that would have been used had a ready market for the investments existed, and the differences could be material. The Board will be presented with a quarterly report showing as of the most recent quarter end, all outstanding securities fair valued by the Fund, including a comparison with the prior quarter end and the percentage of the Fund that the security represents at each quarter end.
With respect to foreign equity securities and certain foreign fixed income securities, the Board has adopted a policy that securities held in a Fund that can be fair valued by the applicable fair value pricing service are fair valued on each business day provided that each individual price exceeds a pre-established confidence level.
U.S. GAAP defines fair value as the price that a fund would receive to sell an asset or pay to transfer a liability in an orderly transaction between market participants at the measurement date. U.S. GAAP also establishes a framework for measuring fair value, and a three-level hierarchy for fair value measurements based upon the transparency of inputs to the valuation of an asset or liability. Inputs may be observable or unobservable and refer broadly to the assumptions that market participants would use in pricing the asset or liability. Observable inputs reflect the assumptions market participants would use in pricing the asset or liability based on market data obtained from sources independent of the Funds. Unobservable inputs reflect the Funds’ own assumptions about the assumptions that market participants would use in pricing the asset or liability developed based on the best information available in the circumstances. Each investment is assigned a level based upon the observability of the inputs which are significant to the overall valuation.
The three-tier hierarchy of inputs is summarized below:
Level 1 – inputs are quoted prices in active markets for identical investments (e.g., equity securities, open-end investment companies)
Level 2 – other observable inputs (including, but not limited to: quoted prices for similar assets or liabilities in markets that are active, quoted prices for identical or similar assets or liabilities in markets that are not active, inputs other than quoted prices that are observable for the assets or liabilities (such as interest rates, yield curves, volatilities, prepayment speeds, loss severities, credit risks and default rates) or other market corroborated inputs) (e.g., debt securities, government securities, foreign currency exchange contracts, foreign securities utilizing international fair value pricing, broker-quoted securities, fair valued securities with observable inputs)
Level 3 – inputs are significant unobservable inputs (including the Fund’s own assumptions used to determine the fair value of investments) (e.g., fair valued securities with unobservable inputs)
Changes in inputs or methodologies used for valuing investments may result in a transfer in or out of levels within the fair value hierarchy. The inputs or methodologies used for valuing investments may not necessarily be an indication of the risk associated with investing in those investments. Transfers between different levels of the fair value disclosure hierarchy are deemed to have occurred as of the beginning of the reporting period.
b. SECURITY TRANSACTIONS
Security transactions are accounted for as of trade date. Realized gains and losses on securities sold are determined on the basis of identified cost.
c. INVESTMENT INCOME AND EXPENSES
Dividend income is recorded on the ex-dividend date. Dividend and interest income on foreign securities is recorded gross of any withholding tax. Interest income, which includes amortization of premium and accretion of discount on debt securities, is accrued as earned. Non-cash dividends included in dividend income, if any, are reported at the fair market value of the securities received. Distributions received in excess of income from return of capital including real estate investment trusts (REITs) are recorded as a reduction of the cost of the related investment and/or as a realized gain. If the Fund no longer owns the applicable securities, any distributions received in excess of income are recorded as an adjustment to realized gain. Other income and expenses are recorded on an accrual basis. Expenses that cannot be directly attributed to a Fund are apportioned among the funds in the AMG Trusts and other affiliated funds based upon their relative average net assets or number of shareholders. Investment income, realized and unrealized capital gains and losses, the common expenses of each Fund, and certain Fund level expense reductions, if any, are allocated on a pro-rata basis to each class based on the relative net assets of each class to the total net assets of each Fund.
The following fund had certain portfolio trades directed to various brokers, under a brokerage recapture program, which paid a portion of such Fund’s expenses. For the year ended December 31, 2015 the amount by which the Small Cap Core Fund’s expenses were reduced and the impact on the annualized expense ratios, if any, were as follows: $170 or 0.00%.
The Funds have a “balance credit” arrangement with The Bank of New York Mellon (“BNYM”), the Funds’ custodian, whereby each Fund is credited with an interest factor equal to 0.75% below the effective 90-day T-Bill rate for account balances left uninvested overnight. If the T-Bill rate falls below 0.75%, no credits will be earned. These credits serve to reduce custodian expenses that would otherwise be charged to each Fund. For the year ended December 31, 2015, the Funds’ custodian expense was not reduced.
Overdraft fees are computed at 1% above the effective Federal Funds rate on the day of the overdraft. For the year ended December 31, 2015, overdraft fees for Enhanced Core Bond, Municipal Bond, Municipal Enhanced, Small Cap Core and Small Cap Growth equaled $0, $104, $289, $35 and $0, respectively.
d. DIVIDENDS AND DISTRIBUTIONS
Fund distributions resulting from either net investment income or realized net capital gains, if any, will normally be declared and paid at least annually in December, as described in the Funds’ prospectus. Distributions to shareholders are recorded on the ex-dividend date. Distributions are determined in accordance with federal income tax regulations, which may differ from net investment income and net realized capital gains for financial statement purposes (U.S. GAAP). Differences may be permanent or temporary. Permanent differences are reclassified among capital accounts in the financial statements to reflect their tax character.
Notes to Financial Statements (continued)
Permanent book and tax basis differences, if any, relating to shareholder distributions will result in reclassifications to paid-in capital. Temporary differences arise when certain items of income, expense and gain or loss are
recognized in different periods for financial statement and tax purposes; these differences will reverse at some time in the future. Permanent differences are due to tax equalization and temporary differences are due to wash sales.
The tax character of distribution paid during the years ended December 31, 2015 and December 31, 2014 were are follows:
| | | | | | | | | | | | | | | | | | | | | | | | | | | | | | | | |
| | | Enhanced Core Bond | | | Municipal Bond* | | | Municipal Enhanced** | | | Small Cap Core | |
Distributions paid
from: | | 2015 | | | 2014 | | | 2015 | | | 2014 | | | 2015 | | | 2014 | | | 2015 | | | 2014 | |
Ordinary income | | $ | 2,623,245 | | | $ | 2,538,408 | | | $ | 11,879,981 | | | $ | 7,913,906 | | | $ | 7,967,114 | | | $ | 9,125,692 | | | $ | 648,345 | | | $ | 480,894 | |
Short-term capital gains | | | — | | | | — | | | | 2,721,008 | | | | 675,428 | | | | 267,207 | | | | — | | | | 986,775 | | | | 2,885,197 | |
Long-term capital gains | | | — | | | | — | | | | 7,423,930 | | | | 1,065,265 | | | | 2,756,948 | | | | — | | | | 14,018,195 | | | | 17,543,220 | |
| | | | | | | | | | | | | | | | | | | | | | | | | | | | | | | | |
| | $ | 2,623,245 | | | $ | 2,538,408 | | | $ | 22,024,919 | | | $ | 9,654,599 | | | $ | 10,991,269 | | | $ | 9,125,692 | | | $ | 15,653,315 | | | $ | 20,909,311 | |
| | | | | | | | | | | | | | | | | | | | | | | | | | | | | | | | |
| * | The ordinary income distributions paid by Municipal Bond which were tax-exempt for the periods 2015 and 2014 were $11,879,981 and $7,912,223, respectively. |
| ** | The ordinary income distributions paid by Municipal Enhanced which were tax-exempt for the periods 2015 and 2014 were $7,948,240 and $9,107,195, respectively. |
As of December 31, 2015, the components of distributions earnings (excluding unrealized appreciation/depreciation) on a tax basis consisted of:
| | | | | | | | | | | | | | | | | | | | |
| | | Enhanced Core Bond | | | Municipal Bond | | | Municipal Enhanced | | | Small Cap Core | | | Small Cap Growth | |
Capital loss carryforward | | $ | 2,222,439 | | | | — | | | | — | | | | — | | | | — | |
Undistributed ordinary income | | | — | | | | — | | | $ | 253 | | | | — | | | | — | |
Undistributed short-term capital gains | | | — | | | $ | 1,535,767 | | | | 399,191 | | | | — | | | $ | 371 | |
Undistributed long-term capital gains | | | — | | | | 2,385,987 | | | | 642,427 | | | $ | 3,297,269 | | | | — | |
Late year loss deferral | | | 3,205,311 | | | | — | | | | — | | | | 936,483 | | | | — | |
e. FEDERAL TAXES
Each Fund intends to comply with the requirements under Subchapter M of the Internal Revenue Code of 1986, as amended, and, to distribute substantially all of its taxable income and gains to its shareholders and to meet certain diversification and income requirements with respect to investment companies. Therefore, no provision for federal income or excise tax is included in the accompanying financial statements.
Additionally, based on Small Cap Core’s and Small cap Growth’s understanding of the tax rules and rates related to income, gains and transactions for the foreign jurisdictions in which it invests, Small Cap Core and Small Cap Growth will provide for foreign taxes, and where appropriate, deferred foreign taxes.
Management has analyzed the Funds’ tax positions taken on federal income tax returns as of December 31, 2015, and for all open tax years (generally, the three prior taxable years), and has concluded that no provision for federal income tax is required in the Funds’ financial statements. Additionally, Management is not aware of any tax position for which it is reasonably possible that the total amounts of unrecognized tax benefits will change materially in the next twelve months.
Net capital losses may be carried forward for an unlimited time period and retain their tax character as either short-term or long-term capital losses.
f. CAPITAL LOSS CARRYOVERS AND DEFERRALS
As of December 31, 2015, the following Funds had accumulated net realized capital loss carryovers from securities transactions for federal income tax purposes as shown in the following chart.
| | | | | | | | |
| | | Capital Loss | |
| | | Carryover Amounts | |
| Fund | | Short-Term | | | Long-Term | |
Enhanced Core Bond | | $ | 540,021 | | | $ | 1,682,418 | |
These amounts may be used to offset future realized capital gains for an unlimited time period.
As of December 31, 2015, Municipal Bond, Municipal Enhanced, Small Cap Core and Small Cap Growth had no accumulated net realized capital loss carryovers from securities transactions for federal income tax purposes. Should Municipal Bond, Municipal Enhanced, Small Cap Core and Small Cap Growth incur net capital losses for the year ended December 31, 2016, such amounts may be used to offset future realized capital gains, for an unlimited time period.
Notes to Financial Statements (continued)
g. CAPITAL STOCK
The Trusts’ Declarations of Trust authorize for each Fund the issuance of an unlimited number of shares of beneficial interest, without par value. Each Fund records sales and repurchases of its capital stock on the trade date. The cost of
securities contributed to the Funds in connection with the issuance of shares is based on the valuation of those securities in accordance with the Funds’ policy on investment valuation.
For the years ended December 31, 2015 and 2014, the capital stock transactions by class for Enhanced Core Bond, Municipal Bond, Municipal Enhanced, Small Cap Core and Small Cap Growth were as follows:
| | | | | | | | | | | | | | | | | | | | | | | | | | | | | | | | |
| | | Enhanced Core Bond | | | Municipal Bond | |
| | | 2015 | | | 2014 | | | 2015 | | | 2014 | |
| | | Shares | | | Amount | | | Shares | | | Amount | | | Shares | | | Amount | | | Shares | | | Amount | |
Investor Class: | | | | | | | | | | | | | | | | | | | | | | | | | | | | | | | | |
Proceeds from sale of shares | | | 745,685 | | | $ | 7,581,134 | | | | 1,105,135 | | | $ | 11,355,152 | | | | 1,539,109 | | | $ | 17,987,833 | | | | 1,313,946 | | | $ | 15,060,926 | |
Reinvestment of distributions | | | 53,402 | | | | 536,159 | | | | 48,652 | | | | 497,882 | | | | 54,114 | | | | 632,448 | | | | 43,890 | | | | 504,129 | |
Cost of shares repurchased | | | (1,376,533 | ) | | | (13,764,481 | ) | | | (1,683,022 | ) | | | (17,154,959 | ) | | | (1,285,745 | ) | | | (14,916,621 | ) | | | (1,926,523 | ) | | | (22,140,073 | ) |
| | | | | | | | | | | | | | | | | | | | | | | | | | | | | | | | |
Net increase (decrease) | | | (577,446 | ) | | $ | (5,647,188 | ) | | | (529,235 | ) | | $ | (5,301,925 | ) | | | 307,478 | | | $ | 3,703,660 | | | | (568,687 | ) | | $ | (6,575,018 | ) |
| | | | | | | | | | | | | | | | | | | | | | | | | | | | | | | | |
Service Class: | | | | | | | | | | | | | | | | | | | | | | | | | | | | | | | | |
Proceeds from sale of shares | | | 590,618 | | | $ | 5,851,078 | | | | 109,002 | | | $ | 1,126,759 | | | | 5,825,773 | | | $ | 68,099,858 | | | | 5,554,498 | | | $ | 63,929,297 | |
Reinvestment of distributions | | | 10,485 | | | | 104,238 | | | | 3,830 | | | | 39,381 | | | | 192,521 | | | | 2,255,691 | | | | 88,317 | | | | 1,018,649 | |
Cost of shares repurchased | | | (67,052 | ) | | | (669,781 | ) | | | (27,386 | ) | | | (280,334 | ) | | | (3,484,494 | ) | | | (40,798,939 | ) | | | (2,008,633 | ) | | | (22,996,704 | ) |
| | | | | | | | | | | | | | | | | | | | | | | | | | | | | | | | |
Net increase | | | 534,051 | | | $ | 5,285,535 | | | | 85,446 | | | $ | 885,806 | | | | 2,533,800 | | | $ | 29,556,610 | | | | 3,634,182 | | | $ | 41,951,242 | |
| | | | | | | | | | | | | | | | | | | | | | | | | �� | | | | | | | |
Class C: | | | | | | | | | | | | | | | | | | | | | | | | | | | | | | | | |
Proceeds from sale of shares | | | 5,337 | | | $ | 53,505 | | | | 7,687 | | | $ | 78,568 | | | | — | | | | — | | | | — | | | | — | |
Reinvestment of distributions | | | 19,802 | | | | 198,380 | | | | 25,851 | | | | 264,164 | | | | — | | | | — | | | | — | | | | — | |
Cost of shares repurchased | | | (433,309 | ) | | | (4,362,382 | ) | | | (563,996 | ) | | | (5,763,405 | ) | | | — | | | | — | | | | — | | | | — | |
| | | | | | | | | | | | | | | | | | | | | | | | | | | | | | | | |
Net decrease | | | (408,170 | ) | | $ | (4,110,497 | ) | | | (530,458 | ) | | $ | (5,420,673 | ) | | | — | | | | — | | | | — | | | | — | |
| | | | | | | | | | | | | | | | | | | | | | | | | | | | | | | | |
Institutional Class: | | | | | | | | | | | | | | | | | | | | | | | | | | | | | | | | |
Proceeds from sale of shares | | | 1,630,862 | | | $ | 16,511,994 | | | | 1,334,860 | | | $ | 13,732,720 | | | | 33,123,648 | | | $ | 388,149,326 | | | | 20,955,711 | | | $ | 241,281,689 | |
Reinvestment of distributions | | | 143,327 | | | | 1,438,083 | | | | 124,781 | | | | 1,280,372 | | | | 1,438,936 | | | | 16,900,334 | | | | 640,309 | | | | 7,411,371 | |
Cost of shares repurchased | | | (937,260 | ) | | | (9,401,582 | ) | | | (3,289,907 | ) | | | (33,620,615 | ) | | | (12,559,632 | ) | | | (147,490,609 | ) | | | (6,356,590 | ) | | | (73,375,703 | ) |
| | | | | | | | | | | | | | | | | | | | | | | | | | | | | | | | |
Net increase (decrease) | | | 836,929 | | | $ | 8,548,495 | | | | (1,830,266 | ) | | $ | (18,607,523 | ) | | | 22,002,952 | | | $ | 257,559,051 | | | | 15,239,430 | | | $ | 175,317,357 | |
| | | | | | | | | | | | | | | | | | | | | | | | | | | | | | | | |
60
Notes to Financial Statements (continued)
| | | | | | | | | | | | | | | | | | | | | | | | | | | | | | | | |
| | | Municipal Enhanced | | | Small Cap Core | |
| | | 2015 | | | 2014 | | | 2015 | | | 2014 | |
| | | Shares | | | Amount | | | Shares | | | Amount | | | Shares | | | Amount | | | Shares | | | Amount | |
Investor Class: | | | | | | | | | | | | | | | | | | | | | | | | | | | | | | | | |
Proceeds from sale of shares | | | 765,332 | | | $ | 7,817,267 | | | | 1,818,662 | | | $ | 17,853,038 | | | | 344,200 | | | $ | 8,072,293 | | | | 634,821 | | | $ | 15,177,787 | |
Reinvestment of distributions | | | 20,792 | | | | 210,164 | | | | 35,200 | | | | 344,366 | | | | 60,630 | | | | 1,336,887 | | | | 83,102 | | | | 1,964,534 | |
Cost of shares repurchased | | | (1,078,015 | ) | | | (11,024,996 | ) | | | (1,910,370 | ) | | | (18,841,404 | ) | | | (392,023 | ) | | | (9,181,256 | ) | | | (1,969,034 | ) | | | (47,032,493 | ) |
| | | | | | | | | | | | | | | | | | | | | | | | | | | | | | | | |
Net increase (decrease) | | | (291,891 | ) | | $ | (2,997,565 | ) | | | (56,508 | ) | | $ | (644,000 | ) | | | 12,807 | | | $ | 227,924 | | | | (1,251,111 | ) | | $ | (29,890,172 | ) |
| | | | | | | | | | | | | | | | | | | | | | | | | | | | | | | | |
Service Class: | | | | | | | | | | | | | | | | | | | | | | | | | | | | | | | | |
Proceeds from sale of shares | | | 1,115,492 | | | $ | 11,383,413 | | | | 2,041,597 | | | $ | 20,091,308 | | | | 162,317 | | | $ | 3,848,812 | | | | 623,346 | | | $ | 15,141,794 | |
Reinvestment of distributions | | | 76,444 | | | | 770,964 | | | | 38,258 | | | | 377,147 | | | | 35,688 | | | | 792,991 | | | | 70,148 | | | | 1,667,423 | |
Cost of shares repurchased | | | (1,152,453 | ) | | | (11,693,012 | ) | | | (1,110,705 | ) | | | (10,961,898 | ) | | | (430,228 | ) | | | (10,436,822 | ) | | | (256,726 | ) | | | (6,139,546 | ) |
| | | | | | | | | | | | | | | | | | | | | | | | | | | | | | | | |
Net increase (decrease) | | | 39,483 | | | $ | 461,365 | | | | 969,150 | | | $ | 9,506,557 | | | | (232,223 | ) | | $ | (5,795,019 | ) | | | 436,768 | | | $ | 10,669,671 | |
| | | | | | | | | | | | | | | | | | | | | | | | | | | | | | | | |
Institutional Class: | | | | | | | | | | | | | | | | | | | | | | | | | | | | | | | | |
Proceeds from sale of shares | | | 5,680,203 | | | $ | 57,465,629 | | | | 5,027,817 | | | $ | 48,928,368 | | | | 2,374,100 | | | $ | 56,191,800 | | | | 6,496,214 | | | $ | 156,385,059 | |
Reinvestment of distributions | | | 587,901 | | | | 5,926,350 | | | | 646,628 | | | | 6,307,190 | | | | 538,090 | | | | 11,994,017 | | | | 629,895 | | | | 15,022,999 | |
Cost of shares repurchased | | | (7,508,463 | ) | | | (76,015,132 | ) | | | (5,796,894 | ) | | | (56,861,576 | ) | | | (1,531,195 | ) | | | (36,165,360 | ) | | | (1,681,058 | ) | | | (40,193,974 | ) |
| | | | | | | | | | | | | | | | | | | | | | | | | | | | | | | | |
Net increase (decrease) | | | (1,240,359 | ) | | $ | (12,623,153 | ) | | | (122,449 | ) | | $ | (1,626,018 | ) | | | 1,380,995 | | | $ | 32,020,457 | | | | 5,445,051 | | | $ | 131,214,084 | |
| | | | | | | | | | | | | | | | | | | | | | | | | | | | | | | | |
| | | | | | | | |
| | | Small Cap Growth | |
| | | 2015 | |
| | | Shares | | | Amount | |
Institutional Class: | | | | | | | | |
Proceeds from sale of shares | | | 159,184 | | | $ | 1,476,468 | |
Cost of shares repurchased | | | (28,038 | ) | | | (257,387 | ) |
| | | | | | | | |
Net increase | | | 131,146 | | | $ | 1,219,081 | |
| | | | | | | | |
At December 31, 2015, certain unaffiliated shareholders of record, specifically omnibus accounts, individually or collectively held greater than 10% of the net assets of the Funds as follows: Enhanced Core Bond—two collectively own 46%; Municipal Bond—two collectively own 66%; Municipal Enhanced—two collectively own 78%; Small Cap Core—three collectively own 64% and Small Cap Growth—three collectively own 76%. Transactions by these shareholders may have a material impact on their respective Funds.
h. REPURCHASE AGREEMENTS AND JOINT REPURCHASE AGREEMENTS
The Funds may enter into repurchase agreements for temporary cash management purposes provided that the value of the underlying collateral, including accrued interest, will equal or exceed the value of the repurchase agreement during the term of the agreement. The underlying collateral for all repurchase agreements is held in safekeeping by the Fund’s custodian or at the Federal Reserve Bank. If the seller defaults and the value of the collateral declines, or if bankruptcy proceedings commence with respect to the seller of the security, realization of the collateral by the Funds may be delayed or limited.
Additionally, the Funds may enter into joint repurchase agreements for reinvestment of cash collateral on securities lending transactions under the securities lending program offered by BNYM (the “Program”), provided that the value of the underlying collateral, including accrued interest, will equal or exceed the value of the joint repurchase agreement during the term of the agreement. The Funds participate on a pro rata basis with other clients of BNYM in its share of the underlying collateral under such joint repurchase agreements and in its share of proceeds from any repurchase or other disposition of the underlying collateral. The underlying collateral for joint repurchase agreements is held in safekeeping by the Fund’s custodian or at the Federal Reserve Bank. If the seller defaults and the value of the collateral declines, or if bankruptcy proceedings commence with respect to the seller of the security, realization of the collateral by the Funds may be delayed or limited. Pursuant to the Program, the Funds are indemnified for such losses by BNYM.
Notes to Financial Statements (continued)
At December 31, 2015, the market value of repurchase agreements or joint repurchase agreements outstanding for Enhanced Core Bond, Small Cap Core and Small Cap Growth were $1,376,580, $20,249,177 and $57,235, respectively.
i. DELAYED DELIVERY TRANSACTIONS AND WHEN-ISSUED SECURITIES
The Funds may enter into securities transactions on a delayed delivery or when issued basis. Payment and delivery may take place after the customary settlement period for that security. The price of the underlying securities and the date when the securities will be delivered and paid for are fixed at the time the transaction is negotiated. During the time a delayed delivery sell is outstanding, the contract is marked to market daily and equivalent deliverable securities are held for the transaction. The value of the securities purchased on a delayed delivery or when-issued basis are identified as such in the Funds’ Schedules of Portfolio Investments. With respect to purchase commitments, the Funds identify securities as segregated in their records with a value at least equal to the amount of the commitment. Losses may arise due to changes in the value of the underlying securities or if the counterparty does not perform under the contract, or if the issuer does not issue the securities due to political, economic, or other factors.
2. AGREEMENTS AND TRANSACTIONS WITH AFFILIATES
For each of the Funds, the Trusts have entered into an investment advisory agreement under which the Investment Manager, a subsidiary and the U.S. retail distribution arm of Affiliated Managers Group, Inc. (“AMG”), serves as investment manager to the Funds and is responsible for the Funds’ overall administration and operations. The Investment Manager selects one or more subadvisors for the Funds (subject to Board approval) and monitors each subadvisor’s investment performance, security holdings and investment strategies. Each Fund’s investment portfolio is managed by GW&K Investment Management, LLC, (GW&K) who serves pursuant to a subadvisory agreement with the Investment Manager. AMG indirectly owns a majority interest in GW&K.
Investment management fees are paid directly by the Funds to the Investment Manager based on average daily net assets. For the year ended December 31, 2015, the Funds’ investment management fees were paid at the following annual rate of each Fund’s respective average daily net assets:
| | | | |
Enhanced Core Bond | | | 0.45 | % |
Municipal Bond | | | 0.35 | % |
Municipal Enhanced | | | 0.50 | % |
Small Cap Core | | | 0.75 | % |
Small Cap Growth | | | 0.75 | % |
The Investment Manager has contractually agreed, through at least May 1, 2016, to waive management fees (but not below zero) and/or reimburse Fund expenses in order to limit total annual Fund operating expenses after fee waiver and expense reimbursements (exclusive of taxes, interest (including interest incurred in connection with bank and custody overdrafts), shareholder servicing fees, distribution and service (12b-1) fees, brokerage commissions and other transaction costs, acquired fund fees and expenses and extraordinary expenses) of Enhanced Core Bond, Municipal Bond, Municipal Enhanced, Small Cap Core
and Small Cap Growth to 0.59%, 0.34%, 0.64%, 0.95% and 0.95%, respectively, of each Fund’s average daily net assets subject to later reimbursement by the Funds in certain circumstances. The contractual expense limitation may only be terminated in the event the Investment Manager or a successor ceases to be the investment manager of the Fund or a successor fund, by mutual agreement between the Investment Manager and the Trust’s Board of Trustees, or in the event of the Fund’s liquidation unless the Fund is reorganized or is a party to a merger in which the surviving entity is successor to the accounting and performance information of the Fund.
Each Fund is obligated to repay the Investment Manager such amounts waived, paid, or reimbursed in future years provided that the repayment occurs within thirty-six (36) months after the waiver or reimbursement and that such repayment would not cause the Fund’s total annual operating expenses after fee waiver and respective expense reimbursements in any such future year to exceed that Funds’ respective contractual expense limitation amount.
For the year ended December 31, 2015, each Fund’s components of reimbursement available are detailed in the following chart:
| | | | | | | | |
| | | Enhanced | | | Municipal | |
| | | Core Bond | | | Bond | |
Reimbursement Available—12/31/14 | | $ | 798,879 | | | $ | 2,659,807 | |
Additional Reimbursements | | | 208,328 | | | | 2,123,295 | |
Expired Reimbursements | | | (279,668 | ) | | | (495,219 | ) |
| | | | | | | | |
Reimbursement Available—12/31/15 | | $ | 727,539 | | | $ | 4,287,883 | |
| | | | | | | | |
| | |
| | | Municipal
Enhanced | | | Small Cap
Core | |
Reimbursement Available—12/31/14 | | $ | 752,877 | | | $ | 806,358 | |
Additional Reimbursements | | | 205,861 | | | | 405,914 | |
Expired Reimbursements | | | (301,526 | ) | | | (175,130 | ) |
| | | | | | | | |
Reimbursement Available—12/31/15 | | $ | 657,212 | | | $ | 1,037,142 | |
| | | | | | | | |
| | | | |
| | | Small Cap Growth | |
Reimbursement Available—12/31/14 | | | — | |
Additional Reimbursements | | $ | 48,523 | |
Expired Reimbursements | | | — | |
| | | | |
Reimbursement Available—12/31/15 | | $ | 48,523 | |
| | | | |
The expiration of each Fund’s reimbursement are as follows:
| | | | | | | | |
| | | Enhanced | | | Municipal | |
| Expiration Period | | Core Bond | | | Bond | |
Less than 1 year | | $ | 290,204 | | | $ | 852,297 | |
Within 2 years | | | 229,007 | | | | 1,312,291 | |
Within 3 years | | | 208,328 | | | | 2,123,295 | |
| | | | | | | | |
Total Amount Subject to Reimbursement | | $ | 727,539 | | | $ | 4,287,883 | |
| | | | | | | | |
Notes to Financial Statements (continued)
| | | | | | | | |
| | | Municipal | | | | |
| Expiration Period | | Enhanced | | | Small Cap Core | |
Less than 1 year | | $ | 219,146 | | | $ | 252,383 | |
Within 2 years | | | 232,205 | | | | 378,845 | |
Within 3 years | | | 205,861 | | | | 405,914 | |
| | | | | | | | |
Total Amount Subject to Reimbursement | | $ | 657,212 | | | $ | 1,037,142 | |
| | | | | | | | |
| | | | |
| Expiration Period | | Small Cap Growth | |
Less than 1 year | | | — | |
Within 2 years | | | — | |
Within 3 years | | $ | 48,523 | |
| | | | |
Total Amount Subject to Reimbursement | | $ | 48,523 | |
| | | | |
Enhanced Core Bond, Municipal Bond, Municipal Enhanced, Small Cap Core and Small Cap Growth have entered into an Administration and Shareholder Servicing Agreement under which the Investment Manager serves as the Funds’ administrator (the “Administrator”) and provides a variety of administration and shareholder services to the Funds. Enhanced Core Bond pays a fee to the Administrator at the rate of 0.20% per annum of the Fund’s average daily net assets for these services. Municipal Bond, Municipal Enhanced, Small Cap Core and Small Cap Growth each pay a fee to the Administrator at the rate of 0.25% per annum of the Fund’s average daily net assets for these services.
The Administrator for Municipal Enhanced is voluntarily waiving a portion of its administration fee on 90% of the Fund’s net assets. The waiver, which may be modified or terminated at any time, amounts to 0.10% on the first $250 million of the Fund’s net assets and 0.15% on the remaining net assets. For the year ended December 31, 2015, the amount waived was $211,783 or 0.09%.
Effective January 1, 2015, the Board provides supervision of the affairs of the Trust, other trusts within the AMG Funds family of mutual funds (collectively the “AMG Funds family”) and other affiliated funds. Previously, the Board provided supervision to only the Trust and other trusts within the AMG Funds family.
Beginning January 1, 2015, the aggregate annual retainer paid to each Independent Trustee of the Board is $200,000, plus $16,000, $4,000 or $2,000 for each regular, in-person special or telephonic special meeting attended, respectively. The Independent Chairman of the Trusts receives an additional payment of $55,000 per year. The Chairman of the Audit Committee receives an additional payment of $25,000 per year.
Prior to January 1, 2015, the aggregate annual retainer paid to each Independent Trustee of the Board was $130,000, plus $7,000 or $2,500 for each regular or special meeting attended, respectively. The Independent Chairman of the Trusts formerly received an additional payment of $35,000 per year. The Chairman of the Audit Committee formerly received an additional payment of $15,000 per year.
Effective January 1, 2015, the Trustees’ fees and expenses are generally allocated among all of the Funds in the Trust, other trusts within the AMG Funds family and other affiliated funds based on the relative net assets of such funds. Before January 1, 2015, the Trustees’ fees and expenses were generally
allocated among all of the funds in the Trust and other trusts within the AMG Funds family. The “Trustees fees and expenses” shown in the financial statements represents each Fund’s allocated portion of the total fees and expenses paid to the Independent Trustees of the Board.
The Funds are distributed by AMG Distributors, Inc. (the “Distributor”), a wholly owned subsidiary of the Investment Manager. The Distributor serves as the distributor and underwriter for each Fund and is a registered broker-dealer and member of the Financial Industry Regulatory Authority, Inc. (“FINRA”). Shares of each Fund will be continuously offered and will be sold directly to prospective purchasers and through brokers, dealers or other financial intermediaries who have executed selling agreements with the Distributor. Subject to the compensation arrangement discussed below, generally the Distributor bears all or a portion of the expenses of providing services pursuant to the distribution agreement, including the payment of the expenses relating to the distribution of prospectuses for sales purposes and any advertising or sales literature. Certain Trustees and Officers of the Funds are Officers and/or Directors of the Investment Manager, AMG and/or the Distributor.
The Trusts have adopted a distribution and service plan (the “Plan”) with respect to the Investor Class shares of each Fund and Class C shares of Enhanced Core Bond, in accordance with the requirements of Rule 12b-1 under the 1940 Act and the requirements of the applicable rules of FINRA regarding asset-based sales charges. Pursuant to the Plan, each Fund may make payments to the Distributor for its expenditures in financing any activity primarily intended to result in the sale of each such class of the Fund’s shares and for maintenance and personal service provided to existing shareholders of that class. The Plan authorizes payments to the Distributors of up to 0.25% and 1.00% annually of each Fund’s average daily net assets attributable to the Investor Class and Class C shares, respectively. The Plan further provides for periodic payments by the Trust or the Distributor to brokers, dealers and other financial intermediaries for providing shareholder services and for promotional and other sales related costs. The portion of payments made under the plan by Class C shares or Investor Class shares for shareholder servicing may not exceed an annual rate of 0.25% of the average daily net asset value of each Fund’s shares of that class owned by clients of such broker, dealer or financial intermediary.
For Enhanced Core Bond’s Service Class and for each of the Investor and Service Classes of Municipal Bond, Municipal Enhanced and Small Cap Core, the Board has approved reimbursement payments to the Investment Manager for shareholder servicing expenses (“shareholder servicing fees”) incurred. Shareholder servicing fees include payments to third parties such as a bank, broker-dealer, trust company or other financial intermediaries who provide shareholder recordkeeping, account servicing and other services. The Investor and Service Class shares may reimburse the Investment Manager for the actual amount incurred up to a maximum annual rate of each Class’s average daily net assets as shown in the table below.
Notes to Financial Statements (continued)
The impact on the annualized expense ratios for the year ended December 31, 2015, were as follows:
| | | | | | | | |
| | | Maximum | | | Actual | |
| Fund | | Amount Allowed | | | Amount Incurred | |
Enhanced Core Bond | | | | | | | | |
Service Class | | | 0.10 | % | | | 0.08 | % |
Municipal Bond | | | | | | | | |
Investor Class | | | 0.25 | % | | | 0.23 | % |
Service Class | | | 0.25 | % | | | 0.17 | % |
Municipal Enhanced | | | | | | | | |
Investor Class | | | 0.25 | % | | | 0.18 | % |
Service Class | | | 0.25 | % | | | 0.07 | % |
Small Cap Core | | | | | | | | |
Investor Class | | | 0.25 | % | | | 0.15 | % |
Service Class | | | 0.25 | % | | | 0.12 | % |
The Securities and Exchange Commission granted an exemptive order that permits the Funds to lend and borrow money for certain temporary purposes directly to and from other eligible Funds in the AMG Funds family. Participation in this interfund lending program is voluntary for both the borrowing and lending funds, and an interfund loan is only made if it benefits each participating Fund. The Investment Manager administers the program according to procedures approved by the Board, and the Board monitors the operation of the program. An interfund loan must comply with certain conditions set out in the exemptive order, which are designed to assure fairness and protect all participating Funds. For the year ended December 31, 2015, the following Funds either borrowed from or lent to other Funds in the AMG Funds family: Enhanced Core Bond lent $1,034,348 for three days earning interest in the amount of $55 and Small Cap Core lent varying amounts not exceeding $2,796,955 for seven days earning interest in the amount of $231. The interest amount is included in the Statement of Operations as interest income. Enhanced Core Bond borrowed $1,886,367 for two days paying interest of $71, Municipal Bond borrowed $7,808,335 for three days paying interest of $414 and Municipal Enhanced borrowed varying amounts not exceeding $4,600,549 for five days paying interest of $173. The interest amount is included in the Statement of Operations as miscellaneous expense. For the year ended December 31, 2015, Small Cap Growth neither borrowed from nor lent to other Funds in the AMG Funds family. At December 31, 2015, Small Cap Core had $2,796,955 in interfund loans outstanding.
The Investment Manager paid the initial state registration fees in the amount of $12,623 on behalf of Small Cap Growth. This balance is reflected as a Payable to Affiliate on the Statement of Assets and Liabilities.
3. PURCHASES AND SALES OF SECURITIES
Purchases and sales of securities (excluding short-term securities and U.S. Government obligations) for the year ended December 31, 2015, were as follows:
| | | | | | | | |
| | | Long-Term Securities excluding
(U.S. Government Obligations) | |
| Fund | | Purchases | | | Sales | |
Enhanced Core Bond | | $ | 34,350,291 | | | $ | 41,044,768 | |
Municipal Bond | | | 807,174,271 | | | | 522,000,265 | |
Municipal Enhanced | | | 275,108,344 | | | | 290,156,255 | |
Small Cap Core | | | 70,658,947 | | | | 59,898,498 | |
Small Cap Growth | | | 1,577,121 | | | | 371,550 | |
| |
| | | U.S. Government Obligations | |
| Fund | | Purchases | | | Sales | |
Enhanced Core Bond | | $ | 18,847,979 | | | $ | 7,648,689 | |
4. PORTFOLIO SECURITIES LOANED
The Funds participate in the Program providing for the lending of securities to qualified brokers. Securities lending income includes earnings of such temporary cash investments, plus or minus any rebate to a borrower. These earnings (after any rebate) are then divided between BNYM, as a fee for its services under the Program, and the Funds, according to agreed-upon rates. Collateral on all securities loaned is accepted in cash and is maintained at a minimum level of 102% (105% in the case of certain foreign securities) of the market value, plus interest, if applicable, of investments on loan. It is the Funds’ policy to obtain additional collateral from or return excess collateral to the borrower by the end of the next business day, following the valuation date of the securities loaned. Therefore, the value of the collateral held may be temporarily less than the value of the securities on loan. Lending securities entails a risk of loss to the Funds if and to the extent that the market value of the securities loaned were to increase and the borrower did not increase the collateral accordingly, and the borrower fails to return the securities. Under the terms of the Program, the Funds are indemnified for such losses by BNYM. Cash collateral is held in a separate omnibus account managed by BNYM, who is authorized to exclusively enter into joint overnight government repurchase agreements. BNYM bears the risk of any deficiency in the amount of the cash collateral available for return to the borrower due to any loss on the collateral invested.
At December 31, 2015, the value of the securities loaned and cash collateral received, were as follows:
| | | | | | | | |
| | | Securities | | | Cash Collateral | |
| Fund | | Loaned | | | Received | |
Enhanced Core Bond | | $ | 1,325,009 | | | $ | 1,376,580 | |
Small Cap Core | | | 19,402,890 | | | | 20,249,177 | |
Small Cap Growth | | | 55,118 | | | | 57,235 | |
5. COMMITMENTS AND CONTINGENCIES
Under each Trusts’ organizational documents, its trustees and officers are indemnified against certain liabilities arising out of the performance of their duties to the Trusts. In addition, in the normal course of business, the Funds may enter into contracts and agreements that contain a variety of representations and warranties, which provide general indemnifications. The maximum exposure to the Funds under these arrangements is unknown, as this
64
Notes to Financial Statements (continued)
would involve future claims that may be made against a Fund that have not yet occurred. However, based on experience, the Funds had no prior claims or losses and expect the risks of loss to be remote.
6. MASTER NETTING AGREEMENTS
The Funds may enter into master netting agreements with their counterparties for the securities lending program and repurchase agreements, which provide
the right, in the event of default (including bankruptcy or insolvency) for the non-defaulting party to liquidate the collateral and calculate net exposure to the defaulting party or request additional collateral. For financial reporting purposes, the Funds do not offset financial assets and financial liabilities that are subject to master netting agreements in the Statement of Assets and Liabilities. For security lending transactions, see Note 4.
The following table is a summary of the Funds’ open repurchase agreements which are subject to a master netting agreement as of December 31, 2015:
| | | | | | | | | | | | | | | | |
| | | | | | Gross Amount Not Offset in the
Statement of Assets and Liabilities | | | | |
| | | Net Amounts of Assets Presented in the Statement
of Assets and Liabilities | | | Financial Instruments Collateral | | | Cash Collateral
Received | | | Net Amount | |
Enhanced Core Bond | | | | | | | | | | | | | | | | |
Cantor Fitzgerald Securities, Inc. | | $ | 1,000,000 | | | $ | 1,000,000 | | | | — | | | | — | |
Daiwa Capital Markets America | | | 376,580 | | | | 376,580 | | | | — | | | | — | |
| | | | | | | | | | | | | | | | |
Total | | $ | 1,376,580 | | | $ | 1,376,580 | | | | — | | | | — | |
| | | | | | | | | | | | | | | | |
Small Cap Core | | | | | | | | | | | | | | | | |
BNP Paribas Securities Corp. | | $ | 4,809,224 | | | $ | 4,809,224 | | | | — | | | | — | |
Cantor Fitzgerald Securities, Inc. | | | 4,809,224 | | | | 4,809,224 | | | | — | | | | — | |
Daiwa Capital Markets America | | | 4,809,224 | | | | 4,809,224 | | | | — | | | | — | |
Nomura Securities International, Inc. | | | 3,842,641 | | | | 3,842,641 | | | | — | | | | — | |
State of Wisconsin Investment Board | | | 1,978,864 | | | | 1,978,864 | | | | — | | | | — | |
| | | | | | | | | | | | | | | | |
Total | | $ | 20,249,177 | | | $ | 20,249,177 | | | | — | | | | — | |
| | | | | | | | | | | | | | | | |
Small Cap Growth | | | | | | | | | | | | | | | | |
Royal Bank of Scotland PLC | | $ | 57,235 | | | $ | 57,235 | | | | — | | | | — | |
| | | | | | | | | | | | | | | | |
7. SUBSEQUENT EVENTS
Each Fund has determined that no material events or transactions occurred through the issuance date of the Funds’ financial statements which require additional disclosure in or adjustment of the Funds’ financial statements.
TAX INFORMATION (unaudited)
The AMG GW&K Enhanced Core Bond Fund, AMG GW&K Municipal Bond Fund, AMG GW&K Municipal Enhanced Yield Fund, AMG GW&K Small Cap Core Fund and AMG GW&K Small Cap Growth Fund each hereby designates the maximum amount allowable of its net taxable income as qualified dividends as provided in the Jobs and Growth Tax Relief Reconciliation Act of 2003. The 2015 Form 1099-DIV you receive for each Fund will show the tax status of all distributions paid to you during the year.
Pursuant to section 852 of the Internal Revenue Code, AMG GW&K Enhanced Core Bond Fund, AMG GW&K Municipal Bond Fund, AMG GW&K Municipal Enhanced Yield Fund, AMG GW&K Small Cap Core Fund and AMG GW&K Small Cap Growth Fund each hereby designates $0, $7,423,930, $2,756,948, $14,031,654 and $0, respectively, as a capital gain distribution with respect to the taxable year ended December 31, 2015, or if subsequently determined to be different, the net capital gains of such fiscal year.
65
Report of Independent Registered Public Accounting Firm
TO THE BOARD OF TRUSTEES OF AMG FUNDS II AND THE SHAREHOLDERS OF AMG GW&K ENHANCED CORE BOND FUND, AS WELL AS THE BOARD OF TRUSTEES OF AMG FUNDS AND THE SHAREHOLDERS OF AMG GW&K MUNICIPAL BOND FUND, AMG GW&K MUNICIPAL ENHANCED YIELD FUND, AMG GW&K SMALL CAP CORE FUND AND AMG GW&K SMALL CAP GROWTH FUND:
In our opinion, the accompanying statements of assets and liabilities, including the schedules of portfolio investments, and the related statements of operations and of changes in net assets and the financial highlights present fairly, in all material respects, the financial position of AMG GW&K Enhanced Core Bond Fund, AMG GW&K Municipal Bond Fund, AMG GW&K Municipal Enhanced Yield Fund, AMG GW&K Small Cap Core Fund, and AMG GW&K Small Cap Growth Fund (the “Funds”) at December 31, 2015, and the results of each of their operations, the changes in each of their net assets and the financial highlights for each of the periods indicated, in conformity with accounting principles generally accepted in the United States of America. These financial statements and financial highlights (hereafter referred to as “financial statements”) are the responsibility of the Funds’ management. Our responsibility is to express an opinion on these financial statements based on our audits. We conducted our audits of these financial statements in accordance with the standards of the Public Company Accounting Oversight Board (United States). Those standards require that we plan and perform the audit to obtain reasonable assurance about whether the financial statements are free of material misstatement. An audit includes examining, on a test basis, evidence supporting the amounts and disclosures in the financial statements, assessing the accounting principles used and significant estimates made by management, and evaluating the overall financial statement presentation. We believe that our audits, which included confirmation of securities at December 31, 2015 by correspondence with the custodian and brokers, and the application of alternative auditing procedures where securities purchased had not been received, provide a reasonable basis for our opinion.
PricewaterhouseCoopers LLP
Boston, Massachusetts
February 29, 2016
66
AMG Funds
Trustees and Officers
The Trustees and Officers of the Trust, their business addresses, principal occupations for the past five years and ages are listed below. The Trustees provide broad supervision over the affairs of the Trust and the Funds. The Trustees are experienced executives who meet periodically throughout the year to oversee the Funds’ activities, review contractual arrangements with
companies that provide services to the Funds, and review the Funds’ performance. Unless otherwise noted, the address of each Trustee or Officer is the address of the Trust: 600 Steamboat Road, Suite 300, Greenwich, Connecticut 06830.
There is no stated term of office for Trustees. Trustees serve until their resignation, retirement or removal in accordance with the Trust’s
organizational documents and policies adopted by the Board from time to time. The Chairman of the Trustees, President, Treasurer and Secretary of the Trust are elected by the Trustees annually. Other officers hold office at the pleasure of the Trustees.
Independent Trustees
The following Trustees are not “interested persons” of the Trust within the meaning of the 1940 Act:
| | |
Number of Funds Overseen in Fund Complex | | Name, Age, Principal Occupation(s) During Past 5 Years and Other Directorships Held by Trustee |
• Trustee since 2012 | | Bruce B. Bingham, 67 |
| |
• Oversees 72 Funds in Fund Complex | | Partner, Hamilton Partners (real estate development firm) (1987-Present); Trustee of Aston Funds (27 portfolios) (2014-Present); Director of The Yacktman Funds (2000-2012). |
| |
• Independent Chairman | | William E. Chapman, II, 74 |
| |
• Trustee since 1999 - AMG Funds • Trustee since 2000 - AMG Funds II • Oversees 72 Funds in Fund Complex | | President and Owner, Longboat Retirement Planning Solutions (1998-Present); Hewitt Associates, LLC (part time) (provider of Retirement and Investment Education Seminars) (2002-2009); Trustee Emeritus of Bowdoin College (2013-Present); Trustee of Bowdoin College (2002-2013); Director of Harding, Loevner Funds, Inc. (6 portfolios); Trustee of Third Avenue Trust (5 portfolios); Trustee of Third Avenue Variable Trust (1 portfolio); Trustee of Aston Funds (27 portfolios) (2010-Present). |
| |
• Trustee since 1999 - AMG Funds | | Edward J. Kaier, 70 |
| |
• Trustee since 2000 - AMG Funds II • Oversees 72 Funds in Fund Complex | | Attorney at Law and Partner, Teeters Harvey Marrone & Kaier LLP (2007-Present); Attorney at Law and Partner, Hepburn Willcox Hamilton & Putnam, LLP (1977-2007); Trustee of Third Avenue Trust (5 portfolios); Trustee of Third Avenue Variable Trust (1 portfolio); Trustee of Aston Funds (27 portfolios) (2010-Present). |
| |
• Trustee since 2013 | | Kurt A. Keilhacker, 52 |
| |
• Oversees 74 Funds in Fund Complex | | Managing Member, TechFund Capital (1997-Present); Managing Member, TechFund Europe (2000-Present); Board Member, 6wind SA, (2002-Present); Managing Member, Elementum Ventures (2013-Present); Trustee of Aston Funds (27 portfolios) (2014-Present); Trustee, Gordon College (2001-2016). |
| |
• Trustee since 2004 - AMG Funds | | Steven J. Paggioli, 65 |
| |
• Trustee since 2000 - AMG Funds II • Oversees 72 Funds in Fund Complex | | Independent Consultant (2002-Present); Formerly Executive Vice President and Director, The Wadsworth Group (1986-2001); Executive Vice President, Secretary and Director, Investment Company Administration, LLC (1990-2001); Vice President, Secretary and Director, First Fund Distributors, Inc. (1991-2001); Trustee, Professionally Managed Portfolios (32 portfolios); Advisory Board Member, Sustainable Growth Advisors, LP; Independent Director, Chase Investment Counsel (2008 – Present); Trustee of Aston Funds (27 portfolios) (2010-Present). |
| |
• Trustee since 2013 | | Richard F. Powers III, 70 |
| |
• Oversees 72 Funds in Fund Complex | | Adjunct Professor, Boston College (2010-2013); Trustee of Aston Funds (27 portfolios) (2014-Present); President and CEO of Van Kampen Investments Inc. (1998-2003). |
| |
• Trustee since 1999 - AMG Funds | | Eric Rakowski, 57 |
| |
• Trustee since 2000 - AMG Funds II • Oversees 74 Funds in Fund Complex | | Professor, University of California at Berkeley School of Law (1990-Present); Director of Harding, Loevner Funds, Inc. (6 portfolios); Trustee of Third Avenue Trust (5 portfolios); Trustee of Third Avenue Variable Trust (1 portfolio); Trustee of Aston Funds (27 portfolios) (2010-Present). |
| |
• Trustee since 2013 | | Victoria L. Sassine, 50 |
| |
• Oversees 74 Funds in Fund Complex | | Lecturer, Babson College (2007 – Present); Trustee of Aston Funds (27 portfolios) (2014-Present). |
| |
• Trustee since 2004 - AMG Funds • Trustee since 2000 - AMG Funds II • Oversees 72 Funds in Fund Complex | | Thomas R. Schneeweis, 68 Professor Emeritus, University of Massachusetts (2013 - Present); Partner, S Capital Wealth Advisors (2015-Present); President, TRS Associates (1982-Present); Board Member, Chartered Alternative Investment Association (“CAIA”) (2002-Present); Director, CAIA Foundation (Education), (2010-Present); Director, Institute for Global Asset and Risk Management (Education) (2010-Present); Partner, S Capital Management, LLC (2007-2015); Director, CISDM at the University of Massachusetts, (1996-2013); President, Alternative Investment Analytics, LLC, (formerly Schneeweis Partners, LLC) (2001-2013); Professor of Finance, University of Massachusetts (1977-2013); Trustee of Aston Funds (27 portfolios) (2010-Present). |
67
AMG Funds
Trustees and Officers (continued)
Interested Trustees
Each Trustee in the following table is an “interested person” of the Trust within the meaning of the 1940 Act. Ms. Carsman is an interested person of the Trust within the meaning of the 1940 Act by virtue of her position with, and interest in securities of AMG.
| | |
Number of Funds Overseen in Fund Complex | | Name, Age, Principal Occupation(s) During Past 5 Years and Other Directorships Held by Trustee |
• Trustee since 2011 | | Christine C. Carsman, 63 |
| |
• Oversees 74 Funds in Fund Complex | | Senior Vice President and Deputy General Counsel, Affiliated Managers Group, Inc. (2011-Present); Trustee of Aston Funds (27 portfolios) (2014-Present); Senior Vice President and Chief Regulatory Counsel, Affiliated Managers Group, Inc. (2007-2011); Vice President and Chief Regulatory Counsel, Affiliated Managers Group, Inc. (2004-2007); Secretary and Chief Legal Officer, AMG Funds, AMG Funds I, AMG Funds II and AMG Funds III (2004-2011); Senior Counsel, Vice President and Director of Operational Risk Management and Compliance, Wellington Management Company, LLP (1995-2004). |
| |
| Officers | | |
| |
Position(s) Held with Fund and Length of Time Served | | Name, Age, Principal Occupation(s) During Past 5 Years |
• President since 2014 | | Jeffrey T. Cerutti, 48 |
| |
• Principal Executive Officer since 2014 | | Chief Executive Officer, AMG Funds LLC (2014-Present); Director, President and Principal, AMG Distributors, Inc. (2014-Present); Chief Executive Officer and President, Aston Funds (2015-Present); President, VP Distributors, (2011-2014); Executive Vice President, Head of Distribution, Virtus Investment Partners, Inc. (2010-2014); Managing Director, Head of Sales, UBS Global Asset Management (2001-2010). |
| |
• Chief Operating Officer since 2007 | | Keitha L. Kinne, 57 Chief Operating Officer, AMG Funds LLC (2007-Present); Chief Investment Officer, AMG Funds LLC (2008-Present); Chief Operating Officer, AMG Distributors, Inc. (2007-Present); Managing Partner, AMG Funds LLC (2007-2014); President, AMG Funds (2012-2014); President, AMG Distributors, Inc. (2012-2014); Managing Director, Legg Mason & Co., LLC (2006-2007); Managing Director, Citigroup Asset Management (2004-2006). |
| |
• Secretary since 2015 | | Mark J. Duggan, 51 |
| |
• Chief Legal Officer since 2015 | | Senior Vice President and Senior Counsel, AMG Funds LLC (2015-Present); Secretary and Chief Legal Officer, AMG Funds, AMG Funds I, AMG Funds II and AMG Funds III (2015-Present); Attorney, K&L Gates, LLP (2009-2015). |
| |
• Chief Financial Officer since 2007 • Treasurer since 1999 • Principal Financial Officer since 2008 | | Donald S. Rumery, 57 Senior Vice President, Director of Mutual Funds Services, AMG Funds LLC (2005-Present); Treasurer, AMG Funds III (1995-Present); Treasurer, AMG Funds (1999-Present); Treasurer, AMG Funds I and AMG Funds II (2000-Present); Chief Financial Officer, AMG Funds, AMG Funds I, AMG Funds II and AMG Funds III (2007-Present); Treasurer and Chief Financial Officer, AMG Distributors, Inc. (2000-2012); Vice President, AMG Funds LLC, (1994-2004). |
| |
• Assistant Treasurer since 2014 | | John C. Ball, 40 Vice President, Assistant Treasurer, AMG Funds LLC (2014-Present); Vice President, State Street Corp. (2010-2014); Vice President, State Street International (Ireland) Limited (2007-2010). |
| |
• Chief Compliance Officer since 2010 | | John J. Ferencz, 53 Vice President, Chief Compliance Officer—AMG Family of Funds, AMG Funds LLC (2010-Present); Code of Ethics Reporting Officer and Sarbanes Oxley Code of Ethics Compliance Officer, AMG Funds, AMG Funds I, AMG Funds II and AMG Funds III (2010-Present); Senior Compliance Analyst, Mutual Funds and Regulatory, GE Asset Management Incorporated (2005-2010). |
| |
• Anti-Money Laundering Compliance Officer since 2014 | | Patrick J. Spellman, 41 Senior Vice President, Chief Compliance Officer, AMG Funds LLC (2011-Present); Chief Compliance Officer, AMG Distributors, Inc., (2010-Present); Compliance Manager, Legal and Compliance, Affiliated Managers Group, Inc. (2005-2011). |
68
INVESTMENT MANAGER AND ADMINISTRATOR
AMG Funds LLC
600 Steamboat Road Suite 300
Greenwich, CT 06830
(800) 835-3879
DISTRIBUTOR
AMG Distributors, Inc.
600 Steamboat Road, Suite 300
Greenwich, CT 06830
(800) 835-3879
SUBADVISOR
GW&K Investment Management, LLC 222 Berkeley St.
Boston, MA 02116
CUSTODIAN
The Bank of New York Mellon
2 Hanson Place
Brooklyn, NY 11217
LEGAL COUNSEL
Ropes & Gray LLP
Prudential Tower, 800 Boylston Street
Boston, MA 02199-3600
TRANSFER AGENT
BNY Mellon Investment Servicing (US) Inc.
Attn: AMG Funds
P.O. Box 9769
Providence, RI 02940
(800) 548-4539
FOR MANAGERSCHOICETM ONLY
AMG Funds
c/o BNY Mellon Investment Servicing (US) Inc.
P.O. Box 9847
Providence, Rhode Island 02940-8047
(800) 358-7668
This report is prepared for the Funds’ shareholders. It is authorized for distribution to prospective investors only when preceded or accompanied by an effective prospectus. To receive a free copy of the prospectus or Statement of Additional Information, which includes additional information about Fund Trustees, please contact us by calling 800.835.3879. Distributed by AMG Distributors, Inc., member FINRA/SIPC.
Current net asset values per share for each Fund are available on the Funds’ website at www.amgfunds.com.
A description of the policies and procedures each Fund uses to vote its proxies is available: (i) without charge, upon request, by calling 800.835.3879, or (ii) on the Securities and Exchange Commission’s (SEC) website at www.sec.gov. For information regarding each Fund’s proxy voting record for the 12-month period ended June 30, call 800.835.3879 or visit the SEC website at www.sec.gov.
Each Fund files its complete schedule of portfolio holdings with the SEC for the first and third quarters of each fiscal year on Form N-Q. The Funds’ Forms N-Q are available on the SEC’s website at www.sec.gov. A Fund’s Forms N-Q may be reviewed and copied at the SEC’s Public Reference Room in Washington, DC. Information on the operation of the Public Reference Room may be obtained by calling 1-800-SEC-0330. To review a complete list of the Funds’ portfolio holdings, or to view the most recent quarterly holdings report, semiannual report, or annual report, please visit www.amgfunds.com.
www.amgfunds.com |
AFFILIATE SUBADVISED FUNDS
BALANCED FUNDS
AMG Chicago Equity Partners Balanced
Chicago Equity Partners, LLC
AMG FQ Global Risk-Balanced
First Quadrant, L.P.
EQUITY FUNDS
AMG Chicago Equity Partners Small Cap Value
Chicago Equity Partners, LLC
AMG FQ Tax-Managed U.S. Equity
AMG FQ U.S. Equity
First Quadrant, L.P.
AMG Frontier Small Cap Growth
Frontier Capital Management Company, LLC
AMG GW&K Small Cap Core
AMG GW&K Small Cap Growth
GW&K Investment Management, LLC
AMG Renaissance International Equity
AMG Renaissance Large Cap Growth
The Renaissance Group LLC
AMG SouthernSun Small Cap
AMG SouthernSun U.S. Equity
SouthernSun Asset Management, LLC
AMG Systematic Large Cap Value
AMG Systematic Mid Cap Value
Systematic Financial Management, L.P.
AMG TimesSquare All Cap Growth
AMG TimesSquare International Small Cap
AMG TimesSquare Mid Cap Growth
AMG TimesSquare Small Cap Growth
TimesSquare Capital Management, LLC
AMG Trilogy Emerging Markets Equity
AMG Trilogy Emerging Wealth Equity
AMG Trilogy Global Equity
AMG Trilogy International Small Cap
Trilogy Global Advisors, L.P.
AMG Yacktman
AMG Yacktman Focused
AMG Yacktman Special Opportunities
Yacktman Asset Management LP
FIXED INCOME FUNDS
AMG GW&K Core Bond
AMG GW&K Enhanced Core Bond
AMG GW&K Municipal Bond
AMG GW&K Municipal Enhanced Yield
GW&K Investment Management, LLC
OPEN-ARCHITECTURE FUNDS
EQUITY FUNDS
AMG Managers Brandywine
AMG Managers Brandywine Advisors Mid Cap Growth
AMG Managers Brandywine Blue
Friess Associates, LLC
AMG Managers Cadence Capital Appreciation
AMG Managers Cadence Emerging Companies
AMG Managers Cadence Mid Cap
Cadence Capital Management, LLC
AMG Managers Emerging Opportunities
Lord, Abbett & Co. LLC
WEDGE Capital Management L.L.P.
Next Century Growth Investors LLC
RBC Global Asset Management (U.S.) Inc.
AMG Managers Essex Small/Micro Cap Growth
Essex Investment Management Co., LLC
AMG Managers Real Estate Securities
CenterSquare Investment Management, Inc.
AMG Managers Skyline Special Equities
Skyline Asset Management, L.P.
AMG Managers Special Equity
Ranger Investment Management, L.P.
Lord, Abbett & Co. LLC
Smith Asset Management Group, L.P.
Federated MDTA LLC
FIXED INCOME FUNDS
AMG Managers Bond
AMG Managers Global Income Opportunity
Loomis, Sayles & Co., L.P.
AMG Managers High Yield
J.P. Morgan Investment Management Inc.
AMG Managers Intermediate Duration Government
AMG Managers Short Duration Government
Amundi Smith Breeden LLC
| | |
 | | | www.amgfunds.com |
| | |
 | | ANNUAL REPORT |
AMG Funds
December 31, 2015
AMG Chicago Equity Partners Balanced Fund
Investor Class: MBEAX | Service Class: MBESX | Institutional Class: MBEYX
AMG Chicago Equity Partners Small Cap Value Fund
Investor Class: CESVX | Service Class: CESSX | Institutional Class: CESIX
AMG Managers High Yield Fund
Investor Class: MHHAX | Institutional Class: MHHYX |
AMG Managers Intermediate Duration Government Fund: MGIDX
AMG Managers Short Duration Government Fund: MGSDX
| | |
| www.amgfunds.com | | | AR002-1215 |
AMG Funds
Annual Report—December 31, 2015
| | | | |
TABLE OF CONTENTS | | PAGE | |
LETTER TO SHAREHOLDERS | | | 2 | |
| |
ABOUT YOUR FUND’S EXPENSES | | | 3 | |
| |
PORTFOLIO MANAGER’S COMMENTS, FUND SNAPSHOTS, AND SCHEDULES OF PORTFOLIO INVESTMENTS | | | | |
| |
AMG Chicago Equity Partners Balanced Fund | | | 4 | |
| |
AMG Chicago Equity Partners Small Cap Value Fund | | | 17 | |
| |
AMG Managers High Yield Fund | | | 23 | |
| |
AMG Managers Intermediate Duration Government Fund | | | 40 | |
| |
AMG Managers Short Duration Government Fund | | | 49 | |
| |
NOTES TO SCHEDULES OF PORTFOLIO INVESTMENTS | | | 60 | |
| |
FINANCIAL STATEMENTS | | | | |
| |
Statement of Assets and Liabilities | | | 67 | |
Balance sheets, net asset value (NAV) per share computations and cumulative undistributed amounts | | | | |
| |
Statement of Operations | | | 70 | |
Detail of sources of income, expenses, and realized and unrealized gains (losses) during the year | | | | |
| |
Statements of Changes in Net Assets | | | 71 | |
Detail of changes in assets for the past two years | | | | |
| |
Financial Highlights | | | 73 | |
Historical net asset values per share, distributions, total returns, income and expense ratios, turnover ratios and net assets | | | | |
| |
Notes to Financial Statements | | | 80 | |
Accounting and distribution policies, details of agreements and transactions with Fund management and affiliates, and descriptions of certain investment risks | | | | |
| |
REPORT OF INDEPENDENT REGISTERED PUBLIC ACCOUNTING FIRM | | | 90 | |
| |
TRUSTEES AND OFFICERS | | | 91 | |
Nothing contained herein is to be considered an offer, sale or solicitation of an offer to buy shares of any series of the AMG Fund family of mutual funds. Such offering is made only by prospectus, which includes details as to offering price and other material information.
| | |
| | | Letter to Shareholders |
DEAR SHAREHOLDER:
Overall, U.S. equity investors achieved modest positive returns for the year ended December 31, 2015, although the second half of the year was characterized by a notable increase in volatility. The S&P 500 Index, a widely followed barometer of the U.S. equity market, returned 1.4% during the past twelve months. However, the U.S. equity market did experience its first correction in four years in August, losing just over 10% of its value in a little more than a week. Fortunately, those losses were almost entirely recovered by the end of the period. Investors had to process the first rate increase from the U.S. Federal Reserve +0.25% in nearly six years, a continued slowing of growth in China and the implications for global economic growth and the impact of commodity prices falling to lows not seen since 2009. During the year, there was significant dispersion in performance across sectors, with consumer discretionary and health care stocks returning 6% while companies within the energy sector fell (23)%. Meanwhile, international stocks fell during the prior year, returning (5.7)%, as measured by the MSCI All Country World ex USA Index (in U.S. Dollar terms). International investment returns in U.S. Dollar terms were negatively impacted by continued strengthening in the U.S. Dollar.
The Barclays U.S. Aggregate Bond Index, a broad U.S. bond market benchmark, returned 0.6% for the year ended December 31, 2015. Interest rates rose modestly during 2015, providing some pressure on bond prices. Investors’ appetite for risk declined during the second half of 2015, reflected in the (4.5)% decline in the Barclays U.S. Corporate High Yield Bond Index.
Our foremost goal at AMG Funds is to provide investment solutions that help our shareholders successfully reach their long-term investment goals. By partnering with AMG’s affiliated investment boutiques, AMG Funds provides access to a distinctive array of actively-managed, return-oriented investment strategies. Additionally, we oversee and distribute a number of complementary open-architecture mutual funds subadvised by unaffiliated investment managers. We thank you for your continued confidence and investment in AMG Funds. You can rest assured that under all market conditions our team is focused on delivering excellent investment management services for your benefit.
Respectfully,

Jeffery Cerutti
President
AMG Funds
| | | | | | | | | | | | | | |
Average Annual Total Returns | | Periods ended December 31, 2015 | |
Stocks: | | | | 1 Year | | | 3 Years | | | 5 Years | |
Large Caps | | (S&P 500 Index) | | | 1.38 | % | | | 15.13 | % | | | 12.57 | % |
Small Caps | | (Russell 2000® Index) | | | (4.41 | )% | | | 11.65 | % | | | 9.19 | % |
International | | (MSCI All Country World ex USA Index) | | | (5.66 | )% | | | 1.50 | % | | | 1.06 | % |
| | | | |
Bonds: | | | | | | | | | | | |
Investment Grade | | (Barclays U.S. Aggregate Bond Index) | | | 0.55 | % | | | 1.44 | % | | | 3.25 | % |
High Yield | | (Barclays U.S. Corporate High Yield Bond Index) | | | (4.47 | )% | | | 1.69 | % | | | 5.04 | % |
Tax-exempt | | (Barclays Municipal Bond Index) | | | 3.30 | % | | | 3.16 | % | | | 5.35 | % |
Treasury Bills | | (BofA Merrill Lynch 6-month U.S. Treasury Bill) | | | 0.22 | % | | | 0.17 | % | | | 0.19 | % |
2
About Your Fund’s Expenses
As a shareholder of a Fund, you may incur two types of costs: (1) transaction costs, which may include sales charges (loads) on purchase payments; redemption fees; and exchange fees; and (2) ongoing costs, including management fees; distribution (12b-1) fees; and other Fund expenses. This example is intended to help you understand your ongoing costs (in dollars) of investing in the Fund and to compare these costs with the ongoing costs of investing in other mutual funds. The example is based on $1,000 invested at the beginning of the period and held for the entire period as indicated below.
ACTUAL EXPENSES
The first line of the following table provides information about the actual account values and actual expenses. You may use the information in this line, together with the amount you invested, to estimate the expenses that you paid over the period. Simply divide your account value by $1,000 (for example, an $8,600 account value divided by $1,000 = 8.6), then multiply the result by the number in the first line under the heading entitled “Expenses Paid During Period” to estimate the expenses you paid on your account during this period.
HYPOTHETICAL EXAMPLE FOR COMPARISON PURPOSES
The second line of the following table provides information about hypothetical account values and hypothetical expenses based on the Fund’s actual expense ratio and an assumed annual rate of return of 5% before expenses, which is not the Fund’s actual return. The hypothetical account values and expenses may not be used to estimate the actual ending account balance or expenses you paid for the period. You may use this information to compare the ongoing costs of investing in the Fund and other funds by comparing this 5% hypothetical example with the 5% hypothetical examples that appear in the shareholder reports of other funds.
Please note that the expenses shown in the table are meant to highlight your ongoing costs only and do not reflect any transactional costs, such as sales charges (loads), redemption fees, or exchange fees. Therefore, the second line of the table is useful in comparing ongoing costs only, and will not help you determine the relative total costs of owning different funds.
| | | | | | | | | | | | | | | | |
| | | | | | Beginning | | | Ending | | | Expenses | |
| | | Expense | | | Account | | | Account | | | Paid | |
| | | Ratio for | | | Value | | | Value | | | During | |
| Six Months Ended December 31, 2015 | | the Period | | | 7/01/15 | | | 12/31/15 | | | the Period* | |
AMG Chicago Equity Partners Balanced Fund | | | | | | | | | | | | | | | | |
Investor Class | | | | | | | | | | | | | | | | |
Based on Actual Fund Return | | | 1.09 | % | | $ | 1,000 | | | $ | 994 | | | $ | 5.48 | |
Hypothetical (5% return before expenses) | | | 1.09 | % | | $ | 1,000 | | | $ | 1,020 | | | $ | 5.55 | |
Service Class | | | | | | | | | | | | | | | | |
Based on Actual Fund Return | | | 0.94 | % | | $ | 1,000 | | | $ | 994 | | | $ | 4.72 | |
Hypothetical (5% return before expenses) | | | 0.94 | % | | $ | 1,000 | | | $ | 1,020 | | | $ | 4.79 | |
Institutional Class | | | | | | | | | | | | | | | | |
Based on Actual Fund Return | | | 0.84 | % | | $ | 1,000 | | | $ | 994 | | | $ | 4.22 | |
Hypothetical (5% return before expenses) | | | 0.84 | % | | $ | 1,000 | | | $ | 1,021 | | | $ | 4.28 | |
AMG Chicago Equity Partners Small Cap Value Fund** | | | | | | | | | | | | | | | | |
Investor Class | | | | | | | | | | | | | | | | |
Based on Actual Fund Return | | | 1.35 | % | | $ | 1,000 | | | $ | 938 | | | $ | 6.58 | |
Hypothetical (5% return before expenses) | | | 1.35 | % | | $ | 1,000 | | | $ | 1,018 | | | $ | 6.86 | |
Service Class | | | | | | | | | | | | | | | | |
Based on Actual Fund Return | | | 1.06 | % | | $ | 1,000 | | | $ | 940 | | | $ | 5.17 | |
Hypothetical (5% return before expenses) | | | 1.06 | % | | $ | 1,000 | | | $ | 1,020 | | | $ | 5.38 | |
Institutional Class | | | | | | | | | | | | | | | | |
Based on Actual Fund Return | | | 0.95 | % | | $ | 1,000 | | | $ | 939 | | | $ | 4.64 | |
Hypothetical (5% return before expenses) | | | 0.95 | % | | $ | 1,000 | | | $ | 1,020 | | | $ | 4.84 | |
AMG Managers High Yield Fund | | | | | | | | | | | | | | | | |
Investor Class | | | | | | | | | | | | | | | | |
Based on Actual Fund Return | | | 1.15 | % | | $ | 1,000 | | | $ | 932 | | | $ | 5.60 | |
Hypothetical (5% return before expenses) | | | 1.15 | % | | $ | 1,000 | | | $ | 1,019 | | | $ | 5.85 | |
Institutional Class | | | | | | | | | | | | | | | | |
Based on Actual Fund Return | | | 0.90 | % | | $ | 1,000 | | | $ | 933 | | | $ | 4.39 | |
Hypothetical (5% return before expenses) | | | 0.90 | % | | $ | 1,000 | | | $ | 1,021 | | | $ | 4.58 | |
AMG Managers Intermediate Duration Government Fund | | | | | | | | | | | | | | | | |
Based on Actual Fund Return | | | 0.89 | % | | $ | 1,000 | | | $ | 1,007 | | | $ | 4.50 | |
Hypothetical (5% return before expenses) | | | 0.89 | % | | $ | 1,000 | | | $ | 1,021 | | | $ | 4.53 | |
AMG Managers Short Duration Government Fund | | | | | | | | | | | | | | | | |
Based on Actual Fund Return | | | 0.79 | % | | $ | 1,000 | | | $ | 994 | | | $ | 3.97 | |
Hypothetical (5% return before expenses) | | | 0.79 | % | | $ | 1,000 | | | $ | 1,021 | | | $ | 4.02 | |
| * | Expenses are equal to the Fund’s annualized expense ratio multiplied by the average account value over the period, multiplied by the number of days in the most recent half-year (184), then divided by 365. |
| ** | Commencement of operations was on January 2, 2015. |
3
AMG Chicago Equity Partners Balanced Fund
Portfolio Manager’s Comments (unaudited)
THE YEAR IN REVIEW
For the year ended December 31, 2015, the AMG Chicago Equity Partners Balanced Fund (Investor Share Class) (the “Fund”) returned 2.2%, compared to the 1.1% return for its benchmark, which consists of 60% of the return of the Russell 1000® Index and 40% of the return of the Barclays U.S. Aggregate Bond Index. The Fund is managed to emphasize stock selection while also using our proprietary models to adjust size, style and allocation exposures. Our disciplined approach worked well during the year as we added value in stock selection and style tilt toward growth in the equity portfolio, as well as sector allocation toward higher-quality in fixed income. The Fund’s slight overweight position in equities had a neutral effect on relative performance for the year.
EQUITY
Stocks recovered in the fourth quarter, with the S&P 500 rising 7% to finish the year slightly positive at 1%. Small caps didn’t recover quite as much, with the Russell 2000® rising 4% in the quarter, finishing down (4.0)% for the year. Size favored large caps in the quarter and the year, with the Russell 1000® beating the Russell 2000® by 3% in the quarter and around 5% for the year. The style spread was wide in favor of growth for the year, with Russell 1000® Growth beating Russell 1000® Value by 9%, and Russell 2000® Growth beating Russell 2000® Value by 6%. Volatility, as measured by the VIX, initially decreased early in the quarter, but picked up in mid-December, only to retreat the last couple of weeks of the year to finish (18) close to where it started the year (19).
The end of zero-interest-rate policy, economic growth in U.S. and global and the drop in commodities were some of the major concerns for investors in 2015. After passing on a rate hike in the third quarter, the U.S. Federal Reserve (the Fed) finally raised rates in December, shifting the concern over the rate hike start date to how the Fed proceeds in 2016. The U.S. economy plugged along in 2015, the sixth year in a row with around 2% GDP growth, helped by continued improvement in the labor market. Commodities continued to decrease in the quarter, as global
demand weakened among solid supply. Despite the backdrop of global weakness and flat U.S. equity returns, M&A set a record year with around $4.6 trillion worth of deals, breaking the 2007 record. Many of the deals occurred in the health care and technology sectors.
The equity portion of the Fund outperformed its benchmark for the year. Our focus on growth over value stocks in 2015 contributed to outperformance as growth stocks outperformed value by more than 900 basis points (“bps”) in the large-cap space and 600 bps in small caps. Our security selection model also added value, with positive performance in three of four factor groups and top-ranked stocks outperforming bottom-ranked counterparts across sectors.
Our research has shown that constructing a well-diversified portfolio of companies with attractive valuation ratios, quality balance sheets and positive growth and momentum expectations, built through a disciplined, risk controlled process, has delivered consistent excess returns. Overall, our philosophy will not change based on short-term trends or conditions in the market. We will continue to use our disciplined approach to provide added value at controlled levels of risk.
We expect equities to perform below long-term equity return averages in the near term. We expect low single digit earnings growth excluding energy to be the primary driver of equity returns. If the market enters a downturn (quality) phase, there is above average potential for multiple contractions and negative equity returns. In terms of alpha, we expect excess returns in line with or above our long-term average of 1% in either an expansion or downturn market phase.
There is somewhat greater risk to this forecast due to continuing global risks, a non-synchronous expansion regime for different global regions, and distortions from central bank accommodation in this environment and related currency movements.
FIXED INCOME
2015 was not a good year for the riskier sectors of the fixed-income markets. While the fourth quarter saw a respite from a 15-month period dominated by weakness in the performance of credit sectors, the combination of poor fundamentals and the anticipation of less accommodative central bank policy resulted in the second consecutive year of negative excess return for the U.S. corporate sector of the Barclays U.S. Aggregate Index relative to duration-equivalent Treasuries.
One area of the investment-grade market hit particularly hard was the BBB-rated industrial sector where several energy components lost over 10% of their market value in 2015 as a result of the significant declines in commodity prices throughout the year. Meanwhile, the high-yield sector of the bond market posted a negative excess return for the year of almost 6% versus U.S. Treasuries.
Spreads on investment-grade credit declined by four bps in the fourth quarter but were wider by 35 bps for the year. Longer-maturity, lower-quality spreads widened more significantly. Interest rates were generally higher in both the fourth quarter and for all of 2015, with the largest increases in shorter maturities. The “flattening” of the yield curve was mostly a function of the anticipation of the December increase in the federal funds overnight rate by the Federal Reserve Open Market Committee. Overall rate increases were modest.
The Barclays U.S. Aggregate Bond Index had a total return of (0.6)% for the fourth quarter and 0.6% for all of 2015. Although modest, the coupon income earned over the full year was enough to offset the year-over-year rate increases. The most significant drag on U.S. Aggregate total returns was the (0.7)% return of the corporate sector of the index. Corporates underperformed Treasuries for the year by 161 bps. The Barclays U.S. Aggregate Bond Index ended 2014 with a yield to maturity of 2.13% and 2015 with a yield of 2.47%.
4
AMG Chicago Equity Partners Balanced Fund
Portfolio Manager’s Comments (continued)
The underperformance of the credit sectors of the benchmark benefited the fixed-income portion of the Fund in 2015. The Fund’s underweight to credit and emphasis on high quality was a strong positive for relative performance, while a yield disadvantage offset a portion of these gains. Our sector allocation research indicates continued difficulties for the credit-related sectors of the markets. We believe the Fund is well-positioned for an environment of higher volatility and risk avoidance. We continue to believe our positioning is prudent and in line with our stated objectives, and will benefit shareholders.
This commentary reflects the viewpoints of the portfolio manager, Chicago Equity Partners, LLC, as of December 31, 2015 and is not intended as a forecast or guarantee of future results.
CUMULATIVE TOTAL RETURN PERFORMANCE
The AMG Chicago Equity Partners Balanced Fund’s cumulative total return is based on the daily change in net asset value (NAV), and assumes that all dividends and distributions were reinvested. The graph compares a hypothetical
$10,000 investment made in the Fund’s Investor Class shares on December 31, 2005 to a $10,000 investment made in the benchmarks for the same time period. The graph and table do not reflect the deduction of taxes that a shareholder would pay on a Fund distribution or redemption of shares. The listed returns for the Fund are net of expenses and the returns for the indices exclude expenses. Total returns for the Fund would have been lower had certain expenses not been reduced.
5
AMG Chicago Equity Partners Balanced Fund
Portfolio Manager’s Comments (continued)
CUMULATIVE TOTAL RETURN PERFORMANCE (continued)
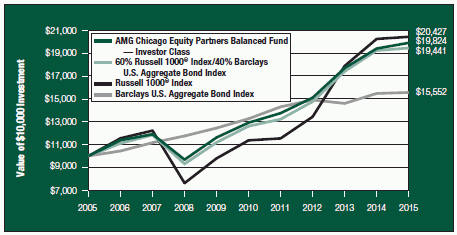
The table below shows the average annual total returns for the AMG Chicago Equity Partners Balanced Fund, the Russell 1000® Index and the Barclays U.S. Aggregate Bond Index for the same time periods ended December 31, 2015.
| | | | | | | | | | | | | | | | | | | | |
| | | One | | | Five | | | Ten | | | Since | | | Inception | |
| Average Annual Total Returns1 | | Year | | | Years | | | Years | | | Inception | | | Date | |
AMG Chicago Equity Partners Balanced Fund 2,3,4,5,6,7 | |
Investor Class | | | 2.19 | % | | | 8.96 | % | | | 7.08 | % | | | 7.85 | % | | | 01/02/97 | |
Service Class | | | 2.29 | % | | | — | | | | — | | | | 9.31 | % | | | 11/30/12 | |
Institutional Class | | | 2.44 | % | | | 9.24 | % | | | 7.35 | % | | | 8.25 | % | | | 01/02/97 | |
60% Russell 1000® Index8/40%
Barclays U.S. Aggregate Bond Index9 | | | 1.11 | % | | | 9.06 | % | | | 6.87 | % | | | 7.36 | % | | | 01/02/97 | † |
Barclays U.S. Aggregate Bond Index9 | | | 0.55 | % | | | 3.25 | % | | | 4.51 | % | | | 5.45 | % | | | 01/02/97 | † |
Russell 1000® Index8 | | | 0.92 | % | | | 12.44 | % | | | 7.40 | % | | | 7.68 | % | | | 01/02/97 | † |
The performance data shown represents past performance. Past performance is not a guarantee of future results. Current performance may be lower or higher than the performance data quoted. The investment return and principal value of an investment in the Fund will fluctuate so that an investor’s shares, when redeemed, may be worth more or less than their original cost.
Investors should carefully consider the Fund’s investment objectives, risks, charges and expenses before investing. For performance information through the most recent month end, current net asset values per share for the Fund and other information, please call (800) 835-3879 or visit our website at www.amgfunds.com for a free prospectus. Read it carefully before investing or sending money.
Distributed by AMG Distributors, Inc., member FINRA/SIPC.
| † | Date reflects inception date of the Fund, not the index. |
| 1 | Total return equals income yield plus share price change and assumes reinvestment of all dividends and capital gain distributions. Returns are net of fees and may reflect offsets of Fund expenses as described in the prospectus. No adjustment has been made for taxes payable by shareholders on their reinvested dividends and capital gain distributions. Returns for periods greater than one year are annualized. The listed returns on the Fund are net of expenses and based on the published NAV as of December 31, 2015. All returns are in U.S. dollars ($). |
| 2 | From time to time, the Fund’s advisor has waived its fees and/or absorbed Fund expenses, which has resulted in higher returns. |
| 3 | Changing interest rates may adversely affect the value of an investment. An increase in interest rates typically causes the value of bonds and other fixed income securities to fall. The Fund is subject to the risks associated with investments in debt securities, such as default risk and fluctuations in the perception of the debtor’s ability to pay its creditors. |
| 4 | Investments in foreign securities, even though publicly traded in the United States, may involve risks which are in addition to those inherent in domestic investments. |
| 5 | The Fund is subject to risks associated with investments in mid-capitalization companies such as greater price volatility, lower trading volume, and less liquidity than the stocks of larger, more established companies. |
| 6 | The Fund invests in value stocks, which may perform differently from the market as a whole and may be undervalued by the market for a long period of time. Value stocks may underperform growth stocks during the given periods. |
| 7 | To the extent that the Fund invests in asset-backed or mortgage-backed securities, its exposure to prepayment and extension risks may be greater than investments in other fixed income securities. |
| 8 | The Russell 1000® Index measures the performance of approximately 1,000 of the largest securities based on a combination of their market cap and current index membership. The Russell 1000® represents approximately 92% of the U.S. market. The Russell 1000® Index is unmanaged, is not available for investment, and does not incur expenses. |
| 9 | The Barclays U.S. Aggregate Bond Index is an index of the U.S. investment-grade fixed-rate bond market, including both government and corporate bonds. The Barclays U.S. Aggregate Bond Index is unmanaged, is not available for investment, and does not incur expenses. |
The Russell 1000® Index is a trademark of the London Stock Exchange Group companies.
Not FDIC insured, nor bank guaranteed. May lose value.
6
AMG Chicago Equity Partners Balanced Fund
Fund Snapshots (unaudited)
December 31, 2015
PORTFOLIO BREAKDOWN
| | | | |
| | | AMG Chicago Equity Partners | |
Sector | | Balanced Fund** | |
U.S. Government and Agency Obligations | | | 32.9 | % |
Information Technology | | | 13.8 | % |
Consumer Discretionary | | | 10.5 | % |
Financials | | | 10.2 | % |
Health Care | | | 10.0 | % |
Industrials | | | 8.4 | % |
Consumer Staples | | | 5.7 | % |
Energy | | | 2.4 | % |
Materials | | | 2.1 | % |
Utilities | | | 1.7 | % |
Telecommunication Services | | | 1.1 | % |
Other Assets and Liabilities | | | 1.2 | % |
| ** | As a percentage of net assets. |
TOP TEN HOLDINGS
| | | | |
| | | %of | |
Security Name | | Net Assets | |
Apple, Inc.* | | | 2.5 | % |
U.S. Treasury Notes, 2.500%, 05/15/24* | | | 2.4 | |
U.S. Treasury Notes, 0.750%, 03/31/18* | | | 2.1 | |
U.S. Treasury Notes, 2.25%, 11/15/24* | | | 2.1 | |
U.S. Treasury Notes, 1.375%, 08/31/20 | | | 2.1 | |
U.S. Treasury Notes, 0.875%, 07/15/18 | | | 2.1 | |
U.S. Treasury Bonds, 2.750%, 08/15/42* | | | 2.1 | |
U.S. Treasury Notes, 0.875%, 10/15/18 | | | 1.7 | |
U.S. Treasury Notes, 1.625%, 07/31/20 | | | 1.4 | |
FHLMC Gold Pool, 3.500%, 09/01/45 | | | 1.3 | |
Top Ten as a Group | | | 19.8 | % |
| * | Top Ten Holdings as of June 30, 2015. |
Because a fund’s strategy may result in multiple investments in particular sectors of the economy, its performance may depend on the performance of those sectors and may fluctuate more widely than investments diversified across more sectors. For additional information on these and other risk considerations, please see the Fund’s prospectus.
Any sectors, industries, or securities discussed should not be perceived as investment recommendations. Mention of a specific security should not be considered a recommendation to buy or solicitation to sell that security. Specific securities mentioned in this report may have been sold from the Fund’s portfolio of investments by the time you receive this report.
7
AMG Chicago Equity Partners Balanced Fund
Schedule of Portfolio Investments
December 31, 2015
| | | | | | | | |
| | | Shares | | | Value | |
Common Stocks—63.7% | | | | | | | | |
Consumer Discretionary—10.5% | | | | | | | | |
Abercrombie & Fitch Co., Class A | | | 190 | | | $ | 5,130 | |
Amazon.com, Inc.* | | | 3,020 | | | | 2,041,188 | |
American Axle & Manufacturing Holdings, Inc.* | | | 1,470 | | | | 27,842 | |
American Eagle Outfitters, Inc.1 | | | 1,800 | | | | 27,900 | |
Asbury Automotive Group, Inc.* | | | 470 | | | | 31,697 | |
Bassett Furniture Industries, Inc. | | | 200 | | | | 5,016 | |
Belmond, Ltd., Class A* | | | 350 | | | | 3,325 | |
Big Lots, Inc. | | | 3,760 | | | | 144,910 | |
Boyd Gaming Corp.*,1 | | | 1,435 | | | | 28,513 | |
Brunswick Corp. | | | 120 | | | | 6,061 | |
Caleres, Inc. | | | 150 | | | | 4,023 | |
Callaway Golf Co. | | | 670 | | | | 6,311 | |
CBS Corp., Class B | | | 4,060 | | | | 191,348 | |
Columbia Sportswear Co. | | | 20 | | | | 975 | |
Comcast Corp., Class A | | | 14,640 | | | | 826,135 | |
Cooper Tire & Rubber Co. | | | 620 | | | | 23,467 | |
Cooper-Standard Holding, Inc.* | | | 30 | | | | 2,328 | |
Cracker Barrel Old Country Store, Inc.1 | | | 20 | | | | 2,537 | |
Crown Media Holdings, Inc., Class A* | | | 3,330 | | | | 18,681 | |
Darden Restaurants, Inc. | | | 4,190 | | | | 266,652 | |
Dave & Buster’s Entertainment, Inc.* | | | 960 | | | | 40,070 | |
Express, Inc.* | | | 2,605 | | | | 45,014 | |
Foot Locker, Inc. | | | 6,240 | | | | 406,162 | |
Francesca’s Holdings Corp.* | | | 550 | | | | 9,576 | |
G-III Apparel Group, Ltd.* | | | 430 | | | | 19,032 | |
The Goodyear Tire & Rubber Co. | | | 19,100 | | | | 623,997 | |
Group 1 Automotive, Inc. | | | 100 | | | | 7,570 | |
Hasbro, Inc. | | | 3,420 | | | | 230,371 | |
The Home Depot, Inc. | | | 10,765 | | | | 1,423,671 | |
Hooker Furniture Corp. | | | 440 | | | | 11,106 | |
Hyatt Hotels Corp., Class A* | | | 1,700 | | | | 79,934 | |
The Interpublic Group of Cos., Inc. | | | 28,770 | | | | 669,766 | |
Isle of Capri Casinos, Inc.* | | | 1,530 | | | | 21,313 | |
Jarden Corp.* | | | 2,100 | | | | 119,952 | |
Johnson Controls, Inc. | | | 9,240 | | | | 364,888 | |
KB Home | | | 270 | | | | 3,329 | |
Lowe’s Cos., Inc. | | | 4,160 | | | | 316,326 | |
The Madison Square Garden Co., Class A* | | | 1,137 | | | | 183,967 | |
McDonald’s Corp. | | | 7,860 | | | | 928,580 | |
MGM Resorts International* | | | 10,530 | | | | 239,242 | |
MSG Networks, Inc., Class A* | | | 340 | | | | 7,072 | |
Nautilus, Inc.* | | | 860 | | | | 14,379 | |
Netflix, Inc.* | | | 3,320 | | | | 379,742 | |
Newell Rubbermaid, Inc. | | | 5,230 | | | | 230,538 | |
| | | | | | | | |
| | | Shares | | | Value | |
NIKE, Inc., Class B | | | 12,380 | | | $ | 773,750 | |
Norwegian Cruise Line Holdings, Ltd.* | | | 3,470 | | | | 203,342 | |
Nutrisystem, Inc. | | | 875 | | | | 18,935 | |
O’Reilly Automotive, Inc.* | | | 4,460 | | | | 1,130,253 | |
Outerwall, Inc.1 | | | 415 | | | | 15,164 | |
Oxford Industries, Inc. | | | 60 | | | | 3,829 | |
PetMed Express, Inc. | | | 425 | | | | 7,284 | |
Pool Corp. | | | 600 | | | | 48,468 | |
Reading International, Inc., Class A* | | | 730 | | | | 9,570 | |
Ruth’s Hospitality Group, Inc. | | | 715 | | | | 11,383 | |
Scholastic Corp. | | | 660 | | | | 25,450 | |
ServiceMaster Global Holdings, Inc.* | | | 11,050 | | | | 433,602 | |
Sinclair Broadcast Group, Inc., Class A1 | | | 430 | | | | 13,992 | |
Smith & Wesson Holding Corp.* | | | 710 | | | | 15,606 | |
Sonic Automotive, Inc., Class A | | | 500 | | | | 11,380 | |
Staples, Inc. | | | 2,605 | | | | 24,669 | |
Starbucks Corp. | | | 14,180 | | | | 851,225 | |
Starwood Hotels & Resorts Worldwide, Inc. | | | 1,610 | | | | 111,541 | |
Target Corp. | | | 10,335 | | | | 750,424 | |
Tempur Sealy International, Inc.* | | | 720 | | | | 50,731 | |
Tenneco, Inc.* | | | 230 | | | | 10,559 | |
Time Warner, Inc. | | | 1,850 | | | | 119,640 | |
Ulta Salon Cosmetics & Fragrance, Inc.* | | | 1,690 | | | | 312,650 | |
Vail Resorts, Inc. | | | 150 | | | | 19,198 | |
The Walt Disney Co. | | | 13,130 | | | | 1,379,700 | |
Wolverine World Wide, Inc. | | | 305 | | | | 5,097 | |
World Wrestling Entertainment, Inc., Class A1 | | | 1,620 | | | | 28,901 | |
Total Consumer Discretionary | | | | | | | 16,425,979 | |
Consumer Staples—5.7% | | | | | | | | |
Altria Group, Inc. | | | 7,375 | | | | 429,299 | |
Brown-Forman Corp., Class B | | | 2,180 | | | | 216,430 | |
Bunge, Ltd. | | | 3,590 | | | | 245,125 | |
Cal-Maine Foods, Inc.1 | | | 100 | | | | 4,634 | |
Casey’s General Stores, Inc. | | | 255 | | | | 30,715 | |
Central Garden and Pet Co., Class A* | | | 555 | | | | 7,548 | |
The Clorox Co. | | | 1,170 | | | | 148,391 | |
The Coca-Cola Co. | | | 3,705 | | | | 159,167 | |
Coca-Cola Enterprises, Inc. | | | 2,850 | | | | 140,334 | |
ConAgra Foods, Inc. | | | 4,570 | | | | 192,671 | |
Constellation Brands, Inc., Class A | | | 7,915 | | | | 1,127,413 | |
Costco Wholesale Corp. | | | 200 | | | | 32,300 | |
Coty, Inc., Class A1 | | | 7,870 | | | | 201,708 | |
Dean Foods Co.1 | | | 3,480 | | | | 59,682 | |
Dr. Pepper Snapple Group, Inc. | | | 8,190 | | | | 763,308 | |
Flowers Foods, Inc. | | | 2,190 | | | | 47,063 | |
Fresh Del Monte Produce, Inc. | | | 790 | | | | 30,715 | |
The accompanying notes are an integral part of these financial statements.
8
AMG Chicago Equity Partners Balanced Fund
Schedule of Portfolio Investments (continued)
| | | | | | | | |
| | | Shares | | | Value | |
Consumer Staples—5.7% (continued) | | | | | | | | |
Hormel Foods Corp. | | | 4,120 | | | $ | 325,810 | |
Ingredion, Inc. | | | 2,170 | | | | 207,973 | |
Kimberly-Clark Corp. | | | 1,070 | | | | 136,211 | |
The Kroger Co. | | | 19,270 | | | | 806,064 | |
Molson Coors Brewing Co., Class B | | | 1,140 | | | | 107,069 | |
Mondelez International, Inc., Class A | | | 5,500 | | | | 246,620 | |
National Beverage Corp.* | | | 185 | | | | 8,406 | |
Natural Health Trends Corp.1 | | | 290 | | | | 9,724 | |
Omega Protein Corp.* | | | 160 | | | | 3,552 | |
PepsiCo, Inc. | | | 6,280 | | | | 627,498 | |
Philip Morris International, Inc. | | | 6,970 | | | | 612,733 | |
Pilgrim’s Pride Corp.1 | | | 4,215 | | | | 93,109 | |
Post Holdings, Inc.* | | | 25 | | | | 1,542 | |
The Procter & Gamble Co. | | | 5,330 | | | | 423,255 | |
Reynolds American, Inc. | | | 12,060 | | | | 556,569 | |
SpartanNash Co. | | | 210 | | | | 4,544 | |
Universal Corp.1 | | | 130 | | | | 7,290 | |
USANA Health Sciences, Inc.* | | | 70 | | | | 8,942 | |
Village Super Market, Inc., Class A | | | 160 | | | | 4,216 | |
Walgreens Boots Alliance, Inc. | | | 3,120 | | | | 265,684 | |
Wal-Mart Stores, Inc. | | | 1,240 | | | | 76,012 | |
The WhiteWave Foods Co.* | | | 13,430 | | | | 522,561 | |
Total Consumer Staples | | | | | | | 8,891,887 | |
Energy—2.4% | | | | | | | | |
Alon USA Energy, Inc.1 | | | 1,300 | | | | 19,292 | |
Cabot Oil & Gas Corp. | | | 8,020 | | | | 141,874 | |
Cameron International Corp.* | | | 3,500 | | | | 221,200 | |
Chevron Corp. | | | 7,265 | | | | 653,559 | |
ConocoPhillips | | | 7,030 | | | | 328,231 | |
EOG Resources, Inc. | | | 1,000 | | | | 70,790 | |
Exxon Mobil Corp. | | | 10,755 | | | | 838,352 | |
Green Plains, Inc. | | | 140 | | | | 3,206 | |
Hess Corp. | | | 5,490 | | | | 266,155 | |
Matador Resources Co.*,1 | | | 115 | | | | 2,274 | |
Matrix Service Co.* | | | 710 | | | | 14,583 | |
McDermott International, Inc.* | | | 1,650 | | | | 5,528 | |
Murphy Oil Corp. | | | 4,420 | | | | 99,229 | |
National Oilwell Varco, Inc. | | | 1,420 | | | | 47,556 | |
Navios Maritime Acquisition Corp. | | | 3,755 | | | | 11,303 | |
Noble Corp. PLC1 | | | 11,380 | | | | 120,059 | |
Nordic American Tankers, Ltd.1 | | | 260 | | | | 4,040 | |
Oasis Petroleum, Inc.*,1 | | | 1,230 | | | | 9,065 | |
PDC Energy, Inc.* | | | 305 | | | | 16,281 | |
Phillips 66 | | | 2,645 | | | | 216,361 | |
QEP Resources, Inc. | | | 10,120 | | | | 135,608 | |
| | | | | | | | |
| | | Shares | | | Value | |
RSP Permian, Inc.* | | | 100 | | | $ | 2,439 | |
Schlumberger, Ltd. | | | 4,270 | | | | 297,832 | |
Ship Finance International, Ltd. | | | 530 | | | | 8,782 | |
Teekay Tankers, Ltd., Class A | | | 1,190 | | | | 8,187 | |
TETRA Technologies, Inc.* | | | 70 | | | | 526 | |
Valero Energy Corp. | | | 3,580 | | | | 253,142 | |
Western Refining, Inc.1 | | | 320 | | | | 11,398 | |
Total Energy | | | | | | | 3,806,852 | |
Financials—9.7% | | | | | | | | |
Access National Corp.1 | | | 140 | | | | 2,864 | |
Allied World Assurance Co. Holdings AG | | | 7,460 | | | | 277,437 | |
The Allstate Corp. | | | 4,370 | | | | 271,333 | |
Ambac Financial Group, Inc.* | | | 170 | | | | 2,395 | |
American International Group, Inc. | | | 4,610 | | | | 285,682 | |
Annaly Capital Management, Inc. | | | 4,900 | | | | 45,962 | |
ARMOUR Residential REIT, Inc. | | | 1,180 | | | | 25,677 | |
Ashford Hospitality Trust, Inc. | | | 2,110 | | | | 13,314 | |
Aspen Insurance Holdings, Ltd. | | | 4,350 | | | | 210,105 | |
Associated Banc-Corp. | | | 6,940 | | | | 130,125 | |
Assured Guaranty, Ltd. | | | 8,670 | | | | 229,148 | |
Axis Capital Holdings, Ltd. | | | 3,130 | | | | 175,969 | |
BancorpSouth, Inc. | | | 620 | | | | 14,874 | |
Bank of America Corp. | | | 37,180 | | | | 625,739 | |
The Bank of New York Mellon Corp. | | | 7,690 | | | | 316,982 | |
BBCN Bancorp, Inc. | | | 950 | | | | 16,359 | |
Beneficial Bancorp, Inc.* | | | 2,160 | | | | 28,771 | |
Berkshire Hathaway, Inc., Class B* | | | 1,560 | | | | 205,982 | |
Boston Properties, Inc. | | | 1,000 | | | | 127,540 | |
Cardinal Financial Corp. | | | 220 | | | | 5,005 | |
Cash America International, Inc. | | | 450 | | | | 13,478 | |
Cathay General Bancorp | | | 800 | | | | 25,064 | |
CBL & Associates Properties, Inc. | | | 9,460 | | | | 117,020 | |
CBRE Group, Inc., Class A* | | | 13,400 | | | | 463,372 | |
CenterState Banks, Inc. | | | 750 | | | | 11,738 | |
Chemical Financial Corp. | | | 110 | | | | 3,770 | |
The Chubb Corp. | | | 2,600 | | | | 344,864 | |
Citigroup, Inc. | | | 5,020 | | | | 259,785 | |
CME Group, Inc. | | | 675 | | | | 61,155 | |
Comerica, Inc. | | | 4,620 | | | | 193,255 | |
Commerce Bancshares, Inc. | | | 3,118 | | | | 132,640 | |
CommunityOne Bancorp* | | | 70 | | | | 943 | |
Cousins Properties, Inc. | | | 580 | | | | 5,469 | |
Crown Castle International Corp. | | | 5,450 | | | | 471,153 | |
CubeSmart | | | 1,975 | | | | 60,474 | |
DCT Industrial Trust, Inc. | | | 80 | | | | 2,990 | |
DiamondRock Hospitality Co. | | | 530 | | | | 5,114 | |
The accompanying notes are an integral part of these financial statements.
9
AMG Chicago Equity Partners Balanced Fund
Schedule of Portfolio Investments (continued)
| | | | | | | | |
| | | Shares | | | Value | |
Financials—9.7% (continued) | | | | | | | | |
Eaton Vance Corp.1 | | | 6,450 | | | $ | 209,174 | |
eHealth, Inc.* | | | 560 | | | | 5,589 | |
Enterprise Financial Services Corp. | | | 180 | | | | 5,103 | |
EPR Properties | | | 425 | | | | 24,841 | |
Equity Lifestyle Properties, Inc. | | | 4,690 | | | | 312,682 | |
Evercore Partners, Inc., Class A | | | 760 | | | | 41,093 | |
Everest Re Group, Ltd. | | | 515 | | | | 94,291 | |
Extra Space Storage, Inc. | | | 4,810 | | | | 424,290 | |
FactSet Research Systems, Inc. | | | 570 | | | | 92,665 | |
Federal Agricultural Mortgage Corp., Class C | | | 30 | | | | 947 | |
First American Financial Corp. | | | 145 | | | | 5,206 | |
First Defiance Financial Corp. | | | 195 | | | | 7,367 | |
First Financial Bancorp | | | 780 | | | | 14,095 | |
First Horizon National Corp. | | | 14,670 | | | | 213,008 | |
First Industrial Realty Trust, Inc. | | | 130 | | | | 2,877 | |
First NBC Bank Holding Co.* | | | 40 | | | | 1,496 | |
First Niagara Financial Group, Inc. | | | 7,270 | | | | 78,880 | |
Flagstar Bancorp, Inc.* | | | 1,340 | | | | 30,967 | |
Fox Chase Bancorp, Inc. | | | 80 | | | | 1,623 | |
Franklin Financial Network, Inc.* | | | 140 | | | | 4,393 | |
Franklin Resources, Inc. | | | 3,910 | | | | 143,966 | |
The Goldman Sachs Group, Inc. | | | 1,290 | | | | 232,497 | |
Government Properties Income Trust1 | | | 690 | | | | 10,950 | |
Great Southern Bancorp, Inc.1 | | | 235 | | | | 10,636 | |
Great Western Bancorp, Inc. | | | 810 | | | | 23,506 | |
Hallmark Financial Services, Inc.* | | | 490 | | | | 5,728 | |
Heartland Financial USA, Inc. | | | 265 | | | | 8,310 | |
Heritage Insurance Holdings, Inc. | | | 90 | | | | 1,964 | |
Hersha Hospitality Trust | | | 202 | | | | 4,396 | |
Highwoods Properties, Inc. | | | 545 | | | | 23,762 | |
Infinity Property & Casualty Corp. | | | 200 | | | | 16,446 | |
Interactive Brokers Group, Inc., Class A | | | 3,960 | | | | 172,656 | |
Intercontinental Exchange, Inc. | | | 330 | | | | 84,566 | |
INTL. FCStone, Inc.* | | | 1,100 | | | | 36,806 | |
Investors Real Estate Trust | | | 260 | | | | 1,807 | |
Iron Mountain, Inc. | | | 2,110 | | | | 56,991 | |
iStar, Inc.*,1 | | | 900 | | | | 10,557 | |
Janus Capital Group, Inc. | | | 270 | | | | 3,804 | |
Jones Lang LaSalle, Inc. | | | 1,220 | | | | 195,029 | |
JPMorgan Chase & Co. | | | 7,208 | | | | 475,944 | |
KeyCorp | | | 11,060 | | | | 145,881 | |
Lamar Advertising Co., Class A | | | 8,090 | | | | 485,238 | |
Lazard, Ltd., Class A | | | 11,070 | | | | 498,261 | |
LendingTree, Inc.* | | | 185 | | | | 16,517 | |
Mack-Cali Realty Corp. | | | 1,050 | | | | 24,518 | |
| | | | | | | | |
| | | Shares | | | Value | |
MarketAxess Holdings, Inc. | | | 150 | | | $ | 16,738 | |
McGraw Hill Financial, Inc. | | | 2,220 | | | | 218,848 | |
Mercantile Bank Corp. | | | 160 | | | | 3,926 | |
MFA Financial, Inc. | | | 7,470 | | | | 49,302 | |
MGIC Investment Corp.*,1 | | | 4,025 | | | | 35,541 | |
Morgan Stanley | | | 7,810 | | | | 248,436 | |
MSCI, Inc. | | | 8,270 | | | | 596,515 | |
Nasdaq, Inc. | | | 3,810 | | | | 221,628 | |
New Residential Investment Corp. | | | 400 | | | | 4,864 | |
NewStar Financial, Inc.* | | | 450 | | | | 4,041 | |
Northern Trust Corp. | | | 5,600 | | | | 403,704 | |
Old Second Bancorp, Inc.* | | | 270 | | | | 2,117 | |
One Liberty Properties, Inc. | | | 385 | | | | 8,262 | |
Pacific Continental Corp. | | | 140 | | | | 2,083 | |
Piedmont Office Realty Trust, Inc., Class A | | | 14,300 | | | | 269,984 | |
Pinnacle Financial Partners, Inc. | | | 305 | | | | 15,665 | |
Post Properties, Inc. | | | 2,280 | | | | 134,885 | |
Preferred Bank | | | 320 | | | | 10,566 | |
PrivateBancorp, Inc. | | | 870 | | | | 35,687 | |
The Progressive Corp. | | | 9,140 | | | | 290,652 | |
PS Business Parks, Inc. | | | 400 | | | | 34,972 | |
Public Storage | | | 1,960 | | | | 485,492 | |
QCR Holdings, Inc. | | | 240 | | | | 5,830 | |
RE/MAX Holdings, Inc., Class A | | | 260 | | | | 9,698 | |
Regional Management Corp.* | | | 210 | | | | 3,249 | |
RLI Corp. | | | 60 | | | | 3,705 | |
The RMR Group, Inc., Class A*,1 | | | 81 | | | | 1,167 | |
Selective Insurance Group, Inc. | | | 150 | | | | 5,037 | |
Senior Housing Properties Trust | | | 8,740 | | | | 129,702 | |
ServisFirst Bancshares, Inc. | | | 470 | | | | 22,339 | |
Signature Bank* | | | 1,675 | | | | 256,895 | |
Simon Property Group, Inc. | | | 1,850 | | | | 359,714 | |
Sovran Self Storage, Inc. | | | 280 | | | | 30,047 | |
State Street Corp. | | | 2,800 | | | | 185,808 | |
Suffolk Bancorp | | | 90 | | | | 2,552 | |
Sunstone Hotel Investors, Inc. | | | 827 | | | | 10,329 | |
SunTrust Banks, Inc. | | | 5,655 | | | | 242,260 | |
SVB Financial Group* | | | 980 | | | | 116,522 | |
Symetra Financial Corp. | | | 160 | | | | 5,083 | |
Taubman Centers, Inc. | | | 1,600 | | | | 122,752 | |
The Travelers Cos., Inc. | | | 2,655 | | | | 299,643 | |
United Fire Group, Inc. | | | 500 | | | | 19,155 | |
Universal Insurance Holdings, Inc.1 | | | 1,565 | | | | 36,277 | |
US Bancorp | | | 4,235 | | | | 180,707 | |
Valley National Bancorp1 | | | 1,290 | | | | 12,706 | |
Walker & Dunlop, Inc.* | | | 190 | | | | 5,474 | |
The accompanying notes are an integral part of these financial statements.
10
AMG Chicago Equity Partners Balanced Fund
Schedule of Portfolio Investments (continued)
| | | | | | | | |
| | | Shares | | | Value | |
Financials—9.7% (continued) | | | | | | | | |
Wells Fargo & Co. | | | 8,660 | | | $ | 470,758 | |
Western Alliance Bancorp* | | | 1,490 | | | | 53,431 | |
WisdomTree Investments, Inc.1 | | | 1,720 | | | | 26,970 | |
Total Financials | | | | | | | 15,156,588 | |
Health Care—10.0% | | | | | | | | |
Abbott Laboratories | | | 8,690 | | | | 390,268 | |
AbbVie, Inc. | | | 10,365 | | | | 614,023 | |
Aetna, Inc. | | | 1,545 | | | | 167,045 | |
Albany Molecular Research, Inc.*,1 | | | 605 | | | | 12,009 | |
Allergan PLC* | | | 3,090 | | | | 965,625 | |
AmerisourceBergen Corp. | | | 6,480 | | | | 672,041 | |
Amgen, Inc. | | | 8,930 | | | | 1,449,607 | |
AMN Healthcare Services, Inc.* | | | 735 | | | | 22,822 | |
Amphastar Pharmaceuticals, Inc.* | | | 1,360 | | | | 19,353 | |
AmSurg Corp.* | | | 25 | | | | 1,900 | |
Anacor Pharmaceuticals, Inc.* | | | 480 | | | | 54,226 | |
Anthem, Inc. | | | 1,465 | | | | 204,280 | |
ARIAD Pharmaceuticals, Inc.*,1 | | | 4,490 | | | | 28,063 | |
Array BioPharma, Inc.* | | | 3,405 | | | | 14,369 | |
Bio-Rad Laboratories, Inc., Class A* | | | 340 | | | | 47,144 | |
Bruker Corp.* | | | 4,850 | | | | 117,710 | |
Cambrex Corp.* | | | 295 | | | | 13,892 | |
Cardinal Health, Inc. | | | 820 | | | | 73,201 | |
Catalent, Inc.* | | | 2,255 | | | | 56,443 | |
Centene Corp.* | | | 7,850 | | | | 516,609 | |
Cepheid, Inc.* | | | 430 | | | | 15,708 | |
Chemed Corp.1 | | | 230 | | | | 34,454 | |
Cigna Corp. | | | 1,290 | | | | 188,766 | |
Corcept Therapeutics, Inc.* | | | 640 | | | | 3,187 | |
Cross Country Healthcare, Inc.* | | | 730 | | | | 11,965 | |
CryoLife, Inc. | | | 290 | | | | 3,126 | |
DENTSPLY International, Inc. | | | 3,650 | | | | 222,102 | |
Dyax Corp.* | | | 670 | | | | 25,205 | |
Eagle Pharmaceuticals, Inc.* | | | 150 | | | | 13,300 | |
Edwards Lifesciences Corp.* | | | 7,420 | | | | 586,032 | |
Eli Lilly & Co. | | | 8,570 | | | | 722,108 | |
Emergent BioSolutions, Inc.* | | | 540 | | | | 21,605 | |
Endo International PLC* | | | 3,100 | | | | 189,782 | |
Exelixis, Inc.*,1 | | | 3,090 | | | | 17,428 | |
Express Scripts Holding Co.* | | | 2,500 | | | | 218,525 | |
Five Star Quality Care, Inc.* | | | 790 | | | | 2,512 | |
Gilead Sciences, Inc. | | | 12,255 | | | | 1,240,083 | |
Globus Medical, Inc., Class A*,1 | | | 200 | | | | 5,564 | |
Greatbatch, Inc.* | | | 35 | | | | 1,838 | |
Halozyme Therapeutics, Inc.* | | | 1,795 | | | | 31,107 | |
| | | | | | | | |
| | | Shares | | | Value | |
Health Net, Inc.* | | | 5,000 | | | $ | 342,300 | |
Hologic, Inc.* | | | 5,020 | | | | 194,224 | |
ICU Medical, Inc.* | | | 630 | | | | 71,051 | |
Illumina, Inc.* | | | 2,930 | | | | 562,399 | |
INC Research Holdings, Inc., Class A* | | | 280 | | | | 13,583 | |
Incyte Corp.* | | | 4,780 | | | | 518,391 | |
Insys Therapeutics, Inc.*,1 | | | 525 | | | | 15,031 | |
Intuitive Surgical, Inc.* | | | 640 | | | | 349,542 | |
Invacare Corp. | | | 45 | | | | 783 | |
iRadimed Corp.* | | | 120 | | | | 3,364 | |
Johnson & Johnson | | | 6,535 | | | | 671,275 | |
Ligand Pharmaceuticals, Inc.*,1 | | | 475 | | | | 51,500 | |
Mallinckrodt PLC* | | | 4,790 | | | | 357,478 | |
Masimo Corp.* | | | 675 | | | | 28,019 | |
McKesson Corp. | | | 230 | | | | 45,363 | |
Medtronic PLC | | | 2,116 | | | | 162,763 | |
Merck & Co., Inc. | | | 2,905 | | | | 153,442 | |
Merrimack Pharmaceuticals, Inc.*,1 | | | 2,705 | | | | 21,370 | |
Mettler-Toledo International, Inc.* | | | 100 | | | | 33,913 | |
Molina Healthcare, Inc.*,1 | | | 770 | | | | 46,300 | |
Natus Medical, Inc.* | | | 1,155 | | | | 55,498 | |
Neurocrine Biosciences, Inc.* | | | 65 | | | | 3,677 | |
NuVasive, Inc.* | | | 375 | | | | 20,291 | |
Orthofix International NV* | | | 200 | | | | 7,842 | |
Owens & Minor, Inc. | | | 70 | | | | 2,519 | |
Pacific Biosciences of California, Inc.*,1 | | | 1,430 | | | | 18,776 | |
Pfizer, Inc. | | | 16,097 | | | | 519,611 | |
PharMerica Corp.* | | | 80 | | | | 2,800 | |
PRA Health Sciences, Inc.* | | | 490 | | | | 22,182 | |
Regeneron Pharmaceuticals, Inc.* | | | 1,270 | | | | 689,445 | |
Repligen Corp.* | | | 540 | | | | 15,277 | |
Sarepta Therapeutics, Inc.*,1 | | | 190 | | | | 7,330 | |
Sequenom, Inc.* | | | 10,435 | | | | 17,113 | |
St. Jude Medical, Inc. | | | 1,910 | | | | 117,981 | |
STAAR Surgical Co.*,1 | | | 210 | | | | 1,499 | |
STERIS PLC | | | 360 | | | | 27,122 | |
Stryker Corp. | | | 500 | | | | 46,470 | |
Sucampo Pharmaceuticals, Inc., Class A* | | | 335 | | | | 5,792 | |
Synergy Pharmaceuticals, Inc.* | | | 1,525 | | | | 8,647 | |
Teligent, Inc.* | | | 2,690 | | | | 23,941 | |
Theravance, Inc.1 | | | 4,740 | | | | 49,960 | |
Triple-S Management Corp., Class B* | | | 520 | | | | 12,433 | |
Ultragenyx Pharmaceutical, Inc.* | | | 25 | | | | 2,804 | |
United Therapeutics Corp.* | | | 770 | | | | 120,590 | |
UnitedHealth Group, Inc. | | | 4,420 | | | | 519,969 | |
Universal Health Services, Inc., Class B | | | 945 | | | | 112,918 | |
The accompanying notes are an integral part of these financial statements.
11
AMG Chicago Equity Partners Balanced Fund
Schedule of Portfolio Investments (continued)
| | | | | | | | |
| | | Shares | | | Value | |
Health Care—10.0% (continued) | | | | | | | | |
VCA, Inc.* | | | 8,930 | | | $ | 491,150 | |
Waters Corp.* | | | 960 | | | | 129,197 | |
Zogenix, Inc.*,1 | | | 1,100 | | | | 16,214 | |
Total Health Care | | | | | | | 15,706,166 | |
Industrials—6.9% | | | | | | | | |
A. O. Smith Corp.1 | | | 2,620 | | | | 200,718 | |
ACCO Brands Corp.* | | | 955 | | | | 6,809 | |
Actuant Corp., Class A | | | 80 | | | | 1,917 | |
Acuity Brands, Inc. | | | 2,920 | | | | 682,696 | |
Aerojet Rocketdyne Holdings, Inc.* | | | 630 | | | | 9,866 | |
Alaska Air Group, Inc. | | | 2,160 | | | | 173,902 | |
AMERCO | | | 1,200 | | | | 467,400 | |
American Woodmark Corp.* | | | 230 | | | | 18,395 | |
Argan, Inc. | | | 680 | | | | 22,032 | |
Atlas Air Worldwide Holdings, Inc.* | | | 260 | | | | 10,748 | |
AZZ, Inc. | | | 230 | | | | 12,781 | |
The Boeing Co. | | | 5,850 | | | | 845,852 | |
Briggs & Stratton Corp. | | | 320 | | | | 5,536 | |
The Brink’s Co. | | | 200 | | | | 5,772 | |
C.H. Robinson Worldwide, Inc. | | | 740 | | | | 45,895 | |
Caterpillar, Inc. | | | 1,110 | | | | 75,436 | |
CBIZ, Inc.* | | | 1,090 | | | | 10,747 | |
Cintas Corp. | | | 6,680 | | | | 608,214 | |
Comfort Systems USA, Inc. | | | 810 | | | | 23,020 | |
Deere & Co.1 | | | 1,280 | | | | 97,626 | |
Deluxe Corp. | | | 645 | | | | 35,178 | |
Dover Corp. | | | 4,210 | | | | 258,115 | |
Dycom Industries, Inc.* | | | 465 | | | | 32,531 | |
EMCOR Group, Inc. | | | 220 | | | | 10,569 | |
Emerson Electric Co. | | | 1,600 | | | | 76,528 | |
Ennis, Inc. | | | 500 | | | | 9,625 | |
Federal Signal Corp. | | | 1,035 | | | | 16,405 | |
FreightCar America, Inc. | | | 920 | | | | 17,876 | |
GATX Corp. | | | 2,840 | | | | 120,842 | |
General Cable Corp. | | | 2,445 | | | | 32,836 | |
General Dynamics Corp. | | | 5,010 | | | | 688,174 | |
General Electric Co. | | | 24,650 | | | | 767,848 | |
Global Brass & Copper Holdings, Inc. | | | 1,700 | | | | 36,210 | |
The Greenbrier Cos., Inc.1 | | | 520 | | | | 16,962 | |
Hawaiian Holdings, Inc.* | | | 830 | | | | 29,324 | |
HD Supply Holdings, Inc.* | | | 12,830 | | | | 385,285 | |
Heidrick & Struggles International, Inc. | | | 230 | | | | 6,261 | |
Hertz Global Holdings, Inc.* | | | 14,210 | | | | 202,208 | |
Hillenbrand, Inc. | | | 340 | | | | 10,074 | |
| | | | | | | | |
| | | Shares | | | Value | |
Honeywell International, Inc. | | | 2,440 | | | $ | 252,711 | |
Illinois Tool Works, Inc. | | | 880 | | | | 81,558 | |
Insperity, Inc. | | | 260 | | | | 12,519 | |
Interface, Inc. | | | 1,435 | | | | 27,466 | |
JetBlue Airways Corp.* | | | 12,725 | | | | 288,221 | |
John Bean Technologies Corp. | | | 240 | | | | 11,959 | |
Joy Global, Inc.1 | | | 3,150 | | | | 39,722 | |
Kaman Corp. | | | 140 | | | | 5,713 | |
KBR, Inc. | | | 12,700 | | | | 214,884 | |
Kennametal, Inc. | | | 5,030 | | | | 96,576 | |
Kforce, Inc. | | | 635 | | | | 16,053 | |
Landstar System, Inc. | | | 1,310 | | | | 76,832 | |
Lawson Products, Inc.* | | | 1,030 | | | | 24,050 | |
Lincoln Electric Holdings, Inc. | | | 1,050 | | | | 54,484 | |
LSI Industries, Inc. | | | 110 | | | | 1,341 | |
Lydall, Inc.* | | | 995 | | | | 35,303 | |
Masco Corp. | | | 5,590 | | | | 158,197 | |
The Middleby Corp.* | | | 910 | | | | 98,162 | |
Moog, Inc., Class A* | | | 150 | | | | 9,090 | |
MRC Global, Inc.* | | | 1,085 | | | | 13,996 | |
National Presto Industries, Inc.1 | | | 100 | | | | 8,286 | |
Northrop Grumman Corp. | | | 1,900 | | | | 358,739 | |
PAM Transportation Services, Inc.* | | | 310 | | | | 8,553 | |
Quanta Services, Inc.* | | | 10,770 | | | | 218,092 | |
Rockwell Automation, Inc. | | | 2,055 | | | | 210,864 | |
Roper Technologies, Inc. | | | 670 | | | | 127,159 | |
SkyWest, Inc. | | | 190 | | | | 3,614 | |
Snap-on, Inc. | | | 2,660 | | | | 456,004 | |
Southwest Airlines Co. | | | 7,110 | | | | 306,157 | |
Spirit AeroSystems Holdings, Inc., Class A* | | | 7,330 | | | | 367,013 | |
Stanley Black & Decker, Inc. | | | 670 | | | | 71,509 | |
Steelcase, Inc., Class A | | | 960 | | | | 14,304 | |
Swift Transportation Co.*,1 | | | 275 | | | | 3,800 | |
Teledyne Technologies, Inc.* | | | 60 | | | | 5,322 | |
TransDigm Group, Inc.* | | | 2,980 | | | | 680,781 | |
TriMas Corp.* | | | 260 | | | | 4,849 | |
Triumph Group, Inc. | | | 4,800 | | | | 190,800 | |
TrueBlue, Inc.* | | | 530 | | | | 13,653 | |
Universal Forest Products, Inc. | | | 395 | | | | 27,006 | |
USA Truck, Inc.* | | | 140 | | | | 2,443 | |
Virgin America, Inc.*,1 | | | 290 | | | | 10,443 | |
Wabash National Corp.*,1 | | | 3,245 | | | | 38,388 | |
Waste Management, Inc. | | | 2,870 | | | | 153,172 | |
West Corp. | | | 90 | | | | 1,941 | |
The accompanying notes are an integral part of these financial statements.
12
AMG Chicago Equity Partners Balanced Fund
Schedule of Portfolio Investments (continued)
| | | | | | | | |
| | | Shares | | | Value | |
Industrials—6.9% (continued) | | | | | | | | |
YRC Worldwide, Inc.* | | | 100 | | | $ | 1,418 | |
Total Industrials | | | | | | | 10,881,360 | |
Information Technology—13.8% | | | | | | | | |
Accenture PLC, Class A | | | 4,120 | | | | 430,540 | |
Activision Blizzard, Inc. | | | 2,030 | | | | 78,581 | |
Advanced Energy Industries, Inc.* | | | 320 | | | | 9,034 | |
Advanced Micro Devices, Inc.* | | | 7,500 | | | | 21,525 | |
Alpha & Omega Semiconductor, Ltd.* | | | 1,125 | | | | 10,339 | |
Alphabet, Inc., Class A* | | | 720 | | | | 560,167 | |
Alphabet, Inc., Class C* | | | 741 | | | | 562,330 | |
Apple, Inc. | | | 37,685 | | | | 3,966,723 | |
Aspen Technology, Inc.* | | | 850 | | | | 32,096 | |
Blackbaud, Inc. | | | 70 | | | | 4,610 | |
Booz Allen Hamilton Holding Corp. | | | 3,205 | | | | 98,874 | |
Broadcom Corp., Class A | | | 2,570 | | | | 148,597 | |
Brocade Communications Systems, Inc. | | | 4,210 | | | | 38,648 | |
CDK Global, Inc. | | | 6,160 | | | | 292,415 | |
CDW Corp. | | | 7,440 | | | | 312,778 | |
Cirrus Logic, Inc.* | | | 350 | | | | 10,336 | |
Cisco Systems, Inc. | | | 3,740 | | | | 101,560 | |
Citrix Systems, Inc.* | | | 8,220 | | | | 621,843 | |
Cognizant Technology Solutions Corp., Class A* | | | 2,585 | | | | 155,152 | |
Cohu, Inc. | | | 1,030 | | | | 12,432 | |
Convergys Corp. | | | 160 | | | | 3,982 | |
CoreLogic, Inc.* | | | 8,910 | | | | 301,693 | |
Cray, Inc.* | | | 890 | | | | 28,881 | |
CSG Systems International, Inc. | | | 600 | | | | 21,588 | |
DST Systems, Inc. | | | 640 | | | | 72,998 | |
EarthLink Holdings Corp. | | | 790 | | | | 5,870 | |
Electronic Arts, Inc.* | | | 5,625 | | | | 386,550 | |
ePlus, Inc.* | | | 95 | | | | 8,860 | |
Euronet Worldwide, Inc.* | | | 765 | | | | 55,409 | |
Facebook, Inc., Class A* | | | 15,995 | | | | 1,674,037 | |
Fairchild Semiconductor International, Inc.* | | | 220 | | | | 4,556 | |
FireEye, Inc.*,1 | | | 14,200 | | | | 294,508 | |
First Solar, Inc.* | | | 3,210 | | | | 211,828 | |
Fleetmatics Group PLC*,1 | | | 360 | | | | 18,284 | |
Gigamon, Inc.* | | | 725 | | | | 19,263 | |
Global Payments, Inc. | | | 7,100 | | | | 458,021 | |
Globant, S.A.* | | | 400 | | | | 15,004 | |
The Hackett Group, Inc. | | | 1,120 | | | | 17,998 | |
Heartland Payment Systems, Inc. | | | 160 | | | | 15,171 | |
Hewlett Packard Enterprise Co. | | | 6,910 | | | | 105,032 | |
HP, Inc. | | | 6,850 | | | | 81,104 | |
II-VI, Inc.* | | | 760 | | | | 14,106 | |
| | | | | | | | |
| | | Shares | | | Value | |
Imperva, Inc.* | | | 640 | | | $ | 40,518 | |
Infinera Corp.*,1 | | | 345 | | | | 6,251 | |
Integrated Device Technology, Inc.* | | | 1,735 | | | | 45,717 | |
InterDigital, Inc. | | | 260 | | | | 12,750 | |
International Business Machines Corp. | | | 870 | | | | 119,729 | |
Intuit, Inc. | | | 900 | | | | 86,850 | |
IPG Photonics Corp.*,1 | | | 7,030 | | | | 626,795 | |
Ixia* | | | 715 | | | | 8,887 | |
IXYS Corp. | | | 660 | | | | 8,336 | |
j2 Global, Inc. | | | 120 | | | | 9,878 | |
Jabil Circuit, Inc. | | | 6,575 | | | | 153,132 | |
Juniper Networks, Inc. | | | 30,060 | | | | 829,656 | |
KLA-Tencor Corp. | | | 6,990 | | | | 484,756 | |
Lam Research Corp. | | | 3,450 | | | | 273,999 | |
Leidos Holdings, Inc. | | | 5,445 | | | | 306,336 | |
Littelfuse, Inc. | | | 200 | | | | 21,402 | |
LogMeln, Inc.* | | | 405 | | | | 27,176 | |
Manhattan Associates, Inc.* | | | 950 | | | | 62,862 | |
Maxim Integrated Products, Inc. | | | 8,160 | | | | 310,080 | |
Microsoft Corp. | | | 30,255 | | | | 1,678,547 | |
Motorola Solutions, Inc. | | | 4,670 | | | | 319,662 | |
Multi-Fineline Electronix, Inc.* | | | 1,445 | | | | 29,883 | |
NeoPhotonics Corp.* | | | 3,150 | | | | 34,209 | |
NETGEAR, Inc.* | | | 440 | | | | 18,440 | |
NeuStar, Inc., Class A*,1 | | | 2,040 | | | | 48,899 | |
NIC, Inc. | | | 330 | | | | 6,494 | |
Oclaro, Inc.* | | | 1,400 | | | | 4,872 | |
OSI Systems, Inc.* | | | 35 | | | | 3,103 | |
Palo Alto Networks, Inc.* | | | 4,980 | | | | 877,177 | |
Paycom Software, Inc.* | | | 1,120 | | | | 42,146 | |
Paylocity Holding Corp.* | | | 540 | | | | 21,897 | |
Pegasystems, Inc. | | | 85 | | | | 2,338 | |
RetailMeNot, Inc.* | | | 210 | | | | 2,083 | |
RingCentral, Inc., Class A* | | | 370 | | | | 8,725 | |
Sabre Corp. | | | 10,280 | | | | 287,532 | |
Sanmina Corp.* | | | 805 | | | | 16,567 | |
Seagate Technology PLC | | | 1,610 | | | | 59,023 | |
ServiceNow, Inc.* | | | 5,920 | | | | 512,435 | |
Silicon Laboratories, Inc.* | | | 30 | | | | 1,456 | |
Stamps.com, Inc.* | | | 185 | | | | 20,278 | |
SunPower Corp.*,1 | | | 2,990 | | | | 89,730 | |
Sykes Enterprises, Inc.* | | | 320 | | | | 9,850 | |
SYNNEX Corp. | | | 180 | | | | 16,187 | |
Tableau Software, Inc., Class A* | | | 2,750 | | | | 259,105 | |
Take-Two Interactive Software, Inc.* | | | 1,360 | | | | 47,382 | |
Tech Data Corp.* | | | 395 | | | | 26,220 | |
The accompanying notes are an integral part of these financial statements.
13
AMG Chicago Equity Partners Balanced Fund
Schedule of Portfolio Investments (continued)
| | | | | | | | |
| | | Shares | | | Value | |
Information Technology—13.8% (continued) | | | | | |
Tessera Technologies, Inc. | | | 795 | | | $ | 23,858 | |
Texas Instruments, Inc. | | | 13,070 | | | | 716,367 | |
Total System Services, Inc. | | | 3,940 | | | | 196,212 | |
Tyler Technologies, Inc.* | | | 285 | | | | 49,681 | |
VeriSign, Inc.*,1 | | | 440 | | | | 38,438 | |
Visa, Inc., Class A | | | 11,130 | | | | 863,132 | |
Web.com Group, Inc.* | | | 430 | | | | 8,604 | |
Xerox Corp. | | | 17,020 | | | | 180,923 | |
Xilinx, Inc. | | | 10,720 | | | | 503,518 | |
Total Information Technology | | | | | | | 21,743,406 | |
Materials—2.1% | | | | | | | | |
AEP Industries, Inc.* | | | 205 | | | | 15,816 | |
Air Products & Chemicals, Inc. | | | 1,580 | | | | 205,574 | |
Ashland, Inc. | | | 1,810 | | | | 185,887 | |
Avery Dennison Corp. | | | 2,230 | | | | 139,732 | |
Cabot Corp. | | | 6,080 | | | | 248,550 | |
Celanese Corp., Series A | | | 5,710 | | | | 384,454 | |
Chemtura Corp.* | | | 1,965 | | | | 53,586 | |
Cliffs Natural Resources, Inc.* | | | 5,290 | | | | 8,358 | |
Commercial Metals Co. | | | 970 | | | | 13,279 | |
Crown Holdings, Inc.* | | | 2,930 | | | | 148,551 | |
The Dow Chemical Co. | | | 5,660 | | | | 291,377 | |
Greif, Inc., Class A | | | 720 | | | | 22,183 | |
Innospec, Inc. | | | 235 | | | | 12,763 | |
LyondellBasell Industries N.V., Class A | | | 9,240 | | | | 802,956 | |
Newmont Mining Corp. | | | 4,320 | | | | 77,717 | |
Rayonier Advanced Materials, Inc. | | | 260 | | | | 2,545 | |
Ryerson Holding Corp.*,1 | | | 430 | | | | 2,008 | |
Schweitzer-Mauduit International, Inc. | | | 35 | | | | 1,470 | |
Sealed Air Corp. | | | 14,865 | | | | 662,979 | |
Stepan Co. | | | 100 | | | | 4,969 | |
Trinseo, S.A.* | | | 675 | | | | 19,035 | |
Total Materials | | | | | | | 3,303,789 | |
Telecommunication Services—1.1% | | | | | | | | |
AT&T, Inc. | | | 32,620 | | | | 1,122,454 | |
Atlantic Tele-Network, Inc. | | | 30 | | | | 2,347 | |
CenturyLink, Inc. | | | 7,830 | | | | 197,003 | |
FairPoint Communications, Inc.*,1 | | | 620 | | | | 9,963 | |
IDT Corp., Class B | | | 655 | | | | 7,637 | |
Shenandoah Telecommunications Co. | | | 500 | | | | 21,525 | |
Verizon Communications, Inc. | | | 9,390 | | | | 434,006 | |
Total Telecommunication Services | | | | | | | 1,794,935 | |
Utilities—1.5% | | | | | | | | |
American States Water Co. | | | 615 | | | | 25,799 | |
| | | | | | | | |
| | | Shares | | | Value | |
American Water Works Co, Inc. | | | 6,495 | | | $ | 388,076 | |
Artesian Resources Corp., Class A | | | 80 | | | | 2,216 | |
Atlantic Power Corp. | | | 390 | | | | 768 | |
CenterPoint Energy, Inc. | | | 21,885 | | | | 401,809 | |
Chesapeake Utilities Corp. | | | 220 | | | | 12,485 | |
Cleco Corp. | | | 90 | | | | 4,699 | |
IDACORP, Inc. | | | 380 | | | | 25,840 | |
Middlesex Water Co. | | | 235 | | | | 6,237 | |
New Jersey Resources Corp. | | | 420 | | | | 13,843 | |
Ormat Technologies, Inc. | | | 355 | | | | 12,947 | |
PPL Corp. | | | 4,180 | | | | 142,663 | |
Public Service Enterprise Group, Inc. | | | 6,010 | | | | 232,527 | |
Questar Corp. | | | 25,900 | | | | 504,532 | |
Vectren Corp. | | | 11,295 | | | | 479,134 | |
WGL Holdings, Inc. | | | 440 | | | | 27,716 | |
Total Utilities | | | | | | | 2,281,291 | |
Total Common Stocks
(cost $97,218,741) | | | | | | | 99,992,253 | |
| | |
| | | Principal
Amount | | | | |
Corporate Bonds and Notes—2.2% | | | | | | | | |
Financials—0.5% | | | | | | | | |
General Electric Capital Corp., | | | | | | | | |
2.900%, 01/09/171 | | $ | 80,000 | | | | 81,345 | |
MTN, 1.000%, 01/08/16 | | | 55,000 | | | | 55,001 | |
MTN, Series A, 6.750%, 03/15/32 | | | 35,000 | | | | 45,805 | |
US Bancorp, MTN, 2.200%, 04/25/19 | | | 135,000 | | | | 136,052 | |
Visa, Inc., Series, 2.200%, 12/14/20 | | | 175,000 | | | | 174,796 | |
Wells Fargo & Co., | | | | | | | | |
2.625%, 12/15/16 | | | 110,000 | | | | 111,510 | |
MTN, 1.400%, 09/08/17 | | | 265,000 | | | | 264,763 | |
Total Financials | | | | | | | 869,272 | |
Industrials—1.5% | | | | | | | | |
The Boeing Co., 2.350%, 10/30/21 | | | 209,000 | | | | 207,317 | |
Burlington Northern Santa Fe LLC, 4.700%, 10/01/19 | | | 35,000 | | | | 37,884 | |
Caterpillar Financial Services Corp., MTN, 1.000%, 11/25/16 | | | 65,000 | | | | 65,025 | |
Colgate-Palmolive Co., MTN, 1.750%, 03/15/19 | | | 70,000 | | | | 70,188 | |
Exxon Mobil Corp., 0.921%, 03/15/17 | | | 85,000 | | | | 84,917 | |
Johnson & Johnson, 0.700%, 11/28/16 | | | 80,000 | | | | 79,869 | |
McDonald’s Corp., MTN, 6.300%, 10/15/37 | | | 130,000 | | | | 152,977 | |
The accompanying notes are an integral part of these financial statements.
14
AMG Chicago Equity Partners Balanced Fund
Schedule of Portfolio Investments (continued)
| | | | | | | | |
| | | Principal
Amount | | | Value | |
Industrials—1.5% (continued) | | | | | | | | |
Medtronic, Inc., 0.875%, 02/27/17 | | $ | 40,000 | | | $ | 39,865 | |
PepsiCo, Inc., | | | | | | | | |
2.500%, 05/10/16 | | | 90,000 | | | | 90,553 | |
Series 1, 1.000%, 10/13/17 | | | 100,000 | | | | 99,505 | |
Pfizer, Inc., 6.200%, 03/15/19 | | | 85,000 | | | | 95,667 | |
Philip Morris International, Inc., 1.625%, 03/20/171 | | | 350,000 | | | | 352,133 | |
Union Pacific Corp., 3.646%, 02/15/24 | | | 115,000 | | | | 120,165 | |
United Parcel Service, Inc., 6.200%, 01/15/38 | | | 170,000 | | | | 218,483 | |
Verizon Communications, Inc., 2.625%, 02/21/20 | | | 288,000 | | | | 289,282 | |
Wal-Mart Stores, Inc., 6.500%, 08/15/37 | | | 200,000 | | | | 258,826 | |
The Walt Disney Co., 1.350%, 08/16/16 | | | 75,000 | | | | 75,210 | |
Total Industrials | | | | | | | 2,337,866 | |
Utilities—0.2% | | | | | | | | |
Consolidated Edison Co. of New York, Inc., | | | | | | | | |
Series 08-B, 6.750%, 04/01/38 | | | 95,000 | | | | 122,694 | |
Dominion Resources, Inc., 4.450%, 03/15/21 | | | 45,000 | | | | 47,674 | |
Georgia Power Co., 5.400%, 06/01/40 | | | 35,000 | | | | 36,959 | |
TransCanada PipeLines, Ltd., 3.800%, 10/01/20 | | | 90,000 | | | | 91,898 | |
Total Utilities | | | | | | | 299,225 | |
Total Corporate Bonds and Notes
(cost $3,507,635) | | | | | | | 3,506,363 | |
U.S. Government and Agency Obligations—32.9% | | | | | | | | |
Federal Home Loan Mortgage Corporation—7.9% | | | | | | | | |
FHLMC, | | | | | | | | |
0.875%, 02/22/17 | | | 340,000 | | | | 339,880 | |
1.375%, 05/01/20 1 | | | 140,000 | | | | 137,926 | |
FHLMC Gold Pool, | | | | | | | | |
2.500%, 07/01/28 to 10/01/30 | | | 679,106 | | | | 686,696 | |
3.000%, 01/01/29 to 07/01/45 | | | 3,045,810 | | | | 3,070,147 | |
3.500%, 03/01/42 to 09/01/45 | | | 4,215,570 | | | | 4,344,381 | |
4.000%, 08/01/43 to 09/01/45 | | | 2,212,599 | | | | 2,340,569 | |
4.500%, 02/01/39 to 03/01/44 | | | 727,598 | | | | 785,249 | |
5.000%, 07/01/35 to 07/01/41 | | | 611,557 | | | | 671,715 | |
5.500%, 04/01/38 to 01/01/39 | | | 72,921 | | | | 81,192 | |
Total Federal Home Loan Mortgage Corporation | | | | | | | 12,457,755 | |
Federal National Mortgage Association—4.0% | | | | | | | | |
FNMA, | | | | | | | | |
0.875%, 12/20/17 to 05/21/18 | | | 530,000 | | | | 525,985 | |
| | | | | | | | |
| | | Principal
Amount | | | Value | |
1.875%, 02/19/19 | | $ | 355,000 | | | $ | 359,927 | |
2.000%, 01/01/30 | | | 77,358 | | | | 76,057 | |
2.500%, 04/01/28 | | | 197,427 | | | | 200,101 | |
2.625%, 09/06/24 | | | 235,000 | | | | 237,757 | |
3.000%, 03/01/42 to 08/01/43 | | | 758,505 | | | | 760,787 | |
3.500%, 11/01/25 to 07/01/43 | | | 749,840 | | | | 779,406 | |
4.000%, 12/01/21 to 11/01/44 | | | 932,098 | | | | 988,536 | |
4.500%, 06/01/39 to 09/01/43 | | | 1,319,018 | | | | 1,427,649 | |
5.000%, 09/01/33 to 10/01/41 | | | 518,431 | | | | 572,546 | |
5.500%, 02/01/35 to 05/01/39 | | | 265,377 | | | | 296,627 | |
Total Federal National Mortgage Association | | | | 6,225,378 | |
U.S. Treasury Obligations—21.0% | | | | | |
U.S. Treasury Bonds, | | | | | | | | |
2.750%, 08/15/42 | | | 3,470,000 | | | | 3,317,917 | |
3.125%, 11/15/41 | | | 1,415,000 | | | | 1,462,397 | |
U.S. Treasury Notes, | | | | | | | | |
0.625%, 12/15/16 to 02/15/17 | | | 2,120,000 | | | | 2,115,964 | |
0.750%, 12/31/17 to 03/31/18 | | | 4,915,000 | | | | 4,874,976 | |
0.875%, 07/15/18 to 10/15/18 | | | 6,070,000 | | | | 6,010,517 | |
1.375%, 05/31/20 to 08/31/20 | | | 4,725,000 | | | | 4,652,098 | |
1.625%, 07/31/20 | | | 2,260,000 | | | | 2,249,405 | |
1.875%, 11/30/21 | | | 815,000 | | | | 811,753 | |
2.250%, 11/15/24 | | | 3,360,000 | | | | 3,358,817 | |
2.500%, 05/15/24 | | | 3,635,000 | | | | 3,714,941 | |
3.125%, 05/15/21 | | | 445,000 | | | | 473,360 | |
Total U.S. Treasury Obligations | | | | | | | 33,042,145 | |
Total U.S. Government and Agency Obligations (cost $51,977,911) | | | | | | | 51,725,278 | |
The accompanying notes are an integral part of these financial statements.
15
AMG Chicago Equity Partners Balanced Fund
Schedule of Portfolio Investments (continued)
| | | | | | | | |
| | | Principal
Amount | | | Value | |
Short-Term Investments—3.5% | | | | | | | | |
Repurchase Agreements—1.4%2 | | | | | | | | |
Cantor Fitzgerald Securities, Inc., dated 12/31/15, due 01/04/16, 0.340%, total to be received $1,000,038 (collateralized by various U.S. Government Agency Obligations, 0.000% - 10.500%, 01/15/16 - 09/01/49,totaling $1,020,000) | | $ | 1,000,000 | | | $ | 1,000,000 | |
Daiwa Capital Markets America, dated 12/31/15, due 01/04/16, 0.350%, total to be received $1,000,039 (collateralized by various U.S. Government Agency Obligations, 0.000% - 7.500%, 01/21/16 - 02/01/49, totaling $1,020,000) | | | 1,000,000 | | | | 1,000,000 | |
Nomura Securities International, Inc., dated 12/31/15, due 01/04/16, 0.330%, total to be received $205,657 (collateralized by various U.S. Government Agency Obligations, 0.000% - 10.500%, 01/15/16 -12/20/65 totaling $209,762) | | | 205,649 | | | | 205,649 | |
Total Repurchase Agreements | | | | | | | 2,205,649 | |
| | | | | | | | |
| | | Shares | | | Value | |
Other Investment Companies—2.1%3 | | | | | | | | |
Dreyfus Institutional Cash Advantage Fund, Institutional Class Shares, 0.26% | | | 3,212,096 | | | $ | 3,212,096 | |
Total Short-Term Investments
(cost $5,417,745) | | | | | | | 5,417,745 | |
Total Investments—102.3%
(cost $158,122,032) | | | | | | | 160,641,639 | |
Other Assets, less Liabilities—(2.3)% | | | | | | | (3,658,616 | ) |
Net Assets—100.0% | | | | | | $ | 156,983,023 | |
The accompanying notes are an integral part of these financial statements.
16
AMG Chicago Equity Partners Small Cap Value Fund
Portfolio Manager’s Comments (unaudited)
THE YEAR IN REVIEW
For the year ended December 31, 2015, the AMG Chicago Equity Partners Small Cap Value (Service Share Class) (the “Fund”) returned (5.8)%, compared to the (7.5)% return for its benchmark, the Russell 2000® Value Index. The Fund is managed to emphasize stock selection while neutralizing size, style and sector exposure. Our disciplined approach worked well relative to the benchmark over the last twelve months as our top ranked stocks outperformed the lower ranked stocks.
MARKET ENVIRONMENT
Stocks recovered in the fourth quarter, with the Russell 2000® Value Index up 2.9% for the quarter, but returning (7.5)% for the year. Size favored large caps in the quarter and the year, with the Russell 1000® beating the Russell 2000® by 3% in the quarter and around 5% for the year. From a style perspective, growth outperformed value across the size spectrum both in the fourth quarter and for 2015. The style spread was wide in favor of growth for the year, with Russell 2000® Growth beating Russell 2000® Value by 6%, and Russell 1000® Growth beating Russell 1000® Value by 9%. Therefore, the market segment with lowest return was small-cap value.
PERFORMANCE REVIEW
After tracking the benchmark for the first half of 2015, the Fund recorded one of its best excess returns in the third quarter. We saw a typical reversal in performance with the beginning of the fourth quarter, but to a much lesser extent versus the prior quarter’s outperformance. Over the last year, the Momentum factors provided the best information across all sectors, and the Growth factors were strong in cyclicals and energy sectors. The Value and Quality factor groups were more muted and did not provide as much information. However, the Fund had positive security selection in seven of the ten sectors. As a result, the Fund outperformed its benchmark in 2015.
OUTLOOK
Our research has shown that constructing a well-diversified portfolio of companies with attractive valuation ratios, quality balance sheets and positive growth and momentum expectations, built through a disciplined, risk controlled process has delivered consistent excess returns. Overall, our philosophy will not change based on short-term trends or conditions in the market. We will continue to use our disciplined approach to provide added value at controlled levels of risk.
We expect equities to perform below long-term equity return averages in the near term. We expect low single digit earnings growth excluding energy to be the primary driver of equity returns. If the market enters a downturn (quality) phase, there is above-average potential for multiple contractions and negative equity returns. In terms of alpha, we expect the Fund to outperform in either an expansion or downturn market phase. There is somewhat greater risk to this forecast due to continuing global risks, a non-synchronous expansion regime for different global regions and distortions from central bank accommodation in this environment and related currency movements.
This commentary reflects the viewpoints of the portfolio manager, Chicago Equity Partners, LLC, as of December 31, 2015 and is not intended as a forecast or guarantee of future results.
17
AMG Chicago Equity Partners Small Cap Value Fund
Portfolio Manager’s Comments (continued)
CUMULATIVE TOTAL RETURN PERFORMANCE
The AMG Chicago Equity Partners Small Cap Value Fund’s cumulative total return is based on the daily change in net asset value (NAV), and assumes that all dividends and distributions were reinvested. The graph compares a hypothetical $10,000 investment made in the Fund’s Service Class shares on December 31, 2014 to a $10,000 investment made in the benchmark for the same time period. The graph and table do not reflect the deduction of taxes that a shareholder would pay on a Fund distribution or redemption of shares. The listed returns for the Fund are net of expenses and the returns for the indices exclude expenses. Total returns for the Fund would have been lower had certain expenses not been reduced.
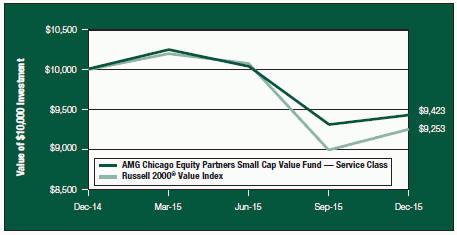
The table below shows the average annual total returns for the AMG Chicago Equity Partners Small Cap Value Fund and the Russell 2000® Value Index for the same time periods ended December 31, 2015.
| | | | | | | | | | | | |
| | | One | | | Since | | | Inception | |
Average Annual Total Returns1 | | Year | | | Inception | | | Date | |
AMG Chicago Equity Partners Small Cap Value Fund 2,3,4,5,6 | |
Investor Class | | | (6.10 | )% | | | (6.10 | )% | | | 12/31/14 | |
Service Class | | | (5.77 | )% | | | (5.77 | )% | | | 12/31/14 | |
Institutional Class | | | (5.69 | )% | | | (5.69 | )% | | | 12/31/14 | |
Russell 2000® Value Index7 | | | (7.47 | )% | | | (7.47 | )% | | | 12/31/14 | † |
The performance data shown represents past performance. Past performance is not a guarantee of future results. Current performance may be lower or higher than the performance data quoted. The investment return and principal value of an investment in the Fund will fluctuate so that an investor’s shares, when redeemed, may be worth more or less than their original cost.
Investors should carefully consider the Fund’s investment objectives, risks, charges and expenses before investing. For performance information through the most recent month end, current net asset values per share for the Fund and other information, please call (800) 835-3879 or visit our website at www.amgfunds.com for a free prospectus. Read it carefully before investing or sending money.
Distributed by AMG Distributors, Inc., member FINRA/SIPC.
| † | Date reflects inception date of the Fund, not the index. |
| 1 | Total return equals income yield plus share price change and assumes reinvestment of all dividends and capital gain distributions. Returns are net of fees and may reflect offsets of Fund expenses as described in the prospectus. No adjustment has been made for taxes payable by shareholders on their reinvested dividends and capital gain distributions. Returns for periods greater than one year are annualized. The listed returns on the Fund are net of expenses and based on the published NAV as of December 31, 2015. All returns are in U.S. dollars ($). |
| 2 | From time to time, the Fund’s advisor has waived its fees and/or absorbed Fund expenses, which has resulted in higher returns. |
| 3 | The Fund is subject to risks associated with investments in small-capitalization companies, such as erratic earnings history and a reliance on one or a limited number of products. The stocks of small capitalization companies may experience greater price volatility than those of larger, more established companies. |
| 4 | Investments in international securities are subject to certain risks of overseas investing including currency fluctuations and changes in political and economic conditions, which could result in significant market fluctuations. These risks are magnified in emerging markets. |
| 5 | The Fund is subject to special risk considerations similar to those associated with the direct ownership of real estate. Real estate valuations may be subject to factors such as changing general and local economic, financial, competitive, and environmental conditions. |
| 6 | The Fund invests in value stocks, which may perform differently from the market as a whole and may be undervalued by the market for a long period of time. Value stocks may underperform growth stocks during given periods. |
| 7 | The Russell 2000® Value Index is an unmanaged, market-value weighted, value-oriented index comprised of small stocks that have relatively low price-to-book ratios and lower forecasted growth values. Unlike the Fund, the Russell 2000® Value Index is unmanaged, is not available for investment and does not incur expenses. |
The Russell 2000® Value Index is a trademark of the London Stock Exchange Group companies.
Not FDIC insured, nor bank guaranteed. May lose value.
AMG Chicago Equity Partners Small Cap Value Fund
Fund Snapshots (unaudited)
December 31, 2015
PORTFOLIO BREAKDOWN
| | | | | | | | |
| | | AMG Chicago Equity Partners Small Cap | | | Russell 2000® | |
Sector | | Value Fund** | | | Value Index | |
Financials | | | 43.8 | % | | | 43.8 | % |
Industrials | | | 14.2 | % | | | 11.6 | % |
Information Technology | | | 10.7 | % | | | 10.8 | % |
Utilities | | | 7.4 | % | | | 7.4 | % |
Consumer Discretionary | | | 7.4 | % | | | 10.1 | % |
Health Care | | | 4.7 | % | | | 4.6 | % |
Energy | | | 4.2 | % | | | 4.4 | % |
Consumer Staples | | | 3.9 | % | | | 3.3 | % |
Materials | | | 2.8 | % | | | 3.1 | % |
Telecommunication Services | | | 0.6 | % | | | 0.9 | % |
Other Assets and Liabilities | | | 0.3 | % | | | 0.0 | % |
| ** | As a percentage of net assets. |
TOP TEN HOLDINGS
| | | | |
| | | %of | |
Security Name | | Net Assets | |
PrivateBancorp, Inc.* | | | 2.2 | % |
PS Business Parks, Inc. | | | 1.7 | |
Flagstar Bancorp, Inc. | | | 1.7 | |
American States Water Co. | | | 1.6 | |
IDACORP, Inc. | | | 1.6 | |
ARMOUR Residential REIT, Inc. | | | 1.6 | |
Cathay General Bancorp | | | 1.5 | |
EPR Properties | | | 1.5 | |
Mack-Cali Realty Corp. | | | 1.5 | |
WGL Holdings, Inc. | | | 1.5 | |
Top Ten as a Group | | | 16.4 | % |
| * | Top Ten Holdings as of June 30, 2015. |
Because a fund’s strategy may result in multiple investments in particular sectors of the economy, its performance may depend on the performance of those sectors and may fluctuate more widely than investments diversified across more sectors. For additional information on these and other risk considerations, please see the Fund’s prospectus.
Any sectors, industries, or securities discussed should not be perceived as investment recommendations. Mention of a specific security should not be considered a recommendation to buy or solicitation to sell that security. Specific securities mentioned in this report may have been sold from the Fund’s portfolio of investments by the time you receive this report.
19
AMG Chicago Equity Partners Small Cap Value Fund
Schedule of Portfolio Investments
December 31, 2015
| | | | | | | | |
| | | Shares | | | Value | |
Common Stocks—99.7% | | | | | | | | |
Consumer Discretionary—7.4% | | | | | | | | |
Abercrombie & Fitch Co., Class A1 | | | 1,460 | | | $ | 39,420 | |
American Eagle Outfitters, Inc.1 | | | 4,910 | | | | 76,105 | |
Bassett Furniture Industries, Inc. | | | 1,480 | | | | 37,118 | |
Belmond, Ltd., Class A* | | | 3,180 | | | | 30,210 | |
Caleres, Inc. | | | 1,130 | | | | 30,307 | |
Callaway Golf Co. | | | 4,810 | | | | 45,310 | |
Columbia Sportswear Co. | | | 140 | | | | 6,826 | |
Cooper Tire & Rubber Co. | | | 3,280 | | | | 124,148 | |
Cooper-Standard Holding, Inc.* | | | 260 | | | | 20,173 | |
Crown Media Holdings, Inc., Class A* | | | 7,615 | | | | 42,720 | |
Express, Inc.* | | | 4,230 | | | | 73,094 | |
Group 1 Automotive, Inc. | | | 745 | | | | 56,396 | |
Hooker Furniture Corp. | | | 1,830 | | | | 46,189 | |
Isle of Capri Casinos, Inc.* | | | 3,310 | | | | 46,108 | |
KB Home | | | 2,130 | | | | 26,263 | |
Reading International, Inc., Class A* | | | 1,800 | | | | 23,598 | |
Ruth’s Hospitality Group, Inc. | | | 550 | | | | 8,756 | |
Scholastic Corp. | | | 3,060 | | | | 117,994 | |
Sonic Automotive, Inc., Class A | | | 3,730 | | | | 84,895 | |
Total Consumer Discretionary | | | | | | | 935,630 | |
Consumer Staples—3.9% | | | | | | | | |
Central Garden and Pet Co., Class A* | | | 2,140 | | | | 29,104 | |
Dean Foods Co.1 | | | 8,445 | | | | 144,832 | |
Fresh Del Monte Produce, Inc. | | | 4,085 | | | | 158,825 | |
Ingles Markets, Inc., Class A | | | 10 | | | | 441 | |
Omega Protein Corp.* | | | 1,090 | | | | 24,198 | |
Post Holdings, Inc.* | | | 230 | | | | 14,191 | |
SpartanNash Co. | | | 1,630 | | | | 35,273 | |
Universal Corp. | | | 920 | | | | 51,594 | |
Village Super Market, Inc., Class A | | | 1,220 | | | | 32,147 | |
Total Consumer Staples | | | | | | | 490,605 | |
Energy—4.2% | | | | | | | | |
Alon USA Energy, Inc. | | | 4,510 | | | | 66,928 | |
Green Plains, Inc. | | | 1,080 | | | | 24,732 | |
Matrix Service Co.* | | | 4,160 | | | | 85,446 | |
McDermott International, Inc.* | | | 12,560 | | | | 42,076 | |
Navios Maritime Acquisition Corp. | | | 22,100 | | | | 66,521 | |
Nordic American Tankers, Ltd.1 | | | 1,750 | | | | 27,195 | |
Oasis Petroleum, Inc.*,1 | | | 4,390 | | | | 32,354 | |
PDC Energy, Inc.* | | | 2,050 | | | | 109,429 | |
RSP Permian, Inc.* | | | 810 | | | | 19,756 | |
Teekay Tankers, Ltd., Class A | | | 9,060 | | | | 62,333 | |
| | | | | | | | |
| | | Shares | | | Value | |
TETRA Technologies, Inc.* | | | 560 | | | $ | 4,211 | |
Triangle Petroleum Corp.* | | | 70 | | | | 54 | |
Total Energy | | | | | | | 541,035 | |
Financials—43.8% | | | | | | | | |
Access National Corp. | | | 1,060 | | | | 21,688 | |
Ambac Financial Group, Inc.* | | | 1,340 | | | | 18,881 | |
ARMOUR Residential REIT, Inc. | | | 9,185 | | | | 199,866 | |
Ashford Hospitality Trust, Inc. | | | 16,440 | | | | 103,736 | |
BancorpSouth, Inc. | | | 4,820 | | | | 115,632 | |
BBCN Bancorp, Inc. | | | 7,405 | | | | 127,514 | |
Beneficial Bancorp, Inc.* | | | 13,860 | | | | 184,615 | |
Cardinal Financial Corp. | | | 1,560 | | | | 35,490 | |
Cash America International, Inc. | | | 3,510 | | | | 105,124 | |
Cathay General Bancorp | | | 6,240 | | | | 195,499 | |
CenterState Banks, Inc. | | | 5,790 | | | | 90,613 | |
Chemical Financial Corp. | | | 950 | | | | 32,556 | |
CommunityOne Bancorp* | | | 500 | | | | 6,735 | |
Cousins Properties, Inc. | | | 4,490 | | | | 42,341 | |
CubeSmart | | | 5,070 | | | | 155,243 | |
DCT Industrial Trust, Inc. | | | 480 | | | | 17,938 | |
DiamondRock Hospitality Co. | | | 3,790 | | | | 36,574 | |
Enterprise Financial Services Corp. | | | 1,410 | | | | 39,974 | |
EPR Properties | | | 3,275 | | | | 191,424 | |
Federal Agricultural Mortgage Corp., Class C | | | 230 | | | | 7,261 | |
First American Financial Corp. | | | 1,120 | | | | 40,208 | |
First Defiance Financial Corp. | | | 1,550 | | | | 58,559 | |
First Financial Bancorp | | | 6,070 | | | | 109,685 | |
First Industrial Realty Trust, Inc. | | | 960 | | | | 21,245 | |
First NBC Bank Holding Co.* | | | 410 | | | | 15,330 | |
Flagstar Bancorp, Inc.* | | | 9,300 | | | | 214,923 | |
Fox Chase Bancorp, Inc. | | | 540 | | | | 10,957 | |
Franklin Financial Network, Inc.* | | | 1,080 | | | | 33,890 | |
Government Properties Income Trust1 | | | 5,250 | | | | 83,318 | |
Great Southern Bancorp, Inc. | | | 1,840 | | | | 83,278 | |
Great Western Bancorp, Inc. | | | 6,230 | | | | 180,795 | |
Hallmark Financial Services, Inc.* | | | 1,080 | | | | 12,625 | |
Heartland Financial USA, Inc. | | | 2,080 | | | | 65,229 | |
Heritage Insurance Holdings, Inc. | | | 700 | | | | 15,274 | |
Hersha Hospitality Trust | | | 1,591 | | | | 34,620 | |
Highwoods Properties, Inc. | | | 4,250 | | | | 185,300 | |
Infinity Property & Casualty Corp. | | | 1,520 | | | | 124,990 | |
INTL. FCStone, Inc.* | | | 4,500 | | | | 150,570 | |
Investors Real Estate Trust | | | 1,850 | | | | 12,858 | |
iStar, Inc.* | | | 6,910 | | | | 81,054 | |
The accompanying notes are an integral part of these financial statements.
20
AMG Chicago Equity Partners Small Cap Value Fund
Schedule of Portfolio Investments (continued)
| | | | | | | | |
| | | Shares | | | Value | |
Financials—43.8% (continued) | | | | | | | | |
Janus Capital Group, Inc. | | | 2,140 | | | $ | 30,153 | |
Mack-Cali Realty Corp. | | | 8,150 | | | | 190,302 | |
Mercantile Bank Corp. | | | 1,230 | | | | 30,184 | |
MGIC Investment Corp.*,1 | | | 17,900 | | | | 158,057 | |
New Residential Investment Corp. | | | 3,115 | | | | 37,878 | |
NewStar Financial, Inc.* | | | 1,150 | | | | 10,327 | |
Old Second Bancorp, Inc.* | | | 2,090 | | | | 16,386 | |
One Liberty Properties, Inc. | | | 1,440 | | | | 30,902 | |
Pacific Continental Corp. | | | 1,080 | | | | 16,070 | |
Pinnacle Financial Partners, Inc. | | | 2,400 | | | | 123,264 | |
Preferred Bank | | | 2,480 | | | | 81,890 | |
PrivateBancorp, Inc. | | | 6,770 | | | | 277,705 | |
PS Business Parks, Inc. | | | 2,485 | | | | 217,264 | |
RE/MAX Holdings, Inc., Class A | | | 1,910 | | | | 71,243 | |
Regional Management Corp.* | | | 1,620 | | | | 25,061 | |
RLI Corp. | | | 430 | | | | 26,552 | |
The RMR Group, Inc., Class A*,1 | | | 57 | | | | 817 | |
Selective Insurance Group, Inc. | | | 1,160 | | | | 38,953 | |
ServisFirst Bancshares, Inc. | | | 3,570 | | | | 169,682 | |
Suffolk Bancorp | | | 710 | | | | 20,128 | |
Sunstone Hotel Investors, Inc. | | | 6,390 | | | | 79,811 | |
Symetra Financial Corp. | | | 1,230 | | | | 39,077 | |
United Fire Group, Inc. | | | 3,910 | | | | 149,792 | |
Universal Insurance Holdings, Inc. | | | 7,240 | | | | 167,823 | |
Valley National Bancorp | | | 9,590 | | | | 94,462 | |
Walker & Dunlop, Inc.* | | | 1,400 | | | | 40,334 | |
Western Alliance Bancorp* | | | 4,410 | | | | 158,143 | |
Total Financials | | | | | | | 5,565,672 | |
Health Care—4.7% | | | | | | | | |
AmSurg Corp.* | | | 240 | | | | 18,240 | |
Anacor Pharmaceuticals, Inc.* | | | 475 | | | | 53,661 | |
Cross Country Healthcare, Inc.* | | | 1,410 | | | | 23,110 | |
CryoLife, Inc. | | | 2,290 | | | | 24,686 | |
Five Star Quality Care, Inc.* | | | 6,210 | | | | 19,748 | |
Greatbatch, Inc.* | | | 260 | | | | 13,650 | |
ICU Medical, Inc.* | | | 970 | | | | 109,397 | |
Invacare Corp. | | | 340 | | | | 5,913 | |
Merrimack Pharmaceuticals, Inc.* | | | 4,625 | | | | 36,538 | |
Orthofix International NV* | | | 1,500 | | | | 58,815 | |
Owens & Minor, Inc. | | | 720 | | | | 25,906 | |
PharMerica Corp.* | | | 630 | | | | 22,050 | |
Theravance, Inc.1 | | | 8,360 | | | | 88,114 | |
Triple-S Management Corp., Class B* | | | 3,900 | | | | 93,249 | |
Total Health Care | | | | | | | 593,077 | |
| | | | | | | | |
| | | Shares | | | Value | |
Industrials—14.2% | | | | | | | | |
ACCO Brands Corp.* | | | 7,420 | | | $ | 52,905 | |
Actuant Corp., Class A | | | 730 | | | | 17,491 | |
Aerojet Rocketdyne Holdings, Inc.* | | | 1,210 | | | | 18,949 | |
ArcBest Corp. | | | 10 | | | | 214 | |
Argan, Inc. | | | 2,660 | | | | 86,184 | |
Atlas Air Worldwide Holdings, Inc.* | | | 2,010 | | | | 83,093 | |
Briggs & Stratton Corp. | | | 2,450 | | | | 42,385 | |
CBIZ, Inc.* | | | 8,350 | | | | 82,331 | |
Deluxe Corp. | | | 2,430 | | | | 132,532 | |
Dycom Industries, Inc.* | | | 340 | | | | 23,786 | |
EMCOR Group, Inc. | | | 1,740 | | | | 83,590 | |
Ennis, Inc. | | | 3,880 | | | | 74,690 | |
Federal Signal Corp. | | | 7,800 | | | | 123,630 | |
FreightCar America, Inc. | | | 3,570 | | | | 69,365 | |
Global Brass & Copper Holdings, Inc. | | | 4,110 | | | | 87,543 | |
Heidrick & Struggles International, Inc. | | | 1,800 | | | | 48,996 | |
Kaman Corp. | | | 1,030 | | | | 42,034 | |
Lawson Products, Inc.* | | | 1,160 | | | | 27,086 | |
LSI Industries, Inc. | | | 980 | | | | 11,946 | |
Lydall, Inc.* | | | 3,620 | | | | 128,438 | |
Moog, Inc., Class A* | | | 1,170 | | | | 70,902 | |
MRC Global, Inc.* | | | 8,200 | | | | 105,780 | |
National Presto Industries, Inc. | | | 760 | | | | 62,974 | |
PAM Transportation Services, Inc.* | | | 1,415 | | | | 39,040 | |
SkyWest, Inc. | | | 1,520 | | | | 28,910 | |
Teledyne Technologies, Inc.* | | | 440 | | | | 39,028 | |
TriMas Corp.* | | | 1,940 | | | | 36,181 | |
Universal Forest Products, Inc. | | | 2,245 | | | | 153,491 | |
West Corp. | | | 740 | | | | 15,962 | |
YRC Worldwide, Inc.* | | | 930 | | | | 13,187 | |
Total Industrials | | | | | | | 1,802,643 | |
Information Technology—10.7% | | | | | | | | |
Advanced Energy Industries, Inc.* | | | 1,740 | | | | 49,120 | |
Advanced Micro Devices, Inc.* | | | 18,390 | | | | 52,779 | |
Alpha & Omega Semiconductor, Ltd.* | | | 3,360 | | | | 30,878 | |
Cohu, Inc. | | | 4,960 | | | | 59,867 | |
Comtech Telecommunications Corp. | | | 10 | | | | 201 | |
Convergys Corp. | | | 1,240 | | | | 30,864 | |
CSG Systems International, Inc. | | | 420 | | | | 15,112 | |
ePlus, Inc.* | | | 710 | | | | 66,215 | |
Fairchild Semiconductor International, Inc.* | | | 1,565 | | | | 32,411 | |
II-VI, Inc.* | | | 1,930 | | | | 35,821 | |
IXYS Corp. | | | 2,120 | | | | 26,776 | |
Multi-Fineline Electronix, Inc.* | | | 6,890 | | | | 142,485 | |
The accompanying notes are an integral part of these financial statements.
21
AMG Chicago Equity Partners Small Cap Value Fund
Schedule of Portfolio Investments (continued)
| | | | | | | | |
| | | Shares | | | Value | |
Information Technology—10.7% (continued) | | | | | |
NeoPhotonics Corp.* | | | 5,550 | | | $ | 60,273 | |
NETGEAR, Inc.* | | | 2,030 | | | | 85,077 | |
NeuStar, Inc., Class A*,1 | | | 5,530 | | | | 132,554 | |
Oclaro, Inc.* | | | 9,950 | | | | 34,626 | |
OSI Systems, Inc.* | | | 160 | | | | 14,186 | |
RetailMeNot, Inc.* | | | 1,470 | | | | 14,582 | |
Sanmina Corp.* | | | 4,175 | | | | 85,922 | |
Sykes Enterprises, Inc.* | | | 2,490 | | | | 76,642 | |
SYNNEX Corp. | | | 720 | | | | 64,750 | |
Take-Two Interactive Software, Inc.* | | | 2,990 | | | | 104,172 | |
Tech Data Corp.* | | | 1,750 | | | | 116,165 | |
Tessera Technologies, Inc. | | | 1,125 | | | | 33,761 | |
Total Information Technology | | | | | | | 1,365,239 | |
Materials—2.8% | | | | | | | | |
Commercial Metals Co. | | | 7,255 | | | | 99,321 | |
Greif, Inc., Class A | | | 2,740 | | | | 84,419 | |
Innospec, Inc. | | | 1,790 | | | | 97,215 | |
Rayonier Advanced Materials, Inc. | | | 1,610 | | | | 15,762 | |
Ryerson Holding Corp.* | | | 3,090 | | | | 14,430 | |
Schweitzer-Mauduit International, Inc. | | | 280 | | | | 11,757 | |
Stepan Co. | | | 695 | | | | 34,535 | |
Total Materials | | | | | | | 357,439 | |
Telecommunication Services—0.6% | | | | | | | | |
Atlantic Tele-Network, Inc. | | | 270 | | | | 21,122 | |
IDT Corp., Class B | | | 2,420 | | | | 28,217 | |
Shenandoah Telecommunications Co. | | | 780 | | | | 33,579 | |
Total Telecommunication Services | | | | | | | 82,918 | |
Utilities—7.4% | | | | | | | | |
American States Water Co. | | | 4,780 | | | | 200,521 | |
Artesian Resources Corp., Class A | | | 610 | | | | 16,897 | |
Atlantic Power Corp. | | | 2,990 | | | | 5,890 | |
Chesapeake Utilities Corp. | | | 1,660 | | | | 94,205 | |
| | | | | | | | |
| | | Shares | | | Value | |
Cleco Corp. | | | 820 | | | $ | 42,812 | |
IDACORP, Inc. | | | 2,940 | | | | 199,920 | |
Middlesex Water Co. | | | 1,670 | | | | 44,322 | |
New Jersey Resources Corp. | | | 3,370 | | | | 111,075 | |
Ormat Technologies, Inc. | | | 920 | | | | 33,552 | |
WGL Holdings, Inc. | | | 2,990 | | | | 188,340 | |
Total Utilities | | | | | | | 937,534 | |
Total Common Stocks
(cost $12,865,125) | | | | | | | 12,671,792 | |
| | |
| | | Principal
Amount | | | | |
Short-Term Investments—4.4% | | | | | | | | |
Repurchase Agreements—3.4%2 | | | | | | | | |
HSBC Securities USA Inc., dated 12/31/15, due 01/04/16, 0.290%, total to be received $65,726 (collateralized by a U.S. Government Agency Obligation, 3.000%, 11/15/44,totaling $67,039) | | $ | 65,724 | | | | 65,724 | |
RBC Capital Markets LLC, dated 12/31/15, due 01/04/16, 0.280%, total to be received $372,446 (collateralized by various U.S. Government Agency Obligations, 0.000% - 7.000%, 04/20/25 - 03/20/65,totaling $379,883) | | | 372,434 | | | | 372,434 | |
Total Repurchase Agreements | | | | | | | 438,158 | |
| | |
| | | Shares | | | | |
Other Investment Companies—1.0%3 | | | | | | | | |
Dreyfus Institutional Cash Advantage Fund, Institutional Class Shares, 0.26% | | | 126,146 | | | | 126,146 | |
Total Short-Term Investments
(cost $564,304) | | | | | | | 564,304 | |
Total Investments—104.1%
(cost $13,429,429) | | | | | | | 13,236,096 | |
Other Assets, less Liabilities—(4.1)% | | | | | | | (525,912 | ) |
Net Assets—100.0% | | | | | | $ | 12,710,184 | |
The accompanying notes are an integral part of these financial statements.
22
AMG Managers High Yield Fund
Portfolio Manager’s Comments (unaudited)
THE YEAR IN REVIEW
The AMG Managers High Yield Fund (Investor Class Shares) (the “Fund”) returned (4.8)% for the year ended December 31, 2015, compared with (4.5)% for the Barclays U.S. Corporate High Yield Bond Index (the Index).
MARKET RECAP
Sentiment within high yield eroded in 2015 on continued global growth uncertainty, geopolitical turmoil, further declines in energy and commodity-related prices and deteriorating technicals. The result of this challenging year was a (4.6)% annual return (as measured by the BAML US High Yield Master II Constrained Index) for high yield, which lagged five-year Treasuries (GA05), +1.5%; Emerging Markets (EMCB), 1.1%; U.S. Aggregate (D0A0), 0.6%; and high-grade credit (C0A0), (0.6)%. Negative returns for high yield were posted in six of the last seven months of the year and the annual return for 2015 was the first negative occurrence in a non-recessionary period. High yield spreads widened a dramatic 193 basis points (bps) for the 12-month period, closing the year at 697 bps. For the same period, yields rose from 6.65% at December 31, 2014, to 8.77%.
Higher quality outperformed dramatically as double-Bs returned (1.2)%, besting single-Bs, (4.7)%, and CCCs, (15.8)%, for the year. Not surprisingly, energy (23.6%) and metals and mining (26.2%) were the worst sector performers, while consumer goods (6.4%) and banking (5.6%) were top sector performers. Big and liquid names (as measured by the Barclays Very Liquid Index) underperformed for the year, posting a return of (5.3)%, trailing the broader high yield market by 65 bps.
2015 new high yield issuance totaled $293 billion, 18% below last year’s issuance tally. Issuers were of better quality overall but acquisition and general corporate purpose use of proceeds increased significantly versus previous years and were more than 50% of new issuance in 2015. With periods of market volatility and declining risk appetites,
technicals were challenging and full-year outflows for U.S. high yield mutual funds totaled $13.4 billion.
The default rate moved lower over the year to 1.82% as Caesars Entertainment dropped from the trailing 12-month par-weighted rate. Excluding energy and metals and mining, the default rate dropped further to 0.30% but will likely increase in 2016, largely driven by commodity-related issuers.
PERFORMANCE AND POSITIONING
The Fund slightly underperformed the Index for the year due to security selection in the independent energy, telecommunications and retailers sectors. Specifically, relative weightings in Sprint Corporation, Claire’s Stores, Legacy Reserves/ Finance and Breitburn Energy Partners hindered results for the year. Alternatively, relative contributions from security selection in the metals and mining, oil field services and consumer products sectors enhanced performance in 2015. The largest contributors came from relative weightings in HCA, First Data Corporation, Reichhold and Caesars Entertainment Corporation.
Compared to the Index at year end, the Fund was overweight in technology, consumer products and gaming due to our view of the relative value opportunities within those sectors. The Fund was underweight in banking/financials, metals and mining and home construction because we have not found these sectors compelling due to challenging fundamental outlooks or rich valuations. Relative to the Index at year end, the Fund’s spread and yield are lower and the duration of the Fund remains slightly shorter than that of the Index.
MARKET OUTLOOK
The impact on global growth from the slowdown in China, coupled with commodity-induced weakness, has increased global recessionary risks. Despite these headwinds, we expect the majority of high yield issuers to maintain solid fundamentals with reasonable growth in revenues
and cash flows. We believe broader market high yield spreads are very attractive and overly discount recessionary risks in the developed markets. We expect defaults to increase to 2.5-3.5% in 2016 driven largely by commodity-related issuers. Commodity-related security prices have moved aggressively lower to reflect the reality of current energy prices for a longer period of time. For the vast majority of the high yield market, the decline in oil is a benefit to either end-demand or cost inputs and should be supportive of fundamentals. However, weak technicals and increased economic uncertainty have contributed to broadening performance pressure away from the energy and commodity-related sectors. New issue activity has slowed due to broader market volatility and commodity markets pressure. Acquisition and general corporate purposes use of proceeds are now more than 50% of new issue volume. As central bank policies develop and if global growth concerns continue, we expect episodes of volatility to persist while dispersion of returns among individual issuers, industry sectors and rating buckets will increase. Spread and performance volatility may also continue around technical pressures resulting from retail fund flows. We believe our current Fund portfolio positioning and our fundamental research, bottom-up-oriented style should allow us to take advantage of market opportunities.
This commentary reflects the viewpoints of the Fund’s subadvisor, JP Morgan Asset Management as of December 31, 2015 and is not intended as a forecast or guarantee of future results.
23
AMG Managers High Yield Fund
Portfolio Manager’s Comments (continued)
CUMULATIVE TOTAL RETURN PERFORMANCE
AMG Managers High Yield Fund’s cumulative total return is based on the daily change in net asset value (NAV), and assumes that all dividends and distributions were reinvested. The graph compares a hypothetical $10,000 investment made in the Fund’s Investor Class shares on December 31, 2005 to a $10,000 investment made in the Barclays U.S. Corporate High Yield Bond Index for the same time period. The graph and table do not reflect the deduction of taxes that a shareholder would pay on a Fund distribution or redemption of shares. The listed returns for the Fund are net of expenses and the returns for the index exclude expenses. Total returns for the Fund would have been lower had certain expenses not been reduced.
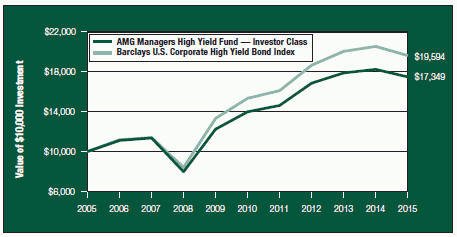
The table below shows the average annual total returns for the AMG Managers High Yield Fund and the Barclays U.S. Corporate High Yield Bond Index for the same time periods ended December 31, 2015.
| | | | | | | | | | | | |
| | | One | | | Five | | | Ten | |
| Average Annual Total Returns1 | | Year | | | Years | | | Years | |
AMG Managers High Yield Fund 2,3,4,5,6,7 | |
Investor Class | | | (4.77 | )% | | | 4.42 | % | | | 5.66 | % |
Institutional Class | | | (4.56 | )% | | | 4.67 | % | | | 5.95 | % |
Barclays U.S. Corporate High Yield Bond Index8 | | | (4.47 | )% | | | 5.04 | % | | | 6.96 | % |
The performance data shown represents past performance. Past performance is not a guarantee of future results. Current performance may be lower or higher than the performance data quoted. The investment return and principal value of an investment in the Fund will fluctuate so that an investor’s shares, when redeemed, may be worth more or less than their original cost.
Investors should carefully consider the Fund’s investment objectives, risks, charges and expenses before investing. For performance information through the most recent month end, current net asset values per share for the Fund and other information, please call (800) 835-3879 or visit our website at www.amgfunds.com for a free prospectus. Read it carefully before investing or sending money.
Distributed by AMG Distributors, Inc., member FINRA/SIPC.
| 1 | Total return equals income yield plus share price change and assumes reinvestment of all dividends and capital gain distributions. Returns are net of fees and may reflect offsets of Fund expenses as described in the prospectus. No adjustment has been made for taxes payable by shareholders on their reinvested dividends and capital gain distributions. Returns for periods greater than one year are annualized. The listed returns on the Fund are net of expenses and based on the published NAV as of December 31, 2015. All returns are in U.S. dollars ($). |
| 2 | From time to time, the Fund’s advisor has waived its fees and/or absorbed Fund expenses, which has resulted in higher returns. |
| 3 | Fixed income funds are subject to risks associated with investments in debt securities, such as default risk and fluctuations in the perception of the debtors’ ability to pay their creditors. Changing interest rates may adversely affect the value of a fixed income investment. An increase in interest rates typically causes the value of bonds and other fixed income securities to fall. |
| 4 | The Fund holds securities in which the issuer of the security may default or otherwise be unable to honor a financial obligation. The Fund holds securities rated below investment grade that are especially susceptible to this risk. These issuers may be involved in bankruptcy proceedings, reorganizations, or financial restructurings, and are not as strong financially as higher-rated issuers. |
| 5 | A short term redemption fee of 2% will be charged on shares held for less than 90 days. |
| 6 | Investments in international securities are subject to certain risks of overseas investing including currency fluctuations and changes in political and economic conditions, which could result in significant market fluctuations. |
| 7 | To the extent that the Fund invests in asset-backed or mortgage-backed securities, its exposure to prepayment and extension risks may be greater than investments in other fixed income securities. |
| 8 | The Barclays U.S. Corporate High Yield Bond Index is a total return performance benchmark for fixed income securities having a maximum quality rating of Ba1 (as determined by Moody’s Investors Service, Inc.). Unlike the Fund, the Barclays U.S. Corporate High Yield Bond Index is unmanaged, is not available for investment, and does not incur expenses. |
Not FDIC insured, nor bank guaranteed. May lose value.
24
AMG Managers High Yield Fund
Fund Snapshots (unaudited)
December 31, 2015
PORTFOLIO BREAKDOWN
| | | | |
| | | AMG Managers | |
Sector | | High Yield Fund** | |
Industrials | | | 85.4 | % |
Financials | | | 6.3 | % |
Floating Rate Senior Loan Interests | | | 4.3 | % |
Utilities | | | 1.1 | % |
Other Assets and Liabilities | | | 2.9 | % |
|
** As a percentage of net assets. | |
| |
| | | AMG Managers | |
Rating | | High Yield Fund*** | |
Baa | | | 3.5 | % |
Ba | | | 34.3 | % |
B | | | 46.4 | % |
Caa & lower | | | 11.0 | % |
N/R | | | 4.8 | % |
| *** | As a percentage of market value of preferred and fixed-income securities. |
TOP TEN HOLDINGS
| | | | |
| | | % of | |
Security Name | | Net Assets | |
HCA, Inc., 7.500%, 02/15/22* | | | 1.6 | % |
First Data Corp., 5.750%, 01/15/24 | | | 1.5 | |
Sprint Corp., 7.875%, 09/15/23* | | | 1.4 | |
Sprint Capital Corp., 8.750%, 03/15/32* | | | 1.1 | |
Caesars Entertainment Operating Co., Inc., 9.000%, 02/15/20* | | | 1.1 | |
Clear Channel Worldwide Holdings, Inc., Series B, 6.500%, 11/15/22* | | | 1.1 | |
Intelsat Jackson Holdings SA, 7.250%, 10/15/20* | | | 1.1 | |
HCA, Inc., 5.375%, 02/01/25* | | | 1.0 | |
Valeant Pharmaceuticals International, Inc., 7.500%, 07/15/21* | | | 1.0 | |
Serta Simmons Bedding LLC, 8.125%, 10/01/20 | | | 0.8 | |
| | | | |
Top Ten as a Group | | | 11.7 | % |
| | | | |
| * | Top Ten Holdings as of June 30, 2015. |
Credit quality ratings shown above reflect the highest rating assigned by either Standard & Poor’s (“S&P”) or Moody’s Investors Service, Inc. (“Moody’s”). These rating agencies are independent, nationally recognized statistical rating organizations and are widely used. Investment grade ratings are credit ratings of BBB/Baa or higher. Below investment grade ratings are credit ratings of BB/Ba or lower. Investments designated N/R are not rated by either rating agency. Unrated investments do not necessarily indicate low credit quality. Credit quality ratings are subject to change.
Because a fund’s strategy may result in multiple investments in particular sectors of the economy, its performance may depend on the performance of those sectors and may fluctuate more widely than investments diversified across more sectors. For additional information on these and other risk considerations, please see the Fund’s prospectus.
Any sectors, industries, or securities discussed should not be perceived as investment recommendations. Mention of a specific security should not be considered a recommendation to buy or solicitation to sell that security. Specific securities mentioned in this report may have been sold from the Fund’s portfolio of investments by the time you receive this report.
25
AMG Managers High Yield Fund
Schedule of Portfolio Investments
December 31, 2015
| | | | | | | | |
| | | Principal Amount | | | Value | |
Corporate Bonds and Notes—92.5% | | | | | | | | |
Financials—6.3% | | | | | | | | |
Ally Financial, Inc., | | | | | | | | |
3.500%, 01/27/19 | | $ | 75,000 | | | $ | 74,156 | |
4.625%, 05/19/22 | | | 80,000 | | | | 80,600 | |
4.625%, 03/30/251 | | | 135,000 | | | | 133,650 | |
5.125%, 09/30/24 | | | 35,000 | | | | 35,962 | |
5.750%, 11/20/25 | | | 40,000 | | | | 40,600 | |
Bank of America Corp., Series K, 8.000%, 07/29/494,5 | | | 165,000 | | | | 168,094 | |
Chinos Intermediate Holdings A, Inc., (7.750% Cash or 8.500% PIK), 7.750%, 05/01/19 (a)6 | | | 60,000 | | | | 15,300 | |
CIT Group, Inc., | | | | | | | | |
3.875%, 02/19/19 | | | 100,000 | | | | 99,750 | |
5.500%, 02/15/19 (a) | | | 120,000 | | | | 125,700 | |
Cogent Communications Finance, Inc., 5.625%, 04/15/21 (a) | | | 90,000 | | | | 83,925 | |
Communications Sales & Leasing, Inc. / CSL Capital LLC, 8.250%, 10/15/23 | | | 100,000 | | | | 85,000 | |
Corrections Corp. of America, | | | | | | | | |
4.125%, 04/01/20 | | | 50,000 | | | | 49,750 | |
4.625%, 05/01/23 | | | 110,000 | | | | 106,700 | |
5.000%, 10/15/22 | | | 25,000 | | | | 25,000 | |
Equinix, Inc., | | | | | | | | |
5.375%, 01/01/22 | | | 25,000 | | | | 25,750 | |
5.750%, 01/01/25 | | | 20,000 | | | | 20,550 | |
5.875%, 01/15/26 | | | 25,000 | | | | 25,812 | |
General Motors Financial Co., Inc., | | | | | | | | |
3.450%, 04/10/22 | | | 5,000 | | | | 4,803 | |
4.250%, 05/15/23 | | | 30,000 | | | | 29,721 | |
International Lease Finance Corp., | | | | | | | | |
4.625%, 04/15/21 | | | 25,000 | | | | 25,688 | |
5.875%, 04/01/19 | | | 185,000 | | | | 196,562 | |
6.250%, 05/15/19 | | | 40,000 | | | | 42,950 | |
Interval Acquisition Corp., 5.625%, 04/15/23 (a) | | | 65,000 | | | | 64,838 | |
Newfield Exploration Co., 5.750%, 01/30/22 | | | 35,000 | | | | 31,150 | |
Serta Simmons Bedding LLC, 8.125%, 10/01/20 (a) | | | 235,000 | | | | 246,750 | |
Vanguard Natural Resources LLC / VNR Finance Corp., 7.875%, 04/01/20 | | | 50,000 | | | | 13,500 | |
Total Financials | | | | | | | 1,852,261 | |
Industrials—85.1% | | | | | | | | |
1011778 BC ULC / New Red Finance, Inc., 6.000%, 04/01/22 (a) | | | 70,000 | | | | 72,275 | |
21st Century Oncology, Inc., 11.000%, 05/01/23 (a) | | | 65,000 | | | | 50,375 | |
ACCO Brands Corp., 6.750%, 04/30/20 | | | 110,000 | | | | 113,850 | |
ACI Worldwide, Inc., 6.375%, 08/15/20 (a) | | | 50,000 | | | | 51,687 | |
The accompanying notes are an integral part of these financial statements.
26
AMG Managers High Yield Fund
Schedule of Portfolio Investments (continued)
| | | | | | | | |
| | | Principal Amount | | | Value | |
Industrials—85.1% (continued) | | | | | | | | |
The ADT Corp., | | | | | | | | |
3.500%, 07/15/22 | | $ | 95,000 | | | $ | 85,500 | |
6.250%, 10/15/211 | | | 10,000 | | | | 10,495 | |
AECOM, | | | | | | | | |
5.750%, 10/15/22 | | | 20,000 | | | | 20,675 | |
5.875%, 10/15/24 | | | 25,000 | | | | 25,594 | |
Aerojet Rocketdyne Holdings, Inc., 7.125%, 03/15/21 | | | 125,000 | | | | 130,625 | |
Air Medical Merger Sub Corp., 6.375%, 05/15/23 (a) | | | 70,000 | | | | 62,650 | |
Aircastle, Ltd., 5.125%, 03/15/21 | | | 20,000 | | | | 20,600 | |
Alere, Inc., | | | | | | | | |
6.375%, 07/01/23 (a)1 | | | 30,000 | | | | 28,125 | |
6.500%, 06/15/20 | | | 20,000 | | | | 19,300 | |
Allegion PLC, 5.875%, 09/15/23 | | | 15,000 | | | | 15,338 | |
Allegion US Holding Co., Inc., 5.750%, 10/01/21 | | | 30,000 | | | | 30,525 | |
Altice Luxembourg, S.A., 7.750%, 05/15/22 (a) | | | 200,000 | | | | 181,000 | |
AMC Entertainment, Inc., 5.750%, 06/15/25 | | | 85,000 | | | | 85,637 | |
American Axle & Manufacturing, Inc., | | | | | | | | |
6.250%, 03/15/21 | | | 25,000 | | | | 25,969 | |
6.625%, 10/15/22 | | | 55,000 | | | | 57,750 | |
American Energy-Permian Basin LLC / AEPB Finance Corp., | | | | | | | | |
7.125%, 11/01/20 (a) | | | 20,000 | | | | 7,625 | |
7.375%, 11/01/21 (a) | | | 40,000 | | | | 15,800 | |
8.000%, 06/15/20 (a) | | | 35,000 | | | | 26,075 | |
Amkor Technology, Inc., | | | | | | | | |
6.375%, 10/01/221 | | | 125,000 | | | | 122,031 | |
6.625%, 06/01/21 | | | 60,000 | | | | 59,775 | |
Anixter, Inc., 5.500%, 03/01/23 (a) | | | 80,000 | | | | 80,600 | |
Antero Resources Corp., | | | | | | | | |
5.125%, 12/01/22 | | | 20,000 | | | | 15,300 | |
5.375%, 11/01/21 | | | 40,000 | | | | 32,200 | |
6.000%, 12/01/20 | | | 15,000 | | | | 12,600 | |
Apex Tool Group LLC, 7.000%, 02/01/21 (a) | | | 25,000 | | | | 19,375 | |
Ardagh Packaging Finance PLC, 9.125%, 10/15/20 (a) | | | 200,000 | | | | 206,500 | |
Argos Merger Sub, Inc., 7.125%, 03/15/23 (a) | | | 175,000 | | | | 173,950 | |
Ashland, Inc., 4.750%, 08/15/22 (b) | | | 195,000 | | | | 190,369 | |
Ashtead Capital, Inc., 6.500%, 07/15/22 (a) | | | 35,000 | | | | 36,662 | |
Aspect Software, Inc., 10.625%, 05/15/177 | | | 80,000 | | | | 62,800 | |
Associated Materials LLC / AMH New Finance, Inc., 9.125%, 11/01/17 | | | 40,000 | | | | 27,800 | |
Atwood Oceanics, Inc., 6.500%, 02/01/20 | | | 75,000 | | | | 40,500 | |
The accompanying notes are an integral part of these financial statements.
27
AMG Managers High Yield Fund
Schedule of Portfolio Investments (continued)
| | | | | | | | |
| | | Principal Amount | | | Value | |
Industrials—85.1% (continued) | | | | | | | | |
Audatex North America, Inc., 6.000%, 06/15/21 (a) | | $ | 150,000 | | | $ | 151,688 | |
Avaya, Inc., 7.000%, 04/01/19 (a) | | | 115,000 | | | | 85,675 | |
Avis Budget Car Rental LLC / Avis Budget Finance, Inc., | | | | | | | | |
5.125%, 06/01/22 (a) | | | 10,000 | | | | 9,912 | |
5.500%, 04/01/231 | | | 95,000 | | | | 95,594 | |
B&G Foods, Inc., 4.625%, 06/01/21 | | | 55,000 | | | | 54,656 | |
Belden, Inc., 5.500%, 09/01/22 (a) | | | 85,000 | | | | 82,238 | |
Berry Petroleum Co. LLC, 6.375%, 09/15/22 | | | 20,000 | | | | 4,950 | |
Berry Plastics Corp., 6.000%, 10/15/22 (a) | | | 20,000 | | | | 20,450 | |
Blackboard, Inc., 7.750%, 11/15/19 (a) | | | 75,000 | | | | 65,250 | |
Blue Racer Midstream LLC / Blue Racer Finance Corp., 6.125%, 11/15/22 (a) | | | 75,000 | | | | 52,125 | |
Bombardier, Inc., | | | | | | | | |
7.500%, 03/15/25 (a) | | | 105,000 | | | | 74,025 | |
7.750%, 03/15/20 (a) | | | 40,000 | | | | 32,500 | |
BreitBurn Energy Partners, L.P. / BreitBurn Finance Corp., | | | | | | | | |
7.875%, 04/15/22 | | | 40,000 | | | | 7,400 | |
8.625%, 10/15/20 | | | 70,000 | | | | 14,350 | |
Bumble Bee Holding, Inc., 9.000%, 12/15/17 (a) | | | 110,000 | | | | 111,650 | |
Caesars Entertainment Operating Co., Inc., | | | | | | | | |
8.500%, 02/15/201,8 | | | 125,000 | | | | 95,625 | |
9.000%, 02/15/208 | | | 490,000 | | | | 374,727 | |
11.250%, 06/01/178 | | | 115,000 | | | | 86,825 | |
California Resources Corp., | | | | | | | | |
6.000%, 11/15/24 | | | 20,000 | | | | 6,150 | |
8.000%, 12/15/22 (a) | | | 52,000 | | | | 27,495 | |
Carrizo Oil & Gas, Inc., 6.250%, 04/15/23 | | | 20,000 | | | | 16,300 | |
CCO Holdings LLC / CCO Holdings Capital Corp., | | | | | | | | |
5.125%, 05/01/23 (a) | | | 115,000 | | | | 115,288 | |
5.375%, 05/01/25 (a)1 | | | 120,000 | | | | 119,700 | |
6.625%, 01/31/22 | | | 65,000 | | | | 68,656 | |
CCOH Safari LLC, 5.750%, 02/15/26 (a) | | | 130,000 | | | | 130,650 | |
Central Garden & Pet Co., 6.125%, 11/15/23 | | | 40,000 | | | | 40,600 | |
CenturyLink, Inc., | | | | | | | | |
Series T, 5.800%, 03/15/22 | | | 60,000 | | | | 55,215 | |
Series W, 6.750%, 12/01/23 | | | 215,000 | | | | 202,369 | |
The Chemours Co., | | | | | | | | |
6.625%, 05/15/23 (a)1 | | | 65,000 | | | | 45,825 | |
7.000%, 05/15/25 (a) | | | 20,000 | | | | 13,700 | |
Chesapeake Energy Corp., | | | | | | | | |
3.571%, 04/15/19 (01/15/16)9 | | | 15,000 | | | | 4,238 | |
The accompanying notes are an integral part of these financial statements.
28
AMG Managers High Yield Fund
Schedule of Portfolio Investments (continued)
| | | | | | | | |
| | | Principal Amount | | | Value | |
Industrials—85.1% (continued) | | | | | | | | |
Chesapeake Energy Corp., | | | | | | | | |
8.000%, 12/15/22 (a)1 | | $ | 102,000 | | | $ | 50,490 | |
Cinemark USA, Inc., | | | | | | | | |
4.875%, 06/01/23 | | | 25,000 | | | | 24,469 | |
7.375%, 06/15/21 | | | 80,000 | | | | 84,500 | |
Claire’s Stores, Inc., | | | | | | | | |
8.875%, 03/15/19 | | | 70,000 | | | | 16,800 | |
9.000%, 03/15/19 (a) | | | 145,000 | | | | 88,450 | |
Clean Harbors, Inc., 5.250%, 08/01/20 | | | 85,000 | | | | 87,125 | |
Clear Channel Worldwide Holdings, Inc., | | | | | | | | |
6.500%, 11/15/22 | | | 85,000 | | | | 82,344 | |
Series A, 7.625%, 03/15/20 | | | 55,000 | | | | 50,256 | |
Series B, 6.500%, 11/15/22 | | | 325,000 | | | | 318,094 | |
Series B, 7.625%, 03/15/20 | | | 155,000 | | | | 143,762 | |
CNH Industrial Capital LLC, | | | | | | | | |
3.625%, 04/15/18 | | | 30,000 | | | | 29,685 | |
4.375%, 11/06/20 | | | 35,000 | | | | 33,075 | |
Cogent Communications Group, Inc., 5.375%, 03/01/22 (a) | | | 70,000 | | | | 68,425 | |
CommScope Technologies Finance LLC, 6.000%, 06/15/25 (a) | | | 75,000 | | | | 72,375 | |
CommScope, Inc., | | | | | | | | |
5.000%, 06/15/21 (a) | | | 30,000 | | | | 28,875 | |
5.500%, 06/15/24 (a) | | | 35,000 | | | | 33,381 | |
Comstock Resources, Inc., 10.000%, 03/15/20 (a)1 | | | 80,000 | | | | 37,200 | |
Concho Resources, Inc., 5.500%, 04/01/23 | | | 5,000 | | | | 4,650 | |
CONSOL Energy, Inc., 5.875%, 04/15/221 | | | 30,000 | | | | 18,750 | |
Crestwood Midstream Partners L.P. / Crestwood Midstream Finance Corp., | | | | | | | | |
6.125%, 03/01/22 | | | 10,000 | | | | 7,000 | |
6.250%, 04/01/23 (a) | | | 35,000 | | | | 24,588 | |
CSI Compressco L.P. / Compressco Finance, Inc., 7.250%, 08/15/22 | | | 20,000 | | | | 14,900 | |
Dana Holding Corp., | | | | | | | | |
5.375%, 09/15/21 | | | 25,000 | | | | 24,906 | |
5.500%, 12/15/24 | | | 55,000 | | | | 53,625 | |
6.000%, 09/15/23 | | | 60,000 | | | | 60,450 | |
6.750%, 02/15/21 | | | 25,000 | | | | 25,781 | |
DaVita HealthCare Partners, Inc., 5.000%, 05/01/25 | | | 70,000 | | | | 67,725 | |
Denali Borrower LLC / Denali Finance Corp., 5.625%, 10/15/20 (a) | | | 100,000 | | | | 105,000 | |
Denbury Resources, Inc., | | | | | | | | |
4.625%, 07/15/23 | | | 55,000 | | | | 17,978 | |
5.500%, 05/01/22 | | | 95,000 | | | | 32,013 | |
The accompanying notes are an integral part of these financial statements.
29
AMG Managers High Yield Fund
Schedule of Portfolio Investments (continued)
| | | | | | | | |
| | | Principal Amount | | | Value | |
Industrials—85.1% (continued) | | | | | | | | |
DISH DBS Corp., | | | | | | | | |
5.000%, 03/15/23 | | $ | 175,000 | | | $ | 152,250 | |
5.875%, 07/15/22 | | | 205,000 | | | | 191,675 | |
5.875%, 11/15/24 | | | 80,000 | | | | 71,400 | |
6.750%, 06/01/21 | | | 175,000 | | | | 176,750 | |
DJO Finco, Inc. / DJO Finance LLC / DJO Finance Corp., 8.125%, 06/15/21 (a) | | | 155,000 | | | | 137,950 | |
DreamWorks Animation SKG, Inc., 6.875%, 08/15/20 (a) | | | 109,000 | | | | 107,910 | |
Energizer Holdings, Inc., 5.500%, 06/15/25 (a) | | | 75,000 | | | | 70,688 | |
Entegris, Inc., 6.000%, 04/01/22 (a) | | | 65,000 | | | | 66,056 | |
EP Energy LLC / Everest Acquisition Finance, Inc., | | | | | | | | |
7.750%, 09/01/22 | | | 65,000 | | | | 33,475 | |
9.375%, 05/01/20 | | | 170,000 | | | | 109,225 | |
EV Energy Partners, L.P. / EV Energy Finance Corp., 8.000%, 04/15/19 | | | 90,000 | | | | 45,450 | |
FGI Operating Co. LLC / FGI Finance, Inc., 7.875%, 05/01/20 | | | 110,000 | | | | 79,750 | |
First Data Corp., | | | | | | | | |
5.750%, 01/15/24 (a) | | | 440,000 | | | | 434,500 | |
7.000%, 12/01/23 (a) | | | 90,000 | | | | 90,225 | |
8.750%, 01/15/22 (a) | | | 118,000 | | | | 123,440 | |
Frontier Communications Corp., | | | | | | | | |
6.250%, 09/15/21 | | | 20,000 | | | | 17,050 | |
6.875%, 01/15/25 | | | 35,000 | | | | 28,962 | |
10.500%, 09/15/22 (a) | | | 70,000 | | | | 69,912 | |
11.000%, 09/15/25 (a) | | | 185,000 | | | | 183,612 | |
Gardner Denver, Inc., 6.875%, 08/15/21 (a) | | | 40,000 | | | | 30,800 | |
GCI, Inc., 6.750%, 06/01/21 | | | 90,000 | | | | 91,800 | |
General Cable Corp., 5.750%, 10/01/22 (b) | | | 95,000 | | | | 73,625 | |
General Motors Co., 4.875%, 10/02/23 | | | 140,000 | | | | 143,872 | |
The Geo Group, Inc., 5.875%, 01/15/22 | | | 135,000 | | | | 133,650 | |
The Goodyear Tire & Rubber Co., | | | | | | | | |
5.125%, 11/15/23 | | | 35,000 | | | | 36,050 | |
6.500%, 03/01/21 | | | 40,000 | | | | 42,200 | |
8.750%, 08/15/20 | | | 65,000 | | | | 77,512 | |
Great Lakes Dredge & Dock Corp., 7.375%, 02/01/19 | | | 120,000 | | | | 112,200 | |
The Gymboree Corp., 9.125%, 12/01/18 | | | 75,000 | | | | 17,625 | |
H&E Equipment Services, Inc., 7.000%, 09/01/221 | | | 90,000 | | | | 88,650 | |
Halcon Resources Corp., | | | | | | | | |
8.625%, 02/01/20 (a) | | | 20,000 | | | | 13,875 | |
13.000%, 02/15/22 (a)1 | | | 106,000 | | | | 36,570 | |
HCA Holdings, Inc., 6.250%, 02/15/21 | | | 20,000 | | | | 21,250 | |
The accompanying notes are an integral part of these financial statements.
30
AMG Managers High Yield Fund
Schedule of Portfolio Investments (continued)
| | | | | | | | |
| | | Principal Amount | | | Value | |
Industrials—85.1% (continued) | | | | | | | | |
HCA, Inc., | | | | | | | | |
5.250%, 04/15/25 | | $ | 25,000 | | | $ | 25,250 | |
5.375%, 02/01/25 | | | 305,000 | | | | 301,569 | |
5.875%, 02/15/26 | | | 100,000 | | | | 100,625 | |
7.500%, 02/15/22 | | | 430,000 | | | | 478,375 | |
HD Supply, Inc., 5.250%, 12/15/21 (a) | | | 40,000 | | | | 40,950 | |
HealthSouth Corp., | | | | | | | | |
5.750%, 11/01/24 | | | 25,000 | | | | 23,969 | |
5.750%, 09/15/25 (a) | | | 30,000 | | | | 28,050 | |
5.750%, 11/01/24 (a) | | | 5,000 | | | | 4,794 | |
7.750%, 09/15/22 | | | 30,000 | | | | 31,350 | |
The Hertz Corp., | | | | | | | | |
5.875%, 10/15/201 | | | 80,000 | | | | 82,900 | |
6.250%, 10/15/221 | | | 75,000 | | | | 78,000 | |
7.375%, 01/15/211 | | | 80,000 | | | | 83,400 | |
Hexion, Inc., | | | | | | | | |
6.625%, 04/15/20 | | | 255,000 | | | | 199,538 | |
8.875%, 02/01/18 | | | 80,000 | | | | 56,800 | |
Hiland Partners, L.P. / Hiland Partners Finance Corp., 7.250%, 10/01/20 (a) | | | 55,000 | | | | 55,619 | |
The Hillman Group, Inc., 6.375%, 07/15/22 (a) | | | 70,000 | | | | 58,450 | |
Hill-Rom Holdings, Inc., 5.750%, 09/01/23 (a) | | | 35,000 | | | | 35,875 | |
Hilton Worldwide Finance LLC / Hilton Worldwide Finance Corp., 5.625%, 10/15/21 | | | 40,000 | | | | 41,650 | |
HRG Group, Inc., 7.750%, 01/15/22 (a) | | | 15,000 | | | | 14,756 | |
Huntsman International LLC, | | | | | | | | |
4.875%, 11/15/201 | | | 100,000 | | | | 91,750 | |
5.125%, 11/15/22 (a)1 | | | 75,000 | | | | 67,875 | |
iHeartCommunications, Inc., | | | | | | | | |
9.000%, 03/01/21 | | | 105,000 | | | | 73,631 | |
10.625%, 03/15/23 | | | 45,000 | | | | 31,680 | |
INEOS Group Holdings, S.A., 5.875%, 02/15/19 (a)1 | | | 200,000 | | | | 194,750 | |
Infinity Acquisition LLC / Infinity Acquisition Finance Corp., 7.250%, 08/01/22 (a) | | | 60,000 | | | | 51,900 | |
Infor Software Parent LLC / Infor Software Parent, Inc., (7.125% Cash or 7.875% PIK), 7.125%, 05/01/21 (a)6 | | | 115,000 | | | | 83,519 | |
Infor US, Inc., 6.500%, 05/15/22 (a) | | | 185,000 | | | | 156,788 | |
Informatica LLC, 7.125%, 07/15/23 (a) | | | 90,000 | | | | 81,900 | |
Intelsat Jackson Holdings S.A., | | | | | | | | |
5.500%, 08/01/23 | | | 110,000 | | | | 86,900 | |
6.625%, 12/15/22 | | | 55,000 | | | | 35,338 | |
7.250%, 04/01/19 | | | 50,000 | | | | 46,125 | |
7.250%, 10/15/20 | | | 355,000 | | | | 312,400 | |
7.500%, 04/01/21 | | | 35,000 | | | | 30,625 | |
The accompanying notes are an integral part of these financial statements.
31
AMG Managers High Yield Fund
Schedule of Portfolio Investments (continued)
| | | | | | | | |
| | | Principal Amount | | | Value | |
Industrials—85.1% (continued) | | | | | | | | |
Intelsat Luxembourg, S.A., 7.750%, 06/01/21 | | $ | 105,000 | | | $ | 49,612 | |
International Game Technology PLC, 6.500%, 02/15/25 (a) | | | 200,000 | | | | 176,500 | |
inVentiv Health, Inc., | | | | | | | | |
9.000%, 01/15/18 (a) | | | 105,000 | | | | 107,888 | |
10.000%, 08/15/18 (b) | | | 35,000 | | | | 33,865 | |
inVentiv Health, Inc., (10.000% Cash or 12.000% PIK), 10.000%, 08/15/18 (a)6 | | | 50,562 | | | | 48,160 | |
Iron Mountain, Inc., 6.000%, 08/15/23 | | | 70,000 | | | | 72,712 | |
Isle of Capri Casinos, Inc., 5.875%, 03/15/21 | | | 60,000 | | | | 61,500 | |
J.C. Penney Corp., Inc., 6.375%, 10/15/36 | | | 90,000 | | | | 56,025 | |
Jack Cooper Holdings Corp., 10.250%, 06/01/20 (a), (b) | | | 120,000 | | | | 100,200 | |
James Hardie International Finance, Ltd., 5.875%, 02/15/23 (a) | | | 20,000 | | | | 20,500 | |
JCH Parent, Inc., (10.500% Cash or 11.250% PIK), 10.500%, 03/15/19 (a)6 | | | 44,031 | | | | 27,299 | |
Kindred Healthcare, Inc., | | | | | | | | |
8.000%, 01/15/20 | | | 60,000 | | | | 56,400 | |
8.750%, 01/15/23 | | | 35,000 | | | | 32,331 | |
Kinetic Concepts, Inc. / KCI USA, Inc., 10.500%, 11/01/18 (b) | | | 150,000 | | | | 146,625 | |
KLX, Inc., 5.875%, 12/01/22 (a) | | | 90,000 | | | | 85,950 | |
Kratos Defense & Security Solutions, Inc., 7.000%, 05/15/19 | | | 69,000 | | | | 47,351 | |
Laredo Petroleum, Inc., 5.625%, 01/15/22 | | | 35,000 | | | | 30,625 | |
Lear Corp., 5.250%, 01/15/25 | | | 65,000 | | | | 66,462 | |
Legacy Reserves, L.P. / Legacy Reserves Finance Corp., | | | | | | | | |
6.625%, 12/01/21 | | | 40,000 | | | | 8,600 | |
8.000%, 12/01/20 | | | 70,000 | | | | 15,050 | |
Level 3 Communications, Inc., 5.750%, 12/01/22 | | | 60,000 | | | | 61,500 | |
Level 3 Financing, Inc., | | | | | | | | |
5.125%, 05/01/23 (a) | | | 30,000 | | | | 29,888 | |
5.375%, 01/15/24 (a) | | | 40,000 | | | | 40,300 | |
5.375%, 05/01/25 (a) | | | 45,000 | | | | 44,944 | |
Linn Energy LLC / Linn Energy Finance Corp., | | | | | | | | |
7.750%, 02/01/21 | | | 90,000 | | | | 13,500 | |
8.625%, 04/15/201 | | | 10,000 | | | | 1,762 | |
12.000%, 12/15/20 (a) | | | 25,000 | | | | 12,750 | |
LSB Industries, Inc., 7.750%, 08/01/19 | | | 104,000 | | | | 86,840 | |
LTF Merger Sub, Inc., 8.500%, 06/15/23 (a) | | | 90,000 | | | | 86,400 | |
Magnachip Semiconductor Corp., 6.625%, 07/15/21 (b) | | | 105,000 | | | | 73,894 | |
Mallinckrodt International Finance, S.A. / Mallinckrodt CB LLC, | | | | | | | | |
4.875%, 04/15/20 (a) | | | 25,000 | | | | 24,188 | |
5.500%, 04/15/25 (a) | | | 35,000 | | | | 32,375 | |
5.625%, 10/15/23 (a) | | | 40,000 | | | | 38,200 | |
McGraw-Hill Global Education Holdings LLC / McGraw-Hill Global Education Finance, 9.750%, 04/01/21 (b) | | | 55,000 | | | | 58,575 | |
The accompanying notes are an integral part of these financial statements.
32
AMG Managers High Yield Fund
Schedule of Portfolio Investments (continued)
| | | | | | | | |
| | | Principal Amount | | | Value | |
Industrials—85.1% (continued) | | | | | | | | |
MEG Energy Corp., | | | | | | | | |
6.375%, 01/30/23 (a) | | $ | 75,000 | | | $ | 51,750 | |
7.000%, 03/31/24 (a) | | | 100,000 | | | | 71,500 | |
Memorial Production Partners, L.P. / Memorial Production Finance Corp., | | | | | | | | |
6.875%, 08/01/22 | | | 30,000 | | | | 9,150 | |
7.625%, 05/01/21 | | | 80,000 | | | | 24,400 | |
MGM Resorts International, | | | | | | | | |
5.250%, 03/31/20 | | | 155,000 | | | | 154,225 | |
6.000%, 03/15/231 | | | 160,000 | | | | 159,200 | |
6.750%, 10/01/20 | | | 20,000 | | | | 20,650 | |
7.750%, 03/15/22 | | | 190,000 | | | | 202,588 | |
Micron Technology, Inc., | | | | | | | | |
5.250%, 01/15/24 (a) | | | 90,000 | | | | 79,425 | |
5.500%, 02/01/25 | | | 35,000 | | | | 30,538 | |
5.875%, 02/15/22 | | | 10,000 | | | | 9,762 | |
Midcontinent Communications & Midcontinent Finance Corp., 6.875%, 08/15/23 (a) | | | 85,000 | | | | 86,488 | |
MPLX L.P., | | | | | | | | |
4.875%, 12/01/24 (a) | | | 30,000 | | | | 27,075 | |
4.875%, 06/01/25 (a) | | | 115,000 | | | | 103,500 | |
5.500%, 02/15/23 (a) | | | 85,000 | | | | 74,800 | |
Neiman Marcus Group, Ltd. LLC, 8.000%, 10/15/21 (a) | | | 40,000 | | | | 29,800 | |
Neiman Marcus Group, Ltd. LLC (8.750% Cash or 9.500% PIK), 8.750%, 10/15/21 (a)6 | | | 80,000 | | | | 50,000 | |
Neptune Finco Corp., 10.875%, 10/15/25 (a) | | | 200,000 | | | | 210,000 | |
Nexeo Solutions LLC / Nexeo Solutions Finance Corp., 8.375%, 03/01/18 | | | 75,000 | | | | 70,688 | |
Nexstar Broadcasting, Inc., | | | | | | | | |
6.125%, 02/15/22 (a) | | | 25,000 | | | | 24,562 | |
6.875%, 11/15/20 | | | 120,000 | | | | 123,150 | |
The Nielsen Co. Luxembourg SARL, 5.500%, 10/01/21 (a) | | | 40,000 | | | | 41,150 | |
Nielsen Finance LLC / Nielsen Finance Co., 5.000%, 04/15/22 (a) | | | 65,000 | | | | 64,431 | |
Noranda Aluminum Acquisition Corp., 11.000%, 06/01/19 | | | 35,000 | | | | 5,162 | |
Numericable-SFR SAS, 6.000%, 05/15/22 (a) | | | 200,000 | | | | 194,500 | |
NXP B.V. / NXP Funding LLC, 5.750%, 02/15/21 (a) | | | 200,000 | | | | 208,750 | |
Oasis Petroleum, Inc., 6.875%, 03/15/22 | | | 85,000 | | | | 54,825 | |
Omega US Sub LLC, 8.750%, 07/15/23 (a) | | | 75,000 | | | | 69,562 | |
Orbital ATK, Inc., 5.250%, 10/01/21 | | | 60,000 | | | | 60,600 | |
Oshkosh Corp., | | | | | | | | |
5.375%, 03/01/22 | | | 45,000 | | | | 45,225 | |
5.375%, 03/01/25 | | | 20,000 | | | | 19,700 | |
Outfront Media Capital LLC / Outfront Media Capital Corp., 5.625%, 02/15/24 | | | 15,000 | | | | 15,469 | |
Party City Holdings, Inc., 6.125%, 08/15/23 (a)1 | | | 50,000 | | | | 48,750 | |
The accompanying notes are an integral part of these financial statements.
33
AMG Managers High Yield Fund
Schedule of Portfolio Investments (continued)
| | | | | | | | |
| | | Principal Amount | | | Value | |
Industrials—85.1% (continued) | | | | | | | | |
Peabody Energy Corp., | | | | | | | | |
6.250%, 11/15/21 | | $ | 85,000 | | | $ | 12,112 | |
6.500%, 09/15/20 | | | 15,000 | | | | 2,138 | |
Petco Animal Supplies, Inc., 9.250%, 12/01/18 (a) | | | 110,000 | | | | 113,025 | |
Plantronics, Inc., 5.500%, 05/31/23 (a) | | | 45,000 | | | | 44,888 | |
Post Holdings, Inc., | | | | | | | | |
6.000%, 12/15/22 (a) | | | 50,000 | | | | 49,188 | |
6.750%, 12/01/21 (a) | | | 10,000 | | | | 10,225 | |
7.375%, 02/15/22 | | | 140,000 | | | | 146,475 | |
7.750%, 03/15/24 (a)1 | | | 75,000 | | | | 78,750 | |
8.000%, 07/15/25 (a) | | | 45,000 | | | | 47,812 | |
Quebecor Media, Inc., 5.750%, 01/15/23 | | | 180,000 | | | | 182,025 | |
Quebecor World, Escrow, 6.500%, 08/01/27*,7,8 | | | 165,000 | | | | 433 | |
Qwest Capital Funding, Inc., 7.750%, 02/15/31 | | | 65,000 | | | | 55,412 | |
Radio Systems Corp., 8.375%, 11/01/19 (a) | | | 105,000 | | | | 109,200 | |
Rain CII Carbon LLC / CII Carbon Corp., 8.000%, 12/01/18 (a) | | | 30,000 | | | | 25,875 | |
Range Resources Corp., 4.875%, 05/15/25 (a) | | | 45,000 | | | | 34,369 | |
Regal Entertainment Group, | | | | | | | | |
5.750%, 03/15/22 | | | 55,000 | | | | 55,206 | |
5.750%, 06/15/23 | | | 10,000 | | | | 10,000 | |
Regency Energy Partners, L.P. / Regency Energy Finance Corp., | | | | | | | | |
5.000%, 10/01/22 | | | 35,000 | | | | 31,049 | |
5.500%, 04/15/231 | | | 45,000 | | | | 40,575 | |
5.875%, 03/01/22 | | | 20,000 | | | | 18,875 | |
Reichhold Holdings International B.V., | | | | | | | | |
12.000%, 03/13/177 | | | 82,609 | | | | 82,609 | |
15.000%, 03/13/177 | | | 52,671 | | | | 52,671 | |
Reichhold Industries, Inc., (9.000% Cash or 11.000% PIK), 9.000%, 05/08/176,7,8 | | | 88,947 | | | | — | |
Reichhold LLC, 12.000%, 03/13/177 | | | 35,000 | | | | 35,000 | |
Rentech Nitrogen Partners, L.P. / Rentech Nitrogen Finance Corp., 6.500%, 04/15/21 (a) | | | 40,000 | | | | 39,000 | |
Reynolds Group Issuer, Inc. / Reynolds Group Issuer LLC / Reynolds Group Issuer Lu, | | | | | | | | |
5.750%, 10/15/20 | | | 145,000 | | | | 147,855 | |
9.000%, 04/15/19 | | | 230,000 | | | | 227,125 | |
RHP Hotel Properties, L.P. / RHP Finance Corp., 5.000%, 04/15/21 | | | 75,000 | | | | 76,688 | |
Rite Aid Corp., 6.125%, 04/01/23 (a) | | | 110,000 | | | | 114,262 | |
Riverbed Technology Inc., 8.875%, 03/01/23 (a) | | | 100,000 | | | | 92,875 | |
RSI Home Products, Inc., 6.500%, 03/15/23 (a) | | | 105,000 | | | | 108,675 | |
RSP Permian, Inc., 6.625%, 10/01/22 | | | 15,000 | | | | 13,875 | |
Sabine Pass Liquefaction LLC, | | | | | | | | |
5.625%, 03/01/25 (a) | | | 25,000 | | | | 21,250 | |
The accompanying notes are an integral part of these financial statements.
34
AMG Managers High Yield Fund
Schedule of Portfolio Investments (continued)
| | | | | | | | |
| | | Principal Amount | | | Value | |
Industrials—85.1% (continued) | | | | | | | | |
Sabine Pass Liquefaction LLC, | | | | | | | | |
5.750%, 05/15/24 | | $ | 100,000 | | | $ | 87,500 | |
6.250%, 03/15/22 | | | 100,000 | | | | 93,000 | |
Sabre GLBL, Inc., | | | | | | | | |
5.250%, 11/15/23 (a) | | | 35,000 | | | | 34,781 | |
5.375%, 04/15/23 (a) | | | 70,000 | | | | 70,000 | |
Sally Holdings LLC / Sally Capital, Inc., 5.625%, 12/01/25 | | | 30,000 | | | | 30,450 | |
Sanchez Energy Corp., 6.125%, 01/15/231 | | | 55,000 | | | | 29,975 | |
SandRidge Energy, Inc., 8.125%, 10/15/22 | | | 70,000 | | | | 8,050 | |
SBA Telecommunications, Inc., 5.750%, 07/15/20 | | | 45,000 | | | | 46,969 | |
The Scotts Miracle-Gro Co., 6.000%, 10/15/23 (a) | | | 40,000 | | | | 41,900 | |
Sensata Technologies BV, 5.000%, 10/01/25 (a) | | | 20,000 | | | | 19,600 | |
Service Corp. International, 7.500%, 04/01/27 | | | 115,000 | | | | 133,975 | |
Sinclair Television Group, Inc., | | | | | | | | |
5.375%, 04/01/21 | | | 85,000 | | | | 85,531 | |
6.125%, 10/01/22 | | | 40,000 | | | | 41,000 | |
Sirius XM Radio, Inc., | | | | | | | | |
4.625%, 05/15/23 (a) | | | 25,000 | | | | 24,594 | |
5.375%, 04/15/25 (a) | | | 85,000 | | | | 85,744 | |
5.750%, 08/01/21 (a)1 | | | 105,000 | | | | 108,544 | |
6.000%, 07/15/24 (a) | | | 40,000 | | | | 41,900 | |
SM Energy Co., | | | | | | | | |
5.625%, 06/01/25 | | | 30,000 | | | | 19,875 | |
6.125%, 11/15/221 | | | 10,000 | | | | 7,400 | |
6.500%, 01/01/23 | | | 10,000 | | | | 7,400 | |
Spectrum Brands, Inc., 5.750%, 07/15/25 (a) | | | 30,000 | | | | 30,900 | |
Sprint Capital Corp., | | | | | | | | |
6.875%, 11/15/28 | | | 15,000 | | | | 10,500 | |
8.750%, 03/15/32 | | | 435,000 | | | | 327,338 | |
Sprint Corp., | | | | | | | | |
7.250%, 09/15/21 | | | 50,000 | | | | 37,860 | |
7.625%, 02/15/25 | | | 125,000 | | | | 91,875 | |
7.875%, 09/15/23 | | | 535,000 | | | | 403,122 | |
Targa Resources Partners L.P. / Targa Resources Partners Finance Corp., | | | | | | | | |
4.125%, 11/15/19 | | | 20,000 | | | | 16,750 | |
6.750%, 03/15/24 (a) | | | 55,000 | | | | 47,025 | |
TEGNA, Inc., | | | | | | | | |
4.875%, 09/15/21 (a) | | | 15,000 | | | | 15,075 | |
5.500%, 09/15/24 (a) | | | 45,000 | | | | 45,112 | |
The accompanying notes are an integral part of these financial statements.
35
AMG Managers High Yield Fund
Schedule of Portfolio Investments (continued)
| | | | | | | | |
| | | Principal Amount | | | Value | |
Industrials—85.1% (continued) | | | | | | | | |
Tempur Sealy International, Inc., | | | | | | | | |
5.625%, 10/15/23 (a) | | $ | 60,000 | | | $ | 60,900 | |
6.875%, 12/15/20 | | | 60,000 | | | | 63,150 | |
Tenet Healthcare Corp., | | | | | | | | |
4.500%, 04/01/21 | | | 10,000 | | | | 9,800 | |
4.750%, 06/01/20 | | | 70,000 | | | | 70,700 | |
6.000%, 10/01/20 | | | 60,000 | | | | 63,450 | |
6.750%, 06/15/231 | | | 245,000 | | | | 227,697 | |
8.125%, 04/01/22 | | | 220,000 | | | | 220,550 | |
Terex Corp., | | | | | | | | |
6.000%, 05/15/21 | | | 140,000 | | | | 129,500 | |
6.500%, 04/01/20 | | | 60,000 | | | | 58,050 | |
Tesoro Logistics L.P. / Tesoro Logistics Finance Corp., | | | | | | | | |
5.875%, 10/01/20 | | | 83,000 | | | | 79,680 | |
6.125%, 10/15/21 | | | 20,000 | | | | 19,100 | |
6.250%, 10/15/22 (a) | | | 20,000 | | | | 19,050 | |
Time, Inc., 5.750%, 04/15/22 (a) | | | 80,000 | | | | 73,400 | |
T-Mobile USA, Inc., | | | | | | | | |
6.500%, 01/15/26 | | | 65,000 | | | | 65,779 | |
6.633%, 04/28/21 | | | 45,000 | | | | 46,800 | |
6.731%, 04/28/22 | | | 210,000 | | | | 219,450 | |
TransDigm, Inc., 6.500%, 05/15/25 (a) | | | 60,000 | | | | 58,350 | |
Trinidad Drilling, Ltd., 7.875%, 01/15/19 (a) | | | 80,000 | | | | 70,800 | |
Triumph Group, Inc., 4.875%, 04/01/21 | | | 80,000 | | | | 64,850 | |
UCI International LLC, 8.625%, 02/15/19 | | | 115,000 | | | | 40,250 | |
Ultra Petroleum Corp., 6.125%, 10/01/24 (a) | | | 50,000 | | | | 11,625 | |
United Rentals North America, Inc., | | | | | | | | |
6.125%, 06/15/23 | | | 40,000 | | | | 41,100 | |
7.625%, 04/15/22 | | | 100,000 | | | | 107,370 | |
United States Cellular Corp., 6.700%, 12/15/33 | | | 50,000 | | | | 45,000 | |
Valeant Pharmaceuticals International, Inc., | | | | | | | | |
5.875%, 05/15/23 (a) | | | 235,000 | | | | 210,912 | |
6.125%, 04/15/25 (a) | | | 135,000 | | | | 120,825 | |
6.750%, 08/15/21 (a) | | | 100,000 | | | | 97,000 | |
7.250%, 07/15/22 (a) | | | 130,000 | | | | 127,725 | |
7.500%, 07/15/21 (a) | | | 280,000 | | | | 280,700 | |
Videotron, Ltd., 5.375%, 06/15/24 (a) | | | 35,000 | | | | 35,262 | |
Vista Outdoor, Inc., 5.875%, 10/01/23 (a) | | | 35,000 | | | | 36,050 | |
Whiting Petroleum Corp., | | | | | | | | |
1.250%, 04/01/20 (a) | | | 25,000 | | | | 17,125 | |
The accompanying notes are an integral part of these financial statements.
36
AMG Managers High Yield Fund
Schedule of Portfolio Investments (continued)
| | | | | | | | |
| | | Principal Amount | | | Value | |
Industrials—85.1% (continued) | | | | | | | | |
Whiting Petroleum Corp., | | | | | | | | |
5.750%, 03/15/211 | | $ | 105,000 | | | $ | 77,070 | |
6.250%, 04/01/231 | | | 50,000 | | | | 36,250 | |
Williams Partners, L.P. / ACMP Finance Corp., 6.125%, 07/15/22 | | | 60,000 | | | | 56,833 | |
Wind Acquisition Finance, S.A., 7.375%, 04/23/21 (a) | | | 200,000 | | | | 189,500 | |
Windstream Services LLC, | | | | | | | | |
6.375%, 08/01/23 | | | 55,000 | | | | 39,806 | |
7.500%, 06/01/22 | | | 60,000 | | | | 46,275 | |
7.500%, 04/01/23 | | | 15,000 | | | | 11,360 | |
7.750%, 10/01/21 | | | 230,000 | | | | 182,131 | |
WMG Acquisition Corp., | | | | | | | | |
5.625%, 04/15/22 (a) | | | 20,000 | | | | 19,350 | |
6.000%, 01/15/21 (a) | | | 56,000 | | | | 56,560 | |
WPX Energy, Inc., | | | | | | | | |
5.250%, 09/15/24 | | | 25,000 | | | | 16,625 | |
8.250%, 08/01/23 | | | 85,000 | | | | 68,212 | |
WR Grace & Co., 5.625%, 10/01/24 (a) | | | 10,000 | | | | 10,138 | |
Wynn Las Vegas LLC / Wynn Las Vegas Capital Corp., 5.500%, 03/01/25 (a)1 | | | 150,000 | | | | 134,250 | |
XPO Logistics, Inc., 6.500%, 06/15/22 (a) | | | 80,000 | | | | 74,300 | |
Zayo Group LLC / Zayo Capital, Inc., | | | | | | | | |
6.000%, 04/01/23 | | | 75,000 | | | | 71,250 | |
6.375%, 05/15/25 | | | 60,000 | | | | 55,950 | |
Zebra Technologies Corp., 7.250%, 10/15/22 | | | 140,000 | | | | 146,650 | |
ZF North America Capital, Inc., 4.750%, 04/29/25 (a) | | | 175,000 | | | | 167,344 | |
Total Industrials | | | | | | | 25,052,752 | |
Utilities—1.1% | | | | | | | | |
AES Corp., | | | | | | | | |
4.875%, 05/15/23 | | | 25,000 | | | | 22,000 | |
7.375%, 07/01/21 | | | 125,000 | | | | 128,125 | |
Dynegy, Inc., | | | | | | | | |
7.375%, 11/01/22 | | | 80,000 | | | | 70,000 | |
7.625%, 11/01/241 | | | 40,000 | | | | 34,392 | |
NRG Energy, Inc., | | | | | | | | |
6.250%, 07/15/22 | | | 40,000 | | | | 34,280 | |
7.875%, 05/15/21 | | | 45,000 | | | | 42,412 | |
Total Utilities | | | | | | | 331,209 | |
Total Corporate Bonds and Notes (cost $30,752,578) | | | | | | | 27,236,222 | |
The accompanying notes are an integral part of these financial statements.
37
AMG Managers High Yield Fund
Schedule of Portfolio Investments (continued)
| | | | | | | | |
| | | Principal Amount | | | Value | |
Floating Rate Senior Loan Interests—4.3%9 | | | | | | | | |
21st Century Oncology Holdings, Inc., Tranche B Term Loan, 6.500%, 04/30/22 (03/31/16) | | $ | 99,500 | | | $ | 84,575 | |
American Energy—Marcelus, LLC, Initial Loan (First Lien), 5.250%, 08/04/20 (02/05/16) | | | 65,000 | | | | 17,631 | |
Bway Intermediate Company, Inc., Initial Term Loan, | | | | | | | | |
5.500%, 08/14/20 (02/22/16) | | | 58,697 | | | | 56,838 | |
5.500%, 08/14/20 (03/07/16) | | | 2,664 | | | | 2,580 | |
7.000%, 08/14/20 (01/28/16) | | | 2,664 | | | | 2,580 | |
CD&R Millennium Holdco. 6 S.A.R.L. (Mauser Holdings), Initial Term Loan (Second Lien), 8.750%, 07/31/22 (01/29/16) | | | 70,000 | | | | 63,000 | |
Clear Channel Communications, Inc., Term Loan D, 7.174%, 01/30/19 (01/29/16) | | | 34,927 | | | | 24,624 | |
Evergreen Skills LUX S.A R.L., Initial Term Loan (First Lien), 5.750%, 04/28/21 (01/29/16) | | | 98,750 | | | | 77,025 | |
Evergreen Skills LUX S.A R.L., Initial Term Loan (Second Lien), 9.250%, 04/28/22 (01/29/16) | | | 100,000 | | | | 68,334 | |
Hercules Achievement, Inc. (Varsity Brands), Initial Term Loan (First Lien), 5.000%, 12/10/21 (03/11/16) | | | 94,050 | | | | 93,168 | |
The Hillman Group, Inc., Initial Term Loan, 4.500%, 06/30/21 (03/31/16) | | | 98,500 | | | | 96,202 | |
Integra Telecom Holdings, Inc., Term Loan B, | | | | | | | | |
5.250%, 08/14/20 (01/29/16) | | | 65,000 | | | | 63,115 | |
5.250%, 08/14/20 (02/29/16) | | | 21,760 | | | | 21,129 | |
5.250%, 08/14/20 (03/31/16) | | | 39,685 | | | | 38,534 | |
Neiman Marcus Group, Inc., Other Term Loan, | | | | | | | | |
4.250%, 10/25/20 (01/29/16) | | | 400 | | | | 355 | |
4.250%, 10/25/20 (03/07/16) | | | 156,795 | | | | 139,205 | |
Ortho-Clinical Diagnostics Holdings Luxembourg S.A.R.L., Initial Term Loan, 4.750%, 06/30/21 (04/01/16) | | | 98,499 | | | | 84,094 | |
Riverbed Technology Inc., Term Loan, 6.000%, 04/24/22 (03/31/16) | | | 79,400 | | | | 79,284 | |
Steinway Musical Instruments, Inc., 1st Lien Term Loan, 4.750%, 09/19/19 (01/29/16) | | | 97,021 | | | | 96,597 | |
Vertaforce, Inc., 2nd Lien Term Loan, 9.750%, 10/27/17 (01/29/16) | | | 45,000 | | | | 44,966 | |
Wilton Brands LLC (FKA Wilton Brands Inc.), Tranche B Loan, 8.500%, 08/30/18 (02/29/16) | | | 127,058 | | | | 121,182 | |
Total Floating Rate Senior Loan Interests (cost $1,445,605) | | | | | | | 1,275,018 | |
| | |
| | | Shares | | | | |
Common Stocks—0.3% | | | | | | | | |
Industrials—0.3% | | | | | | | | |
Reichhold Cayman Equity (Industrials)7 (cost $58,016) | | | 148 | | | | 81,252 | |
The accompanying notes are an integral part of these financial statements.
38
AMG Managers High Yield Fund
Schedule of Portfolio Investments (continued)
| | | | | | | | |
| | | Principal Amount | | | Value | |
Short-Term Investments—7.2% | | | | | | | | |
Repurchase Agreements—5.6%2 | | | | | | | | |
Cantor Fitzgerald Securities, Inc., dated 12/31/15, due 01/04/16, 0.340%, total to be received $1,000,038 (collateralized by various U.S. Government Agency Obligations, 0.000% - 10.500%, 01/15/16 - 09/01/49,totaling $1,020,000) | | $ | 1,000,000 | | | $ | 1,000,000 | |
Daiwa Capital Markets America, dated 12/31/15, due 01/04/16, 0.350%, total to be received $652,221 (collateralized by various U.S. Government Agency Obligations, 0.000% - 7.500%, 01/21/16 - 02/01/49, totaling $665,240) | | | 652,196 | | | | 652,196 | |
Total Repurchase Agreements | | | | | | | 1,652,196 | |
| | |
| | | Shares | | | | |
Other Investment Companies—1.6%3 | | | | | | | | |
Dreyfus Institutional Cash Advantage Fund, Institutional Class Shares, 0.26% | | | 476,208 | | | | 476,208 | |
Total Short-Term Investments
(cost $2,128,404) | | | | | | | 2,128,404 | |
Total Investments—104.3% (cost $34,384,603) | | | | | | | 30,720,896 | |
Other Assets, less Liabilities—(4.3)% | | | | | | | (1,276,460 | ) |
Net Assets—100.0% | | | | | | $ | 29,444,436 | |
The accompanying notes are an integral part of these financial statements.
39
AMG Managers Intermediate Duration Government Fund
Portfolio Manager’s Comments (unaudited)
THE YEAR IN REVIEW
During the year ended December 31, 2015, the AMG Managers Intermediate Duration Government Fund (the “Fund”) returned 1.1%, compared to 1.6% for its benchmark, the Citigroup Mortgage Index.
2015 was marked by a number of notable events. The Greece debt problem was resolved (at least temporarily) by the brinksmanship that led to increased market volatility and risk premia. In accordance with market expectations, the U.S. Federal Reserve (the “Fed”) finally raised rates at the end of the year to begin moving monetary policy to a more “normalized” place. Energy (led by oil) dropped dramatically. However, the expected benefit to increased consumer spending was disappointing throughout the year.
Agency mortgage-backed securities (MBS) experienced a difficult environment to begin the first quarter, particularly for higher coupon MBS, as the rally in rates led to the market pricing higher prepayment rates. These concerns were short-lived as the bear steepener in the middle of the quarter removed prepayment concerns, leading to stronger performance in MBS pricing, led by the higher coupons. Weaker economic data led to expectations that the Fed would likely remain accommodative for longer than initially anticipated, which further benefited agency MBS.
Interest rates continued to rise to start the second quarter, further benefiting agency MBS by pacifying concerns related to higher prepayment rates. However, May proved to be a mixed month. Interest rates rose yet again, albeit more modestly than at the start of the quarter. However, higher realized volatility hampered performance in MBS. MBS continued to experience challenges through the end of the quarter as elevated macro risks and higher levels of mortgage supply detracted from MBS performance. Realized volatility remained high as markets digested headlines from Greece and China to try to determine future monetary policy. Fed repurchase activity remained heavy and ultimately helped support MBS spreads.
The third quarter provided for mixed performance within Agency MBS. MBS continued its struggles to start the third quarter due to increased realized volatility, only to reverse course as macro concerns
abated. However, by the middle of the quarter, both nominal and option-adjusted MBS spreads widened due to the increased market volatility.
Agency MBS ended the quarter on weakness as MBS spreads hit multi-year wides. The fourth quarter was one of recovery, as Agency MBS spreads joined most other risk assets by reversing the weakness from 3Q. The middle of the quarter was quiet as stable rates supported MBS. Tepid prepayments rates led once again to higher coupons outperforming their lower-coupon counterparts.
The Fund’s underperformance during the year was driven primarily by the Fund’s positioning relative to the yield curve. As volatility and macro uncertainty increased starting the second half of the year, we saw spreads widen in sympathy across most spread sectors. While our holdings in Residential Asset-Backed Securities (ABS) and Commercial Mortgage-Backed Securities (CMBS) were both skewed towards the high credit-quality securities, the lackluster performance in both areas caused our holdings in these securities to also modestly detract from performance. The Fund’s positioning in agency FRMs (Fixed-Rate MBS) was a positive contributor to performance. Specifically, we avoided the coupons in which the Fed was most active. Additionally, we maintained a bias to higher coupons, which provided significant carry and experienced lower prepayments than the market had priced into the securities. The lower-than-expected prepayments also benefited our Interest Only (IOs) positions. Finally, our holdings in Non-Agency Adjustable Rate MBS (ARMs) and Fixed Rate MBS (FRMs) also both modestly contributed to the Fund during the year.
Derivatives, such as financial futures, options and mortgage derivatives, are used for portfolio duration and convexity risk management. We continue to find value in mortgage derivatives with beneficial underlying collateral characteristics.
We increased the leverage in the Fund’s portfolio during the course of the year. The vast majority of Fund assets were invested in 30-year agency FRMs. By the end of the year, the 30-year Agency FRM holdings accounted for 95% of the Fund’s capital, up from about 89% to start the year. However, the market weight of the Agency ARM
holdings was reduced by over half during the year. We continue to view MBS as an attractive alternative to Treasuries due to the additional spread offered.
LOOKING FORWARD
As we enter 2016, Agency MBS spreads are attractively priced relative to historical levels. Shorter-term, demand should be sufficient to support Agency MBS, at least relative to other spread sectors. The Fed continues to reinvest any cash flows from its existing portfolio and will absorb much of the gross supply. Now that the Fed tightening cycle has begun, it is natural to wonder when the reinvestment policy will be altered, but it seems likely that the timeframe will be pushed out to 2017. Additional demand should continue from banks and money managers. Banks are large holders of agency MBS, and regulatory factors continue to push them into the sector, especially towards GNMA MBS. Also large buyers in 2015, total-return-oriented investors are likely to continue to add, dependent on spreads. Demand from non-U.S. investors will be interesting to watch. The MBS sector should be appealing, as yields are significantly higher than any similar duration sovereign debt alternatives. However, global flows could limit USD investments due to Dollar strength, which would negatively impact MBS demand.
Overall, we continue to be positive on agency MBS, both shorter and longer-term. MBS spreads are back in a range that is attractive historically, and we believe that the market has substantially priced-in the Fed’s eventual exit. We expect prepayment activity will be low in the near-term, which also supports valuations, but have taken positions that have less exposure to prepayment risk longer-term. Empirical data illustrates that MBS have performed better than U.S. Treasuries with generally lower volatility over time. We expect this performance advantage will continue.
This commentary reflects the viewpoints of Amundi Smith Breeden LLC as of December 31, 2015 and is not intended as a forecast or guarantee of future results.
AMG Managers Intermediate Duration Government Fund
Portfolio Manager’s Comments (continued)
CUMULATIVE TOTAL RETURN PERFORMANCE
AMG Managers Intermediate Duration Government Fund’s cumulative total return is based on the daily change in net asset value (NAV), and assumes that all dividends and distributions were reinvested. The graph compares a hypothetical $10,000 investment made in the AMG Managers Intermediate Duration Government Fund on December 31, 2005 to a $10,000 investment made in the benchmarks for the same time period. The graph and table do not reflect the deduction of taxes that a shareholder would pay on a Fund distribution or redemption of shares. The listed returns for the Fund are net of expenses and the returns for the index exclude expenses. Total returns would have been lower had certain expenses not been reduced.
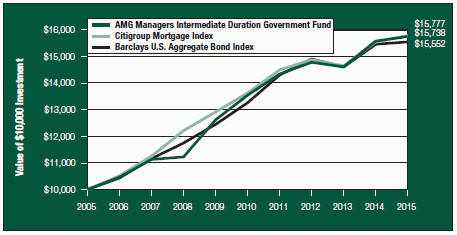
The table below shows the average annual total returns for the AMG Managers Intermediate Duration Government Fund, Barclays U.S. Aggregate Bond Index and the Citigroup Mortgage Index for the same time periods ended December 31, 2015.
| | | | | | | | | | | | |
| | | One | | | Five | | | Ten | |
| Average Annual Total Returns1 | | Year | | | Years | | | Years | |
AMG Managers Intermediate Duration Government Fund 2,3,4,5,6,7 | | | 1.09 | % | | | 3.06 | % | | | 4.64 | % |
Barclays U.S. Aggregate Bond Index8 | | | 0.55 | % | | | 3.25 | % | | | 4.51 | % |
Citigroup Mortgage Index9 | | | 1.56 | % | | | 2.98 | % | | | 4.67 | % |
The performance data shown represents past performance. Past performance is not a guarantee of future results. Current performance may be lower or higher than the performance data quoted. The investment return and principal value of an investment in the Fund will fluctuate so that an investor’s shares, when redeemed, may be worth more or less than their original cost.
Investors should carefully consider the Fund’s investment objectives, risks, charges, and expenses before investing. For performance information through the most recent month end, current net asset values per share for the Fund and other information, please call (800) 835-3879 or visit our website at www.amgfunds.com for a free prospectus. Read it carefully before investing or sending money.
Distributed by AMG Distributors, Inc., member FINRA/SIPC.
| 1 | Total return equals income yield plus share price change and assumes reinvestment of all dividends and capital gain distributions. Returns are net of fees and may reflect offsets of Fund expenses as described in the prospectus. No adjustment has been made for taxes payable by shareholders on their reinvested dividends and capital gain distributions. Returns for periods greater than one year are annualized. The listed returns on the Fund are net of expenses and based on the published NAV as of December 31, 2015. All returns are in U.S. dollars ($). |
| 2 | From time to time the Fund’s advisor has waived its fees and/or absorbed Fund expenses, which has resulted in higher returns. |
| 3 | The Fund is subject to the risks associated with investments in debt securities, such as default risk, fluctuations in the debtor’s perceived ability to pay its creditors and changing interest rate risk. An increase in interest rates typically causes the value of bonds and other fixed-income securities to fall. |
| 4 | The Fund may use derivative instruments for hedging purposes or as part of its investment strategy. There is a risk that a derivative intended as a hedge may not perform as expected. The main risk with derivatives is that some types can amplify a gain or loss, potentially earning or losing substantially more money than the actual cost of the derivative; or that the counterparty may fail to honor its contract terms, causing a loss for the Fund. Use of these instruments may also involve certain costs and risks such as liquidity risk, interest rate risk, market risk, credit risk, management risk and the risk that a fund could not close out a position when it would be most advantageous to do so. |
| 5 | Many bonds have call provisions which allow the debtors to pay them back before maturity. This is especially true with mortgage securities, which can be paid back anytime. Typically debtors prepay their debt when it is to their advantage (when interest rates drop making a new loan at current rates more attractive), and thus likely to the disadvantage of bondholders, who may have to reinvest prepayment proceeds in securities with lower yields. Prepayment risk will vary depending on the provisions of the security and current interest rates relative to the interest rate of the debt. |
| 6 | To the extent that the Fund invests in asset-backed or mortgage-backed securities, its exposure to prepayment and extension risks may be greater than investments in other fixed income securities. |
| 7 | Obligations of certain government agencies are not backed by the full faith and credit of the U.S. Government. If one of these agencies defaulted on a loan, there is no guarantee that the U.S. Government will provide financial support. Additionally, debt securities of the U.S. Government may be affected by changing interest rates and subject to prepayment risk. |
41
AMG Managers Intermediate Duration Government Fund
Portfolio Manager’s Comments (continued)
CUMULATIVE TOTAL RETURN PERFORMANCE (continued)
| 8 | The Barclays U.S. Aggregate Bond Index is an index of the U.S. investment-grade fixed-rate bond market, including both government and corporate bonds. Unlike the Fund, the Barclays U.S. Aggregate Bond Index is unmanaged, is not available for investment, and does not incur expenses. |
| 9 | The Citigroup Mortgage Index includes all outstanding government sponsored fixed-rate mortgage-backed securities, weighted in proportion to their current market capitalization. The Index reflects no deductions for fees, expenses, or taxes. Unlike the Fund, the Citigroup Mortgage Index is unmanaged, is not available for investment, and does not incur expenses. |
Not FDIC insured, nor bank guaranteed. May lose value.
42
AMG Managers Intermediate Duration Government Fund
Fund Snapshots (unaudited)
December 31, 2015
PORTFOLIO BREAKDOWN
| | | | |
| | | AMG Managers Intermediate | |
Category | | Duration
Government Fund** | |
U.S. Government and Agency Obligations | | | 118.3 | % |
Asset-Backed Securities | | | 6.1 | % |
Mortgage-Backed Securities | | | 6.7 | % |
TBA Forward Sale Commitments | | | (16.0 | )% |
Other Assets and Liabilities | | | (15.1 | )% |
|
** As a percentage of net assets. | |
| |
| | | AMG Managers
Intermediate | |
Rating | | Duration
Government Fund*** | |
U.S. Government and Agency Obligations | | | 88.9 | % |
Aaa | | | 10.1 | % |
Aa | | | 0.0 | %# |
A | | | 0.1 | % |
Baa | | | 0.3 | % |
Ba & lower | | | 0.6 | % |
| *** | As a percentage of market value of fixed-income securities. |
| # | Rounds to less than 0.1%. |
TOP TEN HOLDINGS
| | | | |
| | | %of | |
Security Name | | Net Assets | |
FNMA, 3.500%, TBA 30 years | | | 12.6 | % |
FHLMC Gold Pool, 4.000%, TBA 30 years | | | 12.1 | |
GNMA, 3.500%, TBA 30 years | | | 8.8 | |
FNMA, 4.500%, TBA 30 years | | | 4.8 | |
FNMA, 4.000%, TBA 30 years | | | 4.6 | |
GNMA, 4.000%, TBA 30 years | | | 3.7 | |
FHLMC Gold Pool, 3.500%, TBA 30 years | | | 2.9 | |
GNMA, 3.000%, TBA 30 years | | | 1.7 | |
Progress Residential Trust, Series 2015-SF, Class A, 2.740%, 06/12/32* | | | 1.5 | |
Invitation Homes Trust, Series 2013-SF, Class A, 1.450%, 12/17/30 (01/17/16)* | | | 1.5 | |
| | | | |
Top Ten as a Group | | | 54.2 | % |
| | | | |
| * | Top Ten Holdings as of June 30, 2015. |
Credit quality ratings shown above reflect the highest rating assigned by either Standard & Poor’s (“S&P”) or Moody’s Investors Service, Inc. (“Moody’s”). These rating agencies are independent, nationally recognized statistical rating organizations and are widely used. Investment grade ratings are credit ratings of BBB/Baa or higher. Below investment grade ratings are credit ratings of BB/Ba or lower. Investments designated N/R are not rated by either rating agency. Unrated investments do not necessarily indicate low credit quality. Credit quality ratings are subject to change.
Because a fund’s strategy may result in multiple investments in particular sectors of the economy, its performance may depend on the performance of those sectors and may fluctuate more widely than investments diversified across more sectors. For additional information on these and other risk considerations, please see the Fund’s prospectus.
Any sectors, industries, or securities discussed should not be perceived as investment recommendations. Mention of a specific security should not be considered a recommendation to buy or solicitation to sell that security. Specific securities mentioned in this report may have been sold from the Fund’s portfolio of investments by the time you receive this report.
43
AMG Managers Intermediate Duration Government Fund
Schedule of Portfolio Investments
December 31, 2015
| | | | | | | | |
| | | Principal Amount | | | Value | |
Asset-Backed Securities—6.1% | | | | | | | | |
American Homes 4 Rent, Series 2014-SFR1, Class A, 1.351%, 06/17/31 (01/17/16) (a)9,10 | | $ | 1,216,528 | | | $ | 1,192,133 | |
American Residential Properties Trust, Series 2014-SFR1, Class A, 1.451%, 09/17/31 (01/17/16) (a)9,10 | | | 1,179,195 | | | | 1,155,921 | |
Colony American Homes, Series 2014-2A, Class A, 1.301%, 07/17/31 (01/17/16) (a)9 | | | 894,994 | | | | 873,615 | |
Invitation Homes Trust, | | | | | | | | |
Series 2013-SFR1, Class A, 1.451%, 12/17/30 (01/17/16) (a)9,10 | | | 2,893,952 | | | | 2,836,210 | |
Series 2014-SFR1, Class A, 1.351%, 06/17/31 (01/17/16) (a)9 | | | 650,000 | | | | 636,063 | |
Series 2015-SFR3, Class A, 1.651%, 08/17/32 (01/17/16) (a)9 | | | 496,969 | | | | 487,513 | |
Progress Residential Trust, | | | | | | | | |
Series 2014-SFR1, Class A, 1.451%, 10/17/31 (01/17/16) (a)9 | | | 898,558 | | | | 885,372 | |
Series 2015-SFR2, Class A, 2.740%, 06/12/32 (a)10 | | | 3,000,000 | | | | 2,930,169 | |
SWAY Residential Trust, Series 2014-1, Class A, 1.651%, 01/17/32 (01/17/16) (a)9 | | | 664,171 | | | | 651,458 | |
Total Asset-Backed Securities (cost $11,835,686) | | | | | | | 11,648,454 | |
Mortgage-Backed Securities—6.7% | | | | | | | | |
American Home Mortgage Assets Trust, Series 2005-1, Class 1A1, 2.732%, 11/25/35 (02/25/16)9 | | | 76,046 | | | | 66,663 | |
American Home Mortgage Investment Trust, | | | | | | | | |
Series 2004-1, Class 4A, 2.654%, 04/25/44 (02/25/16)9 | | | 113,921 | | | | 105,608 | |
Series 2005-1, Class 5A1, 2.654%, 06/25/45 (02/25/16)9 | | | 42,523 | | | | 41,950 | |
Bank of America Funding Trust, Series 2004-B, Class 1A2, 2.811%, 12/20/34 (02/20/16)9 | | | 110,424 | | | | 99,672 | |
Bear Stearns Alt-A Trust, Series 2005-3, Class 2A3, 2.747%, 04/25/35 (02/25/16)9 | | | 115,114 | | | | 101,744 | |
Bear Stearns Commercial Mortgage Securities Trust, | | | | | | | | |
Series 2006-PW14, Class A1A, 5.189%, 12/11/38 | | | 646,729 | | | | 660,639 | |
Series 2006-T22, Class A4, 5.620%, 04/12/384,10 | | | 807,561 | | | | 807,878 | |
Series 2007-PW16, Class A4, 5.722%, 06/11/404,10 | | | 1,791,695 | | | | 1,834,164 | |
COMM 2006-C8 Mortgage Trust, Series 2006-C8, Class A4, 5.306%, 12/10/46 | | | 1,571,438 | | | | 1,599,434 | |
Countrywide Home Loan Mortgage Pass Through Trust, | | | | | | | | |
Series 2005-HYB2, Class 1A4, 2.666%, 05/20/35 (02/20/16)9 | | | 87,514 | | | | 82,112 | |
Series 2005-HYB8, Class 1A1, 2.561%, 12/20/35 (02/20/16)9 | | | 97,960 | | | | 80,846 | |
Countrywide Home Loan reperforming loan REMIC Trust, Series 2004-R2, Class 1AF1, 0.842%, 11/25/34 (01/25/16) (a)7,9 | | | 115,394 | | | | 100,918 | |
Credit Suisse Commercial Mortgage Trust, | | | | | | | | |
Series 2006-C3, Class A1A, 5.816%, 06/15/384 | | | 860,379 | | | | 866,191 | |
Series 2006-C3, Class A3, 5.816%, 06/15/384 | | | 873,081 | | | | 874,738 | |
GSMPS Mortgage Loan Trust, Series 2005-RP2, Class 1AF, 0.772%, 03/25/35 (01/25/16) (a)7,9 | | | 173,149 | | | | 148,533 | |
GSR Mortgage Loan Trust, Series 2004-5, Class 1A3, 2.250%, 05/25/34 (02/25/16)9 | | | 38,438 | | | | 36,784 | |
Harborview Mortgage Loan Trust, Series 2004-7, Class 2A2, 2.430%, 11/19/34 (02/19/16)9 | | | 65,792 | | | | 61,159 | |
LB-UBS Commercial Mortgage Trust, Series 2006-C4, Class A4, 5.820%, 06/15/384 | | | 363,835 | | | | 367,024 | |
Master Alternative Loans Trust, Series 2005-2, Class 2A1, 6.000%, 01/25/3510 | | | 531,408 | | | | 564,711 | |
Morgan Stanley Capital I Trust, | | | | | | | | |
Series 2006-HQ9, Class A1A, 5.728%, 07/12/444 | | | 349,981 | | | | 352,808 | |
The accompanying notes are an integral part of these financial statements.
44
AMG Managers Intermediate Duration Government Fund
Schedule of Portfolio Investments (continued)
| | | | | | | | |
| | | Principal Amount | | | Value | |
Mortgage-Backed Securities—6.7% (continued) | | | | | | | | |
Series 2006-IQ12, Class A4, 5.332%, 12/15/43 | | $ | 809,432 | | | $ | 823,795 | |
Morgan Stanley Mortgage Loan Trust, Series 2005-4, Class 2A1, 5.942%, 08/25/354,10 | | | 733,539 | | | | 706,169 | |
Structured Asset Securities Corp., Series 2005-RF1, Class A, 0.772%, 03/25/35 (01/25/16) (a)7,9 | | | 200,898 | | | | 166,595 | |
Wachovia Bank Commercial Mortgage Trust, | | | | | | | | |
Series 2006-C27, Class A3, 5.765%, 07/15/454 | | | 654,683 | | | | 653,868 | |
Series 2006-C29, Class A4, 5.308%, 11/15/48 | | | 1,521,525 | | | | 1,542,308 | |
Wells Fargo Mortgage Backed Securities Trust, Series 2007-16, Class 1A1, 6.000%, 12/28/37 | | | 192,537 | | | | 199,663 | |
Total Mortgage-Backed Securities (cost $13,253,303) | | | | | | | 12,945,974 | |
U.S. Government and Agency Obligations—118.3% | | | | | | | | |
Federal Home Loan Mortgage Corporation—32.6% | | | | | | | | |
FHLMC, | | | | | | | | |
2.592%, 11/01/33 (03/15/16)9,10 | | | 868,855 | | | | 921,521 | |
2.790%, 02/01/37 (03/15/16)9 | | | 59,511 | | | | 64,002 | |
FHLMC Gold Pool, | | | | | | | | |
3.000%, 06/01/45 | | | 1,756,187 | | | | 1,756,607 | |
3.500%, 04/01/32 to 01/01/4410 | | | 11,037,274 | | | | 11,427,782 | |
3.500%, TBA 30 years,11,12 | | | 5,500,000 | | | | 5,649,585 | |
4.000%, 05/01/24 to 07/01/4410 | | | 6,415,677 | | | | 6,792,886 | |
4.000%, TBA 30 years,11,12 | | | 22,000,000 | | | | 23,194,099 | |
4.500%, 02/01/20 to 09/01/4110 | | | 3,006,163 | | | | 3,236,350 | |
5.000%, 05/01/18 to 06/01/4110 | | | 3,599,077 | | | | 3,949,872 | |
5.500%, 11/01/17 to 01/01/4010 | | | 3,208,727 | | | | 3,547,122 | |
6.000%, 09/01/17 to 01/01/2410 | | | 830,748 | | | | 897,693 | |
7.000%, 07/01/19 | | | 94,951 | | | | 99,675 | |
7.500%, 07/01/3410 | | | 812,565 | | | | 959,293 | |
Total Federal Home Loan Mortgage Corporation | | | | | | | 62,496,487 | |
Federal National Mortgage Association—51.4% | | | | | | | | |
FNMA, | | | | | | | | |
2.054%, 06/01/34 (02/25/16)9,10 | | | 610,328 | | | | 633,215 | |
2.345%, 08/01/34 (02/25/16)9 | | | 269,266 | | | | 285,269 | |
2.500%, 02/01/43 | | | 800,845 | | | | 773,875 | |
3.000%, 03/01/43 to 04/01/4510 | | | 3,388,624 | | | | 3,395,794 | |
3.000%, TBA 30 years,11,12 | | | 2,000,000 | | | | 1,996,034 | |
3.500%, 05/01/42 to 11/01/4510 | | | 14,328,306 | | | | 14,807,561 | |
3.500%, TBA 30 years,11,12 | | | 23,510,000 | | | | 24,242,255 | |
4.000%, 01/01/26 to 11/01/4510 | | | 17,395,321 | | | | 18,483,144 | |
4.000%, TBA 30 years,11,12 | | | 8,300,000 | | | | 8,766,292 | |
4.500%, 04/01/25 to 05/01/4510 | | | 7,245,950 | | | | 7,859,946 | |
4.500%, TBA 30 years,11,12 | | | 8,550,000 | | | | 9,226,778 | |
The accompanying notes are an integral part of these financial statements.
45
AMG Managers Intermediate Duration Government Fund
Schedule of Portfolio Investments (continued)
| | | | | | | | |
| | | Principal Amount | | | Value | |
Federal National Mortgage Association—51.4% (continued) | | | | | | | | |
FNMA, | | | | | | | | |
4.750%, 07/01/34 to 09/01/34 | | $ | 316,119 | | | $ | 348,242 | |
5.000%, 06/01/18 to 11/01/39 | | | 403,504 | | | | 437,758 | |
5.500%, 03/01/17 to 08/01/4110 | | | 3,157,828 | | | | 3,520,387 | |
6.000%, 08/01/17 to 06/01/3910 | | | 2,031,282 | | | | 2,232,238 | |
6.500%, 11/01/28 to 07/01/32 | | | 102,090 | | | | 109,081 | |
7.000%, 11/01/2210 | | | 455,808 | | | | 493,797 | |
FNMA REMICS, | | | | | | | | |
Series 1994-55, Class H, 7.000%, 03/25/2410 | | | 582,064 | | | | 637,756 | |
Series 2005-13, Class AF, 0.822%, 03/25/35 (01/25/16)9,10 | | | 317,728 | | | | 318,717 | |
FNMA REMICS Whole Loan, Series 2003-W4, Class 4A, 7.028%, 10/25/424 | | | 68,851 | | | | 79,022 | |
Total Federal National Mortgage Association | | | | | | | 98,647,161 | |
Government National Mortgage Association—33.4% | | | | | | | | |
GNMA, | | | | | | | | |
2.000%, 05/20/21 (02/20/16)9 | | | 11,026 | | | | 11,168 | |
3.000%, 11/15/42 to 06/20/45 | | | 4,153,524 | | | | 4,227,416 | |
3.000%, 03/20/16 to 08/20/18 (02/20/16)9,10 | | | 53,672 | | | | 54,604 | |
3.000%, TBA 30 years,11,12 | | | 3,200,000 | | | | 3,243,376 | |
3.500%, 08/15/43 to 11/20/4510 | | | 9,051,090 | | | | 9,464,039 | |
3.500%, TBA 30 years,11,12 | | | 16,180,000 | | | | 16,867,019 | |
4.000%, 06/20/43 to 12/20/4510 | | | 10,466,090 | | | | 11,206,672 | |
4.000%, TBA 30 years,11,12 | | | 6,700,000 | | | | 7,115,085 | |
4.500%, 05/15/39 to 12/15/4510,11 | | | 4,365,967 | | | | 4,749,472 | |
5.000%, 12/15/35 to 10/20/4110 | | | 5,031,585 | | | | 5,582,244 | |
5.500%, 10/15/39 to 11/15/3910 | | | 1,473,031 | | | | 1,656,015 | |
7.500%, 09/15/28 to 11/15/31 | | | 21,581 | | | | 22,474 | |
Total Government National Mortgage Association | | | | | | | 64,199,584 | |
Interest Only Strips—0.9% | | | | | | | | |
FHLMC, | | | | | | | | |
Series 212, Class IO, 6.000%, 05/01/317 | | | 1,356 | | | | 296 | |
Series 233, Class 5, 4.500%, 09/15/35 | | | 90,483 | | | | 15,741 | |
FHLMC REMICS, | | | | | | | | |
Series 2380, Class SI, 7.570%, 06/15/31 (01/15/16)7,9 | | | 11,749 | | | | 2,728 | |
Series 2922, Class SE, 6.420%, 02/15/35 (01/15/16)9 | | | 114,108 | | | | 21,643 | |
Series 2934, Class HI, 5.000%, 02/15/20 | | | 46,245 | | | | 3,308 | |
Series 2934, Class KI, 5.000%, 02/15/20 | | | 34,907 | | | | 2,318 | |
Series 2965, Class SA, 5.720%, 05/15/32 (01/15/16)9 | | | 234,429 | | | | 37,119 | |
Series 2967, Class JI, 5.000%, 04/15/20 | | | 87,306 | | | | 6,407 | |
Series 2980, Class SL, 6.370%, 11/15/34 (01/15/16)9 | | | 150,867 | | | | 39,019 | |
The accompanying notes are an integral part of these financial statements.
46
AMG Managers Intermediate Duration Government Fund
Schedule of Portfolio Investments (continued)
| | | | | | | | |
| | | Principal Amount | | | Value | |
Interest Only Strips—0.9% (continued) | | | | | | | | |
FHLMC REMICS, | | | | | | | | |
Series 3031, Class BI, 6.359%, 08/15/35 (01/15/16)9 | | $ | 308,011 | | | $ | 72,813 | |
Series 3065, Class DI, 6.290%, 04/15/35 (01/15/16)9 | | | 266,037 | | | | 53,680 | |
Series 3114, Class GI, 6.270%, 02/15/36 (01/15/16)9 | | | 222,534 | | | | 49,006 | |
Series 3308, Class S, 6.870%, 03/15/32 (01/15/16)9 | | | 221,656 | | | | 46,656 | |
Series 3424, Class XI, 6.240%, 05/15/36 (01/15/16)9 | | | 239,824 | | | | 44,834 | |
Series 3489, Class SD, 7.470%, 06/15/32 (01/15/16)9 | | | 128,089 | | | | 26,937 | |
Series 3606, Class SN, 5.920%, 12/15/39 (01/15/16)9 | | | 316,622 | | | | 53,211 | |
Series 3685, Class EI, 5.000%, 03/15/19 | | | 218,102 | | | | 8,291 | |
Series 3731, Class IO, 5.000%, 07/15/19 | | | 104,303 | | | | 4,477 | |
Series 3882, Class AI, 5.000%, 06/15/26 | | | 176,908 | | | | 10,783 | |
FNMA, | | | | | | | | |
Series 215, Class 2, 7.000%, 04/25/237 | | | 73,022 | | | | 12,427 | |
Series 222, Class 2, 7.000%, 06/25/237 | | | 6,981 | | | | 1,205 | |
Series 343, Class 21, 4.000%, 09/25/18 | | | 63,224 | | | | 2,491 | |
Series 343, Class 22, 4.000%, 11/25/18 | | | 34,275 | | | | 1,350 | |
Series 351, Class 3, 5.000%, 04/25/34 | | | 73,785 | | | | 14,518 | |
Series 351, Class 4, 5.000%, 04/25/34 | | | 43,118 | | | | 8,484 | |
Series 351, Class 5, 5.000%, 04/25/34 | | | 36,331 | | | | 7,148 | |
Series 365, Class 4, 5.000%, 04/25/36 | | | 94,979 | | | | 16,076 | |
FNMA REMICS, | | | | | | | | |
Series 2003-73, Class SM, 6.178%, 04/25/18 (01/25/16)7,9 | | | 6,208 | | | | 24 | |
Series 2004-49, Class SQ, 6.628%, 07/25/34 (01/25/16)9 | | | 95,155 | | | | 18,091 | |
Series 2004-51, Class SX, 6.698%, 07/25/34 (01/25/16)9 | | | 129,007 | | | | 29,281 | |
Series 2004-64, Class SW, 6.628%, 08/25/34 (01/25/16)9 | | | 390,964 | | | | 79,727 | |
Series 2005-12, Class SC, 6.328%, 03/25/35 (01/25/16)9 | | | 147,481 | | | | 28,576 | |
Series 2005-45, Class SR, 6.298%, 06/25/35 (01/25/16)9 | | | 309,260 | | | | 57,490 | |
Series 2005-65, Class KI, 6.578%, 08/25/35 (01/25/16)9,10 | | | 717,142 | | | | 136,298 | |
Series 2005-89, Class S, 6.278%, 10/25/35 (01/25/16)9 | | | 730,977 | | | | 135,011 | |
Series 2006-3, Class SA, 5.728%, 03/25/36 (01/25/16)9 | | | 149,960 | | | | 24,791 | |
Series 2007-75, Class JI, 6.123%, 08/25/37 (01/25/16)9 | | | 149,864 | | | | 26,062 | |
Series 2008-86, Class IO, 4.500%, 03/25/23 | | | 197,757 | | | | 7,845 | |
Series 2010-37, Class GI, 5.000%, 04/25/25 | | | 215,011 | | | | 7,473 | |
Series 2010-65, Class IO, 5.000%, 09/25/20 | | | 336,106 | | | | 21,255 | |
Series 2010-121, Class IO, 5.000%, 10/25/25 | | | 120,697 | | | | 6,457 | |
Series 2011-69, Class AI, 5.000%, 05/25/18 | | | 272,614 | | | | 9,942 | |
Series 2011-88, Class WI, 3.500%, 09/25/26 | | | 354,228 | | | | 37,842 | |
Series 2011-124, Class IC, 3.500%, 09/25/21 | | | 312,603 | | | | 17,854 | |
Series 2012-126, Class SJ, 4.578%, 11/25/42 (01/25/16)9 | | | 731,373 | | | | 110,033 | |
The accompanying notes are an integral part of these financial statements.
47
AMG Managers Intermediate Duration Government Fund
Schedule of Portfolio Investments (continued)
| | | | | | | | |
| | | Principal Amount | | | Value | |
Interest Only Strips—0.9% (continued) | | | | | | | | |
GNMA, | | | | | | | | |
Series 2011-32, Class KS, 11.411%, 06/16/34 (01/16/16)9 | | $ | 262,095 | | | $ | 38,873 | |
Series 2011-94, Class IS, 6.356%, 06/16/36 (01/16/16)9 | | | 240,716 | | | | 31,394 | |
Series 2011-157, Class SG, 6.198%, 12/20/41 (01/20/16)9 | | | 971,068 | | | | 214,772 | |
Series 2011-167, Class IO, 5.000%, 12/16/20 | | | 244,469 | | | | 12,186 | |
Series 2012-34, Class KS, 5.706%, 03/16/42 (01/16/16)9 | | | 420,274 | | | | 87,306 | |
Series 2012-69, Class QI, 4.000%, 03/16/41 | | | 292,383 | | | | 48,665 | |
Series 2012-103, Class IB, 3.500%, 04/20/40 | | | 254,196 | | | | 30,395 | |
Total Interest Only Strips | | | | | | | 1,780,609 | |
Total U.S. Government and Agency Obligations (cost $224,999,225) | | | | | | | 227,123,841 | |
Short-Term Investments—21.4% | | | | | | | | |
U.S. Treasury Bills—0.0%# | | | | | | | | |
U. S. Treasury Bills, 0.46%, 06/23/1613,14 | | | 90,000 | | | | 89,800 | |
| | |
| | | Shares | | | | |
Other Investment Companies—21.4%3 | | | | | | | | |
Dreyfus Institutional Cash Advantage Fund, Institutional Class Shares, 0.26%10 | | | 12,013,722 | | | | 12,013,722 | |
JP Morgan US Government Money Market Fund, 0.12%10 | | | 9,000,093 | | | | 9,000,093 | |
JPMorgan Liquid Assets Money Market Fund, Capital Shares, 0.25%10 | | | 10,030,024 | | | | 10,030,024 | |
JPMorgan Prime Money Market Fund, Capital Shares, 0.21% | | | 10,005,333 | | | | 10,005,333 | |
Total Other Investment Companies | | | | | | | 41,049,172 | |
Total Short-Term Investments | | | | | | | | |
(cost $41,139,079) | | | | | | | 41,138,972 | |
Total Investments—152.5% (cost $291,227,293) | | | | | | | 292,857,241 | |
Other Assets, less Liabilities—(52.5)% | | | | | | | (100,817,765 | ) |
Net Assets—100.0% | | | | | | $ | 192,039,476 | |
The accompanying notes are an integral part of these financial statements.
48
AMG Managers Short Duration Government Fund
Portfolio Manager’s Comments (unaudited)
THE YEAR IN REVIEW
During the year ended December 31, 2015, the AMG Managers Short Duration Government Fund (the “Fund”) returned (0.2)%, while the BofA Merrill Lynch 6-Month U.S. Treasury Bill Index returned 0.2%.
2015 was marked by a number of notable events. The Greece debt problem was resolved (at least temporarily) by the brinksmanship that led to increased market volatility and risk premia. In accordance with market expectations, the U.S. Federal Reserve (the “Fed”) finally raised rates at the end of the year to begin moving monetary policy to a more “normalized” place. Energy (led by oil) dropped dramatically. However, the expected benefit to increased consumer spending was disappointing throughout the year.
Agency mortgage-backed securities (MBS) experienced a difficult environment to begin the first quarter, particularly for higher-coupon MBS, as the rally in rates led to the market pricing higher prepayment rates. These concerns were short-lived as the bear steepener in the middle of the quarter removed prepayment concerns, leading to stronger performance in MBS pricing, led by the higher coupons. Weaker economic data led to expectations that the Fed would likely remain accommodative for longer than initially anticipated, which further benefited agency MBS.
Interest rates continued to rise to start the second quarter, further benefiting agency MBS by pacifying concerns related to higher prepayment rates. However, May proved to be a mixed month. Interest rates rose yet again, albeit more modestly than at the start of the quarter. However, higher realized volatility hampered performance in MBS. MBS continued to experience challenges through the end of the quarter, as elevated macro risks and higher levels of mortgage supply detracted from MBS performance. Realized volatility remained high as markets digested headlines from Greece and China to try to determine future monetary policy. Fed repurchase activity remained heavy and ultimately helped support MBS spreads.
The third quarter provided for mixed performance within Agency MBS. MBS continued its struggles to start the third quarter due to increased realized volatility, only to reverse course as macro concerns abated. However, by the middle of the quarter, both nominal and option-adjusted MBS spreads widened due to the increased market volatility. Agency MBS ended the quarter on weakness as MBS spreads hit multi-year wides.
The fourth quarter was one of recovery as Agency MBS spreads joined most other risk assets by reversing the weakness from 3Q. The middle of the quarter was quiet as stable rates supported MBS. Tepid prepayment rates led once again to higher coupons outperforming their lower-coupon counterparts.
While employment continued to improve throughout 2015, that improvement did not result in wage growth. Additionally, the decline in energy prices quelled any concerns regarding inflation, which ultimately led our Treasury Inflation-Protected Securities (TIPS) exposure to detract from performance. The slight flattening of the yield curve also modestly detracted from performance. Our holdings in residential-related asset-backed securities (ABS) also moderately detracted from performance for the year. Offsetting that weakness was a positive contribution from our positioning in Agency FRMs (Fixed-Rate MBS). Specifically, we avoided the coupons in which the Fed was most active. Additionally, we maintained a bias to higher coupons, which provided significant carry and experienced lower prepayments than the market had priced into the securities. The lower-than-expected prepayments also benefited our Interest Only (IOs) positions. Our positioning in Agency Collateralized Mortgage Obligations (CMOs), Agency Adjustable-Rate Mortgages (ARMs), Non-Agency CMOs, Commercial Mortgage-Backed Securities (CMBS) and Consumer ABS all moderately contributed to the positive performance for the year.
At the end of the year, 15-year Agency FRMs were the largest component of the Fund. They stayed relatively stable at ~25% during the year. We increased our exposure to 30-year Agency FRMs by 10% to end the year with ~19% weighting in the sector. We reduced our holdings in Agency ARMs by almost 6% during the year. Additionally,
we reduced our weighting to Commercial Mortgage-Backed Securities (CMBS) by half to end the year at 2%. We continue to view Agency MBS as an attractive alternative to Treasuries due to the additional spread offered.
LOOKING FORWARD
As we enter 2016, we believe Agency MBS spreads are attractively priced relative to historical levels. Shorter-term, demand should be sufficient to support Agency MBS, at least relative to other spread sectors. The Fed continues to reinvest any cash flows from its existing portfolio and will absorb much of the gross supply. Now that the Fed tightening cycle has begun, it is natural to wonder when the reinvestment policy will be altered, but it seems likely that the timeframe will be pushed out to 2017. Additional demand should continue from banks and money managers. Banks are large holders of agency MBS, and regulatory factors continue to push them into the sector, especially towards GNMA MBS. Also large buyers in 2015, total-return-oriented investors are likely to continue to add, dependent on spreads. Demand from non-U.S. investors will be interesting to watch. The MBS sector should be appealing as yields are significantly higher than any similar duration sovereign debt alternatives. However, global flows could limit USD investments due to Dollar strength, which would negatively swap MBS demand.
Overall, we continue to be positive on agency MBS, both shorter and longer-term. MBS spreads are back in a range that is attractive historically, and we believe that the market has substantially priced-in the Fed’s eventual exit. We expect prepayment activity will be low in the near-term, which also supports valuations, but have taken positions that have less exposure to prepayment risk longer-term. Empirical data illustrates that MBS have performed better than U.S. Treasuries with generally lower volatility over time. We expect this performance advantage will continue.
This commentary reflects the viewpoints of Amundi Smith Breeden LLC as of December 31, 2015 and is not intended as a forecast or guarantee of future results.
AMG Managers Short Duration Government Fund
Portfolio Manager’s Comments (continued)
CUMULATIVE TOTAL RETURN PERFORMANCE
AMG Managers Short Duration Government Fund’s cumulative total return is based on the daily change in net asset value (NAV), and assumes that all dividends and distributions were reinvested. This graph compares a hypothetical $10,000 investment made in the AMG Managers Short Duration Government Fund on December 31, 2005 to a $10,000 investment made in the BofA Merrill Lynch 6-Month U.S. Treasury Bill Index for the same time period. The graph and table do not reflect the deduction of taxes that a shareholder would pay on a Fund distribution or redemption of shares. The listed returns for the Fund are net of expenses and the returns for the index exclude expenses. Total returns would have been lower had certain expenses not been reduced.
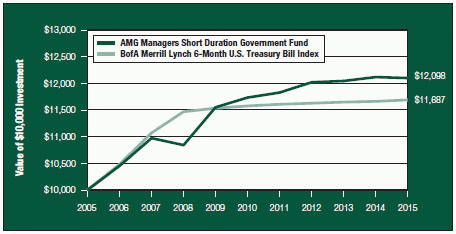
The table below shows the average annual total returns for the AMG Managers Short Duration Government Fund and the BofA Merrill Lynch 6-Month U.S. Treasury Bill Index for the same time periods ended December 31, 2015.
| | | | | | | | | | | | |
| Average Annual Total Returns1 | | One
Year | | | Five
Years | | | Ten
Years | |
AMG Managers Short Duration Government Fund 2,3,4,5,6,7 | | | (0.15 | )% | | | 0.62 | % | | | 1.92 | % |
BofA Merrill Lynch 6-Month U.S. Treasury Bill Index8 | | | 0.22 | % | | | 0.19 | % | | | 1.57 | % |
The performance data shown represents past performance. Past performance is not a guarantee of future results. Current performance may be lower or higher than the performance data quoted. The investment return and principal value of an investment in the Fund will fluctuate so that an investor’s shares, when redeemed, may be worth more or less than their original cost.
Investors should carefully consider the Fund’s investment objectives, risks, charges, and expenses before investing. For performance information through the most recent month end, current net asset values per share for the Fund and other information, please call (800) 835-3879 or visit our website at www.amgfunds.com for a free prospectus. Read it carefully before investing or sending money.
Distributed by AMG Distributors, Inc., member FINRA/SIPC.
| 1 | Total return equals income yield plus share price change and assumes reinvestment of all dividends and capital gain distributions. Returns are net of fees and may reflect offsets of Fund expenses as described in the prospectus. No adjustment has been made for taxes payable by shareholders on their reinvested dividends and capital gain distributions. Returns for periods greater than one year are annualized. The listed returns on the Fund are net of expenses and based on the published NAV as of December 31, 2015. All returns are in U.S. dollars ($). |
| 2 | From time to time the Fund’s advisor has waived its fees and/or absorbed Fund expenses, which has resulted in higher returns. |
| 3 | The Fund is subject to the risks associated with investments in debt securities, such as default risk and fluctuations in the perception of the debtors’ ability to pay its creditors. Changing investments may adversely affect the value of an investment. An increase in interest rates typically causes the value of bonds and other fixed-income securities to fall. |
| 4 | The Fund may use derivative instruments for hedging purposes or as part of its investment strategy. There is a risk that a derivative intended as a hedge may not perform as expected. The main risks with derivatives is that some types can amplify a gain or loss, potentially earning or losing substantially more money than the actual cost of the derivative; or that the counterparty may fail to honor its contract terms, causing a loss for the Fund. Use of these instruments may also involve certain costs and risks such as liquidity risk, interest rate risk, market risk, credit risk, management risk and the risk that a fund could not close out a position when it would be most advantageous to do so. |
| 5 | Many bonds have call provisions which allow the debtors to pay them back before maturity. This is especially true with mortgage securities, which can be paid back anytime. Typically debtors prepay their debt when it is to their advantage (when interest rates drop making a new loan at current rates more attractive), and thus likely to the disadvantage of bondholders, who may have to reinvest prepayment proceeds in securities with lower yields. Prepayment risk will vary depending on the provisions of the security and current interest rates relative to the interest rate of the debt. |
| 6 | To the extent that the Fund invests in asset-backed or mortgage-backed securities, its exposure to prepayment and extension risks may be greater than investments in other fixed income securities. |
| 7 | Obligations of certain government agencies are not backed by the full faith and credit of the U.S. Government. If one of these agencies defaulted on a loan, there is no guarantee that the U.S. Government will provide financial support. Additionally, debt securities of the U.S. Government may be affected by changing interest rates and subject to prepayment risk. |
| 8 | The BofA Merrill Lynch 6-Month U.S. Treasury Bill Index is an unmanaged index that measures returns of six-month Treasury Bills. Unlike the Fund, the BofA Merrill Lynch 6-Month Treasury Bill Index is unmanaged, is not available for investment, and does not incur expenses. |
Not FDIC insured, nor bank guaranteed. May lose value.
50
AMG Managers Short Duration Government Fund
Fund Snapshots (unaudited)
December 31, 2015
PORTFOLIO BREAKDOWN
| | | | |
Category | | AMG Managers
Short Duration
Government
Fund** | |
U.S. Government and Agency Obligations | | | 79.8 | % |
Asset-Backed Securities | | | 9.1 | % |
Mortgage-Backed Securities | | | 2.2 | % |
Other Assets and Liabilities | | | 8.9 | % |
|
** As a percentage of net assets. | |
| | | | |
Rating | | AMG Managers
Short Duration
Government
Fund*** | |
U.S. Government and Agency Obligations | | | 87.6 | % |
Aaa | | | 12.3 | % |
A | | | 0.1 | % |
Ba & lower | | | 0.0 | %# |
| *** | As a percentage of market value of fixed-income securities. |
| # | Rounds to less than 0.1%. |
TOP TEN HOLDINGS
| | | | |
Security Name | | %of
Net
Assets | |
FNMA, 3.000%, TBA 15 years | | | 5.0 | % |
FHLMC, 0.543%, 04/07/16 | | | 3.8 | |
FNMA, 3.500%, 11/01/30 | | | 2.7 | |
FNMA, 5.500%, 12/01/38 | | | 2.6 | |
FHLMC, 0.493%, 04/04/16 | | | 2.5 | |
U.S. Treasury Inflation Indexed Bonds, 0.375%, 07/15/23* | | | 2.2 | |
GNMA, 6.000%, 01/15/36 | | | 2.2 | |
FNMA, 4.500%, 11/01/25 | | | 2.0 | |
FHLMC REMICS, Series 3990, Class GF, 0.731%, 03/15/41* | | | 1.9 | |
FNMA REMICS, Series 2011-115, Class FK, 0.792%, 10/25/39* | | | 1.8 | |
| | | | |
Top Ten as a Group | | | 26.7 | % |
| | | | |
| * | Top Ten Holdings as of June 30, 2015. |
Credit quality ratings shown above reflect the highest rating assigned by either Standard & Poor’s (“S&P”) or Moody’s Investors Service, Inc. (“Moody’s”). These rating agencies are independent, nationally recognized statistical rating organizations and are widely used. Investment grade ratings are credit ratings of BBB/Baa or higher. Below investment grade ratings are credit ratings of BB/Ba or lower. Investments designated N/R are not rated by either rating agency. Unrated investments do not necessarily indicate low credit quality. Credit quality ratings are subject to change.
Because a fund’s strategy may result in multiple investments in particular sectors of the economy, its performance may depend on the performance of those sectors and may fluctuate more widely than investments diversified across more sectors. For additional information on these and other risk considerations, please see the Fund’s prospectus.
Any sectors, industries, or securities discussed should not be perceived as investment recommendations. Mention of a specific security should not be considered a recommendation to buy or solicitation to sell that security. Specific securities mentioned in this report may have been sold from the Fund’s portfolio of investments by the time you receive this report.
51
AMG Managers Short Duration Government Fund
Schedule of Portfolio Investments
December 31, 2015
| | | | | | | | |
| | | Principal Amount | | | Value | |
Asset-Backed Securities—9.1% | | | | | | | | |
American Homes 4 Rent, Series 2014-SFR1, Class A, 1.351%, 06/17/31 (01/17/16) (a)9 | | $ | 2,744,486 | | | $ | 2,689,453 | |
American Residential Properties Trust, Series 2014-SFR1, Class A, 1.451%, 09/17/31 (01/17/16) (a)9 | | | 3,337,722 | | | | 3,271,843 | |
AmeriCredit Automobile Receivables Trust, | | | | | | | | |
Series 2012-1, Class C, 2.670%, 01/08/18 | | | 113,626 | | | | 113,778 | |
Series 2012-3, Class D, 3.030%, 07/09/18 | | | 1,000,000 | | | | 1,009,473 | |
Colony American Homes, | | | | | | | | |
Series 2014-2A, Class A, 1.301%, 07/17/31 (01/17/16) (a)9 | | | 2,243,385 | | | | 2,189,798 | |
Series 2015-1A, Class A, 1.551%, 07/17/32 (01/17/16) (a)9 | | | 2,426,896 | | | | 2,370,933 | |
Invitation Homes Trust, | | | | | | | | |
Series 2013-SFR1, Class A, 1.451%, 12/17/30 (01/17/16) (a)9 | | | 1,462,909 | | | | 1,433,720 | |
Series 2014-SFR1, Class A, 1.351%, 06/17/31 (01/17/16) (a)9 | | | 2,920,000 | | | | 2,857,390 | |
Series 2014-SFR2, Class A, 1.451%, 09/17/31 (01/17/16) (a)9 | | | 1,140,000 | | | | 1,118,897 | |
Series 2015-SFR3, Class A, 1.651%, 08/17/32 (01/17/16) (a)9 | | | 2,584,237 | | | | 2,535,067 | |
Progress Residential Trust, Series 2014-SFR1, Class A, 1.451%, 10/17/31 (01/17/16) (a)9 | | | 1,677,308 | | | | 1,652,695 | |
Santander Drive Auto Receivables Trust, | | | | | | | | |
Series 2012-2, Class D, 3.870%, 02/15/18 | | | 910,000 | | | | 919,868 | |
Series 2012-3, Class D, 3.640%, 05/15/18 | | | 3,657,000 | | | | 3,713,886 | |
Series 2012-4, Class C, 2.940%, 12/15/17 | | | 1,513,621 | | | | 1,520,466 | |
Series 2012-4, Class D, 3.500%, 06/15/18 | | | 3,790,000 | | | | 3,843,052 | |
Series 2012-6, Class D, 2.520%, 09/17/18 | | | 3,680,000 | | | | 3,696,980 | |
SWAY Residential Trust, Series 2014-1, Class A, 1.651%, 01/17/32 (01/17/16) (a)9 | | | 1,149,907 | | | | 1,127,897 | |
Total Asset-Backed Securities (cost $36,331,058) | | | | | | | 36,065,196 | |
Mortgage-Backed Securities—2.2% | | | | | | | | |
Bear Stearns Commercial Mortgage Securities Trust, | | | | | | | | |
Series 2006-PW14, Class A1A, 5.189%, 12/11/38 | | | 1,649,158 | | | | 1,684,631 | |
Series 2006-T22, Class A4, 5.620%, 04/12/384 | | | 568,510 | | | | 568,733 | |
Countrywide Home Loan Mortgage Pass Through Trust, Series 2004-25, Class 2A4, 1.422%, 02/25/35 (01/25/16)7,9 | | | 325,948 | | | | 141,522 | |
Merrill Lynch Mortgage Investors Trust, Series 1998-C1, Class A3, 6.720%, 11/15/264 | | | 342,123 | | | | 345,478 | |
Morgan Stanley Capital I Trust, | | | | | | | | |
Series 2006-HQ9, Class A1A, 5.728%, 07/12/444 | | | 849,953 | | | | 856,820 | |
Series 2006-IQ12, Class A4, 5.332%, 12/15/43 | | | 2,032,303 | | | | 2,068,366 | |
Wachovia Bank Commercial Mortgage Trust, Series 2006-C29, Class A4, 5.308%, 11/15/48 | | | 2,733,040 | | | | 2,770,371 | |
WaMu Mortgage Pass Through Certificates, Series 2005-AR2, Class 2A3, 0.772%, 01/25/45 (01/25/16)9 | | | 390,590 | | | | 361,209 | |
Total Mortgage-Backed Securities (cost $9,139,172) | | | | | | | 8,797,130 | |
U.S. Government and Agency Obligations—79.8% | | | | | | | | |
Federal Home Loan Mortgage Corporation—19.8% | | | | | | | | |
FHLMC, | | | | | | | | |
2.372%, 11/01/33 (03/15/16)9 | | | 844,272 | | | | 886,687 | |
The accompanying notes are an integral part of these financial statements.
52
AMG Managers Short Duration Government Fund
Schedule of Portfolio Investments (continued)
| | | | | | | | |
| | | Principal Amount | | | Value | |
Federal Home Loan Mortgage Corporation—19.8% (continued) | | | | | | | | |
FHLMC, | | | | | | | | |
2.390%, 10/01/28 (03/15/16)9 | | $ | 29,535 | | | $ | 31,114 | |
2.469%, 10/01/33 (03/15/16)9 | | | 1,039,262 | | | | 1,097,529 | |
2.482%, 07/01/34 (03/15/16)9 | | | 331,031 | | | | 349,559 | |
2.484%, 10/01/33 (03/15/16)9 | | | 1,662,505 | | | | 1,766,737 | |
2.493%, 03/01/34 (03/15/16)9 | | | 2,485,247 | | | | 2,626,167 | |
2.499%, 04/01/34 (03/15/16)9 | | | 610,796 | | | | 649,019 | |
2.511%, 09/01/33 (03/15/16)9 | | | 1,706,081 | | | | 1,801,970 | |
2.526%, 05/01/34 (03/15/16)9 | | | 1,849,464 | | | | 1,953,395 | |
2.567%, 12/01/32 (03/15/16)9 | | | 458,847 | | | | 485,084 | |
2.568%, 11/01/33 (03/15/16)9 | | | 991,398 | | | | 1,052,846 | |
2.599%, 12/01/33 (03/15/16)9 | | | 1,357,853 | | | | 1,429,995 | |
2.629%, 02/01/23 (03/15/16)9 | | | 187,890 | | | | 198,325 | |
2.765%, 06/01/35 (03/15/16)9 | | | 639,910 | | | | 681,515 | |
2.790%, 02/01/37 (03/15/16)9 | | | 710,728 | | | | 764,372 | |
FHLMC Gold Pool, | | | | | | | | |
4.000%, 05/01/24 to 12/01/26 | | | 7,853,350 | | | | 8,285,286 | |
4.500%, 05/01/19 to 03/01/31 | | | 6,054,924 | | | | 6,454,345 | |
5.000%, 10/01/18 to 11/01/20 | | | 2,808,816 | | | | 2,936,122 | |
5.500%, 01/01/20 to 08/01/40 | | | 16,988,306 | | | | 18,608,753 | |
6.000%, 02/01/22 to 01/01/24 | | | 4,799,006 | | | | 5,197,085 | |
6.500%, 03/01/18 to 10/01/23 | | | 314,962 | | | | 336,501 | |
7.000%, 06/01/17 to 07/01/19 | | | 122,284 | | | | 127,131 | |
7.500%, 04/01/29 to 03/01/33 | | | 282,188 | | | | 330,944 | |
FHLMC REMICS, | | | | | | | | |
Series 2427, Class LW, 6.000%, 03/15/17 | | | 208,859 | | | | 213,595 | |
Series 2429, Class HB, 6.500%, 12/15/23 | | | 525,028 | | | | 583,588 | |
Series 2541, Class ED, 5.000%, 12/15/17 | | | 1,137,237 | | | | 1,169,805 | |
Series 2627, Class BM, 4.500%, 06/15/18 | | | 94,977 | | | | 97,692 | |
Series 2631, Class PD, 4.500%, 06/15/18 | | | 31,646 | | | | 32,636 | |
Series 2645, Class BY, 4.500%, 07/15/18 | | | 1,085,305 | | | | 1,117,839 | |
Series 2653, Class PA, 4.000%, 07/15/31 | | | 1,142,431 | | | | 1,158,767 | |
Series 2668, Class AZ, 4.000%, 09/15/18 | | | 541,601 | | | | 555,138 | |
Series 2682, Class LC, 4.500%, 07/15/32 | | | 417,094 | | | | 422,377 | |
Series 2683, Class JB, 4.000%, 09/15/18 | | | 344,721 | | | | 352,911 | |
Series 2684, Class PE, 5.000%, 01/15/33 | | | 85,430 | | | | 86,376 | |
Series 2786, Class BC, 4.000%, 04/15/19 | | | 122,656 | | | | 126,651 | |
Series 2809, Class UC, 4.000%, 06/15/19 | | | 131,447 | | | | 135,379 | |
Series 2877, Class PA, 5.500%, 07/15/33 | | | 118,552 | | | | 123,130 | |
Series 2935, Class LM, 4.500%, 02/15/35 | | | 370,679 | | | | 379,442 | |
The accompanying notes are an integral part of these financial statements.
53
AMG Managers Short Duration Government Fund
Schedule of Portfolio Investments (continued)
| | | | | | | | |
| | | Principal Amount | | | Value | |
Federal Home Loan Mortgage Corporation—19.8% (continued) | | | | | | | | |
FHLMC REMICS, | | | | | | | | |
Series 3013, Class GA, 5.000%, 06/15/34 | | $ | 55,233 | | | $ | 55,355 | |
Series 3033, Class CI, 5.500%, 01/15/35 | | | 212,868 | | | | 220,035 | |
Series 3535, Class CA, 4.000%, 05/15/24 | | | 109,971 | | | | 112,781 | |
Series 3609, Class LA, 4.000%, 12/15/24 | | | 396,994 | | | | 409,503 | |
Series 3632, Class AG, 4.000%, 06/15/38 | | | 251,551 | | | | 261,340 | |
Series 3653, Class JK, 5.000%, 11/15/38 | | | 240,961 | | | | 257,125 | |
Series 3659, Class EJ, 3.000%, 06/15/1810 | | | 2,163,437 | | | | 2,195,363 | |
Series 3683, Class AD, 2.250%, 06/15/20 | | | 1,202,982 | | | | 1,209,005 | |
Series 3756, Class DA, 1.200%, 11/15/18 | | | 420,427 | | | | 420,321 | |
Series 3798, Class BD, 2.500%, 06/15/24 | | | 610,582 | | | | 613,795 | |
Series 3818, Class UA, 1.350%, 02/15/17 | | | 209,144 | | | | 209,249 | |
Series 3827, Class CA, 1.500%, 04/15/17 | | | 93,153 | | | | 93,198 | |
Series 3846, Class CK, 1.500%, 09/15/20 | | | 122,414 | | | | 122,660 | |
Series 3990, Class GF, 0.731%, 03/15/41 (01/15/16)9 | | | 7,352,388 | | | | 7,383,138 | |
Total Federal Home Loan Mortgage Corporation | | | | | | | 78,168,675 | |
Federal National Mortgage Association—47.6% | | | | | | | | |
FNMA, | | | | | | | | |
1.938%, 08/01/34 (02/25/16)9 | | | 265,189 | | | | 273,591 | |
1.942%, 02/01/33 (02/25/16)9 | | | 1,211,139 | | | | 1,262,897 | |
1.958%, 08/01/33 (02/25/16)9 | | | 452,733 | | | | 473,109 | |
2.030%, 01/01/24 (02/25/16)9 | | | 442,775 | | | | 449,649 | |
2.054%, 06/01/34 (02/25/16)9 | | | 765,713 | | | | 794,427 | |
2.164%, 01/01/34 (02/25/16)9 | | | 675,897 | | | | 710,209 | |
2.175%, 09/01/33 (02/25/16)9 | | | 875,515 | | | | 923,182 | |
2.195%, 01/01/33 (02/25/16)9 | | | 32,075 | | | | 32,815 | |
2.221%, 03/01/34 (02/25/16)9 | | | 242,926 | | | | 256,732 | |
2.276%, 01/01/36 (02/25/16)9 | | | 57,645 | | | | 59,715 | |
2.320%, 03/01/33 (02/25/16)9 | | | 373,773 | | | | 394,429 | |
2.326%, 04/01/37 (02/25/16)9,10 | | | 5,351,626 | | | | 5,668,836 | |
2.335%, 08/01/36 (02/25/16)9 | | | 197,365 | | | | 208,923 | |
2.345%, 08/01/34 (02/25/16)9 | | | 336,583 | | | | 356,587 | |
2.361%, 10/01/35 (02/25/16)9 | | | 1,408,076 | | | | 1,481,213 | |
2.366%, 05/01/33 (02/25/16)9 | | | 1,650,716 | | | | 1,733,095 | |
2.375%, 02/01/37 (02/25/16)9 | | | 310,166 | | | | 330,756 | |
2.381%, 09/01/33 (02/25/16)9 | | | 547,179 | | | | 575,785 | |
2.412%, 01/01/36 (02/25/16)9 | | | 45,699 | | | | 48,428 | |
2.422%, 07/01/34 (02/25/16)9 | | | 1,322,044 | | | | 1,395,622 | |
2.425%, 01/01/34 (02/25/16)9 | | | 1,680,840 | | | | 1,783,558 | |
The accompanying notes are an integral part of these financial statements.
54
AMG Managers Short Duration Government Fund
Schedule of Portfolio Investments (continued)
| | | | | | | | |
| | | Principal Amount | | | Value | |
Federal National Mortgage Association—47.6% (continued) | | | | | | | | |
FNMA, | | | | | | | | |
2.435%, 01/01/33 (02/25/16)9 | | $ | 1,089,297 | | | $ | 1,160,680 | |
2.443%, 06/01/33 (02/25/16)9 | | | 378,334 | | | | 398,627 | |
2.456%, 01/01/26 (02/25/16)9 | | | 217,347 | | | | 224,229 | |
2.459%, 12/01/33 (02/25/16)9 | | | 489,669 | | | | 517,963 | |
2.480%, 01/01/25 to 05/01/36 (02/25/16)9 | | | 755,311 | | | | 796,008 | |
2.494%, 05/01/34 (02/25/16)9 | | | 1,793,781 | | | | 1,902,987 | |
2.498%, 12/01/34 (02/25/16)9 | | | 2,540,519 | | | | 2,700,569 | |
2.520%, 09/01/37 (02/25/16)9 | | | 207,020 | | | | 218,814 | |
2.545%, 06/01/34 (02/25/16)9 | | | 2,252,303 | | | | 2,392,594 | |
2.578%, 04/01/34 (02/25/16)9 | | | 555,393 | | | | 589,883 | |
2.602%, 04/01/34 (02/25/16)9 | | | 621,475 | | | | 659,989 | |
2.614%, 11/01/34 (02/25/16)9 | | | 3,392,797 | | | | 3,588,256 | |
2.645%, 01/01/36 (02/25/16)9 | | | 3,592,973 | | | | 3,820,431 | |
2.655%, 12/01/34 (02/25/16)9 | | | 2,140,420 | | | | 2,264,471 | |
2.679%, 08/01/35 (02/25/16)9 | | | 1,506,700 | | | | 1,605,326 | |
3.000%, TBA 15 years,11,12 | | | 19,300,000 | | | | 19,881,760 | |
3.500%, 11/01/30 | | | 9,987,317 | | | | 10,538,610 | |
4.000%, 10/01/21 to 08/01/30 | | | 894,782 | | | | 948,215 | |
4.500%, 10/01/19 to 10/01/44 | | | 17,160,494 | | | | 18,562,242 | |
5.000%, 10/01/18 to 09/01/25 | | | 10,465,857 | | | | 11,103,001 | |
5.500%, 11/01/17 to 08/01/4110,11 | | | 39,947,194 | | | | 44,822,529 | |
6.000%, 09/01/19 to 08/01/37 | | | 9,757,245 | | | | 10,796,758 | |
6.500%, 04/01/17 to 08/01/32 | | | 3,958,484 | | | | 4,513,697 | |
7.000%, 11/01/22 | | | 1,698,905 | | | | 1,840,496 | |
7.500%, 08/01/33 to 09/01/33 | | | 67,140 | | | | 81,135 | |
FNMA Grantor Trust, | | | | | | | | |
Series 2002-T5, Class A1, 0.662%, 05/25/32 (01/25/16)9 | | | 263,727 | | | | 257,130 | |
Series 2003-T4, Class 1A, 0.642%, 09/26/33 (01/26/16)9 | | | 13,978 | | | | 13,863 | |
FNMA REMICS, | | | | | | | | |
Series 1994-31, Class ZC, 6.500%, 02/25/24 | | | 493,988 | | | | 564,493 | |
Series 1994-76, Class J, 5.000%, 04/25/24 | | | 130,587 | | | | 135,024 | |
Series 2001-63, Class FA, 0.910%, 12/18/31 (01/18/16)9 | | | 475,158 | | | | 483,214 | |
Series 2001-76, Class UD, 5.500%, 01/25/17 | | | 236,390 | | | | 240,521 | |
Series 2002-47, Class FD, 0.822%, 08/25/32 (01/25/16)9 | | | 505,561 | | | | 510,472 | |
Series 2002-56, Class UC, 5.500%, 09/25/17 | | | 127,451 | | | | 130,996 | |
Series 2002-74, Class FV, 0.872%, 11/25/32 (01/25/16)9 | | | 876,770 | | | | 881,068 | |
Series 2003-2, Class FA, 0.922%, 02/25/33 (01/25/16)9 | | | 420,849 | | | | 426,302 | |
Series 2003-3, Class HJ, 5.000%, 02/25/18 | | | 87,989 | | | | 90,387 | |
The accompanying notes are an integral part of these financial statements.
55
AMG Managers Short Duration Government Fund
Schedule of Portfolio Investments (continued)
| | | | | | | | |
| | | Principal Amount | | | Value | |
Federal National Mortgage Association—47.6% (continued) | | | | | | | | |
FNMA REMICS, | | | | | | | | |
Series 2003-64, Class YA, 3.000%, 05/25/23 | | $ | 81,175 | | | $ | 82,082 | |
Series 2004-1, Class AC, 4.000%, 02/25/19 | | | 65,704 | | | | 67,396 | |
Series 2004-21, Class AE, 4.000%, 04/25/19 | | | 300,502 | | | | 308,775 | |
Series 2004-27, Class HB, 4.000%, 05/25/19 | | | 150,238 | | | | 154,982 | |
Series 2004-28, Class MD, 4.500%, 01/25/34 | | | 1,722,947 | | | | 1,850,359 | |
Series 2004-53, Class NC, 5.500%, 07/25/24 | | | 379,717 | | | | 411,631 | |
Series 2005-13, Class AF, 0.822%, 03/25/35 (01/25/16)9 | | | 592,278 | | | | 594,121 | |
Series 2005-19, Class PA, 5.500%, 07/25/34 | | | 226,444 | | | | 241,682 | |
Series 2005-58, Class EP, 5.500%, 07/25/35 | | | 299,449 | | | | 326,041 | |
Series 2005-68, Class PB, 5.750%, 07/25/35 | | | 55,657 | | | | 59,054 | |
Series 2005-68, Class PC, 5.500%, 07/25/35 | | | 330,382 | | | | 349,795 | |
Series 2005-100, Class BQ, 5.500%, 11/25/25 | | | 770,532 | | | | 838,389 | |
Series 2005-100, Class GC, 5.000%, 12/25/34 | | | 53,625 | | | | 53,738 | |
Series 2006-18, Class PD, 5.500%, 08/25/34 | | | 35,603 | | | | 36,091 | |
Series 2007-56, Class FN, 0.792%, 06/25/37 (01/25/16)9 | | | 222,628 | | | | 222,579 | |
Series 2007-69, Class AB, 5.500%, 12/25/32 | | | 957 | | | | 956 | |
Series 2008-59, Class KB, 4.500%, 07/25/23 | | | 141,396 | | | | 146,605 | |
Series 2010-12, Class AC, 2.500%, 12/25/18 | | | 182,832 | | | | 185,029 | |
Series 2010-48, Class GV, 5.000%, 05/25/21 | | | 626,928 | | | | 631,577 | |
Series 2011-60, Class UC, 2.500%, 09/25/39 | | | 379,806 | | | | 384,444 | |
Series 2011-60, Class UE, 3.000%, 09/25/39 | | | 922,163 | | | | 942,835 | |
Series 2011-115, Class FK, 0.792%, 10/25/39 (01/25/16)9 | | | 7,029,025 | | | | 7,041,802 | |
FNMA REMICS Whole Loan, | | | | | | | | |
Series 2003-W1, Class 2A, 6.392%, 12/25/424 | | | 18,663 | | | | 21,475 | |
Series 2003-W4, Class 4A, 7.028%, 10/25/424 | | | 413,105 | | | | 474,131 | |
Series 2003-W13, Class AV2, 0.702%, 10/25/33 (01/25/16)7,9 | | | 20,864 | | | | 20,021 | |
Series 2004-W5, Class F1, 0.872%, 02/25/47 (01/25/16)9 | | | 473,864 | | | | 473,958 | |
Series 2004-W14, Class 1AF, 0.822%, 07/25/44 (01/25/16)9 | | | 1,939,751 | | | | 1,912,776 | |
Series 2005-W2, Class A1, 0.622%, 05/25/35 (01/25/16)9 | | | 1,293,741 | | | | 1,279,269 | |
Total Federal National Mortgage Association | | | | | | | 187,987,891 | |
Government National Mortgage Association—7.7% | | | | | | | | |
GNMA, | | | | | | | | |
1.625%, 12/20/21 to 10/20/34 (02/20/16)9 | | | 841,062 | | | | 871,680 | |
1.750%, 04/20/24 to 03/20/37 (02/20/16)9 | | | 1,150,544 | | | | 1,185,944 | |
1.875%, 09/20/22 to 09/20/35 (02/20/16)9 | | | 3,332,507 | | | | 3,447,186 | |
2.000%, 06/20/22 (02/20/16)9 | | | 39,605 | | | | 40,597 | |
2.500%, 07/20/18 to 08/20/21 (02/20/16)9 | | | 36,395 | | | | 37,060 | |
2.750%, 10/20/17 (02/20/16)9 | | | 8,154 | | | | 8,287 | |
3.000%, 11/20/17 to 03/20/21 (02/20/16)9 | | | 41,543 | | | | 42,858 | |
The accompanying notes are an integral part of these financial statements.
56
AMG Managers Short Duration Government Fund
Schedule of Portfolio Investments (continued)
| | | | | | | | |
| | | Principal Amount | | | Value | |
Government National Mortgage Association—7.7% (continued) | | | | | | | | |
GNMA, | | | | | | | | |
3.500%, 07/20/18 (02/20/16)9 | | $ | 11,264 | | | $ | 11,500 | |
4.000%, 09/15/18 | | | 171,677 | | | | 180,566 | |
4.500%, 04/15/18 to 07/15/24 | | | 1,138,262 | | | | 1,193,139 | |
6.000%, 01/15/36 | | | 7,535,842 | | | | 8,759,451 | |
9.500%, 12/15/17 | | | 818 | | | | 843 | |
Series 2000-36, Class F, 0.895%, 11/16/30 (01/16/16)9 | | | 530,745 | | | | 534,308 | |
Series 2005-47, Class QC, 5.000%, 11/20/3210 | | | 2,828,663 | | | | 2,927,915 | |
Series 2010-2, Class F, 0.895%, 01/16/40 (01/16/16)9 | | | 1,080,417 | | | | 1,093,377 | |
Series 2010-14, Class DC, 4.500%, 07/20/37 | | | 692,512 | | | | 701,990 | |
Series 2010-145, Class GL, 2.500%, 09/20/34 | | | 4,119,236 | | | | 4,142,184 | |
Series 2010-167, Class CJ, 3.000%, 09/20/33 | | | 5,408,180 | | | | 5,476,257 | |
Total Government National Mortgage Association | | | | | | | 30,655,142 | |
Interest Only Strips—1.5% | | | | | | | | |
FHLMC, | | | | | | | | |
Series 215, Class IO, 8.000%, 06/15/317 | | | 97,656 | | | | 27,362 | |
Series 233, Class 5, 4.500%, 09/15/35 | | | 46,164 | | | | 8,030 | |
FHLMC REMICS, | | | | | | | | |
Series 2649, Class IM, 7.000%, 07/15/33 | | | 359,279 | | | | 93,919 | |
Series 2922, Class SE, 6.420%, 02/15/35 (01/15/16)9 | | | 257,205 | | | | 48,785 | |
Series 2934, Class HI, 5.000%, 02/15/20 | | | 66,065 | | | | 4,726 | |
Series 2934, Class KI, 5.000%, 02/15/20 | | | 40,725 | | | | 2,704 | |
Series 2965, Class SA, 5.720%, 05/15/32 (01/15/16)9 | | | 580,474 | | | | 91,911 | |
Series 2967, Class JI, 5.000%, 04/15/20 | | | 205,450 | | | | 15,076 | |
Series 2980, Class SL, 6.370%, 11/15/34 (01/15/16)9 | | | 332,939 | | | | 86,108 | |
Series 2981, Class SU, 7.470%, 05/15/30 (01/15/16)9 | | | 274,008 | | | | 56,512 | |
Series 3031, Class BI, 6.359%, 08/15/35 (01/15/16)9 | | | 941,566 | | | | 222,584 | |
Series 3065, Class DI, 6.290%, 04/15/35 (01/15/16)9 | | | 813,255 | | | | 164,094 | |
Series 3114, Class GI, 6.270%, 02/15/36 (01/15/16)9 | | | 1,370,944 | | | | 301,907 | |
Series 3308, Class S, 6.870%, 03/15/32 (01/15/16)9 | | | 502,809 | | | | 105,835 | |
Series 3424, Class XI, 6.240%, 05/15/36 (01/15/16)9 | | | 624,695 | | | | 116,784 | |
Series 3489, Class SD, 7.470%, 06/15/32 (01/15/16)9 | | | 286,666 | | | | 60,287 | |
Series 3606, Class SN, 5.920%, 12/15/39 (01/15/16)9 | | | 842,915 | | | | 141,658 | |
Series 3685, Class EI, 5.000%, 03/15/19 | | | 487,020 | | | | 18,514 | |
Series 3731, Class IO, 5.000%, 07/15/19 | | | 236,597 | | | | 10,155 | |
Series 3882, Class AI, 5.000%, 06/15/26 | | | 141,498 | | | | 8,624 | |
FNMA, | | | | | | | | |
Series 92, Class 2, 9.000%, 12/25/167 | | | 1,710 | | | | 40 | |
Series 306, Class IO, 8.000%, 05/25/307 | | | 78,029 | | | | 21,668 | |
Series 365, Class 4, 5.000%, 04/25/36 | | | 64,092 | | | | 10,848 | |
The accompanying notes are an integral part of these financial statements.
57
AMG Managers Short Duration Government Fund
Schedule of Portfolio Investments (continued)
| | | | | | | | |
| | | Principal Amount | | | Value | |
Interest Only Strips—1.5% (continued) | | | | | | | | |
FNMA REMICS, | | | | | | | | |
Series 2001-82, Class S, 7.408%, 05/25/28 (01/25/16)7,9 | | $ | 245,376 | | | $ | 57,288 | |
Series 2003-48, Class SJ, 5.578%, 06/25/18 (01/25/16)7,9 | | | 60,218 | | | | 1,692 | |
Series 2003-73, Class SM, 6.178%, 04/25/18 (01/25/16)7,9 | | | 8,110 | | | | 31 | |
Series 2004-49, Class SQ, 6.628%, 07/25/34 (01/25/16)9 | | | 212,199 | | | | 40,343 | |
Series 2004-51, Class SX, 6.698%, 07/25/34 (01/25/16)9 | | | 323,772 | | | | 73,486 | |
Series 2004-64, Class SW, 6.628%, 08/25/34 (01/25/16)9 | | | 899,674 | | | | 183,465 | |
Series 2004-66, Class SE, 6.078%, 09/25/34 (01/25/16)9 | | | 145,237 | | | | 26,169 | |
Series 2005-5, Class SD, 6.278%, 01/25/35 (01/25/16)9 | | | 251,668 | | | | 42,022 | |
Series 2005-12, Class SC, 6.328%, 03/25/35 (01/25/16)9 | | | 331,786 | | | | 64,288 | |
Series 2005-45, Class SR, 6.298%, 06/25/35 (01/25/16)9 | | | 762,013 | | | | 141,655 | |
Series 2005-65, Class KI, 6.578%, 08/25/35 (01/25/16)9 | | | 1,788,623 | | | | 339,942 | |
Series 2005-66, Class GS, 6.428%, 07/25/20 (01/25/16)9 | | | 116,028 | | | | 9,752 | |
Series 2006-3, Class SA, 5.728%, 03/25/36 (01/25/16)9 | | | 347,068 | | | | 57,376 | |
Series 2007-75, Class JI, 6.123%, 08/25/37 (01/25/16)9 | | | 179,800 | | | | 31,268 | |
Series 2007-85, Class SI, 6.038%, 09/25/37 (01/25/16)9 | | | 365,455 | | | | 68,600 | |
Series 2008-86, Class IO, 4.500%, 03/25/23 | | | 495,024 | | | | 19,638 | |
Series 2008-87, Class AS, 7.228%, 07/25/33 (01/25/16)9 | | | 1,071,447 | | | | 240,279 | |
Series 2010-37, Class GI, 5.000%, 04/25/25 | | | 552,318 | | | | 19,197 | |
Series 2010-65, Class IO, 5.000%, 09/25/20 | | | 868,809 | | | | 54,942 | |
Series 2010-68, Class SJ, 6.128%, 07/25/40 (01/25/16)9 | | | 391,838 | | | | 79,142 | |
Series 2010-105, Class IO, 5.000%, 08/25/20 | | | 452,771 | | | | 31,265 | |
Series 2010-121, Class IO, 5.000%, 10/25/25 | | | 323,912 | | | | 17,329 | |
Series 2011-69, Class AI, 5.000%, 05/25/18 | | | 728,283 | | | | 26,559 | |
Series 2011-88, Class WI, 3.500%, 09/25/26 | | | 1,039,364 | | | | 111,034 | |
Series 2011-124, Class IC, 3.500%, 09/25/21 | | | 1,482,196 | | | | 84,652 | |
Series 2012-126, Class SJ, 4.578%, 11/25/42 (01/25/16)9 | | | 4,810,122 | | | | 723,672 | |
GNMA, | | | | | | | | |
Series 2011-32, Class KS, 11.411%, 06/16/34 (01/16/16)9 | | | 636,747 | | | | 94,440 | |
Series 2011-94, Class IS, 6.356%, 06/16/36 (01/16/16)9 | | | 540,823 | | | | 70,534 | |
Series 2011-146, Class EI, 5.000%, 11/16/41 | | | 343,812 | | | | 85,020 | |
Series 2011-157, Class SG, 6.198%, 12/20/41 (01/20/16)9 | | | 1,285,946 | | | | 284,414 | |
Series 2011-167, Class IO, 5.000%, 12/16/20 | | | 1,439,790 | | | | 71,769 | |
Series 2012-34, Class KS, 5.706%, 03/16/42 (01/16/16)9 | | | 3,227,437 | | | | 670,457 | |
Series 2012-69, Class QI, 4.000%, 03/16/41 | | | 1,546,721 | | | | 257,441 | |
Series 2012-96, Class IC, 3.000%, 08/20/27 | | | 920,731 | | | | 97,178 | |
Series 2012-101, Class AI, 3.500%, 08/20/27 | | | 671,615 | | | | 81,255 | |
Series 2012-103, Class IB, 3.500%, 04/20/40 | | | 1,106,585 | | | | 132,320 | |
Total Interest Only Strips | | | | | | | 6,008,045 | |
The accompanying notes are an integral part of these financial statements.
58
AMG Managers Short Duration Government Fund
Schedule of Portfolio Investments (continued)
| | | | | | | | |
| | | Principal Amount | | | Value | |
U.S. Government Obligations—3.2% | | | | | | | | |
U.S. Treasury Inflation Indexed Bonds, | | | | | | | | |
0.375%, 07/15/23 | | $ | 8,993,600 | | | $ | 8,785,857 | |
2.375%, 01/15/2710 | | | 3,219,680 | | | | 3,722,044 | |
Total U.S. Government Obligations | | | | | | | 12,507,901 | |
Total U.S. Government and Agency Obligations (cost $309,741,773) | | | | | | | 315,327,654 | |
Short-Term Investments—14.0% | | | | | | | | |
U.S. Government and Agency Discount Notes—11.4% | | | | | | | | |
FHLMC, 0.30%, 01/22/1613 | | | 2,600,000 | | | | 2,599,805 | |
FHLMC, 0.49%, 04/04/1610,13 | | | 10,000,000 | | | | 9,991,150 | |
FHLMC, 0.52%, 05/02/1613 | | | 7,000,000 | | | | 6,990,284 | |
FHLMC, 0.54%, 04/07/1613 | | | 15,000,000 | | | | 14,986,290 | |
FNMA, 0.27%, 04/20/1613 | | | 3,000,000 | | | | 2,996,880 | |
FNMA, 0.39%, 05/11/1613 | | | 5,000,000 | | | | 4,992,535 | |
FNMA, 0.39%, 05/18/1613 | | | 2,500,000 | | | | 2,496,062 | |
Total U.S. Government and Agency Discount Notes | | | | | | | 45,053,006 | |
U.S. Treasury Bills—0.3% | | | | | | | | |
U. S. Treasury Bills, 0.46%, 06/23/1613,14 | | | 1,030,000 | | | | 1,027,710 | |
| | |
| | | Shares | | | | |
Other Investment Companies—2.3%3 | | | | | | | | |
Dreyfus Institutional Cash Advantage Fund, Institutional Class Shares, 0.26% | | | 9,190,210 | | | | 9,190,210 | |
Total Short-Term Investments
(cost $55,277,425) | | | | | | | 55,270,926 | |
Total Investments—105.1% (cost $410,489,428) | | | | | | | 415,460,906 | |
Other Assets, less Liabilities—(5.1)% | | | | | | | (20,154,651 | ) |
Net Assets—100.0% | | | | | | $ | 395,306,255 | |
The accompanying notes are an integral part of these financial statements.
59
Note to Schedules of Portfolio Investments
The following footnotes should be read in conjunction with each of the Schedules of Portfolio Investments previously presented in this report.
At December 31, 2015, the approximate cost of investments and the aggregate gross unrealized appreciation and depreciation for federal income tax were as follows:
| | | | | | | | | | | | | | | | |
| Fund | | Cost | | | Appreciation | | | Depreciation | | | Net | |
AMG Chicago Equity Partners Balanced Fund | | $ | 158,508,788 | | | $ | 5,645,729 | | | $ | (3,512,878 | ) | | $ | 2,132,851 | |
AMG Chicago Equity Partners Small Cap Value Fund | | | 13,434,296 | | | | 515,697 | | | | (713,897 | ) | | | (198,200 | ) |
AMG Managers High Yield Fund | | | 34,470,673 | | | | 260,731 | | | | (4,010,508 | ) | | | (3,749,777 | ) |
AMG Managers Intermediate Duration Government Fund | | | 291,240,991 | | | | 3,085,239 | | | | (1,468,989 | ) | | | 1,616,250 | |
AMG Managers Short Duration Government Fund | | | 410,504,963 | | | | 6,214,809 | | | | (1,258,866 | ) | | | 4,955,943 | |
| * | Non-income producing security. |
| # | Rounds to less than 0.1%. |
| (a) | Security exempt from registration under Rule 144A of the Securities Act of 1933. This security may be resold in transactions exempt from registration, normally to qualified buyers. At December 31, 2015, the value of these securities amounted to the following: |
| | | | | | | | |
| Fund | | Market Value | | | % of Net Assets | |
AMG Managers High Yield Fund | | $ | 11,074,251 | | | | 37.6 | % |
AMG Managers Intermediate Duration Government Fund | | | 12,064,500 | | | | 6.3 | % |
AMG Managers Short Duration Government Fund | | | 21,247,693 | | | | 5.4 | % |
| (b) | Step Bond: A debt instrument with either deferred interest or an interest rate that resets at specific times during its term. |
| 1 | Some or all of these shares were out on loan to various brokers as of December 31, 2015, amounting to the following: |
| | | | | | | | |
| Fund | | Market Value | | | % of Net Assets | |
AMG Chicago Equity Partners Balanced Fund | | $ | 2,123,769 | | | | 1.4 | % |
AMG Chicago Equity Partners Small Cap Value Fund | | | 419,919 | | | | 3.3 | % |
AMG Managers High Yield Fund | | | 1,580,119 | | | | 5.4 | % |
| 2 | Collateral received from brokers for securities lending was invested in these joint repurchase agreements. |
| 3 | Yield shown represents the December 31, 2015, seven-day average yield, which refers to the sum of the previous seven days’ dividends paid, expressed as an annual percentage. |
| 4 | Variable Rate Security: The rate listed is as of December 31, 2015 and is periodically reset subject to terms and conditions set forth in the debenture. |
| 5 | Perpetuity Bond. The date shown is the final call date. |
| 6 | Payment-in-Kind Security: The security may pay interest/dividends in additional par/shares and/or in cash. Rates shown are the current rate and possible payment rates. |
| 7 | Illiquid Security: A security not readily convertible into cash such as a stock, bond or commodity that is not actively traded and would be difficult to sell in a timely sale. The Funds may not invest more than 15% of their net assets in illiquid securities. Illiquid securities market value at December 31, 2015, amounted to the following: |
| | | | | | | | |
| Fund | | Market Value | | | % of Net Assets | |
AMG Managers High Yield | | $ | 314,765 | | | | 1.1 | % |
AMG Managers Intermediate Duration Government Fund | | | 432,726 | | | | 0.2 | % |
AMG Managers Short Duration Government Fund | | | 269,624 | | | | 0.1 | % |
| 8 | Security is in default. Issuer has failed to make a timely payment of either principal or interest or has failed to comply with some provision of the bond indenture. |
| 9 | Floating Rate Security: The rate listed is as of December 31, 2015. Date in parentheses represents the security’s next coupon rate reset. |
The accompanying notes are an integral part of these financial statements.
60
Notes to Schedules of Portfolio Investments (continued)
| 10 | Some or all of these securities are segregated as collateral for delayed delivery agreements. At December 31, 2015, the value of these securities amounted to the following: |
| | | | | | | | |
| Fund | | Market Value | | | % of Net Assets | |
AMG Managers Intermediate Duration Government Fund | | $ | 101,078,496 | | | | 52.6 | % |
AMG Managers Short Duration Government Fund | | | 30,843,052 | | | | 7.8 | % |
| 11 | All or part of the security is delayed delivery transactions. The market value of delayed delivery securities at December 31, 2015, amounted to the following: |
| | | | | | | | |
| Fund | | Market Value | | | % of Net Assets | |
AMG Managers Intermediate Duration Government Fund | | $ | 101,078,496 | | | | 52.6 | % |
AMG Managers Short Duration Government Fund | | | 20,364,453 | | | | 5.2 | % |
| 12 | TBA Securities are purchased/sold on a forward commitment basis with an approximate principal amount and no defined maturity date. The actual principal and maturity date will be determined upon settlement when the specific mortgage pools are assigned. |
| 13 | Represents yield to maturity at December 31, 2015. |
| 14 | Some or all of this security is held with brokers as collateral for futures contracts. The collateral market value at December 31, 2015, amounted to the following: |
| | | | | | | | |
| Fund | | Market Value | | | % of Net Assets | |
AMG Managers Intermediate Duration Government Fund | | $ | 89,800 | | | | 0.0 | %# |
AMG Managers Short Duration Government Fund | | | 1,027,710 | | | | 0.3 | % |
The following tables summarize the inputs used to value the Funds’ investments by the fair value hierarchy levels as of December 31, 2015: (See Note 1(a) in the Notes to the Financial Statements.)
| | | | | | | | | | | | | | | | |
| | | Quoted Prices in Active Markets | | | Significant
Other | | | Significant | | | | |
| | | for Identical Investments | | | Observable Inputs | | | Unobservable Inputs | | | | |
| | | Level 1 | | | Level 2 | | | Level 3 | | | Total | |
AMG Chicago Equity Partners Balanced Fund | | | | | | | | | | | | | | | | |
Investments in Securities | | | | | | | | | | | | | | | | |
Common Stocks† | | $ | 99,992,253 | | | | — | | | | — | | | $ | 99,992,253 | |
Corporate Bonds and Notes†† | | | — | | | $ | 3,506,363 | | | | — | | | | 3,506,363 | |
U.S. Government and Agency Obligations†† | | | — | | | | 51,725,278 | | | | — | | | | 51,725,278 | |
Short-Term Investments | | | | | | | | | | | | | | | | |
Repurchase Agreements | | | — | | | | 2,205,649 | | | | — | | | | 2,205,649 | |
Other Investment Companies | | | 3,212,096 | | | | — | | | | — | | | | 3,212,096 | |
| | | | | | | | | | | | | | | | |
Total Investments in Securities | | $ | 103,204,349 | | | $ | 57,437,290 | | | | — | | | $ | 160,641,639 | |
| | | | | | | | | | | | | | | | |
The accompanying notes are an integral part of these financial statements.
61
Notes to Schedules of Portfolio Investments (continued)
| | | | | | | | | | | | | | | | |
| | | Quoted Prices in Active Markets | | | Significant Other | | | Significant | | | | |
| | | for Identical
Investments | | | Observable Inputs | | | Unobservable Inputs | | | | |
| | | Level 1 | | | Level 2 | | | Level 3 | | | Total | |
AMG Chicago Equity Partners Small Cap Value Fund | | | | | | | | | | | | | | | | |
Investments in Securities | | | | | | | | | | | | | | | | |
Common Stocks† | | $ | 12,671,792 | | | | — | | | | — | | | $ | 12,671,792 | |
Short-Term Investments | | | | | | | | | | | | | | | | |
Repurchase Agreements | | | — | | | $ | 438,158 | | | | — | | | | 438,158 | |
Other Investment Companies | | | 126,146 | | | | — | | | | — | | | | 126,146 | |
| | | | | | | | | | | | | | | | |
Total Investments in Securities | | $ | 12,797,938 | | | $ | 438,158 | | | | — | | | $ | 13,236,096 | |
| | | | | | | | | | | | | | | | |
| | | | | | | | | | | | | | | | |
| | | Quoted Prices in Active Markets | | | Significant Other | | | Significant | | | | |
| | | for Identical
Investments | | | Observable Inputs | | | Unobservable Inputs | | | | |
| | | Level 1 | | | Level 2 | | | Level 3 | | | Total | |
AMG Managers High Yield Fund | | | | | | | | | | | | | | | | |
Investments in Securities | | | | | | | | | | | | | | | | |
Corporate Bonds and Notes | | | | | | | | | | | | | | | | |
Industrials | | | — | | | $ | 24,882,039 | | | $ | 170,713 | | | $ | 25,052,752 | |
Financials | | | — | | | | 1,852,261 | | | | — | | | | 1,852,261 | |
Utilities | | | — | | | | 331,209 | | | | — | | | | 331,209 | |
Floating Rate Senior Loan Interests | | | — | | | | 574,935 | | | | 700,083 | | | | 1,275,018 | |
Common Stocks | | | | | | | | | | | | | | | | |
Industrials | | | — | | | | — | | | | 81,252 | | | | 81,252 | |
Short-Term Investments | | | | | | | | | | | | | | | | |
Repurchase Agreements | | | — | | | | 1,652,196 | | | | — | | | | 1,652,196 | |
Other Investment Companies | | $ | 476,208 | | | | — | | | | — | | | | 476,208 | |
| | | | | | | | | | | | | | | | |
Total Investments in Securities | | $ | 476,208 | | | $ | 29,292,640 | | | $ | 952,048 | | | $ | 30,720,896 | |
| | | | | | | | | | | | | | | | |
The following table below is a reconciliation of investments in which significant unobservable inputs (Level 3) were used in determining fair value at December 31, 2015:
| | | | | | | | | | | | | | | | |
| | | | | | | | | Floating Rate | | | | |
| | | Common | | | Corporate | | | Senior Loan | | | | |
| AMG Managers High Yield Fund | | Stock | | | Bond | | | Interests* | | | Total | |
Balance as of December 31, 2014 | | | — | | | | — | | | $ | 274,666 | | | $ | 274,666 | |
Accrued discounts (premiums) | | | — | | | $ | 337 | | | | 1,245 | | | | 1,582 | |
Realized gain (loss) | | | — | | | | — | | | | 831 | | | | 831 | |
Change in unrealized appreciation (depreciation) | | $ | 23,236 | | | | 2,418 | | | | (70,401 | ) | | | (44,747 | ) |
Purchases | | | 58,016 | | | | 167,280 | | | | 163,805 | | | | 389,101 | |
Sales | | | — | | | | (44 | ) | | | (18,777 | ) | | | (18,821 | ) |
Transfers in to Level 3 | | | — | | | | 722 | | | | 425,626 | | | | 426,348 | |
Transfers out of Level 3 | | | — | | | | — | | | | (76,912 | ) | | | (76,912 | ) |
Balance as of December 31, 2015 | | $ | 81,252 | | | $ | 170,713 | | | $ | 700,083 | | | $ | 952,048 | |
Net change in unrealized appreciation/depreciation on investments still held at December 31, 2015 | | $ | 23,236 | | | $ | 2,418 | | | $ | (70,401 | ) | | $ | (44,747 | ) |
| * | The Fund transferred certain investments into Level 3 due to decreased liquidity and decreased visibility into pricing inputs of the third party pricing vendor. |
The accompanying notes are an integral part of these financial statements.
62
Notes to Schedules of Portfolio Investments (continued)
The following table summarizes the quantitative inputs and assumptions used for items categorized in level 3 of the fair value hierarchy as of December 31, 2015. The table below is not intended to be all-inclusive, but rather provides information on the significant level 3 inputs as they relate to the Fund’s fair value measurements:
Quantitative Information about Level 3 Fair Value Measurements
| | | | | | | | | | | | | | | | |
| | | Fair Value as of | | | Valuation | | Unobservable | | | | | | |
| | | September 30, 2015 | | | Technique(s) | | Inputs | | Range | | | Average | |
AMG Managers High Yield Fund | | | | | | | | | | | | | | | | |
Common Stocks | | $ | 81,252 | | | Enterprise Value | | EV Multiple, Discount | | | 7.4-8.4 | | | | 7.9 | |
Corporate Bonds | | | 170,280 | | | Enterprise Value | | EV Multiple, Discount | | | 7.4-8.4 | | | | 7.9 | |
Corporate Bonds | | | 433 | | | Broker Quote | | Price | | | n/a | | | | n/a | |
Floating Rate Senior Loan Interests | | | 700,083 | | | Unadjusted Price from Third Party | | Price | | | n/a | | | | n/a | |
| | | | | | | | | | | | | | | | |
Total | | $ | 952,048 | | | | | | | | | | | | | |
| | | | | | | | | | | | | | | | |
| | | | | | | | | | | | | | | | |
| | | Quoted Prices in Active Markets | | | Significant Other | | | Significant | | | | |
| | | for Identical
Investments | | | Observable Inputs | | | Unobservable Inputs | | | | |
| | | Level 1 | | | Level 2 | | | Level 3 | | | Total | |
AMG Managers Intermediate Duration Government Fund | | | | | | | | | | | | | | | | |
Investments in Securities | | | | | | | | | | | | | | | | |
Asset-Backed Securities | | | — | | | $ | 11,648,454 | | | | — | | | $ | 11,648,454 | |
Mortgage-Backed Securities | | | — | | | | 12,945,974 | | | | — | | | | 12,945,974 | |
U.S. Government and Agency Obligations†† | | | — | | | | 227,123,841 | | | | — | | | | 227,123,841 | |
Short-Term Investments | | | | | | | | | | | | | | | | |
U.S. Treasury Bills | | | — | | | | 89,800 | | | | — | | | | 89,800 | |
Other Investment Companies | | $ | 41,049,172 | | | | — | | | | — | | | | 41,049,172 | |
| | | | | | | | | | | | | | | | |
Total Investments in Securities | | $ | 41,049,172 | | | $ | 251,808,069 | | | | — | | | $ | 292,857,241 | |
| | | | | | | | | | | | | | | | |
TBA Sale Commitments | | | — | | | $ | (30,746,253 | ) | | | — | | | $ | (30,746,253 | ) |
| | | | | | | | | | | | | | | | |
Financial Derivative Instruments-Assets††† | | | | | | | | | | | | | | | | |
Interest Rate Contracts | | $ | 4,382 | | | | — | | | | — | | | $ | 4,382 | |
| | | | | | | | | | | | | | | | |
Financial Derivative Instruments-Liabilities††† | | | | | | | | | | | | | | | | |
Interest Rate Contracts | | | (18,402 | ) | | | — | | | | — | | | | (18,402 | ) |
| | | | | | | | | | | | | | | | |
Total Financial Derivative Instruments | | $ | (14,020 | ) | | | — | | | | — | | | $ | (14,020 | ) |
| | | | | | | | | | | | | | | | |
The accompanying notes are an integral part of these financial statements.
63
Notes to Schedules of Portfolio Investments (continued)
| | | | | | | | | | | | | | | | |
| | | Quoted Prices in Active Markets | | | Significant Other | | | Significant | | | | |
| | | for Identical Investments | | | Observable Inputs | | | Unobservable Inputs | | | | |
| | | Level 1 | | | Level 2 | | | Level 3 | | | Total | |
AMG Managers Short Duration Government Fund | | | | | | | | | | | | | | | | |
Investments in Securities | | | | | | | | | | | | | | | | |
Asset-Backed Securities | | | — | | | $ | 36,065,196 | | | | — | | | $ | 36,065,196 | |
Mortgage-Backed Securities | | | — | | | | 8,797,130 | | | | — | | | | 8,797,130 | |
U.S. Government and Agency Obligations†† | | | — | | | | 315,327,654 | | | | — | | | | 315,327,654 | |
Short-Term Investments | | | | | | | | | | | | | | | | |
U.S. Government and Agency Discount Notes | | | — | | | | 45,053,006 | | | | — | | | | 45,053,006 | |
U.S. Treasury Bills | | | — | | | | 1,027,710 | | | | — | | | | 1,027,710 | |
Other Investment Companies | | $ | 9,190,210 | | | | — | | | | — | | | | 9,190,210 | |
| | | | | | | | | | | | | | | | |
Total Investments in Securities | | $ | 9,190,210 | | | $ | 406,270,696 | | | | — | | | $ | 415,460,906 | |
| | | | | | | | | | | | | | | | |
Financial Derivative Instruments-Assets††† | | | | | | | | | | | | | | | | |
Interest Rate Contracts | | $ | 73,551 | | | | — | | | | — | | | $ | 73,551 | |
| | | | | | | | | | | | | | | | |
Financial Derivative Instruments-Liabilities††† | | | | | | | | | | | | | | | | |
Interest Rate Contracts | | | (53,854 | ) | | | — | | | | — | | | | (53,854 | ) |
| | | | | | | | | | | | | | | | |
Total Financial Derivative Instruments | | $ | 19,697 | | | | — | | | | — | | | $ | 19,697 | |
| | | | | | | | | | | | | | | | |
| † | All common stocks held in the Funds are Level 1 securities. For a detailed breakout of the common stocks, please refer to the respective Schedule of Portfolio Investments. |
| †† | All corporate bonds and notes and U.S. government and agency obligations held in the Funds are Level 2 securities. For a detailed breakout of the corporate bonds and notes and U.S. government and agency obligations; by major industry or agency classification, please refer to the respective Schedule of Portfolio Investments. |
| ††† | Derivative instruments, such as futures contracts, are not reflected in the Schedule of Portfolio Investments and are valued at the unrealized appreciation/depreciation of the instrument. |
As of December 31, 2015, the Funds had no significant transfers between Levels 1 and 2 from the beginning of the reporting period.
The following schedule shows the value of derivative instruments at December 31, 2015:
| | | | | | | | | | | | | | |
| | | | | Asset Derivatives | | | Liability Derivatives | |
| | | Derivatives not accounted | | Statement of Assets and | | | | | Statement of Assets and | | | |
| Fund | | for as hedging instruments | | Liabilities Location | | Fair Value | | | Liabilities Location | | Fair Value | |
AMG Managers Intermediate Duration Government Fund | | | | | | | | | | |
| | Interest rate contracts | | Receivable for variation margin1 | | $ | 3,484 | | | Payable for variation margin1 | | $ | 15,516 | |
| | | | | | | | | | | | | | |
| | | |
| | | | | Asset Derivatives | | | Liability Derivatives | |
| | | Derivatives not accounted | | Statement of Assets and | | | | | Statement of Assets and | | | |
| Fund | | for as hedging instruments | | Liabilities Location | | Fair Value | | | Liabilities Location | | Fair Value | |
AMG Managers Short Duration Government Fund | | | | | | | | | | |
| | Interest rate contracts | | Receivable for variation margin1 | | | — | | | Payable for variation margin1 | | $ | 117,516 | |
| | | | | | | | | | | | | | |
| 1 | Only current day’s variation margin is reported within the Statement of Assets and Liabilities. The variation margin is included in the open futures cumulative appreciation/ (depreciation) for AMG Managers Intermediate Duration Government Fund and AMG Managers Short Duration Government Fund of $(14,020) and $19,697, respectively, as reported in the Notes to Schedule of Portfolio Investments. |
The accompanying notes are an integral part of these financial statements.
64
Notes to Schedules of Portfolio Investments (continued)
For the year ended December 31, 2015, the effect of derivative instruments on the Statement of Operations for the Funds and the amount of realized gain/(loss) and change in unrealized gain (loss) on derivatives recognized in income were as follows:
| | | | | | | | | | | | | | |
| | | | | Realized Gain (Loss) | | | Change in Unrealized Gain (Loss) | |
| | | Derivatives not accounted | | Statement of Operations | | Realized | | | Statement of Operations | | Change in Unrealized | |
| Fund | | for as hedging instruments | | Location | | Gain/(Loss) | | | Location | | Gain/(Loss) | |
AMG Managers Intermediate Duration Government Fund | | | | | | | | | | |
| | Interest rate contracts | | Net realized loss on futures contracts | | $ | (205,712 | ) | | Net change in unrealized appreciation- (depreciation) of futures contracts | | $ | 15,439 | |
| | | | | | | | | | | | | | |
| | | |
| | | | | Realized Gain (Loss) | | | Change in Unrealized Gain (Loss) | |
| | | Derivatives not accounted | | Statement of Operations | | Realized | | | Statement of Operations | | Change in Unrealized | |
| Fund | | for as hedging instruments | | Location | | Gain/(Loss) | | | Location | | Gain/(Loss) | |
AMG Managers Short Duration Government Fund | | | | | | | | | | |
| | Interest rate contracts futures contracts | | Net realized loss on | | $ | (1,360,083 | ) | | Net change in unrealized appreciation- (depreciation) of futures contracts | | $ | 375,560 | |
| | | | | | | | | | | | | | |
At December 31, 2015, the following Fund had TBA forward sale commitments:
(See Note 1(i) in the Notes to Financial Statements.)
AMG Managers Intermediate Duration Government Fund
| | | | | | | | | | | | | | | | |
| | | Principal | | | Settlement | | | Current | | | | |
| Security | | Amount | | | Date | | | Liability | | | Proceeds | |
FNMA, 3.500%, TBA 30 years | | $ | 6,900,000 | | | | 01/13/16 | | | $ | 7,118,890 | | | $ | (7,118,859 | ) |
FNMA, 4.500%, TBA 30 years | | | 1,050,000 | | | | 01/13/16 | | | | 1,133,869 | | | | (1,132,195 | ) |
GNMA, 3.500%, TBA 30 years | | | 16,180,000 | | | | 01/21/16 | | | | 16,867,019 | | | | (16,794,456 | ) |
GNMA, 4.000%, TBA 30 years | | | 1,600,000 | | | | 01/21/16 | | | | 1,697,249 | | | | (1,689,750 | ) |
GNMA, 4.000%, TBA 30 years | | | 3,700,000 | | | | 01/21/16 | | | | 3,929,226 | | | | (3,921,938 | ) |
| | | | | | | | | | | | | | | | |
| | | | | | | Totals | | | $ | 30,746,253 | | | $ | (30,657,198 | ) |
| | | | | | | | | | | | | | | | |
At December 31, 2015, the following Funds had open futures contracts:
(See Note 8 in the Notes to Financial Statements.)
AMG Managers Intermediate Duration Government Fund
| | | | | | | | | | | | | | | | |
| Type | | Number of Contracts | | | Position | | | Expiration Date | | | Unrealized Gain/(Loss) | |
2-Year U.S. Treasury Note | | | 3 | | | | Short | | | | 04/05/16 | | | $ | 883 | |
5-Year Interest Rate Swap | | | 23 | | | | Short | | | | 03/16/16 | | | | 1,286 | |
5-Year U.S. Treasury Note | | | 2 | | | | Short | | | | 04/05/16 | | | | 526 | |
10-Year Interest Rate Swap | | | 34 | | | | Short | | | | 03/16/16 | | | | (16,554 | ) |
10-Year U.S. Treasury Note | | | 5 | | | | Long | | | | 03/31/16 | | | | (1,848 | ) |
Ultra U.S. Treasury Bond | | | 2 | | | | Long | | | | 03/31/16 | | | | 1,687 | |
| | | | | | | | | | | | | | | | |
| | | | | | | | | | | Total | | | $ | (14,020 | ) |
| | | | | | | | | | | | | | | | |
The accompanying notes are an integral part of these financial statements.
65
Notes to Schedules of Portfolio Investments (continued)
AMG Managers Short Duration Government Fund
| | | | | | | | | | | | | | | | |
| Type | | Number of Contracts | | | Position | | | Expiration Date | | | Unrealized Gain/(Loss) | |
2-Year U.S. Treasury Note | | | 119 | | | | Short | | | | 04/05/16 | | | $ | 35,031 | |
5-Year Interest Rate Swap | | | 424 | | | | Short | | | | 03/16/16 | | | | 26,161 | |
5-Year U.S. Treasury Note | | | 9 | | | | Short | | | | 04/05/16 | | | | 2,368 | |
10-Year Interest Rate Swap | | | 65 | | | | Short | | | | 03/16/16 | | | | (31,647 | ) |
10-Year U.S. Treasury Note | | | 28 | | | | Short | | | | 03/31/16 | | | | 9,991 | |
Ultra U.S. Treasury Bond | | | 26 | | | | Short | | | | 03/31/16 | | | | (22,207 | ) |
| | | | | | | | | | | | | | | | |
| | | | | | | | | | | Total | | | $ | 19,697 | |
| | | | | | | | | | | | | | | | |
| | |
| INVESTMENTS DEFINITIONS AND ABBREVIATIONS: |
| |
| FHLMC: | | Federal Home Loan Mortgage Corporation |
| FNMA: | | Federal National Mortgage Association |
| GNMA: | | Government National Mortgage Association |
| GSMPS: | | Goldman Sachs Mortgage Participation Securities |
| GSR: | | Goldman Sachs REMIC |
| IO: | | Interest Only |
| | |
| LB-UBS: | | Lehman Brothers-Union Bank of Switzerland |
| MTN: | | Medium-Term Notes |
| PIK: | | Payment-in-Kind |
| PLC: | | Public Limited Company |
| REIT: | | Real Estate Investment Trust |
| REMICS: | | Real Estate Mortgage Investment Conduits |
| TBA: | | To Be Announced |
The accompanying notes are an integral part of these financial statements.
66
Statement of Assets and Liabilities
December 31, 2015
| | | | | | | | | | | | |
| | | | | | AMG | | | | |
| | | AMG | | | Chicago Equity | | | | |
| | | Chicago Equity | | | Partners | | | AMG Managers | |
| | | Partners | | | Small Cap Value | | | High Yield | |
| | | Balanced Fund | | | Fund | | | Fund | |
Assets: | | | | | | | | | | | | |
Investments at value* (including securities on loan valued at $2,123,769, $419,919 and $1,580,119, respectively) | | $ | 160,641,639 | | | $ | 13,236,096 | | | $ | 30,720,896 | |
Receivable for Fund shares sold | | | 1,774,818 | | | | 2,063 | | | | 18,906 | |
Receivable for investments sold | | | 833,028 | | | | 21,170 | | | | — | |
Dividends, interest and other receivables | | | 304,924 | | | | 21,601 | | | | 549,810 | |
Receivable from affiliate | | | 48,176 | | | | 11,147 | | | | 16,415 | |
Prepaid expenses | | | 21,253 | | | | 24,084 | | | | 16,266 | |
Total assets | | | 163,623,838 | | | | 13,316,161 | | | | 31,322,293 | |
Liabilities: | | | | | | | | | | | | |
Payable for investments purchased | | | 2,382,667 | | | | 66,081 | | | | — | |
Payable upon return of securities loaned | | | 2,205,649 | | | | 438,158 | | | | 1,652,196 | |
Payable for Fund shares repurchased | | | 1,842,933 | | | | 12,521 | | | | 108,913 | |
Payable to affiliate | | | — | | | | 47,346 | | | | — | |
Accrued expenses: | | | | | | | | | | | | |
Investment advisory and management fees | | | 90,711 | | | | 6,861 | | | | 17,792 | |
Administrative fees | | | 25,918 | | | | 2,766 | | | | 5,084 | |
Distribution fees—Investor Class | | | 19,377 | | | | 3 | | | | 5,834 | |
Shareholder servicing fees—Investor Class | | | — | | | | 2 | | | | — | |
Shareholder servicing fees—Service Class | | | 5,058 | | | | 839 | | | | — | |
Trustees fees and expenses | | | 82 | | | | 6 | | | | 29 | |
Other | | | 68,420 | | | | 31,394 | | | | 88,009 | |
Total liabilities | | | 6,640,815 | | | | 605,977 | | | | 1,877,857 | |
Net Assets | | $ | 156,983,023 | | | $ | 12,710,184 | | | $ | 29,444,436 | |
Net Assets Represent: | | | | | | | | | | | | |
Paid-in capital | | $ | 155,449,478 | | | $ | 13,906,227 | | | $ | 35,247,267 | |
(Distributions in excess of) undistributed net investment income | | | (11,114 | ) | | | — | | | | 24,681 | |
Accumulated net realized loss from investments | | | (974,948 | ) | | | (1,002,710 | ) | | | (2,163,805 | ) |
Net unrealized appreciation (depreciation) of investments | | | 2,519,607 | | | | (193,333 | ) | | | (3,663,707 | ) |
Net Assets | | $ | 156,983,023 | | | $ | 12,710,184 | | | $ | 29,444,436 | |
* Investments at cost | | $ | 158,122,032 | | | $ | 13,429,429 | | | $ | 34,384,603 | |
The accompanying notes are an integral part of these financial statements.
67
Statement of Assets and Liabilitiess (continued)
| | | | | | | | | | | | |
| | | | | | AMG | | | | |
| | | AMG | | | Chicago Equity | | | AMG | |
| | | Chicago Equity | | | Partners | | | Managers | |
| | | Partners | | | Small Cap Value | | | High Yield | |
| | | Balanced Fund | | | Fund | | | Fund | |
Investor Class Shares: | | | | | | | | | | | | |
Net Assets | | $ | 94,476,153 | | | $ | 16,254 | | | $ | 27,020,168 | |
Shares outstanding | | | 6,333,138 | | | | 1,731 | | | | 3,824,295 | |
Net asset value, offering and redemption price per share | | $ | 14.92 | | | $ | 9.39 | | | $ | 7.07 | |
Service Class Shares: | | | | | | | | | | | | |
Net Assets | | $ | 60,797,788 | | | $ | 11,084,657 | | | | n/a | |
Shares outstanding | | | 4,039,287 | | | | 1,185,670 | | | | n/a | |
Net asset value, offering and redemption price per share | | $ | 15.05 | | | $ | 9.35 | | | | n/a | |
Institutional Class Shares: | | | | | | | | | | | | |
Net Assets | | $ | 1,709,082 | | | $ | 1,609,273 | | | $ | 2,424,268 | |
Shares outstanding | | | 113,576 | | | | 172,077 | | | | 339,517 | |
Net asset value, offering and redemption price per share | | $ | 15.05 | | | $ | 9.35 | | | $ | 7.14 | |
The accompanying notes are an integral part of these financial statements.
68
Statement of Assets and Liabilities (continued)
| | | | | | | | |
| | | AMG Managers | | | | |
| | | Intermediate | | | AMG Managers | |
| | | Duration | | | Short Duration | |
| | | Government Fund | | | Government Fund | |
Assets: | | | | | | | | |
Investments at value* | | $ | 292,857,241 | | | $ | 415,460,906 | |
Receivable for delayed delivery investments sold | | | 84,070,114 | | | | — | |
Receivable for paydowns | | | 35,688 | | | | 221,731 | |
Dividends, interest and other receivables | | | 635,151 | | | | 1,129,885 | |
Receivable for Fund shares sold | | | 394,349 | | | | 5,549,567 | |
Cash collateral | | | — | | | | 252,000 | |
Receivable from affiliate | | | 19,471 | | | | — | |
Receivable for variation margin | | | 3,484 | | | | — | |
Prepaid expenses | | | 9,651 | | | | 10,883 | |
Total assets | | | 378,025,149 | | | | 422,624,972 | |
Liabilities: | | | | | | | | |
Payable for delayed delivery investments purchased | | | 154,475,535 | | | | 20,457,884 | |
TBA sale commitments at value (proceeds receivable of $30,657,198 and $0,respectively) | | | 30,746,253 | | | | — | |
Payable for Fund shares repurchased | | | 464,005 | | | | 6,384,176 | |
Payable for variation margin | | | 15,516 | | | | 117,516 | |
Payable for investments purchased | | | 4,467 | | | | — | |
Accrued expenses: | | | | | | | | |
Investment advisory and management fees | | | 114,802 | | | | 235,151 | |
Shareholder servicing fees | | | 16,400 | | | | 340 | |
Trustees fees and expenses | | | 136 | | | | 409 | |
Other | | | 148,559 | | | | 123,241 | |
Total liabilities | | | 185,985,673 | | | | 27,318,717 | |
Net Assets | | $ | 192,039,476 | | | $ | 395,306,255 | |
Net Assets Represent: | | | | | | | | |
Paid-in capital | | $ | 192,887,451 | | | $ | 399,176,782 | |
Undistributed net investment income | | | 165,617 | | | | 324,504 | |
Accumulated net realized loss from investments and futures contracts | | | (2,540,465 | ) | | | (9,186,206 | ) |
Net unrealized appreciation of investments and futures contracts | | | 1,526,873 | | | | 4,991,175 | |
Net Assets | | $ | 192,039,476 | | | $ | 395,306,255 | |
Shares outstanding | | | 17,771,959 | | | | 41,087,189 | |
Net asset value, offering and redemption price per share | | $ | 10.81 | | | $ | 9.62 | |
* Investments at cost | | $ | 291,227,293 | | | $ | 410,489,428 | |
The accompanying notes are an integral part of these financial statements.
69
Statement of Operations
For the year ended December 31, 2015
| | | | | | | | | | | | | | | | | | | | |
| | | | | | AMG | | | | | | | | | | |
| | | AMG | | | Chicago Equity | | | AMG | | | AMG Managers | | | | |
| | | Chicago Equity | | | Partners | | | Managers | | | Intermediate | | | AMG Managers | |
| | | Partners | | | Small Cap Value | | | High Yield | | | Duration | | | Short Duration | |
| | | Balanced Fund | | | Fund* | | | Fund | | | Government Fund | | | Government Fund | |
Investment Income: | | | | | | | | | | | | | | | | | | | | |
Dividend income | | $ | 1,032,191 | 1 | | $ | 195,761 | 2 | | $ | 588 | | | $ | 53,923 | | | $ | 15,140 | |
Interest income | | | 617,327 | | | | — | | | | 2,265,980 | | | | 3,496,435 | | | | 3,916,506 | |
Securities lending income | | | 15,990 | | | | 5,192 | | | | 17,360 | | | | — | | | | — | |
Foreign withholding tax | | | (9 | ) | | | (22 | ) | | | — | | | | — | | | | — | |
Total investment income | | | 1,665,499 | | | | 200,931 | | | | 2,283,928 | | | | 3,550,358 | | | | 3,931,646 | |
Expenses: | | | | | | | | | | | | | | | | | | | | |
Investment advisory and management fees | | | 678,609 | | | | 63,364 | | | | 243,906 | | | | 1,325,791 | | | | 2,662,834 | |
Administrative fees | | | 193,888 | | | | 25,551 | | | | 69,687 | | | | — | | | | — | |
Distribution fees—Investor Class | | | 154,319 | | | | 544 | | | | 79,604 | | | | — | | | | — | |
Shareholder servicing fees—Investor Class | | | — | | | | 326 | | | | — | | | | — | | | | — | |
Shareholder servicing fees—Service Class | | | 28,730 | | | | 9,055 | | | | — | | | | — | | | | — | |
Shareholder servicing fees | | | — | | | | — | | | | — | | | | 189,399 | | | | 3,676 | |
Custodian fees | | | 61,154 | | | | 9,445 | | | | 66,593 | | | | 71,236 | | | | 103,330 | |
Registration fees | | | 56,446 | | | | 54,420 | | | | 31,072 | | | | 23,058 | | | | 26,907 | |
Professional fees | | | 44,275 | | | | 25,157 | | | | 57,726 | | | | 63,276 | | | | 76,736 | |
Reports to shareholders | | | 16,098 | | | | 12,125 | | | | 13,449 | | | | 37,836 | | | | 71,749 | |
Transfer agent fees | | | 12,511 | | | | 4,890 | | | | 13,361 | | | | 19,023 | | | | 18,203 | |
Trustees fees and expenses | | | 5,126 | | | | 406 | | | | 2,141 | | | | 11,126 | | | | 22,182 | |
Miscellaneous | | | 2,794 | | | | 1,828 | | | | 1,344 | | | | 3,704 | | | | 4,293 | |
Total expenses before offsets/reductions | | | 1,253,950 | | | | 207,111 | | | | 578,883 | | | | 1,744,449 | | | | 2,989,910 | |
Expense reimbursements | | | (256,154 | ) | | | (100,095 | ) | | | (185,686 | ) | | | (58,801 | ) | | | — | |
Expense reductions | | | (13,795 | ) | | | (3,877 | ) | | | — | | | | — | | | | — | |
Fee waivers | | | — | | | | — | | | | — | | | | (13,520 | ) | | | — | |
Net expenses | | | 984,001 | | | | 103,139 | | | | 393,197 | | | | 1,672,128 | | | | 2,989,910 | |
Net investment income | | | 681,498 | | | | 97,792 | | | | 1,890,731 | | | | 1,878,230 | | | | 941,736 | |
Net Realized and Unrealized Gain (Loss): | | | | | | | | | | | | | | | | | | | | |
Net realized gain (loss) on investments | | | 2,473,703 | | | | (999,755 | ) | | | (45,820 | ) | | | 1,843,016 | | | | 497,541 | |
Net realized loss on futures contracts | | | — | | | | — | | | | — | | | | (205,712 | ) | | | (1,360,083 | ) |
Net change in unrealized appreciation (depreciation) of investments | | | (1,434,299 | ) | | | (193,333 | ) | | | (3,262,411 | ) | | | (1,618,789 | ) | | | (992,062 | ) |
Net change in unrealized appreciation (depreciation) of futures contracts | | | — | | | | — | | | | — | | | | 15,439 | | | | 375,560 | |
Net realized and unrealized gain (loss) | | | 1,039,404 | | | | (1,193,088 | ) | | | (3,308,231 | ) | | | 33,954 | | | | (1,479,044 | ) |
Net increase (decrease) in net assets resulting from operations | | $ | 1,720,902 | | | $ | (1,095,296 | ) | | $ | (1,417,500 | ) | | $ | 1,912,184 | | | $ | (537,308 | ) |
| * | Commencement of operations was on January 2, 2015. |
| 1 | Includes non-recurring dividends of $ 64,131. |
| 2 | Includes non-recurring dividends of $ 11,502. |
The accompanying notes are an integral part of these financial statements.
70
Statements of Changes in Net Assets
For the years ended December 31,
| | | | | | | | | | | | | | | | | | | | |
| | | | | | | | | AMG Chicago | | | | | | | |
| | | | | | | | | Equity | | | AMG Managers High | |
| | | AMG Chicago Equity | | | Small Cap Value | | | Yield | |
| | | Partners Balanced Fund | | | Fund* | | | Fund | |
| | | 2015 | | | 2014 | | | 2015 | | | 2015 | | | 2014 | |
Increase (Decrease) in Net Assets Resulting From Operations: | | | | | | | | | | | | | | | | | | | | |
Net investment income | | $ | 681,498 | | | $ | 445,430 | | | $ | 97,792 | | | $ | 1,890,731 | | | $ | 1,942,264 | |
Net realized gain (loss) on investments | | | 2,473,703 | | | | 5,348,407 | | | | (999,755 | ) | | | (45,820 | ) | | | 463,758 | |
Net change in unrealized appreciation (depreciation) of investments | | | (1,434,299 | ) | | | (680,658 | ) | | | (193,333 | ) | | | (3,262,411 | ) | | | (1,737,634 | ) |
Net increase (decrease) in net assets resulting from operations | | | 1,720,902 | | | | 5,113,179 | | | | (1,095,296 | ) | | | (1,417,500 | ) | | | 668,388 | |
Distributions to Shareholders: | | | | | | | | | | | | | | | | | | | | |
From net investment income: | | | | | | | | | | | | | | | | | | | | |
Investor Class | | | (520,943 | ) | | | (255,532 | ) | | | — | | | | (1,716,173 | ) | | | (1,776,356 | ) |
Service Class | | | (326,230 | ) | | | (67,831 | ) | | | (87,485 | ) | | | — | | | | — | |
Institutional Class | | | (45,707 | ) | | | (108,580 | ) | | | (14,054 | ) | | | (169,087 | ) | | | (166,982 | ) |
From net realized gain on investments: | | | | | | | | | | | | | | | | | | | | |
Investor Class | | | (2,381,784 | ) | | | (3,590,785 | ) | | | — | | | | — | | | | — | |
Service Class | | | (1,556,354 | ) | | | (810,554 | ) | | | — | | | | — | | | | — | |
Institutional Class | | | (43,342 | ) | | | (1,055,585 | ) | | | — | | | | — | | | | — | |
Total distributions to shareholders | | | (4,874,360 | ) | | | (5,888,867 | ) | | | (101,539 | ) | | | (1,885,260 | ) | | | (1,943,338 | ) |
Capital Share Transactions:1 | | | | | | | | | | | | | | | | | | | | |
Net increase (decrease) from capital share transactions | | | 91,503,363 | | | | 23,554,155 | | | | 13,907,019 | | | | (5,092,769 | ) | | | 4,598,297 | |
Total increase (decrease) in net assets | | | 88,349,905 | | | | 22,778,467 | | | | 12,710,184 | | | | (8,395,529 | ) | | | 3,323,347 | |
Net Assets: | | | | | | | | | | | | | | | | | | | | |
Beginning of year | | | 68,633,118 | | | | 45,854,651 | | | | — | | | | 37,839,965 | | | | 34,516,618 | |
End of year | | $ | 156,983,023 | | | $ | 68,633,118 | | | $ | 12,710,184 | | | $ | 29,444,436 | | | $ | 37,839,965 | |
End of year (distributions in excess of) undistributed net investment income | | $ | (11,114 | ) | | $ | 7,856 | | | | — | | | $ | 24,681 | | | $ | 7,556 | |
| | | | | | | | | | | | | | | | | | | | |
| * | Commencement of operations was on January 2, 2015. |
| 1 | See Note 1(g) of the Notes to Financial Statements. |
The accompanying notes are an integral part of these financial statements.
71
Statement of Changes in Net Assets (continued)
For the years ended December 31,
| | | | | | | | | | | | | | | | |
| | | AMG Managers Intermediate Duration | | | AMG Managers Short Duration | |
| | | Government Fund | | | Government Fund | |
| | | 2015 | | | 2014 | | | 2015 | | | 2014 | |
Increase (Decrease) in Net Assets Resulting From Operations: | | | | | | | | | | | | | | | | |
Net investment income | | $ | 1,878,230 | | | $ | 2,189,952 | | | $ | 941,736 | | | $ | 1,950,075 | |
Net realized gain (loss) on investments and futures contracts | | | 1,637,304 | | | | 4,637,953 | | | | (862,542 | ) | | | (35,126 | ) |
Net change in unrealized appreciation (depreciation) of investments and futures contracts | | | (1,603,350 | ) | | | 2,287,316 | | | | (616,502 | ) | | | 418,867 | |
Net increase (decrease) in net assets resulting from operations | | | 1,912,184 | | | | 9,115,221 | | | | (537,308 | ) | | | 2,333,816 | |
Distributions to Shareholders: | | | | | | | | | | | | | | | | |
From net investment income | | | (1,715,923 | ) | | | (2,186,725 | ) | | | (613,266 | ) | | | (2,078,120 | ) |
From net realized gain on investments | | | (2,980,423 | ) | | | (3,467,539 | ) | | | — | | | | — | |
Total distributions to shareholders | | | (4,696,346 | ) | | | (5,654,264 | ) | | | (613,266 | ) | | | (2,078,120 | ) |
Capital Share Transactions: | | | | | | | | | | | | | | | | |
Proceeds from sale of shares | | | 80,828,756 | | | | 63,567,920 | | | | 247,057,885 | | | | 160,549,746 | |
Reinvestment of dividends and distributions | | | 4,309,750 | | | | 5,096,002 | | | | 544,398 | | | | 1,907,063 | |
Cost of shares repurchased | | | (64,452,490 | ) | | | (34,902,523 | ) | | | (236,391,813 | ) | | | (199,954,281 | ) |
Net increase (decrease) from capital share transactions | | | 20,686,016 | | | | 33,761,399 | | | | 11,210,470 | | | | (37,497,472 | ) |
Total increase (decrease) in net assets | | | 17,901,854 | | | | 37,222,356 | | | | 10,059,896 | | | | (37,241,776 | ) |
Net Assets: | | | | | | | | | | | | | | | | |
Beginning of year | | | 174,137,622 | | | | 136,915,266 | | | | 385,246,359 | | | | 422,488,135 | |
End of year | | $ | 192,039,476 | | | $ | 174,137,622 | | | $ | 395,306,255 | | | $ | 385,246,359 | |
End of year undistributed net investment income | | $ | 165,617 | | | $ | 3,101 | | | $ | 324,504 | | | | — | |
| | | | | | | | | | | | | | | | |
Share Transactions: | | | | | | | | | | | | | | | | |
Sale of shares | | | 7,332,604 | | | | 5,754,077 | | | | 25,577,569 | | | | 16,610,106 | |
Reinvested shares from dividends and distributions | | | 396,581 | | | | 465,823 | | | | 56,336 | | | | 197,427 | |
Shares repurchased | | | (5,851,649 | ) | | | (3,191,247 | ) | | | (24,480,608 | ) | | | (20,694,738 | ) |
Net increase (decrease) in shares | | | 1,877,536 | | | | 3,028,653 | | | | 1,153,297 | | | | (3,887,205 | ) |
The accompanying notes are an integral part of these financial statements.
72
AMG Chicago Equity Partners Balanced Fund
Financial Highlights
For a share outstanding throughout each period
| | | | | | | | | | | | | | | | | | | | |
| | | For the years ended December 31, | |
| Investor Class | | 2015 | | | 2014 | | | 2013 | | | 2012 | | | 2011 | |
Net Asset Value, Beginning of Year | | $ | 15.09 | | | $ | 15.13 | | | $ | 14.19 | | | $ | 13.70 | | | $ | 13.49 | |
Income from Investment Operations: | | | | | | | | | | | | | | | | | | | | |
Net investment income1,2 | | | 0.10 | 17 | | | 0.11 | | | | 0.10 | 4 | | | 0.18 | | | | 0.18 | |
Net realized and unrealized gain on investments | | | 0.23 | | | | 1.37 | | | | 2.33 | | | | 1.16 | | | | 0.69 | |
Total income from investment operations | | | 0.33 | | | | 1.48 | | | | 2.43 | | | | 1.34 | | | | 0.87 | |
Less Distributions to Shareholders from: | | | | | | | | | | | | | | | | | | | | |
Net investment income | | | (0.11 | ) | | | (0.11 | ) | | | (0.09 | ) | | | (0.17 | ) | | | (0.18 | ) |
Net realized gain on investments | | | (0.39 | ) | | | (1.41 | ) | | | (1.40 | ) | | | (0.68 | ) | | | (0.48 | ) |
Total distributions to shareholders | | | (0.50 | ) | | | (1.52 | ) | | | (1.49 | ) | | | (0.85 | ) | | | (0.66 | ) |
Net Asset Value, End of Year | | $ | 14.92 | | | $ | 15.09 | | | $ | 15.13 | | | $ | 14.19 | | | $ | 13.70 | |
Total Return1 | | | 2.19 | % | | | 9.69 | % | | | 17.14 | % | | | 9.86 | % | | | 6.45 | % |
Ratio of net expenses to average net assets (with offsets/reductions) | | | 1.08 | % | | | 1.07 | % | | | 1.10 | %5 | | | 1.17 | %6,7 | | | 1.24 | % |
Ratio of expenses to average net assets (with offsets) | | | 1.09 | % | | | 1.09 | % | | | 1.11 | %5 | | | 1.18 | %6 | | | 1.25 | % |
Ratio of total expenses to average net assets (without offsets/reductions)3 | | | 1.36 | % | | | 1.40 | % | | | 1.55 | %5 | | | 1.52 | %6 | | | 1.70 | % |
Ratio of net investment income to average net assets1 | | | 0.64 | % | | | 0.70 | % | | | 0.62 | %5 | | | 1.21 | %6 | | | 1.27 | % |
Portfolio turnover | | | 105 | % | | | 92 | % | | | 90 | % | | | 110 | % | | | 94 | % |
Net assets at end of year (000’s omitted) | | $ | 94,476 | | | $ | 41,751 | | | $ | 33,151 | | | $ | 26,047 | | | $ | 17,519 | |
| | | | | | | | | | | | | | | | | | | | |
| | | | | | | | | | | | | | | | |
| | | | | | | | | | | | For the period ended | |
| | | For the years ended | | | December 1, 2012 | |
| | | December 31, | | | through | |
| Service Class | | 2015 | | | 2014 | | | 2013 | | | December 31, 2012* | |
Net Asset Value, Beginning of Period | | $ | 15.23 | | | $ | 15.26 | | | $ | 14.30 | | | $ | 15.11 | |
Income from Investment Operations: | | | | | | | | | | | | | | | | |
Net investment income1,2 | | | 0.12 | 17 | | | 0.15 | | | | 0.13 | 4 | | | 0.02 | |
Net realized and unrealized gain (loss) on investments | | | 0.23 | | | | 1.37 | | | | 2.36 | | | | (0.08 | ) |
Total income (loss) from investment operations | | | 0.35 | | | | 1.52 | | | | 2.49 | | | | (0.06 | ) |
Less Distributions to Shareholders from: | | | | | | | | | | | | | | | | |
Net investment income | | | (0.14 | ) | | | (0.13 | ) | | | (0.12 | ) | | | (0.06 | ) |
Net realized gain on investments | | | (0.39 | ) | | | (1.42 | ) | | | (1.41 | ) | | | (0.69 | ) |
Total distributions to shareholders | | | (0.53 | ) | | | (1.55 | ) | | | (1.53 | ) | | | (0.75 | ) |
Net Asset Value, End of Period | | $ | 15.05 | | | $ | 15.23 | | | $ | 15.26 | | | $ | 14.30 | |
Total Return1 | | | 2.29 | % | | | 9.93 | % | | | 17.45 | %8 | | | (0.36 | )%8,15 |
Ratio of net expenses to average net assets (with offsets/reductions) | | | 0.93 | % | | | 0.86 | % | | | 0.92 | %5 | | | 0.82 | %6,16 |
Ratio of expenses to average net assets (with offsets) | | | 0.94 | % | | | 0.88 | % | | | 0.93 | %5 | | | 0.83 | %6,16 |
Ratio of total expenses to average net assets (without offsets/reductions)3 | | | 1.21 | % | | | 1.20 | % | | | 1.39 | %5 | | | 1.62 | %6,16 |
Ratio of net investment income to average net assets1 | | | 0.80 | % | | | 0.91 | % | | | 0.83 | %5 | | | 1.90 | %6,16 |
Portfolio turnover | | | 105 | % | | | 92 | % | | | 90 | % | | | 110 | %15 |
Net assets at end of period (000’s omitted) | | $ | 60,798 | | | $ | 14,481 | | | $ | 1,581 | | | $ | 9 | |
| | | | | | | | | | | | | | | | |
73
AMG Chicago Equity Partners Balanced Fund
Financial Highlights
For a share outstanding throughout each year
| | | | | | | | | | | | | | | | | | | | |
| | | For the years ended December 31, | |
| Institutional Class | | 2015 | | | 2014 | | | 2013 | | | 2012 | | | 2011 | |
Net Asset Value, Beginning of Year | | $ | 15.22 | | | $ | 15.26 | | | $ | 14.31 | | | $ | 13.82 | | | $ | 13.60 | |
Income from Investment Operations: | | | | | | | | | | | | | | | | | | | | |
Net investment income1,2 | | | 0.14 | 17 | | | 0.15 | | | | 0.14 | 4 | | | 0.21 | | | | 0.21 | |
Net realized and unrealized gain on investments | | | 0.23 | | | | 1.38 | | | | 2.35 | | | | 1.18 | | | | 0.71 | |
Total income from investment operations | | | 0.37 | | | | 1.53 | | | | 2.49 | | | | 1.39 | | | | 0.92 | |
Less Distributions to Shareholders from: | | | | | | | | | | | | | | | | | | | | |
Net investment income | | | (0.15 | ) | | | (0.15 | ) | | | (0.13 | ) | | | (0.21 | ) | | | (0.22 | ) |
Net realized gain on investments | | | (0.39 | ) | | | (1.42 | ) | | | (1.41 | ) | | | (0.69 | ) | | | (0.48 | ) |
Total distributions to shareholders | | | (0.54 | ) | | | (1.57 | ) | | | (1.54 | ) | | | (0.90 | ) | | | (0.70 | ) |
Net Asset Value, End of Year | | $ | 15.05 | | | $ | 15.22 | | | $ | 15.26 | | | $ | 14.31 | | | $ | 13.82 | |
Total Return1 | | | 2.44 | % | | | 9.97 | % | | | 17.45 | % | | | 10.09 | % | | | 6.77 | % |
Ratio of net expenses to average net assets (with offsets/reductions) | | | 0.83 | % | | | 0.82 | % | | | 0.85 | %5 | | | 0.92 | %6,7 | | | 0.99 | % |
Ratio of expenses to average net assets (with offsets) | | | 0.84 | % | | | 0.84 | % | | | 0.86 | %5 | | | 0.93 | %6 | | | 1.00 | % |
Ratio of total expenses to average net assets (without offsets/reductions)3 | | | 1.09 | % | | | 1.15 | % | | | 1.30 | %5 | | | 1.27 | %6 | | | 1.45 | % |
Ratio of net investment income to average net assets1 | | | 0.89 | % | | | 0.95 | % | | | 0.88 | %5 | | | 1.46 | %6 | | | 1.52 | % |
Portfolio turnover | | | 105 | % | | | 92 | % | | | 90 | % | | | 110 | % | | | 94 | % |
Net assets at end of year (000’s omitted) | | $ | 1,709 | | | $ | 12,401 | | | $ | 11,122 | | | $ | 9,601 | | | $ | 8,885 | |
| | | | | | | | | | | | | | | | | | | | |
74
AMG Chicago Equity Partners Small Cap Value Fund
Financial Highlights
For a share outstanding throughout each period
| | | | |
| | | For the period ended | |
| Investor Class | | December 31, 2015** | |
Net Asset Value, Beginning of Period | | $ | 10.00 | |
Income from Investment Operations: | | | | |
Net investment loss1,2 | | | (0.08 | )17 |
Net realized and unrealized loss on investments | | | (0.53 | ) |
Total loss from investment operations | | | (0.61 | ) |
Net Asset Value, End of Period | | $ | 9.39 | |
Total Return1 | | | (6.10 | )%15 |
Ratio of net expenses to average net assets (with offsets/reductions) | | | 1.32 | %16 |
Ratio of expenses to average net assets (with offsets) | | | 1.35 | %16 |
Ratio of total expenses to average net assets (without offsets/reductions)3 | | | 2.34 | %16 |
Ratio of net investment loss to average net assets1 | | | (0.77 | )%16 |
Portfolio turnover | | | 138 | %15 |
Net assets at end of period (000’s omitted) | | $ | 16 | |
| | | | |
| |
| | | For the period ended | |
| Service Class | | December 31, 2015** | |
Net Asset Value, Beginning of Period | | $ | 10.00 | |
Income from Investment Operations: | | | | |
Net investment income1,2 | | | 0.10 | 17 |
Net realized and unrealized loss on investments | | | (0.68 | ) |
Total loss from investment operations | | | (0.58 | ) |
Less Distributions to Shareholders from: | | | | |
Net investment income | | | (0.07 | ) |
Net Asset Value, End of Period | | $ | 9.35 | |
Total Return1 | | | (5.77 | )%15 |
Ratio of net expenses to average net assets (with offsets/reductions) | | | 1.03 | %16 |
Ratio of expenses to average net assets (with offsets) | | | 1.06 | %16 |
Ratio of total expenses to average net assets (without offsets/reductions)3 | | | 1.85 | %16 |
Ratio of net investment income to average net assets1 | | | 0.98 | %16 |
Portfolio turnover | | | 138 | %15 |
Net assets at end of period (000’s omitted) | | $ | 11,085 | |
| | | | |
75
AMG Chicago Equity Partners Small Cap Value Fund
Financial Highlights
For a share outstanding throughout each period
| | | | |
| | | For the period ended | |
| Institutional Class | | December 31, 2015** | |
Net Asset Value, Beginning of Period | | $ | 10.00 | |
Income from Investment Operations: | | | | |
Net investment income1,2 | | | 0.11 | 17 |
Net realized and unrealized loss on investments | | | (0.68 | ) |
Total loss from investment operations | | | (0.57 | ) |
Less Distributions to Shareholders from: | | | | |
Net investment income | | | (0.08 | ) |
Net Asset Value, End of Period | | $ | 9.35 | |
Total Return1 | | | (5.69 | )%15 |
Ratio of net expenses to average net assets (with offsets/reductions) | | | 0.92 | %16 |
Ratio of expenses to average net assets (with offsets) | | | 0.95 | %16 |
Ratio of total expenses to average net assets (without offsets/reductions)3 | | | 3.06 | %16 |
Ratio of net investment income to average net assets1 | | | 1.07 | %16 |
Portfolio turnover | | | 138 | %15 |
Net assets at end of period (000’s omitted) | | $ | 1,609 | |
| | | | |
76
AMG Managers High Yield Fund
Financial Highlights
For a share outstanding throughout each year
| | | | | | | | | | | | | | | | | | | | |
| | | For the years ended December 31, | |
| Investor Class | | 2015 | | | 2014 | | | 2013 | | | 2012 | | | 2011 | |
Net Asset Value, Beginning of Year | | $ | 7.84 | | | $ | 8.09 | | | $ | 8.07 | | | $ | 7.51 | | | $ | 7.74 | |
Income from Investment Operations: | | | | | | | | | | | | | | | | | | | | |
Net investment income1,2 | | | 0.42 | | | | 0.42 | | | | 0.47 | | | | 0.54 | | | | 0.56 | |
Net realized and unrealized gain (loss) on investments | | | (0.77 | ) | | | (0.26 | ) | | | 0.02 | | | | 0.56 | | | | (0.22 | ) |
Total income (loss) from investment operations | | | (0.35 | ) | | | 0.16 | | | | 0.49 | | | | 1.10 | | | | 0.34 | |
Less Distributions to Shareholders from: | | | | | | | | | | | | | | | | | | | | |
Net investment income | | | (0.42 | ) | | | (0.41 | ) | | | (0.47 | ) | | | (0.54 | ) | | | (0.57 | ) |
Net Asset Value, End of Year | | $ | 7.07 | | | $ | 7.84 | | | $ | 8.09 | | | $ | 8.07 | | | $ | 7.51 | |
Total Return1 | | | (4.77 | )% | | | 1.99 | % | | | 6.21 | %8 | | | 15.12 | %8 | | | 4.54 | % |
Ratio of net expenses to average net assets (with offsets/reductions) | | | 1.15 | % | | | 1.15 | % | | | 1.17 | %9 | | | 1.15 | %10 | | | 1.15 | % |
Ratio of expenses to average net assets (with offsets) | | | 1.15 | % | | | 1.15 | % | | | 1.17 | %9 | | | 1.15 | %10 | | | 1.15 | % |
Ratio of total expenses to average net assets (without offsets/reductions)3 | | | 1.68 | % | | | 1.67 | % | | | 1.70 | %9 | | | 1.73 | %10 | | | 1.69 | % |
Ratio of net investment income to average net assets1 | | | 5.41 | % | | | 5.12 | % | | | 5.76 | %9 | | | 6.87 | %10 | | | 7.35 | % |
Portfolio turnover | | | 42 | % | | | 40 | % | | | 39 | % | | | 48 | % | | | 48 | % |
Net assets at end of year (000’s omitted) | | $ | 27,020 | | | $ | 34,709 | | | $ | 31,751 | | | $ | 30,817 | | | $ | 23,957 | |
| | | | | | | | | | | | | | | | | | | | |
| |
| | | For the years ended December 31, | |
| Institutional Class | | 2015 | | | 2014 | | | 2013 | | | 2012 | | | 2011 | |
Net Asset Value, Beginning of Year | | $ | 7.92 | | | $ | 8.18 | | | $ | 8.16 | | | $ | 7.59 | | | $ | 7.82 | |
Income from Investment Operations: | | | | | | | | | | | | | | | | | | | | |
Net investment income1,2 | | | 0.44 | | | | 0.44 | | | | 0.49 | | | | 0.56 | | | | 0.59 | |
Net realized and unrealized gain (loss) on investments | | | (0.78 | ) | | | (0.26 | ) | | | 0.02 | | | | 0.58 | | | | (0.22 | ) |
Total income (loss) from investment operations | | | (0.34 | ) | | | 0.18 | | | | 0.51 | | | | 1.14 | | | | 0.37 | |
Less Distributions to Shareholders from: | | | | | | | | | | | | | | | | | | | | |
Net investment income | | | (0.44 | ) | | | (0.44 | ) | | | (0.49 | ) | | | (0.57 | ) | | | (0.60 | ) |
Net Asset Value, End of Year | | $ | 7.14 | | | $ | 7.92 | | | $ | 8.18 | | | $ | 8.16 | | | $ | 7.59 | |
Total Return1 | | | (4.56 | )% | | | 2.16 | % | | | 6.47 | % | | | 15.46 | % | | | 4.83 | % |
Ratio of net expenses to average net assets (with offsets/reductions) | | | 0.90 | % | | | 0.90 | % | | | 0.92 | %9 | | | 0.90 | %10 | | | 0.90 | % |
Ratio of expenses to average net assets (with offsets) | | | 0.90 | % | | | 0.90 | % | | | 0.92 | %9 | | | 0.90 | %10 | | | 0.90 | % |
Ratio of total expenses to average net assets (without offsets/reductions)3 | | | 1.43 | % | | | 1.42 | % | | | 1.45 | %9 | | | 1.48 | %10 | | | 1.44 | % |
Ratio of net investment income to average net assets1 | | | 5.65 | % | | | 5.37 | % | | | 6.01 | %9 | | | 7.12 | %10 | | | 7.60 | % |
Portfolio turnover | | | 42 | % | | | 40 | % | | | 39 | % | | | 48 | % | | | 48 | % |
Net assets at end of year (000’s omitted) | | $ | 2,424 | | | $ | 3,131 | | | $ | 2,765 | | | $ | 2,538 | | | $ | 5,247 | |
| | | | | | | | | | | | | | | | | | | | |
77
AMG Managers Intermediate Duration Government Fund
Financial Highlights
For a share outstanding throughout each year
| | | | | | | | | | | | | | | | | | | | |
| | | For the years ended December 31, | |
| | | 2015 | | | 2014 | | | 2013 | | | 2012 | | | 2011 | |
Net Asset Value, Beginning of Year | | $ | 10.96 | | | $ | 10.64 | | | $ | 10.98 | | | $ | 11.10 | | | $ | 11.01 | |
Income from Investment Operations: | | | | | | | | | | | | | | | | | | | | |
Net investment income1 | | | 0.11 | 2 | | | 0.17 | 2 | | | 0.18 | 2 | | | 0.20 | 2 | | | 0.30 | |
Net realized and unrealized gain (loss) on investments | | | 0.01 | | | | 0.54 | | | | (0.32 | ) | | | 0.14 | | | | 0.34 | |
Total income (loss) from investment operations | | | 0.12 | | | | 0.71 | | | | (0.14 | ) | | | 0.34 | | | | 0.64 | |
Less Distributions to Shareholders from: | | | | | | | | | | | | | | | | | | | | |
Net investment income | | | (0.10 | ) | | | (0.17 | ) | | | (0.18 | ) | | | (0.20 | ) | | | (0.30 | ) |
Net realized gain on investments | | | (0.17 | ) | | | (0.22 | ) | | | (0.02 | ) | | | (0.26 | ) | | | (0.25 | ) |
Total distributions to shareholders | | | (0.27 | ) | | | (0.39 | ) | | | (0.20 | ) | | | (0.46 | ) | | | (0.55 | ) |
Net Asset Value, End of Year | | $ | 10.81 | | | $ | 10.96 | | | $ | 10.64 | | | $ | 10.98 | | | $ | 11.10 | |
Total Return1 | | | 1.09 | %8 | | | 6.73 | %8 | | | (1.25 | )%8 | | | 3.15 | %8 | | | 5.88 | %8 |
Ratio of net expenses to average net assets (with offsets/reductions) | | | 0.88 | % | | | 0.89 | % | | | 0.91 | %11 | | | 0.89 | %12 | | | 0.88 | % |
Ratio of expenses to average net assets (with offsets) | | | 0.88 | % | | | 0.89 | % | | | 0.91 | %11 | | | 0.89 | %12 | | | 0.88 | % |
Ratio of total expenses to average net assets (without offsets/reductions)3 | | | 0.92 | % | | | 0.96 | % | | | 0.94 | %11 | | | 0.92 | %12 | | | 0.94 | % |
Ratio of net investment income to average net assets1 | | | 0.99 | % | | | 1.54 | % | | | 1.64 | %11 | | | 1.81 | %12 | | | 2.64 | % |
Portfolio turnover | | | 21 | % | | | 11 | % | | | 29 | % | | | 21 | % | | | 453 | % |
Net assets at end of year (000’s omitted) | | $ | 192,039 | | | $ | 174,138 | | | $ | 136,915 | | | $ | 185,898 | | | $ | 178,087 | |
| | | | | | | | | | | | | | | | | | | | |
78
AMG Managers Short Duration Government Fund
Financial Highlights
For a share outstanding throughout each year
| | | | | | | | | | | | | | | | | | | | |
| | | For the years ended December 31, | |
| | | 2015 | | | 2014 | | | 2013 | | | 2012 | | | 2011 | |
Net Asset Value, Beginning of Year | | $ | 9.65 | | | $ | 9.64 | | | $ | 9.65 | | | $ | 9.57 | | | $ | 9.58 | |
Income from Investment Operations: | | | | | | | | | | | | | | | | | | | | |
Net investment income1 | | | 0.02 | 2 | | | 0.05 | 2 | | | 0.03 | 2 | | | 0.08 | 2 | | | 0.09 | |
Net realized and unrealized gain (loss) on investments | | | (0.03 | ) | | | 0.01 | | | | (0.01 | ) | | | 0.08 | | | | (0.01 | ) |
Total income (loss) from investment operations | | | (0.01 | ) | | | 0.06 | | | | 0.02 | | | | 0.16 | | | | 0.08 | |
Less Distributions to Shareholders from: | | | | | | | | | | | | | | | | | | | | |
Net investment income | | | (0.02 | ) | | | (0.05 | ) | | | (0.03 | ) | | | (0.08 | ) | | | (0.09 | ) |
Net Asset Value, End of Year | | $ | 9.62 | | | $ | 9.65 | | | $ | 9.64 | | | $ | 9.65 | | | $ | 9.57 | |
Total Return1 | | | (0.15 | )% | | | 0.60 | % | | | 0.20 | % | | | 1.64 | % | | | 0.80 | % |
Ratio of net expenses to average net assets (with offsets/reductions) | | | 0.79 | % | | | 0.80 | % | | | 0.79 | %13 | | | 0.81 | %14 | | | 0.82 | % |
Ratio of expenses to average net assets (with offsets) | | | 0.79 | % | | | 0.80 | % | | | 0.79 | %13 | | | 0.81 | %14 | | | 0.82 | % |
Ratio of total expenses to average net assets (without offsets/reductions)3 | | | 0.79 | % | | | 0.80 | % | | | 0.79 | %13 | | | 0.81 | %14 | | | 0.82 | % |
Ratio of net investment income to average net assets1 | | | 0.25 | % | | | 0.47 | % | | | 0.27 | %13 | | | 0.80 | %14 | | | 0.89 | % |
Portfolio turnover | | | 51 | % | | | 41 | % | | | 48 | % | | | 49 | % | | | 141 | % |
Net assets at end of year (000’s omitted) | | $ | 395,306 | | | $ | 385,246 | | | $ | 422,488 | | | $ | 466,415 | | | $ | 393,014 | |
| | | | | | | | | | | | | | | | | | | | |
Notes to Financial Highlights
| * | Commencement of operations was December 1, 2012. |
| ** | Commencement of operations was January 2, 2015. |
| 1 | Total returns and net investment income would have been lower had certain expenses not been offset. |
| 2 | Per share numbers have been calculated using average shares. |
| 3 | Excludes the impact of expense reimbursements or fee waivers and expense reductions such as brokerage credits, but includes expense repayments and non-reimbursable expenses, if any, such as interest, taxes and extraordinary expenses. (See Notes 1(c) and 2 in the Notes to Financial Statements.) |
| 4 | Includes non-recurring dividends. Without these dividends, net investment income per share would have been $0.09, $0.12, and $0.13 for AMG Chicago Equity Partners Balanced Fund’s Investor Class, Service Class, and Institutional Class shares, respectively. |
| 5 | Includes non-routine extraordinary expenses amounting to 0.019%, 0.014% and 0.019% of average net assets for the Investor Class, Service Class and Institutional Class, respectively. |
| 6 | Includes non-routine extraordinary expenses amounting to 0.005%, 0.005% and 0.004% of average net assets for the Investor Class, Service Class and Institutional Class, respectively. |
| 7 | Effective July 1, 2012, the Fund’s expense cap was reduced to 0.84% from 1.00%. The expense ratio shown reflects the weighted average expense ratio for the full year ended December 31, 2012. |
| 8 | The total return is based on the Financial Statement Net Asset Values as shown in the Financial Highlights. |
| 9 | Includes non-routine extraordinary expenses amounting to 0.020% and 0.021% of average net assets for the Investor Class and Institutional Class, respectively. |
| 10 | Includes non-routine extraordinary expenses amounting to 0.005% and 0.004% of average net assets for the Investor Class and Institutional Class, respectively. |
| 11 | Includes non-routine extraordinary expenses amounting to 0.020% of average net assets. |
| 12 | Includes non-routine extraordinary expenses amounting to 0.004% of average net assets. |
| 13 | Includes non-routine extraordinary expenses amounting to 0.019% of average net assets. |
| 14 | Includes non-routine extraordinary expenses amounting to 0.005% of average net assets. |
| 17 | Includes non-recurring dividends. Without these dividends, net investment income per share would have been $0.09, $0.11, and $0.13 for AMG Chicago Equity Partners Balanced Fund’s Investor Class, Service Class, and Institutional Class shares, respectively and net investment income (loss) per share would have been $(0.09), $0.09, and $0.10 for AMG Chicago Equity Partners Small Cap Value Fund’s Investor Class, Service Class, and Institutional Class share, respectively. |
79
Notes to Financial Statements
December 31, 2015
1. SUMMARY OF SIGNIFICANT ACCOUNTING POLICIES
AMG Funds and AMG Funds II (the “Trusts”) are open-end management investment companies, organized as a Massachusetts business trusts, and registered under the Investment Company Act of 1940, as amended (the “1940 Act”). Currently, the Trusts consist of a number of different funds, each having distinct investment management objectives, strategies, risks, and policies. Included in this report are AMG Funds: AMG Chicago Equity Partners Small Cap Value Fund (“Small Cap Value”) and AMG Funds II: AMG Chicago Equity Partners Balanced Fund (“Balanced”), AMG Managers High Yield Fund (“High Yield”), AMG Managers Intermediate Duration Government Fund (“Intermediate Duration”) and AMG Managers Short Duration Government Fund (“Short Duration”), each a “Fund” and collectively the “Funds.” High Yield will deduct a 2.00% redemption fee from the proceeds of any redemption (including a redemption by exchange) of shares if the redemption occurs within 90 days of the purchase of those shares. For the year ended December 31, 2015, High Yield had redemption fees amounting to $4,518.
The Small Cap Value Fund had an inception date of December 31, 2014. The Fund’s commencement of operations was on January 2, 2015.
Balanced and Small Cap Value offer three classes of shares: Investor, Service and Institutional Class. High Yield offers two classes of shares: Investor and Institutional Class. Each class represents an interest in the same assets of the Fund. Although all share classes generally have identical voting rights, each share class votes separately when required by law. Different share classes may pay different distribution amounts to the extent the net asset value per share and/or the expenses of such share classes differ. Each share class has its own expense structure. Please refer to a current prospectus for additional information on each share class.
The Funds’ financial statements are prepared in accordance with accounting principles generally accepted in the United States of America (“U.S. GAAP”), which require management to make estimates and assumptions that affect the reported amounts of assets and liabilities and disclosure of contingent assets and liabilities at the date of the financial statements and the reported amounts of income and expenses during the reporting period. Actual results could differ from those estimates and such differences could be material. The following is a summary of significant accounting policies followed by the Funds in the preparation of their financial statements:
a. VALUATION OF INVESTMENTS
Equity securities traded on a national securities exchange or reported on the NASDAQ national market system (“NMS”) are valued at the last quoted sales price on the primary exchange or, if applicable, the NASDAQ official closing price or the official closing price of the relevant exchange or, lacking any sales, at the last quoted bid price or the mean between the last quoted bid and ask prices (the “exchange mean price”). Equity securities traded in the over-the-counter market (other than NMS securities) are valued at the exchange mean price. Foreign equity securities (securities principally traded in markets other than U.S. markets) are valued at the official closing price on the primary exchange or, for markets that either do not offer an official closing price or where the official closing price may not be representative of the overall market, the last quoted sale price.
Fixed income securities purchased with a remaining maturity exceeding 60 days are valued at the evaluated bid price or the mean price provided by an authorized pricing service or, if an evaluated price is not available, by reference to other securities which are considered comparable in credit rating, interest rate, due date and other features (generally referred to as “matrix pricing”) or other similar pricing methodologies. Investments in certain mortgage-backed and stripped mortgage-backed securities, preferred stocks, convertible securities, derivatives and other debt securities not traded on an organized securities market are valued on the basis of valuations provided by dealers or by a pricing service which uses information with respect to transactions in such securities and various relationships between such securities and yield to maturity in determining value.
Fixed income securities purchased with a remaining maturity of 60 days or less are valued at amortized cost, provided that the amortized cost value is approximately the same as the fair value of the security valued without the use of amortized cost. Investments in other open-end regulated investment companies are valued at their end of day net asset value per share.
Futures contracts for which market quotations are readily available are valued at the settlement price as of the close of the futures exchange.
The Funds’ portfolio investments are generally valued based on independent market quotations or prices or, if none, “evaluative” or other market based valuations provided by third-party pricing services approved by the Board of Trustees of the Trust (the “Board”). Under certain circumstances, the value of certain Fund portfolio investments (including derivatives) may be based on an evaluation of fair value, pursuant to procedures established by and under the general supervision of the Board. The Valuation Committee, which is comprised of the Independent Trustees of the Board, and the Pricing Committee, which is comprised of representatives from AMG Funds LLC (the “Investment Manager”) are the committees appointed by the Board to make fair value determinations. Each Fund may use the fair value of a portfolio investment to calculate its net asset value (“NAV”) in the event that the market quotation, price or market based valuation for the portfolio investment is not readily available or otherwise not determinable pursuant to the Board’s valuation procedures, if the Investment Manager or the Pricing Committee believes the quotation, price or market based valuation to be unreliable, or in certain other circumstances. When determining the fair value of an investment, the Pricing Committee and, if required under the Trust’s securities valuation procedures, the Valuation Committee, seeks to determine the price that the Fund might reasonably expect to receive from current sale of that portfolio investment in an arms-length transaction. Fair value determinations shall be based upon consideration of all available facts and information, including, but not limited to (i) attributes specific to the investment; (ii) fundamental and analytical data relating to the investment; and (iii) the value of other comparable securities or relevant financial instruments, including derivative securities, traded on other markets or among dealers.
The values assigned to fair value portfolio investments are based on available information and do not necessarily represent amounts that might ultimately be realized in the future, since such amounts depend on future developments inherent in long-term investments. Because of the inherent uncertainty of valuation, those estimated values may differ significantly from the values that
Notes to Financial Statements (continued)
would have been used had a ready market for the investments existed, and the differences could be material. The Board will be presented with a quarterly report showing as of the most recent quarter end, all outstanding securities fair valued by the Fund, including a comparison with the prior quarter end and the percentage of the Fund that the security represents at each quarter end.
With respect to foreign equity securities and certain foreign fixed income securities, the Board has adopted a policy that securities held in a Fund that can be fair valued by the applicable fair value pricing service are fair valued on each business day provided that each individual price exceeds a pre-established confidence level.
U.S. GAAP defines fair value as the price that a fund would receive to sell an asset or pay to transfer a liability in an orderly transaction between market participants at the measurement date. U.S. GAAP also establishes a framework for measuring fair value, and a three-level hierarchy for fair value measurements based upon the transparency of inputs to the valuation of an asset or liability. Inputs may be observable or unobservable and refer broadly to the assumptions that market participants would use in pricing the asset or liability. Observable inputs reflect the assumptions market participants would use in pricing the asset or liability based on market data obtained from sources independent of the Funds. Unobservable inputs reflect the Funds’ own assumptions about the assumptions that market participants would use in pricing the asset or liability developed based on the best information available in the circumstances. Each investment is assigned a level based upon the observability of the inputs which are significant to the overall valuation.
The three-tier hierarchy of inputs is summarized below:
Level 1 – inputs are quoted prices in active markets for identical investments (e.g., equity securities, open-end investment companies, futures contracts)
Level 2 – other observable inputs (including, but not limited to: quoted prices for similar assets or liabilities in markets that are active, quoted prices for identical or similar assets or liabilities in markets that are not active, inputs other than quoted prices that are observable for the assets or liabilities (such as interest rates, yield curves, volatilities, prepayment speeds, loss severities, credit risks and default rates) or other market corroborated inputs) (e.g., debt securities, government securities, foreign currency exchange contracts, foreign securities utilizing international fair value pricing, broker-quoted securities, fair valued securities with observable inputs)
Level 3 – inputs are significant unobservable inputs (including the Funds’ own assumptions used to determine the fair value of investments) (e.g., fair valued securities with unobservable inputs)
Changes in inputs or methodologies used for valuing investments may result in a transfer in or out of levels within the fair value hierarchy. The inputs or methodologies used for valuing investments may not necessarily be an indication of the risk associated with investing in those investments. Transfers between different levels of the fair value disclosure hierarchy are deemed to have occurred as of the beginning of the reporting period.
b. SECURITY TRANSACTIONS
Security transactions are accounted for as of trade date. Realized gains and losses on securities sold are determined on the basis of identified cost.
c. INVESTMENT INCOME AND EXPENSES
Dividend income is recorded on the ex-dividend date. Dividend and interest income on foreign securities is recorded gross of any withholding tax. Interest income, which includes amortization of premium and accretion of discount on debt securities, is accrued as earned. Non-cash dividends included in dividend income, if any, are reported at the fair market value of the securities received. Distributions received in excess of income including real estate investment trusts (REITs) are recorded as a reduction of the cost of the related investment and/or as a realized gain. If the Funds no longer own the applicable securities, any distributions received in excess of income are recorded as an adjustment to realized gain. Other income and expenses are recorded on an accrual basis. Expenses that cannot be directly attributed to a Fund are apportioned among the Funds in the Trust and in some cases other affiliated funds based upon their relative average net assets or number of shareholders. Investment income, realized and unrealized capital gains and losses, the common expenses of each Fund, and certain Fund level expense reductions, if any, are allocated on a pro-rata basis to each class based on the relative net assets of each class to the total net assets of each Fund.
The following Funds had certain portfolio trades directed to various brokers, under a brokerage recapture program, which paid a portion of such Fund’s expenses. For the year ended December 31, 2015, the amount by which the Fund’s expenses were reduced and the impact on the expense ratios, if any, were as follows: Balanced—$13,795 or 0.01%, and Small Cap Value—$3,877 or 0.03%.
The Funds have a “balance credit” arrangement with The Bank of New York Mellon (“BNYM”), the Funds’ custodian, whereby each Fund is credited with an interest factor equal to 0.75% below the effective 90-day T-Bill rate for account balances left uninvested overnight. If the T-Bill rate falls below 0.75%, no credits will be earned. These credits serve to reduce custodian expenses that would otherwise be charged to each Fund. For the year ended December 31, 2015, the Funds’ custodian expense was not reduced.
Overdraft fees are computed at 1% above the effective Federal Funds rate on the day of the overdraft. For the year ended December 31, 2015, the Funds did not incur overdraft fees.
Notes to Financial Statements (continued)
d. DIVIDENDS AND DISTRIBUTIONS
Fund distributions resulting from either net investment income or realized net capital gains, if any, will normally be declared and paid at least annually in December, as described in the Funds’ prospectus. Distributions to shareholders are recorded on the ex-dividend date. Distributions are determined in accordance with federal income tax regulations, which may differ from net investment income and net realized capital gains for financial statement purposes (U.S. GAAP). Differences may be permanent or temporary. Permanent differences are reclassified among capital accounts in the financial statements
to reflect their tax character. Permanent book and tax basis differences, if any, relating to shareholder distributions will result in reclassifications to paid-in capital. Temporary differences arise when certain items of income, expense and gain or loss are recognized in different periods for financial statement and tax purposes; these differences will reverse at some time in the future. The permanent differences are due to write-off of interest on certain defaulted bonds, and the treatment of certain sales or exchanges in corporate inversion transactions. Temporary differences are due to differing treatments for losses deferred due to tax regulations, wash sales, futures and tax straddles.
The tax character of distributions paid during the years ended December 31, 2015 and December 31, 2014 were as follows:
| | | | | | | | | | | | | | | | | | | | | | | | | | | | | | | | | | | | |
| | | | | | | | | Small Cap | | | | | | | | | | | | | | | | | | | |
| | | Balanced | | | Value | | | High Yield | | | Intermediate Duration | | | Short Duration | |
| | | 2015 | | | 2014 | | | 2015 | | | 2015 | | | 2014 | | | 2015 | | | 2014 | | | 2015 | | | 2014 | |
Distributions paid from: | | | | | | | | | | | | | | | | | | | | | | | | | | | | | | | | | | | | |
Ordinary income | | $ | 891,722 | | | $ | 431,943 | | | $ | 101,539 | | | $ | 1,885,260 | | | $ | 1,943,338 | | | $ | 1,715,923 | | | $ | 2,186,725 | | | $ | 613,266 | | | $ | 1,950,075 | |
Short-term capital gains | | | 428,523 | | | | 1,411,082 | | | | — | | | | — | | | | — | | | | 2,802,915 | | | | 3,286,678 | | | | — | | | | — | |
Long-term capital gains | | | 3,554,115 | | | | 4,045,842 | | | | — | | | | — | | | | — | | | | 177,508 | | | | 180,861 | | | | — | | | | — | |
| | | | | | | | | | | | | | | | | | | | | | | | | | | | | | | | | | | | |
Total | | $ | 4,874,360 | | | $ | 5,888,867 | | | $ | 101,539 | | | $ | 1,885,260 | | | $ | 1,943,338 | | | $ | 4,696,346 | | | $ | 5,654,264 | | | $ | 613,266 | | | $ | 1,950,075 | |
| | | | | | | | | | | | | | | | | | | | | | | | | | | | | | | | | | | | |
As of December 31, 2015, the components of distributable earnings (excluding unrealized appreciation/depreciation) on a tax basis consisted of:
| | | | | | | | | | | | | | | | | | | | |
| | | Balanced | | | Small Cap Value | | | High Yield | | | Intermediate Duration | | | Short Duration | |
Capital loss carryforward | | | — | | | $ | 418,019 | | | $ | 1,914,719 | | | | — | | | $ | 2,561,397 | |
Undistributed ordinary income | | | — | | | | — | | | | 24,681 | | | $ | 165,617 | | | | 324,504 | |
Undistributed short-term capital gains | | | — | | | | — | | | | — | | | | 3,504 | | | | — | |
Undistributed long-term capital gains | | | — | | | | — | | | | — | | | | — | | | | — | |
Late-year loss deferral | | $ | (588,729 | ) | | | (579,824 | ) | | | (163,016 | ) | | | — | | | | — | |
e. FEDERAL TAXES
Each Fund intends to comply with the requirements under Subchapter M of the Internal Revenue Code of 1986, as amended, to distribute substantially all of its taxable income and gains to its shareholders and to meet certain diversification and income requirements with respect to investment companies. Therefore, no provision for federal income or excise tax is included in the accompanying financial statements.
Additionally, based on each Fund’s understanding of the tax rules and rates related to income, gains and transactions for the foreign jurisdictions in which it invests, each Fund will provide for foreign taxes, and where appropriate, deferred foreign taxes.
Management has analyzed the Funds’ tax positions taken on federal income tax returns as of December 31, 2015 and all open tax years (generally, the three prior taxable years), and has concluded that no provision for federal income tax is required in the Funds’ financial statements. Additionally, Management is not aware of any tax position for which it is reasonably possible that the total amounts of unrecognized tax benefits will change materially in the next twelve months.
Net capital losses incurred in taxable years beginning after the enactment of the Regulated Investment Company Modernization Act of 2010, may be carried forward for an unlimited time period. Such losses will be required to be utilized prior to any loss carryovers incurred in pre-enactment taxable years, which generally expire eight years following the close of the taxable year in which they were incurred. As a result of this ordering rule, pre-enactment capital loss carryovers may be more likely to expire unused. Additionally, post-enactment capital losses that are carried forward retain their tax character as either short-term or long-term capital losses, unlike pre-enactment losses which are considered all short-term.
f. CAPITAL LOSS CARRYOVERS AND DEFERRALS
As of December 31, 2015, the following Funds had accumulated net realized capital loss carryovers from securities transactions for federal income tax purposes as shown in the following chart. These amounts may be used to offset future realized capital gains, if any, through the expiration dates listed or in the case of post-enactment losses, for an unlimited time period.
Notes to Financial Statements (continued)
| | | | | | | | | | | | |
| | | Capital Loss | | | | |
| | | Carryover Amounts | | | | |
| Fund | | Short-Term Long-
Term | | | Expires December 31, | |
Small Cap Value | | | | | | | | | | | | |
(Post-Enactment) | | $ | 418,019 | | | | — | | | | Unlimited | |
High Yield | | | | | | | | | | | | |
(Pre-Enactment) | | $ | 1,914,719 | | | | — | | | | 2017 | |
Short Duration | | | | | | | | | | | | |
(Pre-Enactment) | | $ | 585,044 | | | | — | | | | 2017 | |
(Post-Enactment) | | $ | 360,270 | | | $ | 1,616,083 | | | | Unlimited | |
Balanced and Intermediate Duration had no accumulated net realized capital loss carryovers from securities transactions for federal income tax purposes. Should Balanced and Intermediate Duration incur net capital losses for the year ended December 31, 2016, such amounts may be used to offset future realized capital gains, for an unlimited time period.
For the year ended December 31, 2015, the following Funds utilized capital loss carryovers in the amount of:
| | | | | | | | |
| | | Capital Loss Carryover Utilized | |
| Fund | | Short-Term | | | Long-Term | |
Balanced | | | — | | | | — | |
Small Cap Value | | | — | | | | — | |
High Yield | | $ | 190,503 | | | | — | |
Intermediate Duration | | | — | | | | — | |
Short Duration | | | — | | | | — | |
g. CAPITAL STOCK
The Trusts’ Declaration of Trust authorizes for each fund the issuance of an unlimited number of shares of beneficial interest, without par value. Each Fund records sales and repurchases of its capital stock on the trade date. The cost of securities contributed to the Funds in connection with the issuance of shares is based on the valuation of those securities in accordance with the Funds’ policy on investment valuation.
For the years ended December 31, 2015 and 2014, the capital stock transactions by class for Balanced, Small Cap Value and High Yield were as follows:
| | | | | | | | | | | | | | | | | | | | | | | | |
| | | Balanced | | | Small Cap* | |
| | | 2015 | | | 2014 | | | 2015 | |
| | | Shares | | | Amount | | | Shares | | | Amount | | | Shares | | | Amount | |
Investor Class: | | | | | | | | | | | | | | | | | | | | | | | | |
Proceeds from sale of shares | | | 4,917,700 | | | $ | 75,876,816 | | | | 1,202,988 | | | $ | 19,138,905 | | | | 1,181,275 | | | $ | 12,083,124 | |
Reinvestment of distributions | | | 169,057 | | | | 2,540,619 | | | | 208,257 | | | | 3,173,093 | | | | — | | | | — | |
Cost of shares repurchased | | | (1,519,741 | ) | | | (23,301,123 | ) | | | (836,466 | ) | | | (13,186,170 | ) | | | (1,179,544 | ) | | | (12,193,236 | ) |
| | | | | | | | | | | | | | | | | | | | | | | | |
Net increase (decrease) | | | 3,567,016 | | | $ | 55,116,312 | | | | 574,779 | | | $ | 9,125,828 | | | | 1,731 | | | $ | (110,112 | ) |
| | | | | | | | | | | | | | | | | | | | | | | | |
Service Class: | | | | | | | | | | | | | | | | | | | | | | | | |
Proceeds from sale of shares | | | 3,649,007 | | | $ | 56,053,664 | | | | 1,334,849 | | | $ | 20,991,730 | | | | 1,308,993 | | | $ | 13,485,730 | |
Reinvestment of distributions | | | 32,172 | | | | 487,073 | | | | 9,184 | | | | 142,301 | | | | 9,228 | | | | 87,485 | |
Cost of shares repurchased | | | (592,922 | ) | | | (9,069,021 | ) | | | (496,623 | ) | | | (8,023,723 | ) | | | (132,551 | ) | | | (1,308,615 | ) |
| | | | | | | | | | | | | | | | | | | | | | | | |
Net increase | | | 3,088,257 | | | $ | 47,471,716 | | | | 847,410 | | | $ | 13,110,308 | | | | 1,185,670 | | | $ | 12,264,600 | |
| | | | | | | | | | | | | | | | | | | | | | | | |
Institutional Class: | | | | | | | | | | | | | | | | | | | | | | | | |
Proceeds from sale of shares | | | 113,841 | | | $ | 1,780,500 | | | | 131,007 | | | $ | 2,098,590 | | | | 185,788 | | | $ | 1,891,574 | |
Reinvestment of distributions | | | 5,616 | | | | 86,077 | | | | 75,120 | | | | 1,155,376 | | | | 1,481 | | | | 14,055 | |
Cost of shares repurchased | | | (820,603 | ) | | | (12,951,242 | ) | | | (120,406 | ) | | | (1,935,947 | ) | | | (15,192 | ) | | | (153,098 | ) |
| | | | | | | | | | | | | | | | | | | | | | | | |
Net increase (decrease) | | | (701,146 | ) | | $ | (11,084,665 | ) | | | 85,721 | | | $ | 1,318,019 | | | | 172,077 | | | $ | 1,752,531 | |
| | | | | | | | | | | | | | | | | | | | | | | | |
83
Notes to Financial Statements (continued)
| | | | | | | | | | | | | | | | |
| | | High Yield | |
| | | 2015 | | | 2014 | |
| | | Shares | | | Amount | | | Shares | | | Amount | |
Investor Class: | | | | | | | | | | | | | | | | |
Proceeds from sale of shares | | | 458,232 | | | $ | 3,548,190 | | | | 1,152,505 | | | $ | 9,370,757 | |
Reinvestment of distributions | | | 201,329 | | | | 1,540,515 | | | | 195,308 | | | | 1,581,726 | |
Cost of shares repurchased | | | (1,264,058 | ) | | | (9,754,397 | ) | | | (841,406 | ) | | | (6,824,466 | ) |
| | | | | | | | | | | | | | | | |
Net increase (decrease) | | | (604,497 | ) | | $ | (4,665,692 | ) | | | 506,407 | | | $ | 4,128,017 | |
| | | | | | | | | | | | | | | | |
Institutional Class: | | | | | | | | | | | | | | | | |
Proceeds from sale of shares | | | 64,450 | | | $ | 499,391 | | | | 109,032 | | | $ | 896,735 | |
Reinvestment of distributions | | | 20,559 | | | | 159,183 | | | | 18,929 | | | | 154,888 | |
Cost of shares repurchased | | | (140,790 | ) | | | (1,085,651 | ) | | | (70,641 | ) | | | (581,343 | ) |
| | | | | | | | | | | | | | | | |
Net increase (decrease) | | | (55,781 | ) | | $ | (427,077 | ) | | | 57,320 | | | $ | 470,280 | |
| | | | | | | | | | | | | | | | |
| * | Commencement of operations was on January 2, 2015, and included an initial subscription from the Investment Manager. |
At December 31, 2015, certain unaffiliated shareholders of record, specifically omnibus accounts, individually or collectively held greater than 10% of the net assets of the Funds as follows: Balanced—two collectively own 39%; Intermediate Duration – two collectively own 49%; Short Duration three collectively own 83%. Transactions by these shareholders may have a material impact on their respective Funds.
h. REPURCHASE AGREEMENTS AND JOINT REPURCHASE AGREEMENTS
The Funds may enter into repurchase agreements for temporary cash management purposes provided that the value of the underlying collateral, including accrued interest, will equal or exceed the value of the repurchase agreement during the term of the agreement. The underlying collateral for all repurchase agreements is held in safekeeping by the Fund’s custodian or at the Federal Reserve Bank. If the seller defaults and the value of the collateral declines, or if bankruptcy proceedings commence with respect to the seller of the security, realization of the collateral by the Funds may be delayed or limited.
Additionally, the Funds may enter into joint repurchase agreements for reinvestment of cash collateral on securities lending transactions under the securities lending program offered by BNYM (the “Program”), provided that the value of the underlying collateral, including accrued interest, will equal or exceed the value of the joint repurchase agreement during the term of the agreement. The Funds participate on a pro rata basis with other clients of BNYM in its share of the underlying collateral under such joint repurchase agreements and in its share of proceeds from any repurchase or other disposition of the underlying collateral. The underlying collateral for joint repurchase agreements is held in safekeeping by the Fund’s custodian or at the Federal Reserve Bank. If the seller defaults and the value of the collateral declines, or if bankruptcy proceedings commence with respect to the seller of the security, realization of the collateral by the Funds may be delayed or limited. Pursuant to the Program, the Funds are indemnified for such losses by BNYM.
At December 31, 2015, the market value of repurchase agreements or joint repurchase agreements outstanding for Balanced, Small Cap Value, High Yield,
Intermediate Duration and Short Duration was $2,205,649, $438,158, $1,652,196, $0 and $0, respectively.
i. SECURITIES TRANSACTED ON A WHEN ISSUED BASIS
The Funds may enter into To-Be-Announced (“TBA”) sale commitments to hedge their portfolio positions or to sell mortgage-backed securities it owns under delayed delivery arrangements. Proceeds of TBA sale commitments are not received until the contractual settlement date. During the time a TBA sale commitment is outstanding, equivalent deliverable securities, or an offsetting TBA purchase commitment deliverable on or before the sale commitment date, are held as “cover” for the transaction. Unsettled TBA sale commitments are valued at the current market value of the underlying securities according to the procedures described under “Valuation of Investments,” in footnote 1a above. Each contract is marked-to-market daily and the change in market value is recorded by the Funds as an unrealized gain or loss. If the TBA sale commitment is closed through the acquisition of an offsetting purchase commitment, the Funds realize a gain or loss. If the Funds deliver securities under the commitment, the Funds realize a gain or a loss from the sale of the securities based upon the unit price established at the date the commitment was entered into.
j. DELAYED DELIVERY TRANSACTIONS AND WHEN-ISSUED SECURITIES
The Funds may enter into securities transactions on a delayed delivery or when issued basis. Payment and delivery may take place after the customary settlement period for that security. The price of the underlying securities and the date when the securities will be delivered and paid for are fixed at the time the transaction is negotiated. During the time a delayed delivery sell is outstanding, the contract is marked to market daily and equivalent deliverable securities are held for the transaction. The value of the securities purchased on a delayed
84
Notes to Financial Statements (continued)
delivery or when-issued basis are identified as such in the Funds’ Schedules of Portfolio Investments. With respect to purchase commitments, the Funds identify securities as segregated in their records with a value at least equal to the amount of the commitment. The payables and receivables associated with the purchases and sales of delayed delivery securities having the same coupon, settlement date and broker are offset. Delayed delivery or when-issued securities that have been purchased from and sold to different brokers are reflected as both payables and receivables in the Funds’ Statement of Assets and Liabilities. Losses may arise due to changes in the value of the underlying securities or if the counterparty does not perform under the contract, or if the issuer does not issue the securities due to political, economic, or other factors.
2. AGREEMENTS AND TRANSACTIONS WITH AFFILIATES
For each of the Funds, the Trusts have entered into an investment advisory agreement under which the Investment Manager, a subsidiary and the U.S. retail distribution arm of Affiliated Managers Group, Inc. (“AMG”), serves as investment manager to the Funds and is responsible for the Funds’ overall administration and operations. The Investment Manager selects one or more subadvisors for the Funds (subject to Board approval) and monitors each subadvisor’s investment performance, security holdings and investment strategies. Each Fund’s investment portfolio is managed by one or more portfolio managers who serve pursuant to a subadvisory agreement with the Investment Manager. The investment portfolio of Balanced and Small Cap Value are managed by Chicago Equity Partners, LLC (“CEP”). AMG indirectly owns a majority interest in CEP.
Investment management fees are paid directly by the Funds to the Investment Manager based on average daily net assets. For the year ended December 31, 2015, the Funds’ investment management fees were paid at the following annual rate of each Fund’s respective average daily net assets:
| | | | |
Balanced | | | 0.70 | % |
Small Cap Value | | | 0.62 | % |
High Yield | | | 0.70 | % |
Intermediate Duration | | | 0.70 | % |
Short Duration | | | 0.70 | % |
The Investment Manager has contractually agreed, through at least May 1, 2016, to waive management fees (but not below zero) and/or reimburse Fund expenses in order to limit total annual Fund operating expenses after fee waiver and expense reimbursements (exclusive of taxes, interest (including interest incurred in connection with bank and custody overdrafts), shareholder servicing, distribution and service (12b-1) fees, brokerage commissions and other transaction costs, acquired fund fees and expenses and extraordinary expenses) of Balanced, Small Cap Value and High Yield to 0.84%, 0.95% and 0.90%, respectively, of each Fund’s average daily net assets subject to later reimbursement by the Funds in certain circumstances.
The Investment Manager has contractually agreed, through at least May 1, 2016, to waive management fees (but not below zero) and/or reimburse Fund expenses in order to limit total annual Fund operating expenses after fee waiver and expense reimbursements (exclusive of taxes, interest (including interest incurred in connection with bank and custody overdrafts), brokerage
commissions and other transaction costs, acquired fund fees and expenses and extraordinary expenses) to 0.89% of Intermediate Duration Fund’s average daily net assets subject to later reimbursement by the Fund in certain circumstances.
The contractual expense limitation may only be terminated in the event the Investment Manager or a successor ceases to be the investment manager of the Fund or a successor fund, by mutual agreement between the Investment Manager and the Board, or in the event of the Fund’s liquidation unless the Fund is reorganized or is a party to a merger in which the surviving entity is successor to the accounting and performance information of the Fund.
Each Fund is obligated to repay the Investment Manager such amounts waived, paid or reimbursed in future years provided that the repayment occurs within thirty-six (36) months after the waiver or reimbursement and that such repayment would not cause the Fund’s total annual operating expenses after fee waiver and expense reimbursements in any such future year to exceed that Fund’s contractual expense limitation amount. For the year ended December 31, 2015, each Fund’s components of reimbursement available are detailed in the following chart:
| | | | | | | | |
| | | Balanced | | | Small Cap Value | |
Reimbursement Available—12/31/14 | | $ | 485,939 | | | | — | |
Additional Reimbursements | | | 256,154 | | | $ | 100,095 | |
Expired Reimbursements | | | (126,271 | ) | | | — | |
| | | | | | | | |
Reimbursement Available—12/31/15 | | $ | 615,822 | | | $ | 100,095 | |
| | | | | | | | |
| | |
| | | High Yield | | | Intermediate
Duration | |
Reimbursement Available—12/31/14 | | $ | 545,202 | | | $ | 183,362 | |
Additional Reimbursements | | | 185,686 | | | | 58,801 | |
Expired Reimbursements | | | (168,498 | ) | | | (45,094 | ) |
| | | | | | | | |
Reimbursement Available—12/31/15 | | $ | 562,390 | | | $ | 197,069 | |
| | | | | | | | |
The expiration of each Fund’s reimbursement are as follows:
| | | | | | | | |
| Expiry Date | | Balanced | | | Small Cap Value | |
Less than 1 year | | $ | 181,501 | | | | — | |
Within 2 years | | | 178,167 | | | | — | |
Within 3 years | | | 256,154 | | | $ | 100,095 | |
| | | | | | | | |
Total Amount Subject to Reimbursement | | $ | 615,822 | | | $ | 100,095 | |
| | | | | | | | |
| | |
| Expiry Date | | High Yield | | | Intermediate
Duration | |
Less than 1 year | | $ | 179,573 | | | $ | 46,830 | |
Within 2 years | | | 197,131 | | | | 91,438 | |
Within 3 years | | | 185,686 | | | | 58,801 | |
| | | | | | | | |
Total Amount Subject to Reimbursement | | $ | 562,390 | | | $ | 197,069 | |
| | | | | | | | |
The Investment Manager has agreed to waive a portion of its management fee in consideration of shareholder servicing fees that it has received from
85
Notes to Financial Statements (continued)
JPMorgan Distribution Services, Inc., with respect to short-term cash investments each Fund may have made in the JPMorgan Money Market Funds. For the year ended December 31, 2015, the management fee for Intermediate Duration was reduced by $13,520.
Balanced, Small Cap Value and High Yield have entered into an Administration and Shareholder Servicing Agreement under which the Investment Manager serves as Funds’ administrator (the “Administrator”) and is responsible for all aspects of managing the Funds’ operations, including administration and shareholder services to each Fund, its shareholders, and certain institutions, such as bank trust departments, broker-dealers and registered investment advisers, that advise or act as an intermediary with the Funds’ shareholders. Balanced, Small Cap Value and High Yield each pay a fee to the Administrator at the rate of 0.20%, 0.25%, 0.20%, respectively, per annum of each Fund’s average daily net assets for this service.
Effective January 1, 2015, the Board provides supervision of the affairs of the Trust, other trusts within the AMG Funds family of mutual funds (collectively the “AMG Funds family”) and other affiliated funds. Previously, the Board provided supervision to only the Trust and other trusts within the AMG Funds family.
Beginning January 1, 2015, the aggregate annual retainer paid to each Independent Trustee of the Board is $200,000, plus $16,000, $4,000 or $2,000 for each regular, in-person special or telephonic special meeting attended, respectively. The Independent Chairman of the Trusts receives an additional payment of $55,000 per year. The Chairman of the Audit Committee receives an additional payment of $25,000 per year.
Prior to January 1, 2015, the aggregate annual retainer paid to each Independent Trustee of the Board was $130,000, plus $7,000 or $2,500 for each regular or special meeting attended, respectively. The Independent Chairman of the Trusts formerly received an additional payment of $35,000 per year. The Chairman of the Audit Committee formerly received an additional payment of $15,000 per year.
Effective January 1, 2015, the Trustees’ fees and expenses are generally allocated among all of the Funds in the Trust, other trusts within the AMG Funds family and other affiliated funds based on the relative net assets of such funds. Before January 1, 2015, the Trustees’ fees and expenses were generally allocated among all of the funds in the Trust and other trusts within the AMG Funds family. The “Trustees fees and expenses” shown in the financial statements represents each Fund’s allocated portion of the total fees and expenses paid to the Independent Trustees of the Board.
The Funds are distributed by AMG Distributors, Inc. (the “Distributor”), a wholly-owned subsidiary of the Investment Manager. The Distributor serves as the distributor and underwriter for each Fund and is a registered broker-dealer and member of the Financial Industry Regulatory Authority, Inc. (“FINRA”). Shares of each Fund will be continuously offered and will be sold directly to prospective purchasers and through brokers, dealers or other financial intermediaries who have executed selling agreements with the Distributor. Subject to the compensation arrangement discussed below, generally the Distributor bears all or a portion of the expenses of providing services pursuant to the distribution agreement, including the payment of the expenses relating to the distribution of
prospectuses for sales purposes and any advertising or sales literature. Certain Trustees and Officers of the Funds are Officers and/or Directors of the Investment Manager, AMG and/or the Distributor.
The Trusts have adopted a distribution and service plan (the “Plan”) with respect to the Investor Class shares in accordance with the requirements of Rule 12b-1 under the 1940 Act and the requirements of the applicable rules of FINRA regarding asset based sales charges. Pursuant to the Plan, Balanced, Small Cap Value and High Yield may make payments to the Distributor for their expenditures in financing any activity primarily intended to result in the sale of each such class of the Fund’s shares and for maintenance and personal service provided to existing shareholders of that class. The Plan authorizes payments to the Distributor up to 0.25% annually of each Fund’s average daily net assets attributable to the Investor Class shares.
For Intermediate Duration, the Investor Class of Small Cap Value, and the Service Class of both Balanced and Small Cap Value, the Board has approved reimbursement payments to the Investment Manager for shareholder servicing expenses (“shareholder servicing fees”) for the actual amount incurred up to a maximum annual rate of each Class’s average daily net assets. Shareholder servicing fees include payments to third parties such as a bank, broker-dealer, trust company or other financial intermediaries who provide shareholder recordkeeping, account servicing and other services. For Short Duration, the Board has approved the Fund to pay shareholder servicing fees directly to a broker-dealer for the actual amount incurred up to a maximum annual rate of the Fund’s average daily net asset value.
The impact on the annualized expense ratios for the year ended December 31, 2015, was as follows:
| | | | | | | | |
| | | Maximum | | | Actual | |
| Fund | | Amount Allowed | | | Amount Incurred | |
Balanced-Service Class | | | 0.100 | % | | | 0.100 | % |
Small Cap Value-Service Class | | | 0.150 | % | | | 0.110 | % |
Small Cap Value-Investor Class | | | 0.150 | % | | | 0.150 | % |
Intermediate Duration | | | 0.100 | % | | | 0.100 | % |
Short Duration | | | 0.100 | % | | | 0.001 | % |
The Securities and Exchange Commission granted an exemptive order that permits the Funds to lend and borrow money for certain temporary purposes directly to and from other eligible Funds in the AMG Funds family. Participation in this interfund lending program is voluntary for both the borrowing and lending Funds, and an interfund loan is only made if it benefits each participating Fund. The Investment Manager administers the program according to procedures approved by the Board, and the Board monitors the operation of the program. An interfund loan must comply with certain conditions set out in the exemptive order, which are designed to assure fairness and protect all participating Funds. For the year ended December 31, 2015, the following Funds either borrowed or lent to other Funds in the AMG Funds family: Balanced lent $1,186,568 for one day earning interest of $23, Intermediate Duration lent varying amounts not exceeding $3,005,600 for two days earning interest of $105 and Short Duration lent $1,640,771 for one day earning interest of $29. The interest amount is included in the Statement of Operations as interest income. Balanced borrowed varying amounts not exceeding $4,386,070, for 15 days paying interest of $417. The interest amount is included in the Statement of Operations as miscellaneous expense. At December 31, 2015, the Funds had no interfund loans outstanding.
Notes to Financial Statements (continued)
3. PURCHASES AND SALES OF SECURITIES
Purchases and sales of securities (excluding short-term securities) for the year ended December 31, 2015, were as follows:
| | | | | | | | |
| | | Long-Term Securities | |
| | | (excluding U.S. Government | |
| | | Obligations) | |
| Fund | | Purchases | | | Sales | |
Balanced | | $ | 129,462,336 | | | $ | 72,480,568 | |
Small Cap Value | | | 29,036,437 | | | | 15,158,228 | |
High Yield | | | 14,144,113 | | | | 18,471,999 | |
Intermediate Duration | | | 37,286,401 | | | | 17,052,876 | |
Short Duration | | | 64,954,905 | | | | 72,530,426 | |
| |
| | | U.S. Government Obligations | |
| Fund | | Purchases | | | Sales | |
Balanced | | $ | 59,323,958 | | | $ | 28,107,373 | |
Small Cap Value | | | — | | | | — | |
High Yield | | | — | | | | — | |
Intermediate Duration | | | 68,381,118 | | | | 30,065,694 | |
Short Duration | | | 121,084,534 | | | | 98,402,312 | |
4. PORTFOLIO SECURITIES LOANED
The Funds participate in the Program providing for the lending of securities to qualified brokers. Securities lending income includes earnings of such temporary cash investments, plus or minus any rebate to a borrower. These earnings (after any rebate) are then divided between BNYM, as a fee for its services under the Program, and the Funds, according to agreed-upon rates. Collateral on all securities loaned is accepted in cash and is maintained at a minimum level of 102% (105% in the case of certain foreign securities) of the market value, plus interest, if applicable, of investments on loan. It is the Funds’ policy to obtain additional collateral from or return excess collateral to the borrower by the end of the next business day, following the valuation date of the securities loaned. Therefore, the value of the collateral held may be temporarily less than the value of the securities on loan. Lending securities entails a risk of loss to the Funds if and to the extent that the market value of the securities loaned were to increase and the borrower did not increase the collateral accordingly, and the borrower fails to return the securities. Under the terms of the Program, the Funds are indemnified for such losses by BNYM. Cash collateral is held in a separate omnibus account managed by BNYM, who is authorized to exclusively enter into joint overnight government repurchase agreements. BNYM bears the risk of any deficiency in the amount of the cash collateral available for return to the borrower due to any loss on the collateral invested.
At December 31, 2015, the value of the securities loaned and cash collateral received, were as follows:
| | | | | | | | |
| | | Securities | | | Cash Collateral | |
| Fund | | Loaned | | | Received | |
Balanced | | $ | 2,123,769 | | | $ | 2,205,649 | |
Small Cap Value | | | 419,919 | | | | 438,158 | |
High Yield | | | 1,580,119 | | | | 1,652,196 | |
5. COMMITMENTS AND CONTINGENCIES
Under the Trusts’ organizational documents, its trustees and officers are indemnified against certain liabilities arising out of the performance of their duties to the Trusts. In addition, in the normal course of business, the Funds may enter into contracts and agreements that contain a variety of representations and warranties which provide general indemnifications. The maximum exposure to the Funds under these arrangements is unknown, as this would involve future claims that may be made against the Funds that have not yet occurred. However, based on experience, the Funds had no prior claims or losses and expect the risks of loss to be remote.
6. RISKS ASSOCIATED WITH HIGH YIELD SECURITIES
Investing in high yield securities involves greater risks and considerations not typically associated with U.S. Government and other high quality/investment grade securities. High yield securities are generally below investment grade securities and do not have an established retail secondary market. Economic downturns may disrupt the high yield market and impair the issuer’s ability to repay principal and interest. Also, an increase in interest rates would likely have an adverse impact on the value of such obligations and could cause the securities to become less liquid.
7. DERIVATIVE INSTRUMENTS
The following disclosures contain information on how and why the Funds use derivative instruments, the credit risk and how derivative instruments affect the Funds’ financial position, results of operations and cash flows. The location and fair value amounts of these instruments on the Statement of Assets and Liabilities and the realized and changes in unrealized gains and losses on the Statement of Operations, each categorized by type of derivative contract, are included in a table in the Notes to the Schedules of Portfolio Investments. For the year ended December 31, 2015, the average quarterly balances of derivative financial instruments outstanding were as follows:
| | | | | | | | |
| | | Intermediate | | | Short | |
| | | Duration | | | Duration | |
Financial futures contracts: | | | | | | | | |
Average number of contracts purchased | | | 7 | | | | 16 | |
Average number of contracts sold | | | 63 | | | | 547 | |
Average notional value of contracts purchased | | $ | 980,466 | | | $ | 1,867,384 | |
Average notional value of contracts sold | | $ | 6,879,500 | | | $ | 65,794,132 | |
87
Notes to Financial Statements (continued)
8. FUTURES CONTRACTS
The Funds entered into futures contracts to achieve a desired level of investment, whether to accommodate portfolio turnover or cash flows from capital shares transactions. There are certain risks associated with futures contracts. Prices may not move as expected or the Fund may not be able to close out the contract when it desires to do so, resulting in losses.
On entering into a futures contract, either cash or securities in an amount equal to a certain percentage of the contract value (initial margin) must be deposited with the futures broker. Subsequent payments (variation margin) are made or received each day. The variation margin payments equal the daily changes in the contract value and are recorded as unrealized gains or losses. For over-the-counter (“OTC”) futures, daily variation margin is not required. The Funds recognize a realized gain or loss when the contract is closed or expires equal to the difference between the value of the contract at the time it was opened and the value at the time it was closed. Futures are valued at their quoted daily settlement prices. The aggregate principal amounts of the contracts are not recorded in the financial statements. Fluctuations in the value of the contracts are recorded in the Statement of Assets and Liabilities as an asset (liability) and in the Statement of Operations as unrealized appreciation (depreciation) until the contracts are closed, when they are recorded as realized gains (losses) on futures contracts.
9. RISKS ASSOCIATED WITH COLLATERALIZED MORTGAGE OBLIGATIONS (“CMOs”)
The net asset values of the Funds may be sensitive to interest rate fluctuations because the Funds may hold several instruments, including CMOs and other derivatives, whose values can be significantly impacted by interest rate movements. CMOs are obligations collateralized by a portfolio of mortgages or mortgage-related securities. Payments of principal and interest on the mortgages are passed through to the holder of the CMOs on the same schedule as they are received, although certain classes of CMOs have priority over others with respect to the receipt of prepayments on the mortgages. Therefore, the investment in CMOs may be subject to a greater or lesser risk of prepayment than other types of mortgage-related securities. CMOs are subject to principal paydowns as a result of prepayments or refinancing of the underlying mortgage instruments. As a result, the average life may be substantially less than the original maturity. CMOs may have a fixed or variable rate of interest.
10. DOLLAR ROLL AGREEMENTS
The Funds may enter into dollar rolls in which they sell debt securities for delivery currently and simultaneously contract to repurchase similar, but not identical, securities at the same price or a lower price on an agreed date. The Funds receive compensation as consideration for entering into the commitment to repurchase. The compensation is the difference between the current sale price and the repurchase price (often referred to as the “drop”) as well as the interest earned on the cash proceeds of the initial sale. The Funds may also be compensated by the receipt of a commitment fee. As the holder, the counterparty receives all principal and interest payments, including prepayments, made with respect to the similar security sold. Dollar rolls may be renewed with a new sale and repurchase price with a cash settlement made at renewal without physical delivery of the securities subject to the contract.
Certain risks may arise upon entering into dollar rolls from the potential inability of counterparties to meet the terms of their commitments. Additionally, the value of such securities may change adversely before the Funds are able to repurchase them. There can be no assurance that the Funds’ use of the cash that they receive from a dollar roll will provide a return that exceeds their cost.
11. STRIPPED SECURITIES
The Funds invest in stripped securities (“STRIPS”), primarily interest-only strips, for their hedging characteristics. Interest-only STRIPS will most likely move differently than typical fixed-income securities in relation to changes in interest rates. STRIPS are usually structured with two classes that receive different proportions of the interest and principal distributions from a pool of underlying assets. A common type of STRIP will have one class receiving all of the interest from the underlying assets (“interest-only” or “IO” class), while the other class will receive the entire principal (“principal only” or “PO” class). However, in some instances, one class will receive some of the interest and most of the principal while the other class will receive most of the interest and the remainder of the principal. STRIPS are unusually volatile in response to changes in interest rates. The yield to maturity on an IO class of STRIPS is extremely sensitive not only to changes in prevailing interest rates but also to the rate of principal payments (including prepayments) on the underlying assets. A rapid rate of principal prepayments may have a measurably adverse effect on a Funds’ yield to maturity to the extent it invests in IOs. Conversely, POs tend to increase in value if prepayments are greater than anticipated and decline if prepayments are slower than anticipated. Thus, if the underlying assets experience greater than anticipated repayments of principal, a Fund may fail to fully recover its initial investment in these securities, even if the STRIPS were rated of the highest credit quality by Standard & Poor’s Corporation or Moody’s Investors Service, Inc. These risks are managed by investing in a variety of such securities and by using certain hedging techniques. In addition the secondary market for STRIPS may be less liquid than that of other mortgage-backed or asset-backed securities, potentially limiting a Fund’s ability to buy or sell those securities at any particular time.
12. MASTER NETTING AGREEMENTS
The Funds may enter into master netting agreements with their counterparties for the securities lending program and repurchase agreements, which provide the right, in the event of default (including bankruptcy or insolvency) for the non-defaulting party to liquidate the collateral and calculate net exposure to the defaulting party or request additional collateral. For financial reporting purposes, the Funds do not offset financial assets and financial liabilities that are subject to master netting agreements in the Statement of Assets and Liabilities. For securities lending transactions, see Note 4.
Notes to Financial Statements (continued)
The following table is a summary of the Funds’ open repurchase agreements that are subject to a master netting agreement as of December 31, 2015:
| | | | | | | | | | | | | | | | |
| | | | | | Gross Amount Not Offset in the | | | | |
| | | | | | Statement of Assets and Liabilities | | | | |
| | | Net Amounts of Assets | | | Financial | | | | | | | |
| | | Presented in the Statement of | | | Instruments | | | Cash Collateral | | | | |
| Fund | | Assets and Liabilities | | | Collateral | | | Received | | | Net Amount | |
Balanced | | | | | | | | | | | | | | | | |
Cantor Fitzgerald Securities, Inc. | | $ | 1,000,000 | | | $ | 1,000,000 | | | | — | | | | — | |
Daiwa Capital Markets America | | | 1,000,000 | | | | 1,000,000 | | | | | | | | | |
Nomura Securities International, Inc. | | | 205,649 | | | | 205,649 | | | | — | | | | — | |
| | | | | | | | | | | | | | | | |
Total | | $ | 2,205,649 | | | $ | 2,205,649 | | | | — | | | | — | |
| | | | | | | | | | | | | | | | |
Small Cap Value | | | | | | | | | | | | | | | | |
HSBC Securities USA, Inc. | | $ | 65,724 | | | $ | 65,724 | | | | — | | | | — | |
RBC Capital Markets LLC | | | 372,434 | | | | 372,434 | | | | — | | | | — | |
| | | | | | | | | | | | | | | | |
Total | | $ | 438,158 | | | $ | 438,158 | | | | — | | | | — | |
| | | | | | | | | | | | | | | | |
High Yield | | | | | | | | | | | | | | | | |
Cantor Fitzgerald Securities, Inc. | | $ | 1,000,000 | | | $ | 1,000,000 | | | | — | | | | — | |
Daiwa Capital Markets America | | | 652,196 | | | | 652,196 | | | | — | | | | — | |
| | | | | | | | | | | | | | | | |
Total | | $ | 1,652,196 | | | $ | 1,652,196 | | | | — | | | | — | |
| | | | | | | | | | | | | | | | |
13. SUBSEQUENT EVENTS
Each Fund has determined that no material events or transactions occurred through the issuance of the Funds’ financial statements, which require additional disclosure in or adjustment of the Funds’ financial statements.
TAX INFORMATION (unaudited)
The AMG Chicago Equity Partners Balanced Fund, AMG Chicago Equity Partners Small Cap Value Fund, AMG Managers High Yield Fund, AMG Managers Intermediate Duration Government Fund and AMG Managers Short Duration Government Fund each hereby designates the maximum amount allowable of its net taxable income as qualified dividends as provided in the Jobs and Growth Tax Relief Reconciliation Act of 2003. The 2015 Form 1099-DIV you receive for each Fund will show the tax status of all distributions paid to you during the year.
Pursuant to section 852 of the Internal Revenue Code, AMG Chicago Equity Partners Balanced Fund, AMG Chicago Equity Partners Small Cap Value Fund, AMG Managers High Yield Fund, AMG Managers Intermediate Duration Government Fund and AMG Managers Short Duration Government Fund each hereby designates $3,554,115, $0, $0, $177,508 and $0, respectively, as a capital gain distribution with respect to the taxable year ended December 31, 2015, or if subsequently determined to be different, the net capital gains of such fiscal year.
89
Report of Independent Registered Public Accounting Firm
TO THE BOARDS OF TRUSTEES OF AMG FUNDS AND AMG FUNDS II AND THE SHAREHOLDERS OF AMG CHICAGO EQUITY PARTNERS BALANCED FUND, AMG CHICAGO EQUITY PARTNERS SMALL CAP VALUE FUND, AMG MANAGERS HIGH YIELD FUND, AMG MANAGERS INTERMEDIATE DURATION GOVERNMENT FUND AND AMG MANAGERS SHORT DURATION GOVERNMENT FUND:
In our opinion, the accompanying statements of assets and liabilities, including the schedules of portfolio investments, and the related statements of operations and of changes in net assets and the financial highlights present fairly, in all material respects, the financial position of AMG Chicago Equity Partners Balanced Fund, AMG Chicago Equity Partners Small Cap Value Fund, AMG Managers High Yield Fund, AMG Managers Intermediate Duration Government Fund, and AMG Managers Short Duration Government Fund (the “Funds”) at December 31, 2015, and the results of each of their operations, the changes in each of their net assets and the financial highlights for each of the periods indicated, in conformity with accounting principles generally accepted in the United States of America. These financial statements and financial highlights (hereafter referred to as “financial statements”) are the responsibility of the Funds’ management. Our responsibility is to express an opinion on these financial statements based on our audits. We conducted our audits of these financial statements in accordance with the standards of the Public Company Accounting Oversight Board (United States). Those standards require that we plan and perform the audit to obtain reasonable assurance about whether the financial statements are free of material misstatement. An audit includes examining, on a test basis, evidence supporting the amounts and disclosures in the financial statements, assessing the accounting principles used and significant estimates made by management, and evaluating the overall financial statement presentation. We believe that our audits, which included confirmation of securities at December 31, 2015 by correspondence with the custodian, brokers, and transfer agent, and the application of alternative auditing procedures where securities purchased had not been received, provide a reasonable basis for our opinion.
PricewaterhouseCoopers LLP
Boston, Massachusetts
February 29, 2016
90
AMG Funds
Trustees and Officers
The Trustees and Officers of the Trust, their business addresses, principal occupations for the past five years and ages are listed below. The Trustees provide broad supervision over the affairs of the Trust and the Funds. The Trustees are experienced executives who meet periodically throughout the year to oversee the Funds’ activities, review contractual arrangements with
companies that provide services to the Funds, and review the Funds’ performance. Unless otherwise noted, the address of each Trustee or Officer is the address of the Trust: 600 Steamboat Road, Suite 300, Greenwich, Connecticut 06830.
There is no stated term of office for Trustees. Trustees serve until their resignation, retirement or removal in accordance with the Trust’s
organizational documents and policies adopted by the Board from time to time. The Chairman of the Trustees, President, Treasurer and Secretary of the Trust are elected by the Trustees annually. Other officers hold office at the pleasure of the Trustees.
Independent Trustees
The following Trustees are not “interested persons” of the Trust within the meaning of the 1940 Act:
| | |
| Number of Funds | | |
Overseen in Fund Complex | | Name, Age, Principal Occupation(s) During Past 5 Years and Other Directorships Held by Trustee |
• Trustee since 2012 | | Bruce B. Bingham, 67 |
• Oversees 72 Funds in Fund Complex | | Partner, Hamilton Partners (real estate development firm) (1987-Present); Trustee of Aston Funds (27 portfolios) (2014-Present); Director of The Yacktman Funds (2000-2012). |
| |
• Independent Chairman | | William E. Chapman, II, 74 |
• Trustee since 1999 - AMG Funds • Trustee since 2000 - AMG Funds II • Oversees 72 Funds in Fund Complex | | President and Owner, Longboat Retirement Planning Solutions (1998-Present); Hewitt Associates, LLC (part time) (provider of Retirement and Investment Education Seminars) (2002-2009); Trustee Emeritus of Bowdoin College (2013-Present); Trustee of Bowdoin College (2002-2013); Director of Harding, Loevner Funds, Inc. (6 portfolios); Trustee of Third Avenue Trust (5 portfolios); Trustee of Third Avenue Variable Trust (1 portfolio); Trustee of Aston Funds (27 portfolios) (2010-Present). |
| |
• Trustee since 1999 - AMG Funds | | Edward J. Kaier, 70 Attorney at Law and Partner, Teeters Harvey Marrone & Kaier LLP (2007-Present); Attorney at Law and Partner, Hepburn Willcox Hamilton & Putnam, LLP (1977-2007); Trustee of Third Avenue Trust (5 portfolios); Trustee of Third Avenue Variable Trust (1 portfolio); Trustee of Aston Funds (27 portfolios) (2010-Present). |
• Trustee since 2000 - AMG Funds II • Oversees 72 Funds in Fund Complex | |
| |
• Trustee since 2013 | | Kurt A. Keilhacker, 52 |
• Oversees 74 Funds in Fund Complex | | Managing Member, TechFund Capital (1997-Present); Managing Member, TechFund Europe (2000-Present); Board Member, 6wind SA, (2002-Present); Managing Member, Elementum Ventures (2013-Present); Trustee of Aston Funds (27 portfolios) (2014-Present); Trustee, Gordon College (2001-2016). |
| |
• Trustee since 2004 - AMG Funds | | Steven J. Paggioli, 65 Independent Consultant (2002-Present); Formerly Executive Vice President and Director, The Wadsworth Group (1986-2001); Executive Vice President, Secretary and Director, Investment Company Administration, LLC (1990-2001); Vice President, Secretary and Director, First Fund Distributors, Inc. (1991-2001); Trustee, Professionally Managed Portfolios (32 portfolios); Advisory Board Member, Sustainable Growth Advisors, LP; Independent Director, Chase Investment Counsel (2008 – Present); Trustee of Aston Funds (27 portfolios) (2010-Present). |
• Trustee since 2000 - AMG Funds II • Oversees 72 Funds in Fund Complex | |
| |
• Trustee since 2013 | | Richard F. Powers III, 70 |
• Oversees 72 Funds in Fund Complex | | Adjunct Professor, Boston College (2010-2013); Trustee of Aston Funds (27 portfolios) (2014-Present); President and CEO of Van Kampen Investments Inc. (1998-2003). |
| |
• Trustee since 1999 - AMG Funds | | Eric Rakowski, 57 Professor, University of California at Berkeley School of Law (1990-Present); Director of Harding, Loevner Funds, Inc. (6 portfolios); Trustee of Third Avenue Trust (5 portfolios); Trustee of Third Avenue Variable Trust (1 portfolio); Trustee of Aston Funds (27 portfolios) (2010-Present). |
• Trustee since 2000 - AMG Funds II • Oversees 74 Funds in Fund Complex | |
| |
• Trustee since 2013 | | Victoria L. Sassine, 50 |
• Oversees 74 Funds in Fund Complex | | Lecturer, Babson College (2007 – Present); Trustee of Aston Funds (27 portfolios) (2014-Present). |
| |
• Trustee since 2004 - AMG Funds • Trustee since 2000 - AMG Funds II • Oversees 72 Funds in Fund Complex | | Thomas R. Schneeweis, 68 Professor Emeritus, University of Massachusetts (2013—Present); Partner, S Capital Wealth Advisors (2015-Present); President, TRS Associates (1982-Present); Board Member, Chartered Alternative Investment Association (“CAIA”) (2002-Present); Director, CAIA Foundation (Education), (2010-Present); Director, Institute for Global Asset and Risk Management (Education) (2010-Present); Partner, S Capital Management, LLC (2007-2015); Director CISDM at the University of Massachusetts, (1996-2013); President, Alternative Investment Analytics, LLC, (formerly Schneeweis Partners, LLC) (2001-2013); Professor of Finance, University of Massachusetts (1977-2013); Trustee of Aston Funds (27 portfolios) (2010-Present). |
| |
91
AMG Funds
Trustees and Officers (continued)
Interested Trustees
Each Trustee in the following table is an “interested person” of the Trust within the meaning of the 1940 Act. Ms. Carsman is an interested person of the Trust within the meaning of the 1940 Act by virtue of her position with, and interest in securities of, AMG.
| | |
| Number of Funds | | |
Overseen in Fund Complex | | Name, Age, Principal Occupation(s) During Past 5 Years and Other Directorships Held by Trustee |
• Trustee since 2011 | | Christine C. Carsman, 63 |
• Oversees 74 Funds in Fund Complex | | Senior Vice President and Deputy General Counsel, Affiliated Managers Group, Inc. (2011-Present); Trustee of Aston Funds (27 portfolios) (2014-Present); Senior Vice President and Chief Regulatory Counsel, Affiliated Managers Group, Inc. (2007-2011); Vice President and Chief Regulatory Counsel, Affiliated Managers Group, Inc. (2004-2007); Secretary and Chief Legal Officer, AMG Funds, AMG Funds I, AMG Funds II and AMG Funds III (2004-2011); Senior Counsel, Vice President and Director of Operational Risk Management and Compliance, Wellington Management Company, LLP (1995-2004). |
| |
| Officers | | |
| |
Position(s) Held with Fund and
Length of Time Served | | Name, Age, Principal Occupation(s) During Past 5 Years |
• President since 2014 | | Jeffrey T. Cerutti, 48 |
• Principal Executive Officer since 2014 | | Chief Executive Officer, AMG Funds LLC (2014-Present); Director, President and Principal, AMG Distributors, Inc. (2014-Present); Chief Executive Officer and President, Aston Funds (2015-Present); President, VP Distributors, (2011-2014); Executive Vice President, Head of Distribution, Virtus Investment Partners, Inc. (2010-2014); Managing Director, Head of Sales, UBS Global Asset Management (2001-2010). |
| |
• Chief Operating Officer | | Keitha L. Kinne, 57 |
since 2007 | | Chief Operating Officer, AMG Funds LLC (2007-Present); Chief Investment Officer, AMG Funds LLC (2008-Present); Chief Operating Officer, AMG Distributors, Inc. (2007-Present); Managing Partner, AMG Funds LLC (2007-2014); President, AMG Funds (2012-2014); President, AMG Distributors, Inc. (2012-2014); Managing Director, Legg Mason & Co., LLC (2006-2007); Managing Director, Citigroup Asset Management (2004-2006). |
| |
• Secretary since 2015 | | Mark J. Duggan, 51 |
• Chief Legal Officer since 2015 | | Senior Vice President and Senior Counsel, AMG Funds LLC (2015-Present); Secretary and Chief Legal Officer, AMG Funds, AMG Funds I, AMG Funds II and AMG Funds III (2015-Present); Attorney, K&L Gates, LLP (2009-2015). |
| |
• Chief Financial | | Donald S. Rumery, 57 |
Officer since 2007 • Treasurer since 1999 • Principal Financial Officer since 2008 | | Senior Vice President, Director of Mutual Funds Services, AMG Funds LLC (2005-Present); Treasurer, AMG Funds III (1995-Present); Treasurer, AMG Funds (1999-Present); Treasurer, AMG Funds I and AMG Funds II (2000-Present); Chief Financial Officer, AMG Funds, AMG Funds I, AMG Funds II and AMG Funds III (2007-Present); Treasurer and Chief Financial Officer, AMG Distributors, Inc. (2000-2012); Vice President, AMG Funds LLC, (1994-2004). |
| |
• Assistant Treasurer | | John C. Ball, 40 |
since 2014 | | Vice President, Assistant Treasurer, AMG Funds LLC (2014-Present); Vice President, State Street Corp. (2010-2014); Vice President, State Street International (Ireland) Limited (2007-2010). |
| |
• Chief Compliance Officer | | John J. Ferencz, 53 |
since 2010 | | Vice President, Chief Compliance Officer—AMG Family of Funds, AMG Funds LLC (2010-Present); Code of Ethics Reporting Officer and Sarbanes Oxley Code of Ethics Compliance Officer, AMG Funds, AMG Funds I, AMG Funds II and AMG Funds III (2010-Present); Senior Compliance Analyst, Mutual Funds and Regulatory, GE Asset Management Incorporated (2005-2010). |
| |
• Anti-Money Laundering | | Patrick J. Spellman, 41 |
Compliance Officer since 2014 | | Senior Vice President, Chief Compliance Officer, AMG Funds LLC (2011-Present); Chief Compliance Officer, AMG Distributors, Inc., (2010-Present); Compliance Manager, Legal and Compliance, Affiliated Managers Group, Inc. (2005-2011). |
92
INVESTMENT MANAGER AND ADMINISTRATOR
AMG Funds LLC
600 Steamboat Road, Suite 300
Greenwich, CT 06830
(800) 835-3879
DISTRIBUTOR
AMG Distributors, Inc.
600 Steamboat Road, Suite 300
Greenwich, CT 06830
(800) 835-3879
CUSTODIAN
The Bank of New York Mellon
2 Hanson Place
Brooklyn, NY 11217
LEGAL COUNSEL
Ropes & Gray LLP
Prudential Tower, 800 Boylston Street
Boston, MA 02199-3600
TRANSFER AGENT
BNY Mellon Investment Servicing (US) Inc.
Attn: AMG Funds
P.O. Box 9769
Providence, RI 02940
(800) 548-4539
FOR MANAGERSCHOICETM ONLY
AMG Funds
c/o BNY Mellon Investment Servicing (US) Inc.
P.O. Box 9847
Providence, Rhode Island 02940-8047
(800) 358-7668
This report is prepared for the Funds’ shareholders. It is authorized for distribution to prospective investors only when preceded or accompanied by an effective prospectus. To receive a free copy of the prospectus or Statement of Additional Information, which includes additional information about Fund Trustees, please contact us by calling 800.835.3879. Distributed by AMG Distributors, Inc., member FINRA/SIPC.
Current net asset values per share for each Fund are available on the Funds’ website at www.amgfunds.com.
A description of the policies and procedures each Fund uses to vote its proxies is available: (i) without charge, upon request, by calling 800.835.3879, or (ii) on the Securities and Exchange Commission’s (SEC) website at www.sec.gov. For information regarding each Fund’s proxy voting record for the 12-month period ended June 30, call 800.835.3879 or visit the SEC website at www.sec.gov.
Each Fund files its complete schedule of portfolio holdings with the SEC for the first and third quarters of each fiscal year on Form N-Q. The Funds’ Forms N-Q are available on the SEC’s website at www.sec.gov. A Fund’s Forms N-Q may be reviewed and copied at the SEC’s Public Reference Room in Washington, DC. Information on the operation of the Public Reference Room may be obtained by calling 1-800-SEC-0330. To review a complete list of the Funds’ portfolio holdings, or to view the most recent quarterly holdings report, semiannual report, or annual report, please visit www.amgfunds.com.
AFFILIATE SUBADVISED FUNDS
BALANCED FUNDS
AMG Chicago Equity Partners Balanced
Chicago Equity Partners, LLC
AMG FQ Global Risk-Balanced
First Quadrant, L.P.
EQUITY FUNDS
AMG Chicago Equity Partners Small Cap Value
Chicago Equity Partners, LLC
AMG FQ Tax-Managed U.S. Equity
AMG FQ U.S. Equity
First Quadrant, L.P.
AMG Frontier Small Cap Growth
Frontier Capital Management Company, LLC
AMG GW&K Small Cap Core
AMG GW&K Small Cap Growth
GW&K Investment Management, LLC
AMG Renaissance International Equity
AMG Renaissance Large Cap Growth
The Renaissance Group LLC
AMG SouthernSun Small Cap
AMG SouthernSun U.S. Equity
SouthernSun Asset Management, LLC
AMG Systematic Large Cap Value
AMG Systematic Mid Cap Value
Systematic Financial Management, L.P.
AMG TimesSquare All Cap Growth
AMG TimesSquare International Small Cap
AMG TimesSquare Mid Cap Growth
AMG TimesSquare Small Cap Growth
TimesSquare Capital Management, LLC
AMG Trilogy Emerging Markets Equity
AMG Trilogy Emerging Wealth Equity
AMG Trilogy Global Equity
AMG Trilogy International Small Cap
Trilogy Global Advisors, L.P.
AMG Yacktman
AMG Yacktman Focused
AMG Yacktman Special Opportunities
Yacktman Asset Management LP
FIXED INCOME FUNDS
AMG GW&K Core Bond
AMG GW&K Enhanced Core Bond
AMG GW&K Municipal Bond
AMG GW&K Municipal Enhanced Yield
GW&K Investment Management, LLC
OPEN-ARCHITECTURE FUNDS
EQUITY FUNDS
AMG Managers Brandywine
AMG Managers Brandywine Advisors Mid Cap Growth
AMG Managers Brandywine Blue
Friess Associates, LLC
AMG Managers Cadence Capital Appreciation
AMG Managers Cadence Emerging Companies
AMG Managers Cadence Mid Cap
Cadence Capital Management, LLC
AMG Managers Emerging Opportunities
Lord, Abbett & Co. LLC
WEDGE Capital Management L.L.P.
Next Century Growth Investors LLC
RBC Global Asset Management (U.S.) Inc.
AMG Managers Essex Small/Micro Cap Growth
Essex Investment Management Co., LLC
AMG Managers Real Estate Securities
CenterSquare Investment Management, Inc.
AMG Managers Skyline Special Equities
Skyline Asset Management, L.P.
AMG Managers Special Equity
Ranger Investment Management, L.P.
Lord, Abbett & Co. LLC
Smith Asset Management Group, L.P.
Federated MDTA LLC
FIXED INCOME FUNDS
AMG Managers Bond
AMG Managers Global Income Opportunity
Loomis, Sayles & Co., L.P.
AMG Managers High Yield
J.P. Morgan Investment Management Inc.
AMG Managers Intermediate Duration Government
AMG Managers Short Duration Government
Amundi Smith Breeden LLC
| | | | |

| | | www.amgfunds.com | |
| | | | |
| | | | |
Item 2. CODE OF ETHICS
Registrant has adopted a Code of Ethics. See attached Exhibit (a)(1).
Item 3. AUDIT COMMITTEE FINANCIAL EXPERT
Registrant’s Board of Trustees has determined that independent Trustee Mr. Steven J. Paggioli qualifies as an Audit Committee Financial Expert. Mr. Paggioli is “independent” as such term is defined in Form N-CSR.
Item 4. PRINCIPAL ACCOUNTANT FEES AND SERVICES
(a) Audit Fees
The aggregate fees billed by the Funds’ independent registered public accounting firm, PricewaterhouseCoopers LLP (“PwC”), to the Funds for the Funds’ two most recent fiscal years for professional services rendered for audits of annual financial statements, or services that are normally provided in connection with statutory and regulatory filings or engagements (“Audit Fees”) were as follows:
| | | | | | | | |
Fund - AMG FUNDS II | | Fiscal 2015 | | | Fiscal 2014 | |
AMG GW&K Enhanced Core Bond Fund | | $ | 41,633 | | | $ | 41,097 | |
AMG Chicago Equity Partners Balanced Fund | | $ | 32,237 | | | $ | 26,100 | |
AMG Managers High Yield Fund | | $ | 46,662 | | | $ | 50,909 | |
AMG Managers Short Duration Government Fund | | $ | 45,939 | | | $ | 44,896 | |
AMG Managers Intermediate Duration Government Fund | | $ | 42,072 | | | $ | 52,186 | |
(b) Audit-Related Fees
There were no fees billed by PwC to the Funds in its two recent fiscal years for services rendered for assurance and related services that are reasonably related to the performance of the audit or review of the Fund’s financial statements, but are not reported as Audit Fees (“Audit-Related Fees”).
For the Funds’ two most recent fiscal years, there were no Audit-Related Fees billed by PwC for engagements related directly to the operations and financial reporting of one or more Funds by a Fund Service Provider. A Fund Service Provider is (a) any investment adviser to the Fund (not including any Subadvisor whose role is primarily portfolio management and is subcontracted with or overseen by another investment adviser) or (b) any entity that provides ongoing services to the Fund and is controlling, controlled by or under common control with a Fund investment adviser described in (a).
(c) Tax Fees
The aggregate fees billed by PwC to the Funds for the two most recent fiscal years for professional services rendered for tax compliance, tax advice, and tax planning (“Tax Fees”) were as follows:
| | | | | | | | |
Fund - AMG FUNDS II | | Fiscal 2015 | | | Fiscal 2014 | |
AMG GW&K Enhanced Core Bond Fund | | $ | 9,240 | | | $ | 8,830 | |
AMG Chicago Equity Partners Balanced Fund | | $ | 7,225 | | | $ | 6,885 | |
AMG Managers High Yield Fund | | $ | 9,240 | | | $ | 8,830 | |
AMG Managers Short Duration Government Fund | | $ | 9,960 | | | $ | 9,530 | |
AMG Managers Intermediate Duration Government Fund | | $ | 9,960 | | | $ | 9,530 | |
For the Funds’ two most recent fiscal years, Tax Fees billed by PwC for engagements by Fund Service Providers that related directly to the operations and financial reporting of the Funds were $0 for fiscal 2014 and $0 for fiscal 2013, respectively.
The services for which Tax Fees were charged comprise all services performed by professional staff in PwC’s tax division except those services related to the audit. Typically, this category would include fees for tax compliance, tax planning, and tax advice. Tax compliance, tax advice, and tax planning services include preparation of original and amended tax returns, claims for refund and tax payment-planning services, assistance with tax audits and appeals, tax advice related to mergers and acquisitions and requests for rulings or technical advice from taxing authorities.
(d) All Other Fees
There were no other fees billed by PwC to the Funds for all other non-audit services (“Other Fees”) during the Funds’ two most recent fiscal years. During the same period, there were no Other Fees billed by PwC for engagements by Fund Service Providers that related directly to the operations and financial reporting of the Funds.
(e) (1) According to policies adopted by the Audit Committee, services provided by PwC to the Funds must be pre-approved by the Audit Committee. On an annual basis, the Audit Committee reviews and pre-approves various types of services that PwC may perform for the Funds without specific approval of each engagement, subject to specified budget limitations. As contemplated by the Sarbanes-Oxley Act of 2002 and related SEC rules, the Audit Committee also pre-approves non-audit services provided by PwC to any Fund Service Provider for any engagement that relates directly to the operations and financial reporting of the Funds. Any engagement that is not already pre-approved or that will exceed a pre-approved budget must be submitted to the Audit Committee for pre-approval. The Chairman of the Audit Committee is authorized on behalf of the Board of Trustees and the Audit Committee to approve the engagement of PwC to perform non-audit services subject to certain conditions, including notification to the Audit Committee of such pre-approval not later than the next meeting of the Audit Committee following the date of such pre-approval.
(e)(2) None.
(f) Not applicable.
(g) The aggregate fees billed by PwC in 2015 and 2014 for non-audit services rendered to the Funds and Fund Service Providers were $111,625 and $109,500, respectively. For the fiscal years ended December 31, 2015, this amount reflects the amounts disclosed above in Item 4(b),(c),(d), plus $0 in fees billed to the Fund Service Providers for non-audit services that did not relate directly to the operations and financial reporting of the Funds. For the fiscal year ended December 31, 2014, this amount reflects the amounts disclosed above in Item 4(b),(c),(d), plus $0 in fees billed to the Fund Service Providers for non-audit services that did not relate directly to the operations and financial reporting of the Funds.
(h) The Trust’s Audit Committee has considered whether the provision of non-audit services by registrant’s independent registered public accounting firm to the registrant’s investment advisor, and any entity controlling, controlled, or under common control with the investment advisor that provided ongoing services to the registrant that were not pre-approved by the Committee (because such services did not relate directly to the operations and financial reporting of the registrant) was compatible with maintaining the independence of the independent registered public accounting firm.
Item 5. AUDIT COMMITTEE OF LISTED REGISTRANTS
Not applicable.
Item 6. SCHEDULE OF INVESTMENTS
The schedule of investments in unaffiliated issuers as of the close of the reporting period is included as part of the shareholder report contained in Item 1 hereof.
Item 7. DISCLOSURE OF PROXY VOTING POLICIES AND PROCEDURES FOR CLOSED-END MANAGEMENT INVESTMENT COMPANIES
Not applicable.
Item 8. PORTFOLIO MANAGERS OF CLOSED-END MANAGEMENT INVESTMENT COMPANIES
Not applicable.
Item 9. PURCHASES OF EQUITY SECURITIES BY CLOSED-END MANAGEMENT INVESTMENT COMPANIES AND AFFILIATED PURCHASERS
Not applicable.
Item 10. SUBMISSION OF MATTERS TO A VOTE OF SECURITY HOLDERS
Not applicable.
Item 11. CONTROLS AND PROCEDURES
(a) The Registrant’s principal executive and principal financial officers have concluded, based on their evaluation of the registrant’s disclosure controls and procedures as of a date within 90 days of the filing of this report, that the Registrant’s disclosure controls and procedures are reasonably designed to ensure that information required to be disclosed by the Registrant on Form N-CSR is recorded, processed, summarized and reported within the required time periods and that information required to be disclosed by the registrant in the reports that it files or submits on Form N-CSR is accumulated and communicated to the Registrant’s management, including its principal executive and principal financial officers, as appropriate to allow timely decisions regarding required disclosure.
(b) There were no changes in the Registrant’s internal control over financial reporting during the Registrant’s fourth fiscal quarter of the period covered by this report that have materially affected, or are reasonably likely to affect, the internal control over financial reporting.
Item 12. EXHIBITS
| | |
| |
(a)(1) | | Any Code of Ethics or amendments hereto. Filed herewith. |
| |
(a)(2) | | Certifications pursuant to Rule 30a-2(a) under the Investment Company Act of 1940 - Filed herewith. |
| |
(a)(3) | | Not applicable. |
| |
(b) | | Certifications pursuant to Rule 30a-2(b) under the Investment Company Act of 1940 - Filed herewith. |
SIGNATURES
Pursuant to the requirements of the Securities Exchange Act of 1934 and the Investment Company Act of 1940, the registrant has duly caused this report to be signed on its behalf by the undersigned, thereunto duly authorized.
| | |
| AMG FUNDS II |
| |
| By: | | /s/ Jeffrey T. Cerutti |
| | Jeffrey T. Cerutti, Principal Executive Officer |
| |
Date: | | March 8, 2016 |
Pursuant to the requirements of the Securities Exchange Act of 1934 and the Investment Company Act of 1940, this report has been signed below by the following persons on behalf of the registrant and in the capacities and on the dates indicated.
| | |
| By: | | /s/ Jeffrey T. Cerutti |
| | Jeffrey T. Cerutti, Principal Executive Officer |
| |
Date: | | March 8, 2016 |
| |
| By: | | /s/ Donald S. Rumery |
| | Donald S. Rumery, Principal Financial Officer |
| |
Date: | | March 8, 2016 |