Table of Contents
UNITED STATES
SECURITIES AND EXCHANGE COMMISSION
Washington, D.C. 20549
FORM N-CSR
CERTIFIED SHAREHOLDER REPORT OF REGISTERED
MANAGEMENT INVESTMENT COMPANIES
Investment Company Act file number: 811-06431
AMG Funds II
(Exact name of registrant as specified in charter)
600 Steamboat Road, Suite 300,
Greenwich, Connecticut 06830
(Address of principal executive offices) (Zip code)
AMG Funds LLC
600 Steamboat Road, Suite 300,
Greenwich, Connecticut 06830
(Name and address of agent for service)
Registrant’s telephone number, including area code: (203) 299-3500
Date of fiscal year end: DECEMBER 31
Date of reporting period: JANUARY 1, 2017 – DECEMBER 31, 2017
(Annual Shareholder Report)
Table of Contents
Item 1. Reports to Shareholders
Table of Contents
 | ANNUAL REPORT |
AMG Funds
December 31, 2017
AMG Chicago Equity Partners Balanced Fund
Class N: MBEAX | Class I: MBESX | Class Z: MBEYX
AMG Chicago Equity Partners Small Cap Value Fund
Class N: CESVX | Class I: CESSX | Class Z: CESIX
AMG Managers Amundi Intermediate Government Fund
Class N: MGIDX | Class I: MADIX | Class Z: MAMZX
AMG Managers Amundi Short Duration Government Fund
Class N: MGSDX | Class I: MANIX | Class Z: MATZX
| amgfunds.com | | 123117 AR009 |
Table of Contents
Table of Contents
AMG Funds
Annual Report—December 31, 2017
| PAGE | ||||
| 2 | ||||
| 3 | ||||
PORTFOLIO MANAGER’S COMMENTS, FUND SNAPSHOTS AND SCHEDULES OF PORTFOLIO INVESTMENTS | ||||
| 4 | ||||
| 16 | ||||
| 23 | ||||
| 31 | ||||
FINANCIAL STATEMENTS | ||||
| 41 | ||||
Balance sheets, net asset value (NAV) per share computations and cumulative undistributed amounts | ||||
| 43 | ||||
Detail of sources of income, expenses, and realized and unrealized gains (losses) during the fiscal year | ||||
| 44 | ||||
Detail of changes in assets for the past two fiscal years | ||||
| 46 | ||||
Historical net asset values per share, distributions, total returns, income and expense ratios, turnover ratios and net assets | ||||
| 58 | ||||
Accounting and distribution policies, details of agreements and transactions with Fund management and affiliates, and descriptions of certain investment risks | ||||
| 68 | ||||
| 69 | ||||
| 70 | ||||
Nothing contained herein is to be considered an offer, sale or solicitation of an offer to buy shares of any series of the AMG Funds family of mutual funds. Such offering is made only by prospectus, which includes details as to offering price and other material information.
Table of Contents
| | Letter to Shareholders |
Dear Shareholder:
The last 12 months was a strong period for equity markets as the health of the global economy improved and positive investor sentiment helped extend the U.S. bull market into its ninth year. The S&P 500® Index, a widely followed barometer of the U.S. equity market, returned 21.83% during the fiscal year ended December 31, 2017. By comparison, small cap stocks underperformed large caps with a 14.65% return for the small cap Russell 2000® Index.
The S&P 500 Index has notched positive performance in every month since the U.S. presidential election amidst the backdrop of strong corporate earnings, improving global economic growth and the passage of sweeping tax reform. 2017 also marked a turning point for the broader global economy as growth accelerated in a more coordinated fashion around the world, global trade improved and commodities recovered. U.S. equity market volatility remained extremely low despite saber rattling in North Korea and a devastating hurricane season. In fact, the S&P 500 Index has not seen a pullback greater than 5% since the summer of 2016.
In total, all but two sectors of the S&P 500 Index were positive during the last 12 months; however, there was significant dispersion in performance across sectors. Information technology and materials stocks led the Index with returns of 38.87% and 23.25%, respectively, while companies within the energy and telecommunication services sectors were the laggards with returns of (1.11)% and (1.49)%, respectively. Growth stocks outperformed value during all four quarters of the year and ended 2017 with returns of 30.2% and 13.7% for the Russell 1000® Growth and Russell 1000® Value Indexes, respectively. International equities outperformed domestic equities for the first time since 2012 as the global economy picked up and international returns were boosted by a weaker U.S. Dollar with the MSCI All Country World ex-USA Index returning 27.19% during the year. Meanwhile, emerging markets had their strongest year since 2009 with a 37.3% return for the MSCI Emerging Markets Index.
The U.S. bond market produced modestly positive returns for the year, as measured by the 3.54% return for the Bloomberg Barclays U.S. Aggregate Bond Index, a broad measure of U.S. bond market performance. The yield curve flattened as the U.S. Federal Reserve (the Fed) continued to normalize monetary policy and short-term interest rates rose more than longer-term rates. The 2-year U.S. Treasury note rose 69 basis points during the year to yield 1.89% while the 10-year U.S. Treasury note
ended 2017 at a 2.40% yield, five basis points lower than where it started. Investment grade corporates outperformed Treasuries and securitized credits with returns of 6.42%, 2.31% and 2.51%, respectively. Bond investors willing to accept more credit risk were rewarded with higher returns as high yield bonds performed strongly and credit spreads tightened. The Bloomberg Barclays U.S. Corporate High Yield Index ended the period with a 7.50% return.
AMG Funds appreciates the privilege of providing investment tools to you and your clients. Our foremost goal is to provide investment solutions that help our shareholders successfully reach their long-term investment goals. By partnering with AMG’s affiliated investment boutiques, AMG Funds provides access to a distinctive array of actively managed return-oriented investment strategies. Additionally, we oversee and distribute a number of complementary open-architecture mutual funds subadvised by unaffiliated investment managers. We thank you for your continued confidence and investment in AMG Funds. You can rest assured that under all market conditions our team is focused on delivering excellent investment management services for your benefit.
Respectfully,

Jeffery Cerutti
President
AMG Funds
| Periods ended December 31, 2017* | ||||||||||||||||
Average Annual Total Returns | 1 Year | 3 Years | 5 Years | |||||||||||||
Stocks: | ||||||||||||||||
Large Caps | (S&P 500® Index) | 21.83 | % | 11.41 | % | 15.79 | % | |||||||||
Small Caps | (Russell 2000® Index) | 14.65 | % | 9.96 | % | 14.12 | % | |||||||||
International | | (MSCI All Country World ex-USA Index) | | 27.19 | % | 7.83 | % | 6.80 | % | |||||||
Bonds: | ||||||||||||||||
Investment Grade | | (Bloomberg Barclays U.S. Aggregate Bond Index) | | 3.54 | % | 2.24 | % | 2.10 | % | |||||||
High Yield | | (Bloomberg Barclays U.S. Corporate High Yield Index) | | 7.50 | % | 6.35 | % | 5.78 | % | |||||||
Tax-exempt | | (Bloomberg Barclays Municipal Bond Index) | | 5.45 | % | 2.98 | % | 3.02 | % | |||||||
Treasury Bills | | (ICE BofAML 6-Month U.S. Treasury Bill Index) | | 0.95 | % | 0.62 | % | 0.43 | % | |||||||
| * | Source: Factset. Past performance is no guarantee of future results. |
2
Table of Contents
As a shareholder of a Fund, you may incur two types of costs: (1) transaction costs, which may include sales charges (loads) on purchase payments; redemption fees; and exchange fees; and (2) ongoing costs, including management fees; distribution (12b-1) fees; and other Fund expenses. This example is intended to help you understand your ongoing costs (in dollars) of investing in the Fund and to compare these costs with the ongoing costs of investing in other mutual funds. The example is based on $1,000 invested at the beginning of the period and held for the entire period as indicated below.
ACTUAL EXPENSES
The first line of the following table provides information about the actual account values and actual expenses. You may use the information in this line, together with the amount you invested, to estimate the expenses that you paid over the period. Simply divide your account value by $1,000 (for example, an $8,600 account value divided by $1,000 = 8.6), then multiply the result by the number in the first line under the heading entitled “Expenses Paid During Period” to estimate the expenses you paid on your account during this period.
HYPOTHETICAL EXAMPLE FOR COMPARISON PURPOSES
The second line of the following table provides information about hypothetical account values and hypothetical expenses based on the Fund’s actual expense ratio and an assumed annual rate of return of 5% before expenses, which is not the Fund’s
actual return. The hypothetical account values and expenses may not be used to estimate the actual ending account balance or expenses you paid for the period. You may use this information to compare the ongoing costs of investing in the Fund and other funds by comparing this 5% hypothetical example with the 5% hypothetical examples that appear in the shareholder reports of other funds.
Please note that the expenses shown in the table are meant to highlight your ongoing costs only and do not reflect any transactional costs, such as sales charges (loads), redemption fees, or exchange fees. Therefore, the second line of the table is useful in comparing ongoing costs only, and will not help you determine the relative total costs of owning different funds.
| Six Months Ended December 31, 2017 | Expense Ratio for the Period | Beginning Account Value 07/01/17 | Ending Account Value 12/31/17 | Expenses Paid During the Period* | ||||||||||||
AMG Chicago Equity Partners Balanced Fund | ||||||||||||||||
Based on Actual Fund Return | ||||||||||||||||
Class N | 1.09 | % | $ | 1,000 | $ | 1,080 | $ | 5.71 | ||||||||
Class I | .94 | % | $ | 1,000 | $ | 1,080 | $ | 4.93 | ||||||||
Class Z | .84 | % | $ | 1,000 | $ | 1,082 | $ | 4.41 | ||||||||
Based on Hypothetical 5% Annual Return | ||||||||||||||||
Class N | 1.09 | % | $ | 1,000 | $ | 1,020 | $ | 5.55 | ||||||||
Class I | .94 | % | $ | 1,000 | $ | 1,020 | $ | 4.79 | ||||||||
Class Z | .84 | % | $ | 1,000 | $ | 1,021 | $ | 4.28 | ||||||||
AMG Chicago Equity Partners Small Cap Value Fund | ||||||||||||||||
Based on Actual Fund Return | ||||||||||||||||
Class N | 1.35 | % | $ | 1,000 | $ | 1,069 | $ | 7.04 | ||||||||
Class I | 1.26 | % | $ | 1,000 | $ | 1,069 | $ | 6.57 | ||||||||
Class Z | .95 | % | $ | 1,000 | $ | 1,072 | $ | 4.96 | ||||||||
Based on Hypothetical 5% Annual Return | ||||||||||||||||
Class N | 1.35 | % | $ | 1,000 | $ | 1,018 | $ | 6.87 | ||||||||
Class I | 1.26 | % | $ | 1,000 | $ | 1,019 | $ | 6.41 | ||||||||
Class Z | .95 | % | $ | 1,000 | $ | 1,020 | $ | 4.84 | ||||||||
AMG Managers Amundi Intermediate Government Fund | ||||||||||||||||
Based on Actual Fund Return | ||||||||||||||||
Class N | .84 | % | $ | 1,000 | $ | 1,006 | $ | 4.25 | ||||||||
Class I | .73 | % | $ | 1,000 | $ | 1,006 | $ | 3.69 | ||||||||
Class Z | .69 | % | $ | 1,000 | $ | 1,007 | $ | 3.49 | ||||||||
Based on Hypothetical 5% Annual Return | ||||||||||||||||
Class N | .84 | % | $ | 1,000 | $ | 1,021 | $ | 4.28 | ||||||||
Class��I | .73 | % | $ | 1,000 | $ | 1,022 | $ | 3.72 | ||||||||
Class Z | .69 | % | $ | 1,000 | $ | 1,022 | $ | 3.52 | ||||||||
AMG Managers Amundi Short Duration Government Fund | ||||||||||||||||
Based on Actual Fund Return | ||||||||||||||||
Class N | .72 | % | $ | 1,000 | $ | 1,004 | $ | 3.64 | ||||||||
Class I | .63 | % | $ | 1,000 | $ | 1,004 | $ | 3.18 | ||||||||
Class Z | .57 | % | $ | 1,000 | $ | 1,005 | $ | 2.88 | ||||||||
Based on Hypothetical 5% Annual Return | ||||||||||||||||
Class N | .72 | % | $ | 1,000 | $ | 1,022 | $ | 3.67 | ||||||||
Class I | .63 | % | $ | 1,000 | $ | 1,022 | $ | 3.21 | ||||||||
Class Z | .57 | % | $ | 1,000 | $ | 1,022 | $ | 2.91 | ||||||||
| * | Expenses are equal to the Fund’s annualized expense ratio multiplied by the average account value over the period, multiplied by the number of days in the most recent fiscal half-year (184), then divided by 365. |
3
Table of Contents
AMG Chicago Equity Partners Balanced Fund
Portfolio Manager’s Comments (unaudited)
THE YEAR IN REVIEW
For the year ended December 31, 2017, the AMG Chicago Equity Partners Balanced Fund (Class N shares) (the “Fund”) returned 15.54%, compared to the 14.17% return for its benchmark, which consists of 60% the return of the Russell 1000® Index and 40% the return of the Bloomberg Barclays U.S. Aggregate Bond Index.
The portfolio is managed to emphasize stock selection while also using our proprietary models to adjust size, style and allocation exposures. The Fund has had a strong year, beating the benchmark in three of the four quarters. A 65/35 asset allocation was maintained throughout the year and the overweight to equities helped returns relative to the 60/40 benchmark. The market phase identified by the firm’s proprietary model was in expansion all year, so the Fund maintained its preference for growth over value—this also helped relative returns as growth beat value in 2017. The equity portion of the Fund significantly outperformed the Russell 1000® Index, helped by the preference for growth over value and good performance from the alpha model. The fixed income portion of the Fund underperformed the Bloomberg Barclays Aggregate Index. The portfolio maintained its underweight to corporate bonds as well as its emphasis on higher quality issuers in this environment, which hurt relative performance.
The strong stock market of 2017 reflected not only multiple expansion, but also strong corporate earnings growth. Economic indicators in the U.S.
were generally strong in the fourth quarter and throughout 2017, with a solid job market, strong housing numbers, improved growth and earnings expectations, and moderate inflation. As such, the Federal Reserve raised rates three times in the year, with the targeted federal funds rate ending the year at 1.5%. Regarding fixed income markets, from a valuation standpoint, risk premiums are at cycle lows, demonstrated by the corporate option-adjusted spread (OAS) declining 30 basis points over the year to end at 93 basis points. Throughout the year, the yield curve flattened as short rates rose and longer rates declined. Additionally, we have seen an increase in risk overall, including in balance sheet leverage. The Federal Reserve’s intent is to continue to raise rates and reverse Quantitative Easing.
Given this backdrop, the fixed income portion of the Fund continues to focus on downside protection and the equity portion continues to follow its disciplined approach. Our research has shown that constructing a well-diversified portfolio of companies with attractive valuation ratios, quality balance sheets, and positive growth and momentum expectations built through a disciplined, risk-controlled process offers the potential to deliver consistent excess returns for the equity portion of the Fund. For the fixed income portion of the Fund, current circumstances support our strategy of maintaining a high quality bias. We believe the current environment demands an emphasis on downside protection in bond portfolios, and we are managing the portfolio in line with that belief. We will continue to monitor inputs to our investment process for indications of improving conditions and opportunity
but believe our positioning is prudent and in line with our stated objectives. Overall, our philosophy will not change based on short-term trends or conditions in the market. We will continue to use our disciplined approach to provide added value at controlled levels of risk.
This commentary reflects the viewpoints of the portfolio manager, Chicago Equity Partners, LLC, as of December 31, 2017 and is not intended as a forecast or guarantee of future results, and is subject to change without notice.
CUMULATIVE TOTAL RETURN PERFORMANCE
AMG Chicago Equity Partners Balanced Fund’s cumulative total return is based on the daily change in net asset value (NAV), and assumes that all dividends and distributions were reinvested. This graph compares a hypothetical $10,000 investment made in the Fund’s Class N shares on December 31, 2007, to a $10,000 investment made in the 60% Russell 1000® Index/40% Bloomberg Barclays U.S. Aggregate Bond Index, Russell 1000® Index and the Bloomberg Barclays U.S. Aggregate Bond Index for the same time period. The graph and table do not reflect the deduction of taxes that a shareholder would pay on a Fund distribution or redemption of shares. The listed returns for the Fund are net of expenses and the returns for the index exclude expenses. Total returns would have been lower had certain expenses not been reduced.
4
Table of Contents
AMG Chicago Equity Partners Balanced Fund
Portfolio Manager’s Comments (continued)
CUMULATIVE TOTAL RETURN PERFORMANCE (continued)
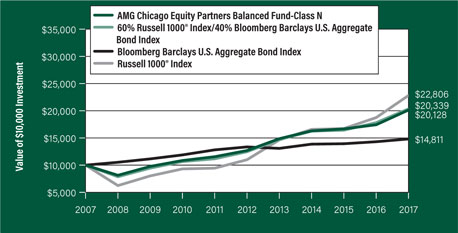
The table below shows the average annual total returns for the AMG Chicago Equity Partners Balanced Fund, the 60% Russell 1000® Index/40% Bloomberg Barclays U.S. Aggregate Bond Index, the Russell 1000® Index and the Bloomberg Barclays U.S. Aggregate Bond Index for the same time periods ended December 31, 2017.
| One | Five | Ten | Since | Inception | ||||||||||||||||
| Average Annual Total Returns1 | Year | Years | Years | Inception | Date | |||||||||||||||
AMG Chicago Equity Partners Balanced Fund2, 3, 4, 5, 6, 7, 8 | ||||||||||||||||||||
Class N | 15.54 | % | 9.67 | % | 7.25 | % | 8.05 | % | 01/02/97 | |||||||||||
Class I | 15.71 | % | 9.89 | % | — | 9.62 | % | 11/30/12 | ||||||||||||
Class Z | 15.90 | % | 9.96 | % | 7.53 | % | 8.43 | % | 01/02/97 | |||||||||||
60% Russell 1000® Index9 /40% Bloomberg Barclays U.S. Aggregate Bond Index10 | 14.17 | % | 10.29 | % | 7.36 | % | 7.72 | % | 01/02/97 | † | ||||||||||
Bloomberg Barclays U.S. Aggregate Bond Index10 | 3.54 | % | 2.10 | % | 4.01 | % | 5.22 | % | 01/02/97 | † | ||||||||||
Russell 1000® Index9 | 21.69 | % | 15.71 | % | 8.59 | % | 8.52 | % | 01/02/97 | † | ||||||||||
The performance data shown represents past performance. Past performance is not a guarantee of future results. Current performance may be lower or higher than the performance data quoted. The investment return and principal value of an investment will fluctuate so that an investor’s shares, when redeemed, may be worth more or less than their original cost.
Investors should carefully consider the Fund’s investment objectives, risks, charges and expenses before investing. For performance information through the most recent month end, current net asset values per share for the Fund and other information, please call 800.835.3879 or visit our website at amgfunds.com for a free prospectus. Read it carefully before investing or sending money.
Distributed by AMG Distributors, Inc., member FINRA/SIPC.
† Date reflects inception date of the Fund, not the index.
| 1 | Total return equals income yield plus share price change and assumes reinvestment of all dividends and capital gain distributions. Returns are net of fees and may reflect offsets of Fund expenses as described in the prospectus. No adjustment has been made for taxes payable by shareholders on their reinvested dividends and capital gain distributions. Returns for periods greater than one year are annualized. The listed returns on the Fund are net of expenses and based on the published NAV as of December 31, 2017. All returns are in U.S. dollars ($). |
| 2 | From time to time, the Fund’s advisor has waived its fees and/or absorbed Fund expenses, which has resulted in higher returns. |
| 3 | To the extent that the Fund invests in asset-backed or mortgage-backed securities, its exposure to prepayment and extension risks may be greater than investments in other fixed income securities. |
| 4 | The Fund is subject to the risks associated with investments in debt securities, such as default risk and fluctuations in the perception of the debtor’s ability to pay its creditors. Changing interest rates may adversely affect the value of an investment. An increase in interest rates typically causes the value of bonds and other fixed income securities to fall. |
| 5 | Investments in international securities are subject to certain risks of overseas investing including currency fluctuations and changes in political and economic conditions, which could result in significant market fluctuations. These risks are magnified in emerging markets. |
| 6 | The Fund is subject to risks associated with investments in mid-capitalization companies such as greater price volatility, lower trading volume, and less liquidity than the stocks of larger, more established companies. |
| 7 | The Fund invests in value stocks, which may perform differently from the market as a whole and may be undervalued by the market for a long period of time. |
| 8 | Obligations of certain government agencies are not backed by the full faith and credit of the U.S. government. If one of these agencies defaulted on a loan, there is no guarantee that the U.S. government would provide financial support. Additionally, debt securities of the U.S. government may be affected by changing interest rates and subject to prepayment risk. |
| 9 | The Russell 1000® Index measures the performance of approximately 1,000 of the largest securities based on a combination of their market cap and current index membership. The Russell 1000® represents approximately 92% of the U.S. market. Unlike the Fund, the Russell 1000® Index is unmanaged, is not available for investment, and does not incur expenses. |
| 10 | The Bloomberg Barclays U.S. Aggregate Bond Index represents securities that are SEC-registered, taxable, and dollar denominated. The index covers the U.S. investment grade fixed rate bond market, with index components for government and corporate securities, mortgage pass-through securities, and asset-backed securities. Unlike the Fund, the Bloomberg Barclays U.S. Aggregate Bond Index is unmanaged, is not available for investment, and does not incur expenses. |
The Russell 1000® Index is a trademark of the London Stock Exchange Group companies.
Not FDIC insured, nor bank guaranteed. May lose value.
5
Table of Contents
AMG Chicago Equity Partners Balanced Fund
Fund Snapshots (unaudited)
December 31, 2017
PORTFOLIO BREAKDOWN
Sector | % of Net Assets | |||
U.S. Government and Agency Obligations | 31.3 | |||
Information Technology | 17.2 | |||
Industrials | 10.4 | |||
Consumer Discretionary | 9.1 | |||
Financials | 8.9 | |||
Health Care | 8.0 | |||
Consumer Staples | 4.6 | |||
Energy | 2.4 | |||
Real Estate | 2.4 | |||
Materials | 2.2 | |||
Utilities | 1.7 | |||
Telecommunication Services | 0.7 | |||
Short-Term Investments* | 1.9 | |||
Other Assets Less Liabilities** | (0.8 | ) | ||
| * | Includes reinvestment of cash collateral into joint repurchase agreements on security lending transactions. |
| ** | Includes repayment of cash collateral on security lending transactions. |
TOP TEN HOLDINGS
Security Name | % of Net Assets | |||
Apple, Inc. | 2.9 | |||
U.S. Treasury Bonds, 2.750%, 08/15/42 | 2.4 | |||
Alphabet, Inc., Class A | 2.1 | |||
U.S. Treasury Notes, 2.250%, 11/15/24 | 2.0 | |||
U.S. Treasury Notes, 2.250%, 02/15/27 | 2.0 | |||
Microsoft Corp. | 1.5 | |||
Facebook, Inc., Class A | 1.4 | |||
Amazon.com, Inc. | 1.2 | |||
FHLMC Gold Pool, 3.500%, 01/01/46 | 1.1 | |||
U.S. Treasury Notes, 1.000%, 06/30/19 | 1.1 | |||
|
| |||
Top Ten as a Group | 17.7 | |||
|
| |||
Because a fund’s strategy may result in multiple investments in particular sectors of the economy, its performance may depend on the performance of those sectors and may fluctuate more widely than investments diversified across more sectors. For additional information on these and other risk considerations, please see the Fund’s prospectus.
Any sectors, industries, or securities discussed should not be perceived as investment recommendations. Mention of a specific security should not be considered a recommendation to buy or solicitation to sell that security. Specific securities mentioned in this report may have been sold from the Fund’s portfolio of investments by the time you receive this report.
6
Table of Contents
AMG Chicago Equity Partners Balanced Fund
Schedule of Portfolio Investments
December 31, 2017
| Shares | Value | |||||||
Common Stocks - 63.8% | ||||||||
Consumer Discretionary - 9.1% | ||||||||
888 Holdings PLC (Gibraltar) | 21,500 | $ | 81,772 | |||||
Amazon.com, Inc.* | 2,020 | 2,362,329 | ||||||
Aoyama Trading Co., Ltd. (Japan) | 1,300 | 48,580 | ||||||
Bellway PLC (United Kingdom) | 300 | 14,382 | ||||||
Beneteau, S.A. (France) | 4,800 | 114,869 | ||||||
Best Buy Co., Inc. | 1,420 | 97,227 | ||||||
BorgWarner, Inc. | 5,780 | 295,300 | ||||||
Burlington Stores, Inc.* | 6,240 | 767,707 | ||||||
Cable One, Inc.1 | 390 | 274,307 | ||||||
Card Factory PLC (United Kingdom) | 29,400 | 117,138 | ||||||
CarMax, Inc.* | 3,480 | 223,172 | ||||||
Chipotle Mexican Grill, Inc.* | 195 | 56,361 | ||||||
Choice Hotels International, Inc. | 1,840 | 142,784 | ||||||
Comcast Corp., Class A | 34,675 | 1,388,734 | ||||||
CTS Eventim AG & Co. KGaA (Germany) | 1,200 | 55,790 | ||||||
De’ Longhi S.P.A. (Italy) | 100 | 3,027 | ||||||
Dollar Tree, Inc.* | 3,140 | 336,953 | ||||||
Domino’s Pizza, Inc. | 2,430 | 459,173 | ||||||
Dunkin’ Brands Group, Inc. | 2,590 | 166,977 | ||||||
EDION Corp. (Japan) | 5,500 | 63,946 | ||||||
Exedy Corp. (Japan) | 3,500 | 107,831 | ||||||
Harley-Davidson, Inc.1 | 2,360 | 120,077 | ||||||
Hilton Worldwide Holdings, Inc. | 9,285 | 741,500 | ||||||
The Home Depot, Inc. | 10,045 | 1,903,829 | ||||||
John Menzies PLC (United Kingdom) | 4,000 | 36,751 | ||||||
Kadokawa Dwango Corp. (Japan) | 4,500 | 55,486 | ||||||
Kindred Group PLC, SDR (Malta) | 3,100 | 44,264 | ||||||
Liberty Interactive Corp. QVC Group, Class A* | 28,355 | 692,429 | ||||||
Liberty Ventures* | 4,190 | 227,266 | ||||||
Macy’s, Inc.1 | 3,785 | 95,344 | ||||||
Marriott International, Inc., Class A | 4,440 | 602,641 | ||||||
McDonald’s Corp. | 5,400 | 929,448 | ||||||
Misawa Homes Co., Ltd. (Japan) | 12,000 | 105,424 | ||||||
N Brown Group PLC (United Kingdom) | 13,400 | 48,975 | ||||||
Netflix, Inc.* | 4,620 | 886,855 | ||||||
Nissan Shatai Co., Ltd. (Japan) | 3,100 | 31,642 | ||||||
Omnicom Group, Inc. | 2,300 | 167,509 | ||||||
Polaris Industries, Inc.1 | 3,305 | 409,787 | ||||||
Ralph Lauren Corp.1 | 2,115 | 219,304 | ||||||
Ross Stores, Inc. | 8,120 | 651,630 | ||||||
Royal Caribbean Cruises, Ltd. | 1,070 | 127,630 | ||||||
| Shares | Value | |||||||
Sanoma OYJ (Finland) | 8,600 | $ | 112,164 | |||||
Service Corp. International | 11,480 | 428,434 | ||||||
Sirius XM Holdings, Inc.1 | 36,585 | 196,096 | ||||||
SKY Perfect JSAT Holdings, Inc. (Japan) | 11,900 | 54,464 | ||||||
SSP Group PLC (United Kingdom) | 400 | 3,674 | ||||||
Target Corp. | 4,295 | 280,249 | ||||||
Thule Group AB (Sweden)2 | 2,000 | 45,054 | ||||||
Time Warner, Inc. | 1,910 | 174,708 | ||||||
Tokai Rika Co., Ltd. (Japan) | 1,800 | 37,771 | ||||||
Tupperware Brands Corp. | 4,875 | 305,662 | ||||||
VF Corp. | 7,620 | 563,880 | ||||||
Visteon Corp.* | 2,210 | 276,559 | ||||||
Wacoal Holdings Corp. (Japan) | 1,500 | 47,314 | ||||||
Total Consumer Discretionary | 17,802,179 | |||||||
Consumer Staples - 4.6% | ||||||||
a2 Milk Co., Ltd. (New Zealand)* | 18,100 | 103,518 | ||||||
Altria Group, Inc. | 7,625 | 544,501 | ||||||
Archer-Daniels-Midland Co. | 9,070 | 363,526 | ||||||
Brown-Forman Corp., Class B | 8,415 | 577,858 | ||||||
The Coca-Cola Co. | 11,535 | 529,226 | ||||||
Colgate-Palmolive Co. | 1,220 | 92,049 | ||||||
Conagra Brands, Inc. | 15,970 | 601,590 | ||||||
Constellation Brands, Inc., Class A | 3,650 | 834,281 | ||||||
CVS Health Corp. | 4,120 | 298,700 | ||||||
Edgewell Personal Care Co.* | 2,835 | 168,371 | ||||||
The Estee Lauder Cos., Inc., Class A | 8,055 | 1,024,918 | ||||||
Flowers Foods, Inc. | 7,530 | 145,404 | ||||||
Ingredion, Inc. | 2,780 | 388,644 | ||||||
La Doria S.P.A. (Italy) | 1,200 | 23,597 | ||||||
Lamb Weston Holdings, Inc. | 4,955 | 279,710 | ||||||
McCormick & Co., Inc., Non-Voting Shares | 1,080 | 110,063 | ||||||
Origin Enterprises PLC (Ireland) | 8,300 | 63,138 | ||||||
PepsiCo, Inc. | 5,970 | 715,922 | ||||||
Philip Morris International, Inc. | 1,660 | 175,379 | ||||||
Pilgrim’s Pride Corp.* | 11,040 | 342,902 | ||||||
The Procter & Gamble Co. | 9,800 | 900,424 | ||||||
Rami Levy Chain Stores Hashikma Marketing 2006, Ltd. (Israel) | 1,600 | 84,882 | ||||||
Salmar A.S.A. (Norway) | 3,100 | 93,135 | ||||||
Stock Spirits Group PLC (United Kingdom) | 27,200 | 98,696 | ||||||
The accompanying notes are an integral part of these financial statements.
7
Table of Contents
AMG Chicago Equity Partners Balanced Fund
Schedule of Portfolio Investments (continued)
| Shares | Value | |||||||
Consumer Staples - 4.6% (continued) | ||||||||
Wal-Mart Stores, Inc. | 3,860 | $ | 381,175 | |||||
Total Consumer Staples | 8,941,609 | |||||||
Energy - 2.4% | ||||||||
Anadarko Petroleum Corp. | 2,800 | 150,192 | ||||||
Apache Corp. | 3,150 | 132,993 | ||||||
Baker Hughes, a GE company | 2,810 | 88,908 | ||||||
Cabot Oil & Gas Corp. | 4,870 | 139,282 | ||||||
Chevron Corp. | 5,335 | 667,889 | ||||||
CNX Resources Corp.* | 6,240 | 91,291 | ||||||
ConocoPhillips | 7,425 | 407,558 | ||||||
Devon Energy Corp. | 6,790 | 281,106 | ||||||
EOG Resources, Inc. | 920 | 99,277 | ||||||
EQT Corp. | 780 | 44,398 | ||||||
Exxon Mobil Corp. | 11,525 | 963,951 | ||||||
Japan Petroleum Exploration Co., Ltd. (Japan) | 2,800 | 74,013 | ||||||
National Oilwell Varco, Inc. | 3,300 | 118,866 | ||||||
Noble Corp. PLC (United Kingdom)*,1 | 16,620 | 75,122 | ||||||
Noble Energy, Inc. | 2,500 | 72,850 | ||||||
Occidental Petroleum Corp. | 1,420 | 104,597 | ||||||
Ocean Yield A.S.A. (Norway) | 2,700 | 22,855 | ||||||
Pioneer Natural Resources | 745 | 128,773 | ||||||
RPC, Inc.1 | 22,950 | 585,914 | ||||||
Sinanen Holdings Co., Ltd. (Japan) | 800 | 19,102 | ||||||
Subsea 7, S.A. (United Kingdom) | 3,000 | 44,946 | ||||||
Tethys Oil AB (Sweden) | 900 | 7,214 | ||||||
Valero Energy Corp. | 2,940 | 270,215 | ||||||
Whitehaven Coal, Ltd. (Australia) | 19,800 | 68,663 | ||||||
Whiting Petroleum Corp.* | 3,000 | 79,440 | ||||||
Total Energy | 4,739,415 | |||||||
Financials - 7.6% | ||||||||
The Allstate Corp. | 12,150 | 1,272,226 | ||||||
American Financial Group, Inc. | 640 | 69,466 | ||||||
Ameriprise Financial, Inc. | 3,870 | 655,849 | ||||||
Aspen Insurance Holdings, Ltd. (Bermuda) | 3,540 | 143,724 | ||||||
Associated Banc-Corp. | 7,100 | 180,340 | ||||||
Assurant, Inc. | 2,230 | 224,873 | ||||||
Assured Guaranty, Ltd. (Bermuda) | 6,240 | 211,349 | ||||||
Banca Mediolanum S.P.A. (Italy) | 1,300 | 11,254 | ||||||
Banca Popolare Di Sondrio SCARL (Italy) | 15,300 | 55,871 | ||||||
Bank of America Corp. | 28,255 | 834,087 | ||||||
Berkshire Hathaway, Inc., Class B* | 2,850 | 564,927 | ||||||
BlackRock, Inc. | 320 | 164,387 | ||||||
| Shares | Value | |||||||
Chesnara PLC (United Kingdom) | 1,500 | $ | 7,883 | |||||
Citizens Financial Group, Inc. | 3,520 | 147,770 | ||||||
CME Group, Inc. | 935 | 136,557 | ||||||
Comerica, Inc. | 2,330 | 202,267 | ||||||
Commerce Bancshares, Inc. | 4,043 | 225,761 | ||||||
Corp. Financiera Alba, S.A. (Spain) | 1,700 | 97,336 | ||||||
Cullen/Frost Bankers, Inc.1 | 1,120 | 106,008 | ||||||
Dah Sing Financial Holdings, Ltd. (Hong Kong) | 16,800 | 107,623 | ||||||
Deutsche Pfandbriefbank AG (Germany)2 | 7,100 | 113,420 | ||||||
Discover Financial Services | 855 | 65,767 | ||||||
Eaton Vance Corp. | 7,260 | 409,391 | ||||||
Erie Indemnity Co., Class A | 1,020 | 124,277 | ||||||
esure Group PLC (United Kingdom) | 30,900 | 103,673 | ||||||
Fifth Third Bancorp | 8,240 | 250,002 | ||||||
Franklin Resources, Inc. | 7,205 | 312,193 | ||||||
Genworth Mortgage Insurance Australia, Ltd. (Australia) | 2,300 | 5,372 | ||||||
Invesco, Ltd. | 4,150 | 151,641 | ||||||
Japan Securities Finance Co., Ltd. (Japan) | 19,700 | 111,365 | ||||||
JPMorgan Chase & Co. | 11,538 | 1,233,874 | ||||||
Lincoln National Corp. | 2,540 | 195,250 | ||||||
LPL Financial Holdings, Inc. | 1,880 | 107,423 | ||||||
M&T Bank Corp. | 1,130 | 193,219 | ||||||
Marusan Securities Co., Ltd. (Japan) | 11,500 | 102,888 | ||||||
MetLife, Inc. | 5,510 | 278,586 | ||||||
MFA Financial, Inc., REIT | 14,840 | 117,533 | ||||||
Moody’s Corp. | 2,735 | 403,713 | ||||||
Navient Corp. | 4,600 | 61,272 | ||||||
Northern Trust Corp. | 6,350 | 634,301 | ||||||
Plus500, Ltd. (Israel) | 8,400 | 102,881 | ||||||
The Progressive Corp. | 9,930 | 559,257 | ||||||
Prudential Financial, Inc. | 1,770 | 203,515 | ||||||
Regions Financial Corp. | 12,230 | 211,334 | ||||||
S&P Global, Inc. | 2,500 | 423,500 | ||||||
SEI Investments Co. | 2,890 | 207,675 | ||||||
SpareBank 1 Nord Norge (Norway) | 3,200 | 24,261 | ||||||
State Street Corp. | 3,680 | 359,205 | ||||||
SunTrust Banks, Inc. | 5,715 | 369,132 | ||||||
SVB Financial Group* | 960 | 224,419 | ||||||
T Rowe Price Group, Inc. | 950 | 99,683 | ||||||
TD Ameritrade Holding Corp. | 11,070 | 566,009 | ||||||
Torchmark Corp. | 1,480 | 134,251 | ||||||
The Travelers Cos., Inc. | 665 | 90,201 | ||||||
The accompanying notes are an integral part of these financial statements.
8
Table of Contents
AMG Chicago Equity Partners Balanced Fund
Schedule of Portfolio Investments (continued)
| Shares | Value | |||||||
Financials - 7.6% (continued) | ||||||||
US Bancorp | 6,565 | $ | 351,753 | |||||
Waddell & Reed Financial, Inc., Class A1 | 10,210 | 228,091 | ||||||
Wells Fargo & Co. | 5,330 | 323,371 | ||||||
White Mountains Insurance Group, Ltd. | 110 | 93,641 | ||||||
Total Financials | 14,966,897 | |||||||
Health Care - 8.0% | ||||||||
AbbVie, Inc. | 2,760 | 266,920 | ||||||
ABIOMED, Inc.* | 1,560 | 292,360 | ||||||
ACADIA Pharmaceuticals, Inc.*,1 | 7,855 | 236,514 | ||||||
Aetna, Inc. | 1,775 | 320,192 | ||||||
Align Technology, Inc.* | 3,080 | 684,345 | ||||||
Amgen, Inc. | 415 | 72,168 | ||||||
Baxter International, Inc. | 22,633 | 1,462,997 | ||||||
Becton Dickinson & Co. | 224 | 47,818 | ||||||
BioGaia AB, Class B (Sweden) | 800 | 31,793 | ||||||
Bioverativ, Inc.* | 3,250 | 175,240 | ||||||
Bristol-Myers Squibb Co. | 2,980 | 182,614 | ||||||
Bruker Corp. | 15,465 | 530,759 | ||||||
Cardinal Health, Inc. | 750 | 45,952 | ||||||
Centene Corp.* | 2,490 | 251,191 | ||||||
Cigna Corp. | 810 | 164,503 | ||||||
COSMO Pharmaceuticals, N.V. (Ireland) | 100 | 15,024 | ||||||
Eli Lilly & Co. | 2,970 | 250,846 | ||||||
Exelixis, Inc.* | 16,450 | 500,080 | ||||||
Express Scripts Holding Co.* | 900 | 67,176 | ||||||
Gilead Sciences, Inc. | 4,915 | 352,111 | ||||||
Humana, Inc. | 1,410 | 349,779 | ||||||
IDEXX Laboratories, Inc.* | 4,390 | 686,508 | ||||||
Idorsia, Ltd. (Switzerland)* | 200 | 5,223 | ||||||
Indivior PLC (United Kingdom)* | 13,400 | 73,586 | ||||||
IQVIA Holdings, Inc.* | 2,870 | 280,973 | ||||||
Johnson & Johnson | 5,095 | 711,873 | ||||||
KYORIN Holdings, Inc. (Japan) | 4,800 | 89,573 | ||||||
McKesson Corp. | 690 | 107,605 | ||||||
Merck & Co., Inc. | 17,695 | 995,698 | ||||||
Mettler-Toledo International, Inc.* | 200 | 123,904 | ||||||
Neurocrine Biosciences, Inc.* | 10,225 | 793,358 | ||||||
Paramount Bed Holdings Co., Ltd. (Japan) | 1,500 | 74,124 | ||||||
Perrigo Co. PLC (Ireland) | 4,425 | 385,683 | ||||||
Pfizer, Inc. | 3,367 | 121,953 | ||||||
Regeneron Pharmaceuticals, Inc.* | 1,210 | 454,912 | ||||||
RHT Health Trust (Singapore) | 73,700 | 46,296 | ||||||
| Shares | Value | |||||||
Ship Healthcare Holdings, Inc. (Japan) | 1,400 | $ | 46,275 | |||||
Toho Holdings Co., Ltd. (Japan) | 5,200 | 117,220 | ||||||
UnitedHealth Group, Inc. | 7,060 | 1,556,448 | ||||||
Varian Medical Systems, Inc.* | 4,985 | 554,083 | ||||||
Veeva Systems, Inc., Class A* | 7,500 | 414,600 | ||||||
Vertex Pharmaceuticals, Inc.* | 1,055 | 158,102 | ||||||
WellCare Health Plans, Inc.* | 4,645 | 934,156 | ||||||
Zoetis, Inc. | 9,050 | 651,962 | ||||||
Total Health Care | 15,684,497 | |||||||
Industrials - 8.1% | ||||||||
3M Co. | 4,945 | 1,163,905 | ||||||
Aida Engineering, Ltd. (Japan) | 7,500 | 91,533 | ||||||
Air New Zealand, Ltd. (New Zealand) | 37,300 | 84,326 | ||||||
Allison Transmission Holdings, Inc. | 13,945 | 600,611 | ||||||
Amadeus Fire AG (Germany) | 500 | 46,320 | ||||||
Biesse S.P.A. (Italy) | 300 | 15,207 | ||||||
The Boeing Co. | 4,770 | 1,406,721 | ||||||
Caterpillar, Inc. | 11,555 | 1,820,837 | ||||||
Cintas Corp. | 2,140 | 333,476 | ||||||
Copa Holdings, S.A., Class A (Panama) | 950 | 127,357 | ||||||
Costain Group PLC (United Kingdom) | 14,700 | 92,835 | ||||||
Cummins, Inc. | 1,070 | 189,005 | ||||||
Eaton Corp. PLC | 870 | 68,739 | ||||||
Emerson Electric Co. | 2,910 | 202,798 | ||||||
Enav S.P.A. (Italy)2 | 5,100 | 27,599 | ||||||
Expeditors International of Washington, Inc. | 14,420 | 932,830 | ||||||
FACC AG (Austria)* | 4,800 | 99,664 | ||||||
Flowserve Corp. | 2,050 | 86,367 | ||||||
Fluor Corp. | 2,490 | 128,608 | ||||||
Fortive Corp. | 2,630 | 190,280 | ||||||
Galliford Try PLC (United Kingdom) | 1,700 | 29,517 | ||||||
GATX Corp.1 | 1,660 | 103,186 | ||||||
General Electric Co. | 10,300 | 179,735 | ||||||
Go-Ahead Group PLC (United Kingdom) | 2,100 | 42,218 | ||||||
HEICO Corp. | 1,990 | 187,756 | ||||||
Honeywell International, Inc. | 2,050 | 314,388 | ||||||
Hopewell Holdings, Ltd. (Hong Kong) | 22,700 | 83,764 | ||||||
Inabata & Co., Ltd. (Japan) | 600 | 9,077 | ||||||
Ingersoll-Rand PLC | 710 | 63,325 | ||||||
Itoki Corp. (Japan) | 6,500 | 48,034 | ||||||
Jacobs Engineering Group, Inc. | 2,980 | 196,561 | ||||||
Kanematsu Corp. (Japan) | 500 | 6,900 | ||||||
KAR Auction Services, Inc. | 2,370 | 119,709 | ||||||
The accompanying notes are an integral part of these financial statements.
9
Table of Contents
AMG Chicago Equity Partners Balanced Fund
Schedule of Portfolio Investments (continued)
| Shares | Value | |||||||
Industrials - 8.1% (continued) |
| |||||||
Kirby Corp.* | 4,450 | $ | 297,260 | |||||
Komori Corp. (Japan) | 7,600 | 106,648 | ||||||
Kyodo Printing Co., Ltd. (Japan) | 3,400 | 109,336 | ||||||
Landstar System, Inc. | 4,820 | 501,762 | ||||||
Macquarie Atlas Roads Group (Australia) | 22,000 | 107,571 | ||||||
Mersen, S.A. (France) | 2,400 | 107,414 | ||||||
Morgan Advanced Materials | ||||||||
PLC (United Kingdom) | 4,200 | 19,127 | ||||||
Mota-Engil SGPS, S.A. (Portugal) | 26,000 | 114,271 | ||||||
Namura Shipbuilding Co., Ltd. (Japan) | 17,400 | 107,028 | ||||||
Northrop Grumman Corp. | 870 | 267,012 | ||||||
OC Oerlikon Corp. AG (Switzerland) | 3,200 | 54,015 | ||||||
Old Dominion Freight Line, Inc. | 3,930 | 516,991 | ||||||
Oshkosh Corp. | 980 | 89,072 | ||||||
Redde PLC (United Kingdom) | 17,000 | 40,224 | ||||||
Rheinmetall AG (Germany) | 100 | 12,646 | ||||||
Robert Half International, Inc. | 5,690 | 316,023 | ||||||
Rockwell Automation, Inc. | 4,775 | 937,571 | ||||||
SG Fleet Group, Ltd. (Australia) | 34,000 | 107,706 | ||||||
Sojitz Corp. (Japan) | 11,100 | 34,007 | ||||||
Spirit AeroSystems Holdings, Inc., Class A | 2,425 | 211,581 | ||||||
Sulzer AG (Switzerland) | 800 | 97,039 | ||||||
The Toro Co. | 770 | 50,227 | ||||||
TransUnion* | 15,480 | 850,781 | ||||||
Union Pacific Corp. | 620 | 83,142 | ||||||
United Rentals, Inc.* | 7,485 | 1,286,746 | ||||||
Valmont Industries, Inc. | 690 | 114,436 | ||||||
Waste Management, Inc. | 1,290 | 111,327 | ||||||
WW Grainger, Inc. | 1,020 | 240,975 | ||||||
Total Industrials | 15,985,126 | |||||||
Information Technology - 17.2% | ||||||||
Activision Blizzard, Inc. | 3,160 | 200,091 | ||||||
Adobe Systems, Inc.* | 2,790 | 488,920 | ||||||
Advanced Micro Devices, Inc.* | 11,890 | 122,229 | ||||||
Alphabet, Inc., Class A* | 3,945 | 4,155,663 | ||||||
Altium, Ltd. (Australia) | 900 | 9,303 | ||||||
Apple, Inc. | 33,810 | 5,721,666 | ||||||
Arista Networks, Inc.* | 3,665 | 863,401 | ||||||
Atea A.S.A. (Norway) | 4,700 | 66,116 | ||||||
Atlassian Corp. PLC, Class A (Australia)* | 2,180 | 99,234 | ||||||
Broadcom, Ltd. | 510 | 131,019 | ||||||
CDW Corp. | 18,100 | 1,257,769 | ||||||
| Shares | Value | |||||||
Cisco Systems, Inc. | 7,240 | $ | 277,292 | |||||
Dell Technologies, Inc., Class V* | 1,800 | 146,304 | ||||||
DXC Technology Co. | 2,800 | 265,720 | ||||||
Facebook, Inc., Class A* | 15,285 | 2,697,191 | ||||||
First Solar, Inc.* | 1,490 | 100,605 | ||||||
Fortinet, Inc.* | 22,450 | 980,840 | ||||||
Harris | 3,770 | 534,020 | ||||||
Hewlett Packard Enterprise Co. | 4,740 | 68,066 | ||||||
HP, Inc. | 19,450 | 408,644 | ||||||
IAC/InterActiveCorp* | 910 | 111,275 | ||||||
Ines Corp. (Japan) | 7,700 | 79,742 | ||||||
IPG Photonics Corp.* | 1,390 | 297,641 | ||||||
Jabil, Inc. | 6,740 | 176,925 | ||||||
Juniper Networks, Inc. | 10,970 | 312,645 | ||||||
Kainos Group PLC (United Kingdom) | 11,100 | 50,880 | ||||||
Leidos Holdings, Inc. | 13,110 | 846,513 | ||||||
LogMeIn, Inc. | 1,525 | 174,612 | ||||||
Mastercard, Inc., Class A | 5,930 | 897,565 | ||||||
Maxim Integrated Products, Inc. | 9,511 | 497,214 | ||||||
Micron Technology, Inc.* | 2,490 | 102,389 | ||||||
Microsoft Corp. | 35,365 | 3,025,122 | ||||||
Nemetschek SE (Germany) | 200 | 17,892 | ||||||
NVIDIA Corp. | 2,940 | 568,890 | ||||||
PayPal Holdings, Inc.* | 11,090 | 816,446 | ||||||
Red Hat, Inc.* | 880 | 105,688 | ||||||
Shinko Electric Industries Co., Ltd. (Japan) | 12,100 | 97,764 | ||||||
Siltronic AG (Germany)* | 400 | 57,829 | ||||||
Skyworks Solutions, Inc. | 6,700 | 636,165 | ||||||
Softcat PLC (United Kingdom) | 11,200 | 78,633 | ||||||
Square, Inc., Class A* | 17,240 | 597,711 | ||||||
Synopsys, Inc.* | 6,220 | 530,193 | ||||||
Take-Two Interactive Software, Inc.* | 5,215 | 572,503 | ||||||
Teradyne, Inc. | 2,635 | 110,327 | ||||||
Texas Instruments, Inc. | 13,290 | 1,388,008 | ||||||
Tower Semiconductor, Ltd. (Israel)* | 100 | 3,398 | ||||||
Toyo Corp./Chuo-ku (Japan) | 12,300 | 107,891 | ||||||
Universal Display Corp. | 1,260 | 217,539 | ||||||
Venture Corp., Ltd. (Singapore) | 5,300 | 80,916 | ||||||
Viavi Solutions, Inc.* | 20,960 | 183,190 | ||||||
Visa, Inc., Class A | 7,670 | 874,533 | ||||||
VMware, Inc., Class A*,1 | 650 | 81,458 | ||||||
Vtech Holdings (Hong Kong) | 3,700 | 48,392 | ||||||
Western Digital Corp. | 4,970 | 395,264 | ||||||
The accompanying notes are an integral part of these financial statements.
10
Table of Contents
AMG Chicago Equity Partners Balanced Fund
Schedule of Portfolio Investments (continued)
| Shares | Value | |||||||
Information Technology - 17.2% (continued) |
| |||||||
Workday, Inc., Class A* | 2,540 | $ | 258,420 | |||||
Zebra Technologies Corp., Class A* | 7,160 | 743,208 | ||||||
Total Information Technology | 33,738,874 | |||||||
Materials - 2.2% | ||||||||
Air Products & Chemicals, Inc. | 1,855 | 304,368 | ||||||
Albemarle Corp. | 400 | 51,156 | ||||||
Avery Dennison Corp. | 1,850 | 212,491 | ||||||
Berry Global Group, Inc.* | 12,390 | 726,921 | ||||||
Cabot Corp. | 1,495 | 92,077 | ||||||
The Chemours Co. | 10,910 | 546,155 | ||||||
Domtar Corp. | 4,060 | 201,051 | ||||||
DowDuPont, Inc. | 5,427 | 386,511 | ||||||
DuluxGroup, Ltd. (Australia) | 12,400 | 73,893 | ||||||
Ence Energia y Celulosa, S.A. (Spain) | 7,200 | 47,514 | ||||||
FMC Corp. | 1,420 | 134,417 | ||||||
Freeport-McMoRan, Inc.* | 24,725 | 468,786 | ||||||
Huntsman Corp. | 4,950 | 164,785 | ||||||
Marshalls PLC (United Kingdom) | 17,200 | 105,639 | ||||||
Mitsubishi Steel Manufacturing Co., Ltd. (Japan) | 4,200 | 104,099 | ||||||
The Navigator Co., S.A. (Portugal) | 3,700 | 18,839 | ||||||
Newmont Mining Corp. | 3,755 | 140,888 | ||||||
Nippon Paper Industries Co., Ltd. (Japan) | 5,800 | 110,089 | ||||||
Nippon Soda Co., Ltd. (Japan) | 700 | 4,654 | ||||||
Owens-Illinois, Inc.* | 5,000 | 110,850 | ||||||
PPG Industries, Inc. | 585 | 68,340 | ||||||
Svenska Cellulosa AB SCA, Class B (Sweden) | 6,400 | 65,965 | ||||||
Toyo Ink SC Holdings Co., Ltd. (Japan) | 3,000 | 17,721 | ||||||
Vedanta Resources PLC (India) | 11,300 | 122,260 | ||||||
Westlake Chemical Corp. | 1,320 | 140,620 | ||||||
Total Materials | 4,420,089 | |||||||
Real Estate - 2.4% | ||||||||
Alexandria Real Estate Equities, Inc., REIT | 760 | 99,248 | ||||||
alstria office REIT-AG, REIT (Germany) | 3,000 | 46,362 | ||||||
Boston Properties, Inc., REIT | 1,530 | 198,946 | ||||||
CapitaLand Retail China Trust, REIT (Singapore) | 7,500 | 9,084 | ||||||
CBRE Group, Inc., Class A* | 11,950 | 517,554 | ||||||
Columbia Property Trust, Inc., REIT | 7,400 | 169,830 | ||||||
CoreSite Realty Corp., REIT | 4,990 | 568,361 | ||||||
Corporate Office Properties Trust, REIT | 4,180 | 122,056 | ||||||
DDR Corp., REIT | 23,260 | 208,410 | ||||||
Digital Realty Trust, Inc., REIT | 5,600 | 637,840 | ||||||
| Shares | Value | |||||||
Equity Residential, REIT | 3,475 | $ | 221,601 | |||||
Eurocommercial Properties, N.V. (Netherlands) | 600 | 26,140 | ||||||
Hemfosa Fastigheter AB (Sweden) | 2,800 | 37,520 | ||||||
Kungsleden AB (Sweden) | 15,500 | 112,399 | ||||||
Leopalace21 Corp. (Japan) | 1,100 | 8,542 | ||||||
The Macerich Co., REIT | 2,270 | 149,094 | ||||||
NSI, N.V., REIT (Netherlands) | 100 | 4,171 | ||||||
Outfront Media Inc., REIT | 10,125 | 234,900 | ||||||
Piedmont Office Realty Trust, Inc., Class A, REIT | 14,790 | 290,032 | ||||||
RDI REIT PLC, REIT (United Kingdom) | 215,200 | 106,380 | ||||||
Realty Income Corp., REIT | 740 | 42,195 | ||||||
Sabra Health Care REIT, Inc., REIT | 19,925 | 373,992 | ||||||
Savills PLC (United Kingdom) | 5,400 | 72,397 | ||||||
Senior Housing Properties Trust, REIT | 3,500 | 67,025 | ||||||
Soilbuild Business Space REIT, REIT (Singapore) | 215,700 | 108,056 | ||||||
Spirit Realty Capital, Inc., REIT | 16,000 | 137,292 | ||||||
Tanger Factory Outlet Centers, Inc., REIT 1 | 3,280 | 86,953 | ||||||
Vastned Retail, N.V., REIT (Netherlands) | 200 | 9,911 | ||||||
Total Real Estate | 4,666,291 | |||||||
Telecommunication Services - 0.7% | ||||||||
AT&T, Inc. | 20,490 | 796,651 | ||||||
B Communications, Ltd. (Israel)* | 6,200 | 113,419 | ||||||
DNA Oyj (Finland) | 700 | 13,144 | ||||||
Ei Towers S.P.A. (Italy) | 300 | 19,258 | ||||||
T-Mobile US, Inc.* | 4,445 | 282,302 | ||||||
Zayo Group Holdings, Inc.* | 4,510 | 165,968 | ||||||
Total Telecommunication Services | 1,390,742 | |||||||
Utilities - 1.5% | ||||||||
American Water Works Co., Inc. | 4,295 | 392,950 | ||||||
Atmos Energy Corp. | 3,300 | 283,437 | ||||||
CenterPoint Energy, Inc. | 9,475 | 268,711 | ||||||
Consolidated Edison, Inc. | 2,620 | 222,569 | ||||||
Entergy Corp. | 720 | 58,601 | ||||||
Eversource Energy | 1,770 | 111,829 | ||||||
Hokuriku Electric Power Co. (Japan) | 12,200 | 98,152 | ||||||
NRG Energy, Inc. | 20,855 | 593,950 | ||||||
OGE Energy Corp. | 4,240 | 139,538 | ||||||
Pinnacle West Capital Corp. | 2,530 | 215,505 | ||||||
PPL Corp. | 7,570 | 234,291 | ||||||
REN - Redes Energeticas Nacionais SGPS, | ||||||||
S.A. (Portugal) | 14,500 | 43,129 | ||||||
Vectren Corp. | 2,130 | 138,493 | ||||||
The accompanying notes are an integral part of these financial statements.
11
Table of Contents
AMG Chicago Equity Partners Balanced Fund
Schedule of Portfolio Investments (continued)
| Shares | Value | |||||||
Utilities - 1.5% (continued) | ||||||||
Xcel Energy, Inc. | 2,650 | $ | 127,492 | |||||
Total Utilities | 2,928,647 | |||||||
Total Common Stocks | ||||||||
(Cost $103,058,322) | 125,264,366 | |||||||
| Principal Amount | ||||||||
Corporate Bonds and Notes - 3.8% |
| |||||||
Consumer Staples - 0.0%# |
| |||||||
Colgate-Palmolive Co., MTN 1.750%, 03/15/19 | $ | 105,000 | 104,703 | |||||
Financials - 1.3% |
| |||||||
American Express Credit Corp., MTN 2.250%, 05/05/21 | 160,000 | 158,813 | ||||||
Bank of America Corp., MTN 2.503%, 10/21/22 | 270,000 | 267,308 | ||||||
Bank of Montreal, MTN (Canada) 2.100%, 12/12/19 | 185,000 | 184,540 | ||||||
The Goldman Sachs Group, Inc. 2.350%, 11/15/21 | 320,000 | 315,438 | ||||||
JPMorgan Chase & Co., MTN 2.295%, 08/15/21 | 330,000 | 327,214 | ||||||
Morgan Stanley, MTN 2.625%, 11/17/21 | 295,000 | 293,817 | ||||||
The Toronto-Dominion Bank, MTN (Canada) 2.250%, 11/05/191 | 70,000 | 70,061 | ||||||
US Bancorp, MTN 2.200%, 04/25/19 | 175,000 | 175,527 | ||||||
Visa, Inc. 2.200%, 12/14/20 | 220,000 | 219,920 | ||||||
Wells Fargo & Co. 2.500%, 03/04/21 | 545,000 | 544,998 | ||||||
Total Financials | 2,557,636 | |||||||
Industrials - 2.3% | ||||||||
3M Co., MTN 2.000%, 06/26/22 | 130,000 | 127,788 | ||||||
Altria Group, Inc. 2.625%, 01/14/20 | 200,000 | 201,346 | ||||||
Apple, Inc. 2.300%, 05/11/22 | 310,000 | 308,023 | ||||||
AT&T, Inc. 4.100%, 02/15/282 | 370,000 | 371,972 | ||||||
BP Capital Markets PLC (United Kingdom) 1.676%, 05/03/19 | 225,000 | 223,860 | ||||||
Burlington Northern Santa Fe LLC 4.700%, 10/01/19 | 65,000 | 67,770 | ||||||
Cisco Systems, Inc. 1.400%, 02/28/18 | 200,000 | 199,900 | ||||||
| Principal Amount | Value | |||||||
Cisco Systems, Inc. 2.200%, 02/28/21 | $ | 160,000 | $ | 159,565 | ||||
Dr Pepper Snapple Group, Inc. 3.130%, 12/15/23 | 120,000 | 121,260 | ||||||
Exxon Mobil Corp. 1.708%, 03/01/19 | 95,000 | 94,794 | ||||||
Ford Motor Co. 4.346%, 12/08/26 | 120,000 | 125,336 | ||||||
General Electric Co. | ||||||||
Series A 6.750%, 03/15/32 | 45,000 | 61,737 | ||||||
The Home Depot, Inc. 2.250%, 09/10/18 | 210,000 | 210,620 | ||||||
Johnson & Johnson 5.150%, 07/15/18 | 90,000 | 91,678 | ||||||
Lockheed Martin Corp. 1.850%, 11/23/18 | 70,000 | 69,930 | ||||||
McDonald’s Corp., MTN 5.350%, 03/01/18 | 195,000 | 196,170 | ||||||
6.300%, 10/15/37 | 80,000 | 107,781 | ||||||
PepsiCo, Inc. 2.250%, 05/02/22 | 335,000 | 331,729 | ||||||
Pfizer, Inc. 1.700%, 12/15/19 | 230,000 | 228,619 | ||||||
Shell International Finance BV (Netherlands) 1.875%, 05/10/21 | 130,000 | 128,150 | ||||||
TransCanada PipeLines, Ltd. (Canada) 3.800%, 10/01/20 | 100,000 | 103,726 | ||||||
Tyson Foods, Inc. 2.650%, 08/15/19 | 200,000 | 201,039 | ||||||
Union Pacific Corp. 3.646%, 02/15/24 | 155,000 | 163,053 | ||||||
United Parcel Service, Inc. 6.200%, 01/15/38 | 120,000 | 165,483 | ||||||
Verizon Communications, Inc. 2.946%, 03/15/22 | 396,000 | 398,804 | ||||||
Total Industrials | 4,460,133 | |||||||
Utilities - 0.2% | ||||||||
Consolidated Edison Co. of New York, Inc. | ||||||||
Series 08-B 6.750%, 04/01/38 | 105,000 | 151,056 | ||||||
Dominion Energy, Inc. 4.450%, 03/15/21 | 75,000 | 79,254 | ||||||
Georgia Power Co. 5.400%, 06/01/40 | 65,000 | 78,288 | ||||||
PacifiCorp 6.000%, 01/15/39 | 85,000 | 114,448 | ||||||
Total Utilities | 423,046 | |||||||
Total Corporate Bonds and Notes | ||||||||
(Cost $7,480,385) | 7,545,518 | |||||||
The accompanying notes are an integral part of these financial statements.
12
Table of Contents
AMG Chicago Equity Partners Balanced Fund
Schedule of Portfolio Investments (continued)
| Principal Amount | Value | |||||||
U.S. Government and Agency Obligations - 31.3% |
| |||||||
Fannie Mae - 2.8% | ||||||||
FNMA, 1.000%, 10/24/19 | $ | 360,000 | $ | 354,193 | ||||
1.375%, 10/07/211 | 170,000 | 165,419 | ||||||
1.875%, 02/19/19 | 440,000 | 440,163 | ||||||
2.000%, 01/01/30 | 57,355 | 56,470 | ||||||
2.500%, 04/01/28 to 05/01/43 | 1,742,100 | 1,713,683 | ||||||
2.625%, 09/06/24 | 305,000 | 309,344 | ||||||
3.000%, 03/01/42 to 08/01/43 | 575,059 | 578,309 | ||||||
3.500%, 11/01/25 to 07/01/43 | 301,315 | 311,195 | ||||||
4.000%, 12/01/21 to 11/01/44 | 320,064 | 335,667 | ||||||
4.500%, 06/01/39 to 09/01/43 | 740,615 | 792,613 | ||||||
5.000%, 09/01/33 to 10/01/41 | 308,405 | 333,389 | ||||||
5.500%, 02/01/35 to 05/01/39 | 147,372 | 162,702 | ||||||
Total Fannie Mae | 5,553,147 | |||||||
Freddie Mac - 9.1% | ||||||||
Federal Home Loan Mortgage Corp., 1.375%, 05/01/201 | 170,000 | 167,516 | ||||||
2.375%, 01/13/22 | 105,000 | 106,005 | ||||||
FHLMC Gold Pool, 2.500%, 07/01/28 to 09/01/46 | 1,329,454 | 1,307,587 | ||||||
3.000%, 01/01/29 to 11/01/47 | 5,012,021 | 5,043,795 | ||||||
3.500%, 03/01/42 to 10/01/47 | 5,650,900 | 5,814,298 | ||||||
4.000%, 03/01/44 to 11/01/45 | 3,414,220 | 3,572,354 | ||||||
4.500%, 02/01/39 to 04/01/44 | 874,010 | 931,285 | ||||||
5.000%, 07/01/35 to 07/01/41 | 706,236 | 767,911 | ||||||
5.500%, 04/01/38 to 01/01/39 | 42,493 | 47,122 | ||||||
Total Freddie Mac | 17,757,873 | |||||||
U.S. Treasury Obligations - 19.4% |
| |||||||
U.S. Treasury Bonds, | ||||||||
2.750%, 08/15/42 to 08/15/47 | 5,925,000 | 5,960,996 | ||||||
3.000%, 11/15/45 | 1,155,000 | 1,213,246 | ||||||
U.S. Treasury Notes, | ||||||||
0.875%, 07/31/19 | 840,000 | 827,400 | ||||||
1.000%, 06/30/19 to 11/30/19 | 3,930,000 | 3,875,554 | ||||||
1.125%, 07/31/21 | 1,555,000 | 1,503,977 | ||||||
1.375%, 05/31/20 to 08/31/20 | 3,155,000 | 3,111,510 | ||||||
1.500%, 02/28/19 to 01/31/22 | 1,955,000 | 1,928,023 | ||||||
1.625%, 07/31/20 to 05/15/26 | 3,185,000 | 3,074,984 | ||||||
1.750%, 05/15/22 to 06/30/22 | 2,175,000 | 2,138,001 | ||||||
1.875%, 11/30/21 | 1,670,000 | 1,656,660 | ||||||
2.000%, 02/15/25 | 725,000 | 708,843 | ||||||
2.250%, 11/15/24 to 02/15/27 | 8,845,000 | 8,766,406 | ||||||
2.500%, 08/15/23 to 05/15/24 | 3,255,000 | 3,295,206 | ||||||
Total U.S. Treasury Obligations | 38,060,806 | |||||||
|
| |||||||
Total U.S. Government and Agency Obligations | 61,371,826 | |||||||
|
| |||||||
| Shares | Value | |||||||
Rights - 0.0% | ||||||||
Health Care - 0.0% | ||||||||
Dyax Corp. CVR Expiration 12/31/19*,3,4 (Cost $0) | 670 | $ | 0 | |||||
| Principal Amount | ||||||||
Short-Term Investments - 1.9% |
| |||||||
Joint Repurchase Agreements - 1.3%5 |
| |||||||
Cantor Fitzgerald Securities, Inc., dated 12/29/17, due 01/02/18, 1.410% total to be received $1,000,157 (collateralized by various U.S. Government Agency Obligations, 0.000% - 8.500%, 01/31/18 - 06/20/63, totaling $1,020,000) | $ | 1,000,000 | 1,000,000 | |||||
Daiwa Capital Markets America, dated 12/29/17, due 01/02/18, 1.430% total to be received $448,828 (collateralized by various U.S. Government Agency Obligations, 0.000% - 6.500%, 01/11/18 - 12/01/51, totaling $457,732) | 448,757 | 448,757 | ||||||
State of Wisconsin Investment Board, dated 12/29/17, due 01/02/18, 1.630% total to be received $1,000,181 (collateralized by various U.S. Government Agency Obligations, 0.125% - 3.875%, 01/15/19 - 02/15/46, totaling $1,027,770) | 1,000,000 | 1,000,000 | ||||||
Total Joint Repurchase Agreements | 2,448,757 | |||||||
| Shares | ||||||||
Other Investment Companies - 0.6% |
| |||||||
Dreyfus Preferred Government Money Market Fund, Institutional Class Shares, 1.25%6 | 1,181,536 | 1,181,536 | ||||||
Total Short-Term Investments |
| 3,630,293 | ||||||
Total Investments - 100.8% | 197,812,003 | |||||||
Other Assets, less Liabilities - (0.8)% |
| (1,523,289 | ) | |||||
|
| |||||||
Net Assets - 100.0% | $ | 196,288,714 | ||||||
|
| |||||||
| # | Less than 0.05%. |
| * | Non-income producing security. |
| 1 | Some or all of these securities, amounting to $2,374,701 or 1.2% of net assets, were out on loan to various brokers. |
| 2 | Security exempt from registration under Rule 144A of the Securities Act of 1933. This security may be resold in transactions exempt from registration, normally to qualified buyers. At December 31, 2017, the value of these securities amounted to $558,045 or 0.3% of net assets. |
| 3 | Security’s value was determined by using significant unobservable inputs. |
The accompanying notes are an integral part of these financial statements.
13
Table of Contents
AMG Chicago Equity Partners Balanced Fund
Schedule of Portfolio Investments (continued)
| 4 | This security is restricted and not available for re-sale. The security was received as part of a corporate action on January 22, 2016. |
| 5 | Collateral received from brokers for securities lending was invested in these joint repurchase agreements. |
| 6 | Yield shown represents the December 31, 2017, seven day average yield, which refers to the sum of the previous seven days’ dividends paid, expressed as an annual percentage. |
CVR Contingent Value Rights
FHLMC Freddie Mac
FNMA Fannie Mae
MTN Medium-Term Note
REIT Real Estate Investment Trust
SDR Sponsored Depositary Receipt
The following table summarizes the inputs used to value the Fund’s investments by the fair value hierarchy levels as of December 31, 2017:
| Level 1 | Level 2† | Level 3 | Total | |||||||||||||
Investments in Securities | ||||||||||||||||
Common Stocks | ||||||||||||||||
Information Technology | $ | 33,235,747 | $ | 503,127 | — | $ | 33,738,874 | |||||||||
Consumer Discretionary | 16,974,393 | 827,786 | — | 17,802,179 | ||||||||||||
Industrials | 15,064,347 | 920,779 | — | 15,985,126 | ||||||||||||
Health Care | 15,237,423 | 447,074 | — | 15,684,497 | ||||||||||||
Financials | 14,475,100 | 491,797 | — | 14,966,897 | ||||||||||||
Consumer Staples | 8,824,877 | 116,732 | — | 8,941,609 | ||||||||||||
Energy | 4,532,691 | 206,724 | — | 4,739,415 | ||||||||||||
Real Estate | 4,355,088 | 311,203 | — | 4,666,291 | ||||||||||||
Materials | 3,968,534 | 451,555 | — | 4,420,089 | ||||||||||||
Utilities | 2,830,495 | 98,152 | — | 2,928,647 | ||||||||||||
Telecommunication Services | 1,264,179 | 126,563 | — | 1,390,742 | ||||||||||||
Corporate Bonds and Notes†† | — | 7,545,518 | — | 7,545,518 | ||||||||||||
U.S. Government and Agency Obligations†† | — | 61,371,826 | — | 61,371,826 | ||||||||||||
Rights | — | — | $ | 0 | — | |||||||||||
Short-Term Investments | ||||||||||||||||
Joint Repurchase Agreements | — | 2,448,757 | — | 2,448,757 | ||||||||||||
Other Investment Companies | 1,181,536 | — | — | 1,181,536 | ||||||||||||
|
|
|
|
|
|
|
| |||||||||
Total Investments in Securities | $ | 121,944,410 | $ | 75,867,593 | $ | 0 | $ | 197,812,003 | ||||||||
|
|
|
|
|
|
|
| |||||||||
| † | As a result of the fair valuation policy utilized by the Fund, certain international equity securities may be level 2 and could result in transfers between level 1 to level 2. (See Note 1(a) in the Notes to Financial Statements.) |
| †† | All corporate bonds and notes and U.S. government and agency obligations held in the Fund are Level 2 securities. For a detailed breakout of corporate bonds and notes and U.S. government and agency obligations by major industry or agency classification, please refer to the Fund’s Schedule of Portfolio Investments. |
At December 31, 2017, the Level 3 securities are Rights received as a result of a corporate action. The security’s value was determined by using significant unobservable inputs which generated a change in unrealized depreciation of $7.
As of December 31, 2017, the Fund had no transfers between levels from the beginning of the reporting period.
The accompanying notes are an integral part of these financial statements.
14
Table of Contents
AMG Chicago Equity Partners Balanced Fund
Schedule of Portfolio Investments (continued)
Country | % of Long-Term Investments | |||
Australia | 0.2 | |||
Austria | 0.0 | # | ||
Bermuda | 0.2 | |||
Canada | 0.2 | |||
Finland | 0.1 | |||
France | 0.1 | |||
Germany | 0.2 | |||
Gibraltar | 0.0 | # | ||
Hong Kong | 0.1 | |||
India | 0.1 | |||
Ireland | 0.2 | |||
Israel | 0.2 | |||
Italy | 0.1 | |||
Japan | 1.2 | |||
Malta | 0.0 | # | ||
Netherlands | 0.1 | |||
New Zealand | 0.1 | |||
Norway | 0.1 | |||
Panama | 0.1 | |||
Portugal | 0.1 | |||
Singapore | 0.1 | |||
Spain | 0.1 | |||
Sweden | 0.1 | |||
Switzerland | 0.1 | |||
United Kingdom | 0.8 | |||
United States | 95.4 | |||
|
| |||
| 100.0 | ||||
|
| |||
| # | Less than 0.05%. |
The accompanying notes are an integral part of these financial statements.
15
Table of Contents
AMG Chicago Equity Partners Small Cap Value Fund
Portfolio Manager’s Comments (unaudited)
THE YEAR IN REVIEW
For the year ended December 31, 2017, the AMG Chicago Equity Partners Small Cap Value Fund (Class I shares) (the “Fund”) returned 5.35%, compared to the 7.84% return for its benchmark, the Russell 2000® Value Index.
The strong stock market of 2017 reflected not only multiple expansion, but also strong corporate earnings growth. Economic indicators in the U.S. were generally strong in the fourth quarter and throughout 2017, with a solid job market, strong housing numbers, improved growth and earnings expectations, and moderate inflation. As such, the Federal Reserve raised rates three times in the year, with the targeted federal funds rate ending the year at 1.5%.
While the Fund outperformed its benchmark in most months of 2017, weaker relative returns in March, May and December had the worst drag on relative performance for the year. In each of those months, at least two if not three factor groups detracted from returns. The Fund’s exposures to value and quality factors had weak performance, while momentum and growth were relatively strong. For the year, the spread between our top quintile-ranked and bottom quintile-ranked stocks was positive, but not as wide as the long-term average of our quantitative model.
Expectations for 2018 are for continued increased earnings as corporate tax reform is incorporated into expectations. It has been our experience that the market rewards a broad set of fundamental factors more often than not, which is why we consistently stick to our disciplined process.
The Fund is managed to emphasize stock selection while neutralizing size, style and sector exposure. Our research has shown that constructing a well-diversified portfolio of companies with attractive valuation ratios, quality balance sheets, and positive growth and momentum expectations built through a disciplined, risk-controlled process offers the potential to deliver consistent excess returns. Overall, our philosophy will not change based on short-term trends or conditions in the market. We will continue to use our disciplined approach to provide added value at controlled levels of risk.
This commentary reflects the viewpoints of the portfolio manager, Chicago Equity Partners, LLC, as of December 31, 2017 and is not intended as a forecast or guarantee of future results and is subject to change without notice.
16
Table of Contents
AMG Chicago Equity Partners Small Cap Value Fund
Portfolio Manager’s Comments (continued)
CUMULATIVE TOTAL RETURN PERFORMANCE
AMG Chicago Equity Partners Small Cap Value Fund’s cumulative total return is based on the daily change in net asset value (NAV), and assumes that all dividends and distributions were reinvested. This graph compares a hypothetical $10,000 investment made in the Fund’s Class I shares on December 31, 2014 (inception date), to a $10,000 investment made in the Russell 2000® Value Index for the same time period. The graph and table do not reflect the deduction of taxes that a shareholder would pay on a Fund distribution or redemption of shares. The listed returns for the Fund are net of expenses and the returns for the index exclude expenses. Total returns would have been lower had certain expenses not been reduced.

The table below shows the average annual total returns for the AMG Chicago Equity Partners Small Cap Value Fund and the Russell 2000® Value Index for the same time periods ended December 31, 2017.
| Average Annual Total Returns1 | One Year | Since Inception | Inception Date | |||||||||
AMG Chicago Equity Partners Small Cap Value Fund2, 3, 4, 5, 6, 7 | ||||||||||||
Class N | 5.18 | % | 8.41 | % | 12/31/14 | |||||||
Class I | 5.35 | % | 8.69 | % | 12/31/14 | |||||||
Class Z | 5.63 | % | 8.86 | % | 12/31/14 | |||||||
Russell 2000® Value Index8 | 7.84 | % | 9.55 | % | 12/31/14 | † | ||||||
The performance data shown represents past performance. Past performance is not a guarantee of future results. Current performance may be lower or higher than the performance data quoted. The investment return and principal value of an investment will fluctuate so that an investor’s shares, when redeemed, may be worth more or less than their original cost.
Investors should carefully consider the Fund’s investment objectives, risks, charges and expenses before investing. For performance information through the most recent month end, current net asset values per share for the Fund and other information, please call 800.835.3879 or visit our website at amgfunds.com for a free prospectus. Read it carefully before investing or sending money.
Distributed by AMG Distributors, Inc., member FINRA/SIPC.
| † | Date reflects inception date of the Fund, not the index. |
| 1 | Total return equals income yield plus share price change and assumes reinvestment of all dividends and capital gain distributions. Returns are net of fees and may reflect offsets of Fund expenses as described in the prospectus. No adjustment has been made for taxes payable by shareholders on their reinvested dividends and capital gain distributions. Returns for periods greater than one year are annualized. The listed returns on the Fund are net of expenses and based on the published NAV as of December 31, 2017. All returns are in U.S. dollars ($). |
| 2 | From time to time, the Fund’s advisor has waived its fees and/or absorbed Fund expenses, which has resulted in higher returns. |
| 3 | The Fund is subject to risks associated with investments in small-capitalization companies, such as erratic earnings patterns, competitive conditions, limited earnings history and a reliance on one or a limited number of products. |
| 4 | Investments in international securities are subject to certain risks of overseas investing including currency fluctuations and changes in political and economic conditions, which could result in significant market fluctuations. |
| 5 | The Fund is subject to the risks associated with investments in emerging markets, such as erratic earnings patterns, economic and political instability, changing exchange controls, limitations on repatriation of foreign capital and changes in local governmental attitudes toward private investment, possibly leading to nationalization or confiscation of investor assets. |
| 6 | The Fund is subject to special risk considerations similar to those associated with the direct ownership of real estate. Real estate valuations may be subject to factors such as changing general and local economic, financial, competitive, and environmental conditions. |
| 7 | The Fund invests in value stocks, which may perform differently from the market as a whole and may be undervalued by the market for a long period of time. |
| 8 | The Russell 2000® Value Index is an unmanaged, market-value weighted, value-oriented index comprised of small stocks that have relatively low price-to-book ratios and lower forecasted growth values. Unlike the Fund, the Russell 2000® Value Index is unmanaged, is not available for investment and does not incur expenses. |
The Russell 2000® Value Index is a trademark of the London Stock Exchange Group companies.
Not FDIC insured, nor bank guaranteed. May lose value.
17
Table of Contents
AMG Chicago Equity Partners Small Cap Value Fund
Fund Snapshots (unaudited)
December 31, 2017
PORTFOLIO BREAKDOWN
Sector | %of Net Assets | |||
Financials | 31.2 | |||
Industrials | 15.5 | |||
Consumer Discretionary | 8.6 | |||
Information Technology | 8.6 | |||
Real Estate | 8.1 | |||
Utilities | 6.6 | |||
Health Care | 6.1 | |||
Energy | 5.4 | |||
Materials | 5.0 | |||
Consumer Staples | 2.7 | |||
Telecommunication Services | 0.7 | |||
Short-Term Investments* | 8.2 | |||
Other Assets Less Liabilities** | (6.7 | ) | ||
| * | Includes reinvestment of cash collateral into joint repurchase agreements on security lending transactions. |
| ** | Includes repayment of cash collateral on security lending transactions. |
TOP TEN HOLDINGS
| Security Name | %of Net Assets | |||
Wintrust Financial Corp. | 2.1 | |||
Cathay General Bancorp | 1.9 | |||
Vishay Intertechnology, Inc. | 1.7 | |||
MGIC Investment Corp. | 1.6 | |||
American Equity Investment Life Holding Co. | 1.6 | |||
Waddell & Reed Financial, Inc., Class A | 1.5 | |||
Invesco Mortgage Capital, Inc., 0.420% | 1.5 | |||
Xenia Hotels & Resorts, Inc., 0.275% | 1.5 | |||
Sunstone Hotel Investors, Inc., 0.580% | 1.4 | |||
Halyard Health, Inc. | 1.3 | |||
|
| |||
Top Ten as a Group | 16.1 | |||
|
| |||
Because a fund’s strategy may result in multiple investments in particular sectors of the economy, its performance may depend on the performance of those sectors and may fluctuate more widely than investments diversified across more sectors. For additional information on these and other risk considerations, please see the Fund’s prospectus.
Any sectors, industries, or securities discussed should not be perceived as investment recommendations. Mention of a specific security should not be considered a recommendation to buy or solicitation to sell that security. Specific securities mentioned in this report may have been sold from the Fund’s portfolio of investments by the time you receive this report.
18
Table of Contents
AMG Chicago Equity Partners Small Cap Value Fund
Schedule of Portfolio Investments
December 31, 2017
| Shares | Value | |||||||
Common Stocks - 98.5% | ||||||||
Consumer Discretionary - 8.6% | ||||||||
Beazer Homes USA, Inc.* | 540 | $ | 10,373 | |||||
Bridgepoint Education, Inc.* | 730 | 6,059 | ||||||
The Buckle, Inc.1 | 235 | 5,581 | ||||||
Callaway Golf Co. | 1,245 | 17,343 | ||||||
Career Education Corp.* | 605 | 7,308 | ||||||
Citi Trends, Inc. | 260 | 6,880 | ||||||
Conn’s, Inc.*,1 | 545 | 19,375 | ||||||
Cooper-Standard Holdings, Inc.* | 30 | 3,675 | ||||||
Dana, Inc. | 250 | 8,002 | ||||||
Deckers Outdoor Corp.* | 80 | 6,420 | ||||||
Flexsteel Industries, Inc. | 120 | 5,614 | ||||||
Group 1 Automotive, Inc. | 180 | 12,775 | ||||||
Johnson Outdoors, Inc., Class A | 320 | 19,869 | ||||||
KB Home | 255 | 8,147 | ||||||
Marriott Vacations Worldwide Corp. | 120 | 16,225 | ||||||
MDC Partners, Inc., Class A* | 1,560 | 15,210 | ||||||
MSG Networks, Inc., Class A* | 375 | 7,594 | ||||||
Office Depot, Inc. | 1,785 | 6,319 | ||||||
Oxford Industries, Inc. | 70 | 5,263 | ||||||
Stoneridge, Inc.* | 260 | 5,944 | ||||||
Tilly’s, Inc., Class A | 235 | 3,469 | ||||||
TopBuild Corp.* | 310 | 23,479 | ||||||
Tower International, Inc. | 205 | 6,263 | ||||||
tronc, Inc.* | 330 | 5,805 | ||||||
ZAGG, Inc.* | 225 | 4,151 | ||||||
Total Consumer Discretionary | 237,143 | |||||||
Consumer Staples - 2.7% | ||||||||
Cal-Maine Foods, Inc.* | 75 | 3,334 | ||||||
Central Garden & Pet Co., Class A* | 430 | 16,215 | ||||||
Ingles Markets, Inc., Class A | 10 | 346 | ||||||
Sanderson Farms, Inc. | 182 | 25,258 | ||||||
SpartanNash Co. | 55 | 1,467 | ||||||
SUPERVALU, Inc.*,1 | 615 | 13,284 | ||||||
United Natural Foods, Inc.* | 185 | 9,115 | ||||||
Village Super Market, Inc., Class A | 215 | 4,930 | ||||||
Total Consumer Staples | 73,949 | |||||||
Energy - 5.4% | ||||||||
C&J Energy Services, Inc.* | 495 | 16,568 | ||||||
Delek US Holdings, Inc. | 970 | 33,892 | ||||||
Exterran Corp.* | 450 | 14,148 | ||||||
McDermott International, Inc.* | 3,000 | 19,740 | ||||||
| Shares | Value | |||||||
Newpark Resources, Inc.* | 1,620 | $ | 13,932 | |||||
Oasis Petroleum, Inc.* | 755 | 6,349 | ||||||
Pacific Ethanol, Inc.* | 400 | 1,820 | ||||||
ProPetro Holding Corp.* | 735 | 14,818 | ||||||
Renewable Energy Group, Inc.* | 340 | 4,012 | ||||||
Unit Corp.* | 210 | 4,620 | ||||||
W&T Offshore, Inc.* | 5,545 | 18,354 | ||||||
Total Energy | 148,253 | |||||||
Financials - 31.2% | ||||||||
AG Mortgage Investment Trust, Inc., REIT | 635 | 12,071 | ||||||
American Equity Investment Life Holding Co. | 1,400 | 43,022 | ||||||
Anworth Mortgage Asset Corp., REIT | 2,275 | 12,376 | ||||||
Apollo Commercial Real Estate Finance, | 3 | 55 | ||||||
ARMOUR Residential REIT, Inc., REIT | 1,195 | 30,735 | ||||||
The Bancorp, Inc.* | 1,180 | 11,658 | ||||||
Bank of Commerce Holdings | 70 | 805 | ||||||
The Bank of NT Butterfield & Son, Ltd. (Bermuda) | 975 | 35,383 | ||||||
Cadence BanCorp* | 275 | 7,458 | ||||||
Cathay General Bancorp | 1,205 | 50,815 | ||||||
Chemical Financial Corp. | 240 | 12,833 | ||||||
City Holding Co. | 60 | 4,048 | ||||||
CNB Financial Corp. | 60 | 1,574 | ||||||
CoBiz Financial, Inc. | 390 | 7,796 | ||||||
Columbia Banking System, Inc. | 565 | 24,544 | ||||||
Evercore, Inc., Class A | 80 | 7,200 | ||||||
Farmers Capital Bank Corp. | 40 | 1,540 | ||||||
FB Financial Corp.* | 100 | 4,199 | ||||||
Federal Agricultural Mortgage Corp., Class C | 279 | 21,829 | ||||||
First American Financial Corp. | 245 | 13,730 | ||||||
First Commonwealth Financial Corp. | 575 | 8,234 | ||||||
First Community Bancshares, Inc. | 65 | 1,867 | ||||||
First Financial Bancorp | 1,224 | 32,252 | ||||||
Hancock Holding Co. | 495 | 24,503 | ||||||
Heritage Financial Corp. | 595 | 18,326 | ||||||
Hope Bancorp, Inc. | 715 | 13,049 | ||||||
Independent Bank Corp. | 570 | 12,740 | ||||||
Invesco Mortgage Capital, Inc., REIT | 2,330 | 41,544 | ||||||
Kearny Financial Corp. | 660 | 9,537 | ||||||
Kemper Corp. | 100 | 6,890 | ||||||
Lakeland Financial Corp. | 345 | 16,729 | ||||||
Macatawa Bank Corp. | 380 | 3,800 | ||||||
MBT Financial Corp. | 280 | 2,968 | ||||||
The accompanying notes are an integral part of these financial statements.
19
Table of Contents
AMG Chicago Equity Partners Small Cap Value Fund
Schedule of Portfolio Investments (continued)
| Shares | Value | |||||||
Financials - 31.2% (continued) | ||||||||
Meta Financial Group, Inc. | 300 | $ | 27,795 | |||||
MGIC Investment Corp.* | 3,195 | 45,082 | ||||||
New Residential Investment Corp., REIT | 855 | 15,287 | ||||||
NMI Holdings, Inc., Class A* | 1,735 | 29,495 | ||||||
Old Second Bancorp, Inc. | 440 | 6,006 | ||||||
Oppenheimer Holdings, Inc., Class A | 130 | 3,484 | ||||||
PCSB Financial Corp.* | 170 | 3,239 | ||||||
Preferred Bank | 449 | 26,392 | ||||||
RBB Bancorp | 65 | 1,779 | ||||||
Republic Bancorp, Inc., Class A | 65 | 2,471 | ||||||
Riverview Bancorp, Inc. | 740 | 6,416 | ||||||
S&T Bancorp, Inc. | 300 | 11,943 | ||||||
Shore Bancshares, Inc. | 170 | 2,839 | ||||||
State Bank Financial Corp. | 390 | 11,638 | ||||||
Third Point Reinsurance, Ltd. (Bermuda)* | 2,035 | 29,813 | ||||||
UMB Financial Corp. | 85 | 6,113 | ||||||
Universal Insurance Holdings, Inc. | 1,155 | 31,589 | ||||||
Waddell & Reed Financial, Inc., Class A1 | 1,895 | 42,334 | ||||||
Walker & Dunlop, Inc.* | 80 | 3,800 | ||||||
Wintrust Financial Corp. | 700 | 57,659 | ||||||
Total Financials | 861,284 | |||||||
Health Care - 6.1% | ||||||||
Agenus, Inc.*,1 | 960 | 3,130 | ||||||
Bluebird Bio, Inc.* | 55 | 9,795 | ||||||
Diplomat Pharmacy, Inc.* | 115 | 2,308 | ||||||
Emergent BioSolutions, Inc.* | 410 | 19,053 | ||||||
Halyard Health, Inc.* | 800 | 36,944 | ||||||
Innoviva, Inc.* | 1,550 | 21,994 | ||||||
Lannett Co., Inc.* | 180 | 4,176 | ||||||
Magellan Health, Inc.* | 130 | 12,551 | ||||||
Novavax, Inc.* | 3,015 | 3,739 | ||||||
Omeros Corp.* | 85 | 1,652 | ||||||
Orthofix International, N.V.* | 115 | 6,290 | ||||||
Owens & Minor, Inc.1 | 340 | 6,419 | ||||||
PDL BioPharma, Inc.* | 3,300 | 9,042 | ||||||
PTC Therapeutics, Inc.* | 110 | 1,835 | ||||||
Spectrum Pharmaceuticals, Inc.* | 235 | 4,453 | ||||||
Tivity Health, Inc.* | 110 | 4,021 | ||||||
Triple-S Management Corp., | ||||||||
Class B (Puerto Rico)* | 535 | 13,295 | ||||||
| Shares | Value | |||||||
Zogenix, Inc.* | 175 | $ | 7,009 | |||||
Total Health Care | 167,706 | |||||||
Industrials - 15.5% | ||||||||
AAR Corp. | 480 | 18,859 | ||||||
ACCO Brands Corp.* | 1,720 | 20,984 | ||||||
Alamo Group, Inc. | 175 | 19,752 | ||||||
Applied Industrial Technologies, Inc. | 100 | 6,810 | ||||||
ArcBest Corp. | 10 | 358 | ||||||
Briggs & Stratton Corp. | 900 | 22,833 | ||||||
CAI International, Inc.* | 150 | 4,248 | ||||||
Costamare, Inc. (Monaco) | 1,020 | 5,885 | ||||||
Covenant Transportation Group, Inc., Class A* | 415 | 11,923 | ||||||
CRA International, Inc. | 75 | 3,371 | ||||||
DMC Global, Inc. | 130 | 3,257 | ||||||
EMCOR Group, Inc. | 145 | 11,854 | ||||||
Ennis, Inc. | 830 | 17,222 | ||||||
The Greenbrier Cos., Inc. | 290 | 15,457 | ||||||
KBR, Inc.1 | 1,080 | 21,416 | ||||||
Kelly Services, Inc., Class A | 680 | 18,544 | ||||||
Kimball International, Inc., Class B | 290 | 5,414 | ||||||
Meritor, Inc.* | 945 | 22,170 | ||||||
Moog, Inc., Class A* | 305 | 26,489 | ||||||
Northwest Pipe Co.* | 125 | 2,393 | ||||||
Quad/Graphics, Inc. | 835 | 18,871 | ||||||
Radiant Logistics, Inc.* | 770 | 3,542 | ||||||
Rexnord Corp.* | 280 | 7,286 | ||||||
Rush Enterprises, Inc., Class A* | 590 | 29,978 | ||||||
SP Plus Corp.* | 500 | 18,550 | ||||||
Textainer Group Holdings, Ltd.* | 670 | 14,405 | ||||||
Triton International, Ltd. (Bermuda) | 500 | 18,725 | ||||||
Tutor Perini Corp.*,1 | 280 | 7,098 | ||||||
Vectrus, Inc.* | 595 | 18,356 | ||||||
Werner Enterprises, Inc. | 445 | 17,199 | ||||||
YRC Worldwide, Inc.* | 1,080 | 15,530 | ||||||
Total Industrials | 428,779 | |||||||
Information Technology - 8.6% | ||||||||
ADTRAN, Inc. | 360 | 6,966 | ||||||
Bel Fuse, Inc., Class B | 280 | 7,049 | ||||||
Belden, Inc. | 215 | 16,592 | ||||||
CACI International, Inc., Class A* | 55 | 7,279 | ||||||
Comtech Telecommunications Corp. | 600 | 13,272 | ||||||
Diodes, Inc.* | 410 | 11,755 | ||||||
DSP Group, Inc.* | 240 | 3,000 | ||||||
The accompanying notes are an integral part of these financial statements.
20
Table of Contents
AMG Chicago Equity Partners Small Cap Value Fund
Schedule of Portfolio Investments (continued)
| Shares | Value | |||||||
Information Technology - 8.6% (continued) | ||||||||
Electro Scientific Industries, Inc.* | 800 | $ | 17,144 | |||||
ePlus, Inc.* | 235 | 17,672 | ||||||
Fitbit, Inc., Class A* | 755 | 4,311 | ||||||
KVH Industries, Inc.* | 320 | 3,312 | ||||||
ManTech International Corp., Class A | 65 | 3,262 | ||||||
Progress Software Corp. | 550 | 23,413 | ||||||
QAD, Inc., Class A | 220 | 8,547 | ||||||
QuinStreet, Inc.* | 600 | 5,028 | ||||||
Ribbon Communications, Inc.* | 855 | 6,609 | ||||||
Sanmina Corp.* | 180 | 5,940 | ||||||
Super Micro Computer, Inc.* | 60 | 1,256 | ||||||
SYNNEX Corp. | 70 | 9,516 | ||||||
Systemax, Inc.1 | 295 | 9,815 | ||||||
Viavi Solutions, Inc.* | 1,070 | 9,352 | ||||||
Vishay Intertechnology, Inc. | 2,255 | 46,791 | ||||||
Zedge, Inc., Class B* | 1 | 3 | ||||||
Total Information Technology | 237,884 | |||||||
Materials - 5.0% | ||||||||
Boise Cascade Co. | 135 | 5,387 | ||||||
The Chemours Co. | 164 | 8,210 | ||||||
Cleveland-Cliffs, Inc.*,1 | 4,420 | 31,868 | ||||||
Greif, Inc., Class A | 200 | 12,116 | ||||||
Kronos Worldwide, Inc. | 550 | 14,173 | ||||||
Louisiana-Pacific Corp.* | 285 | 7,484 | ||||||
Ryerson Holding Corp.* | 950 | 9,880 | ||||||
Schnitzer Steel Industries, Inc., Class A | 1,035 | 34,672 | ||||||
Tronox, Ltd., Class A | 260 | 5,333 | ||||||
Valhi, Inc. | 745 | 4,597 | ||||||
Verso Corp., Class A* | 265 | 4,656 | ||||||
Total Materials | 138,376 | |||||||
Real Estate - 8.1% | ||||||||
Ashford Hospitality Trust, Inc., REIT | 1,630 | 10,970 | ||||||
Chatham Lodging Trust, REIT | 830 | 18,891 | ||||||
Chesapeake Lodging Trust, REIT | 895 | 24,245 | ||||||
Consolidated-Tomoka Land Co. | 70 | 4,445 | ||||||
DiamondRock Hospitality Co., REIT | 1,930 | 21,790 | ||||||
First Industrial Realty Trust, Inc., REIT | 305 | 9,598 | ||||||
iStar, Inc., REIT * | 940 | 10,622 | ||||||
Jernigan Capital, Inc., REIT 1 | 210 | 3,992 | ||||||
Lexington Realty Trust, REIT | 1,555 | 15,006 | ||||||
One Liberty Properties, Inc., REIT | 135 | 3,499 | ||||||
Pebblebrook Hotel Trust, REIT 1 | 390 | 14,496 | ||||||
| Shares | Value | |||||||
PS Business Parks, Inc., REIT | 51 | $ | 6,380 | |||||
Sunstone Hotel Investors, Inc., REIT 1 | 2,330 | 38,515 | ||||||
Xenia Hotels & Resorts, Inc., REIT | 1,875 | 40,481 | ||||||
Total Real Estate | 222,930 | |||||||
Telecommunication Services - 0.7% | ||||||||
Cincinnati Bell, Inc.* | 420 | 8,757 | ||||||
Iridium Communications, Inc. *,1 | 885 | 10,443 | ||||||
Total Telecommunication Services | 19,200 | |||||||
Utilities - 6.6% | ||||||||
ALLETE, Inc. | 50 | 3,718 | ||||||
American States Water Co. | 230 | 13,319 | ||||||
Avista Corp. | 160 | 8,238 | ||||||
California Water Service Group | 215 | 9,750 | ||||||
Chesapeake Utilities Corp. | 105 | 8,248 | ||||||
IDACORP, Inc. | 217 | 19,825 | ||||||
New Jersey Resources Corp. | 405 | 16,281 | ||||||
Northwest Natural Gas Co. | 30 | 1,790 | ||||||
ONE Gas, Inc. | 250 | 18,315 | ||||||
Otter Tail Corp. | 315 | 14,002 | ||||||
PNM Resources, Inc. | 605 | 24,472 | ||||||
SJW Group | 350 | 22,340 | ||||||
Spire, Inc. | 70 | 5,261 | ||||||
Unitil Corp. | 90 | 4,106 | ||||||
WGL Holdings, Inc. | 140 | 12,018 | ||||||
Total Utilities | 181,683 | |||||||
Total Common Stocks | 2,717,187 | |||||||
The accompanying notes are an integral part of these financial statements.
21
Table of Contents
AMG Chicago Equity Partners Small Cap Value Fund
Schedule of Portfolio Investments (continued)
| Principal Amount | Value | |||||||
Short-Term Investments - 8.2% |
| |||||||
Joint Repurchase Agreements - 6.1%2 |
| |||||||
Cantor Fitzgerald Securities, Inc., dated 12/29/17, due 01/02/18, 1.410% total to be received $169,452 (collateralized by various U.S. Government Agency Obligations, 0.000% -8.500%, 01/31/18 - 06/20/63, totaling $172,813) | $ | 169,425 | $ | 169,425 | ||||
| Shares | ||||||||
Other Investment Companies - 2.1% |
| |||||||
Dreyfus Preferred Government Money Market Fund, Institutional Class Shares, 1.25%3 | 57,469 | 57,469 | ||||||
Total Short-Term Investments |
| 226,894 | ||||||
| Value | ||||||
Total Investments - 106.7% | $ | 2,944,081 | ||||
Other Assets, less Liabilities - (6.7)% | (184,419 | ) | ||||
Net Assets - 100.0% | $ | 2,759,662 | ||||
| * | Non-income producing security. |
| 1 | Some or all of these securities, amounting to $161,259 or 5.8% of net assets, were out on loan to various brokers. |
| 2 | Collateral received from brokers for securities lending was invested in these joint repurchase agreements. |
| 3 | Yield shown represents the December 31, 2017, seven day average yield, which refers to the sum of the previous seven days’ dividends paid, expressed as an annual percentage. |
REIT Real Estate Investment Trust
The following table summarizes the inputs used to value the Fund’s investments by the fair value hierarchy levels as of December 31, 2017:
| Level 1 | Level 2 | Level 3 | Total | |||||||||||||
Investments in Securities | ||||||||||||||||
Common Stocks† | $ | 2,717,187 | — | — | $ | 2,717,187 | ||||||||||
Short-Term Investments | ||||||||||||||||
Joint Repurchase Agreements | — | $ | 169,425 | — | 169,425 | |||||||||||
Other Investment Companies | 57,469 | — | — | 57,469 | ||||||||||||
|
|
|
|
|
|
|
| |||||||||
Total Investments in Securities | $ | 2,774,656 | $ | 169,425 | — | $ | 2,944,081 | |||||||||
|
|
|
|
|
|
|
| |||||||||
| † | All common stocks held in the Fund are Level 1 securities. For a detailed breakout of common stocks by major industry classification, please refer to the Fund’s Schedule of Portfolio Investments. |
As of December 31, 2017, the Fund had no transfers between levels from the beginning of the reporting period.
The accompanying notes are an integral part of these financial statements.
22
Table of Contents
AMG Managers Amundi Intermediate Government Fund
Portfolio Manager’s Comments (unaudited)
THE YEAR IN REVIEW
During the year ended December 31, 2017, the AMG Managers Amundi Intermediate Government Fund (Class N shares) (formerly Class S shares) (the “Fund”) returned 1.68%, while the Citigroup Mortgage Index returned 2.47%.
Low interest rate volatility helped agency mortgage-backed securities (MBS) performance relative to U.S. Treasuries. Performance was weak early in the first quarter despite lower volatility, as concerns over Federal Reserve (Fed) policy impacted performance. Coupon performance was mixed, but the coupon stack generally widened modestly versus Treasury hedges and tighter versus swaps. Overseas buying, which helped to support Ginnie Mae (GNMA) MBS for much of 2016, was light for first quarter of 2017. MBS rebounded later in the quarter with the market gaining greater comfort concerning the tapering of asset purchases by the Fed.
Agency MBS continued to exhibit low spread volatility into the second quarter. While lower volatility and good carry helped agency MBS performance relative to U.S. Treasuries, spreads widened modestly during the quarter. The market had a muted reaction to the Fed’s continued guidance regarding their plans for the tapering of mortgage purchases. Prepayment speeds remained relatively low. Ginnie Mae/Fannie Mae (GNMA/FNMA) spreads were weaker in the quarter due to expectations of bank reform resulting in easier liquidity rules.
Agency MBS finished the third quarter in strong fashion as the sell-off in rates in September proved to be supportive of spreads. Generally, Agency MBS traded with short empirical durations throughout the quarter as concern over recent interest rate lows in August gave way to relief in September. Higher coupon MBS outperformed production coupons significantly. Higher rates also brought in fresh demand. Because the plan and timing of the Fed tapering were well previewed through the middle of the year, markets took the formal announcement in stride.
MBS performance began the fourth quarter with fair performance, only to finish stronger in the month of December. The Treasury rate curve flattened over the quarter, driving lower coupon FNMA and Freddie Mac (FHLMC) 30-year MBS to be best performers while higher coupon MBS lagged significantly despite the favorable prepayment environment.
The Fed began tapering their MBS portfolio in the fourth quarter. The immediate impact on the market was minimal. The size of the MBS market grew in 2016 and 2017 due to high net supply. However, the Fed maintained the size of its MBS portfolio, leading to a reduction of the Fed’s footprint on the market. The gradual start of tapering tempered the market impact.
PERFORMANCE AND POSITIONING
The Fund underperformed its benchmark during the period. Performance was negatively impacted by the Fund’s shorter-than-benchmark duration exposure as the Fed raised rates and short-term interest rates rose more than long-term rates. Agency FRMs (fixed-rate MBS) were positive contributors to performance in 2017. Specifically, the Fund remained underweight in lower coupon MBS and generally overweight in middle to higher coupon MBS relative to the benchmark. Our asset-backed securities (ABS) exposure also provided a contribution to the portfolio’s performance.
During 2017, 30-year Agency FRMs continued to account for the majority of the portfolio exposure, generally ranging between 100% and 110% of capital. We slightly reduced our exposure to 15-year Agency FRMs by 1% from 6.7% to 5.7% by year-end. We eliminated the modest 2% exposure to collateralized mortgage-backed securities (CMBS) over the course of the year. We have maintained our asset-backed securities (ABS) and Agency collateralized mortgage obligations (CMO) exposure at approximately 7% and 2% of capital, respectively.
The Fund held both U.S. Treasury and swap futures throughout the year. These derivative positions were held primarily to hedge the effective duration (i.e., interest rate risk) of the total portfolio. In general, the presence of these positions reduced the portfolio duration by 0.22 years to 0.35 years.
LOOKING FORWARD
In the aftermath of the financial crisis, multiple factors inhibited leverage, including tighter regulation and more costly secured financing. The unleveraged investor was then king. Times have changed, and balance sheets are expanding. We are now in the final phase of the credit cycle, the “leverage” phase. Abundant liquidity and low defaults support higher asset prices with low volatility. The resulting excellent Sharpe ratios invite the increasing application of leverage and extend the virtuous cycle, further compressing spreads.
The rates market is pricing fewer than half of the seven rate hikes that the Federal Open Market Committee (FOMC) forecasts over the next three
years. We think Fed rate hikes are underpriced. Still, we do not fear the Fed upsetting the apple cart, unless inflation surprises substantially to the upside.
Fundamentally, the U.S. housing market remains in healing mode. Affordability levels continue to support stable or rising home prices in most parts of the country. Mortgage credit availability has barely begun to expand from the severely restricted post-crisis levels. Housing construction rates and household formation rates are more likely to reveal a housing shortage than a housing surplus. One new obstacle to continued home price appreciation is the recent tax reform legislation that reduced the historic subsidy for home ownership. While we see modest risk in pockets of the housing market where home prices and state taxes are high, in the aggregate this headwind is likely to be overwhelmed by the aforementioned tailwinds. In the base case, the U.S. housing market remains positioned for home price gains that continue to outpace inflation in the majority of geographies and price points.
Additionally, the risk remains minimal for a “left tail” scenario of broad and severe home price declines. The housing crisis was made possible by an unsustainable combination of low affordability levels, weak mortgage credit standards and oversupply of housing. Today’s environment remains in the opposite corner of this matrix.
This commentary reflects the viewpoints of the portfolio manager, Amundi Pioneer Institutional Asset Management, Inc. as of December 31, 2017, and is not intended as a forecast or guarantee of future results and is subject to change without notice.
CUMULATIVE TOTAL RETURN PERFORMANCE
AMG Managers Amundi Intermediate Government Fund’s cumulative total return is based on the daily change in net asset value (NAV), and assumes that all dividends and distributions were reinvested. This graph compares a hypothetical $10,000 investment made in the Fund’s Class N (formerly Class S) shares on December 31, 2007, to a $10,000 investment made in the Bloomberg Barclays U.S. Aggregate Bond Index and the Citigroup Mortgage Index for the same time period. The graph and table do not reflect the deduction of taxes that a shareholder would pay on a Fund distribution or redemption of shares. The listed returns for the Fund are net of expenses and the returns for the index exclude expenses. Total returns would have been lower had certain expenses not been reduced.
23
Table of Contents
AMG Managers Amundi Intermediate Government Fund
Portfolio Manager’s Comments (continued)
CUMULATIVE TOTAL RETURN PERFORMANCE (continued)
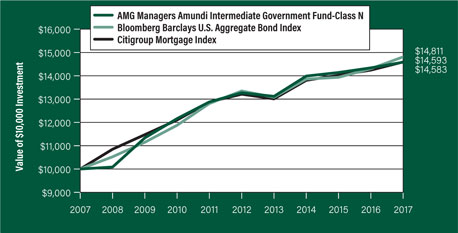
The table below shows the average annual total returns for the AMG Managers Amundi Intermediate Government Fund and the Bloomberg Barclays U.S. Aggregate Bond Index and the Citigroup Mortgage Index for the same time periods ended December 31, 2017.
| Average Annual Total Returns1 | One Year | Five Years | Ten Years | Since Inception | Inception Date | |||||||||||||||
AMG Managers Amundi Intermediate Government Fund2, 3, 4, 5, 6, 7 |
| |||||||||||||||||||
Class N8 | 1.68 | % | 1.90 | % | 3.84 | % | 5.48 | % | 03/31/92 | |||||||||||
Class I | — | — | — | 1.15 | % | 02/24/17 | ||||||||||||||
Class Z | — | — | — | 1.15 | % | 02/24/17 | ||||||||||||||
Bloomberg Barclays U.S. Aggregate Bond Index9 | 3.54 | % | 2.10 | % | 4.01 | % | 5.66 | % | 03/31/92 | † | ||||||||||
Citigroup Mortgage Index10 | 2.47 | % | 2.02 | % | 3.85 | % | 5.52 | % | 03/31/92 | † | ||||||||||
The performance data shown represents past performance. Past performance is not a guarantee of future results. Current performance may be lower or higher than the performance data quoted. The investment return and principal value of an investment will fluctuate so that an investor’s shares, when redeemed, may be worth more or less than their original cost.
Investors should carefully consider the Fund’s investment objectives, risks, charges and expenses before investing. For performance information through the most recent month end, current net asset values per share for the Fund and other information, please call 800.835.3879 or visit our website at amgfunds.com for a free prospectus. Read it carefully before investing or sending money.
Distributed by AMG Distributors, Inc., member FINRA/SIPC.
| † | Date reflects the inception date of the Fund, not the index. |
| 1 | Total return equals income yield plus share price change and assumes reinvestment of all dividends and capital gain distributions. Returns are net of fees and may reflect offsets of Fund expenses as described in the prospectus. No adjustment has been made for taxes payable by shareholders on their reinvested dividends and capital gain distributions. Returns for periods greater than one year are annualized. The listed returns on the Fund are net of expenses and based on the published NAV as of December 31, 2017. All returns are in U.S. dollars ($). |
| 2 | From time to time the Fund’s advisor has waived its fees and/or absorbed Fund expenses, which has resulted in higher returns. |
| 3 | The Fund is subject to the risks associated with investments in debt securities, such as default risk and fluctuations in the perception of the debtor’s ability to pay its creditors. Changing interest rates may adversely affect the value of an investment. An increase in interest rates typically causes the value of bonds and other fixed income securities to fall. |
| 4 | To the extent that the Fund invests in asset-backed or mortgage-backed securities, its exposure to prepayment and extension risks may be greater than investments in other fixed income securities. |
| 5 | The Fund may invest in derivatives such as options and futures; the complexity and rapidly changing structure of derivatives markets may increase the possibility of market losses. |
| 6 | Many bonds have call provisions which allow the debtors to pay them back before maturity. This is especially true with mortgage securities, which can be paid back anytime. Typically debtors prepay their debt when it is to their advantage (when interest rates drop making a new loan at current rates more attractive), and thus likely to the disadvantage of bondholders, who may have to reinvest prepayment proceeds in securities with lower yields. Prepayment risk will vary depending on the provisions of the security and current interest rates relative to the interest rate of the debt. |
| 7 | Obligations of certain government agencies are not backed by the full faith and credit of the U.S. government. If one of these agencies defaulted on a loan, there is no guarantee that the U.S. government would provide financial support. Additionally, debt securities of the U.S. government may be affected by changing interest rates and subject to prepayment risk. |
| 8 | Effective February 27, 2017, Class S was renamed Class N. |
| 9 | The Bloomberg Barclays U.S. Aggregate Bond Index represents securities that are SEC-registered, taxable, and dollar denominated. The index covers the U.S. investment grade fixed rate bond market, with index components for government and corporate securities, mortgage pass-through securities, and asset-backed securities. Unlike the Fund, the Bloomberg Barclays U.S. Aggregate Bond Index is unmanaged, is not available for investment, and does not incur expenses. |
| 10 | The Citigroup Mortgage Index includes all outstanding government sponsored fixed-rate mortgage-backed securities, weighted in proportion to their current market capitalization. The Index reflects no deductions for fees, expenses, or taxes. Unlike the Fund, the Citigroup Mortgage Index is unmanaged, is not available for investment, and does not incur expenses. |
Not FDIC insured, nor bank guaranteed. May lose value.
24
Table of Contents
AMG Managers Amundi Intermediate Government Fund
Fund Snapshots (unaudited)
December 31, 2017
PORTFOLIO BREAKDOWN
Category | %of Net Assets | |||
U.S. Government and Agency Obligations | 123.4 | |||
Asset-Backed Securities | 7.2 | |||
Mortgage-Backed Securities | 0.4 | |||
Short-Term Investments | 16.6 | |||
TBA Forward Sale Commitments | (0.9 | ) | ||
Other Assets Less Liabilities* | (46.7 | ) | ||
| * | Includes payables for To Be Announced securities, and net unrealized appreciation of $16,584 on open futures contracts. |
Rating | % of Market Value* | |||
U.S. Government and Agency Obligations | 94.2 | |||
Aaa | 5.5 | |||
Aa | 0.0 | # | ||
A | 0.0 | # | ||
Baa | 0.1 | |||
Ba | 0.1 | |||
B | 0.1 | |||
Caa & lower | 0.0 | # | ||
N/R | 0.0 | # | ||
| * | Includes market value of fixed-income securities only. |
| # | Less than 0.05%. |
TOP TEN HOLDINGS
Security Name | %of Net Assets | |||
FHLMC Gold Pool, 4.000%, TBA 30 years | 15.0 | |||
FNMA, 4.000%, TBA 30 years | 13.1 | |||
FHLMC Gold Pool, 3.500%, TBA 30 years | 9.9 | |||
FNMA, 3.000%, TBA 15 years | 3.9 | |||
Progress Residential Trust, Series 2015-SFR2, Class A, 2.740%, 06/12/32 | 2.7 | |||
FNMA, 4.000%, 09/01/55 | 2.6 | |||
FNMA, 3.000%, 06/01/45 | 2.3 | |||
FNMA, 3.500%, TBA 30 years | 2.3 | |||
FNMA, 4.500%, 09/01/53 | 2.1 | |||
FNMA, 4.500%, TBA 30 years | 2.0 | |||
|
| |||
Top Ten as a Group | 55.9 | |||
|
| |||
Credit quality ratings shown above reflect the highest rating assigned by either Standard & Poor’s (“S&P”) or Moody’s Investors Service, Inc. (“Moody’s”). These rating agencies are independent, nationally recognized statistical rating organizations and are widely used. Investment grade ratings are credit ratings of BBB/Baa or higher. Below investment grade ratings are credit ratings of BB/Ba or lower. Investments designated N/R are not rated by either rating agency. Unrated investments do not necessarily indicate low credit quality. Credit quality ratings are subject to change.
Because a fund’s strategy may result in multiple investments in particular sectors of the economy, its performance may depend on the performance of those sectors and may fluctuate more widely than investments diversified across more sectors. For additional information on these and other risk considerations, please see the Fund’s prospectus.
Any sectors, industries, or securities discussed should not be perceived as investment recommendations. Mention of a specific security should not be considered a recommendation to buy or solicitation to sell that security. Specific securities mentioned in this report may have been sold from the Fund’s portfolio of investments by the time you receive this report.
25
Table of Contents
AMG Managers Amundi Intermediate Government Fund
Schedule of Portfolio Investments
December 31, 2017
| Principal Amount | Value | |||||||
Asset-Backed Securities - 7.2% | ||||||||
Colony American Homes | ||||||||
Series 2014-1A, Class A (1-Month LIBOR plus 1.150%), 2.627%, 05/17/31 (01/17/18)1,2,3 | $ | 1,424,362 | $ | 1,428,227 | ||||
Series 2014-2A, Class A (1-Month LIBOR plus 0.950%), 2.427%, 07/17/31 (01/17/18)1,3 | 1,210,550 | 1,212,613 | ||||||
Invitation Homes Trust | ||||||||
Series 2015-SFR3, Class A (1-Month LIBOR plus 1.300%), 2.760%, 08/17/32 (01/17/18)1,3 | 1,823,604 | 1,835,003 | ||||||
Progress Residential Trust | ||||||||
Series 2015-SFR2, Class A 2.740%, 06/12/321,2 | 2,955,301 | 2,947,970 | ||||||
Series 2016-SFR1, Class A (1-Month LIBOR plus 1.500%), 2.960%, 09/17/33 (01/17/18)1,3 | 351,817 | 355,774 | ||||||
Total Asset-Backed Securities | ||||||||
(Cost $7,753,093) | 7,779,587 | |||||||
Mortgage-Backed Securities - 0.4% | ||||||||
American Home Mortgage Assets Trust | ||||||||
Series 2005-1, Class 1A1 3.730%, 11/25/354 | 44,522 | 39,470 | ||||||
American Home Mortgage Investment Trust | ||||||||
Series 2004-1, Class 4A (6-Month LIBOR plus 2.000%), 3.661%, 04/25/44 (01/01/18)3 | 88,880 | 83,336 | ||||||
Series 2005-1, Class 5A1 (6-Month LIBOR plus 2.000%), 3.652%, 06/25/45 (01/01/18)3 | 5,887 | 5,889 | ||||||
Banc of America Funding | ||||||||
Series 2004-B, Class 1A2 3.218%, 12/20/344 | 64,029 | 52,428 | ||||||
GSR Mortgage Loan Trust | ||||||||
Series 2004-5, Class 1A3 (US Treasury 1 Year plus 1.750%), 3.360%, 05/25/34 (01/01/18)3 | 17,528 | 17,216 | ||||||
Reperforming Loan REMIC Trust | ||||||||
Series 2004-R2, Class 1AF1 (1-Month LIBOR plus 0.420%), 1.972%, 11/25/34 (01/25/18)1,3 | 69,806 | 62,518 | ||||||
Structured Asset Securities Corp. | ||||||||
Series 2005-RF1, Class A (1-Month LIBOR plus 0.350%), 1.902%, 03/25/35 (01/25/18)1,3 | 157,481 | 140,623 | ||||||
| Principal Amount | Value | |||||||
Wells Fargo Mortgage Backed Securities Trust | ||||||||
Series 2007-16, Class 1A1 6.000%, 12/28/37 | $ | 79,425 | $ | 82,749 | ||||
Total Mortgage-Backed Securities | ||||||||
(Cost $525,364) | 484,229 | |||||||
U.S. Government and Agency Obligations - 123.4% | ||||||||
Fannie Mae - 54.4% | ||||||||
FNMA, | ||||||||
2.500%, 02/01/43 | 646,228 | 626,614 | ||||||
3.000%, 01/01/43 to 06/01/452 | 4,376,764 | 4,396,732 | ||||||
3.000%, TBA 15 years5,6 | 4,200,000 | 4,277,930 | ||||||
(6-Month LIBOR plus 1.600%), 3.121%, 06/01/342,3 | 426,737 | 442,906 | ||||||
(12-Month LIBOR plus 1.624%), 3.420%, 08/01/343 | 119,707 | 125,193 | ||||||
3.500%, 05/01/42 to 10/01/452 | 6,845,835 | 7,063,474 | ||||||
3.500%, TBA 30 years5,6 | 2,400,000 | 2,464,125 | ||||||
4.000%, 12/01/26 to 09/01/552 | 8,952,109 | 9,453,663 | ||||||
4.000%, TBA 30 years5,6 | 13,600,000 | 14,222,049 | ||||||
4.500%, 11/01/26 to 09/01/532 | 6,878,995 | 7,381,676 | ||||||
4.500%, TBA 30 years5,6 | 2,000,000 | 2,127,812 | ||||||
4.750%, 07/01/34 to 09/01/34 | 195,479 | 211,035 | ||||||
5.000%, 06/01/18 to 08/01/40 | 1,971,122 | 2,152,144 | ||||||
5.500%, 02/01/18 to 08/01/412 | 2,121,407 | 2,317,807 | ||||||
6.000%, 11/01/22 to 06/01/392 | 810,776 | 886,192 | ||||||
6.500%, 07/01/32 | 59,505 | 60,437 | ||||||
7.000%, 11/01/222 | 185,003 | 194,253 | ||||||
FNMA REMICS, | ||||||||
Series 1994-55, Class H 7.000%, 03/25/242 | 328,264 | 356,005 | ||||||
Series 2005-13, Class AF | ||||||||
(1-Month LIBOR plus 0.400%), 1.952%, 03/25/352,3 | 203,273 | 203,859 | ||||||
FNMA REMICS Whole Loan | ||||||||
Series 2003-W4, Class 4A 7.500%, 10/25/424 | 50,578 | 56,569 | ||||||
Total Fannie Mae | 59,020,475 | |||||||
Freddie Mac - 36.5% | ||||||||
FHLMC, | ||||||||
(US Treasury 1 Year plus 2.224%), 3.474%, 11/01/332,3 | 392,045 | 409,827 | ||||||
FHLMC Gold Pool, 3.000%, 10/01/42 to 06/01/45 | 2,169,106 | 2,176,775 | ||||||
3.500%, 04/01/32 to 02/01/472 | 3,051,838 | 3,163,361 | ||||||
3.500%, TBA 30 years5,6 | 10,400,000 | 10,680,045 | ||||||
4.000%, 09/01/31 | 298,860 | 315,761 | ||||||
4.000%, TBA 30 years5,6 | 15,600,000 | 16,312,968 | ||||||
4.500%, 02/01/20 to 09/01/412 | 1,621,141 | 1,725,223 | ||||||
5.000%, 05/01/18 to 06/01/412 | 2,024,942 | 2,194,681 | ||||||
5.500%, 01/01/18 to 01/01/392 | 1,621,453 | 1,786,268 | ||||||
6.000%, 09/01/21 to 01/01/24 | 156,742 | 163,960 | ||||||
7.000%, 07/01/19 | 28,608 | 29,135 | ||||||
The accompanying notes are an integral part of these financial statements.
26
Table of Contents
AMG Managers Amundi Intermediate Government Fund
Schedule of Portfolio Investments (continued)
| Principal Amount | Value | |||||||
Freddie Mac - 36.5% (continued) | ||||||||
FHLMC Gold Pool, 7.500%, 07/01/342 | $ | 541,695 | $ | 631,934 | ||||
Total Freddie Mac | 39,589,938 | |||||||
Ginnie Mae - 31.0% | ||||||||
GNMA, | ||||||||
3.000%, 11/15/42 to 06/20/45 | 3,285,559 | 3,322,810 | ||||||
3.000%, TBA 30 years5,6 | 1,000,000 | 1,009,062 | ||||||
3.500%, 08/15/43 to 11/20/452 | 7,700,831 | 7,990,048 | ||||||
4.000%, 06/20/43 to 04/20/472 | 12,477,930 | 13,143,029 | ||||||
4.500%, 05/15/39 to 02/15/462 | 2,459,427 | 2,632,794 | ||||||
4.500%, TBA 30 years5,6 | 600,000 | 631,219 | ||||||
5.000%, 12/15/35 to 12/15/452 | 3,587,608 | 3,908,021 | ||||||
5.500%, 10/15/39 to 11/15/392 | 857,417 | 954,757 | ||||||
7.500%, 09/15/28 to 11/15/31 | 19,459 | 20,084 | ||||||
Total Ginnie Mae | 33,611,824 | |||||||
Interest Only Strip - 1.5% | ||||||||
FHLMC | ||||||||
Series 212, Class IO 6.000%, 05/15/31 | 805 | 171 | ||||||
FHLMC REMICS, | ||||||||
Series 2380, Class SI | ||||||||
(7.900% minus 1-Month LIBOR, Cap 7.900%, | ||||||||
Floor 0.000%), 6.423%, 06/15/313 | 7,568 | 1,506 | ||||||
Series 2922, Class SE | ||||||||
(6.750% minus 1-Month LIBOR, Cap 6.750%, | ||||||||
Floor 0.000%), 5.273%, 02/15/353 | 77,443 | 14,257 | ||||||
Series 2934, Class HI 5.000%, 02/15/20 | 14,769 | 525 | ||||||
Series 2934, Class KI 5.000%, 02/15/20 | 9,884 | 328 | ||||||
Series 2965, Class SA | ||||||||
(6.050% minus 1-Month LIBOR, Cap 6.050%, Floor 0.000%), 4.573%, 05/15/323 | 154,041 | 20,339 | ||||||
Series 2967, Class JI 5.000%, 04/15/20 | 29,562 | 1,119 | ||||||
Series 2980, Class SL | ||||||||
(6.700% minus 1-Month LIBOR, Cap 6.700%, | ||||||||
Floor 0.000%), 5.223%, 11/15/343 | 112,039 | 25,611 | ||||||
Series 3065, Class DI | ||||||||
(6.620% minus 1-Month LIBOR, Cap 6.620%, | ||||||||
Floor 0.000%), 5.143%, 04/15/353 | 222,825 | 37,438 | ||||||
Series 3308, Class S | ||||||||
(7.200% minus 1-Month LIBOR, Cap 7.200%, | ||||||||
Floor 0.000%), 5.723%, 03/15/323 | 138,693 | 25,267 | ||||||
Series 3424, Class XI | ||||||||
(6.570% minus 1-Month LIBOR, Cap 6.570%, | ||||||||
Floor 0.000%), 5.093%, 05/15/363 | 183,514 | 30,035 | ||||||
Series 3489, Class SD | ||||||||
(7.800% minus 1-Month LIBOR, Cap 7.800%, | ||||||||
Floor 0.000%), 6.323%, 06/15/323 | 82,273 | 16,042 | ||||||
Series 3685, Class EI 5.000%, 03/15/19 | 9,292 | 85 | ||||||
Series 3731, Class IO 5.000%, 07/15/19 | 6,381 | 59 | ||||||
Series 3882, Class AI 5.000%, 06/15/26 | 41,834 | 1,190 | ||||||
| Principal Amount | Value | |||||||
FHLMC REMICS, | ||||||||
Series 4395, Class TI 4.000%, 05/15/26 | $ | 498,722 | $ | 46,962 | ||||
FNMA, | ||||||||
Series 222, Class 2 7.000%, 06/25/23 | 4,065 | 600 | ||||||
Series 343, Class 21 4.000%, 09/25/18 | 6,678 | 54 | ||||||
Series 343, Class 22 4.000%, 11/25/18 | 3,758 | 37 | ||||||
Series 351, Class 5 5.000%, 04/25/34 | 22,796 | 4,086 | ||||||
Series 351, Class 3 5.000%, 04/25/34 | 46,302 | 8,067 | ||||||
Series 351, Class 4 5.000%, 04/25/34 | 26,926 | 4,826 | ||||||
FNMA REMICS, | ||||||||
Series 2004-51, Class SX | ||||||||
(7.120% minus 1-Month LIBOR, Cap 7.120%, | ||||||||
Floor 0.000%), 5.568%, 07/25/343 | 81,453 | 14,893 | ||||||
Series 2004-64, Class SW | ||||||||
(7.050% minus 1-Month LIBOR, Cap 7.050%, | ||||||||
Floor 0.000%), 5.498%, 08/25/343 | 265,541 | 47,247 | ||||||
Series 2005-12, Class SC | ||||||||
(6.750% minus 1-Month LIBOR, Cap 6.750%, | ||||||||
Floor 0.000%), 5.198%, 03/25/353 | 117,172 | 18,797 | ||||||
Series 2005-45, Class SR | ||||||||
(6.720% minus 1-Month LIBOR, Cap 6.720%, | ||||||||
Floor 0.000%), 5.168%, 06/25/353 | 209,961 | 35,907 | ||||||
Series 2005-65, Class KI | ||||||||
(7.000% minus 1-Month LIBOR, Cap 7.000%, | ||||||||
Floor 0.000%), 5.448%, 08/25/352,3 | 484,107 | 85,074 | ||||||
Series 2005-89, Class S | ||||||||
(6.700% minus 1-Month LIBOR, Cap 6.700%, | ||||||||
Floor 0.000%), 5.148%, 10/25/353 | 499,746 | 84,989 | ||||||
Series 2006-3, Class SA | ||||||||
(6.150% minus 1-Month LIBOR, Cap 6.150%, | ||||||||
Floor 0.000%), 4.598%, 03/25/363 | 99,022 | 14,531 | ||||||
Series 2007-75, Class JI | ||||||||
(6.545% minus 1-Month LIBOR, Cap 6.545%, | ||||||||
Floor 0.000%), 4.993%, 08/25/373 | 93,467 | 15,761 | ||||||
Series 2008-86, Class IO 4.500%, 03/25/23 | 29,935 | 468 | ||||||
Series 2009-31, Class PI 5.000%, 11/25/38 | 582,197 | 89,026 | ||||||
Series 2010-121, Class IO 5.000%, 10/25/25 | 20,444 | 416 | ||||||
Series 2010-37, Class GI 5.000%, 04/25/25 | 8,211 | 91 | ||||||
Series 2010-65, Class IO 5.000%, 09/25/20 | 87,529 | 2,925 | ||||||
Series 2011-124, Class IC 3.500%, 09/25/21 | 119,045 | 3,567 | ||||||
Series 2011-69, Class AI 5.000%, 05/25/18 | 1,816 | 6 | ||||||
Series 2011-88, Class WI 3.500%, 09/25/26 | 214,076 | 21,184 | ||||||
The accompanying notes are an integral part of these financial statements.
27
Table of Contents
AMG Managers Amundi Intermediate Government Fund
Schedule of Portfolio Investments (continued)
| Principal Amount | Value | |||||||
Interest Only Strip - 1.5% (continued) |
| |||||||
FNMA REMICS, | ||||||||
Series 2012-126, Class SJ | ||||||||
(5.000% minus 1-Month LIBOR, Cap 5.000%, Floor 0.000%), 3.448%, 11/25/423 | $ | 505,412 | $ | 65,735 | ||||
GNMA, | ||||||||
Series 2011-167, Class IO 5.000%, 12/16/20 | 28,937 | 813 | ||||||
Series 2011-32, Class KS | ||||||||
(12.100% minus 2 times 1-Month LIBOR, Cap 12.100%, Floor 0.000%), 9.118%, 06/16/343 | 118,236 | 8,148 | ||||||
Series 2011-94, Class IS | ||||||||
(6.700% minus 1-Month LIBOR, Cap 6.700%, | ||||||||
Floor 0.000%), 5.209%, 06/16/363 | 163,558 | 18,497 | ||||||
Series 2012-103, Class IB 3.500%, 04/20/40 | 169,689 | 15,376 | ||||||
Series 2012-140, Class IC 3.500%, 11/20/42 | 485,057 | 98,363 | ||||||
Series 2012-34, Class KS | ||||||||
(6.050% minus 1-Month LIBOR, Cap 6.050%, Floor 0.000%), 4.559%, 03/16/423 | 353,326 | 78,873 | ||||||
Series 2012-69, Class QI 4.000%, 03/16/41 | 208,431 | 30,558 | ||||||
Series 2014-173, Class AI 4.000%, 11/20/38 | 194,953 | 13,547 | ||||||
Series 2016-108, Class QI 4.000%, 08/20/46 | 277,411 | 63,144 | ||||||
Series 2016-118, Class DS | ||||||||
(6.100% minus 1-Month LIBOR, Cap 6.100%, | ||||||||
Floor 0.000%), 4.599%, 09/20/463 | 341,346 | 72,500 | ||||||
Series 2016-145, Class UI 3.500%, 10/20/46 | 442,499 | 88,059 | ||||||
Series 2016-17, Class JS | ||||||||
(6.100% minus 1-Month LIBOR, Cap 6.100%, | ||||||||
Floor 0.000%), 4.599%, 02/20/463 | 366,916 | 64,181 | ||||||
Series 2016-20, Class SB | ||||||||
(6.100% minus 1-Month LIBOR, Cap 6.100%, | ||||||||
Floor 0.000%), 4.599%, 02/20/463 | 382,496 | 68,390 | ||||||
| 1 | Security exempt from registration under Rule 144A of the Securities Act of 1933. This security may be resold in transactions exempt from registration, normally to qualified buyers. At December 31, 2017, the value of these securities amounted to $7,982,728 or 7.4% of net assets. |
| 2 | Some of this security has been pledged as collateral for delayed delivery securities. |
| 3 | Variable rate security. The rate shown is based on the latest available information as of December 31, 2017. |
| 4 | Certain variable rate securities are not based on a published reference rate and spread but are determined by the issuer or agent and are based on current market conditions. These securities do not indicate a reference rate and spread in their description above. |
| 5 | All or part of the security is delayed delivery transaction. The market value for delayed delivery securities at December 31, 2017, amounted to $51,725,210, or 47.7% of net assets. |
| 6 | TBA Securities are purchased/sold on a forward commitment basis with an approximate principal amount and no defined maturity date. The actual principal and maturity date will be determined upon settlement when the specific mortgage pools are assigned. |
| Principal Amount | Value | |||||||
GNMA, | ||||||||
Series 2016-46, Class JI 4.500%, 04/20/46 | $ | 231,027 | $ | 50,540 | ||||
Series 2016-5, Class CS | ||||||||
(6.150% minus 1-Month LIBOR, Cap 6.150%, | ||||||||
Floor 0.000%), 4.649%, 01/20/463 | 352,360 | 65,306 | ||||||
Series 2016-81, Class IO 4.000%, 06/20/46 | 431,944 | 81,762 | ||||||
Series 2016-88, Class SM | ||||||||
(6.100% minus 1-Month LIBOR, Cap 6.100%, | ||||||||
Floor 0.000%), 4.599%, 07/20/463 | 355,534 | 69,012 | ||||||
Total Interest Only Strip | 1,626,290 | |||||||
Total U.S. Government and Agency Obligations | ||||||||
(Cost $133,384,690) | 133,848,527 | |||||||
Short-Term Investments - 16.6% |
| |||||||
U.S. Government Obligation - 0.1% |
| |||||||
U.S. Treasury Bill, 0.276%, 02/15/187,8 | 90,000 | 89,878 | ||||||
| Shares | ||||||||
Other Investment Companies - 16.5% |
| |||||||
Dreyfus Government Cash Management Fund, Institutional Class | 14,228,475 | 14,228,475 | ||||||
Dreyfus Preferred Government Money Market Fund, Institutional Class | 3,722,763 | 3,722,763 | ||||||
Total Other Investment Companies | 17,951,238 | |||||||
Total Short-Term Investments | 18,041,116 | |||||||
Total Investments - 147.6% | 160,153,459 | |||||||
Other Assets, less Liabilities - (47.6)% | (51,667,762 | ) | ||||||
Net Assets - 100.0% | $ | 108,485,697 | ||||||
| 7 | Some or all of this security is held as collateral for futures contracts. The market value of collateral at December 31, 2017, amounted to $89,878, or 0.1% of net assets. |
| 8 | Represents yield to maturity at December 31, 2017. |
| 9 | Yield shown represents the December 31, 2017, seven day average yield, which refers to the sum of the previous seven days’ dividends paid, expressed as an annual percentage. |
FHLMC Freddie Mac
FNMA Fannie Mae
GNMA Ginnie Mae
GSR Goldman Sachs REMIC
IO Interest Only
LIBOR London Interbank Offered Rate
REMICS Real Estate Mortgage Investment Conduit
TBA To Be Announced
The accompanying notes are an integral part of these financial statements.
28
Table of Contents
AMG Managers Amundi Intermediate Government Fund
Schedule of Portfolio Investments (continued)
TBA Forward Sale Commitments
| Security | Principal Amount | Settlement Date | Market Value | Proceeds | ||||||||||||
GNMA, 3.000%, TBA 30 years | $ | 1,000,000 | 01/22/18 | $ | 1,009,063 | $ | (1,005,078 | ) | ||||||||
|
|
|
| |||||||||||||
| Totals | $ | 1,009,063 | $ | (1,005,078 | ) | |||||||||||
|
|
|
| |||||||||||||
Open Futures Contracts
| Description | Number of Contracts | Position | Expiration Date | Current Notional Amount | Value and Unrealized Gain/(Loss) | |||||||||||||||
10-Year U.S. Treasury Note | 2 | Long | 03/20/18 | $ | 248,094 | $ | (1,692 | ) | ||||||||||||
U.S. Ultra Bond CBT Mar 18 | 2 | Long | 03/20/18 | 335,312 | 1,730 | |||||||||||||||
10-Year Interest Rate Swap | 35 | Short | 03/19/18 | (3,438,203 | ) | 10,030 | ||||||||||||||
2-Year U.S. Treasury Note | 3 | Short | 03/29/18 | (642,328 | ) | 1,446 | ||||||||||||||
5-Year Interest Rate Swap | 23 | Short | 03/19/18 | (2,268,196 | ) | 1,919 | ||||||||||||||
5-Year U.S. Treasury Note | 5 | Short | 03/29/18 | (580,820 | ) | 3,151 | ||||||||||||||
|
| |||||||||||||||||||
| Total | $ | 16,584 | ||||||||||||||||||
|
| |||||||||||||||||||
The following table summarizes the inputs used to value the Fund’s investments by the fair value hierarchy levels as of December 31, 2017:
| Level 1 | Level 2 | Level 3 | Total | |||||||||||||
Investments in Securities | ||||||||||||||||
Asset-Backed Securities | — | $ | 7,779,587 | — | $ | 7,779,587 | ||||||||||
Mortgage-Backed Securities | — | 484,229 | — | 484,229 | ||||||||||||
U.S. Government and Agency Obligations† | — | 133,848,527 | — | 133,848,527 | ||||||||||||
Short-Term Investments | ||||||||||||||||
U.S. Government Obligation | — | 89,878 | — | 89,878 | ||||||||||||
Other Investment Companies | $ | 17,951,238 | — | — | 17,951,238 | |||||||||||
|
|
|
|
|
|
|
| |||||||||
Total Investments in Securities | $ | 17,951,238 | $ | 142,202,221 | — | $ | 160,153,459 | |||||||||
|
|
|
|
|
|
|
| |||||||||
TBA Sale Commitments | — | $ | (1,009,063 | ) | — | $ | (1,009,063 | ) | ||||||||
|
|
|
|
|
|
|
| |||||||||
Financial Derivative Instruments - Assets | ||||||||||||||||
Interest Rate Contracts | $ | 18,276 | — | — | $ | 18,276 | ||||||||||
Financial Derivative Instruments - Liabilities | ||||||||||||||||
Interest Rate Contracts | (1,692 | ) | — | — | (1,692 | ) | ||||||||||
|
|
|
|
|
|
|
| |||||||||
Total Financial Derivative Instruments | $ | 16,584 | — | — | $ | 16,584 | ||||||||||
|
|
|
|
|
|
|
| |||||||||
| † | All U.S. government and agency obligations held in the Fund are Level 2 securities. For a detailed breakout of U.S. government and agency obligations by agency classification, please refer to the Fund’s Schedule of Portfolio Investments. |
As of December 31, 2017, the Fund had no transfers between levels from the beginning of the reporting period.
The accompanying notes are an integral part of these financial statements.
29
Table of Contents
AMG Managers Amundi Intermediate Government Fund
Schedule of Portfolio Investments (continued)
The following schedule shows the value of derivative instruments at December 31, 2017:
Asset Derivatives | Liability Derivatives | |||||||||||
| Derivatives not accounted for as hedging instruments | Statement of Assets and Liabilities Location | Fair Value | Statement of Assets and Liabilities Location | Fair Value | ||||||||
Interest rate contracts | Receivable for variation margin1 | $ | 1,281 | Payable for variation margin1 | $ | 8,102 | ||||||
|
|
|
| |||||||||
| 1 | Only current day’s variation margin is reported within the Statement of Assets and Liabilities. The variation margin is included in the open futures cumulative appreciation/depreciation of $16,584. |
For the fiscal year ended December 31, 2017, the effect of derivative instruments on the Statement of Operations for the Fund and the amount of realized gain (loss) and unrealized gain (loss) on derivatives recognized in income is as follows:
Realized Gain (Loss) | Change in Unrealized Gain (Loss) | |||||||||||
| Derivatives not accounted for as hedging instruments | Statement of Operations Location | Realized Gain/(Loss) | Statement of Operations Location | Change in Unrealized Gain (Loss) | ||||||||
Interest rate contracts | Net realized gain (loss) on futures contracts | $ | 5,893 | Net change in unrealized appreciation/ depreciation on futures contracts | $ | (9,807 | ) | |||||
|
|
|
| |||||||||
The accompanying notes are an integral part of these financial statements.
30
Table of Contents
AMG Managers Amundi Short Duration Government Fund
Portfolio Manager’s Comments (unaudited)
THE YEAR IN REVIEW
During the year ended December 31, 2017, the AMG Managers Amundi Short Duration Government Fund (Class N shares) (formerly Class S shares) (the “Fund”) returned 0.58%, while the ICE BofA Merrill Lynch 6-Month U.S. Treasury Bill Index returned
0.95%.
Low interest rate volatility helped agency mortgage-backed securities (MBS) performance relative to U.S. Treasuries. Performance was weak early in the first quarter, despite lower volatility as concerns over Federal Reserve (Fed) policy impacted performance. Coupon performance was mixed, but the coupon stack generally widened modestly versus Treasury hedges and tighter versus swaps. Overseas buying, which helped to support Ginnie Mae (GNMA) MBS for much of 2016, was light for first quarter of 2017. MBS rebounded later in the quarter with the market gaining greater comfort concerning the tapering of asset purchases by the Fed.
Agency MBS continued to exhibit low spread volatility into the second quarter. While lower volatility and good carry helped agency MBS performance relative to U.S. Treasuries, spreads widened modestly during the quarter. The market had a muted reaction to the Fed’s continued guidance regarding their plans for the tapering of mortgage purchases. Prepayment speeds remained relatively low. Ginnie Mae/Fannie Mae (GNMA/FNMA) spreads were weaker in the quarter due to expectations of bank reform resulting in easier liquidity rules.
Agency MBS finished the third quarter in strong fashion as the sell-off in rates in September proved to be supportive of spreads. Generally, Agency MBS traded with short empirical durations throughout the quarter as concern over recent interest rate lows in August gave way to relief in September. Higher coupon MBS outperformed production coupons significantly. Higher rates also brought in fresh demand. Because the plan and timing of the Fed tapering were well-previewed through the middle of the year, markets took the formal announcement in stride.
MBS performance began the fourth quarter with fair performance, only to finish stronger in the month of December. The Treasury rate curve flattened over the
quarter, driving lower coupon FNMA and Freddie Mac (FHLMC) 30-year MBS to be best performers while higher coupon MBS lagged significantly despite the favorable prepayment environment.
The Fed began tapering their MBS portfolio in the fourth quarter. The immediate impact on the market was minimal. The size of the MBS market grew in 2016 and 2017 due to high net supply. However, the Fed maintained the size of its MBS portfolio, leading to a reduction of the Fed’s footprint on the market. The gradual start of tapering tempered the market impact.
PERFORMANCE AND POSITIONING
The Fund underperformed its benchmark during the period. Agency FRMs (fixed-rate MBS) contributed positively to performance in 2017. Our asset-backed security (ABS) exposure also contributed to the Fund’s performance. The Fund’s Agency collateralized-mortgage obligations (CMO) exposure detracted modestly from performance.
During 2017, we increased our positioning of 30-year Agency FRMs by 5% from 33% to 38% by year end. We slightly reduced our exposure to 15-year Agency FRMs by 4% to end the year at 10% of capital. Our asset-backed securities (ABS) positioning declined by a modest 1% to also end the year at 10% of capital.
Agency adjustable rate mortgages (ARMs) represented 21% of the fund’s positioning (1% higher than where we began the year). We sold the majority of our Agency CMO positions, which accounted for 6% of the portfolio at the beginning of the year.
The Fund held both U.S. Treasury and swap futures throughout the year. These derivative positions were held primarily to hedge the effective duration (i.e., interest rate risk) of the total portfolio. In general, the presence of these positions reduced the portfolio duration by 1.47 years to 1.73 years.
LOOKING FORWARD
In the aftermath of the financial crisis, multiple factors inhibited leverage, including tighter regulation and more costly secured financing. The unleveraged investor was then king. Times have
changed, and balance sheets are expanding. We are now in the final phase of the credit cycle, the “leverage” phase. Abundant liquidity and low defaults support higher asset pries with low volatility. The resulting excellent Sharpe ratios invite the increasing application of leverage and extend the virtuous cycle, further compressing spreads.
The rates market is pricing fewer than half of the seven rate hikes that the Federal Open Market Committee (FOMC) forecasts over the next three years. We think Fed rate hikes are underpriced. Still, we do not fear the Fed upsetting the apple cart, unless inflation surprises substantially to the upside.
Fundamentally, the U.S. housing market remains in healing mode. Affordability levels continue to support stable or rising home prices in most parts of the country. Mortgage credit availability has barely begun to expand from the severely restricted post-crisis levels. Housing construction rates and household formation rates are more likely to reveal a housing shortage than a housing surplus. One new obstacle to continued home price appreciation is the recent tax reform legislation that reduced the historic subsidy for home ownership. While we see modest risk in pockets of the housing market where home prices and state taxes are high, in the aggregate this headwind is likely to be overwhelmed by the aforementioned tailwinds. In the base case, the U.S. housing market remains positioned for home price gains that continue to outpace inflation in the majority of geographies and price points. Additionally, the risk remains minimal for a “left tail” scenario of broad and severe home price declines. The housing crisis was made possible by an unsustainable combination of low affordability levels, weak mortgage credit standards, and oversupply of housing. Today’s environment remains in the opposite corner of this matrix.
This commentary reflects the viewpoints of the portfolio manager, Amundi Pioneer Institutional Asset Management, Inc. as of December 31, 2017, and is not intended as a forecast or guarantee of future results and is subject to change without notice.
31
Table of Contents
AMG Managers Amundi Short Duration Government Fund
Portfolio Manager’s Comments (continued)
CUMULATIVE TOTAL RETURN PERFORMANCE
AMG Managers Amundi Short Duration Government Fund’s cumulative total return is based on the daily change in net asset value (NAV), and assumes that all dividends and distributions were reinvested. This graph compares a hypothetical $10,000 investment made in the Fund’s Class N (formerly Class S) shares on December 31, 2007, to a $10,000 investment made in the ICE BofAML U.S. 6-Month Treasury Bill Index for the same time period. The graph and table do not reflect the deduction of taxes that a shareholder would pay on a Fund distribution or redemption of shares. The listed returns for the Fund are net of expenses and the returns for the index exclude expenses. Total returns would have been lower had certain expenses not been reduced.
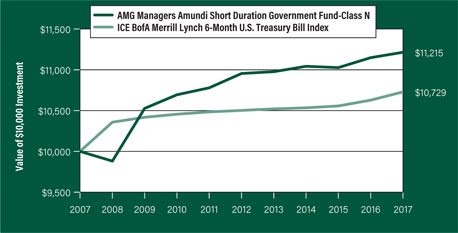
The table below shows the average annual total returns for the AMG Managers Amundi Short Duration Government Fund and the ICE BofAML U.S. 6-Month Treasury Bill Index for the same time periods ended December 31, 2017.
| Average Annual Total Returns1 | One Year | Five Years | Ten Years | Since Inception | Inception Date | |||||||||||||||
AMG Managers Amundi Short Duration Government Fund2, 3, 4, 5, 6, 7 |
| |||||||||||||||||||
Class N8 | 0.58 | % | 0.47 | % | 1.15 | % | 3.32 | % | 03/31/92 | |||||||||||
Class I | — | — | — | 0.31 | % | 02/24/17 | ||||||||||||||
Class Z | — | — | — | 0.44 | % | 02/24/17 | ||||||||||||||
ICE BofAML U.S. 6-Month Treasury Bill Index9 | 0.95 | % | 0.43 | % | 0.71 | % | 2.90 | % | 03/31/92 | † | ||||||||||
The performance data shown represents past performance. Past performance is not a guarantee of future results. Current performance may be lower or higher than the performance data quoted. The investment return and principal value of an investment will fluctuate so that an investor’s shares, when redeemed, may be worth more or less than their original cost.
Investors should carefully consider the Fund’s investment objectives, risks, charges and expenses before investing. For performance information through the most recent month end, current net asset values per share for the Fund and other information, please call 800.835.3879 or visit our website at amgfunds.com for a free prospectus. Read it carefully before investing or sending money.
Distributed by AMG Distributors, Inc., member FINRA/SIPC.
| † | Date reflects inception date of the Fund, not the index. |
| 1 | Total return equals income yield plus share price change and assumes reinvestment of all dividends and capital gain distributions. Returns are net of fees and may reflect offsets of Fund expenses as described in the prospectus. No adjustment has been made for taxes payable by shareholders on their reinvested dividends and capital gain |
| distributions. Returns for periods greater than one year are annualized. The listed returns on the Fund are net of expenses and based on the published NAV as of December 31, 2017. All returns are in U.S. dollars ($). |
| 2 | From time to time the Fund’s advisor has waived its fees and/or absorbed Fund expenses, which has resulted in higher returns. |
| 3 | The Fund is subject to the risks associated with investments in debt securities, such as default risk and fluctuations in the perception of the debtor’s ability to pay its creditors. Changing interest rates may adversely affect the value of an investment. An increase in interest rates typically causes the value of bonds and other fixed-income securities to fall. |
| 4 | To the extent that the Fund invests in asset-backed or mortgage-backed securities, its exposure to prepayment and extension risks may be greater than investments in other fixed income securities. |
| 5 | The Fund may invest in derivatives such as options and futures; the complexity and rapidly changing structure of derivatives markets may increase the possibility of market losses. |
| 6 | Many bonds have call provisions which allow the debtors to pay them back before maturity. This is especially true with mortgage securities, which can be paid back anytime. Typically debtors prepay their debt when it is to their advantage (when interest rates drop making a new loan at current rates more attractive), and thus likely to the disadvantage of bondholders, who may have to reinvest prepayment proceeds in securities with lower yields. Prepayment risk will vary depending on the provisions of the security and current interest rates relative to the interest rate of the debt. |
| 7 | Obligations of certain government agencies are not backed by the full faith and credit of the U.S. government. If one of these agencies defaulted on a loan, there is no guarantee that the U.S. government would provide financial support. Additionally, debt securities of the U.S. government may be affected by changing interest rates and subject to prepayment risk. |
| 8 | Effective February 27, 2017, Class S was renamed Class N. |
| 9 | The ICE BofAML U.S. 6-Month Treasury Bill Index is an unmanaged index that measures returns of six-month Treasury Bills. Unlike the Fund, the ICE BofAML U.S. 6-Month Treasury Bill Index is unmanaged, is not available for investment, and does not incur expenses. |
Not FDIC insured, nor bank guaranteed. May lose value.
32
Table of Contents
AMG Managers Amundi Short Duration Government Fund
Fund Snapshots (unaudited)
December 31, 2017
PORTFOLIO BREAKDOWN
Category | % of Net Assets | |||
U.S. Government and Agency Obligations | 86.5 | |||
Asset-Backed Securities | 10.0 | |||
Mortgage-Backed Securities | 0.3 | |||
Short-Term Investments | 4.2 | |||
TBA Forward Sale Commitments | (2.9 | ) | ||
Other Assets Less Liabilities* | 1.9 | |||
| * | Includes net unrealized depreciation of $2,514 on open futures contracts. |
Rating | % of Market Value* | |||
U.S. Government and Agency Obligations | 89.4 | |||
Aaa | 10.6 | |||
| * | Includes market value of fixed-income securities only. |
TOP TEN HOLDINGS
Security Name | % of Net Assets | |||
GNMA, 6.000%, 01/15/36 | 3.8 | |||
FNMA, 4.000%, 02/01/41 | 2.9 | |||
FNMA, 5.500%, 05/01/34 | 2.5 | |||
FNMA, 4.500%, 04/01/35 | 2.5 | |||
United States Treasury Inflation Indexed Bonds, 2.375%, 01/15/27 | 2.4 | |||
FHLMC Gold Pool, 4.500%, 10/01/44 | 2.4 | |||
FNMA, 5.500%, 08/01/41 | 2.3 | |||
FHLMC Gold Pool, 4.500%, 03/01/42 | 2.2 | |||
Colony American Homes, Series 2015-1A, Class A, 2.632%, 07/17/32 | 2.1 | |||
FHLMC Gold Pool, 4.000%, 12/01/44 | 2.1 | |||
|
| |||
Top Ten as a Group | 25.2 | |||
|
| |||
Credit quality ratings shown above reflect the highest rating assigned by either Standard & Poor’s (“S&P”) or Moody’s Investors Service, Inc. (“Moody’s”). These rating agencies are independent, nationally recognized statistical rating organizations and are widely used. Investment grade ratings are credit ratings of BBB/Baa or higher. Below investment grade ratings are credit ratings of BB/Ba or lower. Investments designated N/R are not rated by either rating agency. Unrated investments do not necessarily indicate low credit quality. Credit quality ratings are subject to change.
Because a fund’s strategy may result in multiple investments in particular sectors of the economy, its performance may depend on the performance of those sectors and may fluctuate more widely than investments diversified across more sectors. For additional information on these and other risk considerations, please see the Fund’s prospectus.
Any sectors, industries, or securities discussed should not be perceived as investment recommendations. Mention of a specific security should not be considered a recommendation to buy or solicitation to sell that security. Specific securities mentioned in this report may have been sold from the Fund’s portfolio of investments by the time you receive this report.
33
Table of Contents
AMG Managers Amundi Short Duration Government Fund
Schedule of Portfolio Investments
December 31, 2017
| Principal Amount | Value | |||||||
Asset-Backed Securities - 10.0% |
| |||||||
AmeriCredit Automobile Receivables Trust | ||||||||
Series 2013-3, Class D 3.000%, 07/08/19 | $ | 233,343 | $ | 233,577 | ||||
Capital Auto Receivables Asset Trust | ||||||||
Series 2013-4, Class D 3.220%, 05/20/19 | 769,448 | 769,960 | ||||||
Colony American Homes | ||||||||
Series 2014-1A, Class A | ||||||||
(1-Month LIBOR plus 1.150%), 2.627%, 05/17/31 (01/17/18)1,2 | 3,199,403 | 3,208,084 | ||||||
Series 2014-2A, Class A | ||||||||
(1-Month LIBOR plus 0.950%), 2.427%, 07/17/31 (01/17/18)1,2 | 1,154,984 | 1,156,953 | ||||||
Series 2015-1A, Class A | ||||||||
(1-Month LIBOR plus 1.200%), 2.632%, 07/17/32 (01/17/18)1,2 | 3,409,472 | 3,421,055 | ||||||
Drive Auto Receivables Trust | ||||||||
Series 2015-AA, Class C 3.060%, 05/17/211 | 1,269,060 | 1,274,499 | ||||||
Series 2015-BA, Class C 2.760%, 07/15/211 | 1,068,456 | 1,071,927 | ||||||
Series 2015-CA, Class C 3.010%, 05/17/211 | 323,174 | 324,512 | ||||||
Series 2016-BA, Class B 2.560%, 06/15/201 | 502,338 | 502,831 | ||||||
Invitation Homes Trust | ||||||||
Series 2015-SFR3, Class A | ||||||||
(1-Month LIBOR plus 1.300%), 2.760%, 08/17/32 (01/17/18)1,2 | 1,448,436 | 1,457,489 | ||||||
Progress Residential Trust | ||||||||
Series 2016-SFR1, Class A | ||||||||
(1-Month LIBOR plus 1.500%), 2.960%, 09/17/33 (01/17/18)1,2 | 510,382 | 516,123 | ||||||
Santander Drive Auto Receivables Trust | ||||||||
Series 2013-4, Class D 3.920%, 01/15/20 | 2,086,598 | 2,096,361 | ||||||
Series 2014-1, Class C 2.360%, 04/15/20 | 28,361 | 28,371 | ||||||
Total Asset-Backed Securities | 16,061,742 | |||||||
Mortgage-Backed Security - 0.3% | ||||||||
Angel Oak Mortgage Trust | ||||||||
Series 2017-2 2.478%, 07/25/47 (Cost $434,652)1,3 | 434,657 | 430,813 | ||||||
U.S. Government and Agency Obligations -86.5% | ||||||||
Fannie Mae - 54.4% | ||||||||
FNMA, | ||||||||
(US Treasury 1 Year plus 2.111%), 2.907%, 05/01/332 | 975,968 | 1,025,748 | ||||||
FNMA, | ||||||||
(6-Month LIBOR plus 1.500%), 2.912%, 02/01/332 | 712,413 | 735,929 | ||||||
(6-Month LIBOR plus 1.560%), 2.986%, 08/01/332 | 300,710 | 311,621 | ||||||
(US Treasury 1 Year plus 2.025%), 3.046%, 01/01/342 | 501,798 | 525,238 | ||||||
(6-Month LIBOR plus 1.600%), 3.121%, 06/01/342 | 535,381 | 555,666 | ||||||
(US Treasury 1 Year plus 2.253%), 3.148%, 05/01/342 | 1,347,701 | 1,427,342 | ||||||
(12-Month LIBOR plus 1.425%), 3.175%, 09/01/332 | 677,705 | 716,334 | ||||||
(US Treasury 1 Year plus 2.202%), 3.185%, 06/01/332 | 273,711 | 286,723 | ||||||
(US Treasury 1 Year plus 2.187%), 3.298%, 12/01/342 | 1,341,915 | 1,410,697 | ||||||
(12-Month LIBOR plus 1.575%), 3.325%, 12/01/332 | 336,330 | 351,985 | ||||||
(US Treasury 1 Year plus 2.108%), 3.341%, 09/01/332 | 201,785 | 210,472 | ||||||
(12-Month LIBOR plus 1.619%), 3.353%, 03/01/342 | 166,383 | 174,691 | ||||||
(12-Month LIBOR plus 1.616%), 3.375%, 10/01/352 | 929,307 | 975,665 | ||||||
(12-Month LIBOR plus 1.648%), 3.401%, 07/01/342 | 876,669 | 920,620 | ||||||
(12-Month LIBOR plus 1.624%), 3.420%, 08/01/342 | 149,634 | 156,491 | ||||||
(12-Month LIBOR plus 1.800%), 3.431%, 01/01/342 | 951,332 | 1,006,068 | ||||||
(US Treasury 1 Year plus 2.349%), 3.444%, 04/01/342 | 394,683 | 416,884 | ||||||
(US Treasury 1 Year plus 2.332%), 3.453%, 04/01/342 | 309,206 | 326,182 | ||||||
(12-Month LIBOR plus 1.717%), 3.460%, 04/01/372,4 | 2,728,028 | 2,857,086 | ||||||
(12-Month LIBOR plus 1.810%), 3.470%, 01/01/332 | 724,306 | 765,130 | ||||||
(US Treasury 1 Year plus 2.380%), 3.492%, 01/01/362 | 2,465,030 | 2,609,235 | ||||||
(US Treasury 1 Year plus 2.360%), 3.547%, 11/01/342 | 2,142,724 | 2,267,182 | ||||||
(12-Month LIBOR plus 1.857%), 3.557%, 01/01/362 | 21,775 | 22,959 | ||||||
(US Treasury 1 Year plus 2.303%), 3.562%, 12/01/342 | 1,309,757 | 1,378,883 | ||||||
(12-Month LIBOR plus 1.820%), 3.572%, 08/01/352 | 879,286 | 928,442 | ||||||
(12-Month LIBOR plus 1.804%), 3.587%, 06/01/342 | 1,250,235 | 1,321,246 | ||||||
(12-Month LIBOR plus 1.730%), 3.605%, 06/01/352 | 71,468 | 75,158 | ||||||
4.000%, 10/01/21 to 06/01/42 | 9,296,323 | 9,759,826 | ||||||
4.500%, 10/01/19 to 11/01/56 | 15,989,046 | 17,217,928 | ||||||
5.000%, 10/01/19 to 01/01/41 | 10,623,768 | 11,451,478 | ||||||
5.500%, 05/01/34 to 08/01/41 | 9,475,352 | 10,525,842 | ||||||
6.000%, 09/01/21 to 08/01/37 | 4,697,428 | 5,157,114 | ||||||
6.500%, 04/01/18 to 08/01/32 | 2,429,738 | 2,723,459 | ||||||
7.000%, 11/01/22 | 689,550 | 724,027 | ||||||
The accompanying notes are an integral part of these financial statements.
34
Table of Contents
AMG Managers Amundi Short Duration Government Fund
Schedule of Portfolio Investments (continued)
| Principal Amount | Value | |||||||
Fannie Mae - 54.4% (continued) | ||||||||
FNMA, | $ | 50,552 | $ | 59,525 | ||||
FNMA Grantor Trust, | ||||||||
Series 2002-T5, Class A1 | ||||||||
(1-Month LIBOR plus 0.120%), 1.568%, 05/25/322 | 162,156 | 161,798 | ||||||
Series 2003-T4, Class 1A | ||||||||
(1-Month LIBOR plus 0.220%), 1.772%, 09/26/332 | 12,977 | 12,913 | ||||||
FNMA REMICS, | ||||||||
Series 1994-31, Class ZC 6.500%, 02/25/24 | 278,144 | 296,925 | ||||||
Series 1994-76, Class J 5.000%, 04/25/24 | 27,302 | 27,399 | ||||||
Series 2001-63, Class FA | ||||||||
(1-Month LIBOR plus 0.550%), 2.041%, 12/18/312 | 293,687 | 298,087 | ||||||
Series 2002-47, Class FD | ||||||||
(1-Month LIBOR plus 0.400%), 1.952%, 08/25/322 | 364,056 | 364,379 | ||||||
Series 2003-2, Class FA | ||||||||
(1-Month LIBOR plus 0.500%), 2.052%, 02/25/332 | 266,283 | 267,502 | ||||||
Series 2003-3, Class HJ 5.000%, 02/25/18 | 735 | 734 | ||||||
Series 2004-1, Class AC 4.000%, 02/25/19 | 3,796 | 3,800 | ||||||
Series 2004-21, Class AE 4.000%, 04/25/19 | 39,052 | 39,203 | ||||||
Series 2004-27, Class HB 4.000%, 05/25/19 | 34,542 | 34,779 | ||||||
Series 2004-53, Class NC 5.500%, 07/25/24 | 213,688 | 226,157 | ||||||
Series 2005-13, Class AF | ||||||||
(1-Month LIBOR plus 0.400%), 1.952%, 03/25/352 | 378,922 | 380,015 | ||||||
Series 2005-19, Class PA 5.500%, 07/25/34 | 95,183 | 98,255 | ||||||
Series 2005-58, Class EP 5.500%, 07/25/35 | 162,632 | 175,784 | ||||||
Series 2005-68, Class PC 5.500%, 07/25/35 | 121,056 | 124,762 | ||||||
Series 2005-68, Class PB 5.750%, 07/25/35 | 17,509 | 18,005 | ||||||
Series 2007-56, Class FN | ||||||||
(1-Month LIBOR plus 0.370%), 1.922%, 06/25/372 | 122,288 | 121,634 | ||||||
Series 2008-59, Class KB 4.500%, 07/25/23 | 23,808 | 24,000 | ||||||
Series 2010-12, Class AC 2.500%, 12/25/18 | 15,832 | 15,812 | ||||||
Series 2011-60, Class UC 2.500%, 09/25/39 | 154,075 | 153,641 | ||||||
FNMA REMICS Whole Loan, | ||||||||
Series 2003-W1, Class 2A 7.500%, 12/25/423 | 14,778 | 16,588 | ||||||
FNMA REMICS Whole Loan, | ||||||||
Series 2003-W13, Class AV2 | ||||||||
(1-Month LIBOR plus 0.280%), 1.832%, 10/25/332 | 9,267 | 9,235 | ||||||
Series 2003-W4, Class 4A 7.500%, 10/25/423 | 303,466 | 339,411 | ||||||
Series 2004-W14, Class 1AF | ||||||||
(1-Month LIBOR plus 0.400%), 1.952%, 07/25/442 | 1,515,378 | 1,497,932 | ||||||
Series 2004-W5, Class F1 | ||||||||
(1-Month LIBOR plus 0.450%), 2.002%, 02/25/472 | 342,780 | 338,846 | ||||||
Series 2005-W2, Class A1 | ||||||||
(1-Month LIBOR plus 0.200%), 1.752%, 05/25/352 | 688,529 | 685,343 | ||||||
Total Fannie Mae | 87,111,815 | |||||||
Freddie Mac - 23.3% | ||||||||
FHLMC, | ||||||||
(US Treasury 1 Year plus 2.250%), 3.039%, 04/01/342 | 383,766 | 405,784 | ||||||
(US Treasury 1 Year plus 2.250%), 3.114%, 03/01/342 | 1,447,439 | 1,529,128 | ||||||
(US Treasury 1 Year plus 2.154%), 3.227%, 10/01/282 | 19,419 | 20,381 | ||||||
(US Treasury 1 Year plus 2.000%), 3.250%, 11/01/332 | 571,024 | 596,707 | ||||||
(US Treasury 1 Year plus 2.406%), 3.317%, 02/01/232 | 54,306 | 56,866 | ||||||
(US Treasury 1 Year plus 2.225%), 3.467%, 10/01/332 | 993,444 | 1,042,582 | ||||||
(US Treasury 1 Year plus 2.219%), 3.467%, 10/01/332 | 569,643 | 598,012 | ||||||
(US Treasury 1 Year plus 2.225%), 3.475%, 11/01/332 | 638,075 | 670,660 | ||||||
(US Treasury 1 Year plus 2.230%), 3.482%, 12/01/332 | 845,747 | 886,719 | ||||||
(US Treasury 1 Year plus 2.250%), 3.523%, 05/01/342 | 1,242,551 | 1,309,975 | ||||||
(US Treasury 1 Year plus 2.514%), 3.551%, 06/01/352 | 441,491 | 468,170 | ||||||
(12-Month LIBOR plus 1.819%), 3.584%, 09/01/332 | 1,229,135 | 1,298,013 | ||||||
(US Treasury 1 Year plus 2.711%), 3.785%, 05/01/352 | 671,778 | 716,833 | ||||||
FHLMC Gold Pool, 3.000%, 04/01/31 | 2,372,459 | 2,419,247 | ||||||
4.000%, 12/01/44 | 3,214,902 | 3,370,077 | ||||||
4.500%, 05/01/19 to 10/01/44 | 10,024,574 | 10,714,312 | ||||||
5.000%, 10/01/18 to 08/01/20 | 455,356 | 466,550 | ||||||
5.500%, 12/01/32 to 08/01/40 | 5,197,881 | 5,768,781 | ||||||
6.000%, 02/01/22 to 01/01/24 | 2,107,138 | 2,210,777 | ||||||
6.500%, 03/01/18 to 10/01/23 | 106,137 | 110,254 | ||||||
7.000%, 07/01/19 | 24,091 | 24,535 | ||||||
7.500%, 03/01/33 | 160,797 | 184,250 | ||||||
FHLMC REMICS, | ||||||||
Series 2627, Class BM 4.500%, 06/15/18 | 9,124 | 9,150 | ||||||
The accompanying notes are an integral part of these financial statements.
35
Table of Contents
AMG Managers Amundi Short Duration Government Fund
Schedule of Portfolio Investments (continued)
| Principal Amount | Value | |||||||
Freddie Mac - 23.3% (continued) | ||||||||
FHLMC REMICS, | ||||||||
Series 2631, Class PD 4.500%, 06/15/18 | $ | 2,932 | $ | 2,942 | ||||
Series 2668, Class AZ 4.000%, 09/15/18 | 70,203 | 70,357 | ||||||
Series 2683, Class JB 4.000%, 09/15/18 | 47,059 | 47,153 | ||||||
Series 2786, Class BC 4.000%, 04/15/19 | 26,955 | 27,166 | ||||||
Series 2809, Class UC 4.000%, 06/15/19 | 23,999 | 24,129 | ||||||
Series 2877, Class PA 5.500%, 07/15/33 | 5,905 | 5,913 | ||||||
Series 3033, Class CI 5.500%, 01/15/35 | 7,438 | 7,444 | ||||||
Series 3153, Class UG | ||||||||
(1-Month LIBOR plus 0.450%), 1.927%, 05/15/362 | 1,756,259 | 1,765,541 | ||||||
Series 3535, Class CA 4.000%, 05/15/24 | 12,042 | 12,098 | ||||||
Series 3609, Class LA 4.000%, 12/15/24 | 88,477 | 89,214 | ||||||
Series 3632, Class AG 4.000%, 06/15/38 | 185,901 | 187,951 | ||||||
Series 3653, Class JK 5.000%, 11/15/38 | 103,735 | 106,871 | ||||||
Series 3756, Class DA 1.200%, 11/15/18 | 59,860 | 59,609 | ||||||
Series 3846, Class CK 1.500%, 09/15/20 | 527 | 524 | ||||||
Total Freddie Mac | 37,284,675 | |||||||
Ginnie Mae - 3.8% | ||||||||
GNMA, 4.000%, 09/15/18 | 27,099 | 27,889 | ||||||
6.000%, 01/15/364 | 5,296,944 | 6,028,346 | ||||||
Total Ginnie Mae | 6,056,235 | |||||||
U.S. Treasury Obligations - 2.4% |
| |||||||
United States Treasury Inflation Indexed Bonds, 2.375%, 01/15/27 | 3,339,172 | 3,906,736 | ||||||
Interest Only Strip - 2.6% |
| |||||||
FHLMC REMICS, | ||||||||
Series 2922, Class SE | ||||||||
(6.750% minus 1-Month LIBOR, Cap 6.750%, Floor 0.000%), 5.273%, 02/15/352 | 174,560 | 32,136 | ||||||
Series 2934, Class HI 5.000%, 02/15/20 | 21,099 | 751 | ||||||
Series 2934, Class KI 5.000%, 02/15/20 | 11,531 | 383 | ||||||
Series 2965, Class SA | ||||||||
(6.050% minus 1-Month LIBOR, Cap 6.050%, Floor 0.000%), 4.573%, 05/15/322 | 381,424 | 50,361 | ||||||
Series 2967, Class JI 5.000%, 04/15/20 | 69,565 | 2,632 | ||||||
Series 2980, Class SL | ||||||||
(6.700% minus 1-Month LIBOR, Cap 6.700%, Floor 0.000%), 5.223%, 11/15/342 | 247,253 | 56,518 | ||||||
FHLMC REMICS, | ||||||||
Series 2981, Class SU | ||||||||
(7.800% minus 1-Month LIBOR, Cap 7.800%, Floor 0.000%), 6.323%, 05/15/302 | 181,506 | 26,501 | ||||||
Series 3065, Class DI | ||||||||
(6.620% minus 1-Month LIBOR, Cap 6.620%, Floor 0.000%), 5.143%, 04/15/352 | 681,159 | 114,446 | ||||||
Series 3308, Class S | ||||||||
(7.200% minus 1-Month LIBOR, Cap 7.200%, Floor 0.000%), 5.723%, 03/15/322 | 314,615 | 57,317 | ||||||
Series 3424, Class XI | ||||||||
(6.570% minus 1-Month LIBOR, Cap 6.570%, Floor 0.000%), 5.093%, 05/15/362 | 478,019 | 78,235 | ||||||
Series 3489, Class SD | ||||||||
(7.800% minus 1-Month LIBOR, Cap 7.800%, Floor 0.000%), 6.323%, 06/15/322 | 184,129 | 35,902 | ||||||
Series 3685, Class EI 5.000%, 03/15/19 | 20,749 | 190 | ||||||
Series 3731, Class IO 5.000%, 07/15/19 | 14,474 | 133 | ||||||
Series 3882, Class AI 5.000%, 06/15/26 | 33,460 | 952 | ||||||
Series 4395, Class TI 4.000%, 05/15/26 | 579,712 | 54,588 | ||||||
FNMA | ||||||||
Series 306, Class IO 8.000%, 05/25/30 | 54,361 | 15,058 | ||||||
FNMA REMICS, | ||||||||
Series 2004-51, Class SX | ||||||||
(7.120% minus 1-Month LIBOR, Cap 7.120%, Floor 0.000%), 5.568%, 07/25/342 | 204,425 | 37,378 | ||||||
Series 2004-64, Class SW | ||||||||
(7.050% minus 1-Month LIBOR, Cap 7.050%, Floor 0.000%), 5.498%, 08/25/342 | 611,055 | 108,723 | ||||||
Series 2004-66, Class SE | ||||||||
(6.500% minus 1-Month LIBOR, Cap 6.500%, Floor 0.000%), 4.948%, 09/25/342 | 96,252 | 15,231 | ||||||
Series 2005-12, Class SC | ||||||||
(6.750% minus 1-Month LIBOR, Cap 6.750%, Floor 0.000%), 5.198%, 03/25/352 | 223,878 | 35,915 | ||||||
Series 2005-45, Class SR | ||||||||
(6.720% minus 1-Month LIBOR, Cap 6.720%, Floor 0.000%), 5.168%, 06/25/352 | 517,343 | 88,475 | ||||||
Series 2005-5, Class SD | ||||||||
(6.700% minus 1-Month LIBOR, Cap 6.700%, Floor 0.000%), 5.148%, 01/25/352 | 149,356 | 22,927 | ||||||
Series 2005-65, Class KI | ||||||||
(7.000% minus 1-Month LIBOR, Cap 7.000%, Floor 0.000%), 5.448%, 08/25/352 | 1,207,412 | 212,183 | ||||||
Series 2005-66, Class GS | ||||||||
(6.850% minus 1-Month LIBOR, Cap 6.850%, Floor 0.000%), 5.298%, 07/25/202 | 34,804 | 1,275 | ||||||
Series 2006-3, Class SA | ||||||||
(6.150% minus 1-Month LIBOR, Cap 6.150%, Floor 0.000%), 4.598%, 03/25/362 | 229,176 | 33,630 | ||||||
Series 2007-75, Class JI | ||||||||
(6.545% minus 1-Month LIBOR, Cap 6.545%, Floor 0.000%), 4.993%, 08/25/372 | 112,138 | 18,909 | ||||||
The accompanying notes are an integral part of these financial statements.
36
Table of Contents
AMG Managers Amundi Short Duration Government Fund
Schedule of Portfolio Investments (continued)
| Principal Amount | Value | |||||||
Interest Only Strip - 2.6% (continued) | ||||||||
FNMA REMICS, | ||||||||
Series 2007-85, Class SI | ||||||||
(6.460% minus 1-Month LIBOR, Cap 6.460%, Floor 0.000%), 4.908%, 09/25/372 | $ | 245,178 | $ | 40,952 | ||||
Series 2008-86, Class IO 4.500%, 03/25/23 | 74,932 | 1,172 | ||||||
Series 2008-87, Class AS | ||||||||
(7.650% minus 1-Month LIBOR, Cap 7.650%, Floor 0.000%), 6.098%, 07/25/332 | 678,303 | 128,984 | ||||||
Series 2009-31, Class PI 5.000%, 11/25/38 | 677,301 | 103,569 | ||||||
Series 2010-105, Class IO 5.000%, 08/25/20 | 137,758 | 4,629 | ||||||
Series 2010-121, Class IO 5.000%, 10/25/25 | 54,865 | 1,117 | ||||||
Series 2010-37, Class GI 5.000%, 04/25/25 | 21,091 | 234 | ||||||
Series 2010-65, Class IO 5.000%, 09/25/20 | 226,257 | 7,560 | ||||||
Series 2010-68, Class SJ | ||||||||
(6.550% minus 1-Month LIBOR, Cap 6.550%, Floor 0.000%), 4.998%, 07/25/402 | 263,997 | 49,926 | ||||||
Series 2011-124, Class IC 3.500%, 09/25/21 | 564,449 | 16,915 | ||||||
Series 2011-63, Class AS | ||||||||
(5.920% minus 1-Month LIBOR, Cap 5.920%, Floor 0.000%), 4.368%, 07/25/412 | 304,855 | 45,335 | ||||||
Series 2011-69, Class AI 5.000%, 05/25/18 | 4,852 | 17 | ||||||
Series 2011-88, Class WI 3.500%, 09/25/26 | 628,134 | 62,156 | ||||||
Series 2012-126, Class SJ | ||||||||
(5.000% minus 1-Month LIBOR, Cap 5.000%, Floor 0.000%), 3.448%, 11/25/422 | 3,324,011 | 432,331 | ||||||
GNMA, | ||||||||
Series 2011-167, Class IO 5.000%, 12/16/20 | 170,421 | 4,785 | ||||||
Series 2011-32, Class KS | ||||||||
(12.100% minus 2 times 1-Month LIBOR, Cap 12.100%, Floor 0.000%), 9.118%, 06/16/342 | 287,249 | 19,795 | ||||||
Series 2011-94, Class IS | ||||||||
(6.700% minus 1-Month LIBOR, Cap 6.700%, Floor 0.000%), 5.209%, 06/16/362 | 367,470 | 41,557 | ||||||
Series 2012-101, Class AI 3.500%, 08/20/27 | 338,690 | 36,238 | ||||||
Series 2012-103, Class IB 3.500%, 04/20/40 | 738,702 | 66,935 | ||||||
Series 2012-140, Class IC 3.500%, 11/20/42 | 609,495 | 123,597 | ||||||
Series 2012-34, Class KS | ||||||||
(6.050% minus 1-Month LIBOR, Cap 6.050%, Floor 0.000%), 4.559%, 03/16/422 | 2,713,315 | 605,698 | ||||||
Series 2012-69, Class QI 4.000%, 03/16/41 | 1,102,609 | 161,654 | ||||||
Series 2012-96, Class IC 3.000%, 08/20/27 | 590,728 | 58,044 | ||||||
GNMA, | ||||||||
Series 2013-5, Class BI 3.500%, 01/20/43 | 244,445 | 44,680 | ||||||
Series 2014-173, Class AI 4.000%, 11/20/38 | 185,157 | 12,866 | ||||||
Series 2016-108, Class QI 4.000%, 08/20/46 | 316,398 | 72,018 | ||||||
Series 2016-118, Class DS | ||||||||
(6.100% minus 1-Month LIBOR, Cap 6.100%, Floor 0.000%), 4.599%, 09/20/462 | 604,758 | 128,448 | ||||||
Series 2016-145, Class UI 3.500%, 10/20/46 | 528,767 | 105,226 | ||||||
Series 2016-17, Class JS | ||||||||
(6.100% minus 1-Month LIBOR, Cap 6.100%, Floor 0.000%), 4.599%, 02/20/462 | 644,830 | 112,795 | ||||||
Series 2016-20, Class SB | ||||||||
(6.100% minus 1-Month LIBOR, Cap 6.100%, Floor 0.000%), 4.599%, 02/20/462 | 649,388 | 116,111 | ||||||
Series 2016-46, Class JI 4.500%, 04/20/46 | 261,433 | 57,192 | ||||||
Series 2016-5, Class CS | ||||||||
(6.150% minus 1-Month LIBOR, Cap 6.150%, Floor 0.000%), 4.649%, 01/20/462 | 608,267 | 112,736 | ||||||
Series 2016-81, Class IO 4.000%, 06/20/46 | 491,234 | 92,984 | ||||||
Series 2016-88, Class SM | ||||||||
(6.100% minus 1-Month LIBOR, Cap 6.100%, Floor 0.000%), 4.599%, 07/20/462 | 624,828 | 121,285 | ||||||
Total Interest Only Strip | 4,090,290 | |||||||
Total U.S. Government and Agency Obligations (Cost $137,647,434) | 138,449,751 | |||||||
Short-Term Investments - 4.2% | ||||||||
U.S. Government and Agency Obligations -2.8% | ||||||||
FHLB, 0.265%, 01/17/185 | 3,000,000 | 2,998,560 | ||||||
FHLB, 0.145%, 01/10/185 | 1,500,000 | 1,499,537 | ||||||
Total U.S. Government and Agency Obligations | 4,498,097 | |||||||
U.S. Government Obligation - 0.5% |
| |||||||
U.S. Treasury Bill, 0.276%, 02/15/185,6 | 760,000 | 758,970 | ||||||
| Shares | ||||||||
Other Investment Companies - 0.9% | ||||||||
Dreyfus Government Cash Management Fund, Institutional Class Shares, 1.18%7 | 1,391,449 | 1,391,449 | ||||||
Total Short-Term Investments (Cost $6,648,516) | 6,648,516 | |||||||
Total Investments - 101.0% (Cost $160,773,776) | 161,590,822 | |||||||
Other Assets, less Liabilities - (1.0)% | (1,538,096 | ) | ||||||
Net Assets - 100.0% | $ | 160,052,726 | ||||||
The accompanying notes are an integral part of these financial statements.
37
Table of Contents
AMG Managers Amundi Short Duration Government Fund
Schedule of Portfolio Investments (continued)
| 1 | Security exempt from registration under Rule 144A of the Securities Act of 1933. This security may be resold in transactions exempt from registration, normally to qualified buyers. At December 31, 2017, the value of these securities amounted to $13,364,286 or 8.3% of net assets. |
| 2 | Variable rate security. The rate shown is based on the latest available information as of December 31, 2017. |
| 3 | Certain variable rate securities are not based on a published reference rate and spread but are determined by the issuer or agent and are based on current market conditions. These securities do not indicate a reference rate and spread in their description above. |
| 4 | Some of this security has been pledged as collateral for delayed delivery securities. |
| 5 | Represents yield to maturity at December 31, 2017. |
| 6 | Some or all of this security is held as collateral for futures contracts. The market value of collateral at December 31, 2017, amounted to $519,295, or 0.3% of net assets. |
| 7 | Yield shown represents the December 31, 2017, seven day average yield, which refers to the sum of the previous seven days’ dividends paid, expressed as an annual percentage. |
| FHLB | Federal Home Loan Bank | |||||
| FHLMC | Freddie Mac | |||||
| FNMA | Fannie Mae | |||||
| GNMA | Ginnie Mae | |||||
| IO | Interest Only | |||||
| LIBOR | London Interbank Offered Rate | |||||
| REMICS | Real Estate Mortgage Investment Conduit | |||||
| TBA | To Be Announced |
TBA Forward Sale Commitments
| Security | Principal Amount | Settlement Date | Market Value | Proceeds | ||||||||||||||||
FNMA, 4.000%, TBA 30 years | $ | 3,000,000 | 01/11/18 | $ | 3,137,217 | $ | (3,135,000 | ) | ||||||||||||
FNMA, 4.500%, TBA 30 years | $ | 1,400,000 | 01/11/18 | 1,489,468 | (1,487,500 | ) | ||||||||||||||
|
|
|
| |||||||||||||||||
| Totals | $ | 4,626,685 | $ | (4,622,500 | ) | |||||||||||||||
|
|
|
| |||||||||||||||||
Open Futures Contracts
| Description | Number of Contracts | Position | Expiration Date | Current Notional Amount | Value and Unrealized Gain/ (Loss) | |||||||||||||||
10-Year U.S. Treasury Note | 39 | Long | 03/20/18 | $ | 4,837,828 | $ | (33,023 | ) | ||||||||||||
5-Year U.S. Treasury Note | 44 | Long | 03/29/18 | 5,111,219 | (28,298 | ) | ||||||||||||||
10-Year Interest Rate Swap | 60 | Short | 03/19/18 | (5,894,062 | ) | 17,194 | ||||||||||||||
2-Year U.S. Treasury Note | 68 | Short | 03/29/18 | (14,559,438 | ) | 32,767 | ||||||||||||||
5-Year Interest Rate Swap | 339 | Short | 03/19/18 | (33,431,227 | ) | 28,286 | ||||||||||||||
90-Day Euro Futures | 3 | Short | 12/17/18 | (733,912 | ) | 405 | ||||||||||||||
90-Day Euro Futures | 3 | Short | 03/16/20 | (732,450 | ) | 292 | ||||||||||||||
90-Day Euro Futures | 3 | Short | 03/15/21 | (732,038 | ) | (45 | ) | |||||||||||||
90-Day Euro Futures | 3 | Short | 03/14/22 | (731,588 | ) | (232 | ) | |||||||||||||
90-Day Euro Futures | 3 | Short | 03/19/18 | (736,800 | ) | 67 | ||||||||||||||
90-Day Euro Futures | 3 | Short | 03/18/19 | (733,462 | ) | 367 | ||||||||||||||
90-Day Euro Futures | 3 | Short | 06/15/20 | (732,375 | ) | 142 | ||||||||||||||
90-Day Euro Futures | 3 | Short | 06/14/21 | (731,963 | ) | (120 | ) | |||||||||||||
90-Day Euro Futures | 3 | Short | 06/13/22 | (731,475 | ) | (270 | ) | |||||||||||||
90-Day Euro Futures | 3 | Short | 06/18/18 | (735,562 | ) | 180 | ||||||||||||||
90-Day Euro Futures | 3 | Short | 06/17/19 | (733,050 | ) | 367 | ||||||||||||||
90-Day Euro Futures | 3 | Short | 09/14/20 | (732,300 | ) | 67 | ||||||||||||||
90-Day Euro Futures | 3 | Short | 09/13/21 | (731,850 | ) | (195 | ) | |||||||||||||
90-Day Euro Futures | 3 | Short | 09/19/22 | (731,325 | ) | (270 | ) | |||||||||||||
90-Day Euro Futures | 3 | Short | 09/17/18 | (734,700 | ) | 330 | ||||||||||||||
90-Day Euro Futures | 3 | Short | 09/16/19 | (732,787 | ) | 367 | ||||||||||||||
The accompanying notes are an integral part of these financial statements.
38
Table of Contents
AMG Managers Amundi Short Duration Government Fund
Schedule of Portfolio Investments (continued)
| Description | Number of Contracts | Position | Expiration Date | Current Notional Amount | Value and Unrealized Gain/(Loss) | |||||||||||||||
90-Day Euro Futures | 3 | Short | 12/14/20 | $ | (732,113 | ) | $ | 30 | ||||||||||||
90-Day Euro Futures | 3 | Short | 12/13/21 | (731,663 | ) | (195 | ) | |||||||||||||
90-Day Euro Futures | 3 | Short | 12/16/19 | (732,525 | ) | 330 | ||||||||||||||
U.S. Ultra Bond CBT Mar 18 | 24 | Short | 03/20/18 | (4,023,750 | ) | (21,057 | ) | |||||||||||||
|
| |||||||||||||||||||
| Total | $ | (2,514 | ) | |||||||||||||||||
|
| |||||||||||||||||||
The following table summarizes the inputs used to value the Fund’s investments by the fair value hierarchy levels as of December 31, 2017:
| Level 1 | Level 2 | Level 3 | Total | |||||||||||||
Investments in Securities | ||||||||||||||||
Asset-Backed Securities | — | $ | 16,061,742 | — | $ | 16,061,742 | ||||||||||
Mortgage-Backed Security | — | 430,813 | — | 430,813 | ||||||||||||
U.S. Government and Agency Obligations† | — | 138,449,751 | — | 138,449,751 | ||||||||||||
Short-Term Investments | ||||||||||||||||
U.S. Government and Agency Obligations | — | 4,498,097 | — | 4,498,097 | ||||||||||||
U.S. Government Obligation | — | 758,970 | — | 758,970 | ||||||||||||
Other Investment Companies | $ | 1,391,449 | — | — | 1,391,449 | |||||||||||
|
|
|
|
|
|
|
| |||||||||
Total Investments in Securities | $ | 1,391,449 | $ | 160,199,373 | — | $ | 161,590,822 | |||||||||
|
|
|
|
|
|
|
| |||||||||
TBA Sale Commitments | — | $ | (4,626,685 | ) | — | $ | (4,626,685 | ) | ||||||||
|
|
|
|
|
|
|
| |||||||||
Financial Derivative Instruments - Assets | ||||||||||||||||
Interest Rate Contract | $ | 81,191 | — | — | $ | 81,191 | ||||||||||
Financial Derivative Instruments - Liabilities | ||||||||||||||||
Interest Rate Contract | (83,705 | ) | — | — | (83,705 | ) | ||||||||||
|
|
|
|
|
|
|
| |||||||||
Total Financial Derivative Instruments | $ | (2,514 | ) | — | — | $ | (2,514 | ) | ||||||||
|
|
|
|
|
|
|
| |||||||||
| † | All U.S. government and agency obligations held in the Fund are Level 2 securities. For a detailed breakout of U.S. government and agency obligations by agency classification, please refer to the Fund’s Schedule of Portfolio Investments. |
As of December 31, 2017, the Fund had no transfers between levels from the beginning of the reporting period.
The accompanying notes are an integral part of these financial statements.
39
Table of Contents
AMG Managers Amundi Short Duration Government Fund
Schedule of Portfolio Investments (continued)
The following schedule shows the value of derivative instruments at December 31, 2017:
| Asset Derivatives | Liability Derivatives | |||||||||||
Derivatives not accounted for as hedging instruments | Statement of Assets and Liabilities Location | Fair Value | Statement of Assets and Liabilities Location | Fair Value | ||||||||
Interest rate contracts | Receivable for variation margin1 | $ | 12,047 | Payable for variation margin1 | $ | 55,959 | ||||||
|
|
|
| |||||||||
| 1 | Only current day’s variation margin is reported within the Statement of Assets and Liabilities. The variation margin is included in the open futures cumulative appreciation/depreciation of $(2,514). |
For the fiscal year ended December 31, 2017, the effect of derivative instruments on the Statement of Operations for the Fund and the amount of realized gain (loss) and unrealized gain (loss) on derivatives recognized in income is as follows:
Realized Gain (Loss) | Change in Unrealized Gain (Loss) | |||||||||||
Derivatives not accounted for as hedging instruments | Statement of Operations Location | Realized Gain/(Loss) | Statement of Operations Location | Change in Unrealized Gain (Loss) | ||||||||
Interest rate contracts | Net realized gain (loss) on futures contracts | $(83,966) | Net change in unrealized appreciation/ depreciation on futures contracts | $(268,606) | ||||||||
|
|
|
| |||||||||
The accompanying notes are an integral part of these financial statements.
40
Table of Contents
Statement of Assets and Liabilities
December 31, 2017
| AMG Chicago Equity Partners Balanced Fund | AMG Chicago Equity Partners Small Cap Value Fund | AMG Managers Amundi Intermediate Government Fund# | AMG Managers Amundi Short Duration Government Fund# | |||||||||||||
Assets: | ||||||||||||||||
Investments at Value* (including securities on loan valued at $2,374,701, $161,259, $0, and $0, respectively) | $ | 197,812,003 | $ | 2,944,081 | $ | 160,153,459 | $ | 161,590,822 | ||||||||
Cash | 1,212 | 44 | — | — | ||||||||||||
Foreign currency** | 56,531 | — | — | — | ||||||||||||
Receivable for investments sold | 98,089 | — | — | — | ||||||||||||
Receivable for delayed delivery investments sold | — | — | 1,523,376 | 4,627,583 | ||||||||||||
Dividend, interest and other receivables | 452,729 | 6,514 | 371,132 | 569,674 | ||||||||||||
Receivable for paydowns | — | — | 7,415 | 158,299 | ||||||||||||
Receivable for Fund shares sold | 959,521 | — | 267,110 | 363,934 | ||||||||||||
Receivable from affiliate | 10,377 | 8,740 | 21,406 | 15,506 | ||||||||||||
Receivable for variation margin | — | — | 1,281 | 12,047 | ||||||||||||
Prepaid expenses | 27,193 | 24,431 | 15,231 | 16,024 | ||||||||||||
Total assets | 199,417,655 | 2,983,810 | 162,360,410 | 167,353,889 | ||||||||||||
Liabilities: | ||||||||||||||||
Payable upon return of securities loaned | 2,448,757 | 169,425 | — | — | ||||||||||||
Payable for investments purchased | 181,915 | — | — | — | ||||||||||||
Payable for delayed delivery investments purchased | — | — | 52,309,032 | — | ||||||||||||
Payable for Fund shares repurchased | 245,909 | 159 | 339,685 | 2,391,163 | ||||||||||||
TBA sale commitments at value (proceeds receivable of $1,005,078 and $4,622,500, respectively) | — | — | 1,009,063 | 4,626,685 | ||||||||||||
Payable for variation margin | — | — | 8,102 | 55,959 | ||||||||||||
Accrued expenses: | ||||||||||||||||
Investment advisory and management fees | 100,947 | 1,467 | 45,005 | 56,383 | ||||||||||||
Administrative fees | 25,237 | 355 | 14,064 | 21,144 | ||||||||||||
Distribution fees | 15,946 | 16 | — | — | ||||||||||||
Shareholder service fees | 9,852 | 1,086 | 13,997 | 20,080 | ||||||||||||
Professional fees | 39,060 | 29,593 | 54,508 | 55,875 | ||||||||||||
Trustee fees and expenses | 2,090 | 29 | 1,189 | 1,811 | ||||||||||||
Other | 59,228 | 22,018 | 80,068 | 72,063 | ||||||||||||
Total liabilities | 3,128,941 | 224,148 | 53,874,713 | 7,301,163 | ||||||||||||
Net Assets | $ | 196,288,714 | $ | 2,759,662 | $ | 108,485,697 | $ | 160,052,726 | ||||||||
* Investments at cost | $ | 176,142,139 | $ | 2,626,026 | $ | 159,704,263 | $ | 160,773,776 | ||||||||
** Foreign currency at cost | $ | 56,400 | — | — | — | |||||||||||
The accompanying notes are an integral part of these financial statements.
41
Table of Contents
Statement of Assets and Liabilities (continued)
| AMG Chicago Equity Partners Balanced Fund | AMG Chicago Equity Partners Small Cap Value Fund | AMG Managers Amundi Intermediate Government Fund# | AMG Managers Amundi Short Duration Government Fund# | |||||||||||||
Net Assets Represent: | ||||||||||||||||
Paid-in capital | $ | 169,915,960 | $ | 2,442,498 | $ | 111,223,590 | $ | 166,269,354 | ||||||||
Undistributed (distribution in excess of) net investment income | (12,953 | ) | — | — | 205,033 | |||||||||||
Accumulated net realized gain (loss) from investments | 4,716,694 | (891 | ) | (3,199,688 | ) | (7,232,008 | ) | |||||||||
Net unrealized appreciation on investments | 21,669,013 | 318,055 | 461,795 | 810,347 | ||||||||||||
Net Assets | $ | 196,288,714 | $ | 2,759,662 | $ | 108,485,697 | $ | 160,052,726 | ||||||||
Class N: | ||||||||||||||||
Net Assets | $ | 74,314,956 | $ | 76,466 | $ | 104,846,586 | $ | 135,620,127 | ||||||||
Shares outstanding | 4,363,297 | 7,059 | 9,867,917 | 14,324,148 | ||||||||||||
Net asset value, offering and redemption price per share | $ | 17.03 | $ | 10.83 | $ | 10.62 | $ | 9.47 | ||||||||
Class I: | ||||||||||||||||
Net Assets | $ | 114,913,377 | $ | 677,717 | $ | 2,312,744 | $ | 23,757,338 | ||||||||
Shares outstanding | 6,684,538 | 62,640 | 217,713 | 2,510,663 | ||||||||||||
Net asset value, offering and redemption price per share | $ | 17.19 | $ | 10.82 | $ | 10.62 | $ | 9.46 | ||||||||
Class Z: | ||||||||||||||||
Net Assets | $ | 7,060,381 | $ | 2,005,479 | $ | 1,326,367 | $ | 675,261 | ||||||||
Shares outstanding | 410,793 | 184,812 | 124,894 | 71,301 | ||||||||||||
Net asset value, offering and redemption price per share | $ | 17.19 | $ | 10.85 | $ | 10.62 | $ | 9.47 | ||||||||
| # | Effective February 27, 2017, Class S shares were renamed to Class N shares and Class I shares and Class Z shares were added as described in the Note 1 of the Notes to Financial Statements. |
The accompanying notes are an integral part of these financial statements.
42
Table of Contents
For the fiscal year ended December 31, 2017
| AMG Chicago Equity Partners Balanced Fund | AMG Chicago Equity Partners Small Cap Value Fund | AMG Managers Amundi Intermediate Government Fund# | AMG Managers Amundi Short Duration Government Fund# | |||||||||||||
Investment Income: | ||||||||||||||||
Dividend income | $ | 1,826,550 | $ | 80,342 | $ | 182,404 | $ | 23,093 | ||||||||
Interest income | 1,366,759 | — | 2,926,134 | 3,662,796 | ||||||||||||
Securities lending income | 18,293 | 2,669 | — | 2 | ||||||||||||
Foreign withholding tax | (230 | ) | — | — | — | |||||||||||
Total investment income | 3,211,372 | 83,011 | 3,108,538 | 3,685,891 | ||||||||||||
Expenses: | ||||||||||||||||
Investment advisory and management fees | 1,122,450 | 41,773 | 647,221 | 807,773 | ||||||||||||
Administrative fees | 280,612 | 10,106 | 202,257 | 302,915 | ||||||||||||
Distribution fees - Class N | 221,747 | 165 | — | — | ||||||||||||
Shareholder servicing fees - Class N | — | 99 | 199,069 | 276,966 | ||||||||||||
Shareholder servicing fees - Class I | 91,837 | 6,809 | 393 | 8,372 | ||||||||||||
Professional fees | 49,659 | 30,168 | 70,627 | 78,728 | ||||||||||||
Registration fees | 72,815 | 49,715 | 66,949 | 64,057 | ||||||||||||
Transfer agent fees | 25,593 | 5,954 | 20,373 | 9,094 | ||||||||||||
Custodian fees | 55,033 | 18,388 | 66,835 | 61,714 | ||||||||||||
Reports to shareholders | 38,405 | 9,322 | 42,301 | 18,544 | ||||||||||||
Trustee fees and expenses | 12,522 | 608 | 10,124 | 15,057 | ||||||||||||
Miscellaneous | 7,062 | 2,172 | 6,698 | 6,878 | ||||||||||||
Total expenses before offsets | 1,977,735 | 175,279 | 1,332,847 | 1,650,098 | ||||||||||||
Expense reimbursements | (92,722 | ) | (104,187 | ) | (135,196 | ) | — | |||||||||
Expense reductions | (9,606 | ) | (5,004 | ) | — | — | ||||||||||
Fee waivers | — | — | (61,463 | ) | (182,649 | ) | ||||||||||
Net expenses | 1,875,407 | 66,088 | 1,136,188 | 1,467,449 | ||||||||||||
Net investment income | 1,335,965 | 16,923 | 1,972,350 | 2,218,442 | ||||||||||||
Net Realized and Unrealized Gain (Loss): | ||||||||||||||||
Net realized gain on investments | 11,775,375 | 1,739,455 | 1,055,935 | 76,802 | ||||||||||||
Net realized gain (loss) on TBA forward sale commitments | — | — | 2,500 | (45,875 | ) | |||||||||||
Net realized loss on foreign currency transactions | (30,293 | ) | — | — | — | |||||||||||
Net realized gain (loss) on futures contracts | — | — | 5,893 | (83,966 | ) | |||||||||||
Net change in unrealized appreciation/depreciation on investments | 14,147,684 | (1,776,787 | ) | (477,597 | ) | (655,370 | ) | |||||||||
Net change in unrealized appreciation/depreciation on foreign currency translations | (851 | ) | — | — | — | |||||||||||
Net change in unrealized appreciation/depreciation on futures contracts | — | — | (9,807 | ) | (268,606 | ) | ||||||||||
Net realized and unrealized gain (loss) | 25,891,915 | (37,332 | ) | 576,924 | (977,015 | ) | ||||||||||
Net increase (decrease) in net assets resulting from operations | $ | 27,227,880 | $ | (20,409 | ) | $ | 2,549,274 | $ | 1,241,427 | |||||||
| # | Effective February 27, 2017, Class S shares were renamed to Class N shares and Class I shares and Class Z shares were added as described in the Note 1 of the Notes to Financial Statements. |
The accompanying notes are an integral part of these financial statements.
43
Table of Contents
Statements of Changes in Net Assets
For the fiscal years ended December 31,
| AMG Chicago Equity Partners Balanced Fund | AMG Chicago Equity Partners Small Cap Value Fund | |||||||||||||||
| 2017 | 2016## | 2017 | 2016## | |||||||||||||
Increase (Decrease) in Net Assets Resulting From Operations: | ||||||||||||||||
Net investment income | $ | 1,335,965 | $ | 1,744,880 | $ | 16,923 | $ | 117,437 | ||||||||
Net realized gain on investments | 11,745,082 | 1,942,643 | 1,739,455 | 735,967 | ||||||||||||
Net change in unrealized appreciation/depreciation on investments | 14,146,833 | 5,002,573 | (1,776,787 | ) | 2,288,175 | |||||||||||
Net increase (decrease) in net assets resulting from operations | 27,227,880 | 8,690,096 | (20,409 | ) | 3,141,579 | |||||||||||
Distributions to Shareholders: | ||||||||||||||||
From net investment income: | ||||||||||||||||
Class N | (544,946 | ) | (899,880 | ) | — | (217 | ) | |||||||||
Class I | (750,899 | ) | (784,679 | ) | — | (102,530 | ) | |||||||||
Class Z | (58,823 | ) | (62,513 | ) | — | (19,183 | ) | |||||||||
From net realized gain on investments: | ||||||||||||||||
Class N | (2,969,365 | ) | (70,151 | ) | (5,985 | ) | — | |||||||||
Class I | (4,597,864 | ) | (57,353 | ) | (1,212,426 | ) | — | |||||||||
Class Z | (281,134 | ) | (4,375 | ) | (281,840 | ) | — | |||||||||
From paid in capital: | ||||||||||||||||
Class N | — | — | (76 | ) | — | |||||||||||
Class I | — | — | (15,312 | ) | — | |||||||||||
Class Z | — | — | (3,559 | ) | — | |||||||||||
Total distributions to shareholders | (9,203,031 | ) | (1,878,951 | ) | (1,519,198 | ) | (121,930 | ) | ||||||||
Capital Share Transactions:1 | ||||||||||||||||
Net increase (decrease) from capital share transactions | 4,076,435 | 10,393,262 | (8,568,796 | ) | (2,861,768 | ) | ||||||||||
Total increase (decrease) in net assets | 22,101,284 | 17,204,407 | (10,108,403 | ) | 157,881 | |||||||||||
Net Assets: | ||||||||||||||||
Beginning of year | 174,187,430 | 156,983,023 | 12,868,065 | 12,710,184 | ||||||||||||
End of year | $ | 196,288,714 | $ | 174,187,430 | $ | 2,759,662 | $ | 12,868,065 | ||||||||
End of year distribution in excess of net investment income | $ | (12,953 | ) | $ | (570 | ) | — | — | ||||||||
|
|
|
|
|
|
|
| |||||||||
| ## | Effective October 1, 2016, the Funds’ share classes were renamed as described in Note 1 of the Notes to the Financial Statements. |
| 1 | See Note 1(g) of the Notes to Financial Statements. |
The accompanying notes are an integral part of these financial statements.
44
Table of Contents
Statements of Changes in Net Assets (continued)
For the fiscal years ended December 31,
| AMG Managers Amundi Intermediate Government Fund# | AMG Managers Amundi Short Duration Government Fund# | |||||||||||||||
| 2017 | 2016 | 2017 | 2016 | |||||||||||||
Increase in Net Assets Resulting From Operations: | ||||||||||||||||
Net investment income | $ | 1,972,350 | $ | 2,538,653 | $ | 2,218,442 | $ | 4,660,640 | ||||||||
Net realized gain (loss) on investments | 1,064,328 | 1,044,235 | (53,039 | ) | 1,422,193 | |||||||||||
Net change in unrealized appreciation/depreciation on investments | (487,404 | ) | (577,674 | ) | (923,976 | ) | (3,256,852 | ) | ||||||||
Net increase in net assets resulting from operations | 2,549,274 | 3,005,214 | 1,241,427 | 2,825,981 | ||||||||||||
Distributions to Shareholders: | ||||||||||||||||
From net investment income: | ||||||||||||||||
Class N | (2,210,849 | ) | (2,324,161 | ) | (4,012,537 | ) | (2,527,449 | ) | ||||||||
Class I | (27,256 | ) | — | (443,522 | ) | — | ||||||||||
Class Z | (23,041 | ) | — | (15,045 | ) | — | ||||||||||
From net realized gain on investments: | ||||||||||||||||
Class N | — | (2,763,558 | ) | — | — | |||||||||||
From paid in capital: | ||||||||||||||||
Class N | (188,523 | ) | — | — | — | |||||||||||
Class I | (2,324 | ) | — | — | — | |||||||||||
Class Z | (1,965 | ) | — | — | — | |||||||||||
Total distributions to shareholders | (2,453,958 | ) | (5,087,719 | ) | (4,471,104 | ) | (2,527,449 | ) | ||||||||
Capital Share Transactions:1 | ||||||||||||||||
Net decrease from capital share transactions | (58,020,446 | ) | (23,546,144 | ) | (71,286,485 | ) | (161,035,899 | ) | ||||||||
Total decrease in net assets | (57,925,130 | ) | (25,628,649 | ) | (74,516,162 | ) | (160,737,367 | ) | ||||||||
Net Assets: | ||||||||||||||||
Beginning of year | 166,410,827 | 192,039,476 | 234,568,888 | 395,306,255 | ||||||||||||
End of year | $ | 108,485,697 | $ | 166,410,827 | $ | 160,052,726 | $ | 234,568,888 | ||||||||
End of year undistributed net investment income | — | $ | 380,109 | $ | 205,033 | $ | 2,457,695 | |||||||||
|
|
|
|
|
|
|
| |||||||||
| # | Effective October 1, 2016, and February 27, 2017, the Fund’s share classes were renamed or redesignated as described in Note 1 of the Notes to the Financial Statements. |
| 1 | See Note 1(g) of the Notes to Financial Statements. |
The accompanying notes are an integral part of these financial statements.
45
Table of Contents
AMG Chicago Equity Partners Balanced Fund
For a share outstanding throughout each fiscal year
| For the fiscal years ended December 31, | ||||||||||||||||||||
| Class N | 2017 | 2016# | 2015 | 2014 | 2013 | |||||||||||||||
Net Asset Value, Beginning of Year | $ | 15.45 | $ | 14.92 | $ | 15.09 | $ | 15.13 | $ | 14.19 | ||||||||||
Income from Investment Operations: | ||||||||||||||||||||
Net investment income1,2 | 0.10 | 0.14 | 3 | 0.10 | 4 | 0.11 | 0.10 | 5 | ||||||||||||
Net realized and unrealized gain on investments | 2.30 | 0.54 | 0.23 | 1.37 | 2.33 | |||||||||||||||
Total income from investment operations | 2.40 | 0.68 | 0.33 | 1.48 | 2.43 | |||||||||||||||
Less Distributions to Shareholders from: | ||||||||||||||||||||
Net investment income | (0.11 | ) | (0.14 | ) | (0.11 | ) | (0.11 | ) | (0.09 | ) | ||||||||||
Net realized gain on investments | (0.71 | ) | (0.01 | ) | (0.39 | ) | (1.41 | ) | (1.40 | ) | ||||||||||
Total distributions to shareholders | (0.82 | ) | (0.15 | ) | (0.50 | ) | (1.52 | ) | (1.49 | ) | ||||||||||
Net Asset Value, End of Year | $ | 17.03 | $ | 15.45 | $ | 14.92 | $ | 15.09 | $ | 15.13 | ||||||||||
Total Return2 | 15.54 | %6 | 4.59 | %6 | 2.19 | %6 | 9.69 | %6 | 17.14 | %6 | ||||||||||
Ratio of net expenses to average net assets7 | 1.09 | % | 1.08 | % | 1.08 | % | 1.07 | % | 1.10 | %8 | ||||||||||
Ratio of gross expenses to average net assets9 | 1.14 | % | 1.25 | % | 1.36 | % | 1.40 | % | 1.55 | %8 | ||||||||||
Ratio of net investment income to average net assets2 | 0.63 | % | 0.94 | % | 0.64 | % | 0.70 | % | 0.62 | %8 | ||||||||||
Portfolio turnover | 75 | % | 119 | % | 105 | % | 92 | % | 90 | % | ||||||||||
Net assets end of year (000’s) omitted | $ | 74,315 | $ | 92,502 | $ | 94,476 | $ | 41,751 | $ | 33,151 | ||||||||||
|
|
|
|
|
|
|
|
|
| |||||||||||
46
Table of Contents
AMG Chicago Equity Partners Balanced Fund
Financial Highlights
For a share outstanding throughout each fiscal year
| For the fiscal years ended December 31, | ||||||||||||||||||||
| Class I | 2017 | 2016# | 2015 | 2014 | 2013 | |||||||||||||||
Net Asset Value, Beginning of Year | $ | 15.59 | $ | 15.05 | $ | 15.23 | $ | 15.26 | $ | 14.30 | ||||||||||
Income from Investment Operations: | ||||||||||||||||||||
Net investment income1,2 | 0.13 | 0.17 | 3 | 0.12 | 4 | 0.15 | 0.13 | 5 | ||||||||||||
Net realized and unrealized gain on investments | 2.31 | 0.54 | 0.23 | 1.37 | 2.36 | |||||||||||||||
Total income from investment operations | 2.44 | 0.71 | 0.35 | 1.52 | 2.49 | |||||||||||||||
Less Distributions to Shareholders from: | ||||||||||||||||||||
Net investment income | (0.13 | ) | (0.16 | ) | (0.14 | ) | (0.13 | ) | (0.12 | ) | ||||||||||
Net realized gain on investments | (0.71 | ) | (0.01 | ) | (0.39 | ) | (1.42 | ) | (1.41 | ) | ||||||||||
Total distributions to shareholders | (0.84 | ) | (0.17 | ) | (0.53 | ) | (1.55 | ) | (1.53 | ) | ||||||||||
Net Asset Value, End of Year | $ | 17.19 | $ | 15.59 | $ | 15.05 | $ | 15.23 | $ | 15.26 | ||||||||||
Total Return2 | 15.71 | %6 | 4.79 | %6 | 2.29 | %6 | 9.93 | %6 | 17.45 | % | ||||||||||
Ratio of net expenses to average net assets7 | 0.94 | % | 0.93 | % | 0.93 | % | 0.86 | % | 0.92 | %8 | ||||||||||
Ratio of gross expenses to average net assets9 | 0.99 | % | 1.10 | % | 1.21 | % | 1.20 | % | 1.39 | %8 | ||||||||||
Ratio of net investment income to average net assets2 | 0.78 | % | 1.09 | % | 0.80 | % | 0.91 | % | 0.83 | %8 | ||||||||||
Portfolio turnover | 75 | % | 119 | % | 105 | % | 92 | % | 90 | % | ||||||||||
Net assets end of year (000’s) omitted | $ | 114,913 | $ | 75,890 | $ | 60,798 | $ | 14,481 | $ | 1,581 | ||||||||||
|
|
|
|
|
|
|
|
|
| |||||||||||
47
Table of Contents
AMG Chicago Equity Partners Balanced Fund
Financial Highlights
For a share outstanding throughout each fiscal year
| For the fiscal years ended December 31, | ||||||||||||||||||||
| Class Z | 2017 | 2016# | 2015 | 2014 | 2013 | |||||||||||||||
Net Asset Value, Beginning of Year | $ | 15.58 | $ | 15.05 | $ | 15.22 | $ | 15.26 | $ | 14.31 | ||||||||||
Income from Investment Operations: | ||||||||||||||||||||
Net investment income1,2 | 0.15 | 0.18 | 3 | 0.14 | 4 | 0.15 | 0.14 | 5 | ||||||||||||
Net realized and unrealized gain on investments | 2.32 | 0.54 | 0.23 | 1.38 | 2.35 | |||||||||||||||
Total income from investment operations | 2.47 | 0.72 | 0.37 | 1.53 | 2.49 | |||||||||||||||
Less Distributions to Shareholders from: | ||||||||||||||||||||
Net investment income | (0.15 | ) | (0.18 | ) | (0.15 | ) | (0.15 | ) | (0.13 | ) | ||||||||||
Net realized gain on investments | (0.71 | ) | (0.01 | ) | (0.39 | ) | (1.42 | ) | (1.41 | ) | ||||||||||
Total distributions to shareholders | (0.86 | ) | (0.19 | ) | (0.54 | ) | (1.57 | ) | (1.54 | ) | ||||||||||
Net Asset Value, End of Year | $ | 17.19 | $ | 15.58 | $ | 15.05 | $ | 15.22 | $ | 15.26 | ||||||||||
Total Return2 | 15.90 | %6 | 4.82 | %6 | 2.44 | %6 | 9.97 | %6 | 17.45 | %6 | ||||||||||
Ratio of net expenses to average net assets7 | 0.84 | % | 0.83 | % | 0.83 | % | 0.82 | % | 0.85 | %8 | ||||||||||
Ratio of gross expenses to average net assets9 | 0.89 | % | 1.00 | % | 1.09 | % | 1.15 | % | 1.30 | %8 | ||||||||||
Ratio of net investment income to average net assets2 | 0.88 | % | 1.20 | % | 0.89 | % | 0.95 | % | 0.88 | %8 | ||||||||||
Portfolio turnover | 75 | % | 119 | % | 105 | % | 92 | % | 90 | % | ||||||||||
Net assets end of year (000’s) omitted | $ | 7,060 | $ | 5,796 | $ | 1,709 | $ | 12,401 | $ | 11,122 | ||||||||||
|
|
|
|
|
|
|
|
|
| |||||||||||
| # | Effective October 1, 2016, the Investor Class, Service Class and Institutional Class were renamed Class N, Class I and Class Z, respectively. |
| 1 | Per share numbers have been calculated using average shares. |
| 2 | Total returns and net investment income would have been lower had certain expenses not been offset. |
| 3 | Includes non-recurring dividends. Without these dividends, net investment income per share would have been $0.12, $0.15, and $0.16 for Class N, Class I, and Class Z shares, respectively. |
| 4 | Includes non-recurring dividends. Without these dividends, net investment income per share would have been $0.09, $0.11, and $0.13 for Class N, Class I and Class Z shares, respectively. |
| 5 | Includes non-recurring dividends. Without these dividends, net investment income per share would have been $0.09, $0.12, and $0.13 for Class N, Class I, and Class Z shares, respectively. |
| 6 | The total return is calculated using the published Net Asset Value as of fiscal year end. |
| 7 | Includes reduction from broker recapture amounting to less than 0.01%, 0.01%, 0.01%, 0.02% and 0.01% for the fiscal years ended 2017, 2016, 2015, 2014 and 2013, respectively. |
| 8 | Includes non-routine extraordinary expenses amounting to 0.019%, 0.014% and 0.019% of average net assets for the Class N, Class I and Class Z, respectively. |
| 9 | Excludes the impact of expense reimbursement or fee waivers and expense reductions such as brokerage credits, but includes expense repayments and non-reimbursable expenses, if any, such as interest, taxes, and extraordinary expenses. (See Note 1(c) and 2 in the Notes to Financial Statements.) |
48
Table of Contents
AMG Chicago Equity Partners Small Cap Value Fund
Financial Highlights
For a share outstanding throughout each fiscal period
| For the fiscal periods ended December 31, | ||||||||||||
| Class N | 2017 | 2016# | 2015* | |||||||||
Net Asset Value, Beginning of Period | $ | 12.02 | $ | 9.39 | $ | 10.00 | ||||||
Income (loss) from Investment Operations: | ||||||||||||
Net investment income (loss)1,2 | (0.00 | )3 | 0.08 | (0.08 | )4 | |||||||
Net realized and unrealized gain (loss) on investments | 0.55 | 2.64 | (0.53 | ) | ||||||||
Total income (loss) from investment operations | 0.55 | 2.72 | (0.61 | ) | ||||||||
Less Distributions to Shareholders from: | ||||||||||||
Net investment income | — | (0.09 | ) | — | ||||||||
Net realized gain on investments | (1.72 | ) | — | — | ||||||||
Paid in capital | (0.02 | ) | — | — | ||||||||
Total distributions to shareholders | (1.74 | ) | (0.09 | ) | — | |||||||
Net Asset Value, End of Period | $ | 10.83 | $ | 12.02 | $ | 9.39 | ||||||
Total Return2,5 | 5.18 | % | 29.00 | % | (6.10 | )%6 | ||||||
Ratio of net expenses to average net assets7 | 1.28 | % | 1.33 | % | 1.32 | %8 | ||||||
Ratio of gross expenses to average net assets9 | 2.90 | % | 2.26 | % | 2.34 | %8 | ||||||
Ratio of net investment income (loss) to average net assets2 | (0.04 | )% | 0.77 | % | (0.77 | )%8 | ||||||
Portfolio turnover | 121 | % | 146 | % | 138 | %6 | ||||||
Net assets end of period (000’s) omitted | $ | 76 | $ | 30 | $ | 16 | ||||||
|
|
|
|
|
| |||||||
49
Table of Contents
AMG Chicago Equity Partners Small Cap Value Fund
Financial Highlights
For a share outstanding throughout each fiscal period
| For the fiscal periods ended December 31, | ||||||||||||
| Class I | 2017 | 2016# | 2015* | |||||||||
Net Asset Value, Beginning of Period | $ | 11.99 | $ | 9.35 | $ | 10.00 | ||||||
Income (loss) from Investment Operations: | ||||||||||||
Net investment income1,2 | 0.02 | 0.09 | 0.10 | 4 | ||||||||
Net realized and unrealized gain (loss) on investments | 0.54 | 2.65 | (0.68 | ) | ||||||||
Total income (loss) from investment operations | 0.56 | 2.74 | (0.58 | ) | ||||||||
Less Distributions to Shareholders from: | ||||||||||||
Net investment income | — | (0.10 | ) | (0.07 | ) | |||||||
Net realized gain on investments | (1.71 | ) | — | — | ||||||||
Paid in capital | (0.02 | ) | — | — | ||||||||
Total distributions to shareholders | (1.73 | ) | (0.10 | ) | (0.07 | ) | ||||||
Net Asset Value, End of Period | $ | 10.82 | $ | 11.99 | $ | 9.35 | ||||||
Total Return2,5 | 5.35 | % | 29.34 | % | (5.77 | )%6 | ||||||
Ratio of net expenses to average net assets7 | 1.02 | % | 1.06 | % | 1.03 | %8 | ||||||
Ratio of gross expenses to average net assets9 | 2.64 | % | 1.85 | % | 1.85 | %8 | ||||||
Ratio of net investment income to average net assets2 | 0.21 | % | 0.96 | % | 0.98 | %8 | ||||||
Portfolio turnover | 121 | % | 146 | % | 138 | %6 | ||||||
Net assets end of period (000’s) omitted | $ | 678 | $ | 10,888 | $ | 11,085 | ||||||
|
|
|
|
|
| |||||||
50
Table of Contents
AMG Chicago Equity Partners Small Cap Value Fund
Financial Highlights
For a share outstanding throughout each fiscal period
| For the fiscal periods ended December 31, | ||||||||||||
| Class Z | 2017 | 2016# | 2015* | |||||||||
Net Asset Value, Beginning of Period | $ | 11.99 | $ | 9.35 | $ | 10.00 | ||||||
Income (loss) from Investment Operations: | ||||||||||||
Net investment income1,2 | 0.04 | 0.11 | 0.11 | 4 | ||||||||
Net realized and unrealized gain (loss) on investments | 0.55 | 2.65 | (0.68 | ) | ||||||||
Total income (loss) from investment operations | 0.59 | 2.76 | (0.57 | ) | ||||||||
Less Distributions to Shareholders from: | ||||||||||||
Net investment income | — | (0.12 | ) | (0.08 | ) | |||||||
Net realized gain on investments | (1.71 | ) | — | — | ||||||||
Paid in capital | (0.02 | ) | — | — | ||||||||
Total distributions to shareholders | (1.73 | ) | (0.12 | ) | (0.08 | ) | ||||||
Net Asset Value, End of Period | $ | 10.85 | $ | 11.99 | $ | 9.35 | ||||||
Total Return2,5 | 5.63 | % | 29.49 | % | (5.69 | )%6 | ||||||
Ratio of net expenses to average net assets7 | 0.88 | % | 0.92 | % | 0.92 | %8 | ||||||
Ratio of gross expenses to average net assets9 | 2.50 | % | 1.71 | % | 3.06 | %8 | ||||||
Ratio of net investment income to average net assets2 | 0.36 | % | 1.04 | % | 1.07 | %8 | ||||||
Portfolio turnover | 121 | % | 146 | % | 138 | %6 | ||||||
Net assets end of period (000’s) omitted | $ | 2,005 | $ | 1,950 | $ | 1,609 | ||||||
|
|
|
|
|
| |||||||
| # | Effective October 1, 2016, the Investor Class, Service Class and Institutional Class were renamed Class N, Class I and Class Z, respectively. |
| * | Commencement of operations was on January 2, 2015. |
| 1 | Per share numbers have been calculated using average shares. |
| 2 | Total returns and net investment income would have been lower had certain expenses not been offset. |
| 3 | Amount is less than $(0.01) per share. |
| 4 | Includes non-recurring dividends. Without these dividends, net investment income (loss) per share would have been $(0.09), $0.09, and $0.10 for Class N, Class I and Class Z shares, respectively. |
| 5 | The total return is calculated using the published Net Asset Value as of fiscal year end. |
| 6 | Not annualized. |
| 7 | Includes reduction from broker recapture amounting to 0.07%, 0.01% and 0.03% for the years ended 2017, 2016 and 2015, respectively. |
| 8 | Annualized. |
| 9 | Excludes the impact of expense reimbursement or fee waivers and expense reductions such as brokerage credits, but includes expense repayments and non-reimbursable expenses, if any, such as interest, taxes, and extraordinary expenses. (See Note 1(c) and 2 in the Notes to Financial Statements.) |
51
Table of Contents
AMG Managers Amundi Intermediate Government Fund
Financial Highlights
For a share outstanding throughout each fiscal year
| For the fiscal years ended December 31, | ||||||||||||||||||||
| Class N | 2017# | 2016## | 2015 | 2014 | 2013 | |||||||||||||||
Net Asset Value, Beginning of Year | $ | 10.65 | $ | 10.81 | $ | 10.96 | $ | 10.64 | $ | 10.98 | ||||||||||
Income (loss) from Investment Operations: | ||||||||||||||||||||
Net investment income1,2 | 0.16 | 0.14 | 0.11 | 0.17 | 0.18 | |||||||||||||||
Net realized and unrealized gain (loss) on investments | 0.02 | 0.01 | 0.01 | 0.54 | (0.32 | ) | ||||||||||||||
Total income (loss) from investment operations | 0.18 | 0.15 | 0.12 | 0.71 | (0.14 | ) | ||||||||||||||
Less Distributions to Shareholders from: | ||||||||||||||||||||
Net investment income | (0.19 | ) | (0.13 | ) | (0.10 | ) | (0.17 | ) | (0.18 | ) | ||||||||||
Net realized gain on investments | — | (0.18 | ) | (0.17 | ) | (0.22 | ) | (0.02 | ) | |||||||||||
Paid in capital | (0.02 | ) | — | — | — | — | ||||||||||||||
Total distributions to shareholders | (0.21 | ) | (0.31 | ) | (0.27 | ) | (0.39 | ) | (0.20 | ) | ||||||||||
Net Asset Value, End of Year | $ | 10.62 | $ | 10.65 | $ | 10.81 | $ | 10.96 | $ | 10.64 | ||||||||||
Total Return2 | 1.68 | %3 | 1.42 | %3 | 1.09 | % | 6.73 | % | (1.25 | )% | ||||||||||
Ratio of net expenses to average net assets | 0.84 | % | 0.88 | % | 0.88 | % | 0.89 | % | 0.91 | %4 | ||||||||||
Ratio of gross expenses to average net assets5 | 0.99 | % | 0.93 | % | 0.92 | % | 0.96 | % | 0.94 | %4 | ||||||||||
Ratio of net investment income to average net assets2 | 1.46 | % | 1.32 | % | 0.99 | % | 1.54 | % | 1.64 | %4 | ||||||||||
Portfolio turnover | 10 | % | 17 | % | 21 | % | 11 | % | 29 | % | ||||||||||
Net assets end of year (000’s) omitted | $ | 104,847 | $ | 166,411 | $ | 192,039 | $ | 174,138 | $ | 136,915 | ||||||||||
|
|
|
|
|
|
|
|
|
| |||||||||||
52
Table of Contents
AMG Managers Amundi Intermediate Government Fund
Financial Highlights
For a share outstanding throughout each fiscal period
| For the fiscal period ended December 31, | ||||
| Class I | 2017* | |||
Net Asset Value, Beginning of Period | $ | 10.70 | ||
Income (loss) from Investment Operations: | ||||
Net investment income1,2 | 0.15 | |||
Net realized and unrealized loss on investments | (0.03 | ) | ||
Total income from investment operations | 0.12 | |||
Less Distributions to Shareholders from: | ||||
Net investment income | (0.18 | ) | ||
Paid in capital | (0.02 | ) | ||
Total distributions to shareholders | (0.20 | ) | ||
Net Asset Value, End of Period | $ | 10.62 | ||
Total Return2 | 1.15 | %3,6 | ||
Ratio of net expenses to average net assets | 0.72 | %7 | ||
Ratio of gross expenses to average net assets5 | 0.88 | %7 | ||
Ratio of net investment income to average net assets2 | 1.68 | %7 | ||
Portfolio turnover | 10 | % | ||
Net assets end of period (000’s) omitted | $ | 2,313 | ||
|
| |||
53
Table of Contents
AMG Managers Amundi Intermediate Government Fund
Financial Highlights
For a share outstanding throughout each fiscal period
| For the fiscal period ended December 31, | ||||
| Class Z | 2017* | |||
Net Asset Value, Beginning of Period | $ | 10.70 | ||
Income (loss) from Investment Operations: | ||||
Net investment income1,2 | 0.16 | |||
Net realized and unrealized loss on investments | (0.04 | ) | ||
Total income from investment operations | 0.12 | |||
Less Distributions to Shareholders from: | ||||
Net investment income | (0.18 | ) | ||
Paid in capital | (0.02 | ) | ||
Total distributions to shareholders | (0.20 | ) | ||
Net Asset Value, End of Period | $ | 10.62 | ||
Total Return2 | 1.15 | %3,6 | ||
Ratio of net expenses to average net assets | 0.69 | %7 | ||
Ratio of gross expenses to average net assets5 | 0.85 | %7 | ||
Ratio of net investment income to average net assets2 | 1.72 | %7 | ||
Portfolio turnover | 10 | % | ||
Net assets end of period (000’s) omitted | $ | 1,326 | ||
|
| |||
| # | Effective February 27, 2017, Class S was renamed Class N. |
| ## | Effective October 1, 2016, the shares were reclassified and redesignated as Class S shares. |
| * | Commencement of operations was February 27, 2017. |
| 1 | Per share numbers have been calculated using average shares. |
| 2 | Total returns and net investment income would have been lower had certain expenses not been offset. |
| 3 | The total return is calculated using the published Net Asset Value as of fiscal period end. |
| 4 | Includes non-routine extraordinary expenses amounting to 0.020% of average net assets. |
| 5 | Excludes the impact of expense reimbursement or fee waivers and expense reductions such as brokerage credits, but includes expense repayments and non-reimbursable expenses, if any, such as interest, taxes, and extraordinary expenses. (See Note 1(c) and 2 in the Notes to Financial Statements.) |
| 6 | Not annualized. |
| 7 | Annualized. |
54
Table of Contents
AMG Managers Amundi Short Duration Government Fund
Financial Highlights
For a share outstanding throughout each fiscal year
| For the fiscal years ended December 31, | ||||||||||||||||||||
| Class N | 2017# | 2016## | 2015 | 2014 | 2013 | |||||||||||||||
Net Asset Value, Beginning of Year | $ | 9.63 | $ | 9.62 | $ | 9.65 | $ | 9.64 | $ | 9.65 | ||||||||||
Income (loss) from Investment Operations: | ||||||||||||||||||||
Net investment income1,2 | 0.10 | 0.16 | 0.02 | 0.05 | 0.03 | |||||||||||||||
Net realized and unrealized gain (loss) on investments | (0.04 | ) | (0.05 | ) | (0.03 | ) | 0.01 | (0.01 | ) | |||||||||||
Total income (loss) from investment operations | 0.06 | 0.11 | (0.01 | ) | 0.06 | 0.02 | ||||||||||||||
Less Distributions to Shareholders from: | ||||||||||||||||||||
Net investment income | (0.22 | ) | (0.10 | ) | (0.02 | ) | (0.05 | ) | (0.03 | ) | ||||||||||
Total distributions to shareholders | (0.22 | ) | (0.10 | ) | (0.02 | ) | (0.05 | ) | (0.03 | ) | ||||||||||
Net Asset Value, End of Year | $ | 9.47 | $ | 9.63 | $ | 9.62 | $ | 9.65 | $ | 9.64 | ||||||||||
Total Return2,3 | 0.58 | % | 1.10 | % | (0.15 | )% | 0.60 | % | 0.20 | % | ||||||||||
Ratio of net expenses to average net assets | 0.74 | % | 0.80 | % | 0.79 | % | 0.80 | % | 0.79 | %5 | ||||||||||
Ratio of gross expenses to average net assets7 | 0.83 | % | 0.80 | % | 0.79 | % | 0.80 | % | 0.79 | %5 | ||||||||||
Ratio of net investment income to average net assets2 | 1.07 | % | 1.69 | % | 0.25 | % | 0.47 | % | 0.27 | %5 | ||||||||||
Portfolio turnover | 20 | % | 37 | % | 51 | % | 41 | % | 48 | % | ||||||||||
Net assets end of year (000’s) omitted | $ | 135,620 | $ | 234,569 | $ | 395,306 | $ | 385,246 | $ | 422,488 | ||||||||||
|
|
|
|
|
|
|
|
|
| |||||||||||
55
Table of Contents
AMG Managers Amundi Short Duration Government Fund
Financial Highlights
For a share outstanding throughout each fiscal period
| For the fiscal period ended December 31, | ||||
| Class I | 2017* | |||
Net Asset Value, Beginning of Period | $ | 9.64 | ||
Income (loss) from Investment Operations: | ||||
Net investment income1,2 | 0.11 | |||
Net realized and unrealized loss on investments | (0.08 | ) | ||
Total income from investment operations | 0.03 | |||
Less Distributions to Shareholders from: | ||||
Net investment income | (0.21 | ) | ||
Total distributions to shareholders | (0.21 | ) | ||
Net Asset Value, End of Period | $ | 9.46 | ||
Total Return2,3 | 0.31 | %4 | ||
Ratio of net expenses to average net assets | 0.62 | %6 | ||
Ratio of gross expenses to average net assets7 | 0.73 | %6 | ||
Ratio of net investment income to average net assets2 | 1.41 | %6 | ||
Portfolio turnover | 20 | % | ||
Net assets end of period (000’s) omitted | $ | 23,757 | ||
|
| |||
56
Table of Contents
AMG Managers Amundi Short Duration Government Fund
Financial Highlights
For a share outstanding throughout each fiscal period
| For the fiscal period ended December 31, | ||||
| Class Z | 2017* | |||
Net Asset Value, Beginning of Period | $ | 9.64 | ||
Income (loss) from Investment Operations: | ||||
Net investment income1,2 | 0.12 | |||
Net realized and unrealized loss on investments | (0.08 | ) | ||
Total income from investment operations | 0.04 | |||
Less Distributions to Shareholders from: | ||||
Net investment income | (0.21 | ) | ||
Total distributions to shareholders | (0.21 | ) | ||
Net Asset Value, End of Period | $ | 9.47 | ||
Total Return2,3 | 0.44 | %4 | ||
Ratio of net expenses to average net assets | 0.57 | %6 | ||
Ratio of gross expenses to average net assets7 | 0.68 | %6 | ||
Ratio of net investment income to average net assets2 | 1.46 | %6 | ||
Portfolio turnover | 20 | % | ||
Net assets end of period (000’s) omitted | $ | 675 | ||
|
| |||
| # | Effective February 27, 2017, Class S was renamed Class N. |
| ## | Effective October 1, 2016, the shares were reclassified and redesignated as Class S shares. |
| * | Commencement of operations was February 27, 2017. |
| 1 | Per share numbers have been calculated using average shares. |
| 2 | Total returns and net investment income would have been lower had certain expenses not been offset. |
| 3 | The total return is calculated using the published Net Asset Value as of fiscal year end. |
| 4 | Not annualized. |
| 5 | Includes non-routine extraordinary expenses amounting to 0.019% of average net assets. |
| 6 | Annualized. |
| 7 | Excludes the impact of expense reimbursement or fee waivers and expense reductions such as brokerage credits, but includes expense repayments and non-reimbursable expenses, if any, such as interest, taxes, and extraordinary expenses. (See Note 1(c) and 2 in the Notes to Financial Statements.) |
57
Table of Contents
December 31, 2017
1. SUMMARY OF SIGNIFICANT ACCOUNTING POLICIES
AMG Funds and AMG Funds II (the “Trusts”) are open-end management investment companies, organized as Massachusetts business trusts, and registered under the Investment Company Act of 1940, as amended (the “1940 Act”). Currently, the Trusts consist of a number of different funds, each having distinct investment management objectives, strategies, risks, and policies. Included in this report are AMG Funds: AMG Chicago Equity Partners Small Cap Value Fund (“Small Cap Value”) and AMG Funds II: AMG Chicago Equity Partners Balanced Fund (“Balanced”), AMG Managers Amundi Intermediate Government Fund (“Intermediate Government”) and AMG Managers Amundi Short Duration Government Fund (“Short Duration”), each a “Fund” and collectively, the “Funds.”
Each Fund offers different classes of shares, which, effective October 1, 2016, were renamed or redesignated. Both Balanced and Small Cap Value previously offered Investor Class shares, Service Class shares, and Institutional Class shares which were renamed to Class N, Class I and Class Z, respectively; and Intermediate Government and Short Duration shares were reclassified and redesignated Class S. Effective February 27, 2017, Intermediate Government and Short Duration’s Class S shares were renamed Class N and both funds commenced offering Class I and Class Z shares. Each class represents an interest in the same assets of the respective Fund. Although all share classes generally have identical voting rights, each share class votes separately when required by law. Different share classes may pay different distribution amounts to the extent the net asset value per share and/or the expenses of such share classes differ. Each share class has its own expense structure. Please refer to a current prospectus for additional information on each share class.
The Funds’ financial statements are prepared in accordance with accounting principles generally accepted in the United States of America (“U.S. GAAP”), including accounting and reporting guidance pursuant to Accounting Standards Codification Topic 946 applicable to investment companies. U.S. GAAP requires management to make estimates and assumptions that affect the reported amounts of assets and liabilities and disclosure of contingent assets and liabilities at the date of the financial statements and the reported amounts of income and expenses during the reporting period. Actual results could differ from those estimates and such differences could be material. The following is a summary of significant accounting policies followed by the Funds in the preparation of their financial statements:
a. VALUATION OF INVESTMENTS
Equity securities traded on a national securities exchange or reported on the NASDAQ national market system (“NMS”) are valued at the last quoted sales price on the primary exchange or, if applicable, the NASDAQ official closing price or the official closing price of the relevant exchange or, lacking any sales, at the last quoted bid price or the mean between the last quoted bid and ask prices (the “exchange mean price”). Equity securities traded in the over-the-counter market (other than NMS securities) are valued at the exchange mean price. Foreign equity securities (securities principally traded in markets other than U.S. markets) are valued at the official closing price on the primary exchange or, for markets that either do not offer an official closing price or where the official closing price may not be representative of the overall market, the last quoted sale price.
Fixed income securities purchased with a remaining maturity exceeding 60 days are valued at the evaluated bid price or the mean price provided by an authorized pricing service or, if an evaluated price is not available, by reference to other securities which are considered comparable in credit rating, interest rate, due date
and other features (generally referred to as “matrix pricing”) or other similar pricing methodologies. Investments in certain mortgage-backed and stripped mortgage-backed securities, preferred stocks, convertible securities, derivatives and other debt securities not traded on an organized securities market are valued on the basis of valuations provided by dealers or by a pricing service which uses information with respect to transactions in such securities and various relationships between such securities and yield to maturity in determining value.
Fixed income securities purchased with a remaining maturity of 60 days or less are valued at amortized cost, provided that the amortized cost value is approximately the same as the fair value of the security valued without the use of amortized cost. Investments in other open-end regulated investment companies are valued at their end of day net asset value per share.
Futures contracts for which market quotations are readily available are valued at the settlement price as of the close of the futures exchange.
The Funds’ portfolio investments are generally valued based on independent market quotations or prices or, if none, “evaluative” or other market based valuations provided by third party pricing services approved by the Board of Trustees of the Trust (the “Board”). Under certain circumstances, the value of certain Fund portfolio investments (including derivatives) may be based on an evaluation of fair value, pursuant to procedures established by and under the general supervision of the Board. The Valuation Committee, which is comprised of the Independent Trustees of the Board, and the Pricing Committee, which is comprised of representatives from AMG Funds LLC (the “Investment Manager”) are the committees appointed by the Board to make fair value determinations. Each Fund may use the fair value of a portfolio investment to calculate its net asset value (“NAV”) in the event that the market quotation, price or market based valuation for the portfolio investment is not readily available or otherwise not determinable pursuant to the Board’s valuation procedures, if the Investment Manager or the Pricing Committee believes the quotation, price or market based valuation to be unreliable, or in certain other circumstances. When determining the fair value of an investment, the Pricing Committee and, if required under the Trusts’ securities valuation procedures, the Valuation Committee, seeks to determine the price that the Fund might reasonably expect to receive from current sale of that portfolio investment in an arms-length transaction. Fair value determinations shall be based upon consideration of all available facts and information, including, but not limited to (i) attributes specific to the investment; (ii) fundamental and analytical data relating to the investment; and (iii) the value of other comparable securities or relevant financial instruments, including derivative securities, traded on other markets or among dealers.
The values assigned to fair value portfolio investments are based on available information and do not necessarily represent amounts that might ultimately be realized in the future, since such amounts depend on future developments inherent in long-term investments. Because of the inherent uncertainty of valuation, those estimated values may differ significantly from the values that would have been used had a ready market for the investments existed, and the differences could be material. The Board will be presented with a quarterly report showing as of the most recent quarter end, all outstanding securities fair valued by the Fund, including a comparison with the prior quarter end and the percentage of the Fund that the security represents at each quarter end.
With respect to foreign equity securities and certain foreign fixed income securities, the Board has adopted a policy that securities held in a Fund that can be fair valued by the applicable fair value pricing service are fair valued on each business day provided that each individual price exceeds a pre-established confidence level.
58
Table of Contents
Notes to Financial Statements (continued)
U.S. GAAP defines fair value as the price that a fund would receive to sell an asset or pay to transfer a liability in an orderly transaction between market participants at the measurement date. U.S. GAAP also establishes a framework for measuring fair value, and a three level hierarchy for fair value measurements based upon the transparency of inputs to the valuation of an asset or liability. Inputs may be observable or unobservable and refer broadly to the assumptions that market participants would use in pricing the asset or liability. Observable inputs reflect the assumptions market participants would use in pricing the asset or liability based on market data obtained from sources independent of the Funds. Unobservable inputs reflect the Funds’ own assumptions about the assumptions that market participants would use in pricing the asset or liability developed based on the best information available in the circumstances. Each investment is assigned a level based upon the observability of the inputs which are significant to the overall valuation.
The three-tier hierarchy of inputs is summarized below:
Level 1 – inputs are quoted prices in active markets for identical investments (e.g., equity securities, open-end investment companies, futures contracts,)
Level 2 – other observable inputs (including, but not limited to: quoted prices for similar assets or liabilities in markets that are active, quoted prices for identical or similar assets or liabilities in markets that are not active, inputs other than quoted prices that are observable for the assets or liabilities (such as interest rates, yield curves, volatilities, prepayment speeds, loss severities, credit risks and default rates) or other market corroborated inputs) (e.g., debt securities, government securities, foreign currency exchange contracts, foreign securities utilizing international fair value pricing, fair valued securities with observable inputs)
Level 3 – inputs are significant unobservable inputs (including the Fund’s own assumptions used to determine the fair value of investments) (e.g., fair valued securities with unobservable inputs)
Changes in inputs or methodologies used for valuing investments may result in a transfer in or out of levels within the fair value hierarchy. The inputs or methodologies used for valuing investments may not necessarily be an indication of the risk associated with investing in those investments. Transfers between different levels of the fair value disclosure hierarchy are deemed to have occurred as of the beginning of the reporting period.
b. SECURITY TRANSACTIONS
Security transactions are accounted for as of trade date. Realized gains and losses on securities sold are determined on the basis of identified cost.
c. INVESTMENT INCOME AND EXPENSES
Dividend income is recorded on the ex-dividend date. Dividends from foreign securities are recorded on the ex-dividend date, and if after the fact, as soon as the Funds become aware of the ex-dividend date. Interest income, which includes amortization of premium and accretion of discount on debt securities, is accrued as earned. Dividend and interest income on foreign securities is recorded gross of any withholding tax. Non-cash dividends included in dividend income, if any, are reported at the fair market value of the securities received. Upon notification from issuers, distributions received from a real estate investment trust (“REIT”) may be redesignated as a reduction of cost of investments and/or realized gain. Other income and expenses are recorded on an accrual basis. Expenses that cannot be directly attributed to a Fund are apportioned among the funds in the Trusts and other trusts within the AMG Funds family of mutual funds (collectively the “AMG Funds Family”) based upon their relative average net assets or number of shareholders. Investment income, realized and unrealized capital gains and losses, the common expenses of each Fund, and certain fund level expense reductions, if any, are allocated on a pro-rata basis to each class based on the relative net assets of each class to the total net assets of each Fund.
The following Funds had certain portfolio trades directed to various brokers under a brokerage recapture program. Credits received from the brokerage recapture program are earned and paid on a monthly basis, and are recorded as expense offsets, which serve to reduce the Funds’ overall expense ratio. For the fiscal year ended December 31, 2017, the impact on the expense ratios, if any, were as follows: Balanced - $9,606 or 0.01% , Small Cap Value - $5,004 or 0.07%.
d. DIVIDENDS AND DISTRIBUTIONS
Fund distributions resulting from either net investment income or realized net capital gains, if any, will normally be declared and paid at least annually in December. Distributions to shareholders are recorded on the ex-dividend date. Distributions are determined in accordance with federal income tax regulations, which may differ from net investment income and net realized capital gains for financial statement purposes (U.S. GAAP). Differences may be permanent or temporary. Permanent differences are reclassified among capital accounts in the financial statements to reflect their tax character. Permanent book and tax basis differences, if any, relating to shareholder distributions will result in reclassifications to paid-in capital. Temporary differences arise when certain items of income, expense and gain or loss are recognized in different periods for financial statement and tax purposes; these differences will reverse at some time in the future. Permanent differences are due to redesignation of dividends paid, foreign currency, expiration of capital loss carryforwards and return of capital distributions paid by the Funds. Temporary differences are due to capital loss deferrals on straddles and mark-to-market on futures.
59
Table of Contents
Notes to Financial Statements (continued)
The tax character of distributions paid during the fiscal years ended December 31, 2017 and December 31, 2016 were as follows:
| Balanced | Small Cap Value | |||||||||||||||
| Distributions paid from: | 2017 | 2016 | 2017 | 2016 | ||||||||||||
Ordinary income | $ | 1,336,645 | $ | 1,747,072 | $ | 32,099 | $ | 121,930 | ||||||||
Short-term capital gains | 3,377,861 | — | 833,144 | — | ||||||||||||
Long-term capital gains | 4,487,937 | 131,879 | 635,008 | — | ||||||||||||
Return of capital | — | — | 18,947 | — | ||||||||||||
|
|
|
|
|
|
|
| |||||||||
| $ | 9,202,443 | $ | 1,878,951 | $ | 1,519,198 | $ | 121,930 | |||||||||
|
|
|
|
|
|
|
| |||||||||
| Intermediate Government | Short Duration | |||||||||||||||
| Distributions paid from: | 2017 | 2016 | 2017 | 2016 | ||||||||||||
Ordinary income | $ | 2,261,146 | $ | 5,087,719 | $ | 4,471,104 | $ | 2,527,449 | ||||||||
Short-term capital gains | — | — | — | — | ||||||||||||
Long-term capital gains | — | — | — | — | ||||||||||||
Return of capital | 192,812 | — | — | — | ||||||||||||
|
|
|
|
|
|
|
| |||||||||
| $ | 2,453,958 | $ | 5,087,719 | $ | 4,471,104 | $ | 2,527,449 | |||||||||
|
|
|
|
|
|
|
| |||||||||
As of December 31, 2017, the components of distributable earnings (excluding unrealized appreciation/depreciation) on tax basis consisted of:
| Balanced | Small Cap Value | Intermediate Government | Short Duration | |||||||||||||
Capital loss carryforward | — | — | $ | 2,178,798 | $ | 5,515,191 | ||||||||||
Undistributed ordinary income | — | — | — | 205,033 | ||||||||||||
Undistributed short-term capital gains | $ | 1,664,599 | — | — | — | |||||||||||
Undistributed long-term capital gains | 3,163,719 | — | — | — | ||||||||||||
Late-year loss deferral | — | — | — | — | ||||||||||||
At December 31, 2017, the approximate cost of investments and the aggregate gross unrealized appreciation and depreciation for federal income tax were as follows:
| Fund | Cost | Appreciation | Depreciation | Net | ||||||||||||
Balanced | $ | 176,266,128 | $ | 23,454,226 | $ | (1,909,202 | ) | $ | 21,545,024 | |||||||
Small Cap Value | 2,626,917 | 367,939 | (50,775 | ) | 317,164 | |||||||||||
Intermediate Government | 159,704,263 | 1,376,051 | (930,840 | ) | 445,211 | |||||||||||
Short Duration | 160,773,775 | 2,938,336 | (2,125,475 | ) | 812,861 | |||||||||||
e. FEDERAL TAXES
Each Fund currently qualifies as an investment company and intends to comply with the requirements under Subchapter M of the Internal Revenue Code of 1986, as amended, and to distribute substantially all of its taxable income and gains to its shareholders and to meet certain diversification and income requirements with respect to investment companies. Therefore, no provision for federal income or excise tax is included in the accompanying financial statements.
Additionally, based on each Fund’s understanding of the tax rules and rates related to income, gains and transactions for the foreign jurisdictions in which it invests, each Fund will provide for foreign taxes, and where appropriate, deferred foreign taxes.
Management has analyzed the Funds’ tax positions taken on federal income tax returns as of December 31, 2017, and for all open tax years (generally, the three
prior taxable years), and has concluded that no provision for federal income tax is required in the Funds’ financial statements. Additionally, Management is not aware of any tax position for which it is reasonably possible that the total amounts of unrecognized tax benefits will change materially in the next twelve months.
Net capital losses incurred may be carried forward for an unlimited time period, and retain their tax character as either short-term or long-term capital losses.
f. CAPITAL LOSS CARRYOVERS AND DEFERRALS
As of December 31, 2017, the following Funds had accumulated net realized capital loss carryovers from securities transactions for federal income tax purposes as shown in the following chart. These amounts may be used to offset future realized capital gains, if any, for an unlimited time period.
60
Table of Contents
Notes to Financial Statements (continued)
| Capital Loss Carryover Amounts | ||||||||||||
| Fund | Short-Term | Long-Term | Total | |||||||||
Intermediate Government | — | $ | 2,178,798 | $ | 2,178,798 | |||||||
Short Duration | $ | 359,813 | 5,155,378 | 5,515,191 | ||||||||
As of December 31, 2017, Balanced and Small Cap Value had no accumulated net realized capital loss carryovers from securities transactions for federal income tax purposes. Should Balanced and Small Cap Value incur net capital losses for the fiscal year ended December 31, 2018, such amounts may be used to offset future realized capital gains, for an unlimited time period.
For the fiscal year ended December 31, 2017, the following Funds utilized capital loss carryovers in the amount of:
| Capital Loss Carryover Utilized | ||||||||
| Fund | Short-Term | Long-Term | ||||||
Small Cap Value | $ | 247,331 | — | |||||
g. CAPITAL STOCK
The Trusts’ Declaration of Trust authorizes for each Fund the issuance of an unlimited number of shares of beneficial interest, without par value. Each Fund records sales and repurchases of its capital stock on the trade date.
For the fiscal years ended December 31, 2017 and December 31, 2016, the capital stock transactions by class for the Funds were as follows:
| Balanced | Small Cap Value | |||||||||||||||||||||||||||||||
| December 31, 2017 | December 31, 2016 | December 31, 2017 | December 31, 2016 | |||||||||||||||||||||||||||||
| Shares | Amount | Shares | Amount | Shares | Amount | Shares | Amount | |||||||||||||||||||||||||
Class N: | ||||||||||||||||||||||||||||||||
Proceeds from sale of shares | 1,239,936 | $ | 20,491,466 | 3,377,841 | $ | 49,948,934 | 5,673 | $ | 59,815 | 1,549 | $ | 18,593 | ||||||||||||||||||||
Reinvestment of distributions | 180,583 | 3,069,279 | 53,953 | 817,953 | 567 | 5,890 | 17 | 207 | ||||||||||||||||||||||||
Cost of shares repurchased | (3,044,466 | ) | (50,984,756 | ) | (3,777,688 | ) | (56,409,174 | ) | (1,695 | ) | (17,799 | ) | (783 | ) | (7,962 | ) | ||||||||||||||||
|
|
|
|
|
|
|
|
|
|
|
|
|
|
|
| |||||||||||||||||
Net increase (decrease) | (1,623,947 | ) | $ | (27,424,011 | ) | (345,894 | ) | $ | (5,642,287 | ) | 4,545 | $ | 47,906 | 783 | $ | 10,838 | ||||||||||||||||
|
|
|
|
|
|
|
|
|
|
|
|
|
|
|
| |||||||||||||||||
Class I: | ||||||||||||||||||||||||||||||||
Proceeds from sale of shares | 2,705,468 | $ | 45,868,384 | 2,263,148 | $ | 34,028,928 | 47,763 | $ | 556,183 | 181,690 | $ | 1,853,567 | ||||||||||||||||||||
Reinvestment of distributions | 161,858 | 2,780,507 | 19,571 | 299,586 | 118,507 | 1,227,738 | 8,418 | 102,527 | ||||||||||||||||||||||||
Cost of shares repurchased | (1,051,459 | ) | (17,798,320 | ) | (1,453,335 | ) | (22,061,566 | ) | (1,012,039 | ) | (10,627,683 | ) | (467,369 | ) | (4,771,305 | ) | ||||||||||||||||
|
|
|
|
|
|
|
|
|
|
|
|
|
|
|
| |||||||||||||||||
Net increase (decrease) | 1,815,867 | $ | 30,850,571 | 829,384 | $ | 12,266,948 | (845,769 | ) | $ | (8,843,762 | ) | (277,261 | ) | $ | (2,815,211 | ) | ||||||||||||||||
|
|
|
|
|
|
|
|
|
|
|
|
|
|
|
| |||||||||||||||||
Class Z: | ||||||||||||||||||||||||||||||||
Proceeds from sale of shares | 77,566 | $ | 1,285,979 | 323,484 | $ | 4,749,655 | 39,324 | $ | 406,905 | 43,104 | $ | 418,513 | ||||||||||||||||||||
Reinvestment of distributions | 19,371 | 332,260 | 4,203 | 64,334 | 27,522 | 285,399 | 1,575 | 19,183 | ||||||||||||||||||||||||
Cost of shares repurchased | (58,065 | ) | (968,364 | ) | (69,342 | ) | (1,045,388 | ) | (44,678 | ) | (465,244 | ) | (54,112 | ) | (495,091 | ) | ||||||||||||||||
|
|
|
|
|
|
|
|
|
|
|
|
|
|
|
| |||||||||||||||||
Net increase (decrease) | 38,872 | $ | 649,875 | 258,345 | $ | 3,768,601 | 22,168 | $ | 227,060 | (9,433 | ) | $ | (57,395 | ) | ||||||||||||||||||
|
|
|
|
|
|
|
|
|
|
|
|
|
|
|
| |||||||||||||||||
61
Table of Contents
Notes to Financial Statements (continued)
| Intermediate Government | Short Duration | |||||||||||||||||||||||||||||||
| December 31, 2017 | December 31, 2016 | December 31, 2017 | December 31, 2016 | |||||||||||||||||||||||||||||
| Shares | Amount | Shares | Amount | Shares | Amount | Shares | Amount | |||||||||||||||||||||||||
Class N:1 | ||||||||||||||||||||||||||||||||
Proceeds from sale of shares | 2,506,899 | $ | 26,802,132 | 6,031,612 | $ | 66,129,198 | 4,487,160 | $ | 43,034,526 | 36,112,882 | $ | 103,879,750 | ||||||||||||||||||||
Reinvestment of distributions | 206,475 | 2,204,214 | 431,895 | 4,630,731 | 392,197 | 3,743,767 | 221,824 | 2,135,935 | ||||||||||||||||||||||||
Cost of shares repurchased | (8,473,695 | ) | (90,681,619 | ) | (8,607,228 | ) | (94,306,073 | ) | (14,919,003 | ) | (142,857,038 | ) | (53,058,101 | ) | (267,051,584 | ) | ||||||||||||||||
|
|
|
|
|
|
|
|
|
|
|
|
|
|
|
| |||||||||||||||||
Net decrease | (5,760,321 | ) | $ | (61,675,273 | ) | (2,143,721 | ) | $ | (23,546,144 | ) | (10,039,646 | ) | $ | (96,078,745 | ) | (16,723,395 | ) | $ | (161,035,899 | ) | ||||||||||||
|
|
|
|
|
|
|
|
|
|
|
|
|
|
|
| |||||||||||||||||
Class I:2 | ||||||||||||||||||||||||||||||||
Proceeds from sale of shares | 282,788 | $ | 3,034,044 | — | — | 5,634,803 | $ | 53,874,614 | — | — | ||||||||||||||||||||||
Reinvestment of distributions | 2,771 | 29,580 | — | — | 15,916 | 151,394 | — | — | ||||||||||||||||||||||||
Cost of shares repurchased | (67,846 | ) | (727,699 | ) | — | — | (3,140,056 | ) | (29,921,094 | ) | — | — | ||||||||||||||||||||
|
|
|
|
|
|
|
|
|
|
|
|
|
|
|
| |||||||||||||||||
Net increase | 217,713 | $ | 2,335,925 | — | — | 2,510,663 | $ | 24,104,914 | — | — | ||||||||||||||||||||||
|
|
|
|
|
|
|
|
|
|
|
|
|
|
|
| |||||||||||||||||
Class Z:2 | ||||||||||||||||||||||||||||||||
Proceeds from sale of shares | 169,759 | $ | 1,799,841 | — | — | 126,003 | $ | 1,211,014 | — | — | ||||||||||||||||||||||
Reinvestment of distributions | 2,342 | 25,005 | — | — | 1,577 | 15,045 | — | — | ||||||||||||||||||||||||
Cost of shares repurchased | (47,207 | ) | (505,944 | ) | — | — | (56,279 | ) | (538,713 | ) | — | — | ||||||||||||||||||||
|
|
|
|
|
|
|
|
|
|
|
|
|
|
|
| |||||||||||||||||
Net increase | 124,894 | $ | 1,318,902 | — | — | 71,301 | $ | 687,346 | — | — | ||||||||||||||||||||||
|
|
|
|
|
|
|
|
|
|
|
|
|
|
|
| |||||||||||||||||
| 1 | Effective February 27, 2017, Class S was renamed Class N. |
| 2 | Commencement of operations was February 27, 2017. |
At December 31, 2017, certain unaffiliated shareholders of record individually held greater than 10% of the net assets of the Funds as follows: Small Cap Value - one owns 23%. Transactions by this shareholder may have a material impact on its respective Fund.
h. REPURCHASE AGREEMENTS AND JOINT REPURCHASE AGREEMENTS
The Funds may enter into third-party repurchase agreements for temporary cash management purposes and third-party joint repurchase agreements for reinvestment of cash collateral on securities lending transactions under the securities lending program offered by The Bank of New York Mellon (“BNYM”) (the “Program”) (collectively, “Repurchase Agreements”). The value of the underlying collateral, including accrued interest, must equal or exceed the value of the Repurchase Agreements during the term of the agreement. For joint repurchase agreements, the Funds participate on a pro rata basis with other clients of BNYM in its share of the underlying collateral under such joint repurchase agreements and in its share of proceeds from any repurchase or other disposition of the underlying collateral. The underlying collateral for all Repurchase Agreements is held in safekeeping by the Funds’ custodian or at the Federal Reserve Bank. If the seller defaults and the value of the collateral declines, or if bankruptcy proceedings commence with respect to the seller of the security, realization of the collateral by the Funds may be delayed or limited. Pursuant to the Program, the Funds are indemnified for such losses by BNYM on joint repurchase agreements.
At December 31, 2017, the market value of Repurchase Agreements outstanding for Balanced and Small Cap Value were $2,448,757 and $169,425, respectively.
i. FOREIGN CURRENCY TRANSLATION
The books and records of the Funds are maintained in U.S. dollars. The value of investments, assets and liabilities denominated in currencies other than U.S. dollars are translated into U.S. dollars based upon current foreign exchange rates. Purchases and sales of foreign investments, income and expenses are converted into U.S. dollars based on currency exchange rates prevailing on the respective dates of such transactions. Net realized and unrealized gain (loss) on foreign currency transactions represent: (1) foreign exchange gains and losses from the sale and holdings of foreign currencies; (2) gains and losses between trade date and settlement date on investment securities transactions and forward foreign currency exchange contracts; and (3) gains and losses from the difference between amounts of interest and dividends recorded and the amounts actually received.
The Funds do not isolate the net realized and unrealized gain or loss resulting from changes in exchange rates from the fluctuations in market prices of securities held. Such fluctuations are included with the net realized and unrealized gain or loss on investments.
j. SECURITIES TRANSACTED ON A WHEN ISSUED BASIS
All Funds except Small Cap Value may enter into To-Be-Announced (“TBA”) sale commitments to hedge their portfolio positions or to sell mortgage-backed securities they own under delayed delivery arrangements. Proceeds of TBA sale
62
Table of Contents
Notes to Financial Statements (continued)
commitments are not received until the contractual settlement date. During the time a TBA sale commitment is outstanding, equivalent deliverable securities, with the same counterparty, or an offsetting TBA purchase commitment deliverable on or before the sale commitment date, are held as “cover” for the transaction. Unsettled TBA sale commitments are valued at the current market value of the underlying securities according to the procedures described under “Valuation of Investments,” in Footnote 1a above.
Each TBA contract is marked-to-market daily and the change in market value is recorded by the Fund as an unrealized gain or loss. If the TBA sale commitment is closed through the acquisition of an offsetting purchase commitment with the same broker, the Fund realizes a gain or loss. If the Fund delivers securities under the commitment, the Fund realizes a gain or a loss from the sale of the securities based upon the unit price established at the date the commitment was entered into.
k. DELAYED DELIVERY TRANSACTIONS AND WHEN-ISSUED SECURITIES
All Funds except Small Cap Value may enter into securities transactions on a delayed delivery or when issued basis. Payment and delivery may take place after the customary settlement period for that security. The price of the underlying securities and the date when the securities will be delivered and paid for are fixed at the time the transaction is negotiated. During the time a delayed delivery sell is outstanding, the contract is marked to market daily and equivalent deliverable securities are held for the transaction. The value of the securities purchased on a delayed delivery or when-issued basis are identified as such in the Funds’ Schedules of Portfolio Investments. With respect to purchase commitments, the Funds identify securities as segregated in their records with a value at least equal to the amount of the commitment. Delayed delivery or when-issued securities that have been purchased from and sold to different brokers are reflected as an investment in securities and a forward sale commitment in the Funds’ Statement of Assets and Liabilities. For financial reporting purposes, the Funds do not offset the receivable and payable for delayed delivery investments purchased and sold on TBA commitments. Losses may arise due to changes in the value of the underlying securities or if the counterparty does not perform under the contract, or if the issuer does not issue the securities due to political, economic, or other factors.
l. FOREIGN SECURITIES
Balanced invests in securities of foreign entities and in instruments denominated in foreign currencies which involve risks not typically associated with investments in domestic securities. Non-domestic securities carry special risks, such as exposure to currency fluctuations, less developed or less efficient trading markets, political instability, a lack of company information, differing auditing and legal standards, and, potentially, less liquidity. Realized gains in certain countries may be subject to foreign taxes at the Fund level and would pay such foreign taxes at the appropriate rate for each jurisdiction.
2. AGREEMENTS AND TRANSACTIONS WITH AFFILIATES
For each of the Funds, the Trusts have entered into an investment advisory agreement under which the Investment Manager, a subsidiary and the U.S. retail distribution arm of Affiliated Managers Group, Inc. (“AMG”), serves as investment manager to the Funds and is responsible for the Funds’ overall administration and operations. The Investment Manager selects one or more subadvisers for the Funds (subject to Board approval) and monitors each subadviser’s investment
performance, security holdings and investment strategies. Each Fund’s investment portfolio is managed by one or more portfolio managers who serve pursuant to a subadvisory agreement with the Investment Manager. Balanced and Small Cap Value are managed by Chicago Equity Partners, LLC (“CEP”). AMG indirectly owns a majority interest in CEP.
Investment management fees are paid directly by the Funds to the Investment Manager based on average daily net assets. Effective October 1, 2016, the Funds’ investment management fees were paid at the following annual rate of each Fund’s respective average daily net assets:
Balanced | 0.60 | % | ||
Small Cap Value | 0.62 | % | ||
Intermediate Government | 0.48 | % | ||
Short Duration | 0.40 | % |
Prior to October 1, 2016, the annual rate for the investment management fees was 0.70%, 0.62%, 0.70% and 0.70% of each Fund’s average daily net assets of Balanced, Small Cap Value, Intermediate Government and Short Duration, respectively.
The Investment Manager has contractually agreed, through at least May 1, 2018, to waive management fees and/or reimburse fund expenses in order to limit total annual Fund operating expenses after fee waiver and expense reimbursements (exclusive of taxes, interest (including interest incurred in connection with bank and custody overdrafts), shareholder servicing fees, distribution and service (12b-1) fees, brokerage commissions and other transaction costs, acquired fund fees and expenses and extraordinary expenses) of Balanced and Small Cap Value to 0.84% and 0.95%, respectively, of each Fund’s average daily net assets subject to later reimbursement by the Funds in certain circumstances.
The Investment Manager has contractually agreed, through at least May 1, 2018, to waive management fees and/or reimburse Fund expenses in order to limit total annual Fund operating expenses after fee waiver and expense reimbursements (exclusive of taxes, interest (including interest incurred in connection with bank and custody overdrafts), shareholder servicing fees, brokerage commissions and other transaction costs, acquired fund fees and expenses and extraordinary expenses) to 0.74% of Intermediate Government’s average daily net assets subject to later reimbursement by the Fund in certain circumstances.
Effective February 27, 2017, the Investment Manager has contractually agreed, through May 1, 2018, to waive Intermediate Government’s management fee by 0.05%, from 0.48% to 0.43%, and Short Duration’s management fee by 0.11%, from 0.40% to 0.29%. For the fiscal year ended December 31, 2017, the management fee for Intermediate Government and Short Duration was reduced by $54,629 and $182,649, respectively.
The contractual expense limitation may only be terminated in the event the Investment Manager or a successor ceases to be the investment manager of the Fund or a successor fund, by mutual agreement between the Investment Manager and the Board, or in the event of the Fund’s liquidation unless the Fund is reorganized or is a party to a merger in which the surviving entity is successor to the accounting and performance information of the Fund.
In general, for a period of up to 36 months, the Investment Manager may recover from each Fund fees waived and expenses paid pursuant to this contractual agreement, provided that such repayment would not cause the Fund’s total annual operating expenses after fee waiver and expense reimbursements (exclusive of the items noted in the parenthetical above) to exceed the contractual expense limitation amount.
63
Table of Contents
Notes to Financial Statements (continued)
At December 31, 2017, the Funds’ expiration of recoupment is as follows:
| Expiration Period | Balanced | Small Cap Value | Intermediate Government | |||||||||
Less than 1 year | $ | 256,154 | $ | 100,095 | $ | 58,801 | ||||||
Within 2 years | 276,286 | 94,463 | 81,422 | |||||||||
Within 3 years | 92,722 | 104,187 | 135,196 | |||||||||
|
|
|
|
|
| |||||||
Total Amount Subject to Recoupment | $ | 625,162 | $ | 298,745 | $ | 275,419 | ||||||
|
|
|
|
|
| |||||||
The Investment Manager has agreed to waive a portion of its management fee in consideration of shareholder servicing fees that it has received from JPMorgan Distribution Services, Inc., with respect to short-term cash investments each Fund may have made in the JPMorgan Money Market Funds. For the fiscal year ended December 31, 2017, the investment management fee for Intermediate Government was reduced by $6,834.
The Trusts, on behalf of the Funds, have entered into an amended and restated Administration Agreement under which the Investment Manager serves as the Funds’ administrator (the “Administrator”) and is responsible for all non-portfolio management aspects of managing the Funds’ operations, including administration and shareholder services to each Fund. Effective October 1, 2016, each Fund pays a fee to the Administrator at the rate of 0.15% per annum of the Fund’s average daily net assets for this service. Prior to October 1, 2016, Balanced and Small Cap Value paid an administration fee under a similar contract at an annual rate of 0.20% and 0.25%, respectively, of each Fund’s average daily net assets, while Intermediate Government and Short Duration did not pay an administration fee.
The Funds are distributed by AMG Distributors, Inc. (the “Distributor”), a wholly-owned subsidiary of the Investment Manager. The Distributor serves as the distributor and underwriter for each Fund and is a registered broker-dealer and member of the Financial Industry Regulatory Authority, Inc. (“FINRA”). Shares of each Fund will be continuously offered and will be sold directly to prospective purchasers and through brokers, dealers or other financial intermediaries who have executed selling agreements with the Distributor. Generally the Distributor bears all or a portion of the expenses of providing services pursuant to the distribution agreement, including the payment of the expenses relating to the distribution of prospectuses for sales purposes and any advertising or sales literature.
Balanced and Small Cap Value have adopted a distribution and service plan (the “Plan”) with respect to the Class N shares in accordance with the requirements of Rule 12b-1 under the 1940 Act and the requirements of the applicable rules of FINRA regarding asset based sales charges. Pursuant to the Plan, each Fund may make payments to the Distributor for its expenditures in financing any activity primarily intended to result in the sale of each Funds’ Class N shares and for maintenance and personal service provided to existing shareholders of that class. The Plan authorizes payments to the Distributor up to 0.25% annually of each Fund’s average daily net assets attributable to the Class N shares.
For Class N of Small Cap Value, Intermediate Government and Short Duration, and Class I of Balanced, Small Cap Value, Intermediate Government and Short Duration, the Board has approved reimbursement payments to the Investment Manager for shareholder servicing expenses (“shareholder servicing fees”) incurred.
Shareholder servicing fees include payments to financial intermediaries, such as broker-dealers (including fund supermarket platforms), banks, and trust companies who provide shareholder recordkeeping, account servicing and other services. Class N shares of Small Cap Value, Intermediate Government and Short Duration and Class I shares of Balanced, Small Cap Value, Intermediate Government and Short Duration may reimburse the Investment Manager for the actual amount incurred up to a maximum annual rate of each Class’s average daily net assets as shown in the table below.
The impact on the annualized expense ratios for the fiscal year ended December 31, 2017, were as follows:
| Fund | Maximum Annual Amount Approved | Actual Amount Incurred | ||||||
Balanced | ||||||||
Class I | 0.10 | % | 0.10 | % | ||||
Small Cap Value | ||||||||
Class N | 0.15 | % | 0.15 | % | ||||
Class I | 0.15 | % | 0.14 | % | ||||
Intermediate Government | ||||||||
Class N* | 0.15 | % | 0.15 | % | ||||
Class I** | 0.05 | % | 0.04 | % | ||||
Short Duration | ||||||||
Class N* | 0.15 | % | 0.15 | % | ||||
Class I** | 0.05 | % | 0.05 | % | ||||
| * | Effective October 1, 2016, the maximum annual rate was increased to 0.15% from 0.10%. |
| ** | Effective February 27, 2017, Class I shares were authorized up to a maximum annual rate of 0.05%. |
The Board provides supervision of the affairs of the Trusts and other trusts within the AMG Funds family. The Trustees of the Trusts who are not affiliated with an Investment Manager receive an annual retainer and per meeting fees for regular, special and telephonic meetings, and they are reimbursed for out-of-pocket expenses incurred while carrying out their duties as Board members. The Chairman of the Board and the Audit Committee Chair receive additional annual retainers. Certain Trustees and Officers of the Funds are Officers and/or Directors of the Investment Manager, AMG and/or the Distributor.
The Securities and Exchange Commission (the “SEC”) granted an exemptive order that permits the Funds to lend and borrow money for certain temporary purposes directly to and from other eligible funds in the AMG Funds family. Participation in this interfund lending program is voluntary for both the borrowing and lending funds, and an interfund loan is only made if it benefits each participating fund. The Administrator manages the program according to procedures approved by the Board, and the Board monitors the operation of the program. An interfund loan must comply with certain conditions set out in the exemptive order, which are designed to assure fairness and protect all participating funds. For the fiscal year ended December 31, 2017, Short Duration lent a maximum of $1,536,965 for five days earning interest of $284. The interest income amount is included in the Statement of Operations as interest income. Small Cap Value borrowed a maximum of $184,534 for six days paying interest of $12. The interest expense amount is included in the Statement of Operations as miscellaneous expense. For
64
Table of Contents
Notes to Financial Statements (continued)
the fiscal year ended December 31, 2017, Balanced and Intermediate Government neither borrowed from nor lent to other funds in the AMG Funds family. At December 31, 2017, the Funds had no interfund loans outstanding.
3. PURCHASES AND SALES OF SECURITIES
Purchases and sales of securities (excluding short-term securities and U.S. Government Obligations) for the fiscal year ended December 31, 2017, were as follows:
| Long Term Securities | ||||||||
| Fund | Purchases | Sales | ||||||
Balanced | $ | 106,659,747 | $ | 115,310,960 | ||||
Small Cap Value | 8,243,046 | 19,204,211 | ||||||
Intermediate Government | 2,556,164 | 9,399,872 | ||||||
Short Duration | 15,202,456 | 23,253,173 | ||||||
| U.S. Government Obligations | ||||||||
| Fund | Purchases | Sales | ||||||
Balanced | $ | 31,734,603 | $ | 27,439,918 | ||||
Small Cap Value | — | — | ||||||
Intermediate Government | 14,389,593 | 38,484,841 | ||||||
Short Duration | 22,896,697 | 60,785,533 | ||||||
4. PORTFOLIO SECURITIES LOANED
The Funds participate in the Program providing for the lending of securities to qualified brokers. Securities lending income includes earnings of such temporary cash investments, plus or minus any rebate to a borrower. These earnings (after any rebate) are then divided between BNYM, as a fee for its services under the Program, and the Funds, according to agreed-upon rates. Collateral on all securities loaned is accepted in cash and is maintained at a minimum level of 102% (105% in the case of certain foreign securities) of the market value, plus interest, if applicable, of investments on loan. It is the Funds’ policy to obtain additional collateral from or return excess collateral to the borrower by the end of the next business day, following the valuation date of the securities loaned. Therefore, the value of the collateral held may be temporarily less than the value of the securities on loan. Lending securities entails a risk of loss to the Funds if and to the extent that the market value of the securities loaned were to increase and the borrower did not increase the collateral accordingly, and the borrower fails to return the securities. Under the terms of the Program, the Funds are indemnified for such losses by BNYM. Cash collateral is held in a separate omnibus account managed by BNYM, who is authorized to exclusively enter into joint repurchase agreements. BNYM bears the risk of any deficiency in the amount of the cash collateral available for return to the borrower due to any loss on the collateral invested.
The value of securities loaned on positions held and cash collateral received at December 31, 2017, were as follows:
| Fund | Securities Loaned | Cash Collateral | ||||||
Balanced | $ | 2,374,701 | $ | 2,448,757 | ||||
Small Cap Value | 161,259 | 169,425 | ||||||
5. COMMITMENTS AND CONTINGENCIES
Under the Trusts’ organizational documents, its trustees and officers are indemnified against certain liabilities arising out of the performance of their duties to the Trusts. In addition, in the normal course of business, the Funds may enter into contracts and agreements that contain a variety of representations and warranties, which provide general indemnifications. The maximum exposure to the Funds under these arrangements is unknown, as this would involve future claims that may be made against a Fund that have not yet occurred. However, based on experience, the Funds had no prior claims or losses and expect the risks of loss to be remote.
6. DERIVATIVE INSTRUMENTS
The following disclosures contain information on how and why certain Funds use derivative instruments, the credit risk and how derivative instruments affect the Funds’ financial position, and results of operations and cash flows. The location and fair value amounts of these instruments on the Statement of Assets and Liabilities, and the realized gains and losses and changes in unrealized gains and losses on the Statement of Operations, each categorized by type of derivative contract, are included in a table at the end of applicable Schedule of Portfolio Investments. For the fiscal year ended December 31, 2017, the average quarterly balances of derivative financial instruments outstanding were as follows:
Intermediate Government | Short Duration | |||||||
| Financial Futures Contracts | ||||||||
Average number of contracts purchased | 5 | 87 | ||||||
Average number of contracts sold | 67 | 625 | ||||||
Average notional value of contracts | $ | 677,244 | $ | 10,517,013 | ||||
Average notional value of contracts sold | $ | 6,962,949 | $ | 78,732,845 | ||||
7. FUTURES CONTRACTS
Intermediate Government and Short Duration purchased and sold futures contracts to achieve a desired level of investment, whether to accommodate portfolio turnover or cash flows from capital shares transactions. There are certain risks associated with futures contracts. Prices may not move as expected or the Fund may not be able to close out the contract when it desires to do so, resulting in losses.
On entering into a futures contract, either cash or securities in an amount equal to a certain percentage of the contract value (initial margin) must be deposited with the futures broker. Subsequent variation margin payments are made or received by the Funds depending on the fluctuations in the value of the futures contract and the value of cash or securities on deposit with the futures broker. Variation
65
Table of Contents
Notes to Financial Statements (continued)
margin is recorded as unrealized gains and losses. The Funds must have total value at the futures broker consisting of either net unrealized gains, cash or securities collateral to meet the initial margin requirement, and any value over the initial margin requirement may be transferred to the Funds. The Funds recognize a realized gain or loss when the contract is closed or expires equal to the difference between the value of the contract at the time it was opened and the value at the time it was closed. Futures are valued at their quoted daily settlement prices. Fluctuations in the value of the contracts are recorded in the Statement of Assets and Liabilities as an asset (liability) and in the Statement of Operations as unrealized appreciation (depreciation) until the contracts are closed, when they are recorded as realized gains (losses) on futures contracts.
8. RISKS ASSOCIATED WITH COLLATERALIZED MORTGAGE OBLIGATIONS (“CMOs”)
The net asset values of a Fund may be sensitive to interest rate fluctuations because a Fund may hold several instruments, including CMOs and other derivatives, whose values can be significantly impacted by interest rate movements. CMOs are obligations collateralized by a portfolio of mortgages or mortgage-related securities. Payments of principal and interest on the mortgages are passed through to the holder of the CMOs on the same schedule as they are received, although certain classes of CMOs have priority over others with respect to the receipt of prepayments on the mortgages. Therefore, the investment in CMOs may be subject to a greater or lesser risk of prepayment than other types of mortgage-related securities. CMOs are subject to principal paydowns as a result of prepayments or refinancing of the underlying mortgage instruments. As a result, the average life may be substantially less than the original maturity. CMOs may have a fixed or variable rate of interest.
9. DOLLAR ROLL AGREEMENTS
All Funds except Small Cap Value may enter into dollar rolls in which they sell debt securities for delivery currently and simultaneously contract to repurchase similar, but not identical, securities at the same price or a lower price on an agreed date. The Funds receive compensation as consideration for entering into the commitment to repurchase. The compensation is the difference between the current sale price and the repurchase price (often referred to as the “drop”) as well as the interest earned on the cash proceeds of the initial sale. The Funds may also be compensated by the receipt of a commitment fee. As the holder, the counterparty receives all principal and interest payments, including prepayments, made with respect to the similar security sold. Dollar rolls may be renewed with a new sale and repurchase price with a cash settlement made at renewal without physical delivery of the securities subject to the contract.
Certain risks may arise upon entering into dollar rolls from the potential inability of counterparties to meet the terms of their commitments. Additionally, the value of
such securities may change adversely before the Funds are able to repurchase them. There can be no assurance that the Funds’ use of the cash that they receive from a dollar roll will provide a return that exceeds their cost.
10. STRIPPED SECURITIES
Intermediate Government and Short Duration may invest in stripped securities (“STRIPS”) for hedging purposes to protect the Funds’ portfolios against interest rate fluctuations. Interest-only STRIPS will most likely move differently than typical fixed-income securities in relation to changes in interest rates. STRIPS are usually structured with two classes that receive different proportions of the interest and principal distributions from a pool of underlying assets. A common type of STRIP will have one class receiving all of the interest from the underlying assets (“interest-only” or “IO” class), while the other class will receive the entire principal (“principal only” or “PO” class). However, in some instances, one class will receive some of the interest and most of the principal while the other class will receive most of the interest and the remainder of the principal. STRIPS are unusually volatile in response to changes in interest rates. The yield to maturity on an IO class of STRIPS is extremely sensitive not only to changes in prevailing interest rates but also to the rate of principal payments (including prepayments) on the underlying assets. A rapid rate of principal prepayments may have a measurably adverse effect on a Funds’ yield to maturity to the extent it invests in IOs. Conversely, POs tend to increase in value if prepayments are greater than anticipated and decline if prepayments are slower than anticipated. Thus, if the underlying assets experience greater than anticipated repayments of principal, a Fund may fail to fully recover its initial investment in these securities, even if the STRIPS were rated of the highest credit quality by Standard & Poor’s Corporation or Moody’s Investors Service, Inc. These risks are managed by investing in a variety of such securities and by using certain hedging techniques. In addition the secondary market for STRIPS may be less liquid than that of other mortgage-backed or asset-backed securities, potentially limiting a Fund’s ability to buy or sell those securities at any particular time.
11. MASTER NETTING AGREEMENTS
The Funds may enter into master netting agreements with their counterparties for the securities lending program, Repurchase Agreements, which provide the right, in the event of default (including bankruptcy or insolvency) for the non-defaulting party to liquidate the collateral and calculate net exposure to the defaulting party or request additional collateral. For financial reporting purposes, the Funds do not offset financial assets and financial liabilities that are subject to master netting agreements in the Statement of Assets and Liabilities. For securities lending transactions, see Note 4.
66
Table of Contents
Notes to Financial Statements (continued)
The following table is a summary of the Funds’ open Repurchase Agreements that are subject to a master netting agreement as of December 31, 2017:
| Gross Amount Not Offset in the Statement of Assets and Liabilities | ||||||||||||||||
| Fund | Net Amounts of Assets Presented in the Statement of Assets and Liabilities | Financial Instruments Collateral | Cash Collateral Received | Net Amount | ||||||||||||
Balanced | ||||||||||||||||
Cantor Fitzgerald Securities, Inc. | $ | 1,000,000 | $ | 1,000,000 | — | — | ||||||||||
Daiwa Capital Markets America | 448,757 | 448,757 | — | — | ||||||||||||
State of Wisconsin Investment Board | 1,000,000 | 1,000,000 | — | — | ||||||||||||
|
|
|
|
|
|
|
| |||||||||
Totals | $ | 2,448,757 | $ | 2,448,757 | — | — | ||||||||||
|
|
|
|
|
|
|
| |||||||||
Small Cap Value | ||||||||||||||||
Cantor Fitzgerald Securities, Inc. | $ | 169,425 | $ | 169,425 | — | — | ||||||||||
|
|
|
|
|
|
|
| |||||||||
12. REGULATORY UPDATES
On October 13, 2016, the SEC amended existing rules intended to modernize reporting and disclosure of information. These amendments relate to Regulation S-X, which sets forth the form and content of financial statements. Effective August 1, 2017, the Funds have adopted these amendments and noted no significant impact on the financial statements and accompanying notes.
13. SUBSEQUENT EVENTS
The Funds have determined that no material events or transactions occurred through the issuance date of the Funds’ financial statements, which require an additional disclosure in or adjustment of the Funds’ financial statements.
67
Table of Contents
Report of Independent Registered Public Accounting Firm
TO THE BOARD OF TRUSTEES OF AMG FUNDS AND AMG FUNDS II AND SHAREHOLDERS OF AMG CHICAGO EQUITY PARTNERS BALANCED FUND, AMG CHICAGO EQUITY PARTNERS SMALL CAP VALUE FUND, AMG MANAGERS AMUNDI INTERMEDIATE GOVERNMENT FUND, AND AMG MANAGERS AMUNDI SHORT DURATION GOVERNMENT FUND
Opinions on the Financial Statements
We have audited the accompanying statements of assets and liabilities, including the schedules of portfolio investments, of AMG Chicago Equity Partners Balanced Fund, AMG Chicago Equity Partners Small Cap Value Fund, AMG Managers Amundi Intermediate Government Fund, and AMG Managers Amundi Short Duration Government Fund (four of the funds constituting AMG Funds and AMG Funds II, hereafter collectively referred to as the “Funds”) as of December 31, 2017, the related statements of operations for the year ended December 31, 2017, the statements of changes in net assets for each of the two years in the period ended December 31, 2017, including the related notes, and the financial highlights for each of the periods indicated therein (collectively referred to as the “financial statements”). In our opinion, the financial statements present fairly, in all material respects, the financial position of each of the Funds as of December 31, 2017, the results of each of their operations for the year then ended, the changes in each of their net assets for each of the two years in the period ended December 31, 2017 and each of the financial highlights for each of the periods indicated therein in conformity with accounting principles generally accepted in the United States of America.
Basis for Opinions
These financial statements are the responsibility of the Funds’ management. Our responsibility is to express an opinion on the Funds’ financial statements based on our audits. We are a public accounting firm registered with the Public Company Accounting Oversight Board (United States) (“PCAOB”) and are required to be independent with respect to the Funds in accordance with the U.S. federal securities laws and the applicable rules and regulations of the Securities and Exchange Commission and the PCAOB.
We conducted our audits of these financial statements in accordance with the standards of the PCAOB. Those standards require that we plan and perform the audit to obtain reasonable assurance about whether the financial statements are free of material misstatement, whether due to error or fraud.
Our audits included performing procedures to assess the risks of material misstatement of the financial statements, whether due to error or fraud, and performing procedures that respond to those risks. Such procedures included examining, on a test basis, evidence regarding the amounts and disclosures in the financial statements. Our audits also included evaluating the accounting principles used and significant estimates made by management, as well as evaluating the overall presentation of the financial statements. Our procedures included confirmation of securities owned as of December 31, 2017 by correspondence with the custodian and brokers; when replies were not received from brokers, we performed other auditing procedures. We believe that our audits provide a reasonable basis for our opinions.
PricewaterhouseCoopers LLP
Boston, Massachusetts
February 27, 2018
We have served as the auditor of one or more investment companies in AMG Funds Family since 1993.
68
Table of Contents
TAX INFORMATION
The AMG Chicago Equity Partners Balanced Fund, AMG Chicago Equity Partners Small Cap Value Fund, AMG Managers Amundi Intermediate Government Fund and AMG Managers Amundi Short Duration Government Fund each hereby designates the maximum amount allowable of its net taxable income as qualified dividends as provided in the Jobs and Growth Tax Relief Reconciliation Act of 2003. The 2017 Form 1099-DIV you receive for each Fund will show the tax status of all distributions paid to you during the year.
Pursuant to section 852 of the Internal Revenue Code, AMG Chicago Equity Partners Balanced Fund, AMG Chicago Equity Partners Small Cap Value Fund, AMG Managers Amundi Intermediate Government Fund and AMG Managers Amundi Short Duration Government Fund each hereby designates $4,487,937, $635,008, $0, and $0 respectively, as a capital gain distribution with respect to the taxable year ended December 31, 2017, or if subsequently determined to be different, the net capital gains of such fiscal year.
AMG Managers Amundi Intermediate Government Fund previously announced the estimated sources of its distributions paid during the year ended December 31, 2017. AMG Managers Amundi Intermediate Government Fund has reclassified certain of those distributions previously announced as constituting ordinary income to distributions constituting return of capital. Pursuant to Rule 19a-1(e)
under the Investment Company Act of 1940, the information in the table below supersedes the Fund’s previously announced estimated sources of its distributions paid during the year ended December 31, 2017.
| Intermediate Government | ||||
| Distributions paid from: | 2017 | |||
Ordinary income | $ | 2,261,146 | ||
Short-term capital gains | — | |||
Long-term capital gains | — | |||
Return of capital | 192,812 | |||
|
| |||
| 2,453,958 | ||||
|
| |||
Please note that the information in this table is for financial accounting purposes only. Form 1099-DIV received by shareholders for the calendar year specifies how shareholders should characterize and report distributions paid by the Fund during the year for U.S. federal income tax purposes.
69
Table of Contents
AMG Funds
The Trustees and Officers of the Trust, their business addresses, principal occupations for the past five years and ages are listed below. The Trustees provide broad supervision over the affairs of the Trust and the Funds. The Trustees are experienced executives who meet periodically throughout the year to oversee the Funds’ activities, review contractual arrangements with companies that provide services to the Funds, and
review the Funds’ performance. Unless otherwise noted, the address of each Trustee or Officer is the address of the Trust: 600 Steamboat Road, Suite 300, Greenwich, Connecticut 06830.
There is no stated term of office for Trustees. Trustees serve until their resignation, retirement or removal in
accordance with the Trust’s organizational documents and policies adopted by the Board from time to time. The Chairman of the Trustees, President, Treasurer and Secretary of the Trust are elected by the Trustees annually. Other officers hold office at the pleasure of the Trustees.
Independent Trustees
The following Trustees are not “interested persons” of the Trust within the meaning of the 1940 Act:
Number of Funds Overseen in Fund Complex | Name, Age, Principal Occupation(s) During Past 5 Years and Other Directorships Held by Trustee | |
• Trustee since 2012 | Bruce B. Bingham, 69 | |
• Oversees 61 Funds in Fund Complex | Partner, Hamilton Partners (real estate development firm) (1987-Present); Director of The Yacktman Funds (2000-2012). | |
• Trustee since 1999 - AMG Funds • Trustee since 2000 - AMG Funds II • Oversees 61 Funds in Fund Complex | Edward J. Kaier, 72 Attorney at Law and Partner, Teeters Harvey Marrone & Kaier LLP (2007-Present); Attorney at Law and Partner, Hepburn Willcox Hamilton & Putnam, LLP (1977-2007); Trustee of Third Avenue Trust (5 portfolios); Trustee of Third Avenue Variable Trust (1 portfolio). | |
• Trustee since 2013 • Oversees 63 Funds in Fund Complex | Kurt A. Keilhacker, 54 Managing Member, TechFund Capital (1997-Present); Managing Member, TechFund Europe (2000-Present); Board Member, 6wind SA, (2002-Present); Managing Member, Elementum Ventures (2013-Present); Trustee, Gordon College (2001-2016). | |
• Trustee since 2004 - AMG Funds Trustee since 2000 - AMG Funds II Oversees 61 Funds in Fund Complex | Steven J. Paggioli, 67 Independent Consultant (2002-Present); Formerly Executive Vice President and Director, The Wadsworth Group (1986-2001); Executive Vice President, Secretary and Director, Investment Company Administration, LLC (1990-2001); Vice President, Secretary and Director, First Fund Distributors, Inc. (1991-2001); Trustee, Professionally Managed Portfolios (32 portfolios); Advisory Board Member, Sustainable Growth Advisors, LP; Independent Director, Chase Investment Counsel (2008–Present). | |
• Trustee since 2013 Oversees 61 Funds in Fund Complex | Richard F. Powers III, 72 Adjunct Professor, U.S. Naval War College (2016); Adjunct Professor, Boston College (2010-2013); President and CEO of Van Kampen Investments Inc. (1998-2003). | |
• Independent Chairman Trustee since 1999 - AMG Funds Trustee since 2000 - AMG Funds II Oversees 63 Funds in Fund Complex | Eric Rakowski, 59 Professor, University of California at Berkeley School of Law (1990-Present); Director of Harding, Loevner Funds, Inc. (9 portfolios); Trustee of Third Avenue Trust (5 portfolios); Trustee of Third Avenue Variable Trust (1 portfolio). | |
• Trustee since 2013 • Oversees 63 Funds in Fund Complex | Victoria L. Sassine, 52 Lecturer, Babson College (2007 – Present). | |
• Trustee since 2004 - AMG Funds • Trustee since 2000 - AMG Funds II • Oversees 61 Funds in Fund Complex | Thomas R. Schneeweis, 70 Professor Emeritus, University of Massachusetts (2013-Present); Partner, S Capital Wealth Advisors (2015-Present); President, TRS Associates (1982-Present); Board Member, Chartered Alternative Investment Association (“CAIA”) (2002-Present); Director, CAIA Foundation (Education) (2010-Present); Director, Institute for GlobalAsset and Risk Management (Education) (2010-Present); Partner, S Capital Management, LLC (2007-2015); Director, CISDM at the University of Massachusetts, (1996-2013); President, Alternative Investment Analytics, LLC, (formerly Schneeweis Partners, LLC) (2001-2013); Professor of Finance, University of Massachusetts (1977-2013). | |
70
Table of Contents
AMG Funds
Trustees and Officers (continued)
Interested Trustees
Each Trustee in the following table is an “interested person” of the Trust within the meaning of the 1940 Act. Ms. Carsman is an interested person of the Trust within the meaning of the 1940 Act by virtue of her position with, and interest in securities of, AMG.
Number of Funds Overseen in Fund Complex | Name, Age, Principal Occupation(s) During Past 5 Years and Other Directorships Held by Trustee | |
• Trustee since 2011 | Christine C. Carsman, 65 | |
• Oversees 63 Funds in Fund Complex | Executive Vice President, Deputy General Counsel and Chief Regulatory Counsel, Affiliated Managers Group, Inc. (2017-Present); Director (2010-Present) and Chair of the Board of Directors (2015-Present), AMG Funds plc; Director of Harding, Loevner Funds, Inc. (9 portfolios); Senior Vice President and Deputy General Counsel, Affiliated Managers Group, Inc. (2011-2016); Senior Vice President and Chief Regulatory Counsel, Affiliated Managers Group, Inc. (2007-2011); Vice President and Chief Regulatory Counsel, Affiliated Managers Group, Inc. (2004-2007); Secretary and Chief Legal Officer, AMG Funds, AMG Funds I, AMG Funds II and AMG Funds III (2004-2011); Senior Counsel, Vice President and Director of Operational Risk Management and Compliance, Wellington Management Company, LLP (1995-2004). |
Officers | ||
Position(s) Held with Fund and Length of Time Served | Name, Age, Principal Occupation(s) During Past 5 Years | |
• President since 2014 | Jeffrey T. Cerutti, 50 | |
• Principal Executive Officer since 2014 Chief Executive Officer since 2016 | Chief Executive Officer, AMG Funds LLC (2014-Present); Director, President and Principal, AMG Distributors, Inc. (2014-Present); President and Principal Executive Officer, AMG Funds, AMG Funds I, AMG Funds II and AMG Funds III (2014-Present); Chief Executive Officer, President and Principal Executive Officer, AMG Funds IV, (2015-Present); Chief Executive Officer, AMG Funds, AMG Funds I, AMG Funds II and AMG Funds III (2016-Present); Chief Executive Officer, Aston Asset Management, LLC (2016); President, VP Distributors, (2011-2014); Executive Vice President, Head of Distribution, Virtus Investment Partners, Inc. (2010-2014); Managing Director, Head of Sales, UBS Global Asset Management (2001-2010). | |
• Chief Operating Officer since 2007 | Keitha L. Kinne, 59 Chief Operating Officer, AMG Funds LLC (2007-Present); Chief Investment Officer, AMG Funds LLC (2008-Present); Chief Operating Officer, AMG Distributors, Inc. (2007-Present); Chief Operating Officer, AMG Funds, AMG Funds I, AMG Funds II, and AMG Funds III (2007-Present); Chief Operating Officer, AMG Funds IV, (2016-Present); Chief Operating Officer and Chief Investment Officer, Aston Asset Management, LLC (2016); President and Principal Executive Officer, AMG Funds, AMG Funds I, AMG Funds II and AMG Funds III (2012-2014); Managing Partner, AMG Funds LLC (2007-2014); President, AMG Funds (2012-2014); President, AMG Distributors, Inc. (2012-2014); Managing Director, Legg Mason & Co., LLC (2006-2007); Managing Director, Citigroup Asset Management (2004-2006). | |
• Secretary since 2015 • Chief Legal Officer since 2015 | Mark J. Duggan, 53 Senior Vice President and Senior Counsel, AMG Funds LLC (2015-Present); Secretary and Chief Legal Officer, AMG Funds, AMG Funds I, AMG Funds II and AMG Funds III (2015-Present); Secretary and Chief Legal Officer, AMG Funds IV, (2015-Present); Attorney, K&L Gates, LLP (2009-2015). | |
• Chief Financial Officer since 2017 • Treasurer since 2017 • Principal Financial Officer since 2017 • Principal Accounting Officer since 2017 | Thomas G. Disbrow, 52 Vice President, Mutual Fund Treasurer & CFO, AMG Funds, AMG Funds LLC (2017-Present); Chief Financial Officer, Principal Financial Officer, Treasurer and Principal Accounting Officer, AMG Funds, AMG Funds I, AMG Funds II, AMG Funds III and AMG Funds IV (2017-Present); Managing Director - Global Head of Traditional Funds Product Control, UBS Asset Management (Americas), Inc. (2015-2017); Managing Director - Head of North American Funds Treasury, UBS Asset Management (Americas), Inc. (2011-2015). | |
• Deputy Treasurer since 2017 | John A. Starace, 47 | |
| Director, Mutual Fund Accounting, AMG Funds LLC (2017-Present); Vice President, Deputy Treasurer of Mutual Funds Services, AMG Funds LLC (2014-2017); Deputy Treasurer, AMG Funds, AMG Funds I, AMG Funds II, AMG Funds III and AMG Funds IV (2017-Present); Vice President, Citi Hedge Fund Services (2010-2014); Audit Senior Manager (2005-2010) and Audit Manager (2001-2005), Deloitte & Touche LLP. | ||
• Controller since 2017 | Christopher R. Townsend, 50 | |
| Vice President, Business Finance, AMG Funds LLC (2017-Present); Head of Business Finance, AMG Funds LLC (2015-2017); Chief Financial Officer and Financial and Operations Principal, AMG Distributors, Inc. (2016-Present); Controller, AMG Funds, AMG Funds I, AMG Funds II, AMG Funds III and AMG Funds IV (2017-Present); Treasurer, Chief Financial Officer, Principal Financial Officer, Principal Accounting Officer, AMG Funds, AMG Funds I, AMG Funds II, AMG Funds III and AMG Funds IV (2017); Chief Financial Officer, Aston Asset Management LLC (2016); Head of Finance and Accounting, Allianz Asset Management (2006-2015). | ||
71
Table of Contents
AMG Funds
Trustees and Officers (continued)
Position(s) Held with Fund and Length of Time Served | Name, Age, Principal Occupation(s) During Past 5 Years | |
• Chief Compliance Officer since 2016 | Gerald F. Dillenburg, 51 Vice President, Chief Compliance Officer AMG Funds, AMG Funds LLC (2017-Present); Chief Compliance Officer AMG Funds, AMG Funds LLC (2016-2017); Chief Compliance Officer and Sarbanes Oxley Code of Ethics Compliance Officer, AMG Funds, AMG Funds I, AMG Funds II and AMG Funds III (2016-Present); ChiefCompliance Officer, AMG Funds IV (1996-Present); Sarbanes-Oxley Code of Ethics Compliance Officer, AMG Funds IV (2016-Present); Chief Compliance Officer, AstonAsset Management, LLC (2006-2016); Chief Operating Officer, Aston Funds (2003-2016); Secretary, Aston Funds (1996-2015); Chief Financial Officer, Aston Funds(1997-2010); Chief Financial Officer, Aston Asset Management, LLC (2006-2010); Treasurer, Aston Funds (1996-2010). | |
• Anti-Money Laundering Compliance Officer since 2014 | Patrick J. Spellman, 43 Vice President, Chief Compliance Officer, AMG Funds LLC (2017-Present); Senior Vice President, Chief Compliance Officer, AMG Funds LLC (2011-2017); Chief Compliance Officer, AMG Distributors, Inc., (2010-Present); Anti-Money Laundering Compliance Officer, AMG Funds, AMG Funds I, AMG Funds II, and AMG Funds III (2014-Present); Anti-Money Laundering Officer, AMG Funds IV, (2016-Present); Compliance Manager, Legal and Compliance, Affiliated Managers Group, Inc. (2005-2011). | |
• Assistant Secretary since 2016 | Maureen A. Meredith, 32 Director, Counsel, AMG Funds LLC (2017-Present); Vice President, Counsel, AMG Funds LLC (2015-2017); Assistant Secretary, AMG Funds, AMG Funds I, AMG Funds II, AMG Funds III and AMG Funds IV (2016-Present); Associate, Ropes & Gray LLP (2011-2015); Law Fellow, Massachusetts Appleseed Center for Law and Justice (2010-2011). | |
72
Table of Contents
Investment Manager and Administrator
AMG Funds LLC
600 Steamboat Road, Suite 300
Greenwich, CT 06830
800.835.3879
Distributor
AMG Distributors, Inc.
600 Steamboat Road, Suite 300
Greenwich, CT 06830
800.835.3879
Custodian
The Bank of New York Mellon
111 Sanders Creek Parkway
East Syracuse, NY 13057
Legal Counsel
Ropes & Gray LLP
Prudential Tower, 800 Boylston Street
Boston, MA 02199-3600
Transfer Agent
BNY Mellon Investment Servicing (US) Inc.
Attn: AMG Funds
P.O. Box 9769
Providence, RI 02940
800.548.4539
This report is prepared for the Funds’ shareholders. It is authorized for distribution to prospective investors only when preceded or accompanied by an effective prospectus. To receive a free copy of the prospectus or Statement of Additional Information, which includes additional information about Fund Trustees, please contact us by calling 800.835.3879. Distributed by AMG Distributors, Inc., member FINRA/SIPC.
Current net asset values per share for each Fund are available on the Funds’ website at amgfunds.com.
A description of the policies and procedures each Fund uses to vote its proxies is available: (i) without charge, upon request, by calling 800.835.3879, or (ii) on the Securities and Exchange Commission’s (SEC) website at sec.gov. For information regarding each Fund’s proxy voting record for the 12-month period ended June 30, call 800.835.3879 or visit the SEC website at sec.gov.
Each Fund files its complete schedule of portfolio holdings with the SEC for the first and third quarters of each fiscal year on Form N-Q. The Funds’ Forms N-Q are available on the SEC’s website at sec.gov. A Fund’s Forms N-Q may be reviewed and copied at the SEC’s Public Reference Room in Washington, DC. Information on the operation of the Public Reference Room may be obtained by calling 1-800-SEC-0330. To review a complete list of the Funds’ portfolio holdings, or to view the most recent quarterly holdings report, semiannual report, or annual report, please visit amgfunds.com.
amgfunds.com | 73
Table of Contents
AFFILIATE SUBADVISED FUNDS
BALANCED FUNDS
AMG Chicago Equity Partners Balanced
Chicago Equity Partners, LLC
AMG FQ Global Risk-Balanced
First Quadrant, L.P.
EQUITY FUNDS
AMG Chicago Equity Partners Small Cap Value
Chicago Equity Partners, LLC
AMG FQ Tax-Managed U.S. Equity
AMG FQ Long-Short Equity
First Quadrant, L.P.
AMG Frontier Small Cap Growth
Frontier Capital Management Company,
LLC
AMG GW&K Small Cap Core
AMG GW&K Small/Mid Cap
AMG GW&K U.S. Small Cap Growth
GW&K Investment Management, LLC
AMG Renaissance International Equity
AMG Renaissance Large Cap Growth
The Renaissance Group LLC
AMG River Road Dividend All Cap
Value
AMG River Road Dividend All Cap Value II
AMG River Road Focused Absolute Value
AMG River Road Long-Short
AMG River Road Small-Mid Cap Value
AMG River Road Small Cap Value
River Road Asset Management, LLC
AMG SouthernSun Small Cap
AMG SouthernSun Global Opportunities
AMG SouthernSun U.S. Equity
SouthernSun Asset Management, LLC
AMG Systematic Mid Cap Value
Systematic Financial Management, L.P.
AMG TimesSquare Emerging Markets Small Cap
AMG TimesSquare International Small
Cap
AMG TimesSquare Mid Cap Growth
AMG TimesSquare Small Cap Growth
TimesSquare Capital Management, LLC
AMG Trilogy Emerging Markets Equity
AMG Trilogy Emerging Wealth Equity
Trilogy Global Advisors, L.P.
AMG Yacktman
AMG Yacktman Focused
AMG Yacktman Focused Fund - Security Selection Only
AMG Yacktman Special Opportunities
Yacktman Asset Management LP
FIXED INCOME FUNDS
AMG GW&K Core Bond
AMG GW&K Enhanced Core Bond
AMG GW&K Municipal Bond
AMG GW&K Municipal Enhanced Yield
GW&K Investment Management, LLC
OPEN-ARCHITECTURE FUNDS
ALTERNATIVE FUNDS
AMG Managers Lake Partners LASSO
Alternative
Lake Partners, Inc.
BALANCED FUNDS
AMG Managers Montag & Caldwell Balanced
Montag & Caldwell, LLC
EQUITY FUNDS
AMG Managers Brandywine
AMG Managers Brandywine Advisors Mid Cap Growth
AMG Managers Brandywine Blue
Friess Associates, LLC
AMG Managers Cadence Emerging Companies
AMG Managers Cadence Mid Cap
Cadence Capital Management, LLC
AMG Managers CenterSquare Real Estate
CenterSquare Investment Management, Inc.
AMG Managers Emerging Opportunities
Lord, Abbett & Co. LLC
WEDGE Capital Management L.L.P.
Next Century Growth Investors LLC
RBC Global Asset Management (U.S.) Inc.
AMG Managers Essex Small/Micro Cap Growth
Essex Investment Management Co., LLC
AMG Managers Fairpointe ESG Equity
AMG Managers Fairpointe Mid Cap
Fairpointe Capital LLC
AMG Managers Guardian Capital Global Dividend
Guardian Capital LP
AMG Managers LMCG Small Cap Growth
LMCG Investments, LLC
AMG Managers Montag & Caldwell Growth
AMG Managers Montag & Caldwell Mid Cap Growth
Montag & Caldwell, LLC
AMG Managers Pictet International
Pictet Asset Management Limited
AMG Managers Silvercrest Small Cap
Silvercrest Asset Management Group LLC
AMG Managers Skyline Special Equities
Skyline Asset Management, L.P.
AMG Managers Special Equity
Ranger Investment Management, L.P.
Lord, Abbett & Co. LLC
Smith Asset Management Group, L.P.
Federated MDTA LLC
AMG Managers Value Partners Asia Dividend
Value Partners Hong Kong Limited
FIXED INCOME FUNDS
AMG Managers Amundi Intermediate Government
AMG Managers Amundi Short Duration
Government
Amundi Pioneer Institutional Asset
Management, Inc.
AMG Managers Doubleline Core Plus
Bond
DoubleLine Capital LP
AMG Managers Global Income
Opportunity
AMG Managers Loomis Sayles Bond
Loomis, Sayles & Co., L.P.
| amgfunds.com | |123117 AR009 |
Table of Contents
| | ANNUAL REPORT |
AMG Funds
December 31, 2017

AMG GW&K Enhanced Core Bond Fund
Class N: MFDAX | Class I: MFDSX | Class C: MFDCX | Class Z: MFDYX
AMG GW&K Municipal Bond Fund
Class N: GWMTX | Class I: GWMIX
AMG GW&K Municipal Enhanced Yield Fund
Class N: GWMNX | Class I: GWMEX | Class Z: GWMZX
AMG GW&K Small Cap Core Fund
Class N: GWETX | Class I: GWEIX | Class Z: GWEZX
AMG GW&K Small/Mid Cap Fund
(formerly AMG GW&K Small Cap Growth Fund)
Class N: GWGVX | Class I: GWGIX | Class Z: GWGZX
| amgfunds.com | | 123117 AR020 |
Table of Contents
Table of Contents
AMG Funds
Annual Report—December 31, 2017
| PAGE | ||||
| 2 | ||||
| 3 | ||||
PORTFOLIO MANAGER’S COMMENTS, FUND SNAPSHOTS AND SCHEDULES OF PORTFOLIO INVESTMENTS | ||||
| 5 | ||||
| 11 | ||||
| 20 | ||||
| 26 | ||||
| 32 | ||||
| 39 | ||||
Balance sheets, net asset value (NAV) per share computations and cumulative undistributed amounts | ||||
| 41 | ||||
Detail of sources of income, expenses, and realized and unrealized gains (losses) during the fiscal year | ||||
| 42 | ||||
Detail of changes in assets for the past two fiscal years | ||||
| 44 | ||||
Historical net asset values per share, distributions, total returns, income and expense ratios, turnover ratios and net assets | ||||
| 59 | ||||
Accounting and distribution policies, details of agreements and transactions with Fund management and affiliates, and descriptions of certain investment risks | ||||
| 69 | ||||
| 70 | ||||
| 71 | ||||
Nothing contained herein is to be considered an offer, sale or solicitation of an offer to buy shares of any series of the AMG Funds family of mutual funds. Such offering is made only by prospectus, which includes details as to offering price and other material information.
Table of Contents
| Letter to Shareholders |
Dear Shareholder:
The last 12 months was a strong period for equity markets as the health of the global economy improved and positive investor sentiment helped extend the U.S. bull market into its ninth year. The S&P 500® Index, a widely followed barometer of the U.S. equity market, returned 21.83% during the fiscal year ended December 31, 2017. By comparison, small cap stocks underperformed large caps with a 14.65% return for the small cap Russell 2000® Index.
The S&P 500 Index has notched positive performance in every month since the U.S. presidential election amidst the backdrop of strong corporate earnings, improving global economic growth and the passage of sweeping tax reform. 2017 also marked a turning point for the broader global economy as growth accelerated in a more coordinated fashion around the world, global trade improved and commodities recovered. U.S. equity market volatility remained extremely low despite saber rattling in North Korea and a devastating hurricane season. In fact, the S&P 500 Index has not seen a pullback greater than 5% since the summer of 2016.
In total, all but two sectors of the S&P 500 Index were positive during the last 12 months; however, there was significant dispersion in performance across sectors. Information technology and materials stocks led the Index with returns of 38.87% and 23.25%, respectively, while companies within the energy and telecommunication services sectors were the laggards with returns of (1.11)% and (1.49)%, respectively. Growth stocks outperformed value during all four quarters of the year and ended 2017 with returns of 30.2% and 13.7% for the Russell 1000® Growth and Russell 1000® Value Indexes, respectively. International equities outperformed domestic equities for the first time since 2012 as the global economy picked up and international returns were boosted by a weaker U.S. Dollar with the MSCI All Country World ex-USA Index returning 27.19% during the year. Meanwhile, emerging markets had their strongest year since 2009 with a 37.3% return for the MSCI Emerging Markets Index.
The U.S. bond market produced modestly positive returns for the year, as measured by the 3.54% return for the Bloomberg Barclays U.S. Aggregate Bond Index, a broad measure of U.S. bond market performance. The yield curve flattened as the U.S. Federal Reserve (the Fed) continued to normalize monetary policy and short-term interest rates rose more than longer-term rates. The 2-year U.S. Treasury note rose 69 basis points during the year to yield 1.89% while the 10-year U.S. Treasury note ended 2017 at a 2.40% yield, five basis points lower than where it started. Investment grade corporates outperformed Treasuries and securitized credits with returns of 6.42%, 2.31% and 2.51%, respectively. Bond investors willing to accept more credit risk were rewarded with higher returns as high yield bonds performed strongly and credit spreads tightened. The Bloomberg Barclays U.S. Corporate High Yield Index ended the period with a 7.50% return.
AMG Funds appreciates the privilege of providing investment tools to you and your clients. Our foremost goal is to provide investment solutions that help our shareholders successfully reach their long-term investment goals. By partnering with AMG’s affiliated investment boutiques, AMG Funds provides access to a distinctive array of actively managed return-oriented investment strategies. Additionally, we oversee and distribute a number of complementary open-architecture mutual funds subadvised by unaffiliated investment managers. We thank you for your continued confidence and investment in AMG Funds. You can rest assured that under all market conditions our team is focused on delivering excellent investment management services for your benefit.
Respectfully,
Jeffery Cerutti
President
AMG Funds
Average Annual Total Returns | Periods ended December 31, 2017* | |||||||||||||
Stocks: | 1 Year | 3 Years | 5 Years | |||||||||||
Large Caps | (S&P 500® Index) | 21.83 | % | 11.41 | % | 15.79 | % | |||||||
Small Caps | (Russell 2000® Index) | 14.65 | % | 9.96 | % | 14.12 | % | |||||||
International | (MSCI All Country World ex-USA Index) | 27.19 | % | 7.83 | % | 6.80 | % | |||||||
Bonds: | ||||||||||||||
Investment Grade | (Bloomberg Barclays U.S. Aggregate Bond Index) | 3.54 | % | 2.24 | % | 2.10 | % | |||||||
High Yield | (Bloomberg Barclays U.S. Corporate High Yield Index) | 7.50 | % | 6.35 | % | 5.78 | % | |||||||
Tax-exempt | (Bloomberg Barclays Municipal Bond Index) | 5.45 | % | 2.98 | % | 3.02 | % | |||||||
Treasury Bills | (ICE BofAML 6-Month U.S. Treasury Bill Index) | 0.95 | % | 0.62 | % | 0.43 | % | |||||||
| * | Source: Factset. Past performance is no guarantee of future results. |
2
Table of Contents
As a shareholder of a Fund, you may incur two types of costs: (1) transaction costs, which may include sales charges (loads) on purchase payments; redemption fees; and exchange fees; and (2) ongoing costs, including management fees; distribution (12b-1) fees; and other Fund expenses. This example is intended to help you understand your ongoing costs (in dollars) of investing in the Fund and to compare these costs with the ongoing costs of investing in other mutual funds. The example is based on $1,000 invested at the beginning of the period and held for the entire period as indicated below.
ACTUAL EXPENSES
The first line of the following table provides information about the actual account values and
actual expenses. You may use the information in this line, together with the amount you invested, to estimate the expenses that you paid over the period. Simply divide your account value by $1,000 (for example, an $8,600 account value divided by $1,000 = 8.6), then multiply the result by the number in the first line under the heading entitled “Expenses Paid During Period” to estimate the expenses you paid on your account during this period.
HYPOTHETICAL EXAMPLE FOR COMPARISON PURPOSES
The second line of the following table provides information about hypothetical account values and hypothetical expenses based on the Fund’s actual expense ratio and an assumed annual rate of return of 5% before expenses, which is not the Fund’s
actual return. The hypothetical account values and expenses may not be used to estimate the actual ending account balance or expenses you paid for the period. You may use this information to compare the ongoing costs of investing in the Fund and other funds by comparing this 5% hypothetical example with the 5% hypothetical examples that appear in the shareholder reports of other funds.
Please note that the expenses shown in the table are meant to highlight your ongoing costs only and do not reflect any transactional costs, such as sales charges (loads), redemption fees, or exchange fees. Therefore, the second line of the table is useful in comparing ongoing costs only, and will not help you determine the relative total costs of owning different funds.
Six Months Ended December 31, 2017 | Expense Ratio for the Period | Beginning Account Value 07/01/17 | Ending Account Value 12/31/17 | Expenses Paid During the Period* | ||||||||||||
AMG GW&K Enhanced Core Bond Fund |
| |||||||||||||||
Based on Actual Fund Return |
| |||||||||||||||
Class N | .73 | % | $ | 1,000 | $ | 1,012 | $ | 3.70 | ||||||||
Class I | .53 | % | $ | 1,000 | $ | 1,013 | $ | 2.69 | ||||||||
Class C | 1.48 | % | $ | 1,000 | $ | 1,009 | $ | 7.49 | ||||||||
Class Z | .48 | % | $ | 1,000 | $ | 1,014 | $ | 2.44 | ||||||||
Based on Hypothetical 5% Annual Return |
| |||||||||||||||
Class N | .73 | % | $ | 1,000 | $ | 1,022 | $ | 3.72 | ||||||||
Class I | .53 | % | $ | 1,000 | $ | 1,023 | $ | 2.70 | ||||||||
Class C | 1.48 | % | $ | 1,000 | $ | 1,018 | $ | 7.53 | ||||||||
Class Z | .48 | % | $ | 1,000 | $ | 1,023 | $ | 2.45 | ||||||||
AMG GW&K Municipal Bond Fund |
| |||||||||||||||
Based on Actual Fund Return |
| |||||||||||||||
Class N | .72 | % | $ | 1,000 | $ | 1,007 | $ | 3.64 | ||||||||
Class I | .38 | % | $ | 1,000 | $ | 1,009 | $ | 1.92 | ||||||||
Based on Hypothetical 5% Annual Return |
| |||||||||||||||
Class N | .72 | % | $ | 1,000 | $ | 1,022 | $ | 3.67 | ||||||||
Class I | .38 | % | $ | 1,000 | $ | 1,023 | $ | 1.94 | ||||||||
Six Months Ended December 31, 2017 | Expense Ratio for the Period | Beginning Account Value 07/01/17 | Ending Account Value 12/31/17 | Expenses Paid During the Period* | ||||||||||||
AMG GW&K Municipal Enhanced Yield Fund |
| |||||||||||||||
Based on Actual Fund Return |
| |||||||||||||||
Class N | 1.02 | % | $ | 1,000 | $ | 1,041 | $ | 5.25 | ||||||||
Class I | .64 | % | $ | 1,000 | $ | 1,043 | $ | 3.30 | ||||||||
Class Z | .59 | % | $ | 1,000 | $ | 1,043 | $ | 3.04 | ||||||||
Based on Hypothetical 5% Annual Return |
| |||||||||||||||
Class N | 1.02 | % | $ | 1,000 | $ | 1,020 | $ | 5.19 | ||||||||
Class I | .64 | % | $ | 1,000 | $ | 1,022 | $ | 3.26 | ||||||||
Class Z | .59 | % | $ | 1,000 | $ | 1,022 | $ | 3.01 | ||||||||
AMG GW&K Small Cap Core Fund |
| |||||||||||||||
Based on Actual Fund Return |
| |||||||||||||||
Class N | 1.32 | % | $ | 1,000 | $ | 1,098 | $ | 6.98 | ||||||||
Class I | .95 | % | $ | 1,000 | $ | 1,100 | $ | 5.03 | ||||||||
Class Z | .90 | % | $ | 1,000 | $ | 1,100 | $ | 4.76 | ||||||||
Based on Hypothetical 5% Annual Return |
| |||||||||||||||
Class N | 1.32 | % | $ | 1,000 | $ | 1,019 | $ | 6.72 | ||||||||
Class I | .95 | % | $ | 1,000 | $ | 1,020 | $ | 4.84 | ||||||||
Class Z | .90 | % | $ | 1,000 | $ | 1,021 | $ | 4.58 | ||||||||
3
Table of Contents
About Your Fund’s Expenses (continued)
Six Months Ended December 31, 2017 | Expense Ratio for the Period | Beginning Account Value 07/01/17 | Ending Account Value 12/31/17 | Expenses Paid During the Period* | ||||||||||||
AMG GW&K Small/Mid Cap Fund |
| |||||||||||||||
Based on Actual Fund Return |
| |||||||||||||||
Class N | 1.10 | % | $ | 1,000 | $ | 1,066 | $ | 5.73 | ||||||||
Class I | .94 | % | $ | 1,000 | $ | 1,066 | $ | 4.90 | ||||||||
Class Z | .85 | % | $ | 1,000 | $ | 1,067 | $ | 4.43 | ||||||||
Based on Hypothetical 5% Annual Return |
| |||||||||||||||
Class N | 1.10 | % | $ | 1,000 | $ | 1,020 | $ | 5.60 | ||||||||
Class I | .94 | % | $ | 1,000 | $ | 1,020 | $ | 4.79 | ||||||||
Class Z | .85 | % | $ | 1,000 | $ | 1,021 | $ | 4.33 | ||||||||
| * | Expenses are equal to the Fund’s annualized expense ratio multiplied by the average account value over the period, multiplied by the number of days in the most recent fiscal half-year (184), then divided by 365. |
4
Table of Contents
AMG GW&K Enhanced Core Bond Fund
Portfolio Manager’s Comments (unaudited)
THE YEAR IN REVIEW
AMG GW&K Enhanced Core Bond Fund (Class N) (the Fund) returned 3.76% for the year ended December 31, 2017, compared to the return of 3.54% for the Bloomberg Barclays U.S. Aggregate Bond Index (the Index).
At the start of 2017, fixed income markets were surprisingly quiet despite all of the headlines, as rapidly shifting fiscal and monetary policy narratives limited major moves in either direction. General improvement in the overall economy coupled with gradually increasing inflationary pressures prompted the U.S. Federal Reserve (Fed) to raise interest rates for the second time since the election. But this move was accompanied by unexpectedly dovish forward guidance that significantly muted the effects of the hike itself. Similarly, ambitious policy goals from the early days of the Trump administration provided a boost to risk markets on expectations of deregulation, tax reform, and infrastructure spending. But Congress’ failure to repeal the Affordable Care Act led to a stark reappraisal of the potential timing and success of future legislative efforts.
The second quarter saw strong returns, with markets benefiting from both lower interest rates and tighter spreads. The continued unwinding of the reflation trade was the most significant driver, as skepticism surrounding the stimulative effect of any legislation out of Washington weighed on growth and inflation expectations. Meanwhile, credit investors chose instead to focus on robust corporate earnings and an improving global economy, largely shrugging off news out of Washington and major geopolitical headlines (terrorist attacks, missile launches, crude oil prices). Interest rate volatility fell to its lowest level in years, leading some to wonder whether investors are becoming too complacent (the last time it was this low was in 2013—a month before the Taper Tantrum); others point to the resilience of risk markets and the lack of negative catalysts on the horizon.
Amid a combination of rising geopolitical tensions, policy uncertainty, and the expected start to the unwinding of the Fed balance sheet, the fixed income market, as measured by the Bloomberg Barclays U.S. Aggregate Bond Index, delivered a
positive return in the third quarter of 2017. The first two months of the quarter were characterized by persistently weak inflation data, record shattering hurricanes, and provocative saber-rattling from North Korea that drove 10-year interest rates to their lows of the year. September brought renewed optimism on tax reform, a more hawkish sounding Fed, and the long-expected announcement regarding the tapering of the Fed’s balance sheet. Interest rates quickly reversed course leaving the 10-year Treasury essentially unchanged for the quarter. The market, once optimistically pricing in less than a 30% chance of a hike before year-end, promptly boosted those odds to a closer certainty of 70%.
Fixed income markets ended the fourth quarter on a relatively calm note following months of policy uncertainty and headline-driven volatility. Debates surrounding Fed policy, tax reform legislation, and the sustainability of record corporate profitability dominated trading at various points throughout the quarter. However, each of these questions was eventually resolved and investors gradually shifted their focus to 2018. Ironically, the absence of obvious risks on the horizon has been cited as a risk in itself, as investors point to record low volatility and broad consensus as evidence of complacency. We continue to closely monitor policy and economic developments while we watch for early signs of wage inflation, an uptick in the default rate, or any indication that we are approaching the late stages of the business cycle.
The yield curve experienced a significant flattening during the fourth quarter and the premium for owning longer bonds fell to its lowest level in a decade. Short rates rose steadily, first as confidence grew that the Fed would hike again in December and then amid calls for as many as four more hikes in 2018. Yields at the long end closed the year near their lowest level of the year, as inflation remained elusive and investors sought protection from the possibility that the Fed would go too far in raising rates.
The Fund slightly outperformed the benchmark for the full year. The yield curve had a negative effect on performance, given our preference for intermediate maturities over the long end. Our sector allocation decisions had a positive effect due to our overweight
of investment grade corporate bonds, which benefited from spread compression during the quarter. An underweight to Treasuries was also a strong contributor to the allocation effect. Our out-of-benchmark allocation to high yield corporate bonds also helped performance.
Now that tax reform has been passed, sentiment in 2018 promises to be driven in large part by the Fed and its influence on the shape of the yield curve. While upward pressure on the short end seems all but certain, the larger question remains what the impact will be on the long end. High funding requirements from the Treasury combined with the roll off of the Fed’s balance sheet could weigh on long rates, but benign inflation and strong demand from pension funds and overseas investors could serve as an anchor. In light of this uncertainty, we have kept the duration of the Fund neutral relative to its benchmark. In addition, we have kept our yield curve positioning close to neutral, with a slight bias away from the short end in favor of intermediate maturities. We believe the belly of the curve offers more attractive returns at this stage of the tightening cycle, given the carry and roll available for the interest rate risk being assumed.
We remain overweight corporate bonds, where we believe yields offer an attractive alternative to Treasuries and strong credit metrics are likely to limit spread widening. Default rates are low by historical standards and corporate profitability is strong. Additionally, we feel the sector is poised to benefit from a positive technical environment, as $4 trillion stashed overseas becomes available to fund capital spending and shareholder returns that otherwise might have been funded with debt. At the same time, we recognize the potential for an uptick in volatility and have opportunistically continued our up-in-quality shift in favor of higher-rated and less cyclical credits. In the mortgage-backed sector we continue to target lower duration pools, which offer protection in the event of spread widening and rate volatility that may occur as the Fed begins to unwind its balance sheet.
This commentary reflects the viewpoints of the portfolio manager, GW&K Investment Management, LLC as of December 31, 2017 , and is not intended as a forecast or guarantee of future results, and is subject to change without notice.
5
Table of Contents
AMG GW&K Enhanced Core Bond Fund
Portfolio Manager’s Comments (continued)
CUMULATIVE TOTAL RETURN PERFORMANCE
AMG GW&K Enhanced Core Bond Fund’s cumulative total return is based on the daily change in net asset value (NAV), and assumes that all dividends and distributions were reinvested. This graph compares a hypothetical $10,000 investment made in the Fund’s Class N shares on December 31, 2007, to a $10,000 investment made in the Bloomberg Barclays U.S. Aggregate Bond Index for the same time period. The graph and table do not reflect the deduction of taxes that a shareholder would pay on a Fund distribution or redemption of shares. The listed returns for the Fund are net of expenses and the returns for the index exclude expenses. Total returns would have been lower had certain expenses not been reduced.
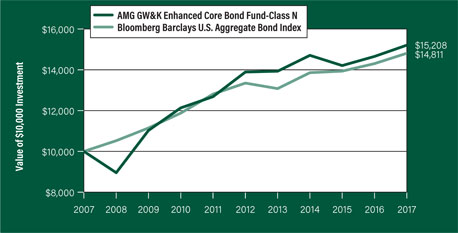
The table below shows the average annual total returns for the AMG GW&K Enhanced Core Bond Fund and the Bloomberg Barclays U.S. Aggregate Bond Index for the same time periods ended December 31, 2017.
| Average Annual Total Returns1 | One Year | Five Years | Ten Years | Since Inception | Inception Date | |||||||||||||||
AMG GW&K Enhanced Core Bond Fund2, 3, 4, 5, 6 |
| |||||||||||||||||||
Class N | 3.76 | % | 1.83 | % | 4.28 | % | 5.41 | % | 01/02/97 | |||||||||||
Class I7 | 4.03 | % | 2.01 | % | — | 2.03 | % | 11/30/12 | ||||||||||||
Class C8 | 3.08 | % | 1.06 | % | 3.50 | % | 4.59 | % | 03/05/98 | |||||||||||
Class Z9 | 4.01 | % | 2.07 | % | 4.53 | % | 5.80 | % | 01/02/97 | |||||||||||
Bloomberg Barclays U.S. Aggregate Bond Index10 | 3.54 | % | 2.10 | % | 4.01 | % | 5.22 | % | 01/02/97 | † | ||||||||||
The performance data shown represents past performance. Past performance is not a guarantee of future results. Current performance may be lower or higher than the performance data quoted. The investment return and principal value of an investment will fluctuate so that an investor’s shares, when redeemed, may be worth more or less than their original cost.
Investors should carefully consider the Fund’s investment objectives, risks, charges and expenses before investing. For performance information through the most recent month end, current net asset values per share for the Fund and other information, please call 800.835.3879 or visit our website at amgfunds.com for a free prospectus. Read it carefully before investing or sending money.
Distributed by AMG Distributors, Inc., member FINRA/SIPC.
| † | Date reflects the inception date of the Fund, not the index. |
| 1 | Total return equals income yield plus share price change and assumes reinvestment of all dividends and capital gain distributions. Returns are net of fees and may reflect offsets of Fund expenses as described in the prospectus. No adjustment has been made for taxes payable by shareholders on their reinvested dividends and capital gain distributions. Returns for periods greater than one year are annualized. The listed returns on the Fund are net of expenses and based on the published NAV as of December 31, 2017. All returns are in U.S. dollars ($). |
| 2 | From time to time, the Fund’s advisor has waived its fees and/or absorbed Fund expenses, which has resulted in higher returns. |
| 3 | The Fund is subject to the risks associated with investments in debt securities, such as default risk and fluctuations in the perception of the debtor’s ability to pay its creditors. Changing interest rates may adversely affect the value of an investment. An increase in interest rates typically causes the value of bonds and other fixed income securities to fall. |
| 4 | To the extent that the Fund invests in asset-backed or mortgage-backed securities, its exposure to prepayment and extension risks may be greater than investments in other fixed income securities. |
| 5 | High-yield bonds (also known as “junk bonds”) may be subject to greater levels of interest rate, credit, and liquidity risk than investments in higher rated securities. These securities are considered predominantly speculative with respect to the issuer’s continuing ability to make principal and interest payments. The issuers of the Fund’s holdings may be involved in bankruptcy proceedings, reorganizations, or financial restructurings, and are not as strong financially as higher-rated issuers. |
| 6 | Investments in international securities are subject to certain risks of overseas investing including currency fluctuations and changes in political and economic conditions, which could result in significant market fluctuations. These risks are magnified in emerging markets. |
| 7 | February 27, 2017 Class S renamed to Class I. |
| 8 | Closed to new investments. |
| 9 | February 27, 2017 Class I renamed to Class Z. |
| 10 | The Bloomberg Barclays U.S. Aggregate Bond Index represents securities that are SEC-registered, taxable, and dollar denominated. The index covers the U.S. investment grade fixed rate bond market, with index components for government and corporate securities, mortgage pass-through securities, and asset-backed securities. Unlike the Fund, the Bloomberg Barclays U.S. Aggregate Bond Index is unmanaged, is not available for investment and does not incur expenses. |
Not FDIC insured, nor bank guaranteed. May lose value.
6
Table of Contents
AMG GW&K Enhanced Core Bond Fund
Fund Snapshots (unaudited)
December 31, 2017
PORTFOLIO BREAKDOWN
| % of | ||||
Category | Net Assets | |||
Corporate Bonds and Notes | 50.3 | |||
U.S. Government and Agency Obligations | 39.2 | |||
Municipal Bonds | 6.5 | |||
Short-Term Investments* | 4.8 | |||
Other Assets Less Liabilities** | (0.8 | ) | ||
| * | Includes reinvestment of cash collateral into joint repurchase agreements on security lending transactions. |
| ** | Includes repayment of cash collateral on security lending transactions. |
Rating | % of Market Value* | |||
U.S. Government and Agency Obligations | 40.9 | |||
Aaa | 1.1 | |||
Aa | 11.7 | |||
A | 12.8 | |||
Baa | 20.7 | |||
Ba | 11.8 | |||
B | 1.0 | |||
| * | Includes market value of fixed-income securities only. |
TOP TEN HOLDINGS
| % of | ||||
Security Name | Net Assets | |||
FNMA, 4.000%, 10/01/43 | 6.9 | |||
FNMA, 4.500%, 04/01/41 | 4.8 | |||
FHLMC Gold Pool, 5.000%, 10/01/36 | 3.1 | |||
United States Treasury Bonds, 4.500%, 02/15/36 | 2.9 | |||
United States Treasury Notes, 2.000%, 11/30/22 | 2.9 | |||
FNMA, 4.000%, 09/01/25 | 2.5 | |||
Apple, Inc., 1.903%, 02/09/22 | 2.4 | |||
Wells Fargo & Co., 2.343%, 02/11/22 | 2.4 | |||
FNMA, 3.500%, 11/01/42 | 2.4 | |||
FNMA, 4.500%, 05/01/39 | 2.3 | |||
|
| |||
Top Ten as a Group | 32.6 | |||
|
| |||
Credit quality ratings shown above reflect the highest rating assigned by either Standard & Poor’s (“S&P”) or Moody’s Investors Service, Inc. (“Moody’s”). These rating agencies are independent, nationally recognized statistical rating organizations and are widely used. Investment grade ratings are credit ratings of BBB/Baa or higher. Below investment grade ratings are credit ratings of BB/Ba or lower. Investments designated N/R are not rated by either rating agency. Unrated investments do not necessarily indicate low credit quality. Credit quality ratings are subject to change.
Because a fund’s strategy may result in multiple investments in particular sectors of the economy, its performance may depend on the performance of those sectors and may fluctuate more widely than investments diversified across more sectors. For additional information on these and other risk considerations, please see the Fund’s prospectus.
Any sectors, industries, or securities discussed should not be perceived as investment recommendations. Mention of a specific security should not be considered a recommendation to buy or solicitation to sell that security. Specific securities mentioned in this report may have been sold from the Fund’s portfolio of investments by the time you receive this report.
7
Table of Contents
AMG GW&K Enhanced Core Bond Fund
Schedule of Portfolio Investments
December 31, 2017
| Principal Amount | Value | |||||||
Corporate Bonds and Notes - 50.3% | ||||||||
Energy - 1.5% |
| |||||||
Newfield Exploration Co. 5.750%, 01/30/22 | $ | 675,000 | $ | 723,937 | ||||
Financials - 13.1% |
| |||||||
American Tower Corp. 4.400%, 02/15/26 | 453,000 | 477,160 | ||||||
Bank of America Corp., MTN 3.875%, 08/01/25 | 694,000 | 732,773 | ||||||
CIT Group, Inc. 5.000%, 08/15/22 | 440,000 | 467,500 | ||||||
Crown Castle International Corp. 5.250%, 01/15/23 | 435,000 | 476,831 | ||||||
Host Hotels & Resorts LP, Series C 4.750%, 03/01/23 | 457,000 | 486,678 | ||||||
Morgan Stanley, GMTN 5.500%, 07/28/21 | 409,000 | 447,745 | ||||||
National Rural Utilities Cooperative Finance | ||||||||
Corp., MTN 3.250%, 11/01/25 | 455,000 | 464,364 | ||||||
The Goldman Sachs Group, Inc. 6.125%, 02/15/33 | 763,000 | 974,021 | ||||||
Wells Fargo & Co. | ||||||||
(3-Month LIBOR plus 0.930%) 2.343%, 02/11/221 | 1,163,000 | 1,178,031 | ||||||
Weyerhaeuser Co. 8.500%, 01/15/25 | 525,000 | 690,992 | ||||||
Total Financials | 6,396,095 | |||||||
Industrials - 35.7% |
| |||||||
The ADT Corp. 6.250%, 10/15/21 | 227,000 | 249,700 | ||||||
American Airlines Group, Inc. 6.125%, 06/01/182 | 245,000 | 248,981 | ||||||
Andeavor Logistics LP / Tesoro Logistics Finance Corp. 5.500%, 10/15/19 | 233,000 | 242,150 | ||||||
Apple, Inc. | ||||||||
(3-Month LIBOR plus 0.500%) 1.903%, 02/09/221 | 1,168,000 | 1,184,773 | ||||||
ArcelorMittal (Luxembourg) 6.000%, 03/01/212 | 225,000 | 244,125 | ||||||
Automatic Data Processing, Inc. 3.375%, 09/15/25 | 660,000 | 681,891 | ||||||
Ball Corp. 5.250%, 07/01/25 | 481,000 | 524,891 | ||||||
Burlington Northern Santa Fe LLC 6.150%, 05/01/37 | 556,000 | 746,695 | ||||||
CDW LLC / CDW Finance Corp. 5.500%, 12/01/24 | 441,000 | 481,792 | ||||||
Charter Communications Operating LLC / Charter Communications Operating Capital 4.908%, 07/23/25 | 447,000 | 475,975 | ||||||
Comcast Corp. 7.050%, 03/15/33 | 345,000 | 480,769 | ||||||
Concho Resources, Inc. 4.375%, 01/15/25 | 225,000 | 234,563 | ||||||
Crown Americas LLC / Crown Americas Capital Corp. IV 4.500%, 01/15/23 | 475,000 | 483,312 | ||||||
CSX Corp. 2.600%, 11/01/26 | 511,000 | 488,583 | ||||||
CVS Health Corp. 5.125%, 07/20/45 | 405,000 | 465,961 | ||||||
Diamondback Energy, Inc. 4.750%, 11/01/24 | 400,000 | 403,500 | ||||||
Georgia-Pacific LLC 8.000%, 01/15/24 | 366,000 | 466,380 | ||||||
HCA, Inc. 5.000%, 03/15/24 | 456,000 | 475,380 | ||||||
International Paper Co. 3.000%, 02/15/27 | 504,000 | 489,617 | ||||||
Kaiser Foundation Hospitals 3.150%, 05/01/27 | 472,000 | 473,014 | ||||||
Leidos Holdings, Inc. 4.450%, 12/01/20 | 225,000 | 234,563 | ||||||
Lennar Corp. 4.750%, 11/15/22 | 454,000 | 478,403 | ||||||
Masco Corp. 4.375%, 04/01/26 | 483,000 | 512,221 | ||||||
McDonald’s Corp., MTN 3.700%, 01/30/26 | 450,000 | 469,870 | ||||||
Microsoft Corp. 3.750%, 02/12/45 | 484,000 | 511,197 | ||||||
Molson Coors Brewing Co. 3.000%, 07/15/26 | 488,000 | 478,536 | ||||||
Murphy Oil USA, Inc. 6.000%, 08/15/23 | 235,000 | 246,163 | ||||||
Northrop Grumman Corp. 3.200%, 02/01/27 | 476,000 | 478,692 | ||||||
NuStar Logistics LP 6.750%, 02/01/21 | 229,000 | 244,458 | ||||||
Omnicom Group, Inc. 3.600%, 04/15/26 | 467,000 | 473,274 | ||||||
Oracle Corp. 3.800%, 11/15/37 | 440,000 | 462,415 | ||||||
Owens Corning 4.200%, 12/15/22 | 470,000 | 493,344 | ||||||
Penske Automotive Group, Inc. 3.750%, 08/15/20 | 470,000 | 479,987 | ||||||
The accompanying notes are an integral part of these financial statements.
8
Table of Contents
AMG GW&K Enhanced Core Bond Fund
Schedule of Portfolio Investments (continued)
| Principal Amount | Value | |||||||
Industrials - 35.7% (continued) | ||||||||
Toll Brothers Finance Corp. | $ | 236,000 | $ | 245,735 | ||||
6.750%, 11/01/19 | 226,000 | 243,798 | ||||||
United Continental Holdings, Inc. | 240,000 | 244,200 | ||||||
Verizon Communications, Inc. | 470,000 | 480,342 | ||||||
Vulcan Materials Co. 4.500%, 04/01/25 | 336,000 | 358,582 | ||||||
Walgreens Boots Alliance, Inc. | 721,000 | 714,256 | ||||||
Total Industrials | 17,392,088 | |||||||
Total Corporate Bonds and Notes | 24,512,120 | |||||||
Municipal Bonds - 6.5% |
| |||||||
California State General Obligation, School | ||||||||
Improvements 7.550%, 04/01/39 | 605,000 | 954,466 | ||||||
JobsOhio Beverage System, Series B 3.985%, 01/01/29 | 445,000 | 472,435 | ||||||
Los Angeles Unified School District, School | ||||||||
Improvements 5.750%, 07/01/34 | 565,000 | 722,019 | ||||||
Metropolitan Transportation Authority, Transit | ||||||||
Improvement 6.668%, 11/15/39 | 350,000 | 496,608 | ||||||
New Jersey Economic Development Authority, | ||||||||
Pension Funding, Series A (National Insured) 7.425%, 02/15/293 | 388,000 | 485,943 | ||||||
Total Municipal Bonds |
| 3,131,471 | ||||||
U.S. Government and Agency Obligations - 39.2% |
| |||||||
Fannie Mae - 26.4% |
| |||||||
FNMA, | 2,174,850 | 2,245,725 | ||||||
4.000%, 09/01/25 to 10/01/43 | 5,286,934 | 5,562,347 | ||||||
4.500%, 05/01/39 to 04/01/41 | 4,039,712 | 4,346,083 | ||||||
FNMA, | 658,274 | 715,558 | ||||||
Total Fannie Mae | 12,869,713 | |||||||
Freddie Mac - 3.4% |
| |||||||
FHLMC Gold Pool, | 110,551 | 114,801 | ||||||
5.000%, 10/01/36 | 1,404,967 | 1,523,661 | ||||||
Total Freddie Mac | 1,638,462 | |||||||
U.S. Treasury Obligations - 9.4% |
| |||||||
United States Treasury Bonds, | 437,000 | 499,272 | ||||||
4.500%, 02/15/36 | 1,109,000 | 1,428,076 | ||||||
6.250%, 08/15/23 | 666,000 | 806,940 | ||||||
United States Treasury Notes, | 470,000 | 462,362 | ||||||
2.000%, 11/30/22 | 1,405,000 | 1,392,377 | ||||||
Total U.S. Treasury Obligations | 4,589,027 | |||||||
Total U.S. Government and Agency Obligations | 19,097,202 | |||||||
Short-Term Investments - 4.8% | ||||||||
Joint Repurchase Agreements - 1.5%4 |
| |||||||
State of Wisconsin Investment Board, dated 12/29/17, due 01/02/18, 1.630% total to be received $759,259 (collateralized by various U.S. Government Agency Obligations, 0.125% -3.875%, 01/15/19 - 02/15/46, totaling $780,202) | 759,122 | 759,122 | ||||||
| Shares | ||||||||
Other Investment Companies - 3.3% |
| |||||||
Dreyfus Preferred Government Money Market Fund, Institutional Class Shares, 1.25%5 | 1,589,487 | 1,589,487 | ||||||
Total Short-Term Investments | 2,348,609 | |||||||
Total Investments - 100.8% | 49,089,402 | |||||||
Other Assets, less Liabilities - (0.8)% |
| (365,726 | ) | |||||
Net Assets - 100.0% | $ | 48,723,676 | ||||||
| 1 | Variable rate security. The rate shown is based on the latest available information as of December 31, 2017. |
| 2 | Some or all of these securities, amounting to $739,043 or 1.5% of net assets, were out on loan to various brokers. |
| 3 | Security is backed by insurance of financial institutions and financial guaranty assurance agencies. At December 31, 2017, the value amounted to $485,943 or 1.0% of net assets. |
| 4 | Collateral received from brokers for securities lending was invested in these joint repurchase agreements. |
| 5 | Yield shown represents the December 31, 2017, seven day average yield, which refers to the sum of the previous seven days’ dividends paid, expressed as an annual percentage. |
FHLMC Freddie Mac
FNMA Fannie Mae
GMTN Global Medium-Term Notes
LIBOR London Interbank Offered Rate
MTN Medium-Term Note
National Insured National Public Finance Guarantee Corp.
The accompanying notes are an integral part of these financial statements.
9
Table of Contents
AMG GW&K Enhanced Core Bond Fund
Schedule of Portfolio Investments (continued)
The following table summarizes the inputs used to value the Fund’s investments by the fair value hierarchy levels as of December 31, 2017:
| Level 1 | Level 2 | Level 3 | Total | |||||||||||||
Investments in Securities | ||||||||||||||||
Corporate Bonds and Notes† | — | $ | 24,512,120 | — | $ | 24,512,120 | ||||||||||
Municipal Bonds†† | — | 3,131,471 | — | 3,131,471 | ||||||||||||
U.S. Government and Agency Obligations | — | 19,097,202 | — | 19,097,202 | ||||||||||||
Short-Term Investments | ||||||||||||||||
Joint Repurchase Agreements | — | 759,122 | — | 759,122 | ||||||||||||
Other Investment Companies | $ | 1,589,487 | — | — | 1,589,487 | |||||||||||
|
|
|
|
|
|
|
| |||||||||
Total Investments in Securities | $ | 1,589,487 | $ | 47,499,915 | — | $ | 49,089,402 | |||||||||
|
|
|
|
|
|
|
| |||||||||
| † | All corporate bonds and notes and U.S. government and agency obligations held in the Fund are Level 2 securities. For a detailed breakout of corporate bonds and notes and U.S. government and agency obligations by major industry or agency classification, please refer to the Fund’s Schedule of Portfolio Investments. |
| †† | All municipal bonds held in the Fund are Level 2 securities. For a detailed breakout of municipal bonds by major classification, please refer to the Fund’s Schedule of Portfolio Investments. |
As of December 31, 2017, the Fund had no transfers between levels from the beginning of the reporting period.
The accompanying notes are an integral part of these financial statements.
10
Table of Contents
Portfolio Manager’s Comments (unaudited)
THE YEAR IN REVIEW
For the year ended December 31, 2017, the AMG GW&K Municipal Bond Fund (Class N) (the Fund) returned 4.58%, underperforming its benchmark, the Bloomberg Barclays 10-Year Municipal Bond Index (the Index), which returned 5.83%.
Municipals posted solid returns in the first quarter amid a backdrop of uncertainty regarding U.S. Federal Reserve (Fed) policy and the so-called reflation trade. Right out of the gates, retail investors favored the perceived haven of shorter municipal bonds, driving down yields at the front end of the curve, even while similar maturities in the Treasury market remained steady. It was a dynamic that played out over the quarter, the municipal bond curve steepening significantly, the Treasury curve modestly flattening. And while sentiment was cautious, that was actually an upgrade over the panic selling that followed November’s election and lasted into year-end. The heavy mutual fund outflows during that stretch reversed in January, removing a major source of selling pressure and helping to stabilize the market.
For the second quarter, Municipals posted impressive returns driven by favorable market technicals and a broad rethink of the Trump trade. Long-term yields had already started to decline in March as political turmoil in Washington cast doubt on the likelihood of large-scale fiscal stimulus emerging any time soon. And with last November’s messy selloff fading further into memory, new cash poured into the tax-exempt market. The increased demand was met by a scarcity of supply, with new issue volume down 18% for the quarter, a product of far fewer refunding transactions. The result was a powerful rally where municipal bonds outperformed even Treasuries, which also posted solid returns for the quarter. And it occurred despite troubling industry headlines, from Puerto Rico’s bankruptcy filing to Connecticut’s triple downgrades to Illinois’ severe budget crisis. In that way, it was technicals, rather than any improvement in credit fundamentals, that made municipals one of the top performers in the fixed income universe.
Municipals performed well in the third quarter despite a late period selloff that turned outsized gains into merely respectable returns. Through the first nine weeks of the quarter, interest rates declined in a steady fashion, establishing year-to-date lows in early September. Besides saber-rattling in North Korea and violence in Spain and Charlottesville, investors were responding to uncertainty surrounding healthcare policy, an
unusually active hurricane season and fears that a divided Washington would fail to raise the debt ceiling. In addition, inflation readings continued to undershoot the Fed’s target, casting doubt on the central bank’s forecast of future rate increases.
Municipal bonds posted mixed returns in the fourth quarter amid a significant flattening of the yield curve. Front-end rates pushed sharply higher, driven by further tightening of Fed policy and investor repositioning ahead of major tax reform. Long municipal bonds, meanwhile, rallied on benign inflation data and the expectation of a supply drought in the coming months. As a consequence, the slope of the municipal curve nearly halved over the quarter, from 1.84% to 0.98%, its lowest level since 2007.
At the start of the fourth quarter, there were few signs the market would experience any sort of upheaval before year end. Supply projections were modest, headline risks dormant and word out of Washington was that the municipal bond exemption would be fully shielded from tax reform. Instead, we had weeks of sloppy trading on record volume after the House of Representatives proposed, in early November, to strip the tax exemption from private activity bonds (PABs) and advance refunding transactions. These two areas collectively account for over a quarter of municipal supply. A week later, the Senate released a more municipal bond-friendly version, which protected PABs but kept advance refundings on the chopping block. Unsure of how the final bill would read, 501(c)(3) issuers, including hospitals and private universities, flooded the market with PABs in case the window closed. In addition, traditional issuers stuffed the remaining calendar with advance refunding deals. The result was a historic slate of issuance, with December volume breaking a single-month record set just before the Tax Reform Act of 1986 took effect.
On the demand side, buyers were just as anxious to transact while bonds were still available. Even though PABs ultimately survived in the final tax bill, advance refundings did not. Issuance is expected to drop dramatically in the first half of 2018 because so many borrowers rushed to market in the last six weeks of the year. To participate in the surge, many sold shorter bonds to raise cash, putting upward pressure on front-end yields, particularly in late November. As the record volume hit the street in mid-December, deals were taken down with only minimal concessions. In the final week of the year, after the new issue pipeline had largely dried up, municipal bonds rallied hard as opportunistic traders marked up bonds and resold them to a market
looking to get invested before origination became scarce. From a high of 2.21% in late November, the yield on 10-year municipal bonds dropped 23 basis points to close 2017 at 1.98%, essentially unchanged for the fourth quarter but down 33 basis points for the year as a whole.
For the fiscal year period, the Fund’s longer duration exposure in declining rates benefited performance. In addition, our extension trades in March and September of 2017 were a positive contributor, as was our underweight in Connecticut and insured Puerto Rico issues. The Fund’s underweight in BBB and single-A rated issues hurt performance for the year, due to our higher quality bias. An overweight to shorter than benchmark maturities was also a detractor.
Looking forward, it appears the municipal market has survived tax reform with only minor bumps and bruises. The most important takeaway is that the tax exemption remains in place. To be sure, there will be shifting sands ahead, requiring some adjustments to the way the market is traded. The loss of advance refundings means the end of newly minted prerefunded paper, an outcome that will lessen supply over the next couple of years. The lower marginal rate for corporations will likely reduce demand for municipal bonds from banks and insurance companies. The significant limitation of the state and local tax deduction will push tax-equivalent hurdles higher, making in-state bonds more attractive to resident investors. Potentially this could lead to wealth flight from high-tax jurisdictions, a development that bears watching. In the immediate future, however, the plunge in supply expected over the first half of 2018 should provide a technical tailwind that eclipses other factors. While much will depend on the movement of Treasury yields, municipal bonds look poised to start the new year from a position of strength.
The supply surge provided an opportunity to find value in the fourth quarter. For most of the year, credit spreads had been historically tight and drifting even tighter. As a result, our positioning has been relatively conservative, choosing to upgrade quality rather than reach for modest yield gains. That dynamic shifted when tax reform negotiations triggered a rush to market, particularly in the health care and higher education sectors. We sold ahead of the issuance, mostly in the five-year part of the curve.
As December progressed, deal flow ramped up to approximately three times the year-to-date average. We found high quality hospital names at spreads 15
11
Table of Contents
AMG GW&K Municipal Bond Fund
Portfolio Manager’s Comments (continued)
to 20 basis points wider than where they were a few months prior. We bought aggressively and increased our exposure in the sector to just over 5%. Advance refunding deals were widespread across all sectors allowing us to sift through a vast variety of offerings and reinvest cash where we saw value. We
purchased maturities mainly in the ten-year area of the curve and, by year end, brought cash down below 2%, which was our goal all along given the strong technical environment expected in the first quarter of the new year.
This commentary reflects the viewpoints of the portfolio manager, GW&K Investment Management, LLC as of December 31, 2017, and is not intended as a forecast or guarantee of future results, and is subject to change without notice.
12
Table of Contents
AMG GW&K Municipal Bond Fund
Portfolio Manager’s Comments (continued)
CUMULATIVE TOTAL RETURN PERFORMANCE
AMG GW&K Municipal Bond Fund’s cumulative total return is based on the daily change in net asset value (NAV), and assumes that all dividends and distributions were reinvested. This graph compares a hypothetical $10,000 investment made in the Fund’s Class I (formerly Class S) shares on June 30, 2009, to a $10,000 investment made in the Bloomberg Barclays 10-Year Municipal Bond Index for the same time period. The graph and table do not reflect the deduction of taxes that a shareholder would pay on a Fund distribution or redemption of shares. The listed returns for the Fund are net of expenses and the returns for the index exclude expenses. Total returns would have been lower had certain expenses not been reduced.

The table below shows the average annual total returns for the AMG GW&K Municipal Bond Fund and the Bloomberg Barclays 10-Year Municipal Bond Index for the same time periods ended December 31, 2017.
| Average Annual Total Returns1 | One Year | Five Years | Since Inception | Inception Date | ||||||||||||
AMG GW&K Municipal Bond Fund2, 3, 4, 5 |
| |||||||||||||||
Class N | 4.58 | % | 2.27 | % | 4.37 | % | 06/30/09 | |||||||||
Class I6 | 4.90 | % | 2.72 | % | 4.86 | % | 06/30/09 | |||||||||
Bloomberg Barclays 10-Year Municipal Bond Index7 | 5.83 | % | 3.13 | % | 5.02 | % | 06/30/09 | † | ||||||||
The performance data shown represents past performance. Past performance is not a guarantee of future results. Current performance may be lower or higher than the performance data quoted. The investment return and principal value of an investment will fluctuate so that an investor’s shares, when redeemed, may be worth more or less than their original cost.
Investors should carefully consider the Fund’s investment objectives, risks, charges and expenses before investing. For performance information through the most recent month end, current net asset values per share for the Fund and other information, please call 800.835.3879 or visit our website at amgfunds.com for a free prospectus. Read it carefully before investing or sending money.
Distributed by AMG Distributors, Inc., member FINRA/SIPC.
| † | Date reflects the inception date of the Fund, not the index. |
| 1 | Total return equals income yield plus share price change and assumes reinvestment of all dividends and capital gain distributions. Returns are net of fees and may reflect offsets of Fund expenses as described in the prospectus. No adjustment has been made for taxes payable by shareholders on their reinvested dividends and capital gain distributions. Returns for periods greater than one year are annualized. The listed returns on the Fund are net of expenses and based on the published NAV as of December 31, 2017. All returns are in U.S. dollars ($). |
| 2 | From time to time, the Fund’s advisor has waived its fees and/or absorbed Fund expenses, which has resulted in higher returns. |
| 3 | The Fund is subject to the risks associated with investments in debt securities, such as default risk and fluctuations in the perception of the debtor’s ability to pay its creditors. Changing interest rates may adversely affect the value of an investment. An increase in interest rates typically causes the value of bonds and other fixed income securities to fall. |
| 4 | Factors unique to the municipal bond market may negatively affect the value in municipal bonds. |
| 5 | Investment income may be subject to certain state and local taxes, and depending on your tax status, the federal alternative minimum tax. Capital gains are not exempt from federal income tax. |
| 6 | Effective June 23, 2017 Class S shares were converted to Class I shares. |
| 7 | The Bloomberg Barclays 10-Year Municipal Bond Index is the 10 Year (8-12) component of the Municipal Bond index. It is a rules-based, market-value-weighted index engineered for the tax-exempt bond market. The Index tracks general obligation bonds, revenue bonds, insured bonds, and prerefunded bonds rated Baa3/BBB- or higher by at least two of the ratings agencies: Moody’s, S&P, Fitch. Unlike the Fund, the Bloomberg Barclays 10-Year Municipal Bond Index is unmanaged, is not available for investment and does not incur expenses. |
Not FDIC insured, nor bank guaranteed. May lose value.
13
Table of Contents
AMG GW&K Municipal Bond Fund
Fund Snapshots (unaudited)
December 31, 2017
PORTFOLIO BREAKDOWN
| % of | ||||
Category | Net Assets | |||
General Obligation | 26.4 | % | ||
Transportation | 23.4 | % | ||
Utilities | 17.3 | % | ||
Public Services | 10.9 | % | ||
Healthcare | 8.0 | % | ||
Education | 7.0 | % | ||
Other | 3.4 | % | ||
Industrial Development | 1.2 | % | ||
Tax | 1.1 | % | ||
Other Assets & Liabilities | 1.3 | % | ||
| Rating | % of Market Value | |||
Aaa | 37.2 | |||
Aa | 50.8 | |||
A | 10.8 | |||
Baa | 1.2 | |||
TOP TEN HOLDINGS
| % of | ||||
Security Name | Net Assets | |||
State of Maryland, Series B, General Obligation, 5.000%, 08/01/25 | 2.3 | |||
North Carolina State Limited Obligation, Series B, Revenue, 5.000%, 05/01/28 | 1.7 | |||
Iowa Finance Authority, Green Bond, Revenue, 5.000%, 08/01/30 | 1.7 | |||
Arizona Water Infrastructure Finance Authority, Water Quality | ||||
Revenue, Series A, Revenue, 5.000%, 10/01/26 | 1.7 | |||
Triborough Bridge & Tunnel Authority, MTA Bridge And Tunnel, | ||||
Revenue, 5.000%, 11/15/27 | 1.6 | |||
Commonwealth of Massachusetts Federal Highway Grant | ||||
Anticipation Note Revenue, Subordinate Revenue, Series A, | ||||
Revenue, 5.000%, 06/15/24 | 1.5 | |||
State of Michigan, Revenue, 5.000%, 03/15/27 | 1.4 | |||
State of Maryland, Department of Transportation, Revenue, 5.000%, 09/01/29 | 1.4 | |||
Texas Transportation Commission Fund, Series A, General | ||||
Obligation, 5.000%, 04/01/27 | 1.3 | |||
State of Washington, Water Utility Improvements Revenue, | ||||
Series 2013 A, General Obligation, 5.000%, 08/01/25 | 1.3 | |||
|
| |||
Top Ten as a Group | 15.9 | |||
|
| |||
Credit quality ratings shown above reflect the highest rating assigned by either Standard & Poor’s (“S&P”) or Moody’s Investors Service, Inc. (“Moody’s”). These rating agencies are independent, nationally recognized statistical rating organizations and are widely used. Investment grade ratings are credit ratings of BBB/Baa or higher. Below investment grade ratings are credit ratings of BB/Ba or lower. Investments designated N/R are not rated by either rating agency. Unrated investments do not necessarily indicate low credit quality. Credit quality ratings are subject to change.
Because a fund’s strategy may result in multiple investments in particular sectors of the economy, its performance may depend on the performance of those sectors and may fluctuate more widely than investments diversified across more sectors. For additional information on these and other risk considerations, please see the Fund’s prospectus.
Any sectors, industries, or securities discussed should not be perceived as investment recommendations. Mention of a specific security should not be considered a recommendation to buy or solicitation to sell that security. Specific securities mentioned in this report may have been sold from the Fund’s portfolio of investments by the time you receive this report.
14
Table of Contents
AMG GW&K Municipal Bond Fund
Schedule of Portfolio Investments
December 31, 2017
| Principal Amount | Value | |||||||
Municipal Bonds - 98.5% | ||||||||
Arizona - 3.5% | ||||||||
Arizona Department of Transportation State Highway Fund Revenue 5.000%, 07/01/28 | $ | 5,000,000 | $ | 6,153,300 | ||||
Arizona Water Infrastructure Finance Authority, Water Quality Revenue, Series A 5.000%, 10/01/26 | 15,000,000 | 18,003,600 | ||||||
Salt River Project Agricultural Improvement & Power District, Salt River Project Electrical 5.000%, 01/01/29 | 6,000,000 | 7,548,960 | ||||||
Salt River Project Agricultural Improvement & Power District, Series A 5.000%, 12/01/24 | 5,550,000 | 6,228,931 | ||||||
Total Arizona | 37,934,791 | |||||||
California - 5.0% | ||||||||
California Municipal Finance Authority, Community Medical Centers, Series A 5.000%, 02/01/27 | 950,000 | 1,144,370 | ||||||
California Municipal Finance Authority, Community Medical Centers, Series A 5.000%, 02/01/30 | 1,620,000 | 1,913,884 | ||||||
California Municipal Finance Authority, Community Medical Centers, Series A 5.000%, 02/01/31 | 1,000,000 | 1,174,380 | ||||||
California Municipal Finance Authority, Community Medical Centers, Series A 5.000%, 02/01/32 | 1,855,000 | 2,168,736 | ||||||
California State Tax Exempt General Obligation 5.000%, 03/01/24 | 5,000,000 | 5,922,600 | ||||||
California State University, Series A 5.000%, 11/01/29 | 4,525,000 | 5,374,524 | ||||||
State of California 5.000%, 09/01/25 | 10,000,000 | 12,192,300 | ||||||
State of California 5.000%, 09/01/29 | 5,010,000 | 6,128,282 | ||||||
State of California 5.000%, 08/01/29 | 7,000,000 | 8,555,050 | ||||||
State of California, Series C 5.000%, 09/01/26 | 7,700,000 | 9,394,154 | ||||||
Total California | 53,968,280 | |||||||
Colorado - 1.3% | ||||||||
City & County of Denver CO. Airport System Revenue, Series A 5.000%, 11/15/23 | 6,000,000 | 7,016,940 | ||||||
Regional Transportation District County COPS, Series A 5.000%, 06/01/24 | 6,000,000 | 6,938,700 | ||||||
Total Colorado | 13,955,640 | |||||||
Connecticut - 0.6% | ||||||||
State of Connecticut Special Tax Revenue, Transit Infrastructure 5.000%, 08/01/24 | 5,340,000 | 6,215,386 | ||||||
District of Columbia - 1.7% | ||||||||
District of Columbia Water & Sewer Authority Public Utility Revenue, Sub Lien, Series C 5.000%, 10/01/24 | 5,475,000 | 6,260,115 | ||||||
District of Columbia, Series A 5.000%, 06/01/24 | 5,000,000 | 5,931,350 | ||||||
District of Columbia, Series A 5.000%, 06/01/30 | 5,025,000 | 6,074,170 | ||||||
Total District of Columbia | 18,265,635 | |||||||
Florida - 4.8% | ||||||||
Florida State Board of Education, Series D 5.000%, 06/01/24 | 6,565,000 | 7,254,653 | ||||||
Florida’s Turnpike Enterprise, Department of Transportation, Series C 5.000%, 07/01/28 | 7,075,000 | 8,626,760 | ||||||
Orange County Health Facilities Authority, Series A 5.000%, 10/01/31 | 4,515,000 | 5,289,187 | ||||||
State of Florida, Capital Outlay, Series B 5.000%, 06/01/27 | 9,045,000 | 10,771,871 | ||||||
State of Florida, Capital Outlay, Series B 5.000%, 06/01/25 | 5,970,000 | 6,773,801 | ||||||
State of Florida, Capital Outlay, Series C 5.000%, 06/01/27 | 5,555,000 | 6,868,258 | ||||||
State of Florida, Department of Transportation, Fuel Sales Tax Revenue, Series B 5.000%, 07/01/26 | 5,780,000 | 6,414,066 | ||||||
Total Florida | 51,998,596 | |||||||
Georgia - 3.6% | ||||||||
Atlanta Water & Wastewater Revenue 5.000%, 11/01/25 | 5,100,000 | 6,164,982 | ||||||
Georgia State University & College Improvements, Series A 5.000%, 07/01/24 | 5,000,000 | 5,708,700 | ||||||
Georgia State University & College Improvements, Series A 5.000%, 07/01/27 | 5,450,000 | 6,207,332 | ||||||
Georgia State University & College Improvements, Series A -Tranche 2 5.000%, 02/01/26 | 5,435,000 | 6,618,091 | ||||||
State of Georgia, Series C 5.000%, 09/01/23 | 5,000,000 | 5,731,450 | ||||||
The accompanying notes are an integral part of these financial statements.
15
Table of Contents
AMG GW&K Municipal Bond Fund
Schedule of Portfolio Investments (continued)
| Principal Amount | Value | |||||||
Georgia - 3.6% (continued) | ||||||||
State of Georgia, Series F 5.000%, 01/01/26 | $ | 7,015,000 | $ | 8,661,841 | ||||
Total Georgia | 39,092,396 | |||||||
Idaho - 0.6% | ||||||||
Idaho Housing & Finance Association 5.000%, 07/15/23 | 5,770,000 | 6,672,428 | ||||||
Illinois - 3.9% | ||||||||
Chicago O’Hare International Airport, Series B 5.000%, 01/01/28 | 10,580,000 | 12,408,436 | ||||||
Illinois State Finance Authority Revenue, Clean Water Initiative Revenue 5.000%, 07/01/27 | 11,000,000 | 13,291,410 | ||||||
Illinois State Finance Authority Revenue, University of Chicago, Series A 5.000%, 10/01/23 | 5,005,000 | 5,830,625 | ||||||
Illinois State Toll Highway Authority, Series A 5.000%, 12/01/31 | 9,260,000 | 10,862,165 | ||||||
Total Illinois | 42,392,636 | |||||||
Indiana - 0.6% | ||||||||
Indiana Finance Authority, Indiana University Health Revenue, Series A 5.000%, 12/01/23 | 5,115,000 | 5,966,392 | ||||||
Iowa - 2.2% | ||||||||
Iowa Finance Authority, Green Bond 5.000%, 08/01/30 | 15,000,000 | 18,579,750 | ||||||
State of Iowa, Series A 5.000%, 06/01/25 | 4,000,000 | 4,838,000 | ||||||
Total Iowa | 23,417,750 | |||||||
Kentucky - 0.6% | ||||||||
Louisville/Jefferson County Metropolitan Government, Norton Healthcare Inc., Series A 5.000%, 10/01/29 | 5,020,000 | 5,948,298 | ||||||
Maryland - 5.8% | ||||||||
State of Maryland, Department of Transportation 5.000%, 05/01/23 | 8,720,000 | 10,179,641 | ||||||
State of Maryland, Department of Transportation 5.000%, 09/01/29 | 11,895,000 | 14,908,598 | ||||||
State of Maryland, Series B 5.000%, 08/01/25 | 20,000,000 | 24,466,800 | ||||||
University System of Maryland, University & College Improvements, Series A 5.000%, 04/01/23 | 5,475,000 | 6,359,815 | ||||||
University System of Maryland, University & College Improvements, Series A 5.000%, 04/01/24 | 5,100,000 | 6,056,352 | ||||||
Total Maryland | 61,971,206 | |||||||
Massachusetts - 7.6% | ||||||||
Commonwealth of Massachusetts Federal Highway Grant Anticipation Note Revenue, Subordinate Revenue, Series A 5.000%, 06/15/24 | 13,770,000 | 16,047,558 | ||||||
Commonwealth of Massachusetts, Series A 5.000%, 07/01/25 | 7,700,000 | 9,348,108 | ||||||
Commonwealth of Massachusetts, Series B 5.000%, 07/01/23 | 5,000,000 | 5,844,900 | ||||||
Massachusetts Development Finance Agency, Partners Healthcare System 5.000%, 07/01/28 | 8,000,000 | 9,774,880 | ||||||
Massachusetts School Building Authority, Series A 5.000%, 08/15/25 | 5,035,000 | 5,738,390 | ||||||
Massachusetts State Development Finance Agency, Boston College, Series S 5.000%, 07/01/23 | 5,700,000 | 6,650,133 | ||||||
Massachusetts Water Resources Authority, Series C 5.000%, 08/01/24 | 10,300,000 | 11,471,110 | ||||||
Massachusetts Water Resources Authority, Series C 5.000%, 08/01/26 | 4,025,000 | 4,983,111 | ||||||
Massachusetts Water Resources Authority, Series C 5.000%, 08/01/31 | 6,000,000 | 7,254,480 | ||||||
The Massachusetts Clean Water Trust 5.000%, 08/01/25 | 4,640,000 | 4,883,275 | ||||||
Total Massachusetts | 81,995,945 | |||||||
Michigan - 3.7% | ||||||||
Michigan Finance Authority, Henry Ford Health System 5.000%, 11/15/29 | 9,950,000 | 11,700,603 | ||||||
Michigan Finance Authority, Hospital Trinity Health Credit 5.000%, 12/01/34 | 5,150,000 | 6,119,642 | ||||||
Michigan State Building Authority Revenue, Series I 5.000%, 04/15/27 | 5,700,000 | 6,849,348 | ||||||
State of Michigan 5.000%, 03/15/27 | 12,640,000 | 15,501,949 | ||||||
Total Michigan | 40,171,542 | |||||||
Minnesota - 1.1% | ||||||||
Minneapolis-St Paul Metropolitan Airports Commission, Series A 5.000%, 01/01/25 | 5,000,000 | 6,010,700 | ||||||
The accompanying notes are an integral part of these financial statements.
16
Table of Contents
AMG GW&K Municipal Bond Fund
Schedule of Portfolio Investments (continued)
| Principal Amount | Value | |||||||
Minnesota - 1.1% (continued) | ||||||||
Minnesota State General Obligation, Series A 5.000%, 08/01/23 | $ | 5,300,000 | $ | 6,057,052 | ||||
Total Minnesota | 12,067,752 | |||||||
Missouri - 1.7% | ||||||||
Missouri Highway & Transportation Commission, | ||||||||
Fuel Sales Tax Revenue, Series B 5.000%, 05/01/23 | 10,330,000 | 12,030,524 | ||||||
University of Missouri, Series A 5.000%, 11/01/26 | 5,495,000 | 6,569,163 | ||||||
Total Missouri | 18,599,687 | |||||||
New Jersey - 2.7% | ||||||||
New Jersey Health Care Facilities Financing Authority, RWJ Barnabas Health Obligation 5.000%, 07/01/29 | 6,570,000 | 7,780,391 | ||||||
New Jersey State Turnpike Authority Revenue, Series 2012B 5.000%, 01/01/24 | 2,790,000 | 3,194,522 | ||||||
New Jersey State Turnpike Authority Revenue, Series A 5.000%, 01/01/33 | 10,270,000 | 12,199,220 | ||||||
New Jersey State Turnpike Authority Revenue, Series A 5.000%, 01/01/24 | 355,000 | 403,834 | ||||||
New Jersey State Turnpike Authority Revenue, Series B 5.000%, 01/01/28 | 4,000,000 | 4,947,320 | ||||||
Total New Jersey | 28,525,287 | |||||||
New York - 16.1% | ||||||||
Metropolitan Transportation Authority, Climate Bond Certified Green Bond 5.000%, 11/15/33 | 5,000,000 | 6,101,550 | ||||||
Metropolitan Transportation Authority, Fuel Sales Tax Revenue, Series A 5.000%, 11/15/24 | 5,000,000 | 6,004,000 | ||||||
Metropolitan Transportation Authority, Transit Revenue, Series F 5.000%, 11/15/24 | 4,950,000 | 5,704,776 | ||||||
Metropolitan Transportation Authority, Transit Revenue, Series F 5.000%, 11/15/27 | 5,000,000 | 5,722,150 | ||||||
Metropolitan Transportation Authority, Transit Revenue, Series F 5.000%, 11/15/28 | 5,000,000 | 5,962,300 | ||||||
Metropolitan Transportation Authority, Variable, Series A-1, REMK 06/1 1.250%, 11/01/31 1 | 10,500,000 | 10,500,000 | ||||||
New York City General Obligation, Series C 5.000%, 08/01/24 | 5,000,000 | 5,957,500 | ||||||
New York City General Obligation, Series C 5.000%, 08/01/26 | 5,510,000 | 6,763,084 | ||||||
New York City General Obligation, Series G 5.000%, 08/01/23 | 5,000,000 | 5,831,000 | ||||||
New York City General Obligation, Series I 5.000%, 08/01/24 | 11,485,000 | 13,060,397 | ||||||
New York City Transitional Finance Authority, Future Tax Secured Revenue, Series A-2 5.000%, 08/01/34 | 5,000,000 | 6,035,050 | ||||||
New York City Transitional Finance Authority, Future Tax Secured Revenue, Series B 5.000%, 02/01/24 | 5,015,000 | 5,493,331 | ||||||
New York City Transitional Finance Authority, Future Tax Secured Revenue, Series C 5.000%, 11/01/23 | 5,000,000 | 5,872,250 | ||||||
New York City Transitional Finance Authority, Future Tax Secured Revenue, Series C 5.000%, 11/01/26 | 5,200,000 | 6,274,008 | ||||||
New York City Water & Sewer System Revenue, Series FF 5.000%, 06/15/25 | 7,940,000 | 8,582,028 | ||||||
New York City Water & Sewer System Revenue, Series FF 5.000%, 06/15/30 | 5,370,000 | 6,397,925 | ||||||
New York State Dormitory Authority, Series A 5.000%, 12/15/25 | 8,645,000 | 9,984,888 | ||||||
New York State Dormitory Authority, Series A 5.000%, 12/15/27 | 5,640,000 | 6,502,582 | ||||||
New York State Dormitory Authority, Series D 5.000%, 02/15/27 | 5,800,000 | 7,129,592 | ||||||
New York State Dormitory Authority, Series D 5.000%, 02/15/27 | 5,395,000 | 6,079,248 | ||||||
New York State Dormitory Authority, Series E 5.000%, 03/15/32 | 8,370,000 | 10,027,930 | ||||||
New York State Urban Development Corp., Personal Income Tax Revenue, Series A 5.000%, 03/15/24 | 5,000,000 | 5,915,200 | ||||||
Triborough Bridge & Tunnel Authority, MTA Bridge And Tunnel 5.000%, 11/15/27 | 13,845,000 | 17,476,267 | ||||||
Total New York | 173,377,056 | |||||||
North Carolina - 4.6% | ||||||||
North Carolina Municipal Power Agency No. 1, Electric, Power and Light Revenue, Series A 5.000%, 01/01/27 | 5,025,000 | 6,047,236 | ||||||
North Carolina State Limited Obligation, Series A 5.000%, 06/01/26 | 10,515,000 | 13,083,919 | ||||||
North Carolina State Limited Obligation, Series B 5.000%, 05/01/28 | 15,010,000 | 18,607,747 | ||||||
North Carolina State Limited Obligation, Series C 5.000%, 05/01/23 | 5,020,000 | 5,840,820 | ||||||
The accompanying notes are an integral part of these financial statements.
17
Table of Contents
AMG GW&K Municipal Bond Fund
Schedule of Portfolio Investments (continued)
| Principal Amount | Value | |||||||
North Carolina - 4.6% (continued) | ||||||||
The Charlotte-Mecklenburg Hospital Authority, Carolinas Healthcare System 5.000%, 01/15/25 | $ | 5,000,000 | $ | 5,997,700 | ||||
Total North Carolina | 49,577,422 | |||||||
Ohio - 3.5% | ||||||||
Ohio State General Obligation, Cleveland Clinic Health 5.000%, 01/01/28 | 3,520,000 | 4,389,229 | ||||||
Ohio State General Obligation, Series A 5.000%, 09/01/26 | 7,040,000 | 8,730,656 | ||||||
Ohio State General Obligation, University & College Improvements, Series C 5.000%, 11/01/26 | 5,000,000 | 6,025,100 | ||||||
Ohio Water Development Authority, Water Pollution Control Loan Fund 5.000%, 06/01/23 | 5,035,000 | 5,870,608 | ||||||
Ohio Water Development Authority, Water Pollution Control Loan Fund, Series 2015A 5.000%, 06/01/25 | 10,050,000 | 12,194,067 | ||||||
Total Ohio | 37,209,660 | |||||||
Oklahoma - 1.4% | ||||||||
Grand River Dam Authority, Series A 5.000%, 06/01/28 | 7,820,000 | 9,575,825 | ||||||
Oklahoma Turnpike Authority, Series A 5.000%, 01/01/26 | 5,000,000 | 5,462,850 | ||||||
Total Oklahoma | 15,038,675 | |||||||
Pennsylvania - 0.8% | ||||||||
Lancaster County Hospital Authority, University of Pennsylvania Health Revenue 5.000%, 08/15/26 | 6,730,000 | 8,202,322 | ||||||
Tennessee - 0.8% | ||||||||
State of Tennessee Fuel Sales Tax Revenue, Series B 5.000%, 09/01/26 | 7,365,000 | 8,843,156 | ||||||
Texas - 10.2% | ||||||||
Central Texas Turnpike System Transportation Commission, Series C 5.000%, 08/15/31 | 11,175,000 | 12,802,639 | ||||||
City of Austin TX Water & Wastewater System Revenue 5.000%, 11/15/26 | 5,085,000 | 6,290,755 | ||||||
City of San Antonio TX Electric & Gas Systems Revenue 5.000%, 02/01/26 | 9,300,000 | 11,386,920 | ||||||
Humble Independent School District, Series B 5.000%, 02/15/23 | 5,610,000 | 6,474,725 | ||||||
Metropolitan Transit Authority of Harris County, Series A 5.000%, 11/01/24 | 5,000,000 | 5,966,800 | ||||||
North Texas Municipal Water District Water System Revenue, Refunding And Improvement 5.000%, 09/01/29 | 5,035,000 | 6,083,740 | ||||||
North Texas Tollway Authority Revenue, Special Projects System, 1st Tier, Series A 5.000%, 01/01/25 | 6,370,000 | 7,444,492 | ||||||
North Texas Tollway Authority, 2nd Tier, Series B 5.000%, 01/01/31 | 2,000,000 | 2,353,940 | ||||||
North Texas Tollway Authority, 2nd Tier, Series B 5.000%, 01/01/32 | 4,000,000 | 4,751,400 | ||||||
North Texas Tollway Authority, Series A 5.000%, 01/01/26 | 7,775,000 | 9,076,924 | ||||||
State of Texas, Transportation Commission Highway Improvements Revenue 5.000%, 04/01/25 | 4,950,000 | 5,603,004 | ||||||
Texas A&M University, Financing System, Series E 5.000%, 05/15/28 | 8,740,000 | 10,876,405 | ||||||
Texas Transportation Commission Fund, Series A 5.000%, 04/01/27 | 12,550,000 | 14,161,671 | ||||||
The University of Texas System, Series H 5.000%, 08/15/26 | 5,045,000 | 6,241,876 | ||||||
Total Texas | 109,515,291 | |||||||
Virginia - 1.7% | ||||||||
Virginia College Building Authority, Series B 5.000%, 09/01/23 | 5,350,000 | 6,245,430 | ||||||
Virginia Public Building Authority, Series B 5.000%, 08/01/25 | 9,750,000 | 11,827,627 | ||||||
Total Virginia | 18,073,057 | |||||||
Washington - 7.2% | ||||||||
City of Seattle WA Municipal Light & Power Revenue, Series B 5.000%, 02/01/23 | 4,620,000 | 4,929,910 | ||||||
County of King WA Sewer Revenue, Series B 5.000%, 01/01/24 | 3,085,000 | 3,377,211 | ||||||
Energy Northwest Electric Revenue, Bonneville Power 5.000%, 07/01/25 | 10,000,000 | 12,148,100 | ||||||
State of Washington School Improvements, Series C 5.000%, 02/01/28 | 5,940,000 | 7,198,864 | ||||||
State of Washington, Series R-2015C 5.000%, 07/01/28 | 10,000,000 | 11,941,900 | ||||||
State of Washington, Water Utility Improvements Revenue, Series 2013 A 5.000%, 08/01/25 | 11,925,000 | 13,588,895 | ||||||
University of Washington, University & College Improvements Revenue, Series A 5.000%, 12/01/32 | 5,760,000 | 6,949,785 | ||||||
The accompanying notes are an integral part of these financial statements.
18
Table of Contents
AMG GW&K Municipal Bond Fund
Schedule of Portfolio Investments (continued)
| Principal Amount | Value | |||||||
Washington - 7.2% (continued) | ||||||||
University of Washington, University & College Improvements Revenue, Series C 5.000%, 07/01/27 | $ | 7,270,000 | $ | 8,338,981 | ||||
Washington Health Care Facilities Authority Multicare Health System, Series B 5.000%, 08/15/23 | 3,940,000 | 4,578,556 | ||||||
Washington Health Care Facilities Authority Providence Health & Services, Series A 5.000%, 10/01/26 | 3,435,000 | 3,926,377 | ||||||
Total Washington | 76,978,579 | |||||||
Wisconsin - 1.2% | ||||||||
Wisconsin State Revenue, Department of Transportation, Series 1 5.000%, 07/01/25 | 2,370,000 | 2,755,623 | ||||||
Wisconsin State Revenue, Department of Transportation, Series A 5.000%, 07/01/24 | 5,000,000 | 5,963,000 | ||||||
Wisconsin State, Series 2 5.000%, 05/01/24 | 3,570,000 | 4,037,134 | ||||||
Total Wisconsin | 12,755,757 | |||||||
Total Municipal Bonds (Cost $1,052,404,795) | 1,058,730,622 | |||||||
| Shares | ||||||||
Short-Term Investments - 0.1% | ||||||||
Other Investment Companies - 0.1% | ||||||||
Dreyfus Preferred Government Money Market Fund, Institutional Class Shares, 1.25% 2 | 688,075 | 688,075 | ||||||
Total Short-Term Investments (Cost $688,074) | 688,075 | |||||||
Total Investments - 98.6% (Cost $1,053,092,869) | 1,059,418,697 | |||||||
Other Assets, less Liabilities - 1.4% | 15,493,010 | |||||||
Net Assets - 100.0% | $ | 1,074,911,707 | ||||||
| 1 | Certain variable rate securities are not based on a published reference rate and spread but are determined by the issuer or agent and are based on current market conditions. These securities do not indicate a reference rate and spread in their description above. |
| 2 | Yield shown represents the December 31, 2017, seven day average yield, which refers to the sum of the previous seven days’ dividends paid, expressed as an annual percentage. |
COPS Certificates of Participation
The following table summarizes the inputs used to value the Fund’s investments by the fair value hierarchy levels as of December 31, 2017:
| Level 1 | Level 2 | Level 3 | Total | |||||||||||||
Investments in Securities | ||||||||||||||||
Municipal Bonds† | — | $ | 1,058,730,622 | — | $ | 1,058,730,622 | ||||||||||
Short-Term Investments | $ | 688,075 | — | — | 688,075 | |||||||||||
|
|
|
|
|
|
|
| |||||||||
Total Investments in Securities | $ | 688,075 | $ | 1,058,730,622 | — | $ | 1,059,418,697 | |||||||||
|
|
|
|
|
|
|
| |||||||||
| † | All municipal bonds held in the Fund are Level 2 securities. For a detailed breakout of municipal bonds by major classification, please refer to the Fund’s Schedule of Portfolio Investments. |
As of December 31, 2017, the Fund had no transfers between levels from the beginning of the reporting period.
The accompanying notes are an integral part of these financial statements.
19
Table of Contents
AMG GW&K Municipal Enhanced Yield Fund
Portfolio Manager’s Comments (unaudited)
THE YEAR IN REVIEW
For the year ended December 31, 2017, the AMG GW&K Municipal Enhanced Yield Fund (Class N) (the Fund) returned 9.51%, modestly outperforming the Bloomberg Barclays Municipal Bond BAA Index, which returned 8.74%.
Municipals posted solid returns in the first quarter amid a backdrop of uncertainty regarding U.S. Federal Reserve (Fed) policy and the so-called reflation trade. Right out of the gates, retail investors favored the perceived haven of shorter municipal bonds, driving down yields at the front end of the curve, even while similar maturities in the Treasury market remained steady. It was a dynamic that played out over the quarter, the municipal bond curve steepening significantly, the Treasury curve modestly flattening. And while sentiment was cautious, that was actually an upgrade over the panic selling that followed November’s election and lasted into year-end. The heavy mutual fund outflows during that stretch reversed in January, removing a major source of selling pressure and helping to stabilize the market.
For the second quarter, Municipals posted impressive returns driven by favorable market technicals and a broad rethink of the Trump trade. Long-term yields had already started to decline in March as political turmoil in Washington cast doubt on the likelihood of large-scale fiscal stimulus emerging any time soon. And with last November’s messy selloff fading further into memory, new cash poured into the tax-exempt market. The increased demand was met by a scarcity of supply, with new issue volume down 18% for the quarter, a product of far fewer refunding transactions. The result was a powerful rally where municipal bonds outperformed even Treasuries, which also posted solid returns for the quarter. And it occurred despite troubling industry headlines, from Puerto Rico’s bankruptcy filing to Connecticut’s triple downgrades to Illinois’ severe budget crisis. In that way, it was technicals, rather than any improvement in credit fundamentals, that made municipals one of the top performers in the fixed income universe.
Municipals performed well in the third quarter despite a late period selloff that turned outsized gains into merely respectable returns. Through the first nine weeks of the quarter, interest rates declined in a steady fashion, establishing year-to-date lows in early September. Besides saber-rattling in North Korea and violence in Spain and Charlottesville, investors were responding to uncertainty surrounding healthcare policy, an unusually active hurricane season and fears that a
divided Washington would fail to raise the debt ceiling. In addition, inflation readings continued to undershoot the Fed’s target, casting doubt on the central bank’s forecast of future rate increases.
Municipal bonds posted mixed returns in the fourth quarter amid a significant flattening of the yield curve. Front-end rates pushed sharply higher, driven by further tightening of Fed policy and investor repositioning ahead of major tax reform. Long municipal bonds, meanwhile, rallied on benign inflation data and the expectation of a supply drought in the coming months. As a consequence, the slope of the municipal curve nearly halved over the quarter, from 1.84% to 0.98%, its lowest level since 2007.
At the start of the fourth quarter, there were few signs the market would experience any sort of upheaval before year end. Supply projections were modest, headline risks were dormant and word out of Washington was that the municipal bond exemption would be fully shielded from tax reform. Instead, we had weeks of sloppy trading on record volume after the House of Representatives proposed, in early November, to strip the tax exemption from private activity bonds (PABs) and advance refunding transactions. These two areas collectively account for over a quarter of municipal supply. A week later, the Senate released a more municipal-bond-friendly version, which protected PABs but kept advance refundings on the chopping block. Unsure of how the final bill would read, 501(c)(3) issuers, including hospitals and private universities, flooded the market with PABs in case the window closed. In addition, traditional issuers stuffed the remaining calendar with advance refunding deals. The result was a historic slate of issuance, with December volume breaking a single-month record set just before the Tax Reform Act of 1986 took effect.
On the demand side, buyers were just as anxious to transact while bonds were still available. Even though PABs ultimately survived in the final tax bill, advance refundings did not. Issuance is expected to drop dramatically in the first half of 2018 because so many borrowers rushed to market in the last six weeks of the year. To participate in the surge, many sold shorter bonds to raise cash, putting upward pressure on front-end yields, particularly in late November. As the record volume hit the street in mid-December, deals were taken down with only minimal concessions. In the final week of the year, after the new issue pipeline had largely dried up, municipal bonds rallied hard as opportunistic traders marked up bonds and resold them to a market looking to get invested before origination became
scarce. From a high of 2.21% in late November, the yield on 10-year municipal bonds dropped 23 basis points to close 2017 at 1.98%, essentially unchanged for the fourth quarter but down 33 basis points for the year as a whole.
PERFORMANCE
The Fund outperformed its benchmark for the fiscal year ended December 31, 2017. An overweight to longer maturities was a positive as interest rates declined and the yield curve flattened during the year. Credit spreads tightened, which negatively impacted the Fund’s relative performance. The Fund has over 40% of its holdings in credits rated A or higher, which underperformed the BBB rated bonds in the Index.
Looking forward, it appears the municipal market has survived tax reform with only minor bumps and bruises. The most important takeaway is that the tax exemption remains in place. To be sure, there will be shifting sands ahead, requiring some adjustments to the way the market is traded. The loss of advance refundings means the end of newly minted prerefunded paper, an outcome that will lessen supply over the next couple of years. The lower marginal rate for corporations will likely reduce demand for municipal bonds from banks and insurance companies. The significant limitation of the state and local tax deduction will push tax-equivalent hurdles higher, making in-state bonds more attractive to resident investors. Potentially this could lead to wealth flight from high-tax jurisdictions, a development that bears watching. In the immediate future, however, the plunge in supply expected over the first half of 2018 should provide a technical tailwind that eclipses other factors. While much will depend on the movement of Treasury yields, municipal bonds look poised to start the new year from a position of strength.
FUND PORTFOLIO
We remain active on the long end of the yield curve in the Fund with over 80% invested in maturities greater than 20 years. The volume was primarily focused on relative value trading as opposed to curve trades that you would see more in an intermediate bond fund, as the yield curve is relatively flat in the 25–30 year range. We continue to avoid local general obligation bonds (GOs) and focus on the hospital and transportation sectors.
This commentary reflects the viewpoints of the portfolio manager, GW&K Investment Management, LLC as of December 31, 2017, and is not intended as a forecast or guarantee of future results, and is subject to change without notice.
20
Table of Contents
AMG GW&K Municipal Enhanced Yield Fund
Portfolio Manager’s Comments (continued)
CUMULATIVE TOTAL RETURN PERFORMANCE
AMG GW&K Municipal Enhanced Yield Fund’s cumulative total return is based on the daily change in net asset value (NAV), and assumes that all dividends and distributions were reinvested. This graph compares a hypothetical $10,000 investment made in the Fund’s Class I (formerly Class S) shares on December 31, 2007, to a $10,000 investment made in the Bloomberg Barclays U.S. Municipal Bond BAA Index for the same time period. The graph and table do not reflect the deduction of taxes that a shareholder would pay on a Fund distribution or redemption of shares. The listed returns for the Fund are net of expenses and the returns for the index exclude expenses. Total returns would have been lower had certain expenses not been reduced.
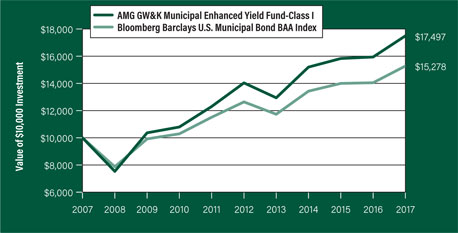
The table below shows the average annual total returns for the AMG GW&K Municipal Enhanced Yield Fund and the Bloomberg Barclays U.S. Municipal Bond BAA Index for the same time periods ended December 31, 2017.
| Average Annual Total Returns1 | One Year | Five Years | Ten Years | Since Inception | Inception Date | |||||||||||||||
AMG GW&K Municipal Enhanced Yield Fund2, 3, 4, 5, 6, 7 |
| |||||||||||||||||||
Class N | 9.51 | % | 4.04 | % | - | 7.14 | % | 07/27/09 | ||||||||||||
Class I8 | 9.79 | % | 4.51 | % | 5.76 | % | 4.95 | % | 12/30/05 | |||||||||||
Class Z | - | - | - | 8.23 | % | 02/24/17 | ||||||||||||||
Bloomberg Barclays U.S. Municipal Bond BAA Index9 | 8.74 | % | 3.87 | % | 4.33 | % | 3.99 | % | 12/30/05 | † | ||||||||||
The performance data shown represents past performance. Past performance is not a guarantee of future results. Current performance may be lower or higher than the performance data quoted. The investment return and principal value of an investment will fluctuate so that an investor’s shares, when redeemed, may be worth more or less than their original cost.
Investors should carefully consider the Fund’s investment objectives, risks, charges and expenses before investing. For performance information through the most recent month end, current net asset values per share for the Fund and other information, please call 800.835.3879 or visit our website at amgfunds.com for a free prospectus. Read it carefully before investing or sending money.
Distributed by AMG Distributors, Inc., member FINRA/SIPC.
| † | Date reflects the inception date of the Fund, not the index. |
| 1 | Total return equals income yield plus share price change and assumes reinvestment of all dividends and capital gain distributions. Returns are net of fees and may reflect offsets of Fund expenses as described in the prospectus. No adjustment has been made for taxes payable by shareholders on their reinvested dividends and capital gain distributions. Returns for periods greater than one year are annualized. The listed returns on the Fund are net of expenses and based on the published NAV as of December 31, 2017. All returns are in U.S. dollars ($). |
| 2 | From time to time, the Fund’s advisor has waived its fees and/or absorbed Fund expenses, which has resulted in higher returns. |
| 3 | The Fund is subject to the risks associated with investments in debt securities, such as default risk and fluctuations in the perception of the debtor’s ability to pay its creditors. Changing interest rates may adversely affect the value of an investment. An increase in interest rates typically causes the value of bonds and other fixed income securities to fall. High-yield bonds (also known as “junk bonds”) may be subject to greater levels of interest rate, credit, and liquidity risk than investments in higher rated securities. These securities are considered predominantly speculative with respect to the issuer’s continuing ability to make principal and interest payments. The issuers of the Fund’s holdings may be involved in bankruptcy proceedings, reorganizations, or financial restructurings, and are not as strong financially as higher-rated issuers. |
| 4 | The use of leverage in a Fund’s strategy, such as futures and forward commitment transactions, can magnify relatively small market movements into relatively larger losses for the Fund. |
| 5 | Factors unique to the municipal bond market may negatively affect the value in municipal bonds. |
| 6 | Investment income may be subject to certain state and local taxes, and depending on your tax status, the federal alternative minimum tax. Capital gains are not exempt from federal income tax. |
| 7 | The performance shown includes that of the predecessor Fund, the BNY Hamilton Municipal Enhanced Yield Fund, a series of BNY Hamilton Funds, Inc., which was reorganized into the GW&K Municipal Enhanced Yield Fund, a series of AMG Funds, as of the close of business on November 7, 2008. |
| 8 | Effective June 23, 2017 Class S shares were converted to Class I shares. |
| 9 | The Bloomberg Barclays U.S. Municipal Bond BAA Index is a subset of the Boomberg Barclays U.S. Municipal Bond Index with an index rating of Baa1, Baa2, or Baa3. The Bloomberg Barclays U.S. Municipal Bond Index is a rules-based, market-value-weighted index engineered for the long-term, tax-exempt bond market. Unlike the Fund, the Bloomberg Barclays U.S. Municipal Bond BAA Index is unmanaged, is not available for investment and does not incur expenses. |
Not FDIC insured, nor bank guaranteed. May lose value.
21
Table of Contents
AMG GW&K Municipal Enhanced Yield Fund
Fund Snapshots (unaudited)
December 31, 2017
PORTFOLIO BREAKDOWN
| % of | ||||
Category | Net Assets | |||
Healthcare | 31.2 | % | ||
Transportation | 31.0 | % | ||
Utilities | 6.8 | % | ||
General Obligation | 6.4 | % | ||
Education | 5.4 | % | ||
Tax | 4.9 | % | ||
Public Services | 3.9 | % | ||
Other | 3.4 | % | ||
State and Non-State Appropriated Tobacco | 2.3 | % | ||
Industrial Development | 2.0 | % | ||
Other Assets & Liabilities | 2.7 | % | ||
Rating | % of Market Value* | |||
Aa | 9.8 | |||
A | 39.2 | |||
Baa | 46.0 | |||
Ba | 5.0 | |||
| * | Includes market value of fixed-income securities only. |
TOP TEN HOLDINGS
Security Name | % of Net Assets | |||
New York Transportation Development Corp., Laguardia Airport Terminal B, Revenue, 5.000%, 07/01/46 | 3.7 | |||
New Hampshire Health and Education Facilities Authority Act, Partners Healthcare System, Revenue, 5.000%, 07/01/41 | 3.5 | |||
Central Texas Turnpike System, Series C, Revenue, 5.000%, 08/15/42 | 3.3 | |||
Alachua County Health Facilities Authority, Shands Teaching Hospital & Clinics, Series A, Revenue, 5.000%, 12/01/44 | 3.1 | |||
Metropolitan Pier and Exposition Authority Revenue, McCormick Place Expansion Project, Series B, Revenue, 5.000%, 06/15/52 | 2.6 | |||
Michigan Finance Authority, Henry Ford Health System, Revenue, 5.000%, 11/15/41 | 2.6 | |||
State of California, General Obligation, 5.000%, 11/01/47 | 2.5 | |||
Railsplitter Tobacco Settlement Authority, Revenue, 5.000%, 06/01/26 | 2.5 | |||
North Texas Tollway Authority, Second Tier, Series B, Revenue, 5.000%, 01/01/48 | 2.5 | |||
Miami Beach Health Facilities Authority, Mt. Sinai Medical Center, Revenue, 5.000%, 11/15/39 | 2.4 | |||
|
| |||
Top Ten as a Group | 28.7 | |||
|
| |||
Credit quality ratings shown above reflect the highest rating assigned by either Standard & Poor’s (“S&P”) or Moody’s Investors Service, Inc. (“Moody’s”). These rating agencies are independent, nationally recognized statistical rating organizations and are widely used. Investment grade ratings are credit ratings of BBB/Baa or higher. Below investment grade ratings are credit ratings of BB/Ba or lower. Investments designated N/R are not rated by either rating agency. Unrated investments do not necessarily indicate low credit quality. Credit quality ratings are subject to change.
Because a fund’s strategy may result in multiple investments in particular sectors of the economy, its performance may depend on the performance of those sectors and may fluctuate more widely than investments diversified across more sectors. For additional information on these and other risk considerations, please see the Fund’s prospectus.
Any sectors, industries, or securities discussed should not be perceived as investment recommendations. Mention of a specific security should not be considered a recommendation to buy or solicitation to sell that security. Specific securities mentioned in this report may have been sold from the Fund’s portfolio of investments by the time you receive this report.
22
Table of Contents
AMG GW&K Municipal Enhanced Yield Fund
Schedule of Portfolio Investments
December 31, 2017
| Principal Amount | Value | |||||||
Municipal Bonds - 97.3% | ||||||||
California - 8.0% | ||||||||
California Municipal Finance Authority, Community Medical Centers, Series A 5.000%, 02/01/47 | $ | 4,000,000 | $ | 4,580,840 | ||||
California Municipal Finance Authority, Community Medical Centers, Series A 5.000%, 02/01/42 | 2,500,000 | 2,862,625 | ||||||
M-S-R Energy Authority, Natural Gas Revenue, Series C 6.500%, 11/01/39 | 3,660,000 | 5,376,320 | ||||||
State of California 5.000%, 11/01/47 | 5,000,000 | 6,010,600 | ||||||
Total California | 18,830,385 | |||||||
Colorado - 1.8% | ||||||||
Public Authority for Colorado Energy Natural Gas Purchase Revenue, Series 2008 6.500%, 11/15/38 | 2,915,000 | 4,207,598 | ||||||
Florida - 11.6% | ||||||||
Alachua County Health Facilities Authority, | ||||||||
Shands Teaching Hospital & Clinics, Series A 5.000%, 12/01/44 | 6,570,000 | 7,337,770 | ||||||
County of Miami - Dade FL Aviation Revenue 5.000%, 10/01/41 | 2,000,000 | 2,349,260 | ||||||
County of Miami - Dade FL Aviation Revenue, Series B 5.000%, 10/01/40 | 2,000,000 | 2,352,360 | ||||||
Martin County Health Facilities Authority, Martin Memorial Medical Center 5.500%, 11/15/42 | 4,430,000 | 4,899,536 | ||||||
Miami Beach Health Facilities Authority, Mt. Sinai Medical Center 5.000%, 11/15/39 | 5,220,000 | 5,713,969 | ||||||
Orange County Health Facilities Authority, | ||||||||
Orlando Health Inc., Series A 5.000%, 10/01/39 | 4,035,000 | 4,618,824 | ||||||
Total Florida | 27,271,719 | |||||||
Illinois - 14.5% | ||||||||
Chicago O’Hare International Airport, Refunding | ||||||||
General Senior Lien, Series B 5.000%, 01/01/41 | 2,000,000 | 2,303,940 | ||||||
Illinois State General Obligation 5.500%, 07/01/38 | 3,275,000 | 3,553,801 | ||||||
Illinois State General Obligation, Series D 5.000%, 11/01/26 | 5,000,000 | 5,493,350 | ||||||
Illinois State Toll Highway Authority, Series B 5.000%, 01/01/40 | 1,675,000 | 1,932,129 | ||||||
Metropolitan Pier and Exposition Authority | ||||||||
Revenue, McCormick Place Expansion Project, Series 2012 A 5.000%, 06/15/42 | 4,990,000 | 5,260,109 | ||||||
Metropolitan Pier and Exposition Authority | ||||||||
Revenue, McCormick Place Expansion Project, Series B 5.000%, 06/15/52 | 5,910,000 | 6,207,627 | ||||||
Railsplitter Tobacco Settlement Authority 5.000%, 06/01/26 | 5,000,000 | 5,815,050 | ||||||
Railsplitter Tobacco Settlement Authority 5.000%, 06/01/27 | 3,000,000 | 3,484,170 | ||||||
Total Illinois | 34,050,176 | |||||||
Kentucky - 1.2% | ||||||||
Louisville/Jefferson County Metropolitan Government, Norton Healthcare Inc. 5.000%, 10/01/33 | 2,500,000 | 2,909,675 | ||||||
Louisiana - 2.6% | ||||||||
Louisiana Public Facilities Authority, Ochsner Clinic Foundation 5.000%, 05/15/47 | 3,385,000 | 3,793,739 | ||||||
New Orleans Aviation Board, General Airport North Terminal, Series B 5.000%, 01/01/48 | 2,000,000 | 2,297,980 | ||||||
Total Louisiana | 6,091,719 | |||||||
Massachusetts - 3.4% | ||||||||
Massachusetts Development Finance Agency, UMass Boston Student Housing 5.000%, 10/01/48 | 5,000,000 | 5,540,650 | ||||||
Massachusetts Development Finance Agency, UMass Boston Student Housing 5.000%, 10/01/41 | 2,250,000 | 2,496,870 | ||||||
Total Massachusetts | 8,037,520 | |||||||
Michigan - 4.6% | ||||||||
Michigan Finance Authority, Henry Ford Health System 5.000%, 11/15/41 | 5,315,000 | 6,021,948 | ||||||
Michigan Finance Authority, Hospital Trinity Health Credit 5.000%, 12/01/37 | 4,000,000 | 4,718,960 | ||||||
Total Michigan | 10,740,908 | |||||||
Nebraska - 1.6% | ||||||||
Central Plains Energy Project, Project #3, Series A 5.000%, 09/01/42 | 3,000,000 | 3,867,810 | ||||||
New Hampshire - 3.5% | ||||||||
New Hampshire Health and Education Facilities Authority Act, Partners Healthcare System 5.000%, 07/01/41 | 7,000,000 | 8,254,190 | ||||||
The accompanying notes are an integral part of these financial statements.
23
Table of Contents
AMG GW&K Municipal Enhanced Yield Fund
Schedule of Portfolio Investments (continued)
| Principal Amount | Value | |||||||
New Jersey - 9.0% | ||||||||
New Jersey Economic Development Authority, Series DDD 5.000%, 06/15/42 | $ | 3,350,000 | $ | 3,674,950 | ||||
New Jersey Economic Development Authority, School Facilities Construction 5.000%, 03/01/25 | 5,205,000 | 5,688,701 | ||||||
New Jersey Economic Development Authority, UMM Energy Partners, Series 2012 A 5.125%, 06/15/43 | 4,450,000 | 4,666,937 | ||||||
New Jersey Health Care Facilities Financing Authority, RWJ Barnabas Health Obligation 5.000%, 07/01/43 | 4,605,000 | 5,284,514 | ||||||
New Jersey Transportation Trust Fund Authority, | ||||||||
Federal Highway Reimbursement Notes 5.000%, 06/15/27 | 1,695,000 | 1,946,351 | ||||||
Total New Jersey | 21,261,453 | |||||||
New York - 6.0% | ||||||||
New York State Dormitory Authority, The New School Project, Series A 5.000%, 07/01/46 | 3,000,000 | 3,467,370 | ||||||
New York Transportation Development Corp., Laguardia Airport Terminal B 5.000%, 07/01/46 | 8,000,000 | 8,798,880 | ||||||
Port Authority of New York and New Jersey Special Project, JFK International Air Terminal LLC Project, Series 2010 6.000%, 12/01/42 | 1,580,000 | 1,758,303 | ||||||
Total New York | 14,024,553 | |||||||
Rhode Island - 2.3% | ||||||||
Tobacco Settlement Financing Corp., Series A 5.000%, 06/01/35 | 2,000,000 | 2,186,100 | ||||||
Tobacco Settlement Financing Corp., Series A 5.000%, 06/01/40 | 3,045,000 | 3,283,058 | ||||||
Total Rhode Island | 5,469,158 | |||||||
Texas - 15.7% | ||||||||
Central Texas Regional Mobility Authority 5.000%, 01/01/46 | 3,750,000 | 4,248,263 | ||||||
Central Texas Regional Mobility Authority 5.000%, 01/01/40 | 4,550,000 | 5,175,261 | ||||||
Central Texas Turnpike System, Series C 5.000%, 08/15/42 | 6,915,000 | 7,730,348 | ||||||
Grand Parkway Transportation Corp., 1st Tier Toll Revenue, Series A 5.500%, 04/01/53 | 3,960,000 | 4,523,548 | ||||||
North Texas Tollway Authority, Second Tier, Series B 5.000%, 01/01/48 | 5,000,000 | 5,800,300 | ||||||
Texas Municipal Gas Acquisition & Supply Corp., Gas Supply Revenue, Senior Lien Series 2008 D 6.250%, 12/15/26 | 2,135,000 | 2,567,209 | ||||||
Texas Private Activity Bond Surface Transportation Corp., Senior Lien-Blueridge Transport 5.000%, 12/31/40 | 2,400,000 | 2,679,288 | ||||||
Texas Private Activity Bond Surface Transportation Corp., Senior Lien-Blueridge Transport 5.000%, 12/31/45 | 3,790,000 | 4,216,981 | ||||||
Total Texas | 36,941,198 | |||||||
Virginia - 6.3% | ||||||||
Chesapeake Bay Bridge & Tunnel District, First Tier General Resolution Revenue 5.000%, 07/01/46 | 4,755,000 | 5,387,225 | ||||||
Chesapeake City Expressway Toll Road Revenue, Series 2012 A 5.000%, 07/15/47 | 3,010,000 | 3,279,335 | ||||||
Virginia Small Business Financing Authority, Transform 66 P3 Project 5.000%, 12/31/49 | 2,500,000 | 2,826,500 | ||||||
Virginia Small Business Financing Authority, Transform 66 P3 Project 5.000%, 12/31/52 | 3,000,000 | 3,365,910 | ||||||
Total Virginia | 14,858,970 | |||||||
West Virginia - 2.4% | ||||||||
West Virginia Hospital Finance Authority, WV United Health System Obligation 5.500%, 06/01/44 | 5,000,000 | 5,672,050 | ||||||
Wisconsin - 2.8% | ||||||||
Wisconsin Health & Educational Facilities Authority, Ascension Health Credit Group 5.000%, 11/15/39 | 1,305,000 | 1,519,895 | ||||||
Wisconsin Health & Educational Facilities Authority, ProHealth Care Obligation Group 5.000%, 08/15/39 | 4,635,000 | 5,197,179 | ||||||
Total Wisconsin | 6,717,074 | |||||||
Total Municipal Bonds (Cost $221,249,401) | 229,206,156 | |||||||
| Shares | ||||||||
Short-Term Investments - 1.3% |
| |||||||
Other Investment Companies - 1.3% |
| |||||||
Dreyfus Government Cash Management Fund, Institutional Class Shares, 1.18% 1 | 3,096,849 | 3,096,849 | ||||||
Total Short-Term Investments (Cost $3,096,849) | 3,096,849 | |||||||
Total Investments - 98.6% (Cost $224,346,250) | 232,303,005 | |||||||
Other Assets, less Liabilities - 1.4% |
| $ | 3,270,854 | |||||
Net Assets - 100.0% | $ | 235,573,859 | ||||||
The accompanying notes are an integral part of these financial statements.
24
Table of Contents
AMG GW&K Municipal Enhanced Yield Fund
Schedule of Portfolio Investments (continued)
| 1 | Yield shown represents the December 31, 2017, seven day average yield, which refers to the sum of the previous seven days’ dividends paid, expressed as an annual percentage. |
The following table summarizes the inputs used to value the Fund’s investments by the fair value hierarchy levels as of December 31, 2017:
| Level 1 | Level 2 | Level 3 | Total | |||||||||||||
Investments in Securities | ||||||||||||||||
Municipal Bonds† | — | $ | 229,206,156 | — | $ | 229,206,156 | ||||||||||
Short-Term Investments | $ | 3,096,849 | — | — | 3,096,849 | |||||||||||
|
|
|
|
|
|
|
| |||||||||
Total Investments in Securities | $ | 3,096,849 | $ | 229,206,156 | — | $ | 232,303,005 | |||||||||
|
|
|
|
|
|
|
| |||||||||
| † | All municipal bonds held in the Fund are Level 2 securities. For a detailed breakout of municipal bonds by major classification, please refer to the Fund’s Schedule of Portfolio Investments. |
As of December 31, 2017, the Fund had no transfers between levels from the beginning of the reporting period.
The accompanying notes are an integral part of these financial statements.
25
Table of Contents
Portfolio Manager’s Comments (unaudited)
THE YEAR IN REVIEW
For the year ended December 31, 2017, the AMG GW&K Small Cap Core Fund (Class N) (the Fund) returned 20.32%, outperforming the Russell 2000® Index, which returned 14.65%.
When pop star and self-proclaimed future presidential candidate Kanye West gifts shares of stock to his beloved wife for Christmas, you know that equities are most certainly in vogue. Sure enough, the headline from the Wall Street Journal’s year-end review stated: “U.S. Stocks Wrap Up Strong 2017.” Strong is certainly one adjective to describe the equity markets but it doesn’t fully capture the environment. One would have to mention descriptors like resilient, consistent or unidirectional to reflect the fact that the S&P 500® Index rose every month of 2017, a feat that has never before happened. One would have to mention how quiet the markets were, scraping record low volatility measures for a good portion of the year. And one would have to mention how a few narrow groups, like FANG (Facebook, Apple, Netflix & Google) stocks in large caps, or biotech and software in small caps, delivered particularly strong performance. These were all important characteristics of the U.S. equity market in 2017, but they don’t speak to the overall health of the market and the likelihood that 2018 and beyond will or won’t offer attractive returns. The answer to this question comes from the fundamental backdrop for the economy, corporate profits, inflation, interest rates and investor psychology. Is there enough good news in these areas that investors will continue to buy equities? Or will Kim Kardashian and other equity investors consider their 2017 gifts to more closely resemble lumps of coal than thoughtfully wrapped packages? After reviewing performance for the quarter and year, we will attempt to explain why we think the risk reward is still favorable for small cap equities as we look out over the next three to five years.
The Russell 2000® Index finished up 3.3% for the fourth quarter, marking its seventh consecutive positive quarterly return. For the full year the Index was up 14.7%. The last meaningful drawdown the Index experienced was in the third quarter of 2015, nearly two and a half years ago. On a style basis, Growth beat Value during the quarter (4.6% vs. 2.1%) and trounced it over the full year (22.2% vs. 7.8%) as measured by the Russell 2000® Growth and Russell 2000® Value Indices, respectively.
Results were mixed between high and low quality factors for both the quarter and year. For the quarter, larger small caps outperformed microcaps and high
return on equity (ROE) stocks outperformed those with low ROE. However, negative equity stocks outperformed, as did those in the highest debt and earnings variability quintiles. For the year, results were even a bit skewed toward low quality stocks, although with many mixed signals from the data. The most visible themes for the year emerged from the outperformance of non-earners, negative ROE, and high beta low quality groups.
On a sector basis, growth styles and cyclical acceleration generally led the Index while more stable and yield-oriented sectors lagged the market. This was particularly true earlier in the year and waned a bit during the fourth quarter. For the year, health care was the best performing sector, driven by the aforementioned strength in biotech. Industrials, information technology and materials also performed well. Energy was the only negative sector, but laggards included consumer staples, telecommunication services, real estate and financials.
For the quarter, consumer discretionary and consumer staples led the way, followed by a rebounding energy sector and industrials. Telecommunications services, real estate, information technology and utilities were the worst performers for the period. The most interesting change in the quarter, relative to the full year, was the flip of energy to the top and information technology to the bottom, as investors had exhausted themselves from either loving or hating each earlier in the year.
The Fund had strong outperformance relative to the benchmark during the year. By any account, this was a very strong year on both a relative and absolute level. It goes without saying that many things in the stock selection column went well for us and it would be a far shorter list to describe where we faltered. Four sectors delivered over 100 basis points of outperformance, including information technology which generated 280 basis points. The selection was so good in this sector that only two of our 13 full year holdings did not outperform the benchmark and only one had a negative return. Five holdings were up close to 50% or greater, one of which more than doubled during the year. Industrials, consumer discretionary and financials all contributed meaningfully, and again, broadly good stock selection was the driver. Energy and consumer staples also added 100 basis points between them, which was impressive given that combined they accounted for less than 5% of the Fund. On the
negative side, our cash position was a drag of about 30 basis points, as was modest underperformance in the materials sector. The only significant issue during the year came from health care, which was a detractor to the tune of 140 basis points. The strong performance of and our lack of exposure to biotech (-170 basis points) caused all the damage.
Regardless of whether you are Kim Kardashian or any other normal equity investor, you have read all the headlines about record highs in the various indices, extended valuations and elongated market upcycles. A rational investor would ask whether the future holds potential for more risk than reward, as over the last five years small caps have compounded at a 14% annual rate and the S&P 500® Index was up over 15.5% annualized. However, we would point out the strength of the current macroeconomic cycle, which is visible in the employment data, industrial production, consumer spending and the various Institute for Supply Management (ISM) survey data. In addition, we are about to pile on tax cuts and further business optimism resulting from lower taxes and deregulation. Two factors are likely to sustain the cycle even further: 1) that the cycle thus far has been a very slow and much doubted climb off the 2009 bottom, and 2) many facets of the economy have yet to be touched by the recovery. In fact, if wage growth and tax cuts occur simultaneously, we could see it self-reinforce in 2018 and into 2019. We believe the most prudent expectation is for corporate earnings growth in the mid-teens and equity returns in the high single digits for 2018. Which, of course, means this will decidedly NOT be the outcome. Risks remain both to the upside and downside. In our opinion, the greatest risk to the downside comes from complacency and the firmly held consensus view that the economy is accelerating and inflation and interest rates will remain in check. The rate increases the Fed has executed and plans to execute could have an unforeseen impact on the capital markets. Yet upside risks are perhaps more likely, as an accelerating economy combines with tax cuts and improving growth prospects outside the U.S. If Kayne wants to give us some gift wrapped stock certificates at Christmas next year, we will be very grateful and be sure to send a thank you note.
This commentary reflects the viewpoints of the portfolio manager, GW&K Investment Management, LLC as of December 31, 2017 and is not intended as a forecast or guarantee of future results, and is subject to change without notice.
26
Table of Contents
AMG GW&K Small Cap Core Fund
Portfolio Manager’s Comments (continued)
CUMULATIVE TOTAL RETURN PERFORMANCE
AMG GW&K Small Cap Core Fund’s cumulative total return is based on the daily change in net asset value (NAV), and assumes that all dividends and distributions were reinvested. This graph compares a hypothetical $10,000 investment made in the Fund’s Class N shares on December 31, 2007, to a $10,000 investment made in the Russell 2000® Index for the same time period. The graph and table do not reflect the deduction of taxes that a shareholder would pay on a Fund distribution or redemption of shares. The listed returns for the Fund are net of expenses and the returns for the index exclude expenses. Total returns would have been lower had certain expenses not been reduced.
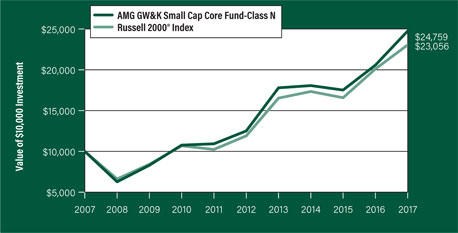
The table below shows the average annual total returns for the AMG GW&K Small Cap Core Fund and the Russell 2000® Index for the same time periods ended December 31, 2017.
| Average Annual Total Returns1 | One Year | Five Years | Ten Years | Since Inception | Inception Date | |||||||||||||||
AMG GW&K Small Cap Core Fund2, 3, 4 |
| |||||||||||||||||||
Class N | 20.32 | % | 14.63 | % | 9.49 | % | 8.60 | % | 12/10/96 | |||||||||||
Class I5 | 20.79 | % | 15.12 | % | — | 16.03 | % | 07/27/09 | ||||||||||||
Class Z | — | — | — | 14.87 | % | 02/24/17 | ||||||||||||||
Russell 2000® Index6 | 14.65 | % | 14.12 | % | 8.71 | % | 8.54 | % | 12/10/96 | † | ||||||||||
The performance data shown represents past performance. Past performance is not a guarantee of future results. Current performance may be lower or higher than the performance data quoted. The investment return and principal value of an investment will fluctuate so that an investor’s shares, when redeemed, may be worth more or less than their original cost.
Investors should carefully consider the Fund’s investment objectives, risks, charges and expenses before investing. For performance information through the most recent month end, current net asset values per share for the Fund and other information, please call 800.835.3879 or visit our website at amgfunds.com for a free prospectus. Read it carefully before investing or sending money.
Distributed by AMG Distributors, Inc., member FINRA/SIPC.
| † | Date reflects the inception date of the Fund, not the index. |
| 1 | Total return equals income yield plus share price change and assumes reinvestment of all dividends and capital gain distributions. Returns are net of fees and may reflect offsets of Fund expenses as described in the prospectus. No adjustment has been made for taxes payable by shareholders on their reinvested dividends and capital gain distributions. Returns for periods greater than one year are annualized. The listed returns on the Fund are net of expenses and based on the published NAV as of December 31, 2017. All returns are in U.S. dollars ($). |
| 2 | From time to time, the Fund’s advisor has waived its fees and/or absorbed Fund expenses, which has resulted in higher returns. |
| 3 | The Fund inception dates and returns for all periods beginning prior to November 7, 2008 reflects performance of the predecessor Fund, The BNY Hamilton Multi-Cap Equity Fund, a series of BNY Hamilton Funds, Inc. |
| 4 | The Fund is subject to risks associated with investments in small-capitalization companies, such as erratic earnings patterns, competitive conditions, limited earnings history, and a reliance on one or a limited number of products. |
| 5 | Effective June 23, 2017 Class S shares were converted to Class I shares. |
| 6 | The Russell 2000® Index is composed of the 2,000 smallest stocks in the Russell 3000® Index and is widely regarded in the industry as the premier measure of small-cap stock performance. Unlike the Fund, the Russell 2000® Index is unmanaged, is not available for investment and does not incur expenses. |
The Russell Indices are trademarks of the London Stock Exchange Group companies.
Not FDIC insured, nor bank guaranteed. May lose value.
27
Table of Contents
AMG GW&K Small Cap Core Fund
Fund Snapshots (unaudited)
December 31, 2017
PORTFOLIO BREAKDOWN
| % of | ||||
Sector | Net Assets | |||
Information Technology | 17.5 | |||
Health Care | 16.8 | |||
Industrials | 16.5 | |||
Financials | 15.9 | |||
Consumer Discretionary | 13.4 | |||
Real Estate | 6.3 | |||
Materials | 4.7 | |||
Energy | 3.0 | |||
Utilities | 2.6 | |||
Consumer Staples | 2.1 | |||
Short-Term Investments* | 5.8 | |||
Other Assets Less Liabilities** | (4.6 | ) | ||
|
| |||
| * | Includes reinvestment of cash collateral into joint repurchase agreements on security lending transactions. |
| ** | Includes repayment of cash collateral on security lending transactions. |
TOP TEN HOLDINGS
| % of | ||||
Security Name | Net Assets | |||
Grand Canyon Education, Inc. | 3.0 | |||
ICU Medical, Inc. | 2.7 | |||
LogMeIn, Inc. | 2.5 | |||
West Pharmaceutical Services, Inc. | 2.2 | |||
Lithia Motors, Inc., Class A | 2.0 | |||
Globus Medical, Inc., Class A | 2.0 | |||
Matador Resources Co. | 1.9 | |||
EPAM Systems, Inc. | 1.9 | |||
Texas Roadhouse, Inc. | 1.9 | |||
Cathay General Bancorp | 1.9 | |||
|
| |||
Top Ten as a Group | 22.0 | |||
|
| |||
Because a fund’s strategy may result in multiple investments in particular sectors of the economy, its performance may depend on the performance of those sectors and may fluctuate more widely than investments diversified across more sectors. For additional information on these and other risk considerations, please see the Fund’s prospectus.
Any sectors, industries, or securities discussed should not be perceived as investment recommendations. Mention of a specific security should not be considered a recommendation to buy or solicitation to sell that security. Specific securities mentioned in this report may have been sold from the Fund’s portfolio of investments by the time you receive this report.
28
Table of Contents
AMG GW&K Small Cap Core Fund
Schedule of Portfolio Investments
December 31, 2017
| Shares | Value | |||||||
Common Stocks - 98.8% | ||||||||
Consumer Discretionary - 13.4% | ||||||||
Five Below, Inc.* | 139,773 | $ | 9,269,745 | |||||
Grand Canyon Education, Inc.* | 181,727 | 16,270,018 | ||||||
Helen of Troy, Ltd.* | 39,739 | 3,828,853 | ||||||
Hibbett Sports, Inc.*,1 | 93,866 | 1,914,867 | ||||||
Installed Building Products, Inc.* | 65,573 | 4,980,269 | ||||||
Lithia Motors, Inc., Class A | 93,142 | 10,580,000 | ||||||
Oxford Industries, Inc. | 68,143 | 5,123,672 | ||||||
Texas Roadhouse, Inc. | 193,351 | 10,185,731 | ||||||
Tupperware Brands Corp. | 70,316 | 4,408,813 | ||||||
Wolverine World Wide, Inc. | 166,936 | 5,321,920 | ||||||
Total Consumer Discretionary | 71,883,888 | |||||||
Consumer Staples - 2.1% | ||||||||
Performance Food Group Co.* | 232,602 | 7,699,126 | ||||||
WD- 40 Co.1 | 28,832 | 3,402,176 | ||||||
Total Consumer Staples | 11,101,302 | |||||||
Energy - 3.0% | ||||||||
Dril- Quip, Inc.* | 56,069 | 2,674,491 | ||||||
Forum Energy Technologies, Inc.* | 194,466 | 3,023,947 | ||||||
Matador Resources Co.*,1 | 328,770 | 10,234,610 | ||||||
Total Energy | 15,933,048 | |||||||
Financials - 15.9% | ||||||||
Ameris Bancorp | 166,579 | 8,029,108 | ||||||
AMERISAFE, Inc. | 93,792 | 5,777,587 | ||||||
Cathay General Bancorp | 240,434 | 10,139,102 | ||||||
Cohen & Steers, Inc. | 132,333 | 6,258,028 | ||||||
Glacier Bancorp, Inc. | 206,487 | 8,133,523 | ||||||
IBERIABANK Corp. | 66,828 | 5,179,170 | ||||||
Meridian Bancorp, Inc. | 134,290 | 2,766,374 | ||||||
PRA Group, Inc.*,1 | 106,698 | 3,542,374 | ||||||
ProAssurance Corp. | 102,400 | 5,852,160 | ||||||
Stifel Financial Corp. | 129,366 | 7,705,039 | ||||||
Texas Capital Bancshares, Inc.* | 102,246 | 9,089,669 | ||||||
United Bankshares, Inc. | 151,835 | 5,276,266 | ||||||
Webster Financial Corp. | 135,028 | 7,583,172 | ||||||
Total Financials | 85,331,572 | |||||||
Health Care - 16.8% | ||||||||
Cambrex Corp.* | 61,810 | 2,966,880 | ||||||
Cantel Medical Corp. | 75,804 | 7,797,958 | ||||||
Catalent, Inc.* | 201,727 | 8,286,945 | ||||||
Cotiviti Holdings, Inc.*,1 | 167,261 | 5,387,477 | ||||||
Diplomat Pharmacy, Inc.* | 243,137 | 4,879,760 | ||||||
| Shares | Value | |||||||
Globus Medical, Inc., Class A* | 256,458 | $ | 10,540,424 | |||||
ICU Medical, Inc.* | 68,217 | 14,734,872 | ||||||
Impax Laboratories, Inc.* | 270,214 | 4,499,063 | ||||||
INC Research Holdings, Inc., Class A* | 149,894 | 6,535,378 | ||||||
Medidata Solutions, Inc.* | 110,503 | 7,002,575 | ||||||
West Pharmaceutical Services, Inc. | 118,312 | 11,673,845 | ||||||
Wright Medical Group, N.V. (Netherlands)*,1 | 269,921 | 5,992,246 | ||||||
Total Health Care | 90,297,423 | |||||||
Industrials - 16.5% | ||||||||
Alamo Group, Inc. | 45,585 | 5,145,179 | ||||||
Healthcare Services Group, Inc. | 160,272 | 8,449,540 | ||||||
Heartland Express, Inc. | 279,842 | 6,531,512 | ||||||
HEICO Corp.1 | 33,953 | 3,203,466 | ||||||
HEICO Corp., Class A | 75,998 | 6,007,642 | ||||||
ICF International, Inc.* | 72,481 | 3,805,252 | ||||||
John Bean Technologies Corp. | 50,969 | 5,647,365 | ||||||
Mobile Mini, Inc. | 113,982 | 3,932,379 | ||||||
Patrick Industries, Inc.* | 93,762 | 6,511,771 | ||||||
Primoris Services Corp. | 212,416 | 5,775,591 | ||||||
RBC Bearings, Inc.* | 59,389 | 7,506,770 | ||||||
Ritchie Bros. Auctioneers, Inc. (Canada)1 | 208,440 | 6,238,609 | ||||||
Sun Hydraulics Corp. | 118,986 | 7,697,204 | ||||||
Universal Forest Products, Inc. | 183,873 | 6,917,302 | ||||||
US Ecology, Inc. | 102,966 | 5,251,266 | ||||||
Total Industrials | 88,620,848 | |||||||
Information Technology - 17.5% | ||||||||
Blackbaud, Inc. | 90,727 | 8,572,794 | ||||||
Callidus Software, Inc.* | 206,640 | 5,920,236 | ||||||
EPAM Systems, Inc.* | 95,029 | 10,208,965 | ||||||
ExlService Holdings, Inc.* | 105,046 | 6,339,526 | ||||||
HubSpot, Inc.*,1 | 113,708 | 10,051,787 | ||||||
LogMeIn, Inc. | 117,350 | 13,436,575 | ||||||
MACOM Technology Solutions Holdings, Inc.* | 155,991 | 5,075,947 | ||||||
Power Integrations, Inc. | 88,881 | 6,537,198 | ||||||
Proofpoint, Inc.* | 58,001 | 5,151,069 | ||||||
Rogers Corp.* | 31,643 | 5,123,635 | ||||||
Silicon Laboratories, Inc.* | 87,100 | 7,690,930 | ||||||
Tyler Technologies, Inc.* | 55,617 | 9,846,990 | ||||||
Total Information Technology | 93,955,652 | |||||||
Materials - 4.7% | ||||||||
Balchem Corp. | 67,503 | 5,440,742 | ||||||
Compass Minerals International, Inc.1 | 56,089 | 4,052,430 | ||||||
KapStone Paper and Packaging Corp. | 176,474 | 4,004,195 | ||||||
The accompanying notes are an integral part of these financial statements.
29
Table of Contents
AMG GW&K Small Cap Core Fund
Schedule of Portfolio Investments (continued)
| Shares | Value | |||||||
Materials - 4.7% (continued) | ||||||||
PolyOne Corp. | 171,235 | $ | 7,448,722 | |||||
Silgan Holdings, Inc. | 151,681 | 4,457,905 | ||||||
Total Materials | 25,403,994 | |||||||
Real Estate - 6.3% | ||||||||
Education Realty Trust, Inc., REIT | 202,138 | 7,058,658 | ||||||
National Health Investors, Inc., REIT | 75,700 | 5,706,266 | ||||||
Pebblebrook Hotel Trust, REIT 1 | 174,830 | 6,498,431 | ||||||
QTS Realty Trust, Inc., Class A, REIT | 132,742 | 7,189,307 | ||||||
STAG Industrial, Inc., REIT | 260,098 | 7,108,478 | ||||||
Total Real Estate | 33,561,140 | |||||||
Utilities - 2.6% | ||||||||
IDACORP, Inc. | 70,257 | 6,418,680 | ||||||
NorthWestern Corp. | 128,516 | 7,672,405 | ||||||
Total Utilities | 14,091,085 | |||||||
Total Common Stocks | 530,179,952 | |||||||
| Principal Amount | ||||||||
Short - Term Investments - 5.8% |
| |||||||
Joint Repurchase Agreements - 4.9%2 |
| |||||||
Cantor Fitzgerald Securities, Inc., dated 12/29/17, due 01/02/18, 1.410% total to be received $6,279,631 (collateralized by various U.S. Government Agency Obligations, 0.000% - 8.500%, 01/31/18 - 06/20/63, totaling $6,404,220) | $ | 6,278,647 | 6,278,647 | |||||
Daiwa Capital Markets America, dated 12/29/17, due 01/02/18, 1.430% total to be received $6,279,645 (collateralized by various U.S. Government Agency Obligations, 0.000% - 6.500%, 01/11/18 - 12/01/51, totaling $6,404,220) | 6,278,647 | 6,278,647 | ||||||
| * | Non - income producing security. |
| 1 | Some or all of these securities, amounting to $25,730,349 or 4.8% of net assets, were out on loan to various brokers. |
| 2 | Collateral received from brokers for securities lending was invested in these joint repurchase agreements. |
| Principal Amount | Value | |||||||
HSBC Securities USA, Inc., dated 12/29/17, due 01/02/18, 1.380% total to be received $6,279,610 (collateralized by various U.S. Government Agency Obligations, 0.000% - 0.375%, 05/15/18 - 08/15/46, totaling $6,404,273) | $ | 6,278,647 | $ | 6,278,647 | ||||
Jefferies LLC, dated 12/29/17, due 01/02/18, 1.500% total to be received $1,320,919 (collateralized by various U.S. Government Agency Obligations, 0.000% - 1.750%, 09/13/18 - 04/30/22, totaling $1,347,113) | 1,320,699 | 1,320,699 | ||||||
State of Wisconsin Investment Board, dated 12/29/17, due 01/02/18, 1.630% total to be received $6,279,784 (collateralized by various U.S. Government Agency Obligations, 0.125% - 3.875%, 01/15/19 - 02/15/46, totaling $6,453,002) | 6,278,647 | 6,278,647 | ||||||
Total Joint Repurchase Agreements | 26,435,287 | |||||||
| Shares | ||||||||
Other Investment Companies - 0.9% | ||||||||
Dreyfus Preferred Government Money Market Fund, Institutional Class Shares, 1.25%3 | 4,595,414 | 4,595,414 | ||||||
Total Short - Term Investments | 31,030,701 | |||||||
Total Investments - 104.6% |
| 561,210,653 | ||||||
Other Assets, less Liabilities - (4.6)% |
| (24,865,711 | ) | |||||
Net Assets - 100.0% | $ | 536,344,942 | ||||||
| 3 | Yield shown represents the December 31, 2017, seven day average yield, which refers to the sum of the previous seven days’ dividends paid, expressed as an annual percentage. |
REIT Real Estate Investment Trust
The accompanying notes are an integral part of these financial statements.
30
Table of Contents
AMG GW&K Small Cap Core Fund
Schedule of Portfolio Investments (continued)
The following table summarizes the inputs used to value the Fund’s investments by the fair value hierarchy levels as of December 31, 2017:
| Level 1 | Level 2 | Level 3 | Total | |||||||||||||
Investments in Securities | ||||||||||||||||
Common Stocks† | $ | 530,179,952 | — | — | $ | 530,179,952 | ||||||||||
Short-Term Investments | ||||||||||||||||
Joint Repurchase Agreements | — | $ | 26,435,287 | — | 26,435,287 | |||||||||||
Other Investment Companies | 4,595,414 | — | — | 4,595,414 | ||||||||||||
|
|
|
|
|
|
|
| |||||||||
Total Investments in Securities | $ | 534,775,366 | $ | 26,435,287 | — | $ | 561,210,653 | |||||||||
|
|
|
|
|
|
|
| |||||||||
| † | All common stocks held in the Fund are Level 1 securities. For a detailed breakout of common stocks by major industry classification, please refer to the Fund’s Schedule of Portfolio Investments. |
As of December 31, 2017, the Fund had no transfers between levels from the beginning of the reporting period.
The accompanying notes are an integral part of these financial statements.
31
Table of Contents
Portfolio Manager’s Comments (unaudited)
THE YEAR IN REVIEW
For the year ended December 31, 2017, the AMG GW&K Small/Mid Cap Fund (Class I) (the Fund) returned 15.44%, underperforming the Russell 2500® Index, which returned 16.81%. The Fund’s former benchmark, the Russell 2000® Growth Index, returned
22.17% over the same period.
Effective February 27, 2017, the Fund’s Principal Investment Strategies changed from a small cap growth investment approach to one that primarily invests in common stock and preferred stock of U.S. small- and mid-capitalization companies with either growth or value-oriented characteristics. The Fund’s name changed from AMG GW&K Small Cap Growth Fund to AMG GW&K Small/Mid Cap Fund and the Fund’s primary benchmark changed from the Russell 2000 Index to the Russell 2500 Index.
When pop star and self-proclaimed future presidential candidate Kanye West gifts shares of stock to his beloved wife for Christmas, you know that equities are most certainly in vogue. Sure enough, the headline from the Wall Street Journal’s year-end review stated: “U.S. Stocks Wrap Up Strong 2017.” Strong is certainly one adjective to describe the equity markets but it doesn’t fully capture the environment. One would have to mention descriptors like resilient, consistent or unidirectional to reflect the fact that the S&P 500® Index rose every month of 2017, a feat that has never before happened. One would have to mention how quiet the markets were, scraping record low volatility measures for a good portion of the year. And one would have to mention how a few narrow groups, like FANG (Facebook, Apple, Netflix & Google) stocks in large caps, or biotech and software in small caps, delivered particularly strong performance. These were all important characteristics of the U.S. equity market in 2017, but they don’t speak to the overall health of the market and the likelihood that 2018 and beyond will or won’t offer attractive returns. The answer to this question comes from the fundamental backdrop for the economy, corporate profits, inflation, interest rates and investor psychology. Is there enough good news in these areas that investors will continue to buy equities? Or will Kim Kardashian and other equity investors consider their 2017 gifts to more closely resemble lumps of coal than thoughtfully wrapped packages? After reviewing performance for the quarter and year, we will attempt to explain why we think the risk reward is still favorable for small/mid cap equities as we look out over the next three to five years.
The Russell 2500® Index finished up 5.2% for the fourth quarter, marking its ninth consecutive positive quarterly return. For the full year the Index was
up 16.8%. The last meaningful drawdown the Index experienced was in the third quarter of 2015, nearly two and a half years ago. On a style basis, Growth beat Value during the quarter (6.4% vs. 4.3%) and trounced it over the full year (24.5% vs. 10.4%) as measured by the Russell 2500® Growth and Value Indices , respectively.
Results were mixed between high and low quality factors for both the quarter and year. For the quarter, larger small caps outperformed microcaps and high return on equity (ROE) stocks outperformed those with low ROE. However, stocks with higher earnings variability outperformed as well. For the year, results were quite similar to the fourth quarter. So while perhaps the market showed a bias to higher quality stocks, the results had a modest impact on performance and were more varied than usual.
On a sector basis, growth styles and cyclical acceleration generally led the Index while more stable and yield-oriented sectors lagged the market. This was particularly true earlier in the year and waned a bit during the fourth quarter. For the year, health care was the best performing sector, driven by the aforementioned strength in biotech. Information technology, materials and industrials also performed well. Energy was the only negative sector, but laggards included, telecommunication services, consumer staples, real estate and financials.
2017 was a very strong year on an absolute basis but the Fund modestly trailed the benchmark on a relative level. On the positive side of the ledger, information technology and financials were our stock selection leaders. Three portfolio holdings in technology were up over 40% and we outperformed broadly in four of the five industry groups. Our outperformance in financials was driven by stock selection in the bank industry, as SVB Financial, Western Alliance Bancorp, Glacier Bancorp and Texas Capital Bancshares all returned a double-digit percentage compared to less than 4% for the Index group. Also in health care, we overcame a headwind from an underweight to the biotechnology industry with strong performers in the healthcare equipment industry, where one stock more than doubled and three others were up over 20%. Our relative performance was held back in materials, consumer staples and industrials. In materials, we were flat footed in the chemicals industry, where the Index added over 29% but we languished as our largest holding, RPM International, was essentially flat. RPM’s results were disappointing this year, but we believe the company is now back on track for steady growth.
Compass Minerals, which was sold during the year, declined over 11% during our holding period, as results in both their salt and plant nutrition businesses lagged expectations. . TreeHouse Foods impacted the full year results and drove our underperformance in the consumer staples sector as the company missed on earnings, guided lower and lost a key executive. We subsequently sold the stock, as our thesis of an immediate recovery proved to be too optimistic and we lacked conviction that management has the ability to execute the turnaround plan. In industrials, we saw WageWorks, Ritchie Brothers and Westinghouse Air Brake each lag a strong group and offset good stock selection elsewhere in the sector. Westinghouse Air Brake and Ritchie Brothers were each digesting large acquisitions this past year, which we think led to a temporary setback in earnings growth. We continue to own these stocks in the Fund.
Regardless of whether you are Kim Kardashian or any other normal equity investor, you have read all the headlines about record highs in the various indices, extended valuations and elongated market upcycles. A rational investor would ask whether the future holds potential for more risk than reward, as over the last five years small/mid caps have compounded at a 14.3% annual rate and the S&P 500 Index was up over 15.7% annualized. However, we would point out the strength of the current macroeconomic cycle, which is visible in the employment data, industrial production, consumer spending and the various Institute for Supply Management (ISM) survey data. In addition, we are about to pile on tax cuts and further business optimism resulting from lower taxes and deregulation. Two factors are likely to sustain the cycle even further: 1) the cycle thus far has been a very slow and much doubted climb off the 2009 bottom, and 2) many facets of the economy have yet to be touched by the recovery. In fact, if wage growth and tax cuts occur simultaneously, we could see it self-reinforce in 2018 and into 2019. We believe the most prudent expectation is for corporate earnings growth in the mid-teens and equity returns in the high single digits for 2018—which, of course, means this will decidedly NOT be the outcome. Risks remain both to the upside and downside. In our opinion, the greatest risk to the downside comes from complacency and the firmly held consensus view that the economy is accelerating and inflation and interest rates will remain in check. The rate increases the Fed has executed and plans to execute could have an unforeseen impact on the capital
32
Table of Contents
AMG GW&K Small/Mid Cap Fund
Portfolio Manager’s Comments (continued)
markets. Yet upside risks are perhaps more likely as an accelerating economy combines with tax cuts and improving growth prospects outside the U.S. If Kayne wants to give us some gift wrapped stock certificates at Christmas next year, we will be very grateful and be sure to send a thank you note.
This commentary reflects the viewpoints of the portfolio manager, GW&K Investment Management, LLC as of December 31, 2017 and is not intended as a forecast or guarantee of future results, and is subject
to change without notice.
33
Table of Contents
AMG GW&K Small/Mid Cap Fund
Portfolio Manager’s Comments (continued)
CUMULATIVE TOTAL RETURN PERFORMANCE
AMG GW&K Small/Mid Cap Fund’s cumulative total return is based on the daily change in net asset value (NAV), and assumes that all dividends and distributions were reinvested. This graph compares a hypothetical $10,000 investment made in the Fund’s Class I shares on December 31, 2007, to a $10,000 investment made in the Russell 2500® Index and the Russell 2000® Growth Index for the same time period. The graph and table do not reflect the deduction of taxes that a shareholder would pay on a Fund distribution or redemption of shares. The listed returns for the Fund are net of expenses and the returns for the index exclude expenses. Total returns would have been lower had certain expenses not been reduced.
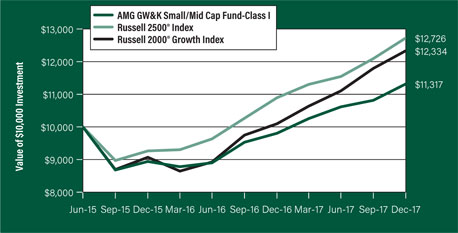
The table below shows the average annual total returns for the AMG GW&K Small/Mid Cap Fund and the Russell 2500® Index and Russell 2000® Growth Index for the same time periods ended December 31, 2017.
| Average Annual Total Returns1 | One Year | Since Inception | Inception Date | |||||||||
AMG GW&K Small/Mid Cap Fund2, 3, 4, 5, 6, 7 | ||||||||||||
Class N | — | 9.17 | % | 02/24/17 | ||||||||
Class I | 15.44 | % | 5.07 | % | 06/30/15 | |||||||
Class Z | — | 9.34 | % | 02/24/17 | ||||||||
Russell 2500® Index8 | 16.81 | % | 10.10 | % | 06/30/15 | † | ||||||
Russell 2000® Growth Index9 | 22.17 | % | 8.74 | % | 06/30/15 | † | ||||||
The performance data shown represents past performance. Past performance is not a guarantee of future results. Current performance may be lower or higher than the performance data quoted. The investment return and principal value of an investment will fluctuate so that an investor’s shares, when redeemed, may be worth more or less than their original cost.
Investors should carefully consider the Fund’s investment objectives, risks, charges and expenses before investing. For performance information through the most recent month end, current net asset values per share for the Fund and other information, please call 800.835.3879 or visit our website at amgfunds.com for a free prospectus. Read it carefully before investing or sending money.
Distributed by AMG Distributors, Inc., member FINRA/SIPC.
| † | Date reflects the inception date of the Fund, not the index |
| 1 | Total return equals income yield plus share price change and assumes reinvestment of all dividends and capital gain distributions. Returns are net of fees and may reflect offsets of Fund expenses as described in the prospectus. No adjustment has been made for taxes payable by shareholders on their reinvested dividends and capital gain |
| distributions. Returns for periods greater than one year are annualized. The listed returns on the Fund are net of expenses and based on the published NAV as of December 31, 2017. All returns are in U.S. dollars ($). |
| 2 | From time to time, the Fund’s advisor has waived its fees and/or absorbed Fund expenses, which has resulted in higher returns. |
| 3 | The Fund is subject to risks associated with investments in small-capitalization companies, such as erratic earnings patterns, competitive conditions, limited earnings history, and a reliance on one or a limited number of products. |
| 4 | The Fund invests in growth stocks, which may be more sensitive to market movements because their prices tend to reflect future investor expectations rather than just current profits. |
| 5 | The Fund is subject to risks associated with investments in mid-capitalization companies such as greater price volatility, lower trading volume, and less liquidity than the stocks of larger, more established companies. |
| 6 | The Fund invests in value stocks, which may perform differently from the market as a whole and may be undervalued by the market for a long period of time. |
| 7 | Effective February 27, 2017, The Fund’s Principal Investment Strategies changed from a small cap growth investment strategy to one that primarily invests in common stock and preferred stock of U.S. small- and Mid- capitalization companies with either growth- or value- oriented characteristics. |
| 8 | The Russell 2500™ Index is composed of the 2500 smallest stocks in the Russell 3000® Index and is widely regarded in the industry as the premier measure of small/mid cap stock performance. |
| 9 | The Russell 2000® Growth Index measures the performance of the Russell 2,000 companies with higher price-to-book ratios and higher forecasted growth values. Unlike the Fund, the Russell 2000® Growth Index is unmanaged, is not available for investment and does not incur expenses. |
The Russell Indices are trademarks of the London Stock Exchange Group companies.
Not FDIC insured, nor bank guaranteed. May lose value.
34
Table of Contents
AMG GW&K Small/Mid Cap Fund
Fund Snapshots (unaudited)
December 31, 2017
PORTFOLIO BREAKDOWN
| % of | ||||
Sector | Net Assets | |||
Information Technology | 18.3 | |||
Industrials | 15.7 | |||
Financials | 15.3 | |||
Consumer Discretionary | 11.9 | |||
Health Care | 11.2 | |||
Real Estate | 8.3 | |||
Materials | 4.8 | |||
Energy | 3.2 | |||
Utilities | 2.0 | |||
Consumer Staples | 1.3 | |||
Short-Term Investments* | 11.5 | |||
Other Assets Less Liabilities** | (3.5 | ) | ||
| * | Includes reinvestment of cash collateral into joint repurchase agreements on security lending transactions. |
| ** | Includes repayment of cash collateral on security lending transactions. |
TOP TEN HOLDINGS
| % of | ||||
Security Name | Net Assets | |||
MarketAxess Holdings, Inc. | 2.5 | |||
SVB Financial Group | 2.3 | |||
RPM International, Inc. | 2.1 | |||
Gartner, Inc. | 2.0 | |||
Zebra Technologies Corp., Class A | 1.8 | |||
West Pharmaceutical Services, Inc. | 1.8 | |||
CoStar Group, Inc. | 1.8 | |||
Tyler Technologies, Inc. | 1.6 | |||
Cognex Corp. | 1.6 | |||
Exponent, Inc. | 1.6 | |||
|
| |||
Top Ten as a Group | 19.1 | |||
|
| |||
Because a fund’s strategy may result in multiple investments in particular sectors of the economy, its performance may depend on the performance of those sectors and may fluctuate more widely than investments diversified across more sectors. For additional information on these and other risk considerations, please see the Fund’s prospectus.
Any sectors, industries, or securities discussed should not be perceived as investment recommendations. Mention of a specific security should not be considered a recommendation to buy or solicitation to sell that security. Specific securities mentioned in this report may have been sold from the Fund’s portfolio of investments by the time you receive this report.
35
Table of Contents
AMG GW&K Small/Mid Cap Fund
Schedule of Portfolio Investments
December 31, 2017
| Shares | Value | |||||||
Common Stocks - 92.0% | ||||||||
Consumer Discretionary - 11.9% |
| |||||||
BJ’s Restaurants, Inc. | 6,240 | $ | 227,136 | |||||
Burlington Stores, Inc.* | 4,062 | 499,748 | ||||||
Carter’s, Inc. | 2,918 | 342,836 | ||||||
Cavco Industries, Inc.* | 2,403 | 366,698 | ||||||
Dorman Products, Inc.* | 5,524 | 337,737 | ||||||
Five Below, Inc.* | 5,175 | 343,206 | ||||||
Horizon Global Corp.*,1 | 10,023 | 140,522 | ||||||
Lithia Motors, Inc., Class A1 | 3,003 | 341,111 | ||||||
The Michaels Cos, Inc.* | 11,820 | 285,926 | ||||||
Polaris Industries, Inc.1 | 3,063 | 379,781 | ||||||
Pool Corp. | 1,920 | 248,928 | ||||||
Tupperware Brands Corp. | 3,088 | 193,618 | ||||||
Total Consumer Discretionary | 3,707,247 | |||||||
Consumer Staples - 1.3% | ||||||||
PriceSmart, Inc. | 4,823 | 415,260 | ||||||
Energy - 3.2% | ||||||||
Callon Petroleum Co.*,1 | 28,440 | 345,546 | ||||||
Dril-Quip, Inc.*,1 | 2,400 | 114,480 | ||||||
Matador Resources Co.* | 10,242 | 318,834 | ||||||
QEP Resources, Inc.* | 12,325 | 117,950 | ||||||
Superior Energy Services, Inc.* | 10,715 | 103,185 | ||||||
Total Energy | 999,995 | |||||||
Financials - 15.3% | ||||||||
Artisan Partners Asset Management, Inc., Class A | 5,190 | 205,005 | ||||||
BankUnited, Inc. | 8,005 | 325,964 | ||||||
Glacier Bancorp, Inc. | 7,553 | 297,513 | ||||||
James River Group Holdings, Ltd. (Bermuda) | 8,005 | 320,280 | ||||||
MarketAxess Holdings, Inc. | 3,835 | 773,711 | ||||||
Pinnacle Financial Partners, Inc. | 4,286 | 284,162 | ||||||
ProAssurance Corp. | 6,175 | 352,901 | ||||||
Signature Bank* | 3,382 | 464,213 | ||||||
SVB Financial Group* | 3,126 | 730,765 | ||||||
Texas Capital Bancshares, Inc.* | 3,769 | 335,064 | ||||||
Webster Financial Corp. | 6,415 | 360,266 | ||||||
Western Alliance Bancorp* | 5,624 | 318,431 | ||||||
Total Financials | 4,768,275 | |||||||
Health Care - 11.2% | ||||||||
Acadia Healthcare Co., Inc.*,1 | 6,595 | 215,195 | ||||||
Align Technology, Inc.* | 1,126 | 250,186 | ||||||
Alkermes PLC (Ireland)* | 5,425 | 296,910 | ||||||
Catalent, Inc.* | 10,555 | 433,599 | ||||||
| Shares | Value | |||||||
ICU Medical, Inc.* | 2,166 | $ | 467,856 | |||||
IDEXX Laboratories, Inc.* | 1,754 | 274,291 | ||||||
Impax Laboratories, Inc.* | 9,901 | 164,852 | ||||||
K2M Group Holdings, Inc.*,1 | 8,660 | 155,880 | ||||||
Premier, Inc., Class A* | 8,085 | 236,001 | ||||||
STERIS PLC (United Kingdom) | 5,240 | 458,343 | ||||||
West Pharmaceutical Services, Inc. | 5,638 | 556,301 | ||||||
Total Health Care | 3,509,414 | |||||||
Industrials - 15.7% | ||||||||
Exponent, Inc. | 7,108 | 505,379 | ||||||
Gardner Denver Holdings, Inc.* | 14,354 | 487,031 | ||||||
Graco, Inc. | 7,417 | 335,397 | ||||||
Lincoln Electric Holdings, Inc. | 3,769 | 345,165 | ||||||
The Middleby Corp.*,1 | 2,278 | 307,416 | ||||||
Nordson Corp. | 2,892 | 423,389 | ||||||
RBC Bearings, Inc.* | 3,915 | 494,856 | ||||||
Ritchie Bros. Auctioneers, Inc. (Canada)1 | 10,720 | 320,850 | ||||||
Schneider National, Inc., Class B1 | 12,727 | 363,483 | ||||||
The Toro Co. | 7,361 | 480,158 | ||||||
Wabtec Corp. 1 | 5,291 | 430,846 | ||||||
WageWorks, Inc.* | 6,601 | 409,262 | ||||||
Total Industrials | 4,903,232 | |||||||
Information Technology - 18.3% | ||||||||
ANSYS, Inc.* | 2,318 | 342,114 | ||||||
Blackbaud, Inc. | 3,849 | 363,692 | ||||||
Booz Allen Hamilton Holding Corp. | 11,385 | 434,110 | ||||||
Cognex Corp. | 8,316 | 508,607 | ||||||
CoStar Group, Inc.* | 1,831 | 543,715 | ||||||
Gartner, Inc.* | 5,165 | 636,070 | ||||||
LogMeIn, Inc. | 3,818 | 437,161 | ||||||
Power Integrations, Inc. | 3,608 | 265,368 | ||||||
Silicon Laboratories, Inc.* | 3,658 | 323,001 | ||||||
SS&C Technologies Holdings, Inc. | 10,640 | 430,707 | ||||||
Tyler Technologies, Inc.* | 2,877 | 509,373 | ||||||
The Ultimate Software Group, Inc.* | 1,658 | 361,825 | ||||||
Zebra Technologies Corp., Class A* | 5,437 | 564,361 | ||||||
Total Information Technology | 5,720,104 | |||||||
Materials - 4.8% | ||||||||
AptarGroup, Inc. | 2,505 | 216,131 | ||||||
Eagle Materials, Inc. | 2,893 | 327,777 | ||||||
Quaker Chemical Corp. | 2,071 | 312,286 | ||||||
The accompanying notes are an integral part of these financial statements.
36
Table of Contents
AMG GW&K Small/Mid Cap Fund
Schedule of Portfolio Investments (continued)
| Shares | Value | |||||||
Materials - 4.8% (continued) | ||||||||
RPM International, Inc. | 12,275 | $ | 643,456 | |||||
Total Materials | 1,499,650 | |||||||
Real Estate - 8.3% | ||||||||
American Campus Communities, Inc., REIT 1 | 11,920 | 489,078 | ||||||
CoreSite Realty Corp., REIT | 3,114 | 354,685 | ||||||
Easterly Government Properties, Inc., REIT | 15,435 | 329,383 | ||||||
Mid-America Apartment Communities, Inc., REIT | 2,846 | 286,194 | ||||||
Physicians Realty Trust, REIT | 20,260 | 364,477 | ||||||
Summit Hotel Properties, Inc., REIT | 24,450 | 372,373 | ||||||
Sun Communities, Inc., REIT | 4,369 | 405,356 | ||||||
Total Real Estate | 2,601,546 | |||||||
Utilities - 2.0% | ||||||||
OGE Energy Corp. | 8,720 | 286,975 | ||||||
Portland General Electric Co. | 7,495 | 341,622 | ||||||
Total Utilities | 628,597 | |||||||
Total Common Stocks | 28,753,320 | |||||||
| Principal Amount | ||||||||
Short-Term Investments - 11.5% | ||||||||
Joint Repurchase Agreements - 5.5%2 |
| |||||||
Cantor Fitzgerald Securities, Inc., dated 12/29/17, due 01/02/18, 1.410% total to be received $1,000,157 (collateralized by various U.S. Government Agency Obligations, 0.000% - 8.500%, 01/31/18 - 06/20/63, totaling $1,020,000) | $ | 1,000,000 | 1,000,000 | |||||
| Principal Amount | Value | |||||||
Daiwa Capital Markets America, dated 12/29/17, due 01/02/18, 1.430% total to be received $726,963 (collateralized by various U.S. Government Agency Obligations, 0.000% - 6.500%, 01/11/18 - 12/01/51, totaling $741,385) | $ | 726,848 | $ | 726,848 | ||||
Total Joint Repurchase Agreements | 1,726,848 | |||||||
| Shares | ||||||||
Other Investment Companies - 6.0% |
| |||||||
Dreyfus Government Cash Management Fund, Institutional Class Shares, 1.18%3 | 1,882,670 | 1,882,670 | ||||||
Total Short-Term Investments | 3,609,518 | |||||||
Total Investments - 103.5% | 32,362,838 | |||||||
Other Assets, less Liabilities - (3.5)% | (1,106,665 | ) | ||||||
Net Assets - 100.0% | $ | 31,256,173 | ||||||
| * | Non-income producing security. |
| 1 | Some or all of these securities, amounting to $1,681,424 or 5.4% of net assets, were out on loan to various brokers. |
| 2 | Collateral received from brokers for securities lending was invested in these joint repurchase agreements. |
| 3 | Yield shown represents the December 31, 2017, seven day average yield, which refers to the sum of the previous seven days’ dividends paid, expressed as an annual percentage. |
REIT Real Estate Investment Trust
The accompanying notes are an integral part of these financial statements.
37
Table of Contents
AMG GW&K Small/Mid Cap Fund
Schedule of Portfolio Investments (continued)
The following table summarizes the inputs used to value the Fund’s investments by the fair value hierarchy levels as of December 31, 2017:
| Level 1 | Level 2 | Level 3 | Total | |||||||||||||
Investments in Securities | ||||||||||||||||
Common Stocks† | $ | 28,753,320 | — | — | $ | 28,753,320 | ||||||||||
Short-Term Investments | ||||||||||||||||
Joint Repurchase Agreements | — | $ | 1,726,848 | — | 1,726,848 | |||||||||||
Other Investment Companies | 1,882,670 | — | — | 1,882,670 | ||||||||||||
|
|
|
|
|
|
|
| |||||||||
Total Investments in Securities | $ | 30,635,990 | $ | 1,726,848 | — | $ | 32,362,838 | |||||||||
|
|
|
|
|
|
|
| |||||||||
| † | All common stocks held in the Fund are Level 1 securities. For a detailed breakout of common stocks by major industry classification, please refer to the Fund’s Schedule of Portfolio Investments. |
As of December 31, 2017, the Fund had no transfers between levels from the beginning of the reporting period.
The accompanying notes are an integral part of these financial statements.
38
Table of Contents
Statement of Assets and Liabilities
December 31, 2017
| AMG GW&K Enhanced Core Bond Fund# | AMG GW&K Municipal Bond Fund# | AMG GW&K Municipal Enhanced Yield Fund# | AMG GW&K Small Cap Core Fund# | AMG GW&K Small/Mid Cap Fund# | ||||||||||||||||
Assets: | ||||||||||||||||||||
Investments at Value* (including securities on loan valued at $739,043, $0, $0, $25,730,349, and $1,681,424, respectively) | $ | 49,089,402 | $ | 1,059,418,697 | $ | 232,303,005 | $ | 561,210,653 | $ | 32,362,838 | ||||||||||
Receivable for investments sold | — | — | 1,395,030 | — | — | |||||||||||||||
Dividend, interest and other receivables | 453,787 | 12,694,603 | 2,453,310 | 987,791 | 43,892 | |||||||||||||||
Receivable for Fund shares sold | 200,771 | 5,933,718 | 670,904 | 1,613,564 | 1,328,852 | |||||||||||||||
Receivable from affiliate | 10,266 | 81,072 | 18,669 | 5,147 | 8,552 | |||||||||||||||
Prepaid expenses | 27,232 | 24,034 | 24,153 | 29,307 | 16,171 | |||||||||||||||
Total assets | 49,781,458 | 1,078,152,124 | 236,865,071 | 563,846,462 | 33,760,305 | |||||||||||||||
Liabilities: | ||||||||||||||||||||
Payable upon return of securities loaned | 759,122 | — | — | 26,435,287 | 1,726,848 | |||||||||||||||
Payable for investments purchased | — | 40,386 | 899,978 | — | 641,317 | |||||||||||||||
Payable for Fund shares repurchased | 179,047 | 2,645,843 | 174,585 | 534,804 | 75,000 | |||||||||||||||
Accrued expenses: | ||||||||||||||||||||
Investment advisory and management fees | 12,304 | 188,330 | 89,722 | 321,887 | 15,213 | |||||||||||||||
Administrative fees | 6,152 | 135,674 | 29,907 | 68,976 | 3,511 | |||||||||||||||
Distribution fees | 7,294 | 6,170 | 1,907 | 5,291 | 2 | |||||||||||||||
Shareholder service fees | 953 | 47,754 | 20,112 | 39,071 | 1,972 | |||||||||||||||
Professional fees | 48,927 | 62,326 | 42,415 | 40,303 | 31,018 | |||||||||||||||
Trustee fees and expenses | 519 | 11,186 | 2,473 | 5,694 | 267 | |||||||||||||||
Other | 43,464 | 102,748 | 30,113 | 50,207 | 8,984 | |||||||||||||||
Total liabilities | 1,057,782 | 3,240,417 | 1,291,212 | 27,501,520 | 2,504,132 | |||||||||||||||
Net Assets | $ | 48,723,676 | $ | 1,074,911,707 | $ | 235,573,859 | $ | 536,344,942 | $ | 31,256,173 | ||||||||||
* Investments at cost | $ | 48,855,680 | $ | 1,053,092,869 | $ | 224,346,250 | $ | 427,115,848 | $ | 30,572,529 | ||||||||||
The accompanying notes are an integral part of these financial statements.
39
Table of Contents
Statement of Assets and Liabilities (continued)
AMG GW&K Enhanced | AMG GW&K Municipal Bond | AMG GW&K Municipal | AMG GW&K Small Cap Core | AMG GW&K Small/Mid | ||||||||||||||||
Net Assets Represent: | ||||||||||||||||||||
Paid-in capital | $ | 52,818,368 | $ | 1,068,275,232 | $ | 228,137,519 | $ | 391,250,428 | $ | 29,495,290 | ||||||||||
Accumulated net realized gain (loss) from investments | (4,328,414 | ) | 310,647 | (520,415 | ) | 10,999,709 | (29,426 | ) | ||||||||||||
Net unrealized appreciation on investments | 233,722 | 6,325,828 | 7,956,755 | 134,094,805 | 1,790,309 | |||||||||||||||
Net Assets | $ | 48,723,676 | $ | 1,074,911,707 | $ | 235,573,859 | $ | 536,344,942 | $ | 31,256,173 | ||||||||||
Class N: | ||||||||||||||||||||
Net Assets | $ | 16,027,453 | $ | 29,512,967 | $ | 8,827,761 | $ | 24,988,623 | $ | 10,920 | ||||||||||
Shares outstanding | 1,633,138 | 2,544,777 | 881,350 | 891,057 | 979 | |||||||||||||||
Net asset value, offering and redemption price per share | $ | 9.81 | $ | 11.60 | $ | 10.02 | $ | 28.04 | $ | 11.15 | ||||||||||
Class I: | ||||||||||||||||||||
Net Assets | $ | 6,864,480 | $ | 1,045,398,740 | $ | 226,637,907 | $ | 403,309,101 | $ | 24,265,613 | ||||||||||
Shares outstanding | 696,851 | 89,669,335 | 22,645,980 | 14,193,364 | 2,176,569 | |||||||||||||||
Net asset value, offering and redemption price per share | $ | 9.85 | $ | 11.66 | $ | 10.01 | $ | 28.42 | $ | 11.15 | ||||||||||
Class C: | ||||||||||||||||||||
Net assets per class | $ | 4,560,822 | — | — | — | — | ||||||||||||||
Shares outstanding | 465,034 | — | — | — | — | |||||||||||||||
Net asset value, offering and redemption price per share | $ | 9.81 | — | — | — | — | ||||||||||||||
Class Z: | ||||||||||||||||||||
Net Assets | $ | 21,270,921 | — | $ | 108,191 | $ | 108,047,218 | $ | 6,979,640 | |||||||||||
Shares outstanding | 2,160,919 | — | 10,810 | 3,801,611 | 625,800 | |||||||||||||||
Net asset value, offering and redemption price per share | $ | 9.84 | — | $ | 10.01 | $ | 28.42 | $ | 11.15 | |||||||||||
| # | Effective February 27, 2017, the Funds’ share classes were renamed as described in Note 1 of the Notes to Financial Statements. |
The accompanying notes are an integral part of these financial statements.
40
Table of Contents
For the fiscal year ended December 31, 2017
| AMG GW&K Enhanced Core Bond Fund# | AMG GW&K Municipal Bond Fund | AMG GW&K Municipal Enhanced Yield Fund | AMG GW&K Small Cap Core Fund | AMG GW&K Small/Mid Cap Fund | ||||||||||||||||
Investment Income: | ||||||||||||||||||||
Interest income | $ | 1,894,053 | $ | 20,145,744 | $ | 8,388,736 | $ | 414 | — | |||||||||||
Dividend income | 7,832 | 172,027 | 57,180 | 5,665,492 | 1 | $ | 153,066 | 2 | ||||||||||||
Securities lending income | 1,655 | — | — | 152,797 | 2,872 | |||||||||||||||
Foreign withholding tax | — | — | — | (24,350 | ) | (510 | ) | |||||||||||||
Total investment income | 1,903,540 | 20,317,771 | 8,445,916 | 5,794,353 | 155,428 | |||||||||||||||
Expenses: | ||||||||||||||||||||
Investment advisory and management fees | 215,219 | 2,102,015 | 1,047,912 | 3,467,084 | 84,418 | |||||||||||||||
Administrative fees | 97,134 | 1,510,886 | 343,518 | 735,672 | 19,393 | |||||||||||||||
Distribution fees - Class N | 40,593 | 81,542 | 21,323 | 78,257 | 22 | |||||||||||||||
Distribution fees - Class C | 59,207 | — | — | — | — | |||||||||||||||
Shareholder servicing fees - Class N | — | 39,211 | 14,153 | 49,235 | — | |||||||||||||||
Shareholder servicing fees - Class S## | — | 121,098 | 6,293 | 12,807 | — | |||||||||||||||
Shareholder servicing fees - Class I | 19,656 | 387,765 | 89,662 | 184,662 | 8,378 | |||||||||||||||
Professional fees | 53,474 | 122,074 | 58,599 | 70,692 | 37,320 | |||||||||||||||
Registration fees | 70,972 | 108,079 | 77,141 | 81,773 | 39,781 | |||||||||||||||
Transfer agent fees | 22,524 | 42,493 | 12,205 | 21,863 | 522 | |||||||||||||||
Custodian fees | 18,262 | 77,770 | 22,242 | 34,215 | 13,458 | |||||||||||||||
Reports to shareholders | 23,239 | 72,650 | 15,850 | 45,202 | — | |||||||||||||||
Trustee fees and expenses | 5,484 | 67,636 | 15,623 | 30,337 | 694 | |||||||||||||||
Miscellaneous | 7,968 | 24,429 | 7,725 | 11,732 | 202 | |||||||||||||||
Repayment of prior reimbursements | — | — | — | 1,317 | — | |||||||||||||||
Total expenses before offsets | 633,732 | 4,757,648 | 1,732,246 | 4,824,848 | 204,188 | |||||||||||||||
Expense reimbursements | (185,809 | ) | (703,359 | ) | (232,286 | ) | (51,380 | ) | (85,512 | ) | ||||||||||
Expense reductions | — | — | — | (24,071 | ) | (14 | ) | |||||||||||||
Fee waivers | — | (77,768 | ) | — | — | — | ||||||||||||||
Net expenses | 447,923 | 3,976,521 | 1,499,960 | 4,749,397 | 118,662 | |||||||||||||||
Net investment income | 1,455,617 | 16,341,250 | 6,945,956 | 1,044,956 | 36,766 | |||||||||||||||
Net Realized and Unrealized Gain: | ||||||||||||||||||||
Net realized gain on investments | 261,715 | 2,781,551 | 1,907,278 | 39,398,970 | 416,050 | |||||||||||||||
Net change in unrealized appreciation/depreciation on investments | 1,012,966 | 27,347,353 | 12,463,029 | 52,180,026 | 1,558,779 | |||||||||||||||
Net realized and unrealized gain | 1,274,681 | 30,128,904 | 14,370,307 | 91,578,996 | 1,974,829 | |||||||||||||||
Net increase in net assets resulting from operations | $ | 2,730,298 | $ | 46,470,154 | $ | 21,316,263 | $ | 92,623,952 | $ | 2,011,595 | ||||||||||
| # | Effective February 27, 2017, the Funds’ share classes were renamed as described in Note 1 of the Notes to Financial Statements. |
| ## | Effective June 23, 2017, Class S shares were converted into Class I Shares. |
| 1 | Includes non-recurring dividends of $1,076,397. |
| 2 | Includes non-recurring dividends of $32,003. |
The accompanying notes are an integral part of these financial statements.
41
Table of Contents
Statements of Changes in Net Assets
For the fiscal years ended December 31
| AMG GW&K Enhanced Core Bond Fund | AMG GW&K Municipal Bond Fund | |||||||||||||||
| 2017# | 2016# | 2017# | 2016# | |||||||||||||
Increase (Decrease) in Net Assets Resulting From Operations: | ||||||||||||||||
Net investment income | $ | 1,455,617 | $ | 2,792,209 | $ | 16,341,250 | $ | 13,478,865 | ||||||||
Net realized gain on investments | 261,715 | 837,864 | 2,781,551 | 11,765,887 | ||||||||||||
Net change in unrealized appreciation/depreciation on investments | 1,012,966 | (777,068 | ) | 27,347,353 | (37,153,635 | ) | ||||||||||
Net increase (decrease) in net assets resulting from operations | 2,730,298 | 2,853,005 | 46,470,154 | (11,908,883 | ) | |||||||||||
Distributions to Shareholders: | ||||||||||||||||
From net investment income: | ||||||||||||||||
Class N | (365,057 | ) | (414,745 | ) | (424,272 | ) | (337,669 | ) | ||||||||
Class S## | — | (777,513 | ) | (1,030,308 | ) | (2,154,034 | ) | |||||||||
Class I | (449,908 | ) | (1,453,169 | ) | (14,934,133 | ) | (11,028,510 | ) | ||||||||
Class C | (86,218 | ) | (137,712 | ) | — | — | ||||||||||
Class Z | (563,837 | ) | — | — | — | |||||||||||
From net realized gain on investments: | ||||||||||||||||
Class N | — | — | (28,908 | ) | (579,320 | ) | ||||||||||
Class S## | — | — | — | (3,103,417 | ) | |||||||||||
Class I | — | — | (1,027,689 | ) | (13,370,506 | ) | ||||||||||
Total distributions to shareholders | (1,465,020 | ) | (2,783,139 | ) | (17,445,310 | ) | (30,573,456 | ) | ||||||||
Capital Share Transactions:1 | ||||||||||||||||
Net increase (decrease) from capital share transactions | (65,807,448 | ) | 27,097,678 | 122,965,822 | 153,597,847 | |||||||||||
Total increase (decrease) in net assets | (64,542,170 | ) | 27,167,544 | 151,990,666 | 111,115,508 | |||||||||||
Net Assets: | ||||||||||||||||
Beginning of year | 113,265,846 | 86,098,302 | 922,921,041 | 811,805,533 | ||||||||||||
End of year | $ | 48,723,676 | $ | 113,265,846 | $ | 1,074,911,707 | $ | 922,921,041 | ||||||||
End of year undistributed net investment income | — | $ | 9,070 | — | — | |||||||||||
|
|
|
|
|
|
|
| |||||||||
| # | Effective October 1, 2016, and February 27, 2017 the Funds’ share classes were renamed as described in Note 1 of the Notes to the Financial Statements. |
| ## | Effective June 23, 2017, Class S shares were converted into Class I Shares. |
| 1 | See Note 1(g) of the Notes to Financial Statements. |
The accompanying notes are an integral part of these financial statements.
42
Table of Contents
Statements of Changes in Net Assets (continued)
For the fiscal years ended December 31,
| AMG GW&K Municipal Enhanced Yield Fund | AMG GW&K Small Cap Core Fund | AMG GW&K Small/Mid Cap Fund | ||||||||||||||||||||||
| 2017# | 2016# | 2017# | 2016# | 2017# | 2016# | |||||||||||||||||||
Increase in Net Assets Resulting From Operations: | ||||||||||||||||||||||||
Net investment income (loss) | $ | 6,945,956 | $ | 7,155,225 | $ | 1,044,956 | $ | 1,422,759 | $ | 36,766 | $ | (6,439 | ) | |||||||||||
Net realized gain (loss) on investments | 1,907,278 | 6,721,972 | 39,398,970 | 14,201,155 | 416,050 | (28,503 | ) | |||||||||||||||||
Net change in unrealized appreciation/depreciation on investments | 12,463,029 | (13,050,976 | ) | 52,180,026 | 49,509,033 | 1,558,779 | 252,237 | |||||||||||||||||
Net increase in net assets resulting from operations | 21,316,263 | 826,221 | 92,623,952 | 65,132,947 | 2,011,595 | 217,295 | ||||||||||||||||||
Distributions to Shareholders: | ||||||||||||||||||||||||
From net investment income: | ||||||||||||||||||||||||
Class N | (234,480 | ) | (141,532 | ) | — | — | — | — | ||||||||||||||||
Class S## | (193,559 | ) | (483,507 | ) | — | (32,695 | ) | — | — | |||||||||||||||
Class I | (6,539,305 | ) | (6,534,101 | ) | (817,532 | ) | (1,399,673 | ) | (26,217 | ) | (1,135 | ) | ||||||||||||
Class Z | (2,693 | ) | — | (263,165 | ) | — | (10,595 | ) | — | |||||||||||||||
From net realized gain on investments: | ||||||||||||||||||||||||
Class N | — | (189,462 | ) | (1,290,786 | ) | (1,490,651 | ) | (144 | ) | — | ||||||||||||||
Class S## | — | (751,847 | ) | — | (721,953 | ) | — | — | ||||||||||||||||
Class I | — | (9,105,322 | ) | (20,845,694 | ) | (15,063,218 | ) | (294,502 | ) | — | ||||||||||||||
Class Z | — | — | (5,500,223 | ) | — | (92,029 | ) | — | ||||||||||||||||
Total distributions to shareholders | (6,970,037 | ) | (17,205,771 | ) | (28,717,400 | ) | (18,708,190 | ) | (423,487 | ) | (1,135 | ) | ||||||||||||
Capital Share Transactions:1 | ||||||||||||||||||||||||
Net increase (decrease) from capital share transactions | 5,434,557 | (1,420,098 | ) | 51,017,083 | 185,281 | 27,436,973 | 841,781 | |||||||||||||||||
Total increase (decrease) in net assets | 19,780,783 | (17,799,648 | ) | 114,923,635 | 46,610,038 | 29,025,081 | 1,057,941 | |||||||||||||||||
Net Assets: | ||||||||||||||||||||||||
Beginning of year | 215,793,076 | 233,592,724 | 421,421,307 | 374,811,269 | 2,231,092 | 1,173,151 | ||||||||||||||||||
End of year | $ | 235,573,859 | $ | 215,793,076 | $ | 536,344,942 | $ | 421,421,307 | $ | 31,256,173 | $ | 2,231,092 | ||||||||||||
End of year undistributed net investment income | — | — | — | — | — | — | ||||||||||||||||||
|
|
|
|
|
|
|
|
|
|
|
| |||||||||||||
| # | Effective October 1, 2016, and February 27, 2017 the Funds’ share classes were renamed as described in Note 1 of the Notes to the Financial Statements. |
| ## | Effective June 23, 2017, Class S shares were converted into Class I Shares. |
| 1 | See Note 1(g) of the Notes to Financial Statements. |
The accompanying notes are an integral part of these financial statements.
43
Table of Contents
AMG GW&K Enhanced Core Bond Fund
Financial Highlights
For a share outstanding throughout each fiscal year
| For the fiscal years ended December 31, | ||||||||||||||||||||
| Class N | 2017 | 2016# | 2015 | 2014 | 2013 | |||||||||||||||
Net Asset Value, Beginning of Year | $ | 9.67 | $ | 9.58 | $ | 10.22 | $ | 9.96 | $ | 11.24 | ||||||||||
Income (loss) from Investment Operations: | ||||||||||||||||||||
Net investment income1,2 | 0.21 | 0.22 | 0.29 | 0.29 | 0.24 | |||||||||||||||
Net realized and unrealized gain (loss) on investments | 0.15 | 0.09 | (0.64 | ) | 0.26 | (0.21 | ) | |||||||||||||
Total income (loss) from investment operations | 0.36 | 0.31 | (0.35 | ) | 0.55 | 0.03 | ||||||||||||||
Less Distributions to Shareholders from: | ||||||||||||||||||||
Net investment income | (0.22 | ) | (0.22 | ) | (0.29 | ) | (0.29 | ) | (0.26 | ) | ||||||||||
Net realized gain on investments | — | — | — | — | (1.05 | ) | ||||||||||||||
Total distributions to shareholders | (0.22 | ) | (0.22 | ) | (0.29 | ) | (0.29 | ) | (1.31 | ) | ||||||||||
Net Asset Value, End of Year | $ | 9.81 | $ | 9.67 | $ | 9.58 | $ | 10.22 | $ | 9.96 | ||||||||||
Total Return2 | 3.76 | %3 | 3.26 | % | (3.51 | )% | 5.58 | %3 | 0.29 | %3 | ||||||||||
Ratio of net expenses to average net assets | 0.75 | % | 0.84 | % | 0.84 | % | 0.84 | % | 0.86 | %4 | ||||||||||
Ratio of gross expenses to average net assets5 | 1.04 | % | 1.05 | % | 1.07 | % | 1.09 | % | 1.08 | %4 | ||||||||||
Ratio of net investment income to average net assets2 | 2.19 | % | 2.27 | % | 2.87 | % | 2.82 | % | 2.14 | %4 | ||||||||||
Portfolio turnover | 39 | % | 88 | % | 57 | % | 22 | % | 43 | % | ||||||||||
Net assets end of year (000’s) omitted | $ | 16,027 | $ | 16,115 | $ | 20,203 | $ | 27,444 | $ | 32,009 | ||||||||||
|
|
|
|
|
|
|
|
|
| |||||||||||
44
Table of Contents
AMG GW&K Enhanced Core Bond Fund
Financial Highlights
For a share outstanding throughout each fiscal year
| For the fiscal years ended December 31, | ||||||||||||||||||||
| Class I | 2017## | 2016# | 2015 | 2014 | 2013 | |||||||||||||||
Net Asset Value, Beginning of Year | $ | 9.70 | $ | 9.62 | $ | 10.26 | $ | 9.99 | $ | 11.28 | ||||||||||
Income (loss) from Investment Operations: | ||||||||||||||||||||
Net investment income1,2 | 0.23 | 0.24 | 0.30 | 0.31 | 0.26 | |||||||||||||||
Net realized and unrealized gain (loss) on investments | 0.16 | 0.08 | (0.63 | ) | 0.27 | (0.22 | ) | |||||||||||||
Total income (loss) from investment operations | 0.39 | 0.32 | (0.33 | ) | 0.58 | 0.04 | ||||||||||||||
Less Distributions to Shareholders from: | ||||||||||||||||||||
Net investment income | (0.24 | ) | (0.24 | ) | (0.31 | ) | (0.31 | ) | (0.28 | ) | ||||||||||
Net realized gain on investments | — | — | — | — | (1.05 | ) | ||||||||||||||
Total distributions to shareholders | (0.24 | ) | (0.24 | ) | (0.31 | ) | (0.31 | ) | (1.33 | ) | ||||||||||
Net Asset Value, End of Year | $ | 9.85 | $ | 9.70 | $ | 9.62 | $ | 10.26 | $ | 9.99 | ||||||||||
Total Return2,3 | 4.03 | % | 3.31 | % | (3.30 | )% | 5.84 | % | 0.41 | % | ||||||||||
Ratio of net expenses to average net assets | 0.61 | % | 0.69 | % | 0.67 | % | 0.65 | % | 0.69 | %4 | ||||||||||
Ratio of gross expenses to average net assets5 | 0.90 | % | 0.90 | % | 0.90 | % | 0.90 | % | 0.91 | %4 | ||||||||||
Ratio of net investment income to average net assets2 | 2.32 | % | 2.39 | % | 2.96 | % | 3.00 | % | 2.31 | %4 | ||||||||||
Portfolio turnover | 39 | % | 88 | % | 57 | % | 22 | % | 43 | % | ||||||||||
Net assets end of year (000’s) omitted | $ | 6,864 | $ | 37,952 | $ | 7,463 | $ | 2,480 | $ | 1,563 | ||||||||||
|
|
|
|
|
|
|
|
|
| |||||||||||
45
Table of Contents
AMG GW&K Enhanced Core Bond Fund
Financial Highlights
For a share outstanding throughout each fiscal year
| For the fiscal years ended December 31, | ||||||||||||||||||||
| Class C | 2017 | 2016 | 2015 | 2014 | 2013 | |||||||||||||||
Net Asset Value, Beginning of Year | $ | 9.66 | $ | 9.57 | $ | 10.20 | $ | 9.94 | $ | 11.22 | ||||||||||
Income (loss) from Investment Operations: | ||||||||||||||||||||
Net investment income1,2 | 0.14 | 0.15 | 0.21 | 0.21 | 0.15 | |||||||||||||||
Net realized and unrealized gain (loss) on investments | 0.16 | 0.08 | (0.63 | ) | 0.26 | (0.20 | ) | |||||||||||||
Total income (loss) from investment operations | 0.30 | 0.23 | (0.42 | ) | 0.47 | (0.05 | ) | |||||||||||||
Less Distributions to Shareholders from: | ||||||||||||||||||||
Net investment income | (0.15 | ) | (0.14 | ) | (0.21 | ) | (0.21 | ) | (0.18 | ) | ||||||||||
Net realized gain on investments | — | — | — | — | (1.05 | ) | ||||||||||||||
Total distributions to shareholders | (0.15 | ) | (0.14 | ) | (0.21 | ) | (0.21 | ) | (1.23 | ) | ||||||||||
Net Asset Value, End of Year | $ | 9.81 | $ | 9.66 | $ | 9.57 | $ | 10.20 | $ | 9.94 | ||||||||||
Total Return2 | 3.08 | %3 | 2.40 | %3 | (4.15 | )% | 4.79 | %3 | (0.50 | )% | ||||||||||
Ratio of net expenses to average net assets | 1.50 | % | 1.59 | % | 1.59 | % | 1.59 | % | 1.61 | %4 | ||||||||||
Ratio of gross expenses to average net assets5 | 1.79 | % | 1.80 | % | 1.82 | % | 1.84 | % | 1.83 | %4 | ||||||||||
Ratio of net investment income to average net assets2 | 1.43 | % | 1.53 | % | 2.12 | % | 2.07 | % | 1.38 | %4 | ||||||||||
Portfolio turnover | 39 | % | 88 | % | 57 | % | 22 | % | 43 | % | ||||||||||
Net assets end of year (000’s) omitted | $ | 4,561 | $ | 7,842 | $ | 11,031 | $ | 15,927 | $ | 20,793 | ||||||||||
|
|
|
|
|
|
|
|
|
| |||||||||||
46
Table of Contents
AMG GW&K Enhanced Core Bond Fund
Financial Highlights
For a share outstanding throughout each fiscal year
| For the fiscal years ended December 31, | ||||||||||||||||||||
| Class Z | 2017## | 2016# | 2015 | 2014 | 2013 | |||||||||||||||
Net Asset Value, Beginning of Year | $ | 9.70 | $ | 9.61 | $ | 10.25 | $ | 9.99 | $ | 11.28 | ||||||||||
Income (loss) from Investment Operations: | ||||||||||||||||||||
Net investment income1,2 | 0.24 | 0.25 | 0.31 | 0.31 | 0.27 | |||||||||||||||
Net realized and unrealized gain (loss) on investments | 0.15 | 0.09 | (0.63 | ) | 0.27 | (0.22 | ) | |||||||||||||
Total income (loss) from investment operations | 0.39 | 0.34 | (0.32 | ) | 0.58 | 0.05 | ||||||||||||||
Less Distributions to Shareholders from: | ||||||||||||||||||||
Net investment income | (0.25 | ) | (0.25 | ) | (0.32 | ) | (0.32 | ) | (0.29 | ) | ||||||||||
Net realized gain on investments | — | — | — | — | (1.05 | ) | ||||||||||||||
Total distributions to shareholders | (0.25 | ) | (0.25 | ) | (0.32 | ) | (0.32 | ) | (1.34 | ) | ||||||||||
Net Asset Value, End of Year | $ | 9.84 | $ | 9.70 | $ | 9.61 | $ | 10.25 | $ | 9.99 | ||||||||||
Total Return2 | 4.01 | %3 | 3.52 | % | (3.15 | )%3 | 5.85 | %3 | 0.46 | %3 | ||||||||||
Ratio of net expenses to average net assets | 0.50 | % | 0.59 | % | 0.59 | % | 0.59 | % | 0.61 | %4 | ||||||||||
Ratio of gross expenses to average net assets5 | 0.79 | % | 0.80 | % | 0.82 | % | 0.84 | % | 0.83 | %4 | ||||||||||
Ratio of net investment income to average net assets2 | 2.43 | % | 2.51 | % | 3.10 | % | 3.05 | % | 2.39 | %4 | ||||||||||
Portfolio turnover | 39 | % | 88 | % | 57 | % | 22 | % | 43 | % | ||||||||||
Net assets end of year (000’s) omitted | $ | 21,271 | $ | 51,357 | $ | 47,402 | $ | 41,968 | $ | 59,182 | ||||||||||
|
|
|
|
|
|
|
|
|
| |||||||||||
| # | Effective October 1, 2016, the Investor Class, Service Class and Institutional Class were renamed Class N, Class S and Class I, respectively. |
| ## | Effective February 27, 2017, Class I shares were renamed Class Z and Class S shares were renamed Class I. |
| 1 | Per share numbers have been calculated using average shares. |
| 2 | Total returns and net investment income would have been lower had certain expenses not been offset. |
| 3 | The total return is calculated using the published Net Asset Value as of fiscal year end. |
| 4 | Includes non-routine extraordinary expenses amounting to 0.021%, 0.016%, 0.021% and 0.020% of average net assets for the Class N, Class I, Class C and Class Z, respectively. |
| 5 | Excludes the impact of expense reimbursement or fee waivers and expense reductions such as brokerage credits, but includes expense repayments and non-reimbursable expenses, if any, such as interest, taxes, and extraordinary expenses. (See Note 1(c) and 2 in the Notes to Financial Statements.) |
47
Table of Contents
AMG GW&K Municipal Bond Fund
Financial Highlights
For a share outstanding throughout each fiscal year
| For the fiscal years ended December 31, | ||||||||||||||||||||
| Class N | 2017 | 2016# | 2015 | 2014 | 2013 | |||||||||||||||
Net Asset Value, Beginning of Year | $ | 11.25 | $ | 11.70 | $ | 11.61 | $ | 11.02 | $ | 11.52 | ||||||||||
Income (loss) from Investment Operations: | ||||||||||||||||||||
Net investment income1,2 | 0.15 | 0.13 | 0.15 | 0.18 | 0.18 | |||||||||||||||
Net realized and unrealized gain (loss) on investments | 0.36 | (0.25 | ) | 0.24 | 0.63 | (0.47 | ) | |||||||||||||
Total income (loss) from investment operations | 0.51 | (0.12 | ) | 0.39 | 0.81 | (0.29 | ) | |||||||||||||
Less Distributions to Shareholders from: | ||||||||||||||||||||
Net investment income | (0.15 | ) | (0.12 | ) | (0.15 | ) | (0.18 | ) | (0.17 | ) | ||||||||||
Net realized gain on investments | (0.01 | ) | (0.21 | ) | (0.15 | ) | (0.04 | ) | (0.04 | ) | ||||||||||
Total distributions to shareholders | (0.16 | ) | (0.33 | ) | (0.30 | ) | (0.22 | ) | (0.21 | ) | ||||||||||
Net Asset Value, End of Year | $ | 11.60 | $ | 11.25 | $ | 11.70 | $ | 11.61 | $ | 11.02 | ||||||||||
Total Return2 | 4.58 | %3 | (1.05 | )%3 | 3.36 | %3 | 7.39 | %3 | (2.51 | )% | ||||||||||
Ratio of net expenses to average net assets | 0.71 | % | 0.71 | % | 0.82 | % | 0.80 | % | 0.81 | %4 | ||||||||||
Ratio of gross expenses to average net assets5 | 0.78 | % | 0.95 | % | 1.13 | % | 1.12 | % | 1.17 | %4 | ||||||||||
Ratio of net investment income to average net assets2 | 1.31 | % | 1.08 | % | 1.28 | % | 1.55 | % | 1.56 | %4 | ||||||||||
Portfolio turnover | 27 | % | 66 | % | 78 | % | 31 | % | 28 | % | ||||||||||
Net assets end of year (000’s) omitted | $ | 29,513 | $ | 31,406 | $ | 27,362 | $ | 23,572 | $ | 28,655 | ||||||||||
|
|
|
|
|
|
|
|
|
| |||||||||||
48
Table of Contents
AMG GW&K Municipal Bond Fund
Financial Highlights
For a share outstanding throughout each fiscal year
| For the fiscal years ended December 31, | ||||||||||||||||||||
| Class I | 2017## | 2016# | 2015 | 2014 | 2013 | |||||||||||||||
Net Asset Value, Beginning of Year | $ | 11.31 | $ | 11.77 | $ | 11.67 | $ | 11.08 | $ | 11.58 | ||||||||||
Income (loss) from Investment Operations: | ||||||||||||||||||||
Net investment income1,2 | 0.19 | 0.17 | 0.21 | 0.23 | 0.23 | |||||||||||||||
Net realized and unrealized gain (loss) on investments | 0.36 | (0.25 | ) | 0.24 | 0.63 | (0.47 | ) | |||||||||||||
Total income (loss) from investment operations | 0.55 | (0.08 | ) | 0.45 | 0.86 | (0.24 | ) | |||||||||||||
Less Distributions to Shareholders from: | ||||||||||||||||||||
Net investment income | (0.19 | ) | (0.17 | ) | (0.20 | ) | (0.23 | ) | (0.22 | ) | ||||||||||
Net realized gain on investments | (0.01 | ) | (0.21 | ) | (0.15 | ) | (0.04 | ) | (0.04 | ) | ||||||||||
Total distributions to shareholders | (0.20 | ) | (0.38 | ) | (0.35 | ) | (0.27 | ) | (0.26 | ) | ||||||||||
Net Asset Value, End of Year | $ | 11.66 | $ | 11.31 | $ | 11.77 | $ | 11.67 | $ | 11.08 | ||||||||||
Total Return2,3 | 4.90 | % | (0.70 | )% | 3.94 | % | 7.80 | % | (2.02 | )% | ||||||||||
Ratio of net expenses to average net assets | 0.37 | % | 0.34 | % | 0.34 | % | 0.34 | % | 0.36 | %4 | ||||||||||
Ratio of gross expenses to average net assets5 | 0.45 | % | 0.58 | % | 0.65 | % | 0.66 | % | 0.72 | %4 | ||||||||||
Ratio of net investment income to average net assets2 | 1.64 | % | 1.45 | % | 1.76 | % | 2.00 | % | 2.01 | %4 | ||||||||||
Portfolio turnover | 27 | % | 66 | % | 78 | % | 31 | % | 28 | % | ||||||||||
Net assets end of year (000’s) omitted | $ | 1,045,399 | $ | 728,365 | $ | 655,760 | $ | 393,581 | $ | 204,711 | ||||||||||
|
|
|
|
|
|
|
|
|
| |||||||||||
| # | Effective October 1, 2016, the Investor Class, Service Class and Institutional Class were renamed Class N, Class S and Class I, respectively. |
| ## | Effective June 23, 2017, Class S shares were converted to Class I shares. |
| 1 | Per share numbers have been calculated using average shares. |
| 2 | Total returns and net investment income would have been lower had certain expenses not been offset. |
| 3 | The total return is calculated using the published Net Asset Value as of fiscal year end. |
| 4 | Includes non-routine extraordinary expenses amounting to 0.021% and 0.020% of average net assets for the Class N and Class I, respectively. |
| 5 | Excludes the impact of expense reimbursement or fee waivers and expense reductions such as brokerage credits, but includes expense repayments and non-reimbursable expenses, if any, such as interest, taxes, and extraordinary expenses. (See Note 1(c) and 2 in the Notes to Financial Statements.) |
49
Table of Contents
AMG GW&K Municipal Enhanced Yield Fund
Financial Highlights
For a share outstanding throughout each fiscal year
| For the fiscal years ended December 31, | ||||||||||||||||||||
| Class N | 2017 | 2016# | 2015 | 2014 | 2013 | |||||||||||||||
Net Asset Value, Beginning of Year | $ | 9.40 | $ | 10.08 | $ | 10.16 | $ | 8.98 | $ | 10.24 | ||||||||||
Income (loss) from Investment Operations: | ||||||||||||||||||||
Net investment income1,2 | 0.26 | 0.25 | 0.30 | 0.34 | 0.35 | |||||||||||||||
Net realized and unrealized gain (loss) on investments | 0.62 | (0.23 | ) | 0.05 | 1.18 | (1.18 | ) | |||||||||||||
Total income (loss) from investment operations | 0.88 | 0.02 | 0.35 | 1.52 | (0.83 | ) | ||||||||||||||
Less Distributions to Shareholders from: | ||||||||||||||||||||
Net investment income | (0.26 | ) | (0.25 | ) | (0.30 | ) | (0.34 | ) | (0.36 | ) | ||||||||||
Net realized gain on investments | — | (0.45 | ) | (0.13 | ) | — | (0.07 | ) | ||||||||||||
Total distributions to shareholders | (0.26 | ) | (0.70 | ) | (0.43 | ) | (0.34 | ) | (0.43 | ) | ||||||||||
Net Asset Value, End of Year | $ | 10.02 | $ | 9.40 | $ | 10.08 | $ | 10.16 | $ | 8.98 | ||||||||||
Total Return2 | 9.51 | %3 | 0.10 | %3 | 3.57 | %3 | 17.14 | %3 | (8.27 | )% | ||||||||||
Ratio of net expenses to average net assets | 1.01 | % | 1.14 | % | 1.07 | % | 1.00 | % | 1.12 | %4 | ||||||||||
Ratio of gross expenses to average net assets5 | 1.11 | % | 1.30 | % | 1.25 | % | 1.19 | % | 1.30 | %4 | ||||||||||
Ratio of net investment income to average net assets2 | 2.67 | % | 2.38 | % | 2.98 | % | 3.46 | % | 3.58 | %4 | ||||||||||
Portfolio turnover | 67 | % | 172 | % | 120 | % | 83 | % | 52 | % | ||||||||||
Net assets end of year (000’s) omitted | $ | 8,828 | $ | 4,184 | $ | 5,500 | $ | 8,507 | $ | 8,030 | ||||||||||
|
|
|
|
|
|
|
|
|
| |||||||||||
50
Table of Contents
AMG GW&K Municipal Enhanced Yield Fund
Financial Highlights
For a share outstanding throughout each fiscal year
| For the fiscal years ended December 31, | ||||||||||||||||||||
| Class I | 2017## | 2016# | 2015 | 2014 | 2013 | |||||||||||||||
Net Asset Value, Beginning of Year | $ | 9.40 | $ | 10.07 | $ | 10.14 | $ | 8.97 | $ | 10.22 | ||||||||||
Income (loss) from Investment Operations: | ||||||||||||||||||||
Net investment income1,2 | 0.30 | 0.30 | 0.34 | 0.37 | 0.39 | |||||||||||||||
Net realized and unrealized gain (loss) on investments | 0.61 | (0.22 | ) | 0.07 | 1.17 | (1.17 | ) | |||||||||||||
Total income (loss) from investment operations | 0.91 | 0.08 | 0.41 | 1.54 | (0.78 | ) | ||||||||||||||
Less Distributions to Shareholders from: | ||||||||||||||||||||
Net investment income | (0.30 | ) | (0.30 | ) | (0.35 | ) | (0.37 | ) | (0.40 | ) | ||||||||||
Net realized gain on investments | — | (0.45 | ) | (0.13 | ) | — | (0.07 | ) | ||||||||||||
Total distributions to shareholders | (0.30 | ) | (0.75 | ) | (0.48 | ) | (0.37 | ) | (0.47 | ) | ||||||||||
Net Asset Value, End of Year | $ | 10.01 | $ | 9.40 | $ | 10.07 | $ | 10.14 | $ | 8.97 | ||||||||||
Total Return2,3 | 9.79 | % | 0.70 | % | 4.15 | % | 17.45 | % | (7.80 | )% | ||||||||||
Ratio of net expenses to average net assets | 0.64 | % | 0.64 | % | 0.64 | % | 0.64 | % | 0.66 | %4 | ||||||||||
Ratio of gross expenses to average net assets5 | 0.74 | % | 0.80 | % | 0.82 | % | 0.83 | % | 0.84 | %4 | ||||||||||
Ratio of net investment income to average net assets2 | 3.05 | % | 2.89 | % | 3.42 | % | 3.83 | % | 4.08 | %4 | ||||||||||
Portfolio turnover | 67 | % | 172 | % | 120 | % | 83 | % | 52 | % | ||||||||||
Net assets end of year (000’s) omitted | $ | 226,638 | $ | 195,193 | $ | 212,057 | $ | 226,284 | $ | 201,161 | ||||||||||
|
|
|
|
|
|
|
|
|
| |||||||||||
51
Table of Contents
AMG GW&K Municipal Enhanced Yield Fund
Financial Highlights
For a share outstanding throughout each fiscal period
| For the fiscal period ended December 31, | ||||
| Class Z | 2017* | |||
Net Asset Value, Beginning of Period | $ | 9.49 | ||
Income from Investment Operations: | ||||
Net investment income1,2 | 0.25 | |||
Net realized and unrealized gain on investments | 0.52 | |||
Total income from investment operations | 0.77 | |||
Less Distributions to Shareholders from: | ||||
Net investment income | (0.25 | ) | ||
Total distributions to shareholders | (0.25 | ) | ||
Net Asset Value, End of Period | $ | 10.01 | ||
Total Return2 | 8.23 | %3,6 | ||
Ratio of net expenses to average net assets | 0.59 | %7 | ||
Ratio of gross expenses to average net assets5 | 0.69 | %7 | ||
Ratio of net investment income to average net assets2 | 3.07 | %7 | ||
Portfolio turnover | 67 | % | ||
Net assets end of period (000’s) omitted | $ | 108 | ||
|
| |||
| # | Effective October 1, 2016, the Investor Class, Service Class and Institutional Class were renamed Class N, Class S and Class I, respectively. |
| ## | Effective June 23, 2017, Class S shares were converted to Class I shares. |
| * | Commencement of operations was on February 27, 2017. |
| 1 | Per share numbers have been calculated using average shares. |
| 2 | Total returns and net investment income would have been lower had certain expenses not been offset. |
| 3 | The total return is calculated using the published Net Asset Value as of fiscal year end. |
| 4 | Includes non-routine extraordinary expenses amounting to 0.024% and 0.023% of average net assets for the Class N and Class l, respectively. |
| 5 | Excludes the impact of expense reimbursement or fee waivers and expense reductions such as brokerage credits, but includes expense repayments and non-reimbursable expenses, if any, such as interest, taxes, and extraordinary expenses. (See Note 1(c) and 2 in the Notes to Financial Statements.) |
| 6 | Not annualized. |
| 7 | Annualized. |
52
Table of Contents
AMG GW&K Small Cap Core Fund
Financial Highlights
For a share outstanding throughout each fiscal year
| For the fiscal years ended December 31, | ||||||||||||||||||||
| Class N | 2017 | 2016# | 2015 | 2014 | 2013 | |||||||||||||||
Net Asset Value, Beginning of Year | $ | 24.57 | $ | 21.80 | $ | 23.39 | $ | 24.34 | $ | 17.72 | ||||||||||
Income (loss) from Investment Operations: | ||||||||||||||||||||
Net investment income (loss)1,2 | (0.06 | )3 | 0.00 | 4,5 | (0.06 | )6 | (0.07 | )7 | (0.07 | )8 | ||||||||||
Net realized and unrealized gain (loss) on investments | 5.06 | 3.81 | (0.64 | ) | 0.46 | 7.56 | ||||||||||||||
Total income (loss) from investment operations | 5.00 | 3.81 | (0.70 | ) | 0.39 | 7.49 | ||||||||||||||
Less Distributions to Shareholders from: | ||||||||||||||||||||
Net realized gain on investments | (1.53 | ) | (1.04 | ) | (0.89 | ) | (1.34 | ) | (0.87 | ) | ||||||||||
Total distributions to shareholders | (1.53 | ) | (1.04 | ) | (0.89 | ) | (1.34 | ) | (0.87 | ) | ||||||||||
Net Asset Value, End of Year | $ | 28.04 | $ | 24.57 | $ | 21.80 | $ | 23.39 | $ | 24.34 | ||||||||||
Total Return2,9 | 20.32 | % | 17.44 | % | (3.02 | )% | 1.53 | % | 42.26 | % | ||||||||||
Ratio of net expenses to average net assets10 | 1.32 | % | 1.33 | % | 1.35 | % | 1.42 | % | 1.37 | %11 | ||||||||||
Ratio of gross expenses to average net assets12 | 1.33 | % | 1.42 | % | 1.46 | % | 1.53 | % | 1.50 | %11 | ||||||||||
Ratio of net investment income (loss) to average net assets2 | (0.21 | )% | 0.01 | % | (0.24 | )% | (0.28 | )% | (0.32 | )%11 | ||||||||||
Portfolio turnover | 23 | % | 19 | % | 16 | % | 26 | % | 19 | % | ||||||||||
Net assets end of year (000’s) omitted | $ | 24,989 | $ | 35,760 | $ | 35,691 | $ | 37,995 | $ | 69,992 | ||||||||||
|
|
|
|
|
|
|
|
|
| |||||||||||
53
Table of Contents
AMG GW&K Small Cap Core Fund
Financial Highlights
For a share outstanding throughout each fiscal year
| For the fiscal years ended December 31, | ||||||||||||||||||||
| Class I | 2017## | 2016# | 2015 | 2014 | 2013 | |||||||||||||||
Net Asset Value, Beginning of Year | $ | 24.84 | $ | 22.04 | $ | 23.61 | $ | 24.49 | $ | 17.76 | ||||||||||
Income (loss) from Investment Operations: | ||||||||||||||||||||
Net investment income1,2 | 0.07 | 3 | 0.10 | 5 | 0.04 | 6 | 0.07 | 7 | 0.02 | 8 | ||||||||||
Net realized and unrealized gain (loss) on investments | 5.10 | 3.86 | (0.65 | ) | 0.44 | 7.58 | ||||||||||||||
Total income (loss) from investment operations | 5.17 | 3.96 | (0.61 | ) | 0.51 | 7.60 | ||||||||||||||
Less Distributions to Shareholders from: | ||||||||||||||||||||
Net investment income | (0.06 | ) | (0.10 | ) | (0.05 | ) | (0.04 | ) | — | |||||||||||
Net realized gain on investments | (1.53 | ) | (1.06 | ) | (0.91 | ) | (1.35 | ) | (0.87 | ) | ||||||||||
Total distributions to shareholders | (1.59 | ) | (1.16 | ) | (0.96 | ) | (1.39 | ) | (0.87 | ) | ||||||||||
Net Asset Value, End of Year | $ | 28.42 | $ | 24.84 | $ | 22.04 | $ | 23.61 | $ | 24.49 | ||||||||||
Total Return2 | 20.79 | %9 | 17.90 | %9 | (2.63 | )%9 | 2.04 | %9 | 42.81 | % | ||||||||||
Ratio of net expenses to average net assets10 | 0.95 | % | 0.94 | % | 0.95 | % | 0.95 | % | 0.97 | %11 | ||||||||||
Ratio of gross expenses to average net assets12 | 0.96 | % | 1.03 | % | 1.06 | % | 1.07 | % | 1.10 | %11 | ||||||||||
Ratio of net investment income to average net assets2 | 0.24 | % | 0.43 | % | 0.17 | % | 0.30 | % | 0.07 | %11 | ||||||||||
Portfolio turnover | 23 | % | 19 | % | 16 | % | 26 | % | 19 | % | ||||||||||
Net assets end of year (000’s) omitted | $ | 403,309 | $ | 367,972 | $ | 302,381 | $ | 291,301 | $ | 168,854 | ||||||||||
|
|
|
|
|
|
|
|
|
| |||||||||||
54
Table of Contents
AMG GW&K Small Cap Core Fund
Financial Highlights
For a share outstanding throughout each fiscal period
| For the fiscal period ended December 31, | ||||
| Class Z | 2017* | |||
Net Asset Value, Beginning of Period | $ | 26.13 | ||
Income from Investment Operations: | ||||
Net investment income1,2 | 0.14 | 3 | ||
Net realized and unrealized gain on investments | 3.75 | |||
Total income from investment operations | 3.89 | |||
Less Distributions to Shareholders from: | ||||
Net investment income | (0.07 | ) | ||
Net realized gain on investments | (1.53 | ) | ||
Total distributions to shareholders | (1.60 | ) | ||
Net Asset Value, End of Period | $ | 28.42 | ||
Total Return2,9 | 14.87 | %13 | ||
Ratio of net expenses to average net assets10 | 0.90 | %14 | ||
Ratio of gross expenses to average net assets12 | 0.91 | %14 | ||
Ratio of net investment income to average net assets2 | 0.56 | %14 | ||
Portfolio turnover | 23 | % | ||
Net assets end of period (000’s) omitted | $ | 108,047 | ||
|
| |||
| # | Effective October 1, 2016, the Investor Class, Service Class and Institutional Class were renamed Class N, Class S and Class I, respectively. |
| ## | Effective June 23, 2017, Class S shares were converted to Class I shares. |
| * | Commencement of operations was on February 27, 2017. |
| 1 | Per share numbers have been calculated using average shares. |
| 2 | Total returns and net investment income would have been lower had certain expenses not been offset. |
| 3 | Includes non-recurring dividends. Without these dividends, net investment income per class would have been $(0.12), $0.01, and $0.09 for Class N, Class I and Class Z, respectively. |
| 4 | Rounds to less than $0.01 per share. |
| 5 | Includes non-recurring dividends. Without these dividends, net investment income per share would have been $(0.06) and $0.04 for the Class N, and Class l, respectively. |
| 6 | Includes non-recurring dividends. Without these dividends, net investment income per share would have been $(0.05) and $0.05 for the Class N, and Class l, respectively. |
| 7 | Includes non-recurring dividends. Without these dividends, net investment income per share would have been $(0.11) and $0.03 for Class N, and Class l shares, respectively. |
| 8 | Includes non-recurring dividends. Without these dividends, net investment income per share would have been $(0.09) and $0.00 for the Class N, and Class l respectively. |
| 9 | The total return is calculated using the published Net Asset Value as of fiscal year end. |
| 10 | Includes reduction from broker recapture amounting to less than 0.01% for fiscal year ended 2017. |
| 11 | Includes non-routine extraordinary expenses amounting to 0.015% and 0.018% of average net assets for the Class N and Class I, respectively. |
| 12 | Excludes the impact of expense reimbursement or fee waivers and expense reductions such as brokerage credits, but includes expense repayments and non-reimbursable expenses, if any, such as interest, taxes, and extraordinary expenses. (See Note 1(c) and 2 in the Notes to Financial Statements.) |
| 13 | Not annualized. |
| 14 | Annualized. |
55
Table of Contents
AMG GW&K Small/Mid Cap Fund
Financial Highlights
For a share outstanding throughout each fiscal period
| For the fiscal period ended | ||||
| Class N | December 31, 2017* | |||
Net Asset Value, Beginning of Period | $ | 10.35 | ||
Income from Investment Operations: | ||||
Net investment income1,2 | 0.01 | 3 | ||
Net realized and unrealized gain on investments | 0.94 | |||
Total income from investment operations | 0.95 | |||
Less Distributions to Shareholders from: | ||||
Net realized gain on investments | (0.15 | ) | ||
Total distributions to shareholders | (0.15 | ) | ||
Net Asset Value, End of Period | $ | 11.15 | ||
Total Return2,4 | 9.17 | %5 | ||
Ratio of net expenses to average net assets6 | 1.10 | %7 | ||
Ratio of gross expenses to average net assets8 | 1.71 | %7 | ||
Ratio of net investment income to average net assets2 | 0.12 | %7 | ||
Portfolio turnover | 38 | % | ||
Net assets end of period (000’s) omitted | $ | 11 | ||
|
| |||
56
Table of Contents
AMG GW&K Small/Mid Cap Fund
Financial Highlights
For a share outstanding throughout each fiscal period
| For the fiscal years ended December 31, | For the fiscal period ended December 31, 2015** | |||||||||||
| Class I | 2017 | 2016# | ||||||||||
Net Asset Value, Beginning of Period | $ | 9.80 | $ | 8.95 | $ | 10.00 | ||||||
Income (loss) from Investment Operations: | ||||||||||||
Net investment income (loss)1,2 | 0.03 | 3 | (0.03 | ) | (0.02 | ) | ||||||
Net realized and unrealized gain (loss) on investments | 1.48 | 0.89 | (1.03 | ) | ||||||||
Total income (loss) from investment operations | 1.51 | 0.86 | (1.05 | ) | ||||||||
Less Distributions to Shareholders from: | ||||||||||||
Net investment income | (0.01 | ) | (0.01 | ) | — | |||||||
Net realized gain on investments | (0.15 | ) | — | — | ||||||||
Total distributions to shareholders | (0.16 | ) | (0.01 | ) | — | |||||||
Net Asset Value, End of Period | $ | 11.15 | $ | 9.80 | $ | 8.95 | ||||||
Total Return2 | 15.44% | 4 | 9.55% | (10.50 | )%4,5 | |||||||
Ratio of net expenses to average net assets6 | 0.94% | 0.95% | 0.95% | 7 | ||||||||
Ratio of gross expenses to average net assets8 | 1.62% | 4.60% | 11.39% | 7 | ||||||||
Ratio of net investment income (loss) to average net assets2 | 0.26% | (0.38 | )% | (0.39 | )%7 | |||||||
Portfolio turnover | 38% | 48% | 41% | 5 | ||||||||
Net assets end of period (000’s) omitted | $ | 24,266 | $ | 2 | $ | 1 | ||||||
|
|
|
|
|
| |||||||
57
Table of Contents
AMG GW&K Small/Mid Cap Fund
Financial Highlights
For a share outstanding throughout each fiscal period
| For the fiscal period ended | ||||
| Class Z | December 31, 2017* | |||
Net Asset Value, Beginning of Period | $ | 10.35 | ||
Income from Investment Operations: | ||||
Net investment income1,2 | 0.03 | 3 | ||
Net realized and unrealized gain on investments | 0.94 | |||
Total income from investment operations | 0.97 | |||
Less Distributions to Shareholders from: | ||||
Net investment income | (0.02 | ) | ||
Net realized gain on investments | (0.15 | ) | ||
Total distributions to shareholders | (0.17 | ) | ||
Net Asset Value, End of Period | $ | 11.15 | ||
Total Return2,4 | 9.34 | %5 | ||
Ratio of net expenses to average net assets6 | 0.85 | %7 | ||
Ratio of gross expenses to average net assets8 | 1.46 | %7 | ||
Ratio of net investment income to average net assets2 | 0.37 | %7 | ||
Portfolio turnover | 38 | % | ||
Net assets end of period (000’s) omitted | $ | 6,980 | ||
|
| |||
| * | Commencement of operations was on February 27, 2017. |
| # | Effective October 1, 2016, Institutional Class was renamed Class I. |
| ** | Commencement of operations was on June 30, 2015. |
| 1 | Per share numbers have been calculated using average shares. |
| 2 | Total returns and net investment income would have been lower had certain expenses not been offset. |
| 3 | Includes non-recurring dividends. Without these dividends, net investment income per class would have been $(0.01), $0.00, and $0.01 for Class N, Class I and Class Z, respectively. |
| 4 | The total return is calculated using the published Net Asset Value as of fiscal year end. |
| 5 | Not annualized. |
| 6 | Includes reduction from broker recapture amounting to less than 0.01% for fiscal year ended 2017. |
| 7 | Annualized. |
| 8 | Excludes the impact of expense reimbursement or fee waivers and expense reductions such as brokerage credits, but includes expense repayments and non-reimbursable expenses, if any, such as interest, taxes, and extraordinary expenses. (See Note 1(c) and 2 in the Notes to Financial Statements.) |
58
Table of Contents
December 31, 2017
1. SUMMARY OF SIGNIFICANT ACCOUNTING POLICIES
AMG Funds and AMG Funds II (the “Trusts”) are open-end management investment companies, organized as Massachusetts business trusts, and registered under the Investment Company Act of 1940, as amended (the “1940 Act”). Currently, the Trusts consist of a number of different funds, each having distinct investment management objectives, strategies, risks, and policies. Included in this report are AMG Funds: AMG GW&K Municipal Bond Fund (“Municipal Bond”), AMG GW&K Municipal Enhanced Yield Fund (“Municipal Enhanced”), AMG GW&K Small Cap Core Fund (“Small Cap Core”) and AMG GW&K Small/Mid Cap Fund (“Small/Mid Cap”) (formerly AMG GW&K Small Cap Growth Fund) and AMG Funds II: AMG GW&K Enhanced Core Bond Fund (“Enhanced Core Bond”), each a “Fund” and collectively, the “Funds.”
Each Fund offers different classes of shares, which, effective October 1, 2016 were renamed. Enhanced Core Bond, Municipal Bond, Municipal Enhanced and Small Cap Core previously offered Investor Class shares, Service Class shares, and Institutional Class shares which were renamed to Class N, Class S and Class I, respectively; Small/Mid Cap previously offered Institutional Class shares which were renamed Class I. Effective February 27, 2017, Enhanced Core Bond Class I shares were renamed Class Z and Class S shares were renamed Class I; Municipal Enhanced Yield and Small Cap Core added Class Z shares and Small/Mid Cap added Class N and Class Z shares. Effective June 23, 2017, Municipal Bond, Municipal Enhanced Yield and Small Cap Core Class S shares were converted to Class I shares. Additionally, Enhanced Core Bond offers Class C shares. Each class represents an interest in the same assets of the respective Fund. Although all share classes generally have identical voting rights, each share class votes separately when required by law. Different share classes may pay different distribution amounts to the extent the net asset value per share and/or the expenses of such share classes differ. Each share class has its own expense structure. Please refer to a current prospectus for additional information on each share class.
Effective February 27, 2017, the Small/Mid Cap Principal Investment Strategies changed from a small cap growth investment strategy to one that primarily invests in common stock and preferred stock of U.S. small- and mid-capitalization companies with either growth- or value- oriented characteristics.
Class C shares of Enhanced Core Bond were closed to all new investors and will no longer be available for purchase by existing shareholders. Shareholders who redeem Class C shares of the Fund will continue to be subject to the deferred sales charges described in the prospectus. Small Cap Core was closed to new investors. Please refer to Enhanced Core Bond’s and Small Cap Core’s current prospectus for additional information.
The Funds’ financial statements are prepared in accordance with accounting principles generally accepted in the United States of America (“U.S. GAAP”), including accounting and reporting guidance pursuant to Accounting Standards Codification Topic 946 applicable to investment companies. U.S. GAAP requires management to make estimates and assumptions that affect the reported amounts of assets and liabilities and disclosure of contingent assets and liabilities at the date of the financial statements and the reported amounts of income and expenses during the reporting period. Actual results could differ from those estimates and such differences could be material. The following is a summary of significant accounting policies followed by the Funds in the preparation of their financial statements:
a. VALUATION OF INVESTMENTS
Equity securities traded on a national securities exchange or reported on the NASDAQ national market system (“NMS”) are valued at the last quoted sales price on the primary exchange or, if applicable, the NASDAQ official closing price or the official closing price of the relevant exchange or, lacking any sales, at the last quoted bid price or the mean between the last quoted bid and ask prices (the “exchange mean price”). Equity securities traded in the over-the-counter market (other than NMS securities) are valued at the exchange mean price. Foreign equity securities (securities principally traded in markets other than U.S. markets) are valued at the official closing price on the primary exchange or, for markets that either do not offer an official closing price or where the official closing price may not be representative of the overall market, the last quoted sale price.
Fixed income securities purchased with a remaining maturity exceeding 60 days are valued at the evaluated bid price or the mean price provided by an authorized pricing service or, if an evaluated price is not available, by reference to other securities which are considered comparable in credit rating, interest rate, due date and other features (generally referred to as “matrix pricing”) or other similar pricing methodologies. Investments in certain mortgage-backed and stripped mortgage-backed securities, preferred stocks, convertible securities, derivatives and other debt securities not traded on an organized securities market are valued on the basis of valuations provided by dealers or by a pricing service which uses information with respect to transactions in such securities and various relationships between such securities and yield to maturity in determining value.
Fixed income securities purchased with a remaining maturity of 60 days or less are valued at amortized cost, provided that the amortized cost value is approximately the same as the fair value of the security valued without the use of amortized cost. Investments in other open-end regulated investment companies are valued at their end of day net asset value per share.
The Funds’ portfolio investments are generally valued based on independent market quotations or prices or, if none, “evaluative” or other market based valuations provided by third party pricing services approved by the Board of Trustees of the Trust (the “Board”). Under certain circumstances, the value of certain Fund portfolio investments may be based on an evaluation of fair value, pursuant to procedures established by and under the general supervision of the Board. The Valuation Committee, which is comprised of the Independent Trustees of the Board, and the Pricing Committee, which is comprised of representatives from AMG Funds LLC (the “Investment Manager”) are the committees appointed by the Board to make fair value determinations. Each Fund may use the fair value of a portfolio investment to calculate its net asset value (“NAV”) in the event that the market quotation, price or market based valuation for the portfolio investment is not readily available or otherwise not determinable pursuant to the Board’s valuation procedures, if the Investment Manager or the Pricing Committee believes the quotation, price or market based valuation to be unreliable, or in certain other circumstances. When determining the fair value of an investment, the Pricing Committee and, if required under the Trusts’ securities valuation procedures, the Valuation Committee, seeks to determine the price that the Fund might reasonably expect to receive from current sale of that portfolio investment in an arms-length transaction. Fair value determinations shall be based upon consideration of all available facts and information, including, but not limited to (i) attributes specific to the investment; (ii) fundamental and analytical data relating to the investment; and (iii) the value of other comparable securities or relevant financial instruments, including derivative securities, traded on other markets or among dealers.
59
Table of Contents
Notes to Financial Statements (continued)
The values assigned to fair value portfolio investments are based on available information and do not necessarily represent amounts that might ultimately be realized in the future, since such amounts depend on future developments inherent in long-term investments. Because of the inherent uncertainty of valuation, those estimated values may differ significantly from the values that would have been used had a ready market for the investments existed, and the differences could be material. The Board will be presented with a quarterly report showing as of the most recent quarter end, all outstanding securities fair valued by the Fund, including a comparison with the prior quarter end and the percentage of the Fund that the security represents at each quarter end.
With respect to foreign equity securities and certain foreign fixed income securities, the Board has adopted a policy that securities held in a Fund that can be fair valued by the applicable fair value pricing service are fair valued on each business day provided that each individual price exceeds a pre-established confidence level.
U.S. GAAP defines fair value as the price that a fund would receive to sell an asset or pay to transfer a liability in an orderly transaction between market participants at the measurement date. U.S. GAAP also establishes a framework for measuring fair value, and a three level hierarchy for fair value measurements based upon the transparency of inputs to the valuation of an asset or liability. Inputs may be observable or unobservable and refer broadly to the assumptions that market participants would use in pricing the asset or liability. Observable inputs reflect the assumptions market participants would use in pricing the asset or liability based on market data obtained from sources independent of the Funds. Unobservable inputs reflect the Funds’ own assumptions about the assumptions that market participants would use in pricing the asset or liability developed based on the best information available in the circumstances. Each investment is assigned a level based upon the observability of the inputs which are significant to the overall valuation.
The three-tier hierarchy of inputs is summarized below:
Level 1 – inputs are quoted prices in active markets for identical investments (e.g., equity securities, open-end investment companies)
Level 2 – other observable inputs (including, but not limited to: quoted prices for similar assets or liabilities in markets that are active, quoted prices for identical or similar assets or liabilities in markets that are not active, inputs other than quoted prices that are observable for the assets or liabilities (such as interest rates, yield curves, volatilities, prepayment speeds, loss severities, credit risks and default rates) or other market corroborated inputs) (e.g., debt securities, government securities, foreign currency exchange contracts, foreign securities utilizing international fair value pricing, fair valued securities with observable inputs)
Level 3 – inputs are significant unobservable inputs (including the Fund’s own assumptions used to determine the fair value of investments) (e.g., fair valued securities with unobservable inputs)
Changes in inputs or methodologies used for valuing investments may result in a transfer in or out of levels within the fair value hierarchy. The inputs or methodologies used for valuing investments may not necessarily be an indication of the risk associated with investing in those investments. Transfers between different levels of the fair value disclosure hierarchy are deemed to have occurred as of the beginning of the reporting period.
b. SECURITY TRANSACTIONS
Security transactions are accounted for as of trade date. Realized gains and losses on securities sold are determined on the basis of identified cost.
c. INVESTMENT INCOME AND EXPENSES
Dividend income is recorded on the ex-dividend date. Dividends from foreign securities are recorded on the ex-dividend date, and if after the fact, as soon as the Funds become aware of the ex-dividend date. Interest income, which includes amortization of premium and accretion of discount on debt securities, is accrued as earned. Dividend and interest income on foreign securities is recorded gross of any withholding tax. Non-cash dividends included in dividend income, if any, are reported at the fair market value of the securities received. Upon notification from issuers, distributions received from a real estate investment trust (“REIT”) may be redesignated as a reduction of cost of investments and/or realized gain. Other income and expenses are recorded on an accrual basis. Expenses that cannot be directly attributed to a Fund are apportioned among the funds in the Trusts and other trusts within the AMG Funds family of mutual funds (collectively the “AMG Funds Family”) based upon their relative average net assets or number of shareholders. Investment income, realized and unrealized capital gains and losses, the common expenses of each Fund, and certain fund level expense reductions, if any, are allocated on a pro-rata basis to each class based on the relative net assets of each class to the total net assets of each Fund.
The following Funds had certain portfolio trades directed to various brokers under a brokerage recapture program. Credits received from the brokerage recapture program are earned and paid on a monthly basis, and are recorded as expense offsets, which serve to reduce the Funds’ overall expense ratio. For the fiscal year ended December 31, 2017, the impact on the expense ratios, if any, were as follows: Small Cap Core - $24,071 or less than 0.01% and Small/Mid Cap - $14 or less than 0.01%.
d. DIVIDENDS AND DISTRIBUTIONS
Fund distributions resulting from either net investment income or realized net capital gains, if any, will normally be declared and paid at least annually in December. Distributions to shareholders are recorded on the ex-dividend date. Distributions are determined in accordance with federal income tax regulations, which may differ from net investment income and net realized capital gains for financial statement purposes (U.S. GAAP). Differences may be permanent or temporary. Permanent differences are reclassified among capital accounts in the financial statements to reflect their tax character. Permanent book and tax basis differences, if any, relating to shareholder distributions will result in reclassifications to paid-in capital. Temporary differences arise when certain items of income, expense and gain or loss are recognized in different periods for financial statement and tax purposes; these differences will reverse at some time in the future. Permanent differences are primarily due to current year redesignation of dividends paid by the fund. Temporary differences are primarily due to differences between book and tax treatment of losses for excise tax purposes and wash sales.
60
Table of Contents
Notes to Financial Statements (continued)
The tax character of distributions paid during the fiscal years ended December 31, 2017 and December 31, 2016 were as follows:
| Enhanced Core Bond | Municipal Bond* | Municipal Enhanced** | ||||||||||||||||||||||
| Distributions paid from: | 2017 | 2016 | 2017 | 2016 | 2017 | 2016 | ||||||||||||||||||
Ordinary income | $ | 1,465,020 | $ | 2,783,139 | $ | 16,341,250 | $ | 13,518,971 | $ | 6,970,037 | $ | 7,158,615 | ||||||||||||
Short-term capital gains | — | — | — | 10,894,944 | — | 5,596,273 | ||||||||||||||||||
Long-term capital gains | — | — | 1,104,060 | 6,159,541 | — | 4,450,883 | ||||||||||||||||||
|
|
|
|
|
|
|
|
|
|
|
| |||||||||||||
| $ | 1,465,020 | $ | 2,783,139 | $ | 17,445,310 | $ | 30,573,456 | $ | 6,970,037 | $ | 17,205,771 | |||||||||||||
|
|
|
|
|
|
|
|
|
|
|
| |||||||||||||
| * | The ordinary income distributions paid by Municipal Bond which were tax-exempt for the periods 2017 and 2016 were $16,185,749 and $13,518,971, respectively. |
| ** | The ordinary income distributions paid by Municipal Enhanced which were tax-exempt for the periods 2017 and 2016 were $6,915,538 and $7,153,068, respectively. |
| Small Cap Core | Small/Mid Cap | |||||||||||||||
| Distributions paid from: | 2017 | 2016 | 2017 | 2016 | ||||||||||||
Ordinary income | $ | 1,075,896 | $ | 1,432,368 | $ | 36,742 | $ | 764 | ||||||||
Short-term capital gains | 823,117 | — | 261,774 | 371 | ||||||||||||
Long-term capital gains | 26,818,387 | 17,275,822 | 124,971 | — | ||||||||||||
|
|
|
|
|
|
|
| |||||||||
| $ | 28,717,400 | $ | 18,708,190 | $ | 423,487 | $ | 1,135 | |||||||||
|
|
|
|
|
|
|
| |||||||||
As of December 31, 2017, the components of distributable earnings (excluding unrealized appreciation/depreciation) on tax basis consisted of:
| Enhanced Core Bond | Municipal Bond | Municipal Enhanced | Small Cap Core | Small/ Mid Cap | ||||||||||||||||
Capital loss carryforward | $ | 4,328,230 | — | $ | 273,380 | — | — | |||||||||||||
Undistributed ordinary income | — | — | — | — | — | |||||||||||||||
Undistributed short-term capital gains | — | — | — | $ | 351,412 | — | ||||||||||||||
Undistributed long-term capital gains | — | $ | 310,654 | — | 11,007,991 | — | ||||||||||||||
Late-year loss deferral | — | — | — | — | $ | 13,357 | ||||||||||||||
At December 31, 2017, the approximate cost of investments and the aggregate gross unrealized appreciation and depreciation for federal income tax were as follows:
| Fund | Cost | Appreciation | Depreciation | Net | ||||||||||||
Enhanced Core Bond | $ | 48,855,864 | $ | 621,702 | $ | (388,164 | ) | $ | 233,538 | |||||||
Municipal Bond | 1,053,092,876 | 11,945,284 | (5,619,463 | ) | 6,325,821 | |||||||||||
Municipal Enhanced | 224,593,285 | 8,349,185 | (639,465 | ) | 7,709,720 | |||||||||||
Small Cap Core | 427,475,542 | 153,891,102 | (20,155,991 | ) | 133,735,111 | |||||||||||
Small/Mid Cap | 30,588,598 | 2,264,893 | (490,653 | ) | 1,774,240 | |||||||||||
e. FEDERAL TAXES
Each Fund currently qualifies as an investment company and intends to comply with the requirements under Subchapter M of the Internal Revenue Code of 1986, as amended, and to distribute substantially all of its taxable income and gains to its shareholders and to meet certain diversification and income requirements with respect to investment companies. Therefore, no provision for federal income or excise tax is included in the accompanying financial statements.
Additionally, based on each Fund’s understanding of the tax rules and rates related to income, gains and transactions for the foreign jurisdictions in which it invests, each Fund will provide for foreign taxes, and where appropriate, deferred foreign taxes.
Management has analyzed the Funds’ tax positions taken on federal income tax returns as of December 31, 2017, and for all open tax years (generally, the three prior taxable years), and has concluded that no provision for federal income tax is required in the Funds’ financial statements. Additionally, Management is not aware of any tax position for which it is reasonably possible that the total amounts of unrecognized tax benefits will change materially in the next twelve months.
Net capital losses incurred may be carried forward for an unlimited time period, and retain their tax character as either short-term or long-term capital losses.
61
Table of Contents
Notes to Financial Statements (continued)
f. CAPITAL LOSS CARRYOVERS AND DEFERRALS
As of December 31, 2017, the following Funds had accumulated net realized capital loss carryovers from securities transactions for federal income tax purposes as
shown in the following chart. These amounts may be used to offset future realized capital gains, if any, for an unlimited time period.
| Capital Loss | ||||||||
| Carryover Amounts | ||||||||
| Fund | Short-Term | Long-Term | ||||||
Enhanced Core Bond | $ | 1,599,857 | $ | 2,728,373 | ||||
Municipal Enhanced | 273,380 | — | ||||||
| Capital Loss Carryover | ||||||||
| Utilized | ||||||||
| Fund | Short-Term | Long-Term | ||||||
Enhanced Core Bond | — | $ | 689,967 | |||||
As of December 31, 2017, Municipal Bond, Small Cap Core and Small/Mid Cap had no accumulated net realized capital loss carryovers from securities transactions for federal income tax purposes. Should the Funds incur net capital losses for the year ending December 31, 2017, such amounts may be used to offset future realized capital gains, for an unlimited time period.
g. CAPITAL STOCK
The Trusts’ Declaration of Trust authorizes for each Fund the issuance of an unlimited number of shares of beneficial interest, without par value. Each Fund records sales and repurchases of its capital stock on the trade date.
For the fiscal years ended December 31, 2017 and December 31, 2016, the capital stock transactions by class for the Funds were as follows:
| Enhanced Core Bond | Municipal Bond | |||||||||||||||||||||||||||||||
| December 31, 2017 | December 31, 2016 | December 31, 2017 | December 31, 2016 | |||||||||||||||||||||||||||||
| Shares | Amount | Shares | Amount | Shares | Amount | Shares | Amount | |||||||||||||||||||||||||
Class N: | ||||||||||||||||||||||||||||||||
Proceeds from sale of shares | 545,254 | $ | 5,338,004 | 385,257 | $ | 3,795,029 | 1,383,931 | $ | 15,924,408 | 1,647,974 | $ | 19,577,982 | ||||||||||||||||||||
Reinvestment of distributions | 25,331 | 247,785 | 27,286 | 268,301 | 37,952 | 438,882 | 75,000 | 856,921 | ||||||||||||||||||||||||
Cost of shares repurchased | (604,413 | ) | (5,915,824 | ) | (853,785 | ) | (8,384,944 | ) | (1,667,771 | ) | (19,328,676 | ) | (1,270,324 | ) | (14,901,658 | ) | ||||||||||||||||
|
|
|
|
|
|
|
|
|
|
|
|
|
|
|
| |||||||||||||||||
Net increase (decrease) | (33,828 | ) | $ | (330,035 | ) | (441,242 | ) | $ | (4,321,614 | ) | (245,888 | ) | $ | (2,965,386 | ) | 452,650 | $ | 5,533,245 | ||||||||||||||
|
|
|
|
|
|
|
|
|
|
|
|
|
|
|
| |||||||||||||||||
Class S: | ||||||||||||||||||||||||||||||||
Proceeds from sale of shares | — | — | — | — | 3,078,878 | $ | 35,271,698 | 10,232,475 | $ | 121,026,163 | ||||||||||||||||||||||
Reinvestment of distributions | — | — | — | — | 53,728 | 615,132 | 291,662 | 3,354,153 | ||||||||||||||||||||||||
Cost of shares repurchased | — | — | — | — | (3,952,625 | ) | (45,334,584 | ) | (7,024,704 | ) | (81,937,500 | ) | ||||||||||||||||||||
Share Conversion | — | — | — | — | (13,649,760 | ) | (160,111,684 | ) | — | — | ||||||||||||||||||||||
|
|
|
|
|
|
|
|
|
|
|
|
|
|
|
| |||||||||||||||||
Net increase (decrease) | — | — | — | — | (14,469,779 | ) | $ | (169,559,438 | ) | 3,499,433 | $ | 42,442,816 | ||||||||||||||||||||
|
|
|
|
|
|
|
|
|
|
|
|
|
|
|
| |||||||||||||||||
Class I: | ||||||||||||||||||||||||||||||||
Proceeds from sale of shares | 499,155 | $ | 4,874,509 | 3,892,108 | $ | 38,388,245 | 34,230,051 | $ | 396,585,461 | 32,007,506 | $ | 379,279,837 | ||||||||||||||||||||
Reinvestment of distributions | 44,098 | 430,918 | 77,281 | 766,271 | 1,264,901 | 14,708,302 | 2,035,999 | 23,482,851 | ||||||||||||||||||||||||
Cost of shares repurchased | (3,757,375 | ) | (36,918,527 | ) | (834,296 | ) | (8,310,804 | ) | (23,820,377 | ) | (275,914,801 | ) | (25,376,090 | ) | (297,140,902 | ) | ||||||||||||||||
Share Conversion | — | — | — | — | 13,603,372 | 160,111,684 | — | — | ||||||||||||||||||||||||
|
|
|
|
|
|
|
|
|
|
|
|
|
|
|
| |||||||||||||||||
Net increase (decrease) | (3,214,122 | ) | $ | (31,613,100 | ) | 3,135,093 | $ | 30,843,712 | 25,277,947 | $ | 295,490,646 | 8,667,415 | $ | 105,621,786 | ||||||||||||||||||
|
|
|
|
|
|
|
|
|
|
|
|
|
|
|
| |||||||||||||||||
Class C: | ||||||||||||||||||||||||||||||||
Proceeds from sale of shares | 1,278 | $ | 12,466 | 2,517 | $ | 24,694 | — | — | — | — | ||||||||||||||||||||||
Reinvestment of distributions | 6,466 | 63,151 | 9,536 | 93,552 | — | — | — | — | ||||||||||||||||||||||||
Cost of shares repurchased | (354,502 | ) | (3,456,425 | ) | (353,217 | ) | (3,475,625 | ) | — | — | — | — | ||||||||||||||||||||
|
|
|
|
|
|
|
|
|
|
|
|
|
|
|
| |||||||||||||||||
Net decrease | (346,758 | ) | $ | (3,380,808 | ) | (341,164 | ) | $ | (3,357,379 | ) | — | — | — | — | ||||||||||||||||||
|
|
|
|
|
|
|
|
|
|
|
|
|
|
|
| |||||||||||||||||
62
Table of Contents
Notes to Financial Statements (continued)
| Enhanced Core Bond | Municipal Bond | |||||||||||||||||||||||||||||||
| December 31, 2017 | December 31, 2016 | December 31, 2017 | December 31, 2016 | |||||||||||||||||||||||||||||
| Shares | Amount | Shares | Amount | Shares | Amount | Shares | Amount | |||||||||||||||||||||||||
Class Z: | ||||||||||||||||||||||||||||||||
Proceeds from sale of shares | 420,620 | $ | 4,105,961 | 2,391,953 | $ | 23,618,757 | — | — | — | — | ||||||||||||||||||||||
Reinvestment of distributions | 55,590 | 545,034 | 145,492 | 1,436,923 | — | — | — | — | ||||||||||||||||||||||||
Cost of shares repurchased | (3,611,083 | ) | (35,134,500 | ) | (2,172,562 | ) | (21,122,721 | ) | — | — | — | — | ||||||||||||||||||||
|
|
|
|
|
|
|
|
|
|
|
|
|
|
|
| |||||||||||||||||
Net increase (decrease) | (3,134,873 | ) | $ | (30,483,505 | ) | 364,883 | $ | 3,932,959 | — | — | — | — | ||||||||||||||||||||
|
|
|
|
|
|
|
|
|
|
|
|
|
|
|
| |||||||||||||||||
| Municipal Enhanced | Small Cap Core | |||||||||||||||||||||||||||||||
| December 31, 2017 | December 31, 2016 | December 31, 2017 | December 31, 2016 | |||||||||||||||||||||||||||||
| Shares | Amount | Shares | Amount | Shares | Amount | Shares | Amount | |||||||||||||||||||||||||
Class N: | ||||||||||||||||||||||||||||||||
Proceeds from sale of shares | 854,262 | $ | 8,245,287 | 569,848 | $ | 5,963,684 | 164,219 | $ | 4,353,577 | 171,093 | $ | 3,879,355 | ||||||||||||||||||||
Reinvestment of distributions | 24,014 | 234,148 | 33,790 | 329,552 | 43,445 | 1,224,282 | 55,106 | 1,367,178 | ||||||||||||||||||||||||
Cost of shares repurchased | (441,848 | ) | (4,333,836 | ) | (704,478 | ) | (7,269,369 | ) | (771,984 | ) | (20,688,735 | ) | (407,888 | ) | (9,392,744 | ) | ||||||||||||||||
|
|
|
|
|
|
|
|
|
|
|
|
|
|
|
| |||||||||||||||||
Net increase (decrease) | 436,428 | $ | 4,145,599 | (100,840 | ) | $ | (976,133 | ) | (564,320 | ) | $ | (15,110,876 | ) | (181,689 | ) | $ | (4,146,211 | ) | ||||||||||||||
|
|
|
|
|
|
|
|
|
|
|
|
|
|
|
| |||||||||||||||||
Class S: | ||||||||||||||||||||||||||||||||
Proceeds from sale of shares | 319,509 | $ | 3,059,584 | 1,219,602 | $ | 12,565,944 | 14,465 | $ | 373,459 | 86,671 | $ | 2,032,563 | ||||||||||||||||||||
Reinvestment of distributions | 20,245 | 193,539 | 127,122 | 1,234,918 | — | — | 29,980 | 750,402 | ||||||||||||||||||||||||
Cost of shares repurchased | (891,675 | ) | (8,586,630 | ) | (1,192,382 | ) | (12,156,404 | ) | (67,690 | ) | (1,761,714 | ) | (1,074,660 | ) | (25,613,152 | ) | ||||||||||||||||
Share Conversion | (1,192,488 | ) | (11,722,161 | ) | — | — | (660,652 | ) | (17,976,373 | ) | — | — | ||||||||||||||||||||
|
|
|
|
|
|
|
|
|
|
|
|
|
|
|
| |||||||||||||||||
Net increase (decrease) | (1,744,409 | ) | $ | (17,055,668 | ) | 154,342 | $ | 1,644,458 | (713,877 | ) | $ | (19,364,628 | ) | (958,009 | ) | $ | (22,830,187 | ) | ||||||||||||||
|
|
|
|
|
|
|
|
|
|
|
|
|
|
|
| |||||||||||||||||
Class I: | ||||||||||||||||||||||||||||||||
Proceeds from sale of shares | 5,135,104 | $ | 49,798,634 | 6,118,953 | $ | 63,716,957 | 4,400,525 | $ | 118,884,418 | 2,961,740 | $ | 68,702,616 | ||||||||||||||||||||
Reinvestment of distributions | 334,730 | 3,259,308 | 835,430 | 8,132,689 | 708,864 | 20,238,054 | 613,419 | 15,384,553 | ||||||||||||||||||||||||
Cost of shares repurchased | (4,794,481 | ) | (46,538,170 | ) | (7,243,382 | ) | (73,938,069 | ) | (6,389,413 | ) | (183,987,173 | ) | (2,480,898 | ) | (56,925,490 | ) | ||||||||||||||||
Share Conversion | 1,194,920 | 11,722,161 | — | — | 658,716 | 17,976,373 | — | — | ||||||||||||||||||||||||
|
|
|
|
|
|
|
|
|
|
|
|
|
|
|
| |||||||||||||||||
Net increase (decrease) | 1,870,273 | $ | 18,241,933 | (288,999 | ) | $ | (2,088,423 | ) | (621,308 | ) | $ | (26,888,328 | ) | 1,094,261 | $ | 27,161,679 | ||||||||||||||||
|
|
|
|
|
|
|
|
|
|
|
|
|
|
|
| |||||||||||||||||
Class Z:1 | ||||||||||||||||||||||||||||||||
Proceeds from sale of shares | 10,535 | $ | 100,000 | — | — | 4,253,757 | $ | 125,555,645 | — | — | ||||||||||||||||||||||
Reinvestment of distributions | 275 | 2,693 | — | — | 201,870 | 5,763,389 | — | — | ||||||||||||||||||||||||
Cost of shares repurchased | — | — | — | — | (654,016 | ) | (18,938,119 | ) | — | — | ||||||||||||||||||||||
|
|
|
|
|
|
|
|
|
|
|
|
|
|
|
| |||||||||||||||||
Net increase | 10,810 | $ | 102,693 | — | — | 3,801,611 | $ | 112,380,915 | — | — | ||||||||||||||||||||||
|
|
|
|
|
|
|
|
|
|
|
|
|
|
|
| |||||||||||||||||
63
Table of Contents
Notes to Financial Statements (continued)
| Small/Mid Cap | ||||||||||||||||
| December 31, 2017 | December 31, 2016 | |||||||||||||||
| Shares | Amount | Shares | Amount | |||||||||||||
Class N:1 | ||||||||||||||||
Proceeds from sale of shares | 966 | $ | 10,000 | — | — | |||||||||||
Reinvestment of distributions | 13 | 144 | — | — | ||||||||||||
|
|
|
|
|
|
|
| |||||||||
Net increase | 979 | $ | 10,144 | — | — | |||||||||||
|
|
|
|
|
|
|
| |||||||||
Class I: | ||||||||||||||||
Proceeds from sale of shares | 1,961,796 | $ | 20,991,750 | 148,293 | $ | 1,303,687 | ||||||||||
Reinvestment of distributions | 28,697 | 320,262 | 114 | 1,126 | ||||||||||||
Cost of shares repurchased | (41,659 | ) | (452,348 | ) | (51,818 | ) | (463,032 | ) | ||||||||
|
|
|
|
|
|
|
| |||||||||
Net increase | 1,948,834 | $ | 20,859,664 | 96,589 | $ | 841,781 | ||||||||||
|
|
|
|
|
|
|
| |||||||||
Class Z:1 | ||||||||||||||||
Proceeds from sale of shares | 618,470 | $ | 6,484,063 | — | — | |||||||||||
Reinvestment of distributions | 9,195 | 102,624 | — | — | ||||||||||||
Cost of shares repurchased | (1,865 | ) | (19,522 | ) | — | — | ||||||||||
|
|
|
|
|
|
|
| |||||||||
Net increase | 625,800 | $ | 6,567,165 | — | — | |||||||||||
|
|
|
|
|
|
|
| |||||||||
| 1 | Commencement of operations was February 27, 2017. |
At December 31, 2017, certain unaffiliated shareholders of record, individually or collectively held greater than 10% of the net assets of the Funds as follows: Small/Mid Cap - one owns 15%. Transactions by this shareholder may have a material impact on the Fund.
h. REPURCHASE AGREEMENTS AND JOINT REPURCHASE AGREEMENTS
The Funds may enter into third-party repurchase agreements for temporary cash management purposes and third-party joint repurchase agreements for reinvestment of cash collateral on securities lending transactions under the securities lending program offered by The Bank of New York Mellon (“BNYM”) (the “Program”) (collectively, “Repurchase Agreements”). The value of the underlying collateral, including accrued interest, must equal or exceed the value of the Repurchase Agreements during the term of the agreement. For joint repurchase agreements, the Funds participate on a pro rata basis with other clients of BNYM in its share of the underlying collateral under such joint repurchase agreements and in its share of proceeds from any repurchase or other disposition of the underlying collateral. The underlying collateral for all Repurchase Agreements is held in safekeeping by the Funds’ custodian or at the Federal Reserve Bank. If the seller defaults and the value of the collateral declines, or if bankruptcy proceedings commence with respect to the seller of the security, realization of the collateral by the Funds may be delayed or limited. Pursuant to the Program, the Funds are indemnified for such losses by BNYM on joint repurchase agreements.
At December 31, 2017, the market value of Repurchase Agreements outstanding for Enhanced Core, Small Cap Core and Small/Mid Cap were $759,122, $26,435,287 and $1,726,848, respectively.
i. DELAYED DELIVERY TRANSACTIONS AND WHEN-ISSUED SECURITIES
The Funds may enter into securities transactions on a delayed delivery or when issued basis. Payment and delivery may take place after the customary settlement period for that security. The price of the underlying securities and the date when the securities will be delivered and paid for are fixed at the time the transaction is negotiated. During the time a delayed delivery sell is outstanding, the contract is marked to market daily and equivalent deliverable securities are held for the transaction. The value of the securities purchased on a delayed delivery or when-issued basis are identified as such in the Funds’ Schedules of Portfolio Investments. With respect to purchase commitments, the Funds identify securities as segregated in their records with a value at least equal to the amount of the commitment. Delayed delivery or when-issued securities that have been purchased from and sold to different brokers are reflected as an investment in securities and a forward sale commitment in the Fund’s Statement of Assets and Liabilities. For financial reporting purposes, the Funds does offset the receivable and payable for delayed delivery and when-issued securities that were purchased or sold. Losses may arise due to changes in the value of the underlying securities or if the counterparty does not perform under the contract, or if the issuer does not issue the securities due to political, economic, or other factors.
2. AGREEMENTS AND TRANSACTIONS WITH AFFILIATES
For each of the Funds, the Trusts have entered into an investment advisory agreement under which the Investment Manager, a subsidiary and the U.S. retail distribution arm of Affiliated Managers Group, Inc. (“AMG”), serves as investment manager to the Funds and is responsible for the Funds’ overall administration and operations. The Investment Manager selects one or more subadvisers for the
64
Table of Contents
Notes to Financial Statements (continued)
Funds (subject to Board approval) and monitors each subadviser’s investment performance, security holdings and investment strategies. Each Fund’s investment portfolio is managed by GW&K Investment Management, LLC, (“GW&K”) who serves pursuant to a subadvisory agreement with the Investment Manager. AMG indirectly owns a majority interest in GW&K.
Investment management fees are paid directly by the Funds to the Investment Manager based on average daily net assets. The Funds’ investment management fees are paid at the following annual rate of each Fund’s respective average daily net assets:
Enhanced Core Bond* | 0.30 | % | ||
Municipal Bond** | ||||
on first $25 million | 0.35 | % | ||
on next $25 million | 0.30 | % | ||
on next $50 million | 0.25 | % | ||
on balance over $100 million | 0.20 | % | ||
Municipal Enhanced * | 0.45 | % | ||
Small Cap Core* | 0.70 | % | ||
Small/Mid Cap* | 0.65 | % |
| * | Prior to February 27, 2017, the annual rate for the investment management fees were 0.45%, 0.50%, 0.75% and 0.75% of the average daily net assets for Enhanced Core Bond, Municipal Enhanced, Small Cap Core and Small/Mid Cap, respectively. |
| ** | Effective October 1, 2016, Municipal Bond changed to a tiered management fee structure. Prior to October 1, 2016, the annual rate for Municipal Bond’s investment management fee was 0.35% of the Fund’s average daily net assets. |
The Investment Manager has contractually agreed, through at least May 1, 2018, to waive management fees and/or reimburse fund expenses in order to limit total annual Fund operating expenses after fee waiver and expense reimbursements (exclusive of taxes, interest (including interest incurred in connection with bank and custody overdrafts), shareholder servicing fees, distribution and service (12b-1) fees, brokerage commissions and other transaction costs, acquired fund fees and expenses and extraordinary expenses) of Enhanced Core Bond, Municipal Bond, Municipal Enhanced, Small Cap Core and Small/Mid Cap to 0.48%, 0.34%, 0.59%, 0.90% and 0.85%, respectively, of each Fund’s average daily net assets subject to later reimbursement by the Funds in certain circumstances. Prior to February 27, 2017, the expense cap was 0.59%, 0.64%, 0.95% and 0.95% of the average daily net assets for Enhanced Core Bond, Municipal Enhanced, Small Cap Core and Small/Mid Cap, respectively.
The contractual expense limitation may only be terminated in the event the Investment Manager or a successor ceases to be the investment manager of the Fund or a successor fund, by mutual agreement between the Investment Manager and the Board, or in the event of the Fund’s liquidation unless the Fund is reorganized or is a party to a merger in which the surviving entity is successor to the accounting and performance information of the Fund.
In general, for a period of up to 36 months, the Investment Manager may recover from each Fund fees waived and expenses paid pursuant to this contractual agreement, provided that such repayment would not cause the Fund’s total annual operating expenses after fee waiver and expense reimbursements (exclusive of
the items noted in the parenthetical above) to exceed the contractual expense limitation amount.
At December 31, 2017, the Funds’ expiration of recoupment is as follows:
| Expiration Period | Enhanced Core Bond | Municipal Bond | ||||||
Less than 1 year | $ | 208,328 | $ | 2,123,295 | ||||
Within 2 years | 249,870 | 2,293,974 | ||||||
Within 3 years | 185,809 | 703,359 | ||||||
|
|
|
| |||||
Total Amount Subject to Recoupment | $ | 644,007 | $ | 5,120,628 | ||||
|
|
|
| |||||
| Expiration Period | Municipal Enhanced | Small Cap Core | ||||||
Less than 1 year | $ | 205,861 | $ | 405,914 | ||||
Within 2 years | 222,096 | 314,503 | ||||||
Within 3 years | 232,286 | 51,380 | ||||||
|
|
|
| |||||
Total Amount Subject to Recoupment | $ | 660,243 | $ | 771,797 | ||||
|
|
|
| |||||
| Expiration Period | Small/ Mid Cap | |||
Less than 1 year | $ | 48,523 | ||
Within 2 years | 57,742 | |||
Within 3 years | 85,512 | |||
|
| |||
Total Amount Subject to Recoupment | $ | 191,777 | ||
|
| |||
The Trusts, on behalf of the Funds, have entered into an amended and restated Administration Agreement under which the Investment Manager serves as the Funds’ administrator (the “Administrator”) and is responsible for all non-portfolio management aspects of managing the Funds’ operations, including administration and shareholder services to each Fund. Each Fund pays a fee to the Administrator at the rate of 0.15% per annum of the Fund’s average daily net assets for this service. Prior to October 1, 2016, Enhanced Core Bond, Municipal Bond, Municipal Enhanced, Small Cap Core and Small/Mid Cap paid an administration fee under a similar contract at an annual rate of 0.20%, 0.25%, 0.25%, 0.25% and 0.25%, respectively, of each Fund’s average daily net assets.
The Funds are distributed by AMG Distributors, Inc. (the “Distributor”), a wholly-owned subsidiary of the Investment Manager. The Distributor serves as the distributor and underwriter for each Fund and is a registered broker-dealer and member of the Financial Industry Regulatory Authority, Inc. (“FINRA”). Shares of each Fund will be continuously offered and will be sold directly to prospective purchasers and through brokers, dealers or other financial intermediaries who have executed selling agreements with the Distributor. Generally the Distributor bears all or a portion of the expenses of providing services pursuant to the distribution agreement, including the payment of the expenses relating to the distribution of prospectuses for sales purposes and any advertising or sales literature.
The Trust have adopted a distribution and service plan (the “Plan”) with respect to the Class N shares of each Fund and Class C shares of Enhanced Core Bond, in accordance with the requirements of Rule 12b-1 under the 1940 Act and the requirements of the applicable rules of FINRA regarding asset based sales
65
Table of Contents
Notes to Financial Statements (continued)
charges. Pursuant to the Plan, each Fund may make payments to the Distributor for its expenditures in financing any activity primarily intended to result in the sale of each Fund’s Class N shares and Enhanced Core Bond Class C shares and for maintenance and personal service provided to existing shareholders of that class. The Plan authorizes payments to the Distributor up to 0.25% and 1.00% annually of each Fund’s average daily net assets attributable to the Class N shares and Enhanced Core Bond Class C shares, respectively.
For Enhanced Core Bond’s Class I shares and for each of the Class N and Class I shares of Municipal Bond, Municipal Enhanced and Small Cap Core, the Board has approved reimbursement payments to the Investment Manager for shareholder servicing expenses (“shareholder servicing fees”) incurred. Shareholder servicing fees include payments to financial intermediaries, such as broker-dealers (including fund supermarket platforms), banks, and trust companies who provide shareholder recordkeeping, account servicing and other services. Class N and Class I shares may reimburse the Investment Manager for the actual amount incurred up to a maximum annual rate of each Class’s average daily net assets as shown in the table below. The Investment Manager has voluntarily agreed, through at least May 1, 2018, to waive 0.01% of the shareholder servicing fees authorized to be paid by Class I shares of Municipal Bond.
The impact on the annualized expense ratios for the fiscal year ended December 31, 2017, were as follows:
| Fund | Maximum Annual Amount Approved | Actual Amount Incurred | ||||||
Enhanced Core Bond | ||||||||
Class I | 0.10 | % | 0.10 | % | ||||
Municipal Bond | ||||||||
Class N | 0.15 | % | 0.12 | % | ||||
Class I** | 0.05 | % | 0.04 | % | ||||
Municipal Enhanced | ||||||||
Class N* | 0.25 | % | 0.17 | % | ||||
Class I** | 0.05 | % | 0.04 | % | ||||
Small Cap Core | ||||||||
Class N* | 0.25 | % | 0.16 | % | ||||
Class I** | 0.05 | % | 0.04 | % | ||||
Small/Mid Cap | ||||||||
Class N | 0.15 | % | — | |||||
Class I** | 0.10 | % | 0.08 | % | ||||
| * | Effective February 27, 2017, Class N maximum annual amount was reduced to 0.15%. |
| ** | Prior to February 27, 2017, Class I shares did not incur shareholder servicing fees. |
The Board provides supervision of the affairs of the Trust and other trusts within the AMG Funds family. The Trustees of the Trust who are not affiliated with an Investment Manager receive an annual retainer and per meeting fees for regular, special and telephonic meetings, and they are reimbursed for out-of-pocket expenses incurred while carrying out their duties as Board members. The Chairman of the Board and the Audit Committee Chair receive additional annual
retainers. Certain Trustees and Officers of the Funds are Officers and/or Directors of the Investment Manager, AMG and/or the Distributor.
The Securities and Exchange Commission (the “SEC”) granted an exemptive order that permits the Funds to lend and borrow money for certain temporary purposes directly to and from other eligible funds in the AMG Funds family. Participation in this interfund lending program is voluntary for both the borrowing and lending funds, and an interfund loan is only made if it benefits each participating fund. The Administrator manages the program according to procedures approved by the Board, and the Board monitors the operation of the program. An interfund loan must comply with certain conditions set out in the exemptive order, which are designed to assure fairness and protect all participating funds. For the fiscal year ended December 31, 2017, Municipal Bond lent a maximum of $1,222,106 for 5 days earning interest in the amount of $130, Municipal Enhanced lent a maximum of $2,317,301 for 5 days earning interest of $595, and Small Cap Core lent a maximum of $6,200,680 for 5 days earning interest in the amount of $414. The interest income amount is included in the Statement of Operations as interest income. Enhanced Core Bond borrowed a maximum of $4,417,211 for 42 days paying interest of $2,274, and Small Cap Core borrowed a maximum of $2,317,301 for 4 days paying interest of $527. The interest expense amount is included in the Statement of Operations as miscellaneous expense. For the year ended December 31, 2017, Small/Mid Cap neither borrowed from nor lent to other Funds in the AMG Funds family. At December 31, 2017, the Funds had no interfund loans outstanding.
3. PURCHASES AND SALES OF SECURITIES
Purchases and sales of securities (excluding short-term securities) for the fiscal year ended December 31, 2017, were as follows:
| Long Term Securities | ||||||||
| Fund | Purchases | Sales | ||||||
Enhanced Core Bond | $ | 21,050,854 | $ | 59,862,559 | ||||
Municipal Bond | 395,142,506 | 260,986,720 | ||||||
Municipal Enhanced | 149,550,829 | 147,888,572 | ||||||
Small Cap Core | 134,380,832 | 109,776,702 | ||||||
Small/Mid Cap | 29,469,356 | 4,886,393 | ||||||
| U.S. Government Obligations | ||||||||
| Fund | Purchases | Sales | ||||||
Enhanced Core Bond | $ | 4,507,337 | $ | 25,931,191 | ||||
4. PORTFOLIO SECURITIES LOANED
The Funds participate in the Program providing for the lending of securities to qualified brokers. Securities lending income includes earnings of such temporary cash investments, plus or minus any rebate to a borrower. These earnings (after any rebate) are then divided between BNYM, as a fee for its services under the Program, and the Funds, according to agreed-upon rates. Collateral on all securities loaned is accepted in cash and is maintained at a minimum level of 102% (105% in the case of certain foreign securities) of the market value, plus interest, if applicable, of investments on loan. It is the Funds’ policy to obtain additional collateral from or return excess collateral to the borrower by the end of the next business day, following the valuation date of the securities loaned. Therefore, the value of the collateral held may be temporarily less than the value of the securities on loan. Lending securities entails a risk of loss to the Funds if and
66
Table of Contents
Notes to Financial Statements (continued)
to the extent that the market value of the securities loaned were to increase and the borrower did not increase the collateral accordingly, and the borrower fails to return the securities. Under the terms of the Program, the Funds are indemnified for such losses by BNYM. Cash collateral is held in a separate omnibus account managed by BNYM, who is authorized to exclusively enter into joint repurchase agreements. BNYM bears the risk of any deficiency in the amount of the cash collateral available for return to the borrower due to any loss on the collateral invested.
The value of securities loaned on positions held and cash collateral received at December 31, 2017, were as follows:
| Fund | Securities Loaned | Cash Collateral Received | ||||||
Enhanced Core Bond | $ | 739,043 | $ | 759,122 | ||||
Small Cap Core | 25,730,349 | 26,435,287 | ||||||
Small/Mid Cap | 1,681,424 | 1,726,848 | ||||||
5. COMMITMENTS AND CONTINGENCIES
Under the Trusts’ organizational documents, its trustees and officers are indemnified against certain liabilities arising out of the performance of their duties
to the Trusts. In addition, in the normal course of business, the Funds may enter into contracts and agreements that contain a variety of representations and warranties, which provide general indemnifications. The maximum exposure to the Funds under these arrangements is unknown, as this would involve future claims that may be made against a Fund that have not yet occurred. However, based on experience, the Funds had no prior claims or losses and expect the risks of loss to be remote.
6. MASTER NETTING AGREEMENTS
The Funds may enter into master netting agreements with their counterparties for the securities lending program, and Repurchase Agreements, which provide the right, in the event of default (including bankruptcy or insolvency) for the non-defaulting party to liquidate the collateral and calculate net exposure to the defaulting party or request additional collateral. For financial reporting purposes, the Funds do not offset financial assets and financial liabilities that are subject to master netting agreements in the Statement of Assets and Liabilities. For securities lending transactions, see Note 4.
The following table is a summary of the Funds’ open Repurchase Agreements that are subject to a master netting agreement as of December 31, 2017:
| Gross Amount Not Offset in the Statement of Assets and Liabilities | ||||||||||||||||
| Fund | Net Amounts of Assets Presented in the Statement of Assets and Liabilities | Financial Instruments Collateral | Cash Collateral Received | Net Amount | ||||||||||||
Enhanced Core Bond | ||||||||||||||||
State of Wisconsin Investment Board | $ | 759,122 | $ | 759,122 | — | — | ||||||||||
|
|
|
| |||||||||||||
Small Cap Core | ||||||||||||||||
Cantor Fitzgerald Securities, Inc. | $ | 6,278,647 | $ | 6,278,647 | — | — | ||||||||||
Daiwa Capital Markets America | 6,278,647 | 6,278,647 | — | — | ||||||||||||
HSBC Securities USA, Inc. | 6,278,647 | 6,278,647 | — | — | ||||||||||||
Jefferies LLC | 1,320,699 | 1,320,699 | — | — | ||||||||||||
State of Wisconsin Investment Board | 6,278,647 | 6,278,647 | — | — | ||||||||||||
|
|
|
|
|
|
|
| |||||||||
Totals | $ | 26,435,287 | $ | 26,435,287 | — | — | ||||||||||
|
|
|
|
|
|
|
| |||||||||
Small/Mid Cap | ||||||||||||||||
Cantor Fitzgerald Securities, Inc. | $ | 1,000,000 | $ | 1,000,000 | — | — | ||||||||||
Daiwa Capital Markets America | 726,848 | 726,848 | — | — | ||||||||||||
|
|
|
|
|
|
|
| |||||||||
Totals | $ | 1,726,848 | $ | 1,726,848 | — | — | ||||||||||
|
|
|
|
|
|
|
| |||||||||
7. REGULATORY UPDATES
On October 13, 2016, the SEC amended existing rules intended to modernize reporting and disclosure of information. These amendments relate to Regulation
S-X, which sets forth the form and content of financial statements. Effective August 1, 2017, the Funds have adopted these amendments and noted no significant impact on the financial statements and accompanying notes.
67
Table of Contents
Notes to Financial Statements (continued)
8. SUBSEQUENT EVENTS
The Funds have determined that no material events or transactions occurred through the issuance date of the Funds’ financial statements, which require an additional disclosure in or adjustment of the Funds’ financial statements.
68
Table of Contents
Report of Independent Registered Public Accounting Firm
TO THE BOARD OF TRUSTEES OF AMG FUNDS AND AMG FUNDS II AND SHAREHOLDERS OF AMG GW&K ENHANCED CORE BOND FUND, AMG GW&K MUNICIPAL BOND FUND, AMG GW&K MUNICIPAL ENHANCED YIELD FUND, AMG GW&K SMALL CAP CORE FUND AND AMG GW&K SMALL/MID CAP FUND (FORMERLY AMG GW&K SMALL CAP GROWTH FUND)
Opinions on the Financial Statements
We have audited the accompanying statements of assets and liabilities, including the schedules of portfolio investments, of AMG GW&K Enhanced Core Bond Fund, AMG GW&K Municipal Bond Fund, AMG GW&K Municipal Enhanced Yield Fund, AMG GW&K Small Cap Core Fund, AMG GW&K Small/Mid Cap Fund (formerly AMG GW&K Small Cap Growth Fund) (five of the funds constituting AMG Funds and AMG Funds II, hereafter collectively referred to as the “Funds”) as of December 31, 2017, the related statements of operations for the year ended December 31, 2017, the statements of changes in net assets for each of the two years in the period ended December 31, 2017, including the related notes, and the financial highlights for each of the periods indicated therein (collectively referred to as the “financial statements”). In our opinion, the financial statements present fairly, in all material respects, the financial position of each of the Funds as of December 31, 2017, the results of each of their operations for the year then ended, the changes in each of their net assets for each of the two years in the period ended December 31, 2017 and each of the financial highlights for each of the periods indicated therein in conformity with accounting principles generally accepted in the United States of America.
Basis for Opinions
These financial statements are the responsibility of the Funds’ management. Our responsibility is to express an opinion on the Funds’ financial statements based on our audits. We are a public accounting firm registered with the Public Company Accounting Oversight Board (United States) (“PCAOB”) and are required to be independent with respect to the Funds in accordance with the U.S. federal securities laws and the applicable rules and regulations of the Securities and Exchange Commission and the PCAOB.
We conducted our audits of these financial statements in accordance with the standards of the PCAOB. Those standards require that we plan and perform the audit to obtain reasonable assurance about whether the financial statements are free of material misstatement, whether due to error or fraud.
Our audits included performing procedures to assess the risks of material misstatement of the financial statements, whether due to error or fraud, and performing procedures that respond to those risks. Such procedures included examining, on a test basis, evidence regarding the amounts and disclosures in the financial statements. Our audits also included evaluating the accounting principles used and significant estimates made by management, as well as evaluating the overall presentation of the financial statements. Our procedures included confirmation of securities owned as of December 31, 2017 by correspondence with the custodian and brokers; when replies were not received from brokers, we performed other auditing procedures. We believe that our audits provide a reasonable basis for our opinions.
PricewaterhouseCoopers LLP
Boston, Massachusetts
February 27, 2018
We have served as the auditor of one or more investment companies in AMG Funds Family since 1993.
69
Table of Contents
TAX INFORMATION
The AMG GW&K Enhanced Core Bond Fund, AMG GW&K Municipal Bond Fund, AMG GW&K Municipal Enhanced Yield Fund, AMG GW&K Small Cap Core Fund and AMG GW&K Small/Mid Cap Fund each hereby designates the maximum amount allowable of its net taxable income as qualified dividends as provided in the Jobs and Growth Tax Relief Reconciliation Act of 2003. The 2017 Form 1099-DIV you receive for each Fund will show the tax status of all distributions paid to you during the year.
Pursuant to section 852 of the Internal Revenue Code, AMG GW&K Enhanced Core Bond Fund, AMG GW&K Municipal Bond Fund, AMG GW&K Municipal Enhanced Yield Fund, AMG GW&K Small Cap Core Fund and AMG GW&K Small/Mid Cap Fund each hereby designates $0, $1,104,060, $0, $26,818,387, and $124,971, respectively, as a capital gain distribution with respect to the taxable year ended December 31, 2017, or if subsequently determined to be different, the net capital gains of such fiscal year.
70
Table of Contents
AMG Funds
The Trustees and Officers of the Trust, their business addresses, principal occupations for the past five years and ages are listed below. The Trustees provide broad supervision over the affairs of the Trust and the Funds. The Trustees are experienced executives who meet periodically throughout the year to oversee the Funds’ activities, review contractual arrangements with companies that provide services to the Funds, and
review the Funds’ performance. Unless otherwise noted, the address of each Trustee or Officer is the address of the Trust: 600 Steamboat Road, Suite 300, Greenwich, Connecticut 06830.
There is no stated term of office for Trustees. Trustees serve until their resignation, retirement or removal in
accordance with the Trust’s organizational documents and policies adopted by the Board from time to time. The Chairman of the Trustees, President, Treasurer and Secretary of the Trust are elected by the Trustees annually. Other officers hold office at the pleasure of the Trustees.
Independent Trustees
The following Trustees are not “interested persons” of the Trust within the meaning of the 1940 Act:
| Number of Funds | ||
Overseen in Fund Complex | Name, Age, Principal Occupation(s) During Past 5 Years and Other Directorships Held by Trustee | |
• Trustee since 2012 | Bruce B. Bingham, 69 | |
• Oversees 61 Funds in Fund Complex | Partner, Hamilton Partners (real estate development firm) (1987-Present); Director of The Yacktman Funds (2000-2012). | |
• Trustee since 1999-AMG Funds • Trustee since 2000-AMG Fund II • Oversees 61 Funds in Fund Complex | Edward J. Kaier, 72 Attorney at Law and Partner, Teeters Harvey Marrone & Kaier LLP (2007-Present); Attorney at Law and Partner, Hepburn Willcox Hamilton & Putnam, LLP (1977-2007); Trustee of Third Avenue Trust (5 portfolios); Trustee of Third Avenue Variable Trust (1 portfolio). | |
• Trustee since 2013 • Oversees 63 Funds in Fund Complex | Kurt A. Keilhacker, 54 Managing Member, TechFund Capital (1997-Present); Managing Member, TechFund Europe (2000-Present); Board Member, 6wind SA, (2002-Present); Managing Member, Elementum Ventures (2013-Present); Trustee, Gordon College (2001-2016). | |
• Trustee since 2004-AMG Funds • Trustee since 2000-AMG Fund II • Oversees 61 Funds in Fund Complex | Steven J. Paggioli, 67 Independent Consultant (2002-Present); Formerly Executive Vice President and Director, The Wadsworth Group (1986-2001); Executive Vice President, Secretary and Director, Investment Company Administration, LLC (1990-2001); Vice President, Secretary and Director, First Fund Distributors, Inc. (1991-2001); Trustee, Professionally Managed Portfolios (32 portfolios); Advisory Board Member, Sustainable Growth Advisors, LP; Independent Director, Chase Investment Counsel (2008–Present). | |
• Trustee since 2013 • Oversees 61 Funds in Fund Complex | Richard F. Powers III, 72 Adjunct Professor, U.S. Naval War College (2016); Adjunct Professor, Boston College (2010-2013); President and CEO of Van Kampen Investments Inc. (1998-2003). | |
• Trustee since 1999-AMG Funds • Trustee since 2000-AMG Fund II • Oversees 61 Funds in Fund Complex | Eric Rakowski, 59 Professor, University of California at Berkeley School of Law (1990-Present); Director of Harding, Loevner Funds, Inc. (9 portfolios); Trustee of Third Avenue Trust (5 portfolios); Trustee of Third Avenue Variable Trust (1 portfolio). | |
• Trustee since 2013 | Victoria L. Sassine, 52 | |
• Oversees 63 Funds in Fund | Lecturer, Babson College (2007 – Present). | |
Complex | ||
• Trustee since 2004-AMG Funds • Trustee since 2000-AMG Fund II • Oversees 61 Funds in Fund Complex | Thomas R. Schneeweis, 70 Professor Emeritus, University of Massachusetts (2013-Present); Partner, S Capital Wealth Advisors (2015-Present); President, TRS Associates (1982-Present); Board Member, Chartered Alternative Investment Association (“CAIA”) (2002-Present); Director, CAIA Foundation (Education) (2010-Present); Director, Institute for GlobalAsset and Risk Management (Education) (2010-Present); Partner, S Capital Management, LLC (2007-2015); Director, CISDM at the University of Massachusetts, (1996-2013); President, Alternative Investment Analytics, LLC, (formerly Schneeweis Partners, LLC) (2001-2013); Professor of Finance, University of Massachusetts (1977-2013). | |
71
Table of Contents
AMG Funds
Trustees and Officers (continued)
Interested Trustees
Each Trustee in the following table is an “interested person” of the Trust within the meaning of the 1940 Act. Ms. Carsman is an interested person of the Trust within the meaning of the 1940 Act by virtue of her position with, and interest in securities of, AMG.
Number of Funds Overseen in Fund Complex | Name, Age, Principal Occupation(s) During Past 5 Years and Other Directorships Held by Trustee | |
• Trustee since 2011 | Christine C. Carsman, 65 | |
• Oversees 63 Funds in Fund Complex | Executive Vice President, Deputy General Counsel and Chief Regulatory Counsel, Affiliated Managers Group, Inc. (2017-Present); Director (2010-Present) and Chair of the Board of Directors (2015-Present), AMG Funds plc; Director of Harding, Loevner Funds, Inc. (9 portfolios); Senior Vice President and Deputy General Counsel, Affiliated Managers Group, Inc. (2011-2016); Senior Vice President and Chief Regulatory Counsel, Affiliated Managers Group, Inc. (2007-2011); Vice President and Chief Regulatory Counsel, Affiliated Managers Group, Inc. (2004-2007); Secretary and Chief Legal Officer, AMG Funds, AMG Funds I, AMG Funds II and AMG Funds III (2004-2011); Senior Counsel, Vice President and Director of Operational Risk Management and Compliance, Wellington Management Company, LLP (1995-2004). | |
| Officers | ||
Position(s) Held with Fund and Length of Time Served | Name, Age, Principal Occupation(s) During Past 5 Years | |
• President since 2014 | Jeffrey T. Cerutti, 50 | |
• Principal Executive Officer since 2014 • Chief Executive Officer since 2016 | Chief Executive Officer, AMG Funds LLC (2014-Present); Director, President and Principal, AMG Distributors, Inc. (2014-Present); President and Principal Executive Officer, AMG Funds, AMG Funds I, AMG Funds II and AMG Funds III (2014-Present); Chief Executive Officer, President and Principal Executive Officer, AMG Funds IV, (2015-Present); Chief Executive Officer, AMG Funds, AMG Funds I, AMG Funds II and AMG Funds III (2016-Present); Chief Executive Officer, Aston Asset Management, LLC (2016); President, VP Distributors, (2011-2014); Executive Vice President, Head of Distribution, Virtus Investment Partners, Inc. (2010-2014); Managing Director, Head of Sales, UBS Global Asset Management (2001-2010). | |
• Chief Operating Officer since 2007 | Keitha L. Kinne, 59 Chief Operating Officer, AMG Funds LLC (2007-Present); Chief Investment Officer, AMG Funds LLC (2008-Present); Chief Operating Officer, AMG Distributors, Inc. (2007-Present); Chief Operating Officer, AMG Funds, AMG Funds I, AMG Funds II, and AMG Funds III (2007-Present); Chief Operating Officer, AMG Funds IV, (2016-Present); Chief Operating Officer and Chief Investment Officer, Aston Asset Management, LLC (2016); President and Principal Executive Officer, AMG Funds, AMG Funds I, AMG Funds II and AMG Funds III (2012-2014); Managing Partner, AMG Funds LLC (2007-2014); President, AMG Funds (2012-2014); President, AMG Distributors, Inc. (2012-2014); Managing Director, Legg Mason & Co., LLC (2006-2007); Managing Director, Citigroup Asset Management (2004-2006). | |
• Secretary since 2015 • Chief Legal Officer since 2015 | Mark J. Duggan, 53 Senior Vice President and Senior Counsel, AMG Funds LLC (2015-Present); Secretary and Chief Legal Officer, AMG Funds, AMG Funds I, AMG Funds II and AMG Funds III (2015-Present); Secretary and Chief Legal Officer, AMG Funds IV, (2015-Present); Attorney, K&L Gates, LLP (2009-2015). | |
• Chief Financial Officer since 2017 • Treasurer since 2017 • Principal Financial Officer since 2017 • Principal Accounting Officer since 2017 | Thomas G. Disbrow, 52 Vice President, Mutual Fund Treasurer & CFO, AMG Funds, AMG Funds LLC (2017-Present); Chief Financial Officer, Principal Financial Officer, Treasurer and Principal Accounting Officer, AMG Funds, AMG Funds I, AMG Funds II, AMG Funds III and AMG Funds IV (2017-Present); Managing Director - Global Head of Traditional Funds Product Control, UBS Asset Management (Americas), Inc. (2015-2017); Managing Director - Head of North American Funds Treasury, UBS Asset Management (Americas), Inc. (2011-2015). | |
• Chief Compliance Officer since 2016 | Gerald F. Dillenburg, 51 Vice President, Chief Compliance Officer AMG Funds, AMG Funds LLC (2017-Present); Chief Compliance Officer AMG Funds, AMG Funds LLC (2016-2017); Chief Compliance Officer and Sarbanes Oxley Code of Ethics Compliance Officer, AMG Funds, AMG Funds I, AMG Funds II and AMG Funds III (2016-Present); Chief Compliance Officer, AMG Funds IV (1996-Present); Sarbanes-Oxley Code of Ethics Compliance Officer, AMG Funds IV (2016-Present); Chief Compliance Officer, Aston Asset Management, LLC (2006-2016); Chief Operating Officer, Aston Funds (2003-2016); Secretary, Aston Funds (1996-2015); Chief Financial Officer, Aston Funds (1997-2010); Chief Financial Officer, Aston Asset Management, LLC (2006-2010); Treasurer, Aston Funds (1996-2010). | |
• Deputy Treasurer since 2017 | John A. Starace, 47 Director, Mutual Fund Accounting, AMG Funds LLC (2017-Present); Vice President, Deputy Treasurer of Mutual Funds Services, AMG Funds LLC (2014-2017); Deputy Treasurer, AMG Funds, AMG Funds I, AMG Funds II, AMG Funds III and AMG Funds IV (2017-Present); Vice President, Citi Hedge Fund Services (2010-2014); Audit Senior Manager (2005-2010) and Audit Manager (2001-2005), Deloitte & Touche LLP. | |
72
Table of Contents
AMG Funds
Trustees and Officers (continued)
Position(s) Held with Fund and Length of Time Served | Name, Age, Principal Occupation(s) During Past 5 Years | |
• Controller since 2017 | Christopher R. Townsend, 50 Vice President, Business Finance, AMG Funds LLC (2017-Present); Head of Business Finance, AMG Funds LLC (2015-2017); Chief Financial Officer and Financial and Operations Principal, AMG Distributors, Inc. (2016-Present); Controller, AMG Funds, AMG Funds I, AMG Funds II, AMG Funds III and AMG Funds IV (2017-Present); Treasurer, Chief Financial Officer, Principal Financial Officer, Principal Accounting Officer, AMG Funds, AMG Funds I, AMG Funds II, AMG Funds III and AMG Funds IV (2017); Chief Financial Officer, Aston Asset Management LLC (2016); Head of Finance and Accounting, Allianz Asset Management (2006-2015). | |
• Anti-Money Laundering Compliance Officer since 2014 | Patrick J. Spellman, 43 Vice President, Chief Compliance Officer, AMG Funds LLC (2017-Present); Senior Vice President, Chief Compliance Officer, AMG Funds LLC (2011-2017); Chief Compliance Officer, AMG Distributors, Inc., (2010-Present); Anti-Money Laundering Compliance Officer, AMG Funds, AMG Funds I, AMG Funds II, and AMG Funds III (2014-Present); Anti-Money Laundering Officer, AMG Funds IV, (2016-Present); Compliance Manager, Legal and Compliance, Affiliated Managers Group, Inc. (2005-2011). | |
• Assistant Secretary since 2016 | Maureen A. Meredith, 32 Director, Counsel, AMG Funds LLC (2017-Present); Vice President, Counsel, AMG Funds LLC (2015-2017); Assistant Secretary, AMG Funds, AMG Funds I, AMG Funds II, AMG Funds III and AMG Funds IV (2016-Present); Associate, Ropes & Gray LLP (2011-2015); Law Fellow, Massachusetts Appleseed Center for Law and Justice (2010-2011). | |
73
Table of Contents
THIS PAGE INTENTIONALLY LEFT BLANK
Table of Contents
THIS PAGE INTENTIONALLY LEFT BLANK
Table of Contents
THIS PAGE INTENTIONALLY LEFT BLANK
Table of Contents
INVESTMENT MANAGER AND
ADMINISTRATOR
AMG Funds LLC
600 Steamboat Road, Suite 300
Greenwich, CT 06830
800.835.3879
DISTRIBUTOR
AMG Distributors, Inc.
600 Steamboat Road, Suite 300
Greenwich, CT 06830
800.835.3879
SUBADVISER
GW&K Investment Management, LLC
222 Berkeley St.
Boston, MA 02116
CUSTODIAN
The Bank of New York Mellon
111 Sanders Creek Parkway
East Syracuse, NY 13057
LEGAL COUNSEL
Ropes & Gray LLP
Prudential Tower, 800 Boylston Street
Boston, MA 02199-3600
TRANSFER AGENT
BNY Mellon Investment Servicing (US) Inc.
Attn: AMG Funds
P.O. Box 9769
Providence, RI 02940
800.548.4539
This report is prepared for the Funds’ shareholders. It is authorized for distribution to prospective investors only when preceded or accompanied by an effective prospectus. To receive a free copy of the prospectus or Statement of Additional Information, which includes additional information about Fund Trustees, please contact us by calling 800.835.3879. Distributed by AMG Distributors, Inc., member FINRA/SIPC.
Current net asset values per share for each Fund are available on the Funds’ website at amgfunds.com.
A description of the policies and procedures each Fund uses to vote its proxies is available: (i) without charge, upon request, by calling 800.835.3879, or (ii) on the Securities and Exchange Commission’s (SEC) website at sec.gov. For information regarding each Fund’s proxy voting record for the 12-month period ended June 30, call 800.835.3879 or visit the SEC website at sec.gov.
Each Fund files its complete schedule of portfolio holdings with the SEC for the first and third quarters of each fiscal year on Form N-Q. The Fund’s Forms N-Q are available on the SEC’s website at sec.gov. A Fund’s Forms N-Q may be reviewed and copied at the SEC’s Public Reference Room in Washington, DC. Information on the operation of the Public Reference Room may be obtained by calling 1.800.SEC.0330. To review a complete list of the Funds’ portfolio holdings, or to view the most recent quarterly holdings report, semiannual report, or annual report, please visit amgfunds.com.
amgfunds.com | | 77 |
Table of Contents
AFFILIATE SUBADVISED FUNDS
BALANCED FUNDS
AMG Chicago Equity Partners Balanced
Chicago Equity Partners, LLC
AMG FQ Global Risk-Balanced
First Quadrant, L.P.
EQUITY FUNDS
AMG Chicago Equity Partners Small Cap Value
Chicago Equity Partners, LLC
AMG FQ Tax-Managed U.S. Equity
AMG FQ Long-Short Equity
First Quadrant, L.P.
AMG Frontier Small Cap Growth
Frontier Capital Management Company, LLC
AMG GW&K Small Cap Core
AMG GW&K Small/Mid Cap
AMG GW&K U.S. Small Cap Growth
GW&K Investment Management, LLC
AMG Renaissance International Equity
AMG Renaissance Large Cap Growth
The Renaissance Group LLC
AMG River Road Dividend All Cap Value
AMG River Road Dividend All Cap Value II
AMG River Road Focused Absolute Value
AMG River Road Long-Short
AMG River Road Small-Mid Cap Value
AMG River Road Small Cap Value
River Road Asset Management, LLC
AMG SouthernSun Small Cap
AMG SouthernSun Global Opportunities
AMG SouthernSun U.S. Equity
SouthernSun Asset Management, LLC
AMG Systematic Mid Cap Value
Systematic Financial Management, L.P.
AMG TimesSquare Emerging Markets Small Cap
AMG TimesSquare International Small Cap
AMG TimesSquare Mid Cap Growth
AMG TimesSquare Small Cap Growth
TimesSquare Capital Management, LLC
AMG Trilogy Emerging Markets Equity
AMG Trilogy Emerging Wealth Equity
Trilogy Global Advisors, L.P.
AMG Yacktman
AMG Yacktman Focused
AMG Yacktman Focused Fund -
Security Selection Only
AMG Yacktman Special Opportunities
Yacktman Asset Management LP
FIXED INCOME FUNDS
AMG GW&K Core Bond
AMG GW&K Enhanced Core Bond
AMG GW&K Municipal Bond
AMG GW&K Municipal Enhanced Yield
GW&K Investment Management, LLC
OPEN-ARCHITECTURE FUNDS
ALTERNATIVE FUNDS
AMG Managers Lake Partners LASSO Alternative
Lake Partners, Inc.
BALANCED FUNDS
AMG Managers Montag & Caldwell Balanced
Montag & Caldwell, LLC
EQUITY FUNDS
AMG Managers Brandywine
AMG Managers Brandywine Advisors Mid Cap Growth
AMG Managers Brandywine Blue
Friess Associates, LLC
AMG Managers Cadence Emerging Companies
AMG Managers Cadence Mid Cap
Cadence Capital Management, LLC
AMG Managers CenterSquare Real Estate
CenterSquare Investment Management, Inc.
AMG Managers Emerging Opportunities
Lord, Abbett & Co. LLC
WEDGE Capital Management L.L.P.
Next Century Growth Investors LLC
RBC Global Asset Management (U.S.) Inc.
AMG Managers Essex Small/Micro Cap Growth
Essex Investment Management Co., LLC
AMG Managers Fairpointe ESG Equity
AMG Managers Fairpointe Mid Cap
Fairpointe Capital LLC
AMG Managers Guardian Capital Global Dividend
Guardian Capital LP
AMG Managers LMCG Small Cap Growth
LMCG Investments, LLC
AMG Managers Montag & Caldwell Growth
AMG Managers Montag & Caldwell Mid Cap Growth
Montag & Caldwell, LLC
AMG Managers Pictet International
Pictet Asset Management Limited
AMG Managers Silvercrest Small Cap
Silvercrest Asset Management Group LLC
AMG Managers Skyline Special Equities
Skyline Asset Management, L.P.
AMG Managers Special Equity
Ranger Investment Management, L.P.
Lord, Abbett & Co. LLC
Smith Asset Management Group, L.P.
Federated MDTA LLC
AMG Managers Value Partners Asia Dividend
Value Partners Hong Kong Limited
FIXED INCOME FUNDS
AMG Managers Amundi Intermediate Government
AMG Managers Amundi Short Duration Government
Amundi Pioneer Institutional Asset
Management, Inc.
AMG Managers Doubleline Core Plus Bond
DoubleLine Capital LP
AMG Managers Global Income Opportunity
AMG Managers Loomis Sayles Bond
Loomis, Sayles & Co., L.P.
| amgfunds.com | |123117 AR020 |
Table of Contents
Item 2. CODE OF ETHICS
Registrant has adopted a Code of Ethics. See attached Exhibit (a)(1).
Item 3. AUDIT COMMITTEE FINANCIAL EXPERT
Registrant’s Board of Trustees has determined that independent Trustee Mr. Steven J. Paggioli qualifies as an Audit Committee Financial Expert. Mr. Paggioli is “independent” as such term is defined in Form N-CSR.
Item 4. PRINCIPAL ACCOUNTANT FEES AND SERVICES
(a) Audit Fees
The aggregate fees billed by the Funds’ independent registered public accounting firm, PricewaterhouseCoopers LLP (“PwC”), to the Funds for the Funds’ two most recent fiscal years for professional services rendered for audits of annual financial statements, or services that are normally provided in connection with statutory and regulatory filings or engagements (“Audit Fees”) were as follows:
Fund - AMG FUNDS II | Fiscal 2017 | Fiscal 2016 | ||||||
AMG GW&K Enhanced Core Bond Fund | $ | 39,699 | $ | 37,846 | ||||
AMG Chicago Equity Partners Balanced Fund | $ | 30,134 | $ | 27,540 | ||||
AMG Managers Amundi Short Duration Government Fund | $ | 54,825 | $ | 41,233 | ||||
AMG Managers Amundi Intermediate Government Fund | $ | 51,156 | $ | 41,219 | ||||
(b) Audit-Related Fees
There were no fees billed by PwC to the Funds in their two recent fiscal years for services rendered for assurance and related services that are reasonably related to the performance of the audit or review of the Fund’s financial statements, but are not reported as Audit Fees (“Audit-Related Fees”).
For the Funds’ two most recent fiscal years, there were no Audit-Related Fees billed by PwC for engagements related directly to the operations and financial reporting of one or more Funds by a Fund Service Provider. A Fund Service Provider is (a) any investment adviser to the Fund (not including any Subadvisor whose role is primarily portfolio management and is subcontracted with or overseen by another investment adviser) or (b) any entity that provides ongoing services to the Fund and is controlling, controlled by or under common control with a Fund investment adviser described in (a).
Table of Contents
(c) Tax Fees
The aggregate fees billed by PwC to the Funds for the two most recent fiscal years for professional services rendered for tax compliance, tax advice, and tax planning (“Tax Fees”) were as follows:
Fund - AMG FUNDS II | Fiscal 2017 | Fiscal 2016 | ||||||
AMG GW&K Enhanced Core Bond Fund | $ | 9,425 | $ | 9,425 | ||||
AMG Chicago Equity Partners Balanced Fund | $ | 7,369 | $ | 7,369 | ||||
AMG Managers Amundi Short Duration Government Fund | $ | 10,159 | $ | 10,159 | ||||
AMG Managers Amundi Intermediate Government Fund | $ | 10,159 | $ | 10,159 | ||||
For the Funds’ two most recent fiscal years, Tax Fees billed by PwC for engagements by Fund Service Providers that related directly to the operations and financial reporting of the Funds were $0 for fiscal 2017 and $0 for fiscal 2016, respectively.
The services for which Tax Fees were charged comprise all services performed by professional staff in PwC’s tax division except those services related to the audit. Typically, this category would include fees for tax compliance, tax planning, and tax advice. Tax compliance, tax advice, and tax planning services include preparation of original and amended tax returns, claims for refund and tax payment-planning services, assistance with tax audits and appeals, tax advice related to mergers and acquisitions and requests for rulings or technical advice from taxing authorities.
(d) All Other Fees
There were no other fees billed by PwC to the Funds for all other non-audit services (“Other Fees”) during the Funds’ two most recent fiscal years. During the same period, there were no Other Fees billed by PwC for engagements by Fund Service Providers that related directly to the operations and financial reporting of the Funds.
(e) (1) According to policies adopted by the Audit Committee, services provided by PwC to the Funds must be pre-approved by the Audit Committee. On an annual basis, the Audit Committee reviews and pre-approves various types of services that PwC may perform for the Funds without specific approval of each engagement, subject to specified budget limitations. As contemplated by the Sarbanes-Oxley Act of 2002 and related SEC rules, the Audit Committee also pre-approves non-audit services provided by PwC to any Fund Service Provider for any engagement that relates directly to the operations and financial reporting of the Funds. Any engagement that is not already pre-approved or that will exceed a pre-approved budget must be submitted to the Audit Committee for pre-approval. The Chairman of the Audit Committee is authorized on behalf of the Board of Trustees and the Audit Committee to approve the engagement of PwC to perform non-audit services subject to certain conditions, including notification to the Audit Committee of such pre-approval not later than the next meeting of the Audit Committee following the date of such pre-approval.
Table of Contents
(e) (2) None.
(f) Not applicable.
(g) The aggregate fees billed by PwC in 2017 and 2016 for non-audit services rendered to the Funds and Fund Service Providers were $120,812 and $69,512, respectively. For the fiscal year ended December 31, 2017, this amount reflects the amounts disclosed above in Item 4(b),(c),(d), plus $83,700 in fees billed to the Fund Service Providers for non-audit services that did not relate directly to the operations and financial reporting of the Funds. For the fiscal year ended December 31, 2016, this amount reflects the amounts disclosed above in Item 4(b),(c),(d), plus $32,400 in fees billed to the Fund Service Providers for non-audit services that did not relate directly to the operations and financial reporting of the Funds.
(h) The Trust’s Audit Committee has considered whether the provision of non-audit services by registrant’s independent registered public accounting firm to the registrant’s investment advisor, and any entity controlling, controlled, or under common control with the investment advisor that provided ongoing services to the registrant that were not pre-approved by the Committee (because such services did not relate directly to the operations and financial reporting of the registrant) was compatible with maintaining the independence of the independent registered public accounting firm.
Item 5. AUDIT COMMITTEE OF LISTED REGISTRANTS
Not applicable.
Item 6. SCHEDULE OF INVESTMENTS
The schedule of investments in unaffiliated issuers as of the close of the reporting period is included as part of the shareholder report contained in Item 1 hereof.
Item 7. DISCLOSURE OF PROXY VOTING POLICIES AND PROCEDURES FOR CLOSED-END MANAGEMENT INVESTMENT COMPANIES
Not applicable.
Item 8. PORTFOLIO MANAGERS OF CLOSED-END MANAGEMENT INVESTMENT COMPANIES
Not applicable.
Item 9. PURCHASES OF EQUITY SECURITIES BY CLOSED-END MANAGEMENT INVESTMENT COMPANIES AND AFFILIATED PURCHASERS
Not applicable.
Item 10. SUBMISSION OF MATTERS TO A VOTE OF SECURITY HOLDERS
Not applicable.
Table of Contents
Item 11. CONTROLS AND PROCEDURES
(a) The Registrant’s principal executive and principal financial officers have concluded, based on their evaluation of the registrant’s disclosure controls and procedures as of a date within 90 days of the filing of this report, that the Registrant’s disclosure controls and procedures are reasonably designed to ensure that information required to be disclosed by the Registrant on Form N-CSR is recorded, processed, summarized and reported within the required time periods and that information required to be disclosed by the registrant in the reports that it files or submits on Form N-CSR is accumulated and communicated to the Registrant’s management, including its principal executive and principal financial officers, as appropriate to allow timely decisions regarding required disclosure.
(b) There were no changes in the Registrant’s internal control over financial reporting during the Registrant’s fourth fiscal quarter of the period covered by this report that have materially affected, or are reasonably likely to affect, the internal control over financial reporting.
Item 12. DISCLOSURE OF SECURITIES LENDING ACTIVITIES FOR CLOSED-END MANAGEMENT INVESTMENT COMPANIES
Not applicable.
Item 13. EXHIBITS
| (a) (1) | Any Code of Ethics or amendments hereto. Filed herewith. | |
| (a) (2) | Certifications pursuant to Rule 30a-2(a) under the Investment Company Act of 1940 - Filed herewith. | |
| (a) (3) | Not applicable. | |
| (b) | Certifications pursuant to Rule 30a-2(b) under the Investment Company Act of 1940 - Filed herewith. | |
Table of Contents
SIGNATURES
Pursuant to the requirements of the Securities Exchange Act of 1934 and the Investment Company Act of 1940, the registrant has duly caused this report to be signed on its behalf by the undersigned, thereunto duly authorized.
AMG FUNDS II
| By: | /s/ Jeffrey T. Cerutti | |
| Jeffrey T. Cerutti, Principal Executive Officer |
Date: March 9, 2018
Pursuant to the requirements of the Securities Exchange Act of 1934 and the Investment Company Act of 1940, this report has been signed below by the following persons on behalf of the registrant and in the capacities and on the dates indicated.
| By: | /s/ Jeffrey T. Cerutti | |
| Jeffrey T. Cerutti, Principal Executive Officer |
Date: March 9, 2018
| By: | /s/ Thomas Disbrow | |
| Thomas Disbrow, Principal Financial Officer |
Date: March 9, 2018