UNITED STATES
SECURITIES AND EXCHANGE COMMISSION
Washington, D.C. 20549
FORMN-CSR
CERTIFIED SHAREHOLDER REPORT OF
REGISTERED MANAGEMENT INVESTMENT COMPANIES
Investment Company Act file number:811-06431
AMG Funds II
(Exact name of registrant as specified in charter)
600 Steamboat Road, Suite 300, Greenwich, Connecticut 06830
(Address of principal executive offices) (Zip code)
AMG Funds LLC
600 Steamboat Road, Suite 300, Greenwich, Connecticut 06830
(Name and address of agent for service)
Registrant’s telephone number, including area code: (203)299-3500
Date of fiscal year end: DECEMBER 31
Date of reporting period: JANUARY 1, 2019 – DECEMBER 31, 2019
(Annual Shareholder Report)
| Item 1. | Reports to Shareholders |
| | |
 | | ANNUAL REPORT |
| | |
| | | AMG Funds December 31, 2019 AMG Chicago Equity Partners Balanced Fund Class N:MBEAX | Class I:MBESX | Class Z:MBEYX |
Beginning on January 1, 2021, as permitted by regulations adopted by the Securities and Exchange Commission, paper copies of the Fund’s shareholder reports like this one will no longer be sent by mail, unless you specifically request paper copies of the reports from the Fund or from your financial intermediary, such as a broker-dealer or bank. Instead, the reports will be made available on the Fund’s website (https://www.amgfunds.com/resources/order_literature.html), and you will be notified by mail each time a report is posted and provided with a website link to access the report.
If you already elected to receive shareholder reports electronically, you will not be affected by this change and you need not take any action. You may elect to receive shareholder reports and other communications from the Fund electronically at any time by contacting your financial intermediary or, if you invest directly with the Fund, by logging into your account at www.amgfunds.com.
You may elect to receive all future reports in paper free of charge. If you invest through a financial intermediary, you can contact your financial intermediary to request that you continue to receive paper copies of your shareholder reports. If you invest directly with the Fund, you can call 1.800.548.4539 to inform the Fund that you wish to continue receiving paper copies of your shareholder reports. Your election to receive reports in paper will apply to all funds in the AMG Funds Family of Funds held in your account if you invest through your financial intermediary or all funds in the AMG Funds Family of Funds held with the fund complex if you invest directly with the Fund.
| | | | | | |
amgfunds.com | | | | 123119 | | AR009 |
| | |
| | | AMG Funds Annual Report — December 31, 2019 |
| | | | |
TABLE OF CONTENTS | | PAGE | |
LETTER TO SHAREHOLDERS | | | 2 | |
| |
ABOUT YOUR FUND’S EXPENSES | | | 3 | |
| |
| PORTFOLIO MANAGER’S COMMENTS, FUND SNAPSHOTS AND SCHEDULE OF PORTFOLIO INVESTMENTS | | | | |
| |
AMG Chicago Equity Partners Balanced Fund | | | 4 | |
| |
FINANCIAL STATEMENTS | | | | |
| |
Statement of Assets and Liabilities | | | 22 | |
| |
Balance sheet, net asset value (NAV) per share computations and cumulative distributable earnings (loss) | | | | |
| |
Statement of Operations | | | 24 | |
| |
Detail of sources of income, expenses, and realized and unrealized gains (losses) during the fiscal year | | | | |
| |
Statements of Changes in Net Assets | | | 25 | |
| |
Detail of changes in assets for the past two fiscal years | | | | |
| |
Financial Highlights | | | 26 | |
| |
Historical net asset values per share, distributions, total returns, income and expense ratios, turnover ratios and net assets | | | | |
| |
Notes to Financial Statements | | | 29 | |
| |
Accounting and distribution policies, details of agreements and transactions with Fund management and affiliates, and descriptions of certain investment risks | | | | |
| |
REPORT OF INDEPENDENT REGISTERED PUBLIC ACCOUNTING FIRM | | | 35 | |
| |
OTHER INFORMATION | | | 36 | |
| |
TRUSTEES AND OFFICERS | | | 37 | |
Nothing contained herein is to be considered an offer, sale or solicitation of an offer to buy shares of any series of the AMG Funds Family of Funds. Such offering is made only by prospectus, which includes details as to offering price and other material information.
| | | | |
| | Letter to Shareholders | | |
Dear Shareholder:
The U.S. bull market celebrated its10-year anniversary during the fiscal year ended December 31, 2019, as stocks proved resilient in the face of global economic weakness, rising geopolitical tensions, and the ongoing trade war. After a painful selloff in late 2018, a dovish pivot from global central banks rescued investors and fueled a strong rebound early in 2019. The rally picked up steam in the final months of the year, as trade tensions eased when the U.S. and China agreed to a limited “phase one” deal in December following months of tenseback-and-forth negotiations. The yield curve, which had inverted earlier in the year and raised investor anxiety given its track record for predicting an impending recession, was no longer inverted byyear-end as the U.S. Federal Reserve (the Fed) cut short-term rates. Worries over a near-term recession lifted while the yield curve steepened and trade developments improved, leading to a wave of investor confidence and strong equity returns, with the S&P 500® Index returning 31.49%. International equities were also resistant to pressures facing the global economy and generated a 21.51% return as measured by the MSCI All Country World ex USA Index.
In total, all eleven sectors of the S&P 500® Index were strongly positive during the prior twelve months, each producing double-digit returns. The higher growth information technology sector led the way with a 50.31% return while the communication services and financial sectors followed closely behind. Energy was the worst performing sector during the fiscal year, yet still produced a very respectable 11.81% return. Growth stocks outperformed Value stocks for the full fiscal year with returns of 36.39% and 26.54% for the Russell 1000® Growth and Russell 1000® Value Indexes, respectively. The cycle of U.S. outperformance over international equities continued but international developed and emerging markets still produced solid positive returns, with the MSCI EAFE and MSCI Emerging Markets Index returning 22.01% and 18.42%, respectively.
Interest rates fell dramatically over the fiscal year and led to strong returns for bond investors as the Fed shifted to a more dovish policy stance early in 2019 and eventually cut short-term rates three times during the year. The10-year Treasury yield fell from its recent high of 3.24% last November to a low of 1.47% in early September and then edged slightly higher to finish the year at 1.92%. The plunge in long-term interest rates caused the yield curve to briefly invert with2-year yields rising higher than the10-year yields. The Bloomberg Barclays U.S. Aggregate Bond Index, a broad measure of U.S. bond market performance, ended the fiscal year with an 8.72% return. High yield bonds outperformed the broader bond market and returned 14.32% as measured by the return of the Bloomberg Barclays U.S. Corporate High Yield Bond Index. Municipal bonds also performed strongly with a 7.54% return for the Bloomberg Barclays Municipal Bond Index.
AMG Funds appreciates the privilege of providing investment tools to you and your clients. Our foremost goal is to provide investment solutions that help our shareholders successfully reach their long-term investment goals. AMG Funds provides access to a distinctive array of actively managed return-oriented investment strategies. We thank you for your continued confidence and investment in AMG Funds. You can rest assured that under all market conditions our team is focused on delivering excellent investment management services for your benefit.
Respectfully,

Keitha Kinne
President
AMG Funds
| | | | | | | | | | | | | | |
Average Annual Total Returns | | Periods ended
December 31, 2019* | |
Stocks: | | | | 1 Year | | | 3 Years | | | 5 Years | |
Large Cap | | (S&P 500® Index) | | | 31.49 | % | | | 15.27 | % | | | 11.70 | % |
Small Cap | | (Russell 2000® Index) | | | 25.52 | % | | | 8.59 | % | | | 8.23 | % |
International | | (MSCI All Country World ex USA Index) | | | 21.51 | % | | | 9.87 | % | | | 5.51 | % |
| | | | | | | | | | | | | | |
| | | | |
Bonds: | | | | | | | | | | | |
Investment Grade | | (Bloomberg Barclays U.S. Aggregate Bond Index) | | | 8.72 | % | | | 4.03 | % | | | 3.05 | % |
High Yield | | (Bloomberg Barclays U.S. Corporate High Yield Bond Index) | | | 14.32 | % | | | 6.37 | % | | | 6.13 | % |
Tax-exempt | | (Bloomberg Barclays Municipal Bond Index) | | | 7.54 | % | | | 4.72 | % | | | 3.53 | % |
Treasury Bills | | (ICE BofAML U.S.6-Month Treasury Bill Index) | | | 2.57 | % | | | 1.81 | % | | | 1.26 | % |
| | | | | | | | | | | | | | |
| * | Source: FactSet. Past performance is no guarantee of future results. |
2
| | |
| | | About Your Fund’s Expenses |
As a shareholder of a Fund, you may incur two types of costs: (1) transaction costs, which may include sales charges (loads) on purchase payments; redemption fees; and exchange fees; and (2) ongoing costs, including management fees; distribution(12b-1) fees; and other Fund expenses. This example is intended to help you understand your ongoing costs (in dollars) of investing in the Fund and to compare these costs with the ongoing costs of investing in other mutual funds. The example is based on $1,000 invested at the beginning of the period and held for the entire period as indicated below.
ACTUAL EXPENSES
The first line of the following table provides information about the actual account values and
actual expenses. You may use the information in this line, together with the amount you invested, to estimate the expenses that you paid over the period. Simply divide your account value by $1,000 (for example, an $8,600 account value divided by $1,000 = 8.6), then multiply the result by the number in the first line under the heading entitled “Expenses Paid During Period” to estimate the expenses you paid on your account during this period.
HYPOTHETICAL EXAMPLE FOR COMPARISON PURPOSES
The second line of the following table provides information about hypothetical account values and hypothetical expenses based on the Fund’s actual expense ratio and an assumed annual rate of return of 5% before expenses, which is not the Fund’s
actual return. The hypothetical account values and expenses may not be used to estimate the actual ending account balance or expenses you paid for the period. You may use this information to compare the ongoing costs of investing in the Fund and other funds by comparing this 5% hypothetical example with the 5% hypothetical examples that appear in the shareholder reports of other funds.
Please note that the expenses shown in the table are meant to highlight your ongoing costs only and do not reflect any transactional costs, such as sales charges (loads), redemption fees, or exchange fees. Therefore, the second line of the table is useful in comparing ongoing costs only, and will not help you determine the relative total costs of owning different funds.
| | | | | | | | | | | | | | | | |
Six Months Ended December 31, 2019 | | Expense
Ratio for the Period | | | Beginning
Account
Value
07/01/19 | | | Ending
Account
Value
12/31/19 | | | Expenses
Paid
During
the Period* | |
AMG Chicago Equity Partners Balanced Fund | |
Based on Actual Fund Return | |
Class N | | | 1.09 | % | | $ | 1,000 | | | $ | 1,055 | | | $ | 5.64 | |
Class I | | | 0.94 | % | | $ | 1,000 | | | $ | 1,055 | | | $ | 4.87 | |
Class Z | | | 0.84 | % | | $ | 1,000 | | | $ | 1,055 | | | $ | 4.35 | |
| | | | | | | | | | | | | | | | |
Based on Hypothetical 5% Annual Return | |
Class N | | | 1.09 | % | | $ | 1,000 | | | $ | 1,020 | | | $ | 5.55 | |
Class I | | | 0.94 | % | | $ | 1,000 | | | $ | 1,020 | | | $ | 4.79 | |
Class Z | | | 0.84 | % | | $ | 1,000 | | | $ | 1,021 | | | $ | 4.28 | |
| | | | | | | | | | | | | | | | |
| * | Expenses are equal to the Fund’s annualized expense ratio multiplied by the average account value over the period, multiplied by the number of days in the most recent fiscal half-year (184), then divided by 365. |
3
| | |
| | | AMG Chicago Equity Partners Balanced Fund Portfolio Manager’s Comments(unaudited) |
THE YEAR IN REVIEW
For the year ended December 31, 2019, AMG Chicago Equity Partners Balanced Fund (Class N shares) (the “Fund”) returned 16.96%, compared to the 22.13% return for its benchmark, which consists of 60% the return of the Russell 1000® Index and 40% the return of the Bloomberg Barclays U.S. Aggregate Bond Index.
CEP’s Market Phase Identification (MPI) model signaled a downturn phase throughout much of the year which resulted in varied underweight equity allocations in the Fund throughout much of 2019. It was not until the fourth quarter that the model shifted to a rebound phase, causing the asset allocation to change from 55% equity/45% fixed income to 65% equity/35% fixed income in the last quarter of the year. The prevalent underweight in equities during 2019 was a primary driver of the Fund’s overall underperformance.
At the beginning of the year, the equity portion of the Fund shifted its style preference to Value from Growth, its factor preference from Momentum to Quality, and risk profile from neutral to lower volatility. In the fourth quarter, the factor preference moved from Quality to Value and continued to maintain its style preference for Value. The equity portfolio underperformed the Russell 1000® Index for the year due to this positioning as Growth stocks outperformed Value stocks.
Stocks had a great year in 2019 with all major U.S indices posting double-digit positive returns. The Russell 1000® Index repeatedly set new record highs, finishing the year with a 31.43% return, the best yearly performance since 2013. The optimism over the U.S.-China trade talks combined with the U.S. Federal Reserve (Fed) cutting interest rates three times this year contributed to the strong equity performance as stock prices rose substantially despite negative earnings revisions. The slowing U.S. economy has been supported by consumers as unemployment hit historic lows and consumer spending remained solid while manufacturing has been weak.
The equity segment of the Fund underperformed this year relative to the Russell 1000® Index. The year’s underperformance was mostly due to weakness in the first and fourth quarters. In the first and fourth quarters the rank performance of our quantitative model performed poorly, with the stocks we had ranked highly underperforming those that we had ranked lower.
The fixed income segment of the Fund outperformed the Bloomberg Barclays U.S. Aggregate Bond Index every quarter in 2019 with strong results in the 4th quarter. While duration, curve exposure and the
mortgage-backed securities (MBS) allocation are closely aligned with benchmark weightings, an overweight to corporate bonds has benefited the portfolio throughout the year as a result of the narrowing of corporate spreads and falling interest rates across the maturity spectrum. Specific security selection and an overweight to BBB rated issuers also helped performance.
Expectations for next year are for corporate earnings to improve along with an increasing investor preference for stocks with quality balance sheets. Our research has shown that constructing a well-diversified portfolio of companies with attractive valuations ratios, quality balance sheets, and positive growth and momentum expectations built through a disciplined, risk-controlled process delivers consistent long-term excess returns. Overall, our philosophy will not change based on short-term trends or conditions in the market. We will continue to use our disciplined approach to provide added value at controlled levels of risk.
This commentary reflects the viewpoints of Chicago Equity Partners, LLC and is not intended as a forecast or guarantee of future results.
4
| | |
| | | AMG Chicago Equity Partners Balanced Fund Portfolio Manager’s Comments(continued) |
CUMULATIVE TOTAL RETURN PERFORMANCE
AMG Chicago Equity Partners Balanced Fund’s cumulative total return is based on the daily change in net asset value (NAV), and assumes that all dividends and distributions were reinvested. This graph compares a hypothetical $10,000 investment made in the AMG Chicago Equity Partners Balanced Fund’s Class N shares on December 31, 2009, to a $10,000 investment made in the 60% Russell 1000® Index/40% Bloomberg Barclays U.S. Aggregate Bond Index, Russell 1000® Index and the Bloomberg Barclays U.S. Aggregate Bond Index for the same time period. The graph and table do not reflect the deduction of taxes that a shareholder would pay on a Fund distribution or redemption of shares. The listed returns for the Fund are net of expenses and the returns for the index exclude expenses. Total returns would have been lower had certain expenses not been reduced.
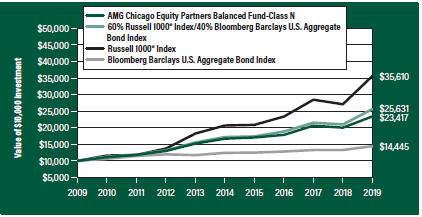
The table below shows the average annual total returns for the AMG Chicago Equity Partners Balanced Fund, the 60% Russell 1000® Index/40% Bloomberg Barclays U.S. Aggregate Bond Index, the Russell 1000® Index and the Bloomberg Barclays U.S. Aggregate Bond Index for the same time periods ended December 31, 2019.
| | | | | | | | | | | | | | | | | | | | |
| Average Annual Total Returns1 | | One
Year | | | Five
Years | | | Ten
Years | | | Since
Inception | | | Inception
Date | |
AMG Chicago Equity Partners Balanced Fund2, 3, 4, 5, 6, 7 | | | | | |
Class N | | | 16.96 | % | | | 7.00 | % | | | 8.88 | % | | | 7.92 | % | | | 01/02/97 | |
Class I | | | 17.17 | % | | | 7.16 | % | | | — | | | | 8.80 | % | | | 11/30/12 | |
Class Z | | | 17.21 | % | | | 7.26 | % | | | 9.16 | % | | | 8.29 | % | | | 01/02/97 | |
| | | | | | | | | | | | | | | | | | | | |
60% Russell 1000® Index/40% Bloomberg Barclays U.S. Aggregate Bond Index8, 9 | | | 22.13 | % | | | 8.31 | % | | | 9.87 | % | | | 7.84 | % | | | 01/02/97 | † |
Russell 1000® Index8 | | | 31.43 | % | | | 11.48 | % | | | 13.54 | % | | | 8.80 | % | | | 01/02/97 | † |
Bloomberg Barclays U.S. Aggregate Bond Index9 | | | 8.72 | % | | | 3.05 | % | | | 3.75 | % | | | 5.14 | % | | | 01/02/97 | † |
| | | | | | | | | | | | | | | | | | | | |
The performance data shown represents past performance. Past performance is not a guarantee of future results. Current performance may be lower or higher than the performance data quoted. The investment return and principal value of an investment will fluctuate so that an investor’s shares, when redeemed, may be worth more or less than their original cost.
Investors should carefully consider the Fund’s investment objectives, risks, charges and expenses before investing. For performance information through the most recent month end, current net asset values per share for the Fund and other information, please call 800.548.4539 or visit our website at amgfunds.com for a free prospectus. Read it carefully before investing or sending money.
Distributed by AMG Distributors, Inc., member FINRA/SIPC.
| † | Date reflects inception date of the Fund, not the index. |
| 1 | Total return equals income yield plus share price change and assumes reinvestment of all dividends and capital gain distributions. Returns are net of fees and may reflect offsets of Fund expenses as described in the prospectus. No adjustment has been made for taxes payable by shareholders on their reinvested dividends and capital gain distributions. Returns for periods greater than one year are annualized. The listed returns on the Fund are net of expenses and based on the published NAV as of December 31, 2019. All returns are in U.S. dollars ($). |
| 2 | From time to time, the Fund’s advisor has waived its fees and/or absorbed Fund expenses, which has resulted in higher returns. |
| 3 | To the extent that the Fund invests in asset-backed or mortgage-backed securities, its exposure to prepayment and extension risks may be greater than investments in other fixed income securities. |
| 4 | The Fund is subject to the risks associated with investments in debt securities, such as default risk and fluctuations in the perception of the debtor’s ability to pay its creditors. Changing interest rates may adversely affect the value of an investment. An increase in interest rates typically causes the value of bonds and other fixed income securities to fall. |
| 5 | Investments in international securities are subject to certain risks of overseas investing including currency fluctuations and changes in political and economic conditions, which could result in significant market fluctuations. These risks are magnified in emerging markets. |
| 6 | The Fund is subject to risks associated with investments inmid-capitalization companies such as greater price volatility, lower trading volume, and less liquidity than the stocks of larger, more established companies. |
| 7 | The Fund invests in value stocks, which may perform differently from the market as a whole and may be undervalued by the market for a long period of time. |
| 8 | The Russell 1000® Index measures the performance of approximately 1,000 of the largest securities based on a combination of their market cap and current index membership. The Russell 1000® represents approximately 92% of the U.S. market. Unlike the Fund, the Russell 1000® Index is unmanaged, is not available for investment, and does not incur expenses. |
| 9 | The Bloomberg Barclays U.S. Aggregate Bond Index represents securities that are Securities and Exchange Commission-registered, taxable, and dollar denominated. The index covers the U.S. investment grade fixed rate bond market, with index components for government and corporate securities, mortgage pass-through securities, and asset-backed securities. Unlike the Fund, the Bloomberg Barclays |
5
| | |
| | | AMG Chicago Equity Partners Balanced Fund Portfolio Manager’s Comments(continued) |
| | U.S. Aggregate Bond Index is unmanaged, is not available for investment, and does not incur expenses. |
The Russell 1000® Index is a trademark of the London Stock Exchange Group companies.
Bloomberg Index Services Limited. BLOOMBERG® is a trademark and service mark of Bloomberg Finance L.P. and its affiliates (collectively “Bloomberg”).
BARCLAYS® is a trademark and service mark of Barclays Bank Plc (collectively with its affiliates, “Barclays”), used under license. Bloomberg or Bloomberg’s licensors, including Barclays, own all proprietary rights in the Bloomberg Barclays Indices. Neither Bloomberg nor Barclays approves or endorses this material, or guarantees the accuracy or completeness of any information herein, or makes
any warranty, express or implied, as to the results to be obtained therefrom and, to the maximum extent allowed by law, neither shall have any liability or responsibility for injury or damages arising in connection therewith.
Not FDIC insured, nor bank guaranteed. May lose value.
6
| | |
| | | AMG Chicago Equity Partners Balanced Fund Fund Snapshots(unaudited) December 31, 2019 |
PORTFOLIO BREAKDOWN
| | | | |
Sector | | % of
Net Assets | |
U.S. Government and Agency Obligations | | | 18.5 | |
Industrials | | | 16.3 | |
Financials | | | 14.4 | |
Information Technology | | | 10.8 | |
Health Care | | | 7.9 | |
Communication Services | | | 5.7 | |
Consumer Discretionary | | | 5.7 | |
Utilities | | | 5.2 | |
Consumer Staples | | | 4.8 | |
Real Estate | | | 3.2 | |
Energy | | | 3.1 | |
Materials | | | 2.2 | |
Exchange Traded Funds | | | 1.0 | |
Short-Term Investments | | | 4.0 | |
Other Assets Less Liabilities | | | (2.8 | ) |
| | | | |
Rating | | % of
Market Value1
| |
U.S. Government and Agency Obligations | | | 54.7 | |
Aa/AA | | | 0.1 | |
A | | | 12.9 | |
Baa/BBB | | | 32.3 | |
| 1 | Includes market value of long-term fixed-income securities only. |
TOP TEN HOLDINGS
| | | | |
Security Name | | % of
Net Assets | |
Apple, Inc. | | | 2.0 | |
Microsoft Corp. | | | 1.6 | |
Johnson & Johnson | | | 1.0 | |
U.S. Treasury Notes, 1.750%, 09/30/22 | | | 1.0 | |
U.S. Treasury Notes, 1.875%, 08/31/22 | | | 1.0 | |
The Procter & Gamble Co. | | | 1.0 | |
Amazon.com, Inc. | | | 0.9 | |
Berkshire Hathaway, Inc., Class B | | | 0.9 | |
JPMorgan Chase & Co. | | | 0.9 | |
Alphabet, Inc., Class A | | | 0.9 | |
| | | | |
Top Ten as a Group | | | 11.2 | |
| | | | |
Credit quality ratings shown above reflect the highest rating assigned by either Standard & Poor’s (“S&P”), Moody’s Investors Service, Inc. (“Moody’s”) or Fitch’s. These rating agencies are independent, nationally recognized statistical rating organizations and are widely used. Investment grade ratings are credit ratings of BBB/Baa or higher. Below investment grade ratings are credit ratings of BB/Ba or lower. Investments designated N/R are not rated by either rating agency. Unrated investments do not necessarily indicate low credit quality. Credit quality ratings are subject to change.
Because a fund’s strategy may result in multiple investments in particular sectors of the economy, its performance may depend on the performance of those sectors and may fluctuate more widely than investments diversified across more sectors. For additional information on these and other risk considerations, please see the Fund’s prospectus.
Any sectors, industries, or securities discussed should not be perceived as investment recommendations. Mention of a specific security should not be considered a recommendation to buy or solicitation to sell that security. Specific securities mentioned in this report may have been sold from the Fund’s portfolio of investments by the time you receive this report.
7
| | |
| | | AMG Chicago Equity Partners Balanced Fund Schedule of Portfolio Investments December 31, 2019 |
| | | | | | | | |
| | | Shares | | | Value | |
Common Stocks - 64.0% | | | | | | | | |
Communication Services - 5.7% | |
Activision Blizzard, Inc. | | | 1,300 | | | $ | 77,246 | |
Alphabet, Inc., Class A* | | | 1,680 | | | | 2,250,175 | |
AT&T, Inc. | | | 27,049 | | | | 1,057,075 | |
Avex, Inc. (Japan) | | | 3,300 | | | | 38,012 | |
Borussia Dortmund GmbH & Co. KGaA (Germany) | | | 1,000 | | | | 9,871 | |
Cinemark Holdings, Inc.1 | | | 9,680 | | | | 327,668 | |
Comcast Corp., Class A | | | 10,305 | | | | 463,416 | |
CTS Eventim AG & Co. KGaA (Germany) | | | 900 | | | | 56,469 | |
Electronic Arts, Inc.* | | | 490 | | | | 52,680 | |
Facebook, Inc., Class A* | | | 6,625 | | | | 1,359,781 | |
Freenet AG (Germany) | | | 700 | | | | 16,049 | |
Gree, Inc. (Japan) | | | 12,200 | | | | 55,123 | |
HKBN, Ltd. (Hong Kong) | | | 15,400 | | | | 25,822 | |
Infrastrutture Wireless Italiane S.P.A. (Italy)2 | | | 1,300 | | | | 12,730 | |
Kadokawa Corp. (Japan) | | | 4,900 | | | | 93,667 | |
Lagardere SCA (France) | | | 3,700 | | | | 80,640 | |
Live Nation Entertainment, Inc.*,1 | | | 1,590 | | | | 113,637 | |
Match Group, Inc.*,1 | | | 1,035 | | | | 84,984 | |
Metropole Television, S.A. (France) | | | 3,600 | | | | 67,760 | |
Mixi, Inc. (Japan) | | | 1,500 | | | | 28,439 | |
MTI, Ltd. (Japan) | | | 1,800 | | | | 11,771 | |
Netflix, Inc.* | | | 715 | | | | 231,353 | |
Omnicom Group, Inc.1 | | | 6,290 | | | | 509,616 | |
Proto Corp. (Japan) | | | 4,200 | | | | 46,209 | |
RAI Way S.P.A. (Italy)2 | | | 3,400 | | | | 23,383 | |
Rightmove PLC (United Kingdom) | | | 2,300 | | | | 19,300 | |
Rovio Entertainment Oyj (Finland)1,2 | | | 6,300 | | | | 31,207 | |
Sinclair Broadcast Group, Inc., Class A1 | | | 4,520 | | | | 150,697 | |
SmarTone Telecommunications Holdings, Ltd. (Hong Kong) | | | 10,700 | | | | 8,241 | |
Spotify Technology S.A. (Sweden)* | | | 785 | | | | 117,397 | |
Sunrise Communications Group AG (Switzerland)2 | | | 300 | | | | 23,569 | |
Take-Two Interactive Software, Inc.* | | | 17,600 | | | | 2,154,768 | |
Telephone & Data Systems, Inc. | | | 10,060 | | | | 255,826 | |
Television Francaise 1 (France) | | | 1,500 | | | | 12,503 | |
T-Mobile US, Inc.* | | | 2,955 | | | | 231,731 | |
TripAdvisor, Inc. | | | 7,495 | | | | 227,698 | |
TV Asahi Holdings Corp. (Japan) | | | 2,300 | | | | 42,469 | |
Verizon Communications, Inc. | | | 32,065 | | | | 1,968,791 | |
ViacomCBS, Inc., Class B | | | 20,942 | | | | 878,936 | |
| | | | | | | | |
| | | Shares | | | Value | |
The Walt Disney Co. | | | 8,384 | | | $ | 1,212,578 | |
Total Communication Services | | | | | | | 14,429,287 | |
Consumer Discretionary - 5.7% | |
888 Holdings PLC (Gibraltar) | | | 21,800 | | | | 47,646 | |
Accent Group, Ltd. (Australia) | | | 55,700 | | | | 72,939 | |
Adient PLC* | | | 18,085 | | | | 384,306 | |
Amazon.com, Inc.* | | | 1,295 | | | | 2,392,953 | |
Autogrill S.P.A. (Italy) | | | 1,600 | | | | 16,750 | |
AutoZone, Inc.* | | | 125 | | | | 148,914 | |
boohoo Group PLC (United Kingdom)* | | | 6,800 | | | | 26,833 | |
Booking Holdings, Inc.* | | | 155 | | | | 318,328 | |
BorgWarner, Inc. | | | 4,535 | | | | 196,728 | |
Chipotle Mexican Grill, Inc.* | | | 330 | | | | 276,246 | |
Darden Restaurants, Inc. | | | 790 | | | | 86,118 | |
DFS Furniture PLC (United Kingdom) | | | 19,700 | | | | 75,414 | |
D’ieteren, S.A. (Belgium) | | | 500 | | | | 35,109 | |
Dollar General Corp. | | | 1,690 | | | | 263,606 | |
Dollar Tree, Inc.*,1 | | | 1,305 | | | | 122,735 | |
Doutor Nichires Holdings Co., Ltd. (Japan) | | | 1,800 | | | | 35,728 | |
Dunkin’ Brands Group, Inc. | | | 2,955 | | | | 223,221 | |
eBay, Inc. | | | 15,435 | | | | 557,358 | |
ES-Con Japan, Ltd. (Japan) | | | 1,800 | | | | 15,448 | |
Evolution Gaming Group AB (Sweden)2 | | | 1,800 | | | | 54,322 | |
Exedy Corp. (Japan) | | | 500 | | | | 11,311 | |
Expedia Group, Inc. | | | 680 | | | | 73,535 | |
Extended Stay America, Inc. | | | 26,235 | | | | 389,852 | |
Floor & Decor Holdings, Inc., Class A*,1 | | | 4,075 | | | | 207,051 | |
Ford Motor Co. | | | 68,335 | | | | 635,516 | |
Foster Electric Co., Ltd. (Japan) | | | 2,300 | | | | 40,400 | |
France Bed Holdings Co., Ltd. (Japan) | | | 1,800 | | | | 15,929 | |
Games Workshop Group PLC (United Kingdom) | | | 200 | | | | 16,174 | |
Garrett Motion, Inc. (Switzerland)* | | | 1 | | | | 10 | |
General Motors Co. | | | 22,390 | | | | 819,474 | |
Grand Canyon Education, Inc.*,1 | | | 1,740 | | | | 166,675 | |
Greggs PLC (United Kingdom) | | | 2,100 | | | | 64,056 | |
G-Tekt Corp. (Japan) | | | 1,500 | | | | 23,840 | |
Harley-Davidson, Inc.1 | | | 12,380 | | | | 460,412 | |
Heiwa Corp. (Japan) | | | 2,800 | | | | 58,635 | |
The Home Depot, Inc. | | | 480 | | | | 104,822 | |
IDP Education, Ltd. (Australia) | | | 5,000 | | | | 60,272 | |
Jumbo Interactive, Ltd. (Australia) | | | 1,500 | | | | 15,730 | |
Just Eat PLC (United Kingdom)* | | | 3,400 | | | | 37,617 | |
Kasai Kogyo Co., Ltd. (Japan) | | | 1,100 | | | | 8,628 | |
The accompanying notes are an integral part of these financial statements.
8
| | |
| | | AMG Chicago Equity Partners Balanced Fund Schedule of Portfolio Investments(continued) |
| | | | | | | | |
| | | Shares | | | Value | |
Consumer Discretionary - 5.7%(continued) | | | | | | | | |
Kaufman & Broad, S.A. (France) | | | 1,100 | | | $ | 45,653 | |
Kohl’s Corp.1 | | | 5,380 | | | | 274,111 | |
Kurabo Industries, Ltd. (Japan) | | | 1,100 | | | | 25,499 | |
Macy’s, Inc.1 | | | 18,185 | | | | 309,145 | |
Mars Group Holdings Corp. (Japan) | | | 700 | | | | 13,106 | |
Marston’s PLC (United Kingdom) | | | 27,100 | | | | 45,661 | |
Matas A/S (Denmark) | | | 5,400 | | | | 44,663 | |
Mattel, Inc.*,1 | | | 11,805 | | | | 159,958 | |
Mitchells & Butlers PLC (United Kingdom)* | | | 5,200 | | | | 31,650 | |
Mizuno Corp. (Japan) | | | 700 | | | | 17,685 | |
Mobilezone Holding AG (Switzerland) | | | 3,900 | | | | 43,772 | |
Newell Brands, Inc. | | | 47,235 | | | | 907,857 | |
Nordstrom, Inc.1 | | | 4,895 | | | | 200,352 | |
Norwegian Cruise Line Holdings, Ltd.* | | | 5,115 | | | | 298,767 | |
Pets at Home Group PLC (United Kingdom)1 | | | 21,900 | | | | 81,109 | |
Piolax, Inc. (Japan) | | | 1,300 | | | | 25,060 | |
Pool Corp. | | | 725 | | | | 153,976 | |
Redrow PLC (United Kingdom) | | | 2,400 | | | | 23,689 | |
Ross Stores, Inc. | | | 2,450 | | | | 285,229 | |
Seiko Holdings Corp. (Japan) | | | 2,000 | | | | 53,336 | |
ServiceMaster Global Holdings, Inc.* | | | 1,700 | | | | 65,722 | |
SSP Group PLC (United Kingdom) | | | 7,359 | | | | 63,357 | |
Starts Corp., Inc. (Japan) | | | 1,200 | | | | 30,535 | |
The Gap, Inc.1 | | | 13,200 | | | | 233,376 | |
The TJX Cos., Inc. | | | 5,700 | | | | 348,042 | |
Tokai Rika Co., Ltd. (Japan) | | | 2,900 | | | | 56,513 | |
Tokmanni Group Corp. (Finland) | | | 3,100 | | | | 43,883 | |
Tractor Supply Co. | | | 1,535 | | | | 143,430 | |
VF Corp. | | | 6,165 | | | | 614,404 | |
The Wendy’s Co.1 | | | 41,230 | | | | 915,718 | |
Xebio Holdings Co., Ltd. (Japan) | | | 4,400 | | | | 53,132 | |
Xinyi Glass Holdings, Ltd. (Hong Kong) | | | 59,300 | | | | 78,571 | |
Yorozu Corp. (Japan) | | | 1,300 | | | | 17,451 | |
Zojirushi Corp. (Japan) | | | 1,500 | | | | 28,143 | |
Total Consumer Discretionary | | | | | | | 14,293,196 | |
Consumer Staples - 4.8% | |
Axfood AB (Sweden) | | | 2,800 | | | | 62,356 | |
Bunge, Ltd. | | | 11,025 | | | | 634,489 | |
C&C Group PLC (Ireland) | | | 10,700 | | | | 57,615 | |
Campbell Soup Co.1 | | | 2,970 | | | | 146,777 | |
Cawachi, Ltd. (Japan) | | | 700 | | | | 14,183 | |
Cloetta AB, Class B (Sweden) | | | 22,300 | | | | 75,623 | |
| | | | | | | | |
| | | Shares | | | Value | |
The Coca-Cola Co. | | | 18,705 | | | $ | 1,035,322 | |
Colgate-Palmolive Co. | | | 2,695 | | | | 185,524 | |
Constellation Brands, Inc., Class A | | | 1,625 | | | | 308,344 | |
Costco Wholesale Corp. | | | 1,460 | | | | 429,123 | |
Edgewell Personal Care Co.* | | | 9,895 | | | | 306,349 | |
General Mills, Inc. | | | 13,965 | | | | 747,965 | |
Kato Sangyo Co., Ltd. (Japan) | | | 700 | | | | 22,938 | |
Keurig Dr Pepper, Inc.1 | | | 10,935 | | | | 316,568 | |
Kimberly-Clark Corp. | | | 4,275 | | | | 588,026 | |
The Kroger Co. | | | 8,905 | | | | 258,156 | |
McCormick & Co., Inc.,Non-Voting Shares | | | 5,310 | | | | 901,266 | |
Metcash Ltd. (Australia) | | | 9,800 | | | | 17,663 | |
Monster Beverage Corp.* | | | 9,315 | | | | 591,968 | |
Nippon Beet Sugar Manufacturing Co., Ltd. (Japan) | | | 700 | | | | 13,045 | |
Nissin Foods Co. Ltd. (Hong Kong) | | | 34,300 | | | | 27,259 | |
Ontex Group N.V. (Belgium) | | | 2,000 | | | | 42,097 | |
Origin Enterprises PLC (Ireland) | | | 13,500 | | | | 56,181 | |
PepsiCo, Inc. | | | 4,945 | | | | 675,833 | |
Philip Morris International, Inc. | | | 4,415 | | | | 375,672 | |
The Procter & Gamble Co. | | | 19,530 | | | | 2,439,297 | |
Rami Levy Chain Stores Hashikma Marketing 2006, Ltd. (Israel) | | | 1,100 | | | | 63,292 | |
Scandi Standard AB (Sweden) | | | 4,600 | | | | 36,539 | |
Sheng Siong Group, Ltd. (Singapore) | | | 14,300 | | | | 13,184 | |
Sprouts Farmers Market, Inc.* | | | 11,180 | | | | 216,333 | |
Starzen Co., Ltd. (Japan) | | | 300 | | | | 12,137 | |
Stock Spirits Group PLC (United Kingdom) | | | 20,800 | | | | 56,760 | |
Tate & Lyle PLC (United Kingdom) | | | 5,700 | | | | 57,433 | |
Walmart, Inc. | | | 10,780 | | | | 1,281,095 | |
Total Consumer Staples | | | | | | | 12,066,412 | |
Energy - 3.1% | |
Anglo Pacific Group PLC (United Kingdom) | | | 14,100 | | | | 35,860 | |
Cabot Oil & Gas Corp. | | | 8,660 | | | | 150,771 | |
Chevron Corp. | | | 13,025 | | | | 1,569,643 | |
China Aviation Oil Singapore Corp., Ltd. (Singapore) | | | 23,700 | | | | 22,399 | |
ConocoPhillips | | | 14,205 | | | | 923,751 | |
Continental Resources, Inc. | | | 3,330 | | | | 114,219 | |
Devon Energy Corp. | | | 14,610 | | | | 379,422 | |
DNO A.S.A. (Norway) | | | 3,700 | | | | 4,880 | |
Exxon Mobil Corp. | | | 26,815 | | | | 1,871,151 | |
Gaztransport Et Technigaz, S.A. (France) | | | 1,300 | | | | 125,212 | |
HollyFrontier Corp. | | | 3,975 | | | | 201,572 | |
The accompanying notes are an integral part of these financial statements.
9
| | |
| | | AMG Chicago Equity Partners Balanced Fund Schedule of Portfolio Investments(continued) |
| | | | | | | | |
| | | Shares | | | Value | |
Energy - 3.1%(continued) | |
Japan Petroleum Exploration Co., Ltd. (Japan) | | | 1,000 | | | $ | 26,929 | |
Naphtha Israel Petroleum Corp., Ltd. (Israel) | | | 11,400 | | | | 68,226 | |
National Oilwell Varco, Inc.1 | | | 12,890 | | | | 322,894 | |
Occidental Petroleum Corp. | | | 4,320 | | | | 178,027 | |
Parsley Energy, Inc., Class A | | | 8,990 | | | | 170,001 | |
PBF Energy, Inc., Class A | | | 3,865 | | | | 121,245 | |
Pioneer Natural Resources Co. | | | 4,275 | | | | 647,107 | |
Schlumberger, Ltd. | | | 16,265 | | | | 653,853 | |
TGS NOPEC Geophysical Co., A.S.A. (Norway) | | | 2,100 | | | | 63,891 | |
Washington H Soul Pattinson & Co., Ltd. (Australia) | | | 800 | | | | 12,069 | |
Whitehaven Coal, Ltd. (Australia) | | | 25,200 | | | | 46,734 | |
Total Energy | | | | | | | 7,709,856 | |
Financials - 10.6% | |
Aflac, Inc. | | | 8,835 | | | | 467,371 | |
The Allstate Corp. | | | 4,855 | | | | 545,945 | |
Ally Financial, Inc. | | | 39,410 | | | | 1,204,370 | |
Ameriprise Financial, Inc. | | | 4,910 | | | | 817,908 | |
Aon PLC (United Kingdom) | | | 425 | | | | 88,523 | |
Bank of America Corp. | | | 34,385 | | | | 1,211,040 | |
Bank of Georgia Group PLC (Georgia) | | | 2,400 | | | | 51,660 | |
BAWAG Group AG (Austria)2 | | | 1,000 | | | | 45,197 | |
Berkshire Hathaway, Inc., Class B* | | | 10,150 | | | | 2,298,975 | |
Brewin Dolphin Holdings PLC (United Kingdom) | | | 8,500 | | | | 41,929 | |
Cboe Global Markets, Inc. | | | 1,475 | | | | 177,000 | |
Cembra Money Bank AG (Switzerland) | | | 1,100 | | | | 120,350 | |
Cerved Group S.P.A. (Italy) | | | 2,100 | | | | 20,493 | |
Chimera Investment Corp., REIT1 | | | 28,160 | | | | 578,970 | |
CIT Group, Inc. | | | 27,360 | | | | 1,248,437 | |
Citigroup, Inc. | | | 27,825 | | | | 2,222,939 | |
Citizens Financial Group, Inc. | | | 10,660 | | | | 432,903 | |
Coface, S.A. (France)* | | | 5,200 | | | | 63,987 | |
Deutsche Pfandbriefbank AG (Germany)2 | | | 7,500 | | | | 122,150 | |
FactSet Research Systems, Inc.1 | | | 655 | | | | 175,736 | |
Franklin Resources, Inc.1 | | | 7,555 | | | | 196,279 | |
Globe Life, Inc. | | | 2,530 | | | | 266,282 | |
IG Group Holdings PLC (United Kingdom) | | | 3,600 | | | | 33,142 | |
Intermediate Capital Group PLC (United Kingdom) | | | 5,900 | | | | 125,842 | |
J Trust Co., Ltd. (Japan) | | | 5,900 | | | | 23,121 | |
Jafco Co., Ltd. (Japan) | | | 1,500 | | | | 58,800 | |
Japan Securities Finance Co., Ltd. (Japan) | | | 15,000 | | | | 71,579 | |
| | | | | | | | |
| | | Shares | | | Value | |
JPMorgan Chase & Co. | | | 16,248 | | | $ | 2,264,971 | |
KBC Ancora (Belgium) | | | 1,100 | | | | 55,339 | |
Legg Mason, Inc. | | | 45,400 | | | | 1,630,314 | |
Lincoln National Corp. | | | 10,200 | | | | 601,902 | |
M&T Bank Corp. | | | 5,030 | | | | 853,842 | |
Man Group PLC (United Kingdom) | | | 5,400 | | | | 11,310 | |
Marusan Securities Co., Ltd. (Japan) | | | 6,300 | | | | 28,115 | |
MetLife, Inc. | | | 20,720 | | | | 1,056,098 | |
Navient Corp.1 | | | 87,395 | | | | 1,195,564 | |
Okasan Securities Group, Inc. (Japan) | | | 17,200 | | | | 61,639 | |
OneSavings Bank PLC (United Kingdom) | | | 3,700 | | | | 21,241 | |
The Phoenix Holdings Ltd (Israel) | | | 3,700 | | | | 22,389 | |
Popular, Inc. (Puerto Rico) | | | 7,096 | | | | 416,890 | |
The Progressive Corp. | | | 900 | | | | 65,151 | |
Prudential Financial, Inc. | | | 1,795 | | | | 168,263 | |
Reinsurance Group of America, Inc. | | | 2,155 | | | | 351,394 | |
S&P Global, Inc. | | | 670 | | | | 182,943 | |
SEI Investments Co. | | | 4,120 | | | | 269,778 | |
Senshu Ikeda Holdings, Inc. (Japan) | | | 8,800 | | | | 16,732 | |
SpareBank 1 Nord Norge (Norway) | | | 8,800 | | | | 78,685 | |
Sparebank 1 Oestlandet (Norway) | | | 3,400 | | | | 35,823 | |
SpareBank 1 SMN (Norway) | | | 1,000 | | | | 11,421 | |
Storebrand A.S.A. (Norway) | | | 300 | | | | 2,363 | |
TCF Financial Corp. | | | 8,105 | | | | 379,314 | |
Tokai Tokyo Financial Holdings, Inc. (Japan) | | | 20,500 | | | | 61,147 | |
Tokyo Kiraboshi Financial Group, Inc. (Japan) | | | 3,400 | | | | 47,344 | |
Topdanmark A/S (Denmark) | | | 1,300 | | | | 64,084 | |
The Travelers Cos., Inc. | | | 8,325 | | | | 1,140,109 | |
Truist Financial Corp. | | | 14,660 | | | | 825,651 | |
U.S. Bancorp | | | 12,960 | | | | 768,398 | |
Unipol Gruppo S.P.A. (Italy) | | | 9,800 | | | | 56,263 | |
Wells Fargo & Co. | | | 19,470 | | | | 1,047,486 | |
White Mountains Insurance Group, Ltd. | | | 182 | | | | 203,023 | |
Wuestenrot & Wuerttembergische AG (Germany) | | | 500 | | | | 10,858 | |
Total Financials | | | | | | | 26,716,772 | |
Health Care - 7.9% | |
AbbVie, Inc. | | | 7,590 | | | | 672,019 | |
ABIOMED, Inc.* | | | 565 | | | | 96,383 | |
Agilent Technologies, Inc. | | | 1,395 | | | | 119,007 | |
Alexion Pharmaceuticals, Inc.* | | | 950 | | | | 102,743 | |
Align Technology, Inc.* | | | 330 | | | | 92,083 | |
Alliance Pharma PLC (United Kingdom) | | | 26,700 | | | | 29,660 | |
AmerisourceBergen Corp. | | | 800 | | | | 68,016 | |
The accompanying notes are an integral part of these financial statements.
10
| | |
| | | AMG Chicago Equity Partners Balanced Fund Schedule of Portfolio Investments(continued) |
| | | | | | | | |
| | | Shares | | | Value | |
Health Care - 7.9%(continued) | |
Amgen, Inc. | | | 2,005 | | | $ | 483,345 | |
Baxter International, Inc. | | | 4,980 | | | | 416,428 | |
Bristol-Myers Squibb Co. | | | 4,720 | | | | 302,977 | |
Cerner Corp. | | | 3,745 | | | | 274,846 | |
Cigna Corp. | | | 2,039 | | | | 416,955 | |
ConvaTec Group PLC (United Kingdom)2 | | | 28,300 | | | | 74,479 | |
Eli Lilly & Co. | | | 2,215 | | | | 291,118 | |
EMIS Group PLC (United Kingdom) | | | 5,700 | | | | 83,657 | |
Exelixis, Inc.* | | | 31,920 | | | | 562,430 | |
Faes Farma, S.A. (Spain) | | | 6,000 | | | | 33,768 | |
Galenica AG (Switzerland)2 | | | 1,550 | | | | 95,730 | |
Gilead Sciences, Inc. | | | 3,850 | | | | 250,173 | |
GN Store Nord A/S (Denmark) | | | 300 | | | | 14,112 | |
Henry Schein, Inc.*,1 | | | 19,235 | | | | 1,283,359 | |
Hogy Medical Co., Ltd. (Japan) | | | 300 | | | | 9,788 | |
Humana, Inc. | | | 795 | | | | 291,383 | |
Illumina, Inc.* | | | 945 | | | | 313,494 | |
Indivior PLC (United Kingdom)* | | | 24,400 | | | | 12,605 | |
Johnson & Johnson | | | 17,455 | | | | 2,546,161 | |
Kaken Pharmaceutical Co., Ltd. (Japan) | | | 1,500 | | | | 82,763 | |
Kissei Pharmaceutical Co., Ltd. (Japan) | | | 600 | | | | 17,046 | |
KYORIN Holdings, Inc. (Japan) | | | 1,000 | | | | 17,428 | |
Laboratory Corp. of America Holdings* | | | 4,555 | | | | 770,569 | |
McKesson Corp. | | | 3,335 | | | | 461,297 | |
MEDNAX, Inc.* | | | 4,850 | | | | 134,782 | |
Medtronic PLC (Ireland) | | | 14,805 | | | | 1,679,627 | |
Merck & Co., Inc. | | | 11,770 | | | | 1,070,482 | |
Mylan N.V.* | | | 13,880 | | | | 278,988 | |
Nanosonics, Ltd. (Australia)* | | | 9,800 | | | | 43,751 | |
Nichi-iko Pharmaceutical Co., Ltd. (Japan) | | | 1,500 | | | | 18,646 | |
Paramount Bed Holdings Co., Ltd. (Japan) | | | 700 | | | | 29,121 | |
Pfizer, Inc. | | | 33,187 | | | | 1,300,267 | |
Pro Medicus, Ltd. (Australia) | | | 1,100 | | | | 17,228 | |
Regis Healthcare, Ltd. (Australia) | | | 5,700 | | | | 9,854 | |
ResMed, Inc. | | | 1,355 | | | | 209,984 | |
STERIS PLC | | | 6,145 | | | | 936,621 | |
Stryker Corp. | | | 615 | | | | 129,113 | |
Toho Holdings Co., Ltd. (Japan) | | | 3,600 | | | | 79,761 | |
Tokai Corp. (Japan) | | | 500 | | | | 12,883 | |
Torii Pharmaceutical Co., Ltd. (Japan) | | | 700 | | | | 19,599 | |
The United Laboratories International Holdings Ltd (Hong Kong) | | | 47,900 | | | | 34,903 | |
| | | | | | | | |
| | | Shares | | | Value | |
UnitedHealth Group, Inc. | | | 1,800 | | | $ | 529,164 | |
Veeva Systems, Inc., Class A* | | | 2,060 | | | | 289,760 | |
Vertex Pharmaceuticals, Inc.* | | | 7,100 | | | | 1,554,545 | |
Vital KSK Holdings, Inc. (Japan) | | | 1,000 | | | | 9,603 | |
Vitrolife AB (Sweden) | | | 1,800 | | | | 38,052 | |
Zimmer Biomet Holdings, Inc. | | | 7,085 | | | | 1,060,483 | |
Total Health Care | | | | | | | 19,773,039 | |
Industrials - 6.9% | |
Aeon Delight Co., Ltd. (Japan) | | | 700 | | | | 25,135 | |
Aichi Corp. (Japan) | | | 2,600 | | | | 17,709 | |
Aida Engineering, Ltd. (Japan) | | | 7,800 | | | | 69,754 | |
ALS, Ltd. (Australia) | | | 5,600 | | | | 36,055 | |
Amadeus Fire AG (Germany) | | | 500 | | | | 83,072 | |
Applus Services, S.A. (Spain) | | | 1,500 | | | | 19,209 | |
Armstrong World Industries, Inc. | | | 2,655 | | | | 249,490 | |
ASTM S.P.A. (Italy) | | | 1,600 | | | | 48,386 | |
The Boeing Co. | | | 1,330 | | | | 433,261 | |
bpost, S.A. (Belgium) | | | 5,000 | | | | 57,808 | |
Bunka Shutter Co., Ltd. (Japan) | | | 8,100 | | | | 71,374 | |
Carlisle Cos., Inc.1 | | | 1,740 | | | | 281,602 | |
CH Robinson Worldwide, Inc.1 | | | 1,835 | | | | 143,497 | |
Chiyoda Integre Co., Ltd. (Japan) | | | 700 | | | | 14,678 | |
Chudenko Corp. (Japan) | | | 1,500 | | | | 34,677 | |
Cintas Corp. | | | 1,575 | | | | 423,801 | |
CTT-Correios de Portugal, S.A. (Portugal) | | | 9,100 | | | | 32,664 | |
Daiichi Jitsugyo Co., Ltd. (Japan) | | | 500 | | | | 17,562 | |
Daiwa Industries, Ltd. (Japan) | | | 1,100 | | | | 12,198 | |
Dart Group PLC (United Kingdom) | | | 4,700 | | | | 105,463 | |
Denyo Co., Ltd. (Japan) | | | 1,300 | | | | 24,625 | |
Diploma PLC (United Kingdom) | | | 300 | | | | 8,043 | |
Dover Corp. | | | 8,080 | | | | 931,301 | |
Enav S.P.A. (Italy)2 | | | 1,300 | | | | 7,758 | |
Expeditors International of Washington, Inc. | | | 2,080 | | | | 162,282 | |
Fujitec Co., Ltd. (Japan) | | | 1,100 | | | | 17,809 | |
Fukuda Corp. (Japan) | | | 330 | | | | 14,817 | |
Furukawa Co., Ltd. (Japan) | | | 1,100 | | | | 14,489 | |
General Electric Co. | | | 84,460 | | | | 942,574 | |
GL Events (France) | | | 500 | | | | 13,488 | |
Glory, Ltd. (Japan) | | | 3,900 | | | | 117,854 | |
TheGo-Ahead Group PLC (United Kingdom) | | | 800 | | | | 23,443 | |
Grupo Empresarial San Jose, S.A. (Spain)* | | | 1,500 | | | | 10,095 | |
HEICO Corp. | | | 621 | | | | 70,887 | |
Hibiya Engineering, Ltd. (Japan) | | | 500 | | | | 9,067 | |
The accompanying notes are an integral part of these financial statements.
11
| | |
| | | AMG Chicago Equity Partners Balanced Fund Schedule of Portfolio Investments(continued) |
| | | | | | | | |
| | | Shares | | | Value | |
Industrials - 6.9%(continued) | |
Honeywell International, Inc. | | | 3,965 | | | $ | 701,805 | |
Inaba Denki Sangyo Co., Ltd. (Japan) | | | 1,000 | | | | 25,363 | |
Intertrust, N.V. (Netherlands)2 | | | 200 | | | | 3,883 | |
Inwido AB (Sweden) | | | 3,400 | | | | 26,187 | |
IPH, Ltd. (Australia) | | | 3,100 | | | | 17,825 | |
Italmobiliare S.P.A. (Italy) | | | 1,300 | | | | 35,216 | |
JetBlue Airways Corp.* | | | 11,800 | | | | 220,896 | |
Johnson Controls International PLC | | | 25,160 | | | | 1,024,264 | |
Johnson Electric Holdings, Ltd. (Hong Kong) | | | 26,500 | | | | 60,280 | |
JOST Werke AG (Germany)2 | | | 1,100 | | | | 46,024 | |
Kandenko Co., Ltd. (Japan) | | | 1,100 | | | | 10,544 | |
Kanematsu Corp. (Japan) | | | 5,500 | | | | 73,903 | |
Kardex AG (Switzerland) | | | 300 | | | | 50,527 | |
Kokuyo Co., Ltd. (Japan) | | | 2,300 | | | | 34,313 | |
Komori Corp. (Japan) | | | 5,900 | | | | 60,734 | |
Koninklijke Volkerwessels, N.V. (Netherlands) | | | 1,100 | | | | 27,084 | |
L3Harris Technologies, Inc. | | | 390 | | | | 77,169 | |
Landstar System, Inc. | | | 12,765 | | | | 1,453,551 | |
Lockheed Martin Corp. | | | 1,225 | | | | 476,990 | |
Lyft, Inc., Class A*,1 | | | 2,185 | | | | 93,999 | |
Macquarie Infrastructure Corp. | | | 9,330 | | | | 399,697 | |
Meisei Industrial Co., Ltd. (Japan) | | | 1,600 | | | | 14,280 | |
Mersen, S.A. (France) | | | 1,800 | | | | 69,072 | |
Mitie Group PLC (United Kingdom)1 | | | 8,300 | | | | 15,942 | |
Mitsuboshi Belting, Ltd. (Japan) | | | 700 | | | | 13,453 | |
Morgan Advanced Materials PLC (United Kingdom) | | | 25,200 | | | | 105,815 | |
Morgan Sindall Group PLC (United Kingdom) | | | 2,600 | | | | 55,792 | |
Nibe Industrier AB, Class B (Sweden) | | | 4,600 | | | | 79,807 | |
Nichiden Corp. (Japan) | | | 800 | | | | 15,230 | |
The Nippon Road Co. Ltd (Japan) | | | 300 | | | | 18,759 | |
Nitto Kohki Co., Ltd. (Japan) | | | 500 | | | | 10,736 | |
Norfolk Southern Corp. | | | 2,150 | | | | 417,379 | |
nVent Electric PLC (United Kingdom) | | | 15,360 | | | | 392,909 | |
PACCAR, Inc. | | | 5,605 | | | | 443,355 | |
Parker-Hannifin Corp. | | | 3,245 | | | | 667,886 | |
QinetiQ Group PLC (United Kingdom) | | | 26,000 | | | | 123,226 | |
Raytheon Co. | | | 1,775 | | | | 390,038 | |
Robert Half International, Inc. | | | 3,445 | | | | 217,552 | |
Ryobi Ltd. (Japan) | | | 3,300 | | | | 58,648 | |
Sanki Engineering Co., Ltd. (Japan) | | | 5,900 | | | | 83,090 | |
Service Stream, Ltd. (Australia) | | | 33,300 | | | | 62,058 | |
| | | | | | | | |
| | | Shares | | | Value | |
Shikun & Binui, Ltd. (Israel) | | | 18,200 | | | $ | 83,794 | |
Signify, N.V. (Netherlands)2 | | | 200 | | | | 6,260 | |
Sintokogio, Ltd. (Japan) | | | 1,500 | | | | 14,493 | |
SITC International Holdings Co., Ltd. (Hong Kong) | | | 91,700 | | | | 111,908 | |
Snap-on, Inc.1 | | | 2,980 | | | | 504,812 | |
Sodick Co., Ltd. (Japan) | | | 3,100 | | | | 27,383 | |
Sojitz Corp. (Japan) | | | 39,000 | | | | 125,701 | |
Southwest Airlines Co. | | | 35,210 | | | | 1,900,636 | |
Spirit AeroSystems Holdings, Inc., Class A | | | 2,540 | | | | 185,115 | |
Stagecoach Group PLC (United Kingdom) | | | 22,800 | | | | 48,322 | |
Stanley Black & Decker, Inc. | | | 1,475 | | | | 244,466 | |
Sumitomo Mitsui Construction Co., Ltd. (Japan) | | | 5,000 | | | | 28,951 | |
Teledyne Technologies, Inc.* | | | 1,990 | | | | 689,615 | |
Textron, Inc. | | | 3,210 | | | | 143,166 | |
Toenec Corp. (Japan) | | | 400 | | | | 14,153 | |
Tonami Holdings Co., Ltd. (Japan) | | | 300 | | | | 14,868 | |
Toppan Forms Co., Ltd. (Japan) | | | 3,100 | | | | 34,710 | |
Toyo Construction Co., Ltd. (Japan) | | | 8,500 | | | | 40,638 | |
Trinity Industries, Inc.1 | | | 6,000 | | | | 132,900 | |
Valmet OYJ (Finland) | | | 1,600 | | | | 38,368 | |
WW Grainger, Inc. | | | 680 | | | | 230,194 | |
Yurtec Corp. (Japan) | | | 2,600 | | | | 16,403 | |
Total Industrials | | | | | | | 17,358,064 | |
Information Technology - 10.8% | |
Accenture PLC, Class A (Ireland) | | | 2,750 | | | | 579,067 | |
Alliance Data Systems Corp. | | | 9,820 | | | | 1,101,804 | |
ALSO Holding AG (Switzerland) | | | 300 | | | | 50,506 | |
Analog Devices, Inc. | | | 11,270 | | | | 1,339,327 | |
Anaplan, Inc.* | | | 2,655 | | | | 139,122 | |
Apple, Inc. | | | 17,070 | | | | 5,012,605 | |
ASM International N.V. (Netherlands) | | | 200 | | | | 22,575 | |
Aubay (France) | | | 500 | | | | 18,761 | |
Autodesk, Inc.* | | | 1,435 | | | | 263,265 | |
Automatic Data Processing, Inc. | | | 1,245 | | | | 212,272 | |
Avalara, Inc.* | | | 585 | | | | 42,851 | |
Avast PLC (United Kingdom)2 | | | 12,500 | | | | 75,120 | |
Barco N.V. (Belgium) | | | 200 | | | | 49,191 | |
BE Semiconductor Industries, N.V. (Netherlands) | | | 2,100 | | | | 81,529 | |
Broadridge Financial Solutions, Inc. | | | 1,530 | | | | 189,016 | |
Canon Marketing Japan, Inc. (Japan) | | | 1,800 | | | | 41,650 | |
CDW Corp. | | | 1,350 | | | | 192,834 | |
Cisco Systems, Inc. | | | 23,315 | | | | 1,118,187 | |
Citrix Systems, Inc. | | | 2,980 | | | | 330,482 | |
The accompanying notes are an integral part of these financial statements.
12
| | |
| | | AMG Chicago Equity Partners Balanced Fund Schedule of Portfolio Investments(continued) |
| | | | | | | | |
| | | Shares | | | Value | |
Information Technology - 10.8%(continued) | | | | | | | | |
Computer Engineering & Consulting, Ltd. (Japan) | | | 800 | | | $ | 14,996 | |
Cree, Inc.* | | | 1,650 | | | | 76,148 | |
Dell Technologies, Inc., Class C* | | | 1,645 | | | | 84,537 | |
Denki Kogyo Co., Ltd. (Japan) | | | 700 | | | | 20,895 | |
Dialog Semiconductor PLC (United Kingdom)* | | | 1,800 | | | | 91,417 | |
Dicker Data, Ltd. (Australia) | | | 3,900 | | | | 18,880 | |
Dynatrace, Inc.*,1 | | | 4,120 | | | | 104,236 | |
Elastic, N.V.* | | | 3,015 | | | | 193,864 | |
Electrocomponents PLC (United Kingdom) | | | 2,600 | | | | 23,385 | |
Elematec Corp. (Japan) | | | 1,300 | | | | 13,720 | |
Fortinet, Inc.* | | | 10,545 | | | | 1,125,784 | |
Fortnox AB (Sweden) | | | 2,800 | | | | 50,222 | |
GoDaddy, Inc., Class A* | | | 2,765 | | | | 187,799 | |
Hosiden Corp. (Japan) | | | 6,700 | | | | 84,651 | |
HP, Inc. | | | 20,285 | | | | 416,857 | |
Ines Corp. (Japan) | | | 4,600 | | | | 57,478 | |
Integrated Research, Ltd. (Australia) | | | 12,400 | | | | 28,370 | |
Intel Corp. | | | 15,520 | | | | 928,872 | |
International Business Machines Corp. | | | 6,600 | | | | 884,664 | |
Intuit, Inc. | | | 520 | | | | 136,204 | |
Juniper Networks, Inc. | | | 18,010 | | | | 443,586 | |
Kanematsu Electronics, Ltd. (Japan) | | | 500 | | | | 16,687 | |
Keysight Technologies, Inc.* | | | 965 | | | | 99,038 | |
Lam Research Corp. | | | 400 | | | | 116,960 | |
Manhattan Associates, Inc.* | | | 1,920 | | | | 153,120 | |
Mastercard, Inc., Class A | | | 710 | | | | 211,999 | |
Maxim Integrated Products, Inc. | | | 6,575 | | | | 404,428 | |
Medallia, Inc.*,1 | | | 3,180 | | | | 98,930 | |
Microsoft Corp. | | | 25,305 | | | | 3,990,598 | |
NEC Networks & System Integration Corp. (Japan) | | | 300 | | | | 10,625 | |
NortonLifeLock, Inc. | | | 8,890 | | | | 226,873 | |
Oracle Corp. | | | 7,185 | | | | 380,661 | |
PagerDuty, Inc.*,1 | | | 4,780 | | | | 111,804 | |
Palo Alto Networks, Inc.* | | | 2,305 | | | | 533,031 | |
PayPal Holdings, Inc.* | | | 1,560 | | | | 168,745 | |
Quadient (France) | | | 1,500 | | | | 36,346 | |
QUALCOMM, Inc. | | | 5,870 | | | | 517,910 | |
Ryosan Co. Ltd. (Japan) | | | 1,800 | | | | 46,359 | |
Sabre Corp. | | | 5,475 | | | | 122,859 | |
Sesa S.P.A. (Italy) | | | 1,000 | | | | 53,449 | |
| | | | | | | | |
| | | Shares | | | Value | |
Siltronic AG (Germany) | | | 500 | | | $ | 50,237 | |
Softcat PLC (United Kingdom) | | | 8,800 | | | | 134,462 | |
Spectris PLC (United Kingdom) | | | 700 | | | | 26,977 | |
Splunk, Inc.* | | | 2,605 | | | | 390,151 | |
Texas Instruments, Inc. | | | 3,890 | | | | 499,048 | |
VeriSign, Inc.* | | | 4,110 | | | | 791,915 | |
Visa, Inc., Class A | | | 8,565 | | | | 1,609,363 | |
VSTECS Holdings, Ltd. (Hong Kong) | | | 22,100 | | | | 11,359 | |
VTech Holdings, Ltd. (Hong Kong) | | | 1,000 | | | | 9,883 | |
The Western Union Co.1 | | | 10,720 | | | | 287,082 | |
Xilinx, Inc. | | | 1,610 | | | | 157,410 | |
Zendesk, Inc.* | | | 1,290 | | | | 98,853 | |
Zscaler, Inc.*,1 | | | 2,100 | | | | 97,650 | |
Total Information Technology | | | | | | | 27,311,541 | |
Materials - 2.2% | | | | | | | | |
Axalta Coating Systems Ltd.* | | | 3,325 | | | | 101,080 | |
APERAM, S.A. (Luxembourg) | | | 300 | | | | 9,637 | |
CF Industries Holdings, Inc. | | | 2,660 | | | | 126,988 | |
The Chemours Co.1 | | | 10,675 | | | | 193,111 | |
Coronado Global Resources, Inc. (Australia)2 | | | 13,200 | | | | 20,486 | |
Corteva, Inc. | | | 14,350 | | | | 424,186 | |
Daiken Corp. (Japan) | | | 1,000 | | | | 18,136 | |
Domtar Corp.1 | | | 12,020 | | | | 459,645 | |
Eagle Materials, Inc. | | | 3,460 | | | | 313,684 | |
Ecolab, Inc. | | | 920 | | | | 177,551 | |
Elkem A.S.A. (Norway)2 | | | 17,200 | | | | 48,503 | |
Ercros, S.A. (Spain) | | | 7,800 | | | | 22,398 | |
Ferrexpo PLC (Switzerland) | | | 10,700 | | | | 22,515 | |
Kemira OYJ (Finland) | | | 1,100 | | | | 16,369 | |
Kyoei Steel, Ltd. (Japan) | | | 1,100 | | | | 21,435 | |
Linde PLC (United Kingdom) | | | 3,345 | | | | 712,151 | |
Lintec Corp. (Japan) | | | 2,800 | | | | 62,335 | |
Metsa Board OYJ (Finland)1 | | | 6,800 | | | | 45,744 | |
Mount Gibson Iron, Ltd. (Australia) | | | 56,900 | | | | 38,212 | |
The Navigator Co., S.A. (Portugal) | | | 10,200 | | | | 41,152 | |
Neturen Co., Ltd. (Japan) | | | 1,500 | | | | 12,256 | |
Nittetsu Mining Co., Ltd. (Japan) | | | 500 | | | | 23,060 | |
O-I Glass, Inc. | | | 47,695 | | | | 569,001 | |
PPG Industries, Inc. | | | 3,815 | | | | 509,264 | |
Regis Resources, Ltd. (Australia) | | | 4,700 | | | | 14,221 | |
Reliance Steel &Aluminum Co. | | | 4,680 | | | | 560,477 | |
Royal Gold, Inc. | | | 3,080 | | | | 376,530 | |
Salzgitter AG (Germany) | | | 300 | | | | 6,622 | |
The accompanying notes are an integral part of these financial statements.
13
| | |
| | | AMG Chicago Equity Partners Balanced Fund Schedule of Portfolio Investments(continued) |
| | | | | | | | |
| | | Shares | | | Value | |
Materials - 2.2%(continued) | | | | | | | | |
The Scotts Miracle-Gro Co.1 | | | 1,285 | | | $ | 136,441 | |
Silgan Holdings, Inc. | | | 6,745 | | | | 209,635 | |
Toagosei Co., Ltd. (Japan) | | | 3,900 | | | | 44,963 | |
Toyo Ink SC Holdings Co., Ltd. (Japan) | | | 1,800 | | | | 43,652 | |
Yodogawa Steel Works, Ltd. (Japan) | | | 2,600 | | | | 48,318 | |
Total Materials | | | | | | | 5,429,758 | |
Real Estate - 3.2% | | | | | | | | |
alstria officeREIT-AG (Germany) | | | 2,300 | | | | 43,214 | |
Argosy Property, Ltd. (New Zealand) | | | 68,100 | | | | 63,304 | |
Aventus Group, REIT (Australia) | | | 18,000 | | | | 35,973 | |
Bayside Land Corp. (Israel) | | | 50 | | | | 38,459 | |
Brookfield Property REIT, Inc., Class A1 | | | 11,505 | | | | 212,210 | |
CapitaLand Retail China Trust, REIT (Singapore) | | | 35,200 | | | | 42,163 | |
Champion REIT (Hong Kong) | | | 15,800 | | | | 10,442 | |
Charter Hall Group, REIT (Australia) | | | 2,600 | | | | 20,250 | |
Corestate Capital Holding, S.A. (Luxembourg)1 | | | 1,000 | | | | 42,064 | |
Corporate Office Properties Trust, REIT | | | 12,625 | | | | 370,923 | |
DIC Asset AG (Germany) | | | 1,500 | | | | 26,753 | |
Fabege AB (Sweden) | | | 2,900 | | | | 48,172 | |
Far East Hospitality Trust (Singapore) | | | 67,800 | | | | 37,342 | |
First Real Estate Investment Trust, REIT (Singapore) | | | 33,600 | | | | 24,866 | |
Frasers Commercial Trust, REIT (Singapore) | | | 47,100 | | | | 58,133 | |
GDI Property Group, REIT (Australia) | | | 78,000 | | | | 80,736 | |
Goldcrest Co., Ltd. (Japan) | | | 1,800 | | | | 34,337 | |
Intervest Offices & Warehouses, N.V., REIT (Belgium) | | | 2,400 | | | | 68,998 | |
K Wah International Holdings, Ltd. (Hong Kong) | | | 22,800 | | | | 12,727 | |
Kenedix Retail REIT Corp. (Japan) | | | 20 | | | | 50,895 | |
Kungsleden AB (Sweden) | | | 11,200 | | | | 117,664 | |
Lar Espana Real Estate Socimi S.A., REIT (Spain) | | | 8,800 | | | | 70,084 | |
Life Storage, Inc., REIT | | | 2,675 | | | | 289,649 | |
Mapletree North Asia Commercial Trust, REIT (Singapore) | | | 40,600 | | | | 35,056 | |
Mori Trust Sogo Reit, Inc. (Japan) | | | 70 | | | | 125,498 | |
NewRiver REIT PLC (United Kingdom) | | | 20,500 | | | | 54,445 | |
Norstar Holdings, Inc. (Israel) | | | 2,800 | | | | 60,015 | |
NSI, N.V., REIT (Netherlands) | | | 1,200 | | | | 58,418 | |
Omega Healthcare Investors, Inc., REIT | | | 2,440 | | | | 103,334 | |
Outfront Media, Inc., REIT | | | 6,070 | | | | 162,797 | |
Park Hotels & Resorts, Inc., REIT1 | | | 55,705 | | | | 1,441,088 | |
Piedmont Office Realty Trust, Inc., Class A, REIT | | | 31,285 | | | | 695,778 | |
Public Storage, REIT | | | 2,470 | | | | 526,011 | |
| | | | | | | | |
| | | Shares | | | Value | |
Raysum Co., Ltd. (Japan) | | | 3,100 | | | $ | 30,469 | |
RDI REIT PLC (United Kingdom) | | | 26,600 | | | | 46,157 | |
Regional REIT, Ltd. (United Kingdom)2 | | | 13,000 | | | | 19,469 | |
Retail Value, Inc., REIT | | | 2,729 | | | | 100,427 | |
S IMMO AG (Austria) | | | 1,800 | | | | 45,025 | |
Selvaag Bolig A.S.A. (Norway) | �� | | 8,300 | | | | 69,816 | |
Service Properties Trust, REIT | | | 34,125 | | | | 830,261 | |
Simon Property Group, Inc., REIT | | | 1,310 | | | | 195,138 | |
Sunlight Real Estate Investment Trust (Hong Kong) | | | 43,100 | | | | 27,880 | |
Takara Leben Co., Ltd. (Japan) | | | 13,800 | | | | 63,988 | |
Tanger Factory Outlet Centers, Inc., REIT1 | | | 11,900 | | | | 175,287 | |
Taubman Centers, Inc., REIT1 | | | 1,540 | | | | 47,879 | |
TOC Co., Ltd. (Japan) | | | 1,500 | | | | 12,328 | |
Tokyo Tatemono Co., Ltd. (Japan) | | | 800 | | | | 12,487 | |
Tosei Corp. (Japan) | | | 500 | | | | 6,826 | |
Vastned Retail, N.V., REIT (Netherlands) | | | 200 | | | | 5,990 | |
Ventas, Inc., REIT | | | 6,595 | | | | 380,795 | |
Weingarten Realty Investors, REIT | | | 21,820 | | | | 681,657 | |
WP Carey, Inc., REIT | | | 2,585 | | | | 206,903 | |
Yanlord Land Group, Ltd. (Singapore) | | | 41,900 | | | | 37,722 | |
Total Real Estate | | | | | | | 8,058,302 | |
Utilities - 3.1% | | | | | | | | |
Acciona, S.A. (Spain) | | | 700 | | | | 73,806 | |
ACEA S.P.A. (Italy) | | | 1,600 | | | | 33,110 | |
Alliant Energy Corp. | | | 12,730 | | | | 696,586 | |
American Electric Power Co., Inc. | | | 9,530 | | | | 900,680 | |
Atmos Energy Corp. | | | 8,140 | | | | 910,540 | |
Avangrid, Inc.1 | | | 6,525 | | | | 333,819 | |
Consolidated Edison, Inc. | | | 8,385 | | | | 758,591 | |
Eversource Energy1 | | | 8,340 | | | | 709,484 | |
Kenon Holdings, Ltd. (Singapore) | | | 2,800 | | | | 59,869 | |
OGE Energy Corp. | | | 11,980 | | | | 532,751 | |
The Okinawa Electric Power Co., Inc. (Japan) | | | 5,000 | | | | 93,825 | |
Pinnacle West Capital Corp. | | | 5,195 | | | | 467,186 | |
REN- Redes Energeticas Nacionais SGPS, S.A. (Portugal) | | | 18,000 | | | | 54,919 | |
Shizuoka Gas Co., Ltd. (Japan) | | | 1,300 | | | | 11,261 | |
The Southern Co. | | | 10,590 | | | | 674,583 | |
WEC Energy Group, Inc. | | | 8,230 | | | | 759,053 | |
Xcel Energy, Inc. | | | 12,150 | | | | 771,404 | |
Total Utilities | | | | | | | 7,841,467 | |
Total Common Stocks
(Cost $141,588,409) | | | | | | | 160,987,694 | |
The accompanying notes are an integral part of these financial statements.
14
| | |
| | | AMG Chicago Equity Partners Balanced Fund Schedule of Portfolio Investments(continued) |
| | | | | | | | |
| | | Principal
Amount | | | Value | |
Corporate Bonds and Notes - 15.3% | | | | | | | | |
Financials - 3.8% | | | | | | | | |
Air Lease Corp.
4.250%, 09/15/24 | | $ | 35,000 | | | $ | 37,520 | |
American Financial Group, Inc.
3.500%, 08/15/26 | | | 25,000 | | | | 25,776 | |
Athene Holding, Ltd. (Bermuda)
4.125%, 01/12/28 | | | 450,000 | | | | 466,353 | |
AXA Equitable Holdings, Inc. | | | | | | | | |
4.350%, 04/20/28 | | | 30,000 | | | | 32,608 | |
5.000%, 04/20/48 | | | 375,000 | | | | 404,239 | |
AXIS Specialty Finance LLC
3.900%, 07/15/29 | | | 30,000 | | | | 31,443 | |
Bank of America Corp., GMTN
(3 month LIBOR + 1.370%)
3.593%, 07/21/283 | | | 1,040,000 | | | | 1,103,321 | |
The Bank of New York Mellon Corp., MTN
3.250%, 09/11/24 | | | 45,000 | | | | 47,322 | |
Brighthouse Financial, Inc.
3.700%, 06/22/271 | | | 485,000 | | | | 484,308 | |
Capital One Financial Corp.
3.800%, 01/31/28 | | | 475,000 | | | | 511,268 | |
Cincinnati Financial Corp.
6.920%, 05/15/28 | | | 20,000 | | | | 25,893 | |
Citigroup, Inc.
(3 month LIBOR + 1.338%)
3.980%, 03/20/303 | | | 60,000 | | | | 65,740 | |
E*TRADE Financial Corp.
4.500%, 06/20/28 | | | 330,000 | | | | 359,291 | |
Enstar Group, Ltd. (Bermuda)
4.500%, 03/10/22 | | | 10,000 | | | | 10,372 | |
EPR Properties
4.750%, 12/15/26 | | | 25,000 | | | | 27,307 | |
Globe Life, Inc.
4.550%, 09/15/28 | | | 380,000 | | | | 422,771 | |
The Goldman Sachs Group, Inc.
(3 month LIBOR + 1.510%), | | | | | | | | |
3.691%, 06/05/283 | | | 115,000 | | | | 122,454 | |
3.850%, 01/26/27 | | | 700,000 | | | | 745,729 | |
Lazard Group LLC
3.750%, 02/13/25 | | | 30,000 | | | | 31,712 | |
Legg Mason, Inc.
4.750%, 03/15/26 | | | 25,000 | | | | 27,390 | |
LifeStorage LP
3.500%, 07/01/26 | | | 30,000 | | | | 30,857 | |
Lincoln National Corp.
7.000%, 06/15/40 | | | 25,000 | | | | 35,625 | |
Mercury General Corp.
4.400%, 03/15/27 | | | 445,000 | | | | 468,258 | |
| | | | | | | | |
| | | Principal
Amount | | | Value | |
Morgan Stanley
(3 month LIBOR + 1.340%)
3.591%, 07/22/283 | | $ | 620,000 | | | $ | 659,757 | |
MUFG Americas Holdings Corp.
3.000%, 02/10/25 | | | 30,000 | | | | 30,624 | |
Office Properties Income Trust | | | | | | | | |
4.250%, 05/15/24 | | | 380,000 | | | | 395,231 | |
4.500%, 02/01/25 | | | 10,000 | | | | 10,461 | |
Omega Healthcare Investors, Inc.
5.250%, 01/15/26 | | | 480,000 | | | | 534,404 | |
People’s United Financial, Inc.
3.650%, 12/06/22 | | | 30,000 | | | | 31,180 | |
Piedmont Operating Partnership LP
4.450%, 03/15/24 | | | 25,000 | | | | 26,676 | |
Prudential Financial, Inc., MTN | | | | | | | | |
4.600%, 05/15/44 | | | 10,000 | | | | 11,826 | |
6.625%, 06/21/40 | | | 20,000 | | | | 28,155 | |
Realty Income Corp.
4.125%, 10/15/26 | | | 470,000 | | | | 516,176 | |
Sabra Health Care LP / Sabra Capital Corp.
4.800%, 06/01/24 | | | 10,000 | | | | 10,661 | |
Santander Holdings USA, Inc.
4.400%, 07/13/27 | | | 470,000 | | | | 507,956 | |
Selective Insurance Group, Inc.
5.375%, 03/01/49 | | | 25,000 | | | | 29,797 | |
Service Properties Trust
5.250%, 02/15/26 | | | 30,000 | | | | 31,603 | |
Tanger Properties LP
3.125%, 09/01/261 | | | 30,000 | | | | 29,767 | |
Transatlantic Holdings, Inc.
8.000%, 11/30/39 | | | 20,000 | | | | 29,809 | |
Webster Financial Corp.
4.100%, 03/25/29 | | | 425,000 | | | | 451,277 | |
Welltower, Inc.
6.500%, 03/15/41 | | | 220,000 | | | | 298,626 | |
The Western Union Co.
6.200%, 11/17/36 | | | 260,000 | | | | 297,020 | |
Weyerhaeuser Co.
7.375%, 03/15/32 | | | 25,000 | | | | 34,595 | |
Total Financials | | | | | | | 9,483,158 | |
Industrials - 9.4% | | | | | | | | |
AbbVie, Inc.
4.400%, 11/06/42 | | | 575,000 | | | | 619,306 | |
Ahold Finance USA LLC
6.875%, 05/01/29 | | | 20,000 | | | | 25,887 | |
Albemarle Corp.
5.450%, 12/01/44 | | | 405,000 | | | | 465,143 | |
Altria Group, Inc.
4.800%, 02/14/29 | | | 505,000 | | | | 563,358 | |
The accompanying notes are an integral part of these financial statements.
15
| | |
| | | AMG Chicago Equity Partners Balanced Fund Schedule of Portfolio Investments(continued) |
| | | | | | | | |
| | | Principal
Amount | | | Value | |
Industrials - 9.4%(continued) | | | | | | | | |
Amcor Finance USA, Inc.
3.625%, 04/28/262 | | $ | 15,000 | | | $ | 15,435 | |
AmerisourceBergen Corp. | | | | | | | | |
4.250%, 03/01/45 | | | 30,000 | | | | 30,941 | |
4.300%, 12/15/47 | | | 500,000 | | | | 520,211 | |
Amgen, Inc.
4.950%, 10/01/41 | | | 495,000 | | | | 590,695 | |
Anheuser-Busch InBev Worldwide Inc.
8.200%, 01/15/39 | | | 60,000 | | | | 95,022 | |
AT&T Inc.
5.550%, 08/15/41 | | | 30,000 | | | | 36,776 | |
Autodesk, Inc.
3.500%, 06/15/27 | | | 30,000 | | | | 31,480 | |
AutoNation, Inc.
3.800%, 11/15/27 | | | 30,000 | | | | 30,519 | |
Avery Dennison Corp.
4.875%, 12/06/28 | | | 25,000 | | | | 28,336 | |
Avnet, Inc.
4.625%, 04/15/26 | | | 30,000 | | | | 31,771 | |
BAT Capital Corp.
3.557%, 08/15/27 | | | 585,000 | | | | 597,821 | |
Bemis Co., Inc.
4.500%, 10/15/212 | | | 15,000 | | | | 15,461 | |
Best Buy Co., Inc.
4.450%, 10/01/28 | | | 25,000 | | | | 27,461 | |
Biogen, Inc.
5.200%, 09/15/45 | | | 410,000 | | | | 495,886 | |
BorgWarner, Inc.
4.375%, 03/15/45 | | | 455,000 | | | | 473,637 | |
Broadcom Corp./Broadcom Cayman Finance, Ltd.
3.500%, 01/15/28 | | | 55,000 | | | | 55,396 | |
Broadridge Financial Solutions, Inc.
3.400%, 06/27/26 | | | 25,000 | | | | 26,156 | |
Bunge, Ltd. Finance Corp.
3.750%, 09/25/27 | | | 30,000 | | | | 30,696 | |
Burlington Northern Santa Fe LLC
5.400%, 06/01/41 | | | 40,000 | | | | 51,841 | |
Campbell Soup Co.
4.150%, 03/15/28 | | | 25,000 | | | | 27,166 | |
Cardinal Health, Inc.
3.410%, 06/15/271 | | | 490,000 | | | | 501,647 | |
Cenovus Energy, Inc. (Canada)
4.250%, 04/15/271 | | | 30,000 | | | | 31,810 | |
Citrix Systems, Inc.
4.500%, 12/01/27 | | | 420,000 | | | | 455,541 | |
CNH Industrial, N.V. (United Kingdom)
3.850%, 11/15/27 | | | 30,000 | | | | 31,343 | |
| | | | | | | | |
| | | Principal
Amount | | | Value | |
Coca-Cola Consolidated, Inc.
3.800%, 11/25/251 | | $ | 25,000 | | | $ | 26,207 | |
Corning, Inc.
4.750%, 03/15/42 | | | 390,000 | | | | 443,895 | |
Crane Co.
4.200%, 03/15/48 | | | 10,000 | | | | 9,969 | |
Cummins, Inc.
4.875%, 10/01/43 | | | 25,000 | | | | 30,883 | |
Darden Restaurants, Inc.
4.550%, 02/15/48 | | | 30,000 | | | | 30,493 | |
Delta Air Lines, Inc.
4.375%, 04/19/281 | | | 470,000 | | | | 496,657 | |
Deutsche Telekom International Finance, B.V. (Netherlands) | | | | | | | | |
8.750%, 06/15/304 | | | 10,000 | | | | 14,742 | |
9.250%, 06/01/32 | | | 265,000 | | | | 421,832 | |
Devon Energy Corp.
7.875%, 09/30/31 | | | 25,000 | | | | 34,861 | |
Discovery Communications LLC
6.350%, 06/01/40 | | | 435,000 | | | | 554,492 | |
Dollar General Corp.
3.875%, 04/15/27 | | | 30,000 | | | | 32,150 | |
The Dow Chemical Co.
5.250%, 11/15/41 | | | 240,000 | | | | 280,269 | |
DR Horton, Inc.
5.750%, 08/15/23 | | | 425,000 | | | | 470,092 | |
Eastman Chemical Co.
3.800%, 03/15/25 | | | 30,000 | | | | 31,669 | |
Embraer Netherlands Finance BV (Netherlands)
5.400%, 02/01/27 | | | 340,000 | | | | 383,642 | |
Eni USA, Inc.
7.300%, 11/15/27 | | | 180,000 | | | | 232,395 | |
Enterprise Products Operating LLC | | | | | | | | |
5.700%, 02/15/42 | | | 420,000 | | | | 542,872 | |
5.950%, 02/01/41 | | | 45,000 | | | | 58,168 | |
EQT Corp.
4.875%, 11/15/21 | | | 230,000 | | | | 237,533 | |
Expedia, Inc.
3.800%, 02/15/28 | | | 30,000 | | | | 30,712 | |
General Electric Co., GMTN | | | | | | | | |
3.450%, 05/15/24 | | | 25,000 | | | | 25,966 | |
4.125%, 10/09/42 | | | 48,000 | | | | 49,625 | |
5.875%, 01/14/38 | | | 440,000 | | | | 535,635 | |
Gilead Sciences, Inc.
5.650%, 12/01/41 | | | 40,000 | | | | 52,653 | |
GLP Capital, LP/GLP Financing II, Inc.
5.300%, 01/15/29 | | | 15,000 | | | | 16,695 | |
Halliburton Co.
4.500%, 11/15/41 | | | 40,000 | | | | 42,586 | |
Harley-Davidson, Inc.
4.625%, 07/28/45 | | | 30,000 | | | | 31,150 | |
The accompanying notes are an integral part of these financial statements.
16
| | |
| | | AMG Chicago Equity Partners Balanced Fund Schedule of Portfolio Investments(continued) |
| | | | | | | | |
| | | Principal
Amount | | | Value | |
Industrials - 9.4%(continued) | | | | | | | | |
Hasbro, Inc.
3.500%, 09/15/27 | | $ | 470,000 | | | $ | 468,504 | |
HCA, Inc.
5.250%, 06/15/26 | | | 30,000 | | | | 33,653 | |
Helmerich & Payne, Inc.
4.650%, 03/15/25 | | | 25,000 | | | | 27,327 | |
Hewlett Packard Enterprise Co.
4.900%, 10/15/254 | | | 495,000 | | | | 550,622 | |
Hillenbrand, Inc.
4.500%, 09/15/26 | | | 210,000 | | | | 219,841 | |
HollyFrontier Corp.
5.875%, 04/01/26 | | | 180,000 | | | | 203,209 | |
Hubbell, Inc.
3.500%, 02/15/28 | | | 25,000 | | | | 25,716 | |
Hyatt Hotels Corp.
4.375%, 09/15/28 | | | 415,000 | | | | 450,967 | |
Ingersoll-Rand Global Holding Co., Ltd.
5.750%, 06/15/43 | | | 10,000 | | | | 12,780 | |
Ingersoll-Rand Luxembourg Finance, S.A. (Luxembourg)
3.500%, 03/21/26 | | | 400,000 | | | | 418,813 | |
Ingredion, Inc.
3.200%, 10/01/26 | | | 30,000 | | | | 30,358 | |
Jabil, Inc.
3.950%, 01/12/28 | | | 30,000 | | | | 30,851 | |
JB Hunt Transport Services, Inc.
3.875%, 03/01/26 | | | 30,000 | | | | 32,264 | |
Kennametal, Inc.
4.625%, 06/15/28 | | | 435,000 | | | | 461,780 | |
Keurig Dr Pepper, Inc.
4.597%, 05/25/28 | | | 35,000 | | | | 39,371 | |
Keysight Technologies, Inc.
4.600%, 04/06/27 | | | 430,000 | | | | 477,307 | |
Kinder Morgan, Inc.
4.300%, 03/01/28 | | | 50,000 | | | | 54,565 | |
KLA Corp. | | | | | | | | |
4.125%, 11/01/21 | | | 25,000 | | | | 25,861 | |
5.000%, 03/15/49 | | | 390,000 | | | | 480,498 | |
Kohl’s Corp.
4.250%, 07/17/25 | | | 450,000 | | | | 478,699 | |
Lowe’s Cos., Inc.
4.650%, 04/15/42 | | | 350,000 | | | | 402,044 | |
LYB International Finance BV (Netherlands)
5.250%, 07/15/43 | | | 20,000 | | | | 23,669 | |
Macy’s Retail Holdings, Inc.
3.625%, 06/01/241 | | | 470,000 | | | | 475,133 | |
Marathon Oil Corp.
4.400%, 07/15/27 | | | 455,000 | | | | 495,249 | |
| | | | | | | | |
| | | Principal
Amount | | | Value | |
Marvell Technology Group, Ltd.
4.875%, 06/22/28 | | $ | 425,000 | | | $ | 470,022 | |
Maxim Integrated Products, Inc.
3.450%, 06/15/27 | | | 30,000 | | | | 30,921 | |
McKesson Corp. | | | | | | | | |
3.950%, 02/16/28 | | | 435,000 | | | | 464,483 | |
4.750%, 05/30/29 | | | 30,000 | | | | 33,763 | |
Methanex Corp. (Canada)
5.250%, 12/15/29 | | | 30,000 | | | | 31,060 | |
Micron Technology, Inc.
5.327%, 02/06/29 | | | 420,000 | | | | 482,337 | |
Mylan, Inc.
4.550%, 04/15/28 | | | 280,000 | | | | 301,704 | |
Noble Energy, Inc.
3.850%, 01/15/28 | | | 35,000 | | | | 37,015 | |
Nvent Finance Sarl (Luxembourg)
4.550%, 04/15/28 | | | 460,000 | | | | 477,913 | |
NVR, Inc.
3.950%, 09/15/22 | | | 25,000 | | | | 26,057 | |
NXP, B.V. / NXP Funding LLC (Netherlands)
5.550%, 12/01/282 | | | 30,000 | | | | 35,128 | |
Occidental Petroleum Corp.
4.625%, 06/15/45 | | | 220,000 | | | | 228,035 | |
Omnicom Group, Inc. / Omnicom Capital, Inc.
3.600%, 04/15/26 | | | 30,000 | | | | 31,634 | |
Oracle Corp.
3.250%, 11/15/27 | | | 80,000 | | | | 84,859 | |
Oshkosh Corp.
4.600%, 05/15/28 | | | 25,000 | | | | 26,736 | |
Owens Corning
3.400%, 08/15/26 | | | 20,000 | | | | 20,353 | |
Pentair Finance S.a.r.l. (Luxembourg)
4.500%, 07/01/29 | | | 30,000 | | | | 31,705 | |
Philip Morris International, Inc.
4.375%, 11/15/41 | | | 495,000 | | | | 549,693 | |
QUALCOMM, Inc.
4.800%, 05/20/45 | | | 35,000 | | | | 42,948 | |
RPM International, Inc. | | | | | | | | |
3.750%, 03/15/27 | | | 30,000 | | | | 31,062 | |
4.550%, 03/01/29 | | | 400,000 | | | | 433,831 | |
S&P Global, Inc.
4.500%, 05/15/48 | | | 10,000 | | | | 12,207 | |
Schlumberger Investment, S.A. (Luxembourg)
3.650%, 12/01/23 | | | 25,000 | | | | 26,470 | |
Southern Copper Corp. (Peru)
3.875%, 04/23/25 | | | 10,000 | | | | 10,524 | |
Southwest Airlines Co.
3.450%, 11/16/27 | | | 30,000 | | | | 31,552 | |
TC PipeLines LP
3.900%, 05/25/27 | | | 355,000 | | | | 371,513 | |
The accompanying notes are an integral part of these financial statements.
17
| | |
| | | AMG Chicago Equity Partners Balanced Fund Schedule of Portfolio Investments(continued) |
| | | | | | | | |
| | | Principal
Amount | | | Value | |
Industrials - 9.4%(continued) | | | | | | | | |
Tech Data Corp.
3.700%, 02/15/22 | | $ | 10,000 | | | $ | 10,225 | |
Telefonica Emisiones, S.A. (Spain)
7.045%, 06/20/36 | | | 210,000 | | | | 294,329 | |
Tennessee Gas Pipeline Co. LLC
7.000%, 10/15/28 | | | 195,000 | | | | 250,181 | |
Thomson Reuters Corp. (Canada)
4.300%, 11/23/23 | | | 650,000 | | | | 697,965 | |
Transcontinental Gas Pipe Line Co. LLC
4.000%, 03/15/28 | | | 45,000 | | | | 47,918 | |
Tyco Electronics Group, S.A. (Luxembourg)
7.125%, 10/01/37 | | | 20,000 | | | | 29,437 | |
Valero Energy Corp.
4.000%, 04/01/29 | | | 35,000 | | | | 37,792 | |
VMware, Inc.
3.900%, 08/21/27 | | | 30,000 | | | | 31,431 | |
Walmart, Inc.
1.900%, 12/15/20 | | | 35,000 | | | | 35,055 | |
Westinghouse Air Brake Technologies Corp.
4.950%, 09/15/284 | | | 385,000 | | | | 423,862 | |
Whirlpool Corp. | | | | | | | | |
4.500%, 06/01/46 | | | 450,000 | | | | 467,454 | |
4.750%, 02/26/29 | | | 30,000 | | | | 33,454 | |
WPP Finance 2010 (United Kingdom)
3.750%, 09/19/24 | | | 30,000 | | | | 31,680 | |
WW Grainger, Inc.
4.600%, 06/15/45 | | | 25,000 | | | | 29,935 | |
Xilinx, Inc.
2.950%, 06/01/24 | | | 25,000 | | | | 25,713 | |
Total Industrials | | | | | | | 23,713,622 | |
Utilities - 2.1% | | | | | | | | |
American Water Capital Corp.
2.950%, 09/01/27 | | | 10,000 | | | | 10,231 | |
Appalachian Power Co.
3.400%, 06/01/25 | | | 15,000 | | | | 15,605 | |
Arizona Public Service Co.
5.050%, 09/01/41 | | | 210,000 | | | | 256,073 | |
Avangrid, Inc.
3.800%, 06/01/29 | | | 25,000 | | | | 26,552 | |
Baker Hughes, a GE Co. LLC
5.125%, 09/15/40 | | | 440,000 | | | | 519,358 | |
Black Hills Corp.
3.950%, 01/15/26 | | | 450,000 | | | | 474,239 | |
Boardwalk Pipelines LP
5.950%, 06/01/26 | | | 395,000 | | | | 444,824 | |
CMS Energy Corp.
5.050%, 03/15/22 | | | 30,000 | | | | 31,669 | |
| | | | | | | | |
| | | Principal
Amount | | | Value | |
Dominion Energy Gas Holdings LLC Series B
3.000%, 11/15/29 | | $ | 350,000 | | | $ | 349,562 | |
Enable Midstream Partners LP
3.900%, 05/15/244 | | | 30,000 | | | | 30,756 | |
Enbridge Energy Partners LP
5.500%, 09/15/40 | | | 35,000 | | | | 41,704 | |
Enel Americas, S.A. (Chile)
4.000%, 10/25/26 | | | 430,000 | | | | 446,279 | |
Evergy Kansas Central, Inc.
4.125%, 03/01/42 | | | 30,000 | | | | 33,437 | |
National Fuel Gas Co.
4.750%, 09/01/28 | | | 450,000 | | | | 482,396 | |
ONE Gas, Inc.
4.658%, 02/01/44 | | | 15,000 | | | | 17,868 | |
PacifiCorp
4.100%, 02/01/42 | | | 50,000 | | | | 55,913 | |
Plains All American Pipeline, LP / PAA Finance Corp.
4.500%, 12/15/26 | | | 480,000 | | | | 511,942 | |
Progress Energy, Inc.
6.000%, 12/01/39 | | | 460,000 | | | | 606,858 | |
Southern California Edison Co. | | | | | | | | |
4.000%, 04/01/47 | | | 45,000 | | | | 47,457 | |
4.050%, 03/15/42 | | | 420,000 | | | | 436,014 | |
Southwestern Electric Power Co.
6.200%, 03/15/40 | | | 365,000 | | | | 481,692 | |
The Toledo Edison Co.
6.150%, 05/15/37 | | | 25,000 | | | | 34,373 | |
Total Utilities | | | | | | | 5,354,802 | |
Total Corporate Bonds and Notes
(Cost $37,445,451) | | | | | | | 38,551,582 | |
U.S. Government and Agency Obligations - 18.5% | | | | | | | | |
Fannie Mae - 3.3% | | | | | | | | |
Federal National Mortgage Association | | | | | | | | |
1.875%, 09/24/26 | | | 345,000 | | | | 344,599 | |
2.000%, 10/05/221 | | | 565,000 | | | | 571,229 | |
2.625%, 09/06/241 | | | 565,000 | | | | 588,462 | |
FNMA | | | | | | | | |
2.000%, 01/01/30 | | | 41,503 | | | | 41,267 | |
2.500%, 04/01/28 to 05/01/43 | | | 1,337,208 | | | | 1,340,875 | |
3.000%, 03/01/42 to 01/01/47 | | | 1,243,213 | | | | 1,276,345 | |
3.500%, 11/01/25 to 08/01/48 | | | 1,530,653 | | | | 1,583,094 | |
4.000%, 12/01/21 to 11/01/48 | | | 1,315,412 | | | | 1,369,045 | |
4.500%, 06/01/39 to 12/01/48 | | | 838,045 | | | | 898,977 | |
5.000%, 09/01/33 to 10/01/41 | | | 210,174 | | | | 231,333 | |
5.500%, 02/01/35 to 05/01/39 | | | 100,452 | | | | 112,874 | |
Total Fannie Mae | | | | | | | 8,358,100 | |
Freddie Mac - 5.5% | | | | | | | | |
Federal Home Loan Mortgage Corp.
2.375%, 01/13/22 | | | 490,000 | | | | 497,652 | |
The accompanying notes are an integral part of these financial statements.
18
| | |
| | | AMG Chicago Equity Partners Balanced Fund Schedule of Portfolio Investments(continued) |
| | | | | | | | |
| | | Principal
Amount | | | Value | |
Freddie Mac - 5.5%(continued) | | | | | | | | |
FHLMC Gold Pool | | | | | | | | |
2.500%, 07/01/28 to 12/01/30 | | $ | 238,206 | | | $ | 241,601 | |
3.000%, 01/01/29 to 01/01/48 | | | 4,014,327 | | | | 4,117,934 | |
3.500%, 03/01/42 to 09/01/48 | | | 4,845,453 | | | | 5,029,127 | |
4.000%, 03/01/44 to 09/01/48 | | | 2,807,947 | | | | 2,964,582 | |
4.500%, 02/01/39 to 04/01/44 | | | 612,701 | | | | 662,291 | |
5.000%, 07/01/35 to 07/01/41 | | | 333,376 | | | | 367,743 | |
Total Freddie Mac | | | | | | | 13,880,930 | |
U.S. Treasury Obligations - 9.7% | | | | | | | | |
U.S. Treasury Bonds | | | | | | | | |
2.250%, 08/15/49 | | | 300,000 | | | | 291,943 | |
2.750%, 08/15/47 | | | 1,620,000 | | | | 1,742,291 | |
3.000%, 02/15/49 | | | 1,040,000 | | | | 1,176,683 | |
U.S. Treasury Notes | | | | | | | | |
1.125%, 07/31/21 | | | 2,000,000 | | | | 1,985,508 | |
1.500%, 01/31/22 | | | 1,725,000 | | | | 1,722,776 | |
1.625%, 11/15/22 | | | 2,090,000 | | | | 2,091,837 | |
1.750%, 05/15/22 to 09/30/22 | | | 3,295,000 | | | | 3,308,679 | |
1.875%, 11/30/21 to 08/31/22 | | | 4,155,000 | | | | 4,183,621 | |
2.000%, 02/15/23 to 02/15/25 | | | 4,335,000 | | | | 4,392,673 | |
2.125%, 12/31/21 | | | 1,810,000 | | | | 1,829,408 | |
2.250%, 04/30/21 to 11/15/25 | | | 1,215,000 | | | | 1,237,777 | |
2.375%, 08/15/24 | | | 400,000 | | | | 412,352 | |
Total U.S. Treasury Obligations | | | | | | | 24,375,548 | |
Total U.S. Government and Agency Obligations
(Cost $45,700,494) | | | | | | | 46,614,578 | |
| | |
| | | Shares | | | | |
Exchange Traded Funds - 1.0% | | | | | | | | |
iShares Russell 1000 Growth ETF | | | 3,900 | | | | 686,088 | |
iShares Russell 1000 Value ETF | | | 13,800 | | | | 1,883,424 | |
Total Exchange Traded Funds(Cost $2,560,604) | | | | | | | 2,569,512 | |
Preferred Stocks - 0.0%# | | | | | | | | |
Industrials - 0.0%# | | | | | | | | |
Sixt SE (Germany) | | | 300 | | | | 21,826 | |
Materials - 0.0%# | | | | | | | | |
STO SE & Co. KGaA (Germany) | | | 200 | | | | 25,575 | |
Total Preferred Stocks
(Cost $43,413) | | | | | | | 47,401 | |
| | |
| | | Principal
Amount | | | | |
Short-Term Investments - 4.0% | | | | | | | | |
Joint Repurchase Agreements - 1.8%5 | | | | | | | | |
Bank of Montreal, dated 12/31/19, due 01/02/20, 1.570% total to be received $1,038,702 (collateralized by various U.S. Government Agency Obligations, 2.500% - 5.000%, 04/20/49 - 12/01/49, totaling $1,059,383) | | $ | 1,038,611 | | | | 1,038,611 | |
| | | | | | | | |
| | | Principal
Amount | | | Value | |
Citadel Securities LLC, dated 12/31/19, due 01/02/20, 1.600% total to be received $217,842 (collateralized by various U.S. Treasuries, 0.000% - 8.500%, 01/15/20 - 11/15/48, totaling $222,199) | | $ | 217,823 | | | $ | 217,823 | |
Citigroup Global Markets, Inc., dated 12/31/19, due 01/02/20, 1.570% total to be received $1,038,702 (collateralized by various U.S. Government Agency Obligations and U.S. Treasuries, 0.000% - 9.000%, 02/13/20 -09/20/69, totaling $1,059,383) | | | 1,038,611 | | | | 1,038,611 | |
Morgan, Stanley & Co. LLC, dated 12/31/19, due 01/02/20, 1.570% total to be received $1,038,702 (collateralized by various U.S. Government Agency Obligations, 2.000% -6.500%, 07/01/27 - 01/01/50, totaling $1,059,383) | | | 1,038,611 | | | | 1,038,611 | |
RBC Dominion Securities, Inc., dated 12/31/19, due 01/02/20, 1.570% total to be received $1,038,702 (collateralized by various U.S. Government Agency Obligations and U.S. Treasuries, 0.000% - 6.500%, 06/30/21 -12/01/49, totaling $1,059,383) | | | 1,038,611 | | | | 1,038,611 | |
Total Joint Repurchase Agreements | | | | | | | 4,372,267 | |
| | |
| | | Shares | | | | |
Other Investment Companies - 2.2% | | | | | | | | |
Dreyfus Government Cash Management Fund, Institutional Shares, 1.51%6 | | | 1,825,651 | | | | 1,825,651 | |
Dreyfus Institutional Preferred Government Money Market Fund, Institutional Shares, 1.55%6 | | | 1,825,651 | | | | 1,825,651 | |
JPMorgan U.S. Government Money Market Fund, IM Shares, 1.53%6 | | | 1,880,974 | | | | 1,880,974 | |
Total Other Investment Companies | | | | | | | 5,532,276 | |
Total Short-Term Investments
(Cost $9,904,543) | | | | | | | 9,904,543 | |
Total Investments - 102.8%
(Cost $237,242,914) | | | | | | | 258,675,310 | |
Other Assets, less Liabilities - (2.8)% | | | | | | | (6,968,006 | ) |
Net Assets - 100.0% | | | | | | $ | 251,707,304 | |
The accompanying notes are an integral part of these financial statements.
19
| | |
| | | AMG Chicago Equity Partners Balanced Fund Schedule of Portfolio Investments(continued) |
| * | Non-income producing security. |
| 1 | Some of these securities, amounting to $14,409,829 or 5.7% of net assets, were out on loan to various borrowers and are collateralized by cash and various U.S. Treasury Obligations. See Note 4 of Notes to Financial Statements. |
| 2 | Security exempt from registration under Rule 144A of the Securities Act of 1933. This security may be resold in transactions exempt from registration, normally to qualified buyers. At December 31, 2019, the value of these securities amounted to $776,294 or 0.3% of net assets. |
| 3 | Variable rate security. The rate shown is based on the latest available information as of December 31, 2019. Certain variable rate securities are not based on a published reference rate and spread but are determined by the issuer or agent and are based on current market conditions. These securities do not indicate a reference rate and spread in their description above. |
| 4 | Step Bond: A debt instrument with either deferred interest payments or an interest rate that resets at specific times during its term. |
| 5 | Cash collateral received for securities lending activity was invested in these joint repurchase agreements. |
| 6 | Yield shown represents the December 31, 2019, seven day average yield, which refers to the sum of the previous seven days’ dividends paid, expressed as an annual percentage. |
| | |
| ETF | | Exchange Traded Fund |
| FHLMC | | Freddie Mac |
| FNMA | | Fannie Mae |
| GMTN | | Global Medium-Term Notes |
| LIBOR | | London Interbank Offered Rate |
| MTN | | Medium-Term Note |
| REIT | | Real Estate Investment Trust |
The following table summarizes the inputs used to value the Fund’s investments by the fair value hierarchy levels as of December 31, 2019:
| | | | | | | | | | | | | | | | |
| | | Level 1 | | | Level 21 | | | Level 3 | | | Total | |
Investments in Securities | | | | | | | | | | | | | | | | |
Common Stocks | | | | | | | | | | | | | | | | |
Information Technology | | $ | 26,294,243 | | | $ | 1,017,298 | | | | — | | | $ | 27,311,541 | |
Financials | | | 25,755,178 | | | | 961,594 | | | | — | | | | 26,716,772 | |
Health Care | | | 19,084,864 | | | | 688,175 | | | | — | | | | 19,773,039 | |
Industrials | | | 15,352,153 | | | | 2,005,911 | | | | — | | | | 17,358,064 | |
Communication Services | | | 13,944,310 | | | | 484,977 | | | | — | | | | 14,429,287 | |
Consumer Discretionary | | | 13,231,742 | | | | 1,061,454 | | | | — | | | | 14,293,196 | |
Consumer Staples | | | 11,601,626 | | | | 464,786 | | | | — | | | | 12,066,412 | |
Real Estate | | | 7,245,213 | | | | 813,089 | | | | — | | | | 8,058,302 | |
Utilities | | | 7,569,596 | | | | 271,871 | | | | — | | | | 7,841,467 | |
Energy | | | 7,339,516 | | | | 370,340 | | | | — | | | | 7,709,856 | |
Materials | | | 4,892,142 | | | | 537,616 | | | | — | | | | 5,429,758 | |
Corporate Bonds and Notes† | | | — | | | | 38,551,582 | | | | — | | | | 38,551,582 | |
U.S. Government and Agency Obligations† | | | — | | | | 46,614,578 | | | | — | | | | 46,614,578 | |
Exchange Traded Funds | | | 2,569,512 | | | | — | | | | — | | | | 2,569,512 | |
Preferred Stocks | | | 25,575 | | | | 21,826 | | | | — | | | | 47,401 | |
Short-Term Investments | | | | | | | | | | | | | | | | |
Joint Repurchase Agreements | | | — | | | | 4,372,267 | | | | — | | | | 4,372,267 | |
Other Investment Companies | | | 5,532,276 | | | | — | | | | — | | | | 5,532,276 | |
| | | | | | | | | | | | | | | | |
Total Investments in Securities | | $ | 160,437,946 | | | $ | 98,237,364 | | | | — | | | $ | 258,675,310 | |
| | | | | | | | | | | | | | | | |
| † | All corporate bonds and notes and U.S. government and agency obligations held in the Fund are Level 2 securities. For a detailed breakout of corporate bonds and notes and U.S. government and agency obligations by major industry or agency classification, please refer to the Fund’s Schedule of Portfolio Investments. |
| 1 | An external pricing service is used to reflect any impact on security value due to market movements between the time the Fund valued such foreign securities and the earlier closing of foreign markets. |
For the fiscal year ended December 31, 2019, there were no transfers in or out of Level 3.
The accompanying notes are an integral part of these financial statements.
20
| | |
| | | AMG Chicago Equity Partners Balanced Fund Schedule of Portfolio Investments(continued) |
The country allocation in the Schedule of Portfolio Investments at December 31, 2019, was as follows:
| | | | |
Country | | % of Long-Term
Investments | |
Australia | | | 0.3 | |
Austria | | | 0.0 | # |
Belgium | | | 0.1 | |
Bermuda | | | 0.2 | |
Canada | | | 0.3 | |
Chile | | | 0.2 | |
Denmark | | | 0.1 | |
Finland | | | 0.1 | |
France | | | 0.2 | |
Georgia | | | 0.0 | # |
Germany | | | 0.2 | |
Gibraltar | | | 0.0 | # |
Hong Kong | | | 0.2 | |
Ireland | | | 1.0 | |
Israel | | | 0.1 | |
Italy | | | 0.1 | |
Japan | | | 1.5 | |
Luxembourg | | | 0.4 | |
Netherlands | | | 0.4 | |
New Zealand | | | 0.0 | # |
Norway | | | 0.1 | |
Peru | | | 0.0 | # |
Portugal | | | 0.1 | |
Puerto Rico | | | 0.2 | |
Singapore | | | 0.1 | |
Spain | | | 0.2 | |
Sweden | | | 0.3 | |
Switzerland | | | 0.2 | |
United Kingdom | | | 1.3 | |
United States | | | 92.1 | |
| | | | |
| | | 100.0 | |
| | | | |
The accompanying notes are an integral part of these financial statements.
21
| | |
| | | Statement of Assets and Liabilities December 31, 2019 |
| | | | |
| | | AMG
Chicago Equity
Partners
Balanced Fund | |
Assets: | | | | |
Investments at value1(including securities on loan valued at $14,409,829) | | $ | 258,675,310 | |
Foreign currency2 | | | 794 | |
Dividend, interest and other receivables | | | 858,489 | |
Receivable for Fund shares sold | | | 411,866 | |
Receivable from affiliate | | | 28,164 | |
Prepaid expenses and other assets | | | 31,988 | |
Total assets | | | 260,006,611 | |
Liabilities: | | | | |
Payable upon return of securities loaned | | | 4,372,267 | |
Payable for investments purchased | | | 2,560,604 | |
Payable for Fund shares repurchased | | | 1,068,318 | |
Accrued expenses: | | | | |
Investment advisory and management fees | | | 130,758 | |
Administrative fees | | | 32,690 | |
Distribution fees | | | 14,928 | |
Shareholder service fees | | | 19,025 | |
Other | | | 100,717 | |
Total liabilities | | | 8,299,307 | |
Net Assets | | $ | 251,707,304 | |
1Investments at cost | | $ | 237,242,914 | |
2Foreign currency at cost | | $ | 787 | |
The accompanying notes are an integral part of these financial statements.
22
| | |
| | | Statement of Assets and Liabilities(continued) |
| | | | |
| | | AMG
Chicago Equity
Partners
Balanced Fund | |
Net Assets Represent: | | | | |
Paid-in capital | | $ | 225,639,912 | |
Total distributable earnings | | | 26,067,392 | |
Net Assets | | $ | 251,707,304 | |
Class N: | | | | |
Net Assets | | $ | 69,774,396 | |
Shares outstanding | | | 4,095,796 | |
Net asset value, offering and redemption price per share | | $ | 17.04 | |
Class I: | | | | |
Net Assets | | $ | 173,575,052 | |
Shares outstanding | | | 10,082,081 | |
Net asset value, offering and redemption price per share | | $ | 17.22 | |
Class Z: | | | | |
Net Assets | | $ | 8,357,856 | |
Shares outstanding | | | 485,587 | |
Net asset value, offering and redemption price per share | | $ | 17.21 | |
The accompanying notes are an integral part of these financial statements.
23
| | |
| | | Statement of Operations For the fiscal year ended December 31, 2019 |
| | | | |
| | | AMG
Chicago Equity
Partners
Balanced Fund | |
Investment Income: | | | | |
Dividend income | | $ | 3,310,980 | |
Interest income | | | 3,489,477 | |
Securities lending income | | | 22,332 | |
Foreign withholding tax | | | (34,308 | ) |
Total investment income | | | 6,788,481 | |
Expenses: | | | | |
Investment advisory and management fees | | | 1,568,773 | |
Administrative fees | | | 392,193 | |
Distribution fees - Class N | | | 183,674 | |
Shareholder servicing fees - Class I | | | 175,098 | |
Custodian fees | | | 180,024 | |
Registration fees | | | 63,792 | |
Professional fees | | | 61,112 | |
Reports to shareholders | | | 42,293 | |
Transfer agent fees | | | 30,585 | |
Trustee fees and expenses | | | 24,315 | |
Miscellaneous | | | 15,190 | |
Total expenses before offsets | | | 2,737,049 | |
Expense reimbursements | | | (179,640 | ) |
Expense reductions | | | (14,642 | ) |
Net expenses | | | 2,542,767 | |
Net investment income | | | 4,245,714 | |
Net Realized and Unrealized Gain: | | | | |
Net realized gain on investments | | | 13,224,295 | |
Net realized loss on foreign currency transactions | | | (20,305 | ) |
Net change in unrealized appreciation/depreciation on investments | | | 23,461,839 | |
Net change in unrealized appreciation/depreciation on foreign currency translations | | | 136 | |
Net realized and unrealized gain | | | 36,665,965 | |
Net increase in net assets resulting from operations | | $ | 40,911,679 | |
The accompanying notes are an integral part of these financial statements.
24
| | |
| | | Statements of Changes in Net Assets For the fiscal years ended December 31, |
| | | | | | | | |
| | | AMG | |
| | | Chicago Equity | |
| | | Partners | |
| | | Balanced Fund | |
| | | 2019 | | | 2018 | |
Increase (Decrease) in Net Assets Resulting From Operations: | | | | | | | | |
Net investment income | | $ | 4,245,714 | | | $ | 2,559,166 | |
Net realized gain on investments | | | 13,203,990 | | | | 11,430,725 | |
Net change in unrealized appreciation/depreciation on investments | | | 23,461,975 | | | | (23,698,513 | ) |
Net increase (decrease) in net assets resulting from operations | | | 40,911,679 | | | | (9,708,622 | ) |
Distributions to Shareholders: | | | | | | | | |
Class N | | | (4,102,350 | ) | | | (4,965,289 | ) |
Class I | | | (10,291,326 | ) | | | (11,086,856 | ) |
Class Z | | | (493,265 | ) | | | (569,332 | ) |
Total distributions to shareholders | | | (14,886,941 | ) | | | (16,621,477 | ) |
Capital Share Transactions:1 | | | | | | | | |
Net increase (decrease) from capital share transactions | | | (24,570,919 | ) | | | 80,294,870 | |
Total increase in net assets | | | 1,453,819 | | | | 53,964,771 | |
Net Assets: | | | | | | | | |
Beginning of year | | | 250,253,485 | | | | 196,288,714 | |
End of year | | $ | 251,707,304 | | | $ | 250,253,485 | |
| 1 | See Note 1(g) of the Notes to Financial Statements. |
The accompanying notes are an integral part of these financial statements.
25
| | |
| | | AMG Chicago Equity Partners Balanced Fund Financial Highlights For a share outstanding throughout each fiscal year |
| | | | | | | | | | | | | | | | | | | | |
| | | For the fiscal years ended December 31, | |
| Class N | | 2019 | | | 2018 | | | 2017 | | | 20161 | | | 2015 | |
Net Asset Value, Beginning of Year | | $ | 15.45 | | | $ | 17.03 | | | $ | 15.45 | | | $ | 14.92 | | | $ | 15.09 | |
Income (loss) from Investment Operations: | | | | | | | | | | | | | | | | | | | | |
Net investment income2,3 | | | 0.25 | | | | 0.18 | | | | 0.10 | | | | 0.14 | 4 | | | 0.10 | 5 |
Net realized and unrealized gain (loss) on investments | | | 2.35 | | | | (0.67 | ) | | | 2.30 | | | | 0.54 | | | | 0.23 | |
Total income (loss) from investment operations | | | 2.60 | | | | (0.49 | ) | | | 2.40 | | | | 0.68 | | | | 0.33 | |
Less Distributions to Shareholders from: | | | | | | | | | | | | | | | | | | | | |
Net investment income | | | (0.27 | ) | | | (0.16 | ) | | | (0.11 | ) | | | (0.14 | ) | | | (0.11 | ) |
Net realized gain on investments | | | (0.74 | ) | | | (0.93 | ) | | | (0.71 | ) | | | (0.01 | ) | | | (0.39 | ) |
Total distributions to shareholders | | | (1.01 | ) | | | (1.09 | ) | | | (0.82 | ) | | | (0.15 | ) | | | (0.50 | ) |
Net Asset Value, End of Year | | $ | 17.04 | | | $ | 15.45 | | | $ | 17.03 | | | $ | 15.45 | | | $ | 14.92 | |
Total Return3,6 | | | 16.96 | % | | | (2.89 | )% | | | 15.54 | % | | | 4.59 | % | | | 2.19 | % |
Ratio of net expenses to average net assets7 | | | 1.08 | % | | | 1.08 | % | | | 1.09 | % | | | 1.08 | % | | | 1.08 | % |
Ratio of gross expenses to average net assets8 | | | 1.16 | % | | | 1.15 | % | | | 1.14 | % | | | 1.25 | % | | | 1.36 | % |
Ratio of net investment income to average net assets3 | | | 1.51 | % | | | 1.02 | % | | | 0.63 | % | | | 0.94 | % | | | 0.64 | % |
Portfolio turnover | | | 123 | % | | | 80 | % | | | 75 | % | | | 119 | % | | | 105 | % |
Net assets end of year (000’s) omitted | | $ | 69,774 | | | $ | 75,271 | | | $ | 74,315 | | | $ | 92,502 | | | $ | 94,476 | |
| | | | | | | | | | | | | | | | | | | | |
26
| | |
| | | AMG Chicago Equity Partners Balanced Fund Financial Highlights For a share outstanding throughout each fiscal year |
| | | | | | | | | | | | | | | | | | | | |
| | | For the fiscal years ended December 31, | |
| Class I | | 2019 | | | 2018 | | | 2017 | | | 20161 | | | 2015 | |
Net Asset Value, Beginning of Year | | $ | 15.60 | | | $ | 17.19 | | | $ | 15.59 | | | $ | 15.05 | | | $ | 15.23 | |
Income (loss) from Investment Operations: | | | | | | | | | | | | | | | | | | | | |
Net investment income2,3 | | | 0.28 | | | | 0.21 | | | | 0.13 | | | | 0.17 | 4 | | | 0.12 | 5 |
Net realized and unrealized gain (loss) on investments | | | 2.38 | | | | (0.68 | ) | | | 2.31 | | | | 0.54 | | | | 0.23 | |
Total income (loss) from investment operations | | | 2.66 | | | | (0.47 | ) | | | 2.44 | | | | 0.71 | | | | 0.35 | |
Less Distributions to Shareholders from: | | | | | | | | | | | | | | | | | | | | |
Net investment income | | | (0.30 | ) | | | (0.19 | ) | | | (0.13 | ) | | | (0.16 | ) | | | (0.14 | ) |
Net realized gain on investments | | | (0.74 | ) | | | (0.93 | ) | | | (0.71 | ) | | | (0.01 | ) | | | (0.39 | ) |
Total distributions to shareholders | | | (1.04 | ) | | | (1.12 | ) | | | (0.84 | ) | | | (0.17 | ) | | | (0.53 | ) |
Net Asset Value, End of Year | | $ | 17.22 | | | $ | 15.60 | | | $ | 17.19 | | | $ | 15.59 | | | $ | 15.05 | |
Total Return3,6 | | | 17.17 | % | | | (2.77 | )% | | | 15.71 | % | | | 4.79 | % | | | 2.29 | % |
Ratio of net expenses to average net assets7 | | | 0.93 | % | | | 0.92 | % | | | 0.94 | % | | | 0.93 | % | | | 0.93 | % |
Ratio of gross expenses to average net assets8 | | | 1.01 | % | | | 0.99 | % | | | 0.99 | % | | | 1.10 | % | | | 1.21 | % |
Ratio of net investment income to average net assets3 | | | 1.66 | % | | | 1.18 | % | | | 0.78 | % | | | 1.09 | % | | | 0.80 | % |
Portfolio turnover | | | 123 | % | | | 80 | % | | | 75 | % | | | 119 | % | | | 105 | % |
Net assets end of year (000’s) omitted | | $ | 173,575 | | | $ | 166,554 | | | $ | 114,913 | | | $ | 75,890 | | | $ | 60,798 | |
| | | | | | | | | | | | | | | | | | | | |
27
| | |
| | | AMG Chicago Equity Partners Balanced Fund Financial Highlights For a share outstanding throughout each fiscal year |
| | | | | | | | | | | | | | | | | | | | |
| | | For the fiscal years ended December 31, | |
| Class Z | | 2019 | | | 2018 | | | 2017 | | | 20161 | | | 2015 | |
Net Asset Value, Beginning of Year | | $ | 15.60 | | | $ | 17.19 | | | $ | 15.58 | | | $ | 15.05 | | | $ | 15.22 | |
Income (loss) from Investment Operations: | | | | | | | | | | | | | | | | | | | | |
Net investment income2,3 | | | 0.30 | | | | 0.22 | | | | 0.15 | | | | 0.18 | 4 | | | 0.14 | 5 |
Net realized and unrealized gain (loss) on investments | | | 2.37 | | | | (0.67 | ) | | | 2.32 | | | | 0.54 | | | | 0.23 | |
Total income (loss) from investment operations | | | 2.67 | | | | (0.45 | ) | | | 2.47 | | | | 0.72 | | | | 0.37 | |
Less Distributions to Shareholders from: | | | | | | | | | | | | | | | | | | | | |
Net investment income | | | (0.32 | ) | | | (0.21 | ) | | | (0.15 | ) | | | (0.18 | ) | | | (0.15 | ) |
Net realized gain on investments | | | (0.74 | ) | | | (0.93 | ) | | | (0.71 | ) | | | (0.01 | ) | | | (0.39 | ) |
Total distributions to shareholders | | | (1.06 | ) | | | (1.14 | ) | | | (0.86 | ) | | | (0.19 | ) | | | (0.54 | ) |
Net Asset Value, End of Year | | $ | 17.21 | | | $ | 15.60 | | | $ | 17.19 | | | $ | 15.58 | | | $ | 15.05 | |
Total Return3,6 | | | 17.21 | % | | | (2.68 | )% | | | 15.90 | % | | | 4.82 | % | | | 2.44 | % |
Ratio of net expenses to average net assets7 | | | 0.83 | % | | | 0.83 | % | | | 0.84 | % | | | 0.83 | % | | | 0.83 | % |
Ratio of gross expenses to average net assets8 | | | 0.91 | % | | | 0.90 | % | | | 0.89 | % | | | 1.00 | % | | | 1.09 | % |
Ratio of net investment income to average net assets3 | | | 1.76 | % | | | 1.27 | % | | | 0.88 | % | | | 1.20 | % | | | 0.89 | % |
Portfolio turnover | | | 123 | % | | | 80 | % | | | 75 | % | | | 119 | % | | | 105 | % |
Net assets end of year (000’s) omitted | | $ | 8,358 | | | $ | 8,429 | | | $ | 7,060 | | | $ | 5,796 | | | $ | 1,709 | |
| | | | | | | | | | | | | | | | | | | | |
| 1 | Effective October 1, 2016, the Investor Class, Service Class and Institutional Class were renamed Class N, Class I and Class Z, respectively. |
| 2 | Per share numbers have been calculated using average shares. |
| 3 | Total returns and net investment income would have been lower had certain expenses not been offset. |
| 4 | Includesnon-recurring dividends. Without these dividends, net investment income per share would have been $0.12, $0.15, and $0.16 for Class N, Class I, and Class Z shares, respectively. |
| 5 | Includesnon-recurring dividends. Without these dividends, net investment income per share would have been $0.09, $0.11, and $0.13 for Class N, Class I and Class Z shares, respectively. |
| 6 | The total return is calculated using the published Net Asset Value as of fiscal year end. |
| 7 | Includes reduction from broker recapture amounting to 0.01% for the fiscal years ended December 31, 2019 and 2018, less than 0.01%, 0.01% and 0.01% for the fiscal years ended 2017, 2016 and 2015, respectively. |
| 8 | Excludes the impact of expense reimbursement or fee waivers and expense reductions such as brokerage credits, but includes expense repayments andnon-reimbursable expenses, if any, such as interest, taxes, and extraordinary expenses. (See Note 1(c) and 2 in the Notes to Financial Statements.) |
28
| | |
| | | Notes to Financial Statements December 31, 2019 |
1. ORGANIZATION AND SUMMARY OF SIGNIFICANT ACCOUNTING POLICIES
AMG Funds II (the “Trust”) is anopen-end management investment company, organized as a Massachusetts business trust, and registered under the Investment Company Act of 1940, as amended (the “1940 Act”). Currently, the Trust consists of a number of different funds, each having distinct investment management objectives, strategies, risks, and policies. Included in this report is AMG Chicago Equity Partners Balanced Fund (the “Fund.”)
The Fund offers Class N, Class I and Class Z shares. Each class represents an interest in the same assets of the respective Fund. Although all share classes generally have identical voting rights, each share class votes separately when required by law. Different share classes may have different net asset values per share to the extent the share classes pay different distribution amounts and/or the expenses of such share classes differ. Each share class has its own expense structure. Please refer to a current prospectus for additional information on each share class.
The Fund’s financial statements are prepared in accordance with accounting principles generally accepted in the United States of America (“U.S. GAAP”), including accounting and reporting guidance pursuant to Accounting Standards Codification Topic 946 applicable to investment companies. U.S. GAAP requires management to make estimates and assumptions that affect the reported amounts of assets and liabilities and disclosure of contingent assets and liabilities at the date of the financial statements and the reported amounts of income and expenses during the reporting period. Actual results could differ from those estimates and such differences could be material. The following is a summary of significant accounting policies followed by the Fund in the preparation of its financial statements:
a. VALUATION OF INVESTMENTS
Equity securities traded on a national securities exchange or reported on the NASDAQ national market system (“NMS”) are valued at the last quoted sales price on the primary exchange or, if applicable, the NASDAQ official closing price or the official closing price of the relevant exchange or, lacking any sales, at the last quoted bid price or the mean between the last quoted bid and ask prices (the “exchange mean price”). Equity securities traded in theover-the-counter market (other than NMS securities) are valued at the mean price. Foreign equity securities (securities principally traded in markets other than U.S. markets) are valued at the official closing price on the primary exchange or, for markets that either do not offer an official closing price or where the official closing price may not be representative of the overall market, the last quoted sale price.
Fixed income securities purchased with a remaining maturity exceeding 60 days are valued at the evaluated mean price provided by an authorized pricing service or, if an evaluated price is not available, by reference to other securities which are considered comparable in credit rating, interest rate, due date and other features (generally referred to as “matrix pricing”) or other similar pricing methodologies. Investments in certain mortgage-backed and stripped mortgage-backed securities and other debt securities not traded on an organized securities market are valued on the basis of valuations provided by dealers or by a pricing service which uses information with respect to transactions in such securities and various relationships between such securities and yield to maturity in determining value.
Fixed income securities purchased with a remaining maturity of 60 days or less are valued at amortized cost, provided that the amortized cost value is
approximately the same as the fair value of the security valued without the use of amortized cost. Investments in otheropen-end registered investment companies are valued at their end of day net asset value per share.
The Fund’s portfolio investments are generally valued based on independent market quotations or prices or, if none, “evaluative” or other market based valuations provided by third party pricing services approved by the Board of Trustees of the Trust (the “Board”). Under certain circumstances, the value of certain Fund portfolio investments may be based on an evaluation of fair value, pursuant to procedures established by and under the general supervision of the Board. The Valuation Committee, which is comprised of the Independent Trustees of the Board, and the Pricing Committee, which is comprised of representatives from AMG Funds LLC (the “Investment Manager”) are the committees appointed by the Board to make fair value determinations. The Fund may use the fair value of a portfolio investment to calculate its net asset value (“NAV”) in the event that the market quotation, price or market based valuation for the portfolio investment is not readily available or otherwise not determinable pursuant to the Board’s valuation procedures, if the Investment Manager or the Pricing Committee believes the quotation, price or market based valuation to be unreliable, or in certain other circumstances. When determining the fair value of an investment, the Pricing Committee and, if required under the Trust’s securities valuation procedures, the Valuation Committee, seeks to determine the price that the Fund might reasonably expect to receive from current sale of that portfolio investment in an arms-length transaction. Fair value determinations shall be based upon consideration of all available facts and information, including, but not limited to (i) attributes specific to the investment; (ii) fundamental and analytical data relating to the investment; and (iii) the value of other comparable securities or relevant financial instruments, including derivative securities, traded on other markets or among dealers.
The values assigned to fair value portfolio investments are based on available information and do not necessarily represent amounts that might ultimately be realized in the future, since such amounts depend on future developments inherent in long-term investments. Because of the inherent uncertainty of valuation, those estimated values may differ significantly from the values that would have been used had a ready market for the investments existed, and the differences could be material. The Board will be presented with a quarterly report showing as of the most recent quarter end, all outstanding securities fair valued by the Fund, including a comparison with the prior quarter end and the percentage of the Fund that the security represents at each quarter end.
With respect to foreign equity securities and certain foreign fixed income securities, the Board has adopted a policy that securities held in the Fund that can be fair valued by the applicable fair value pricing service are fair valued on each business day provided that each individual price exceeds apre-established confidence level.
U.S. GAAP defines fair value as the price that a fund would receive to sell an asset or pay to transfer a liability in an orderly transaction between market participants at the measurement date. U.S. GAAP also establishes a framework for measuring fair value, and a three level hierarchy for fair value measurements based upon the transparency of inputs to the valuation of an asset or liability. Inputs may be observable or unobservable and refer broadly to the assumptions that market participants would use in pricing the asset or liability. Observable inputs reflect the assumptions market participants would use in pricing the asset or liability based on market data obtained from sources independent of the Fund. Unobservable inputs reflect the Fund’s own assumptions about the assumptions that market participants would use in pricing the asset or liability developed based on the best information available in the circumstances. Each investment is
29
| | |
| | | Notes to Financial Statements(continued) |
assigned a level based upon the observability of the inputs which are significant to the overall valuation.
The three-tier hierarchy of inputs is summarized below:
Level 1 – inputs are quoted prices in active markets for identical investments (e.g., equity securities,open-end investment companies)
Level 2 – other observable inputs (including, but not limited to: quoted prices for similar assets or liabilities in markets that are active, quoted prices for identical or similar assets or liabilities in markets that are not active, inputs other than quoted prices that are observable for the assets or liabilities (such as interest rates, yield curves, volatilities, prepayment speeds, loss severities, credit risks and default rates) or other market corroborated inputs) (e.g., debt securities, government securities, foreign currency exchange contracts, swaps, foreign securities utilizing international fair value pricing, fair valued securities with observable inputs)
Level 3 – inputs are significant unobservable inputs (including the Fund’s own assumptions used to determine the fair value of investments) (e.g., fair valued securities with unobservable inputs)
Changes in inputs or methodologies used for valuing investments may result in a transfer in or out of levels within the fair value hierarchy. The inputs or methodologies used for valuing investments may not necessarily be an indication of the risk associated with investing in those investments.
b. SECURITY TRANSACTIONS
Security transactions are accounted for as of trade date. Realized gains and losses on securities sold are determined on the basis of identified cost.
c. INVESTMENT INCOME AND EXPENSES
Dividend income is recorded on theex-dividend date. Dividends from foreign securities are recorded on theex-dividend date, and if after the fact, as soon as the Funds become aware of theex-dividend date. Interest income, which includes amortization of premium and accretion of discount on debt securities, is accrued as earned. Dividend and interest income on foreign securities is recorded gross of any withholding tax.Non-cash dividends included in dividend income, if any, are reported at the fair market value of the securities received. Upon notification from issuers, distributions received from a real estate investment trust (“REIT”) may be redesignated as a reduction of cost of investments and/or realized gain. Other income and expenses are recorded on an accrual basis. Expenses that cannot be directly attributed to a Fund are apportioned among the funds in the Trust and other trusts or funds within the AMG Funds Family of Funds (collectively the “AMG Funds Family”) based upon their relative average net assets or number of shareholders. Investment income, realized and unrealized capital gains and losses, the common expenses of each Fund, and certain fund level expense reductions, if any, are allocated on apro-rata basis to each class based on the relative net assets of each class to the total net assets of each Fund.
The Fund had certain portfolio trades directed to various brokers under a brokerage recapture program. Credits received from the brokerage recapture program are earned and paid on a monthly basis, and are recorded as expense offsets, which serve to reduce the Fund’s overall expense ratio. For the fiscal year ended December 31, 2019, the impact on the expenses and expense ratios were as follows: $14,642 or 0.01%.
d. DIVIDENDS AND DISTRIBUTIONS
Fund distributions resulting from either net investment income or realized net capital gains, if any, will normally be declared and paid at least annually in December. Distributions to shareholders are recorded on theex-dividend date. Distributions are determined in accordance with federal income tax regulations, which may differ from net investment income and net realized capital gains for financial statement purposes (U.S. GAAP). Differences may be permanent or temporary. Permanent differences are reclassified among capital accounts in the financial statements to reflect their tax character. Permanent book and tax basis differences, if any, relating to shareholder distributions will result in reclassifications topaid-in capital. Temporary differences arise when certain items of income, expense and gain or loss are recognized in different periods for financial statement and tax purposes; these differences will reverse at some time in the future. Temporary differences are due to wash sales and PFIC mark to market.
The tax character of distributions paid during the fiscal years ended December 31, 2019 and December 31, 2018 were as follows:
| | | | | | | | |
| Distributions paid from: | | 2019 | | | 2018 | |
Ordinary income | | $ | 4,414,354 | | | $ | 2,473,972 | |
Short-term capital gains | | | — | | | | 4,164,098 | |
Long-term capital gains | | | 10,472,587 | | | | 9,983,986 | |
| | | | | | | | |
| | $ | 14,886,941 | | | $ | 16,622,056 | |
| | | | | | | | |
As of December 31, 2019, the components of distributable earnings (excluding unrealized appreciation/depreciation) on a tax basis consisted of:
| | | | |
Undistributed ordinary income | | $ | 89,747 | |
Undistributed long-term capital gains | | | 4,925,039 | |
At December 31, 2019, the cost of investments and the aggregate gross unrealized appreciation and depreciation for federal income tax purposes were as follows:
| | | | | | | | | | | | |
| Cost | | Appreciation | | | Depreciation | | | Net | |
$237,622,783 | | $ | 24,297,346 | | | $ | (3,244,740 | ) | | $ | 21,052,606 | |
e. FEDERAL TAXES
The Fund currently qualifies as an investment company and intends to comply with the requirements under Subchapter M of the Internal Revenue Code of 1986, as amended, and to distribute substantially all of its taxable income and gains to its shareholders and to meet certain diversification and income requirements with respect to investment companies. Therefore, no provision for federal income or excise tax is included in the accompanying financial statements.
Additionally, based on the Fund’s understanding of the tax rules and rates related to income, gains and transactions for the foreign jurisdictions in which it invests, the Fund will provide for foreign taxes, and where appropriate, deferred foreign taxes.
Management has analyzed the Fund’s tax positions taken on federal income tax returns as of December 31, 2019, and for all open tax years (generally, the three prior taxable years), and has concluded that no provision for federal income tax is required in the Fund’s financial statements. Additionally, Management is not aware
30
| | |
| | | Notes to Financial Statements(continued) |
of any tax position for which it is reasonably possible that the total amounts of unrecognized tax benefits will change materially in the next twelve months.
f. CAPITAL LOSS CARRYOVERS AND DEFERRALS
As of December 31, 2019, the Fund had no capital loss carryovers for federal income tax purposes. Should the Fund incur net capital losses for the fiscal year ended December 31, 2020, such amounts may be used to offset future realized capital gains indefinitely, and retain their character as short-term and/or long-term.
g. CAPITAL STOCK
The Trust’s Declaration of Trust authorizes for the Fund the issuance of an unlimited number of shares of beneficial interest, without par value. The Fund records sales and repurchases of its capital stock on the trade date.
For the fiscal years ended December 31, 2019 and December 31, 2018, the capital stock transactions by class for the Fund were as follows:
| | | | | | | | | | | | | | | | |
| | | December 31, 2019 | | | December 31, 2018 | |
| | | Shares | | | Amount | | | Shares | | | Amount | |
Class N: | | | | | | | | | | | | | | | | |
Proceeds from sale of shares | | | 755,483 | | | $ | 12,585,390 | | | | 1,829,410 | | | $ | 31,862,118 | |
Reinvestment of distributions | | | 219,225 | | | | 3,700,415 | | | | 275,306 | | | | 4,281,568 | |
Cost of shares repurchased | | | (1,751,239 | ) | | | (29,287,443 | ) | | | (1,595,686 | ) | | | (27,737,463 | ) |
| | | | | | | | | | | | | | | | |
Net increase (decrease) | | | (776,531 | ) | | $ | (13,001,638 | ) | | | 509,030 | | | $ | 8,406,223 | |
| | | | | | | | | | | | | | | | |
Class I: | | | | | | | | | | | | | | | | |
Proceeds from sale of shares | | | 2,971,394 | | | $ | 49,904,550 | | | | 5,399,926 | | | $ | 94,484,167 | |
Reinvestment of distributions | | | 320,513 | | | | 5,466,578 | | | | 364,983 | | | | 5,735,369 | |
Cost of shares repurchased | | | (3,884,175 | ) | | | (66,016,224 | ) | | | (1,775,098 | ) | | | (30,603,938 | ) |
| | | | | | | | | | | | | | | | |
Net increase (decrease) | | | (592,268 | ) | | $ | (10,645,096 | ) | | | 3,989,811 | | | $ | 69,615,598 | |
| | | | | | | | | | | | | | | | |
Class Z: | | | | | | | | | | | | | | | | |
Proceeds from sale of shares | | | 55,790 | | | $ | 947,599 | | | | 183,387 | | | $ | 3,281,181 | |
Reinvestment of distributions | | | 28,546 | | | | 486,627 | | | | 33,709 | | | | 529,976 | |
Cost of shares repurchased | | | (139,084 | ) | | | (2,358,411 | ) | | | (87,554 | ) | | | (1,538,108 | ) |
| | | | | | | | | | | | | | | | |
Net increase (decrease) | | | (54,748 | ) | | $ | (924,185 | ) | | | 129,542 | | | $ | 2,273,049 | |
| | | | | | | | | | | | | | | | |
31
| | |
| | | Notes to Financial Statements(continued) |
h. REPURCHASE AGREEMENTS AND JOINT REPURCHASE AGREEMENTS
The Fund may enter into third-party repurchase agreements for temporary cash management purposes and third-party or bilateral joint repurchase agreements for reinvestment of cash collateral on securities lending transactions under the securities lending program offered by The Bank of New York Mellon (“BNYM”) (the “Program”) (collectively, “Repurchase Agreements”). The value of the underlying collateral, including accrued interest, must equal or exceed the value of the Repurchase Agreements during the term of the agreement. For joint repurchase agreements, the Fund participates on a pro rata basis with other clients of BNYM in its share of the underlying collateral under such joint repurchase agreements and in its share of proceeds from any repurchase or other disposition of the underlying collateral. The underlying collateral for all Repurchase Agreements is held in safekeeping by the Fund’s custodian or at the Federal Reserve Bank. If the seller defaults and the value of the collateral declines, or if bankruptcy proceedings commence with respect to the seller of the security, realization of the collateral by the Fund may be delayed or limited. Pursuant to the Program, the Fund is indemnified for such losses by BNYM on joint repurchase agreements.
At December 31, 2019, the market value of Repurchase Agreements outstanding was $4,372,267.
i. FOREIGN CURRENCY TRANSLATION
The books and records of the Fund are maintained in U.S. dollars. The value of investments, assets and liabilities denominated in currencies other than U.S. dollars are translated into U.S. dollars based upon current foreign exchange rates. Purchases and sales of foreign investments, income and expenses are converted into U.S. dollars based on currency exchange rates prevailing on the respective dates of such transactions. Net realized and unrealized gain (loss) on foreign currency transactions represent: (1) foreign exchange gains and losses from the sale and holdings of foreign currencies; (2) gains and losses between trade date and settlement date on investment securities transactions and foreign currency exchange contracts; and (3) gains and losses from the difference between amounts of interest and dividends recorded and the amounts actually received.
The Fund does not isolate the net realized and unrealized gain or loss resulting from changes in exchange rates from the fluctuations in market prices of securities held. Such fluctuations are included with the net realized and unrealized gain or loss on investments.
2. AGREEMENTS AND TRANSACTIONS WITH AFFILIATES
The Trust has entered into an investment advisory agreement under which the Investment Manager, a subsidiary and the U.S. retail distribution arm of Affiliated Managers Group, Inc. (“AMG”), serves as investment manager to the Fund and is responsible for the Fund’s overall administration and operations. The Investment Manager selects one or more subadvisers for the Fund (subject to Board approval) and monitors each subadviser’s investment performance, security holdings and investment strategies. The Fund’s investment portfolio is managed by Chicago Equity Partners, LLC (“CEP”) who serves pursuant to a subadvisory agreement with the Investment Manager. AMG indirectly owns a majority interest in CEP.
Investment management fees are paid directly by the Fund to the Investment Manager based on average daily net assets. For the fiscal year ended December 31, 2019, the Fund paid an investment management fee at the annual rate of 0.60% of the average daily net assets of the Fund.
The Investment Manager has contractually agreed, through at least May 1, 2020, to waive management fees and/or pay or reimburse fund expenses in order to limit total annual Fund operating expenses after fee waiver and expense reimbursements (exclusive of taxes, interest (including interest incurred in connection with bank and custody overdrafts, and in connection with securities sold short), shareholder servicing fees, distribution and service(12b-1) fees, brokerage commissions and other transaction costs, dividends payable with respect to securities sold short, acquired fund fees and expenses and extraordinary expenses) of the Fund to the annual rate of 0.84% of the Fund’s average daily net assets (this annual rate or such other annual rate that may be in effect from time to time, the “Expense Cap”), subject to later reimbursement by the Fund in certain circumstances.
The contractual expense limitation may only be terminated in the event the Investment Manager or a successor ceases to be the investment manager of the Fund or a successor fund, by mutual agreement between the Investment Manager and the Board, or in the event of the Fund’s liquidation unless the Fund is reorganized or is a party to a merger in which the surviving entity is successor to the accounting and performance information of the Fund.
In general, for a period of up to 36 months, the Investment Manager may recover from the Fund fees waived and expenses paid pursuant to this contractual agreement, provided that such repayment would not cause the Fund’s total annual operating expenses after fee waiver and expense reimbursements (exclusive of the items noted in the parenthetical above) to exceed the contractual expense limitation amount.
At December 31, 2019, the Fund’s expiration of reimbursements subject to recoupment is as follows:
| | | | |
Expiration Period | | | |
Less than 1 year | | $ | 92,722 | |
1-2 years | | | 132,068 | |
2-3 years | | | 179,640 | |
| | | | |
Total | | $ | 404,430 | |
| | | | |
The Trust, on behalf of the Fund, has entered into an amended and restated Administration Agreement under which the Investment Manager serves as the Fund’s administrator (the “Administrator”) and is responsible for allnon-portfolio management aspects of managing the Fund’s operations, including administration and shareholder services to the Fund. The Fund pays a fee to the Administrator at the rate of 0.15% per annum of the Fund’s average daily net assets for this service.
The Fund is distributed by AMG Distributors, Inc. (the “Distributor”), a wholly-owned subsidiary of the Investment Manager. The Distributor serves as the distributor and underwriter for the Fund and is a registered broker-dealer and member of the Financial Industry Regulatory Authority, Inc. (“FINRA”). Shares of the Fund will be continuously offered and will be sold directly to prospective purchasers and through brokers, dealers or other financial intermediaries who have executed selling agreements with the Distributor. Generally the Distributor bears all or a portion of the expenses of providing services pursuant to the distribution agreement, including the payment of the expenses relating to the distribution of prospectuses for sales purposes and any advertising or sales literature.
The Fund has adopted a distribution and service plan (the “Plan”) with respect to the Class N shares, in accordance with the requirements of Rule12b-1 under the
32
| | |
| | | Notes to Financial Statements(continued) |
1940 Act and the requirements of the applicable rules of FINRA regarding asset-based sales charges. Pursuant to the Plan, the Fund may make payments to the Distributor for its expenditures in financing any activity primarily intended to result in the sale of the Fund’s Class N shares and for maintenance and personal service provided to existing shareholders of that class. The Plan authorized payments to the Distributor up to 0.25% annually of the Fund’s average daily net assets attributable to the Class N shares.
For Class I shares, the Board has approved reimbursement payments to the Investment Manager for shareholder servicing expenses (“shareholder servicing fees”) incurred. Shareholder servicing fees include payments to financial intermediaries, such as broker-dealers (including fund supermarket platforms), banks, and trust companies who provide shareholder recordkeeping, account servicing and other services. Class I shares, may reimburse the Investment Manager for the actual amount incurred up to a maximum annual rate of each Class’s average daily net assets as shown in the table below.
The impact on the annualized expense ratios for the fiscal year ended December 31, 2019, were as follows:
| | | | | | | | |
| | | Maximum
Annual
Amount
Approved | | | Actual
Amount
Incurred | |
Class I | | | 0.10 | % | | | 0.10 | % |
| | | | | | | | |
The Board provides supervision of the affairs of the Trust and other trusts within the AMG Funds family. The Trustees of the Trust who are not affiliated with the Investment Manager receive an annual retainer and per meeting fees for regular, special and telephonic meetings, and they are reimbursed forout-of-pocket expenses incurred while carrying out their duties as Board members. The Chairman of the Board and the Audit Committee Chair receive additional annual retainers. Certain Trustees and Officers of the Fund are Officers and/or Directors of the Investment Manager, AMG and/or the Distributor.
The Securities and Exchange Commission (the “SEC”) granted an exemptive order that permits the Fund to lend and borrow money for certain temporary purposes directly to and from other eligible funds in the AMG Funds family. Participation in this interfund lending program is voluntary for both the borrowing and lending funds, and an interfund loan is only made if it benefits each participating fund. The Administrator manages the program according to procedures approved by the Board, and the Board monitors the operation of the program. An interfund loan must comply with certain conditions set out in the exemptive order, which are designed to assure fairness and protect all participating funds. For the fiscal year ended December 31, 2019, the Fund borrowed a maximum of $9,219,636 for four days paying interest of $2,053. The interest expense amount is included in the Statement of Operations as miscellaneous expense. At December 31, 2019, the Fund had no interfund loans outstanding.
3. PURCHASES AND SALES OF SECURITIES
Purchases and sales of securities (excluding short-term securities and U.S. Government Obligations) for the fiscal year ended December 31, 2019, were $228,528,818 and $233,055,050, respectively.
Purchases and sales of U.S. Government obligations during the fiscal year ended December 31, 2019 were $89,524,090 and $118,166,890, respectively.
4. PORTFOLIO SECURITIES LOANED
The Fund participates in the Program providing for the lending of securities to qualified borrowers. Securities lending income includes earnings of such temporary cash investments, plus or minus any rebate to a borrower. These earnings (after any rebate) are then divided between BNYM, as a fee for its services under the Program, and the Fund, according to agreed-upon rates. Collateral on all securities loaned is accepted in cash, U.S. Treasury Obligations or U.S. Government Agency Obligations. Collateral is maintained at a minimum level of 102% (105% in the case of certain foreign securities) of the market value, plus interest, if applicable, of investments on loan. It is the Fund’s policy to obtain additional collateral from or return excess collateral to the borrower by the end of the next business day, following the valuation date of the securities loaned. Therefore, the value of the collateral held may be temporarily less than the value of the securities on loan. Lending securities entails a risk of loss to the Fund if and to the extent that the market value of the securities loaned were to increase and the borrower did not increase the collateral accordingly, and the borrower fails to return the securities. Under the terms of the Program, the Fund is indemnified for such losses by BNYM. Cash collateral is held in separate omnibus accounts managed by BNYM, who is authorized to exclusively enter into joint repurchase agreements for that cash collateral. Securities collateral is held in separate omnibus accounts managed by BNYM that cannot be sold or pledged. BNYM bears the risk of any deficiency in the amount of the cash collateral available for return to the borrower due to any loss on the collateral invested.
The value of securities loaned on positions held, cash collateral and securities collateral received at December 31, 2019, were as follows:
| | | | | | | | | | | | | | |
| | | | Cash | | | Securities | | | Total | |
| Securities | | | Collateral | | | Collateral | | | Collateral | |
| Loaned | | | Received | | | Received | | | Received | |
| $ | 14,409,829 | | | $ | 4,372,267 | | | $ | 10,362,676 | | | $ | 14,734,943 | |
The following table summarizes the securities received as collateral for securities lending at December 31, 2019:
| | | | |
| Collateral Type | | Coupon Range | | Maturity Date Range |
| U.S. Treasury Obligations | | 0.000%-8.500% | | 01/09/20-11/15/49 |
5. FOREIGN SECURITIES
The Fund invests in securities of foreign entities and in instruments denominated in foreign currencies which involve risks not typically associated with investments in domestic securities.Non-domestic securities carry special risks, such as exposure to currency fluctuations, less developed or less efficient trading markets, political instability, a lack of company information, differing auditing and legal standards, and, potentially, less liquidity. The Fund’s investments in emerging market countries are exposed to additional risks. The Fund’s performance will be influenced by political, social and economic factors affecting companies in emerging market countries. Emerging market countries generally have economic structures that are less diverse and mature, and political systems that are less stable, than those of developed countries. Realized gains in certain countries may be subject to foreign taxes at the Fund level and the Fund would pay such foreign taxes at the appropriate rate for each jurisdiction.
33
| | |
| | | Notes to Financial Statements(continued) |
6. COMMITMENTS AND CONTINGENCIES
Under the Trust’s organizational documents, its trustees and officers are indemnified against certain liabilities arising out of the performance of their duties to the Trust. In addition, in the normal course of business, the Fund may enter into contracts and agreements that contain a variety of representations and
warranties, which provide general indemnifications. The maximum exposure to the Fund under these arrangements is unknown, as this would involve future claims that may be made against the Fund that have not yet occurred. However, based on experience, the Fund had no prior claims or losses and expects the risks of loss to be remote.
7. MASTER NETTING AGREEMENTS
The Fund may enter into master netting agreements with its counterparties for the securities lending program and Repurchase Agreements, which provide the right, in the event of default (including bankruptcy or insolvency) for thenon-defaulting party to liquidate the collateral and calculate net exposure to the defaulting party or request additional collateral. For financial reporting purposes, the Fund does not offset financial assets and financial liabilities that are subject to master netting agreements in the Statement of Assets and Liabilities. For securities lending transactions, see Note 4.
The following table is a summary of the Fund’s open Repurchase Agreements that are subject to a master netting agreement as of December 31, 2019:
| | | | | | | | | | | | | | | | | | | | |
| | | | | | Gross Amount Not Offset in the
Statement of Assets and Liabilities | | | | | | | |
| | | Gross Amounts of
Assets Presented in
the Statement of
Assets and Liabilities | | | Offset
Amount | | | Net Asset
Balance | | | Collateral
Received | | | Net
Amount | |
Bank of Montreal | | $ | 1,038,611 | | | | — | | | $ | 1,038,611 | | | $ | 1,038,611 | | | | — | |
Citadel Securities LLC | | | 217,823 | | | | — | | | | 217,823 | | | | 217,823 | | | | — | |
Citigroup Global Markets, Inc. | | | 1,038,611 | | | | — | | | | 1,038,611 | | | | 1,038,611 | | | | — | |
Morgan, Stanley & Co. LLC | | | 1,038,611 | | | | — | | | | 1,038,611 | | | | 1,038,611 | | | | — | |
RBC Dominion Securities, Inc. | | | 1,038,611 | | | | — | | | | 1,038,611 | | | | 1,038,611 | | | | — | |
| | | | | | | | | | | | | | | | | | | | |
Total | | $ | 4,372,267 | | | | — | | | $ | 4,372,267 | | | $ | 4,372,267 | | | | — | |
| | | | | | | | | | | | | | | | | | | | |
8. SUBSEQUENT EVENTS
The Fund has determined that no material events or transactions occurred through the issuance date of the Fund’s financial statements which require an additional disclosure in or adjustment of the Fund’s financial statements.
34
| | |
| | | Report of Independent Registered Public Accounting Firm |
TO THE BOARD OF TRUSTEES OF AMG FUNDS II AND SHAREHOLDERS OF AMG CHICAGO EQUITY PARTNERS BALANCED FUND
Opinion on the Financial Statements
We have audited the accompanying statement of assets and liabilities, including the schedule of portfolio investments, of AMG Chicago Equity Partners Balanced Fund (one of the funds constituting AMG Funds II, hereafter collectively referred to as the “Fund”) as of December 31, 2019, the related statement of operations for the year ended December 31, 2019, the statement of changes in net assets for each of the two years in the period ended December 31, 2019, including the related notes, and the financial highlights for each of the five years in the period ended December 31, 2019 (collectively referred to as the “financial statements”). In our opinion, the financial statements present fairly, in all material respects, the financial position of the Fund as of December 31, 2019, the results of its operations for the year then ended, the changes in its net assets for each of the two years in the period ended December 31, 2019 and each of the financial highlights for each of the five years in the period ended December 31, 2019 in conformity with accounting principles generally accepted in the United States of America.
Basis for Opinion
These financial statements are the responsibility of the Fund’s management. Our responsibility is to express an opinion on the Fund’s financial statements based on our audit. We are a public accounting firm registered with the Public Company Accounting Oversight Board (United States) (PCAOB) and are required to be independent with respect to the Fund in accordance with the U.S. federal securities laws and the applicable rules and regulations of the Securities and Exchange Commission and the PCAOB.
We conducted our audit of these financial statements in accordance with the standards of the PCAOB. Those standards require that we plan and perform the audit to obtain reasonable assurance about whether the financial statements are free of material misstatement, whether due to error or fraud.
Our audit included performing procedures to assess the risks of material misstatement of the financial statements, whether due to error or fraud, and performing procedures that respond to those risks. Such procedures included examining, on a test basis, evidence regarding the amounts and disclosures in the financial statements. Our audit also included evaluating the accounting principles used and significant estimates made by management, as well as evaluating the overall presentation of the financial statements. Our procedures included confirmation of securities owned as of December 31, 2019 by correspondence with the custodian and brokers; when replies were not received from brokers, we performed other auditing procedures. We believe that our audits provide a reasonable basis for our opinion.
PricewaterhouseCoopers LLP
Boston, Massachusetts
February 24, 2020
We have served as the auditor of one or more investment companies in the AMG Funds Family since 1993.
35
TAX INFORMATION
AMG Chicago Equity Partners Balanced Fund hereby designates the maximum amount allowable of its net taxable income as qualified dividends as provided in the Jobs and Growth Tax Relief Reconciliation Act of 2003. The 2019 Form1099-DIV you receive for the Fund will show the tax status of all distributions paid to you during the year.
Pursuant to section 852 of the Internal Revenue Code, AMG Chicago Equity Partners Balanced Fund hereby designates $10,472,587 as a capital gain distribution with respect to the taxable year ended December 31, 2019, or if subsequently determined to be different, the net capital gains of such fiscal year.
36
| | |
| | | AMG Funds Trustees and Officers |
The Trustees and Officers of the Trust, their business addresses, principal occupations for the past five years and ages are listed below. The Trustees provide broad supervision over the affairs of the Trust and the Funds. The Trustees are experienced executives who meet periodically throughout the year to oversee the Funds’ activities, review contractual arrangements with companies that provide services to the Funds, and
review the Funds’ performance. Unless otherwise noted, the address of each Trustee or Officer is the address of the Trust: 600 Steamboat Road, Suite 300, Greenwich, Connecticut 06830.
There is no stated term of office for Trustees. Trustees serve until their resignation, retirement or removal in
accordance with the Trust’s organizational documents and policies adopted by the Board from time to time. The Chairman of the Trustees, President, Treasurer and Secretary of the Trust are elected by the Trustees annually. Other officers hold office at the pleasure of the Trustees.
Independent Trustees
The following Trustees are not “interested persons” of the Trust within the meaning of the 1940 Act:
| | |
Number of Funds Overseen in Fund Complex | | Name, Age, Principal Occupation(s) During Past 5 Years and Other Directorships Held by Trustee |
| |
• Trustee since 2012 • Oversees 49 Funds in Fund Complex | | Bruce B. Bingham, 71 Partner, Hamilton Partners (real estate development firm) (1987-Present); Director of The Yacktman Funds (2000-2012). |
| |
• Trustee since 2000 • Oversees 49 Funds in Fund Complex | | Edward J. Kaier, 74 Attorney at Law and Partner, Teeters Harvey Marrone & Kaier LLP (2007-Present); Attorney at Law and Partner, Hepburn Willcox Hamilton & Putnam, LLP (1977-2007); Trustee of Third Avenue Trust (2002-2019); Trustee of Third Avenue Variable Trust (2002-2019). |
| |
• Trustee since 2013 • Oversees 49 Funds in Fund Complex | | Kurt A. Keilhacker, 56 Managing Partner, TechFund Capital (1997-Present); Managing Partner, TechFund Europe (2000-Present); Board Member, 6wind SA, (2002-Present); Managing Partner, Elementum Ventures (2013-Present); Director, MetricStory, Inc. (2017-Present); Trustee, Wheaton College (2018-Present); Trustee, Gordon College (2001-2016). |
| |
• Trustee since 2000 • Oversees 49 Funds in Fund Complex | | Steven J. Paggioli, 69 Independent Consultant (2002-Present); Trustee, Professionally Managed Portfolios (28 portfolios); Advisory Board Member, Sustainable Growth Advisors, LP; Independent Director, Muzinich BDC, Inc. (business development company) (2019-Present); Independent Director, Chase Investment Counsel (2008–2019); Executive Vice President, Secretary and Director, Investment Company Administration, LLC (1990-2001). |
| |
• Trustee since 2013 • Oversees 49 Funds in Fund Complex | | Richard F. Powers III, 73 Adjunct Professor, U.S. Naval War College (2016-Present); Adjunct Professor, Boston College (2010-2013); President and CEO of Van Kampen Investments Inc. (1998-2003). |
| |
• Independent Chairman • Trustee since 2000 • Oversees 52 Funds in Fund Complex | | Eric Rakowski, 61 Professor of Law, University of California at Berkeley School of Law - Boalt Hall (1990-Present); Director of Harding, Loevner Funds, Inc. (9 portfolios); Trustee of Third Avenue Trust (2002-2019); Trustee of Third Avenue Variable Trust (2002-2019). |
| |
• Trustee since 2013 • Oversees 52 Funds in Fund Complex | | Victoria L. Sassine, 54 Adjunct Professor, Babson College (2007–Present); Director, Board of Directors, PRG Group (2017-Present); CEO, Founder, Scale Smarter Partners, LLC (2018-Present); Chairperson, Board of Directors, Business Management Associates (2018-Present). |
| |
• Trustee since 2000 • Oversees 49 Funds in Fund Complex | | Thomas R. Schneeweis, 72 Professor Emeritus, University of Massachusetts (2013-Present); President, TRS Associates (1982-Present); Board Member, Chartered Alternative Investment Association (“CAIA”) (2002-Present); Director, Institute for Global Asset and Risk Management (Education) (2010-Present);Co-Owner, Quantitative Investment Technologies (2014-Present); Director of Research, Yes Wealth Management (2018-Present); Partner, S Capital Wealth Advisors (2015-2018); Partner, S Capital Management, LLC (2007-2015); President, Alternative Investment Analytics, LLC, (formerly Schneeweis Partners, LLC) (2001-2013). |
37
| | |
| | | AMG Funds Trustees and Officers(continued) |
Interested Trustees
Each Trustee in the following table is an “interested person” of the Trust within the meaning of the 1940 Act. Ms. Carsman is an interested person of the Trust within the meaning of the 1940 Act by virtue of her position with, and interest in securities of, AMG.
| | |
Number of Funds Overseen in Fund Complex | | Name, Age, Principal Occupation(s) During Past 5 Years and Other Directorships Held by Trustee |
| |
• Trustee since 2011 • Oversees 52 Funds in Fund Complex | | Christine C. Carsman, 67 Senior Policy Advisor, Affiliated Managers Group, Inc. (2019-Present); Director of Harding, Loevner Funds, Inc. (9 portfolios); Executive Vice President, Deputy General Counsel and Chief Regulatory Counsel, Affiliated Managers Group, Inc. (2017-2018); Director (2010-2018) and Chair of the Board of Directors (2015-2018), AMG Funds plc; Senior Vice President and Deputy General Counsel, Affiliated Managers Group, Inc. (2011-2016); Senior Vice President and Chief Regulatory Counsel, Affiliated Managers Group, Inc. (2007-2011); Vice President and Chief Regulatory Counsel, Affiliated Managers Group, Inc. (2004-2007); Secretary and Chief Legal Officer, AMG Funds, AMG Funds I, AMG Funds II and AMG Funds III (2004-2011); Senior Counsel, Vice President and Director of Operational Risk Management and Compliance, Wellington Management Company, LLP (1995-2004). |
| |
| Officers | | |
| |
| Position(s) Held with Fund and Length of Time Served | | Name, Age, Principal Occupation(s) During Past 5 Years |
| |
• President since 2018 • Principal Executive Officer since 2018 • Chief Executive Officer since 2018 • Chief Operating Officer since 2007 | | Keitha L. Kinne, 61 Chief Operating Officer, AMG Funds LLC (2007-Present); Chief Investment Officer, AMG Funds LLC (2008-Present); President and Principal, AMG Distributors, Inc. (2018-Present); Chief Operating Officer, AMG Distributors, Inc. (2007-Present); President, Chief Executive Officer and Principal Executive Officer, AMG Funds, AMG Funds I, AMG Funds II, AMG Funds III and AMG Funds IV (2018-Present); Chief Operating Officer, AMG Funds, AMG Funds I, AMG Funds II, and AMG Funds III (2007-Present); Chief Operating Officer, AMG Funds IV (2016-Present); Chief Operating Officer and Chief Investment Officer, Aston Asset Management, LLC (2016); President and Principal Executive Officer, AMG Funds, AMG Funds I, AMG Funds II and AMG Funds III (2012-2014); Managing Partner, AMG Funds LLC (2007-2014); President and Principal, AMG Distributors, Inc. (2012-2014); Managing Director, Legg Mason & Co., LLC (2006-2007); Managing Director, Citigroup Asset Management (2004-2006). |
| |
• Secretary since 2015 • Chief Legal Officer since 2015 | | Mark J. Duggan, 54 Senior Vice President and Senior Counsel, AMG Funds LLC (2015-Present); Secretary and Chief Legal Officer, AMG Funds, AMG Funds I, AMG Funds II, AMG Funds III and AMG Funds IV (2015-Present); Attorney, K&L Gates, LLP (2009-2015). |
| |
• Chief Financial Officer since 2017 • Treasurer since 2017 • Principal Financial Officer since 2017 • Principal Accounting Officer since 2017 | | Thomas G. Disbrow, 53 Vice President, Mutual Fund Treasurer & CFO, AMG Funds, AMG Funds LLC (2017-Present); Chief Financial Officer, Principal Financial Officer, Treasurer and Principal Accounting Officer, AMG Funds, AMG Funds I, AMG Funds II, AMG Funds III and AMG Funds IV (2017-Present); Managing Director - Global Head of Traditional Funds Product Control, UBS Asset Management (Americas), Inc. (2015-2017); Managing Director - Head of North American Funds Treasury, UBS Asset Management (Americas), Inc. (2011-2015). |
| |
• Deputy Treasurer since 2017 | | John A. Starace, 49 Director, Mutual Fund Accounting, AMG Funds LLC (2017-Present); Vice President, Deputy Treasurer of Mutual Funds Services, AMG Funds LLC (2014-2017); Deputy Treasurer, AMG Funds, AMG Funds I, AMG Funds II, AMG Funds III and AMG Funds IV (2017-Present); Vice President, Citi Hedge Fund Services (2010-2014); Audit Senior Manager (2005-2010) and Audit Manager (2001-2005), Deloitte & Touche LLP. |
| |
• Chief Compliance Officer since 2019 | | Patrick J. Spellman, 45 Vice President, Chief Compliance Officer, AMG Funds LLC (2017-Present); Chief Compliance Officer and Sarbanes-Oxley Code of Ethics Compliance Officer, AMG Funds, AMG Funds I, AMG Funds II, AMG Funds III and AMG Funds IV (2019-Present); Chief Compliance Officer, AMG Distributors, Inc., (2010-Present) Senior Vice President, Chief Compliance Officer, AMG Funds LLC (2011-2017); Anti-Money Laundering Compliance Officer, AMG Funds, AMG Funds I, AMG Funds II, and AMG Funds III (2014-2019); Anti-Money Laundering Officer, AMG Funds IV, (2016-2019); Compliance Manager, Legal and Compliance, Affiliated Managers Group, Inc. (2005-2011). |
| |
• Assistant Secretary since 2016 | | Maureen A. Meredith, 34 Vice President, Counsel, AMG Funds LLC (2019-Present); Director, Counsel, AMG Funds LLC (2017-2018); Vice President, Counsel, AMG Funds LLC (2015-2017); Assistant Secretary, AMG Funds, AMG Funds I, AMG Funds II, AMG Funds III and AMG Funds IV (2016-Present); Associate, Ropes & Gray LLP (2011-2015); Law Fellow, Massachusetts Appleseed Center for Law and Justice (2010-2011). |
| |
• Anti-Money Laundering Compliance Officer since 2019 | | Hector D. Roman, 42 Director, Legal and Compliance, AMG Funds LLC (2020-Present); Manager, Legal and Compliance, AMG Funds LLC (2017-2019); Director of Compliance, Morgan Stanley Investment Management (2015-2017); Senior Advisory, PricewaterhouseCoopers LLP (2014-2015); Risk Manager, Barclays Investment Bank (2008-2014); Anti-Money Laundering Compliance Officer, AMG Funds, AMG Funds I, AMG Funds II, AMG Funds III and AMG Funds IV (2019-Present). |
38
THIS PAGE INTENTIONALLY LEFT BLANK
THIS PAGE INTENTIONALLY LEFT BLANK
INVESTMENT MANAGER AND ADMINISTRATOR
AMG Funds LLC
600 Steamboat Road, Suite 300
Greenwich, CT 06830
800.548.4539
DISTRIBUTOR
AMG Distributors, Inc.
600 Steamboat Road, Suite 300
Greenwich, CT 06830
800.548.4539
SUBADVISER
Chicago Equity Partners, LLC
180 N LaSalle Street, Suite 3800
Chicago, IL 60601
CUSTODIAN
The Bank of New York Mellon
111 Sanders Creek Parkway
East Syracuse, NY 13057
LEGAL COUNSEL
Ropes & Gray LLP
Prudential Tower, 800 Boylston Street
Boston, MA 02199-3600
TRANSFER AGENT
BNY Mellon Investment Servicing (US) Inc.
Attn: AMG Funds
P.O. Box 9769
Providence, RI 02940
800.548.4539
This report is prepared for the Fund’s shareholders. It is authorized for distribution to prospective investors only when preceded or accompanied by an effective prospectus. To receive a free copy of the prospectus or Statement of Additional Information, which includes additional information about Fund Trustees, please contact us by calling 800.548.4539. Distributed by AMG Distributors, Inc., member FINRA/SIPC.
Current net asset values per share for the Fund are available on the Fund’s website at amgfunds.com.
A description of the policies and procedures the Fund uses to vote its proxies is available: (i) without charge, upon request, by calling 800.548.4539, or (ii) on the Securities and Exchange Commission’s (SEC) website at sec.gov. For information regarding the Fund’s proxy voting record for the12-month period ended June 30, call 800.548.4539 or visit the SEC website at sec.gov.
The Fund files its complete schedule of portfolio holdings with the SEC for the first and third quarters of each fiscal year as an exhibit to their reports on FormN-PORT, which has replaced FormN-Q. The Fund’s portfolio holdings on FormN-PORT are available on the SEC’s website at sec.gov. To review a complete list of the Fund’s portfolio holdings, or to view the most recent semiannual report or annual report, please visit amgfunds.com.
AFFILIATE SUBADVISED FUNDS
BALANCED FUNDS
AMG Chicago Equity Partners Balanced
Chicago Equity Partners, LLC
AMG FQ Global Risk-Balanced
First Quadrant, L.P.
EQUITY FUNDS
AMG FQTax-Managed U.S. Equity
AMG FQ Long-Short Equity
First Quadrant, L.P.
AMG Frontier Small Cap Growth
Frontier Capital Management Co., LLC
AMG GW&K Small Cap Core
AMG GW&K Small/Mid Cap
AMG GW&K Trilogy Emerging Markets Equity
AMG GW&K Trilogy Emerging Wealth Equity
GW&K Investment Management, LLC
AMG Renaissance Large Cap Growth
The Renaissance Group LLC
AMG River Road Dividend All Cap Value
AMG River Road Dividend All Cap Value II
AMG River Road Focused Absolute Value
AMG River Road Long-Short
AMG River RoadSmall-Mid Cap Value
AMG River Road Small Cap Value
River Road Asset Management, LLC
AMG SouthernSun Small Cap
AMG SouthernSun U.S. Equity
SouthernSun Asset Management, LLC
AMG TimesSquare Emerging Markets Small Cap
AMG TimesSquare Global Small Cap
AMG TimesSquare International Small Cap
AMG TimesSquare Mid Cap Growth
AMG TimesSquare Small Cap Growth
TimesSquare Capital Management, LLC
AMG Yacktman
AMG Yacktman Focused
AMG Yacktman Focused Fund - Security Selection Only
AMG Yacktman Special Opportunities
Yacktman Asset Management LP
FIXED INCOME FUNDS
AMG GW&K Core Bond ESG
AMG GW&K Enhanced Core Bond ESG
AMG GW&K Municipal Bond
AMG GW&K Municipal Enhanced Yield
GW&K Investment Management, LLC
OPEN-ARCHITECTURE FUNDS
EQUITY FUNDS
AMG Managers Brandywine
AMG Managers Brandywine Advisors Mid Cap Growth
AMG Managers Brandywine Blue
Friess Associates, LLC
AMG Managers Cadence Emerging Companies
AMG Managers Cadence Mid Cap
Cadence Capital Management LLC
AMG Managers CenterSquare Real Estate
CenterSquare Investment Management LLC
AMG Managers Emerging Opportunities
WEDGE Capital Management L.L.P.
Next Century Growth Investors LLC
RBC Global Asset Management (U.S.) Inc.
AMG Managers Fairpointe ESG Equity
AMG Managers Fairpointe Mid Cap
Fairpointe Capital LLC
AMG Managers LMCG Small Cap Growth
LMCG Investments, LLC
AMG Managers Montag & Caldwell Growth
Montag & Caldwell, LLC
AMG Managers Pictet International
Pictet Asset Management Limited
AMG Managers Silvercrest Small Cap
Silvercrest Asset Management Group LLC
AMG Managers Skyline Special Equities
Skyline Asset Management, L.P.
AMG Managers Special Equity
Ranger Investment Management, L.P.
Lord, Abbett & Co. LLC
Smith Asset Management Group, L.P.
Federated MDTA LLC
FIXED INCOME FUNDS
AMG Managers Doubleline Core Plus Bond
DoubleLine Capital LP
AMG Managers Global Income Opportunity
AMG Managers Loomis Sayles Bond
Loomis, Sayles & Company, L.P.
| | | | | | | | |
amgfunds.com | | | | 123119 | | | | AR009 | |
| | |
| | ANNUAL REPORT |
| | | | | | | | |
| | | AMG Funds | | |
| | | |
| | | December 31, 2019 | | |
| | | 
| | |
| | | |
| | | AMG GW&K Enhanced Core Bond ESG Fund | | |
| | | (formerly AMG GW&K Enhanced Core Bond Fund) | | |
| | | Class N: MFDAX | | Class I:MFDSX | | Class Z:MFDYX | | |
| | | |
| | | AMG GW&K Municipal Bond Fund | | |
| | | Class N: GWMTX | | Class I: GWMIX | | | | |
| | | |
| | | AMG GW&K Municipal Enhanced Yield Fund | | |
| | | Class N: GWMNX | | Class I: GWMEX | | Class Z: GWMZX | | |
| | | |
| | | AMG GW&K Small Cap Core Fund | | |
| | | Class N: GWETX | | Class I: GWEIX | | Class Z: GWEZX | | |
| | | |
| | | AMG GW&K Small/Mid Cap Fund | | |
| | | Class N: GWGVX | | Class I:GWGIX | | Class Z: GWGZX | | |
Beginning on January 1, 2021, as permitted by regulations adopted by the Securities and Exchange Commission, paper copies of the Funds’ shareholder reports like this one will no longer be sent by mail, unless you specifically request paper copies of the reports from the Funds or from your financial intermediary, such as a broker-dealer or bank. Instead, the reports will be made available on the Funds’ website (https://www.amgfunds.com/resources/order_literature.html), and you will be notified by mail each time a report is posted and provided with a website link to access the report.
If you already elected to receive shareholder reports electronically, you will not be affected by this change and you need not take any action. You may elect to receive shareholder reports and other communications from the Funds electronically at any time by contacting your financial intermediary or, if you invest directly with the Funds, by logging into your account at www.amgfunds.com.
You may elect to receive all future reports in paper free of charge. If you invest through a financial intermediary, you can contact your financial intermediary to request that you continue to receive paper copies of your shareholder reports. If you invest directly with the Funds, you can call 1.800.548.4539 to inform the Funds that you wish to continue receiving paper copies of your shareholder reports. Your election to receive reports in paper will apply to all funds in the AMG Funds Family of Funds held in your account if you invest through your financial intermediary or all funds in the AMG Funds Family of Funds held with the fund complex if you invest directly with the Funds.
| | | | | | | | |
| | | | |
| amgfunds.com | | | | 123119 | | | AR019 | |
| | |
| | | AMG Funds Annual Report — December 31, 2019 |
| | | | |
TABLE OF CONTENTS | | PAGE | |
LETTER TO SHAREHOLDERS | | | 2 | |
| |
ABOUT YOUR FUND’S EXPENSES | | | 3 | |
| |
PORTFOLIO MANAGER’S COMMENTS, FUND SNAPSHOTS AND SCHEDULES OF PORTFOLIO INVESTMENTS | | | | |
| |
AMG GW&K Enhanced Core Bond ESG Fund | | | 4 | |
| |
AMG GW&K Municipal Bond Fund | | | 13 | |
| |
AMG GW&K Municipal Enhanced Yield Fund | | | 21 | |
| |
AMG GW&K Small Cap Core Fund | | | 29 | |
| |
AMG GW&K Small/Mid Cap Fund | | | 35 | |
| |
FINANCIAL STATEMENTS | | | | |
| |
Statement of Assets and Liabilities | | | 40 | |
| |
Balance sheets, net asset value (NAV) per share computations and cumulative distributable earnings (loss) | | | | |
| |
Statement of Operations | | | 42 | |
| |
Detail of sources of income, expenses, and realized and unrealized gains (losses) during the fiscal year | | | | |
| |
Statements of Changes in Net Assets | | | 43 | |
| |
Detail of changes in assets for the past two fiscal years | | | | |
| |
Financial Highlights | | | 45 | |
| |
Historical net asset values per share, distributions, total returns, income and expense ratios, turnover ratios and net assets | | | | |
| |
Notes to Financial Statements | | | 59 | |
| |
Accounting and distribution policies, details of agreements and transactions with Fund management and affiliates, and descriptions of certain investment risks | | | | |
| |
REPORT OF INDEPENDENT REGISTERED PUBLIC ACCOUNTING FIRM | | | 68 | |
| |
OTHER INFORMATION | | | 69 | |
| |
TRUSTEES AND OFFICERS | | | 70 | |
Nothing contained herein is to be considered an offer, sale or solicitation of an offer to buy shares of any series of the AMG Funds Family of Funds. Such offering is made only by prospectus, which includes details as to offering price and other material information.
| | |
 | | Letter to Shareholders |
Dear Shareholder:
The U.S. bull market celebrated its10-year anniversary during the fiscal year ended December 31, 2019, as stocks proved resilient in the face of global economic weakness, rising geopolitical tensions, and the ongoing trade war. After a painful selloff in late 2018, a dovish pivot from global central banks rescued investors and fueled a strong rebound early in 2019. The rally picked up steam in the final months of the year, as trade tensions eased when the U.S. and China agreed to a limited “phase one” deal in December following months of tenseback-and-forth negotiations. The yield curve, which had inverted earlier in the year and raised investor anxiety given its track record for predicting an impending recession, was no longer inverted byyear-end as the U.S. Federal Reserve (the Fed) cut short-term rates. Worries over a near-term recession lifted while the yield curve steepened and trade developments improved, leading to a wave of investor confidence and strong equity returns, with the S&P 500® Index returning 31.49%. International equities were also resistant to pressures facing the global economy and generated a 21.51% return as measured by the MSCI All Country World ex USA Index.
In total, all eleven sectors of the S&P 500® Index were strongly positive during the prior twelve months, each producing double-digit returns. The higher growth information technology sector led the way with a 50.31% return while the communication services and financial sectors followed closely behind. Energy was the worst performing sector during the fiscal year, yet still produced a very respectable 11.81% return. Growth stocks outperformed Value stocks for the full fiscal year with returns of 36.39% and 26.54% for the Russell 1000® Growth and Russell 1000® Value Indexes, respectively. The cycle of U.S. outperformance over international equities continued but international developed and emerging markets still produced solid positive returns, with the MSCI EAFE and MSCI Emerging Markets Index returning 22.01% and 18.42%, respectively.
Interest rates fell dramatically over the fiscal year and led to strong returns for bond investors as the Fed shifted to a more dovish policy stance early in 2019 and eventually cut short-term rates three times during the year. The10-year Treasury yield fell from its recent high of 3.24% last November to a low of 1.47% in early September and then edged slightly higher to finish the year at 1.92%. The plunge in long-term interest rates caused the yield curve to briefly invert with2-year yields rising higher than the10-year yields. The Bloomberg Barclays U.S. Aggregate Bond Index, a broad measure of U.S. bond market performance, ended the fiscal year with an 8.72% return. High yield bonds outperformed the broader bond market and returned 14.32% as measured by the return of the Bloomberg Barclays U.S. Corporate High Yield Bond Index. Municipal bonds also performed strongly with a 7.54% return for the Bloomberg Barclays Municipal Bond Index.
AMG Funds appreciates the privilege of providing investment tools to you and your clients. Our foremost goal is to provide investment solutions that help our shareholders successfully reach their long-term investment goals. AMG Funds provides access to a distinctive array of actively managed return-oriented investment strategies. We thank you for your continued confidence and investment in AMG Funds. You can rest assured that under all market conditions our team is focused on delivering excellent investment management services for your benefit.
Respectfully,
Keitha Kinne
President
AMG Funds
| | | | | | | | | | | | | | |
Average Annual Total Returns | | Periods ended
December 31, 2019* | |
Stocks: | | | | 1 Year | | | 3 Years | | | 5 Years | |
Large Cap | | (S&P 500® Index) | | | 31.49 | % | | | 15.27 | % | | | 11.70 | % |
Small Cap | | (Russell 2000® Index) | | | 25.52 | % | | | 8.59 | % | | | 8.23 | % |
International | | (MSCI All Country World ex USA Index) | | | 21.51 | % | | | 9.87 | % | | | 5.51 | % |
| | | | | | | | | | | | | | |
| | | | |
Bonds: | | | | | | | | | | | | | | |
Investment Grade | | (Bloomberg Barclays U.S. Aggregate Bond Index) | | | 8.72 | % | | | 4.03 | % | | | 3.05 | % |
High Yield | | (Bloomberg Barclays U.S. Corporate High Yield Bond Index) | | | 14.32 | % | | | 6.37 | % | | | 6.13 | % |
Tax-exempt | | (Bloomberg Barclays Municipal Bond Index) | | | 7.54 | % | | | 4.72 | % | | | 3.53 | % |
Treasury Bills | | (ICE BofAML U.S.6-Month Treasury Bill Index) | | | 2.57 | % | | | 1.81 | % | | | 1.26 | % |
| | | | | | | | | | | | | | |
| * | Source: FactSet. Past performance is no guarantee of future results. |
2
| | |
| | | About Your Fund’s Expenses |
As a shareholder of a Fund, you may incur two types of costs: (1) transaction costs, which may include sales charges (loads) on purchase payments; redemption fees; and exchange fees; and (2) ongoing costs, including management fees; distribution(12b-1) fees; and other Fund expenses. This example is intended to help you understand your ongoing costs (in dollars) of investing in the Fund and to compare these costs with the ongoing costs of investing in other mutual funds. The example is based on $1,000 invested at the beginning of the period and held for the entire period as indicated below.
ACTUAL EXPENSES
The first line of the following table provides information about the actual account values and
actual expenses. You may use the information in this line, together with the amount you invested, to estimate the expenses that you paid over the period. Simply divide your account value by $1,000 (for example, an $8,600 account value divided by $1,000 = 8.6), then multiply the result by the number in the first line under the heading entitled “Expenses Paid During Period” to estimate the expenses you paid on your account during this period.
HYPOTHETICAL EXAMPLE FOR COMPARISON PURPOSES
The second line of the following table provides information about hypothetical account values and hypothetical expenses based on the Fund’s actual expense ratio and an assumed annual rate of return of 5% before expenses, which is not the Fund’s
actual return. The hypothetical account values and expenses may not be used to estimate the actual ending account balance or expenses you paid for the period. You may use this information to compare the ongoing costs of investing in the Fund and other funds by comparing this 5% hypothetical example with the 5% hypothetical examples that appear in the shareholder reports of other funds.
Please note that the expenses shown in the table are meant to highlight your ongoing costs only and do not reflect any transactional costs, such as sales charges (loads), redemption fees, or exchange fees. Therefore, the second line of the table is useful in comparing ongoing costs only, and will not help you determine the relative total costs of owning different funds.
| | | | | | | | | | | | | | | | |
Six Months Ended December 31, 2019 | | Expense
Ratio for
the Period | | | Beginning
Account
Value
07/01/19 | | | Ending
Account
Value
12/31/19 | | | Expenses
Paid
During
the Period* | |
AMG GW&K Enhanced Core Bond ESG Fund | |
Based on Actual Fund Return | |
Class N | | | 0.73 | % | | $ | 1,000 | | | $ | 1,027 | | | $ | 3.73 | |
Class I | | | 0.55 | % | | $ | 1,000 | | | $ | 1,028 | | | $ | 2.81 | |
Class Z | | | 0.48 | % | | $ | 1,000 | | | $ | 1,028 | | | $ | 2.45 | |
| | | | | | | | | | | | | | | | |
Based on Hypothetical 5% Annual Return | |
Class N | | | 0.73 | % | | $ | 1,000 | | | $ | 1,022 | | | $ | 3.72 | |
Class I | | | 0.55 | % | | $ | 1,000 | | | $ | 1,022 | | | $ | 2.80 | |
Class Z | | | 0.48 | % | | $ | 1,000 | | | $ | 1,023 | | | $ | 2.45 | |
AMG GW&K Municipal Bond Fund | |
Based on Actual Fund Return | | | | | |
Class N | | | 0.71 | % | | $ | 1,000 | | | $ | 1,018 | | | $ | 3.61 | |
Class I | | | 0.39 | % | | $ | 1,000 | | | $ | 1,019 | | | $ | 1.98 | |
| | | | | | | | | | | | | | | | |
Based on Hypothetical 5% Annual Return | |
Class N | | | 0.71 | % | | $ | 1,000 | | | $ | 1,022 | | | $ | 3.62 | |
Class I | | | 0.39 | % | | $ | 1,000 | | | $ | 1,023 | | | $ | 1.99 | |
AMG GW&K Municipal Enhanced Yield Fund | |
Based on Actual Fund Return | |
Class N | | | 0.99 | % | | $ | 1,000 | | | $ | 1,030 | | | $ | 5.07 | |
Class I | | | 0.64 | % | | $ | 1,000 | | | $ | 1,032 | | | $ | 3.28 | |
Class Z | | | 0.59 | % | | $ | 1,000 | | | $ | 1,032 | | | $ | 3.02 | |
| | | | | | | | | | | | | | | | |
Based on Hypothetical 5% Annual Return | | | | | |
Class N | | | 0.99 | % | | $ | 1,000 | | | $ | 1,020 | | | $ | 5.04 | |
Class I | | | 0.64 | % | | $ | 1,000 | | | $ | 1,022 | | | $ | 3.26 | |
Class Z | | | 0.59 | % | | $ | 1,000 | | | $ | 1,022 | | | $ | 3.01 | |
| | | | | | | | | | | | | | | | |
| | | | | | | | | | | | | | | | |
Six Months Ended December 31, 2019 | | Expense
Ratio for
the Period | | | Beginning
Account
Value
07/01/19 | | | Ending
Account
Value
12/31/19 | | | Expenses
Paid
During
the Period* | |
AMG GW&K Small Cap Core Fund | |
Based on Actual Fund Return | |
Class N | | | 1.30 | % | | $ | 1,000 | | | $ | 1,097 | | | $ | 6.87 | |
Class I | | | 0.95 | % | | $ | 1,000 | | | $ | 1,099 | | | $ | 5.03 | |
Class Z | | | 0.90 | % | | $ | 1,000 | | | $ | 1,099 | | | $ | 4.76 | |
| | | | | | | | | | | | | | | | |
Based on Hypothetical 5% Annual Return | |
Class N | | | 1.30 | % | | $ | 1,000 | | | $ | 1,019 | | | $ | 6.61 | |
Class I | | | 0.95 | % | | $ | 1,000 | | | $ | 1,020 | | | $ | 4.84 | |
Class Z | | | 0.90 | % | | $ | 1,000 | | | $ | 1,021 | | | $ | 4.58 | |
AMG GW&K Small/Mid Cap Fund | |
Based on Actual Fund Return | |
Class N | | | 1.10 | % | | $ | 1,000 | | | $ | 1,080 | | | $ | 5.77 | |
Class I | | | 0.95 | % | | $ | 1,000 | | | $ | 1,081 | | | $ | 4.98 | |
Class Z | | | 0.85 | % | | $ | 1,000 | | | $ | 1,081 | | | $ | 4.46 | |
| | | | | | | | | | | | | | | | |
Based on Hypothetical 5% Annual Return | |
Class N | | | 1.10 | % | | $ | 1,000 | | | $ | 1,020 | | | $ | 5.60 | |
Class I | | | 0.95 | % | | $ | 1,000 | | | $ | 1,020 | | | $ | 4.84 | |
Class Z | | | 0.85 | % | | $ | 1,000 | | | $ | 1,021 | | | $ | 4.33 | |
| | | | | | | | | | | | | | | | |
| * | Expenses are equal to the Fund’s annualized expense ratio multiplied by the average account value over the period, multiplied by the number of days in the most recent fiscal half-year (184), then divided by 365. |
3
| | |
| | | AMG GW&K Enhanced Core Bond ESG Fund Portfolio Manager’s Comments(unaudited) |
THE YEAR IN REVIEW
AMG GW&K Enhanced Core Bond ESG Fund (Class N shares) (the “Fund”) returned 10.35% for the year ended December 31, 2019, compared to the return of 8.72% for the Bloomberg Barclays U.S. Aggregate Bond Index (the Index).
OVERVIEW
On May 1, 2019, the AMG GW&K Enhanced Core Bond Fund changed its name to the AMG GW&K Enhanced Core Bond ESG Fund (the “Fund”). While the Fund’s overall investment process remains the same, the Fund transitioned to having an environmental, social, and governance (ESG) mandate.
GW&K Investment Management, LLC (“GW&K”) believes that responsible corporate behavior with respect to ESG factors can lead to positive and sustainable long-term financial performance and aligns with our pursuit of quality investments. GW&K has been incorporating ESG factors into our equity and fixed income analysis process for several years, and as a signatory of the U.N. Principles for Responsible Investment, we are committed to incorporating the assessment of ESG issues into our fundamental research process. We believe ESG investing adds value to our investment process by improving our assessment of risk and enhancing our ability to identify high quality credits; aids ourup-in-quality bias by improving identification of credits with less long-term volatility; limits our exposure to credit ratings downgrades and negative events that are difficult to quantify; and deepens our fundamental credit analysis, which leads to better outcomes by providing a more nuanced and complete picture.
ESG considerations have long informed our process. We focus on business and credit fundamentals, relative valuation, and technical considerations. We believe ESG factors are important considerations in analyzing a company’s business and financial policy, highlightnon-financial risks that can significantly affect a company’s financial health over the long term, and just as with credit risks, investors require additional compensation for ESG risks, leading to potential inefficiencies in valuation.
MARKET OVERVIEW
Fixed income markets started 2019 on a strong note, helped by the unusual combination of a sharp rally in rates and a significant tightening in spreads. The U.S. Federal Reserve’s (the “Fed”) reduced growth outlook and dovish posture were the major drivers of the yield curve’s downward shift, reflecting softening
U.S. economic data and renewed growth concerns out of Europe and China. Risk assets proved to be largely immune to these worries, benefiting instead from a fierce snap back in sentiment following a brutal fourth quarter. Corporates were also helped by a better-than-expected earnings season and a favorable technical backdrop. The rising tension between these competingrisk-on/risk-off narratives underscores the high degree of investor uncertainty as the cycle continues to age, and we viewed volatility as likely to remain elevated until a clearer picture of the economy emerges.
Having benefited from a second straight quarter of lower rates and tighter spreads, fixed income markets posted their strongest first-half returns in almost 25 years through June. Escalating trade rhetoric, decelerating industrial activity, and rising geopolitical tensions stoked concerns of a worldwide recession and drove a global flight to safety. In response, central banks around the world made clear their willingness to move forward with caution—if not provide outright stimulus as conditions warrant. In the U.S., this shift resulted in a massive collapse of the yield curve, driven by the perception that the Federal Open Market Committee (FOMC) had capitulated by removing the word “patient” from its post-meeting statement. This move had the perverse effect of both validating the risk aversion that drove the rally in rates and emboldening investors in risky assets, who promptly sent equities back to record highs.
Fixed income markets endured a volatile third quarter amid the tumult of the trade war, mounting evidence of a global slowdown, and an increase in political tensions in the U.S. and abroad. Trade negotiations between the U.S. and China were the primary cause of uncertainty, as rhetoric escalated dramatically before calming in the closing days on hopes that tensions might be easing. This turmoil coincided with further signs of deterioration out of Europe, where both Germany and the U.K. posted negative Gross Domestic Product (GDP) readings. Against this already challenging backdrop, several other narratives weighed on investor sentiment: Saudi Arabia sustained an attack on its crude infrastructure, the overnight funding market required emergency intervention from the Fed, and talks of an impeachment inquiry began to gain traction.
The fourth quarter saw a sharp turn in sentiment across fixed income markets that led to a selloff in interest rates and further tightening in credit spreads. The primary catalyst for the reversal was
the completion of a “phase one” trade agreement between the U.S. and China, though positive signs from the labor market and evidence of stability in global manufacturing lifted sentiment as well. Additionally, the Fed made it clear that tightening was effectively out of the question until the committee sees meaningful evidence of inflation, suggesting monetary policy is likely to remain accommodative indefinitely. By year end, worries of a tradewar-inspired global slowdown or a central bank-induced liquidity crisis had been replaced with talk of green shoots, inflection points, and the recession that never was.
FUND REVIEW
The Fund’s overweight to investment grade corporates, which performed stronger than other bond sectors within the Index, was a significant contributor to performance. For theone-year period ending December 2019, interest rates decreased, and the investment grade corporate sector outperformed due to its longer duration and 60 basis points of spread tightening. Positive security selection within investment grade corporates also contributed to performance during theone-year period. Corporate selection in the consumernon-cyclical and banking sectors were notable positives, while selection in communications and finance companies detracted. The Fund’sout-of-benchmark allocation to high yield also added to returns, as the sector outperformed on the back of 190 basis points of spread narrowing. Treasuries were modest underperformers versus the Index, thus our underweight was helpful. We had a modest overweight to mortgage-backed securities and commercial mortgage-backed securities, and with both segments lagging the Index somewhat, the allocation effect was moderately negative. Overall security selection in the mortgage space was positive. We overweighed taxable municipal bonds, a sector that benefited due to the decrease in rates and a contraction in spreads, although security selection within the space was neutral. The Fund’s overall yield curve positioning added to performance with the Fund’s slightly longer duration in the falling rate environment and modest underweight to the long end, where yields fell the least.
OUTLOOK
Even though rates have rebounded solidly from their September lows and the yield curve has regained a healthy steepness, we continue to see room for rates—particularly at the long end—to drift higher. An extended period of accommodation from the Fed seems likely, given subdued inflationary pressure and the signaling that policy is in a “good place.”
4
| | |
| | | AMG GW&K Enhanced Core Bond ESG Fund Portfolio Manager’s Comments(continued) |
Major geopolitical overhangs have lifted, at least temporarily, and the recent drag from the trade war should abate and put the economy on sturdier footing in 2020. We recognize that pockets of uncertainty remain, but recent trends seem likely to continue. While our Strategies’ durations are essentially neutral to their benchmarks, we are expressing our view of rates by favoring intermediate maturities to capture the carry and roll.
We continue to see value in spread product. In addition to the relief we expect across the economy from the signing of a phase one trade deal, our outlook for corporate profits is constructive and we believe credit offers an attractive alternative to Treasuries. We acknowledge that spreads have tightened significantly in recent months and sit just wide of cycle tights, so we are being opportunistic in shifting toward less-cyclical and higher-quality
names. We also see notable value in the mortgage space, where recent refinancing worries have caused a defensive shift toward specified pools, giving us an opportunity to move into some lowerpay-up, less-seasoned cohorts.
This commentary reflects the viewpoints of GW&K Investment Management, LLC and is not intended as a forecast or guarantee of future results.
5
| | |
| | | AMG GW&K Enhanced Core Bond ESG Fund Portfolio Manager’s Comments(continued) |
CUMULATIVE TOTAL RETURN PERFORMANCE
AMG GW&K Enhanced Core Bond ESG Fund’s cumulative total return is based on the daily change in net asset value (NAV), and assumes that all dividends and distributions were reinvested. The graph compares a hypothetical $10,000 investment made in the AMG GW&K Enhanced Core Bond ESG Fund’s Class N shares on December 31, 2009, to a $10,000 investment made in the Bloomberg Barclays U.S. Aggregate Bond Index for the same time period. The graph and table do not reflect the deduction of taxes that a shareholder would pay on a Fund distribution or redemption of shares. The listed returns for the Fund are net of expenses and the returns for the index exclude expenses. Total returns would have been lower had certain expenses not been reduced.
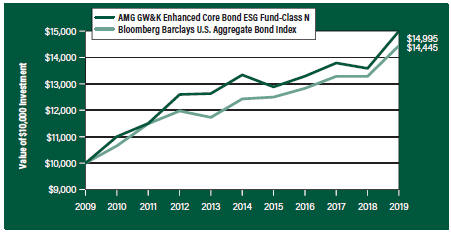
The table below shows the average annual total returns for the AMG GW&K Enhanced Core Bond ESG Fund and the Bloomberg Barclays U.S. Aggregate Bond Index for the same time periods ended December 31, 2019.
| | | | | | | | | | | | | | | | | | | | |
| Average Annual Total Returns1 | | One
Year | | | Five
Years | | | Ten
Years | | | Since
Inception | | | Inception
Date | |
AMG GW&K Enhanced Core Bond ESG Fund2,3, 4, 5, 6, 7, 8 | |
Class N | | | 10.35 | % | | | 2.37 | % | | | 4.13 | % | | | 5.31 | % | | | 01/02/97 | |
Class I | | | 10.51 | % | | | 2.54 | % | | | — | | | | 2.70 | % | | | 11/30/12 | |
Class Z | | | 10.59 | % | | | 2.62 | % | | | 4.39 | % | | | 5.69 | % | | | 01/02/97 | |
| | | | | | | | | | | | | | | | | | | | |
Bloomberg Barclays U.S. Aggregate Bond Index9 | | | 8.72 | % | | | 3.05 | % | | | 3.75 | % | | | 5.14 | % | | | 01/02/97 | † |
| | | | | | | | | | | | | | | | | | | | |
The performance data shown represents past performance. Past performance is not a guarantee of future results. Current performance may be lower or higher than the performance data quoted. The investment return and principal value of an investment will fluctuate so that an investor’s shares, when redeemed, may be worth more or less than their original cost.
Investors should carefully consider the Fund’s investment objectives, risks, charges and expenses before investing. For performance information through the most recent month end, current net asset values per share for the Fund and other information, please call 800.548.4539 or visit our website at amgfunds.com for a free prospectus. Read it carefully before investing or sending money.
Distributed by AMG Distributors, Inc., member FINRA/SIPC.
| † | Date reflects the inception date of the Fund, not the index. |
| 1 | Total return equals income yield plus share price change and assumes reinvestment of all dividends and capital gain distributions. Returns are net of fees and may reflect offsets of Fund expenses as described in the prospectus. No adjustment has been made for taxes payable by shareholders on their reinvested dividends and |
| | capital gain distributions. Returns for periods greater than one year are annualized. The listed returns on the Fund are net of expenses and based on the published NAV as of December 31, 2019. All returns are in U.S. dollars ($). |
| 2 | From time to time, the Fund’s advisor has waived its fees and/or absorbed Fund expenses, which has resulted in higher returns. |
| 3 | The Fund is subject to the risks associated with investments in debt securities, such as default risk and fluctuations in the perception of the debtor’s ability to pay its creditors. Changing interest rates may adversely affect the value of an investment. An increase in interest rates typically causes the value of bonds and other fixed income securities to fall. |
| 4 | To the extent that the Fund invests in asset-backed or mortgage-backed securities, its exposure to prepayment and extension risks may be greater than investments in other fixed income securities. |
| 5 | High-yield bonds (also known as “junk bonds”) may be subject to greater levels of interest rate, credit, and liquidity risk than investments in higher rated securities. These securities are considered predominantly speculative with respect to the issuer’s continuing ability to make principal and interest payments. The issuers of the Fund’s holdings may be involved in bankruptcy proceedings, reorganizations, or financial restructurings, and are not as strong financially as higher-rated issuers. |
| 6 | Investments in international securities are subject to certain risks of overseas investing including currency fluctuations and changes in political and economic conditions, which could result in significant market fluctuations. These risks are magnified in emerging markets. |
| 7 | Obligations of certain government agencies are not backed by the full faith and credit of the U.S. government. If one of these agencies defaulted on a loan, there is no guarantee that the U.S. government would provide financial support. Additionally, debt securities of the U.S. government may be affected by changing interest rates and subject to prepayment risk. |
6
| | |
| | | AMG GW&K Enhanced Core Bond ESG Fund Portfolio Manager’s Comments(continued) |
| 8 | Applying the Fund’s ESG investment criteria may result in the selection or exclusion of securities of certain issuers for reasons other than performance, and the Fund may underperform funds that do not utilize an ESG investment strategy. The application of this strategy may affect the Fund’s exposure to certain companies, sectors, regions, countries or types of investments, which could negatively impact the Fund’s performance depending on whether such investments are in or out of favor. Applying ESG criteria to investment decisions is qualitative and subjective by nature, and there is no guarantee that the criteria utilized by the Subadviser or any judgment exercised by the Subadviser will reflect the beliefs or values of any particular investor. |
| 9 | The Bloomberg Barclays U.S. Aggregate Bond Index is an index of the U.S. investment-grade fixed-rate bond market, including both government and corporate bonds. Unlike the Fund, the Bloomberg Barclays U.S. Aggregate Bond Index is unmanaged, is not available for investment and does not incur expenses. |
Bloomberg Index Services Limited. BLOOMBERG® is a trademark and service mark of Bloomberg Finance L.P. and its affiliates (collectively “Bloomberg”). BARCLAYS® is a trademark and service mark of Barclays Bank Plc (collectively with its affiliates, “Barclays”), used under license. Bloomberg or
Bloomberg’s licensors, including Barclays, own all proprietary rights in the Bloomberg Barclays Indices. Neither Bloomberg nor Barclays approves or endorses this material, or guarantees the accuracy or completeness of any information herein, or makes any warranty, express or implied, as to the results to be obtained therefrom and, to the maximum extent allowed by law, neither shall have any liability or responsibility for injury or damages arising in connection therewith
Not FDIC insured, nor bank guaranteed. May lose value.
7
| | |
| | | AMG GW&K Enhanced Core Bond ESG Fund Fund Snapshots(unaudited) December 31, 2019 |
| | | | |
| PORTFOLIO BREAKDOWN | | | | |
Category | | % of
Net Assets | |
Corporate Bonds and Notes | | | 49.5 | |
U.S. Government and Agency Obligations | | | 41.5 | |
Municipal Bonds | | | 7.8 | |
Short-Term Investments | | | 3.9 | |
Other Assets Less Liabilities | | | (2.7 | ) |
| | | | |
Rating | | % of
Market Value1 | |
U.S. Government and Agency Obligations | | | 42.0 | |
Aaa/AAA | | | 0.5 | |
Aa/AA | | | 11.5 | |
A | | | 13.6 | |
Baa/BBB | | | 19.5 | |
Ba/BB | | | 12.9 | |
| 1 | Includes market value of long-term fixed-income securities only. |
| | | | |
| TOP TEN HOLDINGS | | | | |
Security Name | | % of
Net Assets | |
FNMA, 4.000%, 10/01/43 | | | 7.2 | |
FNMA, 4.500%, 04/01/41 | | | 5.2 | |
United States Treasury Bonds, 4.500%, 02/15/36 | | | 3.8 | |
FHLMC Gold Pool, 5.000%, 10/01/36 | | | 3.2 | |
FNMA, 4.000%, 12/01/33 | | | 2.7 | |
FNMA, 3.500%, 11/01/42 | | | 2.5 | |
FNMA, 4.500%, 05/01/39 | | | 2.4 | |
California State General Obligation, School Improvements, 7.550%, 04/01/39 | | | 2.1 | |
FHLMC Multifamily Structured Pass Through Certificates, Series K071, Class A2, 3.286%, 11/25/27 | | | 1.9 | |
FNMA, 3.500%, 03/01/46 | | | 1.7 | |
| | | | |
Top Ten as a Group | | | 32.7 | |
| | | | |
Credit quality ratings shown above reflect the highest rating assigned by either Standard & Poor’s (“S&P”), Moody’s Investors Service, Inc. (“Moody’s”) or Fitch. These rating agencies are independent, nationally recognized statistical rating organizations and are widely used. Investment grade ratings are credit ratings of BBB/Baa or higher. Below investment grade ratings are credit ratings of BB/Ba or lower. Investments designated N/R are not rated by either rating agency. Unrated investments do not necessarily indicate low credit quality. Credit quality ratings are subject to change.
Because a fund’s strategy may result in multiple investments in particular sectors of the economy, its performance may depend on the performance of those sectors and may fluctuate more widely than investments diversified across more sectors. For additional information on these and other risk considerations, please see the Fund’s prospectus.
Any sectors, industries, or securities discussed should not be perceived as investment recommendations. Mention of a specific security should not be considered a recommendation to buy or solicitation to sell that security. Specific securities mentioned in this report may have been sold from the Fund’s portfolio of investments by the time you receive this report.
8
| | |
| | | AMG GW&K Enhanced Core Bond ESG Fund Schedule of Portfolio Investments December 31, 2019 |
| | | | | | | | |
| | | Principal
Amount | | | Value | |
Corporate Bonds and Notes - 49.5% | | | | | |
Financials - 16.3% | | | | | | | | |
Aircastle, Ltd.
5.000%, 04/01/23 | | $ | 301,000 | | | $ | 322,133 | |
Ally Financial, Inc.
8.000%, 11/01/31 | | | 237,000 | | | | 329,418 | |
American Tower Corp.
4.400%, 02/15/26 | | | 302,000 | | | | 329,805 | |
Boston Properties, LP
3.400%, 06/21/29 | | | 313,000 | | | | 327,454 | |
CIT Group, Inc.
6.125%, 03/09/28 | | | 280,000 | | | | 331,197 | |
Crown Castle International Corp.
4.300%, 02/15/291 | | | 300,000 | | | | 332,797 | |
CyrusOne LP / CyrusOne Finance Corp.
3.450%, 11/15/29 | | | 327,000 | | | | 328,501 | |
Equinix, Inc.
3.200%, 11/18/29 | | | 325,000 | | | | 326,810 | |
The Goldman Sachs Group, Inc.
3.500%, 11/16/26 | | | 474,000 | | | | 499,230 | |
Host Hotels & Resorts, LP Series C
4.750%, 03/01/23 | | | 298,000 | | | | 318,296 | |
Iron Mountain US Holdings, Inc.
5.375%, 06/01/262 | | | 161,000 | | | | 168,703 | |
JPMorgan Chase & Co.
2.950%, 10/01/26 | | | 314,000 | | | | 323,865 | |
MGM Resorts International
7.750%, 03/15/22 | | | 293,000 | | | | 328,315 | |
Morgan Stanley, GMTN (3 month LIBOR + 1.628%)
4.431%, 01/23/303 | | | 441,000 | | | | 499,182 | |
National Rural Utilities Cooperative Finance Corp., MTN
3.250%, 11/01/25 | | | 310,000 | | | | 327,332 | |
Visa, Inc.
4.300%, 12/14/45 | | | 289,000 | | | | 355,768 | |
Total Financials | | | | | | | 5,448,806 | |
Industrials - 32.2% | | | | | | | | |
The ADT Security Corp.
6.250%, 10/15/21 | | | 149,000 | | | | 157,466 | |
Advocate Health & Hospitals Corp.
3.829%, 08/15/28 | | | 300,000 | | | | 326,474 | |
AECOM
5.875%, 10/15/24 | | | 294,000 | | | | 325,980 | |
AT&T, Inc.
4.250%, 03/01/27 | | | 304,000 | | | | 334,170 | |
Ball Corp.
4.875%, 03/15/26 | | | 152,000 | | | | 165,201 | |
| | | | | | | | |
| | | Principal
Amount | | | Value | |
CDW LLC / CDW Finance Corp. | | | | | | | | |
5.000%, 09/01/25 | | $ | 25,000 | | | $ | 26,177 | |
5.500%, 12/01/241 | | | 276,000 | | | | 306,936 | |
Charter Communications Operating LLC / Charter Communications Operating Capital
4.908%, 07/23/25 | | | 299,000 | | | | 329,492 | |
Cheniere Corpus Christi Holdings LLC
5.125%, 06/30/271 | | | 300,000 | | | | 332,109 | |
Comcast Corp.
4.150%, 10/15/28 | | | 436,000 | | | | 491,479 | |
CommonSpirit Health
3.347%, 10/01/29 | | | 327,000 | | | | 329,658 | |
Crown Americas LLC / Crown Americas Capital Corp. IV
4.500%, 01/15/23 | | | 238,000 | | | | 250,790 | |
Crown Americas LLC / Crown Americas Capital Corp. V
4.250%, 09/30/26 | | | 77,000 | | | | 80,973 | |
CVS Health Corp.
5.125%, 07/20/45 | | | 280,000 | | | | 332,692 | |
Dell, Inc.
7.100%, 04/15/281 | | | 135,000 | | | | 161,372 | |
Elanco Animal Health, Inc.
4.900%, 08/28/28 | | | 305,000 | | | | 332,172 | |
Fidelity National Information Services, Inc. Series 10Y
4.250%, 05/15/28 | | | 298,000 | | | | 334,304 | |
The George Washington University Series 2018
4.126%, 09/15/48 | | | 461,000 | | | | 532,918 | |
HCA, Inc.
5.375%, 02/01/25 | | | 297,000 | | | | 329,051 | |
Hilton Domestic Operating Co, Inc.
4.250%, 09/01/24 | | | 317,000 | | | | 323,868 | |
Kaiser Foundation Hospitals
3.150%, 05/01/27 | | | 319,000 | | | | 333,513 | |
Kinder Morgan, Inc.
4.300%, 03/01/28 | | | 300,000 | | | | 327,390 | |
Lennar Corp.
4.750%, 05/30/25 | | | 154,000 | | | | 165,871 | |
McDonald’s Corp., MTN
3.700%, 01/30/26 | | | 302,000 | | | | 326,111 | |
Microsoft Corp.
3.750%, 02/12/45 | | | 146,000 | | | | 166,285 | |
Murphy Oil USA, Inc.
5.625%, 05/01/27 | | | 150,000 | | | | 161,302 | |
Netflix, Inc.
4.375%, 11/15/26 | | | 155,000 | | | | 159,162 | |
Newell Brands, Inc.
4.200%, 04/01/264 | | | 318,000 | | | | 331,859 | |
The accompanying notes are an integral part of these financial statements.
9
| | |
| | | AMG GW&K Enhanced Core Bond ESG Fund Schedule of Portfolio Investments(continued) |
| | | | | | | | |
| | | Principal
Amount | | | Value | |
Industrials - 32.2%(continued) | | | | | |
Nokia Oyj (Finland) 4.375%, 06/12/27 | | $ | 162,000 | | | $ | 169,185 | |
Northrop Grumman Corp. 3.200%, 02/01/27 | | | 327,000 | | | | 340,613 | |
NuStar Logistics, LP 6.750%, 02/01/21 | | | 157,000 | | | | 163,343 | |
Parker-Hannifin Corp. 3.250%, 06/14/29 | | | 318,000 | | | | 332,893 | |
PulteGroup, Inc. | | | | | | | | |
5.000%, 01/15/27 | | | 147,000 | | | | 160,424 | |
5.500%, 03/01/26 | | | 145,000 | | | | 162,374 | |
RELX Capital, Inc.
4.000%, 03/18/29 | | | 305,000 | | | | 331,558 | |
T-Mobile USA, Inc., Contingent Value Bond 0.000%, *,5,6 | | | 207,000 | | | | 0 | |
Toll Brothers Finance Corp. 4.375%, 04/15/23 | | | 154,000 | | | | 161,379 | |
Twitter, Inc.
3.875%, 12/15/271,2 | | | 165,000 | | | | 165,327 | |
United Rentals North America, Inc. 6.500%, 12/15/26 | | | 150,000 | | | | 165,137 | |
Verizon Communications, Inc. 3.875%, 02/08/29 | | | 297,000 | | | | 327,897 | |
Waste Management, Inc. 3.450%, 06/15/29 | | | 306,000 | | | | 327,985 | |
WESCO Distribution, Inc. 5.375%, 06/15/241 | | | 155,000 | | | | 161,264 | |
Total Industrials | | | | | | | 10,744,154 | |
Utilities - 1.0% | | | | | | | | |
Northern States Power Co. 2.900%, 03/01/50 | | | 339,000 | | | | 324,828 | |
Total Corporate Bonds and Notes
(Cost $15,887,334) | | | | | | | 16,517,788 | |
Municipal Bonds - 7.8% | | | | | | | | |
California State General Obligation, School Improvements
7.550%, 04/01/39 | | | 430,000 | | | | 690,563 | |
County of Miami-Dade FL Aviation Revenue, Series C 4.280%, 10/01/41 | | | 460,000 | | | | 492,862 | |
JobsOhio Beverage System, Series B 3.985%, 01/01/29 | | | 295,000 | | | | 320,520 | |
JobsOhio Beverage System, Series B 4.532%, 01/01/35 | | | 5,000 | | | | 5,866 | |
Los Angeles Unified School District, School Improvements 5.750%, 07/01/34 | | | 370,000 | | | | 474,285 | |
| | | | | | | | |
| | | Principal
Amount | | | Value | |
Metropolitan Transportation Authority, Transit Improvement 6.668%, 11/15/39 | | $ | 220,000 | | | $ | 312,602 | |
University of California, University & College Improvements, Series BD 3.349%, 07/01/29 | | | 305,000 | | | | 324,825 | |
Total Municipal Bonds
(Cost $2,485,411) | | | | | | | 2,621,523 | |
U.S. Government and Agency Obligations - 41.5% | | | | | | | | |
Fannie Mae - 25.6% | | | | | | | | |
FNMA | | | | | | | | |
3.000%, 06/01/34 to 03/01/47 | | | 741,159 | | | | 762,233 | |
3.500%, 11/01/42 to 03/01/46 | | | 1,315,730 | | | | 1,387,589 | |
4.000%, 12/01/33 to 10/01/43 | | | 3,091,362 | | | | 3,296,038 | |
4.500%, 05/01/39 to 04/01/41 | | | 2,573,485 | | | | 2,790,499 | |
5.000%, 11/01/43 | | | 255,661 | | | | 281,860 | |
Total Fannie Mae | | | | | | | 8,518,219 | |
Freddie Mac - 10.4% | | | | | | | | |
FHLMC
2.500%, 10/01/34 to 11/01/34 | | | 576,049 | | | | 583,649 | |
FHLMC Gold Pool | | | | | | | | |
3.000%, 01/01/43 | | | 352,866 | | | | 363,882 | |
3.500%, 02/01/30 to 05/01/44 | | | 477,066 | | | | 500,214 | |
5.000%, 10/01/36 | | | 953,030 | | | | 1,051,622 | |
FHLMC Multifamily Structured Pass Through Certificates | | | | | | | | |
Series K071, Class A2 3.286%, 11/25/27 | | | 611,000 | | | | 650,895 | |
Series K076, Class A2 3.900%, 04/25/28 | | | 291,000 | | | | 322,261 | |
Total Freddie Mac | | | | | | | 3,472,523 | |
U.S. Treasury Obligations - 5.5% | | | | | | | | |
United States Treasury Bonds | | | | | | | | |
3.500%, 02/15/39 | | | 193,000 | | | | 231,777 | |
4.500%, 02/15/36 | | | 966,000 | | | | 1,282,874 | |
United States Treasury Notes 6.250%, 08/15/23 | | | 283,000 | | | | 328,938 | |
Total U.S. Treasury Obligations | | | | | | | 1,843,589 | |
Total U.S. Government and Agency Obligations
(Cost $13,560,522) | | | | | | | 13,834,331 | |
Short-Term Investments - 3.9% | | | | | | | | |
Joint Repurchase Agreements - 3.9%7 | | | | | | | | |
Citadel Securities LLC, dated 12/31/19, due 01/02/20, 1.600% total to be received $285,669 (collateralized by various U.S. Treasuries, 0.000% - 8.500%, 01/15/20 - 11/15/48, totaling $291,383) | | | 285,644 | | | | 285,644 | |
The accompanying notes are an integral part of these financial statements.
10
| | |
| | | AMG GW&K Enhanced Core Bond ESG Fund Schedule of Portfolio Investments(continued) |
| | | | | | | | |
| | | Principal
Amount | | | Value | |
Joint Repurchase Agreements - 3.9%7(continued) | | | | | | | | |
RBC Dominion Securities, Inc., dated 12/31/19, due 01/02/20, 1.570% total to be received $1,000,087 (collateralized by various U.S. Government Agency Obligations and U.S. Treasuries, 0.000% - 6.500%, 06/30/21 -12/01/49, totaling $1,020,000) | | $ | 1,000,000 | | | $ | 1,000,000 | |
Total Joint Repurchase Agreements | | | | | | | 1,285,644 | |
| | |
| | | Shares | | | | |
Other Investment Companies - 0.0%# | | | | | | | | |
Dreyfus Government Cash Management Fund, Institutional Shares, 1.51%8 | | | 3,831 | | | | 3,831 | |
Dreyfus Institutional Preferred Government Money Market Fund, Institutional Shares,
1.55%8 | | | 3,830 | | | | 3,830 | |
JPMorgan U.S. Government Money Market Fund, IM Shares, 1.53%8 | | | 3,947 | | | | 3,947 | |
Total Other Investment Companies | | | | | | | 11,608 | |
Total Short-Term Investments
(Cost $1,297,252) | | | | | | | 1,297,252 | |
| | | | | | | | |
| | | | | |
Value | |
Total Investments - 102.7%
(Cost $33,230,519) | | | | | | $ | 34,270,894 | |
Other Assets, less Liabilities - (2.7)% | | | | | | | (909,822 | ) |
Net Assets - 100.0% | | | | | | $ | 33,361,072 | |
| * | Non-income producing security. |
| 1 | Some of these securities, amounting to $1,399,391 or 4.2% of net assets, were out on loan to various borrowers and are collateralized by cash and various U.S. Treasury Obligations. See Note 4 of Notes to Financial Statements. |
| 2 | Security exempt from registration under Rule 144A of the Securities Act of 1933. This security may be resold in transactions exempt from registration, normally to qualified buyers. At December 31, 2019, the value of these securities amounted to $334,030 or 1.0% of net assets. |
| 3 | Variable rate security. The rate shown is based on the latest available information as of December 31, 2019. Certain variable rate securities are not based on a published reference rate and spread but are determined by the issuer or agent and are based on current market conditions. These securities do not indicate a reference rate and spread in their description above. |
| 4 | Step Bond: A debt instrument with either deferred interest payments or an interest rate that resets at specific times during its term. |
| 6 | Security’s value was determined by using significant unobservable inputs. |
| 7 | Cash collateral received for securities lending activity was invested in these joint repurchase agreements. |
| 8 | Yield shown represents the December 31, 2019, seven day average yield, which refers to the sum of the previous seven days’ dividends paid, expressed as an annual percentage. |
FHLMC Freddie Mac
FNMA Fannie Mae
GMTN Global Medium-Term Notes
LIBOR London Interbank Offered Rate
MTN Medium-Term Note
The accompanying notes are an integral part of these financial statements.
11
| | |
| | | AMG GW&K Enhanced Core Bond ESG Fund Schedule of Portfolio Investments(continued) |
The following table summarizes the inputs used to value the Fund’s investments by the fair value hierarchy levels as of December 31, 2019:
| | | | | | | | | | | | | | | | |
| | | Level 1 | | | Level 2 | | | Level 3 | | | Total | |
Investments in Securities | | | | | | | | | | | | | | | | |
Corporate Bonds and Notes | | | | | | | | | | | | | | | | |
Industrials | | | — | | | $ | 10,744,154 | | | $ | 0 | | | $ | 10,744,154 | |
Financials | | | — | | | | 5,448,806 | | | | — | | | | 5,448,806 | |
Utilities | | | — | | | | 324,828 | | | | — | | | | 324,828 | |
Municipal Bonds† | | | — | | | | 2,621,523 | | | | — | | | | 2,621,523 | |
U.S. Government and Agency Obligations† | | | — | | | | 13,834,331 | | | | — | | | | 13,834,331 | |
Short-Term Investments | | | | | | | | | | | | | | | | |
Joint Repurchase Agreements | | | — | | | | 1,285,644 | | | | — | | | | 1,285,644 | |
Other Investment Companies | | $ | 11,608 | | | | — | | | | — | | | | 11,608 | |
| | | | | | | | | | | | | | | | |
Total Investments in Securities | | $ | 11,608 | | | $ | 34,259,286 | | | $ | 0 | | | $ | 34,270,894 | |
| | | | | | | | | | | | | | | | |
| † | All municipal bonds, and U.S. government and agency obligations held in the Fund are Level 2 securities. For a detailed breakout of municipal bonds, and U.S. government and agency obligations by major industry or agency classification, please refer to the Fund’s Schedule of Portfolio Investments. |
At December 31, 2019, the Level 3 corporate bond was received as a result of a corporate action on June 12, 2019. The security’s value was determined by using significant unobservable inputs.
For the fiscal year ended December 31, 2019, there were no transfers in or out of Level 3.
The accompanying notes are an integral part of these financial statements.
12
| | |
| | | AMG GW&K Municipal Bond Fund Portfolio Manager’s Comments(unaudited) |
THE YEAR IN REVIEW
For the year ended December 31, 2019, AMG GW&K Municipal Bond Fund (Class N shares) (the “Fund”) returned 7.29%, underperforming its benchmark, the Bloomberg Barclays10-Year Municipal Bond Index (the “Index”), which returned 7.70%.
Municipal bonds began 2019 by posting their best quarterly return in five years, driven by a drop in global interest rates and a surge in demand fortax-exempt income. A striking about-face in monetary policy helped risk sentiment recover from an ugly fourth quarter. Bond yields stayed in a narrow range, held in check by muted inflation and lingering concerns over global growth. By the time the U.S. Federal Reserve (the “Fed”) actually followed through on their promises, at the March Federal Open Market Committee (FOMC) meeting, economic uncertainty had deepened overseas. Municipal bonds did not just ride the momentum in Treasuries, they outperformed across the curve. Demand for bonds proved voracious as money poured into the space. Retail investors led the way, spurred on by the performance rebound from the fourth quarter and the heightened value of thetax-exemption in a new world of fewer available deductions. The shift by the Fed supplied the final incentive. Retail investors tend to (falsely) equate hikes in the Fed funds rate with rising rates throughout the curve. When policymakers hit the pause button, all lights were flashing green. Mutual fund inflows, a reliable indicator of retail sentiment, surged to $22 billion, the fastest start to a year on record. Even the month of March could not put a dent in the rally. In most years, March brings seasonal weakness, as elevated supply typically coincides with selling pressure from investors needing to pay tax bills. This year, however, supply came in below its five-year average, still held back from the recent elimination of advanced refunding transactions. And instead of selling, investors stampeded into the market looking to accumulate one of the few remaining high-quality tax havens.
Municipal bonds posted impressive gains in the second quarter, helped along by a powerful rally in Treasuries. Slowing economic activity, unresolved trade tensions and stubbornly low inflation measures all fueled concerns over global growth and pushed investors toward the relative safety of bonds. As the quarter progressed, the Treasury market started flashing an ominous warning sign: the yield on the10-year note dropped below the rate on short-term bills, an inversion that has preceded every recession for the past 60 years. The
Fed came under increasing pressure to act. At the June FOMC meeting, the Fed essentially capitulated, dropping its prior commitment to “be patient” and signaling a willingness to ease policy in the face of increasing threats to an expansion that just became the longest on record. By the end of June, the yield on thetwo-year Treasury had fallen over half a percentage point, its largest quarterly drop since the financial crisis. Yields on longer maturities declined as well, though not by quite the same magnitude, which had the effect of steepening the curve over the quarter. Municipal bonds started the quarter on a tear, outperforming Treasuries as money continued to pour into the market. Industry mutual funds took in another $20 billion of cash, setting a new record for first half inflows at nearly $44 billion. Meanwhile, supply remained constrained, leading to a scramble for bonds and an almost indiscriminate reach for yield. Bymid-May, the10-year municipal/Treasury ratio had fallen to 71%, within a whisker of itsall-time low. But as the Treasury market continued to surge, municipal bonds simply could not keep up. In June, just as rate fatigue started to creep in, new issue volume began to perk up and investors became much more selective with purchases. Deals that would have been heavily oversubscribed earlier in the quarter suddenly saw mixed demand resulting in more leftover balances or dealer concessions to clear the market. By the end of the quarter, ratios had rebounded to more reasonable levels with the10-year finishing back above 80% and the30-year again topping 90%.
The third quarter provided another round of impressive gains for municipal bonds, fueled once again by a sharp rally in the Treasury market. July started innocuously enough with interest rates generally muddling along ahead of the Fed’s first rate cut in a decade. In August, however, yields plummeted in response to a dramatic escalation in the trade war between the U.S. and China. Before the month was out, the yield on the30-year Treasury slid to a record low while the amount of global debt trading at negative yields climbed to $17 trillion. As the trade war continued to simmer, central banks took action. The European Central Bank lowered deposit rates and relaunched an asset purchase program. The Fed cut rates a second time in September and signaled a willingness to do more if the economy wavered. Growth fears began to subside and interest rates retraced some of their prior fall. The yield on the10-year Treasury, which began the quarter at 2.01% and touched a low of 1.43% amid the worst of the turmoil, finished September at 1.67%, which is down over 100 basis points from the start of the year.Tax-exempt rates
likewise plummeted over the first two months of the quarter. By the end of August, the yield on the10-year municipal fell to 1.21%, breaking through the previousall-time low of 1.26% set back in the summer of 2016. Municipal bonds actually outperformed Treasuries in the initial part of the rally with record amounts of cash pouring into the space and overwhelming a supply calendar that proved insufficient to satisfy demand. Relative value metrics, expressed as the ratio oftax-exempt yields to Treasury yields, dropped nearall-time lows, with the10-year ratio declining to 74% andshort-end ratios bottoming at 57%. Interest rates were so low that municipalities found it economically viable to issue taxable debt topre-refund existingtax-exempt securities. Eventually, however, yield fatigue set in and investors were less inclined to chase rates lower. A surge in issuance that started in August did not help matters and when global rates rebounded in the final third of the quarter, municipal bonds sold off hard. Yields finished the quarter well above their lows and relative value ratios moved back to historical averages.
Despite a sharp backup in Treasury yields, municipal bonds were able to post modest returns in the fourth quarter, locking in the strongest calendar year for returns since 2014. During the quarter, global sentiment seemed to hang on every word of the U.S.-China trade negotiations, rising on breakthroughs and declining when talks fell apart. Ultimately, animal spirits won out after the two nations agreed to a “phase one” deal in early December. Risk markets rallied and bonds suffered, a dynamic that was reinforced by a decisive U.K. election that finally offered clarity on Brexit. Strong employment numbers and corporate earnings beats added further fuel to the fire. Meanwhile, the Fed struck a dovish tone, setting a high bar for future rate hikes, making any increase contingent on a “significant” and “persistent” pickup in inflation. Relieved investors, increasingly confident in the economy and global backdrop, bid up stocks and sold safe-haven assets. By year end, equity markets had climbed toall-time highs while Treasuries gave up some of their strongyear-to-date gains. For the quarter, the yield on the10-year Treasury rose 25 basis points, but still finished 77 basis points lower than where it began the year. The outperformance of municipal bonds versus Treasuries was largely driven by heavy flows into thetax-exempt space. Industry mutual funds experienced $25 billion of net new cash during the quarter, pushing calendar year inflows over $90 billion, a new record high. The appetite for paper overwhelmed even the spike in supply. While new issue volume increased 50% over
13
| | |
| | | AMG GW&K Municipal Bond Fund Portfolio Manager’s Comments(continued) |
the fourth quarter of 2018, most of that was due to a surge in taxable deals. Issuing authorities, no longer able to advance refund outstanding debt withtax-exempt bonds (due to federal tax reform), issued taxable bonds instead, with record low rates making the deals economically viable.Tax-exempt supply was still up year over year, but only by 13%, no match for the deluge of inflows. The strong technical environment pushed municipal/Treasury ratios lower across the curve. For the quarter,10-year municipal bonds were up only 2 basis points, barely denting the gains established by an 87 basis point drop for the year.
For the year, the Fund slightly underperformed the Index. Earlier in the year, a longer duration in the declining rate environment and the favorable timing
of a yield curve extension benefited performance. However, the Fund underperformed due to its higher quality bias as credit spreads continued to tighten in 2019.
Looking ahead to 2020, the municipal bond market appears to be in good shape, both fundamentally and technically. States and municipalities have banked the revenue windfall of the past few years, building reserves back above theirpre-recession highs. Conservative budgeting practices have been cited in a substantial number of upgrades in 2019, and barring a downturn, there’s little reason to believe that will change anytime soon. Meanwhile,
even with the tremendous run of performance in 2019, demand fortax-exempt income should continue to be relentless, especially with the political uncertainty that will accompany thelead-up to November’s presidential election. On the supply side, the longer rates stay near these lows, the more taxable volume should eat into the amount oftax-exempt debt needed to be issued. This would only further support prices.
This commentary reflects the viewpoints of GW&K Investment Management, LLC and is not intended as a forecast or guarantee of future results.
14
| | |
| | | AMG GW&K Municipal Bond Fund Portfolio Manager’s Comments(continued) |
CUMULATIVE TOTAL RETURN PERFORMANCE
AMG GW&K Municipal Bond Fund’s cumulative total return is based on the daily change in net asset value (NAV), and assumes that all dividends and distributions were reinvested. The graph compares a hypothetical $10,000 investment made in the AMG GW&K Municipal Bond Fund’s Class N shares on December 31, 2009, to a $10,000 investment made in the Bloomberg Barclays10-Year Municipal Bond Index for the same time period. The graph and table do not reflect the deduction of taxes that a shareholder would pay on a Fund distribution or redemption of shares. The listed returns for the Fund are net of expenses and the returns for the index exclude expenses. Total returns would have been lower had certain expenses not been reduced.
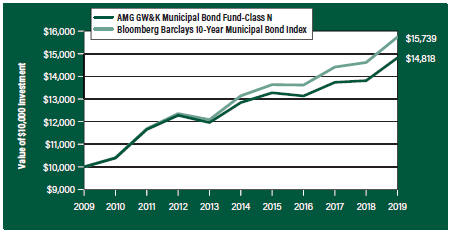
The table below shows the average annual total returns for the AMG GW&K Municipal Bond Fund and the Bloomberg Barclays10-Year Municipal Bond Index for the same time periods ended December 31, 2019.
| | | | | | | | | | | | |
| | | | | | Five | | | | |
| Average Annual Total Returns1 | | One Year | | | Years | | | Ten Years | |
AMG GW&K Municipal Bond Fund2,3, 4, 5, 6 | | | | | |
Class N | | | 7.29 | % | | | 2.90 | % | | | 4.01 | % |
Class I | | | 7.58 | % | | | 3.27 | % | | | 4.42 | % |
| | | | | | | | | | | | |
Bloomberg Barclays10-Year Municipal Bond Index7 | | | 7.70 | % | | | 3.68 | % | | | 4.64 | % |
| | | | | | | | | | | | |
The performance data shown represents past performance. Past performance is not a guarantee of future results. Current performance may be lower or higher than the performance data quoted. The investment return and principal value of an investment will fluctuate so that an investor’s shares, when redeemed, may be worth more or less than their original cost.
Investors should carefully consider the Fund’s investment objectives, risks, charges and expenses before investing. For performance information through the most recent month end, current net asset values per share for the Fund and other information, please call 800.548.4539 or visit our website at amgfunds.com for a free prospectus. Read it carefully before investing or sending money.
Distributed by AMG Distributors, Inc., member FINRA/SIPC.
| 1 | Total return equals income yield plus share price change and assumes reinvestment of all dividends and capital gain distributions. Returns are net of fees and may reflect offsets of Fund expenses as described in the prospectus. No adjustment has been made for taxes payable by shareholders on their reinvested dividends and capital gain distributions. Returns for periods greater than one year are annualized. The listed returns on the Fund are net of expenses and based on the published NAV as of December 31, 2019. All returns are in U.S. dollars ($). |
| 2 | From time to time, the Fund’s advisor has waived its fees and/or absorbed Fund expenses, which has resulted in higher returns. |
| 3 | The Fund is subject to the risks associated with investments in debt securities, such as default risk and fluctuations in the perception of the debtor’s ability to pay its creditors. Changing interest rates may adversely affect the value of an investment. An increase in interest rates typically causes the value of bonds and other fixed income securities to fall. |
| 4 | Factors unique to the municipal bond market may negatively affect the value in municipal bonds. |
| 5 | Investment income may be subject to certain state and local taxes, and depending on your tax status, the federal alternative minimum tax. Capital gains are not exempt from federal income tax. |
| 6 | Companies that are in similar businesses may be similarly affected by particular economic or market events; to the extent the Fund has substantial holdings within a particular sector, the risks associated with that sector increase. |
| 7 | The Bloomberg Barclays10-Year Municipal Bond Index is the 10 Year(8-12) component of the Municipal Bond index. It is a rules-based, market-value-weighted index engineered for thetax-exempt bond market. The Index tracks general obligation bonds, revenue bonds, insured bonds, and prerefunded bonds ratedBaa3/BBB- or higher by at least two of the ratings agencies: Moody’s, S&P, Fitch. Unlike the Fund, the Bloomberg Barclays10-Year Municipal Bond Index is unmanaged, is not available for investment and does not incur expenses. |
Bloomberg Index Services Limited. BLOOMBERG® is a trademark and service mark of Bloomberg Finance L.P. and its affiliates (collectively “Bloomberg”). BARCLAYS® is a trademark and service mark of Barclays Bank Plc (collectively with its affiliates, “Barclays”), used under license. Bloomberg or Bloomberg’s licensors, including Barclays, own all proprietary rights in the Bloomberg Barclays Indices. Neither Bloomberg nor Barclays approves or endorses this material, or guarantees the accuracy or completeness of any information herein, or makes any warranty, express or implied, as to the results to be obtained therefrom and, to the maximum extent allowed by law, neither shall have any liability or responsibility for injury or damages arising in connection therewith.
Not FDIC insured, nor bank guaranteed. May lose value.
15
| | |
| | | AMG GW&K Municipal Bond Fund Fund Snapshots(unaudited) December 31, 2019 |
PORTFOLIO BREAKDOWN
| | | | |
Category | | % of
Net Assets | |
Transportation | | | 25.4 | |
Utilities | | | 25.4 | |
General Obligation | | | 20.6 | |
Medical | | | 7.9 | |
Water | | | 7.0 | |
Higher Education | | | 3.0 | |
Power | | | 2.1 | |
Tobacco Settlement | | | 0.9 | |
Short-Term Investments | | | 7.1 | |
Other Assets & Liabilities | | | 0.6 | |
| | | | |
Rating | | % of
Market Value1 | |
Aaa/AAA | | | 31.3 | |
Aa/AA | | | 44.8 | |
A | | | 22.0 | |
Baa/BBB | | | 1.9 | |
| 1 | Includes market value of long-term fixed-income securities only. |
TOP TEN HOLDINGS
| | | | |
Security Name | | % of
Net Assets | |
State of Maryland, Series B, General Obligation, 5.000%, 08/01/25 | | | 2.8 | |
Wisconsin State Revenue, Department of Transportation, Series 2, Revenue, 5.000%, 07/01/29 | | | 2.5 | |
North Carolina State Limited Obligation, Series B, Revenue, 5.000%, 05/01/28 | | | 1.8 | |
Iowa Finance Authority, State Revolving Fund Green Bond, Revenue, 5.000%, 08/01/30 | | | 1.8 | |
Metropolitan Transportation Authority, Transit Revenue, Green Bond, Series B, Revenue, 5.000%, 11/15/27 | | | 1.7 | |
State of Maryland, Department of Transportation, Revenue, 5.000%, 09/01/29 | | | 1.5 | |
State of Maryland, Department of Transportation, Revenue, 5.000%, 10/01/28 | | | 1.4 | |
New Mexico Finance Authority, Subordinate, Series A, Revenue, 5.000%, 06/15/28 | | | 1.4 | |
Michigan Finance Authority, Henry Ford Health System, Revenue, 5.000%, 11/15/29 | | | 1.3 | |
Texas Transportation Commission Fund, Series A, General Obligation, 5.000%, 04/01/27 | | | 1.3 | |
| | | | |
Top Ten as a Group | | | 17.5 | |
| | | | |
Credit quality ratings shown above reflect the highest rating assigned by either Standard & Poor’s (“S&P”), Moody’s Investors Service, Inc. (“Moody’s”) or Fitch. These rating agencies are independent, nationally recognized statistical rating organizations and are widely used. Investment grade ratings are credit ratings of BBB/Baa or higher. Below investment grade ratings are credit ratings of BB/Ba or lower. Investments designated N/R are not rated by either rating agency. Unrated investments do not necessarily indicate low credit quality. Credit quality ratings are subject to change.
Because a fund’s strategy may result in multiple investments in particular sectors of the economy, its performance may depend on the performance of those sectors and may fluctuate more widely than investments diversified across more sectors. For additional information on these and other risk considerations, please see the Fund’s prospectus.
Any sectors, industries, or securities discussed should not be perceived as investment recommendations. Mention of a specific security should not be considered a recommendation to buy or solicitation to sell that security. Specific securities mentioned in this report may have been sold from the Fund’s portfolio of investments by the time you receive this report.
16
| | |
| | | AMG GW&K Municipal Bond Fund Schedule of Portfolio Investments December 31, 2019 |
| | | | | | | | |
| | | Principal
Amount | | | Value | |
Municipal Bonds - 92.3% | | | | | | | | |
Arizona - 1.7% | | | | | | | | |
Arizona Department of Transportation State Highway Fund Revenue 5.000%, 07/01/28 | | $ | 5,030,000 | | | $ | 6,155,513 | |
Arizona Water Infrastructure Finance Authority, Water Quality Revenue, Series A 5.000%, 10/01/26 | | | 10,000,000 | | | | 11,739,100 | |
Total Arizona | | | | | | | 17,894,613 | |
California - 5.0% | | | | | | | | |
California Municipal Finance Authority, Community Medical Centers, Series A | | | | | | | | |
5.000%, 02/01/27 | | | 950,000 | | | | 1,170,381 | |
5.000%, 02/01/30 | | | 1,630,000 | | | | 1,959,716 | |
5.000%, 02/01/31 | | | 900,000 | | | | 1,077,372 | |
5.000%, 02/01/32 | | | 1,855,000 | | | | 2,215,241 | |
San Francisco City & County Airport Commission, San Francisco International Airport, Series A | | | | | | | | |
5.000%, 05/01/34 | | | 5,000,000 | | | | 6,206,600 | |
5.000%, 05/01/35 | | | 5,800,000 | | | | 7,179,356 | |
State of California | | | | | | | | |
5.000%, 08/01/29 | | | 7,235,000 | | | | 8,900,786 | |
5.000%, 09/01/29 | | | 5,075,000 | | | | 6,266,306 | |
5.000%, 04/01/32 | | | 5,000,000 | | | | 6,812,250 | |
State of California, Series C 5.000%, 09/01/26 | | | 7,715,000 | | | | 9,341,322 | |
Total California | | | | | | | 51,129,330 | |
Colorado - 2.1% | | | | | | | | |
Colorado Health Facilities Authority, Series A | | | | | | | | |
5.000%, 01/01/27 | | | 2,500,000 | | | | 3,076,400 | |
5.000%, 01/01/28 | | | 2,500,000 | | | | 3,135,425 | |
5.000%, 01/01/29 | | | 4,000,000 | | | | 5,100,360 | |
5.000%, 08/01/33 | | | 2,750,000 | | | | 3,350,930 | |
Regional Transportation District County COPS, Series A | | | | | | | | |
5.000%, 06/01/24 | | | 6,000,000 | | | | 6,750,420 | |
Total Colorado | | | | | | | 21,413,535 | |
Connecticut - 3.6% | | | | | | | | |
State of Connecticut Special Tax Revenue, Transportation Infrastructure | | | | | | | | |
5.000%, 08/01/24 | | | 5,340,000 | | | | 6,227,241 | |
5.000%, 01/01/30 | | | 10,170,000 | | | | 12,581,002 | |
State of Connecticut Special Tax Revenue, Series B 5.000%, 10/01/35 | | | 7,500,000 | | | | 9,177,675 | |
State of Connecticut, Series A 5.000%, 01/15/311 | | | 7,500,000 | | | | 9,520,050 | |
Total Connecticut | | | | | | | 37,505,968 | |
District of Columbia - 3.8% | | | | | |
District of Columbia Water & Sewer Authority Public Utility Revenue, Sub Lien, Series C 5.000%, 10/01/24 | | | 5,500,000 | | | | 6,077,940 | |
| | | | | | | | |
| | | Principal
Amount | | | Value | |
District of Columbia, Series A 5.000%, 06/01/30 | | $ | 6,020,000 | | | $ | 7,281,431 | |
5.000%, 10/15/30 | | | 5,010,000 | | | | 6,468,411 | |
District of Columbia, Series B 5.000%, 06/01/31 | | | 10,065,000 | | | | 12,673,244 | |
Washington Convention & Sports Authority, Series A 5.000%, 10/01/27 | | | 5,525,000 | | | | 6,955,091 | |
Total District of Columbia | | | | | | | 39,456,117 | |
Florida - 4.0% | | | | | | | | |
Florida’s Turnpike Enterprise, Department of Transportation, Series C
5.000%, 07/01/28 | | | 7,075,000 | | | | 8,643,386 | |
Lee Memorial Health System, Series A
5.000%, 04/01/34 | | | 5,500,000 | | | | 6,792,005 | |
Orange County Health Facilities Authority, Series A
5.000%, 10/01/31 | | | 4,515,000 | | | | 5,420,438 | |
Orange County Health Facilities Authority, Series G 5.000%, 10/01/26 | | | 3,000,000 | | | | 3,665,430 | |
State of Florida, Capital Outlay, Series B
5.000%, 06/01/27 | | | 9,045,000 | | | | 10,538,601 | |
State of Florida, Department of Transportation, Fuel Sales Tax Revenue, Series B 5.000%, 07/01/26 | | | 5,780,000 | | | | 6,114,893 | |
Total Florida | | | | | | | 41,174,753 | |
Georgia - 1.2% | | | | | | | | |
Atlanta Water & Wastewater Revenue
5.000%, 11/01/25 | | | 5,100,000 | | | | 6,081,648 | |
Georgia State University & College Improvements, Series A 5.000%, 07/01/27 | | | 5,450,000 | | | | 5,969,930 | |
Total Georgia | | | | | | | 12,051,578 | |
Illinois - 6.6% | | | | | | | | |
Chicago O’Hare International Airport, Series B 5.000%, 01/01/28 | | | 10,670,000 | | | | 12,477,178 | |
Chicago O’Hare International Airport, Senior Lien, Series A | | | | | | | | |
5.000%, 01/01/36 | | | 10,000,000 | | | | 12,140,300 | |
5.000%, 01/01/38 | | | 5,500,000 | | | | 6,630,910 | |
Illinois State Finance Authority Revenue, Clean Water Initiative Revenue
5.000%, 07/01/27 | | | 11,000,000 | | | | 13,271,500 | |
Illinois State Toll Highway Authority, Series A
5.000%, 12/01/31 | | | 9,565,000 | | | | 11,230,266 | |
Illinois State Toll Highway Authority, Senior Revenue Bonds, Series A
5.000%, 01/01/30 | | | 10,050,000 | | | | 12,669,231 | |
Total Illinois | | | | | | | 68,419,385 | |
The accompanying notes are an integral part of these financial statements.
17
| | |
| | | AMG GW&K Municipal Bond Fund Schedule of Portfolio Investments(continued) |
| | | | | | | | |
| | | Principal
Amount | | | Value | |
Indiana - 2.0% | | | | | | | | |
Indiana Finance Authority 5.000%, 02/01/21 | | $ | 6,500,000 | | | $ | 6,773,650 | |
Indiana Finance Authority,
Series C
5.000%, 06/01/29 | | | 4,800,000 | | | | 6,239,808 | |
Indiana Transportation Finance Authority, Series C 5.500%, 12/01/25 | | | 6,070,000 | | | | 7,563,463 | |
Total Indiana | | | | | | | 20,576,921 | |
Iowa - 2.3% | | | | | | | | |
Iowa Finance Authority, State Revolving Fund Green Bond 5.000%, 08/01/30 | | | 15,025,000 | | | | 18,734,823 | |
State of Iowa, Series A 5.000%, 06/01/25 | | | 4,000,000 | | | | 4,791,960 | |
Total Iowa | | | | | | | 23,526,783 | |
Kentucky - 0.6% | | | | | | | | |
Louisville/Jefferson County Metropolitan Government, Norton Healthcare Inc., Series A
5.000%, 10/01/29 | | | 5,430,000 | | | | 6,519,475 | |
Maryland - 6.5% | | | | | | | | |
State of Maryland, Department of Transportation | | | | | | | | |
5.000%, 10/01/28 | | | 12,085,000 | | | | 14,899,234 | |
5.000%, 09/01/29 | | | 12,125,000 | | | | 15,246,824 | |
State of Maryland, Series B 5.000%, 08/01/25 | | | 24,115,000 | | | | 29,089,683 | |
State of Maryland, State & Local Facilities Loan of 2019, 1st Series
5.000%, 03/15/30 | | | 6,000,000 | | | | 7,781,580 | |
Total Maryland | | | | | | | 67,017,321 | |
Massachusetts - 1.6% | | | | | | | | |
Commonwealth of Massachusetts, Series A 5.000%, 07/01/25 | | | 7,700,000 | | | | 9,281,426 | |
Massachusetts Water Resources Authority, Series C 5.000%, 08/01/31 | | | 6,050,000 | | | | 7,359,220 | |
Total Massachusetts | | | | | | | 16,640,646 | |
Michigan - 3.2% | | | | | | | | |
Michigan Finance Authority, Henry Ford Health System 5.000%, 11/15/29 | | | 11,450,000 | | | | 13,836,523 | |
Michigan State Building Authority Revenue, Series I 5.000%, 04/15/27 | | | 5,700,000 | | | | 6,856,758 | |
State of Michigan 5.000%, 03/15/27 | | | 10,000,000 | | | | 12,482,600 | |
Total Michigan | | | | | | | 33,175,881 | |
| | | | | | | | |
| | | Principal
Amount | | | Value | |
Minnesota- 1.9% | | | | | | | | |
City of Minneapolis MN, Fairview Health Services, Series A 5.000%, 11/15/35 | | $ | 3,165,000 | | | $ | 3,903,521 | |
Minneapolis-St Paul Metropolitan Airports Commission, Series A 5.000%, 01/01/25 | | | 5,000,000 | | | | 5,936,000 | |
State of Minnesota 5.000%, 08/01/23 | | | 9,415,000 | | | | 9,627,497 | |
Total Minnesota | | | | | | | 19,467,018 | |
Missouri - 0.6% | | | | | | | | |
University of Missouri, Series A 5.000%, 11/01/26 | | | 5,495,000 | | | | 6,456,845 | |
Nebraska - 0.6% | | | | | | | | |
University of Nebraska Facilities Corp.
5.000%, 07/15/25 | | | 5,010,000 | | | | 6,036,349 | |
New Jersey - 0.5% | | | | | | | | |
New Jersey State Turnpike Authority Revenue, Series B
5.000%, 01/01/28 | | | 4,010,000 | | | | 5,070,444 | |
New Mexico - 1.4% | | | | | | | | |
New Mexico Finance Authority, Subordinate, Series A 5.000%, 06/15/28 | | | 11,425,000 | | | | 14,553,736 | |
New York - 10.2% | | | | | | | | |
Long Island Power Authority 5.000%, 09/01/35 | | | 5,000,000 | | | | 6,168,050 | |
Metropolitan Transportation Authority, Transit Revenue, Green Bond, Series B 5.000%, 11/15/27 | | | 14,225,000 | | | | 17,796,044 | |
Metropolitan Transportation Authority, Transit Revenue, Series F | | | | | | | | |
5.000%, 11/15/24 | | | 4,950,000 | | | | 5,469,404 | |
5.000%, 11/15/27 | | | 5,000,000 | | | | 5,517,050 | |
5.000%, 11/15/28 | | | 4,750,000 | | | | 5,650,363 | |
New York City General Obligation, Series I 5.000%, 08/01/24 | | | 5,000,000 | | | | 5,487,300 | |
New York City Transitional Finance Authority Building Aid Revenue, SeriesS-3,Sub-SeriesS-3A
5.000%, 07/15/31 | | | 5,070,000 | | | | 6,367,362 | |
New York City Transitional Finance Authority, Future Tax Secured Revenue, Series C
5.000%, 11/01/26 | | | 9,535,000 | | | | 11,349,510 | |
New York State Dormitory Authority, Series A | | | | | | | | |
5.000%, 12/15/25 | | | 8,645,000 | | | | 9,628,542 | |
5.000%, 12/15/27 | | | 5,640,000 | | | | 6,269,424 | |
5.000%, 03/15/31 | | | 7,515,000 | | | | 9,502,417 | |
New York State Dormitory Authority, Series D 5.000%, 02/15/27 | | | 5,345,000 | | | | 5,775,005 | |
The accompanying notes are an integral part of these financial statements.
18
| | |
| | | AMG GW&K Municipal Bond Fund Schedule of Portfolio Investments(continued) |
| | | | | | | | |
| | | Principal
Amount | | | Value | |
New York - 10.2%(continued) | | | | | |
New York State Dormitory Authority, Series E 5.000%, 03/15/32 | | $ | 8,370,000 | | | $ | 9,906,732 | |
Total New York | | | | | | | 104,887,203 | |
North Carolina - 1.8% | | | | | | | | |
North Carolina State Limited Obligation, Series B 5.000%, 05/01/28 | | | 15,255,000 | | | | 19,002,238 | |
Ohio - 2.6% | | | | | | | | |
Ohio State General Obligation, Series A
5.000%, 09/01/26 | | | 7,090,000 | | | | 8,768,628 | |
Ohio State General Obligation, Series T
5.000%, 05/01/30 | | | 5,000,000 | | | | 6,199,350 | |
Ohio Water Development Authority, Water Pollution Control Loan Fund, Series 2015A
5.000%, 06/01/25 | | | 10,050,000 | | | | 12,057,287 | |
Total Ohio | | | | | | | 27,025,265 | |
Oregon - 2.2% | | | | | | | | |
Oregon State Lottery, Series C
5.000%, 04/01/27 | | | 10,000,000 | | | | 11,880,700 | |
Oregon State Lottery, Series D
5.000%, 04/01/28 | | | 9,225,000 | | | | 10,935,499 | |
Total Oregon | | | | | | | 22,816,199 | |
Pennsylvania - 2.4% | | | | | | | | |
Allegheny County Hospital Development Authority, University Pittsburgh Medical Center
5.000%, 07/15/31 | | | 5,500,000 | | | | 6,932,420 | |
Commonwealth Financing Authority, Pennsylvania Tobacco
5.000%, 06/01/32 | | | 7,870,000 | | | | 9,631,621 | |
Lancaster County Hospital Authority, University of Pennsylvania Health Revenue
5.000%, 08/15/26 | | | 6,970,000 | | | | 8,541,804 | |
Total Pennsylvania | | | | | | | 25,105,845 | |
Texas - 12.1% | | | | | | | | |
Central Texas Turnpike System Transportation Commission, Series C
5.000%, 08/15/31 | | | 11,175,000 | | | | 12,799,733 | |
City of Austin TX Water & Wastewater System Revenue
5.000%, 11/15/26 | | | 5,100,000 | | | | 6,296,103 | |
City of Corpus Christi TX Utility System Revenue, Junior Lien
5.000%, 07/15/29 | | | 3,125,000 | | | | 3,927,000 | |
City of San Antonio TX Electric & Gas Systems Revenue
5.000%, 02/01/26 | | | 9,300,000 | | | | 11,274,669 | |
Dallas Area Rapid Transit, Senior Lien
5.250%, 12/01/28 | | | 8,865,000 | | | | 11,615,632 | |
| | | | | | | | |
| | | Principal
Amount | | | Value | |
Lower Colorado River Authority, LCRA Transmission Services Corporation
5.000%, 05/15/29 | | $ | 3,815,000 | | | $ | 4,358,638 | |
North Texas Municipal Water District Water System Revenue, Refunding And Improvement 5.000%, 09/01/29 | | | 7,350,000 | | | | 8,944,436 | |
North Texas Tollway Authority Revenue, Special Projects System, 1st Tier, Series A 5.000%, 01/01/25 | | | 6,460,000 | | | | 7,405,356 | |
North Texas Tollway Authority, 2nd Tier, Series B | | | | | | | | |
5.000%, 01/01/31 | | | 2,000,000 | | | | 2,361,320 | |
5.000%, 01/01/32 | | | 4,010,000 | | | | 4,845,243 | |
North Texas Tollway Authority, Series A
5.000%, 01/01/26 | | | 7,795,000 | | | | 8,919,507 | |
State of Texas, Transportation Commission Mobility Fund
5.000%, 10/01/26 | | | 10,510,000 | | | | 12,145,356 | |
Texas Private Activity Bond Surface Transportation Corp.
| | | | | | | | |
4.000%, 12/31/37 | | | 5,000,000 | | | | 5,636,100 | |
4.000%, 12/31/38 | | | 3,735,000 | | | | 4,197,953 | |
Texas Transportation Commission Fund, Series A
5.000%, 04/01/27 | | | 12,550,000 | | | | 13,628,547 | |
Texas Water Development Board, State Revolving Fund 5.000%, 08/01/26 | | | 5,405,000 | | | | 6,660,149 | |
Total Texas | | | | | | | 125,015,742 | |
Utah - 1.8% | | | | | | | | |
Salt Lake City Corp. Airport Revenue, Series A | | | | | | | | |
5.000%, 07/01/29 | | | 3,450,000 | | | | 4,262,026 | |
5.000%, 07/01/30 | | | 6,585,000 | | | | 8,086,907 | |
Utah Transit Authority, Series A 5.000%, 06/15/27 | | | 5,020,000 | | | | 5,990,015 | |
Total Utah | | | | | | | 18,338,948 | |
Virginia - 2.2% | | | | | | | | |
Virginia College Building Authority, Series A 5.000%, 09/01/21 | | | 10,000,000 | | | | 10,650,300 | |
Virginia Public Building Authority, Series B 5.000%, 08/01/25 | | | 10,335,000 | | | | 12,467,007 | |
Total Virginia | | | | | | | 23,117,307 | |
Washington - 4.9% | | | | | | | | |
Energy Northwest Electric Revenue, Bonneville Power 5.000%, 07/01/25 | | | 10,225,000 | | | | 12,294,847 | |
Energy Northwest Nuclear Revenue, Project 3, Series A 5.000%, 07/01/25 | | | 7,965,000 | | | | 9,577,355 | |
State of Washington School Improvements, Series C 5.000%, 02/01/28 | | | 7,370,000 | | | | 8,922,048 | |
The accompanying notes are an integral part of these financial statements.
19
| | |
| | | AMG GW&K Municipal Bond Fund Schedule of Portfolio Investments(continued) |
| | | | | | | | |
| | | Principal
Amount | | | Value | |
Washington - 4.9%(continued) | | | | | | | | |
State of Washington, SeriesR-2015C
5.000%, 07/01/28 | | $ | 10,215,000 | | | $ | 12,001,706 | |
University of Washington, University & College Improvements Revenue, Series C
5.000%, 07/01/27 | | | 7,270,000 | | | | 8,086,566 | |
Total Washington | | | | | | | 50,882,522 | |
West Virginia - 0.4% | | | | | | | | |
West Virginia Hospital Finance Authority, Cabell Huntington Hospital Obligation 5.000%, 01/01/35 | | | 3,745,000 | | | | 4,502,951 | |
Wisconsin - 2.5% | | | | | | | | |
Wisconsin State Revenue, Department of Transportation, Series 2
5.000%, 07/01/29 | | | 20,405,000 | | | | 25,439,118 | |
Total Municipal Bonds
(Cost $907,467,174) | | | | | | | 954,220,036 | |
Short-Term Investments - 7.1% | | | | | | | | |
Municipal Bonds - 7.1% | | | | | | | | |
Massachusetts - 2.0% | | | | | | | | |
Commonwealth of Massachusetts, Series C 4.000%, 06/18/20 | | | 20,000,000 | | | | 20,266,800 | |
| | | | | | | | |
| | | Principal
Amount | | | Value | |
New York - 0.8% | | | | | | | | |
City of New York, Subordinated SeriesD-4 1.700%, 01/06/202,3 | | $ | 8,000,000 | | | $ | 8,000,000 | |
Texas - 4.3% | | | | | | | | |
State of Texas 4.000%, 08/27/20 | | | 44,210,000 | | | | 45,038,054 | |
Total Municipal Bonds
(Cost $73,264,172) | | | | | | | 73,304,854 | |
Total Short-Term Investments
(Cost $73,264,172) | | | | | | | 73,304,854 | |
Total Investments - 99.4%
(Cost $980,731,346) | | | | | | | 1,027,524,890 | |
Other Assets, less Liabilities - 0.6% | | | | 5,700,415 | |
Net Assets - 100.0% | | | | | | $ | 1,033,225,305 | |
| 1 | All or part of the security is delayed delivery transaction. The market value for delayed delivery security at December 31, 2019, amounted to $9,520,050, or 0.9% of net assets. |
| 2 | Date shown is the next coupon reset date. |
| 3 | Variable rate security. The rate shown is based on the latest available information as of December 31, 2019. Certain variable rate securities are not based on a published reference rate and spread but are determined by the issuer or agent and are based on current market conditions. These securities do not indicate a reference rate and spread in their description above. |
COPS Certificates of Participation
The following table summarizes the inputs used to value the Fund’s investments by the fair value hierarchy levels as of December 31, 2019:
| | | | | | | | | | | | | | | | |
| | | Level 1 | | | Level 2 | | | Level 3 | | | Total | |
Investments in Securities | | | | | | | | | | | | | | | | |
Municipal Bonds† | | | — | | | $ | 954,220,036 | | | | — | | | $ | 954,220,036 | |
Short-Term Investments | | | | | | | | | | | | | | | | |
Municipal Bonds† | | | — | | | | 73,304,854 | | | | — | | | | 73,304,854 | |
| | | | | | | | | | | | | | | | |
Total Investments in Securities | | | — | | | $ | 1,027,524,890 | | | | — | | | $ | 1,027,524,890 | |
| | | | | | | | | | | | | | | | |
| † | All municipal bonds held in the Fund are Level 2 securities. For a detailed breakout of municipal bonds by major classification, please refer to the Fund’s Schedule of Portfolio Investments. |
For the fiscal year ended December 31, 2019, there were no transfers in or out of Level 3.
The accompanying notes are an integral part of these financial statements.
20
| | |
| | | AMG GW&K Municipal Enhanced Yield Fund Portfolio Manager’s Comments(unaudited) |
THE YEAR IN REVIEW
For the year ended December 31, 2019, AMG GW&K Municipal Enhanced Yield Fund (Class N shares) (the “Fund”) returned 10.92%, compared to the Bloomberg Barclays U.S. Municipal Bond BAA Index (the “Index”), which returned 9.94%.
Municipal bonds began 2019 by posting their best quarterly return in five years, driven by a drop in global interest rates and a surge in demand fortax-exempt income. A striking about-face in monetary policy helped risk sentiment recover from an ugly fourth quarter. Bond yields stayed in a narrow range, held in check by muted inflation and lingering concerns over global growth. By the time the U.S. Federal Reserve (the “Fed”) actually followed through on their promises, at the March Federal Open Market Committee (FOMC) meeting, economic uncertainty had deepened overseas. Municipal bonds did not just ride the momentum in Treasuries, they outperformed across the curve. Demand for bonds proved voracious as money poured into the space. Retail investors led the way, spurred on by the performance rebound from the fourth quarter and the heightened value of the tax exemption in a new world of fewer available deductions. The shift by the Fed supplied the final incentive. Retail investors tend to (falsely) equate hikes in the Fed fund rate with rising rates throughout the curve. When policymakers hit the pause button, all lights were flashing green. Mutual fund inflows, a reliable indicator of retail sentiment, surged to $22 billion, the fastest start to a year on record. Even the month of March could not put a dent in the rally. In most years, March brings seasonal weakness, as elevated supply typically coincides with selling pressure from investors needing to pay tax bills. This year, however, supply came in below its five-year average, still held back from the recent elimination of advanced refunding transactions. And instead of selling, investors stampeded into the market looking to accumulate one of the few remaining high-quality tax havens.
Municipal bonds posted impressive gains in the second quarter, helped along by a powerful rally in Treasuryies. Slowing economic activity, unresolved trade tensions and stubbornly low inflation measures all fueled concerns over global growth and pushed investors toward the relative safety of bonds. As the quarter progressed, the Treasury market started flashing an ominous warning sign: the yield on the10-year note dropped below the rate on short-term bills, an inversion that has preceded every recession for the past 60 years. The
Fed came under increasing pressure to act. At the June FOMC meeting, the Fed essentially capitulated, dropping its prior commitment to “be patient” and signaling a willingness to ease policy in the face of increasing threats to an expansion that just became the longest on record. By the end of June, the yield on thetwo-year Treasury had fallen over half a percentage point, its largest quarterly drop since the financial crisis. Yields on longer maturities declined as well, though not by quite the same magnitude, which had the effect of steepening the curve over the quarter. Municipal bonds started the quarter on a tear, outperforming Treasuryies as money continued to pour into the market. Industry mutual funds took in another $20 billion of cash, setting a new record for first half inflows at nearly $44 billion. Meanwhile, supply remained constrained, leading to a scramble for bonds and an almost indiscriminate reach for yield. Bymid-May, the10-year municipal/Treasury ratio had fallen to 71%, within a whisker of itsall-time low. But as the Treasury market continued to surge, municipal bonds simply could not keep up. In June, just as rate fatigue started to creep in, new issue volume began to perk up and investors became much more selective with purchases. Deals that would have been heavily oversubscribed earlier in the quarter suddenly saw mixed demand resulting in more leftover balances or dealer concessions to clear the market. By the end of the quarter, ratios had rebounded to more reasonable levels with the10-year finishing back above 80% and the30-year again topping 90%.
The third quarter provided another round of impressive gains for municipal bonds, fueled once again by a sharp rally in the Treasury market. July started innocuously enough with interest rates generally muddling along ahead of the Fed’s first interest rate cut in a decade. In August, however, yields plummeted in response to a dramatic escalation in the trade war between the U.S. and China. Before the month was out, the yield on the30-year Treasury slid to a record low while the amount of global debt trading at negative yields climbed to $17 trillion. As the trade war continued to simmer, central banks took action. The European Central Bank lowered deposit rates and relaunched an asset purchase program. The Fed cut rates a second time in September and signaled a willingness to do more if the economy wavered. Growth fears began to subside and interest rates retraced some of their prior fall. The yield on the10-year Treasury, which began the quarter at 2.01% and touched a low of 1.43% amid the worst of the turmoil, finished September at 1.67%, which is down over 100 basis points from the start of the year.
Tax-exempt rates likewise plummeted over the first two months of the quarter. By the end of August, the yield on the10-year municipal fell to 1.21%, breaking through the previousall-time low of 1.26% set back in the summer of 2016. Municipal bonds actually outperformed Treasuries in the initial part of the rally with record amounts of cash pouring into the space and overwhelming a supply calendar that proved insufficient to satisfy demand. Relative value metrics, expressed as the ratio oftax-exempt yields to Treasuries yields, dropped nearall-time lows, with the10-year ratio declining to 74% andshort-end ratios bottoming at 57%. Interest rates were so low that municipalities found it economically viable to issue taxable debt topre-refund existingtax-exempt securities. Eventually, however, yield fatigue set in and investors were less inclined to chase rates lower. A surge in issuance that started in August did not help matters and when global rates finally rebounded in the final third of the quarter, municipal bonds sold off hard. Yields finished the quarter well above their lows and relative value ratios moved back to historical averages.
Despite a sharp backup in Treasuries yields, municipal bonds were able to post modest returns in the fourth quarter, locking in the strongest calendar year for returns since 2014. During the quarter, global sentiment seemed to hang on every word of the U.S.-China trade negotiations, rising on breakthroughs and declining when talks fell apart. Ultimately, animal spirits won out after the two nations agreed to a “phase one” deal in early December. Risk markets rallied and bonds suffered, a dynamic that was reinforced by a decisive U.K. election that finally offered clarity on Brexit. Strong employment numbers and corporate earnings beats added further fuel to the fire. Meanwhile, the Fed struck a dovish tone, setting a high bar for future rate hikes, making any increase contingent on a “significant” and “persistent” pickup in inflation. Relieved investors, increasingly confident in the economy and global backdrop, bid up stocks and sold safe-haven assets. By year end, equity markets had climbed toall-time highs while Treasuries gave up some of their strongyear-to-date gains. For the quarter, the yield on the10-year Treasury rose 25 basis points, but still finished 77 basis points lower than where it began the year. The outperformance of municipal bonds versus Treasuries was largely driven by heavy flows into thetax-exempt space. Industry mutual funds experienced $25 billion of net new cash during the quarter, pushing calendar year inflows over $90 billion, a new record high. The appetite for paper overwhelmed even the spike in supply. While new issue volume increased 50% over
21
| | |
| | | AMG GW&K Municipal Enhanced Yield Fund Portfolio Manager’s Comments(continued) |
the fourth quarter of 2018, most of that was due to a surge in taxable deals. Issuing authorities, no longer able to advance refund outstanding debt withtax-exempt bonds (due to federal tax reform), issued taxable bonds instead, with record low rates making the deals economically viable.Tax-exempt supply was still up year over year, but only by 13%, no match for the deluge of inflows. The strong technical environment pushed municipal/Treasury ratios lower across the curve. For the quarter,10-year municipal bonds were up only 2 basis points, barely denting the gains established by an 87 basis point drop for the year.
The Fund outperformed the Index for the year. The Fund’s overweight to longer maturities was a positive as long- term interest rates declined. On the
other hand, the Fund’s higher quality bias was a negative as the Fund has over 50% of its holdings in credits rated A or higher, which underperformed the BBB rated bonds in the Index.
Looking ahead to 2020, the municipal bond market appears to be in good shape, both fundamentally and technically. States and municipalities have banked the revenue windfall of the past few years, building reserves back above theirpre-recession highs. Conservative budgeting practices have been cited in a substantial number of upgrades in 2019, and barring a downturn, there’s little reason to believe that will change anytime soon. Meanwhile,
even with the tremendous run of performance in 2019, demand fortax-exempt income should continue to be relentless, especially with the political uncertainty that will accompany thelead-up to November’s presidential election. On the supply side, the longer rates stay near these lows, the more taxable volume should eat into the amount oftax-exempt debt needed to be issued. This would only further support prices.
This commentary reflects the viewpoints of GW&K Investment Management, LLC and is not intended as a forecast or guarantee of future results.
22
| | |
| | | AMG GW&K Municipal Enhanced Yield Fund Portfolio Manager’s Comments(continued) |
CUMULATIVE TOTAL RETURN PERFORMANCE
AMG GW&K Municipal Enhanced Yield Fund’s cumulative total return is based on the daily change in net asset value (NAV), and assumes that all dividends and distributions were reinvested. The graph compares a hypothetical $10,000 investment made in the AMG GW&K Municipal Enhanced Yield Fund’s Class I shares on December 31, 2009, to a $10,000 investment made in the Bloomberg Barclays U.S. Municipal Bond BAA Index for the same time period. The graph and table do not reflect the deduction of taxes that a shareholder would pay on a Fund distribution or redemption of shares. The listed returns for the Fund are net of expenses and the returns for the index exclude expenses. Total returns would have been lower had certain expenses not been reduced.
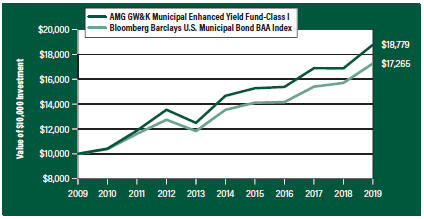
The table below shows the average annual total returns for the AMG GW&K Municipal Enhanced Yield Fund and the Bloomberg Barclays U.S. Municipal Bond BAA Index for the same time periods ended December 31, 2019.
| | | | | | | | | | | | | | | | | | | | |
| | | One | | | Five | | | Ten | | | Since | | | Inception | |
| Average Annual Total Returns1 | | Year | | | Years | | | Years | | | Inception | | | Date | |
AMG GW&K Municipal Enhanced Yield Fund2,3, 4, 5, 6, 7, 8, 9 | |
Class N | | | 10.92 | % | | | 4.60 | % | | | 6.07 | % | | | 6.74 | % | | | 07/27/09 | |
Class I | | | 11.28 | % | | | 5.07 | % | | | 6.50 | % | | | 5.03 | % | | | 12/30/05 | |
Class Z | | | 11.45 | % | | | — | | | | — | | | | 6.77 | % | | | 02/24/17 | |
| | | | | | | | | | | | | | | | | | | | |
Bloomberg Barclays U.S. Municipal Bond BAA Index10 | | | 9.94 | % | | | 4.98 | % | | | 5.61 | % | | | 4.26 | % | | | 12/30/05 | † |
| | | | | | | | | | | | | | | | | | | | |
The performance data shown represents past performance. Past performance is not a guarantee of future results. Current performance may be lower or higher than the performance data quoted. The investment return and principal value of an investment will fluctuate so that an investor’s shares, when redeemed, may be worth more or less than their original cost.
Investors should carefully consider the Fund’s investment objectives, risks, charges and expenses before investing. For performance information through the most recent month end, current net asset values per share for the Fund and other information, please call 800.548.4539 or visit our website at amgfunds.com for a free prospectus. Read it carefully before investing or sending money.
Distributed by AMG Distributors, Inc., member FINRA/SIPC.
| † | Date reflects the inception date of the Fund, not the index. |
| 1 | Total return equals income yield plus share price change and assumes reinvestment of all dividends and capital gain distributions. Returns are net of fees and may reflect offsets of Fund expenses as described in the prospectus. No adjustment has been made for taxes payable by shareholders on their reinvested dividends and |
| | capital gain distributions. Returns for periods greater than one year are annualized. The listed returns on the Fund are net of expenses and based on the published NAV as of December 31, 2019. All returns are in U.S. dollars ($). |
| 2 | From time to time, the Fund’s advisor has waived its fees and/or absorbed Fund expenses, which has resulted in higher returns. |
| 3 | The Fund is subject to the risks associated with investments in debt securities, such as default risk and fluctuations in the perception of the debtor’s ability to pay its creditors. Changing interest rates may adversely affect the value of an investment. An increase in interest rates typically causes the value of bonds and other fixed income securities to fall. |
| 4 | Companies that are in similar businesses may be similarly affected by particular economic or market events; to the extent the Fund has substantial holdings within a particular sector, the risks associated with that sector increase. |
| 5 | The Fund may invest in derivatives such as options and futures; the complexity and rapidly changing structure of derivatives markets may increase the possibility of market losses. |
| 6 | High-yield bonds (also known as “junk bonds”) may be subject to greater levels of interest rate, credit, and liquidity risk than investments in higher rated securities. These securities are considered predominantly speculative with respect to the issuer’s continuing ability to make principal and interest payments. The issuers of the Fund’s holdings may be involved in bankruptcy proceedings, reorganizations, or financial restructurings, and are not as strong financially as higher-rated issuers. |
| 7 | The use of leverage in a Fund’s strategy, such as futures and forward commitment transactions, can magnify relatively small market movements into relatively larger losses for the Fund. |
| 8 | Factors unique to the municipal bond market may negatively affect the value in municipal bonds. |
| 9 | Investment income may be subject to certain state and local taxes, and depending on your tax status, the federal alternative minimum tax. Capital gains are not exempt from federal income tax. |
23
| | |
| | | AMG GW&K Municipal Enhanced Yield Fund Portfolio Manager’s Comments(continued) |
| 10 | The Bloomberg Barclays U.S. Municipal Bond BAA Index is a subset of the Boomberg Barclays U.S. Municipal Bond Index with an index rating of Baa1, Baa2, or Baa3. The Bloomberg Barclays U.S. Municipal Bond Index is a rules-based, market-value-weighted index engineered for the long-term,tax-exempt bond market. Unlike the Fund, the Bloomberg Barclays U.S. Municipal Bond BAA Index is unmanaged, is not available for investment and does not incur expenses. |
Bloomberg Index Services Limited. BLOOMBERG® is a trademark and service mark of Bloomberg Finance L.P. and its affiliates (collectively “Bloomberg”). BARCLAYS® is a trademark and service mark of Barclays Bank Plc (collectively with its affiliates, “Barclays”), used under license. Bloomberg or Bloomberg’s licensors, including Barclays, own all proprietary rights in the Bloomberg Barclays Indices. Neither Bloomberg nor Barclays approves or endorses this material, or guarantees the accuracy
or completeness of any information herein, or makes any warranty, express or implied, as to the results to be obtained therefrom and, to the maximum extent allowed by law, neither shall have any liability or responsibility for injury or damages arising in connection therewith.
Not FDIC insured, nor bank guaranteed. May lose value.
24
| | |
| | | AMG GW&K Municipal Enhanced Yield Fund Fund Snapshots(unaudited) December 31, 2019 |
PORTFOLIO BREAKDOWN
| | | | |
| | | % of | |
Category | | Net Assets | |
Healthcare | | | 32.1 | |
Transportation | | | 30.6 | |
Utilities | | | 15.3 | |
General Obligation | | | 6.2 | |
Public Services | | | 6.2 | |
State andNon-State Appropriated Tobacco | | | 5.4 | |
Education | | | 3.4 | |
Industrial Development | | | 1.3 | |
Short-Term Investments | | | 2.1 | |
Other Assets Less Liabilities | | | (2.6 | ) |
| | | | |
Rating | | % of
Market Value1 | |
Aa/AA | | | 11.6 | |
A | | | 43.3 | |
Baa/BBB | | | 44.3 | |
Ba/BB | | | 0.8 | |
| 1 | Includes market value of long-term fixed-income securities only. |
TOP TEN HOLDINGS
| | | | |
| | | % of | |
Security Name | | Net Assets | |
West Virginia Hospital Finance Authority, Cabell Huntington Hospital Obligation, 5.000%, 01/01/43 | | | 3.3 | |
Texas Private Activity Bond Surface Transportation Corp., 5.000%, 06/30/58 | | | 3.1 | |
California Municipal Finance Authority, Senior Lien-LINXS APM Project, Revenue, 5.000%, 12/31/43 | | | 3.0 | |
New Jersey Economic Development Authority, Series DDD, Revenue, 5.000%, 06/15/42 | | | 3.0 | |
Central Texas Turnpike System, Series C, Revenue, 5.000%, 08/15/42 | | | 2.9 | |
Chicago O’Hare International Airport, Senior Lien, Series A, Revenue, 5.000%, 01/01/48 | | | 2.9 | |
New York Transportation Development Corp., Laguardia Airport Terminal B, Revenue, 5.000%, 07/01/46 | | | 2.7 | |
Central Plains Energy Project Project #3, Series A, Revenue, 5.000%, 09/01/42 | | | 2.7 | |
Colorado Health Facilities Authority, Series A, 5.000%, 08/01/44 | | | 2.6 | |
City of Minneapolis MN, Fairview Health Services, Series A, Revenue, 5.000%, 11/15/49 | | | 2.5 | |
| | | | |
Top Ten as a Group | | | 28.7 | |
| | | | |
Credit quality ratings shown above reflect the highest rating assigned by either Standard & Poor’s (“S&P”), Moody’s Investors Service, Inc. (“Moody’s”) or Fitch. These rating agencies are independent, nationally recognized statistical rating organizations and are widely used. Investment grade ratings are credit ratings of BBB/Baa or higher. Below investment grade ratings are credit ratings of BB/Ba or lower. Investments designated N/R are not rated by either rating agency. Unrated investments do not necessarily indicate low credit quality. Credit quality ratings are subject to change.
Because a fund’s strategy may result in multiple investments in particular sectors of the economy, its performance may depend on the performance of those sectors and may fluctuate more widely than investments diversified across more sectors. For additional information on these and other risk considerations, please see the Fund’s prospectus.
Any sectors, industries, or securities discussed should not be perceived as investment recommendations. Mention of a specific security should not be considered a recommendation to buy or solicitation to sell that security. Specific securities mentioned in this report may have been sold from the Fund’s portfolio of investments by the time you receive this report.
25
| | |
| | | AMG GW&K Municipal Enhanced Yield Fund Schedule of Portfolio Investments December 31, 2019 |
| | | | | | | | |
| | | Principal
Amount | | | Value | |
Municipal Bonds - 100.5% | | | | | | | | |
California - 7.2% | | | | | | | | |
California Municipal Finance Authority, Community Medical Centers, Series A
5.000%, 02/01/42 | | $ | 2,450,000 | | | $ | 2,846,386 | |
California Municipal Finance Authority, Senior Lien-LINXS APM Project
5.000%, 12/31/43 | | | 7,175,000 | | | | 8,381,476 | |
California Municipal Finance Authority, Series I | | | | | | | | |
5.000%, 05/15/43 | | | 3,000,000 | | | | 3,557,100 | |
5.000%, 05/15/48 | | | 4,600,000 | | | | 5,428,782 | |
Total California | | | | | | | 20,213,744 | |
Colorado - 7.1% | | | | | | | | |
Colorado Health Facilities Authority, Series A | | | | | | | | |
5.000%, 08/01/44 | | | 6,115,000 | | | | 7,212,154 | |
5.000%, 11/01/44 | | | 5,500,000 | | | | 6,621,560 | |
Public Authority for Colorado Energy Natural Gas Purchase Revenue, Series 2008
6.500%, 11/15/38 | | | 4,015,000 | | | | 6,103,402 | |
Total Colorado | | | | | | | 19,937,116 | |
Connecticut - 4.3% | | | | | | | | |
State of Connecticut Special Tax Revenue, Transportation Infrastructure
5.000%, 01/01/38 | | | 5,100,000 | | | | 6,100,314 | |
State of Connecticut, Series E | | | | | | | | |
5.000%, 09/15/35 | | | 2,425,000 | | | | 2,971,789 | |
5.000%, 09/15/37 | | | 2,500,000 | | | | 3,043,975 | |
Total Connecticut | | | | | | | 12,116,078 | |
Florida - 6.4% | | | | | | | | |
Alachua County Health Facilities Authority, Shands Teaching Hospital & Clinics, Series A
5.000%, 12/01/44 | | | 6,175,000 | | | | 6,910,566 | |
Miami Beach Health Facilities Authority Mt. Sinai Medical Center
5.000%, 11/15/39 | | | 5,220,000 | | | | 5,838,465 | |
Orange County Health Facilities Authority, Orlando Health Inc., Series A
5.000%, 10/01/39 | | | 4,280,000 | | | | 5,021,125 | |
Total Florida | | | | | | | 17,770,156 | |
Illinois - 9.3% | | | | | | | | |
Chicago O’Hare International Airport, Senior Lien, Series A 5.000%, 01/01/48 | | | 6,750,000 | | | | 7,979,040 | |
Illinois State General Obligation, Series D
5.000%, 11/01/26 | | | 5,225,000 | | | | 5,982,886 | |
Metropolitan Pier & Exposition Authority
5.000%, 06/15/501 | | | 5,000,000 | | | | 5,762,600 | |
| | | | | | | | |
| | | Principal
Amount | | | Value | |
Metropolitan Pier and Exposition Authority Revenue, McCormick Place Expansion Project, Series B
5.000%, 06/15/52 | | $ | 5,990,000 | | | $ | 6,304,535 | |
Total Illinois | | | | | | | 26,029,061 | |
Indiana - 2.1% | | | | | | | | |
Indiana Health & Educational Facilities Financing Authority, Ascension Senior Credit Group
5.000%, 11/15/46 | | | 5,000,000 | | | | 5,819,000 | |
Louisiana - 4.0% | | | | | | | | |
Louisiana Public Facilities Authority, Ochsner Clinic Foundation
5.000%, 05/15/47 | | | 4,100,000 | | | | 4,573,960 | |
New Orleans Aviation Board, General Airport North Terminal, Series B
5.000%, 01/01/48 | | | 5,830,000 | | | | 6,673,135 | |
Total Louisiana | | | | | | | 11,247,095 | |
Massachusetts - 2.9% | | | | | | | | |
Massachusetts Development Finance Agency, UMass Boston Student Housing | | | | | | | | |
5.000%, 10/01/41 | | | 2,250,000 | | | | 2,552,062 | |
5.000%, 10/01/48 | | | 5,000,000 | | | | 5,630,250 | |
Total Massachusetts | | | | | | | 8,182,312 | |
Michigan - 2.6% | | | | | | | | |
Michigan Finance Authority, Series A
5.000%, 12/01/41 | | | 3,100,000 | | | | 3,823,478 | |
Michigan State Hospital Finance Authority, Ascension Senior Credit Group
5.000%, 11/15/46 | | | 3,000,000 | | | | 3,491,400 | |
Total Michigan | | | | | | | 7,314,878 | |
Minnesota - 4.3% | | | | | | | | |
City of Minneapolis MN, Fairview Health Services, Series A
5.000%, 11/15/49 | | | 5,910,000 | | | | 7,031,482 | |
Duluth Economic Development Authority, Essentia Health Obligated Group
5.000%, 02/15/48 | | | 4,100,000 | | | | 4,856,081 | |
Total Minnesota | | | | | | | 11,887,563 | |
Nebraska - 2.7% | | | | | | | | |
Central Plains Energy Project Project #3, Series A
5.000%, 09/01/42 | | | 5,500,000 | | | | 7,522,570 | |
New Jersey - 8.5% | | | | | | | | |
New Jersey Economic Development Authority, Series DDD
5.000%, 06/15/42 | | | 7,365,000 | | | | 8,298,735 | |
The accompanying notes are an integral part of these financial statements.
26
| | |
| | | AMG GW&K Municipal Enhanced Yield Fund Schedule of Portfolio Investments(continued) |
| | | | | | | | |
| | | Principal
Amount | | | Value | |
New Jersey - 8.5%(continued) | |
New Jersey Economic Development Authority, Series WW | | | | | | | | |
5.250%, 06/15/40 | | $ | 65,000 | | | $ | 78,657 | |
5.250%, 06/15/40 | | | 1,095,000 | | | | 1,237,076 | |
New Jersey Transportation Trust Fund Authority, Series BB
5.000%, 06/15/44 | | | 2,000,000 | | | | 2,297,700 | |
New Jersey Transportation Trust Fund Authority, Transportation System, Series A
5.000%, 12/15/34 | | | 2,515,000 | | | | 2,951,503 | |
Tobacco Settlement Financing Corp. Series A | | | | | | | | |
5.000%, 06/01/46 | | | 2,500,000 | | | | 2,843,300 | |
5.250%, 06/01/46 | | | 3,285,000 | | | | 3,812,078 | |
Tobacco Settlement Financing Corp. Series B
5.000%, 06/01/46 | | | 2,000,000 | | | | 2,229,220 | |
Total New Jersey | | | | | | | 23,748,269 | |
New York - 10.1% | |
City of New York, Series A
5.000%, 08/01/45 | | | 4,405,000 | | | | 5,418,943 | |
New York State Dormitory Authority, Series A
5.000%, 03/15/45 | | | 4,990,000 | | | | 6,004,218 | |
New York State Dormitory Authority, Series D
4.000%, 02/15/471 | | | 5,000,000 | | | | 5,618,300 | |
New York Transportation Development Corp., Delta Air Lines, Inc. - Laguardia
5.000%, 01/01/31 | | | 2,900,000 | | | | 3,500,184 | |
New York Transportation Development Corp., Laguardia Airport Terminal B
5.000%, 07/01/46 | | | 6,820,000 | | | | 7,583,908 | |
Total New York | | | | | | | 28,125,553 | |
Oklahoma - 5.0% | |
Norman Regional Hospital Authority
5.000%, 09/01/45 | | | 4,335,000 | | | | 5,125,487 | |
Oklahoma Development Finance Authority, Health Ou Medicine Project, Series B | | | | | | | | |
5.250%, 08/15/48 | | | 2,975,000 | | | | 3,518,414 | |
5.500%, 08/15/52 | | | 4,500,000 | | | | 5,368,005 | |
Total Oklahoma | | | | | | | 14,011,906 | |
Rhode Island - 2.3% | |
Tobacco Settlement Financing Corp. Series A | | | | | | | | |
5.000%, 06/01/35 | | | 2,000,000 | | | | 2,246,160 | |
5.000%, 06/01/40 | | | 3,635,000 | | | | 4,037,903 | |
Total Rhode Island | | | | | | | 6,284,063 | |
| | | | | | | | |
| | | Principal
Amount | | | Value | |
Texas - 16.0% | |
Central Texas Regional Mobility Authority | | | | | | | | |
5.000%, 01/01/40 | | $ | 1,650,000 | | | $ | 1,912,201 | |
5.000%, 01/01/46 | | | 3,750,000 | | | | 4,314,712 | |
Central Texas Turnpike System, Series C
5.000%, 08/15/42 | | | 7,065,000 | | | | 7,989,597 | |
Grand Parkway Transportation Corp., 1st Tier Toll Revenue, Series A
5.500%, 04/01/53 | | | 4,010,000 | | | | 4,486,909 | |
Tarrant County Cultural Education Facilities Finance Corp., Baylor Scott & White Health
5.000%, 11/15/45 | | | 1,905,000 | | | | 2,186,826 | |
Texas Private Activity Bond Surface Transportation Corp.
5.000%, 06/30/58 | | | 7,500,000 | | | | 8,751,900 | |
Texas Private Activity Bond Surface Transportation Corp., Senior Lien-Blueridge Transport | | | | | | | | |
5.000%, 12/31/40 | | | 3,930,000 | | | | 4,414,648 | |
5.000%, 12/31/45 | | | 3,880,000 | | | | 4,328,450 | |
Texas Private Activity Bond Surface Transportation Corp., Series A
4.000%, 12/31/39 | | | 5,500,000 | | | | 6,163,960 | |
Total Texas | | | | | | | 44,549,203 | |
Virginia - 2.3% | |
Virginia Small Business Financing Authority, Transform 66 P3 Project | | | | | | | | |
5.000%, 12/31/49 | | | 2,500,000 | | | | 2,856,675 | |
5.000%, 12/31/52 | | | 3,060,000 | | | | 3,489,930 | |
Total Virginia | | | | | | | 6,346,605 | |
West Virginia - 3.4% | | | | | | | | |
West Virginia Hospital Finance Authority, Cabell Huntington Hospital Obligation
5.000%, 01/01/43 | | | 8,000,000 | | | | 9,365,520 | |
Total Municipal Bonds
(Cost $264,728,473) | | | | | | | 280,470,692 | |
Short-Term Investments - 2.1% | | | | | | | | |
Municipal Bonds - 2.1% | | | | | | | | |
New York - 0.7% | | | | | | | | |
City of New York, SubordinatedSeries D-4
1.700%, 01/06/202,3 | | | 2,000,000 | | | | 2,000,000 | |
Texas - 1.4% | |
State of Texas
4.000%, 08/27/20 | | | 3,870,000 | | | | 3,942,485 | |
Total Municipal Bonds
(Cost $5,940,589) | | | | | | | 5,942,485 | |
Total Short-Term Investments
(Cost $5,940,589) | | | | | | | 5,942,485 | |
Total Investments - 102.6%
(Cost $270,669,062) | | | | | | | 286,413,177 | |
The accompanying notes are an integral part of these financial statements.
27
| | |
| | | AMG GW&K Municipal Enhanced Yield Fund Schedule of Portfolio Investments(continued) |
| | | | | | | | |
| | | | | | Value | |
Other Assets, less Liabilities - (2.6)% | | | | | | $ | (7,342,700 | ) |
Net Assets - 100.0% | | | | | | $ | 279,070,477 | |
| 1 | All or part of the security is delayed delivery transaction. The market value for delayed delivery security at December 31, 2019, amounted to $11,380,900, or 4.1% of net assets. |
| 2 | Date shown is the next coupon reset date. |
| 3 | Variable rate security. The rate shown is based on the latest available information as of December 31, 2019. Certain variable rate securities are not based on a published reference rate and spread but are determined by the issuer or agent and are based on current market conditions. These securities do not indicate a reference rate and spread in their description above. |
The following table summarizes the inputs used to value the Fund’s investments by the fair value hierarchy levels as of December 31, 2019:
| | | | | | | | | | | | | | | | |
| | | Level 1 | | | Level 2 | | | Level 3 | | | Total | |
Investments in Securities | | | | | | | | | | | | | | | | |
Municipal Bonds† | | | — | | | $ | 280,470,692 | | | | — | | | $ | 280,470,692 | |
Short-Term Investments | | | | | | | | | | | | | | | | |
Municipal Bonds† | | | — | | | | 5,942,485 | | | | — | | | | 5,942,485 | |
| | | | | | | | | | | | | | | | |
Total Investments in Securities | | | — | | | $ | 286,413,177 | | | | — | | | $ | 286,413,177 | |
| | | | | | | | | | | | | | | | |
| † | All municipal bonds held in the Fund are Level 2 securities. For a detailed breakout of municipal bonds by major classification, please refer to the Fund’s Schedule of Portfolio Investments. |
For the fiscal year ended December 31, 2019, there were no transfers in or out of Level 3.
The accompanying notes are an integral part of these financial statements.
28
| | |
| | | AMG GW&K Small Cap Core Fund Portfolio Manager’s Comments(unaudited) |
THE YEAR IN REVIEW
For the year ended December 31, 2019, AMG GW&K Small Cap Core Fund (Class N shares) (the “Fund”) returned 30.66%, outperforming the Russell 2000® Index, which returned 25.52%.
After surviving the fourth quarter of 2018, investors could be forgiven for bracing themselves as the calendar turned to October in 2019. Not to disappoint, the fourth quarter turned out to be nearly as dramatic as the previous one, with a notable exception: the sign in front of the return measurement. It turns out this symbol tends to be an important determinant of whether investors enjoy the drama or not. In terms of investor psychology, the sign has told the difference in the last two fourth quarters between fear and fear of missing out (FOMO). In the fourth quarter of 2018, the Russell 2000® Index dropped (20.2)% and we experienced fear, as investors had visions of a 2008-like recession hitting the economy. In the final quarter of 2019, investors instead focused on a potentially improving global economy, which boosted the Russell 2000® Index by 9.9%. This fortunate turn in sentiment came from two main factors: the hope for improved trade relations between the U.S. and China and a shift in U.S. Federal Reserve (the “Fed”) policy toward accommodation. These factors helped deliver a full year return of 25.52% for the Russell 2000® Index, although in truth the lower starting point after last year’s fourth-quarter selloff was a meaningful contributor to this strong 2019 result. This impressive gain for the year was driven by multiple expansion rather than earnings growth, although the prospect for future growth appears better today than it did 365 days ago. For perspective, the Russell 2000® Index remains a few percentage points below the high set in late August 2018, so while fear has receded somewhat, investors have yet to embrace full FOMO mode.
While the Russell 2000® Index had an exceptional year, the Fund outperformed the benchmark by over 500 basis points (5.00%). In what feels like a semi-permanent trend, information technology led all sectors with a blazing 40.8% return for the year, retaining its strength throughout all four quarters. Technology was followed by closely grouped
industrials, health care, and real estate. It is worth noting that this mix of secular growth, cyclical growth, and yield sensitive stocks all participated in the 2019 rally, but experienced strength at different times during the year. At the bottom of the sector list, energy, down (6.9)%, lost more ground to the Russell 2000® Index this year. Communication services, consumer staples, and utilities also lagged.
On a factor basis, results were mixed.Non-earners very slightly outperformed profit-making firms, negative equity outperformed somewhat, and those without a five-year earnings record were nicely higher. However, performance among beta quintiles and debt level quintiles was muted and higher return on equity (ROE) stocks outperformed. In total, we believe there was a slight bias toward lower quality stocks in the Index for 2019.
How then did the Fund outperform against a lower quality headwind? The drivers were excellent stock selection in six sectors and underweight positions in energy and communication services. The underweight posture in these two sectors added about 100 basis points, which was partially offset by the drag from our small cash exposure. Stock selection in financials led the way, as the sector was a strong contributor to relative performance. Cohen & Steers, Inc., Stifel Financial Corp, and PRA Group, Inc. were each up over 45% during the year on improved earnings outlooks and higher valuations. Ameris Bancorp and Pacific Premier Bancorp, Inc. both outperformed their banking peers. The industrial sector was next best in stock selection, with six stocks up over 50%: Universal Forest Products, Inc., Patrick Industries, Inc., Allegiant Travel Co., SiteOne Landscape Supply, Inc., Alamo Group, Inc., and John Bean Technologies Corp. Information technology was our third largest stock selection contributor with the software and semiconductor industries as the main drivers. Finally, stock selection in energy and materials was excellent, as nearly all holdings outperformed the benchmark during the year.
While there were of course negative outliers in the Fund, the only groups that were large enough in size to hurt relative performance were the aforementioned cash drag and our lack of exposure
to the biotechnology industry. Biotechnology was up 42.2% in the benchmark and its meaningful 6.9% weight in the Russell 2000® Index compared to our lack of any meaningful direct participation led to a loss of more than 100 basis points in relative performance during the year. Still, health care overall lost only (22) basis points, meaning our selection in the sector outside of biotechnology was generally good.
As we enter January it is customary to ask the question of what the New Year will hold for the stock market. It is our practice to consider as many economic and market facts as possible, but also acknowledge that confidence and psychology can have a significant impact on short-term results. The following are a few items that we believe investors should take into consideration for the year ahead. First, strong market returns in one year of a long multi-year rally don’t necessarily portend a market pullback. Work by Furey Research indicated that since 1950, in the year following a 20% market appreciation, small caps have averaged 12% returns. Second, there are signals that global growth is starting to improve. While U.S. manufacturing remains an area of weakness, global central bank accommodation appears to be stimulating growth in many pockets of the economy. Third, the small cap revision ratio has begun to turn upward, a positive sign for earnings expectations. Finally, the continuing outflows from equity investment vehicles would indicate that investor sentiment is not ebullient. Of course, investors will likely find reasons to worry at some point this year, perhaps with good reason. Some candidates for concern might be the ups and downs of election polls, some geopolitical event, or the longevity of the current economic expansion. It is our belief that by building portfolios of high quality, well managed businesses with strong balance sheets, the Fund can participate in market upside, but also protect in downside scenarios if investor sentiment, or the investment facts, change for the worse.
This commentary reflects the viewpoints of GW&K Investment Management, LLC and is not intended as a forecast or guarantee of future results.
29
| | |
| | | AMG GW&K Small Cap Core Fund Portfolio Manager’s Comments(continued) |
CUMULATIVE TOTAL RETURN PERFORMANCE
AMG GW&K Small Cap Core Fund’s cumulative total return is based on the daily change in net asset value (NAV), and assumes that all dividends and distributions were reinvested. The graph compares a hypothetical $10,000 investment made in the AMG GW&K Small Cap Core Fund’s Class N shares on December 31, 2009, to a $10,000 investment made in the Russell 2000® Index for the same time period. The graph and table do not reflect the deduction of taxes that a shareholder would pay on a Fund distribution or redemption of shares. The listed returns for the Fund are net of expenses and the returns for the index exclude expenses. Total returns would have been lower had certain expenses not been reduced.
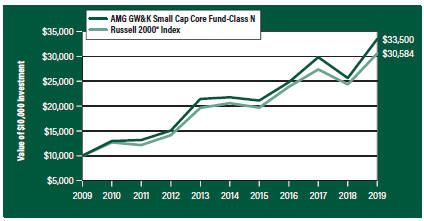
The table below shows the average annual total returns for the AMG GW&K Small Cap Core Fund and the Russell 2000® Index for the same time periods ended December 31, 2019.
| | | | | | | | | | | | | | | | | | | | |
| | | One | | | Five | | | Ten | | | Since | | | Inception | |
| Average Annual Total Returns1 | | Year | | | Years | | | Years | | | Inception | | | Date | |
AMG GW&K Small Cap Core Fund2, 3 | |
Class N | | | 30.66 | % | | | 9.00 | % | | | 12.85 | % | | | 8.37 | % | | | 12/10/96 | |
Class I | | | 31.13 | % | | | 9.40 | % | | | 13.30 | % | | | 14.10 | % | | | 07/27/09 | |
Class Z | | | 31.13 | % | | | — | | | | — | | | | 9.63 | % | | | 02/24/17 | |
| | | | | | | | | | | | | | | | | | | | |
Russell 2000® Index4 | | | 25.52 | % | | | 8.23 | % | | | 11.83 | % | | | 8.29 | % | | | 12/10/96 | † |
| | | | | | | | | | | | | | | | | | | | |
The performance data shown represents past performance. Past performance is not a guarantee of future results. Current performance may be lower or higher than the performance data quoted. The investment return and principal value of an investment will fluctuate so that an investor’s shares, when redeemed, may be worth more or less than their original cost.
Investors should carefully consider the Fund’s investment objectives, risks, charges and expenses before investing. For performance information through the most recent month end, current net asset values per share for the Fund and other information, please call 800.548.4539 or visit our website at amgfunds.com for a free prospectus. Read it carefully before investing or sending money.
Distributed by AMG Distributors, Inc., member FINRA/SIPC.
| † | Date reflects the inception date of the Fund, not the index. |
| 1 | Total return equals income yield plus share price change and assumes reinvestment of all dividends and capital gain distributions. Returns are net of fees and may reflect offsets of Fund expenses as described in the prospectus. No adjustment has been made for taxes payable by shareholders on their reinvested dividends and |
| | capital gain distributions. Returns for periods greater than one year are annualized. The listed returns on the Fund are net of expenses and based on the published NAV as of December 31, 2019. All returns are in U.S. dollars ($). |
| 2 | From time to time, the Fund’s advisor has waived its fees and/or absorbed Fund expenses, which has resulted in higher returns. |
| 3 | The Fund is subject to risks associated with investments in small-capitalization companies, such as erratic earnings patterns, competitive conditions, limited earnings history, and a reliance on one or a limited number of products. |
| 4 | The Russell 2000® Index is composed of the 2,000 smallest stocks in the Russell 3000® Index and is widely regarded in the industry as the premier measure ofsmall-cap stock performance. Unlike the Fund, the Russell 2000® Index is unmanaged, is not available for investment and does not incur expenses. |
The Russell Indices are trademarks of the London Stock Exchange Group companies.
Not FDIC insured, nor bank guaranteed. May lose value.
30
| | |
| | | AMG GW&K Small Cap Core Fund Fund Snapshots(unaudited) December 31, 2019 |
PORTFOLIO BREAKDOWN
| | | | |
| | | % of | |
Sector | | Net Assets | |
Industrials | | | 19.5 | |
Financials | | | 15.2 | |
Information Technology | | | 14.6 | |
Health Care | | | 14.1 | |
Consumer Discretionary | | | 14.1 | |
Real Estate | | | 5.8 | |
Consumer Staples | | | 4.9 | |
Materials | | | 4.9 | |
Utilities | | | 2.7 | |
Energy | | | 2.6 | |
Short-Term Investments | | | 2.5 | |
Other Assets Less Liabilities | | | (0.9 | ) |
TOP TEN HOLDINGS
| | | | |
| | | % of | |
Security Name | | Net Assets | |
Globus Medical, Inc., Class A | | | 2.9 | |
Performance Food Group Co. | | | 2.4 | |
Catalent, Inc. | | | 2.3 | |
Syneos Health, Inc. | | | 2.1 | |
Grand Canyon Education, Inc. | | | 2.1 | |
Paylocity Holding Corp. | | | 2.0 | |
Lithia Motors, Inc., Class A | | | 1.8 | |
HubSpot, Inc. | | | 1.8 | |
RBC Bearings, Inc. | | | 1.8 | |
Ritchie Bros. Auctioneers, Inc. (Canada) | | | 1.7 | |
| | | | |
Top Ten as a Group | | | 20.9 | |
| | | | |
Because a fund’s strategy may result in multiple investments in particular sectors of the economy, its performance may depend on the performance of those sectors and may fluctuate more widely than investments diversified across more sectors. For additional information on these and other risk considerations, please see the Fund’s prospectus.
Any sectors, industries, or securities discussed should not be perceived as investment recommendations. Mention of a specific security should not be considered a recommendation to buy or solicitation to sell that security. Specific securities mentioned in this report may have been sold from the Fund’s portfolio of investments by the time you receive this report.
31
| | |
| | | AMG GW&K Small Cap Core Fund Schedule of Portfolio Investments December 31, 2019 |
| | | | | | | | |
| | | Shares | | | Value | |
Common Stocks - 98.4% | | | | | | | | |
Consumer Discretionary - 14.1% | |
Churchill Downs, Inc. | | | 46,549 | | | $ | 6,386,523 | |
Chuy’s Holdings, Inc.* | | | 86,820 | | | | 2,250,374 | |
Five Below, Inc.* | | | 55,040 | | | | 7,037,414 | |
Grand Canyon Education, Inc.* | | | 98,464 | | | | 9,431,867 | |
Helen of Troy, Ltd.* | | | 22,837 | | | | 4,105,864 | |
Lithia Motors, Inc., Class A1 | | | 55,748 | | | | 8,194,956 | |
Ollie’s Bargain Outlet Holdings, Inc.*,1 | | | 68,700 | | | | 4,486,797 | |
Oxford Industries, Inc.1 | | | 50,057 | | | | 3,775,299 | |
Skyline Champion Corp.* | | | 187,798 | | | | 5,953,197 | |
Texas Roadhouse, Inc.1 | | | 137,432 | | | | 7,740,170 | |
Wolverine World Wide, Inc.1 | | | 123,920 | | | | 4,181,061 | |
Total Consumer Discretionary | | | | | | | 63,543,522 | |
Consumer Staples - 4.9% | | | | | | | | |
Central Garden & Pet Co.*,1 | | | 78,478 | | | | 2,438,312 | |
Central Garden & Pet Co., Class A* | | | 182,247 | | | | 5,350,772 | |
Performance Food Group Co.* | | | 210,682 | | | | 10,845,909 | |
WD-40 Co.1 | | | 17,060 | | | | 3,312,028 | |
Total Consumer Staples | | | | | | | 21,947,021 | |
Energy - 2.6% | | | | | | | | |
Dril-Quip, Inc.*,1 | | | 51,750 | | | | 2,427,593 | |
Matador Resources Co.*,1 | | | 342,423 | | | | 6,153,341 | |
WPX Energy, Inc.*,1 | | | 236,000 | | | | 3,242,640 | |
Total Energy | | | | | | | 11,823,574 | |
Financials - 15.2% | | | | | | | | |
Ameris Bancorp | | | 154,448 | | | | 6,570,218 | |
AMERISAFE, Inc. | | | 87,495 | | | | 5,777,295 | |
Cathay General Bancorp | | | 194,065 | | | | 7,384,173 | |
Cohen & Steers, Inc.1 | | | 81,114 | | | | 5,090,715 | |
Glacier Bancorp, Inc.1 | | | 152,931 | | | | 7,033,297 | |
Houlihan Lokey, Inc. | | | 95,267 | | | | 4,655,698 | |
Meridian Bancorp, Inc. | | | 152,313 | | | | 3,059,968 | |
Pacific Premier Bancorp, Inc. | | | 155,963 | | | | 5,085,174 | |
PRA Group, Inc.*,1 | | | 99,625 | | | | 3,616,387 | |
Seacoast Banking Corp. of Florida* | | | 158,270 | | | | 4,838,314 | |
Stifel Financial Corp. | | | 95,470 | | | | 5,790,255 | |
United Bankshares, Inc.1 | | | 91,791 | | | | 3,548,640 | |
Webster Financial Corp. | | | 112,724 | | | | 6,014,953 | |
Total Financials | | | | | | | 68,465,087 | |
Health Care - 14.1% | | | | | | | | |
AtriCure, Inc.* | | | 168,234 | | | | 5,469,287 | |
Cantel Medical Corp.1 | | | 63,709 | | | | 4,516,968 | |
| | | | | | | | |
| | | Shares | | | Value | |
Catalent, Inc.* | | | 184,216 | | | $ | 10,371,361 | |
Globus Medical, Inc., Class A* | | | 218,684 | | | | 12,876,114 | |
ICU Medical, Inc.* | | | 27,656 | | | | 5,174,991 | |
LHC Group, Inc.* | | | 51,390 | | | | 7,079,486 | |
Syneos Health, Inc.*,1 | | | 162,562 | | | | 9,668,375 | |
Veracyte, Inc.* | | | 151,622 | | | | 4,233,286 | |
Wright Medical Group, N.V. (Netherlands)* | | | 148,041 | | | | 4,512,290 | |
Total Health Care | | | | | | | 63,902,158 | |
Industrials - 19.5% | | | | | | | | |
AAR Corp. | | | 118,049 | | | | 5,324,010 | |
Alamo Group, Inc. | | | 48,300 | | | | 6,064,065 | |
Allegiant Travel Co. | | | 40,806 | | | | 7,101,876 | |
Heartland Express, Inc. | | | 205,167 | | | | 4,318,765 | |
Helios Technologies, Inc. | | | 79,490 | | | | 3,674,823 | |
ICF International, Inc. | | | 79,023 | | | | 7,240,087 | |
John Bean Technologies Corp.1 | | | 38,048 | | | | 4,286,488 | |
Mobile Mini, Inc. | | | 129,758 | | | | 4,919,126 | |
Patrick Industries, Inc.1 | | | 103,259 | | | | 5,413,870 | |
Primoris Services Corp. | | | 233,368 | | | | 5,190,104 | |
RBC Bearings, Inc.* | | | 50,715 | | | | 8,030,213 | |
Ritchie Bros. Auctioneers, Inc. (Canada) | | | 184,020 | | | | 7,903,659 | |
SiteOne Landscape Supply, Inc.*,1 | | | 60,905 | | | | 5,521,038 | |
Universal Forest Products, Inc. | | | 152,423 | | | | 7,270,577 | |
US Ecology, Inc. | | | 102,141 | | | | 5,914,985 | |
Total Industrials | | | | | | | 88,173,686 | |
Information Technology - 14.6% | |
Entegris, Inc. | | | 145,075 | | | | 7,266,807 | |
ExlService Holdings, Inc.* | | | 67,138 | | | | 4,663,405 | |
Globant SA (Argentina)* | | | 27,121 | | | | 2,876,182 | |
HubSpot, Inc.* | | | 51,425 | | | | 8,150,863 | |
MACOM Technology Solutions Holdings, Inc.* | | | 137,409 | | | | 3,655,079 | |
Novanta, Inc.* | | | 56,275 | | | | 4,976,961 | |
Paylocity Holding Corp.* | | | 74,272 | | | | 8,973,543 | |
Power Integrations, Inc. | | | 34,417 | | | | 3,404,185 | |
Proofpoint, Inc.* | | | 42,649 | | | | 4,895,252 | |
Rogers Corp.*,1 | | | 34,357 | | | | 4,285,349 | |
Silicon Laboratories, Inc.* | | | 56,576 | | | | 6,561,685 | |
Virtusa Corp.* | | | 142,950 | | | | 6,479,924 | |
Total Information Technology | | | | | | | 66,189,235 | |
Materials - 4.9% | |
Balchem Corp. | | | 50,221 | | | | 5,103,960 | |
Compass Minerals International, Inc.1 | | | 60,461 | | | | 3,685,703 | |
PolyOne Corp. | | | 190,901 | | | | 7,023,248 | |
The accompanying notes are an integral part of these financial statements.
32
| | |
| | | AMG GW&K Small Cap Core Fund Schedule of Portfolio Investments(continued) |
| | | | | | | | |
| | | Shares | | | Value | |
Materials - 4.9%(continued) | |
Silgan Holdings, Inc. | | | 203,053 | | | $ | 6,310,887 | |
Total Materials | | | | | | | 22,123,798 | |
Real Estate - 5.8% | |
National Health Investors, Inc., REIT | | | 61,650 | | | | 5,023,242 | |
Pebblebrook Hotel Trust, REIT1 | | | 101,631 | | | | 2,724,727 | |
QTS Realty Trust, Inc., Class A, REIT1 | | | 128,352 | | | | 6,965,663 | |
Ryman Hospitality Properties, Inc., REIT | | | 54,187 | | | | 4,695,846 | |
STAG Industrial, Inc., REIT | | | 212,463 | | | | 6,707,457 | |
Total Real Estate | | | | | | | 26,116,935 | |
Utilities - 2.7% | |
IDACORP, Inc. | | | 52,125 | | | | 5,566,950 | |
NorthWestern Corp. | | | 94,818 | | | | 6,795,606 | |
Total Utilities | | | | | | | 12,362,556 | |
Total Common Stocks
(Cost $347,568,554) | | | | | | | 444,647,572 | |
| | |
| | | Principal
Amount | | | | |
Short-Term Investments - 2.5% | |
Joint Repurchase Agreements - 0.8%2 | |
Cantor Fitzgerald Securities, Inc., dated 12/31/19, due 01/02/20, 1.580% total to be received $1,000,088 (collateralized by various U.S. Government Agency Obligations and U.S. Treasuries, 0.000% - 8.500%, 01/25/20 -10/15/60, totaling $1,020,000) | | $ | 1,000,000 | | | | 1,000,000 | |
Citadel Securities LLC, dated 12/31/19, due 01/02/20, 1.600% total to be received $780,523 (collateralized by various U.S. Treasuries, 0.000% - 8.500%, 01/15/20 - 11/15/48, totaling $796,134) | | | 780,454 | | | | 780,454 | |
| | | | | | | | |
| | | Principal
Amount | | | Value | |
Citigroup Global Markets, Inc., dated 12/31/19, due 01/02/20, 1.570% total to be received $1,000,087 (collateralized by various U.S. Government Agency Obligations and U.S. Treasuries, 0.000% - 9.000%, 02/13/20 - 09/20/69, totaling $1,020,000) | | $ | 1,000,000 | | | $ | 1,000,000 | |
RBC Dominion Securities, Inc., dated 12/31/19, due 01/02/20, 1.570% total to be received $1,000,087 (collateralized by various U.S. Government Agency Obligations and U.S. Treasuries, 0.000% - 6.500%, 06/30/21 -12/01/49, totaling $1,020,000) | | | 1,000,000 | | | | 1,000,000 | |
Total Joint Repurchase Agreements | | | | | | | 3,780,454 | |
| | |
| | | Shares | | | | |
Other Investment Companies - 1.7% | | | | | | | | |
Dreyfus Government Cash Management Fund, Institutional Shares, 1.51%3 | | | 2,562,037 | | | | 2,562,037 | |
Dreyfus Institutional Preferred Government Money Market Fund, Institutional Shares, 1.55%3 | | | 2,562,036 | | | | 2,562,036 | |
JPMorgan U.S. Government Money Market Fund, IM Shares, 1.53%3 | | | 2,639,674 | | | | 2,639,674 | |
Total Other Investment Companies | | | | 7,763,747 | |
Total Short-Term Investments
(Cost $11,544,201) | | | | | | | 11,544,201 | |
Total Investments - 100.9%
(Cost $359,112,755) | | | | | | | 456,191,773 | |
Other Assets, less Liabilities - (0.9)% | | | | (4,229,226 | ) |
Net Assets - 100.0% | | | | | | $ | 451,962,547 | |
| * | Non-income producing security. |
| 1 | Some of these securities, amounting to $74,630,943 or 16.5% of net assets, were out on loan to various borrowers and are collateralized by cash and various U.S. Treasury Obligations. See Note 4 of Notes to Financial Statements. |
| 2 | Cash collateral received for securities lending activity was invested in these joint repurchase agreements. |
| 3 | Yield shown represents the December 31, 2019, seven day average yield, which refers to the sum of the previous seven days’ dividends paid, expressed as an annual percentage. |
REIT Real Estate Investment Trust
The accompanying notes are an integral part of these financial statements.
33
| | |
| | | AMG GW&K Small Cap Core Fund Schedule of Portfolio Investments(continued) |
The following table summarizes the inputs used to value the Fund’s investments by the fair value hierarchy levels as of December 31, 2019:
| | | | | | | | | | | | | | | | |
| | | Level 1 | | | Level 2 | | | Level 3 | | | Total | |
Investments in Securities | | | | | | | | | | | | | | | | |
Common Stocks† | | $ | 444,647,572 | | | | — | | | | — | | | $ | 444,647,572 | |
Short-Term Investments | | | | | | | | | | | | | | | | |
Joint Repurchase Agreements | | | — | | | $ | 3,780,454 | | | | — | | | | 3,780,454 | |
Other Investment Companies | | | 7,763,747 | | | | — | | | | — | | | | 7,763,747 | |
| | | | | | | | | | | | | | | | |
Total Investments in Securities | | $ | 452,411,319 | | | $ | 3,780,454 | | | | — | | | $ | 456,191,773 | |
| | | | | | | | | | | | | | | | |
| † | All common stocks held in the Fund are Level 1 securities. For a detailed breakout of common stocks by major industry classification, please refer to the Fund’s Schedule of Portfolio Investments. |
For the fiscal year ended December 31, 2019, there were no transfers in or out of Level 3.
The accompanying notes are an integral part of these financial statements.
34
| | |
| | | AMG GW&K Small/Mid Cap Fund Portfolio Manager’s Comments(unaudited) |
REVIEW
For the year ended December 31, 2019, AMG GW&K Small/Mid Cap Fund (Class N shares) (the “Fund”) returned 30.64%, compared to the Russell 2500® Index, which returned 27.77%.
After surviving the fourth quarter of 2018, investors could be forgiven for bracing themselves as the calendar turned to October in 2019. Not to disappoint, the fourth quarter that just passed turned out to be nearly as dramatic as the previous one, with a notable exception: the sign in front of the return measurement. It turns out this symbol tends to be an important determinant of whether investors enjoy the drama or not. In terms of investor psychology, the sign has told the difference in the last two fourth quarters between fear and fear of missing out (FOMO). In the fourth quarter of 2018, the Russell 2500® Index dropped (18.5)% and we experienced fear, as investors had visions of a 2008-like recession hitting the economy. In the final quarter of 2019, investors instead focused on a potentially improving global economy, which boosted the Russell 2500® Index by 8.5%. This fortunate turn in sentiment came from two main factors: the hope for improved trade relations between the U.S. and China and a shift in U.S. Federal Reserve (the “Fed”) policy toward accommodation. These factors helped deliver a full-year return of 27.77% for the Russell 2500® Index, although in truth the lower starting point after last year’s fourth-quarter selloff was a meaningful contributor to this strong 2019 result. This impressive gain for the year was driven by multiple expansion rather than earnings growth, although the prospect for future growth appears better today than it did 365 days ago. For perspective, the Russell 2500® Index just eclipsed by a hair its previous high set in late August 2018, so while fear has receded somewhat, investors have yet to embrace full FOMO mode.
While the Russell 2500® Index had an exceptional year, the Fund outperformed the benchmark by nearly 300 basis points. In what feels like a semi-permanent trend, information technology led all sectors with a blazing 43.5% return for the year, retaining its strength throughout all four quarters. Technology was followed by closely grouped
industrials, health care, and real estate. It is worth noting that this mix of secular growth, cyclical growth, and yield sensitive stocks all participated in the 2019 rally, but experienced strength at different times during the year. At the bottom of the sector list, energy, down (7.0)%, lost more ground to the Index again this year. Consumer staples, utilities, and communication services also lagged.
On a factor basis, results were mixed.Non-earners very slightly outperformed, high beta outperformed, and those without a five-year earnings record were nicely higher. However, performance among return on equity (ROE) quintiles and debt level quintiles was muted and higher ROE stocks outperformed. In total, we believe there was a slight bias toward lower quality stocks in the Index for 2019.
How then did the Fund outperform by such a nice margin in this environment? The drivers were excellent stock selection in six sectors and underweight positions in consumer staples, energy, and communication services. The underweight posture in these three sectors added about 100 basis points. Stock selection in information technology led the way, as the sector contributed strongly to relative performance. Five stocks (Booz Allen Hamilton Holding Corporation, Rapid7 Inc., Typer Technologies, Inc., EPAM Systems, Inc., and Power Integrations, Inc.) were each up over 45% during the year on improved earnings outlooks and higher valuations. The financial sector was the next largest contributor, with notable strength of two names (MarketAxess Holdings Inc. and Artisan Partners Asset Management, Inc.) as well as solid results among bank holdings. In energy all four of the five stocks held during the period (Parsley Energy, Inc, Matador Resources Company, Drill-Quip, Inc. and Superior Energy Services, Inc.) delivered positive returns in a negative sector. Superior Energy Services, Inc. and Callon Petroleum Company were sold during the period. We also benefited from our modest underweight positioning.
On the other side of the ledger, we did lose relative performance from our cash position, and from stock selection in consumer discretionary and materials. The materials sector saw otherwise good
performance washed out by two stocks (Berry Global Group Inc. and Quaker Chemical Corporation) with slightly negative returns. Both were done in by weaker-than-expected results and distraction of sizable acquisitions. In consumer discretionary, the largest detractors included some meaningful valuation reductions for two stocks (Grand Canyon Education, Inc. and BJ’s Restaurants, Inc.) , although both had good earnings results.
As we enter January it is customary to ask what the New Year will hold for the stock market. It is our practice to consider as many economic and market facts as possible, but also acknowledge that confidence and psychology can have a significant impact on short-term results. The following are a few items that we believe investors should take into consideration for the year ahead. First, strong market returns in one year or a long multi-year rally don’t necessarily portend a market pullback. Work by Furey Research indicated that since 1950, in the year following a 20% market appreciation, small caps have averaged 12% returns. Second, there are signals that global growth is starting to improve. While U.S. manufacturing remains an area of weakness, global central bank accommodation appears to be stimulating growth in many pockets of the economy. Third, the small cap revision ratio has begun to turn upward, a positive sign for earnings expectations. Finally, the continuing outflows from equity investment vehicles would indicate that investor sentiment is not ebullient. Of course, investors will likely find reasons to worry at some point this year, perhaps with good reason. Some candidates for concern might be the ups and downs of election polls, some geopolitical event, or the longevity of the current economic expansion. It is our belief that by building portfolios of high quality, well managed businesses with strong balance sheets, the Fund can participate in market upside, but also protect in downside scenarios if investor sentiment, or the investment facts, change for the worse.
This commentary reflects the viewpoints of GW&K Investment Management, LLC and is not intended as a forecast or guarantee of future results.
35
| | |
| | | AMG GW&K Small/Mid Cap Fund Portfolio Manager’s Comments(continued) |
CUMULATIVE TOTAL RETURN PERFORMANCE
AMG GW&K Small/Mid Cap Fund’s cumulative total return is based on the daily change in net asset value (NAV), and assumes that all dividends and distributions were reinvested. The graph compares a hypothetical $10,000 investment made in the AMG GW&K Small/Mid Cap Fund’s Class I shares on June 30, 2015, to a $10,000 investment made in the Russell 2500® Index for the same time period. The graph and table do not reflect the deduction of taxes that a shareholder would pay on a Fund distribution or redemption of shares. The listed returns for the Fund are net of expenses and the returns for the index exclude expenses. Total returns would have been lower had certain expenses not been reduced.
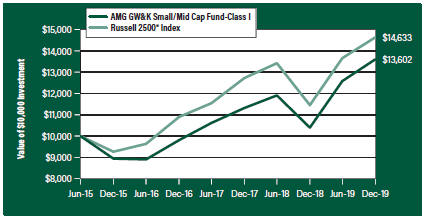
The table below shows the average annual total returns for the AMG GW&K Small/Mid Cap Fund and the Russell 2500® Index for the same time periods ended December 31, 2019.
| | | | | | | | | | | | |
| | | One | | | Since | | | Inception | |
| Average Annual Total Returns1 | | Year | | | Inception | | | Date | |
AMG GW&K Small/Mid Cap Fund2,3, 4, 5, 6 | | | | | | | | | | | | |
Class N | | | 30.64 | % | | | 9.90 | % | | | 02/24/17 | |
Class I | | | 30.86 | % | | | 7.07 | % | | | 06/30/15 | |
Class Z | | | 30.94 | % | | | 10.16 | % | | | 02/24/17 | |
| | | | | | | | | | | | |
Russell 2500® Index7 | | | 27.77 | % | | | 8.82 | % | | | 06/30/15 | † |
| | | | | | | | | | | | |
The performance data shown represents past performance. Past performance is not a guarantee of future results. Current performance may be lower or higher than the performance data quoted. The investment return and principal value of an investment will fluctuate so that an investor’s shares, when redeemed, may be worth more or less than their original cost.
Investors should carefully consider the Fund’s investment objectives, risks, charges and expenses before investing. For performance information through the most recent month end, current net asset values per share for the Fund and other information, please call 800.548.4539 or visit our website at amgfunds.com for a free prospectus. Read it carefully before investing or sending money.
Distributed by AMG Distributors, Inc., member FINRA/SIPC.
| † | Date reflects the inception date of the Fund, not the index |
| 1 | Total return equals income yield plus share price change and assumes reinvestment of all dividends and capital gain distributions. Returns are net of fees and may reflect offsets of Fund expenses as described in the prospectus. No adjustment has been made for taxes payable by shareholders on their reinvested dividends and |
| | capital gain distributions. Returns for periods greater than one year are annualized. The listed returns on the Fund are net of expenses and based on the published NAV as of December 31, 2019. All returns are in U.S. dollars ($). |
| 2 | From time to time, the Fund’s advisor has waived its fees and/or absorbed Fund expenses, which has resulted in higher returns. |
| 3 | The Fund is subject to risks associated with investments in small-capitalization companies, such as erratic earnings patterns, competitive conditions, limited earnings history, and a reliance on one or a limited number of products. |
| 4 | The Fund is subject to risks associated with investments in mid-capitalization companies such as greater price volatility, lower trading volume, and less liquidity than the stocks of larger, more established companies. |
| 5 | The Fund invests in growth stocks, which may be more sensitive to market movements because their prices tend to reflect future investor expectations rather than just current profits. Growth stocks may underperform value stocks during given periods. |
| 6 | The Fund invests in value stocks, which may perform differently from the market as a whole and may be undervalued by the market for a long period of time. |
| 7 | The Russell 2500® Index is composed of the 2,500 smallest stocks in the Russell 3000® Index and is widely regarded in the industry as the premier measure of small/mid cap stock performance. Unlike the Fund, the Russell 2500® Index is unmanaged, is not available for investment and does not incur expenses. |
The Russell Indices are trademarks of the London Stock Exchange Group companies.
Not FDIC insured, nor bank guaranteed. May lose value.
36
| | |
| | | AMG GW&K Small/Mid Cap Fund Fund Snapshots(unaudited) December 31, 2019 |
PORTFOLIO BREAKDOWN
| | | | |
| | | % of | |
Sector | | Net Assets | |
Information Technology | | | 18.4 | |
Industrials | | | 16.6 | |
Consumer Discretionary | | | 15.0 | |
Health Care | | | 13.2 | |
Financials | | | 12.5 | |
Real Estate | | | 8.7 | |
Materials | | | 6.2 | |
Energy | | | 2.4 | |
Utilities | | | 2.2 | |
Consumer Staples | | | 1.7 | |
Short-Term Investments | | | 3.1 | |
Other Assets Less Liabilities | | | 0.0 | 1 |
TOP TEN HOLDINGS
| | | | |
Security Name | | % of
Net Assets | |
Zebra Technologies Corp., Class A | | | 2.5 | |
MarketAxess Holdings, Inc. | | | 2.3 | |
Booz Allen Hamilton Holding Corp. | | | 2.3 | |
RPM International, Inc. | | | 2.1 | |
Exponent, Inc. | | | 2.1 | |
West Pharmaceutical Services, Inc. | | | 2.1 | |
The Toro Co. | | | 1.9 | |
Western Alliance Bancorp. | | | 1.9 | |
STERIS PLC | | | 1.9 | |
Sun Communities, Inc. | | | 1.8 | |
| | | | |
Top Ten as a Group | | | 20.9 | |
| | | | |
Because a fund’s strategy may result in multiple investments in particular sectors of the economy, its performance may depend on the performance of those sectors and may fluctuate more widely than investments diversified across more sectors. For additional information on these and other risk considerations, please see the Fund’s prospectus.
Any sectors, industries, or securities discussed should not be perceived as investment recommendations. Mention of a specific security should not be considered a recommendation to buy or solicitation to sell that security. Specific securities mentioned in this report may have been sold from the Fund’s portfolio of investments by the time you receive this report.
37
| | |
| | | AMG GW&K Small/Mid Cap Fund Schedule of Portfolio Investments December 31, 2019 |
| | | | | | | | |
| | | Shares | | | Value | |
Common Stocks - 96.9% | | | | | | | | |
Consumer Discretionary - 15.0% | | | | | | | | |
BJ’s Restaurants, Inc. | | | 47,175 | | | $ | 1,790,763 | |
Burlington Stores, Inc.* | | | 13,313 | | | | 3,035,763 | |
Carter’s, Inc.1 | | | 21,480 | | | | 2,348,623 | |
Cavco Industries, Inc.* | | | 15,036 | | | | 2,937,734 | |
Dorman Products, Inc.*,1 | | | 31,430 | | | | 2,379,879 | |
Five Below, Inc.* | | | 26,244 | | | | 3,355,558 | |
Grand Canyon Education, Inc.* | | | 17,229 | | | | 1,650,366 | |
Lithia Motors, Inc., Class A1 | | | 16,648 | | | | 2,447,256 | |
Polaris, Inc. | | | 25,647 | | | | 2,608,300 | |
Pool Corp. | | | 10,735 | | | | 2,279,899 | |
Texas Roadhouse, Inc. | | | 42,456 | | | | 2,391,122 | |
Vail Resorts, Inc.1 | | | 10,555 | | | | 2,531,406 | |
Total Consumer Discretionary | | | | | | | 29,756,669 | |
Consumer Staples - 1.7% | | | | | | | | |
BJ’s Wholesale Club Holdings, Inc.*,1 | | | 105,027 | | | | 2,388,314 | |
Performance Food Group Co.* | | | 21,358 | | | | 1,099,510 | |
Total Consumer Staples | | | | | | | 3,487,824 | |
Energy - 2.4% | | | | | | | | |
Dril-Quip,Inc.* | | | 13,141 | | | | 616,444 | |
Matador Resources Co.*,1 | | | 89,561 | | | | 1,609,411 | |
Parsley Energy, Inc., Class A | | | 131,100 | | | | 2,479,101 | |
Total Energy | | | | | | | 4,704,956 | |
Financials - 12.5% | | | | | | | | |
Artisan Partners Asset Management, Inc., Class A | | | 28,836 | | | | 931,980 | |
Atlantic Union Bankshares Corp. | | | 50,129 | | | | 1,882,344 | |
Glacier Bancorp, Inc. | | | 42,344 | | | | 1,947,401 | |
James River Group Holdings, Ltd. (Bermuda) | | | 23,530 | | | | 969,671 | |
MarketAxess Holdings, Inc. | | | 12,029 | | | | 4,560,314 | |
Pinnacle Financial Partners, Inc. | | | 43,314 | | | | 2,772,096 | |
Signature Bank | | | 20,807 | | | | 2,842,444 | |
TCF Financial Corp. | | | 46,784 | | | | 2,189,491 | |
Webster Financial Corp. | | | 56,453 | | | | 3,012,332 | |
Western Alliance Bancorp. | | | 66,877 | | | | 3,811,989 | |
Total Financials | | | | | | | 24,920,062 | |
Health Care - 13.2% | | | | | | | | |
Acadia Healthcare Co., Inc.*,1 | | | 51,093 | | | | 1,697,310 | |
Bio-Rad Laboratories, Inc., Class A* | | | 8,168 | | | | 3,022,405 | |
Catalent, Inc.* | | | 58,265 | | | | 3,280,320 | |
ICU Medical, Inc.* | | | 12,170 | | | | 2,277,250 | |
Insulet Corp.* | | | 10,050 | | | | 1,720,560 | |
Jazz Pharmaceuticals PLC (Ireland)* | | | 15,048 | | | | 2,246,365 | |
| | | | | | | | |
| | | Shares | | | Value | |
Neurocrine Biosciences, Inc.* | | | 23,875 | | | $ | 2,566,324 | |
Premier, Inc., Class A* | | | 39,194 | | | | 1,484,669 | |
STERIS PLC | | | 24,672 | | | | 3,760,506 | |
West Pharmaceutical Services, Inc. | | | 27,406 | | | | 4,119,944 | |
Total Health Care | | | | | | | 26,175,653 | |
Industrials - 16.6% | | | | | | | | |
Exponent, Inc. | | | 61,038 | | | | 4,212,232 | |
Gardner Denver Holdings, Inc.* | | | 94,464 | | | | 3,464,939 | |
Gibraltar Industries, Inc.* | | | 31,635 | | | | 1,595,669 | |
Graco, Inc. | | | 41,191 | | | | 2,141,932 | |
Hexcel Corp. | | | 40,395 | | | | 2,961,357 | |
The Middleby Corp.*,1 | | | 16,594 | | | | 1,817,375 | |
Nordson Corp. | | | 19,008 | | | | 3,095,263 | |
RBC Bearings, Inc.* | | | 21,890 | | | | 3,466,063 | |
Ritchie Bros. Auctioneers, Inc. (Canada) | | | 59,714 | | | | 2,564,716 | |
Schneider National, Inc., Class B | | | 70,307 | | | | 1,534,099 | |
The Toro Co. | | | 48,143 | | | | 3,835,553 | |
Wabtec Corp. | | | 29,382 | | | | 2,285,920 | |
Total Industrials | | | | | | | 32,975,118 | |
Information Technology - 18.4% | | | | | |
Booz Allen Hamilton Holding Corp. | | | 63,316 | | | | 4,503,667 | |
Cognex Corp. | | | 59,444 | | | | 3,331,242 | |
Entegris, Inc. | | | 46,900 | | | | 2,349,221 | |
Envestnet,Inc.*,1 | | | 31,745 | | | | 2,210,404 | |
EPAM Systems, Inc.* | | | 10,238 | | | | 2,172,094 | |
Gartner, Inc.* | | | 23,186 | | | | 3,572,963 | |
HubSpot, Inc.* | | | 8,750 | | | | 1,386,875 | |
Power Integrations, Inc. | | | 15,473 | | | | 1,530,435 | |
Rapid7, Inc.* | | | 46,270 | | | | 2,592,045 | |
Silicon Laboratories, Inc.* | | | 20,266 | | | | 2,350,451 | |
SS&C Technologies Holdings, Inc. | | | 49,532 | | | | 3,041,265 | |
Tyler Technologies, Inc.* | | | 8,571 | | | | 2,571,471 | |
Zebra Technologies Corp., Class A* | | | 19,318 | | | | 4,934,590 | |
Total Information Technology | | | | | | | 36,546,723 | |
Materials - 6.2% | | | | | | | | |
AptarGroup, Inc. | | | 14,021 | | | | 1,621,108 | |
Berry Global Group, Inc.* | | | 40,013 | | | | 1,900,217 | |
Eagle Materials, Inc. | | | 21,358 | | | | 1,936,316 | |
Quaker Chemical Corp.1 | | | 15,751 | | | | 2,591,355 | |
RPM International, Inc. | | | 55,517 | | | | 4,261,485 | |
Total Materials | | | | | | | 12,310,481 | |
Real Estate - 8.7% | | | | | | | | |
American Campus Communities, Inc., REIT | | | 65,991 | | | | 3,103,557 | |
The accompanying notes are an integral part of these financial statements.
38
| | |
| | | AMG GW&K Small/Mid Cap Fund Schedule of Portfolio Investments(continued) |
| | | | | | | | |
| | | Shares | | | Value | |
Real Estate - 8.7%(continued) | | | | | | | | |
CoreSite Realty Corp., REIT | | | 17,276 | | | $ | 1,936,985 | |
Easterly Government Properties, Inc., REIT | | | 125,835 | | | | 2,986,065 | |
Mid-America Apartment Communities, Inc., REIT | | | 10,649 | | | | 1,404,177 | |
Physicians Realty Trust, REIT | | | 112,695 | | | | 2,134,443 | |
Summit Hotel Properties, Inc.,
REIT1 | | | 166,598 | | | | 2,055,819 | |
Sun Communities, Inc., REIT | | | 24,327 | | | | 3,651,483 | |
Total Real Estate | | | | | | | 17,272,529 | |
Utilities - 2.2% | | | | | | | | |
OGE Energy Corp. | | | 48,572 | | | | 2,159,997 | |
Portland General Electric Co. | | | 41,505 | | | | 2,315,564 | |
Total Utilities | | | | | | | 4,475,561 | |
Total Common Stocks
(Cost $165,781,952) | | | | | | | 192,625,576 | |
| | | | | | | | |
| | | Shares | | | Value | |
| Short-Term Investments - 3.1% | |
| Other Investment Companies - 3.1% | |
Dreyfus Government Cash Management Fund, Institutional Shares, 1.51%2 | | | 2,019,155 | | | $ | 2,019,155 | |
Dreyfus Institutional Preferred Government Money Market Fund, Institutional Shares,
1.55%2 | | | 2,019,153 | | | | 2,019,153 | |
JPMorgan U.S. Government Money Market Fund, IM Shares, 1.53%2 | | | 2,080,340 | | | | 2,080,340 | |
Total Short-Term Investments
(Cost $6,118,648) | | | | | | | 6,118,648 | |
Total Investments - 100.0%
(Cost $171,900,600) | | | | | | | 198,744,224 | |
Other Assets, less Liabilities - 0.0%# | | | | | | | 95,570 | |
Net Assets - 100.0% | | | | | | $ | 198,839,794 | |
| * | Non-income producing security. |
| 1 | Some of these securities, amounting to $16,055,086 or 8.1% of net assets, were out on loan to various borrowers and are collateralized by various U.S. Treasury Obligations. See Note 4 of Notes to Financial Statements. |
| 2 | Yield shown represents the December 31, 2019, seven day average yield, which refers to the sum of the previous seven days’ dividends paid, expressed as an annual percentage. |
REIT Real Estate Investment Trust
The following table summarizes the inputs used to value the Fund’s investments by the fair value hierarchy levels as of December 31, 2019:
| | | | | | | | | | | | | | | | |
| | | Level 1 | | | Level 2 | | | Level 3 | | | Total | |
Investments in Securities | | | | | | | | | | | | | | | | |
Common Stocks† | | $ | 192,625,576 | | | | — | | | | — | | | $ | 192,625,576 | |
Short-Term Investments | | | | | | | | | | | | | | | | |
Other Investment Companies | | | 6,118,648 | | | | — | | | | — | | | | 6,118,648 | |
| | | | | | | | | | | | | | | | |
Total Investments in Securities | | $ | 198,744,224 | | | | — | | | | — | | | $ | 198,744,224 | |
| | | | | | | | | | | | | | | | |
| † | All common stocks held in the Fund are Level 1 securities. For a detailed breakout of common stocks by major industry classification, please refer to the Fund’s Schedule of Portfolio Investments. |
For the fiscal year ended December 31, 2019, there were no transfers in or out of Level 3.
The accompanying notes are an integral part of these financial statements.
39
| | |
| | | Statement of Assets and Liabilities December 31, 2019 |
| | | | | | | | | | | | | | | | | | | | |
| | | AMG
GW&K Enhanced
Core Bond
ESG Fund | | | AMG
GW&K Municipal
Bond Fund | | | AMG
GW&K Municipal
Enhanced
Yield Fund | | | AMG
GW&K Small
Cap
Core Fund | | | AMG
GW&K Small/Mid
Cap Fund | |
Assets: | | | | | | | | | | | | | | | | | | | | |
Investments at value1(including securities on loan valued at $1,399,391, $0, $0, $74,630,943, and $16,055,086, respectively) | | $ | 34,270,894 | | | $ | 1,027,524,890 | | | $ | 286,413,177 | | | $ | 456,191,773 | | | $ | 198,744,224 | |
Cash | | | — | | | | 1,658,897 | | | | 1,045,649 | | | | — | | | | — | |
Receivable for investments sold | | | 78,451 | | | | — | | | | 113,758 | | | | — | | | | — | |
Receivable for delayed delivery investments sold | | | — | | | | 5,175,400 | | | | — | | | | — | | | | — | |
Dividend, interest and other receivables | | | 271,555 | | | | 12,817,156 | | | | 2,606,489 | | | | 450,828 | | | | 107,570 | |
Receivable for Fund shares sold | | | 89,157 | | | | 1,708,296 | | | | 368,747 | | | | 126,196 | | | | 208,981 | |
Receivable from affiliate | | | 14,548 | | | | 60,426 | | | | 25,107 | | | | — | | | | 10,148 | |
Prepaid expenses and other assets | | | 27,338 | | | | 45,367 | | | | 29,912 | | | | 32,764 | | | | 12,595 | |
Total assets | | | 34,751,943 | | | | 1,048,990,432 | | | | 290,602,839 | | | | 456,801,561 | | | | 199,083,518 | |
Liabilities: | | | | | | | | | | | | | | | | | | | | |
Payable upon return of securities loaned | | | 1,285,644 | | | | — | | | | — | | | | 3,780,454 | | | | — | |
Payable for delayed delivery investments purchased | | | — | | | | 14,648,300 | | | | 11,281,750 | | | | — | | | | — | |
Payable for Fund shares repurchased | | | 36,618 | | | | 654,617 | | | | 43,499 | | | | 651,806 | | | | 60,447 | |
Accrued expenses: | | | | | | | | | | | | | | | | | | | | |
Investment advisory and management fees | | | 8,783 | | | | 180,860 | | | | 105,436 | | | | 274,929 | | | | 107,895 | |
Administrative fees | | | 4,392 | | | | 130,072 | | | | 35,145 | | | | 57,419 | | | | 24,899 | |
Distribution fees | | | 3,413 | | | | 3,969 | | | | 1,176 | | | | 2,168 | | | | 36 | |
Shareholder service fees | | | 467 | | | | 44,510 | | | | 12,180 | | | | 15,399 | | | | 8,527 | |
Other | | | 51,554 | | | | 102,799 | | | | 53,176 | | | | 56,839 | | | | 41,920 | |
Total liabilities | | | 1,390,871 | | | | 15,765,127 | | | | 11,532,362 | | | | 4,839,014 | | | | 243,724 | |
Net Assets | | $ | 33,361,072 | | | $ | 1,033,225,305 | | | $ | 279,070,477 | | | $ | 451,962,547 | | | $ | 198,839,794 | |
1Investments at cost | | $ | 33,230,519 | | | $ | 980,731,346 | | | $ | 270,669,062 | | | $ | 359,112,755 | | | $ | 171,900,600 | |
The accompanying notes are an integral part of these financial statements.
40
| | |
| | | Statement of Assets and Liabilities(continued) |
| | | | | | | | | | | | | | | | | | | | |
| | | AMG
GW&K Enhanced
Core Bond
ESG Fund | | | AMG
GW&K Municipal
Bond Fund | | | AMG
GW&K Municipal
Enhanced
Yield Fund | | | AMG
GW&K Small
Cap
Core Fund | | | AMG
GW&K Small/Mid
Cap Fund | |
Net Assets Represent: | | | | | | | | | | | | | | | | | | | | |
Paid-in capital | | $ | 36,604,732 | | | $ | 986,411,161 | | | $ | 262,511,991 | | | $ | 359,621,890 | | | $ | 174,292,799 | |
Total distributable earnings (loss) | | | (3,243,660 | ) | | | 46,814,144 | | | | 16,558,486 | | | | 92,340,657 | | | | 24,546,995 | |
Net Assets | | $ | 33,361,072 | | | $ | 1,033,225,305 | | | $ | 279,070,477 | | | $ | 451,962,547 | | | $ | 198,839,794 | |
Class N: | | | | | | | | | | | | | | | | | | | | |
Net Assets | | $ | 14,778,984 | | | $ | 18,710,887 | | | $ | 5,722,436 | | | $ | 10,239,158 | | | $ | 172,460 | |
Shares outstanding | | | 1,456,080 | | | | 1,544,045 | | | | 549,035 | | | | 392,467 | | | | 13,231 | |
Net asset value, offering and redemption price per share | | $ | 10.15 | | | $ | 12.12 | | | $ | 10.42 | | | $ | 26.09 | | | $ | 13.03 | |
Class I: | | | | | | | | | | | | | | | | | | | | |
Net Assets | | $ | 8,501,775 | | | $ | 1,014,514,418 | | | $ | 273,227,600 | | | $ | 331,703,256 | | | $ | 102,783,532 | |
Shares outstanding | | | 834,595 | | | | 83,263,454 | | | | 26,921,935 | | | | 12,485,299 | | | | 7,879,265 | |
Net asset value, offering and redemption price per share | | $ | 10.19 | | | $ | 12.18 | | | $ | 10.15 | | | $ | 26.57 | | | $ | 13.04 | |
Class Z: | | | | | | | | | | | | | | | | | | | | |
Net Assets | | $ | 10,080,313 | | | | — | | | $ | 120,441 | | | $ | 110,020,133 | | | $ | 95,883,802 | |
Shares outstanding | | | 990,009 | | | | — | | | | 11,870 | | | | 4,141,065 | | | | 7,344,862 | |
Net asset value, offering and redemption price per share | | $ | 10.18 | | | | — | | | $ | 10.15 | | | $ | 26.57 | | | $ | 13.05 | |
The accompanying notes are an integral part of these financial statements.
41
| | |
| | | Statement of Operations For the fiscal year ended December 31, 2019 |
| | | | | | | | | | | | | | | | | | | | |
| | | AMG
GW&K Enhanced
Core Bond
ESG Fund | | | AMG
GW&K Municipal
Bond Fund | | | AMG
GW&K Municipal
Enhanced
Yield Fund | | | AMG
GW&K Small
Cap
Core Fund | | | AMG
GW&K Small/Mid
Cap Fund | |
Investment Income: | | | | | | | | | | | | | | | | | | | | |
Dividend income | | $ | 13,673 | | | $ | 722,263 | | | $ | 182,380 | | | $ | 4,792,157 | | | $ | 1,834,246 | |
Interest income | | | 1,119,725 | | | | 21,949,988 | | | | 8,586,771 | | | | 92 | | | | 1,440 | |
Securities lending income | | | 2,637 | | | | — | | | | — | | | | 81,343 | | | | 17,814 | |
Foreign withholding tax | | | — | | | | — | | | | — | | | | (21,958 | ) | | | (6,404 | ) |
Total investment income | | | 1,136,035 | | | | 22,672,251 | | | | 8,769,151 | | | | 4,851,634 | | | | 1,847,096 | |
Expenses: | | | | | | | | | | | | | | | | | | | | |
Investment advisory and management fees | | | 107,053 | | | | 2,059,847 | | | | 1,111,711 | | | | 2,974,885 | | | | 1,082,972 | |
Administrative fees | | | 53,526 | | | | 1,479,261 | | | | 370,570 | | | | 637,475 | | | | 249,917 | |
Distribution fees - Class N | | | 37,804 | | | | 47,740 | | | | 16,746 | | | | 26,295 | | | | 292 | |
Distribution fees - Class C | | | 8,775 | | | | — | | | | — | | | | — | | | | — | |
Shareholder servicing fees - Class N | | | — | | | | 22,081 | | | | 10,047 | | | | 15,777 | | | | — | |
Shareholder servicing fees - Class I | | | 4,810 | | | | 483,539 | | | | 120,117 | | | | 157,887 | | | | 86,501 | |
Registration fees | | | 65,374 | | | | 82,596 | | | | 54,699 | | | | 66,242 | | | | 42,641 | |
Professional fees | | | 48,872 | | | | 104,852 | | | | 53,564 | | | | 59,093 | | | | 43,428 | |
Custodian fees | | | 27,027 | | | | 88,964 | | | | 36,636 | | | | 46,060 | | | | 29,126 | |
Reports to shareholders | | | 10,830 | | | | 32,648 | | | | 10,461 | | | | 14,266 | | | | 8,610 | |
Transfer agent fees | | | 4,535 | | | | 28,760 | | | | 7,287 | | | | 17,556 | | | | 4,947 | |
Trustee fees and expenses | | | 3,247 | | | | 89,687 | | | | 22,287 | | | | 39,296 | | | | 14,659 | |
Miscellaneous | | | 4,565 | | | | 39,372 | | | | 10,709 | | | | 21,196 | | | | 8,331 | |
Total expenses before offsets | | | 376,418 | | | | 4,559,347 | | | | 1,824,834 | | | | 4,076,028 | | | | 1,571,424 | |
Expense reimbursements | | | (153,359 | ) | | | (651,229 | ) | | | (220,347 | ) | | | (48,563 | ) | | | (68,437 | ) |
Expense reductions | | | — | | | | — | | | | — | | | | (27,588 | ) | | | (18,178 | ) |
Net expenses | | | 223,059 | | | | 3,908,118 | | | | 1,604,487 | | | | 3,999,877 | | | | 1,484,809 | |
Net investment income | | | 912,976 | | | | 18,764,133 | | | | 7,164,664 | | | | 851,757 | | | | 362,287 | |
Net Realized and Unrealized Gain: | | | | | | | | | | | | | | | | | | | | |
Net realized gain (loss) on investments | | | 404,962 | | | | 5,823,265 | | | | 2,874,832 | | | | 22,218,128 | 1 | | | (1,633,170 | ) |
Net change in unrealized appreciation/depreciation on investments | | | 2,227,923 | | | | 47,803,351 | | | | 15,319,807 | | | | 92,751,979 | | | | 42,609,178 | |
Net realized and unrealized gain | | | 2,632,885 | | | | 53,626,616 | | | | 18,194,639 | | | | 114,970,107 | | | | 40,976,008 | |
Net increase in net assets resulting from operations | | $ | 3,545,861 | | | $ | 72,390,749 | | | $ | 25,359,303 | | | $ | 115,821,864 | | | $ | 41,338,295 | |
| 1 | Includes realized gains of $12,622,827 relating to redemptionsin-kind. See note 1(g) of the Notes to Financial Statement. |
The accompanying notes are an integral part of these financial statements.
42
| | |
| | | Statements of Changes in Net Assets For the fiscal years ended December 31, |
| | | | | | | | | | | | | | | | |
| | | AMG
GW&K Enhanced
Core Bond ESG Fund | | | AMG
GW&K Municipal
Bond Fund | |
| | | 2019 | | | 2018 | | | 2019 | | | 2018 | |
Increase (Decrease) in Net Assets Resulting From Operations: | | | | | | | | | | | | | | | | |
Net investment income | | $ | 912,976 | | | $ | 1,054,750 | | | $ | 18,764,133 | | | $ | 19,317,449 | |
Net realized gain (loss) on investments | | | 404,962 | | | | (360,583 | ) | | | 5,823,265 | | | | (5,814,705 | ) |
Net change in unrealized appreciation/depreciation on investments | | | 2,227,923 | | | | (1,421,270 | ) | | | 47,803,351 | | | | (7,335,635 | ) |
Net increase (decrease) in net assets resulting from operations | | | 3,545,861 | | | | (727,103 | ) | | | 72,390,749 | | | | 6,167,109 | |
Distributions to Shareholders: | | | | | | | | | | | | | | | | |
Class N | | | (379,255 | ) | | | (351,771 | ) | | | (308,006 | ) | | | (340,725 | ) |
Class I | | | (192,619 | ) | | | (153,460 | ) | | | (18,444,080 | ) | | | (19,323,073 | ) |
Class C1 | | | (16,702 | ) | | | (53,217 | ) | | | — | | | | — | |
Class Z | | | (338,179 | ) | | | (489,194 | ) | | | — | | | | — | |
Total distributions to shareholders | | | (926,755 | ) | | | (1,047,642 | ) | | | (18,752,086 | ) | | | (19,663,798 | ) |
Capital Share Transactions:2 | | | | | | | | | | | | | | | | |
Net increase (decrease) from capital share transactions | | | (5,633,199 | ) | | | (10,573,766 | ) | | | 21,588,783 | | | | (103,417,159 | ) |
Total increase (decrease) in net assets | | | (3,014,093 | ) | | | (12,348,511 | ) | | | 75,227,446 | | | | (116,913,848 | ) |
Net Assets: | | | | | | | | | | | | | | | | |
Beginning of year | | | 36,375,165 | | | | 48,723,676 | | | | 957,997,859 | | | | 1,074,911,707 | |
End of year | | $ | 33,361,072 | | | $ | 36,375,165 | | | $ | 1,033,225,305 | | | $ | 957,997,859 | |
| 1 | Effective May 31, 2019, Class C shares were converted into Class N shares. |
| 2 | See Note 1(g) of the Notes to Financial Statements. |
The accompanying notes are an integral part of these financial statements.
43
| | |
| | | Statements of Changes in Net Assets(continued) For the fiscal years ended December 31, |
| | | | | | | | | | | | | | | | | | | | | | | | |
| | | AMG
GW&K Municipal
Enhanced Yield Fund | | | AMG
GW&K Small
Cap Core Fund | | | AMG
GW&K Small/Mid
Cap Fund | |
| | | 2019 | | | 2018 | | | 2019 | | | 2018 | | | 2019 | | | 2018 | |
Increase (Decrease) in Net Assets Resulting From Operations: | | | | | | | | | | | | | | | | | | | | | | | | |
Net investment income | | $ | 7,164,664 | | | $ | 6,853,206 | | | $ | 851,757 | | | $ | 1,105,255 | | | $ | 362,287 | | | $ | 152,361 | |
Net realized gain (loss) on investments | | | 2,874,832 | | | | 193,354 | | | | 22,218,128 | | | | 50,596,134 | | | | (1,633,170 | ) | | | 2,299,546 | |
Net change in unrealized appreciation/depreciation on investments | | | 15,319,807 | | | | (7,532,447 | ) | | | 92,751,979 | | | | (129,767,766 | ) | | | 42,609,178 | | | | (17,555,863 | ) |
Net increase (decrease) in net assets resulting from operations | | | 25,359,303 | | | | (485,887 | ) | | | 115,821,864 | | | | (78,066,377 | ) | | | 41,338,295 | | | | (15,103,956 | ) |
Distributions to Shareholders: | | | | | | | | | | | | | | | | | | | | | | | | |
Class N | | | (199,815 | ) | | | (70,830 | ) | | | (519,512 | ) | | | (1,606,615 | ) | | | (280 | ) | | | (2,061 | ) |
Class I | | | (8,694,071 | ) | | | (6,778,865 | ) | | | (17,342,704 | ) | | | (42,856,809 | ) | | | (248,675 | ) | | | (1,246,181 | ) |
Class Z | | | (4,178 | ) | | | (3,511 | ) | | | (5,682,701 | ) | | | (10,281,471 | ) | | | (316,750 | ) | | | (1,634,280 | ) |
Frompaid-in capital: | | | | | | | | | | | | | | | | | | | | | | | | |
Class N | | | — | | | | (53,402 | ) | | | — | | | | — | | | | — | | | | — | |
Class I | | | — | | | | (5,110,821 | ) | | | — | | | | — | | | | — | | | | — | |
Class Z | | | — | | | | (2,647 | ) | | | — | | | | — | | | | — | | | | — | |
Total distributions to shareholders | | | (8,898,064 | ) | | | (12,020,076 | ) | | | (23,544,917 | ) | | | (54,744,895 | ) | | | (565,705 | ) | | | (2,882,522 | ) |
Capital Share Transactions:1 | | | | | | | | | | | | | | | | | | | | | | | | |
Net increase (decrease) from capital share transactions | | | 51,350,874 | | | | (11,809,532 | ) | | | (49,229,890 | ) | | | 5,381,820 | | | | 38,228,007 | | | | 106,569,502 | |
Total increase (decrease) in net assets | | | 67,812,113 | | | | (24,315,495 | ) | | | 43,047,057 | | | | (127,429,452 | ) | | | 79,000,597 | | | | 88,583,024 | |
Net Assets: | | | | | | | | | | | | | | | | | | | | | | | | |
Beginning of year | | | 211,258,364 | | | | 235,573,859 | | | | 408,915,490 | | | | 536,344,942 | | | | 119,839,197 | | | | 31,256,173 | |
End of year | | $ | 279,070,477 | | | $ | 211,258,364 | | | $ | 451,962,547 | | | $ | 408,915,490 | | | $ | 198,839,794 | | | $ | 119,839,197 | |
| 1 | See Note 1(g) of the Notes to Financial Statements. |
The accompanying notes are an integral part of these financial statements.
44
| | |
| | | AMG GW&K Enhanced Core Bond ESG Fund Financial Highlights For a share outstanding throughout each fiscal year |
| | | | | | | | | | | | | | | | | | | | |
| | | For the fiscal years ended December 31, | |
| Class N | | 2019 | | | 2018 | | | 2017 | | | 20161 | | | 2015 | |
Net Asset Value, Beginning of Year | | $ | 9.43 | | | $ | 9.81 | | | $ | 9.67 | | | $ | 9.58 | | | $ | 10.22 | |
Income (loss) from Investment Operations: | | | | | | | | | | | | | | | | | | | | |
Net investment income2,3 | | | 0.24 | | | | 0.23 | | | | 0.21 | | | | 0.22 | | | | 0.29 | |
Net realized and unrealized gain (loss) on investments | | | 0.73 | | | | (0.38 | ) | | | 0.15 | | | | 0.09 | | | | (0.64 | ) |
Total income (loss) from investment operations | | | 0.97 | | | | (0.15 | ) | | | 0.36 | | | | 0.31 | | | | (0.35 | ) |
Less Distributions to Shareholders from: | | | | | | | | | | | | | | | | | | | | |
Net investment income | | | (0.25 | ) | | | (0.23 | ) | | | (0.22 | ) | | | (0.22 | ) | | | (0.29 | ) |
Net Asset Value, End of Year | | $ | 10.15 | | | $ | 9.43 | | | $ | 9.81 | | | $ | 9.67 | | | $ | 9.58 | |
Total Return3 | | | 10.35 | %4 | | | (1.48 | )%4 | | | 3.76 | %4 | | | 3.26 | % | | | (3.51 | )% |
Ratio of net expenses to average net assets | | | 0.73 | % | | | 0.73 | % | | | 0.75 | % | | | 0.84 | % | | | 0.84 | % |
Ratio of gross expenses to average net assets5 | | | 1.16 | % | | | 0.99 | % | | | 1.04 | % | | | 1.05 | % | | | 1.07 | % |
Ratio of net investment income to average net assets3 | | | 2.43 | % | | | 2.45 | % | | | 2.19 | % | | | 2.27 | % | | | 2.87 | % |
Portfolio turnover | | | 71 | % | | | 26 | % | | | 39 | % | | | 88 | % | | | 57 | % |
Net assets end of year (000’s) omitted | | $ | 14,779 | | | $ | 12,884 | | | $ | 16,027 | | | $ | 16,115 | | | $ | 20,203 | |
| | | | | | | | | | | | | | | | | | | | |
45
| | |
| | | AMG GW&K Enhanced Core Bond ESG Fund Financial Highlights For a share outstanding throughout each fiscal year |
| | | | | | | | | | | | | | | | | | | | |
| | | For the fiscal years ended December 31, | |
| Class I | | 2019 | | | 2018 | | | 20176 | | | 20161 | | | 2015 | |
Net Asset Value, Beginning of Year | | $ | 9.47 | | | $ | 9.85 | | | $ | 9.70 | | | $ | 9.62 | | | $ | 10.26 | |
Income (loss) from Investment Operations: | | | | | | | | | | | | | | | | | | | | |
Net investment income2,3 | | | 0.26 | | | | 0.25 | | | | 0.23 | | | | 0.24 | | | | 0.30 | |
Net realized and unrealized gain (loss) on investments | | | 0.73 | | | | (0.38 | ) | | | 0.16 | | | | 0.08 | | | | (0.63 | ) |
Total income (loss) from investment operations | | | 0.99 | | | | (0.13 | ) | | | 0.39 | | | | 0.32 | | | | (0.33 | ) |
Less Distributions to Shareholders from: | | | | | | | | | | | | | | | | | | | | |
Net investment income | | | (0.27 | ) | | | (0.25 | ) | | | (0.24 | ) | | | (0.24 | ) | | | (0.31 | ) |
Net Asset Value, End of Year | | $ | 10.19 | | | $ | 9.47 | | | $ | 9.85 | | | $ | 9.70 | | | $ | 9.62 | |
Total Return3,4 | | | 10.51 | % | | | (1.27 | )% | | | 4.03 | % | | | 3.31 | % | | | (3.30 | )% |
Ratio of net expenses to average net assets | | | 0.55 | % | | | 0.54 | % | | | 0.61 | % | | | 0.69 | % | | | 0.67 | % |
Ratio of gross expenses to average net assets5 | | | 0.98 | % | | | 0.80 | % | | | 0.90 | % | | | 0.90 | % | | | 0.90 | % |
Ratio of net investment income to average net assets3 | | | 2.62 | % | | | 2.64 | % | | | 2.32 | % | | | 2.39 | % | | | 2.96 | % |
Portfolio turnover | | | 71 | % | | | 26 | % | | | 39 | % | | | 88 | % | | | 57 | % |
Net assets end of year (000’s) omitted | | $ | 8,502 | | | $ | 5,967 | | | $ | 6,864 | | | $ | 37,952 | | | $ | 7,463 | |
| | | | | | | | | | | | | | | | | | | | |
46
| | |
| | | AMG GW&K Enhanced Core Bond ESG Fund Financial Highlights For a share outstanding throughout each fiscal year |
| | | | | | | | | | | | | | | | | | | | |
| | | For the fiscal years ended December 31, | |
| Class Z | | 2019 | | | 2018 | | | 20176 | | | 20161 | | | 2015 | |
Net Asset Value, Beginning of Year | | $ | 9.46 | | | $ | 9.84 | | | $ | 9.70 | | | $ | 9.61 | | | $ | 10.25 | |
Income (loss) from Investment Operations: | | | | | | | | | | | | | | | | | | | | |
Net investment income2,3 | | | 0.27 | | | | 0.26 | | | | 0.24 | | | | 0.25 | | | | 0.31 | |
Net realized and unrealized gain (loss) on investments | | | 0.72 | | | | (0.38 | ) | | | 0.15 | | | | 0.09 | | | | (0.63 | ) |
Total income (loss) from investment operations | | | 0.99 | | | | (0.12 | ) | | | 0.39 | | | | 0.34 | | | | (0.32 | ) |
Less Distributions to Shareholders from: | | | | | | | | | | | | | | | | | | | | |
Net investment income | | | (0.27 | ) | | | (0.26 | ) | | | (0.25 | ) | | | (0.25 | ) | | | (0.32 | ) |
Net Asset Value, End of Year | | $ | 10.18 | | | $ | 9.46 | | | $ | 9.84 | | | $ | 9.70 | | | $ | 9.61 | |
Total Return3,4 | | | 10.59 | % | | | (1.23 | )% | | | 4.01 | % | | | 3.52 | % | | | (3.15 | )% |
Ratio of net expenses to average net assets | | | 0.48 | % | | | 0.48 | % | | | 0.50 | % | | | 0.59 | % | | | 0.59 | % |
Ratio of gross expenses to average net assets5 | | | 0.91 | % | | | 0.74 | % | | | 0.79 | % | | | 0.80 | % | | | 0.82 | % |
Ratio of net investment income to average net assets3 | | | 2.72 | % | | | 2.70 | % | | | 2.43 | % | | | 2.51 | % | | | 3.10 | % |
Portfolio turnover | | | 71 | % | | | 26 | % | | | 39 | % | | | 88 | % | | | 57 | % |
Net assets end of year (000’s) omitted | | $ | 10,080 | | | $ | 15,254 | | | $ | 21,271 | | | $ | 51,357 | | | $ | 47,402 | |
| | | | | | | | | | | | | | | | | | | | |
| 1 | Effective October 1, 2016, the Investor Class, Service Class and Institutional Class were renamed Class N, Class S and Class I, respectively. |
| 2 | Per share numbers have been calculated using average shares. |
| 3 | Total returns and net investment income would have been lower had certain expenses not been offset. |
| 4 | The total return is calculated using the published Net Asset Value as of fiscal year end. |
| 5 | Excludes the impact of expense reimbursement or fee waivers and expense reductions such as brokerage credits, but includes expense repayments andnon-reimbursable expenses, if any, such as interest, taxes, and extraordinary expenses. (See Note 1(c) and 2 in the Notes to Financial Statements.) |
| 6 | Effective February 27, 2017, Class I shares were renamed Class Z and Class S shares were renamed Class I. |
47
| | |
| | | AMG GW&K Municipal Bond Fund Financial Highlights For a share outstanding throughout each fiscal year |
| | | | | | | | | | | | | | | | | | | | |
| | | For the fiscal years ended December 31, | |
| Class N | | 2019 | | | 2018 | | | 2017 | | | 20161 | | | 2015 | |
Net Asset Value, Beginning of Year | | $ | 11.48 | | | $ | 11.60 | | | $ | 11.25 | | | $ | 11.70 | | | $ | 11.61 | |
Income (loss) from Investment Operations: | | | | | | | | | | | | | | | | | | | | |
Net investment income2,3 | | | 0.19 | | | | 0.17 | | | | 0.15 | | | | 0.13 | | | | 0.15 | |
Net realized and unrealized gain (loss) on investments | | | 0.64 | | | | (0.11 | ) | | | 0.36 | | | | (0.25 | ) | | | 0.24 | |
Total income (loss) from investment operations | | | 0.83 | | | | 0.06 | | | | 0.51 | | | | (0.12 | ) | | | 0.39 | |
Less Distributions to Shareholders from: | | | | | | | | | | | | | | | | | | | | |
Net investment income | | | (0.19 | ) | | | (0.18 | ) | | | (0.15 | ) | | | (0.12 | ) | | | (0.15 | ) |
Net realized gain on investments | | | — | | | | (0.00 | )4 | | | (0.01 | ) | | | (0.21 | ) | | | (0.15 | ) |
Total distributions to shareholders | | | (0.19 | ) | | | (0.18 | ) | | | (0.16 | ) | | | (0.33 | ) | | | (0.30 | ) |
Net Asset Value, End of Year | | $ | 12.12 | | | $ | 11.48 | | | $ | 11.60 | | | $ | 11.25 | | | $ | 11.70 | |
Total Return3,5 | | | 7.29 | % | | | 0.54 | % | | | 4.58 | % | | | (1.05 | )% | | | 3.36 | % |
Ratio of net expenses to average net assets | | | 0.71 | % | | | 0.71 | % | | | 0.71 | % | | | 0.71 | % | | | 0.82 | % |
Ratio of gross expenses to average net assets6 | | | 0.78 | % | | | 0.77 | % | | | 0.78 | % | | | 0.95 | % | | | 1.13 | % |
Ratio of net investment income to average net assets3 | | | 1.59 | % | | | 1.53 | % | | | 1.31 | % | | | 1.08 | % | | | 1.28 | % |
Portfolio turnover | | | 18 | % | | | 35 | % | | | 27 | % | | | 66 | % | | | 78 | % |
Net assets end of year (000’s) omitted | | $ | 18,711 | | | $ | 17,445 | | | $ | 29,513 | | | $ | 31,406 | | | $ | 27,362 | |
| | | | | | | | | | | | | | | | | | | | |
48
| | |
| | | AMG GW&K Municipal Bond Fund Financial Highlights For a share outstanding throughout each fiscal year |
| | | | | | | | | | | | | | | | | | | | |
| | | For the fiscal years ended December 31, | |
| Class I | | 2019 | | | 2018 | | | 20177 | | | 20161 | | | 2015 | |
Net Asset Value, Beginning of Year | | $ | 11.54 | | | $ | 11.66 | | | $ | 11.31 | | | $ | 11.77 | | | $ | 11.67 | |
Income (loss) from Investment Operations: | | | | | | | | | | | | | | | | | | | | |
Net investment income2,3 | | | 0.23 | | | | 0.21 | | | | 0.19 | | | | 0.17 | | | | 0.21 | |
Net realized and unrealized gain (loss) on investments | | | 0.64 | | | | (0.12 | ) | | | 0.36 | | | | (0.25 | ) | | | 0.24 | |
Total income (loss) from investment operations | | | 0.87 | | | | 0.09 | | | | 0.55 | | | | (0.08 | ) | | | 0.45 | |
Less Distributions to Shareholders from: | | | | | | | | | | | | | | | | | | | | |
Net investment income | | | (0.23 | ) | | | (0.21 | ) | | | (0.19 | ) | | | (0.17 | ) | | | (0.20 | ) |
Net realized gain on investments | | | — | | | | (0.00 | )4 | | | (0.01 | ) | | | (0.21 | ) | | | (0.15 | ) |
Total distributions to shareholders | | | (0.23 | ) | | | (0.21 | ) | | | (0.20 | ) | | | (0.38 | ) | | | (0.35 | ) |
Net Asset Value, End of Year | | $ | 12.18 | | | $ | 11.54 | | | $ | 11.66 | | | $ | 11.31 | | | $ | 11.77 | |
Total Return3,5 | | | 7.58 | % | | | 0.87 | % | | | 4.90 | % | | | (0.70 | )% | | | 3.94 | % |
Ratio of net expenses to average net assets | | | 0.39 | % | | | 0.39 | % | | | 0.37 | % | | | 0.34 | % | | | 0.34 | % |
Ratio of gross expenses to average net assets6 | | | 0.46 | % | | | 0.45 | % | | | 0.45 | % | | | 0.58 | % | | | 0.65 | % |
Ratio of net investment income to average net assets3 | | | 1.91 | % | | | 1.85 | % | | | 1.64 | % | | | 1.45 | % | | | 1.76 | % |
Portfolio turnover | | | 18 | % | | | 35 | % | | | 27 | % | | | 66 | % | | | 78 | % |
Net assets end of year (000’s) omitted | | $ | 1,014,514 | | | $ | 940,553 | | | $ | 1,045,399 | | | $ | 728,365 | | | $ | 655,760 | |
| | | | | | | | | | | | | | | | | | | | |
| 1 | Effective October 1, 2016, the Investor Class, Service Class and Institutional Class were renamed Class N, Class S and Class I, respectively. |
| 2 | Per share numbers have been calculated using average shares. |
| 3 | Total returns and net investment income would have been lower had certain expenses not been offset. |
| 4 | Less than $(0.005) per share. |
| 5 | The total return is calculated using the published Net Asset Value as of fiscal year end. |
| 6 | Excludes the impact of expense reimbursement or fee waivers and expense reductions such as brokerage credits, but includes expense repayments andnon-reimbursable expenses, if any, such as interest, taxes, and extraordinary expenses. (See Note 1(c) and 2 in the Notes to Financial Statements.) |
| 7 | Effective June 23, 2017, Class S shares were converted to Class I shares. |
49
| | |
| | | AMG GW&K Municipal Enhanced Yield Fund Financial Highlights For a share outstanding throughout each fiscal year |
| | | | | | | | | | | | | | | | | | | | |
| | | For the fiscal years ended December 31, | |
| Class N | | 2019 | | | 2018 | | | 2017 | | | 20161 | | | 2015 | |
Net Asset Value, Beginning of Year | | $ | 9.69 | | | $ | 10.02 | | | $ | 9.40 | | | $ | 10.08 | | | $ | 10.16 | |
Income (loss) from Investment Operations: | | | | | | | | | | | | | | | | | | | | |
Net investment income2,3 | | | 0.26 | | | | 0.27 | | | | 0.26 | | | | 0.25 | | | | 0.30 | |
Net realized and unrealized gain (loss) on investments | | | 0.78 | | | | (0.33 | ) | | | 0.62 | | | | (0.23 | ) | | | 0.05 | |
Total income (loss) from investment operations | | | 1.04 | | | | (0.06 | ) | | | 0.88 | | | | 0.02 | | | | 0.35 | |
Less Distributions to Shareholders from: | | | | | | | | | | | | | | | | | | | | |
Net investment income | | | (0.25 | ) | | | (0.15 | ) | | | (0.26 | ) | | | (0.25 | ) | | | (0.30 | ) |
Net realized gain on investments | | | (0.06 | ) | | | — | | | | — | | | | (0.45 | ) | | | (0.13 | ) |
Paid in capital | | | — | | | | (0.12 | ) | | | — | | | | — | | | | — | |
Total distributions to shareholders | | | (0.31 | ) | | | (0.27 | ) | | | (0.26 | ) | | | (0.70 | ) | | | (0.43 | ) |
Net Asset Value, End of Year | | $ | 10.42 | | | $ | 9.69 | | | $ | 10.02 | | | $ | 9.40 | | | $ | 10.08 | |
Total Return3,4 | | | 10.92 | % | | | (0.55 | )% | | | 9.51 | % | | | 0.10 | % | | | 3.57 | % |
Ratio of net expenses to average net assets | | | 0.99 | % | | | 0.99 | % | | | 1.01 | % | | | 1.14 | % | | | 1.07 | % |
Ratio of gross expenses to average net assets5 | | | 1.08 | % | | | 1.08 | % | | | 1.11 | % | | | 1.30 | % | | | 1.25 | % |
Ratio of net investment income to average net assets3 | | | 2.56 | % | | | 2.79 | % | | | 2.67 | % | | | 2.38 | % | | | 2.98 | % |
Portfolio turnover | | | 40 | % | | | 89 | % | | | 67 | % | | | 172 | % | | | 120 | % |
Net assets end of year (000’s) omitted | | $ | 5,722 | | | $ | 7,283 | | | $ | 8,828 | | | $ | 4,184 | | | $ | 5,500 | |
| | | | | | | | | | | | | | | | | | | | |
50
| | |
| | | AMG GW&K Municipal Enhanced Yield Fund Financial Highlights For a share outstanding throughout each fiscal year |
| | | | | | | | | | | | | | | | | | | | |
| | | For the fiscal years ended December 31, | |
| Class I | | 2019 | | | 2018 | | | 20176 | | | 20161 | | | 2015 | |
Net Asset Value, Beginning of Year | | $ | 9.45 | | | $ | 10.01 | | | $ | 9.40 | | | $ | 10.07 | | | $ | 10.14 | |
Income (loss) from Investment Operations: | | | | | | | | | | | | | | | | | | | | |
Net investment income2,3 | | | 0.29 | | | | 0.31 | | | | 0.30 | | | | 0.30 | | | | 0.34 | |
Net realized and unrealized gain (loss) on investments | | | 0.76 | | | | (0.32 | ) | | | 0.61 | | | | (0.22 | ) | | | 0.07 | |
Total income (loss) from investment operations | | | 1.05 | | | | (0.01 | ) | | | 0.91 | | | | 0.08 | | | | 0.41 | |
Less Distributions to Shareholders from: | | | | | | | | | | | | | | | | | | | | |
Net investment income | | | (0.29 | ) | | | (0.31 | ) | | | (0.30 | ) | | | (0.30 | ) | | | (0.35 | ) |
Net realized gain on investments | | | (0.06 | ) | | | — | | | | — | | | | (0.45 | ) | | | (0.13 | ) |
Paid in capital | | | — | | | | (0.24 | ) | | | — | | | | — | | | | — | |
Total distributions to shareholders | | | (0.35 | ) | | | (0.55 | ) | | | (0.30 | ) | | | (0.75 | ) | | | (0.48 | ) |
Net Asset Value, End of Year | | $ | 10.15 | | | $ | 9.45 | | | $ | 10.01 | | | $ | 9.40 | | | $ | 10.07 | |
Total Return3,4 | | | 11.28 | % | | | (0.07 | )% | | | 9.79 | % | | | 0.70 | % | | | 4.15 | % |
Ratio of net expenses to average net assets | | | 0.64 | % | | | 0.64 | % | | | 0.64 | % | | | 0.64 | % | | | 0.64 | % |
Ratio of gross expenses to average net assets5 | | | 0.73 | % | | | 0.73 | % | | | 0.74 | % | | | 0.80 | % | | | 0.82 | % |
Ratio of net investment income to average net assets3 | | | 2.91 | % | | | 3.14 | % | | | 3.05 | % | | | 2.89 | % | | | 3.42 | % |
Portfolio turnover | | | 40 | % | | | 89 | % | | | 67 | % | | | 172 | % | | | 120 | % |
Net assets end of year (000’s) omitted | | $ | 273,228 | | | $ | 203,867 | | | $ | 226,638 | | | $ | 195,193 | | | $ | 212,057 | |
| | | | | | | | | | | | | | | | | | | | |
51
| | |
| | | AMG GW&K Municipal Enhanced Yield Fund Financial Highlights For a share outstanding throughout each fiscal period |
| | | | | | | | | | | | |
| | | For the fiscal years
ended December 31, | | | For the fiscal period
ended December 31, | |
| Class Z | | 2019 | | | 2018 | | | 20177 | |
Net Asset Value, Beginning of Period | | $ | 9.44 | | | $ | 10.01 | | | $ | 9.49 | |
Income (loss) from Investment Operations: | | | | | | | | | | | | |
Net investment income2,3 | | | 0.30 | | | | 0.31 | | | | 0.25 | |
Net realized and unrealized gain (loss) on investments | | | 0.76 | | | | (0.32 | ) | | | 0.52 | |
Total income (loss) from investment operations | | | 1.06 | | | | (0.01 | ) | | | 0.77 | |
Less Distributions to Shareholders from: | | | | | | | | | | | | |
Net investment income | | | (0.29 | ) | | | (0.32 | ) | | | (0.25 | ) |
Net realized gain on investments | | | (0.06 | ) | | | — | | | | — | |
Paid in capital | | | — | | | | (0.24 | ) | | | — | |
Total distributions to shareholders | | | (0.35 | ) | | | (0.56 | ) | | | (0.25 | ) |
Net Asset Value, End of Period | | $ | 10.15 | | | $ | 9.44 | | | $ | 10.01 | |
Total Return3,4 | | | 11.45 | % | | | (0.09 | )% | | | 8.23 | %8 |
Ratio of net expenses to average net assets | | | 0.59 | % | | | 0.59 | % | | | 0.59 | %9 |
Ratio of gross expenses to average net assets5 | | | 0.68 | % | | | 0.68 | % | | | 0.69 | %9 |
Ratio of net investment income to average net assets3 | | | 2.96 | % | | | 3.19 | % | | | 3.07 | %9 |
Portfolio turnover | | | 40 | % | | | 89 | % | | | 67 | % |
Net assets end of period (000’s) omitted | | $ | 120 | | | $ | 108 | | | $ | 108 | |
| | | | | | | | | | | | |
| 1 | Effective October 1, 2016, the Investor Class, Service Class and Institutional Class were renamed Class N, Class S and Class I, respectively. |
| 2 | Per share numbers have been calculated using average shares. |
| 3 | Total returns and net investment income would have been lower had certain expenses not been offset. |
| 4 | The total return is calculated using the published Net Asset Value as of fiscal year end. |
| 5 | Excludes the impact of expense reimbursement or fee waivers and expense reductions such as brokerage credits, but includes expense repayments andnon-reimbursable expenses, if any, such as interest, taxes, and extraordinary expenses. (See Note 1(c) and 2 in the Notes to Financial Statements.) |
| 6 | Effective June 23, 2017, Class S shares were converted to Class I shares. |
| 7 | Commencement of operations was February 27, 2017. |
52
| | |
| | | AMG GW&K Small Cap Core Fund Financial Highlights For a share outstanding throughout each fiscal year |
| | | | | | | | | | | | | | | | | | | | |
| | | For the fiscal years ended December 31, | |
| Class N | | 2019 | | | 2018 | | | 2017 | | | 20161 | | | 2015 | |
Net Asset Value, Beginning of Year | | $ | 21.03 | | | $ | 28.04 | | | $ | 24.57 | | | $ | 21.80 | | | $ | 23.39 | |
Income (loss) from Investment Operations: | | | | | | | | | | | | | | | | | | | | |
Net investment income (loss)2,3 | | | (0.04 | ) | | | (0.04 | ) | | | (0.06 | )4 | | | 0.00 | 5,6 | | | (0.06 | )7 |
Net realized and unrealized gain (loss) on investments | | | 6.47 | | | | (3.95 | ) | | | 5.06 | | | | 3.81 | | | | (0.64 | ) |
Total income (loss) from investment operations | | | 6.43 | | | | (3.99 | ) | | | 5.00 | | | | 3.81 | | | | (0.70 | ) |
Less Distributions to Shareholders from: | | | | | | | | | | | | | | | | | | | | |
Net realized gain on investments | | | (1.37 | ) | | | (3.02 | ) | | | (1.53 | ) | | | (1.04 | ) | | | (0.89 | ) |
Net Asset Value, End of Year | | $ | 26.09 | | | $ | 21.03 | | | $ | 28.04 | | | $ | 24.57 | | | $ | 21.80 | |
Total Return3,8 | | | 30.66 | % | | | (14.08 | )% | | | 20.32 | % | | | 17.44 | % | | | (3.02 | )% |
Ratio of net expenses to average net assets9 | | | 1.29 | % | | | 1.28 | % | | | 1.32 | % | | | 1.33 | % | | | 1.35 | % |
Ratio of gross expenses to average net assets10 | | | 1.31 | % | | | 1.28 | % | | | 1.33 | % | | | 1.42 | % | | | 1.46 | % |
Ratio of net investment income (loss) to average net assets3 | | | (0.15 | )% | | | (0.13 | )% | | | (0.21 | )% | | | 0.01 | % | | | (0.24 | )% |
Portfolio turnover | | | 20 | % | | | 25 | % | | | 23 | % | | | 19 | % | | | 16 | % |
Net assets end of year (000’s) omitted | | $ | 10,239 | | | $ | 12,655 | | | $ | 24,989 | | | $ | 35,760 | | | $ | 35,691 | |
| | | | | | | | | | | | | | | | | | | | |
53
| | |
| | | AMG GW&K Small Cap Core Fund Financial Highlights For a share outstanding throughout each fiscal year |
| | | | | | | | | | | | | | | | | | | | |
| | | For the fiscal years ended December 31, | |
| Class I | | 2019 | | | 2018 | | | 201711 | | | 20161 | | | 2015 | |
Net Asset Value, Beginning of Year | | $ | 21.37 | | | $ | 28.42 | | | $ | 24.84 | | | $ | 22.04 | | | $ | 23.61 | |
Income (loss) from Investment Operations: | | | | | | | | | | | | | | | | | | | | |
Net investment income2,3 | | | 0.05 | | | | 0.06 | | | | 0.07 | 4 | | | 0.10 | 5 | | | 0.04 | 7 |
Net realized and unrealized gain (loss) on investments | | | 6.58 | | | | (4.03 | ) | | | 5.10 | | | | 3.86 | | | | (0.65 | ) |
Total income (loss) from investment operations | | | 6.63 | | | | (3.97 | ) | | | 5.17 | | | | 3.96 | | | | (0.61 | ) |
Less Distributions to Shareholders from: | | | | | | | | | | | | | | | | | | | | |
Net investment income | | | (0.06 | ) | | | (0.06 | ) | | | (0.06 | ) | | | (0.10 | ) | | | (0.05 | ) |
Net realized gain on investments | | | (1.37 | ) | | | (3.02 | ) | | | (1.53 | ) | | | (1.06 | ) | | | (0.91 | ) |
Total distributions to shareholders | | | (1.43 | ) | | | (3.08 | ) | | | (1.59 | ) | | | (1.16 | ) | | | (0.96 | ) |
Net Asset Value, End of Year | | $ | 26.57 | | | $ | 21.37 | | | $ | 28.42 | | | $ | 24.84 | | | $ | 22.04 | |
Total Return3,8 | | | 31.13 | % | | | (13.83 | )% | | | 20.79 | % | | | 17.90 | % | | | (2.63 | )% |
Ratio of net expenses to average net assets9 | | | 0.94 | % | | | 0.95 | % | | | 0.95 | % | | | 0.94 | % | | | 0.95 | % |
Ratio of gross expenses to average net assets10 | | | 0.96 | % | | | 0.95 | % | | | 0.96 | % | | | 1.03 | % | | | 1.06 | % |
Ratio of net investment income to average net assets3 | | | 0.20 | % | | | 0.20 | % | | | 0.24 | % | | | 0.43 | % | | | 0.17 | % |
Portfolio turnover | | | 20 | % | | | 25 | % | | | 23 | % | | | 19 | % | | | 16 | % |
Net assets end of year (000’s) omitted | | $ | 331,703 | | | $ | 311,252 | | | $ | 403,309 | | | $ | 367,972 | | | $ | 302,381 | |
| | | | | | | | | | | | | | | | | | | | |
54
| | |
| | | AMG GW&K Small Cap Core Fund Financial Highlights For a share outstanding throughout each fiscal period |
| | | | | | | | | | | | |
| | | For the fiscal years
ended December 31, | | | For the fiscal period
ended December 31, | |
| Class Z | | 2019 | | | 2018 | | | 201712 | |
Net Asset Value, Beginning of Period | | $ | 21.37 | | | $ | 28.42 | | | $ | 26.13 | |
Income (loss) from Investment Operations: | | | | | | | | | | | | |
Net investment income2,3 | | | 0.06 | | | | 0.07 | | | | 0.14 | 4 |
Net realized and unrealized gain (loss) on investments | | | 6.59 | | | | (4.03 | ) | | | 3.75 | |
Total income (loss) from investment operations | | | 6.65 | | | | (3.96 | ) | | | 3.89 | |
Less Distributions to Shareholders from: | | | | | | | | | | | | |
Net investment income | | | (0.08 | ) | | | (0.07 | ) | | | (0.07 | ) |
Net realized gain on investments | | | (1.37 | ) | | | (3.02 | ) | | | (1.53 | ) |
Total distributions to shareholders | | | (1.45 | ) | | | (3.09 | ) | | | (1.60 | ) |
Net Asset Value, End of Period | | $ | 26.57 | | | $ | 21.37 | | | $ | 28.42 | |
Total Return3,8 | | | 31.13 | % | | | (13.73 | )% | | | 14.87 | %13 |
Ratio of net expenses to average net assets9 | | | 0.89 | % | | | 0.90 | % | | | 0.90 | %14 |
Ratio of gross expenses to average net assets10 | | | 0.91 | % | | | 0.90 | % | | | 0.91 | %14 |
Ratio of net investment income to average net assets3 | | | 0.25 | % | | | 0.25 | % | | | 0.56 | %14 |
Portfolio turnover | | | 20 | % | | | 25 | % | | | 23 | % |
Net assets end of period (000’s) omitted | | $ | 110,020 | | | $ | 85,009 | | | $ | 108,047 | |
| | | | | | | | | | | | |
| 1 | Effective October 1, 2016, the Investor Class, Service Class and Institutional Class were renamed Class N, Class S and Class I, respectively. |
| 2 | Per share numbers have been calculated using average shares. |
| 3 | Total returns and net investment income (loss) would have been lower had certain expenses not been offset. |
| 4 | Includesnon-recurring dividends. Without these dividends, net investment income per share would have been $(0.12), $0.01, and $0.09 for Class N, Class I and Class Z shares, respectively. |
| 5 | Includesnon-recurring dividends. Without these dividends, net investment income per share would have been $(0.06) and $0.04 for Class N and Class I, respectively. |
| 6 | Less than $0.005 per share. |
| 7 | Includesnon-recurring dividends. Without these dividends, net investment income per share would have been $(0.05) and $0.05 for Class N, and Class I, respectively. |
| 8 | The total return is calculated using the published Net Asset Value as of fiscal year end. |
| 9 | Includes reduction from broker recapture amounting to 0.01% for the fiscal year ended 2019, less than 0.01% for fiscal year ended 2018 and period ended December 31, 2017. |
| 10 | Excludes the impact of expense reimbursement or fee waivers and expense reductions such as brokerage credits, but includes expense repayments andnon-reimbursable expenses, if any, such as interest, taxes, and extraordinary expenses. (See Note 1(c) and 2 in the Notes to Financial Statements.) |
| 11 | Effective June 23, 2017, Class S shares were converted to Class I shares. |
| 12 | Commencement of operations was on February 27, 2017. |
55
| | |
| | | AMG GW&K Small/Mid Cap Fund Financial Highlights For a share outstanding throughout each fiscal period |
| | | | | | | | | | | | |
| | | For the fiscal years
ended December 31, | | | For the fiscal period
ended December 31, | |
| Class N | | 2019 | | | 2018 | | | 20171 | |
Net Asset Value, Beginning of Period | | $ | 9.99 | | | $ | 11.15 | | | $ | 10.35 | |
Income (loss) from Investment Operations: | | | | | | | | | | | | |
Net investment income (loss)2,3 | | | 0.00 | 4 | | | (0.01 | ) | | | 0.01 | 5 |
Net realized and unrealized gain (loss) on investments | | | 3.07 | | | | (0.91 | ) | | | 0.94 | |
Total income (loss) from investment operations | | | 3.07 | | | | (0.92 | ) | | | 0.95 | |
Less Distributions to Shareholders from: | | | | | | | | | | | | |
Net investment income | | | (0.01 | ) | | | — | | | | — | |
Net realized gain on investments | | | (0.02 | ) | | | (0.24 | ) | | | (0.15 | ) |
Total distributions to shareholders | | | (0.03 | ) | | | (0.24 | ) | | | (0.15 | ) |
Net Asset Value, End of Period | | $ | 13.03 | | | $ | 9.99 | | | $ | 11.15 | |
Total Return3,6 | | | 30.64 | % | | | (8.25 | )% | | | 9.17 | %7 |
Ratio of net expenses to average net assets8 | | | 1.09 | % | | | 1.09 | % | | | 1.10 | %9 |
Ratio of gross expenses to average net assets10 | | | 1.14 | % | | | 1.16 | % | | | 1.71 | %9 |
Ratio of net investment income (loss) to average net assets3 | | | 0.02 | % | | | (0.09 | )% | | | 0.12 | %9 |
Portfolio turnover | | | 18 | % | | | 53 | % | | | 38 | % |
Net assets end of period (000’s) omitted | | $ | 172 | | | $ | 89 | | | $ | 11 | |
| | | | | | | | | | | | |
56
| | |
| | | AMG GW&K Small/Mid Cap Fund Financial Highlights For a share outstanding throughout each fiscal period |
| | | | | | | | | | | | | | | | | | | | |
| | | For the fiscal years
ended December 31, | | | For the fiscal period
ended December 31, | |
| Class I | | 2019 | | | 2018 | | | 2017 | | | 201611 | | | 201512 | |
Net Asset Value, Beginning of Period | | $ | 9.99 | | | $ | 11.15 | | | $ | 9.80 | | | $ | 8.95 | | | $ | 10.00 | |
Income (loss) from Investment Operations: | | | | | | | | | | | | | | | | | | | | |
Net investment income (loss)2,3 | | | 0.02 | | | | 0.01 | | | | 0.03 | 5 | | | (0.03 | ) | | | (0.02 | ) |
Net realized and unrealized gain (loss) on investments | | | 3.07 | | | | (0.92 | ) | | | 1.48 | | | | 0.89 | | | | (1.03 | ) |
Total income (loss) from investment operations | | | 3.09 | | | | (0.91 | ) | | | 1.51 | | | | 0.86 | | | | (1.05 | ) |
Less Distributions to Shareholders from: | | | | | | | | | | | | | | | | | | | | |
Net investment income | | | (0.02 | ) | | | (0.01 | ) | | | (0.01 | ) | | | (0.01 | ) | | | — | |
Net realized gain on investments | | | (0.02 | ) | | | (0.24 | ) | | | (0.15 | ) | | | — | | | | — | |
Total distributions to shareholders | | | (0.04 | ) | | | (0.25 | ) | | | (0.16 | ) | | | (0.01 | ) | | | — | |
Net Asset Value, End of Period | | $ | 13.04 | | | $ | 9.99 | | | $ | 11.15 | | | $ | 9.80 | | | $ | 8.95 | |
Total Return3,6 | | | 30.86 | % | | | (8.15 | )% | | | 15.44 | % | | | 9.55 | % | | | (10.50 | )%7 |
Ratio of net expenses to average net assets8 | | | 0.94 | % | | | 0.94 | % | | | 0.94 | % | | | 0.95 | % | | | 0.95 | %9 |
Ratio of gross expenses to average net assets10 | | | 0.99 | % | | | 1.01 | % | | | 1.62 | % | | | 4.60 | % | | | 11.39 | %9 |
Ratio of net investment income (loss) to average net assets3 | | | 0.17 | % | | | 0.06 | % | | | 0.26 | % | | | (0.38 | )% | | | (0.39 | )%9 |
Portfolio turnover | | | 18 | % | | | 53 | % | | | 38 | % | | | 48 | % | | | 41 | %7 |
Net assets end of period (000’s) omitted | | $ | 102,784 | | | $ | 54,376 | | | $ | 24,266 | | | $ | 2 | | | $ | 1 | |
| | | | | | | | | | | | | | | | | | | | |
57
| | |
| | | AMG GW&K Small/Mid Cap Fund Financial Highlights For a share outstanding throughout each fiscal period |
| | | | | | | | | | | | |
| | | For the fiscal years
ended December 31, | | | For the fiscal period
ended December 31, | |
| Class Z | | 2019 | | | 2018 | | | 20171 | |
Net Asset Value, Beginning of Period | | $ | 10.00 | | | $ | 11.15 | | | $ | 10.35 | |
Income (loss) from Investment Operations: | | | | | | | | | | | | |
Net investment income2,3 | | | 0.03 | | | | 0.02 | | | | 0.03 | 5 |
Net realized and unrealized gain (loss) on investments | | | 3.07 | | | | (0.91 | ) | | | 0.94 | |
Total income (loss) from investment operations | | | 3.10 | | | | (0.89 | ) | | | 0.97 | |
Less Distributions to Shareholders from: | | | | | | | | | | | | |
Net investment income | | | (0.03 | ) | | | (0.02 | ) | | | (0.02 | ) |
Net realized gain on investments | | | (0.02 | ) | | | (0.24 | ) | | | (0.15 | ) |
Total distributions to shareholders | | | (0.05 | ) | | | (0.26 | ) | | | (0.17 | ) |
Net Asset Value, End of Period | | $ | 13.05 | | | $ | 10.00 | | | $ | 11.15 | |
Total Return3,6 | | | 30.94 | % | | | (7.98 | )% | | | 9.34 | %7 |
Ratio of net expenses to average net assets8 | | | 0.84 | % | | | 0.84 | % | | | 0.85 | %9 |
Ratio of gross expenses to average net assets10 | | | 0.89 | % | | | 0.91 | % | | | 1.46 | %9 |
Ratio of net investment income to average net assets3 | | | 0.27 | % | | | 0.16 | % | | | 0.37 | %9 |
Portfolio turnover | | | 18 | % | | | 53 | % | | | 38 | % |
Net assets end of period (000’s) omitted | | $ | 95,884 | | | $ | 65,375 | | | $ | 6,980 | |
| | | | | | | | | | | | |
| 1 | Commencement of operations was on February 27, 2017. |
| 2 | Per share numbers have been calculated using average shares. |
| 3 | Total returns and net investment income (loss) would have been lower had certain expenses not been offset. |
| 4 | Less than $0.005 per share. |
| 5 | Includesnon-recurring dividends. Without these dividends, net investment income per class would have been $(0.01), $0.00, and $0.01 for Class N, Class I and Class Z, respectively. |
| 6 | The total return is calculated using the published Net Asset Value as of fiscal year end. |
| 8 | Includes reduction from broker recapture amounting to 0.01% for the fiscal years ended 2019, 2018, and less than 0.01% for the fiscal year ended 2017. |
| 10 | Excludes the impact of expense reimbursement or fee waivers and expense reductions such as brokerage credits, but includes expense repayments andnon-reimbursable expenses, if any, such as interest, taxes, and extraordinary expenses. (See Note 1(c) and 2 in the Notes to Financial Statements.) |
| 11 | Effective October 1, 2016, Institutional Class was renamed Class I. |
| 12 | Commencement of operations was on June 30, 2015. |
58
| | |
| | | Notes to Financial Statements December 31, 2019 |
1. ORGANIZATION AND SUMMARY OF SIGNIFICANT ACCOUNTING POLICIES
AMG Funds and AMG Funds II (the “Trusts”) areopen-end management investment companies, organized as Massachusetts business trusts, and registered under the Investment Company Act of 1940, as amended (the “1940 Act”). Currently, the Trusts consist of a number of different funds, each having distinct investment management objectives, strategies, risks, and policies. Included in this report are AMG Funds: AMG GW&K Municipal Bond Fund (“Municipal Bond”), AMG GW&K Municipal Enhanced Yield Fund (“Municipal Enhanced”), AMG GW&K Small Cap Core Fund (“Small Cap Core”) and AMG GW&K Small/Mid Cap Fund (“Small/Mid Cap”) and AMG Funds II: AMG GW&K Enhanced Core Bond ESG Fund (“Enhanced Core Bond ESG”) (formerly AMG GW&K Enchanced Core Bond Fund), each a “Fund” and collectively, the “Funds”.
Each Fund offers different classes of shares. Each Fund offers Class N and Class I shares, and Enhanced Core Bond ESG, Municipal Enhanced, Small Cap Core, and Small/Mid Cap offer Class Z shares. Effective May 31, 2019, Enhanced Core Bond ESG Class C shares were converted to Class N shares. Each class represents an interest in the same assets of the respective Fund. Although all share classes generally have identical voting rights, each share class votes separately when required by law. Different share classes may have different net asset values per share to the extent the share classes pay different distribution amounts and/or the expenses of such share classes differ. Each share class has its own expense structure. Please refer to a current prospectus for additional information on each share class.
Class C shares of Enhanced Core Bond ESG, were closed to all new investors and were not available for purchase by existing shareholders. Shareholders who redeemed Class C shares of the Fund were not subject to the deferred sales charges because they have been closed for longer than one year as described in the prospectus. On July 31, 2019, Small Cap Core wasre-opened to new investors. Please refer to Enhanced Core Bond ESG’s and Small Cap Core’s current prospectus for additional information.
The Funds’ financial statements are prepared in accordance with accounting principles generally accepted in the United States of America (“U.S. GAAP”), including accounting and reporting guidance pursuant to Accounting Standards Codification Topic 946 applicable to investment companies. U.S. GAAP requires management to make estimates and assumptions that affect the reported amounts of assets and liabilities and disclosure of contingent assets and liabilities at the date of the financial statements and the reported amounts of income and expenses during the reporting period. Actual results could differ from those estimates and such differences could be material. The following is a summary of significant accounting policies followed by the Funds in the preparation of their financial statements:
a. VALUATION OF INVESTMENTS
Equity securities traded on a national securities exchange or reported on the NASDAQ national market system (“NMS”) are valued at the last quoted sales price on the primary exchange or, if applicable, the NASDAQ official closing price or the official closing price of the relevant exchange or, lacking any sales, at the last quoted bid price or the mean between the last quoted bid and ask prices (the “exchange mean price”). Equity securities traded in theover-the-counter market (other than NMS securities) are valued at the mean price. Foreign equity securities (securities principally traded in markets other than U.S. markets) are valued at the official closing price on the primary exchange or, for markets that either do not
offer an official closing price or where the official closing price may not be representative of the overall market, the last quoted sale price.
Fixed income securities purchased with a remaining maturity exceeding 60 days are valued at the evaluated mean price provided by an authorized pricing service or, if an evaluated price is not available, by reference to other securities which are considered comparable in credit rating, interest rate, due date and other features (generally referred to as “matrix pricing”) or other similar pricing methodologies. Investments in certain mortgage-backed and stripped mortgage-backed securities, preferred stocks, convertible securities, derivatives and other debt securities not traded on an organized securities market are valued on the basis of valuations provided by dealers or by a pricing service which uses information with respect to transactions in such securities and various relationships between such securities and yield to maturity in determining value.
Fixed income securities purchased with a remaining maturity of 60 days or less are valued at amortized cost, provided that the amortized cost value is approximately the same as the fair value of the security valued without the use of amortized cost. Investments in otheropen-end registered investment companies are valued at their end of day net asset value per share.
The Funds’ portfolio investments are generally valued based on independent market quotations or prices or, if none, “evaluative” or other market based valuations provided by third party pricing services approved by the Board of Trustees of the Trust (the “Board”). Under certain circumstances, the value of certain Fund portfolio investments may be based on an evaluation of fair value, pursuant to procedures established by and under the general supervision of the Board. The Valuation Committee, which is comprised of the Independent Trustees of the Board, and the Pricing Committee, which is comprised of representatives from AMG Funds LLC (the “Investment Manager”) are the committees appointed by the Board to make fair value determinations. Each Fund may use the fair value of a portfolio investment to calculate its net asset value (“NAV”) in the event that the market quotation, price or market based valuation for the portfolio investment is not readily available or otherwise not determinable pursuant to the Board’s valuation procedures, if the Investment Manager or the Pricing Committee believes the quotation, price or market based valuation to be unreliable, or in certain other circumstances. When determining the fair value of an investment, the Pricing Committee and, if required under the Trusts’ securities valuation procedures, the Valuation Committee, seeks to determine the price that the Fund might reasonably expect to receive from current sale of that portfolio investment in an arms-length transaction. Fair value determinations shall be based upon consideration of all available facts and information, including, but not limited to (i) attributes specific to the investment; (ii) fundamental and analytical data relating to the investment; and (iii) the value of other comparable securities or relevant financial instruments, including derivative securities, traded on other markets or among dealers.
The values assigned to fair value portfolio investments are based on available information and do not necessarily represent amounts that might ultimately be realized in the future, since such amounts depend on future developments inherent in long-term investments. Because of the inherent uncertainty of valuation, those estimated values may differ significantly from the values that would have been used had a ready market for the investments existed, and the differences could be material. The Board will be presented with a quarterly report showing as of the most recent quarter end, all outstanding securities fair valued by the Funds, including a comparison with the prior quarter end and the percentage of the Funds that the security represents at each quarter end.
59
| | |
| | | Notes to Financial Statements(continued) |
With respect to foreign equity securities and certain foreign fixed income securities, the Board has adopted a policy that securities held in the Funds that can be fair valued by the applicable fair value pricing service are fair valued on each business day provided that each individual price exceeds apre-established confidence level.
U.S. GAAP defines fair value as the price that a fund would receive to sell an asset or pay to transfer a liability in an orderly transaction between market participants at the measurement date. U.S. GAAP also establishes a framework for measuring fair value, and a three level hierarchy for fair value measurements based upon the transparency of inputs to the valuation of an asset or liability. Inputs may be observable or unobservable and refer broadly to the assumptions that market participants would use in pricing the asset or liability. Observable inputs reflect the assumptions market participants would use in pricing the asset or liability based on market data obtained from sources independent of the Funds. Unobservable inputs reflect the Funds’ own assumptions about the assumptions that market participants would use in pricing the asset or liability developed based on the best information available in the circumstances. Each investment is assigned a level based upon the observability of the inputs which are significant to the overall valuation.
The three-tier hierarchy of inputs is summarized below:
Level 1 – inputs are quoted prices in active markets for identical investments (e.g., equity securities,open-end investment companies)
Level 2 – other observable inputs (including, but not limited to: quoted prices for similar assets or liabilities in markets that are active, quoted prices for identical or similar assets or liabilities in markets that are not active, inputs other than quoted prices that are observable for the assets or liabilities (such as interest rates, yield curves, volatilities, prepayment speeds, loss severities, credit risks and default rates) or other market corroborated inputs) (e.g., debt securities, government securities, foreign currency exchange contracts, swaps, foreign securities utilizing international fair value pricing, fair valued securities with observable inputs)
Level 3 – inputs are significant unobservable inputs (including the Fund’s own assumptions used to determine the fair value of investments) (e.g., fair valued securities with unobservable inputs)
Changes in inputs or methodologies used for valuing investments may result in a transfer in or out of levels within the fair value hierarchy. The inputs or methodologies used for valuing investments may not necessarily be an indication of the risk associated with investing in those investments.
b. SECURITY TRANSACTIONS
Security transactions are accounted for as of trade date. Realized gains and losses on securities sold are determined on the basis of identified cost.
c. INVESTMENT INCOME AND EXPENSES
Dividend income is recorded on theex-dividend date. Interest income, which includes amortization of premium and accretion of discount on debt securities, is accrued as earned. Dividend and interest income on foreign securities is recorded gross of any withholding tax.Non-cash dividends included in dividend income, if any, are reported at the fair market value of the securities received. Upon notification from issuers, distributions received from a real estate investment trust (“REIT”) may be redesignated as a reduction of cost of investments and/or realized gain. Other income and expenses are recorded on an accrual basis. Expenses that cannot be directly attributed to a Fund are apportioned among the funds in the Trusts and other trusts or funds within the AMG Funds Family of Funds (collectively the “AMG Funds Family”) based upon their relative average net assets or number of shareholders. Investment income, realized and unrealized capital gains and losses, the common expenses of each Fund, and certain fund level expense reductions, if any, are allocated on apro-rata basis to each class based on the relative net assets of each class to the total net assets of each Fund.
Small Cap Core and Small/Mid Cap had certain portfolio trades directed to various brokers under a brokerage recapture program. Credits received from the brokerage recapture program are earned and paid on a monthly basis, and are recorded as expense offsets, which serve to reduce the Fund’s overall expense ratio. For the fiscal year ended December 31, 2019, the impact on the expenses and expense ratios were as follows: Small Cap Core $27,588 or 0.01%, and Small/Mid Cap $18,178 or 0.01%.
d. DIVIDENDS AND DISTRIBUTIONS
Fund distributions resulting from either net investment income or realized net capital gains, if any, will normally be declared and paid at least annually in December. Distributions to shareholders are recorded on theex-dividend date. Distributions are determined in accordance with federal income tax regulations, which may differ from net investment income and net realized capital gains for financial statement purposes (U.S. GAAP). Differences may be permanent or temporary. Permanent differences are reclassified among capital accounts in the financial statements to reflect their tax character. Permanent book and tax basis differences, if any, relating to shareholder distributions will result in reclassifications topaid-in capital. Temporary differences arise when certain items of income, expense and gain or loss are recognized in different periods for financial statement and tax purposes; these differences will reverse at some time in the future. Permanent differences are primarily due to redemptions in kind. Temporary differences are primarily due to qualified late-year losses, wash sales loss deferrals, and capital loss carryforwards.
60
| | |
| | | Notes to Financial Statements(continued) |
The tax character of distributions paid during the fiscal years ended December 31, 2019 and December 31, 2018 were as follows:
| | | | | | | | | | | | | | | | | | | | | | | | |
| | | Enhanced Core Bond ESG | | | Municipal Bond | | | Municipal Enhanced | |
| Distributions paid from: | | 2019 | | | 2018 | | | 2019 | | | 2018 | | | 2019 | | | 2018 | |
Ordinary income | | $ | 926,755 | | | $ | 1,047,632 | | | $ | 659,218 | | | $ | 153,142 | | | $ | 155,860 | | | $ | 56,855 | |
Tax-exempt income | | | — | | | | — | | | | 18,092,868 | | | | 19,200,002 | | | | 7,002,372 | | | | 6,796,351 | |
Short-term capital gains | | | — | | | | — | | | | — | | | | — | | | | 610,420 | | | | — | |
Long-term capital gains | | | — | | | | — | | | | — | | | | 310,654 | | | | 1,129,412 | | | | — | |
Paid-in capital | | | — | | | | — | | | | — | | | | — | | | | — | | | | 5,166,870 | |
| | | | | | | | | | | | | | | | | | | | | | | | |
| | $ | 926,755 | | | $ | 1,047,632 | | | $ | 18,752,086 | | | $ | 19,633,798 | | | $ | 8,898,064 | | | $ | 12,020,726 | |
| | | | | | | | | | | | | | | | | | | | | | | | |
| | | | | | | | | | | | | | | | |
| | | Small Cap Core | | | Small/Mid Cap | |
| Distributions paid from: | | 2019 | | | 2018 | | | 2019 | | | 2018 | |
Ordinary income | | $ | 994,828 | | | $ | 1,050,912 | | | $ | 326,001 | | | $ | 152,361 | |
Short-term capital gains | | | — | | | | 1,716,078 | | | | — | | | | 2,222,595 | |
Long-term capital gains | | | 22,550,089 | | | | 51,977,905 | | | | 239,704 | | | | 507,566 | |
| | | | | | | | | | | | | | | | |
| | $ | 23,544,917 | | | $ | 54,744,895 | | | $ | 565,705 | | | $ | 2,882,522 | |
| | | | | | | | | | | | | | | | |
As of December 31, 2019, the components of distributable earnings (excluding unrealized appreciation/depreciation) on a tax basis consisted of:
| | | | | | | | | | | | | | | | | | | | |
| | | Enhanced
Core Bond
ESG | | | Municipal
Bond | | | Municipal
Enhanced | | | Small Cap
Core | | | Small/Mid
Cap | |
Capital loss carryforward | | $ | 4,277,204 | | | | — | | | | — | | | | — | | | $ | 1,784,947 | |
Undistributed ordinary income | | | — | | | | — | | | | — | | | | — | | | | 34,343 | |
Undistributedtax-exempt income | | | — | | | $ | 12,047 | | | $ | 6,432 | | | | — | | | | — | |
Undistributed short-term capital gains | | | — | | | | 8,553 | | | | 52,820 | | | | — | | | | — | |
Undistributed long-term capital gains | | | — | | | | — | | | | 777,604 | | | | — | | | | — | |
Late-year loss deferral | | | — | | | | — | | | | — | | | $ | 3,779,686 | | | | — | |
At December 31, 2019, the cost of investments and the aggregate gross unrealized appreciation and depreciation for federal income tax purposes were as follows:
| | | | | | | | | | | | | | | | |
| Fund | | Cost | | | Appreciation | | | Depreciation | | | Net | |
Enhanced Core Bond ESG | | $ | 33,237,350 | | | $ | 1,061,323 | | | $ | (27,779 | ) | | $ | 1,033,544 | |
Municipal Bond | | | 980,731,346 | | | | 46,996,470 | | | | (202,926 | ) | | | 46,793,544 | |
Municipal Enhanced | | | 270,691,547 | | | | 15,780,795 | | | | (59,165 | ) | | | 15,721,630 | |
Small Cap Core | | | 360,071,430 | | | | 109,450,249 | | | | (13,329,906 | ) | | | 96,120,343 | |
Small/Mid Cap | | | 172,446,625 | | | | 31,531,149 | | | | (5,233,550 | ) | | | 26,297,599 | |
e. FEDERAL TAXES
Each Fund currently qualifies as an investment company and intends to comply with the requirements under Subchapter M of the Internal Revenue Code of 1986, as amended, and to distribute substantially all of its taxable income and gains to its shareholders and to meet certain diversification and income requirements with respect to investment companies. Therefore, no provision for federal income or excise tax is included in the accompanying financial statements.
Additionally, based on each Fund’s understanding of the tax rules and rates related to income, gains and transactions for the foreign jurisdictions in which it invests, each Fund will provide for foreign taxes, and where appropriate, deferred foreign taxes.
Management has analyzed the Funds’ tax positions taken on federal income tax returns as of December 31, 2019, and for all open tax years (generally, the three prior taxable years), and has concluded that no provision for federal income tax is required in the Funds’ financial statements. Additionally, Management is not aware of any tax position for which it is reasonably possible that the total amounts of unrecognized tax benefits will change materially in the next twelve months.
f. CAPITAL LOSS CARRYOVERS AND DEFERRALS
As of December 31, 2019, the following Funds had capital loss carryovers for federal income tax purposes as shown in the following chart. These amounts may be used
61
| | |
| | | Notes to Financial Statements(continued) |
to offset future realized capital gains indefinitely, and retain their character as short-term and/or long-term.
| | | | | | | | | | | | |
| | | Capital Loss Carryover Amounts | |
| Fund | | Short-Term | | | Long-Term | | | Total | |
Enhanced Core Bond ESG | | $ | 1,514,015 | | | $ | 2,763,189 | | | $ | 4,277,204 | |
Small/Mid Cap Value | | | 499,380 | | | | 1,285,567 | | | | 1,784,947 | |
As of December 31, 2019, Municipal Bond, Municipal Enhanced, and Small Cap Core had no accumulated net realized capital loss carryovers from securities transactions for federal income tax purposes. Should the Funds incur net capital losses for the year ending December 31, 2020, such amounts may be used to offset future realized capital gains, for an unlimited time period.
For the fiscal year ended December 31, 2019, the following Funds utilized capital loss carryovers in the amount of:
| | | | | | | | |
| | | Capital Loss Carryover
Utilized | |
| Fund | | Short-Term | | | Long-Term | |
Enhanced Core Bond ESG | | $ | 171,504 | | | $ | 234,325 | |
Municipal Bond | | | 719,813 | | | | 5,094,899 | |
Municipal Enhanced Yield | | | 304,591 | | | | — | |
g. CAPITAL STOCK
The Trust’s Declaration of Trust authorizes for each Fund the issuance of an unlimited number of shares of beneficial interest, without par value. Each Fund records sales and repurchases of its capital stock on the trade date. For the fiscal year ended December 31, 2019, Small Cap Core transferred securities and cash to certain shareholders in connection with redemptionsin-kind transactions in the amount of $47,933,644. For the purposes of U.S. GAAP, the transactions were treated as a sale of securities and the resulting gain or loss was recognized based on the market value of the securities on the date of the transfer. For tax purposes, no gains or losses were recognized.
For the fiscal years ended December 31, 2019 and December 31, 2018, the capital stock transactions by class for the Funds were as follows:
| | | | | | | | | | | | | | | | | | | | | | | | | | | | | | | | |
| | | Enhanced Core Bond ESG | | | Municipal Bond | |
| | | December 31, 2019 | | | December 31, 2018 | | | December 31, 2019 | | | December 31, 2018 | |
| | | Shares | | | Amount | | | Shares | | | Amount | | | Shares | | | Amount | | | Shares | | | Amount | |
Class N: | | | | | | | | | | | | | | | | | | | | | | | | | | | | | | | | |
Proceeds from sale of shares | | | 385,161 | | | $ | 3,841,569 | | | | 424,957 | | | $ | 4,049,618 | | | | 587,077 | | | $ | 6,987,998 | | | | 1,361,049 | | | $ | 15,628,138 | |
Reinvestment of distributions | | | 30,307 | | | | 301,677 | | | | 27,223 | | | | 258,273 | | | | 25,450 | | | | 304,213 | | | | 29,687 | | | | 336,857 | |
Cost of shares repurchased | | | (514,970 | ) | | | (5,145,719 | ) | | | (719,736 | ) | | | (6,838,184 | ) | | | (588,678 | ) | | | (7,045,640 | ) | | | (2,415,317 | ) | | | (27,584,411 | ) |
Share Conversion | | | 190,000 | | | | 1,871,729 | | | | — | | | | — | | | | — | | | | — | | | | — | | | | — | |
| | | | | | | | | | | | | | | | | | | | | | | | | | | | | | | | |
Net increase (decrease) | | | 90,498 | | | $ | 869,256 | | | | (267,556 | ) | | $ | (2,530,293 | ) | | | 23,849 | | | $ | 246,571 | | | | (1,024,581 | ) | | $ | (11,619,416 | ) |
| | | | | | | | | | | | | | | | | | | | | | | | | | | | | | | | |
Class I: | | | | | | | | | | | | | | | | | | | | | | | | | | | | | | | | |
Proceeds from sale of shares | | | 442,100 | | | $ | 4,378,909 | | | | 380,957 | | | $ | 3,660,749 | | | | 25,467,262 | | | $ | 305,694,822 | | | | 34,143,663 | | | $ | 390,076,652 | |
Reinvestment of distributions | | | 16,552 | | | | 165,239 | | | | 12,169 | | | | 115,703 | | | | 1,156,277 | | | | 13,901,387 | | | | 1,241,970 | | | | 14,166,368 | |
Cost of shares repurchased | | | (254,280 | ) | | | (2,503,281 | ) | | | (459,754 | ) | | | (4,456,226 | ) | | | (24,889,281 | ) | | | (298,253,997 | ) | | | (43,525,772 | ) | | | (496,040,763 | ) |
| | | | | | | | | | | | | | | | | | | | | | | | | | | | | | | | |
Net increase (decrease) | | | 204,372 | | | $ | 2,040,867 | | | | (66,628 | ) | | $ | (679,774 | ) | | | 1,734,258 | | | $ | 21,342,212 | | | | (8,140,139 | ) | | $ | (91,797,743 | ) |
| | | | | | | | | | | | | | | | | | | | | | | | | | | | | | | | |
Class C:1 | | | | | | | | | | | | | | | | | | | | | | | | | | | | | | | | |
Proceeds from sale of shares | | | 81 | | | $ | 779 | | | | 498 | | | $ | 4,748 | | | | — | | | | — | | | | — | | | | — | |
Reinvestment of distributions | | | 1,516 | | | | 14,667 | | | | 4,736 | | | | 44,928 | | | | — | | | | — | | | | — | | | | — | |
Cost of shares repurchased | | | (52,291 | ) | | | (505,697 | ) | | | (229,466 | ) | | | (2,178,365 | ) | | | — | | | | — | | | | — | | | | — | |
Share Conversion | | | (190,108 | ) | | | (1,871,729 | ) | | | — | | | | — | | | | — | | | | — | | | | — | | | | — | |
| | | | | | | | | | | | | | | | | | | | | | | | | | | | | | | | |
Net decrease | | | (240,802 | ) | | $ | (2,361,980 | ) | | | (224,232 | ) | | $ | (2,128,689 | ) | | | — | | | | — | | | | — | | | | — | |
| | | | | | | | | | | | | | | | | | | | | | | | | | | | | | | | |
62
| | |
| | | Notes to Financial Statements(continued) |
| | | | | | | | | | | | | | | | | | | | | | | | | | | | | | | | |
| | | Enhanced Core Bond ESG | | | Municipal Bond | |
| | | December 31, 2019 | | | December 31, 2018 | | | December 31, 2019 | | | December 31, 2018 | |
| | | Shares | | | Amount | | | Shares | | | Amount | | | Shares | | | Amount | | | Shares | | | Amount | |
Class Z: | | | | | | | | | | | | | | | | | | | | | | | | | | | | | | | | |
Proceeds from sale of shares | | | 141,124 | | | $ | 1,392,522 | | | | 112,597 | | | $ | 1,079,678 | | | | — | | | | — | | | | — | | | | — | |
Reinvestment of distributions | | | 26,209 | | | | 260,974 | | | | 32,270 | | | | 307,362 | | | | — | | | | — | | | | — | | | | — | |
Cost of shares repurchased | | | (789,299 | ) | | | (7,834,838 | ) | | | (693,811 | ) | | | (6,622,050 | ) | | | — | | | | — | | | | — | | | | — | |
| | | | | | | | | | | | | | | | | | | | | | | | | | | | | | | | |
Net decrease | | | (621,966 | ) | | $ | (6,181,342 | ) | | | (548,944 | ) | | $ | (5,235,010 | ) | | | — | | | | — | | | | — | | | | — | |
| | | | | | | | | | | | | | | | | | | | | | | | | | | | | | | | |
| | |
| | | Municipal Enhanced | | | Small Cap Core | |
| | | December 31, 2019 | | | December 31, 2018 | | | December 31, 2019 | | | December 31, 2018 | |
| | | Shares | | | Amount | | | Shares | | | Amount | | | Shares | | | Amount | | | Shares | | | Amount | |
Class N: | | | | | | | | | | | | | | | | | | | | | | | | | | | | | | | | |
Proceeds from sale of shares | | | 1,153,398 | | | $ | 11,800,890 | | | | 503,883 | | | $ | 4,895,415 | | | | 37,380 | | | $ | 923,528 | | | | 118,455 | | | $ | 3,333,417 | |
Reinvestment of distributions | | | 19,060 | | | | 194,890 | | | | 12,650 | | | | 123,277 | | | | 20,023 | | | | 515,592 | | | | 74,956 | | | | 1,556,082 | |
Cost of shares repurchased | | | (1,375,096 | ) | | | (14,098,046 | ) | | | (646,210 | ) | | | (6,320,716 | ) | | | (266,629 | ) | | | (6,460,696 | ) | | | (482,775 | ) | | | (13,686,615 | ) |
| | | | | | | | | | | | | | | | | | | | | | | | | | | | | | | | |
Net decrease | | | (202,638 | ) | | $ | (2,102,266 | ) | | | (129,677 | ) | | $ | (1,302,024 | ) | | | (209,226 | ) | | $ | (5,021,576 | ) | | | (289,364 | ) | | $ | (8,797,116 | ) |
| | | | | | | | | | | | | | | | | | | | | | | | | | | | | | | | |
Class I: | | | | | | | | | | | | | | | | | | | | | | | | | | | | | | | | |
Proceeds from sale of shares | | | 8,484,080 | | | $ | 84,587,165 | | | | 3,422,201 | | | $ | 33,378,454 | | | | 2,631,723 | | | $ | 65,737,211 | | | | 3,424,698 | | | $ | 99,405,234 | |
Reinvestment of distributions | | | 459,497 | | | | 4,602,583 | | | | 618,327 | | | | 5,929,747 | | | | 614,371 | | | | 16,108,801 | | | | 1,913,334 | | | | 40,371,352 | |
Cost of shares repurchased | | | (3,603,519 | ) | | | (35,740,786 | ) | | | (5,104,631 | ) | | | (49,821,867 | ) | | | (5,324,375 | ) | | | (130,505,862 | )2 | | | (4,967,816 | ) | | | (125,593,850 | ) |
| | | | | | | | | | | | | | | | | | | | | | | | | | | | | | | | |
Net increase (decrease) | | | 5,340,058 | | | $ | 53,448,962 | | | | (1,064,103 | ) | | $ | (10,513,666 | ) | | | (2,078,281 | ) | | $ | (48,659,850 | ) | | | 370,216 | | | $ | 14,182,736 | |
| | | | | | | | | | | | | | | | | | | | | | | | | | | | | | | | |
Class Z: | | | | | | | | | | | | | | | | | | | | | | | | | | | | | | | | |
Proceeds from sale of shares | | | — | | | | — | | | | — | | | | — | | | | 355,072 | | | $ | 9,136,099 | | | | 428,733 | | | $ | 11,243,997 | |
Reinvestment of distributions | | | 418 | | | $ | 4,178 | | | | 642 | | | $ | 6,158 | | | | 216,732 | | | | 5,682,701 | | | | 487,274 | | | | 10,281,472 | |
Cost of shares repurchased | | | — | | | | — | | | | — | | | | — | | | | (408,010 | ) | | | (10,367,264 | ) | | | (740,347 | ) | | | (21,529,269 | ) |
| | | | | | | | | | | | | | | | | | | | | | | | | | | | | | | | |
Net increase (decrease) | | | 418 | | | $ | 4,178 | | | | 642 | | | $ | 6,158 | | | | 163,794 | | | $ | 4,451,536 | | | | 175,660 | | | $ | (3,800 | ) |
| | | | | | | | | | | | | | | | | | | | | | | | | | | | | | | | |
63
| | |
| | | Notes to Financial Statements(continued) |
| | | | | | | | | | | | | | | | |
| | | Small/Mid Cap | |
| | | December 31, 2019 | | | December 31, 2018 | |
| | | Shares | | | Amount | | | Shares | | | Amount | |
Class N: | | | | | | | | | | | | | | | | |
Proceeds from sale of shares | | | 4,335 | | | $ | 52,000 | | | | 7,686 | | | $ | 90,000 | |
Reinvestment of distributions | | | 22 | | | | 280 | | | | 209 | | | | 2,061 | |
| | | | | | | | | | | | | | | | |
Net increase | | | 4,357 | | | $ | 52,280 | | | | 7,895 | | | $ | 92,061 | |
| | | | | | | | | | | | | | | | |
Class I: | | | | | | | | | | | | | | | | |
Proceeds from sale of shares | | | 3,410,892 | | | $ | 38,761,509 | | | | 4,362,093 | | | $ | 49,100,133 | |
Reinvestment of distributions | | | 17,872 | | | | 230,903 | | | | 123,071 | | | | 1,215,947 | |
Cost of shares repurchased | | | (989,978 | ) | | | (11,582,617 | ) | | | (1,221,254 | ) | | | (13,093,212 | ) |
| | | | | | | | | | | | | | | | |
Net increase | | | 2,438,786 | | | $ | 27,409,795 | | | | 3,263,910 | | | $ | 37,222,868 | |
| | | | | | | | | | | | | | | | |
Class Z: | | | | | | | | | | | | | | | | |
Proceeds from sale of shares | | | 2,176,455 | | | $ | 26,780,755 | | | | 8,619,193 | | | $ | 100,520,967 | |
Reinvestment of distributions | | | 24,497 | | | | 316,750 | | | | 165,413 | | | | 1,634,280 | |
Cost of shares repurchased | | | (1,393,119 | ) | | | (16,331,573 | ) | | | (2,873,377 | ) | | | (32,900,674 | ) |
| | | | | | | | | | | | | | | | |
Net increase | | | 807,833 | | | $ | 10,765,932 | | | | 5,911,229 | | | $ | 69,254,573 | |
| | | | | | | | | | | | | | | | |
| 1 | Effective May 31, 2019, Class C shares were converted into Class N shares. |
| 2 | Includes redemptionin-kind in the amount of $47,933,644. |
h. REPURCHASE AGREEMENTS AND JOINT REPURCHASE AGREEMENTS
The Funds may enter into third-party repurchase agreements for temporary cash management purposes and third-party or bilateral joint repurchase agreements for reinvestment of cash collateral on securities lending transactions under the securities lending program offered by The Bank of New York Mellon (“BNYM”) (the “Program”) (collectively, “Repurchase Agreements”). The value of the underlying collateral, including accrued interest, must equal or exceed the value of the Repurchase Agreements during the term of the agreement. For joint repurchase agreements, the Funds participate on a pro rata basis with other clients of BNYM in its share of the underlying collateral under such joint repurchase agreements and in its share of proceeds from any repurchase or other disposition of the underlying collateral. The underlying collateral for all Repurchase Agreements is held in safekeeping by the Funds’ custodian or at the Federal Reserve Bank. If the seller defaults and the value of the collateral declines, or if bankruptcy proceedings commence with respect to the seller of the security, realization of the collateral by the Funds may be delayed or limited. Pursuant to the Program, the Funds are indemnified for such losses by BNYM on joint repurchase agreements.
At December 31, 2019, the market value of Repurchase Agreements outstanding for Enhanced Core Bond ESG and Small Cap Core were $1,285,644 and $3,780,454, respectively.
i. DELAYED DELIVERY TRANSACTIONS AND WHEN-ISSUED SECURITIES
The Funds may enter into securities transactions on a delayed delivery or when issued basis. Payment and delivery may take place after the customary settlement period for that security. The price of the underlying securities and the date when
the securities will be delivered and paid for are fixed at the time the transaction is negotiated. During the time a delayed delivery sell is outstanding, the contract is marked to market daily and equivalent deliverable securities are held for the transaction. The value of the securities purchased on a delayed delivery or when-issued basis are identified as such in the Fund’s Schedules of Portfolio Investments. With respect to purchase commitments, the Fund identifies securities as segregated in its records with a value at least equal to the amount of the commitment. Losses may arise due to changes in the value of the underlying securities or if the counterparty does not perform under the contract, or if the issuer does not issue the securities due to political, economic, or other factors.
2. AGREEMENTS AND TRANSACTIONS WITH AFFILIATES
For each of the Funds, the Trusts have entered into an investment advisory agreement under which the Investment Manager, a subsidiary and the U.S. retail distribution arm of Affiliated Managers Group, Inc. (“AMG”), serves as investment manager to the Funds and is responsible for the Funds’ overall administration and operations. The Investment Manager selects one or more subadvisers for the Funds (subject to Board approval) and monitors each subadviser’s investment performance, security holdings and investment strategies. Each Fund’s investment portfolio is managed by GW&K Investment Management, LLC, (“GW&K”) who serves pursuant to a subadvisory agreement with the Investment Manager. AMG indirectly owns a majority interest in GW&K.
Investment management fees are paid directly by the Funds to the Investment Manager based on average daily net assets. For the fiscal year ended
64
| | |
| | | Notes to Financial Statements(continued) |
December 31, 2019, the Funds’ investment management fees were paid at the following annual rates of each Fund’s respective average daily net assets:
| | | | |
Enhanced Core Bond ESG | | | 0.30 | % |
Municipal Bond | | | | |
on first $25 million | | | 0.35 | % |
on next $25 million | | | 0.30 | % |
on next $50 million | | | 0.25 | % |
on balance over $100 million | | | 0.20 | % |
Municipal Enhanced | | | 0.45 | % |
Small Cap Core | | | 0.70 | % |
Small/Mid Cap | | | 0.65 | % |
The Investment Manager has contractually agreed, through at least May 1, 2020, to waive management fees and/or pay or reimburse fund expenses in order to limit total annual Fund operating expenses after fee waiver and expense reimbursements (exclusive of taxes, interest (including interest incurred in connection with bank and custody overdrafts, and in connection with securities sold short), shareholder servicing fees, distribution and service(12b-1) fees, brokerage commissions and other transaction costs, dividends payable with respect to securities sold short, acquired fund fees and expenses and extraordinary expenses) of Enhanced Core Bond ESG, Municipal Bond, Municipal Enhanced, Small Cap Core and Small/Mid Cap to the annual rate of 0.48%, 0.34%, 0.59%, 0.90% and 0.85%, respectively, of each Fund’s average daily net assets (this annual rate or such other annual rate that may be in effect from time to time, the “Expense Cap”), subject to later reimbursement by the Funds in certain circumstances.
The contractual expense limitation may only be terminated in the event the Investment Manager or a successor ceases to be the investment manager of a Fund or a successor fund, by mutual agreement between the Investment Manager and the Board, or in the event of a Fund’s liquidation unless the Fund is reorganized or is a party to a merger in which the surviving entity is successor to the accounting and performance information of a Fund.
In general, for a period of up to 36 months, the Investment Manager may recover from each Fund fees waived and expenses paid pursuant to this contractual agreement, provided that such repayment would not cause a Fund’s total annual operating expenses after fee waiver and expense reimbursements (exclusive of the items noted in the parenthetical above) to exceed the contractual expense limitation amount.
At December 31, 2019, the Funds’ expiration of reimbursements subject to recoupment is as follows:
| | | | | | | | |
Expiration Period | | Enhanced Core
Bond ESG | | | Municipal Bond | |
Less than 1 year | | $ | 185,809 | | | $ | 703,359 | |
1-2 years | | | 110,054 | | | | 604,775 | |
2-3 years | | | 153,359 | | | | 651,229 | |
| | | | | | | | |
Total | | $ | 449,222 | | | $ | 1,959,363 | |
| | | | | | | | |
| | | | | | | | |
Expiration Period | | Municipal Enhanced | | | Small Cap Core | |
Less than 1 year | | $ | 232,286 | | | $ | 51,380 | |
1-2 years | | | 186,327 | | | | 3,686 | |
2-3 years | | | 220,347 | | | | 48,563 | |
| | | | | | | | |
Total | | $ | 638,960 | | | $ | 103,629 | |
| | | | | | | | |
| | |
Expiration Period | | | | | Small/Mid Cap | |
Less than 1 year | | | | | | $ | 85,512 | |
1-2 years | | | | | | | 67,647 | |
2-3 years | | | | | | | 68,437 | |
| | | | | | | | |
Total | | | | | | $ | 221,596 | |
| | | | | | | | |
The Trusts, on behalf of the Funds, have entered into an amended and restated Administration Agreement under which the Investment Manager serves as the Funds’ administrator (the “Administrator”) and is responsible for allnon-portfolio management aspects of managing the Funds’ operations, including administration and shareholder services to each Fund. Each Fund pays a fee to the Administrator at the rate of 0.15% per annum of the Fund’s average daily net assets for this service.
The Funds are distributed by AMG Distributors, Inc. (the “Distributor”), a wholly-owned subsidiary of the Investment Manager. The Distributor serves as the distributor and underwriter for each Fund and is a registered broker-dealer and member of the Financial Industry Regulatory Authority, Inc. (“FINRA”). Shares of each Fund will be continuously offered and will be sold directly to prospective purchasers and through brokers, dealers or other financial intermediaries who have executed selling agreements with the Distributor. Generally the Distributor bears all or a portion of the expenses of providing services pursuant to the distribution agreement, including the payment of the expenses relating to the distribution of prospectuses for sales purposes and any advertising or sales literature.
The Trusts have adopted a distribution and service plan (the “Plan”) with respect to the Class N shares of each Fund and Class C shares of Enhanced Core Bond ESG, in accordance with the requirements of Rule12b-1 under the 1940 Act and the requirements of the applicable rules of FINRA regarding asset-based sales charges. Pursuant to the Plan, each Fund may make payments to the Distributor for its expenditures in financing any activity primarily intended to result in the sale of each Fund’s Class N shares and Enhanced Core Bond ESG Class C shares and for maintenance and personal service provided to existing shareholders of that class. The Plan authorized payments to the Distributor up to 0.25% and 1.00% annually of each Fund’s average daily net assets attributable to the Class N shares and Enhanced Core Bond ESG Class C shares, respectively. The portion of payments made under the plan by Class N shares of each Fund and Class C shares of Enhanced Core Bond ESG for shareholder servicing may not exceed an annual rate of 0.25% of the average daily net asset value of each Fund’s shares of that class owned by clients of such broker, dealer or financial intermediary. On June 1, 2019, the plan with Enhanced Core Bond ESG Class C shares terminated.
For Enhanced Core Bond ESG’s Class I shares and for each of the Class N and Class I shares of Municipal Bond, Municipal Enhanced, Small Cap Core, and
65
| | |
| | | Notes to Financial Statements(continued) |
Small/Mid Cap, the Board has approved reimbursement payments to the Investment Manager for shareholder servicing expenses (“shareholder servicing fees”) incurred. Shareholder servicing fees include payments to financial intermediaries, such as broker-dealers (including fund supermarket platforms), banks, and trust companies who provide shareholder recordkeeping, account servicing and other services. The Class N and Class I shares may reimburse the Investment Manager for the actual amount incurred up to a maximum annual rate of each Class’s average daily net assets as shown in the table below.
The impact on the annualized expense ratios for the fiscal year ended December 31, 2019, were as follows:
| | | | | | | | |
| Fund | | Maximum Annual
Amount
Approved | | | Actual
Amount
Incurred | |
Enhanced Core Bond ESG | | | | | | | | |
Class I | | | 0.10 | % | | | 0.07 | % |
Municipal Bond | | | | | | | | |
Class N | | | 0.15 | % | | | 0.12 | % |
Class I | | | 0.05 | % | | | 0.05 | % |
Municipal Enhanced | | | | | | | | |
Class N | | | 0.15 | % | | | 0.15 | % |
Class I | | | 0.05 | % | | | 0.05 | % |
Small Cap Core | | | | | | | | |
Class N | | | 0.15 | % | | | 0.15 | % |
Class I | | | 0.05 | % | | | 0.05 | % |
Small/Mid Cap | | | | | | | | |
Class N | | | 0.15 | % | | | — | |
Class I | | | 0.10 | % | | | 0.10 | % |
| | | | | | | | |
The Board provides supervision of the affairs of the Trusts and other trusts within the AMG Funds family. The Trustees of the Trusts who are not affiliated with the Investment Manager receive an annual retainer and per meeting fees for regular, special and telephonic meetings, and they are reimbursed forout-of-pocket expenses incurred while carrying out their duties as Board members. The Chairman of the Board and the Audit Committee Chair receive additional annual retainers. Certain Trustees and Officers of the Funds are Officers and/or Directors of the Investment Manager, AMG and/or the Distributor.
The Securities and Exchange Commission (the “SEC”) granted an exemptive order that permits the Funds to lend and borrow money for certain temporary purposes directly to and from other eligible funds in the AMG Funds family. Participation in this interfund lending program is voluntary for both the borrowing and lending funds, and an interfund loan is only made if it benefits each participating fund. The Administrator manages the program according to procedures approved by the Board, and the Board monitors the operation of the program. An interfund loan must comply with certain conditions set out in the exemptive order, which are designed to assure fairness and protect all participating funds. For the fiscal year ended December 31, 2019, Municipal Bond lent a maximum of $1,316,546 for one day earning interest of $117, Municipal Enhanced lent a maximum of $5,655,726 for two days earning interest of $637, Small Cap Core lent a maximum of $1,394,179 for one day earning interest of $92 and Small/Mid Cap lent a maximum of $2,809,656 for
six days earning interest of $1,440. The interest income amount is included in the Statement of Operations as interest income. Enhanced Core Bond ESG borrowed a maximum of $1,393,052 for four days paying interest of $263, Municipal Bond borrowed a maximum of $4,490,591 for seven days paying interest of $1,475 and Small Cap Core borrowed a maximum of $14,519,499 for three days paying interest of $2,236. The interest expense amount is included in the Statement of Operations as miscellaneous expense. At December 31, 2019, the Funds had no interfund loans outstanding.
3. PURCHASES AND SALES OF SECURITIES
Purchases and sales of securities (excluding short-term securities and U.S. Government Obligations) for the fiscal year ended December 31, 2019, were as follows:
| | | | | | | | |
| | | Long Term Securities | |
| Fund | | Purchases | | | Sales | |
Enhanced Core Bond ESG | | $ | 18,946,710 | | | $ | 21,701,169 | |
Municipal Bond | | | 167,285,286 | | | | 199,899,494 | |
Municipal Enhanced | | | 156,120,460 | | | | 95,769,768 | |
Small Cap Core | | | 82,252,160 | | | | 120,315,692 | |
Small/Mid Cap | | | 66,319,015 | | | | 28,686,531 | |
Purchases and sales of U.S. Government Obligations for the fiscal year ended December 31, 2019 were as follows:
| | | | | | | | |
| | | U.S. Government
Obligations | |
| Fund | | Purchases | | | Sales | |
Enhanced Core Bond ESG | | $ | 5,662,827 | | | $ | 8,195,799 | |
4. PORTFOLIO SECURITIES LOANED
The Funds participate in the Program providing for the lending of securities to qualified borrowers. Securities lending income includes earnings of such temporary cash investments, plus or minus any rebate to a borrower. These earnings (after any rebate) are then divided between BNYM, as a fee for its services under the Program, and the Funds, according to agreed-upon rates. Collateral on all securities loaned is accepted in cash, U.S. Treasury Obligations or U.S. Government Agency Obligations. Collateral is maintained at a minimum level of 102% (105% in the case of certain foreign securities) of the market value, plus interest, if applicable, of investments on loan. It is the Funds’ policy to obtain additional collateral from or return excess collateral to the borrower by the end of the next business day, following the valuation date of the securities loaned. Therefore, the value of the collateral held may be temporarily less than the value of the securities on loan. Lending securities entails a risk of loss to the Funds if and to the extent that the market value of the securities loaned were to increase and the borrower did not increase the collateral accordingly, and the borrower fails to return the securities. Under the terms of the Program, the Funds are indemnified for such losses by BNYM. Cash collateral is held in separate omnibus accounts managed by BNYM, who is authorized to exclusively enter into joint repurchase agreements for that cash collateral. Securities collateral is held in separate omnibus accounts managed by BNYM that cannot be sold or pledged. BNYM bears the risk of any deficiency in the amount of the cash collateral available for return to the borrower due to any loss on the collateral invested.
66
| | |
| | | Notes to Financial Statements(continued) |
The value of securities loaned on positions held, cash collateral and securities collateral received at December 31, 2019, were as follows:
| | | | | | | | | | | | | | | | |
| Fund | | Securities
Loaned | | | Cash
Collateral
Received | | | Securities
Collateral
Received | | | Total
Collateral
Received | |
Enhanced Core Bond ESG | | $ | 1,399,391 | | | $ | 1,285,644 | | | $ | 162,780 | | | $ | 1,448,424 | |
Small Cap Core | | | 74,630,943 | | | | 3,780,454 | | | | 72,240,554 | | | | 76,021,008 | |
Small/Mid Cap | | | 16,055,086 | | | | — | | | | 16,361,819 | | | | 16,361,819 | |
The following table summarizes the securities received as collateral for securities lending at December 31, 2019:
| | | | | | | | | | | | |
| Fund | | Collateral Type | | | Coupon Range | | | Maturity Date
Range | |
Enhanced Core | | | | | | | | | | | | |
Bond ESG | | | U.S. Treasury Obligations | | | | 0.010%-3.125% | | | | 04/15/20-05/15/47 | |
Small Cap Core | | | U.S. Treasury Obligations | | | | 0.000%-8.500% | | | | 01/09/20-11/15/49 | |
Small/Mid Cap | | | U.S. Treasury Obligations | | | | 0.000%-8.500% | | | | 01/23/20-05/15/49 | |
5. COMMITMENTS AND CONTINGENCIES
Under the Trusts’ organizational documents, its trustees and officers are indemnified against certain liabilities arising out of the performance of their duties to the Trusts. In addition, in the normal course of business, the Funds may enter into contracts and agreements that contain a variety of representations and warranties, which provide general indemnifications. The maximum exposure to the Funds under these arrangements is unknown, as this would involve future claims that may be made against a Fund that have not yet occurred. However, based on experience, the Funds had no prior claims or losses and expect the risks of loss to be remote.
6. MASTER NETTING AGREEMENTS
The Funds may enter into master netting agreements with their counterparties for the securities lending program and Repurchase Agreements, which provide the right, in the event of default (including bankruptcy or insolvency) for thenon-defaulting party to liquidate the collateral and calculate net exposure to the defaulting party or request additional collateral. For financial reporting purposes, the Funds do not offset financial assets and financial liabilities that are subject to master netting agreements in the Statement of Assets and Liabilities. For securities lending transactions, see Note 4.
The following table is a summary of the Funds’ open Repurchase Agreements that are subject to a master netting agreement as of December 31, 2019:
| | | | | | | | | | | | | | | | | | | | |
| | | | | | Gross Amount Not
Offset in the Statement
of Assets and Liabilities | | | | | | | |
Fund | | Gross Amounts of
Assets Presented in
the Statement of
Assets and Liabilities | | | Offset
Amount | | | Net Asset
Balance | | | Collateral
Received | | | Net
Amount | |
Enhanced Core Bond ESG | | | | | | | | | | | | | | | | | | | | |
Citadel Securities LLC | | $ | 285,644 | | | | — | | | $ | 285,644 | | | $ | 285,644 | | | | — | |
RBC Dominion Securities, Inc. | | | 1,000,000 | | | | — | | | | 1,000,000 | | | | 1,000,000 | | | | — | |
| | | | | | | | | | | | | | | | | | | | |
Total | | $ | 1,285,644 | | | | — | | | $ | 1,285,644 | | | $ | 1,285,644 | | | | — | |
| | | | | | | | | | | | | | | | | | | | |
Small Cap Core | | | | | | | | | | | | | | | | | | | | |
Cantor Fitzgerald Securities, Inc. | | $ | 1,000,000 | | | | — | | | $ | 1,000,000 | | | $ | 1,000,000 | | | | — | |
Citadel Securities LLC | | | 780,454 | | | | — | | | | 780,454 | | | | 780,454 | | | | — | |
Citigroup Global Markets, Inc. | | | 1,000,000 | | | | — | | | | 1,000,000 | | | | 1,000,000 | | | | — | |
RBC Dominion Securities, Inc. | | | 1,000,000 | | | | — | | | | 1,000,000 | | | | 1,000,000 | | | | — | |
| | | | | | | | | | | | | | | | | | | | |
Total | | $ | 3,780,454 | | | | — | | | $ | 3,780,454 | | | $ | 3,780,454 | | | | — | |
| | | | | | | | | | | | | | | | | | | | |
7. SUBSEQUENT EVENTS
The Funds have determined that no material events or transactions occurred through the issuance date of the Funds’ financial statements which require an additional disclosure in or adjustment of the Funds’ financial statements.
67
| | |
| | | Report of Independent Registered Public Accounting Firm |
TO THE BOARD OF TRUSTEES OF AMG FUNDS AND AMG FUNDS II AND SHAREHOLDERS OF AMG GW&K ENHANCED CORE BOND ESG FUND, AMG GW&K MUNICIPAL BOND FUND, AMG GW&K MUNICIPAL ENHANCED YIELD FUND, AMG GW&K SMALL CAP CORE FUND AND AMG GW&K SMALL/MID CAP FUND
Opinions on the Financial Statements
We have audited the accompanying statements of assets and liabilities, including the schedules of portfolio investments, of AMG GW&K Enhanced Core Bond ESG Fund (one of the funds constituting AMG Funds II), AMG GW&K Municipal Bond Fund, AMG GW&K Municipal Enhanced Yield Fund, AMG GW&K Small Cap Core Fund, and AMG GW&K Small/Mid Cap Fund (four of the funds constituting AMG Funds) (hereafter collectively referred to as the “Funds”) as of December 31, 2019, the related statements of operations for the year ended December 31, 2019, the statements of changes in net assets for each of the two years in the period ended December 31, 2019, including the related notes, and the financial highlights for each of the periods indicated therein (collectively referred to as the “financial statements”). In our opinion, the financial statements present fairly, in all material respects, the financial position of each of the Funds as of December 31, 2019, the results of each of their operations for the year then ended, the changes in each of their net assets for each of the two years in the period ended December 31, 2019 and each of the financial highlights for each of the periods indicated therein in conformity with accounting principles generally accepted in the United States of America.
Basis for Opinions
These financial statements are the responsibility of the Funds’ management. Our responsibility is to express an opinion on the Funds’ financial statements based on our audits. We are a public accounting firm registered with the Public Company Accounting Oversight Board (United States) (PCAOB) and are required to be independent with respect to the Funds in accordance with the U.S. federal securities laws and the applicable rules and regulations of the Securities and Exchange Commission and the PCAOB.
We conducted our audits of these financial statements in accordance with the standards of the PCAOB. Those standards require that we plan and perform the audit to obtain reasonable assurance about whether the financial statements are free of material misstatement, whether due to error or fraud.
Our audits included performing procedures to assess the risks of material misstatement of the financial statements, whether due to error or fraud, and performing procedures that respond to those risks. Such procedures included examining, on a test basis, evidence regarding the amounts and disclosures in the financial statements. Our audits also included evaluating the accounting principles used and significant estimates made by management, as well as evaluating the overall presentation of the financial statements. Our procedures included confirmation of securities owned as of December 31, 2019 by correspondence with the custodian and brokers; when replies were not received from brokers, we performed other auditing procedures. We believe that our audits provide a reasonable basis for our opinions.
PricewaterhouseCoopers LLP
Boston, Massachusetts
February 25, 2020
We have served as the auditor of one or more investment companies in AMG Funds Family since 1993.
68
TAX INFORMATION
AMG GW&K Enhanced Core Bond ESG Fund, AMG GW&K Municipal Bond Fund, AMG GW&K Municipal Enhanced Yield Fund, AMG GW&K Small Cap Core Fund and AMG GW&K Small/Mid Cap Fund each hereby designates the maximum amount allowable of its net taxable income as qualified dividends as provided in the Jobs and Growth Tax Relief Reconciliation Act of 2003. The 2019 Form1099-DIV you receive for each Fund will show the tax status of all distributions paid to you during the year.
Pursuant to section 852 of the Internal Revenue Code, AMG GW&K Enhanced Core Bond ESG Fund, AMG GW&K Municipal Bond Fund, AMG GW&K Municipal Enhanced Yield Fund, AMG GW&K Small Cap Core Fund and AMG GW&K Small/Mid Cap Fund each hereby designates $0, $0, $1,129,412, $22,550,089, and $239,704, respectively, as a capital gain distribution with respect to the taxable year ended December 31, 2019, or if subsequently determined to be different, the net capital gains of such fiscal year.
69
| | |
| | | AMG Funds Trustees and Officers |
The Trustees and Officers of the Trust, their business addresses, principal occupations for the past five years and ages are listed below. The Trustees provide broad supervision over the affairs of the Trust and the Funds. The Trustees are experienced executives who meet periodically throughout the year to oversee the Funds’ activities, review contractual arrangements with companies that provide services to the Funds, and
review the Funds’ performance. Unless otherwise noted, the address of each Trustee or Officer is the address of the Trust: 600 Steamboat Road, Suite 300, Greenwich, Connecticut 06830.
There is no stated term of office for Trustees. Trustees serve until their resignation, retirement or removal in
accordance with the Trust’s organizational documents and policies adopted by the Board from time to time. The Chairman of the Trustees, President, Treasurer and Secretary of the Trust are elected by the Trustees annually. Other officers hold office at the pleasure of the Trustees.
Independent Trustees
The following Trustees are not “interested persons” of the Trust within the meaning of the 1940 Act:
| | |
Number of Funds Overseen in Fund
Complex | | Name, Age, Principal Occupation(s) During Past 5 Years and Other Directorships Held by Trustee |
• Trustee since 2012 • Oversees 49 Funds in Fund Complex | | Bruce B. Bingham, 71 Partner, Hamilton Partners (real estate development firm) (1987-Present); Director of The Yacktman Funds (2000-2012). |
| |
• Trustee since 1999 - AMG Funds • Trustee since 2000 - AMG Funds II • Oversees 49 Funds in Fund Complex | | Edward J. Kaier, 74 Attorney at Law and Partner, Teeters Harvey Marrone & Kaier LLP (2007-Present); Attorney at Law and Partner, Hepburn Willcox Hamilton & Putnam, LLP (1977-2007); Trustee of Third Avenue Trust (2002-2019); Trustee of Third Avenue Variable Trust (2002-2019). |
| |
• Trustee since 2013 • Oversees 52 Funds in Fund Complex | | Kurt A. Keilhacker, 56 Managing Partner, TechFund Capital (1997-Present); Managing Partner, TechFund Europe (2000-Present); Board Member, 6wind SA, (2002-Present); Managing Partner, Elementum Ventures (2013-Present); Director, MetricStory, Inc. (2017-Present); Trustee, Wheaton College (2018-Present); Trustee, Gordon College (2001-2016). |
| |
• Trustee since 2000 • Oversees 49 Funds in Fund Complex | | Steven J. Paggioli, 69 Independent Consultant (2002-Present); Trustee, Professionally Managed Portfolios (28 portfolios); Advisory Board Member, Sustainable Growth Advisors, LP; Independent Director, Muzinich BDC, Inc. (business development company) (2019-Present); Independent Director, Chase Investment Counsel (2008–2019); Executive Vice President, Secretary and Director, Investment Company Administration, LLC (1990-2001). |
| |
• Trustee since 2013 • Oversees 49 Funds in Fund Complex | | Richard F. Powers III, 73 Adjunct Professor, U.S. Naval War College (2016-Present); Adjunct Professor, Boston College (2010-2013); President and CEO of Van Kampen Investments Inc. (1998-2003). |
| |
• Independent Chairman • Trustee since 2000 • Oversees 52 Funds in Fund Complex | | Eric Rakowski, 61 Professor of Law, University of California at Berkeley School of Law - Boalt Hall (1990-Present); Director of Harding, Loevner Funds, Inc. (9 portfolios); Trustee of Third Avenue Trust (2002-2019); Trustee of Third Avenue Variable Trust (2002-2019). |
| |
• Trustee since 2013 • Oversees 52 Funds in Fund Complex | | Victoria L. Sassine, 54 Adjunct Professor, Babson College (2007–Present); Director, Board of Directors, PRG Group (2017-Present); CEO, Founder, Scale Smarter Partners, LLC (2018-Present); Chairperson, Board of Directors, Business Management Associates (2018-Present). |
| |
• Trustee since 2004 - AMG Funds • Trustee since 2000 - AMG Funds II • Oversees 49 Funds in Fund Complex | | Thomas R. Schneeweis, 72 Professor Emeritus, University of Massachusetts (2013-Present); President, TRS Associates (1982-Present); Board Member, Chartered Alternative Investment Association (“CAIA”) (2002-Present); Director, Institute for Global Asset and Risk Management (Education) (2010-Present);Co-Owner, Quantitative Investment Technologies (2014-Present); Director of Research, Yes Wealth Management (2018-Present); Partner, S Capital Wealth Advisors (2015-2018); Partner, S Capital Management, LLC (2007-2015); President, Alternative Investment Analytics, LLC, (formerly Schneeweis Partners, LLC) (2001-2013). |
70
| | |
| | | AMG Funds Trustees and Officers(continued) |
Interested Trustees
Each Trustee in the following table is an “interested person” of the Trust within the meaning of the 1940 Act. Ms. Carsman is an interested person of the Trust within the meaning of the 1940 Act by virtue of her position with, and interest in securities of, AMG.
| | |
Number of Funds Overseen in Fund
Complex | | Name, Age, Principal Occupation(s) During Past 5 Years and Other Directorships Held by Trustee |
• Trustee since 2011 • Oversees 52 Funds in Fund Complex | | Christine C. Carsman, 67 Senior Policy Advisor, Affiliated Managers Group, Inc. (2019-Present); Director of Harding, Loevner Funds, Inc. (9 portfolios); Executive Vice President, Deputy General Counsel and Chief Regulatory Counsel, Affiliated Managers Group, Inc. (2017-2018); Director (2010-2018) and Chair of the Board of Directors (2015-2018), AMG Funds plc; Senior Vice President and Deputy General Counsel, Affiliated Managers Group, Inc. (2011-2016); Senior Vice President and Chief Regulatory Counsel, Affiliated Managers Group, Inc. (2007-2011); Vice President and Chief Regulatory Counsel, Affiliated Managers Group, Inc. (2004-2007); Secretary and Chief Legal Officer, AMG Funds, AMG Funds I, AMG Funds II and AMG Funds III (2004-2011); Senior Counsel, Vice President and Director of Operational Risk Management and Compliance, Wellington Management Company, LLP (1995-2004). |
| |
| Officers | | |
| |
Position(s) Held with Fund and Length of
Time Served | | Name, Age, Principal Occupation(s) During Past 5 Years |
| |
• President since 2018 • Principal Executive Officer since 2018 • Chief Executive Officer since 2018 • Chief Operating Officer since 2007 | | Keitha L. Kinne, 61 Chief Operating Officer, AMG Funds LLC (2007-Present); Chief Investment Officer, AMG Funds LLC (2008-Present); President and Principal, AMG Distributors, Inc. (2018-Present); Chief Operating Officer, AMG Distributors, Inc. (2007-Present); President, Chief Executive Officer and Principal Executive Officer, AMG Funds, AMG Funds I, AMG Funds II, AMG Funds III and AMG Funds IV (2018-Present); Chief Operating Officer, AMG Funds, AMG Funds I, AMG Funds II, and AMG Funds III (2007-Present); Chief Operating Officer, AMG Funds IV (2016-Present); Chief Operating Officer and Chief Investment Officer, Aston Asset Management, LLC (2016); President and Principal Executive Officer, AMG Funds, AMG Funds I, AMG Funds II and AMG Funds III (2012-2014); Managing Partner, AMG Funds LLC (2007-2014); President and Principal, AMG Distributors, Inc. (2012-2014); Managing Director, Legg Mason & Co., LLC (2006-2007); Managing Director, Citigroup Asset Management (2004-2006). |
| |
• Secretary since 2015 • Chief Legal Officer since 2015 | | Mark J. Duggan, 54 Senior Vice President and Senior Counsel, AMG Funds LLC (2015-Present); Secretary and Chief Legal Officer, AMG Funds, AMG Funds I, AMG Funds II, AMG Funds III and AMG Funds IV (2015-Present); Attorney, K&L Gates, LLP (2009-2015). |
| |
• Chief Financial Officer since 2017 • Treasurer since 2017 • Principal Financial Officer since 2017 • Principal Accounting Officer since 2017 | | Thomas G. Disbrow, 53 Vice President, Mutual Fund Treasurer & CFO, AMG Funds, AMG Funds LLC (2017-Present); Chief Financial Officer, Principal Financial Officer, Treasurer and Principal Accounting Officer, AMG Funds, AMG Funds I, AMG Funds II, AMG Funds III and AMG Funds IV (2017-Present); Managing Director - Global Head of Traditional Funds Product Control, UBS Asset Management (Americas), Inc. (2015-2017); Managing Director - Head of North American Funds Treasury, UBS Asset Management (Americas), Inc. (2011-2015). |
| |
• Deputy Treasurer since 2017 | | John A. Starace, 49 Director, Mutual Fund Accounting, AMG Funds LLC (2017-Present); Vice President, Deputy Treasurer of Mutual Funds Services, AMG Funds LLC (2014-2017); Deputy Treasurer, AMG Funds, AMG Funds I, AMG Funds II, AMG Funds III and AMG Funds IV (2017-Present); Vice President, Citi Hedge Fund Services (2010-2014); Audit Senior Manager (2005-2010) and Audit Manager (2001-2005), Deloitte & Touche LLP. |
| |
• Chief Compliance Officer since 2019 | | Patrick J. Spellman, 45 Vice President, Chief Compliance Officer, AMG Funds LLC (2017-Present); Chief Compliance Officer and Sarbanes-Oxley Code of Ethics Compliance Officer, AMG Funds, AMG Funds I, AMG Funds II, AMG Funds III and AMG Funds IV (2019-Present); Chief Compliance Officer, AMG Distributors, Inc., (2010-Present) Senior Vice President, Chief Compliance Officer, AMG Funds LLC (2011-2017); Anti-Money Laundering Compliance Officer, AMG Funds, AMG Funds I, AMG Funds II, and AMG Funds III (2014-2019); Anti-Money Laundering Officer, AMG Funds IV, (2016-2019); Compliance Manager, Legal and Compliance, Affiliated Managers Group, Inc. (2005-2011). |
| |
• Assistant Secretary since 2016 | | Maureen A. Meredith, 34 Vice President, Counsel, AMG Funds LLC (2019-Present); Director, Counsel, AMG Funds LLC (2017-2018); Vice President, Counsel, AMG Funds LLC (2015-2017); Assistant Secretary, AMG Funds, AMG Funds I, AMG Funds II, AMG Funds III and AMG Funds IV (2016-Present); Associate, Ropes & Gray LLP (2011-2015); Law Fellow, Massachusetts Appleseed Center for Law and Justice (2010-2011). |
| |
• Anti-Money Laundering Compliance Officer since 2019 | | Hector D. Roman, 42 Director, Legal and Compliance, AMG Funds LLC (2020-Present); Manager, Legal and Compliance, AMG Funds LLC (2017-2019); Director of Compliance, Morgan Stanley Investment Management (2015-2017); Senior Advisory, PricewaterhouseCoopers LLP (2014-2015); Risk Manager, Barclays Investment Bank (2008-2014); Anti-Money Laundering Compliance Officer, AMG Funds, AMG Funds I, AMG Funds II, AMG Funds III and AMG Funds IV (2019-Present). |
71
THIS PAGE INTENTIONALLY LEFT BLANK
INVESTMENT MANAGER AND ADMINISTRATOR
AMG Funds LLC
600 Steamboat Road, Suite 300
Greenwich, CT 06830
800.548.4539
DISTRIBUTOR
AMG Distributors, Inc.
600 Steamboat Road, Suite 300
Greenwich, CT 06830
800.548.4539
SUBADVISER
GW&K Investment Management, LLC
222 Berkeley St.
Boston, MA 02116
CUSTODIAN
The Bank of New York Mellon
111 Sanders Creek Parkway
East Syracuse, NY 13057
LEGAL COUNSEL
Ropes & Gray LLP
Prudential Tower, 800 Boylston Street
Boston, MA 02199-3600
TRANSFER AGENT
BNY Mellon Investment Servicing (US) Inc.
Attn: AMG Funds
P.O. Box 9769
Providence, RI 02940
800.548.4539
This report is prepared for the Funds’ shareholders. It is authorized for distribution to prospective investors only when preceded or accompanied by an effective prospectus. To receive a free copy of the prospectus or Statement of Additional Information, which includes additional information about Fund Trustees, please contact us by calling 800.548.4539. Distributed by AMG Distributors, Inc., member FINRA/SIPC.
Current net asset values per share for each Fund are available on the Funds’ website at amgfunds.com.
A description of the policies and procedures each Fund uses to vote its proxies is available: (i) without charge, upon request, by calling 800.548.4539, or (ii) on the Securities and Exchange Commission’s (SEC) website at sec.gov. For information regarding each Fund’s proxy voting record for the12-month period ended June 30, call 800.548.4539 or visit the SEC website at sec.gov.
The Funds file their complete schedule of portfolio holdings with the SEC for the first and third quarters of each fiscal year as an exhibit to their reports on FormN-PORT, which has replaced FormN-Q. The Funds’ portfolio holdings on FormN-PORT are available on the SEC’s website at sec.gov. To review a complete list of the Funds’ portfolio holdings, or to view the most recent semiannual report or annual report, please visit amgfunds.com.
AFFILIATE SUBADVISED FUNDS
BALANCED FUNDS
AMG Chicago Equity Partners Balanced
Chicago Equity Partners, LLC
AMG FQ Global Risk-Balanced
First Quadrant, L.P.
EQUITY FUNDS
AMG FQTax-Managed U.S. Equity
AMG FQ Long-Short Equity
First Quadrant, L.P.
AMG Frontier Small Cap Growth
Frontier Capital Management Co., LLC
AMG GW&K Small Cap Core
AMG GW&K Small/Mid Cap
AMG GW&K Trilogy Emerging Markets Equity
AMG GW&K Trilogy EmergingWealth Equity
GW&K Investment Management, LLC
AMG Renaissance Large Cap Growth
The Renaissance Group LLC
AMG River Road Dividend All Cap Value
AMG River Road Dividend All Cap Value II
AMG River Road Focused Absolute Value
AMG River Road Long-Short
AMG River RoadSmall-Mid Cap Value
AMG River Road Small Cap Value
River Road Asset Management, LLC
AMG SouthernSun Small Cap
AMG SouthernSun U.S. Equity
SouthernSun Asset Management, LLC
AMG TimesSquare Emerging Markets Small Cap
AMG TimesSquare Global Small Cap
AMG TimesSquare International Small Cap
AMG TimesSquare Mid Cap Growth
AMG TimesSquare Small Cap Growth
TimesSquare Capital Management, LLC
AMG Yacktman
AMG Yacktman Focused
AMG Yacktman Focused Fund - Security Selection Only
AMG Yacktman Special Opportunities
Yacktman Asset Management LP
FIXED INCOME FUNDS
AMG GW&K Core Bond ESG
AMG GW&K Enhanced Core Bond ESG
AMG GW&K Municipal Bond
AMG GW&K Municipal Enhanced Yield
GW&K Investment Management, LLC
OPEN-ARCHITECTURE FUNDS
EQUITY FUNDS
AMG Managers Brandywine
AMG Managers Brandywine Advisors Mid Cap Growth
AMG Managers Brandywine Blue
Friess Associates, LLC
AMG Managers Cadence Emerging Companies
AMG Managers Cadence Mid Cap
Cadence Capital Management LLC
AMG Managers CenterSquare Real Estate
CenterSquare Investment Management LLC
AMG Managers Emerging Opportunities
WEDGE Capital Management L.L.P.
Next Century Growth Investors LLC
RBC Global Asset Management (U.S.) Inc.
AMG Managers Fairpointe ESG Equity
AMG Managers Fairpointe Mid Cap
Fairpointe Capital LLC
AMG Managers LMCG Small Cap Growth
LMCG Investments, LLC
AMG Managers Montag & Caldwell Growth
Montag &Caldwell, LLC
AMG Managers Pictet International
Pictet Asset Management Limited
AMG Managers Silvercrest Small Cap
Silvercrest Asset Management Group LLC
AMG Managers Skyline Special Equities
Skyline Asset Management, L.P.
AMG Managers Special Equity
Ranger Investment Management, L.P. Lord, Abbett & Co. LLC
Smith Asset Management Group, L.P. Federated MDTA LLC
FIXED INCOME FUNDS
AMG Managers Doubleline Core Plus Bond
DoubleLine Capital LP
AMG Managers Global Income Opportunity
AMG Managers Loomis Sayles Bond
Loomis, Sayles & Company, L.P.
| | | | | | | | |
amgfunds.com | | | | 123119 | | | | AR019 | |
Registrant has adopted a Code of Ethics. See attached Exhibit (a)(1).
| Item 3. | AUDIT COMMITTEE FINANCIAL EXPERT |
Registrant’s Board of Trustees has determined that independent Trustee Mr. Steven J. Paggioli qualifies as an Audit Committee Financial Expert. Mr. Paggioli is “independent” as such term is defined in FormN-CSR.
| Item 4. | PRINCIPAL ACCOUNTANT FEES AND SERVICES |
The aggregate fees billed by the Funds’ independent registered public accounting firm, PricewaterhouseCoopers LLP (“PwC”), to the Funds for the Funds’ two most recent fiscal years for professional services rendered for audits of annual financial statements, or services that are normally provided in connection with statutory and regulatory filings or engagements (“Audit Fees”) were as follows:
| | | | | | | | |
Fund - AMG FUNDS II | | Fiscal
2019 | | | Fiscal
2018 | |
AMG GW&K Enhanced Core Bond ESG Fund | | $ | 40,423 | | | $ | 38,029 | |
AMG Chicago Equity Partners Balanced Fund | | $ | 37,044 | | | $ | 28,203 | |
There were no fees billed by PwC to the Funds in their two recent fiscal years for services rendered for assurance and related services that are reasonably related to the performance of the audit or review of the Fund’s financial statements, but are not reported as Audit Fees (“Audit-Related Fees”).
For the Funds’ two most recent fiscal years, there were no Audit-Related Fees billed by PwC for engagements related directly to the operations and financial reporting of one or more Funds by a Fund Service Provider. A Fund Service Provider is (a) any investment adviser to the Fund (not including any Subadvisor whose role is primarily portfolio management and is subcontracted with or overseen by another investment adviser) or (b) any entity that provides ongoing services to the Fund and is controlling, controlled by or under common control with a Fund investment adviser described in (a).
The aggregate fees billed by PwC to the Funds for the two most recent fiscal years for professional services rendered for tax compliance, tax advice, and tax planning (“Tax Fees”) were as follows:
| | | | | | | | |
Fund - AMG FUNDS II | | Fiscal
2019 | | | Fiscal
2018 | |
AMG GW&K Enhanced Core Bond ESG Fund | | $ | 6,250 | | | $ | 9,425 | |
AMG Chicago Equity Partners Balanced Fund | | $ | 7,450 | | | $ | 7,369 | |
For the Funds’ two most recent fiscal years, Tax Fees billed by PwC for engagements by Fund Service Providers that related directly to the operations and financial reporting of the Funds were $0 for fiscal 2019 and $0 for fiscal 2018, respectively.
The services for which Tax Fees were charged comprise all services performed by professional staff in PwC’s tax division except those services related to the audit. Typically, this category would include fees for tax compliance, tax planning, and tax advice. Tax compliance, tax advice, and tax planning services include preparation of original and amended tax returns, claims for refund and tax payment-planning services, assistance with tax audits and appeals, tax advice related to mergers and acquisitions and requests for rulings or technical advice from taxing authorities.
There were no other fees billed by PwC to the Funds for all othernon-audit services (“Other Fees”) during the Funds’ two most recent fiscal years. During the same period, there were no Other Fees billed by PwC for engagements by Fund Service Providers that related directly to the operations and financial reporting of the Funds.
(e) (1) According to policies adopted by the Audit Committee, services provided by PwC to the Funds must bepre-approved by the Audit Committee. On an annual basis, the Audit Committee reviews andpre-approves various types of services that PwC may perform for the Funds without specific approval of each engagement, subject to specified budget limitations. As contemplated by the Sarbanes-Oxley Act of 2002 and related SEC rules, the Audit Committee alsopre-approvesnon-audit services provided by PwC to any Fund Service Provider for any engagement that relates directly to the operations and financial reporting of the Funds. Any engagement that is not alreadypre-approved or that will exceed apre-approved budget must be submitted to the Audit Committee forpre-approval. The Chairman of the Audit Committee is authorized on behalf of the Board of Trustees and the Audit Committee to approve the engagement of PwC to performnon-audit services subject to certain conditions, including notification to the Audit Committee of suchpre-approval not later than the next meeting of the Audit Committee following the date of suchpre-approval.
(e)(2) None.
(f) Not applicable.
(g) The aggregate fees billed by PwC in 2019 and 2018 fornon-audit services rendered to the Funds and Fund Service Providers were $63,200 and $86,812, respectively. For the fiscal year ended December 31, 2019, this amount reflects the amounts disclosed above in Item 4(b),(c),(d), plus $49,500 in fees billed to the Fund Service Providers fornon-audit services that did not relate directly to the operations and financial reporting of the Funds. For the fiscal year ended December 31, 2018, this amount reflects the amounts disclosed above in Item 4(b),(c),(d), plus $49,500 in fees billed to the Fund Service Providers fornon-audit services that did not relate directly to the operations and financial reporting of the Funds.
(h) The Trust’s Audit Committee has considered whether the provision ofnon-audit services by registrant’s independent registered public accounting firm to the registrant’s investment adviser, and any entity controlling, controlled by, or under common control with the investment adviser that provided ongoing services to the registrant that were notpre-approved by the Committee (because such services did not relate directly to the operations and financial reporting of the registrant) was compatible with maintaining the independence of the independent registered public accounting firm.
| Item 5. | AUDIT COMMITTEE OF LISTED REGISTRANTS |
Not applicable.
| Item 6. | SCHEDULE OF INVESTMENTS |
The schedule of investments in securities of unaffiliated issuers as of the close of the reporting period is included as part of the report to shareholders filed under Item 1 of this form.
| Item 7. | DISCLOSURE OF PROXY VOTING POLICIES AND PROCEDURES FORCLOSED-END MANAGEMENT INVESTMENT COMPANIES |
Not applicable.
| Item 8. | PORTFOLIO MANAGERS OFCLOSED-END MANAGEMENT INVESTMENT COMPANIES |
Not applicable.
| Item 9. | PURCHASES OF EQUITY SECURITIES BYCLOSED-END MANAGEMENT INVESTMENT COMPANIES AND AFFILIATED PURCHASERS |
Not applicable.
| Item 10. | SUBMISSION OF MATTERS TO A VOTE OF SECURITY HOLDERS |
Not applicable.
| Item 11. | CONTROLS AND PROCEDURES |
(a) The Registrant’s principal executive and principal financial officers have concluded, based on their evaluation of the registrant’s disclosure controls and procedures as of a date within 90 days of the filing of this report, that the Registrant’s disclosure
controls and procedures are reasonably designed to ensure that information required to be disclosed by the Registrant on FormN-CSR is recorded, processed, summarized and reported within the required time periods and that information required to be disclosed by the registrant in the reports that it files or submits on FormN-CSR is accumulated and communicated to the Registrant’s management, including its principal executive and principal financial officers, as appropriate to allow timely decisions regarding required disclosure.
(b) There were no changes in the Registrant’s internal control over financial reporting during the period covered by this report that have materially affected, or are reasonably likely to materially affect, the internal control over financial reporting.
| Item 12. | DISCLOSURE OF SECURITIES LENDING ACTIVITIES FORCLOSED-END MANAGEMENT INVESTMENT COMPANIES |
Not applicable.
| | |
| (a)(1) | | Any Code of Ethics or amendments hereto. Filed herewith. |
| |
| (a)(2) | | Certifications pursuant to Rule30a-2(a) under the Investment Company Act of 1940 - Filed herewith. |
| |
| (a)(3) | | Not applicable. |
| |
| (b) | | Certifications pursuant to Rule30a-2(b) under the Investment Company Act of 1940 - Filed herewith. |
SIGNATURES
Pursuant to the requirements of the Securities Exchange Act of 1934 and the Investment Company Act of 1940, the registrant has duly caused this report to be signed on its behalf by the undersigned, thereunto duly authorized.
AMG FUNDS II
| | |
| By: | | /s/ Keitha L. Kinne |
| | Keitha L. Kinne, Principal Executive Officer |
| |
Date: | | March 6, 2020 |
Pursuant to the requirements of the Securities Exchange Act of 1934 and the Investment Company Act of 1940, this report has been signed below by the following persons on behalf of the registrant and in the capacities and on the dates indicated.
| | |
By: | | /s/ Keitha L. Kinne |
| | Keitha L. Kinne, Principal Executive Officer |
| |
Date: | | March 6, 2020 |
| | |
By: | | /s/ Thomas Disbrow |
| | Thomas Disbrow, Principal Financial Officer |
| |
Date: | | March 6, 2020 |