Table of Contents
UNITED STATES
SECURITIES AND EXCHANGE COMMISSION
Washington, D.C. 20549
FORMN-CSR
CERTIFIED SHAREHOLDER REPORT OF REGISTERED
MANAGEMENT INVESTMENT COMPANIES
Investment Company Act file number:811-06431
AMG Funds II
(Exact name of registrant as specified in charter)
600 Steamboat Road, Suite 300, Greenwich, Connecticut 06830
(Address of principal executive offices) (Zip code)
AMG Funds LLC
600 Steamboat Road, Suite 300, Greenwich, Connecticut 06830
(Name and address of agent for service)
Registrant’s telephone number, including area code: (203)299-3500
Date of fiscal year end: DECEMBER 31
Date of reporting period: JANUARY 1, 2018 – DECEMBER 31, 2018
(Annual Shareholder Report)
Table of Contents
| Item 1. | Reports to Shareholders |
Table of Contents
|
| ANNUAL REPORT |
| AMG Funds | ||||||||||||||
| December 31, 2018 | ||||||||||||||
AMG Chicago Equity Partners Balanced Fund
|
| |||||||||||||
Class N: MBEAX
|
| Class I: MBESX
| Class Z: MBEYX | |||||||||||
AMG Managers Amundi Intermediate Government Fund
|
| |||||||||||||
| Class N: MGIDX | Class I: MADIX | Class Z: MAMZX | ||||||||||||
AMG Managers Amundi Short Duration Government Fund
|
| |||||||||||||
| Class N: MGSDX | Class I: MANIX | Class Z: MATZX | ||||||||||||
Beginning on January 1, 2021, as permitted by regulations adopted by the Securities and Exchange Commission, paper copies of the Funds’ shareholder reports like this one will no longer be sent by mail, unless you specifically request paper copies of the reports from the Funds or from your financial intermediary, such as a broker-dealer or bank. Instead, the reports will be made available on the Funds’ website (https://www.amgfunds.com/resources/order_literature.html), and you will be notified by mail each time a report is posted and provided with a website link to access the report.
If you already elected to receive shareholder reports electronically, you will not be affected by this change and you need not take any action. You may elect to receive shareholder reports and other communications from the Funds electronically at any time by contacting your financial intermediary or, if you invest directly with the Funds, by logging into your account at www.amgfunds.com.
You may elect to receive all future reports in paper free of charge. If you invest through a financial intermediary, you can contact your financial intermediary to request that you continue to receive paper copies of your shareholder reports. If you invest directly with the Funds, you can call1-800-548-4539 to inform the Funds that you wish to continue receiving paper copies of your shareholder reports. Your election to receive reports in paper will apply to all funds in the AMG Funds Family of Funds held in your account if you invest through your financial intermediary or all funds in the AMG Funds Family of Funds held with the fund complex if you invest directly with the Funds.
amgfunds.com
|
123118 AR002
|
Table of Contents
Table of Contents
AMG Funds Annual Report — December 31, 2018 |
TABLE OF CONTENTS
| PAGE
| |||||
| ||||||
| 2 | |||||
| 3 | ||||||
| PORTFOLIO MANAGER’S COMMENTS, FUND SNAPSHOTS AND SCHEDULES OF PORTFOLIO INVESTMENTS | ||||||
| 4 | ||||||
| 21 | ||||||
| 29 | ||||||
FINANCIAL STATEMENTS | ||||||
| 38 | ||||||
Balance sheets, net asset value (NAV) per share computations and cumulative distributable earnings (loss) | ||||||
| 40 | ||||||
Detail of sources of income, expenses, and realized and unrealized gains (losses) during the fiscal year | ||||||
| 41 | ||||||
Detail of changes in assets for the past two fiscal years | ||||||
| 42 | ||||||
Historical net asset values per share, distributions, total returns, income and expense ratios, turnover ratios and net assets | ||||||
| 51 | ||||||
Accounting and distribution policies, details of agreements and transactions with Fund management and affiliates, and descriptions of certain investment risks | ||||||
| REPORT OF INDEPENDENT REGISTERED PUBLIC ACCOUNTING FIRM | 60 | |||||
| 61 | ||||||
| 62 | ||||||
Nothing contained herein is to be considered an offer, sale or solicitation of an offer to buy shares of any series of the AMG Funds family of mutual funds. Such offering is made only by prospectus, which includes details as to offering price and other material information.
Table of Contents
Dear Shareholder:
It was a difficult year for financial markets in 2018. Strong domestic economic growth fueled equity returns for the majority of the year, but a pullback in the fourth quarter reversed returns, leaving indices across market caps firmly in negative territory. Investors were driven by signs of deceleration in growth across the globe combined with political uncertainty and tighter monetary policy. The S&P 500® Index, a widely followed barometer of the U.S. equity market, returned +9.9% in the first three quarters of the year before a period of heightened volatility resulted in a fourth quarter return of-13.5% and a-4.4% return for the full fiscal year.
In 2018, there was wide performance dispersion across the eleven economic sectors of the S&P 500® Index. Despite a weak fourth quarter, health care, utilities, information technology, and consumer discretionary sectors ended the year on a positive note with returns of +6.4%, +4.1%, +3.4% and +1.9%, respectively. Corporate earnings are expected to continue growing at double digits for the fifth consecutive quarter. According to FactSet, fourth quarter earnings growth for S&P 500® companies is +10.9% (as of January 25, 2019). Growth stocks outperformed value for the first three quarters of the year until the fourth quarter’s risk off environment reversed the trend. Full year returns for the Russell 1000® Growth and Russell 1000® Value Indexes were-1.5% and-8.3%, respectively.
Despite skittish investor sentiment, the U.S. economy continued to show signs of growth, albeit at a slower pace with third quarter GDP growth ringing in at 3.4%. The Federal Reserve raised short-term interest rates four times over the course of the year to end the year at a target rate of 2.25%–2.50%. Higher interest rates eroded the performance of bonds in the first three quarters of the year and a risk off fourth quarter resulted in mixed results. The Bloomberg Barclays U.S. Aggregate Bond Index, a broad measure of U.S. bond market performance, ended the year where it began with a 0.0% return for 2018. The yield on the10-year U.S. Treasury note crossed above 3% at the end of September but fell dramatically as investors sought to insulate themselves from market volatility. During the past year, the short end of the yield curve has risen faster than the longer end, resulting in the 2–10 year Treasury spread of 0.21%. As expected, high yield bonds held up in the rising interest rate environment but struggled in the fourth quarter as investors removed risk from their portfolios. As a result, spreads between investment grade and high yield corporate debt climbed past 300 bps. In 2018, the Bloomberg Barclays U.S. Aggregate Credit Index and Bloomberg Barclays U.S. Corporate High Yield Bond Index returned-2.1% and-2.1%, respectively.
Economic conditions outside the U.S. started the year with strong growth indicators but finished with signs of deceleration. At the European Central Bank’s most recent monetary policy meeting, the governing council issued guidance that quantitative easing measures would continue and interest rates would remain at their present levels through summer of 2019. This is a departure from guidance earlier in the year which indicated the asset repurchase program would come to an end in December 2018 and rates would rise in 2019. The Bank of England increased its target rate in August for the first time since 2009, but deceleration in growth and increased downside risks, including a disorderly Brexit, have halted discussion of additional hikes in the near future.
International equities and emerging markets demonstrated significantly weaker returns, with the MSCI EAFE and MSCI Emerging Markets Index returning-13.8% and-14.6%, respectively, in the 12 months ending December 31, 2018. In a recent speech at the Hudson Institute, Vice President Mike Pence acknowledged China’s
aggressive actions toward the United States and highlighted a dramatic shift in U.S foreign policy with China: “We seek a relationship grounded in fairness, reciprocity and respect for sovereignty, and we have taken strong and swift action to achieve that goal.” This new tone combined with two rounds of new U.S. tariffs for Chinese imports and signs of a slowing economy acted as a drag on the largest economy within the MSCI Emerging Markets Index. Concurrently, the U.S. Dollar strengthened against most major global currencies, particularly in emerging markets, where those with large current account deficits faced significant pressure, adding to the drag on performance for emerging markets.
AMG Funds appreciates the privilege of providing investment tools to you and your clients. Our foremost goal is to provide investment solutions that help our shareholders successfully reach their long-term investment goals. AMG Funds provides access to a distinctive array of actively managed return-oriented investment strategies. We thank you for your continued confidence and investment in AMG Funds. You can rest assured that under all market conditions our team is focused on delivering excellent investment management services for your benefit.
Respectfully,

Keitha Kinne
President
AMG Funds
Average Annual Total Returns | | Periods ended December 31, 2018* | | |||||||||||
Stocks: | 1 Year | 3 Years | 5 Years | |||||||||||
Large Caps | (S&P 500® Index) | (4.38 | )% | 9.26% | 8.49% | |||||||||
Small Caps | (Russell 2000® Index) | (11.01 | )% | 7.36% | 4.41% | |||||||||
International | (MSCI All Country World Index ex USA) | (14.20 | )% | 4.48% | 0.68% | |||||||||
Bonds: | ||||||||||||||
Investment Grade | (Bloomberg Barclays U.S. Aggregate Bond Index) | 0.01 | % | 2.06% | 2.52% | |||||||||
High Yield | (Bloomberg Barclays U.S. Corporate High Yield Bond Index) | (2.08 | )% | 7.23% | 3.83% | |||||||||
Tax-exempt | (Bloomberg Barclays Municipal Bond Index) | 1.28 | % | 2.30% | 3.82% | |||||||||
Treasury Bills | (ICE BofAML U.S.6-Month Treasury Bill Index) | 1.92 | % | 1.18% | 0.78% | |||||||||
*Source: FactSet. Past performance is no guarantee of future results.
| 2 |
Table of Contents
As a shareholder of a Fund, you may incur two types of costs: (1) transaction costs, which may include sales charges (loads) on purchase payments; redemption fees; and exchange fees; and (2) ongoing costs, including management fees; distribution(12b-1) fees; and other Fund expenses. This example is intended to help you understand your ongoing costs (in dollars) of investing in the Fund and to compare these costs with the ongoing costs of investing in other mutual funds. The example is based on $1,000 invested at the beginning of the period and held for the entire period as indicated below.
ACTUAL EXPENSES
The first line of the following table provides information about the actual account values and | actual expenses. You may use the information in this line, together with the amount you invested, to estimate the expenses that you paid over the period. Simply divide your account value by $1,000 (for example, an $8,600 account value divided by $1,000 = 8.6), then multiply the result by the number in the first line under the heading entitled “Expenses Paid During Period” to estimate the expenses you paid on your account during this period.
HYPOTHETICAL EXAMPLE FOR COMPARISON PURPOSES
The second line of the following table provides information about hypothetical account values and hypothetical expenses based on the Fund’s actual expense ratio and an assumed annual rate of return of 5% before expenses, which is not the Fund’s | actual return. The hypothetical account values and expenses may not be used to estimate the actual ending account balance or expenses you paid for the period. You may use this information to compare the ongoing costs of investing in the Fund and other funds by comparing this 5% hypothetical example with the 5% hypothetical examples that appear in the shareholder reports of other funds.
Please note that the expenses shown in the table are meant to highlight your ongoing costs only and do not reflect any transactional costs, such as sales charges (loads), redemption fees, or exchange fees. Therefore, the second line of the table is useful in comparing ongoing costs only, and will not help you determine the relative total costs of owning different funds. |
| Six Months Ended December 31, 2018 | Expense Ratio for the Period | Beginning Account Value 07/01/18 | Ending Account Value 12/31/18 | Expenses Paid During the Period* | ||||||
AMG Chicago Equity Partners Balanced Fund |
| |||||||||
Based on Actual Fund Return | ||||||||||
Class N | 1.09% | $1,000 | $943 | $5.34 | ||||||
Class I | 0.93% | $1,000 | $943 | $4.56 | ||||||
Class Z | 0.84% | $1,000 | $944 | $4.12 | ||||||
Based on Hypothetical 5% Annual Return |
| |||||||||
Class N | 1.09% | $1,000 | $1,020 | $5.55 | ||||||
Class I | 0.93% | $1,000 | $1,021 | $4.74 | ||||||
Class Z | 0.84% | $1,000 | $1,021 | $4.28 | ||||||
AMG Managers Amundi Intermediate Government Fund |
| |||||||||
Based on Actual Fund Return | ||||||||||
Class N | 0.84% | $1,000 | $1,013 | $4.26 | ||||||
Class I | 0.75% | $1,000 | $1,013 | $3.80 | ||||||
Class Z | 0.69% | $1,000 | $1,013 | $3.50 | ||||||
Based on Hypothetical 5% Annual Return |
| |||||||||
Class N | 0.84% | $1,000 | $1,021 | $4.28 | ||||||
Class I | 0.75% | $1,000 | $1,021 | $3.82 | ||||||
Class Z | 0.69% | $1,000 | $1,022 | $3.52 | ||||||
| Six Months Ended December 31, 2018 | Expense Ratio for the Period | Beginning Account Value 07/01/18 | Ending Account Value 12/31/18 | Expenses Paid During the Period* | ||||||
AMG Managers Amundi Short Duration Government Fund |
| |||||||||
Based on Actual Fund Return | ||||||||||
Class N | 0.72% | $1,000 | $1,002 | $3.63 | ||||||
Class I | 0.62% | $1,000 | $1,003 | $3.13 | ||||||
Class Z | 0.57% | $1,000 | $1,003 | $2.88 | ||||||
Based on Hypothetical 5% Annual Return |
| |||||||||
Class N | 0.72% | $1,000 | $1,022 | $3.67 | ||||||
Class I | 0.62% | $1,000 | $1,022 | $3.16 | ||||||
Class Z | 0.57% | $1,000 | $1,022 | $2.91 | ||||||
| * | Expenses are equal to the Fund’s annualized expense ratio multiplied by the average account value over the period, multiplied by the number of days in the most recent fiscal half-year (184), then divided by 365. |
| 3 |
Table of Contents
THE YEAR IN REVIEW
For the year ended December 31, 2018, the AMG Chicago Equity Partners Balanced Fund (Class N shares) (the “Fund”) returned-2.89%, compared to the-2.53% return for its benchmark, which consists of 60% the return of the Russell 1000® Index and 40% the return of the Bloomberg Barclays U.S. Aggregate Bond Index.
After hitting new highs in the third quarter, stocks declined sharply, resulting in negative returns across size and style indices in 2018. The S&P 500® Index posted its first negative total return year since the global financial crisis (2008). As stocks went down, volatility shot up, and the VIX was up 130% in 2018. A mix of early performers—technology and health care—joined utilities as the best-performing sectors of 2018. The stock market finished the year with the worst December since the Great Depression due to uncertainty over trade, rising rates, and declining earnings expectations for 2019. The Fed raised rates in the fourth quarter for the fourth time in 2018, with two more hikes slated for 2019. Corporate spreads widened in the year and the slope of the yield curve continued to flatten. The move in rates and spreads largely reflected growing concern over the impact of tighter monetary policy from the Federal Reserve on future economic growth. While parts of the U.S. economy remain strong (2018 GDP expected at just under 3%, unemployment under 4%, strong consumer spending), business confidence declined, as uncertainty over trade weighs on expectations. | The Fund was overweight equities (65/35) in the first three quarters of the year, when stocks (Russell 1000® Index) outperformed bonds (Bloomberg Barclays U.S. Aggregate Bond Index) by more than 12% (+10.5% vs.-1.6%, respectively). This contributed to performance during the first three quarters of the year. In October, we moved to a neutral asset allocation (60/40) due to weaker signals for the Expansion regime in our Market Phase Identification Model. The timing was right, as bonds outperformed equities in the fourth quarter by more than 15% (1.6% vs.-13.8%, respectively).
The equity portfolio added more than 100 bps of excess return relative to the Russell 1000® Index for the year. Our tilt toward secular growth stocks in 2018 contributed to excess returns as growth style stocks (Russell 1000® Growth Index) outperformed value (Russell 1000® Value Index) by nearly 7%(-1.5% vs.-8.3%) in large caps, despite a reversal in the fourth quarter. The equity portfolio’s factor emphasis also added value throughout the year. Momentum demonstrated positive performance across most sectors, particularly in the more cyclical sectors emphasized. The avoidance of value factors also helped, as they experienced their second worst year in three decades (in U.S. large caps).
In 2018, the fixed income sleeve of the portfolio slightly detracted approximately-30 bps from excess return relative to the Bloomberg Barclays U.S. Aggregate Bond Index, all of which came in the fourth quarter. Taking advantage of some volatility | and spread widening, the portfolio increased exposure to corporate bonds throughout the year, which can be a good hedge in periods of rising interest rates. This hurt relative performance in the fourth quarter, when corporate spreads widened.
Our research has shown that constructing a well-diversified portfolio of companies with attractive valuation ratios, quality balance sheets, and positive growth and momentum expectations built through a disciplined, risk-controlled process offers the potential to deliver consistent excess returns for the equity portion of the Fund. For the fixed income sleeve, we will continue to use our disciplined approach to investing to provide principal preservation, income, diversification, and risk control. We will continue to monitor inputs to our investment process for indications of improving conditions and opportunity but believe our positioning is in line with our stated objectives. Overall, our philosophy will not change based on short-term trends or conditions in the market. We will continue to use our disciplined approach to provide added value at controlled levels of risk.
This commentary reflects the viewpoints of the portfolio manager, Chicago Equity Partners, LLC, as of December 31, 2018, is not intended as a forecast or guarantee of future results, and is subject to change without notice. |
| 4 |
Table of Contents
AMG Chicago Equity Partners Balanced Fund Portfolio Manager’s Comments(continued) |
CUMULATIVE TOTAL RETURN PERFORMANCE
AMG Chicago Equity Partners Balanced Fund’s cumulative total return is based on the daily change in net asset value (NAV), and assumes that all dividends and distributions were reinvested. This graph compares a hypothetical $10,000 investment made in the AMG Chicago Equity Partners Balanced Fund’s Class N shares on December 31, 2008, to a $10,000 investment made in the 60% Russell 1000® Index/40% Bloomberg Barclays U.S. Aggregate Bond Index, Russell 1000® Index and the Bloomberg Barclays U.S. Aggregate Bond Index for the same time period. The graph and table do not reflect the deduction of taxes that a shareholder would pay on a Fund distribution or redemption of shares. The listed returns for the Fund are net of expenses and the returns for the index exclude expenses. Total returns would have been lower had certain expenses not been reduced.
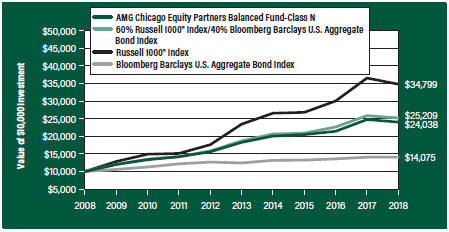
The table below shows the average annual total returns for the AMG Chicago Equity Partners Balanced Fund, the 60% Russell 1000® Index/40% Bloomberg Barclays U.S. Aggregate Bond Index, the Russell 1000® Index and the Bloomberg Barclays U.S. Aggregate Bond Index for the same time periods ended December 31, 2018.
| Average Annual Total Returns1 | One Year | Five Years | Ten Years | Since Inception | Inception Date | |||||||||||||||||
AMG Chicago Equity Partners Balanced Fund2,3, 4, 5, 6, 7
|
| |||||||||||||||||||||
Class N | (2.89% | ) | 5.64% | 9.17% | 7.53% | 01/02/97 | ||||||||||||||||
Class I | (2.77% | ) | 5.80% | — | 7.48% | 11/30/12 | ||||||||||||||||
Class Z | (2.68% | ) | 5.90% | 9.45% | 7.90% | 01/02/97 | ||||||||||||||||
60% Russell 1000® Index8/40% Bloomberg Barclays U.S. Aggregate Bond Index9 | (2.53% | ) | 6.16% | 9.69% | 7.23% | 01/02/97 | † | |||||||||||||||
Russell 1000® Index8 | (4.78% | ) | 8.21% | 13.28% | 7.87% | 01/02/97 | † | |||||||||||||||
Bloomberg Barclays U.S. Aggregate Bond Index9 | 0.01% | 2.52% | 3.48% | 4.98% | 01/02/97 | † | ||||||||||||||||
The performance data shown represents past performance. Past performance is not a guarantee of future results. Current performance may be lower or higher than the performance data quoted. The investment return and principal value of an investment will fluctuate so that an investor’s shares, when redeemed, may be worth more or less than their original cost.
Investors should carefully consider the Fund’s investment objectives, risks, charges and expenses before investing. For performance information through the most recent month end, current net asset values per share for the Fund and other information, please call 800.835.3879 or visit our website at amgfunds.com for a free prospectus. Read it carefully before investing or sending money.
Distributed by AMG Distributors, Inc., member FINRA/SIPC.
† Date reflects inception date of the Fund, not the index.
1 Total return equals income yield plus share price change and assumes reinvestment of all dividends and capital gain distributions. Returns are net of fees and may reflect offsets of Fund expenses as described in the prospectus. No adjustment has been made for taxes payable by shareholders on their reinvested dividends and capital gain distributions. Returns for periods greater than one year are annualized. The listed returns on the Fund are net of expenses and based on the published NAV as of December 31, 2018. All returns are in U.S. dollars ($).
2 From time to time, the Fund’s advisor has waived its fees and/or absorbed Fund expenses, which has resulted in higher returns.
3 To the extent that the Fund invests in asset-backed or mortgage-backed securities, its exposure to prepayment and extension risks may be greater than investments in other fixed income securities.
4 The Fund is subject to the risks associated with investments in debt securities, such as default risk and fluctuations in the perception of the debtor’s ability to pay its creditors. Changing interest rates may adversely affect the value of an investment. An increase in interest rates typically causes the value of bonds and other fixed income securities to fall.
5 Investments in international securities are subject to certain risks of overseas investing including currency fluctuations and changes in political and economic conditions, which could result in significant market fluctuations.
6 The Fund is subject to risks associated with investments inmid-capitalization companies such as greater price volatility, lower trading volume, and less liquidity than the stocks of larger, more established companies.
7 The Fund invests in value stocks, which may perform differently from the market as a whole and may be undervalued by the market for a long period of time.
8 The Russell 1000® Index measures the performance of approximately 1,000 of the largest securities based on a combination of their market cap and current index membership. The Russell 1000® represents approximately 92% of the U.S. market. Unlike the Fund, the Russell 1000® Index is unmanaged, is not available for investment, and does not incur expenses.
9 The Bloomberg Barclays U.S. Aggregate Bond Index represents securities that are Securities and Exchange Commission-registered, taxable, and dollar denominated. The index covers the U.S. investment grade fixed rate bond market, with index components for government and corporate securities, mortgage pass-through securities, and asset-backed securities. Unlike the Fund, the Bloomberg Barclays U.S. Aggregate Bond Index is unmanaged, is not available for investment, and does not incur expenses. |
| 5 |
Table of Contents
AMG Chicago Equity Partners Balanced Fund Portfolio Manager’s Comments(continued) |
The Russell 1000® Index is a trademark of the London Stock Exchange Group companies.
Source: Bloomberg Index Services Limited. BLOOMBERG® is a trademark and service mark of Bloomberg Finance L.P. and its affiliates (collectively “Bloomberg”). BARCLAYS® is a trademark and service mark of Barclays Bank Plc (collectively with its | affiliates, “Barclays”), used under license. Bloomberg or Bloomberg’s licensors, including Barclays, own all proprietary rights in the Bloomberg Barclays Indices. Neither Bloomberg nor Barclays approves or endorses this material, or guarantees the accuracy or completeness of any information herein, or makes any warranty, express or implied, as to the results to be obtained therefrom and, to the maximum extent | allowed by law, neither shall have any liability or responsibility for injury or damages arising in connection therewith.
Not FDIC insured, nor bank guaranteed. May lose value. |
| 6 |
Table of Contents
AMG Chicago Equity Partners Balanced Fund Fund Snapshots(unaudited) December 31, 2018 |
PORTFOLIO BREAKDOWN
| Sector | % of Net Assets | |||
U.S. Government and Agency Obligations | 28.9 | |||
Industrials | 14.8 | |||
Information Technology | 13.5 | |||
Financials | 9.6 | |||
Health Care | 8.2 | |||
Consumer Discretionary | 7.1 | |||
Consumer Staples | 4.1 | |||
Communication Services | 3.9 | |||
Utilities | 2.4 | |||
Real Estate | 2.0 | |||
Energy | 2.0 | |||
Materials | 1.6 | |||
Short-Term Investments | 1.9 | |||
Other Assets Less Liabilities | 0.01 | |||
| 1 | Less than 0.05% |
| Rating | % of Market Value1 | |||
U.S. Government and Agency Obligations | 69.2 | |||
Aaa | 0.1 | |||
Aa | 2.2 | |||
A | 14.6 | |||
Baa | 13.9 | |||
| 1 | Includes market value of long-term fixed-income securities only. |
TOP TEN HOLDINGS
| Security Name | % of Net Assets | |
Microsoft Corp.
| 2.4
| |
Amazon.com, Inc.
| 2.1
| |
Apple, Inc.
| 2.0
| |
U.S. Treasury Notes, 1.500%, 01/31/22
| 1.5
| |
Alphabet, Inc., Class A
| 1.5
| |
U.S. Treasury Notes, 2.625%, 06/15/21
| 1.1
| |
U.S. Treasury Notes, 1.375%, 08/31/20
| 0.9
| |
U.S. Treasury Notes, 1.625%, 07/31/20
| 0.8
| |
U.S. Treasury Notes, 1.125%, 07/31/21
| 0.8
| |
Facebook, Inc., Class A
| 0.8
| |
| ||
Top Ten as a Group
| 13.9
| |
| ||
Credit quality ratings shown above reflect the highest rating assigned by either Standard & Poor’s (“S&P”) or Moody’s Investors Service, Inc. (“Moody’s”). These rating agencies are independent, nationally recognized statistical rating organizations and are widely used. Investment grade ratings are credit ratings of BBB/Baa or higher. Below investment grade ratings are credit ratings of BB/Ba or lower. Investments designated N/R are not rated by either rating agency. Unrated investments do not necessarily indicate low credit quality. Credit quality ratings are subject to change.
Because a fund’s strategy may result in multiple investments in particular sectors of the economy, its performance may depend on the performance of those sectors and may fluctuate more widely than investments diversified across more sectors. For additional information on these and other risk considerations, please see the Fund’s prospectus.
Any sectors, industries, or securities discussed should not be perceived as investment recommendations. Mention of a specific security should not be considered a recommendation to buy or solicitation to sell that security. Specific securities mentioned in this report may have been sold from the Fund’s portfolio of investments by the time you receive this report.
| 7 |
Table of Contents
AMG Chicago Equity Partners Balanced Fund Schedule of Portfolio Investments December 31, 2018 |
| Shares | Value | |||||||
Common Stocks - 56.3% |
| |||||||
Communication Services - 3.9% |
| |||||||
Alphabet, Inc., Class A* | 3,615 | $3,777,530 | ||||||
AT&T, Inc. | 18,134 | 517,544 | ||||||
Borussia Dortmund GmbH & Co. KGaA (Germany) | 1,800 | 16,499 | ||||||
Cable One, Inc.1 | 230 | 188,623 | ||||||
Capcom Co., Ltd. (Japan) | 2,500 | 49,569 | ||||||
Comcast Corp., Class A | 24,005 | 817,370 | ||||||
CTS Eventim AG & Co. KGaA (Germany) | 1,200 | 44,813 | ||||||
GungHo Online Entertainment, Inc. (Japan)* | 14,000 | 25,623 | ||||||
HKBN, Ltd. (Hong Kong) | 29,000 | 43,965 | ||||||
Infrastrutture Wireless Italiane S.P.A. (Italy)2 | 1,300 | 8,899 | ||||||
KCOM Group PLC (United Kingdom) | 11,200 | 10,421 | ||||||
Live Nation Entertainment, Inc.*,1 | 2,860 | 140,855 | ||||||
Match Group, Inc. | 8,050 | 344,299 | ||||||
Netflix, Inc.* | 3,140 | 840,452 | ||||||
Nine Entertainment Co. Holdings, Ltd. (Australia) | 33,290 | 32,390 | ||||||
Proto Corp. (Japan) | 800 | 10,190 | ||||||
Rightmove PLC (United Kingdom) | 1,400 | 7,716 | ||||||
Sirius XM Holdings, Inc.1 | 36,585 | 208,900 | ||||||
SKY Perfect JSAT Holdings, Inc. (Japan) | 11,900 | 50,789 | ||||||
SmarTone Telecommunications Holdings, Ltd. (Hong Kong) | 20,100 | 22,289 | ||||||
Take-Two Interactive Software, Inc.* | 5,745 | 591,390 | ||||||
Telephone & Data Systems, Inc. | 8,040 | 261,622 | ||||||
T-Mobile US, Inc.* | 1,875 | 119,269 | ||||||
TripAdvisor, Inc.* | 8,240 | 444,466 | ||||||
Twenty-First Century Fox, Inc., Class A | 3,930 | 189,112 | ||||||
United States Cellular Corp.* | 1,790 | 93,026 | ||||||
Verizon Communications, Inc. | 12,610 | 708,934 | ||||||
Viacom, Inc., Class B | 13,240 | 340,268 | ||||||
Total Communication Services | 9,906,823 | |||||||
Consumer Discretionary - 7.1% | ||||||||
888 Holdings PLC (Gibraltar) | 23,400 | 52,195 | ||||||
Accent Group, Ltd. (Australia) | 93,300 | 78,889 | ||||||
Amazon.com, Inc.* | 3,470 | 5,211,836 | ||||||
AMC Networks, Inc., Class A*,1 | 1,700 | 93,296 | ||||||
Aptiv PLC (Ireland) | 5,050 | 310,929 | ||||||
Beneteau, S.A. (France) | 3,300 | 43,399 | ||||||
Best Buy Co., Inc. | 5,360 | 283,866 | ||||||
boohoo Group PLC (United Kingdom)* | 700 | 1,444 | ||||||
BorgWarner, Inc. | 6,870 | 238,664 | ||||||
Burlington Stores, Inc.*,1 | 4,260 | 692,974 | ||||||
| Shares | Value | |||||||
Capri Holdings, Ltd. (United Kingdom)* | 3,970 | $150,542 | ||||||
Chipotle Mexican Grill, Inc.* | 840 | 362,704 | ||||||
Choice Hotels International, Inc. | 1,840 | 131,707 | ||||||
Columbia Sportswear Co. | 6,350 | 533,972 | ||||||
De’ Longhi S.P.A. (Italy) | 500 | 12,667 | ||||||
DFS Furniture PLC (United Kingdom) | 12,100 | 28,038 | ||||||
Discovery, Inc., Class A*,1 | 4,520 | 111,825 | ||||||
Domino’s Pizza Group PLC (United Kingdom) | 2,800 | 8,322 | ||||||
Domino’s Pizza, Inc.1 | 2,465 | 611,295 | ||||||
Dunkin’ Brands Group, Inc.1 | 5,620 | 360,354 | ||||||
Exedy Corp. (Japan) | 3,200 | 78,165 | ||||||
Fujibo Holdings, Inc. (Japan) | 300 | 6,766 | ||||||
Garrett Motion, Inc. (Switzerland)* | 1 | 12 | ||||||
Harley-Davidson, Inc.1 | 6,470 | 220,756 | ||||||
Hilton Grand Vacations, Inc.*,1 | 2,825 | 74,552 | ||||||
HIS Co., Ltd. (Japan) | 400 | 14,544 | ||||||
The Home Depot, Inc. | 6,625 | 1,138,307 | ||||||
Hyatt Hotels Corp., Class A | 7,355 | 497,198 | ||||||
IDP Education, Ltd. (Australia) | 8,900 | 61,899 | ||||||
The Interpublic Group of Cos., Inc. | 22,360 | 461,287 | ||||||
Kindred Group PLC, SDR (Malta) | 3,100 | 28,497 | ||||||
Kohl’s Corp. | 2,920 | 193,713 | ||||||
Lifestyle International Holdings, Ltd. (Hong Kong) | 26,500 | 40,173 | ||||||
Lululemon Athletica, Inc. (Canada)*,1 | 2,860 | 347,805 | ||||||
Macy’s, Inc.1 | 4,925 | 146,667 | ||||||
Marriott International, Inc., Class A | 1,640 | 178,038 | ||||||
Matas A/S (Denmark) | 2,600 | 23,175 | ||||||
Moneysupermarket.com Group PLC (United Kingdom) | 5,400 | 18,959 | ||||||
NetEnt AB (Sweden) | 7,700 | 31,700 | ||||||
NIKE, Inc., Class B | 1,920 | 142,349 | ||||||
Nishimatsuya Chain Co., Ltd. (Japan) | 2,800 | 22,677 | ||||||
Nobia AB (Sweden) | 1,500 | 8,362 | ||||||
Ocado Group PLC (United Kingdom)* | 3,000 | 30,239 | ||||||
Omnicom Group, Inc. | 6,540 | 478,990 | ||||||
On the Beach Group PLC (United Kingdom)2 | 2,800 | 12,001 | ||||||
Pool Corp.1 | 4,775 | 709,804 | ||||||
Ralph Lauren Corp. | 3,565 | 368,835 | ||||||
Ross Stores, Inc. | 7,595 | 631,904 | ||||||
Sa Sa International Holdings, Ltd. (Hong Kong)1 | 40,000 | 15,109 | ||||||
Seiko Holdings Corp. (Japan) | 1,200 | 23,040 | ||||||
SSP Group PLC (United Kingdom) | 2,387 | 19,704 | ||||||
Thule Group AB (Sweden)2 | 800 | 14,642 | ||||||
| The accompanying notes are an integral part of these financial statements. |
| 8 |
Table of Contents
AMG Chicago Equity Partners Balanced Fund Schedule of Portfolio Investments(continued) |
| Shares | Value | |||||||
Consumer Discretionary - 7.1%(continued) | ||||||||
The TJX Cos., Inc. | 13,380 | $598,621 | ||||||
Tokai Rika Co., Ltd. (Japan) | 1,800 | 29,722 | ||||||
Tractor Supply Co. | 5,260 | 438,894 | ||||||
Trade Me Group, Ltd. (New Zealand) | 2,300 | 9,805 | ||||||
Urban Outfitters, Inc.* | 4,420 | 146,744 | ||||||
VF Corp. | 4,020 | 286,787 | ||||||
The Walt Disney Co. | 2,540 | 278,511 | ||||||
Xinyi Glass Holdings, Ltd. (Hong Kong) | 11,900 | 13,145 | ||||||
Yum! Brands, Inc. | 5,520 | 507,398 | ||||||
Total Consumer Discretionary |
| 17,668,414 | ||||||
Consumer Staples - 4.1% | ||||||||
Altria Group, Inc. | 14,595 | 720,847 | ||||||
Archer-Daniels-Midland Co. | 10,305 | 422,196 | ||||||
Austevoll Seafood A.S.A. (Norway) | 2,200 | 27,158 | ||||||
Axfood AB (Sweden) | 1,700 | 29,077 | ||||||
Bakkafrost P/F (Faroe Islands) | 300 | 14,683 | ||||||
Best World International, Ltd. (Singapore) | 30,700 | 59,199 | ||||||
C&C Group PLC (Ireland) | 11,500 | 35,905 | ||||||
The Coca-Cola Co. | 11,785 | 558,020 | ||||||
Constellation Brands, Inc., Class A | 1,120 | 180,118 | ||||||
Costco Wholesale Corp. | 2,600 | 529,646 | ||||||
Edgewell Personal Care Co.*,1 | 5,205 | 194,407 | ||||||
The Estee Lauder Cos., Inc., Class A | 4,930 | 641,393 | ||||||
Flowers Foods, Inc.1 | 12,750 | 235,493 | ||||||
Herbalife Nutrition, Ltd.*,1 | 9,900 | 583,605 | ||||||
Kimberly-Clark Corp. | 9,610 | 1,094,963 | ||||||
The Kroger Co. | 9,930 | 273,075 | ||||||
La Doria S.P.A. (Italy) | 1,400 | 12,719 | ||||||
Lamb Weston Holdings, Inc. | 1,355 | 99,674 | ||||||
McCormick & Co., Inc.,Non-Voting Shares | 320 | 44,557 | ||||||
Monster Beverage Corp.* | 11,440 | 563,077 | ||||||
Oriflame Holding AG (Switzerland) | 400 | 8,997 | ||||||
Origin Enterprises PLC (Ireland) | 8,300 | 54,403 | ||||||
PepsiCo, Inc. | 6,320 | 698,234 | ||||||
Philip Morris International, Inc. | 5,760 | 384,538 | ||||||
The Procter & Gamble Co. | 7,930 | 728,926 | ||||||
Rallye, S.A. (France)1 | 2,000 | 20,644 | ||||||
Rami Levy Chain Stores Hashikma Marketing 2006, Ltd. (Israel) | 650 | 33,455 | ||||||
Royal Unibrew A/S (Denmark) | 450 | 31,092 | ||||||
Salmar A.S.A. (Norway) | 2,000 | 99,198 | ||||||
Sysco Corp. | 14,870 | 931,754 | ||||||
| Shares | Value | |||||||
Tate & Lyle PLC (United Kingdom) | 4,800 | $40,391 | ||||||
TreeHouse Foods, Inc.*,1 | 7,910 | 401,116 | ||||||
US Foods Holding Corp.* | 4,460 | 141,114 | ||||||
Walmart, Inc. | 3,910 | 364,216 | ||||||
Total Consumer Staples |
| 10,257,890 | ||||||
Energy - 2.0% | ||||||||
Anadarko Petroleum Corp. | 2,800 | 122,752 | ||||||
Apache Corp.1 | 8,770 | 230,213 | ||||||
Baker Hughes, a GE Co. | 3,650 | 78,475 | ||||||
Cabot Oil & Gas Corp.1 | 5,680 | 126,948 | ||||||
Cheniere Energy, Inc.*,1 | 2,620 | 155,078 | ||||||
Chevron Corp. | 5,905 | 642,405 | ||||||
CNX Resources Corp.*,1 | 16,420 | 187,516 | ||||||
ConocoPhillips | 6,775 | 422,421 | ||||||
Continental Resources, Inc.* | 5,890 | 236,719 | ||||||
Devon Energy Corp. | 8,060 | 181,672 | ||||||
EOG Resources, Inc. | 1,020 | 88,954 | ||||||
Exxon Mobil Corp. | 12,965 | 884,083 | ||||||
Gaztransport Et Technigaz, S.A. (France) | 1,050 | 80,745 | ||||||
Gulf Keystone Petroleum, Ltd. (United Kingdom)* | 5,400 | 12,371 | ||||||
Japan Petroleum Exploration Co., Ltd. (Japan) | 600 | 10,637 | ||||||
Kosmos Energy, Ltd.*,1 | 27,050 | 110,094 | ||||||
Marathon Oil Corp. | 7,770 | 111,422 | ||||||
Modec, Inc. (Japan) | 1,400 | 28,918 | ||||||
Naphtha Israel Petroleum Corp., Ltd. (Israel)* | 5,800 | 37,033 | ||||||
National Oilwell Varco, Inc. | 5,790 | 148,803 | ||||||
Occidental Petroleum Corp. | 3,280 | 201,326 | ||||||
ONEOK, Inc. | 7,670 | 413,797 | ||||||
PBF Energy, Inc., Class A1 | 1,985 | 64,850 | ||||||
Petrofac, Ltd. (United Kingdom) | 7,500 | 45,526 | ||||||
Pioneer Natural Resources Co. | 745 | 97,982 | ||||||
TGS NOPEC Geophysical Co., A.S.A. (Norway) | 400 | 9,665 | ||||||
Washington H Soul Pattinson & Co., Ltd. (Australia) | 3,500 | 61,379 | ||||||
Whitehaven Coal, Ltd. (Australia) | 19,800 | 60,339 | ||||||
Whiting Petroleum Corp.*,1 | 3,000 | 68,070 | ||||||
Total Energy |
| 4,920,193 | ||||||
Financials - 6.2% | ||||||||
The Allstate Corp. | 4,430 | 366,051 | ||||||
Ameriprise Financial, Inc. | 6,330 | 660,662 | ||||||
Aspen Insurance Holdings, Ltd. (Bermuda) | 3,880 | 162,921 | ||||||
Assured Guaranty, Ltd. (Bermuda) | 5,480 | 209,774 | ||||||
Bank of America Corp. | 29,195 | 719,365 | ||||||
| The accompanying notes are an integral part of these financial statements. |
| 9 |
Table of Contents
AMG Chicago Equity Partners Balanced Fund Schedule of Portfolio Investments(continued) |
| Shares | Value | |||||||
Financials - 6.2%(continued) |
| |||||||
Bank of Georgia Group PLC (Georgia) | 1,500 | $26,350 | ||||||
Berkshire Hathaway, Inc., Class B* | 5,490 | 1,120,948 | ||||||
BlackRock, Inc. | 420 | 164,984 | ||||||
Burford Capital, Ltd. | 600 | 12,657 | ||||||
Cembra Money Bank AG (Switzerland) | 800 | 63,476 | ||||||
Citizens Financial Group, Inc. | 4,220 | 125,461 | ||||||
CME Group, Inc. | 3,390 | 637,727 | ||||||
Comerica, Inc. | 2,630 | 180,655 | ||||||
Commerce Bancshares, Inc.1 | 4,297 | 242,222 | ||||||
Credit Acceptance Corp.* | 1,160 | 442,842 | ||||||
Cullen/Frost Bankers, Inc. | 1,420 | 124,875 | ||||||
Dah Sing Financial Holdings, Ltd. (Hong Kong) | 10,400 | 51,418 | ||||||
Deutsche Pfandbriefbank AG (Germany)2 | 2,700 | 26,998 | ||||||
E*TRADE Financial Corp. | 3,700 | 162,356 | ||||||
Fifth Third Bancorp | 9,920 | 233,418 | ||||||
FinecoBank Banca Fineco S.P.A. (Italy) | 900 | 9,055 | ||||||
Franklin Resources, Inc. | 10,885 | 322,849 | ||||||
Israel Discount Bank, Ltd., Class A (Israel) | 16,500 | 50,913 | ||||||
JPMorgan Chase & Co. | 11,958 | 1,167,340 | ||||||
Just Group PLC (United Kingdom) | 1,500 | 1,753 | ||||||
kabu.com Securities Co., Ltd. (Japan) | 13,400 | 45,999 | ||||||
Legg Mason, Inc. | 7,020 | 179,080 | ||||||
Lincoln National Corp. | 5,210 | 267,325 | ||||||
LPL Financial Holdings, Inc. | 1,880 | 114,830 | ||||||
M&T Bank Corp. | 3,790 | 542,463 | ||||||
Marusan Securities Co., Ltd. (Japan) | 10,700 | 74,687 | ||||||
MetLife, Inc. | 5,750 | 236,095 | ||||||
Navient Corp.1 | 12,920 | 113,825 | ||||||
nib holdings, Ltd. (Australia) | 3,200 | 11,732 | ||||||
Northern Trust Corp. | 6,780 | 566,740 | ||||||
Okasan Securities Group, Inc. (Japan) | 3,800 | 16,855 | ||||||
Plus500, Ltd. (Israel)1 | 6,500 | 113,502 | ||||||
ProAssurance Corp. | 2,110 | 85,582 | ||||||
The Progressive Corp. | 27,050 | 1,631,927 | ||||||
Prudential Financial, Inc. | 1,770 | 144,344 | ||||||
Regions Financial Corp. | 13,780 | 184,376 | ||||||
S&P Global, Inc. | 5,050 | 858,197 | ||||||
Santander Consumer USA Holdings, Inc.1 | 43,370 | 762,878 | ||||||
SEI Investments Co. | 3,620 | 167,244 | ||||||
SpareBank 1 Nord Norge (Norway) | 7,500 | 54,433 | ||||||
State Street Corp. | 1,590 | 100,281 | ||||||
Storebrand A.S.A. (Norway) | 200 | 1,427 | ||||||
| Shares | Value | |||||||
SunTrust Banks, Inc. | 3,225 | $162,669 | ||||||
SVB Financial Group* | 1,745 | 331,410 | ||||||
Swissquote Group Holding, S.A. (Switzerland) | 650 | 30,075 | ||||||
T Rowe Price Group, Inc. | 950 | 87,704 | ||||||
TD Ameritrade Holding Corp. | 2,270 | 111,139 | ||||||
TOC Co., Ltd. (Japan) | 8,100 | 54,091 | ||||||
Tokai Tokyo Financial Holdings, Inc. (Japan) | 3,100 | 13,234 | ||||||
Topdanmark A/S (Denmark) | 2,100 | 98,005 | ||||||
Torchmark Corp. | 1,480 | 110,304 | ||||||
U.S. Bancorp | 6,675 | 305,048 | ||||||
Waddell & Reed Financial, Inc., Class A | 12,580 | 227,446 | ||||||
Wells Fargo & Co. | 10,220 | 470,938 | ||||||
White Mountains Insurance Group, Ltd. | 2 | 1,715 | ||||||
Total Financials |
| 15,564,670 | ||||||
Health Care - 8.2% | ||||||||
AbbVie, Inc. | 5,805 | 535,163 | ||||||
ABIOMED, Inc.* | 560 | 182,022 | ||||||
Alexion Pharmaceuticals, Inc.* | 9,170 | 892,791 | ||||||
Almirall, S.A. (Spain) | 300 | 4,593 | ||||||
Amgen, Inc. | 3,355 | 653,118 | ||||||
Baxter International, Inc. | 2,040 | 134,273 | ||||||
BioGaia AB, Class B (Sweden) | 1,300 | 46,562 | ||||||
Biogen, Inc.* | 1,900 | 571,748 | ||||||
Bio-Rad Laboratories, Inc., Class A* | 580 | 134,688 | ||||||
Bristol-Myers Squibb Co. | 7,090 | 368,538 | ||||||
Bruker Corp. | 9,015 | 268,377 | ||||||
Celgene Corp.* | 1,460 | 93,571 | ||||||
Chemed Corp. | 2,000 | 566,560 | ||||||
Cigna Corp. | 1,479 | 280,892 | ||||||
CVS Health Corp. | 1,155 | 75,676 | ||||||
Eli Lilly & Co. | 5,570 | 644,560 | ||||||
EMIS Group PLC (United Kingdom) | 5,500 | 64,004 | ||||||
Exelixis, Inc.* | 30,660 | 603,082 | ||||||
Galenica AG (Switzerland)2 | 350 | 15,417 | ||||||
Gilead Sciences, Inc. | 4,115 | 257,393 | ||||||
GN Store Nord A/S (Denmark) | 200 | 7,494 | ||||||
HCA Healthcare, Inc. | 1,760 | 219,032 | ||||||
Henry Schein, Inc.*,1 | 2,620 | 205,722 | ||||||
Humana, Inc. | 2,410 | 690,417 | ||||||
IDEXX Laboratories, Inc.* | 4,740 | 881,735 | ||||||
Illumina, Inc.* | 2,620 | 785,817 | ||||||
Intuitive Surgical, Inc.* | 1,940 | 929,105 | ||||||
Johnson & Johnson | 5,445 | 702,677 | ||||||
| The accompanying notes are an integral part of these financial statements. |
| 10 |
Table of Contents
AMG Chicago Equity Partners Balanced Fund Schedule of Portfolio Investments(continued) |
| Shares | Value | |||||||
Health Care - 8.2%(continued) |
| |||||||
Kaken Pharmaceutical Co., Ltd. (Japan) | 1,200 | $53,282 | ||||||
KYORIN Holdings, Inc. (Japan) | 2,700 | 58,980 | ||||||
McKesson Corp. | 2,510 | 277,280 | ||||||
Medtronic PLC (Ireland) | 7,425 | 675,378 | ||||||
Merck & Co., Inc. | 19,725 | 1,507,187 | ||||||
Molina Healthcare, Inc.*,1 | 4,850 | 563,667 | ||||||
Paramount Bed Holdings Co., Ltd. (Japan) | 400 | 16,495 | ||||||
Perrigo Co. PLC (Ireland) | 4,515 | 174,956 | ||||||
Pfizer, Inc. | 26,157 | 1,141,753 | ||||||
Regeneron Pharmaceuticals, Inc.* | 1,340 | 500,490 | ||||||
ResMed, Inc. | 8,540 | 972,450 | ||||||
Seikagaku Corp. (Japan) | 2,400 | 27,208 | ||||||
STADA Arzneimittel AG (Germany) | 50 | 4,612 | ||||||
Toho Holdings Co., Ltd. (Japan) | 3,300 | 80,715 | ||||||
UnitedHealth Group, Inc. | 5,340 | 1,330,301 | ||||||
Varian Medical Systems, Inc.* | 4,025 | 456,073 | ||||||
Veeva Systems, Inc., Class A* | 6,540 | 584,153 | ||||||
Vertex Pharmaceuticals, Inc.* | 2,085 | 345,505 | ||||||
Waters Corp.* | 1,400 | 264,110 | ||||||
WellCare Health Plans, Inc.* | 1,315 | 310,458 | ||||||
ZERIA Pharmaceutical Co., Ltd. (Japan) | 1,100 | 19,758 | ||||||
Zimmer Biomet Holdings, Inc. | 2,350 | 243,742 | ||||||
Total Health Care | 20,423,580 | |||||||
Industrials - 6.3% |
| |||||||
Aeon Delight Co., Ltd. (Japan) | 100 | 3,336 | ||||||
Aida Engineering, Ltd. (Japan) | 9,900 | 64,835 | ||||||
Allegion PLC (Ireland)1 | 2,120 | 168,985 | ||||||
Allison Transmission Holdings, Inc. | 23,305 | 1,023,323 | ||||||
Amadeus Fire AG (Germany) | 500 | 46,763 | ||||||
Armstrong World Industries, Inc. | 12,150 | 707,251 | ||||||
The Boeing Co. | 5,330 | 1,718,925 | ||||||
Caterpillar, Inc. | 9,425 | 1,197,635 | ||||||
Cintas Corp. | 1,000 | 167,990 | ||||||
CIR-Compagnie Industriali Riunite S.P.A. (Italy) | 32,100 | 34,282 | ||||||
Copart, Inc.*,1 | 2,120 | 101,294 | ||||||
Costain Group PLC (United Kingdom) | 5,300 | 21,313 | ||||||
CoStar Group, Inc.* | 1,665 | 561,671 | ||||||
CSX Corp. | 12,810 | 795,885 | ||||||
Cummins, Inc. | 920 | 122,949 | ||||||
Daiseki Co., Ltd. (Japan) | 300 | 6,195 | ||||||
Dart Group PLC (United Kingdom) | 2,900 | 28,569 | ||||||
Delta Air Lines, Inc. | 2,180 | 108,782 | ||||||
| Shares | Value | |||||||
Diploma PLC (United Kingdom) | 200 | $3,087 | ||||||
Dover Corp. | 7,420 | 526,449 | ||||||
Enav S.P.A. (Italy)2 | 800 | 3,894 | ||||||
Expeditors International of Washington, Inc. | 15,870 | 1,080,588 | ||||||
Fudo Tetra Corp. (Japan) | 2,070 | 31,974 | ||||||
Galliford Try PLC (United Kingdom) | 1,700 | 13,506 | ||||||
TheGo-Ahead Group PLC (United Kingdom) | 4,500 | 87,643 | ||||||
Harris Corp. | 780 | 105,027 | ||||||
HEICO Corp. | 1 | 77 | ||||||
Huber + Suhner AG (Switzerland) | 350 | 23,381 | ||||||
Huntington Ingalls Industries, Inc. | 875 | 166,521 | ||||||
Intertrust, N.V. (Netherlands)2 | 300 | 5,036 | ||||||
Irish Continental Group PLC (Ireland) | 5,700 | 27,756 | ||||||
Italmobiliare S.P.A. (Italy) | 800 | 16,847 | ||||||
Itoki Corp. (Japan) | 6,500 | 35,245 | ||||||
Kanematsu Corp. (Japan) | 2,900 | 35,121 | ||||||
Kardex AG (Switzerland) | 390 | 45,096 | ||||||
Kokuyo Co., Ltd. (Japan) | 1,100 | 16,067 | ||||||
Komori Corp. (Japan) | 9,100 | 91,407 | ||||||
Kyodo Printing Co., Ltd. (Japan) | 900 | 20,113 | ||||||
Landstar System, Inc. | 4,540 | 434,342 | ||||||
Lockheed Martin Corp. | 3,620 | 947,861 | ||||||
Meitec Corp. (Japan) | 300 | 12,174 | ||||||
Mersen, S.A. (France) | 1,100 | 29,545 | ||||||
Morgan Advanced Materials PLC (United Kingdom) | 19,500 | 65,418 | ||||||
Nibe Industrier AB, Class B (Sweden) | 4,000 | 41,118 | ||||||
Nissin Electric Co., Ltd. (Japan) | 600 | 4,364 | ||||||
Norfolk Southern Corp. | 1,100 | 164,494 | ||||||
Okumura Corp. (Japan) | 1,800 | 52,447 | ||||||
Old Dominion Freight Line, Inc. | 2,310 | 285,262 | ||||||
PACCAR, Inc. | 3,785 | 216,275 | ||||||
QinetiQ Group PLC (United Kingdom) | 16,000 | 58,432 | ||||||
Raytheon Co. | 860 | 131,881 | ||||||
Redde PLC (United Kingdom) | 4,100 | 8,860 | ||||||
Robert Half International, Inc. | 16,410 | 938,652 | ||||||
Rockwell Automation, Inc. | 5,035 | 757,667 | ||||||
Rockwool International A/S, Class B (Denmark) | 110 | 28,765 | ||||||
Sanki Engineering Co., Ltd. (Japan) | 5,600 | 58,108 | ||||||
Signify, N.V. (Netherlands)2 | 100 | 2,339 | ||||||
Sodick Co., Ltd. (Japan) | 1,900 | 11,903 | ||||||
Sojitz Corp. (Japan) | 19,800 | 68,561 | ||||||
Southwest Airlines Co. | 1,970 | 91,566 | ||||||
| The accompanying notes are an integral part of these financial statements. |
| 11 |
Table of Contents
AMG Chicago Equity Partners Balanced Fund Schedule of Portfolio Investments(continued) |
| Shares | Value | |||||||
Industrials - 6.3%(continued) |
| |||||||
Stagecoach Group PLC (United Kingdom) | 14,000 | $23,644 | ||||||
Star Micronics Co., Ltd. (Japan) | 2,500 | 33,888 | ||||||
Tokyu Construction Co., Ltd. (Japan) | 9,100 | 82,217 | ||||||
Toshiba Plant Systems & Services Corp. (Japan) | 400 | 7,362 | ||||||
Toyo Construction Co., Ltd. (Japan) | 5,200 | 17,887 | ||||||
TransUnion | 2,340 | 132,912 | ||||||
Union Pacific Corp. | 620 | 85,703 | ||||||
United Rentals, Inc.* | 6,315 | 647,477 | ||||||
Waste Management, Inc. | 1,290 | 114,797 | ||||||
WW Grainger, Inc.1 | 2,730 | 770,843 | ||||||
XPO Logistics, Inc.*,1 | 2,840 | 161,994 | ||||||
Total Industrials | 15,703,576 | |||||||
Information Technology - 13.5% |
| |||||||
Accenture PLC, Class A (Ireland) | 9,850 | 1,388,948 | ||||||
Adobe, Inc.* | 4,420 | 999,981 | ||||||
Advanced Micro Devices, Inc.* | 8,150 | 150,449 | ||||||
Akamai Technologies, Inc.* | 1,120 | 68,410 | ||||||
Amphenol Corp., Class A | 985 | 79,805 | ||||||
Apple, Inc. | 31,050 | 4,897,827 | ||||||
Arista Networks, Inc.* | 1,100 | 231,770 | ||||||
Atlassian Corp. PLC, Class A (Australia)* | 1,380 | 122,792 | ||||||
Automatic Data Processing, Inc. | 2,740 | 359,269 | ||||||
Azbil Corp. (Japan) | 1,000 | 19,764 | ||||||
BE Semiconductor Industries, N.V. (Netherlands) | 300 | 6,324 | ||||||
Booz Allen Hamilton Holding Corp. | 4,330 | 195,153 | ||||||
Broadridge Financial Solutions, Inc. | 3,060 | 294,525 | ||||||
CDW Corp. | 15,320 | 1,241,686 | ||||||
Cisco Systems, Inc. | 11,925 | 516,710 | ||||||
Citizen Watch Co., Ltd. (Japan) | 6,500 | 32,011 | ||||||
Citrix Systems, Inc. | 11,460 | 1,174,192 | ||||||
Conduent, Inc.* | 9,120 | 96,946 | ||||||
CyberArk Software, Ltd. (Israel)* | 150 | 11,121 | ||||||
Electrocomponents PLC (United Kingdom) | 3,100 | 20,024 | ||||||
F5 Networks, Inc.* | 3,900 | 631,917 | ||||||
Facebook, Inc., Class A* | 14,625 | 1,917,191 | ||||||
Fortinet, Inc.* | 6,180 | 435,257 | ||||||
Halma PLC (United Kingdom) | 1,300 | 22,647 | ||||||
Hewlett Packard Enterprise Co. | 24,780 | 327,344 | ||||||
HP, Inc. | 7,350 | 150,381 | ||||||
Ines Corp. (Japan) | 4,400 | 45,575 | ||||||
Intel Corp. | 3,040 | 142,667 | ||||||
Intuit, Inc. | 4,400 | 866,140 | ||||||
| Shares | Value | |||||||
Juniper Networks, Inc. | 10,830 | $291,435 | ||||||
Kainos Group PLC (United Kingdom) | 6,900 | 35,027 | ||||||
KLA-Tencor Corp. | 2,720 | 243,413 | ||||||
Logitech International, S.A. (Switzerland) | 600 | 18,953 | ||||||
Manhattan Associates, Inc.*,1 | 16,500 | 699,105 | ||||||
Mastercard, Inc., Class A | 9,810 | 1,850,656 | ||||||
Maxim Integrated Products, Inc. | 3,690 | 187,637 | ||||||
Micron Technology, Inc.* | 13,220 | 419,471 | ||||||
Microsoft Corp. | 58,635 | 5,955,557 | ||||||
National Instruments Corp. | 12,000 | 544,560 | ||||||
Nemetschek SE (Germany) | 60 | 6,601 | ||||||
Neopost, S.A. (France) | 900 | 24,568 | ||||||
NetApp, Inc. | 6,170 | 368,164 | ||||||
NSD Co., Ltd. (Japan) | 1,900 | 36,566 | ||||||
NVIDIA Corp. | 3,980 | 531,330 | ||||||
Okta, Inc.* | 2,060 | 131,428 | ||||||
Paycom Software, Inc.*,1 | 1,260 | 154,287 | ||||||
PayPal Holdings, Inc.* | 4,730 | 397,746 | ||||||
Pure Storage, Inc., Class A* | 18,630 | 299,570 | ||||||
QUALCOMM, Inc. | 7,355 | 418,573 | ||||||
Red Hat, Inc.* | 650 | 114,166 | ||||||
Riso Kagaku Corp. (Japan) | 3,700 | 56,944 | ||||||
Shinko Electric Industries Co., Ltd. (Japan) | 5,200 | 33,132 | ||||||
Siltronic AG (Germany) | 560 | 46,593 | ||||||
Skyworks Solutions, Inc. | 1,865 | 124,992 | ||||||
Softcat PLC (United Kingdom) | 5,500 | 41,274 | ||||||
Square, Inc., Class A* | 1,530 | 85,818 | ||||||
SS&C Technologies Holdings, Inc. | 2,970 | 133,977 | ||||||
Texas Instruments, Inc. | 11,530 | 1,089,585 | ||||||
TIS, Inc. (Japan) | 800 | 31,498 | ||||||
Total System Services, Inc. | 980 | 79,664 | ||||||
Twitter, Inc.* | 9,540 | 274,180 | ||||||
Visa, Inc., Class A | 12,350 | 1,629,459 | ||||||
VTech Holdings, Ltd. (Hong Kong) | 600 | 4,977 | ||||||
WEX, Inc.* | 1,080 | 151,265 | ||||||
Worldpay, Inc., Class A* | 2,140 | 163,560 | ||||||
Xilinx, Inc. | 1,980 | 168,637 | ||||||
Zebra Technologies Corp., Class A* | 2,780 | 442,659 | ||||||
Total Information Technology | 33,733,853 | |||||||
Materials - 1.6% |
| |||||||
Altri SGPS, S.A. (Portugal) | 6,300 | 41,980 | ||||||
Avery Dennison Corp. | 1,850 | 166,186 | ||||||
Cabot Corp. | 1,285 | 55,178 | ||||||
| The accompanying notes are an integral part of these financial statements. |
| 12 |
Table of Contents
AMG Chicago Equity Partners Balanced Fund Schedule of Portfolio Investments(continued) |
| Shares | Value | |||||||
Materials - 1.6%(continued) | ||||||||
Celanese Corp.1 | 3,840 | $345,485 | ||||||
CF Industries Holdings, Inc. | 1,360 | 59,174 | ||||||
The Chemours Co. | 4,960 | 139,971 | ||||||
Domtar Corp. | 10,090 | 354,462 | ||||||
DowDuPont, Inc. | 1,355 | 72,465 | ||||||
Ence Energia y Celulosa, S.A. (Spain) | 6,000 | 37,705 | ||||||
Evraz PLC (Russia) | 2,100 | 12,859 | ||||||
Ferrexpo PLC (Switzerland) | 3,500 | 8,683 | ||||||
Freeport-McMoRan, Inc. | 16,845 | 173,672 | ||||||
Fujimi, Inc. (Japan) | 900 | 17,223 | ||||||
LyondellBasell Industries, N.V., Class A | 6,540 | 543,866 | ||||||
Metsa Board OYJ (Finland) | 4,200 | 24,670 | ||||||
The Navigator Co., S.A. (Portugal) | 100 | 413 | ||||||
NOF Corp. (Japan) | 400 | 13,619 | ||||||
PPG Industries, Inc. | 2,235 | 228,484 | ||||||
Reliance Steel & Aluminum Co. | 2,740 | 195,006 | ||||||
Royal Gold, Inc. | 3,845 | 329,324 | ||||||
Sealed Air Corp. | 9,080 | 316,347 | ||||||
Southern Copper Corp. (Peru) | 16,190 | 498,166 | ||||||
Svenska Cellulosa AB SCA, Class B (Sweden) | 6,400 | 49,732 | ||||||
Toagosei Co., Ltd. (Japan) | 600 | 6,613 | ||||||
Toyo Ink SC Holdings Co., Ltd. (Japan) | 600 | 13,274 | ||||||
Westlake Chemical Corp.1 | 3,160 | 209,097 | ||||||
Yodogawa Steel Works, Ltd. (Japan) | 200 | 3,972 | ||||||
Total Materials |
| 3,917,626 | ||||||
Real Estate - 2.0% | ||||||||
Alexandria Real Estate Equities, Inc., REIT | 1,210 | 139,440 | ||||||
alstria officeREIT-AG, REIT (Germany) | 600 | 8,400 | ||||||
Bayside Land Corp. (Israel) | 30 | 12,777 | ||||||
CapitaLand Retail China Trust, REIT (Singapore) | 7,500 | 7,486 | ||||||
CBRE Group, Inc., Class A* | 3,420 | 136,937 | ||||||
CoreSite Realty Corp., REIT | 2,250 | 196,268 | ||||||
Corporate Office Properties Trust, REIT | 5,940 | 124,918 | ||||||
Crown Castle International Corp., REIT | 860 | 93,422 | ||||||
Digital Realty Trust, Inc., REIT | 1,780 | 189,659 | ||||||
Equinix, Inc., REIT | 320 | 112,819 | ||||||
Equity Residential, REIT | 3,455 | 228,065 | ||||||
Eurocommercial Properties, N.V. (Netherlands) | 600 | 18,519 | ||||||
Fabege AB (Sweden) | 3,700 | 49,454 | ||||||
First Real Estate Investment Trust, REIT (Singapore) | 33,400 | 24,130 | ||||||
GDI Property Group, REIT (Australia) | 46,500 | 44,218 | ||||||
| Shares | Value | |||||||
Great Portland Estates PLC, REIT (United Kingdom) | 8,800 | $73,973 | ||||||
Hemfosa Fastigheter AB (Sweden) | 5,700 | 44,980 | ||||||
Intervest Offices & Warehouses, N.V., REIT (Belgium) | 2,100 | 49,558 | ||||||
Jones Lang LaSalle, Inc. | 400 | 50,640 | ||||||
Kungsleden AB (Sweden) | 9,500 | 67,569 | ||||||
Lamar Advertising Co., Class A, REIT | 6,090 | 421,306 | ||||||
Life Storage, Inc., REIT | 5,630 | 523,534 | ||||||
LondonMetric Property PLC, REIT (United Kingdom) | 5,500 | 12,194 | ||||||
The Macerich Co., REIT | 2,710 | 117,289 | ||||||
Mori Trust Sogo Reit, Inc., REIT (Japan) | 40 | 58,242 | ||||||
NSI, N.V., REIT (Netherlands) | 100 | 3,907 | ||||||
Nyfosa AB (Sweden)* | 4,600 | 22,191 | ||||||
OUE Hospitality Trust (Singapore) | 31,700 | 15,580 | ||||||
Park Hotels & Resorts, Inc., REIT | 12,670 | 329,167 | ||||||
Piedmont Office Realty Trust, Inc., Class A, REIT1 | 16,810 | 286,442 | ||||||
Prologis, Inc., REIT | 3,350 | 196,712 | ||||||
Raysum Co., Ltd. (Japan) | 1,400 | 12,403 | ||||||
RDI REIT PLC, REIT (United Kingdom) | 8,000 | 2,923 | ||||||
Retail Value, Inc., REIT | 1,382 | 35,365 | ||||||
SBA Communications Corp., REIT* | 3,765 | 609,516 | ||||||
Selvaag Bolig A.S.A. (Norway) | 1,900 | 8,895 | ||||||
Senior Housing Properties Trust, REIT | 11,990 | 140,523 | ||||||
SITE Centers Corp., REIT | 14,940 | 165,386 | ||||||
Soilbuild Business Space REIT, REIT (Singapore) | 215,700 | 91,791 | ||||||
Spirit Realty Capital, Inc., REIT | 3,816 | 134,514 | ||||||
Takara Leben Co., Ltd. (Japan) | 1,300 | 3,579 | ||||||
Tanger Factory Outlet Centers, Inc., REIT 1 | 6,480 | 131,026 | ||||||
Taubman Centers, Inc., REIT | 2,280 | 103,717 | ||||||
Vastned Retail, N.V., REIT (Netherlands) | 100 | 3,585 | ||||||
Total Real Estate |
| 5,103,019 | ||||||
Utilities - 1.4% | ||||||||
American Electric Power Co., Inc. | 2,920 | 218,241 | ||||||
American Water Works Co., Inc. | 4,965 | 450,673 | ||||||
Atmos Energy Corp. | 4,870 | 451,547 | ||||||
CenterPoint Energy, Inc. | 12,345 | 348,499 | ||||||
Consolidated Edison, Inc. | 4,170 | 318,838 | ||||||
Eversource Energy | 3,610 | 234,794 | ||||||
FirstEnergy Corp. | 4,420 | 165,971 | ||||||
Italgas S.P.A. (Italy) | 5,000 | 28,673 | ||||||
Kenon Holdings, Ltd. (Singapore) | 3,900 | 58,662 | ||||||
NRG Energy, Inc. | 6,445 | 255,222 | ||||||
| The accompanying notes are an integral part of these financial statements. |
| 13 |
Table of Contents
AMG Chicago Equity Partners Balanced Fund Schedule of Portfolio Investments(continued) |
Shares | Value | |||||||
Utilities - 1.4%(continued) | ||||||||
OGE Energy Corp. | 6,290 | $246,505 | ||||||
Pinnacle West Capital Corp. | 3,460 | 294,792 | ||||||
PPL Corp.1 | 9,910 | 280,750 | ||||||
REN - Redes Energeticas Nacionais SGPS, S.A. (Portugal) | 11,100 | 31,007 | ||||||
Xcel Energy, Inc. | 3,780 | 186,241 | ||||||
Total Utilities |
| 3,570,415 | ||||||
Total Common Stocks | ||||||||
(Cost $141,951,269) | 140,770,059 | |||||||
| Principal Amount | ||||||||
Corporate Bonds and Notes - 12.9% |
| |||||||
Financials - 3.4% |
| |||||||
Aflac, Inc. | $30,000 | 27,752 | ||||||
The Allstate Corp. | 30,000 | 29,993 | ||||||
American Express Co. | 435,000 | 431,365 | ||||||
4.050%, 12/03/421 | 250,000 | 236,450 | ||||||
American Financial Group, Inc. | 25,000 | 22,518 | ||||||
Aon Corp. | 20,000 | 20,592 | ||||||
Bank of America Corp., GMTN | 1,150,000 | 1,091,753 | ||||||
Brown & Brown, Inc. | 25,000 | 24,889 | ||||||
Capital One Financial Corp. | 210,000 | 194,439 | ||||||
CBRE Services, Inc. | 210,000 | 219,040 | ||||||
EPR Properties | 25,000 | 24,769 | ||||||
The Goldman Sachs Group, Inc. | ||||||||
(3 month LIBOR + 1.510%), 3.691%, 06/05/283 | 125,000 | 116,295 | ||||||
3.850%, 01/26/27 | 700,000 | 659,126 | ||||||
Hospitality Properties Trust | 245,000 | 247,889 | ||||||
Host Hotels & Resorts, LP | ||||||||
Series F, 4.500%, 02/01/26 | 255,000 | 253,660 | ||||||
Series C, 4.750%, 03/01/23 | 170,000 | 173,843 | ||||||
JPMorgan Chase & Co. | 490,000 | 452,991 | ||||||
3.200%, 01/25/23 | 820,000 | 808,510 | ||||||
Kemper Corp. | 25,000 | 24,712 | ||||||
Principal Amount | Value | |||||||
Lazard Group LLC | $340,000 | $320,319 | ||||||
3.750%, 02/13/25 | 25,000 | 24,281 | ||||||
Mastercard, Inc. | 30,000 | 29,049 | ||||||
Mercury General Corp. | 530,000 | 513,450 | ||||||
MetLife, Inc. | 40,000 | 39,512 | ||||||
Morgan Stanley | ||||||||
(3 month LIBOR + 1.340%) 3.591%, 07/22/283 | 355,000 | 336,019 | ||||||
Old Republic International Corp. | 540,000 | 516,476 | ||||||
Omega Healthcare Investors, Inc. | 540,000 | 550,280 | ||||||
The Progressive Corp. | 330,000 | 300,796 | ||||||
4.350%, 04/25/44 | 205,000 | 209,458 | ||||||
SunTrust Bank, BKNT | 30,000 | 29,432 | ||||||
TD Ameritrade Holding Corp. | 25,000 | 24,743 | ||||||
Visa, Inc. | 210,000 | 199,107 | ||||||
2.800%, 12/14/22 | 40,000 | 39,520 | ||||||
4.150%, 12/14/35 | 240,000 | 248,655 | ||||||
Total Financials |
| 8,441,683 | ||||||
Industrials - 8.5% | ||||||||
3M Co., MTN | 20,000 | 19,431 | ||||||
AbbVie, Inc. | 700,000 | 617,746 | ||||||
Advance Auto Parts, Inc. | 25,000 | 25,614 | ||||||
Aetna, Inc. | 520,000 | 484,428 | ||||||
Agilent Technologies, Inc. | 30,000 | 30,316 | ||||||
Altria Group, Inc. | 645,000 | 522,015 | ||||||
Amazon.com, Inc. | 45,000 | 43,594 | ||||||
AmerisourceBergen Corp. | 30,000 | 25,812 | ||||||
Amgen, Inc. | 40,000 | 40,554 | ||||||
Anthem, Inc. | 40,000 | 38,691 | ||||||
Apple, Inc. | 100,000 | 94,917 | ||||||
| The accompanying notes are an integral part of these financial statements. |
| 14 |
Table of Contents
AMG Chicago Equity Partners Balanced Fund Schedule of Portfolio Investments(continued) |
Principal Amount | Value | |||||||
Industrials - 8.5%(continued) | ||||||||
Aptiv PLC (Ireland) | $25,000 | $24,357 | ||||||
AstraZeneca PLC (United Kingdom) | 35,000 | 33,600 | ||||||
AT&T, Inc. | 190,000 | 183,042 | ||||||
5.200%, 03/15/20 | 100,000 | 102,193 | ||||||
Automatic Data Processing, Inc. | 20,000 | 19,895 | ||||||
Baxter International, Inc. | 30,000 | 24,872 | ||||||
Becton Dickinson and Co. | 25,000 | 24,551 | ||||||
Best Buy Co., Inc. | 520,000 | 496,951 | ||||||
5.500%, 03/15/21 | 25,000 | 25,790 | ||||||
Biogen, Inc. | 30,000 | 31,088 | ||||||
The Boeing Co. | 275,000 | 260,800 | ||||||
2.800%, 03/01/27 | 325,000 | 310,076 | ||||||
Boston Scientific Corp. | 350,000 | 355,308 | ||||||
BP Capital Markets PLC (United Kingdom) | 55,000 | 53,254 | ||||||
3.994%, 09/26/23 | 295,000 | 301,448 | ||||||
Broadridge Financial Solutions, Inc. | 25,000 | 23,824 | ||||||
CA, Inc. | 25,000 | 23,746 | ||||||
Caterpillar Financial Services Corp., MTN | 440,000 | 428,295 | ||||||
Celanese US Holdings LLC | 25,000 | 25,719 | ||||||
Cisco Systems, Inc. | 45,000 | 44,134 | ||||||
Citrix Systems, Inc. | 530,000 | 507,494 | ||||||
Comcast Corp. | 450,000 | 423,127 | ||||||
ConocoPhillips Co. | 465,000 | 498,056 | ||||||
Costco Wholesale Corp. | 30,000 | 29,694 | ||||||
CSX Corp. | 25,000 | 24,999 | ||||||
3.700%, 10/30/20 | 495,000 | 500,403 | ||||||
Danaher Corp. | 20,000 | 19,822 | ||||||
Principal Amount | Value | |||||||
Darden Restaurants, Inc. | $30,000 | $27,678 | ||||||
Delta Air Lines, Inc. | 10,000 | 9,793 | ||||||
4.375%, 04/19/28 | 15,000 | 14,402 | ||||||
Devon Energy Corp. | 315,000 | 299,614 | ||||||
Dollar General Corp. | 235,000 | 228,152 | ||||||
DXC Technology Co. | 25,000 | 25,130 | ||||||
Eastman Chemical Co. | 25,000 | 23,117 | ||||||
Emerson Electric Co. | 30,000 | 29,601 | ||||||
Enable Midstream Partners, LP | 25,000 | 23,709 | ||||||
The Estee Lauder Cos., Inc. | 300,000 | 291,877 | ||||||
Express Scripts Holding Co. | 230,000 | 213,734 | ||||||
4.800%, 07/15/46 | 440,000 | 423,392 | ||||||
Fibria Overseas Finance, Ltd. (Brazil) | 280,000 | 285,012 | ||||||
Fidelity National Information Services, Inc. | 185,000 | 170,478 | ||||||
4.500%, 08/15/461 | 30,000 | 27,387 | ||||||
Fiserv, Inc. | 30,000 | 29,819 | ||||||
Fluor Corp. | 25,000 | 24,402 | ||||||
Gilead Sciences, Inc. | 645,000 | 601,127 | ||||||
3.250%, 09/01/221 | 50,000 | 49,908 | ||||||
Hess Corp. | 475,000 | 435,996 | ||||||
Hewlett Packard Enterprise Co. | 495,000 | 499,584 | ||||||
HollyFrontier Corp. | 430,000 | 435,308 | ||||||
The Home Depot, Inc. | 50,000 | 49,512 | ||||||
Honeywell International, Inc. | 10,000 | 9,363 | ||||||
HP, Inc. | 30,000 | 30,373 | ||||||
4.050%, 09/15/221 | 350,000 | 355,180 | ||||||
Hyatt Hotels Corp. | 25,000 | 24,635 | ||||||
Intel Corp. | 40,000 | 43,547 | ||||||
| The accompanying notes are an integral part of these financial statements. |
| 15 |
Table of Contents
AMG Chicago Equity Partners Balanced Fund Schedule of Portfolio Investments(continued) |
Principal Amount | Value | |||||||
Industrials - 8.5%(continued) |
| |||||||
International Paper Co. | $40,000 | $36,475 | ||||||
The Interpublic Group of Cos., Inc. | 10,000 | 9,504 | ||||||
John Deere Capital Corp., MTN | 40,000 | 39,638 | ||||||
3.050%, 01/06/28 | 530,000 | 504,568 | ||||||
Kerr-McGee Corp. | 30,000 | 33,484 | ||||||
Keysight Technologies, Inc. | 25,000 | 25,137 | ||||||
Kinder Morgan, Inc. | 50,000 | 49,028 | ||||||
KLA-Tencor Corp. | 25,000 | 25,419 | ||||||
Kohl’s Corp. | 485,000 | 479,262 | ||||||
The Kroger Co. | 290,000 | 295,596 | ||||||
Lockheed Martin Corp. | 40,000 | 39,753 | ||||||
Lowe’s Cos., Inc. | 35,000 | 33,161 | ||||||
LYB International Finance BV (Netherlands) | 225,000 | 215,224 | ||||||
LYB International Finance II BV (Netherlands) | 200,000 | 182,381 | ||||||
Macy’s Retail Holdings, Inc. | 510,000 | 472,668 | ||||||
Marathon Oil Corp. | 15,000 | 14,278 | ||||||
McDonald’s Corp., MTN | 40,000 | 41,110 | ||||||
Merck & Co., Inc. | 35,000 | 34,550 | ||||||
3.600%, 09/15/42 | 210,000 | 198,826 | ||||||
Micron Technology, Inc. | 335,000 | 329,556 | ||||||
Microsoft Corp. | 85,000 | 84,282 | ||||||
NetApp, Inc. | 180,000 | 171,583 | ||||||
3.375%, 06/15/21 | 25,000 | 24,920 | ||||||
NIKE, Inc. | 30,000 | 27,778 | ||||||
Nordstrom, Inc. | 30,000 | 28,383 | ||||||
Norfolk Southern Corp. | 20,000 | 19,675 | ||||||
3.850%, 01/15/24 | 170,000 | 172,267 | ||||||
Principal Amount | Value | |||||||
Norfolk Southern Corp. | $15,000 | $15,594 | ||||||
Occidental Petroleum Corp. | 235,000 | 233,845 | ||||||
ONEOK Partners, LP | 30,000 | 30,062 | ||||||
6.125%, 02/01/41 | 235,000 | 242,851 | ||||||
Oracle Corp. | 80,000 | 77,247 | ||||||
O’Reilly Automotive, Inc. | 30,000 | 29,930 | ||||||
Pfizer, Inc. | 50,000 | 48,328 | ||||||
Philip Morris International, Inc. | 45,000 | 43,313 | ||||||
4.375%, 11/15/41 | 610,000 | 555,906 | ||||||
Phillips 66 | 25,000 | 24,484 | ||||||
Praxair, Inc. | 30,000 | 30,037 | ||||||
QUALCOMM, Inc. | 605,000 | 577,525 | ||||||
Ralph Lauren Corp. | 25,000 | 24,737 | ||||||
Raytheon Co. | 30,000 | 30,452 | ||||||
Reliance Steel & Aluminum Co. | 25,000 | 25,302 | ||||||
S&P Global, Inc. | 30,000 | 30,070 | ||||||
Shell International Finance BV (Netherlands) | 60,000 | 57,736 | ||||||
2.500%, 09/12/26 | 660,000 | 613,268 | ||||||
The Sherwin-Williams Co. | 35,000 | 29,533 | ||||||
Shire Acquisitions Investments Ireland DAC (Ireland) | 40,000 | 36,257 | ||||||
Spirit AeroSystems, Inc. | 25,000 | 23,030 | ||||||
Stanley Black & Decker, Inc. | 15,000 | 16,400 | ||||||
Target Corp. | 300,000 | 280,357 | ||||||
4.000%, 07/01/42 | 235,000 | 222,111 | ||||||
The TJX Cos., Inc. | 30,000 | 27,247 | ||||||
Total System Services, Inc. | 25,000 | 25,232 | ||||||
Toyota Motor Credit Corp., MTN | 400,000 | 411,439 | ||||||
| The accompanying notes are an integral part of these financial statements. |
| 16 |
Table of Contents
AMG Chicago Equity Partners Balanced Fund Schedule of Portfolio Investments(continued) |
Principal Amount | Value | |||||||
Industrials - 8.5%(continued) |
| |||||||
Union Pacific Corp. | $10,000 | $10,057 | ||||||
4.000%, 04/15/47 | 250,000 | 233,961 | ||||||
United Technologies Corp. | 50,000 | 46,265 | ||||||
UnitedHealth Group, Inc. | 55,000 | 54,646 | ||||||
Vale Overseas, Ltd. (Brazil) | 525,000 | 568,312 | ||||||
Verisk Analytics, Inc. | 25,000 | 25,394 | ||||||
Verizon Communications, Inc. | 855,000 | 800,820 | ||||||
4.750%, 11/01/41 | 100,000 | 97,287 | ||||||
VF Corp. | 25,000 | 25,214 | ||||||
VMware, Inc. | 30,000 | 26,658 | ||||||
Walmart, Inc. | 35,000 | 34,461 | ||||||
4.000%, 04/11/431 | 25,000 | 24,928 | ||||||
Waste Management, Inc. | 30,000 | 30,711 | ||||||
Westlake Chemical Corp. | 25,000 | 22,909 | ||||||
WW Grainger, Inc. | 450,000 | 463,383 | ||||||
Zoetis, Inc. | 30,000 | 30,096 | ||||||
Total Industrials |
| 21,267,387 | ||||||
Utilities - 1.0% | ||||||||
BP Capital Markets America, Inc. | 245,000 | 246,133 | ||||||
Commonwealth Edison Co. | ||||||||
Series 122 2.950%, 08/15/27 | 485,000 | 466,884 | ||||||
Enterprise Products Operating LLC | 20,000 | 20,192 | ||||||
Exelon Generation Co. LLC | 245,000 | 244,550 | ||||||
Florida Power & Light Co. | 40,000 | 39,169 | ||||||
Georgia Power Co. | ||||||||
Series10-C 4.750%, 09/01/40 | 285,000 | 282,740 | ||||||
IPALCO Enterprises, Inc. | 25,000 | 24,362 | ||||||
National Fuel Gas Co. | 425,000 | 419,962 | ||||||
Principal Amount | Value | |||||||
NextEra Energy Capital Holdings, Inc. | $460,000 | $439,733 | ||||||
PacifiCorp | 280,000 | 272,496 | ||||||
Plains All American Pipeline, LP / PAA Finance Corp. | 35,000 | 33,768 | ||||||
Total Utilities | 2,489,989 | |||||||
Total Corporate Bonds and Notes | ||||||||
(Cost $32,634,134) | 32,199,059 | |||||||
U.S. Government and AgencyObligations - 28.9% |
| |||||||
Fannie Mae - 3.5% |
| |||||||
Federal National Mortgage Association | 510,000 | 494,867 | ||||||
1.625%, 01/21/20 | 425,000 | 420,814 | ||||||
2.625%, 09/06/24 | 345,000 | 344,069 | ||||||
FNMA | 48,620 | 47,514 | ||||||
2.500%, 04/01/28 to 05/01/43 | 1,543,232 | 1,485,001 | ||||||
3.000%, 03/01/42 to 01/01/47 | 1,394,882 | 1,364,824 | ||||||
3.500%, 11/01/25 to 08/01/48 | 2,411,036 | 2,420,489 | ||||||
4.000%, 12/01/21 to 07/01/48 | 1,261,129 | 1,288,000 | ||||||
4.500%, 06/01/39 to 09/01/43 | 598,643 | 627,265 | ||||||
5.000%, 09/01/33 to 10/01/41 | 254,893 | 270,728 | ||||||
5.500%, 02/01/35 to 05/01/39 | 119,729 | 128,336 | ||||||
Total Fannie Mae |
| 8,891,907 | ||||||
Freddie Mac - 8.0% | ||||||||
Federal Home Loan Mortgage Corp. 1.375%, 05/01/20 | 170,000 | 167,397 | ||||||
2.375%, 01/13/22 | 490,000 | 488,261 | ||||||
FHLMC Gold Pool | 1,180,025 | 1,134,977 | ||||||
3.000%, 01/01/29 to 01/01/48 | 6,221,198 | 6,108,316 | ||||||
3.500%, 03/01/42 to 09/01/48 | 6,536,296 | 6,553,039 | ||||||
4.000%, 03/01/44 to 09/01/48 | 3,978,479 | 4,063,679 | ||||||
4.500%, 02/01/39 to 04/01/44 | 731,136 | 761,302 | ||||||
5.000%, 07/01/35 to 07/01/41 | 580,777 | 615,968 | ||||||
5.500%, 04/01/38 to 01/01/39 | 35,170 | 37,853 | ||||||
Total Freddie Mac |
| 19,930,792 | ||||||
U.S. Treasury Obligations - 17.4% |
| |||||||
U.S. Treasury Notes | 2,065,000 | 1,995,790 | ||||||
1.375%, 05/31/20 to 08/31/20 | 3,915,000 | 3,846,522 | ||||||
1.500%, 01/31/22 | 3,900,000 | 3,789,551 | ||||||
1.625%, 07/31/20 to 10/31/23 | 5,765,000 | 5,599,031 | ||||||
1.750%, 11/15/20 to 06/30/22 | 3,390,000 | 3,320,973 | ||||||
1.875%, 06/30/20 to 11/30/21 | 2,950,000 | 2,910,146 | ||||||
2.000%, 02/28/21 to 02/15/25 | 3,905,000 | 3,821,893 | ||||||
2.125%, 12/31/21 | 1,310,000 | 1,297,412 | ||||||
2.250%, 03/31/20 to 11/15/25 | 3,035,000 | 2,995,837 | ||||||
2.375%, 08/15/24 | 1,145,000 | 1,134,847 | ||||||
2.500%, 06/30/20 to 05/15/24 | 4,360,000 | 4,356,602 | ||||||
2.625%, 06/15/21 | 2,850,000 | 2,860,187 | ||||||
| The accompanying notes are an integral part of these financial statements. |
| 17 |
Table of Contents
AMG Chicago Equity Partners Balanced Fund Schedule of Portfolio Investments(continued) |
Principal Amount | Value | |||||||
U.S. Treasury Obligations - 17.4% |
| |||||||
U.S. Treasury Bonds | $1,330,000 | $1,260,019 | ||||||
3.000%, 11/15/45 to 02/15/48 | 2,845,000 | 2,834,772 | ||||||
3.125%, 05/15/48 | 1,510,000 | 1,539,109 | ||||||
Total U.S. Treasury Obligations |
| 43,562,691 | ||||||
Total U.S. Government and Agency Obligations | ||||||||
(Cost $72,793,789) | 72,385,390 | |||||||
| Shares | ||||||||
Preferred Stock - 0.0%# |
| |||||||
Industrials - 0.0%# | ||||||||
Sixt SE (Germany) | 150 | 8,260 | ||||||
| Principal Amount | ||||||||
Short-Term Investments - 1.9% |
| |||||||
Joint Repurchase Agreements - 0.9%4 |
| |||||||
Cantor Fitzgerald Securities, Inc., dated 12/31/18, due 01/02/19, 3.350% total to be received $1,000,186 (collateralized by various U.S. Government Agency Obligations and U.S. Treasuries, 0.000% - 10.000%, 01/25/19 -10/20/68, totaling $1,020,000) | $1,000,000 | 1,000,000 | ||||||
Deutsche Bank Securities, Inc., dated 12/31/18, due 01/02/19, 2.950% total to be received $307,905 (collateralized by U.S. Government Agency Obligation, 4.125%, 03/13/20, totaling $314,019) | 307,855 | 307,855 | ||||||
Principal Amount | Value | |||||||
RBC Dominion Securities, Inc., dated 12/31/18, due 01/02/19, 3.020% total to be received $1,000,168 (collateralized by various U.S. Government Agency Obligations, 3.000%- 7.000%, 10/01/25 - 10/20/48, totaling $1,020,000) | $1,000,000 | $1,000,000 | ||||||
Total Joint Repurchase Agreements |
| 2,307,855 | ||||||
| Shares | ||||||||
Other Investment Companies - 1.0% |
| |||||||
Dreyfus Government Cash Management Fund, Institutional Shares, 2.29%5 | 835,172 | 835,172 | ||||||
Dreyfus Institutional Preferred Government Money Market Fund, Institutional Shares, 2.40%5 | 835,172 | 835,172 | ||||||
JPMorgan U.S. Government Money Market Fund, IM Shares, 2.36%5 | 860,480 | 860,480 | ||||||
Total Other Investment Companies | 2,530,824 | |||||||
Total Short-Term Investments | ||||||||
(Cost $4,838,679) | 4,838,679 | |||||||
Total Investments - 100.0% |
| 250,201,447 | ||||||
Other Assets, less Liabilities - 0.0%# |
| 52,038 | ||||||
Net Assets - 100.0% | $250,253,485 | |||||||
| * | Non-income producing security. |
| # | Less than 0.05%. |
| 1 | Some or all of these securities, amounting to $12,415,179 or 5.0% of net assets, were out on loan to various brokers and are collateralized by cash and various U.S. Treasury Obligations. See Note 4 of Notes to Financial Statements. |
| 2 | Security exempt from registration under Rule 144A of the Securities Act of 1933. This security may be resold in transactions exempt from registration, normally to qualified buyers. At December 31, 2018, the value of these securities amounted to $89,226 or less than 0.1% of net assets. |
| 3 | Variable rate security. The rate shown is based on the latest available information as of December 31, 2018. |
| 4 | Cash collateral received from brokers for securities lending was invested in these joint repurchase agreements. |
| 5 | Yield shown represents the December 31, 2018, seven day average yield, which refers to the sum of the previous seven days’ dividends paid, expressed as an annual percentage. |
| BKNT | Bank Note |
| FHLMC | Freddie Mac |
| FNMA | Fannie Mae |
| GMTN | Global Medium-Term Notes |
| LIBOR | London Interbank Offered Rate |
| MTN | Medium-Term Note |
| REIT | Real Estate Investment Trust |
| SDR | Sponsored Depositary Receipt |
| The accompanying notes are an integral part of these financial statements. |
| 18 |
Table of Contents
AMG Chicago Equity Partners Balanced Fund Schedule of Portfolio Investments(continued) |
The following table summarizes the inputs used to value the Fund’s investments by the fair value hierarchy levels as of December 31, 2018:
| Level 1 | Level 21 | Level 3 | Total | |||||||||||||
Investments in Securities | ||||||||||||||||
Common Stocks | ||||||||||||||||
Information Technology | $33,251,375 | $482,478 | — | $33,733,853 | ||||||||||||
Health Care | 20,093,076 | 330,504 | — | 20,423,580 | ||||||||||||
Consumer Discretionary | 17,021,369 | 647,045 | — | 17,668,414 | ||||||||||||
Industrials | 14,590,056 | 1,113,520 | — | 15,703,576 | ||||||||||||
Financials | 14,808,010 | 756,660 | — | 15,564,670 | ||||||||||||
Consumer Staples | 9,826,874 | 431,016 | — | 10,257,890 | ||||||||||||
Communication Services | 9,594,081 | 312,742 | — | 9,906,823 | ||||||||||||
Real Estate | 4,584,554 | 518,465 | — | 5,103,019 | ||||||||||||
Energy | 4,573,580 | 346,613 | — | 4,920,193 | ||||||||||||
Materials | 3,686,883 | 230,743 | — | 3,917,626 | ||||||||||||
Utilities | 3,452,073 | 118,342 | — | 3,570,415 | ||||||||||||
Corporate Bonds and Notes† | — | 32,199,059 | — | 32,199,059 | ||||||||||||
U.S. Government and Agency Obligations† | — | 72,385,390 | — | 72,385,390 | ||||||||||||
Preferred Stock†† | — | 8,260 | — | 8,260 | ||||||||||||
Short-Term Investments | ||||||||||||||||
Joint Repurchase Agreements | — | 2,307,855 | — | 2,307,855 | ||||||||||||
Other Investment Companies | 2,530,824 | — | — | 2,530,824 | ||||||||||||
|
|
|
|
|
|
|
| |||||||||
Total Investments in Securities | $ | 138,012,755 | $ | 112,188,692 | — | $ | 250,201,447 | |||||||||
|
|
|
|
|
|
|
| |||||||||
| † | All corporate bonds and notes and U.S. government and agency obligations held in the Fund are Level 2 securities. For a detailed breakout of corporate bonds and notes and U.S. government and agency obligations by major industry or agency classification, please refer to the Fund’s Schedule of Portfolio Investments. |
| †† | All preferred stocks held in the Fund are Level 2 securities. For a detailed breakout of preferred stocks by major industry classification, please refer to the Fund’s Schedule of Portfolio Investments. |
| 1 | An external pricing service is used to reflect any impact on security value due to market movements between the time the Fund valued such foreign securities and the earlier closing of foreign markets. |
During the fiscal year ended December 31, 2018, a Level 3 security transferred from Level 3 to Level 2 and was subsequently sold, generating a realized gain of $2,680.
| The accompanying notes are an integral part of these financial statements. |
| 19 |
Table of Contents
AMG Chicago Equity Partners Balanced Fund Schedule of Portfolio Investments(continued) |
Country | % of Long-Term Investments | ||||
Australia
| 0.2
| ||||
Belgium
| 0.0#
| ||||
Bermuda
| 0.2
| ||||
Brazil
| 0.3
| ||||
Canada
| 0.1
| ||||
Denmark
| 0.1
| ||||
Faroe Islands
| 0.0#
| ||||
Finland
| 0.0#
| ||||
France
| 0.1
| ||||
Georgia
| 0.0#
| ||||
Germany
| 0.1
| ||||
Gibraltar
| 0.0#
| ||||
Hong Kong
| 0.1
| ||||
Ireland
| 1.2
| ||||
Israel
| 0.1
| ||||
Italy
| 0.0#
| ||||
Japan
| 0.8
| ||||
Malta
| 0.0#
| ||||
Netherlands
| 0.4
| ||||
New Zealand
| 0.0#
| ||||
Norway
| 0.1
| ||||
Peru
| 0.2
| ||||
Portugal
| 0.0#
| ||||
Russia
| 0.0#
| ||||
Singapore
| 0.1
| ||||
Spain
| 0.0#
| ||||
Sweden
| 0.2
| ||||
Switzerland
| 0.1
| ||||
United Kingdom
| 0.6
| ||||
United States
| 95.0
| ||||
| 100.0
| |||||
# Less than 0.05%.
| The accompanying notes are an integral part of these financial statements. |
| 20 |
Table of Contents
THE YEAR IN REVIEW
During the year ended December 31, 2018, the AMG Managers Amundi Intermediate Government Fund (the “Fund”) (Class N shares) returned-0.27%, while the FTSE Mortgage Index returned +1.01%.
Agency Mortgage-Backed Security (“MBS”) spreads leaked modestly wider during the first quarter. This led to consistent underperformance of MBS relative to swap and Treasury hedges. The Treasury curve steepened early in the quarter, but reversed course late and finished modestly flatter, supporting lower coupon30-year MBS relative to higher coupons. The cheapening of higher coupons occurred despite a very favorable prepayment environment, as prepayment rates continued to drop during the first quarter.
Fixed income markets proved to be a bit skittish in the second quarter, as fears of trade wars weighed heavily. Most spread sectors widened during the quarter and agency MBS were no exception. Treasury rates were modestly higher with a flatter curve as the Federal Reserve continued to tighten monetary policy, causing lower coupon 30-year MBS to again outperform higher coupons. Government National Mortgage Association (“GNMA”) MBS traded well during the quarter as the agency took steps to curtail “churning” activity by certain servicers.
Interest rates continued their march higher in the third quarter and the curve continued to flatten. Continued economic strength helped corporate spreads narrow while agency MBS spreads were pushed wider by summer supply and higher rates. Treasury rates were higher again with a flatter curve as the Fed continued to tighten monetary policy. The curve move helped support lower coupon MBS again, but the performance difference was smaller across the coupon stack this quarter. GNMA MBS continued to trade well during the quarter as the agency took additional steps to curtail churning”. GNMA MBS valuations approached rich levels.
Interest rates continued to rise to start the fourth quarter, reaching levels not seen since 2011. However, after peaking in early November, interest rates reversed course in a dramatic fashion as the10-year Treasury rate went from a high of 3.24% down to 2.68% to finish the year. The curve also reversed course after starting the quarter steeper | and then finishing substantially flatter. The curve flattening again helped lower coupons relative to higher coupons. Equities moved down during the quarter and the selloff picked up steam in December, when they turned in their worst December performance since 1931. MBS spreads widened in sympathy as all risk markets underperformed. The Federal Reserve raised rates again in December, but appears to be on hold to start 2019. GNMA MBS were slightly weaker in the fourth quarter after better performance in the prior quarter.
The Fed made their last material purchase of MBS in the fourth quarter, as the runoff from their portfolio fell below the reinvestment cap. In the minutes from the December meeting, members of the Federal Open Market Committee (“FOMC”) did mention the possibility of future MBS sales following balance sheet normalization. We do not anticipate this happening in the near term, and should it eventually occur, it would likely be limited to reducing the MBS portfolio by $20 billion a month between paydowns and sales.
PERFORMANCE AND POSITIONING
FRMs (Fixed-Rate MBS) were the largest negative contributor to performance in 2018. The Fund was overweight higher coupons which underperformed as the curve flattened, even as prepayment rates remained low. Our Asset-Backed Security (“ABS”) exposure provided a small positive contribution to the Fund’s performance. Agency Collateralized Mortgage Obligations (“CMOs”) were a small negative for performance.
During 2018,30-year agency FRMs continued to account for the majority of the portfolio exposure, generally ranging between 105% and 110% of capital. We reduced our exposure to15-year agency FRMs by-4.4% from 5.7% to 1.3% byyear-end. We also reduced our ABS exposure from 7% to 4% over the course of the year. We have maintained our agency CMO exposure at approximately 2% of capital.
The Fund held both U.S. Treasury and swap futures throughout the year. These derivative positions were held primarily to hedge the effective duration (i.e., interest rate risk) of the total portfolio. In general, the presence of these positions reduced the portfolio duration by-0.34% to 0.62%. | LOOKING FORWARD
With the Federal Reserve (the “Fed”) no longer making substantial purchases of MBS because of their balance sheet reduction targets, the large marginal buyers will now drive the market. These include banks, money managers, international investors, and others. These investors will have different opportunity sets they will be evaluating when looking at the MBS market. For money managers, the recent dramatic widening in corporate bond spreads changed the relative attractiveness of MBS. International investors who hedge their purchases have seen the cost of hedging increase as the Federal Reserve has raised short-term rates. The MBS market is now priced more attractively than it has been for much of the time the Fed was actively making large purchases. It should provide better but more volatile returns going forward.
The rates market is not pricing any moves this year from the Fed. Global growth concerns have increased and the Fed appears to be in await-and-see mode on more hikes. Unless inflation or the economy picks up materially, we do not think they will raise rates.
The U.S. housing market has started to show signs of slowing. Certain high-cost markets inhigh-tax states have seen cooling as a result of last year’s tax reform. The increase in mortgage rates through the first ten months of the year also had a slowing effect. We do not anticipate that any significant problems will come from the mortgage sector even if we enter another recession. The market has been so focused on what happened in the financial crisis that market segments that were the cause of problems then will not cause major problems in the next recession. Banks and securitized products should perform fine in the next downturn. Areas that did not have major problems in the last recession, like investment grade corporates and the leveraged loan market, would be of more concern in the next recession.
This commentary reflects the viewpoints of Amundi Pioneer Institutional Asset Management, Inc. as of December 31, 2018, and is not intended as a forecast or guarantee of future results. |
| 21 |
Table of Contents
AMG Managers Amundi Intermediate Government Fund Portfolio Manager’s Comments(continued) |
CUMULATIVE TOTAL RETURN PERFORMANCE
AMG Managers Amundi Intermediate Government Fund’s cumulative total return is based on the daily change in net asset value (NAV), and assumes that all dividends and distributions were reinvested. This graph compares a hypothetical $10,000 investment made in the AMG Managers Amundi Intermediate Government Fund’s Class N shares on December 31, 2008, to a $10,000 investment made in the FTSE Mortgage Index and the Bloomberg Barclays U.S. Aggregate Bond Index for the same time period. The graph and table do not reflect the deduction of taxes that a shareholder would pay on a Fund distribution or redemption of shares. The listed returns for the Fund are net of expenses and the returns for the index exclude expenses. Total returns would have been lower had certain expenses not been reduced.

The table below shows the average annual total returns for the AMG Managers Amundi Intermediate Government Fund and the Bloomberg Barclays U.S. Aggregate Bond Index and the FTSE Mortgage Index for the same time periods ended December 31, 2018.
| Average Annual Total Returns1 | One Year | Five Years | Ten Years | Since Inception | Inception Date | |||||||||||||||||
AMG Managers Amundi Intermediate Government Fund2,3, 4, 5, 6
|
| |||||||||||||||||||||
Class N | (0.27 | %) | 2.08 | % | 3.73 | % | 5.26 | % | 03/31/92 | |||||||||||||
Class I | (0.17 | %) | — | — | 0.52 | % | 02/24/17 | |||||||||||||||
Class Z | (0.22 | %) | — | — | 0.50 | % | 02/24/17 | |||||||||||||||
FTSE Mortgage Index7 | 1.01 | % | 2.53 | % | 3.11 | % | 5.34 | % | 03/31/92 | † | ||||||||||||
Bloomberg Barclays U.S. Aggregate Bond Index8 | 0.01 | % | 2.52 | % | 3.48 | % | 5.44 | % | 03/31/92 | † | ||||||||||||
The performance data shown represents past performance. Past performance is not a guarantee of future results. Current performance may be lower or higher than the performance data quoted. The investment return and principal value of an investment will fluctuate so that an investor’s shares, when redeemed, may be worth more or less than their original cost.
Investors should carefully consider the Fund’s investment objectives, risks, charges and expenses before investing. For performance information through the most recent month end, current net asset values per share for the Fund and other information, please call 800.835.3879 or visit our website at amgfunds.com for a free prospectus. Read it carefully before investing or sending money.
Distributed by AMG Distributors, Inc., member FINRA/SIPC.
| † | Date reflects inception date of the Fund, not the index. |
1 Total return equals income yield plus share price change and assumes reinvestment of all dividends and capital gain distributions. Returns are net of fees and may reflect offsets of Fund expenses as described in the prospectus. No adjustment has been made for taxes payable by shareholders on their reinvested dividends and capital gain distributions. Returns for periods greater than one year are annualized. The listed returns on the Fund are net of expenses and based on the published NAV as of December 31, 2018. All returns are in U.S. dollars ($).
2 From time to time the Fund’s advisor has waived its fees and/or absorbed Fund expenses, which has resulted in higher returns.
3 The Fund is subject to the risks associated with investments in debt securities, such as default risk and fluctuations in the perception of the debtor’s ability to pay its creditors. Changing interest rates may adversely affect the value of an investment. An increase in interest rates typically causes the value of bonds and other fixed income securities to fall.
4 The Fund may invest in derivatives such as options and futures; the complexity and rapidly changing structure of derivatives markets may increase the possibility of market losses.
5 Many bonds have call provisions which allow the debtors to pay them back before maturity. This is especially true with mortgage securities, which can be paid back anytime. Typically debtors prepay their debt when it is to their advantage (when interest rates drop making a new loan at current rates more attractive), and thus likely to the disadvantage of bondholders, who may have to reinvest prepayment proceeds in securities with lower yields. Prepayment risk will vary depending on the provisions of the security and current interest rates relative to the interest rate of the debt.
6 Obligations of certain government agencies are not backed by the full faith and credit of the U.S. government. If one of these agencies defaulted on a loan, there is no guarantee that the U.S. government would provide financial support. Additionally, debt securities of the U.S. government may be affected by changing interest rates and subject to prepayment risk.
7 The FTSE Mortgage Index includes all outstanding government sponsored fixed-rate mortgage-backed securities, weighted in proportion to their current market capitalization. The Index reflects no deductions for fees, expenses, or taxes. Prior to July 31, 2018, the FTSE Mortgage Index was known as the Citigroup Mortgage Index. Unlike the Fund, the FTSE Mortgage Index is unmanaged, is not available for investment and does not incur expenses.
8 The Bloomberg Barclays U.S. Aggregate Bond Index is an index of the U.S. investment-grade fixed-rate bond market, including both government and corporate bonds. Unlike the Fund, the Bloomberg Barclays
|
| 22 |
Table of Contents
AMG Managers Amundi Intermediate Government Fund Portfolio Manager’s Comments(continued) |
U.S. Aggregate Bond Index is unmanaged, is not available for investment and does not incur expenses.
Source: Bloomberg Index Services Limited. BLOOMBERG® is a trademark and service mark of Bloomberg Finance L.P. and its affiliates (collectively “Bloomberg”). BARCLAYS® is a trademark and service mark of Barclays Bank Plc (collectively with its | affiliates, “Barclays”), used under license. Bloomberg or Bloomberg’s licensors, including Barclays, own all proprietary rights in the Bloomberg Barclays Indices. Neither Bloomberg nor Barclays approves or endorses this material, or guarantees the accuracy or completeness of any information herein, or makes any warranty, express or implied, as to the results to be obtained therefrom and, to the maximum extent | allowed by law, neither shall have any liability or responsibility for injury or damages arising in connection therewith.
Not FDIC insured, nor bank guaranteed. May lose value. |
| 23 |
Table of Contents
AMG Managers Amundi Intermediate Government Fund Fund Snapshots(unaudited) December 31, 2018 |
PORTFOLIO BREAKDOWN
| Category | % of Net Assets | |
U.S. Government and Agency Obligations | 122.1 | |
Asset-Backed Securities | 3.6 | |
Mortgage-Backed Securities | 0.5 | |
Short-Term Investments | 17.0 | |
Other Assets Less Liabilities1 | (43.2) | |
| 1 | Includes payable for delayed delivery securities. |
| Rating | % of Market Value1 | |
U.S. Government and Agency Obligations | 96.7 | |
Aaa | 2.9 | |
A | 0.02 | |
Ba | 0.1 | |
B | 0.2 | |
N/R | 0.1 | |
| 1 | Includes market value of long-term fixed-income securities only. |
| 2 | Less than 0.05% |
TOP TEN HOLDINGS
| Security Name | % of Net Assets | |
FHLMC Gold Pool, 4.000%, TBA 30 years
| 19.7
| |
FNMA, 4.000%, TBA 30 years
| 12.7
| |
FNMA, 4.500%, TBA 30 years
| 5.6
| |
FHLMC Gold Pool, 3.500%, TBA 30 years
| 4.1
| |
Progress Residential Trust, Series 2015-SFR2, Class A, 2.740%, 06/12/32
| 3.6
| |
FNMA, 4.000%, 09/01/55
| 3.0
| |
FNMA, 3.000%, 06/01/45
| 2.7
| |
FNMA, 4.500%, 09/01/53
| 2.4
| |
FNMA, 5.000%, 08/01/40
| 2.1
| |
GNMA, 3.500%, 11/20/45
| 2.1
| |
| ||
Top Ten as a Group
| 58.0
| |
| ||
Credit quality ratings shown above reflect the highest rating assigned by either Standard & Poor’s (“S&P”) or Moody’s Investors Service, Inc. (“Moody’s”). These rating agencies are independent, nationally recognized statistical rating organizations and are widely used. Investment grade ratings are credit ratings of BBB/Baa or higher. Below investment grade ratings are credit ratings of BB/Ba or lower. Investments designated N/R are not rated by either rating agency. Unrated investments do not necessarily indicate low credit quality. Credit quality ratings are subject to change.
Because a fund’s strategy may result in multiple investments in particular sectors of the economy, its performance may depend on the performance of those sectors and may fluctuate more widely than investments diversified across more sectors. For additional information on these and other risk considerations, please see the Fund’s prospectus.
Any sectors, industries, or securities discussed should not be perceived as investment recommendations. Mention of a specific security should not be considered a recommendation to buy or solicitation to sell that security. Specific securities mentioned in this report may have been sold from the Fund’s portfolio of investments by the time you receive this report.
| 24 |
Table of Contents
AMG Managers Amundi Intermediate Government Fund Schedule of Portfolio Investments December 31, 2018 |
Principal Amount | Value | |||||||
Asset-Backed Security - 3.6% | ||||||||
Progress Residential Trust | ||||||||
Series 2015-SFR2, Class A | $2,948,845 | $2,910,435 | ||||||
Total Asset-Backed Security | 2,910,435 | |||||||
Mortgage-Backed Securities - 0.5% | ||||||||
American Home Mortgage Assets Trust | ||||||||
Series2005-1, Class 1A1 4.453%, 11/25/352 | 41,568 | 36,411 | ||||||
American Home Mortgage Investment Trust | ||||||||
Series2004-1, Class 4A | ||||||||
(6 month LIBOR + 2.000%), 4.885%, 04/25/443 | 78,960 | 76,712 | ||||||
Banc of America Funding | ||||||||
Series2004-B, Class 1A2 3.711%, 12/20/342 | 59,275 | 46,805 | ||||||
GSR Mortgage Loan Trust | ||||||||
Series2004-5, Class 1A3 | ||||||||
(U.S. Treasury Yield Curve CMT 1 year + 1.750%), 4.440%, 05/25/343 | 10,098 | 9,908 | ||||||
Reperforming Loan REMIC Trust | ||||||||
Series2004-R2, Class 1AF1 | ||||||||
(1 month LIBOR + 0.420%), 2.926%, 11/25/341,3 | 57,047 | 51,745 | ||||||
Structured Asset Securities Corp. | ||||||||
Series2005-RF1, Class A | ||||||||
(1 month LIBOR + 0.350%), 2.856%, 03/25/351,3 | 143,504 | 132,830 | ||||||
Wells Fargo Mortgage Backed Securities Trust | ||||||||
Series2007-16, Class 1A1 6.000%, 12/28/37 | 54,415 | 53,789 | ||||||
Total Mortgage-Backed Securities | 408,200 | |||||||
U.S. Government and Agency Obligations - 122.1% | ||||||||
Fannie Mae - 50.4% |
| |||||||
FNMA | 576,525 | 546,844 | ||||||
3.000%, 01/01/43 to 06/01/45 | 3,856,449 | 3,785,443 | ||||||
3.500%, 05/01/42 to 10/01/45 | 6,138,242 | 6,166,620 | ||||||
3.500%, TBA 30 years4,5 | 400,000 | 399,930 | ||||||
4.000%, 12/01/26 to 09/01/55 | 6,088,690 | 6,241,331 | ||||||
4.000%, TBA 30 years4,5 | 10,100,000 | 10,295,687 | ||||||
(6 month LIBOR + 1.600%), 4.224%, 06/01/343 | 265,794 | 274,217 | ||||||
(12 month LIBOR + 1.654%), 4.338%, 08/01/343 | 69,914 | 72,788 | ||||||
4.500%, 11/01/26 to 09/01/53 | 3,605,093 | 3,772,493 | ||||||
4.500%, TBA 30 years4,5 | 4,400,000 | 4,556,148 | ||||||
4.750%, 07/01/34 to 09/01/34 | 171,339 | 179,855 | ||||||
5.000%, 08/01/40 | 1,564,310 | 1,661,649 | ||||||
5.500%, 01/01/19 to 08/01/41 | 1,462,280 | 1,552,587 | ||||||
6.000%, 11/01/22 to 06/01/39 | 529,196 | 561,353 | ||||||
6.500%, 07/01/32 | 57,147 | 57,693 | ||||||
7.000%, 11/01/22 | 110,142 | 113,537 | ||||||
| Principal Amount | Value | |||||||
FNMA REMICS | ||||||||
Series2005-13, Class AF (1 month LIBOR + 0.400%), 2.906%, 03/25/353 | $170,813 | $171,274 | ||||||
Series1994-55, Class H 7.000%, 03/25/24 | 227,732 | 246,240 | ||||||
FNMA REMICS Whole Loan | ||||||||
Series2003-W4, Class 4A 7.500%, 10/25/422 | 44,796 | 49,446 | ||||||
Total Fannie Mae | 40,705,135 | |||||||
Freddie Mac - 36.4% |
| |||||||
FHLMC Gold Pool | 1,874,695 | 1,835,577 | ||||||
3.500%, 04/01/32 to 02/01/47 | 2,732,115 | 2,760,501 | ||||||
3.500%, TBA 30 years4,5 | 3,300,000 | 3,298,101 | ||||||
4.000%, 09/01/31 | 250,609 | 257,377 | ||||||
4.000%, TBA 30 years4,5 | 15,600,000 | 15,903,164 | ||||||
4.500%, 05/01/23 to 09/01/41 | 1,214,261 | 1,265,007 | ||||||
5.000%, 10/01/19 to 06/01/41 | 1,694,710 | 1,796,262 | ||||||
5.500%, 01/01/19 to 01/01/39 | 1,261,417 | 1,348,841 | ||||||
6.000%, 09/01/21 to 01/01/24 | 93,998 | 96,283 | ||||||
7.000%, 07/01/19 | 5,994 | 6,003 | ||||||
7.500%, 07/01/34 | 414,315 | 473,726 | ||||||
FHLMC | ||||||||
(U.S. Treasury Yield Curve CMT 1 year + 2.224%), 4.717%, 11/01/333 | 310,829 | 326,465 | ||||||
Total Freddie Mac | 29,367,307 | |||||||
Ginnie Mae - 33.6% |
| |||||||
GNMA | 2,787,223 | 2,755,413 | ||||||
3.500%, 08/15/43 to 11/20/45 | 6,847,349 | 6,902,380 | ||||||
4.000%, 06/20/43 to 04/20/47 | 11,228,653 | 11,544,270 | ||||||
4.500%, 05/15/39 to 02/15/46 | 2,065,581 | 2,164,307 | ||||||
5.000%, 12/15/35 to 12/15/45 | 2,906,761 | 3,072,528 | ||||||
5.500%, 10/15/39 to 11/15/39 | 681,928 | 735,308 | ||||||
7.500%, 11/15/31 | 4,241 | 4,687 | ||||||
Total Ginnie Mae | 27,178,893 | |||||||
Interest Only Strip - 1.7% |
| |||||||
FHLMC | ||||||||
Series 212, Class IO 6.000%, 05/15/31 | 647 | 136 | ||||||
FHLMC REMICS | ||||||||
Series 2380, Class SI | 6,087 | 1,097 | ||||||
Series 2922, Class SE | 63,229 | 10,517 | ||||||
Series 2934, Class HI | 4,922 | 87 | ||||||
Series 2934, Class KI | 3,160 | 49 | ||||||
Series 2965, Class SA | 130,289 | 15,172 | ||||||
| The accompanying notes are an integral part of these financial statements. |
| 25 |
Table of Contents
AMG Managers Amundi Intermediate Government Fund Schedule of Portfolio Investments(continued) |
Principal Amount | Value | |||||||
Interest Only Strip - 1.7%(continued) |
| |||||||
FHLMC REMICS | ||||||||
Series 2967, Class JI | $11,262 | $234 | ||||||
Series 2980, Class SL | ||||||||
(6.700% minus 1 month LIBOR, Cap 6.700%, Floor 0.000%), 4.245%, 11/15/343 | 99,438 | 20,229 | ||||||
Series 3065, Class DI | ||||||||
(6.620% minus 1 month LIBOR, Cap 6.620%, Floor 0.000%), 4.165%, 04/15/353 | 161,225 | 24,024 | ||||||
Series 3308, Class S | ||||||||
(7.200% minus 1 month LIBOR, Cap 7.200%, Floor 0.000%), 4.745%, 03/15/323 | 115,483 | 19,018 | ||||||
Series 3424, Class XI | ||||||||
(6.570% minus 1 month LIBOR, Cap 6.570%, Floor 0.000%), 4.115%, 05/15/363 | 146,522 | 21,869 | ||||||
Series 3489, Class SD | ||||||||
(7.800% minus 1 month LIBOR, Cap 7.800%, Floor 0.000%), 5.345%, 06/15/323 | 67,290 | 11,866 | ||||||
Series 3882, Class AI | 8,725 | 180 | ||||||
Series 3927, Class AI | 170,495 | 13,850 | ||||||
Series 4097, Class CI | 213,789 | 17,531 | ||||||
Series 4123, Class DI | 546,665 | 42,417 | ||||||
Series 4395, Class TI | 374,617 | 30,971 | ||||||
FNMA | ||||||||
Series 222, Class 2 | 3,061 | 353 | ||||||
Series 351, Class 5 | 18,635 | 3,151 | ||||||
Series 351, Class 3 | 38,597 | 6,333 | ||||||
Series 351, Class 4 | 22,011 | 4,107 | ||||||
FNMA REMICS | ||||||||
Series2004-51, Class SX | ||||||||
(7.120% minus 1 month LIBOR, Cap 7.120%, Floor 0.000%), 4.614%, 07/25/343 | 66,956 | 10,995 | ||||||
Series2004-64, Class SW | ||||||||
(7.050% minus 1 month LIBOR, Cap 7.050%, Floor 0.000%), 4.544%, 08/25/343 | 214,935 | 34,895 | ||||||
Series2005-12, Class SC | ||||||||
(6.750% minus 1 month LIBOR, Cap 6.750%, Floor 0.000%), 4.244%, 03/25/353 | 91,494 | 12,968 | ||||||
Series2005-45, Class SR | ||||||||
(6.720% minus 1 month LIBOR, Cap 6.720%, Floor 0.000%), 4.214%, 06/25/353 | 168,411 | 26,064 | ||||||
Series2005-65, Class KI | ||||||||
(7.000% minus 1 month LIBOR, Cap 7.000%, Floor 0.000%), 4.494%, 08/25/353 | 396,901 | 63,038 | ||||||
Series2005-89, Class S | ||||||||
(6.700% minus 1 month LIBOR, Cap 6.700%, Floor 0.000%), 4.194%, 10/25/353 | 406,467 | 62,586 | ||||||
Principal Amount | Value | |||||||
FNMA REMICS | ||||||||
Series2006-3, Class SA | ||||||||
(6.150% minus 1 month LIBOR, Cap 6.150%, Floor 0.000%), 3.644%, 03/25/363 | $81,229 | $10,399 | ||||||
Series2007-75, Class JI | ||||||||
(6.545% minus 1 month LIBOR, Cap 6.545%, Floor 0.000%), 4.039%, 08/25/373 | 77,451 | 12,126 | ||||||
Series2008-86, Class IO | 2,330 | 17 | ||||||
Series2009-31, Class PI | 471,752 | 71,366 | ||||||
Series2010-121, Class IO | 2,048 | 20 | ||||||
Series2010-65, Class IO | 24,624 | 564 | ||||||
Series2011-124, Class IC | 51,135 | 775 | ||||||
Series2011-88, Class WI | 164,797 | 14,272 | ||||||
Series2012-126, Class SJ | ||||||||
(5.000% minus 1 month LIBOR, Cap 5.000%, Floor 0.000%), 2.494%, 11/25/423 | 431,959 | 51,210 | ||||||
Series2012-130, Class UI | 264,163 | 21,650 | ||||||
Series2012-150, Class BI | 206,865 | 17,147 | ||||||
Series2013-5, Class YI | 285,504 | 23,580 | ||||||
GNMA | ||||||||
Series2011-167, Class IO | 6,885 | 180 | ||||||
Series2011-32, Class KS | ||||||||
(12.100% minus 2 times 1 month LIBOR, Cap 12.100%, Floor 0.000%), 7.190%, 06/16/343 | 55,274 | 1,631 | ||||||
Series2011-94, Class IS | ||||||||
(6.700% minus 1 month LIBOR, Cap 6.700%, Floor 0.000%), 4.245%, 06/16/363 | 139,556 | 14,173 | ||||||
Series2012-103, Class IB | 135,655 | 11,290 | ||||||
Series2012-140, Class IC | 420,857 | 74,107 | ||||||
Series2012-34, Class KS | ||||||||
(6.050% minus 1 month LIBOR, Cap 6.050%, Floor 0.000%), 3.595%, 03/16/423 | 329,950 | 70,998 | ||||||
Series2012-69, Class QI | 171,836 | 25,062 | ||||||
Series2014-173, Class AI | 118,359 | 5,947 | ||||||
Series2016-108, Class QI | 268,751 | 58,213 | ||||||
Series2016-118, Class DS | ||||||||
(6.100% minus 1 month LIBOR, Cap 6.100%, Floor 0.000%), 3.630%, 09/20/463 | 301,893 | 50,070 | ||||||
Series2016-145, Class UI | 387,934 | 76,233 | ||||||
Series2016-17, Class JS | ||||||||
(6.100% minus 1 month LIBOR, Cap 6.100%, Floor 0.000%), 3.630%, 02/20/463 | 302,690 | 42,911 | ||||||
| The accompanying notes are an integral part of these financial statements. |
| 26 |
Table of Contents
AMG Managers Amundi Intermediate Government Fund Schedule of Portfolio Investments(continued) |
| Principal Amount | Value | |||||||
Interest Only Strip - 1.7%(continued) |
| |||||||
GNMA | ||||||||
Series2016-20, Class SB | ||||||||
(6.100% minus 1 month LIBOR, Cap 6.100%, Floor 0.000%), 3.630%, 02/20/463 | $322,653 | $46,237 | ||||||
Series2016-46, Class JI | 188,852 | 44,051 | ||||||
Series2016-5, Class CS | ||||||||
(6.150% minus 1 month LIBOR, Cap 6.150%, Floor 0.000%), 3.680%, 01/20/463 | 292,720 | 47,366 | ||||||
Series2016-81, Class IO | 362,888 | 69,372 | ||||||
Series2016-88, Class SM | ||||||||
(6.100% minus 1 month LIBOR, Cap 6.100%, Floor 0.000%), 3.630%, 07/20/463 | 309,750 | 51,872 | ||||||
Total Interest Only Strip | 1,366,576 | |||||||
Total U.S. Government and Agency Obligations | 98,617,911 | |||||||
Short-Term Investments - 17.0% | ||||||||
U.S. Government Obligation - 0.1% |
| |||||||
U.S. Treasury Bill, 0.276%, 01/24/196,7 | 90,000 | 89,877 | ||||||
Shares | Value | |||||||
Other Investment Companies - 16.9% |
| |||||||
Dreyfus Government Cash Management Fund, Institutional Shares, 2.29%8 | 4,503,561 | $4,503,561 | ||||||
Dreyfus Institutional Preferred Government Money Market Fund, Institutional Shares, 2.40%8 | 4,503,562 | 4,503,562 | ||||||
JPMorgan U.S. Government Money Market Fund, IM Shares, 2.36%8 | 4,640,033 | 4,640,033 | ||||||
Total Other Investment Companies | 13,647,156 | |||||||
Total Short-Term Investments | 13,737,033 | |||||||
Total Investments - 143.2% | 115,673,579 | |||||||
Other Assets, less Liabilities - (43.2)% |
| (34,894,746 | ) | |||||
Net Assets - 100.0% | $80,778,833 | |||||||
| 1 | Security exempt from registration under Rule 144A of the Securities Act of 1933. This security may be resold in transactions exempt from registration, normally to qualified buyers. At December 31, 2018, the value of these securities amounted to $3,095,010 or 3.8% of net assets. |
| 2 | Certain variable rate securities are not based on a published reference rate and spread but are determined by the issuer or agent and are based on current market conditions. These securities do not indicate a reference rate and spread in their description above. |
| 3 | Variable rate security. The rate shown is based on the latest available information as of December 31, 2018. |
| 4 | All or part of the security is delayed delivery transaction. The market value for delayed delivery security at December 31, 2018, amounted to $34,453,030, or 42.7% of net assets. |
| 5 | TBA Securities are purchased/sold on a forward commitment basis with an approximate principal amount and no defined maturity date. The actual principal and maturity date will be determined upon settlement when the specific mortgage pools are assigned. |
| 6 | Some or all of this security is held as collateral for futures contracts. The market value of collateral at December 31, 2018, amounted to $89,877, or 0.1% of net assets. |
| 7 | Represents yield to maturity at December 31, 2018. |
| 8 | Yield shown represents the December 31, 2018, seven day average yield, which refers to the sum of the previous seven days’ dividends paid, expressed as an annual percentage. |
| CMT | Constant Maturity Treasury | |
FHLMC | Freddie Mac | |
FNMA | Fannie Mae | |
GNMA | Ginnie Mae | |
GSR | Goldman Sachs REMIC | |
IO | Interest Only | |
LIBOR | London Interbank Offered Rate | |
REMICS | Real Estate Mortgage Investment Conduit | |
TBA | To Be Announced |
Open Futures Contracts
| Description | Currency | Number of Contracts | Position | Expiration Date | Current Notional Amount | Value and Unrealized Gain/(Loss) | ||||||||||
10-Year U.S. Treasury Note
| USD
| 2
| Long
| 03/20/19
|
| $244,031
|
|
| $5,834
|
| ||||||
U.S. Ultra Bond CBT Mar 19
| USD
| 2
| Long
| 03/20/19
|
| 321,313
|
|
| 16,552
|
| ||||||
10-Year Interest Rate Swap
| USD
| 34
| Short
| 03/18/19
|
| (3,478,625
| )
|
| (68,017
| )
| ||||||
2-Year U.S. Treasury Note
| USD
| 3
| Short
| 03/29/19
|
| (636,938
| )
|
| (4,328
| )
| ||||||
5-Year Interest Rate Swap
| USD
| 23
| Short
| 03/18/19
|
| (2,318,148
| )
|
| (33,659
| )
| ||||||
5-Year U.S. Treasury Note
| USD
| 33
| Short
| 03/29/19
|
| (3,784,688
| )
|
| (63,073
| )
| ||||||
|
| |||||||||||||||
| Total | $(146,691 | ) | ||||||||||||||
|
| |||||||||||||||
| The accompanying notes are an integral part of these financial statements. |
| 27 |
Table of Contents
AMG Managers Amundi Intermediate Government Fund Schedule of Portfolio Investments(continued) |
The following table summarizes the inputs used to value the Fund’s investments by the fair value hierarchy levels as of December 31, 2018:
Level 1
| Level 2
| Level 3
| Total
| |||||||||||||
Investments in Securities
| ||||||||||||||||
Asset-Backed Security | — | $2,910,435 | — | $2,910,435 | ||||||||||||
Mortgage-Backed Securities | — | 408,200 | — | 408,200 | ||||||||||||
U.S. Government and Agency Obligations† | — | 98,617,911 | — | 98,617,911 | ||||||||||||
Short-Term Investments | ||||||||||||||||
U.S. Government Obligation | — | 89,877 | — | 89,877 | ||||||||||||
Other Investment Companies | $ | 13,647,156 | — | — | 13,647,156 | |||||||||||
|
|
|
|
|
|
|
| |||||||||
Total Investments in Securities | $ | 13,647,156 | $ | 102,026,423 | — | $ | 115,673,579 | |||||||||
|
|
|
|
|
|
|
| |||||||||
Financial Derivative Instruments - Assets | ||||||||||||||||
Interest Rate Futures Contracts | $22,386 | — | — | $22,386 | ||||||||||||
Financial Derivative Instruments - Liabilities | ||||||||||||||||
Interest Rate Futures Contracts | (169,077 | ) | — | — | (169,077 | ) | ||||||||||
|
|
|
|
|
|
|
| |||||||||
Total Financial Derivative Instruments | $(146,691 | ) | — | — | $(146,691 | ) | ||||||||||
|
|
|
|
|
|
|
| |||||||||
| † | All U.S. government and agency obligations held in the Fund are Level 2 securities. For a detailed breakout of U.S. government and agency obligations by major industry or agency classification, please refer to the Fund’s Schedule of Portfolio Investments. |
For the fiscal year ended December 31, 2018, there were no transfers in or out of Level 3.
The following schedule shows the value of derivative instruments at December 31, 2018:
| Asset Derivatives | Liability Derivatives | |||||||||||
Derivatives not accounted for as hedging instruments | Statement of Assets and Liabilities Location | Fair Value | Statement of Assets and Liabilities Location | Fair Value | ||||||||
Interest rate futures contracts | Receivable for variation margin1 | $1,969 | Payable for variation margin1 | $24,672 | ||||||||
|
|
|
| |||||||||
| 1 | Only current day’s variation margin is reported within the Statement of Assets and Liabilities. The variation margin is included in the open futures cumulative appreciation/depreciation of $(146,691). |
For the fiscal year ended December 31, 2018 the effect of derivative instruments on the Statement of Operations for the Fund and the amount of realized gain/loss and unrealized appreciation/depreciation on derivatives recognized in income was as follows:
| Realized Gain/Loss | Change in Unrealized Appreciation/Depreciation | |||||||||||||||
Derivatives not accounted for as hedging instruments | Statement of Operations Location | Realized Gain/Loss | Statement of Operations Location | Change in Unrealized Appreciation/ Depreciation | ||||||||||||
|
Net change in unrealized appreciation/ |
| ||||||||||||||
| Interest rate futures contracts | Net realized gain on futures contracts | $167,702 | depreciation on futures contracts | $(163,275 | ) | |||||||||||
|
|
|
| |||||||||||||
| The accompanying notes are an integral part of these financial statements. |
| 28 |
Table of Contents
THE YEAR IN REVIEW
During the year ended December 31, 2018, the AMG Managers Amundi Short Duration Government Fund (Class N shares) (the “Fund”) returned +0.74%, while the ICE BofAML6-Month U.S. Treasury Bill Index returned +1.92%.
Agency Mortgage-Backed Security (“MBS”) spreads leaked modestly wider during the first quarter. This led to consistent underperformance of MBS relative to swap and Treasury hedges. The Treasury curve steepened early in the quarter, but reversed course late and finished modestly flatter, supporting lower coupon30-year MBS relative to higher coupons. The cheapening of higher coupons occurred despite a very favorable prepayment environment, as prepayment rates continued to drop during the first quarter.
Fixed income markets proved to be a bit skittish in the second quarter as fears of trade wars weighed heavily. Most spread sectors widened during the quarter and agency MBS were no exception. Treasury rates were modestly higher with a flatter curve as the Federal Reserve (the “Fed”) continued to tighten monetary policy, causing lower coupon30-year MBS to again outperform higher coupons. Government National Mortgage Association (“GNMA”) MBS traded well during the quarter as the agency took steps to curtail “churning” activity by certain servicers.
Interest rates continued their march higher in the third quarter and the curve continued to flatten. Continued economic strength helped corporate spreads narrow while agency MBS spreads were pushed wider by summer supply and higher rates. Treasury rates were higher again with a flatter curve as the Fed continued to tighten monetary policy. The curve move helped support lower coupon MBS again, but the performance difference was smaller across the coupon stack this quarter. GNMA MBS continued to trade well during the quarter as the agency took additional steps to curtail churning. GNMA MBS valuations approached rich levels.
Interest rates continued to rise to start the fourth quarter, reaching levels not seen since 2011. However, after peaking in early November, interest rates reversed course in a dramatic fashion, as the10-year Treasury rate went from a high of 3.24% down to 2.68% to finish the year. The curve also | reversed course after starting the quarter steeper and then finishing substantially flatter. The curve flattening again helped lower coupons relative to higher coupons. Equities moved down during the quarter and the selloff picked up steam in December, when they turned in their worst December performance since 1931. MBS spreads widened in sympathy as all risk markets underperformed. The Fed raised rates again in December, but appears to be on hold to start 2019. GNMA MBS were slightly weaker in the fourth quarter after better performance in the prior quarter.
The Fed made their last material purchase of MBS in the fourth quarter, as the runoff from their portfolio fell below the reinvestment cap. In the minutes from the December meeting, members of the Federal Open Market Committee (“FOMC”) did mention the possibility of future MBS sales following balance sheet normalization. We do not anticipate this happening in the near term, and should it eventually occur, it would likely be limited to reducing the MBS portfolio by $20 billion a month between paydowns and sales.
PERFORMANCE AND POSITIONING
Agency FRMs (Fixed-Rate MBS) were the largest negative contributor to performance in 2018. Our Asset-Backed Security (“ABS”) exposure and our agency Collateralized Mortgage Obligation (“CMO”) exposure both provided small positive contributions to the Fund’s performance. Treasury Inflation Protected Securities (“TIPS”) positions were a small negative for performance.
During 2018, we increased our positioning in30-year agency FRMs from 37.6% to 39.5%. We slightly reduced our exposure to15-year agency FRMs by-1% to end the year at 9% of capital. Our ABS positioning declined by-7% to end the year at 2% of capital. Agency ARMs represented 19% of the Fund’s positioning (2% lower than where we began the year). Our cash position increased during the year, as there were fewer attractive short duration cash flow opportunities.
The Fund held both U.S. Treasury and swap futures throughout the year. These derivative positions were held primarily to hedge the effective duration (i.e., interest rate risk) of the total portfolio. In general, the presence of these positions reduced the portfolio duration by-1.55% to 1.89%. | LOOKING FORWARD
With the Fed no longer making substantial purchases of MBS because of their balance sheet reduction targets, the large marginal buyers will now drive the market. These include banks, money managers, international investors, and others. These investors will have different opportunity sets they will be evaluating when looking at the MBS market. For money managers, the recent dramatic widening in corporate bond spreads changed the relative attractiveness of MBS. International investors who hedge their purchases have seen the cost of hedging increase as the Fed has raised short-term rates. The MBS market is now priced more attractively than it has been for much of the time the Fed was actively making large purchases. It should provide better but more volatile returns going forward.
The rates market is not pricing any moves this year from the Fed. Global growth concerns have increased and the Fed appears to be in a wait and see mode on more hikes. Unless inflation or the economy picks up materially, we do not think they will raise rates.
The U.S. housing market has started to show signs of slowing. Certain high-cost markets inhigh-tax states have seen cooling as a result of last year’s tax reform. The increase in mortgage rates through the first ten months of the year also had a slowing effect. We do not anticipate any significant problems to come from the mortgage sector even if we enter another recession. The market has been so focused on what happened in the financial crisis that market segments that were the cause of problems then will not cause major problems in the next recession. Banks and securitized products should perform fine in the next downturn. Areas that did not have major problems in the last recession, like investment grade corporates and the leveraged loan market, would be of more concern in the next recession.
This commentary reflects the viewpoints of Amundi Pioneer Institutional Asset Management, Inc. as of December 31, 2018, and is not intended as a forecast or guarantee of future results. |
| 29 |
Table of Contents
AMG Managers Amundi Short Duration Government Fund Portfolio Manager’s Comments(continued) |
CUMULATIVE TOTAL RETURN PERFORMANCE
AMG Managers Amundi Short Duration Government Fund’s cumulative total return is based on the daily change in net asset value (NAV), and assumes that all dividends and distributions were reinvested. This graph compares a hypothetical $10,000 investment made in the AMG Managers Amundi Short Duration Government Fund’s Class N shares on December 31, 2008, to a $10,000 investment made in the ICE BofAML US6-Month Treasury Bill Index for the same time period. The graph and table do not reflect the deduction of taxes that a shareholder would pay on a Fund distribution or redemption of shares. The listed returns for the Fund are net of expenses and the returns for the index exclude expenses. Total returns would have been lower had certain expenses not been reduced.
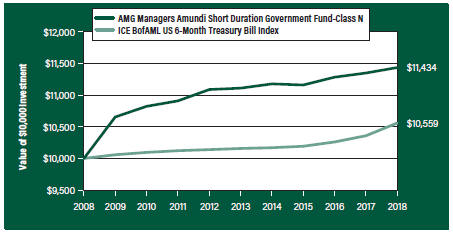
The table below shows the average annual total returns for the AMG Managers Amundi Short Duration Government Fund and the ICE BofAML US6-Month Treasury Bill Index for the same time periods ended December 31, 2018.
| Average Annual Total Returns1 | One Year | Five Years | Ten Years | Since Inception | Inception Date | |||||||||||||||||
AMG Managers Amundi Short Duration Government Fund2,3, 4, 5, 6, 7
|
| |||||||||||||||||||||
Class N | 0.74% | 0.58% | 1.35% | 3.22% | 03/31/92 | |||||||||||||||||
Class I | 0.84% | — | — | 0.62% | 02/24/17 | |||||||||||||||||
Class Z | 0.89% | — | — | 0.72% | 02/24/17 | |||||||||||||||||
ICE BofAML US6-Month Treasury Bill Index8 | 1.92% | 0.78% | 0.54% | 2.86% | 03/31/92 | † | ||||||||||||||||
The performance data shown represents past performance. Past performance is not a guarantee of future results. Current performance may be lower or higher than the performance data quoted. The investment return and principal value of an investment will fluctuate so that an investor’s shares, when redeemed, may be worth more or less than their original cost.
Investors should carefully consider the Fund’s investment objectives, risks, charges and expenses before investing. For performance information through the most recent month end, current net asset values per share for the Fund and other information, please call 800.835.3879 or visit our website at amgfunds.com for a free prospectus. Read it carefully before investing or sending money.
Distributed by AMG Distributors, Inc., member FINRA/SIPC.
| † | Date reflects inception date of the Fund, not the index. |
| 1 | Total return equals income yield plus share price change and assumes reinvestment of all dividends and capital gain distributions. Returns are net of fees and may reflect offsets of Fund expenses as described in the prospectus. No adjustment has been made for taxes payable by shareholders on their reinvested dividends and capital gain |
distributions. Returns for periods greater than one year are annualized. The listed returns on the Fund are net of expenses and based on the published NAV as of December 31, 2018. All returns are in U.S. dollars ($).
2 From time to time the Fund’s advisor has waived its fees and/or absorbed Fund expenses, which has resulted in higher returns.
3 The Fund is subject to the risks associated with investments in debt securities, such as default risk and fluctuations in the perception of the debtor’s ability to pay its creditors. Changing interest rates may adversely affect the value of an investment. An increase in interest rates typically causes the value of bonds and other fixed income securities to fall.
4 To the extent that the Fund invests in asset-backed or mortgage-backed securities, its exposure to prepayment and extension risks may be greater than investments in other fixed income securities.
5 The Fund may invest in derivatives such as options and futures; the complexity and rapidly changing structure of derivatives markets may increase the possibility of market losses.
6 Many bonds have call provisions which allow the debtors to pay them back before maturity. This is especially true with mortgage securities, which can be paid back anytime. Typically debtors prepay their debt when it is to their advantage (when interest rates drop making a new loan at current rates more attractive), and thus likely to the disadvantage of bondholders, who may have to reinvest prepayment proceeds in securities with lower yields. Prepayment risk will vary depending on the provisions of the security and current interest rates relative to the interest rate of the debt.
7 Obligations of certain government agencies are not backed by the full faith and credit of the U.S. government. If one of these agencies defaulted on a loan, there is no guarantee that the U.S. government would provide financial support. Additionally, debt securities of the U.S. government may be affected by changing interest rates and subject to prepayment risk.
8 The ICE BofAML US6-Month Treasury Bill Index is an unmanaged index that measures returns ofsix-month Treasury Bills. Unlike the Fund, the ICE BofAML US6-Month Treasury Bill Index is unmanaged, is not available for investment and does not incur expenses.
Not FDIC insured, nor bank guaranteed. May lose value. |
| 30 |
Table of Contents
AMG Managers Amundi Short Duration Government Fund Fund Snapshots(unaudited) December 31, 2018 |
PORTFOLIO BREAKDOWN
| Category | % of Net Assets | |
U.S. Government and Agency Obligations | 84.3 | |
Asset-Backed Securities | 2.4 | |
Mortgage-Backed Securities | 0.2 | |
Short-Term Investments | 14.3 | |
Other Assets Less Liabilities | (1.2) | |
| Rating | % of Market Value1 | |
U.S. Government and Agency Obligations | 97.0 | |
Aaa | 3.0 | |
1Includes market value of long-term fixed-income securities only.
TOP TEN HOLDINGS
| Security Name | % of Net Assets | |
GNMA, 6.000%, 01/15/36
| 3.7 | |
United States Treasury Inflation Indexed Bonds, 2.375%, 01/15/27
| 2.8 | |
FNMA, 4.500%, 04/01/35
| 2.5 | |
FNMA, 5.500%, 05/01/34
| 2.4 | |
FHLMC Gold Pool, 4.500%, 10/01/44
| 2.4 | |
FHLMC Gold Pool, 4.500%, 03/01/42
| 2.2 | |
FHLMC Gold Pool, 4.000%, 12/01/44
| 1.9 | |
FNMA, 5.500%, 08/01/41
| 1.8 | |
FNMA, 4.500%, 04/01/39
| 1.8 | |
FNMA, 5.000%, 08/01/40
| 1.7 | |
| ||
Top Ten as a Group | 23.2 | |
| ||
Credit quality ratings shown above reflect the highest rating assigned by either Standard & Poor’s (“S&P”) or Moody’s Investors Service, Inc. (“Moody’s”). These rating agencies are independent, nationally recognized statistical rating organizations and are widely used. Investment grade ratings are credit ratings of BBB/Baa or higher. Below investment grade ratings are credit ratings of BB/Ba or lower. Investments designated N/R are not rated by either rating agency. Unrated investments do not necessarily indicate low credit quality. Credit quality ratings are subject to change.
Because a fund’s strategy may result in multiple investments in particular sectors of the economy, its performance may depend on the performance of those sectors and may fluctuate more widely than investments diversified across more sectors. For additional information on these and other risk considerations, please see the Fund’s prospectus.
Any sectors, industries, or securities discussed should not be perceived as investment recommendations. Mention of a specific security should not be considered a recommendation to buy or solicitation to sell that security. Specific securities mentioned in this report may have been sold from the Fund’s portfolio of investments by the time you receive this report.
| 31 |
Table of Contents
AMG Managers Amundi Short Duration Government Fund Schedule of Portfolio Investments December 31, 2018 |
Principal Amount | Value | |||||||
Asset-Backed Securities - 2.4% |
| |||||||
Drive Auto Receivables Trust | ||||||||
Series2015-AA, Class C | $45,285 | $45,282 | ||||||
Series2016-BA, Class C | 525,738 | 525,784 | ||||||
Home Partners of America Trust | ||||||||
Series2017-1, Class A | 1,696,920 | 1,685,302 | ||||||
Series2018-1, Class A | 957,854 | 949,784 | ||||||
Total Asset-Backed Securities | ||||||||
(Cost $3,230,964) | 3,206,152 | |||||||
Mortgage-Backed Security - 0.2% |
| |||||||
Angel Oak Mortgage Trust | ||||||||
Series2017-2, Class A1 | 261,313 | 257,359 | ||||||
Total Mortgage-Backed Security | ||||||||
(Cost $261,310) | 257,359 | |||||||
U.S. Government and Agency |
| |||||||
Fannie Mae - 53.8% | ||||||||
FNMA REMICS | ||||||||
Series2011-60, Class UC | 90,462 | 90,586 | ||||||
Series2007-56, Class FN | ||||||||
(1 month LIBOR + 0.370%), 2.876%, 06/25/372 | 105,468 | 104,822 | ||||||
Series2002-47, Class FD | ||||||||
(1 month LIBOR + 0.400%), 2.906%, 08/25/322 | 288,902 | 289,169 | ||||||
Series2005-13, Class AF | ||||||||
(1 month LIBOR + 0.400%), 2.906%, 03/25/352 | 318,414 | 319,273 | ||||||
Series2011-101, Class KA | 775,405 | 775,075 | ||||||
Series2001-63, Class FA | ||||||||
(1 month LIBOR + 0.550%), 3.005%, 12/18/312 | 249,294 | 252,883 | ||||||
Series2003-2, Class FA | ||||||||
(1 month LIBOR + 0.500%), 3.006%, 02/25/332 | 221,086 | 222,051 | ||||||
Series2010-8, Class FY | ||||||||
(1 month LIBOR + 0.750%), 3.256%, 02/25/402 | 610,126 | 622,265 | ||||||
Series2004-27, Class HB | 5,066 | 5,057 | ||||||
Series2008-59, Class KB | 1,916 | 1,918 | ||||||
Series2004-53, Class NC | 153,306 | 157,386 | ||||||
Series2005-19, Class PA | 50,771 | 51,421 | ||||||
Principal Amount | Value | |||||||
FNMA REMICS | ||||||||
Series2005-58, Class EP | $119,329 | $127,097 | ||||||
Series2005-68, Class PC | 63,178 | 64,025 | ||||||
Series2005-68, Class PB | 7,323 | 7,396 | ||||||
Series1994-31, Class ZC | 188,892 | 197,861 | ||||||
FNMA REMICS Whole Loan | ||||||||
Series2005-W2, Class A1 | ||||||||
(1 month LIBOR + 0.200%), 2.706%, 05/25/352 | 520,430 | 518,837 | ||||||
Series2003-W13, Class AV2 | ||||||||
(1 month LIBOR + 0.280%), 2.786%, 10/25/332 | 8,826 | 8,798 | ||||||
Series2004-W14, Class 1AF | ||||||||
(1 month LIBOR + 0.400%), 2.906%, 07/25/442 | 1,319,931 | 1,305,912 | ||||||
Series2004-W5, Class F1 | ||||||||
(1 month LIBOR + 0.450%), 2.956%, 02/25/472 | 296,464 | 293,071 | ||||||
Series2003-W1, Class 2A | 12,972 | 13,904 | ||||||
Series2003-W4, Class 4A | 268,774 | 296,675 | ||||||
FNMA Grantor Trust | ||||||||
Series2003-T4, Class 1A | ||||||||
(1 month LIBOR + 0.220%), 2.726%, 09/26/332 | 55,842 | 55,609 | ||||||
Series2002-T5, Class A1 | ||||||||
(1 month LIBOR + 0.240%), 2.746%, 05/25/322 | 111,601 | 110,636 | ||||||
FNMA | ||||||||
(12 month LIBOR + 1.800%), 3.829%, 01/01/342 | 690,725 | 726,339 | ||||||
(12 month LIBOR + 1.714%), 3.941%, 04/01/372 | 2,128,797 | 2,208,879 | ||||||
(12 month LIBOR + 1.810%), 3.970%, 01/01/332 | 607,651 | 636,747 | ||||||
4.000%, 10/01/21 to 09/01/48 | 5,049,578 | 5,168,950 | ||||||
(U.S. Treasury Yield Curve CMT 1 year + 2.107%), 4.000%, 05/01/332 | 728,568 | 765,836 | ||||||
(U.S. Treasury Yield Curve CMT 1 year + 2.025%), 4.027%, 01/01/342 | 422,401 | 443,781 | ||||||
(6 month LIBOR + 1.500%), 4.029%, 02/01/332 | 587,400 | 604,578 | ||||||
(6 month LIBOR + 1.560%), 4.097%, 08/01/332 | 223,478 | 230,437 | ||||||
(12 month LIBOR + 1.425%), 4.175%, 09/01/332 | 368,434 | 385,622 | ||||||
(12 month LIBOR + 1.614%), 4.189%, 03/01/342 | 131,692 | 137,454 | ||||||
(U.S. Treasury Yield Curve CMT 1 year + 2.256%), 4.192%, 05/01/342 | 1,184,286 | 1,252,148 | ||||||
(U.S. Treasury Yield Curve CMT 1 year + 2.205%), 4.215%, 06/01/332 | 169,355 | 176,280 | ||||||
(6 month LIBOR + 1.600%), 4.224%, 06/01/342 | 333,463 | 344,031 | ||||||
(12 month LIBOR + 1.804%), 4.270%, 06/01/342 | 927,274 | 973,677 | ||||||
(12 month LIBOR + 1.613%), 4.314%, 10/01/352 | 675,788 | 704,499 | ||||||
(12 month LIBOR + 1.654%), 4.338%, 08/01/342 | 87,392 | 90,985 | ||||||
(12 month LIBOR + 1.654%), 4.362%, 07/01/342 | 636,997 | 664,991 | ||||||
(12 month LIBOR + 1.857%), 4.420%, 01/01/362 | 17,667 | 18,673 | ||||||
(12 month LIBOR + 1.598%), 4.473%, 12/01/332 | 259,968 | 270,194 | ||||||
(12 month LIBOR + 1.730%), 4.480%, 06/01/352 | 55,696 | 58,337 | ||||||
| The accompanying notes are an integral part of these financial statements. |
| 32 |
Table of Contents
AMG Managers Amundi Short Duration Government Fund Schedule of Portfolio Investments(continued) |
| Principal Amount | Value | |||||||
Fannie Mae - 53.8%(continued) |
| |||||||
FNMA | ||||||||
(U.S. Treasury Yield Curve CMT 1 year + 2.178%), 4.484%, 12/01/342 | $916,498 | $962,786 | ||||||
4.500%, 10/01/19 to 11/01/56 | 11,100,207 | 11,621,832 | ||||||
4.500%, TBA 30 years4,5 | 1,500,000 | 1,553,232 | ||||||
(U.S. Treasury Yield Curve CMT 1 year + 2.348%), 4.516%, 04/01/342 | 275,896 | 290,874 | ||||||
(U.S. Treasury Yield Curve CMT 1 year + 2.332%), 4.546%, 04/01/342 | 222,123 | 231,758 | ||||||
(U.S. Treasury Yield Curve CMT 1 year + 2.121%), 4.559%, 09/01/332 | 163,057 | 167,978 | ||||||
(U.S. Treasury Yield Curve CMT 1 year + 2.380%), 4.656%, 01/01/362 | 1,950,485 | 2,046,411 | ||||||
(12 month LIBOR + 1.820%), 4.691%, 08/01/352 | 620,246 | 653,115 | ||||||
(U.S. Treasury Yield Curve CMT 1 year + 2.360%), 4.714%, 11/01/342 | 1,631,511 | 1,725,309 | ||||||
(U.S. Treasury Yield Curve CMT 1 year + 2.303%), 4.814%, 12/01/342 | 1,031,555 | 1,088,422 | ||||||
5.000%, 10/01/19 to 07/01/48 | 13,303,124 | 14,017,183 | ||||||
5.500%, 01/01/24 to 08/01/41 | 8,690,075 | 9,282,749 | ||||||
6.000%, 09/01/21 to 08/01/37 | 3,462,264 | 3,694,724 | ||||||
6.500%, 12/01/28 to 08/01/32 | 1,964,443 | 2,173,602 | ||||||
7.000%, 11/01/22 | 410,526 | 423,180 | ||||||
7.500%, 08/01/33 to 09/01/33 | 43,610 | 50,976 | ||||||
Total Fannie Mae | 71,738,296 | |||||||
Freddie Mac - 21.2% | ||||||||
FHLMC REMICS | ||||||||
Series 3846, Class CK | 114 | 114 | ||||||
Series 4305, Class KN | 561,497 | 558,034 | ||||||
Series 3153, Class UG | 1,342,913 | 1,349,668 | ||||||
Series 3501, Class FC | 566,437 | 586,754 | ||||||
Series 2786, Class BC | 4,024 | 4,020 | ||||||
Series 2809, Class UC | 507 | 506 | ||||||
Series 3535, Class CA | 117 | 117 | ||||||
Series 3609, Class LA | 16,142 | 16,137 | ||||||
Series 3632, Class AG | 98,584 | 99,028 | ||||||
Series 3653, Class JK | 57,494 | 58,485 | ||||||
FHLMC Gold Pool | ||||||||
2.000%, 01/01/23 | 198,083 | 197,368 | ||||||
2.500%, 06/01/22 to 05/01/23 | 512,622 | 513,050 | ||||||
4.000%, 12/01/44 | 2,439,091 | 2,494,005 | ||||||
4.500%, 05/01/19 to 10/01/44 | 8,120,633 | 8,484,997 | ||||||
5.000%, 09/01/19 to 08/01/20 | 109,518 | 110,185 | ||||||
5.500%, 12/01/32 to 08/01/40 | 4,231,615 | 4,558,551 | ||||||
6.000%, 02/01/22 to 01/01/24 | 1,280,010 | 1,314,798 | ||||||
| Principal Amount | Value | |||||||
FHLMC Gold Pool | ||||||||
6.500%, 10/01/23 | $65,948 | $67,163 | ||||||
7.000%, 07/01/19 | 5,047 | 5,055 | ||||||
7.500%, 03/01/33 | 135,514 | 155,216 | ||||||
FHLMC | ||||||||
(U.S. Treasury Yield Curve CMT 1 year + 2.250%), 4.106%, 03/01/342 | 1,109,954 | 1,172,086 | ||||||
(U.S. Treasury Yield Curve CMT 1 year + 2.250%), 4.125%, 04/01/342 | 276,651 | 292,012 | ||||||
(U.S. Treasury Yield Curve CMT 1 year + 2.159%), 4.188%, 10/01/282 | 11,687 | 12,175 | ||||||
(12 month LIBOR + 1.819%), 4.236%, 09/01/332 | 888,152 | 929,462 | ||||||
(U.S. Treasury Yield Curve CMT 1 year + 2.399%), 4.314%, 02/01/232 | 29,536 | 30,751 | ||||||
(U.S. Treasury Yield Curve CMT 1 year + 2.000%), 4.500%, 11/01/332 | 491,228 | 512,830 | ||||||
(U.S. Treasury Yield Curve CMT 1 year + 2.219%), 4.591%, 10/01/332 | 418,047 | 439,108 | ||||||
(U.S. Treasury Yield Curve CMT 1 year + 2.225%), 4.596%, 10/01/332 | 611,825 | 640,482 | ||||||
(U.S. Treasury Yield Curve CMT 1 year + 2.511%), 4.604%, 06/01/352 | 332,020 | 351,842 | ||||||
(U.S. Treasury Yield Curve CMT 1 year + 2.225%), 4.705%, 11/01/332 | 457,139 | 479,760 | ||||||
(U.S. Treasury Yield Curve CMT 1 year + 2.250%), 4.724%, 05/01/342 | 1,023,901 | 1,077,507 | ||||||
(U.S. Treasury Yield Curve CMT 1 year + 2.230%), 4.725%, 12/01/332 | 709,747 | 745,660 | ||||||
(U.S. Treasury Yield Curve CMT 1 year + 2.690%), 4.858%, 05/01/352 | 543,302 | 579,004 | ||||||
5.000%, 07/01/48 | 424,162 | 456,649 | ||||||
Total Freddie Mac | 28,292,579 | |||||||
Ginnie Mae - 4.0% | ||||||||
GNMA | ||||||||
Series 2014-60, Class DA | 342,179 | 340,705 | ||||||
6.000%, 01/15/36 | 4,507,900 | 4,938,825 | ||||||
Total Ginnie Mae | 5,279,530 | |||||||
U.S. Treasury Obligations - 2.9% | ||||||||
United States Treasury Inflation Indexed Bonds | 3,423,393 | 3,779,189 | ||||||
Interest Only Strip - 2.4% | ||||||||
FHLMC REMICS | ||||||||
Series 2922, Class SE | 142,521 | 23,706 | ||||||
Series 2934, Class HI | 7,032 | 124 | ||||||
Series 2934, Class KI | 3,687 | 58 | ||||||
Series 2965, Class SA | 322,610 | 37,568 | ||||||
Series 2967, Class JI | 26,501 | 551 | ||||||
| The accompanying notes are an integral part of these financial statements. |
| 33 |
Table of Contents
AMG Managers Amundi Short Duration Government Fund Schedule of Portfolio Investments(continued) |
| Principal Amount | Value | |||||||
Interest Only Strip - 2.4%(continued) |
| |||||||
FHLMC REMICS | ||||||||
Series 2980, Class SL | $219,444 | $44,641 | ||||||
Series 2981, Class SU | 158,161 | 24,688 | ||||||
Series 3065, Class DI | 492,852 | 73,439 | ||||||
Series 3308, Class S | 261,963 | 43,141 | ||||||
Series 3424, Class XI | 381,661 | 56,965 | ||||||
Series 3489, Class SD | 150,597 | 26,557 | ||||||
Series 3882, Class AI | 6,979 | 144 | ||||||
Series 3927, Class AI | 132,923 | 10,798 | ||||||
Series 4097, Class CI | 164,947 | 13,526 | ||||||
Series 4123, Class DI | 424,194 | 32,914 | ||||||
Series 4395, Class TI | 435,452 | 36,000 | ||||||
FNMA | ||||||||
Series 306, Class IO 8.000%, 05/25/30 | 46,612 | 12,467 | ||||||
FNMA REMICS | ||||||||
Series 2004-51, Class SX | 168,041 | 27,596 | ||||||
Series 2004-64, Class SW | 494,601 | 80,298 | ||||||
Series 2004-66, Class SE | 79,438 | 11,295 | ||||||
Series 2005-12, Class SC | 174,815 | 24,777 | ||||||
Series 2005-45, Class SR | 414,962 | 64,220 | ||||||
Series 2005-65, Class KI | 989,910 | 157,222 | ||||||
Series 2005-66, Class GS | 10,433 | 162 | ||||||
Series 2006-3, Class SA | 187,997 | 24,068 | ||||||
| Principal Amount | Value | |||||||
FNMA REMICS | ||||||||
Series 2007-75, Class JI | $92,922 | $14,548 | ||||||
Series 2007-85, Class SI | 199,601 | 30,312 | ||||||
Series 2008-86, Class IO | 5,833 | 43 | ||||||
Series 2008-87, Class AS | 546,960 | 94,316 | ||||||
Series 2009-31, Class PI | 548,815 | 83,024 | ||||||
Series 2010-105, Class IO | 43,679 | 643 | ||||||
Series 2010-121, Class IO | 5,495 | 54 | ||||||
Series 2010-65, Class IO | 63,652 | 1,459 | ||||||
Series 2010-68, Class SJ | 224,721 | 38,455 | ||||||
Series 2011-124, Class IC | 242,453 | 3,676 | ||||||
Series 2011-63, Class AS | 254,042 | 32,376 | ||||||
Series 2011-88, Class WI | 483,543 | 41,875 | ||||||
Series 2012-126, Class SJ | 2,840,923 | 336,803 | ||||||
Series 2012-130, Class UI | 195,962 | 16,061 | ||||||
Series 2012-150, Class BI | 204,143 | 16,921 | ||||||
Series 2013-5, Class YI | 221,565 | 18,299 | ||||||
GNMA | ||||||||
Series 2011-167, Class IO | 40,549 | 1,058 | ||||||
Series 2011-32, Class KS | 134,286 | 3,963 | ||||||
Series 2011-94, Class IS | 313,544 | 31,843 | ||||||
Series 2012-101, Class AI | 222,916 | 21,864 | ||||||
Series 2012-103, Class IB | 590,541 | 49,148 | ||||||
Series 2012-140, Class IC | 528,826 | 93,118 | ||||||
Series 2012-34, Class KS | 2,533,805 | 545,223 | ||||||
Series 2012-69, Class QI | 909,023 | 132,581 | ||||||
| The accompanying notes are an integral part of these financial statements. |
| 34 |
Table of Contents
AMG Managers Amundi Short Duration Government Fund Schedule of Portfolio Investments(continued) |
Principal Amount | Value | |||||||
Interest Only Strip - 2.4%(continued) |
| |||||||
GNMA | ||||||||
Series2012-96, Class IC | $483,976 | $43,890 | ||||||
Series2013-5, Class BI | 208,508 | 36,686 | ||||||
Series2014-173, Class AI | 112,412 | 5,648 | ||||||
Series2016-108, Class QI | 306,521 | 66,395 | ||||||
Series2016-118, Class DS | 534,861 | 88,708 | ||||||
Series2016-145, Class UI 3.500%, 10/20/46 | 463,565 | 91,095 | ||||||
Series2016-17, Class JS | ||||||||
(6.100% minus 1 month LIBOR, Cap 6.100%, Floor 0.000%), 3.630%, 02/20/462 | 531,958 | 75,413 | ||||||
Series2016-20, Class SB | ||||||||
(6.100% minus 1 month LIBOR, Cap 6.100%, Floor 0.000%), 3.630%, 02/20/462 | 547,788 | 78,500 | ||||||
Series2016-46, Class JI | 213,708 | 49,849 | ||||||
Series2016-5, Class CS | ||||||||
(6.150% minus 1 month LIBOR, Cap 6.150%, Floor 0.000%), 3.680%, 01/20/462 | 505,313 | 81,767 | ||||||
Series2016-81, Class IO 4.000%, 06/20/46 | 412,699 | 78,894 | ||||||
Series2016-88, Class SM | ||||||||
(6.100% minus 1 month LIBOR, Cap 6.100%, Floor 0.000%), 3.630%, 07/20/462 | 544,365 | 91,161 | ||||||
Total Interest Only Strip |
| 3,222,594 | ||||||
Total U.S. Government and Agency Obligations | ||||||||
(Cost $113,056,559) | 112,312,188 | |||||||
Principal Amount | Value | |||||||
Short-Term Investments - 14.3% |
| |||||||
U.S. Government and AgencyObligations - 8.2% |
| |||||||
FHLB, 0.204, 01/18/196 | $4,000,000 | $3,995,962 | ||||||
FHLMC, 0.053, 01/03/196 | 3,000,000 | 2,999,628 | ||||||
FNMA, 0.053, 01/02/196 | 4,000,000 | 3,999,753 | ||||||
Total U.S. Government and Agency Obligations |
| 10,995,343 | ||||||
U.S. Government Obligation - 0.4% |
| |||||||
U.S. Treasury Bill, 0.276%, 01/24/196,7 | 470,000 | 469,358 | ||||||
| Shares | ||||||||
Other Investment Companies - 5.7% |
| |||||||
Dreyfus Government Cash Management Fund, Institutional Shares, 2.29%8 | 2,523,005 | 2,523,005 | ||||||
Dreyfus Institutional Preferred Government Money Market Fund, Institutional Shares, 2.40%8 | 2,523,005 | 2,523,005 | ||||||
JPMorgan U.S. Government Money Market Fund, IM Shares, 2.36%8 | 2,599,459 | 2,599,459 | ||||||
Total Other Investment Companies | 7,645,469 | |||||||
Total Short-Term Investments | ||||||||
(Cost $19,110,170) | 19,110,170 | |||||||
Total Investments - 101.2% |
| 134,885,869 | ||||||
Other Assets, less Liabilities - (1.2)% |
| (1,603,676 | ) | |||||
Net Assets - 100.0% | $133,282,193 | |||||||
| 1 | Security exempt from registration under Rule 144A of the Securities Act of 1933. This security may be resold in transactions exempt from registration, normally to qualified buyers. At December 31, 2018, the value of these securities amounted to $3,463,511 or 2.6% of net assets. |
| 2 | Variable rate security. The rate shown is based on the latest available information as of December 31, 2018. |
| 3 | Certain variable rate securities are not based on a published reference rate and spread but are determined by the issuer or agent and are based on current market conditions. These securities do not indicate a reference rate and spread in their description above. |
| 4 | All or part of the security is delayed delivery transaction. The market value for delayed delivery security at December 31, 2018, amounted to $1,553,232, or 1.2% of net assets. |
| 5 | TBA Securities are purchased/sold on a forward commitment basis with an approximate principal amount and no defined maturity date. The actual principal and maturity date will be determined upon settlement when the specific mortgage pools are assigned. |
| 6 | Represents yield to maturity at December 31, 2018. |
| 7 | Some or all of this security is held as collateral for futures contracts. The market value of collateral at December 31, 2018, amounted to $469,358, or 0.4% of net assets. |
| 8 | Yield shown represents the December 31, 2018, seven day average yield, which refers to the sum of the previous seven days’ dividends paid, expressed as an annual percentage. |
| CMT | Constant Maturity Treasury |
| FHLB | Federal Home Loan Bank |
| FHLMC | Freddie Mac |
| FNMA | Fannie Mae |
| GNMA | Ginnie Mae |
| IO | Interest Only |
| LIBOR | London Interbank Offered Rate |
| REMICS | Real Estate Mortgage Investment Conduit |
| TBA | To Be Announced |
| The accompanying notes are an integral part of these financial statements. |
| 35 |
Table of Contents
AMG Managers Amundi Short Duration Government Fund Schedule of Portfolio Investments(continued) |
Open Futures Contracts
| Description | Currency | Number of Contracts | Position | Expiration Date | Current Notional Amount | Value and Unrealized Gain/(Loss) | ||||||||||||||||||
10-Year U.S. Treasury Note | USD | 27 | Long | 03/20/19 | $3,294,422 | $78,752 | ||||||||||||||||||
5-Year U.S. Treasury Note | USD | 25 | Long | 03/29/19 | 2,867,188 | 47,335 | ||||||||||||||||||
10-Year Interest Rate Swap | USD | 71 | Short | 03/18/19 | (7,264,187 | ) | (142,036 | ) | ||||||||||||||||
2-Year U.S. Treasury Note | USD | 4 | Short | 03/29/19 | (849,250 | ) | (5,770 | ) | ||||||||||||||||
5-Year Interest Rate Swap | USD | 173 | Short | 03/18/19 | (17,436,507 | ) | (253,173 | ) | ||||||||||||||||
90-Day Euro Futures | USD | 17 | Short | 03/18/19 | (4,134,825 | ) | 10,469 | |||||||||||||||||
90-Day Euro Futures | USD | 17 | Short | 06/17/19 | (4,135,888 | ) | 5,294 | |||||||||||||||||
90-Day Euro Futures | USD | 17 | Short | 09/16/19 | (4,136,950 | ) | 1,519 | |||||||||||||||||
90-Day Euro Futures | USD | 17 | Short | 03/16/20 | (4,141,413 | ) | (7,206 | ) | ||||||||||||||||
90-Day Euro Futures | USD | 17 | Short | 03/15/21 | (4,146,300 | ) | (16,344 | ) | ||||||||||||||||
90-Day Euro Futures | USD | 17 | Short | 03/14/22 | (4,143,113 | ) | (15,669 | ) | ||||||||||||||||
90-Day Euro Futures | USD | 17 | Short | 06/15/20 | (4,143,962 | ) | (10,856 | ) | ||||||||||||||||
90-Day Euro Futures | USD | 17 | Short | 06/14/21 | (4,146,300 | ) | (16,844 | ) | ||||||||||||||||
90-Day Euro Futures | USD | 17 | Short | 06/13/22 | (4,142,263 | ) | (15,319 | ) | ||||||||||||||||
90-Day Euro Futures | USD | 17 | Short | 09/14/20 | (4,145,662 | ) | (13,581 | ) | ||||||||||||||||
90-Day Euro Futures | USD | 17 | Short | 09/13/21 | (4,145,875 | ) | (17,131 | ) | ||||||||||||||||
90-Day Euro Futures | USD | 17 | Short | 09/19/22 | (4,141,413 | ) | (15,144 | ) | ||||||||||||||||
90-Day Euro Futures | USD | 17 | Short | 12/14/20 | (4,145,025 | ) | (14,394 | ) | ||||||||||||||||
90-Day Euro Futures | USD | 17 | Short | 12/13/21 | (4,143,962 | ) | (16,231 | ) | ||||||||||||||||
90-Day Euro Futures | USD | 14 | Short | 12/19/22 | (3,409,350 | ) | (15,011 | ) | ||||||||||||||||
90-Day Euro Futures | USD | 17 | Short | 12/16/19 | (4,137,375 | ) | (2,031 | ) | ||||||||||||||||
U.S. Ultra Bond CBT Dec 18 | USD | 23 | Short | 03/20/19 | (3,695,094 | ) | (190,949 | ) | ||||||||||||||||
|
| |||||||||||||||||||||||
| Total | $(624,320 | ) | ||||||||||||||||||||||
|
| |||||||||||||||||||||||
| The accompanying notes are an integral part of these financial statements. |
| 36 |
Table of Contents
AMG Managers Amundi Short Duration Government Fund Schedule of Portfolio Investments(continued) |
The following table summarizes the inputs used to value the Fund’s investments by the fair value hierarchy levels as of December 31, 2018:
| Level 1 | Level 2 | Level 3 | Total | |||||||||||||
Investments in Securities | ||||||||||||||||
Asset-Backed Securities | — | $3,206,152 | — | $3,206,152 | ||||||||||||
Mortgage-Backed Security | — | 257,359 | — | 257,359 | ||||||||||||
U.S. Government and Agency Obligations† | — | 112,312,188 | — | 112,312,188 | ||||||||||||
Short-Term Investments | ||||||||||||||||
U.S. Government and Agency Obligations | — | 10,995,343 | — | 10,995,343 | ||||||||||||
U.S. Government Obligation | — | 469,358 | — | 469,358 | ||||||||||||
Other Investment Companies | $ | 7,645,469 | — | — | 7,645,469 | |||||||||||
|
|
|
|
|
|
|
| |||||||||
Total Investments in Securities | $ | 7,645,469 | $ | 127,240,400 | — | $ | 134,885,869 | |||||||||
|
|
|
|
|
|
|
| |||||||||
Financial Derivative Instruments - Assets | ||||||||||||||||
Interest Rate Futures Contracts | $143,369 | — | — | $143,369 | ||||||||||||
Financial Derivative Instruments - Liabilities | ||||||||||||||||
Interest Rate Futures Contracts | (767,689 | ) | — | — | (767,689 | ) | ||||||||||
|
|
|
|
|
|
|
| |||||||||
Total Financial Derivative Instruments | $(624,320 | ) | — | — | $(624,320 | ) | ||||||||||
|
|
|
|
|
|
|
| |||||||||
| † | All U.S. government and agency obligations held in the Fund are Level 2 securities. For a detailed breakout of U.S. government and agency obligations by major industry or agency classification, please refer to the Fund’s Schedule of Portfolio Investments. |
For the fiscal year ended December 31, 2018, there were no transfers in or out of Level 3.
The following schedule shows the value of derivative instruments at December 31, 2018:
| Asset Derivatives | Liability Derivatives | |||||||||||
| Derivatives not accounted | Statement of Assets and | Statement of Assets and | ||||||||||
| for as hedging instruments | Liabilities Location | Fair Value | Liabilities Location | Fair Value | ||||||||
Interest rate futures contracts | Receivable for variation margin1 | $16,797 | Payable for variation margin1 | $97,312 | ||||||||
|
|
|
| |||||||||
1 Only current day’s variation margin is reported within the Statement of Assets and Liabilities. The variation margin is included in the open futures cumulative appreciation/depreciation of $(624,320).
For the fiscal year ended December 31, 2018 the effect of derivative instruments on the Statement of Operations for the Fund and the amount of realized gain/loss and unrealized appreciation/depreciation on derivatives recognized in income was as follows:
| Realized Gain/Loss | Change in Unrealized Appreciation/Depreciation | |||||||||||
| Derivatives not accounted for as hedging instruments | Statement of Operations Location | Realized Gain/Loss | Statement of Operations Location | Change in Unrealized | ||||||||
Interest rate futures contracts | Net realized gain on futures contracts | $1,119,043 | Net change in unrealized appreciation/ depreciation on futures contracts | $(621,806) | ||||||||
|
|
|
| |||||||||
| The accompanying notes are an integral part of these financial statements. |
| 37 |
Table of Contents
| AMG Chicago Equity Partners Balanced Fund | AMG Managers Amundi Intermediate Government Fund | AMG Managers Amundi Short Duration Government Fund | ||||||||||
Assets: | ||||||||||||
Investments at Value1(including securities on loan valued at $12,415,179, $0, and $0, respectively) | $250,201,447 | $115,673,579 | $134,885,869 | |||||||||
Foreign currency2 | 236 | — | — | |||||||||
Dividend, interest and other receivables | 882,121 | 311,184 | 503,426 | |||||||||
Receivable for paydowns | — | 1,462 | 320,604 | |||||||||
Receivable for Fund shares sold | 3,220,227 | 184,142 | 375,416 | |||||||||
Receivable from affiliate | 40,061 | — | 12,580 | |||||||||
Receivable for variation margin | — | 1,969 | 16,797 | |||||||||
Prepaid expenses and other assets | 28,161 | 12,090 | 14,224 | |||||||||
Total assets | 254,372,253 | 116,184,426 | 136,128,916 | |||||||||
Liabilities: | ||||||||||||
Payable upon return of securities loaned | 2,307,855 | — | — | |||||||||
Payable for delayed delivery investments purchased | — | 33,991,527 | 1,537,828 | |||||||||
Payable for Fund shares repurchased | 1,504,999 | 967,308 | 1,036,760 | |||||||||
Payable for variation margin | — | 24,672 | 97,312 | |||||||||
Due to custodian | — | 258,562 | — | |||||||||
Accrued expenses: | ||||||||||||
Investment advisory and management fees | 128,418 | 53,064 | 45,747 | |||||||||
Administrative fees | 32,105 | 10,472 | 17,155 | |||||||||
Distribution fees | 16,437 | — | — | |||||||||
Shareholder service fees | 5,333 | 9,746 | 14,317 | |||||||||
Professional fees | 37,884 | 53,017 | 55,028 | |||||||||
Other | 85,737 | 37,225 | 42,576 | |||||||||
Total liabilities | 4,118,768 | 35,405,593 | 2,846,723 | |||||||||
|
| |||||||||||
Net Assets | $250,253,485 | $80,778,833 | $133,282,193 | |||||||||
1Investments at cost | $252,230,890 | $116,356,804 | $135,659,003 | |||||||||
2Foreign currency at cost | $234 | — | — | |||||||||
| The accompanying notes are an integral part of these financial statements. |
| 38 |
Table of Contents
Statement of Assets and Liabilities(continued) |
| AMG Chicago Equity Partners Balanced Fund | AMG Managers Amundi Intermediate Government Fund | AMG Managers Amundi Short Duration Government Fund | ||||||||||
Net Assets Represent: | ||||||||||||
Paid-in capital | $250,210,831 | $86,019,036 | $141,030,851 | |||||||||
Distributable earnings (loss) | 42,654 | (5,240,203 | ) | (7,748,658 | ) | |||||||
Net Assets | $250,253,485 | $80,778,833 | $133,282,193 | |||||||||
Class N: | ||||||||||||
Net Assets | $75,270,822 | $72,765,676 | $99,523,866 | |||||||||
Shares outstanding | 4,872,327 | 7,005,639 | 10,626,234 | |||||||||
Net asset value, offering and redemption price per share | $15.45 | $10.39 | $9.37 | |||||||||
Class I: | ||||||||||||
Net Assets | $166,553,933 | $6,896,612 | $33,038,486 | |||||||||
Shares outstanding | 10,674,349 | 663,883 | 3,529,262 | |||||||||
Net asset value, offering and redemption price per share | $15.60 | $10.39 | $9.36 | |||||||||
Class Z: | ||||||||||||
Net Assets | $8,428,730 | $1,116,545 | $719,841 | |||||||||
Shares outstanding | 540,335 | 107,544 | 76,837 | |||||||||
Net asset value, offering and redemption price per share | $15.60 | $10.38 | $9.37 | |||||||||
| The accompanying notes are an integral part of these financial statements. |
| 39 |
Table of Contents
| AMG Chicago Equity Partners Balanced Fund | AMG Managers Amundi Intermediate Government Fund | AMG Managers Amundi Short Duration Government Fund | ||||||||||
Investment Income: | ||||||||||||
Dividend income | $2,524,716 | $279,668 | $94,742 | |||||||||
Interest income | 2,261,380 | 2,261,617 | 3,453,450 | |||||||||
Securities lending income | 16,386 | — | — | |||||||||
Foreign withholding tax | (28,015 | ) | — | — | ||||||||
Total investment income | 4,774,467 | 2,541,285 | 3,548,192 | |||||||||
Expenses: | ||||||||||||
Investment advisory and management fees | 1,362,602 | 447,467 | 594,575 | |||||||||
Administrative fees | 340,651 | 139,833 | 222,966 | |||||||||
Distribution fees - Class N | 191,900 | — | — | |||||||||
Shareholder servicing fees - Class N | — | 127,434 | 177,788 | |||||||||
Shareholder servicing fees - Class I | 131,552 | 3,566 | 14,725 | |||||||||
Custodian fees | 141,513 | 52,629 | 59,367 | |||||||||
Registration fees | 61,715 | 58,472 | 66,403 | |||||||||
Professional fees | 45,485 | 54,518 | 57,657 | |||||||||
Reports to shareholders | 34,732 | 10,572 | 17,140 | |||||||||
Transfer agent fees | 30,806 | (1,200 | ) | 5,570 | ||||||||
Trustee fees and expenses | 15,687 | 7,372 | 11,785 | |||||||||
Miscellaneous | 6,520 | 4,114 | 4,220 | |||||||||
Total expenses before offsets | 2,363,163 | 904,777 | 1,232,196 | |||||||||
Expense reimbursements | (132,068 | ) | (83,933 | ) | — | |||||||
Expense reductions | (15,794 | ) | — | — | ||||||||
Fee waivers | — | (46,611 | ) | (163,508 | ) | |||||||
Net expenses | 2,215,301 | 774,233 | 1,068,688 | |||||||||
|
| |||||||||||
Net investment income | 2,559,166 | 1,767,052 | 2,479,504 | |||||||||
Net Realized and Unrealized Loss: | ||||||||||||
Net realized gain (loss) on investments | 11,445,105 | (1,379,396 | ) | (318,752 | ) | |||||||
Net realized gain on TBA forward sale commitments | — | — | 67,016 | |||||||||
Net realized gain on futures contracts | — | 167,702 | 1,119,043 | |||||||||
Net realized loss on foreign currency transactions | (14,380 | ) | — | — | ||||||||
Net change in unrealized appreciation/depreciation on investments | (23,699,307 | ) | (1,132,421 | ) | (1,590,180 | ) | ||||||
Net change in unrealized appreciation/depreciation on TBA forward sale commitments | — | 3,985 | 4,185 | |||||||||
Net change in unrealized appreciation/depreciation on futures contracts | — | (163,275 | ) | (621,806 | ) | |||||||
Net change in unrealized appreciation/depreciation on foreign currency translations | 794 | — | — | |||||||||
Net realized and unrealized loss | (12,267,788 | ) | (2,503,405 | ) | (1,340,494 | ) | ||||||
|
| |||||||||||
Net increase (decrease) in net assets resulting from operations | $(9,708,622 | ) | $(736,353 | ) | $1,139,010 | |||||||
| The accompanying notes are an integral part of these financial statements. |
| 40 |
Table of Contents
| AMG Chicago Equity Partners Balanced Fund | AMG Managers Amundi Intermediate Government Fund | AMG Managers Amundi Short Duration Government Fund | ||||||||||||||||||||||
| 2018 | 2017 | 2018 | 20171 | 2018 | 20171 | |||||||||||||||||||
Increase (Decrease) in Net Assets Resulting From Operations: | ||||||||||||||||||||||||
Net investment income | $2,559,166 | $1,335,965 | $1,767,052 | $1,972,350 | $2,479,504 | $2,218,442 | ||||||||||||||||||
Net realized gain (loss) on investments | 11,430,725 | 11,745,082 | (1,211,694 | ) | 1,064,328 | 867,307 | (53,039 | ) | ||||||||||||||||
Net change in unrealized appreciation/depreciation on investments | (23,698,513 | ) | 14,146,833 | (1,291,711 | ) | (487,404 | ) | (2,207,801 | ) | (923,976 | ) | |||||||||||||
Net increase (decrease) in net assets resulting from operations | (9,708,622 | ) | 27,227,880 | (736,353 | ) | 2,549,274 | 1,139,010 | 1,241,427 | ||||||||||||||||
Distributions to Shareholders:2 | ||||||||||||||||||||||||
Class N | (4,965,289 | ) | (3,514,311 | ) | (1,592,224 | ) | (2,210,849 | ) | (2,084,939 | ) | (4,012,537 | ) | ||||||||||||
Class I | (11,086,856 | ) | (5,348,763 | ) | (150,473 | ) | (27,256 | ) | (572,925 | ) | (443,522 | ) | ||||||||||||
Class Z | (569,332 | ) | (339,957 | ) | (23,260 | ) | (23,041 | ) | (13,176 | ) | (15,045 | ) | ||||||||||||
Frompaid-in capital: | ||||||||||||||||||||||||
Class N | — | — | — | (188,523 | ) | — | — | |||||||||||||||||
Class I | — | — | — | (2,324 | ) | — | — | |||||||||||||||||
Class Z | — | — | — | (1,965 | ) | — | — | |||||||||||||||||
Total distributions to shareholders | (16,621,477 | ) | (9,203,031 | ) | (1,765,957 | ) | (2,453,958 | ) | (2,671,040 | ) | (4,471,104 | ) | ||||||||||||
Capital Share Transactions:3 | ||||||||||||||||||||||||
Net increase (decrease) from capital share transactions | 80,294,870 | 4,076,435 | (25,204,554 | ) | (58,020,446 | ) | (25,238,503 | ) | (71,286,485 | ) | ||||||||||||||
Total increase (decrease) in net assets | 53,964,771 | 22,101,284 | (27,706,864 | ) | (57,925,130 | ) | (26,770,533 | ) | (74,516,162 | ) | ||||||||||||||
Net Assets: | ||||||||||||||||||||||||
Beginning of year | 196,288,714 | 174,187,430 | 108,485,697 | 166,410,827 | 160,052,726 | 234,568,888 | ||||||||||||||||||
End of year4 | $250,253,485 | $196,288,714 | $80,778,833 | $108,485,697 | $133,282,193 | $160,052,726 | ||||||||||||||||||
| 1 | Effective February 27, 2017, the Funds’ share classes were renamed as described in Note 1 of the Notes to the Financial Statements. |
| 2 | See Note 1(d) of the Notes to Financial Statements. |
| 3 | See Note 1(g) of the Notes to Financial Statements. |
| 4 | Net assets - End of year includes undistributed (distributions in excess of) net investment income of $(12,953), $0 and $205,033 for AMG Chicago Equity Partners Balanced Fund, AMG Managers Amundi Intermediate Government Fund and AMG Managers Amundi Short Duration Government Fund, respectively, in 2017. During 2018, the requirement to disclose undistributed (distributions in excess of) net investment income was eliminated. |
| The accompanying notes are an integral part of these financial statements. |
| 41 |
Table of Contents
AMG Chicago Equity Partners Balanced Fund For a share outstanding throughout each fiscal year |
| For the fiscal years ended December 31, | ||||||||||||||||||||
Class N
|
| 2018
|
|
| 2017
|
|
| 20161
|
|
| 2015
|
|
| 2014
|
| |||||
Net Asset Value, Beginning of Year
|
| $17.03
|
|
| $15.45
|
|
| $14.92
|
|
| $15.09
|
|
| $15.13
|
| |||||
Income (loss) from Investment Operations: | ||||||||||||||||||||
Net investment income2,3 | 0.18 | 0.10 | 0.14 | 4 | 0.10 | 5 | 0.11 | |||||||||||||
Net realized and unrealized gain (loss) on investments
|
| (0.67
| )
|
| 2.30
|
|
| 0.54
|
|
| 0.23
|
|
| 1.37
|
| |||||
Total income (loss) from investment operations
|
| (0.49
| )
|
| 2.40
|
|
| 0.68
|
|
| 0.33
|
|
| 1.48
|
| |||||
Less Distributions to Shareholders from: | ||||||||||||||||||||
Net investment income | (0.16 | ) | (0.11 | ) | (0.14 | ) | (0.11 | ) | (0.11 | ) | ||||||||||
Net realized gain on investments
|
| (0.93
| )
|
| (0.71
| )
|
| (0.01
| )
|
| (0.39
| )
|
| (1.41
| )
| |||||
Total distributions to shareholders
|
| (1.09
| )
|
| (0.82
| )
|
| (0.15
| )
|
| (0.50
| )
|
| (1.52
| )
| |||||
Net Asset Value, End of Year
|
| $15.45
|
|
| $17.03
|
|
| $15.45
|
|
| $14.92
|
|
| $15.09
|
| |||||
Total Return3,6
|
| (2.89
| )%
|
| 15.54
| %
|
| 4.59
| %
|
| 2.19
| %
|
| 9.69
| %
| |||||
Ratio of net expenses to average net assets7 | 1.08 | % | 1.09 | % | 1.08 | % | 1.08 | % | 1.07 | % | ||||||||||
Ratio of gross expenses to average net assets8 | 1.15 | % | 1.14 | % | 1.25 | % | 1.36 | % | 1.40 | % | ||||||||||
Ratio of net investment income to average net assets3 | 1.02 | % | 0.63 | % | 0.94 | % | 0.64 | % | 0.70 | % | ||||||||||
Portfolio turnover | 80 | % | 75 | % | 119 | % | 105 | % | 92 | % | ||||||||||
Net assets end of year (000’s) omitted | $75,271 | $74,315 | $92,502 | $94,476 | $41,751 | |||||||||||||||
| ||||||||||||||||||||
| 42 |
Table of Contents
AMG Chicago Equity Partners Balanced Fund Financial Highlights For a share outstanding throughout each fiscal year |
| For the fiscal years ended December 31, | ||||||||||||||||||||
Class I
| 2018
| 2017
| 20161
| 2015
| 2014
| |||||||||||||||
Net Asset Value, Beginning of Year
|
| $17.19
|
|
| $15.59
|
|
| $15.05
|
|
| $15.23
|
|
| $15.26
|
| |||||
Income (loss) from Investment Operations: | ||||||||||||||||||||
Net investment income2,3 | 0.21 | 0.13 | 0.17 | 4 | 0.12 | 5 | 0.15 | |||||||||||||
Net realized and unrealized gain (loss) on investments
|
| (0.68
| )
|
| 2.31
|
|
| 0.54
|
|
| 0.23
|
|
| 1.37
|
| |||||
Total income (loss) from investment operations
|
| (0.47
| )
|
| 2.44
|
|
| 0.71
|
|
| 0.35
|
|
| 1.52
|
| |||||
Less Distributions to Shareholders from: | ||||||||||||||||||||
Net investment income | (0.19 | ) | (0.13 | ) | (0.16 | ) | (0.14 | ) | (0.13 | ) | ||||||||||
Net realized gain on investments
|
| (0.93
| )
|
| (0.71
| )
|
| (0.01
| )
|
| (0.39
| )
|
| (1.42
| )
| |||||
Total distributions to shareholders
|
| (1.12
| )
|
| (0.84
| )
|
| (0.17
| )
|
| (0.53
| )
|
| (1.55
| )
| |||||
Net Asset Value, End of Year
|
| $15.60
|
|
| $17.19
|
|
| $15.59
|
|
| $15.05
|
|
| $15.23
|
| |||||
Total Return3,6
|
| (2.77
| )%
|
| 15.71
| %
|
| 4.79
| %
|
| 2.29
| %
|
| 9.93
| %
| |||||
Ratio of net expenses to average net assets7 | 0.92 | % | 0.94 | % | 0.93 | % | 0.93 | % | 0.86 | % | ||||||||||
Ratio of gross expenses to average net assets8 | 0.99 | % | 0.99 | % | 1.10 | % | 1.21 | % | 1.20 | % | ||||||||||
Ratio of net investment income to average net assets3 | 1.18 | % | 0.78 | % | 1.09 | % | 0.80 | % | 0.91 | % | ||||||||||
Portfolio turnover | 80 | % | 75 | % | 119 | % | 105 | % | 92 | % | ||||||||||
Net assets end of year (000’s) omitted | $166,554 | $114,913 | $75,890 | $60,798 | $14,481 | |||||||||||||||
| ||||||||||||||||||||
| 43 |
Table of Contents
AMG Chicago Equity Partners Balanced Fund Financial Highlights For a share outstanding throughout each fiscal year |
| For the fiscal years ended December 31, | ||||||||||||||||||||
Class Z
| 2018
| 2017
| 20161
| 2015
| 2014
| |||||||||||||||
Net Asset Value, Beginning of Year
| $
| 17.19
|
| $
| 15.58
|
| $
| 15.05
|
| $
| 15.22
|
| $
| 15.26
|
| |||||
Income (loss) from Investment Operations: | ||||||||||||||||||||
Net investment income2,3 | 0.22 | 0.15 | 0.18 | 4 | 0.14 | 5 | 0.15 | |||||||||||||
Net realized and unrealized gain (loss) on investments
|
| (0.67
| )
|
| 2.32
|
|
| 0.54
|
|
| 0.23
|
|
| 1.38
|
| |||||
Total income (loss) from investment operations
|
| (0.45
| )
|
| 2.47
|
|
| 0.72
|
|
| 0.37
|
|
| 1.53
|
| |||||
Less Distributions to Shareholders from: | ||||||||||||||||||||
Net investment income | (0.21 | ) | (0.15 | ) | (0.18 | ) | (0.15 | ) | (0.15 | ) | ||||||||||
Net realized gain on investments
|
| (0.93
| )
|
| (0.71
| )
|
| (0.01
| )
|
| (0.39
| )
|
| (1.42
| )
| |||||
Total distributions to shareholders
|
| (1.14
| )
|
| (0.86
| )
|
| (0.19
| )
|
| (0.54
| )
|
| (1.57
| )
| |||||
Net Asset Value, End of Year
| $
| 15.60
|
| $
| 17.19
|
| $
| 15.58
|
| $
| 15.05
|
| $
| 15.22
|
| |||||
Total Return3,6
|
| (2.68
| )%
|
| 15.90
| %
|
| 4.82
| %
|
| 2.44
| %
|
| 9.97
| %
| |||||
Ratio of net expenses to average net assets7 | 0.83 | % | 0.84 | % | 0.83 | % | 0.83 | % | 0.82 | % | ||||||||||
Ratio of gross expenses to average net assets8 | 0.90 | % | 0.89 | % | 1.00 | % | 1.09 | % | 1.15 | % | ||||||||||
Ratio of net investment income to average net assets3 | 1.27 | % | 0.88 | % | 1.20 | % | 0.89 | % | 0.95 | % | ||||||||||
Portfolio turnover | 80 | % | 75 | % | 119 | % | 105 | % | 92 | % | ||||||||||
Net assets end of year (000’s) omitted | $ | 8,429 | $ | 7,060 | $ | 5,796 | $ | 1,709 | $ | 12,401 | ||||||||||
| ||||||||||||||||||||
| 1 | Effective October 1, 2016, the Investor Class, Service Class and Institutional Class were renamed Class N, Class I and Class Z, respectively. |
| 2 | Per share numbers have been calculated using average shares. |
| 3 | Total returns and net investment income would have been lower had certain expenses not been offset. |
| 4 | Includesnon-recurring dividends. Without these dividends, net investment income per share would have been $0.12, $0.15, and $0.16 for Class N, Class I, and Class Z shares, respectively. |
| 5 | Includesnon-recurring dividends. Without these dividends, net investment income per share would have been $0.09, $0.11, and $0.13 for Class N, Class I and Class Z shares, respectively. |
| 6 | The total return is calculated using the published Net Asset Value as of fiscal year end. |
| 7 | Includes reduction from broker recapture amounting to 0.01%, less than 0.01%, 0.01%, 0.01% and 0.02% for the fiscal years ended 2018, 2017, 2016, 2015 and 2014, respectively. |
| 8 | Excludes the impact of expense reimbursement or fee waivers and expense reductions such as brokerage credits, but includes expense repayments andnon-reimbursable expenses, if any, such as interest, taxes, and extraordinary expenses. (See Note 1(c) and 2 in the Notes to Financial Statements.) |
| 44 |
Table of Contents
AMG Managers Amundi Intermediate Government Fund Financial Highlights For a share outstanding throughout each fiscal year |
| For the fiscal years ended December 31, | ||||||||||||||||||||
| Class N | 2018 | 20171 | 20162 | 2015 | 2014 | |||||||||||||||
Net Asset Value, Beginning of Year
|
| $10.62
|
|
| $10.65
|
|
| $10.81
|
|
| $10.96
|
|
| $10.64
|
| |||||
Income (loss) from Investment Operations: | ||||||||||||||||||||
Net investment income3,4 | 0.20 | 0.16 | 0.14 | 0.11 | 0.17 | |||||||||||||||
Net realized and unrealized gain (loss) on investments | (0.23 | ) | 0.02 | 0.01 | 0.01 | 0.54 | ||||||||||||||
Total income (loss) from investment operations
|
| (0.03
| )
|
| 0.18
|
|
| 0.15
|
|
| 0.12
|
|
| 0.71
|
| |||||
Less Distributions to Shareholders from: | ||||||||||||||||||||
Net investment income | (0.20 | ) | (0.19 | ) | (0.13 | ) | (0.10 | ) | (0.17 | ) | ||||||||||
Net realized gain on investments | — | — | (0.18 | ) | (0.17 | ) | (0.22 | ) | ||||||||||||
Paid in capital | — | (0.02 | ) | — | — | — | ||||||||||||||
Total distributions to shareholders
|
| (0.20
| )
|
| (0.21
| )
|
| (0.31
| )
|
| (0.27
| )
|
| (0.39
| )
| |||||
Net Asset Value, End of Year | $10.39 | $10.62 | $10.65 | $10.81 | $10.96 | |||||||||||||||
Total Return4
|
| (0.27
| )%5
|
| 1.68
| %5
|
| 1.42
| %5
|
| 1.09
| %
|
| 6.73
| %
| |||||
Ratio of net expenses to average net assets | 0.84 | % | 0.84 | % | 0.88 | % | 0.88 | % | 0.89 | % | ||||||||||
Ratio of gross expenses to average net assets6 | 0.98 | % | 0.99 | % | 0.93 | % | 0.92 | % | 0.96 | % | ||||||||||
Ratio of net investment income to average net assets4 | 1.89 | % | 1.46 | % | 1.32 | % | 0.99 | % | 1.54 | % | ||||||||||
Portfolio turnover | 0 | %7 | 10 | % | 17 | % | 21 | % | 11 | % | ||||||||||
Net assets end of year (000’s) omitted | $72,766 | $104,847 | $166,411 | $192,039 | $174,138 | |||||||||||||||
| ||||||||||||||||||||
| 45 |
Table of Contents
AMG Managers Amundi Intermediate Government Fund Financial Highlights For a share outstanding throughout each fiscal period |
For the fiscal year ended December 31,
| For the fiscal period ended December 31,
| |||||||||
Class I | 2018 | 20178 | ||||||||
Net Asset Value, Beginning of Period
|
| $10.62
|
|
| $10.70
|
| ||||
Income (loss) from Investment Operations: | ||||||||||
Net investment income3,4 | 0.21 | 0.15 | ||||||||
Net realized and unrealized loss on investments | (0.23 | ) | (0.03 | ) | ||||||
Total income (loss) from investment operations
|
| (0.02
| )
|
| 0.12
|
| ||||
Less Distributions to Shareholders from: | ||||||||||
Net investment income | (0.21 | ) | (0.18 | ) | ||||||
Paid in capital | — | (0.02 | ) | |||||||
Total distributions to shareholders
|
| (0.21
| )
|
| (0.20
| )
| ||||
Net Asset Value, End of Period | $10.39 | $10.62 | ||||||||
Total Return4
|
| (0.17
| )%5
|
| 1.15
| %5,9
| ||||
Ratio of net expenses to average net assets | 0.74 | % | 0.72 | %10 | ||||||
Ratio of gross expenses to average net assets6 | 0.88 | % | 0.88 | %10 | ||||||
Ratio of net investment income to average net assets4 | 1.99 | % | 1.68 | %10 | ||||||
Portfolio turnover | 0 | %7 | 10 | % | ||||||
Net assets end of period (000’s) omitted | $6,897 | $2,313 | ||||||||
| 46 |
Table of Contents
AMG Managers Amundi Intermediate Government Fund Financial Highlights For a share outstanding throughout each fiscal period |
| For the fiscal year ended December 31, | For the fiscal period ended December 31, | |||||||||
Class Z | 2018 | 20178 | ||||||||
Net Asset Value, Beginning of Period
|
| $10.62
|
|
| $10.70
|
| ||||
Income (loss) from Investment Operations: | ||||||||||
Net investment income3,4 | 0.21 | 0.16 | ||||||||
Net realized and unrealized loss on investments | (0.24 | ) | (0.04 | ) | ||||||
Total income (loss) from investment operations
|
| (0.03
| )
|
| 0.12
|
| ||||
Less Distributions to Shareholders from: | ||||||||||
Net investment income | (0.21 | ) | (0.18 | ) | ||||||
Paid in capital | — | (0.02 | ) | |||||||
Total distributions to shareholders
|
| (0.21
| )
|
| (0.20
| )
| ||||
Net Asset Value, End of Period | $10.38 | $10.62 | ||||||||
Total Return4
|
| (0.22
| )%5
|
| 1.15
| %5,9
| ||||
Ratio of net expenses to average net assets | 0.69 | % | 0.69 | %10 | ||||||
Ratio of gross expenses to average net assets6 | 0.83 | % | 0.85 | %10 | ||||||
Ratio of net investment income to average net assets4 | 2.04 | % | 1.72 | %10 | ||||||
Portfolio turnover | 0 | %7 | 10 | % | ||||||
Net assets end of period (000’s) omitted | $1,117 | $1,326 | ||||||||
| 1 | Effective February 27, 2017, Class S was renamed Class N. |
| 2 | Effective October 1, 2016, the shares were reclassified and redesignated as Class S shares. |
| 3 | Per share numbers have been calculated using average shares. |
| 4 | Total returns and net investment income would have been lower had certain expenses not been offset. |
| 5 | The total return is calculated using the published Net Asset Value as of fiscal year end. |
| 6 | Excludes the impact of expense reimbursement or fee waivers and expense reductions such as brokerage credits, but includes expense repayments andnon-reimbursable expenses, if any, such as interest, taxes, and extraordinary expenses. (See Note 1(c) and 2 in the Notes to Financial Statements.) |
| 7 | Less than 0.5%. |
| 8 | Commencement of operations was February 27, 2017. |
| 9 | Not annualized. |
| 10 | Annualized. |
| 47 |
Table of Contents
AMG Managers Amundi Short Duration Government Fund Financial Highlights For a share outstanding throughout each fiscal year |
For the fiscal years ended December 31,
| ||||||||||||||||||||
Class N | 2018 | 20171 | 20162 | 2015 | 2014 | |||||||||||||||
Net Asset Value, Beginning of Year | $9.47 | $9.63 | $9.62 | $9.65 | $9.64 | |||||||||||||||
Income (loss) from Investment Operations: | ||||||||||||||||||||
Net investment income3,4 | 0.16 | 0.10 | 0.16 | 0.02 | 0.05 | |||||||||||||||
Net realized and unrealized gain (loss) on investments | (0.09 | ) | (0.04 | ) | (0.05 | ) | (0.03 | ) | 0.01 | |||||||||||
Total income (loss) from investment operations | 0.07 | 0.06 | 0.11 | (0.01 | ) | 0.06 | ||||||||||||||
Less Distributions to Shareholders from: | ||||||||||||||||||||
Net investment income | (0.17 | ) | (0.22 | ) | (0.10 | ) | (0.02 | ) | (0.05 | ) | ||||||||||
Total distributions to shareholders | (0.17 | ) | (0.22 | ) | (0.10 | ) | (0.02 | ) | (0.05 | ) | ||||||||||
Net Asset Value, End of Year | $9.37 | $9.47 | $9.63 | $9.62 | $9.65 | |||||||||||||||
Total Return4,5 | 0.74 | % | 0.58 | % | 1.10 | % | (0.15 | )% | 0.60 | % | ||||||||||
Ratio of net expenses to average net assets | 0.74 | % | 0.74 | % | 0.80 | % | 0.79 | % | 0.80 | % | ||||||||||
Ratio of gross expenses to average net assets6 | 0.85 | % | 0.83 | % | 0.80 | % | 0.79 | % | 0.80 | % | ||||||||||
Ratio of net investment income to average net assets4 | 1.65 | % | 1.07 | % | 1.69 | % | 0.25 | % | 0.47 | % | ||||||||||
Portfolio turnover | 14 | % | 20 | % | 37 | % | 51 | % | 41 | % | ||||||||||
Net assets end of year (000’s) omitted
|
| $99,524
|
|
| $135,620
|
|
| $234,569
|
|
| $395,306
|
|
| $385,246
|
| |||||
| 48 |
Table of Contents
AMG Managers Amundi Short Duration Government Fund Financial Highlights For a share outstanding throughout each fiscal period |
For the fiscal year ended December 31,
| For the fiscal period ended December 31,
| |||||||||
Class I | 2018 | 20177 | ||||||||
Net Asset Value, Beginning of Period | $9.46 | $9.64 | ||||||||
Income (loss) from Investment Operations: | ||||||||||
Net investment income3,4 | 0.16 | 0.11 | ||||||||
Net realized and unrealized loss on investments | (0.08 | ) | (0.08 | ) | ||||||
Total income from investment operations | 0.08 | 0.03 | ||||||||
Less Distributions to Shareholders from: | ||||||||||
Net investment income | (0.18 | ) | (0.21 | ) | ||||||
Total distributions to shareholders | (0.18 | ) | (0.21 | ) | ||||||
Net Asset Value, End of Period | $9.36 | $9.46 | ||||||||
Total Return4,5 | 0.84 | % | 0.31 | %8 | ||||||
Ratio of net expenses to average net assets | 0.64 | % | 0.62 | %9 | ||||||
Ratio of gross expenses to average net assets6 | 0.75 | % | 0.73 | %9 | ||||||
Ratio of net investment income to average net assets4 | 1.75 | % | 1.41 | %9 | ||||||
Portfolio turnover | 14 | % | 20 | % | ||||||
Net assets end of period (000’s) omitted
|
| $33,038
|
|
| $23,757
|
| ||||
| 49 |
Table of Contents
AMG Managers Amundi Short Duration Government Fund Financial Highlights For a share outstanding throughout each fiscal period |
For the fiscal year ended December 31,
| For the fiscal period ended December 31,
| |||||||||
Class Z | 2018 | 20177 | ||||||||
Net Asset Value, Beginning of Period | $9.47 | $9.64 | ||||||||
Income (loss) from Investment Operations: | ||||||||||
Net investment income3,4 | 0.17 | 0.12 | ||||||||
Net realized and unrealized loss on investments | (0.09 | ) | (0.08 | ) | ||||||
Total income from investment operations | 0.08 | 0.04 | ||||||||
Less Distributions to Shareholders from: | ||||||||||
Net investment income | (0.18 | ) | (0.21 | ) | ||||||
Total distributions to shareholders | (0.18 | ) | (0.21 | ) | ||||||
Net Asset Value, End of Period | $9.37 | $9.47 | ||||||||
Total Return4,5 | 0.89 | % | | 0.44 | %8 | |||||
Ratio of net expenses to average net assets | 0.59 | % | | 0.57 | %9 | |||||
Ratio of gross expenses to average net assets6 | 0.70 | % | | 0.68 | %9 | |||||
Ratio of net investment income to average net assets4 | 1.80 | % | | 1.46 | %9 | |||||
Portfolio turnover | 14 | % | 20 | % | ||||||
Net assets end of period (000’s) omitted
|
| $720
|
|
| $675
|
| ||||
| 1 | Effective February 27, 2017, Class S was renamed Class N. |
| 2 | Effective October 1, 2016, the shares were reclassified and redesignated as Class S shares. |
| 3 | Per share numbers have been calculated using average shares. |
| 4 | Total returns and net investment income would have been lower had certain expenses not been offset. |
| 5 | The total return is calculated using the published Net Asset Value as of fiscal year end. |
| 6 | Excludes the impact of expense reimbursement or fee waivers and expense reductions such as brokerage credits, but includes expense repayments andnon-reimbursable expenses, if any, such as interest, taxes, and extraordinary expenses. (See Note 1(c) and 2 in the Notes to Financial Statements.) |
| 7 | Commencement of operations was on February 27, 2017. |
| 8 | Not annualized. |
| 9 | Annualized. |
| 50 |
Table of Contents
1. SUMMARY OF SIGNIFICANT ACCOUNTING POLICIES
AMG Funds II (the “Trust”) is anopen-end management investment company, organized as a Massachusetts business trust, and registered under the Investment Company Act of 1940, as amended (the “1940 Act”). Currently, the Trust consists of a number of different funds, each having distinct investment management objectives, strategies, risks, and policies. Included in this report are AMG Chicago Equity Partners Balanced Fund (“Balanced”), AMG Managers Amundi Intermediate Government Fund (“Intermediate Government”) and AMG Managers Amundi Short Duration Government Fund (“Short Duration”), each a “Fund” and collectively, the “Funds.”
Each Fund offers different classes of shares. Balanced offers Class N, Class I and Class Z. Effective February 27, 2017, Intermediate Government and Short Duration’s Class S shares were renamed Class N and both funds commenced offering Class I and Class Z shares. Each class represents an interest in the same assets of the respective Fund. Although all share classes generally have identical voting rights, each share class votes separately when required by law. Different share classes may have different net asset values per share to the extent the share classes pay different distribution amounts and/or the expenses of such share classes differ. Each share class has its own expense structure. Please refer to a current prospectus for additional information on each share class.
The Funds’ financial statements are prepared in accordance with accounting principles generally accepted in the United States of America (“U.S. GAAP”), including accounting and reporting guidance pursuant to Accounting Standards Codification Topic 946 applicable to investment companies. U.S. GAAP requires management to make estimates and assumptions that affect the reported amounts of assets and liabilities and disclosure of contingent assets and liabilities at the date of the financial statements and the reported amounts of income and expenses during the reporting period. Actual results could differ from those estimates and such differences could be material. The following is a summary of significant accounting policies followed by the Funds in the preparation of their financial statements:
a. VALUATION OF INVESTMENTS
Equity securities traded on a national securities exchange or reported on the NASDAQ national market system (“NMS”) are valued at the last quoted sales price on the primary exchange or, if applicable, the NASDAQ official closing price or the official closing price of the relevant exchange or, lacking any sales, at the last quoted bid price or the mean between the last quoted bid and ask prices (the “exchange mean price”). Equity securities traded in theover-the-counter market (other than NMS securities) are valued at the exchange mean price. Foreign equity securities (securities principally traded in markets other than U.S. markets) are valued at the official closing price on the primary exchange or, for markets that either do not offer an official closing price or where the official closing price may not be representative of the overall market, the last quoted sale price.
Fixed income securities purchased with a remaining maturity exceeding 60 days are valued at the evaluated bid price or the mean price provided by an authorized pricing service or, if an evaluated price is not available, by reference to other securities which are considered comparable in credit rating, interest rate, due date and other features (generally referred to as “matrix pricing”) or other similar pricing methodologies. Investments in certain mortgage-backed and stripped mortgage-backed securities, preferred stocks, convertible securities, derivatives and other debt securities not traded on an organized securities market are valued on the basis of valuations provided by dealers or by a pricing service which uses
information with respect to transactions in such securities and various relationships between such securities and yield to maturity in determining value.
Fixed income securities purchased with a remaining maturity of 60 days or less are valued at amortized cost, provided that the amortized cost value is approximately the same as the fair value of the security valued without the use of amortized cost. Investments in otheropen-end regulated investment companies are valued at their end of day net asset value per share.
Futures contracts for which market quotations are readily available are valued at the settlement price as of the close of the futures exchange.
The Funds’ portfolio investments are generally valued based on independent market quotations or prices or, if none, “evaluative” or other market based valuations provided by third party pricing services approved by the Board of Trustees of the Trust (the “Board”). Under certain circumstances, the value of certain Fund portfolio investments (including derivatives) may be based on an evaluation of fair value, pursuant to procedures established by and under the general supervision of the Board. The Valuation Committee, which is comprised of the Independent Trustees of the Board, and the Pricing Committee, which is comprised of representatives from AMG Funds LLC (the “Investment Manager”) are the committees appointed by the Board to make fair value determinations. Each Fund may use the fair value of a portfolio investment to calculate its net asset value (“NAV”) in the event that the market quotation, price or market based valuation for the portfolio investment is not readily available or otherwise not determinable pursuant to the Board’s valuation procedures, if the Investment Manager or the Pricing Committee believes the quotation, price or market based valuation to be unreliable, or in certain other circumstances. When determining the fair value of an investment, the Pricing Committee and, if required under the Trust’s securities valuation procedures, the Valuation Committee, seeks to determine the price that the Fund might reasonably expect to receive from current sale of that portfolio investment in an arms-length transaction. Fair value determinations shall be based upon consideration of all available facts and information, including, but not limited to (i) attributes specific to the investment; (ii) fundamental and analytical data relating to the investment; and (iii) the value of other comparable securities or relevant financial instruments, including derivative securities, traded on other markets or among dealers.
The values assigned to fair value portfolio investments are based on available information and do not necessarily represent amounts that might ultimately be realized in the future, since such amounts depend on future developments inherent in long-term investments. Because of the inherent uncertainty of valuation, those estimated values may differ significantly from the values that would have been used had a ready market for the investments existed, and the differences could be material. The Board will be presented with a quarterly report showing as of the most recent quarter end, all outstanding securities fair valued by the Funds, including a comparison with the prior quarter end and the percentage of the Funds that the security represents at each quarter end.
With respect to foreign equity securities and certain foreign fixed income securities, the Board has adopted a policy that securities held in a Fund that can be fair valued by the applicable fair value pricing service are fair valued on each business day provided that each individual price exceeds apre-established confidence level.
U.S. GAAP defines fair value as the price that a fund would receive to sell an asset or pay to transfer a liability in an orderly transaction between market participants at the measurement date. U.S. GAAP also establishes a framework for measuring fair value, and a three level hierarchy for fair value measurements based upon the
| 51 |
Table of Contents
Notes to Financial Statements(continued) |
transparency of inputs to the valuation of an asset or liability. Inputs may be observable or unobservable and refer broadly to the assumptions that market participants would use in pricing the asset or liability. Observable inputs reflect the assumptions market participants would use in pricing the asset or liability based on market data obtained from sources independent of the Funds. Unobservable inputs reflect the Funds’ own assumptions about the assumptions that market participants would use in pricing the asset or liability developed based on the best information available in the circumstances. Each investment is assigned a level based upon the observability of the inputs which are significant to the overall valuation.
The three-tier hierarchy of inputs is summarized below:
Level 1 – inputs are quoted prices in active markets for identical investments (e.g., equity securities,open-end investment companies, futures contracts)
Level 2 – other observable inputs (including, but not limited to: quoted prices for similar assets or liabilities in markets that are active, quoted prices for identical or similar assets or liabilities in markets that are not active, inputs other than quoted prices that are observable for the assets or liabilities (such as interest rates, yield curves, volatilities, prepayment speeds, loss severities, credit risks and default rates) or other market corroborated inputs) (e.g., debt securities, government securities, foreign currency exchange contracts, swaps, foreign securities utilizing international fair value pricing, fair valued securities with observable inputs)
Level 3 – inputs are significant unobservable inputs (including the Fund’s own assumptions used to determine the fair value of investments) (e.g., fair valued securities with unobservable inputs)
Changes in inputs or methodologies used for valuing investments may result in a transfer in or out of levels within the fair value hierarchy. The inputs or methodologies used for valuing investments may not necessarily be an indication of the risk associated with investing in those investments.
b. SECURITY TRANSACTIONS
Security transactions are accounted for as of trade date. Realized gains and losses on securities sold are determined on the basis of identified cost.
c. INVESTMENT INCOME AND EXPENSES
Dividend income is recorded on theex-dividend date. Dividends from foreign securities are recorded on theex-dividend date, and if after the fact, as soon as the Funds become aware of theex-dividend date. Interest income, which includes amortization of premium and accretion of discount on debt securities, is accrued as earned. Dividend and interest income on foreign securities is recorded gross of any withholding tax.Non-cash dividends included in dividend income, if any, are reported at the fair market value of the securities received. Upon notification from issuers, distributions received from a real estate investment trust (“REIT”) may be redesignated as a reduction of cost of investments and/or realized gain. Other income and expenses are recorded on an accrual basis. Expenses that cannot be directly attributed to a Fund are apportioned among the funds in the Trust and other trusts within the AMG Funds family of mutual funds (collectively the “AMG Funds Family”) based upon their relative average net assets or number of shareholders. Investment income, realized and unrealized capital gains and losses, the common expenses of each Fund, and certain fund level expense reductions, if any, are allocated on apro-rata basis to each class based on the relative net assets of each class to the total net assets of each Fund.
Balanced had certain portfolio trades directed to various brokers under a brokerage recapture program. Credits received from the brokerage recapture program are earned and paid on a monthly basis, and are recorded as expense offsets, which serve to reduce the Fund’s overall expense ratio. For the fiscal year ended December 31, 2018, the impact on the expenses and expense ratios, if any, was $15,794 or 0.01%.
d. DIVIDENDS AND DISTRIBUTIONS
Fund distributions resulting from either net investment income or realized net capital gains, if any, will normally be declared and paid at least annually in December. Distributions to shareholders are recorded on theex-dividend date. Distributions are determined in accordance with federal income tax regulations, which may differ from net investment income and net realized capital gains for financial statement purposes (U.S. GAAP). Differences may be permanent or temporary. Permanent differences are reclassified among capital accounts in the financial statements to reflect their tax character. Permanent book and tax basis differences, if any, relating to shareholder distributions will result in reclassifications topaid-in capital. Temporary differences arise when certain items of income, expense and gain or loss are recognized in different periods for financial statement and tax purposes; these differences will reverse at some time in the future. Permanent differences are due to redesignation of dividends paid, foreign currency and tax adjustments relating to corporate actions. Temporary differences are due to capital loss deferrals on straddles, qualified late-year loss deferrals, wash sales and capital loss carryforwards not yet utilized.
The distributions disclosed on the Statements of Changes in Net Assets for the fiscal year ended December 31, 2017 were from the following sources:
| Fund | Net Investment Income | Realized Gain on Investments | ||||||
Balanced | ||||||||
Class N | $544,946 | $2,969,365 | ||||||
Class I | 750,899 | 4,597,864 | ||||||
Class Z | 58,823 | 281,134 | ||||||
|
|
|
| |||||
Total | $1,354,668 | $7,848,363 | ||||||
|
|
|
| |||||
Intermediate Government |
| |||||||
Class N | $2,210,849 | — | ||||||
Class I | 27,256 | — | ||||||
Class Z | 23,041 | — | ||||||
|
|
|
| |||||
Total | $2,261,146 | — | ||||||
|
|
|
| |||||
Short Duration | ||||||||
Class N | $4,012,537 | — | ||||||
Class I | 443,522 | — | ||||||
Class Z | 15,045 | — | ||||||
|
|
|
| |||||
Total | $4,471,104 | — | ||||||
|
|
|
| |||||
| 52 |
Table of Contents
Notes to Financial Statements(continued) |
The tax character of distributions paid during the fiscal years ended December 31, 2018 and December 31, 2017 were as follows:
| Balanced | Intermediate Government | Short Duration | ||||||||||||||||||||||
Distributions paid from:
| 2018
| 2017
| 2018
| 2017
| 2018
| 2017
| ||||||||||||||||||
Ordinary income | $2,473,972 | $1,336,645 | $1,765,957 | $2,261,146 | $2,671,040 | $4,471,104 | ||||||||||||||||||
Short-term capital gains | 4,164,098 | 3,377,861 | — | — | — | — | ||||||||||||||||||
Long-term capital gains | 9,983,986 | 4,487,937 | — | — | — | — | ||||||||||||||||||
Paid-in capital | — | — | — | 192,812 | — | — | ||||||||||||||||||
|
|
|
|
|
|
|
|
|
|
|
| |||||||||||||
| $16,622,056 | $9,202,443 | $1,765,957 | $2,453,958 | $2,671,040 | $4,471,104 | |||||||||||||||||||
|
|
|
|
|
|
|
|
|
|
|
| |||||||||||||
As of December 31, 2018, the components of distributable earnings (excluding unrealized appreciation/depreciation) on a tax basis consisted of:
| Balanced | Intermediate Government | Short Duration | ||||||||||
Capital loss carryforward | — | $3,590,912 | $5,828,478 | |||||||||
Undistributed ordinary income | $95,468 | 1,095 | 13,497 | |||||||||
Undistributed short-term capital gains | — | — | — | |||||||||
Undistributed long-term capital gains | 3,124,169 | — | — | |||||||||
Late-year loss deferral | 659,748 | — | — | |||||||||
At December 31, 2018, the cost of investments and the aggregate gross unrealized appreciation and depreciation for federal income tax purposes were as follows:
| Fund | Cost | Appreciation | Depreciation | Net | ||||||||||||
Balanced | $252,718,619 | $12,424,298 | $(14,941,524 | ) | $(2,517,226 | ) | ||||||||||
Intermediate Government | 116,356,804 | 962,814 | (1,646,039 | ) | (683,225 | ) | ||||||||||
Short Duration | 135,659,003 | 1,156,707 | (1,929,841 | ) | (773,134 | ) | ||||||||||
e. FEDERAL TAXES
Each Fund currently qualifies as an investment company and intends to comply with the requirements under Subchapter M of the Internal Revenue Code of 1986, as amended, and to distribute substantially all of its taxable income and gains to its shareholders and to meet certain diversification and income requirements with respect to investment companies. Therefore, no provision for federal income or excise tax is included in the accompanying financial statements.
Additionally, based on each Fund’s understanding of the tax rules and rates related to income, gains and transactions for the foreign jurisdictions in which it invests, each Fund will provide for foreign taxes, and where appropriate, deferred foreign taxes.
Management has analyzed the Funds’ tax positions taken on federal income tax returns as of December 31, 2018, and for all open tax years (generally, the three prior taxable years), and has concluded that no provision for federal income tax is required in the Funds’ financial statements. Additionally, Management is not aware of any tax position for which it is reasonably possible that the total amounts of unrecognized tax benefits will change materially in the next twelve months.
Net capital losses incurred may be carried forward for an unlimited time period, and retain their tax character as either short-term or long-term capital losses.
f. CAPITAL LOSS CARRYOVERS AND DEFERRALS
As of December 31, 2018, the following Funds had accumulated net realized capital loss carryovers from securities transactions for federal income tax purposes as shown in the following chart. These amounts may be used to offset future realized capital gains, if any, for an unlimited time period.
| Capital Loss Carryover Amounts | ||||||||||||
| Fund | Short-Term | Long-Term | Total | |||||||||
Intermediate Government | $98,490 | $3,492,422 | $3,590,912 | |||||||||
Short Duration | 417,832 | 5,410,646 | 5,828,478 | |||||||||
As of December 31, 2018, Balanced had no accumulated net realized capital loss carryovers from securities transactions for federal income tax purposes. Should Balanced incur net capital losses for the fiscal year ended December 31, 2019, such amounts may be used to offset future realized capital gains, for an unlimited time period.
g. CAPITAL STOCK
The Trust’s Declaration of Trust authorizes for each Fund the issuance of an unlimited number of shares of beneficial interest, without par value. Each Fund records sales and repurchases of its capital stock on the trade date.
| 53 |
Table of Contents
Notes to Financial Statements(continued) |
For the fiscal years ended December 31, 2018 and December 31, 2017, the capital stock transactions by class for the Funds were as follows:
| Balanced | ||||||||||||||||
| December 31, 2018 | December 31, 2017 | |||||||||||||||
| Shares | Amount | Shares | Amount | |||||||||||||
Class N:
| ||||||||||||||||
Proceeds from sale of shares | 1,829,410 | $31,862,118 | 1,239,936 | $20,491,466 | ||||||||||||
Reinvestment of distributions | 275,306 | 4,281,568 | 180,583 | 3,069,279 | ||||||||||||
Cost of shares repurchased | (1,595,686 | ) | (27,737,463 | ) | (3,044,466 | ) | (50,984,756 | ) | ||||||||
|
|
|
|
|
|
|
| |||||||||
Net increase (decrease) | 509,030 | $8,406,223 | (1,623,947) | $(27,424,011) | ||||||||||||
|
|
|
|
|
|
|
| |||||||||
Class I: | ||||||||||||||||
Proceeds from sale of shares | 5,399,926 | $94,484,167 | 2,705,468 | $45,868,384 | ||||||||||||
Reinvestment of distributions | 364,983 | 5,735,369 | 161,858 | 2,780,507 | ||||||||||||
Cost of shares repurchased | (1,775,098 | ) | (30,603,938 | ) | (1,051,459 | ) | (17,798,320 | ) | ||||||||
|
|
|
|
|
|
|
| |||||||||
Net increase | 3,989,811 | $69,615,598 | 1,815,867 | $30,850,571 | ||||||||||||
|
|
|
|
|
|
|
| |||||||||
Class Z: | ||||||||||||||||
Proceeds from sale of shares | 183,387 | $3,281,181 | 77,566 | $1,285,979 | ||||||||||||
Reinvestment of distributions | 33,709 | 529,976 | 19,371 | 332,260 | ||||||||||||
Cost of shares repurchased | (87,554 | ) | (1,538,108 | ) | (58,065 | ) | (968,364 | ) | ||||||||
|
|
|
|
|
|
|
| |||||||||
Net increase | 129,542 | $2,273,049 | 38,872 | $649,875 | ||||||||||||
|
|
|
|
|
|
|
| |||||||||
| Intermediate Government | Short Duration | |||||||||||||||||||||||||||||||
| December 31, 2018 | December 31, 2017 | December 31, 2018 | December 31, 2017 | |||||||||||||||||||||||||||||
| Shares | Amount | Shares | Amount | Shares | Amount | Shares | Amount | |||||||||||||||||||||||||
Class N:1 | ||||||||||||||||||||||||||||||||
Proceeds from sale of shares | 1,508,515 | $15,684,417 | 2,506,899 | $26,802,132 | 2,561,424 | $24,214,558 | 4,487,160 | $43,034,526 | ||||||||||||||||||||||||
Reinvestment of distributions | 136,575 | 1,413,662 | 206,475 | 2,204,214 | 217,861 | 2,054,398 | 392,197 | 3,743,767 | ||||||||||||||||||||||||
Cost of shares repurchased | (4,507,368 | ) | (46,771,107 | ) | (8,473,695 | ) | (90,681,619 | ) | (6,477,199 | ) | (61,190,958 | ) | (14,919,003 | ) | (142,857,038 | ) | ||||||||||||||||
|
|
|
|
|
|
|
|
|
|
|
|
|
|
|
| |||||||||||||||||
Net decrease | (2,862,278 | ) | $(29,673,028 | ) | (5,760,321 | ) | $(61,675,273 | ) | (3,697,914 | ) | $(34,922,002 | ) | (10,039,646 | ) | $(96,078,745) | |||||||||||||||||
|
|
|
|
|
|
|
|
|
|
|
|
|
|
|
| |||||||||||||||||
Class I:2 | ||||||||||||||||||||||||||||||||
Proceeds from sale of shares | 831,734 | $8,636,946 | 282,788 | $3,034,044 | 2,341,950 | $22,119,771 | 5,634,803 | $53,874,614 | ||||||||||||||||||||||||
Reinvestment of distributions | 14,551 | 150,473 | 2,771 | 29,580 | 24,973 | 235,383 | 15,916 | 151,394 | ||||||||||||||||||||||||
Cost of shares repurchased | (400,115 | ) | (4,136,899 | ) | (67,846 | ) | (727,699 | ) | (1,348,324 | ) | (12,723,634 | ) | (3,140,056 | ) | (29,921,094 | ) | ||||||||||||||||
|
|
|
|
|
|
|
|
|
|
|
|
|
|
|
| |||||||||||||||||
Net increase | 446,170 | $4,650,520 | 217,713 | $2,335,925 | 1,018,599 | $9,631,520 | 2,510,663 | $24,104,914 | ||||||||||||||||||||||||
|
|
|
|
|
|
|
|
|
|
|
|
|
|
|
| |||||||||||||||||
Class Z:2 | ||||||||||||||||||||||||||||||||
Proceeds from sale of shares | 13,037 | $135,483 | 169,759 | $1,799,841 | 13,154 | $124,228 | 126,003 | $1,211,014 | ||||||||||||||||||||||||
Reinvestment of distributions | 2,249 | 23,260 | 2,342 | 25,005 | 1,397 | 13,176 | 1,577 | 15,045 | ||||||||||||||||||||||||
Cost of shares repurchased | (32,636 | ) | (340,789 | ) | (47,207 | ) | (505,944 | ) | (9,015 | ) | (85,425 | ) | (56,279 | ) | (538,713 | ) | ||||||||||||||||
|
|
|
|
|
|
|
|
|
|
|
|
|
|
|
| |||||||||||||||||
Net increase (decrease) | (17,350 | ) | $(182,046 | ) | 124,894 | $1,318,902 | 5,536 | $51,979 | 71,301 | $687,346 | ||||||||||||||||||||||
|
|
|
|
|
|
|
|
|
|
|
|
|
|
|
| |||||||||||||||||
1 Effective February 27, 2017, Class S was renamed Class N.
2 Commencement of operations was February 27, 2017.
| 54 |
Table of Contents
Notes to Financial Statements(continued) |
h. REPURCHASE AGREEMENTS AND JOINT REPURCHASE AGREEMENTS
The Funds may enter into third-party repurchase agreements for temporary cash management purposes and third-party or bilateral joint repurchase agreements for reinvestment of cash collateral on securities lending transactions under the securities lending program offered by The Bank of New York Mellon (“BNYM”) (the “Program”) (collectively, “Repurchase Agreements”). The value of the underlying collateral, including accrued interest, must equal or exceed the value of the Repurchase Agreements during the term of the agreement. For joint repurchase agreements, the Funds participate on a pro rata basis with other clients of BNYM in its share of the underlying collateral under such joint repurchase agreements and in its share of proceeds from any repurchase or other disposition of the underlying collateral. The underlying collateral for all Repurchase Agreements is held in safekeeping by the Funds’ custodian or at the Federal Reserve Bank. If the seller defaults and the value of the collateral declines, or if bankruptcy proceedings commence with respect to the seller of the security, realization of the collateral by the Funds may be delayed or limited. Pursuant to the Program, the Funds are indemnified for such losses by BNYM on joint repurchase agreements.
At December 31, 2018, the market value of Repurchase Agreements outstanding for Balanced was $2,307,855.
i. FOREIGN CURRENCY TRANSLATION
The books and records of the Funds are maintained in U.S. dollars. The value of investments, assets and liabilities denominated in currencies other than U.S. dollars are translated into U.S. dollars based upon current foreign exchange rates. Purchases and sales of foreign investments, income and expenses are converted into U.S. dollars based on currency exchange rates prevailing on the respective dates of such transactions. Net realized and unrealized gain (loss) on foreign currency transactions represent: (1) foreign exchange gains and losses from the sale and holdings of foreign currencies; (2) gains and losses between trade date and settlement date on investment securities transactions and foreign currency exchange contracts; and (3) gains and losses from the difference between amounts of interest and dividends recorded and the amounts actually received.
The Funds do not isolate the net realized and unrealized gain or loss resulting from changes in exchange rates from the fluctuations in market prices of securities held. Such fluctuations are included with the net realized and unrealized gain or loss on investments.
j. SECURITIES TRANSACTED ON A WHEN ISSUED BASIS
The Funds may enter intoTo-Be-Announced (“TBA”) sale commitments to hedge their portfolio positions or to sell mortgage-backed securities they own under delayed delivery arrangements. Proceeds of TBA sale commitments are not received until the contractual settlement date. During the time a TBA sale commitment is outstanding, equivalent deliverable securities, with the same counterparty, or an offsetting TBA purchase commitment deliverable on or before the sale commitment date, are held as “cover” for the transaction. Unsettled TBA sale commitments are valued at the current market value of the underlying securities according to the procedures described under “Valuation of Investments,” in Footnote 1a above.
Each TBA contract ismarked-to-market daily and the change in market value is recorded by the Fund as an unrealized gain or loss. If the TBA sale commitment is closed through the acquisition of an offsetting purchase commitment with the same broker, the Fund realizes a gain or loss. If the Fund delivers securities under
the commitment, the Fund realizes a gain or a loss from the sale of the securities based upon the unit price established at the date the commitment was entered into.
k. DELAYED DELIVERY TRANSACTIONS AND WHEN-ISSUED SECURITIES
The Funds may enter into securities transactions on a delayed delivery or when issued basis. Payment and delivery may take place after the customary settlement period for that security. The price of the underlying securities and the date when the securities will be delivered and paid for are fixed at the time the transaction is negotiated. During the time a delayed delivery sell is outstanding, the contract is marked to market daily and equivalent deliverable securities are held for the transaction. The value of the securities purchased on a delayed delivery or when-issued basis are identified as such in the Funds’ Schedules of Portfolio Investments. With respect to purchase commitments, the Funds identify securities as segregated in their records with a value at least equal to the amount of the commitment. Delayed delivery or when-issued securities that have been purchased from and sold to different brokers are reflected as an investment in securities and a forward sale commitment in the Funds’ Statement of Assets and Liabilities. For financial reporting purposes, the Funds do not offset the receivable and payable for delayed delivery investments purchased and sold on TBA commitments. Losses may arise due to changes in the value of the underlying securities or if the counterparty does not perform under the contract, or if the issuer does not issue the securities due to political, economic, or other factors.
2. AGREEMENTS AND TRANSACTIONS WITH AFFILIATES
For each of the Funds, the Trust has entered into an investment advisory agreement under which the Investment Manager, a subsidiary and the U.S. retail distribution arm of Affiliated Managers Group, Inc. (“AMG”), serves as investment manager to the Funds and is responsible for the Funds’ overall administration and operations. The Investment Manager selects one or more subadvisers for the Funds (subject to Board approval) and monitors each subadviser’s investment performance, security holdings and investment strategies. Each Fund’s investment portfolio is managed by one or more portfolio managers who serve pursuant to a subadvisory agreement with the Investment Manager. Balanced is managed by Chicago Equity Partners, LLC (“CEP”) and Intermediate Government and Short Duration are managed by Amundi Pioneer Institutional Asset Management, Inc. AMG indirectly owns a majority interest in CEP.
Investment management fees are paid directly by the Funds to the Investment Manager based on average daily net assets. For the fiscal year ended December 31, 2018, the Funds’ investment management fees were paid at the following annual rate of each Fund’s respective average daily net assets:
Balanced | 0.60% | |||
Intermediate Government | 0.48% | |||
Short Duration | 0.40% | |||
The Investment Manager has contractually agreed, through at least May 1, 2019, to waive management fees and/or reimburse fund expenses in order to limit total annual Fund operating expenses after fee waiver and expense reimbursements (exclusive of taxes, interest (including interest incurred in connection with bank and custody overdrafts), shareholder servicing fees, distribution and service(12b-1) fees, brokerage commissions and other transaction costs, acquired fund
| 55 |
Table of Contents
Notes to Financial Statements(continued) |
fees and expenses and extraordinary expenses) of Balanced to 0.84% of the Fund’s average daily net assets subject to later reimbursement by the Fund in certain circumstances.
The Investment Manager has contractually agreed, through at least May 1, 2019, to waive management fees and/or reimburse Fund expenses in order to limit total annual Fund operating expenses after fee waiver and expense reimbursements (exclusive of taxes, interest (including interest incurred in connection with bank and custody overdrafts), shareholder servicing fees, brokerage commissions and other transaction costs, acquired fund fees and expenses and extraordinary expenses) to 0.74% of Intermediate Government’s average daily net assets subject to later reimbursement by the Fund in certain circumstances.
Effective February 27, 2017, the Investment Manager has contractually agreed, through May 1, 2019, to waive Intermediate Government’s management fee by 0.05%, from 0.48% to 0.43%, and Short Duration’s management fee by 0.11%, from 0.40% to 0.29%. For the fiscal year ended December 31, 2018, the management fee for Intermediate Government and Short Duration was reduced by $46,611 and $163,508, respectively.
The contractual expense limitation may only be terminated in the event the Investment Manager or a successor ceases to be the investment manager of a Fund or a successor fund, by mutual agreement between the Investment Manager and the Board, or in the event of a Fund’s liquidation unless the Fund is reorganized or is a party to a merger in which the surviving entity is successor to the accounting and performance information of a Fund.
In general, for a period of up to 36 months, the Investment Manager may recover from each Fund fees waived and expenses paid pursuant to this contractual agreement, provided that such repayment would not cause a Fund’s total annual operating expenses after fee waiver and expense reimbursements (exclusive of the items noted in the parenthetical above) to exceed the contractual expense limitation amount.
At December 31, 2018, the Funds’ expiration of recoupment is as follows:
Expiration Period | Balanced | Intermediate Government | ||||||
Less than 1 year
|
| $276,286
|
|
| $81,422
|
| ||
Within 2 years
|
| 92,722
|
|
| 135,196
|
| ||
Within 3 years
|
| 132,068
|
|
| 83,933
|
| ||
|
|
|
| |||||
Total Amount Subject to Recoupment
|
| $501,076
|
|
| $300,551
|
| ||
|
|
|
| |||||
The Investment Manager has agreed to waive a portion of its management fee in consideration of shareholder servicing fees that it has received from JPMorgan Distribution Services, Inc., with respect to short-term cash investments each Fund may have made in the JPMorgan Money Market Funds. For the fiscal year ended December 31, 2018, the investment management fee for the Funds was not reduced.
The Trust, on behalf of the Funds, has entered into an amended and restated Administration Agreement under which the Investment Manager serves as the Funds’ administrator (the “Administrator”) and is responsible for allnon-portfolio management aspects of managing the Funds’ operations, including administration and shareholder services to each Fund. Each Fund pays a fee to the Administrator at the rate of 0.15% per annum of the Fund’s average daily net assets for this service.
The Funds are distributed by AMG Distributors, Inc. (the “Distributor”), a wholly-owned subsidiary of the Investment Manager. The Distributor serves as the distributor and underwriter for each Fund and is a registered broker-dealer and member of the Financial Industry Regulatory Authority, Inc. (“FINRA”). Shares of each Fund will be continuously offered and will be sold directly to prospective purchasers and through brokers, dealers or other financial intermediaries who have executed selling agreements with the Distributor. Generally the Distributor bears all or a portion of the expenses of providing services pursuant to the distribution agreement, including the payment of the expenses relating to the distribution of prospectuses for sales purposes and any advertising or sales literature.
Balanced has adopted a distribution and service plan (the “Plan”) with respect to the Class N shares, in accordance with the requirements of Rule12b-1 under the 1940 Act and the requirements of the applicable rules of FINRA regarding asset based sales charges. Pursuant to the Plan, the Fund may make payments to the Distributor for its expenditures in financing any activity primarily intended to result in the sale of the Fund’s Class N shares and for maintenance and personal service provided to existing shareholders of that class. The Plan authorizes payments to the Distributor up to 0.25% annually of the Fund’s average daily net assets attributable to the Class N shares.
For Class N of Intermediate Government and Short Duration, and Class I of Balanced, Intermediate Government and Short Duration, the Board has approved reimbursement payments to the Investment Manager for shareholder servicing expenses (“shareholder servicing fees”) incurred. Shareholder servicing fees include payments to financial intermediaries, such as broker-dealers (including fund supermarket platforms), banks, and trust companies who provide shareholder recordkeeping, account servicing and other services. Class N shares of Intermediate Government and Short Duration and Class I shares of Balanced, Intermediate Government and Short Duration may reimburse the Investment Manager for the actual amount incurred up to a maximum annual rate of each Class’s average daily net assets as shown in the table below.
The impact on the annualized expense ratios for the fiscal year ended December 31, 2018, were as follows:
| Fund | Maximum Annual Amount | Actual Amount |
| |||||||||
Balanced | ||||||||||||
Class I | 0.10 | % | 0.09% | |||||||||
Intermediate Government | ||||||||||||
Class N | 0.15 | % | 0.15% | |||||||||
Class I | 0.05 | % | 0.05% | |||||||||
Short Duration | ||||||||||||
Class N | 0.15 | % | 0.15% | |||||||||
Class I | 0.05 | % | 0.05% | |||||||||
The Board provides supervision of the affairs of the Trust and other trusts within the AMG Funds family. The Trustees of the Trust who are not affiliated with the Investment Manager receive an annual retainer and per meeting fees for regular, special and telephonic meetings, and they are reimbursed forout-of-pocket expenses incurred while carrying out their duties as Board members. The Chairman of the Board and the Audit Committee Chair receive additional annual
| 56 |
Table of Contents
Notes to Financial Statements(continued) |
retainers. Certain Trustees and Officers of the Funds are Officers and/or Directors of the Investment Manager, AMG and/or the Distributor.
The Securities and Exchange Commission (the “SEC”) granted an exemptive order that permits the Funds to lend and borrow money for certain temporary purposes directly to and from other eligible funds in the AMG Funds family. Participation in this interfund lending program is voluntary for both the borrowing and lending funds, and an interfund loan is only made if it benefits each participating fund. The Administrator manages the program according to procedures approved by the Board, and the Board monitors the operation of the program. An interfund loan must comply with certain conditions set out in the exemptive order, which are designed to assure fairness and protect all participating funds. For the fiscal year ended December 31, 2018, Intermediate Government lent a maximum of $1,120,395 for two days earning interest of $171 and Short Duration lent a maximum of $3,365,377, for six days earning interest of $1,389. The interest income amount is included in the Statement of Operations as interest income. For the fiscal year ended December 31, 2018, Balanced neither borrowed from nor lent to other funds in the AMG Funds family. At December 31, 2018, the Funds had no interfund loans outstanding.
3. PURCHASES AND SALES OF SECURITIES
Purchases and sales of securities (excluding short-term securities and U.S. Government Obligations) for the fiscal year ended December 31, 2018, were as follows:
| Long Term Securities | ||||||||
| Fund | Purchases | Sales | ||||||
Balanced | $175,097,657 | $123,879,751 | ||||||
Intermediate Government | — | 4,897,401 | ||||||
Short Duration | 3,926,216 | 16,870,487 | ||||||
Purchases and sales of U.S. Government Obligations for the fiscal year ended December 31, 2018 were as follows:
| U.S. Government Obligations | ||||||||
| Fund | Purchases | Sales | ||||||
Balanced | $68,470,533 | $56,224,146 | ||||||
Intermediate Government | 52,041 | 15,313,316 | ||||||
Short Duration | 14,595,294 | 37,554,940 | ||||||
4. PORTFOLIO SECURITIES LOANED
The Funds participate in the Program providing for the lending of securities to qualified brokers. Securities lending income includes earnings of such temporary cash investments, plus or minus any rebate to a borrower. These earnings (after any rebate) are then divided between BNYM, as a fee for its services under the Program, and the Funds, according to agreed-upon rates. Collateral on all securities loaned is accepted in cash and, effective October 1, 2018, may also be accepted in U.S. Government and Agency Obligations. Collateral is maintained at a minimum level of 102% (105% in the case of certain foreign securities) of the market value, plus interest, if applicable, of investments on loan. It is the Funds’ policy to obtain additional collateral from or return excess collateral to the borrower by the end of the next business day, following the valuation date of the securities loaned. Therefore, the value of the collateral held may be temporarily
less than the value of the securities on loan. Lending securities entails a risk of loss to the Funds if and to the extent that the market value of the securities loaned were to increase and the borrower did not increase the collateral accordingly, and the borrower fails to return the securities. Under the terms of the Program, the Funds are indemnified for such losses by BNYM. Cash collateral is held in separate omnibus accounts managed by BNYM, who is authorized to exclusively enter into joint repurchase agreements for that cash collateral. Securities collateral is held in separate omnibus accounts managed by BNYM that cannot be sold or pledged. BNYM bears the risk of any deficiency in the amount of the cash collateral available for return to the borrower due to any loss on the collateral invested.
The value of securities loaned on positions held, cash and securities collateral received at December 31, 2018, were as follows:
| Fund | Securities Loaned | Cash Collateral Received | Securities Collateral Received | Total Collateral Received | ||||||||||||
Balanced | $12,415,179 | $2,307,855 | $10,339,584 | $12,647,439 | ||||||||||||
The following table summarizes the securities received as collateral for securities lending:
| Fund | Collateral Type | Coupon Range | Maturity Date Range | |||||||
Balanced | U.S. Treasury Obligations | 0.000%-8.750% | 01/10/19-08/15/47 | |||||||
5. FOREIGN SECURITIES
Balanced invests in securities of foreign entities and in instruments denominated in foreign currencies which involve risks not typically associated with investments in domestic securities.Non-domestic securities carry special risks, such as exposure to currency fluctuations, less developed or less efficient trading markets, political instability, a lack of company information, differing auditing and legal standards, and, potentially, less liquidity. The Fund’s investments in emerging market countries are exposed to additional risks. The Fund’s performance will be influenced by political, social and economic factors affecting companies in emerging market countries. Emerging market countries generally have economic structures that are less diverse and mature, and political systems that are less stable, than those of developed countries. Realized gains in certain countries may be subject to foreign taxes at the Fund level and the Fund would pay such foreign taxes at the appropriate rate for each jurisdiction.
6. COMMITMENTS AND CONTINGENCIES
Under the Trust’s organizational documents, its trustees and officers are indemnified against certain liabilities arising out of the performance of their duties to the Trust. In addition, in the normal course of business, the Funds may enter into contracts and agreements that contain a variety of representations and warranties, which provide general indemnifications. The maximum exposure to the Funds under these arrangements is unknown, as this would involve future claims that may be made against a Fund that have not yet occurred. However, based on experience, the Funds had no prior claims or losses and expect the risks of loss to be remote.
7. DERIVATIVE INSTRUMENTS
The following disclosures contain information on how and why certain Funds use derivative instruments, the credit risk and how derivative instruments affect the
| 57 |
Table of Contents
Notes to Financial Statements(continued) |
Funds’ financial position, and results of operations. The location and fair value amounts of these instruments on the Statement of Assets and Liabilities, and the realized gains and losses and changes in unrealized gains and losses on the Statement of Operations, each categorized by type of derivative contract, are included in a table at the end of the applicable Fund’s Schedule of Portfolio Investments. For the fiscal year ended December 31, 2018, the average quarterly balances of derivative financial instruments outstanding were as follows:
| | Intermediate Government | | Short Duration | |||||
Financial Futures Contracts
| ||||||||
Average number of contracts purchased | 4 | 65 | ||||||
Average number of contracts sold | 77 | 593 | ||||||
Average notional value of contracts purchased | $563,519 | $7,694,503 | ||||||
Average notional value of contracts sold
|
| $8,173,560
|
|
| $100,768,301
|
| ||
8. FUTURES CONTRACTS
Intermediate Government and Short Duration purchased and sold futures contracts to achieve a desired level of investment, whether to accommodate portfolio turnover or cash flows from capital shares transactions. There are certain risks associated with futures contracts. Prices may not move as expected or the Fund may not be able to close out the contract when it desires to do so, resulting in losses.
On entering into a futures contract, either cash or securities in an amount equal to a certain percentage of the contract value (initial margin) must be deposited with the futures broker. Subsequent variation margin payments are made or received by the Funds depending on the fluctuations in the value of the futures contracts and the value of cash or securities on deposit with the futures broker. The Funds must have total value at the futures broker consisting of either net unrealized gains, cash or securities collateral to meet the initial margin requirement, and any value over the initial margin requirement may be transferred to the Funds.
Variation margin on future contracts is recorded as unrealized appreciation or depreciation until the futures contract is closed or expired. The Funds recognize a realized gain or loss when the contract is closed or expires equal to the difference between the value of the contract at the time it was opened and the value at the time it was closed. Fluctuations in the value of the contracts are recorded in the Statement of Assets and Liabilities as an asset (liability) and in the Statement of Operations as unrealized appreciation (depreciation) until the contracts are closed, when they are recorded as realized gains (losses) on futures contracts.
9. RISKS ASSOCIATED WITH COLLATERALIZED MORTGAGE OBLIGATIONS (“CMOs”)
The net asset values of a Fund may be sensitive to interest rate fluctuations because a Fund may hold several instruments, including CMOs and other derivatives, whose values can be significantly impacted by interest rate movements. CMOs are obligations collateralized by a portfolio of mortgages or mortgage-related securities. Payments of principal and interest on the mortgages are passed through to the holder of the CMOs on the same schedule as they are received, although certain classes of CMOs have priority over others with respect to the receipt of prepayments on the mortgages. Therefore, the investment in
CMOs may be subject to a greater or lesser risk of prepayment than other types of mortgage-related securities. CMOs are subject to principal paydowns as a result of prepayments or refinancing of the underlying mortgage instruments. As a result, the average life may be substantially less than the original maturity. CMOs may have a fixed or variable rate of interest.
10. DOLLAR ROLL AGREEMENTS
The Funds may enter into dollar rolls in which they sell debt securities for delivery currently and simultaneously contract to repurchase similar, but not identical, securities at the same price or a lower price on an agreed date. The Funds receive compensation as consideration for entering into the commitment to repurchase. The compensation is the difference between the current sale price and the repurchase price (often referred to as the “drop”) as well as the interest earned on the cash proceeds of the initial sale. The Funds may also be compensated by the receipt of a commitment fee. As the holder, the counterparty receives all principal and interest payments, including prepayments, made with respect to the similar security sold. Dollar rolls may be renewed with a new sale and repurchase price with a cash settlement made at renewal without physical delivery of the securities subject to the contract.
Certain risks may arise upon entering into dollar rolls from the potential inability of counterparties to meet the terms of their commitments. Additionally, the value of such securities may change adversely before the Funds are able to repurchase them. There can be no assurance that the Funds’ use of the cash that they receive from a dollar roll will provide a return that exceeds their cost.
11. STRIPPED SECURITIES
Intermediate Government and Short Duration may invest in stripped securities (“STRIPS”) for hedging purposes to protect the Funds’ portfolios against interest rate fluctuations. Interest-only STRIPS will most likely move differently than typical fixed-income securities in relation to changes in interest rates. STRIPS are usually structured with two classes that receive different proportions of the interest and principal distributions from a pool of underlying assets. A common type of STRIP will have one class receiving all of the interest from the underlying assets (“interest-only” or “IO” class), while the other class will receive the entire principal (“principal only” or “PO” class). However, in some instances, one class will receive some of the interest and most of the principal while the other class will receive most of the interest and the remainder of the principal. STRIPS are unusually volatile in response to changes in interest rates. The yield to maturity on an IO class of STRIPS is extremely sensitive not only to changes in prevailing interest rates but also to the rate of principal payments (including prepayments) on the underlying assets. A rapid rate of principal prepayments may have a measurably adverse effect on a Funds’ yield to maturity to the extent it invests in IOs.
Conversely, POs tend to increase in value if prepayments are greater than anticipated and decline if prepayments are slower than anticipated. Thus, if the underlying assets experience greater than anticipated repayments of principal, a Fund may fail to fully recover its initial investment in these securities, even if the STRIPS were rated of the highest credit quality by Standard & Poor’s Corporation or Moody’s Investors Service, Inc. These risks are managed by investing in a variety of such securities and by using certain hedging techniques. In addition the secondary market for STRIPS may be less liquid than that of other mortgage-backed or asset-backed securities, potentially limiting the Funds’ ability to buy or sell those securities at any particular time.
| 58 |
Table of Contents
Notes to Financial Statements(continued) |
12. MASTER NETTING AGREEMENTS
The Funds may enter into master netting agreements with their counterparties for the securities lending program and Repurchase Agreements, which provide the right, in the event of default (including bankruptcy or insolvency) for thenon-defaulting party to liquidate the collateral and calculate net exposure to the
defaulting party or request additional collateral. For financial reporting purposes, the Funds do not offset financial assets and financial liabilities that are subject to master netting agreements in the Statement of Assets and Liabilities. For securities lending transactions, see Note 4.
The following table is a summary of the Funds’ open Repurchase Agreements that are subject to a master netting agreement as of December 31, 2018:
| Gross Amount Not Offset in the Statement of Assets and Liabilities | ||||||||||||||||||||
| Fund | Net Amounts of Assets Presented in the Statement of Assets and Liabilities | Financial Instruments | Cash Collateral Received | Net Amount | ||||||||||||||||
Balanced
| ||||||||||||||||||||
Cantor Fitzgerald Securities, Inc. | $1,000,000 | $1,000,000 | — | — | ||||||||||||||||
Deutsche Bank Securities, Inc. | 307,855 | 307,855 | — | — | ||||||||||||||||
RBC Dominion Securities, Inc. | 1,000,000 | 1,000,000 | — | — | ||||||||||||||||
|
|
|
|
|
|
|
| |||||||||||||
Totals | $2,307,855 | $2,307,855 | — | — | ||||||||||||||||
|
|
|
|
|
|
|
| |||||||||||||
13. REGULATORY UPDATES
In August 2018, the FASB issued Accounting Standards UpdateNo. 2018-13, Fair Value Measurement (Topic 820), Disclosure Framework - Changes to the Disclosure Requirements for Fair Value Measurement (“ASU2018-13”) which is effective for periods starting after December 15, 2019. The primary focus of the update is to improve the effectiveness of ASC 820’s disclosure in the notes to financial statements. The Funds have early adopted these changes and there was no significant impact on the financial statements and accompanying notes.
Effective November 15, 2018, the SEC amended existing rules intended to modernize reporting and disclosure of information. These amendments relate to RegulationS-X which sets forth the form and content of financial statements. The
amendment requires collapsing the components of distributable earnings on the Statement of Assets and Liabilities and collapsing the distributions paid to shareholders on the Statements of Changes in Net Assets. The Funds have adopted these amendments and there was no significant impact on the financial statements and accompanying notes.
14. SUBSEQUENT EVENTS
The Funds have determined that no material events or transactions occurred through the issuance date of the Funds’ financial statements, which require an additional disclosure in or adjustment of the Funds’ financial statements.
| 59 |
Table of Contents
TO THE BOARD OF TRUSTEES OF AMG FUNDS II AND SHAREHOLDERS OF AMG CHICAGO EQUITY PARTNERS BALANCED FUND, AMG MANAGERS AMUNDI INTERMEDIATE GOVERNMENT FUND, AND AMG MANAGERS AMUNDI SHORT DURATION GOVERNMENT FUND
Opinions on the Financial Statements
We have audited the accompanying statements of assets and liabilities, including the schedules of portfolio investments, of AMG Chicago Equity Partners Balanced Fund, AMG Managers Amundi Intermediate Government Fund, and AMG Managers Amundi Short Duration Government Fund (three of the funds constituting AMG Funds II, hereafter collectively referred to as the “Funds”) as of December 31, 2018, the related statements of operations for the year ended December 31, 2018, the statements of changes in net assets for each of the two years in the period ended December 31, 2018, including the related notes, and the financial highlights for each of the periods indicated therein (collectively referred to as the “financial statements”). In our opinion, the financial statements present fairly, in all material respects, the financial position of each of the Funds as of December 31, 2018, the results of each of their operations for the year then ended, the changes in each of their net assets for each of the two years in the period ended December 31, 2018 and each of the financial highlights for each of the periods indicated therein in conformity with accounting principles generally accepted in the United States of America.
Basis for Opinions
These financial statements are the responsibility of the Funds’ management. Our responsibility is to express an opinion on the Funds’ financial statements based on our audits. We are a public accounting firm registered with the Public Company Accounting Oversight Board (United States) (PCAOB) and are required to be independent with respect to the Funds in accordance with the U.S. federal securities laws and the applicable rules and regulations of the Securities and Exchange Commission and the PCAOB.
We conducted our audits of these financial statements in accordance with the standards of the PCAOB. Those standards require that we plan and perform the audit to obtain reasonable assurance about whether the financial statements are free of material misstatement, whether due to error or fraud.
Our audits included performing procedures to assess the risks of material misstatement of the financial statements, whether due to error or fraud, and performing procedures that respond to those risks. Such procedures included examining, on a test basis, evidence regarding the amounts and disclosures in the financial statements. Our audits also included evaluating the accounting principles used and significant estimates made by management, as well as evaluating the overall presentation of the financial statements. Our procedures included confirmation of securities owned as of December 31, 2018 by correspondence with the custodian and brokers; when replies were not received from brokers, we performed other auditing procedures. We believe that our audits provide a reasonable basis for our opinions.
PricewaterhouseCoopers LLP
Boston, Massachusetts
February 27, 2019
We have served as the auditor of one or more investment companies in AMG Funds Family since 1993.
| 60 |
Table of Contents
TAX INFORMATION
The AMG Chicago Equity Partners Balanced Fund, AMG Managers Amundi Intermediate Government Fund and AMG Managers Amundi Short Duration Government Fund each hereby designates the maximum amount allowable of its net taxable income as qualified dividends as provided in the Jobs and Growth Tax Relief Reconciliation Act of 2003. The 2018 Form1099-DIV you receive for each Fund will show the tax status of all distributions paid to you during the year.
Pursuant to section 852 of the Internal Revenue Code, AMG Chicago Equity Partners Balanced Fund, AMG Managers Amundi Intermediate Government Fund and AMG Managers Amundi Short Duration Government Fund each hereby designates $9,983,986, $0, and $0 respectively, as a capital gain distribution with respect to the taxable year ended December 31, 2018, or if subsequently determined to be different, the net capital gains of such fiscal year.
| 61 |
Table of Contents
| The Trustees and Officers of the Trust, their business addresses, principal occupations for the past five years and ages are listed below. The Trustees provide broad supervision over the affairs of the Trust and the Funds. The Trustees are experienced executives who meet periodically throughout the year to oversee the Funds’ activities, review contractual arrangements with companies that provide services to the Funds, and | review the Funds’ performance. Unless otherwise noted, the address of each Trustee or Officer is the address of the Trust: 600 Steamboat Road, Suite 300, Greenwich, Connecticut 06830.
There is no stated term of office for Trustees. Trustees serve until their resignation, retirement or removal in | accordance with the Trust’s organizational documents and policies adopted by the Board from time to time. The Chairman of the Trustees, President, Treasurer and Secretary of the Trust are elected by the Trustees annually. Other officers hold office at the pleasure of the Trustees. |
Independent Trustees
The following Trustees are not “interested persons” of the Trust within the meaning of the 1940 Act:
Number of Funds Overseen in Fund Complex | Name, Age, Principal Occupation(s) During Past 5 Years and Other Directorships Held by Trustee | |
• Trustee since 2012 • Oversees 55 Funds in Fund Complex | Bruce B. Bingham, 70 Partner, Hamilton Partners (real estate development firm) (1987-Present); Director of The Yacktman Funds (2000-2012). | |
• Trustee since 2000 • Oversees 55 Funds in Fund Complex | Edward J. Kaier, 73 Attorney at Law and Partner, Teeters Harvey Marrone & Kaier LLP (2007-Present); Attorney at Law and Partner, Hepburn Willcox Hamilton & Putnam, LLP (1977-2007); Trustee of Third Avenue Trust (3 portfolios); Trustee of Third Avenue Variable Trust (1 portfolio). | |
• Trustee since 2013 • Oversees 58 Funds in Fund Complex | Kurt A. Keilhacker, 55 Managing Partner, TechFund Capital (1997-Present); Managing Partner, TechFund Europe (2000-Present); Board Member, 6wind SA, (2002-Present); Managing Partner, Elementum Ventures (2013-Present); Director, MetricStory, Inc. (2017-Present); Trustee, Wheaton College (2018-Present); Trustee, Gordon College (2001-2016). | |
• Trustee since 2000 • Oversees 55 Funds in Fund Complex | Steven J. Paggioli, 68 Independent Consultant (2002-Present); Trustee, Professionally Managed Portfolios (32 portfolios); Advisory Board Member, Sustainable Growth Advisors, LP; Independent Director, Chase Investment Counsel (2008–Present); Executive Vice President, Secretary and Director, Investment Company Administration, LLC (1990-2001). | |
• Trustee since 2013 • Oversees 55 Funds in Fund Complex | Richard F. Powers III, 73 Adjunct Professor, U.S. Naval War College (2016-Present); Adjunct Professor, Boston College (2010-2013); President and CEO of Van Kampen Investments Inc. (1998-2003). | |
• Independent Chairman • Trustee since 2000 • Oversees 58 Funds in Fund Complex | Eric Rakowski, 60 Professor of Law, University of California at Berkeley School of Law - Boalt Hall (1990-Present); Director of Harding, Loevner Funds, Inc. (9 portfolios); Trustee of Third Avenue Trust (3 portfolios); Trustee of Third Avenue Variable Trust (1 portfolio). | |
• Trustee since 2013 • Oversees 58 Funds in Fund Complex | Victoria L. Sassine, 53 Adjunct Professor, Babson College (2007–Present); Director, Board of Directors, PRG Group (2017-Present); CEO, Founder, Scale Smarter Partners, LLC (2018-Present); Chairperson, Board of Directors, Business Management Associates (2018-Present). | |
• Trustee since 2000 • Oversees 55 Funds in Fund Complex | Thomas R. Schneeweis, 71 Professor Emeritus, University of Massachusetts (2013-Present); President, TRS Associates (1982-Present); Board Member, Chartered Alternative Investment Association (“CAIA”) (2002-Present); Director, Institute for Global Asset and Risk Management (Education) (2010-Present);Co-Owner, Quantitative Investment Technologies (2014-Present); Director of Research, Yes Wealth Management (2018-Present); Partner, S Capital Wealth Advisors (2015-2018); Partner, S Capital Management, LLC (2007-2015); President, Alternative Investment Analytics, LLC, (formerly Schneeweis Partners, LLC) (2001-2013). | |
| 62 |
Table of Contents
AMG Funds Trustees and Officers(continued) |
Interested Trustees
Each Trustee in the following table is an “interested person” of the Trust within the meaning of the 1940 Act. Ms. Carsman is an interested person of the Trust within the meaning of the 1940 Act by virtue of her position with, and interest in securities of, AMG.
Number of Funds Overseen in Fund Complex | Name, Age, Principal Occupation(s) During Past 5 Years and Other Directorships Held by Trustee | |
• Trustee since 2011 • Oversees 58 Funds in Fund Complex | Christine C. Carsman, 66 Senior Policy Advisor, Affiliated Managers Group, Inc. (2019-Present); Director of Harding, Loevner Funds, Inc. (9 portfolios); Executive Vice President, Deputy General Counsel and Chief Regulatory Counsel, Affiliated Managers Group, Inc. (2017-2018); Director (2010-2018) and Chair of the Board of Directors (2015-2018), AMG Funds plc; Senior Vice President and Deputy General Counsel, Affiliated Managers Group, Inc. (2011-2016); Senior Vice President and Chief Regulatory Counsel, Affiliated Managers Group, Inc. (2007-2011); Vice President and Chief Regulatory Counsel, Affiliated Managers Group, Inc. (2004-2007); Secretary and Chief Legal Officer, AMG Funds, AMG Funds I, AMG Funds II and AMG Funds III (2004-2011); Senior Counsel, Vice President and Director of Operational Risk Management and Compliance, Wellington Management Company, LLP (1995-2004). | |
| Officers | ||
Position(s) Held with Fund and Length of Time Served | Name, Age, Principal Occupation(s) During Past 5 Years | |
• President since 2018 • Principal Executive Officer since 2018 • Chief Executive Officer since 2018 • Chief Operating Officer since 2007 | Keitha L. Kinne, 60 Chief Operating Officer, AMG Funds LLC (2007-Present); Chief Investment Officer, AMG Funds LLC (2008-Present); President and Principal, AMG Distributors, Inc. (2018-Present); Chief Operating Officer, AMG Distributors, Inc. (2007-Present); President, Chief Executive Officer and Principal Executive Officer, AMG Funds, AMG Funds I, AMG Funds II, AMG Funds III and AMG Funds IV (2018-Present); Chief Operating Officer, AMG Funds, AMG Funds I, AMG Funds II, and AMG Funds III (2007-Present); Chief Operating Officer, AMG Funds IV (2016-Present); Chief Operating Officer and Chief Investment Officer, Aston Asset Management, LLC (2016); President and Principal Executive Officer, AMG Funds, AMG Funds I, AMG Funds II and AMG Funds III (2012-2014); Managing Partner, AMG Funds LLC (2007-2014); President and Principal, AMG Distributors, Inc. (2012-2014); Managing Director, Legg Mason & Co., LLC (2006-2007); Managing Director, Citigroup Asset Management (2004-2006). | |
• Secretary since 2015 • Chief Legal Officer since 2015 | Mark J. Duggan, 54 Senior Vice President and Senior Counsel, AMG Funds LLC (2015-Present); Secretary and Chief Legal Officer, AMG Funds, AMG Funds I, AMG Funds II, AMG Funds III and AMG Funds IV (2015-Present); Attorney, K&L Gates, LLP (2009-2015). | |
• Chief Financial Officer since 2017 • Treasurer since 2017 • Principal Financial Officer since 2017 • Principal Accounting Officer since 2017 | Thomas G. Disbrow, 53 Vice President, Mutual Fund Treasurer & CFO, AMG Funds, AMG Funds LLC (2017-Present); Chief Financial Officer, Principal Financial Officer, Treasurer and Principal Accounting Officer, AMG Funds, AMG Funds I, AMG Funds II, AMG Funds III and AMG Funds IV (2017-Present); Managing Director - Global Head of Traditional Funds Product Control, UBS Asset Management (Americas), Inc. (2015-2017); Managing Director - Head of North American Funds Treasury, UBS Asset Management (Americas), Inc. (2011-2015). | |
| • Deputy Treasurer since 2017 | John A. Starace, 48 Director, Mutual Fund Accounting, AMG Funds LLC (2017-Present); Vice President, Deputy Treasurer of Mutual Funds Services, AMG Funds LLC (2014-2017); Deputy Treasurer, AMG Funds, AMG Funds I, AMG Funds II, AMG Funds III and AMG Funds IV (2017-Present); Vice President, Citi Hedge Fund Services (2010-2014); Audit Senior Manager (2005-2010) and Audit Manager (2001-2005), Deloitte & Touche LLP. | |
| • Chief Compliance Officer since 2016 | Gerald F. Dillenburg, 52 Vice President, Chief Compliance Officer AMG Funds, AMG Funds LLC (2017-Present); Chief Compliance Officer AMG Funds, AMG Funds LLC (2016-2017); Chief Compliance Officer and Sarbanes-Oxley Code of Ethics Compliance Officer, AMG Funds, AMG Funds I, AMG Funds II and AMG Funds III (2016-Present); Chief Compliance Officer, AMG Funds IV (1996-Present); Sarbanes-Oxley Code of Ethics Compliance Officer, AMG Funds IV (2016-Present); Chief Compliance Officer, Aston Asset Management, LLC (2006-2016); Chief Operating Officer, Aston Funds (2003-2016); Secretary, Aston Funds (1996-2015); Chief Financial Officer, Aston Funds (1997-2010); Chief Financial Officer, Aston Asset Management, LLC (2006-2010); Treasurer, Aston Funds (1996-2010). | |
| • Anti-Money Laundering Compliance Officer since 2014 | Patrick J. Spellman, 44 Vice President, Chief Compliance Officer, AMG Funds LLC (2017-Present); Senior Vice President, Chief Compliance Officer, AMG Funds LLC (2011-2017); Chief Compliance Officer, AMG Distributors, Inc., (2010-Present); Anti-Money Laundering Compliance Officer, AMG Funds, AMG Funds I, AMG Funds II, and AMG Funds III (2014-Present); Anti-Money Laundering Officer, AMG Funds IV, (2016-Present); Compliance Manager, Legal and Compliance, Affiliated Managers Group, Inc. (2005-2011). | |
| • Assistant Secretary since 2016 | Maureen A. Meredith, 33 Vice President, Counsel, AMG Funds LLC (2019-Present); Director, Counsel, AMG Funds LLC (2017-2018); Vice President, Counsel, AMG Funds LLC (2015-2017); Assistant Secretary, AMG Funds, AMG Funds I, AMG Funds II, AMG Funds III and AMG Funds IV (2016-Present); Associate, Ropes & Gray LLP (2011-2015); Law Fellow, Massachusetts Appleseed Center for Law and Justice (2010-2011). | |
| 63 |
Table of Contents
THIS PAGE INTENTIONALLY LEFT BLANK
Table of Contents
 |
INVESTMENT MANAGER AND ADMINISTRATOR
AMG Funds LLC 600 Steamboat Road, Suite 300 Greenwich, CT 06830 800.835.3879
DISTRIBUTOR
AMG Distributors, Inc. 600 Steamboat Road, Suite 300 Greenwich, CT 06830 800.835.3879
CUSTODIAN
The Bank of New York Mellon 111 Sanders Creek Parkway East Syracuse, NY 13057
LEGAL COUNSEL
Ropes & Gray LLP Prudential Tower, 800 Boylston Street Boston, MA 02199-3600 | TRANSFER AGENT
BNY Mellon Investment Servicing (US) Inc. Attn: AMG Funds P.O. Box 9769 Providence, RI 02940 800.548.4539 | This report is prepared for the Funds’ shareholders. It is authorized for distribution to prospective investors only when preceded or accompanied by an effective prospectus. To receive a free copy of the prospectus or Statement of Additional Information, which includes additional information about Fund Trustees, please contact us by calling 800.835.3879. Distributed by AMG Distributors, Inc., member FINRA/SIPC.
Current net asset values per share for each Fund are available on the Funds’ website at amgfunds.com.
A description of the policies and procedures each Fund uses to vote its proxies is available: (i) without charge, upon request, by calling 800.835.3879, or (ii) on the Securities and Exchange Commission’s (SEC) website at sec.gov. For information regarding each Fund’s proxy voting record for the12-month period ended June 30, call 800.835.3879 or visit the SEC website at sec.gov.
Each Fund files its complete schedule of portfolio holdings with the SEC for the first and third quarters of each fiscal year on FormN-Q. The Funds’ FormsN-Q are available on the SEC’s website at sec.gov. To review a complete list of the Funds’ portfolio holdings, or to view the semiannual report, or annual report, please visit amgfunds.com. |
| amgfunds.com | 65 |
Table of Contents
 |
AFFILIATE SUBADVISED FUNDS
BALANCED FUNDS AMG Chicago Equity Partners Balanced Chicago Equity Partners, LLC
AMG FQ Global Risk-Balanced First Quadrant, L.P.
EQUITY FUNDS AMG FQTax-Managed U.S. Equity AMG FQ Long-Short Equity First Quadrant, L.P.
AMG Frontier Small Cap Growth Frontier Capital Management Co., LLC
AMG GW&K Small Cap Core AMG GW&K Small/Mid Cap AMG GW&K Trilogy Emerging Markets Equity AMG GW&K Trilogy Emerging Wealth Equity AMG GW&K U.S. Small Cap Growth GW&K Investment Management, LLC
AMG Renaissance Large Cap Growth The Renaissance Group LLC
AMG River Road Dividend All Cap Value AMG River Road Dividend All Cap Value II AMG River Road Focused Absolute Value AMG River Road Long-Short AMG River RoadSmall-Mid Cap Value AMG River Road Small Cap Value River Road Asset Management, LLC
AMG SouthernSun Small Cap AMG SouthernSun U.S. Equity SouthernSun Asset Management, LLC
AMG Systematic Mid Cap Value Systematic Financial Management L.P. | AMG TimesSquare Emerging Markets Small Cap AMG TimesSquare Global Small Cap AMG TimesSquare International Small Cap AMG TimesSquare Mid Cap Growth AMG TimesSquare Small Cap Growth TimesSquare Capital Management, LLC
AMG Yacktman AMG Yacktman Focused AMG Yacktman FocusedFund - Security Selection Only AMG Yacktman Special Opportunities Yacktman Asset Management LP
FIXED INCOME FUNDS AMG GW&K Core Bond AMG GW&K Enhanced Core Bond AMG GW&K Municipal Bond AMG GW&K Municipal Enhanced Yield GW&K Investment Management, LLC
OPEN-ARCHITECTURE FUNDS
EQUITY FUNDS AMG Managers Brandywine AMG Managers Brandywine Advisors Mid Cap Growth AMG Managers Brandywine Blue Friess Associates, LLC
AMG Managers Cadence Emerging Companies AMG Managers Cadence Mid Cap Cadence Capital Management LLC
AMG Managers CenterSquare Real Estate CenterSquare Investment Management LLC
AMG Managers Emerging Opportunities Lord, Abbett & Co. LLC WEDGE Capital Management L.L.P. Next Century Growth Investors LLC RBC Global Asset Management (U.S.) Inc. | AMG Managers Essex Small/Micro Cap Growth Essex Investment Management Company, LLC
AMG Managers Fairpointe ESG Equity AMG Managers Fairpointe Mid Cap Fairpointe Capital LLC
AMG Managers LMCG Small Cap Growth LMCG Investments, LLC
AMG Managers Montag & Caldwell Growth Montag & Caldwell, LLC
AMG Managers Pictet International Pictet Asset Management Limited
AMG Managers Silvercrest Small Cap Silvercrest Asset Management Group LLC
AMG Managers Skyline Special Equities Skyline Asset Management, L.P.
AMG Managers Special Equity Ranger Investment Management, L.P. Lord, Abbett & Co. LLC Smith Asset Management Group, L.P. Federated MDTA LLC
AMG Managers Value Partners Asia Dividend Value Partners Hong Kong Limited
FIXED INCOME FUNDS AMG Managers Amundi Intermediate Government AMG Managers Amundi Short Duration Government Amundi Pioneer Institutional Asset Management, Inc.
AMG Managers Doubleline Core Plus Bond DoubleLine Capital LP
AMG Managers Global Income Opportunity AMG Managers Loomis Sayles Bond Loomis, Sayles & Company, L.P. |
| amgfunds.com | 123118 AR002 |
Table of Contents
|
| ANNUAL REPORT |
| AMG Funds | ||||||||||||
| December 31, 2018 | ||||||||||||
 | ||||||||||||
AMG GW&K Enhanced Core Bond Fund
| ||||||||||||
Class N: MFDAX
|
| Class I: MFDSX
| Class C: MFDCX | Class Z: MFDYX | ||||||||
AMG GW&K Municipal Bond Fund
| ||||||||||||
| Class N: GWMTX | Class I: GWMIX | |||||||||||
AMG GW&K Municipal Enhanced Yield Fund
| ||||||||||||
| Class N: GWMNX | Class I: GWMEX | Class Z: GWMZX | ||||||||||
AMG GW&K Small Cap Core Fund
| ||||||||||||
| Class N: GWETX | Class I: GWEIX | Class Z: GWEZX | ||||||||||
AMG GW&K Small/Mid Cap Fund
| ||||||||||||
| Class N: GWGVX | Class I: GWGIX | Class Z: GWGZX | ||||||||||
Beginning on January 1, 2021, as permitted by regulations adopted by the Securities and Exchange Commission, paper copies of the Funds’ shareholder reports like this one will no longer be sent by mail, unless you specifically request paper copies of the reports from the Funds or from your financial intermediary, such as a broker-dealer or bank. Instead, the reports will be made available on the Funds’ website (https://www.amgfunds.com/resources/order_literature.html), and you will be notified by mail each time a report is posted and provided with a website link to access the report.
If you already elected to receive shareholder reports electronically, you will not be affected by this change and you need not take any action. You may elect to receive shareholder reports and other communications from the Funds electronically at any time by contacting your financial intermediary or, if you invest directly with the Funds, by logging into your account at www.amgfunds.com.
You may elect to receive all future reports in paper free of charge. If you invest through a financial intermediary, you can contact your financial intermediary to request that you continue to receive paper copies of your shareholder reports. If you invest directly with the Funds, you can call1-800-548-4539 to inform the Funds that you wish to continue receiving paper copies of your shareholder reports. Your election to receive reports in paper will apply to all funds in the AMG Funds Family of Funds held in your account if you invest through your financial intermediary or all funds in the AMG Funds Family of Funds held with the fund complex if you invest directly with the Funds.
| amgfunds.com | | 123118 | AR020 |
Table of Contents
Table of Contents
AMG Funds Annual Report — December 31, 2018 |
| PAGE | |||||
| ||||||
| 2 | |||||
| 3 | ||||||
| PORTFOLIO MANAGER’S COMMENTS, FUND SNAPSHOTS AND SCHEDULES OF PORTFOLIO INVESTMENTS | ||||||
| 5 | ||||||
| 12 | ||||||
| 21 | ||||||
| 28 | ||||||
| 34 | ||||||
FINANCIAL STATEMENTS | ||||||
| 40 | ||||||
Balance sheets, net asset value (NAV) per share computations and cumulative distributable earnings (loss) | ||||||
| 42 | ||||||
Detail of sources of income, expenses, and realized and unrealized gains (losses) during the fiscal year | ||||||
| 43 | ||||||
Detail of changes in assets for the past two fiscal years | ||||||
| 45 | ||||||
Historical net asset values per share, distributions, total returns, income and expense ratios, turnover ratios and net assets | ||||||
| 60 | ||||||
Accounting and distribution policies, details of agreements and transactions with Fund management and affiliates, and descriptions of certain investment risks | ||||||
| REPORT OF INDEPENDENT REGISTERED PUBLIC ACCOUNTING FIRM | 71 | |||||
| 72 | ||||||
| 73 | ||||||
Nothing contained herein is to be considered an offer, sale or solicitation of an offer to buy shares of any series of the AMG Funds family of mutual funds. Such offering is made only by prospectus, which includes details as to offering price and other material information.
Table of Contents
Dear Shareholder:
It was a difficult year for financial markets in 2018. Strong domestic economic growth fueled equity returns for the majority of the year, but a pullback in the fourth quarter reversed returns, leaving indices across market caps firmly in negative territory. Investors were driven by signs of deceleration in growth across the globe combined with political uncertainty and tighter monetary policy. The S&P 500® Index, a widely followed barometer of the U.S. equity market, returned +9.9% in the first three quarters of the year before a period of heightened volatility resulted in a fourth quarter return of-13.5% and a-4.4% return for the full fiscal year.
In 2018, there was wide performance dispersion across the eleven economic sectors of the S&P 500® Index. Despite a weak fourth quarter, health care, utilities, information technology, and consumer discretionary sectors ended the year on a positive note with returns of +6.4%, +4.1%, +3.4% and +1.9%, respectively. Corporate earnings are expected to continue growing at double digits for the fifth consecutive quarter. According to FactSet, fourth quarter earnings growth for S&P 500® companies is +10.9% (as of January 25, 2019). Growth stocks outperformed value for the first three quarters of the year until the fourth quarter’s risk off environment reversed the trend. Full year returns for the Russell 1000® Growth and Russell 1000® Value Indexes were-1.5% and-8.3%, respectively.
Despite skittish investor sentiment, the U.S. economy continued to show signs of growth, albeit at a slower pace with third quarter GDP growth ringing in at 3.4%. The Federal Reserve raised short-term interest rates four times over the course of the year to end the year at a target rate of 2.25%–2.50%. Higher interest rates eroded the performance of bonds in the first three quarters of the year and a risk off fourth quarter resulted in mixed results. The Bloomberg Barclays U.S. Aggregate Bond Index, a broad measure of U.S. bond market performance, ended the year where it began with a 0.0% return for 2018. The yield on the10-year U.S. Treasury note crossed above 3% at the end of September but fell dramatically as investors sought to insulate themselves from market volatility. During the past year, the short end of the yield curve has risen faster than the longer end, resulting in the 2–10 year Treasury spread of 0.21%. As expected, high yield bonds held up in the rising interest rate environment but struggled in the fourth quarter as investors removed risk from their portfolios. As a result, spreads between investment grade and high yield corporate debt climbed past 300 bps. In 2018, the Bloomberg Barclays U.S. Aggregate Credit Index and Bloomberg Barclays U.S. Corporate High Yield Bond Index returned-2.1% and-2.1%, respectively.
Economic conditions outside the U.S. started the year with strong growth indicators but finished with signs of deceleration. At the European Central Bank’s most recent monetary policy meeting, the governing council issued guidance that quantitative easing measures would continue and interest rates would remain at their present levels through summer of 2019. This is a departure from guidance earlier in the year which indicated the asset repurchase program would come to an end in December 2018 and rates would rise in 2019. The Bank of England increased its target rate in August for the first time since 2009, but deceleration in growth and increased downside risks, including a disorderly Brexit, have halted discussion of additional hikes in the near future.
International equities and emerging markets demonstrated significantly weaker returns, with the MSCI EAFE and MSCI Emerging Markets Index returning-13.8% and-14.6%, respectively, in the 12 months ending December 31, 2018. In a recent speech at the Hudson Institute, Vice President Mike Pence acknowledged China’s
aggressive actions toward the United States and highlighted a dramatic shift in U.S foreign policy with China: “We seek a relationship grounded in fairness, reciprocity and respect for sovereignty, and we have taken strong and swift action to achieve that goal.” This new tone combined with two rounds of new U.S. tariffs for Chinese imports and signs of a slowing economy acted as a drag on the largest economy within the MSCI Emerging Markets Index. Concurrently, the U.S. Dollar strengthened against most major global currencies, particularly in emerging markets, where those with large current account deficits faced significant pressure, adding to the drag on performance for emerging markets.
AMG Funds appreciates the privilege of providing investment tools to you and your clients. Our foremost goal is to provide investment solutions that help our shareholders successfully reach their long-term investment goals. AMG Funds provides access to a distinctive array of actively managed return-oriented investment strategies. We thank you for your continued confidence and investment in AMG Funds. You can rest assured that under all market conditions our team is focused on delivering excellent investment management services for your benefit.
Respectfully,

Keitha Kinne
President
AMG Funds
| Periods ended | ||||||||||||||
Average Annual Total Returns | December 31, 2018* | |||||||||||||
Stocks: | 1 Year | 3 Years | 5 Years | |||||||||||
Large Caps | (S&P 500® Index) | (4.38 | )% | 9.26% | 8.49% | |||||||||
Small Caps | (Russell 2000® Index) | (11.01 | )% | 7.36% | 4.41% | |||||||||
International | (MSCI All Country World Index ex USA) | (14.20 | )% | 4.48% | 0.68% | |||||||||
Bonds: | ||||||||||||||
Investment Grade | (Bloomberg Barclays U.S. Aggregate Bond Index) | 0.01% | 2.06% | 2.52% | ||||||||||
High Yield | (Bloomberg Barclays U.S. Corporate High Yield Bond Index) | (2.08 | )% | 7.23% | 3.83% | |||||||||
Tax-exempt | (Bloomberg Barclays Municipal Bond Index) | 1.28% | 2.30% | 3.82% | ||||||||||
Treasury Bills | (ICE BofAML U.S.6-Month Treasury Bill Index) | 1.92% | 1.18% | 0.78% | ||||||||||
*Source: FactSet. Past performance is no guarantee of future results.
| 2 |
Table of Contents
As a shareholder of a Fund, you may incur two types of costs: (1) transaction costs, which may include sales charges (loads) on purchase payments; redemption fees; and exchange fees; and (2) ongoing costs, including management fees; distribution(12b-1) fees; and other Fund expenses. This example is intended to help you understand your ongoing costs (in dollars) of investing in the Fund and to compare these costs with the ongoing costs of investing in other mutual funds. The example is based on $1,000 invested at the beginning of the period and held for the entire period as indicated below.
ACTUAL EXPENSES
The first line of the following table provides information about the actual account values and
| actual expenses. You may use the information in this line, together with the amount you invested, to estimate the expenses that you paid over the period. Simply divide your account value by $1,000 (for example, an $8,600 account value divided by $1,000 = 8.6), then multiply the result by the number in the first line under the heading entitled “Expenses Paid During Period” to estimate the expenses you paid on your account during this period.
HYPOTHETICAL EXAMPLE FOR COMPARISON PURPOSES
The second line of the following table provides information about hypothetical account values and hypothetical expenses based on the Fund’s actual expense ratio and an assumed annual rate of return of 5% before expenses, which is not the Fund’s | actual return. The hypothetical account values and expenses may not be used to estimate the actual ending account balance or expenses you paid for the period. You may use this information to compare the ongoing costs of investing in the Fund and other funds by comparing this 5% hypothetical example with the 5% hypothetical examples that appear in the shareholder reports of other funds.
Please note that the expenses shown in the table are meant to highlight your ongoing costs only and do not reflect any transactional costs, such as sales charges (loads), redemption fees, or exchange fees. Therefore, the second line of the table is useful in comparing ongoing costs only, and will not help you determine the relative total costs of owning different funds. |
Six Months Ended December 31, 2018 | Expense Ratio for the Period | Beginning Account Value 07/01/18 | Ending Account Value 12/31/18 | Expenses Paid During the Period* | ||||||
AMG GW&K Enhanced Core Bond Fund |
| |||||||||
Based on Actual Fund Return | ||||||||||
Class N | 0.74% | $1,000 | $1,009 | $3.75 | ||||||
Class I | 0.56% | $1,000 | $1,011 | $2.84 | ||||||
Class C | 1.48% | $1,000 | $1,005 | $7.48 | ||||||
Class Z | 0.49% | $1,000 | $1,010 | $2.48 | ||||||
Based on Hypothetical 5% Annual Return |
| |||||||||
Class N | 0.74% | $1,000 | $1,021 | $3.77 | ||||||
Class I | 0.56% | $1,000 | $1,022 | $2.85 | ||||||
Class C | 1.48% | $1,000 | $1,018 | $7.53 | ||||||
Class Z
| 0.49%
| $1,000
| $1,023
|
| $2.50
|
| ||||
AMG GW&K Municipal Bond Fund |
| |||||||||
Based on Actual Fund Return | ||||||||||
Class N | 0.71% | $1,000 | $1,018 | $3.61 | ||||||
Class I | 0.39% | $1,000 | $1,020 | $1.99 | ||||||
Based on Hypothetical 5% Annual Return |
| |||||||||
Class N | 0.71% | $1,000 | $1,022 | $3.62 | ||||||
Class I | 0.39% | $1,000 | $1,023 | $1.99 | ||||||
Six Months Ended December 31, 2018 | Expense Ratio for the Period | Beginning Account Value 07/01/18 | Ending Account Value 12/31/18 | Expenses Paid During the Period* | ||||||
AMG GW&K Municipal Enhanced Yield Fund |
| |||||||||
Based on Actual Fund Return | ||||||||||
Class N | 0.99% | $1,000 | $999 | $4.99 | ||||||
Class I | 0.64% | $1,000 | $1,001 | $3.23 | ||||||
Class Z | 0.59% | $1,000 | $1,001 | $2.98 | ||||||
Based on Hypothetical 5% Annual Return |
| |||||||||
Class N | 0.99% | $1,000 | $1,020 | $5.04 | ||||||
Class I | 0.64% | $1,000 | $1,022 | $3.26 | ||||||
Class Z
| 0.59%
| $1,000
| $1,022
|
| $3.01
|
| ||||
AMG GW&K Small Cap Core Fund |
| |||||||||
Based on Actual Fund Return | ||||||||||
Class N | 1.27% | $1,000 | $818 | $5.82 | ||||||
Class I | 0.95% | $1,000 | $820 | $4.36 | ||||||
Class Z | 0.90% | $1,000 | $820 | $4.13 | ||||||
Based on Hypothetical 5% Annual Return |
| |||||||||
Class N | 1.27% | $1,000 | $1,019 | $6.46 | ||||||
Class I | 0.95% | $1,000 | $1,020 | $4.84 | ||||||
Class Z | 0.90% | $1,000 | $1,021 | $4.58 | ||||||
| 3 |
Table of Contents
| About Your Fund’s Expenses(continued) |
Six Months Ended December 31, 2018 | Expense Ratio for the Period | Beginning Account Value 07/01/18 | Ending Account Value 12/31/18 | Expenses Paid During the Period* | ||||||
AMG GW&K Small/Mid Cap Fund |
| |||||||||
Based on Actual Fund Return | ||||||||||
Class N | 1.10% | $1,000 | $873 | $5.19 | ||||||
Class I | 0.95% | $1,000 | $873 | $4.49 | ||||||
Class Z | 0.85% | $1,000 | $874 | $4.01 | ||||||
Based on Hypothetical 5% Annual Return |
| |||||||||
Class N | 1.10% | $1,000 | $1,020 | $5.60 | ||||||
Class I | 0.95% | $1,000 | $1,020 | $4.84 | ||||||
Class Z | 0.85% | $1,000 | $1,021 | $4.33 | ||||||
| * | Expenses are equal to the Fund’s annualized expense ratio multiplied by the average account value over the period, multiplied by the number of days in the most recent fiscal half-year (184), then divided by 365. |
| 4 |
Table of Contents
THE YEAR IN REVIEW
AMG GW&K Enhanced Core Bond Fund (Class N) (the Fund) returned-1.48% for the year ended December 31, 2018, compared to the return of 0.01% for the Bloomberg Barclays U.S. Aggregate Bond Index (the Index).
At the start of 2018, fixed income markets endured turbulence, as the narrative shifted abruptly from one of optimism surrounding synchronized global growth to one of risk-aversion. Rates began the quarter under pressure due to concerns that the global economy was doing too well—strong GDP out of Europe and Asia, better-than-expected corporate profits in the U.S., and high consumer confidence pushed inflation expectations to their highest level in years. Meanwhile, equities traded at record highs and credit spreads reached decade lows. But when wage growth unexpectedly showed signs of accelerating at its fastest pace since 2009, the story changed. Interest rates spiked, equities headed toward their first correction in two years, and volatility soared. Hawkish rhetoric from the White House raised the potential for a global trade war, the prospect of increased regulation weighed heavily on the technology space, and worries about overly aggressive U.S. Federal Reserve policy stoked fears of a recession. The debate continued as to whether the tumult was simply a healthy consolidation or a more ominous sign of things to come.
Fixed income markets were less volatile in the second quarter though interest rates continued to rise as a stronger economy outweighed geopolitical tensions. The10-year U.S. Treasury crossed 3% for the first time since the end of 2013 and hit a seven-year high before reversing course on concerns over Italy’s political crisis. Yields at the shorter end of the curve moved even more, creating the flattest curve in over ten years, as the Federal Reserve, up until this point, had raised rates for the second time this year and seventh time since the start of its tightening path. Positive readings from the housing market, retail sales, and business investment pointed to an improving economy while the job market continued to chug along with unemployment at levels not seen in nearly 20 years. The strong labor market and lower income tax rates resulted in solid consumer spending and record corporate profits. However, the synchronized global growth story was called into question toward the end of the quarter by a negative GDP print in Japan, softness in Europe, and emerging trade disputes. Furthermore, central banks seemed keen on pulling back from overly accommodative monetary policy. | Those potential disruptors did little to dent the economic environment in the U.S., but were a concern to investors as we entered the second half of the year.
Risk appetite returned to fixed income markets in the third quarter, sending interest rates higher and credit spreads tighter. Investors largely shrugged off persistent trade tensions, the specter of tighter monetary policy, and turmoil in emerging markets. Instead, market sentiment was lifted by a healthy outlook for corporate earnings, a surge in consumer and business confidence, and the renewed prospect of synchronized global growth. On top of that, the Federal Reserve remained transparent and predictable in its normalization of monetary policy, promising an orderly shift to a neutral interest rate environment.
Investor sentiment deteriorated significantly in the fourth quarter as markets grew increasingly concerned about global growth, tightening Fed policy, and escalating trade tensions with China. These concerns took precedence over domestic economic data that, on balance, remains solid. The dominant narrative of synchronized global growth suddenly shifted to a serious debate around whether the post-crisis economic recovery was coming to an end—or worse. As expected, the Fed raised rates and tilted in a dovish direction, but not nearly enough for investors, who wanted a pause. Instead the Fed merely signaled a modestly slower pace of tightening along with continued balance sheet reduction. Volatility surged as a result, and risk assets sold off in a swift and decisive rebuke of Fed policy.
The Treasury market was the primary beneficiary of therisk-off mode. After briefly reaching a new multi-year high in response to strong economic data, the10-year Treasury rate sharply changed course as a decisive flight to quality drove the yield to its lowest level since April. Much of the conversation fixated on the growth implications of the flattening yield curve as it finished the year at its flattest slope in a decade with spreads between2/10-year Treasuries at just 20 basis points. The spread between2/5-years ended at 2 basis points, but actually inverted at one point during the quarter.
Tightening financial conditions and thinyear-end liquidity also took their toll on risk assets. U.S. stocks sank to a17-month low in the most significant selloff in ten years. The corporate bond market suffered alongside equities, and spreads reached their widest | levels since 2016. The selloff in the high yield market was particularly dramatic, as spreads in early October briefly touched their tightest level of the cycle, only to be followed by one of the worst repricing episodes in history. The sector was particularly hard hit by a record-setting plunge in crude oil prices. Investment grade corporates continued their almost year-long struggle, and like equities experienced their worst year in a decade. Growing concerns about the end of the cycle, rising corporate borrowing costs, and ratings downgrade anxiety (specifically amongBBB-rated securities) drove the decline. Mortgage-backed securities lagged Treasuries due to their shorter duration profile amidst a significant rally in rates and modest spread widening as a result of a challenging technical backdrop.
Yields rose across the Treasury curve in 2018, but the bond market eked out a small gain, as losses in the first half of the year were offset by marginal gains in Q3 and strong gains in Q4. Rates, which had been marching higher throughout most of the period, plunged in the last quarter due to global growth and trade concerns. Investors turned abruptly from risk to drive markets such as stocks, investment grade corporates, and high yield down for the year. The rub was that stocks had madeall-time highs just a few months ago, high yield spreads hit acycle-low in early October, and investment grade corporate spreads hit their lows in February. Along with growth and trade worries, investors fretted about the Fed possibly having a tin ear to market signals, helping to spike volatility and drive many assets down. In fact, not many assets finished in the black in 2018 and the Bloomberg Barclays U.S. Aggregate Bond Index was only up a miniscule 0.01%.
For the year, the Fund underperformed its benchmark. The Fund’s overweight to spread product was the top detractor from performance as investment grade corporate bonds were the worst performing sector of the Index. Notably, our selection within investment grade was a positive factor. Ourout-of-benchmark allocation to high yield corporates had a negative impact, as high yield underperformed the Index. Our overweight to taxable municipals within the government-related sector was a slight detractor, as spreads increased during the year. Our mortgage-backed securities allocation was overall neutral, as sector outperformance was offset by our security selection being a small detractor. The strategy’s yield curve positioning was also relatively neutral. |
| 5 |
Table of Contents
AMG GW&K Enhanced Core Bond Fund Portfolio Manager’s Comments(continued) |
Volatility in the capital markets has so far exhibited little effect on the real economy. While growth is moderating from the strong pace we saw earlier in the year, economic indicators still point to an above-trend rate of economic expansion for 2019. Additionally, the Fed has signaled they are now “data dependent” and thus likely nearing the end of their three year tightening cycle. In this environment, rates should be range-bound. As such, we are keeping our portfolio duration close to neutral
Concerns that global growth is slowing continue to rise even as evidence of a downturn remains scant, suggesting that risk assets have moved meaningfully toward pricing in a recession that may not occur. As | a result, valuations appear increasingly attractive. With economic data that continues to exhibit positive momentum and a Fed that seems to have adopted a more cautious stance, we remain constructive on the corporate bond market. The fundamentals for high yield remain favorable, as record cash flow, strong interest coverage, and low default rates should keep spreads contained. Investment grade companies are also on solid footing supported by steady U.S. growth that continues to underpin earnings and support ample interest coverage. That said, we recognize that we are approaching the end of the cycle and continue to have a preference for higher quality and less capital intensive sectors of the corporate bond market. We have significantly reduced our exposure | toBBB-rated debt, where investors are most concerned about potential ratings downgrades. Our allocation to mortgage-backed securities remains neutral, though we are becoming more constructive on the sector as the demand outlook and valuation improves. We continue to favor seasoned mortgage pools that should better withstand the continued runoff in the Fed’s balance sheet next year.
This commentary reflects the viewpoints of the portfolio manager, GW&K Investment Management, LLC as of December 31, 2018, and is not intended as a forecast or guarantee of future results. |
| 6 |
Table of Contents
AMG GW&K Enhanced Core Bond Fund Portfolio Manager’s Comments(continued) |
CUMULATIVE TOTAL RETURN PERFORMANCE
AMG GW&K Enhanced Core Bond Fund’s cumulative total return is based on the daily change in net asset value (NAV), and assumes that all dividends and distributions were reinvested. The graph compares a hypothetical $10,000 investment made in the AMG GW&K Enhanced Core Bond Fund’s Class N shares on December 31, 2008 to a $10,000 investment made in the Bloomberg Barclays U.S. Aggregate Bond Index for the same time period. The graph and table do not reflect the deduction of taxes that a shareholder would pay on a Fund distribution or redemption of shares. The listed returns for the Fund are net of expenses and the returns for the index exclude expenses. Total returns would have been lower had certain expenses not been reduced.
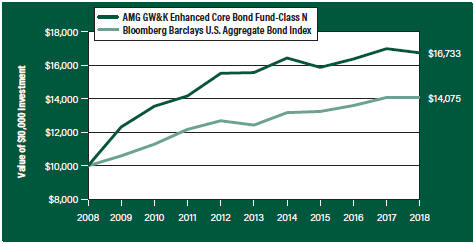
The table below shows the average annual total returns for the AMG GW&K Enhanced Core Bond Fund and the Bloomberg Barclays U.S. Aggregate Bond Index for the same time periods ended December 31, 2018.
| Average Annual Total Returns1 | One Year | Five Years | Ten Years | Since Inception | Inception Date | |||||||||||||||
AMG GW&K Enhanced Core Bond Fund2, 3, 4, 5, 6, 7 |
| |||||||||||||||||||
Class N | (1.48%) | 1.46% | 5.28% | 5.09% | 01/02/97 | |||||||||||||||
Class I | (1.27%) | 1.66% | — | 1.48% | 11/30/12 | |||||||||||||||
Class C8 | (2.23%) | 0.72% | 4.49% | 4.25% | 03/05/98 | |||||||||||||||
Class Z | (1.23%) | 1.72% | 5.54% | 5.47% | 01/02/97 | |||||||||||||||
Bloomberg Barclays U.S. Aggregate Bond Index9 | 0.01% | 2.52% | 3.48% | 4.98% | 01/02/97 | † | ||||||||||||||
The performance data shown represents past performance. Past performance is not a guarantee of future results. Current performance may be lower or higher than the performance data quoted. The investment return and principal value of an investment will fluctuate so that an investor’s shares, when redeemed, may be worth more or less than their original cost.
Investors should carefully consider the Fund’s investment objectives, risks, charges and expenses before investing. For performance information through the most recent month end, current net asset values per share for the Fund and other information, please call 800.835.3879 or visit our website at amgfunds.com for a free prospectus. Read it carefully before investing or sending money.
Distributed by AMG Distributors, Inc., member FINRA/SIPC.
| † | Date reflects the inception date of the Fund, not the index. |
| 1 | Total return equals income yield plus share price change and assumes reinvestment of all dividends and capital gain distributions. Returns are net of fees and may reflect offsets of Fund expenses as described in the |
prospectus. No adjustment has been made for taxes payable by shareholders on their reinvested dividends and capital gain distributions. Returns for periods greater than one year are annualized. The listed returns on the Fund are net of expenses and based on the published NAV as of December 31, 2018. All returns are in U.S. dollars ($). | ||
2 From time to time, the Fund’s advisor has waived its fees and/or absorbed Fund expenses, which has resulted in higher returns. | ||
3 The Fund is subject to the risks associated with investments in debt securities, such as default risk and fluctuations in the perception of the debtor’s ability to pay its creditors. Changing interest rates may adversely affect the value of an investment. An increase in interest rates typically causes the value of bonds and other fixed income securities to fall. | ||
4 To the extent that the Fund invests in asset-backed or mortgage-backed securities, its exposure to prepayment and extension risks may be greater than investments in other fixed income securities. | ||
5 High-yield bonds (also known as “junk bonds”) may be subject to greater levels of interest rate, credit, and liquidity risk than investments in higher rated securities. These securities are considered predominantly speculative with respect to the issuer’s continuing ability to make principal and interest payments. The issuers of the Fund’s holdings may be involved in bankruptcy proceedings, reorganizations, or financial restructurings, and are not as strong financially as higher-rated issuers. | ||
6 Investments in international securities are subject to certain risks of overseas investing including currency fluctuations and changes in political and economic conditions, which could result in significant market fluctuations. These risks are magnified in emerging markets. | ||
7 Obligations of certain government agencies are not backed by the full faith and credit of the U.S. government. If one of these agencies defaulted on a loan, there is no guarantee that the U.S. government would provide financial support. Additionally, debt securities of the U.S. government may be affected by changing interest rates and subject to prepayment risk. | ||
8 Closed to new investments. | ||
9 The Bloomberg Barclays U.S. Aggregate Bond Index is an index of the U.S. investment-grade fixed-rate bond market, including both government and corporate bonds. Unlike the Fund, the Bloomberg Barclays U.S. Aggregate Bond Index is unmanaged, is not available for investment and does not incur expenses. | ||
Not FDIC insured, nor bank guaranteed. May lose value. |
| 7 |
Table of Contents
AMG GW&K Enhanced Core Bond Fund Fund Snapshots(unaudited) December 31, 2018 |
PORTFOLIO BREAKDOWN
| Category | % of Net Assets | |
Corporate Bonds and Notes | 47.5 | |
U.S. Government and Agency Obligations | 43.5 | |
Municipal Bonds | 7.7 | |
Short-Term Investments | 0.7 | |
Other Assets Less Liabilities | 0.6 | |
| Rating | % of Market Value1 | |
U.S. Government and Agency Obligations | 44.0 | |
Aaa | 1.0 | |
Aa | 11.3 | |
A | 13.4 | |
Baa | 14.5 | |
Ba | 15.3 | |
B | 0.5 | |
| 1 | Includes market value of fixed-income securities only. |
TOP TEN HOLDINGS
| Security Name | % of Net Assets | |||||
FNMA, 4.000%, 10/01/43 | 7.6 | |||||
FNMA, 4.500%, 04/01/41 | 5.3 | |||||
United States Treasury Bonds, 4.500%, 02/15/36 | 4.6 | |||||
FHLMC Gold Pool, 5.000%, 10/01/36 | 3.3 | |||||
United States Treasury Notes, 2.000%, 11/30/22 | 3.1 | |||||
FNMA, 3.500%, 11/01/42 | 2.7 | |||||
FNMA, 3.500%, 03/01/46 | 2.6 | |||||
FNMA, 4.500%, 05/01/39 | 2.6 | |||||
FNMA, 4.000%, 09/01/25 | 2.5 | |||||
Apple, Inc., 3.101%, 02/09/22 | 2.5 | |||||
Top Ten as a Group | 36.8 | |||||
Credit quality ratings shown above reflect the highest rating assigned by either Standard & Poor’s (“S&P”) or Moody’s Investors Service, Inc. (“Moody’s”). These rating agencies are independent, nationally recognized statistical rating organizations and are widely used. Investment grade ratings are credit ratings of BBB/Baa or higher. Below investment grade ratings are credit ratings of BB/Ba or lower. Investments designated N/R are not rated by either rating agency. Unrated investments do not necessarily indicate low credit quality. Credit quality ratings are subject to change.
Because a fund’s strategy may result in multiple investments in particular sectors of the economy, its performance may depend on the performance of those sectors and may fluctuate more widely than investments diversified across more sectors. For additional information on these and other risk considerations, please see the Fund’s prospectus.
Any sectors, industries, or securities discussed should not be perceived as investment recommendations. Mention of a specific security should not be considered a recommendation to buy or solicitation to sell that security. Specific securities mentioned in this report may have been sold from the Fund’s portfolio of investments by the time you receive this report.
| 8 |
Table of Contents
AMG GW&K Enhanced Core Bond Fund Schedule of Portfolio Investments December 31, 2018 |
Principal Amount | Value | |||||||
Corporate Bonds and Notes - 47.5% |
| |||||||
Financials - 12.8% | ||||||||
Aircastle, Ltd. | ||||||||
5.000%, 04/01/23 | $170,000 | $170,830 | ||||||
American Tower Corp. | ||||||||
4.400%, 02/15/26 | 362,000 | 362,265 | ||||||
Bank of America Corp., MTN | ||||||||
3.875%, 08/01/25 | 541,000 | 535,653 | ||||||
CIT Group, Inc. | ||||||||
5.000%, 08/15/22 | 350,000 | 346,062 | ||||||
Crown Castle International Corp. | ||||||||
5.250%, 01/15/23 | 340,000 | 353,384 | ||||||
CyrusOne, LP / CyrusOne Finance Corp. | ||||||||
5.000%, 03/15/24 | 179,000 | 175,868 | ||||||
Host Hotels & Resorts, LP | ||||||||
Series C | ||||||||
4.750%, 03/01/23 | 346,000 | 353,822 | ||||||
JPMorgan Chase & Co. | ||||||||
2.950%, 10/01/26 | 395,000 | 365,166 | ||||||
MGM Resorts International | ||||||||
7.750%, 03/15/22 | 333,000 | 355,061 | ||||||
National Rural Utilities Cooperative Finance Corp., MTN | ||||||||
3.250%, 11/01/25 | 370,000 | 365,153 | ||||||
Visa, Inc. | ||||||||
4.300%, 12/14/45 | 340,000 | 352,224 | ||||||
Wells Fargo & Co. | ||||||||
(3 month LIBOR + 0.930%) | ||||||||
3.548%, 02/11/221 | 908,000 | 902,513 | ||||||
Total Financials | 4,638,001 | |||||||
Industrials - 34.7% | ||||||||
The ADT Security Corp. | ||||||||
6.250%, 10/15/21 | 167,000 | 170,131 | ||||||
AES Corp. | ||||||||
4.875%, 05/15/23 | 358,000 | 350,840 | ||||||
Anheuser-Busch InBev Finance, Inc. | ||||||||
3.300%, 02/01/23 | 350,000 | 340,643 | ||||||
Antero Resources Corp. | ||||||||
5.125%, 12/01/22 | 172,000 | 162,325 | ||||||
Apple, Inc. | ||||||||
(3 month LIBOR + 0.500%) | ||||||||
3.101%, 02/09/221 | 909,000 | 908,909 | ||||||
Aramark Services, Inc. | ||||||||
5.125%, 01/15/24 | 171,000 | 169,718 | ||||||
AT&T, Inc. | ||||||||
4.250%, 03/01/27 | 370,000 | 362,610 | ||||||
Automatic Data Processing, Inc. | ||||||||
3.375%, 09/15/25 | 549,000 | 545,038 | ||||||
Principal Amount | Value | |||||||
Ball Corp. | ||||||||
5.250%, 07/01/25 | $335,000 | $335,000 | ||||||
Burlington Northern Santa Fe LLC | ||||||||
6.150%, 05/01/372 | 430,000 | 524,725 | ||||||
CDW LLC / CDW Finance Corp. | ||||||||
5.500%, 12/01/24 | 356,000 | 353,330 | ||||||
Charter Communications Operating LLC / Charter Communications Operating Capital | ||||||||
4.908%, 07/23/25 | 347,000 | 345,521 | ||||||
Cheniere Corpus Christi Holdings LLC | ||||||||
5.875%, 03/31/25 | 150,000 | 149,625 | ||||||
Crown Americas LLC / Crown Americas Capital Corp. IV | ||||||||
4.500%, 01/15/23 | 304,000 | 297,540 | ||||||
Crown Americas LLC / Crown Americas Capital Corp. V | ||||||||
4.250%, 09/30/26 | 62,000 | 55,878 | ||||||
CVS Health Corp. | ||||||||
5.125%, 07/20/45 | 345,000 | 337,026 | ||||||
Diamondback Energy, Inc. | ||||||||
4.750%, 11/01/24 | 318,000 | 308,460 | ||||||
5.375%, 05/31/25 | 47,000 | 45,943 | ||||||
General Motors Financial Co., Inc. | ||||||||
4.250%, 05/15/23 | 356,000 | 348,566 | ||||||
The George Washington University, | ||||||||
Series 2018 | ||||||||
4.126%, 09/15/48 | 560,000 | 561,231 | ||||||
Georgia-Pacific LLC | ||||||||
8.000%, 01/15/24 | 276,000 | 331,577 | ||||||
HCA, Inc. | ||||||||
5.000%, 03/15/24 | 358,000 | 355,315 | ||||||
Huntsman International LLC | ||||||||
5.125%, 11/15/222 | 168,000 | 169,890 | ||||||
International Paper Co. | ||||||||
3.000%, 02/15/27 | 399,000 | 363,841 | ||||||
Kaiser Foundation Hospitals | ||||||||
3.150%, 05/01/27 | 377,000 | 362,815 | ||||||
Lennar Corp. | ||||||||
4.750%, 11/15/22 | 354,000 | 344,707 | ||||||
McDonald’s Corp., MTN | ||||||||
3.700%, 01/30/26 | 355,000 | 348,539 | ||||||
Microsoft Corp. | ||||||||
3.750%, 02/12/45 | 357,000 | 346,224 | ||||||
Murphy Oil USA, Inc. | ||||||||
6.000%, 08/15/23 | 167,000 | 168,461 | ||||||
Northrop Grumman Corp. | ||||||||
3.200%, 02/01/27 | 381,000 | 357,888 | ||||||
NuStar Logistics, LP | ||||||||
6.750%, 02/01/21 | 162,000 | 164,025 | ||||||
Oracle Corp. | ||||||||
3.800%, 11/15/37 | 358,000 | 335,449 | ||||||
| The accompanying notes are an integral part of these financial statements. |
| 9 |
Table of Contents
AMG GW&K Enhanced Core Bond Fund Schedule of Portfolio Investments(continued) |
Principal Amount | Value | |||||||
Industrials - 34.7%(continued) | ||||||||
Owens Corning | ||||||||
4.200%, 12/15/22 | $364,000 | $361,734 | ||||||
Penske Automotive Group, Inc. | ||||||||
3.750%, 08/15/20 | 361,000 | 353,780 | ||||||
PulteGroup, Inc. | ||||||||
5.500%, 03/01/26 | 175,000 | 169,094 | ||||||
Sprint Corp. | ||||||||
7.250%, 09/15/21 | 166,000 | 170,316 | ||||||
Teleflex, Inc. | ||||||||
4.875%, 06/01/26 | 173,000 | 166,080 | ||||||
Teva Pharmaceutical Finance Netherlands III BV (Netherlands) | ||||||||
2.200%, 07/21/21 | 198,000 | 182,114 | ||||||
T-Mobile USA, Inc. | ||||||||
6.500%, 01/15/26 | 172,000 | 175,870 | ||||||
Toll Brothers Finance Corp. | ||||||||
4.375%, 04/15/23 | 185,000 | 174,363 | ||||||
Vulcan Materials Co. | ||||||||
4.500%, 04/01/25 | 246,000 | 244,699 | ||||||
WESCO Distribution, Inc. | ||||||||
5.375%, 06/15/24 | 175,000 | 165,594 | ||||||
WPX Energy, Inc. | ||||||||
5.250%, 09/15/24 | 168,000 | 152,880 | ||||||
Total Industrials | 12,638,314 | |||||||
Total Corporate Bonds and Notes | 17,276,315 | |||||||
| Municipal Bonds - 7.7% |
| |||||||
California State General Obligation, School Improvements | ||||||||
7.550%, 04/01/39 | 485,000 | 696,455 | ||||||
County of Miami-Dade FL Aviation Revenue, Series C | ||||||||
4.280%, 10/01/41 | 535,000 | 542,014 | ||||||
JobsOhio Beverage System, Series B | ||||||||
3.985%, 01/01/29 | 315,000 | 325,011 | ||||||
Los Angeles Unified School District, School Improvements | ||||||||
5.750%, 07/01/34 | 455,000 | 539,480 | ||||||
Metropolitan Transportation Authority, Transit Improvement | ||||||||
6.668%, 11/15/39 | 275,000 | 358,971 | ||||||
New Jersey Economic Development Authority, Pension Funding, Series A (National Insured) | ||||||||
7.425%, 02/15/293 | 293,000 | 355,359 | ||||||
Total Municipal Bonds | 2,817,290 | |||||||
Principal Amount | Value | |||||||
| U.S. Government and Agency Obligations - 43.5% |
| |||||||
Fannie Mae - 27.5% | ||||||||
FNMA | ||||||||
3.500%, 11/01/42 to 03/01/46 | $1,923,630 | $1,934,774 | ||||||
4.000%, 09/01/25 to 10/01/43 | 3,910,064 | 4,012,229 | ||||||
4.500%, 05/01/39 to 08/01/48 | 3,865,128 | 4,048,025 | ||||||
Total Fannie Mae | 9,995,028 | |||||||
Freddie Mac - 4.6% | ||||||||
FHLMC Gold Pool | ||||||||
3.500%, 02/01/30 | 483,906 | 491,230 | ||||||
5.000%, 10/01/36 | 1,124,647 | 1,194,654 | ||||||
Total Freddie Mac | 1,685,884 | |||||||
U.S. Treasury Obligations - 11.4% |
| |||||||
United States Treasury Notes | ||||||||
2.000%, 11/30/22 | 1,131,000 | 1,110,677 | ||||||
(U.S. Treasury 3 month Bill Money Market Yield + 0.000%), 2.480%, 01/31/201 | 368,000 | 367,877 | ||||||
6.250%, 08/15/23 | 533,000 | 619,456 | ||||||
United States Treasury Bonds | ||||||||
3.500%, 02/15/39 | 340,000 | 372,068 | ||||||
4.500%, 02/15/36 | 1,357,000 | 1,673,192 | ||||||
Total U.S. Treasury Obligations | 4,143,270 | |||||||
Total U.S. Government and Agency Obligations |
| 15,824,182 | ||||||
| Short-Term Investments - 0.7% |
| |||||||
Joint Repurchase Agreements - 0.0%#,4 |
| |||||||
Citigroup Global Markets, Inc., dated 12/31/18, due 01/02/19, 3.000% total to be received $12,573 (collateralized by various U.S. Treasuries, 0.000% - 3.125%, 01/31/19 - 09/09/49, totaling $12,822) | 12,571 | 12,571 | ||||||
Shares | ||||||||
Other Investment Companies - 0.7% |
| |||||||
Dreyfus Government Cash Management Fund, Institutional Shares, 2.29%5 | 77,373 | 77,373 | ||||||
Dreyfus Institutional Preferred Government Money Market Fund, Institutional Shares, 2.40%5 | 77,374 | 77,374 | ||||||
JPMorgan U.S. Government Money Market Fund, IM Shares, 2.36%5 | 79,718 | 79,718 | ||||||
Total Other Investment Companies | 234,465 | |||||||
Total Short-Term Investments | 247,036 | |||||||
Total Investments - 99.4% | 36,164,823 | |||||||
Other Assets, less Liabilities - 0.6% | 210,342 | |||||||
Net Assets - 100.0% | $36,375,165 | |||||||
| The accompanying notes are an integral part of these financial statements. |
| 10 |
Table of Contents
AMG GW&K Enhanced Core Bond Fund Schedule of Portfolio Investments(continued) |
| # | Less than 0.05%. |
| 1 | Variable rate security. The rate shown is based on the latest available information as of December 31, 2018. |
| 2 | Some or all of these securities, amounting to $11,740 or 0.0% of net assets, were out on loan to various brokers and are collateralized by cash. See Note 4 of Notes to Financial Statements. |
| 3 | Security is backed by insurance of financial institutions and financial guaranty assurance agencies. At December 31, 2018, the value amounted to $355,359 or 1.0% of net assets. |
| 4 | Cash collateral received from brokers for securities lending was invested in these joint repurchase agreements. |
| 5 | Yield shown represents the December 31, 2018, seven day average yield, which refers to the sum of the previous seven days’ dividends paid, expressed as an annual percentage. |
| FHLMC | Freddie Mac | |
| FNMA | Fannie Mae | |
| LIBOR | London Interbank Offered Rate | |
| MTN | Medium-Term Note | |
| National Insured | National Public Finance Guarantee Corp. |
The following table summarizes the inputs used to value the Fund’s investments by the fair value hierarchy levels as of December 31, 2018:
Level 1 | Level 2 | Level 3 | Total | |||||||||||||
Investments in Securities | ||||||||||||||||
Corporate Bonds and Notes† |
| — |
| $ | 17,276,315 |
|
| — |
| $ | 17,276,315 |
| ||||
Municipal Bonds† |
| — |
|
| 2,817,290 |
|
| — |
|
| 2,817,290 |
| ||||
U.S. Government and Agency Obligations† |
| — |
|
| 15,824,182 |
|
| — |
|
| 15,824,182 |
| ||||
Short-Term Investments | ||||||||||||||||
Joint Repurchase Agreements |
| — |
|
| 12,571 |
|
| — |
|
| 12,571 |
| ||||
Other Investment Companies | $ | 234,465 |
|
| — |
|
| — |
|
| 234,465 |
| ||||
|
|
|
|
|
|
|
| |||||||||
Total Investments in Securities | $ | 234,465 |
| $ | 35,930,358 |
|
| — |
| $ | 36,164,823 |
| ||||
|
|
|
|
|
|
|
| |||||||||
| † | All corporate bonds and notes, municipal bonds, and U.S. government and agency obligations held in the Fund are Level 2 securities. For a detailed breakout of corporate bonds and notes, municipal bonds, and U.S. government and agency obligations by major industry or agency classification, please refer to the Fund’s Schedule of Portfolio Investments. |
For the fiscal year ended December 31, 2018, there were no transfers in or out of Level 3.
| The accompanying notes are an integral part of these financial statements. |
| 11 |
Table of Contents
THE YEAR IN REVIEW
For the year ended December 31, 2018, the AMG GW&K Municipal Bond Fund (Class I) (the Fund) returned 0.87%, underperforming its benchmark, the Bloomberg Barclays10-Year Municipal Bond Index (the Index), which returned 1.41%.
Intermediate municipal bonds posted their worst first quarter losses since 1994 amid increasing inflation fears. A synchronized global recovery combined with concerns over rising deficits and a tightening labor market pushed interest rates higher. January’s employment report added to the narrative, showing wages growing at the fastest rate in eight years. The inflation breakeven rate, implied by the spread between nominal U.S. Treasuries and Treasury Inflation Protected Securities (TIPs), soared to three-year highs while the yield on the10-year Treasury note came within a whisker of 3%, a level it has not topped since 2013. But the quarter was filled with turmoil as well, which ultimately kept a lid on rising rates. Equity market volatility, beginning with the unwinding of crowded short-volatility trades and continuing with worries over a protracted trade war and a sharp selloff in technology stocks, drove investors into the safe haven of bonds. The yield on the10-year Treasury finished March at 2.74%, up +33 basis points for the quarter, but down-21 basis points from the February peak.
For the second quarter, municipals fared better than Treasuries astax-exempt rates were little changed for the quarter. With the aftershocks of tax reform fading, municipal bonds regained a sense of normalcy and worked through some of the issues that plagued the space in the first quarter. Recall that earlier in the year banks were flooding the market with paper, selling large chunks of their municipal holdings which were no longer as attractive to them under the new lower corporate tax rate. At the time, dealer inventories were already overloaded from the December supply surge and price discovery was limited by a lack of primary issuance. In the second quarter, all of those negative factors reversed. Bank selling slowed to a trickle, dealers eventually shed the additional supply and primary issuance returned closer to normal levels. Demand remained robust throughout, with the usual April tax selling sandwiched between healthy flows into mutual funds. Much of the buying interest was concentrated in shorter maturities, which is fairly typical for a retail-dominated market like municipal bonds. The best performing part of the curve was the five-year, where rates declined five basis points, while the worst was the10-year, where rates inched up four basis points. At the wings, both thetwo- and30-year were essentially unchanged. | In the third quarter, municipals sold off in line with Treasuries. The technical tailwinds that usually create positive momentum in the summer months proved surprisingly muted this year. Normally, we see a considerable drop in new issue supply coupled with a surge in reinvestment demand, two seasonal forces that typically combine to produce strong returns. This year, issuance was down but did not drop as much as expected, especially in August. In addition, flows into mutual funds, which started the quarter at a healthy clip, slowed intomid-summer and actually turned negative in September as rates drifted higher. Banks and insurance companies, which had been significant buyers oftax-exempt paper in recent years, continued to shed exposure due to the changes from last year’s corporate tax reform. This shift has had a particular impact on the long end, where much of the selling has been concentrated, cheapening the relative value ratios of longer maturities in the process.
Municipal bonds posted a furious rally in the fourth quarter, pushing performance, which had been negative throughout the year, back into positive territory. Municipal rates actually rose in the first half of the quarter, touching their highs for the year in November, driven by strong employment data. But the tide turned quickly as concerns over global growth resurfaced, exacerbated by an ongoing trade war with China and fears of peak earnings. A vigilant Federal Reserve (the Fed), sticking to a plan of more rate hikes and a steady unwinding of the balance sheet, only made matters worse. Oil plummeted below $50 a barrel, equities came within a whisker of a bear market, and bonds became the major beneficiary as investors ran for safety. The10-year AAA municipal yield curve finished December at 2.28%, down-49 basis points from its November peak.
While the flight to quality was the main driver of performance, municipals also benefited from increased clarity on potential tax reform and a supportive technical environment. The election results came in as expected, but municipal participants still breathed a sigh of relief as a split Congress laid to rest any near-term threats to the market, such as capping the exemption, lowering tax rates, or eliminating private activity bonds. Meanwhile, favorable supply/demand factors continued to underpin performance. The larger effect came from a lack of supply. New issue volume was down-44% in the fourth quarter, and-68% in December alone. Mutual fund flows turned positive | after 11 straight weeks of net redemptions, helped by heavy seasonal investment demand. And while banks continued to step back from the market, their sales were mostly confined to the long end.
Earlier in the year, we turned down multiple chances to extend duration, mainly because moving out a historically flat yield curve promised more risk than reward. Later in the year, however, an opportunity presented itself. A temporary surge in issuance coincided with a Treasury selloff and a sloppy secondary market that was bloated from mutual fund liquidations and bank selling. This was the time to move: interest rates were spiking, municipal bonds were cheapening relative to Treasuries, and the yield curve was actually steepening. We stepped in and started accumulating bonds that were among the most out of favor: those with maturities between 10 and 15 years. To fund the purchases, we leaned on the liquidity embedded in our shortest holdings, selling securities with maturities inside of five years. In executing the trade, we picked up about 80 basis points in yield, captured wider credit spreads and improved expected return from the additional roll. Duration extended and the move paid immediate dividends, benefiting from the sharp decline in rates and significant flattening of the curve that occurred in November and December
The Fund underperformed the Bloomberg Barclays10-Year Municipal Bond Index for the year. The Fund’s higher quality bias was a detractor for most of the year as credit spreads tightened and due to less portfolio yield versus the benchmark. When rates declined late in the year, the longer duration position and favorable timing of the extension trade benefited performance. Also, our higher quality bias was a net positive during the final months of the year.
Looking forward, municipal bonds should offer investors a welcome source of value and stability. In 2018, while the Treasury yield curve flattened dramatically, the municipal curve actually steepened. At every major segment, the municipal curve will begin the new year at least twice as steep as its Treasury counterpart. As a result, opportunities to extract relative value and bond roll can be found along the curve. In addition, municipal bonds look well positioned as a haven against continued turbulence in the global markets. The fourth quarter was a clear reminder of the protection the sector adds to a portfolio in periods of stress, as it was one of the few asset classes to post positive returns. As we enter 2019, volatility is likely on the rise. Between |
| 12 |
Table of Contents
AMG GW&K Municipal Bond Fund Portfolio Manager’s Comments(continued) |
| unresolved trade issues, geopolitical flashpoints, and a Fed policy increasingly at odds with the Street, outsized swings in risk markets would not be a surprise. Against this backdrop, municipal bonds continue to look appealing as a stable hedge. | This commentary reflects the viewpoints of the portfolio manager, GW&K Investment Management, LLC as of December 31, 2018, and is not intended as a forecast or guarantee of future results, and is subject to change without notice. | |||||||
| 13 |
Table of Contents
AMG GW&K Municipal Bond Fund Portfolio Manager’s Comments(continued) |
CUMULATIVE TOTAL RETURN PERFORMANCE
AMG GW&K Municipal Bond Fund’s cumulative total return is based on the daily change in net asset value (NAV), and assumes that all dividends and distributions were reinvested. The graph compares a hypothetical $10,000 investment made in the AMG GW&K Municipal Bond Fund’s Class I shares on June 30, 2009 to a $10,000 investment made in the Bloomberg Barclays10-Year Municipal Bond Index for the same time period. The graph and table do not reflect the deduction of taxes that a shareholder would pay on a Fund distribution or redemption of shares. The listed returns for the Fund are net of expenses and the returns for the index exclude expenses. Total returns would have been lower had certain expenses not been reduced.
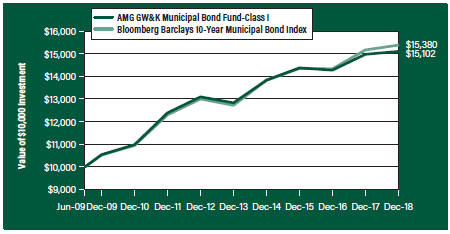
The table below shows the average annual total returns for the AMG GW&K Municipal Bond Fund and the Bloomberg Barclays10-Year Municipal Bond Index for the same time periods ended December 31, 2018.
| Average Annual Total Returns1 | One Year | Five Years | Since Inception | Inception Date | ||||||||||||
AMG GW&K Municipal Bond Fund2, 3, 4, 5, 6 |
| |||||||||||||||
Class N | 0.54% | 2.92% | 3.96% | 06/30/09 | ||||||||||||
Class I | 0.87% | 3.32% | 4.43% | 06/30/09 | ||||||||||||
Bloomberg Barclays10-Year Municipal Bond Index7 | 1.41% | 3.87% | 4.63% | 06/30/09 | † | |||||||||||
The performance data shown represents past performance. Past performance is not a guarantee of future results. Current performance may be lower or higher than the performance data quoted. The investment return and principal value of an investment will fluctuate so that an investor’s shares, when redeemed, may be worth more or less than their original cost.
Investors should carefully consider the Fund’s investment objectives, risks, charges and expenses before investing. For performance information through the most recent month end, current net asset values per share for the Fund and other information, please call 800.835.3879 or visit our website at amgfunds.com for a free prospectus. Read it carefully before investing or sending money.
Distributed by AMG Distributors, Inc., member FINRA/SIPC.
| † | Date reflects the inception date of the Fund, not the index. |
| 1 | Total return equals income yield plus share price change and assumes reinvestment of all dividends and capital gain distributions. Returns are net of fees and may reflect offsets of Fund expenses as described in the prospectus. No adjustment has been made for taxes payable by shareholders on their reinvested dividends and capital gain distributions. Returns for periods greater than one year are annualized. The listed returns on the Fund are net of expenses and based on the published NAV as of December 31, 2018. All returns are in U.S. dollars ($). |
2 From time to time, the Fund’s advisor has waived its fees and/or absorbed Fund expenses, which has resulted in higher returns. | ||
3 The Fund is subject to the risks associated with investments in debt securities, such as default risk and fluctuations in the perception of the debtor’s ability to pay its creditors. Changing interest rates may adversely affect the value of an investment. An increase in interest rates typically causes the value of bonds and other fixed income securities to fall. | ||
4 Factors unique to the municipal bond market may negatively affect the value in municipal bonds. | ||
5 Investment income may be subject to certain state and local taxes, and depending on your tax status, the federal alternative minimum tax. Capital gains are not exempt from federal income tax. | ||
6 Companies that are in similar businesses may be similarly affected by particular economic or market events; to the extent the Fund has substantial holdings within a particular sector, the risks associated with that sector increase. | ||
7 The Bloomberg Barclays10-Year Municipal Bond Index is the 10 Year(8-12) component of the Municipal Bond index. It is a rules-based, market-value-weighted index engineered for thetax-exempt bond market. The Index tracks general obligation bonds, revenue bonds, insured bonds, and prerefunded bonds ratedBaa3/BBB- or higher by at least two of the ratings agencies: Moody’s, S&P, Fitch. Unlike the Fund, the Bloomberg Barclays10-Year Municipal Bond Index is unmanaged, is not available for investment and does not incur expenses. | ||
Not FDIC insured, nor bank guaranteed. May lose value. |
| 14 |
Table of Contents
AMG GW&K Municipal Bond Fund Fund Snapshots(unaudited) December 31, 2018 |
PORTFOLIO BREAKDOWN
| Category | % of Net Assets | |
Utilities | 29.1 | |
Transportation | 27.2 | |
General Obligation | 21.7 | |
Public Services | 7.3 | |
Healthcare | 7.3 | |
Industrial Development | 3.8 | |
Education | 2.7 | |
State andNon-State Appropriated Tobacco | 0.9 | |
Short-Term Investments | 0.7 | |
Other Assets Less Liabilities | (0.7) | |
| Rating | % of Market Value1 | |
Aaa | 29.9 | |
Aa | 47.0 | |
A | 21.4 | |
Baa | 1.7 | |
| 1 | Includes market value of fixed-income securities only. |
TOP TEN HOLDINGS
| Security Name | % of Net Assets | |||||
State of Maryland, Series B, General Obligation, 5.000%, 08/01/25 | 2.7 | |||||
Wisconsin State Revenue, Department of Transportation, Series 2, Revenue, 5.000%, 07/01/29 | 2.5 | |||||
North Carolina State Limited Obligation, Series B, Revenue, 5.000%, 05/01/28 | 1.9 | |||||
Iowa Finance Authority, State Revolving Fund Green Bond, Revenue, 5.000%, 08/01/30 | 1.9 | |||||
Arizona Water Infrastructure Finance Authority, Water Quality Revenue, Series A, Revenue, 5.000%, 10/01/26 | 1.8 | |||||
Metropolitan Transportation Authority, Transit Revenue, Green Bond, Series B, Revenue, 5.000%, 11/15/27 | 1.7 | |||||
State of Michigan, Revenue, 5.000%, 03/15/27 | 1.6 | |||||
State of Maryland, Department of Transportation, Revenue, 5.000%, 09/01/29 | 1.5 | |||||
State of Maryland Department of Transportation, 2nd Issue, Revenue, 5.000%, 10/01/28 | 1.5 | |||||
New Mexico Finance Authority, Subordinate, Series A, Revenue, 5.000%, 06/15/28 | 1.4 | |||||
Top Ten as a Group | 18.5 | |||||
Credit quality ratings shown above reflect the highest rating assigned by either Standard & Poor’s (“S&P”) or Moody’s Investors Service, Inc. (“Moody’s”). These rating agencies are independent, nationally recognized statistical rating organizations and are widely used. Investment grade ratings are credit ratings of BBB/Baa or higher. Below investment grade ratings are credit ratings of BB/Ba or lower. Investments designated N/R are not rated by either rating agency. Unrated investments do not necessarily indicate low credit quality. Credit quality ratings are subject to change.
Because a fund’s strategy may result in multiple investments in particular sectors of the economy, its performance may depend on the performance of those sectors and may fluctuate more widely than investments diversified across more sectors. For additional information on these and other risk considerations, please see the Fund’s prospectus.
Any sectors, industries, or securities discussed should not be perceived as investment recommendations. Mention of a specific security should not be considered a recommendation to buy or solicitation to sell that security. Specific securities mentioned in this report may have been sold from the Fund’s portfolio of investments by the time you receive this report.
| 15 |
Table of Contents
AMG GW&K Municipal Bond Fund Schedule of Portfolio Investments December 31, 2018 |
Principal Amount | Value | |||||||
Municipal Bonds - 100.0% |
| |||||||
Arizona - 2.4% | ||||||||
Arizona Department of Transportation State Highway Fund Revenue | ||||||||
5.000%, 07/01/28 | $5,030,000 | $5,929,716 | ||||||
Arizona Water Infrastructure Finance Authority, Water Quality Revenue, Series A | ||||||||
5.000%, 10/01/26 | 14,890,000 | 17,232,197 | ||||||
Total Arizona | 23,161,913 | |||||||
California - 4.3% | ||||||||
California Municipal Finance Authority, Community Medical Centers, Series A | ||||||||
5.000%, 02/01/27 | 950,000 | 1,115,139 | ||||||
5.000%, 02/01/30 | 1,620,000 | 1,854,608 | ||||||
5.000%, 02/01/31 | 900,000 | 1,024,101 | ||||||
5.000%, 02/01/32 | 1,855,000 | 2,098,024 | ||||||
State of California | ||||||||
5.000%, 09/01/25 | 10,020,000 | 11,858,269 | ||||||
5.000%, 08/01/29 | 7,235,000 | 8,520,153 | ||||||
5.000%, 09/01/29 | 5,075,000 | 5,985,455 | ||||||
State of California, Series C | ||||||||
5.000%, 09/01/26 | 7,715,000 | 9,093,516 | ||||||
Total California | 41,549,265 | |||||||
Colorado - 1.6% | ||||||||
City of Colorado Springs Co. Utilities System Revenue, Series A-1 | ||||||||
5.000%, 11/15/24 | 7,500,000 | 8,721,450 | ||||||
Regional Transportation District County COPS, | ||||||||
Series A | ||||||||
5.000%, 06/01/24 | 6,000,000 | 6,694,440 | ||||||
Total Colorado | 15,415,890 | |||||||
Connecticut - 2.7% | ||||||||
State of Connecticut Special Tax Revenue, Transportation Infrastructure | ||||||||
5.000%, 08/01/24 | 5,340,000 | 6,019,088 | ||||||
5.000%, 01/01/30 | 10,170,000 | 11,659,396 | ||||||
State of Connecticut Special Tax Revenue, | ||||||||
Series B | ||||||||
5.000%, 10/01/35 | 7,500,000 | 8,441,475 | ||||||
Total Connecticut | 26,119,959 | |||||||
District of Columbia - 3.9% | ||||||||
District of Columbia Water & Sewer Authority Public Utility Revenue, Sub Lien, Series C | ||||||||
5.000%, 10/01/24 | 5,475,000 | 6,052,010 | ||||||
District of Columbia, Series A | ||||||||
5.000%, 06/01/24 | 5,000,000 | 5,768,350 | ||||||
5.000%, 06/01/30 | 5,995,000 | 6,994,247 | ||||||
District of Columbia, Series B | ||||||||
5.000%, 06/01/31 | 10,050,000 | 11,996,283 | ||||||
Principal Amount | Value | |||||||
Washington Convention & Sports Authority, | ||||||||
Series A | ||||||||
5.000%, 10/01/27 | $5,375,000 | $6,377,975 | ||||||
Total District of Columbia | 37,188,865 | |||||||
Florida - 3.1% | ||||||||
Florida’s Turnpike Enterprise, Department of Transportation, Series C | ||||||||
5.000%, 07/01/28 | 7,075,000 | 8,335,199 | ||||||
Orange County Health Facilities Authority, | ||||||||
Series A | ||||||||
5.000%, 10/01/31 | 4,515,000 | 5,108,045 | ||||||
State of Florida, Capital Outlay, Series B | ||||||||
5.000%, 06/01/27 | 9,045,000 | 10,374,886 | ||||||
State of Florida, Department of Transportation, Fuel Sales Tax Revenue, Series B | ||||||||
5.000%, 07/01/26 | 5,780,000 | 6,210,090 | ||||||
Total Florida | 30,028,220 | |||||||
Georgia - 2.4% | ||||||||
Atlanta Water & Wastewater Revenue | ||||||||
5.000%, 11/01/25 | 5,100,000 | 5,952,210 | ||||||
Georgia State University & College Improvements, Series A | ||||||||
5.000%, 07/01/24 | 4,650,000 | 5,130,159 | ||||||
5.000%, 07/01/27 | 5,450,000 | 5,977,887 | ||||||
Georgia State University & College Improvements, SeriesA-Tranche 2 | ||||||||
5.000%, 02/01/26 | 5,435,000 | 6,336,612 | ||||||
Total Georgia | 23,396,868 | |||||||
Illinois - 6.6% | ||||||||
Chicago O’Hare International Airport, Series B | ||||||||
5.000%, 01/01/28 | 10,650,000 | 12,022,465 | ||||||
Chicago O’Hare International Airport, | ||||||||
Senior Lien, Series A | ||||||||
5.000%, 01/01/36 | 8,500,000 | 9,514,220 | ||||||
5.000%, 01/01/38 | 5,500,000 | 6,107,420 | ||||||
Illinois State Finance Authority Revenue, Clean Water Initiative Revenue | ||||||||
5.000%, 07/01/27 | 11,000,000 | 12,831,390 | ||||||
Illinois State Toll Highway Authority, Series A | ||||||||
5.000%, 12/01/31 | 9,550,000 | 10,798,472 | ||||||
Illinois State Toll Highway Authority, | ||||||||
Senior Revenue Bonds, Series A | ||||||||
5.000%, 01/01/301 | 10,010,000 | 11,876,665 | ||||||
Total Illinois | 63,150,632 | |||||||
Indiana - 1.4% | ||||||||
Indiana Finance Authority, | ||||||||
Series C | ||||||||
5.000%, 06/01/29 | 4,750,000 | 5,842,310 | ||||||
| The accompanying notes are an integral part of these financial statements. |
| 16 |
Table of Contents
AMG GW&K Municipal Bond Fund Schedule of Portfolio Investments(continued) |
Principal Amount | Value | |||||||
Indiana - 1.4%(continued) | ||||||||
Indiana Transportation Finance Authority, | ||||||||
Series C | ||||||||
5.500%, 12/01/25 | $6,070,000 | $7,386,704 | ||||||
Total Indiana | 13,229,014 | |||||||
Iowa - 2.4% |
| |||||||
Iowa Finance Authority, State Revolving Fund Green Bond | ||||||||
5.000%, 08/01/30 | 15,000,000 | 17,929,950 | ||||||
State of Iowa, Series A | ||||||||
5.000%, 06/01/25 | 4,000,000 | 4,676,640 | ||||||
Total Iowa | 22,606,590 | |||||||
Kentucky - 0.6% |
| |||||||
Louisville/Jefferson County Metropolitan Government, Norton Healthcare Inc., | ||||||||
Series A | ||||||||
5.000%, 10/01/29 | 5,300,000 | 6,011,790 | ||||||
Maryland - 5.7% |
| |||||||
State of Maryland, Department of Transportation | ||||||||
5.000%, 10/01/28 | 12,030,000 | 14,293,565 | ||||||
5.000%, 09/01/29 | 12,100,000 | 14,578,201 | ||||||
State of Maryland, Series B | ||||||||
5.000%, 08/01/25 | 21,550,000 | 25,457,446 | ||||||
Total Maryland | 54,329,212 | |||||||
Massachusetts - 3.8% |
| |||||||
Commonwealth of Massachusetts Federal Highway Grant Anticipation Note Revenue, Subordinate Revenue, Series A | ||||||||
5.000%, 06/15/24 | 10,000,000 | 11,289,300 | ||||||
Commonwealth of Massachusetts, Series A | ||||||||
5.000%, 07/01/25 | 7,700,000 | 9,059,281 | ||||||
Massachusetts Development Finance Agency, Partners Healthcare System | ||||||||
5.000%, 07/01/28 | 7,900,000 | 9,404,950 | ||||||
Massachusetts Water Resources Authority, | ||||||||
Series C | ||||||||
5.000%, 08/01/31 | 6,050,000 | 7,051,759 | ||||||
Total Massachusetts | 36,805,290 | |||||||
Michigan - 4.3% |
| |||||||
Michigan Finance Authority, Henry Ford Health System | ||||||||
5.000%, 11/15/29 | 11,450,000 | 13,069,488 | ||||||
Michigan Finance Authority, Hospital Trinity Health Credit | ||||||||
5.000%, 12/01/34 | 5,440,000 | 6,239,245 | ||||||
Michigan State Building Authority Revenue, | ||||||||
Series I | ||||||||
5.000%, 04/15/27 | 5,700,000 | 6,649,620 | ||||||
Principal Amount | Value | |||||||
State of Michigan | ||||||||
5.000%, 03/15/27 | $12,640,000 | $15,124,645 | ||||||
Total Michigan | 41,082,998 | |||||||
Minnesota - 1.0% |
| |||||||
City of Minneapolis MN, Fairview Health Services, | ||||||||
Series A | ||||||||
5.000%, 11/15/35 | 3,130,000 | 3,569,233 | ||||||
Minneapolis-St Paul Metropolitan Airports Commission, Series A | ||||||||
5.000%, 01/01/25 | 5,000,000 | 5,803,550 | ||||||
Total Minnesota | 9,372,783 | |||||||
Missouri - 0.7% |
| |||||||
University of Missouri, Series A | ||||||||
5.000%, 11/01/26 | 5,495,000 | 6,332,108 | ||||||
Nebraska - 0.6% |
| |||||||
University of Nebraska Facilities Corp. | ||||||||
5.000%, 07/15/25 | 5,000,000 | 5,877,550 | ||||||
New Jersey - 2.6% |
| |||||||
New Jersey Health Care Facilities Financing Authority, RWJ Barnabas Health Obligation | ||||||||
5.000%, 07/01/29 | 6,740,000 | 7,815,165 | ||||||
New Jersey State Turnpike Authority Revenue, | ||||||||
Series A | ||||||||
5.000%, 01/01/33 | 10,295,000 | 11,835,647 | ||||||
New Jersey State Turnpike Authority Revenue, | ||||||||
Series B | ||||||||
5.000%, 01/01/28 | 4,010,000 | 4,813,042 | ||||||
Total New Jersey | 24,463,854 | |||||||
New Mexico - 1.5% |
| |||||||
New Mexico Finance Authority, Subordinate, | ||||||||
Series A | ||||||||
5.000%, 06/15/28 | 11,425,000 | 13,890,744 | ||||||
New York - 14.4% |
| |||||||
Long Island Power Authority | ||||||||
5.000%, 09/01/35 | 5,000,000 | 5,783,150 | ||||||
Metropolitan Transportation Authority, Climate Bond Certified Green Bond | ||||||||
5.000%, 11/15/33 | 6,795,000 | 7,972,981 | ||||||
Metropolitan Transportation Authority, Transit Revenue, Green Bond, | ||||||||
Series B | ||||||||
5.000%, 11/15/27 | 14,225,000 | 16,703,279 | ||||||
| The accompanying notes are an integral part of these financial statements. |
| 17 |
Table of Contents
AMG GW&K Municipal Bond Fund Schedule of Portfolio Investments(continued) |
Principal Amount | Value | |||||||
New York - 14.4%(continued) | ||||||||
Metropolitan Transportation Authority, Transit Revenue, | ||||||||
5.000%, 11/15/24 | $4,950,000 | $5,428,170 | ||||||
5.000%, 11/15/27 | 5,000,000 | 5,440,500 | ||||||
5.000%, 11/15/28 | 4,750,000 | 5,379,518 | ||||||
New York City General Obligation, Series C | ||||||||
5.000%, 08/01/24 | 5,000,000 | 5,765,050 | ||||||
5.000%, 08/01/26 | 5,525,000 | 6,569,556 | ||||||
New York City General Obligation, Series I | ||||||||
5.000%, 08/01/24 | 11,000,000 | 12,125,740 | ||||||
New York City Transitional Finance Authority Building Aid Revenue, | ||||||||
Series S-3, Sub-Series S-3A | ||||||||
5.000%, 07/15/31 | 5,070,000 | 6,011,550 | ||||||
New York City Transitional Finance Authority, Future Tax Secured Revenue, Series C | ||||||||
5.000%, 11/01/26 | 11,930,000 | 13,854,548 | ||||||
New York State Dormitory Authority, Series A | ||||||||
5.000%, 12/15/25 | 8,645,000 | 9,597,420 | ||||||
5.000%, 12/15/27 | 5,640,000 | 6,240,998 | ||||||
5.000%, 03/15/31 | 7,500,000 | 8,963,175 | ||||||
New York State Dormitory Authority, Series D | ||||||||
5.000%, 02/15/27 | 5,700,000 | 6,769,491 | ||||||
5.000%, 02/15/27 | 5,395,000 | 5,852,604 | ||||||
New York State Dormitory Authority, Series E | ||||||||
5.000%, 03/15/32 | 8,370,000 | 9,569,923 | ||||||
Total New York | 138,027,653 | |||||||
North Carolina - 2.5% |
| |||||||
North Carolina Municipal Power Agency No. 1, Electric, Power and Light Revenue, Series A | ||||||||
5.000%, 01/01/27 | 5,050,000 | 5,880,170 | ||||||
North Carolina State Limited Obligation, Series B | ||||||||
5.000%, 05/01/28 | 15,235,000 | 18,246,502 | ||||||
Total North Carolina | 24,126,672 | |||||||
Ohio - 2.1% |
| |||||||
Ohio State General Obligation, Series A | ||||||||
5.000%, 09/01/26 | 7,090,000 | 8,482,405 | ||||||
Ohio Water Development Authority, Water Pollution Control Loan Fund, | ||||||||
Series 2015A | ||||||||
5.000%, 06/01/25 | 10,050,000 | 11,829,051 | ||||||
Total Ohio | 20,311,456 | |||||||
Oklahoma - 1.5% |
| |||||||
Grand River Dam Authority, Series A | ||||||||
5.000%, 06/01/28 | 7,845,000 | 9,281,733 | ||||||
Oklahoma Turnpike Authority, Series A | ||||||||
5.000%, 01/01/26 | 5,000,000 | 5,292,850 | ||||||
Total Oklahoma | 14,574,583 | |||||||
Principal Amount | Value | |||||||
Oregon - 2.3% |
| |||||||
Oregon State Lottery, Series C | ||||||||
5.000%, 04/01/27 | $10,000,000 | $11,587,000 | ||||||
Oregon State Lottery, Series D | ||||||||
5.000%, 04/01/28 | 9,225,000 | 10,636,794 | ||||||
Total Oregon | 22,223,794 | |||||||
Pennsylvania - 1.8% |
| |||||||
Commonwealth Financing Authority, Pennsylvania Tobacco | ||||||||
5.000%, 06/01/32 | 7,870,000 | 8,930,955 | ||||||
Lancaster County Hospital Authority, University of Pennsylvania Health Revenue | ||||||||
5.000%, 08/15/26 | 6,970,000 | 8,245,719 | ||||||
Total Pennsylvania | 17,176,674 | |||||||
Texas - 12.5% |
| |||||||
Central Texas Turnpike System Transportation Commission, Series C | ||||||||
5.000%, 08/15/31 | 11,175,000 | 12,153,259 | ||||||
City of Austin TX Water & Wastewater System Revenue | ||||||||
5.000%, 11/15/26 | 5,100,000 | 6,081,546 | ||||||
City of San Antonio TX Electric & Gas Systems Revenue | ||||||||
5.000%, 02/01/26 | 9,300,000 | 10,991,298 | ||||||
Dallas Area Rapid Transit, Senior Lien | ||||||||
5.250%, 12/01/28 | 8,865,000 | 10,975,668 | ||||||
Lower Colorado River Authority, LCRA Transmission Services Corporation | ||||||||
5.000%, 05/15/29 | 3,800,000 | 4,282,372 | ||||||
Metropolitan Transit Authority of Harris County, | ||||||||
Series A | ||||||||
5.000%, 11/01/24 | 5,060,000 | 5,872,889 | ||||||
North Texas Municipal Water District Water System Revenue, Refunding And Improvement | ||||||||
5.000%, 09/01/29 | 7,350,000 | 8,623,681 | ||||||
North Texas Tollway Authority Revenue, Special Projects System, 1st Tier, | ||||||||
Series A | ||||||||
5.000%, 01/01/25 | 6,460,000 | 7,281,777 | ||||||
North Texas Tollway Authority, 2nd Tier, | ||||||||
5.000%, 01/01/31 | 2,000,000 | 2,272,300 | ||||||
5.000%, 01/01/32 | 4,010,000 | 4,585,515 | ||||||
North Texas Tollway Authority, Series A | ||||||||
5.000%, 01/01/26 | 7,795,000 | 8,763,061 | ||||||
State of Texas, Transportation Commission Mobility Fund | ||||||||
5.000%, 10/01/26 | 10,510,000 | 11,982,136 | ||||||
Texas Transportation Commission Fund, Series A | ||||||||
5.000%, 04/01/27 | 12,550,000 | 13,664,691 | ||||||
| The accompanying notes are an integral part of these financial statements. |
| 18 |
Table of Contents
AMG GW&K Municipal Bond Fund Schedule of Portfolio Investments(continued) |
Principal Amount | Value | |||||||
Texas - 12.5%(continued) | ||||||||
Texas Water Development Board, State Revolving Fund | ||||||||
5.000%, 08/01/26 | $5,395,000 | $6,435,696 | ||||||
The University of Texas System, Series H | ||||||||
5.000%, 08/15/26 | 5,045,000 | 6,022,721 | ||||||
Total Texas | 119,988,610 | |||||||
Utah - 1.8% |
| |||||||
Salt Lake City Corp. Airport Revenue, Series A | ||||||||
5.000%, 07/01/29 | 3,450,000 | 4,038,156 | ||||||
5.000%, 07/01/30 | 6,585,000 | 7,660,199 | ||||||
Utah Transit Authority, Series A | ||||||||
5.000%, 06/15/27 | 5,020,000 | 5,837,908 | ||||||
Total Utah | 17,536,263 | |||||||
Virginia - 1.3% |
| |||||||
Virginia Public Building Authority, Series B | ||||||||
5.000%, 08/01/25 | 10,310,000 | 12,117,034 | ||||||
Washington - 5.2% |
| |||||||
Energy Northwest Electric Revenue, Bonneville Power | ||||||||
5.000%, 07/01/25 | 10,180,000 | 11,956,817 | ||||||
Energy Northwest Nuclear Revenue, | ||||||||
Project 3, Series A | ||||||||
5.000%, 07/01/25 | 7,965,000 | 9,355,211 | ||||||
State of Washington School Improvements, | ||||||||
Series C | ||||||||
5.000%, 02/01/28 | 7,370,000 | 8,620,837 | ||||||
State of Washington, Series R-2015C | ||||||||
5.000%, 07/01/28 | 10,195,000 | 11,678,984 | ||||||
University of Washington, University & College Improvements Revenue, | ||||||||
Series C | ||||||||
5.000%, 07/01/27 | 7,270,000 | 8,061,994 | ||||||
Total Washington | 49,673,843 | |||||||
| 1 | All or part of the security is delayed delivery transaction. The market value for delayed delivery security at December 31, 2018, amounted to $11,864,800, or 1.2% of net assets. |
| 2 | Yield shown represents the December 31, 2018, seven day average yield, which refers to the sum of the previous seven days’ dividends paid, expressed as an annual percentage. |
Principal Amount | Value | |||||||
West Virginia - 0.4% | ||||||||
West Virginia Hospital Finance Authority, Cabell Huntington Hospital Obligation | ||||||||
5.000%, 01/01/35 | $3,745,000 | $4,195,186 | ||||||
Wisconsin - 2.6% | ||||||||
Wisconsin State Revenue, Department of Transportation, Series 2 | ||||||||
5.000%, 07/01/29 | 20,370,000 | 24,366,187 | ||||||
Total Municipal Bonds | 958,331,500 | |||||||
Shares | ||||||||
| Short-Term Investments - 0.7% |
| |||||||
Other Investment Companies - 0.7% |
| |||||||
Dreyfus Government Cash Management Fund, Institutional Shares, 2.29%2 | 2,125,078 | 2,125,078 | ||||||
Dreyfus Institutional Preferred Government Money Market Fund, Institutional Shares, 2.40%2 | 2,125,078 | 2,125,078 | ||||||
JPMorgan U.S. Government Money Market Fund, IM Shares, 2.36%2 | 2,189,474 | 2,189,474 | ||||||
Total Short-Term Investments | 6,439,630 | |||||||
Total Investments - 100.7% | 964,771,130 | |||||||
Other Assets, less Liabilities - (0.7)% | (6,773,271 | ) | ||||||
Net Assets - 100.0% | $957,997,859 | |||||||
| COPS | Certificates of Participation |
| The accompanying notes are an integral part of these financial statements. |
| 19 |
Table of Contents
AMG GW&K Municipal Bond Fund Schedule of Portfolio Investments(continued) |
The following table summarizes the inputs used to value the Fund’s investments by the fair value hierarchy levels as of December 31, 2018:
Level 1 | Level 2 | Level 3 | Total | |||||||||||||
Investments in Securities | ||||||||||||||||
Municipal Bonds† |
| — |
| $ | 958,331,500 |
|
| — |
| $ | 958,331,500 |
| ||||
Short-Term Investments | ||||||||||||||||
Other Investment Companies | $ | 6,439,630 |
|
| — |
|
| — |
|
| 6,439,630 |
| ||||
|
|
|
|
|
|
|
| |||||||||
Total Investments in Securities | $ | 6,439,630 |
| $ | 958,331,500 |
|
| — |
| $ | 964,771,130 |
| ||||
|
|
|
|
|
|
|
| |||||||||
| † | All municipal bonds held in the Fund are Level 2 securities. For a detailed breakout of municipal bonds by major classification, please refer to the Fund’s Schedule of Portfolio Investments. |
For the fiscal year ended December 31, 2018, there were no transfers in or out of Level 3.
| The accompanying notes are an integral part of these financial statements. |
| 20 |
Table of Contents
THE YEAR IN REVIEW
For the year ended December 31, 2018, the AMG GW&K Municipal Enhanced Yield Fund (Class I) (the Fund) returned-0.07%, compared to the Bloomberg Barclays U.S. Municipal Bond BAA Index, which returned 1.96%.
Municipal bonds posted their worst first quarter losses since 1994 amid increasing inflation fears. A synchronized global recovery combined with concerns over rising deficits and a tightening labor market pushed interest rates higher. January’s employment report added to the narrative, showing wages growing at the fastest rate in eight years. The inflation breakeven rate, implied by the spread between nominal U.S. Treasuries and Treasury Inflation Protected Securities (TIPs), soared to three-year highs while the yield on the10-year Treasury note came within a whisker of 3%, a level it has not topped since 2013. But the quarter was filled with turmoil as well, which ultimately kept a lid on rising rates. Equity market volatility, beginning with the unwinding of crowded short-volatility trades and continuing with worries over a protracted trade war and a sharp selloff in technology stocks, drove investors into the safe haven of bonds. The yield on the10-year Treasury finished March at 2.74%, up +33 basis points for the quarter, but down-21 basis points from the February peak.
For the second quarter, municipals fared better than Treasuries astax-exempt rates were little changed for the quarter. With the aftershocks of tax reform fading, municipal bonds regained a sense of normalcy and worked through some of the issues that plagued the space in the first quarter. Recall that earlier in the year banks were flooding the market with paper, selling large chunks of their municipal holdings which were no longer as attractive to them under the new lower corporate tax rate. At the time, dealer inventories were already overloaded from the December supply surge and price discovery was limited by a lack of primary issuance. In the second quarter, all of those negative factors reversed. Bank selling slowed to a trickle, dealers eventually shed the additional supply, and primary issuance returned closer to normal levels. Demand remained robust throughout, with the usual April tax selling sandwiched between healthy flows into mutual funds. Much of the buying interest was concentrated in shorter maturities, which is fairly typical for a retail-dominated market like municipal bonds. The best performing part of the curve was the five-year, where rates declined five basis points, | while the worst was the10-year, where rates inched up four basis points. At the wings, both thetwo- and30-year were essentially unchanged.
In the third quarter, municipals sold off in line with treasuries. The technical tailwinds that usually create positive momentum in the summer months proved surprisingly muted this year. Normally, we see a considerable drop in new issue supply coupled with a surge in reinvestment demand, two seasonal forces that typically combine to produce strong returns. This year, issuance was down, but did not drop as much as expected, especially in August. In addition, flows into mutual funds, which started the quarter at a healthy clip, slowed intomid-summer and actually turned negative in September as rates drifted higher. Banks and insurance companies, which had been significant buyers oftax-exempt paper in recent years, continued to shed exposure due to the changes from last year’s corporate tax reform. This shift has had a particular impact on the long end, where much of the selling has been concentrated, cheapening the relative value ratios of longer maturities in the process.
Municipal bonds posted a furious rally in the fourth quarter, pushing performance, which had been negative throughout the year, back into positive territory. Municipal rates actually rose in the first half of the quarter, touching their highs for the year in November driven by strong employment data. But the tide turned quickly as concerns over global growth resurfaced, exacerbated by an ongoing trade war with China and fears of peak earnings. A vigilant Federal Reserve (the “Fed”), sticking to a plan of more rate hikes and a steady unwinding of the balance sheet, only made matters worse. Oil plummeted below $50 a barrel, equities came within a whisker of a bear market and bonds became the major beneficiary as investors ran for safety. The10-year AAA municipal yield curve finished December at 2.28%, down-49 basis points from its November peak
While the flight to quality was the main driver of performance, municipals also benefited from increased clarity on potential tax reform and a supportive technical environment. The election results came in as expected, but municipal participants still breathed a sigh of relief as a split Congress laid to rest any near-term threats to the market, such as capping the exemption, lowering tax rates, or eliminating private activity bonds. Meanwhile, favorable supply/demand factors continued to underpin performance. The larger effect | came from a lack of supply. New issue volume was down-44% in the fourth quarter, and-68% in December alone. Mutual fund flows turned positive after 11 straight weeks of net redemptions, helped by heavy seasonal investment demand. And while banks continued to step back from the market, their sales were mostly confined to the long end.
The Fund underperformed its benchmark for the year. A higher quality bias helped late in the year as the Fund held over 30% of its holdings in credits rated A or higher, which outperformed theBBB-rated bonds in the Index. However, the higher quality bias throughout the year was the primary detractor from relative performance. In addition, the underweight to shorter maturities was a negative as the municipal yield curve steepened.
We remain active on the long end of the yield curve in the Fund with over 80% invested in maturities greater than 20 years. The volume was primarily focused on relative value trading as opposed to curve trades that you would see more in an intermediate strategy, as the yield curve is relatively flat in the 25–30 year range. We continue to avoid local general obligation bonds and focus on the hospital and transportation sectors.
Looking forward, municipal bonds should offer investors a welcome source of value and stability. In 2018, while the Treasury yield curve flattened dramatically, the municipal curve actually steepened. At every major segment, the municipal curve will begin the new year at least twice as steep as its Treasury counterpart. As a result, opportunities to extract relative value and bond roll can be found along the curve. In addition, municipal bonds look well positioned as a haven against continued turbulence in the global markets. The fourth quarter was a clear reminder of the protection the sector adds to a portfolio in periods of stress, as it was one of the few asset classes to post positive returns. As we enter 2019, volatility is likely on the rise. Between unresolved trade issues, geopolitical flashpoints, and a Fed policy increasingly at odds with the Street, outsized swings in risk markets would not be a surprise. Against this backdrop, municipal bonds continue to look appealing as a stable hedge.
This commentary reflects the viewpoints of the portfolio manager, GW&K Investment Management, LLC as of December 31, 2018, and is not intended as a forecast or guarantee of future results, and is subject to change without notice. |
| 21 |
Table of Contents
AMG GW&K Municipal Enhanced Yield Fund Portfolio Manager’s Comments(continued) |
CUMULATIVE TOTAL RETURN PERFORMANCE
AMG GW&K Municipal Enhanced Yield Fund’s cumulative total return is based on the daily change in net asset value (NAV), and assumes that all dividends and distributions were reinvested. The graph compares a hypothetical $10,000 investment made in the AMG GW&K Municipal Enhanced Yield Fund’s Class I shares on December 31, 2008 to a $10,000 investment made in the Bloomberg Barclays U.S. Municipal Bond BAA Index for the same time period. The graph and table do not reflect the deduction of taxes that a shareholder would pay on a Fund distribution or redemption of shares. The listed returns for the Fund are net of expenses and the returns for the index exclude expenses. Total returns would have been lower had certain expenses not been reduced.
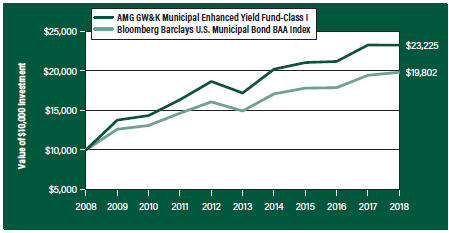
The table below shows the average annual total returns for the AMG GW&K Municipal Enhanced Yield Fund and the Bloomberg Barclays U.S. Municipal Bond BAA Index for the same time periods ended December 31, 2018.
| Average Annual Total Returns1 | One Year | Five Years | Ten Years | Since Inception | Inception Date | |||||||||||||||
AMG GW&K Municipal Enhanced Yield Fund2,3, 4, 5, 6, 7, 8, 9, 10 |
| |||||||||||||||||||
Class N | (0.55% | ) | 5.75% | — | 6.30% | 07/27/09 | ||||||||||||||
Class I | (0.07% | ) | 6.21% | 8.79% | 4.56% | 12/30/05 | ||||||||||||||
Class Z | (0.09% | ) | — | — | 4.32% | 02/24/17 | ||||||||||||||
Bloomberg Barclays U.S. Municipal Bond BAA Index11 | 1.96% | 5.83% | 7.07% | 3.83% | 12/30/05 | † | ||||||||||||||
The performance data shown represents past performance. Past performance is not a guarantee of future results. Current performance may be lower or higher than the performance data quoted. The investment return and principal value of an investment will fluctuate so that an investor’s shares, when redeemed, may be worth more or less than their original cost.
Investors should carefully consider the Fund’s investment objectives, risks, charges and expenses before investing. For performance information through the most recent month end, current net asset values per share for the Fund and other information, please call 800.835.3879 or visit our website at amgfunds.com for a free prospectus. Read it carefully before investing or sending money.
Distributed by AMG Distributors, Inc., member FINRA/SIPC.
| † | Date reflects the inception date of the Fund, not the index. |
| 1 | Total return equals income yield plus share price change and assumes reinvestment of all dividends and capital gain distributions. Returns are net of fees and may reflect offsets of Fund expenses as described in the prospectus. No adjustment has been made for taxes payable by shareholders on their reinvested dividends and |
capital gain distributions. Returns for periods greater than one year are annualized. The listed returns on the Fund are net of expenses and based on the published NAV as of December 31, 2018. All returns are in U.S. dollars ($).
2 From time to time, the Fund’s advisor has waived its fees and/or absorbed Fund expenses, which has resulted in higher returns.
3 The Fund is subject to the risks associated with investments in debt securities, such as default risk and fluctuations in the perception of the debtor’s ability to pay its creditors. Changing interest rates may adversely affect the value of an investment. An increase in interest rates typically causes the value of bonds and other fixed income securities to fall.
4 Companies that are in similar businesses may be similarly affected by particular economic or market events; to the extent the Fund has substantial holdings within a particular sector, the risks associated with that sector increase.
5 Active and frequent trading of a fund may result in higher transaction costs and increased tax liability.
6 The Fund may invest in derivatives such as options and futures; the complexity and rapidly changing structure of derivatives markets may increase the possibility of market losses.
7 High-yield bonds (also known as “junk bonds”) may be subject to greater levels of interest rate, credit, and liquidity risk than investments in higher rated securities. These securities are considered predominantly speculative with respect to the issuer’s continuing ability to make principal and interest payments. The issuers of the Fund’s holdings may be involved in bankruptcy proceedings, reorganizations, or financial restructurings, and are not as strong financially as higher-rated issuers.
8 The use of leverage in a Fund’s strategy, such as futures and forward commitment transactions, can magnify relatively small market movements into relatively larger losses for the Fund. |
9 Factors unique to the municipal bond market may negatively affect the value in municipal bonds.
10 Investment income may be subject to certain state and local taxes, and depending on your tax status, the federal alternative minimum tax. Capital gains are not exempt from federal income tax.
|
| 22 |
Table of Contents
AMG GW&K Municipal Enhanced Yield Fund Portfolio Manager’s Comments(continued) |
11 The Bloomberg Barclays U.S. Municipal Bond BAA Index is a subset of the Boomberg Barclays U.S. Municipal Bond Index with an index rating of Baa1, Baa2, or Baa3. The Bloomberg Barclays U.S. Municipal Bond Index is a rules-based, | market-value-weighted index engineered for the long-term,tax-exempt bond market. Unlike the Fund, the Bloomberg Barclays U.S. Municipal Bond BAA Index is unmanaged, is not available for investment and does not incur expenses.
| Not FDIC insured, nor bank guaranteed. May lose value. |
| 23 |
Table of Contents
AMG GW&K Municipal Enhanced Yield Fund Fund Snapshots(unaudited) December 31, 2018 |
PORTFOLIO BREAKDOWN
| Category | % of Net Assets | |
Healthcare | 29.4 | |
Transportation | 29.3 | |
Utilities | 13.6 | |
Public Services | 7.5 | |
General Obligation | 6.8 | |
State andNon-State Appropriated Tobacco | 6.8 | |
Industrial Development | 4.0 | |
Short-Term Investments | 1.7 | |
Other Assets Less Liabilities | 0.9 | |
| Rating | % of Market Value1 | |
A | 38.2 | |
Baa | 59.4 | |
N/R | 2.4 | |
| 1 | Includes market value of fixed-income securities only. |
TOP TEN HOLDINGS
| Security Name | % of Net Assets | |
New Jersey Economic Development Authority, Series DDD, Revenue, 5.000%, 06/15/42
| 3.8 | |
New York Transportation Development Corp., Laguardia Airport Terminal B, Revenue, 5.000%, 07/01/46
| 3.6 | |
Central Texas Turnpike System, Series C, Revenue, 5.000%, 08/15/42
| 3.5 | |
Alachua County Health Facilities Authority, Shands Teaching Hospital & Clinics, Series A, Revenue, 5.000%, 12/01/44
| 3.4 | |
New Orleans Aviation Board, General Airport North Terminal, Series B, Revenue, 5.000%, 01/01/48
| 3.0 | |
Metropolitan Pier and Exposition Authority Revenue, McCormick Place Expansion Project, Series B, Revenue, 5.000%, 06/15/52
| 2.9 | |
Chicago O’Hare International Airport, Senior Lien, Series A, Revenue, 5.000%, 01/01/48
| 2.7 | |
Illinois State General Obligation, Series D, General Obligation, 5.000%, 11/01/26
| 2.7 | |
City of Minneapolis MN, Fairview Health Services, Series A, Revenue, 5.000%, 11/15/49
| 2.6 | |
Miami Beach Health Facilities Authority Mt. Sinai Medical Center, Revenue, 5.000%, 11/15/39
| 2.6 | |
| ||
Top Ten as a Group | 30.8 | |
| ||
Credit quality ratings shown above reflect the highest rating assigned by either Standard & Poor’s (“S&P”) or Moody’s Investors Service, Inc. (“Moody’s”). These rating agencies are independent, nationally recognized statistical rating organizations and are widely used. Investment grade ratings are credit ratings of BBB/Baa or higher. Below investment grade ratings are credit ratings of BB/Ba or lower. Investments designated N/R are not rated by either rating agency. Unrated investments do not necessarily indicate low credit quality. Credit quality ratings are subject to change.
Because a fund’s strategy may result in multiple investments in particular sectors of the economy, its performance may depend on the performance of those sectors and may fluctuate more widely than investments diversified across more sectors. For additional information on these and other risk considerations, please see the Fund’s prospectus.
Any sectors, industries, or securities discussed should not be perceived as investment recommendations. Mention of a specific security should not be considered a recommendation to buy or solicitation to sell that security. Specific securities mentioned in this report may have been sold from the Fund’s portfolio of investments by the time you receive this report.
| 24 |
Table of Contents
AMG GW&K Municipal Enhanced Yield Fund Schedule of Portfolio Investments December 31, 2018 |
| Principal Amount | Value | |||||||
Municipal Bonds - 97.4% |
| |||||||
California - 7.6% |
| |||||||
California Municipal Finance Authority, Community Medical Centers, Series A | $2,500,000 | $2,736,025 | ||||||
California Municipal Finance Authority, Senior Lien-LINXS APM Project | 4,600,000 | 5,017,266 | ||||||
California Municipal Finance Authority, Series I | 3,000,000 | 3,291,180 | ||||||
5.000%, 05/15/48 | 4,600,000 | 5,018,784 | ||||||
Total California | 16,063,255 | |||||||
Colorado - 2.5% |
| |||||||
Public Authority for Colorado Energy Natural Gas Purchase Revenue, Series 2008 | 3,955,000 | 5,374,054 | ||||||
Connecticut - 5.2% |
| |||||||
State of Connecticut Special Tax Revenue, Transportation Infrastructure | 5,000,000 | 5,509,550 | ||||||
State of Connecticut, Series E | ||||||||
5.000%, 09/15/35 | 2,425,000 | 2,692,381 | ||||||
5.000%, 09/15/37 | 2,500,000 | 2,752,025 | ||||||
Total Connecticut | 10,953,956 | |||||||
Florida - 10.5% |
| |||||||
Alachua County Health Facilities Authority, Shands Teaching Hospital & Clinics, Series A | 6,720,000 | 7,212,979 | ||||||
Martin County Health Facilities Authority, Martin Memorial Medical Center | 4,430,000 | 4,736,910 | ||||||
Miami Beach Health Facilities Authority Mt. Sinai Medical Center | 5,220,000 | 5,523,909 | ||||||
Orange County Health Facilities Authority, Orlando Health Inc., Series A | 4,250,000 | 4,651,795 | ||||||
Total Florida | 22,125,593 | |||||||
Illinois - 11.3% |
| |||||||
Chicago O’Hare International Airport, Senior Lien, Series A | 5,250,000 | 5,751,532 | ||||||
Illinois State General Obligation | 3,225,000 | 3,376,253 | ||||||
Illinois State General Obligation, Series D | 5,215,000 | 5,598,511 | ||||||
Metropolitan Pier and Exposition Authority Revenue, McCormick Place Expansion Project, Series B
|
| 6,075,000
|
|
| 6,159,321
|
| ||
| Principal Amount | Value | |||||||
Metropolitan Pier and Exposition Authority Revenue, McCormick Place Expansion Project, Series 2012 A | $2,990,000 | $3,041,039 | ||||||
Total Illinois | 23,926,656 | |||||||
Louisiana - 5.2% |
| |||||||
Louisiana Public Facilities Authority, Ochsner Clinic Foundation | 4,285,000 | 4,570,681 | ||||||
New Orleans Aviation Board, General Airport North Terminal, Series B | 5,830,000 | 6,333,537 | ||||||
Total Louisiana | 10,904,218 | |||||||
Massachusetts - 3.6% |
| |||||||
Massachusetts Development Finance Agency, UMass Boston Student Housing | ||||||||
5.000%, 10/01/41 | 2,250,000 | 2,369,340 | ||||||
5.000%, 10/01/48 | 5,000,000 | 5,238,100 | ||||||
Total Massachusetts | 7,607,440 | |||||||
Michigan - 2.0% |
| |||||||
Michigan Finance Authority, Henry Ford Health System | 4,005,000 | 4,320,514 | ||||||
Minnesota - 5.2% |
| |||||||
City of Minneapolis MN, Fairview Health Services, Series A | 5,050,000 | 5,535,810 | ||||||
Duluth Economic Development Authority, Essentia Health Obligated Group | 5,000,000 | 5,446,400 | ||||||
Total Minnesota | 10,982,210 | |||||||
Nebraska - 1.6% |
| |||||||
Central Plains Energy Project | ||||||||
Project #3, Series A 5.000%, 09/01/42 | 3,000,000 | 3,411,210 | ||||||
New Jersey - 11.1% |
| |||||||
New Jersey Economic Development Authority, Series DDD | 7,665,000 | 8,074,924 | ||||||
New Jersey Economic Development Authority, UMM Energy Partners, Series 2012 A | 4,450,000 | 4,588,039 | ||||||
New Jersey Transportation Trust Fund Authority, Transportation System, Series A
|
| 2,500,000
|
|
| 2,716,350
|
| ||
| The accompanying notes are an integral part of these financial statements. |
| 25 |
Table of Contents
AMG GW&K Municipal Enhanced Yield Fund Schedule of Portfolio Investments(continued) |
| Principal Amount | Value | |||||||
New Jersey - 11.1%(continued) |
| |||||||
Tobacco Settlement Financing Corp. Series A
5.000%, 06/01/46 | $2,500,000 | $2,601,825 | ||||||
5.250%, 06/01/46 | 3,285,000 | 3,507,263 | ||||||
Tobacco Settlement Financing Corp. Series B | 2,000,000 | 2,018,460 | ||||||
Total New Jersey | 23,506,861 | |||||||
New York - 5.4% |
| |||||||
New York Transportation Development Corp., Delta Air Lines, Inc. - Laguardia | 3,500,000 | 3,925,075 | ||||||
New York Transportation Development Corp., Laguardia Airport Terminal B | 7,150,000 | 7,524,732 | ||||||
Total New York | 11,449,807 | |||||||
Oklahoma - 3.9% |
| |||||||
Oklahoma Development Finance Authority, Health Ou Medicine Project, Series B
5.250%, 08/15/48 | 2,975,000 | 3,219,902 | ||||||
5.500%, 08/15/52 | 4,500,000 | 4,940,010 | ||||||
Total Oklahoma | 8,159,912 | |||||||
Rhode Island - 3.0% |
| |||||||
Tobacco Settlement Financing Corp. Series A
5.000%, 06/01/35 | 2,000,000 | 2,105,120 | ||||||
5.000%, 06/01/40 | 3,985,000 | 4,141,969 | ||||||
Total Rhode Island | 6,247,089 | |||||||
Texas - 12.2% |
| |||||||
Central Texas Regional Mobility Authority
5.000%, 01/01/40 | 2,000,000 | 2,170,480 | ||||||
5.000%, 01/01/46 | 3,750,000 | 4,052,813 | ||||||
Central Texas Turnpike System, Series C | 6,915,000 | 7,341,655 | ||||||
Grand Parkway Transportation Corp., 1st Tier Toll Revenue, Series A | 4,010,000 | 4,396,123 | ||||||
Texas Private Activity Bond Surface Transportation Corp., Senior Lien-Blueridge Transport
5.000%, 12/31/40 | 3,490,000 | 3,703,274 | ||||||
5.000%, 12/31/45 | 3,880,000 | 4,100,151 | ||||||
Total Texas
|
| 25,764,496
|
| |||||
| 1 | Yield shown represents the December 31, 2018, seven day average yield, which refers to the sum of the previous seven days’ dividends paid, expressed as an annual percentage. |
| Principal Amount | Value | |||||||
Virginia - 2.8% |
| |||||||
Virginia Small Business Financing Authority, Transform 66 P3 Project
5.000%, 12/31/49 | $2,500,000 | $2,676,625 | ||||||
5.000%, 12/31/52 | 3,090,000 | 3,296,845 | ||||||
Total Virginia | 5,973,470 | |||||||
West Virginia - 4.3% |
| |||||||
West Virginia Hospital Finance Authority, Cabell Huntington Hospital Obligation | 4,000,000 | 4,392,560 | ||||||
West Virginia Hospital Finance Authority, WV United Health System Obligation | 4,250,000 | 4,636,240 | ||||||
Total West Virginia | 9,028,800 | |||||||
Total Municipal Bonds |
| 205,799,541 | ||||||
| Shares | ||||||||
Short-Term Investments - 1.7% |
| |||||||
Other Investment Companies - 1.7% |
| |||||||
Dreyfus Government Cash Management Fund, Institutional Shares, 2.29%1 | 1,160,310 | 1,160,310 | ||||||
Dreyfus Institutional Preferred Government Money Market Fund, Institutional Shares, 2.40%1 | 1,160,310 | 1,160,310 | ||||||
JPMorgan U.S. Government Money Market Fund, IM Shares, 2.36%1 | 1,195,471 | 1,195,471 | ||||||
Total Short-Term Investments |
| 3,516,091 | ||||||
Total Investments - 99.1% |
| 209,315,632 | ||||||
Other Assets, less Liabilities - 0.9% |
| 1,942,732 | ||||||
Net Assets - 100.0%
|
| $211,258,364
|
| |||||
| The accompanying notes are an integral part of these financial statements. |
| 26 |
Table of Contents
AMG GW&K Municipal Enhanced Yield Fund Schedule of Portfolio Investments(continued) |
The following table summarizes the inputs used to value the Fund’s investments by the fair value hierarchy levels as of December 31, 2018:
| Level 1 | Level 2 | Level 3 | Total | |||||||||||||
Investments in Securities | ||||||||||||||||
Municipal Bonds† | — | $ | 205,799,541 | — | $ | 205,799,541 | ||||||||||
Short-Term Investments | ||||||||||||||||
Other Investment Companies | $ | 3,516,091 | — | — | 3,516,091 | |||||||||||
|
|
|
|
|
|
|
| |||||||||
Total Investments in Securities | $ | 3,516,091 | $ | 205,799,541 | — | $ | 209,315,632 | |||||||||
|
|
|
|
|
|
|
| |||||||||
| † | All municipal bonds held in the Fund are Level 2 securities. For a detailed breakout of municipal bonds by major classification, please refer to the Fund’s Schedule of Portfolio Investments. |
For the fiscal year ended December 31, 2018, there were no transfers in or out of Level 3.
| The accompanying notes are an integral part of these financial statements. |
| 27 |
Table of Contents
THE YEAR IN REVIEW
For the year ended December 31, 2018, the AMG GW&K Small Cap Core Fund (Class N) (the Fund) returned-14.08%, underperforming the Russell 2000® Index, which returned-11.01%.
Unbeknownst to us, 2018 was apparently a fantastic year for new and remade horror films. A bumper crop of frightening tales such as Annihilation, Suspiria, Hereditary, A Quiet Place, and, yes, Halloween, were all released to great fanfare by critics and horror film aficionados alike. These films and many others shared in box office success, as moviegoers enjoyed a good scare. For those of us in the investing world, there was another release, entitled The Fourth Quarter, which was a masterpiece in the horror genre. The Fourth Quarter saw returns slashed by-13.5% for the S&P 500® Index while a chainsaw cut-20.2% from the Russell 2000® Index. Commodity prices were also spooked, with oil getting cut by over-30% and aluminum and nickel gutted by double digits. The Cboe Volatility Index® (VIX® Index), often called the investor fear gauge, more than doubled. The only safe house was in U.S. Treasuries and municipal bonds, as frightened investors trampled each other to get back into bonds tied to the federal, state, and local governments. Surely there must be a really nasty looking villain in the story to cause this much destruction. Like any suspenseful horror movie, The Fourth Quarter kept viewers guessing as to who the bad guys were and from where they might next jump out. Trade friction, cyclical peak corporate earnings, the Federal Reserve tightening, flat yield curves, housing slowdowns, and government shutdowns all were thought to be potential bogeymen. Or perhaps were we being stalked by the most frightening of all monsters: the return of the financial crisis? It likely goes without saying, but we are no fans of the investing horror genre. And at the risk of ruining a suspenseful story and whistling past the graveyard, we think the current obsession with a near-term recession or worse is overly dramatic and imaginative. While economic activity is slowing from the quicker pace of 2018, we think the road ahead should be sunnier than the dark and frightening future foretold in The Fourth Quarter.
The Russell 2000® Index lost-11.0% during the year. Utilities finished alone in positive territory—ironic considering the group was already expensive | relative to its history to start the year and interest rates were presumed to be rising. The worst performing groups in 2018 included energy, materials, industrials, real estate, and financials. Investors clearly shunned cyclical exposure, as most of these areas are tied to global and domestic growth, which has begun to slow.
Factor performance for the year showed an investor preference for companies exhibiting higher market caps, more expensive valuations, low debt levels, and lower return of equity measures. This was an odd mixture that showed a simultaneous preference and abhorrence for low quality companies.
For the Fund underperformed during the year, hurt primarily by financials and information technology. In financials, banks were the biggest negative, with Texas Capital, Pacific Premier, Ameris, and Cathay General all meaningfully underperforming. ProAssurance Corp. dropped nearly (26%), causing us to lose ground in insurance, while Stifel Financial and PRA Group both lagged the market as well. We cut our exposure to ProAssurance during the year, but retain conviction in the other positions. In information technology Rogers and MACOM were big laggards for the year as well as the quarter. We added incrementally to Rogers in September given the weakness and our belief that results there should improve into 2019. In software, Blackbaud and LogMeIn Inc. were the largest detractors. We sold LogMeIn and have trimmed exposure to Blackbaud.
In industrials weakness came primarily from exposure to building products (United Forest Products and Patrick Industries) and one highly cyclical machinery name (Sun Hydraulics) where execution has tried investor patience. We continue to own all three stocks.
On the flip side, we benefited from good stock selection in consumer staples, consumer discretionary, materials, and a larger-than-normal cash position in the second half of the year.
Consumer staples was boosted by the 57.7% rise in the stock ofWD-40 Company as estimates for its 2019 rose as did the stock’s valuation. Performance Food Group and timely additions to Central Garden & | Pet were also additive. In consumer discretionary, Five Below, Helen of Troy, Texas Roadhouse, and Grand Canyon Education were the winners that contributed most. The materials sector benefited from the acquisition of Kapstone Paper and better-than-Index performance from Balchem Corp.
As we enter 2019, most investors are asking themselves one question: is it safe to open my eyes yet? While The Fourth Quarter horror movie finished when we turned the calendar, it is less clear whether this is a standalone story or whether we will be forced to stay in our theater seats for the sequel, prequel, and other multiple iterations (Saw VI, anyone?). We addressed in previous letters that one of the key threats in the equity markets in 2018 came from the Fed’s push toward normalization of monetary policy, as we are on a road not previously traveled. How various markets react to this normalization and the potential for unseen cross connects between adjacent markets could pose a challenge. The best we can do is make prudent risk versus reward decisions in our investing process with an eye to longer-term prospects and outcomes. We believe the economy is slowing but still healthy and that corporate profits will show growth in 2019. Valuations, post the selloff in the fourth quarter, are now much more attractive. Investors are eager to call the cycle over and are most fearful of the last scary horror bad guy they faced—the financial crisis and great recession. We do not see any signals that an economic event like this is likely to recur again in the near future. We will continue to look for quality businesses run by shareholder-friendly managers where the equities are reasonably priced. It is this steadfast investment philosophy that we believe provides our portfolios with a margin of safety for most periods of market turmoil. However, we will not go charging back into the abandoned house without waiting for sunrise and/or a police backup. We have seen that movie before.
This commentary reflects the viewpoints of the portfolio manager, GW&K Investment Management, LLC as of December 31, 2018 and is not intended as a forecast or guarantee of future results, and is subject to change without notice. |
| 28 |
Table of Contents
AMG GW&K Small Cap Core Fund Portfolio Manager’s Comments(continued) |
CUMULATIVE TOTAL RETURN PERFORMANCE
AMG GW&K Small Cap Core Fund’s cumulative total return is based on the daily change in net asset value (NAV), and assumes that all dividends and distributions were reinvested. The graph compares a hypothetical $10,000 investment made in the AMG GW&K Small Cap Core Fund’s Class N shares on December 31, 2008 to a $10,000 investment made in the Russell 2000® Index for the same time period. The graph and table do not reflect the deduction of taxes that a shareholder would pay on a Fund distribution or redemption of shares. The listed returns for the Fund are net of expenses and the returns for the index exclude expenses. Total returns would have been lower had certain expenses not been reduced.
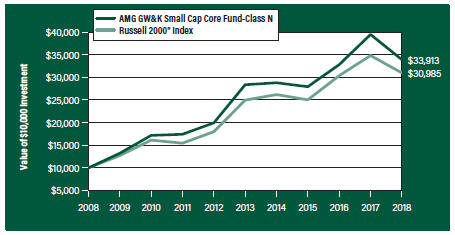
The table below shows the average annual total returns for the AMG GW&K Small Cap Core Fund and the Russell 2000® Index for the same time periods ended December 31, 2018.
| Average Annual Total Returns1 | One Year | Five Years | Ten Years | Since Inception | Inception Date | |||||||||||||||
AMG GW&K Small Cap Core Fund2,3 |
| |||||||||||||||||||
Class N | (14.08% | ) | 3.64% | 12.99% | 7.45% | 12/10/96 | ||||||||||||||
Class I | (13.83% | ) | 4.04% | — | 12.43% | 07/27/09 | ||||||||||||||
Class Z | (13.73% | ) | — | — | (0.49% | ) | 02/24/17 | |||||||||||||
Russell 2000® Index4 | (11.01% | ) | 4.41% | 11.97% | 7.57% | 12/10/96 | † | |||||||||||||
The performance data shown represents past performance. Past performance is not a guarantee of future results. Current performance may be lower or higher than the performance data quoted. The investment return and principal value of an investment will fluctuate so that an investor’s shares, when redeemed, may be worth more or less than their original cost.
Investors should carefully consider the Fund’s investment objectives, risks, charges and expenses before investing. For performance information through the most recent month end, current net asset values per share for the Fund and other information, please call 800.835.3879 or visit our website at amgfunds.com for a free prospectus. Read it carefully before investing or sending money.
Distributed by AMG Distributors, Inc., member FINRA/SIPC.
| † | Date reflects the inception date of the Fund, not the index. |
| 1 | Total return equals income yield plus share price change and assumes reinvestment of all dividends and capital gain distributions. Returns are net of fees and may reflect offsets of Fund expenses as described in the prospectus. No adjustment has been made for taxes payable by shareholders on their reinvested dividends and |
capital gain distributions. Returns for periods greater than one year are annualized. The listed returns on the Fund are net of expenses and based on the published NAV as of December 31, 2018. All returns are in U.S. dollars ($).
2 From time to time, the Fund’s advisor has waived its fees and/or absorbed Fund expenses, which has resulted in higher returns.
3 The Fund is subject to risks associated with investments in small-capitalization companies, such as erratic earnings patterns, competitive conditions, limited earnings history, and a reliance on one or a limited number of products.
4 The Russell 2000® Index is composed of the 2,000 smallest stocks in the Russell 3000® Index and is widely regarded in the industry as the premier measure ofsmall-cap stock performance. Unlike the Fund, the Russell 2000® Index is unmanaged, is not available for investment and does not incur expenses.
The Russell Indices are trademarks of the London Stock Exchange Group companies.
Not FDIC insured, nor bank guaranteed. May lose value.
|
| 29 |
Table of Contents
AMG GW&K Small Cap Core Fund Fund Snapshots(unaudited) December 31, 2018 |
PORTFOLIO BREAKDOWN
| Sector | % of Net Assets | ||||
Health Care | 17.8 | ||||
Industrials | 17.6 | ||||
Financials | 15.9 | ||||
Consumer Discretionary | 15.9 | ||||
Information Technology | 14.6 | ||||
Consumer Staples | 5.2 | ||||
Real Estate | 5.0 | ||||
Materials | 4.5 | ||||
Utilities | 3.1 | ||||
Energy | 2.0 | ||||
Short-Term Investments | 3.3 | ||||
Other Assets Less Liabilities | (4.9 | ) | |||
TOP TEN HOLDINGS
| Security Name | % of Net Assets | |
ICU Medical, Inc. | 3.1 | |
Grand Canyon Education, Inc. | 3.0 | |
EPAM Systems, Inc. | 2.4 | |
Five Below, Inc. | 2.4 | |
Globus Medical, Inc., Class A | 2.3 | |
Texas Roadhouse, Inc. | 2.2 | |
HubSpot, Inc. | 2.2 | |
Performance Food Group Co. | 2.0 | |
Glacier Bancorp, Inc. | 1.8 | |
Ritchie Bros. Auctioneers, Inc. (Canada) | 1.8 | |
| ||
Top Ten as a Group | 23.2 | |
| ||
Because a fund’s strategy may result in multiple investments in particular sectors of the economy, its performance may depend on the performance of those sectors and may fluctuate more widely than investments diversified across more sectors. For additional information on these and other risk considerations, please see the Fund’s prospectus.
Any sectors, industries, or securities discussed should not be perceived as investment recommendations. Mention of a specific security should not be considered a recommendation to buy or solicitation to sell that security. Specific securities mentioned in this report may have been sold from the Fund’s portfolio of investments by the time you receive this report.
| 30 |
Table of Contents
AMG GW&K Small Cap Core Fund Schedule of Portfolio Investments December 31, 2018 |
| Shares | Value | |||||||
Common Stocks - 101.6% |
| |||||||
Consumer Discretionary - 15.9% |
| |||||||
Churchill Downs, Inc. | 17,800 | $4,342,132 | ||||||
Chuy’s Holdings, Inc.* | 90,296 | 1,601,851 | ||||||
Five Below, Inc.* | 95,015 | 9,721,935 | ||||||
Grand Canyon Education, Inc.* | 129,468 | 12,447,054 | ||||||
Helen of Troy, Ltd.*,1 | 35,681 | 4,680,634 | ||||||
Installed Building Products, Inc.*,1 | 104,903 | 3,534,182 | ||||||
Lithia Motors, Inc., Class A1 | 83,006 | 6,335,848 | ||||||
Oxford Industries, Inc.1 | 61,010 | 4,334,150 | ||||||
Skyline Champion Corp. | 147,306 | 2,163,925 | ||||||
Texas Roadhouse, Inc. | 150,908 | 9,009,208 | ||||||
Tupperware Brands Corp. | 63,576 | 2,007,094 | ||||||
Wolverine World Wide, Inc. | 150,946 | 4,813,668 | ||||||
Total Consumer Discretionary | 64,991,681 | |||||||
Consumer Staples - 5.2% |
| |||||||
Central Garden & Pet Co.*,1 | 94,377 | 3,251,288 | ||||||
Central Garden & Pet Co., Class A* | 160,946 | 5,029,562 | ||||||
Performance Food Group Co.* | 256,789 | 8,286,581 | ||||||
WD-40 Co.1 | 25,956 | 4,756,697 | ||||||
Total Consumer Staples | 21,324,128 | |||||||
Energy - 2.0% |
| |||||||
Dril-Quip, Inc.*,1 | 50,737 | 1,523,632 | ||||||
Forum Energy Technologies, Inc.*,1 | 180,870 | 746,993 | ||||||
Matador Resources Co.* | 370,411 | 5,752,483 | ||||||
Total Energy | 8,023,108 | |||||||
Financials - 15.9% |
| |||||||
Ameris Bancorp | 188,303 | 5,963,556 | ||||||
AMERISAFE, Inc. | 106,573 | 6,041,623 | ||||||
Cathay General Bancorp | 180,522 | 6,052,903 | ||||||
Cohen & Steers, Inc.1 | 118,605 | 4,070,524 | ||||||
Glacier Bancorp, Inc. | 186,440 | 7,386,753 | ||||||
IBERIABANK Corp. | 59,359 | 3,815,596 | ||||||
Meridian Bancorp, Inc. | 183,387 | 2,626,102 | ||||||
Pacific Premier Bancorp, Inc.* | 190,129 | 4,852,092 | ||||||
PRA Group, Inc.*,1 | 121,448 | 2,959,688 | ||||||
ProAssurance Corp. | 61,486 | 2,493,872 | ||||||
Stifel Financial Corp.1 | 116,277 | 4,816,193 | ||||||
Texas Capital Bancshares, Inc.* | 91,522 | 4,675,859 | ||||||
United Bankshares, Inc.1 | 110,535 | 3,438,744 | ||||||
Webster Financial Corp. | 121,018 | 5,964,977 | ||||||
Total Financials
|
| 65,158,482
|
| |||||
| Shares | Value | |||||||
Health Care - 17.8% | ||||||||
Amneal Pharmaceuticals, Inc.*,1 | 241,106 | $3,262,164 | ||||||
AtriCure, Inc.* | 74,952 | 2,293,531 | ||||||
Cambrex Corp.*,1 | 98,363 | 3,714,187 | ||||||
Cantel Medical Corp. | 79,636 | 5,928,900 | ||||||
Catalent, Inc.* | 224,462 | 6,998,725 | ||||||
Diplomat Pharmacy, Inc.*,1 | 255,714 | 3,441,910 | ||||||
Globus Medical, Inc., Class A* | 213,657 | 9,247,075 | ||||||
ICU Medical, Inc.* | 54,334 | 12,476,716 | ||||||
LHC Group, Inc.* | 55,307 | 5,192,221 | ||||||
Medidata Solutions, Inc.*,1 | 99,818 | 6,729,730 | ||||||
Syneos Health, Inc.*,1 | 178,653 | 7,029,996 | ||||||
Wright Medical Group, N.V. (Netherlands)* | 242,198 | 6,592,630 | ||||||
Total Health Care | 72,907,785 | |||||||
Industrials - 17.6% |
| |||||||
AAR Corp. | 143,802 | 5,369,567 | ||||||
Alamo Group, Inc. | 58,817 | 4,547,730 | ||||||
Allegiant Travel Co. | 38,354 | 3,843,838 | ||||||
Healthcare Services Group, Inc.1 | 101,727 | 4,087,391 | ||||||
Heartland Express, Inc.1 | 249,996 | 4,574,927 | ||||||
ICF International, Inc. | 88,359 | 5,723,896 | ||||||
John Bean Technologies Corp.1 | 45,943 | 3,299,167 | ||||||
Mobile Mini, Inc. | 103,590 | 3,288,983 | ||||||
Patrick Industries, Inc.*,1 | 112,021 | 3,316,942 | ||||||
Primoris Services Corp. | 259,273 | 4,959,892 | ||||||
RBC Bearings, Inc.* | 53,639 | 7,032,073 | ||||||
Ritchie Bros. Auctioneers, Inc. (Canada) | 224,242 | 7,337,198 | ||||||
Sun Hydraulics Corp. | 129,613 | 4,301,855 | ||||||
Universal Forest Products, Inc. | 163,208 | 4,236,880 | ||||||
US Ecology, Inc. | 92,577 | 5,830,499 | ||||||
Total Industrials | 71,750,838 | |||||||
Information Technology - 14.6% |
| |||||||
Blackbaud, Inc. | 70,455 | 4,431,619 | ||||||
EPAM Systems, Inc.* | 85,268 | 9,891,941 | ||||||
ExlService Holdings, Inc.* | 81,785 | 4,303,527 | ||||||
HubSpot, Inc.*,1 | 70,567 | 8,872,389 | ||||||
MACOM Technology Solutions Holdings, Inc.*,1 | 137,919 | 2,001,205 | ||||||
Paylocity Holding Corp.* | 90,436 | 5,445,151 | ||||||
Power Integrations, Inc. | 79,663 | 4,857,850 | ||||||
Proofpoint, Inc.* | 51,922 | 4,351,583 | ||||||
Rogers Corp.*,1 | 40,021 | 3,964,480 | ||||||
Silicon Laboratories, Inc.*
|
| 87,001
|
|
| 6,856,549
|
| ||
| The accompanying notes are an integral part of these financial statements. |
| 31 |
Table of Contents
AMG GW&K Small Cap Core Fund Schedule of Portfolio Investments(continued) |
| Shares |
Value | |||||||
Information Technology - 14.6% |
| |||||||
(continued) | ||||||||
Virtusa Corp.* | 107,168 | $4,564,285 | ||||||
Total Information Technology |
| 59,540,579 | ||||||
Materials - 4.5% |
| |||||||
Balchem Corp. | 61,149 | 4,791,024 | ||||||
Compass Minerals International, Inc.1 | 49,691 | 2,071,618 | ||||||
PolyOne Corp. | 203,413 | 5,817,612 | ||||||
Silgan Holdings, Inc. | 247,394 | 5,843,446 | ||||||
Total Materials |
| 18,523,700 | ||||||
Real Estate - 5.0% |
| |||||||
National Health Investors, Inc., REIT | 67,489 | 5,098,119 | ||||||
Pebblebrook Hotel Trust, REIT | 155,732 | 4,408,773 | ||||||
QTS Realty Trust, Inc., Class A, REIT | 140,216 | 5,195,003 | ||||||
STAG Industrial, Inc., REIT | 234,412 | 5,832,170 | ||||||
Total Real Estate |
| 20,534,065 | ||||||
Utilities - 3.1% |
| |||||||
IDACORP, Inc. | 63,454 | 5,905,029 | ||||||
NorthWestern Corp.1 | 115,527 | 6,866,925 | ||||||
Total Utilities |
| 12,771,954 | ||||||
Total Common Stocks | 415,526,320 | |||||||
| Principal Amount | ||||||||
Short-Term Investments - 3.3% |
| |||||||
Joint Repurchase Agreements - 3.2%2 |
| |||||||
Cantor Fitzgerald Securities, Inc., dated 12/31/18, due 01/02/19, 3.350% total to be received $3,153,236 (collateralized by various U.S. Government Agency Obligations and U.S. Treasuries, 0.000% - 10.000%, 01/25/19 -10/20/68, totaling $3,215,702) | $3,152,649 | 3,152,649 | ||||||
Daiwa Capital Markets America, dated 12/31/18, due 01/02/19, 3.050% total to be received $3,153,183 (collateralized by various U.S. Government Agency Obligations, 2.000% -6.500%, 01/25/19 - 02/01/49, totaling $3,215,702)
|
| 3,152,649
|
|
| 3,152,649
|
| ||
| Principal Amount | Value | |||||||
Mizuho Securities USA, LLC, dated 12/31/18, due 01/02/19, 2.920% total to be received $661,050 (collateralized by various U.S. Treasuries, 1.875% - 2.625%, 02/29/24 - 09/09/49, totaling $674,162) | $660,943 | $660,943 | ||||||
RBC Dominion Securities, Inc., dated 12/31/18, due 01/02/19, 3.020% total to be received $3,153,178 (collateralized by various U.S. Government Agency Obligations, 3.000% -7.000%, 10/01/25 - 10/20/48, totaling $3,215,702) | 3,152,649 | 3,152,649 | ||||||
State of Wisconsin Investment Board, dated 12/31/18, due 01/02/19, 3.370% total to be received $3,153,239 (collateralized by various U.S. Treasuries, 0.125% - 3.875%, 07/15/20 -02/15/47, totaling $3,215,752) | 3,152,649 | 3,152,649 | ||||||
Total Joint Repurchase Agreements |
| 13,271,539 | ||||||
| Shares | ||||||||
Other Investment Companies - 0.1% |
| |||||||
Dreyfus Government Cash Management Fund, Institutional Shares, 2.29%3 | 113,295 | 113,295 | ||||||
Dreyfus Institutional Preferred Government Money Market Fund, Institutional Shares, 2.40%3 | 113,296 | 113,296 | ||||||
Total Other Investment Companies |
| 226,591 | ||||||
Total Short-Term Investments |
| 13,498,130 | ||||||
Total Investments - 104.9% |
| 429,024,450 | ||||||
Other Assets, less Liabilities - (4.9)% |
| (20,108,960 | ) | |||||
Net Assets - 100.0%
|
| $408,915,490
|
| |||||
| * | Non-income producing security. |
| 1 | Some or all of these securities, amounting to $65,435,236 or 16.0% of net assets, were out on loan to various brokers and are collateralized by cash and various U.S. Treasury Obligations. See Note 4 of Notes to Financial Statements. |
| 2 | Cash collateral received from brokers for securities lending was invested in these joint repurchase agreements. |
| 3 | Yield shown represents the December 31, 2018, seven day average yield, which refers to the sum of the previous seven days’ dividends paid, expressed as an annual percentage. |
REIT Real Estate Investment Trust
| The accompanying notes are an integral part of these financial statements. |
| 32 |
Table of Contents
AMG GW&K Small Cap Core Fund Schedule of Portfolio Investments(continued) |
The following table summarizes the inputs used to value the Fund’s investments by the fair value hierarchy levels as of December 31, 2018:
| Level 1 | Level 2 | Level 3 | Total | |||||||||||||
Investments in Securities | ||||||||||||||||
Common Stocks† | $ | 415,526,320 | — | — | $ | 415,526,320 | ||||||||||
Short-Term Investments | ||||||||||||||||
Joint Repurchase Agreements | — | $ | 13,271,539 | — | 13,271,539 | |||||||||||
Other Investment Companies | 226,591 | — | — | 226,591 | ||||||||||||
|
|
|
|
|
|
|
| |||||||||
Total Investments in Securities | $ | 415,752,911 | $ | 13,271,539 | — | $ | 429,024,450 | |||||||||
|
|
|
|
|
|
|
| |||||||||
| † | All common stocks held in the Fund are Level 1 securities. For a detailed breakout of common stocks by major industry classification, please refer to the Fund’s Schedule of Portfolio Investments. |
For the fiscal year ended December 31, 2018, there were no transfers in or out of Level 3.
| The accompanying notes are an integral part of these financial statements. |
| 33 |
Table of Contents
THE YEAR IN REVIEW
For the year ended December 31, 2018, the AMG GW&K Small/Mid Cap Fund (Class I) (the Fund) returned-8.15%, compared to the Russell 2500® Index, which returned-10.00%. The Fund’s former benchmark, the Russell 2000® Growth Index, returned-9.31% over the same period.
Unbeknownst to us, 2018 was apparently a fantastic year for new and remade horror films. A bumper crop of frightening tales such as Annihilation, Suspiria, Hereditary, A Quiet Place, and, yes, Halloween, were all released to great fanfare by critics and horror film aficionados alike. These films and many others shared in box office success, as moviegoers enjoyed a good scare. For those of us in the investing world, there was another release, entitled The Fourth Quarter, which was a masterpiece in the horror genre. The Fourth Quarter saw returns slashed by-13.5% for the S&P 500® Index while a chainsaw cut-18.5% from the Russell 2500® Index. Commodity prices were also spooked, with oil getting cut by over-30% and aluminum and nickel gutted by double digits. The Cboe Volatility Index® (VIX® Index), often called the investor fear gauge, more than doubled. The only safe house was in U.S. Treasuries and Municipal bonds, as frightened investors trampled each other to get back into bonds tied to the federal, state, and local governments. Surely there must be a really nasty looking villain in the story to cause this much destruction. Like any suspenseful horror movie, The Fourth Quarter kept viewers guessing as to who the bad guys were and from where they might next jump out. Trade friction, cyclical peak corporate earnings, U.S. Federal Reserve tightening, flat yield curves, housing slowdowns, and government shutdowns, all were thought to be potential bogeymen. Or perhaps were we being stalked by the most frightening of all monsters: the return of the financial crisis? It likely goes without saying, but we are no fans of the investing horror genre. And at the risk of ruining a suspenseful story and whistling past the graveyard, we think the current obsession with a near-term recession or worse is overly dramatic and imaginative. While economic activity is slowing from the quicker pace of 2018, we think the road ahead should be sunnier than the dark and frightening future foretold in The Fourth Quarter.
The end of 2018 felt like one of those slasher movies where no character is safe. In the small/mid cap world, both growth and value stocks experienced | significant pain. The Russell 2500® Growth Index was off-20.1% in the fourth quarter, while the Russell 2500® Value Index fared better but was still down-17.1%. During the quarter, energy was by far the worst performing sector, off-41.5%, followed by healthcare, materials, and industrials. Information technology held up a bit better at-17.8%. The best performing meaningful sectors were the relative safe havens of utilities, real estate, and consumer staples. An emphasis should be placed on “relative,” as these sectors were down-0.1%,-10.2%, and-9.7%, respectively.
The Russell 2500® Index lost-10.0% during the year. Utilities finished alone in positive territory—ironic considering the group was already expensive relative to its history to start the year and interest rateswerepresumedtoberising. Theworst performing groups in 2018 included energy, materials, industrials, and financials. Investors clearly shunned cyclical exposure, as most of these areas are tied to global and domestic growth, which has begun to slow.
Factor performance for the year showed an investor preference for companies exhibiting higher market caps, more expensive valuations, low debt levels, and lower ROE measures. Even stranger, the lowest-beta quintile outperformed the highest-beta quintile by more than 1,800 basis points. This was an odd mixture that showed a simultaneous preference and abhorrence for low quality companies
For the year, the Fund outperformed the benchmark driven by very strong stock selection in three sectors: consumer discretionary, industrials, and materials. Consumer discretionary was our best performing sector. Retailers Five Below and Burlington Stores, as well as Dorman Products and BJ Restaurants each rose over +30% as both estimates and investor confidence increased with strong earnings execution. The industrials sector was boosted by Exponent Inc. and CoStar Group with returns over +40%. Materials had three of the Fund’s five holdings deliver positive returns versus-23% for the benchmark sector, led by Quaker Chemical, RPM International, and Aptargroup.
The Fund suffered somewhat from stock selection in financials, energy, and consumer staples. In financials, our bank and insurance holdings both underperformed the benchmark, led by Texas Capital Bancshares, Western Alliance Bankcorp, Pinnacle Financial Partners, and ProAssurance Corporation. In
| each of these names, the valuation saw a much sharper decline than any change in earnings estimates. In energy, we had four stocks, Matador Resources, Callon Petroleum Co., Parsley Energy Inc., and Superior Energy Services, caught up in the selling wave with declines over-40%. Finally, consumer staples was hurt by an underweight position and exposure to PriceSmart Inc., which dropped-31% over the year on declining earnings estimates.
As we enter 2019, most investors are asking themselves one question: is it safe to open my eyes yet? While The Fourth Quarter horror movie finished when we turned the calendar, it is less clear whether this is a standalone story or whether we will be forced to stay in our theater seats for the sequel, prequel, and other multiple iterations (Saw VI, anyone?). We noted in previous letters that one of the key threats in the equity markets in 2018 came from the Fed’s push toward normalization of monetary policy, as we are on a road not previously traveled. How various markets react to this normalization and the potential for unseen cross connects between adjacent markets could pose a challenge. The best we can do is make prudent risk versus reward decisions in our investing process with an eye to longer-term prospects and outcomes. We believe the economy is slowing but still healthy and that corporate profits will show growth in 2019. Valuations, post the selloff in the fourth quarter, are now much more attractive. Investors are eager to call the cycle over and are most fearful of the last scary horror bad guy they faced—the financial crisis and great recession. We do not see any signals that an economic event like this is likely to recur again in the near future. We will continue to look for quality businesses run by shareholder-friendly managers where the equities are reasonably priced. It is this steadfast investment philosophy that we believe provides our portfolios with a margin of safety for most periods of market turmoil. However, we will not go charging back into the abandoned house without waiting for sunrise and/or a police backup. We have seen that movie before.
This commentary reflects the viewpoints of the portfolio manager, GW&K Investment Management, LLC as of December 31, 2018 and is not intended as a forecast or guarantee of future results, and is subject to change without notice. |
| 34 |
Table of Contents
AMG GW&K Small/Mid Cap Fund Portfolio Manager’s Comments(continued) |
CUMULATIVE TOTAL RETURN PERFORMANCE
AMG GW&K Small/Mid Cap Fund’s cumulative total return is based on the daily change in net asset value (NAV), and assumes that all dividends and distributions were reinvested. The graph compares a hypothetical $10,000 investment made in the AMG GW&K Small/Mid Cap Fund’s Class I shares on June 30, 2015 to a $10,000 investment made in the Russell 2500® Index for the same time period. The graph and table do not reflect the deduction of taxes that a shareholder would pay on a Fund distribution or redemption of shares. The listed returns for the Fund are net of expenses and the returns for the index exclude expenses. Total returns would have been lower had certain expenses not been reduced.
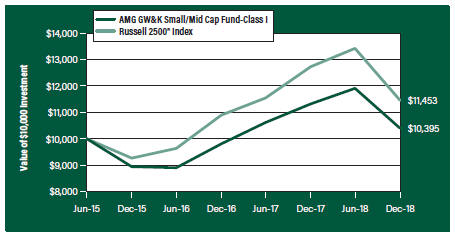
The table below shows the average annual total returns for the AMG GW&K Small/Mid Cap Fund and the Russell 2500® Index for the same time periods ended December 31, 2018.
| Average Annual Total Returns1 | One Year | Since Inception | Inception Date | |||||||||
AMG GW&K Small/Mid Cap Fund2,3, 4, 5, 6 | ||||||||||||
Class N | (8.25% | ) | 0.09% | 02/24/17 | ||||||||
Class I | (8.15% | ) | 1.11% | 06/30/15 | ||||||||
Class Z | (7.98% | ) | 0.33% | 02/24/17 | ||||||||
Russell 2500® Index7 | (10.00% | ) | 3.95% | 06/30/15 | † | |||||||
The performance data shown represents past performance. Past performance is not a guarantee of future results. Current performance may be lower or higher than the performance data quoted. The investment return and principal value of an investment will fluctuate so that an investor’s shares, when redeemed, may be worth more or less than their original cost.
Investors should carefully consider the Fund’s investment objectives, risks, charges and expenses before investing. For performance information through the most recent month end, current net asset values per share for the Fund and other information, please call 800.835.3879 or visit our website at amgfunds.com for a free prospectus. Read it carefully before investing or sending money.
Distributed by AMG Distributors, Inc., member FINRA/SIPC.
| † | Date reflects the inception date of the Fund, not the index |
| 1 | Total return equals income yield plus share price change and assumes reinvestment of all dividends and capital gain distributions. Returns are net of fees and may reflect offsets of Fund expenses as described in the prospectus. No adjustment has been made for taxes payable by shareholders on their reinvested dividends and |
capital gain distributions. Returns for periods greater than one year are annualized. The listed returns on the Fund are net of expenses and based on the published NAV as of December 31, 2018. All returns are in U.S. dollars ($).
2 From time to time, the Fund’s advisor has waived its fees and/or absorbed Fund expenses, which has resulted in higher returns.
3 The Fund is subject to risks associated with investments in small-capitalization companies, such as erratic earnings patterns, competitive conditions, limited earnings history, and a reliance on one or a limited number of products.
4 The Fund is subject to risks associated with investments inmid-capitalization companies such as greater price volatility, lower trading volume, and less liquidity than the stocks of larger, more established companies.
5 The Fund invests in growth stocks, which may be more sensitive to market movements because their prices tend to reflect future investor expectations rather than just current profits. Growth stocks may underperform value stocks during given periods.
6 The Fund invests in value stocks, which may perform differently from the market as a whole and may be undervalued by the market for a long period of time.
7 The Russell 2500® Index is composed of the 2,500 smallest stocks in the Russell 3000® Index and is widely regarded in the industry as the premier measure of small/mid cap stock performance. Unlike the Fund, the Russell 2500® Index is unmanaged, is not available for investment and does not incur expenses.
The Russell Indices are trademarks of the London Stock Exchange Group companies.
Not FDIC insured, nor bank guaranteed. May lose value.
|
| 35 |
Table of Contents
AMG GW&K Small/Mid Cap Fund Fund Snapshots(unaudited) December 31, 2018 |
PORTFOLIO BREAKDOWN
| Sector | % of Net Assets | |||||
Information Technology | 17.4 | |||||
Industrials | 16.6 | |||||
| Consumer Discretionary | 14.5 | ||||
Financials | 12.9 | |||||
Health Care | 11.9 | |||||
Real Estate | 8.8 | |||||
Materials | 7.1 | |||||
Energy | 2.6 | |||||
Utilities | 2.5 | |||||
Consumer Staples | 1.1 | |||||
Short-Term Investments | 3.9 | |||||
Other Assets Less Liabilities | 0.7 | |||||
TOP TEN HOLDINGS
| Security Name | % of Net Assets | |
MarketAxess Holdings, Inc. | 3.0 | |
RPM International, Inc. | 2.5 | |
Zebra Technologies Corp., Class A | 2.5 | |
Burlington Stores, Inc. | 2.4 | |
Exponent, Inc. | 2.3 | |
Gartner, Inc. | 2.2 | |
West Pharmaceutical Services, Inc. | 2.0 | |
Five Below, Inc. | 1.9 | |
RBC Bearings, Inc. | 1.9 | |
Booz Allen Hamilton Holding Corp. | 1.9 | |
| ||
Top Ten as a Group | 22.6 | |
| ||
Because a fund’s strategy may result in multiple investments in particular sectors of the economy, its performance may depend on the performance of those sectors and may fluctuate more widely than investments diversified across more sectors. For additional information on these and other risk considerations, please see the Fund’s prospectus.
Any sectors, industries, or securities discussed should not be perceived as investment recommendations. Mention of a specific security should not be considered a recommendation to buy or solicitation to sell that security. Specific securities mentioned in this report may have been sold from the Fund’s portfolio of investments by the time you receive this report.
| 36 |
Table of Contents
AMG GW&K Small/Mid Cap Fund Schedule of Portfolio Investments December 31, 2018 |
| Shares | Value | |||||||
Common Stocks - 95.4% |
| |||||||
Consumer Discretionary - 14.5% |
| |||||||
BJ’s Restaurants, Inc. | 24,721 | $1,250,141 | ||||||
Burlington Stores, Inc.* | 17,863 | 2,905,774 | ||||||
Carter’s, Inc.1 | 16,894 | 1,378,888 | ||||||
Cavco Industries, Inc.* | 10,529 | 1,372,771 | ||||||
Dorman Products, Inc.*,1 | 24,824 | 2,234,656 | ||||||
Five Below, Inc.* | 22,702 | 2,322,869 | ||||||
Lithia Motors, Inc., Class A1 | 13,041 | 995,420 | ||||||
The Michaels Cos., Inc.*,1 | 52,146 | 706,057 | ||||||
Polaris Industries, Inc. | 15,602 | 1,196,361 | ||||||
Pool Corp.1 | 8,460 | 1,257,579 | ||||||
Texas Roadhouse, Inc. | 29,064 | 1,735,121 | ||||||
Total Consumer Discretionary | 17,355,637 | |||||||
Consumer Staples - 1.1% |
| |||||||
PriceSmart, Inc. | 21,187 | 1,252,152 | ||||||
Energy - 2.6% |
| |||||||
Callon Petroleum Co.*,1 | 124,295 | 806,675 | ||||||
Dril-Quip, Inc.*,1 | 10,401 | 312,342 | ||||||
Matador Resources Co.*,1 | 51,521 | 800,121 | ||||||
Parsley Energy, Inc., Class A* | 59,300 | 947,614 | ||||||
Superior Energy Services, Inc.* | 76,840 | 257,414 | ||||||
Total Energy | 3,124,166 | |||||||
Financials - 12.9% |
| |||||||
Artisan Partners Asset Management, Inc., Class A | 22,746 | 502,914 | ||||||
Glacier Bancorp, Inc. | 33,262 | 1,317,840 | ||||||
James River Group Holdings, Ltd. (Bermuda) | 34,898 | 1,275,173 | ||||||
MarketAxess Holdings, Inc.1 | 16,834 | 3,557,193 | ||||||
Pinnacle Financial Partners, Inc.1 | 34,180 | 1,575,698 | ||||||
ProAssurance Corp. | 26,935 | 1,092,484 | ||||||
Signature Bank | 16,353 | 1,681,252 | ||||||
Texas Capital Bancshares, Inc.* | 24,814 | 1,267,747 | ||||||
Webster Financial Corp. | 27,961 | 1,378,198 | ||||||
Western Alliance Bancorp* | 45,258 | 1,787,238 | ||||||
Total Financials | 15,435,737 | |||||||
Health Care - 11.9% |
| |||||||
Acadia Healthcare Co., Inc.*,1 | 28,837 | 741,399 | ||||||
Amneal Pharmaceuticals, Inc.* | 35,174 | 475,904 | ||||||
Bio-Rad Laboratories, Inc., Class A* | 5,106 | 1,185,715 | ||||||
Catalent, Inc.* | 45,969 | 1,433,314 | ||||||
ICU Medical, Inc.* | 9,595 | 2,203,300 | ||||||
Jazz Pharmaceuticals PLC (Ireland)* | 6,233 | 772,643 | ||||||
Neurocrine Biosciences, Inc.*
|
| 16,730
|
|
| 1,194,689
|
| ||
| Shares | Value | |||||||
Premier, Inc., Class A* | 48,699 | $1,818,908 | ||||||
STERIS PLC (United Kingdom) | 19,413 | 2,074,279 | ||||||
West Pharmaceutical Services, Inc. | 24,500 | 2,401,735 | ||||||
Total Health Care | 14,301,886 | |||||||
Industrials - 16.6% |
| |||||||
Exponent, Inc. | 53,504 | 2,713,188 | ||||||
Gardner Denver Holdings, Inc.* | 63,555 | 1,299,700 | ||||||
Graco, Inc. | 32,314 | 1,352,341 | ||||||
Hexcel Corp. | 26,852 | 1,539,694 | ||||||
Lincoln Electric Holdings, Inc. | 16,362 | 1,290,144 | ||||||
The Middleby Corp.*,1 | 9,992 | 1,026,478 | ||||||
Nordson Corp. | 12,678 | 1,513,119 | ||||||
RBC Bearings, Inc.* | 17,131 | 2,245,874 | ||||||
Ritchie Bros. Auctioneers, Inc. (Canada) | 46,858 | 1,533,194 | ||||||
Schneider National, Inc., Class B | 55,217 | 1,030,901 | ||||||
The Toro Co. | 37,826 | 2,113,717 | ||||||
Wabtec Corp.1 | 23,081 | 1,621,440 | ||||||
WageWorks, Inc.* | 22,440 | 609,470 | ||||||
Total Industrials | 19,889,260 | |||||||
Information Technology - 17.4% |
| |||||||
ANSYS, Inc.* | 7,957 | 1,137,373 | ||||||
Blackbaud, Inc. | 13,813 | 868,838 | ||||||
Booz Allen Hamilton Holding Corp. | 49,687 | 2,239,393 | ||||||
Cognex Corp. | 46,843 | 1,811,419 | ||||||
EPAM Systems, Inc.* | 8,068 | 935,969 | ||||||
Gartner, Inc.* | 20,485 | 2,618,802 | ||||||
Power Integrations, Inc. | 15,806 | 963,850 | ||||||
Rapid7, Inc.* | 36,461 | 1,136,125 | ||||||
Silicon Laboratories, Inc.* | 15,941 | 1,256,310 | ||||||
SS&C Technologies Holdings, Inc. | 39,288 | 1,772,282 | ||||||
Tyler Technologies, Inc.* | 9,491 | 1,763,617 | ||||||
The Ultimate Software Group, Inc.* | 5,954 | 1,457,956 | ||||||
Zebra Technologies Corp., Class A* | 18,473 | 2,941,456 | ||||||
Total Information Technology | 20,903,390 | |||||||
Materials - 7.1% |
| |||||||
AptarGroup, Inc. | 11,006 | 1,035,334 | ||||||
Berry Global Group, Inc.* | 31,736 | 1,508,412 | ||||||
Eagle Materials, Inc. | 16,818 | 1,026,403 | ||||||
Quaker Chemical Corp. | 11,044 | 1,962,629 | ||||||
RPM International, Inc. | 51,229 | 3,011,241 | ||||||
Total Materials | 8,544,019 | |||||||
Real Estate - 8.8% |
| |||||||
American Campus Communities, Inc., REIT | 51,952 |
| 2,150,293
|
| ||||
| The accompanying notes are an integral part of these financial statements. |
| 37 |
Table of Contents
AMG GW&K Small/Mid Cap Fund Schedule of Portfolio Investments(continued) |
Shares | Value | |||||||
Real Estate - 8.8%(continued) | ||||||||
CoreSite Realty Corp., REIT | 13,542 | $1,181,269 | ||||||
Easterly Government Properties, Inc., REIT | 85,883 | 1,346,645 | ||||||
Mid-America Apartment Communities, Inc., REIT | 12,537 | 1,199,791 | ||||||
Physicians Realty Trust, REIT | 88,436 | 1,417,629 | ||||||
Summit Hotel Properties, Inc., REIT | 130,668 | 1,271,400 | ||||||
Sun Communities, Inc., REIT | 19,136 | 1,946,322 | ||||||
Total Real Estate |
| 10,513,349 | ||||||
Utilities - 2.5% | ||||||||
OGE Energy Corp. | 38,096 | 1,492,982 | ||||||
Portland General Electric Co. | 32,608 | 1,495,077 | ||||||
Total Utilities |
| 2,988,059 | ||||||
Total Common Stocks | 114,307,655 | |||||||
| Principal Amount | ||||||||
Short-Term Investments - 3.9% |
| |||||||
Joint Repurchase Agreements - 1.6%2 |
| |||||||
Cantor Fitzgerald Securities, Inc., dated 12/31/18, due 01/02/19, 3.350% total to be received $954,371 (collateralized by various U.S. Government Agency Obligations and U.S. Treasuries, 0.000% - 10.000%, 01/25/19 -10/20/68, totaling $973,277)
|
| $954,193
|
|
| 954,193
|
| ||
| Principal Amount | Value | |||||||
RBC Dominion Securities, Inc., dated 12/31/18, due 01/02/19, 3.020% total to be received $1,000,168 (collateralized by various U.S. Government Agency Obligations, 3.000% -7.000%, 10/01/25 - 10/20/48, totaling $1,020,000) | $1,000,000 | $1,000,000 | ||||||
Total Joint Repurchase Agreements |
| 1,954,193 | ||||||
| Shares | ||||||||
Other Investment Companies - 2.3% |
| |||||||
Dreyfus Government Cash Management Fund, Institutional Shares, 2.29%3 | 893,123 | 893,123 | ||||||
Dreyfus Institutional Preferred Government Money Market Fund, Institutional Shares, 2.40%3 | 893,123 | 893,123 | ||||||
JPMorgan U.S. Government Money Market Fund, IM Shares, 2.36%3 | 920,187 | 920,187 | ||||||
Total Other Investment Companies |
| 2,706,433 | ||||||
Total Short-Term Investments |
| 4,660,626 | ||||||
Total Investments - 99.3% |
| 118,968,281 | ||||||
Other Assets, less Liabilities - 0.7% |
| 870,916 | ||||||
Net Assets - 100.0%
|
| $119,839,197
|
| |||||
| * | Non-income producing security. |
| 1 | Some or all of these securities, amounting to $13,295,996 or 11.1% of net assets, were out on loan to various brokers and are collateralized by cash and various U.S. Treasury Obligations. See Note 4 of Notes to Financial Statements. |
| 2 | Cash collateral received from brokers for securities lending was invested in these joint repurchase agreements. |
| 3 | Yield shown represents the December 31, 2018, seven day average yield, which refers to the sum of the previous seven days’ dividends paid, expressed as an annual percentage. |
REIT Real Estate Investment Trust
| The accompanying notes are an integral part of these financial statements. |
| 38 |
Table of Contents
AMG GW&K Small/Mid Cap Fund Schedule of Portfolio Investments(continued) |
The following table summarizes the inputs used to value the Fund’s investments by the fair value hierarchy levels as of December 31, 2018:
| Level 1 | Level 2 | Level 3 | Total | |||||||||||||
Investments in Securities | ||||||||||||||||
Common Stocks† | $ | 114,307,655 | — | — | $ | 114,307,655 | ||||||||||
Short-Term Investments | ||||||||||||||||
Joint Repurchase Agreements | — | $ | 1,954,193 | — | 1,954,193 | |||||||||||
Other Investment Companies | 2,706,433 | — | — | 2,706,433 | ||||||||||||
|
|
|
|
|
|
|
| |||||||||
Total Investments in Securities | $ | 117,014,088 | $ | 1,954,193 | — | $ | 118,968,281 | |||||||||
|
|
|
|
|
|
|
| |||||||||
| † | All common stocks held in the Fund are Level 1 securities. For a detailed breakout of common stocks by major industry classification, please refer to the Fund’s Schedule of Portfolio Investments. |
For the fiscal year ended December 31, 2018, there were no transfers in or out of Level 3.
| The accompanying notes are an integral part of these financial statements. |
| 39 |
Table of Contents
| AMG GW&K Enhanced Core Bond Fund | AMG GW&K Municipal Bond Fund | AMG GW&K Municipal Enhanced Yield Fund | AMG GW&K Small Cap Core Fund | AMG GW&K Small/Mid Cap Fund | ||||||||||||||||
Assets: | ||||||||||||||||||||
Investments at Value1(including securities on loan valued at $11,740, $0, $0, $65,435,236, and $13,295,996, respectively) | $36,164,823 | $964,771,130 | $209,315,632 | $429,024,450 | $118,968,281 | |||||||||||||||
Receivable for investments sold | — | — | 1,098,020 | 10,336,763 | — | |||||||||||||||
Dividend, interest and other receivables | 343,649 | 12,031,272 | 2,023,812 | 572,589 | 96,128 | |||||||||||||||
Receivable for Fund shares sold | 28,817 | 4,018,669 | 1,183,731 | 5,072,919 | 3,887,859 | |||||||||||||||
Receivable from affiliate | — | 37,162 | 8,232 | — | 5,728 | |||||||||||||||
Prepaid expenses and other assets | 30,121 | 20,009 | 20,126 | 18,803 | 10,107 | |||||||||||||||
Total assets | 36,567,410 | 980,878,242 | 213,649,553 | 445,025,524 | 122,968,103 | |||||||||||||||
Liabilities: | ||||||||||||||||||||
Payable upon return of securities loaned | 12,571 | — | — | 13,271,539 | 1,954,193 | |||||||||||||||
Payable for investments purchased | — | 2,420,454 | 1,155,257 | 1,046,841 | 482,023 | |||||||||||||||
Payable for delayed delivery investments purchased | — | 11,722,500 | — | — | — | |||||||||||||||
Payable for Fund shares repurchased | 81,447 | 8,194,204 | 1,049,143 | 19,679,243 | 559,151 | |||||||||||||||
Interfund loan payable | — | — | — | 1,426,389 | — | |||||||||||||||
Due to custodian | — | — | — | 226,591 | — | |||||||||||||||
Accrued expenses: | ||||||||||||||||||||
Investment advisory and management fees | 26,451 | 172,711 | 80,723 | 292,292 | 67,157 | |||||||||||||||
Administrative fees | 4,750 | 123,960 | 26,908 | 61,333 | 15,498 | |||||||||||||||
Distribution fees | 4,744 | 3,663 | 908 | 2,899 | 20 | |||||||||||||||
Shareholder service fees | 901 | 102,616 | 14,707 | 17,155 | 4,534 | |||||||||||||||
Professional fees | 48,119 | 52,464 | 40,201 | 35,609 | 31,628 | |||||||||||||||
Other | 13,262 | 87,811 | 23,342 | 50,143 | 14,702 | |||||||||||||||
Total liabilities | 192,245 | 22,880,383 | 2,391,189 | 36,110,034 | 3,128,906 | |||||||||||||||
Net Assets | $36,375,165 | $957,997,859 | $211,258,364 | $408,915,490 | $119,839,197 | |||||||||||||||
1Investments at cost | $37,352,371 | $965,780,937 | $208,891,324 | $424,697,411 | $134,733,835 | |||||||||||||||
| The accompanying notes are an integral part of these financial statements. |
| 40 |
Table of Contents
Statement of Assets and Liabilities(continued) |
| AMG GW&K Enhanced Core Bond Fund | AMG GW&K Municipal Bond Fund | AMG GW&K Municipal Enhanced Yield Fund | AMG GW&K Small Cap Core Fund | AMG GW&K Small/Mid Cap Fund | ||||||||||||||||
Net Assets Represent: | ||||||||||||||||||||
Paid-in capital | $42,244,602 | $964,822,378 | $211,161,117 | $396,632,248 | $136,064,792 | |||||||||||||||
Distributable earnings (loss) | (5,869,437 | ) | (6,824,519 | ) | 97,247 | 12,283,242 | (16,225,595 | ) | ||||||||||||
Net Assets | $36,375,165 | $957,997,859 | $211,258,364 | $408,915,490 | $119,839,197 | |||||||||||||||
Class N: | ||||||||||||||||||||
Net Assets | $12,883,519 | $17,444,800 | $7,283,477 | $12,654,780 | $88,674 | |||||||||||||||
Shares outstanding | 1,365,582 | 1,520,196 | 751,673 | 601,693 | 8,874 | |||||||||||||||
Net asset value, offering and redemption price per share | $9.43 | $11.48 | $9.69 | $21.03 | $9.99 | |||||||||||||||
Class I: | ||||||||||||||||||||
Net Assets | $5,966,596 | $940,553,059 | $203,866,738 | $311,252,146 | $54,375,886 | |||||||||||||||
Shares outstanding | 630,223 | 81,529,196 | 21,581,877 | 14,563,580 | 5,440,479 | |||||||||||||||
Net asset value, offering and redemption price per share | $9.47 | $11.54 | $9.45 | $21.37 | $9.99 | |||||||||||||||
Class C: | ||||||||||||||||||||
Net assets per class | $2,270,713 | — | — | — | — | |||||||||||||||
Shares outstanding | 240,802 | — | — | — | — | |||||||||||||||
Net asset value, offering and redemption price per share | $9.43 | — | — | — | — | |||||||||||||||
Class Z: | ||||||||||||||||||||
Net Assets | $15,254,337 | — | $108,149 | $85,008,564 | $65,374,637 | |||||||||||||||
Shares outstanding | 1,611,975 | — | 11,452 | 3,977,271 | 6,537,029 | |||||||||||||||
Net asset value, offering and redemption price per share | $9.46 | — | $9.44 | $21.37 | $10.00 | |||||||||||||||
| The accompanying notes are an integral part of these financial statements. |
| 41 |
Table of Contents
| AMG GW&K Enhanced Core Bond Fund | AMG GW&K Municipal Bond Fund | AMG GW&K Municipal Enhanced Yield Fund | AMG GW&K Small Cap Core Fund | AMG GW&K Small/Mid Cap Fund | ||||||||||||||||
Investment Income: | ||||||||||||||||||||
Dividend income | $11,889 | $227,022 | $93,059 | $6,317,064 | $1,221,375 | |||||||||||||||
Interest income | 1,315,086 | 23,220,024 | 8,175,300 | 1,068 | — | |||||||||||||||
Securities lending income | 1,824 | — | — | 89,941 | 10,762 | |||||||||||||||
Foreign withholding tax | — | — | — | (25,318 | ) | (4,711 | ) | |||||||||||||
Total investment income | 1,328,799 | 23,447,046 | 8,268,359 | 6,382,755 | 1,227,426 | |||||||||||||||
Expenses: | ||||||||||||||||||||
Investment advisory and management fees | 125,446 | 2,186,356 | 984,786 | 3,882,611 | 797,030 | |||||||||||||||
Administrative fees | 62,723 | 1,574,142 | 328,262 | 831,988 | 183,930 | |||||||||||||||
Distribution fees - Class N | 35,935 | 56,174 | 10,725 | 57,841 | 236 | |||||||||||||||
Distribution fees - Class C | 32,852 | — | — | — | — | |||||||||||||||
Shareholder servicing fees - Class N | — | 26,232 | 6,435 | 29,135 | — | |||||||||||||||
Shareholder servicing fees - Class I | 3,492 | 513,479 | 106,695 | 214,761 | 44,231 | |||||||||||||||
Registration fees | 60,888 | 81,163 | 59,682 | 69,326 | 48,215 | |||||||||||||||
Professional fees | 48,587 | 77,229 | 45,040 | 49,639 | 36,770 | |||||||||||||||
Custodian fees | 15,984 | 92,564 | 28,306 | 40,378 | 26,029 | |||||||||||||||
Trustee fees and expenses | 3,310 | 78,360 | 16,567 | 40,967 | 7,683 | |||||||||||||||
Transfer agent fees | (3,117 | ) | 23,259 | 3,552 | 21,009 | 3,458 | ||||||||||||||
Reports to shareholders | (4,487 | ) | 40,017 | 5,497 | 29,979 | 4,140 | ||||||||||||||
Miscellaneous | 2,490 | 19,791 | 5,933 | 16,695 | 3,666 | |||||||||||||||
Repayment of prior reimbursements | — | — | — | 16,826 | — | |||||||||||||||
Total expenses before offsets | 384,103 | 4,768,766 | 1,601,480 | 5,301,155 | 1,155,388 | |||||||||||||||
Expense reimbursements | (110,054 | ) | (604,775 | ) | (186,327 | ) | (3,686 | ) | (67,647 | ) | ||||||||||
Expense reductions | — | — | — | (19,969 | ) | (12,676 | ) | |||||||||||||
Fee waivers | — | (34,394 | ) | — | — | — | ||||||||||||||
Net expenses | 274,049 | 4,129,597 | 1,415,153 | 5,277,500 | 1,075,065 | |||||||||||||||
Net investment income | 1,054,750 | 19,317,449 | 6,853,206 | 1,105,255 | 152,361 | |||||||||||||||
Net Realized and Unrealized Loss: | ||||||||||||||||||||
Net realized gain (loss) on investments | (360,583 | ) | (5,814,705 | ) | 193,354 | 50,596,134 | 2,299,546 | |||||||||||||
Net change in unrealized appreciation/depreciation on investments | (1,421,270 | ) | (7,335,635 | ) | (7,532,447 | ) | (129,767,766 | ) | (17,555,863 | ) | ||||||||||
Net realized and unrealized loss | (1,781,853 | ) | (13,150,340 | ) | (7,339,093 | ) | (79,171,632 | ) | (15,256,317 | ) | ||||||||||
Net increase (decrease) in net assets resulting from operations | $(727,103 | ) | $6,167,109 | $(485,887 | ) | $(78,066,377 | ) | $(15,103,956 | ) | |||||||||||
| The accompanying notes are an integral part of these financial statements. |
| 42 |
Table of Contents
| AMG GW&K Enhanced Core Bond Fund | AMG GW&K Municipal Bond Fund | |||||||||||||||
| 2018 | 20171 | 2018 | 20171 | |||||||||||||
Increase (Decrease) in Net Assets Resulting From Operations: | ||||||||||||||||
Net investment income | $1,054,750 | $1,455,617 | $19,317,449 | $16,341,250 | ||||||||||||
Net realized gain (loss) on investments | (360,583 | ) | 261,715 | (5,814,705 | ) | 2,781,551 | ||||||||||
Net change in unrealized appreciation/depreciation on investments | (1,421,270 | ) | 1,012,966 | (7,335,635 | ) | 27,347,353 | ||||||||||
Net increase (decrease) in net assets resulting from operations | (727,103 | ) | 2,730,298 | 6,167,109 | 46,470,154 | |||||||||||
Distributions to Shareholders:2 | ||||||||||||||||
Class N | (351,771 | ) | (365,057 | ) | (340,725 | ) | (453,180 | ) | ||||||||
Class S3 | — | — | — | (1,030,308 | ) | |||||||||||
Class I | (153,460 | ) | (449,908 | ) | (19,323,073 | ) | (15,961,822 | ) | ||||||||
Class C | (53,217 | ) | (86,218 | ) | — | — | ||||||||||
Class Z | (489,194 | ) | (563,837 | ) | — | — | ||||||||||
Total distributions to shareholders | (1,047,642 | ) | (1,465,020 | ) | (19,663,798 | ) | (17,445,310 | ) | ||||||||
Capital Share Transactions:4 | ||||||||||||||||
Net increase (decrease) from capital share transactions | (10,573,766 | ) | (65,807,448 | ) | (103,417,159 | ) | 122,965,822 | |||||||||
Total increase (decrease) in net assets | (12,348,511 | ) | (64,542,170 | ) | (116,913,848 | ) | 151,990,666 | |||||||||
Net Assets: | ||||||||||||||||
Beginning of year | 48,723,676 | 113,265,846 | 1,074,911,707 | 922,921,041 | ||||||||||||
End of year5 | $36,375,165 | $48,723,676 | $957,997,859 | $1,074,911,707 | ||||||||||||
| 1 | Effective February 27, 2017, the Funds’ share classes were renamed as described in Note 1 of the Notes to the Financial Statements. |
| 2 | See Note 1(d) of the Notes to Financial Statements. |
| 3 | Effective June 23, 2017, Class S shares were converted into Class I shares. |
| 4 | See Note 1(g) of the Notes to Financial Statements. |
| 5 | The Funds Net assets - End of year did not include any undistributed net investment income in 2017. During 2018, the requirement to disclose undistributed net investment income was eliminated. |
| The accompanying notes are an integral part of these financial statements. |
| 43 |
Table of Contents
Statements of Changes in Net Assets(continued) For the fiscal years ended December 31, |
| AMG GW&K Municipal Enhanced Yield Fund | AMG GW&K Small Cap Core Fund | AMG GW&K Small/Mid Cap Fund | ||||||||||||||||||||||
| 2018 | 20171 | 2018 | 20171 | 2018 | 20171 | |||||||||||||||||||
Increase (Decrease) in Net Assets Resulting From Operations: | ||||||||||||||||||||||||
Net investment income | $6,853,206 | $6,945,956 | $1,105,255 | $1,044,956 | $152,361 | $36,766 | ||||||||||||||||||
Net realized gain on investments | 193,354 | 1,907,278 | 50,596,134 | 39,398,970 | 2,299,546 | 416,050 | ||||||||||||||||||
Net change in unrealized appreciation/depreciation on investments | (7,532,447 | ) | 12,463,029 | (129,767,766 | ) | 52,180,026 | (17,555,863 | ) | 1,558,779 | |||||||||||||||
Net increase (decrease) in net assets resulting from operations | (485,887 | ) | 21,316,263 | (78,066,377 | ) | 92,623,952 | (15,103,956 | ) | 2,011,595 | |||||||||||||||
Distributions to Shareholders:2 | ||||||||||||||||||||||||
Class N | (70,830 | ) | (234,480 | ) | (1,606,615 | ) | (1,290,786 | ) | (2,061 | ) | (144 | ) | ||||||||||||
Class S3 | — | (193,559 | ) | — | — | — | — | |||||||||||||||||
Class I | (6,778,865 | ) | (6,539,305 | ) | (42,856,809 | ) | (21,663,226 | ) | (1,246,181 | ) | (320,719 | ) | ||||||||||||
Class Z | (3,511 | ) | (2,693 | ) | (10,281,471 | ) | (5,763,388 | ) | (1,634,280 | ) | (102,624 | ) | ||||||||||||
From paid in capital: | ||||||||||||||||||||||||
Class N | (53,402 | ) | — | — | — | — | — | |||||||||||||||||
Class I | (5,110,821 | ) | — | — | — | — | — | |||||||||||||||||
Class Z | (2,647 | ) | — | — | — | — | — | |||||||||||||||||
Total distributions to shareholders | (12,020,076 | ) | (6,970,037 | ) | (54,744,895 | ) | (28,717,400 | ) | (2,882,522 | ) | (423,487 | ) | ||||||||||||
Capital Share Transactions:4 | ||||||||||||||||||||||||
Net increase (decrease) from capital share transactions | (11,809,532 | ) | 5,434,557 | 5,381,820 | 51,017,083 | 106,569,502 | 27,436,973 | |||||||||||||||||
Total increase (decrease) in net assets | (24,315,495 | ) | 19,780,783 | (127,429,452 | ) | 114,923,635 | 88,583,024 | 29,025,081 | ||||||||||||||||
Net Assets: | ||||||||||||||||||||||||
Beginning of year | 235,573,859 | 215,793,076 | 536,344,942 | 421,421,307 | 31,256,173 | 2,231,092 | ||||||||||||||||||
End of year5 | $211,258,364 | $235,573,859 | $408,915,490 | $536,344,942 | $119,839,197 | $31,256,173 | ||||||||||||||||||
| 1 | Effective February 27, 2017, the Funds’ share classes were renamed as described in Note 1 of the Notes to the Financial Statements. |
| 2 | See Note 1(d) of the Notes to Financial Statements. |
| 3 | Effective June 23, 2017, Class S shares were converted into Class I shares. |
| 4 | See Note 1(g) of the Notes to Financial Statements. |
| 5 | The Funds Net assets - End of year did not include any undistributed net investment income in 2017. During 2018, the requirement to disclose undistributed net investment income was eliminated. |
| The accompanying notes are an integral part of these financial statements. |
| 44 |
Table of Contents
AMG GW&K Enhanced Core Bond Fund For a share outstanding throughout each fiscal year |
| For the fiscal years ended December 31, | ||||||||||||||||||||
Class N | 2018 | 2017 | 20161 | 2015 | 2014 | |||||||||||||||
Net Asset Value, Beginning of Year | $9.81 | $9.67 | $9.58 | $10.22 | $9.96 | |||||||||||||||
Income (loss) from Investment Operations: | ||||||||||||||||||||
Net investment income2,3 | 0.23 | 0.21 | 0.22 | 0.29 | 0.29 | |||||||||||||||
Net realized and unrealized gain (loss) on investments | (0.38 | ) | 0.15 | 0.09 | (0.64 | ) | 0.26 | |||||||||||||
Total income (loss) from investment operations | (0.15 | ) | 0.36 | 0.31 | (0.35 | ) | 0.55 | |||||||||||||
Less Distributions to Shareholders from: | ||||||||||||||||||||
Net investment income | (0.23 | ) | (0.22 | ) | (0.22 | ) | (0.29 | ) | (0.29 | ) | ||||||||||
Total distributions to shareholders | (0.23 | ) | (0.22 | ) | (0.22 | ) | (0.29 | ) | (0.29 | ) | ||||||||||
Net Asset Value, End of Year | $9.43 | $9.81 | $9.67 | $9.58 | $10.22 | |||||||||||||||
Total Return3 | (1.48 | )%4 | 3.76 | %4 | 3.26 | % | (3.51 | )% | 5.58 | %4 | ||||||||||
Ratio of net expenses to average net assets | 0.73 | % | 0.75 | % | 0.84 | % | 0.84 | % | 0.84 | % | ||||||||||
Ratio of gross expenses to average net assets5 | 0.99 | % | 1.04 | % | 1.05 | % | 1.07 | % | 1.09 | % | ||||||||||
Ratio of net investment income to average net assets3 | 2.45 | % | 2.19 | % | 2.27 | % | 2.87 | % | 2.82 | % | ||||||||||
Portfolio turnover | 26 | % | 39 | % | 88 | % | 57 | % | 22 | % | ||||||||||
Net assets end of year (000’s) omitted | $12,884 | $16,027 | $16,115 | $20,203 | $27,444 | |||||||||||||||
| 45 |
Table of Contents
AMG GW&K Enhanced Core Bond Fund Financial Highlights For a share outstanding throughout each fiscal year |
| For the fiscal years ended December 31, | ||||||||||||||||||||
Class I | 2018 | 20176 | 20161 | 2015 | 2014 | |||||||||||||||
Net Asset Value, Beginning of Year | $9.85 | $9.70 | $9.62 | $10.26 | $9.99 | |||||||||||||||
Income (loss) from Investment Operations: | ||||||||||||||||||||
Net investment income2,3 | 0.25 | 0.23 | 0.24 | 0.30 | 0.31 | |||||||||||||||
Net realized and unrealized gain (loss) on investments | (0.38 | ) | 0.16 | 0.08 | (0.63 | ) | 0.27 | |||||||||||||
Total income (loss) from investment operations | (0.13 | ) | 0.39 | 0.32 | (0.33 | ) | 0.58 | |||||||||||||
Less Distributions to Shareholders from: | ||||||||||||||||||||
Net investment income | (0.25 | ) | (0.24 | ) | (0.24 | ) | (0.31 | ) | (0.31 | ) | ||||||||||
Total distributions to shareholders | (0.25 | ) | (0.24 | ) | (0.24 | ) | (0.31 | ) | (0.31 | ) | ||||||||||
Net Asset Value, End of Year | $9.47 | $9.85 | $9.70 | $9.62 | $10.26 | |||||||||||||||
Total Return3,4 | (1.27 | )% | 4.03 | % | 3.31 | % | (3.30 | )% | 5.84 | % | ||||||||||
Ratio of net expenses to average net assets | 0.54 | % | 0.61 | % | 0.69 | % | 0.67 | % | 0.65 | % | ||||||||||
Ratio of gross expenses to average net assets5 | 0.80 | % | 0.90 | % | 0.90 | % | 0.90 | % | 0.90 | % | ||||||||||
Ratio of net investment income to average net assets3 | 2.64 | % | 2.32 | % | 2.39 | % | 2.96 | % | 3.00 | % | ||||||||||
Portfolio turnover | 26 | % | 39 | % | 88 | % | 57 | % | 22 | % | ||||||||||
Net assets end of year (000’s) omitted | $5,967 | $6,864 | $37,952 | $7,463 | $2,480 | |||||||||||||||
| 46 |
Table of Contents
AMG GW&K Enhanced Core Bond Fund Financial Highlights For a share outstanding throughout each fiscal year |
| For the fiscal years ended December 31, | ||||||||||||||||||||
Class C | 2018 | 2017 | 2016 | 2015 | 2014 | |||||||||||||||
Net Asset Value, Beginning of Year | $9.81 | $9.66 | $9.57 | $10.20 | $9.94 | |||||||||||||||
Income (loss) from Investment Operations: | ||||||||||||||||||||
Net investment income2,3 | 0.16 | 0.14 | 0.15 | 0.21 | 0.21 | |||||||||||||||
Net realized and unrealized gain (loss) on investments | (0.38 | ) | 0.16 | 0.08 | (0.63 | ) | 0.26 | |||||||||||||
Total income (loss) from investment operations | (0.22 | ) | 0.30 | 0.23 | (0.42 | ) | 0.47 | |||||||||||||
Less Distributions to Shareholders from: | ||||||||||||||||||||
Net investment income | (0.16 | ) | (0.15 | ) | (0.14 | ) | (0.21 | ) | (0.21 | ) | ||||||||||
Total distributions to shareholders | (0.16 | ) | (0.15 | ) | (0.14 | ) | (0.21 | ) | (0.21 | ) | ||||||||||
Net Asset Value, End of Year | $9.43 | $9.81 | $9.66 | $9.57 | $10.20 | |||||||||||||||
Total Return3 | (2.23 | )%4 | 3.08 | %4 | 2.40 | %4 | (4.15 | )% | 4.79 | %4 | ||||||||||
Ratio of net expenses to average net assets | 1.48 | % | 1.50 | % | 1.59 | % | 1.59 | % | 1.59 | % | ||||||||||
Ratio of gross expenses to average net assets5 | 1.74 | % | 1.79 | % | 1.80 | % | 1.82 | % | 1.84 | % | ||||||||||
Ratio of net investment income to average net assets3 | 1.70 | % | 1.43 | % | 1.53 | % | 2.12 | % | 2.07 | % | ||||||||||
Portfolio turnover | 26 | % | 39 | % | 88 | % | 57 | % | 22 | % | ||||||||||
Net assets end of year (000’s) omitted | $2,271 | $4,561 | $7,842 | $11,031 | $15,927 | |||||||||||||||
| 47 |
Table of Contents
AMG GW&K Enhanced Core Bond Fund Financial Highlights For a share outstanding throughout each fiscal year |
| For the fiscal years ended December 31, | ||||||||||||||||||||
Class Z | 2018 | 20176 | 20161 | 2015 | 2014 | |||||||||||||||
Net Asset Value, Beginning of Year | $9.84 | $9.70 | $9.61 | $10.25 | $9.99 | |||||||||||||||
Income (loss) from Investment Operations: | ||||||||||||||||||||
Net investment income2,3 | 0.26 | 0.24 | 0.25 | 0.31 | 0.31 | |||||||||||||||
Net realized and unrealized gain (loss) on investments | (0.38 | ) | 0.15 | 0.09 | (0.63 | ) | 0.27 | |||||||||||||
Total income (loss) from investment operations | (0.12 | ) | 0.39 | 0.34 | (0.32 | ) | 0.58 | |||||||||||||
Less Distributions to Shareholders from: | ||||||||||||||||||||
Net investment income | (0.26 | ) | (0.25 | ) | (0.25 | ) | (0.32 | ) | (0.32 | ) | ||||||||||
Total distributions to shareholders | (0.26 | ) | (0.25 | ) | (0.25 | ) | (0.32 | ) | (0.32 | ) | ||||||||||
Net Asset Value, End of Year | $9.46 | $9.84 | $9.70 | $9.61 | $10.25 | |||||||||||||||
Total Return3 | (1.23 | )%4 | 4.01 | %4 | 3.52 | % | (3.15 | )%4 | 5.85 | %4 | ||||||||||
Ratio of net expenses to average net assets | 0.48 | % | 0.50 | % | 0.59 | % | 0.59 | % | 0.59 | % | ||||||||||
Ratio of gross expenses to average net assets5 | 0.74 | % | 0.79 | % | 0.80 | % | 0.82 | % | 0.84 | % | ||||||||||
Ratio of net investment income to average net assets3 | 2.70 | % | 2.43 | % | 2.51 | % | 3.10 | % | 3.05 | % | ||||||||||
Portfolio turnover | 26 | % | 39 | % | 88 | % | 57 | % | 22 | % | ||||||||||
Net assets end of year (000’s) omitted | $15,254 | $21,271 | $51,357 | $47,402 | $41,968 | |||||||||||||||
| 1 | Effective October 1, 2016, the Investor Class, Service Class and Institutional Class were renamed Class N, Class S and Class I, respectively. |
| 2 | Per share numbers have been calculated using average shares. |
| 3 | Total returns and net investment income would have been lower had certain expenses not been offset. |
| 4 | The total return is calculated using the published Net Asset Value as of fiscal year end. |
| 5 | Excludes the impact of expense reimbursement or fee waivers and expense reductions such as brokerage credits, but includes expense repayments andnon-reimbursable expenses, if any, such as interest, taxes, and extraordinary expenses. (See Note 1(c) and 2 in the Notes to Financial Statements.) |
| 6 | Effective February 27, 2017, Class I shares were renamed Class Z and Class S shares were renamed Class I. |
| 48 |
Table of Contents
AMG GW&K Municipal Bond Fund Financial Highlights For a share outstanding throughout each fiscal year |
| For the fiscal years ended December 31, | ||||||||||||||||||||
Class N | 2018 | 2017 | 20161 | 2015 | 2014 | |||||||||||||||
Net Asset Value, Beginning of Year | $11.60 | $11.25 | $11.70 | $11.61 | $11.02 | |||||||||||||||
Income (loss) from Investment Operations: | ||||||||||||||||||||
Net investment income2,3 | 0.17 | 0.15 | 0.13 | 0.15 | 0.18 | |||||||||||||||
Net realized and unrealized gain (loss) on investments | (0.11 | ) | 0.36 | (0.25 | ) | 0.24 | 0.63 | |||||||||||||
Total income (loss) from investment operations | 0.06 | 0.51 | (0.12 | ) | 0.39 | 0.81 | ||||||||||||||
Less Distributions to Shareholders from: | ||||||||||||||||||||
Net investment income | (0.18 | ) | (0.15 | ) | (0.12 | ) | (0.15 | ) | (0.18 | ) | ||||||||||
Net realized gain on investments | (0.00 | )4 | (0.01 | ) | (0.21 | ) | (0.15 | ) | (0.04 | ) | ||||||||||
Total distributions to shareholders | (0.18 | ) | (0.16 | ) | (0.33 | ) | (0.30 | ) | (0.22 | ) | ||||||||||
Net Asset Value, End of Year | $11.48 | $11.60 | $11.25 | $11.70 | $11.61 | |||||||||||||||
| Total Return3,5 | 0.54 | % | 4.58 | % | (1.05 | )% | 3.36 | % | 7.39 | % | ||||||||||
Ratio of net expenses to average net assets | 0.71 | % | 0.71 | % | 0.71 | % | 0.82 | % | 0.80 | % | ||||||||||
Ratio of gross expenses to average net assets6 | 0.77 | % | 0.78 | % | 0.95 | % | 1.13 | % | 1.12 | % | ||||||||||
Ratio of net investment income to average net assets3 | 1.53 | % | 1.31 | % | 1.08 | % | 1.28 | % | 1.55 | % | ||||||||||
Portfolio turnover | 35 | % | 27 | % | 66 | % | 78 | % | 31 | % | ||||||||||
Net assets end of year (000’s) omitted | $17,445 | $29,513 | $31,406 | $27,362 | $23,572 | |||||||||||||||
| 49 |
Table of Contents
AMG GW&K Municipal Bond Fund Financial Highlights For a share outstanding throughout each fiscal year |
| For the fiscal years ended December 31, | ||||||||||||||||||||
Class I | 2018 | 20177 | 20161 | 2015 | 2014 | |||||||||||||||
Net Asset Value, Beginning of Year | $11.66 | $11.31 | $11.77 | $11.67 | $11.08 | |||||||||||||||
Income (loss) from Investment Operations: | ||||||||||||||||||||
Net investment income2,3 | 0.21 | 0.19 | 0.17 | 0.21 | 0.23 | |||||||||||||||
Net realized and unrealized gain (loss) on investments | (0.12 | ) | 0.36 | (0.25 | ) | 0.24 | 0.63 | |||||||||||||
Total income (loss) from investment operations | 0.09 | 0.55 | (0.08 | ) | 0.45 | 0.86 | ||||||||||||||
Less Distributions to Shareholders from: | ||||||||||||||||||||
Net investment income | (0.21 | ) | (0.19 | ) | (0.17 | ) | (0.20 | ) | (0.23 | ) | ||||||||||
Net realized gain on investments | (0.00 | )4 | (0.01 | ) | (0.21 | ) | (0.15 | ) | (0.04 | ) | ||||||||||
Total distributions to shareholders | (0.21 | ) | (0.20 | ) | (0.38 | ) | (0.35 | ) | (0.27 | ) | ||||||||||
Net Asset Value, End of Year | $11.54 | $11.66 | $11.31 | $11.77 | $11.67 | |||||||||||||||
| Total Return3,5 | 0.87 | % | 4.90 | % | (0.70 | )% | 3.94 | % | 7.80 | % | ||||||||||
Ratio of net expenses to average net assets | 0.39 | % | 0.37 | % | 0.34 | % | 0.34 | % | 0.34 | % | ||||||||||
Ratio of gross expenses to average net assets6 | 0.45 | % | 0.45 | % | 0.58 | % | 0.65 | % | 0.66 | % | ||||||||||
Ratio of net investment income to average net assets3 | 1.85 | % | 1.64 | % | 1.45 | % | 1.76 | % | 2.00 | % | ||||||||||
Portfolio turnover | 35 | % | 27 | % | 66 | % | 78 | % | 31 | % | ||||||||||
Net assets end of year (000’s) omitted | $940,553 | $1,045,399 | $728,365 | $655,760 | $393,581 | |||||||||||||||
| 1 | Effective October 1, 2016, the Investor Class, Service Class and Institutional Class were renamed Class N, Class S and Class I, respectively. |
| 2 | Per share numbers have been calculated using average shares. |
| 3 | Total returns and net investment income would have been lower had certain expenses not been offset. |
| 4 | Less than $(0.005) per share. |
| 5 | The total return is calculated using the published Net Asset Value as of fiscal year end. |
| 6 | Excludes the impact of expense reimbursement or fee waivers and expense reductions such as brokerage credits, but includes expense repayments andnon-reimbursable expenses, if any, such as interest, taxes, and extraordinary expenses. (See Note 1(c) and 2 in the Notes to Financial Statements.) |
| 7 | Effective June 23, 2017, Class S shares were converted to Class I shares. |
| 50 |
Table of Contents
AMG GW&K Municipal Enhanced Yield Fund Financial Highlights For a share outstanding throughout each fiscal year |
| For the fiscal years ended December 31, | ||||||||||||||||||||
| Class N | 2018 | 2017 | 20161 | 2015 | 2014 | |||||||||||||||
Net Asset Value, Beginning of Year | $10.02 | $9.40 | $10.08 | $10.16 | $8.98 | |||||||||||||||
Income (loss) from Investment Operations: | ||||||||||||||||||||
Net investment income2,3 | 0.27 | 0.26 | 0.25 | 0.30 | 0.34 | |||||||||||||||
Net realized and unrealized gain (loss) on investments | (0.33 | ) | 0.62 | (0.23 | ) | 0.05 | 1.18 | |||||||||||||
Total income (loss) from investment operations | (0.06 | ) | 0.88 | 0.02 | 0.35 | 1.52 | ||||||||||||||
Less Distributions to Shareholders from: | ||||||||||||||||||||
Net investment income | (0.15 | ) | (0.26 | ) | (0.25 | ) | (0.30 | ) | (0.34 | ) | ||||||||||
Net realized gain on investments | — | — | (0.45 | ) | (0.13 | ) | — | |||||||||||||
Paid in capital | (0.12 | ) | — | — | — | — | ||||||||||||||
Total distributions to shareholders | (0.27 | ) | (0.26 | ) | (0.70 | ) | (0.43 | ) | (0.34 | ) | ||||||||||
Net Asset Value, End of Year | $9.69 | $10.02 | $9.40 | $10.08 | $10.16 | |||||||||||||||
| Total Return3,4 | (0.55 | )% | 9.51 | % | 0.10 | % | 3.57 | % | 17.14 | % | ||||||||||
Ratio of net expenses to average net assets | 0.99 | % | 1.01 | % | 1.14 | % | 1.07 | % | 1.00 | % | ||||||||||
Ratio of gross expenses to average net assets5 | 1.08 | % | 1.11 | % | 1.30 | % | 1.25 | % | 1.19 | % | ||||||||||
Ratio of net investment income to average net assets3 | 2.79 | % | 2.67 | % | 2.38 | % | 2.98 | % | 3.46 | % | ||||||||||
Portfolio turnover | 89 | % | 67 | % | 172 | % | 120 | % | 83 | % | ||||||||||
Net assets end of year (000’s) omitted | $7,283 | $8,828 | $4,184 | $5,500 | $8,507 | |||||||||||||||
| 51 |
Table of Contents
AMG GW&K Municipal Enhanced Yield Fund Financial Highlights For a share outstanding throughout each fiscal year |
| For the fiscal years ended December 31, | ||||||||||||||||||||
| Class I | 2018 | 20176 | 20161 | 2015 | 2014 | |||||||||||||||
Net Asset Value, Beginning of Year | $10.01 | $9.40 | $10.07 | $10.14 | $8.97 | |||||||||||||||
Income (loss) from Investment Operations: | ||||||||||||||||||||
Net investment income2,3 | 0.31 | 0.30 | 0.30 | 0.34 | 0.37 | |||||||||||||||
Net realized and unrealized gain (loss) on investments | (0.32 | ) | 0.61 | (0.22 | ) | 0.07 | 1.17 | |||||||||||||
Total income (loss) from investment operations | (0.01 | ) | 0.91 | 0.08 | 0.41 | 1.54 | ||||||||||||||
Less Distributions to Shareholders from: | ||||||||||||||||||||
Net investment income | (0.31 | ) | (0.30 | ) | (0.30 | ) | (0.35 | ) | (0.37 | ) | ||||||||||
Net realized gain on investments | — | — | (0.45 | ) | (0.13 | ) | — | |||||||||||||
Paid in capital | (0.24 | ) | — | — | — | — | ||||||||||||||
Total distributions to shareholders | (0.55 | ) | (0.30 | ) | (0.75 | ) | (0.48 | ) | (0.37 | ) | ||||||||||
Net Asset Value, End of Year | $9.45 | $10.01 | $9.40 | $10.07 | $10.14 | |||||||||||||||
| Total Return3,4 | (0.07 | )% | 9.79 | % | 0.70 | % | 4.15 | % | 17.45 | % | ||||||||||
Ratio of net expenses to average net assets | 0.64 | % | 0.64 | % | 0.64 | % | 0.64 | % | 0.64 | % | ||||||||||
Ratio of gross expenses to average net assets5 | 0.73 | % | 0.74 | % | 0.80 | % | 0.82 | % | 0.83 | % | ||||||||||
Ratio of net investment income to average net assets3 | 3.14 | % | 3.05 | % | 2.89 | % | 3.42 | % | 3.83 | % | ||||||||||
Portfolio turnover | 89 | % | 67 | % | 172 | % | 120 | % | 83 | % | ||||||||||
Net assets end of year (000’s) omitted | $203,867 | $226,638 | $195,193 | $212,057 | $226,284 | |||||||||||||||
| 52 |
Table of Contents
AMG GW&K Municipal Enhanced Yield Fund Financial Highlights For a share outstanding throughout each fiscal period |
| For the fiscal year ended December 31, | For the fiscal period ended December 31, | |||||||||
| Class Z | 2018 | 20177 | ||||||||
| Net Asset Value, Beginning of Period | $10.01 | $9.49 | ||||||||
Income (loss) from Investment Operations: | ||||||||||
Net investment income2,3 | 0.31 | 0.25 | ||||||||
Net realized and unrealized gain (loss) on investments | (0.32 | ) | 0.52 | |||||||
Total income (loss) from investment operations | (0.01 | ) | 0.77 | |||||||
Less Distributions to Shareholders from: | ||||||||||
Net investment income | (0.32 | ) | (0.25 | ) | ||||||
Paid in capital | (0.24 | ) | — | |||||||
Total distributions to shareholders | (0.56 | ) | (0.25 | ) | ||||||
| Net Asset Value, End of Period | $9.44 | $10.01 | ||||||||
| Total Return3,4 | (0.09 | )% | 8.23 | %8 | ||||||
Ratio of net expenses to average net assets | 0.59 | % | 0.59 | %9 | ||||||
Ratio of gross expenses to average net assets5 | 0.68 | % | 0.69 | %9 | ||||||
Ratio of net investment income to average net assets3 | 3.19 | % | 3.07 | %9 | ||||||
Portfolio turnover | 89 | % | 67 | % | ||||||
Net assets end of period (000’s) omitted | $108 | $108 | ||||||||
| 1 | Effective October 1, 2016, the Investor Class, Service Class and Institutional Class were renamed Class N, Class S and Class I, respectively. |
| 2 | Per share numbers have been calculated using average shares. |
| 3 | Total returns and net investment income would have been lower had certain expenses not been offset. |
| 4 | The total return is calculated using the published Net Asset Value as of fiscal year end. |
| 5 | Excludes the impact of expense reimbursement or fee waivers and expense reductions such as brokerage credits, but includes expense repayments andnon-reimbursable expenses, if any, such as interest, taxes, and extraordinary expenses. (See Note 1(c) and 2 in the Notes to Financial Statements.) |
| 6 | Effective June 23, 2017, Class S shares were converted to Class I shares. |
| 7 | Commencement of operations was on February 27, 2017. |
| 8 | Not annualized. |
| 9 | Annualized. |
| 53 |
Table of Contents
AMG GW&K Small Cap Core Fund Financial Highlights For a share outstanding throughout each fiscal year |
| For the fiscal years ended December 31, | ||||||||||||||||||||
| Class N | 2018 | 2017 | 20161 | 2015 | 2014 | |||||||||||||||
Net Asset Value, Beginning of Year | $28.04 | $24.57 | $21.80 | $23.39 | $24.34 | |||||||||||||||
Income (loss) from Investment Operations: | ||||||||||||||||||||
Net investment income (loss)2,3 | (0.04 | ) | (0.06 | )4 | 0.00 | 5,6 | (0.06 | )7 | (0.07 | )8 | ||||||||||
Net realized and unrealized gain (loss) on investments | (3.95 | ) | 5.06 | 3.81 | (0.64 | ) | 0.46 | |||||||||||||
Total income (loss) from investment operations | (3.99 | ) | 5.00 | 3.81 | (0.70 | ) | 0.39 | |||||||||||||
Less Distributions to Shareholders from: | ||||||||||||||||||||
Net realized gain on investments | (3.02 | ) | (1.53 | ) | (1.04 | ) | (0.89 | ) | (1.34 | ) | ||||||||||
Total distributions to shareholders | (3.02 | ) | (1.53 | ) | (1.04 | ) | (0.89 | ) | (1.34 | ) | ||||||||||
Net Asset Value, End of Year | $21.03 | $28.04 | $24.57 | $21.80 | $23.39 | |||||||||||||||
| Total Return3,9 | (14.08 | )% | 20.32 | % | 17.44 | % | (3.02 | )% | 1.53 | % | ||||||||||
Ratio of net expenses to average net assets10 | 1.28 | % | 1.32 | % | 1.33 | % | 1.35 | % | 1.42 | % | ||||||||||
Ratio of gross expenses to average net assets11 | 1.28 | % | 1.33 | % | 1.42 | % | 1.46 | % | 1.53 | % | ||||||||||
Ratio of net investment income (loss) to average net assets3 | (0.13 | )% | (0.21 | )% | 0.01 | % | (0.24 | )% | (0.28 | )% | ||||||||||
Portfolio turnover | 25 | % | 23 | % | 19 | % | 16 | % | 26 | % | ||||||||||
Net assets end of year (000’s) omitted | $12,655 | $24,989 | $35,760 | $35,691 | $37,995 | |||||||||||||||
| 54 |
Table of Contents
AMG GW&K Small Cap Core Fund Financial Highlights For a share outstanding throughout each fiscal year |
| For the fiscal years ended December 31, | ||||||||||||||||||||
| Class I | 2018 | 201712 | 20161 | 2015 | 2014 | |||||||||||||||
Net Asset Value, Beginning of Year | $28.42 | $24.84 | $22.04 | $23.61 | $24.49 | |||||||||||||||
Income (loss) from Investment Operations: | ||||||||||||||||||||
Net investment income2,3 | 0.06 | 0.07 | 4 | 0.10 | 5 | 0.04 | 7 | 0.07 | 8 | |||||||||||
Net realized and unrealized gain (loss) on investments | (4.03 | ) | 5.10 | 3.86 | (0.65 | ) | 0.44 | |||||||||||||
Total income (loss) from investment operations | (3.97 | ) | 5.17 | 3.96 | (0.61 | ) | 0.51 | |||||||||||||
Less Distributions to Shareholders from: | ||||||||||||||||||||
Net investment income | (0.06 | ) | (0.06 | ) | (0.10 | ) | (0.05 | ) | (0.04 | ) | ||||||||||
Net realized gain on investments | (3.02 | ) | (1.53 | ) | (1.06 | ) | (0.91 | ) | (1.35 | ) | ||||||||||
Total distributions to shareholders | (3.08 | ) | (1.59 | ) | (1.16 | ) | (0.96 | ) | (1.39 | ) | ||||||||||
Net Asset Value, End of Year | $21.37 | $28.42 | $24.84 | $22.04 | $23.61 | |||||||||||||||
Total Return3,9 | (13.83 | )% | 20.79 | % | 17.90 | % | (2.63 | )% | 2.04 | % | ||||||||||
Ratio of net expenses to average net assets10 | 0.95 | % | 0.95 | % | 0.94 | % | 0.95 | % | 0.95 | % | ||||||||||
Ratio of gross expenses to average net assets11 | 0.95 | % | 0.96 | % | 1.03 | % | 1.06 | % | 1.07 | % | ||||||||||
Ratio of net investment income to average net assets3 | 0.20 | % | 0.24 | % | 0.43 | % | 0.17 | % | 0.30 | % | ||||||||||
Portfolio turnover | 25 | % | 23 | % | 19 | % | 16 | % | 26 | % | ||||||||||
Net assets end of year (000’s) omitted | $311,252 | $403,309 | $367,972 | $302,381 | $291,301 | |||||||||||||||
| 55 |
Table of Contents
AMG GW&K Small Cap Core Fund Financial Highlights For a share outstanding throughout each fiscal period |
| For the fiscal year ended December 31, | For the fiscal period ended December 31, | |||||||||
| Class Z | 2018 | 201713 | ||||||||
Net Asset Value, Beginning of Period | $28.42 | $26.13 | ||||||||
Income (loss) from Investment Operations: | ||||||||||
Net investment income2,3 | 0.07 | 0.14 | 4 | |||||||
Net realized and unrealized gain (loss) on investments | (4.03 | ) | 3.75 | |||||||
Total income (loss) from investment operations | (3.96 | ) | 3.89 | |||||||
Less Distributions to Shareholders from: | ||||||||||
Net investment income | (0.07 | ) | (0.07 | ) | ||||||
Net realized gain on investments | (3.02 | ) | (1.53 | ) | ||||||
Total distributions to shareholders | (3.09 | ) | (1.60 | ) | ||||||
Net Asset Value, End of Period | $21.37 | $28.42 | ||||||||
| Total Return3,9 | (13.73 | )% | 14.87 | %14 | ||||||
Ratio of net expenses to average net assets10 | 0.90 | % | 0.90 | %15 | ||||||
Ratio of gross expenses to average net assets11 | 0.90 | % | 0.91 | %15 | ||||||
Ratio of net investment income to average net assets3 | 0.25 | % | 0.56 | %15 | ||||||
Portfolio turnover | 25 | % | 23 | % | ||||||
Net assets end of period (000’s) omitted | $85,009 | $108,047 | ||||||||
|
|
| 1 | Effective October 1, 2016, the Investor Class, Service Class and Institutional Class were renamed Class N, Class S and Class I, respectively. |
| 2 | Per share numbers have been calculated using average shares. |
| 3 | Total returns and net investment income would have been lower had certain expenses not been offset. |
| 4 | Includesnon-recurring dividends. Without these dividends, net investment income per share would have been $(0.12), $0.01, and $0.09 for Class N, Class I and Class Z shares, respectively. |
| 5 | Includesnon-recurring dividends. Without these dividends, net investment income per share would have been $(0.06) and$0.04 for Class N and Class I, respectively. |
| 6 | Less than $0.005 per share. |
| 7 | Includesnon-recurring dividends. Without these dividends, net investment income per share would have been $(0.05) and $0.05 for Class N, and Class I, respectively. |
| 8 | Includesnon-recurring dividends. Without these dividends, net investment income per share would have been $(0.11) and $0.03 for the Class N, and Class I respectively. |
| 9 | The total return is calculated using the published Net Asset Value as of fiscal year end. |
| 10 | Includes reduction from broker recapture amounting to less than 0.01% for fiscal year ended 2018 and period ended December 31, 2017. |
| 11 | Excludes the impact of expense reimbursement or fee waivers and expense reductions such as brokerage credits, but includes expense repayments andnon-reimbursable expenses, if any, such as interest, taxes, and extraordinary expenses. (See Note 1(c) and 2 in the Notes to Financial Statements.) |
| 12 | Effective June 23, 2017, Class S shares were converted to Class I shares. |
| 13 | Commencement of operations was on February 27, 2017. |
| 14 | Not annualized. |
| 15 | Annualized. |
| 56 |
Table of Contents
AMG GW&K Small/Mid Cap Fund Financial Highlights For a share outstanding throughout each fiscal period |
| For the fiscal year ended December 31, | For the fiscal period ended December 31, | |||||||||
| Class N | 2018 | 20171 | ||||||||
| Net Asset Value, Beginning of Period | $11.15 | $10.35 | ||||||||
Income (loss) from Investment Operations: | ||||||||||
Net investment income (loss)2,3 | (0.01 | ) | 0.01 | 4 | ||||||
Net realized and unrealized gain (loss) on investments | (0.91 | ) | 0.94 | |||||||
Total income (loss) from investment operations | (0.92 | ) | 0.95 | |||||||
Less Distributions to Shareholders from: | ||||||||||
Net realized gain on investments | (0.24 | ) | (0.15 | ) | ||||||
Total distributions to shareholders | (0.24 | ) | (0.15 | ) | ||||||
Net Asset Value, End of Period | $9.99 | $11.15 | ||||||||
| Total Return3,5 | (8.25 | )% | 9.17 | %6 | ||||||
Ratio of net expenses to average net assets7 | 1.09 | % | 1.10 | %8 | ||||||
Ratio of gross expenses to average net assets9 | 1.16 | % | 1.71 | %8 | ||||||
Ratio of net investment income (loss) to average net assets3 | (0.09 | )% | 0.12 | %8 | ||||||
Portfolio turnover | 53 | % | 38 | % | ||||||
Net assets end of period (000’s) omitted | $89 | $11 | ||||||||
|
|
| 57 |
Table of Contents
AMG GW&K Small/Mid Cap Fund Financial Highlights For a share outstanding throughout each fiscal period |
| For the fiscal years ended December 31, | For the fiscal period ended December 31, | |||||||||||||||||||||
| Class I | 2018 | 2017 | 201610 | 201511 | ||||||||||||||||||
Net Asset Value, Beginning of Period | $11.15 | $9.80 | $8.95 | $10.00 | ||||||||||||||||||
Income (loss) from Investment Operations: | ||||||||||||||||||||||
Net investment income (loss)2,3 | 0.01 | 0.03 | 4 | (0.03 | ) | (0.02 | ) | |||||||||||||||
Net realized and unrealized gain (loss) on investments | (0.92 | ) | 1.48 | 0.89 | (1.03 | ) | ||||||||||||||||
Total income (loss) from investment operations | (0.91 | ) | 1.51 | 0.86 | (1.05 | ) | ||||||||||||||||
Less Distributions to Shareholders from: | ||||||||||||||||||||||
Net investment income | (0.01 | ) | (0.01 | ) | (0.01 | ) | — | |||||||||||||||
Net realized gain on investments | (0.24 | ) | (0.15 | ) | — | — | ||||||||||||||||
Total distributions to shareholders | (0.25 | ) | (0.16 | ) | (0.01 | ) | — | |||||||||||||||
Net Asset Value, End of Period | $9.99 | $11.15 | $9.80 | $8.95 | ||||||||||||||||||
Total Return3 | (8.15 | )%5 | 15.44 | %5 | 9.55 | % | (10.50 | )%5,6 | ||||||||||||||
Ratio of net expenses to average net assets7 | 0.94 | % | 0.94 | % | 0.95 | % | 0.95 | %8 | ||||||||||||||
Ratio of gross expenses to average net assets9 | 1.01 | % | 1.62 | % | 4.60 | % | 11.39 | %8 | ||||||||||||||
Ratio of net investment income (loss) to average net assets3 | 0.06 | % | 0.26 | % | (0.38 | )% | (0.39 | )%8 | ||||||||||||||
Portfolio turnover | 53 | % | 38 | % | 48 | % | 41 | %6 | ||||||||||||||
Net assets end of period (000’s) omitted | $54,376 | $24,266 | $2 | $1 | ||||||||||||||||||
| 58 |
Table of Contents
AMG GW&K Small/Mid Cap Fund Financial Highlights For a share outstanding throughout each fiscal period |
| For the fiscal year ended December 31, | For the fiscal period ended December 31, | |||||||||
| Class Z | 2018 | 20171 | ||||||||
Net Asset Value, Beginning of Period | $11.15 | $10.35 | ||||||||
Income (loss) from Investment Operations: | ||||||||||
Net investment income2,3 | 0.02 | 0.03 | 4 | |||||||
Net realized and unrealized gain (loss) on investments | (0.91 | ) | 0.94 | |||||||
Total income (loss) from investment operations | (0.89 | ) | 0.97 | |||||||
Less Distributions to Shareholders from: | ||||||||||
Net investment income | (0.02 | ) | (0.02 | ) | ||||||
Net realized gain on investments | (0.24 | ) | (0.15 | ) | ||||||
Total distributions to shareholders | (0.26 | ) | (0.17 | ) | ||||||
Net Asset Value, End of Period | $10.00 | $11.15 | ||||||||
| Total Return3,5 | (7.98 | )% | 9.34 | %6 | ||||||
Ratio of net expenses to average net assets7 | 0.84 | % | 0.85 | %8 | ||||||
Ratio of gross expenses to average net assets9 | 0.91 | % | 1.46 | %8 | ||||||
Ratio of net investment income to average net assets3 | 0.16 | % | 0.37 | %8 | ||||||
Portfolio turnover | 53 | % | 38 | % | ||||||
Net assets end of period (000’s) omitted | $65,375 | $6,980 | ||||||||
|
|
| 1 | Commencement of operations was on February 27, 2017. |
| 2 | Per share numbers have been calculated using average shares. |
| 3 | Total returns and net investment income would have been lower had certain expenses not been offset. |
| 4 | Includesnon-recurring dividends. Without these dividends, net investment income per class would have been $(0.01), $0.00, and $0.01 for Class N, Class I and Class Z, respectively. |
| 5 | The total return is calculated using the published Net Asset Value as of fiscal year end. |
| 6 | Not annualized. |
| 7 | Includes reduction from broker recapture amounting to 0.01% for the fiscal year ended 2018, and less than 0.01% for the fiscal year ended 2017. |
| 8 | Annualized. |
| 9 | Excludes the impact of expense reimbursement or fee waivers and expense reductions such as brokerage credits, but includes expense repayments andnon-reimbursable expenses, if any, such as interest, taxes, and extraordinary expenses. (See Note 1(c) and 2 in the Notes to Financial Statements.) |
| 10 | Effective October 1, 2016, Institutional Class was renamed Class I. |
| 11 | Commencement of operations was on June 30, 2015. |
| 59 |
Table of Contents
1. SUMMARY OF SIGNIFICANT ACCOUNTING POLICIES
AMG Funds and AMG Funds II (the “Trusts”) areopen-end management investment companies, organized as Massachusetts business trusts, and registered under the Investment Company Act of 1940, as amended (the “1940 Act”). Currently, the Trusts consist of a number of different funds, each having distinct investment management objectives, strategies, risks, and policies. Included in this report are AMG Funds: AMG GW&K Municipal Bond Fund (“Municipal Bond”), AMG GW&K Municipal Enhanced Yield Fund (“Municipal Enhanced”), AMG GW&K Small Cap Core Fund (“Small Cap Core”) and AMG GW&K Small/Mid Cap Fund (“Small/Mid Cap”) and AMG Funds II: AMG GW&K Enhanced Core Bond Fund (“Enhanced Core Bond”), each a “Fund” and collectively, the “Funds.”
Each Fund offers different classes of shares, which, effective February 27, 2017, were renamed. Enhanced Core Bond, Municipal Bond, Municipal Enhanced and Small Cap Core offer Class N, Class S and Class I shares. Enhanced Core Bond Class I shares were renamed Class Z and Class S shares were renamed Class I; Municipal Enhanced and Small Cap Core added Class Z shares and Small/Mid Cap added Class N and Class Z shares. Effective June 23, 2017, Municipal Bond, Municipal Enhanced and Small Cap Core Class S shares were converted to Class I shares. Additionally, Enhanced Core Bond offers Class C shares. Each class represents an interest in the same assets of the respective Fund. Although all share classes generally have identical voting rights, each share class votes separately when required by law. Different share classes may have different net asset values per share to the extent the share classes pay different distribution amounts and/or the expenses of such share classes differ. Each share class has its own expense structure. Please refer to a current prospectus for additional information on each share class.
Effective February 27, 2017, the Small/Mid Cap Principal Investment Strategies changed from a small cap growth investment strategy to one that primarily invests in common stock and preferred stock of U.S. small- andmid-capitalization companies with either growth- or value- oriented characteristics.
Class C shares of Enhanced Core Bond were closed to all new investors and will no longer be available for purchase by existing shareholders. Shareholders who redeem Class C shares of the Fund will not be subject to the deferred sales charges because they have been closed for longer than one year as described in the prospectus. Small Cap Core was closed to new investors. Please refer to Enhanced Core Bond’s and Small Cap Core’s current prospectus for additional information.
The Funds’ financial statements are prepared in accordance with accounting principles generally accepted in the United States of America (“U.S. GAAP”), including accounting and reporting guidance pursuant to Accounting Standards Codification Topic 946 applicable to investment companies. U.S. GAAP requires management to make estimates and assumptions that affect the reported amounts of assets and liabilities and disclosure of contingent assets and liabilities at the date of the financial statements and the reported amounts of income and expenses during the reporting period. Actual results could differ from those estimates and such differences could be material. The following is a summary of significant accounting policies followed by the Funds in the preparation of their financial statements:
a. VALUATION OF INVESTMENTS
Equity securities traded on a national securities exchange or reported on the NASDAQ national market system (“NMS”) are valued at the last quoted sales price
on the primary exchange or, if applicable, the NASDAQ official closing price or the official closing price of the relevant exchange or, lacking any sales, at the last quoted bid price or the mean between the last quoted bid and ask prices (the “exchange mean price”). Equity securities traded in theover-the-counter market (other than NMS securities) are valued at the exchange mean price. Foreign equity securities (securities principally traded in markets other than U.S. markets) are valued at the official closing price on the primary exchange or, for markets that either do not offer an official closing price or where the official closing price may not be representative of the overall market, the last quoted sale price.
Fixed income securities purchased with a remaining maturity exceeding 60 days are valued at the evaluated bid price or the mean price provided by an authorized pricing service or, if an evaluated price is not available, by reference to other securities which are considered comparable in credit rating, interest rate, due date and other features (generally referred to as “matrix pricing”) or other similar pricing methodologies. Investments in certain mortgage-backed and stripped mortgage-backed securities, preferred stocks, convertible securities, derivatives and other debt securities not traded on an organized securities market are valued on the basis of valuations provided by dealers or by a pricing service which uses information with respect to transactions in such securities and various relationships between such securities and yield to maturity in determining value.
Fixed income securities purchased with a remaining maturity of 60 days or less are valued at amortized cost, provided that the amortized cost value is approximately the same as the fair value of the security valued without the use of amortized cost. Investments in otheropen-end regulated investment companies are valued at their end of day net asset value per share.
The Funds’ portfolio investments are generally valued based on independent market quotations or prices or, if none, “evaluative” or other market based valuations provided by third party pricing services approved by the Board of Trustees of the Trust (the “Board”). Under certain circumstances, the value of certain Fund portfolio investments may be based on an evaluation of fair value, pursuant to procedures established by and under the general supervision of the Board. The Valuation Committee, which is comprised of the Independent Trustees of the Board, and the Pricing Committee, which is comprised of representatives from AMG Funds LLC (the “Investment Manager”) are the committees appointed by the Board to make fair value determinations. Each Fund may use the fair value of a portfolio investment to calculate its net asset value (“NAV”) in the event that the market quotation, price or market based valuation for the portfolio investment is not readily available or otherwise not determinable pursuant to the Board’s valuation procedures, if the Investment Manager or the Pricing Committee believes the quotation, price or market based valuation to be unreliable, or in certain other circumstances. When determining the fair value of an investment, the Pricing Committee and, if required under the Trusts’ securities valuation procedures, the Valuation Committee, seeks to determine the price that the Fund might reasonably expect to receive from current sale of that portfolio investment in an arms-length transaction. Fair value determinations shall be based upon consideration of all available facts and information, including, but not limited to (i) attributes specific to the investment; (ii) fundamental and analytical data relating to the investment; and (iii) the value of other comparable securities or relevant financial instruments, including derivative securities, traded on other markets or among dealers.
The values assigned to fair value portfolio investments are based on available information and do not necessarily represent amounts that might ultimately be realized in the future, since such amounts depend on future developments inherent in long-term investments. Because of the inherent uncertainty of valuation, those estimated values may differ significantly from the values that
| 60 |
Table of Contents
would have been used had a ready market for the investments existed, and the differences could be material. The Board will be presented with a quarterly report showing as of the most recent quarter end, all outstanding securities fair valued by the Funds, including a comparison with the prior quarter end and the percentage of the Funds that the security represents at each quarter end.
With respect to foreign equity securities and certain foreign fixed income securities, the Board has adopted a policy that securities held in a Fund that can be fair valued by the applicable fair value pricing service are fair valued on each business day provided that each individual price exceeds apre-established confidence level.
U.S. GAAP defines fair value as the price that a fund would receive to sell an asset or pay to transfer a liability in an orderly transaction between market participants at the measurement date. U.S. GAAP also establishes a framework for measuring fair value, and a three level hierarchy for fair value measurements based upon the transparency of inputs to the valuation of an asset or liability. Inputs may be observable or unobservable and refer broadly to the assumptions that market participants would use in pricing the asset or liability. Observable inputs reflect the assumptions market participants would use in pricing the asset or liability based on market data obtained from sources independent of the Funds. Unobservable inputs reflect the Funds’ own assumptions about the assumptions that market participants would use in pricing the asset or liability developed based on the best information available in the circumstances. Each investment is assigned a level based upon the observability of the inputs which are significant to the overall valuation.
The three-tier hierarchy of inputs is summarized below:
Level 1 – inputs are quoted prices in active markets for identical investments (e.g., equity securities,open-end investment companies)
Level 2 – other observable inputs (including, but not limited to: quoted prices for similar assets or liabilities in markets that are active, quoted prices for identical or similar assets or liabilities in markets that are not active, inputs other than quoted prices that are observable for the assets or liabilities (such as interest rates, yield curves, volatilities, prepayment speeds, loss severities, credit risks and default rates) or other market corroborated inputs) (e.g., debt securities, government securities, foreign currency exchange contracts, swaps, foreign securities utilizing international fair value pricing, fair valued securities with observable inputs)
Level 3 – inputs are significant unobservable inputs (including the Fund’s own assumptions used to determine the fair value of investments) (e.g., fair valued securities with unobservable inputs)
Changes in inputs or methodologies used for valuing investments may result in a transfer in or out of levels within the fair value hierarchy. The inputs or methodologies used for valuing investments may not necessarily be an indication of the risk associated with investing in those investments.
b. SECURITY TRANSACTIONS
Security transactions are accounted for as of trade date. Realized gains and losses on securities sold are determined on the basis of identified cost.
c. INVESTMENT INCOME AND EXPENSES
Dividend income is recorded on theex-dividend date. Interest income, which includes amortization of premium and accretion of discount on debt securities, is accrued as earned. Dividend and interest income on foreign securities is recorded
gross of any withholding tax.Non-cash dividends included in dividend income, if any, are reported at the fair market value of the securities received. Upon notification from issuers, distributions received from a real estate investment trust (“REIT”) may be redesignated as a reduction of cost of investments and/or realized gain. Other income and expenses are recorded on an accrual basis. Expenses that cannot be directly attributed to a Fund are apportioned among the funds in the Trusts and other trusts within the AMG Funds family of mutual funds (collectively the “AMG Funds Family”) based upon their relative average net assets or number of shareholders. Investment income, realized and unrealized capital gains and losses, the common expenses of each Fund, and certain fund level expense reductions, if any, are allocated on apro-rata basis to each class based on the relative net assets of each class to the total net assets of each Fund.
Small Cap Core and Small/Mid Cap had certain portfolio trades directed to various brokers under a brokerage recapture program. Credits received from the brokerage recapture program are earned and paid on a monthly basis, and are recorded as expense offsets, which serve to reduce the Fund’s overall expense ratio. For the fiscal year ended December 31, 2018, the impact on the expense and expense ratios, if any, for Small Cap Core was $19,969, or less than 0.005%, and Small/Mid Cap was $12,676, or 0.01%.
d. DIVIDENDS AND DISTRIBUTIONS
Fund distributions resulting from either net investment income or realized net capital gains, if any, will normally be declared and paid at least annually in December. Distributions to shareholders are recorded on theex-dividend date. Distributions are determined in accordance with federal income tax regulations, which may differ from net investment income and net realized capital gains for financial statement purposes (U.S. GAAP). Differences may be permanent or temporary. Permanent differences are reclassified among capital accounts in the financial statements to reflect their tax character. Permanent book and tax basis differences, if any, relating to shareholder distributions will result in reclassifications topaid-in capital. Temporary differences arise when certain items of income, expense and gain or loss are recognized in different periods for financial statement and tax purposes; these differences will reverse at some time in the future. Permanent differences are primarily due to current year redesignation of dividends paid by the fund and return of capital. Temporary differences are primarily due to differences between book and tax treatment of losses for excise tax purposes and wash sales.
The distributions disclosed on the Statements of Changes in Net Assets for the fiscal year ended December 31, 2017 were from the following sources:
| Fund | Net Investment Income | Realized Gain on Investments | ||||||
Enhanced Core Bond
|
| |||||||
Class N | $365,057 | — | ||||||
Class I | 449,908 | — | ||||||
Class C | 86,218 | — | ||||||
Class Z | 563,837 | — | ||||||
|
|
|
| |||||
Total | $1,465,020 | — | ||||||
|
|
|
| |||||
| 61 |
Table of Contents
Notes to Financial Statements(continued) |
Fund
| Net Investment
| Realized Gain on
| ||||||
Municipal Bond
| ||||||||
Class N | $424,272 | $28,908 | ||||||
Class S | 1,030,308 | — | ||||||
Class I | 14,934,133 | 1,027,689 | ||||||
|
|
|
| |||||
Total | $16,388,713 | $1,056,597 | ||||||
|
|
|
| |||||
Municipal Enhanced
| ||||||||
Class N | $234,480 | — | ||||||
Class S | 193,559 | — | ||||||
Class I | 6,539,305 | — | ||||||
Class Z | 2,693 | — | ||||||
|
|
|
| |||||
Total | $6,970,037 | — | ||||||
|
|
|
| |||||
Fund
| Net Investment
| Realized Gain on
| ||||||
Small Cap Core
| ||||||||
Class N | — | $1,290,786 | ||||||
Class I | $817,532 | 20,845,694 | ||||||
Class Z | 263,165 | 5,500,223 | ||||||
|
|
|
| |||||
Total | $1,080,697 | $27,636,703 | ||||||
|
|
|
| |||||
Small/Mid Cap
| ||||||||
Class N | — | $144 | ||||||
Class I | $26,217 | 294,502 | ||||||
Class Z | 10,595 | 92,029 | ||||||
|
|
|
| |||||
Total | $36,812 | $386,675 | ||||||
|
|
|
| |||||
The tax character of distributions paid during the fiscal years ended December 31, 2018 and December 31, 2017 were as follows:
| Enhanced Core Bond | Municipal Bond | Municipal Enhanced | ||||||||||||||||||||||
Distributions paid from:
| 2018 | 2017 | 2018 | 2017 | 2018 | 2017 | ||||||||||||||||||
Ordinary income | $1,047,632 | $1,465,020 | $153,142 | $155,501 | $56,855 | $54,499 | ||||||||||||||||||
Tax-exempt income | — | — | 19,200,002 | 16,185,749 | 6,796,351 | 6,915,538 | ||||||||||||||||||
Short-term capital gains | — | — | — | — | — | — | ||||||||||||||||||
Long-term capital gains | — | — | 310,654 | 1,104,060 | — | — | ||||||||||||||||||
Paid-in capital | — | — | — | — | 5,166,870 | — | ||||||||||||||||||
|
|
|
|
|
|
|
|
|
|
|
| |||||||||||||
| $1,047,632 | $1,465,020 | $19,663,798 | $17,445,310 | $12,020,076 | $6,970,037 | |||||||||||||||||||
|
|
|
|
|
|
|
|
|
|
|
| |||||||||||||
| Small Cap Core | Small/Mid Cap | |||||||||||||||||||||||
Distributions paid from:
| 2018 | 2017 | 2018 | 2017 | ||||||||||||||||||||
Ordinary income | $1,050,912 | $1,075,896 | $152,361 | $36,742 | ||||||||||||||||||||
Short-term capital gains | 1,716,078 | 823,117 | 2,222,595 | 261,774 | ||||||||||||||||||||
Long-term capital gains | 51,977,905 | 26,818,387 | 507,566 | 124,971 | ||||||||||||||||||||
Paid-in capital | — | — | — | — | ||||||||||||||||||||
|
|
|
|
|
|
|
| |||||||||||||||||
| $54,744,895 | $28,717,400 | $2,882,522 | $423,487 | |||||||||||||||||||||
|
|
|
|
|
|
|
| |||||||||||||||||
As of December 31, 2018, the components of distributable earnings (excluding unrealized appreciation/depreciation) on a tax basis consisted of:
| Enhanced Core Bond | Municipal Bond | Municipal Enhanced | Small Cap Core | Small/Mid Cap | ||||||||||||||||
Capital loss carryforward | $4,683,033 | $5,814,712 | $304,591 | — | — | |||||||||||||||
Undistributed ordinary income | 7,118 | — | — | $54,343 | — | |||||||||||||||
Undistributed short-term capital gains | — | — | — | — | — | |||||||||||||||
Undistributed long-term capital gains | — | — | — | 10,927,368 | $239,125 | |||||||||||||||
Late-year loss deferral | — | — | — | 1,834,452 | 83,145 | |||||||||||||||
| 62 |
Table of Contents
Notes to Financial Statements(continued) |
At December 31, 2018, the cost of investments and the aggregate gross unrealized appreciation and depreciation for federal income tax purposes were as follows:
Fund
| Cost
| Appreciation
| Depreciation
| Net
| ||||||||||||
Enhanced Core Bond | $37,358,335 | $26,089 | $(1,219,601 | ) | $(1,193,512 | ) | ||||||||||
Municipal Bond | 965,780,937 | 7,208,593 | (8,218,400 | ) | (1,009,807 | ) | ||||||||||
Municipal Enhanced | 208,913,794 | 2,501,092 | (2,099,254 | ) | 401,838 | |||||||||||
Small Cap Core | 425,888,467 | 68,454,742 | (65,318,759 | ) | 3,135,983 | |||||||||||
Small/Mid Cap | 135,349,856 | 5,701,424 | (22,082,999 | ) | (16,381,575 | ) | ||||||||||
e. FEDERAL TAXES
Each Fund currently qualifies as an investment company and intends to comply with the requirements under Subchapter M of the Internal Revenue Code of 1986, as amended, and to distribute substantially all of its taxable income and gains to its shareholders and to meet certain diversification and income requirements with respect to investment companies. Therefore, no provision for federal income or excise tax is included in the accompanying financial statements.
Additionally, based on each Fund’s understanding of the tax rules and rates related to income, gains and transactions for the foreign jurisdictions in which it invests, each Fund will provide for foreign taxes, and where appropriate, deferred foreign taxes.
Management has analyzed the Funds’ tax positions taken on federal income tax returns as of December 31, 2018, and for all open tax years (generally, the three prior taxable years), and has concluded that no provision for federal income tax is required in the Funds’ financial statements. Additionally, Management is not aware of any tax position for which it is reasonably possible that the total amounts of unrecognized tax benefits will change materially in the next twelve months.
Net capital losses incurred may be carried forward for an unlimited time period, and retain their tax character as either short-term or long-term capital losses.
f. CAPITAL LOSS CARRYOVERS AND DEFERRALS
As of December 31, 2018, the following Funds had accumulated net realized capital loss carryovers from securities transactions for federal income tax purposes as
shown in the following chart. These amounts may be used to offset future realized capital gains, if any, for an unlimited time period.
| Capital Loss Carryover Amounts | ||||||||||||
| Fund | Short-Term | Long-Term | Total | |||||||||
Enhanced Core Bond | $1,685,519 | $2,997,514 | $4,683,033 | |||||||||
Municipal Bond | 719,813 | 5,094,899 | 5,814,712 | |||||||||
Municipal Enhanced | 304,591 | — | 304,591 | |||||||||
As of December 31, 2018, Small Cap Core and Small/Mid Cap had no accumulated net realized capital loss carryovers from securities transactions for federal income tax purposes. Should the Funds incur net capital losses for the year ending December 31, 2019, such amounts may be used to offset future realized capital gains, for an unlimited time period.
g. CAPITAL STOCK
The Trusts’ Declaration of Trust authorizes for each Fund the issuance of an unlimited number of shares of beneficial interest, without par value. Each Fund records sales and repurchases of its capital stock on the trade date.
| 63 |
Table of Contents
Notes to Financial Statements(continued) |
For the fiscal years ended December 31, 2018 and December 31, 2017, the capital stock transactions by class for the Funds were as follows:
| Enhanced Core Bond | Municipal Bond | |||||||||||||||||||||||||||||||
December 31, 2018 | December 31, 2017 | December 31, 2018 | December 31, 2017 | |||||||||||||||||||||||||||||
Shares | Amount | Shares | Amount | Shares | Amount | Shares | Amount | |||||||||||||||||||||||||
Class N:
| ||||||||||||||||||||||||||||||||
Proceeds from sale of shares | 424,957 | $4,049,618 | 545,254 | $5,338,004 | 1,361,049 | $15,628,138 | 1,383,931 | $15,924,408 | ||||||||||||||||||||||||
Reinvestment of distributions | 27,223 | 258,273 | 25,331 | 247,785 | 29,687 | 336,857 | 37,952 | 438,882 | ||||||||||||||||||||||||
Cost of shares repurchased | (719,736 | ) | (6,838,184 | ) | (604,413 | ) | (5,915,824 | ) | (2,415,317 | ) | (27,584,411 | ) | (1,667,771 | ) | (19,328,676 | ) | ||||||||||||||||
|
|
|
|
|
|
|
|
|
|
|
|
|
|
|
|
|
|
|
|
|
|
|
| |||||||||
Net decrease | (267,556 | ) | $(2,530,293 | ) | (33,828 | ) | $(330,035 | ) | (1,024,581 | ) | $(11,619,416 | ) | (245,888 | ) | $(2,965,386 | ) | ||||||||||||||||
|
|
|
|
|
|
|
|
|
|
|
|
|
|
|
|
|
|
|
|
|
|
|
| |||||||||
Class S:
| ||||||||||||||||||||||||||||||||
Proceeds from sale of shares | — | — | — | — | — | — | 3,078,878 | $35,271,698 | ||||||||||||||||||||||||
Reinvestment of distributions | — | — | — | — | — | — | 53,728 | 615,132 | ||||||||||||||||||||||||
Cost of shares repurchased | — | — | — | — | — | — | (3,952,625 | ) | (45,334,584 | ) | ||||||||||||||||||||||
Share Conversion | — | — | — | — | — | — | (13,649,760 | ) | (160,111,684 | ) | ||||||||||||||||||||||
|
|
|
|
|
|
|
|
|
|
|
|
|
|
|
|
|
|
|
|
|
|
|
| |||||||||
Net decrease | — | — | — | — | — | — | (14,469,779 | ) | $(169,559,438 | ) | ||||||||||||||||||||||
|
|
|
|
|
|
|
|
|
|
|
|
|
|
|
|
|
|
|
|
|
|
|
| |||||||||
Class I:
| ||||||||||||||||||||||||||||||||
Proceeds from sale of shares | 380,957 | $3,660,749 | 499,155 | $4,874,509 | 34,143,663 | $390,076,652 | 34,230,051 | $396,585,461 | ||||||||||||||||||||||||
Reinvestment of distributions | 12,169 | 115,703 | 44,098 | 430,918 | 1,241,970 | 14,166,368 | 1,264,901 | 14,708,302 | ||||||||||||||||||||||||
Cost of shares repurchased | (459,754 | ) | (4,456,226 | ) | (3,757,375 | ) | (36,918,527 | ) | (43,525,772 | ) | (496,040,763 | ) | (23,820,377 | ) | (275,914,801 | ) | ||||||||||||||||
Share Conversion | — | — | — | — | — | — | 13,603,372 | 160,111,684 | ||||||||||||||||||||||||
|
|
|
|
|
|
|
|
|
|
|
|
|
|
|
|
|
|
|
|
|
|
|
| |||||||||
Net increase (decrease) | (66,628 | ) | $(679,774 | ) | (3,214,122 | ) | $(31,613,100 | ) | (8,140,139 | ) | $(91,797,743 | ) | 25,277,947 | $295,490,646 | ||||||||||||||||||
|
|
|
|
|
|
|
|
|
|
|
|
|
|
|
|
|
|
|
|
|
|
|
| |||||||||
Class C:
| ||||||||||||||||||||||||||||||||
Proceeds from sale of shares | 498 | $4,748 | 1,278 | $12,466 | — | — | — | — | ||||||||||||||||||||||||
Reinvestment of distributions | 4,736 | 44,928 | 6,466 | 63,151 | — | — | — | — | ||||||||||||||||||||||||
Cost of shares repurchased | (229,466 | ) | (2,178,365 | ) | (354,502 | ) | (3,456,425 | ) | — | — | — | — | ||||||||||||||||||||
|
|
|
|
|
|
|
|
|
|
|
|
|
|
|
|
|
|
|
|
|
|
|
| |||||||||
Net decrease | (224,232 | ) | $(2,128,689 | ) | (346,758 | ) | $(3,380,808 | ) | — | — | — | — | ||||||||||||||||||||
|
|
|
|
|
|
|
|
|
|
|
|
|
|
|
|
|
|
|
|
|
|
|
| |||||||||
Class Z:
| ||||||||||||||||||||||||||||||||
Proceeds from sale of shares | 112,597 | $1,079,678 | 420,620 | $4,105,961 | — | — | — | — | ||||||||||||||||||||||||
Reinvestment of distributions | 32,270 | 307,362 | 55,590 | 545,034 | — | — | — | — | ||||||||||||||||||||||||
Cost of shares repurchased | (693,811 | ) | (6,622,050 | ) | (3,611,083 | ) | (35,134,500 | ) | — | — | — | — | ||||||||||||||||||||
|
|
|
|
|
|
|
|
|
|
|
|
|
|
|
|
|
|
|
|
|
|
|
| |||||||||
Net decrease | (548,944 | ) | $(5,235,010 | ) | (3,134,873 | ) | $(30,483,505 | ) | — | — | — | — | ||||||||||||||||||||
|
|
|
|
|
|
|
|
|
|
|
|
|
|
|
|
|
|
|
|
|
|
|
| |||||||||
| 64 |
Table of Contents
Notes to Financial Statements(continued) |
| Municipal Enhanced | Small Cap Core | |||||||||||||||||||||||||||||||
December 31, 2018 | December 31, 2017 | December 31, 2018 | December 31, 2017 | |||||||||||||||||||||||||||||
Shares | Amount | Shares | Amount | Shares | Amount | Shares | Amount | |||||||||||||||||||||||||
Class N:
| ||||||||||||||||||||||||||||||||
Proceeds from sale of shares | 503,883 | $4,895,415 | 854,262 | $8,245,287 | 118,455 | $3,333,417 | 164,219 | $4,353,577 | ||||||||||||||||||||||||
Reinvestment of distributions | 12,650 | 123,277 | 24,014 | 234,148 | 74,956 | 1,556,082 | 43,445 | 1,224,282 | ||||||||||||||||||||||||
Cost of shares repurchased | (646,210 | ) | (6,320,716 | ) | (441,848 | ) | (4,333,836 | ) | (482,775 | ) | (13,686,615 | ) | (771,984 | ) | (20,688,735 | ) | ||||||||||||||||
|
|
|
|
|
|
|
|
|
|
|
|
|
|
|
|
|
|
|
|
|
|
|
| |||||||||
Net increase (decrease) | (129,677 | ) | $(1,302,024 | ) | 436,428 | $4,145,599 | (289,364 | ) | $(8,797,116 | ) | (564,320 | ) | $(15,110,876 | ) | ||||||||||||||||||
|
|
|
|
|
|
|
|
|
|
|
|
|
|
|
|
|
|
|
|
|
|
|
| |||||||||
Class S:
| ||||||||||||||||||||||||||||||||
Proceeds from sale of shares | — | — | 319,509 | $3,059,584 | — | — | 14,465 | $373,459 | ||||||||||||||||||||||||
Reinvestment of distributions | — | — | 20,245 | 193,539 | — | — | — | — | ||||||||||||||||||||||||
Cost of shares repurchased | — | — | (891,675 | ) | (8,586,630 | ) | — | — | (67,690 | ) | (1,761,714 | ) | ||||||||||||||||||||
Share Conversion | — | — | (1,192,488 | ) | (11,722,161 | ) | — | — | (660,652 | ) | (17,976,373 | ) | ||||||||||||||||||||
|
|
|
|
|
|
|
|
|
|
|
|
|
|
|
|
|
|
|
|
|
|
|
| |||||||||
Net decrease | — | — | (1,744,409 | ) | $(17,055,668 | ) | — | — | (713,877 | ) | $(19,364,628 | ) | ||||||||||||||||||||
|
|
|
|
|
|
|
|
|
|
|
|
|
|
|
|
|
|
|
|
|
|
|
| |||||||||
Class I:
| ||||||||||||||||||||||||||||||||
Proceeds from sale of shares | 3,422,201 | $33,378,454 | 5,135,104 | $49,798,634 | 3,424,698 | $99,405,234 | 4,400,525 | $118,884,418 | ||||||||||||||||||||||||
Reinvestment of distributions | 618,327 | 5,929,747 | 334,730 | 3,259,308 | 1,913,334 | 40,371,352 | 708,864 | 20,238,054 | ||||||||||||||||||||||||
Cost of shares repurchased | (5,104,631 | ) | (49,821,867 | ) | (4,794,481 | ) | (46,538,170 | ) | (4,967,816 | ) | (125,593,850 | ) | (6,389,413 | ) | (183,987,173 | ) | ||||||||||||||||
Share Conversion | — | — | 1,194,920 | 11,722,161 | — | — | 658,716 | 17,976,373 | ||||||||||||||||||||||||
|
|
|
|
|
|
|
|
|
|
|
|
|
|
|
|
|
|
|
|
|
|
|
| |||||||||
Net increase (decrease) | (1,064,103 | ) | $(10,513,666 | ) | 1,870,273 | $18,241,933 | 370,216 | $14,182,736 | (621,308 | ) | $(26,888,328 | ) | ||||||||||||||||||||
|
|
|
|
|
|
|
|
|
|
|
|
|
|
|
|
|
|
|
|
|
|
|
| |||||||||
Class Z:1
| ||||||||||||||||||||||||||||||||
Proceeds from sale of shares | — | — | 10,535 | $100,000 | 428,733 | $11,243,997 | 4,253,757 | $125,555,645 | ||||||||||||||||||||||||
Reinvestment of distributions | 642 | $6,158 | 275 | 2,693 | 487,274 | 10,281,472 | 201,870 | 5,763,389 | ||||||||||||||||||||||||
Cost of shares repurchased | — | — | — | — | (740,347 | ) | (21,529,269 | ) | (654,016 | ) | (18,938,119 | ) | ||||||||||||||||||||
|
|
|
|
|
|
|
|
|
|
|
|
|
|
|
|
|
|
|
|
|
|
|
| |||||||||
Net increase (decrease) | 642 | $6,158 | 10,810 | $102,693 | 175,660 | $(3,800 | ) | 3,801,611 | $112,380,915 | |||||||||||||||||||||||
|
|
|
|
|
|
|
|
|
|
|
|
|
|
|
|
|
|
|
|
|
|
|
| |||||||||
| 65 |
Table of Contents
Notes to Financial Statements(continued) |
| Small/Mid Cap | ||||||||||||||||
| December 31, 2018 | December 31, 2017 | |||||||||||||||
| Shares | Amount | Shares | Amount | |||||||||||||
Class N:1
| ||||||||||||||||
Proceeds from sale of shares | 7,686 | $90,000 | 966 | $10,000 | ||||||||||||
Reinvestment of distributions | 209 | 2,061 | 13 | 144 | ||||||||||||
|
|
|
|
|
|
|
| |||||||||
Net increase | 7,895 | $92,061 | 979 | $10,144 | ||||||||||||
|
|
|
|
|
|
|
| |||||||||
Class I:
| ||||||||||||||||
Proceeds from sale of shares | 4,362,093 | $49,100,133 | 1,961,796 | $20,991,750 | ||||||||||||
Reinvestment of distributions | 123,071 | 1,215,947 | 28,697 | 320,262 | ||||||||||||
Cost of shares repurchased | (1,221,254) | (13,093,212) | (41,659) | (452,348) | ||||||||||||
|
|
|
|
|
|
|
| |||||||||
Net increase | 3,263,910 | $37,222,868 | 1,948,834 | $20,859,664 | ||||||||||||
|
|
|
|
|
|
|
| |||||||||
Class Z:1
| ||||||||||||||||
Proceeds from sale of shares | 8,619,193 | $100,520,967 | 618,470 | $6,484,063 | ||||||||||||
Reinvestment of distributions | 165,413 | 1,634,280 | 9,195 | 102,624 | ||||||||||||
Cost of shares repurchased | (2,873,377) | (32,900,674) | (1,865) | (19,522) | ||||||||||||
|
|
|
|
|
|
|
| |||||||||
Net increase | 5,911,229 | $69,254,573 | 625,800 | $6,567,165 | ||||||||||||
|
|
|
|
|
|
|
| |||||||||
1 Commencement of operations was February 27, 2017.
h. REPURCHASE AGREEMENTS AND JOINT REPURCHASE AGREEMENTS
The Funds may enter into third-party repurchase agreements for temporary cash management purposes and third-party or bilateral joint repurchase agreements for reinvestment of cash collateral on securities lending transactions under the securities lending program offered by The Bank of New York Mellon (“BNYM”) (the “Program”) (collectively, “Repurchase Agreements”). The value of the underlying collateral, including accrued interest, must equal or exceed the value of the Repurchase Agreements during the term of the agreement. For joint repurchase agreements, the Funds participate on a pro rata basis with other clients of BNYM in its share of the underlying collateral under such joint repurchase agreements and in its share of proceeds from any repurchase or other disposition of the underlying collateral. The underlying collateral for all Repurchase Agreements is held in safekeeping by the Funds’ custodian or at the Federal Reserve Bank. If the seller defaults and the value of the collateral declines, or if bankruptcy proceedings commence with respect to the seller of the security, realization of the collateral by the Funds may be delayed or limited. Pursuant to the Program, the Funds are indemnified for such losses by BNYM on joint repurchase agreements.
At December 31, 2018, the market value of Repurchase Agreements outstanding for Enhanced Core, Small Cap Core and Small/Mid Cap were $12,571, $13,271,539 and $1,954,193, respectively.
i. DELAYED DELIVERY TRANSACTIONS AND WHEN-ISSUED SECURITIES
The Funds may enter into securities transactions on a delayed delivery or when issued basis. Payment and delivery may take place after the customary settlement period for that security. The price of the underlying securities and the date when the securities will be delivered and paid for are fixed at the time the transaction is
negotiated. During the time a delayed delivery sell is outstanding, the contract is marked to market daily and equivalent deliverable securities are held for the transaction. The value of the securities purchased on a delayed delivery or when-issued basis are identified as such in the Fund’s Schedules of Portfolio Investments. With respect to purchase commitments, the Fund identifies securities as segregated in its records with a value at least equal to the amount of the commitment. Losses may arise due to changes in the value of the underlying securities or if the counterparty does not perform under the contract, or if the issuer does not issue the securities due to political, economic, or other factors.
2. AGREEMENTS AND TRANSACTIONS WITH AFFILIATES
For each of the Funds, the Trusts have entered into an investment advisory agreement under which the Investment Manager, a subsidiary and the U.S. retail distribution arm of Affiliated Managers Group, Inc. (“AMG”), serves as investment manager to the Funds and is responsible for the Funds’ overall administration and operations. The Investment Manager selects one or more subadvisers for the Funds (subject to Board approval) and monitors each subadviser’s investment performance, security holdings and investment strategies. Each Fund’s investment portfolio is managed by GW&K Investment Management, LLC, (“GW&K”) who serves pursuant to a subadvisory agreement with the Investment Manager. AMG indirectly owns a majority interest in GW&K.
Investment management fees are paid directly by the Funds to the Investment Manager based on average daily net assets. For the fiscal year ended December 31, 2018, the Funds’ investment management fees were paid at the following annual rate of each Fund’s respective average daily net assets:
| 66 |
Table of Contents
Notes to Financial Statements(continued) |
Enhanced Core Bond*
|
| 0.30%
|
| ||
Municipal Bond
| |||||
on first $25 million
|
| 0.35%
|
| ||
on next $25 million
| 0.30% | ||||
on next $50 million
|
| 0.25%
|
| ||
on balance over $100 million
| 0.20% | ||||
Municipal Enhanced*
|
| 0.45%
|
| ||
Small Cap Core*
| 0.70% | ||||
Small/Mid Cap*
|
| 0.65%
|
| ||
*Prior to February 27, 2017, the annual rate for the investment management fees were 0.45%, 0.50%, 0.75% and 0.75% of the average daily net assets for Enhanced Core Bond, Municipal Enhanced, Small Cap Core and Small/Mid Cap, respectively.
The Investment Manager has contractually agreed, through at least May 1, 2019, to waive management fees and/or reimburse fund expenses in order to limit total annual Fund operating expenses after fee waiver and expense reimbursements (exclusive of taxes, interest (including interest incurred in connection with bank and custody overdrafts), shareholder servicing fees, distribution and service(12b-1) fees, brokerage commissions and other transaction costs, acquired fund fees and expenses and extraordinary expenses) of Enhanced Core Bond, Municipal Bond, Municipal Enhanced, Small Cap Core and Small/Mid Cap to 0.48%, 0.34%, 0.59%, 0.90% and 0.85%, respectively, of each Fund’s average daily net assets subject to later reimbursement by the Funds in certain circumstances. Prior to February 27, 2017, the expense cap was 0.59%, 0.64%, 0.95% and 0.95% of the average daily net assets for Enhanced Core Bond, Municipal Enhanced, Small Cap Core and Small/Mid Cap, respectively. There was no change to the expense cap for Municipal Bond.
The contractual expense limitation may only be terminated in the event the Investment Manager or a successor ceases to be the investment manager of a Fund or a successor fund, by mutual agreement between the Investment Manager and the Board, or in the event of a Fund’s liquidation unless the Fund is reorganized or is a party to a merger in which the surviving entity is successor to the accounting and performance information of a Fund.
In general, for a period of up to 36 months, the Investment Manager may recover from each Fund fees waived and expenses paid pursuant to this contractual agreement, provided that such repayment would not cause the Fund’s total annual operating expenses after fee waiver and expense reimbursements (exclusive of the items noted in the parenthetical above) to exceed the contractual expense limitation amount.
At December 31, 2018, the Funds’ expiration of recoupment is as follows:
Expiration Period
| Enhanced Core Bond
| Municipal Bond
| ||||||
Less than 1 year
|
| $249,870
|
|
| $2,293,974
|
| ||
Within 2 years
|
| 185,809
|
|
| 703,359
|
| ||
Within 3 years
|
| 110,054
|
|
| 604,775
|
| ||
|
|
|
| |||||
Total Amount Subject to Recoupment | $545,733 | $3,602,108 | ||||||
|
|
|
| |||||
Expiration Period
| Municipal Enhanced
| Small Cap Core
| ||||||
Less than 1 year
|
| $222,096
|
|
| $314,503
|
| ||
Within 2 years
|
| 232,286
|
|
| 51,380
|
| ||
Within 3 years
| 186,327 | 3,686 | ||||||
|
|
|
| |||||
Total Amount Subject to Recoupment | $640,709 | $369,569 | ||||||
|
|
|
| |||||
Expiration Period
| Small/Mid Cap
| |||||||
Less than 1 year
|
| $57,742
|
| |||||
Within 2 years
|
| 85,512
|
| |||||
Within 3 years
| 67,647 | |||||||
|
| |||||||
Total Amount Subject to Recoupment |
| $210,901 | ||||||
|
| |||||||
The Trusts, on behalf of the Funds, have entered into an amended and restated Administration Agreement under which the Investment Manager serves as the Funds’ administrator (the “Administrator”) and is responsible for allnon-portfolio management aspects of managing the Funds’ operations, including administration and shareholder services to each Fund. Each Fund pays a fee to the Administrator at the rate of 0.15% per annum of the Fund’s average daily net assets for this service.
The Funds are distributed by AMG Distributors, Inc. (the “Distributor”), a wholly-owned subsidiary of the Investment Manager. The Distributor serves as the distributor and underwriter for each Fund and is a registered broker-dealer and member of the Financial Industry Regulatory Authority, Inc. (“FINRA”). Shares of each Fund will be continuously offered and will be sold directly to prospective purchasers and through brokers, dealers or other financial intermediaries who have executed selling agreements with the Distributor. Generally the Distributor bears all or a portion of the expenses of providing services pursuant to the distribution agreement, including the payment of the expenses relating to the distribution of prospectuses for sales purposes and any advertising or sales literature.
The Trusts have adopted a distribution and service plan (the “Plan”) with respect to the Class N shares of each Fund and Class C shares of Enhanced Core Bond, in accordance with the requirements of Rule12b-1 under the 1940 Act and the requirements of the applicable rules of FINRA regarding asset based sales charges. Pursuant to the Plan, each Fund may make payments to the Distributor for its expenditures in financing any activity primarily intended to result in the sale of each Fund’s Class N shares and Enhanced Core Bond Class C shares and for maintenance and personal service provided to existing shareholders of that class. The Plan authorizes payments to the Distributor up to 0.25% and 1.00% annually of each Fund’s average daily net assets attributable to the Class N shares and Enhanced Core Bond Class C shares, respectively. The portion of payments made under the plan by Class N shares of each Fund and Class C shares of Enhanced Core Bond for shareholder servicing may not exceed an annual rate of 0.25% of the average daily net asset value of each Fund’s shares of that class owned by clients of such broker, dealer or financial intermediary.
For Enhanced Core Bond’s Class I shares and for each of the Class N and Class I shares of Municipal Bond, Municipal Enhanced, Small Cap Core, and Small/Mid Cap, the Board has approved reimbursement payments to the Investment Manager
| 67 |
Table of Contents
Notes to Financial Statements(continued) |
for shareholder servicing expenses (“shareholder servicing fees”) incurred. Shareholder servicing fees include payments to financial intermediaries, such as broker-dealers (including fund supermarket platforms), banks, and trust companies who provide shareholder recordkeeping, account servicing and other services. Class N and Class I shares may reimburse the Investment Manager for the actual amount incurred up to a maximum annual rate of each Class’s average daily net assets as shown in the table below. The Investment Manager had voluntarily agreed, through at least May 1, 2018, to waive 0.01% of the shareholder servicing fees authorized to be paid by Class I shares of Municipal Bond. This waiver expired on April 30, 2018.
The impact on the annualized expense ratios for the fiscal year ended December 31, 2018, were as follows:
Fund
| Maximum Annual
| Actual
| ||||||
Enhanced Core Bond
| ||||||||
Class I
|
| 0.10
| %
|
| 0.06
| %
| ||
Municipal Bond
| ||||||||
Class N
|
| 0.15
| %
|
| 0.12
| %
| ||
Class I*
|
| 0.05
| %
|
| 0.05
| %
| ||
Municipal Enhanced
| ||||||||
Class N**
|
| 0.15
| %
|
| 0.15
| %
| ||
Class I*
|
| 0.05
| %
|
| 0.05
| %
| ||
Small Cap Core
| ||||||||
Class N**
|
| 0.15
| %
|
| 0.13
| %
| ||
Class I*
|
| 0.05
| %
|
| 0.05
| %
| ||
Small/Mid Cap
| ||||||||
Class N
|
| 0.15
| %
|
| —
|
| ||
Class I*
|
| 0.10
| %
|
| 0.10
| %
| ||
*Prior to February 27, 2017, Class I shares did not incur shareholder servicing fees.
**Effective February 27, 2017, the maximum annual rate was decreased to 0.15% from 0.25%.
The Board provides supervision of the affairs of the Trust and other trusts within the AMG Funds family. The Trustees of the Trust who are not affiliated with the Investment Manager receive an annual retainer and per meeting fees for regular, special and telephonic meetings, and they are reimbursed forout-of-pocket expenses incurred while carrying out their duties as Board members. The Chairman of the Board and the Audit Committee Chair receive additional annual retainers. Certain Trustees and Officers of the Funds are Officers and/or Directors of the Investment Manager, AMG and/or the Distributor.
The Securities and Exchange Commission (the “SEC”) granted an exemptive order that permits the Funds to lend and borrow money for certain temporary purposes directly to and from other eligible funds in the AMG Funds family. Participation in this interfund lending program is voluntary for both the borrowing and lending funds, and an interfund loan is only made if it benefits each participating fund. The Administrator manages the program according to procedures approved by the Board, and the Board monitors the operation of the program. An interfund loan must comply with certain conditions set out in the exemptive order, which are
designed to assure fairness and protect all participating funds. For the fiscal year ended December 31, 2018, Municipal Enhanced lent a maximum of $2,900,150 for one day earning interest of $209, and Small Cap Core lent a maximum of $3,763,830 for four days earning interest in the amount of $1,068. The interest income amount is included in the Statement of Operations as interest income. Small Cap Core borrowed a maximum of $5,815,368 for nine days paying interest of $3,804, and Small/Mid Cap borrowed a maximum of $5,032,190 for five days paying interest of $1,004. The interest expense amount is included in the Statement of Operations as miscellaneous expense. For the year ended December 31, 2018, Enchanced Core Bond and Municipal Bond neither lent to nor borrowed from other Funds in the AMG Funds family. At December 31, 2018, Small Cap Core had an interfund loan of $1,426,389 outstanding.
3. PURCHASES AND SALES OF SECURITIES
Purchases and sales of securities (excluding short-term securities and U.S. Government Obligations) for the fiscal year ended December 31, 2018, were as follows:
| Long Term Securities | ||||||||
Fund
| Purchases
| Sales
| ||||||
Enhanced Core Bond
|
| $8,559,813
|
|
| $14,482,702
|
| ||
Municipal Bond
|
| 363,616,631
|
|
| 429,639,021
|
| ||
Municipal Enhanced
|
| 190,151,686
|
|
| 204,537,908
|
| ||
Small Cap Core
|
| 134,697,817
|
|
| 169,936,568
|
| ||
Small/Mid Cap
|
| 163,100,789
|
|
| 62,079,424
|
| ||
Purchases and sales of U.S. Government Obligations for the fiscal year ended December 31, 2018 were as follows:
| U.S. Government Obligations | ||||||||
Fund
| Purchases
| Sales
| ||||||
Enhanced Core Bond
|
| $2,108,797
|
|
| $4,822,901
|
| ||
4. PORTFOLIO SECURITIES LOANED
The Funds participate in the Program providing for the lending of securities to qualified brokers. Securities lending income includes earnings of such temporary cash investments, plus or minus any rebate to a borrower. These earnings (after any rebate) are then divided between BNYM, as a fee for its services under the Program, and the Funds, according to agreed-upon rates. Collateral on all securities loaned is accepted in cash and, effective October 1, 2018, may also be accepted in U.S. Government and Agency Obligations. Collateral is maintained at a minimum level of 102% (105% in the case of certain foreign securities) of the market value, plus interest, if applicable, of investments on loan. It is the Funds’ policy to obtain additional collateral from or return excess collateral to the borrower by the end of the next business day, following the valuation date of the securities loaned. Therefore, the value of the collateral held may be temporarily less than the value of the securities on loan. Lending securities entails a risk of loss to the Funds if and to the extent that the market value of the securities loaned were to increase and the borrower did not increase the collateral accordingly, and the borrower fails to return the securities. Under the terms of the Program, the Funds are indemnified for such losses by BNYM. Cash collateral is held in separate omnibus accounts managed by BNYM, who is authorized to exclusively enter into
| 68 |
Table of Contents
Notes to Financial Statements(continued) |
joint repurchase agreements for that cash collateral. Securities collateral is held in separate omnibus accounts managed by BNYM that cannot be sold or pledged. BNYM bears the risk of any deficiency in the amount of the cash collateral available for return to the borrower due to any loss on the collateral invested.
The value of securities loaned on positions held, cash and securities collateral received at December 31, 2018, were as follows:
Fund
| Securities
| Cash
| Securities
| Total
| ||||||||||||
Enhanced Core Bond
|
| $11,740
|
|
| $12,571
|
|
| —
|
|
| $12,571
|
| ||||
Small Cap Core
|
| 65,435,236
|
|
| 13,271,539
|
|
| $53,186,874
|
|
| 66,458,413
|
| ||||
Small/Mid Cap
|
| 13,295,996
|
|
| 1,954,193
|
|
| 11,506,767
|
|
| 13,460,960
|
| ||||
The following table summarizes the securities received as collateral for securities lending:
Fund
| Collateral
| Coupon
Range | Maturity
Date Range | |||||||
Small Cap Core
| U.S. Treasury Obligations
|
| 0.000%-8.750%
|
|
| 01/10/19-08/15/47
|
| |||
Small/Mid Cap
| U.S. Treasury Obligations
|
| 0.000%-8.000%
|
|
| 01/15/19-08/15/47
|
| |||
5. COMMITMENTS AND CONTINGENCIES
Under the Trusts’ organizational documents, its trustees and officers are indemnified against certain liabilities arising out of the performance of their duties to the Trusts. In addition, in the normal course of business, the Funds may enter into contracts and agreements that contain a variety of representations and warranties, which provide general indemnifications. The maximum exposure to the Funds under these arrangements is unknown, as this would involve future claims that may be made against a Fund that have not yet occurred. However, based on experience, the Funds had no prior claims or losses and expect the risks of loss to be remote.
6. MASTER NETTING AGREEMENTS
The Funds may enter into master netting agreements with their counterparties for the securities lending program and Repurchase Agreements, which provide the right, in the event of default (including bankruptcy or insolvency) for thenon-defaulting party to liquidate the collateral and calculate net exposure to the defaulting party or request additional collateral. For financial reporting purposes, the Funds do not offset financial assets and financial liabilities that are subject to master netting agreements in the Statement of Assets and Liabilities. For securities lending transactions, see Note 4.
The following table is a summary of the Funds’ open Repurchase Agreements that are subject to a master netting agreement as of December 31, 2018:
| Gross Amount Not Offset in the Statement of Assets and Liabilities | ||||||||||||||||
Fund
| Net Amounts of Assets
| Financial
| Cash Collateral
| Net Amount
| ||||||||||||
Enhanced Core Bond
| ||||||||||||||||
Citigroup Global Markets, Inc. | $12,571 | $12,571 | — | — | ||||||||||||
|
|
|
|
|
|
|
| |||||||||
Small Cap Core
| ||||||||||||||||
Cantor Fitzgerald Securities, Inc.
|
| $3,152,649
|
|
| $3,152,649
|
|
| —
|
|
| —
|
| ||||
Daiwa Capital Markets America
|
| 3,152,649
|
|
| 3,152,649
|
|
| —
|
|
| —
|
| ||||
Mizuho Securities USA, LLC
|
| 660,943
|
|
| 660,943
|
|
| —
|
|
| —
|
| ||||
RBC Dominion Securities, Inc.
|
| 3,152,649
|
|
| 3,152,649
|
|
| —
|
|
| —
|
| ||||
State of Wisconsin Investment Board | 3,152,649 | 3,152,649 | — | — | ||||||||||||
|
|
|
|
|
|
|
| |||||||||
Total | $13,271,539 | $13,271,539 | — | — | ||||||||||||
|
|
|
|
|
|
|
| |||||||||
Small/Mid Cap
| ||||||||||||||||
Cantor Fitzgerald Securities, Inc.
|
| $954,193
|
|
| $954,193
|
|
| —
|
|
| —
|
| ||||
RBC Dominion Securities, Inc. | 1,000,000 | 1,000,000 | — | — | ||||||||||||
|
|
|
|
|
|
|
| |||||||||
Total | $1,954,193 | $1,954,193 | — | — | ||||||||||||
|
|
|
|
|
|
|
| |||||||||
| 69 |
Table of Contents
Notes to Financial Statements(continued) |
7. REGULATORY UPDATES
In August 2018, the FASB issued Accounting Standards UpdateNo. 2018-13, Fair Value Measurement (Topic 820), Disclosure Framework - Changes to the Disclosure Requirements for Fair Value Measurement (“ASU2018-13”) which is effective for periods starting after December 15, 2019. The primary focus of the update is to improve the effectiveness of ASC 820’s disclosure in the notes to financial statements. The Funds have early adopted these changes and there was no significant impact on the financial statements and accompanying notes.
Effective November 15, 2018, the SEC amended existing rules intended to modernize reporting and disclosure of information. These amendments relate to RegulationS-X which sets forth the form and content of financial statements. The
amendment requires collapsing the components of distributable earnings on the Statement of Assets and Liabilities and collapsing the distributions paid to shareholders on the Statements of Changes in Net Assets. The Funds have adopted these amendments and there was no significant impact on the financial statements and accompanying notes.
8. SUBSEQUENT EVENTS
The Funds have determined that no material events or transactions occurred through the issuance date of the Funds’ financial statements, which require an additional disclosure in or adjustment of the Funds’ financial statements.
| 70 |
Table of Contents
TO THE BOARD OF TRUSTEES OF AMG FUNDS AND AMG FUNDS II AND SHAREHOLDERS OF AMG GW&K ENHANCED CORE BOND FUND, AMG GW&K MUNICIPAL BOND FUND, AMG GW&K MUNICIPAL ENHANCED YIELD FUND, AMG GW&K SMALL CAP CORE FUND AND AMG GW&K SMALL/MID CAP FUND
Opinions on the Financial Statements
We have audited the accompanying statements of assets and liabilities, including the schedules of portfolio investments, of AMG GW&K Enhanced Core Bond Fund, AMG GW&K Municipal Bond Fund, AMG GW&K Municipal Enhanced Yield Fund, AMG GW&K Small Cap Core Fund, and AMG GW&K Small/Mid Cap Fund (five of the funds constituting AMG Funds and AMG Funds II, hereafter collectively referred to as the “Funds”) as of December 31, 2018, the related statements of operations for the year ended December 31, 2018, the statements of changes in net assets for each of the two years in the period ended December 31, 2018, including the related notes, and the financial highlights for each of the periods indicated therein (collectively referred to as the “financial statements”). In our opinion, the financial statements present fairly, in all material respects, the financial position of each of the Funds as of December 31, 2018, the results of each of their operations for the year then ended, the changes in each of their net assets for each of the two years in the period ended December 31, 2018 and each of the financial highlights for each of the periods indicated therein in conformity with accounting principles generally accepted in the United States of America.
Basis for Opinions
These financial statements are the responsibility of the Funds’ management. Our responsibility is to express an opinion on the Funds’ financial statements based on our audits. We are a public accounting firm registered with the Public Company Accounting Oversight Board (United States) (PCAOB) and are required to be independent with respect to the Funds in accordance with the U.S. federal securities laws and the applicable rules and regulations of the Securities and Exchange Commission and the PCAOB.
We conducted our audits of these financial statements in accordance with the standards of the PCAOB. Those standards require that we plan and perform the audit to obtain reasonable assurance about whether the financial statements are free of material misstatement, whether due to error or fraud.
Our audits included performing procedures to assess the risks of material misstatement of the financial statements, whether due to error or fraud, and performing procedures that respond to those risks. Such procedures included examining, on a test basis, evidence regarding the amounts and disclosures in the financial statements. Our audits also included evaluating the accounting principles used and significant estimates made by management, as well as evaluating the overall presentation of the financial statements. Our procedures included confirmation of securities owned as of December 31, 2018 by correspondence with the custodian and brokers; when replies were not received from brokers, we performed other auditing procedures. We believe that our audits provide a reasonable basis for our opinions.
PricewaterhouseCoopers LLP
Boston, Massachusetts
February 27, 2019
We have served as the auditor of one or more investment companies in AMG Funds Family since 1993.
| 71 |
Table of Contents
TAX INFORMATION
The AMG GW&K Enhanced Core Bond Fund, AMG GW&K Municipal Bond Fund, AMG GW&K Municipal Enhanced Yield Fund, AMG GW&K Small Cap Core Fund and AMG GW&K Small/Mid Cap Fund each hereby designates the maximum amount allowable of its net taxable income as qualified dividends as provided in the Jobs and Growth Tax Relief Reconciliation Act of 2003. The 2018 Form1099-DIV you receive for each Fund will show the tax status of all distributions paid to you during the year.
Pursuant to section 852 of the Internal Revenue Code, AMG GW&K Enhanced Core Bond Fund, AMG GW&K Municipal Bond Fund, AMG GW&K Municipal Enhanced Yield Fund, AMG GW&K Small Cap Core Fund and AMG GW&K Small/Mid Cap Fund each hereby designates $0, $310,654, $0, $51,977,905, and $507,566, respectively, as a capital gain distribution with respect to the taxable year ended December 31, 2018, or if subsequently determined to be different, the net capital gains of such fiscal year.
| 72 |
Table of Contents
| The Trustees and Officers of the Trust, their business addresses, principal occupations for the past five years and ages are listed below. The Trustees provide broad supervision over the affairs of the Trust and the Funds. The Trustees are experienced executives who meet periodically throughout the year to oversee the Funds’ activities, review contractual arrangements with companies that provide services to the Funds, and | review the Funds’ performance. Unless otherwise noted, the address of each Trustee or Officer is the address of the Trust: 600 Steamboat Road, Suite 300, Greenwich, Connecticut 06830.
There is no stated term of office for Trustees. Trustees serve until their resignation, retirement or removal in | accordance with the Trust’s organizational documents and policies adopted by the Board from time to time. The Chairman of the Trustees, President, Treasurer and Secretary of the Trust are elected by the Trustees annually. Other officers hold office at the pleasure of the Trustees. |
Independent Trustees
The following Trustees are not “interested persons” of the Trust within the meaning of the 1940 Act:
Number of Funds Overseen in Fund Complex | Name, Age, Principal Occupation(s) During Past 5 Years and Other Directorships Held by Trustee | |
• Trustee since 2012 • Oversees 55 Funds in Fund Complex | Bruce B. Bingham,70 Partner, Hamilton Partners (real estate development firm) (1987-Present); Director of The Yacktman Funds (2000-2012). | |
• Trustee since 1999 - AMG Funds Trustee since 2000 - AMG Funds II • Oversees 55 Funds in Fund Complex | Edward J. Kaier, 73 Attorney at Law and Partner, Teeters Harvey Marrone & Kaier LLP (2007-Present); Attorney at Law and Partner, Hepburn Willcox Hamilton & Putnam, LLP (1977-2007); Trustee of Third Avenue Trust (3 portfolios); Trustee of Third Avenue Variable Trust (1 portfolio). | |
• Trustee since 2013 • Oversees 58 Funds in Fund Complex | Kurt A. Keilhacker, 55 Managing Partner, TechFund Capital (1997-Present); Managing Partner, TechFund Europe (2000-Present); Board Member, 6wind SA, (2002-Present); Managing Partner, Elementum Ventures (2013-Present); Director, MetricStory, Inc. (2017-Present); Trustee, Wheaton College (2018-Present); Trustee, Gordon College (2001-2016). | |
• Trustee since 2000 • Oversees 55 Funds in Fund Complex | Steven J. Paggioli, 68 Independent Consultant (2002-Present); Trustee, Professionally Managed Portfolios (32 portfolios); Advisory Board Member, Sustainable Growth Advisors, LP; Independent Director, Chase Investment Counsel (2008–Present); Executive Vice President, Secretary and Director, Investment Company Administration, LLC (1990-2001). | |
• Trustee since 2013 • Oversees 55 Funds in Fund Complex | Richard F. Powers III, 73 Adjunct Professor, U.S. Naval War College (2016-Present); Adjunct Professor, Boston College (2010-2013); President and CEO of Van Kampen Investments Inc. (1998-2003). | |
• Independent Chairman • Trustee since 2000 • Oversees 58 Funds in Fund Complex | Eric Rakowski, 60 Professor of Law, University of California at Berkeley School of Law - Boalt Hall (1990-Present); Director of Harding, Loevner Funds, Inc. (9 portfolios); Trustee of Third Avenue Trust (3 portfolios); Trustee of Third Avenue Variable Trust (1 portfolio). | |
• Trustee since 2013 • Oversees 58 Funds in Fund Complex | Victoria L. Sassine, 53 Adjunct Professor, Babson College (2007–Present); Director, Board of Directors, PRG Group (2017-Present); CEO, Founder, Scale Smarter Partners, LLC (2018-Present); Chairperson, Board of Directors, Business Management Associates (2018-Present). | |
• Trustee since 2004 - AMG Funds Trustee since 2000- AMG Funds II • Oversees 55 Funds in Fund Complex | Thomas R. Schneeweis, 71 Professor Emeritus, University of Massachusetts (2013-Present); President, TRS Associates (1982-Present); Board Member, Chartered Alternative Investment Association (“CAIA”) (2002-Present); Director, Institute for Global Asset and Risk Management (Education) (2010-Present);Co-Owner, Quantitative Investment Technologies (2014-Present); Director of Research, Yes Wealth Management (2018-Present); Partner, S Capital Wealth Advisors (2015-2018); Partner, S Capital Management, LLC (2007-2015); President, Alternative Investment Analytics, LLC, (formerly Schneeweis Partners, LLC) (2001-2013). | |
| 73 |
Table of Contents
AMG Funds Trustees and Officers(continued) |
Interested Trustees
Each Trustee in the following table is an “interested person” of the Trust within the meaning of the 1940 Act. Ms. Carsman is an interested person of the Trust within the meaning of the 1940 Act by virtue of her position with, and interest in securities of, AMG.
Number of Funds Overseen in Fund Complex | Name, Age, Principal Occupation(s) During Past 5 Years and Other Directorships Held by Trustee | |
• Trustee since 2011 • Oversees 58 Funds in Fund Complex | Christine C. Carsman, 66 Senior Policy Advisor, Affiliated Managers Group, Inc. (2019-Present); Director of Harding, Loevner Funds, Inc. (9 portfolios); Executive Vice President, Deputy General Counsel and Chief Regulatory Counsel, Affiliated Managers Group, Inc. (2017-2018); Director (2010-2018) and Chair of the Board of Directors (2015-2018), AMG Funds plc; Senior Vice President and Deputy General Counsel, Affiliated Managers Group, Inc.(2011-2016); Senior Vice President and Chief Regulatory Counsel, Affiliated Managers Group, Inc. (2007-2011); Vice President and Chief Regulatory Counsel, Affiliated Managers Group, Inc. (2004-2007); Secretary and Chief Legal Officer,AMG Funds, AMG Funds I, AMG Funds II and AMG Funds III (2004-2011); Senior Counsel, Vice President and Director of Operational Risk Management and Compliance, Wellington Management Company, LLP (1995-2004). | |
| Officers | ||
Position(s) Held with Fund and Length of Time Served | Name, Age, Principal Occupation(s) During Past 5 Years | |
• President since 2018 • Principal Executive Officer since 2018 • Chief Executive Officer since 2018 • Chief Operating Officer since 2007 | Keitha L. Kinne, 60 Chief Operating Officer, AMG Funds LLC (2007-Present); Chief Investment Officer, AMG Funds LLC (2008-Present); President and Principal, AMG Distributors, Inc. (2018-Present); Chief Operating Officer, AMG Distributors, Inc. (2007-Present); President, Chief Executive Officer and Principal Executive Officer, AMG Funds, AMG Funds I, AMG Funds II, AMG Funds III and AMG Funds IV (2018-Present); Chief Operating Officer, AMG Funds, AMG Funds I, AMG Funds II, and AMG Funds III (2007-Present); Chief Operating Officer, AMG Funds IV (2016-Present); Chief Operating Officer and Chief Investment Officer, Aston Asset Management, LLC (2016); President and Principal Executive Officer, AMG Funds, AMG Funds I, AMG Funds II and AMG Funds III (2012-2014); Managing Partner, AMG Funds LLC (2007-2014); President and Principal, AMG Distributors, Inc. (2012-2014); Managing Director, Legg Mason & Co., LLC (2006-2007); Managing Director, Citigroup Asset Management (2004-2006). | |
• Secretary since 2015 • Chief Legal Officer since 2015 | Mark J. Duggan, 54 Senior Vice President and Senior Counsel, AMG Funds LLC (2015-Present); Secretary and Chief Legal Officer, AMG Funds, AMG Funds I, AMG Funds II, AMG Funds III and AMG Funds IV (2015-Present); Attorney, K&L Gates, LLP (2009-2015). | |
• Chief Financial Officer since 2017 • Treasurer since 2017 • Principal Financial Officer since 2017 • Principal Accounting Officer since 2017 | Thomas G. Disbrow, 53 Vice President, Mutual Fund Treasurer & CFO, AMG Funds, AMG Funds LLC (2017-Present); Chief Financial Officer, Principal Financial Officer, Treasurer and Principal Accounting Officer, AMG Funds, AMG Funds I, AMG Funds II, AMG Funds III and AMG Funds IV (2017-Present); Managing Director - Global Head of Traditional Funds Product Control, UBS Asset Management (Americas), Inc. (2015-2017); Managing Director - Head of North American Funds Treasury, UBS Asset Management (Americas), Inc. (2011-2015). | |
| • Chief Compliance Officer since 2016 | Gerald F. Dillenburg, 52 Vice President, Chief Compliance Officer AMG Funds, AMG Funds LLC (2017-Present); Chief Compliance Officer AMG Funds, AMG Funds LLC (2016-2017); Chief Compliance Officer and Sarbanes-Oxley Code of Ethics Compliance Officer, AMG Funds, AMG Funds I, AMG Funds II and AMG Funds III (2016-Present); Chief Compliance Officer, AMG Funds IV (1996-Present); Sarbanes-Oxley Code of Ethics Compliance Officer, AMG Funds IV (2016-Present); Chief Compliance Officer, Aston Asset Management, LLC (2006-2016); Chief Operating Officer, Aston Funds (2003-2016); Secretary, Aston Funds (1996-2015); Chief Financial Officer, Aston Funds (1997-2010); Chief Financial Officer, Aston Asset Management, LLC (2006-2010); Treasurer, Aston Funds (1996-2010). | |
| • Deputy Treasurer since 2017 | John A. Starace, 48 Director, Mutual Fund Accounting, AMG Funds LLC (2017-Present); Vice President, Deputy Treasurer of Mutual Funds Services, AMG Funds LLC (2014-2017); Deputy Treasurer, AMG Funds, AMG Funds I, AMG Funds II, AMG Funds III and AMG Funds IV (2017-Present); Vice President, Citi Hedge Fund Services (2010-2014); Audit Senior Manager (2005-2010) and Audit Manager (2001-2005), Deloitte & Touche LLP. | |
• Anti-Money Laundering Compliance Officer since 2014 | Patrick J. Spellman, 44 Vice President, Chief Compliance Officer, AMG Funds LLC (2017-Present); Senior Vice President, Chief Compliance Officer, AMG Funds LLC (2011-2017); Chief Compliance Officer, AMG Distributors, Inc., (2010-Present); Anti-Money Laundering Compliance Officer, AMG Funds, AMG Funds I, AMG Funds II, and AMG Funds III (2014-Present); Anti-Money Laundering Officer, AMG Funds IV, (2016-Present); Compliance Manager, Legal and Compliance, Affiliated Managers Group, Inc. (2005-2011). | |
| • Assistant Secretary since 2016 | Maureen A. Meredith, 33 Vice President, Counsel, AMG Funds LLC (2019-Present); Director, Counsel, AMG Funds LLC (2017-2018); Vice President, Counsel, AMG Funds LLC (2015-2017); Assistant Secretary, AMG Funds, AMG Funds I, AMG Funds II, AMG Funds III and AMG Funds IV (2016-Present); Associate, Ropes & Gray LLP (2011-2015); Law Fellow, Massachusetts Appleseed Center for Law and Justice (2010-2011). | |
| 74 |
Table of Contents
THIS PAGE INTENTIONALLY LEFT BLANK
Table of Contents
THIS PAGE INTENTIONALLY LEFT BLANK
Table of Contents
 |
INVESTMENT MANAGER AND ADMINISTRATOR
AMG Funds LLC 600 Steamboat Road, Suite 300 Greenwich, CT 06830 800.835.3879
DISTRIBUTOR
AMG Distributors, Inc. 600 Steamboat Road, Suite 300 Greenwich, CT 06830 800.835.3879
SUBADVISER
GW&K Investment Management, LLC 222 Berkeley St. Boston, MA 02116 | CUSTODIAN
The Bank of New York Mellon 111 Sanders Creek Parkway East Syracuse, NY 13057
LEGAL COUNSEL
Ropes & Gray LLP Prudential Tower, 800 Boylston Street Boston, MA 02199-3600
TRANSFER AGENT
BNY Mellon Investment Servicing (US) Inc. Attn: AMG Funds P.O. Box 9769 Providence, RI 02940 800.548.4539 | This report is prepared for the Funds’ shareholders. It is authorized for distribution to prospective investors only when preceded or accompanied by an effective prospectus. To receive a free copy of the prospectus or Statement of Additional Information, which includes additional information about Fund Trustees, please contact us by calling 800.835.3879. Distributed by AMG Distributors, Inc., member FINRA/SIPC.
Current net asset values per share for each Fund are available on the Funds’ website at amgfunds.com.
A description of the policies and procedures each Fund uses to vote its proxies is available: (i) without charge, upon request, by calling 800.835.3879, or (ii) on the Securities and Exchange Commission’s (SEC) website at sec.gov. For information regarding each Fund’s proxy voting record for the12-month period ended June 30, call 800.835.3879 or visit the SEC website at sec.gov.
Each Fund files its complete schedule of portfolio holdings with the SEC for the first and third quarters of each fiscal year on FormN-Q. The Fund’s FormsN-Q are available on the SEC’s website at sec.gov. To review a complete list of the Funds’ portfolio holdings, or to view the semiannual report, or annual report, please visit amgfunds.com. amgfunds.com |
| amgfunds.com | ||
| 77 | ||
Table of Contents
 |
AFFILIATE SUBADVISED FUNDS
BALANCED FUNDS AMG Chicago Equity Partners Balanced Chicago Equity Partners, LLC
AMG FQ Global Risk-Balanced First Quadrant, L.P.
EQUITY FUNDS
AMG FQTax-Managed U.S. Equity AMG FQ Long-Short Equity First Quadrant, L.P.
AMG Frontier Small Cap Growth Frontier Capital Management Co., LLC
AMG GW&K Small Cap Core AMG GW&K Small/Mid Cap AMG GW&K Trilogy Emerging Markets Equity AMG GW&K Trilogy Emerging Wealth Equity AMG GW&K U.S. Small Cap Growth GW&K Investment Management, LLC
AMG Renaissance Large Cap Growth The Renaissance Group LLC
AMG River Road Dividend All Cap Value AMG River Road Dividend All Cap Value II AMG River Road Focused Absolute Value AMG River Road Long-Short AMG River RoadSmall-Mid Cap Value AMG River Road Small Cap Value River Road Asset Management, LLC
AMG SouthernSun Small Cap AMG SouthernSun U.S. Equity SouthernSun Asset Management, LLC
AMG Systematic Mid Cap Value Systematic Financial Management L.P. |
| AMG TimesSquare Emerging Markets Small Cap AMG TimesSquare Global Small Cap AMG TimesSquare International Small Cap AMG TimesSquare Mid Cap Growth AMG TimesSquare Small Cap Growth TimesSquare Capital Management, LLC
AMG Yacktman AMG Yacktman Focused
AMG Yacktman Focused Fund - Security Selection Only AMG Yacktman Special Opportunities Yacktman Asset Management LP
FIXED INCOME FUNDS
AMG GW&K Core Bond AMG GW&K Enhanced Core Bond AMG GW&K Municipal Bond AMG GW&K Municipal Enhanced Yield GW&K Investment Management, LLC
OPEN-ARCHITECTURE FUNDS
EQUITY FUNDS
AMG Managers Brandywine
AMG Managers Brandywine Advisors Mid Cap Growth AMG Managers Brandywine Blue Friess Associates, LLC
AMG Managers Cadence Emerging Companies AMG Managers Cadence Mid Cap Cadence Capital Management LLC
AMG Managers CenterSquare Real Estate CenterSquare Investment Management LLC
AMG Managers Emerging Opportunities Lord, Abbett & Co. LLC WEDGE Capital Management L.L.P. Next Century Growth Investors LLC RBC Global Asset Management (U.S.) Inc. |
| AMG Managers Essex Small/Micro Cap Growth Essex Investment Management Company, LLC
AMG Managers Fairpointe ESG Equity AMG Managers Fairpointe Mid Cap Fairpointe Capital LLC
AMG Managers LMCG Small Cap Growth LMCG Investments, LLC
AMG Managers Montag & Caldwell Growth Montag & Caldwell, LLC
AMG Managers Pictet International Pictet Asset Management Limited
AMG Managers Silvercrest Small Cap Silvercrest Asset Management Group LLC
AMG Managers Skyline Special Equities Skyline Asset Management, L.P.
AMG Managers Special Equity Ranger Investment Management, L.P. Lord, Abbett & Co. LLC Smith Asset Management Group, L.P. Federated MDTA LLC
AMG Managers Value Partners Asia Dividend Value Partners Hong Kong Limited
FIXED INCOME FUNDS
AMG Managers Amundi Intermediate Government AMG Managers Amundi Short Duration Government Amundi Pioneer Institutional Asset Management, Inc.
AMG Managers Doubleline Core Plus Bond DoubleLine Capital LP
AMG Managers Global Income Opportunity AMG Managers Loomis Sayles Bond Loomis, Sayles & Company, L.P. |
|
| amgfunds.com | 123118 AR020 |
Table of Contents
| Item 2. | CODE OF ETHICS |
Registrant has adopted a Code of Ethics. See attached Exhibit (a)(1).
| Item 3. | AUDIT COMMITTEE FINANCIAL EXPERT |
Registrant’s Board of Trustees has determined that independent Trustee Mr. Steven J. Paggioli qualifies as an Audit Committee Financial Expert. Mr. Paggioli is “independent” as such term is defined in FormN-CSR.
| Item 4. | PRINCIPAL ACCOUNTANT FEES AND SERVICES |
(a)Audit Fees
The aggregate fees billed by the Funds’ independent registered public accounting firm, PricewaterhouseCoopers LLP (“PwC”), to the Funds for the Funds’ two most recent fiscal years for professional services rendered for audits of annual financial statements, or services that are normally provided in connection with statutory and regulatory filings or engagements (“Audit Fees”) were as follows:
Fund - AMG FUNDS II | Fiscal 2018 | Fiscal 2017 | ||||||
AMG GW&K Enhanced Core Bond Fund | $ | 38,029 | $ | 39,699 | ||||
AMG Chicago Equity Partners Balanced Fund | $ | 28,203 | $ | 30,134 | ||||
AMG Managers Amundi Short Duration Government Fund | $ | 43,212 | $ | 54,825 | ||||
AMG Managers Amundi Intermediate Government Fund | $ | 41,763 | $ | 51,156 | ||||
(b)Audit-Related Fees
There were no fees billed by PwC to the Funds in their two recent fiscal years for services rendered for assurance and related services that are reasonably related to the performance of the audit or review of the Fund’s financial statements, but are not reported as Audit Fees (“Audit-Related Fees”).
For the Funds’ two most recent fiscal years, there were no Audit-Related Fees billed by PwC for engagements related directly to the operations and financial reporting of one or more Funds by a Fund Service Provider. A Fund Service Provider is (a) any investment adviser to the Fund (not including any Subadvisor whose role is primarily portfolio management and is subcontracted with or overseen by another investment adviser) or (b) any entity that provides ongoing services to the Fund and is controlling, controlled by or under common control with a Fund investment adviser described in (a).
Table of Contents
(c)Tax Fees
The aggregate fees billed by PwC to the Funds for the two most recent fiscal years for professional services rendered for tax compliance, tax advice, and tax planning (“Tax Fees”) were as follows:
Fund - AMG FUNDS II | Fiscal 2018 | Fiscal 2017 | ||||||
AMG GW&K Enhanced Core Bond Fund | $ | 9,425 | $ | 9,425 | ||||
AMG Chicago Equity Partners Balanced Fund | $ | 7,369 | $ | 7,369 | ||||
AMG Managers Amundi Short Duration Government Fund | $ | 10,159 | $ | 10,159 | ||||
AMG Managers Amundi Intermediate Government Fund | $ | 10,159 | $ | 10,159 | ||||
For the Funds’ two most recent fiscal years, Tax Fees billed by PwC for engagements by Fund Service Providers that related directly to the operations and financial reporting of the Funds were $0 for fiscal 2018 and $0 for fiscal 2017, respectively.
The services for which Tax Fees were charged comprise all services performed by professional staff in PwC’s tax division except those services related to the audit. Typically, this category would include fees for tax compliance, tax planning, and tax advice. Tax compliance, tax advice, and tax planning services include preparation of original and amended tax returns, claims for refund and tax payment-planning services, assistance with tax audits and appeals, tax advice related to mergers and acquisitions and requests for rulings or technical advice from taxing authorities.
(d)All Other Fees
There were no other fees billed by PwC to the Funds for all othernon-audit services (“Other Fees”) during the Funds’ two most recent fiscal years. During the same period, there were no Other Fees billed by PwC for engagements by Fund Service Providers that related directly to the operations and financial reporting of the Funds.
(e) (1) According to policies adopted by the Audit Committee, services provided by PwC to the Funds must bepre-approved by the Audit Committee. On an annual basis, the Audit Committee reviews andpre-approves various types of services that PwC may perform for the Funds without specific approval of each engagement, subject to specified budget limitations. As contemplated by the Sarbanes-Oxley Act of 2002 and related SEC rules, the Audit Committee alsopre-approvesnon-audit services provided by PwC to any Fund Service Provider for any engagement that relates directly to the operations and financial reporting of the Funds. Any engagement that is not alreadypre-approved or that will exceed apre-approved budget must be submitted to the Audit Committee forpre-approval. The Chairman of the Audit Committee is authorized on behalf of the Board of Trustees and the Audit Committee to approve the engagement of PwC to performnon-audit services subject to certain conditions, including notification to the Audit Committee of suchpre-approval not later than the next meeting of the Audit Committee following the date of suchpre-approval.
Table of Contents
(e)(2) None.
(f) Not applicable.
(g) The aggregate fees billed by PwC in 2018 and 2017 fornon-audit services rendered to the Funds and Fund Service Providers were $86,612 and $120,812, respectively. For the fiscal year ended December 31, 2018, this amount reflects the amounts disclosed above in Item 4(b),(c),(d), plus $49,500 in fees billed to the Fund Service Providers fornon-audit services that did not relate directly to the operations and financial reporting of the Funds. For the fiscal year ended December 31, 2017, this amount reflects the amounts disclosed above in Item 4(b),(c),(d), plus $83,700 in fees billed to the Fund Service Providers fornon-audit services that did not relate directly to the operations and financial reporting of the Funds.
(h) The Trust’s Audit Committee has considered whether the provision ofnon-audit services by registrant’s independent registered public accounting firm to the registrant’s investment advisor, and any entity controlling, controlled, or under common control with the investment advisor that provided ongoing services to the registrant that were notpre-approved by the Committee (because such services did not relate directly to the operations and financial reporting of the registrant) was compatible with maintaining the independence of the independent registered public accounting firm.
| Item 5. | AUDIT COMMITTEE OF LISTED REGISTRANTS |
Not applicable.
| Item 6. | SCHEDULE OF INVESTMENTS |
The schedule of investments in unaffiliated issuers as of the close of the reporting period is included as part of the shareholder report contained in Item 1 hereof.
| Item 7. | DISCLOSURE OF PROXY VOTING POLICIES AND PROCEDURES FORCLOSED-END MANAGEMENT INVESTMENT COMPANIES |
Not applicable.
| Item 8. | PORTFOLIO MANAGERS OFCLOSED-END MANAGEMENT INVESTMENT COMPANIES |
Not applicable.
| Item 9. | PURCHASES OF EQUITY SECURITIES BYCLOSED-END MANAGEMENT INVESTMENT COMPANIES AND AFFILIATED PURCHASERS |
Not applicable.
| Item 10. | SUBMISSION OF MATTERS TO A VOTE OF SECURITY HOLDERS |
Not applicable.
Table of Contents
| Item 11. | CONTROLS AND PROCEDURES |
(a) The Registrant’s principal executive and principal financial officers have concluded, based on their evaluation of the registrant’s disclosure controls and procedures as of a date within 90 days of the filing of this report, that the Registrant’s disclosure controls and procedures are reasonably designed to ensure that information required to be disclosed by the Registrant on FormN-CSR is recorded, processed, summarized and reported within the required time periods and that information required to be disclosed by the registrant in the reports that it files or submits on FormN-CSR is accumulated and communicated to the Registrant’s management, including its principal executive and principal financial officers, as appropriate to allow timely decisions regarding required disclosure.
(b) There were no changes in the Registrant’s internal control over financial reporting during the Registrant’s fourth fiscal quarter of the period covered by this report that have materially affected, or are reasonably likely to affect, the internal control over financial reporting.
| Item 12. | DISCLOSURE OF SECURITIES LENDING ACTIVITIES FORCLOSED-END MANAGEMENT INVESTMENT COMPANIES |
Not applicable.
| Item 13. | EXHIBITS |
| (a)(1) | Any Code of Ethics or amendments hereto. Filed herewith. | |
| (a)(2) | Certifications pursuant to Rule30a-2(a) under the Investment Company Act of 1940 - Filed herewith. | |
| (a)(3) | Not applicable. | |
| (b) | Certifications pursuant to Rule30a-2(b) under the Investment Company Act of 1940 - Filed herewith. | |
Table of Contents
SIGNATURES
Pursuant to the requirements of the Securities Exchange Act of 1934 and the Investment Company Act of 1940, the registrant has duly caused this report to be signed on its behalf by the undersigned, thereunto duly authorized.
| AMG FUNDS II | ||
| By: | /s/ Keitha L. Kinne | |
| Keitha L. Kinne, Principal Executive Officer | ||
| Date: | March 7, 2019 | |
Pursuant to the requirements of the Securities Exchange Act of 1934 and the Investment Company Act of 1940, this report has been signed below by the following persons on behalf of the registrant and in the capacities and on the dates indicated.
| By: | /s/ Keitha L. Kinne | |
| Keitha L. Kinne, Principal Executive Officer | ||
| Date: | March 7, 2019 | |
| By: | /s/ Thomas Disbrow | |
| Thomas Disbrow, Principal Financial Officer | ||
| Date: | March 7, 2019 | |