UNITED STATES
SECURITIES AND EXCHANGE COMMISSION
Washington, D.C. 20549
FORM N-CSR
CERTIFIED SHAREHOLDER REPORT OF
REGISTERED MANAGEMENT INVESTMENT COMPANIES
Investment Company Act file number: 811-06431
MANAGERS TRUST II
(Exact name of registrant as specified in charter)
800 Connecticut Avenue, Norwalk, Connecticut 06854
(Address of principal executive offices) (Zip code)
Managers Investment Group LLC
800 Connecticut Avenue, Norwalk, Connecticut 06854
(Name and address of agent for service)
Registrant’s telephone number, including area code: (203) 299-3500
Date of fiscal year end: DECEMBER 31
Date of reporting period: JANUARY 1, 2012 – DECEMBER 31, 2012
(Annual Shareholder Report)
Item 1. Reports to Shareholders
Managers Funds
Annual Report — December 31, 2012
| | | | |
TABLE OF CONTENTS | | Page | |
| |
LETTER TO SHAREHOLDERS | | | 1 | |
| |
ABOUT YOUR FUND’S EXPENSES | | | 2 | |
| |
PORTFOLIO MANAGER’S COMMENTS, FUND SNAPSHOTS, AND SCHEDULES OF PORTFOLIO INVESTMENTS | | | | |
| |
Managers Short Duration Government Fund | | | 3 | |
| |
Managers Intermediate Duration Government Fund | | | 15 | |
| |
NOTES TO SCHEDULE OF PORTFOLIO INVESTMENTS | | | 24 | |
| |
FINANCIAL STATEMENTS | | | | |
| |
Statement of Assets and Liabilities | | | 28 | |
Balance sheets, net asset value (NAV) per share computations and cumulative undistributed amounts | | | | |
| |
Statement of Operations | | | 29 | |
Detail of sources of income, expenses, and realized and unrealized gains (losses) during the year | | | | |
| |
Statements of Changes in Net Assets | | | 30 | |
Detail of changes in assets for the past two years | | | | |
| |
FINANCIAL HIGHLIGHTS | | | 31 | |
Historical net asset values per share, distributions, total returns, income and expense ratios, turnover ratios and net assets | | | | |
| |
NOTES TO FINANCIAL STATEMENTS | | | 33 | |
Accounting and distribution policies, details of agreements and transactions with Fund management and affiliates, and descriptions of certain investment risks | | | | |
| |
REPORT OF INDEPENDENT REGISTERED PUBLIC ACCOUNTING FIRM | | | 39 | |
| |
TRUSTEES AND OFFICERS | | | 40 | |
Nothing contained herein is to be considered an offer, sale or solicitation of an offer to buy shares of any series of the Managers Family of Funds. Such offering is made only by Prospectus, which includes details as to offering price and other material information.
Letter to Shareholders
Dear Shareholder:
Thank you for your investment in The Managers Funds. Our foremost goal at Managers Investment Group (MIG) is to provide investment products and solutions that help our shareholders and clients successfully reach their investment goals and objectives. We do this by offering a broad selection of funds managed by a collection of Affiliated Managers Group’s (AMG) Affiliate investment boutiques, along with a complementary series of open-architecture mutual funds.
The past year has been an exciting one for us at MIG. In connection with AMG’s investment in Yacktman Asset Management (“Yacktman”), MIG partnered with Yacktman in reorganizing the Yacktman Focused Fund and the Yacktman Fund into The Managers Funds. The addition of the Yacktman Funds to our platform brought our total assets under management to over $25 billion at the end of 2012.
Additionally, in an effort to better meet our shareholders’ needs as well as bring consistency across our funds, we restructured our share class offerings across many of our Funds, which included discontinuing certain share classes with sales charges (commonly called sales loads). As a result, many of our Funds now offer three No Load share classes – Investor, Service, and Institutional Share Classes. We believe this simplified structure makes it easier for our clients as well as Financial Advisors to select the appropriate share class to match their needs.
During 2012, we also executed on other changes to certain Funds, which included reducing expense ratios on several Funds to ensure that our offerings remain competitive and affordable for our clients.
As we enter into 2013, both known and unknown risks remain to the global economy and its growth prospects. Nevertheless, we remain optimistic that the collective fiscal and monetary efforts undertaken over the past several years will continue to have a positive impact on the global economy. In the meantime, we remain confident that our Funds are well positioned to weather an uncertain economic environment.
We thank you for your continued confidence and investment in The Managers Funds. You can rest assured that under all market conditions our team is focused on delivering excellent investment management services for your benefit.
Respectfully,

Keitha Kinne
President
Managers Investment Group LLC
1
About Your Fund’s Expenses
|
As a shareholder of a Fund, you may incur two types of costs: (1) transaction costs, which may include sales charges (loads) on purchase payments; redemption fees; and exchange fees; and (2) ongoing costs, including management fees; distribution (12b-1) fees; and other Fund expenses. This example is intended to help you understand your ongoing costs (in dollars) of investing in the Fund and to compare these costs with the ongoing costs of investing in other mutual funds. The example is based on $1,000 invested at the beginning of the period and held for the entire period as indicated below. Actual Expenses The first line of the following table provides information about the actual account values and actual expenses. You may use the information in this line, together with the amount you invested, to estimate the expenses that you paid over the period. Simply divide your account value by $1,000 (for example, an $8,600 account value divided by $1,000 = 8.6), then multiply the result by the number in the first line under the heading entitled “Expenses Paid During Period” to estimate the expenses you paid on your account during this period. Hypothetical Example for Comparison Purposes The second line of the following table provides information about hypothetical account values and hypothetical expenses based on the Fund’s actual expense ratio and an assumed annual rate of return of 5% before expenses, which is not the Fund’s actual return. The hypothetical account values and expenses may not be used to estimate the actual ending account balance or expenses you paid for the period. You may use this information to compare the ongoing costs of investing in the Fund and other funds by comparing this 5% hypothetical example with the 5% hypothetical examples that appear in the shareholder reports of other funds. Please note that the expenses shown in the table are meant to highlight your ongoing costs only and do not reflect any transactional costs, such as sales charges (loads), redemption fees, or exchange fees. Therefore, the second line of the table is useful in comparing ongoing costs only, and will not help you determine the relative total costs of owning different funds. |
| | | | | | | | | | | | | | | | |
Six Months Ended December 31, 2012 | | Expense
Ratio for
the Period | | | Beginning
Account Value
07/01/12 | | | Ending
Account Value
12/31/12 | | | Expenses
Paid During
the Period* | |
Managers Short Duration Government Fund | | | | | |
Based on Actual Fund Return | | | 0.79 | % | | $ | 1,000 | | | $ | 1,006 | | | $ | 3.98 | |
Hypothetical (5% return before expenses) | | | 0.79 | % | | $ | 1,000 | | | $ | 1,021 | | | $ | 4.01 | |
Managers Intermediate Duration Government Fund | | | | | |
Based on Actual Fund Return | | | 0.89 | % | | $ | 1,000 | | | $ | 1,012 | | | $ | 4.50 | |
Hypothetical (5% return before expenses) | | | 0.89 | % | | $ | 1,000 | | | $ | 1,021 | | | $ | 4.52 | |
| * | Expenses are equal to the Fund’s annualized expense ratio multiplied by the average account value over the period, multiplied by the number of days in the most recent half-year (184), then divided by 366. |
2
Managers Short Duration Government Fund
Portfolio Manager’s Comments
The Managers Short Duration Government Bond Fund (“the Fund”) seeks to provide investors with a high level of current income, consistent with a low volatility of net asset value.
The Fund seeks to achieve its objective by matching the duration, or interest-rate risk, of a portfolio that invests exclusively in six-month U.S. Treasury securities on a constant maturity basis. Under normal circumstances, the Fund will invest at least 80% of its net assets, plus the amount of any borrowings for investment purposes, in debt securities issued by the U.S. government or its agencies and instrumentalities and synthetic instruments or derivatives having economic characteristics similar to such debt securities.
The Fund typically employs hedging techniques using instruments such as interest rate futures, options, floors, caps and swaps, designed to reduce the interest-rate risk of their fixed-income securities. The Fund’s benchmark is the six-month U.S. Treasury bill.
THE PORTFOLIO MANAGER
Smith Breeden Associates, Inc.
Smith Breeden Associates, Inc. (“Smith Breeden”) is the subadvisor for the Fund. Smith Breeden, located at 280 South Mangum Street, Suite 301, Durham, NC, was founded in 1982. Smith Breeden is an investment management firm for a client base including corporate and public pension plans, central and supranational banks, endowments and foundations, private banks and financial institutions, insurance companies and other institutional investors. Specializing in fixed income portfolios, the firm offers separate accounts, commingled funds and serves as a subadvisor to ‘40 Act funds.
Smith Breeden believes that innovative research provides critical insights into the fixed income market. The firm’s experienced investment professionals apply these research insights to the management of investment portfolios designed to achieve their clients’ objectives. The key tenets of this market-tested investment philosophy are:
| | • | | Over a market cycle, a portfolio of fixed income securities with wide risk-adjusted spreads produces an attractive total return in comparison to the market return. |
| | • | | The incremental return available from security selection and sector allocation, based on careful relative value analysis, quantitative research and experienced market judgment, is more consistent than the incremental return from predicting the direction of interest rates or other macro-factor trading strategies. |
| | • | | Within the investment-grade fixed income market, the spread sectors, e.g., corporate bonds, mortgage-backed securities (MBS), commercial MBS (CMBS), and asset-backed securities (ABS), will tend to outperform Treasury securities over a market cycle. The corporate, mortgage, CMBS, and ABS sectors also offer the greatest active management opportunity for adding value through security selection. |
The portfolio management team at Smith Breeden specializes in analyzing and investing in mortgage securities. Through careful analysis and comparison of the characteristics of these securities, such as type of issuer, coupon, maturity, geographic structure and prepayment rates, the portfolio manager seeks to structure a portfolio with similar risk characteristics to six-month U.S. Treasury
securities and slightly higher returns. Because there is less certainty about the timing of principal payments to individual mortgage securities than for U.S. Treasury securities, they tend to carry a slightly higher yield. A properly structured portfolio of mortgage securities, however, can have a highly predictable cash flow while maintaining a yield advantage over treasuries. Although the portfolio management team often purchases securities with maturities longer than six months, it does not attempt to increase returns by actively positioning the interest rate sensitivity of the Portfolio. Instead, the team typically manages the weighted average duration of the Portfolio so that it remains close to the Index.
The ideal investment exhibits many of the following traits:
| | • | | Yield advantage over treasuries |
| | • | | Very high quality (Government or AAA) |
| | • | | Attractive value relative to other MBS opportunities |
The Portfolio:
| | • | | Seeks to optimize return per unit of risk |
| | • | | Maintains minimal exposure to credit risk and interest rate risk |
| | • | | Consists of high-quality MBS, CMBS, and ABS securities |
| | • | | Will tend to have an interest-rate sensitivity similar to a six-month Treasury bill |
The investment team will make a sell decision when:
| | • | | They no longer view the bonds as attractive |
| | • | | They deem it necessary to reallocate the Portfolio |
| | • | | They need to maintain the Portfolio’s target duration |
THE YEAR IN REVIEW
During the year ended December 31, 2012, the Fund returned 1.64%, while the Merrill Lynch Six-Month U.S Treasury Bill Index returned 0.17%.
The year was filled with macro uncertainty and superiority of fixed income spread over duration as developed nations had too much debt in the wrong places and more commitments, especially for pensions and health care, than could be honored. The macro uncertainty was tempered by accommodative monetary policy, and spread exposure reaped high returns compared with duration exposure. As we entered a period of negotiations when the U.S. faced the “fiscal cliff,” market pressure continued and will inevitably continue into 2013 as the over-commitments mentioned above will not go away on their own accord.
Coming into the year, market consensus was that the likelihood of QE3 was high, and it was almost universally accepted that agency MBS would be part of the program. The first quarter data, however, suggested a rebounding economy. Several voting Fed members believed further QE would require increased weakness from upcoming economic data, while a couple of members were explicitly against increasing the Fed’s balance sheet. Demand for MBS remained strong, and volatility was low. Fixed-rate MBS performance was pretty uniform across the stack as lower coupons continued to benefit from demand from the Fed and the REIT community, while higher coupon MBS performed well as prepayment rates continue to be relatively low. Mortgage derivatives, such as interest-only strips or inverse interest-only floaters, performed well during the quarter.
Managers Short Duration Government Fund
Portfolio Manager’s Comments (continued)
The second quarter marked another strong quarter for the Fund. Economic news was generally negative as problems in Europe continued to manifest themselves with no clear solution. Domestic payrolls continued to disappoint, as the rebound in jobs was not as robust as expected. The FHA’s new streamline finance program with lower insurance fees kicked in the latter part of the quarter. The Mortgage Bankers Association’s Government Refinance index spiked following the rules’ change, and high coupon GNMA securities sold off significantly. The Fund’s exposure to agency MBS, adjustable-rate MBS and fixed-rate MBS were the largest contributors to performance for the quarter. Small positions in Interest Onlys (IOs) and Collateralized Mortgage Obligations (CMOs), which benefitted from continued low short-term rates, were also positive for the quarter.
The FOMC jolted global markets in September with the announcement of QE3. The purchases will continue until unemployment recedes sufficiently, as long as CPI inflation does not get out of hand. This development provides major support for mortgages, and despite spreads being at historical tights, we expect the sector to do well. The Fund continued with its strong performance as mortgage rates ended the quarter lower, as the Fed’s commitment to purchase additional MBS securities kept the market well-bid. Performance favored lower coupons given the market rally as higher coupon prices stalled, but specified pools with prepayment protection also performed well.
The Fund finished the fourth quarter strong as positions in CMBS spreads followed other risky asset spreads tighter. Throughout the quarter, positions in collateralized mortgage obligations and seasoned 15-year fixed-rate mortgage pools were added at attractive spread levels. The Fund added modestly to its MBS derivative positions. Despite elevated prepayment levels, there are certain types of borrower characteristics which we believe will deliver low levels of prepayments going forward.
Most of the Portfolio outperformance for 2012 was attributed to agency MBS exposure, with positive contributions also from non-agency MBS and CMBS. Agency adjustable-rate (ARMs), fixed-rate (FRMs) and Collateralized Mortgage Obligations (CMOs) benefitted from low mortgage rates and prepayments.
Derivatives such as financial futures, options and mortgage derivatives are used for portfolio duration and convexity risk management. We continue to find value in mortgage derivatives with beneficial underlying collateral characteristics.
On December 31, portfolio duration was shorter than that of the six-month Treasury bill by 0.15 years due to the current low absolute
level of rates. In 2012, Agency ARMs were reduced by approximately 13%, on a market value basis within the Portfolio. The largest securitized sector increase was in 15-year agency FRMs, which moved from 24% of capital to 32%. Thirty-year agency FRMs also increased from 0.5% to 2.94%. The allocation to CMBS and consumer ABS ended the year at relatively the same level where they started — at 9% and 1%, respectively. The Fund maintained a small allocation (1%) to Treasury Inflation-Protected Securities (TIPS).
LOOKING FORWARD
Smith Breeden believes 2013 will begin much in the same way that 2012 ended. The short-term supply/demand characteristics in the market make it likely that mortgage performance could be solid. Primary mortgage rates start the year near all-time lows, and prepayment rates continue to be elevated and should remain elevated for the foreseeable future. Given that, we feel the most attractive opportunity in creating value within the MBS sector is finding specified pools and mortgage derivatives backed by collateral that will prepay slower than generic borrowers. We will continue to monitor the effects of monetary policy and fiscal policy on the markets as volatility is expected to continue.
This commentary reflects the viewpoints of the portfolio manager, Smith Breeden Associates, Inc., as of December 31, 2012, and is not intended as a forecast or guarantee of future results.
CUMULATIVE TOTAL RETURN PERFORMANCE
Managers Short Duration Government Fund’s cumulative total return is based on the daily change in net asset value (NAV), and assumes that all distributions were reinvested. The chart illustrates the performance of a hypothetical $10,000 investment made in the Fund on December 31, 2002 to a $10,000 investment made in the BofA Merrill Lynch Six-Month U.S. Treasury Bill Index for the same time period. Performance for periods longer than one year is the average annual return. The graph and table do not reflect the deduction of taxes that a shareholder would pay on a Fund distribution or redemption of shares. Figures include reinvestment of capital gains and dividends. The listed returns for the Fund are net of expenses and the returns for the index exclude expenses. Past performance is not indicative of future results. Total returns for the Fund would have been lower had certain expenses not been reduced.
Managers Short Duration Government Fund
Portfolio Manager’s Comments (continued)
CUMULATIVE TOTAL RETURN PERFORMANCE (continued)
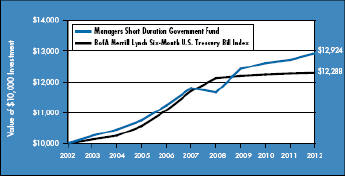
The table below shows the average annual total returns for the Managers Short Duration Government Fund and the BofA Merrill Lynch Six-Month U.S. Treasury Bill Index for the same time periods ended December 31, 2012.
| | | | | | | | | | | | |
| | | Average Annualized Total Returns1 | |
| | | One Year | | | Five Years | | | Ten Years | |
Managers Short Duration Government Fund 2,3,4,5,6 | | | 1.64 | % | | | 1.84 | % | | | 2.60 | % |
BofA Merrill Lynch Six-Month Treasury Bill Index7 | | | 0.17 | % | | | 0.98 | % | | | 2.08 | % |
The performance data shown represents past performance. Past performance is not a guarantee of future results. Current performance may be lower or higher than the performance data quoted. The investment return and principal value of an investment in the Fund will fluctuate so that an investor’s shares, when redeemed, may be worth more or less than their original cost. For performance information through the most recent month end, please call (800) 835-3879 or visit our Web site at www.managersinvest.com.
Investors should carefully consider the Fund’s investment objectives, risks, charges, and expenses before investing. For this and other information, please call (800) 835-3879 or visit www.managersinvest.com for a free prospectus. Read it carefully before investing or sending money. Funds are distributed by Managers Distributors, Inc., a member of FINRA.
|
1 Total return equals income yield plus share price change and assumes reinvestment of all dividends and capital gain distributions. Returns are net of fees and may reflect offsets of Fund expenses as described in the Prospectus. No adjustment has been made for taxes payable by shareholders on their reinvested dividends and capital gain distributions. Returns for periods greater than one year are the average annual return. The listed returns on the Fund are net of expenses and based on the published NAV as of December 31, 2012. All returns are in
U.S. dollars ($). 2 From time to time the Fund’s advisor has waived its fees and/or absorbed Fund expenses, which may have resulted in higher returns. 3 Changing interest rates may adversely affect the value of an investment. An increase in interest rates typically causes the value of bonds and other fixed income securities to fall. 4 The Fund is subject to the risks associated with investments in debt securities, such as default risk and fluctuations in the perception of the debtors’ ability to pay their creditors. 5 The Fund may use derivative instruments for hedging purposes or as part of its investment strategy. There is a risk that a derivative intended as a hedge may not perform as expected. The main risks with derivatives is that some types can amplify a gain or loss, potentially earning or losing substantially more money than the actual cost of the derivative or that the counterparty may fail to honor its contract terms, causing a loss for the Fund. Use of these instruments may also involve certain costs and risks such as liquidity risk, interest rate risk, market risk, credit risk, management risk and the risk that a fund could not close out a position when it would be most advantageous to do so. 6 Many bonds have call provisions which allow the debtors to pay them back before maturity. This is especially true with mortgage securities, which can be paid back anytime. Typically debtors prepay their debt when it is to their advantage (when interest rates drop making a new loan at current rates more attractive), and thus likely to the disadvantage of bondholders, who may have to reinvest prepayment proceeds in securities with lower yields. Prepayment risk will vary depending on the provisions of the security and current interest rates relative to the interest rate of the debt. 7 The BofA Merrill Lynch Six-Month Treasury Bill Index is an unmanaged index that measures returns of six-month Treasury Bills. Unlike the Fund, the BofA Merrill Lynch 6-Month T-Bill Index is unmanaged, is not available for investment, and does not incur expenses. Not FDIC insured, nor bank guaranteed. May lose value. |
5
Managers Short Duration Government Fund
Fund Snapshots
December 31, 2012
Portfolio Breakdown (unaudited)
| | | | |
Portfolio Breakdown | | Managers Short Duration
Government Fund** | |
U.S. Government and Agency Obligations | | | 80.6 | % |
Mortgage-Backed Securities | | | 9.3 | % |
Asset-Backed Securities | | | 0.2 | % |
Other Assets and Liabilities | | | 9.9 | % |
| ** | As a percentage of net assets. |
| | | | |
Rating | | Managers Short
Duration
Government
Fund† | |
U.S. Treasury & Agency | | | 90.7 | % |
Aaa | | | 9.0 | % |
Aa | | | 0.0 | % |
A | | | 0.1 | % |
Baa | | | 0.0 | % |
Ba & lower | | | 0.2 | % |
| † | As a percentage of market value of fixed income securities. Chart does not include equity securities. |
Top Ten Holdings (unaudited)
| | | | |
Security Name | | % of
Net Assets | |
FHLMC, 0.008%, 01/14/13 | | | 3.2 | % |
FNMA, 3.500%, TBA | | | 1.8 | |
FNMA, 2.286%, 02/01/35* | | | 1.6 | |
FHLMC Gold Pool, 3.500%, 08/01/26 | | | 1.6 | |
FHLMC, 0.110%, 05/20/13 | | | 1.5 | |
Morgan Stanley Capital l, Inc., Series 2004-T13, Class | | | | |
A4, 4.660%, 09/13/45 | | | 1.5 | |
FNMA, 2.492%, 11/01/34* | | | 1.5 | |
FNMA, 5.500%, 12/01/17* | | | 1.4 | |
FNMA, 0.075%, 03/06/13 | | | 1.3 | |
FNMA, 2.526%, 01/01/36* | | | 1.3 | |
| | | | |
Top Ten as a Group | | | 16.7 | % |
| | | | |
| * | Top Ten Holding at June 30, 2012 |
Any sectors, industries, or securities discussed should not be perceived as investment recommendations. Mention of a specific security should not be considered a recommendation to buy or solicitation to sell that security. Specific securities mentioned in this report may have been sold from the Fund’s portfolio of investments by the time you receive this report.
Managers Short Duration Government Fund
Schedule of Portfolio Investments
December 31, 2012
| | | | | | | | |
| | | Principal Amount | | | Value | |
| | | | | | | | |
| | | | | | | | |
Asset-Backed Securities - 0.2% | | | | | | | | |
First Franklin Mortgage Loan Asset Backed Certificates, Series 2005-FF10, Class A4, 0.530%, 11/25/35 (01/25/13)1 | | $ | 695,943 | | | $ | 667,782 | |
Structured Asset Investment Loan Trust, Series 2004-BNC2, Class A5, 1.290%, 12/25/34 (01/25/13)1,2 | | | 199,984 | | | | 192,736 | |
Total Asset-Backed Securities (cost $896,315) | | | | | | | 860,518 | |
Mortgage-Backed Securities - 9.3% | | | | | | | | |
Bank of America Merrill Lynch Commercial Mortgage, Inc., | | | | | | | | |
Series 2003-1, Class A2, 4.648%, 09/11/36 | | | 231,720 | | | | 231,872 | |
Series 2003-2, Class A4, 5.061%, 03/11/413 | | | 245,230 | | | | 248,947 | |
Series 2006-6, Class A2, 5.309%, 10/10/45 | | | 266,425 | | | | 269,998 | |
Bear Stearns Commercial Mortgage Securities, Inc., | | | | | | | | |
Series 2003-T10, Class A2, 4.740%, 03/13/40 | | | 243,215 | | | | 243,677 | |
Series 2003-T12, Class A4, 4.680%, 08/13/393 | | | 1,551,790 | | | | 1,582,804 | |
Series 2004-PWR3, Class A4, 4.715%, 02/11/41 | | | 300,000 | | | | 309,158 | |
Series 2004-T14, Class A4, 5.200%, 01/12/413 | | | 1,199,880 | | | | 1,246,336 | |
Series 2006-PW11, Class A2, 5.404%, 03/11/393 | | | 284,484 | | | | 287,127 | |
Citigroup Commercial Mortgage Trust, Series 2005-C3, Class A2, 4.639%, 05/15/43 | | | 623,677 | | | | 629,673 | |
Countrywide Home Loan Mortgage Pass Through Trust, Series 2004-25, Class 2A4, 0.710%, 02/25/35 (01/25/13)1,2,4 | | | 1,093,157 | | | | 336,683 | |
Credit Suisse First Boston Mortgage Securities Corp., | | | | | | | | |
Series 2002-CP5, Class C, 5.230%, 12/15/35 | | | 289,671 | | | | 289,668 | |
Series 2003-C3, Class A5, 3.936%, 05/15/38 | | | 718,077 | | | | 720,240 | |
Series 2003-C5, Class A4, 4.900%, 12/15/363 | | | 609,966 | | | | 623,569 | |
Series 2004-C2, Class A2, 5.416%, 05/15/363 | | | 4,884,000 | | | | 5,126,369 | |
Series 2004-C5, Class A3, 4.499%, 11/15/37 | | | 485,487 | | | | 485,366 | |
GE Capital Commercial Mortgage Corp., Series 2004-C2, Class A4, 4.893%, 03/10/40 | | | 900,000 | | | | 937,686 | |
GMAC Commercial Mortgage Securities, Inc., | | | | | | | | |
Series 2003-C2, Class A2, 5.444%, 05/10/403 | | | 774,815 | | | | 786,144 | |
Series 2003-C3, Class A4, 5.023%, 04/10/40 | | | 2,457,809 | | | | 2,514,798 | |
Greenwich Capital Commercial Funding Corp., Series 2005-GG3, Class A3, 4.569%, 08/10/42 | | | 1,880,203 | | | | 1,884,289 | |
JPMorgan Chase Commercial Mortgage Securities Corp., | | | | | | | | |
Series 2003-C1, Class A2, 4.985%, 01/12/37 | | | 170,138 | | | | 170,142 | |
Series 2003-CB7, Class A4, 4.879%, 01/12/383 | | | 2,682,269 | | | | 2,753,322 | |
Series 2003-LN1, Class A2, 4.920%, 10/15/373 | | | 3,350,000 | | | | 3,418,903 | |
LB-UBS Commercial Mortgage Trust, | | | | | | | | |
Series 2003-C7, Class A4, 4.931%, 09/15/353 | | | 2,100,000 | | | | 2,134,186 | |
Series 2003-C8, Class A3, 4.830%, 11/15/27 | | | 325,823 | | | | 328,896 | |
Series 2005-C7, Class A2, 5.103%, 11/15/30 | | | 17,912 | | | | 17,922 | |
Merrill Lynch Mortgage Investors, Inc., Series 1998-C1, Class A3, 6.720%, 11/15/263 | | | 1,721,435 | | | | 1,906,593 | |
Merrill Lynch Mortgage Trust, | | | | | | | | |
Series 2003-KEY1, Class A4, 5.236%, 11/12/353 | | | 1,900,000 | | | | 1,949,970 | |
Series 2004-MKB1, Class A3, 4.892%, 02/12/42 | | | 535,618 | | | | 536,778 | |
Morgan Stanley Capital I, Inc., | | | | | | | | |
Series 2003-IQ4, Class A2, 4.070%, 05/15/40 | | | 446,248 | | | | 447,800 | |
|
The accompanying notes are an integral part of these financial statements. 7 |
Managers Short Duration Government Fund
Schedule of Portfolio Investments (continued)
| | | | | | | | |
| | | Principal Amount | | | Value | |
| | | | | | | | |
| | | | | | | | |
Mortgage-Backed Securities - 9.3% (continued) | | | | | | | | |
Series 2003-IQ5, Class A4, 5.010%, 04/15/38 | | $ | 370,627 | | | $ | 376,370 | |
Series 2004-T13, Class A4, 4.660%, 09/13/45 | | | 6,800,000 | | | | 6,994,548 | |
Morgan Stanley Dean Witter Capital I, Series 2002-IQ3, Class A4, 5.080%, 09/15/37 | | | 66,833 | | | | 66,814 | |
Prudential Commercial Mortgage Trust, Series 2003-PWR1, Class A2, 4.493%, 02/11/36 | | | 495,038 | | | | 494,935 | |
Wachovia Bank Commercial Mortgage Trust, | | | | | | | | |
Series 2003-C6, Class A4, 5.125%, 08/15/353 | | | 357,785 | | | | 364,105 | |
Series 2003-C6, Class B, 5.125%, 08/15/353 | | | 396,000 | | | | 404,455 | |
Series 2003-C8, Class A4, 4.964%, 11/15/353 | | | 1,762,000 | | | | 1,820,373 | |
WaMu Mortgage Pass Through Certificates, Series 2005-AR2, Class 2A3, 0.560%, 01/25/45 (01/25/13)1 | | | 577,948 | | | | 545,746 | |
Total Mortgage-Backed Securities (cost $44,706,543) | | | | | | | 43,486,262 | |
| | |
U.S. Government and Agency Obligations - 80.6%5 | | | | | | | | |
Federal Home Loan Mortgage Corporation - 30.8% | | | | | | | | |
FHLMC, | | | | | | | | |
2.126%, 11/01/33 (03/15/13)1 | | | 1,296,346 | | | | 1,368,830 | |
2.315%, 10/01/28 (03/15/13)1 | | | 84,272 | | | | 88,121 | |
2.357%, 07/01/34 (03/15/13)1,2 | | | 433,448 | | | | 460,633 | |
2.358%, 12/01/33 (03/15/13)1 | | | 2,567,770 | | | | 2,741,226 | |
2.375%, 12/01/32 to 04/01/34 (03/15/13)1,2 | | | 6,222,583 | | | | 6,589,151 | |
2.384%, 11/01/33 (03/15/13)1 | | | 1,657,050 | | | | 1,764,847 | |
2.397%, 05/01/33 (03/15/13)1 | | | 1,421,172 | | | | 1,501,737 | |
2.411%, 05/01/34 (03/15/13)1 | | | 2,947,004 | | | | 3,129,913 | |
2.446%, 10/01/33 (03/15/13)1,2 | | | 2,933,148 | | | | 3,111,710 | |
2.454%, 10/01/33 (03/15/13)1,2 | | | 1,762,675 | | | | 1,866,066 | |
2.500%, 09/01/35 (03/15/13)1,2 | | | 2,420,095 | | | | 2,545,199 | |
2.541%, 02/01/23 (03/15/13)1 | | | 591,554 | | | | 613,152 | |
2.617%, 06/01/35 (03/15/13)1,2 | | | 1,040,902 | | | | 1,116,572 | |
2.680%, 12/01/35 (03/15/13)1 | | | 461,295 | | | | 490,604 | |
2.893%, 09/01/33 (03/15/13)1,2 | | | 2,627,379 | | | | 2,796,006 | |
3.184%, 02/01/37 (03/15/13)1,2 | | | 880,427 | | | | 925,938 | |
FHLMC Gold Pool, | | | | | | | | |
3.000%, 05/01/27 to 07/01/27 | | | 2,001,165 | | | | 2,118,817 | |
3.500%, 12/01/25 to 03/01/27 | | | 18,898,855 | | | | 20,006,047 | |
4.000%, 05/01/24 to 09/01/26 | | | 10,495,840 | | | | 11,112,921 | |
4.500%, 07/01/18 to 06/01/262 | | | 12,901,731 | | | | 13,784,239 | |
5.000%, 09/01/17 to 04/01/232 | | | 13,166,009 | | | | 14,195,446 | |
5.500%, 08/01/17 to 05/01/382 | | | 21,360,120 | | | | 23,107,635 | |
6.000%, 03/01/18 to 01/01/242 | | | 1,822,066 | | | | 1,998,137 | |
6.500%, 03/01/182 | | | 576,418 | | | | 621,988 | |
7.000%, 06/01/17 to 07/01/192 | | | 888,499 | | | | 944,150 | |
7.500%, 04/01/15 to 03/01/33 | | | 646,345 | | | | 772,663 | |
FHLMC REMICS, | | | | | | | | |
Series 2429, Class HB, 6.500%, 12/15/23 | | | 325,630 | | | | 367,403 | |
|
The accompanying notes are an integral part of these financial statements. 8 |
Managers Short Duration Government Fund
Schedule of Portfolio Investments (continued)
| | | | | | | | |
| | | Principal Amount | | | Value | |
| | | | | | | | |
| | | | | | | | |
Federal Home Loan Mortgage Corporation - 30.8% (continued) | | | | | | | | |
FHLMC REMICS, | | | | | | | | |
Series 2554, Class HA, 4.500%, 04/15/32 | | $ | 1,532,541 | | | $ | 1,581,472 | |
Series 2558, Class UE, 5.500%, 05/15/22 | | | 76,981 | | | | 77,440 | |
Series 2621, Class PG, 5.500%, 12/15/31 | | | 1,665,078 | | | | 1,695,490 | |
Series 2627, Class BM, 4.500%, 06/15/18 | | | 417,496 | | | | 441,456 | |
Series 2628, Class GQ, 3.140%, 11/15/17 | | | 294,317 | | | | 298,074 | |
Series 2631, Class PD, 4.500%, 06/15/18 | | | 149,735 | | | | 158,106 | |
Series 2635, Class DG, 4.500%, 01/15/18 | | | 349,221 | | | | 360,171 | |
Series 2682, Class LC, 4.500%, 07/15/32 | | | 2,832,025 | | | | 2,931,101 | |
Series 2683, Class JB, 4.000%, 09/15/18 | | | 747,509 | | | | 785,946 | |
Series 2709, Class PE, 5.000%, 12/15/22 | | | 596,734 | | | | 623,769 | |
Series 2718, Class MD, 4.500%, 06/15/17 | | | 40,022 | | | | 40,131 | |
Series 2764, Class OD, 4.500%, 10/15/17 | | | 153,545 | | | | 154,456 | |
Series 2766, Class PG, 5.000%, 05/15/32 | | | 767,817 | | | | 779,144 | |
Series 2783, Class TC, 4.000%, 04/15/19 | | | 608,603 | | | | 614,301 | |
Series 2786, Class BC, 4.000%, 04/15/19 | | | 476,447 | | | | 506,708 | |
Series 2791, Class AJ, 5.000%, 07/15/16 | | | 155,110 | | | | 156,326 | |
Series 2809, Class UC, 4.000%, 06/15/19 | | | 479,041 | | | | 504,725 | |
Series 2843, Class BH, 4.000%, 01/15/18 | | | 83,934 | | | | 83,914 | |
Series 2850, Class BN, 4.500%, 09/15/18 | | | 88,916 | | | | 90,112 | |
Series 2877, Class PA, 5.500%, 07/15/33 | | | 403,530 | | | | 431,409 | |
Series 2882, Class UL, 4.500%, 02/15/19 | | | 404,520 | | | | 411,111 | |
Series 2890, Class KC, 4.500%, 02/15/19 | | | 397,451 | | | | 405,670 | |
Series 2935, Class LM, 4.500%, 02/15/35 | | | 1,565,165 | | | | 1,661,834 | |
Series 2986, Class KL, 4.570%, 11/15/19 | | | 3,368,254 | | | | 3,453,423 | |
Series 3000, Class PB, 3.900%, 01/15/23 | | | 252,465 | | | | 261,105 | |
Series 3266, Class C, 5.000%, 02/15/20 | | | 87,236 | | | | 87,697 | |
Series 3294, Class DA, 4.500%, 12/15/20 | | | 264,346 | | | | 268,369 | |
Series 3535, Class CA, 4.000%, 05/15/24 | | | 452,827 | | | | 479,227 | |
Series 3609, Class LA, 4.000%, 12/15/24 | | | 655,291 | | | | 693,838 | |
Series 3632, Class AG, 4.000%, 06/15/38 | | | 647,659 | | | | 679,806 | |
Series 3756, Class DA, 1.200%, 11/15/18 | | | 1,841,669 | | | | 1,852,623 | |
Series 3846, Class CK, 1.500%, 09/15/20 | | | 793,931 | | | | 800,716 | |
FHLMC Structured Pass Through Securities, Series T-51, Class 2A, 7.500%, 08/25/423 | | | 154,115 | | | | 182,839 | |
Total Federal Home Loan Mortgage Corporation | | | | | | | 143,691,660 | |
Federal National Mortgage Association - 41.5% | | | | | | | | |
FNMA, | | | | | | | | |
1.893%, 01/01/24 (02/25/13)1 | | | 1,229,383 | | | | 1,262,219 | |
2.150%, 01/01/34 (02/25/13)1 | | | 1,043,455 | | | | 1,094,901 | |
2.201%, 08/01/34 (02/25/13)1 | | | 539,214 | | | | 569,088 | |
2.220%, 01/01/35 (02/25/13)1 | | | 824,928 | | | | 875,019 | |
2.237%, 02/01/33 to 05/01/34 (02/25/13)1 | | | 4,181,446 | | | | 4,434,615 | |
2.245%, 05/01/33 (02/25/13)1 | | | 2,037,104 | | | | 2,162,101 | |
2.250%, 03/01/33 (02/25/13)1 | | | 815,140 | | | | 867,010 | |
|
The accompanying notes are an integral part of these financial statements. 9 |
Managers Short Duration Government Fund
Schedule of Portfolio Investments (continued)
| | | | | | | | |
| | | Principal Amount | | | Value | |
| | | | | | | | |
| | | | | | | | |
Federal National Mortgage Association - 41.5% (continued) | | | | | | | | |
FNMA, | | | | | | | | |
2.272%, 01/01/35 (02/25/13)1 | | $ | 550,475 | | | $ | 584,314 | |
2.273%, 11/01/34 (02/25/13)1 | | | 711,089 | | | | 754,883 | |
2.274%, 06/01/33 (02/25/13)1 | | | 786,168 | | | | 834,613 | |
2.280%, 01/01/35 (02/25/13)1 | | | 1,337,527 | | | | 1,420,127 | |
2.286%, 02/01/35 (02/25/13)1 | | | 7,190,475 | | | | 7,646,369 | |
2.294%, 12/01/34 (02/25/13)1 | | | 4,014,260 | | | | 4,274,717 | |
2.300%, 03/01/36 to 02/01/37 (02/25/13)1 | | | 1,660,961 | | | | 1,768,569 | |
2.306%, 01/01/35 (02/25/13)1 | | | 4,203,622 | | | | 4,485,961 | |
2.309%, 06/01/34 to 09/01/34 (02/25/13)1 | | | 3,924,315 | | | | 4,174,799 | |
2.310%, 08/01/33 (02/25/13)1 | | | 1,283,368 | | | | 1,358,370 | |
2.331%, 09/01/33 (02/25/13)1 | | | 1,090,506 | | | | 1,153,017 | |
2.333%, 06/01/34 (02/25/13)1 | | | 1,968,824 | | | | 2,089,853 | |
2.338%, 10/01/34 (02/25/13)1 | | | 1,368,412 | | | | 1,455,845 | |
2.342%, 01/01/26 (02/25/13)1 | | | 524,671 | | | | 550,174 | |
2.371%, 05/01/34 (02/25/13)1 | | | 3,248,936 | | | | 3,451,929 | |
2.378%, 01/01/25 (02/25/13)1 | | | 742,668 | | | | 793,301 | |
2.433%, 02/01/36 (02/25/13)1 | | | 4,085,391 | | | | 4,357,226 | |
2.434%, 12/01/34 (02/25/13)1 | | | 3,301,526 | | | | 3,493,465 | |
2.476%, 04/01/34 (02/25/13)1 | | | 1,083,054 | | | | 1,152,233 | |
2.492%, 11/01/34 (02/25/13)1 | | | 6,375,436 | | | | 6,859,699 | |
2.526%, 01/01/36 (02/25/13)1 | | | 5,765,607 | | | | 6,142,681 | |
2.550%, 09/01/33 (02/25/13)1,2 | | | 988,171 | | | | 1,029,877 | |
2.553%, 01/01/36 (02/25/13)1 | | | 158,950 | | | | 168,846 | |
2.593%, 01/01/33 (02/25/13)1 | | | 67,007 | | | | 70,959 | |
2.614%, 12/01/33 (02/25/13)1 | | | 877,116 | | | | 931,495 | |
2.656%, 08/01/34 (02/25/13)1 | | | 619,855 | | | | 657,876 | |
2.674%, 10/01/35 (02/25/13)1 | | | 2,596,806 | | | | 2,754,012 | |
2.682%, 07/01/34 (02/25/13)1 | | | 2,342,312 | | | | 2,488,584 | |
2.739%, 08/01/36 (02/25/13)1 | | | 313,324 | | | | 333,659 | |
2.779%, 01/01/36 (02/25/13)1 | | | 85,955 | | | | 92,511 | |
2.800%, 01/01/34 (02/25/13)1 | | | 3,613,584 | | | | 3,840,512 | |
2.810%, 01/01/33 (02/25/13)1 | | | 1,395,344 | | | | 1,483,216 | |
2.855%, 06/01/35 to 05/01/36 (02/25/13)1 | | | 753,172 | | | | 802,517 | |
2.885%, 06/01/34 (02/25/13)1 | | | 4,121,534 | | | | 4,390,855 | |
2.895%, 09/01/37 (02/25/13)1 | | | 303,995 | | | | 325,353 | |
3.000%, TBA | | | 2,000,000 | | | | 2,095,625 | |
3.500%, TBA | | | 8,000,000 | | | | 8,514,062 | |
4.000%, 12/01/26 | | | 495,752 | | | | 531,162 | |
4.500%, 04/01/19 to 04/01/25 | | | 2,244,719 | | | | 2,454,724 | |
5.000%, 03/01/18 to 03/01/252 | | | 8,430,084 | | | | 9,172,200 | |
5.500%, 10/01/17 to 07/01/262 | | | 27,241,972 | | | | 29,453,290 | |
6.000%, 03/01/17 to 07/01/252 | | | 12,448,435 | | | | 13,531,113 | |
|
The accompanying notes are an integral part of these financial statements. 10 |
Managers Short Duration Government Fund
Schedule of Portfolio Investments (continued)
| | | | | | | | |
| | | Principal Amount | | | Value | |
| | | | | | | | |
| | | | | | | | |
Federal National Mortgage Association - 41.5% (continued) | | | | | | | | |
FNMA, | | | | | | | | |
6.500%, 04/01/17 to 08/01/322 | | $ | 1,924,845 | | | $ | 2,121,093 | |
7.000%, 09/01/14 to 11/01/22 | | | 3,385,746 | | | | 3,719,813 | |
7.500%, 08/01/33 to 09/01/33 | | | 132,326 | | | | 161,892 | |
FNMA Grantor Trust, | | | | | | | | |
Series 2002-T5, Class A1, 0.450%, 05/25/32 (01/25/13)1 | | | 395,201 | | | | 388,456 | |
Series 2003-T4, Class A1, 0.430%, 09/26/33 (01/28/13)1 | | | 15,786 | | | | 15,572 | |
Series 2004-T1, Class 1A2, 6.500%, 01/25/44 | | | 386,633 | | | | 463,239 | |
FNMA REMICS, | | | | | | | | |
Series 1994-76, Class J, 5.000%, 04/25/24 | | | 436,272 | | | | 460,468 | |
Series 2001-63, Class FA, 0.759%, 12/18/31 (01/18/13)1,4 | | | 1,052,653 | | | | 1,064,906 | |
Series 2002-33, Class A2, 7.500%, 06/25/32 | | | 95,342 | | | | 116,655 | |
Series 2002-47, Class FD, 0.610%, 08/25/32 (01/25/13)1 | | | 883,304 | | | | 887,909 | |
Series 2002-56, Class UC, 5.500%, 09/25/17 | | | 864,232 | | | | 921,218 | |
Series 2002-74, Class FV, 0.660%, 11/25/32 (01/25/13)1 | | | 1,557,091 | | | | 1,565,613 | |
Series 2003-2, Class FA, 0.710%, 02/25/33 (01/25/13)1 | | | 1,047,948 | | | | 1,057,290 | |
Series 2003-3, Class HJ, 5.000%, 02/25/18 | | | 442,575 | | | | 472,571 | |
Series 2003-5, Class EL, 5.000%, 08/25/22 | | | 367,524 | | | | 372,755 | |
Series 2004-1, Class AC, 4.000%, 02/25/19 | | | 320,838 | | | | 337,382 | |
Series 2004-19, Class AE, 4.000%, 03/25/18 | | | 96,089 | | | | 96,887 | |
Series 2004-20, Class AD, 4.000%, 02/25/18 | | | 801,575 | | | | 806,181 | |
Series 2004-21, Class AE, 4.000%, 04/25/19 | | | 500,000 | | | | 527,228 | |
Series 2004-27, Class HB, 4.000%, 05/25/19 | | | 500,000 | | | | 533,515 | |
Series 2004-65, Class AE, 4.500%, 11/25/31 | | | 244,092 | | | | 244,615 | |
Series 2004-78, Class AC, 5.000%, 05/25/32 | | | 1,486,600 | | | | 1,537,588 | |
Series 2005-13, Class AF, 0.610%, 03/25/35 (01/25/13)1,2 | | | 1,478,771 | | | | 1,491,646 | |
Series 2005-19, Class PA, 5.500%, 07/25/34 | | | 294,234 | | | | 325,551 | |
Series 2005-38, Class DP, 5.000%, 06/25/19 | | | 259,023 | | | | 262,277 | |
Series 2005-58, Class EP, 5.500%, 07/25/35 | | | 421,202 | | | | 472,927 | |
Series 2005-93, Class HD, 4.500%, 11/25/19 | | | 431,625 | | | | 441,112 | |
Series 2005-100, Class GC, 5.000%, 12/25/34 | | | 2,817,149 | | | | 2,909,467 | |
Series 2006-99, Class PC, 5.500%, 12/25/33 | | | 1,070,890 | | | | 1,087,233 | |
Series 2006-125, Class FA, 0.490%, 01/25/37 (01/25/13)1 | | | 1,939,202 | | | | 1,938,120 | |
Series 2007-56, Class FN, 0.580%, 06/25/37 (01/25/13)1 | | | 771,176 | | | | 775,631 | |
Series 2008-54, Class EC, 5.000%, 02/25/35 | | | 52,897 | | | | 53,171 | |
Series 2008-59, Class KB, 4.500%, 07/25/23 | | | 500,000 | | | | 531,100 | |
Series 2008-75, Class DA, 4.500%, 03/25/21 | | | 206,408 | | | | 206,764 | |
Series 2008-81, Class KA, 5.000%, 10/25/22 | | | 209,709 | | | | 217,238 | |
Series 2010-12, Class AC, 2.500%, 12/25/18 | | | 426,913 | | | | 439,366 | |
FNMA Whole Loan, | | | | | | | | |
Series 2002-W1, Class 2A, 6.940%, 02/25/422,3 | | | 426,142 | | | | 496,723 | |
Series 2002-W6, Class 2A, 7.066%, 06/25/423 | | | 1,413,085 | | | | 1,679,273 | |
Series 2003-W1, Class 2A, 6.947%, 12/25/423 | | | 25,932 | | | | 31,490 | |
|
The accompanying notes are an integral part of these financial statements. 11 |
Managers Short Duration Government Fund
Schedule of Portfolio Investments (continued)
| | | | | | | | |
| | | Principal Amount | | | Value | |
| | | | | | | | |
| | | | | | | | |
Federal National Mortgage Association - 41.5% (continued) | | | | | | | | |
FNMA Whole Loan, | | | | | | | | |
Series 2003-W4, Class 4A, 7.232%, 10/25/422,3 | | $ | 759,663 | | | $ | 893,394 | |
Series 2003-W13, Class AV2, 0.490%, 10/25/33 (01/25/13)1,4 | | | 53,443 | | | | 53,374 | |
Series 2004-W5, Class F1, 0.660%, 02/25/47 (01/25/13)1 | | | 702,076 | | | | 706,730 | |
Series 2004-W14, Class 1AF, 0.610%, 07/25/44 (01/25/13)1,2 | | | 2,839,061 | | | | 2,852,762 | |
Series 2005-W2, Class A1, 0.410%, 05/25/35 (01/25/13)1,2 | | | 2,696,578 | | | | 2,685,811 | |
Total Federal National Mortgage Association | | | | | | | 193,613,552 | |
Government National Mortgage Association - 4.3% | | | | | | | | |
GNMA, | | | | | | | | |
0.759%, 11/16/30 to 01/16/40 (01/16/13)1 | | | 3,038,278 | | | | 3,075,417 | |
1.625%, 12/20/21 to 03/20/37 (02/20/13)1 | | | 2,028,327 | | | | 2,096,350 | |
1.750%, 09/20/22 to 09/20/35 (02/20/13)1,2 | | | 6,195,392 | | | | 6,446,882 | |
2.000%, 06/20/22 (02/20/13)1 | | | 77,497 | | | | 80,554 | |
2.500%, 07/20/18 to 08/20/21 (02/20/13)1 | | | 77,371 | | | | 80,516 | |
2.750%, 10/20/17 (02/20/13)1,2 | | | 32,194 | | | | 33,584 | |
3.000%, 11/20/17 to 03/20/21 (02/20/13)1 | | | 111,400 | | | | 116,307 | |
3.500%, 07/20/18 (02/20/13)1 | | | 34,721 | | | | 36,284 | |
4.000%, 09/15/18 | | | 610,136 | | | | 657,515 | |
4.500%, 04/15/18 to 07/20/35 | | | 3,478,445 | | | | 3,635,936 | |
4.750%, 07/20/35 | | | 272,826 | | | | 275,182 | |
5.000%, 05/20/32 | | | 227,602 | | | | 229,329 | |
5.500%, 06/17/16 to 04/20/32 | | | 3,180,494 | | | | 3,366,951 | |
9.500%, 12/15/17 | | | 5,563 | | | | 5,985 | |
Total Government National Mortgage Association | | | | | | | 20,136,792 | |
Interest Only Strips - 3.1% | | | | | | | | |
FHLMC, | | | | | | | | |
Series 215, Class IO, 8.000%, 06/15/314 | | | 185,216 | | | | 37,660 | |
Series 233, Class 5, 4.500%, 09/15/35 | | | 136,502 | | | | 15,808 | |
FHLMC REMICS, | | | | | | | | |
Series 2530, Class QI, 6.791%, 01/15/32 (01/15/13)1 | | | 303,960 | | | | 65,470 | |
Series 2637, Class SI, 5.791%, 06/15/18 (01/15/13)1 | | | 296,899 | | | | 25,292 | |
Series 2649, Class IM, 7.000%, 07/15/33 | | | 558,454 | | | | 129,200 | |
Series 2763, Class KS, 6.441%, 10/15/18 (01/15/13)1 | | | 710,779 | | | | 58,660 | |
Series 2877, Class GS, 6.491%, 11/15/18 (01/15/13)1 | | | 261,292 | | | | 13,490 | |
Series 2922, Class SE, 6.541%, 02/15/35 (01/15/13)1 | | | 494,690 | | | | 96,688 | |
Series 2934, Class HI, 5.000%, 02/15/20 | | | 188,671 | | | | 21,168 | |
Series 2934, Class KI, 5.000%, 02/15/20 | | | 128,926 | | | | 13,974 | |
Series 2965, Class SA, 5.841%, 05/15/32 (01/15/13)1 | | | 1,315,510 | | | | 191,656 | |
Series 2967, Class JI, 5.000%, 04/15/20 | | | 610,692 | | | | 64,180 | |
Series 2980, Class SL, 6.491%, 11/15/34 (01/15/13)1 | | | 663,206 | | | | 139,104 | |
Series 2981, Class SU, 7.591%, 05/15/30 (01/15/13)1 | | | 513,153 | | | | 127,965 | |
Series 3031, Class BI, 6.480%, 08/15/35 (01/15/13)1 | | | 1,177,640 | | | | 242,495 | |
Series 3065, Class DI, 6.411%, 04/15/35 (01/15/13)1 | | | 1,027,392 | | | | 209,042 | |
Series 3114, Class GI, 6.391%, 02/15/36 (01/15/13)1 | | | 1,908,174 | | | | 383,269 | |
|
The accompanying notes are an integral part of these financial statements. 12 |
Managers Short Duration Government Fund
Schedule of Portfolio Investments (continued)
| | | | | | | | |
| | | Principal Amount | | | Value | |
| | | | | | | | |
| | | | | | | | |
Interest Only Strips - 3.1% (continued) | | | | | | | | |
FHLMC REMICS, | | | | | | | | |
Series 3308, Class S, 6.991%, 03/15/32 (01/15/13)1 | | $ | 1,257,870 | | | $ | 240,864 | |
Series 3424, Class XI, 6.361%, 05/15/36 (01/15/13)1 | | | 1,140,966 | | | | 222,198 | |
Series 3489, Class SD, 7.591%, 06/15/32 (01/15/13)1 | | | 642,815 | | | | 136,236 | |
Series 3606, Class SN, 6.041%, 12/15/39 (01/15/13)1 | | | 1,496,250 | | | | 227,812 | |
Series 3685, Class EI, 5.000%, 03/15/19 | | | 2,384,149 | | | | 220,071 | |
Series 3731, Class IO, 5.000%, 07/15/19 | | | 1,109,295 | | | | 94,176 | |
Series 3882, Class AI, 5.000%, 06/15/26 | | | 474,274 | | | | 45,201 | |
Series 3995, Class KI, 3.500%, 02/15/27 | | | 1,538,064 | | | | 203,050 | |
FNMA, | | | | | | | | |
Series 92, Class 2, 9.000%, 12/15/164 | | | 16,009 | | | | 1,972 | |
Series 306, Class IO, 8.000%, 05/01/304 | | | 137,205 | | | | 27,463 | |
Series 365, Class 4, 5.000%, 04/01/36 | | | 202,585 | | | | 25,462 | |
FNMA REMICS, | | | | | | | | |
Series 2001-82, Class S, 7.620%, 05/25/28 (01/25/13)1,4 | | | 520,021 | | | | 111,354 | |
Series 2003-48, Class SJ, 5.790%, 06/25/18 (01/25/13)1 | | | 370,912 | | | | 34,447 | |
Series 2003-73, Class SM, 6.390%, 04/25/18 (01/25/13)1 | | | 385,736 | | | | 35,104 | |
Series 2004-49, Class SQ, 6.840%, 07/25/34 (01/25/13)1 | | | 394,810 | | | | 78,266 | |
Series 2004-51, Class SX, 6.910%, 07/25/34 (01/25/13)1 | | | 552,876 | | | | 94,165 | |
Series 2004-64, Class SW, 6.840%, 08/25/34 (01/25/13)1 | | | 1,824,176 | | | | 372,462 | |
Series 2004-66, Class SE, 6.290%, 09/25/34 (01/25/13)1 | | | 283,980 | | | | 60,934 | |
Series 2005-5, Class SD, 6.490%, 01/25/35 (01/25/13)1 | | | 609,530 | | | | 92,661 | |
Series 2005-12, Class SC, 6.540%, 03/25/35 (01/25/13)1 | | | 686,189 | | | | 143,075 | |
Series 2005-45, Class SR, 6.510%, 06/25/35 (01/25/13)1 | | | 1,633,949 | | | | 319,802 | |
Series 2005-65, Class KI, 6.790%, 08/25/35 (01/25/13)1 | | | 3,689,214 | | | | 792,484 | |
Series 2005-66, Class GS, 6.640%, 07/25/20 (01/25/13)1 | | | 325,040 | | | | 44,845 | |
Series 2005-67, Class SM, 5.940%, 08/25/35 (01/25/13)1 | | | 316,817 | | | | 52,780 | |
Series 2006-3, Class SA, 5.940%, 03/25/36 (01/25/13)1 | | | 759,127 | | | | 132,317 | |
Series 2007-75, Class JI, 6.335%, 08/25/37 (01/25/13)1 | | | 289,721 | | | | 44,003 | |
Series 2007-85, Class SI, 6.250%, 09/25/37 (01/25/13)1 | | | 844,873 | | | | 166,577 | |
Series 2008-86, Class IO, 4.500%, 03/25/23 | | | 2,045,162 | | | | 176,134 | |
Series 2008-87, Class AS, 7.440%, 07/25/33 (01/25/13)1 | | | 2,613,662 | | | | 486,839 | |
Series 2010-29, Class KJ, 5.000%, 12/25/21 | | | 8,410,536 | | | | 813,813 | |
Series 2010-37, Class GI, 5.000%, 04/25/25 | | | 2,352,045 | | | | 159,228 | |
Series 2010-65, Class IO, 5.000%, 09/25/20 | | | 2,600,035 | | | | 288,823 | |
Series 2010-68, Class SJ, 6.340%, 07/25/40 (01/25/13)1 | | | 748,047 | | | | 135,038 | |
Series 2010-105, Class IO, 5.000%, 08/25/20 | | | 1,082,440 | | | | 104,895 | |
Series 2010-121, Class IO, 5.000%, 10/25/25 | | | 1,199,373 | | | | 112,628 | |
Series 2011-69, Class AI, 5.000%, 05/25/18 | | | 3,842,031 | | | | 306,103 | |
Series 2011-88, Class WI, 3.500%, 09/25/26 | | | 1,765,171 | | | | 248,395 | |
Series 2011-124, Class IC, 3.500%, 09/25/21 | | | 3,438,834 | | | | 327,366 | |
Series 2012-126, Class SJ, 4.790%, 11/25/42 (01/25/13)1 | | | 6,311,523 | | | | 1,219,315 | |
GNMA, | | | | | | | | |
Series 1999-40, Class TW, 6.791%, 02/17/29 (01/17/13)1 | | | 671,527 | | | | 139,048 | |
|
The accompanying notes are an integral part of these financial statements. 13 |
Managers Short Duration Government Fund
Schedule of Portfolio Investments (continued)
| | | | | | | | |
| | | Principal Amount | | | Value | |
| | | | | | | | |
| | | | | | | | |
Interest Only Strips - 3.1% (continued) | | | | | | | | |
GNMA, | | | | | | | | |
Series 2002-7, Class ST, 7.291%, 08/17/27 (01/17/13)1 | | $ | 610,818 | | | $ | 138,609 | |
Series 2010-111, Class BI, 2.000%, 09/16/13 | | | 3,863,560 | | | | 54,089 | |
Series 2010-147, Class IG, 2.000%, 11/16/13 | | | 16,317,597 | | | | 342,622 | |
Series 2011-32, Class KS, 11.682%, 06/16/34 (01/16/13)1 | | | 1,080,342 | | | | 320,570 | |
Series 2011-37, Class IG, 2.000%, 03/20/13 | | | 2,710,202 | | | | 15,122 | |
Series 2011-94, Class IS, 6.491%, 06/16/36 (01/16/13)1 | | | 940,502 | | | | 187,537 | |
Series 2011-146, Class EI, 5.000%, 11/16/41 | | | 534,324 | | | | 109,401 | |
Series 2011-157, Class SG, 6.389%, 12/20/41 (01/20/13)1 | | | 1,336,663 | | | | 396,978 | |
Series 2011-167, Class IO, 5.000%, 12/16/20 | | | 5,298,090 | | | | 511,463 | |
Series 2012-34, Class KS, 5.841%, 03/16/42 (01/16/13)1 | | | 4,264,475 | | | | 1,153,307 | |
Series 2012-69, Class QI, 4.000%, 03/16/41 | | | 2,193,098 | | | | 430,932 | |
Series 2012-96, Class IC, 3.000%, 08/20/27 | | | 1,463,196 | | | | 216,466 | |
Total Interest Only Strips | | | | | | | 14,249,623 | |
U.S. Government Obligations - 0.9% | | | | | | | | |
U.S. Treasury Inflation Linked Notes, 2.375%, 01/15/25 | | | 3,190,668 | | | | 4,304,160 | |
Total U.S. Government and Agency Obligations (cost $368,452,126) | | | | | | | 375,995,787 | |
Short-Term Investments - 11.3% | | | | | | | | |
U.S. Government and Agency Discount Notes - 6.4% | | | | | | | | |
FHLMC, 0.008%, 01/14/136 | | | 15,000,000 | | | | 14,999,895 | |
FHLMC, 0.062%, 02/25/136 | | | 1,400,000 | | | | 1,399,916 | |
FHLMC, 0.110%, 05/20/136,7 | | | 7,000,000 | | | | 6,997,585 | |
FNMA, 0.075%, 03/06/136 | | | 6,200,000 | | | | 6,199,454 | |
FNMA, 0.082%, 03/20/136,7 | | | 250,000 | | | | 249,973 | |
Total U.S. Government and Agency Discount Notes | | | | | | | 29,846,823 | |
| | |
| | | Shares | | | | |
| | | | | | | | |
Other Investment Companies - 4.9%8 | | | | | | | | |
Dreyfus Cash Management Fund, Institutional Class Shares, 0.06% 2 | | | 22,549,302 | | | | 22,549,302 | |
Total Short-Term Investments (cost $52,393,020) | | | | | | | 52,396,125 | |
Total Investments - 101.4% (cost $466,448,004) | | | | | | | 472,738,692 | |
Other Assets, less Liabilities - (1.4)% | | | | | | | (6,324,019 | ) |
Net Assets - 100.0% | | | | | | $ | 466,414,673 | |
|
The accompanying notes are an integral part of these financial statements. 14 |
Portfolio Intermediate Duration Government Fund
Investment Manager’s Comments
The Managers Intermediate Duration Government Fund’s objective is to achieve total return in excess of the total return of the major market indices for mortgage-backed securities.
The Managers Intermediate Duration Government Fund seeks to achieve its objective by matching the duration, or interest-rate risk, of a portfolio that invests exclusively in mortgage-backed securities, as weighted in the major market indices for mortgage-backed securities. These indices currently include the Citigroup Mortgage Index and the Barclays Capital Mortgage Index, each of which includes all outstanding government sponsored fixed-rate mortgage-backed securities, weighted in proportion to their current market capitalization. The duration of these indices is generally similar to that of intermediate-term U.S. Treasury notes, and typically will range between three and five years.
Under normal circumstances, the Fund will invest at least 80% of its assets in debt securities issued by the U.S. Government, its agencies and instrumentalities, and synthetic instruments or derivatives, or securities having economic characteristics similar to such debt securities. The Fund’s benchmark is the Citigroup Mortgage Index.
THE PORTFOLIO MANAGER
Smith Breeden Associates, Inc.
Smith Breeden Associates, Inc. (“Smith Breeden”) is the subadvisor for the Fund. Smith Breeden, located at 280 South Mangum Street, Suite 301, Durham, NC, was founded in 1982. Smith Breeden is an investment management firm for a client base including corporate and public pension plans, central and supranational banks, endowments and foundations, private banks and financial institutions, insurance companies, and other institutional investors. Specializing in fixed income portfolios, the firm offers separate accounts, commingled funds, and serves as a subadvisor to ‘40 Act funds.
Smith Breeden believes that innovative research provides critical insights into the fixed-income market. The firm’s experienced investment professionals apply these research insights to the management of investment portfolios designed to achieve their clients’ objectives. The key tenets of this market-tested investment philosophy are:
| | • | | Over a market cycle, a portfolio of fixed income securities with wide risk-adjusted spreads produces an attractive total return in comparison to the market return. |
| | • | | The incremental return available from security selection and sector allocation, based on careful relative value analysis, quantitative research, and experienced market judgment, is more consistent than the incremental return from predicting the direction of interest rates or other macro-factor trading strategies. |
| | • | | Within the investment-grade fixed-income market, the spread sectors, e.g., corporate bonds, mortgage-backed securities (MBS), commercial MBS (CMBS), and asset-backed securities (ABS), will tend to outperform Treasury securities over a market cycle. The corporate, mortgage, CMBS, and ABS sectors also offer the greatest active management opportunity for adding value through security selection. |
The portfolio management team at Smith Breeden Associates specializes in analyzing and investing in mortgage-backed
securities. Through careful analysis and comparison of the characteristics of these securities, such as type of issuer, coupon, maturity, geographic structure, and historic and prospective prepayment rates, the team seeks to structure a portfolio that will outperform the Citigroup Mortgage Index. While the portfolio managers will purchase securities of any maturity or duration, they do not attempt to add value by actively positioning the interest-rate sensitivity of the portfolio. Instead, they typically manage the weighted average duration of the portfolio so that it is similar to that of the duration of the Citigroup Mortgage Index.
The ideal investment exhibits the following traits:
| | • | | Very high quality (AAA or Government) |
| | • | | Attractive value relative to other MBS opportunities |
The portfolio managers limit purchases to securities from the following asset classes:
| | • | | Securities issued directly or guaranteed by the U.S. Government or its agencies or instrumentalities |
| | • | | Mortgage-backed securities rated AAA by Standard & Poor’s Corporation (“S&P”) or Aaa by Moody’s Investors Service, Inc. (“Moody’s”) |
| | • | | Securities fully collateralized by assets in either of the above classes |
| | • | | Assets that would qualify as liquidity items under federal regulations (which may change from time to time) if held by a commercial bank or savings institution; and hedge instruments |
| | • | | Stripped mortgage-backed securities, which may only be used for risk management purposes |
The investment team will make a sell decision when:
| | • | | They no longer view the bonds as attractive |
| | • | | They need to maintain the portfolio’s target duration |
| | • | | They deem it necessary for portfolio allocation purposes |
THE YEAR IN REVIEW
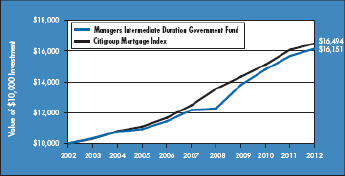
During the year ended December 31, 2012, the Fund returned 3.06%, compared to 2.60% for its benchmark, the Citigroup Mortgage Index (“Citi Mortgage”).
The year was filled with macro uncertainty and superiority of fixed income spread over duration as developed nations had too much debt in the wrong places and more commitments, especially for pensions and healthcare, than could be honored. The macro uncertainty was tempered by accommodative monetary policy. Spread exposure reaped high returns compared with duration exposure. As we entered a period of negotiations when the U.S. faced the “fiscal cliff,” market pressure continued and will inevitably continue into 2013 as the over-commitments mentioned above will not go away on their own accord.
Coming into the year, market consensus was that the likelihood of QE3 was high, and it was almost universally accepted that agency MBS would be part of the program. The first quarter data, however, suggested a rebounding economy. Several voting Fed members believed further QE would require increased weakness from upcoming economic data, while a couple of members were explicitly against increasing the Fed’s balance sheet. Demand for MBS remained strong, and volatility was low. The Fund’s Fixed-Rate MBS
Portfolio Intermediate Duration Government Fund
Investment Manager’s Comments (continued)
performance was pretty uniform across the stack as lower coupons continued to benefit from demand from the Fed and the REIT community, while higher coupon MBS performed well as prepayment rates continue to be relatively low. Mortgage derivatives, such as interest-only strips (IO) or inverse interest-only floaters (IIO), performed well during the quarter.
The second quarter marked another strong quarter for the Fund. Economic news was generally negative as problems in Europe continued to manifest themselves with no clear solution. Domestic payrolls continued to disappoint, as the rebound in jobs was not as robust as expected. The FHA’s new streamline finance program with lower insurance fees kicked in the latter part of the quarter. The Mortgage Bankers Association’s Government Refinance index spiked following the rules change, and high coupon GNMA securities sold off significantly. The Fund’s underweight in GNMA MBS was a positive given weakness in select coupons. Small positions in IOs and IIOs, which benefitted from continued low short-term rates, were also positive for the quarter.
The FOMC jolted global markets in September with the announcement of QE3. The purchases will continue until unemployment recedes sufficiently, as long as CPI inflation does not get out of hand. This development provides major support for mortgages, and despite spreads being at historical tights, we expect the sector to do well. The Fund continued with its strong performance as mortgage rates ended the quarter lower, as the Fed’s commitment to purchase additional MBS securities kept the market well-bid. Performance favored lower coupons given the market rally as higher coupon prices stalled, but specified pools with prepayment protection also performed well.
The Fund finished the fourth quarter strong as positions in non-agency MBS and CMBS were a positive as prices increased on continued demand for risk assets. Agency MBS positions continued to exhibit slower prepayments than the sector as a whole and provided roughly a third of the outperformance. For the year, the Fund showed strong performance due to record-low mortgage rates and increased prepayment rates as the Fed continued its accommodativestance.
Most of the portfolio outperformance for 2012 was attributed to agency and non-agency MBS exposure. Agency fixed-rate (FRMs), Collateralized Mortgage Obligations (CMOs), high quality CMBS, and non-agency adjustable-rate (ARMs) benefitted from low mortgage rates and prepayments.
Derivatives such as financial futures, options and mortgage derivatives are used for portfolio duration and convexity risk management. We continue to find value in mortgage derivatives with beneficial underlying collateral characteristics.
On December 31, 2012, the Fund held the bulk of its exposure in 15- and 30-year agency FRMs, although maintained an underweight versus the benchmark. We increased the allocation to 15- and 30-year agency FRMs by 6% during the year and added a 2% allocation to a 20-year agency FRM, which is not included in the Citigroup Mortgage Index. The total allocation to CMBS decreased by 3.4% of capital during the year. In adjustable-rate mortgages (ARMs), the allocation was reduced only slightly from 7.7% to 6%. The Fund also maintained its small allocation to Interest-Only (IO) strips, and CMOs. We continue to see opportunities and believe that high-quality spread assets held in the Portfolio are likely to continue experiencing positive performance.
LOOKING FORWARD
Smith Breeden believes 2013 will begin much in the same way that 2012 ended. The short-term supply/demand characteristics in the market make it likely that mortgage performance should be solid. Primary mortgage rates start the year near all-time lows, and prepayment rates continue to be elevated and should remain elevated for the foreseeable future. Given that, we feel the most attractive opportunity in creating value within the MBS sector is finding specified pools and mortgage derivatives backed by collateral that will prepay slower than generic borrowers. We will continue to monitor the effects of monetary policy and fiscal policy on the markets as volatility is expected to continue.
This commentary reflects the viewpoints of the portfolio manager, Smith Breeden Associates, Inc., as of December 31, 2012, and is not intended as a forecast or guarantee of future results.
CUMULATIVE TOTAL RETURN PERFORMANCE
Managers Intermediate Duration Government Fund’s cumulative total return is based on the daily change in net asset value (NAV), and assumes that all distributions were reinvested. The chart illustrates the performance of a hypothetical $10,000 investment made in the Fund on December 31, 2002 to a $10,000 investment made in the Citigroup Mortgage Index for the same time period. Performance for periods longer than one year is the average annual return. The graph and table do not reflect the deduction of taxes that a shareholder would pay on a Fund distribution or redemption of shares. Figures include reinvestment of capital gains and dividends. The listed returns for the Fund are net of expenses and the returns for the index exclude expenses. Past performance is not indicative of future results. Total returns for the Fund would have been lower had certain expenses not been reduced.
Portfolio Intermediate Duration Government Fund
Investment Manager’s Comments (continued)
CUMULATIVE TOTAL RETURN PERFORMANCE (continued)
The table below shows the average annual total returns for the Managers Intermediate Duration Government Fund and the Citigroup Mortgage Index for the same time periods ended December 31, 2012.
| | | | | | | | | | | | |
| | | Average Annualized Total Returns1 | |
| | | One
Year | | | Five
Years | | | Ten
Years | |
Managers Intermediate Duration Government Fund2,3,4,5 | | | 3.06 | % | | | 5.82 | % | | | 4.91 | % |
Citigroup Mortgage Index6 | | | 2.60 | % | | | 5.73 | % | | | 5.13 | % |
The performance data shown represents past performance. Past performance is not a guarantee of future results. Current performance may be lower or higher than the performance data quoted. The investment return and principal value of an investment in the Fund will fluctuate so that an investor’s shares, when redeemed, may be worth more or less than their original cost. For performance information through the most recent month end, please call (800) 835-3879 or visit our Web site at www.managersinvest.com.
Investors should carefully consider the Fund’s investment objectives, risks, charges, and expenses before investing. For this and other information, please call (800) 835-3879 or visit www.managersinvest.com for a free prospectus. Read it carefully before investing or sending money. Funds are distributed by Managers Distributors, Inc., a member of FINRA.
| | |
| | | 1 Total return equals income yield plus share price change and assumes reinvestment of all dividends and capital gain distributions. Returns are net of fees and may reflect offsets of Fund expenses as described in the Prospectus. No adjustment has been made for taxes payable by shareholders on their reinvested dividends and capital gain distributions. Returns for periods greater than one year are the average annual return. The listed returns on the Fund are net of expenses and based on the published NAV as of December 31, 2012. All returns are in U.S. dollars ($). 2 From time to time the Fund’s advisor has waived its fees and/or absorbed Fund expenses, which may have resulted in higher returns. 3 Fixed income funds are subject to the risks associated with investments in debt securities, such as default risk, fluctuations in the debtor’s perceived ability to pay its creditors, and changing interest rate risk. An increase in interest rates typically causes the value of bonds and other fixed income securities to fall. 4 The Fund may use derivative instruments for hedging purposes or as part of its investment strategy. There is a risk that a derivative intended as a hedge may not perform as expected. The main risk with derivatives is that some types can amplify a gain or loss, potentially earning or losing substantially more money than the actual cost of the derivative or that the counterparty may fail to honor its contract terms, causing a loss for the Fund. Use of these instruments may also involve certain costs and risks such as liquidity risk, interest rate risk, market risk, credit risk, management risk and the risk that a fund could not close out a position when it would be most advantageous to do so. 5 Many bonds have call provisions which allow the debtors to pay them back before maturity. This is especially true with mortgage securities, which can be paid back anytime. Typically debtors prepay their debt when it is to their advantage (when interest rates drop making a new loan at current rates more attractive), and thus likely to the disadvantage of bondholders, who may have to reinvest prepayment proceeds in securities with lower yields. Prepayment risk will vary depending on the provisions of the security and current interest rates relative to the interest rate of the debt. 6 The Citigroup Mortgage Index includes all outstanding government sponsored fixed-rate mortgage-backed securities, weighted in proportion to their current market capitalization. The Index reflects no deductions for fees, expenses, or taxes. Unlike the Fund, the Citigroup Mortgage Index is unmanaged, is not available for investment, and does not incur expenses. Not FDIC insured, nor bank guaranteed. May lose value. |
17
Managers Intermediate Duration Government Fund
Fund Snapshots
December 31, 2012
Portfolio Breakdown (unaudited)
| | | | |
Category | | Managers Intermediate Duration
Government Fund** | |
U.S. Government and Agency Obligations | | | 104.6 | % |
Mortgage-Backed Securities | | | 7.9 | % |
Other Assets and Liabilities | | | (12.5 | )% |
| ** | As a percentage of net assets. |
| | | | |
Rating | | Managers Intermediate Duration
Government Fund† | |
U.S. Treasury & Agency | | | 92.9 | % |
Aaa | | | 5.0 | % |
Aa | | | 0.0 | % |
A | | | 0.0 | % |
Baa | | | 0.0 | % |
Ba & lower | | | 2.1 | % |
| † | As a percentage of market value of fixed income securities. Chart does not include equity securities. |
Top Ten Holdings (unaudited)
| | |
Security Name | | % of
Net Assets |
FHLMC Gold Pool, 4.000%, TBA* | | 13.8% |
FNMA, 4.000%, TBA* | | 6.8 |
FHLMC Gold Pool, 4.500%, TBA* | | 6.5 |
FNMA, 5.000%, TBA* | | 6.4 |
FHLMC Gold Pool, 5.000%, TBA* | | 3.1 |
FHLMC Gold Pool, 5.500%, TBA* | | 1.9 |
FHLMC Gold Pool, 3.500%, 01/01/26* | | 1.8 |
FNMA, 4.500%, 10/01/40* | | 1.7 |
FHLMC, 5.146%, 01/01/36 | | 1.6 |
FHLMC Gold Pool, 3.500%, 04/01/32* | | 1.6 |
Top Ten as a Group | | 45.2% |
| | |
| * | Top Ten Holding at June 30, 2012 |
Any sectors, industries, or securities discussed should not be perceived as investment recommendations. Mention of a specific security should not be considered a recommendation to buy or solicitation to sell that security. Specific securities mentioned in this report may have been sold from the Fund’s portfolio of investments by the time you receive this report.
18
Managers Intermediate Duration Government Fund
Schedule of Portfolio Investments
December 31, 2012
| | | | | | | | |
| | | Principal Amount | | | Value | |
| | | | | | | |
Mortgage-Backed Securities - 7.9% | | | | | | | | |
American Home Mortgage Assets LLC, Series 2005-1, Class 1A1, 3.036%, 11/25/35 (02/25/13)1 | | $ | 94,177 | | | $ | 69,172 | |
American Home Mortgage Investment Trust, | | | | | | | | |
Series 2004-1, Class 4A, 2.510%, 04/25/44 (02/25/13)1 | | | 145,522 | | | | 125,605 | |
Series 2004-4, Class 4A, 2.526%, 02/25/45 (02/25/13)1 | | | 595,809 | | | | 576,715 | |
Series 2005-1, Class 5A1, 2.510%, 06/25/45 (02/25/13)1 | | | 67,279 | | | | 66,207 | |
Series 2005-1, Class 6A, 2.510%, 06/25/45 (02/25/13)1 | | | 1,312,295 | | | | 1,237,751 | |
Bank of America Funding Corp., Series 2004-B, Class 1A2, 3.021%, 12/20/34 (02/20/13)1 | | | 167,372 | | | | 140,250 | |
Bank of America Merrill Lynch Commercial Mortgage, Inc., | | | | | | | | |
Series 2006-6, Class A2, 5.309%, 10/10/45 | | | 1,208,400 | | | | 1,224,609 | |
Series 2007-3, Class A2, 5.685%, 06/10/493 | | | 259,909 | | | | 259,836 | |
Bear Stearns Alt-A Trust, Series 2005-3, Class 2A3, 2.765%, 04/25/35 (02/25/13)1 | | | 149,506 | | | | 122,918 | |
Bear Stearns Commercial Mortgage Securities, Inc., | | | | | | | | |
Series 2005-PWR9, Class A3, 4.868%, 09/11/42 | | | 1,000,000 | | | | 1,042,386 | |
Series 2006-PW11, Class A2, 5.404%, 03/11/393 | | | 118,690 | | | | 119,793 | |
Series 2006-PW13, Class A2, 5.426%, 09/11/41 | | | 41,357 | | | | 41,763 | |
Citigroup Commercial Mortgage Trust, | | | | | | | | |
Series 2005-C3, Class A2, 4.639%, 05/15/43 | | | 330,566 | | | | 333,744 | |
Series 2008-C7, Class A3, 6.060%, 12/10/493 | | | 1,148,000 | | | | 1,167,898 | |
Citigroup/Deutsche Bank Commercial Mortgage Trust, Series 2006-CD3, Class A4, 5.658%, 10/15/48 | | | 2,000,000 | | | | 2,061,372 | |
Countrywide Alternative Loan Trust, Series 2005-J5, Class 1A1, 0.510%, 05/25/35 (01/25/13)1 | | | 231,943 | | | | 221,924 | |
Countrywide Home Loan Mortgage Pass Through Trust, | | | | | | | | |
Series 2004-R2, Class 1AF1, 0.630%, 11/25/34 (01/25/13) (a)1,4 | | | 235,679 | | | | 198,754 | |
Series 2005-HYB2, Class 1A4, 3.046%, 05/20/35 (02/20/13)1 | | | 119,875 | | | | 103,147 | |
Series 2005-HYB8, Class 1A1, 2.856%, 12/20/35 (02/20/13)1 | | | 136,879 | | | | 109,021 | |
Credit Suisse First Boston Mortgage Securities Corp., Series 2005-C3, Class A3, 4.645%, 07/15/37 | | | 920,796 | | | | 958,107 | |
GMAC Commercial Mortgage Securities, Inc., Series 2005-C1, Class A3, 4.538%, 05/10/43 | | | 122,708 | | | | 124,134 | |
GSMPS Mortgage Loan Trust, Series 2005-RP2, Class 1AF, 0.560%, 03/25/35 (01/25/13) (a)1,4 | | | 245,100 | | | | 205,234 | |
GSR Mortgage Loan Trust, Series 2004-5, Class 1A3, 1.900%, 05/25/34
(02/25/13)1 | | | 53,092 | | | | 50,936 | |
Harborview Mortgage Loan Trust, Series 2004-7, Class 2A2, 2.634%, 11/19/34 (02/19/13)1 | | | 95,163 | | | | 81,919 | |
JPMorgan Chase Commercial Mortgage Securities Corp., | | | | | | | | |
Series 2005-LDP1, Class A2, 4.625%, 03/15/46 | | | 57,933 | | | | 58,031 | |
Series 2006-LDP7, Class A3B, 5.871%, 04/15/453 | | | 686,514 | | | | 702,186 | |
LB-UBS Commercial Mortgage Trust, Series 2005-C7, Class A2, 5.103%, 11/15/30 | | | 10,455 | | | | 10,461 | |
Master Alternative Loans Trust, Series 2005-2, Class 2A1, 6.000%, 01/25/35 | | | 772,036 | | | | 750,329 | |
Morgan Stanley Dean Witter Capital I, Series 2002-IQ3, Class A4, 5.080%, 09/15/37 | | | 33,230 | | | | 33,221 | |
Morgan Stanley Mortgage Loan Trust, Series 2005-4, Class 2A1, 6.005%, 08/25/353 | | | 1,199,387 | | | | 1,142,219 | |
Structured Asset Securities Corp., Series 2005-RF1, Class A, 0.560%, 03/25/35 (01/25/13) (a)1,4 | | | 299,038 | | | | 242,706 | |
Wachovia Bank Commercial Mortgage Trust, | | | | | | | | |
Series 2003-C7, Class A1, 4.241%, 10/15/35 (a) | | | 82,827 | | | | 83,098 | |
Series 2006-C28, Class A2, 5.500%, 10/15/48 | | | 243,536 | | | | 244,685 | |
Wells Fargo Mortgage Backed Securities Trust, Series 2007-16, Class 1A1, 6.000%, 12/28/37 | | | 734,814 | | | | 764,209 | |
| | |
Total Mortgage-Backed Securities (cost $14,109,664) | | | | | | | 14,674,340 | |
|
The accompanying notes are an integral part of these financial statements. 19 |
Managers Intermediate Duration Government Fund
Schedule of Portfolio Investments (continued)
| | | | | | | | |
| | | Principal Amount | | | Value | |
| | | | | | | |
U.S. Government and Agency Obligations - 104.6%5 | | | | | | | | |
Federal Home Loan Mortgage Corporation - 54.8% | | | | | | | | |
FHLMC, | | | | | | | | |
2.353%, 11/01/33 (03/15/13)1,2 | | $ | 1,388,026 | | | $ | 1,479,295 | |
3.184%, 02/01/37 (03/15/13)1 | | | 73,720 | | | | 77,531 | |
5.146%, 01/01/36 (03/15/13)1,2 | | | 2,878,754 | | | | 3,037,905 | |
FHLMC Gold Pool, | | | | | | | | |
3.000%, 04/01/21 to 07/01/27 | | | 981,632 | | | | 1,038,389 | |
3.500%, 01/01/26 to 09/01/42 | | | 8,472,909 | | | | 8,988,330 | |
3.500%, TBA | | | 1,000,000 | | | | 1,063,359 | |
4.000%, 05/01/24 to 11/01/41 | | | 6,739,009 | | | | 7,190,696 | |
4.000%, TBA | | | 24,000,000 | | | | 25,620,000 | |
4.500%, 02/01/20 to 09/01/412 | | | 10,145,414 | | | | 10,895,852 | |
4.500%, TBA | | | 11,200,000 | | | | 12,017,251 | |
5.000%, 05/01/18 to 07/01/412 | | | 5,472,045 | | | | 5,972,072 | |
5.000%, TBA | | | 5,300,000 | | | | 5,702,469 | |
5.500%, 11/01/17 to 01/01/402 | | | 9,193,718 | | | | 9,989,479 | |
5.500%, TBA | | | 3,300,000 | | | | 3,561,422 | |
6.000%, 09/01/17 to 01/01/242 | | | 2,441,942 | | | | 2,689,830 | |
7.000%, 07/01/19 | | | 278,868 | | | | 314,234 | |
7.500%, 07/01/342 | | | 1,581,450 | | | | 1,915,029 | |
FHLMC Structured Pass Through Securities, Series T-51, Class 2A, 7.500%, 08/25/423 | | | 215,761 | | | | 255,975 | |
Total Federal Home Loan Mortgage Corporation | | | | | | | 101,809,118 | |
Federal National Mortgage Association - 40.2% | | | | | | | | |
FNMA, | | | | | | | | |
2.292%, 07/01/33 (02/25/13)1 | | | 431,962 | | | | 454,674 | |
2.309%, 06/01/34 (02/25/13)1,2 | | | 1,137,782 | | | | 1,212,366 | |
2.333%, 06/01/34 (02/25/13)1,2 | | | 1,183,263 | | | | 1,256,002 | |
2.438%, 02/01/36 (02/25/13)1 | | | 117,209 | | | | 122,839 | |
2.656%, 08/01/34 (02/25/13)1 | | | 495,884 | | | | 526,301 | |
3.500%, 10/01/26 to 01/01/27 | | | 3,506,397 | | | | 3,728,037 | |
3.500%, TBA | | | 2,000,000 | | | | 2,128,516 | |
4.000%, 12/01/26 to 02/01/42 | | | 4,719,333 | | | | 5,077,157 | |
4.000%, TBA | | | 11,800,000 | | | | 12,644,297 | |
4.500%, 04/01/25 to 12/01/412 | | | 16,498,488 | | | | 17,982,394 | |
5.000%, 06/01/18 to 08/01/41 | | | 4,868,701 | | | | 5,323,816 | |
5.000%, TBA | | | 11,000,000 | | | | 11,914,375 | |
5.500%, 03/01/17 to 07/01/382 | | | 4,237,522 | | | | 4,619,513 | |
6.000%, 08/01/17 to 06/01/392 | | | 3,405,633 | | | | 3,695,596 | |
6.500%, 11/01/28 to 07/01/32 | | | 270,357 | | | | 301,807 | |
7.000%, 11/01/22 | | | 1,273,137 | | | | 1,402,759 | |
FNMA REMICS, | | | | | | | | |
Series 1994-55, Class H, 7.000%, 03/25/242 | | | 1,239,695 | | | | 1,425,319 | |
|
The accompanying notes are an integral part of these financial statements. 20 |
Managers Intermediate Duration Government Fund
Schedule of Portfolio Investments (continued)
| | | | | | | | |
| | | Principal Amount | | | Value | |
| | | | | | | |
Federal National Mortgage Association - 40.2% (continued) | | | | | | | | |
FNMA REMICS, | | | | | | | | |
Series 2005-13, Class AF, 0.610%, 03/25/35 (01/25/13)1,2 | | $ | 793,287 | | | $ | 800,195 | |
FNMA Whole Loan, Series 2003-W4, Class 4A, 7.232%, 10/25/423 | | | 126,610 | | | | 148,899 | |
Total Federal National Mortgage Association | | | | | | | 74,764,862 | |
Government National Mortgage Association - 7.1% | | | | | | | | |
GNMA, | | | | | | | | |
2.000%, 05/20/21 (02/20/13)1 | | | 25,655 | | | | 26,667 | |
3.000%, 03/20/16 to 08/20/18 (02/20/13)1 | | | 219,721 | | | | 229,276 | |
4.500%, 06/15/39 to 05/15/41 | | | 2,193,274 | | | | 2,419,491 | |
5.000%, 09/15/39 to 09/15/412 | | | 6,190,964 | | | | 6,807,380 | |
5.500%, 10/15/39 to 11/15/392 | | | 3,297,537 | | | | 3,636,191 | |
7.500%, 09/15/28 to 11/15/31 | | | 24,141 | | | | 25,488 | |
Total Government National Mortgage Association | | | | | | | 13,144,493 | |
Interest Only Strips - 2.5% | | | | | | | | |
FHLMC, | | | | | | | | |
Series 212, Class IO, 6.000%, 05/01/314 | | | 3,128 | | | | 481 | |
Series 233, Class 5, 4.500%, 09/15/35 | | | 267,544 | | | | 30,984 | |
FHLMC REMICS, | | | | | | | | |
Series 2380, Class SI, 7.691%, 06/15/31 (01/15/13)1 | | | 28,187 | | | | 5,842 | |
Series 2590, Class UC, 5.000%, 05/15/17 | | | 22,381 | | | | 304 | |
Series 2637, Class SI, 5.791%, 06/15/18 (01/15/13)1 | | | 227,289 | | | | 19,362 | |
Series 2877, Class GS, 6.491%, 11/15/18 (01/15/13)1 | | | 207,694 | | | | 10,723 | |
Series 2922, Class SE, 6.541%, 02/15/35 (01/15/13)1 | | | 219,469 | | | | 42,896 | |
Series 2934, Class HI, 5.000%, 02/15/20 | | | 132,070 | | | | 14,818 | |
Series 2934, Class KI, 5.000%, 02/15/20 | | | 110,508 | | | | 11,977 | |
Series 2965, Class SA, 5.841%, 05/15/32 (01/15/13)1 | | | 531,279 | | | | 77,402 | |
Series 2967, Class JI, 5.000%, 04/15/20 | | | 259,514 | | | | 27,273 | |
Series 2980, Class SL, 6.491%, 11/15/34 (01/15/13)1 | | | 300,523 | | | | 63,033 | |
Series 3031, Class BI, 6.481%, 08/15/35 (01/15/13)1 | | | 438,777 | | | | 90,351 | |
Series 3065, Class DI, 6.411%, 04/15/35 (01/15/13)1 | | | 382,797 | | | | 77,887 | |
Series 3114, Class GI, 6.391%, 02/15/36 (01/15/13)1 | | | 325,067 | | | | 65,292 | |
Series 3308, Class S, 6.991%, 03/15/32 (01/15/13)1 | | | 554,513 | | | | 106,181 | |
Series 3424, Class XI, 6.361%, 05/15/36 (01/15/13)1 | | | 438,022 | | | | 85,303 | |
Series 3489, Class SD, 7.591%, 06/15/32 (01/15/13)1 | | | 287,224 | | | | 60,873 | |
Series 3606, Class SN, 6.041%, 12/15/39 (01/15/13)1 | | | 602,413 | | | | 91,720 | |
Series 3685, Class EI, 5.000%, 03/15/19 | | | 1,067,695 | | | | 98,554 | |
Series 3731, Class IO, 5.000%, 07/15/19 | | | 489,027 | | | | 41,517 | |
Series 3882, Class AI, 5.000%, 06/15/26 | | | 592,964 | | | | 56,513 | |
Series 3995, Class KI, 3.500%, 02/15/27 | | | 2,280,146 | | | | 301,016 | |
FNMA, | | | | | | | | |
Series 215, Class 2, 7.000%, 04/01/234 | | | 142,135 | | | | 27,905 | |
Series 222, Class 2, 7.000%, 06/01/234 | | | 14,856 | | | | 2,830 | |
Series 343, Class 2, 4.500%, 10/01/33 | | | 161,858 | | | | 19,604 | |
|
The accompanying notes are an integral part of these financial statements. 21 |
Managers Intermediate Duration Government Fund
Schedule of Portfolio Investments (continued)
| | | | | | | | |
| | | Principal Amount | | | Value | |
| | | | | | | |
Interest Only Strips - 2.5% (continued) | | | | | | | | |
FNMA, | | | | | | | | |
Series 343, Class 21, 4.000%, 09/01/18 | | $ | 266,746 | | | $ | 17,810 | |
Series 343, Class 22, 4.000%, 11/01/18 | | | 140,292 | | | | 9,477 | |
Series 351, Class 3, 5.000%, 04/01/34 | | | 198,566 | | | | 24,306 | |
Series 351, Class 4, 5.000%, 04/01/34 | | | 117,953 | | | | 15,247 | |
Series 351, Class 5, 5.000%, 04/01/34 | | | 100,050 | | | | 12,969 | |
Series 365, Class 4, 5.000%, 04/01/36 | | | 300,216 | | | | 37,733 | |
FNMA REMICS, | | | | | | | | |
Series 2003-73, Class SM, 6.390%, 04/25/18 (01/25/13)1 | | | 295,297 | | | | 26,874 | |
Series 2004-49, Class SQ, 6.840%, 07/25/34 (01/25/13)1 | | | 177,042 | | | | 35,096 | |
Series 2004-51, Class SX, 6.910%, 07/25/34 (01/25/13)1 | | | 311,244 | | | | 53,011 | |
Series 2004-64, Class SW, 6.840%, 08/25/34 (01/25/13)1 | | | 792,718 | | | | 161,858 | |
Series 2005-12, Class SC, 6.540%, 03/25/35 (01/25/13)1 | | | 305,014 | | | | 63,597 | |
Series 2005-45, Class SR, 6.510%, 06/25/35 (01/25/13)1 | | | 663,131 | | | | 129,790 | |
Series 2005-65, Class KI, 6.790%, 08/25/35 (01/25/13)1 | | | 1,479,177 | | | | 317,744 | |
Series 2005-89, Class S, 6.490%, 10/25/35 (01/25/13)1 | | | 1,512,173 | | | | 286,347 | |
Series 2006-3, Class SA, 5.940%, 03/25/36 (01/25/13)1 | | | 328,001 | | | | 57,171 | |
Series 2007-75, Class JI, 6.335%, 08/25/37 (01/25/13)1 | | | 390,333 | | | | 59,284 | |
Series 2008-86, Class IO, 4.500%, 03/25/23 | | | 914,051 | | | | 78,720 | |
Series 2010-29, Class KJ, 5.000%, 12/25/21 | | | 2,152,505 | | | | 208,279 | |
Series 2010-37, Class GI, 5.000%, 04/25/25 | | | 1,072,746 | | | | 72,623 | |
Series 2010-65, Class IO, 5.000%, 09/25/20 | | | 1,123,538 | | | | 124,807 | |
Series 2010-121, Class IO, 5.000%, 10/25/25 | | | 446,915 | | | | 41,968 | |
Series 2011-69, Class AI, 5.000%, 05/25/18 | | | 1,438,166 | | | | 114,582 | |
Series 2011-88, Class WI, 3.500%, 09/25/26 | | | 658,772 | | | | 92,702 | |
Series 2011-124, Class IC, 3.500%, 09/25/21 | | | 764,290 | | | | 72,758 | |
Series 2012-126, Class SJ, 4.790%, 11/25/42 (01/25/13)1 | | | 986,755 | | | | 190,630 | |
GNMA, | | | | | | | | |
Series 1999-40, Class TW, 6.791%, 02/17/29 (01/17/13)1 | | | 199,930 | | | | 41,398 | |
Series 2010-111, Class BI, 2.000%, 09/16/13 | | | 1,698,124 | | | | 23,773 | |
Series 2011-32, Class KS, 11.682%, 06/16/34 (01/16/13)1 | | | 444,685 | | | | 131,952 | |
Series 2011-94, Class IS, 6.491%, 06/16/36 (01/16/13)1 | | | 418,610 | | | | 83,471 | |
Series 2011-157, Class SG, 6.389%, 12/20/41 (01/20/13)1 | | | 1,446,248 | | | | 429,524 | |
Series 2011-167, Class IO, 5.000%, 12/16/20 | | | 899,590 | | | | 86,844 | |
Series 2012-34, Class KS, 5.841%, 03/16/42 (01/16/13)1 | | | 555,316 | | | | 135,585 | |
Series 2012-69, Class QI, 4.000%, 03/16/41 | | | 434,839 | | | | 85,444 | |
Total Interest Only Strips | | | | | | | 4,754,015 | |
Total U.S. Government and Agency Obligations (cost $190,096,511) | | | | | | | 194,472,488 | |
|
The accompanying notes are an integral part of these financial statements. 22 |
Managers Intermediate Duration Government Fund
Schedule of Portfolio Investments (continued)
| | | | | | | | |
| | | Principal Amount | | | Value | |
| | | | | | | |
Short-Term Investments - 27.2% | | | | | | | | |
U.S. Government and Agency Discount Notes - 0.0%# | | | | | | | | |
FHLMC, 0.020%, 01/07/136 | | $ | 20,000 | | | $ | 20,000 | |
FNMA, 0.075%, 03/06/136,7 | | | 100,000 | | | | 99,991 | |
Total U.S. Government and Agency Discount Notes | | | | | | | 119,991 | |
| | | Shares | | | | |
Other Investment Companies - 27.2%8 | | | | | | | | |
Dreyfus Cash Management Fund, Institutional Class Shares, 0.06% | | | 21,390,236 | | | | 21,390,236 | |
JPMorgan Liquid Assets Money Market Fund, Capital Shares, 0.12% | | | 29,130,450 | | | | 29,130,450 | |
Total Other Investment Companies | | | | | | | 50,520,686 | |
Total Short-Term Investments (cost $50,640,658) | | | | | | | 50,640,677 | |
Total Investments - 139.7% (cost $254,846,833) | | | | | | | 259,787,505 | |
Other Assets, less Liabilities - (39.7)% | | | | | | | (73,889,014 | ) |
Net Assets - 100.0% | | | | | | $ | 185,898,491 | |
|
The accompanying notes are an integral part of these financial statements. 23 |
Notes to Schedules of Portfolio Investments
The following footnotes and abbreviations should be read in conjunction with each of the Schedules of Portfolio Investments previously presented in this report.
At December 31, 2012, the approximate cost of investments for Federal income tax purposes and the gross aggregate unrealized appreciation and/or depreciation based on tax cost were as follows:
| | | | | | | | | | | | | | | | |
Fund | | Cost | | | Appreciation | | | Depreciation | | | Net | |
Managers Short Duration Government Fund | | $ | 466,448,004 | | | $ | 8,226,252 | | | $ | (1,935,564 | ) | | $ | 6,290,688 | |
Managers Intermediate Duration Government Fund | | | 254,846,833 | | | | 6,050,085 | | | | (1,109,413 | ) | | | 4,940,672 | |
| # | Rounds to less than 0.1%. |
| (a) | Security exempt from registration under Rule 144A of the Securities Act of 1933. This security may be resold in transactions exempt from registration, normally to qualified buyers. At December 31, 2012, the value of these securities amounted to the following: |
| | | | | | | | |
Fund | | Value | | | % of Net Assets | |
Managers Intermediate Duration Government Fund | | $ | 729,792 | | | | 0.39 | % |
| 1 | Floating Rate Security: The rate listed is as of December 31, 2012. Date in parentheses represents the security’s next coupon rate reset. |
| 2 | Some or all of these securities are segregated as collateral for delayed delivery agreements. At December 31, 2012, the value of these securities amounted to the following: |
| | | | | | | | |
Fund | | Value | | | % of Net Assets | |
Managers Short Duration Government Fund | | $ | 73,958,774 | | | | 15.9 | % |
Managers Intermediate Duration Government Fund | | | 38,835,002 | | | | 20.9 | % |
| 3 | Variable Rate Security: The rate listed is as of December 31, 2012 and is periodically reset subject to terms and conditions set forth in the debenture. |
| 4 | Illiquid Security: A security not readily convertible into cash such as a stock, bond or commodity that is not actively traded and would be difficult to sell in a timely sale. The Funds may not invest more than 15% of their net assets in illiquid securities. All illiquid securities are valued by an independent pricing agent and are fair valued at Level 2. The market value of illiquid securities at December 31, 2012, amounted to the following: |
| | | | | | | | |
Fund | | Value | | | % of Net Assets | |
Managers Short Duration Government Fund | | $ | 1,633,412 | | | | 0.4 | % |
Managers Intermediate Duration Government Fund | | | 677,910 | | | | 0.4 | % |
| 5 | The interest rate shown is the rate in effect at December 31, 2012. |
| 6 | Represents yield to maturity at December 31, 2012. |
| 7 | Some or all of this security is held as collateral for futures contracts. The collateral market value at December 31, 2012, amounted to the following: |
| | | | | | | | |
Fund | | Value | | | % of Net Assets | |
Managers Short Duration Government Fund | | $ | 349,939 | | | | 0.08 | % |
Managers Intermediate Duration Government Fund | | | 59,995 | | | | 0.03 | % |
| 8 | Yield shown for each investment company represents the December 31, 2012, seven-day average yield, which refers to the sum of the previous seven days’ dividends paid, expressed as an annual percentage. |
|
The accompanying notes are an integral part of these financial statements. 24 |
Notes to Schedules of Portfolio Investments (continued)
The following tables summarize the inputs used to value the Funds’ net assets by the fair value hierarchy levels as of December 31, 2012. (See Note 1(a) in the Notes to the Financial Statements.)
| | | | | | | | | | | | | | | | |
| | | Quoted Prices in Active
Markets for Identical
Investments
Level 1 | | | Significant Other
Unobservable Inputs
Level 2 | | | Significant Observable Inputs
Level 3 | | | Total | |
Managers Short Duration Government Fund | | | | | | | | | |
Investments in Securities | | | | | | | | | | | | | |
Asset-Backed Securities | | | — | | | $ | 860,518 | | | | — | | | $ | 860,518 | |
Mortgage-Backed Securities | | | — | | | | 43,486,262 | | | | — | | | | 43,486,262 | |
U.S. Government and Agency Obligations† | | | — | | | | 375,995,787 | | | | — | | | | 375,995,787 | |
Short-Term Investments | | | | | | | | | | | | | | | | |
U.S. Government and Agency Discount Notes | | | — | | | | 29,846,823 | | | | — | | | | 29,846,823 | |
Other Investment Companies | | $ | 22,549,302 | | | | — | | | | — | | | | 22,549,302 | |
| | | | | | | | | | | | | | | | |
Total Investments in Securities | | $ | 22,549,302 | | | $ | 450,189,390 | | | | — | | | $ | 472,738,692 | |
| | | | | | | | | | | | | | | | |
TBA Sale Commitments | | | — | | | $ | (2,110,938 | ) | | | — | | | $ | (2,110,938 | ) |
| | | | | | | | | | | | | | | | |
Financial Derivative Instruments-Assets†† | | | | | | | | | | | | | | | | |
Interest Rate Contracts | | $ | 201,505 | | | | — | | | | — | | | $ | 201,505 | |
| | | | | | | | | | | | | | | | |
Financial Derivative Instruments-Liabilities†† | | | | | | | | | | | | | | | | |
Interest Rate Contracts | | | (266,958 | ) | | | — | | | | — | | | | (266,958 | ) |
| | | | | | | | | | | | | | | | |
Total Financial Derivative Instruments | | $ | (65,453 | ) | | | — | | | | — | | | $ | (65,453 | ) |
| | | | | | | | | | | | | | | | |
| | | | |
| | | Quoted Prices in Active
Markets for Identical
Investments
Level 1 | | | Significant Other
Observable Inputs
Level 2 | | | Significant Unobservable Inputs
Level 3 | | | Total | |
Managers Intermediate Duration Government Fund | | | | | | | | | |
Investments in Securities | | | | | | | | — | | | | | |
Mortgage-Backed Securities | | | — | | | $ | 14,674,340 | | | | — | | | $ | 14,674,340 | |
U.S. Government and Agency Obligations† | | | — | | | | 194,472,488 | | | | | | | | 194,472,488 | |
Short-Term Investments | | | | | | | | | | | — | | | | | |
U.S. Government and Agency Discount Notes | | | — | | | | 119,991 | | | | — | | | | 119,991 | |
Other Investment Companies | | $ | 50,520,686 | | | | — | | | | — | | | | 50,520,686 | |
| | | | | | | | | | | | | | | | |
Total Investments in Securities | | $ | 50,520,686 | | | $ | 209,266,819 | | | | — | | | $ | 259,787,505 | |
| | | | | | | | | | | | | | | | |
TBA Sale Commitments | | | | | | $ | (3,913,586 | ) | | | | | | $ | (3,913,586 | ) |
| | | | | | | | | | | | | | | | |
Financial Derivative Instruments-Assets†† | | | | | | | | | | | | | | | | |
Interest Rate Contracts | | $ | 37,940 | | | | — | | | | — | | | $ | 37,940 | |
| | | | | | | | | | | | | | | | |
Financial Derivative Instruments-Liabilities†† | | | | | | | | | | | — | | | | | |
Interest Rate Contracts | | | (219,739 | ) | | | — | | | | — | | | | (219,739 | ) |
| | | | | | | | | | | | | | | | |
Total Financial Derivative Instruments | | $ | (181,799 | ) | | | — | | | | — | | | $ | (181,799 | ) |
| | | | | | | | | | | | | | | | |
| † | All U.S. government and agency obligations held in the Fund are Level 2 securities. For a detailed breakout of the U.S. government and agency obligations by major industry or agency classification, please refer to the Schedule of Portfolio Investments. |
| †† | Derivative instruments, such as futures, are not reflected in the Schedule of Portfolio Investments and are valued at the unrealized appreciation/depreciation of the instrument. |
|
The accompanying notes are an integral part of these financial statements. 25 |
Notes to Schedules of Portfolio Investments (continued)
As of December 31, 2012, the Funds had no transfers between levels from the beginning of the reporting period.
The following schedule is the fair value of derivative instruments at December 31, 2012:
| | | | | | | | | | | | | | |
| | | | | Asset Derivatives | | | Liability Derivatives | |
Fund | | Derivatives not accounted for as
hedging instruments | | Statement of Assets and Liabilities
Location | | Fair Value | | | Statement of Assets and Liabilities
Location | | Fair Value | |
Managers Short Duration Government Fund | | Interest rate contracts | | Variation margin receivable1 | | $ | 44,734 | | | Variation margin payable1 | | $ | 1,775 | |
| | | | | | | | | | | | | | |
Managers Intermediate Duration Government Fund | | Interest rate contracts | | Variation margin receivable1 | | $ | 9,484 | | | Variation margin payable1 | | $ | 4,172 | |
| | | | | | | | | | | | | | |
| 1 | Only current day’s variation margin is reported within the Statement of Assets and Liabilities. The variation margin is included in the open futures cumulative appreciation/(depreciation) of $(65,453) for Managers Short Duration Government Fund and $(181,799) for the Managers Intermediate Duration Government Fund. |
For the year ended December 31, 2012 , the effect of derivative instruments on the Statement of Operations and the amount of realized gain/(loss)on derivatives recognized in income were as follows:
| | | | | | |
Fund | | Derivatives not accounted for as hedging instruments | | Amount | |
Managers Short Duration Government Fund | | Interest rate contracts | | $ | (1,824,410 | ) |
| | | | | | |
Managers Intermediate Duration Government Fund | | Interest rate contracts | | $ | (306,692 | ) |
| | | | | | |
|
The change in unrealized gain/(loss) on derivatives recognized in income were as follows: | |
| | |
Fund | | Derivatives not accounted for as hedging instruments | | Amount | |
Managers Short Duration Government Fund | | Interest rate contracts | | $ | 847,806 | |
| | | | | | |
Managers Intermediate Duration Government Fund | | Interest rate contracts | | $ | 170,170 | |
| | | | | | |
|
At December 31, 2012, the Funds had the following TBA forward sale commitments: | |
(See Note 1(i) in the Notes to Financial Statements.) | |
| | | | | | | | | | | | | | |
Fund | | Principal Amount | | | Security | | | | | Current Liability | |
Managers Short Duration Government Fund | | | | | | | | | | | | | | |
| | $ | 2,000,000 | | | FNMA, 3.000%, TBA | | | | | | $ | (2,110,938 | ) |
| | | | | | | | | | | | | | |
| | | | |
Fund | | Principal Amount | | | Security | | | | | Current Liability | |
Managers Intermediate Duration Government Fund | | | | | | | | | | | | | | |
| | $ | 800,000 | | | FNMA, 3.000%, TBA | | | | | | $ | (844,375 | ) |
| | | 1,500,000 | | | FNMA, 3.500%, TBA | | | | | | | (1,591,172 | ) |
| | | 1,350,000 | | | GNMA, 4.500%, TBA | | | | | | | (1,478,039 | ) |
| | | | | | | | | | | | | | |
| | | | | | | | | Total | | | $ | (3,913,586 | ) |
| | | | | | | | | | | | | | |
|
The accompanying notes are an integral part of these financial statements. 26 |
Notes to Schedules of Portfolio Investments (continued)
At December 31, 2012, the Funds had the following open futures contracts:
(See Note 7 in the Notes to Financial Statements.)
| | | | | | | | | | | | |
Managers Short Duration Government Fund | | | | | |
| | | | |
Type | | Number of Contracts | | Position | | Expiration Date | | | Unrealized Gain/(Loss) | |
2-Year U.S. Treasury Note | | 36 | | Short | | | 03/28/13 | | | $ | (2,902 | ) |
3-Month Eurodollar | | 33 | | Short | | | 03/18/13 to 03/17/14 | | | | (259,120 | ) |
5-Year Interest Rate Swap | | 169 | | Short | | | 03/18/13 | | | | 62,953 | |
5-Year U.S. Treasury Note | | 39 | | Long | | | 03/28/13 | | | | (3,145 | ) |
10-Year Interest Rate Swap | | 60 | | Short | | | 03/18/13 | | | | 64,538 | |
10-Year U.S. Treasury Note | | 4 | | Long | | | 03/19/13 | | | | (1,791 | ) |
U.S. Treasury Long Bond | | 29 | | Short | | | 03/19/13 | | | | 74,014 | |
| | | | | | | | | | | | |
| | | | | | | Total | | | $ | (65,453 | ) |
| | | | | | | | | | | | |
| | |
Managers Intermediate Duration Government Fund | | | | | | | | |
| | | | |
Type | | Number of Contracts | | Position | | Expiration Date | | | Unrealized Gain/(Loss) | |
2-Year U.S. Treasury Note | | 5 | | Short | | | 03/28/13 | | | $ | (403 | ) |
3-Month Eurodollar | | 20 | | Short | | | 03/18/13 to 12/16/13 | | | | (205,613 | ) |
5-Year Interest Rate Swap | | 21 | | Short | | | 03/18/13 | | | | 7,822 | |
5-Year U.S. Treasury Note | | 47 | | Long | | | 03/28/13 | | | | (3,789 | ) |
10-Year Interest Rate Swap | | 28 | | Short | | | 03/18/13 | | | | 30,118 | |
10-Year U.S. Treasury Note | | 5 | | Long | | | 03/19/13 | | | | (2,239 | ) |
U.S. Treasury Long Bond | | 3 | | Long | | | 03/19/13 | | | | (7,695 | ) |
| | | | | | | | | | | | |
| | | | | | | Total | | | $ | (181,799 | ) |
| | | | | | | | | | | | |
| | |
Investments Definitions and Abbreviations: |
| |
| FHLMC: | | Federal Home Loan Mortgage Corp. |
| FNMA: | | Federal National Mortgage Association |
| GMAC: | | General Motors Acceptance Corp. |
| GNMA: | | Government National Mortgage Association |
| GSR: | | Goldman Sachs REMIC |
| REMICS: | | Real Estate Mortgage Investment Conduits |
| TBA: | | To Be Announced |
|
The accompanying notes are an integral part of these financial statements. 27 |
Statement of Assets and Liabilities
December 31, 2012
| | | | | | | | |
| | | Managers
Short Duration
Government Fund | | | Managers
Intermediate
Duration
Government Fund | |
Assets: | | | | | | | | |
Investments at value* | | $ | 472,738,692 | | | $ | 259,787,505 | |
Receivable for delayed delivery instruments sold | | | 10,618,125 | | | | 6,033,430 | |
Receivable for Fund shares sold | | | 5,110,238 | | | | 478,619 | |
Dividends, interest and other receivables | | | 1,594,030 | | | | 698,829 | |
Receivable for investments sold | | | 376,409 | | | | 120,048 | |
Variation margin receivable | | | 44,734 | | | | 9,484 | |
Receivable from affiliate | | | — | | | | 12,689 | |
Prepaid expenses | | | 17,298 | | | | 15,281 | |
Total assets | | | 490,499,526 | | | | 267,155,885 | |
Liabilities: | | | | | | | | |
Payable for delayed delivery investments purchased | | | 19,119,896 | | | | 76,777,181 | |
Payable for Fund shares repurchased | | | 2,485,159 | | | | 384,529 | |
Payable for TBA sale commitments | | | 2,110,938 | | | | 3,913,586 | |
Variation margin payable | | | 1,775 | | | | 4,172 | |
Accrued expenses: | | | | | | | | |
Investment management and advisory fees | | | 274,564 | | | | 110,713 | |
Trustees fees and expenses | | | 104 | | | | 342 | |
Other | | | 92,417 | | | | 66,871 | |
Total liabilities | | | 24,084,853 | | | | 81,257,394 | |
| | |
Net Assets | | $ | 466,414,673 | | | $ | 185,898,491 | |
Net Assets Represent: | | | | | | | | |
Paid-in capital | | $ | 469,320,607 | | | $ | 182,344,259 | |
Undistributed net investment income | | | — | | | | 2,112 | |
Accumulated net realized loss from investments and futures contracts | | | (9,128,043 | ) | | | (1,199,331 | ) |
Net unrealized appreciation of investments and futures contracts | | | 6,222,109 | | | | 4,751,451 | |
Net Assets | | $ | 466,414,673 | | | $ | 185,898,491 | |
Shares outstanding | | | 48,341,471 | | | | 16,937,634 | |
Net asset value, offering and redemption price per share | | $ | 9.65 | | | $ | 10.98 | |
* Investments at cost | | $ | 466,448,004 | | | $ | 254,846,833 | |
|
The accompanying notes are an integral part of these financial statements. 28 |
Statement of Operations
For the year ended December 31, 2012
| | | | | | | | |
| | | Managers
Short Duration
Government Fund | | | Managers
Intermediate
Duration
Government Fund | |
Investment Income: | | | | | | | | |
Interest income | | $ | 6,521,711 | | | $ | 5,128,933 | |
Dividend income | | | 11,645 | | | | 82,590 | |
Total investment income | | | 6,533,356 | | | | 5,211,523 | |
Expenses: | | | | | | | | |
Investment management and advisory fees | | | 2,851,689 | | | | 1,353,487 | |
Custodian | | | 133,251 | | | | 67,191 | |
Registration fees | | | 69,029 | | | | 28,240 | |
Professional fees | | | 63,285 | | | | 49,848 | |
Transfer agent | | | 60,826 | | | | 233,567 | |
Reports to shareholders | | | 45,717 | | | | 14,899 | |
Trustees fees and expenses | | | 19,795 | | | | 10,099 | |
Extraordinary expense | | | 18,686 | | | | 7,528 | |
Miscellaneous | | | 17,886 | | | | 8,673 | |
Total expenses before offsets | | | 3,280,164 | | | | 1,773,532 | |
Expense reimbursements | | | — | | | | (45,094 | ) |
Expense reductions | | | (103 | ) | | | (49 | ) |
Fee waivers | | | — | | | | (17,464 | ) |
Net expenses | | | 3,280,061 | | | | 1,710,925 | |
| | |
Net investment income | | | 3,253,295 | | | | 3,500,598 | |
Net Realized and Unrealized Gain (Loss): | | | | | | | | |
Net realized gain (loss) on investments and futures contracts | | | (1,516,499 | ) | | | 3,016,798 | |
Net change in unrealized appreciation (depreciation) of investments and futures contracts | | | 4,683,729 | | | | (612,254 | ) |
Net realized and unrealized gain | | | 3,167,230 | | | | 2,404,544 | |
| | |
Net increase in net assets resulting from operations | | $ | 6,420,525 | | | $ | 5,905,142 | |
|
The accompanying notes are an integral part of these financial statements. 29 |
Statements of Changes in Net Assets
For the year ended December 31,
| | | | | | | | | | | | | | | | |
| | | Managers Short Duration
Government Fund | | | Managers Intermediate Duration
Government Fund | |
| | | 2012 | | | 2011 | | | 2012 | | | 2011 | |
Increase (Decrease) in Net Assets From Operations: | | | | | | | | | | | | | | | | |
Net investment income | | $ | 3,253,295 | | | $ | 3,317,481 | | | $ | 3,500,598 | | | $ | 4,093,549 | |
Net realized gain (loss) on investments and futures contracts | | | (1,516,499 | ) | | | (1,249,488 | ) | | | 3,016,798 | | | | 4,339,722 | |
Net change in unrealized appreciation (depreciation) of investments and futures contracts | | | 4,683,729 | | | | 859,912 | | | | (612,254 | ) | | | 312,033 | |
Net increase in net assets resulting from operations | | | 6,420,525 | | | | 2,927,905 | | | | 5,905,142 | | | | 8,745,304 | |
Distributions to Shareholders: | | | | | | | | | | | | | | | | |
From net investment income | | | (3,255,617 | ) | | | (3,319,280 | ) | | | (3,498,486 | ) | | | (4,122,038 | ) |
From net realized gain on investments | | | — | | | | — | | | | (4,353,483 | ) | | | (3,945,014 | ) |
Total distributions to shareholders | | | (3,255,617 | ) | | | (3,319,280 | ) | | | (7,851,969 | ) | | | (8,067,052 | ) |
Capital Share Transactions: | | | | | | | | | | | | | | | | |
Proceeds from sale of shares | | | 288,999,135 | | | | 291,803,165 | | | | 76,305,567 | | | | 69,723,400 | |
Reinvestment of dividends and distributions | | | 2,828,712 | | | | 3,068,327 | | | | 6,862,325 | | | | 7,112,821 | |
Cost of shares repurchased | | | (221,591,585 | ) | | | (282,392,872 | ) | | | (73,409,869 | ) | | | (53,071,474 | ) |
Net increase from capital share transactions | | | 70,236,262 | | | | 12,478,620 | | | | 9,758,023 | | | | 23,764,747 | |
| | | | |
Total increase in net assets | | | 73,401,170 | | | | 12,087,245 | | | | 7,811,196 | | | | 24,442,999 | |
Net Assets: | | | | | | | | | | | | | | | | |
Beginning of year | | | 393,013,503 | | | | 380,926,258 | | | | 178,087,295 | | | | 153,644,296 | |
End of year | | $ | 466,414,673 | | | $ | 393,013,503 | | | $ | 185,898,491 | | | $ | 178,087,295 | |
End of year undistributed net investment income | | | — | | | | — | | | $ | 2,112 | | | | — | |
| | | | | | | | | | | | | | | | |
Share Transactions: | | | | | | | | | | | | | | | | |
Sale of shares | | | 29,967,411 | | | | 30,439,393 | | | | 6,814,998 | | | | 6,206,673 | |
Reinvested shares from dividends and distributions | | | 293,690 | | | | 320,229 | | | | 620,611 | | | | 639,973 | |
Shares repurchased | | | (22,995,811 | ) | | | (29,452,374 | ) | | | (6,534,755 | ) | | | (4,759,069 | ) |
Net increase in shares | | | 7,265,290 | | | | 1,307,248 | | | | 900,854 | | | | 2,087,577 | |
|
The accompanying notes are an integral part of these financial statements. 30 |
Short Duration Government Fund
Financial Highlights
For a share outstanding throughout each year
| | | | | | | | | | | | | | | | | | | | |
| | | For the year ended December 31, | |
| | | 2012 | | | 2011 | | | 2010 | | | 2009 | | | 2008 | |
Net Asset Value, Beginning of Year | | $ | 9.57 | | | $ | 9.58 | | | $ | 9.56 | | | $ | 9.20 | | | $ | 9.68 | |
Income from Investment Operations: | | | | | | | | | | | | | | | | | | | | |
Net investment income | | | 0.08 | 3 | | | 0.09 | | | | 0.13 | | | | 0.24 | | | | 0.34 | |
Net realized and unrealized gain (loss) on investments | | | 0.08 | 3 | | | (0.01 | ) | | | 0.03 | | | | 0.35 | | | | (0.45 | ) |
Total from investment operations | | | 0.16 | | | | 0.08 | | | | 0.16 | | | | 0.59 | | | | (0.11 | ) |
Less Distributions to Shareholders from: | | | | | | | | | | | | | | | | | | | | |
Net investment income | | | (0.08 | ) | | | (0.09 | ) | | | (0.14 | ) | | | (0.23 | ) | | | (0.37 | ) |
Net Asset Value, End of Year | | $ | 9.65 | | | $ | 9.57 | | | $ | 9.58 | | | $ | 9.56 | | | $ | 9.20 | |
Total Return1 | | | 1.64 | % | | | 0.80 | % | | | 1.68 | %5 | | | 6.43 | %5 | | | (1.19 | )% |
Ratio of net expenses to average net assets | | | 0.81 | %4 | | | 0.82 | % | | | 0.81 | % | | | 0.84 | % | | | 0.83 | % |
Ratio of net investment income to average net assets1 | | | 0.80 | %4 | | | 0.89 | % | | | 1.38 | % | | | 2.43 | % | | | 3.88 | % |
Portfolio turnover | | | 49 | % | | | 141 | % | | | 116 | % | | | 152 | % | | | 282 | % |
Net assets at end of year (000’s omitted) | | $ | 466,415 | | | $ | 393,014 | | | $ | 380,926 | | | $ | 275,330 | | | $ | 243,548 | |
| | | | | | | | | | | | | | | | | | | | |
Ratios absent expense offsets:2 | | | | | | | | | | | | | | | | | | | | |
Ratio of total expenses to average net assets | | | 0.81 | % | | | 0.82 | % | | | 0.82 | % | | | 0.84 | % | | | 0.84 | % |
Ratio of net investment income to average net assets | | | 0.80 | % | | | 0.89 | % | | | 1.37 | % | | | 2.43 | % | | | 3.87 | % |
| | | | | | | | | | | | | | | | | | | | |
Intermediate Duration Government Fund
Financial Highlights
For a share outstanding throughout each year
| | | | | | | | | | | | | | | | | | | | |
| | | For the year ended December 31, | |
| | | 2012 | | | 2011 | | | 2010 | | | 2009 | | | 2008 | |
Net Asset Value, Beginning of Year | | $ | 11.10 | | | $ | 11.01 | | | $ | 10.90 | | | $ | 10.17 | | | $ | 10.67 | |
Income from Investment Operations: | | | | | | | | | | | | | | | | | | | | |
Net investment income | | | 0.20 | 3 | | | 0.30 | | | | 0.32 | | | | 0.41 | | | | 0.45 | |
Net realized and unrealized gain (loss) on investments | | | 0.14 | 3 | | | 0.34 | | | | 0.46 | | | | 0.83 | | | | (0.37 | ) |
Total from investment operations | | | 0.34 | | | | 0.64 | | | | 0.78 | | | | 1.24 | | | | 0.08 | |
Less Distributions to Shareholders from: | | | | | | | | | | | | | | | | | | | | |
Net investment income | | | (0.20 | ) | | | (0.30 | ) | | | (0.32 | ) | | | (0.41 | ) | | | (0.45 | ) |
Net realized gain on investments | | | (0.26 | ) | | | (0.25 | ) | | | (0.35 | ) | | | (0.10 | ) | | | (0.13 | ) |
Total distributions to shareholders | | | (0.46 | ) | | | (0.55 | ) | | | (0.67 | ) | | | (0.51 | ) | | | (0.58 | ) |
Net Asset Value, End of Year | | $ | 10.98 | | | $ | 11.10 | | | $ | 11.01 | | | $ | 10.90 | | | $ | 10.17 | |
Total Return1 | | | 3.15 | %5 | | | 5.88 | %5 | | | 7.20 | %5 | | | 12.40 | % | | | 0.85 | % |
Ratio of net expenses to average net assets | | | 0.89 | %6 | | | 0.88 | % | | | 0.89 | % | | | 0.89 | % | | | 0.89 | % |
Ratio of net investment income to average net assets1 | | | 1.81 | %6 | | | 2.64 | % | | | 2.80 | % | | | 3.84 | % | | | 4.32 | % |
Portfolio turnover | | | 21 | % | | | 453 | % | | | 409 | % | | | 370 | % | | | 429 | % |
Net assets at end of year (000’s omitted) | | $ | 185,898 | | | $ | 178,087 | | | $ | 153,644 | | | $ | 155,226 | | | $ | 170,181 | |
| | | | | | | | | | | | | | | | | | | | |
Ratios absent expense offsets:2 | | | | | | | | | | | | | | | | | | | | |
Ratio of total expenses to average net assets | | | 0.92 | % | | | 0.94 | % | | | 0.96 | % | | | 0.98 | % | | | 0.95 | % |
Ratio of net investment income to average net assets | | | 1.78 | % | | | 2.58 | % | | | 2.73 | % | | | 3.75 | % | | | 4.26 | % |
| | | | | | | | | | | | | | | | | | | | |
Notes to Financial Highlights
The following footnotes should be read in conjunction with the Financial Highlights of the Funds previously presented in this report.
| 1 | Total returns and net investment income would have been lower had certain expenses not been reduced. (See Note 1(c) of Notes to Financial Statements.) |
| 2 | Excludes the impact of expense reimbursements or fee waivers and expense reductions such as brokerage credits, but includes expense repayments and non-reimbursable expenses, if any, such as interest, taxes and extraordinary expenses. (See Note 1(c) of Notes to Financial Statements.) |
| 3 | Per share numbers have been calculated using average shares. |
| 4 | Includes non-routine extraordinary expenses amounting to $18,686 and represents 0.005% of average net assets. |
| 5 | The total return is based on the Financial Statement Net Asset Values as shown. |
| 6 | Includes non-routine extraordinary expenses amounting to $7,528 and represents 0.004% of average net assets. |
Notes to Financial Statements
December 31, 2012
| 1. | Summary of Significant Accounting Policies |
Managers Trust II (the “Trust”) is an open-end management investment company organized as a Massachusetts business trust and registered under the Investment Company Act of 1940, as amended (the “1940 Act”). Currently, the Trust consists of a number of different Funds, each having distinct investment management objectives, strategies, risks, and policies. Included in this report are two series of Trust II: Managers Short Duration Government Fund (“Short Duration”), and Managers Intermediate Duration Government Fund (“Intermediate Duration”), each a “Fund” and collectively the “Funds.”
The Funds’ financial statements are prepared in accordance with accounting principles generally accepted in the United States of America (“U.S. GAAP”), which require management to make estimates and assumptions that affect the reported amounts of assets and liabilities and disclosure of contingent assets and liabilities at the date of the financial statements and the reported amounts of income and expenses during the reporting period. Actual results could differ from those estimates and such differences could be material. The following is a summary of significant accounting policies followed by the Funds in the preparation of their financial statements:
| a. | Valuation of Investments |
Equity securities traded on a domestic or international securities exchange are valued at the last quoted sale price, or, lacking any sales, at the last quoted bid price. Over-the-counter securities are valued at the Nasdaq Official Closing Price, if one is available. Lacking any sales, over-the-counter securities are valued at the last quoted bid price. The Funds’ investments are generally valued based on market quotations provided by third-party pricing services approved by the Board of Trustees of the Funds (the “Board”).
Fixed-income securities are valued based on valuations furnished by independent pricing services that utilize matrix systems, which reflect such factors as security prices, yields, maturities, and ratings, and are supplemented by dealer and exchange quotations. Futures contracts for which market quotations are readily available are valued at the settlement price as of the close of the futures exchange. Short-term investments having a remaining maturity of 60 days or less are generally valued at amortized cost, which approximates market value. Investments in other open-end regulated investment companies are valued at their end of day net asset value per share. Investments in certain mortgage-backed and stripped mortgage-backed securities, preferred stocks, convertible securities, derivatives and other debt securities not traded on an organized securities market are valued on the basis of valuations provided by dealers or by a pricing service which uses information with respect to transactions in such securities and various relationships between such securities and yield to maturity in determining value. Securities (including derivatives) for which market quotations are not readily available are valued at fair value, as determined in good faith, and pursuant to procedures adopted by the Board. The values assigned to fair value investments are based on available information and do not necessarily represent amounts that might ultimately be realized, since such amounts depend on future developments inherent in long-term investments. Further, because of the inherent uncertainty of valuation, those estimated values may differ significantly from the values that would have been
used had a ready market for the investments existed, and the differences could be material.
Under certain circumstances, the value of certain Fund investments (including derivatives) may be based on an evaluation of fair value, pursuant to procedures established by and under the general supervision of the Board. The Pricing Committee is the committee formed by the Board to make fair value determinations for such investments. When determining the fair value of an investment, the Pricing Committee seeks to determine the price that the Fund might reasonably expect to receive from a current sale of that investment in an arm’s-length transaction. Fair value determinations shall be based upon consideration of all available facts and information, including, but not limited to (i) attributes specific to the investment; (ii) fundamental analytical data and press releases relating to the investment and its issuer; (iii) the value of comparable securities or relevant financial instruments, including derivative securities, traded on other markets or among dealers; and (iv) other factors, such as future cash flows, interest rates, yield curves, volatilities, credit risks and/or default rates. The Board will be presented with a quarterly report comparing fair values determined by the Pricing Committee against subsequent market valuations for those securities. The values assigned to fair value investments are based on available information and do not necessarily represent amounts that might ultimately be realized, since such amounts depend on future developments inherent in long-term investments. Further, because of the inherent uncertainty of valuation, those estimated values may differ significantly from the values that would have been used had a ready market for the investments existed, and the differences could be material. Each Fund may use the fair value of a portfolio investment to calculate its net asset value (“NAV”) when, for example, (1) market quotations are not readily available because a portfolio investment is not traded in a public market or the principal market in which the investment trades is closed, (2) trading in a portfolio investment is suspended and has not resumed before the Fund calculates its NAV, (3) a significant event affecting the value of a portfolio investment is determined to have occurred between the time of the market quotation provided for a portfolio investment and the time as of which the Fund calculates its NAV, (4) an investment’s price has remained unchanged over a period of time (often referred to as a “stale price”), or (5) Managers Investment Group LLC (the “Investment Manager”) determines that a market quotation is inaccurate. Portfolio investments that trade primarily on foreign markets are priced based upon the market quotation of such securities as of the close of their respective principal markets. Under certain circumstances, the Investment Manager may adjust such prices based on its determination of the impact of events occurring subsequent to the close of such markets but prior to the time as of which the Fund calculates its NAV. The Funds may invest in securities that may be thinly traded. The Board has adopted procedures to adjust prices of thinly traded securities that are judged to be stale so that they reflect fair value. An investment valued on the basis of its fair value may be valued at a price higher or lower than available market quotations. An investment valuation may differ depending on the method used and the factors considered in determining value according to the Funds’ fair value procedures.
U.S. GAAP defines fair value as the price that a Fund would receive to sell an asset or pay to transfer a liability in an orderly transaction between market participants at the measurement date. U.S. GAAP
Notes to Financial Statements (continued)
also establishes a framework for measuring fair value, and a three-level hierarchy for fair value measurements based upon the transparency of inputs to the valuation of an asset or liability. Inputs may be observable or unobservable and refer broadly to the assumptions that market participants would use in pricing the asset or liability. Observable inputs reflect the assumptions market participants would use in pricing the asset or liability based on market data obtained from sources independent of the Funds. Unobservable inputs reflect the Funds’ own assumptions about the assumptions that market participants would use in pricing the asset or liability developed based on the best information available in the circumstances. Each investment is assigned a level based upon the observability of the inputs which are significant to the overall valuation.
The three-tier hierarchy of inputs is summarized below:
Level 1 – inputs are quoted prices in active markets for identical investments (e.g., equity securities, open-end investment companies, futures contracts, options contracts)
Level 2 – other observable inputs (including, but not limited to: quoted prices for similar assets or liabilities in markets that are active, quoted prices for identical or similar assets or liabilities in markets that are not active, inputs other than quoted prices that are observable for the assets or liabilities (such as interest rates, yield curves, volatilities, prepayment speeds, loss severities, credit risks and default rates) or other market corroborated inputs) (e.g., debt securities, government securities, swap contracts, foreign currency exchange contracts, foreign securities utilizing international fair value pricing, broker-quoted securities, fair valued securities with observable inputs)
Level 3 – inputs are significant unobservable inputs (including the Funds’ own assumptions used to determine the fair value of investments) (e.g., fair valued securities with unobservable inputs)
Changes in inputs or methodologies used for valuing investments may result in a transfer in or out of levels within the fair value hierarchy. The inputs or methodologies used for valuing investments are not necessarily an indication of the risk associated with investing in those investments.
Security transactions are accounted for as of trade date. Realized gains and losses on securities sold are determined on the basis of identified cost.
| c. | Investment Income and Expenses |
Dividend income is recorded on the ex-dividend date. Dividend and interest income on foreign securities is recorded net of any withholding tax. Interest income, which includes amortization of premium and accretion of discount on debt securities, is accrued as earned. Non-cash dividends included in dividend income, if any, are reported at the fair market value of the securities received. Other income and expenses are recorded on an accrual basis. Expenses that cannot be directly attributed to a Fund are apportioned among the Funds in the Trust and in some cases other affiliated funds based upon their relative average net assets or number of shareholders.
The Funds have a “balance credit” arrangement with The Bank of New York Mellon (“BNYM”), the Fund’s custodian, whereby each
Fund is credited with an interest factor equal to 0.75% below the effective 90-day T-Bill rate for account balances left uninvested overnight. If the T-Bill rate falls below 0.75%, no credits will be earned. These credits serve to reduce custody expenses that would otherwise be charged to each Fund. For the year ended December 31, 2012, the custodian expense was not reduced.
Overdrafts will cause a reduction of any balance credits, computed at 2% above the effective Federal funds rate on the day of the overdraft. For the year endedDecember 31, 2012, the Funds did not incur overdraft fees.
The Trust also has a balance credit arrangement with its Transfer Agent, BNY Mellon Investment Servicing (US) Inc., whereby balance credits are used to offset banking charges and other out-of-pocket expenses. For the year endedDecember 31, 2012, the transfer agent expense for Short Duration and Intermediate Duration was reduced by $103 and $49, respectively.
The Investment Manager has agreed to waive a portion of its management fee in consideration of shareholder servicing fees that it has received from JPMorgan Distribution Services, Inc., with respect to short-term cash investments each Fund may have made in the JPMorgan Liquid Assets Money Market Fund – Capital Shares. For the year endedDecember 31, 2012, the management fee for Intermediate Duration was reduced by $17,464.
Total returns and net investment income for the Funds would have been lower had certain expenses not been offset. Total expenses before offsets exclude the impact of expense reimbursements or fee waivers and expense reductions such as brokerage recapture credits, but include non-reimbursable expenses, if any, such as interest, taxes and extraordinary expenses.
| d. | Dividends and Distributions |
Dividends resulting from net investment income, if any, normally will be declared and paid monthly for the Funds. Distributions of capital gains, if any, will be made on an annual basis and when required for Federal excise tax purposes. Income and capital gain distributions are determined in accordance with Federal income tax regulations, which may differ from U.S. GAAP. These differences are primarily due to differing treatments for losses deferred due to wash sales, equalization accounting for tax purposes, options, futures and market discount transactions. Permanent book and tax basis differences, if any, relating to shareholder distributions will result in reclassifications to paid-in capital.
Notes to Financial Statements (continued)
| | | | | | | | | | | | | | | | |
| | | Short Duration | | | Intermediate Duration | |
| | | 2012 | | | 2011 | | | 2012 | | | 2011 | |
Distributions paid from: | | | | | | | | | | | | | | | | |
Ordinary income | | $ | 3,255,617 | | | $ | 3,319,280 | | | $ | 3,498,486 | | | $ | 4,119,606 | |
Short-term capital gains | | | — | | | | — | | | | 2,936,108 | | | | 3,628,005 | |
Long-term capital gains | | | — | | | | — | | | | 1,417,375 | | | | 319,441 | |
| | | | | | | | | | | | | | | | |
Total | | $ | 3,255,617 | | | $ | 3,319,280 | | | $ | 7,851,969 | | | $ | 8,067,052 | |
| | | | | | | | | | | | | | | | |
As of December 31, 2012, the components of distributable earnings (excluding unrealized appreciation/depreciation) on a tax basis consisted of:
| | | | | | | | |
| | | Short Duration | | | Intermediate Duration | |
Capital loss carryforward | | $ | 2,331,118 | | | | — | |
Undistributed ordinary income | | | — | | | $ | 2,112 | |
Undistributed short-term capital gains | | | — | | | | 104,695 | |
Undistributed long-term capital gains | | | — | | | | 179,026 | |
Post-October loss deferral | | | — | | | | 157,251 | |
Each Fund intends to comply with the requirements under Subchapter M of the Internal Revenue Code of 1986, as amended, and to distribute substantially all of its taxable income and gains to its shareholders and to meet certain diversification and income requirements with respect to investment companies. Therefore, no provision for Federal income or excise tax is included in the accompanying financial statements.
Additionally, based on the Funds’ understanding of the tax rules and rates related to income, gains and transactions for the foreign jurisdictions in which it invests, each Fund will provide for foreign taxes, and where appropriate, deferred foreign taxes.
Management has analyzed the Funds’ tax positions taken on Federal income tax returns as of December 31, 2012 and all open tax years and has concluded that no provision for federal income tax is required in the Funds’ financial statements. Additionally, the Funds are not aware of any tax position for which it is reasonably possible that the total amounts of unrecognized tax benefits will change materially in the next twelve months.
Under the Regulated Investment Company Modernization Act of 2010, post-enactment capital losses may now be carried forward for an unlimited time period. However, any new losses incurred will be required to be utilized prior to any loss carryovers incurred in pre-enactment taxable years, which generally expire eight years following the close of the taxable year in which they were incurred. As a result of this ordering rule, pre-enactment capital loss carryovers may be more likely to expire unused. Additionally, post-enactment capital losses that are carried forward will retain their tax character as either short-term or long-term capital losses rather than being considered all short-term as under previous law.
| f. | Capital Loss Carryovers and Deferrals |
As of December 31, 2012, the following Fund had accumulated net realized capital loss carryovers from securities transactions for Federal income tax purposes as shown in the following chart. These
amounts may be used to offset future realized capital gains, if any, through the expiration dates listed or in the case of post-enactmaent losses, for an unlimited time period.
| | | | | | | | | | | | |
| | | Capital Loss Carryover Amounts | | | Expires | |
Fund | | Short-Term | | | Long-Term | | | December 31, | |
Short Duration | | | | | | | | | | | | |
(Pre-Enactment) | | $ | 2,331,118 | | | | — | | | | 2017 | |
| | | | | | | | | | | | |
For the year ended December 31, 2011, the following Fund utilized capital loss carryovers in the amount of:
| | | | | | | | |
| | | Capital Loss Carryover Utilized | |
| | | Short-Term | | | Long-Term | |
Short Duration | | $ | 387,225 | | | | — | |
The Trust’s Declaration of Trust authorizes for each series the issuance of an unlimited number of shares of beneficial interest, without par value. Each Fund records sales and repurchases of its capital stock on the trade date. The cost of securities contributed to the Funds in connection with the issuance of shares is based on the valuation of those securities in accordance with the Funds’ policy on investment valuation. Dividends and distributions to shareholders are recorded on the ex-dividend date.
At December 31, 2012, certain unaffiliated shareholders of record, specifically omnibus accounts, individually or collectively held greater than 10% of the outstanding shares of the following Funds: Short Duration – two collectively own 62%; Intermediate Duration – two collectively own 56%. Transactions by these shareholders may have a material impact on their respective Funds.
Notes to Financial Statements (continued)
| h. | Delayed Delivery Transactions and When-Issued Securities |
The Funds may enter into securities transactions on a delayed delivery or when-issued basis. Payment and delivery may take place after the customary settlement period for that security. The price of the underlying securities and the date when the securities will be delivered and paid for are fixed at the time the transaction is negotiated. During the time a delayed delivery sell is outstanding, the contract is marked to market daily and equivalent deliverable securities are held for the transaction. The value of the securities purchased on a delayed delivery or when-issued basis are identified as such in the Funds’ Schedule of Portfolio Investments. With respect to purchase commitments, the Funds identify securities as segregated in their records with a value at least equal to the amount of the commitment. The payables and receivables associated with the purchases and sales of delayed delivery securities having the same coupon, settlement date and broker are offset. Delayed delivery or when-issued securities that have been purchased from and sold to different brokers are reflected as both payables and receivables in the Funds’ Statement of Assets and Liabilities. Losses may arise due to changes in the value of the underlying securities or if the counterparty does not perform under the contract, or if the issuer does not issue the securities due to political, economic, or other factors.
| i. | Securities Issued on a When Issued Basis |
The Funds may enter into To Be Announced (“TBA”) sale commitments to hedge its portfolio positions or to sell mortgage backed securities it owns under delayed delivery arrangements. Proceeds of TBA sale commitments are not received until the contractual settlement date. During the time a TBA sale commitment is outstanding, equivalent deliverable securities, or an offsetting TBA purchase commitment deliverable on or before the sale commitment date, are held as “cover” for the transaction. Unsettled TBA sale commitments are valued at the current market value of the underlying securities according to the procedures described under “Valuation of Investments,” in note 1a above. Each contract is marked-to-market daily and the change in market value is recorded by the Funds as an unrealized gain or loss. If the TBA sale commitment is closed through the acquisition of an offsetting purchase commitment, the Fund realizes a gain or loss. If the Funds deliver securities under the commitment, the Funds realize a gain or a loss from the sale of the securities based upon the unit price established at the date the commitment was entered into.
| 2. | Agreements and Transactions with Affiliates |
For each of the Funds, the Trust has entered into an Investment Management Agreement under which the Investment Manager, a subsidiary of Affiliated Managers Group, Inc. (“AMG”), serves as investment manager to the Funds and is responsible for the Funds’ overall administration. The Investment Manager selects subadvisor’s for the Funds (subject to Board approval) and monitors each subadvisor’s investment performance, security holdings and investment strategies. Each Fund’s investment portfolio is managed by Smith Breeden Associates, Inc., who serves pursuant to a subadvisory agreement with the Investment Manager.
Investment management fees are paid directly by the Funds to the Investment Manager based on average daily net assets. For the year ended December 31, 2012, the annual investment management fee rates, as a percentage of average daily net assets, were as follows:
| | | | |
| | | Investment
Management Fee | |
Short Duration | | | 0.70 | % |
Intermediate Duration | | | 0.70 | % |
The Investment Manager has contractually agreed, through at least May 1, 2013, to waive management fees and/or reimburse Fund expenses in order to limit total annual Fund operating expenses after fee waiver and expense reimbursements (exclusive of taxes, interest (including interest incurred in connection with bank and custody overdrafts), brokerage commissions and other transaction costs, acquired fund fees and expenses, and extraordinary expenses) to 0.89% of Intermediate Duration Fund’s average daily net assets.
Intermediate Duration is obligated to repay the Investment Manager such amounts waived, paid or reimbursed in future years provided that the repayment occurs within thirty-six (36) months after the waiver or reimbursement and that such repayment would not cause the Fund’s total operating expenses in any such future year to exceed the Fund’s expense cap. For the year ended December 31, 2012, the Fund’s components of reimbursement available are detailed in the following chart:
| | | | |
| | | Intermediate Duration | |
Reimbursement Available - 12/31/11 | | $ | 336,446 | |
Additional Reimbursements | | | 45,094 | |
Repayments | | | — | |
Expired Reimbursements | | | (145,541 | ) |
| | | | |
Reimbursement Available - 12/31/12 | | $ | 235,999 | |
| | | | |
The aggregate annual retainer paid to each Independent Trustee of the Board is $80,000, plus $5,000 or $2,500 for each regular or special meeting attended, respectively. The Independent Chairman of the Trust receives an additional payment of $20,000 per year. The Chairman of the Audit Committee receives an additional payment of $8,000 per year. The Trustees’ fees and expenses are allocated among all of the Funds for which the Investment Manager serves as the advisor (the “Managers Funds”) based on the relative net assets of such Funds. The “Trustees fees and expenses” shown in the financial statements represents each Fund’s allocated portion of the total fees and expenses paid by the Managers Funds.
Beginning January 1, 2013, the annual retainer paid to each Independent Trustee of the Board will be $105,000, plus $6,000 or $2,500 for each regular or special meeting attended, respectively. The Independent Chairman of the Trusts will receive an additional payment of $25,000 per year. The Chairman of the Audit Committee will receive an additional payment of $10,000 per year.
The Funds are distributed by Managers Distributors, Inc. (the “Distributor” or “MDI”), a wholly-owned subsidiary of the Investment Manager. MDI serves as the distributor and underwriter for each Fund and is a registered broker-dealer and member of the Financial Industry Regulatory Authority, Inc. (“FINRA”). Shares of each Fund will be continuously offered and will be sold directly to prospective purchasers through brokers, dealers or other financial intermediaries who have executed selling agreements with MDI. Subject to the compensation arrangement discussed below, generally MDI bears all or a portion of the expenses of providing services
Notes to Financial Statements (continued)
pursuant to the distribution agreement, including the payment of the expenses relating to the distribution of prospectuses for sales purposes and any advertising or sales literature. Certain Trustees and Officers of the Funds are Officers and/or Directors of the Investment Manager, AMG and/or the Distributor.
| 3. | Purchases and Sales of Securities |
Purchases and sales of securities (excluding short-term securities) for the year ended December 31, 2012, were as follows:
| | | | | | | | |
| | | Long-Term Securities
(excluding U.S. Government Obligations) | |
Fund | | Purchases | | | Sales | |
Short Duration | | $ | 65,726,986 | | | $ | 56,858,326 | |
Intermediate Duration | | $ | 9,541,623 | | | $ | 13,677,285 | |
| | | | | | | | |
| | | U.S. Government Obligations | |
Fund | | Purchases | | | Sales | |
Short Duration | | $ | 176,950,605 | | | $ | 125,125,645 | |
Intermediate Duration | | $ | 44,741,597 | | | $ | 31,085,069 | |
| 4. | Portfolio Securities Loaned |
The Funds participate in a securities lending program offered by BNYM (the “Program”), providing for the lending of securities to qualified brokers. Securities lending income include earnings of such temporary cash investments, plus or minus any rebate to a borrower. These earnings (after any rebate) are then divided between BNYM, as a fee for its services under the program, and the Funds, according to agreed-upon rates. Collateral on all securities loaned is accepted in cash and/or government securities and is maintained at a minimum level of 102% (105% in the case of certain foreign securities) of the market value, plus interest, if applicable, of investments on loan. It is the Funds’ policy to obtain additional collateral from or return excess collateral to the borrower by the end of the next business day, following the valuation date of the securities loaned. Therefore, the value of the collateral held may be temporarily less than the value of the securities on loan. Lending securities entails a risk of loss to the Funds if and to the extent that the market value of the securities loaned were to increase and the borrower did not increase the collateral accordingly, and the borrower fails to return the securities. Under the terms of the Program, the Funds are indemnified for such losses by BNYM. The Funds bear the risk of any deficiency in the amount of the collateral available for return to the borrower due to any loss on the collateral invested. Collateral received in the form of cash is invested temporarily in the BNY Mellon Overnight Government Fund, or other short-term investments as defined in the Securities Lending Agreement with BNYM. For the year ended December 31, 2012 and the year December 31, 2011, the Funds did not loan any securities.
| 5. | Commitments and Contingencies |
In the normal course of business, the Funds may enter into contracts and agreements that contain a variety of representations and warranties which provide general indemnifications. The maximum exposure to the Funds under these agreements is unknown, as this would involve future claims that may be made against the Funds that have not yet occurred. However, the Funds have had no prior claims or losses and expect the risks of material loss to be remote.
The following disclosures contain information on how and why the Funds use derivative instruments, the credit risk and how derivative instruments affect the Funds’ financial position, results of operations and cash flows. The location and fair value amounts of these instruments on the Statement of Assets and Liabilities and the realized and changes in unrealized gains and losses on the Statement of Operations, each categorized by type of derivative contract, are included in a table in the Schedules of Portfolio Investments. For the year ended December 31, 2012, the average quarterly balances of outstanding derivative financial instruments were as follows:
| | | | | | | | |
| | | Short
Duration | | | Intermediate
Duration | |
Financial futures contracts: | | | | | | | | |
Average number of contracts purchased | | | 115 | | | | 55 | |
Average number of contracts sold | | | 449 | | | | 83 | |
Average notional value of contracts purchased | | $ | 14,303,413 | | | $ | 6,938,183 | |
Average notional value of contracts sold | | $ | 81,994,603 | | | $ | 13,968,566 | |
The Funds entered into futures contracts to achieve a desired level of investment, whether to accommodate portfolio turnover or cash flows from capital shares transactions. There are certain risks associated with futures contracts. Prices may not move as expected or the Fund may not be able to close out the contract when it desires to do so, resulting in losses.
On entering into a futures contract, either cash or securities in an amount equal to a certain percentage of the contract value (initial margin) must be deposited with the futures broker. Subsequent payments (variation margin) are made or received each day. The variation margin payments equal the daily changes in the contract value and are recorded as unrealized gains or losses. For OTC futures, daily variation margin is not required. The Funds recognize a realized gain or loss when the contract is closed or expires equal to the difference between the value of the contract at the time it was opened and the value at the time it was closed. Futures are valued at their quoted daily settlement prices. The aggregate principal amounts of the contracts are not recorded in the financial statements. Fluctuations in the value of the contracts are recorded in the Statement of Assets and Liabilities as an asset (liability) and in the Statement of Operations as unrealized appreciation (depreciation) until the contracts are closed, when they are recorded as realized gains (losses) on futures contracts.
| 8. | Risks Associated with Collateralized Mortgage Obligations (“CMOs”) |
The net asset value of the Funds may be sensitive to interest rate fluctuations because the Funds may hold several instruments, including CMOs and other derivatives, whose values can be significantly impacted by interest rate movements. CMOs are obligations collateralized by a portfolio of mortgages or mortgage-related securities. Payments of principal and interest on the mortgages are passed through to the holder of the CMOs on the same schedule as they are received, although certain classes of CMOs have priority over others with respect to the receipt of prepayments
Notes to Financial Statements (continued)
on the mortgages. Therefore, the investment in CMOs may be subject to a greater or lesser risk of prepayment than other types of mortgage- related securities. CMOs are subject to principal paydowns as a result of prepayments or refinancing of the underlying mortgage instruments. As a result, the average life may be substantially less than the original maturity. CMOs may have a fixed or variable rate of interest.
| 9. | Dollar Roll and Reverse Dollar Roll Agreements |
The Funds may enter into dollar rolls in which they sell debt securities for delivery currently and simultaneously contract to repurchase similar, but not identical, securities at the same price or a lower price on an agreed date. The Funds receive compensation as consideration for entering into the commitment to repurchase. The compensation is the difference between the current sale price and the forward price for the future purchase (often referred to as the “drop”) as well as by the interest earned on the cash proceeds of the initial sale. The Funds may also be compensated by the receipt of a commitment fee. As the holder, the counterparty receives all principal and interest payments, including prepayments, made with respect to the similar security sold. Dollar rolls may be renewed with a new sale and repurchase price with a cash settlement made at renewal without physical delivery of the securities subject to the contract.
Certain risks may arise upon entering into dollar rolls from the potential inability of counterparties to meet the terms of their commitments. Additionally, the value of such securities may change adversely before the Funds are able to repurchase them. There can be no assurance that the Funds’ use of the cash that they receive from a dollar roll will provide a return that exceeds their cost.
Each of the Funds invests in stripped securities (“STRIPS”), primarily interest-only strips, for their hedging characteristics. Interest-only STRIPS will most likely move differently than typical fixed-income securities in relation to changes in interest rates. STRIPS are usually structured with two classes that receive different proportions of the interest and principal distributions from a pool of underlying assets. A common type of STRIP will have one class receiving all of the interest from the underlying assets (“interest-only” or “IO” class), while the other class will receive the entire principal (“principal only” or “PO” class). However, in some instances, one class will receive some of the interest and most of the principal while the other class will receive most of the interest and the remainder of the principal. STRIPS are unusually volatile in response to changes in interest rates. The yield to maturity on an IO class of STRIPS is extremely sensitive not only to changes in prevailing interest rates but also to the rate of principal payments (including prepayments) on the underlying assets. A rapid rate of principal prepayments may have a measurably adverse effect on a Funds’ yield to maturity to the extent it invests in IOs. Conversely,
POs tend to increase in value if prepayments are greater than anticipated and decline if prepayments are slower than anticipated. Thus, if the underlying assets experience greater than anticipated prepayments of principal, a Fund may fail to fully recover its initial investment in these securities, even if the STRIPS were rated of the highest credit quality by Standard & Poor’s Corporation or Moody’s Investors Service, Inc. These risks are managed by investing in a variety of such securities and by using certain hedging techniques. In addition the secondary market for STRIPS may be less liquid than that of other mortgage-backed or asset-backed securities, potentially limiting a Fund’s ability to buy or sell those securities at any particular time.
| 11. | New Accounting Pronouncements |
In December 2011, the FASB issued ASU No. 2011-11 “Disclosures about Offsetting Assets and Liabilities.” ASU 2011-11 requires disclosures to make financial statements that are prepared under U.S. GAAP more comparable to those prepared under IFRS. The new disclosure requirements mandate that entities disclose both gross and net information about instruments and transactions eligible for offset in the statement of assets and liabilities as well as instruments and transactions subject to an agreement similar to a master netting arrangement. In addition, ASU 2011-11 requires disclosure of collateral received and posted in connection with master netting agreements or similar arrangements. New disclosures are required for annual reporting periods beginning on or after January 1, 2013, and interim periods within those annual periods. Management is evaluating the impact of ASU 2011-11 on the Funds’ financial statements and disclosures.
The Funds have determined that no material events or transactions occurred through the issuance of the Funds’ financial statements, which require additional disclosure in the Funds’ financial statements.
Tax Information(unaudited)
The Managers Short Duration Government Fund and the Managers Intermediate Duration Government Fund hereby designates the maximum amount allowable of its net taxable income as qualified dividends as provided in the Jobs and Growth Tax Relief Reconciliation Act of 2003. The 2012 Form 1099-DIV you receive for each Fund will show the tax status of all distributions paid to you during the calendar year.
Pursuant to section 852 of the Internal Revenue Code, Managers Short Duration Government Fund and Managers Intermediate Duration Government Fund hereby designate $0 and $1,417,374, respectively, as a capital gain distribution with respect to the taxable year ended December 31, 2012, or if subsequently determined to be different, the net capital gains of such year.
Report of Independent Registered Public Accounting Firm
To the Board of Trustees of Managers Trust II and the Shareholders of Managers Short Duration Government Fund and Managers Intermediate Duration Government Fund:
In our opinion, the accompanying statements of assets and liabilities, including the schedules of portfolio investments, and the related statements of operations and of changes in net assets and the financial highlights present fairly, in all material respects, the financial position of Managers Short Duration Government Fund and Managers Intermediate Duration Government Fund (the “Funds”) at December 31, 2012, and the results of each of their operations, the changes in each of their net assets and the financial highlights for each of the periods indicated, in conformity with accounting principles generally accepted in the United States of America. These financial statements and financial highlights (hereafter referred to as “financial statements”) are the responsibility of the Funds’ management. Our responsibility is to express an opinion on these financial statements based on our audits. We conducted our audits of these financial statements in accordance with the standards of the Public Company Accounting Oversight Board (United States). Those standards require that we plan and perform the audit to obtain reasonable assurance about whether the financial statements are free of material misstatement. An audit includes examining, on a test basis, evidence supporting the amounts and disclosures in the financial statements, assessing the accounting principles used and significant estimates made by management, and evaluating the overall financial statement presentation. We believe that our audits, which included confirmation of securities at December 31, 2012 by correspondence with the custodian and brokers, and the application of alternative auditing procedures where securities purchased had not been received, provide a reasonable basis for our opinion.
PricewaterhouseCoopers LLP
Boston, Massachusetts
February 27, 2013
39
Trustees and Officers
The Trustees and Officers of the Trust, their business addresses, principal occupations for the past five years and dates of birth are listed below. The Trustees provide broad supervision over the affairs of the Trust and the Funds. The Trustees are experienced executives who meet periodically throughout the year to oversee the Funds’ activities, review contractual arrangements with companies that provide services to the Funds, and review the Funds’ performance. Unless otherwise noted, the address of each Trustee or Officer is the address of the Trust: 800 Connecticut Avenue, Norwalk, Connecticut 06854.
There is no stated term of office for Trustees. Trustees serve until their resignation, retirement or removal in accordance with the Trust’s organizational documents and policies adopted by the Board from time to time. The Chairman of the Trustees, President, Treasurer and Secretary of the Trust are elected by the Trustees annually. Other officers hold office at the pleasure of the Trustees.
Independent Trustees
The following Trustees are not “interested persons” of the Trust within the meaning of the 1940 Act:
| | |
Name, Date of Birth, Number of
Funds Overseen in Fund Complex* | | Principal Occupation(s) During
Past 5 Years and Other
Directorships Held by Trustee |
Bruce B. Bingham, 12/01/48 • Trustee since 2012 • Oversees 37 Funds in Fund Complex | | Partner, Hamilton Partners (real estate development firm) (1987-Present). |
William E. Chapman, II, 9/23/41 • Independent Chairman • Trustee since 2000 • Oversees 37 Funds in Fund Complex | | President and Owner, Longboat Retirement Planning Solutions (1998-Present); Hewitt Associates, LLC (part time) (provider of Retirement and Investment Education Seminars) (2002-2009); Trustee of Bowdoin College (2002-Present); Director of Harding, Loevner Funds, Inc. (6 portfolios); Trustee of Third Avenue Trust (5 portfolios); Trustee of Third Avenue Variable Trust (1 portfolio); Trustee of Aston Funds (26 portfolios). |
Edward J. Kaier, 9/23/45 • Trustee since 2000 • Oversees 37 Funds in Fund Complex | | Attorney at Law and Partner, Teeters Harvey Gilboy & Kaier LLP (2007-Present); Attorney at Law and Partner, Hepburn Willcox Hamilton & Putnam, LLP (1977-2007); Trustee of Third Avenue Trust (5 portfolios); Trustee of Third Avenue Variable Trust (1 portfolio); Trustee of Aston Funds (26 portfolios). |
Steven J. Paggioli, 4/3/50 • Trustee since 2000 • Oversees 37 Funds in Fund Complex | | Independent Consultant (2002-Present); Formerly Executive Vice President and Director, The Wadsworth Group (1986-2001); Executive Vice President, Secretary and Director, Investment Company Administration, LLC (1990-2001); Vice President, Secretary and Director, First Fund Distributors, Inc. (1991-2001); Trustee, Professionally Managed Portfolios (38 portfolios); Advisory Board Member, Sustainable Growth Advisors, LP; Independent Director, Chase Investment Counsel (2008 – Present); Trustee of Aston Funds (26 portfolios). |
Eric Rakowski, 6/5/58 • Trustee since 2000 • Oversees 37 Funds in Fund Complex | | Professor, University of California at Berkeley School of Law (1990-Present); Director of Harding, Loevner Funds, Inc. (6 portfolios); Trustee of Third Avenue Trust (5 portfolios); Trustee of Third Avenue Variable Trust (1 portfolio); Trustee of Aston Funds (26 portfolios). |
Thomas R. Schneeweis, 5/10/47 • Trustee since 2000 • Oversees 37 Funds in Fund Complex | | Professor of Finance, University of Massachusetts (1977-Present); Director, CISDM at the University of Massachusetts, (1996-Present); President, Alternative Investment Analytics, LLC, (formerly Schneeweis Partners, LLC) (2001-Present); Partner, S Capital Management, LLC (2007-Present); President, TRS Associates (1982-Present); Partner, White Bear Partners, LLC (2007-2010); Partner, Northampton Capital Management, LLC (2004-2010); Trustee of Aston Funds (26 portfolios). |
| * | The Fund Complex consists of Managers AMG Funds, The Managers Funds, Managers Trust I and Managers Trust II. |
Interested Trustees
Each Trustee in the following table is an “interested person” of the Trust within the meaning of the 1940 Act. Ms. Carsman is an interested person of the Trust within the meaning of the 1940 Act by virtue of her position with, and interest in securities of, AMG, and her former position as Chief Legal Officer of the Trust.
| | |
Name, Date of Birth, Number of
Funds Overseen in Fund Complex* | | Principal Occupation(s) During
Past 5 Years and Other
Directorships Held by Trustee |
Christine C. Carsman, 4/2/52 • Trustee since 2011 • Oversees 37 Funds in Fund Complex | | Senior Vice President and Deputy General Counsel, Affiliated Managers Group, Inc. (2011-Present); Senior Vice President and Chief Regulatory Counsel, Affiliated Managers Group, Inc. (2007-2011); Vice President and Chief Regulatory Counsel, Affiliated Managers Group, Inc. (2004-2007); Secretary and Chief Legal Officer, Managers AMG Funds, The Managers Funds, Managers Trust I and Managers Trust II (2004-2011); Senior Counsel, Vice President and Director of Operational Risk Management and Compliance, Wellington Management Company, LLP (1995-2004) |
Officers
| | |
Name, Date of Birth, Position(s)
Held with Fund and Length of Time
Served | | Principal Occupation(s) During
Past 5 Years |
| |
Keitha L. Kinne, 5/16/58 • President since 2012 • Chief Operating Officer since 2007 | | Managing Partner and Chief Operating Officer, Managers Investment Group LLC (2007-Present); Chief Investment Officer, Managers Investment Group LLC (2008-Present); President, Managers Distributors, Inc. (2012-Present); Chief Operating Officer, The Managers Funds, Managers AMG Funds and Managers Trust I (2007-Present); Managing Director, Legg Mason & Co., LLC (2006-2007); Managing Director, Citigroup Asset Management (2004-2006). |
Lewis Collins, 2/22/66 • Secretary since 2011 • Chief Legal Officer since 2011 | | Senior Vice President and Senior Counsel, Affiliated Managers Group, Inc. (2010-Present); Vice President and Senior Counsel, Affiliated Managers Group, Inc. (2006-2010); Senior Counsel, Affiliated Managers Group, Inc. (2002-2006); Attorney, Ropes & Gray LLP (1998-2002) |
Donald S. Rumery, 5/29/58 • Chief Financial Officer since 2007 • Treasurer since 2000 | | Senior Vice President, Managers Investment Group LLC (2005-Present); Treasurer, The Managers Funds (1995-Present); Treasurer, Managers AMG Funds (1999-Present); Treasurer, Managers Trust I (2000-Present); Chief Financial Officer, The Managers Funds, Managers AMG Funds and Managers Trust I (2007-Present); Treasurer and Chief Financial Officer, Managers Distributors, Inc. (2000-2012); Vice President, The Managers Funds LLC, (1994-2004) |
John J. Ferencz, 3/09/62 • Chief Compliance Officer since 2010 | | Vice President, Legal and Compliance, Managers Investment Group LLC (2010-Present); Senior Compliance Analyst, Mutual Funds and Regulatory, GE Asset Management Incorporated (2005-2010) |
Michael S. Ponder, 9/12/73 • Assistant Secretary since 2011 | | Senior Vice President and Counsel, Managers Investment Group LLC (2011-Present); Attorney, DeNovo Legal (2009-2010); Vice President, Credit Suisse (2007-2009); Associate, Willkie Farr & Gallagher LLP (2006-2007) |
Matthew B. Wallace, 11/24/80 • Anti-Money Laundering Compliance Officer since 2012 | | Senior Associate, Legal and Compliance, Managers Investment Group LLC (2012-Present); Associate, Legal and Compliance, Managers Investment Group LLC (2010-2012); Compliance Specialist, Calamos Advisors LLC (2007-2010). |
THIS PAGE INTENTIONALLY LEFT BLANK
THIS PAGE INTENTIONALLY LEFT BLANK
THIS PAGE INTENTIONALLY LEFT BLANK
Investment Manager and Administrator
Managers Investment Group LLC
800 Connecticut Avenue
Norwalk, CT 06854
(800) 835-3879
Distributor
Managers Distributors, Inc.
800 Connecticut Avenue
Norwalk, CT 06854
(800) 835-3879
Custodian
The Bank of New York Mellon
2 Hanson Place
Legal Counsel
Ropes & Gray LLP
Prudential Tower, 800 Boylston Street
Boston, MA 02199-3600
Transfer Agent
BNY Mellon Investment Servicing (US) Inc.
Attn: Managers
P.O. Box 9769
Providence, RI 02940
(800) 548-4539
For ManagersChoiceTM Only
Managers
c/o BNY Mellon Investment Servicing (US) Inc.
P.O. Box 9847
Providence, RI 02940-8047
(800) 358-7668

MANAGERSAND MANAGERS AMG FUNDS
| | | | |
EQUITY FUNDS | | BALANCED FUNDS |
CADENCE CAPITAL APPRECIATION CADENCE MID-CAP CADENCE EMERGING COMPANIES Cadence Capital Management, LLC ESSEX SMALL/MICRO CAP GROWTH Essex Investment Management Co., LLC FQ TAX-MANAGED U.S. EQUITY FQ U.S. EQUITY First Quadrant, L.P. FRONTIER SMALL CAP GROWTH Frontier Capital Management Company, LLC GW&K SMALL CAP EQUITY Gannett Welsh & Kotler, LLC MICRO-CAP Lord, Abbett & Co. LLC WEDGE Capital Management L.L.P. Next Century Growth Investors LLC RBC Global Asset Management (U.S.) Inc. REAL ESTATE SECURITIES Urdang Securities Management, Inc. RENAISSANCE LARGE CAP GROWTH Renaissance Group LLC | | SKYLINE SPECIAL EQUITIES PORTFOLIO Skyline Asset Management, L.P. SPECIAL EQUITY Ranger Investment Management, L.P. Lord, Abbett & Co. LLC Smith Asset Management Group, L.P. Federated MDTA LLC SYSTEMATIC VALUE SYSTEMATIC MID CAP VALUE Systematic Financial Management, L.P. TIMESSQUARE INTERNATIONAL SMALL CAP FUND TIMESSQUARE MID CAP GROWTH TIMESSQUARE SMALL CAP GROWTH TSCM GROWTH EQUITY TimesSquare Capital Management, LLC TRILOGY GLOBAL EQUITY TRILOGY EMERGING MARKETS EQUITY TRILOGY INTERNATIONAL SMALL CAP Trilogy Global Advisors, L.P. YACKTMAN FUND YACKTMAN FOCUSED FUND Yacktman Asset Management L.P. | | CHICAGO EQUITY PARTNERS BALANCED Chicago Equity Partners, LLC ALTERNATIVE FUNDS FQ GLOBAL ALTERNATIVES FQ GLOBAL ESSENTIALS First Quadrant, L.P. INCOME FUNDS BOND (MANAGERS) GLOBAL INCOME OPPORTUNITY Loomis, Sayles & Co., L.P. BOND (MANAGERS PIMCO) Pacific Investment Management Co. LLC CALIFORNIA INTERMEDIATE TAX-FREE Miller Tabak Asset Management LLC GW&K FIXED INCOME FUND GW&K MUNICIPAL BOND GW&K MUNICIPAL ENHANCED YIELD Gannett Welsh & Kotler, LLC HIGH YIELD J.P. Morgan Investment Management LLC INTERMEDIATE DURATION GOVERNMENT SHORT DURATION GOVERNMENT Smith Breeden Associates, Inc. |
| | | | |
This report is prepared for the Funds’ shareholders. It is authorized for distribution to prospective investors only when preceded or accompanied by an effective prospectus. To receive a free copy of the prospectus or Statement of Additional Information, which includes additional information about Fund Trustees, please contact us by calling 800.835.3879. Distributed by Managers Distributors, Inc., member FINRA. A description of the policies and procedures each Fund uses to vote its proxies is available: (i) without charge, upon request, by calling 800.835.3879, or (ii) on the Securities and Exchange Commission’s (SEC) Web site at www. sec.gov. For information regarding each Fund’s proxy voting record for the 12-month period ended June 30, call 800.835.3879 or visit the SEC Web site at www.sec.gov. The Funds file their complete schedule of portfolio holdings with the SEC for the first and third quarters of each fiscal year on Form N-Q. The Funds’ Forms N-Q are available on the SEC’s website at www.sec.gov. A Fund’s Forms N-Q may be reviewed and copied at the SEC’s Public Reference Room in Washington, DC. Information on the operation of the Public Reference Room may be obtained by calling 800.SEC.0330. To review a complete list of the Funds’ portfolio holdings, or to view the most recent quarterly holdings report, semiannual report, or annual report, please visit www.managersinvest.com. | | | |  |
 | | | | |
Managers Funds
Annual Report — December 31, 2012
| | | | |
TABLE OF CONTENTS | | Page | |
| |
LETTER TO SHAREHOLDERS | | | 1 | |
| |
ABOUT YOUR FUND’S EXPENSES | | | 2 | |
| |
PORTFOLIO MANAGER’S COMMENTS, FUND SNAPSHOTS, AND SCHEDULES OF PORTFOLIO INVESTMENTS | | | | |
| |
Managers AMG Chicago Equity Partners Balanced Fund | | | 3 | |
| |
Managers High Yield Fund | | | 13 | |
| |
Managers AMG GW&K Fixed Income Fund | | | 27 | |
| |
NOTES TO SCHEDULES OF PORTFOLIO INVESTMENTS | | | 32 | |
| |
FINANCIAL STATEMENTS | | | | |
| |
Statement of Assets and Liabilities | | | 34 | |
Balance sheets, net asset value (NAV) per share computations and cumulative undistributed amounts | | | | |
| |
Statement of Operations | | | 36 | |
Detail of sources of income, expenses, and realized and unrealized gains (losses) during the year | | | | |
| |
Statements of Changes in Net Assets | | | 37 | |
Detail of changes in assets for the past two years | | | | |
| |
FINANCIAL HIGHLIGHTS | | | 39 | |
Historical net asset values per share, distributions, total returns, income and expense ratios, turnover ratios and net assets | | | | |
| |
NOTES TO FINANCIAL HIGHLIGHTS | | | 44 | |
| |
NOTES TO FINANCIAL STATEMENTS | | | 45 | |
Accounting and distribution policies, details of agreements and transactions with Fund management and affiliates, and descriptions of certain investment risks | | | | |
| |
REPORT OF INDEPENDENT REGISTERED PUBLIC ACCOUNTING FIRM | | | 53 | |
| |
TRUSTEES AND OFFICERS | | | 54 | |
Nothing contained herein is to be considered an offer, sale or solicitation of an offer to buy shares of any series of the Managers Family of Funds. Such offering is made only by Prospectus, which includes details as to offering price and other material information.
Letter to Shareholders
Dear Shareholder:
Thank you for your investment in The Managers Funds. Our foremost goal at Managers Investment Group (MIG) is to provide investment products and solutions that help our shareholders and clients successfully reach their investment goals and objectives. We do this by offering a broad selection of funds managed by a collection of Affiliated Managers Group’s (AMG) Affiliate investment boutiques, along with a complementary series of open-architecture mutual funds.
The past year has been an exciting one for us at MIG. In connection with AMG’s investment in Yacktman Asset Management (“Yacktman”), MIG partnered with Yacktman in reorganizing the Yacktman Focused Fund and the Yacktman Fund into The Managers Funds. The addition of the Yacktman Funds to our platform brought our total assets under management to over $25 billion at the end of 2012.
Additionally, in an effort to better meet our shareholders’ needs as well as bring consistency across our funds, we restructured our share class offerings across many of our Funds, which included discontinuing certain share classes with sales charges (commonly called sales loads). As a result, many of our Funds now offer three No Load share classes – Investor, Service, and Institutional Share Classes. We believe this simplified structure makes it easier for our clients as well as Financial Advisors to select the appropriate share class to match their needs.
During 2012, we also executed on other changes to certain Funds, which included reducing expense ratios on several Funds to ensure that our offerings remain competitive and affordable for our clients.
As we enter into 2013, both known and unknown risks remain to the global economy and its growth prospects. Nevertheless, we remain optimistic that the collective fiscal and monetary efforts undertaken over the past several years will continue to have a positive impact on the global economy. In the meantime, we remain confident that our Funds are well positioned to weather an uncertain economic environment.
We thank you for your continued confidence and investment in The Managers Funds. You can rest assured that under all market conditions our team is focused on delivering excellent investment management services for your benefit.
Respectfully,
Keitha Kinne
President
The Managers Funds
About Your Fund’s Expenses
|
As a shareholder of a Fund, you may incur two types of costs: (1) transaction costs, which may include sales charges (loads) on purchase payments; redemption fees; and exchange fees; and (2) ongoing costs, including management fees; distribution (12b-1) fees; and other Fund expenses. This example is intended to help you understand your ongoing costs (in dollars) of investing in the Fund and to compare these costs with the ongoing costs of investing in other mutual funds. The example is based on $1,000 invested at the beginning of the period and held for the entire period as indicated below. Actual Expenses The first line of the following table provides information about the actual account values and actual expenses. You may use the information in this line, together with the amount you invested, to estimate the expenses that you paid over the period. Simply divide your account value by $1,000 (for example, an $8,600 account value divided by $1,000 = 8.6), then multiply the result by the number in the first line under the heading entitled “Expenses Paid During Period” to estimate the expenses you paid on your account during this period. Hypothetical Example for Comparison Purposes The second line of the following table provides information about hypothetical account values and hypothetical expenses based on the Fund’s actual expense ratio and an assumed annual rate of return of 5% before expenses, which is not the Fund’s actual return. The hypothetical account values and expenses may not be used to estimate the actual ending account balance or expenses you paid for the period. You may use this information to compare the ongoing costs of investing in the Fund and other funds by comparing this 5% hypothetical example with the 5% hypothetical examples that appear in the shareholder reports of other funds. Please note that the expenses shown in the table are meant to highlight your ongoing costs only and do not reflect any transactional costs, such as sales charges (loads), redemption fees, or exchange fees. Therefore, the second line of the table is useful in comparing ongoing costs only, and will not help you determine the relative total costs of owning different funds. |
| | | | | | | | | | | | | | | | |
Six Months Ended December 31, 2012 | | Expense
Ratio for
the Period | | | Beginning
Account Value
07/01/2012 | | | Ending
Account Value
12/31/2012 | | | Expenses
Paid During
the Period* | |
Managers AMG Chicago Equity Partners Balanced Fund | | | | | | | | | | | | | | | | |
Investor Class Shares | | | | | | | | | | | | | | | | |
Based on Actual Fund Return | | | 1.09 | % | | $ | 1,000 | | | $ | 1,037 | | | $ | 5.57 | |
Hypothetical (5% return before expenses) | | | 1.09 | % | | $ | 1,000 | | | $ | 1,020 | | | $ | 5.52 | |
Service Class Shares** | | | | | | | | | | | | | | | | |
Based on Actual Fund Return | | | 0.94 | % | | $ | 1,000 | | | $ | 996 | | | $ | 4.73 | |
Hypothetical (5% return before expenses) | | | 0.94 | % | | $ | 1,000 | | | $ | 1,020 | | | $ | 4.79 | |
Institutional Class Shares | | | | | | | | | | | | | | | | |
Based on Actual Fund Return | | | 0.84 | % | | $ | 1,000 | | | $ | 1,038 | | | $ | 4.30 | |
Hypothetical (5% return before expenses) | | | 0.84 | % | | $ | 1,000 | | | $ | 1,021 | | | $ | 4.27 | |
Managers High Yield Fund | | | | | | | | | | | | | | | | |
Investor Class Shares | | | | | | | | | | | | | | | | |
Based on Actual Fund Return | | | 1.15 | % | | $ | 1,000 | | | $ | 1,075 | | | $ | 5.99 | |
Hypothetical (5% return before expenses) | | | 1.15 | % | | $ | 1,000 | | | $ | 1,019 | | | $ | 5.83 | |
Institutional Class Shares | | | | | | | | | | | | | | | | |
Based on Actual Fund Return | | | 0.90 | % | | $ | 1,000 | | | $ | 1,075 | | | $ | 4.70 | |
Hypothetical (5% return before expenses) | | | 0.90 | % | | $ | 1,000 | | | $ | 1,021 | | | $ | 4.58 | |
Managers AMG GW&K Fixed Income Fund | | | | | | | | | | | | | | | | |
Investor Class Shares | | | | | | | | | | | | | | | | |
Based on Actual Fund Return | | | 0.84 | % | | $ | 1,000 | | | $ | 1,043 | | | $ | 4.31 | |
Hypothetical (5% return before expenses) | | | 0.84 | % | | $ | 1,000 | | | $ | 1,021 | | | $ | 4.26 | |
Service Class Shares** | | | | | | | | | | | | | | | | |
Based on Actual Fund Return | | | 0.64 | % | | $ | 1,000 | | | $ | 1,003 | | | $ | 3.22 | |
Hypothetical (5% return before expenses) | | | 0.64 | % | | $ | 1,000 | | | $ | 1,022 | | | $ | 3.25 | |
Class C Shares | | | | | | | | | | | | | | | | |
Based on Actual Fund Return | | | 1.59 | % | | $ | 1,000 | | | $ | 1,040 | | | $ | 8.15 | |
Hypothetical (5% return before expenses) | | | 1.59 | % | | $ | 1,000 | | | $ | 1,017 | | | $ | 8.06 | |
Institutional Class Shares | | | | | | | | | | | | | | | | |
Based on Actual Fund Return | | | 0.59 | % | | $ | 1,000 | | | $ | 1,045 | | | $ | 3.03 | |
Hypothetical (5% return before expenses) | | | 0.59 | % | | $ | 1,000 | | | $ | 1,022 | | | $ | 3.00 | |
| * | Expenses are equal to the Fund’s annualized expense ratio multiplied by the average account value over the period, multiplied by the number of days in the period (184), then divided by 366. |
| ** | Commenced operations December 1, 2012. |
2
Managers AMG Chicago Equity Partners Balanced Fund
Portfolio Manager’s Comments
THE YEAR IN REVIEW
For the year ended December 31, 2012, the Managers AMG Chicago Equity Partners Balanced Fund (Institutional Share Class) returned 10.09%, underperforming the 11.65% return for its benchmark, which consists of 60% of the return of the Russell 1000® Index and 40% of the return of the Barclays Capital U.S. Aggregate Bond Index. Throughout the year, the Portfolio’s allocation was neutral and we continue to manage the Fund in line with the neutral allocation.
EQUITY
2012 proved to be a strong year for equities, with all Indices posting double digit gains for the year. Mid cap stocks led the pack with a 17% return, while large caps tied with small caps at 16%. For the year, value beat growth, ending a three-year run by growth stocks. 2012 started out strong as the Euro zone showed temporary signs of stabilization and the U.S. economy continued to improve. The rally was short lived, however, as the market corrected 10% from April-May, once again weighed down by Euro zone concerns, slowing growth in China and weakness in the U.S. economy. The Fed came to the rescue (again!) with QE3, and stocks ended the 3rd quarter 6% higher. Politics stole the spotlight during the 4th quarter as investors’ attention became focused on the policy implications of the presidential election. Immediately following the election, attention pivoted towards the contentious negotiations regarding the fast approaching fiscal cliff. Progress was made and an agreement reached, but much like the broader recovery to date the pace and scope was less than satisfying to many. Even though the Russell 1000® Index delivered an impressive 16.4% gain for the year, many of the lingering concerns remain: reduced forecasts for global growth, decelerating earnings growth in the U.S., continued showdowns in Washington over the debt ceiling and budget deficits, and a muted recovery in the labor markets. As a result, some market participants have grown more weary than those undecided voters from Ohio.
Regarding the equity portion of the Fund, all four factor groups (Growth, Value, Momentum, Quality) averaged positive returns for 2012, due to strong performance from each group at different times of the year. The model’s stock-selection forecasts were mixed for the quarter. Valuation factors continued their rebound in the second half finishing the year strongly. December was a particularly good month for valuation factors. Momentum, after being strong during the year, reversed course and delivered a negative quarter. The growth group and quality group ended slightly positive for the year as well. For the year, the highest ranked stocks outperformed the bottom ranked stocks, but some of the lower ranked stock groupings also did well. As a result, equity performance for the Fund was roughly in line with the equity benchmark. Overall, our philosophy will not change based on short-term trends or conditions in the market. We will continue to use our disciplined approach to provide added value at controlled levels of risk.
During the fourth quarter we introduced our proprietary market phase identification model to the equity portion of the Portfolio, which is part of our ongoing efforts to continually enhance our multi-factor model. The market phase identification model improves portfolio performance by identifying the right time to emphasize or de-emphasize certain factors. Contrary to a short-term timing model, the objective is to capture major inflection points that historically
have been challenging environments for quantitative models. We apply this information during the portfolio construction process by altering factor constraints in the optimization depending on the current market phase. The information captured in our phase identification method is used to enhance upside returns and improve downside risk management.
FIXED INCOME
Throughout 2012, Chicago Equity Partners maintained an emphasis on higher quality sectors of the market and higher rated issuers within the corporate bond universe. Uncertainty regarding the sustainability of economic growth, as well as the future of government fiscal and monetary policy, was the key factor influencing our decision. Throughout the year overall spreads tightened and the types of securities in which we held an underweight position (such as credit in general, and BBBs specifically) outperformed. As a result, the fixed income portion of the Portfolio trailed its benchmark.
A strong appetite for risk throughout most of 2012 resulted in valuations achieving historically rich levels. While it has been the stated goal of Federal Reserve Monetary Policy to drive the prices of risk assets higher through ongoing Quantitative Easing programs, it may have resulted in valuations disconnecting from underlying fundamental circumstances. Our stated objective for this portion of the Fund is to provide income, stability and to reduce overall portfolio risk. As a result, we positioned the Portfolio toward preserving capital and to benefit if the market’s risk appetite reversed.
The risk premium offered for all non-Treasury sectors of the investment grade market declined in 2012. The most dramatic declines occurred in the lower rated financial issuers within the investment grade market. The spread offered by “BBB” rated securities, over U.S. Treasuries declined by 93 basis points in 2012. Yields for financial companies, relative to U.S. Treasuries, declined by 161 basis points in 2012. Non-financials declined by a smaller 48 basis points.
We continue to believe our positioning is prudent, is in line with our stated objectives, and will benefit shareholders during times of financial stress, especially given the dramatic decline in spreads that occurred in 2012.
This commentary reflects the viewpoints of the portfolio manager, Chicago Equity Partners, as of December 31, 2012 and is not intended as a forecast or guarantee of future results.
Managers AMG Chicago Equity Partners Balanced Fund
Portfolio Manager’s Comments (continued)
CUMULATIVE TOTAL RETURN PERFORMANCE
The Managers AMG Chicago Equity Partners Balanced Fund’s (“Managers AMG CEP Balanced Fund”) cumulative total return is based on the daily change in net asset value (NAV), and assumes that all dividends and distributions were reinvested. The chart compares a hypothetical $10,000 investment made in the Fund’s Investor Class shares (formerly Class A shares of the Fund, which were renamed Investor Class shares as of December 1, 2012) on December 31, 2002 to a $10,000 investment made in the benchmarks for the same time period. Performance for periods longer than one year is annualized. The graph and table do not reflect the deduction of taxes that a shareholder would pay on a Fund distribution or redemption of shares. Past performance is not indicative of future results. The listed returns for the Fund are net of expenses and the returns for the indices exclude expenses. Total returns for the Fund would have been lower had certain expenses not been reduced.
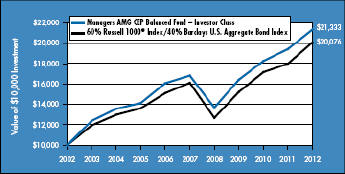
The table below shows the average annual total returns for the Managers AMG CEP Balanced Fund, the Russell 1000® Index & the Barclays U.S. Aggregate Bond Index for the same time periods ended December 31, 2012.
| | | | | | | | | | | | | | | | | | | | |
| | | Average Annual Total Returns1 | |
| | | One
Year | | | Five
Years | | | Ten
Years | | | Since
Inception | | | Inception
Date | |
Managers AMG CEP Balanced Fund2,3,4,5 | | | | | | | | | | | | | | | | | | | | |
Investor Class6 | | | 9.86 | % | | | 4.88 | % | | | 7.87 | % | | | 7.55 | % | | | 01/02/97 | |
Service Class | | | — | | | | — | | | | — | | | | (0.43 | )% | | | 11/30/12 | |
Institutional Class | | | 10.09 | % | | | 5.15 | % | | | 8.21 | % | | | 7.96 | % | | | 01/02/97 | |
60% Russell
1000®Index7/40%
Barclays U.S. Aggregate Index8 | | | 11.65 | % | | | 4.50 | % | | | 7.22 | % | | | 6.62 | % | | | 01/02/97 | † |
The performance data shown represents past performance. Past performance is not a guarantee of future results. Current performance may be lower or higher than the performance data quoted. The investment return and principal value of an investment in the Fund will fluctuate so that an investor’s shares, when redeemed, may be worth more or less than their original cost. For performance information through the most recent month end, please call (800) 835-3879 or visit our Web site at www.managersinvest.com.
Investors should carefully consider the Fund’s investment objectives, risks, charges and expenses before investing. For this and other information, please call (800) 835-3879 or visit www.managersinvest.com for a free prospectus. Read it carefully before investing or sending money. Funds are distributed by Managers Distributors, Inc., a member of FINRA.
| † | Date reflects inception date of the Fund, not the index. |
|
1 Total return equals income yield plus share price change and assumes reinvestment of all dividends and capital gain distributions. Returns are net of fees and may reflect offsets of Fund expenses as described in the Prospectus. No adjustment has been made for taxes payable by shareholders on their reinvested dividends and capital gain distributions. Returns for periods greater than one year are annualized. The listed returns on the Fund are net of expenses and based on the published NAV as of December 31, 2012. All returns are in U.S. dollars ($). 2 Changing interest rates may adversely affect the value of an investment. An increase in interest rates typically causes the value of bonds and other fixed income securities to fall. The Fund is subject to the risks associated with investments in debt securities, such as default risk and fluctuations in the perception of the debtor’s ability to pay its creditors. Investments in foreign securities, even though publicly traded in the United States, may involve risks which are in addition to those inherent in domestic investments. 3 The Fund invests in large-capitalization companies that may underperform other stock funds (such as funds that focus on small- and medium-capitalization companies) when stocks of large-capitalization companies are out of favor. 4 The Fund invests in value stocks, which may perform differently from the market as a whole and may be undervalued by the market for a long period of time. Value stocks may underperform growth stocks during the given periods. 5 From time to time, the Fund’s advisor has waived its fees and/or absorbed Fund expenses, which has resulted in higher returns. 6 As of December 1, 2012 the Fund’s Class A shares were renamed Investor Class Shares. Additionally, the Fund’s Class C shares converted to Investor Class shares. 7 The Russell 1000® Index measures the performance of approximately 1,000 of the largest securities based on a combination of their market cap and current index membership. The Russell 1000® represents approximately 92% of the U.S. market. The Russell 1000® Index is unmanaged, is not available for investment, and does not incur expenses. 8 The Barclays U.S. Aggregate Bond Index is an index of the U.S. investment grade fixed-rate bond market, including both government and corporate bonds. The Barclays U.S. Aggregate Bond Index is unmanaged, is not available for investment, and does not incur expenses. The Russell 1000® Index is a registered trademark of Russell Investments. Russell® is a trademark of Russell Investments. Not FDIC insured, nor bank guaranteed. May lose value. |
4
Managers AMG Chicago Equity Partners Balanced Fund
Fund Snapshots
December 31, 2012
Portfolio Breakdown (unaudited)
| | | | |
Industry | | Managers AMG
Chicago Equity Partners
Balanced Fund** | |
U.S. Government and Agency Obligations | | | 37.2 | % |
Information Technology | | | 14.3 | % |
Consumer Discretionary | | | 9.0 | % |
Financials | | | 8.4 | % |
Health Care | | | 7.4 | % |
Industrials | | | 6.6 | % |
Consumer Staples | | | 5.8 | % |
Energy | | | 4.4 | % |
Utilities | | | 2.4 | % |
Materials | | | 1.9 | % |
Telecommunication Services | | | 1.8 | % |
Mortgage Backed Securities | | | 0.0 | % |
Foreign Government Obligations | | | 0.0 | % |
Asset Backed Securities | | | 0.0 | % |
Other Assets and Liabilities | | | 0.8 | % |
| ** | As a percentage of net assets |
Top Ten Holdings (unaudited)
| | | | |
Security Name | | % of
Net Assets | |
U.S. Treasury Notes, 0.625%, 01/13/13 | | | 3.5 | % |
Apple, Inc.* | | | 3.2 | |
U.S. Treasury Bonds, 4.750%, 02/15/41 | | | 2.7 | |
U.S. Treasury Notes, 1.000%, 03/31/17 | | | 2.0 | |
FHLB, 5.000%, 11/17/17* | | | 1.9 | |
FHLMC, 3.750%, 03/27/19* | | | 1.9 | |
Exxon Mobil Corp.* | | | 1.8 | |
U.S. Treasury Notes, 2.625%, 08/15/20* | | | 1.4 | |
U.S. Treasury Notes, 2.750%, 02/28/18 | | | 1.4 | |
FHLMC, 2.500%, 05/27/16 | | | 1.4 | |
Top Ten as a Group | | | 21.2 | % |
| | | | |
| * | Top Ten Holding at June 30, 2012 |
Any sectors, industries, or securities discussed should not be perceived as investment recommendations. Mention of a specific security should not be considered a recommendation to buy or solicitation to sell that security. Specific securities mentioned in this report may have been sold from the Fund’s portfolio of investments by the time you receive this report.
5
Managers AMG Chicago Equity Partners Balanced Fund
Schedule of Portfolio Investments
December 31, 2012
| | | | | | | | |
| | | Shares | | | Value | |
| | | | | | | |
Common Stocks - 60.1% | | | | | | | | |
Consumer Discretionary - 9.0% | | | | | | | | |
American Eagle Outfitters, Inc. | | | 2,100 | | | $ | 43,071 | |
Bally Technologies, Inc.* | | | 3,400 | | | | 152,014 | |
CBS Corp., Class B | | | 6,100 | | | | 232,105 | |
Comcast Corp., Class A | | | 400 | | | | 14,952 | |
Dillard’s, Inc., Class A | | | 1,550 | | | | 129,843 | |
DISH Network Corp., Class A | | | 2,025 | | | | 73,710 | |
Expedia, Inc. | | | 3,550 | | | | 218,147 | |
Foot Locker, Inc. | | | 6,325 | | | | 203,159 | |
Gap, Inc., The | | | 6,500 | | | | 201,760 | |
Hanesbrands, Inc.* | | | 2,000 | | | | 71,640 | |
Harley-Davidson, Inc. | | | 475 | | | | 23,199 | |
Home Depot, Inc., The | | | 6,275 | | | | 388,109 | |
Liberty Global, Inc., Class A* | | | 250 | | | | 15,748 | |
Liberty Interactive Corp., Class A* | | | 5,875 | | | | 115,620 | |
Liberty Media Corp. - Liberty Capital, Class A* | | | 1,125 | | | | 130,511 | |
Mattel,, Inc. | | | 6,100 | | | | 223,382 | |
Newell Rubbermaid, Inc. | | | 5,550 | | | | 123,598 | |
Panera Bread Co., Class A* | | | 450 | | | | 71,474 | |
Polaris Industries, Inc. | | | 2,505 | | | | 210,796 | |
priceline.com, Inc.* | | | 25 | | | | 15,530 | |
PulteGroup, Inc.* | | | 4,725 | | | | 85,806 | |
PVH Corp. | | | 425 | | | | 47,179 | |
Royal Caribbean Cruises, Ltd. | | | 1,825 | | | | 62,050 | |
Thor Industries, Inc. | | | 1,200 | | | | 44,916 | |
Time Warner Cable, Inc. | | | 1,850 | | | | 179,801 | |
TJX Cos., Inc. | | | 2,475 | | | | 105,064 | |
VF Corp. | | | 75 | | | | 11,323 | |
Walt Disney Co., The | | | 275 | | | | 13,692 | |
Total Consumer Discretionary | | | | | | | 3,208,199 | |
Consumer Staples - 5.8% | | | | | | | | |
Altria Group, Inc. | | | 2,275 | | | | 71,481 | |
Archer-Daniels-Midland Co. | | | 1,675 | | | | 45,878 | |
Avon Products, Inc. | | | 775 | | | | 11,129 | |
Brown-Forman Corp., Class B | | | 1,800 | | | | 113,850 | |
Coca-Cola Co., The | | | 4,400 | | | | 159,500 | |
Coca-Cola Enterprises, Inc. | | | 475 | | | | 15,072 | |
CVS Caremark Corp. | | | 2,900 | | | | 140,215 | |
Dean Foods Co.* | | | 5,000 | | | | 82,550 | |
Dr Pepper Snapple Group, Inc. | | | 1,075 | | | | 47,494 | |
Herbalife, Ltd.1 | | | 300 | | | | 9,882 | |
Ingredion, Inc. | | | 1,925 | | | | 124,028 | |
|
The accompanying notes are an integral part of these financial statements. 6 |
Managers AMG Chicago Equity Partners Balanced Fund
Schedule of Portfolio Investments (continued)
| | | | | | | | |
| | | Shares | | | Value | |
| | | | | | | |
Consumer Staples - 5.8% (continued) | | | | | | | | |
Kellogg Co. | | | 4,000 | | | $ | 223,400 | |
Kroger Co., The | | | 1,025 | | | | 26,671 | |
Molson Coors Brewing Co., Class B | | | 2,750 | | | | 117,672 | |
Nu Skin Enterprises, Inc., Class A1 | | | 4,275 | | | | 158,389 | |
PepsiCo, Inc. | | | 200 | | | | 13,686 | |
Philip Morris International, Inc. | | | 5,400 | | | | 451,656 | |
Procter & Gamble Co., The | | | 1,025 | | | | 69,587 | |
Whole Foods Market, Inc. | | | 2,100 | | | | 191,793 | |
Total Consumer Staples | | | | | | | 2,073,933 | |
Energy - 4.4% | | | | | | | | |
Atwood Oceanics, Inc.* | | | 475 | | | | 21,750 | |
Cabot Oil & Gas Corp. | | | 6,920 | | | | 344,201 | |
Chevron Corp. | | | 1,375 | | | | 148,692 | |
Diamond Offshore Drilling, Inc.1 | | | 3,450 | | | | 234,462 | |
EQT Corp. | | | 125 | | | | 7,373 | |
Exxon Mobil Corp. | | | 7,445 | | | | 644,365 | |
Kosmos Energy, Ltd.* | | | 2,700 | | | | 33,345 | |
Murphy Oil Corp. | | | 2,025 | | | | 120,589 | |
Valero Energy Corp. | | | 1,125 | | | | 38,385 | |
Total Energy | | | | | | | 1,593,162 | |
Financials - 8.2% | | | | | | | | |
Allstate Corp., The | | | 1,750 | | | | 70,298 | |
Axis Capital Holdings, Ltd. | | | 200 | | | | 6,928 | |
Bank of America Corp. | | | 7,700 | | | | 89,320 | |
Bank of New York Mellon Corp., The | | | 5,625 | | | | 144,562 | |
BB&T Corp. | | | 2,275 | | | | 66,225 | |
CME Group, Inc. | | | 2,275 | | | | 115,365 | |
Discover Financial Services | | | 3,700 | | | | 142,635 | |
Everest Re Group, Ltd. | | | 950 | | | | 104,452 | |
Extra Space Storage, Inc. | | | 2,775 | | | | 100,982 | |
Fidelity National Financial, Inc., Class A | | | 2,125 | | | | 50,044 | |
First Horizon National Corp. | | | 4,850 | | | | 48,064 | |
Goldman Sachs Group, Inc., The | | | 500 | | | | 63,780 | |
JPMorgan Chase & Co. | | | 5,623 | | | | 247,243 | |
Legg Mason, Inc. | | | 300 | | | | 7,716 | |
Lincoln National Corp. | | | 4,875 | | | | 126,262 | |
M&T Bank Corp. | | | 75 | | | | 7,385 | |
Mack-Cali Realty Corp. | | | 1,925 | | | | 50,262 | |
Moody’s Corp. | | | 2,525 | | | | 127,058 | |
NYSE Euronext | | | 1,625 | | | | 51,253 | |
Public Storage | | | 700 | | | | 101,472 | |
SLM Corp. | | | 3,900 | | | | 66,807 | |
St Joe Co., The*1 | | | 1,125 | | | | 25,965 | |
State Street Corp. | | | 2,900 | | | | 136,329 | |
|
The accompanying notes are an integral part of these financial statements. 7 |
Managers AMG Chicago Equity Partners Balanced Fund
Schedule of Portfolio Investments (continued)
| | | | | | | | |
| | | Shares | | | Value | |
| | | | | | | |
Financials - 8.2% (continued) | | | | | | | | |
SunTrust Banks, Inc. | | | 4,575 | | | $ | 129,701 | |
Travelers Cos., Inc., The | | | 4,075 | | | | 292,666 | |
US Bancorp | | | 2,300 | | | | 73,462 | |
Wells Fargo & Co. | | | 225 | | | | 7,691 | |
Weyerhaeuser Co. | | | 12,375 | | | | 344,272 | |
XL Group PLC | | | 4,750 | | | | 119,035 | |
Total Financials | | | | | | | 2,917,234 | |
Health Care - 7.4% | | | | | | | | |
Abbott Laboratories | | | 1,150 | | | | 75,325 | |
Aetna, Inc. | | | 625 | | | | 28,938 | |
Alexion Pharmaceuticals, Inc.* | | | 625 | | | | 58,631 | |
Amgen, Inc. | | | 3,698 | | | | 319,211 | |
Ariad Pharmaceuticals, Inc.* | | | 3,425 | | | | 65,692 | |
Cooper Cos., Inc., The | | | 250 | | | | 23,120 | |
DaVita Health Care Partners, Inc.* | | | 575 | | | | 63,555 | |
Eli Lilly & Co. | | | 300 | | | | 14,796 | |
Express Scripts Holding Co.* | | | 125 | | | | 6,750 | |
Johnson & Johnson | | | 4,250 | | | | 297,925 | |
McKesson Corp. | | | 75 | | | | 7,272 | |
Merck & Co., Inc. | | | 5,450 | | | | 223,123 | |
Mylan, Inc.* | | | 8,625 | | | | 237,015 | |
Patterson Cos., Inc. | | | 1,725 | | | | 59,047 | |
Pfizer, Inc. | | | 3,057 | | | | 76,670 | |
Regeneron Pharmaceuticals, Inc.* | | | 1,615 | | | | 276,278 | |
ResMed, Inc.1 | | | 6,225 | | | | 258,773 | |
Salix Pharmaceuticals, Ltd.* | | | 1,475 | | | | 59,708 | |
St Jude Medical, Inc. | | | 2,975 | | | | 107,516 | |
United Therapeutics Corp.* | | | 275 | | | | 14,691 | |
Warner Chilcott PLC, Class A | | | 19,825 | | | | 238,693 | |
Zimmer Holdings, Inc. | | | 1,800 | | | | 119,988 | |
Total Health Care | | | | | | | 2,632,717 | |
Industrials - 5.4% | | | | | | | | |
AMETEK, Inc. | | | 5,575 | | | | 209,453 | |
B/E Aerospace, Inc.* | | | 325 | | | | 16,055 | |
Con-way, Inc. | | | 1,925 | | | | 53,554 | |
Copa Holdings, S.A., Class A | | | 200 | | | | 19,890 | |
Crane Co. | | | 750 | | | | 34,710 | |
Fluor Corp. | | | 125 | | | | 7,343 | |
ITT Corp. | | | 2,500 | | | | 58,650 | |
Matson, Inc. | | | 1,275 | | | | 31,518 | |
MRC Global, Inc.* | | | 625 | | | | 17,363 | |
Nordson Corp. | | | 1,350 | | | | 85,212 | |
Northrop Grumman Corp. | | | 3,750 | | | | 253,425 | |
|
The accompanying notes are an integral part of these financial statements. 8 |
Managers AMG Chicago Equity Partners Balanced Fund
Schedule of Portfolio Investments (continued)
| | | | | | | | |
| | | Shares | | | Value | |
| | | | | | | |
Industrials - 5.4% (continued) | | | | | | | | |
Rockwell Automation, Inc. | | | 425 | | | $ | 35,696 | |
RR Donnelley & Sons Co.1 | | | 750 | | | | 6,750 | |
Textron, Inc. | | | 4,725 | | | | 117,133 | |
TransDigm Group, Inc. | | | 1,555 | | | | 212,040 | |
Triumph Group, Inc. | | | 2,125 | | | | 138,762 | |
Union Pacific Corp. | | | 1,150 | | | | 144,578 | |
United Rentals, Inc.* | | | 5,350 | | | | 243,532 | |
United Technologies Corp. | | | 1,650 | | | | 135,316 | |
Valmont Industries, Inc. | | | 700 | | | | 95,585 | |
Total Industrials | | | | | | | 1,916,565 | |
Information Technology - 14.3% | | | | | | | | |
Accenture PLC, Class A | | | 4,300 | | | | 285,950 | |
Akamai Technologies, Inc.* | | | 5,775 | | | | 236,255 | |
Amphenol Corp., Class A | | | 2,775 | | | | 179,542 | |
AOL, Inc.* | | | 2,200 | | | | 65,142 | |
Apple, Inc. | | | 2,145 | | | | 1,143,349 | |
Automatic Data Processing, Inc. | | | 850 | | | | 48,459 | |
Avago Technologies, Ltd. | | | 5,975 | | | | 189,168 | |
BMC Software, Inc.* | | | 5,100 | | | | 202,266 | |
Brocade Communications Systems, Inc.* | | | 26,850 | | | | 143,110 | |
Cadence Design Systems, Inc.* | | | 19,900 | | | | 268,849 | |
Cisco Systems, Inc. | | | 16,650 | | | | 327,172 | |
Computer Sciences Corp. | | | 3,100 | | | | 124,155 | |
First Solar, Inc.* | | | 1,750 | | | | 54,040 | |
FleetCor Technologies, Inc.* | | | 2,075 | | | | 111,324 | |
Freescale Semiconductor, Ltd.*1 | | | 1,900 | | | | 20,919 | |
Harris Corp. | | | 2,150 | | | | 105,264 | |
International Business Machines Corp. | | | 1,470 | | | | 281,578 | |
Itron, Inc.* | | | 675 | | | | 30,071 | |
Jabil Circuit, Inc. | | | 2,050 | | | | 39,545 | |
Lender Processing Services, Inc. | | | 2,150 | | | | 52,933 | |
LinkedIn Corp., Class A* | | | 650 | | | | 74,633 | |
Microsoft Corp. | | | 1,000 | | | | 26,730 | |
Motorola Solutions, Inc. | | | 1,425 | | | | 79,344 | |
ServiceNow, Inc.*1 | | | 3,275 | | | | 98,348 | |
SolarWinds, Inc.* | | | 3,850 | | | | 201,932 | |
Splunk, Inc.* | | | 4,000 | | | | 116,080 | |
Synopsys, Inc.* | | | 3,775 | | | | 120,196 | |
Visa, Inc., Class A | | | 3,050 | | | | 462,319 | |
Total Information Technology | | | | | | | 5,088,673 | |
Materials - 1.9% | | | | | | | | |
Ball Corp. | | | 1,650 | | | | 73,838 | |
CF Industries Holdings, Inc. | | | 380 | | | | 77,201 | |
Commercial Metals Co. | | | 2,625 | | | | 39,008 | |
|
The accompanying notes are an integral part of these financial statements. 9 |
Managers AMG Chicago Equity Partners Balanced Fund
Schedule of Portfolio Investments (continued)
| | | | | | | | |
| | | Shares | | | Value | |
| | | | | | | |
Materials - 1.9% (continued) | | | | | | | | |
Cytec Industries, Inc. | | | 100 | | | $ | 6,883 | |
LyondellBasell Industries N.V., Class A | | | 2,350 | | | | 134,161 | |
Nucor Corp. | | | 475 | | | | 20,511 | |
PPG Industries, Inc. | | | 125 | | | | 16,919 | |
Sherwin-Williams Co., The | | | 775 | | | | 119,210 | |
Westlake Chemical Corp.1 | | | 2,300 | | | | 182,390 | |
Total Materials | | | | | | | 670,121 | |
Telecommunication Services - 1.8% | | | | | | | | |
AT&T, Inc. | | | 13,500 | | | | 455,085 | |
Verizon Communications, Inc. | | | 4,650 | | | | 201,205 | |
Total Telecommunication Services | | | | | | | 656,290 | |
Utilities - 1.9% | | | | | | | | |
Ameren Corp. | | | 5,150 | | | | 158,208 | |
American Water Works Co, Inc. | | | 5,125 | | | | 190,291 | |
Integrys Energy Group,, Inc. | | | 1,075 | | | | 56,137 | |
National Fuel Gas Co. | | | 300 | | | | 15,207 | |
ONEOK, Inc. | | | 2,150 | | | | 91,913 | |
Public Service Enterprise Group, Inc. | | | 2,450 | | | | 74,970 | |
Questar Corp. | | | 3,225 | | | | 63,726 | |
Vectren Corp. | | | 1,025 | | | | 30,135 | |
Total Utilities | | | | | | | 680,587 | |
Total Common Stocks
(cost $20,003,049) | | | | | | | 21,437,481 | |
| | |
| | | Principal Amount | | | | |
Corporate Bonds and Notes - 1.9% | | | | | | | | |
Financials - 0.2% | | | | | | | | |
American Express Co., 7.250%, 05/20/14 | | $ | 40,000 | | | | 43,543 | |
General Electric Capital Corp., MTN, Series A, 6.750%, 03/15/32 | | | 10,000 | | | | 13,026 | |
Total Financials | | | | | | | 56,569 | |
Industrials - 1.2% | | | | | | | | |
Altria Group, Inc., 9.700%, 11/10/18 | | | 7,000 | | | | 9,811 | |
AT&T, Inc., 5.100%, 09/15/14 | | | 70,000 | | | | 75,225 | |
Coca-Cola Refreshments USA, Inc., 7.375%, 03/03/14 | | | 40,000 | | | | 43,192 | |
ConocoPhillips, 4.600%, 01/15/15 | | | 15,000 | | | | 16,218 | |
EI du Pont de Nemours & Co., 5.000%, 01/15/13 | | | 6,000 | | | | 6,009 | |
Honeywell International, Inc., 4.250%, 03/01/13 | | | 45,000 | | | | 45,284 | |
International Business Machines Corp., 4.000%, 06/20/42 | | | 16,000 | | | | 17,009 | |
Kellogg Co., Series B, 7.450%, 04/01/31 | | | 15,000 | | | | 20,745 | |
McDonald’s Corp., | | | | | | | | |
Series MTN, 4.300%, 03/01/13 | | | 35,000 | | | | 35,221 | |
Series MTN, 6.300%, 10/15/37 | | | 15,000 | | | | 20,838 | |
PepsiCo, Inc., 2.500%, 05/10/16 | | | 35,000 | | | | 36,892 | |
|
The accompanying notes are an integral part of these financial statements. 10 |
Managers AMG Chicago Equity Partners Balanced Fund
Schedule of Portfolio Investments (continued)
| | | | | | | | |
| | | Principal Amount | | | Value | |
| | | | | | | |
Industrials - 1.2% (continued) | | | | | | | | |
Pfizer, Inc., 6.200%, 03/15/19 | | $ | 20,000 | | | $ | 25,313 | |
United Parcel Service, Inc., 6.200%, 01/15/38 | | | 20,000 | | | | 26,922 | |
Verizon Communications, Inc., 3.000%, 04/01/16 | | | 35,000 | | | | 37,297 | |
Wal-Mart Stores, Inc., 6.500%, 08/15/37 | | | 20,000 | | | | 28,224 | |
Total Industrials | | | | | | | 444,200 | |
Utilities - 0.5% | | | | | | | | |
Consolidated Edison Co. of New York, Inc., Series 08-B, 6.750%, 04/01/38 | | | 15,000 | | | | 21,520 | |
Dominion Resources, Inc., 4.450%, 03/15/21 | | | 10,000 | | | | 11,541 | |
Duke Energy Corp., 3.550%, 09/15/21 | | | 20,000 | | | | 21,117 | |
Florida Power & Light Co., 4.850%, 02/01/13 | | | 40,000 | | | | 40,141 | |
Georgia Power Co., 5.400%, 06/01/40 | | | 15,000 | | | | 18,055 | |
TransCanada PipeLines, Ltd., | | | | | | | | |
3.800%, 10/01/20 | | | 20,000 | | | | 22,356 | |
4.875%, 01/15/15 | | | 40,000 | | | | 43,369 | |
Total Utilities | | | | | | | 178,099 | |
Total Corporate Bonds and Notes (cost $628,354) | | | | | | | 678,868 | |
U.S. Government and Agency Obligations - 37.2% | | | | | | | | |
Federal Home Loan Banks - 2.5% | | | | | | | | |
FHLB, | | | | | | | | |
5.000%, 11/17/17 | | | 565,000 | | | | 678,098 | |
5.375%, 05/18/16 | | | 185,000 | | | | 215,655 | |
Total Federal Home Loan Banks | | | | | | | 893,753 | |
Federal Home Loan Mortgage Corporation - 6.6% | | | | | | | | |
FHLMC, | | | | | | | | |
2.500%, 05/27/161 | | | 460,000 | | | | 491,201 | |
3.500%, 03/01/42 | | | 186,605 | | | | 199,055 | |
3.750%, 03/27/19 | | | 580,000 | | | | 671,378 | |
4.500%, 11/01/24 to 11/01/39 | | | 466,324 | | | | 500,409 | |
4.750%, 11/17/15 | | | 115,000 | | | | 129,381 | |
5.000%, 12/01/20 | | | 29,702 | | | | 31,993 | |
5.500%, 04/01/38 | | | 138,005 | | | | 149,019 | |
6.000%, 01/01/38 to 06/01/38 | | | 151,154 | | | | 164,786 | |
Total Federal Home Loan Mortgage Corporation | | | | | | | 2,337,222 | |
Federal National Mortgage Association - 14.1% | | | | | | | | |
FNMA, | | | | | | | | |
2.500%, 04/01/22 | | | 368,977 | | | | 387,387 | |
3.000%, 03/01/42 | | | 604,178 | | | | 633,896 | |
3.500%, 09/01/25 to 04/01/42 | | | 485,696 | | | | 517,570 | |
4.000%, 08/01/19 to 12/01/41 | | | 716,633 | | | | 768,770 | |
4.500%, 11/01/19 to 05/01/41 | | | 656,419 | | | | 711,080 | |
5.000%, 05/11/17 to 08/01/41 | | | 858,110 | | | | 968,047 | |
5.375%, 07/15/16 to 06/12/17 | | | 560,000 | | | | 667,752 | |
|
The accompanying notes are an integral part of these financial statements. 11 |
Managers AMG Chicago Equity Partners Balanced Fund
Schedule of Portfolio Investments (continued)
| | | | | | | | |
| | | Principal Amount | | | Value | |
| | | | | | | |
Federal National Mortgage Association - 14.1% (continued) | | | | | | | | |
FNMA, | | | | | | | | |
5.500%, 02/01/22 to 06/01/38 | | $ | 219,082 | | | $ | 238,375 | |
6.000%, 03/01/37 to 06/01/38 | | | 93,214 | | | | 102,777 | |
6.500%, 03/01/37 | | | 26,368 | | | | 29,588 | |
Total Federal National Mortgage Association | | | | | | | 5,025,242 | |
United States Treasury Securities - 14.0% | | | | | | | | |
U.S. Treasury Bonds, | | | | | | | | |
3.125%, 11/15/41 | | | 375,000 | | | | 392,578 | |
3.500%, 02/15/39 | | | 390,000 | | | | 440,944 | |
4.750%, 02/15/41 | | | 695,000 | | | | 958,231 | |
U.S. Treasury Notes, | | | | | | | | |
0.375%, 07/31/13 | | | 100,000 | | | | 100,156 | |
0.625%, 01/31/13 to 07/15/14 | | | 1,345,000 | | | | 1,346,310 | |
1.000%, 03/31/17 | | | 695,000 | | | | 707,543 | |
2.625%, 08/15/20 | | | 470,000 | | | | 516,192 | |
2.750%, 02/28/18 | | | 460,000 | | | | 506,791 | |
3.125%, 05/15/21 | | | 25,000 | | | | 28,354 | |
Total United States Treasury Securities | | | | | | | 4,997,099 | |
Total U.S. Government and Agency Obligations (cost $12,995,590) | | | | | | | 13,253,316 | |
| | |
| | | Shares | | | | |
Other Investment Companies - 4.0%2 | | | | | | | | |
BNY Mellon Overnight Government Fund, 0.19%3
(cost $1,418,443) | | | 1,418,443 | | | | 1,418,443 | |
Total Investments - 103.2% (cost $35,045,436) | | | | | | | 36,788,108 | |
Other Assets, less Liabilities - (3.2)% | | | | | | | (1,129,892 | ) |
Net Assets - 100.0% | | | | | | $ | 35,658,216 | |
|
The accompanying notes are an integral part of these financial statements. 12 |
Managers High Yield Fund
Portfolio Manager’s Comments
THE YEAR IN REVIEW
The Managers High Yield Fund (Institutional Class Shares) returned 15.46% for the year ended December 31, 2012, compared with 15.81% for the Barclays Capital U.S. Corporate High Yield Index (the “Index”).
Accommodations from central banks, an improving U.S. economy, solid corporate fundamentals, modest economic growth, robust and record-setting primary market conditions, strong demand from mutual fund inflows and a low default environment were all conducive to producing strong returns in high yield bonds during 2012. Ultimately, investors’ desire for yield and the support of positive corporate fundamentals continue to drive interest in the asset class. Overall, both spreads and yields tightened dramatically during the period. At December 31, high-yield spreads, as measured by the Index, were 539 basis points (bps), 211 bps tighter for the 12-month period, while yields fell from 8.36% (at December 31, 2011) to 6.13%.
Riskier CCC-rated bonds outperformed in 2012 despite lagging higher quality credits in each of the final three quarters of the year. With nearly all sectors posting positive returns (as measured by the Index), home construction, banking and insurance led performance this year. The lowest performing sectors for the year were supermarkets, environmental and refining.
Primary market conditions were robust and 2012 was a record-setting year as high-yield issuers priced a total of $337 billion during the 12-month period. The quality of new issues remained conservative overall, though lower-quality issuance increased during the second half of the year. Refinancing activity continues to dominate the use of proceeds as companies amended terms or extended maturities. Supported by a desire for yield, strong fundamentals and low defaults, demand for risky assets drove $31.9 billion into high-yield mutual funds during 2012, although a few periods of market volatility and waning risk appetites resulted in some noticeable weekly outflows.
While the number of defaults increased during 2012, default volumes were basically unchanged for the third straight year. The par-weighted, high-yield default rate of 1.73% at the beginning of the year decreased gradually in six of the last seven months to 1.14%, well below historical averages of 4%.
PERFORMANCE
The Fund underperformed its benchmark for the year due to security selection in the banking, real estate investment trust and home builders sectors. The largest detractors came from relative weightings in the Royal Bank of Scotland, Ford Motor Company, James River Coal, Sungard Data System and Energy Future
Holdings. Alternatively, relative contributions from security selection in the telecommunication services, independent energy and chemicals sectors enhanced performance. Specifically, relative weightings in Sprint Nextel Corporation, Reichhold Industries, First Data Corporation, Reynolds Group and Edison Mission Energy improved results for the year.
Compared to the Benchmark at year end, the Fund was overweight in consumer products, health care and consumer services due to our view of the relative value opportunities within those sectors. The Fund was underweight in banking, metals and mining and electric utilities because we have not found these sectors compelling due to challenging fundamental outlooks or rich valuations.
LOOKING FORWARD
Corporate health remains strong and company management’s stance towards leverage is still cautious despite some weakness in revenues and operating profits revealed in third-quarter results. We expect modest economic growth in the U.S. and positive growth globally. We believe spreads reflect current risks and still provide an attractive risk/return trade-off. Although the potential for further capital appreciation is limited and, given the global desire for yield, demand for high yield will remain. Given the solid corporate fundamentals and proactive refinancing activities, we expect default rates will remain in the low single digits and well below historical averages of 4%. As high yield remains vulnerable to short-term volatility, we will continue to rely on our individual security selection to be the primary driver of performance.
This commentary reflects the viewpoints of the Fund’s subadvisor, JP Morgan Asset Management as of 12/31/12 and is not intended as a forecast or guarantee of future results.
CUMULATIVE TOTAL RETURN PERFORMANCE
Managers High Yield Fund’s cumulative total return is based on the daily change in net asset value (NAV), and assumes that all distributions were reinvested. The chart compares a hypothetical $10,000 investment made in the Fund’s Investor Class shares (formerly Class A shares of the Fund, which were renamed Investor Class shares as of the date of the Prospectus, December 1, 2012) on December 31, 2002 to a $10,000 investment made in the Barclays U.S. Corporate High Yield Bond Index for the same time period. Performance for periods longer than one year is annualized. The graph and table do not reflect the deduction of taxes that a shareholder would pay on a Fund distribution or redemption of shares. Past performance is not indicative of future results. The listed returns for the Fund are net of expenses and the returns for the index exclude expenses. Total returns for the Fund would have been lower had certain expenses not been reduced.
Managers High Yield Fund
Portfolio Manager’s Comments (continued)
CUMULATIVE TOTAL RETURN PERFORMANCE (continued)
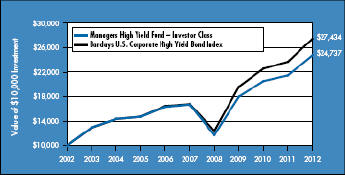
The table below shows the average annual total returns for the Managers High Yield Fund and the Barclays U.S. Corporate High Yield Bond Index for the same time periods ended December 31, 2012.
| | | | | | | | | | | | |
| | | Average Annual Total Returns1 | |
| | | One Year | | | Five Years | | | Ten Years | |
Managers High Yield Fund2,3,4 | | | | | | | | | | | | |
Investor Class5 | | | 15.26 | % | | | 8.19 | % | | | 9.48 | % |
Institutional Class | | | 15.46 | % | | | 8.52 | % | | | 9.83 | % |
Barclays U.S. Corporate High Yield Bond Index6 | | | 15.81 | % | | | 10.34 | % | | | 10.62 | % |
The performance data shown represents past performance. Past performance is not a guarantee of future results. Current performance may be lower or higher than the performance data quoted. The investment return and principal value of an investment in the Fund will fluctuate so that an investor’s shares, when redeemed, may be worth more or less than their original cost. For performance information through the most recent month end please call (800) 835-3879 or visit our Web site at www.managersinvest.com.
Investors should carefully consider the Fund’s investment objectives, risks, charges and expenses before investing. For this and other information, please call (800) 835-3879 or visit www.managersinvest.com for a free prospectus. Read it carefully before investing or sending money. Funds are distributed by Managers Distributors, Inc., a member of FINRA.
|
1 Total return equals income yield plus share price change and assumes reinvestment of all dividends and capital gain distributions. Returns are net of fees and may reflect offsets of Fund expenses as described in the Prospectus. No adjustment has been made for taxes payable by shareholders on their reinvested dividends and capital gain distributions. Returns for periods greater than one year are the average annual returns. The listed returns on the Fund are net of expenses and based on the published NAV as of December 31, 2012. All returns are in U.S. dollars ($). 2 Fixed income funds are subject to risks associated with investments in debt securities, such as default risk and fluctuations in the perception of the debtors’ ability to pay their creditors. Changing interest rates may adversely affect the value of a fixed income investment. An increase in interest rates typically causes the value of bonds and other fixed income securities to fall. 3 From time to time, the Fund’s advisor has waived its fees and/or absorbed Fund expenses, which has resulted in higher returns 4 The Fund holds securities in which the issuer of the security may default or otherwise be unable to honor a financial obligation. The Fund holds securities rated below investment grade that are especially susceptible to this risk. These issuers may be involved in bankruptcy proceedings, reorganizations, or financial restructurings, and are not as strong financially as higher-rated issuers. 5 As of December 1, 2012, the Fund’s Class A shares were renamed Investor Class shares. Additionally, the Fund’s Class C shares converted to Investor Class shares. 6 The Barclays U.S. Corporate High Yield Bond Index is a total return performance benchmark for fixed income securities having a maximum quality rating of Ba1 (as determined by Moody’s Investors Service, Inc.). Unlike the Fund, the Barclays U.S. Corporate High Yield Bond Index is unmanaged, is not available for investment, and does not incur expenses. Not FDIC insured, nor bank guaranteed. May lose value. |
14
Managers High Yield Fund
Fund Snapshots
December 31, 2012
Portfolio Breakdown (unaudited)
| | | | |
Industry | | Managers High
Yield Fund** | |
Industrials | | | 82.3 | % |
Financials | | | 6.5 | % |
Utilities | | | 2.0 | % |
Bank Loan Obligations | | | 0.7 | % |
Materials | | | 0.0 | %# |
Energy | | | 0.0 | %# |
Other Assets and Liabilities | | | 8.5 | % |
| ** | As a percentage of net assets |
| # | Rounds to less than 0.1% |
| | | | |
Rating | | Managers High
Yield Fund† | |
U.S. Treasury | | | 0.0 | % |
U.S. Agency | | | 0.0 | % |
Aaa | | | 0.0 | % |
Aa | | | 0.0 | % |
A | | | 0.0 | % |
Baa | | | 2.9 | % |
Ba | | | 23.7 | % |
B | | | 58.8 | % |
Caa | | | 13.6 | % |
Ca | | | 0.0 | % |
C | | | 0.0 | % |
D | | | 0.0 | % |
Not Rated | | | 1.0 | % |
| † | As a percentage of market value of fixed income securities. Chart does not include equity securities. |
Top Ten Holdings (unaudited)
| | | | |
Security Name | | % of
Net Assets | |
Sprint Capital Corp., 8.750%, 03/15/32* | | | 2.0 | % |
HCA, Inc., 7.500%, 02/15/22* | | | 1.3 | |
Reynolds Group Issuer, Inc. / Reynolds Group | | | | |
Issuer LLC, 9.000%, 04/15/19* | | | 1.1 | |
Ally Financial, Inc., 6.250%, 12/01/17* | | | 1.1 | |
DISH DBS Corp., 7.875%, 09/01/19* | | | 1.0 | |
International Lease Finance Corp., 8.750%, 03/15/17* | | | 0.9 | |
First Data Corp., 8.750%, 01/15/22 | | | 0.8 | |
Sprint Nextel Corp., 9.000%, 11/15/18 | | | 0.8 | |
HCA Holdings, Inc., 7.750%, 05/15/21* | | | 0.7 | |
Tenet Healthcare Corp., 8.000%, 08/01/20 | | | 0.7 | |
| | | | |
Top Ten as a Group | | | 10.4 | % |
| | | | |
| * | Top Ten Holding at June 30, 2012 |
Any sectors, industries, or securities discussed should not be perceived as investment recommendations. Mention of a specific security should not be considered a recommendation to buy or solicitation to sell that security. Specific securities mentioned in this report may have been sold from the Fund’s portfolio of investments by the time you receive this report.
Managers High Yield Fund
Schedule of Portfolio Investments
December 31, 2012
| | | | | | | | |
| | | Principal Amount | | | Value | |
| | | | | | | |
Bank Loan Obligations - 0.7% | | | | | | | | |
Caesars Entertainment Operating Co., Inc., Extended B-6 Term Loan, 5.454%, 01/28/18 (02/25/13)4 | | $ | 70,221 | | | $ | 62,900 | |
Clear Channel Communications, Inc., Term Loan, Class B, 3.862%, 01/29/16 (01/31/13)4 | | | 46,768 | | | | 38,876 | |
First Data Corp., Extended 2018 Dollar Term Loan, 4.205%, 03/23/18 (02/02/13)4 | | | 48,028 | | | | 45,850 | |
SUPERVALU Inc., Term Loan, 8.000%, 08/30/18 (01/31/13)4 | | | 19,900 | | | | 20,244 | |
Vertafore, Inc., 2nd Lien Term Loan, 9.750%, 10/27/17 (03/28/13)4 | | | 45,000 | | | | 45,225 | |
Total Bank Loan Obligations (cost $193,290) | | | | | | | 213,095 | |
| | |
| | | Shares | | | | |
Common Stocks - 0.0%# | | | | | | | | |
GMX Resources, Inc. (Energy)*5 | | | 2,156 | | | | 1,078 | |
LyondellBasell Industries N.V., Class A (Materials) | | | 3 | | | | 171 | |
Total Common Stocks (cost $2,156) | | | | | | | 1,249 | |
| | |
| | | Principal Amount | | | | |
Corporate Bonds and Notes - 90.8% | | | | | | | | |
Financials - 6.5% | | | | | | | | |
Ally Financial, Inc., | | | | | | | | |
4.625%, 06/26/15 | | | 70,000 | | | | 73,016 | |
5.500%, 02/15/17 | | | 115,000 | | | | 123,590 | |
6.250%, 12/01/17 | | | 325,000 | | | | 361,064 | |
Bank of America Corp., Series K, 8.000%, 12/29/496 | | | 130,000 | | | | 143,941 | |
CIT Group, Inc., | | | | | | | | |
4.250%, 08/15/17 | | | 95,000 | | | | 98,271 | |
5.000%, 05/15/17 | | | 55,000 | | | | 58,575 | |
5.250%, 03/15/18 | | | 110,000 | | | | 118,250 | |
Ford Motor Credit Co. LLC, 6.625%, 08/15/17 | | | 100,000 | | | | 116,965 | |
International Lease Finance Corp., | | | | | | | | |
5.875%, 04/01/19 | | | 105,000 | | | | 111,195 | |
6.250%, 05/15/19 | | | 35,000 | | | | 37,450 | |
8.625%, 09/15/15 | | | 90,000 | | | | 101,475 | |
8.750%, 03/15/17 | | | 270,000 | | | | 313,200 | |
Nuveen Investments, Inc., 9.500%, 10/15/20 (a) | | | 80,000 | | | | 80,000 | |
Realogy Corp., | | | | | | | | |
7.625%, 01/15/20 (a) | | | 65,000 | | | | 73,937 | |
7.875%, 02/15/19 (a) | | | 110,000 | | | | 120,450 | |
Serta Simmons Holdings LLC, 8.125%, 10/01/20 (a) | | | 150,000 | | | | 150,750 | |
Vanguard Natural Resources LLC/VNR Finance Corp., 7.875%, 04/01/20 | | | 90,000 | | | | 94,500 | |
Total Financials | | | | | | | 2,176,629 | |
Industrials - 82.3% | | | | | | | | |
313 Group, Inc., 6.375%, 12/01/19 (a) | | | 55,000 | | | | 54,794 | |
Academy, Ltd. / Academy Finance Corp., 9.250%, 08/01/19 (a) | | | 60,000 | | | | 66,900 | |
|
The accompanying notes are an integral part of these financial statements. 16 |
Managers High Yield Fund
Schedule of Portfolio Investments (continued)
| | | | | | | | |
| | | Principal Amount | | | Value | |
| | | | | | | |
Industrials - 82.3% (continued) | | | | | | | | |
Accellent, Inc., | | | | | | | | |
8.375%, 02/01/17 | | $ | 80,000 | | | $ | 84,400 | |
10.000%, 11/01/17 | | | 85,000 | | | | 70,337 | |
Access Midstream Partners, L.P. / ACMP Finance Corp., | | | | | | | | |
4.875%, 05/15/23 | | | 55,000 | | | | 55,894 | |
6.125%, 07/15/22 | | | 50,000 | | | | 54,125 | |
ADS Waste Holdings, Inc., 8.250%, 10/01/20 (a) | | | 50,000 | | | | 52,750 | |
Aircastle, Ltd., | | | | | | | | |
6.750%, 04/15/17 | | | 30,000 | | | | 32,250 | |
7.625%, 04/15/20 | | | 20,000 | | | | 22,450 | |
9.750%, 08/01/18 | | | 75,000 | | | | 85,125 | |
Alcatel-Lucent USA, Inc., 6.450%, 03/15/29 | | | 180,000 | | | | 137,700 | |
Allison Transmission, Inc., 7.125%, 05/15/19 (a) | | | 100,000 | | | | 107,250 | |
AMC Entertainment, Inc., | | | | | | | | |
8.750%, 06/01/191 | | | 40,000 | | | | 44,500 | |
9.750%, 12/01/20 | | | 115,000 | | | | 133,400 | |
American Axle & Manufacturing Holdings, Inc., 9.250%, 01/15/17 (a) | | | 19,000 | | | | 21,185 | |
American Axle & Manufacturing, Inc., | | | | | | | | |
7.750%, 11/15/19 | | | 25,000 | | | | 27,250 | |
7.875%, 03/01/17 | | | 50,000 | | | | 51,875 | |
American Tire Distributors, Inc., 9.750%, 06/01/17 | | | 40,000 | | | | 42,600 | |
Amkor Technology, Inc., 7.375%, 05/01/18 | | | 55,000 | | | | 57,200 | |
Anixter, Inc., 5.625%, 05/01/19 | | | 35,000 | | | | 37,013 | |
Arch Coal, Inc., | | | | | | | | |
7.000%, 06/15/19 | | | 35,000 | | | | 32,725 | |
7.250%, 06/15/211 | | | 50,000 | | | | 46,375 | |
8.750%, 08/01/161 | | | 65,000 | | | | 67,925 | |
Ardagh Packaging Finance PLC, 9.125%, 10/15/20 (a) | | | 200,000 | | | | 219,000 | |
Ashtead Capital, Inc., 6.500%, 07/15/22 (a) | | | 35,000 | | | | 38,150 | |
Aspect Software, Inc., 10.625%, 05/15/17 | | | 55,000 | | | | 50,325 | |
Associated Materials LLC / AMH New Finance, Inc., 9.125%, 11/01/171 | | | 60,000 | | | | 61,200 | |
Atkore International, Inc., 9.875%, 01/01/18 | | | 90,000 | | | | 96,075 | |
Audatex North America, Inc., 6.750%, 06/15/18 (a) | | | 60,000 | | | | 64,500 | |
Avaya, Inc., | | | | | | | | |
7.000%, 04/01/19 (a)1 | | | 90,000 | | | | 84,600 | |
9.750%, 11/01/151 | | | 10,000 | | | | 8,950 | |
10.125%, 11/01/15 | | | 79,893 | | | | 71,904 | |
Avis Budget Car Rental LLC / Avis Budget Finance, Inc., | | | | | | | | |
4.875%, 11/15/17 (a) | | | 30,000 | | | | 30,600 | |
8.250%, 01/15/19 | | | 155,000 | | | | 172,050 | |
9.625%, 03/15/18 | | | 40,000 | | | | 44,800 | |
Belden, Inc., 5.500%, 09/01/22 (a) | | | 70,000 | | | | 72,275 | |
Berry Petroleum Co., 6.375%, 09/15/22 | | | 40,000 | | | | 41,800 | |
|
The accompanying notes are an integral part of these financial statements. 17 |
Managers High Yield Fund
Schedule of Portfolio Investments (continued)
| | | | | | | | |
| | | Principal Amount | | | Value | |
| | | | | | | |
Industrials - 82.3% (continued) | | | | | | | | |
Biomet, Inc., 6.500%, 08/01/20 (a) | | $ | 165,000 | | | $ | 175,931 | |
Block Communications, Inc., 7.250%, 02/01/20 (a) | | | 60,000 | | | | 64,050 | |
BOE Merger Corp., 9.500%, 11/01/17 (a)7 | | | 25,000 | | | | 25,125 | |
Bombardier, Inc., | | | | | | | | |
5.750%, 03/15/22 (a)1 | | | 40,000 | | | | 41,300 | |
7.750%, 03/15/20 (a) | | | 30,000 | | | | 34,200 | |
BreitBurn Energy Partners, L.P. / BreitBurn Finance Corp., | | | | | | | | |
7.875%, 04/15/22 (a) | | | 70,000 | | | | 72,975 | |
8.625%, 10/15/20 | | | 70,000 | | | | 76,650 | |
Building Materials Corp. of America, 6.875%, 08/15/18 (a) | | | 30,000 | | | | 32,550 | |
Bumble Bee Acquisition Corp., 9.000%, 12/15/17 (a)1 | | | 135,000 | | | | 145,800 | |
BWAY Holding Co., 10.000%, 06/15/18 | | | 110,000 | | | | 122,650 | |
Cablevision Systems Corp., Series B, 8.625%, 09/15/17 | | | 80,000 | | | | 93,700 | |
Caesars Entertainment Operating Co., Inc., | | | | | | | | |
8.500%, 02/15/20 | | | 70,000 | | | | 69,694 | |
9.000%, 02/15/20 (a) | | | 65,000 | | | | 65,325 | |
10.000%, 12/15/18 | | | 57,000 | | | | 38,048 | |
11.250%, 06/01/17 | | | 155,000 | | | | 166,819 | |
Caesars Operating Escrow LLC / Caesars Escrow Corp., 9.000%, 02/15/20 (a) | | | 150,000 | | | | 150,750 | |
Case New Holland, Inc., 7.875%, 12/01/17 | | | 50,000 | | | | 59,375 | |
CCO Holdings LLC / CCO Holdings Capital Corp., | | | | | | | | |
7.000%, 01/15/19 | | | 50,000 | | | | 54,187 | |
7.375%, 06/01/20 | | | 10,000 | | | | 11,150 | |
7.875%, 04/30/18 | | | 200,000 | | | | 216,250 | |
CDW LLC / CDW Finance Corp., | | | | | | | | |
8.000%, 12/15/18 | | | 15,000 | | | | 16,669 | |
8.500%, 04/01/19 | | | 165,000 | | | | 179,437 | |
Central Garden and Pet Co., 8.250%, 03/01/18 | | | 150,000 | | | | 159,375 | |
CenturyLink, Inc., 5.800%, 03/15/22 | | | 75,000 | | | | 79,426 | |
CEVA Group PLC, 8.375%, 12/01/17 (a) | | | 150,000 | | | | 149,250 | |
Chesapeake Energy Corp., | | | | | | | | |
6.625%, 08/15/20 | | | 5,000 | | | | 5,388 | |
6.875%, 08/15/18 | | | 55,000 | | | | 58,300 | |
Chrysler Group LLC / CG Co-Issuer, Inc., 8.000%, 06/15/191 | | | 200,000 | | | | 219,000 | |
CHS/Community Health Systems, Inc., | | | | | | | | |
5.125%, 08/15/18 | | | 45,000 | | | | 47,025 | |
8.000%, 11/15/19 | | | 20,000 | | | | 21,750 | |
Cincinnati Bell, Inc., 8.375%, 10/15/20 | | | 37,000 | | | | 40,238 | |
Cinemark USA, Inc., 7.375%, 06/15/21 | | | 55,000 | | | | 61,050 | |
CityCenter Holdings LLC / CityCenter Finance Corp., 7.625%, 01/15/16 | | | 100,000 | | | | 107,500 | |
Claire’s Stores, Inc., | | | | | | | | |
8.875%, 03/15/19 | | | 70,000 | | | | 66,500 | |
9.000%, 03/15/19 (a) | | | 150,000 | | | | 161,625 | |
Clean Harbors, Inc., 5.250%, 08/01/20 | | | 45,000 | | | | 47,138 | |
|
The accompanying notes are an integral part of these financial statements. 18 |
Managers High Yield Fund
Schedule of Portfolio Investments (continued)
| | | | | | | | |
| | | Principal Amount | | | Value | |
| | | | | | | |
Industrials - 82.3% (continued) | | | | | | | | |
Clear Channel Communications, Inc., | | | | | | | | |
9.000%, 12/15/19 (a) | | $ | 14,000 | | | $ | 12,880 | |
9.000%, 03/01/21 | | | 85,000 | | | | 76,287 | |
Clear Channel Worldwide Holdings, Inc., | | | | | | | | |
6.500%, 11/15/22 (a) | | | 310,000 | | | | 322,324 | |
Series A, 7.625%, 03/15/20 | | | 5,000 | | | | 5,013 | |
Series B, 7.625%, 03/15/20 | | | 65,000 | | | | 65,812 | |
Clearwater Paper Corp., 7.125%, 11/01/18 | | | 5,000 | | | | 5,475 | |
CNH Capital LLC, | | | | | | | | |
3.875%, 11/01/15 (a) | | | 30,000 | | | | 31,088 | |
Series WI, 6.250%, 11/01/16 | | | 50,000 | | | | 55,375 | |
Cogent Communications Group, Inc., 8.375%, 02/15/18 (a) | | | 55,000 | | | | 60,637 | |
CommScope, Inc., 8.250%, 01/15/19 (a) | | | 115,000 | | | | 126,500 | |
Constellation Brands, Inc., 7.250%, 05/15/17 | | | 65,000 | | | | 76,862 | |
Crosstex Energy, L.P. / Crosstex Energy Finance Corp., 8.875%, 02/15/18 | | | 125,000 | | | | 135,625 | |
Crown Castle International Corp., 5.250%, 01/15/23 (a) | | | 75,000 | | | | 80,531 | |
CSC Holdings LLC, 8.625%, 02/15/19 | | | 50,000 | | | | 60,000 | |
Dana Holding Corp., 6.500%, 02/15/19 | | | 60,000 | | | | 64,350 | |
DaVita HealthCare Partners, Inc., | | | | | | | | |
5.750%, 08/15/22 | | | 10,000 | | | | 10,588 | |
6.625%, 11/01/20 | | | 85,000 | | | | 92,862 | |
Del Monte Corp., 7.625%, 02/15/191 | | | 205,000 | | | | 214,737 | |
Denbury Resources, Inc., 8.250%, 02/15/20 | | | 60,000 | | | | 67,800 | |
DISH DBS Corp., | | | | | | | | |
4.625%, 07/15/17 | | | 45,000 | | | | 47,138 | |
5.875%, 07/15/22 | | | 105,000 | | | | 113,400 | |
6.750%, 06/01/21 | | | 105,000 | | | | 120,225 | |
7.125%, 02/01/16 | | | 30,000 | | | | 33,750 | |
7.875%, 09/01/19 | | | 285,000 | | | | 339,150 | |
DJO Finance LLC / DJO Finance Corp., | | | | | | | | |
7.750%, 04/15/18 | | | 135,000 | | | | 130,612 | |
8.750%, 03/15/18 (a) | | | 50,000 | | | | 54,875 | |
9.875%, 04/15/18 (a) | | | 20,000 | | | | 20,750 | |
Dole Food Co., Inc., 8.000%, 10/01/16 (a) | | | 40,000 | | | | 41,800 | |
Eagle Rock Energy Partners L.P. / Eagle Rock Energy Finance Corp.,
8.375%, 06/01/19 (a)1 | | | 85,000 | | | | 87,125 | |
Easton-Bell Sports, Inc., 9.750%, 12/01/16 | | | 145,000 | | | | 156,071 | |
El Paso LLC, 7.250%, 06/01/18 | | | 75,000 | | | | 87,063 | |
Encore Acquisition Co., 9.500%, 05/01/16 | | | 10,000 | | | | 10,800 | |
EP Energy LLC / EP Energy Finance, Inc., 9.375%, 05/01/20 | | | 150,000 | | | | 169,875 | |
EP Energy LLC / Everest Acquisition Finance, Inc., | | | | | | | | |
6.875%, 05/01/19 | | | 30,000 | | | | 32,700 | |
7.750%, 09/01/22 | | | 60,000 | | | | 63,900 | |
Epicor Software Corp., 8.625%, 05/01/19 | | | 100,000 | | | | 105,500 | |
|
The accompanying notes are an integral part of these financial statements. 19 |
Managers High Yield Fund
Schedule of Portfolio Investments (continued)
| | | | | | | | |
| | | Principal Amount | | | Value | |
| | | | | | | |
Industrials - 82.3% (continued) | | | | | | | | |
EV Energy Partners, L.P. / EV Energy Finance Corp., 8.000%, 04/15/19 | | $ | 125,000 | | | $ | 133,281 | |
FGI Operating Co. LLC / FGI Finance, Inc., 7.875%, 05/01/20 (a) | | | 75,000 | | | | 77,625 | |
First Data Corp., | | | | | | | | |
6.750%, 11/01/20 (a) | | | 55,000 | | | | 55,825 | |
7.375%, 06/15/19 (a) | | | 30,000 | | | | 31,200 | |
8.750%, 01/15/22 (a)7 | | | 260,000 | | | | 267,150 | |
8.875%, 08/15/20 (a) | | | 150,000 | | | | 164,250 | |
12.625%, 01/15/21 | | | 190,000 | | | | 200,925 | |
FMG Resources August 2006 Pty, Ltd., | | | | | | | | |
6.000%, 04/01/17 (a)1 | | | 20,000 | | | | 20,500 | |
6.875%, 02/01/18 (a)1 | | | 155,000 | | | | 160,619 | |
8.250%, 11/01/19 (a) | | | 50,000 | | | | 53,500 | |
Forest Oil Corp., 7.250%, 06/15/191 | | | 100,000 | | | | 101,000 | |
Freescale Semiconductor, Inc., 9.250%, 04/15/18 (a) | | | 155,000 | | | | 170,112 | |
Fresenius Medical Care US Finance II, Inc., 5.625%, 07/31/19 (a) | | | 30,000 | | | | 32,363 | |
GCI, Inc., 8.625%, 11/15/19 | | | 80,000 | | | | 85,400 | |
General Cable Corp., 5.750%, 10/01/22 (a) | | | 40,000 | | | | 41,600 | |
Geo Group Inc, The, 6.625%, 02/15/21 | | | 75,000 | | | | 83,625 | |
Goodyear Tire & Rubber Co., The, | | | | | | | | |
7.000%, 05/15/22 | | | 50,000 | | | | 53,875 | |
8.250%, 08/15/201 | | | 90,000 | | | | 99,225 | |
8.750%, 08/15/20 | | | 10,000 | | | | 11,575 | |
Great Lakes Dredge & Dock Corp., 7.375%, 02/01/19 | | | 95,000 | | | | 102,363 | |
Griffon Corp., 7.125%, 04/01/18 | | | 80,000 | | | | 85,200 | |
GWR Operating Partnership LLP, 10.875%, 04/01/17 | | | 65,000 | | | | 74,262 | |
GXS Worldwide, Inc., 9.750%, 06/15/15 | | | 35,000 | | | | 36,619 | |
Gymboree Corp., 9.125%, 12/01/181 | | | 85,000 | | | | 76,075 | |
H&E Equipment Services, Inc., 7.000%, 09/01/22 (a) | | | 60,000 | | | | 64,200 | |
Halcon Resources Corp., 8.875%, 05/15/21 (a) | | | 60,000 | | | | 63,900 | |
Hanesbrands, Inc., 6.375%, 12/15/20 | | | 50,000 | | | | 55,250 | |
HCA Holdings, Inc., | | | | | | | | |
6.250%, 02/15/21 | | | 55,000 | | | | 56,512 | |
7.750%, 05/15/21 | | | 225,000 | | | | 245,250 | |
HCA, Inc., | | | | | | | | |
7.500%, 02/15/22 | | | 370,000 | | | | 425,500 | |
8.000%, 10/01/18 | | | 40,000 | | | | 46,400 | |
HD Supply, Inc., | | | | | | | | |
8.125%, 04/15/19 (a) | | | 100,000 | | | | 114,250 | |
11.000%, 04/15/20 (a) | | | 55,000 | | | | 65,175 | |
11.500%, 07/15/20 (a) | | | 60,000 | | | | 67,725 | |
HDTFS, Inc., 5.875%, 10/15/20 (a) | | | 40,000 | | | | 42,000 | |
Health Management Associates, Inc., | | | | | | | | |
6.125%, 04/15/16 | | | 115,000 | | | | 124,775 | |
7.375%, 01/15/20 | | | 55,000 | | | | 59,675 | |
|
The accompanying notes are an integral part of these financial statements. 20 |
Managers High Yield Fund
Schedule of Portfolio Investments (continued)
| | | | | | | | |
| | | Principal Amount | | | Value | |
| | | | | | | |
Industrials - 82.3% (continued) | | | | | | | | |
HealthSouth Corp., | | | | | | | | |
5.750%, 11/01/24 | | $ | 25,000 | | | $ | 25,563 | |
7.250%, 10/01/18 | | | 36,000 | | | | 39,240 | |
7.750%, 09/15/22 | | | 46,000 | | | | 50,658 | |
8.125%, 02/15/20 | | | 20,000 | | | | 22,125 | |
Hertz Corp., The, 7.500%, 10/15/18 | | | 135,000 | | | | 149,850 | |
Hexion US Finance Corp., Series WI, 6.625%, 04/15/20 | | | 40,000 | | | | 40,900 | |
Hexion US Finance Corp. / Hexion Nova Scotia Finance ULC, | | | | | | | | |
8.875%, 02/01/18 | | | 65,000 | | | | 67,112 | |
9.000%, 11/15/20 | | | 70,000 | | | | 64,225 | |
Hiland Partners, L.P. / Hiland Partners Finance Corp., 7.250%, 10/01/20 (a) | | | 30,000 | | | | 32,250 | |
Hillman Group, Inc., | | | | | | | | |
10.875%, 05/31/18 (a) | | | 10,000 | | | | 10,800 | |
10.875%, 06/01/18 | | | 75,000 | | | | 81,000 | |
Hologic, Inc., 6.250%, 08/01/20 (a) | | | 30,000 | | | | 32,475 | |
Hughes Satellite Systems Corp., 6.500%, 06/15/19 | | | 55,000 | | | | 60,912 | |
Huntsman International LLC, | | | | | | | | |
5.500%, 06/30/161 | | | 16,000 | | | | 16,040 | |
8.625%, 03/15/20 | | | 45,000 | | | | 51,188 | |
8.625%, 03/15/21 | | | 25,000 | | | | 28,688 | |
IMS Health, Inc., 6.000%, 11/01/20 (a) | | | 45,000 | | | | 47,250 | |
Ineos Finance PLC, 8.375%, 02/15/19 (a) | | | 200,000 | | | | 216,250 | |
INEOS Group Holdings Ltd., 8.500%, 02/15/16 (a) | | | 100,000 | | | | 100,000 | |
Infor US, Inc., | | | | | | | | |
Series WI, 9.375%, 04/01/19 | | | 70,000 | | | | 78,925 | |
Series WI, 11.500%, 07/15/18 | | | 55,000 | | | | 64,625 | |
Integra Telecom Holdings, Inc., 10.750%, 04/15/16 (a) | | | 75,000 | | | | 78,750 | |
Intelsat Jackson Holdings SA, | | | | | | | | |
6.625%, 12/15/22 (a) | | | 175,000 | | | | 181,344 | |
7.250%, 04/01/19 | | | 70,000 | | | | 75,600 | |
7.250%, 10/15/20 (a) | | | 125,000 | | | | 136,319 | |
Intelsat Luxembourg SA, | | | | | | | | |
11.250%, 02/04/17 | | | 70,000 | | | | 74,287 | |
11.500%, 02/04/177 | | | 80,000 | | | | 85,300 | |
Interactive Data Corp., 10.250%, 08/01/18 | | | 105,000 | | | | 118,256 | |
Interline Brands, Inc., | | | | | | | | |
7.500%, 11/15/18 | | | 65,000 | | | | 70,525 | |
10.000%, 11/15/18 (a)7 | | | 25,000 | | | | 27,250 | |
inVentiv Health, Inc., | | | | | | | | |
9.000%, 01/15/18 (a) | | | 65,000 | | | | 65,812 | |
10.000%, 08/15/18 (a) | | | 15,000 | | | | 13,088 | |
10.250%, 08/15/18 (a) | | | 55,000 | | | | 47,988 | |
ITC Deltacom, Inc., 10.500%, 04/01/16 | | | 59,000 | | | | 63,425 | |
J. Crew Group, Inc., 8.125%, 03/01/191 | | | 90,000 | | | | 95,625 | |
|
The accompanying notes are an integral part of these financial statements. 21 |
Managers High Yield Fund
Schedule of Portfolio Investments (continued)
| | | | | | | | |
| | | Principal Amount | | | Value | |
| | | | | | | |
Industrials - 82.3% (continued) | | | | | | | | |
J.C. Penney Corp., Inc., | | | | | | | | |
5.750%, 02/15/18 | | $ | 10,000 | | | $ | 8,850 | |
6.375%, 10/15/36 | | | 60,000 | | | | 45,300 | |
7.950%, 04/01/171 | | | 30,000 | | | | 28,950 | |
James River Coal Co., 7.875%, 04/01/19 | | | 75,000 | | | | 43,125 | |
Jarden Corp., 7.500%, 05/01/17 | | | 105,000 | | | | 118,781 | |
Kinetic Concepts, Inc./KCI USA, Inc., 10.500%, 11/01/18 (a) | | | 165,000 | | | | 173,869 | |
Kodiak Oil & Gas Corp., 8.125%, 12/01/19 | | | 90,000 | | | | 99,675 | |
Legacy Reserves, L.P. / Finance Corp., 8.000%, 12/01/20 (a) | | | 60,000 | | | | 61,500 | |
Level 3 Communications, Inc., | | | | | | | | |
8.875%, 06/01/19 (a) | | | 15,000 | | | | 16,031 | |
11.875%, 02/01/19 | | | 55,000 | | | | 63,662 | |
Level 3 Financing, Inc., | | | | | | | | |
8.125%, 07/01/19 | | | 90,000 | | | | 98,550 | |
8.625%, 07/15/20 | | | 65,000 | | | | 72,394 | |
9.375%, 04/01/19 | | | 60,000 | | | | 67,350 | |
Libbey Glass, Inc., 6.875%, 05/15/20 | | | 45,000 | | | | 48,600 | |
Linn Energy LLC/Linn Energy Finance Corp., | | | | | | | | |
6.250%, 11/01/19 (a) | | | 100,000 | | | | 101,000 | |
7.750%, 02/01/21 | | | 60,000 | | | | 64,200 | |
8.625%, 04/15/20 | | | 70,000 | | | | 76,650 | |
Series WI, 6.500%, 05/15/19 | | | 30,000 | | | | 30,450 | |
Longview Fibre Paper & Packaging, Inc., 8.000%, 06/01/16 (a) | | | 20,000 | | | | 21,100 | |
Ltd Brands, Inc., 6.625%, 04/01/21 | | | 55,000 | | | | 63,250 | |
MagnaChip Semiconductor SA / MagnaChip Semiconductor Finance Co., 10.500%, 04/15/18 | | | 125,000 | | | | 140,625 | |
Magnum Hunter Resources Corp., 9.750%, 05/15/20 (a) | | | 55,000 | | | | 57,338 | |
Manitowoc Co., Inc., The, 8.500%, 11/01/20 | | | 100,000 | | | | 112,750 | |
Mantech International Corp., 7.250%, 04/15/18 | | | 65,000 | | | | 69,387 | |
Marina District Finance Co., Inc., | | | | | | | | |
9.500%, 10/15/151 | | | 15,000 | | | | 14,625 | |
9.875%, 08/15/181 | | | 145,000 | | | | 139,925 | |
MarkWest Energy Partners, L.P. / MarkWest Energy Finance Corp., 5.500%, 02/15/23 | | | 70,000 | | | | 76,300 | |
Mead Products LLC/ACCO Brands Corp., 6.750%, 04/30/20 (a) | | | 25,000 | | | | 26,375 | |
MEG Energy Corp., 6.375%, 01/30/23 (a) | | | 45,000 | | | | 47,138 | |
MEMC Electronic Materials, Inc., 7.750%, 04/01/19 | | | 65,000 | | | | 54,925 | |
MetroPCS Wireless, Inc., 7.875%, 09/01/18 | | | 100,000 | | | | 108,750 | |
MGM Resorts International, | | | | | | | | |
6.625%, 12/15/21 | | | 90,000 | | | | 90,112 | |
6.750%, 10/01/20 (a) | | | 100,000 | | | | 102,375 | |
7.625%, 01/15/17 | | | 125,000 | | | | 134,375 | |
8.625%, 02/01/19 (a) | | | 125,000 | | | | 140,000 | |
Michael Foods Group, Inc., 9.750%, 07/15/18 | | | 95,000 | | | | 105,450 | |
Michaels Stores, Inc., 7.750%, 11/01/18 | | | 135,000 | | | | 148,837 | |
Midstates Petroleum Co., Inc. / Midstates Petroleum Co. LLC, 10.750%, 10/01/20 (a) | | | 50,000 | | | | 53,375 | |
|
The accompanying notes are an integral part of these financial statements. 22 |
Managers High Yield Fund
Schedule of Portfolio Investments (continued)
| | | | | | | | |
| | | Principal Amount | | | Value | |
| | | | | | | |
Industrials - 82.3% (continued) | | | | | | | | |
Mueller Water Products, Inc., 8.750%, 09/01/20 | | $ | 38,000 | | | $ | 43,510 | |
Mylan, Inc., 7.875%, 07/15/20 (a) | | | 105,000 | | | | 124,158 | |
Nexeo Solutions LLC / Nexeo Solutions Finance Corp., 8.375%, 03/01/18 | | | 75,000 | | | | 71,250 | |
Nexstar Broadcasting, Inc., 6.875%, 11/15/20 (a) | | | 35,000 | | | | 36,094 | |
Nexstar Broadcasting, Inc. / Mission Broadcasting, Inc., 8.875%, 04/15/17 | | | 75,000 | | | | 82,687 | |
Noranda Aluminum Acquisition Corp., 4.524%, (01/31/13)7 | | | 107,114 | | | | 101,223 | |
Novelis, Inc., | | | | | | | | |
8.375%, 12/15/17 | | | 70,000 | | | | 77,525 | |
8.750%, 12/15/20 | | | 25,000 | | | | 28,000 | |
NXP, B.V. / NXP Funding LLC, 9.750%, 08/01/18 (a) | | | 100,000 | | | | 116,375 | |
Oshkosh Corp., | | | | | | | | |
8.250%, 03/01/17 | | | 80,000 | | | | 88,200 | |
8.500%, 03/01/20 | | | 35,000 | | | | 38,938 | |
Packaging Dynamics Corp., 8.750%, 02/01/16 (a) | | | 70,000 | | | | 73,500 | |
PAETEC Holding Corp., 9.875%, 12/01/18 | | | 95,000 | | | | 109,250 | |
Party City Holdings, Inc., 8.875%, 08/01/20 (a) | | | 120,000 | | | | 129,300 | |
Peabody Energy Corp., | | | | | | | | |
6.000%, 11/15/18 | | | 70,000 | | | | 74,725 | |
6.250%, 11/15/21 | | | 30,000 | | | | 32,025 | |
Petco Animal Supplies, Inc., 9.250%, 12/01/18 (a) | | | 80,000 | | | | 89,200 | |
Plains Exploration & Production Co., | | | | | | | | |
6.500%, 11/15/20 | | | 160,000 | | | | 178,000 | |
6.875%, 02/15/23 | | | 75,000 | | | | 86,062 | |
Ply Gem Industries, Inc., 8.250%, 02/15/181 | | | 45,000 | | | | 48,825 | |
Polymer Group, Inc., 7.750%, 02/01/19 | | | 70,000 | | | | 75,425 | |
PolyOne Corp., 7.375%, 09/15/20 | | | 55,000 | | | | 60,362 | |
Polypore International, Inc., 7.500%, 11/15/17 | | | 85,000 | | | | 93,075 | |
Post Holdings, Inc., 7.375%, 02/15/22 (a) | | | 105,000 | | | | 115,566 | |
QR Energy LP / QRE Finance Corp., 9.250%, 08/01/20 | | | 60,000 | | | | 63,300 | |
Quebecor Media, Inc., 5.750%, 01/15/23 (a) | | | 65,000 | | | | 68,819 | |
Quebecor World, Escrow, 0.000%, 08/01/278 | | | 165,000 | | | | 2,063 | |
Radiation Therapy Services, Inc., | | | | | | | | |
8.875%, 01/15/17 | | | 60,000 | | | | 59,100 | |
9.875%, 04/15/17 | | | 90,000 | | | | 63,900 | |
Radio Systems Corp., 8.375%, 11/01/19 (a) | | | 65,000 | | | | 67,925 | |
Rain CII Carbon LLC / CII Carbon Corp., 8.000%, 12/01/18 (a) | | | 30,000 | | | | 30,675 | |
RBS Global, Inc. / Rexnord LLC, 8.500%, 05/01/18 | | | 115,000 | | | | 125,206 | |
Regency Energy Partners LP / Regency Energy Finance Corp., 5.500%, 04/15/23 | | | 55,000 | | | | 58,987 | |
Reichhold Industries, Inc., 9.000%, 05/08/17 (a)7 | | | 190,247 | | | | 138,880 | |
Reynolds Group Issuer, Inc. / Reynolds Group Issuer LLC, | | | | | | | | |
5.750%, 10/15/20 (a) | | | 45,000 | | | | 46,575 | |
7.875%, 08/15/19 | | | 100,000 | | | | 111,750 | |
9.000%, 04/15/19 | | | 355,000 | | | | 370,975 | |
9.875%, 08/15/19 | | | 200,000 | | | | 215,000 | |
|
The accompanying notes are an integral part of these financial statements. 23 |
Managers High Yield Fund
Schedule of Portfolio Investments (continued)
| | | | | | | | |
| | | Principal Amount | | | Value | |
| | | | | | | |
Industrials - 82.3% (continued) | | | | | | | | |
Rite Aid Corp., | | | | | | | | |
7.500%, 03/01/17 | | $ | 50,000 | | | $ | 51,625 | |
9.250%, 03/15/201 | | | 70,000 | | | | 74,900 | |
Rockwood Specialties Group, Inc., 4.625%, 10/15/20 | | | 85,000 | | | | 88,294 | |
Sabre, Inc., 8.500%, 05/15/19 (a) | | | 145,000 | | | | 154,969 | |
Sally Holdings LLC / Sally Capital, Inc., | | | | | | | | |
5.750%, 06/01/22 | | | 15,000 | | | | 16,350 | |
6.875%, 11/15/19 | | | 30,000 | | | | 33,300 | |
SandRidge Energy, Inc., | | | | | | | | |
7.500%, 03/15/21 | | | 50,000 | | | | 53,750 | |
7.500%, 02/15/23 | | | 50,000 | | | | 53,750 | |
8.000%, 06/01/18 (a) | | | 35,000 | | | | 37,275 | |
8.125%, 10/15/22 | | | 35,000 | | | | 38,500 | |
SBA Telecommunications, Inc., 8.250%, 08/15/19 | | | 44,000 | | | | 49,390 | |
Scotts Miracle-Gro Co., The, | | | | | | | | |
6.625%, 12/15/20 | | | 60,000 | | | | 66,150 | |
7.250%, 01/15/18 | | | 20,000 | | | | 21,600 | |
Sealed Air Corp., | | | | | | | | |
6.500%, 12/01/20 (a) | | | 35,000 | | | | 37,975 | |
8.125%, 09/15/19 (a) | | | 10,000 | | | | 11,300 | |
8.375%, 09/15/21 (a) | | | 60,000 | | | | 68,850 | |
Sealy Mattress Co., | | | | | | | | |
8.250%, 06/15/141 | | | 190,000 | | | | 190,714 | |
10.875%, 04/15/16 (a) | | | 25,000 | | | | 26,563 | |
Sensata Technologies, B.V., 6.500%, 05/15/19 (a) | | | 110,000 | | | | 117,700 | |
Service Corp. International, | | | | | | | | |
7.000%, 06/15/17 | | | 60,000 | | | | 69,300 | |
7.000%, 05/15/19 | | | 50,000 | | | | 55,000 | |
7.500%, 04/01/27 | | | 60,000 | | | | 64,800 | |
ServiceMaster Co., 7.000%, 08/15/20 (a) | | | 80,000 | | | | 80,600 | |
Sinclair Television Group, Inc., | | | | | | | | |
6.125%, 10/01/22 (a) | | | 60,000 | | | | 63,975 | |
8.375%, 10/15/181 | | | 25,000 | | | | 28,063 | |
9.250%, 11/01/17 (a) | | | 90,000 | | | | 99,450 | |
Spectrum Brands Escrow Corp., | | | | | | | | |
6.375%, 11/15/20 (a) | | | 25,000 | | | | 26,313 | |
6.625%, 11/15/22 (a) | | | 25,000 | | | | 26,875 | |
Spectrum Brands, Inc., | | | | | | | | |
6.750%, 03/15/20 (a) | | | 35,000 | | | | 37,625 | |
9.500%, 06/15/18 | | | 120,000 | | | | 136,800 | |
Sprint Capital Corp., 8.750%, 03/15/32 | | | 545,000 | | | | 668,987 | |
Sprint Nextel Corp., 9.000%, 11/15/18 (a) | | | 200,000 | | | | 247,500 | |
SSI Investments II/SSI Co-Issuer LLC, 11.125%, 06/01/18 | | | 100,000 | | | | 111,125 | |
|
The accompanying notes are an integral part of these financial statements. 24 |
Managers High Yield Fund
Schedule of Portfolio Investments (continued)
| | | | | | | | |
| | | Principal Amount | | | Value | |
| | | | | | | |
Industrials - 82.3% (continued) | | | | | | | | |
Stewart Enterprises, Inc., 6.500%, 04/15/19 | | $ | 45,000 | | | $ | 48,375 | |
SunGard Data Systems, Inc., | | | | | | | | |
6.625%, 11/01/19 (a) | | | 100,000 | | | | 102,750 | |
7.375%, 11/15/18 | | | 80,000 | | | | 86,100 | |
SUPERVALU, Inc., 8.000%, 05/01/161 | | | 95,000 | | | | 90,962 | |
Surgical Care Affiliates, Inc., 8.875%, 07/15/15 (a) | | | 159,291 | | | | 162,079 | |
Syniverse Holdings, Inc., 9.125%, 01/15/19 | | | 20,000 | | | | 21,450 | |
Targa Resources Partners LP / Targa Resources Partners Finance Corp., 5.250%, 05/01/23 (a) | | | 20,000 | | | | 20,800 | |
Tekni-Plex, Inc., 9.750%, 06/01/19 (a) | | | 65,000 | | | | 71,175 | |
Tempur-Pedic International, Inc., 6.875%, 12/15/20 (a) | | | 20,000 | | | | 20,675 | |
Tenet Healthcare Corp., | | | | | | | | |
6.250%, 11/01/18 | | | 90,000 | | | | 99,225 | |
8.000%, 08/01/20 | | | 220,000 | | | | 238,012 | |
8.875%, 07/01/19 | | | 20,000 | | | | 22,500 | |
Terex Corp., | | | | | | | | |
6.000%, 05/15/21 | | | 45,000 | | | | 47,588 | |
6.500%, 04/01/20 | | | 60,000 | | | | 63,900 | |
Tesoro Logistics LP / Tesoro Logistics Finance Corp., 5.875%, 10/01/20 (a) | | | 55,000 | | | | 57,337 | |
Tomkins LLC / Tomkins, Inc., 9.000%, 10/01/18 | | | 30,000 | | | | 33,750 | |
Trinidad Drilling, Ltd., 7.875%, 01/15/19 (a) | | | 70,000 | | | | 74,725 | |
UCI International, Inc., 8.625%, 02/15/19 | | | 110,000 | | | | 109,587 | |
United Rentals North America, Inc., | | | | | | | | |
7.375%, 05/15/20 (a) | | | 50,000 | | | | 55,125 | |
7.625%, 04/15/22 (a) | | | 25,000 | | | | 28,063 | |
8.250%, 02/01/21 | | | 80,000 | | | | 90,600 | |
8.375%, 09/15/201 | | | 55,000 | | | | 61,187 | |
9.250%, 12/15/19 | | | 85,000 | | | | 97,325 | |
United Surgical Partners International, Inc., Series WI, 9.000%, 04/01/20 | | | 75,000 | | | | 83,625 | |
UPCB Finance III, Ltd., 6.625%, 07/01/20 (a) | | | 150,000 | | | | 161,437 | |
UPCB Finance VI, Ltd., 6.875%, 01/15/22 (a) | | | 150,000 | | | | 163,125 | |
Vail Resorts, Inc., 6.500%, 05/01/19 | | | 80,000 | | | | 86,500 | |
Valeant Pharmaceuticals International, | | | | | | | | |
6.750%, 08/15/21 (a) | | | 90,000 | | | | 96,975 | |
6.875%, 12/01/18 (a) | | | 80,000 | | | | 86,600 | |
7.250%, 07/15/22 (a) | | | 125,000 | | | | 137,187 | |
Venoco, Inc., 8.875%, 02/15/19 | | | 15,000 | | | | 14,138 | |
Visant Corp., 10.000%, 10/01/17 | | | 33,000 | | | | 29,783 | |
Visteon Corp., 6.750%, 04/15/19 | | | 81,000 | | | | 86,670 | |
Vulcan Materials Co., | | | | | | | | |
6.500%, 12/01/16 | | | 25,000 | | | | 27,688 | |
7.500%, 06/15/21 | | | 65,000 | | | | 74,425 | |
Wind Acquisition Finance SA, 7.250%, 02/15/18 (a) | | | 200,000 | | | | 203,500 | |
|
The accompanying notes are an integral part of these financial statements. 25 |
Managers High Yield Fund
Schedule of Portfolio Investments (continued)
| | | | | | | | |
| | | Principal Amount | | | Value | |
| | | | | | | |
Industrials - 82.3% (continued) | | | | | | | | |
Windstream Corp., | | | | | | | | |
7.500%, 04/01/23 | | $ | 100,000 | | | $ | 105,750 | |
7.750%, 10/01/21 | | | 65,000 | | | | 70,525 | |
8.125%, 09/01/18 | | | 40,000 | | | | 43,900 | |
WMG Acquisition Corp., | | | | | | | | |
6.000%, 01/15/21 (a) | | | 35,000 | | | | 37,100 | |
11.500%, 10/01/18 | | | 35,000 | | | | 40,600 | |
Wolverine World Wide, Inc., 6.125%, 10/15/20 (a) | | | 10,000 | | | | 10,550 | |
WPX Energy, Inc., 6.000%, 01/15/22 | | | 90,000 | | | | 97,425 | |
Yankee Candle Co., Inc., Series B, 9.750%, 02/15/17 | | | 10,000 | | | | 10,438 | |
Zayo Group LLC / Zayo Capital, Inc., Series WI, 8.125%, 01/01/20 | | | 25,000 | | | | 27,938 | |
Total Industrials | | | | | | | 27,451,274 | |
Utilities - 2.0% | | | | | | | | |
AES Corp., The, | | | | | | | | |
8.000%, 10/15/17 | | | 30,000 | | | | 34,800 | |
9.750%, 04/15/16 | | | 95,000 | | | | 114,000 | |
Calpine Corp., | | | | | | | | |
7.250%, 10/15/17 (a) | | | 36,000 | | | | 38,520 | |
7.500%, 02/15/21 (a) | | | 94,000 | | | | 104,340 | |
7.875%, 07/31/20 (a) | | | 23,000 | | | | 25,933 | |
7.875%, 01/15/23 (a) | | | 16,000 | | | | 18,160 | |
Energy Future Holdings Corp., 10.000%, 01/15/20 | | | 50,000 | | | | 56,125 | |
Energy Future Intermediate Holding Co. LLC / EFIH Finance, Inc., | | | | | | | | |
6.875%, 08/15/17 (a) | | | 15,000 | | | | 16,050 | |
10.000%, 12/01/20 | | | 51,000 | | | | 57,757 | |
NRG Energy, Inc., | | | | | | | | |
6.625%, 03/15/23 (a) | | | 15,000 | | | | 16,125 | |
7.625%, 01/15/18 | | | 130,000 | | | | 144,950 | |
8.250%, 09/01/20 | | | 35,000 | | | | 39,375 | |
Total Utilities | | | | | | | 666,135 | |
Total Corporate Bonds and Notes (cost $28,462,478) | | | | | | | 30,294,038 | |
| | |
| | | Shares | | | | |
Other Investment Companies - 10.6%2 | | | | | | | | |
BNY Mellon Overnight Government Fund, 0.19%3 | | | 1,792,891 | | | | 1,792,891 | |
Dreyfus Cash Management Fund,
Institutional Class Shares, 0.06% | | | 1,737,946 | | | | 1,737,946 | |
Total Other Investment Companies
(cost $3,530,837) | | | | | | | 3,530,837 | |
Total Investments - 102.1% (cost $32,188,761) | | | | | | | 34,039,219 | |
Other Assets, less Liabilities - (2.1)% | | | | | | | (683,960 | ) |
Net Assets - 100.0% | | | | | | $ | 33,355,259 | |
|
The accompanying notes are an integral part of these financial statements. 26 |
Managers AMG GW&K Fixed Income Fund
Portfolio Manager’s Comments
THE YEAR IN REVIEW
Managers AMG GW&K Fixed Income Fund (Institutional Class) returned 9.89% for the year ended December 31, 2012, outpacing the return of 4.22% for the Barclays Capital U.S. Aggregate Bond Index (“the Index”).
During the fourth quarter, GW&K Investment Management (“GW&K”) replaced Loomis Sayles and Company, L.P. as the subadvisor to the Fund. GW&K is using its Enhanced Core Bond discipline to manage the Fund. This change was approved by the Fund’s Board of Trustees at a meeting on November 13, 2012.
GW&K is an affiliate of Affiliated Managers Group and has been managing taxable fixed income portfolios for almost 20 years. GW&K, a Boston based investment manager founded in 1974, manages over $16 billion in assets. The Enhanced Core Bond strategy offers broad market exposure across multiple bond sectors, including high yield bonds, while seeking to provide strong income. The investment process combines bottom-up and top-down components to construct portfolios.
Effective November 30, 2012 the name of the Fund changed to the Managers AMG GW&K Fixed Income Fund. Also, as of the close of business on November 30, 2012, the Fund launched a Service Class of shares, renamed the Class A shares as Investor Class, converted Class B shares into Investor Class shares, and closed Class C shares to new investments. Finally, the Fund lowered the minimum initial investment on the Institutional Class to $1,000,000 from $2,500,000.
The Fund delivered strong absolute and relative performance for the year only trailing its benchmark during the second quarter. In addition, the Fund rallied at the end of the year after GW&K became subadvisor to the Fund and outperformed its benchmark in December. During this time our allocation to high yield bonds, which outperformed all major investment grade sectors during both periods, augmented our overweight to investment grade corporate bonds and strong security selection within both financials and energy and allowed us to finish ahead of the Index.
LOOKING FORWARD
As we moved through the fourth quarter, it became increasingly apparent that the world’s central banks had again succeeded in minimizing the likelihood of a systemic catastrophe and had positioned the global economy for growth. By maintaining an environment of repressed interest rates and improved access to credit, the Federal Reserve continues to allow our domestic housing market to heal and unlock the potential of the domestic consumer along with it. One needs only look as far as recent, multi-year highs in consumer confidence readings to find an early read-through to this success. While the polarization in Washington has done little to improve the economic climate, we are hopeful that a credible resolution around the fiscal cliff and a healthier consumer will drive gains in manufacturing and output.
In this context, we enter 2013 prepared for near-term volatility in rates surrounding the fiscal cliff negotiations with a longer-term expectation for a steeper curve as the economic outlook improves. As such, we shortened our portfolios during the fourth quarter and enter the New Year neutral duration relative to our benchmarks.
With current spreads roughly in line with their long-term averages, we remain constructive on corporate credit, as valuations remain attractive relative to both the negative real yields seen across most of the Treasury curve and the tight spreads on other government credit. We freely admit that we have rationalized our expectations for total returns with the tighter spreads and lower yields with which we begin the year but believe carry and curve positioning offer low-to-mid single-digit and coupon-type returns for investment grade and high yield bonds, respectively. Within investment grade, we prefer money-center banks and BBB-rated industrials leveraged to an improving global economy and expect both to trend tighter during the year. Our focus within high yield remains on higher-quality issuers, as we expect BB and B-rated companies to best weather the modest outlook for growth and for their default experience to remain benign.
We remain broadly neutral on mortgage-backed securities, as we believe they offer attractive valuations relative to other high-quality credit assets and will continue to benefit from deep technical support stemming from $40 billion worth of Fed purchases per month. Our main concern remains prepayment risk, and we will continue to monitor the structural and political impediments which have kept prepayment speeds contained despite record-low mortgage rates.
This commentary reflects the viewpoints of the portfolio manager, GW&K Investment Management, as of December 31, 2012 and is not intended as a forecast or guarantee of future results
CUMULATIVE TOTAL RETURN PERFORMANCE
Managers Fixed Income Fund’s cumulative total return is based on the daily change in net asset value (NAV), and assumes that all distributions were reinvested. The chart compares a hypothetical $10,000 investment made in the Fund’s Investor Class shares (formerly Class A shares of the Fund, which were renamed Investor Class shares as of the date of the Prospectus, December 1, 2012) on December 31, 2002, with a $10,000 investment made in the Barclays U.S. Aggregate Bond Index for the same time period. Performance for periods longer than one year is annualized. The graph and table do not reflect the deduction of taxes that a shareholder would pay on a Fund distribution or redemption of shares. Past performance is not indicative of future results. The listed returns for the Fund are net of expenses and the returns for the index exclude expenses. Total returns for the Fund would have been lower had certain expenses not been reduced.
Managers AMG GW&K Fixed Income Fund
Portfolio Manager’s Comments (continued)
CUMULATIVE TOTAL RETURN PERFORMANCE (continued)
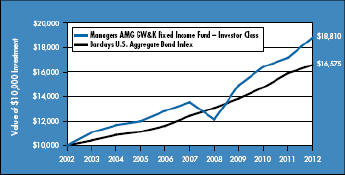
The table below shows the average annual total returns for the Managers AMG GW&K Fixed Income Fund and the Barclays U.S. Aggregate Bond Index for the same time periods ended December 31, 2012.
| | | | | | | | | | | | | | | | | | | | |
| | | Average Annual Total Returns1 | |
| | | One Year | | | Five Years | | | Ten Years | | | Since Inception | | | Inception Date | |
Managers AMG GW&K Fixed Income Fund2,3,4,5,6 | | | | | |
Investor Class7 | | | 9.53 | % | | | 6.79 | % | | | 6.52 | % | | | 6.56 | % | | | 01/02/97 | |
Service Class | | | — | | | | — | | | | — | | | | 0.26 | % | | | 11/30/12 | |
Class C8 | | | 8.81 | % | | | 6.00 | % | | | 5.78 | % | | | 5.81 | % | | | 03/05/98 | |
Institutional Class | | | 9.89 | % | | | 7.06 | % | | | 6.84 | % | | | 6.99 | % | | | 01/02/97 | |
Barclays U.S. Aggregate Bond Index9 | | | 4.22 | % | | | 5.95 | % | | | 5.18 | % | | | 6.22 | % | | | 01/02/97 | † |
The performance data shown represents past performance. Past performance is not a guarantee of future results. Current performance may be lower or higher than the performance data quoted. The investment return and principal value of an investment in the Fund will fluctuate so that an investor’s shares, when redeemed, may be worth more or less than their original cost. For performance information through the most recent month end please call (800) 835-3879 or visit our Web site at www.managersinvest.com.
Investors should carefully consider the Fund’s investment objectives, risks, charges and expenses before investing. For this and other information, please call (800) 835-3879 or visit www.managersinvest.com for a free prospectus. Read it carefully before investing or sending money. Funds are distributed by Managers Distributors, Inc., a member of FINRA.
| † | Date reflects inception date of the Fund, not the index. |
|
1 Total return equals income yield plus share price change and assumes reinvestment of all dividends and capital gain distributions. Returns are net of fees and may reflect offsets of Fund expenses as described in the Prospectus. No adjustment has been made for taxes payable by shareholders on their reinvested dividends and capital gain distributions. Returns for periods greater than one year are the average annual returns. The listed returns on the Fund are net of expenses and based on the published NAV as of December 31, 2012. All returns are in
U.S. dollars ($). 2 From time to time, the Fund’s advisor has waived its fees and/or absorbed Fund expenses, which has resulted in higher returns. 3 Fixed income funds are subject to the risks associated with investments in debt securities, such as default risk and fluctuations in the perception of the debtor’s ability to pay its creditors. 4 High Yield bonds (also known as “junk bonds”) are subject to additional risks such as the risk of default. 5 Changing interest rates may adversely affect the value of an investment. An increase in interest rates typically causes the value of bonds and other fixed income securities to fall. 6 Market risk associated with equity securities may become more pronounced for the Fund. 7 As of December 1, 2012 the Fund’s Class A were renamed Investor Class shares. Additionally, the Fund’s Class B shares converted to Investor shares. 8 Closed to new investments. 9 The Barclays U.S. Aggregate Bond Index is an index of the U.S. investment grade, fixed-rate bond market, including both government and corporate bonds. Unlike the Fund, the Barclays U.S. Aggregate Bond Index is unmanaged, is not available for investment, and does not incur expenses. Not FDIC insured, nor bank guaranteed. May lose value. |
28
Managers AMG GW&K Fixed Income Fund
Fund Snapshots
December 31, 2012
Portfolio Breakdown (unaudited)
| | | | |
Industry | | Managers AMG
GW&F Fixed
Income Fund** | |
Industrials | | | 42.7 | % |
U.S. Government and Agency Obligations | | | 29.7 | % |
Financials | | | 12.3 | % |
Municipal Bonds | | | 5.2 | % |
Other Assets and Liabilities | | | 10.1 | % |
| ** | As a percentage of net assets |
| | | | |
Rating | | Managers AMG
GW&K Fixed
Income Fund† | |
U.S. Treasury | | | 1.6 | % |
U.S. Agency | | | 31.5 | % |
Aaa | | | 0.0 | % |
Aa | | | 3.20 | % |
A | | | 16.8 | % |
Baa | | | 28.6 | % |
Ba | | | 10.3 | % |
B | | | 8.0 | % |
Caa | | | 0.0 | % |
Ca | | | 0.0 | % |
C | | | 0.0 | % |
D | | | 0.0 | % |
Not Rated | | | 0.0 | % |
| † | As a percentage of market value of fixed income securities. Chart does not include equity securities. |
Top Ten Holdings (unaudited)
| | | | |
Security Name | | % of
Net Assets | |
Fannie Mae Pool, 5.500%, 02/01/39 | | | 7.3 | % |
Freddie Mac Gold Pool, 5.000%, 10/01/36 | | | 6.4 | |
Fannie Mae Pool, 4.500%, 05/01/39 | | | 4.7 | |
Fannie Mae Pool, 6.000%, 06/01/36 | | | 4.5 | |
Freddie Mac Gold Pool, 5.000%, 06/01/26 | | | 2.7 | |
Fannie Mae Pool, 5.500%, 05/01/25 | | | 2.7 | |
Associates Corp. of North America, 6.950%, 11/01/18 | | | 2.2 | |
Goldman Sachs Group, Inc., The, 6.125%, 02/15/33 | | | 2.0 | |
American Tower Corp., 7.250%, 05/15/19 | | | 1.9 | |
General Electric Capital Corp., Series GMTN, 6.000%, 08/07/19 | | | 1.9 | |
| | | | |
Top Ten as a Group | | | 36.3 | % |
| | | | |
Any sectors, industries, or securities discussed should not be perceived as investment recommendations. Mention of a specific security should not be considered a recommendation to buy or solicitation to sell that security. Specific securities mentioned in this report may have been sold from the Fund’s portfolio of investments by the time you receive this report.
Managers AMG GW&K Fixed Income Fund
Schedule of Portfolio Investments
December 31, 2012
| | | | | | | | |
| | | Principal Amount | | | Value | |
| | | | | | | |
Corporate Bonds and Notes - 55.0% | | | | | | | | |
Financials - 12.3% | | | | | | | | |
American Tower Corp., 7.250%, 05/15/19 | | $ | 2,200,000 | | | $ | 2,702,170 | |
Associates Corp. of North America, 6.950%, 11/01/18 | | | 2,552,000 | | | | 3,077,919 | |
Bank of America Corp., 6.000%, 09/01/17 | | | 1,150,000 | | | | 1,348,062 | |
General Electric Capital Corp., Series GMTN, 6.000%, 08/07/19 | | | 2,200,000 | | | | 2,680,181 | |
Goldman Sachs Group, Inc., The, 6.125%, 02/15/33 | | | 2,350,000 | | | | 2,750,729 | |
International Lease Finance Corp., 8.250%, 12/15/20 | | | 1,150,000 | | | | 1,374,250 | |
JPMorgan Chase & Co., 6.000%, 01/15/18 | | | 1,700,000 | | | | 2,037,477 | |
Morgan Stanley, Series GMTN, 5.500%, 07/28/21 | | | 1,200,000 | | | | 1,364,815 | |
Total Financials | | | | | | | 17,335,603 | |
Industrials - 42.7% | | | | | | | | |
ArcelorMittal, 10.350%, 06/01/19 | | | 1,150,000 | | | | 1,380,946 | |
AutoNation, Inc., 6.750%, 04/15/18 | | | 1,200,000 | | | | 1,362,000 | |
CBS Corp., 8.875%, 05/15/19 | | | 1,000,000 | | | | 1,350,495 | |
CenturyLink, Inc., Series S, 6.450%, 06/15/21 | | | 1,200,000 | | | | 1,328,184 | |
CF Industries, Inc., 7.125%, 05/01/20 | | | 2,100,000 | | | | 2,646,851 | |
Chesapeake Energy Corp., 6.125%, 02/15/21 | | | 1,400,000 | | | | 1,459,500 | |
Chrysler Group LLC / CG Co-Issuer, Inc., 8.000%, 06/15/19 | | | 1,250,000 | | | | 1,368,750 | |
Comcast Corp., 7.050%, 03/15/33 | | | 1,000,000 | | | | 1,336,096 | |
CRH America, Inc., 8.125%, 07/15/18 | | | 1,100,000 | | | | 1,329,831 | |
DIRECTV Holdings LLC / DIRECTV Financing Co., Inc., Series WI, 5.200%, 03/15/20 | | | 2,350,000 | | | | 2,670,874 | |
DISH DBS Corp., 5.000%, 03/15/23 (a) | | | 1,250,000 | | | | 1,256,250 | |
Domtar Corp., 10.750%, 06/01/17 | | | 1,050,000 | | | | 1,361,543 | |
Eastman Chemical Co., 3.600%, 08/15/22 | | | 2,550,000 | | | | 2,675,988 | |
El Paso LLC, Series GMTN, 7.750%, 01/15/32 | | | 1,150,000 | | | | 1,356,992 | |
Energy Transfer Equity L.P., 7.500%, 10/15/20 | | | 1,200,000 | | | | 1,392,000 | |
Ford Motor Co., 7.450%, 07/16/31 | | | 1,050,000 | | | | 1,338,750 | |
Frontier Communications Corp., Series WI, 8.500%, 04/15/20 | | | 1,150,000 | | | | 1,328,250 | |
Georgia-Pacific LLC, 8.000%, 01/15/24 | | | 950,000 | | | | 1,330,906 | |
Goodyear Tire & Rubber Co., The, 8.250%, 08/15/20 | | | 1,250,000 | | | | 1,378,125 | |
Huntsman International LLC, 8.625%, 03/15/21 | | | 1,170,000 | | | | 1,342,575 | |
International Paper Co., 7.500%, 08/15/21 | | | 1,000,000 | | | | 1,310,872 | |
Iron Mountain, Inc., 8.375%, 08/15/21 | | | 1,800,000 | | | | 2,007,000 | |
L-3 Communications Corp., 4.950%, 02/15/21 | | | 1,800,000 | | | | 2,034,392 | |
Lubrizol Corp., 8.875%, 02/01/19 | | | 950,000 | | | | 1,327,232 | |
Rio Tinto Finance USA, Ltd., 9.000%, 05/01/19 | | | 1,450,000 | | | | 1,994,168 | |
Royal Caribbean Cruises, Ltd., 7.250%, 03/15/18 | | | 1,800,000 | | | | 2,043,000 | |
Sprint Capital Corp., 6.900%, 05/01/19 | | | 1,250,000 | | | | 1,368,750 | |
Teck Resources, Ltd., 6.125%, 10/01/35 | | | 1,800,000 | | | | 2,052,063 | |
Teekay Corp., 8.500%, 01/15/20 | | | 1,250,000 | | | | 1,325,000 | |
Time Warner, Inc., 7.700%, 05/01/32 | | | 950,000 | | | | 1,332,090 | |
United Rentals North America, Inc., 8.250%, 02/01/21 | | | 1,200,000 | | | | 1,359,000 | |
|
The accompanying notes are an integral part of these financial statements. 30 |
Managers AMG GW&K Fixed Income Fund
Schedule of Portfolio Investments (continued)
| | | | | | | | |
| | | Principal Amount | | | Value | |
| | | | | | | |
Industrials - 42.7% (continued) | | | | | | | | |
United States Steel Corp., 7.375%, 04/01/20 | | $ | 1,350,000 | | | $ | 1,447,875 | |
Valero Energy Corp., 9.375%, 03/15/19 | | | 1,000,000 | | | | 1,377,199 | |
Weatherford International, Ltd./Bermuda, 9.625%, 03/01/19 | | | 2,050,000 | | | | 2,677,771 | |
Williams Cos, Inc., The, 8.750%, 03/15/32 | | | 1,850,000 | | | | 2,571,243 | |
Xerox Corp., 6.350%, 05/15/18 | | | 2,300,000 | | | | 2,655,658 | |
Total Industrials | | | | | | | 59,878,219 | |
Total Corporate Bonds and Notes
(cost $76,757,777) | | | | | | | 77,213,822 | |
Municipal Bonds - 5.2% | | | | | | | | |
California State General Obligation, Build America Bonds, 7.550%, 04/01/39 | | | 1,850,000 | | | | 2,669,180 | |
Illinois State General Obligation, 5.365%, 03/01/17 | | | 1,800,000 | | | | 2,019,816 | |
Metropolitan Transportation Authority NY Revenue, Build America Bonds, 6.668%, 11/15/39 | | | 2,050,000 | | | | 2,673,303 | |
Total Municipal Bonds
(cost $7,434,947) | | | | | | | 7,362,299 | |
| | |
U.S. Government and Agency Obligations - 29.7% | | | | | | | | |
Federal Home Loan Mortgage Corporation - 9.1% | | | | | | | | |
FHLMC Mac Gold Pool, 5.000%, 06/01/26 to 10/01/36 | | | 11,879,003 | | | | 12,789,655 | |
Federal National Mortgage Association - 19.2% | | | | | | | | |
FNMA, 4.500%, 05/01/39 | | | 5,940,411 | | | | 6,577,718 | |
FNMA, 5.500%, 05/01/25 to 02/01/39 | | | 12,821,193 | | | | 13,977,771 | |
FNMA, 6.000%, 06/01/36 | | | 5,824,233 | | | | 6,376,433 | |
Total Federal National Mortgage Association | | | | | | | 26,931,922 | |
U.S. Treasury Obligations - 1.4% | | | | | | | | |
United States Treasury Notes, 3.500%, 05/15/20 | | | 1,700,000 | | | | 1,973,992 | |
Total U.S. Government and Agency Obligations
(cost $41,869,149) | | | | | | | 41,695,569 | |
| | | Shares | | | | |
Other Investment Companies - 4.8%2 | | | | | | | | |
Dreyfus Cash Management Fund, Institutional Class Shares, 0.06%
(cost $6,662,567) | | | 6,662,567 | | | | 6,662,567 | |
Total Investments - 94.7%
(cost $132,724,440) | | | | | | | 132,934,257 | |
Other Assets, less Liabilities - 5.3% | | | | | | | 7,446,705 | |
Net Assets - 100.0% | | | | | | $ | 140,380,962 | |
|
The accompanying notes are an integral part of these financial statements. 31 |
Notes to Schedules of Portfolio Investments
The following footnotes and abbreviations should be read in conjunction with each of the Schedules of Portfolio Investments previously presented in this report.
At December 31, 2012, the approximate cost of investments for Federal income tax purposes and the gross aggregate unrealized appreciation and/or depreciation based on tax cost were as follows:
| | | | | | | | | | | | | | | | |
Fund | | Cost | | | Appreciation | | | Depreciation | | | Net | |
Managers AMG Chicago Equity Partners Balanced Fund | | $ | 35,064,946 | | | $ | 1,997,519 | | | $ | (274,357 | ) | | $ | 1,723,162 | |
Managers High Yield Fund | | | 32,190,396 | | | | 2,067,421 | | | | (218,598 | ) | | | 1,848,823 | |
Managers AMG GW&K Fixed Income Fund | | | 132,724,440 | | | | 822,481 | | | | (612,664 | ) | | | 209,817 | |
| * | Non-income producing security. |
| # | Rounds to less than 0.1%. |
| (a) | Security exempt from registration under Rule 144A of the Securities Act of 1933. This security may be resold in transactions exempt from registration, normally to qualified buyers. At December 31, 2012, the value of these securities amounted to the following: |
| | | | | | | | |
Fund | | Market Value | | | % of Net Assets | |
Managers High Yield Fund | | $ | 10,137,052 | | | | 30.4 | % |
Managers AMG GW&K Fixed Income Fund | | | 1,256,250 | | | | 0.9 | % |
| 1 | Some or all of these shares were out on loan to various brokers as of December 31, 2012, amounting to: |
| | | | | | | | |
Fund | | Market Value | | | % of Net Assets | |
Managers AMG Chicago Equity Partners Balanced Fund | | $ | 1,410,213 | | | | 4.0 | % |
Managers High Yield Fund | | | 1,728,164 | | | | 5.2 | % |
| 2 | Yield shown for each investment company represents the December 31, 2012, seven-day average yield, which refers to the sum of the previous seven days’ dividends paid, expressed as an annual percentage. |
| 3 | Collateral received from brokers for securities lending was invested in this short-term investment. |
| 4 | Floating Rate Security: The rate listed is as of December 31, 2012. Date in parentheses represents the security’s next coupon rate reset. |
| 5 | Illiquid Security: A security not readily convertible into cash such as a stock, bond or commodity that is not actively traded and would be difficult to sell in a timely sale. The Funds may not invest more than 15% of their net assets in illiquid securities. All illiquid securities are valued by an independent pricing agent and are fair valued at Level 2. The market value of illiquid securities at December 31, 2012, amounted to the following: |
| | | | | | | | |
Fund | | Market Value | | | % of Net Assets | |
Managers High Yield Fund | | $ | 1,078 | | | | 0.0 | % |
| 6 | Variable Rate Security: The rate listed is as of December 31, 2012 and is periodically reset subject to terms and conditions set forth in the debenture. |
| 7 | Payment-in-kind security: A type of high yield debt instrument whose issuer has the option of making interest payments either in cash or in additional debt securities. |
| 8 | Security is in default. Issuer has failed to make a timely payment of either principal or interest or has failed to comply with some provision of the bond indenture. |
|
The accompanying notes are an integral part of these financial statements. 32 |
Notes to Schedules of Portfolio Investments (continued)
The following tables summarize the inputs used to value the Funds’ net assets by the fair value hierarchy levels as of December 31, 2012. (See Note 1(a) in the Notes to the Financial Statements.)
| | | | | | | | | | | | | | | | |
| | | Quoted Prices in Active
Markets for Identical
Investments
Level 1 | | | Significant Other
Observable Inputs
Level 2 | | | Significant Unobservable Inputs
Level 3 | | | Total | |
Managers AMG Chicago Equity Partners Balanced Fund | | | | | | | | | |
Investments in Securities | | | | | | | | | | | | | | | | |
Common Stocks† | | $ | 21,437,481 | | | | — | | | | — | | | $ | 21,437,481 | |
Corporate Bonds and Notes†† | | | — | | | $ | 678,868 | | | | — | | | | 678,868 | |
U.S. Government and Agency Obligations†† | | | — | | | | 13,253,316 | | | | — | | | | 13,253,316 | |
Other Investment Companies | | | 1,418,443 | | | | — | | | | — | | | | 1,418,443 | |
| | | | | | | | | | | | | | | | |
Total Investments in Securities | | $ | 22,855,924 | | | $ | 13,932,184 | | | | — | | | $ | 36,788,108 | |
| | | | | | | | | | | | | | | | |
| | | | |
| | | Quoted Prices in Active
Markets for Identical
Investments
Level 1 | | | Significant Other
Observable Inputs
Level 2 | | | Significant Unobservable Inputs
Level 3 | | | Total | |
Managers High Yield Fund | | | | | | | | | | | | | | | | |
Investments in Securities | | | | | | | | | | | | | | | | |
Bank Loan Obligations | | | — | | | $ | 213,095 | | | | — | | | $ | 213,095 | |
Common Stocks† | | $ | 171 | | | | 1,078 | | | | — | | | | 1,249 | |
Corporate Bonds and Notes†† | | | — | | | | 30,294,038 | | | | — | | | | 30,294,038 | |
Other Investment Companies | | | 3,530,837 | | | | — | | | | — | | | | 3,530,837 | |
| | | | | | | | | | | | | | | | |
Total Investments in Securities | | $ | 3,531,008 | | | $ | 30,508,211 | | | | — | | | $ | 34,039,219 | |
| | | | | | | | | | | | | | | | |
| | | | |
| | | Quoted Prices in Active
Markets for Identical
Investments
Level 1 | | | Significant Other
Observable Inputs
Level 2 | | | Significant Unobservable Inputs
Level 3 | | | Total | |
Managers AMG GW&K Fixed Income Fund | | | | | | | | | |
Investments in Securities | | | | | | | | | | | | | | | | |
Corporate Bonds and Notes†† | | | — | | | $ | 77,213,822 | | | | — | | | $ | 77,213,822 | |
Municipal Bonds | | | — | | | | 7,362,299 | | | | — | | | | 7,362,299 | |
U.S. Government and Agency Obligations†† | | | — | | | | 41,695,569 | | | | — | | | | 41,695,569 | |
Other Investment Companies | | $ | 6,662,567 | | | | — | | | | — | | | | 6,662,567 | |
| | | | | | | | | | | | | | | | |
Total Investments in Securities | | $ | 6,662,567 | | | $ | 126,271,690 | | | | — | | | $ | 132,934,257 | |
| | | | | | | | | | | | | | | | |
| † | All common stocks and preferred stocks held in the Fund are level 1 securities. For a detailed breakout of these securities, please refer to the Schedule of Portfolio Investments. |
| †† | All corporate bonds and notes and U.S. government and agency obligations held in the Fund are level 2 securities. For a detailed breakout of the corporate bonds and U.S. government and agency obligations by major industry or agency classification, please refer to the Schedule of Portfolio Investments. |
As of December 31, 2012, the Funds had no transfers between levels from the beginning of the reporting period.
| | | | | | |
| Investments Definitions and Abbreviations: |
| | | |
| FHLB: | | Federal Home Loan Bank | | GMTN: | | Global Medium-Term Notes |
| FHLMC: | | Federal Home Loan Mortgage Corp. | | MTN: | | Medium-Term Notes |
| FNMA: | | Federal National Mortgage Association | | | | |
|
The accompanying notes are an integral part of these financial statements. 33 |
Statement of Assets and Liabilities
December 31, 2012
| | | | | | | | | | | | |
| | | Managers AMG
Chicago Equity
Partners
Balanced Fund | | | Managers
High Yield
Fund | | | Managers AMG
GW&K Fixed
Income Fund | |
Assets: | | | | | | | | | | | | |
Investments at value* (including securities on loan valued at $1,410,213, $1,728,164,and $0, respectively) | | $ | 36,788,108 | | | $ | 34,039,219 | | | $ | 132,934,257 | |
Cash | | | — | | | | — | | | | 535 | |
Receivable for investments sold | | | 235,795 | | | | 29,212 | | | | — | |
Receivable for Fund shares sold | | | 201,872 | | | | 113,270 | | | | 6,305,224 | |
Dividends, interest and other receivables | | | 96,753 | | | | 595,300 | | | | 1,547,571 | |
Receivable from affiliate | | | 20,712 | | | | 14,439 | | | | 33,144 | |
Receivable for interfund lending | | | — | | | | 768,404 | | | | — | |
Prepaid expenses | | | 9,214 | | | | 8,354 | | | | 9,632 | |
Total assets | | | 37,352,454 | | | | 35,568,198 | | | | 140,830,363 | |
Liabilities: | | | | | | | | | | | | |
Payable upon return of securities loaned | | | 1,418,443 | | | | 1,792,891 | | | | — | |
Payable for Fund shares repurchased | | | 143,965 | | | | 226,799 | | | | 307,972 | |
Payable for investments purchased | | | — | | | | 139,077 | | | | — | |
Payable to custodian | | | 81,596 | | | | — | | | | — | |
Accrued expenses: | | | | | | | | | | | | |
Investment advisory and management fees | | | 21,406 | | | | 19,517 | | | | 51,523 | |
Administrative fees | | | 6,116 | | | | 5,576 | | | | 22,899 | |
Distribution fees - Investor Class | | | 5,583 | | | | 6,437 | | | | 8,898 | |
Distribution fees - Class C | | | — | | | | — | | | | 28,380 | |
Trustees fees and expenses | | | — | | | | 21 | | | | 197 | |
Other | | | 17,129 | | | | 22,621 | | | | 29,532 | |
Total liabilities | | | 1,694,238 | | | | 2,212,939 | | | | 449,401 | |
| | | |
Net Assets | | $ | 35,658,216 | | | $ | 33,355,259 | | | $ | 140,380,962 | |
Net Assets Represent: | | | | | | | | | | | | |
Paid-in capital | | $ | 32,703,955 | | | $ | 34,721,000 | | | $ | 129,027,735 | |
Undistributed net investment income | | | 2,142 | | | | — | | | | 294,174 | |
Accumulated net realized gain (loss) from investments and foreign currency transactions | | | 1,209,447 | | | | (3,216,199 | ) | | | 10,849,236 | |
Net unrealized appreciation of investments and foreign currency translations | | | 1,742,672 | | | | 1,850,458 | | | | 209,817 | |
Net Assets | | $ | 35,658,216 | | | $ | 33,355,259 | | | $ | 140,380,962 | |
* Investments at cost | | $ | 35,045,436 | | | $ | 32,188,761 | | | $ | 132,724,440 | |
|
The accompanying notes are an integral part of these financial statements. 34 |
Statement of Assets and Liabilities
December 31, 2012 (continued)
| | | | | | | | | | | | |
| | | Managers AMG
Chicago Equity
Partners
Balanced Fund | | | Managers
High Yield
Fund | | | Managers AMG
GW&K Fixed
Income Fund | |
Investor Class Shares: | | | | | | | | | | | | |
Net Assets | | $ | 26,047,393 | 1 | | $ | 30,817,326 | 1 | | $ | 41,771,612 | 2 |
Shares outstanding | | | 1,836,007 | 1 | | | 3,816,915 | 1 | | | 3,715,137 | 2 |
Net asset value, offering and redemption price per share | | $ | 14.19 | 1 | | $ | 8.07 | 1 | | $ | 11.24 | 2 |
Service Class Shares: | | | | | | | | | | | | |
Net Assets | | $ | 9,967 | | | $ | — | | | $ | 10,022 | |
Shares outstanding | | | 697 | | | | — | | | | 889 | |
Net asset value, offering and redemption price per share | | $ | 14.30 | | | $ | — | | | $ | 11.28 | 3 |
Class C Shares: | | | | | | | | | | | | |
Net Assets | | $ | — | | | $ | — | | | $ | 33,025,855 | 4 |
Shares outstanding | | | — | | | | — | | | | 2,942,434 | 4 |
Net asset value, offering and redemption price per share | | $ | — | | | $ | — | | | $ | 11.22 | 4 |
Institutional Class Shares: | | | | | | | | | | | | |
Net Assets | | $ | 9,600,856 | | | $ | 2,537,933 | | | $ | 65,573,473 | |
Shares outstanding | | | 671,035 | | | | 311,057 | | | | 5,814,230 | |
Net asset value, offering and redemption price per share | | $ | 14.31 | | | $ | 8.16 | | | $ | 11.28 | |
| 1 | Effective at the close of business on November 30, 2012, all Class A shares were renamed Investor Class shares and Class C shares converted to Investor Class shares. |
| 2 | Effective at the close of business on November 30, 2012, all Class A shares were renamed Investor Class shares and Class B shares converted to Investor Class shares. |
| 3 | The NAV reported above varies from the recalculated NAV due to rounding. |
| 4 | Effective at the close of business on November 30, 2012, shares are no longer available for purchase. |
|
The accompanying notes are an integral part of these financial statements. 35 |
Statement of Operations
For the year ended December 31, 2012
| | | | | | | | | | | | |
| | | Managers AMG
Chicago Equity
Partners
Balanced Fund | | | Managers
High Yield
Fund | | | Managers AMG
GW&K Fixed
Income Fund | |
Investment Income: | | | | | | | | | | | | |
Dividend income | | $ | 570,539 | | | $ | 1,159 | | | $ | 1,073,966 | |
Interest income | | | 286,470 | | | | 2,377,411 | | | | 5,712,535 | |
Securities lending income | | | 5,557 | | | | 27,314 | | | | 25,219 | |
Foreign withholding tax | | | (1,110 | ) | | | — | | | | (73,503 | ) |
Total investment income | | | 861,456 | | | | 2,405,884 | | | | 6,738,217 | |
Expenses: | | | | | | | | | | | | |
Investment advisory and management fees | | | 253,797 | | | | 210,292 | | | | 633,510 | |
Administrative fees | | | 72,513 | | | | 60,084 | | | | 281,560 | |
Distribution fees - Investor Class | | | 57,788 | | | | 62,975 | | | | 98,930 | |
Distribution fees - Class B | | | — | | | | — | | | | 28,174 | |
Distribution fees - Class C | | | 36,248 | | | | 24,012 | | | | 337,835 | |
Registration fees | | | 42,577 | | | | 45,109 | | | | 49,517 | |
Professional fees | | | 35,325 | | | | 29,257 | | | | 45,582 | |
Custodian | | | 28,470 | | | | 58,602 | | | | 37,800 | |
Reports to shareholders | | | 11,649 | | | | 16,061 | | | | 22,958 | |
Transfer agent | | | 8,994 | | | | 15,310 | | | | 23,970 | |
Trustees fees and expenses | | | 1,819 | | | | 1,400 | | | | 7,033 | |
Extraordinary expense | | | 1,460 | | | | 1,317 | | | | 5,456 | |
Miscellaneous | | | 2,954 | | | | 2,807 | | | | 8,376 | |
Total expenses before offsets | | | 553,594 | | | | 527,226 | | | | 1,580,701 | |
Expense reimbursements | | | (126,271 | ) | | | (168,498 | ) | | | (279,669 | ) |
Expense reductions | | | (3,350 | ) | | | (48 | ) | | | (25 | ) |
Net expenses | | | 423,973 | | | | 358,680 | | | | 1,301,007 | |
| | | |
Net investment income | | | 437,483 | | | | 2,047,204 | | | | 5,437,210 | |
Net Realized and Unrealized Gain (Loss): | | | | | | | | | | | | |
Net realized gain on investments | | | 2,805,172 | | | | 540,791 | | | | 12,844,976 | |
Net realized loss on foreign currency transactions | | | — | | | | — | | | | (3,677 | ) |
Net change in unrealized appreciation (depreciation) of investments | | | (14,941 | ) | | | 1,657,826 | | | | (5,702,087 | ) |
Net realized and unrealized gain | | | 2,790,231 | | | | 2,198,617 | | | | 7,139,212 | |
Net increase in net assets resulting from operations | | $ | 3,227,714 | | | $ | 4,245,821 | | | $ | 12,576,422 | |
|
The accompanying notes are an integral part of these financial statements. 36 |
Statements of Changes in Net Assets
For the year ended December 31,
| | | | | | | | | | | | | | | | |
| | | Managers AMG Chicago Equity
Partners Balanced Fund | | | Managers High Yield
Fund | |
| | | 2012 | | | 2011 | | | 2012 | | | 2011 | |
Increase (Decrease) in Net Assets From Operations: | | | | | | | | | | | | | | | | |
Net investment income | | $ | 437,483 | | | $ | 273,923 | | | $ | 2,047,204 | | | $ | 2,296,451 | |
Net realized gain on investments | | | 2,805,172 | | | | 1,415,947 | | | | 540,791 | | | | 655,638 | |
Net change in unrealized appreciation (depreciation) of investments | | | (14,941 | ) | | | (146,517 | ) | | | 1,657,826 | | | | (1,626,756 | ) |
Net increase in net assets resulting from operations | | | 3,227,714 | | | | 1,543,353 | | | | 4,245,821 | | | | 1,325,333 | |
Distributions to Shareholders: | | | | | | | | | | | | | | | | |
From net investment income: | | | | | | | | | | | | | | | | |
Investor Class | | | (294,226 | ) | | | (141,069 | ) | | | (1,738,220 | ) | | | (1,680,397 | ) |
Service Class | | | (43 | ) | | | — | | | | — | | | | — | |
Class B | | | — | | | | (2,358 | )2 | | | — | | | | (20,401 | )2 |
Class C | | | (15,502 | )3 | | | (8,301 | ) | | | (146,925 | ) | | | (231,424 | ) |
Institutional Class | | | (137,356 | ) | | | (118,047 | ) | | | (167,867 | ) | | | (385,752 | ) |
From net realized gain on investments: | | | | | | | | | | | | | | | | |
Investor Class | | | (1,192,459 | ) | | | (609,401 | ) | | | — | | | | — | |
Service Class | | | (454 | ) | | | — | | | | — | | | | — | |
Class B | | | — | | | | — | | | | — | | | | — | |
Class C | | | — | | | | (86,651 | ) | | | — | | | | — | |
Institutional Class | | | (445,138 | ) | | | (303,733 | ) | | | — | | | | — | |
Total distributions to shareholders | | | (2,085,178 | ) | | | (1,269,560 | ) | | | (2,053,012 | ) | | | (2,317,974 | ) |
Capital Share Transactions:1 | | | | | | | | | | | | | | | | |
Proceeds from sale of shares | | | 26,041,500 | | | | 16,250,809 | | | | 11,399,448 | | | | 11,057,218 | |
Reinvestment of dividends and distributions | | | 1,363,859 | | | | 731,974 | | | | 1,678,710 | | | | 1,889,659 | |
Cost of shares repurchased | | | (21,827,377 | ) | | | (7,154,472 | ) | | | (14,087,853 | ) | | | (10,976,061 | ) |
Net increase (decrease) from capital share transactions | | | 5,577,982 | | | | 9,828,311 | | | | (1,009,695 | ) | | | 1,970,816 | |
| | | | |
Total increase in net assets | | | 6,720,518 | | | | 10,102,104 | | | | 1,183,114 | | | | 978,175 | |
Net Assets: | | | | | | | | | | | | | | | | |
Beginning of year | | | 28,937,698 | | | | 18,835,594 | | | | 32,172,145 | | | | 31,193,970 | |
End of year | | $ | 35,658,216 | | | $ | 28,937,698 | | | $ | 33,355,259 | | | $ | 32,172,145 | |
End of year undistributed net investment income (loss) | | $ | 2,142 | | | $ | 2,988 | | | $ | — | | | ($ | 222 | ) |
| | | | | | | | | | | | | | | | |
| 1 | See Note 1(g) of the Notes to Financial Statements. |
| 2 | The amounts disclosed above were incurred prior to the closing of B shares and/or the conversion to A shares. |
| 3 | The amounts disclosed above were incurred prior to the closing of C shares and/or the conversion to Investor shares. |
|
The accompanying notes are an integral part of these financial statements. 37 |
Statements of Changes in Net Assets
For the year ended December 31,
| | | | | | | | |
| | | Managers AMG
GW&K Fixed Income Fund | |
| | | 2012 | | | 2011 | |
Increase (Decrease) in Net Assets From Operations: | | | | | | | | |
Net investment income | | $ | 5,437,210 | | | $ | 5,661,635 | |
Net realized gain on investments and foreign currency transactions | | | 12,841,299 | | | | 3,644,382 | |
Net change in unrealized appreciation (depreciation) of investments and foreign currency translations | | | (5,702,087 | ) | | | (3,373,659 | ) |
Net increase in net assets resulting from operations | | | 12,576,422 | | | | 5,932,358 | |
Distributions to Shareholders: | | | | | | | | |
From net investment income: | | | | | | | | |
Investor Class | | | (1,771,132 | ) | | | (1,603,759 | ) |
Service Class | | | (44 | ) | | | — | |
Class B | | | — | | | | (132,088 | )2 |
Class C | | | (1,169,612 | ) | | | (1,401,818 | ) |
Institutional Class | | | (2,895,211 | ) | | | (3,048,326 | ) |
From net realized gain on investments: | | | | | | | | |
Investor Class | | | (400,733 | ) | | | (568,193 | ) |
Service Class | | | (96 | ) | | | — | |
Class B | | | — | | | | (51,604 | ) |
Class C | | | (320,362 | ) | | | (535,426 | ) |
Institutional Class | | | (568,638 | ) | | | (1,019,018 | ) |
Total distributions to shareholders | | | (7,125,828 | ) | | | (8,360,232 | ) |
Capital Share Transactions:1 | | | | | | | | |
Proceeds from sale of shares | | | 39,597,714 | | | | 51,743,179 | |
Reinvestment of dividends and distributions | | | 5,017,172 | | | | 5,549,842 | |
Cost of shares repurchased | | | (46,752,526 | ) | | | (67,335,959 | ) |
Net decrease from capital share transactions | | | (2,137,640 | ) | | | (10,042,938 | ) |
| | |
Total increase (decrease) in net assets | | | 3,312,954 | | | | (12,470,812 | ) |
Net Assets: | | | | | | | | |
Beginning of year | | | 137,068,008 | | | | 149,538,820 | |
End of year | | $ | 140,380,962 | | | $ | 137,068,008 | |
End of year undistributed net investment income (loss) | | $ | 294,174 | | | $ | (9,271 | ) |
| | | | | | | | |
| 1 | See Note 1(g) of the Notes to Financial Statements. |
| 2 | The amounts disclosed above were incurred prior to the closing of B shares and/or the conversion to A shares. |
|
The accompanying notes are an integral part of these financial statements. 38 |
Managers AMG Chicago Equity Partners Balanced Fund
Financial Highlights
For a share outstanding throughout each period
| | | | | | | | | | | | | | | | | | | | |
| | | For the year ended December 31, | |
Investor Class | | 2012* | | | 2011 | | | 2010 | | | 2009 | | | 2008 | |
Net Asset Value, Beginning of Year | | $ | 13.70 | | | $ | 13.49 | | | $ | 12.33 | | | $ | 10.45 | | | $ | 13.18 | |
Income from Investment Operations: | | | | | | | | | | | | | | | | | | | | |
Net investment income | | | 0.18 | 3 | | | 0.18 | 3 | | | 0.20 | | | | 0.22 | | | | 0.29 | |
Net realized and unrealized gain (loss) on investments | | | 1.16 | 3 | | | 0.69 | 3 | | | 1.16 | | | | 1.87 | | | | (2.74 | ) |
Total from investment operations | | | 1.34 | | | | 0.87 | | | | 1.36 | | | | 2.09 | | | | (2.45 | ) |
Less Distributions to Shareholders from: | | | | | | | | | | | | | | | | | | | | |
Net investment income | | | (0.17 | ) | | | (0.18 | ) | | | (0.20 | ) | | | (0.21 | ) | | | (0.27 | ) |
Net realized gain on investments | | | (0.68 | ) | | | (0.48 | ) | | | — | | | | — | | | | (0.01 | ) |
Total distributions to shareholders | | | (0.85 | ) | | | (0.66 | ) | | | (0.20 | ) | | | (0.21 | ) | | | (0.28 | ) |
Net Asset Value, End of Year | | $ | 14.19 | | | $ | 13.70 | | | $ | 13.49 | | | $ | 12.33 | | | $ | 10.45 | |
Total Return1 | | | 9.86 | % | | | 6.45 | % | | | 11.14 | % | | | 20.06 | % | | | (18.68 | )% |
Ratio of net expenses to average net assets | | | 1.17 | %4,5 | | | 1.24 | % | | | 1.22 | % | | | 1.23 | % | | | 1.17 | % |
Ratio of net investment income to average net assets1 | | | 1.21 | %4 | | | 1.27 | % | | | 1.56 | % | | | 1.77 | % | | | 2.53 | % |
Portfolio turnover | | | 110 | % | | | 94 | % | | | 97 | % | | | 114 | % | | | 99 | % |
Net assets at end of year (000’s omitted) | | $ | 26,047 | | | $ | 17,519 | | | $ | 7,605 | | | $ | 6,933 | | | $ | 9,932 | |
| | | | | | | | | | | | | | | | | | | | |
Ratios absent expense offsets:2 | | | | | | | | | | | | | | | | | | | | |
Ratio of total expenses to average net assets | | | 1.52 | % | | | 1.70 | % | | | 1.80 | % | | | 1.76 | % | | | 1.68 | % |
Ratio of net investment income to average net assets | | | 0.86 | % | | | 0.81 | % | | | 0.98 | % | | | 1.24 | % | | | 2.03 | % |
| | | | | | | | | | | | | | | | | | | | |
| | | | |
Service Class | | For the period ended
December��1, 2012
through
December 31, 2012** | |
Net Asset Value, Beginning of Period | | $ | 15.11 | |
Income from Investment Operations: | | | | |
Net investment income3 | | | 0.02 | |
Net realized and unrealized loss on investments3 | | | (0.08 | ) |
Total from investment operations | | | (0.06 | ) |
Less Distributions to Shareholders from: | | | | |
Net investment income | | | (0.06 | ) |
Net realized gain on investments | | | (0.69 | ) |
Total distributions to shareholders | | | (0.75 | ) |
Net Asset Value, End of Period | | $ | 14.30 | |
Total Return1 | | | (0.36 | )%7,10 |
Ratio of net expenses to average net assets | | | 0.82 | %4,5,11 |
Ratio of net investment income to average net assets1 | | | 1.90 | %4,11 |
Portfolio turnover | | | 110 | % |
Net assets at end of period (000’s omitted) | | $ | 9 | |
| | | | |
Ratios absent expense offsets:2 | | | | |
Ratio of total expenses to average net assets | | | 1.62 | %11 |
Ratio of net investment income to average net assets | | | 1.10 | %11 |
| | | | |
Managers AMG Chicago Equity Partners Balanced Fund
Financial Highlights
For a share outstanding throughout each period
| | | | | | | | | | | | | | | | | | | | |
| | | For the year ended December 31, | |
Institutional Class | | 2012 | | | 2011 | | | 2010 | | | 2009 | | | 2008 | |
Net Asset Value, Beginning of Year | | $ | 13.82 | | | $ | 13.60 | | | $ | 12.43 | | | $ | 10.54 | | | $ | 13.28 | |
Income from Investment Operations: | | | | | | | | | | | | | | | | | | | | |
Net investment income | | | 0.21 | 3 | | | 0.21 | 3 | | | 0.24 | | | | 0.23 | | | | 0.31 | |
Net realized and unrealized gain (loss) on investments | | | 1.18 | 3 | | | 0.71 | 3 | | | 1.17 | | | | 1.90 | | | | (2.74 | ) |
Total from investment operations | | | 1.39 | | | | 0.92 | | | | 1.41 | | | | 2.13 | | | | (2.43 | ) |
Less Distributions to Shareholders from: | | | | | | | | | | | | | | | | | | | | |
Net investment income | | | (0.21 | ) | | | (0.22 | ) | | | (0.24 | ) | | | (0.24 | ) | | | (0.30 | ) |
Net realized gain on investments | | | (0.69 | ) | | | (0.48 | ) | | | — | | | | — | | | | (0.01 | ) |
Total distributions to shareholders | | | (0.90 | ) | | | (0.70 | ) | | | (0.24 | ) | | | (0.24 | ) | | | (0.31 | ) |
Net Asset Value, End of Year | | $ | 14.31 | | | $ | 13.82 | | | $ | 13.60 | | | $ | 12.43 | | | $ | 10.54 | |
Total Return1 | | | 10.09 | % | | | 6.77 | % | | | 11.42 | % | | | 20.44 | % | | | (18.51 | )% |
Ratio of net expenses to average net assets | | | 0.92 | %4,5 | | | 0.99 | % | | | 0.97 | % | | | 0.98 | % | | | 0.96 | % |
Ratio of net investment income to average net assets1 | | | 1.46 | %4 | | | 1.52 | % | | | 1.81 | % | | | 2.03 | % | | | 2.58 | % |
Portfolio turnover | | | 110 | % | | | 94 | % | | | 97 | % | | | 114 | % | | | 99 | % |
Net assets at end of year (000’s omitted) | | $ | 9,601 | | | $ | 8,885 | | | $ | 7,863 | | | $ | 7,164 | | | $ | 6,065 | |
| | | | | | | | | | | | | | | | | | | | |
Ratios absent expense offsets:2 | | | | | | | | | | | | | | | | | | | | |
Ratio of total expenses to average net assets | | | 1.27 | % | | | 1.45 | % | | | 1.55 | % | | | 1.51 | % | | | 1.52 | % |
Ratio of net investment income to average net assets | | | 1.11 | % | | | 1.06 | % | | | 1.23 | % | | | 1.50 | % | | | 2.02 | % |
| | | | | | | | | | | | | | | | | | | | |
Managers High Yield Fund
Financial Highlights
For a share outstanding throughout each period
| | | | | | | | | | | | | | | | | | | | |
| | | For the year ended December 31, | |
Investor Class | | 2012* | | | 2011 | | | 2010 | | | 2009 | | | 2008 | |
Net Asset Value, Beginning of Year | | $ | 7.51 | | | $ | 7.74 | | | $ | 7.35 | | | $ | 5.25 | | | $ | 8.23 | |
Income from Investment Operations: | | | | | | | | | | | | | | | | | | | | |
Net investment income | | | 0.54 | 3 | | | 0.56 | 3 | | | 0.61 | | | | 0.60 | | | | 0.64 | |
Net realized and unrealized gain (loss) on investments | | | 0.56 | 3 | | | (0.22 | )3 | | | 0.39 | | | | 2.10 | | | | (2.99 | ) |
Total from investment operations | | | 1.10 | | | | 0.34 | | | | 1.00 | | | | 2.70 | | | | (2.35 | ) |
Less Distributions to Shareholders from: | | | | | | | | | | | | | | | | | | | | |
Net investment income | | | (0.54 | ) | | | (0.57 | ) | | | (0.61 | ) | | | (0.60 | ) | | | (0.63 | ) |
Net Asset Value, End of Year | | $ | 8.07 | | | $ | 7.51 | | | $ | 7.74 | | | $ | 7.35 | | | $ | 5.25 | |
Total Return1 | | | 15.12 | %7 | | | 4.54 | % | | | 14.20 | % | | | 53.97 | %7 | | | (30.02 | )%7 |
Ratio of net expenses to average net assets | | | 1.15 | %6 | | | 1.15 | % | | | 1.15 | % | | | 1.15 | % | | | 1.15 | %8 |
Ratio of net investment income to average net assets1 | | | 6.87 | %6 | | | 7.35 | % | | | 8.06 | % | | | 9.33 | % | | | 8.57 | %8 |
Portfolio turnover | | | 48 | % | | | 48 | % | | | 60 | % | | | 56 | % | | | 41 | % |
Net assets at end of year (000’s omitted) | | $ | 30,817 | | | $ | 23,957 | | | $ | 21,729 | | | $ | 28,450 | | | $ | 17,105 | |
| | | | | | | | | | | | | | | | | | | | |
Ratios absent expense offsets:2 | | | | | | | | | | | | | | | | | | | | |
Ratio of total expenses to average net assets | | | 1.73 | % | | | 1.69 | % | | | 1.78 | % | | | 1.68 | % | | | 1.70 | % |
Ratio of net investment income to average net assets | | | 6.29 | % | | | 7.43 | % | | | 7.43 | % | | | 8.80 | % | | | 8.01 | % |
| | | | | | | | | | | | | | | | | | | | |
| | | | | | | | | | | | | | | | | | | | |
| | | For the year ended December 31, | |
Institutional Class | | 2012 | | | 2011 | | | 2010 | | | 2009 | | | 2008 | |
Net Asset Value, Beginning of Year | | $ | 7.59 | | | $ | 7.82 | | | $ | 7.42 | | | $ | 5.29 | | | $ | 8.29 | |
Income from Investment Operations: | | | | | | | | | | | | | | | | | | | | |
Net investment income | | | 0.56 | 3 | | | 0.59 | 3 | | | 0.63 | | | | 0.64 | | | | 0.64 | |
Net realized and unrealized gain (loss) on investments | | | 0.58 | 3 | | | (0.22 | )3 | | | 0.40 | | | | 2.11 | | | | (2.98 | ) |
Total from investment operations | | | 1.14 | | | | 0.37 | | | | 1.03 | | | | 2.75 | | | | (2.34 | ) |
Less Distributions to Shareholders from: | | | | | | | | | | | | | | | | | | | | |
Net investment income | | | (0.57 | ) | | | (0.60 | ) | | | (0.63 | ) | | | (0.62 | ) | | | (0.66 | ) |
Net Asset Value, End of Year | | $ | 8.16 | | | $ | 7.59 | | | $ | 7.82 | | | $ | 7.42 | | | $ | 5.29 | |
Total Return1 | | | 15.46 | % | | | 4.83 | % | | | 14.58 | %7 | | | 54.64 | %7 | | | (29.80 | )%7 |
Ratio of net expenses to average net assets | | | 0.90 | %6 | | | 0.90 | % | | | 0.90 | % | | | 0.90 | % | | | 0.90 | %8 |
Ratio of net investment income to average net assets1 | | | 7.12 | %6 | | | 7.60 | % | | | 8.26 | % | | | 9.68 | % | | | 8.90 | %8 |
Portfolio turnover | | | 48 | % | | | 48 | % | | | 60 | % | | | 56 | % | | | 41 | % |
Net assets at end of year (000’s omitted) | | $ | 2,538 | | | $ | 5,247 | | | $ | 4,718 | | | $ | 3,658 | | | $ | 2,890 | |
| | | | | | | | | | | | | | | | | | | | |
Ratios absent expense offsets:2 | | | | | | | | | | | | | | | | | | | | |
Ratio of total expenses to average net assets | | | 1.48 | % | | | 1.44 | % | | | 1.53 | % | | | 1.42 | % | | | 1.46 | % |
Ratio of net investment income to average net assets | | | 6.54 | % | | | 7.06 | % | | | 7.63 | % | | | 9.16 | % | | | 8.34 | % |
| | | | | | | | | | | | | | | | | | | | |
Managers AMG GW&K Fixed Income Fund
Financial Highlights
For a share outstanding throughout each period
| | | | | | | | | | | | | | | | | | | | |
| | | For the year ended December 31, | |
Investor Class | | 2012† | | | 2011 | | | 2010 | | | 2009 | | | 2008 | |
Net Asset Value, Beginning of Year | | $ | 10.81 | | | $ | 11.00 | | | $ | 10.43 | | | $ | 8.93 | | | $ | 10.54 | |
Income from Investment Operations: | | | | | | | | | | | | | | | | | | | | |
Net investment income | | | 0.44 | 3 | | | 0.46 | 3 | | | 0.47 | | | | 0.52 | | | | 0.55 | |
Net realized and unrealized gain (loss) on investments | | | 0.58 | 3 | | | 0.03 | 3 | | | 0.56 | | | | 1.49 | | | | (1.62 | ) |
Total from investment operations | | | 1.02 | | | | 0.49 | | | | 1.03 | | | | 2.01 | | | | (1.07 | ) |
Less Distributions to Shareholders from: | | | | | | | | | | | | | | | | | | | | |
Net investment income | | | (0.48 | ) | | | (0.51 | ) | | | (0.46 | ) | | | (0.49 | ) | | | (0.54 | ) |
Net realized gain on investments | | | (0.11 | ) | | | (0.17 | ) | | | — | | | | (0.02 | ) | | | — | |
Total distributions to shareholders | | | (0.59 | ) | | | (0.68 | ) | | | (0.46 | ) | | | (0.51 | ) | | | (0.54 | ) |
Net Asset Value, End of Year | | $ | 11.24 | | | $ | 10.81 | | | $ | 11.00 | | | $ | 10.43 | | | $ | 8.93 | |
Total Return1 | | | 9.53 | % | | | 4.53 | % | | | 10.04 | % | | | 23.14 | % | | | (10.45 | )% |
Ratio of net expenses to average net assets | | | 0.84 | %9 | | | 0.84 | % | | | 0.84 | % | | | 0.84 | % | | | 0.84 | % |
Ratio of net investment income to average net assets1 | | | 3.92 | %9 | | | 4.18 | % | | | 4.13 | % | | | 5.30 | % | | | 5.72 | % |
Portfolio turnover | | | 110 | % | | | 28 | % | | | 23 | % | | | 42 | % | | | 16 | % |
Net assets at end of year (000’s omitted) | | $ | 41,772 | | | $ | 35,647 | | | $ | 38,655 | | | $ | 40,625 | | | $ | 33,417 | |
| | | | | | | | | | | | | | | | | | | | |
Ratios absent expense offsets:2 | | | | | | | | | | | | | | | | | | | | |
Ratio of total expenses to average net assets | | | 1.04 | % | | | 1.05 | % | | | 1.07 | % | | | 1.08 | % | | | 1.08 | % |
Ratio of net investment income to average net assets | | | 3.72 | % | | | 3.97 | % | | | 3.90 | % | | | 5.06 | % | | | 5.48 | % |
| | | | | | | | | | | | | | | | | | | | |
| | | | |
Service Class | | For the period ended
December 1, 2012
through
December 31, 2012** | |
Net Asset Value, Beginning of Period | | $ | 11.41 | |
Income from Investment Operations: | | | | |
Net investment income3 | | | 0.02 | |
Net realized and unrealized gain on investments3 | | | 0.01 | |
Total from investment operations | | | 0.03 | |
Less Distributions to Shareholders from: | | | | |
Net investment income | | | (0.05 | ) |
Net realized gain on investments | | | (0.11 | ) |
Total distributions to shareholders | | | (0.16 | ) |
Net Asset Value, End of Period | | $ | 11.28 | |
Total Return1 | | | 0.26 | %10 |
Ratio of net expenses to average net assets | | | 0.64 | %9,11 |
Ratio of net investment income to average net assets1 | | | 2.07 | %9,11 |
Portfolio turnover | | | 110 | % |
Net assets at end of period (000’s omitted) | | $ | 10 | |
| | | | |
Ratios absent expense offsets:2 | | | | |
Ratio of total expenses to average net assets | | | 0.90 | %11 |
Ratio of net investment income to average net assets | | | 1.81 | %11 |
| | | | |
Managers AMG GW&K Fixed Income Fund
Financial Highlights
For a share outstanding throughout each period
| | | | | | | | | | | | | | | | | | | | |
| | | For the year ended December 31, | |
Class C | | 2012†† | | | 2011 | | | 2010 | | | 2009 | | | 2008 | |
Net Asset Value, Beginning of Year | | $ | 10.79 | | | $ | 10.98 | | | $ | 10.41 | | | $ | 8.92 | | | $ | 10.54 | |
Income from Investment Operations: | | | | | | | | | | | | | | | | | | | | |
Net investment income | | | 0.36 | 3 | | | 0.38 | 3 | | | 0.39 | | | | 0.44 | | | | 0.48 | |
Net realized and unrealized gain (loss) on investments | | | 0.57 | 3 | | | 0.02 | 3 | | | 0.56 | | | | 1.49 | | | | (1.62 | ) |
Total from investment operations | | | 0.93 | | | | 0.40 | | | | 0.95 | | | | 1.93 | | | | (1.14 | ) |
Less Distributions to Shareholders from: | | | | | | | | | | | | | | | | | | | | |
Net investment income | | | (0.39 | ) | | | (0.42 | ) | | | (0.38 | ) | | | (0.42 | ) | | | (0.48 | ) |
Net realized gain on investments | | | (0.11 | ) | | | (0.17 | ) | | | — | | | | (0.02 | ) | | | — | |
Total distributions to shareholders | | | (0.50 | ) | | | (0.59 | ) | | | (0.38 | ) | | | (0.44 | ) | | | (0.48 | ) |
Net Asset Value, End of Year | | $ | 11.22 | | | $ | 10.79 | | | $ | 10.98 | | | $ | 10.41 | | | $ | 8.92 | |
Total Return1 | | | 8.72 | %7 | | | 3.73 | % | | | 9.22 | % | | | 22.13 | % | | | (11.11 | )% |
Ratio of net expenses to average net assets | | | 1.59 | %9 | | | 1.59 | % | | | 1.59 | % | | | 1.59 | % | | | 1.59 | % |
Ratio of net investment income to average net assets1 | | | 3.18 | %9 | | | 3.42 | % | | | 3.39 | % | | | 4.53 | % | | | 4.96 | % |
Portfolio turnover | | | 110 | % | | | 28 | % | | | 23 | % | | | 42 | % | | | 16 | % |
Net assets at end of year (000’s omitted) | | $ | 33,026 | | | $ | 33,615 | | | $ | 45,363 | | | $ | 57,658 | | | $ | 41,387 | |
| | | | | | | | | | | | | | | | | | | | |
Ratios absent expense offsets:2 | | | | | | | | | | | | | | | | | | | | |
Ratio of total expenses to average net assets | | | 1.79 | % | | | 1.80 | % | | | 1.82 | % | | | 1.83 | % | | | 1.83 | % |
Ratio of net investment income to average net assets | | | 2.98 | % | | | 3.21 | % | | | 3.16 | % | | | 4.29 | % | | | 4.73 | % |
| | | | | | | | | | | | | | | | | | | | |
| |
| | | For the year ended December 31, | |
Institutional Class | | 2012 | | | 2011 | | | 2010 | | | 2009 | | | 2008 | |
Net Asset Value, Beginning of Year | | $ | 10.84 | | | $ | 11.03 | | | $ | 10.46 | | | $ | 8.96 | | | $ | 10.59 | |
Income from Investment Operations: | | | | | | | | | | | | | | | | | | | | |
Net investment income | | | 0.47 | 3 | | | 0.49 | 3 | | | 0.49 | | | | 0.55 | | | | 0.58 | |
Net realized and unrealized gain (loss) on investments | | | 0.58 | 3 | | | 0.02 | 3 | | | 0.57 | | | | 1.48 | | | | (1.63 | ) |
Total from investment operations | | | 1.05 | | | | 0.51 | | | | 1.06 | | | | 2.03 | | | | (1.05 | ) |
Less Distributions to Shareholders from: | | | | | | | | | | | | | | | | | | | | |
Net investment income | | | (0.50 | ) | | | (0.53 | ) | | | (0.49 | ) | | | (0.51 | ) | | | (0.58 | ) |
Net realized gain on investments | | | (0.11 | ) | | | (0.17 | ) | | | — | | | | (0.02 | ) | | | — | |
Total distributions to shareholders | | | (0.61 | ) | | | (0.70 | ) | | | (0.49 | ) | | | (0.53 | ) | | | (0.58 | ) |
Net Asset Value, End of Year | | $ | 11.28 | | | $ | 10.84 | | | $ | 11.03 | | | $ | 10.46 | | | $ | 8.96 | |
Total Return1 | | | 9.89 | % | | | 4.79 | % | | | 10.29 | % | | | 23.39 | % | | | (10.23 | )% |
Ratio of net expenses to average net assets | | | 0.59 | %9 | | | 0.59 | % | | | 0.59 | % | | | 0.59 | % | | | 0.59 | % |
Ratio of net investment income to average net assets1 | | | 4.21 | %9 | | | 4.41 | % | | | 4.34 | % | | | 5.55 | % | | | 5.93 | % |
Portfolio turnover | | | 110 | % | | | 28 | % | | | 23 | % | | | 42 | % | | | 16 | % |
Net assets at end of year (000’s omitted) | | $ | 65,573 | | | $ | 64,573 | | | $ | 61,748 | | | $ | 34,723 | | | $ | 28,561 | |
| | | | | | | | | | | | | | | | | | | | |
Ratios absent expense offsets:2 | | | | | | | | | | | | | | | | | | | | |
Ratio of total expenses to average net assets | | | 0.79 | % | | | 0.80 | % | | | 0.82 | % | | | 0.83 | % | | | 0.83 | % |
Ratio of net investment income to average net assets | | | 4.01 | % | | | 4.20 | % | | | 4.11 | % | | | 5.31 | % | | | 5.69 | % |
| | | | | | | | | | | | | | | | | | | | |
Notes to Financial Highlights
The following footnotes should be read in conjunction with the Financial Highlights of the Funds previously presented in this report.
| * | Effective December 1, 2012, the Fund’s Class A shares were renamed Investor Class shares. Additionally, the Fund’s Class C shares converted to Investor Class shares. |
| ** | Commenced operations on December 1, 2012. |
| † | Effective December 1, 2012, the Fund’s Class A shares were renamed Investor Class shares. Additionally, the Fund’s Class B shares converted to Investor Class shares. |
| †† | Closed to new investments. |
| 1 | Total returns and net investment income would have been lower had certain expenses not been reduced. (See Note 1(c) of Notes to Financial Statements. |
| 2 | Excludes the impact of expense reimbursements or fee waivers and expense reductions such as brokerage credits, but includes expense repayments and non-reimbursable expenses, if any, such as interest, taxes and extraordinary expenses. (See Note 1(c) of Notes to Financial Statements.) |
| 3 | Per share numbers have been calculated using average shares. |
| 4 | Includes non-routine extraordinary expenses amounting to $1,064 or 0.005%, $1 or 0.005% and $395 or 0.004% of average net assets for the Investor Class, Service Class and Institutional Class, respectively. |
| 5 | Effective July 1, 2012, as described in the current prospectus, the Fund’s expense cap was reduced to 0.84% from 1.00%. The expense ratio shown reflects the weighted average expense ratio for the full year ended December 31, 2012. |
| 6 | Includes non-routine extraordinary expenses amounting to $1,217 or 0.005% and $100 or 0.004% of average net assets for the Investor Class and Institutional Class, respectively. |
| 7 | The total return is based on the Financial Statement Net Asset Values as shown. |
| 8 | Excludes interest expense for the year ended December 31, 2008 of 0.06%. |
| 9 | Includes non-routine extraordinary expenses amounting to $1,695 or 0.004%, $1 or 0.005%, $1,351 or 0.004% and $2,409 or 0.004% of average net assets for the Investor Class, Service Class, Class C and Institutional Class, respectively. |
Notes to Financial Statements
December 31, 2012
| 1. | Summary of Significant Accounting Policies |
The Managers Trust II (the “Trust”) is an open-end management investment company organized as a Massachusetts business trust and registered under the Investment Company Act of 1940, as amended (the “1940 Act”). Currently, the Trust consists of a number of different Funds, each having distinct investment management objectives, strategies, risks, and policies. Included in this report are Managers AMG Chicago Equity Partners Balanced Fund (“Balanced”), Managers High Yield Fund (“High Yield”) and Managers AMG GW&K Fixed Income Fund, formerly Managers Fixed Income Fund (“Fixed Income”), each a “Fund” and collectively the “Funds.” High Yield will deduct a 2.00% redemption fee from the proceeds of any redemption (including a redemption by exchange) of shares if the redemption occurs within 30 days of the purchase of those shares. For the year ended December 31, 2012, High Yield had redemption fees amounting to $1,097.
Effective December 1, 2012, Class A shares of the Balanced, High Yield and Fixed Income Funds were renamed Investor Class shares. Additionally, Balanced and Fixed Income Funds established one additional share class: Service Class shares. On November 30, 2012 at the close of business, all outstanding Class C shares of the Balanced, and High Yield Funds were automatically converted to a number of full and/or fractional Investor Class shares equal in value to the shareholder Class C shares of each respective Fund. On November 30, 2012 at the close of business, all outstanding Class B shares of the Fixed Income Fund were automatically converted to a number of full and/or fractional Investor Class shares equal in value to the shareholder Class B shares.
Effective December 1, 2012, Class C shares of Fixed Income were closed to all new investors and will no longer be available for purchase by existing shareholders, including purchase by exchange, except for purchases made by automatic reinvestment of dividends and capital gains pursuant to the Fund’s automatic reinvestment plan. Shareholders who redeem Class C shares of the Fund will continue to be subject to the deferred sales charges described in the Prospectus.
Balanced and Fixed Income each offer three classes of shares: Investor, Service and Institutional Class. Investor and Service Class shares are available, with no sales charge and are subject to different expenses than Institutional Class Shares. Institutional Class shares are available, with no sales charge, to certain institutional investors and qualifying individual investors. Each class represents an interest in the same assets of the Fund and the classes are identical except for class specific expenses related to shareholder activity. Each class has equal voting privileges except that each class has exclusive voting rights with respect to its services and/or distribution plan. Please refer to a current prospectus for additional information on each share class.
The Funds’ financial statements are prepared in accordance with accounting principles generally accepted in the United States of America (“U.S. GAAP”), which require management to make estimates and assumptions that affect the reported amounts of assets and liabilities and disclosure of contingent assets and liabilities at the date of the financial statements and the reported amounts of income and expenses during the , reporting period. Actual results could differ from those estimates and such differences could be
material. The following is a summary of significant accounting policies followed by the Funds in the preparation of their financial statements:
| a. | Valuation of Investments |
Equity securities traded on a domestic or international securities exchange are valued at the last quoted sale price, or, lacking any sales, at the last quoted bid price. Over-the-counter securities are valued at the Nasdaq Official Closing Price, if one is available. Lacking any sales, over-the-counter securities are valued at the last quoted bid price. The Funds investments are generally valued based on market quotations provided by third-party pricing services approved by the Board of Trustees of the Funds (the “Board”).
Fixed-income securities are valued based on valuations furnished by independent pricing services that utilize matrix systems, which reflect such factors as security prices, yields, maturities, and ratings, and are supplemented by dealer and exchange quotations. Short-term investments having a remaining maturity of 60 days or less are generally valued at amortized cost, which approximates market value. Investments in other open-end regulated investment companies are valued at their end of day net asset value per share.
Under certain circumstances, the value of certain Fund investments (including derivatives) may be based on an evaluation of fair value, pursuant to procedures established by and under the general supervision of the Board. The Pricing Committee is the committee formed by the Board to make fair value determinations for such investments. When determining the fair value of an investment, the Pricing Committee seeks to determine the price that the Fund might reasonably expect to receive from a current sale of that investment in an arm’s-length transaction. Fair value determinations shall be based upon consideration of all available facts and information, including, but not limited to (i) attributes specific to the investment; (ii) fundamental analytical data and press releases relating to the investment and its issuer; (iii) the value of comparable securities or relevant financial instruments, including derivative securities, traded on other markets or among dealers; and (iv) other factors, such as future cash flows, interest rates, yield curves, volatilities, credit risks and/or default rates. The Board will be presented with a quarterly report comparing fair values determined by the Pricing Committee against subsequent market valuations for those securities. The values assigned to fair value investments are based on available information and do not necessarily represent amounts that might ultimately be realized, since such amounts depend on future developments inherent in long-term investments. Further, because of the inherent uncertainty of valuation, those estimated values may differ significantly from the values that would have been used had a ready market for the investments existed, and the differences could be material. Each Fund may use the fair value of a portfolio investment to calculate its Net Asset Value (“NAV”) when, for example, (1) market quotations are not readily available because a portfolio investment is not traded in a public market or the principal market in which the investment trades is closed, (2) trading in a portfolio investment is suspended and has not resumed before the Fund calculates its NAV, (3) a significant event affecting the value of a portfolio investment is determined to have occurred between the time of the market quotation provided for a portfolio investment and the time as of which the Fund calculates its NAV, (4) an investment’s price has remained unchanged over a period of time
Notes to Financial Statements (continued)
(often referred to as a “stale price”), or (5) Managers Investment Group LLC (the “Investment Manager”) determines that a market quotation is inaccurate. Portfolio investments that trade primarily on foreign markets are priced based upon the market quotation of such securities as of the close of their respective principal markets. Under certain circumstances, the Investment Manager may adjust such prices based on its determination of the impact of events occurring subsequent to the close of such markets but prior to the time as of which the Fund calculates its NAV. The Funds may invest in securities that may be thinly traded. The Board has adopted procedures to adjust prices of thinly traded securities that are judged to be stale so that they reflect fair value. An investment valued on the basis of its fair value may be valued at a price higher or lower than available market quotations. An investment’s valuation may differ depending on the method used and the factors considered in determining value according to the Fund’s fair value procedures.
U.S. GAAP defines fair value as the price that a Fund would receive to sell an asset or pay to transfer a liability in an orderly transaction between market participants at the measurement date. U.S. GAAP also establishes a framework for measuring fair value, and a three level hierarchy for fair value measurements based upon the transparency of inputs to the valuation of an asset or liability. Inputs may be observable or unobservable and refer broadly to the assumptions that market participants would use in pricing the asset or liability. Observable inputs reflect the assumptions market participants would use in pricing the asset or liability based on market data obtained from sources independent of the Funds. Unobservable inputs reflect the Fund’s own assumptions about the assumptions that market participants would use in pricing the asset or liability developed based on the best information available in the circumstances. Each investment is assigned a level based upon the observability of the inputs which are significant to the overall valuation.
The three-tier hierarchy of inputs is summarized below:
Level 1 – inputs are quoted prices in active markets for identical investments (e.g., equity securities, open-end investment companies)
Level 2 – other observable inputs (including, but not limited to: quoted prices for similar assets or liabilities in markets that are active, quoted prices for identical or similar assets or liabilities in markets that are not active, inputs other than quoted prices that are observable for the assets or liabilities (such as interest rates, yield curves, volatilities, prepayment speeds, loss severities, credit risks and default rates) or other market corroborated inputs) (e.g., debt securities, government securities, foreign securities utilizing international fair value pricing, broker-quoted securities, fair valued securities with observable inputs)
Level 3 – inputs are significant unobservable inputs (including the Fund’s own assumptions used to determine the fair value of investments) (e.g., fair valued securities with unobservable inputs)
Changes in inputs or methodologies used for valuing investments may result in a transfer in or out of levels within the fair value hierarchy. The inputs or methodologies used for valuing investments are not necessarily an indication of the risk associated with investing in those investments.
Security transactions are accounted for as of trade date. Realized gains and losses on securities sold are determined on the basis of identified cost.
| c. | Investment Income and Expenses |
Dividend income is recorded on the ex-dividend date. Dividend and interest income on foreign securities is recorded net of any withholding tax. Interest income, which includes amortization of premium and accretion of discount on debt securities, is accrued as earned. Non-cash dividends included in dividend income, if any, are reported at the fair market value of the securities received. Other income and expenses are recorded on an accrual basis. Expenses that cannot be directly attributed to a Fund are apportioned among the Funds in the Trust and in some cases other affiliated funds based upon their relative average net assets or number of shareholders. Investment income, realized and unrealized capital gains and losses, the common expenses of each Fund, and certain Fund level expense reductions, if any, are allocated on a pro-rata basis to each class based on the relative net assets of each class to the total net assets of each Fund.
Balanced had certain portfolio trades directed to various brokers, under a brokerage recapture program, which paid a portion of the Fund expenses. For the year ended December 31, 2012, the amount by which the Fund’s expenses were reduced and the impact on the expense ratios, if any, was $3,333 or 0.01%.
The Funds have a “balance credit” arrangement with The Bank of New York Mellon (“BNYM”), the Fund’s custodian, whereby each Fund is credited with an interest factor equal to 0.75% below the effective 90-day T-Bill rate for account balances left uninvested overnight. If the T-Bill rate falls below 0.75%, no credits will be earned. These credits serve to reduce custody expenses that would otherwise be charged to each Fund. For the year ended December 31, 2012, the custodian expense was not reduced.
Overdrafts will cause a reduction of any balance credits, computed at 2% above the effective Federal funds rate on the day of the overdraft. For the year ended December 31, 2012, overdraft fees for Fixed Income equaled $11.
The Trust also has a balance credit arrangement with its Transfer Agent, BNY Mellon Investment Servicing (US) Inc., whereby balance credits are used to offset banking charges and other out-of-pocket expenses. For the year ended December 31, 2012, the transfer agent expense for Balanced, High Yield and Fixed Income was reduced by $17, $48 and $25, respectively.
Total returns and net investment income for the Funds would have been lower had certain expenses not been offset. Total expenses before offsets exclude the impact of expense reimbursements or fee waivers and expense reductions such as brokerage recapture credits, but include non-reimbursable expenses, if any, such as interest, taxes and extraordinary expenses.
| d. | Dividends and Distributions |
Dividends resulting from net investment income, if any, normally will be declared and paid monthly for Fixed Income and High Yield, and quarterly for Balanced. Distributions of capital gains, if any, will be made on an annual basis and when required for Federal excise tax purposes. Income and capital gain distributions are determined
Notes to Financial Statements (continued)
in accordance with Federal income tax regulations, which may differ from U.S. GAAP. These differences are primarily due to differing treatments for losses deferred due to wash sales, REITs, equalization accounting for tax purposes, foreign currency, and market discount
transactions. Permanent book and tax basis differences, if any, relating to shareholder distributions will result in reclassifications to paid-in capital.
The tax character of distributions paid during the years ended December 31, 2012 and December 31, 2011 were as follows:
| | | | | | | | | | | | | | | | | | | | | | | | |
| | | Balanced | | | High Yield | | | Fixed Income | |
| | | 2012 | | | 2011 | | | 2012 | | | 2011 | | | 2012 | | | 2011 | |
Distributions paid from: | | | | | | | | | | | | | | | | | | | | | | | | |
Ordinary income | | $ | 435,372 | | | $ | 909,874 | | | $ | 2,053,012 | | | $ | 2,317,974 | | | $ | 5,835,999 | | | $ | 6,173,492 | |
Short-term capital gains | | | 291,196 | | | | — | | | | — | | | | — | | | | 16,794 | | | | — | |
Long-term capital gains | | | 1,358,610 | | | | 359,686 | | | | — | | | | — | | | | 1,273,035 | | | | 2,186,740 | |
| | | | | | | | | | | | | | | | | | | | | | | | |
Total | | $ | 2,085,178 | | | $ | 1,269,560 | | | $ | 2,053,012 | | | $ | 2,317,974 | | | $ | 7,125,828 | | | $ | 8,360,232 | |
| | | | | | | | | | | | | | | | | | | | | | | | |
As of December 31, 2012, the components of distributable earnings (excluding unrealized appreciation/depreciation) on a tax basis consisted of:
| | | | | | | | | | | | |
| | | Balanced | | | High Yield | | | Fixed Income | |
Capital loss carryforward | | | — | | | $ | 3,214,564 | | | | — | |
Undistributed ordinary income | | | — | | | | — | | | $ | 294,174 | |
Undistributed short-term capital gains | | $ | 186,405 | | | | — | | | | 501,201 | |
Undistributed long-term capital gains | | | 1,044,694 | | | | — | | | | 10,348,035 | |
Post-October loss deferral | | | — | | | | — | | | | — | |
Each Fund intends to comply with the requirements under Subchapter M of the Internal Revenue Code of 1986, as amended, and to distribute substantially all of its taxable income and gains to its shareholders to meet certain diversification and income requirements with respect to investment companies. Therefore, no provision for Federal income or excise tax is included in the accompanying financial statements.
Additionally, based on each Funds’ understanding of the tax rules and rates related to income, gains and transactions for the foreign jurisdictions in which they invest, each Fund will provide for foreign taxes, and where appropriate, deferred foreign taxes.
Management has analyzed the Funds’ tax positions taken on Federal income tax returns as of December 31, 2012 and all open tax years and has concluded that no provision for federal income tax is required in the Funds’ financial statements. Additionally, the Funds are not aware of any tax position for which it is reasonably possible that the total amounts of unrecognized tax benefits will change materially in the next twelve months.
Under the Regulated Investment Company Modernization Act of 2010, post-enactment capital losses may be carried forward for an unlimited time period. However, any new losses incurred will be required to be utilized prior to any loss carryovers incurred in pre-enactment taxable years, which generally expire eight years following the close of the taxable year in which they were incurred. As a result of this ordering rule, pre-enactment capital loss carryovers may be more likely to expire unused. Additionally, post-enactment capital losses that are carried forward will retain their tax character as either short-term or long-term capital losses rather than being considered all short-term as under previous law.
| f. | Capital Loss Carryovers and Deferrals |
As of December 31, 2012, the following Funds had accumulated net realized capital loss carryovers from securities transactions for Federal income tax purposes as shown in the following chart. These amounts may be used to offset future realized capital gains, if any, through the expiration dates listed or in the case of post-enactment losses, for an unlimited time period.
| | | | | | | | | | | | |
| | | Capital Loss Carryover Amounts | | | | |
Fund | | Short-Term | | | Long-Term | | | Expires
December 31, | |
Balanced | | | | | | | | | | | | |
(Pre-Enactment) | | | — | | | | — | | | | — | |
| | | | | | | | | | | | |
High Yield | | | | | | | | | | | | |
(Pre-Enactment) | | $ | 3,214,564 | | | | — | | | | 2017 | |
| | | | | | | | | | | | |
Fixed Income | | | | | | | | | | | | |
(Pre-Enactment) | | | — | | | | — | | | | — | |
| | | | | | | | | | | | |
For the year ended December 31, 2012, the following Funds utilized capital loss carryovers in the amount of:
| | | | | | | | |
| | | Capital Loss Carryovers Utilized | |
| | | Short-Term | | | Long-Term | |
Balanced | | | — | | | | — | |
High Yield | | $ | 327,856 | | | | — | |
Fixed Income | | | — | | | | — | |
Notes to Financial Statements (continued)
The Trust’s Declaration of Trust authorizes for each series the issuance of an unlimited number of shares of beneficial interest, without par value. Each Fund records sales and repurchases of its capital stock on the trade date. The cost of securities contributed to
the Funds in connection with the issuance of shares is based on the valuation of those securities in accordance with the Funds’ policy on investment valuation. Dividends and distributions to shareholders are recorded on the ex-dividend date.
For the years ended December 31, 2012 and December 31, 2011, the capital stock transactions by class for Balanced, High Yield, and Fixed Income were as follows:
| | | | | | | | | | | | | | | | | | | | | | | | | | | | | | | | |
| | | Balanced | | | High Yield | |
| | | 2012 | | | 2011 | | | 2012 | | | 2011 | |
| | | Shares | | | Amount | | | Shares | | | Amount | | | Shares | | | Amount | | | Shares | | | Amount | |
Investor Class: | | | | | | | | | | | | | | | | | | | | | | | | | | | | | | | | |
Proceeds from sale of shares† | | | 1,298,034 | | | $ | 19,007,524 | | | | 909,939 | | | $ | 12,576,072 | | | | 1,324,130 | | | $ | 10,466,494 | | | | 1,215,827 | | | $ | 9,320,334 | |
Reinvestment of distributions | | | 55,303 | | | | 783,378 | | | | 20,194 | | | | 277,613 | | | | 182,953 | | | | 1,433,603 | | | | 180,827 | | | | 1,378,945 | |
Cost of shares repurchased | | | (795,780 | ) | | | (11,779,865 | ) | | | (215,408 | ) | | | (2,998,631 | ) | | | (879,360 | ) | | | (6,852,197 | ) | | | (1,015,358 | ) | | | (7,730,623 | ) |
| | | | | | | | | | | | | | | | | | | | | | | | | | | | | | | | |
Net Increase | | | 557,557 | 1 | | $ | 8,011,037 | 1 | | | 714,725 | | | $ | 9,855,054 | | | | 627,723 | 1 | | $ | 5,047,900 | 1 | | | 381,296 | | | $ | 2,968,656 | |
| | | | | | | | | | | | | | | | | | | | | | | | | | | | | | | | |
Service: | | | | | | | | | | | | | | | | | | | | | | | | | | | | | | | | |
Proceeds from sale of shares | | | 662 | | | $ | 10,000 | | | | — | | | | — | | | | — | | | | — | | | | — | | | | — | |
Reinvestment of distributions | | | 35 | | | | 497 | | | | — | | | | — | | | | — | | | | — | | | | — | | | | — | |
Cost of shares repurchased | | | — | | | | — | | | | — | | | | — | | | | — | | | | — | | | | — | | | | — | |
| | | | | | | | | | | | | | | | | | | | | | | | | | | | | | | | |
Net Increase (Decrease) | | | 697 | 2 | | $ | 10,497 | 2 | | | — | | | | — | | | | — | | | | — | | | | — | | | | — | |
| | | | | | | | | | | | | | | | | | | | | | | | | | | | | | | | |
Class B: | | | | | | | | | | | | | | | | | | | | | | | | | | | | | | | | |
Proceeds from sale of shares | | | — | | | | — | | | | 25,358 | | | $ | 346,964 | | | | — | | | | — | | | | 357 | | | $ | 2,756 | |
Reinvestment of distributions | | | — | | | | — | | | | 141 | | | | 1,906 | | | | — | | | | — | | | | 1,556 | | | | 12,016 | |
Cost of shares repurchased | | | — | | | | — | | | | (67,705 | ) | | | (955,063 | ) | | | — | | | | — | | | | (92,823 | ) | | | (711,810 | ) |
| | | | | | | | | | | | | | | | | | | | | | | | | | | | | | | | |
Net Increase | | | — | | | | — | | | | (42,206 | )3 | | $ | (606,193 | )3 | | | — | | | | — | | | | (90,910 | )3 | | $ | (697,038 | )3 |
| | | | | | | | | | | | | | | | | | | | | | | | | | | | | | | | |
Class C: | | | | | | | | | | | | | | | | | | | | | | | | | | | | | | | | |
Proceeds from sale of shares | | | 278,363 | | | $ | 4,045,328 | | | | 98,793 | | | $ | 1,350,143 | | | | 34,188 | | | $ | 263,193 | | | | 44,565 | | | $ | 335,390 | |
Reinvestment of distributions | | | 313 | | | | 4,619 | | | | 2,507 | | | | 34,234 | | | | 12,626 | | | | 97,097 | | | | 18,025 | | | | 136,020 | |
Cost of shares repurchased | | | (464,632 | ) | | | (6,881,020 | ) | | | (124,616 | ) | | | (1,733,656 | ) | | | (447,833 | ) | | | (3,503,391 | ) | | | (193,035 | ) | | | (1,455,549 | ) |
| | | | | | | | | | | | | | | | | | | | | | | | | | | | | | | | |
Net Increase | | | (185,956 | )4 | | $ | (2,831,073 | )4 | | | (23,316 | ) | | $ | (349,279 | ) | | | (401,019 | )4 | | $ | (3,143,101 | )4 | | | (130,445 | ) | | $ | (984,139 | ) |
| | | | | | | | | | | | | | | | | | | | | | | | | | | | | | | | |
Institutional Class: | | | | | | | | | | | | | | | | | | | | | | | | | | | | | | | | |
Proceeds from sale of shares | | | 203,895 | | | $ | 2,978,828 | | | | 139,385 | | | $ | 1,977,630 | | | | 85,065 | | | $ | 669,760 | | | | 180,762 | | | $ | 1,398,738 | |
Reinvestment of distributions | | | 40,168 | | | | 575,365 | | | | 30,148 | | | | 418,221 | | | | 18,704 | | | | 148,010 | | | | 47,020 | | | | 362,678 | |
Cost of shares repurchased | | | (216,030 | ) | | | (3,166,672 | ) | | | (104,613 | ) | | | (1,467,122 | ) | | | (484,301 | ) | | | (3,732,264 | ) | | | (139,737 | ) | | | (1,078,079 | ) |
| | | | | | | | | | | | | | | | | | | | | | | | | | | | | | | | |
Net Increase (Decrease) | | | 28,033 | | | $ | 387,521 | | | | 64,920 | | | $ | 928,729 | | | | (380,532 | ) | | $ | (2,914,494 | ) | | | 88,045 | | | $ | 683,337 | |
| | | | | | | | | | | | | | | | | | | | | | | | | | | | | | | | |
| † | For the year ended December 31, 2012, 409,598 shares and $6,135,903 are included due to the conversion of Class C shares into Investor Class shares for Balanced and 313,604 shares and $2,509,713 are included due to the conversion of Class C shares into Investor Class shares for High Yield. |
| 1 | Effective at the close of business on November 30, 2012, all Class A shares were renamed to Investor Class shares. |
| 2 | Commencement operations on December 1, 2012 |
| 3 | Effective at the close of business on June 30, 2011, all B shares converted to A shares |
| 4 | Effective at the close of business on November 30, 2012, all C shares converted to Investor shares |
Notes to Financial Statements (continued)
| | | | | | | | | | | | | | | | |
| | | Fixed Income | |
| | | 2012 | | | 2011 | |
| | | Shares | | | Amount | | | Shares | | | Amount | |
Investor Class: | | | | | | | | | | | | | | | | |
Proceeds from sale of shares† | | | 1,133,166 | | | $ | 12,743,800 | | | | 1,204,327 | | | $ | 13,370,619 | |
Reinvestment of distributions | | | 114,841 | | | | 1,287,693 | | | | 122,816 | | | | 1,344,883 | |
Cost of shares repurchased | | | (831,087 | ) | | | (9,359,763 | ) | | | (1,543,478 | ) | | | (17,095,985 | ) |
| | | | | | | | | | | | | | | | |
Net Increase (Decrease) | | | 416,920 | 1 | | $ | 4,671,730 | 1 | | | (216,335 | ) | | $ | (2,380,483 | ) |
| | | | | | | | | | | | | | | | |
Service Class: | | | | | | | | | | | | | | | | |
Proceeds from sale of shares | | | 877 | | | $ | 10,000 | | | | — | | | | — | |
Reinvestment of distributions | | | 12 | | | | 140 | | | | — | | | | — | |
Cost of shares repurchased | | | — | | | | — | | | | — | | | | — | |
| | | | | | | | | | | | | | | | |
Net Increase | | | 889 | 2 | | $ | 10,140 | 2 | | | — | | | | — | |
| | | | | | | | | | | | | | | | |
Class B: | | | | | | | | | | | | | | | | |
Proceeds from sale of shares | | | 2,268 | | | $ | 25,299 | | | | 14,740 | | | $ | 161,405 | |
Reinvestment of distributions | | | 4,350 | | | | 48,360 | | | | 8,809 | | | | 95,746 | |
Cost of shares repurchased | | | (308,045 | ) | | | (3,467,737 | ) | | | (67,872 | ) | | | (747,832 | ) |
| | | | | | | | | | | | | | | | |
Net Decrease | | | (301,427 | )3 | | $ | (3,394,078 | )3 | | | (44,323 | )4 | | $ | (490,681 | )4 |
| | | | | | | | | | | | | | | | |
Class C: | | | | | | | | | | | | | | | | |
Proceeds from sale of shares | | | 414,299 | | | $ | 4,657,294 | | | | 335,178 | | | $ | 3,710,019 | |
Reinvestment of distributions | | | 90,235 | | | | 1,009,759 | | | | 111,887 | | | | 1,222,852 | |
Cost of shares repurchased | | | (677,615 | ) | | | (7,595,940 | ) | | | (1,463,649 | ) | | | (16,217,517 | ) |
| | | | | | | | | | | | | | | | |
Net Decrease | | | (173,081 | )5 | | $ | (1,928,887 | )5 | | | (1,016,584 | ) | | $ | (11,284,646 | ) |
| | | | | | | | | | | | | | | | |
Institutional Class: | | | | | | | | | | | | | | | | |
Proceeds from sale of shares | | | 1,965,175 | | | $ | 22,161,321 | | | | 3,098,532 | | | $ | 34,501,136 | |
Reinvestment of distributions | | | 237,467 | | | | 2,671,220 | | | | 262,525 | | | | 2,886,361 | |
Cost of shares repurchased | | | (2,344,687 | ) | | | (26,329,086 | ) | | | (3,002,243 | ) | | | (33,274,625 | ) |
| | | | | | | | | | | | | | | | |
Net Increase | | | (142,045 | ) | | $ | (1,496,545 | ) | | | 358,814 | | | $ | 4,112,872 | |
| | | | | | | | | | | | | | | | |
| † | For the year ended December 31, 2012, 265,965 shares and $3,026,608 are included due to the conversion of Class B shares into Investor Class shares. |
| 1 | Effective at the close of business on November 30, 2012, all Class A shares were renamed to Investor Class shares. |
| 2 | Commenced operations on December 1, 2012. |
| 3 | Effective at the close of business on November 30, 2012, Class B shares converted to Investor Class shares. |
| 4 | Effective at the close of business on June 30, 2011, shares are no longer available for purchase. |
| 5 | Effective at the close of business on November 30, 2012, shares are no longer available for purchase. |
At December 31, 2012, certain unaffiliated shareholders of record, specifically omnibus accounts, individually or collectively held greater than 10% of the outstanding shares of the following Funds: Balanced – two collectively own 54%; High Yield – three collectively own 35%; Fixed Income – four collectively own 56%. Transactions by these shareholders may have a material impact on their respective Fund.
| h. | Foreign Currency Translation |
The books and records of the Funds are maintained in U.S. dollars. The value of investments, assets and liabilities denominated in currencies other than U.S. dollars are translated into U.S. dollars based upon current foreign exchange rates. Purchases and sales of foreign investments, income and expenses are converted into U.S. dollars based on currency exchange rates prevailing on the respective dates of such transactions. Net realized and unrealized gain (loss) on foreign currency transactions represent: (1) foreign exchange gains and losses from the sale and holdings of foreign currencies; (2) gains and losses between trade date and settlement
date on investment securities transactions; and (3) gains and losses from the difference between amounts of interest and dividends recorded and the amounts actually received.
The Funds do not isolate the net realized and unrealized gain or loss resulting from changes in exchange rates from the fluctuations in market prices of securities held. Such fluctuations are included with the net realized and unrealized gain or loss on investments.
The Funds invest in securities of foreign entities and in instruments denominated in foreign currencies which involve risks not typically associated with investments in domestic securities. Non-domestic securities carry special risks, such as exposure to currency fluctuations, less developed or less efficient trading markets, political instability, a lack of company information, differing auditing and legal standards, and, potentially, less liquidity.
Realized gains in certain countries may be subject to foreign taxes at the Fund level, at rates ranging from approximately 10% to 15%.
Notes to Financial Statements (continued)
The Funds would pay such foreign taxes on net realized gains at the appropriate rate for each jurisdiction.
| 2. | Agreements and Transactions with Affiliates |
For each of the Funds, the Trust has entered into an investment management agreement under which the Investment Manager, a subsidiary of Affiliated Managers Group, Inc. (“AMG”), serves as investment manager to the Funds and is responsible for the Funds’ overall administration and operations. The Investment Manager selects subadvisors for the Funds (subject to Board approval) and monitors the subadvisor investment performance, security holdings and investment strategies. Each’s Fund investment portfolio is managed by one or more portfolio managers who serve pursuant to a subadvisory agreement with the Investment Manager.
Investment management fees are paid directly by the Funds to the Investment Manager based on average daily net assets. For the year ended December 31, 2012, the annual investment management fee rates, as a percentage of average daily net assets, were as follows: Balanced – 0.70%; High Yield – 0.70%; and Fixed Income –0.45%.
The Investment Manager has contractually agreed, through at least May 1, 2014, to waive fees and pay or reimburse Fund expenses in order to limit total annual Fund operating expenses after fee waiver and expense reimbursements (exclusive of taxes, interest (including interest incurred in connection with bank and custody overdrafts), shareholder servicing fees, distribution and service (12b-1) fees, brokerage commission and other transaction costs, acquired fund fees and expenses and extraordinary expenses) to the following percentages of the following Funds’ average daily net assets:
| | | | |
Balanced* | | | 0.84 | % |
High Yield | | | 0.90 | % |
Fixed Income | | | 0.59 | % |
| * | Effective July 1, 2012. Immediately prior to July 1, 2012, Balanced had a contractual expense limitation of 1.00%. |
Each Fund is obligated to repay the Investment Manager such amounts waived, paid or reimbursed in future years provided that the repayment occurs within thirty-six (36) months after the waiver or reimbursement occurs and that such repayment would not cause that Fund’s total operating expenses in any such future year to exceed that Fund’s respective expense cap. For the year ended December 31, 2012, each Fund’s components of reimbursement are detailed in the following chart:
| | | | | | | | | | | | |
| | | Balanced | | | High Yield | | | Fixed Income | |
Reimbursement Available - 12/31/11 | | $ | 300,319 | | | $ | 539,411 | | | $ | 941,142 | |
Additional Reimbursements | | | 126,271 | | | | 168,498 | | | | 279,669 | |
Repayments | | | — | | | | — | | | | — | |
Expired | | | | | | | | | | | | |
Reimbursements | | | (107,402 | ) | | | (170,328 | ) | | | (310,628 | ) |
| | | | | | | | | | | | |
Reimbursement Available - 12/31/12 | | $ | 319,188 | | | $ | 537,581 | | | $ | 910,183 | |
| | | | | | | | | | | | |
Each Fund has entered into an Administration and Shareholder Servicing Agreement under which the Investment Manager serves as
each Fund’s administrator (the “Administrator”) and is responsible for all aspects of managing the Funds’ operations, including administration and shareholder services to each Fund, its shareholders, and certain institutions, such as bank trust departments, broker-dealers and registered investment advisers, that advise or act as an intermediary with the Funds shareholders. The Funds pay a fee to the Administrator at the rate of 0.20% per annum of each Fund’s average daily net assets for this service.
The aggregate annual retainer paid to each Independent Trustee of the Board is $80,000, plus $5,000 or $2,500 for each regular or special meeting attended, respectively. The Independent Chairman of the Trust receives an additional payment of $20,000 per year. The Chairman of the Audit Committee receives an additional payment of $8,000 per year. The Trustees’ fees and expenses are allocated among all of the Funds for which the Investment Manager serves as the advisor (the “Managers Funds”) based on the relative net assets of such Funds. The “Trustees fees and expenses” shown in the financial statements represents each Fund’s allocated portion of the total fees and expenses paid by the Managers Funds.
Beginning January 1, 2013, the annual retainer paid to each Independent Trustee of the Board will be $105,000, plus $6,000 or $2,500 for each regular or special meeting attended, respectively. The Independent Chairman of the Trusts will receive an additional payment of $25,000 per year. The Chairman of the Audit Committee will receive an additional payment of $10,000 per year.
The Funds are distributed by Managers Distributors, Inc. (the “Distributor” or “MDI”), a wholly-owned subsidiary of the Investment Manager. MDI serves as the distributor and underwriter for each Fund and is a registered broker-dealer and member of the Financial Industry Regulatory Authority, Inc. (“FINRA”). Shares of each Fund will be continuously offered and will be sold directly to prospective purchasers through brokers, dealers or other financial intermediaries who have executed selling agreements with MDI. Subject to the compensation arrangement discussed below, generally MDI bears all or a portion of the expenses of providing services pursuant to the distribution agreement, including payment of the expenses relating to the distribution of prospectuses for sales purposes and any advertising or sales literature. Certain Trustees and Officers of the Funds are Officers and/or Directors of the Investment Manager, AMG and/or the Distributor.
The Trust has adopted a distribution and service plan (the “Plan”) with respect to the Investor Class, Class B and Class C shares in accordance with the requirements of Rule 12b-1 under the 1940 Act and the requirements of the applicable rules of FINRA regarding asset-based sales charges. Pursuant to the Plan, each Fund may make payments to the Distributor for its expenditures in financing any activity primarily intended to result in the sale of each such class of the Fund’s shares and for maintenance and personal service provided to existing shareholders of that class. The Plan authorizes payments to the Distributor up to 0.25% annually of each Fund’s average daily net assets attributable to the Investor Class shares and 1.00% annually of each Fund’s average daily net assets attributable to Class B and Class C shares.
The Plan further provides for periodic payments by the Trust or MDI to brokers, dealers and other financial intermediaries for providing shareholder services and for promotional and other sales related costs. The portion of payments by the Investor Class, Class B and
Notes to Financial Statements (continued)
Class C shares of a Fund for shareholder servicing may not exceed an annual rate of 0.25% of the average daily net asset value of the Fund’s shares of that class owned by clients of such broker, dealer or financial intermediary. The portion of payments by the Service Class shares of a Fund for shareholder servicing may not exceed an annual rate of 0.10% of the average daily net asset value of the Fund’s shares of that class owned by clients of such broker, dealer or financial intermediary.
The following summarizes the total fees incurred under the Plan for Investor Class, Class B, and Class C shares for the year ended December 31, 2012:
| | | | |
| | | Amount | |
Balanced | | $ | 94,036 | |
High Yield | | | 84,987 | |
Fixed Income | | | 464,939 | |
The Securities and Exchange Commission granted an exemptive order that permits the Funds to lend and borrow money for certain temporary purposes directly to and from other eligible Managers Funds. Participation in this interfund lending program is voluntary for both borrowing and lending funds, and an interfund loan is only made if it benefits each participating fund. The Investment Manager administers the program according to procedures approved by the Board, and the Board monitors the operation of the program. An interfund loan must comply with certain conditions set out in the exemptive order, which are designed to assure fairness and protect all participating Funds. For the year ended December 31, 2012, Balanced lent $528,823 for 5 days earning interest of $82, High Yield lent varying amounts not exceeding $768,404, for 6 days earning interest of $148 and Fixed Income lent varying amounts not exceeding $1,274,083 for 7 days earning interest of $177. The interest earned is included in the Statements of Operations as interest income. For the same time period, the Funds did not borrow from any other Managers Funds. At December 31, 2012, High Yield had $768,404 in loans outstanding. At December 31, 2012, Balanced and Fixed Income had no loans outstanding.
| 3. | Purchases and Sales of Securities |
Purchases and sales of securities (excluding short-term securities) for the year ended December 31, 2012, were as follows:
| | | | | | | | |
| | | Long-Term Securities
(excluding U.S. Government Obligations) | |
Fund | | Purchases | | | Sales | |
Balanced | | $ | 31,326,312 | | | $ | 30,422,534 | |
High Yield | | | 13,776,094 | | | | 16,178,697 | |
Fixed Income | | | 112,671,557 | | | | 151,752,832 | |
| |
| | | U.S. Government Obligations | |
Fund | | Purchases | | | Sales | |
Balanced | | $ | 10,327,061 | | | $ | 8,239,162 | |
High Yield | | | n/a | | | | n/a | |
Fixed Income | | | 37,327,130 | | | | 11,722,016 | |
| 4. | Portfolio Securities Loaned |
The Funds participate in a securities lending program offered by BNYM (the “Program”), providing for the lending of securities to qualified brokers. Securities lending income includes earnings of such temporary cash investments, plus or minus any rebate to a borrower. These earnings (after any rebate) are then divided between BNYM, as a fee for its services under the program, and the Funds, according to agreed-upon rates. Collateral on all securities loaned is accepted in cash and/or government securities and is maintained at a minimum level of 102% (105% in the case of certain foreign securities) of the market value, plus interest, if applicable, of investments on loan. It is the Funds’ policy to obtain additional collateral from or return excess collateral to the borrower by the end of the next business day, following the valuation date of the securities loaned. Therefore, the value of the collateral held may be temporarily less than the value of the securities on loan. Lending securities entails a risk of loss to the Funds if and to the extent that the market value of the securities loaned were to increase and the borrower did not increase the collateral accordingly, and the borrower fails to return the securities. Under the terms of the Program, the Funds are indemnified for such losses by BNYM. The Funds bear the risk of any deficiency in the amount of the collateral available for return to the borrower due to any loss on the collateral invested. Collateral received in the form of cash is invested temporarily in the BNY Mellon Overnight Government Fund, formerly the BNY Institutional Cash Reserves Fund, or other short-term investments as defined in the Securities Lending Agreement with BNYM. For the year ended December 31, 2012, the Funds participated in the program.
| 5. | Commitments and Contingencies |
In the normal course of business, the Funds may enter into contracts and agreements that contain a variety of representations and warranties, which provide general indemnifications. The maximum exposure to the Funds under these arrangements is unknown, as this would involve future claims that may be made against a Fund that have not yet occurred. However the Funds have had no prior claims or losses and expect the risks of loss to be remote.
| 6. | Risks Associated with High Yield Securities (High Yield) |
Investing in high yield securities involves greater risks and considerations not typically associated with U.S. Government and other high quality/investment grade securities. High Yield securities are generally below investment grade securities and do not have an established retail secondary market. Economic downturns may disrupt the high yield market and impair the issuer’s ability to repay principal and interest. Also, an increase in interest rates would likely have an adverse impact on the value of such obligations and could cause the securities to become less liquid.
| 7. | New Accounting Pronouncements |
In December 2011, the Financial Account Standards Board (“FASB”) issued Accounting Standards Update (“ASU”) No. 2011- 11 “Disclosures about Offsetting Assets and Liabilities.” ASU 2011-11 requires disclosures to make financial statements that are prepared under U.S. GAAP more comparable to those prepared under International Financial Reporting Standards (“IFRS”). The new disclosure requirements mandate that entities disclose both gross and net information about instruments and transactions eligible for offset in the Statement of Assets and Liabilities as well
Notes to Financial Statements (continued)
as instruments and transactions subject to an agreement similar to a master netting arrangement. In addition, ASU 2011-11 requires disclosure of collateral received and posted in connection with master netting agreements or similar arrangements. New disclosures are required for annual reporting periods beginning on or after January 1, 2013, and interim periods within those annual periods. Management is evaluating the impact of ASU 2011-11 on the Funds’ financial statements and disclosures.
The Funds have determined that no material events or transactions occurred through the issuance date of the Funds’ financial statements which require additional disclosure in or adjustment of the Funds financial statements.
Tax Information(unaudited)
Managers AMG Chicago Equity Partners Balanced Fund, Managers High Yield Fund and Managers AMG GW&K Fixed Income Fund each hereby designates the maximum amount allowable of its net taxable income as qualified dividends as provided in the Jobs and Growth Tax Relief Reconciliation Act of 2003. The 2012 Form 1099-DIV you receive for each Fund will show the tax status of all distributions paid to you during the year.
The percentage of Qualified Dividend Income (“QDI”) and the Dividends-Received Deduction (“DRD”) for distributions paid is as follows:
| | | | | | | | |
| | | 2012 | | | 2011 | |
Balanced | | | | | | | | |
Ordinary Income - QDI | | | 66.41 | % | | | 74.16 | % |
Ordinary Income - DRD | | | 69.32 | % | | | 79.14 | % |
High Yield | | | | | | | | |
Ordinary Income - QDI | | | — | | | | — | |
Ordinary Income - DRD | | | — | | | | — | |
Fixed Income | | | | | | | | |
Ordinary Income - QDI | | | 9.87 | % | | | 9.24 | % |
Ordinary Income - DRD | | | 8.95 | % | | | 5.49 | % |
Pursuant to section 852 of the Internal Revenue Code, Managers AMG Chicago Equity Partners Balanced Fund, Managers High Yield Fund and Managers AMG GW&K Fixed Income Fund each hereby designates $1,358,610, $0 and $1,273,035, respectively, as a capital gain distribution with respect to the taxable year ended December 31, 2012, or if subsequently determined to be different, the net capital gains of such year.
Report of Independent Registered Public Accounting Firm
To the Board of Trustees of The Managers Trust II and the Shareholders of Managers AMG Chicago Equity Partners Balanced Fund, Managers High Yield Fund and Managers AMG GW&K Fixed Income Fund (formerly Managers Fixed Income Fund):
In our opinion, the accompanying statements of assets and liabilities, including the schedules of portfolio investments, and the related statements of operations and of changes in net assets and the financial highlights present fairly, in all material respects, the financial position of Managers AMG Chicago Equity Partners Balanced Fund, Managers High Yield Fund, and Managers AMG GW&K Fixed Income Fund (formerly Managers Fixed Income Fund) (the “Funds”) at December 31, 2012, and the results of each of their operations, the changes in each of their net assets and the financial highlights for each of the periods indicated, in conformity with accounting principles generally accepted in the United States of America. These financial statements and financial highlights (hereafter referred to as “financial statements”) are the responsibility of the Funds’ management. Our responsibility is to express an opinion on these financial statements based on our audits. We conducted our audits of these financial statements in accordance with the standards of the Public Company Accounting Oversight Board (United States). Those standards require that we plan and perform the audit to obtain reasonable assurance about whether the financial statements are free of material misstatement. An audit includes examining, on a test basis, evidence supporting the amounts and disclosures in the financial statements, assessing the accounting principles used and significant estimates made by management, and evaluating the overall financial statement presentation. We believe that our audits, which included confirmation of securities at December 31, 2012 by correspondence with the custodian, brokers and agent banks, and the application of alternative auditing procedures where securities purchased had not been received, provide a reasonable basis for our opinion.
PricewaterhouseCoopers LLP
Boston, Massachusetts
February 27, 2013
Trustees and Officers
The Trustees and Officers of the Trust, their business addresses, principal occupations for the past five years and dates of birth are listed below. The Trustees provide broad supervision over the affairs of the Trust and the Funds. The Trustees are experienced executives who meet periodically throughout the year to oversee the Funds’ activities, review contractual arrangements with companies that provide services to the Funds, and review the Funds’ performance. Unless otherwise noted, the address of each Trustee or Officer is the address of the Trust: 800 Connecticut Avenue, Norwalk, Connecticut 06854.
There is no stated term of office for Trustees. Trustees serve until their resignation, retirement or removal in accordance with the Trust’s organizational documents and policies adopted by the Board from time to time. The Chairman of the Trustees, President, Treasurer and Secretary of the Trust are elected by the Trustees annually. Other officers hold office at the pleasure of the Trustees.
Independent Trustees
The following Trustees are not “interested persons” of the Trust within
the meaning of the 1940 Act:
| | |
Name, Date of Birth,
Number of Funds Overseen
in Fund Complex* | | Principal Occupation(s) During Past 5
Years and Other Directorships Held by
Trustee |
Bruce B. Bingham, 12/01/48 • Trustee since 2012 • Oversees 37 Funds in Fund Complex | | Partner, Hamilton Partners (real estate development firm)(1987-Present). |
William E. Chapman, II, 9/23/41 • Independent Chairman • Trustee since 2000 • Oversees 37 Funds in Fund Complex | | President and Owner, Longboat Retirement Planning Solutions (1998-Present); Hewitt Associates, LLC (part time) (provider of Retirement and Investment Education Seminars) (2002-2009); Trustee of Bowdoin College (2002-Present); Director of Harding, Loevner Funds, Inc. (6 portfolios); Trustee of Third Avenue Trust (5 portfolios); Trustee of Third Avenue Variable Trust (1 portfolio); Trustee of Aston Funds (26 portfolios). |
Edward J. Kaier, 9/23/45 • Trustee since 2000 • Oversees 37 Funds in Fund Complex | | Attorney at Law and Partner, Teeters Harvey Gilboy & Kaier LLP (2007-Present); Attorney at Law and Partner, Hepburn Willcox Hamilton & Putnam, LLP (1977-2007); Trustee of Third Avenue Trust (5 portfolios); Trustee of Third Avenue Variable Trust (1 portfolio); Trustee of Aston Funds (26 portfolios). |
Steven J. Paggioli, 4/3/50 • Trustee since 2000 • Oversees 37 Funds in Fund Complex | | Independent Consultant (2002-Present); Formerly Executive Vice President and Director, The Wadsworth Group (1986-2001); Executive Vice President, Secretary and Director, Investment Company Administration, LLC (1990-2001); Vice President, Secretary and Director, First Fund Distributors, Inc. (1991-2001); Trustee, Professionally Managed Portfolios (38 portfolios); Advisory Board Member, Sustainable Growth Advisors, LP; Independent Director, Chase Investment Counsel (2008 – Present); Trustee of Aston Funds (26 portfolios). |
Eric Rakowski, 6/5/58 • Trustee since 2000 • Oversees 37 Funds in Fund Complex | | Professor, University of California at Berkeley School of Law (1990-Present); Director of Harding, Loevner Funds, Inc. (6 portfolios); Trustee of Third Avenue Trust (5 portfolios); Trustee of Third Avenue Variable Trust (1 portfolio); Trustee of Aston Funds (26 portfolios). |
Thomas R. Schneeweis, 5/10/47 • Trustee since 2000 • Oversees 37 Funds in Fund Complex | | Professor of Finance, University of Massachusetts (1977-Present); Director, CISDM at the University of Massachusetts, (1996-Present); President, Alternative Investment Analytics, LLC, (formerly Schneeweis Partners, LLC) (2001-Present); Partner, S Capital Management, LLC (2007-Present); President, TRS Associates (1982-Present); Partner, White Bear Partners, LLC (2007-2010); Partner, Northampton Capital Management, LLC (2004-2010); Trustee of Aston Funds (26 portfolios). |
| * | The Fund Complex consists of Managers AMG Funds, The Managers Funds, Managers Trust I and Managers Trust II. |
Interested Trustees
Each Trustee in the following table is an “interested person” of the Trust within the meaning of the 1940 Act. Ms. Carsman is an interested person of the Trust within the meaning of the 1940 Act by virtue of her position with, and interest in securities of, AMG, and her former position as Chief Legal Officer of the Trust.
| | |
Name, Date of Birth,
Number of Funds Overseen
in Fund Complex* | | Principal Occupation(s) During Past 5
Years and Other Directorships Held by
Trustee |
Christine C. Carsman, 4/2/52 • Trustee since 2011 • Oversees 37 Funds in Fund Complex | | Senior Vice President and Deputy General Counsel, Affiliated Managers Group, Inc. (2011-Present); Senior Vice President and Chief Regulatory Counsel, Affiliated Managers Group, Inc. (2007-2011); Vice President and Chief Regulatory Counsel, Affiliated Managers Group, Inc. (2004-2007); Secretary and Chief Legal Officer, Managers AMG Funds, The Managers Funds, Managers Trust I and Managers Trust II (2004-2011); Senior Counsel, Vice President and Director of Operational Risk Management and Compliance, Wellington Management Company, LLP (1995-2004). |
| Officers | | |
Name, Date of Birth,
Position(s) Held with
Fund and Length of Time
Served | | Principal Occupation(s) During Past 5
Years |
Keitha L. Kinne, 5/16/58 • President since 2012 • Chief Operating Officer since 2007 | | Managing Partner and Chief Operating Officer, Managers Investment Group LLC (2007-Present); Chief Investment Officer, Managers Investment Group LLC (2008-Present); President, Managers Distributors, Inc. (2012-Present; Chief Operating Officer, The Managers Funds, Managers AMG Funds and Managers Trust I (2007-Present); Managing Director, Legg Mason & Co., LLC (2006-2007); Managing Director, Citigroup Asset Management (2004-2006). |
Lewis Collins, 2/22/66 • Secretary since 2011 • Chief Legal Officer since 2011 | | Senior Vice President and Senior Counsel, Affiliated Managers Group, Inc. (2010-Present); Vice President and Senior Counsel, Affiliated Managers Group, Inc. (2006-2010); Senior Counsel, Affiliated Managers Group, Inc. (2002-2006); Attorney, Ropes & Gray LLP (1998-2002). |
Donald S. Rumery, 5/29/58 • Chief Financial Officer since 2007 • Treasurer since 2000 | | Senior Vice President, Managers Investment Group LLC (2005-Present); Treasurer, The Managers Funds (1995-Present); Treasurer, Managers AMG Funds (1999-Present); Treasurer, Managers Trust I (2000-Present); Chief Financial Officer, The Managers Funds, Managers AMG Funds and Managers Trust I (2007-Present); Treasurer and Chief Financial Officer, Managers Distributors, Inc. (2000-2012); Vice President, The Managers Funds LLC, (1994-2004). |
John J. Ferencz, 3/09/62 • Chief Compliance Officer since 2010 | | Vice President, Legal and Compliance, Managers Investment Group LLC (2010-Present); Senior Compliance Analyst, Mutual Funds and Regulatory, GE Asset Management Incorporated (2005-2010). |
Michael S. Ponder, 9/12/73 • Assistant Secretary since 2011 | | Senior Vice President and Counsel, Managers Investment Group LLC (2011-Present); Attorney, DeNovo Legal (2009-2010); Vice President, Credit Suisse (2007-2009); Associate, Willkie Farr & Gallagher LLP (2006-2007). |
Matthew B. Wallace, 11/24/80 • Anti-Money Laundering Compliance Officer since 2012 | | Senior Associate, Legal and Compliance, Managers Investment Group LLC (2012-Present); Associate, Legal and Compliance, Managers Investment Group LLC (2010-2012); Compliance Specialist, Calamos Advisors LLC (2007-2010). |
THIS PAGE INTENTIONALLY LEFT BLANK
Investment Manager and Administrator
Managers Investment Group LLC
800 Connecticut Avenue
Norwalk, CT 06854
(800) 835-3879
Distributor
Managers Distributors, Inc.
800 Connecticut Avenue
Norwalk, CT 06854
(800) 835-3879
Custodian
The Bank of New York Mellon
2 Hanson Place
Legal Counsel
Ropes & Gray LLP
Prudential Tower, 800 Boylston Street
Boston, MA 02199-3600
Transfer Agent
BNY Mellon Investment Servicing (US) Inc.
Attn: Managers
P.O. Box 9769
Providence, RI 02940
(800) 548-4539
For ManagersChoiceTM Only
Managers
c/o BNY Mellon Investment Servicing (US) Inc.
P.O. Box 9847
Providence, RI 02940-8047
(800) 358-7668
MANAGERSAND MANAGERS AMG FUNDS
| | | | |
EQUITY FUNDS | | BALANCED FUNDS |
| CADENCE CAPITAL APPRECIATION | | SKYLINE SPECIAL EQUITIES PORTFOLIO | | CHICAGO EQUITY PARTNERS BALANCED |
| CADENCE MID-CAP | | | Chicago Equity Partners, LLC |
| CADENCE EMERGING COMPANIES | | Skyline Asset Management, L.P. | | |
| Cadence Capital Management, LLC | | | | ALTERNATIVE FUNDS |
| | SPECIAL EQUITY | | |
| ESSEX SMALL/MICRO CAP GROWTH | | Ranger Investment Management, L.P. | | FQ GLOBAL ALTERNATIVES |
| Essex Investment Management Co., LLC | | Lord, Abbett & Co. LLC | | FQ GLOBAL ESSENTIALS |
| | Smith Asset Management Group, L.P. | | First Quadrant, L.P. |
| FQ TAX-MANAGED U.S. EQUITY | | Federated MDTA LLC | | |
| FQ U.S. EQUITY | | | | INCOME FUNDS |
| First Quadrant, L.P. | | SYSTEMATIC VALUE | | |
| | SYSTEMATIC MID CAP VALUE | | BOND (MANAGERS) |
| FRONTIER SMALL CAP GROWTH | | Systematic Financial Management, L.P. | | GLOBAL INCOME OPPORTUNITY |
| Frontier Capital Management Company, LLC | | | | Loomis, Sayles & Co., L.P. |
| | TIMESSQUARE INTERNATIONAL SMALL | | |
| GW&K SMALL CAP EQUITY | | CAP FUND | | BOND (MANAGERS PIMCO) |
| Gannett Welsh & Kotler, LLC | | TIMESSQUARE MID CAP GROWTH | | Pacific Investment Management Co. LLC |
| | TIMESSQUARE SMALL CAP GROWTH | | |
| MICRO-CAP | | TSCM GROWTH EQUITY | | CALIFORNIA INTERMEDIATE TAX-FREE |
| Lord, Abbett & Co. LLC | | TimesSquare Capital Management, LLC | | Miller Tabak Asset Management LLC |
| WEDGE Capital Management L.L.P. | | | | |
| Next Century Growth Investors LLC | | TRILOGY GLOBAL EQUITY | | GW&K FIXED INCOME FUND GW&K MUNICIPAL BOND |
| RBC Global Asset Management (U.S.) Inc. | | |
| | TRILOGY EMERGING MARKETS EQUITY | |
| REAL ESTATE SECURITIES | | TRILOGY INTERNATIONAL SMALL CAP Trilogy Global Advisors, L.P. | | GW&K MUNICIPAL ENHANCED YIELD BOND |
| Urdang Securities Management, Inc. | | | |
| | | | Gannett Welsh & Kotler, LLC |
| RENAISSANCE LARGE CAP GROWTH | | YACKTMAN FUND YACKTMAN FOCUSED FUND | | HIGH YIELD |
| Renaissance Group LLC | | Yacktman Asset Management L.P. | | J.P. Morgan Investment Management LLC |
| | |
| | | | INTERMEDIATE DURATION GOVERNMENT SHORT DURATION GOVERNMENT |
| | | | Smith Breeden Associates, Inc. |
| | |
| | | | |
This report is prepared for the Funds’ shareholders. It is authorized for distribution to prospective investors only when preceded or accompanied by an effective prospectus. To receive a free copy of the prospectus or Statement of Additional Information, which includes additional information about Fund Trustees, please contact us by calling 800.835.3879. Distributed by Managers Distributors, Inc., member FINRA. A description of the policies and procedures each Fund uses to vote its proxies is available: (i) without charge, upon request, by calling 800.835.3879, or (ii) on the Securities and Exchange Commission’s (SEC) Web site at www. sec.gov. For information regarding each Fund’s proxy voting record for the 12-month period ended June 30, call 800.835.3879 or visit the SEC Web site at www.sec.gov. The Funds file their complete schedule of portfolio holdings with the SEC for the first and third quarters of each fiscal year on Form N-Q. The Funds’ Forms N-Q are available on the SEC’s website at www.sec.gov. A Fund’s Forms N-Q may be reviewed and copied at the SEC’s Public Reference Room in Washington, DC. Information on the operation of the Public Reference Room may be obtained by calling 800.SEC.0330. To review a complete list of the Funds’ portfolio holdings, or to view the most recent quarterly holdings report, semiannual report, or annual report, please visit www.managersinvest.com. | | |
Item 2. CODE OF ETHICS
Registrant has adopted a Code of Ethics. See attached Exhibit (a)(1).
Item 3. AUDIT COMMITTEE FINANCIAL EXPERT
Registrant’s Board of Trustees has determined that independent Trustees Mr. Jack W. Aber and Mr. Steven J. Paggioli each qualify as the Audit Committee Financial Expert. Mr. Aber and Mr. Paggioli are “independent” as such term is defined in Form N-CSR.
Item 4. PRINCIPAL ACCOUNTANT FEES AND SERVICES
The aggregate fees billed by the Funds’ independent registered public accounting firm, PricewaterhouseCoopers LLP (“PwC”), to the Funds for the Funds’ two most recent fiscal years for professional services rendered for audits of annual financial statements, or services that are normally provided in connection with statutory and regulatory filings or engagements (“Audit Fees”) were as follows:
| | | | | | | | |
Fund | | Fiscal 2012 | | | Fiscal 2011 | |
Managers AMG GW&K Fixed Income Fund* | | $ | 29,603 | | | $ | 29,885 | |
Managers AMG Chicago Equity Partners Balanced Fund | | $ | 23,583 | | | $ | 20,530 | |
Managers High Yield Fund | | $ | 17,747 | | | $ | 24,403 | |
Managers Short Duration Government Fund | | $ | 28,037 | | | $ | 35,185 | |
Managers Intermediate Duration Government Fund | | $ | 27,468 | | | $ | 30,348 | |
| * | Formerly known as Managers Fixed Income Fund |
There were no fees billed by PwC to the Funds in its two recent fiscal years for services rendered for assurance and related services that are reasonably related to the performance of the audit or review of the Fund’s financial statements, but are not reported as Audit Fees (“Audit-Related Fees”).
For the Funds’ two most recent fiscal years, there were no Audit-Related Fees billed by PwC for engagements related directly to the operations and financial reporting of one or more Funds by a Fund Service Provider. A Fund Service Provider is (a) any investment adviser to the Fund (not including any Subadvisor whose role is primarily portfolio management and is subcontracted with or overseen by another investment adviser) or (b) any entity that provides ongoing services to the Fund and is controlling, controlled by or under common control with a Fund investment adviser described in (a).
The aggregate fees billed by PwC to the Funds for the two most recent fiscal years for professional services rendered for tax compliance, tax advice, and tax planning (“Tax Fees”) were as follows:
| | | | | | | | |
Fund | | Fiscal 2012 | | | Fiscal 2011 | |
Managers GW&K Fixed Income Fund* | | $ | 7,000 | | | $ | 7,340 | |
Managers AMG Chicago Equity Partners Balanced Fund | | $ | 9,000 | | | $ | 7,340 | |
Managers High Yield Fund | | $ | 9,500 | | | $ | 7,340 | |
Managers Short Duration Government Fund | | $ | 9,000 | | | $ | 8,620 | |
Managers Intermediate Duration Government Fund | | $ | 9,000 | | | $ | 8,620 | |
| * | Formerly known as Managers Fixed Income Fund |
For the Funds’ two most recent fiscal years, Tax Fees billed by PwC for engagements by Fund Service Providers that related directly to the operations and financial reporting of the Funds were $0 for fiscal 2012 and $0 for fiscal 2011, respectively.
The services for which Tax Fees were charged comprise all services performed by professional staff in PwC’s tax division except those services related to the audit. Typically, this category would include fees for tax compliance, tax planning, and tax advice. Tax compliance, tax advice, and tax planning services include preparation of original and amended tax returns, claims for refund and tax payment-planning services, assistance with tax audits and appeals, tax advice related to mergers and acquisitions and requests for rulings or technical advice from taxing authorities.
There were no other fees billed by PwC to the Funds for all other non-audit services (“Other Fees”) during the Funds’ two most recent fiscal years. During the same period, there were no Other Fees billed by PwC for engagements by Fund Service Providers that related directly to the operations and financial reporting of the Funds.
(e)(1) According to policies adopted by the Audit Committee, services provided by PwC to the Funds must be pre-approved by the Audit Committee. On an annual basis, the Audit Committee reviews and pre-approves various types of services that PwC may perform for the Funds without specific approval of each engagement, subject to specified budget limitations. As contemplated by the Sarbanes-Oxley Act of 2002 and related SEC rules, the Audit Committee also pre-approves non-audit services provided by PwC to any Fund Service Provider for any engagement that relates directly to the operations and financial reporting of the Funds. Any engagement that is not already pre-approved or that will exceed a pre-approved budget must be submitted to the Audit Committee for pre-approval. The Chairman of the Audit Committee is authorized on behalf of the Board of Trustees and the Audit Committee to approve the engagement of PwC to perform non-audit services subject to certain conditions, including notification to the Audit Committee of such pre-approval not later than the next meeting of the Audit Committee following the date of such pre-approval.
(e)(2) None.
(f) Not applicable.
(g) The aggregate fees billed by PwC in 2012 and 2011 for non-audit services rendered to the Funds and Fund Service Providers were $109,500 and $103,260, respectively. For the fiscal year ended December 31, 2012, this amount reflects the amounts disclosed above in Item 4(b),(c),(d), plus $66,000 in fees billed to the Fund Service Providers for non-audit services that did not relate directly to the operations and financial reporting of the Funds. For the fiscal year ended December 31, 2011, this amount reflects the amounts disclosed above in Item 4(b),(c),(d), plus $64,000 in fees billed to the Fund Service Providers for non-audit services that did not relate directly to the operations and financial reporting of the Funds.
(h) The Trust’s Audit Committee has considered whether the provision of non-audit services by registrant’s independent registered public accounting firm to the registrant’s investment advisor, and any entity controlling, controlled, or under common control with the investment advisor that provided ongoing services to the registrant that were not pre-approved by the Committee (because such services did not relate directly to the operations and financial reporting of the registrant) was compatible with maintaining the independence of the independent registered public accounting firm.
Item 5. AUDIT COMMITTEE OF LISTED REGISTRANTS
Not applicable.
Item 6. SCHEDULE OF INVESTMENTS
The schedule of investments in unaffiliated issuers as of the close of the reporting period is included as part of the shareholder report contained in Item 1 hereof.
Item 7. DISCLOSURE OF PROXY VOTING POLICIES AND PROCEDURES FOR CLOSED-END MANAGEMENT INVESTMENT COMPANIES
Not applicable.
Item 8. PORTFOLIO MANAGERS OF CLOSED-END MANAGEMENT INVESTMENT COMPANIES
Not applicable.
Item 9. PURCHASES OF EQUITY SECURITIES BY CLOSED-END MANAGEMENT INVESTMENT COMPANIES AND AFFILIATED PURCHASERS
Not applicable.
Item 10. SUBMISSION OF MATTERS TO A VOTE OF SECURITY HOLDERS
Not applicable.
Item 11. CONTROLS AND PROCEDURES
(a) The Registrant’s principal executive and principal financial officers have concluded, based on their evaluation of the registrant’s disclosure controls and procedures as of a date within 90 days of the filing of this report, that the Registrant’s disclosure controls and procedures are reasonably designed to ensure that information required to be disclosed by the Registrant on Form N-CSR is recorded, processed, summarized and reported within the required time periods and that information required to be disclosed by the registrant in the reports that it files or submits on Form N-CSR is accumulated and communicated to the Registrant’s management, including its principal executive and principal financial officers, as appropriate to allow timely decisions regarding required disclosure.
(b) There were no changes in the Registrant’s internal control over financial reporting during the Registrant’s fourth fiscal quarter of the period covered by this report that have materially affected, or are reasonably likely to affect, the internal control over financial reporting.
Item 12. EXHIBITS
| | |
| |
| (a)(1) | | Any Code of Ethics or amendments hereto. Filed herewith. |
| |
| (a)(2) | | Certifications pursuant to Rule 30a-2(a) under the Investment Company Act of 1940 - Filed herewith. |
| |
| (a)(3) | | Not applicable. |
| |
| (b) | | Certifications pursuant to Rule 30a-2(b) under the Investment Company Act of 1940 - Filed herewith. |
SIGNATURES
Pursuant to the requirements of the Securities Exchange Act of 1934 and the Investment Company Act of 1940, the registrant has duly caused this report to be signed on its behalf by the undersigned, thereunto duly authorized.
| | |
| MANAGERS TRUST II |
| |
| By: | | /s/ Keitha L. Kinne |
| | Keitha L. Kinne, President |
| |
| Date: | | March 11, 2013 |
Pursuant to the requirements of the Securities Exchange Act of 1934 and the Investment Company Act of 1940, this report has been signed below by the following persons on behalf of the registrant and in the capacities and on the dates indicated.
| | |
| By: | | /s/ Keitha L. Kinne |
| | Keitha L. Kinne, President |
| |
| Date: | | March 11, 2013 |
| |
| By: | | /s/ Donald S. Rumery |
| | Donald S. Rumery, Chief Financial Officer |
| |
| Date: | | March 11, 2013 |