UNITED STATES
SECURITIES AND EXCHANGE COMMISSION
Washington, D.C. 20549
FORM N-CSR
CERTIFIED SHAREHOLDER REPORT OF REGISTERED
MANAGEMENT INVESTMENT COMPANIES
Investment Company Act file number: 811-06431
MANAGERS TRUST II
(Exact name of registrant as specified in charter)
800 Connecticut Avenue, Norwalk, Connecticut 06854
(Address of principal executive offices) (Zip code)
Managers Investment Group LLC
800 Connecticut Avenue, Norwalk, Connecticut 06854
(Name and address of agent for service)
Registrant’s telephone number, including area code: (203) 299-3500
Date of fiscal year end: DECEMBER 31
| | |
| Date of reporting period: | | JANUARY 1, 2011 – DECEMBER 31, 2011 (Annual Shareholder Report) |
Item 1. Reports to Shareholders
Managers Funds
Annual Report — December 31, 2011
| | | | |
| |
TABLE OF CONTENTS | | Page | |
| |
LETTER TO SHAREHOLDERS | | | 1 | |
| |
ABOUT YOUR FUND’S EXPENSES | | | 4 | |
| |
INVESTMENT MANAGER’S COMMENTS, FUND SNAPSHOTS, AND SCHEDULES OF PORTFOLIO INVESTMENTS | | | | |
| |
Managers AMG Chicago Equity Partners Mid-Cap Fund | | | 6 | |
| |
Managers AMG Chicago Equity Partners Balanced Fund | | | 11 | |
| |
Managers High Yield Fund | | | 20 | |
| |
Managers Fixed Income Fund | | | 34 | |
| |
NOTES TO SCHEDULES OF PORTFOLIO INVESTMENTS | | | 44 | |
| |
FINANCIAL STATEMENTS: | | | | |
| |
Statements of Assets and Liabilities | | | 47 | |
Funds’ balance sheets, net asset value (NAV) per share computations and cumulative undistributed amounts | | | | |
| |
Statements of Operations | | | 49 | |
Detail of sources of income, Fund expenses, and realized and unrealized gains (losses) during the year | | | | |
| |
Statements of Changes in Net Assets | | | 50 | |
Detail of changes in Fund assets for the past two years | | | | |
| |
FINANCIAL HIGHLIGHTS | | | 52 | |
Historical net asset values per share, distributions, total returns, expense ratios, turnover ratios and net assets | | | | |
| |
NOTES TO FINANCIAL HIGHLIGHTS | | | 60 | |
| |
NOTES TO FINANCIAL STATEMENTS | | | 61 | |
Accounting and distribution policies, details of agreements and transactions with Fund management and affiliates, and descriptions of certain investment risks | | | | |
| |
REPORT OF INDEPENDENT REGISTERED PUBLIC ACCOUNTING FIRM | | | 69 | |
| |
TRUSTEES AND OFFICERS | | | 70 | |
Nothing contained herein is to be considered an offer, sale or solicitation of an offer to buy shares of any series of the Managers Family of Funds. Such offering is made only by Prospectus, which includes details as to offering price and other material information.
Letter to Shareholders
Dear Shareholder:
Our foremost goal at Managers Investment Group (“MIG”) is to structure and manage mutual funds that will help our shareholders and clients successfully reach their investment goals and objectives.
Each of our Funds is geared to provide you with exposure to a specific asset class or style of investing. Investors tend to use our Funds as part of their broader portfolio in order to tailor their asset allocation to meet their individual needs. Most of our Funds, like those detailed in this report, are therefore designed to be building blocks.
At MIG, we have overall responsibility for the investment management and administration of the Funds. As a “manager of managers,” we work with external investment managers that make the day-to-day investment decisions in the Funds (the “Portfolio Managers”). We devote considerable resources to our disciplined process of identifying and selecting unaffiliated Portfolio Managers for the Funds. As a manager of managers, MIG performs many activities to monitor the ongoing investment, compliance, and administrative aspects of all of the Funds, which gives our shareholders added confidence in their investments.
Our parent company, Affiliated Managers Group (“AMG”), is a global asset management company with ownership interests in a diverse group of boutique investment management firms (its “Affiliates”). MIG has the unique opportunity to access the investment skills and acumen of some of AMG’s Affiliates. The set of our Funds managed by these proprietary firms also benefit from our activities to monitor the investment, compliance, and administrative aspects of the Funds.
Below is a brief overview of the securities markets and the performance results for the Funds. Following this letter, we also provide the Portfolio Managers’ discussion of their investment management approach, performance results, and market outlook.
Although U.S. equity markets generally ended the year flat or modestly negative, investors in those markets certainly experienced high levels of volatility along the way. After markets shook off macroeconomic events in the first half of the year such as the Arab Spring and the devastating consequences of the Japanese tsunami, markets were not nearly as resilient in the summer months as the political stalemate in Washington involving the U.S. debt ceiling, the S&P downgrade of U.S. sovereign credit rating, and the fear of European sovereign debt contagion shook equity markets. The end of September and into the fourth quarter, however, featured almost a complete reversal of the “risk off” trade from the summer months with markets responding positively both to the coordinated efforts of European policymakers to head off issues surrounding their collective sovereign debt crisis as well as to generally positive earnings reports at the company level in the U.S. Meanwhile fixed income markets generally rose for the year amid the turbulence as the uncertainty boosted fixed income returns. After a solid start to the first half of the year, the summer months were highlighted by bond gains as a sharp decline in treasury yields amid a flight to safety boosted demand for treasuries. This reversed in October as risk aversion began to ease across global markets amid optimism that the European debt crisis could be contained. As a result, U.S. treasury yields rose during October and riskier areas of the fixed income market, such as high yield and credit, outperformed. This reversed again during November, before markets normalized during December. Overall, fixed income securities generated decent absolute returns, but it was a volatile year with multiple shifts in market leadership.
1
Letter to Shareholders (continued)
Against this backdrop, the Managers AMG Chicago Equity Partners Mid Cap Fund (Institutional Class), Managers AMG Chicago Equity Partners Balanced Fund (Institutional Class), Managers High Yield Fund (Institutional Class), and the Managers Fixed Income Fund (Institutional Class) generated the following returns as detailed below:
| | | | | | | | | | | | | | | | | | | | |
Periods Ended 12/31/2011 | | Six Months | | | One Year | | | Three Years | | | Five Years | | | Ten Years | |
Managers AMG Chicago Equity Partners
Mid-Cap Fund | | | | | | | | | | | | | | | | | | | | |
Institutional Class | | | (10.59 | )% | | | 1.08 | % | | | 21.77 | % | | | 1.04 | % | | | 6.01 | % |
Russell Midcap® Index | | | (8.91 | )% | | | (1.55 | )% | | | 20.17 | % | | | 1.41 | % | | | 6.99 | % |
Managers AMG Chicago Equity Partners Balanced Fund | | | | | | | | | | | | | | | | | | | | |
Institutional Class | | | (0.26 | )% | | | 6.77 | % | | | 12.73 | % | | | 4.13 | % | | | 5.81 | % |
60% Russell 1000® Index/40% Barclays Capital U.S. Aggregate Bond Index | | | (0.18 | )% | | | 4.84 | % | | | 12.39 | % | | | 3.55 | % | | | 5.01 | % |
Managers High Yield Fund | | | | | | | | | | | | | | | | | | | | |
Institutional Class | | | 0.55 | % | | | 4.83 | % | | | 22.77 | % | | | 5.95 | % | | | 8.54 | % |
Barclays Capital U.S. Corporate High Yield Bond Index | | | 0.01 | % | | | 4.98 | % | | | 24.12 | % | | | 7.54 | % | | | 8.85 | % |
Managers Fixed Income Fund | | | | | | | | | | | | | | | | | | | | |
Institutional Class | | | 0.35 | % | | | 4.79 | % | | | 12.56 | % | | | 6.26 | % | | | 6.43 | % |
Barclays Capital U.S. Aggregate Bond Index | | | 4.98 | % | | | 7.84 | % | | | 6.77 | % | | | 6.50 | % | | | 5.78 | % |
For the year ended December 31, 2011, the Managers AMG Chicago Equity Partners Mid-Cap Fund’s Institutional Class returned 1.08% for 2011, versus -1.55% for the benchmark Russell Midcap® Index. The Fund experienced solid outperformance during the year with the outperformance being achieved from holdings in eight out of ten sectors. Momentum factors were also beneficial to the Fund for the year.
For the year ended December 31, 2011, the Managers AMG Chicago Equity Partners Balanced Fund’s Institutional Class returned 6.77%, outperforming the 4.84% return for its hypothetical benchmark, which consists of 60% of the return of the Russell 1000® Index and 40% of the return of the Barclays Capital U.S. Aggregate Bond Index. The equity portion of the Fund experienced solid outperformance during the year, while the fixed income portion of the Fund had another successful year. Within fixed income, an underweight to corporate bonds, an emphasis on quality, attractive yield-curve positioning, and income from government mortgages were the primary sources of excess return.
For the year ended December 31, 2011, the Managers High Yield Fund’s Institutional Class returned 4.83%, compared to 4.98% for the Barclays Capital U.S. Corporate High Yield Index. The Fund slightly underperformed its primary benchmark during 2011 due to exposure to the chemicals, retailers, and consumer services sectors. On the upside, performance was aided by security selection in the financials, real estate investment trusts, and transportation services sectors.
For the year ended December 31, 2011, Managers Fixed Income Fund’s Institutional Class returned 4.79%, lagging the 7.84% return for the Barclays Capital U.S. Aggregate Bond Index. The primary driver of the Fund’s underperformance relative to the Index during 2011 was its emphasis on convertibles, below investment grade bonds, and its underweight to the U.S. Treasury sector.
The following report covers the one-year period ended December 31, 2011. Should you have any questions about this report, or if you’d like to receive a prospectus and additional information, including fees and expenses for this or any of the other Funds in our family, please feel free to contact us at 1-800-835-3879, or visit our Web site at www.managersinvest.com. As always, please read the prospectus carefully before you invest or send money.
2
Letter to Shareholders (continued)
If you are curious about how you can better diversify your investment program, visit our web site for information on other MIG product offerings. You can rest assured that under all market conditions our team is focused on delivering excellent investment management services for your benefit.
We thank you for your continued confidence and investment in The Managers Funds.
Respectfully,

Keitha Kinne
Managing Partner
Managers Investment Group LLC
3
About Your Fund’s Expenses
As a shareholder of a Fund, you may incur two types of costs: (1) transaction costs, which may include sales charges (loads) on purchase payments; redemption fees; and exchange fees; and (2) ongoing costs, including management fees; distribution (12b-1) fees; and other Fund expenses. This example is intended to help you understand your ongoing costs (in dollars) of investing in the Fund and to compare these costs with the ongoing costs of investing in other mutual funds. The example is based on $1,000 invested at the beginning of the period and held for the entire period as indicated below.
Actual Expenses
The first line of the following table provides information about the actual account values and actual expenses. You may use the information in this line, together with the amount you invested, to estimate the expenses that you paid over the period. Simply divide your account value by $1,000 (for example, an $8,600 account value divided by $1,000 = 8.6), then multiply the result by the number in the first line under the heading entitled “Expenses Paid During Period” to estimate the expenses you paid on your account during this period.
Hypothetical Example for Comparison Purposes
The second line of the following table provides information about hypothetical account values and hypothetical expenses based on the Fund’s actual expense ratio and an assumed annual rate of return of 5% before expenses, which is not the Fund’s actual return. The hypothetical account values and expenses may not be used to estimate the actual ending account balance or expenses you paid for the period. You may use this information to compare the ongoing costs of investing in the Fund and other funds by comparing this 5% hypothetical example with the 5% hypothetical examples that appear in the shareholder reports of other funds.
Please note that the expenses shown in the table are meant to highlight your ongoing costs only and do not reflect any transactional costs, such as sales charges (loads), redemption fees, or exchange fees. Therefore, the second line of the table is useful in comparing ongoing costs only, and will not help you determine the relative total costs of owning different funds.
| | | | | | | | | | | | | | | | |
Six Months Ended December 31, 2011 | | Expense
Ratio for
the Period | | | Beginning
Account Value
07/01/2011 | | | Ending
Account Value
12/31/2011 | | | Expenses
Paid During
the Period* | |
Managers AMG Chicago Equity Partners
Mid-Cap Fund | | | | | | | | | | | | | |
Class A | | | | | | | | | | | | | | | | |
Based on Actual Fund Return | | | 1.24 | % | | $ | 1,000 | | | $ | 893 | | | $ | 5.92 | |
Hypothetical (5% return before expenses) | | | 1.24 | % | | $ | 1,000 | | | $ | 1,019 | | | $ | 6.31 | |
Class C | | | | | | | | | | | | | | | | |
Based on Actual Fund Return | | | 1.99 | % | | $ | 1,000 | | | $ | 890 | | | $ | 9.48 | |
Hypothetical (5% return before expenses) | | | 1.99 | % | | $ | 1,000 | | | $ | 1,015 | | | $ | 10.11 | |
Institutional Class | | | | | | | | | | | | | | | | |
Based on Actual Fund Return | | | 0.99 | % | | $ | 1,000 | | | $ | 894 | | | $ | 4.73 | |
Hypothetical (5% return before expenses) | | | 0.99 | % | | $ | 1,000 | | | $ | 1,020 | | | $ | 5.04 | |
Managers AMG Chicago Equity Partners Balanced Fund | | | | | | | | | | | | | | | | |
Class A | | | | | | | | | | | | | | | | |
Based on Actual Fund Return | | | 1.25 | % | | $ | 1,000 | | | $ | 996 | | | $ | 6.29 | |
Hypothetical (5% return before expenses) | | | 1.25 | % | | $ | 1,000 | | | $ | 1,019 | | | $ | 6.36 | |
Class C | | | | | | | | | | | | | | | | |
Based on Actual Fund Return | | | 2.00 | % | | $ | 1,000 | | | $ | 992 | | | $ | 10.04 | |
Hypothetical (5% return before expenses) | | | 2.00 | % | | $ | 1,000 | | | $ | 1,015 | | | $ | 10.16 | |
Institutional Class | | | | | | | | | | | | | | | | |
Based on Actual Fund Return | | | 1.00 | % | | $ | 1,000 | | | $ | 997 | | | $ | 5.03 | |
Hypothetical (5% return before expenses) | | | 1.00 | % | | $ | 1,000 | | | $ | 1,020 | | | $ | 5.09 | |
Managers High Yield Fund | | | | | | | | | | | | | | | | |
Class A | | | | | | | | | | | | | | | | |
Based on Actual Fund Return | | | 1.15 | % | | $ | 1,000 | | | $ | 1,004 | | | $ | 5.81 | |
Hypothetical (5% return before expenses) | | | 1.15 | % | | $ | 1,000 | | | $ | 1,019 | | | $ | 5.85 | |
Class C | | | | | | | | | | | | | | | | |
Based on Actual Fund Return | | | 1.90 | % | | $ | 1,000 | | | $ | 1,001 | | | $ | 9.58 | |
Hypothetical (5% return before expenses) | | | 1.90 | % | | $ | 1,000 | | | $ | 1,016 | | | $ | 9.65 | |
Institutional Class | | | | | | | | | | | | | | | | |
Based on Actual Fund Return | | | 0.90 | % | | $ | 1,000 | | | $ | 1,006 | | | $ | 4.55 | |
Hypothetical (5% return before expenses) | | | 0.90 | % | | $ | 1,000 | | | $ | 1,021 | | | $ | 4.58 | |
4
About Your Fund’s Expenses
| | | | | | | | | | | | | | | | |
Six Months Ended December 31, 2011 | | Expense
Ratio for
the Period | | | Beginning
Account Value
07/01/2011 | | | Ending
Account Value
12/31/2011 | | | Expenses
Paid During
the Period* | |
Managers Fixed Income Fund | | | | | | | | | | | | | | | | |
Class A | | | | | | | | | | | | | | | | |
Based on Actual Fund Return | | | 0.84 | % | | $ | 1,000 | | | $ | 1,002 | | | $ | 4.24 | |
Hypothetical (5% return before expenses) | | | 0.84 | % | | $ | 1,000 | | | $ | 1,021 | | | $ | 4.28 | |
Class B1 | | | | | | | | | | | | | | | | |
Based on Actual Fund Return | | | 1.59 | % | | $ | 1,000 | | | $ | 1,001 | | | $ | 8.02 | |
Hypothetical (5% return before expenses) | | | 1.59 | % | | $ | 1,000 | | | $ | 1,017 | | | $ | 8.08 | |
Class C | | | | | | | | | | | | | | | | |
Based on Actual Fund Return | | | 1.59 | % | | $ | 1,000 | | | $ | 1,002 | | | $ | 8.02 | |
Hypothetical (5% return before expenses) | | | 1.59 | % | | $ | 1,000 | | | $ | 1,017 | | | $ | 8.08 | |
Institutional Class | | | | | | | | | | | | | | | | |
Based on Actual Fund Return | | | 0.59 | % | | $ | 1,000 | | | $ | 1,004 | | | $ | 2.98 | |
Hypothetical (5% return before expenses) | | | 0.59 | % | | $ | 1,000 | | | $ | 1,022 | | | $ | 3.01 | |
| * | Expenses are equal to the Fund’s annualized expense ratio multiplied by the average account value over the period, multiplied by the number of days in the most recent fiscal half-year (184), then divided by 365. |
| 1 | Effective at the close of business on June 30, 2011, shares are no longer available for purchase. |
5
Managers AMG Chicago Equity Partners Mid-Cap Fund
Investment Manager’s Comments
THE YEAR IN REVIEW
For the year ended December 31, 2011 the Managers AMG Chicago Equity Partners Mid-Cap Fund’s Institutional class returned 1.08%, versus the Russell Midcap® Index at -1.55%. Overall, a broad set of our proprietary quantitative factors did well in 2011, and as a result, the top-ranked stocks (in our model) outperformed the bottom-ranked stocks. This led to consistent value-added excess return for the Fund.
If you were going to forecast tomorrow’s weather, a decent rule of thumb would be to use today’s actual temperature as your prediction — unless you are in Chicago, of course! If you were trying to forecast equity returns for the coming year, you would expect a more sophisticated approach would be warranted. But that was not the case in 2011. The Russell 1000® Index finished the year close to where it started, falling 3 points from 696 to 693. Dividends resulted in the year being positive. The mid-cap indices were negative for the year, underperforming the large-cap stocks.
Equity markets began with a strong start during the first part of the year peaking near the end of April. Performance then headed south as the Russell 1000® experienced seven consecutive weeks of negative performance. A strong rally during the final four days of June resulted in a quarter that was marginally positive. After an angst-filled third quarter, markets quickly regained their footing, and rebounded in the early part of the fourth quarter. Pessimism about an impending economic deceleration receded, and investors shifted their focus toward corporations, with strong balance sheets and attractive valuations that continued to deliver strong earnings. But worries remain unresolved, and many investors expect the pace of earnings growth to decline. The latest headlines coming out of Europe will continue to influence market movements. While references to green shoots are no longer part of the lexicon, encouraging data with respect to construction, manufacturing and auto and retail sales suggest the economy continues to make progress. But will that progress be sufficient to win over the non-believers?
The Fund experienced solid outperformance during the year. Year-to-date we saw broad and balanced outperformance with eight out of ten sectors providing returns in excess of the benchmark. From our factor groups, the Momentum factors performed the best; Quality was also strong while Growth and Value groups were flat. For the year, the model ranks provided strong discrimination as the top-ranked stocks performed the best and the lowest-ranked stocks showed the weakest performance. Overall, our philosophy will not change based on short-term trends or conditions in the market. Our goal is to add value through security selection, while attempting to neutralize other risk factors, such as market timing and sector rotation, for which there is not adequate compensation by the market. We will continue to use our disciplined approach to provide added value at controlled levels of risk.
This commentary reflects the viewpoints of the portfolio manager, Chicago Equity Partners, as of December 31, 2011, and is not intended as a forecast or guarantee of future results.
CUMULATIVE TOTAL RETURN PERFORMANCE
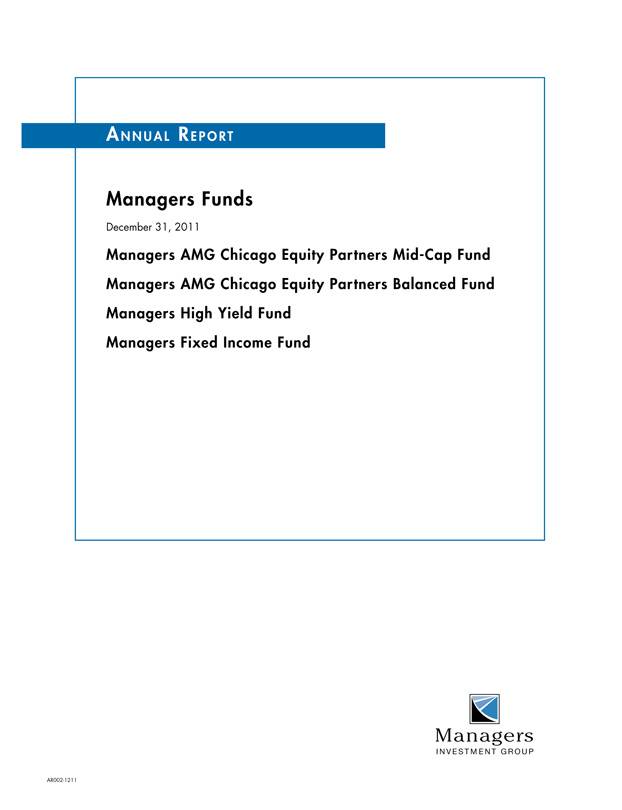
Managers AMG Chicago Equity Partners Mid-Cap Fund’s (“Managers Mid-Cap Fund”) cumulative total return is based on the daily change in net asset value (NAV), and assumes that all dividends and distributions were reinvested. This chart compares a hypothetical $10,000 investment made in the Fund’s Class A Shares (with load) on December 31, 2001, with a $10,000 investment made in the Rus-sell Midcap® Index for the same time period. Performance for periods longer than one year is annualized. The graph and table do not reflect the deduction of taxes that a shareholder would pay on a Fund distribution or redemption of shares. Past performance is not indicative of future results. The listed returns for the Fund are net of expenses and the returns for the indices exclude expenses.
6
Managers AMG Chicago Equity Partners Mid-Cap Fund
Investment Manager’s Comments (continued)
CUMULATIVE TOTAL RETURN PERFORMANCE (continued)
The table below shows the average annual total returns for the Managers Mid-Cap Fund and the Russell Midcap® Index from December 31, 2001 through December 31, 2011.
| | | | | | | | | | | | | | |
| | | | | Average Annual Total Returns1 | |
| | | | | One Year | | | Five Years | | | Ten Years | |
Managers AMG CEP Mid-Cap Fund 2,3 | | | | | | | | | |
-Class A | | No Load | | | 0.86 | % | | | 0.91 | % | | | 5.73 | % |
-Class A | | With Load | | | (4.94) | % | | | (0.27) | % | | | 5.10 | % |
-Class C | | No Load | | | 0.08 | % | | | 0.04 | % | | | 4.96 | % |
-Class C | | With Load | | | (0.92) | % | | | 0.04 | % | | | 4.96 | % |
-Institutional Class | | No Load | | | 1.08 | % | | | 1.04 | % | | | 6.01 | % |
Russell Midcap® Index4 | | | | | (1.55) | % | | | 1.41 | % | | | 6.99 | % |
The performance data shown represents past performance. Past performance is not a guarantee of future results. Current performance may be lower or higher than the performance data quoted. The investment return and principal value of an investment in the Fund will fluctuate so that an investor’s shares, when redeemed, may be worth more or less than their original cost. For performance information through the most recent month end, please call (800) 835-3879 or visit our Web site at www.managersinvest.com.
Performance differences among the share classes are due to differences in sales charge structures and class expenses. Returns shown reflect maximum sales charge of 5.75% on Class A, as well as the applicable contingent deferred sales charge (CDSC) on Class C shares. Class C shares held for less than one year are subject to a 1% CDSC.
Investors should carefully consider the Fund’s investment objectives, risks, charges, and expenses before investing. For this and other information, please call 800.835.3879 or visit www.managersinvest.com for a free prospectus. Read it carefully before investing or sending money. Funds are distributed by Managers Distributors, Inc., a member of FINRA.
|
1 Total return equals income yield plus share price change and assumes reinvestment of all dividends and capital gain distributions. Returns are net of fees and may reflect offsets of Fund expenses as described in the Prospectus. No adjustment has been made for taxes payable by shareholders on their reinvested dividends and capital gain distributions. Returns for periods greater than one year are annualized. The listed returns on the Fund are net of expenses and based on the published NAV as of December 31, 2011. All returns are in U.S. dollars ($). 2 The Fund is subject to risks associated with investments in mid-capitalization companies, such as erratic earnings patterns, competitive conditions, limited earnings history, and a reliance on one or a limited number of products. 3 From time to time, the Fund’s advisor has waived its fees and/or absorbed Fund expenses, which has resulted in higher returns. 4 The Russell Midcap® Index is a subset of the Russell 1000® Index and measures the performance of the 800 smallest companies in the Russell 1000® Index. The index is unmanaged, is not available for investment and does not incur expenses. The Russell Midcap® Index is a registered trademark of Russell Investments. Russell® is a trademark of Russell Investments. Not FDIC insured, nor bank guaranteed. May lose value. |
7
Managers AMG Chicago Equity Partners Mid-Cap Fund
Fund Snapshots (unaudited)
December 31, 2011
Portfolio Breakdown
| | | | | | | | |
Industry | | Managers AMG CEP
Mid-Cap Fund** | | | Russell
Midcap® Index | |
Financials | | | 19.0 | % | | | 19.1 | % |
Information Technology | | | 16.8 | % | | | 13.0 | % |
Industrials | | | 15.5 | % | | | 12.7 | % |
Consumer Discretionary | | | 14.6 | % | | | 15.6 | % |
Health Care | | | 9.6 | % | | | 9.6 | % |
Energy | | | 6.5 | % | | | 8.2 | % |
Materials | | | 6.1 | % | | | 6.6 | % |
Utilities | | | 6.1 | % | | | 7.5 | % |
Consumer Staples | | | 4.6 | % | | | 6.5 | % |
Telecommunication Services | | | 0.9 | % | | | 1.2 | % |
Other Assets and Liabilities | | | 0.3 | % | | | 0.0 | % |
| ** | As a percentage of net assets |
Top Ten Holdings
| | | | |
Security Name | | % of
Net Assets | |
National Retail Properties, Inc.* | | | 2.0 | % |
PetSmart, Inc. | | | 1.9 | |
Alliance Data Systems Corp. | | | 1.9 | |
Rayonier, Inc.* | | | 1.8 | |
Tractor Supply Co. | | | 1.8 | |
Kennametal, Inc.* | | | 1.8 | |
Convergys Corp. | | | 1.7 | |
Domtar Corp.* | | | 1.7 | |
Cadence Design Systems, Inc. | | | 1.6 | |
AMERIGROUP Corp.* | | | 1.6 | |
| | | | |
Top Ten as a Group | | | 17.8 | % |
| | | | |
| * | Top Ten Holding at June 30, 2011 |
|
| Any sectors, industries, or securities discussed should not be perceived as investment recommendations. Mention of a specific security should not be considered a recommendation to buy or solicitation to sell that security. Specific securities mentioned in this report may have been sold from the Fund’s portfolio of investments by the time you receive this report. |
8
Managers AMG Chicago Equity Partners Mid-Cap Fund
Schedule of Portfolio Investments
December 31, 2011
| | | | | | | | |
| | | Shares | | | Value | |
| | | | | | | | |
Common Stocks - 99.7% | | | | | | | | |
Consumer
Discretionary - 14.6% | | | | | | | | |
AMC Networks, Inc.,
Class A* | | | 3,000 | | | $ | 112,740 | |
Columbia Sportswear Co.1 | | | 3,900 | | | | 181,545 | |
Dana Holding Corp.* | | | 7,000 | | | | 85,050 | |
Dollar Tree, Inc.* | | | 4,250 | | | | 353,218 | |
Foot Locker, Inc. | | | 7,700 | | | | 183,568 | |
Fossil, Inc.* | | | 1,350 | | | | 107,136 | |
Gannett Co., Inc. | | | 13,300 | | | | 177,821 | |
Garmin, Ltd.1 | | | 7,300 | | | | 290,613 | |
Goodyear Tire & Rubber Co., The* | | | 4,300 | | | | 60,931 | |
H&R Block, Inc. | | | 21,500 | | | | 351,095 | |
Harman International Industries, Inc. | | | 5,200 | | | | 197,808 | |
Interpublic Group of Cos., Inc., The | | | 20,900 | | | | 203,357 | |
ITT Educational Services, Inc.*1 | | | 3,100 | | | | 176,359 | |
PetSmart, Inc. | | | 15,100 | | | | 774,479 | |
Polaris Industries, Inc. | | | 11,050 | | | | 618,579 | |
PVH Corp. | | | 4,400 | | | | 310,156 | |
Scripps Networks Interactive, Inc., Class A | | | 1,900 | | | | 80,598 | |
Tempur-Pedic International, Inc.* | | | 4,700 | | | | 246,891 | |
Tractor Supply Co. | | | 10,400 | | | | 729,560 | |
TRW Automotive Holdings Corp.* | | | 4,300 | | | | 140,180 | |
Weight Watchers International, Inc.1 | | | 4,400 | | | | 242,044 | |
Wyndham Worldwide Corp. | | | 6,600 | | | | 249,678 | |
Total Consumer Discretionary | | | | | | | 5,873,406 | |
Consumer Staples - 4.6% | | | | | | | | |
Church & Dwight Co., Inc. | | | 6,500 | | | | 297,440 | |
Constellation Brands, Inc., Class A* | | | 3,300 | | | | 68,211 | |
Corn Products International, Inc. | | | 4,300 | | | | 226,137 | |
Hansen Natural Corp.* | | | 3,550 | | | | 327,097 | |
Herbalife, Ltd. | | | 4,300 | | | | 222,181 | |
Hormel Foods Corp. | | | 9,500 | | | | 278,255 | |
Ralcorp Holdings, Inc.* | | | 2,200 | | | | 188,100 | |
Smithfield Foods, Inc.* | | | 5,600 | | | | 135,968 | |
Tyson Foods, Inc. | | | 5,500 | | | | 113,520 | |
Total Consumer Staples | | | | | | | 1,856,909 | |
Energy - 6.5% | | | | | | | | |
Atwood Oceanics, Inc.* | | | 1,500 | | | | 59,685 | |
CVR Energy, Inc. | | | 6,100 | | | | 114,253 | |
Energy XXI Bermuda, Ltd.* | | | 5,200 | | | | 165,776 | |
Exterran Holdings, Inc.* | | | 8,200 | | | | 74,620 | |
Forest Oil Corp.* | | | 12,600 | | | | 170,730 | |
Golar LNG, Ltd. | | | 6,800 | | | | 302,260 | |
Helix Energy Solutions Group, Inc.* | | | 25,100 | | | | 396,580 | |
| | | | | | | | |
| | | Shares | | | Value | |
| | | | | | | | |
Rosetta Resources, Inc.* | | | 6,400 | | | $ | 278,400 | |
SEACOR Holdings, Inc.* | | | 4,800 | | | | 427,008 | |
Southern Union Co. | | | 4,500 | | | | 189,495 | |
Tesoro Corp.* | | | 6,600 | | | | 154,176 | |
Unit Corp.* | | | 6,300 | | | | 292,320 | |
Total Energy | | | | | | | 2,625,303 | |
Financials - 19.0% | | | | | | | | |
Allied World Assurance Co. Holdings, AG | | | 5,500 | | | | 346,115 | |
American Campus Communities, Inc. | | | 11,600 | | | | 486,736 | |
American Capital Agency Corp. | | | 11,200 | | | | 314,496 | |
Arch Capital Group, Ltd.* | | | 12,100 | | | | 450,483 | |
Assurant, Inc. | | | 13,100 | | | | 537,886 | |
BOK Financial Corp. | | | 4,400 | | | | 241,692 | |
Camden Property Trust | | | 2,700 | | | | 168,048 | |
Cathay General Bancorp | | | 18,900 | | | | 282,177 | |
CBL & Associates Properties, Inc. | | | 11,800 | | | | 185,260 | |
Chimera Investment Corp. | | | 72,500 | | | | 181,975 | |
Commerce Bancshares, Inc. | | | 6,657 | | | | 253,765 | |
CommonWealth REIT | | | 15,200 | | | | 252,928 | |
East West Bancorp, Inc. | | | 13,700 | | | | 270,575 | |
Eaton Vance Corp. | | | 4,300 | | | | 101,652 | |
Federal Realty Investment Trust | | | 1,500 | | | | 136,125 | |
Highwoods Properties, Inc. | | | 4,700 | | | | 139,449 | |
Hospitality Properties Trust | | | 14,900 | | | | 342,402 | |
MFA Financial, Inc. | | | 28,400 | | | | 190,848 | |
NASDAQ OMX Group, Inc., The* | | | 9,900 | | | | 242,649 | |
National Retail Properties, Inc. | | | 31,100 | | | | 820,418 | |
Prosperity Bancshares, Inc. | | | 6,100 | | | | 246,135 | |
Raymond James Financial, Inc. | | | 2,100 | | | | 65,016 | |
Rayonier, Inc. | | | 16,500 | | | | 736,395 | |
Tanger Factory Outlet Centers | | | 7,000 | | | | 205,240 | |
Torchmark Corp. | | | 4,500 | | | | 195,255 | |
Transatlantic Holdings, Inc. | | | 2,300 | | | | 125,879 | |
Webster Financial Corp. | | | 4,400 | | | | 89,716 | |
Total Financials | | | | | | | 7,609,315 | |
Health Care - 9.6% | | | | | | | | |
AMERIGROUP Corp.* | | | 10,800 | | | | 638,064 | |
Charles River Laboratories International, Inc.* | | | 7,300 | | | | 199,509 | |
Community Health Systems, Inc.* | | | 10,100 | | | | 176,245 | |
Cooper Cos., Inc., The | | | 5,300 | | | | 373,756 | |
DENTSPLY International, Inc. | | | 12,300 | | | | 430,377 | |
Health Net, Inc.* | | | 19,900 | | | | 605,358 | |
Hill-Rom Holdings, Inc. | | | 3,500 | | | | 117,915 | |
Medicis Pharmaceutical Corp., Class A | | | 8,900 | | | | 295,925 | |
The accompanying notes are an integral part of these financial statements.
9
Managers AMG Chicago Equity Partners Mid-Cap Fund
Schedule of Portfolio Investments (continued)
| | | | | | | | |
| | | Shares | | | Value | |
| | | | | | | | |
Health Care - 9.6% (continued) | | | | | | | | |
PerkinElmer, Inc. | | | 10,600 | | | $ | 212,000 | |
Thoratec Corp.* | | | 2,300 | | | | 77,188 | |
United Therapeutics Corp.* | | | 11,500 | | | | 543,375 | |
WellCare Health Plans, Inc.* | | | 3,200 | | | | 168,000 | |
Total Health Care | | | | | | | 3,837,712 | |
Industrials - 15.5% | | | | | | | | |
AGCO Corp.* | | | 10,800 | | | | 464,076 | |
Alaska Air Group, Inc.* | | | 4,800 | | | | 360,432 | |
Chicago Bridge & Iron Co., NV | | | 6,500 | | | | 245,700 | |
Crane Co. | | | 8,700 | | | | 406,377 | |
EMCOR Group, Inc. | | | 10,500 | | | | 281,505 | |
Gardner Denver, Inc. | | | 4,700 | | | | 362,182 | |
Granite Construction, Inc. | | | 15,300 | | | | 362,916 | |
Herman Miller, Inc. | | | 7,300 | | | | 134,685 | |
Hexcel Corp.* | | | 14,500 | | | | 351,045 | |
Hubbell, Inc., Class B | | | 7,200 | | | | 481,392 | |
Huntington Ingalls Industries, Inc.* | | | 4,900 | | | | 153,272 | |
Kennametal, Inc. | | | 19,600 | | | | 715,792 | |
Landstar System, Inc. | | | 9,800 | | | | 469,616 | |
Lennox International, Inc. | | | 3,100 | | | | 104,625 | |
Manpower, Inc. | | | 13,900 | | | | 496,925 | |
Timken Co. | | | 12,400 | | | | 480,004 | |
TransDigm Group, Inc.* | | | 1,400 | | | | 133,952 | |
URS Corp.* | | | 5,600 | | | | 196,672 | |
Total Industrials | | | | | | | 6,201,168 | |
Information
Technology - 16.8% | | | | | | | | |
Advanced Micro Devices, Inc.*1 | | | 20,600 | | | | 111,240 | |
Alliance Data Systems Corp.* | | | 7,200 | | | | 747,648 | |
Anixter International, Inc.* | | | 5,400 | | | | 322,056 | |
AOL, Inc.* | | | 5,800 | | | | 87,580 | |
Atmel Corp.* | | | 13,200 | | | | 106,920 | |
Booz Allen Hamilton Holding Corp.* | | | 8,600 | | | | 148,350 | |
Cadence Design Systems, Inc.* | | | 63,100 | | | | 656,240 | |
Convergys Corp.* | | | 52,700 | | | | 672,979 | |
Cypress Semiconductor Corp.* | | | 9,300 | | | | 157,077 | |
Fairchild Semiconductor International, Inc.* | | | 19,400 | | | | 233,576 | |
Gartner, Inc.* | | | 10,300 | | | | 358,131 | |
Global Payments, Inc. | | | 4,500 | | | | 213,210 | |
IAC/InterActiveCorp | | | 11,000 | | | | 468,600 | |
Integrated Device Technology, Inc.* | | | 10,500 | | | | 57,330 | |
Jabil Circuit, Inc. | | | 12,100 | | | | 237,886 | |
LSI Corp.* | | | 20,200 | | | | 120,190 | |
Mentor Graphics Corp.* | | | 16,200 | | | | 219,672 | |
| | | | | | | | |
| | | Shares | | | Value | |
| | | | | | | | |
MICROS Systems, Inc.* | | | 5,100 | | | $ | 237,558 | |
NCR Corp.* | | | 25,000 | | | | 411,500 | |
NeuStar, Inc., Class A* | | | 1,700 | | | | 58,089 | |
Plantronics, Inc. | | | 4,800 | | | | 171,072 | |
Riverbed Technology, Inc.* | | | 12,400 | | | | 291,400 | |
Teradyne, Inc.* | | | 12,000 | | | | 163,560 | |
TIBCO Software, Inc.* | | | 11,800 | | | | 282,138 | |
Vishay Intertechnology, Inc.* | | | 22,900 | | | | 205,871 | |
Total Information Technology | | | | | | | 6,739,873 | |
Materials - 6.1% | | | | | | | | |
Albemarle Corp. | | | 3,600 | | | | 185,436 | |
Ashland, Inc. | | | 6,600 | | | | 377,256 | |
Cabot Corp. | | | 14,600 | | | | 469,244 | |
Coeur d’Alene Mines Corp.* | | | 5,200 | | | | 125,528 | |
Domtar Corp. | | | 8,325 | | | | 665,667 | |
Temple-Inland, Inc. | | | 4,300 | | | | 136,353 | |
Worthington Industries, Inc. | | | 30,600 | | | | 501,228 | |
Total Materials | | | | | | | 2,460,712 | |
Telecommunication Services - 0.9% | | | | | | | | |
Telephone & Data Systems, Inc. | | | 6,600 | | | | 170,874 | |
tw telecom, Inc.* | | | 5,700 | | | | 110,466 | |
United States Cellular Corp.* | | | 1,400 | | | | 61,082 | |
Total Telecommunication Services | | | | | | | 342,422 | |
Utilities - 6.1% | | | | | | | | |
Cleco Corp. | | | 12,300 | | | | 468,630 | |
IDACORP, Inc. | | | 11,500 | | | | 487,715 | |
NiSource, Inc. | | | 25,300 | | | | 602,393 | |
NRG Energy, Inc.* | | | 7,900 | | | | 143,148 | |
PNM Resources, Inc. | | | 26,000 | | | | 473,980 | |
Questar Corp. | | | 12,700 | | | | 252,222 | |
Total Utilities | | | | | | | 2,428,088 | |
Total Common Stocks
(cost $37,488,015) | | | | | | | 39,974,908 | |
Other Investment
Companies - 2.5%2 | | | | | | | | |
BNY Mellon Overnight Government Fund, 0.04%3 | | | 828,080 | | | | 828,080 | |
Dreyfus Cash Management Fund, Institutional Class Shares, 0.05% | | | 167,586 | | | | 167,586 | |
Total Other Investment Companies
(cost $995,666) | | | | | | | 995,666 | |
Total Investments - 102.2%
(cost $38,483,681) | | | | | | | 40,970,574 | |
Other Assets, less
Liabilities - (2.2)% | | | | | | | (873,938 | ) |
Net Assets 100.0% | | | | | | $ | 40,096,636 | |
The accompanying notes are an integral part of these financial statements.
10
Managers AMG Chicago Equity Partners Balanced Fund
Investment Manager’s Comments
THE YEAR IN REVIEW
For the year ended December 31, 2011, the Managers AMG Chicago Equity Partners Balanced Fund returned 6.77%, outperforming the 4.84% return for its benchmark, which consists of 60% of the return of the Russell 1000® Index and 40% of the return of the Barclays Capital U.S. Aggregate Bond Index. For the year, excess return came from out performance in both the equity and fixed income portions of the Fund.
If you were going to forecast tomorrow’s weather, a decent rule of thumb would be to use today’s actual temperature as your prediction, unless you are in Chicago, of course! If you were trying to forecast equity returns for the coming year, you would expect a more sophisticated approach would be warranted. But that was not the case in 2011. The Russell 1000® Index finished the year close to where it started, falling 3 points from 696 to 693. Dividends resulted in the year being positive.
Equity markets began with a strong start during the first part of the year peaking near the end of April. Performance then headed south as the Russell 1000® experienced seven consecutive weeks of negative performance. A strong rally during the final four days of June resulted in a quarter that was marginally positive. After an angst-filled third quarter, markets quickly regained their footing, and rebounded in the early part of the fourth quarter. Pessimism about an impending economic deceleration receded, and investors shifted their focus toward corporations with strong balance sheets and attractive valuations that continued to deliver strong earnings. But worries remain unresolved, and many investors expect the pace of earnings growth to decline. The latest headlines coming out of Europe will continue to influence market movements. While references to green shoots are no longer part of the lexicon, encouraging data with respect to construction, manufacturing and auto and retail sales suggest the economy continues to make progress. But will that progress be sufficient to win over the non-believers?
The equity portion of the Fund experienced solid out performance during the year. Year-to-date, the Portfolio experienced broad and balanced out performance with all ten sectors registering above benchmark returns. From our factor groups, the momentum factors performed the best; the quality and growth factor groups were also strong while the value group was flat. For the year, the model ranks provided strong discrimination as the top ranked stocks performed the best and the lowest ranked stocks showed the weakest performance. Overall, our philosophy will not change based on short-term trends or conditions in the market. We will continue to use our disciplined approach to provide added value at controlled levels of risk.
Headlines regarding the European sovereign debt crisis greatly influenced capital markets throughout the world in 2011. While policymakers have yet to achieve a lasting solution, attempts to calm markets, restore confidence, and put government budgets on a more-sound trajectory threaten the growth outlook for the world’s largest economic region in 2012. The combination of increasing risk and slowing growth resulted in lower rates and higher risk premiums in the United States. After starting the year at historically low levels,
interest rates on U.S. Treasury securities fell further, even as Standard & Poor’s downgraded the U.S.’s credit rating. Corporate bonds, after starting the year with strong performance, were unable to keep pace with government bonds, as the outlook for a sustained U.S. recovery remains uncertain. Elevated levels of unemployment and household debt, combined with continued weakness in the housing market, are preventing the U.S. economy from achieving the desired momentum. Attempts by federal, state, and local governments to trim spending and boost revenues will further challenge the U.S. economy in 2012.
U.S. Treasuries represented the best-performing sector of the fixed income market in 2011, with a total return of 9.81%. On a duration-adjusted basis, agency debentures represented the best-performing non-treasury sector, followed by agency mortgage-backed securities (MBS). While investment-grade corporate bonds had attractive total returns for the year, the sector’s relative return trailed the Treasury Index by more than 3.5%.
The fixed income portion of the Fund had another successful year. An underweight to corporate bonds, an emphasis on quality, attractive yield-curve positioning, and income from government mortgages were the primary sources of excess return. 2011 marks the fifth-consecutive year in which our core Strategy outperformed the Barclays Capital U.S. Aggregate Bond Index. The combination of research, risk management, and a commitment to a disciplined decision-making process has led to out performance by the fixed income portion of the Fund versus the index for our core product in nine of the last 10 years. A consistent track record through meaningfully different economic environments and difficult market climates demonstrates the value of our fixed income management approach. Portfolios remain positioned to benefit from an environment characterized by a lower appetite for risk. As always, we will be diligent in monitoring exposures and will adjust the portfolio accordingly as we monitor the market conditions.
This commentary reflects the viewpoints of the portfolio manager, Chicago Equity Partners, as of December 31, 2011, and is not intended as a forecast or guarantee of future results.
CUMULATIVE TOTAL RETURN PERFORMANCE
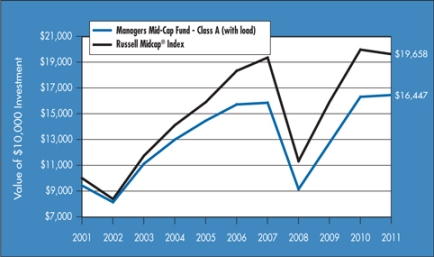
The Managers AMG Chicago Equity Partners Balanced Fund’s (“Managers Balanced Fund”) cumulative total return is based on the daily change in net asset value (NAV), and assumes that all dividends and distributions were reinvested. The chart illustrates the performance of a hypothetical $10,000 investment made in the Fund’s Class A Shares (with load) on December 31, 2001, to a $10,000 investment made in the benchmarks for the same time period. The graph and table do not reflect the deduction of taxes that a shareholder would pay on a Fund distribution or redemption of shares. Performance for periods longer than one year is annualized. The listed returns for the Fund are net of expenses and the returns for the indices exclude expenses. Total returns for the Fund would have been lower had certain expenses not been reduced.
Managers AMG Chicago Equity Partners Balanced Fund
Investment Manager’s Comments (continued)
CUMULATIVE TOTAL RETURN PERFORMANCE (continued)
The table below shows the average annual total returns for the Managers Balanced Fund, the Russell 1000® Index & the Barclays Capital U.S. Aggregate Bond Index from December 31, 2001 through December 31, 2011.
| | | | | | | | | | | | | | |
| | | | | Average Annual Total Returns1 | |
| | | | | One Year | | | Five Years | | | Ten Years | |
Managers AMG CEP Balanced Fund2,3 | |
-Class A | | No Load | | | 6.45 | % | | | 3.86 | % | | | 5.45 | % |
-Class A | | With Load | | | 0.35 | % | | | 2.64 | % | | | 4.82 | % |
-Class C | | No Load | | | 5.73 | % | | | 3.11 | % | | | 4.76 | % |
-Class C | | With Load | | | 4.73 | % | | | 3.11 | % | | | 4.76 | % |
-Institutional Class | | No Load | | | 6.77 | % | | | 4.13 | % | | | 5.81 | % |
60% Russell 1000® Index4/40% Barclays Capital U.S. Aggregate Index5 | | | 4.84 | % | | | 3.55 | % | | | 5.01 | % |
The performance data shown represents past performance. Past performance is not a guarantee of future results. Current performance may be lower or higher than the performance data quoted. The investment return and principal value of an investment in the Fund will fluctuate so that an investor’s shares, when redeemed, may be worth more or less than their original cost. For performance information through the most recent month end, please call (800) 835-3879 or visit our Web site at www.managersinvest.com.
Performance differences among the share classes are due to differences in sales charge structures and class expenses. Returns shown reflect maximum sales charge of 5.75% on Class A, as well as the applicable contingent deferred sales charge (CDSC) on Class C shares. Class C shares held for less than one year are subject to a 1% CDSC.
Investors should carefully consider the Fund’s investment objectives, risks, charges and expenses before investing. For this and other information, please call 800.835.3879 or visit www.managersinvest.com for a free prospectus. Read it carefully before investing or sending money. Funds are distributed by Managers Distributors, Inc., a member of FINRA.
|
1 Total return equals income yield plus share price change and assumes reinvestment of all dividends and capital gain distributions. Returns are net of fees and may reflect offsets of Fund expenses as described in the Prospectus. No adjustment has been made for taxes payable by shareholders on their reinvested dividends and capital gain distributions. Returns for periods greater than one year are annualized. The listed returns on the Fund are net of expenses and based on the published NAV as of December 31, 2011. All returns are in U.S. dollars ($). 2 The Fund is subject to risks associated with investments in debt securities, such as default risk and fluctuations in the perception of the debtors’ ability to pay their creditors. 3 From time to time, the Fund’s advisor has waived its fees and/or absorbed Fund expenses, which has resulted in higher returns. 4 The Russell 1000® Index measures the performance of approximately 1,000 of the largest securities based on a combination of their market cap and current index membership. The Russell 1000® represents approximately 92% of the U.S. market. The Russell 1000® Index is unmanaged, is not available for investment, and does not incur expenses. 5 The Barclays Capital U.S. Aggregate Bond Index is an index of the U.S. investment grade fixed-rate bond market, including both government and corporate bonds. The Barclays Capital U.S. Aggregate Bond Index is unmanaged, is not available for investment, and does not incur expenses. The Russell 1000® Index is a registered trademark of Russell Investments. Russell® is a trademark of Russell Investments. Not FDIC insured, nor bank guaranteed. May lose value. |
12
Managers AMG Chicago Equity Partners Balanced Fund
Fund Snapshots (unaudited)
December 31, 2011
Portfolio Breakdown
| | | | | | | | |
Industry | | Managers AMG CEP
Balanced Fund** | | | 60% Russell 1000® Index/
40% Barclays Capital
U.S. Aggregate
Bond Index | |
U.S. Government and Agency Obligations | | | 34.2 | % | | | 29.0 | % |
Information Technology | | | 12.5 | % | | | 11.0 | % |
Financials | | | 8.8 | % | | | 11.2 | % |
Industrials | | | 8.2 | % | | | 11.0 | % |
Health Care | | | 7.1 | % | | | 7.1 | % |
Energy | | | 6.5 | % | | | 7.0 | % |
Consumer Discretionary | | | 6.2 | % | | | 6.9 | % |
Consumer Staples | | | 6.2 | % | | | 6.3 | % |
Utilities | | | 3.3 | % | | | 3.3 | % |
Materials | | | 2.5 | % | | | 2.4 | % |
Telecommunication Services | | | 1.9 | % | | | 1.7 | % |
Mortgage-Backed Securities | | | 0.8 | % | | | 0.9 | % |
Asset-Backed Securities | | | 0.0 | % | | | 0.1 | % |
Foreign Government Obligations | | | 0.0 | % | | | 2.1 | % |
Other Assets and Liabilities | | | 1.8 | % | | | 0.0 | % |
| ** | As a percentage of net assets |
| | | | |
Top Ten Holdings | | | | |
Security Name | | % of
Net Assets | |
U.S. Treasury Bonds, 3.500%, 02/15/39 | | | 3.1 | % |
U.S. Treasury Notes, 2.625%, 08/15/20* | | | 2.2 | |
Verizon Communications, Inc.* | | | 1.7 | |
Johnson & Johnson* | | | 1.7 | |
U.S. Treasury Bonds, 3.125%, 05/15/21 | | | 1.7 | |
FHLB, 5.375%, 05/18/16 | | | 1.6 | |
FNMA, 5.375%, 06/12/17 | | | 1.5 | |
U.S. Treasury Notes, 2.750%, 02/28/18* | | | 1.5 | |
Apple, Inc.* | | | 1.5 | |
FHLB, 5.000%, 11/17/17 | | | 1.5 | |
| | | | |
Top Ten as a Group | | | 18.0 | % |
| | | | |
| * | Top Ten Holding at June 30, 2011 |
|
| Any sectors, industries, or securities discussed should not be perceived as investment recommendations. Mention of a specific security should not be considered a recommendation to buy or solicitation to sell that security. Specific securities mentioned in this report may have been sold from the Fund’s portfolio of investments by the time you receive this report. |
13
Managers AMG Chicago Equity Partners Balanced Fund
Schedule of Portfolio Investments
December 31, 2011
| | | | | | | | |
| | | Shares | | | Value | |
| | | | | | | | |
Common Stocks - 60.0% | | | | | | | | |
Consumer Discretionary - 6.2% | | | | | | | | |
CBS Corp., Class B | | | 7,150 | | | $ | 194,051 | |
Macy’s, Inc. | | | 3,950 | | | | 127,111 | |
Polaris Industries, Inc. | | | 3,200 | | | | 179,136 | |
Ross Stores, Inc. | | | 3,100 | | | | 147,343 | |
Signet Jewelers, Ltd. | | | 2,775 | | | | 121,989 | |
Starbucks Corp. | | | 4,500 | | | | 207,045 | |
Time Warner, Inc. | | | 5,100 | | | | 184,314 | |
TJX Cos., Inc. | | | 2,700 | | | | 174,285 | |
TRW Automotive Holdings Corp.* | | | 5,550 | | | | 180,930 | |
VF Corp. | | | 800 | | | | 101,592 | |
Viacom, Inc., Class B | | | 3,950 | | | | 179,370 | |
Total Consumer Discretionary | | | | | | | 1,797,166 | |
Consumer Staples - 6.2% | | | | | | | | |
Brown-Forman Corp., Class B | | | 1,300 | | | | 104,663 | |
Coca-Cola Enterprises, Inc. | | | 4,900 | | | | 126,322 | |
Colgate-Palmolive Co. | | | 2,400 | | | | 221,736 | |
Constellation Brands, Inc., Class A* | | | 7,300 | | | | 150,891 | |
Costco Wholesale Corp. | | | 1,650 | | | | 137,478 | |
Dean Foods Co.* | | | 7,300 | | | | 81,760 | |
Estee Lauder Cos. Inc., The, Class A | | | 825 | | | | 92,664 | |
Herbalife, Ltd. | | | 1,850 | | | | 95,589 | |
Hormel Foods Corp. | | | 6,100 | | | | 178,669 | |
Kroger Co., The | | | 6,450 | | | | 156,219 | |
Lorillard, Inc. | | | 825 | | | | 94,050 | |
Mead Johnson Nutrition Co. | | | 1,500 | | | | 103,095 | |
Philip Morris International, Inc. | | | 3,300 | | | | 258,984 | |
Total Consumer Staples | | | | | | | 1,802,120 | |
Energy - 6.5% | | | | | | | | |
Cabot Oil & Gas Corp. | | | 2,350 | | | | 178,365 | |
Chevron Corp. | | | 3,700 | | | | 393,680 | |
ConocoPhillips | | | 4,250 | | | | 309,698 | |
Devon Energy Corp. | | | 1,350 | | | | 83,700 | |
Diamond Offshore Drilling, Inc. | | | 2,000 | | | | 110,520 | |
Exxon Mobil Corp. | | | 4,595 | | | | 389,472 | |
Helmerich & Payne, Inc. | | | 1,000 | | | | 58,360 | |
National Oilwell Varco, Inc. | | | 2,500 | | | | 169,975 | |
Tesoro Corp.* | | | 2,900 | | | | 67,744 | |
Valero Energy Corp. | | | 5,000 | | | | 105,250 | |
Total Energy | | | | | | | 1,866,764 | |
Financials - 8.4% | | | | | | | | |
ACE, Ltd. | | | 2,700 | | | | 189,324 | |
American Financial Group, Inc. | | | 5,500 | | | | 202,895 | |
The accompanying notes are an integral part of these financial statements.
14
Managers AMG Chicago Equity Partners Balanced Fund
Schedule of Portfolio Investments (continued)
| | | | | | | | |
| | | Shares | | | Value | |
| | | | | | | | |
Financials - 8.4% (continued) | | | | | | | | |
Annaly Capital Management, Inc. | | | 7,750 | | | $ | 123,690 | |
Bank of America Corp. | | | 17,300 | | | | 96,188 | |
Berkshire Hathaway, Inc., Class B* | | | 1,300 | | | | 99,190 | |
Capital One Financial Corp. | | | 3,200 | | | | 135,328 | |
Chubb Corp., The | | | 2,400 | | | | 166,128 | |
Citigroup, Inc. | | | 6,530 | | | | 171,804 | |
CommonWealth REIT | | | 9,600 | | | | 159,744 | |
Discover Financial Services | | | 4,100 | | | | 98,400 | |
Interactive Brokers Group, Inc. | | | 4,400 | | | | 65,736 | |
JPMorgan Chase & Co. | | | 7,148 | | | | 237,671 | |
KeyCorp | | | 28,900 | | | | 222,241 | |
Public Storage | | | 2,050 | | | | 275,643 | |
SLM Corp. | | | 4,000 | | | | 53,600 | |
Wells Fargo & Co. | | | 5,100 | | | | 140,556 | |
Total Financials | | | | | | | 2,438,138 | |
Health Care - 7.1% | | | | | | | | |
Abbott Laboratories | | | 3,700 | | | | 208,051 | |
Aetna, Inc. | | | 2,600 | | | | 109,694 | |
Alexion Pharmaceuticals, Inc.* | | | 1,150 | | | | 82,225 | |
Amgen, Inc. | | | 1,153 | | | | 74,034 | |
Bristol-Myers Squibb Co. | | | 5,700 | | | | 200,868 | |
Humana, Inc. | | | 2,025 | | | | 177,410 | |
Johnson & Johnson | | | 7,350 | | | | 482,013 | |
Medco Health Solutions, Inc.* | | | 1,400 | | | | 78,260 | |
PerkinElmer, Inc. | | | 3,400 | | | | 68,000 | |
Pfizer, Inc. | | | 18,257 | | | | 395,081 | |
United Therapeutics Corp.* | | | 3,900 | | | | 184,275 | |
Total Health Care | | | | | | | 2,059,911 | |
Industrials - 6.0% | | | | | | | | |
Caterpillar, Inc. | | | 1,825 | | | | 165,345 | |
Fluor Corp. | | | 1,800 | | | | 90,450 | |
General Dynamics Corp. | | | 2,400 | | | | 159,384 | |
General Electric Co. | | | 15,150 | | | | 271,337 | |
Norfolk Southern Corp. | | | 2,450 | | | | 178,507 | |
Northrop Grumman Corp. | | | 3,300 | | | | 192,984 | |
Timken Co. | | | 6,050 | | | | 234,196 | |
United Parcel Service, Inc., Class B | | | 2,425 | | | | 177,486 | |
WW Grainger, Inc. | | | 1,400 | | | | 262,066 | |
Total Industrials | | | | | | | 1,731,755 | |
Information Technology - 12.5% | | | | | | | | |
Accenture PLC, Class A | | | 4,900 | | | | 260,827 | |
Altera Corp. | | | 4,725 | | | | 175,297 | |
Apple, Inc.* | | | 1,090 | | | | 441,450 | |
Automatic Data Processing, Inc. | | | 3,425 | | | | 184,984 | |
|
The accompanying notes are an integral part of these financial statements. 15 |
Managers AMG Chicago Equity Partners Balanced Fund
Schedule of Portfolio Investments (continued)
| | | | | | | | |
| | | Shares | | | Value | |
| | | | | | | | |
Information Technology - 12.5% (continued) | | | | | | | | |
Avago Technologies, Ltd. | | | 3,200 | | | $ | 92,352 | |
Cadence Design Systems, Inc.* | | | 16,900 | | | | 175,760 | |
Cognizant Technology Solutions Corp.* | | | 2,075 | | | | 133,443 | |
Dell, Inc.* | | | 7,450 | | | | 108,994 | |
F5 Networks, Inc.* | | | 1,100 | | | | 116,732 | |
Google, Inc., Class A* | | | 270 | | | | 174,393 | |
Intel Corp. | | | 7,600 | | | | 184,300 | |
International Business Machines Corp. | | | 2,160 | | | | 397,181 | |
Jabil Circuit, Inc. | | | 3,800 | | | | 74,708 | |
Microsoft Corp. | | | 4,650 | | | | 120,714 | |
NCR Corp.* | | | 4,450 | | | | 73,247 | |
Oracle Corp. | | | 12,125 | | | | 311,006 | |
QUALCOMM, Inc. | | | 4,700 | | | | 257,090 | |
Visa, Inc., Class A | | | 2,725 | | | | 276,669 | |
VistaPrint N.V.*1 | | | 1,600 | | | | 48,960 | |
Total Information Technology | | | | | | | 3,608,107 | |
Materials - 2.5% | | | | | | | | |
Alcoa, Inc. | | | 14,900 | | | | 128,885 | |
CF Industries Holdings, Inc. | | | 1,200 | | | | 173,976 | |
Domtar Corp. | | | 1,775 | | | | 141,929 | |
Freeport-McMoRan Copper & Gold, Inc., Class B | | | 1,575 | | | | 57,944 | |
PPG Industries, Inc. | | | 2,475 | | | | 206,638 | |
Total Materials | | | | | | | 709,372 | |
Telecommunication Services - 1.9% | | | | | | | | |
Telephone & Data Systems, Inc. | | | 2,100 | | | | 54,369 | |
Verizon Communications, Inc. | | | 12,400 | | | | 497,488 | |
Total Telecommunication Services | | | | | | | 551,857 | |
Utilities - 2.7% | | | | | | | | |
Ameren Corp. | | | 5,250 | | | | 173,933 | |
Consolidated Edison, Inc. | | | 2,700 | | | | 167,481 | |
Duke Energy Corp. | | | 11,600 | | | | 255,200 | |
NiSource, Inc. | | | 8,050 | | | | 191,671 | |
Total Utilities | | | | | | | 788,285 | |
Total Common Stocks
| | | | | | | 17,353,475 | |
(cost $15,957,528) | | | | | | | | |
| | | Principal Amount | | | | |
Corporate Bonds and Notes - 3.2% | | | | | | | | |
Financials - 0.4% | | | | | | | | |
American Express Co., 7.250%, 05/20/14 | | $ | 40,000 | | | | 44,696 | |
General Electric Capital Corp.: | | | | | | | | |
2.950%, 05/09/16 | | | 30,000 | | | | 30,886 | |
MTN, Series A, 6.750%, 03/15/32 | | | 10,000 | | | | 11,744 | |
The accompanying notes are an integral part of these financial statements.
16
Managers AMG Chicago Equity Partners Balanced Fund
Schedule of Portfolio Investments (continued)
| | | | | | | | |
| | | Principal Amount | | | Value | |
| | | | | | | | |
Financials - 0.4% (continued) | | | | | | | | |
JPMorgan Chase & Co.: | | | | | | | | |
6.000%, 01/15/18 | | $ | 15,000 | | | $ | 16,757 | |
4.625%, 05/10/21 | | | 15,000 | | | | 15,549 | |
Total Financials | | | | | | | 119,632 | |
Industrials - 2.2% | | | | | | | | |
Altria Group, Inc., 9.700%, 11/10/18 | | | 18,000 | | | | 24,250 | |
Amgen, Inc., 4.100%, 06/15/21 | | | 20,000 | | | | 20,556 | |
Anheuser-Busch InBev Worldwide, Inc., 5.375%, 01/15/20 | | | 20,000 | | | | 23,495 | |
AT&T, Inc., 5.100%, 09/15/14 | | | 70,000 | | | | 77,150 | |
Coca-Cola Refreshments USA, Inc., 7.375%, 03/03/14 | | | 40,000 | | | | 45,456 | |
ConocoPhillips, 4.600%, 01/15/15 | | | 15,000 | | | | 16,602 | |
EI du Pont de Nemours & Company, 5.000%, 01/15/13 | | | 6,000 | | | | 6,260 | |
Honeywell International, Inc., 4.250%, 03/01/13 | | | 45,000 | | | | 46,959 | |
International Business Machines Corp., 5.600%, 11/30/39 | | | 15,000 | | | | 19,346 | |
Kellogg Co., Series B, 7.450%, 04/01/31 | | | 15,000 | | | | 20,515 | |
Kraft Foods, Inc., 5.375%, 02/10/20 | | | 20,000 | | | | 23,116 | |
Kroger Co., The: | | | | | | | | |
5.500%, 02/01/13 | | | 20,000 | | | | 20,866 | |
6.750%, 04/15/12 | | | 40,000 | | | | 40,669 | |
McDonald’s Corp.: | | | | | | | | |
6.300%, 10/15/37 | | | 15,000 | | | | 21,038 | |
Series MTN, 4.300%, 03/01/13 | | | 35,000 | | | | 36,466 | |
PepsiCo, Inc., 2.500%, 05/10/16 | | | 35,000 | | | | 36,449 | |
Pfizer, Inc., 6.200%, 03/15/19 | | | 20,000 | | | | 24,715 | |
United Parcel Service, Inc., 6.200%, 01/15/38 | | | 20,000 | | | | 27,001 | |
Verizon Communications, Inc., 3.000%, 04/01/16 | | | 35,000 | | | | 36,688 | |
Wal-Mart Stores, Inc., 6.500%, 08/15/37 | | | 20,000 | | | | 27,729 | |
Wyeth, 5.500%, 03/15/13 | | | 35,000 | | | | 37,009 | |
Total Industrials | | | | | | | 632,335 | |
Utilities - 0.6% | | | | | | | | |
Consolidated Edison Co of New York, Inc., Series 08-B, 6.750%, 04/01/38 | | | 15,000 | | | | 21,079 | |
Dominion Resources, Inc., 4.450%, 03/15/21 | | | 10,000 | | | | 11,159 | |
Duke Energy Corp., 3.550%, 09/15/21 | | | 20,000 | | | | 20,498 | |
Florida Power & Light Co., 4.850%, 02/01/13 | | | 40,000 | | | | 41,741 | |
Georgia Power Co., 5.400%, 06/01/40 | | | 15,000 | | | | 18,142 | |
TransCanada PipeLines, Ltd.: | | | | | | | | |
3.800%, 10/01/20 | | | 20,000 | | | | 21,625 | |
4.875%, 01/15/15 | | | 40,000 | | | | 44,069 | |
Total Utilities | | | | | | | 178,313 | |
Total Corporate Bonds and Notes (cost $870,360) | | | | | | | 930,280 | |
|
The accompanying notes are an integral part of these financial statements. 17 |
Managers AMG Chicago Equity Partners Balanced Fund
Schedule of Portfolio Investments (continued)
| | | | | | | | |
| | | Principal Amount | | | Value | |
| | | | | | | | |
Mortgage-Backed Securities - 0.8% | | | | | | | | |
Credit Suisse First Boston Mortgage Securities Corp., Series 2005-C2, Class C2, 4.691%, 04/15/37 | | $ | 63,885 | | | $ | 66,181 | |
Greenwich Capital Commercial Funding Corp., Series 2005-GG5, Class A2, 5.117%, 04/10/37 | | | 89,050 | | | | 89,460 | |
JPMorgan Chase Commercial Mortgage Securities Corp., Series 2002-C2, Class A2, 5.050%, 12/12/34 | | | 75,992 | | | | 77,687 | |
Total Mortgage-Backed Securities (cost $229,217) | | | | | | | 233,328 | |
| | |
U.S. Government and Agency Obligations - 34.2% | | | | | | | | |
Federal Home Loan Banks - 3.9% | | | | | | | | |
FHLB, 1.625%, 11/21/12 | | | 10,000 | | | | 10,123 | |
FHLB, 5.000%, 11/17/17 | | | 365,000 | | | | 438,606 | |
FHLB, 5.250%, 06/18/14 | | | 190,000 | | | | 211,592 | |
FHLB, 5.375%, 05/18/16 | | | 385,000 | | | | 457,062 | |
Total Federal Home Loan Banks | | | | | | | 1,117,383 | |
Federal Home Loan Mortgage Corporation - 6.0% | | | | | | | | |
FHLMC, 2.500%, 05/27/16 | | | 310,000 | | | | 328,656 | |
FHLMC, 3.750%, 03/27/19 | | | 370,000 | | | | 423,044 | |
FHLMC, 4.375%, 07/17/15 | | | 235,000 | | | | 264,387 | |
FHLMC, 4.500%, 11/01/24 | | | 30,807 | | | | 32,674 | |
FHLMC, 4.750%, 11/17/15 | | | 115,000 | | | | 131,815 | |
FHLMC, 5.000%, 12/01/20 | | | 44,342 | | | | 47,803 | |
FHLMC, 5.500%, 04/01/38 | | | 226,490 | | | | 246,104 | |
FHLMC, 6.000%, 01/01/38 | | | 46,101 | | | | 50,713 | |
FHLMC, 6.000%, 04/01/38 | | | 34,583 | | | | 38,032 | |
FHLMC, 6.000%, 06/01/38 | | | 157,622 | | | | 173,755 | |
Total Federal Home Loan Mortgage Corporation | | | | | | | 1,736,983 | |
Federal National Mortgage Association - 13.3% | | | | | | | | |
FNMA, 4.000%, 08/01/19 | | | 145,640 | | | | 153,829 | |
FNMA, 4.000%, 10/01/20 | | | 4,557 | | | | 4,846 | |
FNMA, 4.000%, 03/01/21 | | | 66,075 | | | | 69,790 | |
FNMA, 4.000%, 05/01/21 | | | 151,692 | | | | 160,221 | |
FNMA, 4.000%, 12/01/21 | | | 33,686 | | | | 35,632 | |
FNMA, 4.000%, 02/01/25 | | | 20,850 | | | | 22,003 | |
FNMA, 4.000%, 07/01/25 | | | 53,655 | | | | 56,621 | |
FNMA, 4.000%, 10/01/40 | | | 85,761 | | | | 90,198 | |
FNMA, 4.000%, 11/01/40 | | | 37,617 | | | | 39,563 | |
FNMA, 4.500%, 11/01/19 | | | 47,023 | | | | 50,335 | |
FNMA, 4.500%, 06/01/24 | | | 21,884 | | | | 23,344 | |
FNMA, 4.500%, 08/01/40 | | | 83,553 | | | | 89,009 | |
FNMA, 4.500%, 09/01/40 | | | 83,317 | | | | 88,700 | |
FNMA, 4.500%, 10/01/40 | | | 209,410 | | | | 223,082 | |
FNMA, 4.500%, 11/01/40 | | | 96,370 | | | | 102,663 | |
FNMA, 4.500%, 05/01/41 | | | 156,875 | | | | 167,118 | |
FNMA, 5.000%, 05/11/17 | | | 335,000 | | | | 398,111 | |
FNMA, 5.000%, 03/01/23 | | | 36,647 | | | | 39,576 | |
FNMA, 5.000%, 09/01/33 | | | 151,113 | | | | 163,443 | |
|
The accompanying notes are an integral part of these financial statements. 18 |
Managers AMG Chicago Equity Partners Balanced Fund
Schedule of Portfolio Investments (continued)
| | | | | | | | |
| | | Principal Amount | | | Value | |
| | | | | | | | |
Federal National Mortgage Association - 13.3% (continued) | | | | | | | | |
FNMA, 5.000%, 05/01/35 | | $ | 81,695 | | | $ | 88,336 | |
FNMA, 5.000%, 02/01/36 | | | 121,175 | | | | 131,025 | |
FNMA, 5.000%, 08/01/40 | | | 111,145 | | | | 120,214 | |
FNMA, 5.000%, 08/01/41 | | | 238,856 | | | | 258,719 | |
FNMA, 5.375%, 07/15/16 | | | 190,000 | | | | 226,428 | |
FNMA, 5.375%, 06/12/17 | | | 370,000 | | | | 447,583 | |
FNMA, 5.500%, 02/01/22 | | | 7,750 | | | | 8,421 | |
FNMA, 5.500%, 03/01/22 | | | 14,578 | | | | 15,971 | |
FNMA, 5.500%, 06/01/22 | | | 13,024 | | | | 14,269 | |
FNMA, 5.500%, 11/01/35 | | | 60,482 | | | | 66,050 | |
FNMA, 5.500%, 02/01/37 | | | 158,154 | | | | 172,567 | |
FNMA, 5.500%, 06/01/38 | | | 101,163 | | | | 110,255 | |
FNMA, 6.000%, 03/01/37 | | | 55,021 | | | | 60,870 | |
FNMA, 6.000%, 08/01/37 | | | 52,952 | | | | 58,373 | |
FNMA, 6.000%, 06/01/38 | | | 34,180 | | | | 38,182 | |
FNMA, 6.500%, 03/01/37 | | | 39,583 | | | | 44,464 | |
Total Federal National Mortgage Association | | | | | | | 3,839,811 | |
United States Treasury Securities - 11.0% | | | | | | | | |
U.S. Treasury Bonds, 0.625%, 07/31/12 | | | 335,000 | | | | 336,086 | |
U.S. Treasury Bonds, 3.125%, 05/15/21 | | | 430,000 | | | | 480,189 | |
U.S. Treasury Bonds, 3.125%, 11/15/41 | | | 225,000 | | | | 235,758 | |
U.S. Treasury Bonds, 3.500%, 02/15/39 | | | 790,000 | | | | 888,750 | |
U.S. Treasury Notes, 2.625%, 08/15/20 | | | 590,000 | | | | 636,416 | |
U.S. Treasury Notes, 2.750%, 02/28/18 | | | 405,000 | | | | 444,108 | |
U.S. Treasury Notes, 3.500%, 02/15/18 | | | 150,000 | | | | 171,035 | |
Total United States Treasury Securities | | | | | | | 3,192,342 | |
Total U.S. Government and Agency Obligations (cost $9,588,884) | | | | | | | 9,886,519 | |
| | |
| | | Shares | | | | |
Other Investment Companies - 2.2%2 | | | | | | | | |
BNY Mellon Overnight Government Fund, 0.04%3 | | | 50,240 | | | | 50,240 | |
Dreyfus Cash Management Fund, Institutional Class Shares, 0.05% | | | 593,002 | | | | 593,002 | |
Total Other Investment Companies (cost $643,242) | | | | | | | 643,242 | |
Total Investments - 100.4% (cost $27,289,231) | | | | | | | 29,046,844 | |
Other Assets, less Liabilities - (0.4)% | | | | | | | (109,146 | ) |
Net Assets - 100.0% | | | | | | $ | 28,937,698 | |
The accompanying notes are an integral part of these financial statements.
19
Managers High Yield Fund
Investment Manager’s Comments
THE YEAR IN REVIEW
The Managers High Yield Fund (Institutional Class) returned 4.83% for the year ended December 31, 2011, compared with 4.98% for the Barclays Capital U.S. Corporate High Yield Index (the “Index”). Solid corporate fundamentals, modest economic growth, healthy primary market conditions, ample mutual fund inflows and a negligible default environment were all conducive to producing strong returns in the high yield market in the first half of the year. However, the onslaught of macroeconomic events overshadowed this backdrop, leading to a more volatile environment in the second half of the year. In the end, the Barclays Capital U.S. Corporate High Yield Bond Index posted a one-year return of 4.98%, closing the year on a positive note. At December 31, high-yield spreads (as measured by the Barclays Capital U.S. Corporate High Yield Bond Index) were 750 basis points (7.50%), 172 bps (1.72%) wider for the 12-month period, while yields rose from 7.51% (at December 31, 2010) to 8.36%.
In 2011, the high-yield market experienced distinct periods of increased volatility: (1) in early March, resulting from the global events that ranged from unrest in the Middle East/North Africa to a devastating earthquake and tsunami in Japan; (2) in May/June due to deteriorating global economic data and ongoing fears surrounding the European sovereign crisis; and (3) starting in late-July/early-August with the U.S. debt-ceiling debate, escalation in the Eurozone sovereign debt crisis and the reporting of disappointing and weakening economic data. In all of these challenging periods, investor risk appetite waned as sentiment weakened, leading to a steady stream of retail outflows and slowdown to new-issue activity. None of these developments afflicting the markets pertained directly to high-yield credit fundamentals, but each was influential in shaping investor confidence and risk appetite. In the final quarter of the year, the high-yield broad market vacillated between risk on and risk off. Improving conditions and a recovery initiated in October came to a halt in mid-November as the market struggled with unpredictable economic news and global events. In December, however, the market volatility subsided as news from Europe was more positive and the tone of U.S. economic data was somewhat better.
As expected during periods of volatility and the resulting flight-to-quality movements, higher-rated credits outperformed their lower-quality counterparts for the year. Supermarkets, pipelines and pharmaceuticals led performance in the year as nearly all sectors posted positive returns (as measured by the Barclays Capital U.S. Corporate High Yield Index). The lowest-performing sectors for the year were transportation, home construction and wireless telecommunications.
Primary market conditions were favorable, which enabled companies to amend terms or extend maturities. Issuer refinancing needs dominated more than 55% of the activity in 2011. Record-low bond yields, minimal default risk and attractive relative valuations contributed to healthy capital market conditions. Despite a significant slowdown in June, new-issuance volumes were strong as high-yield issuers priced a total of $228.3B in 2011, the second-highest total on record. Positive mutual fund flows into the asset class from multiple channels fueled the tightening from market lows.
Default activity was negligible in the first half before slightly accelerating in the final months of 2011. At December 31, the 12-month par-weighted default rate of 1.72% was well below historical averages of 4%.
PERFORMANCE
The Fund slightly underperformed its primary benchmark during 2011, due to exposure to the chemicals, retailers and consumer services sectors. Performance was hindered by relative weightings in Reichhold Industries, Sprint Capital Corporation, First Data Corporation, Huntsman International and Flextronics. On the upside, performance was aided by security selection in the financials, real estate investment trusts and transportation services sectors, with the largest contributions coming from DISH DBS Corporation, Ceasar’s Entertainment, HCA, Texas Competitive Electric Holdings and Royal Bank of Scotland.
LOOKING FORWARD
In 2012, we expect a more stable economic environment and still-solid corporate fundamentals to underpin a strong high-yield environment. We anticipate that U.S. economic growth will improve slightly, averaging between 2-3%. Global growth will remain positive but be slightly impacted by weak economic conditions in the Eurozone and slowing conditions in parts of Asia. Given the continued uncertainty in the global environment, we expect corporations to remain conservative in their use of capital and cash generation. This should result in continued improvement in overall credit metrics for much of the high-yield universe. Although defaults will likely rise modestly in 2012 from their sub-2% level in 2011, we think they will remain in the low single digits. As a result, we expect overall high-yield broad market spreads to tighten from current levels of approximately 740 basis points (7.40%) to the 600-650 basis point (6.0%-6.5%) range by the end of 2012. In this credit environment, we will continue to rely on our individual security selection as the primary driver of performance.
This commentary reflects the viewpoints of the Fund’s subadvisor, JP Morgan Asset Management as of December 31, 2011, and is not intended as a forecast or guarantee of future results.
CUMULATIVE TOTAL RETURN PERFORMANCE
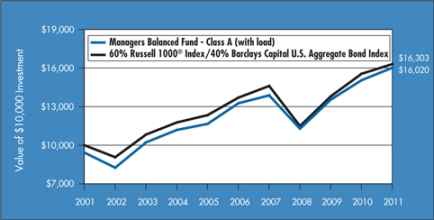
Managers High Yield Fund’s cumulative total return is based on the daily change in net asset value (NAV), and assumes that all distributions were reinvested. The chart illustrates the performance of a hypothetical $10,000 investment made in the Fund’s Class A Shares (with load) on December 31, 2001 to a $10,000 investment made in the Barclays Capital U.S. Corporate High Yield Bond Index for the same time period. The graph and table do not reflect the deduction of taxes that a shareholder would pay on a Fund distribution or redemption of shares. Performance for periods longer than one year is annualized. The listed returns for the Fund are net of expenses and the returns for the index exclude expenses. Total returns for the Fund would have been lower had certain expenses not been reduced.
20
Managers High Yield Fund
Investment Manager’s Comments (continued)
CUMULATIVE TOTAL RETURN PERFORMANCE (continued)
The table below shows the average annual total returns for the Managers High Yield Fund and the Barclays Capital U.S. Corporate High Yield Bond Index from December 31, 2001 through December 31, 2011.
| | | | | | | | | | | | | | |
| | | | | Average Annual Total Returns1 | |
| | | | | One Year | | | Five Years | | | Ten Years | |
Managers High Yield Fund2,3 | |
-Class A | | No Load | | | 4.54 | % | | | 5.63 | % | | | 8.13 | % |
-Class A | | With Load | | | 0.14 | % | | | 4.73 | % | | | 7.67 | % |
-Class C | | No Load | | | 3.69 | % | | | 4.78 | % | | | 7.38 | % |
-Class C | | With Load | | | 2.72 | % | | | 4.78 | % | | | 7.38 | % |
-Institutional Class | | No Load | | | 4.83 | % | | | 5.95 | % | | | 8.54 | % |
Barclays Capital U.S Corporate High Yield Bond Index4 | | | 4.98 | % | | | 7.54 | % | | | 8.85 | % |
The performance data shown represents past performance, which is not a guarantee of future results. Current performance may be lower or higher than the performance data quoted. The investment return and principal value of an investment in the Fund will fluctuate so that an investor’s shares, when redeemed, may be worth more or less than their original cost. For performance information through the most recent month end please call (800) 835-3879 or visit our Web site at www.managersinvest.com.
Performance differences among the share classes are due to differences in sales charge structures and class expenses. Returns shown reflect maximum sales charge of 4.25% on Class A, as well as the applicable contingent deferred sales charge (CDSC) on Class C shares. Class C shares held for less than one year are subject to a 1% CDSC.
Investors should carefully consider the Fund’s investment objectives, risks, charges and expenses before investing. For this and other information, please call 800.835.3879 or visit ww.managersinvest.com for a free prospectus. Read it carefully before investing or sending money. Funds are distributed by Managers Distributors, Inc., a member of FINRA.
|
1 Total return equals income yield plus share price change and assumes reinvestment of all dividends and capital gain distributions. Returns are net of fees and may reflect offsets of Fund expenses as described in the Prospectus. No adjustment has been made for taxes payable by shareholders on their reinvested dividends and capital gain distributions. Returns for periods greater than one year are the average annual returns. The listed returns on the Fund are net of expenses and based on the published NAV as of December 31, 2011. All returns are in U.S. dollars ($). 2 The Fund is subject to the risks associated with investments in debt securities, such as default risk and fluctuations in the perception of the debtors’ ability to pay their creditors. 3 From time to time, the Fund’s advisor has waived its fees and/or absorbed Fund expenses, which has resulted in higher returns. 4 The Barclays Capital U.S. Corporate High Yield Bond Index is a total return performance benchmark for fixed income securities having a maximum quality rating of Ba1 (as determined by Moody’s Investors Service). The Barclays Capital U.S. Corporate High Yield Bond Index is unmanaged, is not available for investment, and does not incur expenses. Not FDIC insured, nor bank guaranteed. May lose value. |
21
Managers High Yield Fund
Fund Snapshots (unaudited)
December 31, 2011
Portfolio Breakdown
| | | | |
Industry | | Managers High
Yield Fund** | |
Industrials | | | 80.9 | % |
Financials | | | 10.4 | % |
Utilities | | | 2.2 | % |
Exchange Traded Notes | | | 1.5 | % |
Information Technology | | | 0.2 | % |
Materials | | | 0.2 | % |
Other Assets and Liabilities | | | 4.6 | % |
| ** | As a percentage of net assets |
| | | | | | | | |
Rating | | Managers High
Yield Fund** | | | Barclays Capital U.S.
Corporate High Yield
Bond Index | |
U.S. Treasury | | | 0.0 | % | | | 0.0 | % |
U.S. Agency | | | 0.0 | % | | | 0.0 | % |
Aaa | | | 0.0 | % | | | 0.0 | % |
Aa | | | 0.0 | % | | | 0.0 | % |
A | | | 0.0 | % | | | 0.0 | % |
Baa | | | 3.3 | % | | | 0.0 | % |
Ba | | | 28.9 | % | | | 40.1 | % |
B | | | 55.4 | % | | | 43.3 | % |
Caa | | | 10.8 | % | | | 14.5 | % |
Ca | | | 0.0 | % | | | 0.0 | % |
C | | | 0.0 | % | | | 1.9 | % |
D | | | 0.0 | % | | | 0.0 | % |
Not Rated | | | 1.6 | % | | | 0.2 | % |
| ** | As a percentage of market value of fixed income securities |
| Chart | does not include equity securities. |
Top Ten Holdings
| | | | |
Security Name | | % of
Net Assets | |
Ford Motor Credit Co. LLC, 6.625%, 08/15/17 | | | 1.6 | % |
SPDR Barclays Capital High Yield Bond | | | 1.5 | |
Sprint Capital Corp., 8.750%, 03/15/32* | | | 1.3 | |
Biomet, Inc., 10.375%, 10/15/17* | | | 1.3 | |
SunGard Data Systems, Inc., 10.250%, 08/15/15 | | | 1.0 | |
CIT Group, Inc., 7.000%, 05/01/16* | | | 1.0 | |
DISH DBS Corp., 7.875%, 09/01/19* | | | 1.0 | |
Ally Financial, Inc., 6.250%, 12/01/17 | | | 1.0 | |
Clear Channel Worldwide Holdings, Inc., Series B, 9.250%, 12/15/17* | | | 0.9 | |
HCA Holdings, Inc., 7.750%, 05/15/21 | | | 0.8 | |
| | | | |
Top Ten as a Group | | | 11.4 | % |
| | | | |
| |
* Top Ten Holding at June 30, 2011 | | | | |
|
| Any sectors, industries, or securities discussed should not be perceived as investment recommendations. Mention of a specific security should not be considered a recommendation to buy or solicitation to sell that security. Specific securities mentioned in this report may have been sold from the Fund’s portfolio of investments by the time you receive this report. |
22
Managers High Yield Fund
Schedule of Portfolio Investments
December 31, 2011
| | | | | | | | |
| | | Shares | | | Value | |
| | | | | | | |
Common Stocks - 0.4% | | | | | | | | |
Information Technology - 0.2% | | | | | | | | |
Flextronics International, Ltd.* | | | 10,500 | | | $ | 59,430 | |
Materials - 0.2% | | | | | | | | |
Huntsman Corp. | | | 5,000 | | | | 50,000 | |
Total Common Stocks
(cost $135,964) | | | | | | | 109,430 | |
| | |
| | | Principal Amount | | | | |
Corporate Bonds and Notes - 93.5% | | | | | | | | |
Financials - 9.6% | | | | | | | | |
Alliance Laundry Systems LLC, Term Loan, Class B, 6.250%, 09/30/16 (04/02/12)4 | | $ | 132,158 | | | | 132,240 | |
Ally Financial, Inc.: | | | | | | | | |
6.250%, 12/01/17 | | | 330,000 | | | | 319,555 | |
Series 8, 6.750%, 12/01/14 | | | 157,000 | | | | 158,570 | |
Bank of America Corp., Series K, 8.000%, 12/29/495 | | | 130,000 | | | | 116,541 | |
CIT Group, Inc.: | | | | | | | | |
6.625%, 04/01/18 (a) | | | 30,000 | | | | 31,200 | |
7.000%, 05/01/16 | | | 327,983 | | | | 328,393 | |
7.000%, 05/01/17 | | | 180,176 | | | | 180,401 | |
Citigroup Capital XXI, 8.300%, 12/21/575 | | | 85,000 | | | | 85,106 | |
CNH Capital LLC, 6.250%, 11/01/16 (a) | | | 30,000 | | | | 31,050 | |
First Data Corp., Term Loan: | | | | | | | | |
Class B-1, 4.294%, 03/26/18 (01/24/12)4 | | | 48,028 | | | | 40,403 | |
Class B-2, 3.044%, 09/24/14 (01/24/12)4 | | | 5,111 | | | | 4,624 | |
Ford Motor Credit Co. LLC, 6.625%, 08/15/17 | | | 460,000 | | | | 501,327 | |
Ineos Holdings, Ltd., Term Loan: | | | | | | | | |
Class B-2, 7.501%, 12/16/13 (01/31/12)4 | | | 95,481 | | | | 97,749 | |
Class C-2, 8.001%, 12/16/14 (01/31/12)4 | | | 109,288 | | | | 111,883 | |
International Lease Finance Corp.: | | | | | | | | |
5.750%, 05/15/16 | | | 40,000 | | | | 37,137 | |
6.250%, 05/15/19 | | | 15,000 | | | | 13,877 | |
8.250%, 12/15/20 | | | 40,000 | | | | 40,500 | |
8.625%, 09/15/15 | | | 125,000 | | | | 128,594 | |
8.750%, 03/15/17 | | | 270,000 | | | | 278,775 | |
Nuveen Investments, Inc., 2nd Lien Term Loan, 12.500%, 07/31/15 (06/29/12)4 | | | 70,000 | | | | 72,654 | |
Realogy Corp., 7.875%, 02/15/19 (a)1 | | | 110,000 | | | | 96,250 | |
Regions Financial Corp., 5.750%, 06/15/15 | | | 90,000 | | | | 86,850 | |
UPCB Finance III, Ltd., 6.625%, 07/01/20 (a) | | | 150,000 | | | | 148,500 | |
Vertafore, Inc., 2nd Lien Term Loan, 9.750%, 10/18/17 (03/29/12)4 | | | 45,000 | | | | 43,763 | |
Total Financials | | | | | | | 3,085,942 | |
Industrials - 81.4% | | | | | | | | |
Academy, Ltd./Academy Finance Corp., 9.250%, 08/01/19 (a) | | | 85,000 | | | | 84,363 | |
|
The accompanying notes are an integral part of these financial statements. 23 |
Managers High Yield Fund
Schedule of Portfolio Investments (continued)
| | | | | | | | |
| | | Principal Amount | | | Value | |
| | | | | | | | |
Industrials - 81.4% (continued) | | | | | | | | |
Accellent, Inc.: | | | | | | | | |
8.375%, 02/01/17 | | $ | 70,000 | | | $ | 68,950 | |
10.000%, 11/01/17 | | | 85,000 | | | | 69,275 | |
ACCO Brands Corp., 7.625%, 08/15/15 | | | 50,000 | | | | 51,250 | |
Aircastle, Ltd.: | | | | | | | | |
9.750%, 08/01/18 (a) | | | 40,000 | | | | 41,900 | |
9.750%, 08/01/181 | | | 55,000 | | | | 57,887 | |
Alcatel-Lucent USA, Inc., 6.450%, 03/15/29 | | | 155,000 | | | | 111,988 | |
Aleris International, Inc., 7.625%, 02/15/18 | | | 25,000 | | | | 24,500 | |
Alliant Techsystems, Inc., 6.750%, 04/01/16 | | | 120,000 | | | | 123,600 | |
Allison Transmission, Inc., 7.125%, 05/15/19 (a) | | | 115,000 | | | | 113,275 | |
AMC Entertainment, Inc.: | | | | | | | | |
8.750%, 06/01/19 | | | 20,000 | | | | 20,800 | |
9.750%, 12/01/20 | | | 130,000 | | | | 124,150 | |
American Axle & Manufacturing Holdings, Inc., 9.250%, 01/15/17 (a) | | | 20,000 | | | | 21,800 | |
American Axle & Manufacturing, Inc.: | | | | | | | | |
7.750%, 11/15/19 | | | 25,000 | | | | 24,625 | |
7.875%, 03/01/17 | | | 110,000 | | | | 109,450 | |
American Tire Distributors, Inc., 9.750%, 06/01/17 | | | 65,000 | | | | 67,275 | |
Amkor Technology, Inc., 7.375%, 05/01/18 | | | 100,000 | | | | 102,750 | |
Amsted Industries, Inc., 8.125%, 03/15/18 (a) | | | 60,000 | | | | 63,900 | |
Arch Coal, Inc.: | | | | | | | | |
7.000%, 06/15/19 (a) | | | 35,000 | | | | 35,875 | |
7.250%, 06/15/21 (a) | | | 50,000 | | | | 51,625 | |
8.750%, 08/01/161 | | | 115,000 | | | | 126,212 | |
Ardagh Packaging Finance PLC, 9.125%, 10/15/20 (a)1 | | | 200,000 | | | | 199,000 | |
Ashland, Inc., 9.125%, 06/01/17 | | | 30,000 | | | | 33,600 | |
Ashtead Capital, Inc., 9.000%, 08/15/16 (a) | | | 70,000 | | | | 73,325 | |
Aspect Software, Inc., 10.625%, 05/07/17 | | | 55,000 | | | | 57,337 | |
Associated Materials LLC, 9.125%, 11/01/171 | | | 110,000 | | | | 96,525 | |
Atkore International, Inc., 9.875%, 01/01/18 | | | 90,000 | | | | 86,625 | |
Audatex North America, Inc., 6.750%, 06/15/18 (a) | | | 60,000 | | | | 60,900 | |
Avaya, Inc.: | | | | | | | | |
7.000%, 04/01/19 (a) | | | 80,000 | | | | 78,000 | |
9.750%, 11/01/15 | | | 65,000 | | | | 58,825 | |
10.125%, 11/01/156 | | | 94,893 | | | | 85,878 | |
Avis Budget Car Rental LLC/Avis Budget Finance, Inc.: | | | | | | | | |
8.250%, 01/15/19 | | | 165,000 | | | | 164,587 | |
9.625%, 03/15/18 | | | 40,000 | | | | 41,600 | |
AWAS Aviation Capital, Ltd., 7.000%, 10/15/16 (a) | | | 90,400 | | | | 90,851 | |
Belden, Inc., 9.250%, 06/15/19 | | | 75,000 | | | | 80,437 | |
Biomet, Inc., 10.375%, 10/15/176 | | | 385,000 | | | | 418,687 | |
Bon-Ton Department Stores, Inc., The, 10.250%, 03/15/14 | | | 85,000 | | | | 54,931 | |
BreitBurn Energy Partners, L.P./BreitBurn Finance Corp., 8.625%, 10/15/20 | | | 70,000 | | | | 73,587 | |
The accompanying notes are an integral part of these financial statements.
24
Managers High Yield Fund
Schedule of Portfolio Investments (continued)
| | | | | | | | |
| | | Principal Amount | | | Value | |
| | | | | | | | |
Industrials - 81.4% (continued) | | | | | | | | |
Brigham Exploration Co., Series 1, 8.750%, 10/01/18 | | $ | 52,000 | | | $ | 63,960 | |
Building Materials Corp. of America: | | | | | | | | |
6.750%, 05/01/21 (a) | | | 55,000 | | | | 57,887 | |
6.875%, 08/15/18 (a) | | | 30,000 | | | | 31,650 | |
Bumble Bee Acquisition Corp., 9.000%, 12/15/17 (a) | | | 141,000 | | | | 143,820 | |
BWAY Holding Co., 10.000%, 06/15/18 | | | 110,000 | | | | 117,700 | |
Cablevision Systems Corp., Series B, 8.625%, 09/15/17 | | | 110,000 | | | | 122,375 | |
Caesars Entertainment Operating Co., Inc., 11.250%, 06/01/17 | | | 250,000 | | | | 266,563 | |
Caesars Entertainment Operating Co., Inc.,, 10.000%, 12/15/18 | | | 82,000 | | | | 56,580 | |
Caesars Entertainment Operating Co., Inc., Term B-3 Loan: | | | | | | | | |
3.418%, 01/28/15 (01/25/12)4 | | | 115,855 | | | | 100,776 | |
3.579%, 01/28/15 (03/30/12)4 | | | 1,179 | | | | 1,026 | |
Calumet Specialty Products Partners, L.P./Calumet Finance Corp., 9.375%, 05/01/19 (a) | | | 30,000 | | | | 29,250 | |
Case New Holland, Inc., 7.875%, 12/01/17 | | | 85,000 | | | | 96,475 | |
CCH II LLC/CCH II Capital Corp., 13.500%, 11/30/16 | | | 14,327 | | | | 16,619 | |
CCO Holdings LLC/CCO Holdings Capital Corp.: | | | | | | | | |
7.000%, 01/15/19 | | | 50,000 | | | | 52,375 | |
7.250%, 10/30/17 | | | 10,000 | | | | 10,588 | |
7.375%, 06/01/20 | | | 25,000 | | | | 26,500 | |
7.875%, 04/30/18 | | | 200,000 | | | | 214,250 | |
Central Garden and Pet Co., 8.250%, 03/01/18 | | | 140,000 | | | | 137,900 | |
Cequel Communications Holdings I LLC and Cequel Capital Corp., 8.625%, 11/15/17 (a) | | | 60,000 | | | | 63,900 | |
Chesapeake Energy Corp.: | | | | | | | | |
6.625%, 08/15/20 | | | 5,000 | | | | 5,388 | |
6.875%, 08/15/18 | | | 55,000 | | | | 59,125 | |
7.250%, 12/15/18 | | | 65,000 | | | | 72,150 | |
Chesapeake Oilfield Operating LLC/Chesapeake Oilfield Finance, Inc., 6.625%, 11/15/19 (a) | | | 25,000 | | | | 26,125 | |
Chrysler Group LLC/CG Co-Issuer, Inc., 8.000%, 06/15/19 (a) | | | 200,000 | | | | 184,000 | |
CHS/Community Health Systems, Inc., 8.875%, 07/15/15 | | | 94,000 | | | | 97,290 | |
Cincinnati Bell, Inc., 8.375%, 10/15/20 | | | 150,000 | | | | 150,000 | |
Cinemark USA, Inc., 7.375%, 06/15/21 | | | 40,000 | | | | 41,100 | |
CityCenter Holdings LLC/CityCenter Finance Corp., 7.625%, 01/15/16 (a) | | | 100,000 | | | | 103,000 | |
Claire’s Stores, Inc., 8.875%, 03/15/19 | | | 70,000 | | | | 53,550 | |
Clean Harbors, Inc., 7.625%, 08/15/16 | | | 56,000 | | | | 59,780 | |
Clear Channel Communications, Inc., 9.000%, 03/01/21 | | | 115,000 | | | | 97,463 | |
Clear Channel Communications, Inc., Term Loan B, 3.946%, 01/29/16 (01/31/12)4 | | | 61,740 | | | | 45,807 | |
Clear Channel Worldwide Holdings, Inc., Series B, 9.250%, 12/15/17 | | | 280,000 | | | | 303,800 | |
The accompanying notes are an integral part of these financial statements.
25
Managers High Yield Fund
Schedule of Portfolio Investments (continued)
| | | | | | | | |
| | | Principal Amount | | | Value | |
| | | | | | | | |
Industrials - 81.4% (continued) | | | | | | | | |
Clearwater Paper Corp.: | | | | | | | | |
7.125%, 11/01/18 | | $ | 5,000 | | | $ | 5,225 | |
10.625%, 06/15/16 | | | 85,000 | | | | 95,200 | |
Clearwire Communications LLC/Clearwire Finance, Inc., 12.000%, 12/01/15 (a) | | | 150,000 | | | | 144,375 | |
Cloud Peak Energy Resources LLC/Cloud Peak Energy Finance Corp., 8.250%, 12/15/17 | | | 65,000 | | | | 69,550 | |
Cogent Communications Group, Inc., 8.375%, 02/15/18 (a) | | | 55,000 | | | | 56,512 | |
CommScope, Inc., 8.250%, 01/15/19 (a) | | | 115,000 | | | | 115,575 | |
Constellation Brands, Inc., 7.250%, 05/15/17 | | | 115,000 | | | | 127,075 | |
Cricket Communications, Inc., 7.750%, 10/15/20 | | | 55,000 | | | | 48,263 | |
Crosstex Energy, L.P./Crosstex Energy Finance Corp., 8.875%, 02/15/18 | | | 115,000 | | | | 126,212 | |
Dana Holding Corp.: | | | | | | | | |
6.500%, 02/15/19 | | | 60,000 | | | | 60,900 | |
6.750%, 02/15/21 | | | 15,000 | | | | 15,450 | |
DaVita, Inc.: | | | | | | | | |
6.375%, 11/01/18 | | | 80,000 | | | | 82,100 | |
6.625%, 11/01/20 | | | 10,000 | | | | 10,325 | |
Del Monte Corp., 7.625%, 02/15/19 | | | 205,000 | | | | 197,825 | |
Denbury Resources, Inc., 8.250%, 02/15/20 | | | 40,000 | | | | 44,900 | |
DineEquity, Inc., 9.500%, 10/30/18 | | | 45,000 | | | | 48,544 | |
DISH DBS Corp.: | | | | | | | | |
6.750%, 06/01/21 | | | 75,000 | | | | 81,187 | |
7.125%, 02/01/16 | | | 260,000 | | | | 281,450 | |
7.875%, 09/01/19 | | | 285,000 | | | | 323,475 | |
DJO Finance LLC/DJO Finance Corp.: | | | | | | | | |
7.750%, 04/15/18 | | | 80,000 | | | | 61,800 | |
10.875%, 11/15/14 | | | 60,000 | | | | 56,250 | |
Dole Food Co., Inc., 8.000%, 10/01/16 (a) | | | 40,000 | | | | 41,900 | |
Eagle Parent, Inc., 8.625%, 05/01/19 (a) | | | 95,000 | | | | 91,200 | |
Eagle Rock Energy Partners, L.P./Eagle Rock Energy Finance Corp., 8.375%, 06/01/19 (a) | | | 80,000 | | | | 80,400 | |
Easton-Bell Sports, Inc., 9.750%, 12/01/16 | | | 145,000 | | | | 158,775 | |
EH Holding Corp.: | | | | | | | | |
6.500%, 06/15/19 (a) | | | 55,000 | | | | 57,612 | |
7.625%, 06/15/21 (a) | | | 25,000 | | | | 26,375 | |
El Paso Corp., 7.250%, 06/01/18 | | | 65,000 | | | | 71,493 | |
Encore Acquisition Co., 9.500%, 05/01/16 | | | 10,000 | | | | 11,075 | |
Endo Pharmaceuticals Holdings, Inc., 7.000%, 07/15/19 | | | 30,000 | | | | 32,100 | |
EV Energy Partners, L.P./EV Energy Finance Corp., 8.000%, 04/15/19 | | | 90,000 | | | | 92,025 | |
Fidelity National Information Services, Inc., 7.625%, 07/15/17 (a) | | | 75,000 | | | | 81,187 | |
First Data Corp.: | | | | | | | | |
7.375%, 06/15/19 (a) | | | 30,000 | | | | 28,350 | |
8.250%, 01/15/21 (a) | | | 118,000 | | | | 106,200 | |
8.750%, 01/15/22 (a)6 | | | 120,000 | | | | 103,800 | |
8.875%, 08/15/20 (a) | | | 150,000 | | | | 150,750 | |
12.625%, 01/15/21 | | | 240,000 | | | | 210,000 | |
The accompanying notes are an integral part of these financial statements.
26
Managers High Yield Fund
Schedule of Portfolio Investments (continued)
| | | | | | | | |
| | | Principal Amount | | | Value | |
| | | | | | | | |
Industrials - 81.4% (continued) | | | | | | | | |
FMG Resources August 2006 Pty., Ltd.: | | | | | | | | |
6.875%, 02/01/18 (a) | | $ | 125,000 | | | $ | 120,313 | |
7.000%, 11/01/15 (a) | | | 25,000 | | | | 25,375 | |
8.250%, 11/01/19 (a) | | | 50,000 | | | | 51,125 | |
Forest Oil Corp., 7.250%, 06/15/19 | | | 75,000 | | | | 76,875 | |
Freescale Semiconductor, Inc.: | | | | | | | | |
8.050%, 02/01/20 | | | 65,000 | | | | 61,425 | |
9.250%, 04/15/18 (a) | | | 155,000 | | | | 166,431 | |
10.125%, 03/15/18 (a) | | | 15,000 | | | | 16,425 | |
Frontier Communications Corp., 6.625%, 03/15/15 | | | 90,000 | | | | 89,550 | |
GCI, Inc., 8.625%, 11/15/19 | | | 90,000 | | | | 95,962 | |
General Cable Corp., 7.125%, 04/01/171 | | | 80,000 | | | | 80,200 | |
Geo Group, Inc., The, 7.750%, 10/15/17 | | | 105,000 | | | | 112,088 | |
GMX Resources, Inc., 11.000%, 12/01/17 (a)6 | | | 95,000 | | | | 78,375 | |
Goodyear Tire & Rubber Co., The: | | | | | | | | |
8.250%, 08/15/201 | | | 90,000 | | | | 98,550 | |
8.750%, 08/15/20 | | | 10,000 | | | | 11,075 | |
10.500%, 05/15/16 | | | 31,000 | | | | 34,332 | |
Great Lakes Dredge & Dock Corp., 7.375%, 02/01/19 | | | 95,000 | | | | 94,525 | |
Griffon Corp., 7.125%, 04/01/18 | | | 80,000 | | | | 79,600 | |
GWR Operating Partnership LLP, 10.875%, 04/01/17 | | | 65,000 | | | | 71,013 | |
GXS Worldwide, Inc., 9.750%, 06/15/15 | | | 85,000 | | | | 79,049 | |
Gymboree Corp., 9.125%, 12/01/181 | | | 110,000 | | | | 96,800 | |
Hanesbrands, Inc.: | | | | | | | | |
6.375%, 12/15/20 | | | 25,000 | | | | 25,500 | |
8.000%, 12/15/16 | | | 160,000 | | | | 174,800 | |
HCA Holdings, Inc., 7.750%, 05/15/21 | | | 250,000 | | | | 255,625 | |
HCA, Inc.: | | | | | | | | |
6.500%, 02/15/20 | | | 50,000 | | | | 52,000 | |
7.500%, 02/15/22 | | | 365,000 | | | | 374,125 | |
8.000%, 10/01/18 | | | 50,000 | | | | 53,000 | |
Health Management Associates, Inc.: | | | | | | | | |
6.125%, 04/15/16 | | | 115,000 | | | | 119,600 | |
7.375%, 01/15/20 (a) | | | 55,000 | | | | 57,337 | |
HealthSouth Corp.: | | | | | | | | |
7.250%, 10/01/18 | | | 75,000 | | | | 74,812 | |
7.750%, 09/15/22 | | | 50,000 | | | | 49,437 | |
Hertz Corp., The, 7.500%, 10/15/18 | | | 145,000 | | | | 152,250 | |
Hexion US Finance Corp./Hexion Nova Scotia Finance ULC: | | | | | | | | |
8.875%, 02/01/18 | | | 55,000 | | | | 51,837 | |
9.000%, 11/15/20 | | | 50,000 | | | | 41,500 | |
Hillman Group, Inc., 10.875%, 06/01/18 | | | 75,000 | | | | 74,625 | |
Host Hotels & Resorts, L.P., 9.000%, 05/15/17 | | | 30,000 | | | | 32,775 | |
The accompanying notes are an integral part of these financial statements.
27
Managers High Yield Fund
Schedule of Portfolio Investments (continued)
| | | | | | | | |
| | | Principal Amount | | | Value | |
| | | | | | | | |
Industrials - 81.4% (continued) | | | | | | | | |
Huntsman International LLC: | | | | | | | | |
5.500%, 06/30/16 | | $ | 55,000 | | | $ | 54,175 | |
8.625%, 03/15/201 | | | 45,000 | | | | 47,925 | |
8.625%, 03/15/211 | | | 25,000 | | | | 26,625 | |
iGate Corp., 9.000%, 05/01/16 (a) | | | 75,000 | | | | 77,812 | |
Ineos Group Holdings, Ltd., 8.500%, 02/15/16 (a) | | | 100,000 | | | | 80,000 | |
Integra Telecom Holdings, Inc., 10.750%, 04/15/16 (a) | | | 55,000 | | | | 45,100 | |
Intelsat Jackson Holdings SA: | | | | | | | | |
7.250%, 04/01/19 (a) | | | 70,000 | | | | 71,225 | |
7.250%, 10/15/20 | | | 75,000 | | | | 76,312 | |
9.500%, 06/15/16 | | | 40,000 | | | | 41,900 | |
11.250%, 06/15/16 | | | 165,000 | | | | 173,766 | |
Intelsat Luxembourg SA: | | | | | | | | |
11.250%, 02/04/17 | | | 60,000 | | | | 58,200 | |
11.500%, 02/04/17 (a)6 | | | 160,000 | | | | 154,800 | |
Interactive Data Corp., 10.250%, 08/01/18 | | | 105,000 | | | | 113,925 | |
Interline Brands, Inc., 7.000%, 11/15/18 | | | 75,000 | | | | 78,000 | |
inVentiv Health, Inc., 10.000%, 08/15/18 (a) | | | 65,000 | | | | 59,800 | |
Iron Mountain, Inc., 8.750%, 07/15/18 | | | 175,000 | | | | 182,875 | |
ITC Deltacom, Inc., 10.500%, 04/01/16 | | | 65,000 | | | | 66,787 | |
J. Crew Group, Inc., 8.125%, 03/01/19 | | | 105,000 | | | | 100,800 | |
J.C. Penney Corp., Inc.: | | | | | | | | |
5.750%, 02/15/18 | | | 10,000 | | | | 10,100 | |
7.950%, 04/01/17 | | | 75,000 | | | | 82,125 | |
James River Coal Co., 7.875%, 04/01/19 | | | 75,000 | | | | 57,000 | |
Jarden Corp., 7.500%, 05/01/17 | | | 105,000 | | | | 111,825 | |
Kinetic Concepts, Inc./KCI USA, Inc., 10.500%, 11/01/18 (a) | | | 165,000 | | | | 162,113 | |
Kodiak Oil & Gas Corp., 8.125%, 12/01/19 (a) | | | 80,000 | | | | 83,000 | |
Lear Corp., 7.875%, 03/15/18 | | | 25,000 | | | | 27,187 | |
Level 3 Communications, Inc., 11.875%, 02/01/19 | | | 55,000 | | | | 58,850 | |
Level 3 Financing, Inc.: | | | | | | | | |
8.125%, 07/01/19 (a) | | | 90,000 | | | | 88,875 | |
9.375%, 04/01/19 | | | 110,000 | | | | 115,363 | |
Libbey Glass, Inc., 10.000%, 02/15/15 | | | 91,000 | | | | 97,825 | |
Limited Brands, Inc., 6.625%, 04/01/21 | | | 30,000 | | | | 31,950 | |
Linn Energy LLC/Linn Energy Finance Corp.: | | | | | | | | |
6.500%, 05/15/19 (a) | | | 20,000 | | | | 19,950 | |
7.750%, 02/01/21 | | | 45,000 | | | | 47,025 | |
8.625%, 04/15/20 | | | 65,000 | | | | 70,850 | |
Longview Fibre Paper & Packaging, Inc., 8.000%, 06/01/16 (a) | | | 20,000 | | | | 20,100 | |
MagnaChip Semiconductor SA/MagnaChip Semiconductor Finance Co., 10.500%, 04/15/18 | | | 125,000 | | | | 130,625 | |
The accompanying notes are an integral part of these financial statements.
28
Managers High Yield Fund
Schedule of Portfolio Investments (continued)
| | | | | | | | |
| | | Principal Amount | | | Value | |
| | | | | | | | |
Industrials - 81.4% (continued) | | | | | | | | |
Manitowoc Co., Inc., The: | | | | | | | | |
8.500%, 11/01/20 | | $ | 70,000 | | | $ | 74,113 | |
9.500%, 02/15/18 | | | 55,000 | | | | 58,850 | |
Mantech International Corp., 7.250%, 04/15/18 | | | 65,000 | | | | 66,544 | |
Marina District Finance Co., Inc.: | | | | | | | | |
9.500%, 10/15/15 | | | 35,000 | | | | 32,900 | |
9.875%, 08/15/181 | | | 130,000 | | | | 119,275 | |
Masco Corp., 7.125%, 03/15/20 | | | 20,000 | | | | 20,216 | |
MEMC Electronic Materials, Inc., 7.750%, 04/01/19 | | | 65,000 | | | | 47,288 | |
MetroPCS Wireless, Inc., 7.875%, 09/01/18 | | | 120,000 | | | | 122,250 | |
MGM Resorts International: | | | | | | | | |
6.875%, 04/01/16 | | | 40,000 | | | | 37,200 | |
7.500%, 06/01/161 | | | 150,000 | | | | 144,375 | |
9.000%, 03/15/20 | | | 50,000 | | | | 55,625 | |
11.125%, 11/15/17 | | | 160,000 | | | | 183,200 | |
Michael Foods, Inc., 9.750%, 07/15/18 | | | 95,000 | | | | 100,463 | |
Michaels Stores, Inc.: | | | | | | | | |
7.750%, 11/01/18 | | | 135,000 | | | | 137,025 | |
13.000%, 11/01/16 (b) | | | 50,000 | | | | 53,495 | |
Mueller Water Products, Inc., 8.750%, 09/01/20 | | | 40,000 | | | | 43,650 | |
Mylan, Inc./PA: | | | | | | | | |
7.625%, 07/15/17 (a) | | | 25,000 | | | | 27,406 | |
7.875%, 07/15/20 (a) | | | 90,000 | | | | 99,788 | |
NewPage Corp., 11.375%, 12/31/141,7 | | | 40,000 | | | | 29,750 | |
Nexeo Solutions LLC/Nexeo Solutions Finance Corp., 8.375%, 03/01/18 (a) | | | 75,000 | | | | 75,000 | |
Nexstar Broadcasting, Inc./Mission Broadcasting, Inc., 8.875%, 04/15/17 | | | 75,000 | | | | 77,250 | |
Noranda Aluminum Acquisition Corp., 4.659%, 05/15/156 | | | 209,114 | | | | 194,476 | |
Nova Chemicals Corp., 8.625%, 11/01/19 | | | 30,000 | | | | 33,225 | |
Novelis, Inc./GA: | | | | | | | | |
8.375%, 12/15/17 | | | 70,000 | | | | 74,725 | |
8.750%, 12/15/20 | | | 90,000 | | | | 96,975 | |
NXP, B.V./NXP Funding LLC: | | | | | | | | |
9.750%, 08/01/18 (a) | | | 165,000 | | | | 180,675 | |
10.000%, 07/15/13 (a) | | | 75,000 | | | | 81,563 | |
Oasis Petroleum, Inc., 7.250%, 02/01/19 | | | 20,000 | | | | 20,800 | |
Oshkosh Corp.: | | | | | | | | |
8.250%, 03/01/17 | | | 80,000 | | | | 83,600 | |
8.500%, 03/01/20 | | | 20,000 | | | | 20,700 | |
Packaging Dynamics Corp., 8.750%, 02/01/16 (a) | | | 70,000 | | | | 70,350 | |
PAETEC Holding Corp.: | | | | | | | | |
8.875%, 06/30/17 | | | 70,000 | | | | 75,950 | |
9.875%, 12/01/18 | | | 100,000 | | | | 110,500 | |
Parker Drilling Co., 9.125%, 04/01/18 | | | 40,000 | | | | 42,300 | |
The accompanying notes are an integral part of these financial statements.
29
Managers High Yield Fund
Schedule of Portfolio Investments (continued)
| | | | | | | | |
| | | Principal Amount | | | Value | |
| | | | | | | | |
Industrials - 81.4% (continued) | | | | | | | | |
Peabody Energy Corp.: | | | | | | | | |
6.000%, 11/15/18 (a) | | $ | 60,000 | | | $ | 61,500 | |
6.250%, 11/15/21 (a) | | | 60,000 | | | | 62,400 | |
Petco Animal Supplies, Inc., 9.250%, 12/01/18 (a)1 | | | 90,000 | | | | 96,975 | |
Petrohawk Energy Corp., 6.250%, 06/01/19 | | | 30,000 | | | | 33,150 | |
PH Glatfelter Co., 7.125%, 05/01/16 | | | 95,000 | | | | 98,860 | |
Ply Gem Industries, Inc., 8.250%, 02/15/18 | | | 90,000 | | | | 78,863 | |
Polymer Group, Inc., 7.750%, 02/01/19 (a) | | | 105,000 | | | | 109,200 | |
PolyOne Corp., 7.375%, 09/15/20 | | | 35,000 | | | | 36,225 | |
Polypore International, Inc., 7.500%, 11/15/17 | | | 85,000 | | | | 88,400 | |
Quebecor Media, Inc., 7.750%, 03/15/16 | | | 250,000 | | | | 258,125 | |
Quebecor World, Escrow, 6.500%, 08/01/277 | | | 165,000 | | | | 2,475 | |
Qwest Communications International, Inc.: | | | | | | | | |
7.500%, 02/15/14 | | | 100,000 | | | | 100,628 | |
Series B, 7.500%, 02/15/14 | | | 35,000 | | | | 35,220 | |
Radiation Therapy Services, Inc., 9.875%, 04/15/17 | | | 90,000 | | | | 67,725 | |
RailAmerica, Inc., 9.250%, 07/01/17 | | | 73,000 | | | | 80,118 | |
Rain CII Carbon LLC/CII Carbon Corp., 8.000%, 12/01/18 (a) | | | 30,000 | | | | 30,225 | |
RBS Global, Inc./Rexnord LLC, 8.500%, 05/01/18 | | | 125,000 | | | | 133,125 | |
Reichhold Industries, Inc., 9.000%, 08/15/14 (a) | | | 235,000 | | | | 125,725 | |
Reynolds Group Issuer, Inc./Reynolds Group Issuer LLC: | | | | | | | | |
8.250%, 02/15/21 (a) | | | 100,000 | | | | 89,000 | |
8.750%, 05/15/18 (a) | | | 70,000 | | | | 67,375 | |
9.000%, 04/15/19 (a) | | | 240,000 | | | | 229,200 | |
9.880%, 08/15/19 (a) | | | 100,000 | | | | 97,500 | |
Rite Aid Corp.: | | | | | | | | |
7.500%, 03/01/17 | | | 55,000 | | | | 55,206 | |
9.500%, 06/15/17 | | | 40,000 | | | | 36,700 | |
9.750%, 06/12/16 | | | 75,000 | | | | 82,500 | |
10.250%, 10/15/191 | | | 15,000 | | | | 16,613 | |
RSC Equipment Rental, Inc./RSC Holdings III LLC: | | | | | | | | |
8.250%, 02/01/21 | | | 80,000 | | | | 81,400 | |
9.500%, 12/01/14 | | | 62,000 | | | | 64,015 | |
10.250%, 11/15/19 | | | 20,000 | | | | 21,900 | |
Sally Holdings LLC/Sally Capital, Inc., 6.875%, 11/15/19 (a) | | | 25,000 | | | | 26,250 | |
SandRidge Energy, Inc.: | | | | | | | | |
7.500%, 03/15/21 | | | 40,000 | | | | 39,900 | |
8.000%, 06/01/18 (a) | | | 30,000 | | | | 30,450 | |
SBA Telecommunications, Inc., 8.250%, 08/15/19 | | | 70,000 | | | | 76,475 | |
Scotts Miracle-Gro Co., The, 7.250%, 01/15/18 | | | 20,000 | | | | 21,100 | |
Sealed Air Corp.: | | | | | | | | |
8.125%, 09/15/19 (a) | | | 25,000 | | | | 27,500 | |
8.375%, 09/15/21 (a) | | | 25,000 | | | | 27,750 | |
Sealy Mattress Co., 8.250%, 06/15/141 | | | 265,000 | | | | 263,675 | |
The accompanying notes are an integral part of these financial statements.
30
Managers High Yield Fund
Schedule of Portfolio Investments (continued)
| | | | | | | | |
| | | Principal Amount | | | Value | |
| | | | | | | | |
Industrials - 81.4% (continued) | | | | | | | | |
Sensata Technologies, B.V., 6.500%, 05/15/19 (a) | | $ | 110,000 | | | $ | 109,175 | |
Service Corp. International: | | | | | | | | |
6.750%, 04/01/16 | | | 30,000 | | | | 32,625 | |
7.000%, 06/15/17 | | | 60,000 | | | | 65,400 | |
7.000%, 05/15/19 | | | 50,000 | | | | 52,875 | |
ServiceMaster Co., 10.750%, 07/15/15 (a)6 | | | 85,000 | | | | 88,400 | |
Simmons Bedding Co., 11.250%, 07/15/15 (a) | | | 210,000 | | | | 217,875 | |
Sinclair Television Group, Inc.: | | | | | | | | |
8.375%, 10/15/181 | | | 25,000 | | | | 25,938 | |
9.250%, 11/01/17 (a) | | | 90,000 | | | | 98,550 | |
Solo Cup Co./Solo Cup Operating Corp., 10.500%, 11/01/13 | | | 20,000 | | | | 20,400 | |
Spectrum Brands Holdings, Inc.: | | | | | | | | |
9.500%, 06/15/18 (a) | | | 110,000 | | | | 120,862 | |
12.000%, 08/28/196 | | | 186,327 | | | | 203,562 | |
Spirit Aerosystems, Inc., 7.500%, 10/01/17 | | | 90,000 | | | | 98,100 | |
Sprint Capital Corp., 8.750%, 03/15/32 | | | 515,000 | | | | 419,081 | |
Sprint Nextel Corp.: | | | | | | | | |
9.000%, 11/15/18 (a) | | | 145,000 | | | | 152,613 | |
11.500%, 11/15/21 (a) | | | 25,000 | | | | 24,813 | |
SSI Investments II/SSI Co-Issuer LLC, 11.125%, 06/01/18 | | | 100,000 | | | | 106,250 | |
Stewart Enterprises, Inc., 6.500%, 04/15/19 | | | 50,000 | | | | 50,500 | |
SunGard Data Systems, Inc.: | | | | | | | | |
7.375%, 11/15/18 | | | 80,000 | | | | 82,300 | |
10.250%, 08/15/15 | | | 320,000 | | | | 333,200 | |
SUPERVALU, Inc., 8.000%, 05/01/16 | | | 120,000 | | | | 124,500 | |
Surgical Care Affiliates, Inc., 8.875%, 07/15/15 (a)6 | | | 159,291 | | | | 159,689 | |
Syniverse Holdings, Inc., 9.125%, 01/15/19 | | | 40,000 | | | | 42,400 | |
Tenet Healthcare Corp.: | | | | | | | | |
6.250%, 11/01/18 (a) | | | 50,000 | | | | 51,000 | |
8.000%, 08/01/20 | | | 130,000 | | | | 130,813 | |
8.875%, 07/01/19 | | | 20,000 | | | | 22,550 | |
9.250%, 02/01/15 | | | 95,000 | | | | 100,344 | |
Terex Corp., 8.000%, 11/15/17 | | | 95,000 | | | | 93,575 | |
Tomkins LLC/Tomkins, Inc., 9.000%, 10/01/18 | | | 80,000 | | | | 89,100 | |
Travelport LLC, 5.152%, 09/01/14 (03/01/12)4 | | | 60,000 | | | | 29,700 | |
Trinidad Drilling, Ltd., 7.875%, 01/15/19 (a) | | | 85,000 | | | | 87,975 | |
UCI International, Inc., 8.625%, 02/15/19 | | | 95,000 | | | | 92,625 | |
United Rentals North America, Inc.: | | | | | | | | |
8.375%, 09/15/201 | | | 55,000 | | | | 53,900 | |
9.250%, 12/15/19 | | | 85,000 | | | | 89,463 | |
United Surgical Partners International, Inc.: | | | | | | | | |
8.875%, 05/01/17 | | | 15,000 | | | | 15,038 | |
9.250%, 05/01/176 | | | 145,000 | | | | 146,450 | |
Vail Resorts, Inc., 6.500%, 05/01/19 | | | 80,000 | | | | 82,000 | |
The accompanying notes are an integral part of these financial statements.
31
Managers High Yield Fund
Schedule of Portfolio Investments (continued)
| | | | | | | | |
| | | Principal Amount | | | Value | |
| | | | | | | | |
Industrials - 81.4% (continued) | | | | | | | | |
Valeant Pharmaceuticals International: | | | | | | | | |
6.750%, 10/01/17 (a) | | $ | 65,000 | | | $ | 65,244 | |
6.875%, 12/01/18 (a) | | | 150,000 | | | | 150,375 | |
7.250%, 07/15/22 (a) | | | 125,000 | | | | 121,875 | |
Venoco, Inc., 8.875%, 02/15/19 | | | 65,000 | | | | 58,825 | |
Vertellus Specialties, Inc., 9.375%, 10/01/15 (a) | | | 75,000 | | | | 57,750 | |
Visant Corp., 10.000%, 10/01/17 | | | 133,000 | | | | 122,360 | |
Visteon Corp./New, 6.750%, 04/15/19 (a) | | | 55,000 | | | | 55,138 | |
Vulcan Materials Co.: | | | | | | | | |
6.500%, 12/01/16 | | | 25,000 | | | | 25,938 | |
7.500%, 06/15/21 | | | 65,000 | | | | 70,525 | |
Wind Acquisition Finance SA, 11.750%, 07/15/17 (a) | | | 100,000 | | | | 90,000 | |
Windstream Corp.: | | | | | | | | |
7.500%, 04/01/23 | | | 100,000 | | | | 99,250 | |
7.750%, 10/01/211 | | | 65,000 | | | | 66,950 | |
7.875%, 11/01/17 | | | 60,000 | | | | 65,250 | |
8.125%, 09/01/18 | | | 40,000 | | | | 43,050 | |
WMG Acquisition Corp.: | | | | | | | | |
9.500%, 06/15/16 | | | 75,000 | | | | 81,750 | |
11.500%, 10/01/18 (a) | | | 45,000 | | | | 44,888 | |
WPX Energy, Inc., 6.000%, 01/15/22 (a) | | | 60,000 | | | | 61,725 | |
Wynn Las Vegas LLC/Wynn Las Vegas Capital Corp., 7.750%, 08/15/20 | | | 25,000 | | | | 27,875 | |
Yankee Candle Co., Inc., Series B, 9.750%, 02/15/17 | | | 105,000 | | | | 102,900 | |
YCC Holdings LLC/Yankee Finance, Inc., 10.250%, 02/15/166 | | | 15,000 | | | | 13,200 | |
Zayo Group LLC/Zayo Capital, Inc., 10.250%, 03/15/17 | | | 90,000 | | | | 96,525 | |
Total Industrials | | | | | | | 26,187,437 | |
Utilities - 2.5% | | | | | | | | |
AES Corp., The: | | | | | | | | |
8.000%, 10/15/17 | | | 30,000 | | | | 33,150 | |
9.750%, 04/15/16 | | | 125,000 | | | | 143,750 | |
Calpine Corp.: | | | | | | | | |
7.250%, 10/15/17 (a) | | | 40,000 | | | | 42,200 | |
7.500%, 02/15/21 (a) | | | 80,000 | | | | 86,000 | |
7.875%, 07/31/20 (a) | | | 90,000 | | | | 97,425 | |
Energy Future Holdings Corp., 10.000%, 01/15/20 | | | 50,000 | | | | 52,750 | |
Energy Future Intermediate Holding Co. LLC/EFIH Finance, Inc., 10.000%, 12/01/20 | | | 81,000 | | | | 85,860 | |
NRG Energy, Inc.: | | | | | | | | |
8.250%, 09/01/20 | | | 55,000 | | | | 55,550 | |
7.625%, 01/15/18 | | | 95,000 | | | | 95,475 | |
Texas Competitive Electric Holdings, Term Loan, 4.776%, 10/10/17 (01/09/12)4 | | | 172,821 | | | | 110,029 | |
Total Utilities | | | | | | | 802,189 | |
Total Corporate Bonds and Notes (cost $29,832,166) | | | | | | | 30,075,568 | |
The accompanying notes are an integral part of these financial statements.
32
Managers High Yield Fund
Schedule of Portfolio Investments (continued)
| | | | | | | | |
| | | Shares | | | Value | |
| | | | | | | | |
Exchange Traded Funds - 1.5% | | | | | | | | |
SPDR Barclays Capital High Yield Bond1 (cost $504,861) | | | 12,500 | | | $ | 480,625 | |
Other Investment Companies - 8.7%2 | | | | | | | | |
BNY Mellon Overnight Government Fund, 0.04%3 | | | 1,878,880 | | | | 1,878,880 | |
Dreyfus Cash Management Fund, Institutional Class Shares, 0.05% | | | 931,925 | | | | 931,925 | |
Total Other Investment Companies (cost $2,810,805) | | | | | | | 2,810,805 | |
Total Investments - 104.1% (cost $33,283,796) | | | | | | | 33,476,428 | |
Other Assets, less Liabilities - (4.1)% | | | | | | | (1,304,283 | ) |
Net Assets - 100.0% | | | | | | $ | 32,172,145 | |
The accompanying notes are an integral part of these financial statements.
33
Managers Fixed Income Fund
Investment Manager’s Comments
THE YEAR IN REVIEW
Managers Fixed Income Fund (Institutional Class) returned 4.79% for the year ended December 31, 2011, lagging the return of 7.84% for the Barclays Capital U.S. Aggregate Bond Index (“the Index”). At the beginning of 2011, a low interest rate environment continued to reinforce the reach for yield at a time when economic conditions had been slowly improving and the outlook for growth expectations was slightly less optimistic. These conditions supported demand for fixed income over the next few months as new issuance continued its torrid pace, reaching $167.9B by the end of the first half of 2011, well ahead of last year’s record pace. Despite negative headline risk out of Japan, the Middle East and the northern Africa region, ongoing European sovereign issues and ratings downgrades in peripheral corporate names, the financial markets had been mostly resilient through the first half of 2011 thanks to positive technicals and fundamentals.
However, growing contagion fears within Europe and an inability to grasp the reach of the global economic slowdown continued to keep investors wary, which affected high yield markets. The seemingly endless buildup of stress on the European banking system and global financial markets increased the downside risk of global growth and led to increased market volatility during the summer months and early fall. Continued market volatility from a lack of resolution regarding the European debt crisis impacted high yield and investment grade corporate bond liquidity into November. Downgrade fears within Europe and continued bickering in Wash-ington around two key items with growth implications for 2012 (payroll taxes and unemployment benefits) kept pressure on markets during the fourth quarter. Better than expected economic releases in the US helped to solidify investor beliefs that the slow domestic economic recovery will continue into 2012. Low yielding investment alternatives and strong corporate fundamentals continue to bode well for high yield demand.
The primary driver of the Fund’s underperformance relative to the Index during 2011 was its emphasis on convertibles, below investment grade bonds, and its underweight to the U.S. Treasury sector. Significant return from select equity positions combined with the Fund’s large underweight to mortgage backed securities were the main returns drivers, limiting the extent of underperformance. Credit spreads drifted wider in 2011, following several years of tightening. The Fund benefited most from a select group of equity securities and exposure to U.S. investment-grade non-financial bonds. The Fund gave back some of those gains from its high-yield and convertible bond exposure which suffered from the risk-off trade in the second half of 2011 associated with slow growth and European bank and sovereign anxiety. Convertible bonds suffered due to a higher beta to domestic stocks, wider credit spreads and a generally lower coupon as compared to high yield. Non-dollar holdings in the Fund did not keep pace with domestic markets during 2011, detracting from relative returns vs. the benchmark.
LOOKING FORWARD
Central banks around the world began to provide more liquidity to the capital markets in the fourth quarter, and risk-oriented assets rejoiced. It was a very good quarter for equities, corporate credit and high yield bonds. However, the all-clear signal has not been given, as the sovereign debt crisis in Europe remains unresolved and signs of a slowdown in China continue to accumulate.
Some significant central bank policy actions during the fourth quarter included:
| | • | | Coordinated efforts by the US, Canada, Britain, Japan, Switzer-land and Europe to ease the global liquidity crunch by lowering |
| | | the cost of existing dollar swap lines by 50 basis points and arranging bilateral swaps to provide liquidity for other currencies |
| | • | | China’s move to cut its bank reserve requirements |
| | • | | The European Central Bank’s decision to cut rates by 50 basis points to 1.0% and its provision of 3-year loans to banks |
| | • | | The Bank of England’s announcement of another round of quantitative easing |
| | • | | The IMF’s decision to grant Greece another tranche of its emergency loan program |
| | • | | Interest-rate cuts by central banks in Australia, Sweden, and Brazil |
These actions were certainly welcome, and markets responded by posting strong returns for the fourth quarter. However, the European economy may be slipping into recession, which should make it much harder to implement fiscal austerity, reduce budget deficits, and convince investors that debt ratios will eventually stabilize.
The negative feedback loop from weak sovereign credit metrics to weak bank balance sheets will likely continue to be a source of risk in 2012. To comply with new European Banking austerity requirements that take effect in June 2012, banks must increase their capitalization ratios and can do so by raising equity, shrinking assets, or cutting staff, bonuses and dividends to retain more earnings. As such, there is evidence that European banks are restricting credit, shrinking their balance sheets and reducing staff to meet tougher capitalization standards. Ultimately, we see these actions reinforcing the negative feedback loop between sovereign credit and bank balance sheets.
We expect the deflationary pressures from Europe and the hangover from the financial crisis to remain intense during 2012, which should keep high-quality bond yields very low around the world. Cooling emerging market economies, especially China, Brazil, and India, have also contributed to lower global bond yields. Commodity price pressures have eased, which should help reduce inflation and allow for more central bank rate cuts around the world.
In this enduring environment of zero policy rates and low yields on high-quality bonds, we believe the global search for yield will remain a key theme in 2012. This environment suggests bonds across the quality spectrum trading at a premium to government bonds could achieve respectable risk-adjusted returns. Moderate growth, strong balance sheets and earnings are also supportive of investments in risk assets and sectors. With that in mind, we favor US investment grade and high yield bonds, convertibles and select equity securities, along with select non-dollar currencies and securities.
This commentary reflects the viewpoints of the portfolio manager, Loomis, Sayles & Company, as of December 31, 2011, and is not intended as a forecast or guarantee of future results.
CUMULATIVE TOTAL RETURN PERFORMANCE
Managers Fixed Income Fund’s cumulative total return is based on the daily change in net asset value (NAV), and assumes that all distributions were reinvested. The chart illustrates the performance of a hypothetical $10,000 investment made in the Fund’s Class A Shares (with load) on December 31, 2001, with a $10,000 investment made in the Barclays Capital U.S. Aggregate Bond Index for the same time period. The graph and table do not reflect the deduction of taxes that a shareholder would pay on a Fund distribution or redemption of shares. Performance for periods longer than one year is annualized. The listed returns for the Fund are net of expenses and the returns for the index exclude expenses. Total returns for the Fund would have been lower had certain expenses not been reduced.
Managers Fixed Income Fund
Investment Manager’s Comments (continued)
CUMULATIVE TOTAL RETURN PERFORMANCE (continued)
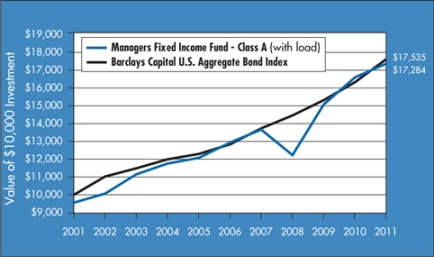
The table below shows the average annual total returns for the Managers Fixed Income Fund and the Barclays Capital U.S. Aggregate Bond Index from December 31, 2001 through December 31, 2011.
| | | | | | | | | | | | | | |
| | | | | Average Annual Total Returns1 | |
| | | | | One Year | | | Five Years | | | Ten Years | |
Managers Fixed Income Fund2,3 | | | | | | | | | | | | |
-Class A | | No Load | | | 4.53 | % | | | 6.00 | % | | | 6.08 | % |
-Class A | | With Load | | | 0.07 | % | | | 5.08 | % | | | 5.62 | % |
-Class B | | No Load | | | 3.73 | % | | | 5.21 | % | | | 5.38 | % |
-Class B | | With Load | | | (1.18) | % | | | 4.88 | % | | | 5.38 | % |
-Class C | | No Load | | | 3.73 | % | | | 5.20 | % | | | 5.37 | % |
-Class C | | With Load | | | 2.75 | % | | | 5.20 | % | | | 5.37 | % |
-Institutional Class | | No Load | | | 4.79 | % | | | 6.26 | % | | | 6.43 | % |
Barclays Capital U.S Aggregate Bond Index4 | | | 7.84 | % | | | 6.50 | % | | | 5.78 | % |
The performance data shown represents past performance, which is not a guarantee of future results. Current performance may be lower or higher than the performance data quoted. The investment return and principal value of an investment in the Fund will fluctuate so that an investor’s shares, when redeemed, may be worth more or less than their original cost. For performance information through the most recent month end please call (800) 835-3879 or visit our Web site at www.managersinvest.com.
Performance differences among the share classes are due to differences in sales charge structures and class expenses. Returns shown reflect maximum sales charge of 4.25% on Class A, as well as the applicable contingent deferred sales charge (CDSC) on both Class B and C shares. The Class B shares’ CDSC declines annually between years 1 through 6 according to the following schedule: 5, 4, 3, 3, 2, 1%. No sales charge is assessed after year six. Class C shares held for less than one year are subject to a 1% CDSC.
Investors should carefully consider the Fund’s investment objectives, risks, charges and expenses before investing. For this and other information, please call 800.835.3879 or visit www.managersinvest.com for a free prospectus. Read it carefully before investing or sending money. Funds are distributed by Managers Distributors, Inc., a member of FINRA.
| | |
| 1 | | Total return equals income yield plus share price change and assumes reinvestment of all dividends and capital gain distributions. Returns are net of fees and may reflect offsets of Fund expenses as described in the Prospectus. No adjustment has been made for taxes payable by shareholders on their reinvested dividends and capital gain distributions. Returns for periods greater than one year are the average annual returns. The listed returns on the Fund are net of expenses and based on the published NAV as of December 31, 2011. All returns are in U.S. dollars ($). |
| 2 | | The Fund is subject to the risks associated with investments in debt securities, such as default risk and fluctuations in the perception of the debtors’ ability to pay its creditors. |
| 3 | | From time to time, the Fund’s advisor has waived its fees and/or absorbed Fund expenses, which has resulted in higher returns. |
| 4 | | The Barclays Capital U.S. Aggregate Bond Index is an index of the U.S. investment grade, fixed-rate bond market, including both government and corporate bonds. The Barclays Capital U.S. Aggregate Bond Index is unmanaged, is not available for investment, and does not incur expenses. |
| |
Not FDIC insured, nor bank guaranteed. May lose value. |
| | | |
| | | |
| | | |
| | | |
| | | |
| | | |
| | | |
| | | |
| | | |
35
Managers Fixed Income Fund
Fund Snapshots (unaudited)
December 31, 2011
Portfolio Breakdown
| | | | |
Industry | | Managers Fixed
Income Fund** | |
Industrials | | | 31.8 | % |
Financials | | | 23.7 | % |
Utilities | | | 9.4 | % |
Foreign Government and Agency Obligations | | | 5.4 | % |
Information Technology | | | 5.6 | % |
Energy | | | 4.4 | % |
Health Care | | | 4.1 | % |
Asset-Backed Securities | | | 3.9 | % |
Telecommunication Services | | | 2.7 | % |
U.S. Government and Agency Obligations | | | 2.6 | % |
Municipal Bonds | | | 1.5 | % |
Materials | | | 1.2 | % |
Preferred Stocks | | | 0.7 | % |
Mortgage-Backed Securities | | | 0.5 | % |
Other Assets and Liabilities | | | 2.5 | % |
| ** | As a percentage of net assets |
| | | | | | | | |
Rating | | Managers
Fixed Income
Fund** | | | Barclays Capital U.S.
Aggregate Bond
Index | |
U.S. Treasury | | | 3.1 | % | | | 35.1 | % |
U.S. Agency | | | 0.0 | % | | | 37.4 | % |
Aaa | | | 6.4 | % | | | 4.0 | % |
Aa | | | 1.1 | % | | | 3.7 | % |
A | | | 24.2 | % | | | 10.7 | % |
Baa | | | 49.8 | % | | | 9.1 | % |
Ba | | | 9.4 | % | | | 0.0 | % |
B | | | 5.6 | % | | | 0.0 | % |
Caa | | | 0.0 | % | | | 0.0 | % |
Ca | | | 0.0 | % | | | 0.0 | % |
C | | | 0.0 | % | | | 0.0 | % |
D | | | 0.0 | % | | | 0.0 | % |
Not Rated | | | 0.4 | % | | | 0.0 | % |
| ** | As a percentage of market value of fixed income securities |
Chart does not include equity securities.
Top Ten Holdings
| | | | |
Security Name | | % of
Net Assets | |
Bristol-Myers Squibb Co.* | | | 4.1 | % |
Intel Corp.* | | | 3.6 | |
Ford Motor Co., 4.250%, 11/15/16* | | | 3.6 | |
U.S. Treasury Bond, 0.125%, 09/30/13 | | | 2.6 | |
Telefonica SA, ADR | | | 2.5 | |
Royal Dutch Shell PLC, ADR | | | 2.3 | |
Inter-American Development Bank, EMTN, 6.000%, 12/15/17* | | | 2.2 | |
Repsol YPF SA, ADR | | | 2.1 | |
Trinity Rail Leasing, L.P., Series 2010-1A, Class A, 5.194%, 10/16/40* | | | 2.0 | |
Microsoft Corp.* | | | 2.0 | |
| | | | |
Top Ten as a Group | | | 27.0 | % |
| | | | |
| * | Top Ten Holding at June 30, 2011 |
|
| Any sectors, industries, or securities discussed should not be perceived as investment recommendations. Mention of a specific security should not be considered a recommendation to buy or solicitation to sell that security. Specific securities mentioned in this report may have been sold from the Fund’s portfolio of investments by the time you receive this report. |
36
Managers Fixed Income Fund
Schedule of Portfolio Investments
December 31, 2011
| | | | | | | | |
| | | Principal Amount | | | Value | |
| | | | | | | | |
Asset-Backed Securities - 3.9% | | | | | | | | |
Centex Home Equity, Series 2004-A, Class AF6, 4.270%, 01/25/345 | | $ | 175,373 | | | $ | 174,972 | |
Countrywide Asset-Backed Certificates, Series 2002-S1, Class A5, 6.460%,
11/25/16 (b) | | | 102,584 | | | | 96,015 | |
Marriott Vacation Club Owner Trust, Series 2009-2A, Class A, 4.809%, 07/20/31 (a) | | | 630,131 | | | | 644,084 | |
Merrill Auto Trust Securitization, Series 2008-1, Class B, 6.750%, 04/15/15 | | | 200,000 | | | | 203,331 | |
Sierra Receivables Funding Co., LLC, Series 2010-2A, Class A, 3.840%, 11/20/25 (a) | | | 903,939 | | | | 923,587 | |
Trinity Rail Leasing, L.P., Series 2010-1A, Class A, 5.194%, 10/16/40 (a) | | | 2,879,161 | | | | 2,789,789 | |
World Financial Network Credit Card Master Trust, Series 2010-A, Class A, 6.750%, 04/15/19 | | | 500,000 | | | | 552,894 | |
Total Asset-Backed Securities (cost $5,378,058) | | | | | | | 5,384,672 | |
| | |
| | | Shares | | | | |
Common Stocks - 18.0% | | | | | | | | |
Energy - 4.4% | | | | | | | | |
Repsol YPF SA, ADR1 | | | 92,853 | | | | 2,832,945 | |
Royal Dutch Shell PLC, ADR | | | 42,903 | | | | 3,135,780 | |
Total Energy | | | | | | | 5,968,725 | |
Health Care - 4.1% | | | | | | | | |
Bristol-Myers Squibb Co. | | | 160,000 | | | | 5,638,398 | |
Information Technology - 5.6% | | | | | | | | |
Intel Corp. | | | 204,750 | | | | 4,965,188 | |
Microsoft Corp. | | | 105,934 | | | | 2,750,047 | |
Total Information Technology | | | | | | | 7,715,235 | |
Materials - 1.2% | | | | | | | | |
PPG Industries, Inc. | | | 20,000 | | | | 1,669,800 | |
Telecommunication Services - 2.7% | | | | | | | | |
Telecom Italia SpA, ADR | | | 25,000 | | | | 266,250 | |
Telefonica SA, ADR | | | 196,243 | | | | 3,373,417 | |
Total Telecommunication Services | | | | | | | 3,639,667 | |
Total Common Stocks (cost $22,467,796) | | | | | | | 24,631,825 | |
| | |
| | | Principal Amount | | | | |
Corporate Bonds and Notes - 64.9% | | | | | | | | |
Financials - 23.7% | | | | | | | | |
AgriBank FCB, Series AI, 9.125%, 07/15/19 | | $ | 810,000 | | | $ | 1,056,212 | |
Alta Wind Holdings LLC, 7.000%, 06/30/35 (a) | | | 577,790 | | | | 637,074 | |
American International Group, Inc.: | | | | | | | | |
EMTN, 5.000%, 04/26/23 | | GBP | 750,000 | | | | 930,570 | |
MTN, 5.450%, 05/18/17 | | | 30,000 | | | | 28,735 | |
Associates Corp. of North America, 6.950%, 11/01/18 | | | 650,000 | | | | 707,277 | |
Bank of America Corp.: | | | | | | | | |
7.625%, 06/01/19 | | | 278,000 | | | | 287,917 | |
MTN, 6.750%, 09/09/13 | | AUD | 1,000,000 | | | | 1,005,594 | |
Bear Stearns Cos. LLC, The, 4.650%, 07/02/18 | | | 480,000 | | | | 491,398 | |
|
The accompanying notes are an integral part of these financial statements. 37 |
Managers Fixed Income Fund
Schedule of Portfolio Investments (continued)
| | | | | | | | | | | | |
| | | | | | Principal Amount | | | Value | |
| | | | | | | | | | | | |
Financials - 23.7% (continued) | | | | | | | | | | | | |
Camden Property Trust, 5.700%, 05/15/17 | | | | | | $ | 255,000 | | | $ | 279,543 | |
Cantor Fitzgerald, L.P.: | | | | | | | | | | | | |
6.375%, 06/26/15 (a) | | | | | | | 910,000 | | | | 867,477 | |
7.875%, 10/15/19 (a)8 | | | | | | | 700,000 | | | | 684,734 | |
Citigroup, Inc.: | | | | | | | | | | | | |
5.500%, 10/15/14 | | | | | | | 1,340,000 | | | | 1,378,466 | |
6.125%, 05/15/18 | | | | | | | 345,000 | | | | 367,688 | |
6.125%, 08/25/36 | | | | | | | 935,000 | | | | 811,165 | |
Duke Realty, L.P., 5.950%, 02/15/17 | | | | | | | 35,000 | | | | 37,671 | |
Equifax, Inc., 7.000%, 07/01/37 | | | | | | | 228,000 | | | | 258,261 | |
ERP Operating, L.P.: | | | | | | | | | | | | |
5.125%, 03/15/16 | | | | | | | 15,000 | | | | 16,087 | |
5.750%, 06/15/17 | | | | | | | 45,000 | | | | 49,952 | |
Forethought Financial Group, Inc., 8.625%, 04/15/21 (a) | | | | | | | 705,000 | | | | 713,994 | |
GE Capital Australia Funding Pty, Ltd., EMTN, 8.000%, 02/13/12 | | | AUD | | | | 260,000 | | | | 266,616 | |
General Electric Capital Corp., MTN, Series A, 0.703%, 05/13/24 (01/17/12)4 | | | | | | | 180,000 | | | | 141,448 | |
HBOS PLC: | | | | | | | | | | | | |
6.000%, 11/01/33 (a) | | | | | | | 1,000,000 | | | | 613,187 | |
GMTN, 6.750%, 05/21/18 (a) | | | | | | | 1,955,000 | | | | 1,569,413 | |
Highwoods Realty, L.P.: | | | | | | | | | | | | |
5.850%, 03/15/17 | | | | | | | 30,000 | | | | 31,766 | |
7.500%, 04/15/18 | | | | | | | 350,000 | | | | 394,660 | |
International Lease Finance Corp.: | | | | | | | | | | | | |
6.250%, 05/15/19 | | | | | | | 1,115,000 | | | | 1,031,503 | |
8.625%, 09/15/15 | | | | | | | 10,000 | | | | 10,288 | |
MTN, 5.650%, 06/01/14 | | | | | | | 105,000 | | | | 100,800 | |
iStar Financial, Inc., 1.081%, 10/01/12 (01/01/12)4,9 | | | | | | | 325,000 | | | | 292,500 | |
MBIA Insurance Corp., 14.000%, 01/15/33 (a)5 | | | | | | | 25,000 | | | | 14,250 | |
Merrill Lynch & Co., Inc.: | | | | | | | | | | | | |
6.110%, 01/29/37 | | | | | | | 1,800,000 | | | | 1,391,539 | |
MTN, Series C, 6.050%, 06/01/34 | | | | | | | 1,100,000 | | | | 846,357 | |
MetLife, Inc., 6.400%, 12/15/36 | | | | | | | 340,000 | | | | 323,426 | |
Morgan Stanley: | | | | | | | | | | | | |
4.750%, 04/01/14 | | | | | | | 540,000 | | | | 532,226 | |
5.500%, 07/24/20 | | | | | | | 1,800,000 | | | | 1,639,323 | |
GMTN, 5.500%, 01/26/20 | | | | | | | 200,000 | | | | 182,343 | |
GMTN, 5.625%, 09/23/19 | | | | | | | 500,000 | | | | 463,746 | |
MTN, 5.950%, 12/28/17 | | | | | | | 200,000 | | | | 190,782 | |
MTN, 6.625%, 04/01/18 | | | | | | | 160,000 | | | | 158,190 | |
Mutual of Omaha Insurance Co., 6.800%, 06/15/36 (a) | | | | | | | 620,000 | | | | 663,304 | |
National City Bank of Indiana, 4.250%, 07/01/18 | | | | | | | 395,000 | | | | 398,388 | |
Old Republic International Corp., 3.750%, 03/15/189 | | | | | | | 2,745,000 | | | | 2,425,894 | |
|
The accompanying notes are an integral part of these financial statements. 38 |
Managers Fixed Income Fund
Schedule of Portfolio Investments (continued)
| | | | | | | | |
| | | Principal Amount | | | Value | |
| | | | | | | | |
Financials - 23.7% (continued) | | | | | | | | |
Penn Mutual Life Insurance Co., The, 7.625%, 06/15/40 (a) | | $ | 895,000 | | | $ | 1,100,956 | |
ProLogis, L.P.: | | | | | | | | |
5.625%, 11/15/15 | | | 15,000 | | | | 15,967 | |
5.750%, 04/01/16 | | | 15,000 | | | | 15,886 | |
Simon Property Group, L.P.: | | | | | | | | |
5.250%, 12/01/16 | | | 25,000 | | | | 27,738 | |
5.750%, 12/01/15 | | | 85,000 | | | | 95,179 | |
5.875%, 03/01/17 | | | 40,000 | | | | 45,738 | |
6.100%, 05/01/16 | | | 100,000 | | | | 113,774 | |
SLM Corp.: | | | | | | | | |
0.718%, 01/27/14 (01/25/12)4 | | | 135,000 | | | | 122,100 | |
8.450%, 06/15/18 | | | 845,000 | | | | 874,575 | |
MTN, Series A, 5.000%, 10/01/13 | | | 10,000 | | | | 10,025 | |
MTN, Series A, 5.375%, 01/15/13 | | | 20,000 | | | | 20,143 | |
Springleaf Finance Corp.: | | | | | | | | |
MTN, 5.850%, 06/01/13 | | | 80,000 | | | | 70,800 | |
MTN, Series H, 5.375%, 10/01/12 | | | 400,000 | | | | 379,000 | |
MTN, Series I, 4.875%, 07/15/12 | | | 400,000 | | | | 385,000 | |
MTN, Series I, 5.400%, 12/01/15 | | | 20,000 | | | | 14,650 | |
MTN, Series J, 6.900%, 12/15/17 | | | 2,770,000 | | | | 2,008,250 | |
Standard Chartered Bank, 6.400%, 09/26/17 (a) | | | 100,000 | | | | 103,091 | |
Standard Chartered PLC, 5.500%, 11/18/14 (a) | | | 750,000 | | | | 797,645 | |
WEA Finance LLC/WT Finance Australia, 6.750%, 09/02/19 (a) | | | 535,000 | | | | 597,614 | |
Western Union Co., The: | | | | | | | | |
6.200%, 11/17/36 | | | 235,000 | | | | 250,858 | |
6.200%, 06/21/40 | | | 5,000 | | | | 5,373 | |
Weyerhaeuser Co.: | | | | | | | | |
6.875%, 12/15/33 | | | 660,000 | | | | 651,582 | |
7.375%, 10/01/19 | | | 50,000 | | | | 56,418 | |
7.375%, 03/15/32 | | | 90,000 | | | | 94,719 | |
Willis North America, Inc., 7.000%, 09/29/19 | | | 220,000 | | | | 245,267 | |
XL Capital Finance Europe PLC, 6.500%, 01/15/12 | | | 105,000 | | | | 105,128 | |
Total Financials | | | | | | | 32,499,240 | |
Industrials - 31.8% | | | | | | | | |
Avnet, Inc.: | | | | | | | | |
6.000%, 09/01/15 | | | 720,000 | | | | 777,081 | |
6.625%, 09/15/16 | | | 140,000 | | | | 156,775 | |
Cardinal Health, Inc., 4.000%, 06/15/15 | | | 320,000 | | | | 342,727 | |
CenturyLink, Inc.: | | | | | | | | |
6.450%, 06/15/21 | | | 500,000 | | | | 501,799 | |
Series G, 6.875%, 01/15/28 | | | 75,000 | | | | 70,079 | |
Series P, 7.600%, 09/15/39 | | | 635,000 | | | | 624,877 | |
Chesapeake Energy Corp.: | | | | | | | | |
2.250%, 12/15/389 | | | 285,000 | | | | 236,550 | |
|
The accompanying notes are an integral part of these financial statements. 39 |
Managers Fixed Income Fund
Schedule of Portfolio Investments (continued)
| | | | | | | | |
| | | Principal Amount | | | Value | |
| | | | | | | | |
Industrials - 31.8% (continued) | | | | | | | | |
2.500%, 05/15/379 | | $ | 120,000 | | | $ | 107,550 | |
Chevron Phillips Chemical Co. LLC/LP, 8.250%, 06/15/19 (a) | | | 1,205,000 | | | | 1,527,715 | |
Ciena Corp., 0.875%, 06/15/179 | | | 1,330,000 | | | | 1,014,125 | |
Coca-Cola HBC Finance, B.V., 5.125%, 09/17/13 | | | 265,000 | | | | 275,947 | |
Comcast Cable Holdings LLC, 9.800%, 02/01/12 | | | 350,000 | | | | 352,327 | |
Continental Airlines, Inc.: | | | | | | | | |
2000-1 Class A-1 Pass Through Trust, Series 00A1, 8.048%, 11/01/20 | | | 79,356 | | | | 85,006 | |
2007-1 Class A Pass Through Trust, Series 071B, 5.983%, 04/19/22 | | | 395,028 | | | | 411,303 | |
2007-1 Class B Pass Through Trust, Series 071B, 6.903%, 04/19/22 | | | 90,578 | | | | 88,087 | |
2010-1 Class B Pass Through Trust, Series B, 6.000%, 01/12/19 | | | 2,500,000 | | | | 2,300,000 | |
Cytec Industries, Inc., 6.000%, 10/01/15 | | | 80,000 | | | | 87,501 | |
Delta Air Lines, Inc.: | | | | | | | | |
2007-1 Class B Pass Through Trust, Series 071B, 8.021%, 08/10/22 | | | 577,221 | | | | 566,369 | |
2010-1 Class A Pass Through Trust, Series 1A, 6.200%, 07/02/18 | | | 330,143 | | | | 351,602 | |
DP World, Ltd., 6.850%, 07/02/37 (a) | | | 1,720,000 | | | | 1,565,200 | |
Dun & Bradstreet Corp., The, 6.000%, 04/01/13 | | | 790,000 | | | | 833,287 | |
Embarq Corp., 7.995%, 06/01/36 | | | 710,000 | | | | 737,700 | |
Energy Transfer Partners, L.P., 6.125%, 02/15/17 | | | 65,000 | | | | 71,444 | |
EQT Corp., 6.500%, 04/01/18 | | | 1,730,000 | | | | 1,931,460 | |
ERAC USA Finance LLC: | | | | | | | | |
6.375%, 10/15/17 (a) | | | 240,000 | | | | 277,674 | |
6.700%, 06/01/34 (a) | | | 65,000 | | | | 73,708 | |
7.000%, 10/15/37 (a) | | | 925,000 | | | | 1,116,482 | |
Express Scripts, Inc.: | | | | | | | | |
6.250%, 06/15/14 | | | 305,000 | | | | 332,621 | |
7.250%, 06/15/19 | | | 165,000 | | | | 196,916 | |
Ford Motor Co., 4.250%, 11/15/169 | | | 3,380,000 | | | | 4,862,968 | |
GATX Corp., 4.750%, 10/01/12 | | | 560,000 | | | | 571,411 | |
Georgia-Pacific LLC, 7.250%, 06/01/28 | | | 70,000 | | | | 84,669 | |
HCA, Inc., 7.500%, 11/06/33 | | | 75,000 | | | | 65,250 | |
Intel Corp.: | | | | | | | | |
2.950%, 12/15/359 | | | 265,000 | | | | 277,256 | |
3.250%, 08/01/399 | | | 1,035,000 | | | | 1,301,513 | |
Intuit, Inc., 5.750%, 03/15/17 | | | 210,000 | | | | 235,837 | |
J.C. Penney Corp., Inc.: | | | | | | | | |
5.750%, 02/15/18 | | | 25,000 | | | | 25,250 | |
6.375%, 10/15/36 | | | 297,000 | | | | 249,851 | |
7.625%, 03/01/97 | | | 25,000 | | | | 22,500 | |
Kinder Morgan Energy Partners, L.P.: | | | | | | | | |
5.300%, 09/15/20 | | | 425,000 | | | | 463,656 | |
5.950%, 02/15/18 | | | 1,910,000 | | | | 2,184,904 | |
Kinder Morgan Finance Co. ULC, 5.700%, 01/05/16 | | | 165,000 | | | | 169,538 | |
|
The accompanying notes are an integral part of these financial statements. 40 |
Managers Fixed Income Fund
Schedule of Portfolio Investments (continued)
| | | | | | | | | | | | |
| | | | | | Principal Amount | | | Value | |
| | | | | | | | | | | | |
Industrials - 31.8% (continued) | | | | | | | | | | | | |
Kroger Co., The, 7.000%, 05/01/18 | | | | | | $ | 460,000 | | | $ | 565,322 | |
Macy’s Retail Holdings, Inc.: | | | | | | | | | | | | |
6.790%, 07/15/27 | | | | | | | 80,000 | | | | 85,496 | |
6.900%, 04/01/29 | | | | | | | 30,000 | | | | 33,081 | |
Marks & Spencer PLC, 7.125%, 12/01/37 (a) | | | | | | | 300,000 | | | | 299,479 | |
Masco Corp.: | | | | | | | | | | | | |
5.850%, 03/15/17 | | | | | | | 350,000 | | | | 349,763 | |
6.500%, 08/15/32 | | | | | | | 25,000 | | | | 22,421 | |
7.125%, 03/15/20 | | | | | | | 300,000 | | | | 303,233 | |
7.750%, 08/01/29 | | | | | | | 50,000 | | | | 48,648 | |
Medco Health Solutions, Inc., 7.250%, 08/15/13 | | | | | | | 420,000 | | | | 453,952 | |
Methanex Corp., 6.000%, 08/15/15 | | | | | | | 320,000 | | | | 329,769 | |
Micron Technology, Inc., 1.875%, 06/01/149 | | | | | | | 20,000 | | | | 19,200 | |
Missouri Pacific Railroad Co., 5.000%, 01/01/458 | | | | | | | 200,000 | | | | 151,662 | |
Nextel Communications, Inc., Series C, 5.950%, 03/15/14 | | | | | | | 710,000 | | | | 688,700 | |
Northwest Airlines 2007-1 Class B Pass Through Trust, 8.028%, 11/01/17 | | | | | | | 285,600 | | | | 271,663 | |
Omnicare, Inc., 3.750%, 12/15/259 | | | | | | | 470,000 | | | | 655,650 | |
Owens & Minor, Inc., 6.350%, 04/15/168 | | | | | | | 125,000 | | | | 135,863 | |
Owens Corning: | | | | | | | | | | | | |
6.500%, 12/01/16 | | | | | | | 210,000 | | | | 229,432 | |
7.000%, 12/01/36 | | | | | | | 385,000 | | | | 394,664 | |
Portugal Telecom International Finance, B.V.: | | | | | | | | | | | | |
EMTN, 4.500%, 06/16/25 | | | EUR | | | | 300,000 | | | | 239,177 | |
EMTN, 5.000%, 11/04/19 | | | EUR | | | | 300,000 | | | | 270,705 | |
EMTN, 5.630%, 02/08/16 | | | EUR | | | | 100,000 | | | | 107,598 | |
GMTN, 4.380%, 03/24/17 | | | EUR | | | | 100,000 | | | | 95,320 | |
PPG Industries, Inc., 6.650%, 03/15/18 | | | | | | | 1,935,000 | | | | 2,344,028 | |
PulteGroup, Inc.: | | | | | | | | | | | | |
6.000%, 02/15/35 | | | | | | | 1,265,000 | | | | 845,969 | |
6.375%, 05/15/33 | | | | | | | 465,000 | | | | 324,338 | |
Qantas Airways, Ltd., 6.050%, 04/15/16 (a) | | | | | | | 1,375,000 | | | | 1,421,178 | |
Qwest Corp., 6.875%, 09/15/33 | | | | | | | 20,000 | | | | 19,966 | |
Rowan Cos., Inc., 7.875%, 08/01/19 | | | | | | | 300,000 | | | | 352,204 | |
Safeway, Inc., 6.350%, 08/15/17 | | | | | | | 400,000 | | | | 454,073 | |
Samsung Electronics Co., Ltd., 7.700%, 10/01/27 (a) | | | | | | | 480,000 | | | | 580,442 | |
Sprint Capital Corp.: | | | | | | | | | | | | |
6.900%, 05/01/19 | | | | | | | 15,000 | | | | 12,413 | |
8.750%, 03/15/32 | | | | | | | 5,000 | | | | 4,069 | |
Telecom Italia Capital SA: | | | | | | | | | | | | |
6.000%, 09/30/34 | | | | | | | 465,000 | | | | 345,470 | |
6.375%, 11/15/33 | | | | | | | 165,000 | | | | 125,281 | |
Telefonica Emisiones SAU, 5.877%, 07/15/19 | | | | | | | 265,000 | | | | 262,285 | |
Time Warner Cable, Inc., 6.750%, 07/01/18 | | | | | | | 1,500,000 | | | | 1,783,968 | |
Toro Co., The, 6.625%, 05/01/378 | | | | | | | 365,000 | | | | 382,775 | |
|
The accompanying notes are an integral part of these financial statements. 41 |
Managers Fixed Income Fund
Schedule of Portfolio Investments (continued)
| | | | | | | | | | | | |
| | | | | | Principal Amount | | | Value | |
| | | | | | | | | | | | |
Industrials - 31.8% (continued) | | | | | | | | | | | | |
Verizon New England, Inc., 7.875%, 11/15/29 | | | | | | $ | 95,000 | | | $ | 115,667 | |
Wyndham Worldwide Corp.: | | | | | | | | | | | | |
6.000%, 12/01/16 | | | | | | | 405,000 | | | | 437,217 | |
7.375%, 03/01/20 | | | | | | | 460,000 | | | | 525,854 | |
Total Industrials | | | | | | | | | | | 43,616,510 | |
Utilities - 9.4% | | | | | | | | | | | | |
Abu Dhabi National Energy Co., 7.250%, 08/01/18 (a) | | | | | | | 1,040,000 | | | | 1,196,000 | |
Ameren Energy Generating Co., Series H, 7.000%, 04/15/181 | | | | | | | 1,200,000 | | | | 1,243,200 | |
Ameren Illinois Co., 6.250%, 04/01/18 | | | | | | | 1,370,000 | | | | 1,583,834 | |
Boardwalk Pipelines, L.P., 5.200%, 06/01/18 | | | | | | | 465,000 | | | | 495,765 | |
Bruce Mansfield Unit 12, 6.850%, 06/01/34 | | | | | | | 312,243 | | | | 340,279 | |
Cleveland Electric Illuminating Co., The, 5.950%, 12/15/36 | | | | | | | 520,000 | | | | 556,027 | |
Commonwealth Edison Co., 4.700%, 04/15/15 | | | | | | | 510,000 | | | | 558,383 | |
EDP Finance, B.V.: | | | | | | | | | | | | |
4.900%, 10/01/19 (a) | | | | | | | 600,000 | | | | 463,680 | |
6.000%, 02/02/18 (a) | | | | | | | 400,000 | | | | 336,882 | |
Endesa SA/Cayman Islands, 7.875%, 02/01/27 | | | | | | | 900,000 | | | | 1,125,367 | |
ITC Holdings Corp., 5.875%, 09/30/16 (a) | | | | | | | 225,000 | | | | 256,427 | |
Korea Gas Corp., 6.000%, 07/15/14 | | | | | | | 300,000 | | | | 323,643 | |
Nisource Finance Corp.: | | | | | | | | | | | | |
6.400%, 03/15/18 | | | | | | | 1,645,000 | | | | 1,893,966 | |
6.800%, 01/15/19 | | | | | | | 900,000 | | | | 1,055,626 | |
Southwestern Electric Power Co., 6.450%, 01/15/19 | | | | | | | 1,225,000 | | | | 1,432,016 | |
Total Utilities | | | | | | | | | | | 12,861,095 | |
Total Corporate Bonds and Notes (cost $85,825,839) | | | | | | | | | | | 88,976,845 | |
Foreign Government and Agency Obligations - 5.4% | | | | | | | | | | | | |
Brazil Bonds, Republic of, 10.250%, 01/10/28 | | | BRL | | | | 750,000 | | | | 460,394 | |
Instituto de Credito Oficial, MTN, 5.500%, 10/11/12 | | | AUD | | | | 255,000 | | | | 253,094 | |
Inter-American Development Bank, Bonds, EMTN, 6.000%, 12/15/17 | | | NZD | | | | 3,500,000 | | | | 3,006,926 | |
International Bank for Reconstruction & Development, GDIF, 1.430%, 03/05/14 | | | SGD | | | | 1,000,000 | | | | 783,772 | |
Ireland Government Bond: | | | | | | | | | | | | |
4.500%, 10/18/18 | | | EUR | | | | 275,000 | | | | 284,015 | |
4.500%, 04/18/20 | | | EUR | | | | 75,000 | | | | 76,015 | |
5.000%, 10/18/20 | | | EUR | | | | 25,000 | | | | 26,766 | |
5.400%, 03/13/25 | | | EUR | | | | 170,000 | | | | 177,067 | |
Italy Buoni Poliennali Del Tesoro: | | | | | | | | | | | | |
5.000%, 08/01/34 | | | EUR | | | | 15,000 | | | | 15,450 | |
5.250%, 11/01/29 | | | EUR | | | | 15,000 | | | | 16,170 | |
5.750%, 02/01/33 | | | EUR | | | | 15,000 | | | | 16,763 | |
Mexican Fixed Rate Bonds, 8.000%, 12/07/23 | | | MXN | | | | 3,500,000 | | | | 281,519 | |
New South Wales Treasury Corp.: | | | | | | | | | | | | |
Series 12, 6.000%, 05/01/12 | | | AUD | | | | 1,660,000 | | | | 1,708,212 | |
Series 12RG, 6.000%, 05/01/12 | | | AUD | | | | 260,000 | | | | 267,390 | |
|
The accompanying notes are an integral part of these financial statements. 42 |
Managers Fixed Income Fund
Schedule of Portfolio Investments (continued)
| | | | | | | | | | | | |
| | | | | | Principal Amount | | | Value | |
| | | | | | | | | | | | |
Foreign Government and Agency Obligations - 5.4% (continued) | | | | | | | | | | | | |
Portugal Obrigacoes do Tesouro OT: | | | | | | | | | | | | |
3.850%, 04/15/21 | | | EUR | | | | 50,000 | | | $ | 33,955 | |
4.800%, 06/15/20 | | | EUR | | | | 25,000 | | | | 17,860 | |
Total Foreign Government and Agency Obligations (cost $6,667,272) | | | | | | | | | | | 7,425,368 | |
Mortgage-Backed Securities - 0.5% | | | | | | | | | | | | |
Credit Suisse Mortgage Capital Certificates, Series 2007-C5, Class A4, 5.695%, 09/15/405 | | | | | | $ | 300,000 | | | | 314,291 | |
JPMorgan Chase Commercial Mortgage Securities Corp.: | | | | | | | | | | | | |
Series 2007-LD11, Class A4, 5.817%, 06/15/495 | | | | | | | 220,000 | | | | 234,723 | |
Series 2007-LDPX, Class A3, 5.420%, 01/15/49 | | | | | | | 110,000 | | | | 119,376 | |
Total Mortgage-Backed Securities (cost $334,757) | | | | | | | | | | | 668,390 | |
Municipal Bonds - 1.5% | | | | | | | | | | | | |
Buckeye Tobacco Settlement Financing Authority, Series 2007 A-2, 5.875%, 06/01/478 | | | | | | | 250,000 | | | | 179,755 | |
Chicago, Illinois O’Hare International Airport Revenue Bond, Series 2008-A, 4.500%, 01/01/38 (AGM Insured)10 | | | | | | | 15,000 | | | | 14,618 | |
Eufaula, Alabama, Series 2003 C, 4.000%, 08/15/12 (AMBAC Insured)10 | | | | | | | 105,000 | | | | 105,800 | |
Michigan Tobacco Settlement Finance Authority, Series 2006 A, 7.309%, 06/01/348 | | | | | | | 390,000 | | | | 286,514 | |
San Jose, California Redevelopment Agency Tax Allocation, Series 2006 C, 3.750%, 08/01/28 (BHAC Insured)10 | | | | | | | 15,000 | | | | 13,420 | |
San Jose, California Redevelopment Agency Tax Allocation, Series 2006 C, 3.750%, 08/01/28 (National Insured)10 | | | | | | | 35,000 | | | | 26,406 | |
State of California, 3.250%, 12/01/27 | | | | | | | 25,000 | | | | 22,589 | |
State of California, 4.500%, 08/01/27 (AMBAC Insured)10 | | | | | | | 45,000 | | | | 46,734 | |
State of California, 4.500%, 08/01/30 (AMBAC Insured)10 | | | | | | | 65,000 | | | | 66,357 | |
State of Illinois, 5.100%, 06/01/33 | | | | | | | 770,000 | | | | 699,653 | |
Virginia Tobacco Settlement Financing Corp., Series 2007 A-1, 6.706%, 06/01/468 | | | | | | | 1,055,000 | | | | 663,785 | |
Total Municipal Bonds (cost $2,545,736) | | | | | | | | | | | 2,125,631 | |
| | | |
| | | | | | Shares | | | | |
Preferred Stocks - 0.7% | | | | | | | | | | | | |
General Motors Co., 4.750% 12/01/13 (Industrials)9 | | | | | | | 8,370 | | | | 286,673 | |
Health Care REIT, Inc., 6.500% (Financials)9 | | | | | | | 1,200 | | | | 61,404 | |
Newell Financial Trust I, 5.250% (Industrials)9 | | | | | | | 13,455 | | | | 571,838 | |
Total Preferred Stocks (cost $998,799) | | | | | | | | | | | 919,915 | |
| | | |
| | | | | | Principal Amount | | | | |
U.S. Government and Agency Obligations - 2.6% | | | | | | | | | | | | |
U.S. Treasury Obligations - 2.6% | | | | | | | | | | | | |
U.S. Treasury Bond, 0.125%, 09/30/13 (cost $3,515,590) | | | | | | $ | 3,525,000 | | | | 3,518,528 | |
| | | |
| | | | | | Shares | | | | |
Other Investment Companies - 2.8%2 | | | | | | | | | | | | |
BNY Mellon Overnight Government Fund, 0.04%3 | | | | | | | 1,737,933 | | | | 1,737,933 | |
Dreyfus Cash Management Fund, Institutional Class Shares, 0.05% | | | | | | | 2,110,758 | | | | 2,110,758 | |
Total Other Investment Companies
(cost $3,848,691) | | | | | | | | | | | 3,848,691 | |
Total Investments - 100.3% (cost $131,582,538) | | | | | | | | | | | 137,499,865 | |
Other Assets, less Liabilities - (0.3)% | | | | | | | | | | | (431,857 | ) |
Net Assets - 100.0% | | | | | | | | | | $ | 137,068,008 | |
|
The accompanying notes are an integral part of these financial statements. 43 |
Notes to Schedules of Portfolio Investments (continued)
The following footnotes and abbreviations should be read in conjunction with each of the Schedules of Portfolio Investments previously presented in this report.
At December 31, 2011, the cost of securities for Federal income tax purposes and the gross aggregate unrealized appreciation and/or depreciation based on tax cost were approximately:
| | | | | | | | | | | | | | | | |
Fund | | Cost | | | Appreciation | | | Depreciation | | | Net | |
Managers AMG Chicago Equity Partners Mid-Cap | | $ | 38,563,150 | | | $ | 3,996,221 | | | ($ | 1,588,797 | ) | | $ | 2,407,424 | |
Managers AMG Chicago Equity Partners Balanced | | | 27,350,699 | | | | 2,196,971 | | | | (500,826 | ) | | | 1,696,145 | |
Managers High Yield | | | 33,289,757 | | | | 1,043,800 | | | | (857,129 | ) | | | 186,671 | |
Managers Fixed Income | | | 131,582,538 | | | | 11,238,715 | | | | (5,321,388 | ) | | | 5,917,327 | |
| | * | Non-income-producing security. |
| | (a) | Security exempt from registration under Rule 144A of the Securities Act of 1933. This security may be resold in transactions exempt from registration, normally to qualified buyers. At December 31, 2011, the value of these securities amounted to the following: |
| | | | | | | | |
Fund | | Market Value | | | % of Net Assets | |
Managers High Yield | | $ | 7,775,736 | | | | 24.2 | % |
Managers Fixed Income | | | 21,835,066 | | | | 15.9 | % |
| | (b) | Step Bond: A debt instrument with either deferred interest payments or an interest rate that resets at specific times during its term. |
| | 1 | Some or all of these securities were out on loan to various brokers as of December 31, 2011, amounting to: |
| | | | | | | | |
Fund | | Market Value | | | % of Net Assets | |
Managers AMG Chicago Equity Partners Mid-Cap | | $ | 793,419 | | | | 2.0 | % |
Managers AMG Chicago Equity Partners Balanced | | | 48,960 | | | | 0.2 | % |
Managers High Yield | | | 1,812,403 | | | | 5.6 | % |
Managers Fixed Income | | | 1,691,386 | | | | 1.2 | % |
| | 2 | Yield shown for each investment company represents the December 31, 2011, seven-day average yield, which refers to the sum of the previous seven days’ dividends paid, expressed as an annual percentage. |
| | 3 | Collateral received from brokers for securities lending was invested in this short-term investment. |
| | 4 | Floating Rate Security: The rate listed is as of December 31, 2011. Date in parentheses represents the security’s next coupon rate reset. |
| | 5 | Variable Rate Security: The rate listed is as of December 31, 2011 and is periodically reset subject to terms and conditions set forth in the debenture. |
| | 6 | Payment-in-kind security: A type of high yield debt instrument whose issuer has the option of making interest payments either in cash or in additional debt securities. |
| | 7 | Security is in default. Issuer has failed to make a timely payment of either principal or interest or has failed to comply with some provision of the bond indenture. |
| | 8 | Illiquid Security: A security not readily convertible into cash such as a stock, bond or commodity that is not actively traded and would be difficult to sell in a current sale. The Funds may not invest more than 15% of their net assets in illiquid securities. All securities are valued by an independent pricing agent and are fair valued at Level 2. Illiquid securities market value at December 31, 2011, amounted to the following: |
| | | | | | | | |
Fund | | Market Value | | | % of Net Assets | |
Managers Fixed Income | | $ | 2,485,088 | | | | 1.8 | % |
| | 9 | Convertible Bond: A corporate, usually a junior debenture that can be converted, at the option of the holder, for a specific number of shares of the company’s preferred stock or common stock. Convertible bonds market value at December 31, 2011, amounted to the following: |
| | | | | | | | |
Fund | | Market Value | | | % of Net Assets | |
Managers Fixed Income | | $ | 12,113,121 | | | | 8.8 | % |
| | 10 | At December 31, 2011, Managers Fixed Income held 0.2% in securities backed by insurance of financial institutions and financial guaranty assurance companies. |
44
Notes to Schedules of Portfolio Investments (continued)
The following table summarizes the inputs used to value the Funds’ net assets by the fair value hierarchy levels as of December 31, 2011:
| | | | | | | | | | | | | | | | |
| | | Quoted Prices in Active
Markets for Identical
Investments
Level 1 | | | Significant Other
Observable Inputs
Level 2 | | | Significant Unobservable Inputs
Level 3 | | | Total | |
Managers AMG Chicago Equity Partners Mid-Cap Fund | | | | | | | | | | | | | | | | |
Investments in Securities | |
Common Stocks† | | $ | 39,974,908 | | | | — | | | | — | | | $ | 39,974,908 | |
Other Investment Companies | | | 995,666 | | | | — | | | | — | | | | 995,666 | |
| | | | | | | | | | | | | | | | |
Total Investments in Securities | | $ | 40,970,574 | | | | — | | | | — | | | $ | 40,970,574 | |
| | | | | | | | | | | | | | | | |
| | | | |
| | | Quoted Prices in Active
Markets for Identical
Investments
Level 1 | | | Significant Other
Observable Inputs
Level 2 | | | Significant Unobservable Inputs
Level 3 | | | Total | |
Managers AMG Chicago Equity Partners Balanced Fund | | | | | | | | | | | | | | | | |
Investments in Securities | |
Common Stocks† | | $ | 17,353,475 | | | | — | | | | — | | | $ | 17,353,475 | |
Corporate Bonds and Notes†† | | | — | | | $ | 930,280 | | | | — | | | | 930,280 | |
Mortgage-Backed Securities | | | — | | | | 233,328 | | | | — | | | | 233,328 | |
U.S. Government and Agency Obligations†† | | | — | | | | 9,886,519 | | | | — | | | | 9,886,519 | |
Other Investment Companies | | | 643,242 | | | | — | | | | — | | | | 643,242 | |
| | | | | | | | | | | | | | | | |
Total Investments in Securities | | $ | 17,996,717 | | | $ | 11,050,127 | | | | — | | | $ | 29,046,844 | |
| | | | | | | | | | | | | | | | |
| | | | |
| | | Quoted Prices in Active
Markets for Identical
Investments
Level 1 | | | Significant Other
Observable Inputs
Level 2 | | | Significant Unobservable Inputs
Level 3 | | | Total | |
Managers High Yield Fund | |
Investments in Securities | |
Common Stocks† | | $ | 109,430 | | | | — | | | | — | | | $ | 109,430 | |
Corporate Bonds and Notes†† | | | — | | | $ | 30,075,568 | | | | — | | | | 30,075,568 | |
Exchange Traded Funds† | | | 480,625 | | | | — | | | | — | | | | 480,625 | |
Other Investment Companies | | | 2,810,805 | | | | — | | | | — | | | | 2,810,805 | |
| | | | | | | | | | | | | | | | |
Total Investments in Securities | | $ | 3,400,860 | | | $ | 30,075,568 | | | | — | | | $ | 33,476,428 | |
| | | | | | | | | | | | | | | | |
Notes to Schedules of Portfolio Investments (continued)
| | | | | | | | | | | | | | | | |
| | | Quoted Prices in Active
Markets for Identical
Investments
Level 1 | | | Significant Other
Observable Inputs
Level 2 | | | Significant Unobservable Inputs
Level 3 | | | Total | |
Managers Fixed Income Fund | | | | | | | | | | | | | | | | |
Investments in Securities | |
Asset-Backed Securities | | | — | | | $ | 5,384,672 | | | | — | | | $ | 5,384,672 | |
Common Stocks† | | $ | 24,631,825 | | | | — | | | | — | | | | 24,631,825 | |
Corporate Bonds and Notes†† | | | — | | | | 88,976,845 | | | | — | | | | 88,976,845 | |
Foreign Government and Agency Obligations | | | — | | | | 7,425,368 | | | | — | | | | 7,425,368 | |
Mortgage-Backed Securities | | | — | | | | 668,390 | | | | — | | | | 668,390 | |
Municipal Bonds | | | — | | | | 2,125,631 | | | | — | | | | 2,125,631 | |
Preferred Stocks† | | | 919,915 | | | | — | | | | — | | | | 919,915 | |
U.S. Government and Agency Obligations†† | | | — | | | | 3,518,528 | | | | — | | | | 3,518,528 | |
Other Investment Companies | | | 3,848,691 | | | | — | | | | — | | | | 3,848,691 | |
| | | | | | | | | | | | | | | | |
Total Investments in Securities | | $ | 29,400,431 | | | $ | 108,099,434 | | | | — | | | $ | 137,499,865 | |
| | | | | | | | | | | | | | | | |
| | † | All common stocks, exchange traded notes and preferred stocks held in the Fund are level 1 securities. For a detailed breakout of these securities, please refer to the Schedule of Portfolio Investments. |
| | †† | All corporate bonds and notes and U.S. government and agency obligations held in the Fund are level 2 securities. For a detailed breakout of the corporate bonds and U.S. government and agency obligations by major industry or agency classification, please refer to the Schedule of Portfolio Investments. |
As of December 31, 2011, the Funds had no significant transfers between Level 1 and Level 2 from the beginning of the reporting period.
Investments Definitions and Abbreviations:
ADR: ADR after the name of a holding stands for American Depositary Receipt, representing ownership of foreign securities on deposit with a domestic custodian bank. The value of the ADR securities is determined or significantly influenced by trading on exchanges not located in the United States or Canada. Sponsored ADRs are initiated by the underlying foreign company.
| | | | | | |
| AGM: | | Assured Guaranty Municipal Corp. | | FNMA: | | Federal National Mortgage Association |
| AMBAC: | | American Municipal Bond Assurance Corp. | | GMTN: | | Global Medium Term Notes |
| BHAC: | | Berkshire Hathaway Assurance Corp. | | GDIF: | | Global Debt Insurance Facility |
| FHLB: | | Federal Home Loan Bank | | MTN: | | Medium Term Notes |
| FHLMC: | | Federal Home Loan Mortgage Corp. | | REIT: | | Real Estate Investment Trust |
Abbreviations have been used throughout the portfolios to indicate amounts shown in currencies of par values other than the U.S. dollar (USD):
| | | | | | |
| | | | | | |
| AUD: | | Australian Dollar | | MXN: | | Mexican Peso |
BRL: | | Brazilian Real | | NZD: | | New Zealand Dollar |
| EUR: | | Euro | | SGD: | | Singapore Dollar |
| GBP: | | British Pound | | | | |
Statements of Assets and Liabilities
December 31, 2011
| | | | | | | | | | | | | | | | |
| | | Managers AMG
Chicago Equity
Partners
Mid-Cap Fund | | | Managers AMG
Chicago Equity
Partners
Balanced Fund | | | Managers
High Yield
Fund | | | Managers
Fixed Income
Fund | |
Assets: | | | | | | | | | | | | | | | | |
Investments at value* (including securities on loan valued at $793,419, $48,960, $1,812,403, and $1,691,386, respectively) | | $ | 40,970,574 | | | $ | 29,046,844 | | | $ | 33,476,428 | | | $ | 137,499,865 | |
Foreign currency** | | | — | | | | — | | | | — | | | | 17,712 | |
Cash | | | — | | | | — | | | | 305 | | | | — | |
Receivable for investments sold | | | 250,786 | | | | — | | | | — | | | | — | |
Receivable for Fund shares sold | | | 9,012 | | | | 39,993 | | | | 45,898 | | | | 162,046 | |
Receivable from affiliate | | | 8,445 | | | | 6,354 | | | | 26,133 | | | | 23,480 | |
Dividends, interest and other receivables | | | 58,287 | | | | 91,037 | | | | 632,381 | | | | 1,543,936 | |
Prepaid expenses | | | 23,042 | | | | 22,908 | | | | 26,356 | | | | 25,902 | |
Total assets | | | 41,320,146 | | | | 29,207,136 | | | | 34,207,501 | | | | 139,272,941 | |
Liabilities: | | | | | | | | | | | | | | | | |
Payable upon return of securities loaned | | | 828,080 | | | | 50,240 | | | | 1,878,880 | | | | 1,737,933 | |
Payable for Fund shares repurchased | | | 316,585 | | | | 3,021 | | | | 59,380 | | | | 280,062 | |
Payable for investments purchased | | | — | | | | 144,849 | | | | — | | | | — | |
Accrued expenses: | | | | | | | | | | | | | | | | |
Investment management and advisory fees | | | 23,850 | | | | 16,944 | | | | 19,015 | | | | 52,018 | |
Administrative fees | | | 6,815 | | | | 4,841 | | | | 5,433 | | | | 23,119 | |
Professional fees | | | 28,567 | | | | 27,749 | | | | 32,764 | | | | 39,730 | |
Other | | | 19,613 | | | | 21,794 | | | | 39,884 | | | | 72,071 | |
Total liabilities | | | 1,223,510 | | | | 269,438 | | | | 2,035,356 | | | | 2,204,933 | |
Net Assets | | $ | 40,096,636 | | | $ | 28,937,698 | | | $ | 32,172,145 | | | $ | 137,068,008 | |
Net Assets Represent: | | | | | | | | | | | | | | | | |
Paid-in capital | | $ | 44,072,255 | | | $ | 27,125,973 | | | $ | 35,733,082 | | | $ | 131,165,375 | |
Undistributed net investment income (loss) | | | 40,422 | | | | 2,988 | | | | (222 | ) | | | (9,271 | ) |
Accumulated net realized gain (loss) from investments and foreign currency transactions | | | (6,502,934 | ) | | | 51,124 | | | | (3,753,347 | ) | | | — | |
Net unrealized appreciation of investments and foreign currency translations | | | 2,486,893 | | | | 1,757,613 | | | | 192,632 | | | | 5,911,904 | |
Net Assets | | $ | 40,096,636 | | | $ | 28,937,698 | | | $ | 32,172,145 | | | $ | 137,068,008 | |
* Investments at cost | | $ | 38,483,681 | | | $ | 27,289,231 | | | $ | 33,283,796 | | | $ | 131,582,538 | |
** Foreign currency at cost | | | — | | | | — | | | | — | | | $ | 17,577 | |
|
The accompanying notes are an integral part of these financial statements. 47 |
Statements of Assets and Liabilities (continued)
December 31, 2011
| | | | | | | | | | | | | | | | |
| | | Managers AMG
Chicago Equity
Partners
Mid-Cap Fund | | | Managers AMG
Chicago Equity
Partners
Balanced Fund | | | Managers
High Yield
Fund | | | Managers
Fixed Income
Fund | |
Class A Shares: | | | | | | | | | | | | | | | | |
Net Assets | | $ | 9,267,697 | | | $ | 17,518,633 | | | $ | 23,957,190 | | | $ | 35,647,493 | |
Shares outstanding | | | 668,915 | | | | 1,278,450 | | | | 3,189,192 | | | | 3,298,217 | |
Net asset value, offering and redemption price per share | | $ | 13.85 | | | $ | 13.70 | | | $ | 7.51 | | | $ | 10.81 | |
Offering price per share based on a maximum sales charge of 5.75% (NAV per share/(100% - 5.75%) | | $ | 14.69 | | | $ | 14.54 | | | | n/a | | | | n/a | |
Offering price per share based on a maximum sales charge of 4.25% (NAV per share/(100% - 4.25%) | | | n/a | | | | n/a | | | $ | 7.84 | | | $ | 11.29 | |
Class B Shares: | | | | | | | | | | | | | | | | |
Net Assets | | | — | 1 | | | — | 1 | | | — | 1 | | $ | 3,232,893 | 2 |
Shares outstanding | | | — | 1 | | | — | 1 | | | — | 1 | | | 301,427 | |
Net asset value, offering and redemption price per share | | | — | 1 | | | — | 1 | | | — | 1 | | $ | 10.73 | |
Class C Shares: | | | | | | | | | | | | | | | | |
Net Assets | | $ | 2,397,386 | | | $ | 2,534,002 | | | $ | 2,968,070 | | | $ | 33,614,916 | |
Shares outstanding | | | 186,924 | | | | 185,956 | | | | 401,019 | | | | 3,115,515 | |
Net asset value, offering and redemption price per share | | $ | 12.83 | | | $ | 13.63 | | | $ | 7.40 | | | $ | 10.79 | |
Institutional Class Shares: | | | | | | | | | | | | | | | | |
Net Assets | | $ | 28,431,553 | | | $ | 8,885,063 | | | $ | 5,246,885 | | | $ | 64,572,706 | |
Shares outstanding | | | 1,952,036 | | | | 643,002 | | | | 691,589 | | | | 5,956,275 | |
Net asset value, offering and redemption price per share | | $ | 14.57 | | | $ | 13.82 | | | $ | 7.59 | | | $ | 10.84 | |
| 1 | Effective at the close of business on June 30, 2011, all B shares converted to A shares. |
| 2 | Effective at the close of business on June 30, 2011, shares are no longer available for purchase. |
|
The accompanying notes are an integral part of these financial statements. 48 |
Statements of Operations
For the year ended December 31, 2011
| | | | | | | | | | | | | | | | |
| | | Managers
AMG
Chicago Equity
Partners
Mid-Cap Fund | | | Managers AMG
Chicago Equity
Partners
Balanced Fund | | | Managers
High Yield
Fund | | | Managers
Fixed Income
Fund | |
Investment Income: | | | | | | | | | | | | | | | | |
Dividend income | | $ | 602,884 | | | $ | 277,660 | | | $ | 20,459 | | | $ | 605,464 | |
Interest income | | | — | | | | 263,363 | | | | 2,639,078 | | | | 6,402,032 | |
Securities lending fees | | | 4,862 | | | | 236 | | | | 15,304 | | | | 24,817 | |
Foreign withholding tax | | | (111 | ) | | | (11 | ) | | | — | | | | (49,174 | ) |
Total investment income | | | 607,635 | | | | 541,248 | | | | 2,674,841 | | | | 6,983,139 | |
Expenses: | | | | | | | | | | | | | | | | |
Investment management and advisory fees | | | 299,213 | | | | 151,078 | | | | 220,354 | | | | 627,394 | |
Administrative fees | | | 85,489 | | | | 43,165 | | | | 62,958 | | | | 278,842 | |
Distribution fees - Class A | | | 23,454 | | | | 27,039 | | | | 56,564 | | | | 87,821 | |
Distribution fees - Class B | | | 1,331 | 1 | | | 3,737 | 1 | | | 3,125 | 1 | | | 35,254 | |
Distribution fees - Class C | | | 27,914 | | | | 22,501 | | | | 35,244 | | | | 375,664 | |
Registration fees | | | 49,789 | | | | 48,421 | | | | 47,587 | | | | 53,023 | |
Professional fees | | | 31,382 | | | | 28,842 | | | | 34,325 | | | | 53,746 | |
Custodian | | | 18,921 | | | | 23,961 | | | | 49,895 | | | | 34,162 | |
Reports to shareholders | | | 8,395 | | | | 5,800 | | | | 19,295 | | | | 20,843 | |
Transfer agent | | | 8,363 | | | | 5,023 | | | | 14,181 | | | | 28,174 | |
Trustees fees and expenses | | | 3,474 | | | | 1,400 | | | | 2,087 | | | | 10,604 | |
Miscellaneous | | | 3,114 | | | | 2,863 | | | | 2,899 | | | | 7,925 | |
Total expenses before offsets | | | 560,839 | | | | 363,830 | | | | 548,514 | | | | 1,613,452 | |
Expense reimbursements | | | (84,837 | ) | | | (94,572 | ) | | | (170,087 | ) | | | (291,775 | ) |
Expense reductions | | | (25,149 | ) | | | (1,933 | ) | | | (37 | ) | | | (173 | ) |
Net expenses | | | 450,853 | | | | 267,325 | | | | 378,390 | | | | 1,321,504 | |
Net investment income | | | 156,782 | | | | 273,923 | | | | 2,296,451 | | | | 5,661,635 | |
Net Realized and Unrealized Gain (Loss): | | | | | | | | | | | | | | | | |
Net realized gain on investments | | | 4,758,007 | | | | 1,415,947 | | | | 655,638 | | | | 3,599,718 | |
Net realized gain on foreign currency transactions | | | — | | | | — | | | | — | | | | 44,664 | |
Net change in unrealized depreciation of investments | | | (4,583,293 | ) | | | (146,517 | ) | | | (1,626,756 | ) | | | (3,364,346 | ) |
Net change in unrealized depreciation on foreign currency translations | | | — | | | | — | | | | — | | | | (9,313 | ) |
Net realized and unrealized gain (loss) | | | 174,714 | | | | 1,269,430 | | | | (971,118 | ) | | | 270,723 | |
Net increase in net assets resulting from operations | | $ | 331,496 | | | $ | 1,543,353 | | | $ | 1,325,333 | | | $ | 5,932,358 | |
| 1 | The amounts disclosed above represent expenses incurred up to the conversion to A shares. |
The accompanying notes are an integral part of these financial statements.
49
Statements of Changes in Net Assets
For the year ended December 31,
| | | | | | | | | | | | | | | | |
| | | Managers AMG Chicago
Equity Partners Mid-Cap Fund | | | Managers AMG Chicago
Equity Partners Balanced Fund | |
| | | 2011 | | | 2010 | | | 2011 | | | 2010 | |
Increase (Decrease) in Net Assets From Operations: | | | | | | | | | | | | | | | | |
Net investment income | | $ | 156,782 | | | $ | 259,108 | | | $ | 273,923 | | | $ | 269,679 | |
Net realized gain on investments | | | 4,758,007 | | | | 5,949,208 | | | | 1,415,947 | | | | 1,761,338 | |
Net change in unrealized appreciation (depreciation) of investments | | | (4,583,293 | ) | | | 2,895,240 | | | | (146,517 | ) | | | (153,247 | ) |
Net increase in net assets resulting from operations | | | 331,496 | | | | 9,103,556 | | | | 1,543,353 | | | | 1,877,770 | |
Distributions to Shareholders: | | | | | | | | | | | | | | | | |
From net investment income: | | | | | | | | | | | | | | | | |
Class A | | | (26,691 | ) | | | (32,789 | ) | | | (141,069 | ) | | | (108,880 | ) |
Class B | | | — | | | | — | | | | (2,358 | )1 | | | (4,280 | ) |
Class C | | | — | | | | — | | | | (8,301 | ) | | | (22,845 | ) |
Institutional Class | | | (148,442 | ) | | | (197,349 | ) | | | (118,047 | ) | | | (136,824 | ) |
From net realized gain on investments: | | | | | | | | | | | | | | | | |
Class A | | | — | | | | — | | | | (609,401 | ) | | | — | |
Class C | | | — | | | | — | | | | (86,651 | ) | | | — | |
Institutional Class | | | — | | | | — | | | | (303,733 | ) | | | — | |
Total distributions to shareholders | | | (175,133 | ) | | | (230,138 | ) | | | (1,269,560 | ) | | | (272,829 | ) |
From Capital Share Transactions: | | | | | | | | | | | | | | | | |
Proceeds from sale of shares | | | 6,691,020 | | | | 3,759,737 | | | | 16,250,809 | | | | 3,414,197 | |
Reinvestment of dividends and distributions | | | 161,604 | | | | 211,777 | | | | 731,974 | | | | 204,143 | |
Cost of shares repurchased | | | (7,655,858 | ) | | | (7,615,267 | ) | | | (7,154,472 | ) | | | (4,518,470 | ) |
Net increase (decrease) from capital share transactions | | | (803,234 | ) | | | (3,643,753 | ) | | | 9,828,311 | | | | (900,130 | ) |
Total increase (decrease) in net assets | | | (646,871 | ) | | | 5,229,665 | | | | 10,102,104 | | | | 704,811 | |
Net Assets: | | | | | | | | | | | | | | | | |
Beginning of year | | | 40,743,507 | | | | 35,513,842 | | | | 18,835,594 | | | | 18,130,783 | |
End of year | | $ | 40,096,636 | | | $ | 40,743,507 | | | $ | 28,937,698 | | | $ | 18,835,594 | |
End of year undistributed net investment income | | $ | 40,422 | | | $ | 72,740 | | | $ | 2,988 | | | $ | 646 | |
Share Transactions: | | | | | | | | | | | | | | | | |
Sale of shares | | | 451,189 | | | | 308,406 | | | | 1,173,475 | | | | 264,911 | |
Reinvested shares from dividends and distributions | | | 11,037 | | | | 14,604 | | | | 52,990 | | | | 15,733 | |
Shares repurchased | | | (524,519 | ) | | | (648,148 | ) | | | (512,342 | ) | | | (355,629 | ) |
Net increase (decrease) in shares | | | (62,293 | ) | | | (325,138 | ) | | | 714,123 | | | | (74,985 | ) |
| 1 | The amounts disclosed above were incurred prior to the closing of B shares and/or the conversion to A shares. |
|
The accompanying notes are an integral part of these financial statements. 50 |
Statements of Changes in Net Assets
For the year ended December 31,
| | | | | | | | | | | | | | | | |
| | | Managers High Yield Fund | | | Managers Fixed Income Fund | |
| | | 2011 | | | 2010 | | | 2011 | | | 2010 | |
Increase (Decrease) in Net Assets From Operations: | | | | | | | | | | | | | | | | |
Net investment income | | $ | 2,296,451 | | | $ | 2,554,270 | | | $ | 5,661,635 | | | $ | 5,732,686 | |
Net realized gain (loss) on investments and foreign currency transactions | | | 655,638 | | | | 1,025,889 | | | | 3,644,382 | | | | (209,231 | ) |
Net change in unrealized appreciation (depreciation) of investments and foreign currency translations | | | (1,626,756 | ) | | | 628,227 | | | | (3,373,659 | ) | | | 7,918,026 | |
Net increase in net assets resulting from operations | | | 1,325,333 | | | | 4,208,386 | | | | 5,932,358 | | | | 13,441,481 | |
Distributions to Shareholders: | | | | | | | | | | | | | | | | |
From net investment income: | | | | | | | | | | | | | | | | |
Class A | | | (1,680,397 | ) | | | (1,845,390 | ) | | | (1,603,759 | ) | | | (1,816,800 | ) |
Class B | | | (20,401 | )1 | | | (57,140 | ) | | | (132,088 | )1 | | | (124,108 | ) |
Class C | | | (231,424 | ) | | | (309,306 | ) | | | (1,401,818 | ) | | | (1,815,282 | ) |
Institutional Class | | | (385,752 | ) | | | (342,789 | ) | | | (3,048,326 | ) | | | (2,145,972 | ) |
From net realized gain on investments: | | | | | | | | | | | | | | | | |
Class A | | | — | | | | — | | | | (568,193 | ) | | | — | |
Class B | | | — | | | | — | | | | (51,604 | ) | | | — | |
Class C | | | — | | | | — | | | | (535,426 | ) | | | — | |
Institutional Class | | | — | | | | — | | | | (1,019,018 | ) | | | — | |
Total distributions to shareholders | | | (2,317,974 | ) | | | (2,554,625 | ) | | | (8,360,232 | ) | | | (5,902,162 | ) |
From Capital Share Transactions: | | | | | | | | | | | | | | | | |
Proceeds from sale of shares | | | 11,057,218 | | | | 6,148,030 | | | | 51,743,179 | | | | 54,457,609 | |
Reinvestment of dividends and distributions | | | 1,889,659 | | | | 1,995,842 | | | | 5,549,842 | | | | 3,976,670 | |
Cost of shares repurchased | | | (10,976,061 | ) | | | (16,508,471 | ) | | | (67,335,959 | ) | | | (53,494,943 | ) |
Net increase (decrease) from capital share transactions | | | 1,970,816 | | | | (8,364,599 | ) | | | (10,042,938 | ) | | | 4,939,336 | |
Total increase (decrease) in net assets | | | 978,175 | | | | (6,710,838 | ) | | | (12,470,812 | ) | | | 12,478,655 | |
Net Assets: | | | | | | | | | | | | | | | | |
Beginning of year | | | 31,193,970 | | | | 37,904,808 | | | | 149,538,820 | | | | 137,060,165 | |
End of year | | $ | 32,172,145 | | | $ | 31,193,970 | | | $ | 137,068,008 | | | $ | 149,538,820 | |
End of year undistributed net investment income (loss) | | ($ | 222 | ) | | $ | 21,178 | | | ($ | 9,271 | ) | | $ | 103,298 | |
| | | | | | | | | | | | | | | | |
Share Transactions: | | | | | | | | | | | | | | | | |
Sale of shares | | | 1,441,511 | | | | 818,520 | | | | 4,652,777 | | | | 4,987,867 | |
Reinvested shares from dividends and distributions | | | 247,428 | | | | 266,804 | | | | 506,037 | | | | 366,086 | |
Shares repurchased | | | (1,440,953 | ) | | | (2,217,561 | ) | | | (6,077,242 | ) | | | (4,912,463 | ) |
Net increase (decrease) in shares | | | 247,986 | | | | (1,132,237 | ) | | | (918,428 | ) | | | 441,490 | |
| 1 | The amounts disclosed above were incurred prior to the closing of B shares and/or the conversion to A shares. |
|
The accompanying notes are an integral part of these financial statements. 51 |
Managers AMG Chicago Equity Partners Mid-Cap Fund
Financial Highlights
For a share outstanding throughout each year
| | | | | | | | | | | | | | | | | | | | |
| | | For the year ended December 31, | |
Class A | | 2011 | | | 2010 | | | 2009 | | | 2008 | | | 2007 | |
Net Asset Value, Beginning of Year | | $ | 13.77 | | | $ | 10.80 | | | $ | 7.82 | | | $ | 13.67 | | | $ | 14.60 | |
Income from Investment Operations: | | | | | | | | | | | | | | | | | | | | |
Net investment income (loss) | | | 0.04 | 3 | | | 0.07 | | | | 0.09 | | | | 0.06 | | | | (0.02 | )3 |
Net realized and unrealized gain (loss) on investments | | | 0.08 | 3 | | | 2.96 | | | | 2.98 | | | | (5.84 | ) | | | 0.17 | 3 |
Total from investment operations | | | 0.12 | | | | 3.03 | | | | 3.07 | | | | (5.78 | ) | | | 0.15 | |
Less Distributions to Shareholders from: | | | | | | | | | | | | | | | | | | | | |
Net investment income | | | (0.04 | ) | | | (0.06 | ) | | | (0.09 | ) | | | (0.06 | ) | | | — | |
Net realized gain on investments | | | — | | | | — | | | | — | | | | (0.01 | ) | | | (1.08 | ) |
Total distributions to shareholders | | | (0.04 | ) | | | (0.06 | ) | | | (0.09 | ) | | | (0.07 | ) | | | (1.08 | ) |
Net Asset Value, End of Year | | $ | 13.85 | | | $ | 13.77 | | | $ | 10.80 | | | $ | 7.82 | | | $ | 13.67 | |
Total Return1 | | | 0.86 | % | | | 28.06 | % | | | 39.20 | % | | | (42.28 | )% | | | 0.84 | % |
Ratio of net expenses to average net assets | | | 1.18 | % | | | 1.19 | % | | | 1.19 | % | | | 1.18 | % | | | 1.21 | % |
Ratio of net investment income (loss) to average net assets1 | | | 0.26 | % | | | 0.60 | % | | | 1.15 | % | | | 0.57 | % | | | (0.10 | )% |
Portfolio turnover | | | 125 | % | | | 137 | % | | | 115 | % | | | 107 | % | | | 125 | % |
Net assets at end of year (000’s omitted) | | $ | 9,268 | | | $ | 7,590 | | | $ | 6,149 | | | $ | 3,863 | | | $ | 6,464 | |
| | | | | | | | | | | | | | | | | | | | |
Ratios absent expense offsets:2 | | | | | | | | | | | | | | | | | | | | |
Ratio of total expenses to average net assets | | | 1.44 | % | | | 1.47 | % | | | 1.53 | % | | | 1.44 | % | | | 1.37 | % |
Ratio of net investment income (loss) to average net assets | | | 0.00 | %4 | | | 0.32 | % | | | 0.81 | % | | | 0.31 | % | | | (0.25 | )% |
| | | | | | | | | | | | | | | | | | | | |
| |
| | | For the year ended December 31, | |
Class C | | 2011 | | | 2010 | | | 2009 | | | 2008 | | | 2007 | |
Net Asset Value, Beginning of Year | | $ | 12.81 | | | $ | 10.11 | | | $ | 7.32 | | | $ | 12.79 | | | $ | 13.80 | |
Income from Investment Operations: | | | | | | | | | | | | | | | | | | | | |
Net investment income (loss) | | | (0.07 | )3 | | | (0.04 | ) | | | 0.02 | | | | (0.03 | ) | | | (0.12 | )3 |
Net realized and unrealized gain (loss) on investments | | | 0.09 | 3 | | | 2.74 | | | | 2.77 | | | | (5.43 | ) | | | 0.12 | 3 |
Total from investment operations | | | 0.02 | | | | 2.70 | | | | 2.79 | | | | (5.46 | ) | | | 0.00 | |
Less Distributions to Shareholders from: | | | | | | | | | | | | | | | | | | | | |
Net investment income | | | — | | | | — | | | | (0.00 | )4 | | | — | | | | — | |
Net realized gain on investments | | | — | | | | — | | | | — | | | | (0.01 | ) | | | (1.01 | ) |
Total distributions to shareholders | | | — | | | | — | | | | (0.00 | )4 | | | (0.01 | ) | | | (1.01 | ) |
Net Asset Value, End of Year | | $ | 12.83 | | | $ | 12.81 | | | $ | 10.11 | | | $ | 7.32 | | | $ | 12.79 | |
Total Return1 | | | 0.16 | %5 | | | 26.71 | % | | | 38.18 | % | | | (42.71 | )% | | | (0.19 | )% |
Ratio of net expenses to average net assets | | | 1.93 | % | | | 1.94 | % | | | 1.94 | % | | | 1.94 | % | | | 1.96 | % |
Ratio of net investment income (loss) to average net assets1 | | | (0.53 | )% | | | (0.18 | )% | | | 0.38 | % | | | (0.23 | )% | | | (0.85 | )% |
Portfolio turnover | | | 125 | % | | | 137 | % | | | 115 | % | | | 107 | % | | | 125 | % |
Net assets at end of year (000’s omitted) | | $ | 2,397 | | | $ | 3,026 | | | $ | 3,669 | | | $ | 3,558 | | | $ | 8,651 | |
| | | | | | | | | | | | | | | | | | | | |
Ratios absent expense offsets:2 | | | | | | | | | | | | | | | | | | | | |
Ratio of total expenses to average net assets | | | 2.19 | % | | | 2.22 | % | | | 2.28 | % | | | 2.19 | % | | | 2.12 | % |
Ratio of net investment income (loss) to average net assets | | | (0.79 | )% | | | (0.46 | )% | | | 0.04 | % | | | (0.49 | )% | | | (1.02 | )% |
| | | | | | | | | | | | | | | | | | | | |
Managers AMG Chicago Equity Partners Mid-Cap Fund
Financial Highlights
For a share outstanding throughout each year
| | | | | | | | | | | | | | | | | | | | |
| | | For the year ended December 31, | |
Institutional Class | | 2011 | | | 2010 | | | 2009 | | | 2008 | | | 2007 | |
Net Asset Value, Beginning of Year | | $ | 14.48 | | | $ | 11.39 | | | $ | 8.24 | | | $ | 14.42 | | | $ | 15.41 | |
Income from Investment Operations: | | | | | | | | | | | | | | | | | | | | |
Net investment income | | | 0.07 | 3 | | | 0.11 | | | | 0.14 | | | | 0.10 | | | | 0.03 | 3 |
Net realized and unrealized gain (loss) on investments | | | 0.10 | 3 | | | 3.08 | | | | 3.12 | | | | (6.18 | ) | | | 0.11 | 3 |
Total from investment operations | | | 0.17 | | | | 3.19 | | | | 3.26 | | | | (6.08 | ) | | | 0.14 | |
Less Distributions to Shareholders from: | | | | | | | | | | | | | | | | | | | | |
Net investment income | | | (0.08 | ) | | | (0.10 | ) | | | (0.11 | ) | | | (0.09 | ) | | | — | |
Net realized gain on investments | | | — | | | | — | | | | — | | | | (0.01 | ) | | | (1.13 | ) |
Total distributions to shareholders | | | (0.08 | ) | | | (0.10 | ) | | | (0.11 | ) | | | (0.10 | ) | | | (1.13 | ) |
Net Asset Value, End of Year | | $ | 14.57 | | | $ | 14.48 | | | $ | 11.39 | | | $ | 8.24 | | | $ | 14.42 | |
Total Return1 | | | 1.14 | %5 | | | 27.97 | % | | | 39.59 | % | | | (42.13 | )% | | | 0.78 | % |
Ratio of net expenses to average net assets | | | 0.93 | % | | | 0.94 | % | | | 0.94 | % | | | 0.94 | % | | | 0.96 | % |
Ratio of net investment income to average net assets1 | | | 0.49 | % | | | 0.84 | % | | | 1.39 | % | | | 0.77 | % | | | 0.16 | % |
Portfolio turnover | | | 125 | % | | | 137 | % | | | 115 | % | | | 107 | % | | | 125 | % |
Net assets at end of year (000’s omitted) | | $ | 28,432 | | | $ | 29,867 | | | $ | 25,075 | | | $ | 22,152 | | | $ | 51,029 | |
| | | | | | | | | | | | | | | | | | | | |
Ratios absent expense offsets:2 | | | | | | | | | | | | | | | | | | | | |
Ratio of total expenses to average net assets | | | 1.19 | % | | | 1.22 | % | | | 1.28 | % | | | 1.19 | % | | | 1.12 | % |
Ratio of net investment income to average net assets | | | 0.23 | % | | | 0.56 | % | | | 1.05 | % | | | 0.51 | % | | | 0.01 | % |
| | | | | | | | | | | | | | | | | | | | |
Managers AMG Chicago Equity Partners Balanced Fund
Financial Highlights
For a share outstanding throughout each year
| | | | | | | | | | | | | | | | | | | | |
| | | For the year ended December 31, | |
Class A | | 2011 | | | 2010 | | | 2009 | | | 2008 | | | 2007 | |
Net Asset Value, Beginning of Year | | $ | 13.49 | | | $ | 12.33 | | | $ | 10.45 | | | $ | 13.18 | | | $ | 12.86 | |
Income from Investment Operations: | | | | | | | | | | | | | | | | | | | | |
Net investment income | | | 0.18 | 3 | | | 0.20 | | | | 0.22 | | | | 0.29 | | | | 0.25 | |
Net realized and unrealized gain (loss) on investments | | | 0.69 | 3 | | | 1.16 | | | | 1.87 | | | | (2.74 | ) | | | 0.34 | |
Total from investment operations | | | 0.87 | | | | 1.36 | | | | 2.09 | | | | (2.45 | ) | | | 0.59 | |
Less Distributions to Shareholders from: | | | | | | | | | | | | | | | | | | | | |
Net investment income | | | (0.18 | ) | | | (0.20 | ) | | | (0.21 | ) | | | (0.27 | ) | | | (0.27 | ) |
Net realized gain on investments | | | (0.48 | ) | | | — | | | | — | | | | (0.01 | ) | | | — | |
Total distributions to shareholders | | | (0.66 | ) | | | (0.20 | ) | | | (0.21 | ) | | | (0.28 | ) | | | (0.27 | ) |
Net Asset Value, End of Year | | $ | 13.70 | | | $ | 13.49 | | | $ | 12.33 | | | $ | 10.45 | | | $ | 13.18 | |
Total Return1 | | | 6.45 | % | | | 11.14 | % | | | 20.06 | % | | | (18.68 | )% | | | 4.63 | % |
Ratio of net expenses to average net assets | | | 1.24 | % | | | 1.22 | % | | | 1.23 | % | | | 1.17 | % | | | 1.23 | % |
Ratio of net investment income to average net assets1 | | | 1.27 | % | | | 1.56 | % | | | 1.77 | % | | | 2.53 | % | | | 1.93 | % |
Portfolio turnover | | | 94 | % | | | 97 | % | | | 114 | % | | | 99 | % | | | 206 | % |
Net assets at end of year (000’s omitted) | | $ | 17,519 | | | $ | 7,605 | | | $ | 6,933 | | | $ | 9,932 | | | $ | 2,076 | |
| | | | | | | | | | | | | | | | | | | | |
Ratios absent expense offsets:2 | | | | | | | | | | | | | | | | | | | | |
Ratio of total expenses to average net assets | | | 1.70 | % | | | 1.80 | % | | | 1.76 | % | | | 1.68 | % | | | 1.78 | % |
Ratio of net investment income to average net assets | | | 0.81 | % | | | 0.98 | % | | | 1.24 | % | | | 2.03 | % | | | 1.38 | % |
| | | | | | | | | | | | | | | | | | | | |
| |
| | | For the year ended December 31, | |
Class C | | 2011 | | | 2010 | | | 2009 | | | 2008 | | | 2007 | |
Net Asset Value, Beginning of Year | | $ | 13.41 | | | $ | 12.25 | | | $ | 10.38 | | | $ | 13.08 | | | $ | 12.76 | |
Income from Investment Operations: | | | | | | | | | | | | | | | | | | | | |
Net investment income | | | 0.07 | 3 | | | 0.11 | | | | 0.12 | | | | 0.18 | | | | 0.16 | |
Net realized and unrealized gain (loss) on investments | | | 0.69 | 3 | | | 1.15 | | | | 1.88 | | | | (2.70 | ) | | | 0.33 | |
Total from investment operations | | | 0.76 | | | | 1.26 | | | | 2.00 | | | | (2.52 | ) | | | 0.49 | |
Less Distributions to Shareholders from: | | | | | | | | | | | | | | | | | | | | |
Net investment income | | | (0.07 | ) | | | (0.10 | ) | | | (0.13 | ) | | | (0.17 | ) | | | (0.17 | ) |
Net realized gain on investments | | | (0.47 | ) | | | — | | | | — | | | | (0.01 | ) | | | — | |
Total distributions to shareholders | | | (0.54 | ) | | | (0.10 | ) | | | (0.13 | ) | | | (0.18 | ) | | | (0.17 | ) |
Net Asset Value, End of Year | | $ | 13.63 | | | $ | 13.41 | | | $ | 12.25 | | | $ | 10.38 | | | $ | 13.08 | |
Total Return1 | | | 5.66 | %5 | | | 10.35 | %5 | | | 19.33 | % | | | (19.36 | )% | | | 3.86 | % |
Ratio of net expenses to average net assets | | | 1.99 | % | | | 1.97 | % | | | 1.98 | % | | | 1.96 | % | | | 1.98 | % |
Ratio of net investment income to average net assets1 | | | 0.52 | % | | | 0.81 | % | | | 1.04 | % | | | 1.57 | % | | | 1.17 | % |
Portfolio turnover | | | 94 | % | | | 97 | % | | | 114 | % | | | 99 | % | | | 206 | % |
Net assets at end of year (000’s omitted) | | $ | 2,534 | | | $ | 2,805 | | | $ | 3,056 | | | $ | 2,926 | | | $ | 4,013 | |
| | | | | | | | | | | | | | | | | | | | |
Ratios absent expense offsets:2 | | | | | | | | | | | | | | | | | | | | |
Ratio of total expenses to average net assets | | | 2.45 | % | | | 2.55 | % | | | 2.51 | % | | | 2.52 | % | | | 2.53 | % |
Ratio of net investment income to average net assets | | | 0.06 | % | | | 0.23 | % | | | 0.51 | % | | | 1.01 | % | | | 0.62 | % |
| | | | | | | | | | | | | | | | | | | | |
Managers AMG Chicago Equity Partners Balanced Fund
Financial Highlights
For a share outstanding throughout each year
| | | | | | | | | | | | | | | | | | | | |
| | | For the year ended December 31, | |
Institutional Class | | 2011 | | | 2010 | | | 2009 | | | 2008 | | | 2007 | |
Net Asset Value, Beginning of Year | | $ | 13.60 | | | $ | 12.43 | | | $ | 10.54 | | | $ | 13.28 | | | $ | 12.96 | |
Income from Investment Operations: | | | | | | | | | | | | | | | | | | | | |
Net investment income | | | 0.21 | 3 | | | 0.24 | | | | 0.23 | | | | 0.31 | | | | 0.29 | |
Net realized and unrealized gain (loss) on investments | | | 0.71 | 3 | | | 1.17 | | | | 1.90 | | | | (2.74 | ) | | | 0.34 | |
Total from investment operations | | | 0.92 | | | | 1.41 | | | | 2.13 | | | | (2.43 | ) | | | 0.63 | |
Less Distributions to Shareholders from: | | | | | | | | | | | | | | | | | | | | |
Net investment income | | | (0.22 | ) | | | (0.24 | ) | | | (0.24 | ) | | | (0.30 | ) | | | (0.31 | ) |
Net realized gain on investments | | | (0.48 | ) | | | — | | | | — | | | | (0.01 | ) | | | — | |
Total distributions to shareholders | | | (0.70 | ) | | | (0.24 | ) | | | (0.24 | ) | | | (0.31 | ) | | | (0.31 | ) |
Net Asset Value, End of Year | | $ | 13.82 | | | $ | 13.60 | | | $ | 12.43 | | | $ | 10.54 | | | $ | 13.28 | |
Total Return1 | | | 6.77 | % | | | 11.42 | % | | | 20.44 | % | | | (18.51 | )% | | | 4.87 | % |
Ratio of net expenses to average net assets | | | 0.99 | % | | | 0.97 | % | | | 0.98 | % | | | 0.96 | % | | | 0.98 | % |
Ratio of net investment income to average net assets1 | | | 1.52 | % | | | 1.81 | % | | | 2.03 | % | | | 2.58 | % | | | 2.18 | % |
Portfolio turnover | | | 94 | % | | | 97 | % | | | 114 | % | | | 99 | % | | | 206 | % |
Net assets at end of year (000’s omitted) | | $ | 8,885 | | | $ | 7,863 | | | $ | 7,164 | | | $ | 6,065 | | | $ | 7,754 | |
| | | | | | | | | | | | | | | | | | | | |
Ratios absent expense offsets:2 | | | | | | | | | | | | | | | | | | | | |
Ratio of total expenses to average net assets | | | 1.45 | % | | | 1.55 | % | | | 1.51 | % | | | 1.52 | % | | | 1.53 | % |
Ratio of net investment income to average net assets | | | 1.06 | % | | | 1.23 | % | | | 1.50 | % | | | 2.02 | % | | | 1.63 | % |
| | | | | | | | | | | | | | | | | | | | |
Managers High Yield Fund
Financial Highlights
For a share outstanding throughout each year
| | | | | | | | | | | | | | | | | | | | |
| | | For the year ended December 31, | |
Class A | | 2011 | | | 2010 | | | 2009 | | | 2008 | | | 2007 | |
Net Asset Value, Beginning of Year | | $ | 7.74 | | | $ | 7.35 | | | $ | 5.25 | | | $ | 8.23 | | | $ | 8.63 | |
Income from Investment Operations: | | | | | | | | | | | | | | | | | | | | |
Net investment income | | | 0.56 | 3 | | | 0.61 | | | | 0.60 | | | | 0.64 | | | | 0.59 | |
Net realized and unrealized gain (loss) on investments | | | (0.22 | )3 | | | 0.39 | | | | 2.10 | | | | (2.99 | ) | | | (0.40 | ) |
Total from investment operations | | | 0.34 | | | | 1.00 | | | | 2.70 | | | | (2.35 | ) | | | 0.19 | |
Less Distributions to Shareholders from: | | | | | | | | | | | | | | | | | | | | |
Net investment income | | | (0.57 | ) | | | (0.61 | ) | | | (0.60 | ) | | | (0.63 | ) | | | (0.59 | ) |
Net Asset Value, End of Year | | $ | 7.51 | | | $ | 7.74 | | | $ | 7.35 | | | $ | 5.25 | | | $ | 8.23 | |
Total Return1 | | | 4.54 | % | | | 14.20 | % | | | 53.97 | %5 | | | (30.02 | )%5 | | | 2.25 | % |
Ratio of net expenses to average net assets | | | 1.15 | % | | | 1.15 | % | | | 1.15 | % | | | 1.15 | %6 | | | 1.15 | % |
Ratio of net investment income to average net assets1 | | | 7.35 | % | | | 8.06 | % | | | 9.33 | % | | | 8.57 | %6 | | | 6.92 | % |
Portfolio turnover | | | 48 | % | | | 60 | % | | | 56 | % | | | 41 | % | | | 51 | % |
Net assets at end of year (000’s omitted) | | $ | 23,957 | | | $ | 21,729 | | | $ | 28,450 | | | $ | 17,105 | | | $ | 24,151 | |
| | | | | | | | | | | | | | | | | | | | |
Ratios absent expense offsets:2 | | | | | | | | | | | | | | | | | | | | |
Ratio of total expenses to average net assets | | | 1.69 | % | | | 1.78 | % | | | 1.68 | % | | | 1.70 | % | | | 1.55 | % |
Ratio of net investment income to average net assets | | | 6.81 | % | | | 7.43 | % | | | 8.80 | % | | | 8.01 | % | | | 6.52 | % |
| | | | | | | | | | | | | | | | | | | | |
| |
| | | For the year ended December 31, | |
Class C | | 2011 | | | 2010 | | | 2009 | | | 2008 | | | 2007 | |
Net Asset Value, Beginning of Year | | $ | 7.63 | | | $ | 7.24 | | | $ | 5.18 | | | $ | 8.12 | | | $ | 8.53 | |
Income from Investment Operations: | | | | | | | | | | | | | | | | | | | | |
Net investment income | | | 0.50 | 3 | | | 0.54 | | | | 0.54 | | | | 0.57 | | | | 0.53 | |
Net realized and unrealized gain (loss) on investments | | | (0.22 | )3 | | | 0.39 | | | | 2.06 | | | | (2.94 | ) | | | (0.41 | ) |
Total from investment operations | | | 0.28 | | | | 0.93 | | | | 2.60 | | | | (2.37 | ) | | | 0.12 | |
Less Distributions to Shareholders from: | | | | | | | | | | | | | | | | | | | | |
Net investment income | | | (0.51 | ) | | | (0.54 | ) | | | (0.54 | ) | | | (0.57 | ) | | | (0.53 | ) |
Net Asset Value, End of Year | | $ | 7.40 | | | $ | 7.63 | | | $ | 7.24 | | | $ | 5.18 | | | $ | 8.12 | |
Total Return1 | | | 3.69 | % | | | 13.42 | % | | | 52.57 | %5 | | | (30.54 | )%5 | | | 1.32 | % |
Ratio of net expenses to average net assets | | | 1.90 | % | | | 1.90 | % | | | 1.90 | % | | | 1.90 | %6 | | | 1.90 | % |
Ratio of net investment income to average net assets1 | | | 6.60 | % | | | 7.29 | % | | | 8.68 | % | | | 7.91 | %6 | | | 6.18 | % |
Portfolio turnover | | | 48 | % | | | 60 | % | | | 56 | % | | | 41 | % | | | 51 | % |
Net assets at end of year (000’s omitted) | | $ | 2,968 | | | $ | 4,053 | | | $ | 4,488 | | | $ | 3,516 | | | $ | 6,186 | |
| | | | | | | | | | | | | | | | | | | | |
Ratios absent expense offsets:2 | | | | | | | | | | | | | | | | | | | | |
Ratio of total expenses to average net assets | | | 2.44 | % | | | 2.53 | % | | | 2.43 | % | | | 2.46 | % | | | 2.30 | % |
Ratio of net investment income to average net assets | | | 6.06 | % | | | 6.66 | % | | | 8.15 | % | | | 7.36 | % | | | 5.78 | % |
| | | | | | | | | | | | | | | | | | | | |
Managers High Yield Fund
Financial Highlights
For a share outstanding throughout each year
| | | | | | | | | | | | | | | | | | | | |
| | | For the year ended December 31, | |
Institutional Class | | 2011 | | | 2010 | | | 2009 | | | 2008 | | | 2007 | |
Net Asset Value, Beginning of Year | | $ | 7.82 | | | $ | 7.42 | | | $ | 5.29 | | | $ | 8.29 | | | $ | 8.70 | |
Income from Investment Operations: | | | | | | | | | | | | | | | | | | | | |
Net investment income | | | 0.59 | 3 | | | 0.63 | | | | 0.64 | | | | 0.64 | | | | 0.64 | |
Net realized and unrealized gain (loss) on investments | | | (0.22 | )3 | | | 0.40 | | | | 2.11 | | | | (2.98 | ) | | | (0.43 | ) |
Total from investment operations | | | 0.37 | | | | 1.03 | | | | 2.75 | | | | (2.34 | ) | | | 0.21 | |
Less Distributions to Shareholders from: | | | | | | | | | | | | | | | | | | | | |
Net investment income | | | (0.60 | ) | | | (0.63 | ) | | | (0.62 | ) | | | (0.66 | ) | | | (0.62 | ) |
Net Asset Value, End of Year | | $ | 7.59 | | | $ | 7.82 | | | $ | 7.42 | | | $ | 5.29 | | | $ | 8.29 | |
Total Return1 | | | 4.83 | % | | | 14.58 | % | | | 54.64 | %5 | | | (29.80 | )%5 | | | 2.40 | % |
Ratio of net expenses to average net assets | | | 0.90 | % | | | 0.90 | % | | | 0.90 | % | | | 0.90 | %6 | | | 0.90 | % |
Ratio of net investment income to average net assets1 | | | 7.60 | % | | | 8.26 | % | | | 9.68 | % | | | 8.90 | %6 | | | 7.16 | % |
Portfolio turnover | | | 48 | % | | | 60 | % | | | 56 | % | | | 41 | % | | | 51 | % |
Net assets at end of year (000’s omitted) | | $ | 5,247 | | | $ | 4,718 | | | $ | 3,658 | | | $ | 2,890 | | | $ | 3,423 | |
| | | | | | | | | | | | | | | | | | | | |
Ratios absent expense offsets:2 | | | | | | | | | | | | | | | | | | | | |
Ratio of total expenses to average net assets | | | 1.44 | % | | | 1.53 | % | | | 1.42 | % | | | 1.46 | % | | | 1.30 | % |
Ratio of net investment income to average net assets | | | 7.06 | % | | | 7.63 | % | | | 9.16 | % | | | 8.34 | % | | | 6.77 | % |
| | | | | | | | | | | | | | | | | | | | |
Managers Fixed Income Fund
Financial Highlights
For a share outstanding throughout each year
| | | | | | | | | | | | | | | | | | | | |
| | | For the year ended December 31, | |
Class A | | 2011 | | | 2010 | | | 2009 | | | 2008 | | | 2007 | |
Net Asset Value, Beginning of Year | | $ | 11.00 | | | $ | 10.43 | | | $ | 8.93 | | | $ | 10.54 | | | $ | 10.55 | |
Income from Investment Operations: | | | | | | | | | | | | | | | | | | | | |
Net investment income | | | 0.46 | 3 | | | 0.47 | | | | 0.52 | | | | 0.55 | | | | 0.56 | |
Net realized and unrealized gain (loss) on investments | | | 0.03 | 3 | | | 0.56 | | | | 1.49 | | | | (1.62 | ) | | | 0.01 | |
Total from investment operations | | | 0.49 | | | | 1.03 | | | | 2.01 | | | | (1.07 | ) | | | 0.57 | |
Less Distributions to Shareholders from: | | | | | | | | | | | | | | | | | | | | |
Net investment income | | | (0.51 | ) | | | (0.46 | ) | | | (0.49 | ) | | | (0.54 | ) | | | (0.58 | ) |
Net realized gain on investments | | | (0.17 | ) | | | — | | | | (0.02 | ) | | | — | | | | — | |
Total distributions to shareholders | | | (0.68 | ) | | | (0.46 | ) | | | (0.51 | ) | | | (0.54 | ) | | | (0.58 | ) |
Net Asset Value, End of Year | | $ | 10.81 | | | $ | 11.00 | | | $ | 10.43 | | | $ | 8.93 | | | $ | 10.54 | |
Total Return1 | | | 4.53 | % | | | 10.04 | % | | | 23.14 | % | | | (10.45 | )% | | | 5.53 | % |
Ratio of net expenses to average net assets | | | 0.84 | % | | | 0.84 | % | | | 0.84 | % | | | 0.84 | % | | | 0.82 | % |
Ratio of net investment income to average net assets1 | | | 4.18 | % | | | 4.13 | % | | | 5.30 | % | | | 5.72 | % | | | 5.12 | % |
Portfolio turnover | | | 28 | % | | | 23 | % | | | 42 | % | | | 16 | % | | | 17 | % |
Net assets at end of year (000’s omitted) | | $ | 35,647 | | | $ | 38,655 | | | $ | 40,625 | | | $ | 33,417 | | | $ | 24,122 | |
| | | | | | | | | | | | | | | | | | | | |
Ratios absent expense offsets:2 | | | | | | | | | | | | | | | | | | | | |
Ratio of total expenses to average net assets | | | 1.05 | % | | | 1.07 | % | | | 1.08 | % | | | 1.08 | % | | | 1.12 | % |
Ratio of net investment income to average net assets | | | 3.97 | % | | | 3.90 | % | | | 5.06 | % | | | 5.48 | % | | | 4.84 | % |
| | | | | | | | | | | | | | | | | | | | |
| |
| | | For the year ended December 31, | |
Class B | | 2011 | | | 2010 | | | 2009 | | | 2008 | | | 2007 | |
Net Asset Value, Beginning of Year | | $ | 10.91 | | | $ | 10.35 | | | $ | 8.86 | | | $ | 10.47 | | | $ | 10.48 | |
Income from Investment Operations: | | | | | | | | | | | | | | | | | | | | |
Net investment income | | | 0.38 | 3 | | | 0.40 | | | | 0.49 | | | | 0.48 | | | | 0.51 | |
Net realized and unrealized gain (loss) on investments | | | 0.03 | 3 | | | 0.54 | | | | 1.43 | | | | (1.62 | ) | | | (0.03 | ) |
Total from investment operations | | | 0.41 | | | | 0.94 | | | | 1.92 | | | | (1.14 | ) | | | 0.48 | |
Less Distributions to Shareholders from: | | | | | | | | | | | | | | | | | | | | |
Net investment income | | | (0.42 | ) | | | (0.38 | ) | | | (0.41 | ) | | | (0.47 | ) | | | (0.49 | ) |
Net realized gain on investments | | | (0.17 | ) | | | — | | | | (0.02 | ) | | | — | | | | — | |
Total distributions to shareholders | | | (0.59 | ) | | | (0.38 | ) | | | (0.43 | ) | | | (0.47 | ) | | | (0.49 | ) |
Net Asset Value, End of Year | | $ | 10.73 | | | $ | 10.91 | | | $ | 10.35 | | | $ | 8.86 | | | $ | 10.47 | |
Total Return1 | | | 3.83 | %5 | | | 9.16 | %5 | | | 22.22 | % | | | (11.13 | )% | | | 4.74 | % |
Ratio of net expenses to average net assets | | | 1.59 | % | | | 1.59 | % | | | 1.59 | % | | | 1.59 | % | | | 1.55 | % |
Ratio of net investment income to average net assets1 | | | 3.42 | % | | | 3.40 | % | | | 4.67 | % | | | 4.90 | % | | | 4.37 | % |
Portfolio turnover | | | 28 | % | | | 23 | % | | | 42 | % | | | 16 | % | | | 17 | % |
Net assets at end of year (000’s omitted) | | $ | 3,233 | 7 | | $ | 3,773 | | | $ | 4,055 | | | $ | 6,349 | | | $ | 9,029 | |
| | | | | | | | | | | | | | | | | | | | |
Ratios absent expense offsets:2 | | | | | | | | | | | | | | | | | | | | |
Ratio of total expenses to average net assets | | | 1.80 | % | | | 1.82 | % | | | 1.83 | % | | | 1.82 | % | | | 1.85 | % |
Ratio of net investment income to average net assets | | | 3.21 | % | | | 3.17 | % | | | 4.43 | % | | | 4.66 | % | | | 4.05 | % |
| | | | | | | | | | | | | | | | | | | | |
Managers Fixed Income Fund
Financial Highlights
For a share outstanding throughout each year
| | | | | | | | | | | | | | | | | | | | |
| | | For the year ended December 31, | |
Class C | | 2011 | | | 2010 | | | 2009 | | | 2008 | | | 2007 | |
Net Asset Value, Beginning of Year | | $ | 10.98 | | | $ | 10.41 | | | $ | 8.92 | | | $ | 10.54 | | | $ | 10.55 | |
Income from Investment Operations: | | | | | | | | | | | | | | | | | | | | |
Net investment income | | | 0.38 | 3 | | | 0.39 | | | | 0.44 | | | | 0.48 | | | | 0.48 | |
Net realized and unrealized gain (loss) on investments | | | 0.02 | 3 | | | 0.56 | | | | 1.49 | | | | (1.62 | ) | | | 0.01 | |
Total from investment operations | | | 0.40 | | | | 0.95 | | | | 1.93 | | | | (1.14 | ) | | | 0.49 | |
Less Distributions to Shareholders from: | | | | | | | | | | | | | | | | | | | | |
Net investment income | | | (0.42 | ) | | | (0.38 | ) | | | (0.42 | ) | | | (0.48 | ) | | | (0.50 | ) |
Net realized gain on investments | | | (0.17 | ) | | | — | | | | (0.02 | ) | | | — | | | | — | |
Total distributions to shareholders | | | (0.59 | ) | | | (0.38 | ) | | | (0.44 | ) | | | (0.48 | ) | | | (0.50 | ) |
Net Asset Value, End of Year | | $ | 10.79 | | | $ | 10.98 | | | $ | 10.41 | | | $ | 8.92 | | | $ | 10.54 | |
Total Return1 | | | 3.73 | % | | | 9.22 | % | | | 22.13 | % | | | (11.11 | )% | | | 4.75 | % |
Ratio of net expenses to average net assets | | | 1.59 | % | | | 1.59 | % | | | 1.59 | % | | | 1.59 | % | | | 1.56 | % |
Ratio of net investment income to average net assets1 | | | 3.42 | % | | | 3.39 | % | | | 4.53 | % | | | 4.96 | % | | | 4.38 | % |
Portfolio turnover | | | 28 | % | | | 23 | % | | | 42 | % | | | 16 | % | | | 17 | % |
Net assets at end of year (000’s omitted) | | $ | 33,615 | | | $ | 45,363 | | | $ | 57,658 | | | $ | 41,387 | | | $ | 32,154 | |
| | | | | | | | | | | | | | | | | | | | |
Ratios absent expense offsets:2 | | | | | | | | | | | | | | | | | | | | |
Ratio of total expenses to average net assets | | | 1.80 | % | | | 1.82 | % | | | 1.83 | % | | | 1.83 | % | | | 1.86 | % |
Ratio of net investment income to average net assets | | | 3.21 | % | | | 3.16 | % | | | 4.29 | % | | | 4.73 | % | | | 4.08 | % |
| | | | | | | | | | | | | | | | | | | | |
| |
| | | For the year ended December 31, | |
Institutional Class | | 2011 | | | 2010 | | | 2009 | | | 2008 | | | 2007 | |
Net Asset Value, Beginning of Year | | $ | 11.03 | | | $ | 10.46 | | | $ | 8.96 | | | $ | 10.59 | | | $ | 10.59 | |
Income from Investment Operations: | | | | | | | | | | | | | | | | | | | | |
Net investment income | | | 0.49 | 3 | | | 0.49 | | | | 0.55 | | | | 0.58 | | | | 0.59 | |
Net realized and unrealized gain (loss) on investments | | | 0.02 | 3 | | | 0.57 | | | | 1.48 | | | | (1.63 | ) | | | 0.01 | |
Total from investment operations | | | 0.51 | | | | 1.06 | | | | 2.03 | | | | (1.05 | ) | | | 0.60 | |
Less Distributions to Shareholders from: | | | | | | | | | | | | | | | | | | | | |
Net investment income | | | (0.53 | ) | | | (0.49 | ) | | | (0.51 | ) | | | (0.58 | ) | | | (0.60 | ) |
Net realized gain on investments | | | (0.17 | ) | | | — | | | | (0.02 | ) | | | — | | | | — | |
Total distributions to shareholders | | | (0.70 | ) | | | (0.49 | ) | | | (0.53 | ) | | | (0.58 | ) | | | (0.60 | ) |
Net Asset Value, End of Year | | $ | 10.84 | | | $ | 11.03 | | | $ | 10.46 | | | $ | 8.96 | | | $ | 10.59 | |
Total Return1 | | | 4.79 | % | | | 10.29 | % | | | 23.39 | % | | | (10.23 | )% | | | 5.84 | % |
Ratio of net expenses to average net assets | | | 0.59 | % | | | 0.59 | % | | | 0.59 | % | | | 0.59 | % | | | 0.56 | % |
Ratio of net investment income to average net assets1 | | | 4.41 | % | | | 4.34 | % | | | 5.55 | % | | | 5.93 | % | | | 5.37 | % |
Portfolio turnover | | | 28 | % | | | 23 | % | | | 42 | % | | | 16 | % | | | 17 | % |
Net assets at end of year (000’s omitted) | | $ | 64,573 | | | $ | 61,748 | | | $ | 34,723 | | | $ | 28,561 | | | $ | 33,412 | |
| | | | | | | | | | | | | | | | | | | | |
Ratios absent expense offsets:2 | | | | | | | | | | | | | | | | | | | | |
Ratio of total expenses to average net assets | | | 0.80 | % | | | 0.82 | % | | | 0.83 | % | | | 0.83 | % | | | 0.86 | % |
Ratio of net investment income to average net assets | | | 4.20 | % | | | 4.11 | % | | | 5.31 | % | | | 5.69 | % | | | 5.07 | % |
| | | | | | | | | | | | | | | | | | | | |
Notes to Financial Highlights
The following should be read in conjunction with each of the Financial Highlights of the Funds presented on the previous pages.
| 1 | Total returns and net investment income would have been lower had certain expenses not been reduced. (See Note 1(c) of Notes to Financial Statements.) |
| 2 | Excludes the impact of expense reimbursements or fee waivers and expense reductions such as brokerage credits, but includes non-reimbursable expenses, if any, such as interest and taxes. (See Note 1(c) of Notes to Financial Statements.) |
| 3 | Per share numbers have been calculated using average shares. |
| 4 | Rounds to less than $0.01, ($0.01) or 0.00%. |
| 5 | The total return is based on the Financial Statement Net Asset Values as shown. |
| 6 | Excludes interest expense for the year ended December 31, 2008 of 0.06%. |
| 7 | Effective at the close of business on June 30, 2011, shares are no longer available for purchase. |
Notes to Financial Statements
December 31, 2011
| 1. | Summary of Significant Accounting Policies |
Managers Trust II (the “Trust”) is an open-end management investment company organized as a Massachusetts business trust and registered under the Investment Company Act of 1940, as amended (the “1940 Act”). Currently, the Trust consists of a number of different funds, each having distinct investment management objectives, strategies, risks, and policies. Included in this report are Managers AMG Chicago Equity Partners Mid-Cap Fund (“Mid-Cap”), Managers AMG Chicago Equity Partners Balanced Fund (“Balanced”), Managers High Yield Fund (“High Yield”) and Managers Fixed Income Fund (“Fixed Income”), each a “Fund” and collectively the “Funds.”
Effective May 1, 2011, Class B shares of the Mid-Cap, Balanced, and High Yield Funds closed to all investors and stopped accepting purchases, including purchase by exchange, except for purchases made by automatic reinvestment of dividends and capital gains pursuant to each Fund’s automatic reinvestment plan. On June 30, 2011 at the close of business, all outstanding Class B shares of the Mid-Cap, Balanced, and High Yield Funds were automatically converted to a number of full and/or fractional Class A shares equal in value to the shareholder’s Class B shares of each respective Fund.
Effective June 30, 2011, Class B shares of Fixed Income was closed to all new investors and will no longer be available for purchase by existing shareholders, including purchase by exchange, except for purchases made by automatic reinvestment of dividends and capital gains pursuant to the Fund’s automatic reinvestment plan. Shareholders who redeem Class B shares of the Fund will continue to be subject to the deferred sales charges described in the Prospectus.
Mid-Cap, Balanced, High Yield and Fixed Income each offer three classes of shares: Class A, Class C and Institutional Class. Sales of Class A shares may be subject to a front-end sales charge. Redemptions of Class A and Class C shares may be subject to a contingent-deferred sales charge (as a percentage of the original offering price or the net asset value at time of sale, whichever is less). Institutional Class shares are available, with no sales charge, to certain institutional investors and qualifying individual investors. Each class represents an interest in the same assets of the Fund and the classes are identical except for class specific expenses related to shareholder activity. Each class has equal voting privileges except that each class has exclusive voting rights with respect to its services and/or distribution plan. Please refer to a current prospectus for additional information on each share class.
The Funds’ financial statements are prepared in accordance with accounting principles generally accepted in the United States of America (“U.S. GAAP”), which require management to make estimates and assumptions that affect the reported amounts of assets and liabilities and disclosure of contingent assets and liabilities at the date of the financial statements and the reported amounts of income and expenses during the reporting period. Actual results could differ from those estimates and such differences could be material. The following is a summary of significant accounting policies followed by the Funds in the preparation of their financial statements:
| a. | Valuation of Investments |
Equity securities traded on a domestic or international securities exchange are valued at the last quoted sale price, or, lacking any
sales, at the last quoted bid price. Over-the-counter securities are valued at the Nasdaq Official Closing Price, if one is available. Lacking any sales, over-the-counter securities are valued at the last quoted bid price. The Funds’ investments are generally valued based on market quotations provided by third-party pricing services approved by the Board of Trustees of the Funds (the “Board”). Under certain circumstances, the value of certain Fund investments may be based on an evaluation of fair value, pursuant to procedures established by and under the general supervision of the Board. Each Fund may use the fair value of a portfolio investment to calculate its Net Asset Value (“NAV”) when, for example, (1) market quotations are not readily available because a portfolio investment is not traded in a public market or the principal market in which the investment trades is closed, (2) trading in a portfolio investment is suspended and has not resumed before the Fund calculates its NAV, (3) a significant event affecting the value of a portfolio investment is determined to have occurred between the time of the market quotation provided for a portfolio investment and the time as of which the Fund calculates its NAV, (4) a investment’s price has remained unchanged over a period of time (often referred to as a “stale price”), or (5) Managers Investment Group LLC (the “Investment Manager”) determines that a market quotation is inaccurate. Portfolio investments that trade primarily on foreign markets are priced based upon the market quotation of such securities as of the close of their respective principal markets, as adjusted to reflect the Investment Manager’s determination of the impact of events occurring subsequent to the close of such markets but prior to the time as of which each Fund calculates its NAV. In accordance with procedures approved by the Board, the Investment Manager relies upon recommendations of a third-party fair valuation service in adjusting the prices of such foreign portfolio investments. The Funds may invest in securities that may be thinly traded. The Board has adopted procedures to adjust prices of thinly traded securities that are judged to be stale so that they reflect fair value. An investment valued on the basis of its fair value may be valued at a price higher or lower than available market quotations. An investment’s valuation may differ depending on the method used and the factors considered in determining value according to the Fund’s fair value procedures.
Fixed-income securities are valued based on valuations furnished by independent pricing services that utilize matrix systems, which reflect such factors as security prices, yields, maturities, and ratings, and are supplemented by dealer and exchange quotations. Short-term investments having a remaining maturity of 60 days or less are generally valued at amortized cost, which approximates market value. Investments in other open-end regulated investment companies are valued at their end of day net asset value per share except ETF’s, which are valued the same as equity securities. Investments in certain mortgage-backed and stripped mortgage-backed securities, preferred stocks, convertible securities, derivatives and other debt securities not traded on an organized securities market are valued on the basis of valuations provided by dealers or by a pricing service which uses information with respect to transactions in such securities and various relationships between securities and yield to maturity in determining value. Securities (including derivatives) for which market quotations are not readily available are valued at fair value, as determined in good faith, and pursuant to procedures adopted by the Board. The values assigned to fair value
Notes to Financial Statements (continued)
investments are based on available information and do not necessarily represent amounts that might ultimately be realized, since such amounts depend on future developments inherent in long-term investments. Further, because of the inherent uncertainty of valuation, those estimated values may differ significantly from the values that would have been used had a ready market for the investments existed, and the differences could be material.
U.S. GAAP defines fair value as the price that a Fund would receive to sell an asset or pay to transfer a liability in an orderly transaction between market participants at the measurement date. U.S. GAAP also establishes a framework for measuring fair value, and a three-level hierarchy for fair value measurements based upon the transparency of inputs to the valuation of an asset or liability. Inputs may be observable or unobservable and refer broadly to the assumptions that market participants would use in pricing the asset or liability. Observable inputs reflect the assumptions market participants would use in pricing the asset or liability based on market data obtained from sources independent of the Funds. Unobservable inputs reflect the Funds’ own assumptions about the assumptions that market participants would use in pricing the asset or liability developed based on the best information available in the circumstances. Each investment is assigned a level based upon the observability of the inputs which are significant to the overall valuation.
The three-tier hierarchy of inputs is summarized below:
Level 1 – inputs are quoted prices in active markets for identical investments (e.g., equity securities, open-end investment companies)
Level 2 – other observable inputs (including, but not limited to: quoted prices for similar assets or liabilities in markets that are active, quoted prices for identical or similar assets or liabilities in markets that are not active, inputs other than quoted prices that are observable for the assets or liabilities (such as interest rates, yield curves, volatilities, prepayment speeds, loss severities, credit risks and default rates) or other market corroborated inputs) (e.g., debt securities, government securities, foreign securities utilizing international fair value pricing, broker-quoted securities, fair valued securities with observable inputs)
Level 3 – inputs are significant unobservable inputs (including the Fund’s own assumptions used to determine the fair value of investments) (e.g., fair valued securities with unobservable inputs)
The inputs or methodologies used for valuing investments are not necessarily an indication of the risk associated with investing in those investments.
Security transactions are accounted for as of trade date. Realized gains and losses on securities sold are determined on the basis of identified cost.
| c. | Investment Income and Expenses |
Dividend income is recorded on the ex-dividend date, except certain dividends from foreign securities where the ex-dividend date may have passed. Dividends from foreign securities are recorded as soon as the Trust becomes aware of the ex-dividend date. Dividend income on foreign securities is recorded net of any withholding tax. Interest income, which includes amortization of premium and accretion of discount on debt securities, is accrued as earned. Non-cash
dividends included in dividend income, if any, are reported at the fair market value of the securities received. Other income and expenses are recorded on an accrual basis. Expenses that cannot be directly attributed to a Fund are apportioned among the Funds in the Trust and in some cases other affiliated funds based upon their relative average net assets or number of shareholders. Investment income, realized and unrealized capital gains and losses, the common expenses of each Fund, and certain Fund level expense reductions, if any, are allocated on a pro-rata basis to each class based on the relative net assets of each class to the total net assets of each Fund.
The following Funds had certain portfolio trades directed to various brokers, under a brokerage recapture program, which paid a portion of such Fund’s expenses. For the year ended December 31, 2011, the amount by which the Funds’ expenses were reduced and the impact on the expense ratios, if any, were as follows: Mid-Cap -$25,098 or 0.06%, and Balanced - $1,908 or 0.01%.
The Funds have a “balance credit” arrangement with The Bank of New York Mellon (“BNYM”), the Funds’ custodian, whereby each Fund is credited with an interest factor equal to 0.75% below the effective 90-day T-Bill rate for account balances left uninvested overnight. If the T-Bill rate falls below 0.75%, no credits will be earned. These credits serve to reduce custody expenses that would otherwise be charged to each Fund. For the year ended December 31, 2011, the custodian expense was not reduced.
Overdrafts will cause a reduction of any earnings credits, computed at 2% above the effective Federal funds rate on the day of the overdraft. For the year ended December 31, 2011, overdraft fees for Mid-Cap, Balanced, High Yield and Fixed Income equaled $80, $0, $65 and $26, respectively.
The Trust also has a balance credit arrangement with its Transfer Agent, BNY Mellon Investment Servicing (US) Inc. (formerly PNC Global Investment Servicing (U.S.) Inc.), whereby earnings credits are used to offset banking charges and other out-of-pocket expenses. For the year ended December 31, 2011, the transfer agent expense for Mid-Cap, Balanced, High Yield and Fixed Income was reduced by $51, $25, $37 and $173, respectively.
The Investment Manager has agreed to waive a portion of its management fee in consideration of shareholder servicing fees that it has received from JPMorgan Distribution Services, Inc., with respect to short-term cash investments each Fund may have made in the JPMorgan Liquid Assets Money Market Fund – Capital Shares. For the year ended December 31, 2011, the management fee was not reduced for any of the Funds.
Total returns and net investment income for the Funds would have been lower had certain expenses not been offset. Total expenses before offsets exclude the impact of expense reimbursements or fee waivers and expense reductions such as brokerage recapture credits, but include non-reimbursable expenses, if any, such as interest and taxes.
Notes to Financial Statements (continued)
| d. | Dividends and Distributions |
Dividends resulting from net investment income, if any, normally will be declared and paid annually for Mid-Cap, monthly for Fixed Income and High Yield, and quarterly for Balanced. Distributions of capital gains, if any, will be made on an annual basis and when required for Federal excise tax purposes. Income and capital gain distributions are determined in accordance with Federal income tax regulations, which may differ from U.S. GAAP. These differences are primarily due to differing treatments for losses deferred due to wash sales, REITs, equalization accounting for tax purposes, foreign currency, and market discount transactions. Permanent book and tax basis differences, if any, relating to shareholder distributions will result in reclassifications to paid-in capital.
The tax character of distributions paid during the years ended December 31, 2011 and December 31, 2010 were as follows:
| | | | | | | | | | | | | | | | | | | | | | | | | | | | | | | | |
| | | Mid-Cap | | | Balanced | | | High Yield | | | Fixed Income | |
| | | 2011 | | | 2010 | | | 2011 | | | 2010 | | | 2011 | | | 2010 | | | 2011 | | | 2010 | |
Distributions paid from: | | | | | | | | | | | | | | | | | | | | | | | | | | | | | | | | |
Ordinary income | | $ | 175,133 | | | $ | 230,138 | | | $ | 909,874 | | | $ | 272,829 | | | $ | 2,317,974 | | | $ | 2,554,625 | | | $ | 6,173,492 | | | $ | 5,902,162 | |
Short-term capital gains | | | — | | | | — | | | | — | | | | — | | | | — | | | | — | | | | — | | | | — | |
Long-term capital gains | | | — | | | | — | | | | 359,686 | | | | — | | | | — | | | | — | | | | 2,186,740 | | | | — | |
Return of capital | | | | | | | | | | | | | | | | | | | | | | | | | | | | | | | | |
| | | | | | | | | | | | | | | | | | | | | | | | | | | | | | | | |
Totals | | $ | 175,133 | | | $ | 230,138 | | | $ | 1,269,560 | | | $ | 272,829 | | | $ | 2,317,974 | | | $ | 2,554,625 | | | $ | 8,360,232 | | | $ | 5,902,162 | |
| | | | | | | | | | | | | | | | | | | | | | | | | | | | | | | | |
As of December 31, 2011, the components of distributable earnings (excluding unrealized appreciation/depreciation) on a tax basis consisted of:
| | | | | | | | | | | | | | | | |
| | | Mid-Cap | | | Balanced | | | High Yield | | | Fixed Income | |
Capital loss carryforward | | $ | 5,731,380 | | | | — | | | $ | 3,542,420 | | | | — | |
Undistributed ordinary income | | | 40,422 | | | | — | | | | 2,067 | | | | — | |
Undistributed short-term capital gains | | | — | | | | — | | | | — | | | | — | |
Undistributed long-term capital gains | | | — | | | $ | 220,582 | | | | — | | | | — | |
Post-October loss deferral | | | 692,085 | | | | 105,002 | | | | 207,255 | | | $ | 9,271 | |
Each Fund intends to comply with the requirements under Subchapter M of the Internal Revenue Code of 1986, as amended, and to distribute substantially all of its taxable income and gains to its shareholders and to meet certain diversification and income requirements with respect to investment companies. Therefore, no provision for Federal income or excise tax is included in the accompanying financial statements.
Additionally, based on the Funds’ understanding of the tax rules and rates related to income, gains and transactions for the foreign jurisdictions in which they invest, the Funds will provide for foreign taxes, and where appropriate, deferred foreign taxes.
Management has analyzed the Funds’ tax positions taken on Federal income tax returns for all open tax years (tax years ended December 31, 2008-2011), and has concluded that no provision for federal income tax is required in the Funds’ financial statements. Additionally, the Funds are not aware of any tax position for which it is reasonably possible that the total amounts of unrecognized tax benefits will change materially in the next twelve months.
New Tax Law: Regulated Investment Company Modernization Act:
Under the recently enacted Regulated Investment Company Modernization Act of 2010 (the “Act”), the Act modernizes several of the federal income and excise tax provisions related to regulated investment companies (“RIC”). Some highlights of the enacted provisions are as follows:
New post-enactment capital losses may now be carried forward for an unlimited time period. However, any new losses incurred will be required to be utilized prior to any loss carryovers incurred in pre-enactment taxable years, which generally expire eight years following the close of the taxable year in which they were incurred. As a result of this ordering rule, pre-enactment capital loss carryovers may be more likely to expire unused. Additionally, post-enactment capital losses that are carried forward will retain their tax character as either short-term or long-term capital losses rather than being considered all short-term as under previous law.
The Act contains simplification provisions, which are aimed at preventing disqualification of a RIC for “inadvertent” failures of the asset diversification and/or qualifying income tests. Additionally, the Act repealed the 60-day designation requirement for certain types of pass-through income and gains.
Finally, the Act contains several provisions aimed at preserving the character of distributions made by a fiscal year RIC during the portion of its taxable year ending after October 31, or December 31, reducing the circumstances under which a RIC might be required to
Notes to Financial Statements (continued)
send shareholders amended Forms 1099 to restate previously reported distributions.
Except for the simplification provisions related to RIC qualification, the Act is effective for taxable years beginning after December 22, 2010. The Funds’ first taxable year subject to the Act will be the current year ended December 31. 2011.
| f. | Capital Loss Carryovers and Deferrals |
As of December 31, 2011, the following Funds had accumulated net realized capital loss carryovers from securities transactions for Federal income tax purposes as shown in the following chart. The amounts may be used to offset future realized capital gains, if any, through the expiration dates listed or in the case of post-enactment losses, for an unlimited time period.
| | | | | | | | |
| | | Capital Loss Carryover Amount | | |
Mid-Cap | | Short-Term | | | Long-Term | | Expires
December 31, |
(Pre-Enactment) | | $ | 5,731,380 | | | | | 2017 |
| | | | | | | | |
| | | |
| High Yield | | | | | | | |
(Pre-Enactment) | | $ | 3,542,420 | | | | | 2017 |
| | | | | | | | |
For the year ended December 31, 2011, the following Funds uti- lized capital loss carryovers in the amount of:
| | | | | | | | |
| | | Capital Loss Carryover Utilized | |
| | | Short-Term | | | Long-Term | |
Mid-Cap | | $ | 5,164,830 | | | | — | |
Balanced | | | 934,426 | | | | — | |
High Yield | | | 861,054 | | | | — | |
Fixed Income | | | 1,069,686 | | | | — | |
The Trust’s Declaration of Trust authorizes for each series the issuance of an unlimited number of shares of beneficial interest, without par value. Each Fund records sales and repurchases of its capital stock on the trade date. The cost of securities contributed to the Funds in connection with the issuance of shares is based on the valuation of those securities in accordance with the Funds’ policy on investment valuation. Dividends and distributions to shareholders are recorded on the ex-dividend date. For the years ended December 31, 2011 and December 31, 2010, the capital stock transactions by class for Mid-Cap, Balanced, High Yield, and Fixed Income were:
| | | | | | | | | | | | | | | | | | | | | | | | | | | | | | | | |
| | | Mid-Cap | | | Balanced | |
| | | 2011 | | | 2010 | | | 2011 | | | 2010 | |
| | | Shares | | | Amount | | | Shares | | | Amount | | | Shares | | | Amount | | | Shares | | | Amount | |
Class A: | | | | | | | | | | | | | | | | | | | | | | | | | | | | | | | | |
Proceeds from sale of shares | | | 263,383 | | | $ | 3,920,400 | | | | 152,527 | | | $ | 1,817,076 | | | | 909,939 | | | $ | 12,576,072 | | | | 153,940 | | | $ | 1,989,622 | |
Reinvestment of distributions | | | 1,042 | | | | 14,584 | | | | 1,201 | | | | 16,634 | | | | 20,194 | | | | 277,613 | | | | 4,484 | | | | 57,927 | |
Cost of shares repurchased | | | (146,524 | ) | | | (2,063,396 | ) | | | (171,982 | ) | | | (2,035,553 | ) | | | (215,408 | ) | | | (2,998,631 | ) | | | (156,920 | ) | | | (1,998,654 | ) |
| | | | | | | | | | | | | | | | | | | | | | | | | | | | | | | | |
Net Increase (Decrease) | | | 117,901 | | | $ | 1,871,588 | | | | (18,254 | ) | | ($ | 201,843 | ) | | | 714,725 | | | $ | 9,855,054 | | | | 1,504 | | | $ | 48,895 | |
| | | | | | | | | | | | | | | | | | | | | | | | | | | | | | | | |
Class B: | | | | | | | | | | | | | | | | | | | | | | | | | | | | | | | | |
Proceeds from sale of shares | | | 1,377 | | | $ | 20,000 | | | | 84 | | | $ | 935 | | | | 25,358 | | | $ | 346,964 | | | | 9,548 | | | $ | 123,057 | |
Reinvestment of distributions | | | — | | | | — | | | | — | | | | — | | | | 141 | | | | 1,906 | | | | 235 | | | | 3,014 | |
Cost of shares repurchased | | | (21,727 | ) | | | (311,090 | ) | | | (41,048 | ) | | | (441,806 | ) | | | (67,705 | ) | | | (955,063 | ) | | | (47,933 | ) | | | (597,986 | ) |
| | | | | | | | | | | | | | | | | | | | | | | | | | | | | | | | |
Net Decrease | | | (20,350 | )1 | | ($ | 291,090 | )1 | | | (40,964 | ) | | ($ | 440,871 | ) | | | (42,206 | )1 | | ($ | 606,193 | )1 | | | (38,150 | ) | | ($ | 471,915 | ) |
| | | | | | | | | | | | | | | | | | | | | | | | | | | | | | | | |
Class C: | | | | | | | | | | | | | | | | | | | | | | | | | | | | | | | | |
Proceeds from sale of shares | | | 24,002 | | | $ | 320,120 | | | | 6,516 | | | $ | 72,671 | | | | 98,793 | | | $ | 1,350,143 | | | | 27,751 | | | $ | 355,635 | |
Reinvestment of distributions | | | — | | | | — | | | | — | | | | — | | | | 2,507 | | | | 34,234 | | | | 585 | | | | 7,541 | |
Cost of shares repurchased | | | (73,236 | ) | | | (971,463 | ) | | | (133,269 | ) | | | (1,439,004 | ) | | | (124,616 | ) | | | (1,733,656 | ) | | | (68,533 | ) | | | (871,532 | ) |
| | | | | | | | | | | | | | | | | | | | | | | | | | | | | | | | |
Net Decrease | | | (49,234 | ) | | ($ | 651,343 | ) | | | (126,753 | ) | | ($ | 1,366,333 | ) | | | (23,316 | ) | | ($ | 349,279 | ) | | | (40,197 | ) | | ($ | 508,356 | ) |
| | | | | | | | | | | | | | | | | | | | | | | | | | | | | | | | |
Institutional Class: | | | | | | | | | | | | | | | | | | | | | | | | | | | | | | | | |
Proceeds from sale of shares | | | 162,427 | | | $ | 2,430,500 | | | | 149,279 | | | $ | 1,869,055 | | | | 139,385 | | | $ | 1,977,630 | | | | 73,672 | | | $ | 945,883 | |
Reinvestment of distributions | | | 9,995 | | | | 147,020 | | | | 13,403 | | | | 195,143 | | | | 30,148 | | | | 418,221 | | | | 10,429 | | | | 135,661 | |
Cost of shares repurchased | | | (283,032 | ) | | | (4,309,909 | ) | | | (301,849 | ) | | | (3,698,904 | ) | | | (104,613 | ) | | | (1,467,122 | ) | | | (82,243 | ) | | | (1,050,298 | ) |
| | | | | | | | | | | | | | | | | | | | | | | | | | | | | | | | |
Net Increase (Decrease) | | | (110,610 | ) | | ($ | 1,732,389 | ) | | | (139,167 | ) | | ($ | 1,634,706 | ) | | | 64,920 | | | $ | 928,729 | | | | 1,858 | | | $ | 31,246 | |
| | | | | | | | | | | | | | | | | | | | | | | | | | | | | | | | |
| 1 | Effective at the close of business on June 30, 2011, all B shares converted to A shares |
Notes to Financial Statements (continued)
| | | | | | | | | | | | | | | | | | | | | | | | | | | | | | | | |
| | | High Yield | | | Fixed Income | |
| | | 2011 | | | 2010 | | | 2011 | | | 2010 | |
| | | Shares | | | Amount | | | Shares | | | Amount | | | Shares | | | Amount | | | Shares | | | Amount | |
Class A: | | | | | | | | | | | | | | | | | | | | | | | | | | | | | | | | |
Proceeds from sale of shares | | | 1,215,827 | | | $ | 9,320,334 | | | | 561,569 | | | $ | 4,207,687 | | | | 1,204,327 | | | $ | 13,370,619 | | | | 1,650,400 | | | $ | 17,834,800 | |
Reinvestment of distributions | | | 180,827 | | | | 1,378,945 | | | | 197,078 | | | | 1,473,915 | | | | 122,816 | | | | 1,344,883 | | | | 104,383 | | | | 1,132,260 | |
Cost of shares repurchased | | | (1,015,358 | ) | | | (7,730,623 | ) | | | (1,823,180 | ) | | | (13,579,835 | ) | | | (1,543,478 | ) | | | (17,095,985 | ) | | | (2,136,300 | ) | | | (23,308,029 | ) |
| | | | | | | | | | | | | | | | | | | | | | | | | | | | | | | | |
Net Increase (Decrease) | | | 381,296 | | | $ | 2,968,656 | | | | (1,064,533 | ) | | ($ | 7,898,233 | ) | | | (216,335 | ) | | ($ | 2,380,483 | ) | | | (381,517 | ) | | ($ | 4,340,969 | ) |
| | | | | | | | | | | | | | | | | | | | | | | | | | | | | | | | |
Class B: | | | | | | | | | | | | | | | | | | | | | | | | | | | | | | | | |
Proceeds from sale of shares | | | 357 | | | $ | 2,756 | | | | 12,741 | | | $ | 93,537 | | | | 14,740 | | | $ | 161,405 | | | | 75,696 | | | $ | 826,667 | |
Reinvestment of distributions | | | 1,556 | | | | 12,016 | | | | 4,785 | | | | 35,193 | | | | 8,809 | | | | 95,746 | | | | 6,279 | | | | 67,622 | |
Cost of shares repurchased | | | (92,823 | ) | | | (711,810 | ) | | | (107,537 | ) | | | (782,312 | ) | | | (67,872 | ) | | | (747,832 | ) | | | (128,184 | ) | | | (1,363,867 | ) |
| | | | | | | | | | | | | | | | | | | | | | | | | | | | | | | | |
Net Decrease | | | (90,910 | )1 | | ($ | 697,038 | )1 | | | (90,011 | ) | | ($ | 653,582 | ) | | | (44,323 | )2 | | ($ | 490,681 | )2 | | | (46,209 | ) | | ($ | 469,578 | ) |
| | | | | | | | | | | | | | | | | | | | | | | | | | | | | | | | |
Class C: | | | | | | | | | | | | | | | | | | | | | | | | | | | | | | | | |
Proceeds from sale of shares | | | 44,565 | | | $ | 335,390 | | | | 54,946 | | | $ | 409,922 | | | | 335,178 | | | $ | 3,710,019 | | | | 399,093 | | | $ | 4,329,562 | |
Reinvestment of distributions | | | 18,025 | | | | 136,020 | | | | 23,277 | | | | 171,625 | | | | 111,887 | | | | 1,222,852 | | | | 98,849 | | | | 1,070,100 | |
Cost of shares repurchased | | | (193,035 | ) | | | (1,455,549 | ) | | | (166,548 | ) | | | (1,234,905 | ) | | | (1,463,649 | ) | | | (16,217,517 | ) | | | (1,905,917 | ) | | | (20,659,178 | ) |
| | | | | | | | | | | | | | | | | | | | | | | | | | | | | | | | |
Net Decrease | | | (130,445 | ) | | ($ | 984,139 | ) | | | (88,325 | ) | | ($ | 653,358 | ) | | | (1,016,584 | ) | | ($ | 11,284,646 | ) | | | (1,407,975 | ) | | ($ | 15,259,516 | ) |
| | | | | | | | | | | | | | | | | | | | | | | | | | | | | | | | |
Institutional Class: | | | | | | | | | | | | | | | | | | | | | | | | | | | | | | | | |
Proceeds from sale of shares | | | 180,762 | | | $ | 1,398,738 | | | | 189,264 | | | $ | 1,436,884 | | | | 3,098,532 | | | $ | 34,501,136 | | | | 2,862,678 | | | $ | 31,466,580 | |
Reinvestment of distributions | | | 47,020 | | | | 362,678 | | | | 41,664 | | | | 315,109 | | | | 262,525 | | | | 2,886,361 | | | | 156,575 | | | | 1,706,688 | |
Cost of shares repurchased | | | (139,737 | ) | | | (1,078,079 | ) | | | (120,296 | ) | | | (911,419 | ) | | | (3,002,243 | ) | | | (33,274,625 | ) | | | (742,062 | ) | | | (8,163,869 | ) |
| | | | | | | | | | | | | | | | | | | | | | | | | | | | | | | | |
Net Increase | | | 88,045 | | | $ | 683,337 | | | | 110,632 | | | $ | 840,574 | | | | 358,814 | | | $ | 4,112,872 | | | | 2,277,191 | | | $ | 25,009,399 | |
| | | | | | | | | | | | | | | | | | | | | | | | | | | | | | | | |
| 1 | Effective at the close of business on June 30, 2011, all B shares converted to A shares. |
| 2 | Effective at the close of business on June 30, 2011, shares are no longer available for purchase. |
At December 31, 2011, certain unaffiliated shareholders of record, specifically omnibus accounts, individually or collectively held greater than 10% of the outstanding shares of the following Funds: Mid-Cap – two collectively own 81%; Balanced – two collectively own 70%; High Yield –three collectively own 45%; Fixed Income – four collectively own 53%. Transactions by these shareholders may have a material impact on the Funds.
| h. | Foreign Currency Translation |
The books and records of the Funds are maintained in U.S. dollars. The value of investments, assets and liabilities denominated in currencies other than U.S. dollars are translated into U.S. dollars based upon current foreign exchange rates. Purchases and sales of foreign investments, income and expenses are converted into U.S. dollars based on currency exchange rates prevailing on the respective dates of such transactions. Net realized and unrealized gain (loss) on foreign currency transactions represent: (1) foreign exchange gains and losses from the sale and holdings of foreign currencies; (2) gains and losses between trade date and settlement date on investment securities transactions; and (3) gains and losses from the difference between amounts of interest and dividends recorded and the amounts actually received.
The Funds do not isolate the net realized and unrealized gain or loss resulting from changes in exchange rates from the fluctuations in market prices of securities held. Such fluctuations are included with the net realized and unrealized gain or loss on investments.
The Funds invests in securities of foreign entities and in instruments denominated in foreign currencies which involve risks not typically associated with investments in domestic securities. Non-domestic securities carry special risks, such as exposure to currency fluctuations, less developed or less efficient trading markets, political
instability, a lack of company information, differing auditing and legal standards, and, potentially, less liquidity. Realized gains in certain countries may be subject to foreign taxes at the Fund level, at rates ranging from approximately 10% to 15%.
The Fund would pay such foreign taxes at the appropriate rate for each jurisdiction.
| 2. | Agreements and Transactions with Affiliates |
For each of the Funds, the Trust has entered into an Investment Management Agreement under which the Investment Manager, an independently managed subsidiary of Affiliated Managers Group, Inc. (“AMG”), serves as investment manager to the Funds and is responsible for the Funds’ overall administration. The Investment Manager selects subadvisors for the Funds (subject to Board approval) and monitors each subadvisor’s investment programs and results. Each Fund’s investment portfolio is managed by one or more portfolio managers who serve pursuant to a subadvisory agreement with the Investment Manager.
Investment management fees are paid directly by the Funds to the Investment Manager based on average daily net assets. For the year ended December 31, 2011, the annual investment management fee rates, as a percentage of average daily net assets, were as follows:
Notes to Financial Statements (continued)
| | | | |
| | | Investment
Management Fee | |
Mid-Cap | | | 0.70 | % |
Balanced | | | 0.70 | % |
High Yield | | | 0.70 | % |
Fixed Income | | | 0.45 | % |
The Investment Manager has contractually agreed, through at least May 1, 2012, to waive fees and pay or reimburse Fund expenses in order to limit total annual Fund operating expenses after fee waiver and expense reimbursements (exclusive of taxes, interest, brokerage commissions, acquired fund fees and expenses and extraordinary items) to the following percentages of the following Funds’ average daily net assets:
| | | | | | | | | | | | | | | | |
| | | Mid-Cap | | | Balanced | | | High Yield | | | Fixed Income | |
Class A | | | 1.24 | % | | | 1.25 | % | | | 1.15 | % | | | 0.84 | % |
Class B | | | n/a | | | | n/a | | | | n/a | | | | 1.59 | % |
Class C | | | 1.99 | % | | | 2.00 | % | | | 1.90 | % | | | 1.59 | % |
Institutional Class | | | 0.99 | % | | | 1.00 | % | | | 0.90 | % | | | 0.59 | % |
Each Fund is obligated to repay the Investment Manager such amounts waived, paid or reimbursed in future years provided that the repayment occurs within thirty-six (36) months after the waiver or reimbursement and that such repayment would not cause the Fund’s total operating expenses in any such future year to exceed that Fund’s respective expense cap. For the year ended December 31, 2011, each Fund’s components of reimbursement available are detailed in the following chart:
| | | | | | | | | | | | | | | | |
| | | Mid-Cap | | | Balanced | | | High
Yield | | | Fixed Income | |
Reimbursement Available - 12/31/10 | | $ | 280,393 | | | $ | 298,953 | | | $ | 541,616 | | | $ | 918,466 | |
Additional Reimbursements | | | 84,837 | | | | 94,572 | | | | 170,087 | | | | 291,775 | |
Repayments | | | — | | | | — | | | | — | | | | — | |
Expired Reimbursements | | | (104,180 | ) | | | (93,206 | ) | | | (170,606 | ) | | | (269,099 | ) |
Reimbursement Available - 12/31/11 | | $ | 261,050 | | | $ | 300,319 | | | $ | 541,097 | | | $ | 941,142 | |
The Funds have entered into an Administration and Shareholder Servicing Agreement under which the Investment Manager serves as each Fund’s administrator (the “Administrator”) and is responsible for all aspects of managing the Funds’ operations, including administration and shareholder services to each Fund, its shareholders, and certain institutions, such as bank trust departments, broker-dealers and registered investment advisers, that advise or act as an intermediary with the Funds’ shareholders. The Funds pay a fee to the Administrator at the rate of 0.20% per annum of each Fund’s average daily net assets for this service.
Effective January 1, 2011, the aggregate annual retainer paid to each Independent Trustee of the Board is $80,000, plus $5,000 or $2,500 for each regular or special meeting attended, respectively. The Independent Chairman of the Trust receives an additional payment of $20,000 per year. The Chairman of the Audit Committee receives an additional payment of $8,000 per year. Prior to January 1, 2011, the aggregate annual retainer paid to each Independent Trustee of the
Board was $65,000, plus $4,000 or $2,500 for each regular or special meeting attended, respectively. The Independent Chairman of the Trusts received an additional payment of $15,000 per year. The Chairman of the Audit Committee received an additional payment of $5,000 per year. The Trustees’ fees and expenses are allocated among all of the funds for which the Investment Manager serves as the advisor (the “Managers Funds”) based on the relative net assets of such funds. The “Trustees fees and expenses” shown in the financial statements represents each Fund’s allocated portion of the total fees and expenses paid by the Managers Funds.
The Funds are distributed by Managers Distributors, Inc. (the “Distributor” or “MDI”), a wholly-owned subsidiary of the Investment Manager. MDI serves as the distributor and underwriter for each Fund and is a registered broker-dealer and member of the Financial Industry Regulatory Authority, Inc. (“FINRA”). Shares of each Fund will be continuously offered and will be sold directly to prospective purchasers through brokers, dealers or other financial intermediaries who have executed selling agreements with MDI. Subject to the compensation arrangement discussed below, generally MDI bears all or a portion of the expenses of providing services pursuant to the distribution agreement, including the payment of the expenses relating to the distribution of prospectuses for sales purposes and any advertising or sales literature. Certain Trustees and Officers of the Funds are Officers and/or Directors of the Investment Manager, AMG and/or the Distributor.
The Trust has adopted a distribution and service plan (the “Plan”) with respect to the Class A, Class B and Class C shares in accordance with the requirements of Rule 12b-1 under the 1940 Act and the requirements of the applicable rules of FINRA regarding asset-based sales charges. Pursuant to the Plan, each Fund may compensate the Distributor for its expenditures in financing any activity primarily intended to result in the sale of each such class of the Fund’s shares and for maintenance and personal service provided to existing shareholders of that class. The Plan authorizes payments to the Distributor up to 0.25% annually of each Fund’s average daily net assets attributable to the Class A shares and 1.00% annually of the Fund’s average daily net assets attributable to Class B and Class C shares, respectively.
The Plan further provides for periodic payments by the Trust or MDI to brokers, dealers and other financial intermediaries for providing shareholder services and for promotional and other sales related costs. The portion of payments by Class A, Class B or Class C shares of a Fund for shareholder servicing may not exceed an annual rate of 0.25% of the average daily net asset value of the Fund’s shares of that class owned by clients of such broker, dealer or financial intermediary.
The following summarizes the total fees incurred under the Plan for Class A, Class B and Class C shares for the year ended December 31, 2011:
| | | | |
| | | Amount | |
Mid-Cap | | $ | 52,699 | |
Balanced | | | 53,277 | |
High Yield | | | 94,933 | |
Fixed Income | | | 498,739 | |
Notes to Financial Statements (continued)
The Securities and Exchange Commission granted an exemptive order that permits the Funds to lend and borrow money for certain temporary purposes directly to and from other eligible Managers Funds. Participation in this interfund lending program is voluntary for both borrowing and lending funds, and an interfund loan is only made if it benefits each participating fund. The Investment Manager administers the program according to procedures approved by the Board, and the Board monitors the operation of the program. An interfund loan must comply with certain conditions set out in the exemptive order, which are designed to assure fairness and protect all participating Funds. For the year ended December 31, 2011, the Fixed Income Fund lent $4,766,224, for 4 days to other Funds receiving interest of $543. The interest amount is included in the Statement of Operations as interest income. For the same period, the Fixed Income Fund borrowed $824,000, for 2 days paying interest of $26 to other Managers Funds. The interest amount is included in the Statement of Operations as miscellaneous expense.
| 3.Purchases | and Sales of Securities |
Purchases and sales of securities (excluding short-term securities) for the year ended December 31, 2011, were as follows:
| | | | | | | | | | | | | | | | |
| | | Long-Term
Securities
excluding
U.S.
Government
Obligations) | | | U.S.
Government
Obligations | |
Fund | | Purchases | | | Sales | | | Purchases | | | Sales | |
Mid-Cap | | $ | 53,201,370 | | | $ | 53,886,998 | | | | n/a | | | | n.a | |
Balanced | | | 16,858,751 | | | | 10,908,889 | | | $ | 12,060,836 | | | $ | 9,106,264 | |
High Yield | | | 15,343,971 | | | | 14,501,355 | | | | n/a | | | | n/a | |
Fixed Income | | | 34,058,047 | | | | 34,122,457 | | | | 4,238,933 | | | | 18,512,213 | |
| 4.Portfolio | Securities Loaned |
The Funds participates in a securities lending program offered by BNYM (the “Program”), providing for the lending of securities to qualified brokers. Securities lending fees include earnings of such temporary cash investments, plus or minus any rebate to a borrower. These earnings (after any rebate) are then divided between BNYM, as a fee for its services under the program, and the Funds, according to agreed-upon rates. Collateral on all securities loaned is accepted in cash and/or government securities and is maintained at a minimum level of 102% (105% in the case of certain foreign securities) of the market value, plus interest, if applicable, of investments on loan. It is the Funds’ policy to obtain additional collateral from or return excess collateral to the borrower by the end of the next business day, following the valuation date of the securities loaned. Therefore, the value of the collateral held may be temporarily less than the value of the securities on loan. Lending securities entails a risk of loss to the Funds if and to the extent that the market value of the securities loaned were to increase and the borrower did not increase the collateral accordingly, and the borrower fails to return the securities. Under the terms of the Program, the Funds are indemnified for such losses by BNYM. The Funds bear the risk of any deficiency in the amount of the collateral available for return to the borrower due to any loss on the collateral invested. Collateral received in the form of cash is invested temporarily in the BNY Mellon Overnight Government Fund, formerly the BNY Institutional Cash Reserves Fund (the “ICRF”), or other short-term investments as defined in the Securities Lending Agreement with BNYM.
Effective August 2, 2010, the Trust, on behalf of each applicable Fund, entered into an agreement with BNYM and the Bank of New York Mellon Corporation (“BNYMC”) with respect to each Fund’s position in ICRF, pursuant to which (i) BNYMC would support the value of certain defaulted securities issued by Lehman Brothers Holdings, Inc. (the “Lehman Securities”) and held by Series B of the ICRF, and (ii) once certain conditions were met, BNYMC would purchase the defaulted securities from the Fund. On October 17, 2011, after certifying that each Fund had met all necessary conditions, BNYMC purchased the Lehman Securities from each Fund at a predetermined price, which represented a premium over the fair market value of the Lehman Securities at that date.
| 5.Commitments | and Contingencies |
In the normal course of business, the Funds may enter into contracts and agreements that contain a variety of representations and warranties, which provide general indemnifications. The maximum exposure to the Funds under these arrangements is unknown, as this would involve future claims that may be made against a Fund that have not yet occurred. However, based on experience, the Funds have not had prior claims or losses and expect the risks of loss to be remote.
| 6.Risks | Associated with High Yield Securities (High Yield) |
Investing in high yield securities involves greater risks and considerations not typically associated with U.S. Government and other high quality/investment grade securities. High Yield securities are generally below investment grade securities and do not have an established retail secondary market. Economic downturns may disrupt the high yield market and impair the issuer’s ability to repay principal and interest. Also, an increase in interest rates would likely have an adverse impact on the value of such obligations and could cause the securities to become less liquid.
| 7.New | Accounting Pronouncements |
In May 2011, the Financial Accounting Standards Board issued Accounting Standards Update (“ASU”) No. 2011-04, “Amendments to Achieve Common Fair Value Measurement and Disclosure Requirements in U.S. GAAP and IFRSs.” ASU 2011-04 requires common fair value measurement and disclosure requirements between U.S. GAAP and International Financial Reporting Standards. The new and revised disclosures are effective for interim and annual reporting periods beginning after December 15, 2011. At this time, management is evaluating the implications of ASU No. 2011-04 and its impact on the financial statements.
In December 2011, the FASB issued ASU No. 2011-11 “Disclosures about Offsetting Assets and Liabilities.” ASU 2011-11 requires disclosures to make financial statements that are prepared under U.S. GAAP more comparable to those prepared under IFRS. The new disclosure requirements mandate that entities disclose both gross and net information about instruments and transactions eligible for offset in the statement of assets and liabilities as well as instruments and transactions subject to an agreement similar to a master netting arrangement. In addition, ASU 2011-11 requires disclosure of collateral received and posted in connection with master netting agreements or similar arrangements. New disclosures are required for annual reporting periods beginning on or after January 1, 2013, and interim periods within those annual periods. Management is evaluating the impact of ASU 2011-11 on the financial statements and disclosures.
Notes to Financial Statements (continued)
The Funds have determined that no material events or transactions occurred through the issuance date of the Funds’ financial statements which require additional disclosure in or adjustment of the Funds’ financial statements.
Tax Information (unaudited)
Each Fund hereby designates the maximum amount allowable of its net taxable income as qualified dividends as provided in the Jobs and Growth Tax Relief Reconciliation Act of 2003. The 2011 Form 1099-DIV you receive for each Fund will show the tax status of all distributions paid to you during the year.
The percentage of Qualified Dividend Income (“QDI”) and the Dividends Received Deduction (“DRD”) for distributions paid is as follows:
| | | | | | | | |
| | | 2011 | | | 2010 | |
Mid-Cap | | | | | | | | |
Ordinary Income - QDI | | | 100.00 | % | | | 100.00 | % |
Ordinary Income - DRD | | | 100.00 | % | | | 100.00 | % |
Balanced | | | | | | | | |
Ordinary Income - QDI | | | 74.16 | % | | | 66.71 | % |
Ordinary Income - DRD | | | 79.14 | % | | | 72.15 | % |
High Yield | | | | | | | | |
Ordinary Income - QDI | | | — | | | | — | |
Ordinary Income - DRD | | | — | | | | — | |
Fixed Income | | | | | | | | |
Ordinary Income - QDI | | | — | | | | — | |
Ordinary Income - DRD | | | — | | | | — | |
Pursuant to section 852 of the Internal Revenue Code, Mid-Cap, Balanced, High Yield and Fixed Income hereby designate $0, $359,686, $0 and $2,174,241, respectively, as a capital gain distri- bution with respect to the taxable year ended December 31, 2011, or if subsequently determined to be different, the net capital gains of such year.
Report of Independent Registered Public Accounting Firm
To the Board of Trustees of The Managers Trust II and the Shareholders of Managers AMG Chicago Equity Partners Mid-Cap Fund, Managers AMG Chicago Equity Partners Balanced Fund, Managers High Yield Fund and Managers Fixed Income Fund:
In our opinion, the accompanying statements of assets and liabilities, including the schedules of portfolio investments, and the related statements of operations and of changes in net assets and the financial highlights present fairly, in all material respects, the financial position of Managers AMG Chicago Equity Partners Mid-Cap Fund, Managers AMG Chicago Equity Partners Balanced Fund, Managers High Yield Fund, and Managers Fixed Income Fund (constituting Managers Trust II, hereafter referred to as the “Funds”) at December 31, 2011, the results of each of their operations for the year then ended, the changes in each of their net assets for each of the two years in the period then ended and the financial highlights for each of the five years in the periods indicated, in conformity with accounting principles generally accepted in the United States of America. These financial statements and financial highlights (hereafter referred to as “financial statements”) are the responsibility of the Funds’ management; our responsibility is to express an opinion on these financial statements based on our audits. We conducted our audits of these financial statements in accordance with the standards of the Public Company Accounting Oversight Board (United States). Those standards require that we plan and perform the audit to obtain reasonable assurance about whether the financial statements are free of material misstatement. An audit includes examining, on a test basis, evidence supporting the amounts and disclosures in the financial statements, assessing the accounting principles used and significant estimates made by management, and evaluating the overall financial statement presentation. We believe that our audits, which included confirmation of securities at December 31, 2011 by correspondence with the custodian and brokers, provide a reasonable basis for our opinion.
PricewaterhouseCoopers LLP
Philadelphia, Pennsylvania
February 27, 2012
Trustees and Officers
The Trustees and Officers of the Trust, their business addresses, principal occupations for the past five years and dates of birth are listed below. The Trustees provide broad supervision over the affairs of the Trust and the Funds. The Trustees are experienced executives who meet periodically throughout the year to oversee the Funds’ activities, review contractual arrangements with companies that provide services to the Funds, and review the Funds’ performance. Unless otherwise noted, the address of each Trustee or Officer is the address of the Trust: 800 Connecticut Avenue, Norwalk, Connecticut 06854.
There is no stated term of office for Trustees. Trustees serve until their resignation, retirement or removal in accordance with the Trust’s organizational documents and policies adopted by the Board from time to time. The Chairman of the Trustees, President, Treasurer and Secretary of the Trust are elected by the Trustees annually. Other officers hold office at the pleasure of the Trustees.
Independent Trustees
The following Trustees are not “interested persons” of the Trust within the meaning of the 1940 Act:
| | |
Name, Date of Birth, Number
of Funds Overseen in Fund
Complex* | | Principal Occupation(s) During Past 5 Years and Other Directorships Held by Trustee |
Jack W. Aber, 9/9/37 • Trustee since 2000 • Oversees 38 Funds in Fund Complex | | Professor of Finance, Boston University School of Management (1972-Present); Trustee of Appleton Growth Fund (1 portfolio); Trustee of Third Avenue Trust (5 portfolios); Trustee of Third Avenue Variable Trust (1 portfolio); Trustee of Aston Funds (26 portfolios). |
William E. Chapman, II, 9/23/41 • Independent Chairman • Trustee since 2000 • Oversees 38 Funds in Fund Complex | | President and Owner, Longboat Retirement Planning Solutions (1998-Present); Hewitt Associates, LLC (part time) (provider of Retirement and Investment Education Seminars) (2002-2009); Trustee of Bowdoin College (2002-Present); Director of Harding, Loevner Funds, Inc. (6 portfolios); Trustee of Third Avenue Trust (5 portfolios); Trustee of Third Avenue Variable Trust (1 portfolio); Trustee of Aston Funds (26 portfolios). |
Edward J. Kaier, 9/23/45 • Trustee since 2000 • Oversees 38 Funds in Fund Complex | | Attorney at Law and Partner, Teeters Harvey Gilboy & Kaier LLP (2007-Present); Attorney at Law and Partner, Hepburn Willcox Hamilton & Putnam, LLP (1977-2007); Trustee of Third Avenue Trust (5 portfolios); Trustee of Third Avenue Variable Trust (1 portfolio); Trustee of Aston Funds (26 portfolios). |
Steven J. Paggioli, 4/3/50 • Trustee since 2000 • Oversees 38 Funds in Fund Complex | | Independent Consultant (2002-Present); Formerly Executive Vice President and Director, The Wadsworth Group (1986-2001); Executive Vice President, Secretary and Director, Investment Company Adminis- tration, LLC (1990-2001); Vice President, Secretary and Director, First Fund Distributors, Inc. (1991-2001); Trustee, Professionally Managed Portfolios (43 portfolios); Advisory Board Member, Sustainable Growth Advisors, LP; Independent Director, Chase Investment Counsel (2008 – Present); Trustee of Aston Funds (26 portfolios). |
Eric Rakowski, 6/5/58 • Trustee since 2000 • Oversees 38 Funds in Fund Complex | | Professor, University of California at Berkeley School of Law (1990-Present); Director of Harding, Loevner Funds, Inc. (6 portfolios); Trustee of Third Avenue Trust (5 portfolios); Trustee of Third Avenue Variable Trust (1 portfolio); Trustee of Aston Funds (26 portfolios). |
Thomas R. Schneeweis, 5/10/47 • Trustee since 2000 • Oversees 38 Funds in Fund Complex | | Professor of Finance, University of Massachusetts (1977-Present); Director, CISDM at the University of Massachusetts, (1996-Present); President, Alternative Investment Analytics, LLC, (formerly Schneeweis Partners, LLC) (2001-Present); Partner, S Capital Management, LLC (2007-Present); President, TRS Associates (1982-Present); Partner, White Bear Partners, LLC (2007-2010);Partner, Northampton Capital Management, LLC (2004-2010); Trustee of Aston Funds (26 portfolios). |
* The Fund Complex consists of Managers AMG Funds, The Managers Funds, Managers |
Interested Trustees
Each Trustee in the following table is an “interested person” of the Trust within the meaning of the 1940 Act. Ms. Carsman is an interested person of the Trust within the meaning of the 1940 Act by virtue of her position with, and interest in securities of, AMG, and her former position as Chief Legal Officer of the Trust.
| | |
Name, Date of Birth,
Number of Funds Overseen
in Fund Complex* | | Principal Occupation(s) During Past 5 Years and Other Directorships Held by Trustee |
Christine C. Carsman, 4/2/52 • Trustee since 2011 • Oversees 38 Funds in Fund Complex | | Deputy General Counsel, Affiliated Managers Group, Inc. (2011-Present); Senior Vice President and Chief Regulatory Counsel, Affiliated Managers Group, Inc. (2004-Present); Secretary and Chief Legal Officer, Managers AMG Funds, The Managers Funds, Managers Trust I and Managers Trust II (2004-2011); Senior Counsel, Vice President and Director of Operational Risk Management and Compliance, Wellington Management Company, LLP (1995-2004) |
| Officers | | |
Name, Date of Birth,
Position(s) Held with Fund and Length of Time Served | | Principal Occupation(s) During Past 5 Years |
Keitha L. Kinne, 5/16/58 • President since 2012 • Chief Operating Officer since 2007 | | Managing Partner and Chief Operating Officer, Managers Investment Group LLC (2007-Present); Chief Investment Officer, Managers Investment Group LLC (2008-Present); President, Managers Distributors, Inc. (2012-Present; Chief Operating Officer, The Managers Funds, Managers AMG Funds and Managers Trust I (2007-Present); Managing Director, Legg Mason & Co., LLC (2006-2007); Managing Director, Citigroup Asset Management (2004-2006). |
Lewis Collins,2/22/66 • Secretary since 2011 • Chief Legal Officer since 2011 | | Senior Vice President and Senior Counsel, Affiliated Managers Group, Inc. (2010-Present); Vice President and Senior Counsel, Affiliated Managers Group, Inc. (2006-2010); Senior Counsel, Affiliated Managers Group, Inc. (2002-2006); Attorney, Ropes & Gray LLP (1998-2002) |
Donald S. Rumery, 5/29/58 • Chief Financial Officer since 2007 • Treasurer since 2000 | | Senior Vice President, Managers Investment Group LLC (2005-Present); Treasurer and Chief Financial Officer, Managers Distributors, Inc. (2000-Present); Treasurer, The Managers Funds (1995-Present); Treasurer, Managers AMG Funds (1999-Present); Treasurer, Managers Trust I (2000-Present); Chief Financial Officer, The Managers Funds, Managers AMG Funds and Managers Trust I (2007-Present); Vice President, The Managers Funds LLC, (1994-2004) |
John J. Ferencz, 3/09/62 • Chief Compliance Officer since 2010 | | Vice President, Legal and Compliance, Managers Investment Group LLC (2010-Present); Senior Compliance Analyst, Mutual Funds and Regulatory, GE Asset Management Incorporated (2005-2010) |
Michael S. Ponder, 9/12/73 • Assistant Secretary since 2011 | | Senior Vice President and Counsel, Managers Investment Group LLC (2011-Present); Attorney, DeNovo Legal (2009-2010); Vice President, Credit Suisse (2007-2009); Associate, Willkie Farr & Gallagher LLP (2006-2007) |
THIS PAGE INTENTIONALLY LEFT BLANK
Investment Manager and Administrator
Managers Investment Group LLC
333 W. Wacker Drive
Suite 1200
Chicago, IL 60606
(800) 835-3879
Distributor
Managers Distributors, Inc.
333 W. Wacker Drive
Suite 1200 Chicago, IL 60606
(800) 835-3879
Custodian
The Bank of New York Mellon
2 Hanson Place
Legal Counsel
Ropes & Gray LLP
Prudential Tower, 800 Boylston Street
Boston, MA 02199-3600
Transfer Agent
BNY Mellon Investment Servicing (US) Inc.*
Attn: Managers
P.O. Box 9769
Providence, RI 02940
(800) 548-4539
For Managers Choice Only
Managers
c/o BNY Mellon Investments Servicing (US) Inc.*
P.O. Box 9847
Providence, Rhode Island 02940-8047
(800) 358-7668
| * | formerly PNC Global Investment Servicing (U.S.) Inc. |
IMPORTANT NOTICE OF REVISIONS TO MANAGERS HIGH YIELD FUND’S
REDEMPTION AND EXCHANGE FEE POLICY
Effective on May 1, 2012, the Fund’s Redemption and Exchange policy will be modified. The modified policy is provided below.
The Fund will deduct a redemption/exchange fee of 2.00% (the “Redemption/Exchange Fee”) from the proceeds of any redemption (including a redemption by exchange) of shares if the redemption occurs within 30 days of the purchase of those shares. For the purpose of determining whether a redemption is subject to the Redemption/Exchange Fee, redemptions of shares of the Fund are conducted on a first in/first out (FIFO) basis such that shares with the longest holding period will be treated as being redeemed first and shares with the shortest holding period will be treated as being redeemed last.
The Redemption/Exchange Fee is paid to the Fund and is intended to offset transaction and other expenses caused by short-term trading. The Redemption/Exchange Fee will not apply to redemptions (including redemptions by exchange) (1) of shares purchased through reinvestment of dividend or capital gain distributions, (2) under hardship circumstances (as determined by the Investment Manager in its discretion, based on a case-by-case analysis), (3) of shares purchased through certain asset allocation programs, as determined by the Investment Manager, (4) of shares where the application of the Redemption/Exchange Fee would cause the Fund, or an asset allocation program of which the Fund is a part, to fail to be considered a “qualified default investment alternative” under the Employee Retirement Income Security Act of 1974, as amended, and the rules and regulations thereunder, or (5) of shares of a Fund after the announcement or other initial public disclosure by such Fund of the liquidation of such Fund or of the merger or reorganization of such Fund into another Fund. Short-term trades not subject to a Redemption/Exchange Fee as a result of these exceptions may result in additional costs to the Fund that would have been otherwise recouped, in whole or in part, if a Redemption/Exchange Fee were applied. The Redemption/ Exchange Fee will only apply to redemptions of shares purchased through a financial intermediary such as a broker, retirement plan administrator, or bank or trust company if the financial intermediary has indicated that it will administer the Redemption/Exchange Fee. If you invest through a financial intermediary, contact your intermediary to determine whether the Redemption/Exchange Fee applies to you and any restrictions on your trading activity. The Fund reserves the right to modify the terms of, or terminate, the Redemption/Exchange Fee at any time upon 60 days’ advance notice to shareholders.

MANAGERS AND MANAGERS AMG FUNDS
| | | | |
EQUITY FUNDS | | BALANCED FUNDS |
CADENCE CAPITAL APPRECIATION CADENCE FOCUSED GROWTH CADENCE MID-CAP CADENCE EMERGING COMPANIES Cadence Capital Management, LLC CHICAGO EQUITY PARTNERS MID-CAP Chicago Equity Partners, LLC EMERGING MARKETS EQUITY Rexiter Capital Management Limited Schroder Investment Management North America Inc. ESSES SMALL/MICRO CAP GROWTH Essex Investment Management Co., LLC FQ TAX-MANAGED U.S. EQUITY FQ U.S. \EQUITY First Quadrant, L.P. FRONTIER SMALL CAP GROWTH Frontier Capital Management Company, LLC GW&K SMALL CAP EQUITY Gannett Welsh & Kotler, LLC INSTITUTIONAL MICRO-CAP MICRO-CAP Lord, Abbett & Co. LLC WEDGE Capital Management L.L.P. Next Century Growth Investors LLC RBC Global Asset Management (U.S.) Inc. | | INTERNATIONAL EQUITY AllianceBernstein L.P. Lazard Asset Management, LLC Martin Currie Inc. REAL ESTATE SECURITIES Urdang Securities Management, Inc. RENAISSANCE LARGE CAP GROWTH Renaissance Group LLC SKYLINE SPECIAL EQUITIES PORTFOLIO Skyline Asset Management, L.P. SPECIAL EQUITY Ranger Investment Management, L.P. Lord, Abbett & Co. LLC Smith Asset Management Group, L.P. Federated MDTA LLC SYSTEMATIC VALUE SYSTEMATIC MID CAP VALUE Systematic Financial Management, L.P. TIMESSQUARE MID CAP GROWTH TIMESSQUARE SMALL CAP GROWTH TSCM GROWTH EQUITY TimesSquare Capital Management, LLC TRILOGY GLOBAL EQUITY TRILOGY EMERGING MARKETS EQUITY TRILOGY INTERNATIONAL SMALL CAP Trilogy Global Advisors, L.P. | | CHICAGO EQUITY PARTNERS BALANCED Chicago Equity Partners, LLC ALTERNATIVE FUNDS FQ GLOBAL ALTERNATIVES FQ GLOBAL ESSENTIALS First Quadrant, L.P. INCOME FUNDS BOND (MANAGERS) FIXED INCOME GLOBAL INCOME OPPORTUNITY Loomis, Sayles & Co., L.P. BOND (MANAGERS PIMCO) Pacific Investment Management Co. LLC CALIFORNIA INTERMEDIATE TAX-FREE Miller Tabak Asset Management LLC GW&K MUNICIPAL BOND GW&K MUNICIPAL ENHANCED YIELD Gannett Welsh & Kotler, LLC HIGH YIELD J.P. Morgan Investment Management LLC INTERMEDIATE DURATION GOVERNMENT SHORT DURATION GOVERNMENT Smith Breeden Associates, Inc. |
This report is prepared for the Funds’ shareholders. It is authorized for distribution to prospective investors only when preceded or accompanied by an effective prospectus. To receive a free copy of the prospectus or Statement of Additional Information, which includes additional information about Fund Trustees, please contact us by calling 800.835.3879. Distributed by Managers Distributors, Inc., member FINRA. A description of the policies and procedures each Fund uses to vote its proxies is available: (i) without charge, upon request, by calling 800.835.3879, or (ii) on the Securities and Exchange Commission’s (SEC) Web site at www. sec.gov. For information regarding each Fund’s proxy voting record for the 12-month period ended June 30, call 800.835.3879 or visit the SEC Web site at www.sec.gov. The Funds file their complete schedule of portfolio holdings with the SEC for the first and third quarters of each fiscal year on Form N-Q. The Funds’ Forms N-Q are available on the SEC’s website at www.sec.gov. A Fund’s Forms N-Q may be reviewed and copied at the SEC’s Public Reference Room in Washington, DC. Information on the operation of the Public Reference Room may be obtained by calling 800.SEC.0330. To review a complete list of the Funds’ portfolio holdings, or to view the most recent quarterly holdings report, semiannual report, or annual report, please visit www.managersinvest.com. | | |
| |  |
 | | | | |
Managers Funds
Annual Report — December 31, 2011
| | | | |
TABLE OF CONTENTS | | Page | |
LETTER TO SHAREHOLDERS | | | 1 | |
| |
ABOUT YOUR FUND'S EXPENSES | | | 3 | |
| |
INVESTMENT MANAGER'S COMMENTS, FUND SNAPSHOTS, AND SCHEDULES OF PORTFOLIO INVESTMENTS | | | | |
| |
Managers Short Duration Government Fund | | | 4 | |
| |
Managers Intermediate Duration Government Fund | | | 16 | |
| |
NOTES TO SCHEDULES OF PORTFOLIO INVESTMENTS | | | 25 | |
| |
FINANCIAL STATEMENTS: | | | | |
| |
Statements of Assets and Liabilities | | | 28 | |
Fund balance sheets, net asset value (NAV) per share computations and cumulative undistributed amounts | | | | |
| |
Statements of Operations | | | 29 | |
Detail of sources of income, Fund expenses, and realized and unrealized gains (losses) during the year | | | | |
| |
Statements of Changes in Net Assets | | | 30 | |
Detail of changes in Fund assets for the past two years | | | | |
| |
FINANCIAL HIGHLIGHTS | | | 31 | |
Historical net asset values per share, distributions, total returns, expense ratios, turnover ratios and net assets | | | | |
| |
NOTES TO FINANCIAL STATEMENTS | | | 33 | |
Accounting and distribution policies, details of agreements and transactions with Fund management and affiliates, and descriptions of certain investment risks | | | | |
| |
REPORT OF INDEPENDENT REGISTERED PUBLIC ACCOUNTING FIRM | | | 41 | |
| |
TRUSTEES AND OFFICERS | | | 42 | |
|
| Nothing contained herein is to be considered an offer, sale or solicitation of an offer to buy shares of any series of the Managers Family of Funds. Such offering is made only by Prospectus, which includes details as to offering price and other material information. |
| |
Letter to Shareholders
Dear Shareholder:
Our foremost goal at Managers Investment Group (“MIG”) is to structure and manage mutual funds that will help our shareholders and clients successfully reach their investment goals and objectives.
Each of our Funds is geared to provide you with exposure to a specific asset class or style of investing. Investors tend to use our Funds as part of their broader portfolio in order to tailor their asset allocation to meet their individual needs. Most of our Funds, like those detailed in this report, are therefore designed to be building blocks.
At MIG, we have overall responsibility for the investment management and administration of the Funds. As a “manager of managers,” we work with external investment managers that make the day-to-day investment decisions in the Funds (the “Portfolio Managers”). We devote considerable resources to our disciplined process of identifying and selecting unaffiliated Portfolio Managers for the Funds. As a manager of managers, MIG performs many activities to monitor the ongoing investment, compliance, and administrative aspects of all of the Funds, which gives our shareholders added confidence in their investments.
Our parent company, Affiliated Managers Group (“AMG”), is a global asset management company with ownership interests in a diverse group of boutique investment management firms (its “Affiliates”). MIG has the unique opportunity to access the investment skills and acumen of some of AMG’s Affiliates. The set of our Funds managed by these proprietary firms also benefit from our activities to monitor the investment, compliance, and administrative aspects of the Funds.
Below is a brief overview of the securities markets and the performance results for the Funds. Following this letter, we also provide the Portfolio Managers’ discussion of their investment management approach, performance results, and market outlook.
Although U.S. equity markets generally ended the year flat or modestly negative, investors in those markets certainly experienced high levels of volatility along the way. After markets shook off macroeconomic events in the first half of the year such as the Arab Spring and the devastating consequences of the Japanese tsunami, markets were not nearly as resilient in the summer months as the political stalemate in Washington involving the U.S. debt ceiling, the S&P downgrade of U.S. sovereign credit rating, and the fear of European sovereign debt contagion shook equity markets. The end of September and into the fourth quarter, however, featured almost a complete reversal of the “risk off” trade from the summer months with markets responding positively both to the coordinated efforts of European policymakers to head off issues surrounding their collective sovereign debt crisis as well as to generally positive earnings reports at the company level in the U.S. Meanwhile fixed income markets generally rose for the year amid the turbulence as the uncertainty boosted fixed income returns. After a solid start to the first half of the year, the summer months were highlighted by bond gains as a sharp decline in treasury yields amid a flight to safety boosted demand for treasuries. This reversed in October as risk aversion began to ease across global markets amid optimism that the European debt crisis could be contained. As a result, U.S. treasury yields rose during October and riskier areas of the fixed income market, such as high yield and credit, outperformed. This reversed again during November, before markets normalized during December. Overall, fixed income securities generated decent absolute returns, but it was a volatile year with multiple shifts in market leadership.
Against this backdrop, the Managers Short Duration Government Fund and the Managers Intermediate Duration Government Fund (each a “Fund” and collectively the “Funds”), generated the following returns as detailed below:
| | | | | | | | | | | | | | | | | | | | | | | | | | | | |
Periods Ended 12/31/11 | | 6 Months | | | 1 Year | | | 3 Years | | | 5 Years | | | 10 Years | | | Since
Inception | | | Inception
Date |
Managers Short Duration Government Fund | | | 0.11 | % | | | 0.80 | % | | | 2.94 | % | | | 2.50 | % | | | 2.85 | % | | | 4.14 | % | | 3/31/1992 |
BofA Merrill Lynch Six-Month U.S. Treasury Bill Index | | | 0.11 | % | | | 0.27 | % | | | 0.40 | % | | | 2.06 | % | | | 2.29 | % | | | 3.67 | % | | 3/31/1992 |
Managers Intermediate Duration Government Fund | | | 2.76 | % | | | 5.88 | % | | | 8.49 | % | | | 6.49 | % | | | 5.47 | % | | | 6.54 | % | | 3/31/1992 |
Citigroup Mortgage Index | | | 3.31 | % | | | 6.38 | % | | | 5.87 | % | | | 6.62 | % | | | 5.76 | % | | | 6.57 | % | | 3/31/1992 |
Letter to Shareholders (continued)
For the year ended December 31, 2011, the Managers Short Duration Government Fund returned 0.80%, outperforming its benchmark, the BofA Merrill Lynch Six-Month U.S. Treasury Bill Index, which returned 0.27%. Most of the Fund’s outperformance for 2011 was attributable to its agency MBS exposure. Minor exposures within the Fund to both mortgage derivatives and TIPs were beneficial to performance as well.
For the year ended December 31, 2011, the Managers Intermediate Duration Government Fund returned 5.88% compared to 6.38% for its benchmark, the Citigroup Mortgage Index. For the year, holdings of non-agency FRMs and ARMs underperformed within the Fund, while positions within agency MBS and CMBS were positive contributors to performance.
The following report covers the one-year period ended December 31, 2011. Should you have any questions about this report, or if you’d like to receive a prospectus and additional information, including fees and expenses for this or any of the other Funds in our family, please feel free to contact us at 1-800-835-3879, or visit our Web site at www.managersinvest.com. As always, please read the prospectus carefully before you invest or send money.
If you are curious about how you can better diversify your investment program, visit our web site for information on other MIG product offerings. You can rest assured that under all market conditions our team is focused on delivering excellent investment management services for your benefit.
We thank you for your continued confidence and investment in The Managers Funds.
Respectfully,
Keitha Kinne
Managing Partner
Managers Investment Group LLC
2
About Your Fund’s Expenses
As a shareholder of a Fund, you may incur two types of costs: (1) transaction costs, which may include sales charges (loads) on purchase payments; redemption fees; and exchange fees; and (2) ongoing costs, including management fees; distribution (12b-1) fees; and other Fund expenses. This example is intended to help you understand your ongoing costs (in dollars) of investing in the Fund and to compare these costs with the ongoing costs of investing in other mutual funds. The example is based on $1,000 invested at the beginning of the period and held for the entire period as indicated below.
Actual Expenses
The first line of the following table provides information about the actual account values and actual expenses. You may use the information in this line, together with the amount you invested, to estimate the expenses that you paid over the period. Simply divide your account value by $1,000 (for example, an $8,600 account value divided by $1,000 = 8.6), then multiply the result by the number in the first line under the heading entitled “Expenses Paid During Period” to estimate the expenses you paid on your account during this period.
Hypothetical Example for Comparison Purposes
The second line of the following table provides information about hypothetical account values and hypothetical expenses based on the Fund’s actual expense ratio and an assumed annual rate of return of 5% before expenses, which is not the Fund’s actual return. The hypothetical account values and expenses may not be used to estimate the actual ending account balance or expenses you paid for the period. You may use this information to compare the ongoing costs of investing in the Fund and other funds by comparing this 5% hypothetical example with the 5% hypothetical examples that appear in the shareholder reports of other funds.
Please note that the expenses shown in the table are meant to high-light your ongoing costs only and do not reflect any transactional costs, such as sales charges (loads), redemption fees, or exchange fees. Therefore, the second line of the table is useful in comparing ongoing costs only, and will not help you determine the relative total costs of owning different funds.
| | | | | | | | | | | | | | | | |
Six Months Ended December 31, 2011 | | Expense
Ratio for
the Period | | | Beginning
Account Value
07/01/2011 | | | Ending
Account Value
12/31/2011 | | | Expenses
Paid During
the Period* | |
Managers Short Duration Government Fund | | | | | | | | | | | | | | | | |
Based on Actual Fund Return | | | 0.82 | % | | $ | 1,000 | | | $ | 1,001 | | | $ | 4.14 | |
Based on Hypothetical 5% Annual Return | | | 0.82 | % | | $ | 1,000 | | | $ | 1,021 | | | $ | 4.18 | |
Managers Intermediate Duration Government Fund | | | | | | | | | | | | | | | | |
Based on Actual Fund Return | | | 0.89 | % | | $ | 1,000 | | | $ | 1,028 | | | $ | 4.55 | |
Based on Hypothetical 5% Annual Return | | | 0.89 | % | | $ | 1,000 | | | $ | 1,021 | | | $ | 4.53 | |
| * | Expenses are equal to the Fund’s annualized expense ratio multiplied by the average account value over the period, multiplied by the number of days in the most recent fiscal half-year (184), then divided by 365. |
Managers Short Duration Government Fund
Investment Manager’s Comments
The Managers Short Duration Government Fund (“the Fund”) seeks to provide investors with a high level of current income, consistent with a low volatility of net asset value.
The Fund seeks to achieve its objective by matching the duration, or interest-rate risk, of a portfolio that invests exclusively in six-month U.S. Treasury securities on a constant maturity basis. Under normal circumstances, the Fund will invest at least 80% of its net assets, plus the amount of any borrowings for investment purposes, in debt securities issued by the U.S. government or its agencies and instrumentalities and synthetic instruments or derivatives having economic characteristics similar to such debt securities.
The Fund typically employs hedging techniques using instruments such as interest rate futures, options, floors, caps, and swaps, designed to reduce the interest-rate risk of their fixed-income securities. The Fund’s benchmark is the BofA Merrill Lynch Six-Month
U.S. Treasury Bill Index.
The Portfolio Manager
Smith Breeden Associates, Inc.
Smith Breeden Associates, Inc. (“Smith Breeden”) is the subadvisor for the Fund. Smith Breeden, located at 280 South Mangum Street, Suite 301, Durham, NC, was founded in 1982. Smith Breeden is an investment management firm for a client base including corporate and public pension plans, central and supranational banks, endowments and foundations, private banks and financial institutions, insurance companies, and other institutional investors. Specializing in fixed income portfolios, the firm offers separate accounts, commingled funds, and serves as a subadvisor to ‘40 Act funds. As of December 31, 2011, Smith Breeden managed assets of approximately $6.2 billion.
Smith Breeden believes that innovative research provides critical insights into the fixed income market. The firm’s experienced investment professionals apply these research insights to the management of investment portfolios designed to achieve their clients’ objectives. The key tenets of this market-tested investment philosophy are:
Over a market cycle, a portfolio of fixed income securities with wide risk-adjusted spreads produces an attractive total return in comparison to the market return.
The incremental return available from security selection and sector allocation, based on careful relative value analysis, quantitative research, and experienced market judgment, is more consistent than the incremental return from predicting the direction of interest rates or other macro-factor trading strategies.
Within the investment-grade fixed income market, the spread sectors, e.g., corporate bonds, mortgage-backed securities (MBS), commercial MBS (CMBS), and asset-backed securities (ABS), will tend to outperform Treasury securities over a market cycle. The corporate, mortgage, CMBS, and ABS sectors also offer the greatest active management opportunity for adding value through security selection.
The portfolio management team at Smith Breeden specializes in analyzing and investing in mortgage securities. Through careful analysis and comparison of the characteristics of these securities,
such as type of issuer, coupon, maturity, geographic structure, and prepayment rates, the portfolio manager seeks to structure a portfolio with similar risk characteristics to six-month U.S. Treasury securities and slightly higher returns. Because there is less certainty about the timing of principal payments to individual mortgage securities than for U.S. Treasury securities, they tend to carry a slightly higher yield. A properly structured portfolio of mortgage securities, however, can have a highly predictable cash flow while maintaining a yield advantage over treasuries. Although the port-folio management team often purchases securities with maturities longer than six months, it does not attempt to increase returns by actively positioning the interest rate sensitivity of the Portfolio. Instead, the team typically manages the weighted average duration of the Portfolio so that it remains close to the Index.
The ideal investment exhibits many of the following traits:
| | • | | Yield advantage over treasuries |
| | • | | Very high quality (Government or AAA) |
| | • | | Attractive value relative to other MBS opportunities |
The Portfolio:
| | • | | Seeks to optimize return per unit of risk |
| | • | | Maintains minimal exposure to credit risk and interest rate risk |
| | • | | Consists of high-quality MBS, CMBS, and ABS securities |
| | • | | Will tend to have an interest-rate sensitivity similar to a six-month Treasury bill |
The investment team will make a sell decision when:
| | • | | They no longer view the bonds as attractive |
| | • | | They deem it necessary to reallocate the Portfolio |
| | • | | They need to maintain the Portfolio’s target duration |
The Year in Review
During the year ended December 31, 2011, the Fund returned 0.80%, while the BofA Merrill Lynch Six-Month U.S. Treasury Bill Index returned 0.27%.
Recent years have been marked by historic market moves, a credit and liquidity crisis, massive deleveraging, and unprecedented government intervention. Investment decisions are being driven more by new policies and macro developments, rather than by relative value. As a result, risk aversion and uncertainty about economic outcomes drove capital into safe havens and investors into higher quality spread product. Overall, 2011 exhibited slow economic growth and periodic bouts of volatility as the markets gradually continued to heal.
Agency fixed-rate MBS started the year off in a strong manner, supported by a steep yield curve and solid demand from banks and REITs, which accounted for approximately $40 billion in MBS demand in the first quarter alone. While the year began with higher rates, it ended the quarter with only marginally higher rates following a mid-March drop on the news of the natural disaster in Japan. Prepayment levels remain contained on weakness in housing and employment reports. While senior CMBS continued its tightening trend from 2010, investors continued to show risk appetite for high-quality paper with low credit risk. Overall, CMBS spreads tightened on the quarter, despite retrenching somewhat on the tsunami and earthquake news.
Managers Short Duration Government Fund
Investment Manager’s Comments (continued)
While the second quarter marked another strong quarter for the Fund, the markets were tempered by more pessimistic prospects for a U.S. recovery, a resurgence of credit concerns in Europe, and political uprisings in the Middle East and North Africa. Overall MBS performance was mixed, but the asset class held its own relative to more credit-sensitive spread products. Strong technicals abetted 15-year MBS and GNMA MBS on continued demand from banks and REITs, and higher coupon 30-year conventional MBS benefitted from a slower prepay environment. However, lower coupon 15-year conventional struggled under increased production and lack of investor interest. During the quarter, risk aversion seemed to settle in as CMBS spreads widened, primarily affecting the tranches with less credit support. While the sector overall underperformed duration-matched swaps, the Fund’s higher-quality holdings still added to performance on the quarter.
Macro concerns in the third quarter kept risk appetite at bay, and weighed on spread products in general. This quarter mirrored that of the third quarter in 2010 with lower treasury yields and mortgage rates as fears of a double dip recession resurfaced. The MBS sector supplied interesting developments throughout the quarter. The concept of a par coupon in MBS became somewhat of a misnomer, as production coupons finished September trading above par with the FNMA 5% approaching $105. In a move unanticipated by the markets, the Fed announced it would resume purchases of agency MBS with funds from principal repayments on its existing portfolio. Reaction was mixed, with the lower coupon 30-year MBS benefitting the most, given expected future purchases. REIT demand subsided, as investors in general became more concerned over policy risk. CMBS continued to weaken versus treasuries; however, our higher-quality holdings in shorter-dated paper slightly boosted returns for the Fund.
Fourth-quarter macro news tended to influence the markets which vacillated between “risk on” and “risk off” postures. While Europe sovereign debt matters continued to dominate headlines, investors also noted news items surrounding government-sponsored refinancing. Although the news was largely discounted by the market, it provides another example of the impact of policy changes and government intervention in the MBS market. The Fund finished the year strong as rates were modestly lower, and risk appetite for higher-quality paper, particularly in securitized sectors such as CMBS, started to return somewhat towards year-end.
Most of the Fund’s outperformance for 2011 was attributed to agency MBS exposure. Agency adjustable-rate (ARMs), fixed-rate mortgages (FRMs), and collateralized mortgage obligations (CMOs) were beneficiaries of lower realized volatility, hedging costs, and mortgage rates. A benign prepayment environment also helped the Fund’s very small exposure (2.6%) to mortgage derivatives on the margin. CMBS also outperformed as risk appetite continues to be
strong for the asset class, especially as the commercial real estate market firms up. Supply in CMBS is very light, and market technicals continue to be supportive of tighter spreads.
The Fund’s Treasury Inflation-Protected Securities (TIPS) expo-sure helped performance for the year given the Federal Reserve remained in its accommodative posture, while inflation concerns persisted and real yields remain depressed. The Portfolio remains positioned largely in the highest quality securities. At year-end, the Fund held no leverage.
Derivatives such as financial futures, options, and mortgage derivatives are used for portfolio duration and convexity risk management. Although we prefer to have the flexibility to use the largest array of instruments possible, derivatives are not crucial to our ability to add value.
Looking Forward
On December 31, 2011, portfolio duration was shorter than that of the six-month U.S. Treasury bill by 0.2 years due to the current low absolute level of rates. In 2011, CMO (agency and non-agency) and 15-year FRM were reduced by approximately 17% and 5%, respectively, on a market value basis within the Portfolio. The largest securitized sector increase was in agency ARMs, which moved from 24% of capital to 41%. Cash and equivalents also increased from 2% of the Portfolio at year-end 2010 to 8% of capital at year-end 2011. The allocation to CMBS and consumer ABS ended the year at relatively the same level where they started—at 9% and 1%, respectively. The Fund maintained a small allocation (1%) of TIPS.
Smith Breeden believes that the agency MBS market is starting off 2012 with fairly attractive spreads and good fundamentals. We do not anticipate that expected supply changes in the sector will pressure spreads, and we expect non-U.S. investors, banks, and possibly a return of REITs to continue as bulk buyers of the paper. We believe the prepay environment should be positive for MBS investors but government action may influence certain homeowner segments. As a result, we will monitor potential policy changes and their effect on MBS, and adjust our holdings as needed. We expect spread volatility in agency MBS will remain somewhat elevated, providing a good environment for active management and security selection opportunities.
This commentary reflects the viewpoints of Smith Breeden Associates, Inc., as of January 23, 2012.
Cumulative Total Return Performance
Managers Short Duration Government Fund’s cumulative total return is based on the daily change in net asset value (NAV), and assumes that all distributions were reinvested. The chart illustrates the performance of a hypothetical $10,000 investment made in the Fund on December 31, 2001 to a $10,000 investment made in the BofA Merrill Lynch Six-Month U.S. Treasury Bill Index for the same time period. Figures include reinvestment of capital gains and
Managers Short Duration Government Fund
Investment Manager’s Comments (continued)
Cumulative Total Return Performance (continued)
dividends. The listed returns for the Fund are net of expenses and the returns for the index exclude expenses. Total returns for the Fund would have been lower had certain expenses not been reduced.
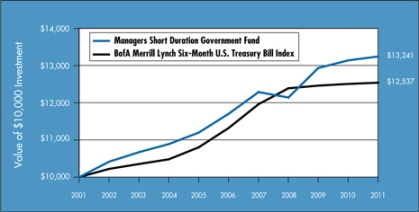
The table below shows the average annual total returns for the Managers Short Duration Government Fund and the BofA Merrill Lynch Six-Month U.S. Treasury Bill Index from December 31, 2001 through December 31, 2011.
| | | | | | | | | | | | |
Average Annual Total Returns1 | | 1 Year | | | 5 Years | | | 10 Years | |
Managers Short Duration Government Fund 2,3,4,5 | | | 0.80 | % | | | 2.50 | % | | | 2.85 | % |
BofA Merrill Lynch Six-Month U.S. Treasury Bill Index6 | | | 0.27 | % | | | 2.06 | % | | | 2.29 | % |
The performance data shown represents past performance. Past performance is not a guarantee of future results. Current performance may be lower or higher than the performance data quoted. The investment return and the principal value of an investment will fluctuate so that an investor’s shares, when redeemed, may be worth more or less than their original cost. For performance information through the most recent month end please call (800) 835-3879 or visit our Web site at www.managersinvest.com.
In choosing a Fund, investors should carefully consider the amount they plan to invest, their investment objectives, the Fund’s investment objectives, risks, charges and expenses before investing. For this and other information, please call (800) 835-3879 or visit www.managersinvest.com for a free prospectus. Read it carefully before investing or sending money. Distributed by Managers Distributors, Inc., member FINRA.
| | 1 | Total return equals income yield plus share price change and assumes reinvestment of all dividends and capital gain distributions. Returns are net of fees and may reflect offsets of Fund expenses as described in the Prospectus. No adjustment has been made for taxes payable by shareholders on their reinvested dividends and capital gain distributions. Returns for periods greater than one year are the average annual return. The listed returns on the Fund are net of expenses and based on the published NAV as of December 31, 2011. All returns are in U.S. dollars ($). |
| | 2 | Changing interest rates may adversely affect the value of an investment. An increase in interest rates typically causes the value of bonds and other fixed income securities to fall. |
| | 3 | The Fund is subject to the risks associated with investments in debt securities, such as default risk and fluctuations in the perception of the debtors’ ability to pay their creditors. |
| | 4 | The Fund may use derivative instruments for hedging purposes or as part of its investment strategy. There is a risk that a derivative intended as a hedge may not perform as expected. The main risk with derivatives is that some types can amplify a gain or loss, potentially earning or losing substantially more money than the actual cost of the derivative or that the counterparty may fail to honor its contract terms, causing a loss for the Fund. Use of these instruments may also involve certain costs and risks such as liquidity risk, interest rate risk, market risk, credit risk, management risk and the risk that a fund could not close out a position when it would be most advantageous to do so. |
|
5 Many bonds have call provisions which allow the debtors to pay them back before maturity. This is especially true with mortgage securities, which can be paid back anytime. Typically debtors prepay their debt when it is to their advantage (when interest rates drop making a new loan at current rates more attractive), and thus likely to the disadvantage of bondholders, who may have to reinvest prepayment proceeds in securities with lower yields. Prepayment risk will vary depending on the provisions of the security and current interest rates relative to the interest rate of the debt. 6 The BofA Merrill Lynch Six-Month U.S.Treasury Bill Index is an unmanaged index that measures returns of six-month Treasury Bills. The BofA Merrill Lynch Six-Month U.S.Treasury Bill Index is unmanaged, is not available for investment, and does not incur expenses. Not FDIC insured, nor bank guaranteed. May lose value. |
6
Managers Short Duration Government Fund
Fund Snapshots
December 31, 2011
Portfolio Breakdown
| | | | |
Portfolio Breakdown | | Managers Short Duration
Government Fund** | |
U.S. Government and Agency Obligations | | | 81.8 | % |
Mortgage-Backed Securities | | | 9.4 | % |
Asset-Backed Securities | | | 0.2 | % |
Other Assets and Liabilities | | | 8.6 | % |
| ** | As a percentage of net assets |
Top Ten Holdings
| | | | |
Security Name | | % of
Net Assets | |
FHLMC, 0.076%, 10/01/12 | | | 2.5 | % |
FNMA, 1.922%, 02/01/35* | | | 2.0 | |
FNMA, 2.521%, 11/01/34* | | | 2.0 | |
FNMA, 6.000%, 11/01/22 | | | 2.0 | |
FNMA, 5.500%, 06/01/20 | | | 1.9 | |
FNMA, 0.033%, 05/02/12 | | | 1.9 | |
FNMA, 2.561%, 01/01/36 | | | 1.7 | |
FNMA, 2.360%, 12/01/34 | | | 1.7 | |
FNMA, 2.381%, 10/01/33* | | | 1.5 | |
FHLMC, 2.500%, 03/01/34 | | | 1.4 | |
| | | | |
Top Ten as a Group | | | 18.6 | % |
| | | | |
| * | Top Ten Holding at June 30, 2011 |
|
| Any sectors, industries, or securities discussed should not be perceived as investment recommendations. Mention of a specific security should not be considered a recommendation to buy or solicitation to sell that security. Specific securities mentioned in this report may have been sold from the Fund’s portfolio of investments by the time you receive this report. |
7
Managers Short Duration Government Fund
Schedule of Portfolio Investments
December 31, 2011
| | | | | | | | |
Security Description | | Principal Amount | | | Value | |
| | | | | | | | |
U.S. Government and Agency Obligations - 81.8%8 | | | | | | | | |
Federal Home Loan Mortgage Corporation - 26.4% | | | | | | | | |
FHLMC, 2.125%, 11/01/33, (11/01/12)3 | | $ | 1,463,610 | | | $ | 1,509,594 | |
FHLMC, 2.125%, 09/01/35, (09/01/12)3,7 | | | 2,663,753 | | | | 2,772,628 | |
FHLMC, 2.286%, 10/01/28, (08/01/12)3 | | | 101,994 | | | | 107,482 | |
FHLMC, 2.347%, 10/01/33, (10/01/12)3,7 | | | 2,125,619 | | | | 2,251,051 | |
FHLMC, 2.350%, 10/01/33, (10/01/12)3,7 | | | 3,462,980 | | | | 3,675,279 | |
FHLMC, 2.351%, 11/01/33, (11/01/12)3 | | | 1,923,304 | | | | 2,041,813 | |
FHLMC, 2.356%, 12/01/33, (11/01/12)3 | | | 2,849,751 | | | | 3,000,000 | |
FHLMC, 2.401%, 12/01/32, (10/01/12)3 | | | 870,987 | | | | 916,104 | |
FHLMC, 2.404%, 05/01/34, (09/01/12)3 | | | 3,487,563 | | | | 3,680,857 | |
FHLMC, 2.470%, 12/01/35, (06/01/12)3 | | | 660,404 | | | | 694,981 | |
FHLMC, 2.482%, 07/01/34, (06/01/12)3,7 | | | 495,756 | | | | 522,876 | |
FHLMC, 2.500%, 03/01/34, (04/01/12)3,7 | | | 5,182,601 | | | | 5,481,636 | |
FHLMC, 2.500%, 04/01/34, (05/01/12)3 | | | 1,403,478 | | | | 1,479,048 | |
FHLMC, 2.503%, 05/01/33, (05/01/12)3 | | | 1,590,725 | | | | 1,674,019 | |
FHLMC, 2.571%, 09/01/33, (06/01/12)3,7 | | | 3,057,935 | | | | 3,239,077 | |
FHLMC, 2.606%, 02/01/23, (06/01/12)3 | | | 821,446 | | | | 868,367 | |
FHLMC, 2.712%, 06/01/35, (06/01/12)3,7 | | | 1,219,731 | | | | 1,292,511 | |
FHLMC, 4.000%, TBA | | | 4,800,000 | | | | 5,037,000 | |
FHLMC, 4.500%, 07/01/187 | | | 2,044,118 | | | | 2,179,823 | |
FHLMC, 4.500%, 09/15/18 to 02/15/19 | | | 619,282 | | | | 637,809 | |
FHLMC, 5.000%, 09/01/17 to 06/01/19 | | | 1,305,282 | | | | 1,406,755 | |
FHLMC, 5.000%, 05/01/187 | | | 580,582 | | | | 630,892 | |
FHLMC, 5.000%, 10/01/187 | | | 3,814,681 | | | | 4,108,286 | |
FHLMC, 5.000%, 11/01/207 | | | 927,290 | | | | 999,530 | |
FHLMC, 5.454%, 02/01/37, (03/01/12)3,7 | | | 1,338,202 | | | | 1,410,971 | |
FHLMC, 5.500%, 08/01/17 to 11/01/19 | | | 3,299,149 | | | | 3,565,666 | |
FHLMC, 5.500%, 08/01/187 | | | 1,002,307 | | | | 1,086,969 | |
FHLMC, 5.500%, 12/01/187 | | | 4,000,628 | | | | 4,338,548 | |
FHLMC, 5.500%, 11/01/197 | | | 2,908,276 | | | | 3,159,382 | |
FHLMC, 5.500%, 06/01/207 | | | 3,767,078 | | | | 4,080,562 | |
FHLMC, 6.000%, 03/01/187 | | | 216,825 | | | | 235,552 | |
FHLMC, 6.000%, 02/01/19 to 03/01/20 | | | 1,727,447 | | | | 1,875,650 | |
FHLMC, 6.500%, 03/01/187 | | | 837,530 | | | | 920,213 | |
FHLMC Gold Pool, 0.528%, 06/15/35, (01/15/12) 3,7 | | | 712,594 | | | | 712,512 | |
FHLMC Gold Pool, 5.000%, 05/01/187 | | | 519,851 | | | | 564,899 | |
FHLMC Gold Pool, 5.000%, 01/01/197 | | | 774,746 | | | | 841,881 | |
FHLMC Gold Pool, 5.000%, 04/01/19 to 08/01/19 | | | 521,376 | | | | 564,732 | |
FHLMC Gold Pool, 5.500%, 11/01/177 | | | 280,924 | | | | 304,652 | |
FHLMC Gold Pool, 5.500%, 12/01/17 to 09/01/19 | | | 542,248 | | | | 591,836 | |
|
The accompanying notes are an integral part of these financial statements. 8 |
Managers Short Duration Government Fund
Schedule of Portfolio Investments (continued)
| | | | | | | | |
Security Description | | Principal Amount | | | Value | |
| | | | | | | | |
Federal Home Loan Mortgage Corporation - 26.4% (continued) | | | | | | | | |
FHLMC Gold Pool, 5.500%, 01/01/207 | | $ | 2,653,259 | | | $ | 2,898,100 | |
FHLMC Gold Pool, 7.000%, 06/01/177 | | | 1,095,243 | | | | 1,166,247 | |
FHLMC Gold Pool, 7.500%, 04/01/15 to 03/01/33 | | | 831,357 | | | | 970,798 | |
FHLMC REMICS, Series 2885, Class DE, 4.500%, 12/15/17 | | | 86,428 | | | | 87,525 | |
FHLMC Structured Pass Through Securities, Series T-51, Class 2A, 7.500%, 08/25/424 | | | 169,334 | | | | 199,238 | |
FHLMC, Series 2628, Class GQ, 3.140%, 11/15/17 | | | 645,192 | | | | 657,589 | |
FHLMC, Series 2692, Class AB, 4.000%, 05/15/16 | | | 160,672 | | | | 160,783 | |
FHLMC, Series 2677, Class BA, 4.000%, 09/15/16 | | | 178,984 | | | | 179,337 | |
FHLMC, Series 2696, Class MD, 4.000%, 11/15/16 | | | 100,962 | | | | 101,161 | |
FHLMC, Series 2843, Class BH, 4.000%, 01/15/18 | | | 1,327,745 | | | | 1,343,251 | |
FHLMC, Series 2561, Class BH, 4.500%, 05/15/17 | | | 303,569 | | | | 305,392 | |
FHLMC, Series 2718, Class MD, 4.500%, 06/15/17 | | | 118,847 | | | | 121,034 | |
FHLMC, Series 2764, Class OD, 4.500%, 10/15/17 | | | 595,766 | | | | 608,202 | |
FHLMC, Series 2664, Class GA, 4.500%, 01/15/18 | | | 2,493 | | | | 2,492 | |
FHLMC, Series 3294, Class DA, 4.500%, 12/15/20 | | | 699,856 | | | | 719,049 | |
FHLMC, Series 2702, Class AC, 4.500%, 07/15/28 | | | 957,796 | | | | 960,816 | |
FHLMC, Series 2695, Class BO, 4.500%, 08/15/28 | | | 129,790 | | | | 130,730 | |
FHLMC, Series 2700, Class PE, 4.500%, 01/15/29 | | | 429,684 | | | | 433,862 | |
FHLMC, Series 2554, Class HA, 4.500%, 04/15/32 | | | 2,482,825 | | | | 2,580,377 | |
FHLMC, Series 2935, Class LM, 4.500%, 02/15/35 | | | 3,331,394 | | | | 3,504,211 | |
FHLMC, Series 2939, Class DE, 4.750%, 04/15/25 | | | 66,838 | | | | 66,819 | |
FHLMC, Series 2877, Class MV, 4.750%, 12/15/28 | | | 95,674 | | | | 95,647 | |
FHLMC, Series 3266, Class C, 5.000%, 02/15/20 | | | 392,078 | | | | 401,936 | |
FHLMC, Series 2827, Class TC, 5.000%, 10/15/28 | | | 1,280 | | | | 1,279 | |
FHLMC, Series 2764, Class TD, 5.000%, 02/15/29 | | | 1,967,422 | | | | 1,974,665 | |
FHLMC, Series 2772, Class YE, 5.000%, 05/15/29 | | | 1,427,085 | | | | 1,438,906 | |
FHLMC, Series 2877, Class HA, 5.000%, 03/15/32 | | | 3,073,357 | | | | 3,128,336 | |
FHLMC, Series 2558, Class UE, 5.500%, 05/15/22 | | | 396,235 | | | | 406,266 | |
FHLMC, Series 2621, Class PG, 5.500%, 12/15/31 | | | 4,107,434 | | | | 4,258,847 | |
FHLMC, Series 2429, Class HB, 6.500%, 12/15/23 | | | 422,147 | | | | 478,255 | |
Total Federal Home Loan Mortgage Corporation | | | | | | | 103,842,593 | |
Federal National Mortgage Association - 49.0% | | | | | | | | |
FNMA, 0.614%, 11/25/30, (06/25/12)3,7 | | | 1,698,623 | | | | 1,695,640 | |
FNMA, 0.694%, 03/25/35, (01/25/12)3,7 | | | 1,822,779 | | | | 1,808,585 | |
FNMA, 1.921%, 03/01/36, (02/01/12)3 | | | 1,152,932 | | | | 1,206,064 | |
FNMA, 1.922%, 02/01/35, (02/01/12)3 | | | 7,666,721 | | | | 8,028,373 | |
FNMA, 1.925%, 02/01/33, (03/01/12)3 | | | 2,267,421 | | | | 2,371,046 | |
FNMA, 1.933%, 01/01/35, (04/01/12)3 | | | 1,463,196 | | | | 1,540,180 | |
FNMA, 1.935%, 08/01/33, (02/01/12)3 | | | 891,148 | | | | 929,691 | |
FNMA, 1.942%, 01/01/35, (04/01/12)3 | | | 593,482 | | | | 621,662 | |
FNMA, 1.943%, 09/01/34, (03/01/12)3 | | | 2,737,207 | | | | 2,874,336 | |
FNMA, 1.949%, 08/01/34, (04/01/12)3 | | | 681,145 | | | | 710,807 | |
|
The accompanying notes are an integral part of these financial statements. 9 |
Managers Short Duration Government Fund
Schedule of Portfolio Investments (continued)
| | | | | | | | |
Security Description | | Principal Amount | | | Value | |
| | | | | | | | |
Federal National Mortgage Association - 49.0% (continued) | | | | | | | | |
FNMA, 1.950%, 01/01/35, (03/01/12)3 | | $ | 4,542,824 | | | $ | 4,771,730 | |
FNMA, 1.954%, 01/01/24, (07/01/12)3 | | | 1,574,832 | | | | 1,607,152 | |
FNMA, 1.954%, 08/01/33, (02/01/12)3 | | | 563,120 | | | | 588,188 | |
FNMA, 1.964%, 01/01/35, (05/01/12)3 | | | 886,309 | | | | 931,520 | |
FNMA, 1.966%, 10/01/34, (03/01/12)3 | | | 1,463,903 | | | | 1,539,111 | |
FNMA, 2.027%, 11/01/34, (04/01/12)3 | | | 759,643 | | | | 798,599 | |
FNMA, 2.034%, 06/01/34, (05/01/12)3 | | | 1,721,558 | | | | 1,815,691 | |
FNMA, 2.175%, 09/01/33, (09/01/12)3,7 | | | 1,021,744 | | | | 1,062,953 | |
FNMA, 2.261%, 02/01/36, (10/01/12)3 | | | 4,348,292 | | | | 4,578,665 | |
FNMA, 2.268%, 01/01/34, (06/01/12)3 | | | 1,191,300 | | | | 1,269,695 | |
FNMA, 2.352%, 10/01/35, (07/01/12)3 | | | 2,891,357 | | | | 3,048,253 | |
FNMA, 2.360%, 12/01/34, (10/01/12)3 | | | 6,236,430 | | | | 6,567,116 | |
FNMA, 2.364%, 09/01/33, (08/01/12)3 | | | 1,243,807 | | | | 1,310,590 | |
FNMA, 2.368%, 04/01/35, (03/01/12)3 | | | 757,350 | | | | 798,570 | |
FNMA, 2.370%, 05/01/33, (04/01/12)3 | | | 2,304,769 | | | | 2,413,111 | |
FNMA, 2.375%, 03/01/33, (01/01/12)3 | | | 990,688 | | | | 1,025,301 | |
FNMA, 2.381%, 10/01/33, (08/01/12)3 | | | 5,738,467 | | | | 6,033,511 | |
FNMA, 2.386%, 08/01/36, (05/01/12)3 | | | 361,751 | | | | 381,320 | |
FNMA, 2.392%, 07/01/34, (08/01/12)3 | | | 2,693,843 | | | | 2,839,356 | |
FNMA, 2.392%, 02/01/37, (07/01/12)3 | | | 616,252 | | | | 651,672 | |
FNMA, 2.401%, 06/01/33, (05/01/12)3 | | | 915,915 | | | | 964,348 | |
FNMA, 2.404%, 01/01/26, (06/01/12)3 | | | 668,894 | | | | 708,062 | |
FNMA, 2.411%, 01/01/33, (07/01/12)3 | | | 69,386 | | | | 73,195 | |
FNMA, 2.415%, 12/01/34, (07/01/12)3 | | | 4,636,631 | | | | 4,891,138 | |
FNMA, 2.418%, 08/01/34, (06/01/12)3 | | | 802,912 | | | | 845,787 | |
FNMA, 2.422%, 01/01/36, (11/01/12)3 | | | 192,249 | | | | 202,695 | |
FNMA, 2.431%, 01/01/25, (07/01/12)3 | | | 869,090 | | | | 919,111 | |
FNMA, 2.436%, 12/01/34, (11/01/12)3 | | | 3,766,957 | | | | 3,977,338 | |
FNMA, 2.440%, 12/01/33, (10/01/12)3 | | | 949,607 | | | | 1,001,441 | |
FNMA, 2.458%, 06/01/34, (06/01/12)3 | | | 2,414,389 | | | | 2,551,802 | |
FNMA, 2.521%, 11/01/34, (09/01/12)3 | | | 7,514,680 | | | | 7,977,788 | |
FNMA, 2.534%, 04/01/34, (07/01/12)3 | | | 1,242,958 | | | | 1,311,817 | |
FNMA, 2.561%, 01/01/36, (07/01/12)3 | | | 6,508,841 | | | | 6,877,062 | |
FNMA, 2.570%, 09/01/35, (07/01/12)3 | | | 1,518,275 | | | | 1,602,842 | |
FNMA, 2.605%, 06/01/35, (06/01/12)3 | | | 351,652 | | | | 372,834 | |
FNMA, 2.605%, 06/01/35, (06/01/12)3 | | | 367,989 | | | | 390,244 | |
FNMA, 2.605%, 05/01/36, (05/01/12)3 | | | 236,326 | | | | 249,455 | |
FNMA, 2.613%, 01/01/36, (08/01/12)3 | | | 98,781 | | | | 105,406 | |
FNMA, 2.629%, 06/01/34, (04/01/12)3 | | | 5,004,944 | | | | 5,290,407 | |
FNMA, 2.675%, 01/01/34, (01/01/12)3 | | | 4,392,138 | | | | 4,612,550 | |
FNMA, 2.685%, 01/01/33, (02/01/12)3 | | | 1,640,115 | | | | 1,734,770 | |
FNMA, 2.686%, 06/01/37, (05/01/12)3 | | | 725,910 | | | | 773,788 | |
|
The accompanying notes are an integral part of these financial statements. 10 |
Managers Short Duration Government Fund
Schedule of Portfolio Investments (continued)
| | | | | | | | |
Security Description | | Principal Amount | | | Value | |
| | | | | | | | |
Federal National Mortgage Association - 49.0% (continued) | | | | | | | | |
FNMA, 2.944%, 03/01/36, (06/01/12)3 | | $ | 1,741,455 | | | $ | 1,858,898 | |
FNMA, 2.946%, 03/01/36, (01/01/12)3 | | | 2,203,939 | | | | 2,352,371 | |
FNMA, 4.000%, 08/01/18 | | | 450,062 | | | | 478,741 | |
FNMA, 4.500%, 10/01/19 | | | 641,143 | | | | 686,105 | |
FNMA, 5.000%, 03/01/18 to 10/01/24 | | | 8,948,850 | | | | 9,679,661 | |
FNMA, 5.000%, 09/01/197 | | | 505,118 | | | | 544,626 | |
FNMA, 5.500%, 10/01/17 to 05/01/24 | | | 16,684,084 | | | | 18,143,435 | |
FNMA, 5.500%, 11/01/187 | | | 848,288 | | | | 922,592 | |
FNMA, 5.764%, 09/01/37, (09/01/12)3 | | | 462,212 | | | | 493,630 | |
FNMA, 6.000%, 03/01/17 to 11/01/23 | | | 13,525,345 | | | | 14,511,082 | |
FNMA, 6.000%, 09/01/227 | | | 2,255,475 | | | | 2,456,974 | |
FNMA, 6.500%, 04/01/177 | | | 355,138 | | | | 390,250 | |
FNMA, 6.500%, 05/01/17 to 08/01/32 | | | 2,026,094 | | | | 2,253,588 | |
FNMA, 7.000%, 09/01/14 to 11/01/22 | | | 4,684,086 | | | | 5,149,581 | |
FNMA, 7.500%, 12/01/33 to 01/01/34 | | | 160,597 | | | | 185,361 | |
FNMA Grantor Trust, Series 2003-T4, Class A1, 0.514%, 09/26/33, (01/26/12)3 | | | 16,862 | | | | 16,631 | |
FNMA Grantor Trust, Series 2002-T5, Class A1, 0.534%, 05/25/32, (01/25/12)3 | | | 395,201 | | | | 377,722 | |
FNMA Grantor Trust Pass Through, Series 2004-T1, Class 1A2, 6.500%, 01/25/44 | | | 431,875 | | | | 484,876 | |
FNMA Pass Through Securities, Series 2002-33, Class A2, 7.500%, 06/25/32 | | | 102,595 | | | | 115,204 | |
FNMA Whole Loan, Series 2005-W2, Class A1, 0.494%, 05/25/35, (01/25/12)3,7 | | | 3,269,079 | | | | 3,244,738 | |
FNMA Whole Loan, Series 2003-W13, Class AV2, 0.574%, 10/25/33, (01/25/12)3,5 | | | 62,006 | | | | 61,925 | |
FNMA Whole Loan, Series 2004-W14, Class 1AF, 0.694%, 07/25/44, (01/25/12)3,7 | | | 3,243,673 | | | | 3,245,201 | |
FNMA Whole Loan, Series 2004-W5, Class F1, 0.744%, 02/25/47, (01/25/12)3 | | | 792,456 | | | | 793,303 | |
FNMA Whole Loan, Series 2002-W1, Class 2A, 7.108%, 02/25/424,7 | | | 478,828 | | | | 556,903 | |
FNMA Whole Loan, Series 2003-W1, Class 2A, 7.122%, 12/25/424 | | | 28,562 | | | | 33,222 | |
FNMA Whole Loan, Series 2002-W6, Class 2A, 7.134%, 06/25/424 | | | 1,560,663 | | | | 1,798,615 | |
FNMA Whole Loan, Series 2003-W4, Class 4A, 7.271%, 10/25/424,7 | | | 854,786 | | | | 991,086 | |
FNMA, Series 2007-25, Class FA, 0.694%, 04/25/37, (01/25/12)3 | | | 1,885,497 | | | | 1,880,630 | |
FNMA, Series 2003-23, Class AB, 4.000%, 03/25/17 | | | 27,941 | | | | 27,928 | |
FNMA, Series 2002-95, Class KB, 4.360%, 02/25/17 | | | 10,639 | | | | 10,633 | |
FNMA, Series 2003-23, Class AD, 4.500%, 03/25/17 | | | 14,584 | | | | 14,576 | |
FNMA, Series 2003-92, Class PD, 4.500%, 03/25/17 | | | 431,718 | | | | 437,891 | |
FNMA, Series 2005-38, Class DP, 5.000%, 06/25/19 | | | 718,548 | | | | 739,806 | |
FNMA, Series 2003-5, Class EL, 5.000%, 08/25/22 | | | 987,904 | | | | 1,015,822 | |
FNMA, Series 2008-81, Class KA, 5.000%, 10/25/22 | | | 368,645 | | | | 386,058 | |
FNMA, Series 1994-76, Class J, 5.000%, 04/25/24 | | | 579,633 | | | | 612,588 | |
FNMA, Series 2005-15, Class EA, 5.000%, 10/25/28 | | | 220,407 | | | | 221,324 | |
FNMA, Series 2003-81, Class MB, 5.000%, 05/25/29 | | | 107,091 | | | | 107,008 | |
FNMA, Series 2003-29, Class PT, 5.000%, 10/25/31 | | | 194,936 | | | | 198,641 | |
FNMA, Series 2005-43, Class TB, 5.000%, 07/25/32 | | | 1,413,727 | | | | 1,439,656 | |
FNMA, Series 2008-54, Class EC, 5.000%, 02/25/35 | | | 252,987 | | | | 259,329 | |
Total Federal National Mortgage Association | | | | | | | 192,430,579 | |
|
The accompanying notes are an integral part of these financial statements. 11 |
Managers Short Duration Government Fund
Schedule of Portfolio Investments (continued)
| | | | | | | | |
Security Description | | Principal Amount | | | Value | |
| | | | | | | | |
Government National Mortgage Association - 2.8% | | | | | | | | |
GNMA, 1.625%, 09/20/22 to 09/20/35, (10/01/12)3 | | $ | 4,263,681 | | | $ | 4,387,590 | |
GNMA, 1.625%, 07/20/35, (10/01/12)3,7 | | | 1,292,637 | | | | 1,329,688 | |
GNMA, 1.750%, 01/20/32 to 03/20/37, (04/01/12)3 | | | 605,988 | | | | 627,549 | |
GNMA, 1.750%, 10/20/34, (01/01/12)3 | | | 316,203 | | | | 326,821 | |
GNMA, 2.000%, 03/20/35, (04/01/12)3 | | | 81,616 | | | | 84,163 | |
GNMA, 2.000%, 06/20/35, (07/01/12)3 | | | 94,862 | | | | 97,945 | |
GNMA, 2.125%, 12/20/21 to 11/20/27, (01/01/13)3 | | | 1,232,518 | | | | 1,270,569 | |
GNMA, 2.250%, 01/20/28, (04/01/12)3 | | | 62,721 | | | | 64,756 | |
GNMA, 2.375%, 06/20/22 to 05/20/33, (07/01/12)3 | | | 274,633 | | | | 284,228 | |
GNMA, 2.375%, 04/20/24, (07/01/12)3,7 | | | 558,312 | | | | 577,817 | |
GNMA, 2.375%, 05/20/27, (07/01/12)3,7 | | | 427,519 | | | | 442,454 | |
GNMA, 2.500%, 07/20/18 to 08/20/21, (10/01/12)3 | | | 100,186 | | | | 104,022 | |
GNMA, 2.750%, 10/20/17, (01/01/13)3,7 | | | 41,767 | | | | 43,486 | |
GNMA, 3.000%, 11/20/17 to 12/20/17, (01/01/13)3 | | | 89,677 | | | | 93,392 | |
GNMA, 3.000%, 03/20/21, (04/01/12)3 | | | 46,773 | | | | 48,842 | |
GNMA, 3.500%, 07/20/18, (10/01/12)3 | | | 49,233 | | | | 51,518 | |
GNMA, 3.500%, 02/20/34 | | | 29,703 | | | | 29,760 | |
GNMA, 9.500%, 12/15/17 | | | 7,282 | | | | 8,208 | |
GNMA, Series 2003-83, Class AB, 4.000%, 05/16/32 | | | 239,255 | | | | 240,090 | |
GNMA, Series 2005-58, Class NJ, 4.500%, 08/20/35 | | | 185,250 | | | | 186,874 | |
GNMA, Series 2003-39, Class PB, 5.500%, 04/20/32 | | | 626,958 | | | | 644,857 | |
Total Government National Mortgage Association | | | | | | | 10,944,629 | |
Interest Only Strips - 2.6% | | | | | | | | |
FHLMC, 4.500%, 09/15/35 | | | 205,638 | | | | 27,983 | |
FHLMC, 5.000%, 02/15/20 to 04/15/20 | | | 668,776 | | | | 67,045 | |
FHLMC, 6.422%, 11/15/18, (01/15/12)3 | | | 558,825 | | | | 35,066 | |
FHLMC, 6.822%, 11/15/30, (01/15/12)3 | | | 142,120 | | | | 4,649 | |
FHLMC, 6.922%, 03/15/32, (01/15/12)3 | | | 1,775,989 | | | | 284,030 | |
FHLMC, 8.000%, 06/15/315 | | | 221,024 | | | | 50,283 | |
FHLMC, Series 3449, Class AI, 4.500%, 10/15/20 | | | 590,416 | | | | 11,221 | |
FHLMC, Series 3659, Class IE, 5.000%, 03/15/19 | | | 1,614,385 | | | | 156,888 | |
FHLMC, Series 3685, Class EI, 5.000%, 03/15/19 | | | 3,639,430 | | | | 314,690 | |
FHLMC, Series 3731, Class IO, 5.000%, 07/15/19 | | | 1,675,679 | | | | 142,132 | |
FNMA, Series 2010-37, Class GI, 5.000%, 04/25/25 | | | 3,616,805 | | | | 271,962 | |
FHLMC, Series 2637, Class SI, 5.722%, 06/15/18, (01/15/12)3 | | | 426,249 | | | | 40,543 | |
FHLMC, Series 2965, Class SA, 5.772%, 05/15/32, (01/15/12)3 | | | 1,695,507 | | | | 228,567 | |
FHLMC, Series 3606, Class SN, 5.972%, 12/15/39, (01/15/12)3 | | | 1,823,378 | | | | 295,333 | |
FHLMC, Series 3424, Class XI, 6.292%, 05/15/36, (01/15/12)3 | | | 1,044,960 | | | | 185,976 | |
FHLMC, Series 2980, Class SL, 6.422%, 11/15/34, (01/15/12)3 | | | 844,494 | | | | 148,555 | |
FHLMC, Series 2922, Class SE, 6.472%, 02/15/35, (01/15/12)3 | | | 618,076 | | | | 114,959 | |
FHLMC, Series 2929, Class CS, 6.522%, 12/15/22, (01/15/12)3 | | | 110,718 | | | | 2,270 | |
|
The accompanying notes are an integral part of these financial statements. 12 |
Managers Short Duration Government Fund
Schedule of Portfolio Investments (continued)
| | | | | | | | |
Security Description | | Principal Amount | | | Value | |
| | | | | | | | |
Interest Only Strips - 2.6% (continued) | | | | | | | | |
FHLMC, Series 2530, Class QI, 6.722%, 01/15/32, (01/15/12)3 | | $ | 402,233 | | | $ | 70,951 | |
FHLMC, Series 2772, Class KS, 6.902%, 06/15/22, (01/15/12)3 | | | 155,322 | | | | 5,865 | |
FHLMC, Series 3489, Class SD, 7.522%, 06/15/32, (01/15/12)3 | | | 838,035 | | | | 156,292 | |
FNMA, 5.000%, 12/01/35 | | | 303,535 | | | | 37,729 | |
FNMA, 7.500%, 11/18/145 | | | 1,527 | | | | 16 | |
FNMA, 8.000%, 05/01/305 | | | 164,554 | | | | 30,785 | |
FNMA, 9.000%, 12/15/165 | | | 23,146 | | | | 3,637 | |
FNMA, Series 2008-22, Class AI, 1.097%, 09/25/124 | | | 16,148,351 | | | | 101,139 | |
FNMA, Series 2011-88, Class WI, 3.500%, 09/25/26 | | | 2,025,018 | | | | 276,403 | |
FNMA, Series 2010-95, Class DI, 4.500%, 11/25/20 | | | 2,235,674 | | | | 196,834 | |
FNMA, Series 2008-86, Class IO, 4.500%, 03/25/23 | | | 3,166,329 | | | | 289,138 | |
FNMA, Series 2011-69, Class AI, 5.000%, 05/25/18 | | | 6,001,039 | | | | 460,005 | |
FNMA, Series 2010-105, Class IO, 5.000%, 08/25/20 | | | 1,574,270 | | | | 160,434 | |
FNMA, Series 2010-65, Class IO, 5.000%, 09/25/20 | | | 3,816,628 | | | | 463,436 | |
FNMA, Series 2010-29, Class KJ, 5.000%, 12/25/21 | | | 6,365,302 | | | | 577,465 | |
FNMA, Series 2010-121, Class IO, 5.000%, 10/25/25 | | | 1,735,396 | | | | 170,009 | |
FNMA, Series 2003-48, Class SJ, 5.706%, 06/25/18, (01/25/12)3 | | | 532,800 | | | | 47,624 | |
FNMA, Series 2005-67, Class SM, 5.856%, 08/25/35, (01/25/12)3 | | | 419,512 | | | | 63,304 | |
FNMA, Series 2006-3, Class SA, 5.856%, 03/25/36, (01/25/12)3 | | | 971,751 | | | | 137,469 | |
FNMA, Series 2003-73, Class SM, 6.306%, 04/25/18, (01/25/12)3 | | | 559,938 | | | | 59,588 | |
FNMA, Series 2005-45, Class SR, 6.426%, 06/25/35, (01/25/12)3 | | | 944,187 | | | | 164,737 | |
FNMA, Series 2005-12, Class SC, 6.456%, 03/25/35, (01/25/12)3 | | | 872,767 | | | | 144,278 | |
FNMA, Series 2008-34, Class SM, 6.456%, 05/25/38 (01/25/12)3 | | | 1,919,930 | | | | 352,154 | |
FNMA, Series 2005-66, Class GS, 6.556%, 07/25/20, (01/25/12)3 | | | 426,472 | | | | 56,826 | |
FNMA, Series 2005-65, Class KI, 6.706%, 08/25/35, (01/25/12)3 | | | 4,646,480 | | | | 888,042 | |
FNMA, Series 2004-49, Class SQ, 6.756%, 07/25/34, (01/25/12)3 | | | 491,174 | | | | 95,388 | |
FNMA, Series 2004-64, Class SW, 6.756%, 08/25/34, (01/25/12)3 | | | 2,326,322 | | | | 414,477 | |
FNMA, Series 2004-51, Class SX, 6.826%, 07/25/34, (01/25/12)3 | | | 751,319 | | | | 108,899 | |
FNMA, Series 2008-87, Class AS, 7.356%, 07/25/33, (01/25/12)3 | | | 3,693,463 | | | | 614,434 | |
GNMA, Series 2011-37, Class IG, 2.000%, 03/20/13 | | | 3,985,502 | | | | 74,911 | |
GNMA, Series 2010-111, Class BI, 2.000%, 09/16/13 | | | 5,140,916 | | | | 141,915 | |
GNMA, Series 2010-147, Class IG, 2.000%, 11/16/13 | | | 20,839,924 | | | | 606,821 | |
GNMA, Series 2011-94, Class IS, 6.417%, 06/16/36, (01/16/12)3 | | | 1,037,009 | | | | 206,735 | |
GNMA, Series 2011-32, Class KS, 11.535%, 06/16/34, (01/16/12)3 | | | 1,213,918 | | | | 409,526 | |
Total Interest Only Strips | | | | | | | 9,969,418 | |
U.S. Treasury Notes - 1.0% | | | | | | | | |
U.S. Treasury Inflation Linked Notes, 2.375%, 01/15/25 | | | 3,123,510 | | | | 3,971,249 | |
Total U.S. Government and Agency Obligations (cost $316,865,346) | | | | | | | 321,158,468 | |
|
The accompanying notes are an integral part of these financial statements. 13 |
Managers Short Duration Government Fund
Schedule of Portfolio Investments (continued)
| | | | | | | | |
Security Description | | Principal Amount | | | Value | |
| | | | | | | | |
Mortgage-Backed Securities - 9.4% | | | | | | | | |
Bank of America Commercial Mortgage, Inc., Series 2005-2, Class A4, 4.783%, 07/10/434 | | $ | 170,085 | | | $ | 170,006 | |
Bank of America Commercial Mortgage, Inc., Series 2002-2, Class A3, 5.118%, 07/11/43 | | | 338,644 | | | | 340,515 | |
Banc of America Commercial Mortgage, Inc., Series 2006-6, Class A2, 5.309%, 10/10/45 | | | 290,756 | | | | 290,465 | |
Bank of America Commercial Mortgage, Inc., Series 2002 PB2, Class A4, 6.186%, 06/11/35 | | | 398,213 | | | | 397,934 | |
Bear Stearns Commercial Mortgage Securities, Inc., Series 2002-PBW1, Class A2, 4.720%, 11/11/354 | | | 4,291,512 | | | | 4,336,561 | |
Bear Stearns Commercial Mortgage Securities, Inc., Series 2006-PW11, Class A2, 5.393%, 03/11/394 | | | 580,118 | | | | 579,848 | |
Bear Stearns Commercial Mortgage Securities, Inc., Series 2002-TOP6, Class A2, 6.460%, 10/15/36 | | | 133,591 | | | | 133,982 | |
Countrywide Home Loans, Inc., 0.794%, 02/25/35, (01/25/12)3,5,7 | | | 1,224,577 | | | | 240,241 | |
Credit Suisse First Boston Mortgage Securities Corp., Series 2002-CKN2, Class A3, 6.133%, 04/15/37 | | | 244,082 | | | | 244,722 | |
CS First Boston Mortgage Securities Corp., Series 2004-C5, Class A3, 4.499%, 11/15/37 | | | 766,186 | | | | 765,779 | |
CS First Boston Mortgage Securities Corp., Series 2002-CP5, Class A2, 4.940%,12/15/35 | | | 1,667,000 | | | | 1,700,508 | |
CS First Boston Mortgage Securities Corp., Series 2002-CP5, Class C, 5.230%, 12/15/35 | | | 1,400,000 | | | | 1,421,524 | |
GE Capital Commercial Mortgage Corp., Series 2002-3A, Class A2, 5.000%, 12/10/37 | | | 1,313,937 | | | | 1,340,237 | |
GE Capital Commercial Mortgage Corp., Series 2002-2A, Class A3, 5.349%, 08/11/36 | | | 2,565,615 | | | | 2,592,484 | |
GE Capital Commercial Mortgage Corp., Series 2002-1A, Class A3, 6.269%, 12/10/35 | | | 665,829 | | | | 668,480 | |
GMAC Commercial Mortgage Securities, Inc., Series 2003-C3, Class A3, 4.646%, 04/10/40 | | | 236,798 | | | | 239,030 | |
Greenwich Capital Commercial Funding Corp., Class A2, Series 2005-GG3, 4.305%, 08/10/42 | | | 611,773 | | | | 611,385 | |
JP Morgan Chase Commercial Mortgage Securities Corp., Series 2004-CBX, Class A4, 4.529%, 01/12/37 | | | 388,724 | | | | 388,621 | |
JP Morgan Chase Commercial Mortgage Securities Corp., Series 2005-CB12, Class A3A1, 4.824%, 09/12/37 | | | 179,027 | | | | 178,919 | |
JP Morgan Chase Commercial Mortgage Securities Corp., Series 2005-LDP4, Class A3A1, 4.871%, 10/15/42 | | | 2,184,699 | | | | 2,181,121 | |
JP Morgan Chase Commercial Mortgage Securities Corp., Series 2002-CIB5, Class A2, 5.161%, 10/12/37 | | | 3,515,000 | | | | 3,586,299 | |
JP Morgan Chase Commercial Mortgage Securities Corp., Series 2002-C1, Class A3, 5.376%, 07/12/37 | | | 2,708,587 | | | | 2,734,650 | |
JP Morgan Chase Commercial Mortgage Securities Corp., Series 2006-LDP6, Class A3B, 5.559%, 04/15/434 | | | 2,278,418 | | | | 2,276,795 | |
LB-UBS Commercial Mortgage Trust, Series 2004-C8, Class A5, 4.720%, 12/15/29 | | | 553,106 | | | | 553,503 | |
LB-UBS Commercial Mortgage Trust, Series 2008-C8, Class A3, 4.830%, 11/15/27 | | | 460,928 | | | | 467,548 | |
LB-UBS Commercial Mortgage Trust, Series 2002-C4, Class A5, 4.853%, 09/15/31 | | | 1,853,000 | | | | 1,882,077 | |
LB-UBS Commercial Mortgage Trust, Series 2005-C7, Class A2, 5.103%, 11/15/30 | | | 454,679 | | | | 454,488 | |
LB-UBS Commercial Mortgage Trust, Series 2002-C1, Class A4, 6.462%, 03/15/31 | | | 274,651 | | | | 274,953 | |
Merrill Lynch Mortgage Trust, Series 2004-MKB1, Class A3, 4.892%, 02/12/42 | | | 897,653 | | | | 907,760 | |
Morgan Stanley Dean Witter Capital I, Series 2003-HQ2, Class A2, 4.920%, 03/12/35 | | | 1,457,000 | | | | 1,499,361 | |
Morgan Stanley Dean Witter Capital I, Series 2002-IQ2, Class A4, 5.740%, 12/15/35 | | | 1,606,504 | | | | 1,623,640 | |
Salomon Brothers Mortgage Securities VII, Series 2002-KEY2, Class A3, 4.865%, 03/18/36 | | | 1,493,000 | | | | 1,506,713 | |
Washington Mutual, Class 2A3, Series 2005-AR2, 0.644%, 01/25/45, (01/25/12)3 | | | 654,314 | | | | 440,428 | |
Total Mortgage-Backed Securities (cost $38,663,391) | | | | | | | 37,030,577 | |
Asset-Backed Securities - 0.2% | | | | | | | | |
First Franklin Mortgage Loan Asset Backed Certificates, Series 2005-FF10, Class A4, 0.614%, 11/25/35, (01/25/12)3 | | | 840,485 | | | | 648,569 | |
Structured Asset Investment Loan Trust, 1.374%, 12/25/34, (01/25/12)3,7 | | | 235,318 | | | | 215,326 | |
Total Asset-Backed Securities (cost $1,076,281) | | | | | | | 863,895 | |
|
The accompanying notes are an integral part of these financial statements. 14 |
Managers Short Duration Government Fund
Schedule of Portfolio Investments (continued)
| | | | | | | | |
Security Description | | Principal Amount | | | Value | |
| | | | | | | | |
Short-Term Investments - 10.1% | | | | | | | | |
U.S. Government and Agency Discount Notes - 6.0% | | | | | | | | |
FHLMC, 0.034%, 05/18/122 | | $ | 4,000,000 | | | $ | 3,999,696 | |
FHLMC, 0.076%, 10/01/122 | | | 10,000,000 | | | | 9,993,200 | |
FNMA, 0.021%, 04/13/122,6 | | | 200,000 | | | | 199,989 | |
FNMA, 0.022%, 02/01/122,6 | | | 1,000,000 | | | | 999,984 | |
FNMA, 0.033%, 04/18/122 | | | 1,200,000 | | | | 1,199,929 | |
FNMA, 0.033%, 05/02/122 | | | 7,300,000 | | | | 7,299,511 | |
Total U.S. Government and Agency Discount Notes | | | | | | | 23,692,309 | |
| | |
| | | Shares | | | | |
Other Investment Companies - 4.1%1 | | | | | | | | |
Dreyfus Cash Management Fund, Institutional Class Shares, 0.05% | | | 16,255,466 | | | | 16,255,466 | |
Total Short-Term Investments (cost $39,944,058) | | | | | | | 39,947,775 | |
Total Investments - 101.5% (cost $396,549,076) | | | | | | | 399,000,715 | |
Other Assets, less Liabilities - (1.5)% | | | | | | | (5,987,212 | ) |
Net Assets - 100.0% | | | | | | $ | 393,013,503 | |
|
The accompanying notes are an integral part of these financial statements. 15 |
Managers Intermediate Duration Government Fund
Investment Manager’s Comments
The Managers Intermediate Duration Government Fund’s objective is to achieve total return in excess of the total return of the major market indices for mortgage-backed securities.
The Managers Intermediate Duration Government Fund seeks to achieve its objective by matching the duration, or interest-rate risk, of a portfolio that invests exclusively in mortgage-backed securities, as weighted in the major market indices for mortgage-backed securities. These indices currently include the Citigroup Mortgage Index and the Barclays Capital Mortgage Index, each of which includes all outstanding government sponsored fixed-rate mortgage-backed securities, weighted in proportion to their current market capitalization. The duration of these indices is generally similar to that of intermediate-term U.S. Treasury notes, and typically will range between three and five years.
Under normal circumstances, the Fund will invest at least 80% of its assets in debt securities issued by the U.S. Government, its agencies and instrumentalities, and synthetic instruments or derivatives, or securities having economic characteristics similar to such debt securities. The Fund’s benchmark is the Citigroup Mortgage Index.
The Portfolio Manager
Smith Breeden Associates, Inc.
Smith Breeden Associates, Inc. (“Smith Breeden”) is the subadvisor for the Fund. Smith Breeden, located at 280 South Mangum Street, Suite 301, Durham, NC, was founded in 1982. Smith Breeden is an investment management firm for a client base including corporate and public pension plans, central and supranational banks, endowments and foundations, private banks and financial institutions, insurance companies, and other institutional investors. Specializing in fixed income portfolios, the firm offers separate accounts, commingled funds, and serves as a subadvisor to ‘40 Act funds. As of December 31, 2011, Smith Breeden managed assets of approximately $6.2 billion.
Smith Breeden believes that innovative research provides critical insights into the fixed-income market. The firm’s experienced investment professionals apply these research insights to the management of investment portfolios designed to achieve their clients’ objectives. The key tenets of this market-tested investment philosophy are:
Over a market cycle, a portfolio of fixed income securities with wide risk-adjusted spreads produces an attractive total return in comparison to the market return.
The incremental return available from security selection and sector allocation, based on careful relative value analysis, quantitative research, and experienced market judgment, is more consistent than the incremental return from predicting the direction of interest rates or other macro-factor trading strategies.
Within the investment-grade fixed-income market, the spread sectors, e.g., corporate bonds, mortgage-backed securities (MBS), commercial MBS (CMBS), and asset-backed securities (ABS), will tend to outperform Treasury securities over a market cycle. The corporate, mortgage, CMBS, and ABS sectors also offer the greatest active management opportunity for adding value through security selection.
The portfolio management team at Smith Breeden Associates specializes in analyzing and investing in mortgage-backed securities. Through careful analysis and comparison of the characteristics of these securities, such as type of issuer, coupon, maturity, geographic structure, and historic and prospective prepayment rates, the team seeks to structure a portfolio that will outperform the Citigroup Mortgage Index. While the portfolio managers will purchase securities of any maturity or duration, they do not attempt to add value by actively positioning the interest-rate sensitivity of the portfolio. Instead, they typically manage the weighted average duration of the portfolio so that it is similar to that of the duration of the Citigroup Mortgage Index.
The ideal investment exhibits the following traits:
| | • | | Very high quality (AAA or Government) |
| | • | | Attractive value relative to other MBS opportunities |
The portfolio managers limit purchases to securities from the following asset classes:
| | • | | Securities issued directly or guaranteed by the U.S. Government or its agencies or instrumentalities |
| | • | | Mortgage-backed securities rated AAA by Standard & Poor’s Corporation (“S&P”) or Aaa by Moody’s Investors Service, Inc. (“Moody’s”) |
| | • | | Securities fully collateralized by assets in either of the above classes |
| | • | | Assets that would qualify as liquidity items under federal regulations (which may change from time to time) if held by a commercial bank or savings institution; and hedge instruments |
| | • | | Stripped mortgage-backed securities, which may only be used for risk management purposes |
The investment team will make a sell decision when:
| | • | | They no longer view the bonds as attractive |
| | • | | They need to maintain the portfolio’s target duration |
| | • | | They deem it necessary for portfolio allocation purposes |
The Year in Review
During the year ended December 31, 2011, the Fund returned 5.88%, compared to 6.38% for its benchmark, the Citigroup Mortgage Index (“Citi Mortgage”).
Recent years have been marked by historic market moves, a credit and liquidity crisis, massive deleveraging, and unprecedented government intervention. Investment decisions are being driven more by new policies and macro developments, rather than by relative value. As a result, risk aversion and uncertainty about economic outcomes drove capital into safe havens and investors into higher-quality spread product. Overall, 2011 exhibited slow economic growth and periodic bouts of volatility as the markets gradually continued to heal.
Agency fixed-rate MBS started the year off in a strong manner, supported by a steep yield curve and solid demand from banks and REITs, which accounted for approximately $40 billion in MBS demand in the first quarter alone. While the year began with higher rates, it ended the quarter with only marginally higher rates following a mid-March drop on the news of the natural disaster in Japan. Prepayment levels remain contained on weakness in
Managers Intermediate Duration Government Fund
Investment Manager’s Comments (continued)
housing and employment reports. While senior CMBS continued its tightening trend from 2010, investors continued to show risk appetite for high-quality paper with low credit risk. Overall, CMBS spreads tightened on the quarter, despite retrenching somewhat on the tsunami and earthquake news.
While the second quarter marked another strong quarter for the Fund, the markets were tempered by more pessimistic prospects for a U.S. recovery, a resurgence of credit concerns in Europe, and political uprisings in the Middle East and North Africa. Overall MBS performance was mixed, but the asset class held its own relative to more credit-sensitive spread products. Strong technicals abetted 15-year MBS and GNMA MBS on continued demand from banks and REITs, and higher coupon
30-year conventional MBS benefitted from a slower prepay environment. However, lower coupon 15-year conventionals struggled under increased production and lack of investor interest. During the quarter, risk aversion seemed to settle in as CMBS spreads widened, primarily affecting the tranches with less credit support. While the sector overall underperformed duration-matched swaps, the Fund’s higher-quality holdings still added to performance on the quarter.
Macro concerns in the third quarter kept risk appetite at bay, and weighed on spread product in general. This quarter mirrored that of the third quarter in 2010 with lower Treasury yields and mortgage rates as fears of a double dip recession resurfaced. The MBS sector supplied interesting developments throughout the quarter. The concept of a par coupon in MBS became somewhat of a misnomer, as production coupons finished September trading above par with the FNMA 5% approaching $105. In a move unanticipated by the markets, the Fed announced it would resume purchases of agency MBS with funds from principal repayments on its existing portfolio. Reaction was mixed, with the lower coupon 30-year MBS benefitting the most, given expected future purchases. REIT demand subsided, as investors in general became more concerned over policy risk. CMBS underperformed Treasuries on poor economic news, and we added some shorter-dated paper on this weakness.
Fourth-quarter macro news tended to influence the markets which vacillated between “risk on” and “risk off” postures. While Europe sovereign debt matters continued to dominate headlines, investors also noticed news items surrounding government-sponsored refinancing. Although the news was largely discounted by the market, it provides another example of the impact of policy changes and government intervention in the MBS market. The Fund finished the year strong as rates were modestly lower, and risk appetite for higher-quality paper, particularly in securitized sectors such as CMBS, started to return somewhat towards year-end.
Most of the Portfolio outperformance for 2011 was attributed to agency MBS and CMBS exposure. Agency adjustable-rate (ARMs), Interest-only strips (IOs), and Collateralized Mortgage Obligations (CMOs) were beneficiaries of lower realized volatility, prepayments, and mortgage rates. Non-agency FRMs and ARMs underperformed
given mid-year selling from Maiden Lane holdings and a general lack of risk appetite for housing-related credit. Despite spread widening throughout the majority of the year, the Fund’s CMBS holdings outperformed on stronger appetite for paper at the top of the capital structure.
Derivatives such as financial futures, options, and mortgage derivatives are used for portfolio duration and convexity risk management. Although we prefer to have the flexibility to use the largest array of instruments possible, derivatives are not crucial to our ability to add value.
Looking Forward
On December 31, 2011, the Fund held the bulk of its exposure in 15- and 30-year agency FRMs, although it maintained an under-weight versus the benchmark. We decreased the allocation to 15- and 30-year agency FRMs by approximately 8% during the year. In addition, over 8% of capital was allocated to CMBS, which are not included in the Citigroup Mortgage Index. The total allocation to CMBS decreased by 2% of capital during the year. The total allocation to adjustable-rate mortgages (ARMs) dropped from nearly 11% to 8%. The Fund also maintained its small allocation to Interest-Only (IO) strips, CMOs, and Treasury Inflation-Protected Securities (TIPS). We believe that high-quality spread assets that are held in the Portfolio are likely to continue experiencing positive performance.
While the Fund started off with a slightly longer duration, we ended the year slightly short the Index due to the current low absolute rate levels. We decreased leverage in the Fund as some CMBS and non-agency positions paid down, and some down-in-coupon trades reduced leverage while maintaining spread duration.
Smith Breeden believes that the agency MBS market is starting off 2012 with fairly attractive spreads and good fundamentals. We do not anticipate that expected supply changes in the sector will pressure spreads, and expect non-U.S. investors, banks, and possibly a return of REITs to continue as bulk buyers of the paper. We believe the prepay environment should be positive for MBS investors but government action may influence certain homeowner segments. We will monitor potential policy changes and their effect on MBS, and adjust our holdings as needed. We expect spread volatility in agency MBS will remain somewhat elevated, providing a good environment for active management and security selection opportunities.
This commentary reflects the viewpoints of Smith Breeden Associates, Inc., as of January 23, 2012.
Cumulative Total Return Performance
Managers Intermediate Duration Government Fund’s cumulative total return is based on the daily change in net asset value (NAV), and assumes that all distributions were reinvested. The chart illustrates the performance of a hypothetical $10,000 investment made in the Fund on December 31, 2001 to a $10,000 investment made in
Managers Intermediate Duration Government Fund
Investment Manager’s Comments (continued)
Cumulative Total Return Performance (continued)
the Citigroup Mortgage Index for the same time period. Figures include reinvestment of capital gains and dividends. The listed returns for the Fund are net of expenses and the returns for the index exclude expenses. Total returns for the Fund would have been lower had certain expenses not been reduced.
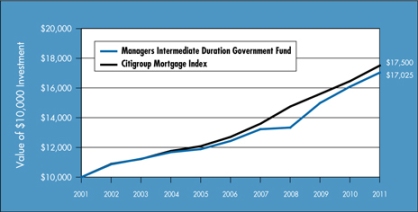
The table below shows the average annual total returns for the Managers Intermediate Duration Government Fund and the Citigroup Mortgage Index from December 31, 2001 through December 31, 2011.
| | | | | | | | | | | | |
Average Annual Total Returns1 | | 1 Year | | | 5 Years | | | 10 Years | |
Managers Intermediate Duration Government Fund 2,3,4,5 | | | 5.88 | % | | | 6.49 | % | | | 5.47 | % |
Citigroup Mortgage Index6 | | | 6.38 | % | | | 6.62 | % | | | 5.76 | % |
The performance data shown represents past performance. Past performance is not a guarantee of future results. Current performance may be lower or higher than the performance data quoted. The investment return and the principal value of an investment will fluctuate so that an investor’s shares, when redeemed, may be worth more or less than their original cost. For performance information through the most recent month end please call (800) 835-3879 or visit our Web site at www.managersinvest.com.
In choosing a Fund, investors should carefully consider the amount they plan to invest, their investment objectives, the Fund’s investment objectives, risks, charges and expenses before investing. For this and other information, please call (800) 835-3879 or visit www.managersinvest.com for a free prospectus. Read it carefully before investing or sending money. Distributed by Managers Distributors, Inc., member FINRA.
| | 1 | Total return equals income yield plus share price change and assumes reinvestment of all dividends and capital gain distributions. Returns are net of fees and may reflect offsets of Fund expenses as described in the Prospectus. No adjustment has been made for taxes payable by shareholders on their reinvested dividends and capital gain distributions. Returns for periods greater than one year are the average annual return. The listed returns on the Fund are net of expenses and based on the published NAV as of December 31, 2011. All returns are in U.S. dollars ($). |
| | 2 | From time to time, the Fund’s advisor has waived its fees and/or absorbed Fund expenses, which has resulted in higher returns. |
| | 3 | The Fund is subject to the risks associated with investments in debt securities, such as default risk and fluctuations in the perception of the debtors’ ability to pay their creditors, and changing interest rate risk. |
|
4 The Fund may use derivative instruments for hedging purposes or as part of its investment strategy. There is a risk that a derivative intended as a hedge may not perform as expected. The main risk with derivatives is that some types can amplify a gain or loss, potentially earning or losing substantially more money than the actual cost of the derivative or that the counterparty may fail to honor its contract terms, causing a loss for the Fund. Use of these instruments may also involve certain costs and risks such as liquidity risk, interest rate risk, market risk, credit risk, management risk and the risk that a fund could not close out a position when it would be most advantageous to do so. 5 Many bonds have call provisions which allow the debtors to pay them back before maturity. This is especially true with mortgage securities, which can be paid back anytime. Typically debtors prepay their debt when it is to their advantage (when interest rates drop making a new loan at current rates more attractive), and thus likely to the disadvantage of bondholders, who may have to reinvest prepayment proceeds in securities with lower yields. Prepayment risk will vary depending on the provisions of the security and current interest rates relative to the interest rate of the debt. 6 The Citigroup Mortgage Index includes all outstanding government sponsored fixed-rate mortgage-backed securities, weighted in proportion to their current market capitalization. The Index reflects no deductions for fees, expenses, or taxes. The Citigroup Mortgage Index is unmanaged, is not available for investment, and does not incur expenses. Not FDIC insured, nor bank guaranteed. May lose value. |
18
Managers Intermediate Duration Government Fund
Fund Snapshots
December 31, 2011
Portfolio Breakdown
| | | | |
Portfolio Breakdown | | Managers Intermediate Duration
Government Fund** | |
U.S. Government and Agency Obligations | | | 104.6 | % |
Mortgage-Backed Securities | | | 11.9 | % |
Other Assets and Liabilities | | | (16.5 | %) |
| ** | As a percentage of net assets |
Top Ten Holdings
| | | | |
Security Name | | % of
Net Assets | |
FNMA, 5.000%, TBA* | | | 12.1 | % |
FNMA, 4.000%, TBA* | | | 10.9 | |
FHLMC, 4.500%, TBA | | | 6.7 | |
FHLMC, 5.000%, TBA | | | 3.2 | |
FHLMC, 5.500%, TBA* | | | 3.1 | |
FNMA, 6.000%, TBA* | | | 2.7 | |
GNMA, 4.500%, 05/15/41* | | | 2.4 | |
FHLMC, 5.655%, 01/01/36* | | | 2.4 | |
FHLMC Gold Pool, 5.500%, 06/01/35* | | | 2.2 | |
FNMA, 4.500%, 10/01/40* | | | 2.1 | |
| | | | |
Top Ten as a Group | | | 47.8 | % |
| | | | |
| * | Top Ten Holding at June 30, 2011 |
|
| Any sectors, industries, or securities discussed should not be perceived as investment recommendations. Mention of a specific security should not be considered a recommendation to buy or solicitation to sell that security. Specific securities mentioned in this report may have been sold from the Fund’s portfolio of investments by the time you receive this report. |
19
Managers Intermediate Duration Government Fund
Schedule of Portfolio Investments
December 31, 2011
| | | | | | | | |
Security Description | | Principal Amount | | | Value | |
| | | | | | | | |
U.S. Government and Agency Obligations - 104.6%8 | | | | | | | | |
Federal Home Loan Mortgage Corporation - 34.8% | | | | | | | | |
FHLMC, 2.349%, 11/01/33, (12/01/12)3 | | $ | 1,587,440 | | | $ | 1,660,791 | |
FHLMC, 4.000%, TBA | | | 1,000,000 | | | | 1,048,750 | |
FHLMC, 4.500%, 04/01/35 to 09/01/41 | | | 2,988,506 | | | | 3,183,132 | |
FHLMC, 4.500%, TBA | | | 11,200,000 | | | | 11,866,749 | |
FHLMC, 5.000%, 05/01/18 to 07/01/41 | | | 1,875,382 | | | | 2,020,157 | |
FHLMC, 5.000%, 11/01/357 | | | 2,537,223 | | | | 2,754,562 | |
FHLMC, 5.000%, TBA | | | 5,300,000 | | | | 5,695,015 | |
FHLMC, 5.454%, 02/01/37, (03/01/12)3 | | | 112,050 | | | | 118,144 | |
FHLMC, 5.500%, 11/01/17 to 01/01/19 | | | 788,440 | | | | 860,067 | |
FHLMC, 5.500%, 09/01/337 | | | 777,360 | | | | 847,228 | |
FHLMC, 5.500%, 05/01/347 | | | 645,107 | | | | 711,354 | |
FHLMC, 5.500%, TBA | | | 5,100,000 | | | | 5,533,500 | |
FHLMC, 5.655%, 01/01/36, (01/01/13)3,7 | | | 3,954,417 | | | | 4,227,225 | |
FHLMC, 6.000%, 02/01/22 to 03/01/22 | | | 619,509 | | | | 674,806 | |
FHLMC, 7.500%, 07/01/347 | | | 1,922,306 | | | | 2,284,764 | |
FHLMC Gold Pool, 4.500%, 05/01/34 to 05/01/35 | | | 519,728 | | | | 552,277 | |
FHLMC Gold Pool, 4.500%, 10/01/347 | | | 1,227,901 | | | | 1,305,332 | |
FHLMC Gold Pool, 4.500%, 04/01/357 | | | 1,770,453 | | | | 1,880,990 | |
FHLMC Gold Pool, 4.500%, 10/01/357 | | | 1,376,666 | | | | 1,462,617 | |
FHLMC Gold Pool, 4.500%, 11/01/357 | | | 1,190,121 | | | | 1,264,426 | |
FHLMC Gold Pool, 5.000%, 10/01/18 to 08/01/19 | | | 323,059 | | | | 350,205 | |
FHLMC Gold Pool, 5.500%, 10/01/33 to 05/01/38 | | | 1,640,478 | | | | 1,788,854 | |
FHLMC Gold Pool, 5.500%, 02/01/357 | | | 1,075,730 | | | | 1,171,070 | |
FHLMC Gold Pool, 5.500%, 06/01/357 | | | 3,598,060 | | | | 3,919,202 | |
FHLMC Gold Pool, 5.500%, 06/01/357 | | | 1,133,153 | | | | 1,234,292 | |
FHLMC Gold Pool, 5.500%, 12/01/387 | | | 509,198 | | | | 555,282 | |
FHLMC Gold Pool, 6.000%, 09/01/17 to 05/01/22 | | | 705,853 | | | | 769,406 | |
FHLMC Gold Pool, 6.000%, 10/01/217 | | | 1,858,763 | | | | 2,025,112 | |
FHLMC Structured Pass Through Securities, Series T-51, Class 2A, 7.500%, 08/25/424 | | | 237,067 | | | | 278,933 | |
Total Federal Home Loan Mortgage Corporation | | | | | | | 62,044,242 | |
Federal National Mortgage Association - 53.9% | | | | | | | | |
FNMA, 0.614%, 11/25/30, (01/25/12)3,7 | | | 1,698,623 | | | | 1,695,640 | |
FNMA, 0.694%, 03/25/35, (01/25/12)3,7 | | | 977,831 | | | | 970,217 | |
FNMA, 1.947%, 07/01/33, (06/01/12)3 | | | 506,849 | | | | 524,791 | |
FNMA, 2.034%, 06/01/34, (05/01/12)3,7 | | | 1,372,204 | | | | 1,447,235 | |
FNMA, 2.182%, 02/01/36, (02/01/12)3 | | | 139,533 | | | | 145,313 | |
FNMA, 2.418%, 08/01/34, (06/01/12)3 | | | 642,329 | | | | 676,629 | |
FNMA, 2.458%, 06/01/34, (06/01/12)3,7 | | | 1,451,048 | | | | 1,533,633 | |
FNMA, 2.686%, 06/01/37, (05/01/12)3 | | | 576,924 | | | | 614,977 | |
|
The accompanying notes are an integral part of these financial statements. 20 |
Managers Intermediate Duration Government Fund
Schedule of Portfolio Investments (continued)
| | | | | | | | |
Security Description | | Principal Amount | | | Value | |
| | | | | | | | |
Federal National Mortgage Association - 53.9% (continued) | | | | | | | | |
FNMA, 3.000%, TBA | | $ | 2,000,000 | | | $ | 2,065,312 | |
FNMA, 4.000%, 03/01/25 to 10/01/41 | | | 3,075,047 | | | | 3,241,960 | |
FNMA, 4.000%, TBA | | | 18,400,000 | | | | 19,344,875 | |
FNMA, 4.500%, 10/01/406 | | | 3,432,984 | | | | 3,670,978 | |
FNMA, 4.500%, 11/01/406 | | | 2,356,214 | | | | 2,519,567 | |
FNMA, 4.500%, 05/01/41 to 12/01/41 | | | 8,423,334 | | | | 8,980,632 | |
FNMA, 5.000%, 06/01/18 to 08/01/41 | | | 4,493,160 | | | | 4,864,821 | |
FNMA, 5.000%, 02/01/366 | | | 2,091,298 | | | | 2,260,963 | |
FNMA, 5.000%, TBA | | | 19,900,000 | | | | 21,498,218 | |
FNMA, 5.500%, 03/01/17 to 07/01/38 | | | 4,005,925 | | | | 4,377,188 | |
FNMA, 5.500%, 01/01/196 | | | 360,212 | | | | 391,764 | |
FNMA, 5.500%, 11/01/346 | | | 1,089,594 | | | | 1,190,420 | |
FNMA, 6.000%, 08/01/17 to 11/01/22 | | | 3,008,447 | | | | 3,205,780 | |
FNMA, 6.000%, 06/01/396 | | | 1,584,861 | | | | 1,745,879 | |
FNMA, 6.000%, TBA | | | 4,300,000 | | | | 4,734,703 | |
FNMA, 6.500%, 11/01/28 to 07/01/32 | | | 296,989 | | | | 332,399 | |
FNMA, 7.000%, 11/01/22 | | | 1,716,965 | | | | 1,892,217 | |
FNMA, Series 1994-55, Class H, 7.000%, 03/25/247 | | | 1,610,028 | | | | 1,839,868 | |
FNMA Whole Loan, Series 2003-W4, Class 4A, 7.271%, 10/25/424 | | | 142,464 | | | | 165,181 | |
Total Federal National Mortgage Association | | | | | | | 95,931,160 | |
Government National Mortgage Association - 13.8% | | | | | | | | |
GNMA, 3.000%, 03/20/16, (04/01/12)3 | | | 13,602 | | | | 14,204 | |
GNMA, 3.000%, 08/20/17 to 08/20/18, (10/01/12)3 | | | 84,046 | | | | 87,737 | |
GNMA, 3.000%, 11/20/17 to 12/20/17, (01/01/13)3 | | | 166,508 | | | | 173,403 | |
GNMA, 4.375%, 06/20/16 to 05/20/21, (07/01/12)3 | | | 47,988 | | | | 49,787 | |
GNMA, 4.500%, 06/15/39 to 05/15/41 | | | 2,371,631 | | | | 2,591,691 | |
GNMA, 4.500%, 09/15/407 | | | 935,228 | | | | 1,026,609 | |
GNMA, 4.500%, 05/15/417 | | | 3,889,716 | | | | 4,270,677 | |
GNMA, 5.000%, 09/15/397 | | | 842,712 | | | | 938,333 | |
GNMA, 5.000%, 09/15/397 | | | 849,975 | | | | 946,420 | |
GNMA, 5.000%, 10/15/397 | | | 884,974 | | | | 981,242 | |
GNMA, 5.000%, 10/15/39 to 09/15/41 | | | 2,905,708 | | | | 3,229,903 | |
GNMA, 5.000%, 10/15/397 | | | 1,657,213 | | | | 1,837,487 | |
GNMA, 5.000%, 11/15/397 | | | 1,752,329 | | | | 1,951,163 | |
GNMA, 5.000%, 12/15/397 | | | 1,830,666 | | | | 2,029,808 | |
GNMA, 5.500%, 10/15/397 | | | 3,054,968 | | | | 3,443,045 | |
GNMA, 5.500%, 11/15/397 | | | 877,263 | | | | 988,703 | |
GNMA, 7.500%, 09/15/28 | | | 19,479 | | | | 19,988 | |
GNMA, 7.500%, 11/15/31 | | | 5,377 | | | | 6,092 | |
Total Government National Mortgage Association | | | | | | | 24,586,292 | |
|
The accompanying notes are an integral part of these financial statements. 21 |
Managers Intermediate Duration Government Fund
Schedule of Portfolio Investments (continued)
| | | | | | | | |
Security Description | | Principal Amount | | | Value | |
| | | | | | | | |
Interest Only Strips - 2.1% | | | | | | | | |
FHLMC, 4.500%, 09/15/35 | | $ | 403,053 | | | $ | 54,846 | |
FHLMC, 5.000%, 05/15/17 to 04/15/20 | | | 670,043 | | | | 62,203 | |
FHLMC, 6.000%, 05/01/315 | | | 4,269 | | | | 735 | |
FHLMC, 6.422%, 11/15/18, (01/15/12)3 | | | 444,195 | | | | 27,873 | |
FHLMC, 6.822%, 11/15/30, (01/15/12)3 | | | 57,778 | | | | 1,890 | |
FHLMC, 6.922%, 03/15/32, (01/15/12)3 | | | 782,918 | | | | 125,211 | |
FHLMC, 7.622%, 06/15/31, (01/15/12)3 | | | 38,774 | | | | 7,013 | |
FHLMC, Series 3685, Class EI, 5.000%, 03/15/19 | | | 1,629,848 | | | | 169,441 | |
FHLMC, Series 3659, Class IE, 5.000%, 03/15/19 | | | 722,971 | | | | 71,831 | |
FHLMC, Series 3731, Class IO, 5.000%, 07/15/19 | | | 738,714 | | | | 62,658 | |
FHLMC, Series 2637, Class SI, 5.722%, 06/15/18, (01/25/12)3 | | | 326,311 | | | | 31,038 | |
FHLMC, Series 2965, Class SA, 5.772%, 05/15/32, (01/25/12)3 | | | 684,744 | | | | 92,308 | |
FHLMC, Series 3606, Class SN, 5.972%, 12/15/39, (01/15/12)3 | | | 734,120 | | | | 118,905 | |
FHLMC, Series 3424, Class XI, 6.292%, 05/15/36, (01/15/12)3 | | | 468,583 | | | | 83,396 | |
FHLMC, Series 2980, Class SL, 6.422%, 11/15/34, (01/25/12)3 | | | 382,670 | | | | 67,316 | |
FHLMC, Series 2922, Class SE, 6.472%, 02/15/35, (01/15/12)3 | | | 274,207 | | | | 51,001 | |
FHLMC, Series 2772, Class KS, 6.902%, 06/15/22, (01/15/12)3 | | | 118,905 | | | | 4,490 | |
FHLMC, Series 3489, Class SD, 7.522%, 06/15/32, (01/15/12)3 | | | 374,452 | | | | 69,834 | |
FNMA, 4.000%, 09/01/33 to 09/01/34 | | | 601,909 | | | | 43,278 | |
FNMA, 4.500%, 09/01/33 | | | 233,726 | | | | 25,483 | |
FNMA, 5.000%, 05/01/34 to 12/01/35 | | | 1,013,315 | | | | 141,260 | |
FNMA, 7.000%, 04/01/235 | | | 178,008 | | | | 38,341 | |
FNMA, 7.000%, 06/01/235 | | | 19,281 | | | | 3,593 | |
FNMA, Series 2011-88, Class WI, 3.500%, 09/25/26 | | | 755,748 | | | | 103,155 | |
FNMA, Series 2010-95, Class DI, 4.500%, 11/25/20 | | | 999,197 | | | | 87,972 | |
FNMA, Series 2008-86, Class IO, 4.500%, 03/25/23 | | | 1,415,139 | | | | 129,226 | |
FNMA, Series 2011-69, Class AI, 5.000%, 05/25/18 | | | 2,246,335 | | | | 172,191 | |
FNMA, Series 2010-65, Class IO, 5.000%, 09/25/20 | | | 1,649,257 | | | | 200,263 | |
FNMA, Series 2010-29, Class KJ, 5.000%, 12/25/21 | | | 2,380,070 | | | | 215,923 | |
FNMA, Series 2010-37, Class GI, 5.000%, 04/25/25 | | | 1,649,591 | | | | 124,039 | |
FNMA, Series 2010-121, Class IO, 5.000%, 10/25/25 | | | 646,649 | | | | 63,349 | |
FNMA, Series 2006-3, Class SA, 5.856%, 03/25/36, (01/25/12)3 | | | 419,870 | | | | 59,397 | |
FNMA, Series 2003-73, Class SM, 6.306%, 04/25/18, (01/25/12)3 | | | 428,657 | | | | 45,617 | |
FNMA, Series 2005-45, Class SR, 6.426%, 06/25/35, (01/25/12)3 | | | 418,886 | | | | 73,085 | |
FNMA, Series 2005-12, Class SC, 6.456%, 03/25/35, (01/25/12)3 | | | 387,950 | | | | 64,132 | |
FNMA, Series 2008-34, Class SM, 6.456%, 05/25/38, (01/25/12)3 | | | 853,418 | | | | 156,534 | |
FNMA, Series 2005-65, Class KI, 6.706%, 08/25/35, (01/25/12)3 | | | 1,862,989 | | | | 334,440 | |
FNMA, Series 2004-49, Class SQ, 6.756%, 07/25/34, (01/25/12)3 | | | 220,253 | | | | 38,640 | |
FNMA, Series 2004-64, Class SW, 6.756%, 08/25/34, (01/25/12)3 | | | 1,010,932 | | | | 180,116 | |
FNMA, Series 2004-51, Class SX, 6.826%, 07/25/34, (01/25/12)3 | | | 422,957 | | | | 61,305 | |
GNMA, Series 2010-111, Class BI, 2.000%, 09/16/13 | | | 2,259,551 | | | | 62,375 | |
|
The accompanying notes are an integral part of these financial statements. 22 |
Managers Intermediate Duration Government Fund
Schedule of Portfolio Investments (continued)
| | | | | | | | |
Security Description | | Principal Amount | | | Value | |
| | | | | | | | |
Interest Only Strips - 2.1% (continued) | | | | | | | | |
GNMA, Series 2011-94, Class IS, 6.417%, 06/16/36, (01/16/12)3 | | $ | 461,565 | | | $ | 92,016 | |
GNMA, Series 2011-32, Class KS, 11.535%, 06/16/34, (01/16/12)3 | | | 499,667 | | | | 168,567 | |
Total Interest Only Strips | | | | | | | 3,786,286 | |
Total U.S. Government and Agency Obligations (cost $180,617,507) | | | | | | | 186,347,980 | |
Mortgage-Backed Securities - 11.9% | | | | | | | | |
American Home Loan Investment Trust, 2.801%, 06/25/45, (02/01/12)3 | | | 1,445,704 | | | | 1,010,375 | |
American Home Mortgage Assets, Series 2005-1, Class 1A1, 2.735%, 11/25/35, (2/25/12)3 | | | 96,829 | | | | 51,154 | |
American Home Mortgage Investment Trust, 2.294%, 02/25/45, (02/01/12)3 | | | 669,344 | | | | 491,682 | |
American Home Mortgage Investment Trust, 2.801%, 04/25/44, (02/01/12) | | | 160,382 | | | | 110,790 | |
American Home Mortgage Investment Trust, 2.801%, 06/25/45, (02/01/12)3 | | | 85,609 | | | | 73,745 | |
Banc of America Commercial Mortgage, Inc., Series 2006-6, Class A2, 5.309%, 10/10/45 | | | 1,318,758 | | | | 1,317,439 | |
Bank of America Funding Corp., Series 2004-B, Class 1A2, 2.735%, 12/20/344 | | | 185,399 | | | | 109,584 | |
Bear Stearns Alt-A Trust, Mortgage Pass-Through Certificates, Series 2005-3,
2.675%, 04/25/354 | | | 177,348 | | | | 114,887 | |
Bear Stearns Commercial Mortgage Securities, Inc., Series 2002-PBW1, Class A2,
4.720%, 11/11/354 | | | 1,745,980 | | | | 1,764,308 | |
Bear Stearns Commercial Mortgage Securities, Inc., Series 2005-PWR9, Class A3,
4.868%, 09/11/42 | | | 1,000,000 | | | | 1,066,942 | |
Bear Stearns Commercial Mortgage Securities, Inc., Series 2006-PW11, Class A2,
5.393%, 03/11/394 | | | 242,032 | | | | 241,919 | |
Bear Stearns Commercial Mortgage Securities Trust, Series 2006-PW13, Class A2,
5.426%, 09/11/41 | | | 56,842 | | | | 57,862 | |
Citigroup Commercial Mortgage Trust, Series 2008-C7, Class A3,
6.072%, 12/10/494 | | | 1,148,000 | | | | 1,195,179 | |
Citigroup/Deutsche Bank Commercial Mortgage Trust, Series 2006-CD3, Class A4,
5.658%, 10/15/48 | | | 2,000,000 | | | | 2,176,100 | |
Countrywide Alternative Loan Trust, 0.594%, 05/25/35, (01/25/12)3 | | | 464,596 | | | | 417,230 | |
Countrywide Home Loans, Inc., Series 2004-R2, Class 1AF1,
0.714%, 11/25/34, (01/25/12) (a)3 | | | 266,783 | | | | 219,283 | |
Countrywide Home Loans, Inc., Series 2005-HYB8, Class 1A1, 2.571%, 12/20/354 | | | 141,582 | | | | 98,599 | |
Countrywide Home Loans, Inc., Series 2005-HYB2, Class 1A4, 2.791%, 05/20/354 | | | 138,901 | | | | 88,785 | |
CS First Boston Mortgage Securities Corp., Series 2005-C3, Class A3, 4.645%, 07/15/37 | | | 2,000,000 | | | | 2,084,476 | |
CS First Boston Mortgage Securities Corp., Series 2002-CP5, Class A2, 4.940%, 12/15/35 | | | 1,734,000 | | | | 1,768,855 | |
GE Capital Commercial Mortgage Corp., Series 2002-2A, Class A3, 5.349%, 08/11/36 | | | 287,169 | | | | 290,176 | |
GMAC Commercial Mortgage Securities, Inc., Series 2005-C1, Class A3, 4.538%, 05/10/43 | | | 345,694 | | | | 348,145 | |
Goldman Sachs Mortgage Loan Trust, Series 2005-RP2, Class 1AF,
0.644%, 03/25/35, (01/25/12) (a)3 | | | 276,217 | | | | 223,049 | |
Greenwich Capital Commercial Funding Corp., Class A2, Series 2005-GG3,
4.305%, 08/10/42 | | | 194,865 | | | | 194,741 | |
GSR Mortgage Loan Trust, Series 2004-5, Class 1A3, 1.860%, 05/25/34, (02/01/12)3 | | | 61,497 | | | | 46,302 | |
Harborview Mortgage Loan Trust, 2.281%, 11/19/344 | | | 106,538 | | | | 71,241 | |
JP Morgan Chase Commercial Mortgage Securities Corp., Series 2004-CBX,
Class A4, 4.529%, 01/12/37 | | | 103,857 | | | | 103,830 | |
JP Morgan Chase Commercial Mortgage Securities Corp., Series 2006-LDP6,
Class A3B, 5.559%, 04/15/434 | | | 1,496,886 | | | | 1,495,820 | |
LB-UBS Commercial Mortgage Trust, Series 2004-C8, Class A5, 4.720%, 12/15/29 | | | 325,233 | | | | 325,466 | |
LB-UBS Commercial Mortgage Trust, Series 2005-C7, Class A2, 5.103%, 11/15/30 | | | 265,384 | | | | 265,273 | |
Master Alternative Loans Trust, 6.000%, 01/25/357 | | | 870,146 | | | | 849,595 | |
Morgan Stanley Mortgage Loan Trust, 6.012%, 08/25/354 | | | 1,341,593 | | | | 1,150,232 | |
Structured Asset Securities Corp., Series 2005-RF1, Class A,
0.644%, 03/25/35, (01/25/12) (a)3 | | | 331,669 | | | | 255,846 | |
Wells Fargo Mortgage Backed Securities Trust, Series 2007-16, Class 1A1,
6.000%, 12/28/37 | | | 1,076,338 | | | | 1,104,192 | |
Total Mortgage-Backed Securities (cost $21,152,513) | | | | | | | 21,183,102 | |
|
The accompanying notes are an integral part of these financial statements. 23 |
Managers Intermediate Duration Government Fund
Schedule of Portfolio Investments (continued)
| | | | | | | | |
Security Description | | Principal Amount | | | Value | |
| | | | | | | | |
Short-Term Investments - 24.9% | | | | | | | | |
U.S. Government and Agency Discount Notes - 0.1% | | | | | | | | |
FNMA, 0.071%, 07/16/122,6 | | $ | 100,000 | | | $ | 99,973 | |
| | |
| | | Shares | | | | |
Other Investment Companies - 24.8%1 | | | | | | | | |
Dreyfus Cash Management Fund, Institutional Class Shares, 0.05% | | | 15,154,655 | | | | 15,154,655 | |
JPMorgan Liquid Assets Money Market Fund, Capital Shares, 0.14% | | | 29,076,866 | | | | 29,076,866 | |
Total Other Investment Companies | | | | | | | 44,231,521 | |
Total Short-Term Investments (cost $44,331,447) | | | | | | | 44,331,494 | |
Total Investments - 141.4% (cost $246,101,467) | | | | | | | 251,862,576 | |
Other Assets, less Liabilities - (41.4)% | | | | | | | (73,775,281 | ) |
Net Assets - 100.0% | | | | | | $ | 178,087,295 | |
|
The accompanying notes are an integral part of these financial statements. 24 |
Notes to Schedules of Portfolio Investments
The following footnotes and abbreviations are to read in conjunction with the Schedules of Portfolio Investments previously presented in this report.
At December 31, 2011, the approximate cost of securities for Federal income tax purposes and the gross aggregate unrealized appreciation and depreciation based on tax cost were approximately as follows:
| | | | | | | | | | | | | | | | |
Fund | | Cost | | | Appreciation | | | Depreciation | | | Net | |
Managers Short Duration Government | | $ | 396,550,352 | | | $ | 5,755,208 | | | ($ | 3,304,845 | ) | | $ | 2,450,363 | |
Managers Intermediate Duration Government | | | 246,101,467 | | | | 7,886,117 | | | | (2,125,008 | ) | | | 5,761,109 | |
| | (a) | Security exempt from registration under Rule 144A of the Securities Act of 1933. These securities may be resold in transactions exempt from registration, normally to qualified buyers. At December 31, 2011, the value of these securities amounted to the following: |
| | | | | | | | |
Fund | | Value | | | % of Net Assets | |
Managers Intermediate Duration Government | | $ | 698,178 | | | | 0.4 | % |
| | 1 | Yield shown for each investment company represents its December 31, 2011, seven-day average yield, which refers to the sum of the previous seven days’ dividends paid, expressed as an annual percentage. |
| | 2 | Percentage rate listed represents yield to maturity at December 31, 2011. |
| | 3 | Floating Rate Security. The rate listed is as of December 31, 2011. Date in parentheses represents the securities next coupon rate reset. |
| | 4 | Variable Rate Security. The rate listed is as of December 31, 2011, and is periodically reset subject to terms and conditions set forth in the debenture. |
| | 5 | Illiquid Security: A security not readily convertible into cash such as a stock, bond or commodity that is not actively traded and would be difficult to sell in a current sale. The Funds may not invest more than 15% of their net assets in illiquid securities. All securities are valued on the basis of valuations provided by dealers or independent pricing services. Illiquid securities market value at December 31, 2011, amounted to the following: |
| | | | | | | | |
Fund | | Value | | | % of Net Assets | |
Managers Short Duration Government | | $ | 386,887 | | | | 0.1 | % |
Managers Intermediate Duration Government | | | 42,669 | | | | 0.0 | %# |
| | # | Rounds to less than 0.01%. |
| | 6 | Security pledged to cover margin requirements for open futures positions at December 31, 2011. |
| | 7 | All or part of the security has been segregated for delayed delivery transactions. |
| | 8 | Mortgage-backed obligations and other assets are subject to principal paydowns as a result of prepayments or refinancing of the underlying mortgage instruments. As a result, the average life may be substantially less than the original maturity. The interest rate shown is the rate in effect at December 31, 2011. |
The following table summarizes the inputs used to value the Funds’ net assets by the fair value hierarchy levels as of December 31, 2011: (See Note 1(a) in the Notes to Financial Statements.)
| | | | | | | | | | | | | | | | |
| | | Quoted Prices in Active Markets
for Identical Investments
Level 1 | | | Significant Other
Observable Inputs
Level 2 | | | Significant Unobservable Inputs
Level 3 | | | Total | |
Managers Short Duration Government Fund | | | | | | | | | |
Investments in Securities | | | | | | | | | | | | | |
U.S. Government and Agency Obligations† | | | — | | | $ | 321,158,468 | | | | — | | | $ | 321,158,468 | |
Mortgage-Backed Securities | | | — | | | | 37,030,577 | | | | — | | | | 37,030,577 | |
Asset-Backed Securities | | | — | | | | 863,895 | | | | — | | | | 863,895 | |
Short-Term Investments: | | | | | | | | | | | | | | | | |
U.S. Government and Agency Discount Notes | | | — | | | | 23,692,309 | | | | — | | | | 23,692,309 | |
Other Investment Companies | | $ | 16,255,466 | | | | — | | | | — | | | | 16,255,466 | |
| | | | | | | | | | | | | | | | |
Total Investments in Securities | | $ | 16,255,466 | | | $ | 382,745,249 | | | | — | | | $ | 399,000,715 | |
| | | | | | | | | | | | | | | | |
Financial Derivative Instruments-Assets‡ | | | | | | | | | | | | | | | | |
Interest Rate Futures Contracts | | $ | 71,928 | | | | — | | | | — | | | $ | 71,928 | |
| | | | | | | | | | | | | | | | |
Financial Derivative Instruments-Liabilities‡ | | | | | | | | | | | | | | | | |
Interest Rate Futures Contracts | | | (985,187 | ) | | | — | | | | — | | | | (985,187 | ) |
| | | | | | | | | | | | | | | | |
Total Financial Derivative Instruments | | ($ | 913,259 | ) | | | — | | | | — | | | ($ | 913,259 | ) |
| | | | | | | | | | | | | | | | |
|
The accompanying notes are an integral part of these financial statements. 25 |
Notes to Schedules of Portfolio Investments (continued)
| | | | | | | | | | | | | | | | |
| | | Quoted Prices in Active
Markets for Identical Investments
Level 1 | | | Significant Other
Observable Inputs
Level 2 | | | Significant Unobservable Inputs
Level 3 | | | Total | |
Managers Intermediate Duration Government Fund | | | | | | | | | | | | | | | | |
Investments in Securities | | | | | | | | | | | | | |
U.S. Government and Agency Obligations† | | | — | | | $ | 186,347,980 | | | | — | | | $ | 186,347,980 | |
Mortgage-Backed Securities | | | — | | | | 21,183,102 | | | | — | | | | 21,183,102 | |
Short-Term Investments: | | | | | | | | | | | | | | | | |
U.S. Government and Agency Discount Notes | | | — | | | | 99,973 | | | | — | | | | 99,973 | |
Other Investment Companies | | $ | 44,231,521 | | | | — | | | | — | | | | 44,231,521 | |
| | | | | | | | | | | | | | | | |
Total Investments in Securities | | $ | 44,231,521 | | | $ | 207,631,055 | | | | — | | | $ | 251,862,576 | |
| | | | | | | | | | | | | | | | |
TBA Sale Commitments | | | — | | | ($ | 13,458,210 | ) | | | — | | | ($ | 13,458,210 | ) |
| | | | | | | | | | | | | | | | |
Financial Derivative Instruments-Assets‡ | | | | | | | | | | | | | | | | |
Interest Rate Futures Contracts | | $ | 33,368 | | | | — | | | | — | | | $ | 33,368 | |
| | | | | | | | | | | | | | | | |
Financial Derivative Instruments-Liabilities‡ | | | | | | | | | | | | | | | | |
Interest Rate Futures Contracts | | | (385,336 | ) | | | — | | | | — | | | | (385,336 | ) |
| | | | | | | | | | | | | | | | |
Total Financial Derivative Instruments | | ($ | 351,968 | ) | | | — | | | | — | | | ($ | 351,968 | ) |
| | | | | | | | | | | | | | | | |
| † | All U.S. Government and Agency Obligations held in the Fund are Level 2 securities. |
| ‡ | Derivative instruments, such as futures, forwards, options and swap contracts, are not reflected in the Schedule of Portfolio Investments and are valued at the unrealized appreciation/depreciation of the instrument. |
As of December 31, 2011, the Funds had no significant transfers between Level 1 and Level 2 from the beginning of the reporting period.
The following schedule shows the fair value of derivative instruments as of December 31, 2011:
| | | | | | | | | | | | | | |
| | | | | Asset Derivatives | | | Liability Derivatives | |
Fund | | Derivatives not accounted for as
hedging instruments | | Statement of Assets and
Liabilities Location | | Fair Value | | | Statement of Assets and
Liabilities Location | | Fair Value | |
Managers Short Duration Government | | Interest rate futures contracts | | Receivable for variation margin on futures | | $ | 23,641 | | | Payable for variation margin on futures | | $ | 51,084 | |
| | | | | | | | | | | | | | |
Managers Intermediate Duration Government | | Interest rate futures contracts | | Receivable for variation margin on futures | | $ | 10,594 | | | Payable for variation margin on futures | | $ | 13,716 | |
| | | | | | | | | | | | | | |
For the year ended December 31, 2011, the effect of derivative instruments on the Statement of Operations and the amount of realized gain/(loss) on derivatives recognized in income were as follows:
| | | | | | |
Fund | | Derivatives not accounted for as hedging instruments | | Amount | |
Managers Short Duration Government | | Interest rate futures contracts | | ($ | 2,496,505 | ) |
| | | | | | |
Managers Intermediate Duration Government | | Interest rate futures contracts | | ($ | 255,388 | ) |
| | | | | | |
The change in unrealized gain/(loss) on derivatives recognized in income were as follows:
| | | | | | |
Fund | | Derivatives not accounted for as hedging instruments | | Amount | |
Managers Short Duration Government | | Interest rate futures contracts | | ($ | 1,048,286 | ) |
| | | | | | |
Managers Intermediate Duration Government | | Interest rate futures contracts | | ($ | 79,859 | ) |
| | | | | | |
|
The accompanying notes are an integral part of these financial statements. 26 |
Notes to Schedules of Portfolio Investments (continued)
At December 31, 2011, the Fund had the following TBA forward sale commitments: (See Note 1(k) in the Notes to Financial Statements.)
| | | | | | | | | | |
Fund | | Principal Amount | | | Security | | Current Liability | |
Managers Intermediate Duration Government | | | | |
| | $ | 2,000,000 | | | FNMA, 4.000%, TBA | | $ | 2,109,062 | |
| | | 6,350,000 | | | GNMA, 4.500%, TBA | | | 6,918,523 | |
| | | 4,000,000 | | | GNMA, 5.000%, TBA | | | 4,430,625 | |
| | | | | | | | | | |
| | | | | | Total | | $ | 13,458,210 | |
| | | | | | | | | | |
At December 31, 2011, the Funds had the following open futures contracts: (See Note 2 (a) in the Notes to Financial Statements.)
| | | | | | | | | | |
Type | | Number of
Contracts | | Position | | Expiration | | Unrealized
Gain/(Loss) | |
Managers Short Duration Government Fund | | | | | | | | |
2-Year U.S. Treasury Note | | 36 | | Short | | March 2012 | | ($ | 4,028 | ) |
5-Year U.S. Treasury Note | | 131 | | Long | | March 2012 | | | 67,219 | |
10-Year U.S. Treasury Note | | 4 | | Long | | March 2012 | | | 4,709 | |
U.S. Treasury Long Bond | | 30 | | Short | | March 2012 | | | (28,903 | ) |
5-Year Interest Rate Swap | | 106 | | Short | | March 2012 | | | (85,562 | ) |
10-Year Interest Rate Swap | | 47 | | Short | | March 2012 | | | (97,789 | ) |
3-Month Eurodollar | | 27 | | Short | | March 2012 - March 2014 | | | (186,330 | ) |
3-Month Eurodollar | | 29 | | Short | | June 2012 - June 2013 | | | (237,598 | ) |
| | | | | | | | | | |
3-Month Eurodollar | | 19 | | Short | | September 2012 - September 2013 | | | (136,147 | ) |
3-Month Eurodollar | | 24 | | Short | | December 2012 - December 2013 | | | (208,830 | ) |
| | | | | | | | | | |
| | | | | | Total | | ($ | 913,259 | ) |
| | | | | | | | | | |
| | | | |
Type | | Number of
Contracts | | Position | | Expiration | | Unrealized
Gain/(Loss) | |
Managers Intermediate Duration Government Fund | | | | |
2-Year U.S. Treasury Note | | 5 | | Short | | March 2012 | | ($ | 559 | ) |
5-Year U.S. Treasury Note | | 48 | | Long | | March 2012 | | | 24,630 | |
10-Year U.S. Treasury Note | | 5 | | Long | | March 2012 | | | 5,886 | |
U.S. Treasury Long Bond | | 3 | | Long | | March 2012 | | | 2,852 | |
5-Year Interest Rate Swap | | 21 | | Short | | March 2012 | | | (16,951 | ) |
10-Year Interest Rate Swap | | 28 | | Short | | March 2012 | | | (58,258 | ) |
3-Month Eurodollar | | 9 | | Short | | March 2012 - March 2013 | | | (69,548 | ) |
3-Month Eurodollar | | 9 | | Short | | June 2012 - June 2013 | | | (73,635 | ) |
3-Month Eurodollar | | 9 | | Short | | September 2012 - September 2013 | | | (77,423 | ) |
3-Month Eurodollar | | 10 | | Short | | December 2012 - December 2013 | | | (88,962 | ) |
| | | | | | | | | | |
| | | | | | Total | | ($ | 351,968 | ) |
| | | | | | | | | | |
| | |
Investments Definitions and Abbreviations: |
| |
FHLMC: | | Federal Home Loan Mortgage Corp. |
FNMA: | | Federal National Mortgage Association |
GMAC: | | General Motors Acceptance Corp. |
GNMA: | | Government National Mortgage Association |
GSR: | | Goldman Sachs REMIC |
TBA: | | To Be Announced |
|
The accompanying notes are an integral part of these financial statements. 27 |
Statements of Assets and Liabilities
December 31, 2011
| | | | | | | | |
| | | Managers
Short Duration
Government Fund | | | Managers
Intermediate Duration
Government Fund | |
Assets: | | | | | | | | |
Investments at value* | | $ | 399,000,715 | | | $ | 251,862,576 | |
Receivable for delayed delivery investments sold | | | 19,710,747 | | | | 23,462,276 | |
Receivable for Fund shares sold | | | 1,061,709 | | | | 478,678 | |
Dividends, interest and other receivables | | | 1,419,154 | | | | 725,677 | |
Receivable for variation margin on futures | | | 23,641 | | | | 10,594 | |
Receivable from affiliate | | | — | | | | 4,570 | |
Prepaid expenses | | | 45,454 | | | | 12,472 | |
Total assets | | | 421,261,420 | | | | 276,556,843 | |
Liabilities: | | | | | | | | |
Payable for delayed delivery investments purchased | | | 26,668,313 | | | | 84,618,292 | |
Payable for Fund shares repurchased | | | 1,157,572 | | | | 161,601 | |
Payable for TBA forward sale commitments | | | — | | | | 13,458,210 | |
Payable for variation margin on futures | | | 51,084 | | | | 13,716 | |
Accrued expenses: | | | | | | | | |
Investment management and advisory fee payable | | | 236,421 | | | | 105,628 | |
Other | | | 134,527 | | | | 112,101 | |
Total liabilities | | | 28,247,917 | | | | 98,469,548 | |
Net Assets | | $ | 393,013,503 | | | $ | 178,087,295 | |
Shares outstanding | | | 41,076,181 | | | | 16,036,780 | |
Net asset value, offering and redemption price per share | | $ | 9.57 | | | $ | 11.10 | |
Net Assets Represent: | | | | | | | | |
Paid-in capital | | $ | 399,086,667 | | | $ | 172,586,236 | |
Undistributed net investment income | | | — | | | | — | |
Accumulated net realized gain (loss) from investments and futures contracts | | | (7,611,544 | ) | | | 137,354 | |
Net unrealized appreciation of investments, futures contracts and TBA forward sale commitments | | | 1,538,380 | | | | 5,363,705 | |
Net Assets | | $ | 393,013,503 | | | $ | 178,087,295 | |
* Investments at cost | | $ | 396,549,076 | | | $ | 246,101,467 | |
|
The accompanying notes are an integral part of these financial statements. 28 |
Statements of Operations
For the year ended December 31, 2011
| | | | | | | | |
| | | Managers Short Duration
Government Fund | | | Managers Intermediate Duration
Government Fund | |
Investment Income: | | | | | | | | |
Interest income | | $ | 6,319,962 | | | $ | 5,417,520 | |
Dividend income | | | 20,483 | | | | 39,640 | |
Total investment income | | | 6,340,445 | | | | 5,457,160 | |
Expenses: | | | | | | | | |
Investment management and advisory fees | | | 2,596,925 | | | | 1,086,218 | |
Custodian | | | 116,822 | | | | 46,203 | |
Professional fees | | | 89,007 | | | | 56,458 | |
Registration fees | | | 65,157 | | | | 33,060 | |
Transfer agent | | | 64,758 | | | | 185,531 | |
Reports to shareholders | | | 48,062 | | | | 32,650 | |
Trustees fees and expenses | | | 28,542 | | | | 11,441 | |
Miscellaneous | | | 16,307 | | | | 5,414 | |
Total expenses before offsets | | | 3,025,580 | | | | 1,456,975 | |
Expense reimbursements | | | — | | | | (75,733 | ) |
Expense reductions | | | (459 | ) | | | (194 | ) |
Fee waivers | | | (2,157 | ) | | | (17,437 | ) |
Net expenses | | | 3,022,964 | | | | 1,363,611 | |
Net investment income | | | 3,317,481 | | | | 4,093,549 | |
| | |
Net Realized and Unrealized Gain (Loss): | | | | | | | | |
Net realized gain on investments | | | 1,247,017 | | | | 4,595,110 | |
Net realized loss on futures contracts | | | (2,496,505 | ) | | | (255,388 | ) |
Net change in unrealized appreciation of investments | | | 1,908,198 | | | | 391,892 | |
Net change in unrealized depreciation of futures contracts | | | (1,048,286 | ) | | | (79,859 | ) |
Net realized and unrealized gain (loss) | | | (389,576 | ) | | | 4,651,755 | |
Net increase in net assets resulting from operations | | $ | 2,927,905 | | | $ | 8,745,304 | |
|
The accompanying notes are an integral part of these financial statements. 29 |
Statements of Changes in Net Assets
For the year ended December 31,
| | | | | | | | | | | | | | | | |
| | | Managers Short Duration Government Fund | | | Managers Intermediate Duration Government Fund | |
| | | 2011 | | | 2010 | | | 2011 | | | 2010 | |
Increase in Net Assets From Operations: | | | | | | | | | | | | | | | | |
Net investment income | | $ | 3,317,481 | | | $ | 4,960,625 | | | $ | 4,093,549 | | | $ | 4,658,085 | |
Net realized gain (loss) on investments and futures contracts | | | (1,249,488 | ) | | | (767,061 | ) | | | 4,339,722 | | | | 3,949,843 | |
Net change in unrealized appreciation of investments and futures contracts | | | 859,912 | | | | 1,429,714 | | | | 312,033 | | | | 2,852,745 | |
Net increase in net assets resulting from operations | | | 2,927,905 | | | | 5,623,278 | | | | 8,745,304 | | | | 11,460,673 | |
Distributions to Shareholders: | | | | | | | | | | | | | | | | |
From net investment income | | | (3,319,280 | ) | | | (5,130,631 | ) | | | (4,122,038 | ) | | | (4,636,850 | ) |
From net realized gain on investments | | | — | | | | — | | | | (3,945,014 | ) | | | (4,790,544 | ) |
Total distributions to shareholders | | | (3,319,280 | ) | | | (5,130,631 | ) | | | (8,067,052 | ) | | | (9,427,394 | ) |
From Capital Share Transactions: | | | | | | | | | | | | | | | | |
Proceeds from sale of shares | | | 291,803,165 | | | | 313,082,969 | | | | 69,723,400 | | | | 92,990,465 | |
Reinvestment of dividends and distributions | | | 3,068,327 | | | | 4,896,319 | | | | 7,112,821 | | | | 8,373,360 | |
Cost of shares repurchased | | | (282,392,872 | ) | | | (212,875,291 | ) | | | (53,071,474 | ) | | | (104,979,200 | ) |
Net increase (decrease) from capital share transactions | | | 12,478,620 | | | | 105,103,997 | | | | 23,764,747 | | | | (3,615,375 | ) |
| | | | |
Total increase (decrease) in net assets | | | 12,087,245 | | | | 105,596,644 | | | | 24,442,999 | | | | (1,582,096 | ) |
Net Assets: | | | | | | | | | | | | | | | | |
Beginning of year | | | 380,926,258 | | | | 275,329,614 | | | | 153,644,296 | | | | 155,226,392 | |
End of year | | $ | 393,013,503 | | | $ | 380,926,258 | | | $ | 178,087,295 | | | $ | 153,644,296 | |
End of year undistributed net investment income | | | — | | | $ | 155 | | | | — | | | $ | 26,057 | |
| | | | | | | | | | | | | | | | |
Share Transactions: | | | | | | | | | | | | | | | | |
Sale of shares | | | 30,439,393 | | | | 32,697,915 | | | | 6,206,673 | | | | 8,279,870 | |
Reinvestment of dividends and distributions | | | 320,229 | | | | 511,626 | | | | 639,973 | | | | 757,008 | |
Shares repurchased | | | (29,452,374 | ) | | | (22,230,366 | ) | | | (4,759,069 | ) | | | (9,332,613 | ) |
Net increase (decrease) in shares | | | 1,307,248 | | | | 10,979,175 | | | | 2,087,577 | | | | (295,735 | ) |
|
The accompanying notes are an integral part of these financial statements. 30 |
Financial Highlights
For a share outstanding throughout each period
| | | | | | | | | | | | | | | | | | | | | | | | |
| | | For the year ended December 31, | | | For the period from
April 1, 2007 to
December 31, 2007 | | | For the fiscal
year ended
March 31, 2007 | |
Short Duration Government Fund | | 2011 | | | 2010 | | | 2009 | | | 2008 | | | |
Net Asset Value, Beginning of Period | | $ | 9.58 | | | $ | 9.56 | | | $ | 9.20 | | | $ | 9.68 | | | $ | 9.68 | | | $ | 9.61 | |
Income from Investment Operations: | | | | | | | | | | | | | | | | | | | | | | | | |
Net investment income | | | 0.09 | | | | 0.13 | | | | 0.24 | | | | 0.34 | | | | 0.31 | | | | 0.42 | |
Net realized and unrealized gain (loss) on investments | | | (0.01 | ) | | | 0.03 | | | | 0.35 | | | | (0.45 | ) | | | 0.01 | | | | 0.06 | |
Total from investment operations | | | 0.08 | | | | 0.16 | | | | 0.59 | | | | (0.11 | ) | | | 0.32 | | | | 0.48 | |
Less Distributions to Shareholders from: | | | | | | | | | | | | | | | | | | | | | | | | |
Net investment income | | | (0.09 | ) | | | (0.14 | ) | | | (0.23 | ) | | | (0.37 | ) | | | (0.32 | ) | | | (0.41 | ) |
Net Asset Value, End of Period | | $ | 9.57 | | | $ | 9.58 | | | $ | 9.56 | | | $ | 9.20 | | | $ | 9.68 | | | $ | 9.68 | |
Total Return1 | | | 0.80 | % | | | 1.68 | %3 | | | 6.43 | %3 | | | (1.19 | )% | | | 3.41 | %6 | | | 5.05 | % |
Ratio of net expenses to average net assets | | | 0.82 | % | | | 0.81 | % | | | 0.84 | % | | | 0.83 | % | | | 0.84 | %4,7 | | | 0.83 | %4 |
Ratio of net investment income to average net assets1 | | | 0.89 | % | | | 1.38 | % | | | 2.43 | % | | | 3.88 | % | | | 4.49 | %4,7 | | | 4.15 | %4 |
Portfolio turnover | | | 141 | % | | | 116 | % | | | 152 | % | | | 282 | % | | | 199 | %6 | | | 230 | % |
Net assets at end of period (000’s omitted) | | $ | 393,014 | | | $ | 380,926 | | | $ | 275,330 | | | $ | 243,548 | | | $ | 235,117 | | | $ | 179,984 | |
| | | | | | | | | | | | | | | | | | | | | | | | |
Ratios absent expense offsets:2 | | | | | | | | | | | | | | | | | | | | | | | | |
Ratio of total expenses to average net assets | | | 0.82 | % | | | 0.82 | % | | | 0.84 | % | | | 0.84 | % | | | 1.22 | %7 | | | 1.36 | % |
Ratio of net investment income to average net assets | | | 0.89 | % | | | 1.37 | % | | | 2.43 | % | | | 3.87 | % | | | 4.11 | %7 | | | 3.62 | % |
| | | | | | | | | | | | | | | | | | | | | | | | |
Financial Highlights
For a share outstanding throughout each period
| | | | | | | | | | | | | | | | | | | | | | | | |
| | | For the year ended December 31, | | | For the period from
April 1, 2007 to
December 31, 2007 | | | For the fiscal
year ended
March 31,2007 | |
Intermediate Duration Government Fund | | 2011 | | | 2010 | | | 2009 | | | 2008 | | | |
Net Asset Value, Beginning of Period | | $ | 11.01 | | | $ | 10.90 | | | $ | 10.17 | | | $ | 10.67 | | | $ | 10.54 | | | $ | 10.37 | |
Income from Investment Operations: | | | | | | | | | | | | | | | | | | | | | | | | |
Net investment income | | | 0.30 | | | | 0.32 | | | | 0.41 | | | | 0.45 | | | | 0.37 | | | | 0.47 | |
Net realized and unrealized gain (loss) on investments | | | 0.34 | | | | 0.46 | | | | 0.83 | | | | (0.37 | ) | | | 0.13 | | | | 0.17 | |
Total from investment operations | | | 0.64 | | | | 0.78 | | | | 1.24 | | | | 0.08 | | | | 0.50 | | | | 0.64 | |
Less Distributions to Shareholders from: | | | | | | | | | | | | | | | | | | | | | | | | |
Net investment income | | | (0.30 | ) | | | (0.32 | ) | | | (0.41 | ) | | | (0.45 | ) | | | (0.37 | ) | | | (0.47 | ) |
Net realized gain on investments | | | (0.25 | ) | | | (0.35 | ) | | | (0.10 | ) | | | (0.13 | ) | | | — | | | | — | |
Total distributions to shareholders | | | (0.55 | ) | | | (0.67 | ) | | | (0.51 | ) | | | (0.58 | ) | | | (0.37 | ) | | | (0.47 | ) |
Net Asset Value, End of Period | | $ | 11.10 | | | $ | 11.01 | | | $ | 10.90 | | | $ | 10.17 | | | $ | 10.67 | | | $ | 10.54 | |
Total Return1 | | | 5.88 | %3 | | | 7.20 | %3 | | | 12.40 | % | | | 0.85 | % | | | 4.85 | %6 | | | 6.30 | % |
Ratio of net expenses to average net assets | | | 0.88 | % | | | 0.89 | % | | | 0.89 | % | | | 0.89 | % | | | 0.83 | %5,7 | | | 0.87 | %5 |
Ratio of net investment income to average net assets1 | | | 2.64 | % | | | 2.80 | % | | | 3.84 | % | | | 4.32 | % | | | 4.62 | %5,7 | | | 4.46 | %5 |
Portfolio turnover | | | 453 | % | | | 409 | % | | | 370 | % | | | 429 | % | | | 240 | %6 | | | 445 | % |
Net assets at end of period (000’s omitted) | | $ | 178,087 | | | $ | 153,644 | | | $ | 155,226 | | | $ | 170,181 | | | $ | 193,440 | | | $ | 182,771 | |
| | | | | | | | | | | | | | | | | | | | | | | | |
Ratios absent expense offsets:2 | | | | | | | | | | | | | | | | | | | | | | | | |
Ratio of total expenses to average net assets | | | 0.94 | % | | | 0.96 | % | | | 0.98 | % | | | 0.95 | % | | | 0.84 | %7 | | | 0.89 | % |
Ratio of net investment income to average net assets | | | 2.58 | % | | | 2.73 | % | | | 3.75 | % | | | 4.26 | % | | | 4.61 | %7 | | | 4.44 | % |
| | | | | | | | | | | | | | | | | | | | | | | | |
Notes to Financial Highlights
The following notes should be read in conjunction with the Financial Highlights of the Funds presented on the previous pages.
| 1 | Total returns and net investment income would have been lower had certain expenses not been reduced. (See Note 1(c) of Notes to Financial Statements.) |
| 2 | Excludes the impact of expense reimbursements or fee waivers and expense reductions such as brokerage credits, but includes non-reimbursable expenses, if any, such as interest and taxes. (See Note 1(c) of Notes to Financial Statements.) |
| 3 | The total return is based on the Financial Statement Net Asset Values as shown. |
| 4 | Excludes interest expense for the period ended December 31, 2007 and the fiscal years ended March 31, 2007 and 2006 of 0.38%, 0.53%, and 0.23%, respectively. (See Note 1(c) of Notes to Financial Statements.) |
| 5 | Excludes interest expense for the period ended December 31, 2007 and the fiscal years ended March 31, 2007 and 2006 of 0.01%, 0.04%, and 0.00%, respectively. (See Note 1(c) of Notes to Financial Statements.) |
Notes to Financial Statements
December 31, 2011
| 1. | Summary of Significant Accounting Policies |
Managers Trust II (the “Trust”) is an open-end management investment company organized as a Massachusetts business trust and registered under the Investment Company Act of 1940, as amended (the “1940 Act”). Currently, the Trust consists of a number of different funds, each having distinct investment management objectives, strategies, risks and policies. Included in this report are two series of Trust II: Managers Short Duration Government Fund (“Short Duration”), and Managers Intermediate Duration Government Fund (“Intermediate Duration”), each a “Fund” and collectively the “Funds.”
The Funds’ financial statements are prepared in accordance with accounting principles generally accepted in the United States of America (“U.S. GAAP”), which require management to make estimates and assumptions that affect the reported amounts of assets and liabilities and disclosure of contingent assets and liabilities at the date of the financial statements and the reported amounts of income and expenses during the reporting periods. Actual results could differ from those estimates and such differences may be material. The following is a summary of significant accounting policies followed by the Funds in the preparation of their financial statements:
| a. | Valuation of Investments |
Equity securities traded on a domestic or international securities exchange are valued at the last quoted sale price, or, lacking any sales, at the last quoted bid price. Over-the-counter securities are valued at the Nasdaq Official Closing Price, if one is available. Lacking any sales, over-the counter securities are valued at the last quoted bid price. The Funds’ investments are generally valued based on market quotations provided by third-party pricing services approved by the Board of Trustees of the Funds (the “Board”). Under certain circumstances, the value of each Fund’s investment may be based on an evaluation of its fair value, pursuant to procedures established by and under the general supervision of the Board. Each Fund may use the fair value of a portfolio investment to calculate its net asset value (“NAV”) when, for example, (1) market quotations are not readily available because a portfolio investment is not traded in a public market or the principal market in which the investment trades is closed, (2) trading in a portfolio investment is suspended and has not resumed before the Fund calculates its NAV, (3) a significant event affecting the value of a portfolio investment is determined to have occurred between the time of the market quotation provided for a portfolio investment and the time as of which the Fund calculates its NAV, (4) an investment’s price has remained unchanged over a period of time (often referred to as a “stale price”), or (5) Managers Investment Group LLC (the “Investment Manager”) determines that a market quotation is inaccurate. The Funds may invest in securities that may be thinly traded. The Board has adopted procedures to adjust prices when thinly traded securities are judged to be stale so that they reflect fair value. An investment valued on the basis of its fair value may be valued at a price higher or lower than available market quotations. An investment’s valuation may differ depending on the method used and the factors considered in determining value according to the Fund’s fair value procedures.
Fixed-income securities are valued based on valuations furnished by independent pricing services that utilize matrix systems, which reflect such factors as security prices, yields, maturities, and ratings, and are supplemented by dealer and exchange quotations. Futures contracts for which market quotations are readily available are valued at the settlement price as of the close of the futures exchange. Short-term investments having a remaining maturity of 60 days or less are generally valued at amortized cost, which approximates market value. Investments in other regulated investment companies are valued at their end of day net asset value per share except iShares or other ETF’s, which are valued the same as equity securities. Investments in certain mortgage-backed and stripped mortgage-backed securities, preferred stocks, convertible securities, derivatives and other debt securities not traded on an organized securities market are valued on the basis of valuations provided by dealers or by a pricing service which uses information with respect to transactions in such securities and various relationships between securities and yield to maturity in determining value. Securities (including derivatives) for which market quotations are not readily available are fair valued, as determined in good faith, and pursuant to procedures adopted by the Board. The values assigned to fair value investments are based on available information and do not necessarily represent amounts that might ultimately be realized, since such amounts depend on future developments inherent in long-term investments. Further, because of the inherent uncertainty of valuation, those estimated values may differ significantly from the values that would have been used had a ready market for the investments existed, and the differences could be material.
U.S. GAAP defines fair value as the price that a Fund would receive to sell an asset or pay to transfer a liability in an orderly transaction between market participants at the measurement date. U.S. GAAP also establish a framework for measuring fair value, and a three-level hierarchy for fair value measurements based upon the transparency of inputs to the valuation of an asset or liability. Inputs may be observable or unobservable and refer broadly to the assumptions that market participants would use in pricing the asset or liability. Observable inputs reflect the assumptions market participants would use in pricing the asset or liability based on market data obtained from sources independent of the Funds. Unobservable inputs reflect the Funds’ own assumptions about the assumptions that market participants would use in pricing the asset or liability developed based on the best information available in the circumstances. Each investment is assigned a level based upon the observability of the inputs which are significant to the overall valuation.
The three-tier hierarchy of inputs is summarized below:
Level 1 – inputs are quoted prices in active markets for identical investments (e.g., equity securities, open-end investment companies, futures contracts, options contracts)
Level 2 – other observable inputs (including, but not limited to: quoted prices for similar assets or liabilities in markets that are active, quoted prices for identical or similar assets or liabilities in markets that are not active, inputs other than quoted prices that are observable for the assets or liabilities (such as interest rates, yield
Notes to Financial Statements (continued)
curves, volatilities, prepayment speeds, loss severities, credit risks and default rates) or other market corroborated inputs) (e.g., debt securities, government securities, swap contracts, foreign currency exchange contracts, foreign securities utilizing international fair value pricing, broker-quoted securities, fair valued securities with observable inputs)
Level 3 – inputs are significant unobservable inputs (including the Fund’s own assumptions used to determine the fair value of investments) (e.g., fair valued securities with unobservable inputs)
The inputs or methodologies used for valuing investments are not necessarily an indication of the risk associated with investing in those investments.
Security transactions are accounted for as of trade date. Realized gains and losses on securities sold are determined on the basis of identified cost.
| c. | Investment Income and Expenses |
Dividend income is recorded on the ex-dividend date, except certain dividends from foreign securities where the ex-dividend date may have passed. Dividends from foreign securities are recorded as soon as the Trust becomes aware of the ex-dividend date. Dividend income on foreign securities is recorded net of any withholding tax. Interest income, which includes amortization of premium and accretion of discount on debt securities, is accrued as earned. Non-cash dividends included in dividend income, if any, are reported at the fair market value of the securities received. Other income and expenses are recorded on an accrual basis. Expenses that cannot be directly attributed to a Fund are apportioned among the Funds in the Trust and in some cases other affiliated funds based upon their relative average net assets or number of shareholders.
The Funds have a “balance credit” arrangement with The Bank of New York Mellon, the Funds’ custodian, whereby each Fund is credited with an interest factor equal to 0.75% below the effective 90-day T-Bill rate for account balances left uninvested overnight. If the T-Bill rate falls below 0.75%, no credits will be earned. These credits serve to reduce custody expenses that would otherwise be
charged to each Fund. For the year ended December 31, 2011, the custodian expense was not reduced for either of the Funds.
Overdrafts will cause a reduction of any earnings credits, computed at 2% above the effective Federal Funds rate on the day of the over-draft. For the year ended December 31, 2011, the Funds did not incur overdraft fees.
The Trust also has a balance credit arrangement with its Transfer Agent, BNY Mellon Investment Servicing (US) Inc. (formerly PNC Global Investment Servicing (U.S.) Inc.), whereby earnings credits are used to offset banking charges and other out-of-pocket expenses. For the year ended December 31, 2011, the transfer agent expense was reduced as follows: Short Duration - $459, and Intermediate Duration - $194.
The Investment Manager has agreed to waive a portion of its management fee in consideration of shareholder servicing fees that it has received from JPMorgan Distribution Services, Inc., with respect to short-term cash investments each Fund has made in the JPMorgan Liquid Assets Money Market Fund – Capital Shares. For the year ended December 31, 2011, the management fee was reduced as follows: Short Duration - $2,157, and Intermediate Duration - $17,437.
Total returns and net investment income for the Funds would have been lower had certain expenses not been offset. Total expenses before offsets exclude the impact of expense reimbursements or fee waivers and expense offsets such as brokerage recapture credits, but include non-reimburseable expenses, if any, such as interest and taxes, except in such cases where interest expense is disclosed separately.
| d. | Dividends and Distributions |
Dividends resulting from net investment income, if any, normally will be declared and paid monthly for the Funds. Distributions of capital gains, if any, will be made on an annual basis and when required for Federal excise tax purposes. Income and capital gain distributions are determined in accordance with Federal income tax regulations, which may differ from U.S. GAAP. These differences are primarily due to differing treatments for losses deferred due to wash sales, equalization accounting for tax purposes, options, futures, and market discount transactions. Permanent book and tax basis differences, if any, relating to shareholder distributions will result in reclassifications to paid-in capital. The tax character of distributions paid during the years ended December 31, 2011 and December 31, 2010 were as follows:
| | | | | | | | | | | | | | | | |
| | | Short Duration | | | Intermediate Duration | |
| | | 2011 | | | 2010 | | | 2011 | | | 2010 | |
Distributions paid from: | |
Ordinary income | | $ | 3,319,280 | | | $ | 5,130,631 | | | $ | 4,119,606 | | | $ | 4,638,090 | |
Short-term capital gains | | | — | | | | — | | | | 3,628,005 | | | | 4,338,776 | |
Long-term capital gains | | | — | | | | — | | | | 319,441 | | | | 450,528 | |
| | | | | | | | | | | | | | | | |
Totals | | $ | 3,319,280 | | | $ | 5,130,631 | | | $ | 8,067,052 | | | $ | 9,427,394 | |
| | | | | | | | | | | | | | | | |
Notes to Financial Statements (continued)
As of December 31, 2011, the components of distributable earnings (excluding unrealized appreciation/depreciation) on a tax basis consisted of:
| | | | | | | | |
| | | Short
Duration | | | Intermediate
Duration | |
Capital loss carry forward | | $ | 2,718,343 | | | | — | |
Undistributed ordinary income | | | — | | | | — | |
Undistributed short-term capital gains | | | — | | | $ | 3,072 | |
Undistributed long-term capital gains | | | — | | | | 1,024,544 | |
Post-October loss deferral | | | 186,811 | | | | — | |
Each Fund intends to comply with the requirements under Subchapter M of the Internal Revenue Code of 1986, as amended, and to distribute substantially all of its taxable income and gains to its shareholders and to meet certain diversification and income requirements with respect to investment companies. Therefore, no provision for Federal income or excise tax is included in the accompanying financial statements.
Management has analyzed the Funds’ tax positions taken on federal income tax returns for all open tax years (tax years ended December 31, 2008-2011), and has concluded that no provision for federal income tax is required in the Funds’ financial statements. Addition-ally, the Funds are not aware of any tax position for which it is reason-ably possible that the total amounts of unrecognized tax benefits will change materially in the next twelve months.
New Tax Law–Regulated Investment Company Modernization Act:
Under the recently enacted Regulated Investment Company Modernization Act of 2010 (the “Act”), the Act modernizes several of the federal income and excise tax provisions related to regulated investment companies (“RIC”). Some highlights of the enacted provisions are as follows:
New post-enactment capital losses may now be carried forward for an unlimited time period. However, any new losses incurred will be required to be utilized prior to any loss carryovers incurred in pre-
enactment taxable years, which generally expire eight years following the close of the taxable year in which they were incurred. As a result of this ordering rule, pre-enactment capital loss carryovers may be more likely to expire unused. Additionally, post-enactment capital losses that are carried forward will retain their tax character as either short-term or long-term capital losses rather than being considered all short-term as under previous law.
The Act contains simplification provisions, which are aimed at preventing disqualification of a RIC for “inadvertent” failures of the asset diversification and/or qualifying income tests. Additionally, the Act repealed the 60-day designation requirement for certain types of pass-through income and gains.
Finally, the Act contains several provisions aimed at preserving the character of distributions made by a fiscal year RIC during the portion of its taxable year ending after October 31, or December 31, reducing the circumstances under which a RIC might be required to send shareholders amended Forms 1099 to restate previously reported distributions.
Except for the simplification provisions related to RIC qualification, the Act is effective for taxable years beginning after December 22, 2010. The Funds’ first taxable year subject to the Act is the current year ended December 31, 2011.
| f. | Capital Loss Carryovers and Deferrals |
As of December 31, 2011, the following Fund had accumulated net realized capital loss carryovers from securities transactions for Federal income tax purposes as shown in the following chart. The amounts may be used to offset future realized capital gains, if any, through the expiration dates listed or in the case of post-enactment losses, for an unlimited time period.
| | | | | | | | | | |
| | | Capital Loss
Carryover Amounts | | | Expires
December 31, |
Fund | | Short-Term | | | Long-Term | | |
Short Duration | | | | | | | | | | |
(Pre-Enactment) | | $ | 2,718,343 | | | | — | | | 2017 |
| | | | | | | | | | |
Notes to Financial Statements (continued)
For the year ended December 31, 2011, the following Fund utilized capital loss carryovers in the amount of:
| | | | | | | | |
| | | Capital Loss
Carryover Utilized | |
Fund | | Short-Term | | | Long-Term | |
Short Duration | | $ | 2,443,882 | | | | — | |
The Trust’s Declaration of Trust authorizes for each series the issuance of an unlimited number of shares of beneficial interest, without par value. Each Fund records sales and repurchases of its capital stock on the trade date. Dividends and distributions to shareholders are recorded on the ex-dividend date.
At December 31, 2011, certain unaffiliated shareholders of record, specifically omnibus accounts, individually or collectively held greater than 10% of the outstanding shares of the following Funds: Short Duration – two collectively own 63%; Intermediate Duration – two collectively own 55%. Transactions by these shareholders may have a material impact on the Funds.
| h. | Delayed Delivery Transactions and When-Issued Securities |
Each of the Funds entered into securities transactions on a delayed delivery or when-issued basis. Payment and delivery may take place after the customary settlement period for that security. The price of the underlying securities and the date when the securities will be delivered and paid for are fixed at the time the transaction is negotiated. During the time a delayed delivery sell is outstanding, the contract is marked to market daily and equivalent deliverable securities are held for the transaction. The value of the securities purchased on a delayed delivery or when-issued basis are identified as such in the Funds’ Schedules of Portfolio Investments. With respect to purchase commitments, the Funds identify securities as segregated in their records with a value at least equal to the amount of the commitment. The payables and receivables associated with the purchases and sales of delayed delivery securities having the same coupon, settlement date and broker are offset. Delayed delivery or when-issued securities that have been purchased from and sold to different brokers are reflected as both payables and receivables in the Funds’ Statement of Assets and Liabilities. Losses may arise due to changes in the value of the underlying securities or if the counterparty does not perform under the
contract, or if the issuer does not issue the securities due to political, economic, or other factors.
| i. | Dollar Roll and Reverse Dollar Roll Agreements |
Each of the Funds entered into dollar rolls in which they sell debt securities for delivery currently and simultaneously contract to repurchase similar, but not identical, securities at the same price or a lower price on an agreed date. The Funds receive compensation as consideration for entering into the commitment to repurchase. The compensation is the difference between the current sale price and the forward price for the future purchase (often referred to as the “drop”) as well as by the interest earned on the cash proceeds of the initial sale. The Funds may also be compensated by the receipt of a commitment fee. As the holder, the counterparty receives all principal and interest payments, including prepayments, made with respect to the similar security sold. Dollar rolls may be renewed with a new sale and repurchase price with a cash settlement made at renewal without physical delivery of the securities subject to the contract.
Certain risks may arise upon entering into dollar rolls from the potential inability of counterparties to meet the terms of their commitments. Additionally, the value of such securities may change adversely before the Funds are able to repurchase them. There can be no assurance that the Funds’ use of the cash that they receive from a dollar roll will provide a return that exceeds their cost.
��
| j. | Securities Transacted on a When Issued Basis |
Each of the Funds entered into To Be Announced (“TBA”) forward sale commitments to hedge their portfolio positions or to sell mortgage-backed securities they own under delayed delivery arrangements. Proceeds of TBA forward sale commitments are not received until the contractual settlement date. During the time a TBA forward sale commitment is outstanding, equivalent deliverable securities, or an offsetting TBA forward purchase commitment deliverable on or before the sale commitment date, are held as “cover” for the transaction. Unsettled TBA forward sale commitments are valued at the current market value of the underlying securities, according to the procedures described under “Valuation of Investments,” in footnote 1a above. Each contract is marked-to-market daily and the change in market value is recorded by the Funds as an unrealized gain or loss. If the TBA forward sale commitment is closed through the acquisition of an offsetting purchase commitment, the Fund realizes a gain or loss. If the
Notes to Financial Statements (continued)
Fund delivers securities under the commitment, the Fund realizes a gain or a loss from the sale of the securities based upon the unit price established at the date the commitment was entered into.
The following disclosures contain information on how and why the Funds use derivative instruments, the credit risk and how derivative instruments affect the Funds’ financial position, results of operations and cash flows. The location and fair value amounts of these instruments on the Statements of Assets and Liabilities and the realized and changes in unrealized gains and losses on the Statements of Operations, each categorized by type of derivative contract, are included in a table in the Schedules of Portfolio Investments for the applicable funds. The derivative instruments outstanding as of period end as disclosed in the Statements of Assets and Liabilities and the realized and changes in unrealized gains and losses on derivative instruments during the period as disclosed in the Statement of Operations serve as indicators of the volume of derivative activity for the Funds.
Each of the Funds invest in interest rate futures contracts for risk management purposes, in order to reduce the interest rate risk of fixed-income securities. The Funds are subject to interest rate risk in the normal course of pursuing their investment objectives. With futures, there is minimal counterparty credit risk to the Funds since futures are exchange traded and the exchange’s clearinghouse, as counterparty to all exchange traded futures, guarantees the futures against default. On entering into a futures contract, either cash or securities in an amount equal to a certain percentage of the contract value (initial margin) must be deposited with the futures broker. Subsequent payments (variation margin) are made or received each day. The variation margin payments equal the daily changes in the contract value and are recorded as unrealized gains or losses. The Funds recognize a realized gain or loss when the contract is closed or expires equal to the difference between the value of the contract at the time it was opened and the value at the time it was closed. Futures are valued at their quoted daily settlement prices. The aggregate principal amounts of the contracts are not recorded in the financial statements. Fluctuations in the value of the contracts are recorded in the Statements of Assets and Liabilities as an asset (liability) and in the Statements of Operations as unrealized appreciation (depreciation) until the contracts are closed, when they are recorded as realized gains (losses) on futures.
Futures transactions involve additional costs and may result in losses. The effective use of futures depends on the Fund’s ability to close futures positions at times when the Fund’s portfolio managers deem it desirable to do so. The use of futures also involves the risk of imperfect correlation among movements in the values of the securities underlying the futures purchased and sold by the Funds, of the futures contracts themselves, and of the securities that are the subject of a hedge.
| b. | Assets Pledged to Cover Margin Requirements for Open Futures Positions |
The aggregate market value of assets pledged to cover margin requirements for the open futures positions at December 31, 2011 was:
| | | | |
Fund | | Assets Pledged | |
Short Duration | | $ | 329,987 | |
Intermediate Duration | | | 99,973 | |
Each of the Funds invest in stripped securities (“STRIPS”), primarily interest-only strips, for their hedging characteristics. Interest-only STRIPS will most likely move differently than typical fixed-income securities in relation to changes in interest rates. STRIPS are usually structured with two classes that receive different proportions of the interest and principal distributions from a pool of underlying assets. A common type of STRIP will have one class receiving all of the interest from the underlying assets (“interest-only” or “IO” class), while the other class will receive the entire principal (“principal only” or “PO” class). However, in some instances, one class will receive some of the interest and most of the principal while the other class will receive most of the interest and the remainder of the principal. STRIPS are unusually volatile in response to changes in interest rates. The yield to maturity on an IO class of STRIPS is extremely sensitive not only to changes in prevailing interest rates but also to the rate of principal payments (including prepayments) on the underlying assets. A rapid rate of principal prepayments may have a measurably adverse effect on a Fund’s yield to maturity to the extent it invests in IOs. Conversely, POs tend to increase in value if prepayments are greater than anticipated and decline if prepayments are slower than anticipated. Thus, if the underlying assets experience greater than anticipated prepayments of principal, a Fund may fail to fully recover its initial investment in these securities, even if the STRIPS were rated of the
Notes to Financial Statements (continued)
highest credit quality by Standard & Poor’s Corporation or Moody’s Investors Service, Inc. These risks are managed by investing in a variety of such securities and by using certain hedging techniques. In addition the secondary market for STRIPS may be less liquid than that of other mortgage-backed or asset-backed securities, potentially limiting a Fund’s ability to buy or sell those securities at any particular time.
| 3. | Commitments and Contingencies |
In the normal course of business, the Funds may enter into contracts and agreements that contain a variety of representations and warranties which provide general indemnifications. The maximum exposure to the Funds under these agreements is unknown, as this would involve future claims that may be made against the Funds that have not yet occurred. However, the Funds have not had prior claims or losses and expect the risks of material loss to be remote.
| 4. | Agreements and Transactions with Affiliates |
The Trust has entered into investment management agreements (each, an “Investment Management Agreement”) under which the Investment Manager, an independently managed subsidiary of Affiliated Managers Group, Inc. (“AMG”), serves as investment manager to the Funds and is responsible for the Funds’ overall administration. The Investment Manager selects subadvisors for each Fund (subject to Board approval), and monitors the subadvisors’ investment programs and results. Each Fund’s investment portfolio is managed by a portfolio manager who serves pursuant to a subadvisory agreement with the Investment Manager.
Investment management fees are paid directly by each Fund to the Investment Manager based on average daily net assets. The annual investment management fee rates, as a percentage of average daily net assets for the year ended December 31, 2011, were as follows:
The Investment Manager has contractually agreed, through at least
| | | | |
| | | Investment
Management Fee | |
Short Duration | | | 0.70 | % |
Intermediate Duration | | | 0.70 | % |
May 1, 2012, to waive management fees and/or reimburse Fund expenses in order to limit total annual Fund operating expenses after fee waiver and expense reimbursements (exclusive of taxes, interest, brokerage commissions, acquired fund fees and expenses, and extraordinary items) to 0.89% of Intermediate Duration Fund’s average daily net assets.
Intermediate Duration is obligated to repay the Investment Manager such amounts waived, paid or reimbursed in future years provided
that the repayment occurs within thirty-six (36) months after the waiver or reimbursement and that such repayment would not cause the Fund’s expenses in any such year to exceed the Fund’s expense cap, based on the Fund’s average daily net assets. For the year ended December 31, 2011, the Fund’s components of reimbursement are detailed in the following chart:
| | | | |
| | | Intermediate Duration | |
Reimbursement Available - 12/31/10 | | $ | 368,116 | |
Additional Reimbursements | | | 75,733 | |
Repayments | | | — | |
Expired Reimbursements | | | (107,403 | ) |
| | | | |
Reimbursement Available - 12/31/11 | | $ | 336,446 | |
| | | | |
Effective January 1, 2011, the aggregate annual retainer paid to each Independent Trustee is $80,000, plus $5,000 or $2,500 for each regular or special meeting attended, respectively. The Independent Chairman of the Trusts receives an additional payment of $20,000 per year. The Chairman of the Audit Committee receives an additional payment of $8,000 per year. (Prior to January 1, 2011, the aggregate annual retainer paid to each Independent Trustee was $65,000, plus $4,000 or $2,500 for each regular or special meeting attended, respectively. The Independent Chairman of the Trusts received an additional payment of $15,000 per year. The Chairman of the Audit Committee received an additional payment of $5,000 per year.) The Trustees’ fees and expenses are allocated among all of the Funds for which the Investment Manager serves as the advisor (the “Managers Funds”) based on the relative net assets of such Funds. The “Trustees fees and expenses” shown in the financial statements represents the Funds’ allocated portion of the total fees and expenses paid by the Managers Funds.
The Funds are distributed by Managers Distributors, Inc. (the “Distributor” or “MDI”), a wholly-owned subsidiary of the Investment Manager. MDI serves as the principal distributor and underwriter for each Fund and is a registered broker-dealer and member of the Financial Industry Regulatory Authority, Inc. (“FINRA”). Shares of each Fund will be continuously offered and will be sold directly to prospective purchasers through brokers, dealers or other financial intermediaries who have executed selling agreements with MDI. Subject to the compensation arrangements discussed below, generally MDI bears all or a portion of the expenses of providing services pursuant to the distribution agreement, including the payment of the expenses relating to the distribution of Prospectuses for sales purposes and any advertising or sales literature. Certain Trustees and Officers of the Funds are Officers and/or Directors of the Investment Manager, AMG and/or the Distributor.
Notes to Financial Statements (continued)
| | | | | | | | | | | | | | | | |
| | | Long-Term Securities | | | | | | | |
| | | (excluding U.S. Government Obligations) | | | U.S. Government Obligations | |
Fund | | Purchases | | | Sales | | | Purchases | | | Sales | |
Short Duration | | $ | 48,125,870 | | | $ | 38,917,044 | | | $ | 445,796,067 | | | $ | 469,358,142 | |
Intermediate Duration | | | 9,788,396 | | | | 11,739,249 | | | | 885,637,153 | | | | 878,125,332 | |
| 6. | Portfolio Securities Loaned |
The Funds participate in a securities lending program offered by BNYM (the “Program”), providing for the lending of securities to qualified brokers. Securities lending fees include earnings of such temporary cash investments, plus or minus any rebate to a borrower. These earnings (after any rebate) are then divided between BNYM, as a fee for its services under the program, and the Fund, according to agreed-upon rates. Collateral on all securities loaned is accepted in cash and/or government securities and is maintained at a minimum level of 102% (105% in the case of certain foreign securities) of the market value, plus interest, if applicable, of investments on loan. It is the Funds’ policy to obtain additional collateral from or return excess collateral to the borrower by the end of the next business day, following the valuation date of the securities loaned. Therefore, the value of the collateral held may be temporarily less than the value of the securities on loan. Lending securities entails a risk of loss to the Funds if and to the extent that the market value of the securities loaned were to increase and the borrower did not increase the collateral accordingly, and the borrower fails to return the securities. Under the terms of the Program, each Fund is indemnified for such losses by BNYM. The Funds bear the risk of any deficiency in the amount of the collateral available for return to the borrower due to any loss on the collateral invested. Collateral received in the form of cash is invested temporarily in the BNY Mellon Overnight Government Fund (formerly BNY Institutional Cash Reserves Fund the “ICRF”), or other short-term investments as defined in the Securities Lending Agreement with BNYM. For the years ended December 31, 2011 and December 31, 2010, the Funds did not lend any securities.
Effective August 2, 2010, the Trust, on behalf of each applicable Fund, entered into an agreement with The Bank of New York Mellon and the Bank of New York Mellon Corporation (“BNYMC”) with respect to each Fund’s position in the Series B of the ICRF, pursuant to which (i) BNYMC would support the value of certain defaulted securities issued by Lehman Brothers Holdings, Inc. (the “Lehman Securities”) and held by Series B of the ICRF, and (ii) once certain conditions were met, BNYMC would purchase the defaulted securities from each Fund. On October 17, 2011, after certifying that the Fund had met all necessary conditions, BNYMC purchased the Lehman Securities from the Fund at a predetermined price, which represented a premium over the fair market value of the Lehman Securities at that date.
| 7. | Risks Associated with Collateralized Mortgage Obligations (“CMOs”) |
The net asset value of the Funds may be sensitive to interest rate fluctuations because the Funds may hold several instruments, including CMOs and other derivatives, whose values can be significantly impacted by interest rate movements. CMOs are obligations collateralized by a portfolio of mortgages or mortgage-related securities. Payments of principal and interest on the mortgages are passed through to the holder of the CMOs on the same schedule as they are received, although certain classes of CMOs have priority over others with respect to the receipt of prepayments on the mortgages. Therefore, the investment in CMOs may be subject to a greater or lesser risk of prepayment than other types of mortgage-related securities. CMOs may have a fixed or variable rate of interest.
Notes to Financial Statements (continued)
| 8. | New Accounting Pronouncement |
In April 2011, the Financial Accounting Standards Board (“FASB”) issued Accounting Standards Update (“ASU”) No. 2011-03, “Reconsideration of Effective Control for Repurchase Agreements.” ASU 2011-03 changes the assessment of effective control for repurchase agreements including dollar roll transactions. The new and revised disclosures are effective for interim and annual reporting periods beginning after December 15, 2011. At this time, management is evaluating the implications of ASU No. 2011-03 and its impact on the financial statements.
In May 2011, the FASB issued ASU No. 2011-04, “Amendments to Achieve Common Fair Value Measurement and Disclosure Requirements in U.S. GAAP and IFRSs.” ASU 2011-04 requires common fair value measurement and disclosure requirements between U.S. GAAP and International Financial Reporting Standards. The new and revised disclosures are effective for interim and annual reporting periods beginning after December 15, 2011. At this time, management is evaluating the implications of ASU No. 2011-04 and its impact on the financial statements.
In December 2011, the FASB issued ASU No. 2011-11, “Disclosures about Offsetting Assets and Liabilities.” ASU 2011-11 requires disclosures to make financial statements that are prepared under U.S. GAAP more comparable to those prepared under IFRS. The new disclosure requirements mandate that entities disclose both gross and net information about instruments and transactions eligible for offset in the statement of assets and liabilities as well as instruments and transactions subject to an agreement similar to a master netting arrangement. In addition, ASU 2011-11 requires disclosure of collateral received and posted in connection with master netting agreements or similar arrangements. New disclosures are required for annual reporting periods beginning on or after January 1, 2013, and interim periods within those annual periods. Management is evaluating the impact of ASU 2011-11 on the financial statements and disclosures.
The Funds have determined that no material events or transactions occurred through the issuance date of the Funds’ financial statements, which requires additional disclosure in or adjustment of the Funds’ financial statements.
Tax Information (unaudited)
Each Fund hereby designates the maximum amount allowable of its net taxable income as qualified dividends as provided in the Jobs and Growth Tax Relief Reconciliation Act of 2003. The 2011 Form 1099-DIV you receive for each Fund will show the tax status of all distributions paid to you during the year.
The percentage of Qualified Dividend Income (“QDI”) and the Dividends Received Deduction (“DRD”) for distributions paid is as follows:
| | | | | | | | | | | | | | | | |
| | | Short Duration | | | Intermediate Duration | |
| | | 2011 | | | 2010 | | | 2011 | | | 2010 | |
Ordinary Income - QDI | | | 0.00 | % | | | 0.00 | % | | | 0.00 | % | | | 0.00 | % |
Ordinary Income - DRD | | | 0.00 | % | | | 0.00 | % | | | 0.00 | % | | | 0.00 | % |
Pursuant to section 852 of the Internal Revenue Code, Short Duration, and Intermediate Duration hereby designate as a capital gain distribution with respect to the taxable year ended December 31, 2011, $0, and $319,441, respectively or, if subsequently determined to be different, the net capital gains of such year.
Report of Independent Registered Public Accounting Firm
To the Board of Trustees of Managers Trust II and the Shareholders of Managers Short Duration Government Fund and Managers Intermediate Duration Government Fund:
In our opinion, the accompanying statements of assets and liabilities, including the schedules of portfolio investments, and the related statements of operations and of changes in net assets and the financial highlights present fairly, in all material respects, the financial position of Managers Short Duration Government Fund and Managers Intermediate Duration Government Fund (constituting Managers Trust II, hereafter referred to as the “Funds”) at December 31, 2011, the results of each of their operations for the year then ended, the changes in each of their net assets for each of the two years in the period then ended and the financial highlights for each of the periods indicated, in conformity with accounting principles generally accepted in the United States of America. These financial statements and financial highlights (hereafter referred to as “financial statements”) are the responsibility of the Funds’ management; our responsibility is to express an opinion on these financial statements based on our audits. We conducted our audits of these financial statements in accordance with the standards of the Public Company Accounting Oversight Board (United States). Those standards require that we plan and perform the audit to obtain reasonable assurance about whether the financial statements are free of material misstatement. An audit includes examining, on a test basis, evidence supporting the amounts and disclosures in the financial statements, assessing the accounting principles used and significant estimates made by management, and evaluating the overall financial statement presentation. We believe that our audits, which included confirmation of securities at December 31, 2011 by correspondence with the custodian and brokers, provide a reasonable basis for our opinion.
PricewaterhouseCoopers, LLP
Philadelphia, Pennsylvania
February 27, 2012
Trustees and Officers
The Trustees and Officers of the Trust, their business addresses, principal occupations for the past five years and dates of birth are listed below. The Trustees provide broad supervision over the affairs of the Trust and the Funds. The Trustees are experienced executives who meet periodically throughout the year to oversee the Funds’ activities, review contractual arrangements with companies that provide services to the Funds, and review the Funds’ performance. Unless otherwise noted, the address of each Trustee or Officer is the address of the Trust: 800 Connecticut Avenue, Norwalk, Connecticut 06854.
There is no stated term of office for Trustees. Trustees serve until their resignation, retirement or removal in accordance with the Trust’s organizational documents and policies adopted by the Board from time to time. The Chairman of the Trustees, President, Treasurer and Secretary of the Trust are elected by the Trustees annually. Other officers hold office at the pleasure of the Trustees.
Independent Trustees
The following Trustees are not “interested persons” of the Trust within the meaning of the 1940 Act:
| | |
Name, Date of Birth, Number
of Funds Overseen in Fund
Complex* | | Principal Occupation(s) During Past 5 Years and Other Directorships Held by Trustee |
Jack W. Aber, 9/9/37 • Trustee since 2000 • Oversees 38 Funds in Fund Complex | | Professor of Finance, Boston University School of Management (1972-Present); Trustee of Appleton Growth Fund (1 portfolio); Trustee of Third Avenue Trust (5 portfolios); Trustee of Third Avenue Variable Trust (1 portfolio); Trustee of Aston Funds (26 portfolios). |
William E. Chapman, II, 9/23/41 • Independent Chairman • Trustee since 2000 • Oversees 38 Funds in Fund Complex | | President and Owner, Longboat Retirement Planning Solutions (1998-Present); Hewitt Associates, LLC (part time) (provider of Retirement and Investment Education Seminars) (2002-2009); Trustee of Bowdoin College (2002-Present); Director of Harding, Loevner Funds, Inc. (6 portfolios); Trustee of Third Avenue Trust (5 portfolios); Trustee of Third Avenue Variable Trust (1 portfolio); Trustee of Aston Funds (26 portfolios). |
Edward J. Kaier, 9/23/45 • Trustee since 2000 • Oversees 38 Funds in Fund Complex | | Attorney at Law and Partner, Teeters Harvey Gilboy & Kaier LLP (2007-Present); Attorney at Law and Partner, Hepburn Willcox Hamilton & Putnam, LLP (1977-2007); Trustee of Third Avenue Trust (5 portfolios); Trustee of Third Avenue Variable Trust (1 portfolio); Trustee of Aston Funds (26 portfolios). |
Steven J. Paggioli, 4/3/50 • Trustee since 2000 • Oversees 38 Funds in Fund Complex | | Independent Consultant (2002-Present); Formerly Executive Vice President and Director, The Wadsworth Group (1986-2001); Executive Vice President, Secretary and Director, Investment Company Administration, LLC (1990-2001); Vice President, Secretary and Director, First Fund Distributors, Inc. (1991-2001); Trustee, Professionally Managed Portfolios (43 portfolios); Advisory Board Member, Sustainable Growth Advisors, LP; Independent Director, Chase Investment Counsel (2008 – Present); Trustee of Aston Funds (26 portfolios). |
Eric Rakowski, 6/5/58 • Trustee since 2000 • Oversees 38 Funds in Fund Complex | | Professor, University of California at Berkeley School of Law (1990-Present); Director of Harding, Loevner Funds, Inc. (6 portfolios); Trustee of Third Avenue Trust (5 portfolios); Trustee of Third Avenue Variable Trust (1 portfolio); Trustee of Aston Funds (26 portfolios). |
Thomas R. Schneeweis, 5/10/47 • Trustee since 2000 • Oversees 38 Funds in Fund Complex | | Professor of Finance, University of Massachusetts (1977-Present); Director, CISDM at the University of Massachusetts, (1996-Present); President, Alternative Investment Analytics, LLC, (formerly Schneeweis Partners, LLC) (2001-Present); Partner, S Capital Management, LLC (2007-Present); President, TRS Associates (1982-Present); Partner, White Bear Partners, LLC (2007-2010); Partner, Northampton Capital Management, LLC (2004-2010); Trustee of Aston Funds (26 portfolios). |
* The Fund Complex consists of Managers AMG Funds, The Managers Funds, Managers Trust I and Managers Trust II. |
| | |
| Interested Trustees |
Each Trustee in the following table is an “interested person” of the Trust within the meaning of the 1940 Act. Ms. Carsman is an interested person of the Trust within the meaning of the 1940 Act by virtue of her position with, and interest in securities of, AMG, and her former position as Chief Legal Officer of the Trust. |
Name, Date of Birth, Number of Funds Overseen in Fund Complex* | | Principal Occupation(s) During Past 5 Years and Other Directorships Held by Trustee |
Christine C. Carsman, 4/2/52 • Trustee since 2011 • Oversees 38 Funds in Fund Complex | | Deputy General Counsel, Affiliated Managers Group, Inc. (2011-Present); Senior Vice President and Chief Regulatory Counsel, Affiliated Managers Group, Inc. (2004-Present); Secretary and Chief Legal Officer, Managers AMG Funds, The Managers Funds, Managers Trust I and Managers Trust II (2004-2011); Senior Counsel, Vice President and Director of Operational Risk Management and Compliance, Wellington Management Company, LLP (1995-2004) |
Officers | | |
Name, Date of Birth, Position(s) Held with Fund and Length of Time Served | | Principal Occupation(s) During Past 5
Years |
Keitha L. Kinne, 5/16/58 • President since 2012 • Chief Operating Officer since 2007 | | Managing Partner and Chief Operating Officer, Managers Investment Group LLC (2007-Present); Chief Investment Officer, Managers Investment Group LLC (2008-Present); President, Managers Distributors, Inc. (2012-Present; Chief Operating Officer, The Managers Funds, Managers AMG Funds and Managers Trust I (2007-Present); Managing Director, Legg Mason & Co., LLC (2006-2007); Managing Director, Citigroup Asset Management (2004-2006). |
Lewis Collins, 2/22/66 • Secretary since 2011 • Chief Legal Officer since 2011 | | Senior Vice President and Senior Counsel, Affiliated Managers Group, Inc. (2010-Present); Vice President and Senior Counsel, Affiliated Managers Group, Inc. (2006- 2010); Senior Counsel, Affiliated Managers Group, Inc. (2002-2006); Attorney, Ropes & Gray LLP (1998-2002) |
Donald S. Rumery, 5/29/58 • Chief Financial Officer since 2007 • Treasurer since 2000 | | Senior Vice President, Managers Investment Group LLC (2005-Present); Treasurer and Chief Financial Officer, Managers Distributors, Inc. (2000-Present); Treasurer, The Managers Funds (1995-Present); Treasurer, Managers AMG Funds (1999-Present); Treasurer, Managers Trust I (2000-Present); Chief Financial Officer, The Managers Funds, Managers AMG Funds and Managers Trust I (2007-Present); Vice President, The Managers Funds LLC, (1994-2004). |
John J. Ferencz, 3/09/62 • Chief Compliance Officer since 2010 | | Vice President, Legal and Compliance, Managers Investment Group LLC (2010-Present); Senior Compliance Analyst, Mutual Funds and Regulatory, GE Asset Management Incorporated (2005-2010). |
Michael S. Ponder, 9/12/73 • Assistant Secretary since 2011 | | Senior Vice President and Counsel, Managers Investment Group LLC (2011-Present); Attorney, DeNovo Legal (2009-2010); Vice President, Credit Suisse (2007-2009); Associate, Willkie Farr & Gallagher LLP (2006-2007) |
THIS PAGE INTENTIONALLY LEFT BLANK
Investment Manager and Administrator
Managers Investment Group LLC
333 W. Wacker Drive
Suite 1200
Chicago, IL 60606
(800) 835-3879
Distributor
Managers Distributors, Inc.
333 W. Wacker Drive
Suite 1200
Chicago, IL 60606
(800) 835-3879
Custodian
The Bank of New York Mellon
2 Hanson Place
Brooklyn, NY 11217
Legal Counsel
Ropes & Gray LLP
Prudential Tower, 800 Boylston Street
Boston, MA 02199-3600
Transfer Agent
BNY Mellon Investment Servicing (US) Inc.*
Attn: Managers
P.O. Box 9769
Providence, RI 02940
(800) 548-4539
For Managers Choice Only
Managers
c/o BNY Mellon Investment Servicing (US) Inc.*
P.O. Box 9847
Providence, RI 02940-8047
(800) 358-7668
| * | Formerly PNC Global Investment Servicing (U.S.) Inc. |
MANAGERS AND MANAGERS AMG FUNDS
| | | | |
EQUITY FUNDS | | BALANCED FUNDS |
CADENCE CAPITAL APPRECIATION CADENCE FOCUSED GROWTH CADENCE MID-CAP CADENCE EMERGING COMPANIES Cadence Capital Management, LLC CHICAGO EQUITY PARTNERS MID-CAP Chicago Equity Partners, LLC EMERGING MARKETS EQUITY Rexiter Capital Management Limited Schroder Investment Management North America Inc. ESSEX SMALL/MICRO CAP GROWTH Essex Investment Management Co., LLC FQ TAX-MANAGED U.S. EQUITY FQ U.S. EQUITY First Quadrant, L.P. FRONTIER SMALL CAP GROWTH Frontier Capital Management Company, LLC GW&K SMALL CAP EQUITY Gannett Welsh & Kotler, LLC MICRO-CAP Lord, Abbett & Co. LLC WEDGE Capital Management L.L.P. Next Century Growth Investors LLC RBC Global Asset Management (U.S.) Inc. | | INTERNATIONAL EQUITY AllianceBernstein L.P. Lazard Asset Management, LLC Martin Currie Inc. REAL ESTATE SECURITIES Urdang Securities Management, Inc. RENAISSANCE LARGE CAP GROWTH Renaissance Group LLC SKYLINE SPECIAL EQUITIES PORTFOLIO Skyline Asset Management, L.P. SPECIAL EQUITY Ranger Investment Management, L.P. Lord, Abbett & Co. LLC Smith Asset Management Group, L.P. Federated MDTA LLC SYSTEMATIC VALUE SYSTEMATIC MID CAP VALUE Systematic Financial Management, L.P. TIMESSQUARE MID CAP GROWTH TIMESSQUARE SMALL CAP GROWTH TSCM GROWTH EQUITY TimesSquare Capital Management, LLC TRILOGY GLOBAL EQUITY TRILOGY EMERGING MARKETS EQUITY TRILOGY INTERNATIONAL SMALL CAP Trilogy Global Advisors, L.P. | | CHICAGO EQUITY PARTNERS BALANCED Chicago Equity Partners, LLC ALTERNATIVE FUNDS FQ GLOBAL ALTERNATIVES FQ GLOBAL ESSENTIALS First Quadrant, L.P. INCOME FUNDS BOND (MANAGERS) FIXED INCOME GLOBAL INCOME OPPORTUNITY Loomis, Sayles & Co., L.P. BOND (MANAGERS PIMCO) Pacific Investment Management Co. LLC CALIFORNIA INTERMEDIATE TAX-FREE Miller Tabak Asset Management LLC GW&K MUNICIPAL BOND GW&K MUNICIPAL ENHANCED YIELD Gannett Welsh & Kotler, LLC HIGH YIELD J.P. Morgan Investment Management LLC INTERMEDIATE DURATION GOVERNMENT SHORT DURATION GOVERNMENT Smith Breeden Associates, Inc. |
This report is prepared for the Funds’ shareholders. It is authorized for distribution to prospective investors only when preceded or accompanied by an effective prospectus. To receive a free copy of the prospectus or Statement of Additional Information, which includes additional information about Fund Trustees, please contact us by calling 800.835.3879. Distributed by Managers Distributors, Inc., member FINRA. A description of the policies and procedures each Fund uses to vote its proxies is available: (i) without charge, upon request, by calling 800.835.3879, or (ii) on the Securities and Exchange Commission’s (SEC) Web site at www. sec.gov. For information regarding each Fund’s proxy voting record for the 12-month period ended June 30, call 800.835.3879 or visit the SEC Web site at www.sec.gov. The Funds file their complete schedule of portfolio holdings with the SEC for the first and third quarters of each fiscal year on Form N-Q. The Funds’ Forms N-Q are available on the SEC’s website at www.sec.gov. A Fund’s Forms N-Q may be reviewed and copied at the SEC’s Public Reference Room in Washington, DC. Information on the operation of the Public Reference Room may be obtained by calling 800.SEC.0330. To review a complete list of the Funds’ portfolio holdings, or to view the most recent quarterly holdings report, semiannual report, or annual report, please visit www.managersinvest.com. | | |
| | |  |

Item 2. CODE OF ETHICS
Registrant has adopted a Code of Ethics. See attached Exhibit (a)(1).
Item 3. AUDIT COMMITTEE FINANCIAL EXPERT
Registrant’s Board of Trustees has determined that independent Trustees Mr. Jack W. Aber and Mr. Steven J. Paggioli each qualify as the Audit Committee Financial Expert. Mr. Aber and Mr. Paggioli are “independent” as such term is defined in Form N-CSR.
Item 4. PRINCIPAL ACCOUNTANT FEES AND SERVICES
The aggregate fees billed by PwC to the Fund for the Funds’ two most recent fiscal years for professional services rendered for audits of annual financial statements, or services that are normally provided in connection with statutory and regulatory filings or engagements (“Audit Fees”) were as follows:
| | | | | | | | |
| | | Fiscal 2011 | | | Fiscal 2010 | |
Managers AMG Chicago Equity Partners Mid-Cap Fund | | $ | 18,374 | | | $ | 20,014 | |
Managers AMG Chicago Equity Partners Balanced Fund | | $ | 19,947 | | | $ | 20,056 | |
Managers High Yield Fund | | $ | 24,489 | | | $ | 24,509 | |
Managers Fixed Income Fund | | $ | 28,088 | | | $ | 27,537 | |
Managers Short Duration Government Fund | | $ | 26,151 | | | $ | 25,638 | |
Managers Intermediate Duration Government Fund | | $ | 26,151 | | | $ | 25,638 | |
All Funds in the Managers Complex Audited by PwC | | $ | 994,830 | | | $ | 994,109 | |
Audit-Related Fees
There were no fees billed by PwC to the Funds in its two recent fiscal years for services rendered for assurance and related services that are reasonably related to the performance of the audit or review of the Fund’s financial statements, but are not reported as Audit Fees (“Audit-Related Fees”).
For the Funds’ two most recent fiscal years, there were no Audit-Related Fees billed by PwC for engagements related directly to the operations and financial reporting of one or more Funds by a Fund Service Provider. A Fund Service Provider is (a) any investment adviser to the Fund (not including any Subadvisor whose role is primarily portfolio management and is subcontracted with or overseen by another investment adviser) or (b) any entity that provides ongoing services to the Fund and is controlling, controlled by or under common control with a Fund investment adviser described in (a).
Tax Fees
The aggregate fees billed by PwC to the Funds for the two most recent fiscal years for professional services rendered for tax compliance, tax advice, and tax planning (“Tax Fees”) were as follows:
| | | | | | | | |
| | | Fiscal 2011 | | | Fiscal 2010 | |
Managers AMG Chicago Equity Partners Mid-Cap Fund | | $ | 7,340 | | | $ | 7,200 | |
Managers AMG Chicago Equity Partners Balanced Fund | | $ | 7,340 | | | $ | 7,200 | |
Managers High Yield Fund | | $ | 7,340 | | | $ | 7,200 | |
Managers Fixed Income Fund | | $ | 7,340 | | | $ | 7,200 | |
Managers Short Duration Government Fund | | $ | 8,620 | | | $ | 9,000 | |
Managers Intermediate Duration Government Fund | | $ | 8,620 | | | $ | 8,450 | |
For the Funds’ two most recent fiscal years, Tax Fees billed by PwC for engagements by Fund Service Providers that related directly to the operations and financial reporting of the Funds were $0 for fiscal 2008 and $0 for fiscal 2007, respectively.
The services for which Tax Fees were charged comprise all services performed by professional staff in PwC’s tax division except those services related to the audit. Typically, this category would include fees for tax compliance, tax planning, and tax advice. Tax compliance, tax advice, and tax planning services include preparation of original and amended tax returns, claims for refund and tax payment-planning services, assistance with tax audits and appeals, tax advice related to mergers and acquisitions and requests for rulings or technical advice from taxing authorities.
All Other Fees
There were no other fees billed by PwC to the Funds for all other non-audit services (“Other Fees”) during the Funds’ two most recent fiscal years. During the same period, there were no Other Fees billed by PwC for engagements by Fund Service Providers that related directly to the operations and financial reporting of the Funds.
According to policies adopted by the Audit Committee, services provided by PwC to the Funds must be pre-approved by the Audit Committee. On an annual basis, the Audit Committee reviews and pre-approves various types of services that PwC may perform for the Funds without specific approval of each engagement, subject to specified budget limitations. As contemplated by the Sarbanes-Oxley Act of 2002 and related SEC rules, the Audit Committee also pre-approves non-audit services provided by PwC to any Fund Service Provider for any engagement that relates directly to the operations and financial reporting of the Funds. Any engagement that is not already pre-approved or that will exceed a pre-approved budget must be submitted to the Audit Committee for pre-approval. The Chairman of the Audit Committee is authorized on behalf of the Board of Trustees and the Audit Committee to approve the engagement of PwC to perform non-audit services subject to certain conditions, including notification to the Audit Committee of such pre-
approval not later than the next meeting of the Audit Committee following the date of such pre-approval.
There were no other fees billed by PwC for non-audit services rendered to the Funds and to Fund Service Providers for the Funds’ two most recent fiscal years.
The Audit Committee has considered whether the provision of non-audit services by PwC to Fund Service Providers that were not required to be pre-approved by the Audit Committee is compatible with maintaining PwC’s independence in its audit of the Funds, taking into account representations from PwC, in accordance with Independence Standards Board Standard No. 1, regarding its independence from the Funds and its related entities.
The following table sets forth the non-audit services provided by PwC to the Funds and its service affiliates defined as the Funds’ investment advisor and any entity controlling, controlled by or under common control with Managers Investment Group LLC that provides ongoing services to the Funds (“Control Affiliates”) for the last two fiscal years.
| | | | | | | | | | | | | | | | | | | | | | | | |
| | | Audit-related fees A | | | Tax fees A | | | All other fees A | |
| | | 2010 | | | 2009 | | | 2010 | | | 2009 | | | 2010 | | | 2009 | |
Control Affiliates | | $ | 424,730 | | | $ | 580,765 | | | $ | 747,820 | | | $ | 479,175 | | | $ | 0 | | | $ | 0 | |
| A | Aggregate amounts may reflect rounding. |
Item 5. AUDIT COMMITTEE OF LISTED REGISTRANTS
Not applicable.
Item 6. SCHEDULE OF INVESTMENTS
The schedule of investments in unaffiliated issuers as of the close of the reporting period is included as part of the shareholder report contained in Item 1 hereof.
Item 7. DISCLOSURE OF PROXY VOTING POLICIES AND PROCEDURES FOR CLOSED-END MANAGEMENT INVESTMENT COMPANIES
Not applicable.
Item 8. PORTFOLIO MANAGERS OF CLOSED-END MANAGEMENT INVESTMENT COMPANIES
Not applicable.
Item 9. PURCHASES OF EQUITY SECURITIES BY CLOSED-END MANAGEMENT INVESTMENT COMPANIES AND AFFILIATED PURCHASERS
Not applicable.
Item 10. SUBMISSION OF MATTERS TO A VOTE OF SECURITY HOLDERS
Not applicable.
Item 11. CONTROLS AND PROCEDURES
(a) The Registrant’s principal executive and principal financial officers have concluded, based on their evaluation of the registrant’s disclosure controls and procedures as of a date within 90 days of the filing of this report, that the Registrant’s disclosure controls and procedures are reasonably designed to ensure that information required to be disclosed by the Registrant on Form N-CSR is recorded, processed, summarized and reported within the required time periods and that information required to be disclosed by the registrant in the reports that it files or submits on Form N-CSR is accumulated and communicated to the Registrant’s management, including its principal executive and principal financial officers, as appropriate to allow timely decisions regarding required disclosure.
(b) There were no changes in the Registrant’s internal control over financial reporting during the Registrant’s fourth fiscal quarter of the period covered by this report that have materially affected, or are reasonably likely to affect, the internal control over financial reporting.
Item 12. EXHIBITS
| | | | |
| | (a | ) (1) | | Any Code of Ethics or amendments hereto. Filed herewith. |
| |
| | (a | ) (2) | | Certifications pursuant to Rule 30a-2(a) under the Investment Company Act of 1940 - Filed herewith. |
| |
| | (a | ) (3) | | Not applicable. |
| |
| | (b | ) | | Certifications pursuant to Rule 30a-2(b) under the Investment Company Act of 1940 - Filed herewith. |
SIGNATURES
Pursuant to the requirements of the Securities Exchange Act of 1934 and the Investment Company Act of 1940, the registrant has duly caused this report to be signed on its behalf by the undersigned, thereunto duly authorized.
MANAGERS TRUST II
| | |
| By: | | /s/ Keitha L. Kinne |
| | Keitha L. Kinne, President |
| |
| Date: | | March 5, 2012 |
Pursuant to the requirements of the Securities Exchange Act of 1934 and the Investment Company Act of 1940, this report has been signed below by the following persons on behalf of the registrant and in the capacities and on the dates indicated.
| | |
| By: | | /s/ Keitha L. Kinne |
| | Keitha L. Kinne, President |
| |
| Date: | | March 5, 2012 |
| |
| By: | | /s/ Donald S. Rumery |
| | Donald S. Rumery, Chief Financial Officer |
| |
| Date: | | March 5, 2012 |