Exhibit 99.(a)(35)

CERTIFICATE OF ACCURACY
I, the undersigned, Arend Bakker, declare that I am fluent in the English and Dutch languages; that I have translated, transcribed, reviewed and/or edited the following Dutch source file.
Van Dijck Tab 38.pdf
I certify that to the best of my knowledge, ability and belief the same is a true and complete translation/transcription of the documents presented to me.
/s/ Arend Bakker |
(Translator) |
JX 246a
www.ubiqus.com
Ubiqus — West Coast | Maeling Services | Ubiqus — East Coast |
2222 Martin Street, Suite 212 | Transcription | 22 Cortlandt Street, Suite 802 |
Irvine, CA 92612 | Translation/Intererstalion | New York, NY 10007 |
ph. (949) 477 4972 | Audience Response Systems | ph. (212) 227 7440 |
From: Dijk, van, J.A. (Johannes) (W&O Financial BC Carrier Services)
Sent: Tuesday, April 14, 2009 11:05:57 AM
To: Meijden, van der, J.G. (Julian) (W&O Financial Segment Control W&O); Farwerck, J.F.E. (Joost)
(W&O Director); Costermans, H.J. (Huib) (W&O Financial Manager); Schot, van der, P.J. (W&O CS DIR
Changing Management); Postma, J.J.L. (Jaap) (W&O Carrier Services Director); Erp, van, P.C. (Peter)
(W&O PFM WS Interconnection Servives)
Cc: Nijs, de, H.W. (Henk) (W&O Finances BC Portfolio Management)
Subject: JEV iBasis
Attachments: Copy of scenario_iBasis_2009-2010-HN-14-03-2009.xlx
Gentlemen,
In particular Henk has fought today with the JEV 09/10 of iBasis. This is not an easy question, because they are mainly focused on margin at this moment. This causes that there has been $50 million turnover less than was foreseen in the plan. Compared to Ql 2008 is this even $70 million. Therefore we are in descending line in minutes and turnover. The question is when will this stop and when will we grow again?
For 2009 we think that the JEV on margin (ebitda and FCF) is considered realistic. They score a reasonable Gross margin and the opex expenses are well under control. We expect a growth in minutes during the coming quarters of the year. We think that 22 billion minutes with a turnover over $l.l billion is a realistic forecast. I have approached iBasis about this and this is not denied. iBasis is not ready to submit a JEV for 2009. So we really have to count on a lower turnover. In market shares this is a worrisome development, what counts in business is expansion, expansion……………
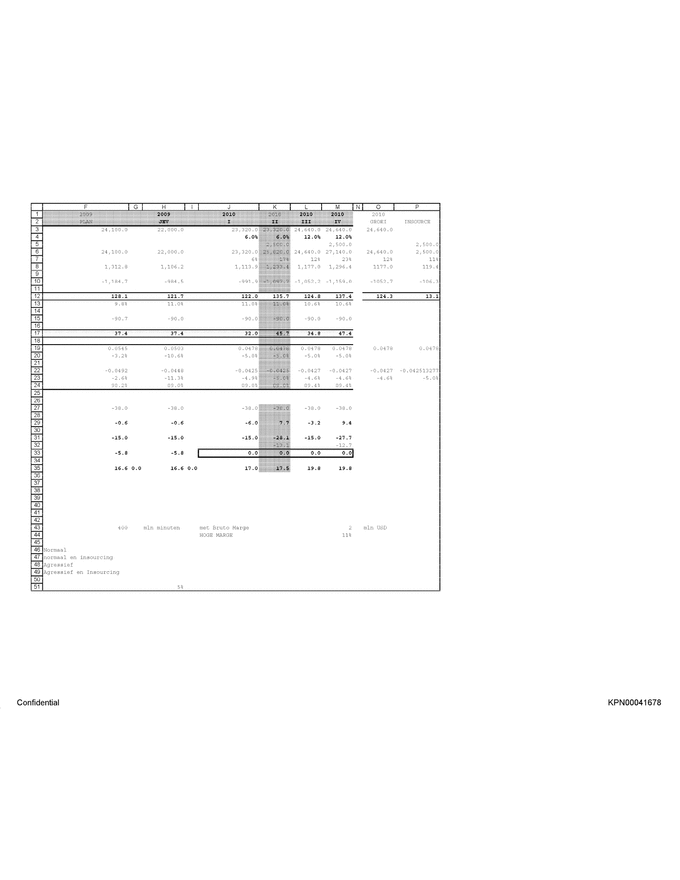
For 2010 it is even more difficult to give a forecast. There we propose 4 scenarios.
Going concern, iBasis takes up the market growth again and maintains a margin of appr. 11% (a little lower than Ql 09)
Going concern, with insourcing deals (2.5 billion minutes)
Organic growth of 12% and a margin of 10.6%
Organic growth of 12% + insourcing deals (2.5 billion minutes).
If we do not do anything, we think that the absolute margin will eventually come under pressure, because the business is faced with continuous decreases in price. In our perception we must do something in terms of extra growth. Therefore the aiming at iBasis must be changed.
For the various scenarios see the excel file.
Willing to debate and discussion. We are in my perception at a difficult decision point.
With kindest regards,
Johannes van Dijk
Financial Portfolio Management Wholesale and Operations
KPN
W&O Financial
Regulusweg 1, suite HV4 BC 1.11
2516 AC The Hague
Telephone: (070) 34 36 205
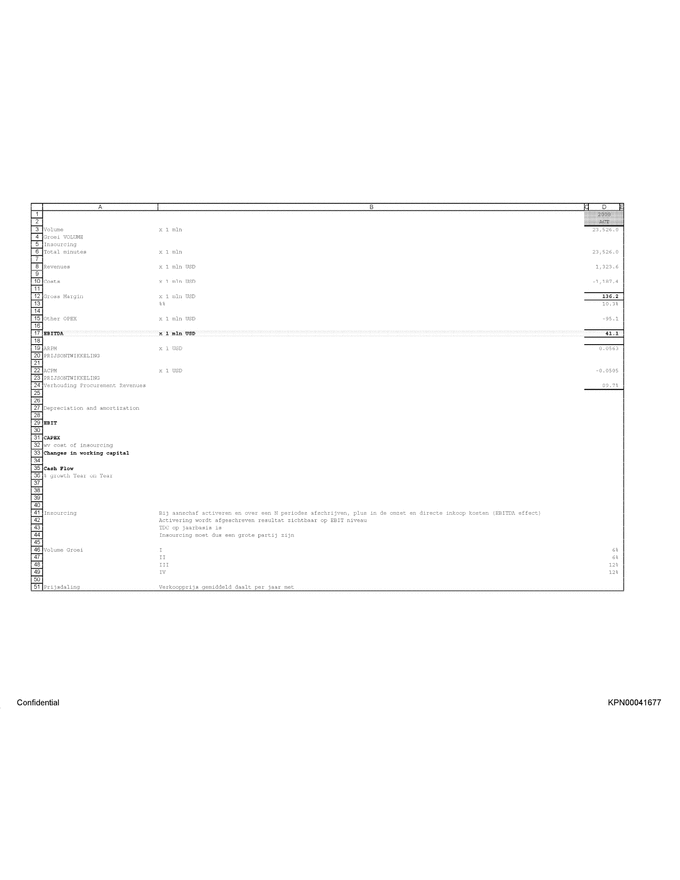
Column A
Row 3: Volume
Row 4: Growth VOLUME
Row 20: PRICE DEVELOPMENT
Row 23: PRICE DEVELOPMENT
Row 24: Relation Procurement Revenues
Row 46: Volume growth
Row 51: Decrease in price
Column B
Row 41: Activate when purchased and write off in N periods, plus in the turnover and direct costs (EBITDA effect)
Row 42: Activation is written off result visible at EBIT level
Row 43: TDC on a yearly basis is
Row 44: Therefore insourcing has to be a big party
Row 51: Selling price decreases per year on average with
Column C
Row 4: Share Ql in ACTUAL YEAR
Row 17: Share Ql in ACTUAL YEAR
Row 25: Relation Procurement Revenues
Column F
Row 46: Normal
Row 47: Normal and insourcing
Row 48: Aggressive
Row 49: Aggressive and Insourcing
Column H
Row 43: million minutes
Column J
Row 43: with Gross Margin
Row 44: HIGH MARGIN
Column O
Row 2: GROWTH
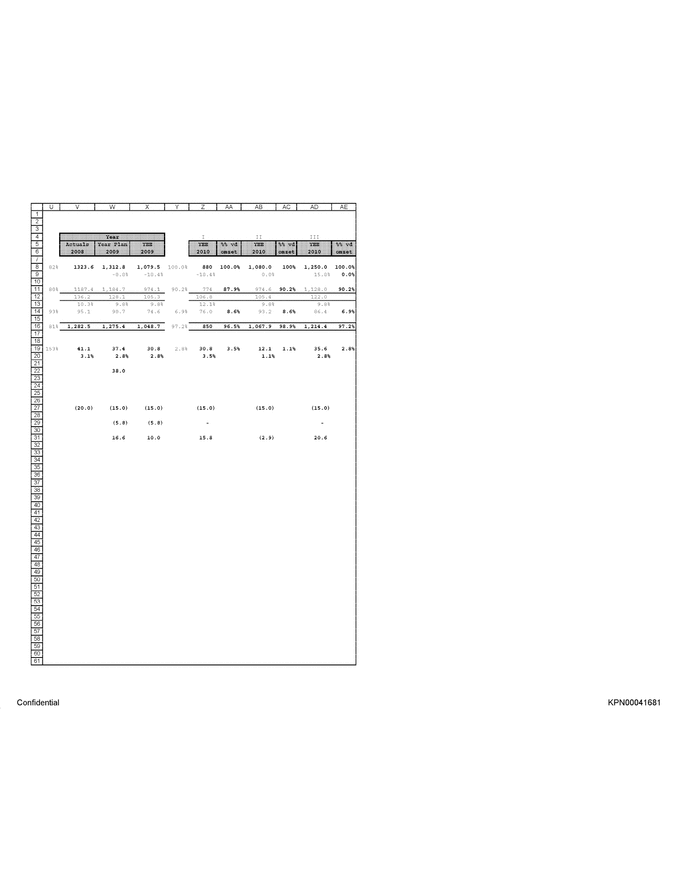
Column AA, AC and AE
Row 6: TURNOVER
From: Dijk, van, J.A. (Johannes) (W&O Financiën BC Carrier Services)
Sent: Tuesday, April 14, 2009 11:05:57 AM
To: Meijden, van der, J.G. (Julian) (W&O Financiën Segment Control W&O); Farwerck, J.F.E. (Joost) (W&O Directeur); Costermans, H.J. (Huib) (W&O Financiën Manager); Schot, van der, P.J. (Paul) (W&O CS DIR Veranderingsmanagement); Postma, J.J.L (Jaap) (W&O Carrier Services Dir); Erp, van, P.C. (Peter) (W&O CS CPM Interconnection Services)
Cc: Nijs, de, H.W. (Henk) (W&O Financiën BC Carrier Services)
Subject: JEV iBasis
Attachments: Kopie van scenario_iBasis_2009-2010-HN-14-03-2009.xls
Heren,
Met name Henk heeft vandaag gestoeid met de JEV 09/10 van iBasis. Dit is geen gemakkelijke vraag, omdat zij op dit moment vooral gefocust zijn op marge. Dit heeft als gevolg dat men 50 mln dollar minder omzet heeft gedraaid dan in het plan was voorzien. T.o.v. van Q1 2008 is dit zelfs 70 mln dollar. We zitten dus in een neergaande lijn in minuten en omzet. De vraag is wanneer houdt dit op en gaan we weer groeien?
Voor 2009 denken we dat de JEV op marge (ebitda en FCF) realistisch moet worden geacht. Ze scoren een redelijke Gross margin en de opex uitgaven zijn goed onder controle. We veronderstellen een groei in minuten in de komende kwartalen. We denken dat 22 mrd minuten met een omzet van 1.1 mrd dollar een realistische forcast is. Ik heb hier ook iBasis over gepolst en dit wordt niet direct ontkend. iBasis is nog niet zover om een JEV af te geven voor 2009. Dus we moeten echt rekening gaan houden met lagere omzet. Dit is in marktaandelen gezien een zorgelijke ontwikkeling, waar het in de business draait op schaalgrootte, schaalgrootte……….
Voor 2010 is het nog moeilijker om een forcast af te geven. We stellen hier 4 scenario’s voor:
Going concern, iBasis pakt de marktgroei weer op en behoudt een marge van ca. 11% (iets lager dan Q1 09)
Going concern, met insourcing deals (2.5 mrd minutes)
Organic growth van 12% en een marge van 10.6%
Organic growth van 12% + insourcing deals (2.5 mrd minutes).
Als we niks doen, denken we dat de absolute marge toch uiteindelijk onder druk komt te staan, doordat de business met voortdurende prijsdalingen wordt geconfronteerd. We moeten in onze beleving wel wat doen in termen van extra groei. Hiervoor zai de aansturing richting iBasis moeten worden veranderd.
Zie voor de verschillende scenario’s de excel file.
Graag bereid tot overieg en discussie. We zitten in mijn beleving op een moeilijk beslispunt.
Met vriendelijke groet,
Johannes van Dijk
Financiën Portfolio Management Wholesale en Operations
KPN
W&O financiën
Regulusweg 1, kamer HV4 BC 1.11
2516 AC’s Gravenhage
Telefoon: (070) 34 36 205
| 2008 ACT Volume x 1 mln 23,526.0 Groel VOLUME Insourcing Total minutes x 1 mln 23,526.0 Revenues x 1 mln USD 1,323.6 Costs x 1 mln USD -1,187.4 Gross Margin x 1 mln USD 136.2 % 10.3% Other OPEX x 1 mln USD - 95.1 EBITDA x 1 mln USD 41.1 ARPM X 1 USD 0.0563 PRIJSONTWIKKELING ACPM X 1 USD -0.0505 PRIJSONTWIKKELING Verhouding Procurement Revenues 89.7% Depreciation and amortization EBIT CAPEX wv cost of insourcing Changes in working capital Cash Flow % growth Year on Year Insourcing Bij aanschaf activeren en over een N periodes afschrijven, plus in de omzet en directe inkoop kosten (EBITDA effect) Activering wordt afgeschreven resultat zichtbaar op EBIT niveau TDC op jaarbasis is Insourcing moet dus een grote partij zijn Volume Groei I 6% II 6% III 12% IV 12% Prijsdaling Verkoopprijs gemiddeld dealt per jaar met Confidential KPN00041677 |
| 2009 2009 2010 2010 2010 2010 2010 PLAN JEV I II III IV GROEI INSOURCE 24,100.0 22,000.0 23,320.0 23,320.0 24,640.0 24,640.0 24,640.0 6.0% 6.0% 12.0% 12.0% 2,500.0 2,500.0 2,500.0 24,100.0 22,000.0 23,320.0 25,820.0 24,640.0 27,140.0 24,640.0 2,500.0 6% 17% 12% 23% 12% 11% 1,312.8 1,106.2 1,113.9 1,233.4 1,177.0 1,296.4 1177.0 119.4 -1,184.7 -984 .5 -991.9 -1,097.7 -1,052.2 -1,159.0 -1052.7 -106.3 128.1 121.7 122.0 135.7 124.8 137.4 124.3 13.1 9.8% 11.0% 11.0% 11.0% 10.6% 10.6% -90.7 -90.0 -90.0 -90.0 -90.0 -90.0 37.4 37.4 32.0 45.7 34.8 47.4 0.0545 0.0503 0.0478 0.0478 0.0478 0.0478 0.0478 0.0478 -3.2% -10.6% -5.0% -5.0% -5.0% -5.0% -0.0492 -0.0448 -0.0425 -0.0425 -0.0427 -0.0427 -0.0427 -0.042513277 -2.6% -11.3% -4. 9% -5.0% -4.6% -4.6% -4.6% -5.0% 90.2% 89.0% 89.0% 89.0% 89.4% 89.4% -38.0 -38.0 -38.0 -38.0 -38.0 -38.0 -0.6 -0.6 -6.0 7.7 -3.2 9.4 -15.0 -15.0 -15.0 -28.1 -15.0 -27.7 -13.1 -12.7 -5.8 -5.8 0.0 0.0 0.0 0.0 16.6 0.0 16.6 0.0 17.0 17.5 19.8 19.8 400 mln minuten met Bruto Marge 2 mln USD HOGE MARGE 11% Normaal normaal en insourcing Agressief Agressief en Insourcing 5% Confidential KPN00041678 |

| GLENN MELONI REPORT APRIL 2009 Month YTD Current Quarter Year Actuals Year Plan Actuals Actuals Year Plan Actuals In millions of USD Actuals%% vd Year Plan Actuals Actuals Year Plan YEE%% vd YEAR PLAN ACTUAL 2008 2009 2009 2008 2009 2009 Unless otherwise stated 2009 omzet 2009 2008 2007 2009 2008 omzet 2009 2009 111.5 103.8 84.3 324.9 311.3 256.0 Total net revenue 256.0 100.0% 311.3 324.9 1,312.8 100.0% 23.7% 19.5% 0.0%% growth Year on Year 0.0% 98.3 93.9 72.9 209.5 281.7 224.9 Cost of services and goods 224.9 87.9% 281.7 289.5 1,184.7 90.2% 23.8% 19.0% 13.2 9.9 11.3 35.4 29.6 31.0 Gross Margin 31.0 29.6 35.4 128.1 11.8% 9.5% 13.4% 10.9% 9.5% 12.1% 12.1% 9.5% 10.9% 9.8% 8.9 7.9 7.4 26.4 23.8 22.1 Other operating expenses 22.1 8.6% 23.8 26.4 90.7 6.9% 26.2% 24.4% - - - - - Other income/expenses - - - 107.1 101.8 80.3 316.0 305.5 247.0 Total operating expenses 247.0 96.5% 305.5 315.9 - 1,275.4 - 97.2% 24 .0% 19.4% -21.8%% growth Year on Year 23.7% 4.3 2.0 3.9 9.0 5.8 8.9 EBITDA 8.9 3.5% 5.8 9.0 - 37.4 _ 2.8% 15.6% 23.9% 3.9% 1.9% 4.7% 2.8% 1.9% 3.5% EBITDA Margin (%) 3.5% 1.9% 2.8% 2.8% 2.4 3.1 2.8 7.2 9.4 8.2 Depreciation and amortization 8.2 9.4 7.2 38.0 2.9% 24 .7% 21.7% 1.9 (1.2) 1.1 1.7 (3.6) 0.7 Operating result (EBIT) 0.7 (3.6) 1.7 (0.6) 1.7% -1.1% 1.3% 0.5% -1.2% 0.3% EBIT margin (%) 0.3% -1.1% 0.5% 0.0% (1.9) (1.3) 0.4 (5.7) (3.8) (1.9) Capex (1.9) (3.8) (5.7) (15.0) - - Changes in working capital - - (5.8) - (0.4) Cash Flow 2.1 (0.4) 16.6 % growth Year on Year Month YTD Current Quarter Year Actuals Year Plan Actuals Actuals Year Plan Actuals In millions of USD Actuals Year Plan Actual Actual Year Plan YEE 2008 2009 2009 2008 2009 2009 Unless otherwise stated 2009 2009 2008 2007 2009 2008 111.5 103.8 84.3 324.9 311.3 256.0 Total Revenues 256.0 311.3 324.9 1,312.8 % growth Year on Year Cost of access Distribution fees Cost of goods sold 98.3 93.9 72.9 289.5 281.7 224 .9 Costs of services sold 224 .9 281.7 289.5 1,184.7 98.3 93.9 72.9 289.5 281.7 224.9 Costs of services and goods 224.9 281.7 289.5 - 1,184.7 - % growth Year on Year 13.2 9.9 11.3 35.4 29.6 31.0 Contribution Margin 31.0 29.6 35.4 - 128.1 - Network costs Marketing & sales costs 6.0 5.6 11.8 11.5 General & admin, costs 17.8 17.2 77.8 Changes in provision & other 8.9 7.9 7.4 26.4 23.8 22.1 Other operating expenses 22.1 23.8 26.4 - 90.7 - % growth Year on Year 107.1 101.8 80.3 315.9 305.5 247.0 Total costs and expenses 247.0 305.5 315.9 - 1,275.4 - Confidential KPN00041679 |
| 4.3 2.0 3.9 9.0 5.8 8.9 EBITDA 8.9 5.8 9.0 - 37.4 - 3.9% 1.9% 4.7% 2.8% 1.9% 3.5% EBITDA Margin (%) 3.5% 1.9% 2.8% #DIV/0! 2.8% #DIV/0! Month YTD Current Quarter Year 107.1 101.8 80.3 315.9 305.5 247.0 Total operating expenses 247.0 305.5 315.9 - 1,275.4 - Own work capitalized #DIV/0! Costs of materials 98.3 93.9 72.9 289.5 281.7 224.9 Work contracted out 224.9 281.7 289.5 1,184.7 3.6 4.0 3.5 10.9 12.0 9.5 Salaried and social security 9.5 12.0 10.9 43.5 1.0 0.6 0.6 2.8 1.8 1.4 Intercompany expenses 1.4 1.8 2.8 7.2 4.3 3.3 3.3 12.7 10.0 11.3 Other operating expenses 11.3 10.0 12.7 40.0 Confidential KPN00041680 |
| Year I II III Actuals 2008 Year Plan 2009 YEE 2009 YEE 2010%% vd omzet YEE 2010%% vd omzet YEE 2010%% vd omzet 82% 1323.6 1,312.8 1,079.5 100.0% 880 100.0% 1,080.0 100% 1,250.0 100.0% -0.8% -18.4% -18.4% 0.0% 15.8% 0.0% 80% 1187.4 1,184.7 974.1 90.2% 774 87.9% 974.6 90.2% 1,128.0 90.2% 136.2 128.1 105.3 106.8 105.4 122.0 10.3% 9.8% 9.8% 12.1% 9.8% 9.8% 93% 95.1 90.7 74.6 6.9% 76.0 8.6% 93.2 8.6% 86.4 6.9% 81% 1,282.5 1,275.4 1,048.7 97.2% 850 96.5% 1,067.9 98.9% 1,214.4 97.2% 153% 41.1 37.4 30.8 2.8% 30.8 3.5% 12.1 1.1% 35.6 2.8% 3.1% 2.8% 2.8% 3.5% 1.1% 2.8% 38.0 (20.0) (15.0) (15.0) (15.0) (15.0) (15.0) (5.8) (5.8) - - 16.6 10.0 15.8 (2.9) 20.6 Confidential KPN00041681 |
U V W X Y Z AA AB AC AD AE
62
63
64
65
66
67
68
69
70
71
72
Confidential KPN00041682
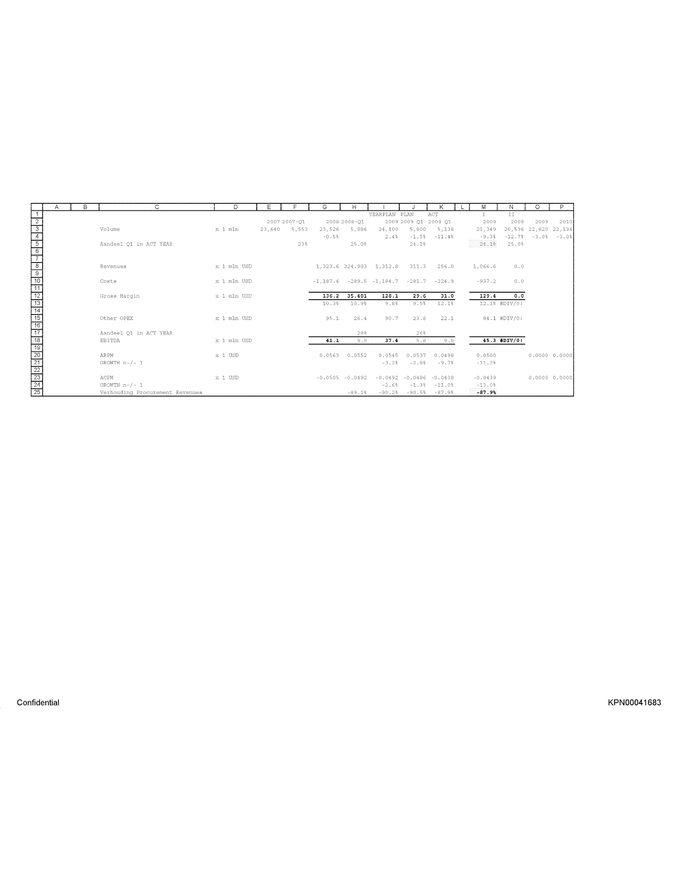
| YEARPLAN PLAN ACT I II 2007 2007-Q1 2008 2008-Q1 2009 2009 Ql 2009 Ql 2009 2009 2009 2010 Volume x 1 mln 23,640 5,553 23,526 5,886 24,100 5,800 5,138 21,349 20,536 22,820 22,136 -0,5% 2.4% -1,5% -11,4% -9,3% -12,7% -3,0% -2,0% Aandeel Ql in ACT YEAR 23% 25.0% 24.3% 24.1% 25.0% Revenues x 1 mln USD 1,323.6 324 .903 1,312.8 311.3 256.0 1,066.6 0.0 Costs x 1 mln USD -1,187.4 -289.5 -1,184.7 -281.7 -224 .9 -937.2 0.0 Gross Margin x 1 mln USD 136.2 35.401 128.1 29.6 31.0 129.4 0.0 10.3% 10.9% 9.8% 9.5% 12.1% 12.1% #DIV/0! Other OPEX x 1 mln USD 95,1 26,4 90.7 23,8 22.1 84.1 #DIV/01 Aandeel Ql in ACT YEAR 28% 26% EBITDA x 1 mln USD 41.1 9.0 37.4 5,8 9.0 45.3 #DIV/01 ARPM x 1 USD 0.0563 0.0552 0.0545 0.0537 0.0498 0.0500 0.0000 0.0000 GROWTH n-/- 1 -3.2% -2.8% -9.7% -11.2% ACPM x 1 USD -0.0505 -0.0492 -0.0492 -0.0486 -0.0438 -0.0439 0.0000 0.0000 GROWTH n / 1 -2.6% -1.3% -11.0% -13.0% Verhouding Procurement Revenues -89.2% -90.2% -90.5% -87.9% -87.9% Confidential KPN00041683 |


