Exhibit 99.(a)(28)
From: Uematsu, K. (Kenji) (KPNCC M&A Management)
Sent: Monday, April 06, 2009 4:04 AM
To: Blok, E. (Eelco) (Raad van Bestuur KPN); Farwerck, J.F.E. (Joost) (W&O Directeur)
Cc: Kwee, R.M.S.H. (Rosa) (W&O Directeur); Braat, D. (Daniel) (KPNCC M&A Management); Rodenburg, J.J. (Jan) (KPNCC M&A Management); Costermans, H.J. (Huib) (W&O Financin Manager); Schot, van der, P.J. (Paul) (W&O CS DIR Veranderingsmanagement)
Subject: Celtic (Part 1)
Attachments: 090406 Celtic RvB Performance considerations v5a.ppt
Dear Eelco and Joost,
Please find attached a draft of the Celtic presentation, for this afternoon’s conference call.
Thanks.
Kind regards,
Kenji
JX 230

| Draft -for discussion purposes only Project Celtic Performance considerations The Hague, 9 April 2009 Strictly private & confidential Q1 2008 1 Confidential KPN00059599 |
| Introduction In October 2008, three strategic scenarios on Celtic were presented and discussed in the Board of Management. The scenarios were: – Buy remaining stake (“public-to-private” transaction) – Sell current KPN stake – Maintain “status quo” (maintain structure and improve operations) Board of Management (October 2008) mandated: – investigate replacement of Celtic management without pursuing the process of acquiring the remaining stake – get business “back on track” In this presentation, we will review developments since October and strategic fit with KPN, and examine preliminary value creation potential Objective is to determine if we are committed to the carrier business Q1 2008 2 Confidential KPN00059600 |
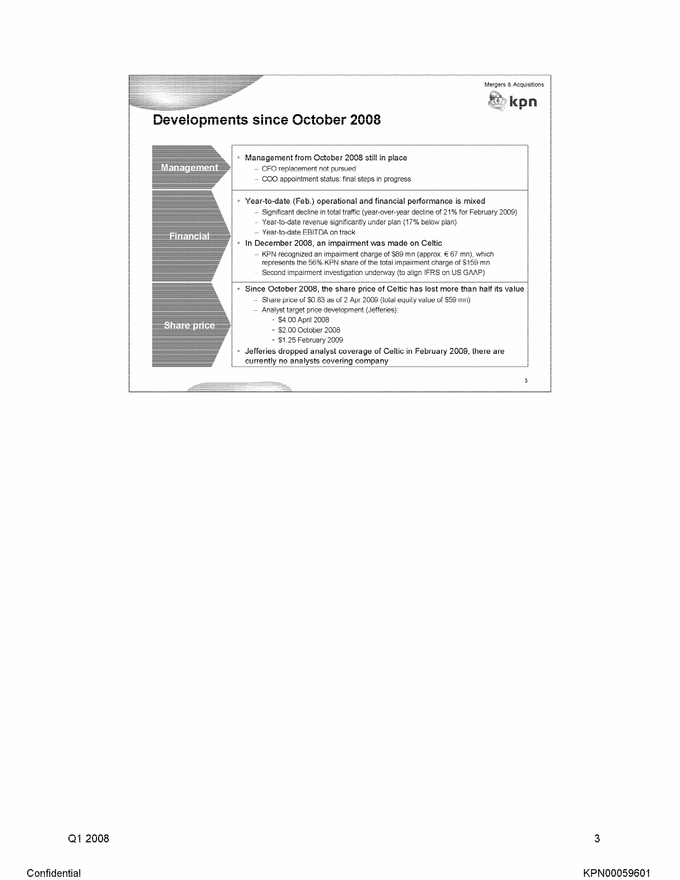
| Developments since October 2008 Management Management from October 2008 still in place – CFO replacement net pursued – COO appointment status: final steps in progress Financial Year-to-date (Feb.) operational and financial performance is mixed – Significant decline in total traffic (year-over-year decline of 21% for February 2009) – Year-to-date revenue significantly under plan (17% plan) – Year-to-date EBITDA on track In December 2008, an impairment was made on Celtic – KPN recognized an impairment charge of $89 mn (approx €67 mn) which represents the 56% KPN share of the total impairment charge of $159 mn – Second impairment investigation underway (to align IFRS on US GAAP) Share price Since October 2008, the share price of Celtic has lost more than half its value – Share price of $0.63 as of 2 Apr 2009 (total equity value of $59 mn) – Analyst target price development (Jefferies) $4.00 April 2008 $2.00 October 2008 $1.25 February 2009 Jefferies dropped analyst coverage of Celtic in February 2009, there are currently no analysts covering company Q1 2008 3 Confidential KPN00059601 |
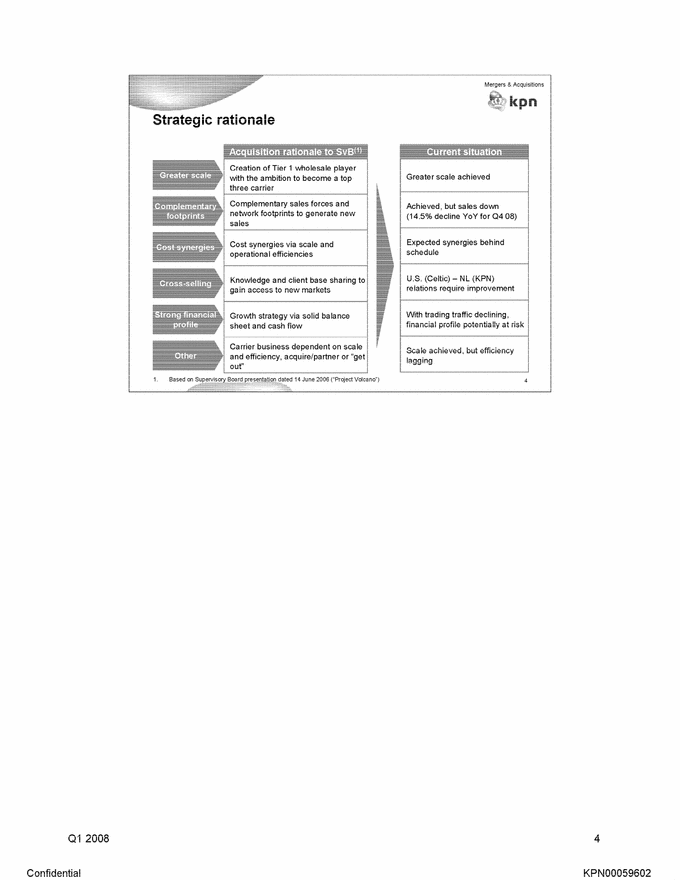
| Strategic rationale Acquisition rationale to SvB Current situation Greater scale Creation of Tier 1 wholesale player with the ambition to become a top three carrier Greater scale achieved Complementary footprints Complementary sales forces and network footprints to generate new sales Achieved, but sales down (14.5% decline YoY for Q4 08) Cost synergies Cost synergies via scale and operational efficiencies Expected synergies behind schedule Cross selling Knowledge and client base sharing to gain access to new markets U.S. (Celtic) – NL (KPN) relations require improvement Strong financial profile Growth strategy via solid balance sheet and cash flow With trading traffic declining, financial profile potentially at risk Other Carrier business dependent on scale and efficiency, acquire/partner or “get out” Scale achieved, but efficiency lagging 1. Based on Supervisory Board presentation dated 14 June 2006 (“Project Volcano”) Q1 2008 4 Confidential KPN00059602 |
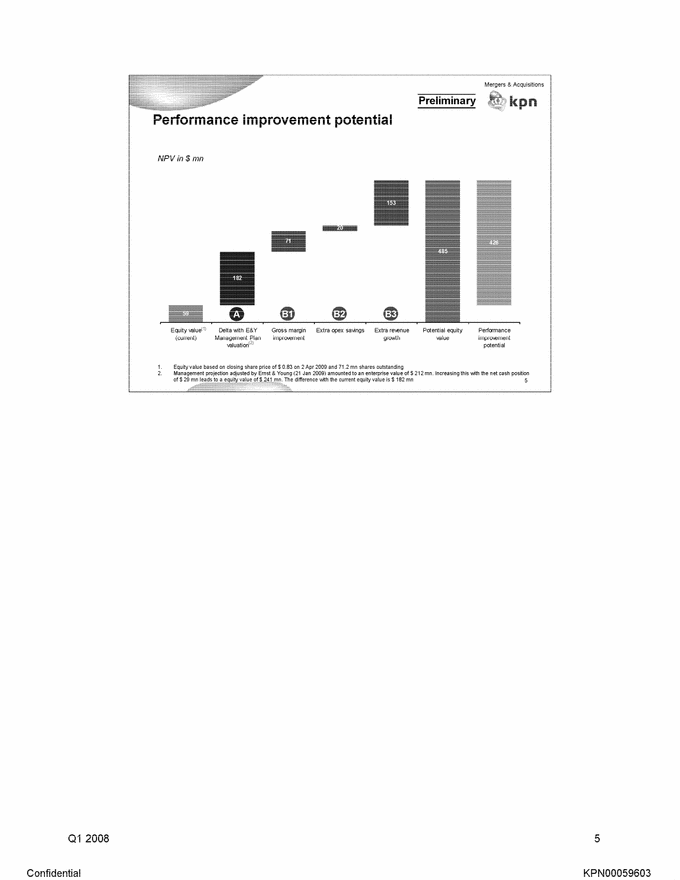
| Performance improvement potential 1. Equity value based on closing share price of $0.83 on 2 Apr 2009 and 71.2mn shares outstanding 2. Management projection adjusted by Ernst & Young (21 Jan 2009) amounted to an enterprise value of $212mn. Increasing this with the cash position of $29mn leads to a equity value $241mn. The difference with the current equity value is $182mn. Q1 2008 5 Confidential KPN00059603 |

| Performance improvement potential (cont’d) A Consideration Likelihood E&Y Management Plan Valuation Management Plan valuation performed by Ernst & Young for goodwill impairment test Market has different perception, further analysis needed to understand valuation gap To be assessed Q1 2008 6 Confidential KPN00059604 |
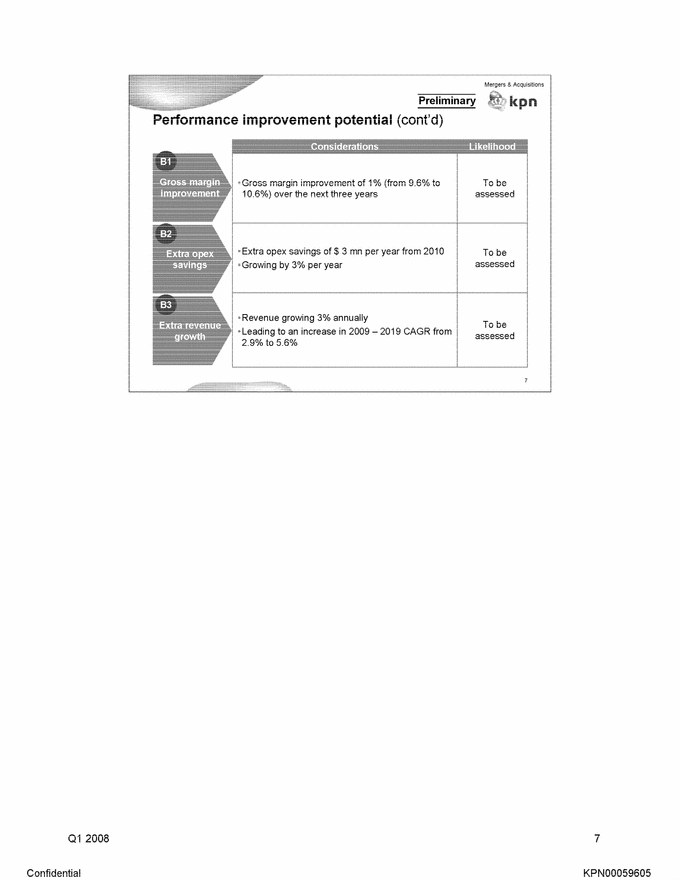
| Performance improvement potential (cont’d) B1 Considerations Likelihood Gross margin Improvement Gross margin improvement of 1% (from 9.6% to 10.6%) over the next three years To be assessed B2 Extra opex savings Extra opex savings of $3 mn per year from 2010 Growing by 3% per year To be assessed B3 Extra revenue growth Revenue growing 3% annually Leading to an increase in 2009 – 2019 CAGR from 2.9% to 5.6% To be assessed Q1 2008 7 Confidential KPN00059605 |

| Conclusion and next steps Preliminary value creation potential suggests that we should “hold on” to business Questions to ask ourselves – Are we committed to the carrier business? – Do we think market is currently undervaluing Celtic? – Do we believe the value creation potential? Next steps – Validate value creation potential – Identify actions required to implement performance improvement – Assess ownership structure going forward (see second presentation) Q1 2008 8 Confidential KPN00059606 |
Mergers & Acquisitions
[kpn logo]
Appendix
Q1 2008 9
Confidential KPN00059607
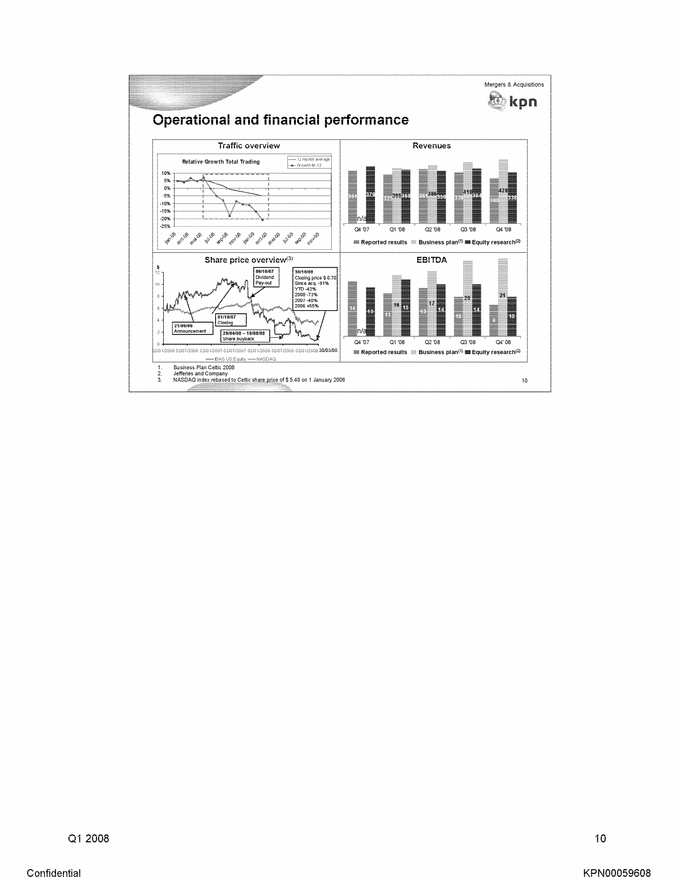
| Operational and financial performance 1. Business Plan Celtic 2008 2. Jefferies and Company 3. NASDAQ index rebased to Celtic share price of $5.49 on 1 January 2005 Q1 2008 10 Confidential KPN00059608 |

| Public valuation development of (non-)KPN stake Non-KPN stake currently valued at €16.5 mn, perhaps undervalued Exchg. rate Share price # Shares (mn) Market cap ($and € mn) KPN share Value KPN ($and € mn) Value non-KPN ($and € mn) Acquisition value (09/10/07) 0.7096 $7.82 €5.55 748 $585.3 €415.3 51% $298.5 €211.8 $286.8 €203.5 October 2008 Value (27/10/08) 0.7957 $1.56 €1.24 712 $111.1 €88.4 56% $62.6 €49.8 $48.5 €38.6 Current Value (2/4/09) 0.7561 $0.83 €0.63 712 $59.1 €44.7 56% $33.3 €25.2 $25.8 €19.5 Value of remaining stake is now $25.8 mn (€19.5 mn) Last Jefferies target price of $1.25 per share (Feb. 2009) represents ~ 50% premium to share price as of 2 April 2009 Value ranges of non-KPN stake (mn) Premium to current share price 0% 25% 50% 75% 100% Price per share $$0.83 $1.04 $1.25 $1.45 $1.66 Value of non-KPN share ($and € in mn) $$25.8 $32.2 $38.7 $45.1 $51.5 € €19.6 €24.4 €29.3 €34.1 €39.0 Share price Last Jefferies as of target price 2 April 2009 (Feb. 09, $1.25 per share) 1 Closing date was 1 October 2008, acquisition value assumed to be post-divided market capitalization Q1 2008 11 Confidential KPN00059609 |
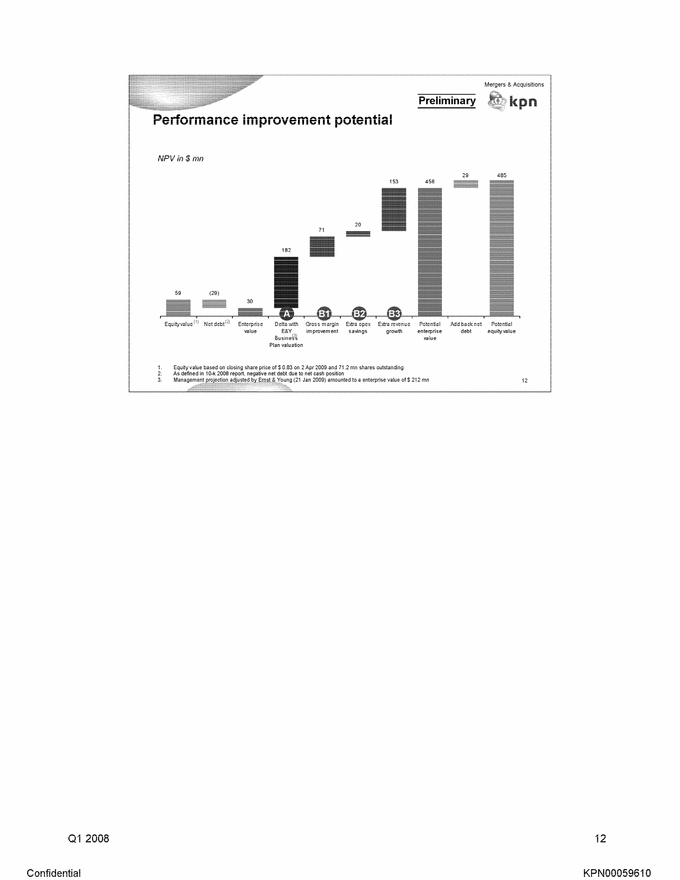
| Performance improvement potential 1 Equity value based on closing share price of $0.83 on 2 Apr 2009 and 71.2 mn shares outstanding 2 As defined in 10-k 2006 report, negative net debt due to net cash position 3 Management projection adjusted by Ernst & Young (21 Jan 2009) amounted to a enterprise value of $212 mn Q1 2008 12 Confidential KPN00059610 |

| Management Case financials ($mn) 2009 2010 2011 2012 2013 2014 2015 2016 2017 2018 Revenues 1,206.9 1,231.0 1,268.0 1,318.7 1,371.4 1,426.3 1.469.1 1,498.5 1,528.5 1,559.0 Growth 2.0% 3.0% 4.0% 4.0% 4.0% 3.0% 2.0% 2.0% 2.0% Gross margin 115.5 117.8 121.3 128.2 131.2 136.5 140.6% 143.9 146.7 149.7 Margin 9.6% 9.6% 9.6% 9.6% 9.6% 9.6% 9.6% 9.6% 9.6% 9.6% Op. Costs 79.1 79.0 80.3 81.1 82.5 84.8 87.2 88.9 90.7 92.5 EBITDA 36.4 38.8 41.0 45.1 48.7 51.7 53.4 54.9 56.0 57.1 Margin 3.0% 3.2% 3.2% 3.4% 3.6% 3.6% 3.6% 3.7% 3.7% 3.7% Depreciation 38.0 39.4 31.8 28.6 20.9 21.0 17.0 17.0 17.0 17.0 EBIT (1.6) (0.6) 9.2 16.5 27.8 30.7 36.4 37.9 39.0 40.1 Margin (0.1%) (0.1%) 0.7% 1.3% 2.0% 2.2% 2.5% 2.5% 2.6% 2.6% Cash flow 79.4 23.5 22.2 22.8 22.2 24.9 24.9 25.9 26.7 27.5 To be validated with Johannes Q1 2008 13 Confidential KPN00059611 |