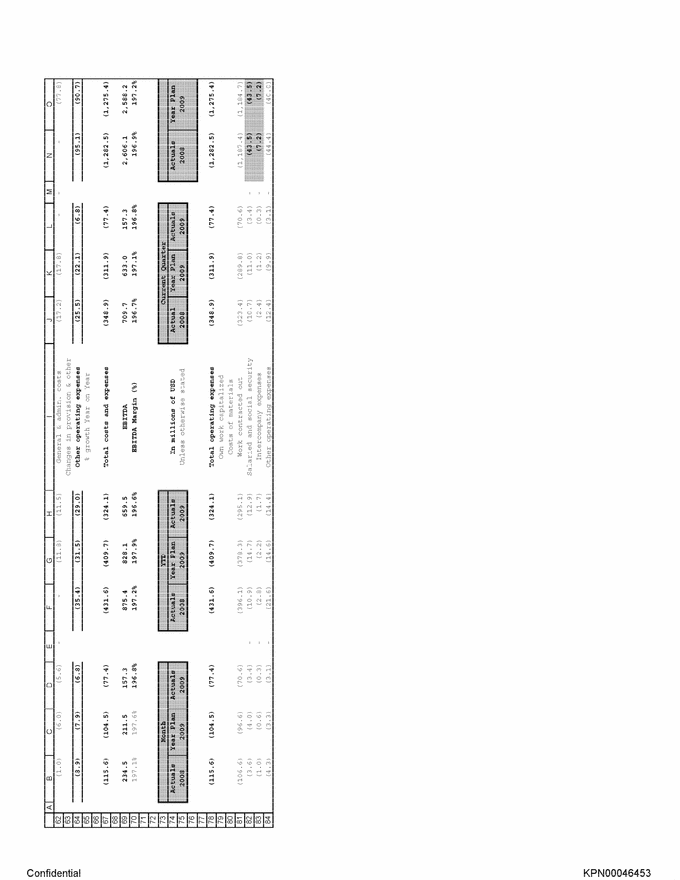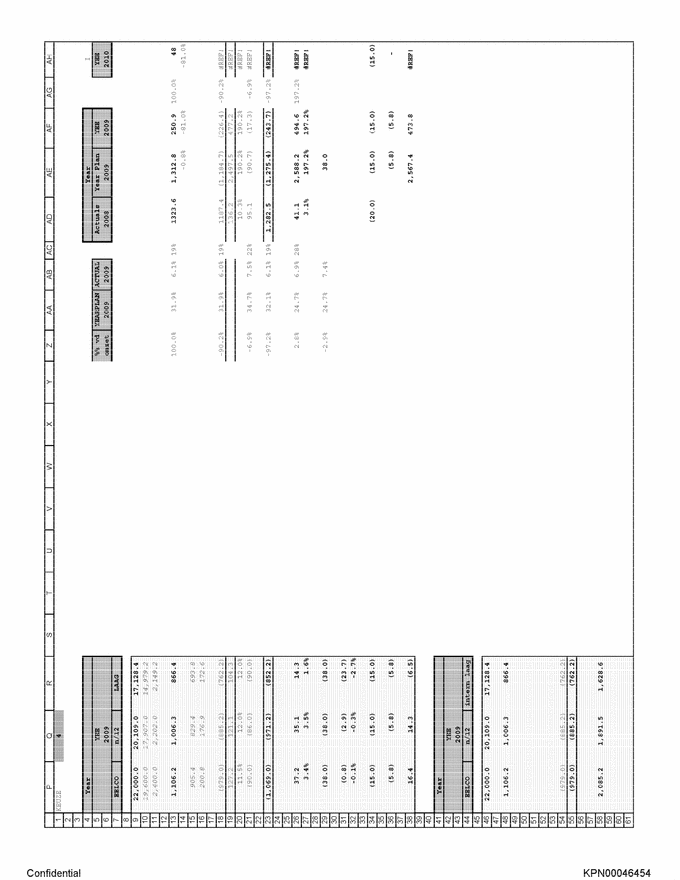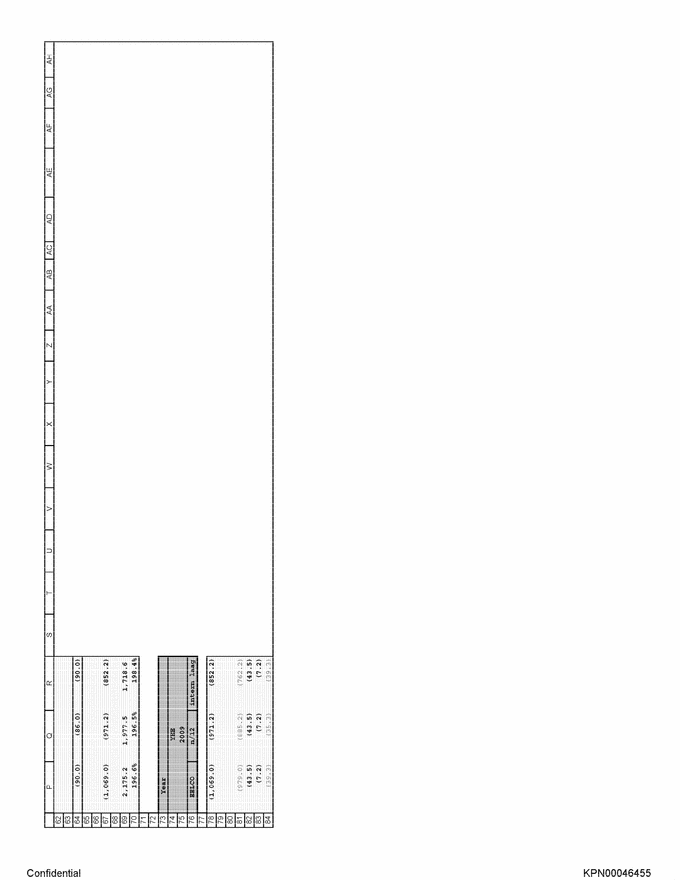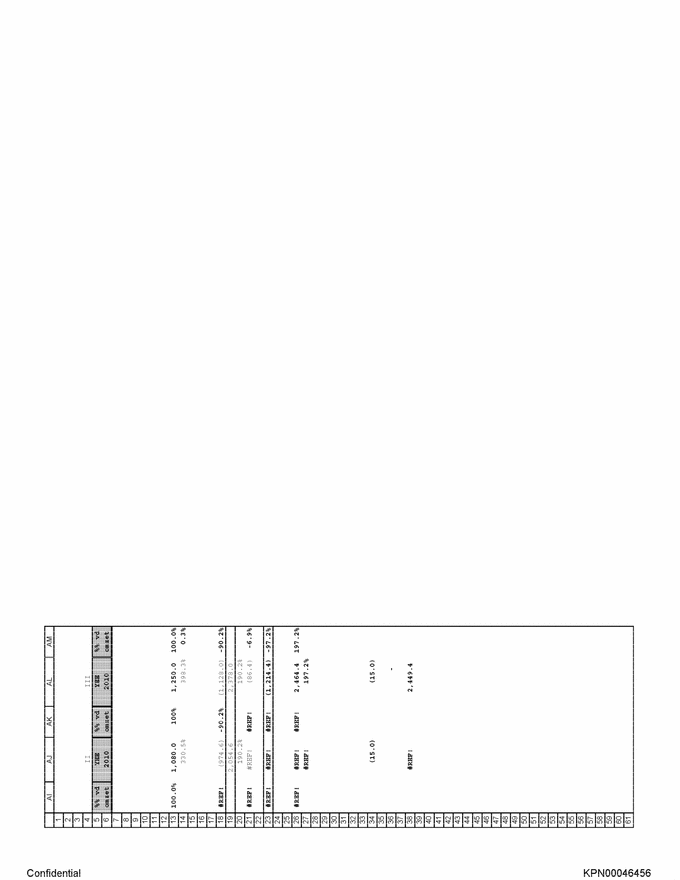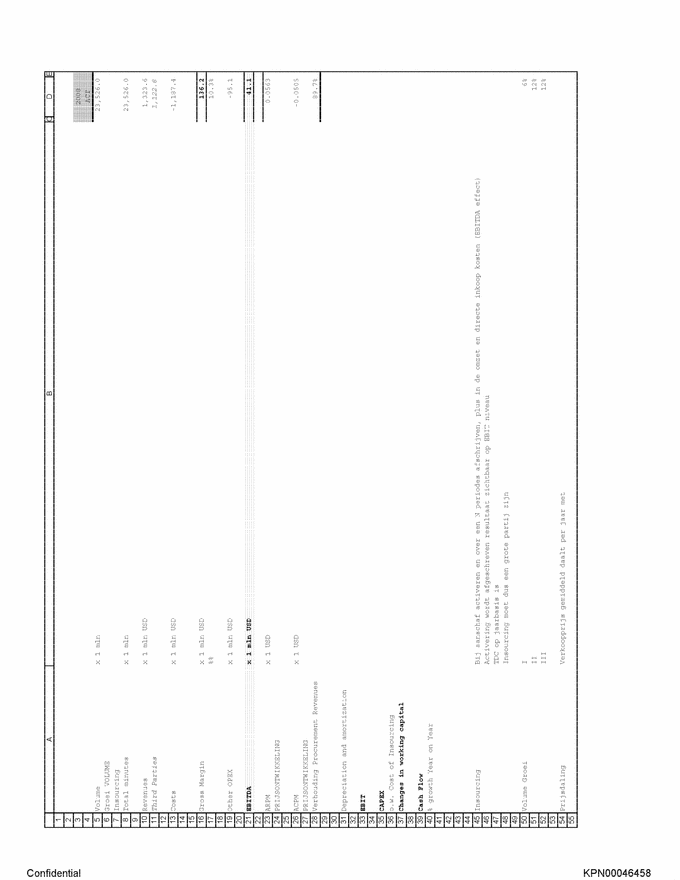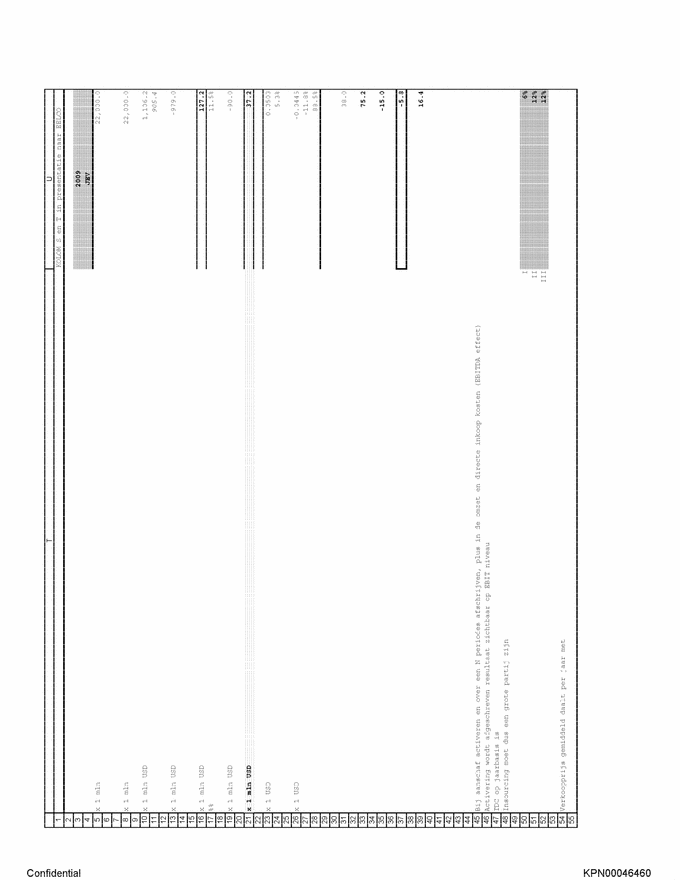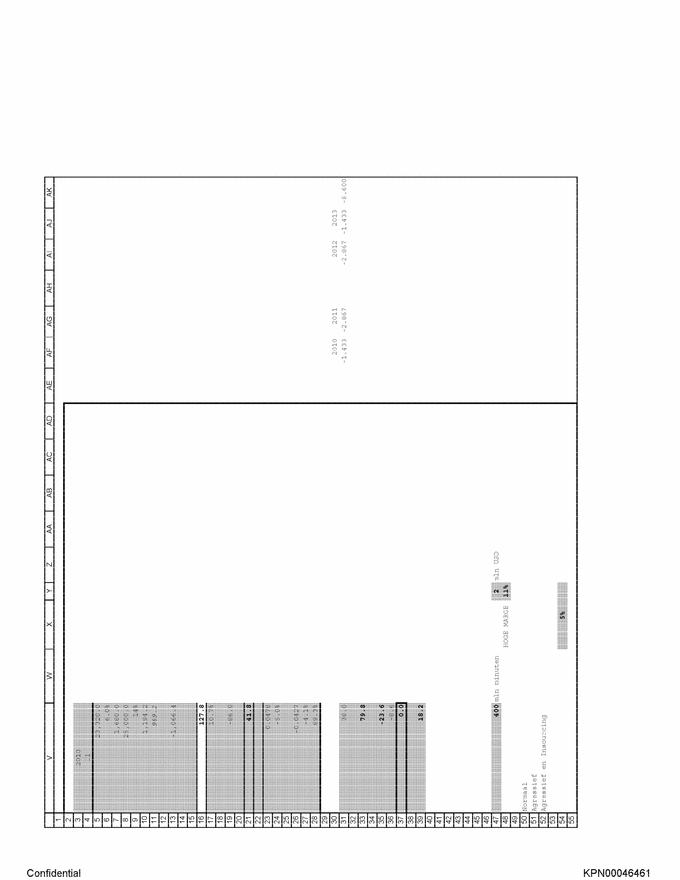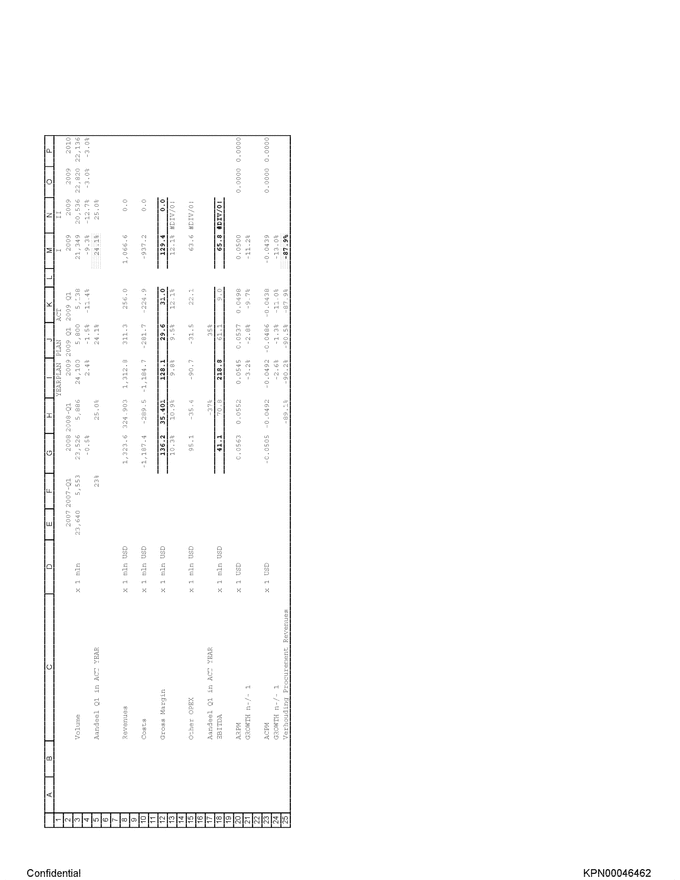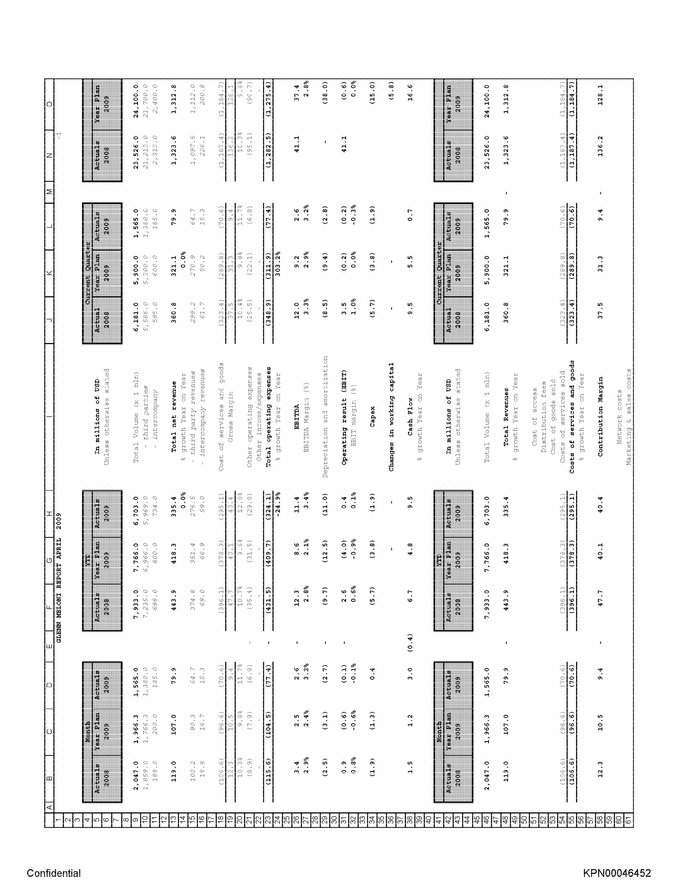
| GLENN MELONI REPORT APRIL 2009 -1 Month YTD Current Quarter Actuals Year Plan Actuals Actuals Year Plan Actuals In millions of USD Actual Year Plan Actuals Actuals Year Plan 2008 2009 2009 2008 2009 2009 Unless otherwise stated 2008 2009 2009 2008 2009 2,047.0 1,966.3 1,565.0 7,933.0 7,766.0 6,703.0 Total Volume (x 1 mln) 6,181.0 5,900.0 1,565.0 23,526.0 24,100.0 1,859.0 1 766.3 1,380.0 7,235.0 6,966.0 5,969.0 - third parties 5,586.0 5,300.0 1,380.0 21,213.0 21,700.0 188.0 200.0 185.0 698.0 800.0 734.0 - intercompany 595.0 600.0 185.0 2,313.0 2,400.0 119.0 107.0 79.9 443.9 418.3 335.4 Total net revenue 360.8 321.1 79.9 1,323.6 1,312.8 0.0% % growth Year on Year 0.0% 100.2 90.3 64. 7 374.8 351.4 276.5 - third party revenues 299.2 270.9 64.7 1,097.5 1,112.0 18.8 16. 7 15.3 69.0 66.9 59.0 - intercompany revenues 61.7 50.2 15.3 226.1 200.8 (106.6) (96.6) (70.6) (396.1) (378.3) (295.1) Cost of services and goods (323.4) (289.8) (70.6) (1,187.4) (1,184.7) 12.3 10.5 9.4 47.7 40.1 40.4 Gross Margin 37.5 31.3 9.4 136.2 128.1 10.3% 9.8% 11.7% 10.7% 9.6% 12.0% 10.4% 9.8% 11.7% 10.3% 9.8% (8.9) (7.9) (6.8) - (35.4) (31.5) (29.0) Other operating expenses (25.5) (22.1) (6.8) (95.1) (90.7) - - - - - Other income/expenses - - - (115.6) (104.5) (77.4) - (431.5) (409.7) (324.1) Total operating expenses (348.9) (311.9) (77.4) (1,282.5) (1,275.4) -24.9% % growth Year on Year 303.2% 3.4 2.5 2.6 - 12.3 8.6 11.4 EBITDA 12.0 9.2 2.6 41.1 37.4 2.9% 2.4% 3.2% 2.8% 2.1% 3.4% EBITDA Margin (%) 3.3% 2.9% 3.2% 2.8% (2.5) (3.1) (2.7) - (9.7) (12.5) (11.0) Depreciation and amortization (8.5) (9.4) (2.8) - (38.0) 0.9 (0.6) (0.1) - 2.6 (4.0) 0.4 Operating result (EBIT) 3.5 (0.2) (0.2) 41.1 (0.6) 0.8% -0.6% -0.1% 0.6% -0.9% 0.1% EBIT margin (%) 1.0% 0.0% -0.3% 0.0% (1.9) (1.3) 0.4 (5.7) (3.8) (1.9) Capex (5.7) (3.8) (1.9) (15.0) - - Changes in working capital - - (5.8) 1.5 1.2 3.0 (0.4) 6.7 4.8 9.5 Cash Flow 9.5 5.5 0.7 16.6 % growth Year on Year Month YTD Current Quarter Actuals Year Plan Actuals Actuals Year Plan Actuals In millions of USD Actual Year Plan Actuals Actuals Year Plan 2008 2009 2009 2008 2009 2009 Unless otherwise stated 2008 2009 2009 2008 2009 2,047.0 1,966.3 1,565.0 7,933.0 7,766.0 6,703.0 Total Volume (x 1 mln) 6,181.0 5,900.0 1,565.0 23,526.0 24,100.0 119.0 107.0 79.9 - 443.9 418.3 335.4 Total Revenues 360.8 321.1 79.9 - 1,323.6 1,312.8 % growth Year on Year Cost of access Distribution fees Cost of goods sold (106.6) (96.6) (70.6) (396.1) (378.3) (295.1) Costs of services sold (323.4) (289.8) (70.6) (1,187.4) (1,184.7) (106.6) (96.6) (70.6) (396.1) (378.3) (295.1) Costs of services and goods (323.4) (289.8) (70.6) (1,187.4) (1,184.7) % growth Year on Year 12.3 10.5 9.4 - 47.7 40.1 40.4 Contribution Margin 37.5 31.3 9.4 - 136.2 128.1 Network costs Marketing & sales costs Confidential KPN00046452 |

