Exhibit 99.(a)(40)
From: Rodenburg, J.J. (Jan) (KPNCC M&A Management)
Sent: Tuesday, June 02, 2009 2:37:17 PM
To: Manning, Matthew; Kadaba, Arvind (IBD)
Cc. Braat, D. (Daniel) (KPNCC M&A Management); House, M. (Matthew) (KPNCC M&A Management)
Subject: Celtic – Business Case
Attachments: 090602 Project Celtic – Business Case v_senttoMS_2.xls
Matt, Arvind,
Please find attached the updated version of the business case as discussed over the phone with Matthew.
Let me know should you have any questions.
Thanks and regards,
Jan
Jan Rodenburg
KPN Royal Dutch Telecom
Mergers & Acquisitions
Maanplein 55
2516 CK The Hague
The Netherlands
Tel: +31 70 3434 861
Mob: +31 6 4714 2925
Email: HYPERLINK “mailto:jan.rodenburg@kpn.com”jan.rodenburg@kpn.com
JX 103
Confidential KPN00080076
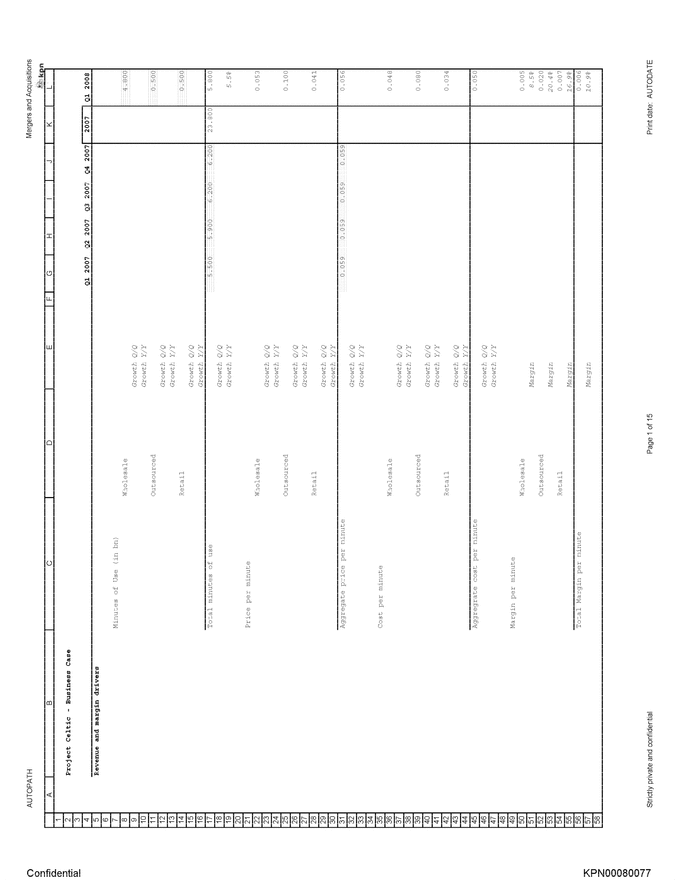
| AUTOPATH Project Celtic – Business Case Q1 2007 Q2 2007 Q3 2007 Q4 2007 2007 Q1 2008 Revenue and margin drivers Minutes of Use (in bn) Wholesale 4.800 Growth Q/Q Growth Y/Y Outsourced 0.500 Growth Q/Q Growth Y/Y Retail 0.500 Growth Q/Q Growth Y/Y Total minutes of use 5.500 5.900 6.200 6.200 23.800 5.800 Growth Q/Q Growth Y/Y 5.5% Price per minute Wholesale 0.053 Growth Q/Q Growth Y/Y Outsourced 0.100 Growth Q/Q Growth Y/Y Retail 0.041 Growth Q/Q Growth Y/Y Aggregate price per minute 0.059 0.059 0.059 0.059 0.056 Growth Q/Q Growth Y/Y Cost per minute Wholesale 0.048 Growth Q/Q Growth Y/Y Outsourced 0.080 Growth Q/Q Growth Y/Y Retail 0.034 Growth Q/Q Growth Y/Y Aggregate cost per minute 0.050 Growth Q/Q Growth Y/Y Margin per minute Wholesale 0.005 Margin 8.5% Outsourced 0.020 Margin 20.4% Retail 0.007 Margin 16.9% Total Margin per minute 0.006 Margin 10.9% Strictly private and confidential Page 1 of 15 Print date: AUTODATE Confidential KPN00080077 |

| AUTOPATH Q1 2007 Q2 2007 Q3 2007 Q4 2007 2007 Q1 2008 P&L Revenue Wholesale 255.7 271.2 282.4 273.8 1,083.1 254.1 Outsourced 43.6 48.6 53.1 52.0 197.3 50.2 Retail 25.5 27.9 32.0 24.8 110.2 20.6 Total revenue 324.8 347.7 367.5 350.6 1,390.6 324.9 Growth Y/Y Cost of sale Wholesale 232.4 Outsourced 40.0 Retail 17.1 Total Cost of sale 1,248.2 289.5 Gross profit Wholesale 21.7 Outsourced 10.2 Retail 3.5 Total gross profit 32.2 36.9 34 39.3 142.4 35.4 Margin 9.9% 10.6% 9.3% 11.2% 10.2% 10.9% Operating expense Research & Development 6.6 % of revenue 2.0% SG&A 17.6 % of revenue 5.4% Total Opex 92.8 24.2 % of revenue 7.4% Stock-based compensation 2.7 0.6 Select On EBITDA 13 14.5 10.4 14.4 49.6 10.6 Margin 4.0% 4.2% 2.8% 4.1% 3.6% 3.3% D&A PPE 8.8 3.1 % of revenue 0.9% Amortization intangibles 23.2 4.2 % of revenue 1.3% Depreciation & Amortization 32.0 7.2 % of revenue 2.2% EBIT 17.6 3.4 Margin 1.3% 1.0% Taxes on EBIT (5.3) (1.0) Tax rate 30.0% 30.0% Interest income 1.7 Interest expense (0.7) Taxes paid 8.5 Implied tax rate Net income 10.1 Cash flow Capex (Cumulative for year) (5.7) Capex (Period) (5.7) Strictly private and confidential Page 2 of 15 Print date: AUTODATE Confidential KPN00080078 |
AUTOPATH � 0; Merger and Acquisitions
KPN
A B C D E F G H I J K &# 160; L
4 Q1 2007 Q2 2007 Q3 2007 Q4 2007 2007 Q12008
119 % of sales 1.7%
120
121 EBITDA less capex 5.0
Strictly private and confidential Page 3 of 15 Print date: AUTODATE
Confidential KPN00080079
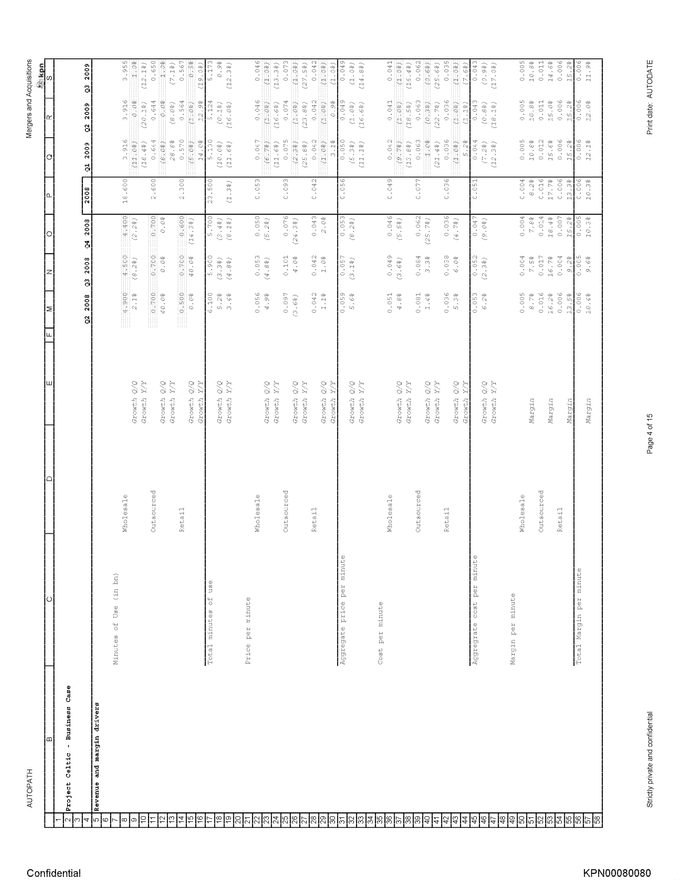
| AUTOPATH Project Celtic – Business Case Q2 2008 Q3 2008 Q4 2008 2008 Q1 2009 Q2 2009 Q3 2009 Revenue and margin drivers Minutes of Use (in bn) Wholesale 4.900 4.500 4.400 18.600 3.916 3.916 3.955 Growth Q/Q 2.1% (8.2%) (2.2%) (11.0%) 0.0% 1.0% Growth Y/Y (18.4%) (20.1%) (12.1%) Outsourced 0.700 0.700 0.700 2.600 0.644 0.644 0.650 Growth Q/Q 40.0% 0.0% 0.0% (8.0%) 0.0% 1.0% Growth Y/Y 28.8% (8.0%) (7.1%) Retail 0.500 0.700 0.600 2.300 0.570 0.564 0.567 Growth Q/Q 0.0% 40.0% (14.3%) (5.0%) (1.0%) 0.5% Growth Y/Y 14.0% 12.9% (19.0%) Total minutes of use 6.100 5.900 5.700 23.500 5.130 5.124 5.173 Growth Q/Q 5.2% (3.3%) (3.4%) (10.0%) (0.1%) 0.9% Growth Y/Y 3.4% (4.8%) (8.1%) (1.3%) (11.6%) (16.0%) (12.3%) Price per minute Wholesale 0.056 0.053 0.050 0.053 0.047 0.046 0.046 Growth Q/Q 4.9% (4.8%) (5.2%) (6.7%) (1.0%) (1.0%) Growth Y/Y (11.6%) (16.6%) (13.3%) Outsourced 0.097 0.101 0.076 0.093 0.075 0.074 0.073 Growth Q/Q (3.6%) 4.0% (24.3%) (2.3%) (1.0%) (1.0%) Growth Y/Y (25.8%) (23.8%) (27.5%) Retail 0.042 0.042 0.043 0.042 0.042 0.042 0.042 Growth Q/Q 1.1% 1.0% 2.0% (1.0%) (1.0%) (1.0%) Growth Y/Y 3.1% 0.9% (1.0%) Aggregate price per minute 0.059 0.057 0.053 0.056 0.050 0.049 0.049 Growth Q/Q 5.6% (3.1%) (8.2%) (5.3%) (1.0%) (1.0%) Growth Y/Y (11.1%) (16.6%) (14.8%) Cost per minute Wholesale 0.051 0.049 0.046 0.049 0.042 0.041 0.041 Growth Q/Q 4.8% (3.6%) (5.5%) (9.7%) (1.0%) (1.0%) Growth Y/Y (13.8%) (18.5%) (16.4%) Outsourced 0.081 0.084 0.062 0.077 0.063 0.063 0.062 Growth Q/Q 1.4% 3.3% (25.7%) 1.0% (0.3%) (0.6%) Growth Y/Y (21.4%) (22.7%) (25.6%) Retail 0.036 0.038 0.036 0.036 0.036 0.036 0.035 Growth Q/Q 5.3% 6.0% (4.7%) (1.0%) (1.0%) (1.0%) Growth Y/Y 5.2% (1.1%) (7.6%) Aggregate cost per minute 0.053 0.052 0.047 0.051 0.044 0.043 0.043 Growth Q/Q 6.2% (2.3%) (9.0%) (7.2%) (0.8%) (0.9%) Growth Y/Y (12.3%) (18.1%) (17.0%) Margin per minute Wholesale 0.005 0.004 0.004 0.004 0.005 0.005 0.005 Margin 8.7% 7.5% 7.8% 8.2% 10.8% 10.8% 10.8% Outsourced 0.016 0.017 0.014 0.016 0.012 0.011 0.011 Margin 16.2% 16.7% 18.4% 17.7% 15.6% 15.0% 14.6% Retail 0.006 0.004 0.007 0.006 0.006 0.006 0.006 Margin 13.5% 9.2% 15.2% 13.3% 15.2% 15.2% 15.2% Total Margin per minute 0.006 0.005 0.005 0.006 0.006 0.006 0.006 Margin 10.4% 9.6% 10.3% 10.3% 12.1% 12.0% 11.9% Strictly private and confidential Page 4 of 15 Print date: AUTODATE Confidential KPN00080080 |
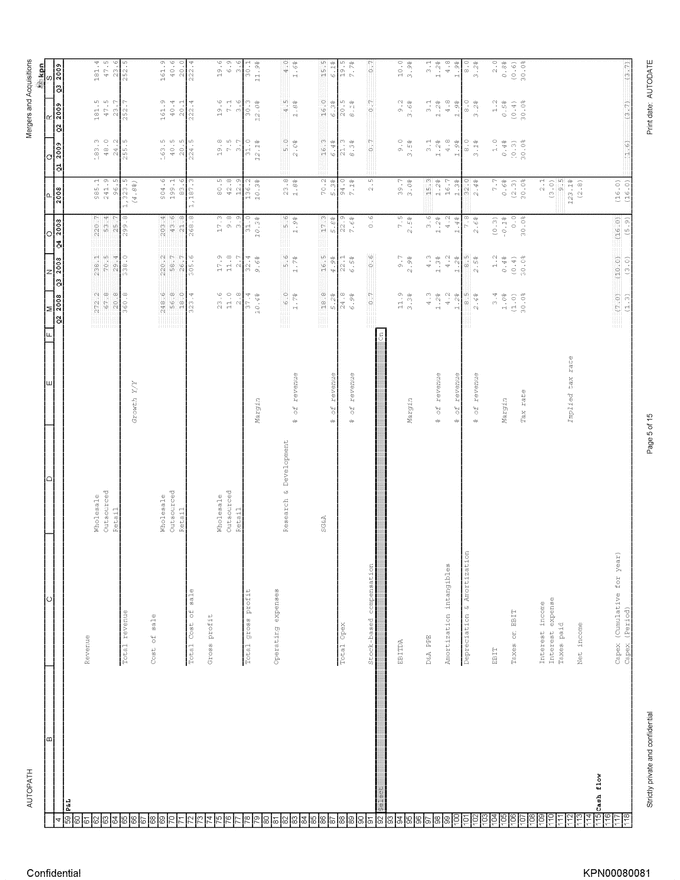
| AUTOPATH Q2 2008 Q3 2008 Q4 2008 2008 Q1 2009 Q2 2009 Q3 2009 P & L Revenue Wholesale 272.2 238.1 220.7 985.1 183.3 181.5 181.4 Outsourced 67.8 70.5 53.4 241.9 48.0 47.5 47.5 Retail 20.8 29.4 25.7 96.5 24.2 23.7 23.6 Total revenue 360.0 338.0 299.8 1,323.5 255.5 252.7 252.5 Growth Y/Y (4.8%) Cost of sale Wholesale 248.6 220.2 203.4 904.6 163.5 161.9 161.9 Outsourced 56.8 58.7 43.6 199.1 40.5 40.4 40.6 Retail 18.0 26.7 21.8 83.6 20.5 20.1 20.0 Total Cost of sale 323.4 305.6 268.8 1,187.3 224.5 222.4 222.4 Gross Profit Wholesale 23.6 17.9 17.3 80.5 19.8 19.6 19.6 Outsourced 11.0 11.8 9.8 42.8 7.5 7.1 6.9 Retail 2.8 2.7 3.9 12.9 3.7 3.6 3.5 Total gross profit 37.4 32.4 31.0 136.2 31.0 30.3 30.1 Margin 10.4% 9.6% 10.3% 10.3% 12.1% 12.0% 11.9% Operating expenses Research & Development 6.0 5.6 5.6 23.8 5.0 4.5 4.0 % of revenue 1.7% 1.7% 1.9% 1.8% 2.0% 1.8% 1.6% SG&A 18.8 16.5 17.3 70.2 16.3 16.0 15.5 % of revenue 5.2% 4.9% 5.8% 5.3% 6.4% 6.3% 6.1% Total Opex 24.8 22.1 22.9 94.0 21.3 20.5 19.5 % of revenue 6.9% 6.5% 7.6% 7.1% 8.3% 8.1% 7.7% Stock-based Compensation 0.7 0.6 0.6 2.5 0.7 0.7 0.7 Select on EBITDA 11.9 9.7 7.5 39.7 9.0 9.2 10.0 Margin 3.3% 2.9% 2.5% 3.0% 3.5% 3.6% 3.9% D&A PPE 4.3 4.3 3.6 15.3 3.1 3.1 3.1 % of revenue 1.2% 1.3% 1.2% 1.2% 1.2% 1.2% 1.2% Amortization intangibles 4.2 4.2 4.2 16.7 4.8 4.8 4.8 % of revenue 1.2% 1.2% 1.4% 1.3% 1.9% 1.9% 1.9% Depreciation & Amortization 8.5 8.5 7.8 32.0 8.0 8.0 8.0 % of revenue 2.4% 2.5% 2.6% 2.4% 3.1% 3.2% 3.2% EBIT 3.4 1.2 (0.3) 7.7 1.0 1.2 2.0 Margin 1.0% 0.4% -0.1% 0.6% 0.4% 0.5% 0.8% Taxes on EBIT (1.0) (0.4) 0.0 (2.3) (0.3) (0.4) (0.6) Tax rate 30.0% 30.0% 30.0% 30.0% 30.0% 30.0% 30.0% Interest income 2.1 Interest expense (3.0) Taxes paid 9.5 Implied tax rate 123.1% Net income (2.8) Cash flow Capex (Cumulative for year) (7.0) (10.0) (16.0) (16.0) Capex (Period) (1.3) (3.0) (5.9) (16.0) (1.6) (3.7) (3.7) Strictly private and confidential Page 5 of 15 Print date: AUTODATE Confidential KPN00080081 |
AUTOPATH � 0; Merger and Acquisitions
KPN
B C D E F M N O P Q R S
4 Q2 2008 Q3 2008 Q4 2008 2008 Q1 2009 Q2 2009 Q3 2009
119 % of sales 0.4% 0.9% 2.0% 1.2% 0.6% 1.4% 1.4%
120
121 EBITDA less capex 10.6 6.6 1.6 23.8 7.5 5.5 6.3
Strictly private and confidential Page 6 of 15 Print date: AUTODATE
Confidential KPN00080082

| AUTOPATH Project Celtic – Business Case Q4 2009 2009 2010 2011 2012 2013 2014 Revenue and margin drivers Minutes of Use (in bn) Wholesale 4.034 15.821 16.929 17.775 18.309 18.858 19.424 Growth Q/Q 2.0% Growth Y/Y (8.3%) (14.9%) 7.0% 5.0% 3.0% 3.0% 3.0% Outsourced 0.663 2.602 2.784 2.923 3.011 3.101 3.194 Growth Q/Q 2.0% Growth Y/Y (5.2%) 0.1% 7.0% 5.0% 3.0% 3.0% 3.0% Retail 0.573 2.274 2.388 2.460 2.509 2.534 2.559 Growth Q/Q 1.0% Growth Y/Y (4.5%) (1.1%) 5.0% 3.0% 2.0% 1.0% 1.0% Total minutes of use 5.271 20.698 22.101 23.158 23.828 24.493 25.177 Growth Q/Q 1.9% Growth Y/Y (7.5%) (11.9%) 6.8% 4.8% 2.9% 2.8% 2.8% Price per minute Wholesale 0.045 0.046 0.044 0.042 0.042 0.042 0.041 Growth Q/Q (1.0%) Growth Y/Y (9.5%) (12.9%) (5.0%) (3.0%) (1.0%) (1.0%) (1.0%) Outsourced 0.072 0.073 0.066 0.063 0.062 0.061 0.060 Growth Q/Q (1.0%) Growth Y/Y (5.2%) (21.1%) (10.0%) (5.0%) (2.0%) (1.5%) (1.0%) Retail 0.041 0.042 0.041 0.040 0.039 0.039 0.038 Growth Q/Q (1.0%) Growth Y/Y (3.9%) (0.4%) (2.0%) (2.0%) (2.0%) (2.0%) (2.0%) Aggregate price per minute 0.048 0.049 0.046 0.045 0.044 0.044 0.043 Growth Q/Q (1.0%) Growth Y/Y (8.1%) (12.9%) (5.6%) (3.2%) (1.3%) (1.2%) (1.1%) Cost per minute Wholesale 0.041 0.041 0.039 0.038 0.038 0.037 0.037 Growth Q/Q (1.0%) Growth Y/Y (12.4%) (15.4%) (4.6%) (3.0%) (1.0%) (1.0%) (1.0%) Outsourced 0.062 0.062 0.057 0.055 0.054 0.054 0.053 Growth Q/Q (1.0%) Growth Y/Y (0.9%) (18.5%) (9.0%) (4.0%) (0.7%) (0.5%) (1.0%) Retail 0.035 0.035 0.035 0.034 0.034 0.033 0.032 Growth Q/Q (1.0%) Growth Y/Y (3.9%) (2.5%) (1.0%) (2.0%) (2.0%) (2.0%) (2.0%) Aggregate cost per minute 0.043 0.043 0.041 0.040 0.039 0.039 0.039 Growth Q/Q (1.0%) Growth Y/Y (9.7%) (14.5%) (5.0%) (3.1%) (1.0%) (1.0%) (1.1%) Margin per minute Wholesale 0.005 0.005 0.005 0.004 0.004 0.004 0.004 Margin 10.8% 10.8% 10.4% 10.4% 10.4% 10.4% 10.4% Outsourced 0.011 0.011 0.009 0.008 0.007 0.007 0.007 Margin 14.6% 15.0% 14.0% 13.1% 12.0% 11.1% 11.1% Retail 0.006 0.006 0.006 0.006 0.006 0.006 0.005 Margin 15.2% 15.2% 14.3% 14.3% 14.3% 14.3% 14.3% Total Margin per minute 0.006 0.006 0.005 0.005 0.005 0.005 0.005 Margin 11.9% 12.0% 11.4% 11.3% 11.1% 10.9% 10.9% Strictly private and confidential Page 7 of 15 Print date: AUTODATE Confidential KPN00080083 |

| AUTOPATH Q4 2009 2009 2010 2011 2012 2013 2014 P&L Revenue Wholesale 183.2 729.4 741.5 755.2 770.1 785.2 800.7 Outsourced 48.0 191.0 183.9 183.5 185.2 187.9 191.6 Retail 23.6 95.0 97.8 98.7 98.6 97.6 96.6 Total revenue 254.8 1,015.5 1,023.2 1,037.4 1,053.9 1,070.8 1,089.0 Growth Y/Y (23.3%) 0.8% 1.4% 1.6% 1.6% 1.7% Cost of sale Wholesale 163.4 650.7 664.2 676.5 689.8 703.4 717.2 Outsourcing 41.0 162.4 158.2 159.4 163.1 167.1 170.4 Retail 20.0 80.6 83.8 84.6 84.5 83.7 82.8 Total Cost of sale 224.4 893.7 906.1 920.5 937.4 954.2 970.5 Gross profit Wholesale 19.8 78.8 77.3 78.7 80.3 81.9 83.5 Outsourcing 7.0 28.6 25.8 24.0 22.1 20.8 21.2 Retail 3.6 14.4 14.0 14.1 14.1 14.0 13.8 Total gross profit 30.4 121.8 117.1 116.9 116.5 116.5 118.5 Margin 11.9% 12.0% 11.4% 11.3% 11.1% 10.9% 10.9% Operating expenses Research & Development 4.0 17.5 17.6 17.9 18.2 18.5 18.8 % of revenue 1.6% 1.7% 1.7% 1.7% 1.7% 1.7% 1.7% SG&A 15.0 62.8 61.4 62.2 63.2 64.2 65.3 % of revenue 5.9% 6.2% 6.0% 6.0% 6.0% 6.0% 6.0% Total Opex 19.0 80.3 79.0 80.1 81.4 82.7 84.1 % of revenue 7.5% 7.9% 7.7% 7.7% 7.7% 7.7% 7.7% Stock –based compensation 0.7 2.6 2.8 2.8 3.2 3.6 4.0 Select On EBITDA 10.7 38.9 35.2 34.0 31.9 30.3 30.4 Margin 4.2% 3.8% 3.4% 3.3% 3.0% 2.8% 2.8% D&A PPE 3.1 12.5 12.6 12.8 13.0 13.2 13.4 % of revenue 1.2% 1.2% 1.2% 1.2% 1.2% 1.2% 1.2% Amortization intangibles 4.8 19.4 17.9 16.4 12.5 3.9 3.0 % of revenue 1.9% 1.9% 1.8% 1.6% 1.2% 0.4% 0.3% Depreciation & Amortization 8.0 31.9 30.5 29.2 25.5 17.1 16.4 % of revenue 3.1% 3.1% 3.0% 2.8% 2.4% 1.6% 1.5% EBIT 2.8 7.0 4.7 4.8 6.4 13.3 14.0 Margin 1.1% 0.7% 0.5% 0.5% 0.6% 1.2% 1.3% Taxes on EBIT (0.8) (2.1) (1.4) (1.4) (1.9) (4.0) (4.2) Tax rate 30.0% 30.0% 30.0% 30.0% 30.0% 30.0% 30.0% Interest income Interest expenses Taxes paid Implied tax rate Net income Cash flow Capex (Cumulative for year) (12.5) Capex (Period) (3.7) (12.5) (12.6) (12.8) (13.0) (13.2) (13.4) Strictly private and confidential Page 8 of 15 Print date: AUTODATE Confidential KPN00080084 |
AUTOPATH � 0; Merger and Acquisitions
KPN
B C D E F T U V W X Y Z
4 Q4 2009 2009 2010 2011 2012 2013 2014
119 % of sales 1.4% 1.2% 1.2% 1.2% 1.2% 1.2% 1.2%
120
121 EBITA less capex 7.1 26.4 22.6 21.2 19.0 17.1 17.0
Strictly private and confidential Page 9 of 15 Print date: AUTODATE
Confidential KPN00080085
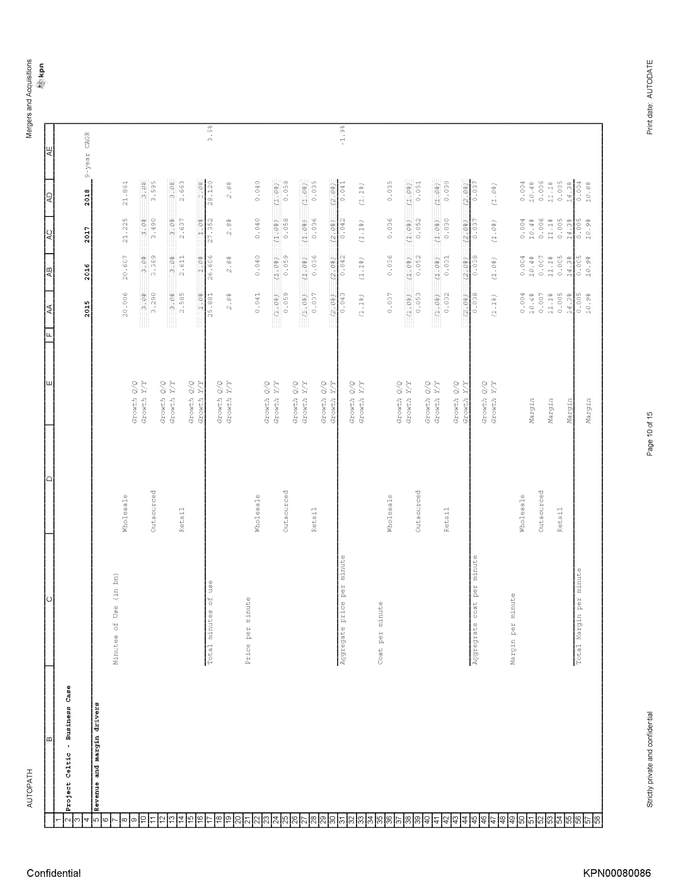
| AUTOPATH Project Celtic – Business Case 2015 2016 2017 2018 9-year CAGR Revenue and margin drivers Minutes of Use (in bn) Wholesale 20.006 20.607 21.225 21.861 Growth Q/Q Growth Y/Y 3.0% 3.0% 3.0% 3.0% Outsourced 3.290 3.389 3.490 3.595 Growth Q/Q Growth Y/Y 3.0% 3.0% 3.0% 3.0% Retail 2.585 2.611 2.637 2.663 Growth Q/Q Growth Y/Y 1.0% 1.0% 1.0% 1.0% Total minutes of use 25.881 26.606 27.352 28.120 3.5% Growth Q/Q Growth Y/Y 2.8% 2.8% 2.8% 2.8% Price per minute Wholesale 0.041 0.040 0.040 0.040 Growth Q/Q Growth Y/Y (1.0%) (1.0%) (1.0%) (1.0%) Outsourced 0.059 0.059 0.058 0.058 Growth Q/Q Growth Y/Y (1.0%) (1.0%) (1.0%) (1.0%) Retail 0.037 0.036 0.036 0.035 Growth Q/Q Growth Y/Y (2.0%) (2.0%) (2.0%) (2.0%) Aggregate price per minute 0.043 0.042 0.042 0.041 -1.9% Growth Q/Q Growth Y/Y (1.1%) (1.1%) (1.1%) (1.1%) Cost per minute Wholesale 0.037 0.036 0.036 0.035 Growth Q/Q Growth Y/Y (1.0%) (1.0%) (1.0%) (1.0%) Outsourced 0.053 0.052 0.052 0.051 Growth Q/Q Growth Y/Y (1.0%) (1.0%) (1.0%) (1.0%) Retail 0.032 0.031 0.030 0.030 Growth Q/Q Growth Y/Y (2.0%) (2.0%) (2.0%) (2.0%) Aggregate cost per minute 0.038 0.038 0.037 0.037 Growth Q/Q Growth Y/Y (1.1%) (1.0%) (1.0%) (1.0%) Margin per minute Wholesale 0.004 0.004 0.004 0.004 Margin 10.4% 10.4% 10.4% 10.4% Outsourced 0.007 0.007 0.006 0.006 Margin 11.1% 11.1% 11.1% 11.1% Retail 0.005 0.005 0.005 0.005 Margin 14.3% 14.3% 14.3% 14.3% Total Margin per minute 0.005 0.005 0.005 0.004 Margin 10.9% 10.9% 10.9% 10.8% Strictly private and confidential Page 10 of 15 Print date: AUTODATE Confidential KPN00080086 |
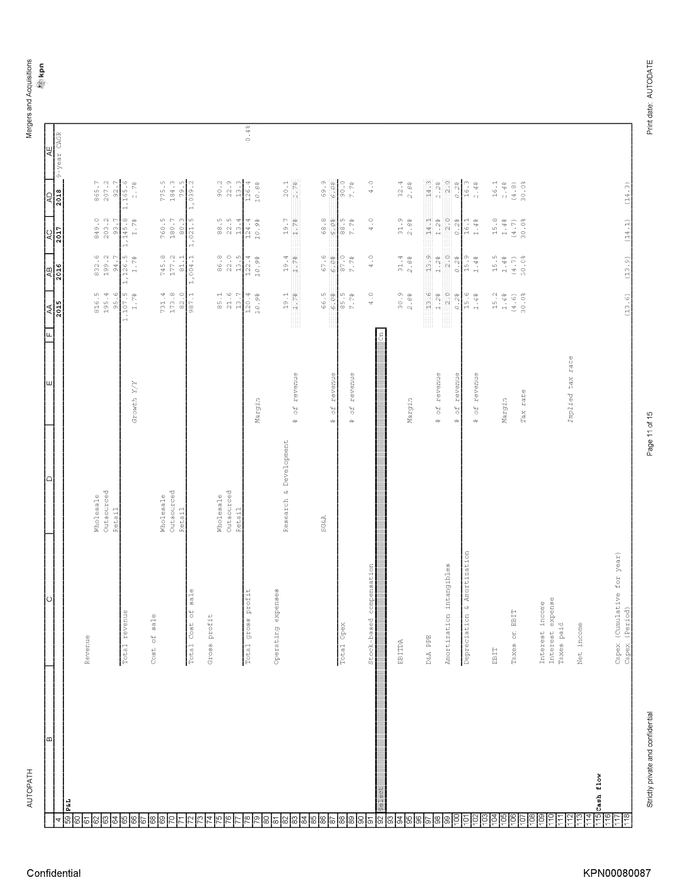
| AUTOPATH 2015 2016 2017 2018 9-year CAGR P&L Revenue Wholesale 816.5 832.6 849.0 865.7 Outsourced 195.4 199.2 203.2 207.2 Retail 95.6 94.7 93.7 92.7 Total revenue 1,107.5 1,126.5 1,145.8 1,165.6 Growth Y/Y 1.7% 1.7% 1.7% 1.7% Cost of sale Wholesale 731.4 745.8 760.5 775.5 Outsourced 173.8 177.2 180.7 184.3 Retail 82.0 81.1 80.3 79.5 Total Cost of sale 987.1 1,004.1 1,021.5 1,039.2 Gross profit Wholesale 85.1 86.8 88.5 90.2 Outsourced 21.6 22.0 22.5 22.9 Retail 13.7 13.5 13.4 13.3 Total gross profit 120.4 122.4 124.4 126.4 0.4% Margin 10.9% 10.9% 10.9% 10.8% Operating expenses Research & Development 19.1 19.4 19.7 20.1 % of revenue 1.7% 1.7% 1.7% 1.7% SG&A 66.5 67.6 68.8 69.9 % of revenue 6.0% 6.0% 6.0% 6.0% Total Opex 85.5 87.0 88.5 90.0 % of revenue 7.7% 7.7% 7.7% 7.7% Stock-based compensation 4.0 4.0 4.0 4.0 Select On EBITDA 30.9 31.4 31.9 32.4 Margin 2.8% 2.8% 2.8% 2.8% D&A PPE 13.6 13.9 14.1 14.3 % of revenue 1.2% 1.2% 1.2% 1.2% Amortization intangibles 2.0 2.0 2.0 2.0 % of revenue 0.2% 0.2% 0.2% 0.2% Depreciation & Amortization 15.6 15.9 16.1 16.3 % of revenue 1.4% 1.4% 1.4% 1.4% EBIT 15.2 15.5 15.8 16.1 Margin 1.4% 1.4% 1.4% 1.4% Taxes on EBIT (4.6) (4.7) (4.7) (4.8) Tax rate 30.0% 30.0% 30.0% 30.0% Interest income Interest expense Taxes paid Implied tax rate Net income Cash flow Capex (Cumulative for year) Capex (Period) (13.6) (13.9) (14.1) (14.3) Strictly private and confidential Page 11 of 15 Print date: AUTODATE Confidential KPN00080087 |
AUTOPATH � 0; Merger and Acquisitions
KPN
B C D E F AA AB AC AD AE
4 2015 2016 2017 2018 9-year CAGR
119 % of sales 1.2% 1.2% 1.2% 1.2%
120
121 EBITDA less capex 17.2 17.5 17.8 18.1
Strictly private and confidential Page 12 of 15 Print date: AUTODATE
Confidential KPN00080088
AUTOPATH
Mergers and Acquisitions
Cell: | | L8 |
Comment: | | Jan Rodenburg: |
| | IBAS press release (all Q’s) |
| | |
Cell: | | L11 |
Comment: | | Jan Rodenburg: |
| | IBAS press release (all Q’s) |
| | |
Cell: | | L14 |
Comment: | | Jan Rodenburg: |
| | IBAS press release (all Q’s) |
| | |
Cell: | | G17 |
Comment: | | Jan Rodenburg: |
| | Jefferies |
| | |
Cell: | | G31 |
Comment: | | Jan Rodenburg: |
| | Jefferies |
| | |
Cell: | | Q31 |
Comment: | | Jan Rodenburg: |
| | IBAS press release |
| | |
Cell: | | Q45 |
Comment: | | Jan Rodenburg: |
| | IBAS press release |
| | |
Cell: | | G62 |
Comment: | | Jan Rodenburg: |
| | Jefferies |
| | |
Cell: | | L62 |
Comment: | | Jan Rodenburg: |
| | Jefferies (all Q’s) |
| | |
Cell: | | Q62 |
Comment: | | Jan Rodenburg: |
| | IBAS press release |
| | |
Cell: | | L63 |
Comment: | | Jan Rodenburg: |
| | Jefferies (all Q’s) |
| | |
Cell: | | Q63 |
Comment: | | Jan Rodenburg: |
| | IBAS press release |
| | |
Cell: | | L64 |
Comment: | | Jan Rodenburg: |
| | Jefferies (all Q’s) |
| | |
Cell: | | Q64 |
Comment: | | Jan Rodenburg: |
| | IBAS press release |
| | |
Cell: | | L69 |
Comment: | | Jan Rodenburg: |
| | Jefferies (all Q’s) |
| | |
Cell: | | L70 |
Comment: | | Jan Rodenburg: |
| | Jefferies (all Q’s) |
| | |
Cell: | | L71 |
Comment: | | Jan Rodenburg |
| | Jefferies (all Q’s) |
Confidential KPN00080089
Strictly Private and confidential
Print date: AUTODATE
AUTOPATH
Mergers and Acquisitions
Cell: | | Q75 |
Comment: | | Jan Rodenburg: |
| | IBAS press release |
| | |
Cell: | | Q76 |
Comment: | | Jan Rodenburg: |
| | IBAS press release |
| | |
Cell: | | Q77 |
Comment: | | Jan Rodenburg: |
| | IBAS press release |
| | |
Cell: | | L82 |
Comment: | | Jan Rodenburg: |
| | Jefferies |
| | |
Cell: | | M82 |
Comment: | | Jan Rodenburg: |
| | Jefferies |
| | |
Cell: | | N82 |
Comment: | | Jan Rodenburg: |
| | Jefferies |
| | |
Cell: | | O82 |
Comment: | | Jan Rodenburg: |
| | Jefferies |
| | |
Cell: | | L86 |
Comment: | | Jan Rodenburg: |
| | Jefferies |
| | |
Cell: | | M86 |
Comment: | | Jan Rodenburg: |
| | Jefferies |
| | |
Cell: | | N86 |
Comment: | | Jan Rodenburg: |
| | Jefferies |
| | |
Cell: | | O86 |
Comment: | | Jan Rodenburg: |
| | Jefferies |
| | |
Cell: | | V91 |
Comment: | | Jan Rodenburg: |
| | Jefferies forecast |
| | |
Cell: | | W91 |
Comment: | | Jan Rodenburg: |
| | Jefferies forecast |
| | |
Cell: | | X91 |
Comment: | | Jan Rodenburg: |
| | Jefferies forecast |
| | |
Cell: | | Y91 |
Comment: | | Jan Rodenburg: |
| | Jefferies forecast |
| | |
Cell: | | Z91 |
Comment: | | Jan Rodenburg: |
| | Jefferies forecast |
| | |
Cell: | | P97 |
Comment: | | Jan Rodenburg: |
| | 10K’08 page 88 |
Confidential KPN00080090
Strictly Private and confidential
Print date: AUTODATE
AUTOPATH
Mergers and Acquisitions
Cell: | | U97 |
Comment: | | Jan Rodenburg: |
| | Set equal to capex |
| | |
Cell: | | U99 |
Comment: | | Jan Rodenburg: |
| | 10K’08 page 89 |
| | |
Cell: | | V99 |
Comment: | | Jan Rodenburg: |
| | 10K’08 page 89 |
| | |
Cell: | | W99 |
Comment: | | Jan Rodenburg: |
| | 10K’08 page 89 |
| | |
Cell: | | X99 |
Comment: | | Jan Rodenburg: |
| | 10K’08 page 89 |
| | |
Cell: | | Y99 |
Comment: | | Jan Rodenburg: |
| | 10K’08 page 89 |
| | |
Cell: | | P101 |
Comment: | | Jan Rodenburg: |
| | 10K’08 page 67 |
| | |
Cell: | | K111 |
Comment: | | Jan Rodenburg: |
| | 10K’08 page 52 |
| | |
Cell: | | P111 |
Comment: | | Jan Rodenburg: |
| | 10K’08 page 52 |
| | |
Cell: | | U118 |
Comment: | | Jan Rodenburg: |
| | Company guidance |
Confidential KPN00080091
Strictly Private and confidential
Print date: AUTODATE


