Exhibit (c)(10)
| Presentation to the Committee of Designated Independent Directors Confidential Material Regarding: July 18, 2006 Confidential Project ACADIA New York – Atlanta - Boston - Chicago - San Francisco SANDLER O'NEILL + PARTNERS, L.P. |
| This presentation, and the oral or video presentation that supplements it, have been developed by and are proprietary to Sandler O'Neill & Partners, L.P. and were prepared exclusively for the benefit and internal use of the recipient. Neither the printed presentation nor the oral or video presentation that supplements it, nor any of their contents, may be reproduced, distributed or used for any other purpose without the prior written consent of Sandler O'Neill & Partners, L.P. The analyses contained herein rely upon information obtained from the recipient or from public sources, the accuracy of which has not been verified, and cannot be assured, by Sandler O'Neill & Partners, L.P. Moreover, many of the projections and financial analyses herein are based on estimated financial performance prepared by or in consultation with the recipient and are intended only to suggest reasonable ranges of results. Finally, the printed presentation is incomplete without the oral or video presentation that supplements it. Sandler O’Neill & Partners, L.P. prohibits employees from offering, directly or indirectly, favorable research, a specific rating or a specific price target, or offering or threatening to change research, a rating or a price target to a company as consideration or inducement for the receipt of business or compensation. The Firm also prohibits research analysts from being compensated for their involvement in, or based upon, specific investment banking transactions. Sandler O'Neill & Partners, L.P. is a limited partnership, the sole general partner of which is Sandler O'Neill & Partners Corp., a New York corporation. Sandler O'Neill & Partners, L.P. is a registered broker-dealer and a member of the National Association of Securities Dealers, Inc. Sandler O'Neill Mortgage Finance L.P. is an indirect wholly-owned subsidiary of Sandler O'Neill & Partners Corp. This material is protected under applicable copyright laws and does not carry any rights of publication or disclosure. GENERAL INFORMATION AND LIMITATIONS |
| Table of Contents I. Progress Update II. Preliminary Valuation of PINE III. MAPLE Overview IV. Pro Forma Analysis V. Appendix |
| I. Progress Update |

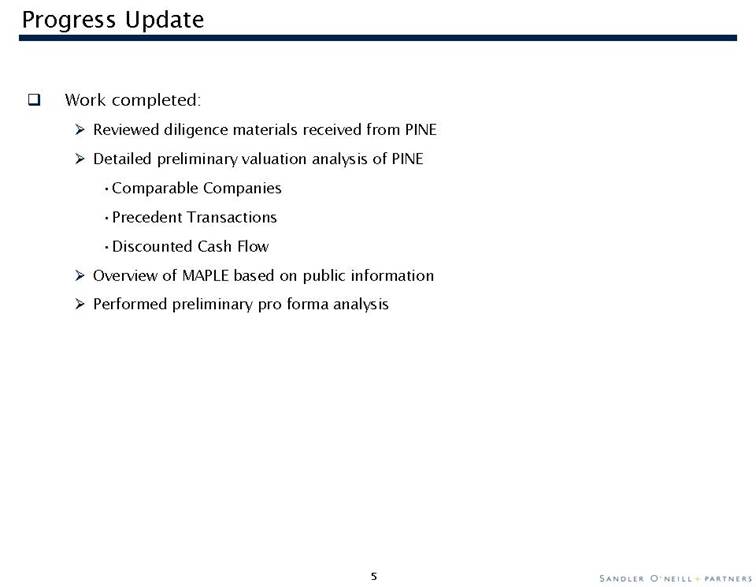
| Progress Update Work completed: Reviewed diligence materials received from PINE Detailed preliminary valuation analysis of PINE Comparable Companies Precedent Transactions Discounted Cash Flow Overview of MAPLE based on public information Performed preliminary pro forma analysis |
| II. Preliminary Valuation of PINE |
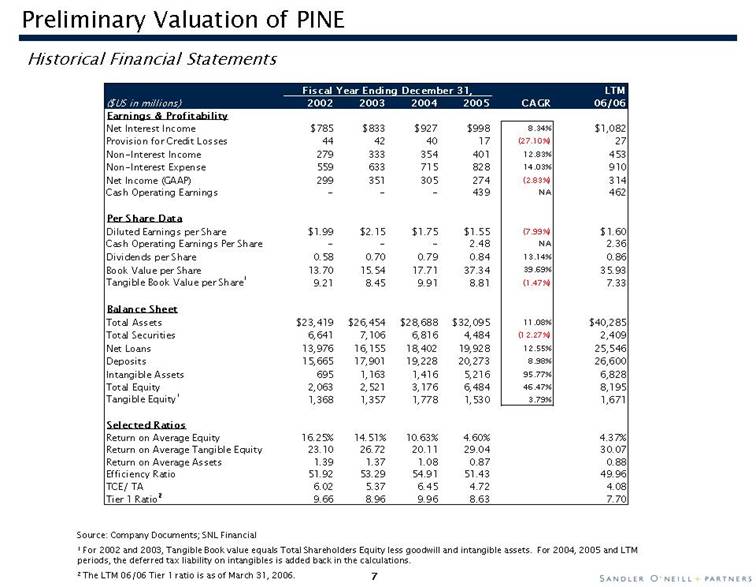
| Preliminary Valuation of PINE Historical Financial Statements $US in millions 2002 2003 2004 2005 Fiscal Year Ending December 31, CAGR LTM 06/06 Earnings & Profitability Net Interest Income $785 $833 $927 $998 8.34% $1,082 Provision for Credit Losses 44 42 40 17 (27.10%) 27 Non-Interest Income 279 333 354 401 12.83% 453 Non-Interest Expense 559 633 715 828 14.03% 910 Net Income (GAAP) 299 351 305 274 (2.83%) 314 Cash Operating Earnings - - - 439 NA 462 Per Share Data Diluted Earnings per Share $1.99 $2.15 $1.75 $1.55 (7.99%) $1.60 Cash Operating Earnings Per Share - - - 2.48 NA 2.36 Dividends per Share 0.58 0.70 0.79 0.84 13.14% 0.86 Book Value per Share 13.70 15.54 17.71 37.34 39.69% 35.93 Tangible Book Value per Share1 9.21 8.45 9.91 8.81 (1.47%) 7.33 Balance Sheet Total Assets $23,419 $26,454 $28,688 $32,095 11.08% $40,285 Total Securities 6,641 7,106 6,816 4,484 (12.27%) 2,409 Net Loans 13,976 16,155 18,402 19,928 12.55% 25,546 Deposits 15,665 17,901 19,228 20,273 8.98% 26,600 Intangible Assets 695 1,163 1,416 5,216 95.77% 6,828 Total Equity 2,063 2,521 3,176 6,484 46.47% 8,195 Tangible Equity1 1,368 1,357 1,778 1,530 3.79% 1,671 Selected Ratios Return on Average Equity 16.25% 14.51% 10.63% 4.60% 4.37% Return on Average Tangible Equity 23.10 26.72 20.11 29.04 30.07 Return on Average Assets 1.39 1.37 1.08 0.87 0.88 Efficiency Ratio 51.92 53.29 54.91 51.43 49.96 TCE/ TA 6.02 5.37 6.45 4.72 4.08 Tier 1 Ratio2 9.66 8.96 9.96 8.63 7.70 Source: Company Documents; SNL Financial 1 For 2002 and 2003, Tangible Book value equals Total Shareholders Equity less goodwill and intangible assets. For 2004, 2005 and LTM periods, the deferred tax liability on intangibles is added back in the calculations. 2 The LTM 06/06 Tier 1 ratio is as of March 31, 2006. |
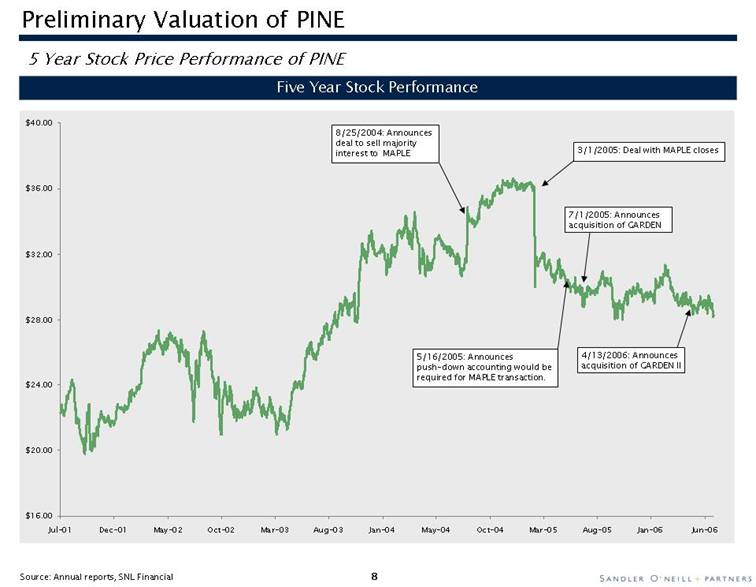
| 5 Year Stock Price Performance of PINE Five Year Stock Performance Source: Annual reports, SNL Financial 8/25/2004: Announces deal to sell majority interest to MAPLE 7/1/2005: Announces acquisition of GARDEN 4/13/2006: Announces acquisition of GARDEN II Preliminary Valuation of PINE 3/1/2005: Deal with MAPLE closes 5/16/2005: Announces push-down accounting would be required for MAPLE transaction. $16.00$20.00$24.00$28.00$32.00$36.00$40.00Jul-01Dec-01May-02Oct-02Mar-03Aug-03Jan-04May-04Oct-04Mar-05Aug-05Jan-06Jun-06 |
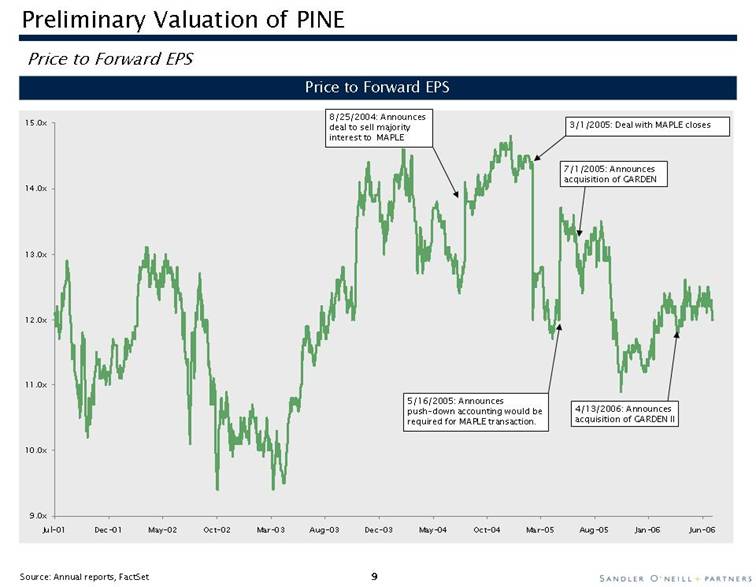
| Price to Forward EPS Price to Forward EPS Source: Annual reports, FactSet 8/25/2004: Announces deal to sell majority interest to MAPLE 7/1/2005: Announces acquisition of GARDEN 4/13/2006: Announces acquisition of GARDEN II Preliminary Valuation of PINE 5/16/2005: Announces push-down accounting would be required for MAPLE transaction. 3/1/2005: Deal with MAPLE closes 9.0x10.0x11.0x12.0x13.0x14.0x15.0xJul-01Dec-01May-02Oct-02Mar-03Aug-03Dec-03May-04Oct-04Mar-05Aug-05Jan-06Jun-06 |
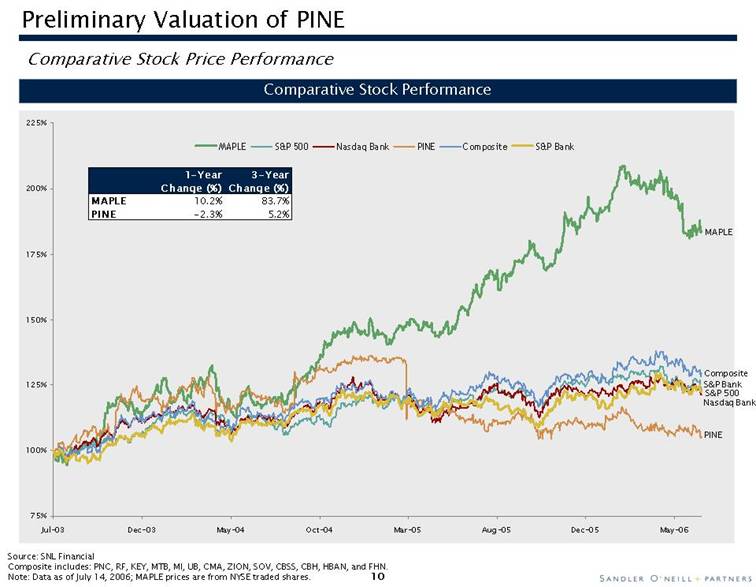
| Comparative Stock Performance Source: SNL Financial Composite includes: PNC, RF, KEY, MTB, MI, UB, CMA, ZION, SOV, CBSS, CBH, HBAN, and FHN. Note: Data as of July 14, 2006; MAPLE prices are from NYSE traded shares. MAPLE Nasdaq Bank S&P 500 PINE Preliminary Valuation of PINE Comparative Stock Price Performance S&P Bank Composite 75%100%125%150%175%200%225%Jul-03Dec-03May-04Oct-04Mar-05Aug-05Dec-05May-06MAPLES&P 500Nasdaq BankPINECompositeS&P Bank 1-Year 3-Year Change (%) Change (%) MAPLE 10.2% 83.7% PINE -2.3% 5.2% |
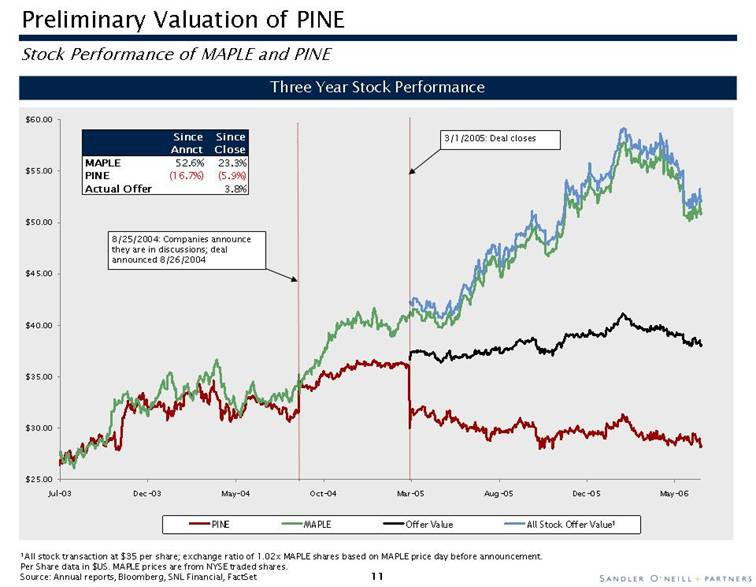
| Preliminary Valuation of PINE Stock Performance of MAPLE and PINE Three Year Stock Performance 3/1/2005: Deal closes 1All stock transaction at $35 per share; exchange ratio of 1.02x MAPLE shares based on MAPLE price day before announcement. Per Share data in $US. MAPLE prices are from NYSE traded shares. Source: Annual reports, Bloomberg, SNL Financial, FactSet 8/25/2004: Companies announce they are in discussions; deal announced 8/26/2004 $25.00$30.00$35.00$40.00$45.00$50.00$55.00$60.00Jul-03Dec-03May-04Oct-04Mar-05Aug-05Dec-05May-06PINEMAPLEOffer ValueAll Stock Offer Value1 |
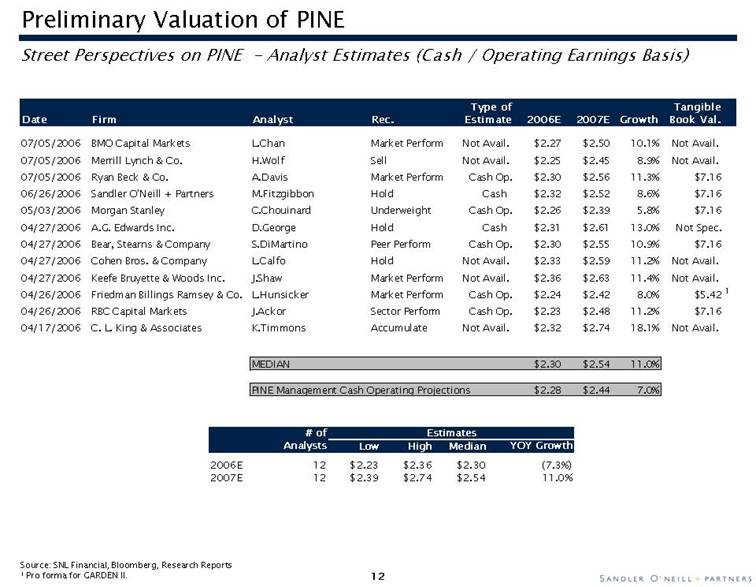
| Preliminary Valuation of PINE Street Perspectives on PINE - Analyst Estimates (Cash / Operating Earnings Basis) Date Firm Analyst Rec. Type of Estimate 2006E 2007E Growth Tangible Book Val. 07/05/2006 BMO Capital Markets L.Chan Market Perform Not Avail. $2.27 $2.50 10.1% Not Avail. 07/05/2006 Merrill Lynch & Co. H.Wolf Sell Not Avail. $2.25 $2.45 8.9% Not Avail. 07/05/2006 Ryan Beck & Co. A.Davis Market Perform Cash Op. $2.30 $2.56 11.3% $7.16 06/26/2006 Sandler O'Neill + Partners M.Fitzgibbon Hold Cash $2.32 $2.52 8.6% $7.16 05/03/2006 Morgan Stanley C.Chouinard Underweight Cash Op. $2.26 $2.39 5.8% $7.16 04/27/2006 A.G. Edwards Inc. D.George Hold Cash $2.31 $2.61 13.0% Not Spec. 04/27/2006 Bear, Stearns & Company S.DiMartino Peer Perform Cash Op. $2.30 $2.55 10.9% $7.16 04/27/2006 Cohen Bros. & Company L.Calfo Hold Not Avail. $2.33 $2.59 11.2% Not Avail. 04/27/2006 Keefe Bruyette & Woods Inc. J.Shaw Market Perform Not Avail. $2.36 $2.63 11.4% Not Avail. 04/26/2006 Friedman Billings Ramsey & Co. L.Hunsicker Market Perform Cash Op. $2.24 $2.42 8.0% $5.42 1 04/26/2006 RBC Capital Markets J.Ackor Sector Perform Cash Op. $2.23 $2.48 11.2% $7.16 04/17/2006 C. L. King & Associates K.Timmons Accumulate Not Avail. $2.32 $2.74 18.1% Not Avail. MEDIAN $2.30 $2.54 11.0% PINE Management Cash Operating Projections $2.28 $2.44 7.0% Source: SNL Financial, Bloomberg, Research Reports 1 Pro forma for GARDEN II. # ofEstimatesAnalystsLowHighMedianYOY Growth2006E12$2.23$2.36$2.30(7.3%)2007E12$2.39$2.74$2.5411.0% |
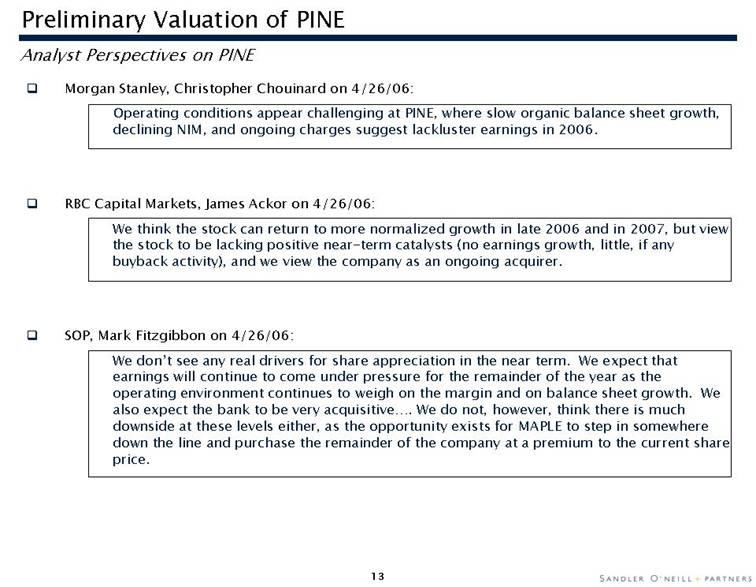
| Analyst Perspectives on PINE Preliminary Valuation of PINE Morgan Stanley, Christopher Chouinard on 4/26/06:Operating conditions appear challenging at PINE, where slow organic balance sheet growth, declining NIM, and ongoing charges suggest lackluster earnings in 2006. RBC Capital Markets, James Ackor on 4/26/06:We think the stock can return to more normalized growth in late 2006 and in 2007, but view the stock to be lacking positive near-term catalysts (no earnings growth, little, if any buyback activity), and we view the company as an ongoing acquirer. SOP, Mark Fitzgibbon on 4/26/06:We don’t see any real drivers for share appreciation in the near term. We expect that earnings will continue to come under pressure for the remainder of the year as the operating environment continues to weigh on the margin and on balance sheet growth. We also expect the bank to be very acquisitive.... We do not, however, think there is much downside at these levels either, as the opportunity exists for MAPLE to step in somewhere down the line and purchase the remainder of the company at a premium to the current share price. |
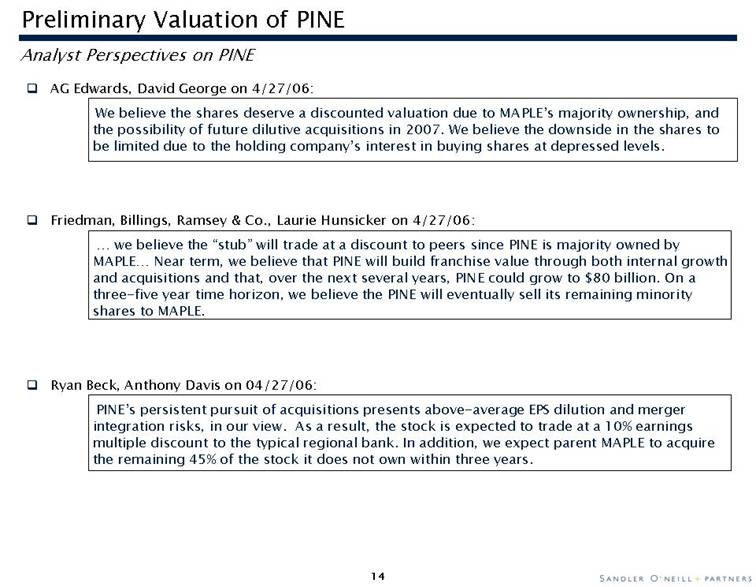
| Analyst Perspectives on PINE Preliminary Valuation of PINE AG Edwards, David George on 4/27/06:We believe the shares deserve a discounted valuation due to MAPLE’s majority ownership, and the possibility of future dilutive acquisitions in 2007. We believe the downside in the shares to be limited due to the holding company’s interest in buying shares at depressed levels. Friedman, Billings, Ramsey & Co., Laurie Hunsicker on 4/27/06:...we believe the “stub” will trade at a discount to peers since PINE is majority owned by MAPLE... Near term, we believe that PINE will build franchise value through both internal growth and acquisitions and that, over the next several years, PINE could grow to $80 billion. On a three-five year time horizon, we believe the PINE will eventually sell its remaining minority shares to MAPLE. Ryan Beck, Anthony Davis on 04/27/06:PINE’s persistent pursuit of acquisitions presents above-average EPS dilution and merger integration risks, in our view. As a result, the stock is expected to trade at a 10% earnings multiple discount to the typical regional bank. In addition, we expect parent MAPLE to acquire the remaining 45% of the stock it does not own within three years. |
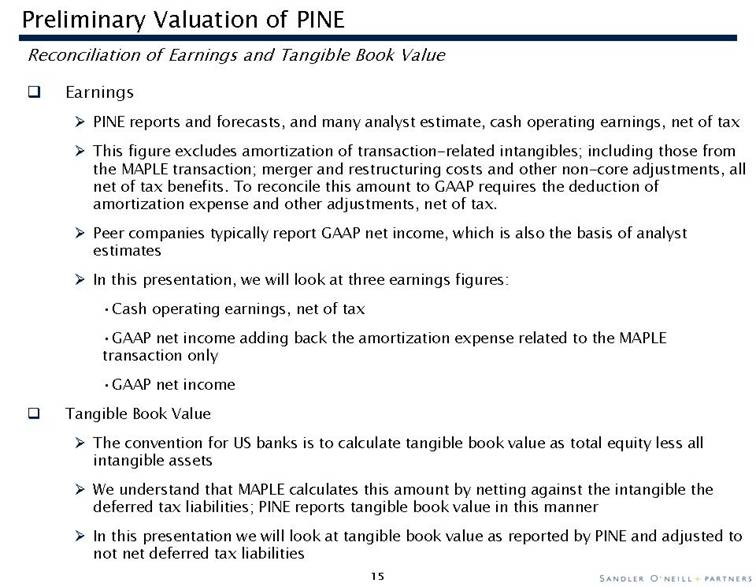
| Preliminary Valuation of PINE Reconciliation of Earnings and Tangible Book Value Earnings PINE reports and forecasts, and many analyst estimate, cash operating earnings, net of tax This figure excludes amortization of transaction-related intangibles; including those from the MAPLE transaction; merger and restructuring costs and other non-core adjustments, all net of tax benefits. To reconcile this amount to GAAP requires the deduction of amortization expense and other adjustments, net of tax. Peer companies typically report GAAP net income, which is also the basis of analyst estimates In this presentation, we will look at three earnings figures: Cash operating earnings, net of tax GAAP net income adding back the amortization expense related to the MAPLE transaction only GAAP net income Tangible Book Value The convention for US banks is to calculate tangible book value as total equity less all intangible assets We understand that MAPLE calculates this amount by netting against the intangible the deferred tax liabilities; PINE reports tangible book value in this manner In this presentation we will look at tangible book value as reported by PINE and adjusted to not net deferred tax liabilities |
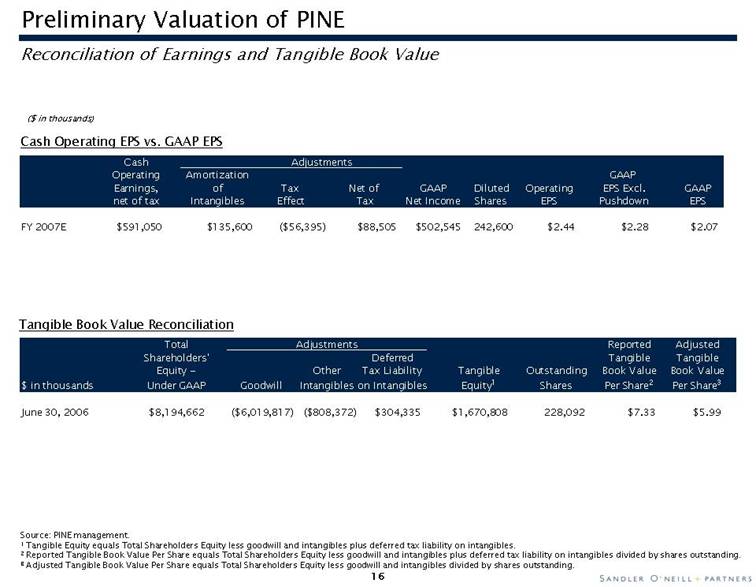
| Preliminary Valuation of PINE Reconciliation of Earnings and Tangible Book Value ($ in thousands) Cash Operating EPS vs. GAAP EPS Cash Adjustments Operating Amortization GAAP Earnings, of Tax Net of GAAP Diluted Operating EPS Excl. GAAP net of tax Intangibles Effect Tax Net Income Shares EPS Pushdown EPS FY 2007E $591,050 $135,600 ($56,395) $88,505 $502,545 242,600 $2.44 $2.28 $2.07 Tangible Book Value Reconciliation Total Adjustments Reported Adjusted Shareholders' Deferred Tangible Tangible Equity – Other Tax Liability Tangible Outstanding Book Value Book Value $ in thousands Under GAAP Goodwill Intangibles on Intangibles Equity1 Shares Per Share2 Per Share3 June 30, 2006 $8,194,662 ($6,019,817) ($808,372) $304,335 $1,670,808 228,092 $7.33 $5.99 Source: PINE management. 1 Tangible Equity equals Total Shareholders Equity less goodwill and intangibles plus deferred tax liability on intangibles. 2 Reported Tangible Book Value Per Share equals Total Shareholders Equity less goodwill and intangibles plus deferred tax liability on intangibles divided by shares outstanding. 3 Adjusted Tangible Book Value Per Share equals Total Shareholders Equity less goodwill and intangibles divided by shares outstanding. |
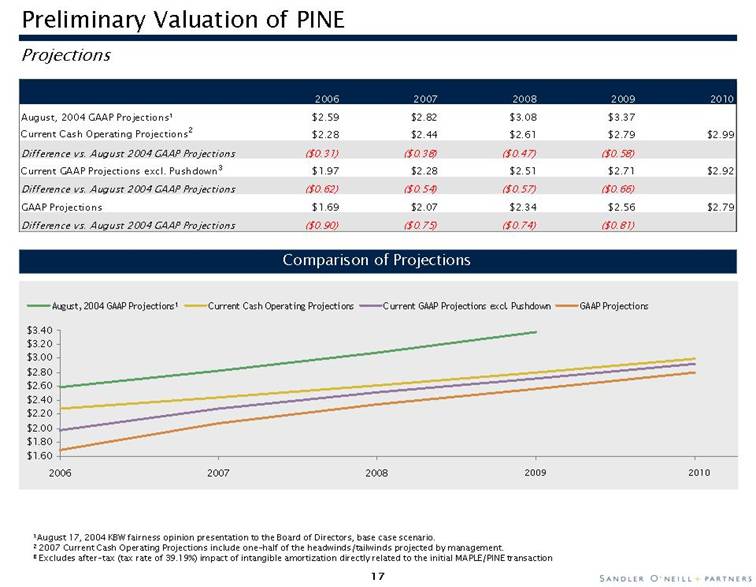
| Preliminary Valuation of PINE Projections Comparison of Projections 2006 2007 2008 2009 2010 August, 2004 GAAP Projections1 $2.59 $2.82 $3.08 $3.37 Current Cash Operating Projections2 $2.28 $2.44 $2.61 $2.79 $2.99 Difference vs. August 2004 GAAP Projections ($0.31) ($0.38) ($0.47) ($0.58) Current GAAP Projections excl. Pushdown3 $1.97 $2.28 $2.51 $2.71 $2.92 Difference vs. August 2004 GAAP Projections ($0.62) ($0.54) ($0.57) ($0.66) GAAP Projections $1.69 $2.07 $2.34 $2.56 $2.79 Difference vs. August 2004 GAAP Projections ($0.90) ($0.75) ($0.74) ($0.81) 1August 17, 2004 KBW fairness opinion presentation to the Board of Directors, base case scenario. 2 2007 Current Cash Operating Projections include one-half of the headwinds/tailwinds projected by management. 3 Excludes after-tax (tax rate of 39.19%) impact of intangible amortization directly related to the initial MAPLE/PINE transaction |
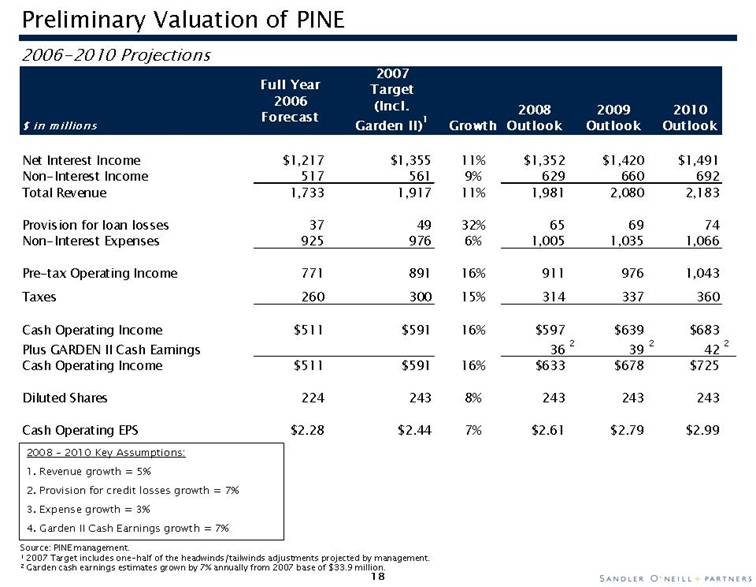
| Preliminary Valuation of PINE 2006-2010 Projections $ in millions Full Year 2006 Forecast 2007 Target (Incl. Garden II)1 Growth 2008 Outlook 2009 Outlook 2010 Outlook Net Interest Income $1,217 $1,355 11% $1,352 $1,420 $1,491 Non-Interest Income 517 561 9% 629 660 692 Total Revenue 1,733 1,917 11% 1,981 2,080 2,183 Provision for loan losses 37 49 32% 65 69 74 Non-Interest Expenses 925 976 6% 1,005 1,035 1,066 Pre-tax Operating Income 771 891 16% 911 976 1,043 Taxes 260 300 15% 314 337 360 Cash Operating Income $511 $591 16% $597 $639 $683 Plus GARDEN II Cash Earnings 36 2 39 2 42 2 Cash Operating Income $511 $591 16% $633 $678 $725 Diluted Shares 224 243 8% 243 243 243 Cash Operating EPS $2.28 $2.44 7% $2.61 $2.79 $2.99 Source: PINE management. 1 2007 Target includes one-half of the headwinds/tailwinds adjustments projected by management. 2 Garden cash earnings estimates grown by 7% annually from 2007 base of $33.9 million. 2008 – 2010 Key Assumptions: 1. Revenue growth = 5% 2. Provision for credit losses growth = 7% 3. Expense growth = 3% 4. Garden II Cash Earnings growth = 7% |
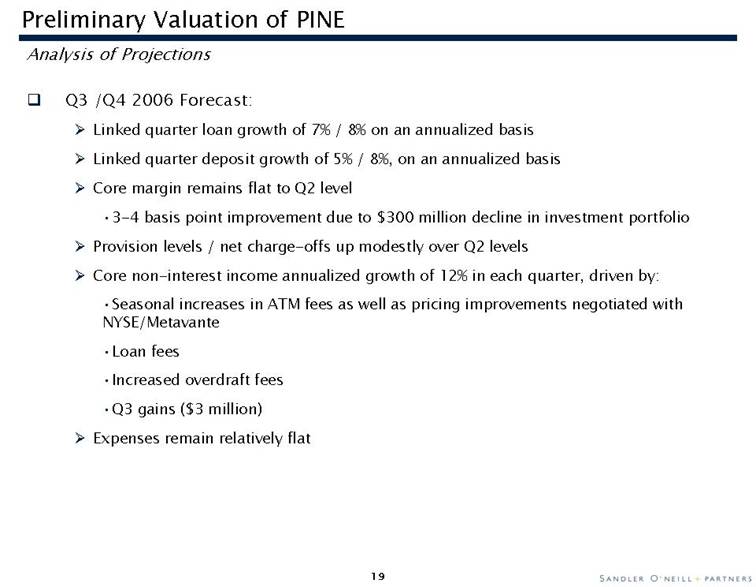
| Preliminary Valuation of PINE Analysis of Projections Q3 /Q4 2006 Forecast: Linked quarter loan growth of 7% / 8% on an annualized basis Linked quarter deposit growth of 5% / 8%, on an annualized basis Core margin remains flat to Q2 level 3-4 basis point improvement due to $300 million decline in investment portfolio Provision levels / net charge-offs up modestly over Q2 levels Core non-interest income annualized growth of 12% in each quarter, driven by: Seasonal increases in ATM fees as well as pricing improvements negotiated with NYSE/Metavante Loan fees Increased overdraft fees Q3 gains ($3 million) Expenses remain relatively flat |
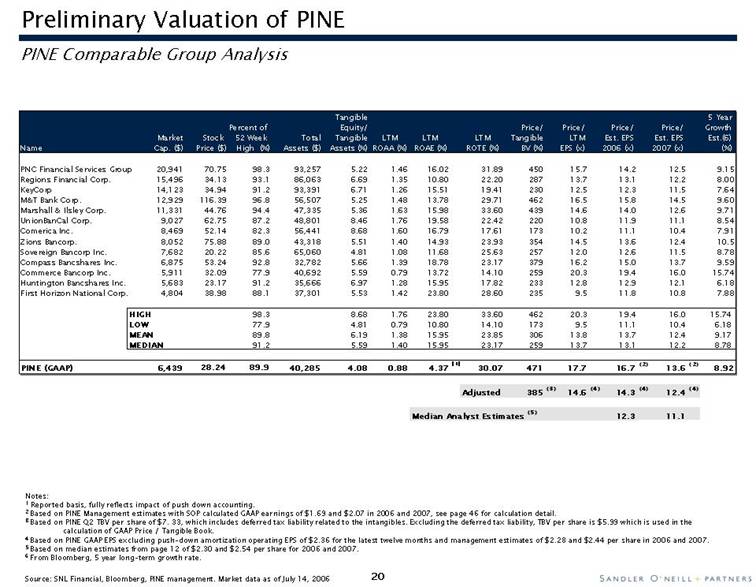
| PINE Comparable Group Analysis Tangible 5 Year Percent of Equity/ Price/ Price/ Price/ Price/ Growth Market Stock 52 Week Total Tangible LTM LTM LTM Tangible LTM Est. EPS Est. EPS Est.(6) Name Cap. ($) Price ($) High (%) Assets ($) Assets (%) ROAA (%) ROAE (%) ROTE (%) BV (%) EPS (x) 2006 (x) 2007 (x) (%) PNC Financial Services Group 20,941 70.75 98.3 93,257 5.22 1.46 16.02 31.89 450 15.7 14.2 12.5 9.15 Regions Financial Corp. 15,496 34.13 93.1 86,063 6.69 1.35 10.80 22.20 287 13.7 13.1 12.2 8.00 KeyCorp 14,123 34.94 91.2 93,391 6.71 1.26 15.51 19.41 230 12.5 12.3 11.5 7.64 M&T Bank Corp. 12,929 116.39 96.8 56,507 5.25 1.48 13.78 29.71 462 16.5 15.8 14.5 9.60 Marshall & Ilsley Corp. 11,331 44.76 94.4 47,335 5.36 1.63 15.98 33.60 439 14.6 14.0 12.6 9.71 UnionBanCal Corp. 9,027 62.75 87.2 48,801 8.46 1.76 19.58 22.42 220 10.8 11.9 11.1 8.54 Comerica Inc. 8,469 52.14 82.3 56,441 8.68 1.60 16.79 17.61 173 10.2 11.1 10.4 7.91 Zions Bancorp. 8,052 75.88 89.0 43,318 5.51 1.40 14.93 23.93 354 14.5 13.6 12.4 10.5 Sovereign Bancorp Inc. 7,682 20.22 85.6 65,060 4.81 1.08 11.68 25.63 257 12.0 12.6 11.5 8.78 Compass Bancshares Inc. 6,875 53.24 92.8 32,782 5.66 1.39 18.78 23.17 379 16.2 15.0 13.7 9.59 Commerce Bancorp Inc. 5,911 32.09 77.9 40,692 5.59 0.79 13.72 14.10 259 20.3 19.4 16.0 15.74 Huntington Bancshares Inc. 5,683 23.17 91.2 35,666 6.97 1.28 15.95 17.82 233 12.8 12.9 12.1 6.18 First Horizon National Corp. 4,804 38.98 88.1 37,301 5.53 1.42 23.80 28.60 235 9.5 11.8 10.8 7.88 HIGH 98.3 8.68 1.76 23.80 33.60 462 20.3 19.4 16.0 15.74 LOW 77.9 4.81 0.79 10.80 14.10 173 9.5 11.1 10.4 6.18 MEAN 89.8 6.19 1.38 15.95 23.85 306 13.8 13.7 12.4 9.17 MEDIAN 91.2 5.59 1.40 15.95 23.17 259 13.7 13.1 12.2 8.78 PINE (GAAP) 6,439 28.24 89.9 40,285 4.08 0.88 4.37 ( 1) 30.07 471 17.7 16.7 (2) 13.6 (2) 8.92 Adjusted 385 (3) 14.6 (4) 14.3 (4) 12.4 (4) Median Analyst Estimates (5) 12.3 11.1 Source: SNL Financial, Bloomberg, PINE management. Market data as of July 14, 2006 Notes: 1 Reported basis, fully reflects impact of push down accounting. 2 Based on PINE Management estimates with SOP calculated GAAP earnings of $1.69 and $2.07 in 2006 and 2007, see page 46 for calculation detail. 3 Based on PINE Q2 TBV per share of $7.33, which includes deferred tax liability related to the intangibles. Excluding the deferred tax liability, TBV per share is $5.99 which is used in the calculation of GAAP Price / Tangible Book. 4 Based on PINE GAAP EPS excluding push-down amortization operating EPS of $2.36 for the latest twelve months and management estimates of $2.28 and $2.44 per share in 2006 and 2007. 5 Based on median estimates from page 12 of $2.30 and $2.54 per share for 2006 and 2007. 6 From Bloomberg, 5 year long-term growth rate. Preliminary Valuation of PINE |
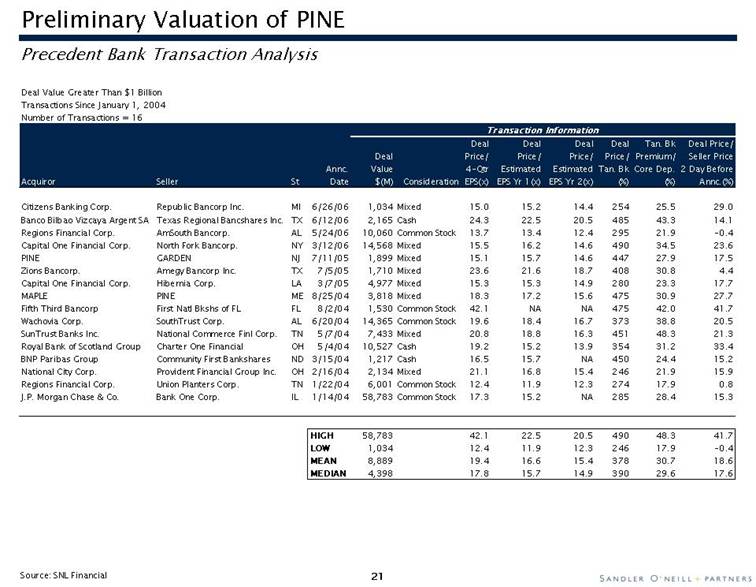
| Precedent Bank Transaction Analysis Deal Value Greater Than $1 Billion Transactions Since January 1, 2004 Number of Transactions = 16 Transaction Information Deal Deal Deal Deal Tan. Bk Deal Price/ Deal Price/ Price/ Price/ Price/ Premium/ Seller Price Annc. Value 4-Qtr Estimated Estimated Tan. Bk Core Dep. 2 Day Before Acquiror Seller St Date $(M) Consideration EPS(x) EPS Yr 1(x) EPS Yr 2(x) (%) (%) Annc. (%) Citizens Banking Corp. Republic Bancorp Inc. MI 6/26/06 1,034 Mixed 15.0 15.2 14.4 254 25.5 29.0 Banco Bilbao Vizcaya Argent SA Texas Regional Bancshares Inc. TX 6/12/06 2,165 Cash 24.3 22.5 20.5 485 43.3 14.1 Regions Financial Corp. AmSouth Bancorp. AL 5/24/06 10,060 Common Stock 13.7 13.4 12.4 295 21.9 -0.4 Capital One Financial Corp. North Fork Bancorp. NY 3/12/06 14,568 Mixed 15.5 16.2 14.6 490 34.5 23.6 PINE GARDEN NJ 7/11/05 1,899 Mixed 15.1 15.7 14.6 447 27.9 17.5 Zions Bancorp. Amegy Bancorp Inc. TX 7/5/05 1,710 Mixed 23.6 21.6 18.7 408 30.8 4.4 Capital One Financial Corp. Hibernia Corp. LA 3/7/05 4,977 Mixed 15.3 15.3 14.9 280 23.3 17.7 MAPLE PINE ME 8/25/04 3,818 Mixed 18.3 17.2 15.6 475 30.9 27.7 Fifth Third Bancorp First Natl Bkshs of FL FL 8/2/04 1,530 Common Stock 42.1 NA NA 475 42.0 41.7 Wachovia Corp. SouthTrust Corp. AL 6/20/04 14,365 Common Stock 19.6 18.4 16.7 373 38.8 20.5 SunTrust Banks Inc. National Commerce Finl Corp. TN 5/7/04 7,433 Mixed 20.8 18.8 16.3 451 48.3 21.3 Royal Bank of Scotland Group Charter One Financial OH 5/4/04 10,527 Cash 19.2 15.2 13.9 354 31.2 33.4 BNP Paribas Group Community First Bankshares ND 3/15/04 1,217 Cash 16.5 15.7 NA 450 24.4 15.2 National City Corp. Provident Financial Group Inc. OH 2/16/04 2,134 Mixed 21.1 16.8 15.4 246 21.9 15.9 Regions Financial Corp. Union Planters Corp. TN 1/22/04 6,001 Common Stock 12.4 11.9 12.3 274 17.9 0.8 J.P. Morgan Chase & Co. Bank One Corp. IL 1/14/04 58,783 Common Stock 17.3 15.2 NA 285 28.4 15.3 HIGH 58,783 42.1 22.5 20.5 490 48.3 41.7 LOW 1,034 12.4 11.9 12.3 246 17.9 -0.4 MEAN 8,889 19.4 16.6 15.4 378 30.7 18.6 MEDIAN 4,398 17.8 15.7 14.9 390 29.6 17.6 Source: SNL Financial Preliminary Valuation of PINE |
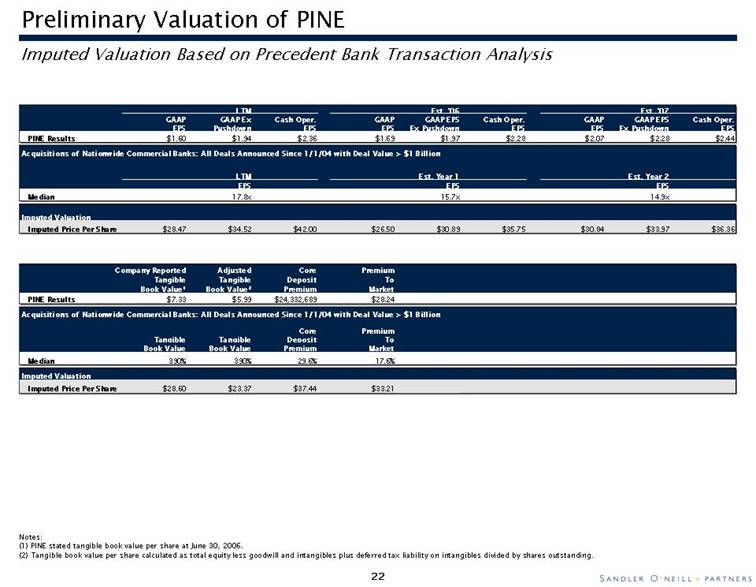
| Imputed Valuation Based on Precedent Bank Transaction Analysis Preliminary Valuation of PINE LTM Est. '06 Est. '07 GAAP GAAP Ex Cash Oper. GAAP GAAP EPS Cash Oper. GAAP GAAP EPS Cash Oper. EPS Pushdown EPS EPS Ex Pushdown EPS EPS Ex Pushdown EPS PINE Results $1.60 $1.94 $2.36 $1.69 $1.97 $2.28 $2.07 $2.28 $2.44 Acquisitions of Nationwide Commercial Banks: All Deals Announced Since 1/1/04 with Deal Value > $1 Billion LTM Est. Year 1 Est. Year 2 EPS EPS EPS Median 17.8x 15.7x 14.9x Imputed Valuation Imputed Price Per Share $28.47 $34.52 $42.00 $26.50 $30.89 $35.75 $30.84 $33.97 $36.36 Company Reported Adjusted Core Premium Tangible Tangible Deposit To Book Value1 Book Value2 Premium Market PINE Results $7.33 $5.99 $24,332,689 $28.24 Acquisitions of Nationwide Commercial Banks: All Deals Announced Since 1/1/04 with Deal Value > $1 Billion Core Premium Tangible Tangible Deposit To Book Value Book Value Premium Market Median 390% 390% 29.6% 17.6% Imputed Valuation Imputed Price Per Share $28.60 $23.37 $37.44 $33.21 Notes: (1) PINE stated tangible book value per share at June 30, 2006. (2) Tangible book value per share calculated as total equity less goodwill and intangibles plus deferred tax liability on intangibles divided by shares outstanding. |
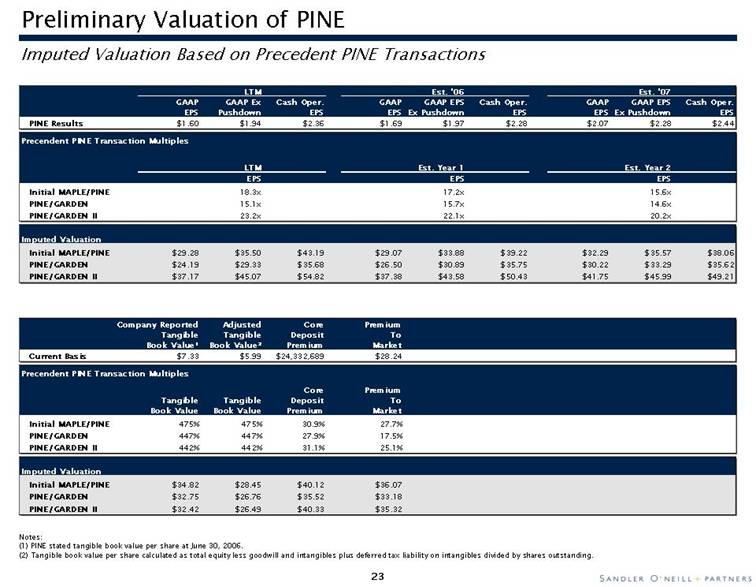
| Imputed Valuation Based on Precedent PINE Transactions Preliminary Valuation of PINE LTM Est. '06 Est. '07 GAAP GAAP Ex Cash Oper. GAAP GAAP EPS Cash Oper. GAAP GAAP EPS Cash Oper. EPS Pushdown EPS EPS Ex Pushdown EPS EPS Ex Pushdown EPS PINE Results $1.60 $1.94 $2.36 $1.69 $1.97 $2.28 $2.07 $2.28 $2.44 Precendent PINE Transaction Multiples LTM Est. Year 1 Est. Year 2 EPS EPS EPS Initial MAPLE/PINE 18.3x 17.2x 15.6x PINE/GARDEN 15.1x 15.7x 14.6x PINE/GARDEN II 23.2x 22.1x 20.2x Imputed Valuation Initial MAPLE/PINE $29.28 $35.50 $43.19 $29.07 $33.88 $39.22 $32.29 $35.57 $38.06 PINE/GARDEN $24.19 $29.33 $35.68 $26.50 $30.89 $35.75 $30.22 $33.29 $35.62 PINE/GARDEN II $37.17 $45.07 $54.82 $37.38 $43.58 $50.43 $41.75 $45.99 $49.21 Company Reported Adjusted Core Premium Tangible Tangible Deposit To Book Value¹ Book Value² Premium Market Current Basis $7.33 $5.99 $24,332,689 $28.24 Precendent PINE Transaction Multiples Core Premium Tangible Tangible Deposit To Book Value Book Value Premium Market Initial MAPLE/PINE 475% 475% 30.9% 27.7% PINE/GARDEN 447% 447% 27.9% 17.5% PINE/GARDEN II 442% 442% 31.1% 25.1% Imputed Valuation Initial MAPLE/PINE $34.82 $28.45 $40.12 $36.07 PINE/GARDEN $32.75 $26.76 $35.52 $33.18 PINE/GARDEN II $32.42 $26.49 $40.33 $35.32 Notes: (1) PINE stated tangible book value per share at June 30, 2006. (2) Tangible book value per share calculated as total equity less goodwill and intangibles plus deferred tax liability on intangibles divided by shares outstanding. |
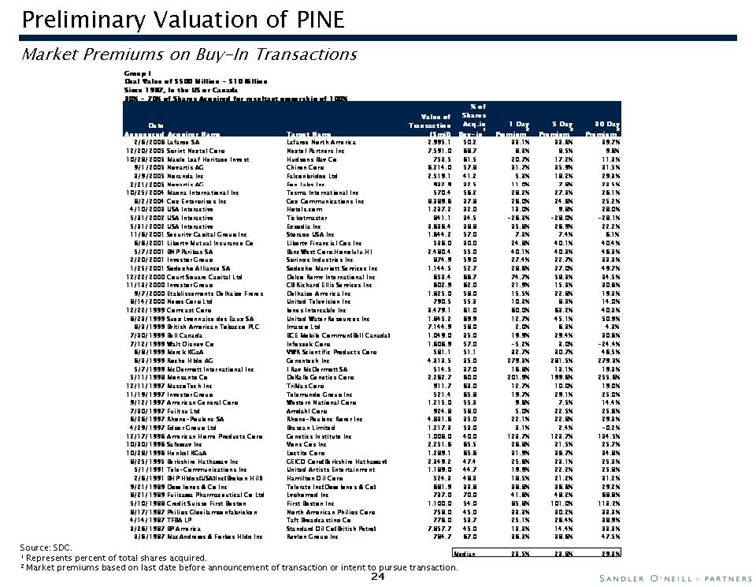
| Market Premiums on Buy-In Transactions Group I Deal Value of $500 Million - $10 Billion Since 1987, In the US or Canada 30% - 70% of Shares Acquired for resultant ownership of 100% Date Announced Acquiror Name Target Name Value of Transaction ($ mil) % of Shares Acq.in Buy-in1 1 Day Premium2 5 Day Premium2 30 Day Premium2 2/6/2006 Lafarge SA Lafarge North America 2,995.1 50.2 33.1% 33.6% 39.7% 12/20/2005 Sprint Nextel Corp Nextel Partners Inc 7,591.0 68.7 8.3% 8.5% 9.6% 10/28/2005 Maple Leaf Heritage Invest Hudsons Bay Co 753.5 61.5 20.7% 17.2% 11.3% 9/1/2005 Novartis AG Chiron Corp 6,214.0 57.8 31.7% 35.9% 31.5% 3/9/2005 Noranda Inc Falconbridge Ltd 2,519.1 41.2 5.3% 18.2% 29.3% 2/21/2005 Novartis AG Eon Labs Inc 932.9 32.5 11.0% 7.8% 23.5% 10/25/2004 Magna International Inc Tesma International Inc 570.4 56.2 28.2% 27.3% 26.1% 8/2/2004 Cox Enterprises Inc Cox Communications Inc 8,389.6 37.8 26.0% 24.6% 25.2% 4/10/2003 USA Interactive Hotels.com 1,237.2 32.0 13.0% 9.8% 28.0% 5/31/2002 USA Interactive Ticketmaster 841.1 34.5 -26.3% -28.0% -28.1% 5/31/2002 USA Interactive Expedia Inc 3,636.4 38.8 35.8% 26.9% 22.2% 11/6/2001 Security Capital Group Inc Storage USA Inc 1,644.2 57.0 7.3% 7.4% 6.1% 6/6/2001 Liberty Mutual Insurance Co Liberty Financial Cos Inc 536.0 30.0 24.8% 40.1% 40.4% 5/7/2001 BNP Paribas SA BancWest Corp, Honolulu, HI 2,480.4 55.0 40.1% 40.3% 46.3% 2/20/2001 Investor Group Springs Industries Inc 874.9 59.0 27.4% 22.7% 33.3% 1/25/2001 Sodexho Alliance SA Sodexho Marriott Services Inc 1,144.5 52.7 28.6% 27.0% 49.7% 12/22/2000 Court Square Capital Ltd Delco Remy International Inc 653.4 66.7 74.7% 58.3% 34.5% 11/13/2000 Investor Group CB Richard Ellis Services Inc 602.9 62.0 21.9% 15.3% 30.6% 9/7/2000 Etablissements Delhaize Freres Delhaize America Inc 1,825.0 58.0 15.5% 22.8% 19.3% 8/14/2000 News Corp Ltd United Television Inc 790.5 55.3 10.3% 8.3% 14.0% 12/22/1999 Comcast Corp Jones Intercable Inc 3,479.1 61.0 60.0% 63.2% 40.3% 8/23/1999 Suez Lyonnaise des Eaux SA United Water Resources Inc 1,845.2 69.9 12.7% 45.1% 50.9% 8/3/1999 British American Tobacco PLC Imasco Ltd 7,144.9 58.0 2.0% 6.3% 4.3% 7/30/1999 Bell Canada BCE Mobile Commun (Bell Canada) 1,049.0 35.0 19.9% 29.4% 30.6% 7/12/1999 Walt Disney Co Infoseek Corp 1,606.9 57.0 -5.2% 3.0% -24.4% 6/8/1999 Merck KGaA VWR Scientific Products Corp 581.1 51.1 32.7% 30.7% 46.5% 6/3/1999 Roche Hldg AG Genentech Inc 4,313.5 35.0 279.3% 281.5% 279.3% 5/7/1999 McDermott International Inc J Ray McDermott SA 514.5 37.0 16.8% 13.1% 19.3% 5/11/1998 Monsanto Co DeKalb Genetics Corp 2,262.7 60.0 201.9% 199.6% 255.6% 12/11/1997 MascoTech Inc TriMas Corp 911.7 63.0 12.7% 10.0% 19.0% 11/19/1997 Investor Group Telemundo Group Inc 521.4 65.8 19.7% 29.1% 25.0% 9/12/1997 American General Corp Western National Corp 1,215.0 55.3 9.6% 7.5% 14.4% 7/30/1997 Fujitsu Ltd Amdahl Corp 924.8 58.0 5.0% 22.5% 25.6% 6/26/1997 Rhone-Poulenc SA Rhone-Poulenc Rorer Inc 4,831.6 35.0 22.1% 22.8% 29.3% 4/29/1997 Edper Group Ltd Brascan Limited 1,217.3 53.0 3.1% 2.4% -0.2% 12/17/1996 American Home Products Corp Genetics Institute Inc 1,006.0 40.0 123.7% 123.7% 134.5% 10/30/1996 Safeway Inc Vons Cos Inc 2,251.6 65.5 26.8% 21.5% 25.7% 10/28/1996 Henkel KGaA Loctite Corp 1,289.1 65.6 31.9% 36.7% 34.8% 8/25/1995 Berkshire Hathaway Inc GEICO Corp (Berkshire Hathaway) 2,349.2 47.4 25.6% 23.1% 25.3% 5/1/1991 Tele-Communications Inc United Artists Entertainment 1,189.0 44.7 19.9% 22.2% 25.8% 2/6/1991 BHP Hldgs (USA) Inc (Broken Hill) Hamilton Oil Corp 524.3 48.3 18.5% 21.2% 31.2% 9/21/1989 Dow Jones & Co Inc Telerate Inc (Dow Jones & Co) 681.9 33.8 38.8% 36.6% 29.2% 8/21/1989 Fujisawa Pharmaceutical Co Ltd Lyphomed Inc 737.0 70.0 41.6% 48.2% 68.8% 5/10/1988 Credit Suisse First Boston First Boston Inc 1,100.0 54.0 85.8% 101.0% 113.2% 8/17/1987 Philips Gloeilampenfabrieken North American Philips Corp 758.0 45.0 33.3% 30.2% 33.3% 4/14/1987 TFBA LP Taft Broadcasting Co 776.0 53.7 25.1% 26.4% 38.9% 3/26/1987 BP America Standard Oil Co (British Petro) 7,857.7 45.0 13.3% 14.4% 33.3% 3/6/1987 MacAndrews & Forbes Hldg Inc Revlon Group Inc 784.7 67.0 36.3% 38.6% 47.5% Median 23.5% 23.8% 29.3% Source: SDC. 1 Represents percent of total shares acquired. 2 Market premiums based on last date before announcement of transaction or intent to pursue transaction. Preliminary Valuation of PINE |
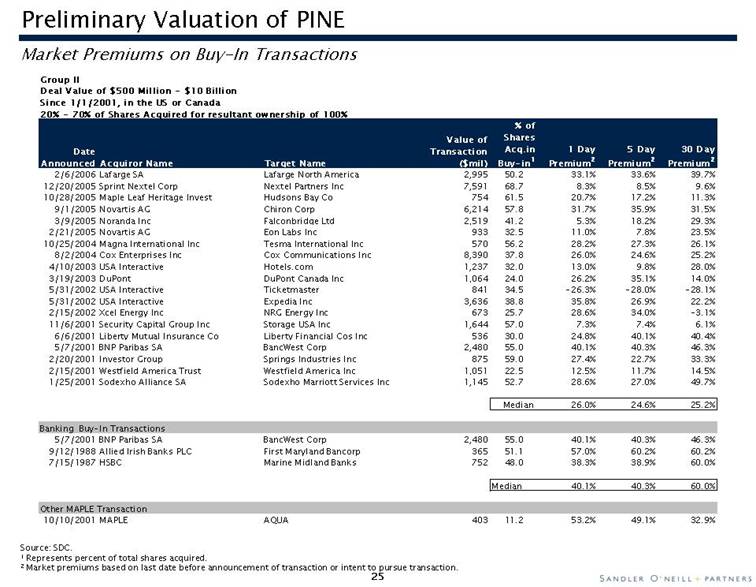
| Market Premiums on Buy-In Transactions Preliminary Valuation of PINE Group II Deal Value of $500 Million - $10 Billion Since 1/1/2001, in the US or Canada 20% - 70% of Shares Acquired for resultant ownership of 100% Date Announced Acquiror Name Target Name Value of Transaction ($ mil) % of Shares Acq.in Buy-in1 1 Day Premium2 5 Day Premium2 30 Day Premium2 2/6/2006 Lafarge SA Lafarge North America 2,995 50.2 33.1% 33.6% 39.7% 12/20/2005 Sprint Nextel Corp Nextel Partners Inc 7,591 68.7 8.3% 8.5% 9.6% 10/28/2005 Maple Leaf Heritage Invest Hudsons Bay Co 754 61.5 20.7% 17.2% 11.3% 9/1/2005 Novartis AG Chiron Corp 6,214 57.8 31.7% 35.9% 31.5% 3/9/2005 Noranda Inc Falconbridge Ltd 2,519 41.2 5.3% 18.2% 29.3% 2/21/2005 Novartis AG Eon Labs Inc 933 32.5 11.0% 7.8% 23.5% 10/25/2004 Magna International Inc Tesma International Inc 570 56.2 28.2% 27.3% 26.1% 8/2/2004 Cox Enterprises Inc Cox Communications Inc 8,390 37.8 26.0% 24.6% 25.2% 4/10/2003 USA Interactive Hotels.com 1,237 32.0 13.0% 9.8% 28.0% 3/19/2003 DuPont DuPont Canada Inc 1,064 24.0 26.2% 35.1% 14.0% 5/31/2002 USA Interactive Ticketmaster 841 34.5 -26.3% -28.0% -28.1% 5/31/2002 USA Interactive Expedia Inc 3,636 38.8 35.8% 26.9% 22.2% 2/15/2002 Xcel Energy Inc NRG Energy Inc 673 25.7 28.6% 34.0% -3.1% 11/6/2001 Security Capital Group Inc Storage USA Inc 1,644 57.0 7.3% 7.4% 6.1% 6/6/2001 Liberty Mutual Insurance Co Liberty Financial Cos Inc 536 30.0 24.8% 40.1% 40.4% 5/7/2001 BNP Paribas SA BancWest Corp 2,480 55.0 40.1% 40.3% 46.3% 2/20/2001 Investor Group Springs Industries Inc 875 59.0 27.4% 22.7% 33.3% 2/15/2001 Westfield America Trust Westfield America Inc 1,051 22.5 12.5% 11.7% 14.5% 1/25/2001 Sodexho Alliance SA Sodexho Marriott Services Inc 1,145 52.7 28.6% 27.0% 49.7% Median 26.0% 24.6% 25.2% Banking Buy-In Transactions 5/7/2001 BNP Paribas SA BancWest Corp 2,480 55.0 40.1% 40.3% 46.3% 9/12/1988 Allied Irish Banks PLC First Maryland Bancorp 365 51.1 57.0% 60.2% 60.2% 7/15/1987 HSBC Marine Midland Banks 752 48.0 38.3% 38.9% 60.0% Median 40.1% 40.3% 60.0% Other MAPLE Transaction 10/10/2001 MAPLE AQUA 403 11.2 53.2% 49.1% 32.9% Source: SDC. 1 Represents percent of total shares acquired. 2 Market premiums based on last date before announcement of transaction or intent to pursue transaction. |
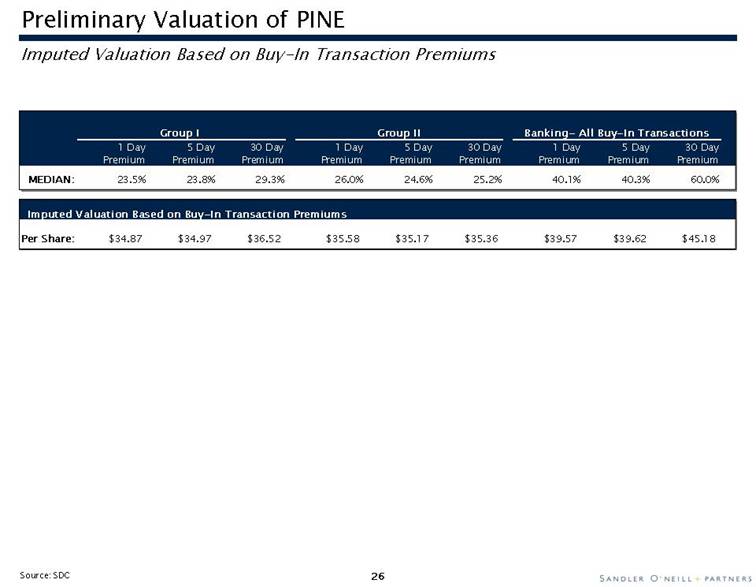
| Imputed Valuation Based on Buy-In Transaction Premiums Group I Group II Banking- All Buy-In Transactions 1 Day 5 Day 30 Day 1 Day 5 Day 30 Day 1 Day 5 Day 30 Day Premium Premium Premium Premium Premium Premium Premium Premium Premium MEDIAN: 23.5% 23.8% 29.3% 26.0% 24.6% 25.2% 40.1% 40.3% 60.0% Imputed Valuation Based on Buy-In Transaction Premiums Per Share: $34.87 $34.97 $36.52 $35.58 $35.17 $35.36 $39.57 $39.62 $45.18 Preliminary Valuation of PINE Source: SDC |
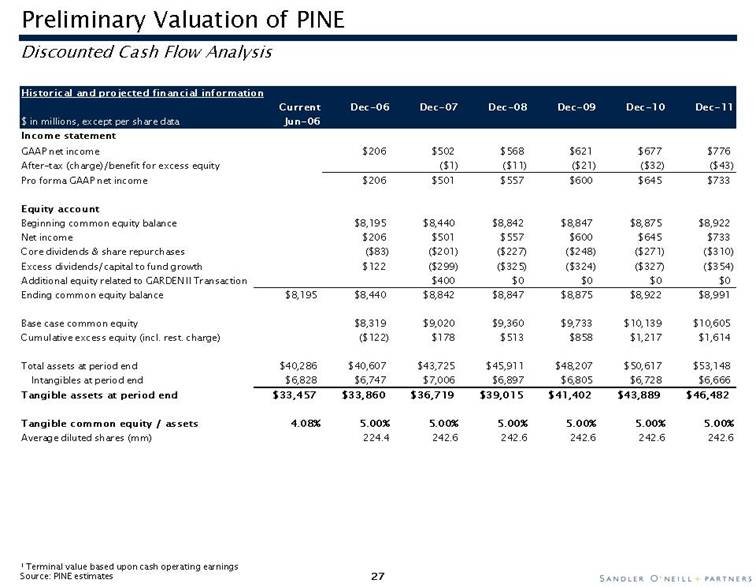
| Preliminary Valuation of PINE Discounted Cash Flow Analysis Historical and projected financial information Current Dec-06 Dec-07 Dec-08 Dec-09 Dec-10 Dec-11 $ in millions, except per share data Jun-06 Income statement GAAP net income $206 $502 $568 $621 $677 $776 After-tax (charge)/benefit for excess equity ($1) ($11) ($21) ($32) ($43) Pro forma GAAP net income $206 $501 $557 $600 $645 $733 Equity account Beginning common equity balance $8,195 $8,440 $8,842 $8,847 $8,875 $8,922 Net income $206 $501 $557 $600 $645 $733 Core dividends & share repurchases ($83) ($201) ($227) ($248) ($271) ($310) Excess dividends/capital to fund growth $122 ($299) ($325) ($324) ($327) ($354) Additional equity related to GARDEN II Transaction $400 $0 $0 $0 $0 Ending common equity balance $8,195 $8,440 $8,842 $8,847 $8,875 $8,922 $8,991 Base case common equity $8,319 $9,020 $9,360 $9,733 $10,139 $10,605 Cumulative excess equity (incl. rest. charge) ($122) $178 $513 $858 $1,217 $1,614 Total assets at period end $40,286 $40,607 $43,725 $45,911 $48,207 $50,617 $53,148 Intangibles at period end $6,828 $6,747 $7,006 $6,897 $6,805 $6,728 $6,666 Tangible assets at period end $33,457 $33,860 $36,719 $39,015 $41,402 $43,889 $46,482 Tangible common equity / assets 4.08% 5.00% 5.00% 5.00% 5.00% 5.00% 5.00% Average diluted shares (mm) 224.4 242.6 242.6 242.6 242.6 242.6 1 Terminal value based upon cash operating earnings Source: PINE estimates |
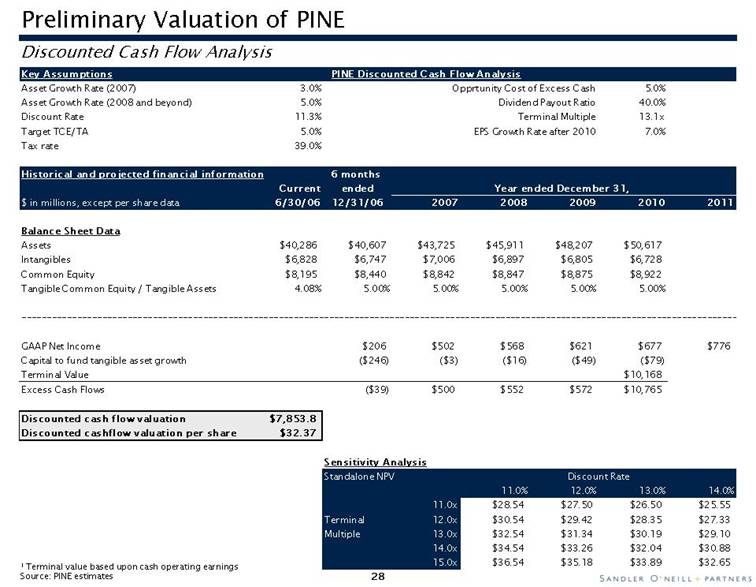
| Preliminary Valuation of PINE Discounted Cash Flow Analysis Key Assumptions PINE Discounted Cash Flow Analysis Asset Growth Rate (2007) 3.0% Opprtunity Cost of Excess Cash 5.0% Asset Growth Rate (2008 and beyond) 5.0% Dividend Payout Ratio 40.0% Discount Rate 11.3% Terminal Multiple 13.1x Target TCE/TA 5.0% EPS Growth Rate after 2010 7.0% Tax rate 39.0% Historical and projected financial information 6 months Current ended Year ended December 31, $ in millions, except per share data 6/30/06 12/31/06 2007 2008 2009 2010 2011 Balance Sheet Data Assets $40,286 $40,607 $43,725 $45,911 $48,207 $50,617 Intangibles $6,828 $6,747 $7,006 $6,897 $6,805 $6,728 Common Equity $8,195 $8,440 $8,842 $8,847 $8,875 $8,922 Tangible Common Equity / Tangible Assets 4.08% 5.00% 5.00% 5.00% 5.00% 5.00% GAAP Net Income $206 $502 $568 $621 $677 $776 Capital to fund tangible asset growth ($246) ($3) ($16) ($49) ($79) Terminal Value $10,168 Excess Cash Flows ($39) $500 $552 $572 $10,765 Discounted cash flow valuation $7,853.8 Discounted cashflow valuation per share $32.37 Sensitivity Analysis Standalone NPV Discount Rate 11.0% 12.0% 13.0% 14.0% 11.0x $28.54 $27.50 $26.50 $25.55 Terminal 12.0x $30.54 $29.42 $28.35 $27.33 Multiple 13.0x $32.54 $31.34 $30.19 $29.10 14.0x $34.54 $33.26 $32.04 $30.88 15.0x $36.54 $35.18 $33.89 $32.65 1 Terminal value based upon cash operating earnings Source: PINE estimates |
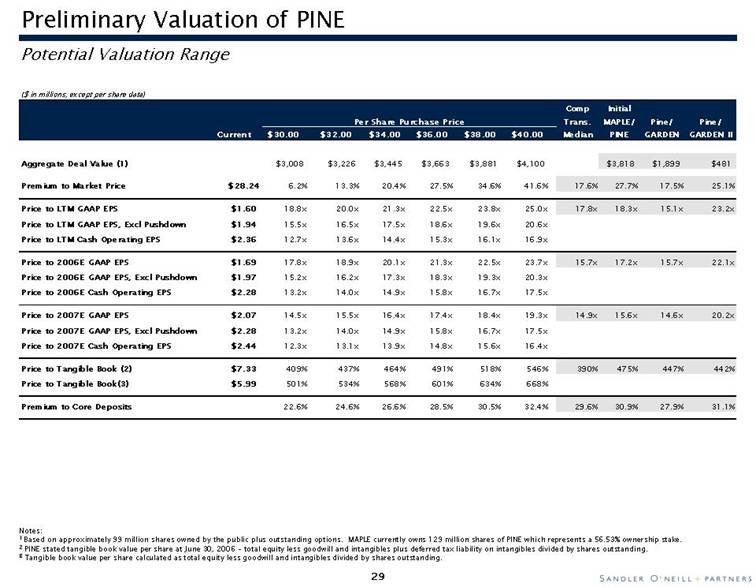
| Preliminary Valuation of PINE Potential Valuation Range ($ in millions, except per share data) Comp Initial Per Share Purchase Price Trans. MAPLE/ Pine/ Pine/ Current $30.00 $32.00 $34.00 $36.00 $38.00 $40.00 Median PINE GARDEN GARDEN II Aggregate Deal Value (1) $3,008 $3,226 $3,445 $3,663 $3,881 $4,100 $3,818 $1,899 $481 Premium to Market Price $28.24 6.2% 13.3% 20.4% 27.5% 34.6% 41.6% 17.6% 27.7% 17.5% 25.1% Price to LTM GAAP EPS $1.60 18.8x 20.0x 21.3x 22.5x 23.8x 25.0x 17.8x 18.3x 15.1x 23.2x Price to LTM GAAP EPS, Excl Pushdown $1.94 15.5x 16.5x 17.5x 18.6x 19.6x 20.6x Price to LTM Cash Operating EPS $2.36 12.7x 13.6x 14.4x 15.3x 16.1x 16.9x Price to 2006E GAAP EPS $1.69 17.8x 18.9x 20.1x 21.3x 22.5x 23.7x 15.7x 17.2x 15.7x 22.1x Price to 2006E GAAP EPS, Excl Pushdown $1.97 15.2x 16.2x 17.3x 18.3x 19.3x 20.3x Price to 2006E Cash Operating EPS $2.28 13.2x 14.0x 14.9x 15.8x 16.7x 17.5x Price to 2007E GAAP EPS $2.07 14.5x 15.5x 16.4x 17.4x 18.4x 19.3x 14.9x 15.6x 14.6x 20.2x Price to 2007E GAAP EPS, Excl Pushdown $2.28 13.2x 14.0x 14.9x 15.8x 16.7x 17.5x Price to 2007E Cash Operating EPS $2.44 12.3x 13.1x 13.9x 14.8x 15.6x 16.4x Price to Tangible Book (2) $7.33 409% 437% 464% 491% 518% 546% 390% 475% 447% 442% Price to Tangible Book(3) $5.99 501% 534% 568% 601% 634% 668% Premium to Core Deposits 22.6% 24.6% 26.6% 28.5% 30.5% 32.4% 29.6% 30.9% 27.9% 31.1% Notes: 1 Based on approximately 99 million shares owned by the public plus outstanding options. MAPLE currently owns 129 million shares of PINE which represents a 56.53% ownership stake. 2 PINE stated tangible book value per share at June 30, 2006 - total equity less goodwill and intangibles plus deferred tax liability on intangibles divided by shares outstanding. 3 Tangible book value per share calculated as total equity less goodwill and intangibles divided by shares outstanding. |
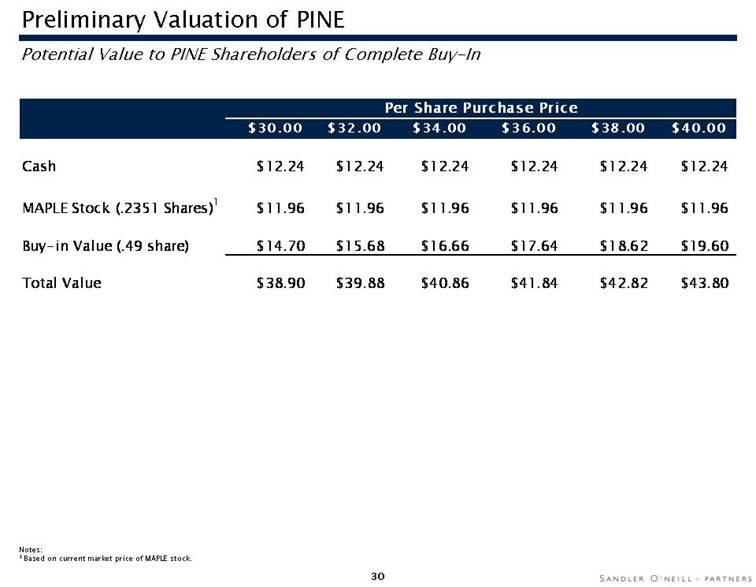
| Preliminary Valuation of PINE Potential Value to PINE Shareholders of Complete Buy-In Per Share Purchase Price $30.00 $32.00 $34.00 $36.00 $38.00 $40.00 Cash $12.24 $12.24 $12.24 $12.24 $12.24 $12.24 MAPLE Stock (.2351 Shares)1 $11.96 $11.96 $11.96 $11.96 $11.96 $11.96 Buy-in Value (.49 share) $14.70 $15.68 $16.66 $17.64 $18.62 $19.60 Total Value $38.90 $39.88 $40.86 $41.84 $42.82 $43.80 Notes: 1 Based on current market price of MAPLE stock. |
| III. Overview of MAPLE |

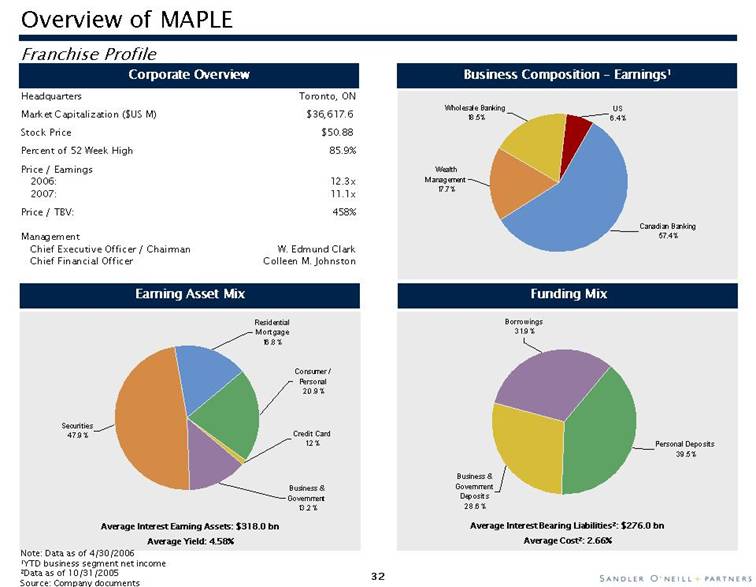
| Overview of MAPLE Franchise Profile Corporate Overview Headquarters Toronto, ON Market Capitalization ($US M) $36,617.6 Stock Price $50.88 Percent of 52 Week High 85.9% Price / Earnings 2006: 12.3x 2007: 11.1x Price / TBV: 458% Management Chief Executive Officer / Chairman W. Edmund Clark Earning Asset Mix Funding Mix Note: Data as of 4/30/2006 1YTD business segment net income 2Data as of 10/31/2005 Source: Company documents Average Interest Earning Assets: $318.0 bn Average Yield: 4.58% Average Interest Bearing Liabilities2: $276.0 bn Average Cost2: 2.66% Business Composition – Earnings1 Credit Card1.2%Business & Government13.2%Securities47.9%Residential Mortgage16.8%Consumer / Personal20.9%US6.4%Wholesale Banking18.5%Wealth Management17.7%Canadian Banking57.4%Borrowings31.9%Business & Government Deposits28.6%Personal Deposits39.5% |
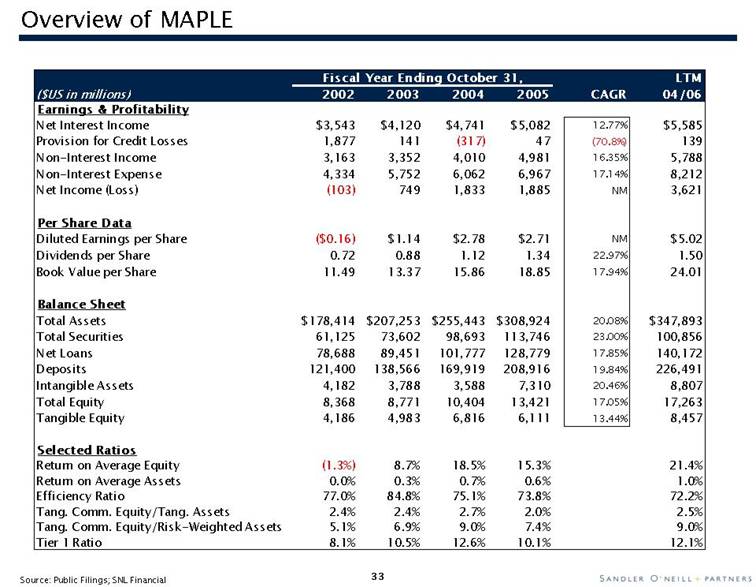
| Overview of MAPLE Fiscal Year Ending October 31, LTM ($US in millions) 2002 2003 2004 2005 CAGR 04/06 Earnings & Profitability Net Interest Income $3,543 $4,120 $4,741 $5,082 12.77% $5,585 Provision for Credit Losses 1,877 141 (317) 47 (70.8%) 139 Non-Interest Income 3,163 3,352 4,010 4,981 16.35% 5,788 Non-Interest Expense 4,334 5,752 6,062 6,967 17.14% 8,212 Net Income (Loss) (103) 749 1,833 1,885 NM 3,621 Per Share Data Diluted Earnings per Share ($0.16) $1.14 $2.78 $2.71 NM $5.02 Dividends per Share 0.72 0.88 1.12 1.34 22.97% 1.50 Book Value per Share 11.49 13.37 15.86 18.85 17.94% 24.01 Balance Sheet Total Assets $178,414 $207,253 $255,443 $308,924 20.08% $347,893 Total Securities 61,125 73,602 98,693 113,746 23.00% 100,856 Net Loans 78,688 89,451 101,777 128,779 17.85% 140,172 Deposits 121,400 138,566 169,919 208,916 19.84% 226,491 Intangible Assets 4,182 3,788 3,588 7,310 20.46% 8,807 Total Equity 8,368 8,771 10,404 13,421 17.05% 17,263 Tangible Equity 4,186 4,983 6,816 6,111 13.44% 8,457 Selected Ratios Return on Average Equity (1.3%) 8.7% 18.5% 15.3% 21.4% Return on Average Assets 0.0% 0.3% 0.7% 0.6% 1.0% Efficiency Ratio 77.0% 84.8% 75.1% 73.8% 72.2% Tang. Comm. Equity/Tang. Assets 2.4% 2.4% 2.7% 2.0% 2.5% Tang. Comm. Equity/Risk-Weighted Assets 5.1% 6.9% 9.0% 7.4% 9.0% Tier 1 Ratio 8.1% 10.5% 12.6% 10.1% 12.1% Source: Public Filings; SNL Financial |
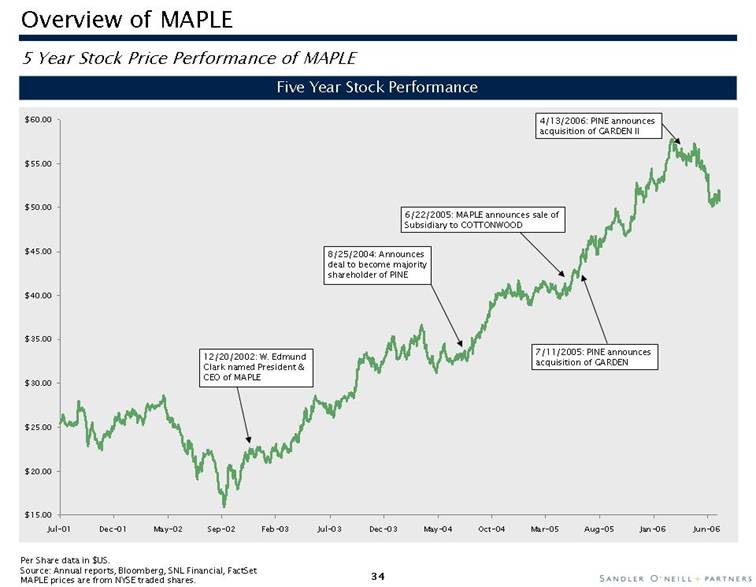
| 5 Year Stock Price Performance of MAPLE Five Year Stock Performance 8/25/2004: Announces deal to become majority shareholder of PINE 6/22/2005: MAPLE announces sale of Subsidiary to COTTONWOOD 7/11/2005: PINE announces acquisition of GARDEN 12/20/2002: W. Edmund Clark named President & CEO of MAPLE Per Share data in $US. Source: Annual reports, Bloomberg, SNL Financial, FactSet MAPLE prices are from NYSE traded shares. 4/13/2006: PINE announces acquisition of GARDEN II Overview of MAPLE $15.00$20.00$25.00$30.00$35.00$40.00$45.00$50.00$55.00$60.00Jul-01Dec-01May-02Sep-02Feb-03Jul-03Dec-03May-04Oct-04Mar-05Aug-05Jan-06Jun-06 |
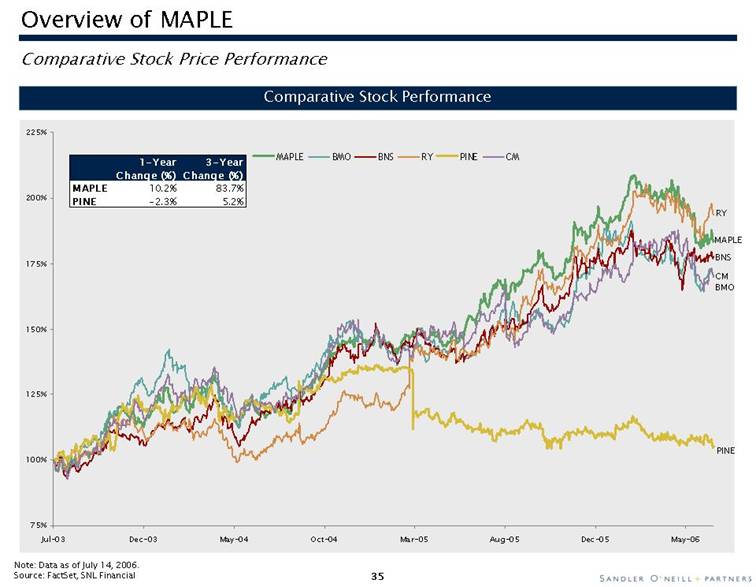
| Comparative Stock Performance Note: Data as of July 14, 2006. Source: FactSet, SNL Financial MAPLE RY BNS BMO CM Overview of MAPLE Comparative Stock Price Performance PINE 75% 100% 125% 150% 175% 200% 225% Jul-03 Dec-03 May-04 Oct-04 Mar-05 Aug-05 Dec-05 May-06 1-Year 3-Year Change (% ) Change (% ) MAPLE 10.2% 83.7% PINE -2.3% 5.2% |
| Overview of MAPLE MAPLE Comparable Group Analysis Dollar Values in US Currency Tangible (in millions except per share data) Percent of Tangible Common 52 Week Equity/ Equity/ LTM Net Price/ Price/ Price/ Price/ Market Stock High Total Tangible Risk Weighted Tier 1 Total RBC Interest LTM LTM Tangible LTM Est. EPS Est. EPS Company Cap. ($) Price ($) (%) Assets ($) Assets (%) Assets (%) Ratio (%) Ratio (%) Margin (%) ROAA (%) ROAE (%) BV (%)3 EPS (x) 2006 (x) 2007 (x) MAPLE 36,618 50.88 85.9 347,893 2.49 9.00 12.10 14.10 2.13 1.07 24.24 336 9.1 12.3 11.1 Canadian Institutions1 Royal Bank of Canada 53,030 41.25 90.4 450,218 3.15 7.29 9.50 12.50 1.68 0.80 18.86 373 14.4 13.8 12.7 Bank of Nova Scotia 39,825 40.32 91.4 319,587 3.15 8.60 10.20 11.90 2.20 1.03 20.67 290 12.2 13.2 12.3 BMO Financial Group 27,205 54.23 87.1 279,687 4.03 7.98 10.17 11.72 1.91 0.81 17.92 245 11.3 12.4 11.7 Canadian Imperial Bank of Commerce 22,935 68.36 89.1 260,269 2.67 7.80 9.20 13.70 1.94 NM NM 334 NM 12.2 11.2 National Bank of Canada 8,313 51.35 88.0 99,537 3.02 7.03 9.10 12.20 1.49 0.84 18.37 350 10.5 11.6 10.8 MEDIAN 27,205 89.1 279,687 3.15 7.80 9.50 12.20 1.91 0.83 18.62 334 11.8 12.4 11.7 Selected U.S. Institutions2 Citigroup Inc. 236,532 47.58 93.8 1,586,201 4.83 8.05 8.60 11.80 2.90 1.63 22.12 316 9.8 10.9 10.2 JPMorgan Chase & Co. 142,074 40.89 87.4 1,273,282 4.87 6.95 8.50 12.10 2.14 0.77 8.76 238 15.7 11.8 10.5 Wachovia Corporation 85,137 52.93 88.2 541,842 4.80 5.74 7.87 11.45 3.22 1.31 14.30 343 12.4 11.3 10.4 PNC Financial Services Group, Inc. 20,941 70.75 98.3 93,257 5.21 6.06 8.80 12.50 2.98 1.46 16.02 450 15.7 14.1 12.5 M&T Bank Corporation 12,929 116.39 96.8 56,507 5.25 5.83 NA NA 3.71 1.48 13.78 462 16.5 15.8 14.5 MEDIAN 85,137 93.8 541,842 4.87 6.06 8.55 11.95 2.98 1.46 14.30 343 15.7 11.8 10.5 Source: SNL Financial, annual reports Market data as of July 14, 2006 1Data for the period ended April 30 2Data for the period ended March 31 3 Price to Tangible Book for Canadian Institutions calculated based upon MAPLE’s methodology (Tangible Book Value per share calculated as follows: Shareholders Equity less goodwill and intangibles plus deferred tax liability on intangibles and minority interest, result divided by shares outstanding) to the extent the information was available. |

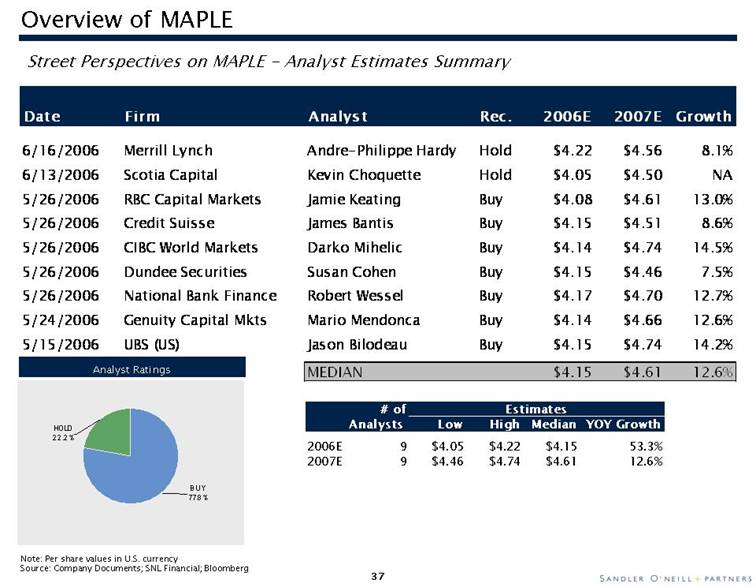
| Overview of MAPLE Street Perspectives on MAPLE - Analyst Estimates Summary Date Firm Analyst Rec. 2006E 2007E Growth 6/16/2006 Merrill Lynch Andre-Philippe Hardy Hold $4.22 $4.56 8.1% 6/13/2006 Scotia Capital Kevin Choquette Hold $4.05 $4.50 NA 5/26/2006 RBC Capital Markets Jamie Keating Buy $4.08 $4.61 13.0% 5/26/2006 Credit Suisse James Bantis Buy $4.15 $4.51 8.6% 5/26/2006 CIBC World Markets Darko Mihelic Buy $4.14 $4.74 14.5% 5/26/2006 Dundee Securities Susan Cohen Buy $4.15 $4.46 7.5% 5/26/2006 National Bank Finance Robert Wessel Buy $4.17 $4.70 12.7% 5/24/2006 Genuity Capital Mkts Mario Mendonca Buy $4.14 $4.66 12.6% 5/15/2006 UBS (US) Jason Bilodeau Buy $4.15 $4.74 14.2% MEDIAN $4.15 $4.61 12.6% # of Estimates Analysts Low High Median YOY Growth 2006E 9 $4.05 $4.22 $4.15 53.3% 2007E 9 $4.46 $4.74 $4.61 12.6% Note: Per share values in U.S. currency Source: Company Documents; SNL Financial; Bloomberg Analyst Ratings BUY77.8%HOLD22.2% |
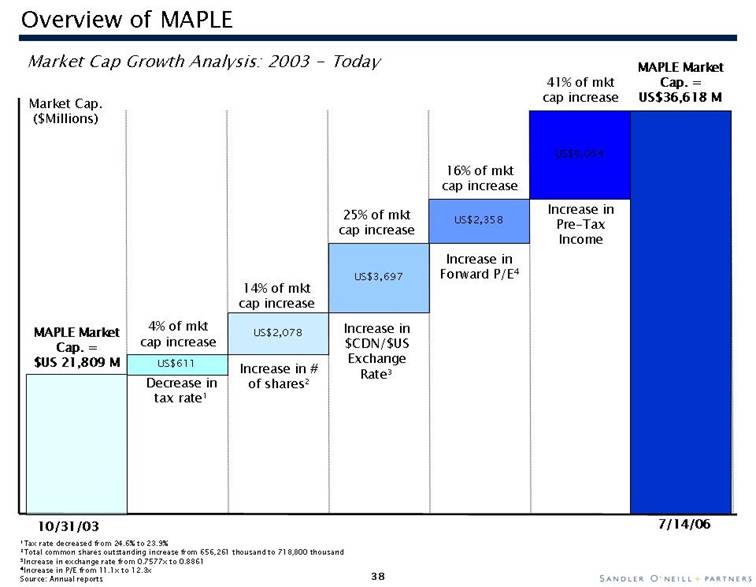
| Overview of MAPLE Market Cap Growth Analysis: 2003 - Today Market Cap. ($Millions) US$2,358 US$2,078 US$3,697 MAPLE Market Cap. = US$36,618 M MAPLE Market Cap. = $US 21,809 M Increase in $CDN/$US Exchange Rate3 Increase in Forward P/E4 Decrease in tax rate1 US$611 16% of mkt cap increase 14% of mkt cap increase 25% of mkt cap increase 4% of mkt cap increase 1Tax rate decreased from 24.6% to 23.9% 2Total common shares outstanding increase from 656,261 thousand to 718,800 thousand 3Increase in exchange rate from 0.7577x to 0.8861 4Increase in P/E from 11.1x to 12.3x Source: Annual reports 10/31/03 7/14/06 US$6,064 Increase in Pre-Tax Income 41% of mkt cap increase Increase in # of shares2 |
| IV. Pro Forma Analysis |

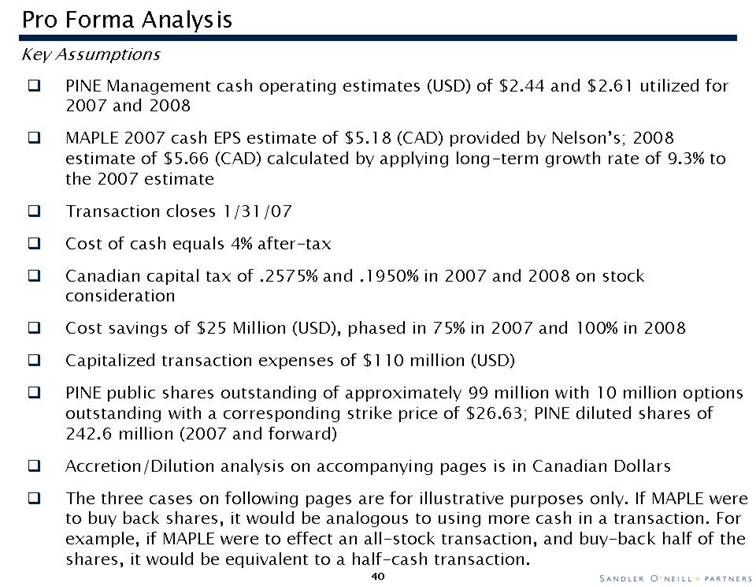
| Pro Forma Analysis PINE Management cash operating estimates (USD) of $2.44 and $2.61 utilized for 2007 and 2008 MAPLE 2007 cash EPS estimate of $5.18 (CAD) provided by Nelson’s; 2008 estimate of $5.66 (CAD) calculated by applying long-term growth rate of 9.3% to the 2007 estimate Transaction closes 1/31/07 Cost of cash equals 4% after-tax Canadian capital tax of .2575% and .1950% in 2007 and 2008 on stock consideration Cost savings of $25 Million (USD), phased in 75% in 2007 and 100% in 2008 Capitalized transaction expenses of $110 million (USD) PINE public shares outstanding of approximately 99 million with 10 million options outstanding with a corresponding strike price of $26.63; PINE diluted shares of 242.6 million (2007 and forward) Accretion/Dilution analysis on accompanying pages is in Canadian Dollars The three cases on following pages are for illustrative purposes only. If MAPLE were to buy back shares, it would be analogous to using more cash in a transaction. For example, if MAPLE were to effect an all-stock transaction, and buy-back half of the shares, it would be equivalent to a half-cash transaction. Key Assumptions |
| Pro Forma Analysis 100% Stock ($ in CAD millions, except per share data) Per Share Purchase Price $32.00 $34.00 $36.00 $38.00 $40.00 Aggregate Deal Value (In USD Millions) $3,226 $3,445 $3,663 $3,881 $4,100 Cash Earnings Impact Pre-Acquis ition 2007E Cash EPS $5.18 $5.14 $5.12 $5.10 $5.08 $5.06 Accretion (Dilution) (0.80%) (1.20%) (1.60%) (2.00%) (2.39%) 2008E Cash EPS $5.66 $5.59 $5.56 $5.53 $5.50 $5.48 Accretion (Dilution) (1.21%) (1.72%) (2.24%) (2.74%) (3.24%) Tangible Book Value Per Share Impact (At Close) 1 $19.77 $18.15 $18.06 $17.97 $17.88 $17.80 Accretion (Dilution) (8.21%) (8.66%) (9.11%) (9.56%) (10.00%) Capital Impact (At Close) Tangible Equity / Risk Weighted Assets 9.87% 9.85% 9.85% 9.85% 9.85% 9.85% Tier 1 Ratio 12.46% 12.59% 12.59% 12.59% 12.59% 12.59% Total Capital Ratio 14.72% 14.30% 14.30% 14.30% 14.30% 14.30% Proforma Price / 07 EPS 11.1x 11.2x 11.2x 11.3x 11.3x 11.4x Proforma Price / Tangible Book Value1 291% 317% 318% 320% 321% 323% 1Tangible Book Value per share calculated as follows: Shareholders Equity less goodwill and intangibles plus deferred tax liability on intangibles and minority interest. Result divided by shares outstanding. |

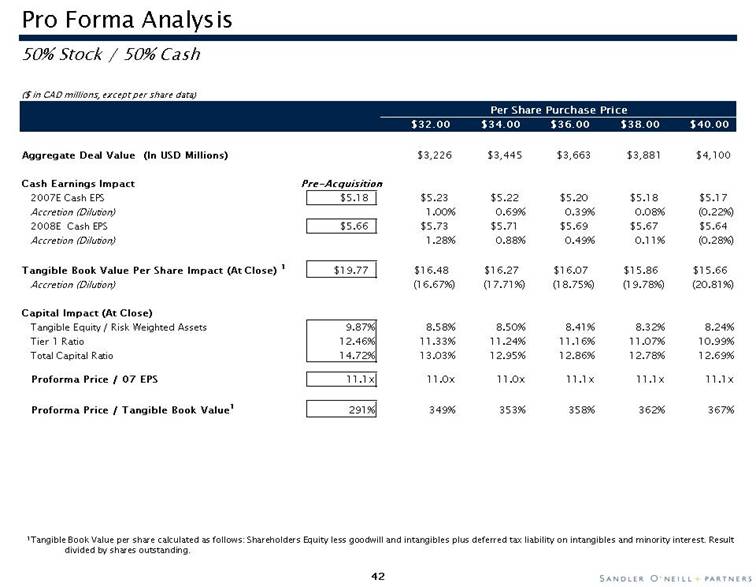
| Pro Forma Analysis 50% Stock / 50% Cash ($ in CAD millions, except per share data) Per Share Purchase Price $32.00 $34.00 $36.00 $38.00 $40.00 Aggregate Deal Value (In USD Millions) $3,226 $3,445 $3,663 $3,881 $4,100 Cash Earnings Impact Pre-Acquisition 2007E Cash EPS $5.18 $5.23 $5.22 $5.20 $5.18 $5.17 Accretion (Dilution) 1.00% 0.69% 0.39% 0.08% (0.22%) 2008E Cash EPS $5.66 $5.73 $5.71 $5.69 $5.67 $5.64 Accretion (Dilution) 1.28% 0.88% 0.49% 0.11% (0.28%) Tangible Book Value Per Share Impact (At Close) 1 $19.77 $16.48 $16.27 $16.07 $15.86 $15.66 Accretion (Dilution) (16.67%) (17.71%) (18.75%) (19.78%) (20.81%) Capital Impact (At Close) Tangible Equity / Risk Weighted Assets 9.87% 8.58% 8.50% 8.41% 8.32% 8.24% Tier 1 Ratio 12.46% 11.33% 11.24% 11.16% 11.07% 10.99% Total Capital Ratio 14.72% 13.03% 12.95% 12.86% 12.78% 12.69% Proforma Price / 07 EPS 11.1x 11.0x 11.0x 11.1x 11.1x 11.1x Proforma Price / Tangible Book Value1 291% 349% 353% 358% 362% 367% 1Tangible Book Value per share calculated as follows: Shareholders Equity less goodwill and intangibles plus deferred tax liability on intangibles and minority interest. Result divided by shares outstanding. |
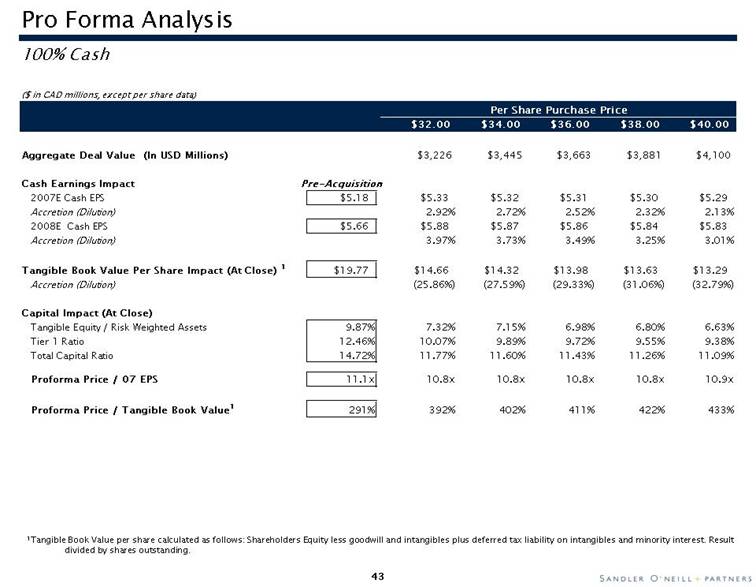
| Pro Forma Analysis 100% Cash ($ in CAD millions, except per share data) Per Share Purchase Price $32.00 $34.00 $36.00 $38.00 $40.00 Aggregate Deal Value (In USD Millions) $3,226 $3,445 $3,663 $3,881 $4,100 Cash Earnings Impact Pre-Acquisition 2007E Cash EPS $5.18 $5.33 $5.32 $5.31 $5.30 $5.29 Accretion (Dilution) 2.92% 2.72% 2.52% 2.32% 2.13% 2008E Cash EPS $5.66 $5.88 $5.87 $5.86 $5.84 $5.83 Accretion (Dilution) 3.97% 3.73% 3.49% 3.25% 3.01% Tangible Book Value Per Share Impact (At Close) 1 $19.77 $14.66 $14.32 $13.98 $13.63 $13.29 Accretion (Dilution) (25.86%) (27.59%) (29.33%) (31.06%) (32.79%) Capital Impact (At Close) Tangible Equity / Risk Weighted Assets 9.87% 7.32% 7.15% 6.98% 6.80% 6.63% Tier 1 Ratio 12.46% 10.07% 9.89% 9.72% 9.55% 9.38% Total Capital Ratio 14.72% 11.77% 11.60% 11.43% 11.26% 11.09% Proforma Price / 07 EPS 11.1x 10.8x 10.8x 10.8x 10.8x 10.9x Proforma Price / Tangible Book Value1 291% 392% 402% 411% 422% 433% 1Tangible Book Value per share calculated as follows: Shareholders Equity less goodwill and intangibles plus deferred tax liability on intangibles and minority interest. Result divided by shares outstanding. |
| V. Appendix |

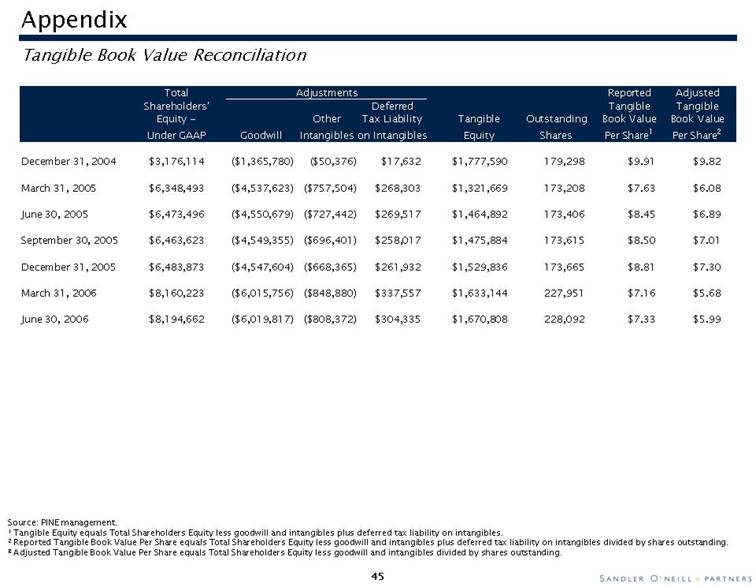
| Appendix Tangible Book Value Reconciliation Total Adjustments Reported Adjusted Shareholders' Deferred Tangible Tangible Equity - Other Tax Liability Tangible Outstanding Book Value Book Value Under GAAP Goodwill Intangibles on Intangibles Equity Shares Per Share1 Per Share2 December 31, 2004 $3,176,114 ($1,365,780) ($50,376) $17,632 $1,777,590 179,298 $9.91 $9.82 March 31, 2005 $6,348,493 ($4,537,623) ($757,504) $268,303 $1,321,669 173,208 $7.63 $6.08 June 30, 2005 $6,473,496 ($4,550,679) ($727,442) $269,517 $1,464,892 173,406 $8.45 $6.89 September 30, 2005 $6,463,623 ($4,549,355) ($696,401) $258,017 $1,475,884 173,615 $8.50 $7.01 December 31, 2005 $6,483,873 ($4,547,604) ($668,365) $261,932 $1,529,836 173,665 $8.81 $7.30 March 31, 2006 $8,160,223 ($6,015,756) ($848,880) $337,557 $1,633,144 227,951 $7.16 $5.68 June 30, 2006 $8,194,662 ($6,019,817) ($808,372) $304,335 $1,670,808 228,092 $7.33 $5.99 Source: PINE management. 1 Tangible Equity equals Total Shareholders Equity less goodwill and intangibles plus deferred tax liability on intangibles. 2 Reported Tangible Book Value Per Share equals Total Shareholders Equity less goodwill and intangibles plus deferred tax liability on intangibles divided by shares outstanding. 3 Adjusted Tangible Book Value Per Share equals Total Shareholders Equity less goodwill and intangibles divided by shares outstanding. |
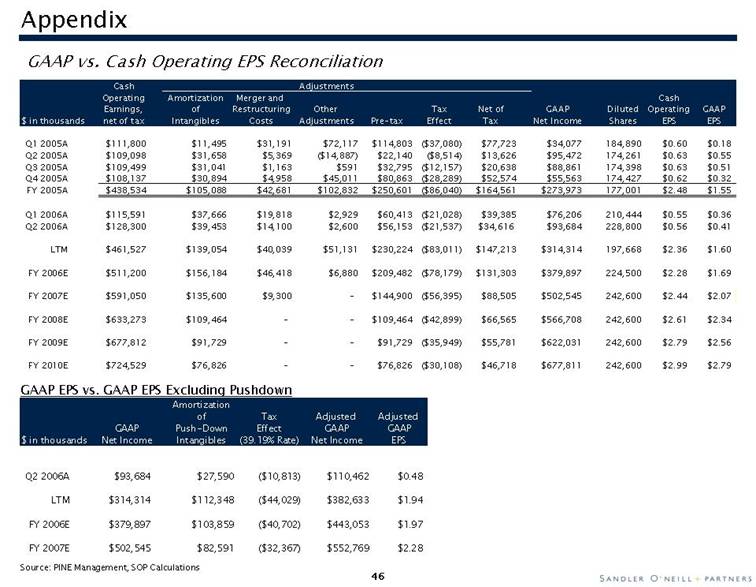
| Appendix GAAP vs. Cash Operating EPS Reconciliation Cash Adjustments Operating Amortization Merger and Cash Earnings, of Restructuring Other Tax Net of GAAP Diluted Operating GAAP $ in thousands net of tax Intangibles Costs Adjustments Pre-tax Effect Tax Net Income Shares EPS EPS Q1 2005A $111,800 $11,495 $31,191 $72,117 $114,803 ($37,080) $77,723 $34,077 184,890 $0.60 $0.18 Q2 2005A $109,098 $31,658 $5,369 ($14,887) $22,140 ($8,514) $13,626 $95,472 174,261 $0.63 $0.55 Q3 2005A $109,499 $31,041 $1,163 $591 $32,795 ($12,157) $20,638 $88,861 174,398 $0.63 $0.51 Q4 2005A $108,137 $30,894 $4,958 $45,011 $80,863 ($28,289) $52,574 $55,563 174,427 $0.62 $0.32 FY 2005A $438,534 $105,088 $42,681 $102,832 $250,601 ($86,040) $164,561 $273,973 177,001 $2.48 $1.55 Q1 2006A $115,591 $37,666 $19,818 $2,929 $60,413 ($21,028) $39,385 $76,206 210,444 $0.55 $0.36 Q2 2006A $128,300 $39,453 $14,100 $2,600 $56,153 ($21,537) $34,616 $93,684 228,800 $0.56 $0.41 LTM $461,527 $139,054 $40,039 $51,131 $230,224 ($83,011) $147,213 $314,314 197,668 $2.36 $1.60 FY 2006E $511,200 $156,184 $46,418 $6,880 $209,482 ($78,179) $131,303 $379,897 224,500 $2.28 $1.69 FY 2007E $591,050 $135,600 $9,300 - $144,900 ($56,395) $88,505 $502,545 242,600 $2.44 $2.07 FY 2008E $633,273 $109,464 - - $109,464 ($42,899) $66,565 $566,708 242,600 $2.61 $2.34 FY 2009E $677,812 $91,729 - - $91,729 ($35,949) $55,781 $622,031 242,600 $2.79 $2.56 FY 2010E $724,529 $76,826 - - $76,826 ($30,108) $46,718 $677,811 242,600 $2.99 $2.79 GAAP EPS vs. GAAP EPS Excluding Pushdown Amortization of Tax Adjusted Adjusted GAAP Push-Down Effect GAAP GAAP $ in thousands Net Income Intangibles (39.19% Rate) Net Income EPS Q2 2006A $93,684 $27,590 ($10,813) $110,462 $0.48 LTM $314,314 $112,348 ($44,029) $382,633 $1.94 FY 2006E $379,897 $103,859 ($40,702) $443,053 $1.97 FY 2007E $502,545 $82,591 ($32,367) $552,769 $2.28 Source: PINE Management, SOP Calculations |