

Searchable text section of graphics shown above
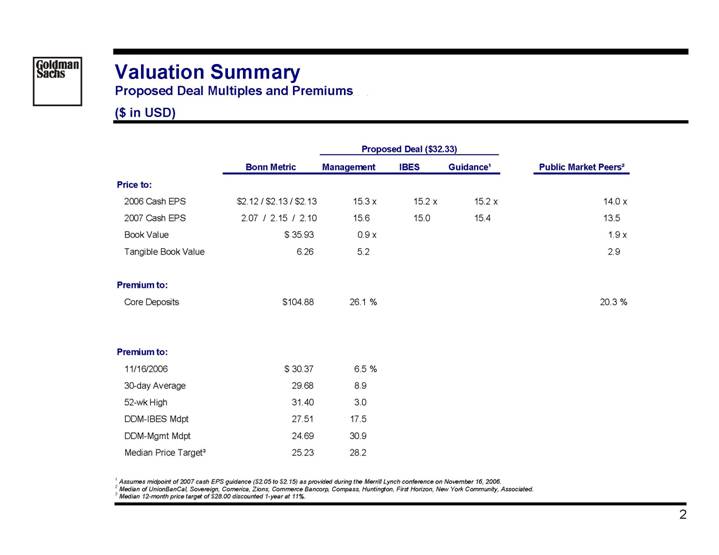
Valuation Summary
Proposed Deal Multiples and Premiums
($ in USD)
|
|
|
| Proposed Deal ($32.33) |
|
|
| |||||
|
| Bonn Metric |
| Management |
| IBES |
| Guidance(1) |
| Public Market Peers(2) |
| |
Price to: |
|
|
|
|
|
|
|
|
|
|
| |
2006 Cash EPS |
| $2.12 / $2.13 / $2.13 |
| 15.3 | x | 15.2 | x | 15.2 | x | 14.0 | x | |
2007 Cash EPS |
| 2.07 / 2.15 / 2.10 |
| 15.6 |
| 15.0 |
| 15.4 |
| 13.5 |
| |
Book Value |
| $ | 35.93 |
| 0.9 | x |
|
|
|
| 1.9 | x |
Tangible Book Value |
| 6.26 |
| 5.2 |
|
|
|
|
| 2.9 |
| |
|
|
|
|
|
|
|
|
|
|
|
| |
Premium to: |
|
|
|
|
|
|
|
|
|
|
| |
Core Deposits |
| $ | 104.88 |
| 26.1 | % |
|
|
|
| 20.3 | % |
|
|
|
|
|
|
|
|
|
|
|
| |
Premium to: |
|
|
|
|
|
|
|
|
|
|
| |
11/16/2006 |
| $ | 30.37 |
| 6.5 | % |
|
|
|
|
|
|
30-day Average |
| 29.68 |
| 8.9 |
|
|
|
|
|
|
| |
52-wk High |
| 31.40 |
| 3.0 |
|
|
|
|
|
|
| |
DDM-IBES Mdpt |
| 27.51 |
| 17.5 |
|
|
|
|
|
|
| |
DDM-Mgmt Mdpt |
| 24.69 |
| 30.9 |
|
|
|
|
|
|
| |
Median Price Target(3) |
| 25.23 |
| 28.2 |
|
|
|
|
|
|
| |
(1) Assumes midpoint of 2007 cash EPS guidance ($2.05 to $2.15) as provided during the Merrill Lynch conference on November 16, 2006.
(2) Median of UnionBanCal, Sovereign, Comerica, Zions, Commerce Bancorp, Compass, Huntington, First Horizon, New York Community, Associated.
(3) Median 12-month price target of $28.00 discounted 1-year at 11%.
2
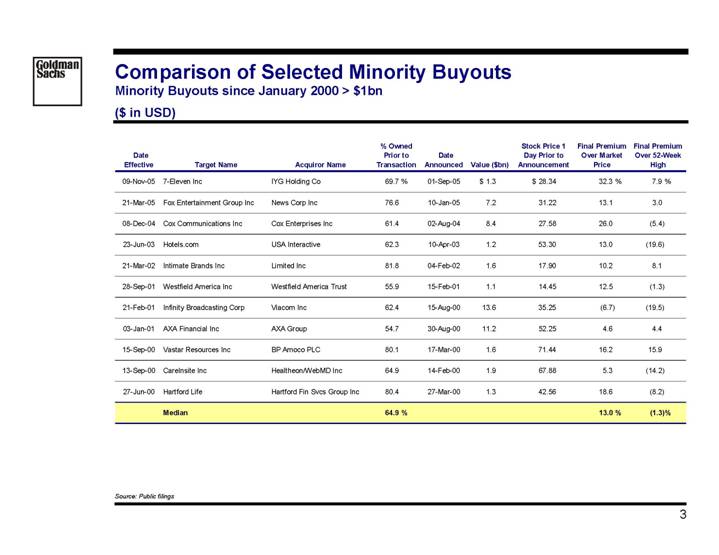
Comparison of Selected Minority Buyouts
Minority Buyouts since January 2000 > $1bn
($ in USD)
|
|
|
|
|
| % Owned |
|
|
|
|
| Stock Price 1 |
| Final Premium |
| Final Premium |
| |||
Date |
|
|
|
|
| Prior to |
| Date |
|
|
| Day Prior to |
| Over Market |
| Over 52-Week |
| |||
Effective |
| Target Name |
| Acquiror Name |
| Transaction |
| Announced |
| Value ($ bn) |
| Announcement |
| Price |
| High |
| |||
|
|
|
|
|
|
|
|
|
|
|
|
|
|
|
|
|
| |||
09-Nov-05 |
|
| 7-Eleven Inc |
| IYG Holding Co |
| 69.7 | % | 01-Sep-05 |
| $ | 1.3 |
| $ | 28.34 |
| 32.3 | % | 7.9 | % |
|
|
|
|
|
|
|
|
|
|
|
|
|
|
|
|
|
|
| ||
21-Mar-05 |
|
| Fox Entertainment Group Inc |
| News Corp Inc |
| 76.6 |
| 10-Jan-05 |
| 7.2 |
| 31.22 |
| 13.1 |
| 3.0 |
| ||
|
|
|
|
|
|
|
|
|
|
|
|
|
|
|
|
|
|
| ||
08-Dec-04 |
|
| Cox Communications Inc |
| Cox Enterprises Inc |
| 61.4 |
| 02-Aug-04 |
| 8.4 |
| 27.58 |
| 26.0 |
| (5.4 | ) | ||
|
|
|
|
|
|
|
|
|
|
|
|
|
|
|
|
|
|
| ||
23-Jun-03 |
|
| Hotels.com |
| USA Interactive |
| 62.3 |
| 10-Apr-03 |
| 1.2 |
| 53.30 |
| 13.0 |
| (19.6 | ) | ||
|
|
|
|
|
|
|
|
|
|
|
|
|
|
|
|
|
|
| ||
21-Mar-02 |
|
| Intimate Brands Inc |
| Limited Inc |
| 81.8 |
| 04-Feb-02 |
| 1.6 |
| 17.90 |
| 10.2 |
| 8.1 |
| ||
|
|
|
|
|
|
|
|
|
|
|
|
|
|
|
|
|
|
| ||
28-Sep-01 |
|
| Westfield America Inc |
| Westfield America Trust |
| 55.9 |
| 15-Feb-01 |
| 1.1 |
| 14.45 |
| 12.5 |
| (1.3 | ) | ||
|
|
|
|
|
|
|
|
|
|
|
|
|
|
|
|
|
|
| ||
21-Feb-01 |
|
| Infinity Broadcasting Corp |
| Viacom Inc |
| 62.4 |
| 15-Aug-00 |
| 13.6 |
| 35.25 |
| (6.7 | ) | (19.5 | ) | ||
|
|
|
|
|
|
|
|
|
|
|
|
|
|
|
|
|
|
| ||
03-Jan-01 |
|
| AXA Financial Inc |
| AXA Group |
| 54.7 |
| 30-Aug-00 |
| 11.2 |
| 52.25 |
| 4.6 |
| 4.4 |
| ||
|
|
|
|
|
|
|
|
|
|
|
|
|
|
|
|
|
|
| ||
15-Sep-00 |
|
| Vastar Resources Inc |
| BP Amoco PLC |
| 80.1 |
| 17-Mar-00 |
| 1.6 |
| 71.44 |
| 16.2 |
| 15.9 |
| ||
|
|
|
|
|
|
|
|
|
|
|
|
|
|
|
|
|
|
| ||
13-Sep-00 |
|
| CareInsite Inc |
| Healtheon/WebMD Inc |
| 64.9 |
| 14-Feb-00 |
| 1.9 |
| 67.88 |
| 5.3 |
| (14.2 | ) | ||
|
|
|
|
|
|
|
|
|
|
|
|
|
|
|
|
|
|
| ||
27-Jun-00 |
|
| Hartford Life |
| Hartford Fin Svcs Group Inc |
| 80.4 |
| 27-Mar-00 |
| 1.3 |
| 42.56 |
| 18.6 |
| (8.2 | ) | ||
|
|
|
|
|
|
|
|
|
|
|
|
|
|
|
|
|
|
| ||
|
|
| Median |
|
|
| 64.9 | % |
|
|
|
|
|
| 13.0 | % | (1.3 | )% | ||
Source: Public filings
3
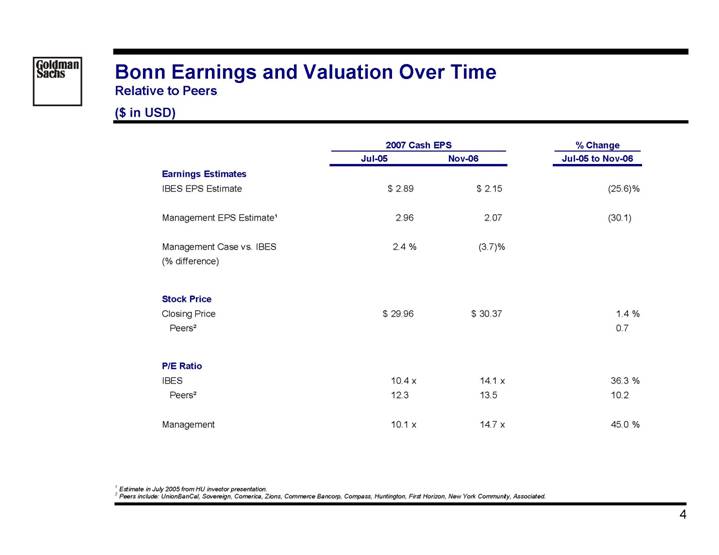
Bonn Earnings and Valuation Over Time
Relative to Peers
($ in USD)
|
| 2007 Cash EPS |
| % Change |
| ||||
|
| Jul-05 |
| Nov-06 |
| Jul-05 to Nov-06 |
| ||
Earnings Estimates |
|
|
|
|
|
|
| ||
IBES EPS Estimate |
| $ | 2.89 |
| $ | 2.15 |
| (25.6 | )% |
|
|
|
|
|
|
|
| ||
Management EPS Estimate(1) |
| 2.96 |
| 2.07 |
| (30.1 | ) | ||
|
|
|
|
|
|
|
| ||
Management Case vs. IBES |
| 2.4 | % | (3.7 | )% |
|
| ||
|
|
|
|
|
|
|
| ||
|
|
|
|
|
|
|
| ||
Stock Price |
|
|
|
|
|
|
| ||
Closing Price |
| $ | 29.96 |
| $ | 30.37 |
| 1.4 | % |
Peers(2) |
|
|
|
|
| 0.7 |
| ||
|
|
|
|
|
|
|
| ||
P/E Ratio |
|
|
|
|
|
|
| ||
IBES |
| 10.4 | x | 14.1 | x | 36.3 | % | ||
Peers(2) |
| 12.3 |
| 13.5 |
| 10.2 |
| ||
|
|
|
|
|
|
|
| ||
Management |
| 10.1 | x | 14.7 | x | 45.0 | % | ||
(1) Estimate in July 2005 from HU investor presentation.
(2) Peers include: UnionBanCal, Sovereign, Comerica, Zions, Commerce Bancorp, Compass, Huntington, First Horizon, New York Community, Associated.
4
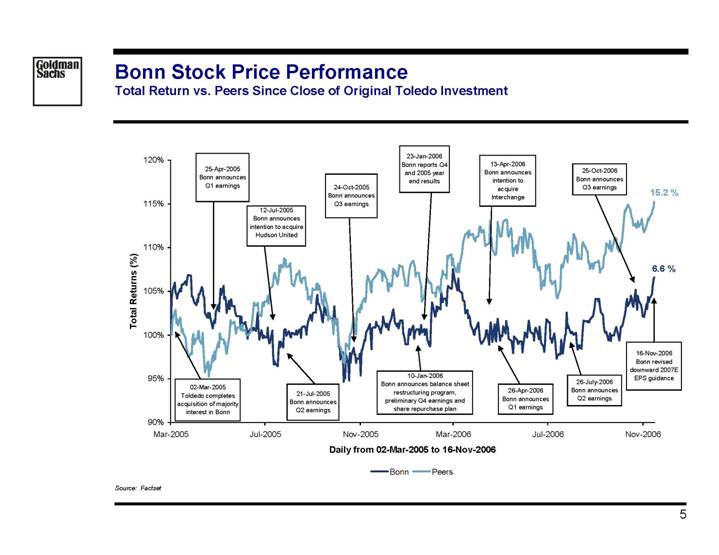
Bonn Stock Price Performance
Total Return vs. Peers Since Close of Original Toledo Investment
[CHART]
Source: Factset
5
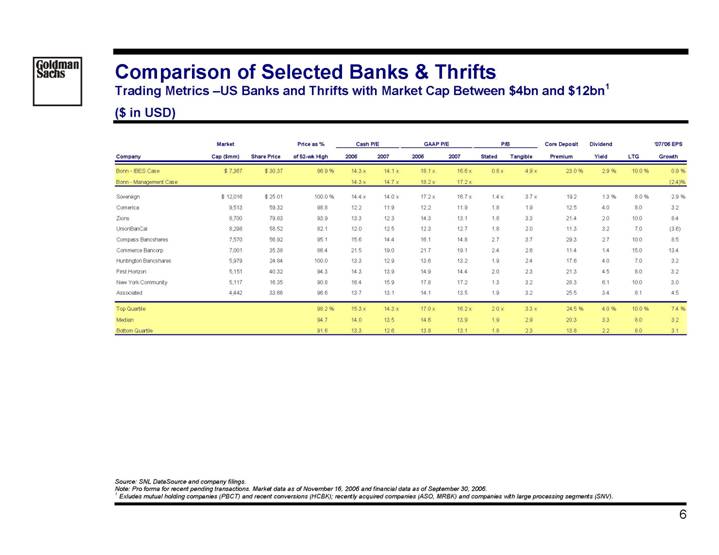
Comparison of Selected Banks & Thrifts
Trading Metrics –US Banks and Thrifts with Market Cap Between $4bn and $12bn (1)
($ in USD)
|
| Market |
|
|
| Price as % |
| Cash P/E |
| GAAP P/E |
| P/B |
| Core Deposit |
| Dividend |
|
|
| ‘07/‘06 EPS |
| ||||||||
Company |
| Cap ($mm) |
| Share Price |
| of 52-wk High |
| 2006 |
| 2007 |
| 2006 |
| 2007 |
| Stated |
| Tangible |
| Premium |
| Yield |
| LTG |
| Growth |
| ||
|
|
|
|
|
|
|
|
|
|
|
|
|
|
|
|
|
|
|
|
|
|
|
|
|
|
|
| ||
Bonn - IBES Case |
| $ | 7,367 |
| $ | 30.37 |
| 96.9 | % | 14.3 | x | 14.1 | x | 18.1 | x | 16.6 | x | 0.8 | x | 4.9 | x | 23.0 | % | 2.9 | % | 10.0 | % | 0.9 | % |
Bonn - Management Case |
|
|
|
|
|
|
| 14.3 | x | 14.7 | x | 18.2 | x | 17.2 | x |
|
|
|
|
|
|
|
|
|
| (2.4 | )% | ||
|
|
|
|
|
|
|
|
|
|
|
|
|
|
|
|
|
|
|
|
|
|
|
|
|
|
|
| ||
Sovereign |
| $ | 12,016 |
| $ | 25.01 |
| 100.0 | % | 14.4 | x | 14.0 | x | 17.2 | x | 16.7 | x | 1.4 | x | 3.7 | x | 19.2 |
| 1.3 | % | 8.0 | % | 2.9 | % |
Comerica |
| 9,513 |
| 59.32 |
| 98.8 |
| 12.2 |
| 11.9 |
| 12.2 |
| 11.9 |
| 1.8 |
| 1.9 |
| 12.5 |
| 4.0 |
| 8.0 |
| 3.2 |
| ||
Zions |
| 8,700 |
| 79.83 |
| 93.9 |
| 13.3 |
| 12.3 |
| 14.3 |
| 13.1 |
| 1.8 |
| 3.3 |
| 21.4 |
| 2.0 |
| 10.0 |
| 8.4 |
| ||
UnionBanCal |
| 8,298 |
| 58.52 |
| 82.1 |
| 12.0 |
| 12.5 |
| 12.3 |
| 12.7 |
| 1.8 |
| 2.0 |
| 11.3 |
| 3.2 |
| 7.0 |
| (3.6 | ) | ||
Compass Bancshares |
| 7,570 |
| 56.92 |
| 95.1 |
| 15.6 |
| 14.4 |
| 16.1 |
| 14.8 |
| 2.7 |
| 3.7 |
| 29.3 |
| 2.7 |
| 10.0 |
| 8.5 |
| ||
Commerce Bancorp |
| 7,001 |
| 35.38 |
| 86.4 |
| 21.5 |
| 19.0 |
| 21.7 |
| 19.1 |
| 2.4 |
| 2.6 |
| 11.4 |
| 1.4 |
| 15.0 |
| 13.4 |
| ||
Huntington Bancshares |
| 5,979 |
| 24.84 |
| 100.0 |
| 13.3 |
| 12.9 |
| 13.6 |
| 13.2 |
| 1.9 |
| 2.4 |
| 17.6 |
| 4.0 |
| 7.0 |
| 3.2 |
| ||
First Horizon |
| 5,151 |
| 40.32 |
| 94.3 |
| 14.3 |
| 13.9 |
| 14.9 |
| 14.4 |
| 2.0 |
| 2.3 |
| 21.3 |
| 4.5 |
| 8.0 |
| 3.2 |
| ||
New York Community |
| 5,117 |
| 16.35 |
| 90.8 |
| 16.4 |
| 15.9 |
| 17.8 |
| 17.2 |
| 1.3 |
| 3.2 |
| 28.3 |
| 6.1 |
| 10.0 |
| 3.0 |
| ||
Associated |
| 4,442 |
| 33.66 |
| 96.6 |
| 13.7 |
| 13.1 |
| 14.1 |
| 13.5 |
| 1.9 |
| 3.2 |
| 25.5 |
| 3.4 |
| 8.1 |
| 4.5 |
| ||
|
|
|
|
|
|
|
|
|
|
|
|
|
|
|
|
|
|
|
|
|
|
|
|
|
|
|
| ||
Top Quartile |
|
|
|
|
| 98.2 | % | 15.3 | x | 14.3 | x | 17.0 | x | 16.2 | x | 2.0 | x | 3.3 | x | 24.5 | % | 4.0 | % | 10.0 | % | 7.4 | % | ||
Median |
|
|
|
|
| 94.7 |
| 14.0 |
| 13.5 |
| 14.6 |
| 13.9 |
| 1.9 |
| 2.9 |
| 20.3 |
| 3.3 |
| 8.0 |
| 3.2 |
| ||
Bottom Quartile |
|
|
|
|
| 91.6 |
| 13.3 |
| 12.6 |
| 13.8 |
| 13.1 |
| 1.8 |
| 2.3 |
| 13.8 |
| 2.2 |
| 8.0 |
| 3.1 |
| ||
Source: SNL DataSource and company filings.
Note: Pro forma for recent pending transactions. Market data as of November 16, 2006 and financial data as of September 30, 2006.
(1) Exludes mutual holding companies (PBCT) and recent conversions (HCBK); recently acquired companies (ASO, MRBK) and companies with large processing segments (SNV).
6
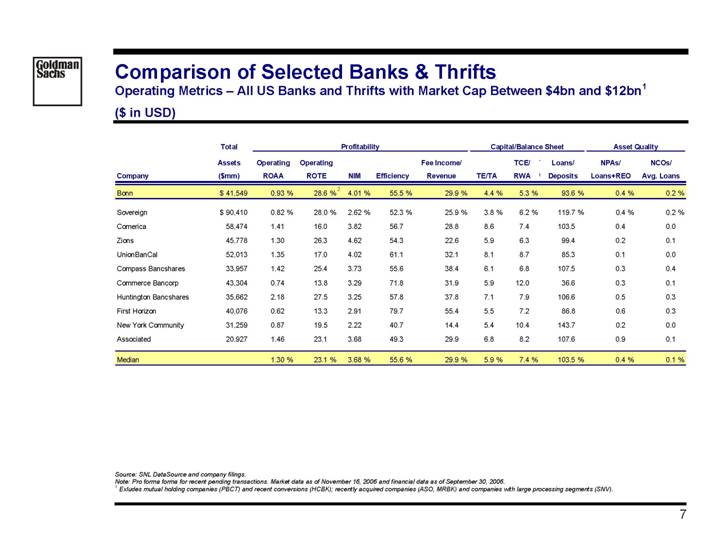
Comparison of Selected Banks & Thrifts
Operating Metrics – All US Banks and Thrifts with Market Cap Between $4bn and $12bn (1)
($ in USD)
|
| Total |
| Profitability |
| Capital/Balance Sheet |
| Asset Quality |
| |||||||||||||||
|
| Assets |
| Operating |
| Operating |
|
|
|
|
| Fee Income/ |
|
|
| TCE/ |
| Loans/ |
| NPAs/ |
| NCOs/ |
| |
Company |
| ($mm) |
| ROAA |
| ROTE |
| NIM |
| Efficiency |
| Revenue |
| TE/TA |
| RWA |
| Deposits |
| Loans+REO |
| Avg. Loans |
| |
|
|
|
|
|
|
|
|
|
|
|
|
|
|
|
|
|
|
|
|
|
|
|
| |
Bonn |
| $ | 41,549 |
| 0.93 | % | 28.6 | %(2) | 4.01 | % | 55.5 | % | 29.9 | % | 4.4 | % | 5.3 | % | 93.6 | % | 0.4 | % | 0.2 | % |
|
|
|
|
|
|
|
|
|
|
|
|
|
|
|
|
|
|
|
|
|
|
|
| |
Sovereign |
| $ | 90,410 |
| 0.82 | % | 28.0 | % | 2.62 | % | 52.3 | % | 25.9 | % | 3.8 | % | 6.2 | % | 119.7 | % | 0.4 | % | 0.2 | % |
Comerica |
| 58,474 |
| 1.41 |
| 16.0 |
| 3.82 |
| 56.7 |
| 28.8 |
| 8.6 |
| 7.4 |
| 103.5 |
| 0.4 |
| 0.0 |
| |
Zions |
| 45,778 |
| 1.30 |
| 26.3 |
| 4.62 |
| 54.3 |
| 22.6 |
| 5.9 |
| 6.3 |
| 99.4 |
| 0.2 |
| 0.1 |
| |
UnionBanCal |
| 52,013 |
| 1.35 |
| 17.0 |
| 4.02 |
| 61.1 |
| 32.1 |
| 8.1 |
| 8.7 |
| 85.3 |
| 0.1 |
| 0.0 |
| |
Compass Bancshares |
| 33,957 |
| 1.42 |
| 25.4 |
| 3.73 |
| 55.6 |
| 38.4 |
| 6.1 |
| 6.8 |
| 107.5 |
| 0.3 |
| 0.4 |
| |
Commerce Bancorp |
| 43,304 |
| 0.74 |
| 13.8 |
| 3.29 |
| 71.8 |
| 31.9 |
| 5.9 |
| 12.0 |
| 36.6 |
| 0.3 |
| 0.1 |
| |
Huntington Bancshares |
| 35,662 |
| 2.18 |
| 27.5 |
| 3.25 |
| 57.8 |
| 37.8 |
| 7.1 |
| 7.9 |
| 106.6 |
| 0.5 |
| 0.3 |
| |
First Horizon |
| 40,076 |
| 0.62 |
| 13.3 |
| 2.91 |
| 79.7 |
| 55.4 |
| 5.5 |
| 7.2 |
| 86.8 |
| 0.6 |
| 0.3 |
| |
New York Community |
| 31,259 |
| 0.87 |
| 19.5 |
| 2.22 |
| 40.7 |
| 14.4 |
| 5.4 |
| 10.4 |
| 143.7 |
| 0.2 |
| 0.0 |
| |
Associated |
| 20,927 |
| 1.46 |
| 23.1 |
| 3.68 |
| 49.3 |
| 29.9 |
| 6.8 |
| 8.2 |
| 107.6 |
| 0.9 |
| 0.1 |
| |
|
|
|
|
|
|
|
|
|
|
|
|
|
|
|
|
|
|
|
|
|
|
|
| |
Median |
|
|
| 1.30 | % | 23.1 | % | 3.68 | % | 55.6 | % | 29.9 | % | 5.9 | % | 7.4 | % | 103.5 | % | 0.4 | % | 0.1 | % | |
Source: SNL DataSource and company filings.
Note: Pro forma forma for recent pending transactions. Market data as of November 16, 2006 and financial data as of September 30, 2006.
(1) Exludes mutual holding companies (PBCT) and recent conversions (HCBK); recently acquired companies (ASO, MRBK) and companies with large processing segments (SNV).
7
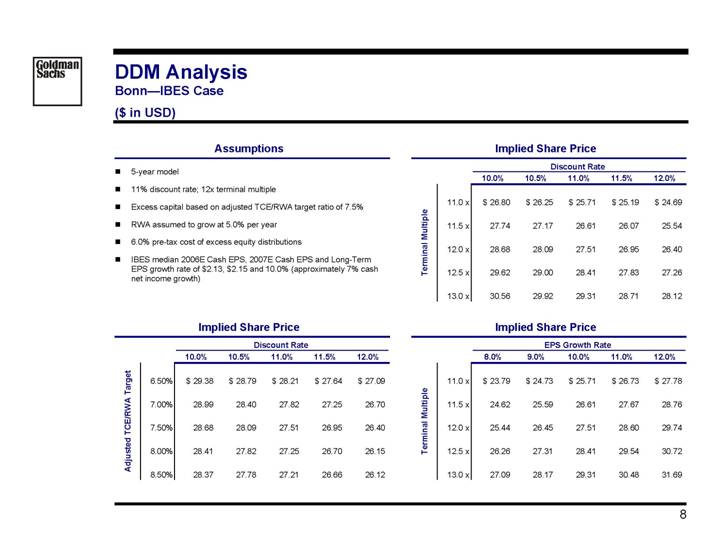
DDM Analysis
Bonn—IBES Case
($ in USD)
Assumptions
• 5-year model
• 11% discount rate; 12x terminal multiple
• Excess capital based on adjusted TCE/RWA target ratio of 7.5%
• RWA assumed to grow at 5.0% per year
• 6.0% pre-tax cost of excess equity distributions
• IBES median 2006E Cash EPS, 2007E Cash EPS and Long-Term EPS growth rate of $2.13, $2.15 and 10.0% (approximately 7% cash net income growth)
Implied Share Price
|
| Discount Rate |
| |||||||||||||
Terminal Multiple |
| 10.0% |
| 10.5% |
| 11.0% |
| 11.5% |
| 12.0% |
| |||||
|
|
|
|
|
|
|
|
|
|
|
| |||||
11.0 x |
| $ | 26.80 |
| $ | 26.25 |
| $ | 25.71 |
| $ | 25.19 |
| $ | 24.69 |
|
|
|
|
|
|
|
|
|
|
|
|
| |||||
11.5 x |
| 27.74 |
| 27.17 |
| 26.61 |
| 26.07 |
| 25.54 |
| |||||
|
|
|
|
|
|
|
|
|
|
|
| |||||
12.0 x |
| 28.68 |
| 28.09 |
| 27.51 |
| 26.95 |
| 26.40 |
| |||||
|
|
|
|
|
|
|
|
|
|
|
| |||||
12.5 x |
| 29.62 |
| 29.00 |
| 28.41 |
| 27.83 |
| 27.26 |
| |||||
|
|
|
|
|
|
|
|
|
|
|
| |||||
13.0 x |
| 30.56 |
| 29.92 |
| 29.31 |
| 28.71 |
| 28.12 |
| |||||
Implied Share Price
|
| Discount Rate |
| |||||||||||||
Adjusted TCE/RWA Target |
| 10.0 % |
| 10.5 % |
| 11.0 % |
| 11.5 % |
| 12.0 % |
| |||||
|
|
|
|
|
|
|
|
|
|
|
| |||||
6.50% |
| $ | 29.38 |
| $ | 28.79 |
| $ | 28.21 |
| $ | 27.64 |
| $ | 27.09 |
|
|
|
|
|
|
|
|
|
|
|
|
| |||||
7.00% |
| 28.99 |
| 28.40 |
| 27.82 |
| 27.25 |
| 26.70 |
| |||||
|
|
|
|
|
|
|
|
|
|
|
| |||||
7.50% |
| 28.68 |
| 28.09 |
| 27.51 |
| 26.95 |
| 26.40 |
| |||||
|
|
|
|
|
|
|
|
|
|
|
| |||||
8.00% |
| 28.41 |
| 27.82 |
| 27.25 |
| 26.70 |
| 26.15 |
| |||||
|
|
|
|
|
|
|
|
|
|
|
| |||||
8.50% |
| 28.37 |
| 27.78 |
| 27.21 |
| 26.66 |
| 26.12 |
| |||||
Implied Share Price
|
| EPS Growth Rate |
| |||||||||||||
Terminal Multiple |
| 8.0 % |
| 9.0 % |
| 10.0 % |
| 11.0 % |
| 12.0 % |
| |||||
|
|
|
|
|
|
|
|
|
|
|
| |||||
11.0 x |
| $ | 23.79 |
| $ | 24.73 |
| $ | 25.71 |
| $ | 26.73 |
| $ | 27.78 |
|
|
|
|
|
|
|
|
|
|
|
|
| |||||
11.5 x |
| 24.62 |
| 25.59 |
| 26.61 |
| 27.67 |
| 28.76 |
| |||||
|
|
|
|
|
|
|
|
|
|
|
| |||||
12.0 x |
| 25.44 |
| 26.45 |
| 27.51 |
| 28.60 |
| 29.74 |
| |||||
|
|
|
|
|
|
|
|
|
|
|
| |||||
12.5 x |
| 26.26 |
| 27.31 |
| 28.41 |
| 29.54 |
| 30.72 |
| |||||
|
|
|
|
|
|
|
|
|
|
|
| |||||
13.0 x |
| 27.09 |
| 28.17 |
| 29.31 |
| 30.48 |
| 31.69 |
| |||||
8
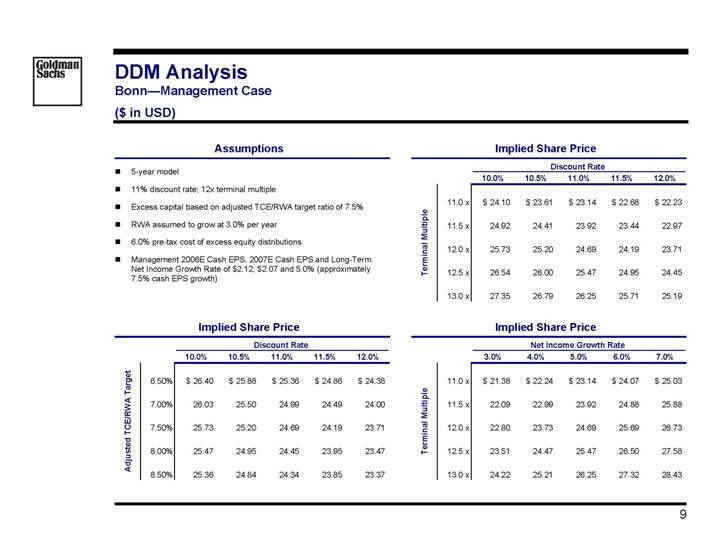
DDM Analysis
Bonn—Management Case
($ in USD)
Assumptions
• 5-year model
• 11% discount rate; 12x terminal multiple
• Excess capital based on adjusted TCE/RWA target ratio of 7.5%
• RWA assumed to grow at 3.0% per year
• 6.0% pre-tax cost of excess equity distributions
• Management 2006E Cash EPS, 2007E Cash EPS and Long-Term Net Income Growth Rate of $2.12, $2.07 and 5.0% (approximately 7.5% cash EPS growth)
Implied Share Price
|
| Discount Rate |
| |||||||||||||
Terminal Multiple |
| 10.0% |
| 10.5% |
| 11.0% |
| 11.5% |
| 12.0% |
| |||||
|
|
|
|
|
|
|
|
|
|
|
| |||||
11.0 x |
| $ | 24.10 |
| $ | 23.61 |
| $ | 23.14 |
| $ | 22.68 |
| $ | 22.23 |
|
|
|
|
|
|
|
|
|
|
|
|
| |||||
11.5 x |
| 24.92 |
| 24.41 |
| 23.92 |
| 23.44 |
| 22.97 |
| |||||
|
|
|
|
|
|
|
|
|
|
|
| |||||
12.0 x |
| 25.73 |
| 25.20 |
| 24.69 |
| 24.19 |
| 23.71 |
| |||||
|
|
|
|
|
|
|
|
|
|
|
| |||||
12.5 x |
| 26.54 |
| 26.00 |
| 25.47 |
| 24.95 |
| 24.45 |
| |||||
|
|
|
|
|
|
|
|
|
|
|
| |||||
13.0 x |
| 27.35 |
| 26.79 |
| 26.25 |
| 25.71 |
| 25.19 |
| |||||
Implied Share Price
|
| Discount Rate |
| |||||||||||||
Adjusted TCE/RWA Target |
| 10.0% |
| 10.5% |
| 11.0% |
| 11.5% |
| 12.0% |
| |||||
|
|
|
|
|
|
|
|
|
|
|
| |||||
6.50% |
| $ | 26.40 |
| $ | 25.88 |
| $ | 25.36 |
| $ | 24.86 |
| $ | 24.38 |
|
|
|
|
|
|
|
|
|
|
|
|
| |||||
7.00% |
| 26.03 |
| 25.50 |
| 24.99 |
| 24.49 |
| 24.00 |
| |||||
|
|
|
|
|
|
|
|
|
|
|
| |||||
7.50% |
| 25.73 |
| 25.20 |
| 24.69 |
| 24.19 |
| 23.71 |
| |||||
|
|
|
|
|
|
|
|
|
|
|
| |||||
8.00% |
| 25.47 |
| 24.95 |
| 24.45 |
| 23.95 |
| 23.47 |
| |||||
|
|
|
|
|
|
|
|
|
|
|
| |||||
8.50% |
| 25.36 |
| 24.84 |
| 24.34 |
| 23.85 |
| 23.37 |
| |||||
Implied Share Price
|
| Net Income Growth Rate |
| |||||||||||||
Terminal Multiple |
| 3.0% |
| 4.0% |
| 5.0% |
| 6.0% |
| 7.0% |
| |||||
|
|
|
|
|
|
|
|
|
|
|
| |||||
11.0 x |
| $ | 21.38 |
| $ | 22.24 |
| $ | 23.14 |
| $ | 24.07 |
| $ | 25.03 |
|
|
|
|
|
|
|
|
|
|
|
|
| |||||
11.5 x |
| 22.09 |
| 22.99 |
| 23.92 |
| 24.88 |
| 25.88 |
| |||||
|
|
|
|
|
|
|
|
|
|
|
| |||||
12.0 x |
| 22.80 |
| 23.73 |
| 24.69 |
| 25.69 |
| 26.73 |
| |||||
|
|
|
|
|
|
|
|
|
|
|
| |||||
12.5 x |
| 23.51 |
| 24.47 |
| 25.47 |
| 26.50 |
| 27.58 |
| |||||
|
|
|
|
|
|
|
|
|
|
|
| |||||
13.0 x |
| 24.22 |
| 25.21 |
| 26.25 |
| 27.32 |
| 28.43 |
| |||||
9
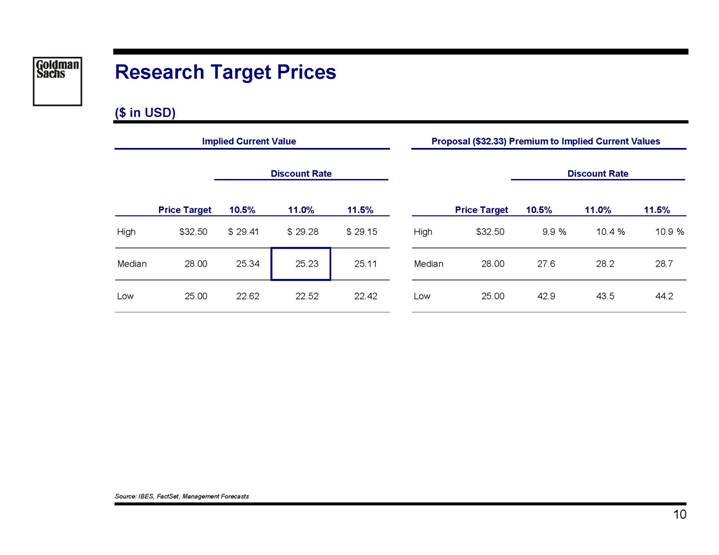
Research Target Prices
($ in USD)
Implied Current Value
|
|
|
| Discount Rate |
| ||||||||
|
| Price Target |
| 10.5% |
| 11.0% |
| 11.5% |
| ||||
|
|
|
|
|
|
|
|
|
| ||||
High |
| $ | 32.50 |
| $ | 29.41 |
| $ | 29.28 |
| $ | 29.15 |
|
|
|
|
|
|
|
|
|
|
| ||||
Median |
| 28.00 |
| 25.34 |
| 25.23 |
| 25.11 |
| ||||
|
|
|
|
|
|
|
|
|
| ||||
Low |
| 25.00 |
| 22.62 |
| 22.52 |
| 22.42 |
| ||||
Proposal ($32.33) Premium to Implied Current Values
|
|
|
| Discount Rate |
| |||||
|
| Price Target |
| 10.5% |
| 11.0% |
| 11.5% |
| |
|
|
|
|
|
|
|
|
|
| |
High |
| $ | 32.50 |
| 9.9 | % | 10.4 | % | 10.9 | % |
|
|
|
|
|
|
|
|
|
| |
Median |
| 28.00 |
| 27.6 |
| 28.2 |
| 28.7 |
| |
|
|
|
|
|
|
|
|
|
| |
Low |
| 25.00 |
| 42.9 |
| 43.5 |
| 44.2 |
| |
Source: IBES, FactSet, Management Forecasts
10
Buy-Out Analysis
Key Model Assumptions
Transaction: |
| • Toledo buys-out Bonn minority for 100% cash |
|
|
|
Assumed Closing: |
| • April 20, 2007 |
|
|
|
Estimated Synergies: |
| • No synergies assumed |
|
|
|
Restructuring Charge: |
| • $25mm after tax |
|
|
|
Bonn Cash Earnings |
| • CY 2006: IBES median EPS of USD 2.13 / Management forecast EPS of USD 2.12 |
Assumptions: |
| • CY 2007: IBES median EPS of USD 2.15 / Management forecast EPS of USD 2.07 |
|
| • Post 2007: IBES median long-term EPS growth of 10.0% / Management forecast long- term net income growth of 5.0% |
|
|
|
Toledo Cash Earnings |
| • FY 2007: IBES median EPS of CAD 5.23 / Management forecast of CAD 5.24 |
Assumptions: |
| • FY 2008: IBES median EPS of CAD 5.78 / Management forecast of CAD 5.67 |
|
|
|
Internal Rate of Return |
| • 5-year model |
|
| • 12x terminal multiple |
|
| • RWA growth of 5.0% per year in the IBES case and 3% per year in the Management case |
|
| • Excess capital based on adjusted TCE/RWA target ratio of 7.5% |
11
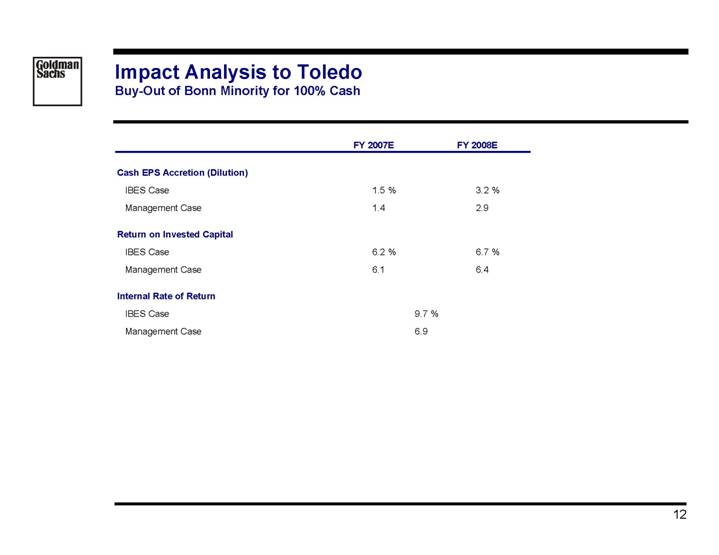
Impact Analysis to Toledo
Buy-Out of Bonn Minority for 100% Cash
|
| FY 2007E |
|
|
| FY 2008E |
|
|
|
|
|
|
|
|
|
Cash EPS Accretion (Dilution) |
|
|
|
|
|
|
|
IBES Case |
| 1.5 | % |
|
| 3.2 | % |
Management Case |
| 1.4 |
|
|
| 2.9 |
|
|
|
|
|
|
|
|
|
Return on Invested Capital |
|
|
|
|
|
|
|
IBES Case |
| 6.2 | % |
|
| 6.7 | % |
Management Case |
| 6.1 |
|
|
| 6.4 |
|
|
|
|
|
|
|
|
|
Internal Rate of Return |
|
|
|
|
|
|
|
IBES Case |
|
|
| 9.7 | % |
|
|
Management Case |
|
|
| 6.9 |
|
|
|
12
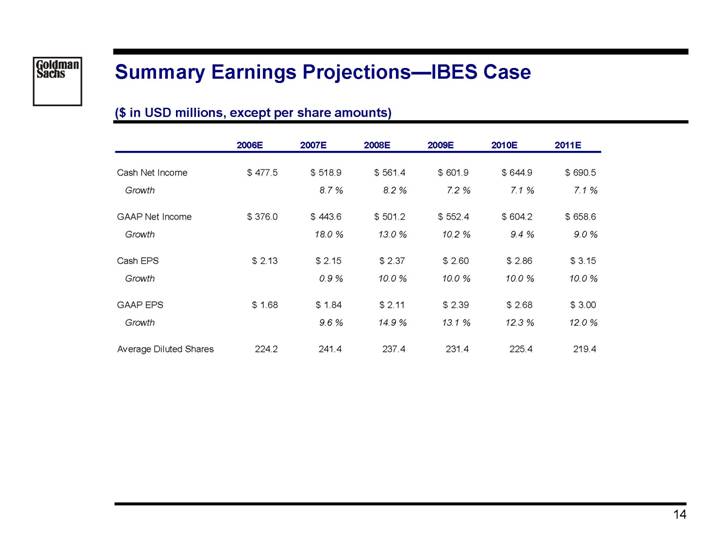
Summary Earnings Projections—IBES Case
($ in USD millions, except per share amounts)
|
| 2006E |
| 2007E |
| 2008E |
| 2009E |
| 2010E |
| 2011E |
| ||||||
|
|
|
|
|
|
|
|
|
|
|
|
|
| ||||||
Cash Net Income |
| $ | 477.5 |
| $ | 518.9 |
| $ | 561.4 |
| $ | 601.9 |
| $ | 644.9 |
| $ | 690.5 |
|
Growth |
|
|
| 8.7 | % | 8.2 | % | 7.2 | % | 7.1 | % | 7.1 | % | ||||||
|
|
|
|
|
|
|
|
|
|
|
|
|
| ||||||
GAAP Net Income |
| $ | 376.0 |
| $ | 443.6 |
| $ | 501.2 |
| $ | 552.4 |
| $ | 604.2 |
| $ | 658.6 |
|
Growth |
|
|
| 18.0 | % | 13.0 | % | 10.2 | % | 9.4 | % | 9.0 | % | ||||||
|
|
|
|
|
|
|
|
|
|
|
|
|
| ||||||
Cash EPS |
| $ | 2.13 |
| $ | 2.15 |
| $ | 2.37 |
| $ | 2.60 |
| $ | 2.86 |
| $ | 3.15 |
|
Growth |
|
|
| 0.9 | % | 10.0 | % | 10.0 | % | 10.0 | % | 10.0 | % | ||||||
|
|
|
|
|
|
|
|
|
|
|
|
|
| ||||||
GAAP EPS |
| $ | 1.68 |
| $ | 1.84 |
| $ | 2.11 |
| $ | 2.39 |
| $ | 2.68 |
| $ | 3.00 |
|
Growth |
|
|
| 9.6 | % | 14.9 | % | 13.1 | % | 12.3 | % | 12.0 | % | ||||||
|
|
|
|
|
|
|
|
|
|
|
|
|
| ||||||
Average Diluted Shares |
| 224.2 |
| 241.4 |
| 237.4 |
| 231.4 |
| 225.4 |
| 219.4 |
| ||||||
14
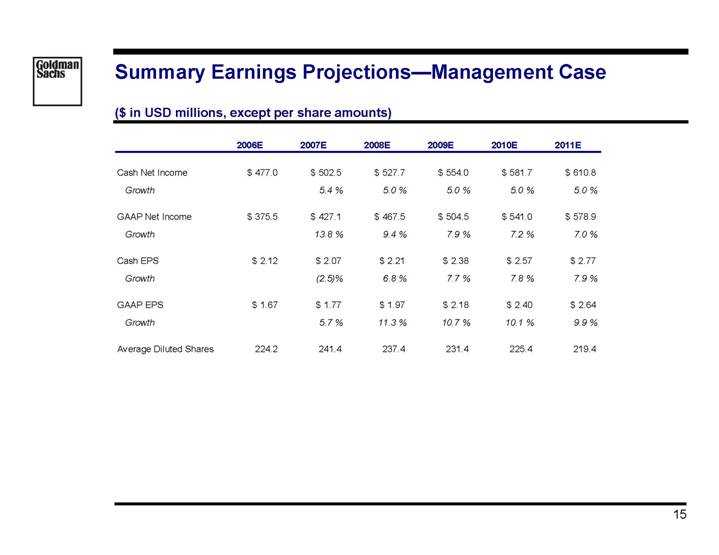
Summary Earnings Projections—Management Case
($ in USD millions, except per share amounts)
|
| 2006E |
| 2007E |
| 2008E |
| 2009E |
| 2010E |
| 2011E |
| ||||||
|
|
|
|
|
|
|
|
|
|
|
|
|
| ||||||
Cash Net Income |
| $ | 477.0 |
| $ | 502.5 |
| $ | 527.7 |
| $ | 554.0 |
| $ | 581.7 |
| $ | 610.8 |
|
Growth |
|
|
| 5.4 | % | 5.0 | % | 5.0 | % | 5.0 | % | 5.0 | % | ||||||
|
|
|
|
|
|
|
|
|
|
|
|
|
| ||||||
GAAP Net Income |
| $ | 375.5 |
| $ | 427.1 |
| $ | 467.5 |
| $ | 504.5 |
| $ | 541.0 |
| $ | 578.9 |
|
Growth |
|
|
| 13.8 | % | 9.4 | % | 7.9 | % | 7.2 | % | 7.0 | % | ||||||
|
|
|
|
|
|
|
|
|
|
|
|
|
| ||||||
Cash EPS |
| $ | 2.12 |
| $ | 2.07 |
| $ | 2.21 |
| $ | 2.38 |
| $ | 2.57 |
| $ | 2.77 |
|
Growth |
|
|
| (2.5 | )% | 6.8 | % | 7.7 | % | 7.8 | % | 7.9 | % | ||||||
|
|
|
|
|
|
|
|
|
|
|
|
|
| ||||||
GAAP EPS |
| $ | 1.67 |
| $ | 1.77 |
| $ | 1.97 |
| $ | 2.18 |
| $ | 2.40 |
| $ | 2.64 |
|
Growth |
|
|
| 5.7 | % | 11.3 | % | 10.7 | % | 10.1 | % | 9.9 | % | ||||||
|
|
|
|
|
|
|
|
|
|
|
|
|
| ||||||
Average Diluted Shares |
| 224.2 |
| 241.4 |
| 237.4 |
| 231.4 |
| 225.4 |
| 219.4 |
| ||||||
15
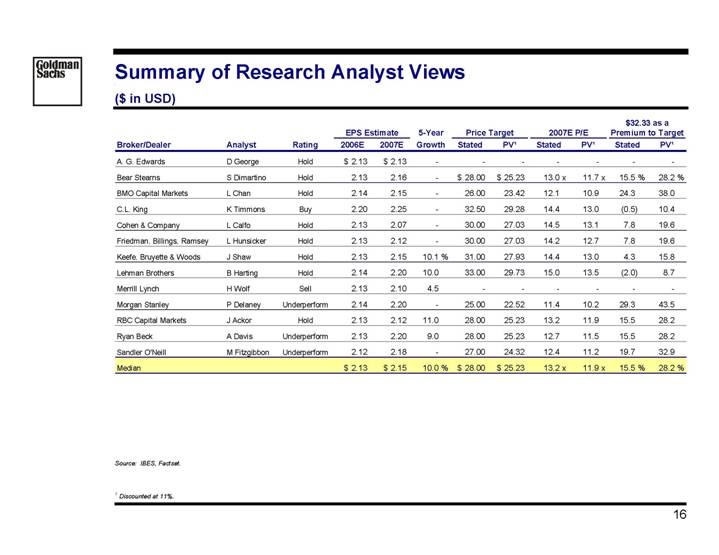
Summary of Research Analyst Views
($ in USD)
|
|
|
|
|
| EPS Estimate |
| 5-Year |
| Price Target |
| 2007E P/E |
| $32.33 as a |
| ||||||||||||
Broker/Dealer |
| Analyst |
| Rating |
| 2006E |
| 2007E |
| Growth |
| Stated |
| PV(1) |
| Stated |
| PV(1) |
| Stated |
| PV(1) |
| ||||
A. G. Edwards |
| D George |
| Hold |
| $ | 2.13 |
| $ | 2.13 |
| — |
| — |
| — |
| — |
| — |
| — |
| — |
| ||
Bear Stearns |
| S Dimartino |
| Hold |
| 2.13 |
| 2.16 |
| — |
| $ | 28.00 |
| $ | 25.23 |
| 13.0 | x | 11.7 | x | 15.5 | % | 28.2 | % | ||
BMO Capital Markets |
| L Chan |
| Hold |
| 2.14 |
| 2.15 |
| — |
| 26.00 |
| 23.42 |
| 12.1 |
| 10.9 |
| 24.3 |
| 38.0 |
| ||||
C.L. King |
| K Timmons |
| Buy |
| 2.20 |
| 2.25 |
| — |
| 32.50 |
| 29.28 |
| 14.4 |
| 13.0 |
| (0.5 | ) | 10.4 |
| ||||
Cohen & Company |
| L Calfo |
| Hold |
| 2.13 |
| 2.07 |
| — |
| 30.00 |
| 27.03 |
| 14.5 |
| 13.1 |
| 7.8 |
| 19.6 |
| ||||
Friedman, Billings, Ramsey |
| L Hunsicker |
| Hold |
| 2.13 |
| 2.12 |
| — |
| 30.00 |
| 27.03 |
| 14.2 |
| 12.7 |
| 7.8 |
| 19.6 |
| ||||
Keefe, Bruyette & Woods |
| J Shaw |
| Hold |
| 2.13 |
| 2.15 |
| 10.1 | % | 31.00 |
| 27.93 |
| 14.4 |
| 13.0 |
| 4.3 |
| 15.8 |
| ||||
Lehman Brothers |
| B Harting |
| Hold |
| 2.14 |
| 2.20 |
| 10.0 |
| 33.00 |
| 29.73 |
| 15.0 |
| 13.5 |
| (2.0 | ) | 8.7 |
| ||||
Merrill Lynch |
| H Wolf |
| Sell |
| 2.13 |
| 2.10 |
| 4.5 |
| — |
| — |
| — |
| — |
| — |
| — |
| ||||
Morgan Stanley |
| P Delaney |
| Underperform |
| 2.14 |
| 2.20 |
| — |
| 25.00 |
| 22.52 |
| 11.4 |
| 10.2 |
| 29.3 |
| 43.5 |
| ||||
RBC Capital Markets |
| J Ackor |
| Hold |
| 2.13 |
| 2.12 |
| 11.0 |
| 28.00 |
| 25.23 |
| 13.2 |
| 11.9 |
| 15.5 |
| 28.2 |
| ||||
Ryan Beck |
| A Davis |
| Underperform |
| 2.13 |
| 2.20 |
| 9.0 |
| 28.00 |
| 25.23 |
| 12.7 |
| 11.5 |
| 15.5 |
| 28.2 |
| ||||
Sandler O’Neill |
| M Fitzgibbon |
| Underperform |
| 2.12 |
| 2.18 |
| — |
| 27.00 |
| 24.32 |
| 12.4 |
| 11.2 |
| 19.7 |
| 32.9 |
| ||||
Median |
|
|
|
|
| $ | 2.13 |
| $ | 2.15 |
| 10.0 | % | $ | 28.00 |
| $ | 25.23 |
| 13.2 | x | 11.9 | x | 15.5 | % | 28.2 | % |
Source: IBES, Factset.
(1) Discounted at 11%.
16