Exhibit (c)(5)
| Presentation to the Committee of Designated Independent Directors Confidential Material Regarding: November 3, 2006 Confidential Project ACADIA SANDLER O'NEILL + PARTNERS, L.P. New York – Atlanta - Boston - Chicago - San Francisco |
| This presentation, and the oral or video presentation that supplements it, have been developed by and are proprietary to Sandler O'Neill & Partners, L.P. and were prepared exclusively for the benefit and internal use of the recipient. Neither the printed presentation nor the oral or video presentation that supplements it, nor any of their contents, may be reproduced, distributed or used for any other purpose without the prior written consent of Sandler O'Neill & Partners, L.P. The analyses contained herein rely upon information obtained from the recipient or from public sources, the accuracy of which has not been verified, and cannot be assured, by Sandler O'Neill & Partners, L.P. Moreover, many of the projections and financial analyses herein are based on estimated financial performance prepared by or in consultation with the recipient and are intended only to suggest reasonable ranges of results. Finally, the printed presentation is incomplete without the oral or video presentation that supplements it. Sandler O’Neill & Partners, L.P. prohibits employees from offering, directly or indirectly, favorable research, a specific rating or a specific price target, or offering or threatening to change research, a rating or a price target to a company as consideration or inducement for the receipt of business or compensation. The Firm also prohibits research analysts from being compensated for their involvement in, or based upon, specific investment banking transactions. Sandler O'Neill & Partners, L.P. is a limited partnership, the sole general partner of which is Sandler O'Neill & Partners Corp., a New York corporation. Sandler O'Neill & Partners, L.P. is a registered broker-dealer and a member of the National Association of Securities Dealers, Inc. Sandler O'Neill Mortgage Finance L.P. is an indirect wholly-owned subsidiary of Sandler O'Neill & Partners Corp. This material is protected under applicable copyright laws and does not carry any rights of publication or disclosure. GENERAL INFORMATION AND LIMITATIONS |
| Table of Contents I. Situation Update II. PINE Valuation Update |
| I. Situation Update |

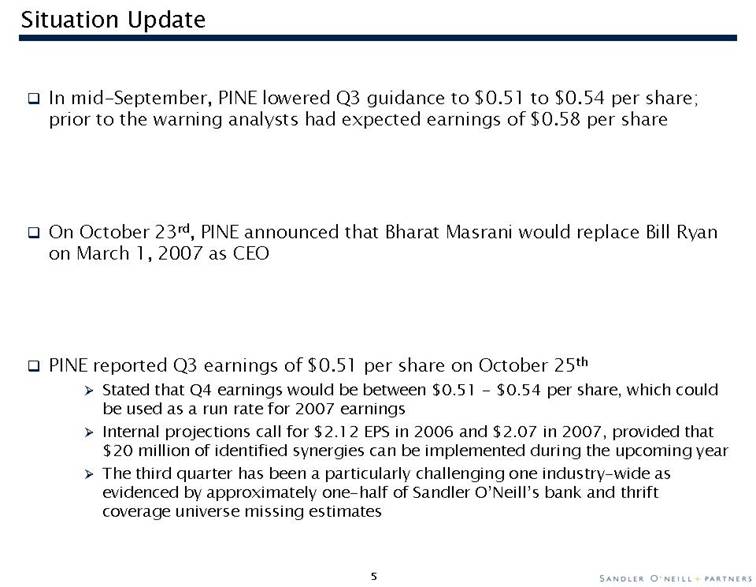
| Situation Update In mid-September, PINE lowered Q3 guidance to $0.51 to $0.54 per share; prior to the warning analysts had expected earnings of $0.58 per share On October 23rd, PINE announced that Bharat Masrani would replace Bill Ryan on March 1, 2007 as CEO PINE reported Q3 earnings of $0.51 per share on October 25thStated that Q4 earnings would be between $0.51 - $0.54 per share, which could be used as a run rate for 2007 earnings Internal projections call for $2.12 EPS in 2006 and $2.07 in 2007, provided that $20 million of identified synergies can be implemented during the upcoming year The third quarter has been a particularly challenging one industry-wide as evidenced by approximately one-half of Sandler O’Neill’s bank and thrift coverage universe missing estimates |
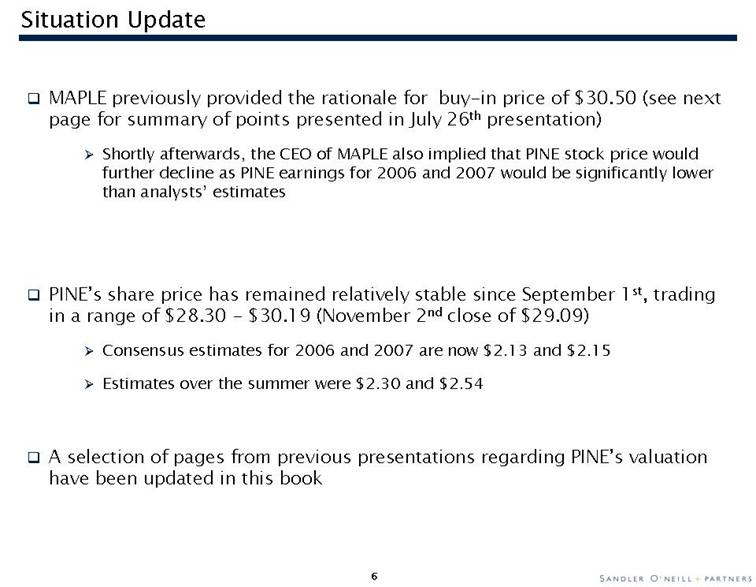
| Situation Update MAPLE previously provided the rationale for buy-in price of $30.50 (see next page for summary of points presented in July 26th presentation) Shortly afterwards, the CEO of MAPLE also implied that PINE stock price would further decline as PINE earnings for 2006 and 2007 would be significantly lower than analysts’ estimates PINE’s share price has remained relatively stable since September 1st, trading in a range of $28.30 - $30.19 (November 2nd close of $29.09) Consensus estimates for 2006 and 2007 are now $2.13 and $2.15 Estimates over the summer were $2.30 and $2.54 A selection of pages from previous presentations regarding PINE’s valuation have been updated in this book |
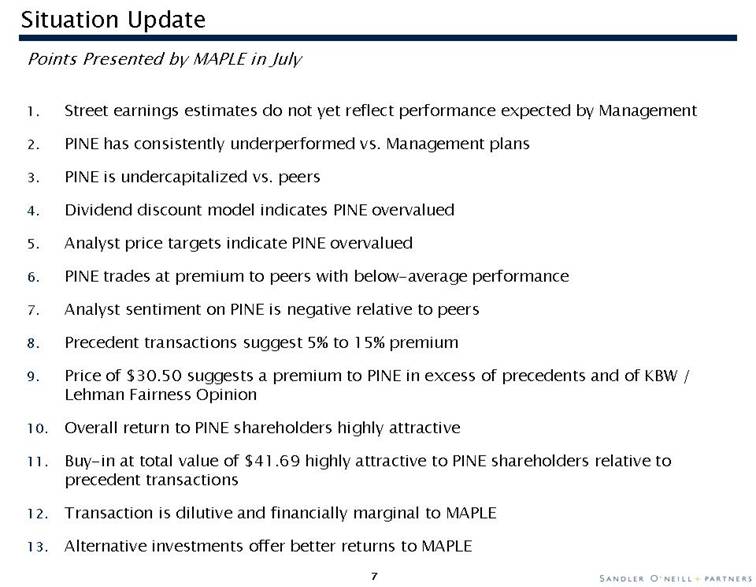
| Situation Update 1. Street earnings estimates do not yet reflect performance expected by Management 2. PINE has consistently underperformed vs. Management plans 3. PINE is undercapitalized vs. peers 4. Dividend discount model indicates PINE overvalued 5. Analyst price targets indicate PINE overvalued 6. PINE trades at premium to peers with below-average performance 7. Analyst sentiment on PINE is negative relative to peers 8. Precedent transactions suggest 5% to 15% premium 9. Price of $30.50 suggests a premium to PINE in excess of precedents and of KBW / Lehman Fairness Opinion 10. Overall return to PINE shareholders highly attractive 11. Buy-in at total value of $41.69 highly attractive to PINE shareholders relative to precedent transactions 12. Transaction is dilutive and financially marginal to MAPLE 13. Alternative investments offer better returns to MAPLE Points Presented by MAPLE in July |
| II. PINE Valuation Update |
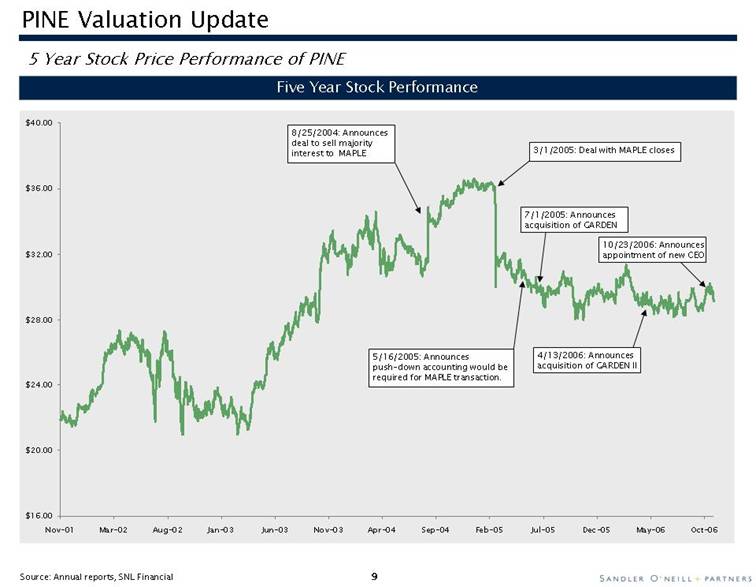
| 5 Year Stock Price Performance of PINE Five Year Stock Performance Source: Annual reports, SNL Financial 8/25/2004: Announces deal to sell majority interest to MAPLE 7/1/2005: Announces acquisition of GARDEN 4/13/2006: Announces acquisition of GARDEN II PINE Valuation Update 3/1/2005: Deal with MAPLE closes 5/16/2005: Announces push-down accounting would be required for MAPLE transaction. 10/23/2006: Announces appointment of new CEO $16.00$20.00$24.00$28.00$32.00$36.00$40.00Nov-01Mar-02Aug-02Jan-03Jun-03Nov-03Apr-04Sep-04Feb-05Jul-05Dec-05May-06Oct-06 |
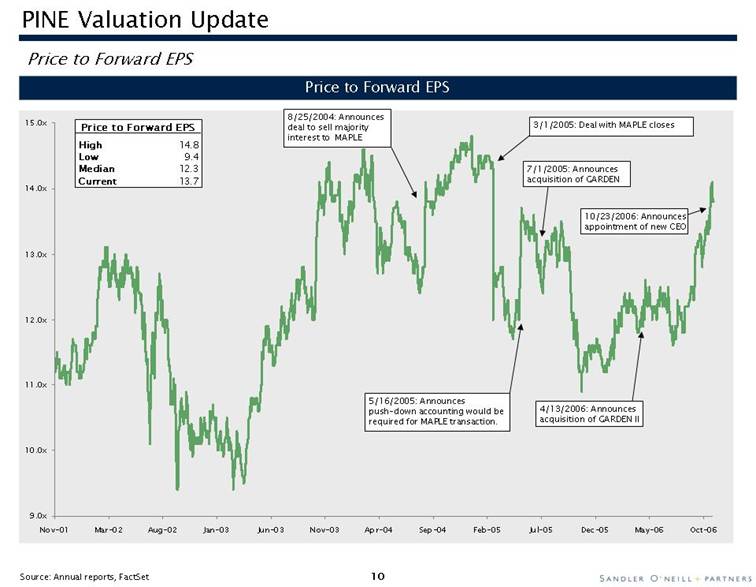
| Price to Forward EPS Price to Forward EPS Source: Annual reports, FactSet 8/25/2004: Announces deal to sell majority interest to MAPLE 7/1/2005: Announces acquisition of GARDEN 4/13/2006: Announces acquisition of GARDEN II PINE Valuation Update 5/16/2005: Announces push-down accounting would be required for MAPLE transaction. 3/1/2005: Deal with MAPLE closes 10/23/2006: Announces appointment of new CEO 9.0x10.0x11.0x12.0x13.0x14.0x15.0xNov-01Mar-02Aug-02Jan-03Jun-03Nov-03Apr-04Sep-04Feb-05Jul-05Dec-05May-06Oct-06 Price to Forward EPS High 14.8 Low 9.4 Median 12.3 Current 13.7 |
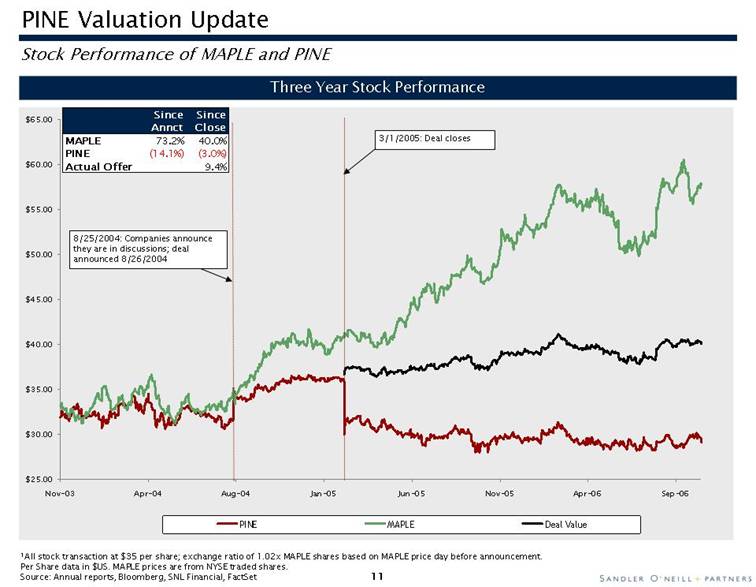
| PINE Valuation Update Stock Performance of MAPLE and PINE Three Year Stock Performance 3/1/2005: Deal closes 1 All stock transaction at $35 per share; exchange ratio of 1.02x MAPLE shares based on MAPLE price day before announcement. Per Share data in $US. MAPLE prices are from NYSE traded shares. Source: Annual reports, Bloomberg, SNL Financial, FactSet 8/25/2004: Companies announce they are in discussions; deal announced 8/26/2004 $25.00$30.00$35.00$40.00$45.00$50.00$55.00$60.00$65.00Nov-03Apr-04Aug-04Jan-05Jun-05Nov-05Apr-06Sep-06PINEMAPLEDeal Value Since Since Annct Close MAPLE 73.2% 40.0% PINE (14.1%) (3.0% ) Actual Offer 9.4% |
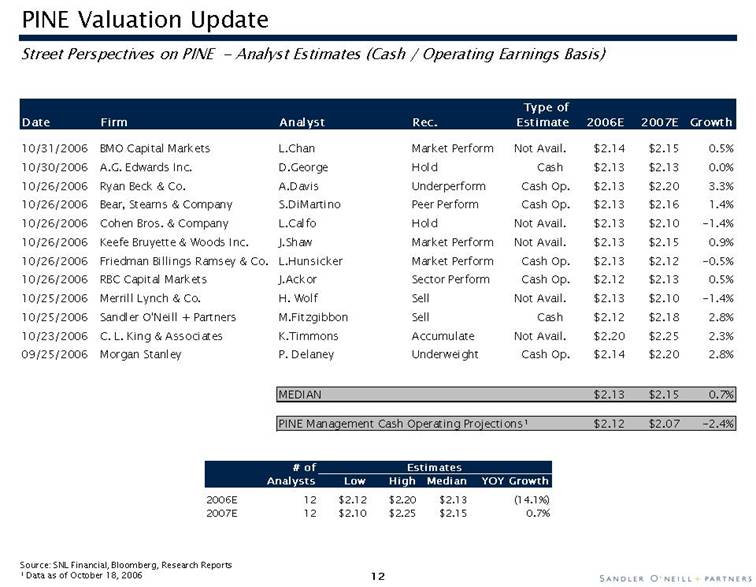
| PINE Valuation Update Street Perspectives on PINE - Analyst Estimates (Cash / Operating Earnings Basis) Source: SNL Financial, Bloomberg, Research Reports 1 Data as of October 18, 2006 Type of Date Firm Analyst Rec. Estimate 2006E 2007E Growth 10/31/2006 BMO Capital Markets L.Chan Market Perform Not Avail. $2.14 $2.15 0.5% 10/30/2006 A.G. Edwards Inc. D.George Hold Cash $2.13 $2.13 0.0% 10/26/2006 Ryan Beck & Co. A.Davis Underperform Cash Op. $2.13 $2.20 3.3% 10/26/2006 Bear, Stearns & Company S.Di Martino Peer Perform Cash Op. $2.13 $2.16 1.4% 10/26/2006 Cohen Bros. & Company L.Calfo Hold Not Avail. $2.13 $2.10 -1.4% 10/26/2006 Keefe Bruyette & Woods Inc. J.Shaw Market Perform Not Avail. $2.13 $2.15 0.9% 10/26/2006 Friedman Billings Ramsey & Co. L.Hunsicker Market Perform Cash Op. $2.13 $2.12 -0.5% 10/26/2006 RBC Capital Markets J.Ackor Sector Perform Cash Op. $2.12 $2.13 0.5% 10/25/2006 Merrill Lynch & Co. H. Wolf Sell Not Avail. $2.13 $2.10 -1.4% 10/25/2006 Sandler O'Neill + Partners M.Fitzgibbon Sell Cash $2.12 $2.18 2.8% 10/23/2006 C. L. King & Associates K.Timmons Accumulate Not Avail. $2.20 $2.25 2.3% 09/25/2006 Morgan Stanley P. Delaney Underweight Cash Op. $2.14 $2.20 2.8% MEDIAN $2.13 $2.15 0.7% PINE Management Cash Operating Projections1 $2.12 $2.07 -2.4% # of Estimates Analysts Low High Median YOY Growth 2006E 12 $2.12 $2.20 $2.13 (14.1%) 2007E 12 $2.10 $2.25 $2.15 0.7% |
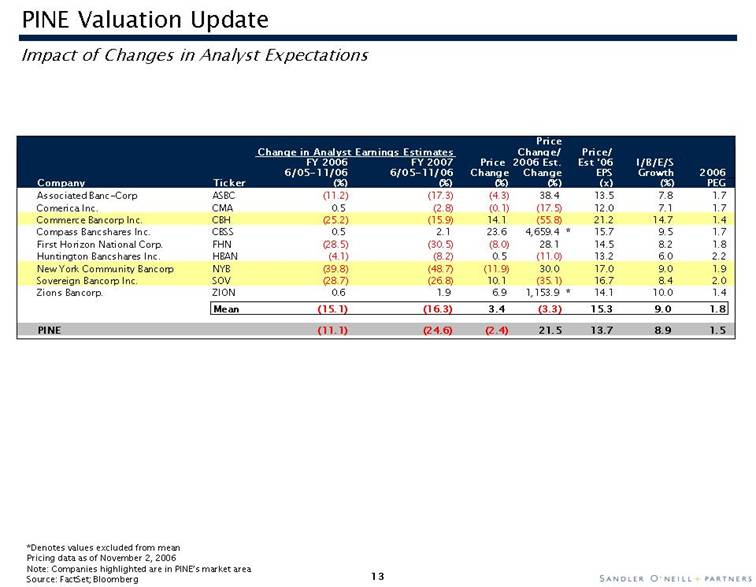
| PINE Valuation Update *Denotes values excluded from mean Pricing data as of November 2, 2006 Note: Companies highlighted are in PINE’s market area Source: FactSet; Bloomberg Impact of Changes in Analyst Expectations Price Change in Analyst Earnings Estimates Change/ Price/ FY 2006 FY 2007 Price 2006 Est. Est '06 I/B/E/S 6/05-11/06 6/05-11/06 Change Change EPS Growth 2006 Company Ticker (%) (%) (%) (%) (x) (%) PEG Associated Banc-Corp ASBC (11.2) (17.3) (4.3) 38.4 13.5 7.8 1.7 Comerica Inc. CMA 0.5 (2.8) (0.1) (17.5) 12.0 7.1 1.7 Commerce Bancorp Inc. CBH (25.2) (15.9) 14.1 (55.8) 21.2 14.7 1.4 Compass Bancshares Inc. CBSS 0.5 2.1 23.6 4,659.4 * 15.7 9.5 1.7 First Horizon National Corp. FHN (28.5) (30.5) (8.0) 28.1 14.5 8.2 1.8 Huntington Bancshares Inc. HBAN (4.1) (8.2) 0.5 (11.0) 13.2 6.0 2.2 New York Community Bancorp NYB (39.8) (48.7) (11.9) 30.0 17.0 9.0 1.9 Sovereign Bancorp Inc. SOV (28.7) (26.8) 10.1 (35.1) 16.7 8.4 2.0 Zions Bancorp. ZION 0.6 1.9 6.9 1,153.9 * 14.1 10.0 1.4 Mean (15.1) (16.3) 3.4 (3.3) 15.3 9.0 1.8 PINE (11.1) (24.6) (2.4) 21.5 13.7 8.9 1.5 |
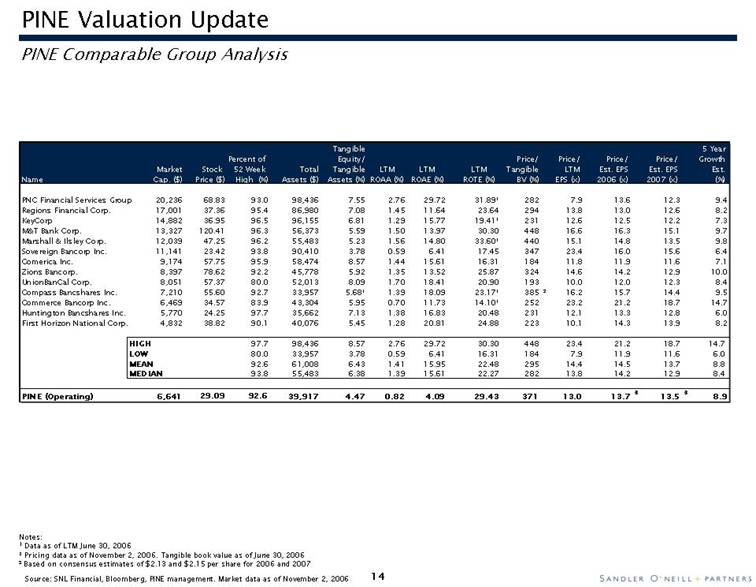
| PINE Comparable Group Analysis Source: SNL Financial, Bloomberg, PINE management. Market data as of November 2, 2006 Notes: 1 Data as of LTM June 30, 2006 2 Pricing data as of November 2, 2006. Tangible book value as of June 30, 2006 3 Based on consensus estimates of $2.13 and $2.15 per share for 2006 and 2007 PINE Valuation Update Tangible 5 Year Percent of Equity/ Price/ Price/ Price/ Price/ Growth Market Stock 52 Week Total Tangible LTM LTM LTM Tangible LTM Est. EPS Est. EPS Est. Name Cap. ($) Price ($) High (%) Assets ($) Assets (%) ROAA (%) ROAE (%) ROTE (%) BV (%) EPS (x) 2006 (x) 2007 (x) (%) PNC Financial Services Group 20,236 68.83 93.0 98,436 7.55 2.76 29.72 31.891 282 7.9 13.6 12.3 9.4 Regions Financial Corp. 17,001 37.36 95.4 86,980 7.08 1.45 11.64 23.64 294 13.8 13.0 12.6 8.2 KeyCorp 14,882 36.95 96.5 96,155 6.81 1.29 15.77 19.41 1 231 12.6 12.5 12.2 7.3 M&T Bank Corp. 13,327 120.41 96.3 56,373 5.59 1.50 13.97 30.30 448 16.6 16.3 15.1 9.7 Marshall & Ilsley Corp. 12,039 47.25 96.2 55,483 5.23 1.56 14.80 33.60 1 440 15.1 14.8 13.5 9.8 Sovereign Bancorp Inc. 11,141 23.42 93.8 90,410 3.78 0.59 6.41 17.45 347 23.4 16.0 15.6 6.4 Comerica Inc. 9,174 57.75 95.9 58,474 8.57 1.44 15.61 16.31 184 11.8 11.9 11.6 7.1 Zions Bancorp. 8,397 78.62 92.2 45,778 5.92 1.35 13.52 25.87 324 14.6 14.2 12.9 10.0 UnionBanCal Corp. 8,051 57.37 80.0 52,013 8.09 1.70 18.41 20.90 193 10.0 12.0 12.3 8.4 Compass Bancshares Inc. 7,210 55.60 92.7 33,957 5.681 1.39 18.09 23.171 3852 16.2 15.7 14.4 9.5 Commerce Bancorp Inc. 6,469 34.57 83.9 43,304 5.95 0.70 11.73 14.101 252 23.2 21.2 18.7 14.7 Huntington Bancshares Inc. 5,770 24.25 97.7 35,662 7.13 1.38 16.83 20.48 231 12.1 13.3 12.8 6.0 First Horizon National Corp. 4,832 38.82 90.1 40,076 5.45 1.28 20.81 24.88 223 10.1 14.3 13.9 8.2 HIGH 97.7 98,436 8.57 2.76 29.72 30.30 448 23.4 21.2 18.7 14.7 LOW 80.0 33,957 3.78 0.59 6.41 16.31 184 7.9 11.9 11.6 6.0 MEAN 92.6 61,008 6.43 1.41 15.95 22.48 295 14.4 14.5 13.7 8.8 MEDIAN 93.8 55,483 6.38 1.39 15.61 22.27 282 13.8 14.2 12.9 8.4 PINE (Operating) 6,641 29.09 92.6 39,917 4.47 0.82 4.09 29.43 371 13.0 13.7 3 13.5 3 8.9 |
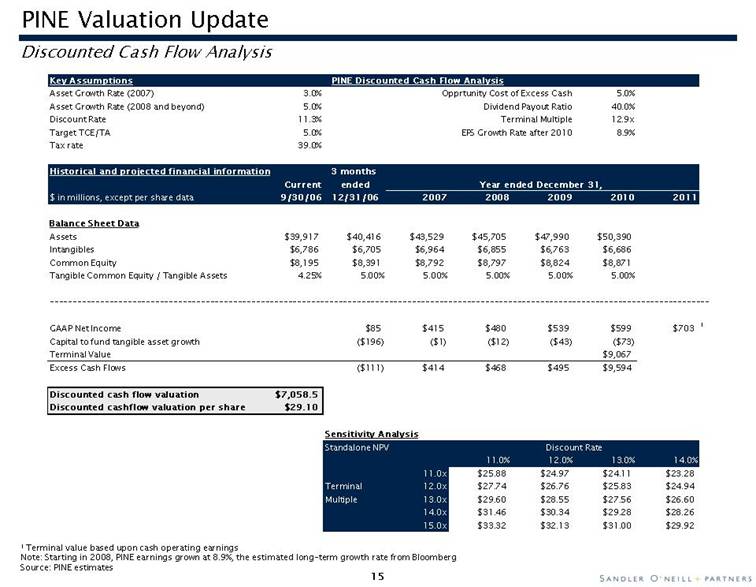
| PINE Valuation Update Discounted Cash Flow Analysis 1 Terminal value based upon cash operating earnings Note: Starting in 2008, PINE earnings grown at 8.9%, the estimated long-term growth rate from Bloomberg Source: PINE estimates Key Assumptions PINE Discounted Cash Flow Analysis Asset Growth Rate (2007) 3.0% Opprtunity Cost of Excess Cash 5.0% Asset Growth Rate (2008 and beyond) 5.0% Dividend Payout Ratio 40.0% Discount Rate 11.3% Terminal Multiple 12.9x Target TCE/TA 5.0% EPS Growth Rate after 2010 8.9% Tax rate 39.0% Historical and projected financial information 3 months Current ended Year ended December 31, $ in millions, except per share data 9/30/06 12/31/06 2007 2008 2009 2010 2011 Balance Sheet Data Assets $39,917 $40,416 $43,529 $45,705 $47,990 $50,390 Intangibles $6,786 $6,705 $6,964 $6,855 $6,763 $6,686 Common Equity $8,195 $8,391 $8,792 $8,797 $8,824 $8,871 Tangible Common Equity / Tangible Assets 4.25% 5.00% 5.00% 5.00% 5.00% 5.00% GAAP Net Income $85 $415 $480 $539 $599 $703 1 Capital to fund tangible asset growth ($196) ($1) ($12) ($43) ($73) Terminal Value $9,067 Excess Cash Flows ($111) $414 $468 $495 $9,594 Discounted cash flow valuation $7,058.5 Discounted cashflow valuation per share $29.10 Sensitivity Analysis Standalone NPV Discount Rate 11.0% 12.0% 13.0% 14.0% 11.0x $25.88 $24.97 $24.11 $23.28 Terminal 12.0x $27.74 $26.76 $25.83 $24.94 Multiple 13.0x $29.60 $28.55 $27.56 $26.60 14.0x $31.46 $30.34 $29.28 $28.26 15.0x $33.32 $32.13 $31.00 $29.92 |
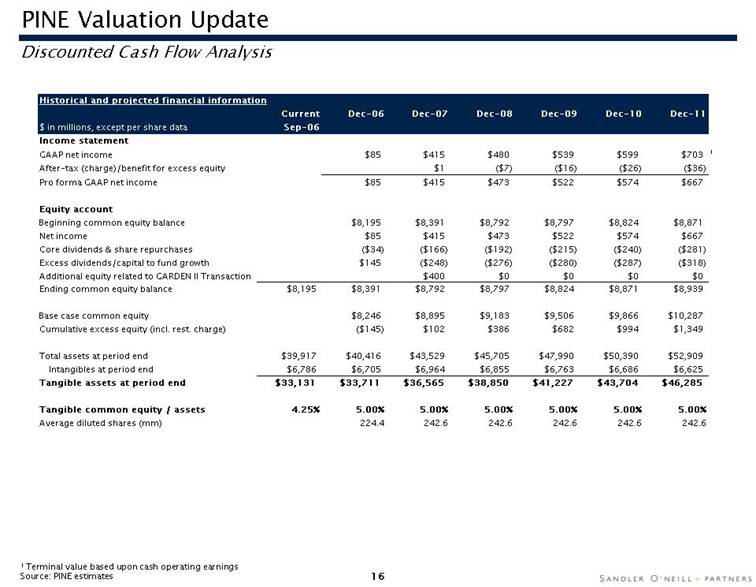
| PINE Valuation Update Discounted Cash Flow Analysis 1 Terminal value based upon cash operating earnings Source: PINE estimates Historical and projected financial information Current Dec-06 Dec-07 Dec-08 Dec-09 Dec-10 Dec-11 $ in millions, except per share data Sep-06 Income statement GAAP net income $85 $415 $480 $539 $599 $703 1 After-tax (charge)/benefit for excess equity $1 ($7) ($16) ($26) ($36) Pro forma GAAP net income $85 $415 $473 $522 $574 $667 Equity account Beginning common equity balance $8,195 $8,391 $8,792 $8,797 $8,824 $8,871 Net income $85 $415 $473 $522 $574 $667 Core dividends & share repurchases ($34) ($166) ($192) ($215) ($240) ($281) Excess dividends/capital to fund growth $145 ($248) ($276) ($280) ($287) ($318) Additional equity related to GARDEN II Transaction $400 $0 $0 $0 $0 Ending common equity balance $8,195 $8,391 $8,792 $8,797 $8,824 $8,871 $8,939 Base case common equity $8,246 $8,895 $9,183 $9,506 $9,866 $10,287 Cumulative excess equity (incl. rest. charge) ($145) $102 $386 $682 $994 $1,349 Total assets at period end $39,917 $40,416 $43,529 $45,705 $47,990 $50,390 $52,909 Intangibles at period end $6,786 $6,705 $6,964 $6,855 $6,763 $6,686 $6,625 Tangible assets at period end $33,131 $33,711 $36,565 $38,850 $41,227 $43,704 $46,285 Tangible common equity / assets 4.25% 5.00% 5.00% 5.00% 5.00% 5.00% 5.00% Average diluted shares (mm) 224.4 242.6 242.6 242.6 242.6 242.6 |
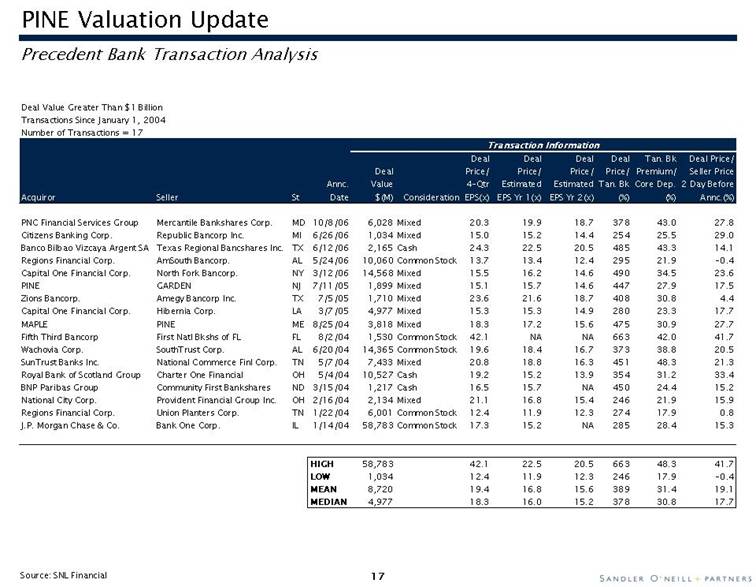
| Precedent Bank Transaction Analysis Source: SNL Financial PINE Valuation Update Deal Value Greater Than $1 Billion Transactions Since January 1, 2004 Number of Transactions = 17 Transaction Information Deal Deal Deal Deal Tan. Bk Deal Price/ Deal Price/ Price/ Price/ Price/ Premium/ Seller Price Annc. Value 4-Qtr Estimated Estimated Tan. Bk Core Dep. 2 Day Before Acquiror Seller St Date $(M) Consideration EPS(x) EPS Yr 1(x) EPS Yr 2(x) (%) (%) Annc.(%) PNC Financial Services Group Mercantile Bankshares Corp. MD 10/8/06 6,028 Mixed 20.3 19.9 18.7 378 43.0 27.8 Citizens Banking Corp. Republic Bancorp Inc. MI 6/26/06 1,034 Mixed 15.0 15.2 14.4 254 25.5 29.0 Banco Bilbao Vizcaya Argent SA Texas Regional Bancshares Inc. TX 6/12/06 2,165 Cash 24.3 22.5 20.5 485 43.3 14.1 Regions Financial Corp. AmSouth Bancorp. AL 5/24/06 10,060 Common Stock 13.7 13.4 12.4 295 21.9 -0.4 Capital One Financial Corp. North Fork Bancorp. NY 3/12/06 14,568 Mixed 15.5 16.2 14.6 490 34.5 23.6 PINE GARDEN NJ 7/11/05 1,899 Mixed 15.1 15.7 14.6 447 27.9 17.5 Zions Bancorp. Amegy Bancorp Inc. TX 7/5/05 1,710 Mixed 23.6 21.6 18.7 408 30.8 4.4 Capital One Financial Corp. Hibernia Corp. LA 3/7/05 4,977 Mixed 15.3 15.3 14.9 280 23.3 17.7 MAPLE PINE ME 8/25/04 3,818 Mixed 18.3 17.2 15.6 475 30.9 27.7 Fifth Third Bancorp First Natl Bkshs of FL FL 8/2/04 1,530 Common Stock 42.1 NA NA 663 42.0 41.7 Wachovia Corp. SouthTrust Corp. AL 6/20/04 14,365 Common Stock 19.6 18.4 16.7 373 38.8 20.5 SunTrust Banks Inc. National Commerce Finl Corp. TN 5/7/04 7,433 Mixed 20.8 18.8 16.3 451 48.3 21.3 Royal Bank of Scotland Group Charter One Financial OH 5/4/04 10,527 Cash 19.2 15.2 13.9 354 31.2 33.4 BNP Paribas Group Community First Bankshares ND 3/15/04 1,217 Cash 16.5 15.7 NA 450 24.4 15.2 National City Corp. Provident Financial Group Inc. OH 2/16/04 2,134 Mixed 21.1 16.8 15.4 246 21.9 15.9 Regions Financial Corp. Union Planters Corp. TN 1/22/04 6,001 Common Stock 12.4 11.9 12.3 274 17.9 0.8 J.P. Morgan Chase & Co. Bank One Corp. IL 1/14/04 58,783 Common Stock 17.3 15.2 NA 285 28.4 15.3 HIGH 58,783 42.1 22.5 20.5 663 48.3 41.7 LOW 1,034 12.4 11.9 12.3 246 17.9 -0.4 MEAN 8,720 19.4 16.8 15.6 389 31.4 19.1 MEDIAN 4,977 18.3 16.0 15.2 378 30.8 17.7 |
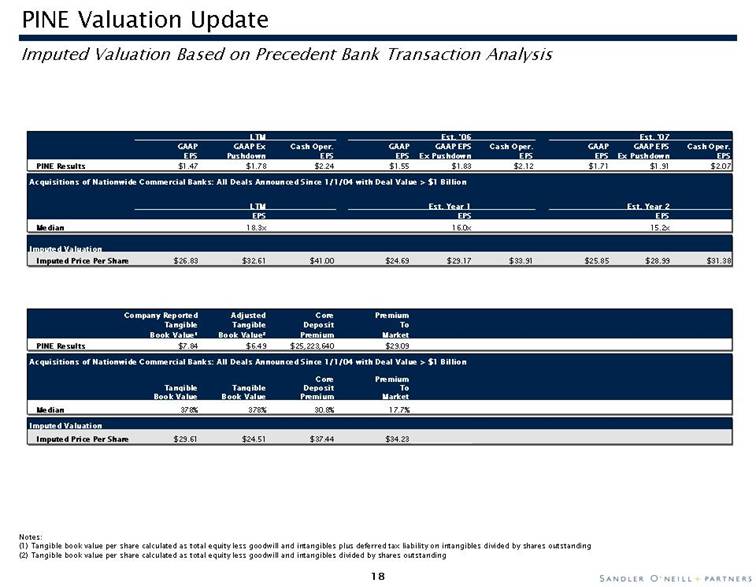
| Imputed Valuation Based on Precedent Bank Transaction Analysis PINE Valuation Update Notes: (1) Tangible book value per share calculated as total equity less goodwill and intangibles plus deferred tax liability on intangibles divided by shares outstanding (2) Tangible book value per share calculated as total equity less goodwill and intangibles divided by shares outstanding LTM Est. '06 Est. '07 GAAP GAAP Ex Cash Oper. GAAP GAAP EPS Cash Oper. GAAP GAAP EPS Cash Oper. EPS Pushdown EPS EPS Ex Pushdown EPS EPS Ex Pushdown EPS PINE Results $1.47 $1.78 $2.24 $1.55 $1.83 $2.12 $1.71 $1.91 $2.07 Acquisitions of Nationwide Commercial Banks: All Deals Announced Since 1/1/04 with Deal Value > $1 Billion LTM Est. Year 1 Est. Year 2 EPS EPS EPS Median 18.3x 16.0x 15.2x Imputed Valuation Imputed Price Per Share $26.83 $32.61 $41.00 $24.69 $29.17 $33.91 $25.85 $28.99 $31.38 Company Reported Adjusted Core Premium Tangible Tangible Deposit To Book Value1 Book Value2 Premium Market PINE Results $7.84 $6.49 $25,223,640 $29.09 Acquisitions of Nationwide Commercial Banks: All Deals Announced Since 1/1/04 with Deal Value > $1 Billion Core Premium Tangible Tangible Deposit To Book Value Book Value Premium Market Median 378% 378% 30.8% 17.7% Imputed Valuation Imputed Price Per Share $29.61 $24.51 $37.44 $34.23 |
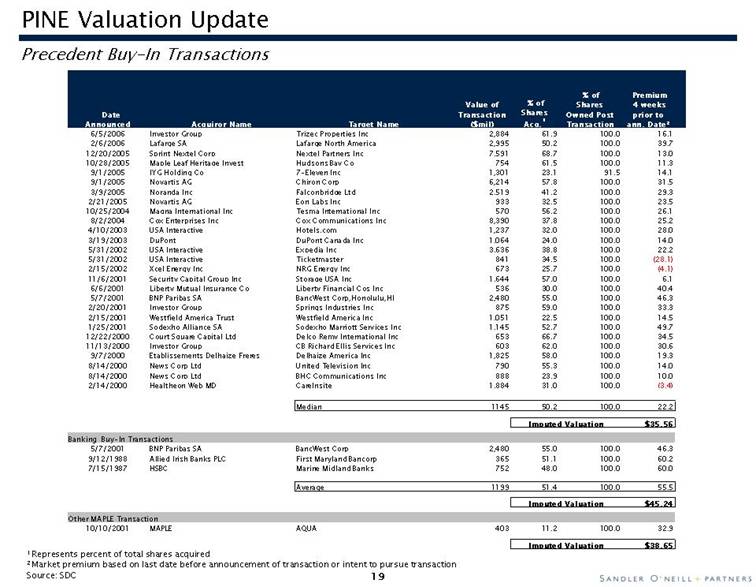
| PINE Valuation Update Precedent Buy-In Transactions 1 Represents percent of total shares acquired 2 Market premium based on last date before announcement of transaction or intent to pursue transaction Source: SDC % of Premium Value of % of Shares 4 weeks Date Transaction Shares Owned Post prior to Announced Acquiror Name Target Name ($mil) Acq.1 Transaction ann. Date2 6/5/2006 Investor Group Trizec Properties Inc 2,884 61.9 100.0 16.1 2/6/2006 Lafarge SA Lafarge North America 2,995 50.2 100.0 39.7 12/20/2005 Sprint Nextel Corp Nextel Partners Inc 7,591 68.7 100.0 13.0 10/28/2005 Maple Leaf Heritage Invest Hudsons Bay Co 754 61.5 100.0 11.3 9/1/2005 IYG Holding Co 7-Eleven Inc 1,301 23.1 91.5 14.1 9/1/2005 Novartis AG Chiron Corp 6,214 57.8 100.0 31.5 3/9/2005 Noranda Inc Falconbridge Ltd 2,519 41.2 100.0 29.3 2/21/2005 Novartis AG Eon Labs Inc 933 32.5 100.0 23.5 10/25/2004 Magna International Inc Tesma International Inc 570 56.2 100.0 26.1 8/2/2004 Cox Enterprises Inc Cox Communications Inc 8,390 37.8 100.0 25.2 4/10/2003 USA Interactive Hotels.com 1,237 32.0 100.0 28.0 3/19/2003 DuPont DuPont Canada Inc 1,064 24.0 100.0 14.0 5/31/2002 USA Interactive Expedia Inc 3,636 38.8 100.0 22.2 5/31/2002 USA Interactive Ticketmaster 841 34.5 100.0 (28.1) 2/15/2002 Xcel Energy Inc NRG Energy Inc 673 25.7 100.0 (4.1) 11/6/2001 Security Capital Group Inc Storage USA Inc 1,644 57.0 100.0 6.1 6/6/2001 Liberty Mutual Insurance Co Liberty Financial Cos Inc 536 30.0 100.0 40.4 5/7/2001 BNP Paribas SA BancWest Corp,Honolulu,HI 2,480 55.0 100.0 46.3 2/20/2001 Investor Group Springs Industries Inc 875 59.0 100.0 33.3 2/15/2001 Westfield America Trust Westfield America Inc 1,051 22.5 100.0 14.5 1/25/2001 Sodexho Alliance SA Sodexho Marriott Services Inc 1,145 52.7 100.0 49.7 12/22/2000 Court Square Capital Ltd Delco Remy International Inc 653 66.7 100.0 34.5 11/13/2000 Investor Group CB Richard Ellis Services Inc 603 62.0 100.0 30.6 9/7/2000 Etablissements Delhaize Freres Delhaize America Inc 1,825 58.0 100.0 19.3 8/14/2000 News Corp Ltd United Television Inc 790 55.3 100.0 14.0 8/14/2000 News Corp Ltd BHC Communications Inc 888 23.9 100.0 10.0 2/14/2000 Healtheon Web MD Carelnsite 1,884 31.0 100.0 (3.4) Median 1145 50.2 100.0 22.2 Imputed Valuation $35.56 Banking Buy-In Transactions 5/7/2001 BNP Paribas SA BancWest Corp 2,480 55.0 100.0 46.3 9/12/1988 Allied Irish Banks PLC First Maryland Bancorp 365 51.1 100.0 60.2 7/15/1987 HSBC Marine Midland Banks 752 48.0 100.0 60.0 Average 1199 51.4 100.0 55.5 Imputed Valuation $45.24 Other MAPLE Transaction 10/10/2001 MAPLE AQUA 403 11.2 100.0 32.9 Imputed Valuation $38.65 |
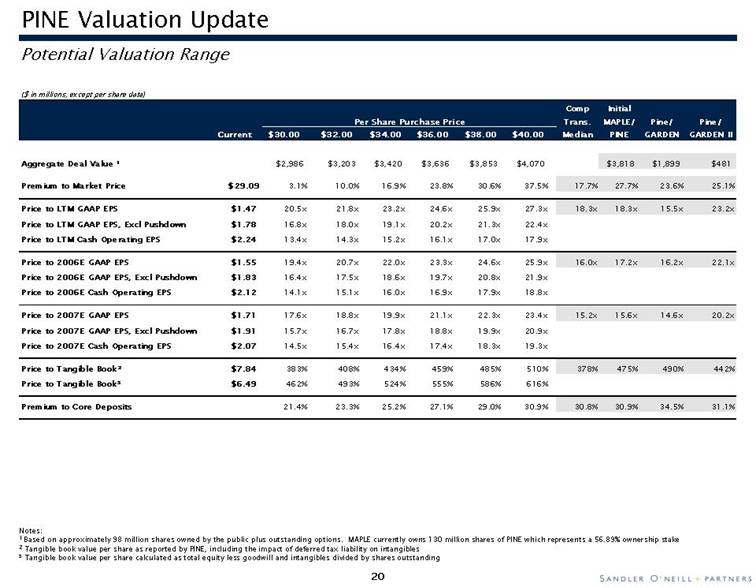
| Notes: 1 Based on approximately 98 million shares owned by the public plus outstanding options. MAPLE currently owns 130 million shares of PINE which represents a 56.89% ownership stake 2 Tangible book value per share as reported by PINE, including the impact of deferred tax liability on intangibles 3 Tangible book value per share calculated as total equity less goodwill and intangibles divided by shares outstanding Potential Valuation Range PINE Valuation Update ($ in millions, except per share data) Comp Initial Per Share Purchase Price Trans. MAPLE/ Pine/ Pine/ Current $30.00 $32.00 $34.00 $36.00 $38.00 $40.00 Median PINE GARDEN GARDEN II Aggregate Deal Value 1 $2,986 $3,203 $3,420 $3,636 $3,853 $4,070 $3,818 $1,899 $481 Premium to Market Price $29.09 3.1% 10.0% 16.9% 23.8% 30.6% 37.5% 17.7% 27.7% 23.6% 25.1% Price to LTM GAAP EPS $1.47 20.5x 21.8x 23.2x 24.6x 25.9x 27.3x 18.3x 18.3x 15.5x 23.2x Price to LTM GAAP EPS, Excl Pushdown $1.78 16.8x 18.0x 19.1x 20.2x 21.3x 22.4x Price to LTM Cash Operating EPS $2.24 13.4x 14.3x 15.2x 16.1x 17.0x 17.9x Price to 2006E GAAP EPS $1.55 19.4x 20.7x 22.0x 23.3x 24.6x 25.9x 16.0x 17.2x 16.2x 22.1x Price to 2006E GAAP EPS, Excl Pushdown $1.83 16.4x 17.5x 18.6x 19.7x 20.8x 21.9x Price to 2006E Cash Operating EPS $2.12 14.1x 15.1x 16.0x 16.9x 17.9x 18.8x Price to 2007E GAAP EPS $1.71 17.6x 18.8x 19.9x 21.1x 22.3x 23.4x 15.2x 15.6x 14.6x 20.2x Price to 2007E GAAP EPS, Excl Pushdown $1.91 15.7x 16.7x 17.8x 18.8x 19.9x 20.9x Price to 2007E Cash Operating EPS $2.07 14.5x 15.4x 16.4x 17.4x 18.3x 19.3x Price to Tangible Book2 $7.84 383% 408% 434% 459% 485% 510% 378% 475% 490% 442% Price to Tangible Book 3 $6.49 462% 493% 524% 555% 586% 616% Premium to Core Deposits 21.4% 23.3% 25.2% 27.1% 29.0% 30.9% 30.8% 30.9% 34.5% 31.1% |