Exhibit (c)(11)
| Confidential Material Regarding: June 27, 2006 Confidential Project ACADIA New York – Atlanta - Boston - Chicago - San Francisco |
| This presentation, and the oral or video presentation that supplements it, have been developed by and are proprietary to Sandler O'Neill & Partners, L.P. and were prepared exclusively for the benefit and internal use of the recipient. Neither the printed presentation nor the oral or video presentation that supplements it, nor any of their contents, may be reproduced, distributed or used for any other purpose without the prior written consent of Sandler O'Neill & Partners, L.P. The analyses contained herein rely upon information obtained from the recipient or from public sources, the accuracy of which has not been verified, and cannot be assured, by Sandler O'Neill & Partners, L.P. Moreover, many of the projections and financial analyses herein are based on estimated financial performance prepared by or in consultation with the recipient and are intended only to suggest reasonable ranges of results. Finally, the printed presentation is incomplete without the oral or video presentation that supplements it. Sandler O’Neill & Partners, L.P. prohibits employees from offering, directly or indirectly, favorable research, a specific rating or a specific price target, or offering or threatening to change research, a rating or a price target to a company as consideration or inducement for the receipt of business or compensation. The Firm also prohibits research analysts from being compensated for their involvement in, or based upon, specific investment banking transactions. Sandler O'Neill & Partners, L.P. is a limited partnership, the sole general partner of which is Sandler O'Neill & Partners Corp., a New York corporation. Sandler O'Neill & Partners, L.P. is a registered broker-dealer and a member of the National Association of Securities Dealers, Inc. Sandler O'Neill Mortgage Finance L.P. is an indirect wholly-owned subsidiary of Sandler O'Neill & Partners Corp. This material is protected under applicable copyright laws and does not carry any rights of publication or disclosure. GENERAL INFORMATION AND LIMITATIONS |
| Table of Contents Executive Summary Credentials Process State of the Banking Environment and Bank M&A Market Initial Valuation Considerations Appendix |
| Executive Summary |

| Executive Summary Sandler O’Neill is uniquely qualified to advise the Committee of Designated Independent Directors of PINE with respect to all facets of a potential going private transaction with MAPLE Valuation Timing Negotiations Fairness Opinion Top Ranked Bank and Thrift M&A Credentials Highly Experienced Deal Team Free of Conflicts |
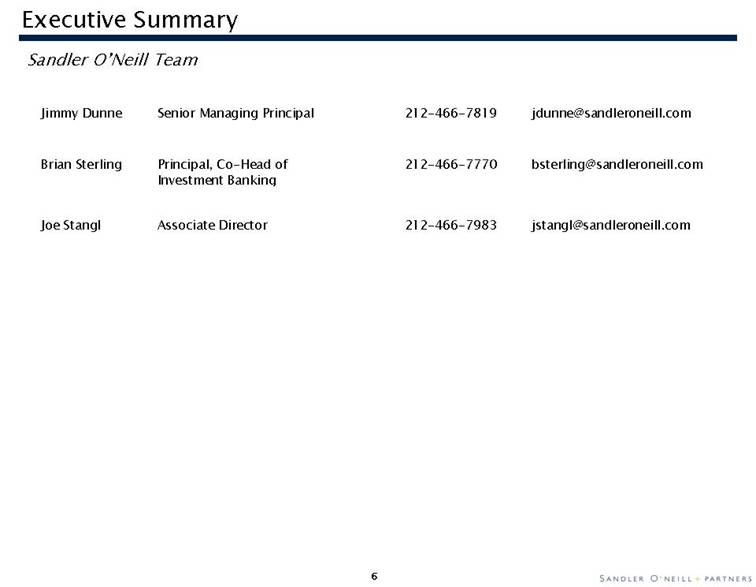
| Executive Summary Sandler O’Neill Team Jimmy DunneSenior Managing Principal212-466-7819jdunne@sandleroneill.comBrian SterlingPrincipal, Co-Head of 212-466-7770bsterling@sandleroneill.comInvestment BankingJoe StanglAssociate Director212-466-7983jstangl@sandleroneill.com |
| Credentials |

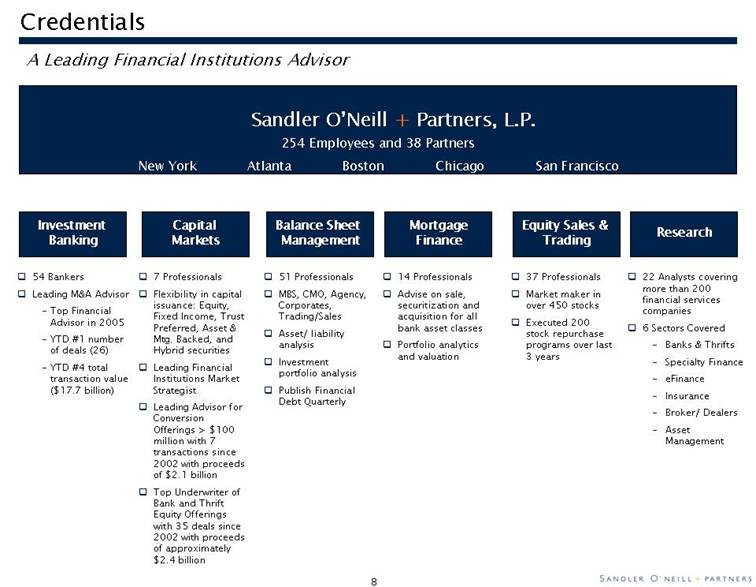
| 254 Employees and 38 Partners New York Atlanta Boston Chicago San Francisco Investment Banking 54 Bankers Leading M&A Advisor Top Financial Advisor in 2005 YTD #1 number of deals (26) YTD #4 total transaction value ($17.7 billion) Capital Markets 7 Professionals Flexibility in capital issuance: Equity, Fixed Income, Trust Preferred, Asset & Mtg. Backed, and Hybrid securities Leading Financial Institutions Market Strategist Leading Advisor for Conversion Offerings > $100 million with 7 transactions since 2002 with proceeds of $2.1 billion Top Underwriter of Bank and Thrift Equity Offerings with 35 deals since 2002 with proceeds of approximately $2.4 billion Balance Sheet Management 51 Professionals MBS, CMO, Agency, Corporates, Trading/Sales Asset/ liability analysis Investment portfolio analysis Publish Financial Debt Quarterly Equity Sales & Trading 37 Professionals Market maker in over 450 stocks Executed 200 stock repurchase programs over last 3 years Mortgage Finance 14 Professionals Advise on sale, securitization and acquisition for all bank asset classes Portfolio analytics and valuationResearch 22 Analysts covering more than 200 financial services companies 6 Sectors Covered Banks & Thrifts Specialty Finance eFinance Insurance Broker/ Dealers Asset Management Sandler O’Neill + Partners, L.P. Credentials A Leading Financial Institutions Advisor |
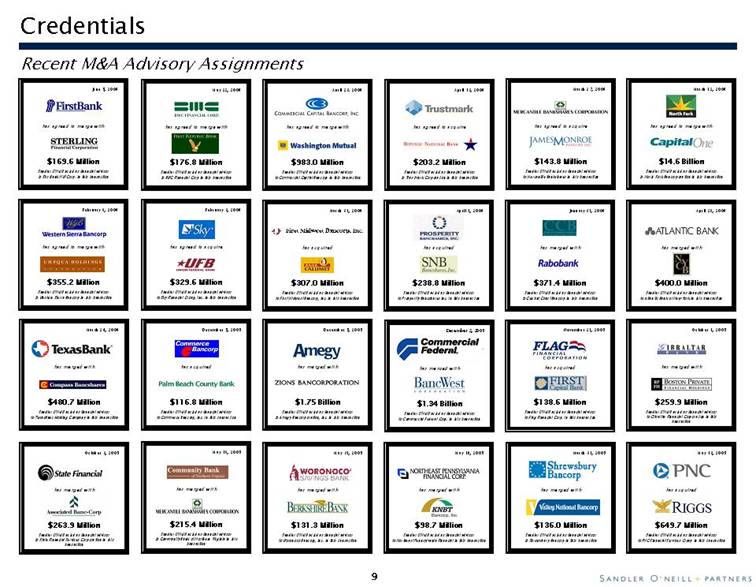
| Credentials Recent M&A Advisory Assignments has merged with$215.4 MillionSandler O'Neill acted as financial advisorMay 18, 2005to Community Bank of Northern Virginia in this transactionhas merged with$98.7 MillionSandler O'Neill acted as financial advisorto Northeast Pennsylvania Financial in this transactionMay 19, 2005has acquired$649.7 MillionSandler O'Neill acted as financial advisorto PNC Financial Services Group in this transactionMay 13, 2005has merged with$263.9 MillionSandler O'Neill acted as financial advisorOctober 3, 2005to State Financial Services Corporation in this transactionhas agreed to merge with$355.2 MillionSandler O'Neill acted as financial advisorto Western Sierra Bancorp in this transactionFebruary 8, 2006has merged with$1.34 BillionSandler O'Neill acted as financial advisorto Commercial Federal Corp. in this transactionDecember 2, 2005has agreed to acquire$143.8 MillionSandler O'Neill acted as financial advisorto Mercantile Bankshares in this transactionMarch 27, 2006has merged with$480.7 MillionSandler O'Neill acted as financial advisorto TexasBanc Holding Company in this transactionMarch 24, 2006has agreed to acquire$203.2 MillionSandler O'Neill acted as financial advisorto Trustmark Corporation in this transactionApril 13, 2006has acquired$307.0 MillionSandler O'Neill acted as financial advisorto First Midwest Bancorp, Inc. in this transactionMarch 31, 2006has merged with$400.0 MillionSandler O'Neill acted as financial advisorto Atlantic Bank of New York in this transactionApril 28, 2006has merged with$131.3 MillionSandler O'Neill acted as financial advisorto Woronoco Bancorp, Inc. in this transactionMay 31, 2005has agreed to acquire$329.6 MillionSandler O'Neill acted as financial advisorto Sky Financial Group, Inc. in this transactionFebruary 3, 2006has merged with$259.9 MillionSandler O'Neill acted as financial advisorOctober 1, 2005to Gibraltar Financial Corporation in this transactionhas agreed to merge with$14.6 BillionSandler O'Neill acted as financial advisorto North Fork Bancorporation in this transactionMarch 12, 2006has acquired$238.8 MillionSandler O'Neill acted as financial advisorto Prosperity Bancshares Inc. in this transactionApril 1, 2006has agreed to merge with$176.8 MillionSandler O'Neill acted as financial advisorto BWC Financial Corp in this transactionMay 22, 2006 |
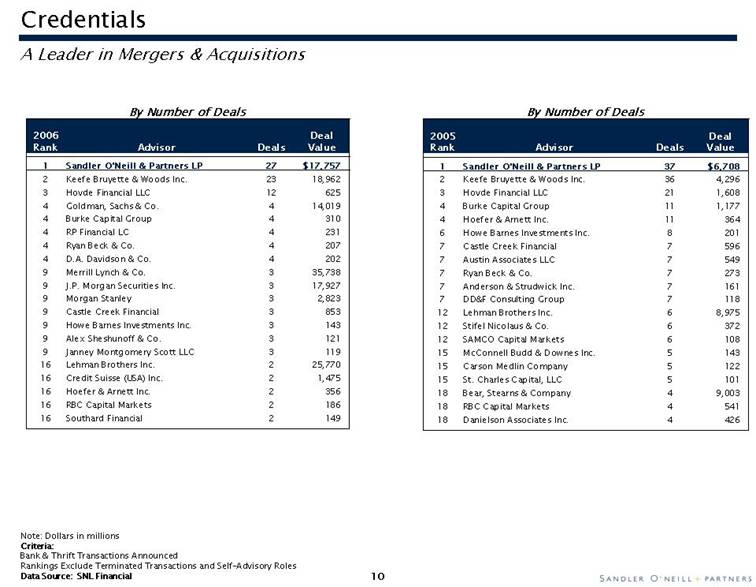
| By Number of Deals 2006 Deal Rank Advisor Deals Value 1 Sandler O'Neill & Partners LP 27 $17,757 2 Keefe Bruyette & Woods Inc. 23 18,962 3 Hovde Financial LLC 12 625 4 Goldman, Sachs & Co. 4 14,019 4 Burke Capital Group 4 310 4 RP Financial LC 4 231 4 Ryan Beck & Co. 4 207 4 D.A. Davidson & Co. 4 202 9 Merrill Lynch & Co. 3 35,738 9 J.P. Morgan Securities Inc. 3 17,927 9 Morgan Stanley 3 2,823 9 Castle Creek Financial 3 853 9 Howe Barnes Investments Inc. 3 143 9 Alex Sheshunoff & Co. 3 121 9 Janney Montgomery Scott LLC 3 119 16 Lehman Brothers Inc. 2 25,770 16 Credit Suisse (USA) Inc. 2 1,475 16 Hoefer & Arnett Inc. 2 356 16 RBC Capital Markets 2 186 16 Southard Financial 2 149 A Leader in Mergers & Acquisitions Note: Dollars in millions Criteria: Bank & Thrift Transactions Announced Rankings Exclude Terminated Transactions and Self-Advisory Roles Data Source: SNL Financial Credentials 2005DealRankAdvisorDealsValue1Sandler O'Neill & Partners LP37$6,7082Keefe Bruyette & Woods Inc.364,296 3Hovde Financial LLC211,6084Burke Capital Group111,1774Hoefer & Arnett Inc.113646Howe Barnes Investments Inc.82017Castle Creek Financial75967Austin Associates LLC75497Ryan Beck & Co.72737Anderson & Strudwick Inc.71617DD&F Consulting Group711812Lehman Brothers Inc.68,97512Stifel Nicolaus & Co.637212SAMCO Capital Markets610815McConnell Budd & Downes Inc.514315Carson Medlin Company512215St. Charles Capital, LLC510118Bear, Stearns & Company49,00318RBC Capital Markets454118Danielson Associates Inc.4426By Number of Deals |
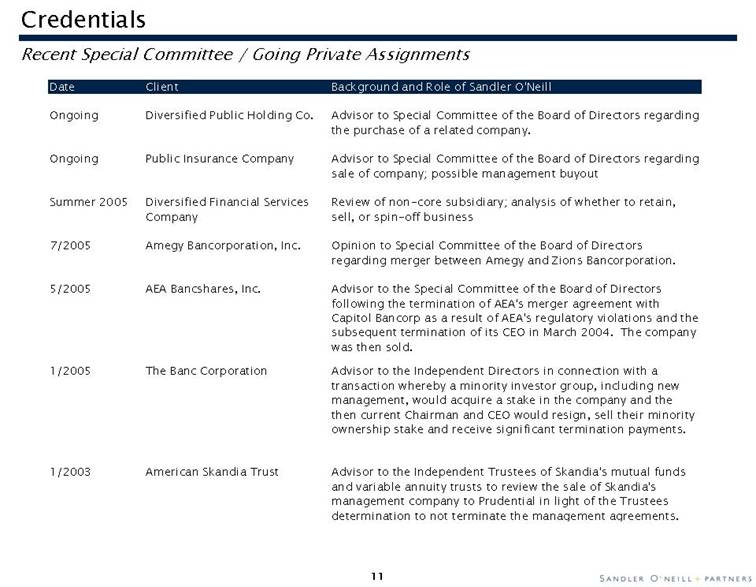
| Credentials Recent Special Committee / Going Private Assignments Date Client Background and Role of Sandler O'Neill Ongoing Diversified Public Holding Co. Advisor to Special Committee of the Board of Directors regarding the purchase of a related company. Ongoing Public Insurance Company Advisor to Special Committee of the Board of Directors regarding sale of company; possible management buyout Summer 2005 Diversified Financial Services Review of non-core subsidiary; analysis of whether to retain, Company sell, or spin-off business 7/2005 Amegy Bancorporation, Inc. Opinion to Special Committee of the Board of Directors regarding merger between Amegy and Zions Bancorporation. 5/2005 AEA Bancshares, Inc. Advisor to the Special Committee of the Board of Directors following the termination of AEA's merger agreement with Capitol Bancorp as a result of AEA's regulatory violations and the subsequent termination of its CEO in March 2004. The company was then sold. 1/2005 The Banc Corporation Advisor to the Independent Directors in connection with a transaction whereby a minority investor group, including new management, would acquire a stake in the company and the then current Chairman and CEO would resign, sell their minority ownership stake and receive significant termination payments. 1/2003 American Skandia Trust Advisor to the Independent Trustees of Skandia's mutual funds and variable annuity trusts to review the sale of Skandia's management company to Prudential in light of the Trustees determination to not terminate the management agreements. |
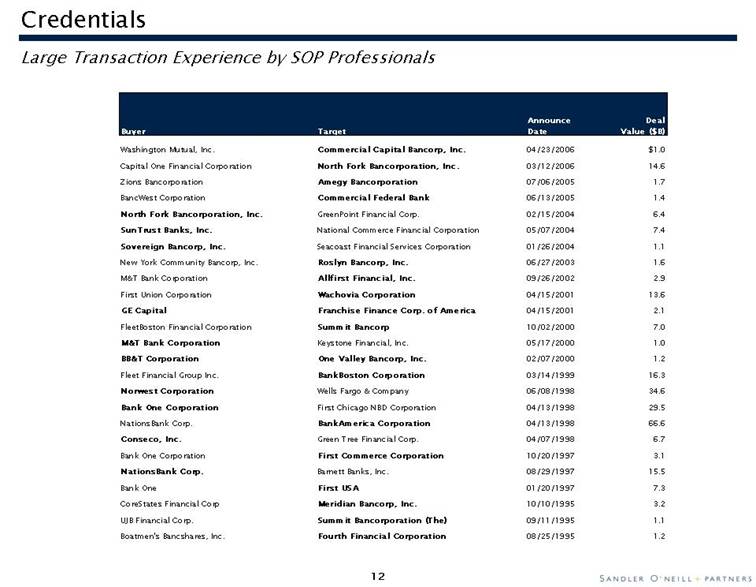
| Credentials Large Transaction Experience by SOP Professionals Announce Deal Buyer Target Date Value ($B) Washington Mutual, Inc. Commercial Capital Bancorp, Inc. 04/23/2006 $1.0 Capital One Financial Corporation North Fork Bancorporation, Inc. 03/12/2006 14.6 Zions Bancorporation Amegy Bancorporation 07/06/2005 1.7 BancWest Corporation Commercial Federal Bank 06/13/2005 1.4 North Fork Bancorporation, Inc. GreenPoint Financial Corp. 02/15/2004 6.4 SunTrust Banks, Inc. National Commerce Financial Corporation 05/07/2004 7.4 Sovereign Bancorp, Inc. Seacoast Financial Services Corporation 01/26/2004 1.1 New York Community Bancorp, Inc. Roslyn Bancorp, Inc. 06/27/2003 1.6 M&T Bank Corporation Allfirst Financial, Inc. 09/26/2002 2.9 First Union Corporation Wachovia Corporation 04/15/2001 13.6 GE Capital Franchise Finance Corp. of America 04/15/2001 2.1 FleetBoston Financial Corporation Summit Bancorp 10/02/2000 7.0 M&T Bank Corporation Keystone Financial, Inc. 05/17/2000 1.0 BB&T Corporation One Valley Bancorp, Inc. 02/07/2000 1.2 Fleet Financial Group Inc. BankBoston Corporation 03/14/1999 16.3 Norwest Corporation Wells Fargo & Company 06/08/1998 34.6 Bank One Corporation First Chicago NBD Corporation 04/13/1998 29.5 NationsBank Corp. BankAmerica Corporation 04/13/1998 66.6 Conseco, Inc. Green Tree Financial Corp. 04/07/1998 6.7 Bank One Corporation First Commerce Corporation 10/20/1997 3.1 NationsBank Corp. Barnett Banks, Inc. 08/29/1997 15.5 Bank One First USA 01/20/1997 7.3 CoreStates Financial Corp Meridian Bancorp, Inc. 10/10/1995 3.2 UJB Financial Corp. Summit Bancorporation (The) 09/11/1995 1.1 Boatmen's Bancshares, Inc. Fourth Financial Corporation 08/25/1995 1.2 |
| Process |

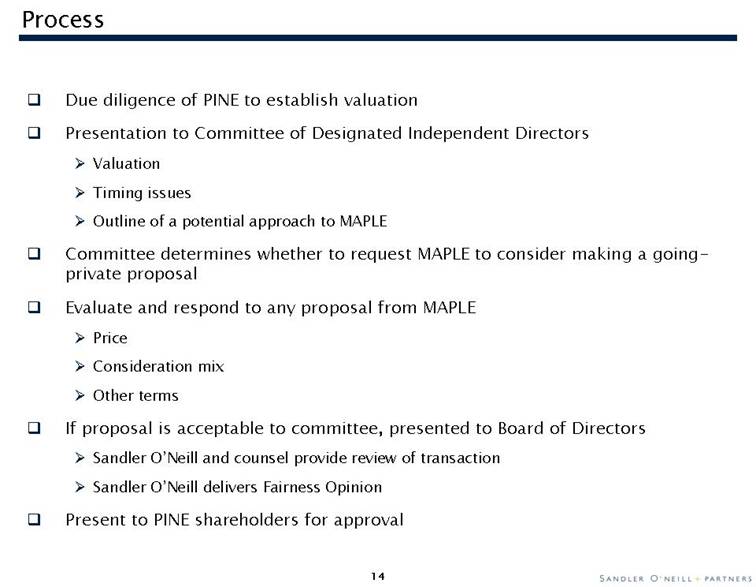
| Process Due diligence of PINE to establish valuation Presentation to Committee of Designated Independent Directors Valuation Timing issues Outline of a potential approach to MAPLE Committee determines whether to request MAPLE to consider making a going-private proposal Evaluate and respond to any proposal from MAPLE Price Consideration mix Other terms If proposal is acceptable to committee, presented to Board of Directors Sandler O’Neill and counsel provide review of transaction Sandler O’Neill delivers Fairness Opinion Present to PINE shareholders for approval |
| Process Scope of Sandler O’Neill Work Valuation analysis of PINE Timing – Now vs. Later Review of MAPLE performance and stock If directed, negotiate with MAPLE Fairness Opinion |

| Process Valuation Analysis Comparable Public Companies Comparable Transactions Transactions over $1 billion Other Buy-In transactions Initial MAPLE / PINE transaction Recent PINE transactions Dividend Discount Analysis Issues to consider Adjust current multiples to remove effect of MAPLE ownership Adjusting current results to remove merger-related charges from recent acquisitions Availability of projections for PINE reflecting value of recent acquisitions Reconciling GAAP vs. Operating/Cash EPS projections Access to PINE management to discuss results and projections Applicability of a “control premium” given MAPLE ownership of 56% Review of MAPLE Historical and expected performance Stock price Pro-forma business, earnings and capital |
| Process The determination of whether to invite MAPLE to make a proposal now should be based on: PINE’S operating performance and prospects The outlook for PINE’s stock price Integration of current transactions and ability to find more companies to buy The current operating environment for banks and trends for the future The M&A market PINE stock price has stagnated since MAPLE acquired controlling interest last year, resulting in weak acquisition currency and low shareholder returns Operating environment has worsened for banks during this period Flat yield curve Pricing competition for loans and deposits Slowing loan growth Spector of credit concerns Observations / Impact on Timing |
| Process Continued pressure on bank operations will lead to reduced M&A pricing in all but the most attractive markets PINE’s recent acquisitions will dampen earnings in the short-run Investors have “priced in” announced accretion Execution increasingly critical in a weak operating environment Reasonable to move now if pricing reflects potential earnings lift from acquisitions and integration Observations / Impact on Timing |
| State of the Banking Environment and Bank M&A Market |

| Operating fundamentals were adequate . . . Bank earnings growth slowed on average by 2% in the 4th quarter, but many regional and community players were able to post 7 – 10% EPS growth rates Anticipated rate increases on the short end occurred, but NIM’s were fairly stable over the second half of the year Loan growth continued, but at slower levels than expected with a particular slowdown on the consumer side Industry deposits grew at 7.5%, though they were marked by a shift to higher-cost funding (such as CDs) Credit quality was strong but low reserve and provision levels imply greater volatility in future quarters Spending on technology and corporate governance/compliance was a significant expense item Additionally, increased personnel expense was evident in lending, finance, compliance, audit, human resources and technology fields State of the Banking Environment and Bank M&A Market 2005 Results |
| Headwinds will continue throughout 2006 Pricing competition remains intense and will continue to pressure net interest margin Although commercial loan growth continues to be a bright spot, loan growth remains under pressure due to slowing consumer trends On balance, average loans grew at an annual rate of 8.5% in Q106, the slowest pace in the last 3 quarters Credit quality continues to be strong but deterioration is widely expected A meaningful difference between loan and core deposit growth rates implies an increased reliance on wholesale funding to fill the void As revenue growth is increasingly difficult, management teams will have to get even more aggressive on expense control and capital management State of the Banking Environment and Bank M&A Market 2006 Themes |
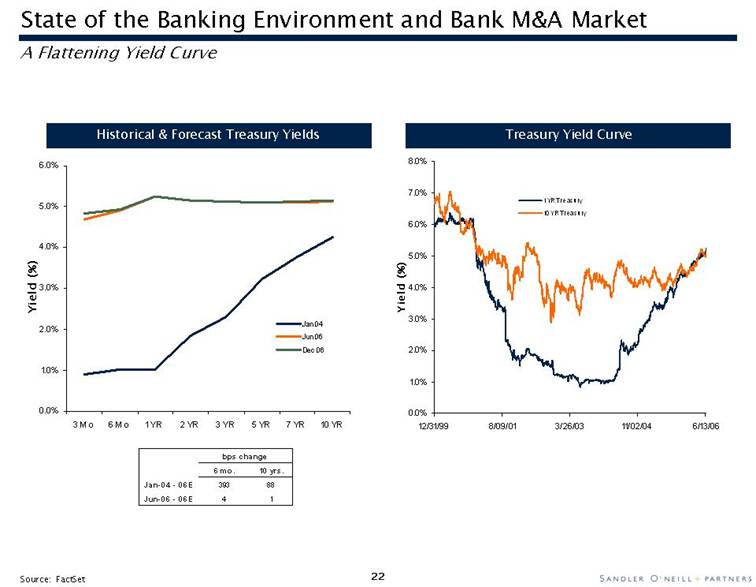
| Source: FactSet Historical & Forecast Treasury Yields Treasury Yield Curve State of the Banking Environment and Bank M&A Market A Flattening Yield Curve |
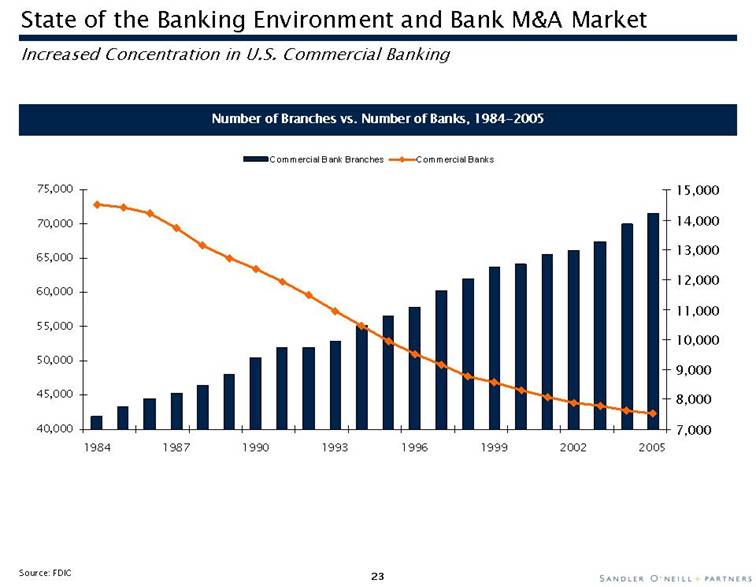
| Source: FDIC Number of Branches vs. Number of Banks, 1984-2005 Increased Concentration in U.S. Commercial Banking State of the Banking Environment and Bank M&A Market 40,00045,00050,00055,00060,00065,00070,00075,000198419871990199319961999200220057,0008,0009,000 10,00011,00012,00013,00014,00015,000Commercial Bank BranchesCommercial Banks |
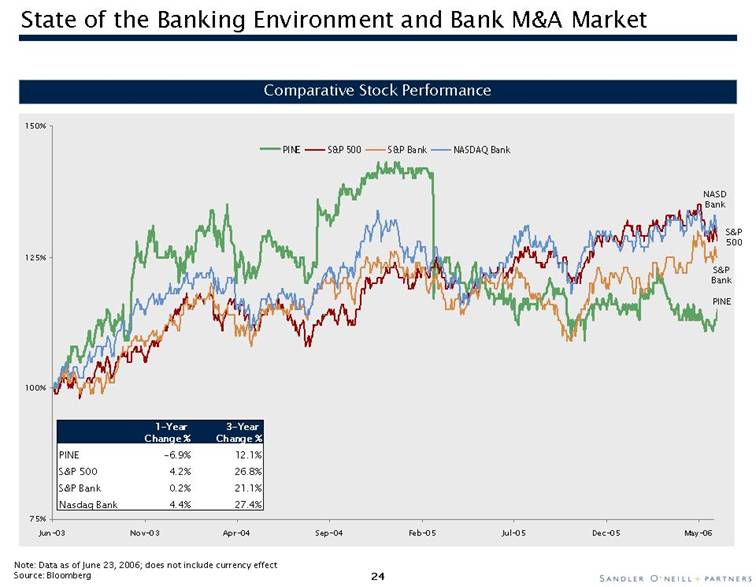
| State of the Banking Environment and Bank M&A Market Comparative Stock Performance Note: Data as of June 23, 2006; does not include currency effect Source: Bloomberg NASD Bank S&P Bank S&P 500 PINE 75%100%125%150%Jun-03Nov-03Apr-04Sep-04Feb-05Jul-05Dec-05May-06PINES&P 500S&P BankNASDAQ Bank1-Year 3-Year Change %Change %PINE-6.9%12.1%S&P 5004.2%26.8%S&P Bank0.2%21.1%Nasdaq Bank4.4%27.4% |
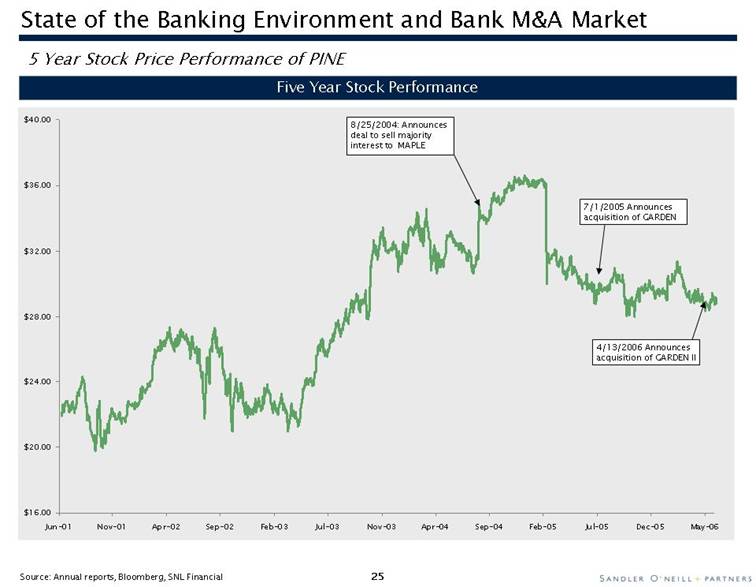
| 5 Year Stock Price Performance of PINE Five Year Stock Performance Source: Annual reports, Bloomberg, SNL Financial 8/25/2004: Announces deal to sell majority interest to MAPLE 7/1/2005 Announces acquisition of GARDEN 4/13/2006 Announces acquisition of GARDEN II State of the Banking Environment and Bank M&A Market $16.00$20.00$24.00$28.00$32.00$36.00$40.00Jun-01Nov-01Apr-02Sep-02Feb-03Jul-03Nov-03Apr-04Sep-04Feb-05Jul-05Dec-05May-06 |
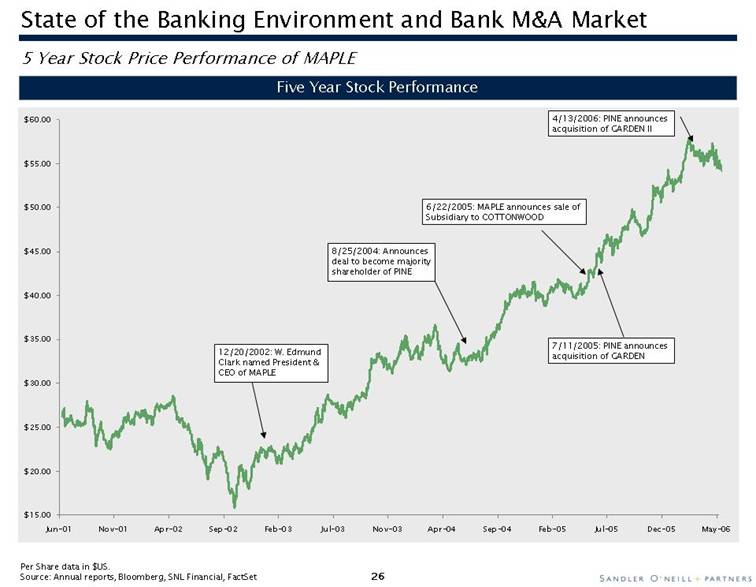
| 5 Year Stock Price Performance of MAPLE Five Year Stock Performance 8/25/2004: Announces deal to become majority shareholder of PINE 6/22/2005: MAPLE announces sale of Subsidiary to COTTONWOOD 7/11/2005: PINE announces acquisition of GARDEN 12/20/2002: W. Edmund Clark named President & CEO of MAPLE Per Share data in $US. Source: Annual reports, Bloomberg, SNL Financial, FactSet 4/13/2006: PINE announces acquisition of GARDEN II State of the Banking Environment and Bank M&A Market $15.00$20.00$25.00$30.00$35.00$40.00$45.00$50.00$55.00$60.00Jun-01Nov-01Apr-02Sep-02Feb-03Jul-03Nov-03Apr-04Sep-04Feb-05Jul-05Dec-05May-06 |
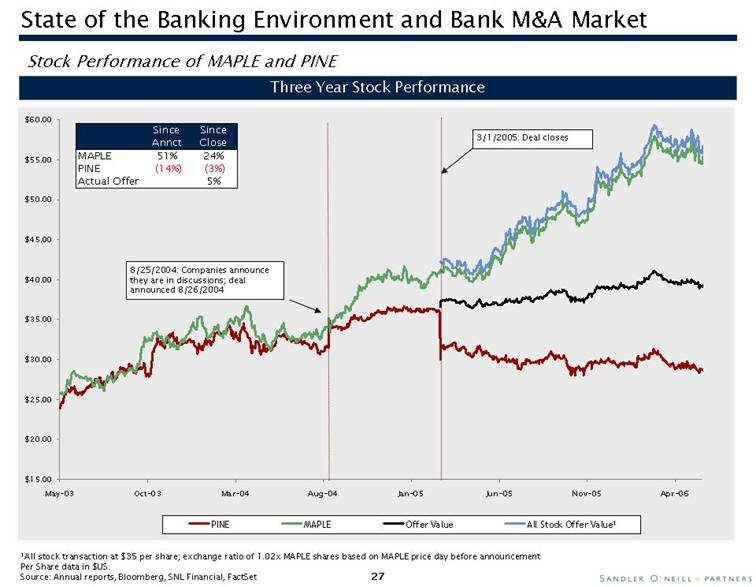
| Stock Performance of MAPLE and PINE Three Year Stock Performance 3/1/2005: Deal closes 1 All stock transaction at $35 per share; exchange ratio of 1.02x MAPLE shares based on MAPLE price day before announcement Per Share data in $US. Source: Annual reports, Bloomberg, SNL Financial, FactSet 8/25/2004: Companies announce they are in discussions; deal announced 8/26/2004 State of the Banking Environment and Bank M&A Market $15.00$20.00$25.00$30.00$35.00$40.00$45.00$50.00$55.00$60.00May-03Oct-03Mar-04Aug-04Jan-05Jun-05Nov-05Apr-06PINEMAPLEOffer ValueAll Stock Offer Value 1SinceSinceAnnctCl oseMAPLE51%24%PINE(14%)(3%)Actual Offer5% |
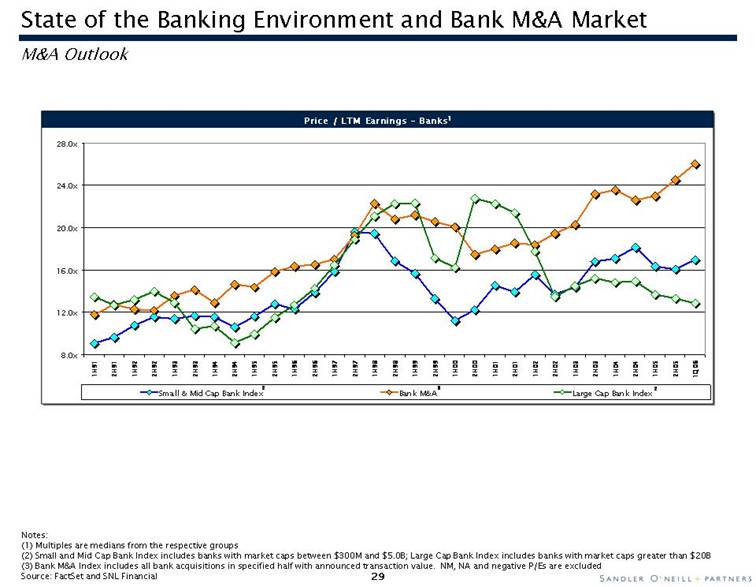
| State of the Banking Environment and Bank M&A Market Merger and acquisition activity: uneven, dominated by community banks Franchises in growth markets (big or small) continue to enjoy above average premiums Further franchise rationalization.branch sales, business line clarification Many “busted” deals or failed auctions General M&A Themes Activity by Big Banks: Very low participation: low P/E’s, de novo preference, market selective Some large, industry transforming deals Foreign banks interested in US assets Activity by Regional/Community Banks Primary participants are using their strong P/E’s in an effort to build relevancy Many small bank sellers due to operating pressures M&A Outlook |
| State of the Banking Environment and Bank M&A Market M&A Outlook Notes: (1) Multiples are medians from the respective groups (2) Small and Mid Cap Bank Index includes banks with market caps between $300M and $5.0B; Large Cap Bank Index includes banks with market caps greater than $20B (3) Bank M&A Index includes all bank acquisitions in specified half with announced transaction value. NM, NA and negative P/Es are excluded Source: FactSet and SNL Financial |
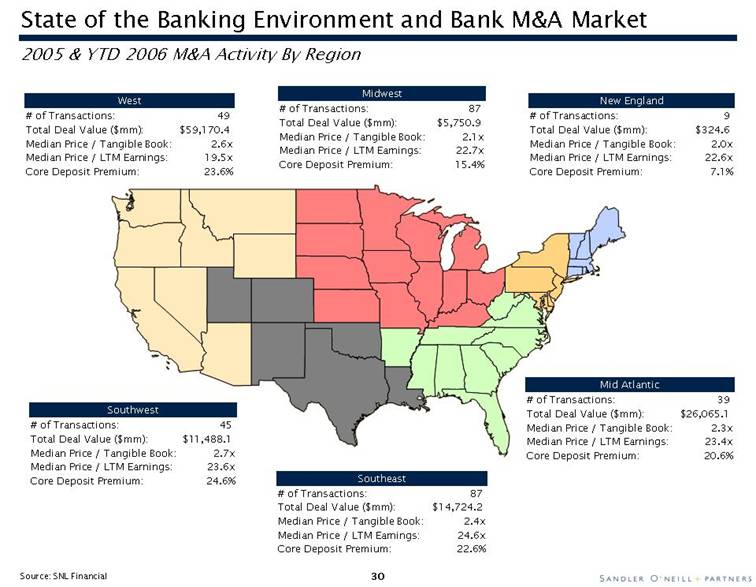
| State of the Banking Environment and Bank M&A Market Source: SNL Financial 2005 & YTD 2006 M&A Activity By Region# of Transactions:87Total Deal Value ($mm):$5,750.9Median Price / Tangible Book:2.1xMedian Price / LTM Earnings:22.7xCore Deposit Premium:15.4%Midwest# of Transactions:9Total Deal Value ($mm):$324.6Median Price / Tangible Book:2.0xMedian Price / LTM Earnings:22.6xCore Deposit Premium:7.1%New England# of Transactions:87Total Deal Value ($mm):$14,724.2Median Price / Tangible Book:2.4xMedian Price / LTM Earnings:24.6xCore Deposit Premium:22.6%Southeast# of Transactions:45Total Deal Value ($mm):$11,488.1Median Price / Tangible Book:2.7xMedian Price / LTM Earnings:23.6xCore Deposit Premium:24.6%Southwest# of Transactions:39Total Deal Value ($mm):$26,065.1Median Price / Tangible Book:2.3xMedi an Price / LTM Earnings:23.4xCore Deposit Premium:20.6%Mid Atlantic# of Transactions:49Total Deal Value ($mm):$59,170.4Median Price / Tangible Book:2.6xMedian Price / LTM Earnings:19.5xCore Deposit Premium:23.6%West |
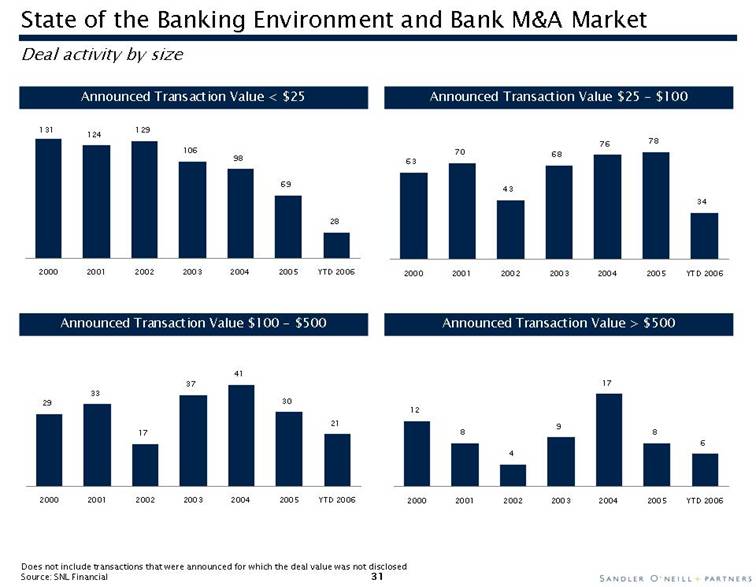
| State of the Banking Environment and Bank M&A Market Deal activity by size Does not include transactions that were announced for which the deal value was not disclosed Source: SNL Financial Announced Transaction Value < $25 131124129106986928200020012002200320042005YTD 2006Announced Transaction Value $100 -$500Announced Transaction Value $25 -$10063704368767834200020012002200320042005YTD 2006Announced Transaction Value > $50029331737413021200020012002200320042005YTD 2006128491786200020012002200320042005YTD 2006 |
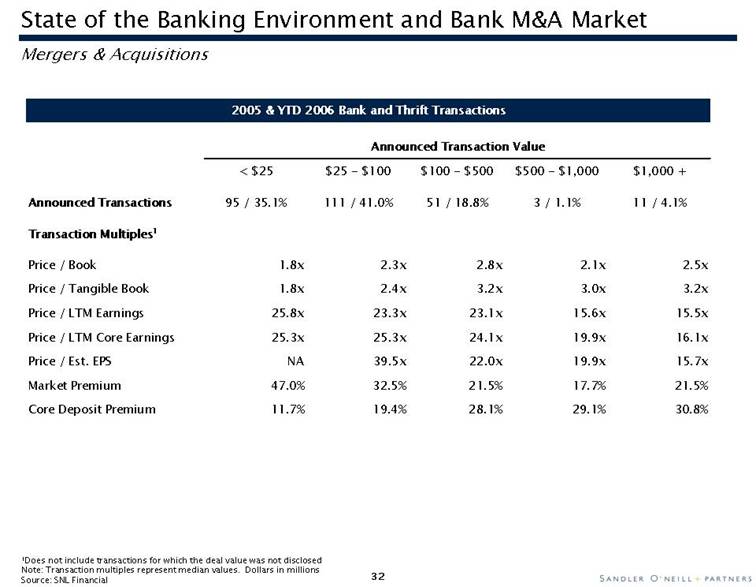
| 1Does not include transactions for which the deal value was not disclosed Note: Transaction multiples represent median values. Dollars in millions Source: SNL Financial State of the Banking Environment and Bank M&A Market Mergers & Acquisitions < $25$25 - $100$100 - $500$500 - $1,000$1,000 +Announced Transactions95 / 35.1%111 / 41.0%51 / 18.8%3 / 1.1%11 / 4.1%Transaction Multiples1Price / Book1.8x2.3x2.8x2.1x2.5xPrice / Tangible Book1.8x2.4x3.2x3.0x3.2xPrice / LTM Earnings25.8x23.3x23.1x15.6x15.5xPrice / LTM Core Ea rnings25.3x25.3x24.1x19.9x16.1xPrice / Est. EPSNA39.5x22.0x19.9x15.7xMarket Premium47.0%32.5%21.5%17.7%21.5%Core Deposit Premium11.7%19.4%28.1%29.1%30.8%Announced Transaction Value2005 & YTD 2006 Bank and Thrift Transactions |
| Initial Valuation Considerations |

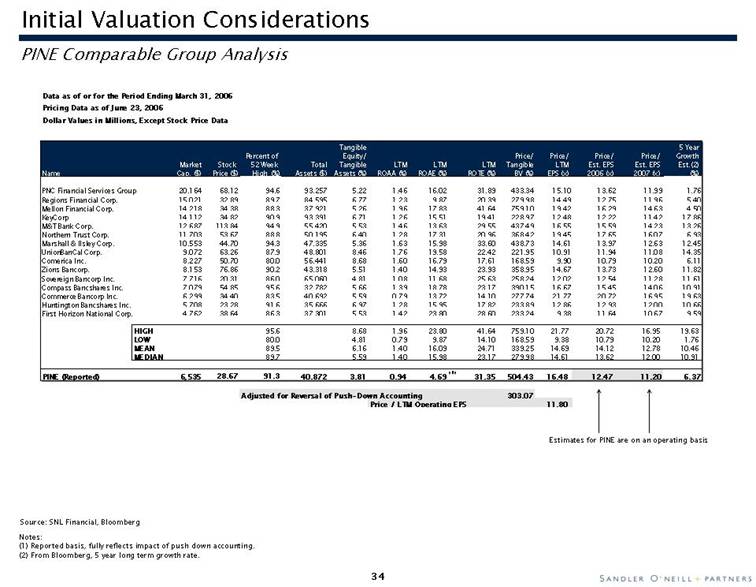
| Initial Valuation Considerations PINE Comparable Group Analysis Data as of or for the Period Ending March 31, 2006 Pricing Data as of June 23, 2006 Dollar Values in Millions, Except Stock Price Data Tangible 5 Year Percent of Equity/ Price/ Price/ Price/ Price/ Growth Market Stock 52 Week Total Tangible LTM LTM LTM Tangible LTM Est. EPS Est. EPS Est.(2) Name Cap. ($) Price ($) High (%) Assets ($) Assets (%) ROAA (%) ROAE (%) ROTE (%) BV (%) EPS (x) 2006 (x) 2007 (x) (%) PNC Financial Services Group 20,164 68.12 94.6 93,257 5.22 1.46 16.02 31.89 433.34 15.10 13.62 11.99 1.76 Regions Financial Corp. 15,021 32.89 89.7 84,595 6.77 1.23 9.87 20.39 279.98 14.49 12.75 11.96 5.40 Mellon Financial Corp. 14,218 34.38 88.3 37,921 5.26 1.96 17.83 41.64 759.10 19.42 16.29 14.63 4.50 KeyCorp 14,112 34.82 90.9 93,391 6.71 1.26 15.51 19.41 228.97 12.48 12.22 11.42 17.86 M&T Bank Corp. 12,687 113.84 94.9 55,420 5.53 1.46 13.63 29.55 437.49 16.55 15.59 14.23 13.26 Northern Trust Corp. 11,703 53.67 88.8 50,195 6.40 1.28 17.31 20.96 368.42 19.45 17.65 16.07 6.93 Marshall & Ilsley Corp. 10,553 44.70 94.3 47,335 5.36 1.63 15.98 33.60 438.73 14.61 13.97 12.63 12.45 UnionBanCal Corp. 9,072 63.26 87.9 48,801 8.46 1.76 19.58 22.42 221.95 10.91 11.94 11.08 14.35 Comerica Inc. 8,227 50.70 80.0 56,441 8.68 1.60 16.79 17.61 168.59 9.90 10.79 10.20 6.11 Zions Bancorp. 8,153 76.86 90.2 43,318 5.51 1.40 14.93 23.93 358.95 14.67 13.73 12.60 11.82 Sovereign Bancorp Inc. 7,716 20.31 86.0 65,060 4.81 1.08 11.68 25.63 258.24 12.02 12.54 11.28 11.61 Compass Bancshares Inc. 7,079 54.85 95.6 32,782 5.66 1.39 18.78 23.17 390.15 16.67 15.45 14.06 10.91 Commerce Bancorp Inc. 6,299 34.40 83.5 40,692 5.59 0.79 13.72 14.10 277.74 21.77 20.72 16.95 19.63 Huntington Bancshares Inc. 5,708 23.28 91.6 35,666 6.97 1.28 15.95 17.82 233.89 12.86 12.93 12.00 10.66 First Horizon National Corp. 4,762 38.64 86.3 37,301 5.53 1.42 23.80 28.60 233.24 9.38 11.64 10.67 9.59 HIGH 95.6 8.68 1.96 23.80 41.64 759.10 21.77 20.72 16.95 19.63 LOW 80.0 4.81 0.79 9.87 14.10 168.59 9.38 10.79 10.20 1.76 MEAN 89.5 6.16 1.40 16.09 24.71 339.25 14.69 14.12 12.78 10.46 MEDIAN 89.7 5.59 1.40 15.98 23.17 279.98 14.61 13.62 12.00 10.91 PINE (Reported) 6,535 28.67 91.3 40,872 3.81 0.94 4.69 ( 1) 31.35 504.43 16.48 12.47 11.20 6.37 Adjusted for Reversal of Push-Down Accounting 303.07 Price / LTM Operating EPS 11.80 Estimates for PINE are on an operating basis Source: SNL Financial, Bloomberg Initial Valuation Considerations Notes: (1) Reported basis, fully reflects impact of push down accounting. (2) From Bloomberg, 5 year long term growth rate. |
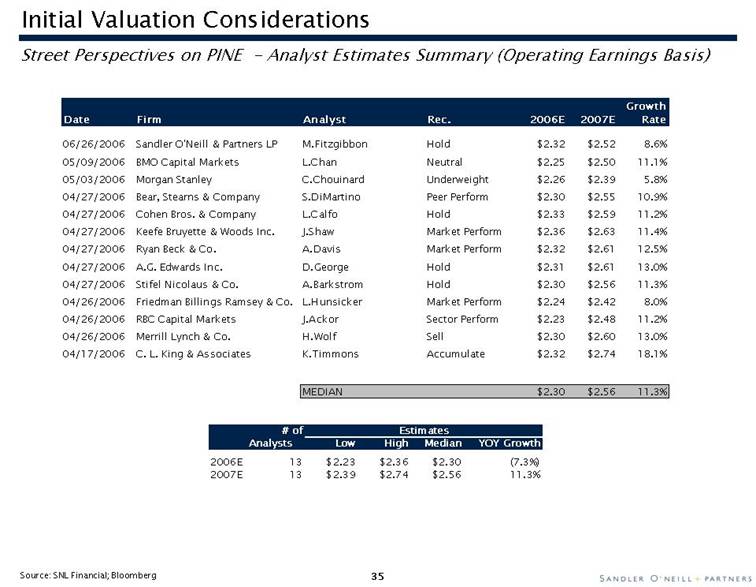
| Street Perspectives on PINE - Analyst Estimates Summary (Operating Earnings Basis) Source: SNL Financial; Bloomberg Initial Valuation Considerations # of Analysts Low High Median YOY Growth 2006E 13 $2.23 $2.36 $2.30 (7.3%) 2007E 13 $2.39 $2.74 $2.56 11.3% Estimates Growth Date Firm Analyst Rec. 2006E 2007E Rate 06/26/2006 Sandler O'Neill & Partners LP M.Fitzgibbon Hold $2.32 $2.52 8.6% 05/09/2006 BMO Capital Markets L.Chan Neutral $2.25 $2.50 11.1% 05/03/2006 Morgan Stanley C.Chouinard Underweight $2.26 $2.39 5.8% 04/27/2006 Bear, Stearns & Company S.DiMartino Peer Perform $2.30 $2.55 10.9% 04/27/2006 Cohen Bros. & Company L.Calfo Hold $2.33 $2.59 11.2% 04/27/2006 Keefe Bruyette & Woods Inc. J.Shaw Market Perform $2.36 $2.63 11.4% 04/27/2006 Ryan Beck & Co. A.Davis Market Perform $2.32 $2.61 12.5% 04/27/2006 A.G. Edwards Inc. D.George Hold $2.31 $2.61 13.0% 04/27/2006 Stifel Nicolaus & Co. A.Barkstrom Hold $2.30 $2.56 11.3% 04/26/2006 Friedman Billings Ramsey & Co. L.Hunsicker Market Perform $2.24 $2.42 8.0% 04/26/2006 RBC Capital Markets J.Ackor Sector Perform $2.23 $2.48 11.2% 04/26/2006 Merrill Lynch & Co. H.Wolf Sell $2.30 $2.60 13.0% 04/17/2006 C. L. King & Associates K.Timmons Accumulate $2.32 $2.74 18.1% MEDIAN $2.30 $2.56 11.3% |
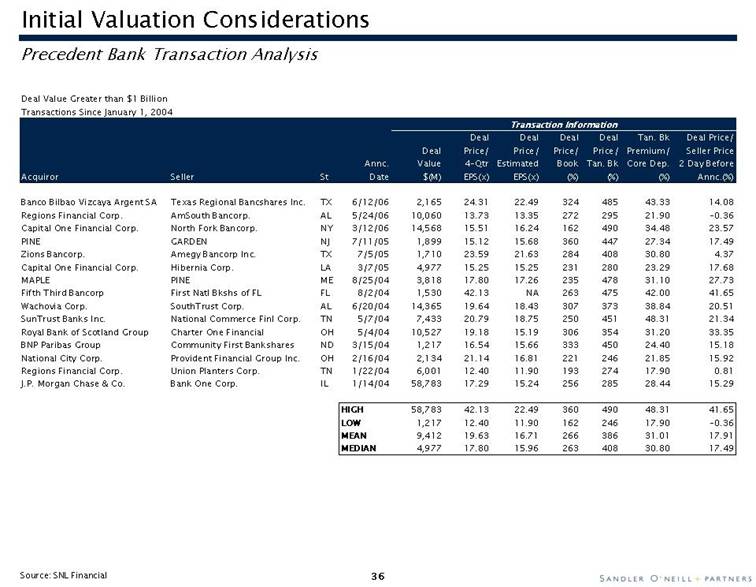
| Precedent Bank Transaction Analysis Source: SNL Financial Initial Valuation Considerations Deal Value Greater than $1 BillionTransactions Since January 1, 2004DealDealDealDealTan. BkDeal Price/DealPrice/Price/Price/Price/Premium/Seller PriceAnnc.Value4-QtrEstimatedBookTan. BkCore Dep.2 Day BeforeAcquirorSellerStDate$(M)EPS(x)EPS(x)(%)(%)(%)Annc.(%)Banco Bilbao Vizcaya Argent SATexas Regional Bancshares Inc.TX6/12/062,16524.3122.4932448543.3314.08Regions Financial Corp.AmSouth Bancorp.AL5/24/0610,06013.7313.3527229521.90-0.36Capital One Financial Corp.North Fork Bancorp.NY3/12/0614,56815.5116.2416249034.4823.57PINEGARDENNJ7/11/051,89915.1215.6836044727.3417.49Zions Bancorp.Amegy Bancorp Inc.TX7/5/051,71023.5921.6328440830.804.37Capital One Financial Corp.Hibernia Corp.LA3/7/054,97715.2515.2523128023.2917.68MAPLEPINEME8/25/043,81817.8017.2623547831.1027.73Fifth Third BancorpFirst Natl Bkshs of FLFL8/2/041,53042.13NA26347542.0041.65Wachovia Corp.SouthTrust Corp.AL6/20/0414,36519.6418.4330737338.8420.51SunTrust Banks Inc.National Commerce Finl Corp.TN5/7/047,43320.7918.7525045148.3121.34Royal Bank of Scotland GroupCharter One FinancialOH5/4/0410,52719.1815.1930635431.2033.35BNP Parib as GroupCommunity First BanksharesND3/15/041,21716.5415.6633345024.4015.18National City Corp.Provident Financial Group Inc.OH2/16/042,13421.1416.8122124621.8515.92Regions Financial Corp.Union Planters Corp.TN1/22/046,00112.4011.9019327417.900.81J.P. Morgan Chase & Co.Bank One Corp.IL1/14/0458,78317.2915.2425628528.4415.29HIGH58,78342.1322.4936049048.3141.65LOW1,21712.4011.9016224617.90-0.36MEAN9,41219.6316.7126638631.0117.91MEDIAN4,97717.8015.9626340830.8017.49Transaction Information |
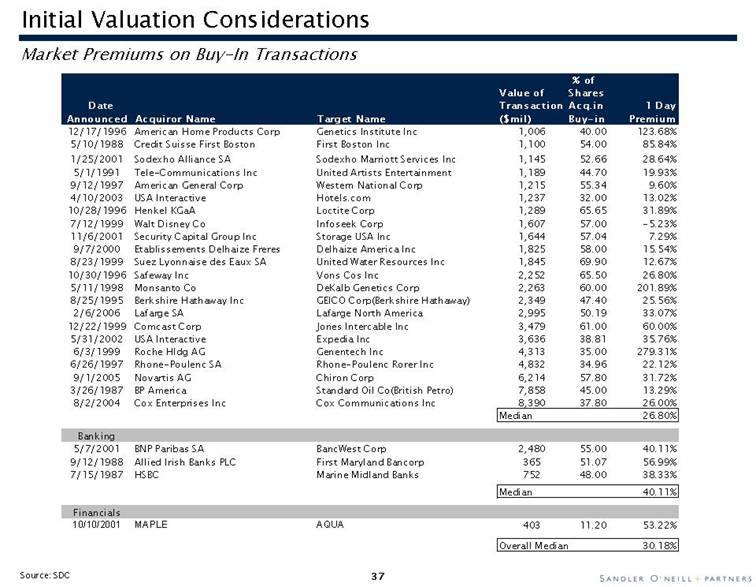
| Market Premiums on Buy-In Transactions Source: SDC Initial Valuation Considerations % of Value of Shares Date Transaction Acq.in 1 Day Announced Acquiror Name Target Name ($mil) Buy-in Premium 12/17/1996 American Home Products Corp Genetics Institute Inc 1,006 40.00 123.68% 5/10/1988 Credit Suisse First Boston First Boston Inc 1,100 54.00 85.84% 1/25/2001 Sodexho Alliance SA Sodexho Marriott Services Inc 1,145 52.66 28.64% 5/1/1991 Tele-Communications Inc United Artists Entertainment 1,189 44.70 19.93% 9/12/1997 American General Corp Western National Corp 1,215 55.34 9.60% 4/10/2003 USA Interactive Hotels.com 1,237 32.00 13.02% 10/28/1996 Henkel KGaA Loctite Corp 1,289 65.65 31.89% 7/12/1999 Walt Disney Co Infoseek Corp 1,607 57.00 -5.23% 11/6/2001 Security Capital Group Inc Storage USA Inc 1,644 57.04 7.29% 9/7/2000 Etablissements Delhaize Freres Delhaize America Inc 1,825 58.00 15.54% 8/23/1999 Suez Lyonnaise des Eaux SA United Water Resources Inc 1,845 69.90 12.67% 10/30/1996 Safeway Inc Vons Cos Inc 2,252 65.50 26.80% 5/11/1998 Monsanto Co DeKalb Genetics Corp 2,263 60.00 201.89% 8/25/1995 Berkshire Hathaway Inc GEICO Corp(Berkshire Hathaway) 2,349 47.40 25.56% 2/6/2006 Lafarge SA Lafarge North America 2,995 50.19 33.07% 12/22/1999 Comcast Corp Jones Intercable Inc 3,479 61.00 60.00% 5/31/2002 USA Interactive Expedia Inc 3,636 38.81 35.76% 6/3/1999 Roche Hldg AG Genentech Inc 4,313 35.00 279.31% 6/26/1997 Rhone-Poulenc SA Rhone-Poulenc Rorer Inc 4,832 34.96 22.12% 9/1/2005 Novartis AG Chiron Corp 6,214 57.80 31.72% 3/26/1987 BP America Standard Oil Co(British Petro) 7,858 45.00 13.29% 8/2/2004 Cox Enterprises Inc Cox Communications Inc 8,390 37.80 26.00% Median 26.80% Banking 5/7/2001 BNP Paribas SA BancWest Corp 2,480 55.00 40.11% 9/12/1988 Allied Irish Banks PLC First Maryland Bancorp 365 51.07 56.99% 7/15/1987 HSBC Marine Midland Banks 752 48.00 38.33% Median 40.11% Financials 10/10/2001 MAPLE AQUA 403 11.20 53.22% Overall Median 30.18% |
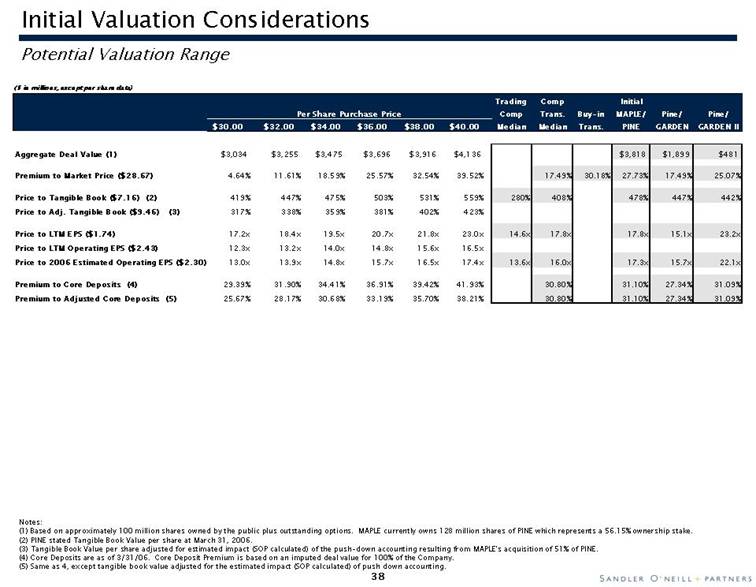
| Initial Valuation Considerations Notes: (1) Based on approximately 100 million shares owned by the public plus outstanding options. MAPLE currently owns 128 million shares of PINE which represents a 56.15% ownership stake. (2) PINE stated Tangible Book Value per share at March 31, 2006. (3) Tangible Book Value per share adjusted for estimated impact (SOP calculated) of the push-down accounting resulting from MAPLE's acquisition of 51% of PINE. (4) Core Deposits are as of 3/31/06. Core Deposit Premium is based on an imputed deal value for 100% of the Company. (5) Same as 4, except tangible book value adjusted for the estimated impact (SOP calculated) of push down accounting. Potential Valuation Range ($ in millions, except per share data) Trading Comp Initial Per Share Purchase Price Comp Trans. Buy-in MAPLE/ Pine/ Pine/ $30.00 $32.00 $34.00 $36.00 $38.00 $40.00 Median Median Trans. PINE GARDEN GARDEN II Aggregate Deal Value (1) $3,034 $3,255 $3,475 $3,696 $3,916 $4,136 $3,818 $1,899 $481 Premium to Market Price ($28.67) 4.64% 11.61% 18.59% 25.57% 32.54% 39.52% 17.49% 30.18% 27.73% 17.49% 25.07% Price to Tangible Book ($7.16) (2) 419% 447% 475% 503% 531% 559% 280% 408% 478% 447% 442% Price to Adj. Tangible Book ($9.46) (3) 317% 338% 359% 381% 402% 423% Price to LTM EPS ($1.74) 17.2x 18.4x 19.5x 20.7x 21.8x 23.0x 14.6x 17.8x 17.8x 15.1x 23.2x Price to LTM Operating EPS ($2.43) 12.3x 13.2x 14.0x 14.8x 15.6x 16.5x Price to 2006 Estimated Operating EPS ($2.30) 13.0x 13.9x 14.8x 15.7x 16.5x 17.4x 13.6x 16.0x 17.3x 15.7x 22.1x Premium to Core Deposits (4) 29.39% 31.90% 34.41% 36.91% 39.42% 41.93% 30.80% 31.10% 27.34% 31.09% Premium to Adjusted Core Deposits (5) 25.67% 28.17% 30.68% 33.19% 35.70% 38.21% 30.80% 31.10% 27.34% 31.09% |
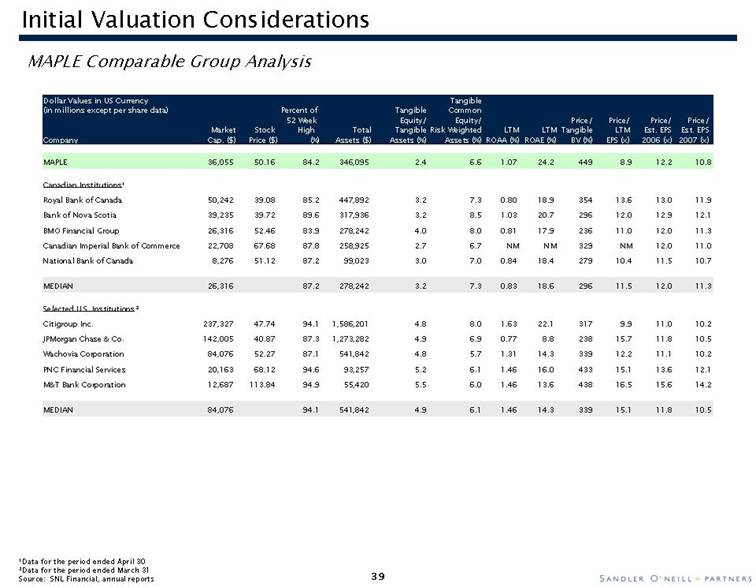
| Initial Valuation ConsiderationsMAPLE Comparable Group Analysis 1 Data for the period ended April 30 2 Data for the period ended March 31 Source: SNL Financial, annual reports Dollar Values in US Currency Tangible (in millions except per share data) Percent of Tangible Common 52 Week Equity/ Equity/ Price/ Price/ Price/ Price/ Market Stock High Total Tangible Risk Weighted LTM LTM Tangible LTM Est. EPS Est. EPS Company Cap. ($) Price ($) (%) Assets ($) Assets (%) Assets (%) ROAA (%) ROAE (%) BV (%) EPS (x) 2006 (x) 2007 (x) MAPLE 36,055 50.16 84.2 346,095 2.4 6.6 1.07 24.2 449 8.9 12.2 10.8 Canadian Institutions 1 Royal Bank of Canada 50,242 39.08 85.2 447,892 3.2 7.3 0.80 18.9 354 13.6 13.0 11.9 Bank of Nova Scotia 39,235 39.72 89.6 317,936 3.2 8.5 1.03 20.7 296 12.0 12.9 12.1 BMO Financial Group 26,316 52.46 83.9 278,242 4.0 8.0 0.81 17.9 236 11.0 12.0 11.3 Canadian Imperial Bank of Commerce 22,708 67.68 87.8 258,925 2.7 6.7 NM NM 329 NM 12.0 11.0 National Bank of Canada 8,276 51.12 87.2 99,023 3.0 7.0 0.84 18.4 279 10.4 11.5 10.7 MEDIAN 26,316 87.2 278,242 3.2 7.3 0.83 18.6 296 11.5 12.0 11.3 Selected U.S. Institutions 2 Citigroup Inc. 237,327 47.74 94.1 1,586,201 4.8 8.0 1.63 22.1 317 9.9 11.0 10.2 JPMorgan Chase & Co. 142,005 40.87 87.3 1,273,282 4.9 6.9 0.77 8.8 238 15.7 11.8 10.5 Wachovia Corporation 84,076 52.27 87.1 541,842 4.8 5.7 1.31 14.3 339 12.2 11.1 10.2 PNC Financial Services 20,163 68.12 94.6 93,257 5.2 6.1 1.46 16.0 433 15.1 13.6 12.1 M&T Bank Corporation 12,687 113.84 94.9 55,420 5.5 6.0 1.46 13.6 438 16.5 15.6 14.2 MEDIAN 84,076 94.1 541,842 4.9 6.1 1.46 14.3 339 15.1 11.8 10.5 |
| Appendix |

| Appendix James J. Dunne IIISenior Managing Principal Jimmy Dunne is Senior Managing Principal of Sandler O’Neill & Partners, L.P. and heads the firm’s three-person Executive Committee. He co-founded Sandler O’Neill in 1988 with the senior management team of Bear Stearns’ Financial Services Group and initially served as the firm’s Managing Principal. Today, Sandler O’Neill is one of the largest full-service investment banking firms exclusively serving the financial services sector. While Mr. Dunne oversees Sandler O’Neill’s long-term strategy and expansion, he also plays a very active role in many of the firm’s key client relationships. Under his leadership the firm has added research, equity sales, trading, and mortgage finance capabilities to go with its longstanding fixed income, capital markets and investment banking practices. In addition to its New York headquarters, Sandler O’Neill has established offices in Atlanta, Boston, Chicago, and San Francisco, and an affiliated mortgage finance company in Memphis, to better serve its clients across the country. On September 11, 2001, Sandler O’Neill suffered the tragic loss of 68 of its 171 partners and employees in the attack of its headquarters on the 104th floor of Two World Trade Center. Among those lost were Herman Sandler and Chris Quackenbush, two of the three executives who ran the firm. Mr. Dunne, who had been Managing Principal with responsibility for all aspects of the day-to-day operations, spearheaded the firm’s recovery process. Currently, Sandler O’Neill has a total of 254 professionals in its various business units, is a market maker for over 450 financial stocks, and writes research on more than 200 financial services companies. Mr. Dunne is a frequent financial industry commentator on CNBC and is also often invited to speak on leadership, management and the financial services sector to business, academic and civic organizations. After graduating from the University of Notre Dame with a B.A. in Economics, Mr. Dunne’s 25 years on Wall Street began. In 1978 he started at L.F. Rothschild's Bank Service Group and continued on at Lehman Brothers where he joined in 1982. Two years later he made the transition to Prudential Bache and in 1986 became part of Bear Stearns’ Financial Services Group. Mr. Dunne is an avid golfer and active with numerous charitable organizations. Biographies |
| Appendix Joseph StanglAssociate Director Mr. Stangl has over ten years of experience in the financial services industry. Prior to joining Sandler O’Neill in April 2004, Mr. Stangl worked at Boston Private Financial Holdings, where he headed up their Bank M&A effort. Prior to joining Boston Private, Mr. Stangl was a Director in the Financial Institutions investment banking group at CIBC World Markets where he spent over three years working with a variety of banking, asset management and specialty finance companies and assisted these clients with mergers and acquisitions and public and private equity transactions. Prior to joining CIBC World Markets, Mr. Stangl was employed by KPMG LLP in their Financial Services audit practice where he focused primarily on commercial bank clients from 1993 to 1997. Mr. Stangl received his B.A. from the College of the Holy Cross in 1993 and his M.B.A. from Columbia Business School in 1999. Brian R. Sterling is a Principal and Co-Head of the Investment Banking Group of Sandler O’Neill + Partners, L.P. Mr. Sterling joined Sandler O’Neill in February 2002 and is responsible for advising banks, thrifts and other financial institutions on strategic matters, focusing on mergers and acquisitions and financings. Since joining Sandler O’Neill, Mr. Sterling has been involved in a number of transactions for depository institutions, including working with Mercantile Bankshares on its acquisitions of F&M Bancorp and James Monroe Bancorp, North Fork on its acquisition of GreenPoint Financial and sale to Capital One Financial, Sun Bancorp on its acquisition of Community Bancorp of New Jersey and Port Financial on its sale to Citizens Financial. In addition, Mr. Sterling has also spearheaded the Firm's work for General Electric Commercial Finance in its acquisition of the healthcare finance company HPSC, Knight Trading in its acquisitions of Donaldson & Co., DirectTrading Institutional and Hotspot FXi, Archipelago in its sale of Wave Securities and the restructuring of the Board of Trade Clearing Corporation. Previously, Mr. Sterling was a Managing Director in the Financial Institutions Group at Merrill Lynch & Co., serving as the senior person responsible for providing relationship management and M&A services to large regional banks, finance companies and trading market participants. Prior to joining Merrill Lynch, Mr. Sterling founded and was Head of the Global Financial Institutions Group at Schroders, where he worked with banks, thrifts, insurers, and specialty finance companies in the U.S. and Europe on mergers, acquisitions and financings. Prior to Schroder Wertheim, Mr. Sterling was a member of the Mergers & Acquisitions Group of the law firm Skadden, Arps, Slate, Meagher & Flom. Mr. Sterling is a graduate of the Wharton School of the University of Pennsylvania, where he was awarded a B.S. in Economics. He also holds a J.D. from Yale Law School. Brian R. SterlingPrincipal & Co-Head of Investment Banking Biographies |