Exhibit (c)(6)
| Presentation to the Committee of Designated Independent Directors Confidential Material Regarding: Confidential Project ACADIA August 24, 2006 SANDLER O'NEILL + PARTNERS, L.P. New York – Atlanta - Boston - Chicago - San Francisco |

| This presentation, and the oral or video presentation that supplements it, have been developed by and are proprietary to Sandler O'Neill + Partners, L.P. and were prepared exclusively for the benefit and internal use of the recipient. Neither the printed presentation nor the oral or video presentation that supplements it, nor any of their contents, may be reproduced, distributed or used for any other purpose without the prior written consent of Sandler O'Neill + Partners, L.P. The analyses contained herein rely upon information obtained from the recipient or from public sources, the accuracy of which has not been verified, and cannot be assured, by Sandler O'Neill + Partners, L.P. Moreover, many of the projections and financial analyses herein are based on estimated financial performance prepared by or in consultation with the recipient and are intended only to suggest reasonable ranges of results. Finally, the printed presentation is incomplete without the oral or video presentation that supplements it. Sandler O’Neill + Partners, L.P. prohibits employees from offering, directly or indirectly, favorable research, a specific rating or a specific price target, or offering or threatening to change research, a rating or a price target to a company as consideration or inducement for the receipt of business or compensation. The Firm also prohibits research analysts from being compensated for their involvement in, or based upon, specific investment banking transactions. Sandler O'Neill + Partners, L.P. is a limited partnership, the sole general partner of which is Sandler O'Neill + Partners Corp., a New York corporation. Sandler O'Neill + Partners, L.P. is a registered broker-dealer and a member of the National Association of Securities Dealers, Inc. Sandler O'Neill Mortgage Finance L.P. is an indirect wholly-owned subsidiary of Sandler O'Neill + Partners Corp. This material is protected under applicable copyright laws and does not carry any rights of publication or disclosure. GENERAL INFORMATION AND LIMITATIONS SANDLER |
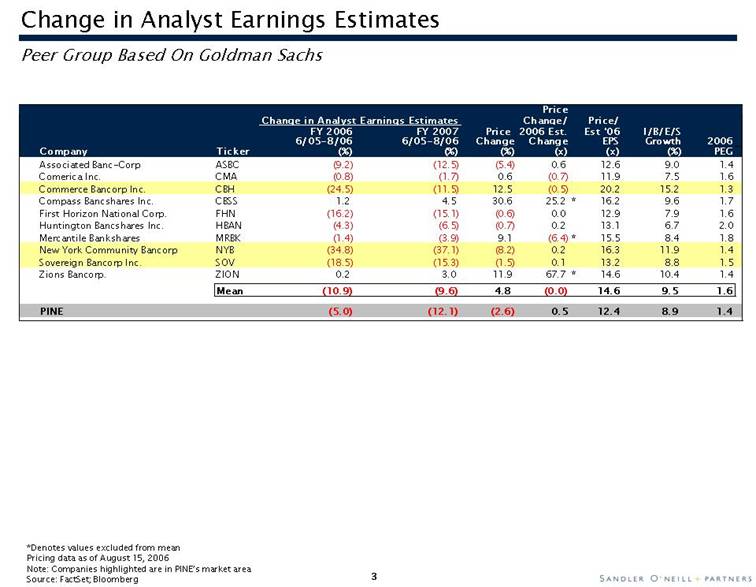
| Change in Analyst Earnings Estimates Peer Group Based On Goldman Sachs Price Change in Analyst Earnings Estimates Change/ Price/ FY 2006 FY 2007 Price 2006 Est. Est '06 I/B/E/S 6/05-8/06 6/05-8/06 Change Change EPS Growth 2006 Company Ticker (%) (%) (%) (x) (x) (%) PEG Associated Banc-Corp ASBC (9.2) (12.5) (5.4) 0.6 12.6 9.0 1.4 Comerica Inc. CMA (0.8) (1.7) 0.6 (0.7) 11.9 7.5 1.6 Commerce Bancorp Inc. CBH (24.5) (11.5) 12.5 (0.5) 20.2 15.2 1.3 Compass Bancshares Inc. CBSS 1.2 4.5 30.6 25.2 * 16.2 9.6 1.7 First Horizon National Corp. FHN (16.2) (15.1) (0.6) 0.0 12.9 7.9 1.6 Huntington Bancshares Inc. HBAN (4.3) (6.5) (0.7) 0.2 13.1 6.7 2.0 Mercantile Bankshares MRBK (1.4) (3.9) 9.1 (6.4) * 15.5 8.4 1.8 New York Community Bancorp NYB (34.8) (37.1) (8.2) 0.2 16.3 11.9 1.4 Sovereign Bancorp Inc. SOV (18.5) (15.3) (1.5) 0.1 13.2 8.8 1.5 Zions Bancorp. ZION 0.2 3.0 11.9 67.7 * 14.6 10.4 1.4 Mean (10.9) (9.6) 4.8 (0.0) 14.6 9.5 1.6 PINE (5.0) (12.1) (2.6) 0.5 12.4 8.9 1.4 *Denotes values excluded from mean Pricing data as of August 15, 2006 Note: Companies highlighted are in PINE’s market area Source: FactSet; Bloomberg |
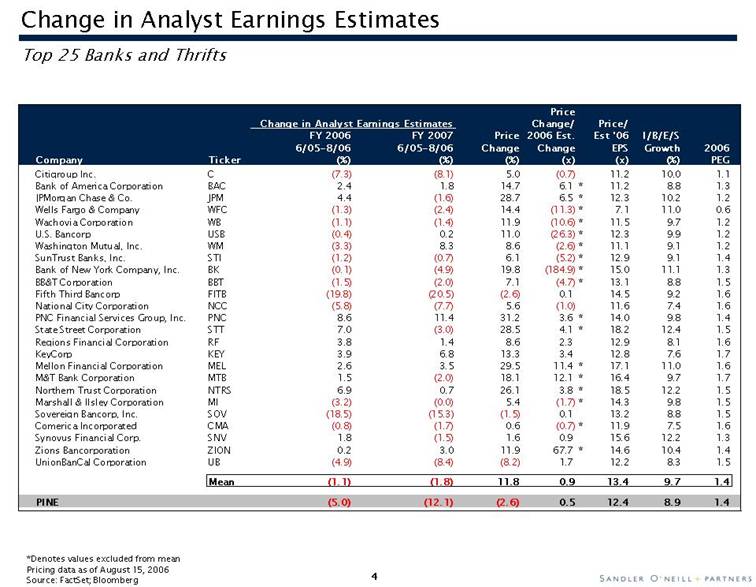
| Change in Analyst Earnings Estimates Top 25 Banks and Thrifts Price Change in Analyst Earnings Estimates Change/ Price/ FY 2006 FY 2007 Price 2006 Est. Est '06 I/B/E/S ` 6/05-8/06 6/05-8/06 Change Change EPS Growth 2006 Company Ticker (%) (%) (%) (x) (x) (%) PEG Citigroup Inc. C (7.3) (8.1) 5.0 (0.7) 11.2 10.0 1.1 Bank of America Corporation BAC 2.4 1.8 14.7 6.1 * 11.2 8.8 1.3 JPMorgan Chase & Co. JPM 4.4 (1.6) 28.7 6.5 * 12.3 10.2 1.2 Wells Fargo & Company WFC (1.3) (2.4) 14.4 (11.3) * 7.1 11.0 0.6 Wachovia Corporation WB (1.1) (1.4) 11.9 (10.6) * 11.5 9.7 1.2 U.S. Bancorp USB (0.4) 0.2 11.0 (26.3) * 12.3 9.9 1.2 Washington Mutual, Inc. WM (3.3) 8.3 8.6 (2.6) * 11.1 9.1 1.2 SunTrust Banks, Inc. STI (1.2) (0.7) 6.1 (5.2) * 12.9 9.1 1.4 Bank of New York Company, Inc. BK (0.1) (4.9) 19.8 (184.9) * 15.0 11.1 1.3 BB&T Corporation BBT (1.5) (2.0) 7.1 (4.7) * 13.1 8.8 1.5 Fifth Third Bancorp FITB (19.8) (20.5) (2.6) 0.1 14.5 9.2 1.6 National City Corporation NCC (5.8) (7.7) 5.6 (1.0) 11.6 7.4 1.6 PNC Financial Services Group, Inc. PNC 8.6 11.4 31.2 3.6 * 14.0 9.8 1.4 State Street Corporation STT 7.0 (3.0) 28.5 4.1 * 18.2 12.4 1.5 Regions Financial Corporation RF 3.8 1.4 8.6 2.3 12.9 8.1 1.6 KeyCorp KEY 3.9 6.8 13.3 3.4 12.8 7.6 1.7 Mellon Financial Corporation MEL 2.6 3.5 29.5 11.4 * 17.1 11.0 1.6 M&T Bank Corporation MTB 1.5 (2.0) 18.1 12.1 * 16.4 9.7 1.7 Northern Trust Corporation NTRS 6.9 0.7 26.1 3.8 * 18.5 12.2 1.5 Marshall & Ilsley Corporation MI (3.2) (0.0) 5.4 (1.7) * 14.3 9.8 1.5 Sovereign Bancorp, Inc. SOV (18.5) (15.3) (1.5) 0.1 13.2 8.8 1.5 Comerica Incorporated CMA (0.8) (1.7) 0.6 (0.7) * 11.9 7.5 1.6 Synovus Financial Corp. SNV 1.8 (1.5) 1.6 0.9 15.6 12.2 1.3 Zions Bancorporation ZION 0.2 3.0 11.9 67.7 * 14.6 10.4 1.4 UnionBanCal Corporation UB (4.9) (8.4) (8.2) 1.7 12.2 8.3 1.5 Mean (1.1) (1.8) 11.8 0.9 13.4 9.7 1.4 PINE (5.0) (12.1) (2.6) 0.5 12.4 8.9 1.4 *Denotes values excluded from mean Pricing data as of August 15, 2006 Source: FactSet; Bloomberg |
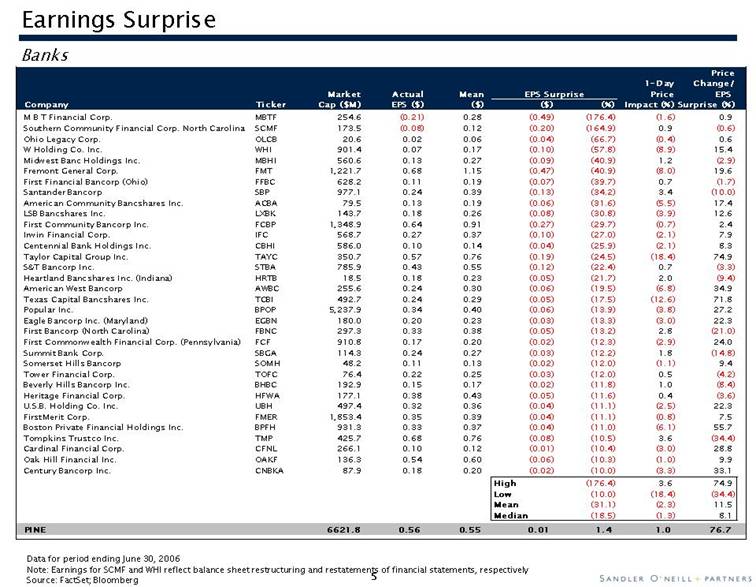
| Earnings Surprise Banks Price 1-Day Change/ Market Actual Mean EPS Surprise Price EPS Company Ticker Cap ($M) EPS ($) ($) ($) (%) Impact (%) Surprise (%) M B T Financial Corp. MBTF 254.6 (0.21) 0.28 (0.49) (176.4) (1.6) 0.9 Southern Community Financial Corp. North Carolina SCMF 173.5 (0.08) 0.12 (0.20) (164.9) 0.9 (0.6) Ohio Legacy Corp. OLCB 20.6 0.02 0.06 (0.04) (66.7) (0.4) 0.6 W Holding Co. Inc. WHI 901.4 0.07 0.17 (0.10) (57.8) (8.9) 15.4 Midwest Banc Holdings Inc. MBHI 560.6 0.13 0.27 (0.09) (40.9) 1.2 (2.9) Fremont General Corp. FMT 1,221.7 0.68 1.15 (0.47) (40.9) (8.0) 19.6 First Financial Bancorp (Ohio) FFBC 628.2 0.11 0.19 (0.07) (39.7) 0.7 (1.7) Santander Bancorp SBP 977.1 0.24 0.39 (0.13) (34.2) 3.4 (10.0) American Community Bancshares Inc. ACBA 79.5 0.13 0.19 (0.06) (31.6) (5.5) 17.4 LSB Bancshares Inc. LXBK 143.7 0.18 0.26 (0.08) (30.8) (3.9) 12.6 First Community Bancorp Inc. FCBP 1,348.9 0.64 0.91 (0.27) (29.7) (0.7) 2.4 Irwin Financial Corp. IFC 568.7 0.27 0.37 (0.10) (27.0) (2.1) 7.9 Centennial Bank Holdings Inc. CBHI 586.0 0.10 0.14 (0.04) (25.9) (2.1) 8.3 Taylor Capital Group Inc. TAYC 350.7 0.57 0.76 (0.19) (24.5) (18.4) 74.9 S&T Bancorp Inc. STBA 785.9 0.43 0.55 (0.12) (22.4) 0.7 (3.3) Heartland Bancshares Inc. (Indiana) HRTB 18.5 0.18 0.23 (0.05) (21.7) 2.0 (9.4) American West Bancorp AWBC 255.6 0.24 0.30 (0.06) (19.5) (6.8) 34.9 Texas Capital Bancshares Inc. TCBI 492.7 0.24 0.29 (0.05) (17.5) (12.6) 71.8 Popular Inc. BPOP 5,237.9 0.34 0.40 (0.06) (13.9) (3.8) 27.2 Eagle Bancorp Inc. (Maryland) EGBN 180.0 0.20 0.23 (0.03) (13.3) (3.0) 22.3 First Bancorp (North Carolina) FBNC 297.3 0.33 0.38 (0.05) (13.2) 2.8 (21.0) First Commonwealth Financial Corp. (Pennsylvania) FCF 910.8 0.17 0.20 (0.02) (12.3) (2.9) 24.0 Summit Bank Corp. SBGA 114.3 0.24 0.27 (0.03) (12.2) 1.8 (14.8) Somerset Hills Bancorp SOMH 48.2 0.11 0.13 (0.02) (12.0) (1.1) 9.4 Tower Financial Corp. TOFC 76.4 0.22 0.25 (0.03) (12.0) 0.5 (4.2) Beverly Hills Bancorp Inc. BHBC 192.9 0.15 0.17 (0.02) (11.8) 1.0 (8.4) Heritage Financial Corp. HFWA 177.1 0.38 0.43 (0.05) (11.6) 0.4 (3.6) U.S.B. Holding Co. Inc. UBH 497.4 0.32 0.36 (0.04) (11.1) (2.5) 22.3 FirstMerit Corp. FMER 1,853.4 0.35 0.39 (0.04) (11.1) (0.8) 7.5 Boston Private Financial Holdings Inc. BPFH 931.3 0.33 0.37 (0.04) (11.0) (6.1) 55.7 Tompkins Trustco Inc. TMP 425.7 0.68 0.76 (0.08) (10.5) 3.6(34.4) Cardinal Financial Corp. CFNL 266.1 0.100.12 (0.01 ) (10.4) (3.0) 28.8 Oak Hill Financial Inc. OAKF 136.3 0.54 0.60 (0.06) (10.3) (1.0) 9.9 Century Bancorp Inc. CNBKA 87.9 0.18 0.20 (0.02) (10.0) (3.3) 33.1 High (176.4) 3.6 74.9 Low (10.0) (18.4) (34.4) Mean (31.1) (2.3) 11.5 Median (18.5) (1.3) 8.1 PINE 6621.8 0.56 0.55 0.01 1.41.0 76.7 Data for period ending June 30, 2006 Note: Earnings for SCMF and WHI reflect balance sheet restructuring and restatements of financial statements, respectively Source: FactSet; Bloomberg SANDLER O'NEILL + PARTNERS |
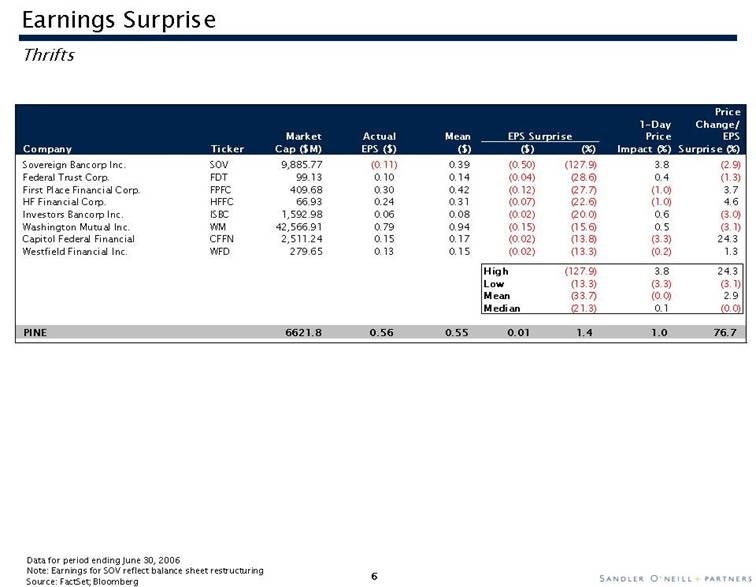
| Earnings Surprise Thrifts Price 1-Day Change/ Market Actual Mean EPS Surprise Price EPS Company Ticker Cap ($M) EPS ($) ($) ($) (%) Impact (%) Surprise (%) Sovereign Bancorp Inc. SOV 9,885.77 (0.11) 0.39 (0.50) (127.9) 3.8 (2.9) Federal Trust Corp. FDT 99.13 0.10 0.14 (0.04) (28.6) 0.4 (1.3) First Place Financial Corp. FPFC 409.68 0.30 0.42 (0.12) (27.7) (1.0) 3.7 HF Financial Corp. HFFC 66.93 0.24 0.31 (0.07) (22.6) (1.0) 4.6 Investors Bancorp Inc. ISBC 1,592.98 0.06 0.08 (0.02) (20.0) 0.6 (3.0) Washington Mutual Inc. WM 42,566.91 0.79 0.94 (0.15) (15.6) 0.5 (3.1) Capitol Federal Financial CFFN 2,511.24 0.15 0.17 (0.02) (13.8) (3.3) 24.3 Westfield Financial Inc. WFD 279.65 0.13 0.15 (0.02) (13.3) (0.2) 1.3 High (127.9) 3.8 24.3 Low (13.3) (3.3) (3.1) Mean (33.7) (0.0) 2.9 Median (21.3) 0.1 (0.0) PINE 6621.8 0.56 0.55 0.01 1.4 1.0 76.7 Data for period ending June 30, 2006 Note: Earnings for SOV reflect balance sheet restructuring Source: FactSet; Bloomberg |
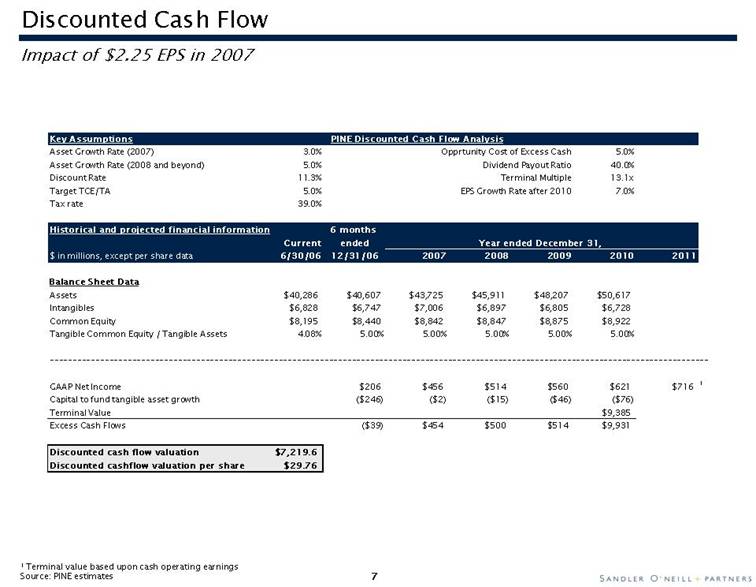
| Discounted Cash Flow Impact of $2.25 EPS in 2007 Key Assumptions Asset Growth Rate (2007) 3.0% Asset Growth Rate (2008 and beyond) 5.0% Discount Rate 11.3% Target TCE/TA 5.0% Tax rate 39.0% PINE Discounted Cash Flow Analysis Opprtunity Cost of Excess Cash 5.0% Dividend Payout Ratio 40.0% Terminal Multiple 13.1x EPS Growth Rate after 2010 7.0% Historical and projected financial information 6 months Current ended Year ended December 31, $ in millions, except per share data 6/30/06 12/31/06 2007 2008 2009 2010 2011 Balance Sheet Data Assets $40,286 $40,607 $43,725 $45,911 $48,207 $50,617 Intangibles $6,828 $6,747 $7,006 $6,897 $6,805 $6,728 Common Equity $8,195 $8,440 $8,842 $8,847 $8,875 $8,922 Tangible Common Equity / Tangible Assets 4.08% 5.00% 5.00% 5.00% 5.00% 5.00% GAAP Net Income $206 $456 $514 $560 $621 $716 1 Capital to fund tangible asset growth ($246) ($2) ($15) ($46) ($76) Terminal Value $9,385 Excess Cash Flows ($39) $454 $500 $514 $9,931 Discounted cash flow valuation $7,219.6 Discounted cashflow valuation per share $29.76 1 Terminal value based upon cash operating earnings Source: PINE estimates |
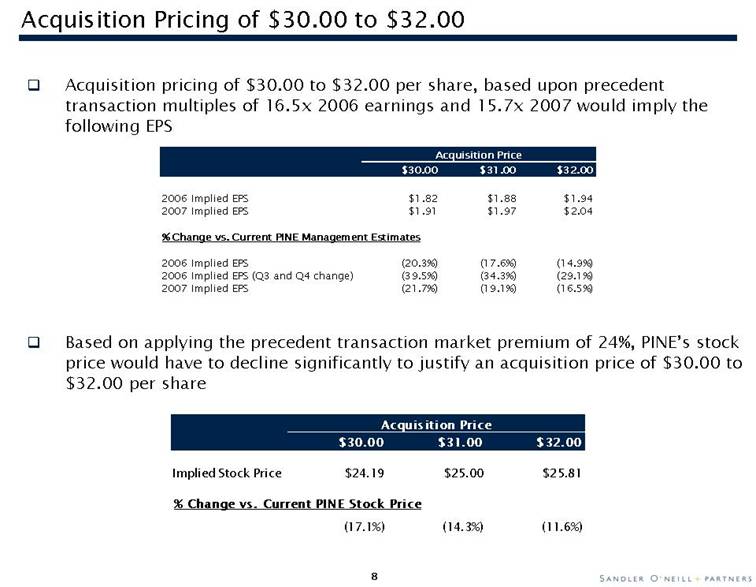
| Acquisition Pricing of $30.00 to $32.00 Acquisition pricing of $30.00 to $32.00 per share, based upon precedent transaction multiples of 16.5x 2006 earnings and 15.7x 2007 would imply the following EPS Acquisition Price $30.00 $31.00 $32.00 2006 Implied EPS $1.82 $1.88 $1.94 2007 Implied EPS $1.91 $1.97 $2.04 % Change vs. Current PINE Management Estimates 2006 Implied EPS (20.3%) (17.6%) (14.9%) 2006 Implied EPS (Q3 and Q4 change) (39.5%) (34.3%) (29.1%) 2007 Implied EPS (21.7%) (19.1%) (16.5%)
Based on applying the precedent transaction market premium of 24%, PINE’s stock price would have to decline significantly to justify an acquisition price of $30.00 to $32.00 per share Acquisition Price $30.00 $31.00 $32.00 Implied Stock Price $24.19 $25.00 $25.81 % Change vs. Current PINE Stock Price (17.1%) (14.3%) (11.6%)
|