united states
securities and exchange commission
washington, d.c. 20549
form n-csr
certified shareholder report of registered management
investment companies
Investment Company Act file number 811-22153
Dunham Funds
(Exact name of registrant as specified in charter)
10251 Vista Sorrento Pkwy, Ste. 200, San Diego, CA 92121
(Address of principal executive offices) (Zip code)
Richard Malinowski
Gemini Fund Services, LLC., 4221 N 203rd St., Suite 100, Elkhorn, NE 68022
(Name and address of agent for service)
Registrant's telephone number, including area code: 631-470-2619
Date of fiscal year end: 10/31
Date of reporting period: 10/31/20
Item 1. Reports to Stockholders.
Beginning on January 1, 2021, as permitted by regulations adopted by the Securities and Exchange Commission, paper copies of the Dunham Funds’ shareholder reports like this one will no longer be sent by mail, unless you specifically request paper copies of the reports from the Dunham Funds or from your financial intermediary, such as a broker-dealer or bank. Instead, the reports will be made available on a website, and you will be notified by mail each time a report is posted and provided with a website link to access the report.
If you already elected to receive shareholder reports electronically, you will not be affected by this change and you need not take any action. You may elect to receive shareholder reports and other communications from the Dunham Funds electronically by calling (888)-3DUNHAM (338-6426) or contacting your financial intermediary.
You may elect to receive all future reports in paper free of charge. You can inform the Dunham Funds or your financial intermediary that you wish to continue receiving paper copies of your shareholder reports by calling (888)-3DUNHAM (338-6426) or contacting your financial intermediary. Your election to receive reports in paper will apply to all Dunham Funds held by you or through your financial intermediary.
| This Annual Report contains “forward-looking statements” within the meaning of the Private Securities Litigation Reform Act of 1995. Forward-looking statements also include those preceded by, followed by or that include the words “believes”, “expects”, “anticipates” or similar expressions. Such statements should be viewed with caution. Actual results or experience could differ materially from the forward-looking statements as a result of many factors. Each Fund makes no commitments to disclose any revisions to forward-looking statements, or any facts, events or circumstances after the date hereof that may bear upon forward-looking statements. In addition, prospective purchasers of the Funds should consider carefully the information set forth herein and the applicable fund’s prospectus. Other factors and assumptions not identified above may also have been involved in the derivation of these forward-looking statements, and the failure of these other assumptions to be realized may also cause actual results to differ materially from those projected. |
| Dunham Funds (Unaudited) |
| Message from the Investment Adviser |
Dear Fellow Shareholders:
As the bull market briefly stumbled, but did not conclude, in the final months of 2018, the 2019 calendar year revitalized the win-streak and provided a wave of momentum. At the transition of 2019 to 2020, the economy boasted strength across nearly all segments, the markets were hitting all-time highs, and concepts that are now experienced in our daily lives were only considered in science fiction. As the pandemic came into focus, the global response primarily included shutting down economies, which brought the thriving bull market to its demise. This is not intended to form a new debate over what other measures would have had a less devastating effect and/or a potentially better outcome. Instead, and more importantly, the retelling of this chapter is intended to highlight the adaptability of businesses and the diligence of many investors. This was evidenced in the remarkably rapid recovery from the turmoil in March. The panic-induced selling was quickly addressed by prudent investors seeking securities that were irrationally discarded. Companies that had traditionally relied on in-person interaction adeptly transitioned to online experiences and delivery options. The MSCI All Country World Index tumbled 33.6 percent between the February market highs and the low reached in March. This deficit was recovered within months, reaching new all-time highs in August.
Bond markets were not immune to the sell-off, as the Barclays Global Aggregate Bond Index shed 8.8 percent during the drawdown. Similar to its equity counterparts, the recovery in bonds only took a few months, reaching new highs in July. Although the markets, both equities and bonds, have broadly seen a recovery, the economy continues to work toward that goal. With tens of millions of jobs lost and hundreds of thousands of businesses shuttered, it is not surprising that the full economic recovery will be drawn out. However, with interest rates near all-time lows and central banks around the globe providing stimulus at an unprecedented magnitude, optimism may be more admissible today than at this same point in previous recessions.
Despite exhibiting lower volatility, the last few months failed to bring back a sense of normalcy, as the pandemic and corresponding restrictions broadly remained in place. Indoor dining, gatherings, and the broad spectrum of products and services associated with these business and social activities continued to experience government-imposed constraints. Efforts to control the spread of the virus produced moderate results, as spikes in cases sporadically erupted around the world. This prolonged pause in progress toward returning to a pre-COVID existence was reflected in the overall slump in the labor markets and anemic inflation. Investors continued to digest improvements in the economy with optimism, but ultimately looked forward to a potential vaccine. In addition, with the U.S. presidential election on the horizon, additional uncertainty swept across markets as investors considered how differing trade, tax, and social policies may affect the United States going forward, especially during a prolonged pandemic.
Although the most recent months have exhibited considerably less volatility than earlier this year, we have not become complacent. While we continue to implement the same disciplined and rational process that helped us to successfully navigate the drawdown and recovery, we believe it is extremely important to be watchful for additional risks on the horizon. For example, interest rate risk has not been prevalent during 2020, and to the contrary having higher interest rate risk was rewarded this year – we continue to carefully monitor this and other risks, strategically making adjustments where needed. Although inflation has remained muted, as it begins to rise, the virtually zero yield offered by money markets today will begin to pose a substantial impairment of purchasing power for investors with significant cash on the sidelines. I strongly believe that risks such as these will prove to be significant threats to your hard-earned wealth.
I continue to personally invest alongside you and I remain confident that we at Dunham have the tools and the discipline to succeed as our economy recovers. You can continue to rely on us to apply a rational and unemotional approach. We thank you for your continued trust and the confidence you have placed in us. We take that trust very seriously. We look forward to servicing the investment needs for you and your family for generations to come.
Sincerely,

Jeffrey A. Dunham
President
Dunham & Associates
October 31, 2020
1
| Dunham Corporate/Government Bond Fund (Unaudited) |
| Message from the Sub-Adviser (Newfleet Asset Management, LLC) |
Asset Class Recap
Investment-grade bonds, as measured by the Bloomberg Barclays U.S. Aggregate Bond Index, experienced one of their greatest drawdowns since the Global Financial Crisis during a short two-week period in the first half of the fiscal year. A subsequent sharp recovery closed out the end of the second fiscal quarter. While investment- grade bonds experienced a 2.6 percent rise in the third fiscal quarter, the final fiscal quarter erased half of that return, declining 1.3 percent. This brought overall performance for the fiscal year to 6.2 percent. During the final three months of the fiscal year, the yield on the 10-year Treasury bonds increased 33 basis points, adding downward pressure on long-duration bonds. While rates are still well-below one percent, residing at 0.88 percent at the end of the fiscal year, this recent increase has served as a reminder that while the Federal Open Market Committee has forecasted a prolonged low interest rate environment, interest rate risk can still spike and adversely affect the fixed income markets. Given the extremely low interest rate environment, many companies extended their debt, providing opportunities in areas where existing debt is being tendered. These dynamics did provide for additional spread compression, with corporate bond yield spreads compressing across the credit-quality spectrum. During the second half of the fiscal year, intermediate-term BBB -rated corporate bond spreads compressed more than 130 basis points, which included the early months of the recovery. Similarly, intermediate- term single-B rate bonds had experienced more than 240 basis points of compression in the second half of the fiscal year. When comparing yield spreads at the end of the fiscal year to where they were when the year began, the current spreads are actually wider by 20 basis points on BBB-rated intermediate-term corporate bonds and more than 60 basis points wider on single-B rated intermediate-term corporate bonds.
Allocation Review
Although much focus during the pandemic has been on corporate strength, nearly two-thirds of broad U.S. investment-grade bonds in the benchmark index are represented by U.S. Treasury and government agency bonds. Therefore, most of the performance of the benchmark index is dictated by how those U.S. government-related bonds perform and far less is dependent on the performance of corporate bonds and non-agency mortgage-backed securities. During the fiscal year, U.S. Treasury bonds, as measured by the BofA U.S. Treasury & Agency Index, increased 7.1 percent. As the Fund had approximately 21 percent allocated to U.S. Treasury and government agency bonds, this is far less than what is represented by the benchmark index and this significant underweight generally detracted from relative performance during the fiscal year, particularly in March’s downturn. Conversely, the Fund’s largest exposure was to investment-grade corporate bonds, comprising more than 25 percent of the Fund. Investment-grade corporate bonds, as measured by the BofA U.S. Corporate Index, increased 7.1 percent during the fiscal year. While the Fund’s 1 percent underweight versus the benchmark index slightly detracted from relative performance, the Sub-Adviser’s superior security selection resulted in an overall outperformance in the space. The Fund’s allocation to non-agency mortgage-backed securities represented the largest overweight versus the benchmark index, at a 15 percent allocation, and the Fund’s second-largest overweight was to asset-backed securities, which comprised 9 percent of the Fund during the fiscal year. Both of these bond sectors also provided positive returns to the Fund during the fiscal year, albeit less than the benchmark index’s overall return, increasing 4.5 percent and 4.0 percent, respectively. The Fund did not have any exposure to derivatives during the fiscal year that meaningfully affected performance.
Holdings Insights
The Sub-Adviser’s security selection within the investment-grade corporate bond sector generally outperformed during the fiscal year. Many holdings in the space experienced volatility as the economy was in flux and interest rates plummeted. This included the multi-national banks Morgan Stanley (617482V92) (holding weight*: 0.37 percent), and the Toronto-Dominion Bank (891160MJ9) (holding weight*: 0.30 percent) . During the fiscal year, the Morgan Stanley and the Toronto-Dominion bonds increased 10.6 percent and 10.8 percent, respectively, as their strong fundamentals generally offset the adverse effects of prolonged low interest rates.
One of the strongest performing bond sectors coming out of March’s drawdown was the high-yield bond sector. Since the low-point in March, high-yield bonds, as measured by the BofA U.S. High-Yield Bond Cash Pay Index, surged 26.2 percent. This recovery brought high-yield bonds into positive territory by 2.6 percent for the fiscal year. Similarly, the Fund’s exposure to the space was generally positive during the fiscal year. For example, the Fund held the debt of Scientific Games International, Inc. (80874YBA7) (holding weight*: 0.07 percent), a systems provider for gaming, lottery, and sports betting. As the company posted stronger than expected financial results and as the recent management change has been viewed as a net-positive, the bonds returned 3.6 percent during the fiscal year. Also rated below investment-grade were the bank loan holdings in the Fund. However, the American Airlines, Inc. loan (BL2698183) (holding weight*: 0.09 percent) was one of the largest detractors from the Fund’s performance during the fiscal year, as a halt in travel caused the loan to freefall. However, as the outlook for airlines looked less dire near the end of the fiscal year, the loan rebounded 12.5 percent in the final fiscal quarter, bringing its overall decline since it was added in December 2019 to a negative 36.2 percent. Energy also provided some headwinds for some of the Fund’s holdings. For example, Transocean Guardian Ltd. (893800AA0) (holding weight*: 0.03 percent), an offshore drilling contractor, declined with energy prices during the fiscal year, shedding 33.2 percent.
Sub-Adviser Outlook
The Sub-Adviser believes that the macroeconomic backdrop for corporate debt and structured products to be fairly neutral. It also expects interest rates to remain fairly range-bound and for continued central bank support around the globe. Therefore, the Sub-Adviser does not expect many macro factors to provide downward forces on the fixed income markets. However, the Sub-Adviser believes that bond sector positioning and security selection will continue to be a meaningful driver of performance, as some bond sectors appear far less attractive regarding fundamentals and relative valuations.
| * | Holdings percentage(s) of total investments, cash and unsettled trades excluding collateral for securities loaned, as of 10/31/2020. |
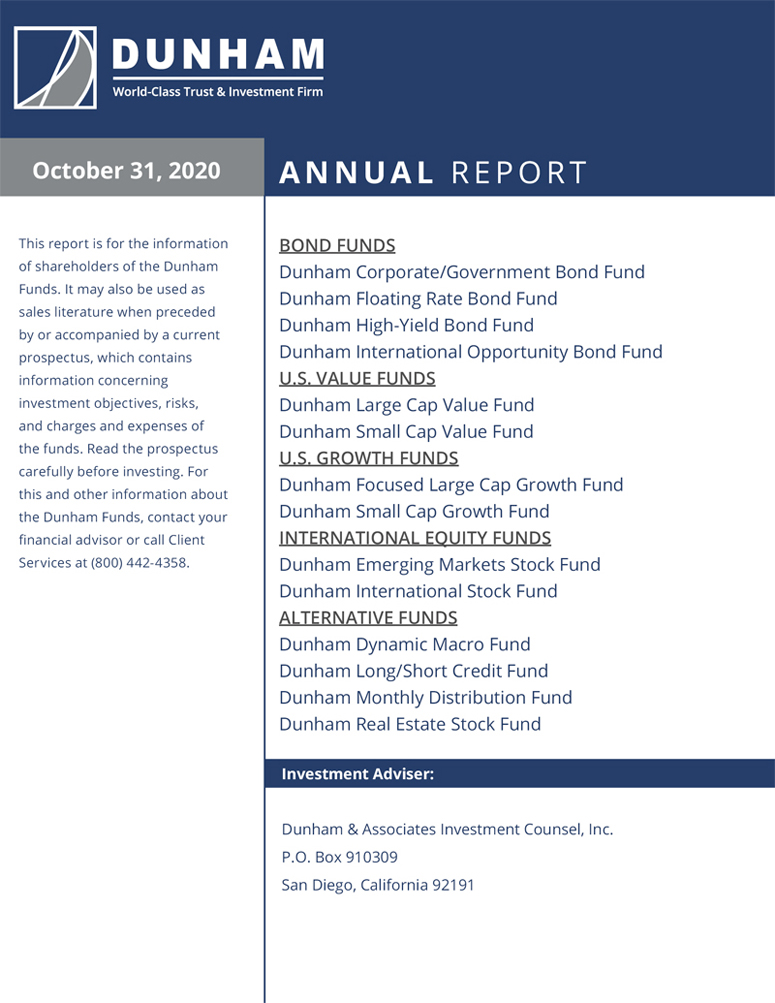
Growth of $100,000 Investment
Total Returns (a) as of October 31, 2020
| Annualized | Annualized | ||
| One Year | Five Years | Ten Years | |
| Class N | 5.17% | 3.57% | 3.24% |
| Class A with load of 4.50% | 0.19% | 2.37% | 2.51% |
| Class A without load | 4.91% | 3.32% | 2.98% |
| Class C | 4.29% | 2.79% | 2.47% |
| Bloomberg Barclays US Aggregate Bond Index | 6.19% | 4.08% | 3.55% |
| Morningstar Intermediate Core Plus Bond Category | 5.80% | 4.18% | 3.85% |
| (a) | Total Returns are calculated based on traded NAVs. |
The Bloomberg Barclays US Aggregate Bond Index is an unmanaged index which represents the U.S. investment-grade fixed-rate bond market (including government and corporate securities, mortgage pass-through securities and asset-backed securities). Investors cannot invest directly in an index or benchmark.
The Morningstar Intermediate Core Plus Bond Category is generally representative of intermediate-term bond mutual funds that primarily invest in corporate and other investment-grade U.S. fixed-income securities and typically have durations of 3.5 to 6.0 years. Funds in this category also invest in high-yield and foreign bonds.
| As disclosed in the Trust’s latest registration statement, the Fund’s total annual operating expenses, including underlying funds, are 1.20% for Class N, 1.95% for Class C and 1.45% for Class A. Class A shares are subject to a sales load of 4.50% and a deferred sales charge of up to 0.75%. The performance data quoted here represents past performance, which is not indicative of future results. Current performance may be lower or higher than the performance data quoted. The investment return and NAV will fluctuate, so that an investor’s shares, when redeemed, may be worth more or less than their original cost. Total returns are calculated assuming reinvestment of all dividends and capital gains distributions, if any. The returns do not reflect the deductions of taxes a shareholder would pay on the redemption of Fund shares or Fund distributions. For performance information current to the most recent month-end, please call 1-800-442-4358 or visit our website www.dunham.com. |
2
| SCHEDULE OF INVESTMENTS |
| Dunham Corporate/Government Bond Fund |
| October 31, 2020 |
| Variable | Principal | Interest | Maturity | |||||||||||||
| Security | Rate | Amount | Rate % | Date | Value | |||||||||||
| ASSET BACKED SECURITIES - 28.1% | ||||||||||||||||
| AUTO LOAN - 4.8% | ||||||||||||||||
| American Credit Acceptance Receivables Trust 2018-3 - 144A | $ | 78,940 | 3.750 | 10/15/2024 | $ | 79,732 | ||||||||||
| American Credit Acceptance Receivables Trust 2019-2 - 144A | 125,000 | 3.170 | 6/12/2025 | 127,488 | ||||||||||||
| American Credit Acceptance Receivables Trust 2020-4 - 144A | 170,000 | 1.770 | 12/14/2026 | 170,341 | ||||||||||||
| Americredit Automobile Receivables Trust 2018-1 | 135,000 | 3.820 | 3/18/2024 | 142,196 | ||||||||||||
| Avid Automobile Receivables Trust 2018-1 - 144A | 6,607 | 2.840 | 8/15/2023 | 6,613 | ||||||||||||
| Avis Budget Rental Car Funding AESOP LLC - 144A | 150,000 | 3.070 | 9/20/2023 | 154,125 | ||||||||||||
| Avis Budget Rental Car Funding AESOP LLC - 144A | 155,000 | 2.360 | 3/20/2026 | 159,577 | ||||||||||||
| Capital Auto Receivables Asset Trust 2017-1 - 144A | 160,000 | 2.700 | 9/20/2022 | 162,378 | ||||||||||||
| Carmax Auto Owner Trust 2019-1 | 140,000 | 3.740 | 1/15/2025 | 145,403 | ||||||||||||
| Carvana Auto Receivables Trust 2019-1 - 144A | 145,000 | 3.880 | 10/15/2024 | 151,098 | ||||||||||||
| Carvana Auto Receivables Trust 2019-3 - 144A | 185,000 | 2.710 | 10/15/2024 | 189,921 | ||||||||||||
| Carvana Auto Receivables Trust 2019-3 - 144A | 175,000 | 3.040 | 4/15/2025 | 180,023 | ||||||||||||
| Drive Auto Receivables Trust 2019-4 | 135,000 | 2.510 | 11/17/2025 | 138,269 | ||||||||||||
| DT Auto Owner Trust 2018-1 - 144A | 28,637 | 3.470 | 12/15/2023 | 28,676 | ||||||||||||
| DT Auto Owner Trust 2019-1 - 144A | 120,000 | 3.610 | 11/15/2024 | 122,841 | ||||||||||||
| First Investors Auto Owner Trust 2019-1 - 144A | 150,000 | 3.260 | 3/17/2025 | 155,618 | ||||||||||||
| Flagship Credit Auto Trust 2017-1 - 144A | 33,735 | 3.220 | 5/15/2023 | 33,873 | ||||||||||||
| Flagship Credit Auto Trust 2020-4 - 144A | 180,000 | 1.280 | 2/16/2027 | 179,954 | ||||||||||||
| GLS Auto Receivables Issuer Trust 2020-1 - 144A | 190,000 | 2.430 | 11/15/2024 | 194,204 | ||||||||||||
| Hertz Vehicle Financing II LP - 144A | 40,498 | 2.670 | 9/25/2021 | 40,734 | ||||||||||||
| OneMain Direct Auto Receivables Trust 2018-1 - 144A | 125,000 | 3.850 | 10/14/2025 | 128,407 | ||||||||||||
| Prestige Auto Receivables Trust 2020-1 -144A | 205,000 | 1.310 | 11/16/2026 | 205,095 | ||||||||||||
| United Auto Credit Securitization Trust 2020-1 - 144A | 100,000 | 2.150 | 2/10/2025 | 101,426 | ||||||||||||
| Veros Automobile Receivables Trust 2020-1 - 144A | 155,000 | 2.190 | 6/16/2025 | 156,009 | ||||||||||||
| Westlake Automobile Receivables Trust 2018-3 - 144A | 150,000 | 3.610 | 10/16/2023 | 152,062 | ||||||||||||
| Westlake Automobile Receivables Trust 2020-1 - 144A | 170,000 | 1.240 | 11/17/2025 | 170,490 | ||||||||||||
| 3,476,553 | ||||||||||||||||
| CMO - 8.7% | ||||||||||||||||
| Arroyo Mortgage Trust 2019-1 - 144A | 277,762 | 3.805 | ++ | 1/25/2049 | 286,707 | |||||||||||
| Arroyo Mortgage Trust 2019-2 - 144A | 137,031 | 3.347 | ++ | 4/25/2049 | 141,221 | |||||||||||
| Banc of America Funding 2005-1 Trust | 32,196 | 5.500 | 2/25/2035 | 33,208 | ||||||||||||
| Bunker Hill Loan Depositary Trust 2019-2 - 144A (a) | 254,432 | 2.879 | 7/25/2049 | 260,735 | ||||||||||||
| Chase Mortgage Finance Corp. - 144A | 73,187 | 3.750 | ++ | 4/25/2045 | 74,008 | |||||||||||
| Chase Mortgage Finance Corp. - 144A | 51,070 | 3.750 | ++ | 2/25/2044 | 52,523 | |||||||||||
| Citigroup Mortgage Loan Trust, Inc. 2004-NCM2 2CB2 | 35,984 | 6.750 | 8/25/2034 | 39,529 | ||||||||||||
| Citigroup Mortgage Loan Trust 2019-IMC1 - 144A | 84,364 | 2.720 | ++ | 7/25/2049 | 85,922 | |||||||||||
| CSMC 2020-NQM1 Trust - 144A (a) | 100,000 | 1.208 | 5/25/2065 | 100,172 | ||||||||||||
| CSMC 2020-RPL4 Trust -144A | 160,000 | 2.000 | 1/25/2060 | 164,980 | ||||||||||||
| Deephaven Residential Mortgage Trust 2017-2 - 144A | 23,896 | 2.453 | ++ | 6/25/2047 | 23,857 | |||||||||||
| Ellington Financial Mortgage Trust 2019-2 - 144A | 77,604 | 3.046 | ++ | 11/25/2059 | 79,179 | |||||||||||
| Flagstar Mortgage Trust 2017-1 - 144A | 108,390 | 3.500 | ++ | 3/25/2047 | 111,569 | |||||||||||
| Galton Funding Mortgage Trust 2017-1 - 144A | 54,220 | 3.500 | ++ | 11/25/2057 | 55,928 | |||||||||||
| Galton Funding Mortgage Trust 2018-2 - 144A | 32,505 | 4.500 | ++ | 10/25/2058 | 33,262 | |||||||||||
| Galton Funding Mortgage Trust 2019-H1 - 144A | 85,046 | 2.657 | ++ | 10/25/2059 | 86,876 | |||||||||||
| Galton Funding Mortgage Trust 2020-H1 -144A | 143,814 | 2.310 | ++ | 1/25/2060 | 146,455 | |||||||||||
| GCAT 2019-NQM1 LLC - 144A (a) | 190,677 | 2.985 | 2/25/2059 | 194,019 | ||||||||||||
| Homeward Opportunities Fund I Trust 2018-2 - 144A | 133,785 | 3.985 | ++ | 11/25/2058 | 138,968 | |||||||||||
| Homeward Opportunities Fund I Trust 2019-1 - 144A | 110,072 | 3.454 | ++ | 1/25/2059 | 111,112 | |||||||||||
| JP Morgan Mortgage Trust 2005-A5 | 49,248 | 2.870 | ++ | 8/25/2035 | 50,495 | |||||||||||
| JP Morgan Mortgage Trust 2017-5 - 144A | 160,499 | 3.125 | ++ | 12/15/2047 | 163,897 | |||||||||||
| LHOME Mortgage Trust 2019-RTL1 - 144A (a) | 145,000 | 4.580 | 10/25/2023 | 147,357 | ||||||||||||
| MASTR Alternative Loan Trust 2004-4 | 37,326 | 5.500 | 4/25/2034 | 38,831 | ||||||||||||
| Metlife Securitization Trust 2017-1A M1 - 144A | 100,000 | 3.630 | ++ | 4/25/2055 | 105,282 | |||||||||||
| Metlife Securitization Trust 2019-1 - 144A | 107,328 | 3.750 | ++ | 4/25/2058 | 115,009 | |||||||||||
| Mill City Mortgage Loan Trust 2019-1 - 144A | 199,632 | 3.500 | ++ | 10/25/2069 | 216,118 | |||||||||||
| New Residential Mortgage Loan Trust 2014-3 - 144A | 276,617 | 3.750 | ++ | 11/25/2054 | 296,716 | |||||||||||
| New Residential Mortgage Loan Trust 2016-4 - 144A | 74,649 | 3.750 | ++ | 11/25/2056 | 80,465 | |||||||||||
| New Residential Mortgage Loan Trust 2017-2 - 144A | 313,082 | 4.000 | ++ | 3/25/2057 | 338,723 | |||||||||||
| New Residential Mortgage Loan Trust 2018-1 - 144A | 153,223 | 4.000 | ++ | 12/25/2057 | 165,958 | |||||||||||
| New Residential Mortgage Loan Trust 2020-1 - 144A | 113,919 | 3.500 | ++ | 10/25/2059 | 122,189 | |||||||||||
| OBX 2018-EXP2 Trust - 144A | 60,595 | 4.000 | ++ | 11/25/2048 | 61,665 | |||||||||||
| OBX 2019-INV1 Trust - 144A | 79,450 | 4.500 | ++ | 11/25/2048 | 82,969 | |||||||||||
| Provident Funding Mortgage Trust 2019-1 - 144A | 116,771 | 3.000 | ++ | 12/25/2049 | 120,497 | |||||||||||
| RCKT Mortgage Trust 2020-1 - 144A | 234,388 | 3.000 | ++ | 2/25/2050 | 241,228 | |||||||||||
| Residential Mortgage Loan Trust 2019-2 - 144A | 118,040 | 2.913 | ++ | 5/25/2059 | 120,387 | |||||||||||
| Residential Mortgage Loan Trust 2020-1 - 144A | 326,824 | 2.376 | ++ | 2/25/2024 | 331,783 | |||||||||||
| Starwood Mortgage Residential Trust 2020-1 - 144A | 354,049 | 2.275 | ++ | 2/25/2050 | 360,738 | |||||||||||
| Towd Point HE Trust 2019-HE1 - 144A | 1 Month LIBOR + 0.900% | 233,071 | 1.049 | + | 4/25/2048 | 232,262 | ||||||||||
See accompanying notes to financial statements.
3
| SCHEDULE OF INVESTMENTS |
| Dunham Corporate/Government Bond Fund (Continued) |
| October 31, 2020 |
| Variable | Principal | Interest | Maturity | |||||||||||||
| Security | Rate | Amount | Rate % | Date | Value | |||||||||||
| ASSET BACKED SECURITIES - 28.1% (Continued) | ||||||||||||||||
| CMO - 8.7% (Continued) | ||||||||||||||||
| Verus Securitization Trust 2018-2 - 144A | $ | 105,000 | 4.426 | ++ | 6/1/2058 | $ | 108,869 | |||||||||
| Verus Securitization Trust 2018-3 - 144A | 61,062 | 4.108 | ++ | 10/25/2058 | 62,699 | |||||||||||
| Verus Securitization Trust 2019-2 - 144A | 114,490 | 3.211 | ++ | 5/25/2049 | 115,761 | |||||||||||
| Verus Securitization Trust 2019-INV2 - 144A | 257,241 | 2.913 | ++ | 7/25/2059 | 263,659 | |||||||||||
| Wells Fargo Mortgage Backed Securities 2020-4 Trust - 144A ^ | 92,805 | 3.000 | ++ | 7/25/2050 | 95,798 | |||||||||||
| 6,259,585 | ||||||||||||||||
| CREDIT CARD - 0.7% | ||||||||||||||||
| Fair Square Issuance Trust - 144A | 305,000 | 2.900 | 9/20/2024 | 305,171 | ||||||||||||
| Genesis Private Label Amortizing Trust 2020-1 - 144A | 200,000 | 2.830 | 7/20/2030 | 200,914 | ||||||||||||
| 506,085 | ||||||||||||||||
| HOME EQUITY - 0.1% | ||||||||||||||||
| NovaStar Mortgage Funding Trust Series 2004-4 | 1 Month LIBOR + 1.725% | 38,268 | 1.874 | + | 3/25/2035 | 38,561 | ||||||||||
| MANUFACTURED HOUSING - 0.1% | ||||||||||||||||
| Towd Point Mortgage Trust 2019-MH1 - 144A | 111,083 | 3.000 | ++ | 11/25/2058 | 113,946 | |||||||||||
| NON AGENCY CMBS - 2.5% | ||||||||||||||||
| BX Trust 2019-OC11 - 144A | 130,000 | 4.075 | ++ | 12/9/2041 | 125,393 | |||||||||||
| CHC Commercial Mortgage Trust 2019 - CHC - 144A | 1 Month LIBOR + 1.120% | 233,990 | 1.268 | + | 6/15/2034 | 223,964 | ||||||||||
| Citigroup Commercial Mortgage Trust 2015-GC27 | 130,000 | 2.878 | 2/10/2048 | 136,505 | ||||||||||||
| Citigroup Commercial Mortgage Trust 2019-SST2 - 144A | 1 Month LIBOR + 0.920% | 145,000 | 1.068 | + | 12/15/2036 | 142,826 | ||||||||||
| Credit Suisse Mortgage Capital Certificates 2019-ICE4 - 144A | 1 Month LIBOR + 0.980% | 205,000 | 1.128 | + | 5/15/2036 | 205,286 | ||||||||||
| Exantas Capital Corp. - 144A | 1 Month LIBOR + 1.150% | 160,000 | 1.297 | + | 3/15/2035 | 159,164 | ||||||||||
| GS Mortgage Securities Corp. Trust 2012-ALOHA - 144A | 252,000 | 3.551 | 4/10/2022 | 254,310 | ||||||||||||
| GS Mortgage Securities Trust 2020-GC45 | 135,000 | 3.173 | ++ | 2/13/2053 | 148,465 | |||||||||||
| Hilton USA Trust 2016-SFP - 144A | 185,000 | 3.323 | 11/5/2035 | 184,753 | ||||||||||||
| JP Morgan Chase Commercial Mortgage Securities Trust 2011-C4 - 144A | 28,649 | 4.388 | 5/15/2021 | 28,959 | ||||||||||||
| JPMBB Commercial Mortgage Securities Trust 2015-C31 | 125,000 | 4.106 | 8/15/2048 | 138,316 | ||||||||||||
| WFRBS Commercial Mortgage Trust 2014-C24 | 62,000 | 3.931 | 11/15/2047 | 63,651 | ||||||||||||
| 1,811,592 | ||||||||||||||||
| OTHER ABS - 5.8% | ||||||||||||||||
| American Homes 4 Rent 2014-SFR2 Trust - 144A | 230,000 | 4.705 | 10/17/2036 | 251,511 | ||||||||||||
| American Homes 4 Rent 2015-SFR2 Trust - 144A | 220,000 | 4.691 | 10/17/2045 | 242,088 | ||||||||||||
| AMSR 2020-SFR1 Trust - 144A | 314,698 | 1.819 | 4/17/2025 | 319,331 | ||||||||||||
| AMSR 2020-SFR1 Trust - 144A | 175,000 | 2.120 | 4/17/2037 | 177,380 | ||||||||||||
| AMSR 2020-SFR2 Trust - 144A | 250,000 | 2.533 | 7/17/2037 | 256,404 | ||||||||||||
| Amur Equipment Finance Receivables VI LLC - 144A | 77,020 | 3.890 | 7/20/2022 | 78,673 | ||||||||||||
| Aqua Finance Trust 2019-A - 144A | 106,780 | 3.140 | 7/16/2040 | 109,197 | ||||||||||||
| Aqua Finance Trust 2019-A - 144A | 180,000 | 4.010 | 7/16/2040 | 183,479 | ||||||||||||
| BRE Grand Islander Timeshare Issuer 2019-A LLC - 144A | 105,098 | 3.280 | 9/26/2033 | 108,101 | ||||||||||||
| CCG Receivables Trust 2019-2 - 144A | 100,000 | 2.550 | 3/15/2027 | 102,029 | ||||||||||||
| CF Hippolyta LLC - 144A | 113,522 | 1.690 | 7/15/2060 | 115,030 | ||||||||||||
| CoreVest American Finance 2018-2 Trust - 144A | 221,322 | 4.026 | 11/15/2052 | 237,625 | ||||||||||||
| CoreVest American Finance 2019-3 Trust - 144A | 100,000 | 3.265 | 10/15/2052 | 102,448 | ||||||||||||
| Corevest American Finance 2020-1 Trust - 144A | 158,017 | 1.832 | 3/15/2050 | 160,012 | ||||||||||||
| Diamond Resorts Owner Trust - 144A | 45,827 | 3.270 | 10/22/2029 | 46,512 | ||||||||||||
| Foundation Finance Trust 2019-1 - 144A | 79,879 | 3.860 | 11/15/2034 | 82,404 | ||||||||||||
| FREED ABS Trust 2020-3FP - 144A | 113,320 | 3.010 | 9/20/2027 | 113,587 | ||||||||||||
| Jersey Mike’s Funding - 144A | 130,000 | 4.433 | 2/15/2050 | 139,313 | ||||||||||||
| LL ABS Trust 2020-1 - 144A | 160,000 | 2.330 | 7/15/2022 | 160,395 | ||||||||||||
| Marlette Funding Trust 2019-4 - 144A | 79,184 | 2.390 | 12/17/2029 | 79,930 | ||||||||||||
| MVW 2019-2 LLC - 144A | 124,168 | 2.220 | 10/20/2038 | 127,654 | ||||||||||||
| MVW 2020-1 LLC - 144A | 161,044 | 1.740 | 10/20/2037 | 163,850 | ||||||||||||
| MVW Owner Trust 2016-1 - 144A | 35,373 | 2.250 | 12/20/2033 | 35,487 | ||||||||||||
| Octane Receivables Trust 2019-1 - 144A | 68,943 | 3.160 | 9/20/2023 | 69,735 | ||||||||||||
| Octane Receivables Trust 2020-1 - 144A | 190,000 | 1.710 | 2/20/2025 | 190,438 | ||||||||||||
| Orange Lake Timeshare Trust 2019-A - 144A | 96,871 | 3.360 | 4/9/2038 | 98,149 | ||||||||||||
| Sierra Timeshare 2020-2 Receivables Funding LLC - 144A | 164,496 | 2.320 | 7/20/2037 | 165,537 | ||||||||||||
| Sofi Consumer Loan Program 2017-5 LLC - 144A | 33,023 | 2.780 | 9/25/2026 | 33,323 | ||||||||||||
| Sofi Consumer Loan Program 2017-6 LLC - 144A | 22,476 | 2.820 | 11/25/2026 | 22,597 | ||||||||||||
| Tricon American Homes 2017-SFR1 Trust - 144A | 98,468 | 2.716 | 9/17/2022 | 99,832 | ||||||||||||
| TRIP Rail Master Funding LLC - 144A | 47,757 | 2.709 | 8/15/2047 | 47,858 | ||||||||||||
| VSE 2017-A VOI Mortgage LLC - 144A | 51,582 | 2.330 | 3/20/2035 | 52,411 | ||||||||||||
| 4,172,320 | ||||||||||||||||
| RESIDENTIAL MORTGAGE - 5.1% | ||||||||||||||||
| Ajax Mortgage Loan Trust 2019-D - 144A (a) | 165,600 | 2.956 | 9/25/2065 | 167,918 | ||||||||||||
| Bayview Opportunity Master Fund IVa Trust 2017-RT1 - 144A | 49,522 | 3.000 | ++ | 3/28/2057 | 50,376 | |||||||||||
| Bayview Opportunity Master Fund IVa Trust 2017-SPL5 - 144A | 100,000 | 4.000 | ++ | 6/28/2057 | 105,541 | |||||||||||
| COLT 2020-RPL1 Trust - 144A | 200,000 | 1.390 | ++ | 1/25/2065 | 199,207 | |||||||||||
| FirstKey Homes 2020-SFR2 Trust - 144A | 270,000 | 1.567 | 10/19/2037 | 269,661 | ||||||||||||
See accompanying notes to financial statements.
4
| SCHEDULE OF INVESTMENTS |
| Dunham Corporate/Government Bond Fund (Continued) |
| October 31, 2020 |
| Variable | Principal | Interest | Maturity | |||||||||||||
| Security | Rate | Amount | Rate % | Date | Value | |||||||||||
| ASSET BACKED SECURITIES - 28.1% (Continued) | ||||||||||||||||
| RESIDENTIAL MORTGAGE - 5.1% (Continued) | ||||||||||||||||
| Mill City Mortgage Loan Trust 2017-1 - 144A | $ | 100,000 | 3.250 | ++ | 11/25/2058 | $ | 108,433 | |||||||||
| PRPM 2020-1 LLC - 144A (a) | 164,663 | 2.981 | 2/25/2025 | 165,101 | ||||||||||||
| PRPM 2020-3 LLC - 144A (a) | 121,995 | 2.857 | 9/25/2025 | 122,201 | ||||||||||||
| RCO V Mortgage LLC 2019-2 - 144A (a) | 140,049 | 3.475 | 11/25/2024 | 140,267 | ||||||||||||
| Towd Point Mortgage Trust 2016-3 - 144A | 345,000 | 3.500 | ++ | 4/25/2056 | 363,716 | |||||||||||
| Towd Point Mortgage Trust 2017-1 - 144A | 115,000 | 3.750 | ++ | 10/25/2056 | 125,321 | |||||||||||
| Towd Point Mortgage Trust 2017-4 - 144A | 200,000 | 3.000 | ++ | 6/25/2057 | 214,567 | |||||||||||
| Towd Point Mortgage Trust 2017-6 - 144A | 135,000 | 3.000 | ++ | 10/25/2057 | 143,166 | |||||||||||
| Towd Point Mortgage Trust 2018-4 - 144A | 176,573 | 3.000 | ++ | 6/25/2058 | 188,711 | |||||||||||
| Towd Point Mortgage Trust 2018-6 - 144A | 300,000 | 3.750 | ++ | 3/25/2058 | 332,006 | |||||||||||
| Towd Point Mortgage Trust 2018-SJ1 - 144A | 64,064 | 4.000 | ++ | 10/25/2058 | 64,613 | |||||||||||
| Towd Point Mortgage Trust 2019-2 - 144A | 255,000 | 3.750 | ++ | 12/25/2058 | 276,999 | |||||||||||
| Tricon American Homes 2020-SFR2 Trust - 144A | 100,000 | 2.281 | 11/17/2027 | 100,533 | ||||||||||||
| VCAT 2019-NPL2 LLC - 144A | 80,275 | 3.573 | ++ | 11/25/2049 | 80,229 | |||||||||||
| Vericrest Opportunity Loan Trust 2019-NPL7 - 144A (a) | 259,597 | 3.179 | 10/25/2049 | 260,394 | ||||||||||||
| Vericrest Opportunity Loan Trust 2020-NPL2 - 144A (a) | 77,288 | 2.981 | 2/25/2050 | 77,462 | ||||||||||||
| VOLT 2020-NPL1 A1A - 144A (a) | 166,775 | 3.228 | 1/25/2050 | 167,375 | ||||||||||||
| 3,723,797 | ||||||||||||||||
| STUDENT LOAN - 0.2% | ||||||||||||||||
| Commonbond Student Loan Trust 2020-1 - 144A | 180,000 | 1.690 | 10/25/2051 | 180,384 | ||||||||||||
| WHOLE BUSINESS - 0.1% | ||||||||||||||||
| Small Business Lending Trust 2019-A - 144A | 48,218 | 2.850 | 7/15/2026 | 48,064 | ||||||||||||
| TOTAL ASSET BACKED SECURITIES(Cost - $20,029,239) | 20,330,887 | |||||||||||||||
| CORPORATE BONDS - 33.7% | ||||||||||||||||
| AEROSPACE & DEFENSE - 1.0% | ||||||||||||||||
| Boeing Co. ^ | 45,000 | 3.750 | 2/1/2050 | 40,308 | ||||||||||||
| Boeing Co. | 108,000 | 5.930 | 5/1/2060 | 128,485 | ||||||||||||
| Boeing Co. ^ | 90,000 | 5.150 | 5/1/2030 | 99,647 | ||||||||||||
| Howmet Aerospace, Inc. ^ | 120,000 | 6.875 | 5/1/2025 | 133,650 | ||||||||||||
| Signature Aviation US Holdings, Inc. - 144A | 105,000 | 4.000 | 3/1/2028 | 101,719 | ||||||||||||
| Spirit AeroSystems, Inc. - 144A ^ | 135,000 | 5.500 | 1/15/2025 | 137,531 | ||||||||||||
| TransDigm, Inc. | 90,000 | 5.500 | 11/15/2027 | 88,033 | ||||||||||||
| 729,373 | ||||||||||||||||
| APPAREL & TEXTILE PRODUCTS - 0.4% | ||||||||||||||||
| Hanesbrands, Inc. - 144A | 100,000 | 5.375 | 5/15/2025 | 105,375 | ||||||||||||
| Under Armour, Inc. ^ | 75,000 | 3.250 | 6/15/2026 | 72,601 | ||||||||||||
| VF Corp. | 74,000 | 2.400 | 4/23/2025 | 78,673 | ||||||||||||
| 256,649 | ||||||||||||||||
| ASSET MANAGEMENT - 1.3% | ||||||||||||||||
| Brightsphere Investment Group, Inc. | 165,000 | 4.800 | 7/27/2026 | 174,858 | ||||||||||||
| Charles Schwab Corp. ^ | 5 Year Treasury Note + 4.971% | 157,000 | 5.375 | + | 9/1/2168 | 172,198 | ||||||||||
| Citadel LP - 144A | 155,000 | 4.875 | 1/15/2027 | 165,956 | ||||||||||||
| Icahn Enterprises LP / Icahn Enterprises Finance Corp. | 130,000 | 6.250 | 5/15/2026 | 135,179 | ||||||||||||
| UBS AG | 250,000 | 7.625 | 8/17/2022 | 278,521 | ||||||||||||
| 926,712 | ||||||||||||||||
| AUTOMOTIVE - 1.2% | ||||||||||||||||
| American Axle & Manufacturing, Inc. | 80,000 | 6.500 | 4/1/2027 | 80,500 | ||||||||||||
| Dana, Inc. ^ | 105,000 | 5.375 | 11/15/2027 | 108,609 | ||||||||||||
| Ford Motor Co. ^ | 103,000 | 9.000 | 4/22/2025 | 121,507 | ||||||||||||
| General Motors Co. ^ | 125,000 | 6.800 | 10/1/2027 | 153,667 | ||||||||||||
| Lear Corp. | 165,000 | 3.800 | 9/15/2027 | 177,032 | ||||||||||||
| Nissan Motor Co. Ltd. - 144A | 200,000 | 4.810 | 9/17/2030 | 201,026 | ||||||||||||
| 842,341 | ||||||||||||||||
| BANKING - 4.9% | ||||||||||||||||
| Bank of America Corp. ^ | 3 Month LIBOR + 0.790% | 145,000 | 3.004 | + | 12/20/2023 | 152,071 | ||||||||||
| Bank of America Corp. | 211,000 | 4.200 | 8/26/2024 | 235,256 | ||||||||||||
| Bank of America Corp. | 3 Month LIBOR + 0.770% | 160,000 | 1.019 | + | 2/5/2026 | 160,105 | ||||||||||
| Bank of Montreal | 5 Year Swap Rate US + 1.432% | 234,000 | 3.803 | + | 12/15/2032 | 259,385 | ||||||||||
| BBVA Bancomer SA - 144A | 5 Year Treasury Note + 2.650% | 200,000 | 5.125 | + | 1/18/2033 | 197,550 | ||||||||||
| Citigroup, Inc. | 300,000 | 4.050 | 7/30/2022 | 318,004 | ||||||||||||
| Citigroup, Inc. | 3 Month LIBOR + 1.250% | 215,000 | 1.475 | + | 7/1/2026 | 218,321 | ||||||||||
| Citigroup, Inc. | 95,000 | 3.200 | 10/21/2026 | 104,563 | ||||||||||||
| Fifth Third Bancorp ^ | 5 Year Treasury Note + 4.215% | 124,000 | 4.500 | + | 9/30/2168 | 125,550 | ||||||||||
| JPMorgan Chase & Co. ^ | SOFRRATE + 2.515% | 400,000 | 2.956 | + | 5/13/2031 | 426,689 | ||||||||||
| JPMorgan Chase & Co. ^ | SOFRRATE + 3.125% | 47,000 | 4.600 | + | 8/1/2168 | 46,401 | ||||||||||
| PNC Financial Services Group, Inc. | 3 Month LIBOR + 3.300% | 170,000 | 5.000 | + | 12/29/2049 | 182,333 | ||||||||||
| Santander Holdings USA, Inc. ^ | 65,000 | 4.400 | 7/13/2027 | 72,597 | ||||||||||||
| Santander Holdings USA, Inc. ^ | 133,000 | 3.700 | 3/28/2022 | 137,865 | ||||||||||||
See accompanying notes to financial statements.
5
| SCHEDULE OF INVESTMENTS |
| Dunham Corporate/Government Bond Fund (Continued) |
| October 31, 2020 |
| Variable | Principal | Interest | Maturity | |||||||||||||
| Security | Rate | Amount | Rate % | Date | Value | |||||||||||
| CORPORATE BONDS - 33.7% (Continued) | ||||||||||||||||
| BANKING - 4.9% (Continued) | ||||||||||||||||
| Synovus Financial Corp. | 5 Year Swap Rate US + 3.379% | $ | 70,000 | 5.900 | + | 2/7/2029 | $ | 72,910 | ||||||||
| Toronto-Dominion Bank | 5 Year Swap Rate US + 2.205% | 195,000 | 3.625 | + | 9/15/2031 | 218,611 | ||||||||||
| Truist Financial Corp. ^ | 10 Year Treasury Note + 4.349% | 155,000 | 5.100 | + | 3/1/2069 | 170,006 | ||||||||||
| Wells Fargo & Co. | SOFRRATE + 2.10% | 350,000 | 2.393 | + | 6/2/2028 | 364,092 | ||||||||||
| Wells Fargo & Co. | 3 Month LIBOR + 3.110% | 115,000 | 5.900 | + | 12/15/2165 | 116,377 | ||||||||||
| 3,578,686 | ||||||||||||||||
| BEVERAGES - 0.4% | ||||||||||||||||
| Anheuser-Busch InBev Worldwide, Inc. | 105,000 | 4.000 | 4/13/2028 | 121,025 | ||||||||||||
| Anheuser-Busch InBev Worldwide, Inc. | 40,000 | 4.750 | 1/23/2029 | 48,474 | ||||||||||||
| Bacardi Ltd. - 144A | 100,000 | 4.700 | 5/15/2028 | 115,507 | ||||||||||||
| 285,006 | ||||||||||||||||
| BIOTECH & PHARMA - 1.0% | ||||||||||||||||
| Bausch Health Cos., Inc. - 144A | 50,000 | 5.750 | 8/15/2027 | 53,719 | ||||||||||||
| Mylan NV | 105,000 | 3.950 | 6/15/2026 | 118,251 | ||||||||||||
| Par Pharmaceutical, Inc. - 144A | 50,000 | 7.500 | 4/1/2027 | 53,065 | ||||||||||||
| Perrigo Finance Unlimited Co. | 200,000 | 4.375 | 3/15/2026 | 222,873 | ||||||||||||
| Royalty Pharma PLC - 144A ^ | 165,000 | 2.200 | 9/2/2030 | 162,757 | ||||||||||||
| Royalty Pharma PLC - 144A | 69,000 | 3.550 | 9/2/2050 | 66,349 | ||||||||||||
| Teva Pharmaceutical Finance Netherlands III BV ^ | 85,000 | 3.150 | 10/1/2026 | 74,959 | ||||||||||||
| 751,973 | ||||||||||||||||
| CABLE & SATELLITE - 0.4% | ||||||||||||||||
| CCO Holdings LLC / CCO Holdings Capital Corp. - 144A | 45,000 | 4.500 | 8/15/2030 | 46,823 | ||||||||||||
| DISH DBS Corp. | 25,000 | 5.000 | 3/15/2023 | 25,219 | ||||||||||||
| Radiate Holdco LLC / Radiate Finance, Inc. - 144A ^ | 20,000 | 4.500 | 9/15/2026 | 20,105 | ||||||||||||
| Virgin Media Finance PLC - 144A ^ | 200,000 | 5.000 | 7/15/2030 | 199,250 | ||||||||||||
| 291,397 | ||||||||||||||||
| CHEMICALS - 0.6% | ||||||||||||||||
| Avient Corp. - 144A | 100,000 | 5.750 | 5/15/2025 | 105,375 | ||||||||||||
| Nutrition & Biosciences, Inc. - 144A | 165,000 | 2.300 | 11/1/2030 | 166,071 | ||||||||||||
| Olin Corp. ^ | 120,000 | 5.625 | 8/1/2029 | 124,199 | ||||||||||||
| 395,645 | ||||||||||||||||
| COMMERCIAL SUPPORT SERVICES - 0.4% | ||||||||||||||||
| Aramark Services, Inc. - 144A ^ | 50,000 | 6.375 | 5/1/2025 | 52,506 | ||||||||||||
| Block Financial LLC ^ | 160,000 | 3.875 | 8/15/2030 | 165,031 | ||||||||||||
| GFL Environmental, Inc. - 144A ^ | 95,000 | 3.750 | 8/1/2025 | 95,178 | ||||||||||||
| 312,715 | ||||||||||||||||
| CONSTRUCTION MATERIALS - 0.2% | �� | |||||||||||||||
| Standard Industries, Inc. - 144A ^ | 130,000 | 4.375 | 7/15/2030 | 134,100 | ||||||||||||
| CONTAINERS & PACKAGING - 0.3% | ||||||||||||||||
| Ardagh Packaging Finance PLC / Ardagh Holdings USA, Inc. - 144A | 200,000 | 4.125 | 8/15/2026 | 204,250 | ||||||||||||
| DIVERSIFIED INDUSTRIALS - 0.1% | ||||||||||||||||
| General Electric Co. | 3 Month LIBOR + 3.330% | 136,000 | 5.000 | + | 12/29/2049 | 110,387 | ||||||||||
| ELEC & GAS MARKETING & TRADING - 0.2% | ||||||||||||||||
| Southern Power Co. | 125,000 | 4.150 | 12/1/2025 | 143,499 | ||||||||||||
| ELECTRIC UTILITIES - 1.5% | ||||||||||||||||
| American Electric Power Co, Inc. | 160,000 | 2.300 | 3/1/2030 | 164,710 | ||||||||||||
| DPL, Inc. | 120,000 | 4.350 | 4/15/2029 | 130,330 | ||||||||||||
| Edison International | 160,000 | 4.125 | 3/15/2028 | 167,670 | ||||||||||||
| Exelon Corp. | 85,000 | 3.497 | 6/1/2022 | 88,632 | ||||||||||||
| Pennsylvania Electric Co. - 144A | 140,000 | 3.600 | 6/1/2029 | 152,614 | ||||||||||||
| Talen Energy Supply LLC - 144A | 60,000 | 6.625 | 1/15/2028 | 57,476 | ||||||||||||
| TerraForm Power Operating LLC - 144A ^ | 90,000 | 5.000 | 1/31/2028 | 98,973 | ||||||||||||
| Vistra Operations Co. LLC - 144A | 180,000 | 4.300 | 7/15/2029 | 195,239 | ||||||||||||
| 1,055,644 | ||||||||||||||||
| ELECTRICAL EQUIPMENT - 0.1% | ||||||||||||||||
| WESCO Distribution, Inc. - 144A | 50,000 | 7.250 | 6/15/2028 | 54,820 | ||||||||||||
| ENGINEERING & CONSTRUCTION - 0.3% | ||||||||||||||||
| Quanta Services, Inc. | 205,000 | 2.900 | 10/1/2030 | 214,147 | ||||||||||||
| ENTERTAINMENT CONTENT - 0.1% | ||||||||||||||||
| Diamond Sports Group LLC / Diamond Sports Finance Co. - 144A | 55,000 | 5.375 | 8/15/2026 | 32,244 | ||||||||||||
| Diamond Sports Group LLC / Diamond Sports Finance Co. - 144A | 30,000 | 6.625 | 8/15/2027 | 12,012 | ||||||||||||
| 44,256 | ||||||||||||||||
| FOOD - 0.2% | ||||||||||||||||
| Conagra Brands, Inc. | 145,000 | 4.300 | 5/1/2024 | 161,502 | ||||||||||||
See accompanying notes to financial statements.
6
| SCHEDULE OF INVESTMENTS |
| Dunham Corporate/Government Bond Fund (Continued) |
| October 31, 2020 |
| Variable | Principal | Interest | Maturity | |||||||||||||
| Security | Rate | Amount | Rate % | Date | Value | |||||||||||
| CORPORATE BONDS - 33.7% (Continued) | ||||||||||||||||
| HEALTH CARE FACILITIES & SERVICES - 1.1% | ||||||||||||||||
| Anthem, Inc. ^ | $ | 150,000 | 2.875 | 9/15/2029 | $ | 161,712 | ||||||||||
| Centene Corp. | 45,000 | 4.625 | 12/15/2029 | 49,051 | ||||||||||||
| CVS Health Corp. | 3 Month LIBOR + 0.720% | 145,000 | 0.962 | + | 3/9/2021 | 145,294 | ||||||||||
| DaVita, Inc. - 144A ^ | 70,000 | 3.750 | 2/15/2031 | 67,419 | ||||||||||||
| HCA, Inc. | 65,000 | 5.375 | 2/1/2025 | 72,073 | ||||||||||||
| Jaguar Holding Co. II / PPD Development LP -144A | 40,000 | 5.000 | 6/15/2028 | 41,742 | ||||||||||||
| Legacy LifePoint Health, Inc. - 144A | 35,000 | 4.375 | 2/15/2027 | 34,727 | ||||||||||||
| Providence Service Corp/The - 144A | 5,000 | 5.875 | 11/15/2025 | 5,097 | ||||||||||||
| Tenet Healthcare Corp. - 144A ^ | 15,000 | 7.500 | 4/1/2025 | 16,179 | ||||||||||||
| Tenet Healthcare Corp. - 144A | 50,000 | 5.125 | 11/1/2027 | 51,610 | ||||||||||||
| Universal Health Services, Inc. - 144A | 161,000 | 2.650 | 10/15/2030 | 160,791 | ||||||||||||
| 805,695 | ||||||||||||||||
| HOME CONSTRUCTION - 0.5% | ||||||||||||||||
| M/I Homes, Inc. | 105,000 | 4.950 | 2/1/2028 | 109,003 | ||||||||||||
| PulteGroup, Inc. ^ | 125,000 | 6.375 | 5/15/2033 | 159,878 | ||||||||||||
| Weekley Homes LLC / Weekley Finance Corp. - 144A | 85,000 | 4.875 | 9/15/2028 | 101,532 | ||||||||||||
| 370,413 | ||||||||||||||||
| INDUSTRIAL SUPPORT SERVICES - 0.3% | ||||||||||||||||
| Ashtead Capital, Inc. - 144A | 200,000 | 4.375 | 8/15/2027 | 210,000 | ||||||||||||
| INSTITUTIONAL FINANCIAL SERVICES - 1.9% | ||||||||||||||||
| Bank of New York Mellon Corp. | 5 Year Treasury Note + 4.358% | 160,000 | 4.700 | + | Perpetual | 171,600 | ||||||||||
| Brookfield Finance, Inc. | 220,000 | 4.250 | 6/2/2026 | 253,692 | ||||||||||||
| Goldman Sachs Group, Inc. ^ | 295,000 | 4.250 | 10/21/2025 | 335,487 | ||||||||||||
| Jefferies Group LLC / Jefferies Group Capital Finance, Inc. | 120,000 | 4.850 | 1/15/2027 | 138,209 | ||||||||||||
| Morgan Stanley | 180,000 | 3.125 | 7/27/2026 | 198,765 | ||||||||||||
| Morgan Stanley ^ | 175,000 | 6.375 | 7/24/2042 | 273,016 | ||||||||||||
| 1,370,769 | ||||||||||||||||
| INSURANCE - 2.0% | ||||||||||||||||
| Allstate Corp. | 3 Month LIBOR + 2.938% | 150,000 | 5.750 | + | 8/15/2053 | 159,447 | ||||||||||
| Athene Holding Ltd. - 144A | 150,000 | 2.450 | 8/20/2027 | 152,342 | ||||||||||||
| Brighthouse Financial, Inc. | 120,000 | 5.625 | 5/15/2030 | 141,920 | ||||||||||||
| Fairfax Financial Holdings Ltd. | 150,000 | 4.850 | 4/17/2028 | 163,394 | ||||||||||||
| Liberty Mutual Group, Inc. - 144A | 150,000 | 4.569 | 2/1/2029 | 181,281 | ||||||||||||
| MetLife, Inc. | 3 Month LIBOR + 2.959% | 76,000 | 5.875 | + | 3/15/2028 | 84,604 | ||||||||||
| MetLife, Inc. | 5 Year Treasury Note + 3.576% | 160,000 | 3.850 | + | 9/15/2025 | 160,858 | ||||||||||
| Prudential Financial, Inc. | 3 Month LIBOR + 3.920% | 230,000 | 5.625 | + | 6/15/2043 | 245,612 | ||||||||||
| Trinity Acquisition PLC | 60,000 | 4.400 | 3/15/2026 | 69,307 | ||||||||||||
| Voya Financial, Inc. ^ | 3 Month LIBOR + 3.580% | 105,000 | 5.650 | + | 5/15/2053 | 108,466 | ||||||||||
| 1,467,231 | ||||||||||||||||
| INTERNET MEDIA & SERVICES - 0.4% | ||||||||||||||||
| ANGI Group LLC - 144A | 65,000 | 3.875 | 8/15/2028 | 64,391 | ||||||||||||
| Tencent Holdings Ltd. - 144A | 200,000 | 3.975 | 4/11/2029 | 225,485 | ||||||||||||
| TripAdvisor, Inc. - 144A | 30,000 | 7.000 | 7/15/2025 | 31,264 | ||||||||||||
| 321,140 | ||||||||||||||||
| LEISURE FACILITIES & SERVICES - 0.5% | ||||||||||||||||
| Caesars Entertainment, Inc. - 144A | 25,000 | 6.250 | 7/1/2025 | 25,641 | ||||||||||||
| Gateway Casinos & Entertainment Ltd. - 144A | 45,000 | 8.250 | 3/1/2024 | 37,739 | ||||||||||||
| International Game Technology PLC - 144A | 20,000 | 5.250 | 1/15/2029 | 19,832 | ||||||||||||
| Marriott Ownership Resorts, Inc. | 95,000 | 4.750 | 1/15/2028 | 90,826 | ||||||||||||
| Scientific Games International, Inc. - 144A ^ | 80,000 | 5.000 | 10/15/2025 | 80,400 | ||||||||||||
| Scientific Games International, Inc. - 144A | 50,000 | 8.250 | 3/15/2026 | 50,805 | ||||||||||||
| Scientific Games International, Inc. - 144A | 20,000 | 7.000 | 5/15/2028 | 19,900 | ||||||||||||
| 325,143 | ||||||||||||||||
| MACHINERY - 0.8% | ||||||||||||||||
| Flowserve Corp. ^ | 200,000 | 3.500 | 10/1/2030 | 199,396 | ||||||||||||
| Hillenbrand, Inc. | 125,000 | 4.500 | 9/15/2026 | 136,250 | ||||||||||||
| Oshkosh Corp. | 41,031 | 3.100 | 3/1/2030 | 43,590 | ||||||||||||
| Oshkosh Corp. | 113,000 | 4.600 | 5/15/2028 | 129,409 | ||||||||||||
| Stanley Black & Decker, Inc. ^ | 5 Year Treasury Note + 2.657% | 90,000 | 4.000 | + | 3/15/2060 | 94,080 | ||||||||||
| 602,725 | ||||||||||||||||
| METALS & MINING - 0.7% | ||||||||||||||||
| Alliance Resource Operating Partners LP - 144A | 70,000 | 7.500 | 5/1/2025 | 46,550 | ||||||||||||
| Cleveland-Cliffs, Inc. - 144A | 85,000 | 6.750 | 3/15/2026 | 89,356 | ||||||||||||
| Glencore Funding LLC - 144A | 160,000 | 1.625 | 9/1/2025 | 159,211 | ||||||||||||
| Novelis Corp. - 144A ^ | 55,000 | 4.750 | 1/30/2030 | 55,879 | ||||||||||||
| Teck Resources Ltd. | 145,000 | 6.125 | 10/1/2035 | 168,251 | ||||||||||||
| 519,247 | ||||||||||||||||
See accompanying notes to financial statements.
7
| SCHEDULE OF INVESTMENTS |
| Dunham Corporate/Government Bond Fund (Continued) |
| October 31, 2020 |
| Variable | Principal | Interest | Maturity | |||||||||||
| Security | Rate | Amount | Rate % | Date | Value | |||||||||
| CORPORATE BONDS - 33.7% (Continued) | ||||||||||||||
| OIL & GAS PRODUCERS - 2.5% | ||||||||||||||
| Aker BP ASA - 144A | $ | 150,000 | 2.875 | 1/15/2026 | $ | 148,676 | ||||||||
| Boardwalk Pipelines LP ^ | 155,000 | 4.950 | 12/15/2024 | 168,993 | ||||||||||
| Cheniere Energy Partners LP - 144A | 45,000 | 4.625 | 10/15/2028 | 46,519 | ||||||||||
| CrownRock LP / CrownRock Finance, Inc. - 144A | 75,000 | 5.625 | 10/15/2025 | 73,894 | ||||||||||
| EQM Midstream Partners LP -144A | 15,000 | 6.000 | 7/1/2025 | 15,394 | ||||||||||
| EQM Midstream Partners LP - 144A | 20,000 | 6.500 | 7/1/2027 | 21,004 | ||||||||||
| Holly Frontier Corp. | 165,000 | 5.875 | 4/1/2026 | 175,681 | ||||||||||
| Kinder Morgan, Inc. | 45,000 | 7.750 | 1/15/2032 | 61,631 | ||||||||||
| Kinder Morgan, Inc. ^ | 160,000 | 4.300 | 6/1/2025 | 179,743 | ||||||||||
| Parsley Energy LLC / Parsley Finance Corp. - 144A ^ | 70,000 | 4.125 | 2/15/2028 | 72,970 | ||||||||||
| Pertamina Persero PT - 144A | 200,000 | 6.450 | 5/30/2044 | 261,983 | ||||||||||
| Petroleos Mexicanos | 100,000 | 7.690 | 1/23/2050 | 83,231 | ||||||||||
| Petronas Capital Ltd. - 144A | 200,000 | 3.500 | 4/21/2030 | 223,285 | ||||||||||
| Sabine Pass Liquefaction LLC | 100,000 | 6.250 | 3/15/2022 | 105,712 | ||||||||||
| Sabine Pass Liquefaction LLC | 65,000 | 4.200 | 3/15/2028 | 70,611 | ||||||||||
| Targa Resources Partners LP ^ | 100,000 | 5.875 | 4/15/2026 | 102,188 | ||||||||||
| 1,811,515 | ||||||||||||||
| OIL & GAS SERVICES & EQUIPMENT - 0.1% | ||||||||||||||
| Patterson-UTI Energy, Inc. | 80,000 | 5.150 | 11/15/2029 | 60,206 | ||||||||||
| Transocean Guardian Ltd. - 144A | 31,200 | 5.875 | 1/15/2024 | 19,110 | ||||||||||
| 79,316 | ||||||||||||||
| PUBLISHING & BROADCASTING - 0.1% | ||||||||||||||
| Meredith Corp. | 85,000 | 6.875 | 2/1/2026 | 70,603 | ||||||||||
| REITS - 2.4% | ||||||||||||||
| Corporate Office Properties LP | 196,000 | 3.600 | 5/15/2023 | 206,624 | ||||||||||
| EPR Properties | 220,000 | 4.750 | 12/15/2026 | 199,875 | ||||||||||
| ESH Hospitality, Inc. - 144A | 80,000 | 4.625 | 10/1/2027 | 78,500 | ||||||||||
| GLP Capital LP / GLP Financing II, Inc. | 155,000 | 5.750 | 6/1/2028 | 176,753 | ||||||||||
| Iron Mountain, Inc. - 144A | 110,000 | 4.875 | 9/15/2029 | 111,265 | ||||||||||
| iStar, Inc. | 105,000 | 4.250 | 8/1/2025 | 96,600 | ||||||||||
| MPT Operating Partnership LP / MPT Finance Corp. | 85,000 | 5.000 | 10/15/2027 | 89,099 | ||||||||||
| MPT Operating Partnership LP / MPT Finance Corp. | 25,000 | 4.625 | 8/1/2029 | 26,218 | ||||||||||
| Office Properties Income Trust | 170,000 | 4.500 | 2/1/2025 | 172,489 | ||||||||||
| Retail Opportunity Investments Partnership LP | 105,000 | 4.000 | 12/15/2024 | 105,015 | ||||||||||
| SBA Tower Trust - 144A | 170,000 | 1.884 | 1/15/2026 | 173,006 | ||||||||||
| Service Properties Trust ^ | 165,000 | 4.950 | 2/15/2027 | 139,013 | ||||||||||
| Spirit Realty LP | 155,000 | 3.200 | 2/15/2031 | 154,770 | ||||||||||
| 1,729,227 | ||||||||||||||
| RETAIL - CONSUMER STAPLES - 0.2% | ||||||||||||||
| Albertsons Cos Inc. / Safeway, Inc. / New Albertsons LP / Albertsons LLC - 144A | 105,000 | 4.625 | 1/15/2027 | 108,381 | ||||||||||
| RETAIL - DISCRETIONARY - 0.2% | ||||||||||||||
| American Builders & Contractors Supply Co., Inc. - 144A | 100,000 | 4.000 | 1/15/2028 | 101,669 | ||||||||||
| QVC, Inc. | 75,000 | 4.375 | 3/15/2023 | 77,906 | ||||||||||
| 179,575 | ||||||||||||||
| SEMICONDUCTORS - 0.4% | ||||||||||||||
| Broadcom, Inc. | 180,000 | 4.150 | 11/15/2030 | 202,060 | ||||||||||
| Microchip Technology, Inc. - 144A | 100,000 | 4.250 | 9/1/2025 | 103,908 | ||||||||||
| 305,968 | ||||||||||||||
| SOFTWARE - 0.5% | ||||||||||||||
| Citrix Systems, Inc. | 190,000 | 3.300 | 3/1/2030 | 200,853 | ||||||||||
| Vmware, Inc. | 100,000 | 3.900 | 8/21/2027 | 110,497 | ||||||||||
| Vmware, Inc. | 55,000 | 4.700 | 5/15/2030 | 65,013 | ||||||||||
| 376,363 | ||||||||||||||
| SPECIALTY FINANCE - 1.3% | ||||||||||||||
| AerCap Ireland Capital DAC / AerCap Global Aviation Trust ^ | 150,000 | 3.650 | 7/21/2027 | 141,611 | ||||||||||
| Aviation Capital Group LLC - 144A ^ | 145,000 | 3.500 | 11/1/2027 | 127,966 | ||||||||||
| Avolon Holdings Funding Ltd. - 144A | 125,000 | 4.375 | 5/1/2026 | 121,383 | ||||||||||
| Capital One Financial Corp. ^ | 120,000 | 4.200 | 10/29/2025 | 133,590 | ||||||||||
| Capital One Financial Corp. | 165,000 | 3.750 | 7/28/2026 | 181,304 | ||||||||||
| FirstCash, Inc. - 144A | 50,000 | 4.625 | 9/1/2028 | 50,844 | ||||||||||
| Ladder Capital Finance Holdings LLLP / Ladder Capital Finance Corp. - 144A | 80,000 | 4.250 | 2/1/2027 | 69,300 | ||||||||||
| OneMain Finance Corp. ^ | 70,000 | 6.875 | 3/15/2025 | 77,131 | ||||||||||
| OneMain Finance Corp. | 25,000 | 7.125 | 3/15/2026 | 27,753 | ||||||||||
| OneMain Finance Corp. | 10,000 | 5.375 | 11/15/2029 | 10,300 | ||||||||||
| 941,182 | ||||||||||||||
See accompanying notes to financial statements.
8
| SCHEDULE OF INVESTMENTS |
| Dunham Corporate/Government Bond Fund (Continued) |
| October 31, 2020 |
| Variable | Principal | Interest | Maturity | |||||||||||||
| Security | Rate | Amount | Rate % | Date | Value | |||||||||||
| CORPORATE BONDS - 33.7% (Continued) | ||||||||||||||||
| TECHNOLOGY HARDWARE - 1.3% | ||||||||||||||||
| Dell International LLC / EMC Corp. - 144A ^ | $ | 105,000 | 8.100 | 7/15/2036 | $ | 141,966 | ||||||||||
| Flex Ltd. | 94,000 | 3.750 | 2/1/2026 | 102,957 | ||||||||||||
| Hewlett Packard Enterprise Co. ^ | 160,000 | 4.900 | 10/15/2025 | 183,945 | ||||||||||||
| HP, Inc. | 220,000 | 3.400 | 6/17/2030 | 235,592 | ||||||||||||
| Motorola Solutions, Inc. | 96,429 | 4.600 | 2/23/2028 | 112,594 | ||||||||||||
| Motorola Solutions, Inc. | 50,000 | 4.600 | 5/23/2029 | 58,821 | ||||||||||||
| NCR Corp. - 144A | 10,000 | 5.250 | 10/1/2030 | 9,919 | ||||||||||||
| Xerox Holdings Corp. - 144A | 95,000 | 5.500 | 8/15/2028 | 93,962 | ||||||||||||
| 939,756 | ||||||||||||||||
| TECHNOLOGY SERVICES - 0.4% | ||||||||||||||||
| Leidos, Inc. - 144A | 185,000 | 2.300 | 2/15/2031 | 183,737 | ||||||||||||
| Science Applications International Corp. - 144A ^ | 120,000 | 4.875 | 4/1/2028 | 125,914 | ||||||||||||
| 309,651 | ||||||||||||||||
| TELECOMMUNICATIONS - 1.0% | ||||||||||||||||
| Consolidated Communications, Inc. - 144A | 95,000 | 6.500 | 10/1/2028 | 97,791 | ||||||||||||
| Frontier Communications Corp. - 144A | 70,000 | 8.500 | 4/1/2026 | 70,508 | ||||||||||||
| Level 3 Financing, Inc. - 144A | 130,000 | 4.250 | 7/1/2028 | 130,780 | ||||||||||||
| Sprint Spectrum Co. LLC - 144A | 100,000 | 3.360 | 9/20/2021 | 101,094 | ||||||||||||
| Telesat Canada - 144A | 45,000 | 6.500 | 10/15/2027 | 44,838 | ||||||||||||
| T-Mobile USA, Inc. - 144A | 145,000 | 3.875 | 4/15/2030 | 163,068 | ||||||||||||
| Verizon Communications, Inc. ^ | 3 Month LIBOR + 1.100% | 85,000 | 1.380 | + | 5/15/2025 | 87,130 | ||||||||||
| 695,209 | ||||||||||||||||
| TOBACCO & CANNABIS - 0.3% | ||||||||||||||||
| BAT Capital Corp. | 195,000 | 4.906 | 4/2/2030 | 227,628 | ||||||||||||
| TRANSPORTATION & LOGISTICS - 0.2% | ||||||||||||||||
| DP World PLC - 144A | 100,000 | 6.850 | 7/2/2037 | 125,880 | ||||||||||||
| TOTAL CORPORATE BONDS (Cost - $23,573,200) | 24,385,719 | |||||||||||||||
| MUNICIPAL BONDS - 5.2% | ||||||||||||||||
| CITY - 0.7% | ||||||||||||||||
| City of Bristol VA | 340,000 | 4.210 | 1/1/2042 | 363,664 | ||||||||||||
| City of San Antonio TX | 145,000 | 1.963 | 2/1/2033 | 146,533 | ||||||||||||
| 510,197 | ||||||||||||||||
| GUARANTEED - 0.4% | ||||||||||||||||
| Rockdale County Water & Sewerage Authority | 305,000 | 3.060 | 7/1/2024 | 322,925 | ||||||||||||
| HIGHER EDUCATION - 0.2% | ||||||||||||||||
| University of California | 115,000 | 4.428 | 5/15/2048 | 129,086 | ||||||||||||
| HOSPITALS - 0.2% | ||||||||||||||||
| Idaho Health Facilities Authority | 135,000 | 5.020 | 3/1/2048 | 163,584 | ||||||||||||
| LOCAL AUTHORITY - 2.4% | ||||||||||||||||
| San Diego County Regional Airport Authority | 325,000 | 5.594 | 7/1/2043 | 342,693 | ||||||||||||
| State of California ^ | 385,000 | 7.600 | 11/1/2040 | 682,713 | ||||||||||||
| State of Texas | 600,000 | 3.211 | 4/1/2044 | 638,274 | ||||||||||||
| Texas Transportation Commission State Highway Fund | 35,000 | 4.000 | 10/1/2033 | 43,718 | ||||||||||||
| 1,707,398 | ||||||||||||||||
| OTHER - 0.2% | ||||||||||||||||
| Klein Independent School District | 95,000 | 5.000 | 8/1/2032 | 127,683 | ||||||||||||
| SALES TAX - 0.3% | ||||||||||||||||
| Massachusetts Bay Transportation Authority | 120,000 | 5.250 | 7/1/2032 | 171,083 | ||||||||||||
| Sales Tax Securitization Corp. | 20,000 | 3.411 | 1/1/2043 | 20,254 | ||||||||||||
| 191,337 | ||||||||||||||||
| SCHOOL DISTRICT - 0.2% | ||||||||||||||||
| Clackamas & Washington Counties School District No 3 | 120,000 | 5.000 | 6/15/2032 | 160,534 | ||||||||||||
| STATE - 0.4% | ||||||||||||||||
| State of Texas | 245,000 | 3.011 | 10/1/2026 | 269,417 | ||||||||||||
| WATER AND SEWER - 0.2% | ||||||||||||||||
| Santa Clara Valley Water District | 160,000 | 2.967 | 6/1/2050 | 159,112 | ||||||||||||
| TOTAL MUNICIPAL BONDS -(Cost - $3,454,733) | 3,741,273 | |||||||||||||||
See accompanying notes to financial statements.
9
| SCHEDULE OF INVESTMENTS |
| Dunham Corporate/Government Bond Fund (Continued) |
| October 31, 2020 |
| Variable | Principal | Interest | Maturity | |||||||||||||
| Security | Rate | Amount | Rate % | Date | Value | |||||||||||
| NON U.S. GOVERNMENT & AGENCIES - 0.8% | ||||||||||||||||
| SOVEREIGN - 0.8% | ||||||||||||||||
| Qatar Government International Bond - 144A | $ | 200,000 | 4.400 | 4/16/2050 | $ | 255,278 | ||||||||||
| Saudi Government International Bond - 144A | 200,000 | 3.250 | 10/22/2030 | 218,438 | ||||||||||||
| Turkey Government International Bond | 130,000 | 7.375 | 2/5/2025 | 133,120 | ||||||||||||
| TOTAL NON U.S. GOVERNMENT & AGENCIES (Cost - $620,280) | 606,836 | |||||||||||||||
| U.S. GOVERNMENT & AGENCIES - 23.6% | ||||||||||||||||
| AGENCY FIXED RATE - 3.3% | ||||||||||||||||
| Fannie Mae Pool 310041 | 51,634 | 6.500 | 5/1/2037 | 62,191 | ||||||||||||
| Fannie Mae Pool 735061 | 14,143 | 6.000 | 11/1/2034 | 16,722 | ||||||||||||
| Fannie Mae Pool 866009 | 13,145 | 6.000 | 3/1/2036 | 15,510 | ||||||||||||
| Fannie Mae Pool 909175 | 24,749 | 5.500 | 4/1/2038 | 28,695 | ||||||||||||
| Fannie Mae Pool 909220 | 61,488 | 6.000 | 8/1/2038 | 71,606 | ||||||||||||
| Fannie Mae Pool 938574 | 123,691 | 5.500 | 9/1/2036 | 145,518 | ||||||||||||
| Fannie Mae Pool 962752 | 19,285 | 5.000 | 4/1/2038 | 22,315 | ||||||||||||
| Fannie Mae Pool AA7001 | 112,554 | 5.000 | 6/1/2039 | 129,887 | ||||||||||||
| Fannie Mae Pool AS6522 | 110,447 | 3.500 | 1/1/2046 | 117,883 | ||||||||||||
| Fannie Mae Pool AS7026 | 158,201 | 4.000 | 4/1/2046 | 170,907 | ||||||||||||
| Fannie Mae Pool BJ9260 | 254,532 | 4.000 | 4/1/2048 | 272,189 | ||||||||||||
| Fannie Mae Pool CA4128 | 136,041 | 3.000 | 9/1/2049 | 142,310 | ||||||||||||
| Fannie Mae Pool CA4978 | 203,309 | 3.000 | 1/1/2050 | 212,673 | ||||||||||||
| Fannie Mae Pool MA3803 | 322,249 | 3.500 | 10/1/2049 | 340,029 | ||||||||||||
| Fannie Mae Pool MA3905 | 422,484 | 3.000 | 1/1/2050 | 441,087 | ||||||||||||
| Freddie Mac Gold Pool G01980 | 133,264 | 5.000 | 12/1/2035 | 154,195 | ||||||||||||
| Freddie Mac Gold Pool G05888 | 20,532 | 5.500 | 10/1/2039 | 23,805 | ||||||||||||
| 2,367,522 | ||||||||||||||||
| U.S. TREASURY BONDS - 6.3% | ||||||||||||||||
| United States Treasury Bond | 590,000 | 3.000 | 8/15/2048 | 778,731 | ||||||||||||
| United States Treasury Bond ^ | 1,280,000 | 2.875 | 5/15/2049 | 1,657,150 | ||||||||||||
| United States Treasury Bond ^ | 1,260,000 | 2.000 | 2/15/2050 | 1,372,022 | ||||||||||||
| United States Treasury Bond ^ | 835,000 | 1.375 | 8/15/2050 | 783,791 | ||||||||||||
| 4,591,694 | ||||||||||||||||
| U.S. TREASURY NOTES - 14.0% | ||||||||||||||||
| United States Treasury Note | 250,000 | 1.750 | 6/15/2022 | 256,445 | ||||||||||||
| United States Treasury Note | 115,000 | 2.250 | 3/31/2021 | 116,011 | ||||||||||||
| United States Treasury Note ^ | 1,905,000 | 0.125 | 5/31/2022 | 1,904,405 | ||||||||||||
| United States Treasury Note | 1,970,000 | 0.250 | 5/31/2025 | 1,962,074 | ||||||||||||
| United States Treasury Note | 1,210,000 | 2.875 | 8/15/2028 | 1,409,508 | ||||||||||||
| United States Treasury Note ^ | 3,890,000 | 2.625 | 2/15/2029 | 4,479,350 | ||||||||||||
| 10,127,793 | ||||||||||||||||
| TOTAL U.S. GOVERNMENT & AGENCIES (Cost - $16,867,297) | 17,087,009 | |||||||||||||||
| TERM LOANS - 5.4% | ||||||||||||||||
| AEROSPACE - 0.2% | ||||||||||||||||
| AI Convoy Luxembourg Sarl Facility B | 6 Month LIBOR + 3.500% | 94,525 | 3.651 | + | 1/18/2027 | 93,078 | ||||||||||
| TransDigm, Inc. New Tranche E Term Loan | 1 Month LIBOR + 2.250% | 49,002 | 2.398 | + | 5/30/2025 | 46,228 | ||||||||||
| 139,306 | ||||||||||||||||
| AUTOMOTIVE - 0.1% | ||||||||||||||||
| Cooper-Standard Automotive, Inc. Additional Term B-1 Loan | 1 Month LIBOR + 2.000% | 68,964 | 2.750 | + | 11/2/2023 | 59,839 | ||||||||||
| BIOTECH & PHARMA - 0.0% | ||||||||||||||||
| Bausch Health Americas, Inc. Initial Term Loan | 1 Month LIBOR + 3.000% | 7,662 | 3.149 | + | 6/2/2025 | 7,497 | ||||||||||
| Bausch Health Americas, Inc. First Incremental Term Loan | 1 Month LIBOR + 2.750% | 24,000 | 2.899 | + | 11/27/2025 | 23,495 | ||||||||||
| 30,992 | ||||||||||||||||
| CABLE & SATELLITE - 0.4% | ||||||||||||||||
| Charter Communications Operating LLC | 1 Month LIBOR + 1.750% | 64,836 | 1.898 | + | 2/1/2027 | 63,292 | ||||||||||
| CSC Holdings LLC | 1 Month LIBOR + 2.250% | 99,746 | 2.398 | + | 1/15/2026 | 96,614 | ||||||||||
| Newco Financing Partnership | 1 Month LIBOR + 3.500% | 45,000 | 3.651 | (b) | 1/31/2029 | 43,999 | ||||||||||
| Radiate Holdco LLC ^ | 1 Month LIBOR + 3.500% | 17,860 | 0.899 | + | 9/25/2026 | 17,591 | ||||||||||
| UPC Financing Partnership | 1 Month LIBOR + 3.500% | 50,000 | 3.651 | (b) | 1/31/2029 | 48,888 | ||||||||||
| Virgin Media Bristol LLC ^ | 1 Month LIBOR + 3.250% | 20,000 | 3.397 | (b) | 1/31/2029 | 19,650 | ||||||||||
| 290,034 | ||||||||||||||||
| CHEMICALS - 0.2% | ||||||||||||||||
| HB Fuller Co | 1 Month LIBOR + 2.000% | 37,701 | 2.151 | + | 10/20/2024 | 37,136 | ||||||||||
| INEOS US Finance LLC | 3 Month LIBOR + 2.000% | 129,667 | 2.148 | (b) | 4/1/2024 | 126,317 | ||||||||||
| 163,453 | ||||||||||||||||
See accompanying notes to financial statements.
10
| SCHEDULE OF INVESTMENTS |
| Dunham Corporate/Government Bond Fund (Continued) |
| October 31, 2020 |
| Variable | Principal | Interest | Maturity | |||||||||||||
| Security | Rate | Amount | Rate % | Date | Value | |||||||||||
| TERM LOANS - 5.4% (Continued) | ||||||||||||||||
| COMMERCIAL SUPPORT SERVICES - 0.2% | ||||||||||||||||
| Aramark Services, Inc. U.S. Term B-4 Loan | 1 Month LIBOR + 1.750% | $ | 24,875 | 1.897 | + | 1/15/2027 | $ | 23,888 | ||||||||
| CHG Healthcare Services, Inc. New Term Loan (2017) (First Lien) | 3 Month LIBOR + 3.000% | 76,818 | 4.000 | + | 6/7/2023 | 75,130 | ||||||||||
| TKC Holdings, Inc. Initial Term Loan (First Lien) | 2 Month LIBOR + 3.750% | 81,428 | 4.750 | + | 2/1/2023 | 76,785 | ||||||||||
| 175,803 | ||||||||||||||||
| CONSTRUCTION MATERIALS - 0.2% | ||||||||||||||||
| AZEK Co. LLC New Term Loan | 3 Month LIBOR + 3.750% | 40,087 | 4.750 | + | 5/5/2024 | 40,092 | ||||||||||
| Summit Materials LLC New Term Loan | 1 Month LIBOR + 2.000% | 97,985 | 2.148 | + | 11/21/2024 | 96,331 | ||||||||||
| 136,423 | ||||||||||||||||
| CONTAINERS & PACKAGING - 0.3% | ||||||||||||||||
| Berry Global, Inc. Term Y Loan | 1 Month LIBOR + 2.000% | 129,123 | 2.145 | + | 7/1/2026 | 125,202 | ||||||||||
| Graham Packaging Co., Inc. Initial Term Loan | 1 Month LIBOR + 3.750% | 125,000 | 3.901 | + | 8/4/2027 | 124,206 | ||||||||||
| 249,408 | ||||||||||||||||
| ELECTRIC UTILITIES - 0.2% | ||||||||||||||||
| APLP Holdings LP Term Loan (2020) | 1 Month LIBOR + 2.500% | 51,474 | 3.500 | + | 4/14/2025 | 51,130 | ||||||||||
| Calpine Corp. Term Loan (2019) | 1 Month LIBOR + 2.250% | 98,750 | 2.398 | + | 4/5/2026 | 96,394 | ||||||||||
| 147,524 | ||||||||||||||||
| ELECTRICAL EQUIPMENT - 0.1% | ||||||||||||||||
| Brookfield WEC Holdings, Inc. Initial Term Loan (2020) | 1 Month LIBOR + 3.000% | 98,199 | 3.750 | + | 8/1/2025 | 96,128 | ||||||||||
| Ingersoll-Rand Services Co | 1 Month LIBOR + 1.750% | 9,975 | 1.893 | + | 3/1/2027 | 9,667 | ||||||||||
| 105,795 | ||||||||||||||||
| HEALTH CARE FACILITIES & SERVICES - 0.3% | ||||||||||||||||
| Catalent Pharma Solutions, Inc. Dollar Term B-2 Loan | 1 Month LIBOR + 2.250% | 49,622 | 2.530 | + | 5/18/2026 | 49,509 | ||||||||||
| Iqvia, Inc. Term B-3 Dollar Loan | 3 Month LIBOR + 1.750% | 107,525 | 1.970 | + | 6/11/2025 | 105,878 | ||||||||||
| Legacy LifePoint Health LLC Term B Loan (First Lien) ^ | 1 Month LIBOR + 3.750% | 82,732 | 3.898 | + | 11/16/2025 | 80,457 | ||||||||||
| 235,844 | ||||||||||||||||
| HOUSEHOLD PRODUCTS - 0.1% | ||||||||||||||||
| KIK Custom Products, Inc. Initial Loan | 3 Month LIBOR + 4.000% | 71,923 | 5.000 | + | 5/15/2023 | 71,428 | ||||||||||
| Reynolds Consumer Products LLC Initial Term Loan | 1 Month LIBOR + 1.750% | 14,319 | 1.901 | + | 2/4/2027 | 14,064 | ||||||||||
| 85,492 | ||||||||||||||||
| INSURANCE - 0.2% | ||||||||||||||||
| Ryan Specialty Group LLC Term Loan | 1 Month LIBOR + 3.250% | 10,000 | 3.398 | + | 9/1/2027 | 9,944 | ||||||||||
| Sedgwick Claims Management Services, Inc. Initial Term Loan | 1 Month LIBOR + 3.250% | 103,409 | 3.398 | + | 12/31/2025 | 99,516 | ||||||||||
| 109,460 | ||||||||||||||||
| INTERNET MEDIA & SERVICES- 0.1% | ||||||||||||||||
| Pug LLC USD Term B Loan | 1 Month LIBOR + 3.500% | 64,513 | 3.651 | + | 2/12/2027 | 56,731 | ||||||||||
| LEISURE FACILITIES & SERVICES - 0.1% | ||||||||||||||||
| Aristocrat International Pty Ltd. Initial Term Loan | 3 Month LIBOR + 3.750% | 14,963 | 3.894 | + | 10/19/2024 | 14,994 | ||||||||||
| Station Casinos LLC Term B-1 Facility Loan | 1 Month LIBOR + 2.250% | 39,739 | 2.401 | + | 2/8/2027 | 38,206 | ||||||||||
| 53,200 | ||||||||||||||||
| MACHINERY - 0.3% | ||||||||||||||||
| Alliance Laundry Systems LLC | 3 Month LIBOR + 3.500% | 60,000 | 4.250 | + | 10/8/2027 | 59,588 | ||||||||||
| Gardner Denver, Inc. Series A New Term Loan | 1 Month LIBOR + 2.750% | 9,950 | 2.895 | + | 3/1/2027 | 9,847 | ||||||||||
| Seminole Tribe of Florida, Inc. | 1 Month LIBOR + 1.750% | 88,193 | 1.898 | + | 7/8/2024 | 84,859 | ||||||||||
| Star US Bidco LLC Initial Term Loan | 1 Month LIBOR + 4.250% | 74,813 | 5.250 | + | 3/17/2027 | 72,007 | ||||||||||
| 226,301 | ||||||||||||||||
| MEDICAL EQUIPMENT & DEVICES - 0.2% | ||||||||||||||||
| Avantor, Inc. | 1 Month LIBOR + 2.500% | 35,000 | 0.000 | (b) | 10/29/2027 | 34,781 | ||||||||||
| Greatbatch Ltd. | 1 Month LIBOR + 2.500% | 125,000 | 3.500 | + | 10/27/2022 | 124,108 | ||||||||||
| 158,889 | ||||||||||||||||
| OIL & GAS PRODUCERS - 0.1% | ||||||||||||||||
| Buckeye Partners LP Initial Term Loan | 1 Month LIBOR + 2.750% | 24,875 | 2.897 | + | 11/1/2026 | 24,475 | ||||||||||
| CITGO Petroleum Corp. 2019 Incremental Term B Loan | 3 Month LIBOR + 5.000% | 58,366 | 6.000 | + | 3/28/2024 | 54,718 | ||||||||||
| 79,193 | ||||||||||||||||
| PUBLISHING & BROADCASTING - 0.1% | ||||||||||||||||
| Nexstar Broadcasting, Inc. Term B-4 Loan | 1 Month LIBOR + 2.750% | 81,653 | 2.899 | + | 9/18/2026 | 79,775 | ||||||||||
| RETAIL - DISCRETIONARY - 0.3% | ||||||||||||||||
| Harbor Freight Tools USA Inc | 1 Month LIBOR + 3.250% | 105,000 | 4.000 | + | 10/19/2027 | 103,681 | ||||||||||
| PriSo Acquisition Corp | 3 Month LIBOR + 3.000% | 100,000 | 4.000 | (b) | 5/8/2022 | 98,000 | ||||||||||
| 201,681 | ||||||||||||||||
| SOFTWARE - 0.4% | ||||||||||||||||
| Applied Systems, Inc. | 3 Month LIBOR + 3.250% | 59,846 | 4.250 | (b) | 9/19/2024 | 59,649 | ||||||||||
| Boxer Parent Co., Inc. Initial Dollar Term Loan | 1 Month LIBOR + 4.250% | 133,501 | 4.398 | + | 10/2/2025 | 130,045 | ||||||||||
| Dun & Bradstreet Corp. Initial Dollar Term Loan | 3 Month LIBOR + 3.750% | 15,000 | 3.898 | + | 10/7/2027 | 14,783 | ||||||||||
| Ultimate Software Group, Inc. | 3 Month LIBOR + 4.000% | 40,000 | 4.147 | + | 5/4/2026 | 39,838 | ||||||||||
| 244,315 | ||||||||||||||||
See accompanying notes to financial statements.
11
| SCHEDULE OF INVESTMENTS |
| Dunham Corporate/Government Bond Fund (Continued) |
| October 31, 2020 |
| Variable | Principal | Interest | Maturity | |||||||||||||
| Security | Rate | Amount | Rate % | Date | Value | |||||||||||
| TERM LOANS - 5.4% (Continued) | ||||||||||||||||
| TECHNOLOGY HARDWARE - 0.2% | ||||||||||||||||
| CommScope, Inc. | 1 Month LIBOR + 3.250% | $ | 39,600 | 3.398 | + | 4/6/2026 | $ | 38,348 | ||||||||
| Dell International LLC | 1 Month LIBOR + 2.000% | 95,000 | 2.750 | + | 9/19/2025 | 94,128 | ||||||||||
| 132,476 | ||||||||||||||||
| TECHNOLOGY SERVICES - 0.3% | ||||||||||||||||
| Dun & Bradstreet Corp. Initial Dollar Term Loan | 1 Month LIBOR + 3.750% | 94,525 | 3.906 | + | 2/6/2026 | 93,265 | ||||||||||
| Refinitiv US Holdings, Inc. | 1 Month LIBOR + 3.250% | 129,670 | 3.398 | + | 10/1/2025 | 127,958 | ||||||||||
| 221,223 | ||||||||||||||||
| TELECOMMUNICATIONS - 0.4% | ||||||||||||||||
| CenturyLink, Inc. Term B Loan | 1 Month LIBOR + 2.250% | 39,688 | 2.401 | + | 3/15/2027 | 38,283 | ||||||||||
| Consolidated Communications, Inc. Initial Term Loan | 3 Month LIBOR + 4.750% | 45,000 | 4.897 | + | 10/2/2027 | 44,684 | ||||||||||
| SBA Senior Finance II LLC | 1 Month LIBOR + 1.750% | 129,668 | 1.898 | (b) | 4/11/2025 | 125,925 | ||||||||||
| Zayo Group Holdings, Inc. Initial Dollar Term Loan | 1 Month LIBOR + 3.000% | 84,575 | 3.147 | + | 3/9/2027 | 81,671 | ||||||||||
| 290,563 | ||||||||||||||||
| TRANSPORTATION & LOGISTICS - 0.4% | ||||||||||||||||
| American Airlines, Inc. 2018 Replacement Term Loan | 1 Month LIBOR + 1.750% | 103,939 | 1.906 | + | 6/27/2025 | 66,326 | ||||||||||
| Mileage Plus Holdings LLC Initial Term Loan | 3 Month LIBOR + 5.250% | 120,000 | 5.399 | + | 6/21/2027 | 122,198 | ||||||||||
| Navistar, Inc. Tranche B Term Loan | 1 Month LIBOR + 3.500% | 87,525 | 3.643 | + | 11/6/2024 | 86,890 | ||||||||||
| 275,414 | ||||||||||||||||
| TOTAL TERM LOANS - (Cost - $4,041,279) | 3,949,134 | |||||||||||||||
| Shares | ||||||||||||||||
| COLLATERAL FOR SECURITIES LOANED - 19.9% | ||||||||||||||||
| Mount Vernon Prime Portfolio # | 14,414,493 | 0.160 | + | 14,414,493 | ||||||||||||
| TOTAL COLLATERAL FOR SECURITIES LOANED (Cost - $14,414,493) | ||||||||||||||||
| TOTAL INVESTMENTS - 116.7% (Cost - $83,000,521) | $ | 84,515,351 | ||||||||||||||
| LIABILITIES IN EXCESS OF OTHER ASSETS - (16.7)% | (12,110,065 | ) | ||||||||||||||
| NET ASSETS - 100.0% | $ | 72,405,286 | ||||||||||||||
ABS - Asset Backed Security
CMBS - Collateralized Mortgage Backed Security
CMO - Collateralized Mortgage Obligation
LLC - Limited Liability Corporation
LP - Limited Partnership
Perpetual - Perpetual bonds are fixed income instruments without defined maturity dates
REITs - Real Estate Investment Trusts
SARL - Private Limited Liability Company in Luxembourg
| ^ | All or a portion of these securities are on loan. Total loaned securities had a value of $13,884,502 at October 31, 2020. |
| + | Variable rate security. Interest rate is as of October 31, 2020. |
| ++ | Variable or floating rate security, the interest rate of which adjusts periodically based on changes in current interest rates and prepayments on the underlying pool of assets. |
144A - Security exempt from registration under Rule 144A of the Securities Act of 1933. These securities may be sold in transactions exempt from registration, normally to qualified institutional buyers. The 144A securities amounted to $27,827,482 or 38.43% of net assets.
| # | The Trust’s securities lending policies and procedures require that the borrower. (i) deliver cash or U.S. Government securities as collateral with respect to each new loan of U.S. securities, at least 102% of the value of the portfolio securities loaned, and (ii) at all times thereafter mark-to-market the collateral on a daily basis so that the market value of such collateral is at least 100% of the value of securities loaned. From time to time the collateral may not be 102% due to end of day market movement. The next business day additional collateral is obtained/received from the borrower to replenish/reestablish 102%. |
| (a) | Step-Up Bond; the interest rate shown is the rate in effect as of October 31, 2020. |
| (b) | Security has not settled. Interst rate will be set at settlement. |
| Portfolio Composition * - (Unaudited) | ||||||||||
| Corporate Bonds | 28.5 | % | Municipal Bonds | 4.4 | % | |||||
| Asset Backed Securities | 23.8 | % | Non U.S. Government & Agencies | 0.7 | % | |||||
| U.S. Government & Agencies | 20.0 | % | Others ** | 18.0 | % | |||||
| Bank Loans | 4.6 | % | Total | 100.0 | % | |||||
| * | Based on total value of investments as of October 31, 2020. |
| ** | Includes collateral for securities loaned as of October 31, 2020. |
Percentage may differ from Schedule of Investments which is based on Fund net assets.
See accompanying notes to financial statements.
12
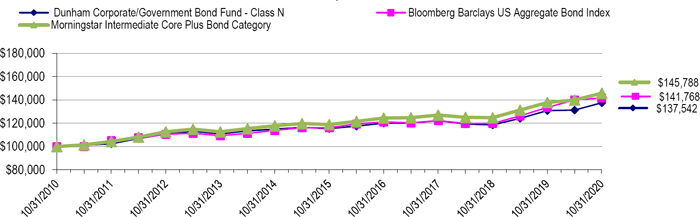
| Dunham Floating Rate Bond Fund (Unaudited) |
| Message from the Sub-Adviser (Newfleet Asset Management, LLC) |
Asset Class Recap
It is extremely rare to see an asset class assigned a single purpose, or rather a single environment for which it may be useful as a part of a diversified portfolio. However, bank loans have more recently been painted with that brush – as an already historically low interest rate environment collapsed to the lowest interest rates imaginable in recent times. Bank loans have seen fairly steady retail investor outflows for the past few years as interest rates failed to increase to the long-term averages, and the plummet in interest rates earlier this year saw a swell in the retail exodus. While the bank loan space is widely known for its debt instruments that are tied to LIBOR, which declined from 190 basis points at the beginning of the fiscal year down to 22 basis points at the end, the coupons on those loans are offered with spreads above the LIBOR rate. Therefore, even if LIBOR were to stagnate at these low levels, then there is a spread that often correlates with the credit rating and corporate hierarchy of the security that may be competitive with traditional high-yield bonds from the same issuer. For example, at the end of the fiscal year, the average yield on the 100 largest bank loans, as measured by the S&P LSTA 100 Leveraged Loan Index, was 4.79 percent while the BofA U.S. High-Yield Bond Cash Pay Index ended the period with a yield of 5.96 percent. This spread between high-yield bonds and bank loans was tighter at the beginning of the fiscal year, with a difference of only 0.12 percent. Bank loans in general, as measured by the Credit Suisse Leveraged Loan Index, were outpaced by traditional high-yield bonds during the fiscal year, increasing 1.5 percent while high-yield bonds increased 2.6 percent.
Allocation Review
As the recovery from the lows reached in March has broadly continued, the Sub-Adviser has shifted to reduce the Fund’s exposure to double-B rated bank loans and rotate into single-B rated loans where it believes that valuations are more attractive. At the beginning of the fiscal year, the Fund had slightly more than 40 percent allocated to single-B rated bank loans, and by the end of the fiscal year that had increased to more than 50 percent. While most of this increase was offset by a corresponding decrease in double-B rated bank loans, the Sub-Adviser also sourced it using reductions in the allocation to CCC-rated bank loans. While this has resulted in a slightly more aggressive tilt from a credit rating perspective compared to the beginning of the fiscal year, the Fund’s allocation to bank loans rated single-B is still less than the benchmark index, as is the Fund’s exposure to bank loans rated CCC and lower. In addition, the Sub-Adviser has been selective in its additions within the lower-rated space, focusing on the bank loans of companies that were heavily impacted by the pandemic, but show prospects of adapting or navigating during the recovery. An example would be surgery centers that specialize in elective surgeries since many of those companies were forced to close earlier this year. From a sector perspective, the Fund ended the fiscal year with large underweights to the information technology and financial services sectors and some overweights to the healthcare and staples-oriented sectors. The Fund did not have any exposure to derivatives during the fiscal year that meaningfully affected performance.
Holdings Insights
Although most of the rebound in bank loans occurred within a short period after March’s decline, some holdings experienced their largest rebound within the final months of the fiscal year. For example, the Rodan & Fields bank loan maturing in 2025 (BL2709733) (holding weight*: 0.27 percent), a provider of multi-stage skincare solutions, saw its price surge 32.1 percent during the final fiscal quarter, recouping the majority of its losses from earlier in the fiscal year. Similarly, the Fund continued to hold the U.S. Farathane bank loan maturing in 2021 (BL2521211) (holding weight*: 0.52 percent), a designer and manufacturer of highly - engineered plastic fabricated products, and its price rose 20.7 percent in the final three months. This leap in price not only recovered what was lost earlier in the year, but also boosted the value above where it began the fiscal year. One of the greatest overall detractors from performance during the downturn was the Univision Communications Inc. bank loan maturing in 2024 (BL2380501) (holding weight*: 1.13 percent), a Spanish language broadcasting company. As this holding had slumped 8.6 percent through the end of the second fiscal quarter, its 9.7 percent price appreciation in the second half of the fiscal year resulted in it appreciating 0.3 percent across the entire 12-month time period.
Although the Sub-Adviser has maintained an underweight to the energy sector, the energy holdings within the Fund provided mixed results during the most recent fiscal quarter. For example, the Fund held the Traverse Midstream bank loan maturing in 2024 (BL2518134) (holding weight*: 0.26 percent), a producer of non-operated midstream assets. During the most recent fiscal quarter, the Traverse Midstream bank loan appreciated 5.4 percent, bringing the overall performance of the holding into positive territory since it was added in the previous fiscal quarter. The Fund also held the CITGO Petroleum Corp. bank loan maturing in 2024 (BL2943522) (holding weight*: 0.30 percent), a refiner, transporter and marketer of motor fuels, lubricants, petrochemicals, and other industrial products. The CITGO bank loan declined 3.5 percent during the most recent fiscal quarter, ending the period 6.5 percent below where it began the fiscal year.
Sub-Adviser Outlook
As the recovery has broadly continued, the Sub-Adviser has cautiously increased the Fund’s exposure to holdings that are in industries that may benefit from progress toward a return to pre-virus conditions. However, it has been selective in the individual holdings that it has added to the Fund and anticipates that volatility may resurface as investors become more concerned about default rates or if the progress is impeded due to increasing virus cases. As some companies have already missed payments, the Sub-Adviser is cautious about being lured into depressed bank loan prices where a recovery or rebound may have an even lower chance of coming to fruition. This approach of being cautious and selective is not a new mantra for the Sub-Adviser.
| * | Holdings percentage(s) of total investments, cash and unsettled trades excluding collateral for securities loaned, as of 10/31/2020. |
Growth of $100,000 Investment
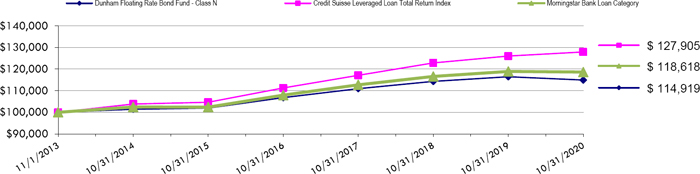
Total Returns (a) as of October 31, 2020
| Annualized | |||
| Annualized | Since Inception | ||
| One Year | Five Years | (11/1/13) | |
| Class N | (1.31)% | 2.42% | 2.01% |
| Class A with load of 4.50% | (5.99)% | 1.24% | 1.08% |
| Class A without load | (1.56)% | 2.18% | 1.75% |
| Class C | (2.06)% | 1.68% | 1.26% |
| Credit Suisse Leveraged Loan Total Return Index | 1.50% | 4.10% | 3.59% |
| Morningstar Bank Loan Category | (0.24)% | 2.99% | 2.48% |
| (a) | Total Returns are calculated based on traded NAVs. |
The Credit Suisse Leveraged Loan Total Return Index tracks the investable market of the U.S. dollar denominated leveraged loan market. It consists of issues rated “5B” or lower, meaning that the highest rated issues included in this index are Moody’s/S&P ratings of Baa1/BB+ or Ba1/BBB+. All loans are funded term loans with a tenor of at least one year and are made by issuers domiciled in developed countries.
The Morningstar Bank Loan Category is generally representative of mutual funds that primarily invest in floating- rate bank loans instead of bonds. These bank loans generally offer interest payments that typically float above a common short-term benchmark such as the London interbank offered rate, or LIBOR.
| As disclosed in the Trust’s latest registration statement, the Fund’s total annual operating expenses, including cost of underlying funds, are 1.02% for Class N, 1.77% for Class C and 1.27% for Class A . Class A shares are subject to a sales load of 4.50% and a deferred sales charge of up to 0.75%.The performance data quoted here represents past performance, which is not indicative of future results. Current performance may be lower or higher than the performance data quoted. The investment return and NAV will fluctuate, so that an investor’s shares, when redeemed, may be worth more or less than their original cost. Total returns are calculated assuming reinvestment of all dividends and capital gains distributions, if any. The returns do not reflect the deductions of taxes a shareholder would pay on the redemption of Fund shares or Fund distributions. For performance information current to the most recent month-end, please call 1-800-442-4358 or visit our website www.dunham.com |
13
| SCHEDULE OF INVESTMENTS |
| Dunham Floating Rate Bond Fund |
| October 31, 2020 |
| Variable | Principal | Interest | Maturity | |||||||||||||
| Security | Rate | Amount | Rate % | Date | Value | |||||||||||
| TERM LOANS - 99.8% | ||||||||||||||||
| BASIC MATERIALS - 5.1% | ||||||||||||||||
| Acuity Specialty Products, Inc. (aka Zep Inc.), Initial Term Loan (First Lien) | LIBOR + 4.000% | $ | 670,572 | 5.000 | + | 8/12/2024 | $ | 635,927 | ||||||||
| Aruba Investments, Inc. (aka ANGUS Chemical Company), USD Term Loan | LIBOR + 4.000% | 445,000 | 4.750 | + | 10/28/2027 | 442,775 | ||||||||||
| Ascend Performance Materials Operations LLC, Initial Term Loan | LIBOR + 5.250% | 222,750 | 6.250 | + | 8/28/2026 | 222,611 | ||||||||||
| Covia Holdings Corporation (fka Unimin Corporation), Initial Term Loan | LIBOR + 4.000% | 460,531 | 8.250 | + | 5/31/2025 | 349,235 | ||||||||||
| Diamond (BC) B.V. (aka Diversey), New Term Loan | LIBOR + 5.000% | 190,000 | 6.000 | + | 9/06/2024 | 190,475 | ||||||||||
| Diamond (BC) B.V. (aka Diversey), Initial USD Term Loan | LIBOR + 3.000% | 1,203,002 | 3.214 | + | 9/06/2024 | 1,154,280 | ||||||||||
| Element Solutions Inc (Macdermid, Incorporated), Tranche B-1 Term Loan | LIBOR + 2.000% | 722,193 | 2.148 | + | 1/30/2026 | 709,106 | ||||||||||
| H.B. Fuller Company, Commitment | LIBOR + 2.000% | 704,909 | 2.151 | + | 10/20/2024 | 694,335 | ||||||||||
| Hexion Inc., USD Term Loan | LIBOR + 3.500% | 567,813 | 3.725 | + | 6/30/2026 | 560,289 | ||||||||||
| Ineos US Finance LLC, New 2024 Dollar Term Loan | LIBOR + 2.000% | 2,270,128 | 2.148 | + | 3/31/2024 | 2,211,491 | ||||||||||
| Innophos Holdings, Inc., Initial Term Loan | LIBOR + 3.500% | 442,775 | 3.648 | + | 2/04/2027 | 436,133 | ||||||||||
| Nouryon Finance B.V. (aka AkzoNobel), Initial Dollar Term Loan | LIBOR + 3.000% | 746,113 | 3.144 | + | 9/30/2025 | 724,848 | ||||||||||
| 8,331,505 | ||||||||||||||||
| COMMUNICATIONS - 16.5% | ||||||||||||||||
| Altice France S.A., USD TLB-13 Incremental Term Loan | LIBOR + 4.000% | 230,300 | 4.237 | + | 8/14/2026 | 224,507 | ||||||||||
| Barracuda Networks, Inc., 2020 Term Loan (First Lien) | LIBOR + 3.750% | 350,000 | 4.250 | + | 2/12/2025 | 344,750 | ||||||||||
| CenturyLink, Inc., Term B Loan | LIBOR + 2.250% | 729,488 | 2.401 | + | 3/16/2027 | 703,667 | ||||||||||
| Charter Communications Operating, LLC (aka CCO Safari LLC), Term B-2 Loan | LIBOR + 1.750% | 1,872,562 | 1.898 | + | 1/31/2027 | 1,827,949 | ||||||||||
| Clear Channel Outdoor Holdings, Inc., Term B Loan | LIBOR + 3.500% | 837,893 | 3.714 | + | 8/20/2026 | 766,149 | ||||||||||
| CNT Holdings I Corporation, First Lien Term Loan Facility | LIBOR + 3.750% | 405,000 | 4.500 | + | 10/16/2027 | 401,033 | ||||||||||
| Consolidated Communications, Inc., Initial Term Loan | LIBOR + 4.750% | 765,000 | 4.897 | + | 10/02/2027 | 759,622 | ||||||||||
| CSC Holdings, LLC, October 2018 Incremental Term Loan | LIBOR + 2.250% | 373,350 | 2.398 | + | 1/16/2026 | 361,625 | ||||||||||
| CSC Holdings, LLC, March 2017 Refinancing Term Loan | LIBOR + 2.250% | 1,729,417 | 2.398 | + | 7/16/2025 | 1,674,292 | ||||||||||
| Diamond Sports Group, LLC, Term Loan | LIBOR + 3.250% | 601,656 | 3.398 | + | 8/24/2026 | 377,289 | ||||||||||
| Frontier Communications Corporation, Term B-1 Loan | LIBOR + 3.750% | 413,936 | 5.918 | + | 6/16/2024 | 408,033 | ||||||||||
| Hoya Midco, LLC (aka Vivid Seats LLC), Initial Term Loan (First Lien) | LIBOR + 3.500% | 648,490 | 4.500 | + | 6/30/2024 | 551,216 | ||||||||||
| iHeartCommunications, Inc. (fka Clear Channel Communications, Inc.), New Term Loan | LIBOR + 3.000% | 1,429,200 | 3.151 | + | 4/30/2026 | 1,345,742 | ||||||||||
| Intelsat Jackson Holdings S.A., DIP Facility | LIBOR + 5.500% | 93,931 | 5.647 | + | 7/12/2021 | 95,771 | ||||||||||
| Intelsat Jackson Holdings S.A., Tranche B-3 Term Loan | LIBOR + 5.750% | 660,000 | 7.918 | + | 11/28/2023 | 665,224 | ||||||||||
| Intelsat Jackson Holdings S.A., Tranche B-5 Term Loan | LIBOR + 8.625% | 354,000 | 8.625 | + | 1/02/2024 | 357,294 | ||||||||||
| Intrado Corporation, Initial Term B Loan | LIBOR + 4.000% | 438,393 | 5.000 | + | 10/10/2024 | 409,420 | ||||||||||
| Intrado Corporation, Incremental Term B-1 Loan | LIBOR + 3.500% | 244,375 | 4.500 | + | 10/10/2024 | 227,639 | ||||||||||
| Level 3 Financing, Inc., Tranche B 2027 Term Loan | LIBOR + 1.750% | 1,936,567 | 1.898 | + | 2/28/2027 | 1,870,240 | ||||||||||
| McGraw-Hill Global Education Holdings, LLC, Term B Loan (First Lien) | LIBOR + 4.000% | 952,116 | 5.000 | + | 5/04/2022 | 864,045 | ||||||||||
| Meredith Corporation, Tranche B-2 Term Loan | LIBOR + 2.500% | 520,864 | 2.648 | + | 2/01/2025 | 505,319 | ||||||||||
| Nexstar Broadcasting, Inc., Term B-4 Loan | LIBOR + 2.750% | 1,008,199 | 2.899 | + | 9/18/2026 | 985,010 | ||||||||||
| Northwest Fiber, LLC, Term B Loan (First Lien) | LIBOR + 5.500% | 159,600 | 5.649 | + | 4/30/2027 | 159,467 | ||||||||||
| Numericable U.S. LLC, USD TLB-11 Term Loan | LIBOR + 2.750% | 627,250 | 2.898 | + | 8/01/2025 | 601,006 | ||||||||||
| Numericable U.S. LLC, USD TLB-[12] Term Loan | LIBOR + 3.688% | 774,767 | 3.836 | + | 2/01/2026 | 752,415 | ||||||||||
| Plantronics, Inc., Initial Term B Loan | LIBOR + 2.500% | 385,000 | 2.741 | + | 7/02/2025 | 369,481 | ||||||||||
| Pug LLC, USD Term B Loan | LIBOR + 3.500% | 744,375 | 3.651 | + | 2/01/2027 | 654,585 | ||||||||||
| Radiate HoldCo, LLC (aka RCN Grande), Term B Loan | LIBOR + 3.500% | 126,901 | 0.899 | + | 9/24/2026 | 124,988 | ||||||||||
| Rodan & Fields, LLC, Closing Date Term Loan | LIBOR + 4.000% | 630,488 | 4.148 | + | 6/16/2025 | 466,561 | ||||||||||
| SBA Senior Finance II LLC, Initial Term Loan | LIBOR + 1.750% | 1,133,445 | 1.898 | + | 4/12/2025 | 1,100,723 | ||||||||||
| Sinclair Television Group, Inc., Tranche B Term Loan | LIBOR + 2.250% | 1,002,164 | 2.398 | + | 1/04/2024 | 974,249 | ||||||||||
| Telesat Canada, Term B-5 Loan | LIBOR + 2.750% | 810,915 | 2.898 | + | 12/08/2026 | 784,815 | ||||||||||
| Uber Technologies, Inc., 2018 Refinancing Term Loan | LIBOR + 3.500% | 900,000 | 3.648 | + | 7/12/2023 | 887,116 | ||||||||||
| Univision Communications Inc., 2017 Replacement Repriced First-Lien Term Loan | LIBOR + 2.750% | 1,992,315 | 3.750 | + | 3/16/2024 | 1,933,791 | ||||||||||
| UPC Financing Partnership , Facility AV | LIBOR + 3.500% | 495,000 | 3.651 | + | 2/01/2029 | 483,986 | ||||||||||
| UPC Financing Partnership , Facility B1 (USD) | LIBOR + 3.500% | 495,000 | 3.651 | + | 2/01/2029 | 483,986 | ||||||||||
| Virgin Media Bristol LLC, N Facility | LIBOR + 2.500% | 500,000 | 2.648 | + | 2/01/2028 | 483,782 | ||||||||||
| Virgin Media Bristol LLC, Term Loan Q | LIBOR + 3.250% | 265,000 | 3.397 | + | 2/01/2029 | 260,363 | ||||||||||
| Zayo Group Holdings, Inc., Initial Dollar Term Loan | LIBOR + 3.000% | 547,250 | 3.147 | + | 3/08/2027 | 528,460 | ||||||||||
| 26,775,610 | ||||||||||||||||
| CONSUMER, CYCLICAL - 16.5% | ||||||||||||||||
| Accuride Corporation, 2017 Refinancing Term Loan | LIBOR + 5.250% | 443,943 | 6.250 | + | 11/16/2023 | 374,854 | ||||||||||
| Affinity Gaming (fka Affinity Gaming, LLC), Initial Term Loan | LIBOR + 3.250% | 962,583 | 4.250 | + | 6/30/2023 | 890,871 | ||||||||||
| American Airlines, Inc., 2017 Class B Term Loan | LIBOR + 2.000% | 484,564 | 2.148 | + | 12/16/2023 | 405,272 | ||||||||||
| American Axle & Manufacturing, Inc., Tranche B Term Loan | LIBOR + 2.250% | 1,255,482 | 3.000 | + | 4/06/2024 | 1,216,248 | ||||||||||
See accompanying notes to financial statements.
14
| SCHEDULE OF INVESTMENTS |
| Dunham Floating Rate Bond Fund (Continued) |
| October 31, 2020 |
| Variable | Principal | Interest | Maturity | |||||||||||||
| Security | Rate | Amount | Rate % | Date | Value | |||||||||||
| TERM LOANS - 99.8% (Continued) | ||||||||||||||||
| CONSUMER, CYCLICAL - 16.5% (Continued) | ||||||||||||||||
| American Builders & Contractors Supply Company, Inc., Restatement Effective Date Term Loan | LIBOR + 2.000% | $ | 1,097,982 | 2.148 | + | 1/16/2027 | $ | 1,067,875 | ||||||||
| Aramark Intermediate HoldCo Corporation, U.S. Term B-2 Loan | LIBOR + 1.750% | 195,170 | 1.898 | + | 3/28/2024 | 187,730 | ||||||||||
| Aramark Intermediate HoldCo Corporation, U.S. Term B-3 Loan | LIBOR + 1.750% | 1,357,024 | 1.898 | + | 3/12/2025 | 1,302,180 | ||||||||||
| Aristocrat Leisure Limited, Initial Term Loan | LIBOR + 3.750% | 49,875 | 3.894 | + | 10/20/2024 | 49,981 | ||||||||||
| Aristocrat Leisure Limited, Term B-3 Loan | LIBOR + 1.750% | 1,368,045 | 1.959 | + | 10/20/2024 | 1,335,212 | ||||||||||
| Bass Pro Group, LLC, Initial Term Loan | LIBOR + 5.000% | 919,485 | 5.750 | + | 9/24/2024 | 918,482 | ||||||||||
| Boyd Gaming Corporation, Refinancing Term B Loan | LIBOR + 2.250% | 505,000 | 2.344 | + | 9/16/2023 | 492,244 | ||||||||||
| Caesars Resort Collection, LLC, Term B-1 Loan | LIBOR + 4.500% | 1,020,000 | 4.647 | + | 6/20/2025 | 990,359 | ||||||||||
| Carlisle FoodService Products, Incorporated, Initial Term Loan (First Lien) | LIBOR + 3.000% | 546,810 | 4.000 | + | 3/20/2025 | 485,294 | ||||||||||
| Carnival Corporation, Initial Advance (USD) | LIBOR + 7.500% | 129,675 | 7.649 | + | 6/30/2025 | 131,166 | ||||||||||
| CCM Merger, Inc. (MotorCity Casino Hotel), Term B Loan | LIBOR + 3.750% | 200,000 | 4.500 | + | 11/04/2025 | 198,250 | ||||||||||
| CDS U.S. Intermediate Holdings, Inc., Term B Loan (First Lien) | LIBOR + 5.500% | 617,586 | 3.970 | + | 7/08/2022 | 304,630 | ||||||||||
| CityCenter Holdings, LLC, Term B Loan | LIBOR + 2.250% | 768,894 | 3.000 | + | 4/18/2024 | 725,644 | ||||||||||
| Clarios Global L.P., Initial Dollar Term Loan (First Lien) | LIBOR + 3.500% | 830,719 | 3.648 | + | 4/30/2026 | 809,121 | ||||||||||
| Cooper-Standard Automotive Inc., Additional Term B-1 Loan | LIBOR + 2.000% | 780,464 | 2.750 | + | 11/02/2023 | 677,193 | ||||||||||
| DexKo Global Inc., Replacement U.S. Dollar Term B Loan (First Lien) | LIBOR + 3.500% | 506,669 | 4.500 | + | 7/24/2024 | 496,221 | ||||||||||
| Gateway Casinos & Entertainment Limited, Initial Term Loan | LIBOR + 3.500% | 493,637 | 4.500 | + | 11/30/2023 | 446,741 | ||||||||||
| Golden Nugget Online Gaming, Inc., 2020 Initial Term Loan | LIBOR + 12.000% | 15,000 | 13.000 | + | 10/04/2023 | 17,025 | ||||||||||
| Golden Nugget, Inc. (aka Landry’s Inc.), Initial B Term Loan | LIBOR + 2.500% | 1,158,805 | 3.250 | + | 10/04/2023 | 1,027,634 | ||||||||||
| Harbor Freight Tools USA, Inc., Initial Loan (2020) | LIBOR + 3.250% | 1,278,165 | 4.000 | + | 10/20/2027 | 1,262,111 | ||||||||||
| Isagenix International, LLC, Senior Lien Term Loan | LIBOR + 5.750% | 520,911 | 6.750 | + | 6/14/2025 | 287,803 | ||||||||||
| Kestrel Bidco Inc. (aka WestJet Airlines), Term Loan | LIBOR + 3.000% | 579,640 | 4.000 | + | 12/12/2026 | 513,300 | ||||||||||
| Leslie’s Poolmart, Inc., Tranche B-2 Term Loan | LIBOR + 3.500% | 647,747 | 3.751 | + | 8/16/2023 | 639,245 | ||||||||||
| Libbey Glass Inc., Initial Loan | LIBOR + 0.000% | 550,876 | 3.220 | + | 4/08/2021 | 89,586 | ||||||||||
| Michaels Stores, Inc., 2020 Refinancing Term B Loan | LIBOR + 3.500% | 810,927 | 3.647 | + | 9/16/2027 | 797,141 | ||||||||||
| Mileage Plus Holdings LLC (Mileage Plus Intellectual Property Assets, Ltd.), Initial Term Loan | LIBOR + 5.250% | 995,000 | 5.399 | + | 6/20/2027 | 1,013,228 | ||||||||||
| Navistar, Inc., Tranche B Term Loan | LIBOR + 3.500% | 914,150 | 3.643 | + | 11/06/2024 | 907,522 | ||||||||||
| Neiman Marcus Group LTD LLC, Cash Pay Extended Term Loan | LIBOR + 8.000% | 990,138 | 6.249 | + | 10/24/2023 | 180,700 | ||||||||||
| PAI Holdco, Inc., Term Loan | LIBOR + 4.000% | 145,000 | 5.000 | + | 10/26/2027 | 144,185 | ||||||||||
| PCI Gaming Authority, Term B Facility Loan | LIBOR + 2.500% | 566,484 | 2.648 | + | 5/28/2026 | 548,781 | ||||||||||
| Playa Resorts Holding B.V., Initial Term Loan | LIBOR + 2.750% | 358,152 | 3.750 | + | 4/28/2024 | 305,325 | ||||||||||
| Priso Acquisition Corporation (aka PrimeSource Building Products), Term B Loan | LIBOR + 3.000% | 510,000 | 4.000 | + | 5/08/2022 | 499,800 | ||||||||||
| Scientific Games International, Inc., Initial Term B-5 Loan | LIBOR + 2.750% | 782,133 | 2.898 | + | 8/14/2024 | 729,644 | ||||||||||
| Serta Simmons Bedding, LLC, Initial Term Loan (First Lien) | LIBOR + 3.500% | 294,525 | 4.500 | + | 11/08/2023 | 154,626 | ||||||||||
| Siteone Landscape Supply, LLC (fka John Deere Landscapes LLC), Tranche E Term Loan | LIBOR + 2.750% | 467,896 | 3.750 | + | 10/28/2024 | 465,556 | ||||||||||
| Station Casinos LLC, Term B-1 Facility Loan | LIBOR + 2.250% | 447,065 | 2.401 | + | 2/01/2027 | 429,815 | ||||||||||
| Tenneco Inc., Tranche B Term Loan | LIBOR + 3.000% | 781,088 | 3.148 | + | 9/30/2025 | 724,849 | ||||||||||
| TI Group Automotive Systems, LLC, Initial US Term Loan (2020) | LIBOR + 3.750% | 316,320 | 3.898 | + | 12/16/2024 | 315,134 | ||||||||||
| TKC Holdings, Inc., Initial Term Loan (First Lien) | LIBOR + 3.750% | 694,565 | 4.750 | + | 1/31/2023 | 654,954 | ||||||||||
| UFC Holdings, LLC, Term B-1 Loan (First Lien) | LIBOR + 3.250% | 1,076,843 | 4.250 | + | 4/28/2026 | 1,057,422 | ||||||||||
| Weber-Stephen Products LLC, Initial Term B Loan | LIBOR + 3.250% | 490,000 | 4.000 | + | 10/20/2027 | 486,021 | ||||||||||
| 26,756,975 | ||||||||||||||||
| CONSUMER, NON-CYCLICAL - 27.4% | ||||||||||||||||
| Accelerated Health Systems, LLC (Athletico Management, LLC), Initial Term Loan | LIBOR + 3.500% | 456,863 | 3.647 | + | 11/01/2025 | 442,014 | ||||||||||
| Advanz Pharma Corporation, Initial Dollar Term Loan | LIBOR + 5.500% | 532,721 | 6.500 | + | 9/06/2024 | 521,179 | ||||||||||
| AHP Health Partners, Inc. (aka Ardent Health Partners, LLC), Term Loan | LIBOR + 4.500% | 565,437 | 5.500 | + | 6/30/2025 | 564,026 | ||||||||||
| AlixPartners, LLP, 2017 Refinancing Term Loan | LIBOR + 2.500% | 1,208,620 | 2.648 | + | 4/04/2024 | 1,175,383 | ||||||||||
| Amentum Government Services Holdings LLC, Incremental TL | LIBOR + 4.750% | 815,000 | 5.500 | + | 2/01/2027 | 799,719 | ||||||||||
| Avantor Funding, Inc., Initial B-3 Dollar Term Loan | LIBOR + 2.250% | 568,604 | 3.250 | + | 11/20/2024 | 564,340 | ||||||||||
| Avantor, Inc., Term Loan B | LIBOR + 2.500% | 305,000 | 3.500 | + | 11/06/2027 | 303,094 | ||||||||||
| Bausch Health Companies, Inc., Initial Term Loan | LIBOR + 3.000% | 963,817 | 3.149 | + | 6/02/2025 | 943,037 | ||||||||||
| Bausch Health Companies, Inc., First Incremental Term Loan | LIBOR + 2.750% | 172,000 | 2.899 | + | 11/28/2025 | 168,381 | ||||||||||
| Brightspring Health Services, Term Loan | LIBOR + 2.750% | 180,000 | 4.250 | + | 3/04/2026 | 177,112 | ||||||||||
| Catalent Pharma Solutions, Inc. (fka Cardinal Health 409, Inc.), Dollar Term B-2 Loan | LIBOR + 2.250% | 579,446 | 2.530 | + | 5/16/2026 | 578,119 | ||||||||||
| CHG Healthcare Services, Inc., New Term Loan (2017) (First Lien) | LIBOR + 3.000% | 806,862 | 4.000 | + | 6/08/2023 | 789,127 | ||||||||||
| CHG PPC Parent LLC, Initial Term Loan (First Lien) | LIBOR + 2.750% | 576,725 | 2.898 | + | 4/01/2025 | 559,423 | ||||||||||
| Chobani, LLC, Term Loan B | LIBOR + 3.500% | 885,000 | 4.500 | + | 10/24/2027 | 875,044 | ||||||||||
| CPI Acquisition, Inc., Term Loan (First Lien) | LIBOR + 4.500% | 673,336 | 5.500 | + | 8/16/2022 | 590,502 | ||||||||||
| CPI Holdco, LLC, Closing Date Term Loan (First Lien) | LIBOR + 4.250% | 223,875 | 4.398 | + | 11/04/2026 | 221,077 | ||||||||||
See accompanying notes to financial statements.
15
| SCHEDULE OF INVESTMENTS |
| Dunham Floating Rate Bond Fund (Continued) |
| October 31, 2020 |
| Variable | Principal | Interest | Maturity | |||||||||||||
| Security | Rate | Amount | Rate % | Date | Value | |||||||||||
| TERM LOANS - 99.8% (Continued) | ||||||||||||||||
| CONSUMER, NON-CYCLICAL - 27.4% (Continued) | ||||||||||||||||
| CSC SW Holdco, Inc. (fka CSC Serviceworks, Inc.), Term B-1 Loan (First Lien) | LIBOR + 3.250% | $ | 598,454 | 4.250 | + | 11/14/2022 | $ | 584,938 | ||||||||
| Dole Food Company, Inc., Tranche B Term Loan | LIBOR + 2.750% | 1,176,412 | 3.750 | + | 4/04/2024 | 1,154,966 | ||||||||||
| DynCorp International Inc., Term Loan | LIBOR + 6.000% | 251,444 | 7.000 | + | 8/18/2025 | 250,082 | ||||||||||
| Elanco Animal Health Incorporated, Term Loan | LIBOR + 1.750% | 771,520 | 1.890 | + | 2/04/2027 | 755,928 | ||||||||||
| Endo Luxembourg Finance Company I SARL, Initial Term Loan | LIBOR + 4.250% | 736,195 | 4.466 | + | 4/28/2024 | 701,841 | ||||||||||
| Envision Healthcare Corporation, Initial Term Loan | LIBOR + 3.750% | 1,111,528 | 3.898 | + | 10/10/2025 | 798,794 | ||||||||||
| eResearchTechnology, Inc., Initial Term Loan (First Lien) | LIBOR + 4.500% | 453,863 | 4.647 | + | 11/20/2026 | 451,877 | ||||||||||
| Froneri International Limited, Facility B2 (First Lien) | LIBOR + 2.250% | 758,100 | 2.401 | + | 1/30/2027 | 732,393 | ||||||||||
| Garda World Security Corporation, Initial Term Loan | LIBOR + 4.750% | 350,000 | 4.899 | + | 10/30/2026 | 349,519 | ||||||||||
| Gentiva Health Services, Inc., Term B Loan (First Lien) | LIBOR + 3.250% | 292,046 | 3.398 | + | 7/02/2025 | 286,570 | ||||||||||
| Greatbatch Ltd., New Term B Loan (2019) | LIBOR + 2.500% | 546,865 | 3.500 | + | 10/28/2022 | 542,961 | ||||||||||
| Greenrock Finance, Inc., Initial USD Term B Loan (First Lien) | LIBOR + 3.500% | 247,992 | 4.500 | + | 6/28/2024 | 236,305 | ||||||||||
| Heartland Dental, LLC, Initial Term Loan | LIBOR + 3.500% | 610,886 | 3.648 | + | 4/30/2025 | 562,525 | ||||||||||
| Help at Home, LLC, Initial Term Loan (First Lien) | LIBOR + 5.000% | 794,698 | 6.000 | + | 10/22/2027 | 784,765 | ||||||||||
| Help at Home, LLC, Delayed Draw Term Loan (First Lien) | LIBOR + 5.000% | 100,302 | 6.000 | + | 10/22/2027 | 99,048 | ||||||||||
| H-Food Holdings, LLC (aka Hearthside Food Solutions, LLC), Initial Term Loan | LIBOR + 3.688% | 1,372,714 | 3.835 | + | 5/24/2025 | 1,325,953 | ||||||||||
| Hostess Brands, LLC, 2019 Refinancing Term B Loan (First Lien) | LIBOR + 2.250% | 906,941 | 3.000 | + | 8/04/2025 | 888,240 | ||||||||||
| Iqvia Inc. (Quintiles IMS), Term B-1 Dollar Loan | LIBOR + 1.750% | 144,019 | 1.898 | + | 3/08/2024 | 142,489 | ||||||||||
| Iqvia Inc. (Quintiles IMS), Incremental Term B-2 Dollar Loan | LIBOR + 1.750% | 72,750 | 1.898 | + | 1/16/2025 | 71,786 | ||||||||||
| Iqvia Inc. (Quintiles IMS), Term B-3 Dollar Loan | LIBOR + 1.750% | 1,127,080 | 1.970 | + | 6/12/2025 | 1,109,818 | ||||||||||
| Jaguar Holding Company I, LLC, 2018 Term Loan | LIBOR + 2.500% | 1,137,311 | 3.500 | + | 8/18/2022 | 1,130,862 | ||||||||||
| JBS USA Lux S.A. (fka JBS USA, LLC), New Term Loan | LIBOR + 2.000% | 988,277 | 2.148 | + | 4/30/2026 | 966,915 | ||||||||||
| Kronos Acquisition Intermediate Inc. (aka KIK Custom Products), Initial Loan | LIBOR + 4.000% | 1,381,538 | 5.000 | + | 5/16/2023 | 1,372,040 | ||||||||||
| LifePoint Health, Inc., Term B Loan (First Lien) | LIBOR + 3.750% | 1,031,246 | 3.898 | + | 11/16/2025 | 1,002,887 | ||||||||||
| Milano Acquisition Corporation., Term B Loan (First Lien) | LIBOR + 4.000% | 775,000 | 4.147 | + | 8/16/2027 | 764,022 | ||||||||||
| Milk Specialties Company, New Term Loan | LIBOR + 4.000% | 518,465 | 5.000 | + | 8/16/2023 | 504,208 | ||||||||||
| NAB Holdings, LLC (aka North American Bancard Holdings), 2018 Refinancing Term Loan | LIBOR + 3.000% | 952,586 | 4.000 | + | 6/30/2024 | 933,482 | ||||||||||
| National Mentor Holdings, Inc. (aka Civitas Solutions, Inc.), Initial Term Loan (First Lien) | LIBOR + 4.250% | 269,504 | 4.398 | + | 3/08/2026 | 265,630 | ||||||||||
| National Mentor Holdings, Inc. (aka Civitas Solutions, Inc.), Initial Term C Loan (First Lien) | LIBOR + 4.250% | 12,302 | 4.398 | + | 3/08/2026 | 12,125 | ||||||||||
| One Call Corporation, Extended Term Loan (First Lien) | LIBOR + 5.250% | 629,864 | 6.250 | + | 11/28/2022 | 583,373 | ||||||||||
| Ortho-Clinical Diagnostics, Inc., Second Amendment New Term Loan | LIBOR + 3.250% | 782,018 | 3.389 | + | 6/30/2025 | 757,338 | ||||||||||
| Packaging Coordinators Midco, Inc., Term Loan | LIBOR + 3.750% | 190,000 | 3.899 | + | 9/24/2027 | 187,151 | ||||||||||
| Parexel International Corporation, Initial Term Loan | LIBOR + 2.750% | 864,513 | 2.898 | + | 9/28/2024 | 831,013 | ||||||||||
| Parfums Holding Company, Inc., Initial Term Loan (First Lien) | LIBOR + 4.000% | 691,601 | 5.000 | + | 6/30/2024 | 671,936 | ||||||||||
| PetVet Care Centers, LLC, Initial Term Loan (First Lien) | LIBOR + 2.750% | 887,026 | 2.898 | + | 2/14/2025 | 858,938 | ||||||||||
| PetVet Care Centers, LLC, 2018 Term Loan (First Lien) | LIBOR + 3.250% | 62,852 | 3.493 | + | 2/14/2025 | 61,163 | ||||||||||
| PetVet Care Centers, LLC, 2020 First Lien Incremental Term Loan | LIBOR + 4.250% | 184,534 | 5.250 | + | 2/14/2025 | 184,592 | ||||||||||
| Phoenix Guarantor, Inc. (aka Brightspring), Tranche B-1 Term Loan (First Lien) | LIBOR + 3.250% | 536,287 | 3.397 | + | 3/04/2026 | 520,311 | ||||||||||
| Precision Medicine Group, LLC, Term Loan | LIBOR + 3.750% | 375,962 | 4.500 | + | 10/30/2027 | 370,322 | ||||||||||
| Precision Medicine Group, LLC, Delayed Draw Term Loan | LIBOR + 3.750% | 49,038 | 4.500 | + | 10/30/2027 | 48,303 | ||||||||||
| Refinitiv US Holdings, Inc. (fka Financial & Risk US Holdings, Inc.), Initial Dollar Term Loan | LIBOR + 3.250% | 1,769,485 | 3.398 | + | 9/30/2025 | 1,746,128 | ||||||||||
| Reynolds Consumer Products LLC, Initial Term Loan | LIBOR + 1.750% | 560,908 | 1.901 | + | 2/04/2027 | 550,918 | ||||||||||
| Select Medical Corporation, Tranche B Term Loan | LIBOR + 2.500% | 632,966 | 2.651 | + | 3/06/2025 | 619,218 | ||||||||||
| Shearer’s Foods, LLC, Term Loan (First Lien) | LIBOR + 4.000% | 1,381,233 | 0.898 | + | 9/24/2027 | 1,368,284 | ||||||||||
| Sigma Holdco B.V. (aka Flora Foods), Facility B2 | LIBOR + 3.000% | 843,661 | 3.369 | + | 7/02/2025 | 819,056 | ||||||||||
| Sotera Health Holdings, LLC, Initial Term Loan (First Lien) | LIBOR + 4.500% | 950,225 | 4.647 | + | 11/22/2026 | 948,543 | ||||||||||
| Southern Veterinary Partners, LLC, Delayed Draw Term Loan (First Lien) | LIBOR + 4.000% | 86,234 | 5.000 | + | 10/02/2027 | 85,803 | ||||||||||
| Southern Veterinary Partners, LLC, Initial Term Loan (First Lien) | LIBOR + 4.000% | 625,195 | 5.000 | + | 10/04/2027 | 622,069 | ||||||||||
| St. George’s University Scholastic Services LLC, Term Loan | LIBOR + 3.250% | 792,784 | 3.398 | + | 7/16/2025 | 777,257 | ||||||||||
| Surgery Center Holdings, Inc., Initial Term Loan | LIBOR + 3.250% | 811,567 | 4.250 | + | 9/04/2024 | 771,747 | ||||||||||
| Surgery Center Holdings, Inc., 2020 Incremental Term Loan | LIBOR + 8.000% | 84,575 | 9.000 | + | 9/04/2024 | 85,985 | ||||||||||
| Trans Union LLC, 2019 Replacement Term B-5 Loan | LIBOR + 1.750% | 1,227,283 | 1.898 | + | 11/16/2026 | 1,199,669 | ||||||||||
| Viant Medical Holdings, Inc., Initial Term Loan (First Lien) | LIBOR + 3.750% | 826,743 | 3.898 | + | 7/02/2025 | 763,017 | ||||||||||
| WEX Inc., Term B-3 Loan | LIBOR + 2.250% | 868,038 | 2.398 | + | 5/16/2026 | 839,827 | ||||||||||
| 44,326,507 | ||||||||||||||||
| ENERGY - 1.2% | ||||||||||||||||
| CITGO Holding, Inc., Term Loan | LIBOR + 7.000% | 342,545 | 8.000 | + | 7/31/2023 | 316,784 | ||||||||||
| CITGO Petroleum Corporation, 2019 Incremental Term B Loan | LIBOR + 5.000% | 542,553 | 6.000 | + | 3/28/2024 | 508,644 | ||||||||||
| Fieldwood Energy, LLC, Closing Date Loan (First Lien) | LIBOR + 5.250% | 605,554 | 7.418 | + | 4/12/2022 | 133,222 | ||||||||||
See accompanying notes to financial statements.
16
| SCHEDULE OF INVESTMENTS |
| Dunham Floating Rate Bond Fund (Continued) |
| October 31, 2020 |
| Variable | Principal | Interest | Maturity | |||||||||||||
| Security | Rate | Amount | Rate % | Date | Value | |||||||||||
| TERM LOANS - 99.8% (Continued) | ||||||||||||||||
| ENERGY - 1.2% (Continued) | ||||||||||||||||
| Gavilan Resources, LLC, Initial Term Loan (Second Lien) | LIBOR + 8.000% | $ | 490,000 | 6.241 | + | 2/29/2024 | $ | 10,412 | ||||||||
| Medallion Midland Acquisition, LLC, Initial Term Loan | LIBOR + 3.250% | 477,667 | 4.250 | + | 10/30/2024 | 450,399 | ||||||||||
| Paragon Offshore Finance Company, Term Loan ** | LIBOR + 2.750% | 1,153 | 2.968 | + | 7/18/2021 | — | ||||||||||
| Traverse Midstream Partners, LLC, Advance | LIBOR + 5.500% | 471,335 | 6.500 | + | 9/28/2024 | 436,826 | ||||||||||
| 1,856,287 | ||||||||||||||||
| FINANCIAL - 4.3% | ||||||||||||||||
| Acrisure, LLC, 2020 Term Loan (First Lien) | LIBOR + 3.500% | 448,872 | 3.648 | + | 2/16/2027 | 433,922 | ||||||||||
| Asurion, LLC (fka Asurion Corporation), Amendment No. 14 Replacement B-4 Term Loan | LIBOR + 3.000% | 507,832 | 3.148 | + | 8/04/2022 | 500,666 | ||||||||||
| Asurion, LLC (fka Asurion Corporation), Replacement B-6 Term Loan | LIBOR + 3.000% | 318,854 | 3.148 | + | 11/04/2023 | 313,475 | ||||||||||
| Asurion, LLC (fka Asurion Corporation), New B-7 Term Loan | LIBOR + 3.000% | 381,225 | 3.148 | + | 11/04/2024 | 374,656 | ||||||||||
| Asurion, LLC (fka Asurion Corporation), Second Lien Replacement B-2 Term Loan | LIBOR + 6.500% | 401,550 | 6.648 | + | 8/04/2025 | 402,654 | ||||||||||
| Blackhawk Network Holdings, Inc., Term Loan (First Lien) | LIBOR + 3.000% | 857,528 | 3.148 | + | 6/16/2025 | 807,955 | ||||||||||
| Deerfield Dakota Holding, LLC (aka Duff & Phelps), Initial Dollar Term Loan (First Lien) | LIBOR + 3.750% | 827,925 | 3.889 | + | 3/06/2027 | 816,197 | ||||||||||
| iStar, Inc. (fka iStar Financial, Inc.), Loan | LIBOR + 2.750% | 208,813 | 2.893 | + | 6/28/2023 | 207,769 | ||||||||||
| PI UK Holdco II Limited, Facility B1 | LIBOR + 3.500% | 1,644,537 | 4.500 | + | 1/04/2025 | 1,601,763 | ||||||||||
| Ryan Specialty Group, LLC, Initial Term Loan | LIBOR + 3.250% | 90,000 | 3.398 | + | 7/24/2027 | 89,494 | ||||||||||
| Sedgwick Claims Management Services, Inc, Initial Term Loan | LIBOR + 3.250% | 1,346,025 | 3.398 | + | 1/01/2026 | 1,295,361 | ||||||||||
| Sedgwick Claims Management Services, Inc., 2019 Term Loan | LIBOR + 4.000% | 192,563 | 4.148 | + | 9/04/2026 | 187,673 | ||||||||||
| 7,031,585 | ||||||||||||||||
| INDUSTRIALS - 19.1% | ||||||||||||||||
| AI Convoy (Luxembourg) SARL, Facility B (USD) | LIBOR + 3.500% | 751,225 | 3.651 | + | 1/20/2027 | 739,724 | ||||||||||
| Alliance Laundry Systems, LLC, Initial Term B Loan | LIBOR + 3.500% | 850,000 | 4.250 | + | 10/08/2027 | 844,156 | ||||||||||
| Anchor Glass Container Corporation, July 2017 Additional Term Loan (First Lien) | LIBOR + 2.750% | 684,501 | 3.750 | + | 12/08/2023 | 518,452 | ||||||||||
| Anchor Glass Container Corporation, 2020 Incremental Loan | LIBOR + 5.000% | 117,120 | 6.000 | + | 12/08/2023 | 88,708 | ||||||||||
| Anchor Glass Container Corporation, Term Loan (Second Lien) | LIBOR + 7.750% | 81,333 | 8.750 | + | 12/08/2024 | 31,898 | ||||||||||
| ASP Navigate Acquisition Corporation, Initial Term Loan | LIBOR + 4.500% | 370,000 | 4.649 | + | 9/24/2027 | 366,300 | ||||||||||
| Atlantic Aviation FBO, Inc., Term Loan | LIBOR + 3.750% | 551,646 | 3.898 | + | 12/06/2025 | 541,074 | ||||||||||
| Berlin Packaging, LLC, Initial Term Loan (First Lien) | LIBOR + 3.000% | 904,959 | 3.829 | + | 11/08/2025 | 871,683 | ||||||||||
| Berry Global, Inc. (fka Berry Plastics Corporation), Term W Loan | LIBOR + 2.000% | 308,192 | 2.145 | + | 9/30/2022 | 305,426 | ||||||||||
| Berry Global, Inc. (fka Berry Plastics Corporation), Term X Loan | LIBOR + 2.000% | 512,873 | 2.145 | + | 1/20/2024 | 506,921 | ||||||||||
| Berry Global, Inc. (fka Berry Plastics Corporation), Term Y Loan | LIBOR + 2.000% | 629,296 | 2.145 | + | 6/30/2026 | 610,187 | ||||||||||
| Brookfield WEC Holdings, Inc., Initial Term Loan (2020) | LIBOR + 3.000% | 1,452,764 | 3.750 | + | 7/31/2025 | 1,422,125 | ||||||||||
| BWay Holding Company, Initial Term Loan | LIBOR + 3.250% | 968,383 | 3.480 | + | 4/04/2024 | 907,859 | ||||||||||
| Circor International, Inc., New Term Loan | LIBOR + 3.250% | 735,114 | 4.250 | + | 12/12/2024 | 722,249 | ||||||||||
| CPG International LLC (fka CPG International, Inc.) , New Term Loan | LIBOR + 3.750% | 1,017,779 | 4.750 | + | 5/04/2024 | 1,017,906 | ||||||||||
| Filtration Group Corporation, Series A Term Loan | LIBOR + 3.750% | 335,000 | 4.500 | + | 3/28/2025 | 331,441 | ||||||||||
| Filtration Group Corporation, Initial Dollar Term Loan | LIBOR + 3.000% | 1,255,012 | 3.148 | + | 4/01/2025 | 1,224,659 | ||||||||||
| Fluidra, S.A., Tranche B-1 USD Term Loan | LIBOR + 2.000% | 712,166 | 2.148 | + | 7/02/2025 | 692,581 | ||||||||||
| Fort Dearborn Holding Company, Inc., Initial Term Loan (First Lien) | LIBOR + 4.000% | 1,082,960 | 5.000 | + | 10/20/2023 | 1,055,886 | ||||||||||
| Gardner Denver, Inc., Series A New Term Loan | LIBOR + 2.750% | 49,875 | 2.895 | + | 2/28/2027 | 49,361 | ||||||||||
| Gardner Denver, Inc., 2020 GDI Tranche B-2 Dollar Term Loan | LIBOR + 1.750% | 824,840 | 1.898 | + | 2/28/2027 | 799,385 | ||||||||||
| Gates Global LLC, Initial B-2 Dollar Term Loan | LIBOR + 2.750% | 555,453 | 3.750 | + | 3/31/2024 | 545,849 | ||||||||||
| GFL Environmental Inc., Effective Date Incremental Term Loan | LIBOR + 3.000% | 934,199 | 4.000 | + | 5/30/2025 | 927,645 | ||||||||||
| Graham Packaging Company Inc., Initial Term Loan | LIBOR + 3.750% | 620,000 | 3.901 | + | 7/28/2027 | 616,060 | ||||||||||
| Klockner Pentaplast of America, Inc. (fka Kleopatra Acquisition Corp), Dollar Term Loan | LIBOR + 4.250% | 1,305,537 | 5.250 | + | 6/30/2022 | 1,272,194 | ||||||||||
| LEB Holdings (USA), Inc., Initial Term Loan | LIBOR + 4.000% | 575,000 | 4.149 | + | 9/24/2027 | 569,972 | ||||||||||
| NN, Inc., Extended 2017 Incremental Term Loan | LIBOR + 5.750% | 14,940 | 5.898 | + | 9/30/2022 | 14,823 | ||||||||||
| NN, Inc., Tranche B Term Loan | LIBOR + 5.750% | 19,170 | 6.500 | + | 10/20/2022 | 19,019 | ||||||||||
| Pactiv Evergreen Inc., Tranche B-1 U.S. Term Loan | LIBOR + 2.750% | 441,668 | 2.898 | + | 2/04/2023 | 434,184 | ||||||||||
| Pactiv Evergreen Inc., Tranche B-2 U.S. Term Loan | LIBOR + 3.250% | 1,365,000 | 3.397 | + | 2/16/2026 | 1,335,141 | ||||||||||
| Patriot Container Corp. (aka Wastequip), Closing Date Term Loan (First Lien) | LIBOR + 3.500% | 713,313 | 4.500 | + | 3/20/2025 | 694,592 | ||||||||||
| QUIKRETE Holdings, Inc., Initial Loan (First Lien) | LIBOR + 2.500% | 780,639 | 2.648 | + | 1/31/2027 | 766,881 | ||||||||||
| RBS Global, Inc. (Rexnord LLC), Term B Loan (2019) | LIBOR + 1.750% | 690,492 | 1.898 | + | 8/20/2024 | 685,990 | ||||||||||
| Spectrum Holdings III Corp., Closing Date Term Loan (First Lien) | LIBOR + 3.250% | 430,316 | 4.250 | + | 2/01/2025 | 393,559 | ||||||||||
| Star US Bidco LLC, Initial Term Loan | LIBOR + 4.250% | 478,800 | 5.250 | + | 3/16/2027 | 460,845 | ||||||||||
| Summit Materials, LLC, New Term Loan | LIBOR + 2.000% | 1,311,907 | 2.148 | + | 11/20/2024 | 1,289,768 | ||||||||||
| Titan Acquisition Limited (aka Husky IMS International Ltd.), Initial Term Loan | LIBOR + 3.000% | 993,359 | 3.220 | + | 3/28/2025 | 945,792 | ||||||||||
| TransDigm Inc., Tranche E Refinancing Term Loan | LIBOR + 2.250% | 785,171 | 2.398 | + | 5/30/2025 | 740,734 | ||||||||||
| TransDigm Inc., Tranche F Refinancing Term Loan | LIBOR + 2.250% | 896,047 | 2.398 | + | 12/08/2025 | 845,367 | ||||||||||
See accompanying notes to financial statements.
17
| SCHEDULE OF INVESTMENTS |
| Dunham Floating Rate Bond Fund (Continued) |
| October 31, 2020 |
| Variable | Principal | Interest | Maturity | |||||||||||||
| Security | Rate | Amount | Rate % | Date | Value | |||||||||||
| TERM LOANS - 99.8% (Continued) | ||||||||||||||||
| INDUSTRIALS - 19.1% (Continued) | ||||||||||||||||
| TRC Companies, Inc., 2019 Incremental Term Loan | LIBOR + 5.000% | $ | 489,716 | 5.147 | + | 6/20/2024 | $ | 478,901 | ||||||||
| Tricorbraun Holdings, Inc., Closing Date Term Loan (First Lien) | LIBOR + 3.750% | 720,391 | 4.750 | + | 11/30/2023 | 711,275 | ||||||||||
| Trident TPI Holdings, Inc., Tranche B-1 Term Loan | LIBOR + 3.000% | 874,542 | 4.000 | + | 10/16/2024 | 849,617 | ||||||||||
| Tunnel Hill Partners, L.P., Initial Term Loan | LIBOR + 3.500% | 645,175 | 3.648 | + | 2/06/2026 | 588,722 | ||||||||||
| U.S. Farathane, LLC, Term B-4 Loan | LIBOR + 3.500% | 975,861 | 4.500 | + | 12/24/2021 | 892,912 | ||||||||||
| Vertical Midco GmbH, Facility B (USD) | LIBOR + 4.250% | 290,000 | 4.397 | + | 8/01/2027 | 286,195 | ||||||||||
| Vertiv Group Corporation (fka Cortes NP Acquisition Corporation), Initial Term Loan | LIBOR + 3.000% | 875,600 | 3.147 | + | 3/02/2027 | 862,904 | ||||||||||
| 30,876,922 | ||||||||||||||||
| TECHNOLOGY - 8.2% | ||||||||||||||||
| Applied Systems, Inc., Closing Date Term Loan (First Lien) | LIBOR + 3.250% | 983,241 | 4.250 | + | 9/20/2024 | 980,002 | ||||||||||
| Aston FinCo SARL, Dollar Term Loan (First Lien) | LIBOR + 4.250% | 238,800 | 4.394 | + | 10/08/2026 | 235,256 | ||||||||||
| Azalea TopCo, Inc., Initial Term Loan (First Lien) | LIBOR + 3.500% | 297,000 | 3.714 | + | 7/24/2026 | 287,125 | ||||||||||
| Azalea TopCo, Inc., 2020 Incremental Term Loan (First Lien) | LIBOR + 4.000% | 135,000 | 4.750 | + | 7/24/2026 | 134,241 | ||||||||||
| Boxer Parent Company, Inc. (aka BMC Software, Inc.), Initial Dollar Term Loan | LIBOR + 4.250% | 1,044,717 | 4.398 | + | 10/02/2025 | 1,017,669 | ||||||||||
| Cardtronics USA, Inc., Initial Term Loan | LIBOR + 4.000% | 538,650 | 4.145 | + | 6/28/2027 | 539,323 | ||||||||||
| Dell International, LLC (EMC Corporation), Refinancing Term B-1 Loan | LIBOR + 2.000% | 1,224,092 | 2.750 | + | 9/20/2025 | 1,212,855 | ||||||||||
| Dun & Bradstreet Corporation (The), Initial Term Borrowing | LIBOR + 3.750% | 840,775 | 3.906 | + | 2/06/2026 | 829,563 | ||||||||||
| Epicor Software Corporation (fka Eagle Parent, Inc.), Term B Loan (2020) | LIBOR + 4.250% | 810,000 | 4.397 | + | 8/01/2027 | 808,076 | ||||||||||
| Everi Payments, Inc., Term Loan | LIBOR + 10.500% | 29,925 | 11.500 | + | 5/08/2024 | 30,224 | ||||||||||
| Everi Payments, Inc., Term B Loan | LIBOR + 2.750% | 966,571 | 3.750 | + | 5/08/2024 | 930,934 | ||||||||||
| Greeneden U.S. Holdings I, LLC, Term Loan B | LIBOR + 4.000% | 570,000 | 4.750 | + | 10/08/2027 | 561,986 | ||||||||||
| Hyland Software, Inc., 2018 Refinancing Term Loan (First Lien) | LIBOR + 3.500% | 405,000 | 4.250 | + | 6/30/2024 | 400,156 | ||||||||||
| Navicure, Inc., Initial Term Loan (First Lien) | LIBOR + 4.000% | 338,300 | 4.148 | + | 10/22/2026 | 330,829 | ||||||||||
| Navicure, Inc., 2020 Incremental Term Loan (First Lien) | LIBOR + 4.000% | 210,000 | 4.750 | + | 10/22/2026 | 207,638 | ||||||||||
| NCR Corporation, Initial Term Loan (2019) | LIBOR + 2.500% | 733,002 | 2.648 | + | 8/28/2026 | 712,236 | ||||||||||
| Science Applications International Corporation, Tranche B2 Loan | LIBOR + 2.250% | 275,818 | 2.398 | + | 3/12/2027 | 261,074 | ||||||||||
| Sophia, L.P., Closing Date Term Loan | LIBOR + 3.750% | 460,000 | 3.898 | + | 10/06/2027 | 453,339 | ||||||||||
| SS&C Technologies Holdings, Inc., Term B-5 Loan | LIBOR + 1.750% | 1,035,443 | 1.898 | + | 4/16/2025 | 1,008,615 | ||||||||||
| Tempo Acquisition, LLC, Extended Term Loan | LIBOR + 3.250% | 684,386 | 3.750 | + | 11/02/2026 | 663,683 | ||||||||||
| Ultimate Software Group, Inc. (The), 2020 Incremental Term Loan (First Lien) | LIBOR + 4.000% | 1,405,000 | 4.147 | + | 5/04/2026 | 1,399,296 | ||||||||||
| Ultimate Software Group, Inc. (The), Initial Term Loan (2020) (Second Lien) | LIBOR + 6.750% | 30,000 | 6.897 | + | 5/04/2027 | 30,612 | ||||||||||
| Zelis Cost Management Buyer, Inc., Initial Term Loan | LIBOR + 4.750% | 307,675 | 4.898 | + | 9/30/2026 | 306,247 | ||||||||||
| 13,340,979 | ||||||||||||||||
| UTILITIES - 1.5% | ||||||||||||||||
| Calpine Construction Finance Company, L.P., Term B Loan | LIBOR + 2.000% | 704,247 | 2.148 | + | 1/16/2025 | 684,880 | ||||||||||
| Calpine Corporation, Term Loan | LIBOR + 2.000% | 632,281 | 2.148 | + | 8/12/2026 | 616,110 | ||||||||||
| Hamilton Projects Acquiror, LLC, Term Loan | LIBOR + 4.750% | 523,688 | 5.750 | + | 6/16/2027 | 523,557 | ||||||||||
| Lightstone Holdco LLC, Refinancing Term B Loan | LIBOR + 3.750% | 470,678 | 4.750 | + | 1/30/2024 | 416,595 | ||||||||||
| Lightstone Holdco LLC, Refinancing Term C Loan | LIBOR + 3.750% | 26,547 | 4.750 | + | 1/30/2024 | 23,497 | ||||||||||
| PG&E Corporation, Loan | LIBOR + 4.500% | 169,575 | 4.648 | + | 6/24/2025 | 168,176 | ||||||||||
| Texas Competitive Electric Holdings Co. LLC Escrow Bonds # | 635,000 | 11.500 | 11/17/2070 | 445 | ||||||||||||
| 2,433,260 | ||||||||||||||||
| TOTAL TERM LOANS (Cost - $168,481,805) | 161,729,630 | |||||||||||||||
| CORPORATE BONDS - 4.7% | ||||||||||||||||
| AEROSPACE/DEFENSE - 0.4% | ||||||||||||||||
| Boeing Co. | 172,000 | 4.875 | 5/01/2025 | 187,226 | ||||||||||||
| Howmet Aerospace, Inc. ^ | 115,000 | 6.875 | 5/01/2025 | 128,081 | ||||||||||||
| Spirit AeroSystems, Inc. | 185,000 | 3.950 | 6/15/2023 | 165,459 | ||||||||||||
| Spirit AeroSystems, Inc. - 144A ^ | 160,000 | 5.500 | 1/15/2025 | 163,000 | ||||||||||||
| 643,766 | ||||||||||||||||
| APPAREL & TEXTILE PRODUCTS - 0.2% | ||||||||||||||||
| Hanesbrands, Inc. - 144A | 210,000 | 5.375 | 5/15/2025 | 221,288 | ||||||||||||
| ASSET MANAGEMENT - 0.2% | ||||||||||||||||
| Icahn Enterprises, L.P. / Icahn Enterprises Finance Corporation ^ | 360,000 | 4.750 | 9/15/2024 | 366,863 | ||||||||||||
| BIOTECHNOLOGY & PHARMACEUTICALS - 0.3% | ||||||||||||||||
| Bausch Health Companies, Inc. - 144A | 445,000 | 5.500 | 11/01/2025 | 457,594 | ||||||||||||
See accompanying notes to financial statements.
18
| SCHEDULE OF INVESTMENTS |
| Dunham Floating Rate Bond Fund (Continued) |
| October 31, 2020 |
| Principal | Interest | Maturity | ||||||||||
| Security | Amount | Rate % | Date | Value | ||||||||
| CORPORATE BONDS - 4.7% (Continued) | ||||||||||||
| CABLE & SATELLITE - 0.3% | ||||||||||||
| CCO Holdings, LLC / CCO Holdings Capital Corporation - 144A | $ | 180,000 | 4.000 | 3/01/2023 | $ | 182,137 | ||||||
| Radiate Holdco, LLC / Radiate Finance, Inc. - 144A ^ | 235,000 | 4.500 | 9/15/2026 | 236,234 | ||||||||
| Sirius XM Radio, Inc. - 144A ^ | 85,000 | 4.625 | 7/15/2024 | 87,758 | ||||||||
| 506,129 | ||||||||||||
| CONTAINERS & PACKAGING - 0.4% | ||||||||||||
| Ardagh Packaging Finance plc / Ardagh Holdings USA, Inc. - 144A | 475,000 | 4.125 | 8/15/2026 | 485,094 | ||||||||
| Ardagh Packaging Finance plc / Ardagh Holdings USA, Inc. - 144A | 200,000 | 5.250 | 8/15/2027 | 205,500 | ||||||||
| 690,594 | ||||||||||||
| ELECTRIC UTILITIES - 0.7% | ||||||||||||
| Vistra Operations Company, LLC - 144A ^ | 460,000 | 3.550 | 7/15/2024 | 490,457 | ||||||||
| Vistra Operations Company, LLC - 144A | 590,000 | 3.700 | 1/30/2027 | 623,904 | ||||||||
| 1,114,361 | ||||||||||||
| ENTERTAINMENT CONTENT - 0.1% | ||||||||||||
| Diamond Sports Group, LLC / Diamond Sports Finance Company - 144A | 210,000 | 5.375 | 8/15/2026 | 123,113 | ||||||||
| FOOD - 0.1% | ||||||||||||
| Dole Food Company, Inc. - 144A | 175,000 | 7.250 | 6/15/2025 | 175,638 | ||||||||
| HEALTH CARE FACILITIES & SERVICES - 1.0% | ||||||||||||
| CHS / Community Health Systems, Inc. - 144A ^ | 215,000 | 6.625 | 2/15/2025 | 210,184 | ||||||||
| Jaguar Holding Company II / PPD Development, L.P. - 144A ^ | 145,000 | 4.625 | 6/15/2025 | 150,020 | ||||||||
| Legacy LifePoint Health, LLC - 144A | 5,000 | 6.750 | 4/15/2025 | 5,300 | ||||||||
| Legacy LifePoint Health, LLC - 144A ^ | 135,000 | 4.375 | 2/15/2027 | 133,948 | ||||||||
| One Call Corporation - 144A | 712,081 | 7.500 | 7/01/2024 | 630,192 | ||||||||
| Tenet Healthcare Corporation ^ | 405,000 | 4.625 | 7/15/2024 | 412,250 | ||||||||
| Tenet Healthcare Corporation - 144A | 50,000 | 7.500 | 4/01/2025 | 53,931 | ||||||||
| 1,595,825 | ||||||||||||
| INSURANCE - 0.1% | ||||||||||||
| Acrisure, LLC / Acrisure Finance, Inc. - 144A | 90,000 | 8.125 | 2/15/2024 | 94,320 | ||||||||
| LEISURE FACILITIES & SERVICES - 0.1% | ||||||||||||
| Caesars Entertainment, Inc. - 144A | 80,000 | 6.250 | 7/01/2025 | 82,050 | ||||||||
| Carnival Corporation - 144A | 45,000 | 11.500 | 4/01/2023 | 49,491 | ||||||||
| 131,541 | ||||||||||||
| METALS & MINING - 0.0% | ||||||||||||
| Cleveland-Cliffs, Inc. - 144A | 50,000 | 6.750 | 3/15/2026 | 52,563 | ||||||||
| PUBLISHING & BROADCASTING - 0.2% | ||||||||||||
| Clear Channel Worldwide Holdings, Inc. - 144A | 65,000 | 5.125 | 8/15/2027 | 63,131 | ||||||||
| iHeartCommunications, Inc. | 96,514 | 6.375 | 5/01/2026 | 100,676 | ||||||||
| iHeartCommunications, Inc. | 174,933 | 8.375 | 5/01/2027 | 170,039 | ||||||||
| 333,846 | ||||||||||||
| REITS - 0.3% | ||||||||||||
| iStar, Inc. | 460,000 | 4.250 | 8/01/2025 | 423,200 | ||||||||
| MGM Growth Properties Operating Partnership, L.P. / MGP Finance Co-Issuer, Inc. - 144A | 60,000 | 4.625 | 6/15/2025 | 61,168 | ||||||||
| 484,368 | ||||||||||||
| RETAIL - DISCRETIONARY - 0.1% | ||||||||||||
| PriSo Acquisition Corporation - 144A | 165,000 | 9.000 | 5/15/2023 | 163,762 | ||||||||
| SPECIALTY FINANCE - 0.2% | ||||||||||||
| Ladder Capital Finance Holdings LLLP / Ladder Capital Finance Corporation - 144A | 140,000 | 4.250 | 2/01/2027 | 121,275 | ||||||||
| OneMain Finance Corporation | 250,000 | 6.125 | 5/15/2022 | 260,938 | ||||||||
| 382,213 | ||||||||||||
| TELECOMMUNICATIONS - 0.0% | ||||||||||||
| Level 3 Financing, Inc. - 144A | 45,000 | 4.250 | 7/01/2028 | 45,270 | ||||||||
| TOTAL CORPORATE BONDS (Cost - $7,636,718) | 7,583,054 | |||||||||||
See accompanying notes to financial statements.
19
| SCHEDULE OF INVESTMENTS |
| Dunham Floating Rate Bond Fund (Continued) |
| October 31, 2020 |
| Security | Shares | Value | ||||||||||
| COMMON STOCKS - 0.1% | ||||||||||||
| PUBLISHING & BROADCASTING - 0.0% | ||||||||||||
| iHeartMedia, Inc. - Class A * | 2,133 | $ | 17,533 | |||||||||
| iHeartMedia, Inc. - Class B *# | 29 | 250 | ||||||||||
| Clear Channel Outdoor Holdings, Inc. * | 40,131 | 35,877 | ||||||||||
| 53,660 | ||||||||||||
| OIL & GAS PRODUCERS - 0.1% | ||||||||||||
| California Resources Corporation * ^ | 7,333 | 98,262 | ||||||||||
| TOTAL COMMON STOCKS (Cost - $674,450) | 151,922 | |||||||||||
| Expiration | ||||||||||||
| Date | ||||||||||||
| RIGHTS - 0.0% | ||||||||||||
| TRA Rights | 10,588 | 11/22/2049 | 11,827 | |||||||||
| TOTAL RIGHTS (Cost - $17,470) | ||||||||||||
| WARRANTS - 0.1% | ||||||||||||
| iHeartMedia, Inc. | 14,903 | 12/31/2049 | 115,379 | |||||||||
| TOTAL WARRANTS (Cost - $287,609) | ||||||||||||
| Interest | ||||||||||||
| Rate % | ||||||||||||
| SHORT-TERM INVESTMENT - 0.5% | ||||||||||||
| MONEY MARKET FUND - 0.5% | ||||||||||||
| Fidelity Government Portfolio - Class Institutional | 852,939 | 0.010 | + | 852,939 | ||||||||
| TOTAL SHORT-TERM INVESTMENT - (Cost - $852,939) | ||||||||||||
| COLLATERAL FOR SECURITIES LOANED - 1.3% | ||||||||||||
| Mount Vernon Prime Portfolio ! | 2,056,793 | 0.160 | + | 2,056,793 | ||||||||
| TOTAL COLLATERAL FOR SECURITIES LOANED (Cost - $2,056,793) | ||||||||||||
| TOTAL INVESTMENTS - 106.5% (Cost - $180,007,784) | $ | 172,501,544 | ||||||||||
| LIABILITIES IN EXCESS OF OTHER ASSETS - (6.5)% | (10,460,586 | ) | ||||||||||
| NET ASSETS - 100.0% | $ | 162,040,958 | ||||||||||
ETF - Exchange Traded Fund
LIBOR - London Inter-bank Offered Rate
L.P. - Limited Partnership
LLC - Limited Liability Company
LLLP - Limited Liability Limited Partnership
LLP - Limited Liability Partnership
LTD - Limited Company
plc - Public Limited Company
REITs - Real Estate Investment Trusts
SARL - Société à Responsabilité Limitée
144A - Security exempt from registration under Rule 144A of the Securities Act of 1933. These securities may be sold in transactions exempt from registration, normally to qualified institutional buyers. As of October 31, 2020 the total market value of 144A securities is $5,368,322 or 3.31% of net assets.
| * | Non-Income producing security. |
| ** | Security is in default. |
| + | Variable rate security. Interest rate is as of October 31, 2020. |
| # | Fair Value estimated using fair value procedures adopted by Board of Trustees. Total Value of such securities is $695 or 0.0% of net assets as of October 31, 2020. |
| ^ | All or a portion of these securities are on loan. Total loaned securities had a value of $1,990,961 at October 31, 2020. |
| ! | The Trust’s securities lending policies and procedures require that the borrower: (i) deliver cash or U.S. Government securities as collateral with respect to each new loan of U.S. securities, equal to at least 102% of the value of the portfolio securities loaned, and (ii) at all times thereafter mark-to-market the collateral on a daily basis so that the market value of such collateral is at least 100% of the value of securities loaned. From time to time the collateral may not be 102% due to end of day market movement. The next business day additional collateral is obtained/received from the borrower to replenish/reestablish 102%. |
| Portfolio Composition * - (Unaudited) | ||||||||||
| Term Loans | 93.5 | % | Common Stocks | 0.1 | % | |||||
| Corporate Bonds | 4.4 | % | Warrants | 0.1 | % | |||||
| Collateral for Securities Loaned | 1.2 | % | Rights | 0.0 | % | |||||
| Short-Term Investments | 0.7 | % | Total | 100.0 | % | |||||
| * | Based on total value of investments as of October 31, 2020 |
Percentage may differ from Schedule of Investments which are based on Fund net assets.
See accompanying notes to financial statements.
20
| Dunham High-Yield Bond Fund (Unaudited) |
| Message from the Sub-Adviser (PineBridge Investments LLC) |
Asset Class Recap
High-yield spreads rallied to begin the fiscal year as the U.S. and China trade negotiations became more constructive and eventually led to the signing of the phase one trade deal. However, the outbreak of the coronavirus during the final weeks of the first fiscal quarter reversed the trend as investors attempted to root out the true economic impact of the outbreak. To begin the second fiscal quarter, investors seemed to shrug off concerns of a meaningful economic impact caused by the pandemic, but sentiment drastically shifted, leading to a sell-off in high-yield bonds. As a result of the outbreak, governments across the globe established containment measures and shut down the bulk of their economies. High-yield bonds sharply recovered in the third fiscal quarter in response to the reopening of economies around the world and unprecedented monetary and fiscal actions taken to combat the adverse economic effects of the shutdowns. In the most recent fiscal quarter, high-yield bonds continued to rise albeit at a slower pace as investors remained focused on second quarter revenue and earnings that beat expectations and further progress on the development of Covid-19 vaccines. Volatility once again spiked towards the end of the most recent fiscal quarter due to increased uncertainty around additional fiscal stimulus in the U.S., the renewed surge of Covid-19 in Europe, and political uncertainty from the upcoming U.S. presidential election and Brexit. High-yield bonds, as measured by the ICE BofA ML US Cash Pay High-Yield Index, rose 2.6 percent over the fiscal year.
Allocation Review
Over the fiscal year, security selection strongly contributed to Fund performance, more than making up for the detraction from sector allocation. Credit selection within the consumer cyclical, capital goods, and technology sectors were the largest contributors to positive Fund performance, while the credits from the energy sector detracted. From a sector allocation perspective, an underweight to the energy sector detracted from Fund performance in the first fiscal quarter as the price of oil rose, strongly contributed as the price of oil plummeted, but detracted as the price of oil rebounded. Allocation to the consumer cyclical sector and REIT sectors also detracted. However, the overweight allocation to the technology and communications sectors contributed to Fund performance.
Holdings Insights
Amid the volatility in the price of oil and corresponding weakness in the energy space, the Fund was underweight the energy sector. This positioning positively contributed to Fund performance in the second fiscal quarter as the price of oil plummeted. However, as previously mentioned, this exposure detracted from Fund performance as the price of oil rallied in the second half of the fiscal year. Despite the drag on Fund performance, one of the largest contributors to positive performance came from this sector. Hilcorp Energy I LP / Hilcorp Finance Co. 5.0% 12/01/2024 (431318AN4) (holding weight*: 1.09 percent), an oil exploratory company, rose 10.5 percent. Holdings that detracted from Fund performance within this sector included Callon Petroleum Co. 6.375% 7/1/26 (13123XAZ5) (holding weight*: 0.19 percent), an independent oil and natural gas company. This credit surged 47.6 in the second half of the fiscal year after plummeting 79.83 percent in the first half of the fiscal year, resulting in an overall decline of 70.3 percent for the full fiscal year. Hi-Crush, Inc. 9.5% 08/01/2026 (428337AA7) (holding weight*: 0.03 percent), a fracking-service provider, also detracted from Fund performance as the credit declined 91.4 percent amidst a chapter 11 filing late in the fiscal year.
The Fund received positive contributions from credits within the communications sector as many of these companies benefited from the stay at home orders and other government mandates. Netflix Inc. 4.875% 06/15/2030 (64110LAV8) (holding weight*: 1.17 percent), a media services provider and production company, added over 16 million subscribers during the aforementioned government mandates. This credit was one of the strongest contributors to Fund performance by surging 17 percent during the fiscal year ended October 31, 2020. Another beneficiary was Grubhub Inc. 5.50% 7/01/2027 (40010PAA6) (holding weight*: 0.70% percent), an online and mobile prepared food ordering and delivery platform. This credit increased 17.4 percent over the fiscal year as delivery was the only option for many restaurants during the lockdowns.
As markets rebounded, the Sub-Adviser added to the more economically sensitive consumer cyclical sector which positively contributed to Fund performance. As states reopened and steps were being taken towards the path to normalcy, many credits from beaten down subsectors rebounded. Viking Cruises Ltd. 13.0% 5/15/2025 (92676XAE7) (holding weight*: 0.08 percent) was added to the Fund in late June and rose 17.3 percent through the rest of the fiscal year. Another credit that benefited from the step towards a return to normalcy was American Airlines Inc. 11.75% 07/15/2025 (023771558) (holding weight*: 0.58 percent). Since being added to the Fund in May, this credit increased 7.1 percent as consumers slowly returned to airports.
Sub-Adviser Outlook
The official outcome of the U.S. presidential race may not be known for days or weeks given the closeness of the current Electoral College count. Assuming a base case where the result is a Biden presidency and a GOP-controlled Senate, the Sub-Adviser no longer expects the massive fiscal package that would have likely come with a clean sweep from the Democrats. However, the Sub-Adviser expects some aid by early next year. The Sub-Adviser also does not expect Trump’s 2017 corporate tax cuts to be rolled back, but does expect more moderate regulatory changes, and reduced global trade tensions. Given the absence of a large fiscal package to deliver economic growth, the Federal Reserve will likely feel additional pressure to continue to provide accommodative monetary policies as we grapple with the broad-ranging effects of Covid-19 and subsequently look to increase employment levels. The Sub-Adviser sees the potential for the benefit of additional monetary policy accommodation to more than offset the impact of a smaller fiscal package and slower economic growth. The Sub-Adviser expects low interest rates to continue for the foreseeable future and expects strong demand for credit-related asset classes to continue as these segments remain attractive relative to fixed income alternatives such as low or negative yielding government bonds.
| * | Holdings percentage(s) of total investments, cash and unsettled trades excluding collateral for securities loaned, as of 10/31/2020. |
Growth of $100,000 Investment
Total Returns (a) as of October 31, 2020
| Annualized | Annualized | ||
| One Year | Five Years | Ten Years | |
| Class N | 3.74% | 4.93% | 4.75% |
| Class A with load of 4.50% | (1.25)% | 3.72% | 4.01% |
| Class A without load | 3.44% | 4.67% | 4.48% |
| Class C | 2.95% | 4.18% | 3.98% |
| Barclays U.S. Corporate High-Yield Bond Ba/B 2% Issuer Capped Index | 4.55% | 6.09% | 6.00% |
| Morningstar High-Yield Bond Category | 1.21% | 4.58% | 4.88% |
| (a) | Total Returns are calculated based on traded NAVs. |
Barclays U.S. Corporate High-Yield Bond Ba/B 2% Issuer Capped Index is an issuer-constrained version of the flagship US Corporate High Yield Index, which measures the USD-denominated, high yield, fixed-rate corporate bond market. Investors cannot invest directly in an index or benchmark.
The Morningstar High-Yield Bond Category is generally representative of mutual funds that primarily invest in U.S. high-income debt securities where at least 65% or more of bond assets are not rated or are rated by a major agency such as Standard & Poor’s or Moody’s at the level of BB (considered speculative for taxable bonds) and below.
| As disclosed in the Trust’s latest registration statement, the Fund’s total annual operating expenses, including the cost of underlying funds, are 1.13% for Class N, 1.88% for Class C and 1.38% for Class A. Class A shares are subject to a sales load of 4.50% and a deferred sales charge of up to 0.75%. The performance data quoted here represents past performance, which is not indicative of future results. Current performance may be lower or higher than the performance data quoted. The investment return and NAV will fluctuate, so that an investor’s shares, when redeemed, may be worth more or less than their original cost. Total returns are calculated assuming reinvestment of all dividends and capital gains distributions, if any. The returns do not reflect the deductions of taxes a shareholder would pay on the redemption of Fund shares or Fund distributions. For performance information current to the most recent month-end, please call 1-800-442-4358 or visit our website www.dunham.com |
21
| SCHEDULE OF INVESTMENTS |
| Dunham High-Yield Bond Fund |
| October 31, 2020 |
| Principal | Interest | Maturity | ||||||||||
| Security | Amount | Rate % | Date | Value | ||||||||
| CONVERTIBLE BONDS - 0.3% | ||||||||||||
| OIL & GAS SERVICES & EQUIPMENT - 0.3% | ||||||||||||
| Hi-Crush, Inc. - 144A | $ | 290,000 | 8.000 | 4/9/2026 | $ | 290,000 | ||||||
| TOTAL CONVERTIBLE BONDS (Cost - $290,000) | ||||||||||||
| CORPORATE BONDS - 94.0% | ||||||||||||
| ADVERTISING & MARKETING - 0.3% | ||||||||||||
| Terrier Media Buyer, Inc. - 144A | 267,000 | 8.875 | 12/15/2027 | 273,440 | ||||||||
| AEROSPACE & DEFENSE - 0.5% | ||||||||||||
| Spirit AeroSystems, Inc. - 144A | 504,000 | 7.500 | 4/15/2025 | 508,722 | ||||||||
| AUTOMOTIVE - 2.4% | ||||||||||||
| BorgWarner, Inc. - 144A | 357,000 | 5.000 | 10/1/2025 | 415,084 | ||||||||
| Ford Motor Company | 690,000 | 6.625 | 10/1/2028 | 773,663 | ||||||||
| Ford Motor Company | 105,000 | 7.450 | 7/16/2031 | 125,278 | ||||||||
| Ford Motor Company | 741,000 | 4.750 | 1/15/2043 | 685,851 | ||||||||
| Ford Motor Credit Company, LLC | 143,000 | 5.125 | 6/16/2025 | 149,226 | ||||||||
| Tesla, Inc. - 144A | 190,000 | 5.300 | 8/15/2025 | 196,817 | ||||||||
| 2,345,919 | ||||||||||||
| BIOTECHNOLOGY & PHARMACEUTICALS - 1.0% | ||||||||||||
| Endo Dac / Endo Finance, LLC / Endo Finco, Inc. - 144A | 521,000 | 6.000 | 6/30/2028 | 402,993 | ||||||||
| Par Pharmaceutical, Inc. - 144A | 547,000 | 7.500 | 4/1/2027 | 580,537 | ||||||||
| 983,530 | ||||||||||||
| CABLE & SATELLITE - 2.7% | ||||||||||||
| Altice Financing S.A. - 144A | 601,000 | 5.000 | 1/15/2028 | 583,760 | ||||||||
| Block Communications, Inc. - 144A | 435,000 | 4.875 | 3/1/2028 | 446,895 | ||||||||
| CCO Holdings, LLC / CCO Holdings Capital Corporation - 144A | 478,000 | 5.500 | 5/1/2026 | 497,792 | ||||||||
| CCO Holdings, LLC / CCO Holdings Capital Corporation - 144A | 378,000 | 5.000 | 2/1/2028 | 397,467 | ||||||||
| CCO Holdings, LLC / CCO Holdings Capital Corporation - 144A | 335,000 | 5.375 | 6/1/2029 | 363,019 | ||||||||
| CSC Holdings, LLC - 144A | 390,000 | 5.500 | 4/15/2027 | 411,353 | ||||||||
| 2,700,286 | ||||||||||||
| CHEMICALS - 1.6% | ||||||||||||
| Consolidated Energy Finance S.A. - 144A | 385,000 | 6.875 | 6/15/2025 | 358,772 | ||||||||
| Minerals Technologies, Inc. - 144A | 387,000 | 5.000 | 7/1/2028 | 399,577 | ||||||||
| OCI N.V. - 144A | 472,000 | 5.250 | 11/1/2024 | 483,505 | ||||||||
| Olin Corporation - 144A | 311,000 | 9.500 | 6/1/2025 | 368,184 | ||||||||
| 1,610,038 | ||||||||||||
| COMMERCIAL SUPPORT SERVICES - 5.1% | ||||||||||||
| Brink’s Company (The) - 144A | 281,000 | 5.500 | 7/15/2025 | 292,826 | ||||||||
| Brink’s Company (The) - 144A | 340,000 | 4.625 | 10/15/2027 | 347,550 | ||||||||
| Covanta Holding Corporation | 506,000 | 5.000 | 9/1/2030 | 515,487 | ||||||||
| Garda World Security Corporation - 144A | 501,000 | 9.500 | 11/1/2027 | 535,664 | ||||||||
| Harsco Corporation - 144A | 610,000 | 5.750 | 7/31/2027 | 624,869 | ||||||||
| Korn Ferry - 144A | 477,000 | 4.625 | 12/15/2027 | 487,732 | ||||||||
| Prime Security Services Borrower, LLC / Prime Finance, Inc. - 144A | 631,000 | 5.250 | 4/15/2024 | 660,859 | ||||||||
| Prime Security Services Borrower, LLC / Prime Finance, Inc. - 144A | 540,000 | 5.750 | 4/15/2026 | 575,775 | ||||||||
| Prime Security Services Borrower, LLC / Prime Finance, Inc. - 144A | 325,000 | 6.250 | 1/15/2028 | 328,864 | ||||||||
| Sotheby’s - 144A ^ | 750,000 | 7.375 | 10/15/2027 | 766,267 | ||||||||
| 5,135,893 | ||||||||||||
| CONSTRUCTION MATERIALS - 0.5% | ||||||||||||
| Standard Industries, Inc. - 144A | 505,000 | 3.375 | 1/15/2031 | 492,165 | ||||||||
| CONTAINERS & PACKAGING - 1.9% | ||||||||||||
| Cascades, Inc. / Cascades USA, Inc. - 144A | 479,000 | 5.375 | 1/15/2028 | 500,256 | ||||||||
| Intertape Polymer Group, Inc. - 144A | 524,000 | 7.000 | 10/15/2026 | 552,065 | ||||||||
| Silgan Holdings, Inc. | 288,000 | 4.750 | 3/15/2025 | 294,660 | ||||||||
| Trivium Packaging Finance BV - 144A | 525,000 | 8.500 | 8/15/2027 | 562,787 | ||||||||
| 1,909,768 | ||||||||||||
See accompanying notes to financial statements.
22
| SCHEDULE OF INVESTMENTS |
| Dunham High-Yield Bond Fund (Continued) |
| October 31, 2020 |
| Principal | Interest | Maturity | ||||||||||
| Security | Amount | Rate % | Date | Value | ||||||||
| CORPORATE BONDS - 94.0% (Continued) | ||||||||||||
| ELECTRIC UTILITIES - 2.3% | ||||||||||||
| Clearway Energy Operating, LLC | $ | 539,000 | 5.000 | 9/15/2026 | $ | 559,045 | ||||||
| NextEra Energy Operating Partners, L.P. - 144A | 550,000 | 4.250 | 7/15/2024 | 575,437 | ||||||||
| Talen Energy Supply, LLC - 144A | 279,000 | 7.250 | 5/15/2027 | 280,046 | ||||||||
| Talen Energy Supply, LLC - 144A | 317,000 | 6.625 | 1/15/2028 | 303,665 | ||||||||
| Vistra Operations Company, LLC - 144A | 535,000 | 5.000 | 7/31/2027 | 559,610 | ||||||||
| 2,277,803 | ||||||||||||
| ELECTRICAL EQUIPMENT - 0.3% | ||||||||||||
| WESCO Distribution, Inc. - 144A | 218,000 | 7.125 | 6/15/2025 | 235,184 | ||||||||
| WESCO Distribution, Inc. - 144A | 101,000 | 7.250 | 6/15/2028 | 110,737 | ||||||||
| 345,921 | ||||||||||||
| ENTERTAINMENT CONTENT - 1.3% | ||||||||||||
| Banijay Entertainment S.A. SU - 144A | 400,000 | 5.375 | 3/1/2025 | 407,250 | ||||||||
| Univision Communications, Inc. - 144A | 74,000 | 5.125 | 2/15/2025 | 72,844 | ||||||||
| Univision Communications, Inc. - 144A | 811,000 | 6.625 | 6/1/2027 | 821,644 | ||||||||
| 1,301,738 | ||||||||||||
| FOOD - 3.5% | ||||||||||||
| Dole Food Company, Inc. - 144A | 550,000 | 7.250 | 6/15/2025 | 552,005 | ||||||||
| Herbalife Nutrition Ltd / HLF Financing, Inc. - 144A | 208,000 | 7.875 | 9/1/2025 | 219,700 | ||||||||
| HLF Financing Sarl, LLC / Herbalife International, Inc. - 144A | 497,000 | 7.250 | 8/15/2026 | 512,375 | ||||||||
| JBS USA LUX S.A. / JBS USA Finance, Inc. - 144A | 272,000 | 5.750 | 6/15/2025 | 280,296 | ||||||||
| Kraft Heinz Foods Company - 144A | 205,000 | 4.875 | 10/1/2049 | 217,075 | ||||||||
| Lamb Weston Holdings, Inc. - 144A | 370,000 | 4.625 | 11/1/2024 | 382,950 | ||||||||
| Land O’ Lakes, Inc. - 144A | 210,000 | 7.000 | 12/29/2049 | 189,492 | ||||||||
| Land O’ Lakes Capital Trust I - 144A | 484,000 | 7.450 | 3/15/2028 | 551,760 | ||||||||
| Pilgrim’s Pride Corporation - 144A | 520,000 | 5.875 | 9/30/2027 | 549,968 | ||||||||
| 3,455,621 | ||||||||||||
| HEALTH CARE FACILITIES & SERVICES - 4.1% | ||||||||||||
| Acadia Healthcare Company, Inc. - 144A | 357,000 | 5.500 | 7/1/2028 | 371,949 | ||||||||
| Acadia Healthcare Company, Inc. - 144A | 96,000 | 5.000 | 4/15/2029 | 99,149 | ||||||||
| Catalent Pharma Solutions, Inc. - 144A | 280,000 | 5.000 | 7/15/2027 | 292,373 | ||||||||
| Encompass Health Corporation | 143,000 | 4.625 | 4/1/2031 | 147,469 | ||||||||
| HCA, Inc. | 900,000 | 5.375 | 2/1/2025 | 997,934 | ||||||||
| Jaguar Holding Company II / PPD Development, L.P. - 144A | 101,000 | 4.625 | 6/15/2025 | 104,497 | ||||||||
| Jaguar Holding Company II / PPD Development, L.P. - 144A | 380,000 | 5.000 | 6/15/2028 | 396,553 | ||||||||
| Legacy LifePoint Health, LLC - 144A | 465,000 | 4.375 | 2/15/2027 | 461,378 | ||||||||
| Providence Service Corporation (The) - 144A | 113,000 | 5.875 | 11/15/2025 | 115,189 | ||||||||
| Tenet Healthcare Corporation | 525,000 | 4.625 | 7/15/2024 | 534,398 | ||||||||
| Tenet Healthcare Corporation - 144A | 616,000 | 6.125 | 10/1/2028 | 598,675 | ||||||||
| 4,119,564 | ||||||||||||
| HOME CONSTRUCTION - 1.0% | ||||||||||||
| Griffon Corporation | 464,000 | 5.750 | 3/1/2028 | 484,300 | ||||||||
| Mattamy Group Corporation - 144A | 489,000 | 5.250 | 12/15/2027 | 518,646 | ||||||||
| 1,002,946 | ||||||||||||
| HOUSEHOLD PRODUCTS - 1.5% | ||||||||||||
| Clearwater Paper Corporation - 144A | 516,000 | 4.750 | 8/15/2028 | 519,548 | ||||||||
| Coty, Inc. - 144A | 770,000 | 6.500 | 4/15/2026 | 603,718 | ||||||||
| Energizer Holdings, Inc. - 144A | 410,000 | 4.375 | 3/31/2029 | 414,510 | ||||||||
| 1,537,776 | ||||||||||||
| INDUSTRIAL SUPPORT SERVICES - 1.1% | ||||||||||||
| Ahern Rentals, Inc. - 144A | 787,000 | 7.375 | 5/15/2023 | 508,107 | ||||||||
| H&E Equipment Services, Inc. | 580,000 | 5.625 | 9/1/2025 | 602,475 | ||||||||
| 1,110,582 | ||||||||||||
| INSTITUTIONAL FINANCIAL SERVICES - 0.4% | ||||||||||||
| LPL Holdings, Inc. - 144A | 397,000 | 5.750 | 9/15/2025 | 412,026 | ||||||||
| INSURANCE - 0.3% | ||||||||||||
| NMI Holdings, Inc. - 144A | 270,000 | 7.375 | 6/1/2025 | 294,690 | ||||||||
See accompanying notes to financial statements.
23
| SCHEDULE OF INVESTMENTS |
| Dunham High-Yield Bond Fund (Continued) |
| October 31, 2020 |
| Principal | Interest | Maturity | ||||||||||
| Security | Amount | Rate % | Date | Value | ||||||||
| CORPORATE BONDS - 94.0% (Continued) | ||||||||||||
| INTERNET MEDIA & SERVICES - 1.8% | ||||||||||||
| GrubHub Holdings, Inc. - 144A | $ | 660,000 | 5.500 | 7/1/2027 | $ | 687,225 | ||||||
| Netflix, Inc. - 144A | 1,010,000 | 4.875 | 6/15/2030 | 1,154,556 | ||||||||
| 1,841,781 | ||||||||||||
| LEISURE FACILITIES & SERVICES - 6.3% | ||||||||||||
| Boyd Gaming Corporation - 144A | 230,000 | 8.625 | 6/1/2025 | 252,068 | ||||||||
| Boyd Gaming Corporation | 382,000 | 4.750 | 12/1/2027 | 372,286 | ||||||||
| Brinker International, Inc. - 144A | 289,000 | 5.000 | 10/1/2024 | 290,097 | ||||||||
| Caesars Entertainment, Inc. - 144A | 630,000 | 6.250 | 7/1/2025 | 646,143 | ||||||||
| Dave & Buster’s, Inc. - 144A ^ | 510,000 | 7.625 | 11/1/2025 | 501,712 | ||||||||
| Golden Nugget, Inc. - 144A | 725,000 | 6.750 | 10/15/2024 | 614,814 | ||||||||
| Hilton Grand Vacations Borrower, LLC / Hilton Grand Vacations Borrower, Inc. | 480,000 | 6.125 | 12/1/2024 | 496,150 | ||||||||
| NCL Corporation Ltd. - 144A | 459,000 | 3.625 | 12/15/2024 | 317,571 | ||||||||
| SeaWorld Parks & Entertainment, Inc. - 144A ^ | 445,000 | 8.750 | 5/1/2025 | 468,362 | ||||||||
| Silversea Cruise Finance Ltd. - 144A | 550,000 | 7.250 | 2/1/2025 | 554,634 | ||||||||
| Six Flags Entertainment Corporation - 144A ^ | 505,000 | 5.500 | 4/15/2027 | 470,433 | ||||||||
| Six Flags Theme Parks, Inc. - 144A | 49,000 | 7.000 | 7/1/2025 | 51,971 | ||||||||
| Viking Cruises Ltd. - 144A | 70,000 | 13.000 | 5/15/2025 | 79,406 | ||||||||
| VOC Escrow Ltd. - 144A | 490,000 | 5.000 | 2/15/2028 | 425,166 | ||||||||
| Wyndham Destinations, Inc. | 750,000 | 5.750 | 4/1/2027 | 774,844 | ||||||||
| 6,315,657 | ||||||||||||
| METALS & MINING - 3.6% | ||||||||||||
| Cleveland-Cliffs, Inc. - 144A | 475,000 | 4.875 | 1/15/2024 | 474,109 | ||||||||
| Cleveland-Cliffs, Inc. | 327,000 | 5.750 | 3/1/2025 | 316,577 | ||||||||
| Cleveland-Cliffs, Inc. - 144A | 200,000 | 6.750 | 3/15/2026 | 210,250 | ||||||||
| First Quantum Minerals Ltd. - 144A | 473,000 | 7.250 | 4/1/2023 | 476,086 | ||||||||
| FMG Resources August 2006 Pty Ltd. - 144A | 469,000 | 4.500 | 9/15/2027 | 503,059 | ||||||||
| Freeport-McMoRan, Inc. | 260,000 | 4.125 | 3/1/2028 | 265,850 | ||||||||
| Freeport-McMoRan, Inc. | 123,000 | 4.375 | 8/1/2028 | 128,612 | ||||||||
| Freeport-McMoRan, Inc. | 352,000 | 5.250 | 9/1/2029 | 380,755 | ||||||||
| Freeport-McMoRan, Inc. | 260,000 | 4.250 | 3/1/2030 | 273,406 | ||||||||
| Mineral Resources Ltd. - 144A | 525,000 | 8.125 | 5/1/2027 | 573,563 | ||||||||
| 3,602,267 | ||||||||||||
| OIL & GAS PRODUCERS - 11.8% | ||||||||||||
| Apache Corporation | 58,000 | 4.625 | 11/15/2025 | 55,173 | ||||||||
| Apache Corporation | 68,000 | 4.875 | 11/15/2027 | 63,920 | ||||||||
| Apache Corporation | 405,000 | 4.375 | 10/15/2028 | 370,980 | ||||||||
| Buckeye Partners, L.P. - 144A | 429,000 | 4.500 | 3/1/2028 | 408,354 | ||||||||
| Callon Petroleum Company | 212,000 | 6.125 | 10/1/2024 | 76,850 | ||||||||
| Callon Petroleum Company | 781,000 | 6.375 | 7/1/2026 | 190,220 | ||||||||
| Cenovus Energy, Inc. | 618,000 | 4.250 | 4/15/2027 | 629,672 | ||||||||
| Cheniere Energy Partners, L.P. | 432,000 | 5.250 | 10/1/2025 | 439,862 | ||||||||
| Cheniere Energy Partners, L.P. | 248,000 | 4.500 | 10/1/2029 | 253,210 | ||||||||
| Cheniere Energy, Inc. - 144A | 360,000 | 4.625 | 10/15/2028 | 372,150 | ||||||||
| DCP Midstream Operating, L.P. | 296,000 | 5.625 | 7/15/2027 | 307,070 | ||||||||
| DCP Midstream Operating, L.P. - 144A | 132,000 | 6.750 | 9/15/2037 | 125,967 | ||||||||
| DCP Midstream Operating, L.P. | 235,000 | 5.600 | 4/1/2044 | 205,459 | ||||||||
| eG Global Finance plc - 144A | 605,000 | 6.750 | 2/7/2025 | 593,808 | ||||||||
| Endeavor Energy Resources, L.P. - EER Finance, Inc. - 144A | 270,000 | 5.750 | 1/30/2028 | 280,530 | ||||||||
| Genesis Energy, L.P. / Genesis Energy Finance Corporation | 893,000 | 5.625 | 6/15/2024 | 769,842 | ||||||||
| Genesis Energy, L.P. / Genesis Energy Finance Corporation | 325,000 | 6.500 | 10/1/2025 | 270,359 | ||||||||
| Harvest Midstream I, L.P. - 144A | 581,000 | 7.500 | 9/1/2028 | 578,095 | ||||||||
| Hilcorp Energy I, L.P. / Hilcorp Finance Company - 144A | 1,160,000 | 5.000 | 12/1/2024 | 1,077,228 | ||||||||
| Holly Energy Partners, L.P. / Holly Energy Finance Corporation - 144A | 714,000 | 5.000 | 2/1/2028 | 677,854 | ||||||||
| MEG Energy Corporation - 144A | 693,000 | 6.500 | 1/15/2025 | 674,483 | ||||||||
| MEG Energy Corporation - 144A | 447,000 | 7.125 | 2/1/2027 | 403,297 | ||||||||
| Murphy Oil USA, Inc. | 405,000 | 4.750 | 9/15/2029 | 425,175 | ||||||||
| NuStar Logistics, L.P. | 152,000 | 5.750 | 10/1/2025 | 153,266 | ||||||||
See accompanying notes to financial statements.
24
| SCHEDULE OF INVESTMENTS |
| Dunham High-Yield Bond Fund (Continued) |
| October 31, 2020 |
| Principal | Interest | Maturity | ||||||||||
| Security | Amount | Rate % | Date | Value | ||||||||
| CORPORATE BONDS - 94.0% (Continued) | ||||||||||||
| OIL & GAS PRODUCERS - 11.8% (Continued) | ||||||||||||
| NuStar Logistics, L.P. | $ | 379,000 | 6.375 | 10/1/2030 | $ | 382,079 | ||||||
| Occidental Petroleum Corporation | 326,000 | 5.875 | 9/1/2025 | 287,369 | ||||||||
| Occidental Petroleum Corporation | 503,000 | 6.375 | 9/1/2028 | 441,068 | ||||||||
| PBF Holding Company, LLC / PBF Finance Corporation - 144A ^ | 520,000 | 6.000 | 2/15/2028 | 201,149 | ||||||||
| Southwestern Energy Company | 300,000 | 7.500 | 4/1/2026 | 305,790 | ||||||||
| Southwestern Energy Company | 189,000 | 8.375 | 9/15/2028 | 197,859 | ||||||||
| Targa Resources Partners, L.P. / Targa Resources Partners Finance Corporation - 144A | 521,000 | 4.875 | 2/1/2031 | 509,231 | ||||||||
| 11,727,369 | ||||||||||||
| OIL & GAS SERVICES & EQUIPMENT - 1.5% | ||||||||||||
| Archrock Partners, L.P. / Archrock Partners Finance Corporation - 144A | 463,000 | 6.875 | 4/1/2027 | 454,898 | ||||||||
| ChampionX Corporation | 397,000 | 6.375 | 5/1/2026 | 380,128 | ||||||||
| Hi-Crush, Inc. - 144A * | 961,000 | 9.500 | 8/1/2026 | 32,434 | ||||||||
| Nine Energy Service, Inc.- 144A | 727,000 | 8.750 | 11/1/2023 | 217,420 | ||||||||
| USA Compression Partners, L.P. / USA Compression Finance Corporation - 144A | 437,000 | 6.875 | 4/1/2026 | 434,153 | ||||||||
| 1,519,033 | ||||||||||||
| PUBLISHING & BROADCASTING - 2.1% | ||||||||||||
| Belo Corporation | 735,000 | 7.750 | 6/1/2027 | 833,508 | ||||||||
| Belo Corporation | 235,000 | 7.250 | 9/15/2027 | 259,337 | ||||||||
| EW Scripps Company (The) - 144A | 739,000 | 5.125 | 5/15/2025 | 706,207 | ||||||||
| National CineMedia, LLC - 144A | 396,000 | 5.875 | 4/15/2028 | 277,200 | ||||||||
| 2,076,252 | ||||||||||||
| REAL ESTATE SERVICES - 1.2% | ||||||||||||
| Cushman & Wakefield US Borrower, LLC - 144A | 416,000 | 6.750 | 5/15/2028 | 443,820 | ||||||||
| Newmark Group, Inc. | 679,000 | 6.125 | 11/15/2023 | 719,161 | ||||||||
| 1,162,981 | ||||||||||||
| REIT - 4.5% | ||||||||||||
| CTR Partnership, L.P. / CareTrust Capital Corporation | 604,000 | 5.250 | 6/1/2025 | 624,322 | ||||||||
| ESH Hospitality, Inc. - 144A | 150,000 | 5.250 | 5/1/2025 | 150,221 | ||||||||
| ESH Hospitality, Inc. - 144A | 355,000 | 4.625 | 10/1/2027 | 348,344 | ||||||||
| GLP Capital, L.P. / GLP Financing II, Inc. | 340,000 | 5.375 | 4/15/2026 | 378,255 | ||||||||
| HAT Holdings I, LLC / HAT Holdings II, LLC - 144A | 621,000 | 5.250 | 7/15/2024 | 640,860 | ||||||||
| MGM Growth Properties Operating Partnership, L.P. / MGP Finance Co-Issuer, Inc. | 513,000 | 5.750 | 2/1/2027 | 554,399 | ||||||||
| MPT Operating Partnership, L.P. / MPT Finance Corporation | 419,000 | 5.000 | 10/15/2027 | 439,206 | ||||||||
| Park Intermediate Holdings, LLC / PK Domestic Property, LLC / PK Finance Co-Issuer - 144A | 520,000 | 5.875 | 10/1/2028 | 510,575 | ||||||||
| Sabra Health Care, L.P. | 812,000 | 5.125 | 8/15/2026 | 886,188 | ||||||||
| 4,532,370 | ||||||||||||
| RENEWABLE ENERGY - 0.5% | ||||||||||||
| EnerSys - 144A | 485,000 | 5.000 | 4/30/2023 | 499,853 | ||||||||
| RETAIL - CONSUMER STAPLES - 0.9% | ||||||||||||
| Albertsons Companies Inc / Safeway Inc / New Albertsons, L.P. / Albertsons, LLC | 454,000 | 5.750 | 3/15/2025 | 469,559 | ||||||||
| Albertsons Companies Inc / Safeway Inc / New Albertsons, L.P. / Albertsons, LLC - 144A | 440,000 | 4.625 | 1/15/2027 | 454,168 | ||||||||
| 923,727 | ||||||||||||
| RETAIL - DISCRETIONARY - 0.8% | ||||||||||||
| Avis Budget Car Rental, LLC / Avis Budget Finance, Inc. - 144A | 433,000 | 5.750 | 7/15/2027 | 407,832 | ||||||||
| Conn’s, Inc. ^ | 405,000 | 7.250 | 7/15/2022 | 385,161 | ||||||||
| 792,993 | ||||||||||||
| SEMICONDUCTORS - 0.4% | ||||||||||||
| ON Semiconductor Corporation - 144A | 350,000 | 3.875 | 9/1/2028 | 356,563 | ||||||||
| SOFTWARE - 1.4% | ||||||||||||
| Camelot Finance S.A. - 144A | 345,000 | 4.500 | 11/1/2026 | 359,447 | ||||||||
| Donnelley Financial Solutions, Inc. | 477,000 | 8.250 | 10/15/2024 | 501,396 | ||||||||
| SS&C Technologies, Inc. - 144A | 520,000 | 5.500 | 9/30/2027 | 553,322 | ||||||||
| 1,414,165 | ||||||||||||
See accompanying notes to financial statements.
25
| SCHEDULE OF INVESTMENTS |
| Dunham High-Yield Bond Fund (Continued) |
| October 31, 2020 |
| Variable | Principal | Interest | Maturity | |||||||||||||
| Security | Rate | Amount | Rate % | Date | Value | |||||||||||
| CORPORATE BONDS - 94.0% (Continued) | ||||||||||||||||
| SPECIALTY FINANCE - 7.4% | ||||||||||||||||
| AerCap Global Aviation Trust Variable Rate - 144A | 3 month LIBOR + 4.300% | $ | 223,000 | 6.500 | + | 6/15/2045 | $ | 197,913 | ||||||||
| Alliance Data Systems Corporation - 144A | 555,000 | 4.750 | 12/15/2024 | 515,803 | ||||||||||||
| Avolon Holdings Funding Ltd. - 144A | 514,000 | 5.125 | 10/1/2023 | 523,672 | ||||||||||||
| Credit Acceptance Corporation | 559,000 | 6.625 | 3/15/2026 | 582,059 | ||||||||||||
| Enova International, Inc. - 144A | 765,000 | 8.500 | 9/1/2024 | 704,676 | ||||||||||||
| Fairstone Financial, Inc. - 144A | 566,000 | 7.875 | 7/15/2024 | 581,859 | ||||||||||||
| FirstCash, Inc. - 144A | 387,000 | 4.625 | 9/1/2028 | 393,531 | ||||||||||||
| Freeport-McMoRan, Inc. | 123,000 | 4.625 | 8/1/2030 | 131,521 | ||||||||||||
| Genworth Mortgage Holdings, Inc. - 144A | 343,000 | 6.500 | 8/15/2025 | 358,221 | ||||||||||||
| goeasy Ltd. - 144A | 482,000 | 5.375 | 12/1/2024 | 487,774 | ||||||||||||
| Ladder Capital Finance Holdings LLLP / Ladder Capital Finance Corporation - 144A | 652,000 | 4.250 | 2/1/2027 | 564,795 | ||||||||||||
| LD Holdings Group, LLC - 144A | 221,000 | 6.500 | 11/1/2025 | 224,867 | ||||||||||||
| Navient Corporation | 236,000 | 5.000 | 3/15/2027 | 220,712 | ||||||||||||
| OneMain Finance Corporation | 263,000 | 6.875 | 3/15/2025 | 289,793 | ||||||||||||
| OneMain Finance Corporation | 89,000 | 5.375 | 11/15/2029 | 91,674 | ||||||||||||
| Pattern Energy Operations, L.P. / Pattern Energy Operations, Inc. - 144A | 475,000 | 4.500 | 8/15/2028 | 496,140 | ||||||||||||
| Quicken Loans, LLC / Quicken Loans Co-Issuer, Inc. - 144A | 342,000 | 3.625 | 3/1/2029 | 337,511 | ||||||||||||
| Starwood Property Trust, Inc. - 144A | 101,000 | 5.500 | 11/1/2023 | 100,221 | ||||||||||||
| Starwood Property Trust, Inc. | 588,000 | 4.750 | 3/15/2025 | 572,197 | ||||||||||||
| 7,374,939 | ||||||||||||||||
| STEEL - 1.1% | ||||||||||||||||
| Commercial Metals Company | 470,000 | 5.750 | 4/15/2026 | 486,669 | ||||||||||||
| SunCoke Energy Partners, L.P. / SunCoke Energy Partners Finance Corporation - 144A | 627,000 | 7.500 | 6/15/2025 | 562,341 | ||||||||||||
| 1,049,010 | ||||||||||||||||
| TECHNOLOGY HARDWARE - 1.8% | ||||||||||||||||
| Dell International, LLC / EMC Corporation - 144A | 490,000 | 7.125 | 6/15/2024 | 508,267 | ||||||||||||
| Diebold Nixdorf, Inc. ^ | 358,000 | 8.500 | 4/15/2024 | 326,227 | ||||||||||||
| Diebold Nixdorf, Inc. - 144A | 181,000 | 9.375 | 7/15/2025 | 192,426 | ||||||||||||
| Ingram Micro, Inc. | 715,000 | 5.450 | 12/15/2024 | 765,393 | ||||||||||||
| 1,792,313 | ||||||||||||||||
| TECHNOLOGY SERVICES - 3.0% | ||||||||||||||||
| Banff Merger Sub, Inc. - 144A | 625,000 | 9.750 | 9/1/2026 | 657,812 | ||||||||||||
| Nielsen Finance, LLC / Nielsen Finance Company - 144A | 299,000 | 5.000 | 4/15/2022 | 299,448 | ||||||||||||
| Nielsen Finance, LLC / Nielsen Finance Company - 144A | 255,000 | 5.625 | 10/1/2028 | 263,447 | ||||||||||||
| Nielsen Finance, LLC / Nielsen Finance Company - 144A | 402,000 | 5.875 | 10/1/2030 | 422,854 | ||||||||||||
| Presidio Holdings, Inc. - 144A | 480,000 | 8.250 | 2/1/2028 | 510,300 | ||||||||||||
| Shift4 Payments, LLC / Shift4 Payments Finance Sub, Inc. - 144A | 344,000 | 4.625 | 11/1/2026 | 349,263 | ||||||||||||
| Tempo Acquisition, LLC / Tempo Acquisition Finance Corporation - 144A | 120,000 | 5.750 | 6/1/2025 | 126,150 | ||||||||||||
| Tempo Acquisition, LLC / Tempo Acquisition Finance Corporation - 144A | 355,000 | 6.750 | 6/1/2025 | 360,680 | ||||||||||||
| 2,989,954 | ||||||||||||||||
| TELECOMMUNICATIONS - 7.8% | ||||||||||||||||
| Altice France Holding S.A. - 144A | 830,000 | 6.000 | 2/15/2028 | 800,415 | ||||||||||||
| Altice France S.A. - 144A | 875,000 | 7.375 | 5/1/2026 | 914,156 | ||||||||||||
| Cablevision Lightpath, LLC - 144A | 360,000 | 3.875 | 9/15/2027 | 357,750 | ||||||||||||
| CenturyLink, Inc. | 497,000 | 7.500 | 4/1/2024 | 549,041 | ||||||||||||
| CenturyLink, Inc. - 144A | 410,000 | 5.125 | 12/15/2026 | 419,822 | ||||||||||||
| Cogent Communications Group, Inc. - 144A | 505,000 | 5.375 | 3/1/2022 | 515,613 | ||||||||||||
| Connect Finco S.A.RL / Connect US Finco, LLC - 144A | 480,000 | 6.750 | 10/1/2026 | 484,200 | ||||||||||||
| Hughes Satellite Systems Corporation | 706,000 | 6.625 | 8/1/2026 | 767,200 | ||||||||||||
| Sprint Corporation | 1,345,000 | 7.875 | 9/15/2023 | 1,535,822 | ||||||||||||
| Telesat Canada / Telesat, LLC - 144A | 302,000 | 4.875 | 6/1/2027 | 308,229 | ||||||||||||
| Telesat Canada / Telesat, LLC - 144A | 740,000 | 6.500 | 10/15/2027 | 737,336 | ||||||||||||
| Zayo Group Holdings, Inc. - 144A | 391,000 | 6.125 | 3/1/2028 | 395,094 | ||||||||||||
| 7,784,678 | ||||||||||||||||
See accompanying notes to financial statements.
26
| SCHEDULE OF INVESTMENTS |
| Dunham High-Yield Bond Fund (Continued) |
| October 31, 2020 |
| Principal | Interest | Maturity | ||||||||||||
| Security | Amount | Rate % | Date | Value | ||||||||||
| CORPORATE BONDS - 94.0% (Continued) | ||||||||||||||
| TRANSPORTATION & LOGISTICS - 2.1% | ||||||||||||||
| American Airlines, Inc. - 144A | $ | 590,000 | 11.750 | 7/15/2025 | $ | 574,660 | ||||||||
| Cargo Aircraft Management, Inc. - 144A | 650,000 | 4.750 | 2/1/2028 | 661,781 | ||||||||||
| Delta Air Lines, Inc. - 144A | 650,000 | 7.000 | 5/1/2025 | 710,043 | ||||||||||
| UAL 2007-1 Pass Through Trust | 184,826 | 6.636 | 7/2/2022 | 176,270 | ||||||||||
| 2,122,754 | ||||||||||||||
| TRANSPORTATION EQUIPMENT - 0.9% | ||||||||||||||
| Allison Transmission, Inc. - 144A | 551,000 | 5.000 | 10/1/2024 | 556,620 | ||||||||||
| JB Poindexter & Company, Inc. - 144A | 287,000 | 7.125 | 4/15/2026 | 306,048 | ||||||||||
| 862,668 | ||||||||||||||
| WHOLESALE - CONSUMER STAPLES - 0.8% | ||||||||||||||
| Performance Food Group, Inc. - 144A | 450,000 | 5.500 | 10/15/2027 | 462,073 | ||||||||||
| US Foods, Inc. - 144A | 303,000 | 6.250 | 4/15/2025 | 317,040 | ||||||||||
| 779,113 | ||||||||||||||
| WHOLESALE - DISCRETIONARY - 0.5% | ||||||||||||||
| KAR Auction Services, Inc. - 144A | 475,000 | 5.125 | 6/1/2025 | 479,156 | ||||||||||
| TOTAL BONDS & NOTES (Cost - $93,741,836) | 93,818,024 | |||||||||||||
| Shares | ||||||||||||||
| SHORT-TERM INVESTMENT - 0.5% | ||||||||||||||
| MONEY MARKET FUND - 0.5% | ||||||||||||||
| First American Government Obligations Fund - Class Z | 510,501 | 0.030 | + | 510,501 | ||||||||||
| TOTAL SHORT-TERM INVESTMENT (Cost - $510,501) | ||||||||||||||
| COLLATERAL FOR SECURITIES LOANED - 2.7% | ||||||||||||||
| HSBC US Government Money Market Fund - Class I # | 2,648,549 | 0.023 | + | 2,648,549 | ||||||||||
| TOTAL COLLATERAL FOR SECURITIES LOANED (Cost - $2,648,549) | ||||||||||||||
| TOTAL INVESTMENTS - 97.5% (Cost - $97,190,886) | $ | 97,267,074 | ||||||||||||
| OTHER ASSETS IN EXCESS OF LIABILITIES - 2.5% | 2,531,306 | |||||||||||||
| NET ASSETS - 100.0% | $ | 99,798,380 | ||||||||||||
LIBOR - London Inter-bank Offered Rate
LLC - Limited Liability Corporation
LLLP - Limited Liability Limited Partnership
L.P. - Limited Partnership
LTD - Limited Company
plc - Public Limited Company
REITs - Real Estate Investment Trusts
| ^ | All or a portion of these securities are on loan. Total loaned securities had a value of $2,551,319 at October 31, 2020. |
| * | Illiquid security. Total illiquid securities had a value of $32,434 at October 31, 2020. |
| + | Variable rate security. Interest rate is as of October 31, 2020. |
| # | The Trust’s securities lending policies and procedures require that the borrower: (i) deliver cash or U.S. Government securities as collateral with respect to each new loan of U.S. securities, equal to at least 102% of the value of the portfolio securities loaned, and (ii) at all times thereafter mark-to-market the collateral on a daily basis so that the market value of such collateral is at least 100% of the value of securities loaned. From time to time the collateral may not be 102% due to end of day market movement. The next business day additional collateral is obtained/received from the borrower to replenish/reestablish 102%. |
144A - Security exempt from registration under Rule 144A of the Securities Act of 1933. These securities may be sold in transactions exempt from registration, normally to qualified institutional buyers. As of October 31, 2020 the total market value of 144A securities is $66,479,337 or 66.61% of net assets.
| Portfolio Composition ** - (Unaudited) | ||||||||||
| Ba3 | 20.5 | % | B3 | 4.7 | % | |||||
| B1 | 16.3 | % | Caa2 | 3.3 | % | |||||
| B2 | 16.0 | % | Collateral For Securities Loaned | 2.7 | % | |||||
| Ba2 | 14.7 | % | Baa3 | 1.3 | % | |||||
| Caa1 | 7.0 | % | Baa2 | 0.7 | % | |||||
| Ba1 | 6.7 | % | Caa3 | 0.7 | % | |||||
| Other/Not Rated | 4.9 | % | Short-Term Investments | 0.5 | % | |||||
| Total | 100.0 | % | ||||||||
| ** | Based on total value of investments as of October 31, 2020. Bond Ratings provided by Moody’s Ratings. |
Percentage may differ from Schedule of Investments which is based on Fund net assets.
See accompanying notes to financial statements.
27
| Dunham International Opportunity Bond Fund (Unaudited) |
| Message from the Sub-Adviser (Stone Harbor Investment Partners LP) |
Asset Class Recap
Global bond yields rose and prices fell for the first two months of the fiscal year. Rising expectations of a phase one trade deal contributed to investor optimism resulting in fixed income spread sector strength. Global economic data saw improvements relative to expectations over the period. In January, global bond yields fell and prices rose as investors sought lower risk assets amid the outbreak of the coronavirus in China and its potential impact on the global economy. Coronavirus cases and deaths surged in the second fiscal quarter, followed by the World Health Organization officially labeling the virus outbreak a pandemic. In response, global economies shut down, volatility spiked, and rates plummeted. Despite dire economic data, volatility subsided and markets rallied in response to historic monetary and fiscal stimulus, totaling over $ 12 trillion, enacted by governments and central banks around the world. This action has helped alleviate illiquidity concerns and negate some of the adverse economic impacts of the coronavirus pandemic. In the second half of the fiscal year, this rally continued until the final month where risk assets took a pause as a second wave of virus cases and subsequent reimposition of restrictions weighed on market sentiment. In currency markets, the flight to the perceived safe haven of the U.S. dollar early in the fiscal year reversed course as risk assets rallied, falling against most major developed market currencies. Foreign bonds, as measured by the Bloomberg Barclays Global Aggregate Bond ex-US Index Hedged, increased 2.7 percent during the fiscal year, which outperformed emerging markets bonds, as measured by the JP Morgan EMBI Global Total Return Index, as it increased 2 percent. Emerging market high-yield bonds, as measured by the JP Morgan Emerging Market High-Yield Bond Index, put in the worst showing over the fiscal year, declining 1.2 percent.
Allocation Review
For the first two months of the fiscal year, the Sub-Adviser’s country allocation detracted from Fund performance. The Fund received negative contributions from developed markets, including exposures to peripheral Europe versus Germany. The exposure to local currency emerging markets also detracted, especially the underweight to Chinese bonds. However, the Fund’s exposure to hard currency emerging markets bonds strongly contributed to Fund performance. To begin 2020, the Fund’s allocation was meaningful shifted with the commencement of the current Sub-Adviser. In the final month of the first fiscal quarter, the Sub-Adviser increased the allocation to corporate bonds, emerging market bonds, and increased the currency exposure hedge. With the exception of the currency exposure, these shifts detracted from Fund performance in the second fiscal quarter. As markets rebounded in the second half of the fiscal year, the Sub-Adviser’s asset allocation and issue allocation strongly contributed to Fund performance with particular strength coming from emerging market hard currency bonds and emerging markets sovereign bonds. At the close of the fiscal year, the Fund’s allocation ended with 47.2 percent allocated to high -yield bonds and 52.8 percent allocated to investment-grade bonds. From a market perspective, 55 percent was allocated to developed markets, while 45 percent was allocated to emerging market bonds. Within emerging markets, 64.4 percent was dedicated to corporates, 30 percent allocated to hard currency government bonds, and 5.6 percent to local currency government bonds. Aside from currency contracts, the Fund did not hold any derivatives that materially affected performance in the fiscal quarter.
Holdings Insights
Emerging market hard currency debt positively contributed to Fund performance in the first fiscal quarter but detracted from Fund performance in the second fiscal quarter. Despite strongly rebounding in the latter half of the fiscal year, this exposure, in general, detracted from Fund performance for the fiscal year. A position within this sector that detracted from Fund performance was the state-owned Argentinian gas company, YPF SA 8.5% 7/28/2025 (984245AL4) (holding weight*: 0.79 percent), which fell 29.2 percent since being added to the Fund in early January. As previously mentioned, emerging market hard currency debt rebounded in the final two quarters of the fiscal year. Two credits that contributed to Fund performance were the Indonesia Asahan Aluminium Persero PT 5.8% 05/15/2050 (74445PAG7) (holding weight*: 0.06 percent) and the Theta Capital Pte Ltd 8.125% 01/22/2025 (BKP8ZV4) (holding weight*: 0.37 percent) .. Since being added to the Fund, these credits increased 6.7 percent and 2.7 percent, respectively. Contrary to emerging market hard currency debt, emerging market sovereign debt issued in local currency positively contributed to Fund performance for the fiscal year. For example, the Mexican Bonos 7.5% 06/03/2027(B1QGYR3) (holding weight*: 0.27 percent) increased 11.5 percent when converted back to USD since being added to the Fund in early January.
As volatility spiked in the second fiscal quarter and to close the most recent fiscal quarter, higher-grade developed government credit positively contributed to Fund performance. The Fund received a positive contribution from the Ireland Government Bond 0.9% 5/15/2028 (BDHDPR4) (holding weight*: 0.13 percent). This credit rose 0.8 percent over the most recent fiscal quarter and 2.4 percent for the full fiscal year. Another contributor to positive Fund performance was the Spain Government Bond 4.2% 1/31/2037 (B05L4R2) (holding weight*: 0.26 percent), which increased 2.7 percent in the final fiscal quarter and 3.1 percent for the full fiscal year. The largest detractor from Fund performance over the second half of the fiscal year was the exposure to pan European high-yield debt. An issue within this sector that detracted from Fund performance was the Nidda Healthcare Holding 3.5% 9/30/2024 (BD8013P1) (holding weight*: 0.23 percent), which declined 1.0 percent since being added to the Fund in January. A pan European high-yield holding that contributed to Fund performance over the fiscal year was the CSN Resources SA 7.625% 4/17/2026 (12644VAC2) (holding weight*: 0.68 percent). This credit rose 3.6 percent since being added to the Fund. Overall, the derivative exposure within the Fund slightly detracted from Fund performance. As the U.S. dollar in general depreciated versus most major currencies across the globe from March through the end of the fiscal year, the currency hedge implemented through derivatives detracted from Fund performance.
Sub-Adviser Outlook
Moving forward, the Sub-Adviser reduced risk within the portfolio through lower exposure to emerging market hard currency sovereign bonds and increased exposure to developed market government credits. The Sub-Adviser also reduced the exposure to emerging market local currency bonds, with a particular emphasis on reducing corporate bonds in Argentina given the concerning economic outlook. Despite the risk mitigation, the Sub-Adviser is optimistic for the remainder of 2020 and beyond. The Sub- Adviser believes that by identifying individual opportunities through their rigorous fundamental credit analysis as well as retaining the ability to actively shift between asset classes, and within individual sectors, will allow the Fund to take advantage of opportunities that emerge.
| * | Holdings percentage(s) of total investments, cash and unsettled trades excluding collateral for securities loaned, as of 10/31/2020. |
Growth of $100,000 Investment
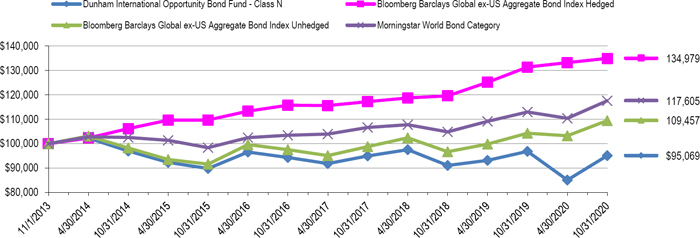
Total Returns (a) as of October 31, 2020
| Annualized | |||
| Annualized | Since Inception | ||
| One Year | Five Years | (11/1/13) | |
| Class N | (1.81)% | 1.15% | (0.72)% |
| Class A with load of 4.50% | (6.43)% | (0.03)% | (1.61)% |
| Class A without load | (2.03)% | 0.90% | (0.96)% |
| Class C | (2.48)% | 0.38% | (1.47)% |
| Bloomberg Barclays Global ex -US Aggregate Bond Index Hedged ** | 2.73% | 4.23% | 4.38% |
| Bloomberg Barclays Global ex -US Aggregate Bond Index Unhedged | 4.96% | 3.62% | 1.30% |
| Morningstar World Bond Category | 4.07% | 3.64% | 2.35% |
| (a) | Total Returns are calculated based on traded NAVs. |
| ** | Change in Fund’s benchmark due to the implementation of the Sub-Adviser’s investment strategy primarily using the new benchmark index. As a result, the Fund’s performance is compared to both indices in the table above. |
The total return of the Bloomberg Barclays Global ex US Aggregate Bond Index Hedged Benchmark is the return (including the reinvestment of any dividends or distributions) of the Benchmark over a specified period. “Hedged” refers to the index being “hedged to US dollars” by Bloomberg Barclays.
The Bloomberg Barclays Global ex US Aggregate Bond Index Unhedged is designed to be a broad-based measure of the global investment-grade, fixed rate, fixed income corporate markets outside the United States. Investors cannot invest directly in an index or benchmark.
The Morningstar World Bond Category is generally representative of funds that invest at least 40% of bonds in foreign markets.
| As disclosed in the Trust’s latest registration statement, the Fund’s total annual operating expenses, including underlying funds, are 1.61% for Class N, 2.36% for Class C and 1.86% for Class A. Class A shares are subject to a sales load of 4.50% and a deferred sales charge of up to 0.75%. The performance data quoted here represents past performance, which is not indicative of future results. Current performance may be lower or higher than the performance data quoted. The investment return and NAV will fluctuate, so that an investor’s shares, when redeemed, may be worth more or less than their original cost. Total returns are calculated assuming reinvestment of all dividends and capital gains distributions, if any. The returns do not reflect the deductions of taxes a shareholder would pay on the redemption of Fund shares or Fund distributions. For performance information current to the most recent month-end, please call 1-800-442-4358 or visit our website www.dunham.com. |
28
| SCHEDULE OF INVESTMENTS |
| Dunham International Opportunity Bond Fund |
| October 31, 2020 |
| Principal | ||||||||||||||
| Security | Variable Rate | Amount | Interest Rate % | Maturity Date | Value | |||||||||
| ASSET BACKED SECURITIES - 0.2% | ||||||||||||||
| RESIDENTIAL MORTGAGE - 0.2% | ||||||||||||||
| Bankinter 10 FTA | 3M Euro LIBOR + 0.16% | 68,120 | EUR | 0.0001 | + | 6/21/2043 | $ | 78,998 | ||||||
| Fondo de Titulizacion de Activos Santander Hipotecario 2 | 3M Euro LIBOR + 0.15% | 29,230 | EUR | 0.0001 | + | 1/18/2049 | 33,856 | |||||||
| TOTAL ASSET BACKED SECURITIES (Cost - $103,304) | 112,854 | |||||||||||||
| CORPORATE BONDS - 62.6% | ||||||||||||||
| AEROSPACE & DEFENSE - 0.2% | ||||||||||||||
| Rolls-Royce PLC - 144A | 100,000 | EUR | 4.6250 | 2/16/2026 | 116,776 | |||||||||
| ASSET MANAGEMENT - 0.2% | ||||||||||||||
| MDGH - GMTN BV - 144A | 87,000 | USD | 2.8750 | 11/7/2029 | 92,751 | |||||||||
| AUTOMOTIVE - 1.6% | ||||||||||||||
| Faurecia SE | 100,000 | EUR | 3.1250 | 6/15/2026 | 117,912 | |||||||||
| Fiat Chrysler Automobiles NV | 100,000 | EUR | 3.8750 | 1/5/2026 | 127,728 | |||||||||
| Nissan Motor Co. Ltd. - 144A ^ | 300,000 | USD | 3.0430 | 9/15/2023 | 304,650 | |||||||||
| Volkswagen International Finance NV | 200,000 | EUR | 1.8750 | 3/30/2027 | 253,756 | |||||||||
| 804,046 | ||||||||||||||
| BANKING - 9.7% | ||||||||||||||
| AIB Group PLC - 144A | 250,000 | USD | 4.7500 | 10/12/2023 | 271,926 | |||||||||
| AIB Group PLC | 250,000 | EUR | 2.2500 | 7/3/2025 | 312,889 | |||||||||
| Banco Bilbao Vizcaya Argentaria SA | 200,000 | EUR | 3.5000 | 2/10/2027 | 260,133 | |||||||||
| Banco Mercantil del Norte SA/Grand Cayman - 144A | 5 Year Treasury + 4.97% | 314,000 | USD | 6.7500 | + | Perpetual | 316,355 | |||||||
| Banco Santander SA | 200,000 | EUR | 1.1250 | 1/17/2025 | �� | 240,660 | ||||||||
| Banque Federative du Credit Mutuel SA | 200,000 | EUR | 2.6250 | 3/18/2024 | 255,034 | |||||||||
| Barclays PLC ^ | 350,000 | USD | 4.8360 | 5/9/2028 | 382,483 | |||||||||
| BPCE SA | 200,000 | EUR | 4.6250 | 7/18/2023 | 259,924 | |||||||||
| Cooperatieve Rabobank UA | 200,000 | EUR | 1.3750 | 2/3/2027 | 253,949 | |||||||||
| Credit Agricole SA/London | 300,000 | EUR | 1.8750 | 12/20/2026 | 380,906 | |||||||||
| Danske Bank A/S - 144A | 5 Year Treasury + 1.35% | 250,000 | USD | 1.6210 | + | 9/11/2026 | 247,184 | |||||||
| HSBC Holdings PLC | 3M LIBOR + 0.99% | 250,000 | USD | 3.9500 | + | 5/18/2024 | 268,947 | |||||||
| ING Bank NV | Euro 5 Year Swap Rate + 2.25% | 200,000 | EUR | 3.6250 | + | 2/25/2026 | 235,392 | |||||||
| Mizuho Financial Group, Inc. ^ | 3M LIBOR + 1.27% | 300,000 | USD | 1.9790 | + | 9/8/2031 | 296,936 | |||||||
| Natwest Group PLC | 3M Euro LIBOR + 1.08% | 250,000 | EUR | 1.7500 | + | 3/2/2026 | 303,613 | |||||||
| Standard Chartered PLC - 144A | 150,000 | USD | 5.7000 | 3/26/2044 | 186,598 | |||||||||
| Standard Chartered PLC - 144A | 3M LIBOR + 1.21% | 300,000 | USD | 2.8190 | + | 1/30/2026 | 312,388 | |||||||
| 4,785,317 | ||||||||||||||
| BEVERAGES - 1.0% | ||||||||||||||
| Heineken NV | 200,000 | EUR | 3.5000 | 3/19/2024 | 261,913 | |||||||||
| Pernod Richard SA | 200,000 | EUR | 1.5000 | 5/18/2026 | 252,104 | |||||||||
| 514,017 | ||||||||||||||
| BIOTECH & PHARMA - 2.6% | ||||||||||||||
| GlaxoSmithKline Capital PLC | 250,000 | GBP | 1.2500 | 10/12/2028 | 331,790 | |||||||||
| Grifols SA | 100,000 | EUR | 2.2500 | 11/15/2027 | 115,137 | |||||||||
| Grifols SA | 100,000 | EUR | 3.2000 | 5/1/2025 | 116,363 | |||||||||
| Mylan NV | 200,000 | EUR | 3.1250 | 11/22/2028 | 272,127 | |||||||||
| Nidda BondCo GmbH | 100,000 | EUR | 5.0000 | 9/30/2025 | 113,665 | |||||||||
| Nidda Healthcare Holding GmbH | 100,000 | EUR | 3.5000 | 9/30/2024 | 113,864 | |||||||||
| Perrigo Finance Unlimited Co. | 200,000 | USD | 3.1500 | 6/15/2030 | 206,742 | |||||||||
| 1,269,688 | ||||||||||||||
| CABLE & SATELLITE - 1.7% | ||||||||||||||
| Telenet Finance Luxembourg Notes Sarl | 100,000 | EUR | 3.5000 | 3/1/2028 | 120,333 | |||||||||
| UPCB Finance VII Ltd. | 200,000 | EUR | 3.6250 | 6/15/2029 | 233,571 | |||||||||
| Virgin Media Secured Finance PLC | 100,000 | GBP | 4.2500 | 1/15/2030 | 126,705 | |||||||||
| Virgin Media Secured Finance PLC | 100,000 | GBP | 5.0000 | 4/15/2027 | 134,133 | |||||||||
| Ziggo Bond Co. BV - 144A | 100,000 | EUR | 3.3750 | 2/28/2030 | 111,199 | |||||||||
| Ziggo BV | 100,000 | EUR | 2.8750 | 1/15/2030 | 113,968 | |||||||||
| 839,909 | ||||||||||||||
| CHEMICALS - 1.0% | ||||||||||||||
| CeramTec BondCo GmbH | 100,000 | EUR | 5.2500 | 12/15/2025 | 112,797 | |||||||||
| OCI NV | 100,000 | EUR | 3.1250 | 11/1/2024 | 115,087 | |||||||||
| Solvay Finance SA | Euro 5 Year Swap Rate + 5.22% | 100,000 | EUR | 5.8690 | + | Perpetual | 129,448 | |||||||
| SPCM SA - 144A | 100,000 | EUR | 2.0000 | 2/1/2026 | 116,533 | |||||||||
| 473,865 | ||||||||||||||
| COMMERCIAL SUPPORT SERVICES - 0.2% | ||||||||||||||
| Intertrust Group BV | 100,000 | EUR | 3.3750 | 11/15/2025 | 116,925 | |||||||||
| CONSTRUCTION MATERIALS - 0.2% | ||||||||||||||
| Cemex SAB de CV - 144A | 69,000 | USD | 7.3750 | 6/5/2027 | 76,090 | |||||||||
See accompanying notes to financial statements.
29
| SCHEDULE OF INVESTMENTS |
| Dunham International Opportunity Bond Fund (Continued) |
| October 31, 2020 |
| Principal | ||||||||||||||
| Security | Variable Rate | Amount | Interest Rate % | Maturity Date | Value | |||||||||
| CORPORATE BONDS - 62.6% (Continued) | ||||||||||||||
| CONTAINERS & PACKAGING - 1.2% | ||||||||||||||
| Ardagh Packaging Finance PLC / Ardagh Holdings USA, Inc. | 200,000 | GBP | 4.7500 | 7/15/2027 | $ | 260,873 | ||||||||
| Smurfit Kappa Treasury ULC | 100,000 | EUR | 1.5000 | 9/15/2027 | 115,966 | |||||||||
| Trivium Packaging Finance BV | 200,000 | EUR | 3.7500 | 8/15/2026 | 231,033 | |||||||||
| 607,872 | ||||||||||||||
| ELECTRIC & GAS MARKETING & TRADING - 0.7% | ||||||||||||||
| Orsted A/S | 250,000 | EUR | 1.5000 | 11/26/2029 | 327,892 | |||||||||
| ELECTRIC UTILITIES - 4.6% | ||||||||||||||
| Enel Finance International NV | 200,000 | EUR | 1.9660 | 1/27/2025 | 252,876 | |||||||||
| Eskom Holdings SOC Ltd. - 144A | 84,000 | USD | 5.7500 | 1/26/2021 | 82,633 | |||||||||
| Eskom Holdings SOC Ltd. - 144A | 950,000 | USD | 6.7500 | 8/6/2023 | 903,941 | |||||||||
| Iberdrola Finanzas SA | 200,000 | EUR | 1.0000 | 3/7/2025 | 244,502 | |||||||||
| innogy Finance BV | 250,000 | EUR | 1.0000 | 4/13/2025 | 305,521 | |||||||||
| Naturgy Finance BV | 200,000 | EUR | 1.5000 | 1/29/2028 | 254,506 | |||||||||
| Star Energy Geothermal Darajat II / Star Energy Geothermal Salak -144A | 233,000 | USD | 4.8500 | 10/14/2038 | 239,819 | |||||||||
| 2,283,798 | ||||||||||||||
| ELECTRICAL EQUIPMENT - 0.2% | ||||||||||||||
| Vertical Midco GmbH - 144A | 100,000 | EUR | 4.3750 | 7/15/2027 | 118,087 | |||||||||
| ENGINEERING & CONSTRUCTION - 0.5% | ||||||||||||||
| IHS Netherlands Holdco BV - 144A | 248,000 | USD | 8.0000 | 9/18/2027 | 253,580 | |||||||||
| FOOD - 3.0% | ||||||||||||||
| Adecoagro SA - 144A | 634,000 | USD | 6.0000 | 9/21/2027 | 637,059 | |||||||||
| Minerva Luxembourg SA - 144A | 512,000 | USD | 6.5000 | 9/20/2026 | 533,125 | |||||||||
| Nomad Foods Bondco PLC | 100,000 | EUR | 3.2500 | 5/15/2024 | 117,799 | |||||||||
| Ulker Biskuvi Sanayi AS - 144A | 207,000 | USD | 6.9500 | 10/30/2025 | 205,735 | |||||||||
| 1,493,718 | ||||||||||||||
| FORESTRY, PAPER & WOOD PRODUCTS - 0.2% | ||||||||||||||
| WEPA Hygieneprodukte GmbH | 100,000 | EUR | 2.8750 | 12/15/2027 | 114,367 | |||||||||
| GAS & WATER UTILITIES - 0.5% | ||||||||||||||
| Veolia Environnement SA | 200,000 | EUR | 1.4960 | 11/30/2026 | 254,133 | |||||||||
| INDUSTRIAL INTERMEDIATE PRODUCTS - 0.9% | ||||||||||||||
| HTA Group Ltd. - 144A | 407,000 | USD | 7.0000 | 12/18/2025 | 427,277 | |||||||||
| INDUSTRIAL SUPPORT SERVICES - 0.7% | ||||||||||||||
| Loxam SAS | 100,000 | EUR | 3.7500 | 7/15/2026 | 109,967 | |||||||||
| Techem Verwaltungsgesellschaft 674 mbH | 100,000 | EUR | 6.0000 | 7/30/2026 | 119,031 | |||||||||
| Techem Verwaltungsgesellschaft 675 mbH - 144A | 100,000 | EUR | 2.0000 | 7/15/2025 | 110,814 | |||||||||
| 339,812 | ||||||||||||||
| INSTITUTIONAL FINANCIAL SERVICES - 0.5% | ||||||||||||||
| Nomura Holdings, Inc. ^ | 225,000 | USD | 1.8510 | 7/16/2025 | 229,379 | |||||||||
| INSURANCE - 1.9% | ||||||||||||||
| Allianz SE | 3M Euro LIBOR + 3.35% | 200,000 | EUR | 3.0990 | + | 7/6/2047 | 264,247 | |||||||
| Great-West Lifeco, Inc. | 300,000 | EUR | 2.5000 | 4/18/2023 | 371,077 | |||||||||
| NN Group NV | 250,000 | EUR | 1.6250 | 6/1/2027 | 317,651 | |||||||||
| 952,975 | ||||||||||||||
| INTERNET MEDIA & SERVICES - 0.4% | ||||||||||||||
| Tencent Holdings Ltd. - 144A | 200,000 | USD | 3.2400 | 6/3/2050 | 201,925 | |||||||||
| LEISURE FACILITIES & SERVICES - 0.4% | ||||||||||||||
| Motion Finco Sarl | 100,000 | EUR | 7.0000 | 5/15/2025 | 114,056 | |||||||||
| Studio City Finance Ltd. -144A | 73,000 | USD | 6.0000 | 7/15/2025 | 73,456 | |||||||||
| 187,512 | ||||||||||||||
| METALS & MINING - 3.3% | ||||||||||||||
| Corp Nacional del Cobre de Chile - 144A | 66,000 | USD | 4.3750 | 9/30/2029 | 69,744 | |||||||||
| Corp Nacional del Cobre de Chile - 144A | 104,000 | USD | 3.0000 | 2/5/2049 | 121,380 | |||||||||
| First Quantum Minerals Ltd. - 144A | 562,000 | USD | 6.8750 | 3/1/2026 | 558,839 | |||||||||
| Indika Energy Capital II Pte Ltd. - 144A | 160,000 | USD | 6.8750 | 4/10/2022 | 165,480 | |||||||||
| Indika Energy Capital IV Pte Ltd. - 144A | 251,000 | USD | 8.2500 | 10/22/2025 | 250,921 | |||||||||
| Indonesia Asahan Aluminium Persero PT - 144A | 26,000 | USD | 5.8000 | 5/15/2050 | 30,323 | |||||||||
| Nexa Resources SA - 144A | 400,000 | USD | 6.2500 | 1/18/2028 | 446,250 | |||||||||
| 1,642,937 | ||||||||||||||
| OIL & GAS PRODUCERS - 6.9% | ||||||||||||||
| BP Capital Markets PLC | 5 Year Treasury + 4.04% | 200,000 | USD | 4.3750 | + | Perpetual | 207,000 | |||||||
| Ecopetrol SA | 41,000 | USD | 6.8750 | 4/29/2030 | 49,350 | |||||||||
| Ecopetrol SA | 109,000 | USD | 5.8750 | 5/28/2045 | 119,023 | |||||||||
See accompanying notes to financial statements.
30
| SCHEDULE OF INVESTMENTS |
| Dunham International Opportunity Bond Fund (Continued) |
| October 31, 2020 |
| Principal | ||||||||||||||
| Security | Variable Rate | Amount | Interest Rate % | Maturity Date | Value | |||||||||
| CORPORATE BONDS - 62.6% (Continued) | ||||||||||||||
| OIL & GAS PRODUCERS - 6.9% (Continued) | ||||||||||||||
| Geopark Ltd. - 144A | 651,000 | USD | 6.5000 | 9/21/2024 | $ | 613,568 | ||||||||
| KazMunayGas National Co JSC - 144A | 71,000 | USD | 5.7500 | 4/19/2047 | 88,337 | |||||||||
| Kosmos Energy Ltd. - 144A | 369,000 | USD | 7.1250 | 4/4/2026 | 307,392 | |||||||||
| Leviathan Bond Ltd. | 94,000 | USD | 6.5000 | 6/30/2027 | 97,116 | |||||||||
| Leviathan Bond Ltd. | 141,000 | USD | 6.7500 | 6/30/2030 | 145,145 | |||||||||
| Petrobras Global Finance BV ^ | 134,000 | USD | 5.9990 | 1/27/2028 | 150,296 | |||||||||
| Petroleos Mexicanos | 45,000 | USD | 6.8750 | 8/4/2026 | 43,308 | |||||||||
| Petroleos Mexicanos | 73,000 | USD | 6.8400 | 1/23/2030 | 65,444 | |||||||||
| Petroleos Mexicanos | 7,000 | USD | 5.9500 | 1/28/2031 | 5,868 | |||||||||
| Petroleos Mexicanos - 144A | 502,000 | USD | 7.6900 | 1/23/2050 | 417,822 | |||||||||
| Petroleos Mexicanos - 144A | 30,000 | USD | 6.9500 | 1/28/2060 | 23,498 | |||||||||
| Total Capital International SA | 200,000 | USD | 3.1270 | 5/29/2050 | 201,119 | |||||||||
| Tullow Oil PLC - 144A | 926,000 | USD | 7.0000 | 3/1/2025 | 488,465 | |||||||||
| YPF SA - 144A | 652,000 | USD | 8.5000 | 7/28/2025 | 384,680 | |||||||||
| 3,407,431 | ||||||||||||||
| REAL ESTATE OWNERS & DEVELOPERS - 4.3% | ||||||||||||||
| China SCE Group Holdings Ltd. | 636,000 | USD | 7.3750 | 4/9/2024 | 653,482 | |||||||||
| Theta Capital Pte Ltd. | 200,000 | USD | 8.1250 | 1/22/2025 | 180,994 | |||||||||
| Wanda Properties International Co. Ltd. | 1,300,000 | USD | 7.2500 | 1/29/2024 | 1,279,070 | |||||||||
| 2,113,546 | ||||||||||||||
| REAL ESTATE SERVICES - 1.2% | ||||||||||||||
| ESR Cayman Ltd. | 557,000 | USD | 7.8750 | 4/4/2022 | 575,792 | |||||||||
| REITS - 0.9% | ||||||||||||||
| LMIRT Capital Pte Ltd. | 200,000 | USD | 7.2500 | 6/19/2024 | 187,490 | |||||||||
| Westfield America Management Ltd. | 200,000 | GBP | 2.1250 | 3/30/2025 | 262,943 | |||||||||
| 450,433 | ||||||||||||||
| RENEWABLE ENERGY - 1.5% | ||||||||||||||
| ENN Clean Energy International Investment Ltd. | 700,000 | USD | 7.5000 | 2/27/2021 | 707,875 | |||||||||
| RETAIL - CONSUMER STAPLES - 0.2% | ||||||||||||||
| Quatrim SASU | 100,000 | EUR | 5.8750 | 1/15/2024 | 113,355 | |||||||||
| SEMICONDUCTORS- 0.5% | ||||||||||||||
| TSMC Global Ltd. - 144A | 150,000 | USD | 1.0000 | 9/28/2027 | 147,659 | |||||||||
| TSMC Global Ltd. - 144A | 100,000 | USD | 1.3750 | 9/28/2030 | 97,867 | |||||||||
| 245,526 | ||||||||||||||
| SPECIALTY FINANCE - 0.6% | ||||||||||||||
| Parts Europe SA - 144A | 100,000 | EUR | 6.5000 | 7/16/2025 | 114,545 | |||||||||
| Studio City Finance Ltd. - 144A | 184,000 | USD | 6.5000 | 1/15/2028 | 182,197 | |||||||||
| 296,742 | ||||||||||||||
| STEEL - 3.1% | ||||||||||||||
| CSN Resources SA - 144A ^ | 321,000 | USD | 7.6250 | 4/17/2026 | 330,148 | |||||||||
| Metinvest BV - 144A | 1,109,000 | USD | 7.7500 | 10/17/2029 | 1,065,915 | |||||||||
| thyssenkrupp AG | 100,000 | EUR | 1.3750 | 3/3/2022 | 114,016 | |||||||||
| 1,510,079 | ||||||||||||||
| TECHNOLOGY HARDWARE - 0.6% | ||||||||||||||
| Seagate HDD Cayman - 144A | 250,000 | USD | 4.1250 | 1/15/2031 | 269,883 | |||||||||
| TELECOMMUNICATIONS - 3.6% | ||||||||||||||
| Altice France Holding SA - 144A | 100,000 | EUR | 8.0000 | 5/15/2027 | 122,528 | |||||||||
| Altice France SA - 144A | 100,000 | EUR | 2.1250 | 2/15/2025 | 108,812 | |||||||||
| Axtel SAB de CV - 144A | 230,000 | USD | 6.3750 | 11/14/2024 | 239,764 | |||||||||
| Deutsche Telekom International Finance BV | 250,000 | EUR | 0.8750 | 1/30/2024 | 301,868 | |||||||||
| Orange SA | 200,000 | EUR | 2.0000 | 1/15/2029 | 268,985 | |||||||||
| Telecom Italia SpA/Milano | 200,000 | EUR | 3.6250 | 5/25/2026 | 250,873 | |||||||||
| Telefonica Europe BV | Euro 6 Year Swap Rate + 4.11% | 100,000 | EUR | 4.3750 | + | Perpetual | 121,072 | |||||||
| VF Ukraine PAT via VFU Funding PLC - 144A | 250,000 | USD | 6.2000 | 2/11/2025 | 249,375 | |||||||||
| Vodafone Group PLC | Euro 5 Year Swap Rate + 2.67% | 100,000 | EUR | 3.1000 | + | 1/3/2079 | 118,232 | |||||||
| 1,781,509 | ||||||||||||||
| TRANSPORTATION & LOGISTICS - 1.8% | ||||||||||||||
| Aerovias de Mexico SA de CV -144A | 250,000 | USD | 7.0000 | 2/5/2025 | 60,625 | |||||||||
| DP World PLC - 144A | 3,000 | USD | 6.8500 | 7/2/2037 | 3,777 | |||||||||
| DP World PLC - 144A | 77,000 | USD | 5.6250 | 9/25/2048 | 88,213 | |||||||||
| DP World PLC - 144A | 6,000 | USD | 4.7000 | 9/30/2049 | 6,141 | |||||||||
| Gol Finance SA - 144A ^ | 662,000 | USD | 7.0000 | 1/31/2025 | 493,203 | |||||||||
| Heathrow Funding Ltd. | 100,000 | GBP | 7.1250 | 2/14/2024 | 142,877 | |||||||||
| Rumo Luxembourg Sarl - 144A | 64,000 | USD | 5.2500 | 1/10/2028 | 67,136 | |||||||||
| 861,972 | ||||||||||||||
| TOTAL CORPORATE BONDS (Cost - $31,161,035) | 30,858,791 | |||||||||||||
See accompanying notes to financial statements.
31
| SCHEDULE OF INVESTMENTS |
| Dunham International Opportunity Bond Fund (Continued) |
| October 31, 2020 |
| Principal | ||||||||||||||||
| Security | Variable Rate | Amount | Interest Rate % | Maturity Date | Value | |||||||||||
| NON U.S. GOVERNMENT & AGENCIES - 27.6% | ||||||||||||||||
| GOVERNMENT GUARANTEED - 0.1% | ||||||||||||||||
| Brazil Minas SPE via State of Minas Gerais - 144A | 44,800 | USD | 5.3330 | 2/15/2028 | $ | 47,600 | ||||||||||
| LOCAL AUTHORITY - 0.7% | ||||||||||||||||
| Province of British Columbia Canada | 150,000 | CAD | 3.2000 | 6/18/2044 | 136,339 | |||||||||||
| Province of Ontario Canada | 250,000 | CAD | 2.8000 | 6/2/2048 | 212,793 | |||||||||||
| 349,132 | ||||||||||||||||
| NON U.S. TREASURY - 15.2% | ||||||||||||||||
| Australia Government Bond | 860,000 | AUD | 1.2500 | 5/21/2032 | 625,353 | |||||||||||
| Canadian Government Bond | 550,000 | CAD | 2.2500 | 6/1/2029 | 470,380 | |||||||||||
| Colombian TES | 448,300,000 | COP | 6.0000 | 4/28/2028 | 121,541 | |||||||||||
| Czech Republic Government Bond | 1,400,000 | CZK | 3.8500 | 9/29/2021 | 61,960 | |||||||||||
| Czech Republic Government Bond | 1,450,000 | CZK | 0.9500 | 5/15/2030 | 61,776 | |||||||||||
| Egypt Treasury Bills | 2,125,000 | EGP | — | @ | 9/28/2021 | 121,290 | ||||||||||
| Indonesia Treasury Bond | 1,040,000,000 | IDR | 9.0000 | 3/15/2029 | 81,284 | |||||||||||
| Indonesia Treasury Bond | 680,000,000 | IDR | 8.2500 | 6/15/2032 | 50,027 | |||||||||||
| Indonesia Treasury Bond | 755,000,000 | IDR | 8.3750 | 3/15/2034 | 56,205 | |||||||||||
| Ireland Government Bond | 76,000 | EUR | 5.4000 | 3/13/2025 | 112,186 | |||||||||||
| Ireland Government Bond | 50,000 | EUR | 0.9000 | 5/15/2028 | 64,153 | |||||||||||
| Ireland Government Bond | 130,000 | EUR | 1.3000 | 5/15/2033 | 179,108 | |||||||||||
| Italy Buoni Poliennali Del Tesoro | 240,000 | EUR | 4.5000 | 3/1/2024 | 322,724 | |||||||||||
| Italy Buoni Poliennali Del Tesoro | 750,000 | EUR | 2.8000 | 12/1/2028 | 1,031,655 | |||||||||||
| Italy Buoni Poliennali Del Tesoro - 144A | 640,000 | EUR | 2.4500 | 9/1/2033 | 881,002 | |||||||||||
| Italy Buoni Poliennali Del Tesoro | 235,000 | EUR | 5.0000 | 9/1/2040 | 448,564 | |||||||||||
| Japan Government Forty Year Bond | 6,150,000 | JPY | 0.8000 | 3/20/2058 | 61,653 | |||||||||||
| Japan Government Thirty Year Bond | 17,000,000 | JPY | 1.5000 | 3/20/2045 | 199,273 | |||||||||||
| Japan Government Thirty Year Bond | 17,150,000 | JPY | 0.5000 | 9/20/2046 | 162,162 | |||||||||||
| Mexican Bonos | 2,529,000 | MXN | 7.5000 | 6/3/2027 | 130,835 | |||||||||||
| Mexican Bonos | 2,170,000 | MXN | 7.7500 | 11/13/2042 | 109,364 | |||||||||||
| Portugal Obrigacoes do Tesouro OT | 100,000 | EUR | 4.1250 | 4/14/2027 | 149,727 | |||||||||||
| Republic of South Africa Government Bond | 690,000 | ZAR | 10.5000 | 12/21/2026 | 49,412 | |||||||||||
| Republic of South Africa Government Bond | 1,868,000 | ZAR | 6.2500 | 3/31/2036 | 75,522 | |||||||||||
| Russian Federal Bond - OFZ | 7,750,000 | RUB | 7.4000 | 12/7/2022 | 103,013 | |||||||||||
| Russian Federal Bond - OFZ | 3,617,000 | RUB | 7.0500 | 1/19/2028 | 48,899 | |||||||||||
| Russian Federal Bond - OFZ | 6,120,000 | RUB | 6.9000 | 5/23/2029 | 81,867 | |||||||||||
| Russian Federal Bond - OFZ | 240,000 | RUB | 7.7000 | 3/23/2033 | 3,368 | |||||||||||
| Spain Government Bond | 350,000 | EUR | 1.2500 | 10/31/2030 | 452,870 | |||||||||||
| Spain Government Bond | 70,000 | EUR | 4.2000 | 1/31/2037 | 129,050 | |||||||||||
| Spain Government Bond | 250,000 | EUR | 2.7000 | 10/31/2048 | 421,867 | |||||||||||
| United Kingdom Gilt | 300,000 | GBP | 4.5000 | 9/7/2034 | 595,646 | |||||||||||
| 7,463,736 | ||||||||||||||||
| SOVEREIGN - 11.0% | ||||||||||||||||
| Angolan Government International Bond - 144A | 100,000 | USD | 9.1250 | 11/26/2049 | 76,595 | |||||||||||
| Argentine Republic Government International Bond | 23,783 | USD | 1.0000 | 7/9/2029 | 9,799 | |||||||||||
| Argentine Republic Government International Bond | 324,000 | USD | 0.1250 | ++ | 7/9/2030 | 119,556 | ||||||||||
| Argentine Republic Government International Bond | 26,000 | USD | 0.1250 | ++ | 7/9/2035 | 8,554 | ||||||||||
| Argentine Republic Government International Bond | 48,520 | USD | 0.1250 | ++ | 1/9/2038 | 18,195 | ||||||||||
| Argentine Republic Government International Bond | 280,000 | USD | 0.1250 | ++ | 7/9/2046 | 92,260 | ||||||||||
| Banque Centrale de Tunisie International Bond - 144A | 200,000 | USD | 5.7500 | 1/30/2025 | 169,667 | |||||||||||
| Benin Government International Bond - 144A | 100,000 | EUR | 5.7500 | 3/26/2026 | 112,034 | |||||||||||
| Brazilian Government International Bond | 137,000 | USD | 4.5000 | 5/30/2029 | 147,026 | |||||||||||
| Colombia Government International Bond | 100,000 | EUR | 3.8750 | 3/22/2026 | 131,266 | |||||||||||
| Colombia Government International Bond | 200,000 | USD | 3.8750 | 4/25/2027 | 217,012 | |||||||||||
| Colombia Government International Bond | 14,000 | USD | 5.6250 | 2/26/2044 | 17,395 | |||||||||||
| Colombia Government International Bond | 44,000 | USD | 5.0000 | 6/15/2045 | 51,557 | |||||||||||
| Dominican Republic International Bond - 144A | 82,000 | USD | 5.8750 | 1/30/2060 | 78,720 | |||||||||||
| Ecuador Government International Bond - 144A | 58,800 | USD | 0.5000 | ++ | 7/31/2030 | 39,397 | ||||||||||
| Ecuador Government International Bond - 144A | 52,074 | USD | — | @ | 7/31/2030 | 23,955 | ||||||||||
| Ecuador Government International Bond - 144A | 46,060 | USD | 0.5000 | ++ | 7/31/2035 | 25,391 | ||||||||||
| Egypt Government International Bond - 144A | 94,000 | USD | 5.2500 | 10/6/2025 | 93,530 | |||||||||||
| Egypt Government International Bond - 144A | 142,000 | USD | 7.0529 | 1/15/2032 | 139,168 | |||||||||||
| Egypt Government International Bond - 144A | 25,000 | USD | 8.5000 | 1/31/2047 | 24,927 | |||||||||||
| Egypt Government International Bond - 144A | 26,000 | USD | 8.7002 | 3/1/2049 | 26,272 | |||||||||||
| Egypt Government International Bond - 144A | 200,000 | USD | 8.1500 | 11/20/2059 | 190,086 | |||||||||||
| El Salvador Government International Bond | 141,000 | USD | 7.7500 | 1/24/2023 | 128,825 | |||||||||||
| El Salvador Government International Bond | 96,000 | USD | 8.2500 | 4/10/2032 | 79,585 | |||||||||||
| El Salvador Government International Bond | 131,000 | USD | 7.6500 | 6/15/2035 | 104,605 | |||||||||||
| Gabon Government International Bond - 144A | 34,000 | USD | 6.9500 | 6/16/2025 | 32,187 | |||||||||||
See accompanying notes to financial statements.
32
| SCHEDULE OF INVESTMENTS |
| Dunham International Opportunity Bond Fund (Continued) |
| October 31, 2020 |
| Principal | ||||||||||||||
| Security | Variable Rate | Amount | Interest Rate % | Maturity Date | Value | |||||||||
| NON U.S. GOVERNMENT & AGENCIES - 27.6% (Continued) | ||||||||||||||
| SOVEREIGN - 11.0% (Continued) | ||||||||||||||
| Ghana Government International Bond - 144A | 17,000 | USD | 6.3750 | 2/11/2027 | $ | 15,869 | ||||||||
| Ghana Government International Bond - 144A | 187,000 | USD | 7.8750 | 3/26/2027 | 182,289 | |||||||||
| Ghana Government International Bond - 144A | 13,000 | USD | 7.6250 | 5/16/2029 | 12,083 | |||||||||
| Ghana Government International Bond - 144A | 37,000 | USD | 7.8750 | 2/11/2035 | 32,987 | |||||||||
| Ghana Government International Bond - 144A | 178,000 | USD | 8.9500 | 3/26/2051 | 160,358 | |||||||||
| Ghana Government International Bond - 144A | 7,000 | USD | 8.7500 | 3/11/2061 | 6,183 | |||||||||
| Indonesia Government International Bond - 144A | 100,000 | EUR | 2.1500 | 7/18/2024 | 123,201 | |||||||||
| Indonesia Government International Bond | 35,000 | USD | 5.1250 | 1/15/2045 | 44,103 | |||||||||
| Ivory Coast Government International Bond - 144A | 123,000 | EUR | 5.8750 | 10/17/2031 | 140,636 | |||||||||
| Kenya Government International Bond - 144A | 143,000 | USD | 8.0000 | 5/22/2032 | 150,731 | |||||||||
| Lebanon Government International Bond | 175,000 | USD | 6.6500 | 2/26/2030 | 25,900 | |||||||||
| Mexico Government International Bond | 100,000 | EUR | 1.6250 | 4/8/2026 | 118,512 | |||||||||
| Mexico Government International Bond | 42,000 | USD | 4.7500 | 4/27/2032 | 48,153 | |||||||||
| Mozambique International Bond - 144A | 200,000 | USD | 5.0000 | 9/15/2031 | 167,374 | |||||||||
| Nigeria Government International Bond - 144A | 98,000 | USD | 7.8750 | 2/16/2032 | 95,419 | |||||||||
| Nigeria Government International Bond - | 200,000 | USD | 7.6250 | 11/28/2047 | 182,912 | |||||||||
| Oman Government International Bond- 144A | 41,000 | USD | 7.3750 | 10/28/2032 | 39,331 | |||||||||
| Oman Government International Bond - 144A | 53,000 | USD | 6.7500 | 1/17/2048 | 43,552 | |||||||||
| Panama Government International Bond | 40,000 | USD | 3.8700 | 7/23/2060 | 45,250 | |||||||||
| Papua New Guinea Government International Bond - 144A | 221,000 | USD | 8.3750 | 10/4/2028 | 218,238 | |||||||||
| Republic of Belarus Ministry of Finance - 144A | 48,000 | USD | 6.3780 | 2/24/2031 | 45,471 | |||||||||
| Republic of Cameroon International Bond - 144A | 104,000 | USD | 9.5000 | 11/19/2025 | 109,392 | |||||||||
| Romanian Government International Bond - 144A | 95,000 | EUR | 3.3750 | 1/28/2050 | 115,463 | |||||||||
| Romanian Government International Bond - 144A | 27,000 | USD | 4.0000 | 2/14/2051 | 27,625 | |||||||||
| Russian Foreign Bond - Eurobond | 400,000 | USD | 4.2500 | 6/23/2027 | 450,028 | |||||||||
| Sri Lanka Government International Bond | 12,000 | USD | 6.2500 | 7/27/2021 | 9,480 | |||||||||
| Trinidad & Tobago Government International Bond | 93,000 | USD | 4.5000 | 8/4/2026 | 97,651 | |||||||||
| Turkey Government International Bond | 47,000 | USD | 5.7500 | 3/22/2024 | 45,829 | |||||||||
| Turkey Government International Bond | 27,000 | USD | 6.3500 | 8/10/2024 | 26,690 | |||||||||
| Turkey Government International Bond | 9,000 | USD | 6.1250 | 10/24/2028 | 8,426 | |||||||||
| Turkey Government International Bond | 180,000 | USD | 7.6250 | 4/26/2029 | 181,869 | |||||||||
| Turkey Government International Bond | 35,000 | USD | 5.7500 | 5/11/2047 | 27,243 | |||||||||
| Ukraine Government International Bond - 144A | 40,000 | USD | 9.7500 | 11/1/2028 | 43,723 | |||||||||
| Ukraine Government International Bond- 144A | 100,000 | EUR | 4.3750 | 1/27/2030 | 97,476 | |||||||||
| Ukraine Government International Bond- 144A | 77,000 | USD | 7.3750 | 9/25/2032 | 74,106 | |||||||||
| Uruguay Government International Bond | 2,480,000 | UYU | 9.8750 | 6/20/2022 | 59,814 | |||||||||
| 5,430,931 | ||||||||||||||
| SUPRANATIONAL - 0.6% | ||||||||||||||
| European Investment Bank | 200,000 | EUR | 1.1250 | 9/15/2036 | 277,604 | |||||||||
| TOTAL NON U.S. GOVERNMENT & AGENCIES (Cost - $13,152,818) | 13,569,003 | |||||||||||||
| Shares | ||||||||||||||
| SHORT-TERM INVESTMENT - 2.0% | ||||||||||||||
| MONEY MARKET - 2.0% | ||||||||||||||
| Fidelity Government Portfolio - Institutional Class | 964,900 | 0.0100 | + | |||||||||||
| TOTAL SHORT-TERM INVESTMENT (Cost - $964,900) | 964,900 | |||||||||||||
| COLLATERAL FOR SECURITIES LOANED - 4.0% | ||||||||||||||
| Mount Vernon Prime Portfolio # | 1,968,855 | 0.1600 | + | |||||||||||
| TOTAL COLLATERAL FOR SECURITIES LOANED (Cost - $1,968,855) | $ | 1,968,855 | ||||||||||||
| TOTAL INVESTMENTS - 96.4% (Cost - $47,350,912) | $ | 47,474,403 | ||||||||||||
| OTHER ASSETS LESS LIABILITIES - 3.6% | 1,773,537 | |||||||||||||
| NET ASSETS - 100.0% | $ | 49,247,940 | ||||||||||||
| AUD - Australian Dollar | CZK - Czech Koruna | GBP - United Kingdom Pound | MXN - Mexican Peso | UYU - Uruguayan Peso |
| CAD - Canadian Dollar | EGP - Egyptian Pound | IDR - Indonesian Rupiah | RUB - Russian Ruble | ZAR - South African Rand |
| COP - Colombian Peso | EUR - Euro | JPY - Japanese Yen | USD - US Dollar | |
GMBH/MBH - Gesellschaft mit beschränkter Haftung, which means “company with limited liability”
LIBOR - London Interbank Offered Rate
Ltd. - Limited Company
PLC - Public Limited Company
Perpetual - Perpetual Bonds are fixed income instruments without a defined maturity date
ULC - Unlimited Liability Company
| + | Variable rate security. Interest rate is as of October 31, 2020. |
| ++ | Step-Up Bond; the interest rate shown is the rate in effect as of October 31, 2020. |
| @ | Zero coupon rate. |
| ^ | All or a portion of these securities are on loan. Total loaned securities had a value of $1,905,266 at October 31, 2020. |
144A - Security exempt from registration under Rule 144A of the Securities Act of 1933. These securities may be sold in transactions exempt from registration, normally to qualified institutional buyers. The 144A securities amounted to $16,975,106 or 34.5% of net assets.
| # | The Trust’s securities lending policies and procedures require that the borrower: (i) deliver cash or U.S. Government securities as collateral with respect to each new loan of U.S. securities, equal to at least 102% (105% for non US Shares) of the value of the portfolio securities loaned, and (ii) at all times thereafter mark-to-market the collateral on a daily basis so that the market value of such collateral is at least 100% of the value of securities loaned. From time to time the collateral may not be 102% due to end of day market movement. The next business day additional collateral is obtained/received from the borrower to replenish/reestablish 102%. |
See accompanying notes to financial statements.
33
| SCHEDULE OF INVESTMENTS |
| Dunham International Opportunity Bond Fund (Continued) |
| October 31, 2020 |
| Unrealized | ||||||||||||||
| Appreciation | ||||||||||||||
| Futures Contracts * | Counterparty | Contracts | Notional | Expiration | (Depreciation) | |||||||||
| LONG FUTURES CONTRACTS - 0.1% | ||||||||||||||
| EURO-BUXL 30 Year Bond Future | Barclays | 3 | 799,413 | 12/8/2020 | $ | 52,862 | ||||||||
| Japanese 10 Year Bond (OSE) | Barclays | 7 | 10,169,887 | 12/14/2020 | 11,841 | |||||||||
| Long Gilt Future | Barclays | 23 | 4,034,991 | 12/29/2020 | (9,725 | ) | ||||||||
| NET UNREALIZED GAINS FROM FUTURES CONTRACTS PURCHASED | 54,978 | |||||||||||||
| SHORT FUTURES CONTRACTS - 0.0% | ||||||||||||||
| US 5 Year NOTE (CBT) | Barclays | (64) | (8,038,528 | ) | 12/31/2020 | 12,973 | ||||||||
| US 10 Year NOTE (CBT) | Barclays | (15) | (2,073,285 | ) | 12/21/2020 | 11,364 | ||||||||
| NET UNREALIZED GAINS FROM FUTURES CONTRACTS SOLD | 24,337 | |||||||||||||
| NET UNREALIZED GAINS FROM FUTURES CONTRACTS | $ | 79,315 | ||||||||||||
| * | Face amounts are the underlying reference notional amounts to stock exchange indices and bonds upon which the fair value of the futures contracts traded by the Fund are based. |
While face amounts do not represent the current fair value and are not necessarily indicative of the future cash flows of the Fund’s futures contracts, the underlying price changes in relation to the variables specified by the face amounts affect the fair value of these derivative financial instruments. Instrument is non-income producing.
OPEN CREDIT DEFAULT SWAP AGREEMENTS
| Notional | ||||||||||||||||||
| Value at | Fixed Deal | Premium | Maturity | Unrealized | ||||||||||||||
| Description | Counterparty | October 31, 2020 | (Received) Rate | Paid (Received) | Date | Appreciation | ||||||||||||
| To Sell Protection CDX.EM.33-V2 (1) | Citibank | $ | (760,000 | ) | 1.00% | $ | (28,450 | ) | 6/20/2025 | $ | 6,233 | |||||||
| To Sell Protection CDX.EM.32-V3 (1) | Citibank | (462,000 | ) | 1.00% | (30,016 | ) | 12/20/2024 | 20,756 | ||||||||||
| 26,989 | ||||||||||||||||||
| (1) | If the Fund is a seller of protection and if a credit event occurs, as defined under the terms of that particular swap agreement, the Fund will either (i) pay the buyer of protection an amount equal to the notional amount of the swap and take delivery of the referenced obligation or underlying securities comprising the referenced index or (ii) pay a net settlement amount in the form of cash or securities equal to the notional amount of the swap less the recovery value of the referenced obligation or underlying securities comprising of the referenced index. |
| Portfolio Composition * - (Unaudited) | ||||||||||
| Netherlands | 11.2 | % | Spain | 4.5 | % | |||||
| Great Britain | 8.5 | % | Cayman Islands | 4.3 | % | |||||
| Italy | 6.3 | % | Canada | 3.8 | % | |||||
| France | 5.8 | % | Mexico | 3.5 | % | |||||
| Virgin Islands | 5.3 | % | Other Countries** | 41.6 | % | |||||
| Luxembourg | 5.2 | % | Total | 100.00 | % | |||||
| * | Based on total value of investments as of October 31, 2020. |
| ** | Includes Collateral for Securities Loaned as of October 31, 2020. |
Percentage may differ from Schedule of Investments which are based on Fund net assets.
See accompanying notes to financial statements.
34
| SCHEDULE OF INVESTMENTS |
| Dunham International Opportunity Bond Fund (Continued) |
| October 31, 2020 |
As of October 31, 2020 the following Forward Foreign Currency Exchange Contracts were open:
| Forward Foreign Currency Exchange Contracts | ||||||||||||||||||||||||||
| Unrealized | ||||||||||||||||||||||||||
| Settlement | Local Currency | U.S. Dollar | Appreciation | |||||||||||||||||||||||
| Foreign Currency | Date | Counterparty | Amount Purchased | Market Value | (Depreciation) | |||||||||||||||||||||
| To Sell USD and To Buy: | ||||||||||||||||||||||||||
| Mexican Peso | 11/3/2020 | Citigroup | $ | 2,650,000 | $ | 124,545 | $ | 3,359 | ||||||||||||||||||
| Euro | 11/5/2020 | JP Morgan Chase | 104,501 | 121,733 | (1,854 | ) | ||||||||||||||||||||
| Euro | 11/13/2020 | Citigroup | 210,000 | 244,672 | (3,328 | ) | ||||||||||||||||||||
| Euro | 11/23/2020 | JP Morgan Chase | 420,000 | 489,452 | (3,759 | ) | ||||||||||||||||||||
| Mexican Peso | 11/23/2020 | Citigroup | 10,650,000 | 499,403 | (3,896 | ) | ||||||||||||||||||||
| Mexican Peso | 11/23/2020 | JP Morgan Chase | 2,500,000 | 117,231 | (828 | ) | ||||||||||||||||||||
| Mexican Peso | 12/3/2020 | Citigroup | 2,650,000 | 124,125 | (2,468 | ) | ||||||||||||||||||||
| Euro | 12/15/2020 | JP Morgan Chase | 390,548 | 455,398 | (2,204 | ) | ||||||||||||||||||||
| $ | (14,978 | ) | ||||||||||||||||||||||||
| Unrealized | ||||||||||||||||||||||||||
| Settlement | Local Currency | U.S. Dollar | Appreciation | |||||||||||||||||||||||
| Foreign Currency | Date | Counterparty | Amount Sold | Market Value | (Depreciation) | |||||||||||||||||||||
| To Buy USD and To Sell: | ||||||||||||||||||||||||||
| Mexican Peso | 11/3/2020 | JP Morgan Chase | $ | (2,650,000 | ) | $ | (124,545 | ) | $ | 2,478 | ||||||||||||||||
| Euro | 11/5/2020 | JP Morgan Chase | (4,256,372 | ) | (4,958,253 | ) | 51,273 | |||||||||||||||||||
| Australian Dollar | 12/15/2020 | Citigroup | (881,100 | ) | (618,897 | ) | 16,797 | |||||||||||||||||||
| British Pound | 12/15/2020 | JP Morgan Chase | (1,236,600 | ) | (1,599,443 | ) | 20,448 | |||||||||||||||||||
| Canadian Dollar | 12/15/2020 | Barclays | (1,123,100 | ) | (842,484 | ) | 8,926 | |||||||||||||||||||
| Euro | 12/15/2020 | Citigroup | (10,890,200 | ) | (12,698,508 | ) | 254,978 | |||||||||||||||||||
| Euro | 12/15/2020 | JP Morgan Chase | (110,301 | ) | (128,617 | ) | 576 | |||||||||||||||||||
| Japanese Yen | 12/15/2020 | Citigroup | (67,608,500 | ) | (647,111 | ) | (8,417 | ) | ||||||||||||||||||
| $ | 347,059 | |||||||||||||||||||||||||
| Local Currency | Local Currency | U.S. Dollar | U.S. Dollar | Unrealized | ||||||||||||||||||||||
| Settlement | Amount Purchased | Amount Purchased | Market Value | Market Value | Appreciation | |||||||||||||||||||||
| Foreign Currency | Date | Counterparty | Buy | Sell | Buy | Sell | (Depreciation) | |||||||||||||||||||
| To Buy: | To Sell: | |||||||||||||||||||||||||
| British Pound | Euro | 11/13/2020 | JP Morgan Chase | $ | 556,227 | $ | (610,000 | ) | $ | 719,247 | $ | (710,714 | ) | $ | 8,532 | |||||||||||
| Euro | Japanese Yen | 11/13/2020 | Citigroup | 210,000 | (26,249,111 | ) | 244,672 | (251,121 | ) | (6,448 | ) | |||||||||||||||
| Japanese Yen | Australian Dollar | 11/19/2020 | Citigroup | 52,747,178 | (710,000 | ) | 504,658 | (498,640 | ) | 6,018 | ||||||||||||||||
| Euro | British Pound | 12/15/2020 | JP Morgan Chase | 463,986 | (421,000 | ) | 541,030 | (544,530 | ) | (3,500 | ) | |||||||||||||||
| $ | 4,602 | |||||||||||||||||||||||||
| Net Unrealized Gains on Forward Foreign Currency Exchange Contracts | $ | 336,683 | ||||||||||||||||||||||||
See accompanying notes to financial statements.
35
| Dunham Large Cap Value Fund (Unaudited) |
| Message from the Sub-Adviser (Rothschild & Co. Asset Management US Inc.) |
Asset Class Recap
At the beginning of the fiscal year, domestic equity markets across all styles and market capitalizations were hitting all-time highs, unemployment was at its lowest level in nearly 50 years, and the U.S. economy looked to be well- positioned for future growth. The S&P 500 Index, a leading indicator for the economy, reached an all-time high on February 19, 2020. All changed as COVID-19 began to spread globally. The second fiscal quarter felt the effects of the virus, as equity markets sharply fell across all major indexes. The S&P 500 Index hit a low on March 23, 2020, its lowest level since 2016, and nearly 34 percent below its record high reached nearly a month before. Volatility reached highs not seen since the financial crisis in 2008 and unemployment skyrocketed to 14.7 percent by the end of March. Since the historic decline, equity markets have rebounded strongly and what many in the financial media consider to be a “V” shaped recovery, given the dramatic drop and steep recovery. However, large cap value stocks, as measured by the Russell 1000 Value Index, are still down 7.6 percent on the fiscal year, while large cap growth stocks, are up 29.2 percent, a near 37 percent differential. The technology heavy Russell 1000 Growth index benefitted from the COVID environment as the need for remote technology grew exponentially with more individuals working from home. As such, traditional value sectors, such as energy and financial services, fell out of favor as individuals were commuting less. This was a blow to the heavily commuter dependent energy sector. A detractor from the financial services sector that is built on interest received from consumer and commercial loan payments.
Allocation Review
The top performing sector over the fiscal year was health care, rising 11.3 percent, the only sector with positive double digit performance. This allocation helped the Sub-adviser, as being slightly overweight the sector contributed to relative performance. However, security selection within the sector detracted more meaningfully from relative performance, ending the year with a net negative detraction. Not surprisingly, the top contributing sector this fiscal year was technology, rising 4.2 percent, as the sector benefitted from individuals’ and business’ dependence on technology. Stock selection was the primary driver behind positive contribution here, with a modest boost from an overweight allocation. The worst performing sector over the fiscal year was energy, dropping nearly 50 percent. The dramatic decline in energy was a result of weak demand across natural gas and crude oil, as the need for energy dropped significantly due to strict lockdown measures. The Sub-Adviser’s slight underweight to energy, coupled with superior stock selection contributed positively to relative Fund performance. Lastly, the financial services sector dropped 18.8 percent, as the cyclical sector struggled to produce positive returns, setting aside massive loan loss reserves for individuals and businesses. The Sub-Adviser’s stock selection in the financial services sector helped contribute meaningfully to performance, avoiding capturing the full downside.
Holdings Insights
Within one of the few positive sectors over the fiscal year, materials & processing, Quanta Services (PWR) (holding weight*: 1.41 percent), a provider of contracting services across electric power, pipeline, industrial and communications industries, rose 49.2 percent, pulling ahead of many of its sector peers. PWR saw positive growth from their contracting in the electric power and communications industries, as they have significantly contributed to the infrastructure powering 5G and electric vehicles nationwide. In health care, the top performing sector over the fiscal year, Thermo Fisher Scientific (TMO) (holding weight*: 1.69 percent), a medical device provider, rose 57.1 percent as TMO provided tests and automated workflows that helped accurately detect and diagnose COVID. Another stock that benefitted during this COVID environment was Prologis (PLD) (holding weight*: 1.62 percent), an industrial real estate investment trust that specializes in warehouses and distribution centers, rising 15.9 percent. PLD has seen its revenue double over the last 5 years, and part of its growth can be attributed to consumers’ shift to e-commerce, as PLD’s top customers include Amazon, UPS, and FedEx. In technology, the top performing sector during the fiscal year, ON Semiconductor Corp. (ON) (holding weight*: 1.01 percent), a manufacturer of semiconductor components, rose 23.0 percent due to beating earnings estimates during the pandemic. ON hit their 52 week low at the onset of the COVID pandemic, as ON and the rest of the semiconductor industry fell on weak guidance. Sentiment has since changed and ON is trading near all-time highs reached before the COVID pandemic.
In the energy sector, the worst performing sector during the fiscal year, Marathon Petroleum Corporation (MPC) (holding weight**: 0.40 percent), Diamondback Energy, Inc. (FANG) (holding weight**: 0.48 percent), and Phillips 66 Company (PSX) (holding weight*: 0.86 percent) all hit multi-year lows, dropping 58.7 percent, 58.5 percent, and 58.2 percent, respectively. Demand for the natural gas and crude oil producers dropped substantially as travel hit a standstill globally. Additionally, the oil price war between Russia and Saudi Arabia in March of 2020 led to a steep drop in the price of oil, as Russia refused to reduce oil production, creating an unnecessary surplus, dampening the outlook for the sector. Although the energy sector makes up a small portion of the Russell 1000 Value Index and the Fund, the losses were substantial, detracting meaningfully from Fund performance. In the health care sector, stock selection detracted from relative performance as Merck & Co. Inc., (MRK) (holding weight*: 1.46 percent) and Medtronic, Plc. (MDT) (holding weight*: 2.46 percent) fell during the fiscal year, dropping 10.6 percent and 5.5 percent, respectively. MRK, a pharmaceuticals and therapeutics provider, lagged behind pharmaceutical peers, as their pharmaceutical sales fluctuated from quarter to quarter, unable to sustain consistent growth. Similarly, MDT’s sales suffered as revenues and earnings dropped meaningfully over the fiscal year, due to a decline in elective procedures, the primary revenue source behind MDT’s products. Another detractor came from within the real estate sector, as Boston Properties, Inc. (BXP) (holding weight*: 1.17 percent), a real estate investment trust that owns, manages, and develops class A office properties, fell 45.0 percent during the fiscal year. The COVID pandemic accelerated the move out of office space and hurt BXP and other office REITs, leading to a steep decline in revenues and weak forward guidance.
Sub-Adviser Outlook
The Sub-Adviser continues to seek what it believes are quality stocks of companies that possess the means to navigate and survive these trying times. Specifically, the Sub-Adviser is not seeking to isolate these holdings to only a few sectors, but instead searching within each sector and maintaining diversification similar to the benchmark index. Therefore, it expects the Fund’s performance to continue to be primarily dictated by stock selection as opposed to macro-oriented sector views.
| * | Holdings percentage(s) of total investments, cash and unsettled trades excluding collateral for securities loaned, as of 10/31/2020. |
| ** | Holdings percentage(s) as of the date prior to the sale of the security. |
Growth of $100,000 Investment
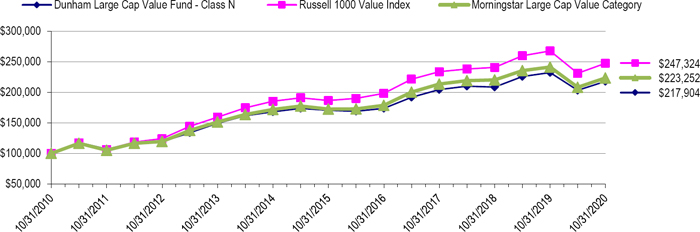
Total Returns (a) as of October 31, 2020
| Annualized | Annualized | ||
| One Year | Five Years | Ten Years | |
| Class N | (6.15)% | 5.02% | 8.10% |
| Class A with load of 5.75% | (11.73)% | 3.53% | 7.19% |
| Class A without load | (6.33)% | 4.77% | 7.83% |
| Class C | (7.07)% | 3.98% | 7.02% |
| Russell 1000 Value Index | (7.57)% | 5.82% | 9.48% |
| Morningstar Large Cap Value Category | (7.47)% | 5.32% | 8.38% |
| (a) | Total Returns are calculated based on traded NAVs. |
The Russell 1000 Value Index is a subset of the Russell 1000 Index which measures the performance of the stocks of the 1000 largest companies in the Russell 3000 Index based on market capitalization. The Russell 1000 Value Index measures the performance of those Russell 1000 companies with lower price- to-book ratios and lower forecasted growth values. Investors cannot invest directly in an index or benchmark.
The Morningstar Large Cap Value Category is generally representative of mutual funds that primarily invest in big (large capitalization) U.S. companies that are less expensive or growing more slowly than other large-cap stocks.
| As disclosed in the Trust’s latest registration statement, the Fund’s total annual operating expenses, including underlying funds, are 1.14% for Class N , 2.14% for Class C and 1.39% for Class A. Class A shares are subject to a sales load of 5.75% and a deferred sales charge of up to 0.75%. The performance data quoted here represents past performance, which is not indicative of future results. Current performance may be lower or higher than the performance data quoted. The investment return and NAV will fluctuate, so that an investor’s shares, when redeemed, may be worth more or less than their original cost. Total returns are calculated assuming reinvestment of all dividends and capital gains distributions, if any. The returns do not reflect the deductions of taxes a shareholder would pay on the redemption of Fund shares or Fund distributions. For performance information current to the most recent month-end, please call 1-800-442-4358 or visit our website www.dunham.com. |
36
| SCHEDULE OF INVESTMENTS |
| Dunham Large Cap Value Fund |
| October 31, 2020 |
| Security | Shares | Value | ||||||
| COMMON STOCKS - 94.0% | ||||||||
| AEROSPACE & DEFENSE - 2.7% | ||||||||
| Lockheed Martin Corp. | 2,505 | $ | 877,075 | |||||
| Northrop Grumman Corp. | 2,913 | 844,246 | ||||||
| Textron, Inc. | 22,695 | 812,481 | ||||||
| 2,533,802 | ||||||||
| ASSET MANAGEMENT - 2.7% | ||||||||
| BlackRock, Inc. | 2,691 | 1,612,474 | ||||||
| Charles Schwab Corp. | 22,154 | 910,751 | ||||||
| 2,523,225 | ||||||||
| AUTOMOTIVE - 0.8% | ||||||||
| General Motors Co. | 21,100 | 728,583 | ||||||
| BANKING - 7.6% | ||||||||
| Bank of America Corp. | 108,347 | 2,567,824 | ||||||
| JPMorgan Chase & Co. | 33,092 | 3,244,340 | ||||||
| Truist Financial Corporation | 31,373 | 1,321,431 | ||||||
| 7,133,595 | ||||||||
| BEVERAGES - 1.4% | ||||||||
| PepsiCo, Inc. | 10,167 | 1,355,159 | ||||||
| BIOTECH & PHARMA - 7.5% | ||||||||
| AbbVie, Inc. | 13,581 | 1,155,743 | ||||||
| Bristol-Myers Squibb Co. | 25,633 | 1,498,249 | ||||||
| Eli Lilly & Co. | 6,032 | 786,935 | ||||||
| Johnson & Johnson | 17,163 | 2,353,219 | ||||||
| Merck & Co., Inc. | 16,760 | 1,260,519 | ||||||
| 7,054,665 | ||||||||
| CABLE & SATELLITE - 2.2% | ||||||||
| Comcast Corp | 49,029 | 2,070,985 | ||||||
| CHEMICALS - 2.6% | ||||||||
| Air Products & Chemicals, Inc. | 5,604 | 1,548,049 | ||||||
| Huntsman Corp. | 38,816 | 942,841 | ||||||
| 2,490,890 | ||||||||
| CONSTRUCTION MATERIALS - 2.7% | ||||||||
| Martin Marietta Materials, Inc. | 6,267 | 1,669,216 | ||||||
| Owens Corning | 12,809 | 838,605 | ||||||
| 2,507,821 | ||||||||
| CONTAINERS & PACKAGING - 0.7% | ||||||||
| Westrock Co. | 17,588 | 660,429 | ||||||
| DIVERSIFIED INDUSTRIALS - 1.4% | ||||||||
| Honeywell International, Inc. | 8,191 | 1,351,105 | ||||||
| ELECTRIC UTILITIES - 6.4% | ||||||||
| American Electric Power Co., Inc. | 14,303 | 1,286,269 | ||||||
| DTE Energy Co. | 13,042 | 1,609,644 | ||||||
| Duke Energy Corp. ^ | 15,723 | 1,448,245 | ||||||
| Xcel Energy, Inc. | 23,953 | 1,677,429 | ||||||
| 6,021,587 | ||||||||
| ELECTRICAL EQUIPMENT - 1.1% | ||||||||
| Trane Technologies PLC | 7,865 | 1,044,079 | ||||||
| ENGINEERING & CONSTRUCTION - 1.6% | ||||||||
| Quanta Services, Inc. | 23,595 | 1,473,036 | ||||||
| ENTERTAINMENT CONTENT - 2.3% | ||||||||
| Discovery, Inc. * ^ | 47,308 | 957,514 | ||||||
| Walt Disney Co. | 9,622 | 1,166,667 | ||||||
| 2,124,181 | ||||||||
See accompanying notes to financial statements.
37
| SCHEDULE OF INVESTMENTS |
| Dunham Large Cap Value Fund (Continued) |
| October 31, 2020 |
| Security | Shares | Value | ||||||
| COMMON STOCKS - 94.0% (Continued) | ||||||||
| FOOD - 1.6% | ||||||||
| Mondelez International, Inc. | 28,805 | $ | 1,530,121 | |||||
| HEALTH CARE FACILITIES & SERVICES - 3.2% | ||||||||
| AmerisourceBergen Corp | 11,990 | 1,151,879 | ||||||
| Cigna Corp. | 5,589 | 933,195 | ||||||
| UnitedHealth Group, Inc. | 3,141 | 958,445 | ||||||
| 3,043,519 | ||||||||
| HOME CONSTRUCTION - 1.0% | ||||||||
| PulteGroup, Inc. | 23,712 | 966,501 | ||||||
| HOUSEHOLD PRODUCTS - 2.6% | ||||||||
| Kimberly-Clark Corp. ^ | 11,218 | 1,487,395 | ||||||
| Procter & Gamble Co. | 7,043 | 965,595 | ||||||
| 2,452,990 | ||||||||
| INSTITUTIONAL FINANCIAL SERVICES - 2.9% | ||||||||
| Bank of New York Mellon Corp. | 42,230 | 1,451,023 | ||||||
| Intercontinental Exchange, Inc. | 13,870 | 1,309,328 | ||||||
| 2,760,351 | ||||||||
| INSURANCE - 6.8% | ||||||||
| Allstate Corp. | 11,479 | 1,018,761 | ||||||
| Berkshire Hathaway, Inc. * | 5,413 | 1,092,885 | ||||||
| Hartford Financial Services Group, Inc. | 27,000 | 1,040,040 | ||||||
| Prudential Financial, Inc. | 18,087 | 1,157,930 | ||||||
| Travelers Cos., Inc. | 6,142 | 741,401 | ||||||
| Willis Towers Watson PLC | 7,353 | 1,341,775 | ||||||
| 6,392,792 | ||||||||
| INTERNET MEDIA & SERVICES - 2.6% | ||||||||
| Alphabet, Inc. * | 1,501 | 2,425,781 | ||||||
| LEISURE FACILITIES & SERVICES - 0.9% | ||||||||
| Darden Restaurants, Inc. | 9,356 | 860,004 | ||||||
| MACHINERY - 2.9% | ||||||||
| Caterpillar, Inc. | 8,123 | 1,275,717 | ||||||
| Parker-Hannifin Corp. | 7,180 | 1,496,025 | ||||||
| 2,771,742 | ||||||||
| MEDICAL EQUIPMENT & DEVICES - 5.5% | ||||||||
| Abbott Laboratories | 20,197 | 2,122,907 | ||||||
| Hill-Rom Holdings, Inc. | 10,607 | 965,979 | ||||||
| Thermo Fisher Scientific, Inc. | 4,407 | 2,085,040 | ||||||
| 5,173,926 | ||||||||
| OIL & GAS PRODUCERS - 3.7% | ||||||||
| Chevron Corp. | 19,975 | 1,388,262 | ||||||
| ConocoPhillips | 33,125 | 948,038 | ||||||
| EOG Resources, Inc. | 18,936 | 648,369 | ||||||
| Phillips 66 | 10,594 | 494,316 | ||||||
| 3,478,985 | ||||||||
| RETAIL - CONSUMER STAPLES - 1.8% | ||||||||
| Target Corp. | 11,348 | 1,727,393 | ||||||
| RETAIL - DISCRETIONARY - 2.2% | ||||||||
| AutoZone, Inc. * | 790 | 891,894 | ||||||
| Lowe’s Cos., Inc. | 7,766 | 1,227,805 | ||||||
| 2,119,699 | ||||||||
| SEMICONDUCTORS - 3.9% | ||||||||
| Broadcom, Inc. | 2,523 | 882,116 | ||||||
| Intel Corp. | 16,036 | 710,074 | ||||||
| Micron Technology, Inc. * | 20,131 | 1,013,395 | ||||||
| ON Semiconductor Corp. * | 43,274 | 1,085,745 | ||||||
| 3,691,330 | ||||||||
See accompanying notes to financial statements.
38
| SCHEDULE OF INVESTMENTS |
| Dunham Large Cap Value Fund (Continued) |
| October 31, 2020 |
| Security | Shares | Value | ||||||
| COMMON STOCKS - 94.0% (Continued) | ||||||||
| SOFTWARE - 1.9% | ||||||||
| Microsoft Corp. | 4,778 | $ | 967,402 | |||||
| Oracle Corp. | 15,059 | 844,960 | ||||||
| 1,812,362 | ||||||||
| SPECIALTY FINANCE - 0.7% | ||||||||
| American Express Co. | 6,931 | 632,384 | ||||||
| TECHNOLOGY HARDWARE - 1.7% | ||||||||
| Apple, Inc. | 5,230 | 569,338 | ||||||
| Cisco Systems, Inc. | 27,607 | 991,091 | ||||||
| 1,560,429 | ||||||||
| TELECOMMUNICATIONS - 3.0% | ||||||||
| Verizon Communications, Inc. | 49,611 | 2,827,331 | ||||||
| TRANSPORTATION & LOGISTICS - 1.4% | ||||||||
| Kansas City Southern | 7,536 | 1,327,391 | ||||||
| TOTAL COMMON STOCKS (Cost - $72,684,285) | 88,628,173 | |||||||
| REITS - 4.0% | ||||||||
| American Tower Corp. | 4,062 | 932,838 | ||||||
| Boston Properties, Inc. | 10,207 | 739,089 | ||||||
| Equity LifeStyle Properties, Inc. | 7,891 | 467,068 | ||||||
| Prologis, Inc. | 16,317 | 1,618,647 | ||||||
| TOTAL REITS (Cost - $3,301,828) | 3,757,642 | |||||||
| COLLATERAL FOR SECURITIES LOANED - 4.1% | ||||||||
| Mount Vernon Prime Portfolio, 0.16% + # | 3,920,117 | 3,920,117 | ||||||
| TOTAL COLLATERAL FOR SECURITIES LOANED (Cost - $3,920,117) | ||||||||
| TOTAL INVESTMENTS - 102.1% (Cost - $79,906,230) | ||||||||
| LIABILITIES IN EXCESS OF OTHER ASSETS - (2.1)% | $ | 96,305,932 | ||||||
| NET ASSETS - 100.0% | (1,996,870 | ) | ||||||
| $ | 94,309,062 | |||||||
PLC - Public Limited Company
REITs - Real Estate Investment Trusts
| * | Non-income producing security. |
| ^ | All or a portion of these securities are on loan. Total loaned securities had a value of $3,854,024 at October 31, 2020. |
| + | Variable rate security. Interest rate is as of October 31, 2020. |
| # | The Trust’s securities lending policies and procedures require that the borrower: deliver cash or U.S. Government securities as collateral with respect to each new loan of U.S. securities, equal to at least 102% of the value of the portfolio securities loaned, and (ii) at all times thereafter mark-to-market the collateral on a daily basis so that the market value of such collateral is at least 100% of the value of securities loaned. From time to time the collateral may not be ’102% due to end of day market movement. The next business day additional collateral is obtained/received from the borrower to replenish/reestablish 102%. |
| Portfolio Composition * - (Unaudited) | ||||||||||
| Financial | 20.2 | % | Technology | 7.3 | % | |||||
| Healthcare | 15.9 | % | Utilities | 6.2 | % | |||||
| Industrials | 10.9 | % | Materials | 5.9 | % | |||||
| Communications | 9.8 | % | Consumer Discretionary | 4.9 | % | |||||
| Consumer Staples | 7.3 | % | Others ** | 11.6 | % | |||||
| Total | 100.0 | % | ||||||||
| * | Based on total value of investments as of October 31, 2020. |
| ** | Includes collateral for securities loaned as of October 31, 2020. |
Percentage may differ from Schedule of Investments which is based on Fund net assets
See accompanying notes to financial statements.
39
| Dunham Small Cap Value Fund (Unaudited) |
| Message from the Sub-Adviser (Ziegler Capital Management, LLC) |
Asset Class Recap
Although the most recent fiscal year could be considered anything but ordinary, the theme of growth outperforming value remained as an annual tradition. In only one fiscal quarter was the race even close, as small cap value stocks, as measured by the Russell 2000 Value Index, performed in-line with their small cap growth peers, as measured by the Russell 2000 Growth Index, during the final quarter of the fiscal year. Small cap value stocks increased 4.1 percent during the three-month period, while small cap growth stocks eked out a slight victory by increasing 4.4 percent. However, the chasm in returns between small cap value and small cap growth stocks for the fiscal year was virtually unchanged by the most recent fiscal quarter’s results. Since the start of the fiscal year, small cap growth stocks boasted a total return of 13.4 percent, while small cap value stocks lamented a decline of 14.0 percent over the same time period. As there is a sizeable overlap in stocks between the small cap value and small cap growth indices, within the small cap value benchmark index most of the highest performers during the fiscal year were those also considered to be “growth” stocks. During the fiscal year, this dispersion was considerable, with the dispersion between the best-performing sector and worst-performing sector ending at 63 percent.
Allocation Review
The Sub-Adviser seeks to match the Fund’s sector allocation to the benchmark index. Therefore, the Fund continued to have its largest exposure, approximately 40 percent, to the financial services sector. This sector was an overall detractor from the Fund, among the four worst performing sectors during the fiscal year, declining nearly 24 percent. The materials & processing sector, which comprised less than 8 percent of the Fund and the benchmark index, was also the best performing sector in the Fund during the fiscal year, as its 7.8 percent increase in the most recent fiscal quarter was enough to push it into first place, returning 7.4 percent over the 12-month period. The health care and utilities sectors, which each declined more than 10 percent in the fourth fiscal quarter alone, were near the bottom in regard to performance during the fiscal year, down 37.4 percent and 28.7 percent, respectively. The last place position during the fiscal year was held by the energy sector, which saw a decline close to 64 percent. These three sectors are also three of the four smallest sectors in the Fund, combined comprising close to 16 percent of the Fund, so the adverse impact of the poor performance was less detrimental than had it occurred in the larger sectors.
Holdings Insights
The financial services sector was the largest detractor from the Fund’s overall return during the fiscal year. However, the performance of the underlying holdings within the sector varied substantially, with some contributing to positive performance and others detracting. For example, the Fund held STAG Industrial Inc. (STAG) (holding weight*: 1.55 percent), a real estate investment trust focused on industrial properties. Although STAG declined 3.5 percent during the final fiscal quarter, it produced a positive return during the fiscal year of 5.3 percent. The Fund also held traditional financial services holdings, such as Flagstar Bancorp Inc. (FBC) (holding weight*: 1.27 percent), a banking and mortgage servicer. FBC detracted 18.8 percent during the fiscal year. However, another of the Fund’s mortgage servicing company holdings, Mr. Cooper Group Inc. (COOP) (holding weight*: 1.37 percent), experienced a strong surge from the increase in mortgages and refinances in 2020, skyrocketing 64.7 percent during the fiscal year. One of the strongest performers for the Fund in the financial services sector during the final fiscal quarter was United Community Bank Inc. (UCBI) (holding weight*: 1.14 percent), a regional bank in the southeast. Despite increasing 18.0 percent in the fourth fiscal quarter, the holding ended the fiscal year down 28.3 percent.
Although the materials & processing sector was the strongest performing sector in the Fund, it was a negatively performing sector overall for the benchmark index. Fund holdings that contributed to this strong outperformance included Minerals Technologies Inc. (MTX) (holding weight*: 1.34 percent), a resource- and technology-based company that develops, produces, and markets a broad range of specialty minerals and mineral products. MTX was the largest Fund holding in the sector and rose 11.1 percent over the fiscal year, with 16.9 percent of the return coming in the final three months of the fiscal year. Similarly, the Fund held Greif Inc. (GEF) (holding weight*: 0.98 percent), a company focused on producing industrial packaging and containers. GEF increased 19.4 percent since it was purchased in June, as it received upgrades from analysts covering the stock.
As the worst performing sector over the fiscal year, the energy sector was extremely difficult to navigate. The sector was home to one of the poorest performing holdings in the Fund during the fiscal year, CVR Energy Inc. (CVI) (holding weight*: 0.65 percent), a refiner and marketer of high-value transportation fuels. After declining 17.8 percent in the third fiscal quarter, CVI plummeted another 42.7 percent during the fourth fiscal quarter, to end the fiscal year down 75.2 percent. However, the Fund also held Liberty Oilfield Services Inc. (LBRT) (holding weight*: 0.78 percent), a company that provides specialized stimulation services to optimize well production. During the final three months of the fiscal year, LBRT rose 18.2 percent as its acquisition of new pumping assets compounded with analyst upgrades. This brought LBRT’s performance in the Fund to a positive 21.9 percent since it was added in June.
Sub-Adviser Outlook
Despite some of the Sub-Adviser’s key valuation factors experiencing difficulties in an environment that has generally rewarded growth characteristics, the Sub-Adviser continues to focus on the disciplined implementation of its quantitatively-driven approach. The Sub-Adviser has retained similar weightings in its models and factors, as it is aware that subjective tampering during periods of large dislocations, such as the current environment, erodes the effectiveness of its process. The Sub-Adviser believes that while the current market continues to underappreciate some of the factors that the Sub-Adviser focuses on, it does expect that its valuation-oriented signals will succeed as a positive contributor to its stock selection for the Fund.
| * | Holdings percentage(s) of total investments, cash and unsettled trades excluding collateral for securities loaned, as of 10/31/2020. |
Growth of $100,000 Investment
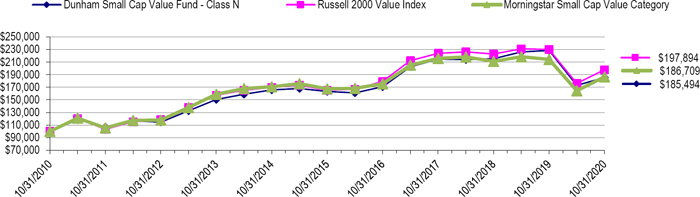
Total Returns (a) as of October 31, 2020
| Annualized | Annualized | ||
| One Year | Five Years | Ten Years | |
| Class N | (18.81)% | 2.58% | 6.37% |
| Class A with load of 5.75% | (23.68)% | 1.10% | 5.50% |
| Class A without load | (19.03)% | 2.31% | 6.12% |
| Class C | (19.66)% | 1.54% | 5.32% |
| Russell 2000 Value Index | (13.92)% | 3.71% | 7.06% |
| Morningstar Small Cap Value Category | (12.90)% | 2.19% | 6.46% |
| (a) | Total Returns are calculated based on traded NAVs. |
The Russell 2000 Value Index is an unmanaged index that measures the performance of small cap companies in the Russell 2000 Index with lower price-to-book ratios and lower forecasted growth rates. Investors cannot invest directly in an index or benchmark.
The Morningstar Small Cap Value Category is generally representative of mutual funds that primarily invest in small (small capitalization) U.S. companies that are less expensive or growing more slowly than other small-cap stocks.
| As disclosed in the Trust’s latest registration statement, the Fund’s total annual operating expenses, including underlying funds, are 1.72% for Class N, 2.72% for Class C and 1.97% for Class A . Class A shares are subject to a sales load of 5.75% and a deferred sales charge of up to 0.75%. The performance data quoted here represents past performance, which is not indicative of future results. Current performance may be lower or higher than the performance data quoted. The investment return and NAV will fluctuate, so that an investor’s shares, when redeemed, may be worth more or less than their original cost. Total returns are calculated assuming reinvestment of all dividends and capital gains distributions, if any. The returns do not reflect the deductions of taxes a shareholder would pay on the redemption of Fund shares or Fund distributions. For performance information current to the most recent month-end, please call 1-800-442-4358 or visit our website www.dunham.com. |
40
| SCHEDULE OF INVESTMENTS |
| Dunham Small Cap Value Fund |
| October 31, 2020 |
| Security | Shares | Value | ||||||
| COMMON STOCKS - 88.2% | ||||||||
| ASSET MANAGEMENT - 2.2% | ||||||||
| Artisan Partners Asset Management, Inc. | 15,380 | $ | 616,123 | |||||
| Waddell & Reed Financial, Inc. ^ | 36,980 | 567,643 | ||||||
| 1,183,766 | ||||||||
| AUTOMOTIVE - 1.1% | ||||||||
| Goodyear Tire & Rubber Co. | 70,550 | 584,154 | ||||||
| BANKING - 18.0% | ||||||||
| Associated Banc-Corp | 46,549 | 637,256 | ||||||
| Banner Corp. | 12,950 | �� | 477,467 | |||||
| Central Pacific Financial Corp. | 21,540 | 296,606 | ||||||
| First Bancorp/Southern Pines NC | 16,220 | 390,740 | ||||||
| First Bancshares, Inc. | 16,220 | 386,685 | ||||||
| First Citizens BancShares, Inc. ^ | 960 | 444,192 | ||||||
| First Financial Corp. | 10,749 | 373,205 | ||||||
| First Interstate BancSystem, Inc. ^ | 14,030 | 495,259 | ||||||
| First Midwest Bancorp, Inc. | 38,940 | 488,697 | ||||||
| Flagstar Bancorp, Inc. | 23,082 | 677,457 | ||||||
| Heartland Financial USA, Inc. | 14,950 | 492,453 | ||||||
| Independent Bank Corp. | 26,600 | 398,202 | ||||||
| Simmons First National Corp. | 29,470 | 500,695 | ||||||
| TriCo Bancshares | 14,613 | 422,754 | ||||||
| Trustmark Corp. | 20,850 | 487,681 | ||||||
| UMB Financial Corp. | 8,496 | 517,151 | ||||||
| United Community Banks, Inc. | 29,100 | 609,354 | ||||||
| Webster Financial Corp. | 19,581 | 630,704 | ||||||
| Wintrust Financial Corp. | 11,210 | 551,868 | ||||||
| WSFS Financial Corp. | 11,110 | 352,076 | ||||||
| 9,630,502 | ||||||||
| BIOTECH & PHARMA - 1.8% | ||||||||
| Anika Therapeutics, Inc. * | 7,407 | 241,616 | ||||||
| Coherus Biosciences, Inc. * ^ | 15,478 | 258,018 | ||||||
| Jounce Therapeutics, Inc. * ^ | 26,825 | 223,184 | ||||||
| Supernus Pharmaceuticals, Inc. * ^ | 12,079 | 221,771 | ||||||
| 944,589 | ||||||||
| CHEMICALS - 2.9% | ||||||||
| Cabot Corp. | 9,000 | 342,090 | ||||||
| Lydall, Inc. * | 24,220 | 479,314 | ||||||
| Minerals Technologies, Inc. | 13,078 | 715,236 | ||||||
| 1,536,640 | ||||||||
| COMMERCIAL SUPPORT SERVICES - 3.1% | ||||||||
| CBIZ, Inc. * | 19,240 | 436,171 | ||||||
| Clean Harbors, Inc. * | 8,000 | 423,760 | ||||||
| Huron Consulting Group, Inc. * | 9,910 | 375,193 | ||||||
| Insperity, Inc. | 5,692 | 435,893 | ||||||
| 1,671,017 | ||||||||
| CONSUMER SERVICES - 2.1% | ||||||||
| Graham Holdings Co. | 1,460 | 555,296 | ||||||
| Laureate Education, Inc. * | 45,330 | 589,290 | ||||||
| 1,144,586 | ||||||||
| CONTAINERS & PACKAGING - 1.0% | ||||||||
| Greif, Inc. | 12,940 | 525,235 | ||||||
| ELECTRIC UTILITIES - 2.6% | ||||||||
| Hawaiian Electric Industries, Inc. | 13,329 | 440,390 | ||||||
| NorthWestern Corp. | 11,470 | 597,931 | ||||||
| Unitil Corp. | 10,510 | 363,121 | ||||||
| 1,401,442 | ||||||||
| ENGINEERING & CONSTRUCTION - 1.2% | ||||||||
| Primoris Services Corp. | 33,610 | 634,221 | ||||||
See accompanying notes to financial statements.
41
| SCHEDULE OF INVESTMENTS |
| Dunham Small Cap Value Fund (Continued) |
| October 31, 2020 |
| Security | Shares | Value | ||||||
| COMMON STOCKS - 88.2% (Continued) | ||||||||
| FOOD - 1.4% | ||||||||
| Phibro Animal Health Corp. | 18,800 | $ | 309,072 | |||||
| Seneca Foods Corp. * | 11,148 | 410,804 | ||||||
| 719,876 | ||||||||
| GAS & WATER UTILITIES - 2.5% | ||||||||
| SJW Group | 5,275 | 320,140 | ||||||
| Southwest Gas Holdings, Inc. | 7,781 | 511,367 | ||||||
| Spire, Inc. ^ | 8,600 | 481,944 | ||||||
| 1,313,451 | ||||||||
| HEALTH CARE FACILITIES & SERVICES - 2.3% | ||||||||
| Hanger, Inc. * | 13,910 | 243,007 | ||||||
| National HealthCare Corp. | 7,060 | 446,898 | ||||||
| Owens & Minor, Inc. | 21,581 | 542,115 | ||||||
| 1,232,020 | ||||||||
| HOME & OFFICE PRODUCTS - 1.4% | ||||||||
| ACCO Brands Corp. | 49,547 | 261,113 | ||||||
| Steelcase, Inc. | 47,767 | 498,687 | ||||||
| 759,800 | ||||||||
| HOME CONSTRUCTION - 3.0% | ||||||||
| American Woodmark Corp. * | 5,630 | 465,094 | ||||||
| M/I Homes, Inc. * | 14,280 | 584,338 | ||||||
| Meritage Homes Corp. * | 6,330 | 551,280 | ||||||
| 1,600,712 | ||||||||
| HOUSEHOLD PRODUCTS - 2.8% | ||||||||
| Clearwater Paper Corp. * | 12,407 | 460,920 | ||||||
| Quanex Building Products Corp. | 25,820 | 469,924 | ||||||
| Spectrum Brands Holdings, Inc. | 10,267 | 583,884 | ||||||
| 1,514,728 | ||||||||
| INDUSTRIAL INTERMEDIATE PRODUCTS - 2.0% | ||||||||
| AZZ, Inc. | 14,660 | 492,429 | ||||||
| Mueller Industries, Inc. | 19,777 | 572,149 | ||||||
| 1,064,578 | ||||||||
| INSURANCE - 4.3% | ||||||||
| American Equity Investment Life Holding Co. | 17,930 | 445,023 | ||||||
| Assured Guaranty Ltd. ^ | 16,250 | 414,863 | ||||||
| Mercury General Corp. | 14,223 | 579,018 | ||||||
| National Western Life Group, Inc . | 1,880 | 318,904 | ||||||
| Selective Insurance Group, Inc. | 10,850 | 564,851 | ||||||
| 2,322,659 | ||||||||
| LEISURE FACILITIES & SERVICES - 2.2% | ||||||||
| St Joe Co. * ^ | 21,627 | 584,794 | ||||||
| Wyndham Destinations, Inc. | 17,300 | 564,499 | ||||||
| 1,149,293 | ||||||||
| MACHINERY - 4.5% | ||||||||
| Columbus McKinnon Corp. | 11,750 | 398,208 | ||||||
| Curtiss-Wright Corp. | 3,930 | 331,535 | ||||||
| Federal Signal Corp. | 17,140 | 491,575 | ||||||
| Hillenbrand, Inc. | 13,600 | 397,800 | ||||||
| Regal Beloit Corp. | 8,050 | 794,132 | ||||||
| 2,413,250 | ||||||||
| MEDICAL EQUIPMENT & DEVICES - 0.9% | ||||||||
| ICU Medical, Inc. * | 1,200 | 213,348 | ||||||
| Lantheus Holdings, Inc. * | 25,250 | 274,215 | ||||||
| 487,563 | ||||||||
| METALS & MINING - 0.9% | ||||||||
| Alcoa Corp. * ^ | 37,400 | 483,208 | ||||||
| OIL & GAS PRODUCERS - 1.8% | ||||||||
| Bonanza Creek Energy, Inc. * | 35,530 | 629,236 | ||||||
| CVR Energy, Inc. ^ | 31,753 | 349,601 | ||||||
| 978,837 | ||||||||
See accompanying notes to financial statements.
42
| SCHEDULE OF INVESTMENTS |
| Dunham Small Cap Value Fund (Continued) |
| October 31, 2020 |
| Security | Shares | Value | ||||||
| COMMON STOCKS - 88.2% (Continued) | ||||||||
| OIL & GAS SERVICES & EQUIPMENT - 1.7% | ||||||||
| Archrock, Inc. | 83,710 | $ | 496,400 | |||||
| Liberty Oilfield Services, Inc. ^ | 62,306 | 416,204 | ||||||
| 912,604 | ||||||||
| PUBLISHING & BROADCASTING - 1.0% | ||||||||
| Gray Television, Inc. * | 42,830 | 543,084 | ||||||
| REAL ESTATE OWNERS & DEVELOPERS - 1.0% | ||||||||
| McGrath RentCorp | 9,660 | 551,393 | ||||||
| RETAIL - CONSUMER STAPLES - 3.3% | ||||||||
| Big Lots, Inc. ^ | 7,123 | 339,055 | ||||||
| Ingles Markets, Inc. | 13,410 | 480,882 | ||||||
| Natural Grocers by Vitamin Cottage, Inc. ^ | 30,700 | 326,648 | ||||||
| PriceSmart, Inc. | 8,560 | 590,640 | ||||||
| 1,737,225 | ||||||||
| RETAIL - DISCRETIONARY- 4.1% | ||||||||
| Abercrombie & Fitch Co. | 25,751 | 366,179 | ||||||
| Foot Locker, Inc. | 20,040 | 739,075 | ||||||
| Lumber Liquidators Holdings, Inc. * | 18,051 | 399,288 | ||||||
| Sonic Automotive, Inc. | 19,260 | 694,516 | ||||||
| 2,199,058 | ||||||||
| SEMICONDUCTORS - 3.1% | ||||||||
| Amkor Technology, Inc. * | 45,340 | 537,279 | ||||||
| Rambus, Inc. * | 36,300 | 500,577 | ||||||
| Synaptics, Inc. * | 8,190 | 627,927 | ||||||
| 1,665,783 | ||||||||
| SPECIALTY FINANCE - 1.4% | ||||||||
| Mr Cooper Group, Inc. * | 34,820 | 734,006 | ||||||
| STEEL - 0.8% | ||||||||
| Commercial Metals Co. | 19,310 | 398,752 | ||||||
| TECHNOLOGY HARDWARE - 1.9% | ||||||||
| Comtech Telecommunications Corp. | 24,490 | 352,656 | ||||||
| Harmonic, Inc. * | 55,608 | 330,312 | ||||||
| Universal Electronics, Inc. * ^ | 8,503 | 315,121 | ||||||
| 998,089 | ||||||||
| TECHNOLOGY SERVICES - 1.2% | ||||||||
| Sykes Enterprises, Inc. * | 19,290 | 660,490 | ||||||
| TRANSPORTATION & LOGISTICS - 1.6% | ||||||||
| Heartland Express, Inc. | 29,500 | 540,145 | ||||||
| SkyWest, Inc. | 9,680 | 281,010 | ||||||
| 821,155 | ||||||||
| WHOLESALE - DISCRETIONARY - 1.1% | ||||||||
| ePlus, Inc. * | 9,050 | 610,965 | ||||||
| TOTAL COMMON STOCKS (Cost - $45,299,515) | 47,128,731 | |||||||
| REITS - 10.9% | ||||||||
| REITS - 8.9% | ||||||||
| Apple Hospitality REIT, Inc. | 52,680 | 521,532 | ||||||
| Chatham Lodging Trust | 55,796 | 410,101 | ||||||
| Community Healthcare Trust, Inc. | 8,464 | 391,883 | ||||||
| Corporate Office Properties Trust | 30,880 | 692,638 | ||||||
| Global Net Lease, Inc. | 35,375 | 503,386 | ||||||
| Physicians Realty Trust ^ | 28,830 | 486,074 | ||||||
| Sabra Health Care REIT, Inc. | 27,840 | 366,374 | ||||||
| STAG Industrial, Inc. | 26,680 | 830,282 | ||||||
| UMH Properties, Inc. ^ | 42,545 | 579,888 | ||||||
| 4,782,158 | ||||||||
See accompanying notes to financial statements.
43
| SCHEDULE OF INVESTMENTS |
| Dunham Small Cap Value Fund (Continued) |
| October 31, 2020 |
| Security | Shares | Value | ||||||
| REITS - 10.9% (Continued) | ||||||||
| SPECIALTY FINANCE - 2.0% | ||||||||
| Capstead Mortgage Corp. | 101,979 | $ | 521,113 | |||||
| Dynex Capital, Inc. ^ | 33,230 | 544,308 | ||||||
| 1,065,421 | ||||||||
| TOTAL REITS (Cost - $5,466,453) | 5,847,579 | |||||||
| COLLATERAL FOR SECURITIES LOANED - 11.7% | ||||||||
| Mount Vernon Prime Portfolio, 0.16% + # | 6,248,698 | 6,248,698 | ||||||
| TOTAL COLLATERAL FOR SECURITIES LOANED (Cost - $6,248,698) | ||||||||
| TOTAL INVESTMENTS - 110.8% (Cost - $57,014,666) | $ | 59,225,008 | ||||||
| LIABILITIES IN EXCESS OF OTHER ASSETS - (10.8)% | (5,762,210 | ) | ||||||
| NET ASSETS - 100.0% | $ | 53,462,798 | ||||||
REITs - Real Estate Investment Trusts
| * | Non-income producing security. |
| ^ | All or a portion of these securities are on loan. Total loaned securities had a value of $5,999,517 at October 31, 2020. |
| + | Variable rate security. Interest rate is as of October 31, 2020. |
| # | The Trust’s securities lending policies and procedures require that the borrower: deliver cash or U.S. Government securities as collateral with respect to each new loan of U.S. securities, equal to at least 102% of the value of the portfolio securities loaned, and (ii) at all times thereafter mark-to-market the collateral on a daily basis so that the market value of such collateral is at least 100% of the value of securities loaned. From time to time the collateral may not be 102% due to end of day market movement. |
The next business day additional collateral is obtained/received from the borrower to replenish/reestablish 102%.
| Portfolio Composition * - (Unaudited) | ||||||||||
| Financials | 25.2 | % | Technology | 5.6 | % | |||||
| Consumer Discretionary | 13.6 | % | Materials | 5.0 | % | |||||
| Industrials | 11.1 | % | Utilities | 4.6 | % | |||||
| Real Estate | 9.0 | % | Healthcare | 4.5 | % | |||||
| Consumer Staples | 6.7 | % | Others** | 14.7 | % | |||||
| Total | 100.0 | % | ||||||||
| * | Based on total value of investments as of October 31, 2020. |
| ** | Includes collateral for securities loaned as of October 31, 2020. |
Percentage may differ from Schedule of Investments which is based on Fund net assets
See accompanying notes to financial statements.
44
| Dunham Focused Large Cap Growth Fund (Unaudited) |
| Message from the Sub-Adviser (The Ithaka Group, LLC) |
Asset Class Recap
Large cap growth stocks, as measured by the Russell 1000 Growth Index, boasted the strongest returns amongst its U.S. large and small cap peers during the fiscal year. While large cap value and small cap value stocks each rested in negative territory after the volatile 12-month period, even the 13.4 percent return generated by small cap growth stocks was not enough to challenge the lead of large cap growth stocks. The outperformance achieved by large cap growth stocks was primarily attributable to having far less of a drawdown in the panic-induced selling that occurred in March. From the beginning of the fiscal year through the lows in March, large cap growth stocks experienced a decline of 19.4 percent. However, large cap growth stocks surged 60.4 percent from those lows through the end of the fiscal year. Within the final months of the fiscal year, the asset class’ fiscal year-to-date return drifted above the 40 percent mark a few times before ending the 12-month period at a positive 29.2 percent.
Allocation Review
Although the dominance exhibited by large cap growth stocks during the fiscal year may hint at the existence of a broad swath of outperforming sectors, it was only a few sectors that led the way. After considering the stellar returns of the technology and consumer discretionary sectors’ 40 percent-plus returns for the fiscal year, the next-best return belonged to the health care sector, which was up 15.3 percent – underperforming the benchmark index’s return by nearly 14 percent. The final fiscal quarter did not disrupt this hierarchy, as the highest performing sectors were the technology and consumer discretionary sectors. While the utilities and energy sectors are virtually non-existent in the large cap growth universe, combined comprising less than one-half of a percent of the benchmark index, they were not considered in the best or worst performing sector calculations. The spread of returns in the benchmark index continued to widen down to the negative 1.4 percent return of the producer durables sector. The producer durables sector also represented the poorest performing sector in the Fund during the fiscal year, although the Fund only held one security in the sector. However, the producer durables sector represented the strongest performing sector in the Fund during the final fiscal quarter. The technology and consumer discretionary sectors combined comprised more than 60 percent of the benchmark index, which caused the extremely strong sector-level performance to dictate the majority of the benchmark index performance, as well. While the Fund had an approximate two percent underweight to the technology sector and a five percent underweight to the consumer discretionary sector, its strong outperformance in the technology sector made up for the adverse effect of the underweight. The underweight to the consumer discretionary sector was not offset by similar outperformance, as it proved to be one of the Fund’s two underperforming sectors.
Holdings Insights
The Fund’s underweight to the technology sector was prevalent for much of the fiscal year. Although it proved to be one of the strongest performing sectors, not only in the final fiscal quarter but also during the fiscal year, the Sub-Adviser’s security selection more than offset the adverse effects of underweighting the sector. During the fiscal year, the Fund experienced an overall return in the sector that was nearly 12 percent higher than that of the benchmark index, seeing the technology allocation in the Fund return close to 58.7 percent while the benchmark index’s technology allocation increased 46.6 percent. Fund holdings that contributed most to this outperformance tended to reside in the software-as-a-service industry, which included holdings such as Salesforce.com Inc. (CRM) (holding weight*: 5.18 percent), the global client relationship management and business processing software provider. During the final fiscal quarter, CRM continued to benefit from the extended work-from-home environment implemented around the world, resulting in a 19.2 percent surge in the fiscal quarter. This strong showing brought its total performance during the fiscal year to 46.8 percent. While all of the technology holdings in the Fund produced positive returns during the fiscal year, some were negative performers during the final fiscal quarter. These holdings included Microsoft Corp. (MSFT) (holding weight*: 5.86 percent), the software and cloud computing giant, Autodesk Inc. (ADSK) (holding weight*: 3.94 percent), a developer of a broad range of software for design, engineering, and entertainment, and Splunk Inc. (SPLk) (holding weight*: 2.32 percent), a software developer focused providing solutions to monitor and examine big data. During the fiscal quarter, MSFT, ADSK, and SPLK declined 1.0 percent, 0.4 percent, and 5.6 percent, respectively. Despite the negative performance in the final fiscal quarter, MSFT, ADSK, and SPLK increased 42.8 percent, 58.3 percent, and 64.4 percent during the fiscal year.
The consumer discretionary sector detracted from relative performance due to the Fund’s underweight allocation during the fiscal year. Despite Amazon Inc. (AMZN) (holding weight*: 7.80 percent), the host of one of the world’s largest online marketplaces, boasting a return of 70.6 percent for the fiscal year, the Fund experienced some declines from other holdings in the sector that were added late in the fiscal year. These holdings included Costco Wholesale Corp. (COST) (holding weight*: 1.23 percent), the membership-only warehouse club operator, and Tractor Supply Company (TSCO) (holding weight*: 1.51 percent), a supplier of farming supplies and equipment, as well as pet and animal feed. Both of these holdings were added to the Fund toward the end of the fiscal year, after which they declined 3.0 percent and 10.5 percent, respectively. The Sub-Adviser believes that both of these holdings are able to navigate their marketplaces and are less adversely impacted by the intense online competition that AMZN has presented to many brick-and-mortar retailers around the globe.
Sub-Adviser Outlook
As long-term stock pickers, the Sub-Adviser seeks to hold what it believes to be the strongest growth stocks. While this may represent evolving technologies, it also includes traditional businesses with strategic and adaptive management teams at their helm. The Sub-Adviser is less concerned with the overall sector exposure, but does seek to source these growth stocks from various industries. The Sub-Adviser continues to focus on free-cash-flow and fundamental factors that traditionally support long-term growth. The Sub-Adviser is optimistic that remaining concentrated in the Fund’s number of holdings will help to provide outperformance relative to its benchmark index over the long-term.
| * | Holdings percentage(s) of total investments, cash and unsettled trades excluding collateral for securities loaned, as of 10/31/2020. |
Growth of $100,000 Investment
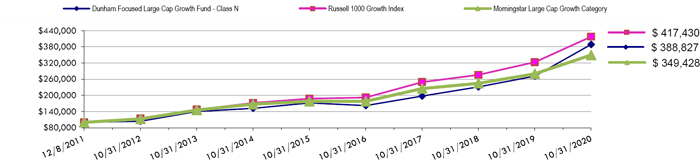
Total Returns (a) as of October 31, 2020
| Annualized | |||
| Annualized | Since Inception | ||
| One Year | Five Years | (12/8/11) | |
| Class N | 43.39% | 17.73% | 16.49% |
| Class A with load of 5.75% | 34.84% | 16.06% | 15.42% |
| Class A without load | 43.09% | 17.44% | 16.19% |
| Class C | 41.97% | 16.56% | 15.34% |
| Russell 1000 Growth Index | 29.22% | 17.32% | 17.42% |
| Morningstar Large Cap Growth Category | 24.81% | 14.42% | 15.13% |
| (a) | Total Returns are calculated based on traded NAVs. |
The Russell 1000 Growth Index is a subset of the Russell 1000 Index which measures the performance of the stocks of the 1000 largest companies in the Russell 3000 Index based on market capitalization. The Russell 1000 Growth Index measures the performance of those stocks of the Russell 1000 with higher price-to-book ratios and higher relative forecasted growth rates. Investors cannot invest directly in an index or benchmark.
The Morningstar Large Cap Growth Category is generally representative of mutual funds that primarily invest in big (large capitalization) U.S. companies that are projected to grow faster than other large-cap stocks.
| As disclosed in the Trust’s latest registration statement, the Fund’s total annual operating expenses, including the cost of underlying funds, are 1.33% for Class N, 2.33% for Class C and 1.58% for Class A. Class A shares are subject to a sales load of 5.75% and a deferred sales charge of up to 0.75%. The performance data quoted here represents past performance, which is not indicative of future results. Current performance may be lower or higher than the performance data quoted. The investment return and NAV will fluctuate, so that an investor’s shares, when redeemed, may be worth more or less than their original cost. Total returns are calculated assuming reinvestment of all dividends and capital gains distributions, if any. The returns do not reflect the deductions of taxes a shareholder would pay on the redemption of Fund shares or Fund distributions. For performance information current to the most recent month-end, please call 1-800-442-4358 or visit our website www.dunham.com |
45
| SCHEDULE OF INVESTMENTS |
| Dunham Focused Large Cap Growth Fund |
| October 31, 2020 |
| Security | Shares | Value | ||||||||||
| COMMON STOCKS - 101.2% | ||||||||||||
| AEROSPACE & DEFENSE - 1.1% | ||||||||||||
| TransDigm Group, Inc. | 3,512 | $ | 1,676,664 | |||||||||
| E-COMMERCE DISCRETIONARY - 13.7% | ||||||||||||
| Alibaba Group Holding Ltd. - ADR * | 14,484 | 4,413,130 | ||||||||||
| Amazon.com, Inc. * | 3,960 | 12,023,154 | ||||||||||
| MercadoLibre, Inc. * ^ | 3,400 | 4,127,770 | ||||||||||
| 20,564,054 | ||||||||||||
| INTERNET MEDIA & SERVICES - 6.2% | ||||||||||||
| Alphabet, Inc. * | 3,063 | 4,965,154 | ||||||||||
| Facebook, Inc. * | 16,644 | 4,379,203 | ||||||||||
| 9,344,357 | ||||||||||||
| LEISURE FACILITIES & SERVICES - 1.5% | ||||||||||||
| Chipotle Mexican Grill, Inc. * | 1,940 | 2,330,871 | ||||||||||
| MEDICAL EQUIPMENT & DEVICES - 9.5% | ||||||||||||
| Align Technology, Inc. * | 7,072 | 3,013,238 | ||||||||||
| DexCom, Inc. * | 11,659 | 3,725,983 | ||||||||||
| Edwards Lifesciences Corporation * | 47,628 | 3,414,451 | ||||||||||
| Intuitive Surgical, Inc. * | 6,293 | 4,197,934 | ||||||||||
| 14,351,606 | ||||||||||||
| RETAIL - CONSUMER STAPLES - 1.3% | ||||||||||||
| Costco Wholesale Corporation | 5,300 | 1,895,386 | ||||||||||
| RETAIL - DISCRETIONARY - 5.6% | ||||||||||||
| Burlington Stores, Inc. * ^ | 22,255 | 4,308,123 | ||||||||||
| Lululemon Athletica, Inc. * | 5,732 | 1,830,170 | ||||||||||
| Tractor Supply Company | 17,477 | 2,328,111 | ||||||||||
| 8,466,404 | ||||||||||||
| SEMICONDUCTORS - 4.7% | ||||||||||||
| NVIDIA Corporation | 14,074 | 7,056,141 | ||||||||||
| SOFTWARE - 35.0% | ||||||||||||
| Adobe, Inc. * | 11,700 | 5,231,070 | ||||||||||
| Autodesk, Inc. * | 25,812 | 6,079,758 | ||||||||||
| Microsoft Corporation | 44,638 | 9,037,856 | ||||||||||
| salesforce.com, Inc. * | 34,367 | 7,982,423 | ||||||||||
| ServiceNow, Inc. * | 16,566 | 8,242,745 | ||||||||||
| Splunk, Inc. * | 18,086 | 3,581,751 | ||||||||||
| Veeva Systems, Inc. * | 26,088 | 7,045,064 | ||||||||||
| Workday, Inc. * ^ | 19,388 | 4,073,807 | ||||||||||
| Zendesk, Inc. * ^ | 12,000 | 1,331,280 | ||||||||||
| 52,605,754 | ||||||||||||
| TECHNOLOGY SERVICES - 22.6% | ||||||||||||
| Global Payments, Inc. | 12,534 | 1,977,113 | ||||||||||
| Mastercard, Inc. | 28,290 | 8,165,626 | ||||||||||
| PayPal Holdings, Inc. * | 41,135 | 7,656,458 | ||||||||||
| S&P Global, Inc. | 10,401 | 3,356,715 | ||||||||||
| Square, Inc. * | 31,769 | 4,920,383 | ||||||||||
| Visa, Inc. ^ | 43,476 | 7,900,024 | ||||||||||
| 33,976,319 | ||||||||||||
| TOTAL COMMON STOCKS (Cost - $64,989,919) | 152,267,556 | |||||||||||
| Interest | ||||||||||||
| Rate % | ||||||||||||
| COLLATERAL FOR SECURITIES LOANED - 8.2% | ||||||||||||
| Mount Vernon Prime Portfolio # | 12,361,094 | 0.160 | + | 12,361,094 | ||||||||
| TOTAL COLLATERAL FOR SECURITIES LOANED (Cost - $12,361,094) | ||||||||||||
See accompanying notes to financial statements.
46
| SCHEDULE OF INVESTMENTS |
| Dunham Focused Large Cap Growth Fund (Continued) |
| October 31, 2020 |
| Value | ||||
| TOTAL INVESTMENTS - 109.4% (Cost - $77,351,013) | $ | 164,628,650 | ||
| LIABILITIES IN EXCESS OF OTHER ASSETS - (9.4)% | (14,193,420 | ) | ||
| NET ASSETS - 100.0% | $ | 150,435,230 | ||
ADR - American Depositary Receipt.
| * | Non-Income producing security. |
| + | Variable rate security. Interest rate is as of October 31, 2020. |
| ^ | All or a portion of these securities are on loan. Total loaned securities had a value of $11,899,810 at October 31, 2020. |
| # | The Trust’s securities lending policies and procedures require that the borrower: (i) deliver cash or U.S. Government securities as collateral with respect to each new loan of U.S. securities, equal to at least 102% of the value of the portfolio securities loaned, and (ii) at all times thereafter mark-to-market the collateral on a daily basis so that the market value of such collateral is at least 100% of the value of securities loaned. From time to time the collateral may not be 102% due to end of day market movement. The next business day additional collateral is obtained/received from the borrower to replenish/reestablish 102%. |
| Portfolio Composition * - (Unaudited) | ||||||||||
| Technology | 56.9 | % | Communications | 5.7 | % | |||||
| Consumer Discretionary | 19.0 | % | Consumer Staples | 1.2 | % | |||||
| Health Care | 8.7 | % | Industrials | 1.0 | % | |||||
| Collateral for Securities Loaned | 7.5 | % | Total | 100.0 | % | |||||
| * | Based on total value of investments as of October 31, 2020. |
Percentage may differ from Schedule of Investments which is based on Fund net assets
See accompanying notes to financial statements.
47
| Dunham Small Cap Growth Fund (Unaudited) |
| Message from the Sub-Adviser (Pier Capital, LLC) |
Asset Class Recap
Small cap growth stocks, as measured by the Russell 2000 Growth Index, grew steadily in the first fiscal quarter, as the index rose to all-time highs in mid-February of 2020, rising 7.1 percent. The future outlook for the asset class looked attractive, as the health care and technology-heavy index looked to build on its gains, with no major headwinds in sight. The second fiscal quarter was an entirely different story, as COVID-19 started spreading across the globe, and government-imposed restrictions caused equity markets to drop sharply. Stocks soon fell from record highs to multi-year lows in late March, as the pandemic resulted in many businesses to shut down, leaving a significant amount of individuals unemployed. The Russell 2000 Growth Index fell over 30 percent from its high in February, rebounding modestly to end the fiscal quarter, resulting in a net 13.8 percent drop on the second fiscal quarter. The second half of the fiscal year, represented by the third and fourth fiscal quarters, continued to rebound, albeit with significant volatility, as the economy continued to reopen and unemployment declined. Small cap growth stocks beat the broader market and significantly pulled ahead of their value counterparts, as measured by the Russell 2000 Value Index. On the fiscal year ending October 31, 2020, the Russell 2000 Growth Index was up 13.4 percent, while the Russell 2000 Value Index was down 13.9, a 27.3 percent differential.
Allocation Review
The sector allocation within the Fund is predominately driven by the Sub-Adviser’s bottom-up security selection process. With that being said, the Sub-Adviser’s stock selection contributed meaningfully to Fund performance over the fiscal year, coupled with a slight contribution from sector allocation. The Fund’s largest overweight by a significant margin was to the technology sector, having roughly 12 percent more exposure to this sector than the benchmark index. Being overweight the technology sector itself only contributed modestly to relative performance though; rather, security selection within the sector primarily drove excess returns. Similarly, the Fund’s security selection in the health care sector, the second largest sector in the Fund, proved beneficial, as holdings within the biotechnology and health care services industries positively contributed to relative performance. However, being significantly underweight the health care sector as a whole detracted from relative performance, although not enough to off-set the positive contribution from security selection. While all sectors contributed positively to relative performance when considering both security selection and sector allocation, security selection within the energy sector detracted a marginal amount. Having exposure to the oil and natural gas exploration industry hurt relative performance, given the demand for oil and natural gas has significantly dropped since the start of the COVID pandemic.
Holdings Insights
The top contributor over the fiscal year came from the health care sector, Livongo Health, Inc. (LVGO) (holding weight**: 0.74 percent). LVGO, a health care solutions provider, rose 427.6 percent during the fiscal year, driven by positive earnings and significant user growth. The Sub-Adviser initiated a position in LVGO in early February, exiting out of the position entirely by early August. Focused on chronic diseases such as diabetes and hypertension, LVGO offers a digital platform providing support, information, and real-time updates that helps individuals track their health conditions. Demand for LVGO’s services surged during the COVID pandemic, as in-person visits to the doctor became limited. As mentioned earlier, security selection within the technology sector contributed meaningfully to relative performance. Pinterest, Inc. (PINS) (holding weight*: 1.37 percent), an image sharing social media platform, rose 189.0 percent during the fiscal year, driven by a substantial increase in domestic and international user growth. Also, the top contributor during the most recent fiscal quarter, PINS continued to gain interest from individuals looking to share recipes, design ideas, and other do-it-yourself activities, as individuals took advantage of at home projects during the pandemic. Also within the technology sector, Twilio, Inc. (TWLO) (holding weight**: 0.92 percent) and Bandwidth, Inc. (holding weight*: 1.31 percent), rose 84.3 percent and 185.6 percent, respectively. Growth surged as both companies offer platforms that enable enterprises to communicate digitally, whether it be via voice, text or instant message, which proved beneficial when many individuals worked from home. The Sub-Adviser initially invested in TWLO late February, withdrawing their position by early September, capturing a substantial portion of the stock’s total gains. In health care, Cryoport, Inc. (CYRX) (holding weight*: 0.62 percent), a provider of temperature-controlled logistics and biostorage services to the life sciences industry, rose 186.1 percent during the fiscal year. Part of this growth can be attributed to CYRX’s acquisition of MVE Biological Solutions, a manufacturer of vacuum-insulated products and cryogenic freezer systems for the life sciences industry. Many sell side analysts believe that CYRX could benefit from MVE Biological Solutions’ larger footprint in the rapidly growing life science logistics industry.
The largest detractor on the fiscal year was Matador Resources, Co., (MTDR) (holding weight**: 0.33 percent) an independent oil and natural gas exploration and production company, falling 16.4 percent. The Sub-Adviser initiated a position in MTDR in November, not holding the stock long, having exited the position in February. MTDR’s share price fell nearly to zero at the onset of the COVID pandemic, as the oil producer had to limit production and cut operating costs to cope with the lack of demand for their primary product. MTDR was one of many oil producers that struggled during the fiscal year, as demand for natural gas and oil dropped dramatically. In the consumer staples sector, Inter Parfums Inc., (IPAR) (holding weight*: 1.08 percent) a manufacturer of a range of fragrances and fragrance related products, fell 46.4 percent, as the need for their products declined sharply during the COVID pandemic. IPAR benefitted from having their products available in stores globally, with IPAR’s primary source of revenue coming from in-store sales. With many traditional brick and mortar retailers shut down globally, IPAR saw revenue drop roughly 70 percent at its worst, rebounding slowly as stores began to reopen, but not enough to make up for the steep decline. Lindbland Expeditions Holdings, Inc. (LIND) (holding weight**: 0.35 percent), a provider of expedition cruising and adventure travel experiences, fell 57.1 percent, as LIND, and other peers in the travel and tourism industry, were severely affected by the COVID pandemic and related travel restrictions. The Sub-Adviser initiated a position in LIND in January and exited the position by August. Finally, in the financial services sector, Seacoast Banking Corp, (SBCF) (holding weight*: 1.31 percent), a regional bank providing financial services to retail and commercial customers in Florida, fell 24.9 percent. SBCF saw revenue decline sharply, as the regional bank had to set aside a massive amount of reserves for projected loan losses.
Sub-Adviser Outlook
The Sub-Adviser’s investment approach involves a thorough understanding of each stock’s value proposition and risk. With that being said, the Sub-Adviser is confident in the long-term horizon for small cap growth stocks. However, in the short-term the Sub-Adviser believes that the asset class will experience volatility as investors have binary reactions to updates regarding potential vaccines for the coronavirus. They believe this will create substantial dispersion between stocks, thus creating meaningful opportunities for active management.
| * | Holdings percentage(s) of total investments, cash and unsettled trades excluding collateral for securities loaned, as of 10/31/2020. |
| ** | Holdings percentage(s) as of the date prior to the sale of the security. |
Growth of $100,000 Investment
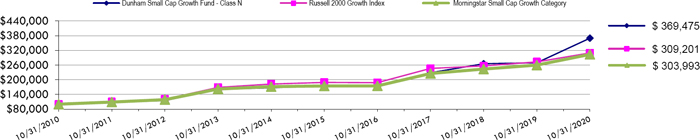
Total Returns (a) as of October 31, 2020
| Annualized | Annualized | ||
| One Year | Five Years | Ten Years | |
| Class N | 37.38% | 16.01% | 13.96% |
| Class A with load of 5.75% | 29.13% | 14.36% | 13.00% |
| Class A without load | 37.00% | 15.72% | 13.67% |
| Class C | 36.07% | 14.87% | 12.83% |
| Russell 2000 Growth Index | 13.37% | 10.36% | 11.95% |
| Morningstar Small Cap Growth Category | 16.92% | 11.74% | 11.76% |
| (a) | Total Returns are calculated based on traded NAVs. |
The Russell 2000 Growth Index measures the performance of the Russell 2000 companies with higher price-to-book ratios and higher forecasted growth values. Investors cannot invest directly in an index or benchmark.
The Morningstar Small Cap Growth Category is generally representative of mutual funds that primarily invest in small (small capitalization) U.S. companies that are projected to grow faster than other small-cap stocks.
| As disclosed in the Trust’s latest registration statement, the Fund’s total annual operating expenses, including the cost of underlying funds, are 1.91% for Class N, 2.91% for Class C and 2.16% for Class A. Class A shares are subject to a sales load of 5.75% and a deferred sales charge of up to 0.75%. The performance data quoted here represents past performance, which is not indicative of future results. Current performance may be lower or higher than the performance data quoted. The investment return and NAV will fluctuate, so that an investor’s shares, when redeemed, may be worth more or less than their original cost. Total returns are calculated assuming reinvestment of all dividends and capital gains distributions, if any. The returns do not reflect the deductions of taxes a shareholder would pay on the redemption of Fund shares or Fund distributions. For performance information current to the most recent month-end, please call 1-800-442-4358 or visit our website www.dunham.com |
48
| SCHEDULE OF INVESTMENTS |
| Dunham Small Cap Growth Fund |
| October 31, 2020 |
| Security | Shares | Value | ||||||
| COMMON STOCKS - 95.7% | ||||||||
| ADVERTISING & MARKETING - 0.9% | ||||||||
| Cardlytics, Inc. * | 7,457 | $ | 550,476 | |||||
| AEROSPACE & DEFENSE - 0.9% | ||||||||
| Mercury Systems, Inc. * | 7,497 | 516,393 | ||||||
| APPAREL & TEXTILE PRODUCTS - 1.2% | ||||||||
| Crocs, Inc. * | 13,271 | 694,471 | ||||||
| AUTOMOTIVE - 1.1% | ||||||||
| Methode Electronics, Inc. | 20,756 | 638,662 | ||||||
| BANKING - 2.5% | ||||||||
| First Merchants Corporation | 25,945 | 677,424 | ||||||
| Seacoast Banking Corporation of Florida * | 35,603 | 764,752 | ||||||
| 1,442,176 | ||||||||
| BIOTECHNOLOGY & PHARMACEUTICALS - 7.9% | ||||||||
| Allogene Therapeutics, Inc. * | 10,575 | 358,704 | ||||||
| Avid Bioservices, Inc. * | 52,752 | 382,452 | ||||||
| Biohaven Pharmaceutical Holding Company Ltd. * | 4,545 | 352,056 | ||||||
| Emergent BioSolutions, Inc. * | 5,750 | 517,327 | ||||||
| Epizyme, Inc. * | 42,024 | 519,417 | ||||||
| Guardant Health, Inc. * | 3,699 | 394,535 | ||||||
| Iovance Biotherapeutics, Inc. * | 11,826 | 421,952 | ||||||
| Mirati Therapeutics, Inc. * | 1,941 | 421,469 | ||||||
| Myovant Sciences Ltd * | 38,981 | 537,938 | ||||||
| PTC Therapeutics, Inc. * | 8,148 | 425,244 | ||||||
| TG Therapeutics, Inc. * | 10,185 | 257,375 | ||||||
| 4,588,469 | ||||||||
| COMMERCIAL SUPPORT SERVICES - 1.9% | ||||||||
| Avalara, Inc. * | 2,880 | 429,264 | ||||||
| FTI Consulting, Inc. * | 6,780 | 667,559 | ||||||
| 1,096,823 | ||||||||
| E-COMMERCE DISCRETIONARY - 0.9% | ||||||||
| Chewy, Inc. * | 8,928 | 549,965 | ||||||
| ELECTRICAL EQUIPMENT - 1.6% | ||||||||
| Itron, Inc. * | 8,557 | 581,448 | ||||||
| nLight, Inc. * | 17,384 | 369,236 | ||||||
| 950,684 | ||||||||
| ENGINEERING & CONSTRUCTION - 2.6% | ||||||||
| Exponent, Inc. | 6,809 | 473,838 | ||||||
| Installed Building Products, Inc. * | 4,969 | 449,893 | ||||||
| WillScot Mobile Mini Holdings Corporation * | 31,393 | 583,282 | ||||||
| 1,507,013 | ||||||||
| FOOD - 1.0% | ||||||||
| Vital Farms, Inc. * | 17,374 | 600,445 | ||||||
| FORESTRY, PAPER & WOOD PRODUCTS - 1.0% | ||||||||
| Trex Company, Inc. * | 8,113 | 564,178 | ||||||
| HEALTH CARE FACILITIES & SERVICES - 6.0% | ||||||||
| Amedisys, Inc. * | 2,626 | 680,134 | ||||||
| Catalent, Inc. * | 6,659 | 584,460 | ||||||
| HealthEquity, Inc. * | 11,651 | 599,910 | ||||||
| LHC Group, Inc. * | 2,727 | 590,532 | ||||||
| Personalis, Inc. * | 21,568 | 533,377 | ||||||
| Progyny, Inc. * | 19,952 | 486,230 | ||||||
| 3,474,643 | ||||||||
See accompanying notes to financial statements.
49
| SCHEDULE OF INVESTMENTS |
| Dunham Small Cap Growth Fund (Continued) |
| October 31, 2020 |
| Security | Shares | Value | ||||||
| COMMON STOCKS - 95.7% (Continued) | ||||||||
| HOME & OFFICE PRODUCTS - 0.6% | ||||||||
| Purple Innovation, Inc. * | 11,846 | $ | 336,071 | |||||
| HOME CONSTRUCTION - 2.3% | ||||||||
| AZEK Company, Inc. (The) * | 14,549 | 486,519 | ||||||
| LGI Homes, Inc. * | 2,723 | 291,034 | ||||||
| Skyline Champion Corporation | 21,771 | 558,426 | ||||||
| 1,335,979 | ||||||||
| HOUSEHOLD PRODUCTS - 2.9% | ||||||||
| elf Beauty, Inc. * | 27,982 | 567,195 | ||||||
| Helen of Troy Ltd. * | 2,661 | 504,526 | ||||||
| Inter Parfums, Inc. | 15,390 | 631,913 | ||||||
| 1,703,634 | ||||||||
| INDUSTRIAL INTERMEDIATE PRODUCTS - 1.1% | ||||||||
| Chart Industries, Inc. * | 7,880 | 665,466 | ||||||
| INDUSTRIAL SUPPORT SERVICES - 1.0% | ||||||||
| SiteOne Landscape Supply, Inc. * | 4,827 | 576,778 | ||||||
| INSTITUTIONAL FINANCIAL SERVICES - 2.3% | ||||||||
| Evercore, Inc. | 8,964 | 712,996 | ||||||
| Houlihan Lokey, Inc. | 9,828 | 616,216 | ||||||
| 1,329,212 | ||||||||
| INSURANCE - 0.6% | ||||||||
| GoHealth, Inc. * | 31,308 | 324,351 | ||||||
| INTERNET MEDIA & SERVICES - 5.1% | ||||||||
| Fiverr International Ltd. * ^ | 2,647 | 387,574 | ||||||
| GoodRx Holdings, Inc. * | 9,180 | 444,220 | ||||||
| Pinterest, Inc. * | 13,507 | 796,238 | ||||||
| Roku, Inc. * | 1,370 | 277,288 | ||||||
| TechTarget, Inc. * | 10,469 | 458,542 | ||||||
| Upwork, Inc. * | 31,550 | 582,098 | ||||||
| 2,945,960 | ||||||||
| LEISURE FACILITIES & SERVICES - 2.5% | ||||||||
| Papa John’s International, Inc. | 7,494 | 574,040 | ||||||
| Shake Shack, Inc. * | 4,101 | 276,900 | ||||||
| Texas Roadhouse, Inc. | 4,190 | 293,426 | ||||||
| Wingstop, Inc. | 2,446 | 284,543 | ||||||
| 1,428,909 | ||||||||
| LEISURE PRODUCTS - 1.6% | ||||||||
| Axon Enterprise, Inc. * | 2,918 | 288,590 | ||||||
| Fox Factory Holding Corporation * | 7,558 | 635,477 | ||||||
| 924,067 | ||||||||
| MACHINERY - 2.0% | ||||||||
| ESCO Technologies, Inc. | 6,256 | 523,565 | ||||||
| MSA Safety, Inc. | 4,761 | 628,071 | ||||||
| 1,151,636 | ||||||||
| MEDICAL EQUIPMENT & DEVICES - 5.1% | ||||||||
| Adaptive Biotechnologies Corporation * | 10,279 | 473,656 | ||||||
| Alphatec Holdings, Inc. * | 61,300 | 523,502 | ||||||
| BioLife Solutions, Inc. * | 10,580 | 303,752 | ||||||
| Cerus Corporation * | 50,026 | 262,636 | ||||||
| Insulet Corporation * | 1,827 | 406,051 | ||||||
| Repligen Corporation * | 3,205 | 533,857 | ||||||
| Tandem Diabetes Care, Inc. * | 4,437 | 483,633 | ||||||
| 2,987,087 | ||||||||
| REAL ESTATE SERVICES - 0.7% | ||||||||
| Redfin Corporation * | 10,045 | 419,580 | ||||||
See accompanying notes to financial statements.
50
| SCHEDULE OF INVESTMENTS |
| Dunham Small Cap Growth Fund (Continued) |
| October 31, 2020 |
| Security | Shares | Value | ||||||
| COMMON STOCKS - 95.7% (Continued) | ||||||||
| RENEWABLE ENERGY - 0.5% | ||||||||
| Enphase Energy, Inc. * | 2,808 | $ | 275,437 | |||||
| RETAIL - CONSUMER STAPLES - 2.1% | ||||||||
| BJ’s Wholesale Club Holdings, Inc. * | 14,590 | 558,651 | ||||||
| Ollie’s Bargain Outlet Holdings, Inc. * | 7,527 | 655,526 | ||||||
| 1,214,177 | ||||||||
| RETAIL - DISCRETIONARY - 1.4% | ||||||||
| Freshpet, Inc. * | 2,803 | 320,944 | ||||||
| Vroom, Inc. * | 12,661 | 520,367 | ||||||
| 841,311 | ||||||||
| SEMICONDUCTORS - 6.6% | ||||||||
| Brooks Automation, Inc. | 12,428 | 580,388 | ||||||
| Cree, Inc. * | 8,227 | 523,237 | ||||||
| FormFactor, Inc. * | 23,453 | 664,893 | ||||||
| Inphi Corporation * | 2,142 | 299,366 | ||||||
| Lattice Semiconductor Corporation * | 17,396 | 607,120 | ||||||
| Semtech Corporation * | 9,246 | 507,513 | ||||||
| Silicon Laboratories, Inc. * | 6,165 | 631,666 | ||||||
| 3,814,183 | ||||||||
| SOFTWARE - 15.8% | ||||||||
| 1Life Healthcare, Inc. * | 19,669 | 554,862 | ||||||
| Appfolio, Inc. * | 2,656 | 379,463 | ||||||
| Appian Corporation * ^ | 7,659 | 484,815 | ||||||
| Bandwidth, Inc. * | 4,765 | 764,092 | ||||||
| Blackline, Inc. * | 6,337 | 618,998 | ||||||
| Coupa Software, Inc. * | 1,328 | 355,506 | ||||||
| Elastic N.V. * | 5,634 | 571,344 | ||||||
| Five9, Inc. * | 4,499 | 682,588 | ||||||
| Intelligent Systems Corporation * | 15,851 | 601,070 | ||||||
| LivePerson, Inc. * | 10,529 | 562,880 | ||||||
| Mimecast Ltd. * | 11,636 | 444,612 | ||||||
| MongoDB, Inc. * | 2,690 | 614,584 | ||||||
| Oak Street Health, Inc. * | 5,538 | 263,553 | ||||||
| Omnicell, Inc. * | 7,658 | 662,800 | ||||||
| Ontrak, Inc. * | 5,746 | 351,885 | ||||||
| Q2 Holdings, Inc. * | 4,054 | 369,887 | ||||||
| Schrodinger, Inc. * | 7,387 | 360,338 | ||||||
| Workiva, Inc. * | 10,286 | 568,919 | ||||||
| 9,212,196 | ||||||||
| TECHNOLOGY HARDWARE - 3.8% | ||||||||
| Cubic Corporation | 10,187 | 602,154 | ||||||
| Fabrinet * | 8,228 | 493,845 | ||||||
| Kornit Digital Ltd. * | 8,143 | 548,187 | ||||||
| PagerDuty, Inc. * | 21,102 | 571,864 | ||||||
| 2,216,050 | ||||||||
| TECHNOLOGY SERVICES - 3.9% | ||||||||
| Endava PLC - ADR * | 9,249 | 591,011 | ||||||
| MAXIMUS, Inc. | 9,161 | 619,100 | ||||||
| MSCI, Inc. | 1,585 | 554,496 | ||||||
| WNS Holdings Ltd. - ADR * | 8,643 | 498,182 | ||||||
| 2,262,789 | ||||||||
| TRANSPORTATION & LOGISTICS - 4.3% | ||||||||
| Air Transport Services Group, Inc. * | 26,177 | 734,003 | ||||||
| Allegiant Travel Company | 2,383 | 321,133 | ||||||
| CryoPort, Inc. * | 8,959 | 359,614 | ||||||
| Marten Transport Ltd. | 29,651 | 454,995 | ||||||
| Saia, Inc. * | 4,186 | 618,105 | ||||||
| 2,487,850 | ||||||||
| TOTAL COMMON STOCKS (Cost - $42,362,059) | 55,627,121 | |||||||
See accompanying notes to financial statements.
51
| SCHEDULE OF INVESTMENTS |
| Dunham Small Cap Growth Fund (Continued) |
| October 31, 2020 |
| Security | Shares | Interest Rate % | Value | |||||||||
| COLLATERAL FOR SECURITIES LOANED - 1.5% | ||||||||||||
| HSBC US Government Money Market Fund - Class I # | 885,126 | 0.023 | + | $ | 885,126 | |||||||
| TOTAL COLLATERAL FOR SECURITIES LOANED (Cost - $885,126) | ||||||||||||
| TOTAL INVESTMENTS - 97.2% (Cost - $43,247,185) | $ | 56,512,247 | ||||||||||
| OTHER ASSETS IN EXCESS OF LIABILITIES - 2.8% | 1,649,004 | |||||||||||
| TOTAL NET ASSETS - 100.00% | $ | 58,161,251 | ||||||||||
ADR - American Depositary Receipt.
PLC - Public Limited Company
| ^ | All or a portion of these securities are on loan. Total loaned securities had a value of $834,470 at October 31, 2020. |
| # | The Trust’s securities lending policies and procedures require that the borrower: (i) deliver cash or U.S. Government securities as collateral with respect to each new loan of U.S. securities, equal to at least 102% of the value of the portfolio securities loaned, and (ii) at all times thereafter mark-to-market the collateral on a daily basis so that the market value of such collateral is at least 100% of the value of securities loaned. From time to time the collateral may not be 102% due to end of day market movement. The next business day additional collateral is obtained/received from the borrower to replenish/reestablish 102%. |
| * | Non-Income producing security. |
| + | Variable rate security. Interest rate is as of October 31, 2020. |
| Portfolio Composition * - (Unaudited) | ||||||||||
| Technology | 31.0 | % | Consumer Staples | 6.2 | % | |||||
| Health Care | 19.6 | % | Collateral For Securities Loaned | 1.6 | % | |||||
| Industrials | 15.8 | % | Materials | 1.0 | % | |||||
| Consumer Discretionary | 11.9 | % | Real Estate | 0.7 | % | |||||
| Communications | 6.2 | % | Energy | 0.5 | % | |||||
| Financials | 5.5 | % | Total | 100.0 | % | |||||
| * | Based on total value of investments as of October 31, 2020. |
Percentage may differ from Schedule of Investments which are based on Fund net assets.
See accompanying notes to financial statements.
52
| Dunham Emerging Markets Stock Fund (Unaudited) |
| Message from the Sub-Adviser (NS Partners Ltd.) |
Asset Class Recap
After emerging markets precipitously declined 20 percent in February and March, markets strongly rebounded in April. The market recovery helped underscore existing momentum in trends towards technology stocks, at the expense of other more traditional sectors. The worst-hit areas included sectors related to travel and leisure, while banks continue to perform poorly as a result of compressed interest margins and fears of rising defaults. In addition to sector dispersion, geographic dispersion was widespread as a result of the varying containment efforts in emerging markets. The virus highlighted the substantial differences between emerging markets’ credit health, fiscal strength, and sensitivity to global activity. Emerging markets surged in the third fiscal quarter as unprecedented policy actions of global monetary authorities helped offset the negative impact of the Covid-19 lockdowns. In the final fiscal quarter, the recovery continued as government restrictions were further eased and encouraging economic data boosted hopes for a sustained V-shaped recovery. Despite a resurgence of coronavirus cases in certain emerging markets late in the fiscal year, the potential for a more predictable and less combative trade policy from the United States helped emerging markets end the fiscal year on a high note. Over the fiscal year ending October 31, 2020, emerging markets stocks, as measured by the MSCI Emerging Markets Index, increased 8.3 percent.
Allocation Review
Over the fiscal year the Fund strongly benefited from both security selection and country allocation. The Fund received contributions from security selection in China, Taiwan, Russia, and South Africa, with detractions coming from stock selections in Thailand, Malaysia, and India. Early in the fiscal year the Sub-Adviser took profits and allowed cash to rise as global economic momentum and the coronavirus began to spread. Following the proliferation of the coronavirus and subsequent government shutdowns, the Sub-Adviser added to internet-related businesses and beneficiaries of the “work from home” environment. As equity markets rebounded, countries reopened, and pharmaceutical companies worked towards a vaccine in the third and fourth fiscal quarters, the Sub-Adviser increased exposure to more economically sensitive names. This resulted in a reduction in the exposure to China and an increase to Korea, India, and Brazil.
Holdings Insights
One of the strongest drivers of positive Fund performance was stock selection in China. As such, many of the best performing holdings over the fiscal year came from that market. Sany Heavy Industry Company LTD (600031 C1) (holding weight*: 2.02 percent) strongly contributed to Fund performance since being added to the Fund. Sany Heavy Industry is China’s largest, and the world’s fifth largest, engineering machinery manufacturer. This holding has been a beneficiary of infrastructure spending as well as the housing recovery. As a result, it increased 38 percent since being added to the Fund in May. Another positive contributor to Fund performance from China was Li Ning Co. LTD (2331 HK) (holding weight*: 1.97 percent). 2331 HK, a leading sports brand company, mainly providing sporting goods including footwear, apparel, and equipment, declined 4.7 percent through the first three fiscal quarters of the year as higher- end athleisure purchases were not a priority during the coronavirus lockdown. The Sub-Adviser believes that this is the best local sportswear brand in China. The founder has regained control of the company, and instilled good brand awareness while improving cash flow and inventory controls. In the final fiscal quarter, 2331 HK online sales surged and retail rebounded resulting in an increase of 60.2 percent and an overall return of 57.2 percent for the full fiscal year. LONGi Green Energy Technology Company Ltd. (601012 CH) (holding weight*: 1.44 percent), the leading manufacturer of wafers, solar cells, and modules benefitting from increased demand for renewable energy rose 151.9 percent since being added to the Fund in the third fiscal quarter.
The outbreak and subsequent pandemic also temporary affected private educator companies. One such company within the Fund was China Education Group Holdings Ltd. (839 HK) (holding weight*: 1.22 percent), a leading private education provider. 839 HK fell 17.7 percent in the first fiscal quarter, rebounded 56.8 percent across the second and third fiscal quarters, but fell 12.4 in the final fiscal quarter as it lagged the more economically sensitive stocks. Although the Sub-Adviser reduced the position as a result of being out of favor, the Sub-Adviser’s belief that it is a great long-term business remained. Wynn Macau Ltd. (1128 HK) (holding weight*: 0.94 percent), a Macau-based gaming company also detracted from Fund performance. 1128 HK rose 10.3 percent in the first quarter before being sold in late January. 1128 HK was purchased back into the Fund in the third fiscal quarter in anticipation of recovery in arrivals from mainland China. Unfortunately, consumers did not return as swiftly as expected and 1128 HK fell 27.5 percent since being purchase back into the Fund in June. The Sub-Adviser is confident this position will rebound as consumers return amid positive vaccine developments.
As previously mentioned, the Sub-Adviser increased the exposure to more economically sensitive names. This was partially accomplished through increasing the allocation to Brazil and India, which yielded mixed results. Within Brazil, the Sub-Adviser increased the allocation to Lojas Renner S.A. (LREN3 BZ) (holding weight*: 1.14 percent), Brazil’s largest department store, and Localiza Rent a Car S.A. (RENT3 BZ) (holding weigh*: 1.24 percent), a Brazilian rental car company. LREN3 BZ detracted from Fund performance, declining 7.4 percent in the final fiscal quarter and 47.9 percent during the full fiscal year. On the other hand, RENT3 BZ rose 8 percent in the final fiscal quarter and 63.5 percent since being added to the Fund in May. Godrej Properties (GPL IN) (holding weight*: 1.14 percent), a residential and commercial construction company in India, was also added to the Fund in the final fiscal quarter of the year. GPL IN increased 15.7 percent since being added to the Fund in June.
Sub-Adviser Outlook
The Sub-Adviser’s outlook has improved over the final fiscal quarter, but it is diligently monitoring geopolitical developments and economic data. The Sub-Adviser believes that unprecedented fiscal and monetary stimulus will drive a strong recovery toward the end of 2020 and into 2021. The Sub-Adviser will look to continue to add to economically sensitive stocks and markets as the liquidity gap reduces while the economy recovers. The Sub-Adviser’s focus remains on what it believes are high quality companies and companies with improved return on invested capital.
| * | Holdings percentage(s) of total investments, cash and unsettled trades excluding collateral for securities loaned, as of 10/31/2020. |
Growth of $100,000 Investment
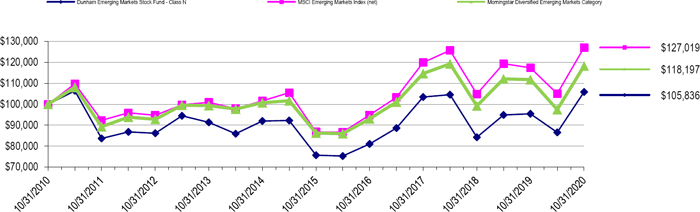
Total Returns (a) as of October 31, 2020
| Annualized | Annualized | ||
| One Year | Five Years | Ten Years | |
| Class N | 10.94% | 6.96% | 0.57% |
| Class A with load of 5.75% | 4.31% | 5.45% | (0.26)% |
| Class A without load | 10.67% | 6.69% | 0.33% |
| Class C | 9.78% | 5.90% | (0.43)% |
| MSCI Emerging Markets Index (net) | 8.25% | 7.92% | 2.42% |
| Morningstar Diversified Emerging Markets Category | 5.74% | 6.54% | 1.69% |
| (a) | Total Returns are calculated based on traded NAVs. |
The MSCI Emerging Markets Index (net) is a free float-adjusted market capitalization index that is designed to measure equity market performance in the global emerging markets. Investors cannot invest directly in an index or benchmark.
The Morningstar Diversified Emerging Markets Category is generally representative of mutual funds that primarily invest among 20 or more developing nations, with a general focus on the emerging markets of Asia and Latin America rather than on the emerging markets countries in the Middle East, Africa, or Europe.
As disclosed in the Trust’s latest registration statement, the Fund’s total annual operating expenses, including underlying funds, are 1.53% for Class N, 2.53% for Class C and 1.78% for Class A . Class A shares are subject to a sales load of 5.75% and a deferred sales charge of up to 0.75%. The performance data quoted here represents past performance, which is not indicative of future results. Current performance may be lower or higher than the performance data quoted. The investment return and NAV will fluctuate, so that an investor’s shares, when redeemed, may be worth more or less than their original cost. Total returns are calculated assuming reinvestment of all dividends and capital gains distributions, if any. The returns do not reflect the deductions of taxes a shareholder would pay on the redemption of Fund shares or Fund distributions. For performance information current to the most recent month-end, please call 1-800-442-4358 or visit our website www.dunham.com.
53
| SCHEDULE OF INVESTMENTS |
| Dunham Emerging Markets Stock Fund |
| October 31, 2020 |
| Security | Shares | Value | ||||||
| COMMON STOCKS - 99.4% | ||||||||
| AUTOMOTIVE - 1.4% | ||||||||
| Geely Automobile Holdings Ltd. | 610,000 | $ | 1,253,083 | |||||
| BANKING - 6.8% | ||||||||
| Banco Bradesco SA - ADR | 272,290 | 953,015 | ||||||
| Bank Central Asia Tbk PT | 428,600 | 843,337 | ||||||
| China Merchants Bank Co. Ltd. | 287,500 | 1,497,115 | ||||||
| Itau Unibanco Holding SA - ADR | 152,100 | 622,089 | ||||||
| KB Financial Group, Inc. | 29,394 | 1,051,418 | ||||||
| Public Bank Bhd | 187,900 | 681,744 | ||||||
| Sberbank of Russia PJSC - ADR | 39,012 | 394,021 | ||||||
| 6,042,739 | ||||||||
| BEVERAGES - 1.1% | ||||||||
| Varun Beverages Ltd. | 105,575 | 932,301 | ||||||
| CHEMICALS - 1.0% | ||||||||
| LG Chem Ltd. | 1,697 | 925,342 | ||||||
| CONSTRUCTION MATERIALS - 1.4% | ||||||||
| Anhui Conch Cement Co. Ltd. | 204,500 | 1,278,860 | ||||||
| COMMERCIAL SERVICES - 1.2% | ||||||||
| China Education Group Holdings Ltd. | 653,000 | 1,088,238 | ||||||
| E-COMMERCE DISCRETIONARY - 11.5% | ||||||||
| Alibaba Group Holding Ltd. * | 237,100 | 8,981,914 | ||||||
| JD.com, Inc. * | 30,650 | 1,249,789 | ||||||
| 10,231,703 | ||||||||
| ENGINEERING & CONSTRUCTION - 2.1% | ||||||||
| Larsen & Toubro Ltd. - ADR | 43,745 | 533,689 | ||||||
| Larsen & Toubro Ltd. | 50,319 | 630,455 | ||||||
| Mytilineos SA | 62,884 | 690,066 | ||||||
| 1,854,210 | ||||||||
| FOOD - 0.6% | ||||||||
| Charoen Pokphand Foods PCL | 687,700 | 556,673 | ||||||
| HOME & OFFICE PRODUCTS - 1.0% | ||||||||
| Joyoung Co. Ltd. | 165,662 | 874,012 | ||||||
| INSTITUTIONAL FINANCIAL SERVICES - 0.9% | ||||||||
| B3 SA - Brasil Bolsa Balcao | 93,700 | 825,685 | ||||||
| INSURANCE - 4.0% | ||||||||
| AIA Group Ltd. | 130,200 | 1,238,761 | ||||||
| Ping An Insurance Group Co. of China Ltd. | 226,000 | 2,336,058 | ||||||
| 3,574,819 | ||||||||
| INTERNET MEDIA & SERVICES - 12.7% | ||||||||
| Dada Nexus Ltd. - ADR * ^ | 65,300 | 2,155,553 | ||||||
| Naspers Ltd. * | 12,683 | 2,479,881 | ||||||
| NAVER Corp. | 5,058 | 1,294,196 | ||||||
| Tencent Holdings Ltd. | 57,300 | 4,376,717 | ||||||
| Yandex NV * ^ | 16,900 | 972,933 | ||||||
| 11,279,280 | ||||||||
| LEISURE FACILITIES & SERVICES - 2.6% | ||||||||
| Lemon Tree Hotels Ltd. * | 1,437,275 | 523,174 | ||||||
| Minor International PCL - ADR * | 593,500 | 317,542 | ||||||
| OPAP SA | 71,741 | 580,490 | ||||||
| Wynn Macau Ltd. * | 608,800 | 840,884 | ||||||
| 2,262,090 | ||||||||
| MACHINERY-CONSTRUCTION & MINING - 3.8% | ||||||||
| Airtac International Group | 58,000 | 1,561,410 | ||||||
| Sany Heavy Industry Co. Ltd. | 462,190 | 1,796,151 | ||||||
| 3,357,561 | ||||||||
| METALS & MINING - 3.0% | ||||||||
| Grupo Mexico SAB de CV | 316,000 | 898,211 | ||||||
| Jiangxi Copper Co. Ltd. | 947,000 | 1,130,554 | ||||||
| MMC Norilsk Nickel PJSC | 2,532 | 600,831 | ||||||
| 2,629,596 | ||||||||
See accompanying notes to financial statements.
54
| SCHEDULE OF INVESTMENTS |
| Dunham Emerging Markets Stock Fund (Continued) |
| October 31, 2020 |
| Security | Shares | Value | ||||||
| COMMON STOCKS - 99.4% (Continued) | ||||||||
| OIL & GAS PRODUCERS - 1.2% | ||||||||
| Reliance Industries Ltd. | 39,071 | $ | 1,083,235 | |||||
| REAL ESTATE OWNERS & DEVELOPERS - 3.0% | ||||||||
| Ayala Corp. | 49,910 | 786,631 | ||||||
| Godrej Properties Ltd. * | 72,527 | 1,011,578 | ||||||
| Powerlong Real Estate Holdings Ltd. | 892,000 | 600,383 | ||||||
| Shimao Services Holdings Ltd. * | 138,163 | 295,751 | ||||||
| 2,694,343 | ||||||||
| REAL ESTATE SERVICES - 1.2% | ||||||||
| ESR Cayman Ltd. * | 365,600 | 1,103,934 | ||||||
| RENEWABLE ENERGY - 2.9% | ||||||||
| Contemporary Amperex Technology Co. Ltd. | 34,200 | 1,256,032 | ||||||
| LONGi Green Energy Technology Co. Ltd. | 113,000 | 1,284,804 | ||||||
| 2,540,836 | ||||||||
| RETAIL - CONSUMER STAPLES - 2.6% | ||||||||
| Alibaba Health Information Technology Ltd. * | 460,000 | 1,205,953 | ||||||
| Atacadao SA | 150,500 | 477,653 | ||||||
| Magnit PJSC | 10,176 | 604,255 | ||||||
| 2,287,861 | ||||||||
| RETAIL - DISCRETIONARY - 5.0% | ||||||||
| Home Product Center PCL | 1,279,600 | 572,281 | ||||||
| Li Ning Co. Ltd. | 336,500 | 1,753,286 | ||||||
| Localiza Rent a Car SA | 104,900 | 1,105,216 | ||||||
| Lojas Renner SA | 156,270 | 1,015,511 | ||||||
| 4,446,294 | ||||||||
| SEMICONDUCTORS - 11.0% | �� | |||||||
| MediaTek, Inc. | 43,000 | 1,022,122 | ||||||
| Realtek Semiconductor Corp. | 82,000 | 1,021,510 | ||||||
| SK Hynix, Inc. | 20,686 | 1,467,524 | ||||||
| Taiwan Semiconductor Manufacturing Co. Ltd. - ADR ^ | 11,600 | 972,892 | ||||||
| Taiwan Semiconductor Manufacturing Co. Ltd. | 349,000 | 5,280,257 | ||||||
| 9,764,305 | ||||||||
| SOFTWARE - 1.8% | ||||||||
| Kingdee International Software Group Co. Ltd. | 590,000 | 1,557,280 | ||||||
| SPECIALTY FINANCE - 2.7% | ||||||||
| Housing Development Finance Corp. Ltd. | 91,007 | 2,361,017 | ||||||
| TECHNOLOGY HARDWARE - 7.4% | ||||||||
| Hon Hai Precision Industry Co. Ltd. | 307,000 | 832,624 | ||||||
| Samsung Electronics Co. Ltd. - ADR - 144A | 296 | 332,704 | ||||||
| Samsung Electronics Co. Ltd. | 69,391 | 3,487,982 | ||||||
| Samsung Electronics Co. Ltd. | 32,043 | 1,425,430 | ||||||
| Sunny Optical Technology Group Co. Ltd. | 30,400 | 504,582 | ||||||
| 6,583,322 | ||||||||
| TELECOMMUNICATIONS - 2.0% | ||||||||
| 21Vianet Group, Inc. - ADR * | 53,500 | 1,228,360 | ||||||
| Bharti Airtel Ltd. * | 87,936 | 514,165 | ||||||
| 1,742,525 | ||||||||
| TRANSPORTATION EQUIPMENT - 1.0% | ||||||||
| Eicher Motors Ltd. | 30,410 | 855,826 | ||||||
| TRANSPORTATION & LOGISTICS - 2.5% | ||||||||
| Spring Airlines Co. Ltd. | 152,990 | 975,010 | ||||||
| Wizz Air Holdings PLC * | 30,321 | 1,252,829 | ||||||
| 2,227,839 | ||||||||
| TOTAL COMMON STOCKS (Cost - $72,732,486) | 88,214,809 | |||||||
| CLOSED END FUND - 0.6% | ||||||||
| MIXED ALLOCATION - 0.6% | ||||||||
| Vietnam Enterprise Investments Limited * | 87,862 | 526,284 | ||||||
| TOTAL CLOSED END FUND (Cost - $499,718) | ||||||||
See accompanying notes to financial statements.
55
| SCHEDULE OF INVESTMENTS |
| Dunham Emerging Markets Stock Fund (Continued) |
| October 31, 2020 |
| Security | Maturity Date | Shares | Value | |||||||
| WARRANTS - 0.0% | ||||||||||
| LEISURE FACILITIES & SERVICES - 0.0% | ||||||||||
| Minor International PCL - NVDR - Warrant * | 9/30/2021 | 51,085 | $ | 393 | ||||||
| Minor International PCL - NVDR - Warrant * | 7/31/2023 | 26,977 | 5,366 | |||||||
| TOTAL WARRANTS (Cost - $867) | 5,759 | |||||||||
| COLLATERAL FOR SECURITIES LOANED - 3.7% | ||||||||||
| Mount Vernon Prime Portfolio, 0.16% + # (Cost - $3,261,479) | 3,261,479 | 3,261,479 | ||||||||
| TOTAL INVESTMENTS - 103.7% (Cost - $76,494,550) | $ | 92,008,331 | ||||||||
| LIABILITIES IN EXCESS OF OTHER ASSETS - (3.7)% | (3,271,975 | ) | ||||||||
| NET ASSETS - 100.0% | $ | 88,736,356 | ||||||||
ADR - American Depositary Receipt
Ltd. - Limited Liability Company
PCL - Petroleum Limited Company
PLC - Public limited Company
PJSC - Public Joint Stock company
Sab de CV - Sociedad Anonima de Capital Variable, which is the most formal business structure in Mexico
Tbk Pt - Publically traded private limited company in indonesia
| * | Non-income producing security |
| ^ | All or a portion of these securities are on loan. Total loaned securities had a value of $3,077,002 at October 31, 2020. |
| + | Variable rate security. Interest rate is as of October 31, 2020. |
| # | The Trust’s securities lending policies and procedures require that the borrower: (i) deliver cash or U.S. Government securities as collateral with respect to each new loan of U.S. securities, equal to at least 102% (105% for non US Shares) of the value of the portfolio securities loaned, and (ii) at all times thereafter mark-to-market the collateral on a daily basis so that the market value of such collateral is at least 100% of the value of securities loaned. From time to time the collateral may not be 102% due to end of day market movement. The next business day additional collateral is obtained/received from the borrower to replenish/reestablish 102%. |
| Portfolio Composition * - (Unaudited) | ||||||||||
| China | 29.8 | % | Hong Kong | 3.9 | % | |||||
| Cayman Islands | 12.4 | % | Russia | 2.8 | % | |||||
| Taiwan | 11.6 | % | South Africa | 2.7 | % | |||||
| South Korea | 10.8 | % | Thailand | 1.6 | % | |||||
| India | 9.2 | % | Other Countries ** | 9.8 | % | |||||
| Brazil | 5.4 | % | Total | 100.0 | % | |||||
| * | Based on total value of investments as of October 31, 2020. |
| ** | Includes Collateral for Securities Loaned as of October 31, 2020. |
Percentage may differ from Schedule of Investments which is based on Fund net assets.
See accompanying notes to financial statements.
56
| Dunham International Stock Fund (Unaudited) |
| Message from the Sub-Adviser (Arrowstreet Capital, L.P.) |
Asset Class Recap
International equity markets, as measured by the MSCI All Country World ex USA Index (Net) (referred to as the “Index”), fell 2.6 percent during the year ending October 31, 2020 (the “fiscal year”). Across sectors, notable underperformers included the energy, financials, and real estate sectors. Conversely, information technology, communication services, and consumer discretionary were the top performing sectors. The best performing developed market countries as measured by the Index in local terms during the fiscal year were Denmark, up 27.4 percent, and New Zealand, up 19.0 percent. The worst performing developed market countries also in local terms were Austria, down 36.9 percent, and Spain, down 28.9 percent. The best performing emerging market countries during the fiscal year as measured by the Index were China, up 33.4 percent, and Argentina, up 25.8 percent. The worst performing emerging market countries were Greece, down 45.8 percent, and Poland, down 35.3 percent.
Allocation Review
The Sub-Adviser’s investment process is best characterized as a dynamic process that uses quantitative models to evaluate securities to exploit opportunities across companies, sectors, and countries while seeking to avoid long-term systematic biases toward any particular country, sector, style, or market capitalization. These stock selection models are designed to understand what information is likely to impact stock prices with a predictable and measurable lag that allows time to invest and profit. The models obtain the information to forecast individual stock returns by evaluating a stock’s potential on the basis of (1) direct effects - characteristics of the company itself; and (2) indirect effects - characteristics of other companies that are related by virtue of a common country and sector affiliation (called country/sector baskets); a common country affiliation; and a common global sector affiliation, and/or other common linkages. Over any time period, the strategy’s performance relative to the Index is driven by allocations to country/sector baskets, stock selection, and the effects of currency exposures differing from those of the Index.
Countries contributing the most to returns relative to the Index during the fiscal year were: The United Kingdom, mainly due to underweight positioning to both the energy and financials sectors, along with positive selection in the United Kingdom financials sector; and Canada, also due to underweight positioning to both the energy and financials sectors, as well as positive selection within the materials sector. Countries contributing the most to underperformance relative to the Index included: China, primarily due to both underweights and negative stock selection within the consumer discretionary and communication services sectors; and Russia, primarily due an overweight to the energy sector.
Sectors contributing the most to returns relative to the Index during the fiscal year included: materials, primarily due to overweights and positive selection within Brazil, Australia, and China; and financials, primarily due to underweights and positive selection within the United Kingdom (noted above) and Australia. Sectors contributing the most to underperformance relative to the Index included: consumer discretionary, mainly due to underweights coupled with negative selection in China as noted above, along with negative selection in the United Kingdom and Japan; and communication services, largely due to an underweight and negative selection within China, also noted above.
Holdings Insights
Stocks contributing the most to returns relative to the Index during the fiscal year included: Royal Dutch Shell PLC (RDSA NA) (holding weight*: 0.22 percent), a United Kingdom energy company; Samsung Electronics Company Ltd. (005930) (holding weight*: 2.77 percent), a South Korean information technology company; and United Microelectronics (2303 TT) (holding weight*: 0.68 percent), a Taiwanese information technology company. The Fund initiated a position in RDSA NA in mid-July, holding it through fiscal year end. During this period, RDSA NA declined 21.8 percent; however, RDSA NA fell 54 percent over the entire fiscal year, which contributed to the Fund’s relative performance, having avoided the full downside. 005930 and 2303 TT increased 18.5 percent and 145.7 percent, respectively during the fiscal year. Stocks contributing the most to underperformance relative to the Index included: Alibaba Group Holding Ltd. (BABA) (holding weight*: 0.25 percent), a Chinese consumer discretionary company; Tencent Holdings Ltd. (TCEHY) (holding weight**: 0.30 percent), a Chinese communication services company; and Meituan-Dianping (MPNGY) (holding weight: not held), a Chinese consumer discretionary company. The Fund initiated a position in BABA in April, holding it through fiscal year end, resulting in a 55.5 percent increase. However, over the entire fiscal year, the stock had appreciated 72.5 percent, detracting from relative performance, by not capturing the full upside. The Fund held TCEHY between March and June, resulting in a 29.2 percent increase. However, the stock returned 89.0 percent over the entire fiscal year, capturing nearly one third of the entire upside, detracting from relative performance. MPGNY, one of the largest contributors to the Index on the fiscal year, rose 197.0 percent. Having no exposure to MPGNY hurt relative performance.
Sub-Adviser Outlook
The Sub-Adviser generally constructs its portfolios by using proprietary econometric models and a proprietary optimization process that balances the trade-off between a stock’s expected return, its contribution to portfolio level risk, portfolio specific restrictions, and its opportunity costs relative to trading costs. As this is performed quantitatively, the Sub-Adviser’s outlook does not play a role in the disciplined investment process.
| * | Holdings percentage(s) of total investments, cash and unsettled trades excluding collateral for securities loaned, as of 10/31/2020. |
Growth of $100,000 Investment
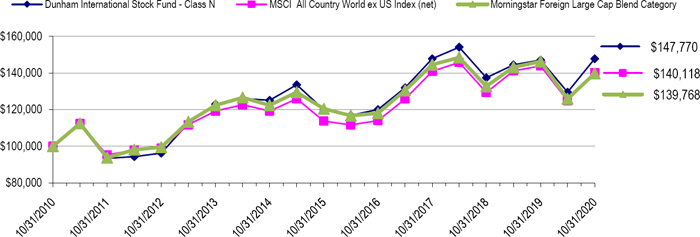
Total Returns (a) as of October 31, 2020
| Annualized | Annualized | ||
| One Year | Five Years | Ten Years | |
| Class N | 0.45% | 4.26% | 3.98% |
| Class A with load of 5.75% | (5.54)% | 2.76% | 3.11% |
| Class A without load | 0.24% | 3.99% | 3.72% |
| Class C | (0.49)% | 3.22% | 2.94% |
| MSCI All Country World ex US Index (net) | (2.61)% | 4.26% | 3.43% |
| Morningstar Foreign Large Cap Blend Category | (4.46)% | 3.03% | 3.41% |
| (a) | Total Returns are calculated based on traded NAVs. |
The MSCI All Country World ex US Index (net) is a free float-adjusted market capitalization index designed to measure equity market performance in the global developed and emerging markets excluding holdings in the United States and is net of any withholding taxes. Investors cannot invest directly in an index or benchmark.
The Morningstar Foreign Large Cap Blend Category is generally representative of mutual funds that primarily invest in non-U.S. stocks that have market caps in the top 70% of each economically integrated market (such as Europe or Asia ex-Japan). The blend style is generally applicable where neither growth nor value characteristics dominate.
| As disclosed in the Trust’s latest registration statement, the Fund’s total annual operating expenses, including underlying funds, are 1.43% for Class N, 2.43% for Class C and 1.68% for Class A. Class A shares are subject to a sales load of 5.75% and a deferred sales charge of up to 0.75%.The performance data quoted here represents past performance, which is not indicative of future results. Current performance may be lower or higher than the performance data quoted. The investment return and NAV will fluctuate, so that an investor’s shares, when redeemed, may be worth more or less than their original cost. Total returns are calculated assuming reinvestment of all dividends and capital gains distributions, if any. The returns do not reflect the deductions of taxes a shareholder would pay on the redemption of Fund shares or Fund distribution. For performance information current to the most recent month-end, please call 1-800-442-4358 or visit our website www.dunham.com. |
57
| SCHEDULE OF INVESTMENTS |
| Dunham International Stock Fund |
| October 31, 2020 |
| Security | Shares | Value | ||||||
| COMMON STOCKS - 98.6% | ||||||||
| ADVERTISING & MARKETING - 0.3% | ||||||||
| Hakuhodo DY Holdings, Inc. | 10,100 | $ | 128,877 | |||||
| WPP PLC - ADR ^ | 6,638 | 265,188 | ||||||
| 394,065 | ||||||||
| AEROSPACE/DEFENSE - 0.2% | ||||||||
| Dassault Aviation SA * | 330 | 276,144 | ||||||
| APPAREL & TEXTILE PRODUCTS - 0.7% | ||||||||
| Gildan Activewear, Inc. | 13,957 | 288,906 | ||||||
| Gildan Activewear, Inc. ^ | 11,300 | 234,701 | ||||||
| Global Top E-Commerce Co. Ltd. * | 184,700 | 157,078 | ||||||
| Pou Chen Corp. | 92,000 | 81,290 | ||||||
| Teijin Ltd. | 2,000 | 30,681 | ||||||
| 792,656 | ||||||||
| ASSET MANAGEMENT - 0.5% | ||||||||
| Industrivarden AB * | 5,759 | 154,660 | ||||||
| Magellan Financial Group Ltd. | 7,753 | 300,217 | ||||||
| Rand Merchant Investment Holdings Ltd. | 57,786 | 101,097 | ||||||
| 555,974 | ||||||||
| AUTOMOTIVE - 5.9% | ||||||||
| Aisin Seiki Co. Ltd. | 26,600 | 807,124 | ||||||
| Bayerische Motoren Werke AG | 1,651 | 85,377 | ||||||
| Continental AG | 7,424 | 788,943 | ||||||
| Fiat Chrysler Automobiles NV * | 60,512 | 742,466 | ||||||
| Hankook Tire Co., Ltd. | 7,314 | 204,896 | ||||||
| Honda Motor Co. Ltd. -ADR ^ | 23,900 | 564,518 | ||||||
| Hyundai Mobis Co., Ltd. | 553 | 110,801 | ||||||
| Hyundai Motor Co. | 3,820 | 256,958 | ||||||
| Hyundai Motor Co. | 923 | 135,105 | ||||||
| Kia Motors Corp. | 11,634 | 521,775 | ||||||
| Magna International, Inc. ^ | 17,182 | 878,172 | ||||||
| Mazda Motor Corp. | 8,000 | 42,069 | ||||||
| Mitsubishi Motors Corp. * | 58,500 | 107,449 | ||||||
| NGK Insulators Ltd. | 1,100 | 15,738 | ||||||
| Nissan Motor Co. Ltd. * | 77,900 | 276,217 | ||||||
| Porsche Automobil Holding SE | 3,193 | 171,086 | ||||||
| Renault SA * | 15,100 | 374,028 | ||||||
| Schaeffler AG | 12,065 | 73,480 | ||||||
| Sumitomo Rubber Industries Ltd. | 3,900 | 34,356 | ||||||
| Tofas Turk Otomobil Fabrikasi AS | 121,994 | 390,472 | ||||||
| Volkswagen AG | 1,732 | 252,334 | ||||||
| Volkswagen AG - ADR | 6,500 | 101,205 | ||||||
| Weifu High-Technology Group Co. Ltd. | 162,600 | 299,417 | ||||||
| 7,233,986 | ||||||||
| BANKING - 3.3% | ||||||||
| Akbank T.A.S. * | 134,695 | 76,382 | ||||||
| Banco Bradesco SA | 99,500 | 312,857 | ||||||
| Banco do Brasil SA - ADR | 19,700 | 100,963 | ||||||
| BNK Financial Group, Inc. | 31,712 | 154,914 | ||||||
| Haci Omer Sabanci Holding AS | 1 | 1 | ||||||
| Hana Financial Group, Inc. | 10,225 | 276,203 | ||||||
| KB Financial Group, Inc. | 1,832 | 65,530 | ||||||
| Sberbank of Russia PJSC | 550,580 | 1,392,459 | ||||||
| Shinsei Bank Ltd. | 6,700 | 80,731 | ||||||
| Sumitomo Mitsui Financial Group, Inc. | 29,800 | 826,144 | ||||||
| VTB BANK PJSC | 1,915,580,000 | 789,126 | ||||||
| 4,075,310 | ||||||||
See accompanying notes to financial statements.
58
| SCHEDULE OF INVESTMENTS |
| Dunham International Stock Fund (Continued) |
| October 31, 2020 |
| Security | Shares | Value | ||||||
| COMMON STOCKS - 98.6% (Continued) | ||||||||
| BEVERAGES - 0.5% | ||||||||
| Anadolu Efes Biracilik Ve Malt Sanayii AS | 42,812 | $ | 99,425 | |||||
| Coca-Cola Bottlers Japan, Inc. | 15,000 | 212,053 | ||||||
| Yakult Honsha Co. Ltd. | 5,800 | 281,096 | ||||||
| 592,574 | ||||||||
| BIOTECH & PHARMA - 7.1% | ||||||||
| AstraZeneca PLC - ADR | 21,360 | 1,071,418 | ||||||
| Chugai Pharmaceutical Co. Ltd. | 29,700 | 1,148,120 | ||||||
| Daiichi Sankyo Co. Ltd. | 32,100 | 848,493 | ||||||
| Eisai Co., Ltd. - ADR | 1,820 | 142,015 | ||||||
| Novartis AG | 20,763 | 1,618,613 | ||||||
| Novo Nordisk A/S | 10,390 | 662,582 | ||||||
| Roche Holding AG | 8,606 | 2,766,586 | ||||||
| Sanofi | 4,137 | 373,608 | ||||||
| 8,631,435 | ||||||||
| CHEMICALS - 7.0% | ||||||||
| Braskem SA | 67,700 | 264,882 | ||||||
| Clariant AG | 43,056 | 738,978 | ||||||
| Covestro AG | 20,889 | 997,120 | ||||||
| Daicel Corp. | 29,100 | 207,984 | ||||||
| Hanwha Solutions Corp. | 6,809 | 264,677 | ||||||
| Huabao Flavours & Fragrances Co. Ltd. | 20,163 | 156,916 | ||||||
| Indorama Ventures PCL | 513,400 | 363,518 | ||||||
| Kaneka Corp. | 8,100 | 227,008 | ||||||
| KCC Corp. | 475 | 64,462 | ||||||
| LG Chem Ltd. | 482 | 133,648 | ||||||
| Methanex Corp. | 5,400 | 160,218 | ||||||
| Mitsubishi Gas Chemical Co., Inc. | 27,300 | 498,400 | ||||||
| Mitsui Chemicals, Inc. | 23,900 | 613,043 | ||||||
| National Industrialization Co. * | 98,285 | 296,142 | ||||||
| National Petrochemical Co. | 6,749 | 48,679 | ||||||
| Nitto Denko Corp. | 3,200 | 225,152 | ||||||
| Nutrien Ltd. ^ | 18,700 | 760,716 | ||||||
| PhosAgro PJSC | 10,128 | 359,314 | ||||||
| Sasol Ltd. * | 14,171 | 74,118 | ||||||
| Saudi Arabian Fertilizer Co. | 26,739 | 537,589 | ||||||
| Shin-Etsu Chemical Co., Ltd. | 6,800 | 909,601 | ||||||
| Sociedad Quimica y Minera de Chile SA | 11,553 | 421,653 | ||||||
| Sumitomo Chemical Co. Ltd. | 53,700 | 175,923 | ||||||
| 8,499,741 | ||||||||
| COMMERCIAL SUPPORT SERVICES - 0.3% | ||||||||
| G4S PLC * | 28,351 | 74,615 | ||||||
| Persol Holdings Co. Ltd. | 19,700 | 298,823 | ||||||
| 373,438 | ||||||||
| CONSTRUCTION MATERIALS - 1.2% | ||||||||
| Cie de Saint-Gobain - ADR * | 8,700 | 67,686 | ||||||
| CSG Holding Co. Ltd. | 619,000 | 187,054 | ||||||
| Guangdong Tapai Group Co. Ltd. | 100,600 | 197,749 | ||||||
| James Hardie Industries PLC - ADR | 24,731 | 602,942 | ||||||
| Taiheiyo Cement Corp. | 10,500 | 246,822 | ||||||
| Titan Cement International SA | 8,762 | 109,479 | ||||||
| 1,411,732 | ||||||||
| CONTAINERS & PACKAGING - 0.2% | ||||||||
| Brambles Ltd. - ADR | 4,200 | 56,658 | ||||||
| Klabin SA | 206,000 | 168,987 | ||||||
| 225,645 | ||||||||
See accompanying notes to financial statements.
59
| SCHEDULE OF INVESTMENTS |
| Dunham International Stock Fund (Continued) |
| October 31, 2020 |
| Security | Shares | Value | ||||||
| COMMON STOCKS - 98.6% (Continued) | ||||||||
| DIVERSIFIED INDUSTRIALS - 1.3% | ||||||||
| Doosan Fuel Cell Co., Ltd. * | 2,940 | $ | 101,152 | |||||
| Hitachi Ltd. | 21,200 | 715,591 | ||||||
| Hitachi Ltd. - ADR | 1,793 | 120,418 | ||||||
| Kawasaki Heavy Industries Ltd. * | 4,000 | 47,859 | ||||||
| Mitsubishi Heavy Industries Ltd. | 5,000 | 107,585 | ||||||
| Omron Corp. | 7,000 | 506,192 | ||||||
| 1,598,797 | ||||||||
| E-COMMERCE DISCRETIONARY - 2.2% | ||||||||
| Alibaba Group Holding Ltd. - ADR * | 1,016 | 309,565 | ||||||
| JD.com, Inc. - ADR * | 21,367 | 1,741,838 | ||||||
| Rakuten, Inc. | 4,900 | 47,744 | ||||||
| Rakuten, Inc. - ADR | 26,500 | 257,315 | ||||||
| Vipshop Holdings Ltd. - ADR * ^ | 16,235 | 347,429 | ||||||
| 2,703,891 | ||||||||
| ELECTRIC UTILITIES - 3.0% | ||||||||
| Cia Paranaense de Energia | 30,600 | 292,520 | ||||||
| EDP Renovaveis SA | 6,376 | 121,233 | ||||||
| Enel SpA | 201,825 | 1,604,887 | ||||||
| Engie Brasil Energia SA | 32,500 | 224,276 | ||||||
| Iberdrola SA | 52,460 | 619,532 | ||||||
| Kansai Electric Power Co., Inc. | 61,100 | 556,858 | ||||||
| Tokyo Electric Power Co. Holdings, Inc. * | 79,600 | 205,702 | ||||||
| 3,625,008 | ||||||||
| ELECTRICAL EQUIPMENT - 0.5% | ||||||||
| Delta Electronics Thailand PCL ++ | 114,000 | 654,122 | ||||||
| ENGINEERING & CONSTRUCTION - 0.3% | ||||||||
| Daelim Industrial Co. Ltd. | 2,392 | 89,946 | ||||||
| Enka Insaat ve Sanayi AS | 1 | 1 | ||||||
| GS Engineering & Construction Corp. | 11,971 | 284,040 | ||||||
| 373,987 | ||||||||
| ENTERTAINMENT CONTENT - 1.1% | ||||||||
| NCSoft Corp. | 105 | 72,144 | ||||||
| NetEase, Inc. - ADR | 2,075 | 180,089 | ||||||
| Sea Ltd. - ADR * ^ | 6,853 | 1,080,718 | ||||||
| 1,332,951 | ||||||||
| FOOD - 1.0% | ||||||||
| Almarai Co. JSC | 16,716 | 229,994 | ||||||
| CJ CheilJedang Corp. | 362 | 50,403 | ||||||
| Nestle SA | 6,175 | 694,854 | ||||||
| Remgro Ltd. | 33,836 | 180,775 | ||||||
| 1,156,026 | ||||||||
| FORESTRY, PAPER & WOOD PRODUCTS - 0.0% | ||||||||
| Suzano SA - ADR * | 5,403 | 46,790 | ||||||
| HEALTH CARE FACILITIES & SERVICES - 0.1% | ||||||||
| Medipal Holdings Corp. | 6,600 | 117,825 | ||||||
| HOME & OFFICE PRODUCTS - 0.8% | ||||||||
| Arcelik AS * | 64,164 | 206,261 | ||||||
| Coway Co. Ltd. * | 2,254 | 138,018 | ||||||
| Electrolux AB | 2,328 | 52,476 | ||||||
| Jason Furniture Hangzhou Co. Ltd. | 52,500 | 561,620 | ||||||
| 958,375 | ||||||||
| HOME CONSTRUCTION - 0.0% | ||||||||
| Taylor Wimpey PLC * | 36,241 | 49,558 | ||||||
See accompanying notes to financial statements.
60
| SCHEDULE OF INVESTMENTS |
| Dunham International Stock Fund (Continued) |
| October 31, 2020 |
| Security | Shares | Value | ||||||
| COMMON STOCKS - 98.6% (Continued) | ||||||||
| HOUSEHOLD PRODUCTS - 1.5% | ||||||||
| Amorepacific Corp. | 2,256 | $ | 105,081 | |||||
| LG Household & Health Care Ltd. ++ | 236 | 144,149 | ||||||
| Unicharm Corp. | 3,100 | 143,652 | ||||||
| Unilever NV | 19,601 | 1,105,172 | ||||||
| Unilever PLC | 4,648 | 264,373 | ||||||
| 1,762,427 | ||||||||
| INDUSTRIAL INTERMEDIATE PROD - 0.6% | ||||||||
| Hartalega Holdings Bhd | 135,100 | 586,042 | ||||||
| NSK Ltd. | 15,500 | 124,278 | ||||||
| 710,320 | ||||||||
| INDUSTRIAL SUPPORT SERVICES - 0.2% | ||||||||
| LG Corp. | 4,445 | 203,889 | ||||||
| INSTITUTIONAL FINANCIAL SERVICES - 1.6% | ||||||||
| B3 SA - Brasil Bolsa Balcao | 35,500 | 312,826 | ||||||
| China Merchants Securities Co. Ltd. * | 98,280 | 121,861 | ||||||
| Computershare Ltd. | 25,961 | 221,655 | ||||||
| Daiwa Securities Group, Inc. | 51,300 | 208,167 | ||||||
| Haitong Securities Co. Ltd. | 268,400 | 227,306 | ||||||
| Mirae Asset Daewoo Co Ltd. | 47,375 | 189,762 | ||||||
| Nomura Holdings, Inc. | 111,000 | 497,844 | ||||||
| Orient Securities Co. Ltd. | 182,400 | 120,142 | ||||||
| 1,899,563 | ||||||||
| INSURANCE - 2.2% | ||||||||
| Aegon NV | 19,630 | 52,814 | ||||||
| CNP Assurances * | 3,854 | 43,475 | ||||||
| Dai-ichi Life Holdings, Inc. | 50,800 | 759,845 | ||||||
| Hanwha Corp. | 12,423 | 264,935 | ||||||
| Hanwha Corp. | 5,255 | 59,833 | ||||||
| Momentum Metropolitan Holdings | 86,000 | 68,907 | ||||||
| MS&AD Insurance Group Holdings, Inc. | 8,900 | 243,912 | ||||||
| NN Group NV | 16,088 | 559,974 | ||||||
| Porto Seguro SA | 13,800 | 114,880 | ||||||
| T&D Holdings, Inc. | 54,900 | 549,489 | ||||||
| 2,718,064 | ||||||||
| INTERNET MEDIA & SERVICES - 2.2% | ||||||||
| NAVER Corp. | 804 | 205,720 | ||||||
| Shopify, Inc. * | 557 | 515,465 | ||||||
| Shopify, Inc. * | 1,286 | 1,184,613 | ||||||
| Spotify Technology SA * | 1,872 | 449,074 | ||||||
| Wix.com Ltd. * ^ | 1,212 | 299,752 | ||||||
| 2,654,624 | ||||||||
| LEISURE FACILITIES & SERVICES- 0.5% | ||||||||
| Aristocrat Leisure Ltd. | 24,953 | 502,007 | ||||||
| Evolution Gaming Group AB | 995 | 73,777 | ||||||
| Melco Resorts & Entertainment Ltd. - ADR | 5,711 | 92,061 | ||||||
| 667,845 | ||||||||
| LEISURE PRODUCTS - 0.3% | ||||||||
| Chinadive Watersports, Inc. | 8,982 | 78,539 | ||||||
| Giant Manufacturing Co. Ltd. | 34,000 | 335,882 | ||||||
| 414,421 | ||||||||
| MACHINERY - 1.9% | ||||||||
| CNH Industrial NV * | 51,375 | 398,414 | ||||||
| GEA Group AG | 7,034 | 234,299 | ||||||
| Sandvik AB * | 19,515 | 347,749 | ||||||
| Techtronic Industries Co. Ltd. | 7,000 | 94,257 | ||||||
| Techtronic Industries Co. Ltd. - ADR | 7,139 | 480,383 | ||||||
| Tian Di Science & Technology Co. Ltd. | 460,500 | 208,778 | ||||||
| WEG SA | 42,400 | 558,127 | ||||||
| 2,322,007 | ||||||||
See accompanying notes to financial statements.
61
| SCHEDULE OF INVESTMENTS |
| Dunham International Stock Fund (Continued) |
| October 31, 2020 |
| Security | Shares | Value | ||||||
| COMMON STOCKS - 98.6% (Continued) | ||||||||
| MEDICAL EQUIPMENT & DEVICES - 3.2% | ||||||||
| Alcon, Inc. * | 4,778 | $ | 271,763 | |||||
| Coloplast A/S | 4,268 | 624,219 | ||||||
| Hoya Corp. | 7,200 | 813,775 | ||||||
| Koninklijke Philips NV * | 13,908 | 644,284 | ||||||
| Olympus Corp. | 28,600 | 548,333 | ||||||
| Smith & Nephew PLC | 27,710 | 480,232 | ||||||
| Terumo Corp. | 12,300 | 453,360 | ||||||
| Top Glove Corp. Bhd - ADR | 3,600 | 29,556 | ||||||
| 3,865,522 | ||||||||
| METALS & MINING - 10.8% | ||||||||
| Anglo American PLC | 42,320 | 991,047 | ||||||
| AngloGold Ashanti Ltd. - ADR ^ | 11,240 | 260,094 | ||||||
| B2Gold Corp. | 82,000 | 528,080 | ||||||
| BHP Group Ltd. | 73,406 | 1,758,034 | ||||||
| BHP Group PLC | 36,022 | 696,485 | ||||||
| BHP Group PLC - ADR | 1,777 | 69,072 | ||||||
| Cia de Minas Buenaventura SAA - ADR | 41,287 | 506,592 | ||||||
| Evolution Mining Ltd. | 55,899 | 218,946 | ||||||
| First Quantum Minerals Ltd. | 27,372 | 314,295 | ||||||
| First Quantum Minerals Ltd. | 10,400 | 120,016 | ||||||
| Franco-Nevada Corp. | 860 | 117,433 | ||||||
| Glencore PLC * | 206,824 | 416,408 | ||||||
| Glencore PLC - ADR * | 27,416 | 109,664 | ||||||
| Grupo Mexico SAB de CV | 5,000 | 14,212 | ||||||
| Huaibei Mining Holdings Co. Ltd. | 116,629 | 175,770 | ||||||
| Impala Platinum Holdings Ltd. - ADR ^ | 59,130 | 521,527 | ||||||
| Kinross Gold Corp. | 74,300 | 592,171 | ||||||
| Mitsubishi Materials Corp. | 4,100 | 75,344 | ||||||
| MMC Norilsk Nickel PJSC | 1,316 | 312,280 | ||||||
| MMC Norilsk Nickel PJSC - ADR | 3,591 | 85,609 | ||||||
| Northam Platinum Ltd. * | 39,026 | 375,536 | ||||||
| Pan American Silver Corp. | 6,648 | 211,105 | ||||||
| Polyus PJSC | 992 | 194,188 | ||||||
| Rio Tinto Ltd. | 9,035 | 587,218 | ||||||
| Rio Tinto PLC | 4,296 | 242,519 | ||||||
| Rio Tinto PLC - ADR ^ | 9,616 | 545,900 | ||||||
| Sibanye Stillwater Ltd. * | 235,014 | 694,057 | ||||||
| South32 Ltd. - ADR | 4,590 | 32,360 | ||||||
| Southern Copper Corp. ^ | 11,689 | 611,802 | ||||||
| Teck Resources Ltd. | 19,452 | 255,450 | ||||||
| Teck Resources Ltd. | 36,900 | 484,866 | ||||||
| Vale SA | 75,400 | 789,176 | ||||||
| Vale SA - ADR | 7,900 | 83,503 | ||||||
| Wheaton Precious Metals Corp. | 3,322 | 152,328 | ||||||
| 13,143,087 | ||||||||
| OIL & GAS PRODUCERS - 4.7% | ||||||||
| BP PLC - ADR | 32,453 | 502,372 | ||||||
| China Petroleum & Chemical Corp. | 1,550,000 | 605,047 | ||||||
| Eni SpA - ADR | 8,627 | 120,605 | ||||||
| Gazprom PJSC | 409,190 | 797,917 | ||||||
| KOC Holding AS | 92,035 | 155,725 | ||||||
| LUKOIL PJSC | 24,250 | 1,234,046 | ||||||
| Petrobras Distribuidora SA | 35,500 | 117,656 | ||||||
| PetroChina Co. Ltd. - ADR | 7,492 | 213,222 | ||||||
| Petroleo Brasileiro SA | 144,300 | 473,492 | ||||||
See accompanying notes to financial statements.
62
| SCHEDULE OF INVESTMENTS |
| Dunham International Stock Fund (Continued) |
| October 31, 2020 |
| Security | Shares | Value | ||||||
| COMMON STOCKS - 98.6% (Continued) | ||||||||
| OIL & GAS PRODUCERS - 4.7% (Continued) | ||||||||
| Rosneft Oil Co PJSC | 142,310 | $ | 628,590 | |||||
| Royal Dutch Shell PLC | 21,449 | 273,410 | ||||||
| Surgutneftegas PJSC | 1,345,800 | 557,875 | ||||||
| 5,679,957 | ||||||||
| PUBLISHING & BROADCASTING - 0.3% | ||||||||
| Fuji Media Holdings, Inc. | 13,100 | 126,175 | ||||||
| Nippon Television Holdings, Inc. | 21,000 | 221,930 | ||||||
| 348,105 | ||||||||
| REAL ESTATE OWNERS & DEVELOPERS - 0.2% | ||||||||
| Hang Lung Group Ltd. | 37,000 | 82,108 | ||||||
| Swire Pacific Ltd. - ADR | 21,900 | 100,740 | ||||||
| 182,848 | ||||||||
| RETAIL - CONSUMER STAPLES - 1.8% | ||||||||
| Abdullah Al Othaim Markets Co. | 8,358 | 291,949 | ||||||
| BIM Birlesik Magazalar AS | 63,578 | 502,468 | ||||||
| Magnit PJSC | 3,577 | 212,404 | ||||||
| Seven & i Holdings Co. Ltd. | 15,100 | 459,640 | ||||||
| Woolworths Group Ltd. | 26,512 | 712,522 | ||||||
| Woolworths Holdings Ltd. | 27,042 | 58,172 | ||||||
| 2,237,155 | ||||||||
| RETAIL - DISCRETIONARY - 1.9% | ||||||||
| CJ ENM Co. Ltd. | 3,385 | 395,500 | ||||||
| JUMBO SA | 4,585 | 64,276 | ||||||
| Kingfisher PLC * | 47,089 | 174,786 | ||||||
| Lao Feng Xiang Co. Ltd. | 18,100 | 53,685 | ||||||
| Localiza Rent a Car SA | 26,100 | 274,987 | ||||||
| Lojas Americanas SA | 94,800 | 379,134 | ||||||
| Pandora A/S | 107 | 8,489 | ||||||
| Wesfarmers Ltd. | 12,057 | 389,920 | ||||||
| Yamada Holdings Co. Ltd. | 108,300 | 528,832 | ||||||
| 2,269,609 | ||||||||
| SEMICONDUCTORS - 6.5% | ||||||||
| ASML Holding NV | 2,446 | 885,123 | ||||||
| ASML Holding NV - ADR ^ | 1,086 | 392,274 | ||||||
| Hoshine Silicon Industry Co. Ltd. | 89,099 | 400,782 | ||||||
| Renesas Electronics Corp. * | 25,700 | 212,459 | ||||||
| Silicon Motion Technology Corp. - ADR | 10,089 | 380,759 | ||||||
| SK Hynix, Inc. | 14,214 | 1,008,382 | ||||||
| STMicroelectronics NV - ADR ^ | 23,921 | 730,547 | ||||||
| Taiwan Semiconductor Manufacturing Co., Ltd. - ADR | 35,000 | 529,539 | ||||||
| Taiwan Semiconductor Manufacturing Co. Ltd. | 24,794 | 2,079,473 | ||||||
| Tokyo Electron Ltd. | 800 | 215,047 | ||||||
| Tokyo Electron Ltd. - ADR | 4,100 | 275,110 | ||||||
| United Microelectronics Corp. | 768,000 | 825,409 | ||||||
| 7,934,904 | ||||||||
| SOFTWARE - 3.0% | ||||||||
| Atlassian Corp PLC * ^ | 5,883 | 1,127,301 | ||||||
| Check Point Software Technologies Ltd. * | 2,081 | 236,318 | ||||||
| Constellation Software, Inc. | 100 | 104,893 | ||||||
| Micro Focus International PLC * | 20,549 | 57,550 | ||||||
| Sage Group PLC | 16,965 | 139,318 | ||||||
| SAP SE | 9,473 | 1,010,797 | ||||||
| Trend Micro, Inc. | 3,700 | 207,563 | ||||||
| WiseTech Global Ltd. | 14,681 | 299,149 | ||||||
| Xero Ltd. * | 6,565 | 508,832 | ||||||
| 3,691,721 | ||||||||
See accompanying notes to financial statements.
63
| SCHEDULE OF INVESTMENTS |
| Dunham International Stock Fund (Continued) |
| October 31, 2020 |
| Security | Shares | Value | ||||||
| COMMON STOCKS - 98.6% (Continued) | ||||||||
| STEEL - 2.2% | ||||||||
| Angang Steel Co. Ltd. | 484,242 | $ | 191,099 | |||||
| ArcelorMittal SA * | 72,078 | 977,548 | ||||||
| BlueScope Steel Ltd. | 9,540 | 98,445 | ||||||
| Eregli Demir ve Celik Fabrikalari TAS | 72,608 | 82,996 | ||||||
| Gerdau SA | 30,700 | 95,678 | ||||||
| Gerdau SA | 73,400 | 277,637 | ||||||
| Hyundai Steel Co. | 8,272 | 212,661 | ||||||
| Iskenderun Demir ve Celik AS | 251,984 | 223,631 | ||||||
| Magnitogorsk Iron & Steel Works PJSC | 614,900 | 291,331 | ||||||
| Nippon Steel Corp. * | 4,700 | 45,654 | ||||||
| Novolipetsk Steel PJSC | 71,280 | 166,795 | ||||||
| POSCO | 383 | 70,703 | ||||||
| 2,734,178 | ||||||||
| TECHNOLOGY HARDWARE - 9.6% | ||||||||
| Alps Alpine Co. Ltd. | 9,400 | 135,818 | ||||||
| Brother Industries Ltd. | 10,100 | 156,299 | ||||||
| Canon, Inc. | 20,500 | 357,356 | ||||||
| Chicony Electronics Co. Ltd. | 144,000 | 434,136 | ||||||
| LG Display Co. Ltd. * | 36,416 | 454,709 | ||||||
| LG Display Co. Ltd. - ADR * | 26,600 | 166,782 | ||||||
| LG Electronics, Inc. | 2,286 | 169,940 | ||||||
| LG Electronics, Inc. ++ | 8,191 | 233,300 | ||||||
| MINEBEA MITSUMI, Inc. | 18,200 | 329,204 | ||||||
| Nikon Corp. | 23,000 | 140,378 | ||||||
| Nintendo Co. Ltd. | 2,900 | 1,570,322 | ||||||
| Panasonic Corp. | 174,600 | 1,615,264 | ||||||
| Samsung Electro-Mechanics Co. Ltd. | 1,460 | 78,009 | ||||||
| Samsung Electronics Co. Ltd. | 67,400 | 3,387,903 | ||||||
| Samsung Electronics Co. Ltd. | 8,550 | 380,346 | ||||||
| Samsung Electronics Co. Ltd. - ADR | 126 | 159,138 | ||||||
| Samsung Electronics Co. Ltd. - ADR 144A | 375 | 421,500 | ||||||
| Sharp Corp. | 48,600 | 562,827 | ||||||
| TDK Corp. | 4,000 | 471,100 | ||||||
| Telefonaktiebolaget LM Ericsson | 44,643 | 498,263 | ||||||
| 11,722,594 | ||||||||
| TECHNOLOGY SERVICES - 1.5% | ||||||||
| CGI, Inc. * | 731 | 45,446 | ||||||
| Experian PLC | 11,174 | 408,558 | ||||||
| Fujitsu Ltd. | 3,600 | 426,564 | ||||||
| NEC Corp. | 5,400 | 272,402 | ||||||
| Nomura Research Institute Ltd. | 12,700 | 374,919 | ||||||
| RELX PLC | 8,912 | 176,010 | ||||||
| Wolters Kluwer NV | 1,876 | 151,920 | ||||||
| 1,855,819 | ||||||||
| TELECOMMUNICATIONS - 2.8% | ||||||||
| China Unicom Hong Kong Ltd. | 22,000 | 13,557 | ||||||
| Hellenic Telecommunications Organization SA | 10,966 | 145,453 | ||||||
| Mobile TeleSystems PJSC | 221,340 | 866,007 | ||||||
| Nippon Telegraph & Telephone Corp | 29,600 | 623,584 | ||||||
| Orange SA - ADR ^ | 30,800 | 346,192 | ||||||
| Telecom Argentina SA - ADR ^ | 28,500 | 182,685 | ||||||
| Telecom Italia SpA/Milano | 48,323 | 17,593 | ||||||
| Telecom Italia SpA/Milano - ADR | 18,181 | 60,234 | ||||||
| Telefonica Brasil SA | 128,811 | 419,098 | ||||||
| TIM Participacoes SA | 150,200 | 307,902 | ||||||
| Turkcell Iletisim Hizmetleri AS | 266,852 | 461,886 | ||||||
| 3,444,191 | ||||||||
See accompanying notes to financial statements.
64
| SCHEDULE OF INVESTMENTS |
| Dunham International Stock Fund (Continued) |
| October 31, 2020 |
| Security | Shares | Value | ||||||||
| COMMON STOCKS - 98.6% (Continued) | ||||||||||
| TRANSPORTATION & LOGISTICS - 1.2% | ||||||||||
| CJ Logistics Corp. * | 1,399 | $ | 197,449 | |||||||
| CMST Development Co. Ltd. * | 318,500 | 212,506 | ||||||||
| Deutsche Lufthansa AG * ^ | 25,294 | 216,429 | ||||||||
| East Japan Railway Co. | 10,000 | 523,710 | ||||||||
| GMexico Transportes SAB de CV | 56,300 | 66,626 | ||||||||
| Nippon Express Co. Ltd. | 400 | 22,465 | ||||||||
| Pan Ocean Co. Ltd. * | 29,363 | 93,490 | ||||||||
| Rumo SA * | 50,500 | 159,137 | ||||||||
| Turk Hava Yollari AO * | 1 | 1 | ||||||||
| 1,491,813 | ||||||||||
| TRANSPORTATION EQUIPMENT - 0.3% | ||||||||||
| Hino Motors Ltd. | 5,400 | 41,435 | ||||||||
| Traton SE | 19,019 | 369,565 | ||||||||
| 411,000 | ||||||||||
| WHOLESALE - CONSUMER STAPLES - 0.1% | ||||||||||
| Marubeni Corp. | 29,500 | 154,254 | ||||||||
| TOTAL COMMON STOCKS (Cost - $112,956,276) | 120,199,947 | |||||||||
| EXCHANGE TRADED FUNDS - 1.0% | ||||||||||
| EQUITY FUND - 1.0% | ||||||||||
| Global X MSCI Argentina ETF ^ | 26,769 | 629,875 | ||||||||
| iShares MSCI Eurozone ETF | 10,300 | 632,317 | ||||||||
| TOTAL EXCHANGE TRADED FUNDS (Cost - $1,280,687) | 1,262,192 | |||||||||
| Expiration Date | ||||||||||
| WARRANT- 0.0% | ||||||||||
| CHEMICALS - 0.0% | ||||||||||
| Barito Pacific TBK PT * ++ | 6/4/2021 | 178,610 | 6,155 | |||||||
| TOTAL WARRANT (Cost - $0) | ||||||||||
| COLLATERAL FOR SECURITIES LOANED - 7.2% | ||||||||||
| Mount Vernon Prime Portfolio, 0.16% + # | 8,764,809 | 8,764,809 | ||||||||
| TOTAL COLLATERAL FOR SECURITIES LOANED (Cost - $8,764,809) | ||||||||||
| TOTAL INVESTMENTS - 106.8% (Cost - $123,001,772) | $ | 130,233,103 | ||||||||
| LIABILITIES IN EXCESS OF OTHER ASSETS - (6.8)% | (8,302,379 | ) | ||||||||
| NET ASSETS - 100.0% | $ | 121,930,724 | ||||||||
ADR - American Depositary Receipt.
ETF - Exchange Traded Fund
Ltd. - Limited Liability Company
NV - Non-Voting
PCL - Petroleum Limited Company
PLC - Public Limited Company
Tbk Pt - Publically traded private limited company in indonesia
| * | Non-income producing security. |
| ^ | All or a portion of these securities are on loan. Total loaned securities had a value of $8,356,960 at October 31, 2020. |
| + | Variable rate security. Interest rate is as of October 31, 2020. |
| ++ | Illiquid security |
144A - Security exempt from registration under Rule 144A of the Securities Act of 1933. These securities may be sold in transactions exempt from registration, normally to qualified institutional buyers. The 144A securities amounted to $421,500 or 0.35% of net assets.
| # | The Trust’s securities lending policies and procedures require that the borrower: (i) deliver cash or U.S. Government securities as collateral with respect to each new loan of U.S. securities, equal to at least 102% (105% for non US Shares) of the value of the portfolio securities loaned, and (ii) at all times thereafter mark-to-market the collateral on a daily basis so that the market value of such collateral is at least 100% of the value of securities loaned. From time to time the collateral may not be 102% due to end of day market movement. The next business day additional collateral is obtained/received from the borrower to replenish/reestablish 102%. |
| Portfolio Composition * - (Unaudited) | ||||||||||
| Japan | 20.1 | % | China | 5.1 | % | |||||
| South Korea | 8.9 | % | Australia | 4.4 | % | |||||
| Great Britain | 6.9 | % | Brazil | 4.1 | % | |||||
| Russia | 6.1 | % | Taiwan | 3.6 | % | |||||
| Switzerland | 5.7 | % | Other Countries ** | 29.8 | % | |||||
| Canada | 5.3 | % | Total | 100.0 | % | |||||
| * | Based on total value of investments as of October 31, 2020. |
| ** | Includes collateral for securities loaned as of October 31, 2020. |
Percentage may differ from Schedule of Investments which is based on Fund net assets
See accompanying notes to financial statements.
65
| Dunham Dynamic Macro Fund (Unaudited) |
| Message from the Sub-Adviser (Mellon Investments Corporation) |
Asset Class Recap
Global equities and bond yields systematically rose to begin the fiscal year and close the 2019 calendar year. The optimism spilled into the New Year as the U.S. and China completed phase one of the trade deal on January 15. Shortly after the signing, concerns over the adverse economic effects of the Coronavirus outbreak sparked volatility, pushing both yields and equity markets substantially lower. Following the historic declines in February and March, markets strongly rebounded in April. This trend continued to begin the third fiscal quarter as markets rallied in reaction to economies beginning to reopen and economic data showing signs of a sharp recovery. Central banks around the world made it unequivocally clear that they stand willing to use their full firepower to keep government and corporate borrowing costs low. Additionally, investors may have become more optimistic about the outlook after initial signs of success in human trials of a vaccine against the Coronavirus. In July and August, investors cheered additional evidence that economic activity improved since the lockdown, however, the pace of new infections rose in most regions causing a slowing of economic reopening and concerns of new government-mandated restrictions. To close the fiscal year, volatility once again rose as investors anxiously awaiting additional government stimulus were disappointed as congress was unable to come to an agreement ahead of the U.S. election. Global macro strategies, as measured by the IQ Hedge Global Macro Beta Index, increased 7.3 percent during the fiscal year ended October 31, 2020.
Allocation Review
As positive economic data came in the final months of 2019, the Sub-Adviser saw this as an opportunity to reduce the defensive asset strategy and increase the exposure to the growth strategy. This shift initially benefited the Fund as equities rose, however, this exposure detracted from performance as the Coronavirus pandemic took hold. As volatility persisted, the Sub-Adviser reduced the growth asset strategy to a low of 29.5 percent and increased the defensive asset strategy to a high of 67.5 percent. As markets rebounded, the Sub-Adviser built back up the exposure to the growth asset strategy and reduced the exposure to the defensive asset strategy. Although the allocation to the strategies remained relatively unchanged as volatility resurfaced near the end of the fiscal year, the Sub-Adviser increased the allocation to cash. The allocation to the real asset strategy was stable through the fiscal year as the Sub-Adviser’s view of the asset class did not change.
Holdings Insights
After being one of the biggest detractors from Fund performance in the first half of the fiscal year, the growth asset strategy was the strongest contributor to positive Fund performance in the second half of the fiscal year, more than making up for the adverse effect to begin the fiscal year. The largest exposure within the growth asset strategy was dedicated to U.S. equities. This was achieved through the SPDR S&P 500 ETF Trust (SPY) (holding weight*: 18.84 percent) as well as through long exposures to S&P 500 call options which also contributed to Fund performance. Over the fiscal year, SPY rose 9.8 percent. The exposure to developed ex-U.S. equities detracted from Fund performance in the fiscal year. The iShares Hedged MSCI Germany ETF (HEWG) (holding weight*: 0.88 percent) slightly contributed to Fund performance in the first half of the fiscal year but strongly detracted to close the period as Europe contended with a second wave of the Coronavirus pandemic and the reimposition of government restrictions. For the fiscal year, HEWG declined 9.4 percent. The Fund’s exposure to Japan also detracted from positive Fund performance. By the close of the fiscal year, the exposure to Japan represented the largest equity short exposure within the Fund and was partially facilitated through the TSE TOPIX Future 12/10/20 (TPZ0) (holding notional weight*: -25.99 percent). This short position detracted as the TPZ0 rose 7.3 percent in the final fiscal quarter of the year. A strong contributor to performance over the fiscal year outside the U.S. was the iShares MSCI Emerging Markets ETF (EEM) (holding weight*: 2.34 percent), which rose 7.9 percent.
The defensive asset strategy broadly achieved its goal of attempting to provide some downside protection for the Fund during the spikes in volatility late in the first half of the fiscal year and in the final fiscal quarter, as well as providing positive absolute returns as markets rebounded. For the fiscal year, the defensive asset strategy was the strongest contributor to positive performance, and the largest portion of the defensive asset strategy is dedicated to U.S. government bonds. This exposure strongly contributed to Fund performance over the full fiscal year despite slightly declining in the final months. The defensive asset strategy also received positive contributions from the SPDR Portfolio Intermediate-Term Corporate Bond Fund (SPIB) (holding weight**: 10.6 percent during the period). As spreads widened, the Sub-Adviser took advantage of these suppressed values by adding SPIB to the Fund in late March. Since being added to the Fund, SPIB increased 23.4 percent until being liquidated in late July. The largest short within the defensive strategy and the Fund was dedicated to developed ex -U.S. bonds. This position was expressed through derivatives and contributed to Fund performance. For example, since being added to the Fund, the Long Gilt Future 12/18/20 (G Z0) (holding notional weight*: -23.34 percent) contributed to Fund performance as the future declined 1.4 percent.
The real assets strategy, while the smallest allocation in the Fund, detracted from Fund performance in the fiscal year. The goal of the strategy is to hedge against inflation while also providing potential diversification benefits. This was implemented through commodities via the iShares Commodities Select Strategy ETF (COMT) (holding weight*: 3.02 percent), which fell 21.9 percent in the fiscal year ended October 31, 2020. The diversifying strategy adversely affected Fund performance over the fiscal year, detracting 221 basis points from Fund performance.
Sub-Adviser Outlook
The Sub- Adviser is optimistic for opportunities within the various asset categories the Fund invests in for the rest of 2020, albeit with continued volatility. The Sub-Adviser remains steadfast in its belief that this volatility-targeted strategy may provide investors with more consistent returns than traditional asset classes. It believes that through the flexibility of its strategy and the use of alternative investments, the Fund may provide what may be considered attractive returns with lower systematic risk and lower correlation than traditional equity investments.
| * | Holdings percentage(s) of total investments, cash and unsettled trades excluding collateral for securities loaned, as of 10/31/2020. |
| ** | Holdings percentage(s) as of the date prior to the sale of the security. |
Growth of $100,000 Investment
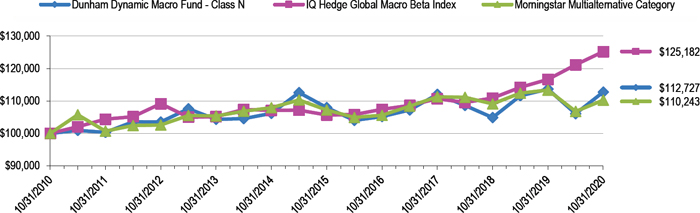
Total Returns (a) as of October 31, 2020
| Annualized | Annualized | ||
| One Year | Five Years | Ten Years | |
| Class N | (0.79)% | 0.87% | 1.21% |
| Class A with load of 5.75% | (6.69)% | (0.57)% | 0.34% |
| Class A without load | (1.00)% | 0.62% | 0.94% |
| Class C | (1.78)% | (0.15)% | 0.18% |
| IQ Hedge Global Macro Beta Index | 7.33% | 3.44% | 2.27% |
| Morningstar Multialternative Category | (2.73)% | 0.56% | 0.98% |
| (a) | Total Returns are calculated based on traded NAVs. |
The IQ Hedge Global Macro Beta Index seeks to replicate the risk-adjusted return characteristics of the collective hedge funds using a global macro investment style.
Investors cannot invest directly in an index or benchmark.
The Morningstar Multialternative Category is generally representative of mutual funds with static allocations to alternative strategies and asset classes. The gross short exposure in these mutual funds is generally greater than 20%.
| As disclosed in the Trust’s latest registration statement, the Fund’s total annual operating expenses, including underlying funds, are 1.69% for Class N, 2.69% for Class C and 1.94% for Class A. Class A shares are subject to a sales load of 5.75% and a deferred sales charge of up to 0.75%. The performance data quoted here represents past performance, which is not indicative of future results. Current performance may be lower or higher than the performance data quoted. The investment return and NAV will fluctuate, so that an investor’s shares, when redeemed, may be worth more or less than their original cost. Total returns are calculated assuming reinvestment of all dividends and capital gains distributions, if any. The returns do not reflect the deductions of taxes a shareholder would pay on the redemption of Fund shares or Fund distributions. For performance information current to the most recent month-end, please call 1-800-442-4358 or visit our website www.dunham.com. |
66
| SCHEDULE OF INVESTMENTS |
| Dunham Dynamic Macro Fund |
| October 31, 2020 |
| Security | Shares | Value | ||||||||||||||
| EXCHANGE TRADED FUNDS - 43.5% | ||||||||||||||||
| COMMODITY - 3.0% | ||||||||||||||||
| iShares Commodities Select Strategy ETF | 37,616 | $ | 909,555 | |||||||||||||
| EQUITY - 32.9% | ||||||||||||||||
| iShares Currency Hedged MSCI Germany ETF | 37,060 | 934,653 | ||||||||||||||
| iShares MSCI Emerging Markets ETF ++ | 15,784 | 705,703 | ||||||||||||||
| SPDR S&P 500 ETF Trust | 25,275 | 8,253,299 | ||||||||||||||
| 9,893,655 | ||||||||||||||||
| FIXED INCOME - 7.6% | ||||||||||||||||
| SPDR Bloomberg Barclays High Yield Bond ETF | 21,748 | 2,268,316 | ||||||||||||||
| TOTAL EXCHANGE TRADED FUNDS (Cost - $10,950,295) | 13,071,526 | |||||||||||||||
| Exercise | Expiration | |||||||||||||||
| Counterparty | Contracts | Notional | Price | Date | ||||||||||||
| PURCHASED OPTIONS * + - 6.3% | ||||||||||||||||
| CALL OPTION ON FUTURES PURCHASED - 4.7% | ||||||||||||||||
| US 10 Year Future, Maturing December 2020 | Goldman Sachs | 106 | $ | 13,250,000 | US $125 | 11/20/2020 | 1,401,193 | |||||||||
| PUT OPTIONS ON FUTURES PURCHASED - 1.6% | ||||||||||||||||
| Euro-Bund Option, Maturing December 2020 @ | Goldman Sachs | 27 | 6,290,190 | EUR $200 | 11/20/2020 | (75,384 | ) | |||||||||
| S&P 500 E-Mini Option, Maturing November 2020 | Goldman Sachs | 27 | 4,590,000 | US $3,400 | 11/20/2020 | 240,705 | ||||||||||
| S&P 500 E-Mini Option, Maturing November 2020 | Goldman Sachs | 27 | 4,684,500 | US $3,470 | 11/20/2020 | 305,370 | ||||||||||
| US 10 Year Future, Maturing December 2020 | Goldman Sachs | 92 | 12,558,000 | US $136.50 | 11/20/2020 | 15,812 | ||||||||||
| 486,503 | ||||||||||||||||
| TOTAL PURCHASED OPTIONS (Cost - $1,756,752) | 1,887,696 | |||||||||||||||
| Principal | Discount | |||||||||||||||
| Amount ($) | Rate (%) | Maturity | ||||||||||||||
| SHORT-TERM INVESTMENTS - 48.2% | ||||||||||||||||
| U.S. GOVERNMENT SECURITIES - 39.7% | ||||||||||||||||
| US Treasury Bill | 10,689,000 | 0.0742 | 12/17/2020 | 10,687,964 | ||||||||||||
| US Treasury Bill ^^ | 1,238,000 | 0.0897 | 2/25/2021 | 1,237,639 | ||||||||||||
| 11,925,603 | ||||||||||||||||
| Shares | Interest Rate (%) | |||||||||||||||
| MONEY MARKET - 8.5% | ||||||||||||||||
| Morgan Stanley Institutional Liquidity Fund - Government Portfolio | 2,562,366 | 0.0200 | ^ | 2,562,366 | ||||||||||||
| TOTAL SHORT-TERM INVESTMENTS - (Cost - $14,487,506) | 14,487,969 | |||||||||||||||
| COLLATERAL FOR SECURITIES LOANED - 1.4% | ||||||||||||||||
| Mount Vernon Prime Portfolio # (Cost - $423,660) | 423,660 | 0.1600 | ^ | 423,660 | ||||||||||||
| TOTAL INVESTMENTS - 99.4% (Cost - $27,618,213) | $ | 29,870,851 | ||||||||||||||
| OTHER ASSETS LESS LIABILITIES - 0.6% | 171,641 | |||||||||||||||
| NET ASSETS - 100.0% | $ | 30,042,492 | ||||||||||||||
See accompanying notes to financial statements.
67
| SCHEDULE OF INVESTMENTS |
| Dunham Dynamic Macro Fund (Continued) |
| October 31, 2020 |
| Unrealized | ||||||||||||||||
| Expiration | Appreciation | |||||||||||||||
| Open Futures Contracts ** | Counterparty | Contracts | Notional | Date | (Depreciation) | |||||||||||
| LONG FUTURES CONTRACTS - (0.7)% | ||||||||||||||||
| AUST 10 Year Bond Future | Goldman Sachs | 56 | $ | 11,922,794 | 12/15/2020 | $ | 50,500 | |||||||||
| CAC40 10 Euro Future | Goldman Sachs | 8 | 427,733 | 11/20/2020 | (11,867 | ) | ||||||||||
| Canadian 10 Year Bond Future | Goldman Sachs | 5 | 566,393 | 12/18/2020 | (1,568 | ) | ||||||||||
| FTSE 100 Index Future | Goldman Sachs | 36 | 2,589,700 | 12/18/2020 | (161,653 | ) | ||||||||||
| FTSE/MIB Index Future | Goldman Sachs | 6 | 625,560 | 12/18/2020 | (41,527 | ) | ||||||||||
| S&P/TSX 60 IX Future | Goldman Sachs | 8 | 1,110,466 | 12/17/2020 | (44,691 | ) | ||||||||||
| SPI 200 Future | Goldman Sachs | 2 | 206,813 | 12/17/2020 | (8,059 | ) | ||||||||||
| US 10 Year Note (CBT) | Goldman Sachs | 5 | 691,095 | 12/21/2020 | (2,968 | ) | ||||||||||
| TOTAL FUTURES CONTRACTS PURCHASED | (221,833 | ) | ||||||||||||||
| SHORT FUTURES CONTRACTS - 0.4% | ||||||||||||||||
| Amsterdam Index Future | Goldman Sachs | (3) | (372,170 | ) | 11/20/2020 | 27,182 | ||||||||||
| Euro-Bond Future | Goldman Sachs | (6) | (1,231,130 | ) | 12/18/2020 | (8,773 | ) | |||||||||
| Hang Seng Index Future | Goldman Sachs | (1) | (155,754 | ) | 11/27/2020 | 3,766 | ||||||||||
| IBEX 35 Index Future | Goldman Sachs | (5) | (374,983 | ) | 11/20/2020 | 24,922 | ||||||||||
| Long Gilt Future | Goldman Sachs | (40) | (7,017,376 | ) | 12/18/2020 | 28,260 | ||||||||||
| S&P 500 E-mini Future | Goldman Sachs | (3) | (489,705 | ) | 12/18/2020 | 11,236 | ||||||||||
| Topix Index Future | Goldman Sachs | (11) | (1,655,156 | ) | 12/10/2020 | 47,984 | ||||||||||
| TOTAL FUTURES CONTRACTS SOLD | 134,577 | |||||||||||||||
| NET UNREALIZED LOSS FROM FUTURES CONTRACTS | $ | (87,256 | ) | |||||||||||||
| WRITTEN OPTIONS + - (1.3)% | ||||||||||||||||
| WRITTEN PUT FUTURE OPTIONS - (1.3)% | ||||||||||||||||
| S&P 500 E-Mini Option, Maturing November 2020 | Goldman Sachs | (40) | (6,400,000 | ) | US $3,200 | 11/20/2020 | $ | (175,800 | ) | |||||||
| S&P 500 E-Mini Option, Maturing November 2020 | Goldman Sachs | (40) | (6,540,000 | ) | US $3,270 | 11/20/2020 | (227,000 | ) | ||||||||
| TOTAL WRITTEN OPTIONS - (Premiums Received - $161,586) | $ | (402,800 | ) | |||||||||||||
ETF - Exchange Traded Fund
| + | Each option contract allows holder to purchase/sell 100 shares of the underlying security at the exercise price. |
| @ | Security traded on Eurex exchange and trades like a future. Security trades with no upfront cost and is mark to market like a future. |
| ^ | Variable rate security. Interest rate is as of October 31, 2020. |
| ^^ | All of this security is segregated as collateral for futures contracts. |
| ** | The amounts shown are the underlying reference notional amounts to stock exchange indices, debt securities and equities upon which the fair value of the futures contracts held by the Fund are based. Notional values do not represent the current fair value of, and are not necessarily indicative of the future cash flows futures contracts. Further, the underlying price changes in relation to the variables specified by the notional values affects the fair value of these derivative financial instruments. The notional values as set forth within this schedule do not purport to represent economic value at risk to the Fund. |
| ++ | All or a portion of these securities are on loan. Total loaned securities had a value of $410,851 at October 31, 2020. Total loaned securities that have been sold and pending settlement had a value of $391,000. |
| # | The Trust’s securities lending policies and procedures require that the borrower. (i) deliver cash or U.S. Government securities as collateral with respect to each new loan of U.S. securities, at least 102% of the value of the portfolio securities loaned, and (ii) at all times thereafter mark-to-market the collateral on a daily basis so that the market value of such collateral is at least 100% of the value of securities loaned. From time to time the collateral may not be 102% due to end of day market movement. The next business day additional collateral is obtained/received from the borrower to replenish/reestablish 102%. |
See accompanying notes to financial statements.
68
| Dunham Long/Short Credit Fund (Unaudited) |
| Message from the Sub-Adviser (MetLife Investment Advisors LLC) |
Asset Class Recap
Credit markets experienced mixed results during the fiscal year, as shutdowns shocked nearly all sectors, highlighting narrow segments and devastating broad swaths of industries. The proceeding reopening of the economy prompted investors to sift through the rubble for survivors. During the fiscal year, the Bloomberg Barclays U.S. Credit Index increased 7.1 percent. Spread expansion and compression was a consistent theme throughout the period. After the tumultuous lows reached in March, BBBs broadly outperformed their higher quality counterparts, posting a return of 21.4 percent versus 15.9 percent for A-rated credit. High-yield bonds, as measured by the BofA Merrill Lynch High-Yield Bond Cash Pay Index, generated a positive return during the fiscal year of 2.6 percent, with its strongest performance coming after March’s turmoil. Similar to high grade credit, lower quality outperformed with CCC’s tallying a total return of 27.6 percent from the March lows, but still ending the fiscal year down 5.3 percent. Another key theme toward the latter part of the fiscal year was primary issuance - investment grade issuers brought nearly $1 trillion to market in the second half of the fiscal year. While bolstering balance sheet liquidity and flexibility were the overarching use of proceeds, the focus in the final fiscal quarter turned to balance sheet optimization, as issuers worked to reduce their interest expense by tendering for higher coupon front end debt and issuing at near record low yields further out the curve. High-yield bond issuance was proportionally lower, with close to $280 billion of issuance. This record issuance across the ratings spectrum has been met with strong demand from investors.
Allocation Review
As high grade credit spreads continued to tighten during the recovery and junk bond yields compressed, the Sub-Adviser became increasingly cautious of those higher valuations. Therefore, the Sub-Adviser sought to limit the Fund’s net long exposure as it attempted to navigate the various risks present in the perilous markets. As the landscape has become increasingly uncertain, due to increasing virus case counts, which have sparked additional calls for a second round of shutdowns, and uncertainty surrounding the U.S. election, broad risks within the bond markets appeared less attractive to the Sub-Adviser. While these are very identifiable risks, these risks are very hard to handicap. Therefore, the Sub-Adviser generally sought to increase the Fund’s allocations to the strategies that it believes could best mitigate such exogenous shocks. This included increasing the allocation to the pairs trades strategy to nearly 20 percent of the Fund as well as continuing to seek opportunistic trades, which exceeded 20 percent, as well. As the Sub-Adviser had identified core long holdings earlier in the year, it retained those at approximately 15 percent of the Fund, while balancing the long exposures with additional rate hedges and credit shorts. Each of these strategies implemented by the Sub-Adviser may utilize derivatives such as credit default SWAPs and total return SWAPs.
Holdings Insights
As the opportunistic strategy was one of the strongest contributors during the fiscal year, it generally entailed short holding periods as the Sub-Adviser sought to take advantage of the temporary pricing discrepancies. For example, the Fund held the Leviathan Offshore Ltd. bond (M6746GAB2) (holding weight**: 0.66 percent), a project located on a large natural gas field in the Mediterranean Sea off the coast of Israel. From when it was initially added to the Fund in early August until it was sold in late September, the Leviathan Offshore bond increased more than 3.5 percent. Another opportunistic strategy holding in the Fund was AngloGold Ashanti Holdings PLC (03512TAE1) (holding weight*: 1.19 percent), the third-largest gold producer globally and the largest on the African continent. The AngloGold bond was added to the Fund at the end of September and returned close to 6.8 percent through the end of the fiscal year. New issuance also provided opportunities for the Fund, including the Agree Realty LP bond (008513AA1) (holding weight*: 1.07 percent), a publicly traded real estate investment trust with tenants in the retail sector. Since it was added to the Fund in August, it increased close to 3.7 percent.
Within the core long positions, the Fund continued to hold the Hard Rock Sacramento bond issued by the Enterprise Development Authority (29390WAA4) (holding weight*: 0.60 percent), which has seen large crowds since its opening. The Hard Rock Sacramento bond returned close to 15 percent during the final fiscal quarter, after experiencing some drawdowns earlier in the fiscal year. However, not all long positions experienced strong performance during the fiscal year or the most recent fiscal quarter, as the Fund held the Transocean Poseidon Ltd. bond (89383JAA6) (holding weight**: 1.12 percent), an offshore drilling contractor. The Transocean Poseidon bond’s price had surged 14.7 percent during the third fiscal quarter as oil prices began to recover, but faltered near 11 percent before it was sold in mid-September.
Similar to the previous fiscal quarter, the Fund’s short positions, such as the SWAPs on the iBoxx USD Liquid High-Yield Index (IBOXHY) (holding weight*: -9.78 percent), detracted from performance during the continued recovery. The IBOXHY increased 1.6 percent during the fiscal year, detracting a similar amount to the Fund due to the short position accessed through the SWAPs. Similar to the inverse effect of the IBOXHY holding, the Fund continued to hold the CDX NA SWAP (CDX) (holding weight*: 8.31 percent), which generally tracks the inverse performance of a basket of investment-grade bonds. Taking into effect the inverse nature of the instrument, the holding depreciated close to 3.2 percent during the fiscal quarter, as the basket of securities generally appreciated.
Sub-Adviser Outlook
The Sub- Adviser believes that the continued broad run-up in corporate bonds has presented concerns that risks may be underappreciated. Therefore, it continues to carefully consider company fundamentals as it assesses individual opportunities for the Fund as well as the broad economic factors as it strategically adjusts the overall risk exposure of the Fund. The Sub-Adviser believes that it is crucial to have the ability to quickly adjust the Fund’s positioning if its concerns come to fruition.
| * | Holdings percentage(s) of total investments, cash and unsettled trades excluding collateral for securities loaned, as of 10/31/2020. |
| ** | Holdings percentage(s) as of the date prior to the sale of the security. |
Growth of $100,000 Investment
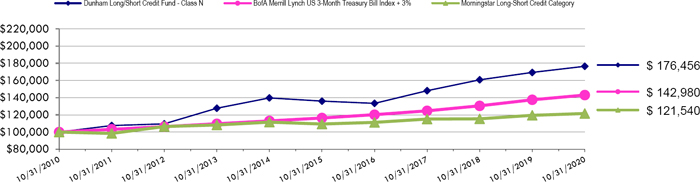
| Total Returns (a) as of October 31, 2020 | |||
| Annualized | Annualized | ||
| One Year | Five Years | Ten Years | |
| Class N | 4.23% | 5.36% | 5.84% |
| Class A with load of 5.75% | (2.00)% | 3.85% | 4.95% |
| Class A without load | 3.98% | 5.08% | 5.58% |
| Class C | 3.24% | 4.29% | 4.78% |
| BofA Merrill Lynch US 3-Month Treasury Bill Index +3% | 3.92% | 4.20% | 3.64% |
| Morningstar Long-Short Credit Category | 1.74% | 2.14% | 1.97% |
| (a) | Total Returns are calculated based on traded NAVs. |
The BofA Merrill Lynch US 3-Month Treasury Bill Index + 3% is comprised of a single issue purchased at the beginning of the month and held for a full month. At the end of the month that issue is sold and rolled in a newly selected issue. The issue selected at each month-end rebalancing is the outstanding Treasury Bill that matures closest to, but not beyond, three months from the rebalancing date. To qualify for selection, an issue must have settled on or before the month-end rebalancing date. Plus an annualized return of 3%.
The Morningstar Long- Short Credit Category is generally representative of funds that purchase or sell bonds, credit default swaps, or other credit derivatives to potentially benefit from changes in the credit markets and/or individual issuers.
| As disclosed in the Trust’s latest registration statement as supplemented the Fund’s total annual operating expenses, including the cost of underlying funds, are 1.26% for Class N, 2.26% for Class C and 1.51% for Class A. Class A shares are subject to a sales load of 5.75% and a deferred sales charge of up to 0.75%. The performance data quoted here represents past performance, which is not indicative of future results. Current performance may be lower or higher than the performance data quoted. The investment return and NAV will fluctuate, so that an investor’s shares, when redeemed, may be worth more or less than their original cost. Total returns are calculated assuming reinvestment of all dividends and capital gains distributions, if any. The returns do not reflect the deductions of taxes a shareholder would pay on the redemption of Fund shares or Fund distributions. For performance information current to the most recent month-end, please call 1-800-442-4358 or visit our website www.dunham.com |
69
| SCHEDULE OF INVESTMENTS |
| Dunham Long/Short Credit Fund |
| October 31, 2020 |
| Variable | Principal | Interest | Maturity | |||||||||||||
| Security | Rate | Amount | Rate % | Date | Value | |||||||||||
| TERM LOANS - 2.0% | ||||||||||||||||
| LEISURE FACILITIES & SERVICES - 2.0% | ||||||||||||||||
| Hard Rock Northern Indiana | 1 mo. LIBOR + 9.000% | $ | 2,502,703 | 9.140 | + | 11/7/2025 | $ | 2,367,132 | ||||||||
| Hard Rock Northern Indiana | 1 mo. LIBOR + 9.000% | 182,297 | 9.140 | + | 11/7/2025 | 172,422 | ||||||||||
| TOTAL TERM LOANS (Cost - $2,575,469) | 2,539,554 | |||||||||||||||
| CORPORATE BONDS - 36.5% | ||||||||||||||||
| APPAREL & TEXTILE PRODUCTS - 1.1% | ||||||||||||||||
| PVH Corporation | 1,360,000 | 4.625 | 7/10/2025 | 1,436,288 | ||||||||||||
| AUTOMOTIVE - 1.2% | ||||||||||||||||
| Ford Motor Company | 415,000 | 9.000 | 4/22/2025 | 489,567 | ||||||||||||
| General Motors Financial Company | 3 mo. LIBOR + 1.550% | 1,010,000 | 1.779 | + | 1/14/2022 | 1,014,979 | ||||||||||
| 1,504,546 | ||||||||||||||||
| BANKING - 3.2% | ||||||||||||||||
| Bank of Nova Scotia (The) | 5 Year Treasury + 4.551% | 415,000 | 4.900 | + | 9/4/2168 | 434,215 | ||||||||||
| JP Morgan Chase & Company | 3 mo. LIBOR + 0.550% | 2,005,000 | 0.800 | + | 2/1/2027 | 1,859,864 | ||||||||||
| Wachovia Capital Trust II - 144A | 3 mo. LIBOR + 0.500% | 1,000,000 | 0.737 | + | 1/15/2027 | 916,434 | ||||||||||
| Wells Fargo & Company | 795,000 | 5.950 | 12/1/2086 | 1,033,470 | ||||||||||||
| 4,243,983 | ||||||||||||||||
| BIOTECHNOLOGY & PHARMACEUTICALS - 3.3% | ||||||||||||||||
| P&L Development, LLC / PLD Finance Corporation - 144A | 1,100,000 | 7.750 | 11/15/2025 | 1,123,375 | ||||||||||||
| Royalty Pharma plc - 144A | 755,000 | 1.750 | 9/2/2027 | 750,125 | ||||||||||||
| Royalty Pharma plc - 144A ^ | 1,130,000 | 2.200 | 9/2/2030 | 1,114,641 | ||||||||||||
| Takeda Pharmaceutical Company Ltd. ^ | 1,310,000 | 3.175 | 7/9/2050 | 1,335,549 | ||||||||||||
| 4,323,690 | ||||||||||||||||
| CHEMICALS - 0.5% | ||||||||||||||||
| TPC Group, Inc. - 144A | 750,000 | 10.500 | 8/1/2024 | 627,735 | ||||||||||||
| CONTAINERS & PACKAGING - 1.4% | ||||||||||||||||
| CCL Industries, Inc. - 144A | 1,690,000 | 3.050 | 6/1/2030 | 1,798,920 | ||||||||||||
| DIVERSIFIED INDUSTRIALS - 0.5% | ||||||||||||||||
| General Electric Company | 90,000 | 5.875 | 1/14/2038 | 108,584 | ||||||||||||
| General Electric Company ^ | 530,000 | 4.250 | 5/1/2040 | 559,384 | ||||||||||||
| 667,968 | ||||||||||||||||
| FOOD - 1.1% | ||||||||||||||||
| Kraft Heinz Foods Company - 144A | 255,000 | 3.875 | 5/15/2027 | 270,130 | ||||||||||||
| Kraft Heinz Foods Company ^ | 250,000 | 5.000 | 6/4/2042 | 275,115 | ||||||||||||
| Smithfield Foods, Inc. - 144A | 890,000 | 2.650 | 10/3/2021 | 894,699 | ||||||||||||
| 1,439,944 | ||||||||||||||||
| HEALTH CARE FACILITIES & SERVICES - 1.6% | ||||||||||||||||
| Catholic Health Services of Long Island Obligated Group | 540,000 | 3.368 | 7/1/2050 | 520,093 | ||||||||||||
| CommonSpirit Health | 1,500,000 | 4.187 | 10/1/2049 | 1,555,071 | ||||||||||||
| 2,075,164 | ||||||||||||||||
| INSTITUTIONAL FINANCIAL SERVICES - 2.1% | ||||||||||||||||
| Blackstone / GSO Secured Lending Fund - 144A | 1,255,000 | 3.625 | 1/15/2026 | 1,238,682 | ||||||||||||
| Goldman Sachs Capital I | 1,150,000 | 6.345 | 2/15/2034 | 1,557,831 | ||||||||||||
| 2,796,513 | ||||||||||||||||
| INSURANCE - 4.6% | ||||||||||||||||
| Brown & Brown, Inc. ^ | 2,365,000 | 2.375 | 3/15/2031 | 2,380,692 | ||||||||||||
| Markel Corporation ^ | 5 Year Treasury + 5.662% | 920,000 | 6.000 | + | 12/1/2068 | 978,650 | ||||||||||
| Mutual of Omaha Insurance Company - 144A | 3 mo. LIBOR + 2.640% | 410,000 | 4.297 | + | 7/15/2054 | 425,679 | ||||||||||
| Ohio National Financial Services, Inc. - 144A | 1,350,000 | 5.550 | 1/24/2030 | 1,300,517 | ||||||||||||
| United Insurance Holdings Corporation | 1,000,000 | 6.250 | 12/15/2027 | 983,190 | ||||||||||||
| 6,068,728 | ||||||||||||||||
| LEISURE FACILITIES & SERVICES - 0.6% | ||||||||||||||||
| Enterprise Development Authority (The) - 144A | 725,000 | 12.000 | 7/15/2024 | 804,750 | ||||||||||||
| MACHINERY - 0.7% | ||||||||||||||||
| Caterpillar Financial Services Corporation | 3 mo. LIBOR + 0.390% | 840,000 | 0.670 | + | 5/17/2021 | 841,775 | ||||||||||
See accompanying notes to financial statements.
70
| SCHEDULE OF INVESTMENTS |
| Dunham Long/Short Credit Fund (Continued) |
| October 31, 2020 |
| Variable | Principal | Interest | Maturity | |||||||||||||
| Security | Rate | Amount | Rate % | Date | Value | |||||||||||
| CORPORATE BONDS - 36.5% (Continued) | ||||||||||||||||
| MEDICAL EQUIPMENT & DEVICES - 0.9% | ||||||||||||||||
| Smith & Nephew plc | $ | 1,225,000 | 2.032 | 10/14/2030 | $ | 1,220,280 | ||||||||||
| METALS & MINING - 2.8% | ||||||||||||||||
| AngloGold Ashanti Holdings plc | 1,500,000 | 3.750 | 10/1/2030 | 1,593,075 | ||||||||||||
| First Quantum Minerals Ltd. - 144A ^ | 1,500,000 | 6.875 | 10/15/2027 | 1,498,110 | ||||||||||||
| Fresnillo plc - 144A | 605,000 | 4.250 | 10/2/2050 | 617,100 | ||||||||||||
| 3,708,285 | ||||||||||||||||
| OIL & GAS PRODUCERS - 4.2% | ||||||||||||||||
| Galaxy Pipeline Assets Bidco Ltd.- 144A | 260,000 | 1.750 | 9/30/2027 | 259,480 | ||||||||||||
| Galaxy Pipeline Assets Bidco Ltd.- 144A | 315,000 | 2.625 | 3/31/2036 | 314,694 | ||||||||||||
| Petroleos Mexicanos - 144A ^ | 2,500,000 | 6.875 | 10/16/2025 | 2,475,000 | ||||||||||||
| WPX Energy, Inc. | 2,385,000 | 5.750 | 6/1/2026 | 2,452,973 | ||||||||||||
| 5,502,147 | ||||||||||||||||
| REITS - 2.4% | ||||||||||||||||
| Agree, L.P. | 1,390,000 | 2.900 | 10/1/2030 | 1,432,313 | ||||||||||||
| Scentre Group Trust - 144A | 5 Year Treasury + 4.379% | 1,775,000 | 4.750 | + | 9/24/2080 | 1,754,920 | ||||||||||
| 3,187,233 | ||||||||||||||||
| SEMICONDUCTORS - 0.7% | ||||||||||||||||
| Broadcom, Inc. ^ | 830,000 | 3.150 | 11/15/2025 | 895,587 | ||||||||||||
| SPECIALTY FINANCE - 2.4% | ||||||||||||||||
| Finance of America Funding, LLC | 1,240,000 | 7.875 | 11/15/2025 | 1,227,600 | ||||||||||||
| Discover Financial Services | 5 Year Treasury + 5.783% | 1,000,000 | 6.125 | + | 3/23/2069 | 1,080,500 | ||||||||||
| GE Capital International Funding Company Unlimited Company | 785,000 | 4.418 | 11/15/2035 | 849,790 | ||||||||||||
| 3,157,890 | ||||||||||||||||
| TECHNOLOGY HARDWARE - 0.4% | ||||||||||||||||
| Hewlett Packard Enterprise Company ^ | 450,000 | 4.650 | 10/1/2024 | 508,374 | ||||||||||||
| TELECOMMUNICATIONS - 0.8% | ||||||||||||||||
| Sprint Spectrum Company, LLC - 144A | 930,000 | 5.152 | 3/20/2028 | 1,085,970 | ||||||||||||
| TOTAL CORPORATE BONDS (Cost - $46,479,980) | 47,895,770 | |||||||||||||||
| Shares | ||||||||||||||||
| COMMON STOCK - 1.5% | ||||||||||||||||
| REAL ESTATE SERVICES - 1.5% | ||||||||||||||||
| UIRC-GSA International, LLC Series QIB - 144A * ! | 2,000 | 2,000,000 | ||||||||||||||
| TELECOMMUNICATIONS - 0.0% | ||||||||||||||||
| NII Holdings, Inc. - 144A * ! | 10,000 | 21,700 | ||||||||||||||
| TOTAL COMMON STOCK (Cost - $2,057,730) | 2,021,700 | |||||||||||||||
| Principal | ||||||||||||||||
| Amount | ||||||||||||||||
| U.S. GOVERNMENT & AGENCIES - 43.4% | ||||||||||||||||
| TREASURY BILLS - 35.4% | ||||||||||||||||
| Treasury Bill | $ | 15,470,000 | 0.078 | 11/27/2020 | 15,469,221 | |||||||||||
| Treasury Bill | 15,470,000 | 0.083 | 12/10/2020 | 15,468,694 | ||||||||||||
| Treasury Bill | 15,475,000 | 0.084 | 1/7/2021 | 15,472,872 | ||||||||||||
| 46,410,787 | ||||||||||||||||
| TREASURY NOTES / BONDS - 8.0% | ||||||||||||||||
| Treasury Note / Bond ^ | 4,360,000 | 0.250 | 9/30/2025 | �� | 4,333,942 | |||||||||||
| Treasury Note / Bond ^ | 755,000 | 0.625 | 8/15/2030 | 738,543 | ||||||||||||
| Treasury Note / Bond | 1,400,000 | 1.125 | 8/15/2040 | 1,332,188 | ||||||||||||
| Treasury Note / Bond ^ | 4,455,000 | 1.250 | 5/15/2050 | 4,048,481 | ||||||||||||
| 10,453,154 | ||||||||||||||||
| TOTAL U.S. GOVERNMENT & AGENCIES (Cost - $57,048,724) | 56,863,941 | |||||||||||||||
See accompanying notes to financial statements.
71
| SCHEDULE OF INVESTMENTS |
| Dunham Long/Short Credit Fund (Continued) |
| October 31, 2020 |
| Principal | Interest | Maturity | ||||||||||
| Security | Amount | Rate % | Date | Value | ||||||||
| NON U.S. GOVERNMENT & AGENCIES - 0.2% | ||||||||||||
| GOVERNMENT GUARANTEED - 0.2% | ||||||||||||
| Kreditanstalt fuer Wiederaufbau | 1,570,000 kr | 1.000 | 10/12/2021 | $ | 165,325 | |||||||
| European Investment Bank | 1,140,000 kr | 1.500 | 1/26/2024 | 123,418 | ||||||||
| TOTAL NON U.S. GOVERNMENT & AGENCIES (Cost - $312,941) | 288,743 | |||||||||||
| Shares | ||||||||||||
| SHORT-TERM INVESTMENT - 13.1% | ||||||||||||
| MONEY MARKET FUND - 13.1% | ||||||||||||
| First American Government Obligations Fund - Class X | 17,218,740 | 0.050 | + | 17,218,740 | ||||||||
| TOTAL SHORT-TERM INVESTMENT (Cost - $17,218,740) | ||||||||||||
| COLLATERAL FOR SECURITIES LOANED - 14.1% | ||||||||||||
| Mount Vernon Prime Portfolio # | 18,515,308 | 0.160 | + | 18,515,308 | ||||||||
| TOTAL COLLATERAL FOR SECURITIES LOANED (Cost - $18,515,308) | ||||||||||||
| TOTAL INVESTMENTS - 110.8% (Cost - $144,208,892) | $ | 145,343,756 | ||||||||||
| LIABILITIES IN EXCESS OF OTHER ASSETS - (10.8)% | (14,153,360 | ) | ||||||||||
| TOTAL NET ASSETS - 100.0% | $ | 131,190,396 | ||||||||||
LIBOR - London Inter-Bank Offered Rate
LLC - Limited Liability Company
L.P. - Limited Partnership
LTD - Limited Company
plc - Public Limited Company
REITs - Real Estate Investment Trusts
| * | Non-income producing security. |
| + | Variable rate security. Interest rate is as of October 31, 2020. |
| ! | Fair Value estimated using fair value procedures adopted by Board of Trustees. Total value of such securities is $2,021,700 or 1.54% of net assets as of October 31, 2020. |
144A - Security exempt from registration under Rule 144A of the Securities Act of 1933. These securities may be sold in transactions exempt from registration, normally to qualified institutional buyers. As of October 31, 2020 the total market value of 144A securities is $21,292,661 or 16.2% of net assets.
| ^ | All or a portion of these securities are on loan. Total loaned securities had a value of $18,010,190 at October 31, 2020. |
| # | The Trust’s securities lending policies and procedures require that the borrower: (i) deliver cash or U.S. Government securities as collateral with respect to each new loan of U.S. securities, equal to at least 102% of the value of the portfolio securities loaned, and (ii) at all times thereafter mark-to-market the collateral on a daily basis so that the market value of such collateral is at least 100% of the value of securities loaned. From time to time the collateral may not be 102% due to end of day market movement. The next business day additional collateral is obtained/received from the borrower to replenish/reestablish 102%. |
| Short | Notional Value at | Maturity | Unrealized | |||||||||||||||
| Security | Counterparty | Contracts | October 31, 2020 | Date | Appreciation | |||||||||||||
| OPEN SHORT FUTURES CONTRACTS ** - (0.4)% | ||||||||||||||||||
| CBOT 5 Year US Treasury Note | HSBC Securities, Inc. | 58 | $ | 7,284,916 | December-20 | $ | 14,075 | |||||||||||
| CBOT 10 Year US Treasury Note | HSBC Securities, Inc. | 147 | 20,318,193 | December-20 | 106,752 | |||||||||||||
| CBOT US Long Bond Future | HSBC Securities, Inc. | 85 | 14,659,865 | December-20 | 336,591 | |||||||||||||
| NET UNREALIZED GAIN FROM OPEN SHORT FUTURE CONTRACTS | $ | 457,418 | ||||||||||||||||
| CREDIT DEFAULT SWAPS | ||||||||||||||||||
| Unrealized | ||||||||||||||||||
| Notional Value at | Fixed Deal | Premium | Maturity | Appreciation/ | ||||||||||||||
| Description | Counterparty | October 31, 2020 | (Received) Rate | Paid (Received) | Date | (Depreciation) | ||||||||||||
| To Buy Protection - CDX NA IG. 32 | HSBC Securities, Inc. | $ | 1,000,000 | 1.00% | $ | (15,307 | ) | 6/20/2024 | $ | 8,761 | ||||||||
| To Buy Protection - CDX NA IG. 33 | HSBC Securities, Inc. | 10,000,000 | 1.00% | (148,350 | ) | 12/20/2024 | 82,897 | |||||||||||
| To Buy Protection - Commonwealth Bank of Australia | Goldman Sachs | 2,000,000 | 1.00% | (10,467 | ) | 12/20/2023 | (38,152 | ) | ||||||||||
| To Buy Protection - D.R. Horton, Inc. | Barclays | 3,000,000 | 1.00% | (89,071 | ) | 6/20/2025 | 3,277 | |||||||||||
| To Buy Protection - Fiserv, Inc. | Barclays | 5,000,000 | 1.00% | (224,072 | ) | 12/20/2025 | 47,390 | |||||||||||
| To Sell Protection - Johnson & Johnson (1) | Barclays | (5,000,000 | ) | 1.00% | 224,072 | 12/20/2025 | (36,277 | ) | ||||||||||
| To Buy Protection - Packaging Corporation of America | Barclays | 3,000,000 | 1.00% | (123,770 | ) | 6/20/2025 | 24,197 | |||||||||||
| To Buy Protection - Prudential Financial, Inc. | JPMorgan | 3,000,000 | 1.00% | (34,197 | ) | 6/20/2024 | (38,124 | ) | ||||||||||
| To Buy Protection - The Williams Company | Goldman Sachs | 3,000,000 | 1.00% | (75,268 | ) | 6/20/2025 | 54,504 | |||||||||||
| To Sell Protection - Total SE (1) | Goldman Sachs | (3,000,000 | ) | 1.00% | 75,602 | 6/20/2025 | (4,649 | ) | ||||||||||
| To Buy Protection - United Rentals | JPMorgan | 3,000,000 | 5.00% | (226,461 | ) | 6/20/2022 | (8,784 | ) | ||||||||||
| To Sell Protection - Verizon Communications (1) | Barclays | (3,000,000 | ) | 1.00% | 21,006 | 6/20/2022 | 49,633 | |||||||||||
| To Buy Protection - Kraft Heinz Food | JPMorgan | 2,000,000 | 1.00% | (31,954 | ) | 6/20/2023 | (885 | ) | ||||||||||
| To Sell Protection - Kraft Heinz Food (1) | Goldman Sachs | (2,000,000 | ) | 1.00% | 14,987 | 6/20/2023 | 19,689 | |||||||||||
| To Buy Protection - Newell Brands | Goldman Sachs | 2,000,000 | 1.00% | 22,030 | 6/20/2023 | 12,027 | ||||||||||||
| To Sell Protection - Newell Brands (1) | JPMorgan | (2,000,000 | ) | 1.00% | (32,614 | ) | 6/20/2023 | (3,280 | ) | |||||||||
| NET UNREALIZED GAIN FROM CREDIT DEFAULT SWAPS | $ | 172,224 | ||||||||||||||||
See accompanying notes to financial statements.
72
| SCHEDULE OF INVESTMENTS |
| Dunham Long/Short Credit Fund (Continued) |
| October 31, 2020 |
| TOTAL RETURN SWAPS | ||||||||||||||
| Unrealized | ||||||||||||||
| Notional Value | Maturity | Appreciation/ | ||||||||||||
| Reference Entity | Counterparty | (Received) Rate | Variable Rate | Date | (Depreciation) | |||||||||
| iBoxx USD Liquid High Yield Index | Goldman Sachs | $ | 5,000,000 | 3 mo LIBOR + 0.00% | 12/20/2020 | $ | (113,430 | ) | ||||||
| iBoxx USD Liquid High Yield Index | Goldman Sachs | 8,000,000 | 3 mo LIBOR + 0.00% | 3/20/2021 | 23,862 | |||||||||
| NET UNREALIZED LOSS FROM TOTAL RETURN SWAPS | $ | (89,568 | ) | |||||||||||
LIBOR - London Inter-bank Offered Rate
| ** | The amounts shown are the underlying reference notional amounts to stock exchange indices, debt securities and equities upon which the fair value of the futures contracts held by the Fund are based. Notional values do not represent the current fair value of, and are not necessarily indicative of the future cash flows futures contracts. Further, the underlying price changes in relation to the variables specified by the notional values affects the fair value of these derivative financial instruments. The notional values as set forth within this schedule do not purport to represent economic value at risk to the Fund. |
| (1) | If the Fund is a seller of protection and if a credit event occurs, as defined under the terms of that particular swap agreement, the Fund will either (i) pay the buyer of protection an amount equal to the notional amount of the swap and take delivery of the referenced obligation or underlying securities comprising the referenced index or (ii) pay a net settlement amount in the form of cash or securities equal to the notional amount of the swap less the recovery value of the referenced obligation or underlying securities comprising of the referenced index. |
| Portfolio Composition * - (Unaudited) | ||||
| U.S. Government & Agencies | 39.1 | % | ||
| Corporate Bonds | 33.0 | % | ||
| Collateral for Securities Loaned | 12.7 | % | ||
| Short-Term Investment | 11.8 | % | ||
| Term Loans | 1.8 | % | ||
| Common Stock | 1.4 | % | ||
| Non U.S. Government & Agencies | 0.2 | % | ||
| Total | 100.0 | % | ||
| * | Based on total value of investments as of October 31, 2020. |
Percentage may differ from Schedule of Investments which are based on Fund net assets.
See accompanying notes to financial statements.
73
| Dunham Monthly Distribution Fund (Unaudited) |
| Message from the Sub-Adviser (Weiss Multi-Strategy Advisers LLC) |
Asset Class Recap
Volatility spiked early in the fiscal year which corresponded with widening spreads on merger deals and other risk-arbitrage opportunities. Following the pandemic-induced recession, record government stimulus, a potential vaccine, and a slowing number of cases helped markets rebound at a record pace. As such, deal spreads tightened with many successfully closing. Despite the turnaround, corporate savings rates had skyrocketed, slowing new deal activity until the final month of the fiscal year as merger and arbitrage deal activity picked up ahead of the U.S. election. During the fiscal year, event driven strategies, as measured by the Credit Suisse Event Driven Liquid Index, rose 3.4 percent. While broader in scope, long/short equity strategies, as measured by the Credit Suisse Long/Short Liquid Index, increased 10.4 percent.
Allocation Review
Within the Fund, the event driven allocation is primarily represented in the form of announced mergers. The allocation to event driven holdings began the fiscal year at 47 percent but rose to 59 percent in the second fiscal quarter as the Sub-Adviser was able to identify above average spreads in strategic deals with manageable regulatory hurdles as the fiscal quarter progressed. The allocation to these strategies significantly declined as prominent deals came to fruition in the third fiscal quarter and through the bulk of the fourth fiscal quarter. New deal announcements were slow until the final month of the fiscal year as a slew of new deals were announced. The fiscal year ended with approximately 35 percent dedicated to event driven holdings, with the remaining dedicated to the long/short book. As volatility spiked in the second fiscal quarter, the Fund’s gross exposure was reduced to 74.4 percent and remained near those levels in the third fiscal quarter. However, in the fiscal year, the gross exposure increased to approximately 94 percent as opportunities arose in both the event driven allocation and the long/short book. The allocation to options slightly contributed to Fund performance during the market sell-off early in the fiscal year, but detracted as market rebounded throughout the remainder of the fiscal year. There were no other material impacts from derivatives within the Fund.
Holdings Insights
As previously mentioned, the allocation to the event driven holdings declined overall during the fiscal year. This was partially due to the largest pharmaceutical deal ever, combining two of the world’s largest cancer drug businesses Celgene Corp. (CELG) (holding weight**: 9.21 percent) and Bristol-Myers Squibb Co. (BMY) (holding weight**: -5.76 percent). The deal was announced in the first fiscal quarter of 2019, and has been a highlight of the Fund’s event driven allocation since its close in the first half of the fiscal year. Another substantial deal that came to fruition in the subsequent fiscal quarter within the Fund was AbbVie Inc.’s (ABBV) (holding weight**: -2.10 percent) acquisition of Allergan PLC (AGN) (holding weight**: 7.52 percent). The spread tightened as AGN successfully sold two drugs as a part of the divestment in order to complete the transaction, widened amid the market sell-off, compressed as markets rebounded, and closed in the third fiscal quarter. Another deal that positively contributed to Fund performance was the LMVH Moet Hennessey Louis Vuitton (LVMH) (holding weight: not held) acquisition of Tiffany and Co. (TIF) (holding weight*: 1.62 percent). This deal was announced in November 2019 and made progress towards completion as the spread of the deal closed to $0.60 to begin 2020. The spread in this deal substantially widened due to the pandemic driving a flood of rumors and headlines that LVMH may be considering renegotiating the terms of the deal. The Sub-Adviser believed that the bulk of the reports were unwarranted and the rationale behind the deal remained intact. In the fourth fiscal quarter alone, the spread on this deal contracted from approximately $22 to $0.50 and is expected to close next quarter. As previously mentioned, many new deals were announced to close during the fiscal year. This includes the cash and stock deal for Eaton Vance Corporation (EV) (holding weight*: 2.69 percent) by Morgan Stanley (MS) (holding weight*: -1.02 percent), the merger between Advanced Micro Devices Inc. (AMD) (holding weight*: -1.64 percent) and Xilinx Inc. (XLNX) (holding weight*: 1.50 percent), and the acquisition of Inphi Corporation (IPHI) (holding weight*: 0.05 percent) by Marvell Technology Group Ltd. (MRVL) (holding weight*: 0.23 percent).
The low net profile of the long/short equity allocation slightly detracted early in the fiscal year as markets rallied, strongly benefitted the Fund as volatility spiked, and once again detracted from Fund performance as volatility subsided. The Sub-Adviser aggressively reduced the gross and net exposure of the long /short strategy allocation as markets became highly volatile and unpredictable. The Sub-Adviser also improved the overall quality of the strategy by moving out of the higher beta names and into stocks like The Home Depot Inc. (HD) (holding weight**: 0.10 percent) and Best Buy Company Inc. (BBY) (holding weight*: 0.66 percent), which the Sub-Adviser believes are capable of thriving during the current pandemic. These moves strongly benefited the Fund as they increased 33.1 percent and 59.1 percent, respectively. Given the volatility, the results for the short positions were mixed. For example, the short exposure to the Financial Select Sector SPDR Fund (XLF) (holding weight*: -0.41 percent) contributed positively to Fund Performance as the underlying decreased 14.7 percent, while the short position to the Consumer Discretionary Select Sector SPDR Fund (XLY) (holding weight* -0.38 percent) detracted from Fund performance as the underlying increased 19.8 percent over the fiscal year. Throughout the volatility, the Sub-Adviser wrote calls on stocks to take advantage of the substantially higher level of implied volatility. This exposure, in general, slightly detracted from performance as equities in general rebounded following the market sell-off in March. For example, the Nike Inc. call 5/15/20 at $82.50 (NKE 5/15/20 C82.5) (holding weight**: -0.03 percent) detracted from Fund performance since it was in the Fund from April 2 to April 24 as the underlying increased 10.3 percent. However, the Fund’s long position to Nike Inc. (NKE) (holding weight*: 0.52 percent) more than made up for the loss.
Sub-Adviser Outlook
Despite the volatility throughout the fiscal year, the Sub-Adviser is optimistic for the end of 2020 and transition into 2021. The Sub-Adviser believes that the increase in merger and acquisition activity, combined with the low rate environment, makes the Fund especially attractive. Although the Sub-Adviser acknowledges that the surge in COVID cases has hampered markets, our country’s experience with getting the virus under control earlier in the year will help us better and more efficiently approach the current surge. The Sub-Adviser is also confident that once we get through the election, investors can expect another stimulus package which is expected to spark optimism and continue to boost the economic rebound.
| * | Holdings percentage(s) of total investments, cash and unsettled trades excluding collateral for securities loaned, as of 10/31/2020. |
| ** | Holdings percentage(s) as of the date prior to the sale of the security. |
Growth of $100,000 Investment
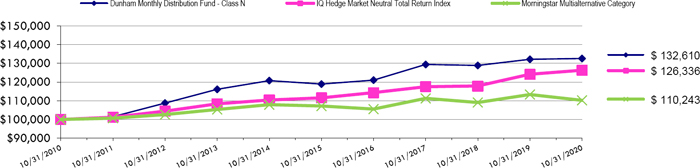
Total Returns (a) as of October 31, 2020
| Annualized | Annualized | ||
| One Year | Five Years | Ten Years | |
| Class N | 0.34% | 2.20% | 2.86% |
| Class A with load of 5.75% | (5.70)% | 0.76% | 2.00% |
| Class A without load | 0.07% | 1.95% | 2.61% |
| Class C | (0.67)% | 1.18% | 1.83% |
| IQ Hedge Market Neutral Total Return Index | 1.73% | 2.52% | 2.37% |
| Morningstar Multialternative Category | (2.73)% | 0.56% | 0.98% |
| (a) | Total Returns are calculated based on traded NAVs. |
IQ Hedge Market Neutral Total Return Index seeks to replicate the risk-adjusted return characteristics of the collective hedge funds using a market neutral hedge fund investment style. Market Neutral hedge funds typically invest in both long and short positions in asset classes while minimizing exposure to systematic risk.
The Morningstar Multialternative Category is generally representative of mutual funds with static allocations to alternative strategies and mutual funds that tactically allocate among alternative strategies and asset classes. The gross short exposure in these mutual funds is generally greater than 20%.
| As disclosed in the Trust’s latest registration statement, the Fund’s total annual operating expenses before any fee waiver, including the cost of underlying funds, are 2.67% for Class N, 3.67% for Class C and 2.92% for Class A. Class A shares are subject to a sales load of 5.75% and a deferred sales charge of up to 0.75%. The performance data quoted here represents past performance, which is not indicative of future results. Current performance may be lower or higher than the performance data quoted. The investment return and NAV will fluctuate, so that an investor’s shares, when redeemed, may be worth more or less than their original cost. Total returns are calculated assuming reinvestment of all dividends and capital gains distributions, if any. The returns do not reflect the deductions of taxes a shareholder would pay on the redemption of Fund shares or Fund distributions. For performance information current to the most recent month-end, please call 1-800-442-4358 or visit our website www.dunham.com. |
74
| SCHEDULE OF INVESTMENTS |
| Dunham Monthly Distribution Fund |
| October 31, 2020 |
| Security | Shares | Value | ||||||
| COMMON STOCKS - 41.1% | ||||||||
| APPAREL & TEXTILE PRODUCTS - 0.5% | ||||||||
| NIKE, Inc. | 6,378 | $ | 765,870 | |||||
| ASSET MANAGEMENT - 3.9% | ||||||||
| ACON S2 Acquisition Corporation * | 7,947 | 78,675 | ||||||
| AEA-Bridges Impact Corporation * | 6,003 | 59,610 | ||||||
| Ajax I * | 8,697 | 87,666 | ||||||
| Alussa Energy Acquisition Corporation * | 7,526 | 74,131 | ||||||
| Apollo Strategic Growth Capital * | 6,000 | 59,760 | ||||||
| Artius Acquisition, Inc. * | 12,899 | 128,603 | ||||||
| Atlas Crest Investment Corporation * | 9,345 | 92,796 | ||||||
| Avanti Acquisition Corporation * | 4,000 | 39,640 | ||||||
| Bridgetown Holdings Ltd. * | 1,002 | 10,120 | ||||||
| Burgundy Technology Acquisition Corporation * | 3,994 | 39,740 | ||||||
| Churchill Capital Corporation II * | 13,052 | 130,128 | ||||||
| Churchill Capital Corporation IV * | 7,388 | 71,146 | ||||||
| Cohn Robbins Holdings Corporation * | 7,995 | 79,790 | ||||||
| D8 Holdings Corporation * | 7,343 | 73,063 | ||||||
| Eaton Vance Corporation | 97,132 | 5,807,522 | ||||||
| Equity Distribution Acquisition Corporation * | 3,997 | 40,170 | ||||||
| Foley Trasimene Acquisition Corporation II * | 12,630 | 125,795 | ||||||
| Fusion Acquisition Corporation * | 4,993 | 48,881 | ||||||
| GO Acquisition Corporation * | 12,810 | 127,203 | ||||||
| Gores Holdings IV, Inc. * | 12,854 | 127,897 | ||||||
| GS Acquisition Holdings Corporation II * | 12,840 | 132,252 | ||||||
| Haymaker Acquisition Corporation II * | 15,810 | 158,416 | ||||||
| HPX Corporation * | 2,130 | 21,428 | ||||||
| Lefteris Acquisition Corporation * | 9,387 | 92,837 | ||||||
| LGL Systems Acquisition Corporation * | 21 | 208 | ||||||
| Oaktree Acquisition Corporation II * | 314 | 3,140 | ||||||
| Peridot Acquisition Corporation * | 7,942 | 78,745 | ||||||
| Reinvent Technology Partners * | 397 | 4,268 | ||||||
| Social Capital Hedosophia Holdings Corporation III * | 3,784 | 39,316 | ||||||
| Spartacus Acquisition Corporation * | 11,647 | 115,655 | ||||||
| Star Peak Energy Transition Corp * | 8,473 | 84,561 | ||||||
| Starboard Value Acquisition Corporation * | 1,589 | 15,811 | ||||||
| Sustainable Opportunities Acquisition Corporation * | 11,140 | 114,965 | ||||||
| Tortoise Acquisition Corporation II * | 1,548 | 15,825 | ||||||
| TPG Pace Beneficial Finance Corporation * | 4,000 | 40,040 | ||||||
| TPG Pace Tech Opportunities Corporation * | 4,000 | 40,000 | ||||||
| Turmeric Acquisition Corporation * | 2,004 | 19,940 | ||||||
| VG Acquisition Corporation * | 5,001 | 49,410 | ||||||
| Vy Global Growth * | 4,000 | 41,160 | ||||||
| 8,370,313 | ||||||||
| AUTOMOTIVE - 1.9% | ||||||||
| Adient plc * | 34,324 | 728,355 | ||||||
| Aptiv plc | 5,583 | 538,704 | ||||||
| Bayerische Motoren Werke AG | 7,253 | 495,767 | ||||||
| Fiat Chrysler Automobiles N.V. * | 62,304 | 765,084 | ||||||
| Fiat Chrysler Automobiles N.V. * | 60,216 | 740,055 | ||||||
| Ford Motor Company @ | 10,371 | 80,168 | ||||||
| General Motors Company @ | 27,300 | 942,669 | ||||||
| 4,290,802 | ||||||||
| BANKING - 0.3% | ||||||||
| CIT Group, Inc. | 1,355 | 39,905 | ||||||
| Citigroup, Inc. | 10,283 | 425,922 | ||||||
| Signature Bank | 1,236 | 99,795 | ||||||
| 565,622 | ||||||||
See accompanying notes to financial statements.
75
| SCHEDULE OF INVESTMENTS |
| Dunham Monthly Distribution Fund (Continued) |
| October 31, 2020 |
| Security | Shares | Value | ||||||
| COMMON STOCKS - 41.1% (Continued) | ||||||||
| BEVERAGES - 0.3% | ||||||||
| Coca-Cola Company (The) | 13,588 | $ | 653,039 | |||||
| BIOTECHNOLOGY & PHARMACEUTICALS - 1.0% | ||||||||
| MyoKardia, Inc. * | 10,242 | 2,289,394 | ||||||
| CHEMICALS - 1.0% | ||||||||
| DuPont de Nemours, Inc. | 22,997 | 1,308,069 | ||||||
| Linde plc | 4,263 | 939,309 | ||||||
| 2,247,378 | ||||||||
| DIVERSIFIED INDUSTRIALS - 0.3% | ||||||||
| Dover Corporation | 5,708 | 631,933 | ||||||
| E-COMMERCE DISCRETIONARY - 1.0% | ||||||||
| Alibaba Group Holding Ltd. - ADR * | 5,033 | 1,533,505 | ||||||
| Amazon.com, Inc. * | 237 | 719,568 | ||||||
| 2,253,073 | ||||||||
| ELECTRIC UTILITIES - 1.6% | ||||||||
| Avangrid, Inc. | 3,960 | 195,386 | ||||||
| NextEra Energy, Inc. | 9,780 | 715,994 | ||||||
| PNM Resources, Inc. | 50,171 | 2,508,550 | ||||||
| 3,419,930 | ||||||||
| ELECTRICAL EQUIPMENT - 1.3% | ||||||||
| Carrier Global Corporation | 22,694 | 757,753 | ||||||
| Otis Worldwide Corporation | 7,172 | 439,500 | ||||||
| Siemens Energy A.G. * | 33,708 | 738,178 | ||||||
| Vontier Corporation * | 34,749 | 998,675 | ||||||
| 2,934,106 | ||||||||
| ENTERTAINMENT CONTENT - 0.2% | ||||||||
| Discovery, Inc. * ^ | 16,919 | 342,441 | ||||||
| FOOD - 0.4% | ||||||||
| Mondelez International, Inc. | 14,758 | 783,945 | ||||||
| FORESTRY, PAPER & WOOD PRODUCTS - 0.3% | ||||||||
| Louisiana-Pacific Corporation | 19,443 | 555,681 | ||||||
| HOME CONSTRUCTION - 1.1% | ||||||||
| AZEK Company, Inc. (The) * | 26,962 | 901,609 | ||||||
| DR Horton, Inc. | 10,913 | 729,097 | ||||||
| KB Home | 25,111 | 809,830 | ||||||
| 2,440,536 | ||||||||
| HOUSEHOLD PRODUCTS - 0.4% | ||||||||
| Procter & Gamble Company (The) | 6,083 | 833,979 | ||||||
| INDUSTRIAL INTERMEDIATE PRODUCTS - 0.4% | ||||||||
| Timken Company, (The) | 15,065 | 899,380 | ||||||
| INDUSTRIAL SUPPORT SERVICES - 0.1% | ||||||||
| WESCO International, Inc. * | 4,041 | 166,651 | ||||||
| INSTITUTIONAL FINANCIAL SERVICES - 0.0% | ||||||||
| Morgan Stanley | 860 | 41,409 | ||||||
| INSURANCE - 0.9% | ||||||||
| Willis Towers Watson plc | 11,247 | 2,052,353 | ||||||
See accompanying notes to financial statements.
76
| SCHEDULE OF INVESTMENTS |
| Dunham Monthly Distribution Fund (Continued) |
| October 31, 2020 |
| Security | Shares | Value | ||||||
| COMMON STOCKS - 41.1% (Continued) | ||||||||
| LEISURE FACILITIES & SERVICES - 2.3% | ||||||||
| Darden Restaurants, Inc. @ | 12,091 | $ | 1,111,405 | |||||
| Dunkin’ Brands Group, Inc. | 6,426 | 640,737 | ||||||
| Marriott International, Inc. | 1,085 | 100,775 | ||||||
| Marriott Vacations Worldwide Corporation | 9,581 | 925,525 | ||||||
| Starbucks Corporation | 16,547 | 1,438,927 | ||||||
| Yum China Holdings, Inc. | 14,618 | 778,116 | ||||||
| 4,995,485 | ||||||||
| MACHINERY - 0.9% | ||||||||
| Parker-Hannifin Corporation | 7,872 | 1,640,210 | ||||||
| Stanley Black & Decker, Inc. | 1,450 | 240,990 | ||||||
| 1,881,200 | ||||||||
| MEDICAL EQUIPMENT & DEVICES - 3.6% | ||||||||
| Danaher Corporation | 5,520 | 1,267,061 | ||||||
| Envista Holdings Corporation * | 27,732 | 732,679 | ||||||
| QIAGEN N.V. * | 8,707 | 413,060 | ||||||
| Varian Medical Systems, Inc. * | 17,637 | 3,047,674 | ||||||
| Wright Medical Group N.V. * ^ | 77,875 | 2,382,196 | ||||||
| 7,842,670 | ||||||||
| METALS & MINING - 1.0% | ||||||||
| Barrick Gold Corporation | 36,875 | 985,669 | ||||||
| Freeport-McMoRan, Inc. | 44,044 | 763,723 | ||||||
| 1,749,392 | ||||||||
| PUBLISHING & BROADCASTING - 0.1% | ||||||||
| TEGNA, Inc. | 20,255 | 243,668 | ||||||
| REITS - 0.6% | ||||||||
| Weyerhaeuser Company | 47,327 | 1,291,554 | ||||||
| RETAIL - CONSUMER STAPLES - 0.5% | ||||||||
| Walmart, Inc. | 7,620 | 1,057,275 | ||||||
| RETAIL - DISCRETIONARY - 3.8% | ||||||||
| Best Buy Company, Inc. | 12,783 | 1,425,944 | ||||||
| BMC Stock Holdings, Inc. * | 19,744 | 781,665 | ||||||
| Dick’s Sporting Goods, Inc. @ | 6,882 | 389,865 | ||||||
| Lithia Motors, Inc. | 392 | 89,991 | ||||||
| Lowe’s Company, Inc. @ | 8,329 | 1,316,815 | ||||||
| Tiffany & Company | 33,314 | 4,358,804 | ||||||
| 8,363,084 | ||||||||
| SEMICONDUCTORS - 6.4% | ||||||||
| Inphi Corporation * | 710 | 99,230 | ||||||
| Marvell Technology Group Ltd. @ | 13,176 | 494,232 | ||||||
| Maxim Integrated Products, Inc. | 66,281 | 4,616,472 | ||||||
| NXP Semiconductors N.V. @ | 13,500 | 1,824,120 | ||||||
| ON Semiconductor Corporation * | 33,529 | 841,243 | ||||||
| QUALCOMM, Inc. @ | 14,193 | 1,750,848 | ||||||
| Skyworks Solutions, Inc. | 4,106 | 580,137 | ||||||
| Texas Instruments, Inc. @ | 2,613 | 377,814 | ||||||
| Xilinx, Inc. | 27,357 | 3,247,002 | ||||||
| 13,831,098 | ||||||||
| SOFTWARE - 0.9% | ||||||||
| Borqs Technologies, Inc. * | 61,731 | 57,225 | ||||||
| Microsoft Corporation | 7,469 | 1,512,248 | ||||||
| MobileIron, Inc. * | 27,517 | 193,720 | ||||||
| Oracle Corporation | 5,325 | 298,786 | ||||||
| 2,061,979 | ||||||||
See accompanying notes to financial statements.
77
| SCHEDULE OF INVESTMENTS |
| Dunham Monthly Distribution Fund (Continued) |
| October 31, 2020 |
| Security | Shares | Value | ||||||||
| COMMON STOCKS - 41.1% (Continued) | ||||||||||
| TECHNOLOGY HARDWARE - 0.5% | ||||||||||
| Apple, Inc. | 9,782 | $ | 1,064,869 | |||||||
| TECHNOLOGY SERVICES - 0.3% | ||||||||||
| DXC Technology Company | 29,277 | 539,282 | ||||||||
| 539,282 | ||||||||||
| TELECOMMUNICATIONS - 0.9% | ||||||||||
| NII Holdings, Inc. * # | 205,893 | 442,670 | ||||||||
| T-Mobile US, Inc. * | 13,393 | 1,467,471 | ||||||||
| 1,910,141 | ||||||||||
| TRANSPORTATION & LOGISTICS - 1.2% | ||||||||||
| American Airlines Group, Inc. * # | 101,283 | 6,077 | ||||||||
| Kansas City Southern | 4,761 | 838,602 | ||||||||
| Norfolk Southern Corporation | 5,248 | 1,097,462 | ||||||||
| Southwest Airlines Company | 12,053 | 476,455 | ||||||||
| Union Pacific Corporation | 1,487 | 263,481 | ||||||||
| 2,682,077 | ||||||||||
| TRANSPORTATION EQUIPMENT - 1.4% | ||||||||||
| Cummins, Inc. @ | 9,196 | 2,022,108 | ||||||||
| Navistar International Corporation * | 16,355 | 705,064 | ||||||||
| PACCAR, Inc. | 3,063 | 261,519 | ||||||||
| 2,988,691 | ||||||||||
| TOTAL COMMON STOCKS (Cost - $88,659,422) | 89,040,300 | |||||||||
| CLOSED END FUND - 1.3% | ||||||||||
| Altaba, Inc. # | 193,882 | 2,747,308 | ||||||||
| TOTAL CLOSED END FUND (Cost - $3,805,238) | ||||||||||
| EXCHANGE-TRADED FUNDS - 2.6% | ||||||||||
| EQUITY FUNDS - 1.3% | ||||||||||
| Invesco S&P 500 Equal Weight ETF | 6,062 | 651,726 | ||||||||
| SPDR S&P 500 ETF Trust | 1,162 | 379,439 | ||||||||
| SPDR S&P Homebuilders ETF | 15,518 | 806,626 | ||||||||
| SPDR S&P Regional Banking ETF | 10,380 | 427,137 | ||||||||
| SPDR S&P Retail ETF | 11,727 | 584,474 | ||||||||
| 2,849,402 | ||||||||||
| FIXED INCOME FUNDS - 1.3% | ||||||||||
| SPDR Blackstone / GSO Senior Loan ETF ^ | 64,092 | 2,836,712 | ||||||||
| TOTAL EXCHANGE-TRADED FUNDS - (Cost - $6,007,770) | 5,686,114 | |||||||||
| Expiration Date | ||||||||||
| RIGHTS - 0.0% | ||||||||||
| Alder BioPharmaceuticals, Inc. * # | 10,079 | 12/31/2024 | 10,079 | |||||||
| Nexstar Broadcasting Group, Inc. * # | 87,600 | Perpetual | 4,380 | |||||||
| Pan American Silver Corporation * | 41,375 | 3/19/2049 | 29,790 | |||||||
| TOTAL RIGHTS (Cost - $73,259) | 44,249 | |||||||||
| WARRANTS - 0.0% | ||||||||||
| Borqs Technologies, Inc. * | 105,552 | 8/19/2022 | 3,293 | |||||||
| Churchill Capital Corporation III * | 10,004 | 3/2/2027 | 12,705 | |||||||
| TOTAL WARRANTS (Cost - $26,975) | 15,998 | |||||||||
See accompanying notes to financial statements.
78
| SCHEDULE OF INVESTMENTS |
| Dunham Monthly Distribution Fund (Continued) |
| October 31, 2020 |
| Security | Counterparty | Contracts** | Notional Value | Exercise Price | Expiration Date | Value | ||||||||||||
| PURCHASED OPTIONS - 0.3% | ||||||||||||||||||
| PURCHASED CALL OPTIONS - 0.1% | ||||||||||||||||||
| Cummins, Inc. | JP Morgan | 32 | $ | 736,000 | $ | 230.00 | 11/20/2020 | $ | 13,440 | |||||||||
| Ford Motor Company | JP Morgan | 405 | 344,250 | 8.50 | 11/20/2020 | 4,860 | ||||||||||||
| iShares Russell 2000 ETF | JP Morgan | 167 | 2,722,100 | 163.00 | 12/18/2020 | 56,947 | ||||||||||||
| Lowe’s Companies, Inc. | JP Morgan | 84 | 1,554,000 | 185.00 | 11/20/2020 | 4,284 | ||||||||||||
| Marvell Technology Group Ltd. | JP Morgan | 155 | 620,000 | 40.00 | 12/18/2020 | 27,125 | ||||||||||||
| TOTAL PURCHASED CALL OPTIONS (Cost - $227,878) | 106,656 | |||||||||||||||||
| PURCHASED PUT OPTIONS - 0.2% | ||||||||||||||||||
| S&P 500 Index | JP Morgan | 24 | 8,040,000 | 3,350.00 | 12/18/2020 | 447,000 | ||||||||||||
| TOTAL PURCHASED PUT OPTIONS (Cost - $418,177) | ||||||||||||||||||
| TOTAL PURCHASED OPTIONS (Cost - $646,055) | 553,656 | |||||||||||||||||
| Shares | Interest Rate % | |||||||||||||||||
| SHORT-TERM INVESTMENT - 37.9% | ||||||||||||||||||
| MONEY MARKET FUND - 37.9% | ||||||||||||||||||
| Fidelity Government Portfolio - Class Institutional | 82,000,800 | 0.010 | + | 82,000,800 | ||||||||||||||
| TOTAL SHORT-TERM INVESTMENT (Cost - $82,000,800) | ||||||||||||||||||
| COLLATERAL FOR SECURITIES LOANED - 2.6% | ||||||||||||||||||
| HSBC US Government Money Market Fund - Class I ! | 5,585,545 | 0.023 | + | 5,585,545 | ||||||||||||||
| TOTAL COLLATERAL FOR SECURITIES LOANED (Cost - $5,585,545) | ||||||||||||||||||
| TOTAL INVESTMENTS - 85.8% (Cost - $186,805,064) | $ | 185,673,970 | ||||||||||||||||
| OTHER ASSETS IN EXCESS OF LIABILITIES - 14.2% | 30,904,355 | |||||||||||||||||
| NET ASSETS - 100.0% | $ | 216,578,325 | ||||||||||||||||
ADR- American Depositary Receipt.
ETF - Exchange Traded Fund
Perpetual - Perpetual bonds or rights are fixed income instruments without defined maturity dates.
plc - Public Limited Company
REITS - Real Estate Investment Trusts
| * | Non-Income producing security. |
| ** | Each Purchased Option contract allows the option holder to buy/sell 100 shares of the underlying security at the exercise price. |
| + | Variable rate security. Interest rate is as of October 31, 2020. |
| # | Fair Value estimated using fair value procedures adopted by Board of Trustees. Total value of such securities is $3,210,514 or 1.48% of net assets as of October 31, 2020. |
| ^ | All or a portion of these securities are on loan. Total loaned securities had a value of $5,465,358 at October 31, 2020. |
| @ | Subject to Options Written |
| ! | The Trust’s securities lending policies and procedures require that the borrower: (i) deliver cash or U.S. Government securities as collateral with respect to each new loan of U.S. securities, equal to at least 102% of the value of the portfolio securities loaned, and (ii) at all times thereafter mark-to-market the collateral on a daily basis so that the market value of such collateral is at least 100% of the value of securities loaned. From time to time the collateral may not be 102% due to end of day market movement. The next business day additional collateral is obtained/received from the borrower to replenish/reestablish 102%. |
| Security | Counterparty | Contracts** | Notional Value | Exercise Price | Expiration Date | Value | ||||||||||||
| WRITTEN OPTIONS - (0.2)% | ||||||||||||||||||
| WRITTEN CALL OPTIONS - (0.2)% | ||||||||||||||||||
| Cummins, Inc. | JP Morgan | 32 | $ | 768,000 | $ | 240.00 | 11/20/2020 | $ | 7,200 | |||||||||
| Darden Restaurants, Inc. | JP Morgan | 65 | 650,000 | 100.00 | 11/20/2020 | 11,375 | ||||||||||||
| Dick’s Sporting Goods, Inc. | JP Morgan | 37 | 240,500 | 65.00 | 11/20/2020 | 1,665 | ||||||||||||
| General Motors Company | JP Morgan | 84 | 294,000 | 35.00 | 11/20/2020 | 13,440 | ||||||||||||
| General Motors Company | JP Morgan | 84 | 306,600 | 36.50 | 11/20/2020 | 8,400 | ||||||||||||
| iShares Russell 2000 ETF | JP Morgan | 167 | 2,839,000 | 170.00 | 12/18/2020 | 25,384 | ||||||||||||
| Lowe’s Companies, Inc. | JP Morgan | 126 | 2,520,000 | 200.00 | 11/20/2020 | 2,016 | ||||||||||||
| NXP Semiconductor N.V. | JP Morgan | 52 | 754,000 | 145.00 | 11/20/2020 | 10,660 | ||||||||||||
| QUALCOMM, Inc. | JP Morgan | 42 | 567,000 | 135.00 | 11/20/2020 | 9,114 | ||||||||||||
| S&P 500 Index | JP Morgan | 24 | 8,040,000 | 3,350.00 | 12/18/2020 | 257,520 | ||||||||||||
| Texas Instruments, Inc. | JP Morgan | 32 | 512,000 | 160.00 | 11/20/2020 | 1,696 | ||||||||||||
| TOTAL WRITTEN CALL OPTIONS - (Premiums Received - $622,664) | 348,470 | |||||||||||||||||
See accompanying notes to financial statements.
79
| SCHEDULE OF INVESTMENTS |
| Dunham Monthly Distribution Fund (Continued) |
| October 31, 2020 |
| Security | Counterparty | Contracts** | Notional Value | Exercise Price | Expiration Date | Value | ||||||||||||
| WRITTEN OPTIONS - (0.2)% (Continued) | ||||||||||||||||||
| WRITTEN PUT OPTIONS - (0.0)% | ||||||||||||||||||
| Cummins, Inc. | JP Morgan | 32 | $ | 672,000 | $ | 210.00 | 11/20/2020 | $ | 22,400 | |||||||||
| Ford Motor Company | JP Morgan | 405 | 283,500 | 7.00 | 11/20/2020 | 5,670 | ||||||||||||
| Marvell Technology Group Ltd. | JP Morgan | 155 | 542,500 | 35.00 | 12/18/2020 | 27,900 | ||||||||||||
| TOTAL WRITTEN PUT OPTIONS - (Premiums Received - $44,690) | 55,970 | |||||||||||||||||
| TOTAL WRITTEN OPTIONS (Premiums Received - $667,354) | 404,440 | |||||||||||||||||
| Shares | ||||||||||||||||||
| SECURITIES SOLD SHORT * - (20.5)% | ||||||||||||||||||
| COMPUTERS - (0.7)% | ||||||||||||||||||
| AeroVironment, Inc. | 176 | 13,439 | ||||||||||||||||
| General Dynamics Corporation | 4,048 | 531,624 | ||||||||||||||||
| L3Harris Technologies, Inc. | 215 | 34,639 | ||||||||||||||||
| Northrop Grumman Corporation | 119 | 34,489 | ||||||||||||||||
| Textron, Inc. | 23,071 | 825,942 | ||||||||||||||||
| 1,440,133 | ||||||||||||||||||
| APPAREL & TEXTILE PRODUCTS - (0.0)% | ||||||||||||||||||
| Wolverine World Wide, Inc. | 603 | 16,082 | ||||||||||||||||
| ASSET MANAGEMENT - (0.0)% | ||||||||||||||||||
| Ameriprise Financial, Inc. | 234 | 37,634 | ||||||||||||||||
| Raymond James Financial, Inc. | 495 | 37,838 | ||||||||||||||||
| 75,472 | ||||||||||||||||||
| BANKING - (0.0)% | ||||||||||||||||||
| First Citizens BancShares, Inc. | 109 | 50,434 | ||||||||||||||||
| Flagstar Bancorp, Inc. | 396 | 11,623 | ||||||||||||||||
| 62,057 | ||||||||||||||||||
| BIOTECHNOLOGY & PHARMACEUTICALS - (0.0)% | ||||||||||||||||||
| Arrowhead Pharmaceuticals, Inc. | 822 | 47,101 | ||||||||||||||||
| CABLE & SATELLITE - (0.2)% | ||||||||||||||||||
| Comcast Corporation | 7,671 | 324,023 | ||||||||||||||||
| CHEMICALS - (0.3)% | ||||||||||||||||||
| Balchem Corporation | 86 | 8,596 | ||||||||||||||||
| International Flavors & Fragrances, Inc. | 6,489 | 666,161 | ||||||||||||||||
| 674,757 | ||||||||||||||||||
| COMMERCIAL SUPPORT SERVICES - (0.0)% | ||||||||||||||||||
| AMN Healthcare Services, Inc. | 331 | 21,608 | ||||||||||||||||
| FTI Consulting, Inc. | 344 | 33,870 | ||||||||||||||||
| HMS Holdings Corporation | 541 | 14,401 | ||||||||||||||||
| 69,879 | ||||||||||||||||||
| CONSTRUCTION MATERIALS - (0.3)% | ||||||||||||||||||
| Martin Marietta Materials, Inc. | 2,303 | 613,404 | ||||||||||||||||
| CONSUMER SERVICES - (0.0)% | ||||||||||||||||||
| Grand Canyon Education, Inc. | 234 | 18,339 | ||||||||||||||||
| Service Corporation International | 856 | 39,641 | ||||||||||||||||
| 57,980 | ||||||||||||||||||
| DIVERSIFIED INDUSTRIALS - (0.7)% | ||||||||||||||||||
| 3M Company | 3,376 | 540,025 | ||||||||||||||||
| Emerson Electric Company | 12,812 | 830,089 | ||||||||||||||||
| Honeywell International, Inc. | 224 | 36,949 | ||||||||||||||||
| ITT, Inc. | 461 | 27,895 | ||||||||||||||||
| 1,434,958 | ||||||||||||||||||
See accompanying notes to financial statements.
80
| SCHEDULE OF INVESTMENTS |
| Dunham Monthly Distribution Fund (Continued) |
| October 31, 2020 |
| Security | Shares | Value | ||||||
| SECURITIES SOLD SHORT * - (20.5)% (Continued) | ||||||||
| ELECTRIC UTILITIES - (0.0)% | ||||||||
| NRG Energy, Inc. | 1,190 | $ | 37,628 | |||||
| ELECTRICAL EQUIPMENT - (0.0)% | ||||||||
| SPX Corporation | 265 | 11,233 | ||||||
| ENGINEERING & CONSTRUCTION - (0.0)% | ||||||||
| AECOM | 843 | 37,800 | ||||||
| ENTERTAINMENT CONTENT - (0.1)% | ||||||||
| Electronic Arts, Inc. | 1,727 | 206,946 | ||||||
| EXCHANGE-TRADED FUNDS - (7.3)% | ||||||||
| Consumer Discretionary Select Sector SPDR Fund | 5,772 | 825,223 | ||||||
| Consumer Staples Select Sector SPDR Fund | 22,427 | 1,396,305 | ||||||
| Financial Select Sector SPDR Fund | 16,858 | 402,232 | ||||||
| Health Care Select Sector SPDR Fund | 25,550 | 2,597,413 | ||||||
| iShares Russell 2000 ETF | 39,785 | 6,090,686 | ||||||
| iShares U.S. Real Estate ETF | 34,357 | 2,663,011 | ||||||
| SPDR S&P 500 ETF Trust | 6,572 | 2,146,021 | ||||||
| 16,120,891 | ||||||||
| FOOD - (0.5)% | ||||||||
| General Mills, Inc. | 10,709 | 633,116 | ||||||
| McCormick & Co, Inc. | 2,790 | 503,623 | ||||||
| 1,136,739 | ||||||||
| GAS & WATER UTILITIES - (0.0)% | ||||||||
| Essential Utilities, Inc. | 891 | 36,709 | ||||||
| HEALTH CARE FACILITIES & SERVICES - (0.3)% | ||||||||
| Anthem, Inc. | 132 | 36,010 | ||||||
| Cigna Corporation | 222 | 37,067 | ||||||
| CVS Health Corporation | 9,185 | 515,187 | ||||||
| Encompass Health Corporation | 502 | 30,778 | ||||||
| HCA Healthcare, Inc. | 291 | 36,066 | ||||||
| Syneos Health, Inc. | 661 | 35,086 | ||||||
| 690,194 | ||||||||
| HOUSEHOLD PRODUCTS - (0.4)% | ||||||||
| Clorox Company (The) | 1,548 | 320,823 | ||||||
| Colgate-Palmolive Company | 6,252 | 493,220 | ||||||
| 814,043 | ||||||||
| INDUSTRIAL SUPPORT SERVICES - (0.2)% | ||||||||
| Fastenal Company | 9,770 | 422,357 | ||||||
| INSTITUTIONAL FINANCIAL SERVICES - (1.0)% | ||||||||
| Morgan Stanley | 46,376 | 2,233,004 | ||||||
| INSURANCE - (1.0)% | ||||||||
| Aon plc | 12,041 | 2,215,664 | ||||||
| eHealth, Inc. | 411 | 27,582 | ||||||
| 2,243,246 | ||||||||
| INTERNET MEDIA & SERVICES - (0.1)% | ||||||||
| Uber Technologies, Inc. | 9,234 | 308,508 | ||||||
| LEISURE FACILITIES & SERVICES - (0.2)% | ||||||||
| Marriott International, Inc. | 1,085 | 100,775 | ||||||
| Royal Caribbean Cruises Ltd. | 3,308 | 186,637 | ||||||
| Wyndham Hotels & Resorts, Inc. | 737 | 34,278 | ||||||
| 321,690 | ||||||||
See accompanying notes to financial statements.
81
| SCHEDULE OF INVESTMENTS |
| Dunham Monthly Distribution Fund (Continued) |
| October 31, 2020 |
| Security | Shares | Value | ||||||
| SECURITIES SOLD SHORT * - (20.5)% (Continued) | ||||||||
| LEISURE PRODUCTS - (0.0)% | ||||||||
| Callaway Golf Company | 1,080 | $ | 16,729 | |||||
| Hasbro, Inc. | 451 | 37,307 | ||||||
| 54,036 | ||||||||
| MACHINERY - (0.3)% | ||||||||
| Hillenbrand, Inc. | 344 | 10,062 | ||||||
| Ingersoll Rand, Inc. | 17,843 | 623,434 | ||||||
| 633,496 | ||||||||
| MEDICAL EQUIPMENT & DEVICES - (0.1)% | ||||||||
| Becton Dickinson and Company | 161 | 37,212 | ||||||
| BioTelemetry, Inc. | 353 | 15,031 | ||||||
| Boston Scientific Corporation | 966 | 33,105 | ||||||
| Haemonetics Corporation | 336 | 33,966 | ||||||
| Medtronic plc | 364 | 36,607 | ||||||
| Teleflex, Inc. | 111 | 35,323 | ||||||
| 191,244 | ||||||||
| OIL & GAS PRODUCERS - (0.2)% | ||||||||
| Exxon Mobil Corporation | 9,602 | 313,217 | ||||||
| REITS - (0.2)% | ||||||||
| American Tower Corporation | 936 | 214,952 | ||||||
| SBA Communications Corporation | 552 | 160,284 | ||||||
| 375,236 | ||||||||
| RENEWABLE ENERGY - (0.0)% | ||||||||
| EnerSys | 191 | 13,676 | ||||||
| RETAIL - DISCRETIONARY - (0.6)% | ||||||||
| Builders FirstSource, Inc. | 11,512 | 348,813 | ||||||
| Group 1 Automotive, Inc. | 149 | 15,806 | ||||||
| Lululemon Athletica, Inc. | 647 | 206,581 | ||||||
| O’Reilly Automotive, Inc. | 570 | 248,862 | ||||||
| TJX Company, Inc. (The) | 7,012 | 356,210 | ||||||
| 1,176,272 | ||||||||
| SEMICONDUCTORS - (4.0)% | ||||||||
| Advanced Micro Devices, Inc. | 47,599 | 3,583,729 | ||||||
| Analog Devices, Inc. | 41,477 | 4,916,269 | ||||||
| Intel Corporation | 1,272 | 56,324 | ||||||
| 8,556,322 | ||||||||
| SOFTWARE - (0.1)% | ||||||||
| CDK Global, Inc. | 711 | 30,644 | ||||||
| Zoom Video Communications, Inc. | 297 | 136,890 | ||||||
| 167,534 | ||||||||
| SPECIALTY FINANCE - (0.0)% | ||||||||
| Walker & Dunlop, Inc. | 169 | 10,627 | ||||||
| TECHNOLOGY HARDWARE - (0.4)% | ||||||||
| Cisco Systems, Inc. | 14,861 | 533,510 | ||||||
| Cubic Corporation | 451 | 26,659 | ||||||
| Hewlett Packard Enterprise Company | 27,325 | 236,088 | ||||||
| 796,257 | ||||||||
See accompanying notes to financial statements.
82
| SCHEDULE OF INVESTMENTS |
| Dunham Monthly Distribution Fund (Continued) |
| October 31, 2020 |
| Security | Shares | Value | ||||||
| SECURITIES SOLD SHORT * - (20.5)% (Continued) | ||||||||
| TECHNOLOGY SERVICES - (0.9)% | ||||||||
| Accenture plc | 4,081 | $ | 885,210 | |||||
| Automatic Data Processing, Inc. | 1,935 | 305,653 | ||||||
| Fiserv, Inc. | 5,211 | 497,494 | ||||||
| Global Payments, Inc. | 212 | 33,441 | ||||||
| International Business Machines Corporation | 650 | 72,579 | ||||||
| Perficient, Inc. | 298 | 11,670 | ||||||
| Science Applications International Corporation | 470 | 35,894 | ||||||
| 1,841,941 | ||||||||
| TELECOMMUNICATIONS - (0.3)% | ||||||||
| AT&T, Inc. | 4,152 | 112,187 | ||||||
| Verizon Communications, Inc. | 9,557 | 544,653 | ||||||
| 656,840 | ||||||||
| TRANSPORTATION EQUIPMENT - (0.1)% | ||||||||
| Westinghouse Air Brake Technologies Corporation | 5,230 | 310,139 | ||||||
| WHOLESALE - DISCRETIONARY - (0.0)% | ||||||||
| LKQ Corporation | 1,303 | 41,683 | ||||||
| TOTAL SECURITIES SOLD SHORT - (Proceeds - $44,499,601) | $ | 44,575,354 | ||||||
ETF - Exchange Traded Fund
plc - Public Limited Company
REITs - Real Estate Investment Trusts
| * | Non-Income producing security. |
| ** | Each Written Option contract allows the option holder to buy/sell 100 shares of the underlying security at the exercise price. |
| TOTAL RETURN SWAPS | ||||||||||||||
| Notional Value at | Maturity | Unrealized Appreciation/ | ||||||||||||
| Reference Entity | Counterparty | October 31, 2020 | Interest Rate | Date | (Depreciation) | |||||||||
| LONG TOTAL RETURN SWAPS | ||||||||||||||
| JPGWCYDE # | JPMorgan | $ | 2,959,517 | 1 mo. LIBOR + 0.700% | 8/1/2024 | $ | 95,488 | |||||||
| JPPQGRO + | JPMorgan | 1,006,214 | 1 mo. LIBOR + 0.700% | 8/1/2024 | (23,263 | ) | ||||||||
| NET UNREALIZED GAIN FROM LONG TOTAL RETURN SWAPS | 72,225 | |||||||||||||
| SHORT TOTAL RETURN SWAPS | ||||||||||||||
| Faurecia SE | JPMorgan | (228,103 | ) | EONIA - 0.400% | 8/1/2024 | 66,773 | ||||||||
| JP1CND ++ | JPMorgan | (1,049,349 | ) | Fed Fund - 0.400% | 8/1/2024 | (6,173 | ) | |||||||
| JP1STP +++ | JPMorgan | (2,233,435 | ) | Fed Fund - 0.400% | 8/1/2024 | 97,551 | ||||||||
| JPGWGGQS ## | JPMorgan | (4,997,172 | ) | Fed Fund - 0.400% | 8/1/2024 | 176,678 | ||||||||
| Peugeot SA | JPMorgan | (1,351,911 | ) | EONIA - 0.400% | 8/1/2024 | 420,273 | ||||||||
| NET UNREALIZED GAIN FROM SHORT TOTAL RETURN SWAPS | 755,102 | |||||||||||||
| NET UNREALIZED GAIN FROM TOTAL RETURN SWAPS | $ | 827,327 | ||||||||||||
EONIA - Euro Overnight Index Average
| # | Total return swap with JPMorgan Chase. The swap provides exposure to the total returns on a basket of common stock that is calculated on a daily basis. Under the terms of the swap, the Sub-Adviser has the ability to periodically adjust the notional level of the swap. The swap was effective on August 25, 2020 and is reset on a monthly basis. The swap has a termination date of August 1, 2024, unless earlier terminated. In addition, the Fund will receive the total return on the basket of securities, including dividends and provide a fee to JPMorgan, in the amount of 1 month LIBOR plus 70 bps. |
| ## | Total return swap with JPMorgan Chase. The swap provides exposure to the total returns on a basket of common stock that is calculated on a daily basis. Under the terms of the swap, the Sub-Adviser has the ability to periodically adjust the notional level of the swap. The swap was effective on August 4, 2020 and is reset on a monthly basis. The swap has a termination date of August 1, 2024, unless earlier terminated. In addition, the Fund will receive the total return on the basket of securities, including dividends and provide a fee to JPMorgan, in the amount of Fed Funds minus 40 bps. |
| + | Total return swap with JPMorgan Chase. The swap provides long exposure to the total returns of the JP Morgan iDex U.S. Growth Top Rank Index and short exposure to the total returns of the JP Morgan iDex U.S. Growth Bottom Rank Index. Under the terms of the swap, the Sub-Adviser has the ability to periodically adjust the notional level of the swap. The swap was effective on October 26, 2020 and is reset on a monthly basis. The swap has a termination date of August 1, 2024, unless earlier terminated. In addition, the Fund will receive the total return on the Index, including dividends and provide a fee to JPMorgan, in the amount of 1 month LIBOR plus 70 bps. |
| ++ | Total return swap with JPMorgan Chase. The swap provides exposure to the total returns of the JP Morgan iDex U.S. Consumer Discretionary USD Index. Under the terms of the swap, the Sub-Adviser has the ability to periodically adjust the notional level of the swap. The swap was effective on August 18, 2020 and is reset on a monthly basis. The swap has a termination date of August 1, 2024, unless earlier terminated. In addition, the Fund will receive the total return on the Index, including dividends and provide a fee to JPMorgan, in the amount of Fed Fund minus 40 bps. |
| +++ | Total return swap with JPMorgan Chase. The swap provides exposure to the total returns of the JP Morgan iDex U.S. Consumer Staples USD Index. Under the terms of the swap, the Sub-Adviser has the ability to periodically adjust the notional level of the swap. The swap was effective on August 26, 2020 and is reset on a monthly basis. The swap has a termination date of August 1, 2024, unless earlier terminated. In addition, the Fund will receive the total return on the Index, including dividends and provide a fee to JPMorgan, in the amount of Fed Fund minus 40 bps. |
See accompanying notes to financial statements.
83
| SCHEDULE OF INVESTMENTS |
| Dunham Monthly Distribution Fund (Continued) |
| October 31, 2020 |
| Portfolio Composition * - (Unaudited) | ||||||||||
| Short-Term Investment | 42.0 | % | Utilities | 1.8 | % | |||||
| Consumer Discretionary | 12.4 | % | Consumer Staples | 1.7 | % | |||||
| Technology | 10.7 | % | Closed-End Fund | 1.4 | % | |||||
| Financials | 6.6 | % | Communications | 1.3 | % | |||||
| Health Care | 6.3 | % | Real Estate | 0.7 | % | |||||
| Industrials | 6.2 | % | Purchased Options | 0.3 | % | |||||
| Exchange Traded Funds | 3.2 | % | Rights | 0.0 | % | |||||
| Collateral for Securities Loaned | 2.9 | % | Warrants | 0.0 | % | |||||
| Materials | 2.5 | % | Total | 100.0 | % | |||||
| * | Based on total value of investments as of October 31, 2020 |
Percentage may differ from Schedule of Investments which are based on Fund net assets.
See accompanying notes to financial statements.
84
| SCHEDULE OF INVESTMENTS |
| Dunham Monthly Distribution Fund (Continued) |
| October 31, 2020 |
| JPGWCYDE Top 50 Holdings ^ | ||||||||
| Reference Entity | Shares | % of Basket Swap | Value | |||||
| JPGWCYCL | 56,541 | 51.7% | $ | 2,939,188 | ||||
| JPGWDEFN | 57,424 | 48.3% | 2,750,866 | |||||
| 5,690,054 | ||||||||
| JPGWGGQS Top 50 Holdings ^ | ||||||||
| Reference Entity | Shares | % of Basket Swap | Value | |||||
| Abbott Laboratories | 429 | 0.9% | $ | 45,116 | ||||
| Analog Devices, Inc. | 564 | 1.3% | 66,852 | |||||
| Archer-Daniels-Midland Company | 1,058 | 1.0% | 48,940 | |||||
| AT&T, Inc. | 2,245 | 1.2% | 60,652 | |||||
| Autodesk, Inc. | 161 | 0.8% | 37,805 | |||||
| Boston Scientific Corporation | 1,354 | 0.9% | 46,396 | |||||
| Bristol-Myers Squibb Company | 1,083 | 1.3% | 63,309 | |||||
| Catalent, Inc. | 452 | 0.8% | 39,648 | |||||
| Consolidated Edison, Inc. | 671 | 1.1% | 52,644 | |||||
| Corteva, Inc. | 1,343 | 0.9% | 44,291 | |||||
| DuPont De Nemours, Inc. | 693 | 0.8% | 39,445 | |||||
| Edison International | 762 | 0.9% | 42,713 | |||||
| Entergy Corporation | 401 | 0.8% | 40,601 | |||||
| Facebook, Inc. - Class A | 162 | 0.9% | 42,708 | |||||
| Fidelity National Information Services | 365 | 0.9% | 45,438 | |||||
| Fifth Third Bancorp | 1,879 | 0.9% | 43,622 | |||||
| Ford Motor Company | 5,710 | 0.9% | 44,137 | |||||
| General Motors Company | 1,318 | 0.9% | 45,520 | |||||
| GlaxoSmithKline plc - ADR | 1,402 | 0.9% | 46,847 | |||||
| Horizon Therapeutics plc | 548 | 0.8% | 41,050 | |||||
| Incyte Corporation | 507 | 0.9% | 43,910 | |||||
| Ingersoll Rand, Inc. | 1,110 | 0.8% | 38,797 | |||||
| International Business Machines Corporation | 538 | 1.2% | 60,119 | |||||
| International Paper Company | 1,074 | 0.9% | 46,968 | |||||
| Johnson Controls International plc | 1,152 | 1.0% | 48,633 | |||||
| Kellogg Company | 675 | 0.8% | 42,437 | |||||
| Keurig Dr. Pepper, Inc. | 1,848 | 1.0% | 49,702 | |||||
| Kraft Heinz Company | 1,592 | 1.0% | 48,693 | |||||
| L3Harris Technologies, Inc. | 264 | 0.9% | 42,576 | |||||
| Medtronic plc | 441 | 0.9% | 44,344 | |||||
| Metlife, Inc. | 1,006 | 0.8% | 38,074 | |||||
| Microchip Technology, Inc. | 431 | 0.9% | 45,267 | |||||
| Mondelez International, Inc. | 952 | 1.0% | 50,568 | |||||
| Netflix, Inc. | 129 | 1.2% | 61,290 | |||||
| NXP Semiconductors NV | 374 | 1.0% | 50,482 | |||||
| Oracle Corporation | 1,165 | 1.3% | 65,388 | |||||
| PPL Corporation | 1,719 | 0.9% | 47,275 | |||||
| Public Service Enterprise Group | 912 | 1.1% | 53,027 | |||||
| Raytheon Technologies Corporation | 891 | 1.0% | 48,409 | |||||
| Republic Services, Inc. | 513 | 0.9% | 45,188 | |||||
| Royal Dutch Shell plc - Class A | 2,230 | 1.1% | 56,987 | |||||
| Sony Corporation - ADR | 849 | 1.4% | 71,048 | |||||
| Total SE - ADR | 1,690 | 1.0% | 51,251 | |||||
| Toyota Motor Corporation - ADR | 355 | 0.9% | 46,609 | |||||
| Twilio, Inc. | 149 | 0.8% | 41,638 | |||||
| Twitter, Inc. | 1,157 | 1.0% | 47,857 | |||||
| Tyson Foods, Inc. - Class A | 746 | 0.9% | 42,670 | |||||
| Verizon Communications, Inc. | 936 | 1.1% | 53,357 | |||||
| Welltower, Inc. | 802 | 0.9% | 43,122 | |||||
| Weyerhaeuser Company | 1,540 | 0.8% | 42,030 | |||||
| 2,405,450 | ||||||||
| ^ | The make up of the underlying index and the total positions will not correlate to the notional value presented for the total return swaps due to timing of contracts opened and closed in the index. The top 50 holdings were determined based on the absolute notional values of the positions within the underlying basket. |
See accompanying notes to financial statements.
85
| Dunham Real Estate Stock Fund (Unaudited) |
| Message from the Sub-Adviser (American Assets Capital Advisers, LLC) |
Asset Class Recap
Following a volatile first half of the fiscal year where REITs, along with nearly all asset classes around the globe, precipitously declined, and then the asset class broadly rebounded. Investors cheered the reopening of states, the continued unprecedented central bank support, slowing virus cases, and stronger than anticipated economic data. In the final month of the fiscal year, volatility once again remerged. Investor confidence of a smooth economic rebound dwindled near the end of the most recent fiscal quarter as concerns of a second wave of the Coronavirus causing states to reintroduce stay at home orders dampened the rebound. Also adding to pessimism was the lack of progress toward another stimulus package as well as election uncertainty. During the fiscal year REITs, as measured by the Dow Jones US Real Estate Total Return Index, fell 14.7 percent.
Allocation Review
The Sub- Adviser focuses on real estate-oriented companies with competitive advantages that it believes are able to increase net operating income, independent of what is happening in the economy. Given this bias, the Fund generally gravitates away from cyclical sectors, which strongly contributed to Fund performance over the fiscal year. Specifically, the Fund had eliminated the exposure to some of the worst-performing property sectors in early January, which were the office REIT, shopping center REIT, and retail REIT sectors. These sectors have been adversely affected by the shutdowns imposed due to the coronavirus. Even though much of the country opened in the third fiscal quarter of this year, many companies were allowing employees to work remotely and consumers are hesitant to visit physical storefronts when online shopping is often a more convenient and health-conscious solution. The Fund also strongly benefited from its largest exposures and largest relative overweights, which were dedicated to the industrial and data center REIT sectors. On the other hand, the Fund’s overweight to casino and gaming detracted from Fund performance.
Holdings Insights
As previously mentioned, the Fund received strong contributions from data center REITs. These positions were largely insulated from the pandemic sell-off in second fiscal quarter. The reliance on data substantially increased as stay-at-home orders forced employees to work remotely and children to attend school from home. Not only did it drive these REITs higher, but it may also have emphasized its vital and expanding role in an increasingly digital economy. Although the need for data did not wane over the second half of the fiscal year, the Sub-Adviser performed some profit taking in October. Two data centers within this sector that contributed to Fund performance were GDS Holdings Inc. (GDS) (holding weight*: 6.67 percent) and CyrusOne Inc. (CONE) (holding weight*: 3.15 percent). These positions increased 79.7 percent and 14.6 percent, respectively since being added into the Fund in early January. The Fund also received positive contributions from the tower REIT sector, as American Tower REIT (AMT) (holding weight*: 9.50 percent), an owner and operator of wireless and broadcast communications infrastructure, rose 7.2 percent for the full fiscal year As the trend for e-commerce proliferated amid the self-imposed lockdowns, industrial REITs with a focus on last mile delivery thrived. Two holdings that benefited from this trend throughout the fiscal year were Rexford Industrial Realty Inc. (REXR) (holding weight*:2.01 percent) and Prologis Inc. (PLD) (holding weight*: 1.97 percent). PLD rose 13.4 percent, while REXR added 3.3 percent over the fiscal year. Another contributor from the industrials sector was Innovative Industrial Properties Inc. (IIPR) (holding weight*: 2.93 percent). IIPR is an industrial REIT that focuses on leasing to tenants in the regulated medical-use cannabis industry. Cannabis is only legal in some states but more and more states are changing their stance, vastly increasing revenue opportunities for these cannabis-related companies. In the upcoming election, five more states have cannabis legalization on the ballot. Since being added to the Fund in January, IIPR rose 60.6 percent.
The Fund received negative detractions from Fund performance from casino and gaming operators such as Las Vegas Sands Corp. (LVS) (holding weight*: 0.83 percent) and Wynn Resorts (WYNN) (holding weight**: 0.85 percent). These holdings struggled amid government-issued mandates and fear dissuading consumers from visiting properties leading to a decline of 29.7 percent and 48.9 percent, respectively since being added to the Fund in January. As the shutdowns adversely affected the gambling revenue from casinos, consumers turned to online gambling. The Sub-Adviser identified this trend and added Caesars Entertainment Inc. (CZR) (holding weight*: 6.63 percent) and MGM Resorts International (MGM) (holding weight*: 0.96 percent). Both of these companies have strategic partnerships or have made acquisitions with establish online gambling companies to help further expand into this growing market. Since being added to the Fund, these positions have had mixed results as CZR added 0.3 percent and MGM decreased 5.3 percent.
Sub-Adviser Outlook
The Sub-Adviser believes that although there may be a COVID-19 vaccine on the horizon, the Coronavirus pandemic has resulted in permanent social and behavioral changes that may have lasting impacts on the real estate market. These include, but are not limited to, the rapid acceleration of the digital economic expansion, further adoption of e-commerce as customers realize the benefits and convenience of shopping online, employers allowing work from home, and a sea change of demographic flow that is reversing urbanization. The Sub-Adviser believes that these changes have and will continue to have lasting adverse effects on retail and office REITs and a positive impact on the future growth of data center, infrastructure, and manufactured housing REITs, to name a few. Given the Sub-Adviser’s emphasis on owning companies with competitive advantages, the Sub-Adviser is optimistic in navigating the mercurial real estate space in the coming fiscal quarter and year.
| * | Holdings percentage(s) of total investments, cash and unsettled trades excluding collateral for securities loaned, as of 10/31/2020. |
| ** | Holdings percentage(s) as of the date prior to the sale of the security. |
Growth of $100,000 Investment
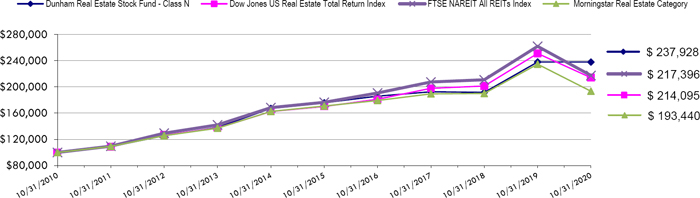
Total Returns (a) as of October 31, 2020
| Annualized | Annualized | ||
| One Year | Five Years | Ten Years | |
| Class N | (0.02)% | 6.25% | 9.05% |
| Class A with load of 5.75% | (6.03)% | 4.74% | 8.14% |
| Class A without load | (0.28)% | 6.00% | 8.78% |
| Class C | (1.08)% | 5.19% | 7.96% |
| Dow Jones US Real Estate Total Return Index ** | (14.72)% | 4.71% | 7.93% |
| FTSE NAREIT All REITs Index | (17.00)% | 4.26% | 8.09% |
| Morningstar Real Estate Category | (17.58)% | 2.53% | 6.83% |
| (a) | Total Returns are calculated based on traded NAVs. |
| ** | Change in Fund’s benchmark due to the implementation of the Sub-Adviser’s investment strategy primarily using the new benchmark index. As a result, the Fund’s performance is compared to both indices in the table above. The Dow Jones US Real Estate Total Return Index is designed to track the performance of real estate investment trusts (REITs) and other companies that invest directly or indirectly in real estate through development, management, or ownership, including property agencies. |
The FTSE NAREIT All REITs Index is a free float adjusted market capitalization weighted index that includes all tax qualified REITs listed on the NYSE and NASDAQ National Market. Investors cannot invest directly in an index or benchmark.
The Morningstar Real Estate Category is generally representative of mutual funds that primarily invest in REITs of various types. REITs are companies that develop and manage real estate properties.
| As disclosed in the Trust’s latest registration statement, the Fund’s total annual operating expenses, including the cost of underlying funds, are 1.42% for Class N, 2.42% for Class C and 1.67% for Class A. Class A shares are subject to a sales load of 5.75% and a deferred sales charge of up to 0.75% The performance data quoted here represents past performance, which is not indicative of future results. Current performance may be lower or higher than the performance data quoted. The investment return and NAV will fluctuate, so that an investor’s shares, when redeemed, may be worth more or less than their original cost. Total returns are calculated assuming reinvestment of all dividends and capital gains distributions, if any. The returns do not reflect the deductions of taxes a shareholder would pay on the redemption of Fund shares or Fund distributions. For performance information current to the most recent month-end, please call 1-800-442-4358 or visit our website www.dunham.com |
86
| SCHEDULE OF INVESTMENTS |
| Dunham Real Estate Stock Fund |
| October 31, 2020 |
| Security | Shares | Value | ||||||
| COMMON STOCKS - 40.6% | ||||||||
| ASSET MANAGEMENT - 2.0% | ||||||||
| Brookfield Infrastructure Corporation | 25,101 | $ | 1,367,252 | |||||
| ELECTRIC UTILITIES - 3.9% | ||||||||
| Brookfield Renewable Corporation | 39,691 | 2,650,168 | ||||||
| LEISURE FACILITIES & SERVICES - 10.2% | ||||||||
| Caesars Entertainment, Inc. * ^ | 103,069 | 4,619,552 | ||||||
| Drive Shack, Inc. * ^ | 714,895 | 1,050,896 | ||||||
| Las Vegas Sands Corporation | 12,035 | 578,402 | ||||||
| MGM Resorts International | 32,497 | 668,463 | ||||||
| 6,917,313 | ||||||||
| SPECIALTY FINANCE - 6.1% | ||||||||
| Fortress Transportation and Infrastructure Investors, LLC | 264,957 | 4,170,423 | ||||||
| TECHNOLOGY SERVICES - 4.8% | ||||||||
| CoStar Group, Inc. * | 3,964 | 3,264,790 | ||||||
| TELECOMMUNICATIONS - 13.6% | ||||||||
| 21Vianet Group, Inc. - ADR * | 5,621 | 129,058 | ||||||
| Chindata Group Holdings Ltd. - ADR * | 20,333 | 283,442 | ||||||
| GDS Holdings Ltd. - ADR * ^ | 55,265 | 4,644,471 | ||||||
| Switch, Inc. | 294,083 | 4,134,807 | ||||||
| 9,191,778 | ||||||||
| TOTAL COMMON STOCKS (Cost - $26,848,325) | 27,561,724 | |||||||
| REITS - 59.9% | ||||||||
| DATA CENTER - 9.3% | ||||||||
| CyrusOne, Inc. ^ | 30,853 | 2,192,106 | ||||||
| Equinix, Inc. | 3,604 | 2,635,389 | ||||||
| QTS Realty Trust, Inc. ^ | 24,281 | 1,493,524 | ||||||
| 6,321,019 | ||||||||
| INDUSTRIAL - 12.3% | ||||||||
| Americold Realty Trust ^ | 38,258 | 1,386,087 | ||||||
| Innovative Industrial Properties, Inc. ^ | 17,512 | 2,042,425 | ||||||
| Prologis, Inc. | 13,860 | 1,374,912 | ||||||
| Rexford Industrial Realty, Inc. ^ | 30,213 | 1,403,696 | ||||||
| Terreno Realty Corporation | 37,415 | 2,105,716 | ||||||
| 8,312,836 | ||||||||
| INFRASTRUCTURE - 20.9% | ||||||||
| American Tower Corporation | 28,811 | 6,616,446 | ||||||
| Crown Castle International Corporation | 30,845 | 4,817,989 | ||||||
| SBA Communications Corporation | 9,513 | 2,762,290 | ||||||
| 14,196,725 | ||||||||
| MULTI ASSET CLASS - 1.4% | ||||||||
| Colony Capital, Inc. ^ | 260,000 | 925,600 | ||||||
| OFFICE - 5.9% | ||||||||
| Alexandria Real Estate Equities, Inc. ^ | 26,431 | 4,004,825 | ||||||
| RESIDENTIAL - 10.1% | ||||||||
| American Homes 4 Rent | 27,572 | 779,461 | ||||||
| Equity LifeStyle Properties, Inc. | 30,713 | 1,817,903 | ||||||
| Invitation Homes, Inc. ^ | 85,878 | 2,341,034 | ||||||
| Sun Communities, Inc. | 13,729 | 1,889,522 | ||||||
| 6,827,920 | ||||||||
| TOTAL REITS (Cost - $34,953,677) | 40,588,925 | |||||||
See accompanying notes to financial statements.
87
| SCHEDULE OF INVESTMENTS |
| Dunham Real Estate Stock Fund (Continued) |
| October 31, 2020 |
| Interest | ||||||||||
| Security | Shares | Rate % | Value | |||||||
| COLLATERAL FOR SECURITIES LOANED - 23.2% | ||||||||||
| Mount Vernon Prime Portfolio # | 15,743,029 | 0.160 + | $ | 15,743,029 | ||||||
| TOTAL COLLATERAL FOR SECURITIES LOANED (Cost - $15,743,029) | ||||||||||
| TOTAL INVESTMENTS - 123.7% (Cost - $77,545,031) | $ | 83,893,678 | ||||||||
| LIABILITIES IN EXCESS OF OTHER ASSETS - (23.7)% | (16,052,407 | ) | ||||||||
| TOTAL NET ASSETS - 100.00% | $ | 67,841,271 | ||||||||
ADR - American Depositary Receipt.
LLC - Limited Liability Company
REITs - Real Estate Investment Trusts
| * | Non-Income producing security. |
| + | Variable rate security. Interest rate is as of October 31, 2020. |
| ^ | All or a portion of these securities are on loan. Total loaned securities had a value of $15,109,492 at October 31, 2020. |
| # | The Trust’s securities lending policies and procedures require that the borrower: (i) deliver cash or U.S. Government securities as collateral with respect to each new loan of U.S. securities, equal to at least 102% of the value of the portfolio securities loaned, and (ii) at all times thereafter mark-to-market the collateral on a daily basis so that the market value of such collateral is at least 100% of the value of securities loaned. From time to time the collateral may not be 102% due to end of day market movement. The next business day additional collateral is obtained/received from the borrower to replenish/reestablish 102%. |
| Portfolio Composition * - (Unaudited) | ||||||||||
| Real Estate | 48.4 | % | Financials | 6.6 | % | |||||
| Collateral for Securities Loaned | 18.8 | % | Technology | 3.9 | % | |||||
| Communications | 11.0 | % | Utilities | 3.1 | % | |||||
| Consumer Discretionary | 8.2 | % | Total | 100.0 | % | |||||
| * | Based on total value of investments as of October 31, 2020. |
Percentage may differ from Schedule of Investments which are based on Fund net assets.
See accompanying notes to financial statements.
88
| STATEMENTS OF ASSETS AND LIABILITIES |
| October 31, 2020 |
| Dunham | Dunham | Dunham | ||||||||||||||||||||||||||
| Corporate / | Dunham | Dunham | International | Dunham | Dunham | Focused | ||||||||||||||||||||||
| Government | Floating Rate | High-Yield | Opportunity | Large Cap | Small Cap | Large Cap | ||||||||||||||||||||||
| Bond Fund | Bond Fund | Bond Fund | Bond Fund | Value Fund | Value Fund | Growth Fund | ||||||||||||||||||||||
| Assets: | ||||||||||||||||||||||||||||
| Investments in securities, at cost | $ | 83,000,521 | $ | 180,007,784 | $ | 97,190,886 | $ | 47,350,912 | $ | 79,906,230 | $ | 57,014,666 | $ | 77,351,013 | ||||||||||||||
| Investments in securities, at value | $ | 84,515,351 | $ | 172,501,544 | $ | 97,267,074 | $ | 47,474,403 | $ | 96,305,932 | $ | 59,225,008 | $ | 164,628,650 | ||||||||||||||
| Cash | 3,055,555 | 405,215 | 4,436,673 | 2,162,267 | 1,791,599 | 480,994 | 2,576,423 | |||||||||||||||||||||
| Foreign currency, at value (cost $577,519) | — | — | — | 576,108 | — | — | — | |||||||||||||||||||||
| Deposits with brokers (a) | — | — | — | 424,143 | — | — | — | |||||||||||||||||||||
| Unrealized appreciation on forward foreign currency exchange contracts | — | — | — | 373,385 | — | — | — | |||||||||||||||||||||
| Unrealized appreciation on futures | — | — | — | 89,040 | — | — | — | |||||||||||||||||||||
| Unrealized appreciation on swap contracts | — | — | — | 26,989 | — | — | — | |||||||||||||||||||||
| Receivable for securities sold | 816,524 | 1,683,616 | 135,011 | — | 2,246,860 | — | — | |||||||||||||||||||||
| Interest and dividends receivable | 424,137 | 584,615 | 1,393,597 | 591,587 | 156,184 | 28,468 | 15,383 | |||||||||||||||||||||
| Receivable for Fund shares sold | 4,313 | 10,737 | 5,943 | 3,751 | 25,404 | 23,027 | 19,649 | |||||||||||||||||||||
| Prepaid expenses and other assets | 15,657 | 22,462 | 15,155 | 23,224 | 17,392 | 66,629 | 22,931 | |||||||||||||||||||||
| Total Assets | 88,831,537 | 175,208,189 | 103,253,453 | 51,744,897 | 100,543,371 | 59,824,126 | 167,263,036 | |||||||||||||||||||||
| Liabilities: | ||||||||||||||||||||||||||||
| Payable for securities purchased | 1,814,790 | 10,524,220 | 431,046 | 27,387 | 2,098,238 | — | 692,076 | |||||||||||||||||||||
| Payable for Fund shares redeemed | 84,691 | 393,282 | 228,038 | 74,263 | 68,464 | 40,359 | 3,553,584 | |||||||||||||||||||||
| Payable to broker | — | — | — | 260,000 | — | — | ||||||||||||||||||||||
| Distributions payable | 747 | 2,664 | 5,843 | 234 | — | — | — | |||||||||||||||||||||
| Payable upon return of securities loaned | 14,414,493 | 2,056,793 | 2,648,549 | 1,968,855 | 3,920,117 | 6,248,698 | 12,361,094 | |||||||||||||||||||||
| Unrealized depreciation on forward foreign currency exchange contracts | — | — | — | 36,702 | — | — | — | |||||||||||||||||||||
| Unrealized depreciation on futures | — | — | — | 9,725 | — | — | — | |||||||||||||||||||||
| Premiums received on swap contracts | — | — | — | 58,466 | — | — | — | |||||||||||||||||||||
| Payable to adviser | 29,435 | 83,258 | 51,225 | 25,132 | 53,787 | 30,681 | 89,212 | |||||||||||||||||||||
| Payable to sub-adviser | 13,133 | 19,878 | 20,064 | 9,109 | 44,587 | 4,656 | 63,860 | |||||||||||||||||||||
| Payable for distribution fees | 5,487 | 6,020 | 16,557 | 696 | 10,833 | 4,517 | 23,565 | |||||||||||||||||||||
| Payable for administration fees | 30,208 | 32,582 | 19,202 | 1,152 | 10,744 | 6,321 | 11,711 | |||||||||||||||||||||
| Payable for fund accounting fees | 2,690 | 7,587 | 6,300 | 1,385 | 2,804 | 2,380 | 4,924 | |||||||||||||||||||||
| Payable for transfer agent fees | 4,927 | 8,034 | — | 374 | 5,564 | 5,586 | 6,479 | |||||||||||||||||||||
| Payable for custody fees | 5,475 | 12,370 | 3,430 | 14,904 | 2,063 | 1,386 | 1,217 | |||||||||||||||||||||
| Payable for third party administrative servicing fees | 845 | 1,244 | 1,774 | 1,042 | 1,053 | 871 | 2,628 | |||||||||||||||||||||
| Accrued expenses and other liabilities | 19,330 | 19,299 | 23,045 | 7,531 | 16,055 | 15,873 | 17,456 | |||||||||||||||||||||
| Total Liabilities | 16,426,251 | 13,167,231 | 3,455,073 | 2,496,957 | 6,234,309 | 6,361,328 | 16,827,806 | |||||||||||||||||||||
| Net Assets | $ | 72,405,286 | $ | 162,040,958 | $ | 99,798,380 | $ | 49,247,940 | $ | 94,309,062 | $ | 53,462,798 | $ | 150,435,230 | ||||||||||||||
| Net Assets: | ||||||||||||||||||||||||||||
| Paid in capital | $ | 72,376,087 | $ | 180,951,684 | $ | 108,630,926 | $ | 49,538,365 | $ | 77,545,587 | $ | 57,569,614 | $ | 61,140,255 | ||||||||||||||
| Accumulated earnings (loss) | 29,199 | (18,910,726 | ) | (8,832,546 | ) | (290,425 | ) | 16,763,475 | (4,106,816 | ) | 89,294,975 | |||||||||||||||||
| Net Assets | $ | 72,405,286 | $ | 162,040,958 | $ | 99,798,380 | $ | 49,247,940 | $ | 94,309,062 | $ | 53,462,798 | $ | 150,435,230 | ||||||||||||||
| Net Asset Value Per Share | ||||||||||||||||||||||||||||
| Class N Shares: | ||||||||||||||||||||||||||||
| Net Assets | $ | 61,029,082 | $ | 135,535,672 | $ | 83,008,795 | $ | 41,346,429 | $ | 73,556,500 | $ | 42,444,469 | $ | 108,816,214 | ||||||||||||||
| Shares of beneficial interest outstanding (no par value; unlimited shares authorized) | 4,227,082 | 15,234,980 | 9,351,736 | 4,568,531 | 5,416,306 | 3,564,731 | 3,232,125 | |||||||||||||||||||||
| Net asset value, offering and redemption price per share | $ | 14.44 | $ | 8.90 | $ | 8.88 | $ | 9.05 | $ | 13.58 | $ | 11.91 | $ | 33.67 | ||||||||||||||
| Class A Shares: | ||||||||||||||||||||||||||||
| Net Assets | $ | 8,490,199 | $ | 19,705,099 | $ | 12,126,835 | $ | 6,722,000 | $ | 16,855,341 | $ | 8,954,648 | $ | 31,204,892 | ||||||||||||||
| Shares of beneficial interest outstanding (no par value; unlimited shares authorized) | 588,855 | 2,216,948 | 1,351,847 | 750,280 | 1,248,876 | 765,426 | 950,316 | |||||||||||||||||||||
| Net asset value and redemption price per share * | $ | 14.42 | $ | 8.89 | $ | 8.97 | $ | 8.96 | $ | 13.50 | $ | 11.70 | $ | 32.84 | ||||||||||||||
| Front-end sales charge factor | 0.9550 | 0.9550 | 0.9550 | 0.9550 | 0.9425 | 0.9425 | 0.9425 | |||||||||||||||||||||
| Offering price per share (Net asset value per share / front-end sales charge factor) | $ | 15.10 | $ | 9.31 | $ | 9.39 | $ | 9.38 | $ | 14.32 | $ | 12.41 | $ | 34.84 | ||||||||||||||
| Class C Shares: | ||||||||||||||||||||||||||||
| Net Assets | $ | 2,886,005 | $ | 6,800,187 | $ | 4,662,750 | $ | 1,179,511 | $ | 3,897,221 | $ | 2,063,681 | $ | 10,414,124 | ||||||||||||||
| Shares of beneficial interest outstanding (no par value; unlimited shares authorized) | 201,627 | 764,610 | 527,925 | 135,102 | 304,546 | 205,415 | 341,352 | |||||||||||||||||||||
| Net asset value, offering and redemption price per share | $ | 14.31 | $ | 8.89 | $ | 8.83 | $ | 8.73 | $ | 12.80 | $ | 10.05 | $ | 30.51 | ||||||||||||||
| * | For certain purchases of $1 million or more, a 0.75% contingent deferred sales charge may apply to redemptions made within eighteen months of purchase. |
| (a) | See Section 2k in the notes for the breakout by counterparty. |
See accompanying notes to financial statements.
89
| STATEMENTS OF ASSETS AND LIABILITIES (Continued) |
| October 31, 2020 |
| Dunham | Dunham | |||||||||||||||||||||||||||
| Dunham | Emerging | Dunham | Dunham | Dunham | Monthly | Dunham | ||||||||||||||||||||||
| Small Cap | Markets | International | Dynamic Macro | Long/Short | Distribution | Real Estate | ||||||||||||||||||||||
| Growth Fund | Stock Fund | Stock Fund | Fund | Credit Fund | Fund | Stock Fund | ||||||||||||||||||||||
| Assets: | ||||||||||||||||||||||||||||
| Investments in securities, at cost | $ | 43,247,185 | $ | 76,494,550 | $ | 123,001,772 | $ | 27,618,213 | $ | 144,208,892 | $ | 186,805,064 | $ | 77,545,031 | ||||||||||||||
| Investments in securities, at value | $ | 56,512,247 | $ | 92,008,331 | $ | 130,233,103 | $ | 29,870,851 | $ | 145,343,756 | $ | 185,673,970 | $ | 83,893,678 | ||||||||||||||
| Cash | 2,177,351 | — | 704,872 | 1,290,114 | 5,840,848 | 8,559,790 | 1,335,468 | |||||||||||||||||||||
| Foreign currency, at value (cost $541,686, $600,292, $831, and $22,345 respectively) | — | 541,641 | 597,562 | 811 | 17,958 | — | — | |||||||||||||||||||||
| Deposit with brokers (a) | — | — | — | 225,090 | 2,351,157 | 75,391,618 | — | |||||||||||||||||||||
| Unrealized appreciation on futures | — | — | — | 193,850 | 457,418 | — | — | |||||||||||||||||||||
| Unrealized appreciation on swap contracts | — | — | — | — | 326,237 | 856,763 | — | |||||||||||||||||||||
| Premiums paid on swap contracts | — | — | 357,697 | — | — | |||||||||||||||||||||||
| Receivable for securities sold | 817,519 | 437,956 | 813,657 | 423,868 | — | 12,884,202 | 586,437 | |||||||||||||||||||||
| Interest and dividends receivable | — | 83,140 | 568,483 | 1,273 | 450,288 | 1,717,650 | 1,063 | |||||||||||||||||||||
| Receivable for Fund shares sold | 9,915 | 14,946 | 34,014 | 7,492 | 150,426 | 55,331 | 282,253 | |||||||||||||||||||||
| Prepaid expenses and other assets | 40,047 | 16,219 | 5,992 | 17,773 | 15,207 | 19,467 | 17,982 | |||||||||||||||||||||
| Total Assets | 59,557,079 | 93,102,233 | 132,957,683 | 32,031,122 | 155,310,992 | 285,158,791 | 86,116,881 | |||||||||||||||||||||
| Liabilities: | ||||||||||||||||||||||||||||
| Option contracts written (premiums received $161,586 and $667,354, respectively) | — | — | — | 402,800 | — | 404,440 | — | |||||||||||||||||||||
| Securities sold short (proceeds $44,499,601) | — | — | — | — | — | 44,575,354 | — | |||||||||||||||||||||
| Line of credit payable | — | 252,557 | — | — | — | — | — | |||||||||||||||||||||
| Foreign currency overdraft (proceeds $2,821,672) | — | — | — | — | — | 3,002,401 | — | |||||||||||||||||||||
| Payable upon return of securities loaned | 885,126 | 3,261,479 | 8,764,809 | 423,660 | 18,515,308 | 5,585,545 | 15,743,029 | |||||||||||||||||||||
| Payable for securities purchased | 315,242 | 564,288 | 1,895,265 | 786,621 | 3,862,353 | 14,123,995 | 408,747 | |||||||||||||||||||||
| Payable for Fund shares redeemed | 66,699 | 89,842 | 110,650 | 31,077 | 291,405 | 459,811 | 1,726,477 | |||||||||||||||||||||
| Distributions Payable | — | — | — | — | 3,331 | 35,313 | — | |||||||||||||||||||||
| Withholding Payable | — | — | — | — | — | — | 4,757 | |||||||||||||||||||||
| Premiums received on swap contracts | — | — | — | — | 1,011,531 | 24 | — | |||||||||||||||||||||
| Unrealized depreciation on swap contracts | — | — | — | — | 243,581 | 29,436 | — | |||||||||||||||||||||
| Unrealized depreciation on futures | — | — | — | 281,106 | — | — | — | |||||||||||||||||||||
| Payable for dividend on short sales | — | — | — | — | — | 80,077 | — | |||||||||||||||||||||
| Payable to adviser | 32,812 | 49,833 | 70,784 | 16,913 | 69,293 | 119,236 | 39,283 | |||||||||||||||||||||
| Payable to sub-adviser | 47,778 | 63,018 | 105,528 | 11,297 | 71,140 | 48,120 | 317,339 | |||||||||||||||||||||
| Payable for distribution fees | 12,875 | 8,510 | 12,279 | 3,136 | 11,329 | 30,449 | 848 | |||||||||||||||||||||
| Payable for administration fees | 4,999 | 13,678 | 22,545 | 5,657 | 9,452 | 22,542 | 6,630 | |||||||||||||||||||||
| Payable for fund accounting fees | 1,665 | 3,936 | 7,751 | 1,369 | 6,373 | 9,290 | 2,868 | |||||||||||||||||||||
| Payable for transfer agent fees | 4,425 | 5,488 | 4,000 | 4,195 | 7,105 | 9,054 | 5,847 | |||||||||||||||||||||
| Payable for custody fees | 4,393 | 27,755 | 9,807 | 2,900 | 2,514 | — | 1,124 | |||||||||||||||||||||
| Payable for third party administrative servicing fees | 1,829 | 639 | 3,692 | 793 | 1,038 | 5,974 | 1,863 | |||||||||||||||||||||
| Accrued expenses and other liabilities | 17,985 | 24,854 | 19,849 | 17,106 | 14,843 | 39,405 | 16,798 | |||||||||||||||||||||
| Total Liabilities | 1,395,828 | 4,365,877 | 11,026,959 | 1,988,630 | 24,120,596 | 68,580,466 | 18,275,610 | |||||||||||||||||||||
| Net Assets | $ | 58,161,251 | $ | 88,736,356 | $ | 121,930,724 | $ | 30,042,492 | $ | 131,190,396 | $ | 216,578,325 | $ | 67,841,271 | ||||||||||||||
| �� | ||||||||||||||||||||||||||||
| Net Assets: | ||||||||||||||||||||||||||||
| Paid in capital | $ | 37,383,556 | $ | 74,305,748 | $ | 113,620,151 | $ | 30,483,626 | $ | 127,554,626 | $ | 223,994,604 | $ | 55,412,672 | ||||||||||||||
| Accumulated earnings (loss) | 20,777,695 | 14,430,608 | 8,310,573 | (441,134 | ) | 3,635,770 | (7,416,279 | ) | 12,428,599 | |||||||||||||||||||
| Net Assets | $ | 58,161,251 | $ | 88,736,356 | $ | 121,930,724 | $ | 30,042,492 | $ | 131,190,396 | $ | 216,578,325 | $ | 67,841,271 | ||||||||||||||
| Net Asset Value Per Share | ||||||||||||||||||||||||||||
| Class N Shares: | ||||||||||||||||||||||||||||
| Net Assets | $ | 42,791,963 | $ | 70,867,530 | $ | 96,238,575 | $ | 23,680,051 | $ | 110,215,133 | $ | 160,250,023 | $ | 53,646,577 | ||||||||||||||
| Shares of beneficial interest outstanding (no par value; unlimited shares authorized) | 1,979,343 | 4,513,997 | 6,305,913 | 2,367,438 | 11,540,570 | 4,893,207 | 3,094,608 | |||||||||||||||||||||
| Net asset value, offering and redemption price per share | $ | 21.62 | $ | 15.70 | $ | 15.26 | $ | 10.00 | $ | 9.55 | $ | 32.75 | $ | 17.34 | ||||||||||||||
| Class A Shares: | ||||||||||||||||||||||||||||
| Net Assets | $ | 12,750,163 | $ | 14,863,841 | $ | 20,938,389 | $ | 5,078,481 | $ | 17,123,340 | $ | 33,156,842 | $ | 11,196,283 | ||||||||||||||
| Shares of beneficial interest outstanding (no par value; unlimited shares authorized) | 626,287 | 969,923 | 1,383,628 | 513,046 | 1,796,706 | 1,052,843 | 640,976 | |||||||||||||||||||||
| Net asset value, and redemption price per share * | $ | 20.36 | $ | 15.32 | $ | 15.13 | $ | 9.90 | $ | 9.53 | $ | 31.49 | $ | 17.47 | ||||||||||||||
| Front-end sales charge factor | 0.9425 | 0.9425 | 0.9425 | 0.9425 | 0.9425 | 0.9425 | 0.9425 | |||||||||||||||||||||
| Offering price per share (Net asset value per share / front-end sales charge factor) | $ | 21.60 | $ | 16.25 | $ | 16.05 | $ | 10.50 | $ | 10.11 | $ | 33.41 | $ | 18.54 | ||||||||||||||
| Class C Shares: | ||||||||||||||||||||||||||||
| Net Assets | $ | 2,619,125 | $ | 3,004,985 | $ | 4,753,760 | $ | 1,283,960 | $ | 3,851,923 | $ | 23,171,460 | $ | 2,998,411 | ||||||||||||||
| Shares of beneficial interest outstanding (no par value; unlimited shares authorized) | 170,142 | 208,574 | 333,604 | 136,975 | 416,993 | 957,853 | 183,960 | |||||||||||||||||||||
| Net asset value, offering and redemption price per share | $ | 15.39 | $ | 14.41 | $ | 14.25 | $ | 9.37 | $ | 9.24 | $ | 24.19 | $ | 16.30 | ||||||||||||||
| * | For certain purchases of $1 million or more, a 0.75% contingent deferred sales charge may apply to redemptions made within eighteen months of purchase. |
| (a) | See Section 2k in the notes for the breakout by counterparty. |
See accompanying notes to financial statements.
90
| STATEMENTS OF OPERATIONS |
| For the Year Ended October 31, 2020 |
| Dunham | Dunham | Dunham | ||||||||||||||||||||||||||
| Corporate / | Dunham | Dunham | International | Dunham | Dunham | Focused | ||||||||||||||||||||||
| Government | Floating Rate | High-Yield | Opportunity | Large Cap | Small Cap | Large Cap | ||||||||||||||||||||||
| Bond Fund | Bond Fund | Bond Fund | Bond Fund | Value Fund | Value Fund | Growth Fund | ||||||||||||||||||||||
| Investment Income: | ||||||||||||||||||||||||||||
| Interest income | $ | 1,813,972 | $ | 8,215,603 | $ | 5,866,987 | $ | 1,444,048 | $ | 10,669 | $ | 3,904 | $ | 10,767 | ||||||||||||||
| Dividend income | 2,913 | 61,756 | — | — | 2,229,704 | 1,079,738 | 238,379 | |||||||||||||||||||||
| Securities lending income -net | 7,369 | 2,426 | 11,680 | 2,594 | 15,463 | 8,259 | 20,032 | |||||||||||||||||||||
| Less: Foreign withholding taxes | — | — | — | (21,850 | ) | — | — | — | ||||||||||||||||||||
| Total Investment Income | 1,824,254 | 8,279,785 | 5,878,667 | 1,424,792 | 2,255,836 | 1,091,901 | 269,178 | |||||||||||||||||||||
| Operating Expenses: | ||||||||||||||||||||||||||||
| Investment advisory fees | 281,526 | 1,032,297 | 604,969 | 248,976 | 589,820 | 358,431 | 832,915 | |||||||||||||||||||||
| Sub-advisory fees | 168,916 | 481,739 | 322,650 | 186,732 | 272,224 | 248,144 | 448,493 | |||||||||||||||||||||
| Sub-advisory performance fees | (49,922 | ) | (200,430 | ) | (61,440 | ) | (103,650 | ) | 33,302 | (98,188 | ) | 113,818 | ||||||||||||||||
| Fund accounting fees | 10,251 | 31,766 | 20,312 | 8,369 | 15,267 | 10,216 | 21,783 | |||||||||||||||||||||
| Distribution fees- Class C Shares | 26,594 | 59,702 | 43,325 | 9,299 | 44,147 | 23,475 | 94,605 | |||||||||||||||||||||
| Distribution fees- Class A Shares | 18,189 | 53,309 | 31,236 | 13,758 | 42,746 | 23,586 | 68,545 | |||||||||||||||||||||
| Administration fees | 124,462 | 150,843 | 101,063 | 67,818 | 57,017 | 42,559 | 67,036 | |||||||||||||||||||||
| Registration fees | 52,933 | 44,830 | 54,854 | 36,433 | 50,591 | 50,303 | 48,704 | |||||||||||||||||||||
| Transfer agent fees | 24,126 | 39,960 | 22,926 | 17,878 | 28,582 | 23,914 | 36,596 | |||||||||||||||||||||
| Custodian fees | 32,462 | 44,090 | 12,279 | 50,808 | 9,239 | 7,786 | 6,163 | |||||||||||||||||||||
| Professional fees | 19,517 | 25,082 | 21,759 | 17,535 | 20,604 | 18,937 | 23,133 | |||||||||||||||||||||
| Chief Compliance Officer fees | 7,327 | 21,592 | 13,356 | 3,910 | 10,963 | 6,629 | 13,866 | |||||||||||||||||||||
| Printing and postage expense | 15,395 | 24,458 | 18,712 | 11,794 | 17,561 | 11,261 | 21,992 | |||||||||||||||||||||
| Trustees’ fees | 2,815 | 7,789 | 5,686 | 1,748 | 4,728 | 3,112 | 6,649 | |||||||||||||||||||||
| Insurance expense | 917 | 3,491 | 1,923 | 675 | 1,449 | 902 | 1,794 | |||||||||||||||||||||
| Interest expense | 984 | 985 | 407 | 7,047 | 191 | 2,438 | 3,168 | |||||||||||||||||||||
| Third party administrative servicing fees | 2,373 | 3,244 | 4,141 | 1,661 | 4,491 | 2,955 | 9,875 | |||||||||||||||||||||
| Miscellaneous expenses | 7,746 | 12,147 | 9,614 | 5,339 | 6,826 | 4,698 | 8,483 | |||||||||||||||||||||
| Total Operating Expenses | 746,611 | 1,836,894 | 1,227,772 | 586,130 | 1,209,748 | 741,158 | 1,827,618 | |||||||||||||||||||||
| Less: Fees paid indirectly | — | — | — | — | (3,171 | ) | (49,836 | ) | (4,019 | ) | ||||||||||||||||||
| Net Operating Expenses | 746,611 | 1,836,894 | 1,227,772 | 586,130 | 1,206,577 | 691,322 | 1,823,599 | |||||||||||||||||||||
| Net Investment Income (Loss) | 1,077,643 | 6,442,891 | 4,650,895 | 838,662 | 1,049,259 | 400,579 | (1,554,421 | ) | ||||||||||||||||||||
| Realized and Unrealized Gain (Loss) on Investments, Futures, Swap Contracts, Foreign Currency Translations, and Forward Foreign Currency Exchange Contracts: | ||||||||||||||||||||||||||||
| Net realized gain (loss) from: | ||||||||||||||||||||||||||||
| Investments | 1,732,785 | (7,085,316 | ) | (1,387,495 | ) | 425,928 | 47,474 | (5,471,307 | ) | 4,881,470 | ||||||||||||||||||
| Futures | — | — | — | (610,074 | ) | — | — | — | ||||||||||||||||||||
| Swap contracts | — | — | — | (101,057 | ) | — | — | — | ||||||||||||||||||||
| Forward foreign currency exchange contracts | — | — | — | (724,118 | ) | — | — | — | ||||||||||||||||||||
| Net realized gain (loss) | 1,732,785 | (7,085,316 | ) | (1,387,495 | ) | (1,009,321 | ) | 47,474 | (5,471,307 | ) | 4,881,470 | |||||||||||||||||
| Net change in unrealized appreciation (depreciation) on: | ||||||||||||||||||||||||||||
| Investments | (794,965 | ) | (2,136,038 | ) | (571,928 | ) | (1,151,192 | ) | (1,295,063 | ) | (1,228,084 | ) | 41,424,027 | |||||||||||||||
| Futures | — | — | — | 64,522 | — | — | — | |||||||||||||||||||||
| Swap contracts | — | — | — | 26,989 | — | — | — | |||||||||||||||||||||
| Foreign currency translations | — | — | — | (4,644 | ) | — | — | — | ||||||||||||||||||||
| Forward foreign currency exchange contracts | — | — | — | 345,835 | — | — | — | |||||||||||||||||||||
| Net change in unrealized appreciation (depreciation) | (794,965 | ) | (2,136,038 | ) | (571,928 | ) | (718,490 | ) | (1,295,063 | ) | (1,228,084 | ) | 41,424,027 | |||||||||||||||
| Net Realized and Unrealized Gain (Loss) | 937,820 | (9,221,354 | ) | (1,959,423 | ) | (1,727,811 | ) | (1,247,589 | ) | (6,699,391 | ) | 46,305,497 | ||||||||||||||||
| Net Increase (Decrease) in Net Assets Resulting From Operations | $ | 2,015,463 | $ | (2,778,463 | ) | $ | 2,691,472 | $ | (889,149 | ) | $ | (198,330 | ) | $ | (6,298,812 | ) | $ | 44,751,076 | ||||||||||
See accompanying notes to financial statements.
91
| STATEMENTS OF OPERATIONS (Continued) |
| For the Year Ended October 31, 2020 |
| Dunham | Dunham | |||||||||||||||||||||||||||
| Dunham | Emerging | Dunham | Dunham | Dunham | Monthly | Dunham | ||||||||||||||||||||||
| Small Cap | Markets | International | Dynamic Macro | Long/Short | Distribution | Real Estate | ||||||||||||||||||||||
| Growth Fund | Stock Fund | Stock Fund | Fund | Credit Fund | Fund | Stock Fund | ||||||||||||||||||||||
| Investment Income: | ||||||||||||||||||||||||||||
| Interest income | $ | 13,424 | $ | 6,720 | $ | 4,170 | $ | 188,644 | $ | 2,593,933 | $ | 419,607 | $ | 6,918 | ||||||||||||||
| Dividend income | 177,559 | 1,528,649 | 3,949,027 | 352,203 | 131,368 | 2,163,790 | 1,383,094 | |||||||||||||||||||||
| Securities lending income - net | 44,351 | 12,554 | 49,852 | 18,243 | 32,422 | 31,238 | 18,281 | |||||||||||||||||||||
| Less: Foreign withholding taxes | — | (205,175 | ) | (545,166 | ) | (49 | ) | — | (16,607 | ) | (19,541 | ) | ||||||||||||||||
| Total Investment Income | 235,334 | 1,342,748 | 3,457,883 | 559,041 | 2,757,723 | 2,598,028 | 1,388,752 | |||||||||||||||||||||
| Operating Expenses: | ||||||||||||||||||||||||||||
| Investment advisory fees | 353,214 | 522,717 | 838,845 | 217,610 | 629,568 | 1,451,379 | 393,870 | |||||||||||||||||||||
| Sub-advisory fees | 271,703 | 361,880 | 838,845 | 251,089 | 581,140 | 1,339,734 | 268,239 | |||||||||||||||||||||
| Sub-advisory performance fees | 142,054 | 273,976 | 83,973 | (62,558 | ) | (88,641 | ) | (814,310 | ) | 148,162 | ||||||||||||||||||
| Fund accounting fees | 9,131 | 14,803 | 26,039 | 5,688 | 19,497 | 40,583 | 11,101 | |||||||||||||||||||||
| Distribution fees- Class C Shares | 24,103 | 30,823 | 53,531 | 15,092 | 45,337 | 284,625 | 27,718 | |||||||||||||||||||||
| Distribution fees- Class A Shares | 28,436 | 33,665 | 55,734 | 14,946 | 33,662 | 90,514 | 26,280 | |||||||||||||||||||||
| Administration fees | 39,540 | 63,867 | 126,180 | 35,631 | 68,950 | 121,538 | 43,617 | |||||||||||||||||||||
| Registration fees | 50,917 | 50,958 | 54,940 | 47,664 | 56,166 | 65,995 | 52,848 | |||||||||||||||||||||
| Transfer agent fees | 22,686 | 26,795 | 25,592 | 20,539 | 31,090 | 48,487 | 25,082 | |||||||||||||||||||||
| Custodian fees | 20,909 | 107,640 | 116,171 | 9,586 | 11,262 | 75,921 | 5,902 | |||||||||||||||||||||
| Professional fees | 19,256 | 28,146 | 23,283 | 17,871 | 20,373 | 27,289 | 19,961 | |||||||||||||||||||||
| Chief Compliance Officer fees | 6,818 | 9,264 | 15,720 | 3,744 | 12,117 | 27,782 | 7,419 | |||||||||||||||||||||
| Printing and postage expense | 13,667 | 13,613 | 21,126 | 9,447 | 18,669 | 74,696 | 17,358 | |||||||||||||||||||||
| Trustees’ fees | 2,737 | 4,315 | 7,309 | 1,004 | 4,934 | 9,702 | 2,997 | |||||||||||||||||||||
| Insurance expense | 903 | 1,349 | 2,208 | 773 | 1,262 | 4,478 | 944 | |||||||||||||||||||||
| Interest expense | 337 | 2,724 | 3,347 | 2,438 | 362 | 373 | 1,438 | |||||||||||||||||||||
| Third party administrative servicing fees | 6,316 | 3,319 | 6,080 | 2,330 | 6,894 | 22,110 | 5,219 | |||||||||||||||||||||
| Dividend expense on short sales | — | — | — | — | — | 1,388,237 | — | |||||||||||||||||||||
| Broker Fees | — | — | — | — | — | 140,223 | — | |||||||||||||||||||||
| Miscellaneous expenses | 4,636 | 8,217 | 14,879 | 3,740 | 7,738 | 17,880 | 4,495 | |||||||||||||||||||||
| Total Operating Expenses | 1,017,363 | 1,558,071 | 2,313,802 | 596,634 | 1,460,380 | 4,417,236 | 1,062,650 | |||||||||||||||||||||
| Less: Fees paid indirectly | (18,856 | ) | — | (1,524 | ) | — | — | — | — | |||||||||||||||||||
| Net Operating Expenses | 998,507 | 1,558,071 | 2,312,278 | 596,634 | 1,460,380 | 4,417,236 | 1,062,650 | |||||||||||||||||||||
| Net Investment Income (Loss) | (763,173 | ) | (215,323 | ) | 1,145,605 | (37,593 | ) | 1,297,343 | (1,819,208 | ) | 326,102 | |||||||||||||||||
| Realized and Unrealized Gain (Loss) on Investments, Futures, Purchased Options, Securities Sold Short, Written Options, Swap Contracts, Foreign Currency Transactions, and Foreign Currency Translations: | ||||||||||||||||||||||||||||
| Net realized gain (loss) from: | ||||||||||||||||||||||||||||
| Investments | 10,620,310 | 1,107,962 | 5,107,536 | 1,412,793 | 4,509,986 | 10,101,372 | 6,128,969 | |||||||||||||||||||||
| Futures | — | — | — | (3,157,257 | ) | (1,830,966 | ) | — | — | |||||||||||||||||||
| Purchased options | — | — | — | 1,696,385 | — | (3,243,326 | ) | — | ||||||||||||||||||||
| Securities sold short | — | — | — | — | — | (6,165,791 | ) | 184 | ||||||||||||||||||||
| Written options | — | — | — | (971,020 | ) | — | 3,626,762 | — | ||||||||||||||||||||
| Swap contracts | — | — | — | — | (278,124 | ) | (946,566 | ) | — | |||||||||||||||||||
| Foreign currency transactions | — | (95,974 | ) | (27,666 | ) | 44,172 | 21,228 | 113,141 | — | |||||||||||||||||||
| Net realized gain (loss) | 10,620,310 | 1,011,988 | 5,079,870 | (974,927 | ) | 2,422,124 | 3,485,592 | 6,129,153 | ||||||||||||||||||||
| Net change in unrealized appreciation (depreciation) on: | — | |||||||||||||||||||||||||||
| Investments | 8,033,898 | 10,340,851 | (3,744,350 | ) | (293,536 | ) | (149,555 | ) | (8,854,335 | ) | (5,861,968 | ) | ||||||||||||||||
| Futures | — | — | — | (318,992 | ) | 176,153 | — | — | ||||||||||||||||||||
| Purchased options | — | — | — | 244,080 | — | 175,946 | — | |||||||||||||||||||||
| Securities sold short | — | — | — | — | — | 5,199,268 | — | |||||||||||||||||||||
| Written options | — | — | — | (237,467 | ) | — | 198,294 | — | ||||||||||||||||||||
| Swap contracts | — | — | — | — | 39,622 | 974,826 | — | |||||||||||||||||||||
| Foreign currency translations | — | (2,586 | ) | 10,714 | 15,726 | (4,389 | ) | (176,225 | ) | — | ||||||||||||||||||
| Net change in unrealized appreciation (depreciation) | 8,033,898 | 10,338,265 | (3,733,636 | ) | (590,189 | ) | 61,831 | (2,482,226 | ) | (5,861,968 | ) | |||||||||||||||||
| Net Realized and Unrealized Gain (Loss) | 18,654,208 | 11,350,253 | 1,346,234 | (1,565,116 | ) | 2,483,955 | 1,003,366 | 267,185 | ||||||||||||||||||||
| Net Increase (Decrease) in Net Assets Resulting From Operations | $ | 17,891,035 | $ | 11,134,930 | $ | 2,491,839 | $ | (1,602,709 | ) | $ | 3,781,298 | $ | (815,842 | ) | $ | 593,287 | ||||||||||||
See accompanying notes to financial statements.
92
| STATEMENTS OF CHANGES IN NET ASSETS |
| Dunham | Dunham | Dunham | Dunham | Dunham | ||||||||||||||||||||||||||||||||||||
| Corporate/Government | Floating Rate | High-Yield | International Opportunity | Large Cap | ||||||||||||||||||||||||||||||||||||
| Bond Fund | Bond Fund | Bond Fund | Bond Fund | Value Fund | ||||||||||||||||||||||||||||||||||||
| Year Ended | Year Ended | Year Ended | Year Ended | Year Ended | Year Ended | Year Ended | Year Ended | Year Ended | Year Ended | |||||||||||||||||||||||||||||||
| October 31, 2020 | Oct. 31, 2019 | October 31, 2020 | Oct. 31, 2019 | October 31, 2020 | Oct. 31, 2019 | October 31, 2020 | Oct. 31, 2019 | October 31, 2020 | Oct. 31, 2019 | |||||||||||||||||||||||||||||||
| Operations: | ||||||||||||||||||||||||||||||||||||||||
| Net investment income (loss) | $ | 1,077,643 | $ | 1,340,868 | $ | 6,442,891 | $ | 8,487,775 | $ | 4,650,895 | $ | 5,490,063 | $ | 838,662 | $ | (132,254 | ) | $ | 1,049,259 | $ | 937,686 | |||||||||||||||||||
| Net realized gain (loss) from investments, futures, swaps and forward foreign currency exchange contracts | 1,732,785 | 113,200 | (7,085,316 | ) | (1,573,440 | ) | (1,387,495 | ) | (1,991,065 | ) | (1,009,321 | ) | 107,492 | 47,474 | 1,944,710 | |||||||||||||||||||||||||
| Net change in unrealized appreciation (depreciation) on investments, futures, foreign currency translations, swaps and forward foreign currency exchange contracts | (794,965 | ) | 3,618,411 | (2,136,038 | ) | (3,869,644 | ) | (571,928 | ) | 4,726,623 | (718,490 | ) | 2,295,850 | (1,295,063 | ) | 5,655,326 | ||||||||||||||||||||||||
| Net Increase (Decrease) in Net Assets Resulting From Operations | 2,015,463 | 5,072,479 | (2,778,463 | ) | 3,044,691 | 2,691,472 | 8,225,621 | (889,149 | ) | 2,271,088 | (198,330 | ) | 8,537,722 | |||||||||||||||||||||||||||
| Distributions to Shareholders From: | ||||||||||||||||||||||||||||||||||||||||
| Distributions From Paid In Capital: | ||||||||||||||||||||||||||||||||||||||||
| Class N | — | — | — | — | — | — | (274,560 | ) | — | — | — | |||||||||||||||||||||||||||||
| Class A | — | — | — | — | — | — | (45,800 | ) | — | — | — | |||||||||||||||||||||||||||||
| Class C | — | — | — | — | — | — | (9,090 | ) | — | — | — | |||||||||||||||||||||||||||||
| Total Distributions Paid | ||||||||||||||||||||||||||||||||||||||||
| Class N | (949,575 | ) | (1,166,344 | ) | (5,328,056 | ) | (7,355,813 | ) | (3,823,771 | ) | (4,676,120 | ) | (514,559 | ) | (206,819 | ) | (2,138,221 | ) | (2,696,550 | ) | ||||||||||||||||||||
| Class A | (133,239 | ) | (145,603 | ) | (743,023 | ) | (929,175 | ) | (543,084 | ) | (597,867 | ) | (72,765 | ) | (16,011 | ) | (567,650 | ) | (634,655 | ) | ||||||||||||||||||||
| Class C | (53,743 | ) | (53,076 | ) | (242,384 | ) | (325,188 | ) | (218,910 | ) | (332,845 | ) | (10,799 | ) | (2,165 | ) | (158,781 | ) | (174,020 | ) | ||||||||||||||||||||
| Total Distributions to Shareholders | (1,136,557 | ) | (1,365,023 | ) | (6,313,463 | ) | (8,610,176 | ) | (4,585,765 | ) | (5,606,832 | ) | (927,573 | ) | (224,995 | ) | (2,864,652 | ) | (3,505,225 | ) | ||||||||||||||||||||
| Share Transactions of Beneficial Interest: | ||||||||||||||||||||||||||||||||||||||||
| Net proceeds from shares sold | ||||||||||||||||||||||||||||||||||||||||
| Class N | 34,990,739 | 18,045,990 | 33,718,680 | 39,184,312 | 21,529,518 | 19,813,226 | 20,678,707 | 6,400,219 | 28,389,285 | 9,646,917 | ||||||||||||||||||||||||||||||
| Class A | 4,193,468 | 3,282,599 | 7,185,997 | 6,544,499 | 4,070,976 | 3,165,578 | 4,067,774 | 1,348,987 | 8,035,665 | 5,417,648 | ||||||||||||||||||||||||||||||
| Class C | 6,432,644 | 498,975 | 3,951,686 | 3,605,718 | 1,096,173 | 918,509 | 671,601 | 232,881 | 1,752,765 | 1,174,322 | ||||||||||||||||||||||||||||||
| Reinvestment of distributions | ||||||||||||||||||||||||||||||||||||||||
| Class N | 942,707 | 1,159,769 | 5,311,644 | 7,342,514 | 3,798,687 | 4,652,938 | 788,679 | 206,756 | 2,127,987 | 2,688,416 | ||||||||||||||||||||||||||||||
| Class A | 129,509 | 140,795 | 720,108 | 899,214 | 516,172 | 565,402 | 116,057 | 15,700 | 521,958 | 612,304 | ||||||||||||||||||||||||||||||
| Class C | 51,829 | 50,669 | 230,928 | 318,158 | 192,957 | 306,338 | 20,043 | 2,165 | 156,442 | 171,204 | ||||||||||||||||||||||||||||||
| Cost of shares redeemed | ||||||||||||||||||||||||||||||||||||||||
| Class N | (18,325,009 | ) | (20,749,068 | ) | (53,806,194 | ) | (48,969,779 | ) | (30,929,031 | ) | (30,912,858 | ) | (11,474,732 | ) | (7,278,732 | ) | (16,938,775 | ) | (9,736,416 | ) | ||||||||||||||||||||
| Class A | (3,486,843 | ) | (1,616,819 | ) | (9,088,943 | ) | (5,055,411 | ) | (4,588,405 | ) | (4,095,837 | ) | (1,606,257 | ) | (1,024,835 | ) | (7,186,295 | ) | (3,148,530 | ) | ||||||||||||||||||||
| Class C | (6,314,796 | ) | (829,785 | ) | (5,498,878 | ) | (2,272,992 | ) | (4,089,688 | ) | (1,318,561 | ) | (923,407 | ) | (229,054 | ) | (2,959,714 | ) | (505,098 | ) | ||||||||||||||||||||
| Net Increase (Decrease) in Net Assets From Share Transactions of Beneficial Interest | 18,614,248 | (16,875 | ) | (17,274,972 | ) | 1,596,233 | (8,402,641 | ) | (6,905,265 | ) | 12,338,465 | (325,913 | ) | 13,899,318 | 6,320,767 | |||||||||||||||||||||||||
| Total Increase (Decrease) in Net Assets | 19,493,154 | 3,690,581 | (26,366,898 | ) | (3,969,252 | ) | (10,296,934 | ) | (4,286,476 | ) | 10,521,743 | 1,720,180 | 10,836,336 | 11,353,264 | ||||||||||||||||||||||||||
| Net Assets: | ||||||||||||||||||||||||||||||||||||||||
| Beginning of Year | 52,912,132 | 49,221,551 | 188,407,856 | 192,377,108 | 110,095,314 | 114,381,790 | 38,726,197 | 37,006,017 | 83,472,726 | 72,119,462 | ||||||||||||||||||||||||||||||
| End of Year | $ | 72,405,286 | $ | 52,912,132 | $ | 162,040,958 | $ | 188,407,856 | $ | 99,798,380 | $ | 110,095,314 | $ | 49,247,940 | $ | 38,726,197 | $ | 94,309,062 | $ | 83,472,726 | ||||||||||||||||||||
See accompanying notes to financial statements.
93
| STATEMENTS OF CHANGES IN NET ASSETS (Continued) |
| Dunham | Dunham | Dunham | Dunham | Dunham | ||||||||||||||||||||||||||||||||||||
| Small Cap | Focused Large Cap | Small Cap | Emerging Markets | International | ||||||||||||||||||||||||||||||||||||
| Value Fund | Growth Fund | Growth Fund | Stock Fund | Stock Fund | ||||||||||||||||||||||||||||||||||||
| Year Ended | Year Ended | Year Ended | Year Ended | Year Ended | Year Ended | Year Ended | Year Ended | Year Ended | Year Ended | |||||||||||||||||||||||||||||||
| October 31, 2020 | Oct. 31, 2019 | October 31, 2020 | Oct. 31, 2019 | October 31, 2020 | Oct. 31, 2019 | October 31, 2020 | Oct. 31, 2019 | October 31, 2020 | Oct. 31, 2019 | |||||||||||||||||||||||||||||||
| Operations: | ||||||||||||||||||||||||||||||||||||||||
| Net investment income (loss) | $ | 400,579 | $ | (52,286 | ) | $ | (1,554,421 | ) | $ | (1,186,033 | ) | $ | (763,173 | ) | $ | (727,691 | ) | $ | (215,323 | ) | $ | 935,043 | $ | 1,145,605 | $ | 2,643,268 | ||||||||||||||
| Net realized gain (loss) from investments, and foreign currency transactions | (5,471,307 | ) | (1,163,298 | ) | 4,881,470 | 4,250,180 | 10,620,310 | (118,043 | ) | 1,011,988 | (1,023,810 | ) | 5,079,870 | (4,843,378 | ) | |||||||||||||||||||||||||
| Net change in unrealized appreciation (depreciation) on investments, and foreign currency transactions | (1,228,084 | ) | 4,454,208 | 41,424,027 | 12,506,512 | 8,033,898 | 2,086,493 | 10,338,265 | 8,465,885 | (3,733,636 | ) | 10,789,801 | ||||||||||||||||||||||||||||
| Net Increase (Decrease) in Net Assets Resulting From Operations | (6,298,812 | ) | 3,238,624 | 44,751,076 | 15,570,659 | 17,891,035 | 1,240,759 | 11,134,930 | 8,377,118 | 2,491,839 | 8,589,691 | |||||||||||||||||||||||||||||
| Distributions to Shareholders From: | ||||||||||||||||||||||||||||||||||||||||
| Total Distributions Paid | ||||||||||||||||||||||||||||||||||||||||
| Class N | — | (3,953,207 | ) | (2,555,392 | ) | (4,430,347 | ) | (690,260 | ) | (6,275,235 | ) | (534,182 | ) | (1,006,872 | ) | (2,225,640 | ) | (5,927,318 | ) | |||||||||||||||||||||
| Class A | — | (859,290 | ) | (797,547 | ) | (1,226,758 | ) | (198,920 | ) | (2,133,326 | ) | (86,590 | ) | (167,073 | ) | (455,807 | ) | (1,198,236 | ) | |||||||||||||||||||||
| Class C | — | (272,184 | ) | (315,113 | ) | (564,922 | ) | (52,820 | ) | (652,365 | ) | (9,790 | ) | (29,750 | ) | (103,682 | ) | (358,199 | ) | |||||||||||||||||||||
| Total Distributions to Shareholders | — | (5,084,681 | ) | (3,668,052 | ) | (6,222,027 | ) | (942,000 | ) | (9,060,926 | ) | (630,562 | ) | (1,203,695 | ) | (2,785,129 | ) | (7,483,753 | ) | |||||||||||||||||||||
| Share Transactions of Beneficial Interest: | ||||||||||||||||||||||||||||||||||||||||
| Net proceeds from shares sold | ||||||||||||||||||||||||||||||||||||||||
| Class N | 25,184,030 | 9,580,246 | 32,398,550 | 21,107,712 | 13,971,721 | 13,660,779 | 24,774,976 | 10,284,122 | 31,744,356 | 18,220,512 | ||||||||||||||||||||||||||||||
| Class A | 4,862,108 | 3,224,004 | 16,798,120 | 19,065,395 | 8,378,581 | 4,059,178 | 5,953,535 | 4,738,975 | 7,148,650 | 6,588,356 | ||||||||||||||||||||||||||||||
| Class C | 1,306,703 | 887,413 | 3,264,800 | 2,938,833 | 770,112 | 981,344 | 1,169,903 | 660,262 | 1,817,542 | 1,156,103 | ||||||||||||||||||||||||||||||
| Reinvestment of distributions | ||||||||||||||||||||||||||||||||||||||||
| Class N | — | 3,947,325 | 2,518,739 | 4,369,570 | 679,654 | 5,929,101 | 531,994 | 997,722 | 2,218,149 | 5,919,259 | ||||||||||||||||||||||||||||||
| Class A | — | 796,269 | 701,996 | 1,096,111 | 182,948 | 1,888,425 | 85,495 | 162,685 | 448,520 | 1,172,202 | ||||||||||||||||||||||||||||||
| Class C | — | 272,184 | 290,053 | 513,630 | 52,391 | 648,129 | 9,428 | 28,820 | 102,577 | 355,855 | ||||||||||||||||||||||||||||||
| Cost of shares redeemed | ||||||||||||||||||||||||||||||||||||||||
| Class N | (21,644,045 | ) | (5,804,339 | ) | (30,649,506 | ) | (17,190,050 | ) | (22,750,347 | ) | (10,930,828 | ) | (22,769,138 | ) | (10,266,820 | ) | (39,253,422 | ) | (12,936,799 | ) | ||||||||||||||||||||
| Class A | (4,477,328 | ) | (1,723,295 | ) | (18,669,199 | ) | (12,817,565 | ) | (9,319,647 | ) | (3,921,776 | ) | (5,076,032 | ) | (3,631,729 | ) | (8,979,890 | ) | (3,706,725 | ) | ||||||||||||||||||||
| Class C | (1,716,676 | ) | (343,347 | ) | (4,460,374 | ) | (2,573,388 | ) | (1,329,745 | ) | (1,318,920 | ) | (1,949,018 | ) | (732,423 | ) | (3,435,552 | ) | (877,014 | ) | ||||||||||||||||||||
| Net Increase (Decrease) in Net Assets From Share Transactions of Beneficial Interest | 3,514,792 | 10,836,460 | 2,193,179 | 16,510,248 | (9,364,332 | ) | 10,995,432 | 2,731,143 | 2,241,614 | (8,189,070 | ) | 15,891,749 | ||||||||||||||||||||||||||||
| Total Increase (Decrease) in Net Assets | (2,784,020 | ) | 8,990,403 | 43,276,203 | 25,858,880 | 7,584,703 | 3,175,265 | 13,235,511 | 9,415,037 | (8,482,360 | ) | 16,997,687 | ||||||||||||||||||||||||||||
| Net Assets: | ||||||||||||||||||||||||||||||||||||||||
| Beginning of Year | 56,246,818 | 47,256,415 | 107,159,027 | 81,300,147 | 50,576,548 | 47,401,283 | 75,500,845 | 66,085,808 | 130,413,084 | 113,415,397 | ||||||||||||||||||||||||||||||
| End of Year | $ | 53,462,798 | $ | 56,246,818 | $ | 150,435,230 | $ | 107,159,027 | $ | 58,161,251 | $ | 50,576,548 | $ | 88,736,356 | $ | 75,500,845 | $ | 121,930,724 | $ | 130,413,084 | ||||||||||||||||||||
See accompanying notes to financial statements.
94
| STATEMENTS OF CHANGES IN NET ASSETS (Continued) |
| Dunham | Dunham | Dunham | Dunham | |||||||||||||||||||||||||||||
| Dynamic Macro | Long/Short | Monthly Distribution | Real Estate | |||||||||||||||||||||||||||||
| Fund | Credit Fund | Fund | Stock Fund | |||||||||||||||||||||||||||||
| Year Ended | Year Ended | Year Ended | Year Ended | Year Ended | Year Ended | Year Ended | Year Ended | |||||||||||||||||||||||||
| October 31, 2020 | Oct. 31, 2019 | October 31, 2020 | Oct. 31, 2019 | October 31, 2020 | Oct. 31, 2019 | October 31, 2020 | Oct. 31, 2019 | |||||||||||||||||||||||||
| Operations: | ||||||||||||||||||||||||||||||||
| Net investment income (loss) | $ | (37,593 | ) | $ | 484,473 | $ | 1,297,343 | $ | 1,677,487 | $ | (1,819,208 | ) | $ | (1,442,620 | ) | $ | 326,102 | $ | 961,475 | |||||||||||||
| Net realized gain (loss) from investments, futures, purchased options, securities sold short, written options, swap contracts and foreign currency transactions | (974,927 | ) | 3,163,684 | 2,422,124 | 367,556 | 3,485,592 | 1,741,024 | 6,129,153 | 3,193,888 | |||||||||||||||||||||||
| Net change in unrealized appreciation (depreciation) on investments, futures, purchased options, securities sold short, written options, and foreign currency translations | (590,189 | ) | (743,996 | ) | 61,831 | 1,672,696 | (2,482,226 | ) | 5,736,652 | (5,861,968 | ) | 7,934,838 | ||||||||||||||||||||
| Net Increase (Decrease) in Net Assets Resulting From Operations | (1,602,709 | ) | 2,904,161 | 3,781,298 | 3,717,739 | (815,842 | ) | 6,035,056 | 593,287 | 12,090,201 | ||||||||||||||||||||||
| Distributions to Shareholders From: | ||||||||||||||||||||||||||||||||
| Distributions From Paid In Capital: | ||||||||||||||||||||||||||||||||
| Class N | — | (178,934 | ) | — | — | (4,434,069 | ) | (10,187,402 | ) | — | — | |||||||||||||||||||||
| Class A | — | (40,574 | ) | — | — | (1,044,734 | ) | (2,350,197 | ) | — | — | |||||||||||||||||||||
| Class C | — | (9,272 | ) | — | — | (1,045,165 | ) | (2,424,555 | ) | — | — | |||||||||||||||||||||
| Total Other Distributions Paid | ||||||||||||||||||||||||||||||||
| Class N | — | (631,590 | ) | (1,583,036 | ) | (1,851,434 | ) | (1,593,496 | ) | — | (2,908,216 | ) | (798,931 | ) | ||||||||||||||||||
| Class A | — | (125,095 | ) | (240,353 | ) | (244,159 | ) | (375,488 | ) | — | (633,067 | ) | (140,920 | ) | ||||||||||||||||||
| Class C | — | (14,866 | ) | (66,771 | ) | (92,505 | ) | (386,677 | ) | — | (191,872 | ) | (23,866 | ) | ||||||||||||||||||
| Total Distributions to Shareholders | — | (1,000,331 | ) | (1,890,160 | ) | (2,188,098 | ) | (8,879,629 | ) | (14,962,154 | ) | (3,733,155 | ) | (963,717 | ) | |||||||||||||||||
| Share Transactions of | ||||||||||||||||||||||||||||||||
| Beneficial Interest: | ||||||||||||||||||||||||||||||||
| Net proceeds from shares sold | ||||||||||||||||||||||||||||||||
| Class N | 7,671,389 | 4,498,166 | 75,882,935 | 49,856,416 | 47,289,525 | 53,671,386 | 25,769,077 | 4,820,022 | ||||||||||||||||||||||||
| Class A | 2,173,289 | 2,260,121 | 10,189,719 | 6,262,396 | 9,578,927 | 16,026,986 | 7,442,319 | 2,547,627 | ||||||||||||||||||||||||
| Class C | 584,749 | 393,839 | 5,528,260 | 1,130,847 | 3,397,393 | 8,179,345 | 1,455,575 | 487,070 | ||||||||||||||||||||||||
| Reinvestment of distributions | ||||||||||||||||||||||||||||||||
| Class N | — | 809,408 | 1,535,217 | 1,830,183 | 5,866,476 | 9,872,584 | 2,900,499 | 797,852 | ||||||||||||||||||||||||
| Class A | — | 163,799 | 225,928 | 221,475 | 1,233,347 | 2,043,964 | 622,675 | 138,429 | ||||||||||||||||||||||||
| Class C | — | 24,112 | 63,281 | 91,248 | 1,176,250 | 2,063,878 | 190,337 | 23,724 | ||||||||||||||||||||||||
| Cost of shares redeemed | ||||||||||||||||||||||||||||||||
| Class N | (14,850,727 | ) | (10,343,817 | ) | (36,079,584 | ) | (21,756,496 | ) | (69,675,608 | ) | (75,962,023 | ) | (15,710,802 | ) | (14,694,994 | ) | ||||||||||||||||
| Class A | (4,454,908 | ) | (2,964,315 | ) | (4,654,840 | ) | (1,842,303 | ) | (18,156,754 | ) | (17,630,659 | ) | (5,277,842 | ) | (3,802,083 | ) | ||||||||||||||||
| Class C | (1,193,068 | ) | (282,970 | ) | (5,831,685 | ) | (348,842 | ) | (13,718,987 | ) | (9,103,352 | ) | (1,248,459 | ) | (521,603 | ) | ||||||||||||||||
| Net Increase (Decrease) in Net Assets From Share Transactions of Beneficial Interest | (10,069,276 | ) | (5,441,657 | ) | 46,859,231 | 35,444,924 | (33,009,431 | ) | (10,837,891 | ) | 16,143,379 | (10,203,956 | ) | |||||||||||||||||||
| Total Increase (Decrease) in Net Assets | (11,671,985 | ) | (3,537,827 | ) | 48,750,369 | 36,974,565 | (42,704,902 | ) | (19,764,989 | ) | 13,003,511 | 922,528 | ||||||||||||||||||||
| Net Assets: | ||||||||||||||||||||||||||||||||
| Beginning of Year | 41,714,477 | 45,252,304 | 82,440,027 | 45,465,462 | 259,283,227 | 279,048,216 | 54,837,760 | 53,915,232 | ||||||||||||||||||||||||
| End of Year | $ | 30,042,492 | $ | 41,714,477 | $ | 131,190,396 | $ | 82,440,027 | $ | 216,578,325 | $ | 259,283,227 | $ | 67,841,271 | $ | 54,837,760 | ||||||||||||||||
See accompanying notes to financial statements.
95
| FINANCIAL HIGHLIGHTS |
| Dunham Corporate/Government Bond Fund |
The table sets forth financial data for one share of beneficial interest outstanding throughout each year.
| Class N | ||||||||||||||||||||||||||||||||||||||||
| Year Ended October 31, | ||||||||||||||||||||||||||||||||||||||||
| 2020 | 2019 | 2018 | 2017 | 2016 | ||||||||||||||||||||||||||||||||||||
| Net asset value, beginning of year | $ | 14.02 | $ | 13.06 | $ | 13.82 | $ | 13.92 | $ | 13.75 | ||||||||||||||||||||||||||||||
| Income (loss) from investment operations: | ||||||||||||||||||||||||||||||||||||||||
| Net investment income* | 0.28 | 0.36 | 0.34 | 0.31 | 0.36 | |||||||||||||||||||||||||||||||||||
| Net realized and unrealized gain (loss) | 0.44 | 0.96 | (0.74 | ) | (0.08 | ) | 0.19 | |||||||||||||||||||||||||||||||||
| Total income (loss) from investment operations | 0.72 | 1.32 | (0.40 | ) | 0.23 | 0.55 | ||||||||||||||||||||||||||||||||||
| Less distributions: | ||||||||||||||||||||||||||||||||||||||||
| Distributions from net investment income | (0.30 | ) | (0.36 | ) | (0.36 | ) | (0.33 | ) | (0.38 | ) | ||||||||||||||||||||||||||||||
| Total distributions | (0.30 | ) | (0.36 | ) | (0.36 | ) | (0.33 | ) | (0.38 | ) | ||||||||||||||||||||||||||||||
| Net asset value, end of year | $ | 14.44 | $ | 14.02 | $ | 13.06 | $ | 13.82 | $ | 13.92 | ||||||||||||||||||||||||||||||
| Total return + # | 5.17 | % | 10.27 | % | (2.93 | )% | 1.72 | % | 4.09 | % | ||||||||||||||||||||||||||||||
| Ratios/Supplemental Data: | ||||||||||||||||||||||||||||||||||||||||
| Net assets, end of year (in 000s) | $ | 61,029 | $ | 42,730 | $ | 41,151 | $ | 62,757 | $ | 48,025 | ||||||||||||||||||||||||||||||
| Ratios of expenses to average net assets: | 1.24 | % | 1.20 | % | 1.20 | % | 1.35 | % | 1.13 | % | ||||||||||||||||||||||||||||||
| Ratios of net investment income to average net assets: | 1.99 | % | 2.68 | % | 2.53 | % | 2.27 | % | 2.61 | % | ||||||||||||||||||||||||||||||
| Portfolio turnover rate | 75 | % | 76 | % | 92 | % | 61 | % | 58 | % | ||||||||||||||||||||||||||||||
| Class A | Class C | |||||||||||||||||||||||||||||||||||||||
| Year Ended October 31, | Year Ended October 31, | |||||||||||||||||||||||||||||||||||||||
| 2020 | 2019 | 2018 | 2017 | 2016 | 2020 | 2019 | 2018 | 2017 | 2016 | |||||||||||||||||||||||||||||||
| Net asset value, beginning of year | $ | 14.01 | $ | 13.04 | $ | 13.80 | $ | 13.90 | $ | 13.73 | $ | 13.91 | $ | 12.95 | $ | 13.71 | $ | 13.81 | $ | 13.65 | ||||||||||||||||||||
| Income (loss) from investment operations: | ||||||||||||||||||||||||||||||||||||||||
| Net investment income* | 0.25 | 0.33 | 0.31 | 0.28 | 0.33 | 0.18 | 0.26 | 0.24 | 0.21 | 0.26 | ||||||||||||||||||||||||||||||
| Net realized and unrealized gain (loss) | 0.42 | 0.97 | (0.74 | ) | (0.08 | ) | 0.19 | 0.41 | 0.96 | (0.74 | ) | (0.08 | ) | 0.18 | ||||||||||||||||||||||||||
| Total income (loss) from investment operations | 0.67 | 1.30 | (0.43 | ) | 0.20 | 0.52 | 0.59 | 1.22 | (0.50 | ) | 0.13 | 0.44 | ||||||||||||||||||||||||||||
| Less distributions: | ||||||||||||||||||||||||||||||||||||||||
| Distributions from net investment income | (0.26 | ) | (0.33 | ) | (0.33 | ) | (0.30 | ) | (0.35 | ) | (0.19 | ) | (0.26 | ) | (0.26 | ) | (0.23 | ) | (0.28 | ) | ||||||||||||||||||||
| Total distributions | (0.26 | ) | (0.33 | ) | (0.33 | ) | (0.30 | ) | (0.35 | ) | (0.19 | ) | (0.26 | ) | (0.26 | ) | (0.23 | ) | (0.28 | ) | ||||||||||||||||||||
| Net asset value, end of year | $ | 14.42 | $ | 14.01 | $ | 13.04 | $ | 13.80 | $ | 13.90 | $ | 14.31 | $ | 13.91 | $ | 12.95 | $ | 13.71 | $ | 13.81 | ||||||||||||||||||||
| Total return + # | 4.84 | % | 10.09 | % | (3.17 | )% | 1.47 | % | 3.86 | % | 4.29 | % | 9.53 | % | (3.67 | )% | 0.98 | % | 3.27 | % | ||||||||||||||||||||
| Ratios/Supplemental Data: | ||||||||||||||||||||||||||||||||||||||||
| Net assets, end of year (in 000s) | $ | 8,490 | $ | 7,510 | $ | 5,311 | $ | 6,260 | $ | 4,832 | $ | 2,886 | $ | 2,672 | $ | 2,760 | $ | 3,199 | $ | 3,364 | ||||||||||||||||||||
| Ratios of expenses to average net assets: | 1.49 | % | 1.45 | % | 1.45 | % | 1.60 | % | 1.38 | % | 1.99 | % | 1.95 | % | 1.95 | % | 2.10 | % | 1.88 | % | ||||||||||||||||||||
| Ratios of net investment income to average net assets: | 1.75 | % | 2.41 | % | 2.31 | % | 2.01 | % | 2.40 | % | 1.31 | % | 1.92 | % | 1.81 | % | 1.52 | % | 1.89 | % | ||||||||||||||||||||
| Portfolio turnover rate | 75 | % | 76 | % | 92 | % | 61 | % | 58 | % | 75 | % | 76 | % | 92 | % | 61 | % | 58 | % | ||||||||||||||||||||
| * | The net investment income per share data was determined using the average shares outstanding throughout each year. |
| + | Assumes reinvestment of all dividends and distributions, if any. Total return does not reflect the deductions of taxes that a shareholder would pay on distributions or on the redemption of shares and does not reflect the impact of any sales charge. |
| # | Includes adjustments in accordance with accounting principles generally accepted in the United States and, consequently, the net asset values for financial reporting purposes and the returns based upon those net asset values may differ from the net asset values and returns for shareholder transactions. Adjustments may apply to some but not all years and classes. |
See accompanying notes to financial statements.
96
| FINANCIAL HIGHLIGHTS |
| Dunham Floating Rate Bond Fund |
The table sets forth financial data for one share of beneficial interest outstanding throughout each year.
| Class N | ||||||||||||||||||||||||||||||||||||||||
| Year Ended October 31, | ||||||||||||||||||||||||||||||||||||||||
| 2020 | 2019 | 2018 | 2017 | 2016 | ||||||||||||||||||||||||||||||||||||
| Net asset value, beginning of year | $ | 9.36 | $ | 9.62 | $ | 9.73 | $ | 9.70 | $ | 9.60 | ||||||||||||||||||||||||||||||
| Income (loss) from investment operations: | ||||||||||||||||||||||||||||||||||||||||
| Net investment income* | 0.34 | 0.44 | 0.40 | 0.35 | 0.33 | |||||||||||||||||||||||||||||||||||
| Net realized and unrealized gain (loss) | (0.47 | ) | (0.26 | ) | (0.11 | ) | 0.03 | 0.10 | ||||||||||||||||||||||||||||||||
| Total income (loss) from investment operations | (0.13 | ) | 0.18 | 0.29 | 0.38 | 0.43 | ||||||||||||||||||||||||||||||||||
| Less distributions: | ||||||||||||||||||||||||||||||||||||||||
| Distributions from net investment income | (0.33 | ) | (0.44 | ) | (0.40 | ) | (0.35 | ) | (0.33 | ) | ||||||||||||||||||||||||||||||
| Total distributions | (0.33 | ) | (0.44 | ) | (0.40 | ) | (0.35 | ) | (0.33 | ) | ||||||||||||||||||||||||||||||
| Net asset value, end of year | $ | 8.90 | $ | 9.36 | $ | 9.62 | $ | 9.73 | $ | 9.70 | ||||||||||||||||||||||||||||||
| Total return + # | (1.30 | )% | 1.99 | % | 3.02 | % | 4.01 | % | 4.63 | % | ||||||||||||||||||||||||||||||
| Ratios/Supplemental Data: | ||||||||||||||||||||||||||||||||||||||||
| Net assets, end of year (in 000s) | $ | 135,536 | $ | 157,757 | $ | 164,936 | $ | 157,485 | $ | 94,219 | ||||||||||||||||||||||||||||||
| Ratios of expenses to average net assets: | 1.00 | % | 1.01 | % | 0.97 | % | 1.03 | % | 1.34 | % | ||||||||||||||||||||||||||||||
| Ratios of net investment income to average net assets: | 3.81 | % | 4.60 | % | 4.08 | % | 3.60 | % | 3.24 | % | ||||||||||||||||||||||||||||||
| Portfolio turnover rate | 76 | % | 44 | % | 79 | % | 91 | % | 62 | % | ||||||||||||||||||||||||||||||
| Class A | Class C | |||||||||||||||||||||||||||||||||||||||
| Year Ended October 31, | Year Ended October 31, | |||||||||||||||||||||||||||||||||||||||
| 2020 | 2019 | 2018 | 2017 | 2016 | 2020 | 2019 | 2018 | 2017 | 2016 | |||||||||||||||||||||||||||||||
| Net asset value, beginning of year | $ | 9.35 | $ | 9.61 | $ | 9.72 | $ | 9.70 | $ | 9.59 | $ | 9.35 | $ | 9.62 | $ | 9.73 | $ | 9.69 | $ | 9.59 | ||||||||||||||||||||
| Income (loss) from investment operations: | ||||||||||||||||||||||||||||||||||||||||
| Net investment income* | 0.32 | 0.41 | 0.37 | 0.32 | 0.31 | 0.27 | 0.37 | 0.33 | 0.28 | 0.26 | ||||||||||||||||||||||||||||||
| Net realized and unrealized gain (loss) | (0.47 | ) | (0.25 | ) | (0.11 | ) | 0.03 | 0.11 | (0.46 | ) | (0.27 | ) | (0.11 | ) | 0.04 | 0.10 | ||||||||||||||||||||||||
| Total income (loss) from investment operations | (0.15 | ) | 0.16 | 0.26 | 0.35 | 0.42 | (0.19 | ) | 0.10 | 0.22 | 0.32 | 0.36 | ||||||||||||||||||||||||||||
| Less distributions: | ||||||||||||||||||||||||||||||||||||||||
| Distributions from net investment income | (0.31 | ) | (0.42 | ) | (0.37 | ) | (0.33 | ) | (0.31 | ) | (0.27 | ) | (0.37 | ) | (0.33 | ) | (0.28 | ) | (0.26 | ) | ||||||||||||||||||||
| Total distributions | (0.31 | ) | (0.42 | ) | (0.37 | ) | (0.33 | ) | (0.31 | ) | (0.27 | ) | (0.37 | ) | (0.33 | ) | (0.28 | ) | (0.26 | ) | ||||||||||||||||||||
| Net asset value, end of year | $ | 8.89 | $ | 9.35 | $ | 9.61 | $ | 9.72 | $ | 9.70 | $ | 8.89 | $ | 9.35 | $ | 9.62 | $ | 9.73 | $ | 9.69 | ||||||||||||||||||||
| Total return + # | (1.56 | )% | 1.74 | % | 2.77 | % | 3.64 | % | 4.49 | % | (2.06 | )% | 1.13 | % | 2.26 | % | 3.31 | % | 3.87 | % | ||||||||||||||||||||
| Ratios/Supplemental Data: | ||||||||||||||||||||||||||||||||||||||||
| Net assets, end of year (in 000s) | $ | 19,705 | $ | 21,997 | $ | 20,205 | $ | 16,229 | $ | 10,923 | $ | 6,800 | $ | 8,654 | $ | 7,236 | $ | 6,215 | $ | 4,545 | ||||||||||||||||||||
| Ratios of expenses to average net assets: | 1.25 | % | 1.26 | % | 1.22 | % | 1.28 | % | 1.59 | % | 1.75 | % | 1.76 | % | 1.72 | % | 1.78 | % | 2.10 | % | ||||||||||||||||||||
| Ratios of net investment income to average net assets: | 3.56 | % | 4.36 | % | 3.84 | % | 3.33 | % | 3.49 | % | 3.07 | % | 3.86 | % | 3.43 | % | 2.89 | % | 2.74 | % | ||||||||||||||||||||
| Portfolio turnover rate | 76 | % | 44 | % | 79 | % | 91 | % | 62 | % | 76 | % | 44 | % | 79 | % | 91 | % | 62 | % | ||||||||||||||||||||
| * | The net investment income per share data was determined using the average shares outstanding throughout each year. |
| + | Assumes reinvestment of all dividends and distributions, if any. Total return does not reflect the deductions of taxes that a shareholder would pay on distributions or on the redemption of shares and does not reflect the impact of any sales charge. |
| # | Includes adjustments in accordance with accounting principles generally accepted in the United States and, consequently, the net asset values for financial reporting purposes and the returns based upon those net asset values may differ from the net asset values and returns for shareholder transactions. Adjustments may apply to some but not all years and classes. |
See accompanying notes to financial statements.
97
| FINANCIAL HIGHLIGHTS |
| Dunham High-Yield Bond Fund |
The table sets forth financial data for one share of beneficial interest outstanding throughout each year.
| Class N | ||||||||||||||||||||||||||||||||||||||||
| Year Ended October 31, | ||||||||||||||||||||||||||||||||||||||||
| 2020 | 2019 | 2018 | 2017 | 2016 | ||||||||||||||||||||||||||||||||||||
| Net asset value, beginning of year | $ | 8.97 | $ | 8.72 | $ | 9.22 | $ | 8.94 | $ | 8.92 | ||||||||||||||||||||||||||||||
| Income (loss) from investment operations: | ||||||||||||||||||||||||||||||||||||||||
| Net investment income* | 0.41 | 0.45 | 0.44 | 0.42 | 0.44 | |||||||||||||||||||||||||||||||||||
| Net realized and unrealized gain (loss) | (0.09 | ) | 0.26 | (0.51 | ) | 0.30 | 0.02 | |||||||||||||||||||||||||||||||||
| Total income (loss) from investment operations | 0.32 | 0.71 | (0.07 | ) | 0.72 | 0.46 | ||||||||||||||||||||||||||||||||||
| Less distributions: | ||||||||||||||||||||||||||||||||||||||||
| Distributions from net investment income | (0.41 | ) | (0.46 | ) | (0.43 | ) | (0.44 | ) | (0.44 | ) | ||||||||||||||||||||||||||||||
| Total distributions | (0.41 | ) | (0.46 | ) | (0.43 | ) | (0.44 | ) | (0.44 | ) | ||||||||||||||||||||||||||||||
| Net asset value, end of year | $ | 8.88 | $ | 8.97 | $ | 8.72 | $ | 9.22 | $ | 8.94 | ||||||||||||||||||||||||||||||
| Total return + # | 3.74 | % | 8.42 | % | (0.80 | )% | 8.19 | % | 5.39 | % | ||||||||||||||||||||||||||||||
| Ratios/Supplemental Data: | ||||||||||||||||||||||||||||||||||||||||
| Net assets, end of year (in 000s) | $ | 83,009 | $ | 90,262 | $ | 94,596 | $ | 103,567 | $ | 78,194 | ||||||||||||||||||||||||||||||
| Ratios of expenses to average net assets: | 1.14 | % | 1.12 | % | 1.12 | % | 1.19 | % | 1.08 | % | ||||||||||||||||||||||||||||||
| Ratios of net investment income to average net assets: | 4.69 | % | 5.12 | % | 4.84 | % | 4.62 | % | 5.09 | % | ||||||||||||||||||||||||||||||
| Portfolio turnover rate | 75 | % | 70 | % | 101 | % | 142 | % | 62 | % | ||||||||||||||||||||||||||||||
| Class A | Class C | |||||||||||||||||||||||||||||||||||||||
| Year Ended October 31, | Year Ended October 31, | |||||||||||||||||||||||||||||||||||||||
| 2020 | 2019 | 2018 | 2017 | 2016 | 2020 | 2019 | 2018 | 2017 | 2016 | |||||||||||||||||||||||||||||||
| Net asset value, beginning of year | $ | 9.06 | $ | 8.81 | $ | 9.29 | $ | 9.02 | $ | 8.99 | $ | 8.92 | $ | 8.68 | $ | 9.17 | $ | 8.88 | $ | 8.86 | ||||||||||||||||||||
| Income (loss) from investment operations: | ||||||||||||||||||||||||||||||||||||||||
| Net investment income* | 0.39 | 0.44 | 0.42 | 0.40 | 0.42 | 0.34 | 0.39 | 0.37 | 0.35 | 0.37 | ||||||||||||||||||||||||||||||
| Net realized and unrealized gain (loss) | (0.09 | ) | 0.25 | (0.49 | ) | 0.28 | 0.03 | (0.09 | ) | 0.25 | (0.50 | ) | 0.30 | 0.02 | ||||||||||||||||||||||||||
| Total income (loss) from investment operations | 0.30 | 0.69 | (0.07 | ) | 0.68 | 0.45 | 0.25 | 0.64 | (0.13 | ) | 0.65 | 0.39 | ||||||||||||||||||||||||||||
| Less distributions: | ||||||||||||||||||||||||||||||||||||||||
| Distributions from net investment income | (0.39 | ) | (0.44 | ) | (0.41 | ) | (0.41 | ) | (0.42 | ) | (0.34 | ) | (0.40 | ) | (0.36 | ) | (0.36 | ) | (0.37 | ) | ||||||||||||||||||||
| Total distributions | (0.39 | ) | (0.44 | ) | (0.41 | ) | (0.41 | ) | (0.42 | ) | (0.34 | ) | (0.40 | ) | (0.36 | ) | (0.36 | ) | (0.37 | ) | ||||||||||||||||||||
| Net asset value, end of year | $ | 8.97 | $ | 9.06 | $ | 8.81 | $ | 9.29 | $ | 9.02 | $ | 8.83 | $ | 8.92 | $ | 8.68 | $ | 9.17 | $ | 8.88 | ||||||||||||||||||||
| Total return + # | 3.44 | % | 8.07 | % | (0.82 | )% | 7.70 | % | 5.21 | % | 2.95 | % | 7.55 | % | (1.43 | )% | 7.45 | % | 4.65 | % | ||||||||||||||||||||
| Ratios/Supplemental Data: | ||||||||||||||||||||||||||||||||||||||||
| Net assets, end of year (in 000s) | $ | 12,127 | $ | 12,336 | $ | 12,393 | $ | 12,085 | $ | 10,478 | $ | 4,663 | $ | 7,497 | $ | 7,392 | $ | 7,785 | $ | 7,687 | ||||||||||||||||||||
| Ratios of expenses to average net assets: | 1.39 | % | 1.37 | % | 1.37 | % | 1.44 | % | 1.33 | % | 1.89 | % | 1.87 | % | 1.87 | % | 1.94 | % | 1.83 | % | ||||||||||||||||||||
| Ratios of net investment income to average net assets: | 4.44 | % | 4.87 | % | 4.60 | % | 4.38 | % | 4.84 | % | 3.93 | % | 4.37 | % | 4.09 | % | 3.88 | % | 4.34 | % | ||||||||||||||||||||
| Portfolio turnover rate | 75 | % | 70 | % | 101 | % | 142 | % | 62 | % | 75 | % | 70 | % | 101 | % | 142 | % | 62 | % | ||||||||||||||||||||
| * | The net investment income per share data was determined using the average shares outstanding throughout each year. |
| + | Assumes reinvestment of all dividends and distributions, if any. Total return does not reflect the deductions of taxes that a shareholder would pay on distributions or on the redemption of shares and does not reflect the impact of any sales charge. |
| # | Includes adjustments in accordance with accounting principles generally accepted in the United States and, consequently, the net asset values for financial reporting purposes and the returns based upon those net asset values may differ from the net asset values and returns for shareholder transactions. Adjustments may apply to some but not all years and classes. |
See accompanying notes to financial statements.
98
| FINANCIAL HIGHLIGHTS |
| Dunham International Opportunity Bond Fund |
The table sets forth financial data for one share of beneficial interest outstanding throughout each year.
| Class N | ||||||||||||||||||||||||||||||||||||||||
| Year Ended October 31, | ||||||||||||||||||||||||||||||||||||||||
| 2020 | 2019 | 2018 | 2017 | 2016 | ||||||||||||||||||||||||||||||||||||
| Net asset value, beginning of year | $ | 9.43 | $ | 8.93 | $ | 9.32 | $ | 9.37 | $ | 8.92 | ||||||||||||||||||||||||||||||
| Income (loss) from investment operations: | ||||||||||||||||||||||||||||||||||||||||
| Net investment income (loss)* | 0.19 | (0.03 | ) | (0.03 | ) | (0.03 | ) | 0.04 | ||||||||||||||||||||||||||||||||
| Net realized and unrealized gain (loss) | (0.37 | ) | 0.58 | (0.35 | ) | 0.07 | 0.42 | |||||||||||||||||||||||||||||||||
| Total income (loss) from investment operations | (0.18 | ) | 0.55 | (0.38 | ) | 0.04 | 0.46 | |||||||||||||||||||||||||||||||||
| Less distributions: | ||||||||||||||||||||||||||||||||||||||||
| Distributions from net investment income | (0.11 | ) | (0.04 | ) | — | — | (0.01 | ) | ||||||||||||||||||||||||||||||||
| Distributions from net realized gains | (0.02 | ) | (0.01 | ) | (0.01 | ) | (0.09 | ) | — | |||||||||||||||||||||||||||||||
| Tax return of capital | (0.07 | ) | — | — | — | — | ||||||||||||||||||||||||||||||||||
| Total distributions | (0.20 | ) | (0.05 | ) | (0.01 | ) | (0.09 | ) | (0.01 | ) | ||||||||||||||||||||||||||||||
| Net asset value, end of year | $ | 9.05 | $ | 9.43 | $ | 8.93 | $ | 9.32 | $ | 9.37 | ||||||||||||||||||||||||||||||
| Total return + # | (1.81 | )% | 6.29 | % | (4.08 | )% | 0.57 | % | 5.14 | % | ||||||||||||||||||||||||||||||
| Ratios/Supplemental Data: | ||||||||||||||||||||||||||||||||||||||||
| Net assets, end of year (in 000s) | $ | 41,346 | $ | 32,927 | $ | 31,838 | $ | 32,441 | $ | 24,728 | ||||||||||||||||||||||||||||||
| Ratios of expenses to average net assets: | 1.36 | % | 1.36 | % | 1.35 | % | 1.54 | % | 1.28 | % | ||||||||||||||||||||||||||||||
| Ratios of net investment income (loss) to average net assets: | 2.08 | % | (0.30 | )% | (0.35 | )% | (0.37 | )% | 0.41 | % | ||||||||||||||||||||||||||||||
| Portfolio turnover rate | 138 | % | 109 | % | 45 | % | 56 | % | 64 | % | ||||||||||||||||||||||||||||||
| Class A | Class C | |||||||||||||||||||||||||||||||||||||||
| Year Ended October 31, | Year Ended October 31, | |||||||||||||||||||||||||||||||||||||||
| 2020 | 2019 | 2018 | 2017 | 2016 | 2020 | 2019 | 2018 | 2017 | 2016 | |||||||||||||||||||||||||||||||
| Net asset value, beginning of year | $ | 9.34 | $ | 8.85 | $ | 9.26 | $ | 9.32 | $ | 8.90 | $ | 9.11 | $ | 8.66 | $ | 9.10 | $ | 9.22 | $ | 8.84 | ||||||||||||||||||||
| Income (loss) from investment operations: | ||||||||||||||||||||||||||||||||||||||||
| Net investment income (loss)* | 0.17 | (0.05 | ) | (0.06 | ) | (0.06 | ) | 0.01 | 0.10 | (0.09 | ) | (0.10 | ) | (0.10 | ) | (0.03 | ) | |||||||||||||||||||||||
| Net realized and unrealized gain (loss) | (0.37 | ) | 0.57 | (0.34 | ) | 0.09 | 0.41 | (0.33 | ) | 0.55 | (0.33 | ) | 0.07 | 0.41 | ||||||||||||||||||||||||||
| Total income (loss) from investment operations | (0.20 | ) | 0.52 | (0.40 | ) | 0.03 | 0.42 | (0.23 | ) | 0.46 | (0.43 | ) | (0.03 | ) | 0.38 | |||||||||||||||||||||||||
| Less distributions: | ||||||||||||||||||||||||||||||||||||||||
| Distributions from net investment income | (0.09 | ) | (0.02 | ) | — | — | (0.00 | ) (a) | (0.06 | ) | — | — | — | (0.00 | ) (a) | |||||||||||||||||||||||||
| Distributions from net realized gains | (0.02 | ) | (0.01 | ) | (0.01 | ) | (0.09 | ) | — | (0.02 | ) | (0.01 | ) | (0.01 | ) | (0.09 | ) | — | ||||||||||||||||||||||
| Tax return of capital | (0.07 | ) | — | — | — | — | (0.07 | ) | — | — | — | — | ||||||||||||||||||||||||||||
| Total distributions | (0.18 | ) | (0.03 | ) | (0.01 | ) | (0.09 | ) | (0.00 | ) (a) | (0.15 | ) | (0.01 | ) | (0.01 | ) | (0.09 | ) | (0.00 | ) (a) | ||||||||||||||||||||
| Net asset value, end of year | $ | 8.96 | $ | 9.34 | $ | 8.85 | $ | 9.26 | $ | 9.32 | $ | 8.73 | $ | 9.11 | $ | 8.66 | $ | 9.10 | $ | 9.22 | ||||||||||||||||||||
| Total return + # | (2.03 | )% | 5.98 | % | (4.32 | )% | 0.46 | % | 4.77 | % | (2.48 | )% | 5.36 | % | (4.72 | )% | (0.19 | )% | 4.31 | % | ||||||||||||||||||||
| Ratios/Supplemental Data: | ||||||||||||||||||||||||||||||||||||||||
| Net assets, end of year (in 000s) | $ | 6,722 | $ | 4,357 | $ | 3,802 | $ | 2,968 | $ | 2,118 | $ | 1,180 | $ | 1,442 | $ | 1,366 | $ | 1,330 | $ | 1,204 | ||||||||||||||||||||
| Ratios of expenses to average net assets: | 1.61 | % | 1.61 | % | 1.60 | % | 1.79 | % | 1.53 | % | 2.11 | % | 2.11 | % | 2.10 | % | 2.29 | % | 2.03 | % | ||||||||||||||||||||
| Ratios of net investment income (loss) to average net assets: | 1.91 | % | (0.55 | )% | (0.59 | )% | (0.63 | )% | 0.10 | % | 1.21 | % | (1.05 | )% | (1.10 | )% | (1.11 | )% | (0.33 | )% | ||||||||||||||||||||
| Portfolio turnover rate | 138 | % | 109 | % | 45 | % | 56 | % | 64 | % | 138 | % | 109 | % | 45 | % | 56 | % | 64 | % | ||||||||||||||||||||
| * | The net investment income (loss) per share data was determined using the average shares outstanding throughout the year. |
| + | Assumes reinvestment of all dividends and distributions, if any. Total return does not reflect the deductions of taxes that a shareholder would pay on distributions or on the redemption of shares and does not reflect the impact of any sales charge. |
| # | Includes adjustments in accordance with accounting principles generally accepted in the United States and, consequently, the net asset values for financial reporting purposes and the returns based upon those net asset values may differ from the net asset values and returns for shareholder transactions. Adjustments may apply to some but not all years and classes. |
| (a) | Represents less than $0.01 per share. |
See accompanying notes to financial statements.
99
| FINANCIAL HIGHLIGHTS |
| Dunham Large Cap Value Fund |
The table sets forth financial data for one share of beneficial interest outstanding throughout each year.
| Class N | ||||||||||||||||||||||||||||||||||||||||
| Year Ended October 31, | ||||||||||||||||||||||||||||||||||||||||
| 2020 | 2019 | 2018 | 2017 | 2016 | ||||||||||||||||||||||||||||||||||||
| Net asset value, beginning of year | $ | 14.96 | $ | 14.18 | $ | 14.16 | $ | 12.22 | $ | 16.32 | ||||||||||||||||||||||||||||||
| Income from investment operations: | ||||||||||||||||||||||||||||||||||||||||
| Net investment income * | 0.17 | 0.18 | 0.14 | 0.15 | 0.22 | |||||||||||||||||||||||||||||||||||
| Net realized and unrealized gain (loss) | (1.03 | ) | 1.29 | 0.15 | 2.01 | (0.04 | ) | |||||||||||||||||||||||||||||||||
| Total income (loss) from investment operations | (0.86 | ) | 1.47 | 0.29 | 2.16 | 0.18 | ||||||||||||||||||||||||||||||||||
| Less distributions: | ||||||||||||||||||||||||||||||||||||||||
| Distributions from net investment income | (0.18 | ) | (0.15 | ) | (0.13 | ) | (0.22 | ) | (0.18 | ) | ||||||||||||||||||||||||||||||
| Distributions from net realized gains | (0.34 | ) | (0.54 | ) | (0.14 | ) | — | (4.10 | ) | |||||||||||||||||||||||||||||||
| Total distributions | (0.52 | ) | (0.69 | ) | (0.27 | ) | (0.22 | ) | (4.28 | ) | ||||||||||||||||||||||||||||||
| Net asset value, end of year | $ | 13.58 | $ | 14.96 | $ | 14.18 | $ | 14.16 | $ | 12.22 | ||||||||||||||||||||||||||||||
| Total return + # | (6.15 | )% | 11.37 | % | 1.98 | % | 17.84 | % | 1.73 | % | ||||||||||||||||||||||||||||||
| Ratios/Supplemental Data: | ||||||||||||||||||||||||||||||||||||||||
| Net assets, end of year (in 000s) | $ | 73,557 | $ | 61,791 | $ | 55,428 | $ | 55,155 | $ | 45,026 | ||||||||||||||||||||||||||||||
| Ratios of expenses to average net assets: | ||||||||||||||||||||||||||||||||||||||||
| Before fees paid indirectly | 1.24 | % | 1.14 | % | 1.30 | % | 1.13 | % | 0.93 | % | ||||||||||||||||||||||||||||||
| After fees paid indirectly | 1.24 | % | 1.14 | % | 1.30 | % | 1.12 | % | 0.93 | % | ||||||||||||||||||||||||||||||
| Ratios of net investment income to average net assets: | ||||||||||||||||||||||||||||||||||||||||
| Before fees paid indirectly | 1.25 | % | 1.30 | % | 0.94 | % | 1.12 | % | 1.81 | % | ||||||||||||||||||||||||||||||
| After fees paid indirectly | 1.25 | % | 1.30 | % | 0.94 | % | 1.13 | % | 1.81 | % | ||||||||||||||||||||||||||||||
| Portfolio turnover rate | 43 | % | 44 | % | 45 | % | 61 | % | 59 | % | ||||||||||||||||||||||||||||||
| Class A | Class C | |||||||||||||||||||||||||||||||||||||||
| Year Ended October 31, | Year Ended October 31, | |||||||||||||||||||||||||||||||||||||||
| 2020 | 2019 | 2018 | 2017 | 2016 | 2020 | 2019 | 2018 | 2017 | 2016 | |||||||||||||||||||||||||||||||
| Net asset value, beginning of year | $ | 14.87 | $ | 14.11 | $ | 14.10 | $ | 12.16 | $ | 16.26 | $ | 14.17 | $ | 13.45 | $ | 13.47 | $ | 11.65 | $ | 15.74 | ||||||||||||||||||||
| Income from investment operations: | ||||||||||||||||||||||||||||||||||||||||
| Net investment income (loss)* | 0.14 | 0.15 | 0.10 | 0.11 | 0.19 | 0.03 | 0.04 | (0.01 | ) | 0.02 | 0.10 | |||||||||||||||||||||||||||||
| Net realized and unrealized gain (loss) | (1.03 | ) | 1.27 | 0.15 | 2.02 | (0.05 | ) | (0.98 | ) | 1.23 | 0.15 | 1.92 | (0.06 | ) | ||||||||||||||||||||||||||
| Total income (loss) from investment operations | (0.89 | ) | 1.42 | 0.25 | 2.13 | 0.14 | (0.95 | ) | 1.27 | 0.14 | 1.94 | 0.04 | ||||||||||||||||||||||||||||
| Less distributions: | ||||||||||||||||||||||||||||||||||||||||
| Distributions from net investment income | (0.14 | ) | (0.12 | ) | (0.10 | ) | (0.19 | ) | (0.14 | ) | (0.08 | ) | (0.01 | ) | (0.02 | ) | (0.12 | ) | (0.03 | ) | ||||||||||||||||||||
| Distributions from net realized gains | (0.34 | ) | (0.54 | ) | (0.14 | ) | — | (4.10 | ) | (0.34 | ) | (0.54 | ) | (0.14 | ) | — | (4.10 | ) | ||||||||||||||||||||||
| Total distributions | (0.48 | ) | (0.66 | ) | (0.24 | ) | (0.19 | ) | (4.24 | ) | (0.42 | ) | (0.55 | ) | (0.16 | ) | (0.12 | ) | (4.13 | ) | ||||||||||||||||||||
| Net asset value, end of year | $ | 13.50 | $ | 14.87 | $ | 14.11 | $ | 14.10 | $ | 12.16 | $ | 12.80 | $ | 14.17 | $ | 13.45 | $ | 13.47 | $ | 11.65 | ||||||||||||||||||||
| Total return + # | (6.33 | )% | 11.00 | % | 1.71 | % | 17.66 | % | 1.43 | % | (7.05 | )% | 10.24 | % | 1.00 | % | 16.72 | % | 0.66 | % | ||||||||||||||||||||
| Ratios/Supplemental Data: | ||||||||||||||||||||||||||||||||||||||||
| Net assets, end of year (in 000s) | $ | 16,855 | $ | 16,363 | $ | 12,525 | $ | 10,174 | $ | 6,544 | $ | 3,897 | $ | 5,319 | $ | 4,167 | $ | 4,640 | $ | 4,850 | ||||||||||||||||||||
| Ratios of expenses to average net assets: | ||||||||||||||||||||||||||||||||||||||||
| Before fees paid indirectly | 1.49 | % | 1.39 | % | 1.55 | % | 1.38 | % | 1.18 | % | 2.24 | % | 2.14 | % | 2.30 | % | 2.13 | % | 1.93 | % | ||||||||||||||||||||
| After fees paid indirectly | 1.49 | % | 1.39 | % | 1.55 | % | 1.37 | % | 1.18 | % | 2.24 | % | 2.14 | % | 2.30 | % | 2.12 | % | 1.93 | % | ||||||||||||||||||||
| Ratios of net investment income (loss) to average net assets: | ||||||||||||||||||||||||||||||||||||||||
| Before fees paid indirectly | 1.00 | % | 1.05 | % | 0.70 | % | 0.84 | % | 1.57 | % | 0.23 | % | 0.30 | % | (0.07 | )% | 0.14 | % | 0.83 | % | ||||||||||||||||||||
| After fees paid indirectly | 1.00 | % | 1.05 | % | 0.70 | % | 0.85 | % | 1.57 | % | 0.23 | % | 0.30 | % | (0.07 | )% | 0.15 | % | 0.83 | % | ||||||||||||||||||||
| Portfolio turnover rate | 43 | % | 44 | % | 45 | % | 61 | % | 59 | % | 43 | % | 44 | % | 45 | % | 61 | % | 59 | % | ||||||||||||||||||||
| * | The net investment income (loss) per share data was determined using the average shares outstanding throughout each year. |
| + | Assumes reinvestment of all dividends and distributions, if any. Total return does not reflect the deductions of taxes that a shareholder would pay on distributions or on the redemption of shares and does not reflect the impact of any sales charge. |
| # | Includes adjustments in accordance with accounting principles generally accepted in the United States and, consequently, the net asset values for financial reporting purposes and the returns based upon those net asset values may differ from the net asset values and returns for shareholder transactions. Adjustments may apply to some but not all years and classes. |
See accompanying notes to financial statements.
100
| FINANCIAL HIGHLIGHTS |
| Dunham Small Cap Value Fund |
The table sets forth financial data for one share of beneficial interest outstanding throughout each year.
| Class N | ||||||||||||||||||||||||||||||||||||||||
| Year Ended October 31, | ||||||||||||||||||||||||||||||||||||||||
| 2020 | 2019 | 2018 | 2017 | 2016 | ||||||||||||||||||||||||||||||||||||
| Net asset value, beginning of year | $ | 14.67 | $ | 15.72 | $ | 17.47 | $ | 14.41 | $ | 14.27 | ||||||||||||||||||||||||||||||
| Income (loss) from investment operations: | ||||||||||||||||||||||||||||||||||||||||
| Net investment income (loss) * | 0.10 | (0.00 | ) (a) | 0.00 | (a) | 0.07 | 0.09 | |||||||||||||||||||||||||||||||||
| Net realized and unrealized gain (loss) | (2.86 | ) | 0.65 | 0.10 | (b) | 3.57 | 0.54 | |||||||||||||||||||||||||||||||||
| Total income (loss) from investment operations | (2.76 | ) | 0.65 | 0.10 | 3.64 | 0.63 | ||||||||||||||||||||||||||||||||||
| Less distributions: | ||||||||||||||||||||||||||||||||||||||||
| Distributions from net investment income | — | — | (0.04 | ) | (0.10 | ) | (0.01 | ) | ||||||||||||||||||||||||||||||||
| Distributions from net realized gains | — | (1.70 | ) | (1.81 | ) | (0.48 | ) | (0.48 | ) | |||||||||||||||||||||||||||||||
| Total distributions | — | (1.70 | ) | (1.85 | ) | (0.58 | ) | (0.49 | ) | |||||||||||||||||||||||||||||||
| Net asset value, end of year | $ | 11.91 | $ | 14.67 | $ | 15.72 | $ | 17.47 | $ | 14.41 | ||||||||||||||||||||||||||||||
| Total return + # | (18.81 | )% | 6.15 | % | 0.37 | % | 25.55 | % | 4.58 | % | ||||||||||||||||||||||||||||||
| Ratios/Supplemental Data: | ||||||||||||||||||||||||||||||||||||||||
| Net assets, end of year (in 000s) | $ | 42,444 | $ | 43,564 | $ | 37,248 | $ | 22,710 | $ | 22,254 | ||||||||||||||||||||||||||||||
| Ratios of expenses to average net assets: | ||||||||||||||||||||||||||||||||||||||||
| Before fees paid indirectly | 1.26 | % | 1.72 | % | 1.54 | % | 1.32 | % | 1.48 | % | ||||||||||||||||||||||||||||||
| After fees paid indirectly | 1.17 | % | 1.72 | % | 1.54 | % | 1.32 | % | 1.48 | % | ||||||||||||||||||||||||||||||
| Ratios of net investment income (loss) to average net assets: (c) ! | ||||||||||||||||||||||||||||||||||||||||
| Before fees paid indirectly | 0.72 | % | (0.01 | )% | 0.01 | % | 0.45 | % | 0.64 | % | ||||||||||||||||||||||||||||||
| After fees paid indirectly | 0.81 | % | (0.01 | )% | 0.01 | % | 0.45 | % | 0.64 | % | ||||||||||||||||||||||||||||||
| Portfolio turnover rate | 135 | % | 85 | % | 101 | % | 100 | % | 129 | % | ||||||||||||||||||||||||||||||
| Class A | Class C | |||||||||||||||||||||||||||||||||||||||
| Year Ended October 31, | Year Ended October 31, | |||||||||||||||||||||||||||||||||||||||
| 2020 | 2019 | 2018 | 2017 | 2016 | 2020 | 2019 | 2018 | 2017 | 2016 | |||||||||||||||||||||||||||||||
| Net asset value, beginning of year | $ | 14.45 | $ | 15.55 | $ | 17.31 | $ | 14.29 | $ | 14.18 | $ | 12.51 | $ | 13.81 | $ | 15.67 | $ | 13.02 | $ | 13.06 | ||||||||||||||||||||
| Income (loss) from investment operations: | ||||||||||||||||||||||||||||||||||||||||
| Net investment income (loss)* | 0.07 | (0.04 | ) | (0.04 | ) | 0.03 | 0.05 | (0.02 | ) | (0.12 | ) | (0.15 | ) | (0.08 | ) | (0.05 | ) | |||||||||||||||||||||||
| Net realized and unrealized gain (loss) | (2.82 | ) | 0.64 | 0.09 | (b) | 3.54 | 0.54 | (2.44 | ) | 0.52 | 0.10 | (b) | 3.21 | 0.49 | ||||||||||||||||||||||||||
| Total income (loss) from investment operations | (2.75 | ) | 0.60 | 0.05 | 3.57 | 0.59 | (2.46 | ) | 0.40 | (0.05 | ) | 3.13 | 0.44 | |||||||||||||||||||||||||||
| Less distributions: | ||||||||||||||||||||||||||||||||||||||||
| Distributions from net investment income | — | — | (0.00 | ) (a) | (0.07 | ) | — | — | — | — | — | — | ||||||||||||||||||||||||||||
| Distributions from net realized gains | — | (1.70 | ) | (1.81 | ) | (0.48 | ) | (0.48 | ) | — | (1.70 | ) | (1.81 | ) | (0.48 | ) | (0.48 | ) | ||||||||||||||||||||||
| Total distributions | — | (1.70 | ) | (1.81 | ) | (0.55 | ) | (0.48 | ) | — | (1.70 | ) | (1.81 | ) | (0.48 | ) | (0.48 | ) | ||||||||||||||||||||||
| Net asset value, end of year | $ | 11.70 | $ | 14.45 | $ | 15.55 | $ | 17.31 | $ | 14.29 | $ | 10.05 | $ | 12.51 | $ | 13.81 | $ | 15.67 | $ | 13.02 | ||||||||||||||||||||
| Total return + # | (19.03 | )% | 5.85 | % | 0.08 | % | 25.26 | % | 4.33 | % | (19.66 | )% | 5.06 | % | (0.63 | )% | 24.29 | % | 3.52 | % | ||||||||||||||||||||
| Ratios/Supplemental Data: | ||||||||||||||||||||||||||||||||||||||||
| Net assets, end of year (in 000s) | $ | 8,955 | $ | 9,848 | $ | 7,869 | $ | 4,569 | $ | 3,802 | $ | 2,064 | $ | 2,835 | $ | 2,139 | $ | 2,611 | $ | 2,241 | ||||||||||||||||||||
| Ratios of expenses to average net assets: | ||||||||||||||||||||||||||||||||||||||||
| Before fees paid indirectly | 1.51 | % | 1.97 | % | 1.79 | % | 1.57 | % | 1.73 | % | 2.26 | % | 2.72 | % | 2.54 | % | 2.32 | % | 2.48 | % | ||||||||||||||||||||
| After fees paid indirectly | 1.42 | % | 1.97 | % | 1.79 | % | 1.57 | % | 1.73 | % | 2.17 | % | 2.72 | % | 2.54 | % | 2.32 | % | 2.48 | % | ||||||||||||||||||||
| Ratios of net investment income (loss) to average net assets: (c) ! | ||||||||||||||||||||||||||||||||||||||||
| Before fees paid indirectly | 0.46 | % | (0.26 | )% | (0.26 | )% | 0.19 | % | 0.40 | % | (0.29 | )% | (1.01 | )% | (1.04 | )% | (0.57 | )% | (0.36 | )% | ||||||||||||||||||||
| After fees paid indirectly | 0.55 | % | (0.26 | )% | (0.26 | )% | 0.19 | % | 0.40 | % | (0.20 | )% | (1.01 | )% | (1.04 | )% | (0.57 | )% | (0.36 | )% | ||||||||||||||||||||
| Portfolio turnover rate | 135 | % | 85 | % | 101 | % | 100 | % | 129 | % | 135 | % | 85 | % | 101 | % | 100 | % | 129 | % | ||||||||||||||||||||
| * | The net investment income (loss) per share data was determined using the average shares outstanding throughout each year. |
| + | Assumes reinvestment of all dividends and distributions, if any. Total return does not reflect the deductions of taxes that a shareholder would pay on distributions or on the redemption of shares and does not reflect the impact of any sales charge. |
| # | Includes adjustments in accordance with accounting principles generally accepted in the United States and, consequently, the net asset values for financial reporting purposes and the returns based upon those net asset values may differ from the net asset values and returns for shareholder transactions. Adjustments may apply to some but not all years and classes. |
| ! | Recognition of net investment income (loss) is affected by the timing and declaration of dividends by underlying funds in which the Fund invests. |
| (a) | Represents less than $0.01 per share. |
| (b) | The amount of net realized and unrealized gain (loss) on investment per share for the year ended October 31, 2018 does not accord with the amounts in the Statements of Operations due to the timing of purchases and sales of Fund shares in relation to fluctuating market values. |
| (c) | Does not Include the expenses of other investment companies in which the Fund invests. |
See accompanying notes to financial statements.
101
| FINANCIAL HIGHLIGHTS |
| Dunham Focused Large Cap Growth Fund |
The table sets forth financial data for one share of beneficial interest outstanding throughout each year.
| Class N | ||||||||||||||||||||||||||||||||||||||||
| Year Ended October 31, | ||||||||||||||||||||||||||||||||||||||||
| 2020 | 2019 | 2018 | 2017 | 2016 | ||||||||||||||||||||||||||||||||||||
| Net asset value, beginning of year | $ | 24.24 | $ | 22.50 | $ | 19.37 | $ | 15.92 | $ | 16.97 | ||||||||||||||||||||||||||||||
| Income (loss) from investment operations: | ||||||||||||||||||||||||||||||||||||||||
| Net investment loss* | (0.32 | ) | (0.25 | ) | (0.22 | ) | (0.14 | ) | (0.10 | ) | ||||||||||||||||||||||||||||||
| Net realized and unrealized gain (loss) | 10.58 | 3.69 | 3.53 | 3.59 | (0.86 | ) | ||||||||||||||||||||||||||||||||||
| Total income (loss) from investment operations | 10.26 | 3.44 | 3.31 | 3.45 | (0.96 | ) | ||||||||||||||||||||||||||||||||||
| Less distributions: | ||||||||||||||||||||||||||||||||||||||||
| Distributions from net realized gains | (0.83 | ) | (1.70 | ) | (0.18 | ) | — | (0.09 | ) | |||||||||||||||||||||||||||||||
| Total distributions | (0.83 | ) | (1.70 | ) | (0.18 | ) | — | (0.09 | ) | |||||||||||||||||||||||||||||||
| Net asset value, end of year | $ | 33.67 | $ | 24.24 | $ | 22.50 | $ | 19.37 | $ | 15.92 | ||||||||||||||||||||||||||||||
| Total return + # | 43.39 | % | 17.19 | % | 17.24 | % | 21.67 | % | (5.66 | )% | ||||||||||||||||||||||||||||||
| Ratios/Supplemental Data: | ||||||||||||||||||||||||||||||||||||||||
| Net assets, end of year (in 000s) | $ | 108,816 | $ | 74,714 | $ | 59,424 | $ | 56,472 | $ | 51,242 | ||||||||||||||||||||||||||||||
| Ratios of expenses to average net assets: | ||||||||||||||||||||||||||||||||||||||||
| Before fee waivers and fees paid indirectly | 1.30 | % | 1.33 | % | 1.30 | % | 1.16 | % | 1.20 | % | ||||||||||||||||||||||||||||||
| After fee waivers and fees paid indirectly | 1.30 | % | 1.33 | % | 1.29 | % | 1.14 | % | 1.20 | % | ||||||||||||||||||||||||||||||
| Ratios of net investment loss to average net assets: | ||||||||||||||||||||||||||||||||||||||||
| Before fee waivers and fees paid indirectly | (1.08 | )% | (1.06 | )% | (1.01 | )% | (0.79 | )% | (0.64 | )% | ||||||||||||||||||||||||||||||
| After fee waivers and fees paid indirectly | (1.08 | )% | (1.06 | )% | (1.01 | )% | (0.77 | )% | (0.64 | )% | ||||||||||||||||||||||||||||||
| Portfolio turnover rate | 17 | % | 28 | % | 25 | % | 38 | % | 29 | % | ||||||||||||||||||||||||||||||
| Class A | Class C | |||||||||||||||||||||||||||||||||||||||
| Year Ended October 31, | Year Ended October 31, | |||||||||||||||||||||||||||||||||||||||
| 2020 | 2019 | 2018 | 2017 | 2016 | 2020 | 2019 | 2018 | 2017 | 2016 | |||||||||||||||||||||||||||||||
| Net asset value, beginning of year | $ | 23.71 | $ | 22.11 | $ | 19.08 | $ | 15.73 | $ | 16.80 | $ | 22.25 | $ | 21.00 | $ | 18.27 | $ | 15.17 | $ | 16.33 | ||||||||||||||||||||
| Income (loss) from investment operations: | ||||||||||||||||||||||||||||||||||||||||
| Net investment loss* | (0.38 | ) | (0.30 | ) | (0.28 | ) | (0.18 | ) | (0.14 | ) | (0.55 | ) | (0.44 | ) | (0.42 | ) | (0.30 | ) | (0.25 | ) | ||||||||||||||||||||
| Net realized and unrealized gain (loss) | 10.34 | 3.60 | 3.49 | 3.53 | (0.84 | ) | 9.64 | 3.39 | 3.33 | 3.40 | (0.82 | ) | ||||||||||||||||||||||||||||
| Total income (loss) from investment operations | 9.96 | 3.30 | 3.21 | 3.35 | (0.98 | ) | 9.09 | 2.95 | 2.91 | 3.10 | (1.07 | ) | ||||||||||||||||||||||||||||
| Less distributions: | ||||||||||||||||||||||||||||||||||||||||
| Distributions from net realized gains | (0.83 | ) | (1.70 | ) | (0.18 | ) | — | (0.09 | ) | (0.83 | ) | (1.70 | ) | (0.18 | ) | — | (0.09 | ) | ||||||||||||||||||||||
| Total distributions | (0.83 | ) | (1.70 | ) | (0.18 | ) | — | (0.09 | ) | (0.83 | ) | (1.70 | ) | (0.18 | ) | — | (0.09 | ) | ||||||||||||||||||||||
| Net asset value, end of year | $ | 32.84 | $ | 23.71 | $ | 22.11 | $ | 19.08 | $ | 15.73 | $ | 30.51 | $ | 22.25 | $ | 21.00 | $ | 18.27 | $ | 15.17 | ||||||||||||||||||||
| Total return + # | 43.09 | % | 16.84 | % | 16.98 | % | 21.30 | % | (5.84 | )% | 41.97 | % | 16.00 | % | 16.08 | % | 20.44 | % | (6.56 | )% | ||||||||||||||||||||
| Ratios/Supplemental Data: | ||||||||||||||||||||||||||||||||||||||||
| Net assets, end of year (in 000s) | $ | 31,205 | $ | 24,131 | $ | 15,031 | $ | 12,944 | $ | 9,620 | $ | 10,414 | $ | 8,314 | $ | 6,844 | $ | 6,758 | $ | 4,988 | ||||||||||||||||||||
| Ratios of expenses to average net assets: | ||||||||||||||||||||||||||||||||||||||||
| Before fee waivers and fees paid indirectly | 1.55 | % | 1.58 | % | 1.55 | % | 1.41 | % | 1.45 | % | 2.30 | % | 2.33 | % | 2.30 | % | 2.16 | % | 2.20 | % | ||||||||||||||||||||
| After fee waivers and fees paid indirectly | 1.55 | % | 1.58 | % | 1.54 | % | 1.39 | % | 1.45 | % | 2.30 | % | 2.33 | % | 2.29 | % | 2.14 | % | 2.20 | % | ||||||||||||||||||||
| Ratios of net investment loss to average net assets: | ||||||||||||||||||||||||||||||||||||||||
| Before fee waivers and fees paid indirectly | (1.34 | )% | (1.32 | )% | (1.26 | )% | (1.05 | )% | (0.91 | )% | (2.08 | )% | (2.06 | )% | (2.01 | )% | (1.80 | )% | (1.67 | )% | ||||||||||||||||||||
| After fee waivers and fees paid indirectly | (1.34 | )% | (1.32 | )% | (1.26 | )% | (1.03 | )% | (0.91 | )% | (2.08 | )% | (2.06 | )% | (2.01 | )% | (1.78 | )% | (1.67 | )% | ||||||||||||||||||||
| Portfolio turnover rate | 17 | % | 28 | % | 25 | % | 38 | % | 29 | % | 17 | % | 28 | % | 25 | % | 38 | % | 29 | % | ||||||||||||||||||||
| * | The net investment loss per share data was determined using the average shares outstanding throughout each year. |
| + | Assumes reinvestment of all dividends and distributions, if any. Total return does not reflect the deductions of taxes that a shareholder would pay on distributions or on the redemption of shares and does not reflect the impact of any sales charge. |
| # | Includes adjustments in accordance with accounting principles generally accepted in the United States and, consequently, the net asset values for financial reporting purposes and the returns based upon those net asset values may differ from the net asset values and returns for shareholder transactions. Adjustments may apply to some but not all years and classes. |
See accompanying notes to financial statements.
102
| FINANCIAL HIGHLIGHTS |
| Dunham Small Cap Growth Fund |
The table sets forth financial data for one share of beneficial interest outstanding throughout each year.
| Class N | ||||||||||||||||||||||||||||||||||||||||
| Year Ended October 31, | ||||||||||||||||||||||||||||||||||||||||
| 2020 | 2019 | 2018 | 2017 | 2016 | ||||||||||||||||||||||||||||||||||||
| Net asset value, beginning of year | $ | 16.00 | $ | 20.28 | $ | 20.31 | $ | 15.34 | $ | 17.08 | ||||||||||||||||||||||||||||||
| Income (loss) from investment operations: | ||||||||||||||||||||||||||||||||||||||||
| Net investment loss* | (0.23 | ) | (0.23 | ) | (0.27 | ) | (0.15 | ) | (0.06 | ) | ||||||||||||||||||||||||||||||
| Net realized and unrealized gain (loss) (a) | 6.15 | (0.25 | ) | 3.20 | 5.12 | (0.24 | ) | |||||||||||||||||||||||||||||||||
| Total income (loss) from investment operations | 5.92 | (0.48 | ) | 2.93 | 4.97 | (0.30 | ) | |||||||||||||||||||||||||||||||||
| Less distributions: | ||||||||||||||||||||||||||||||||||||||||
| Distributions from net investment income | (0.05 | ) | — | — | — | — | ||||||||||||||||||||||||||||||||||
| Distributions from net realized gains | (0.25 | ) | (3.80 | ) | (2.96 | ) | — | (1.40 | ) | |||||||||||||||||||||||||||||||
| Tax return of capital | — | — | — | — | (0.04 | ) | ||||||||||||||||||||||||||||||||||
| Total distributions | (0.30 | ) | (3.80 | ) | (2.96 | ) | — | (1.44 | ) | |||||||||||||||||||||||||||||||
| Net asset value, end of year | $ | 21.62 | $ | 16.00 | $ | 20.28 | $ | 20.31 | $ | 15.34 | ||||||||||||||||||||||||||||||
| Total return + # | 37.55 | % | 1.36 | % | 16.02 | % | 32.40 | % | (1.88 | )% | ||||||||||||||||||||||||||||||
| Ratios/Supplemental Data: | ||||||||||||||||||||||||||||||||||||||||
| Net assets, end of year (in 000s) | $ | 42,792 | $ | 37,340 | $ | 33,882 | $ | 24,641 | $ | 26,010 | ||||||||||||||||||||||||||||||
| Ratios of expenses to average net assets: | ||||||||||||||||||||||||||||||||||||||||
| Before fees paid indirectly | 1.78 | % | 1.90 | % | 1.94 | % | 1.36 | % | 1.23 | % | ||||||||||||||||||||||||||||||
| After fees paid indirectly | 1.75 | % | 1.88 | % | 1.93 | % | 1.35 | % | 1.23 | % | ||||||||||||||||||||||||||||||
| Ratios of net investment loss to average net assets: | ||||||||||||||||||||||||||||||||||||||||
| Before fees paid indirectly | (1.34 | )% | (1.36 | )% | (1.31 | )% | (0.86 | )% | (0.38 | )% | ||||||||||||||||||||||||||||||
| After fees paid indirectly | (1.31 | )% | (1.34 | )% | (1.29 | )% | (0.85 | )% | (0.38 | )% | ||||||||||||||||||||||||||||||
| Portfolio turnover rate | 178 | % | 169 | % | 190 | % | 174 | % | 181 | % | ||||||||||||||||||||||||||||||
| Class A | Class C | |||||||||||||||||||||||||||||||||||||||
| Year Ended October 31, | Year Ended October 31, | |||||||||||||||||||||||||||||||||||||||
| 2020 | 2019 | 2018 | 2017 | 2016 | 2020 | 2019 | 2018 | 2017 | 2016 | |||||||||||||||||||||||||||||||
| Net asset value, beginning of year | $ | 15.09 | $ | 19.42 | $ | 19.62 | $ | 14.85 | $ | 16.62 | $ | 11.54 | $ | 16.00 | $ | 16.77 | $ | 12.79 | $ | 14.61 | ||||||||||||||||||||
| Income (loss) from investment operations: | ||||||||||||||||||||||||||||||||||||||||
| Net investment loss* | (0.26 | ) | (0.25 | ) | (0.31 | ) | (0.19 | ) | (0.10 | ) | (0.29 | ) | (0.29 | ) | (0.37 | ) | (0.28 | ) | (0.18 | ) | ||||||||||||||||||||
| Net realized and unrealized gain (loss) (a) | 5.80 | (0.28 | ) | 3.07 | 4.96 | (0.23 | ) | 4.39 | (0.37 | ) | 2.56 | 4.26 | (0.20 | ) | ||||||||||||||||||||||||||
| Total income (loss) from investment operations | 5.54 | (0.53 | ) | 2.76 | 4.77 | (0.33 | ) | 4.10 | (0.66 | ) | 2.19 | 3.98 | (0.38 | ) | ||||||||||||||||||||||||||
| Less distributions: | ||||||||||||||||||||||||||||||||||||||||
| Distributions from net investment income | (0.02 | ) | — | — | — | — | — | — | — | — | — | |||||||||||||||||||||||||||||
| Distributions from net realized gains | (0.25 | ) | (3.80 | ) | (2.96 | ) | — | (1.40 | ) | (0.25 | ) | (3.80 | ) | (2.96 | ) | — | (1.40 | ) | ||||||||||||||||||||||
| Tax return of capital | — | — | — | — | (0.04 | ) | — | — | — | — | (0.04 | ) | ||||||||||||||||||||||||||||
| Total distributions | (0.27 | ) | (3.80 | ) | (2.96 | ) | — | (1.44 | ) | (0.25 | ) | (3.80 | ) | (2.96 | ) | — | (1.44 | ) | ||||||||||||||||||||||
| Net asset value, end of year | $ | 20.36 | $ | 15.09 | $ | 19.42 | $ | 19.62 | $ | 14.85 | $ | 15.39 | $ | 11.54 | $ | 16.00 | $ | 16.77 | $ | 12.79 | ||||||||||||||||||||
| Total return + # | 37.18 | % | 1.11 | % | 15.69 | % | 32.12 | % | (2.12 | )% | 36.10 | % | 0.36 | % | 14.84 | % | 31.12 | % | (2.82 | )% | ||||||||||||||||||||
| Ratios/Supplemental Data: | ||||||||||||||||||||||||||||||||||||||||
| Net assets, end of year (in 000s) | $ | 12,750 | $ | 10,797 | $ | 10,799 | $ | 6,925 | $ | 5,540 | $ | 2,619 | $ | 2,440 | $ | 2,720 | $ | 2,644 | $ | 2,155 | ||||||||||||||||||||
| Ratios of expenses to average net assets: | ||||||||||||||||||||||||||||||||||||||||
| Before fees paid indirectly | 2.03 | % | 2.15 | % | 2.19 | % | 1.61 | % | 1.48 | % | 2.78 | % | 2.90 | % | 2.94 | % | 2.36 | % | 2.23 | % | ||||||||||||||||||||
| After fees paid indirectly | 2.00 | % | 2.13 | % | 2.18 | % | 1.60 | % | 1.48 | % | 2.75 | % | 2.88 | % | 2.93 | % | 2.35 | % | 2.23 | % | ||||||||||||||||||||
| Ratios of net investment loss to average net assets: | ||||||||||||||||||||||||||||||||||||||||
| Before fees paid indirectly | (1.57 | )% | (1.61 | )% | (1.56 | )% | (1.13 | )% | (0.69 | )% | (2.32 | )% | (2.37 | )% | (2.30 | )% | (1.89 | )% | (1.45 | )% | ||||||||||||||||||||
| After fees paid indirectly | (1.54 | )% | (1.59 | )% | (1.55 | )% | (1.12 | )% | (0.69 | )% | (2.29 | )% | (2.35 | )% | (2.29 | )% | (1.88 | )% | (1.45 | )% | ||||||||||||||||||||
| Portfolio turnover rate | 178 | % | 169 | % | 190 | % | 174 | % | 181 | % | 178 | % | 169 | % | 190 | % | 174 | % | 181 | % | ||||||||||||||||||||
| * | The net investment loss per share data was determined using the average shares outstanding throughout each year. |
| + | Assumes reinvestment of all dividends and distributions, if any. Total return does not reflect the deductions of taxes that a shareholder would pay on distributions or on the redemption of shares and does not reflect the impact of any sales charge. |
| # | Includes adjustments in accordance with accounting principles generally accepted in the United States and, consequently, the net asset values for financial reporting purposes and the returns based upon those net asset values may differ from the net asset values and returns for shareholder transactions. Adjustments may apply to some but not all years and classes. |
| (a) | The amount of net realized and unrealized gain (loss) on investment per share for the years ended October 31, 2019 and October 31, 2016 does not accord with the amounts in the Statements of Operations due to the timing of purchases and sales of Fund shares in relation to fluctuating market values. |
See accompanying notes to financial statements.
103
| FINANCIAL HIGHLIGHTS |
| Dunham Emerging Markets Stock Fund |
The table sets forth financial data for one share of beneficial interest outstanding throughout each year.
| Class N | ||||||||||||||||||||||||||||||||||||||||
| Year Ended October 31, | ||||||||||||||||||||||||||||||||||||||||
| 2020 | 2019 | 2018 | 2017 | 2016 | ||||||||||||||||||||||||||||||||||||
| Net asset value, beginning of year | $ | 14.27 | $ | 12.85 | $ | 15.94 | $ | 12.73 | $ | 11.97 | ||||||||||||||||||||||||||||||
| Income (loss) from investment operations: | ||||||||||||||||||||||||||||||||||||||||
| Net investment income (loss) * | (0.03 | ) | 0.19 | 0.27 | 0.17 | 0.20 | ||||||||||||||||||||||||||||||||||
| Net realized and unrealized gain (loss) | 1.59 | 1.48 | (3.20 | ) | 3.28 | 0.64 | ||||||||||||||||||||||||||||||||||
| Total income (loss) from investment operations | 1.56 | 1.67 | (2.93 | ) | 3.45 | 0.84 | ||||||||||||||||||||||||||||||||||
| Less distributions: | ||||||||||||||||||||||||||||||||||||||||
| Distributions from net investment income | (0.13 | ) | (0.25 | ) | (0.16 | ) | (0.24 | ) | (0.08 | ) | ||||||||||||||||||||||||||||||
| Total distributions | (0.13 | ) | (0.25 | ) | (0.16 | ) | (0.24 | ) | (0.08 | ) | ||||||||||||||||||||||||||||||
| Net asset value, end of year | $ | 15.70 | $ | 14.27 | $ | 12.85 | $ | 15.94 | $ | 12.73 | ||||||||||||||||||||||||||||||
| Total return + # | 10.94 | % | 13.29 | % | (18.57 | )% | 27.69 | % | 7.13 | % | ||||||||||||||||||||||||||||||
| Ratios/Supplemental Data: | ||||||||||||||||||||||||||||||||||||||||
| Net assets, end of year (in 000s) | $ | 70,868 | $ | 59,931 | $ | 53,261 | $ | 51,365 | $ | 46,481 | ||||||||||||||||||||||||||||||
| Ratios of expenses to average net assets: | 1.86 | % | 1.61 | % | 1.19 | % | 1.75 | % | 1.27 | % | ||||||||||||||||||||||||||||||
| Ratios of net investment income (loss) to average net assets: | (0.19 | )% | 1.42 | % | 1.79 | % | 1.18 | % | 1.73 | % | ||||||||||||||||||||||||||||||
| Portfolio turnover rate | 113 | % | 129 | % | 66 | % | 74 | % | 97 | % | ||||||||||||||||||||||||||||||
| Class A | Class C | |||||||||||||||||||||||||||||||||||||||
| Year Ended October 31, | Year Ended October 31, | |||||||||||||||||||||||||||||||||||||||
| 2020 | 2019 | 2018 | 2017 | 2016 | 2020 | 2019 | 2018 | 2017 | 2016 | |||||||||||||||||||||||||||||||
| Net asset value, beginning of year | $ | 13.94 | $ | 12.56 | $ | 15.58 | $ | 12.45 | $ | 11.71 | $ | 13.16 | $ | 11.85 | $ | 14.74 | $ | 11.82 | $ | 11.14 | ||||||||||||||||||||
| Income (loss) from investment operations: | ||||||||||||||||||||||||||||||||||||||||
| Net investment income (loss)* | (0.06 | ) | 0.16 | 0.23 | 0.14 | 0.17 | (0.16 | ) | 0.05 | 0.11 | 0.02 | 0.08 | ||||||||||||||||||||||||||||
| Net realized and unrealized gain (loss) | 1.54 | 1.44 | (3.13 | ) | 3.20 | 0.62 | 1.45 | 1.38 | (2.94 | ) | 3.04 | 0.60 | ||||||||||||||||||||||||||||
| Total income (loss) from investment operations | 1.48 | 1.60 | (2.90 | ) | 3.34 | 0.79 | 1.29 | 1.43 | (2.83 | ) | 3.06 | 0.68 | ||||||||||||||||||||||||||||
| Less distributions: | ||||||||||||||||||||||||||||||||||||||||
| Distributions from net investment income | (0.10 | ) | (0.22 | ) | (0.12 | ) | (0.21 | ) | (0.05 | ) | (0.04 | ) | (0.12 | ) | (0.06 | ) | (0.14 | ) | — | |||||||||||||||||||||
| Total distributions | (0.10 | ) | (0.22 | ) | (0.12 | ) | (0.21 | ) | (0.05 | ) | (0.04 | ) | (0.12 | ) | (0.06 | ) | (0.14 | ) | — | |||||||||||||||||||||
| Net asset value, end of year | $ | 15.32 | $ | 13.94 | $ | 12.56 | $ | 15.58 | $ | 12.45 | $ | 14.41 | $ | 13.16 | $ | 11.85 | $ | 14.74 | $ | 11.82 | ||||||||||||||||||||
| Total return + # | 10.58 | % | 12.98 | % | (18.73 | )% | 27.36 | % | 6.84 | % | 9.78 | % | 12.18 | % | (19.30 | )% | 26.31 | % | 6.10 | % | ||||||||||||||||||||
| Ratios/Supplemental Data: | ||||||||||||||||||||||||||||||||||||||||
| Net assets, end of year (in 000s) | $ | 14,864 | $ | 12,106 | $ | 9,662 | $ | 8,242 | $ | 6,348 | $ | 3,005 | $ | 3,463 | $ | 3,163 | $ | 3,467 | $ | 3,380 | ||||||||||||||||||||
| Ratios of expenses to average net assets: | 2.11 | % | 1.86 | % | 1.44 | % | 2.00 | % | 1.52 | % | 2.86 | % | 2.61 | % | 2.19 | % | 2.75 | % | 2.27 | % | ||||||||||||||||||||
| Ratios of net investment income (loss) to average net assets: | (0.43 | )% | 1.17 | % | 1.54 | % | 0.98 | % | 1.46 | % | (1.22 | )% | 0.41 | % | 0.77 | % | 0.10 | % | 0.77 | % | ||||||||||||||||||||
| Portfolio turnover rate | 113 | % | 129 | % | 66 | % | 74 | % | 97 | % | 113 | % | 129 | % | 66 | % | 74 | % | 97 | % | ||||||||||||||||||||
| * | The net investment income (loss) per share data was determined using the average shares outstanding throughout each year. |
| + | Assumes reinvestment of all dividends and distributions, if any. Total return does not reflect the deductions of taxes that a shareholder would pay on distributions or on the redemption of shares and does not reflect the impact of any sales charge. |
| # | Includes adjustments in accordance with accounting principles generally accepted in the United States and, consequently, the net asset values for financial reporting purposes and the returns based upon those net asset values may differ from the net asset values and returns for shareholder transactions. Adjustments may apply to some but not all years and classes. |
See accompanying notes to financial statements.
104
| FINANCIAL HIGHLIGHTS |
| Dunham International Stock Fund |
The table sets forth financial data for one share of beneficial interest outstanding throughout each year.
| Class N | ||||||||||||||||||||||||||||||||||||||||
| Year Ended October 31, | ||||||||||||||||||||||||||||||||||||||||
| 2020 | 2019 | 2018 | 2017 | 2016 | ||||||||||||||||||||||||||||||||||||
| Net asset value, beginning of year | $ | 15.51 | $ | 15.61 | $ | 17.54 | $ | 14.24 | $ | 14.24 | ||||||||||||||||||||||||||||||
| Income (loss) from investment operations: | ||||||||||||||||||||||||||||||||||||||||
| Net investment income * | 0.15 | 0.34 | 0.21 | 0.21 | 0.16 | |||||||||||||||||||||||||||||||||||
| Net realized and unrealized gain (loss) ! | (0.06 | ) | 0.62 | (1.39 | ) | 3.09 | (0.15 | ) | ||||||||||||||||||||||||||||||||
| Total income (loss) from investment operations | 0.09 | 0.96 | (1.18 | ) | 3.30 | 0.01 | ||||||||||||||||||||||||||||||||||
| Less distributions: | ||||||||||||||||||||||||||||||||||||||||
| Distributions from net investment income | (0.34 | ) | (0.18 | ) | (0.26 | ) | — | (0.01 | ) | |||||||||||||||||||||||||||||||
| Distributions from net realized gains | — | (0.88 | ) | (0.49 | ) | — | — | |||||||||||||||||||||||||||||||||
| Total distributions | (0.34 | ) | (1.06 | ) | (0.75 | ) | — | (0.01 | ) | |||||||||||||||||||||||||||||||
| Net asset value, end of year | $ | 15.26 | $ | 15.51 | $ | 15.61 | $ | 17.54 | $ | 14.24 | ||||||||||||||||||||||||||||||
| Total return + # | 0.45 | % | 7.08 | % | (7.08 | )% | 23.17 | % | 0.06 | % | ||||||||||||||||||||||||||||||
| Ratios/Supplemental Data: | ||||||||||||||||||||||||||||||||||||||||
| Net assets, end of year (in 000s) | $ | 96,239 | $ | 101,505 | $ | 89,401 | $ | 90,257 | $ | 78,640 | ||||||||||||||||||||||||||||||
| Ratios of expenses to average net assets: | ||||||||||||||||||||||||||||||||||||||||
| Before fees paid indirectly | 1.71 | % | 1.43 | % | 1.67 | % | 1.56 | % | 1.63 | % | ||||||||||||||||||||||||||||||
| After fees paid indirectly | 1.71 | % | 1.43 | % | 1.67 | % | 1.55 | % | 1.63 | % | ||||||||||||||||||||||||||||||
| Ratios of net investment income to average net assets: | ||||||||||||||||||||||||||||||||||||||||
| Before fees paid indirectly | 0.98 | % | 2.28 | % | 1.24 | % | 1.34 | % | 1.17 | % | ||||||||||||||||||||||||||||||
| After fees paid indirectly | 0.98 | % | 2.28 | % | 1.24 | % | 1.35 | % | 1.17 | % | ||||||||||||||||||||||||||||||
| Portfolio turnover rate | 156 | % | 100 | % | 113 | % | 119 | % | 143 | % | ||||||||||||||||||||||||||||||
| Class A | Class C | |||||||||||||||||||||||||||||||||||||||
| Year Ended October 31, | Year Ended October 31, | |||||||||||||||||||||||||||||||||||||||
| 2020 | 2019 | 2018 | 2017 | 2016 | 2020 | 2019 | 2018 | 2017 | 2016 | |||||||||||||||||||||||||||||||
| Net asset value, beginning of year | $ | 15.38 | $ | 15.49 | $ | 17.42 | $ | 14.17 | $ | 14.21 | $ | 14.55 | $ | 14.68 | $ | 16.59 | $ | 13.60 | $ | 13.73 | ||||||||||||||||||||
| Income (loss) from investment operations: | ||||||||||||||||||||||||||||||||||||||||
| Net investment income (loss)* | 0.11 | 0.30 | 0.17 | 0.17 | 0.13 | (0.02 | ) | 0.18 | 0.04 | 0.04 | 0.03 | |||||||||||||||||||||||||||||
| Net realized and unrealized gain (loss) ! | (0.06 | ) | 0.61 | (1.38 | ) | 3.08 | (0.17 | ) | (0.05 | ) | 0.59 | (1.31 | ) | 2.95 | (0.16 | ) | ||||||||||||||||||||||||
| Total income (loss) from investment operations | 0.05 | 0.91 | (1.21 | ) | 3.25 | (0.04 | ) | (0.07 | ) | 0.77 | (1.27 | ) | 2.99 | (0.13 | ) | |||||||||||||||||||||||||
| Less distributions: | ||||||||||||||||||||||||||||||||||||||||
| Distributions from net investment income | (0.30 | ) | (0.14 | ) | (0.23 | ) | — | — | (0.23 | ) | (0.02 | ) | (0.15 | ) | — | — | ||||||||||||||||||||||||
| Distributions from net realized gains | — | (0.88 | ) | (0.49 | ) | — | — | — | (0.88 | ) | (0.49 | ) | — | — | ||||||||||||||||||||||||||
| Total distributions | (0.30 | ) | (1.02 | ) | (0.72 | ) | — | — | (0.23 | ) | (0.90 | ) | (0.64 | ) | — | — | ||||||||||||||||||||||||
| Net asset value, end of year | $ | 15.13 | $ | 15.38 | $ | 15.49 | $ | 17.42 | $ | 14.17 | $ | 14.25 | $ | 14.55 | $ | 14.68 | $ | 16.59 | $ | 13.60 | ||||||||||||||||||||
| Total return + # | 0.24 | % | 6.78 | % | (7.30 | )% | 22.94 | % | (0.28 | )% | (0.55 | )% | 6.03 | % | (8.03 | )% | 21.99 | % | (0.95 | )% | ||||||||||||||||||||
| Ratios/Supplemental Data: | ||||||||||||||||||||||||||||||||||||||||
| Net assets, end of year (in 000s) | $ | 20,938 | $ | 22,499 | $ | 18,250 | $ | 15,524 | $ | 10,305 | $ | 4,754 | $ | 6,409 | $ | 5,764 | $ | 6,570 | $ | 6,483 | ||||||||||||||||||||
| Ratios of expenses to average net assets: | ||||||||||||||||||||||||||||||||||||||||
| Before fees paid indirectly | 1.96 | % | 1.68 | % | 1.92 | % | 1.81 | % | 1.88 | % | 2.71 | % | 2.43 | % | 2.67 | % | 2.56 | % | 2.63 | % | ||||||||||||||||||||
| After fees paid indirectly | 1.96 | % | 1.68 | % | 1.92 | % | 1.80 | % | 1.88 | % | 2.71 | % | 2.43 | % | 2.67 | % | 2.55 | % | 2.63 | % | ||||||||||||||||||||
| Ratios of net investment income (loss) to average net assets: | ||||||||||||||||||||||||||||||||||||||||
| Before fees paid indirectly | 0.71 | % | 2.04 | % | 1.01 | % | 1.07 | % | 0.93 | % | (0.11 | )% | 1.26 | % | 0.22 | % | 0.30 | % | 0.20 | % | ||||||||||||||||||||
| After fees paid indirectly | 0.71 | % | 2.04 | % | 1.01 | % | 1.08 | % | 0.93 | % | (0.11 | )% | 1.26 | % | 0.22 | % | 0.31 | % | 0.20 | % | ||||||||||||||||||||
| Portfolio turnover rate | 156 | % | 100 | % | 113 | % | 119 | % | 143 | % | 156 | % | 100 | % | 113 | % | 119 | % | 143 | % | ||||||||||||||||||||
| * | The net investment income (loss) per share data was determined using the average shares outstanding throughout each year. |
| + | Assumes reinvestment of all dividends and distributions, if any. Total return does not reflect the deductions of taxes that a shareholder would pay on distributions or on the redemption of shares and does not reflect the impact of any sales charge. |
| # | Includes adjustments in accordance with accounting principles generally accepted in the United States and, consequently, the net asset values for financial reporting purposes and the returns based upon those net asset values may differ from the net asset values and returns for shareholder transactions. Adjustments may apply to some but not all years and classes. |
| ! | The amount of net realized and unrealized gain (loss) on investment per share for the year ended October 31, 2020 does not accord with the amounts in the Statements of Operations due to the timing of purchases and sales of Fund shares in relation to fluctuating market values. |
See accompanying notes to financial statements.
105
| FINANCIAL HIGHLIGHTS |
| Dunham Dynamic Macro Fund |
The table sets forth financial data for one share of beneficial interest outstanding throughout each year.
| Class N | ||||||||||||||||||||||||||||||||||||||||
| Year Ended October 31, | ||||||||||||||||||||||||||||||||||||||||
| 2020 | 2019 | 2018 | 2017 | 2016 | ||||||||||||||||||||||||||||||||||||
| Net asset value, beginning of year | $ | 10.08 | $ | 9.53 | $ | 10.18 | $ | 9.55 | $ | 9.81 | ||||||||||||||||||||||||||||||
| Income (loss) from investment operations: | ||||||||||||||||||||||||||||||||||||||||
| Net investment income (loss) * | (0.00 | ) (a) | 0.12 | 0.02 | (0.03 | ) | (0.00 | ) (a) | ||||||||||||||||||||||||||||||||
| Net realized and unrealized gain (loss) | (0.08 | ) | 0.65 | (0.67 | ) | 0.66 | (0.26 | ) | ||||||||||||||||||||||||||||||||
| Total income (loss) from investment operations | (0.08 | ) | 0.77 | (0.65 | ) | 0.63 | (0.26 | ) | ||||||||||||||||||||||||||||||||
| Less distributions: | ||||||||||||||||||||||||||||||||||||||||
| Distributions from net investment income | — | (0.17 | ) | — | — | — | ||||||||||||||||||||||||||||||||||
| Tax return of capital | — | (0.05 | ) | — | — | — | ||||||||||||||||||||||||||||||||||
| Total distributions | — | (0.22 | ) | — | — | — | ||||||||||||||||||||||||||||||||||
| Net asset value, end of year | $ | 10.00 | $ | 10.08 | $ | 9.53 | $ | 10.18 | $ | 9.55 | ||||||||||||||||||||||||||||||
| Total return + # | (0.79 | )% | 8.35 | % | (6.39 | )% | 6.60 | % | (2.68 | )% | ||||||||||||||||||||||||||||||
| Ratios/Supplemental Data: | ||||||||||||||||||||||||||||||||||||||||
| Net assets, end of year (in 000s) | $ | 23,680 | $ | 32,074 | $ | 35,638 | $ | 36,104 | $ | 28,650 | ||||||||||||||||||||||||||||||
| Ratios of expenses to average net assets: | 1.69 | % | 1.54 | % | 1.80 | % | 1.83 | % | 1.63 | % | ||||||||||||||||||||||||||||||
| Ratios of net investment income (loss) to average net assets: | (0.02 | )% | 1.29 | % | 0.20 | % | (0.32 | )% | (0.03 | )% | ||||||||||||||||||||||||||||||
| Portfolio turnover rate | 187 | % | 28 | % | 11 | % | 7 | % | 54 | % | ||||||||||||||||||||||||||||||
| Class A | Class C | |||||||||||||||||||||||||||||||||||||||
| Year Ended October 31, | Year Ended October 31, | |||||||||||||||||||||||||||||||||||||||
| 2020 | 2019 | 2018 | 2017 | 2016 | 2020 | 2019 | 2018 | 2017 | 2016 | |||||||||||||||||||||||||||||||
| Net asset value, beginning of year | $ | 10.00 | $ | 9.46 | $ | 10.12 | $ | 9.52 | $ | 9.81 | $ | 9.55 | $ | 9.03 | $ | 9.74 | $ | 9.23 | $ | 9.58 | ||||||||||||||||||||
| Income (loss) from investment operations: | ||||||||||||||||||||||||||||||||||||||||
| Net investment income (loss) * | (0.03 | ) | 0.10 | 0.00 | (a) | (0.06 | ) | (0.02 | ) | (0.10 | ) | 0.02 | (0.08 | ) | (0.12 | ) | (0.09 | ) | ||||||||||||||||||||||
| Net realized and unrealized gain (loss) | (0.07 | ) | 0.64 | (0.66 | ) | 0.66 | (0.27 | ) | (0.08 | ) | 0.63 | (0.63 | ) | 0.63 | (0.26 | ) | ||||||||||||||||||||||||
| Total income (loss) from investment operations | (0.10 | ) | 0.74 | (0.66 | ) | 0.60 | (0.29 | ) | (0.18 | ) | 0.65 | (0.71 | ) | 0.51 | (0.35 | ) | ||||||||||||||||||||||||
| Less distributions: | ||||||||||||||||||||||||||||||||||||||||
| Distributions from net investment income | — | (0.15 | ) | — | — | — | — | (0.08 | ) | — | — | — | ||||||||||||||||||||||||||||
| Tax return of capital | — | (0.05 | ) | — | — | — | — | (0.05 | ) | — | — | — | ||||||||||||||||||||||||||||
| Total distributions | — | (0.20 | ) | — | — | — | — | (0.13 | ) | — | — | — | ||||||||||||||||||||||||||||
| Net asset value, end of year | $ | 9.90 | $ | 10.00 | $ | 9.46 | $ | 10.12 | $ | 9.52 | $ | 9.37 | $ | 9.55 | $ | 9.03 | $ | 9.74 | $ | 9.23 | ||||||||||||||||||||
| Total return + # | (1.00 | )% | 8.04 | % | (6.52 | )% | 6.30 | % | (2.95 | )% | (1.88 | )% | 7.31 | % | (7.29 | )% | 5.53 | % | (3.66 | )% | ||||||||||||||||||||
| Ratios/Supplemental Data: | ||||||||||||||||||||||||||||||||||||||||
| Net assets, end of year (in 000s) | $ | 5,078 | $ | 7,713 | $ | 7,918 | $ | 6,224 | $ | 3,897 | $ | 1,284 | $ | 1,927 | $ | 1,696 | $ | 1,969 | $ | 2,131 | ||||||||||||||||||||
| Ratios of expenses to average net assets: | 1.94 | % | 1.79 | % | 2.05 | % | 2.08 | % | 1.88 | % | 2.69 | % | 2.54 | % | 2.80 | % | 2.83 | % | 2.63 | % | ||||||||||||||||||||
| Ratios of net investment income (loss) to average net assets: | (0.26 | )% | 1.03 | % | 0.00 | % (b) | (0.58 | )% | (0.26 | )% | (1.04 | )% | 0.20 | % | (0.84 | )% | (1.34 | )% | (1.02 | )% | ||||||||||||||||||||
| Portfolio turnover rate | 187 | % | 28 | % | 11 | % | 7 | % | 54 | % | 187 | % | 28 | % | 11 | % | 7 | % | 54 | % | ||||||||||||||||||||
| * | The net investment income (loss) per share data was determined using the average shares outstanding throughout each year. |
| + | Assumes reinvestment of all dividends and distributions, if any. Total return does not reflect the deductions of taxes that a shareholder would pay on distributions or on the redemption of shares and does not reflect the impact of any sales charge. |
| # | Includes adjustments in accordance with accounting principles generally accepted in the United States and, consequently, the net asset values for financial reporting purposes and the returns based upon those net asset values may differ from the net asset values and returns for shareholder transactions. Adjustments may apply to some but not all years and classes. |
| (a) | Represents less than $0.01 per share. |
| (b) | Represents less than 0.01%. |
See accompanying notes to financial statements.
106
| FINANCIAL HIGHLIGHTS |
| Dunham Long/Short Credit Fund |
The table sets forth financial data for one share of beneficial interest outstanding throughout each year.
| Class N | ||||||||||||||||||||||||||||||||||||||||
| Year Ended October 31, | ||||||||||||||||||||||||||||||||||||||||
| 2020 | 2019 | 2018 | 2017 | 2016 | ||||||||||||||||||||||||||||||||||||
| Net asset value, beginning of year | $ | 9.36 | $ | 9.19 | $ | 8.68 | $ | 8.05 | $ | 8.75 | ||||||||||||||||||||||||||||||
| Income (loss) from investment operations: | �� | |||||||||||||||||||||||||||||||||||||||
| Net investment income* | 0.13 | 0.24 | 0.23 | 0.16 | 0.23 | |||||||||||||||||||||||||||||||||||
| Net realized and unrealized gain (loss) | 0.26 | 0.24 | 0.49 | 0.72 | (0.39 | ) | ||||||||||||||||||||||||||||||||||
| Total income (loss) from investment operations | 0.39 | 0.48 | 0.72 | 0.88 | (0.16 | ) | ||||||||||||||||||||||||||||||||||
| Less distributions: | ||||||||||||||||||||||||||||||||||||||||
| Distributions from net investment income | (0.15 | ) | (0.31 | ) | (0.21 | ) | (0.25 | ) | (0.36 | ) | ||||||||||||||||||||||||||||||
| Distributions from net realized gains | (0.05 | ) | — | — | — | (0.18 | ) | |||||||||||||||||||||||||||||||||
| Total distributions | (0.20 | ) | (0.31 | ) | (0.21 | ) | (0.25 | ) | (0.54 | ) | ||||||||||||||||||||||||||||||
| Net asset value, end of year | $ | 9.55 | $ | 9.36 | $ | 9.19 | $ | 8.68 | $ | 8.05 | ||||||||||||||||||||||||||||||
| Total return + # | 4.23 | % | 5.31 | % | 8.42 | % | 11.20 | % | (1.92 | )% | ||||||||||||||||||||||||||||||
| Ratios/Supplemental Data: | ||||||||||||||||||||||||||||||||||||||||
| Net assets, end of year (in 000s) | $ | 110,215 | $ | 67,276 | $ | 36,055 | $ | 12,953 | $ | 16,929 | ||||||||||||||||||||||||||||||
| Ratios of expenses to average net assets: | 1.43 | % | 1.24 | % | 1.44 | % | 1.41 | % | 1.42 | % | ||||||||||||||||||||||||||||||
| Ratios of net investment income to average net assets: | 1.41 | % | 2.60 | % | 2.52 | % | 1.90 | % | 2.83 | % | ||||||||||||||||||||||||||||||
| Portfolio turnover rate | 519 | % | 426 | % | 275 | % | 106 | % | 96 | % | ||||||||||||||||||||||||||||||
| Class A | Class C | |||||||||||||||||||||||||||||||||||||||
| Year Ended October 31, | Year Ended October 31, | |||||||||||||||||||||||||||||||||||||||
| 2020 | 2019 | 2018 | 2017 | 2016 | 2020 | 2019 | 2018 | 2017 | 2016 | |||||||||||||||||||||||||||||||
| Net asset value, beginning of year | $ | 9.33 | $ | 9.17 | $ | 8.66 | $ | 8.03 | $ | 8.73 | $ | 9.08 | $ | 8.94 | $ | 8.46 | $ | 7.86 | $ | 8.56 | ||||||||||||||||||||
| Income (loss) from investment operations: | ||||||||||||||||||||||||||||||||||||||||
| Net investment income* | 0.11 | 0.22 | 0.19 | 0.14 | 0.20 | 0.05 | 0.15 | 0.11 | 0.07 | 0.14 | ||||||||||||||||||||||||||||||
| Net realized and unrealized gain (loss) | 0.26 | 0.22 | 0.50 | 0.72 | (0.39 | ) | 0.24 | 0.23 | 0.49 | 0.71 | (0.39 | ) | ||||||||||||||||||||||||||||
| Total income (loss) from investment operations | 0.37 | 0.44 | 0.69 | 0.86 | (0.19 | ) | 0.29 | 0.38 | 0.60 | 0.78 | (0.25 | ) | ||||||||||||||||||||||||||||
| Less distributions: | ||||||||||||||||||||||||||||||||||||||||
| Distributions from net investment income | (0.12 | ) | (0.28 | ) | (0.18 | ) | (0.23 | ) | (0.33 | ) | (0.08 | ) | (0.24 | ) | (0.12 | ) | (0.18 | ) | (0.27 | ) | ||||||||||||||||||||
| Distributions from net realized gains | (0.05 | ) | — | — | — | (0.18 | ) | (0.05 | ) | — | — | — | (0.18 | ) | ||||||||||||||||||||||||||
| Total distributions | (0.17 | ) | (0.28 | ) | (0.18 | ) | (0.23 | ) | (0.51 | ) | (0.13 | ) | (0.24 | ) | (0.12 | ) | (0.18 | ) | (0.45 | ) | ||||||||||||||||||||
| Net asset value, end of year | $ | 9.53 | $ | 9.33 | $ | 9.17 | $ | 8.66 | $ | 8.03 | $ | 9.24 | $ | 9.08 | $ | 8.94 | $ | 8.46 | $ | 7.86 | ||||||||||||||||||||
| Total return + # | 4.09 | % | 4.95 | % | 8.10 | % | 10.92 | % | (2.19 | )% | 3.24 | % | 4.34 | % | 7.21 | % | 10.08 | % | (2.95 | )% | ||||||||||||||||||||
| Ratios/Supplemental Data: | ||||||||||||||||||||||||||||||||||||||||
| Net assets, end of year (in 000s) | $ | 17,123 | $ | 11,087 | $ | 6,265 | $ | 3,125 | $ | 3,638 | $ | 3,852 | $ | 4,077 | $ | 3,145 | $ | 2,708 | $ | 3,181 | ||||||||||||||||||||
| Ratios of expenses to average net assets: | 1.68 | % | 1.48 | % | 1.69 | % | 1.66 | % | 1.67 | % | 2.43 | % | 2.22 | % | 2.44 | % | 2.41 | % | 2.44 | % | ||||||||||||||||||||
| Ratios of net investment income to average net assets: | 1.21 | % | 2.36 | % | 2.13 | % | 1.66 | % | 2.57 | % | 0.53 | % | 1.63 | % | 1.22 | % | 0.93 | % | 1.81 | % | ||||||||||||||||||||
| Portfolio turnover rate | 519 | % | 426 | % | 275 | % | 106 | % | 96 | % | 519 | % | 426 | % | 275 | % | 106 | % | 96 | % | ||||||||||||||||||||
| * | The net investment income per share data was determined using the average shares outstanding throughout each year. |
| + | Assumes reinvestment of all dividends and distributions, if any. Total return does not reflect the deductions of taxes that a shareholder would pay on distributions or on the redemption of shares and does not reflect the impact of any sales charge. |
| # | Includes adjustments in accordance with accounting principles generally accepted in the United States and, consequently, the net asset values for financial reporting purposes and the returns based upon those net asset values may differ from the net asset values and returns for shareholder transactions. Adjustments may apply to some but not all years and classes. |
See accompanying notes to financial statements.
107
| FINANCIAL HIGHLIGHTS |
| Dunham Monthly Distribution Fund |
The table sets forth financial data for one share of beneficial interest outstanding throughout each year.
| Class N | ||||||||||||||||||||||||||||||||||||||||
| Year Ended October 31, | ||||||||||||||||||||||||||||||||||||||||
| 2020 | 2019 | 2018 | 2017 | 2016 | ||||||||||||||||||||||||||||||||||||
| Net asset value, beginning of year | $ | 33.88 | $ | 34.84 | $ | 36.71 | $ | 35.74 | $ | 36.36 | ||||||||||||||||||||||||||||||
| Income (loss) from investment operations: | ||||||||||||||||||||||||||||||||||||||||
| Net investment income (loss)* | (0.21 | ) | (0.13 | ) | 0.09 | (0.36 | ) | 0.14 | ||||||||||||||||||||||||||||||||
| Net realized and unrealized gain (loss) | 0.33 | 1.02 | (0.25 | ) | 2.79 | 0.49 | ||||||||||||||||||||||||||||||||||
| Total income (loss) from investment operations | 0.12 | 0.89 | (0.16 | ) | 2.43 | 0.63 | ||||||||||||||||||||||||||||||||||
| Less distributions: | ||||||||||||||||||||||||||||||||||||||||
| Distributions from net investment income | (0.30 | ) | — | — | — | (0.55 | ) | |||||||||||||||||||||||||||||||||
| Distributions from net realized gains | — | — | (0.35 | ) | — | — | ||||||||||||||||||||||||||||||||||
| Tax return of capital | (0.95 | ) | (1.85 | ) | (1.36 | ) | (1.46 | ) | (0.70 | ) | ||||||||||||||||||||||||||||||
| Total distributions | (1.25 | ) | (1.85 | ) | (1.71 | ) | (1.46 | ) | (1.25 | ) | ||||||||||||||||||||||||||||||
| Net asset value, end of year | $ | 32.75 | $ | 33.88 | $ | 34.84 | $ | 36.71 | $ | 35.74 | ||||||||||||||||||||||||||||||
| Total return + # | 0.37 | % | 2.61 | % | (0.45 | )% | 6.92 | % | 1.79 | % | ||||||||||||||||||||||||||||||
| Ratios/Supplemental Data: | ||||||||||||||||||||||||||||||||||||||||
| Net assets, end of year (in 000s) | $ | 160,250 | $ | 183,319 | $ | 201,405 | $ | 212,178 | $ | 153,084 | ||||||||||||||||||||||||||||||
| Ratios of expenses to average net assets: | ||||||||||||||||||||||||||||||||||||||||
| After waivers | 1.81 | % | 2.62 | % | 2.16 | % | 2.73 | % | 1.85 | % | ||||||||||||||||||||||||||||||
| Dividends/borrowings on short sales | 0.69 | % | 1.24 | % | 1.10 | % | 1.17 | % | 0.61 | % | ||||||||||||||||||||||||||||||
| Excluding dividends/borrowings on short sales: | ||||||||||||||||||||||||||||||||||||||||
| Before fee waivers | 1.13 | % | 1.38 | % | 1.06 | % | 1.59 | % | 1.26 | % | ||||||||||||||||||||||||||||||
| After fee waivers | 1.13 | % | 1.38 | % | 1.06 | % | 1.56 | % | 1.24 | % | ||||||||||||||||||||||||||||||
| Ratios of net investment income (loss) to average net assets: | ||||||||||||||||||||||||||||||||||||||||
| Before fee waivers | (0.62 | )% | (0.39 | )% | 0.25 | % | (1.06 | )% | 0.39 | % | ||||||||||||||||||||||||||||||
| After fee waivers | (0.62 | )% | (0.39 | )% | 0.25 | % | (1.03 | )% | 0.40 | % | ||||||||||||||||||||||||||||||
| Portfolio turnover rate | 605 | % | 496 | % | 453 | % | 382 | % | 208 | % | ||||||||||||||||||||||||||||||
| Class A | Class C | |||||||||||||||||||||||||||||||||||||||
| Year Ended October 31, | Year Ended October 31, | |||||||||||||||||||||||||||||||||||||||
| 2020 | 2019 | 2018 | 2017 | 2016 | 2020 | 2019 | 2018 | 2017 | 2016 | |||||||||||||||||||||||||||||||
| Net asset value, beginning of year | $ | 32.71 | $ | 33.77 | $ | 35.73 | $ | 34.90 | $ | 35.63 | $ | 25.60 | $ | 27.02 | $ | 29.15 | $ | 28.94 | $ | 29.99 | ||||||||||||||||||||
| Income (loss) from investment operations: | ||||||||||||||||||||||||||||||||||||||||
| Net investment income (loss)* | (0.30 | ) | (0.21 | ) | 0.00 | (a) | (0.40 | ) | 0.13 | (0.43 | ) | (0.36 | ) | (0.21 | ) | (0.55 | ) | (0.14 | ) | |||||||||||||||||||||
| Net realized and unrealized gain (loss) | 0.33 | 1.00 | (0.25 | ) | 2.69 | 0.39 | 0.27 | 0.79 | (0.21 | ) | 2.22 | 0.34 | ||||||||||||||||||||||||||||
| Total income (loss) from investment operations | 0.03 | 0.79 | (0.25 | ) | 2.29 | 0.52 | (0.16 | ) | 0.43 | (0.42 | ) | 1.67 | 0.20 | |||||||||||||||||||||||||||
| Less distributions: | ||||||||||||||||||||||||||||||||||||||||
| Distributions from net investment income | (0.30 | ) | — | — | — | (0.55 | ) | (0.30 | ) | — | — | — | (0.55 | ) | ||||||||||||||||||||||||||
| Distributions from net realized gains | — | — | (0.35 | ) | — | — | — | — | (0.35 | ) | — | — | ||||||||||||||||||||||||||||
| Tax return of capital | (0.95 | ) | (1.85 | ) | (1.36 | ) | (1.46 | ) | (0.70 | ) | (0.95 | ) | (1.85 | ) | (1.36 | ) | (1.46 | ) | (0.70 | ) | ||||||||||||||||||||
| Total distributions | (1.25 | ) | (1.85 | ) | (1.71 | ) | (1.46 | ) | (1.25 | ) | (1.25 | ) | (1.85 | ) | (1.71 | ) | (1.46 | ) | (1.25 | ) | ||||||||||||||||||||
| Net asset value, end of year | $ | 31.49 | $ | 32.71 | $ | 33.77 | $ | 35.73 | $ | 34.90 | $ | 24.19 | $ | 25.60 | $ | 27.02 | $ | 29.15 | $ | 28.94 | ||||||||||||||||||||
| Total return + # | 0.10 | % | 2.39 | % | (0.72 | )% | 6.64 | % | 1.54 | % | (0.63 | )% | 1.63 | % | (1.48 | )% | 5.82 | % | 0.75 | % | ||||||||||||||||||||
| Ratios/Supplemental Data: | ||||||||||||||||||||||||||||||||||||||||
| Net assets, end of year (in 000s) | $ | 33,157 | $ | 42,052 | $ | 42,980 | $ | 41,186 | $ | 45,552 | $ | 23,171 | $ | 33,913 | $ | 34,664 | $ | 34,601 | $ | 39,118 | ||||||||||||||||||||
| Ratios of expenses to average net assets: | ||||||||||||||||||||||||||||||||||||||||
| After waivers | 2.06 | % | 2.87 | % | 2.41 | % | 2.93 | % | 2.06 | % | 2.81 | % | 3.62 | % | 3.16 | % | 3.68 | % | 2.83 | % | ||||||||||||||||||||
| Dividends/borrowings on short sales | 0.68 | % | 1.24 | % | 1.10 | % | 1.12 | % | 0.59 | % | 0.68 | % | 1.23 | % | 1.10 | % | 1.12 | % | 0.60 | % | ||||||||||||||||||||
| Excluding dividends/borrowings on short sales: | ||||||||||||||||||||||||||||||||||||||||
| Before fee waivers | 1.38 | % | 1.63 | % | 1.31 | % | 1.83 | % | 1.49 | % | 2.12 | % | 2.39 | % | 2.06 | % | 2.58 | % | 2.24 | % | ||||||||||||||||||||
| After fee waivers | 1.38 | % | 1.63 | % | 1.31 | % | 1.81 | % | 1.48 | % | 2.12 | % | 2.39 | % | 2.06 | % | 2.56 | % | 2.23 | % | ||||||||||||||||||||
| Ratios of net investment income (loss) to average net assets: | ||||||||||||||||||||||||||||||||||||||||
| Before fee waivers | (0.94 | )% | (0.63 | )% | 0.01 | % | (1.14 | )% | 0.36 | % | (1.74 | )% | (1.38 | )% | (0.73 | )% | (1.89 | )% | (0.50 | )% | ||||||||||||||||||||
| After fee waivers | (0.94 | )% | (0.63 | )% | 0.01 | % | (1.11 | )% | 0.37 | % | (1.74 | )% | (1.38 | )% | (0.73 | )% | (1.86 | )% | (0.48 | )% | ||||||||||||||||||||
| Portfolio turnover rate | 605 | % | 496 | % | 453 | % | 382 | % | 208 | % | 605 | % | 496 | % | 453 | % | 382 | % | 208 | % | ||||||||||||||||||||
| * | The net investment income per share data was determined using the average shares outstanding throughout each year. |
| + | Assumes reinvestment of all dividends and distributions, if any. Total return does not reflect the deductions of taxes that a shareholder would pay on distributions or on the redemption of shares and does not reflect the impact of any sales charge. |
| # | Includes adjustments in accordance with accounting principles generally accepted in the United States and, consequently, the net asset values for financial reporting purposes and the returns based upon those net asset values may differ from the net asset values and returns for shareholder transactions. Adjustments may apply to some but not all years and classes. |
| (a) | Represents less than $0.01 per share. |
See accompanying notes to financial statements.
108
| FINANCIAL HIGHLIGHTS |
| Dunham Real Estate Stock Fund |
The table sets forth financial data for one share of beneficial interest outstanding throughout each year.
| Class N | ||||||||||||||||||||||||||||||||||||||||
| Year Ended October 31, | ||||||||||||||||||||||||||||||||||||||||
| 2020 | 2019 | 2018 | 2017 | 2016 | ||||||||||||||||||||||||||||||||||||
| Net asset value, beginning of year | $ | 18.68 | $ | 15.35 | $ | 15.66 | $ | 18.31 | $ | 19.23 | ||||||||||||||||||||||||||||||
| Income (loss) from investment operations: | ||||||||||||||||||||||||||||||||||||||||
| Net investment income * | 0.11 | 0.30 | 0.28 | 0.13 | 0.32 | |||||||||||||||||||||||||||||||||||
| Net realized and unrealized gain (loss) ! | (0.14 | ) | 3.32 | (0.35 | ) | 0.40 | 0.73 | |||||||||||||||||||||||||||||||||
| Total income (loss) from investment operations | (0.03 | ) | 3.62 | (0.07 | ) | 0.53 | 1.05 | |||||||||||||||||||||||||||||||||
| Less distributions: | ||||||||||||||||||||||||||||||||||||||||
| Distributions from net investment income | (0.31 | ) | (0.29 | ) | (0.12 | ) | (0.36 | ) | (0.21 | ) | ||||||||||||||||||||||||||||||
| Distributions from net realized gains | (1.00 | ) | — | (0.12 | ) | (2.82 | ) | (1.76 | ) | |||||||||||||||||||||||||||||||
| Total distributions | (1.31 | ) | (0.29 | ) | (0.24 | ) | (3.18 | ) | (1.97 | ) | ||||||||||||||||||||||||||||||
| Net asset value, end of year | $ | 17.34 | $ | 18.68 | $ | 15.35 | $ | 15.66 | $ | 18.31 | ||||||||||||||||||||||||||||||
| Total return + # | (0.02 | )% | 24.16 | % | (0.48 | )% | 3.63 | % | 5.77 | % | ||||||||||||||||||||||||||||||
| Ratios/Supplemental Data: | ||||||||||||||||||||||||||||||||||||||||
| Net assets, end of year (in 000s) | $ | 53,647 | $ | 42,865 | $ | 43,163 | $ | 34,256 | $ | 25,479 | ||||||||||||||||||||||||||||||
| Ratios of expenses to average net assets: | 1.66 | % | 1.15 | % | 1.10 | % | 1.17 | % | 1.21 | % | ||||||||||||||||||||||||||||||
| Ratios of net investment income to average net assets: | 0.63 | % | 1.81 | % | 1.82 | % | 0.79 | % | 1.74 | % | ||||||||||||||||||||||||||||||
| Portfolio turnover rate | 125 | % | 63 | % | 74 | % | 101 | % | 110 | % | ||||||||||||||||||||||||||||||
| Class A | Class C | |||||||||||||||||||||||||||||||||||||||
| Year Ended October 31, | Year Ended October 31, | |||||||||||||||||||||||||||||||||||||||
| 2020 | 2019 | 2018 | 2017 | 2016 | 2020 | 2019 | 2018 | 2017 | 2016 | |||||||||||||||||||||||||||||||
| Net asset value, beginning of year | $ | 18.81 | $ | 15.46 | $ | 15.78 | $ | 18.35 | $ | 19.26 | $ | 17.69 | $ | 14.54 | $ | 14.88 | $ | 17.55 | $ | 18.50 | ||||||||||||||||||||
| Income (loss) from investment operations: | ||||||||||||||||||||||||||||||||||||||||
| Net investment income (loss) * | 0.06 | 0.26 | 0.24 | 0.10 | 0.27 | (0.06 | ) | 0.13 | 0.12 | (0.02 | ) | 0.13 | ||||||||||||||||||||||||||||
| Net realized and unrealized gain (loss) ! | (0.13 | ) | 3.35 | (0.35 | ) | 0.41 | 0.74 | (0.14 | ) | 3.17 | (0.34 | ) | 0.38 | 0.70 | ||||||||||||||||||||||||||
| Total income (loss) from investment operations | (0.07 | ) | 3.61 | (0.11 | ) | 0.51 | 1.01 | (0.20 | ) | 3.30 | (0.22 | ) | 0.36 | 0.83 | ||||||||||||||||||||||||||
| Less distributions: | ||||||||||||||||||||||||||||||||||||||||
| Distributions from net investment income | (0.27 | ) | (0.26 | ) | (0.09 | ) | (0.26 | ) | (0.16 | ) | (0.19 | ) | (0.15 | ) | — | (0.21 | ) | (0.02 | ) | |||||||||||||||||||||
| Distributions from net realized gains | (1.00 | ) | — | (0.12 | ) | (2.82 | ) | (1.76 | ) | (1.00 | ) | — | (0.12 | ) | (2.82 | ) | (1.76 | ) | ||||||||||||||||||||||
| Total distributions | (1.27 | ) | (0.26 | ) | (0.21 | ) | (3.08 | ) | (1.92 | ) | (1.19 | ) | (0.15 | ) | (0.12 | ) | (3.03 | ) | (1.78 | ) | ||||||||||||||||||||
| Net asset value, end of year | $ | 17.47 | $ | 18.81 | $ | 15.46 | $ | 15.78 | $ | 18.35 | $ | 16.30 | $ | 17.69 | $ | 14.54 | $ | 14.88 | $ | 17.55 | ||||||||||||||||||||
| Total return + # | (0.28 | )% | 23.81 | % | (0.74 | )% | 3.44 | % | 5.54 | % | (1.08 | )% | 22.97 | % | (1.50 | )% | 2.61 | % | 4.73 | % | ||||||||||||||||||||
| Ratios/Supplemental Data: | ||||||||||||||||||||||||||||||||||||||||
| Net assets, end of year (in 000s) | $ | 11,196 | $ | 9,161 | $ | 8,444 | $ | 6,002 | $ | 9,376 | $ | 2,998 | $ | 2,812 | $ | 2,308 | $ | 2,448 | $ | 3,211 | ||||||||||||||||||||
| Ratios of expenses to average net assets: | 1.91 | % | 1.40 | % | 1.35 | % | 1.42 | % | 1.45 | % | 2.66 | % | 2.15 | % | 2.10 | % | 2.17 | % | 2.21 | % | ||||||||||||||||||||
| Ratios of net investment income (loss) to average net assets: | 0.36 | % | 1.56 | % | 1.57 | % | 0.60 | % | 1.45 | % | (0.36 | )% | 0.79 | % | 0.85 | % | (0.11 | )% | 0.70 | % | ||||||||||||||||||||
| Portfolio turnover rate | 125 | % | 63 | % | 74 | % | 101 | % | 110 | % | 125 | % | 63 | % | 74 | % | 101 | % | 110 | % | ||||||||||||||||||||
| * | The net investment income (loss) per share data was determined using the average shares outstanding throughout each year. |
| + | Assumes reinvestment of all dividends and distributions, if any. Total return does not reflect the deductions of taxes that a shareholder would pay on distributions or on the redemption of shares and does not reflect the impact of any sales charge. |
| # | Includes adjustments in accordance with accounting principles generally accepted in the United States and, consequently, the net asset values for financial reporting purposes and the returns based upon those net asset values may differ from the net asset values and returns for shareholder transactions. Adjustments may apply to some but not all years and classes. |
| ! | The amount of net realized and unrealized gain (loss) on investment per share for the year ended October 31, 2020 does not accord with the amounts in the Statements of Operations due to the timing of purchases and sales of Fund shares in relation to fluctuating market values. |
See accompanying notes to financial statements.
109
| NOTES TO FINANCIAL STATEMENTS |
| October 31, 2020 |
| 1. | ORGANIZATION |
Each Dunham Fund (each, a “Fund” and collectively the “Funds”) is a series of shares of beneficial interest in the Dunham Funds (the “Trust”), a Delaware Business Trust organized on November 28, 2007 and registered under the Investment Company Act of 1940, as amended, (the “1940 Act”) as an open -end management investment company. The Dunham Funds currently consist of fourteen funds: Dunham Corporate/Government Bond Fund; Dunham Floating Rate Bond Fund; Dunham High-Yield Bond Fund; Dunham International Opportunity Bond Fund; Dunham Large Cap Value Fund; Dunham Small Cap Value Fund; Dunham Focused Large Cap Growth Fund; Dunham Small Cap Growth Fund; Dunham Emerging Markets Stock Fund; Dunham International Stock Fund; Dunham Dynamic Macro Fund; Dunham Long/Short Credit Fund; Dunham Monthly Distribution Fund; and Dunham Real Estate Stock Fund. With the exception of Dunham International Opportunity Bond Fund, Dunham Focused Large Cap Growth Fund, and Dunham Real Estate Stock Fund, the remaining Funds are diversified funds within the meaning of the 1940 Act.
| Fund | Primary Objective | |
| Dunham Corporate/Government Bond Fund (“Corporate/Government Bond”) | Current income and capital appreciation | |
| Dunham Floating Rate Bond Fund (“Floating Rate Bond”) | High level of current income | |
| Dunham High-Yield Bond Fund (“High-Yield Bond”) | High level of current income | |
| Dunham International Opportunity Bond Fund (“International Opportunity Bond”) | High level of current income | |
| Dunham Large Cap Value Fund (“Large Cap Value”) | Maximize total return from capital appreciation and dividends | |
| Dunham Small Cap Value Fund (“Small Cap Value”) | Maximize total return from capital appreciation and income | |
| Dunham Focused Large Cap Growth Fund (“Focused Large Cap Growth”) | Maximize capital appreciation | |
| Dunham Small Cap Growth Fund (“Small Cap Growth”) | Maximize capital appreciation | |
| Dunham Emerging Markets Stock Fund (“Emerging Markets Stock”) | Maximize capital appreciation | |
| Dunham International Stock Fund (“International Stock”) | Maximize total return from capital appreciation and dividends | |
| Dunham Dynamic Macro Fund (“Dynamic Macro”) | Maximize total return from capital appreciation and dividends | |
| Dunham Long/Short Credit Fund (“Long/Short Credit”) income and capital appreciation | Maximize total return under varying market conditions through both current | |
| Dunham Monthly Distribution Fund (“Monthly Distribution”) | Positive returns in rising and falling market environments | |
| Dunham Real Estate Stock Fund (“Real Estate Stock”) | Maximize total return from capital appreciation and dividends |
Currently, each Fund offers Class A, Class C and Class N shares. Each class represents an interest in the same assets of the applicable Fund with the only differences being that Class A shares are subject to a front-end sales charge and an annual service fee, Class C shares are subject to an annual service and distribution fee and Class N shares have a higher minimum investment amount. Investors that purchase $1,000,000 or more of Class A shares will not pay any initial sales charge on the purchase. However, purchases of $1,000,000 or more of Class A shares may be subject to a contingent deferred sales charge (“CDSC”) on shares redeemed during the first 18 months after their purchase in the amount of the commissions paid on the shares redeemed. The Class C and Class N shares, with the exception of Floating Rate Bond, High-Yield Bond, International Opportunity Bond, Focused Large Cap Growth, Dynamic Macro, and Monthly Distribution commenced operations on December 10, 2004 and were formed as a result of tax -free conversions from common trusts. The conversions were accomplished through the exchange of the common trust securities, cash, and other assets for equivalent value of the Funds’ shares. High-Yield Bond Class C and Class N shares commenced operations on July 1, 2005. The Class A shares for all Funds except Floating Rate Bond, International Opportunity Bond, Focused Large Cap Growth, Dynamic Macro, and Monthly Distribution commenced operations on January 3, 2007. Monthly Distribution’s Predecessor Fund’s Class A shares and Class C shares commenced operations on December 26, 2000. Monthly Distribution’s Class N shares commenced operations on September 29, 2008. Dynamic Macro commenced operations on April 30, 2010. Focused Large Cap Growth commenced operations on December 8, 2011. Floating Rate Bond and International Opportunity Bond commenced operations on November 1, 2013.
| 2. | SUMMARY OF SIGNIFICANT ACCOUNTING POLICIES |
The preparation of financial statements in conformity with accounting principles generally accepted in the United States of America (“GAAP”) requires management to make estimates and assumptions that affect the reported amounts of assets and liabilities and disclosure of contingent assets and liabilities at the date of the financial statements and the reported amounts of increases and decreases in net assets from operations during the reporting period. Actual results could differ from those estimates. The Funds are investment companies and accordingly follow the investment company accounting and reporting guidance of the Financial Accounting Standards Board (FASB) Accounting Standard Codification Topic 946 “Financial Services – Investment Companies.”
110
| NOTES TO FINANCIAL STATEMENTS |
| October 31, 2020 (Continued) |
The following is a summary of significant accounting policies followed by the Funds in preparation of their financial statements.
a. Security Valuation – In determining each Fund’s Net Asset Value (“NAV”) per share, equity securities for which market quotations are readily available are valued at current market value using the last reported sales price. NASDAQ traded securities are valued using the NASDAQ official closing price (“NOCP”). If no sale price is reported, the mean between the current bid and ask price is used. If market quotations are not readily available, then securities are valued at fair value as determined by the Board of Trustees of the Trust (the “Board”) (or its delegate). U.S. Government and Agency securities are valued at the mean between the most recent bid and ask prices. Short-term debt instruments with a remaining maturity of more than 60 days, intermediate and long -term bonds, convertible bonds, bank loans and other debt securities are generally valued on the basis of dealer supplied quotations or by a pricing system selected by Dunham & Associates Investment Counsel, Inc. (“Dunham & Associates” or the “Adviser”) and approved by the Board. Where such prices are not available, valuations will be obtained from brokers who are market makers for such securities. However, in circumstances where the Adviser deems it appropriate to do so, the mean of the bid and ask prices for over-the-counter securities or the last available sale price for exchange-traded debt securities may be used. Where no last sale price for exchange traded debt securities is available, the mean of the bid and ask prices may be used. Short-term debt securities with a remaining maturity of 60 days or less may be valued at amortized cost, provided such valuations represent fair value.
Options are valued at the last reported sale price at the close of the exchange on which the security is primarily traded. If no sales are reported for the exchange-traded options, or the options are not exchange-traded, then they are valued at the mean of their most recent quoted bid and ask price.
Futures and future options are valued daily at the final settled price or, in the absence of a settled price, at the mean between the current bid and ask prices on the day of valuation.
Swap transactions are valued through an independent pricing service or at fair value based on daily price reporting from the swap counterparty issuing the swap. Total return swaps on securities listed on an exchange shall be valued at the last quoted sales price or, in the absence of a sale, at the mean between the current bid and ask prices.
Trading in securities on Far East securities exchanges and over-the-counter markets is normally completed well before the close of business on each business day in New York (i.e., a day on which the New York Stock Exchange (“NYSE”) is open). In addition, Far East securities trading generally, or in a particular country or countries, may not take place on all business days in New York. Furthermore, trading takes place in Japanese markets on certain Saturdays and in various foreign markets on days, which are not business days in New York, and on which a Fund’s NAV is not calculated. Each Fund calculates the NAV per share, and therefore effects sales, redemptions and repurchases of its shares, as of the close of regular trading on the NYSE once on each day on which the NYSE is open. Such calculation may not take place contemporaneously with the determination of the prices of the majority of the portfolio securities used in such calculation. If events that may materially affect the value of such securities occur between the time when their price is determined and the time when the Fund’s NAV is calculated, such securities may be valued at fair value as determined in good faith in accordance with procedures approved by the Board.
Securities in which the Funds invest may be traded in markets that close before 4:00 p.m. Eastern Time (“ET”). Normally, developments that occur between the close of the foreign markets and 4:00 p.m. ET will not be reflected in a Fund’s NAV. However, management may determine that such developments are so significant that they will materially affect the value of a Fund’s securities, and the Fund may adjust the previous closing prices to reflect what the Board believes to be the fair value of these securities as of 4:00 p.m. ET. Both Emerging Markets Stock and International Stock utilize fair value prices as provided by an independent pricing vendor on a daily basis for those securities traded on a foreign exchange.
Securities for which current market quotations are not readily available, or for which quotations are not deemed to be representative of market values, are valued at fair value as determined in good faith by or under the direction of the Board in accordance with the Trust’s Portfolio Securities Valuation Procedures (the “Procedures”). The Procedures consider, among others, the following factors to determine a security’s fair value: the nature and pricing history (if any) of the security; whether any dealer quotations for the security are available; and possible valuation methodologies that could be used to determine the fair value of the security.
Valuation of Fund of Funds – The Funds may invest in portfolios of open-end or closed-end investment companies (the “Underlying Funds”). The Underlying Funds value securities in their portfolios for which market quotations are readily available at their market values (generally the last reported sale price) and all other securities and assets at their fair value based upon the methods established by the board of directors of the Underlying Funds.
Open-end investment companies are valued at their respective net asset values as reported by such investment companies. The shares of many closed-end investment companies, after their initial public offering, frequently trade at a price per share, which is different than the net asset value per share. The difference represents a market premium or market discount of such shares. There can be no assurances that the market discount or market premium on shares of any closed-end investment company purchased by the Funds will not change.
111
| NOTES TO FINANCIAL STATEMENTS |
| October 31, 2020 (Continued) |
The Funds utilize various methods to measure the fair value of their investments on a recurring basis. GAAP establishes a hierarchy that prioritizes inputs to valuation methods. The three levels of input are:
Level 1 – Unadjusted quoted prices in active markets for identical assets and liabilities.
Level 2 – Observable inputs other than quoted prices included in Level 1 that are observable for the asset or liability, either directly or indirectly. These inputs may include quoted prices for the identical instrument on an inactive market, prices for similar instruments, interest rates, prepayment speeds, credit risk, yield curves, default rates and similar data.
Level 3 – Unobservable inputs for the asset or liability, to the extent relevant observable inputs are not available, representing the Funds’ own assumptions about the assumptions a market participant would use in valuing the asset or liability, and would be based on the best information available.
The availability of observable inputs can vary from security to security and is affected by a wide variety of factors, including, for example, the type of security, whether the security is new and not yet established in the marketplace, the liquidity of markets, and other characteristics particular to the security. To the extent that valuation is based on models or inputs that are less observable or unobservable in the market, the determination of fair value requires more judgment. Accordingly, the degree of judgment exercised in determining fair value is greatest for instruments categorized in Level 3.
The inputs used to measure fair value may fall into different levels of the fair value hierarchy. In such cases, for disclosure purposes, the level in the fair value hierarchy within which the fair value measurement falls in its entirety, is determined based on the lowest level input that is significant to the fair value measurement in its entirety.
The inputs or methodology used for valuing securities are not necessarily an indication of the risk associated with investing in those securities. The following tables summarize the inputs used as of October 31, 2020 for the Funds’ assets and liabilities measured at fair value:
| Corporate/Government Bond | ||||||||||||||||
| Assets | Level 1 | Level 2 | Level 3 | Total | ||||||||||||
| Asset Backed Securities * | $ | — | $ | 20,330,887 | $ | — | $ | 20,330,887 | ||||||||
| Corporate Bonds * | — | 24,385,719 | — | 24,385,719 | ||||||||||||
| Municipal Bonds | — | 3,741,273 | — | 3,741,273 | ||||||||||||
| Non U.S. Government & Agencies | — | 606,836 | — | 606,836 | ||||||||||||
| U.S. Government & Agencies | — | 17,087,009 | — | 17,087,009 | ||||||||||||
| Term Loans * | — | 3,949,134 | — | 3,949,134 | ||||||||||||
| Collateral for Securities Loaned | 14,414,493 | — | — | 14,414,493 | ||||||||||||
| Total | $ | 14,414,493 | $ | 70,100,858 | $ | — | $ | 84,515,351 | ||||||||
| Floating Rate Bond | ||||||||||||||||
| Assets | Level 1 | Level 2 | Level 3 | Total | ||||||||||||
| Term Loans * | $ | — | $ | 161,729,630 | $ | — | $ | 161,729,630 | ||||||||
| Corporate Bonds * | — | 7,583,054 | — | 7,583,054 | ||||||||||||
| Common Stocks * | 151,672 | 250 | — | 151,922 | ||||||||||||
| Rights | — | 11,827 | — | 11,827 | ||||||||||||
| Warrants | — | 115,379 | — | 115,379 | ||||||||||||
| Short-Term Investment | 852,939 | — | — | 852,939 | ||||||||||||
| Collateral for Securities Loaned | 2,056,793 | — | — | 2,056,793 | ||||||||||||
| Total | $ | 3,061,404 | $ | 169,440,140 | $ | — | $ | 172,501,544 | ||||||||
| High-Yield Bond | ||||||||||||||||
| Assets | Level 1 | Level 2 | Level 3 | Total | ||||||||||||
| Convertible Bonds * | $ | — | $ | 290,000 | $ | — | $ | 290,000 | ||||||||
| Corporate Bonds * | — | 93,818,024 | — | 93,818,024 | ||||||||||||
| Short-Term Investment | 510,501 | — | — | 510,501 | ||||||||||||
| Collateral for Securities Loaned | 2,648,549 | — | — | 2,648,549 | ||||||||||||
| Total | $ | 3,159,050 | $ | 94,108,024 | $ | — | $ | 97,267,074 | ||||||||
112
| NOTES TO FINANCIAL STATEMENTS |
| October 31, 2020 (Continued) |
| International Opportunity Bond | ||||||||||||||||
| Assets | Level 1 | Level 2 | Level 3 | Total | ||||||||||||
| Asset Backed Securities | $ | — | $ | 112,854 | $ | — | $ | 112,854 | ||||||||
| Corporate Bonds * | — | 30,858,791 | — | 30,858,791 | ||||||||||||
| Non U.S. Government & Agencies | — | 13,569,003 | — | 13,569,003 | ||||||||||||
| Short-Term Investment | 964,900 | — | — | 964,900 | ||||||||||||
| Collateral for Securities Loaned | 1,968,855 | — | — | 1,968,855 | ||||||||||||
| Total Assets | $ | 2,933,755 | $ | 44,540,648 | $ | — | $ | 47,474,403 | ||||||||
| Assets - Derivatives | ||||||||||||||||
| Futures Contracts | $ | 89,040 | $ | — | $ | — | $ | 89,040 | ||||||||
| Forward Foreign Currency Exchange Contracts | — | 373,385 | — | 373,385 | ||||||||||||
| Swap Contracts | — | 26,989 | — | 26,989 | ||||||||||||
| Total Asset Derivatives | $ | 89,040 | $ | 400,374 | $ | — | $ | 489,414 | ||||||||
| Liabilities - Derivatives | ||||||||||||||||
| Futures Contracts | $ | 9,725 | $ | — | $ | — | $ | 9,725 | ||||||||
| Forward Foreign Currency Exchange Contracts | — | 36,702 | — | 36,702 | ||||||||||||
| Total Liability Derivatives | $ | 9,725 | $ | 36,702 | $ | — | $ | 46,427 | ||||||||
| Large Cap Value | ||||||||||||||||
| Assets | Level 1 | Level 2 | Level 3 | Total | ||||||||||||
| Common Stocks * | $ | 88,628,173 | $ | — | $ | — | $ | 88,628,173 | ||||||||
| REITs * | 3,757,642 | — | — | 3,757,642 | ||||||||||||
| Collateral for Securities Loaned | 3,920,117 | — | — | 3,920,117 | ||||||||||||
| Total | $ | 96,305,932 | $ | — | $ | — | $ | 96,305,932 | ||||||||
| Small Cap Value | ||||||||||||||||
| Assets | Level 1 | Level 2 | Level 3 | Total | ||||||||||||
| Common Stocks * | $ | 47,128,731 | $ | — | $ | — | $ | 47,128,731 | ||||||||
| REITs * | 5,847,579 | — | — | 5,847,579 | ||||||||||||
| Collateral for Securities Loaned | 6,248,698 | — | — | 6,248,698 | ||||||||||||
| Total | $ | 59,225,008 | $ | — | $ | — | $ | 59,225,008 | ||||||||
| Focused Large Cap Growth | ||||||||||||||||
| Assets | Level 1 | Level 2 | Level 3 | Total | ||||||||||||
| Common Stocks * | $ | 152,267,556 | $ | — | $ | — | $ | 152,267,556 | ||||||||
| Collateral for Securities Loaned | 12,361,094 | — | — | 12,361,094 | ||||||||||||
| Total | $ | 164,628,650 | $ | — | $ | — | $ | 164,628,650 | ||||||||
| Small Cap Growth | ||||||||||||||||
| Assets | Level 1 | Level 2 | Level 3 | Total | ||||||||||||
| Common Stocks * | $ | 55,627,121 | $ | — | $ | — | $ | 55,627,121 | ||||||||
| Collateral for Securities Loaned | 885,126 | — | — | 885,126 | ||||||||||||
| Total | $ | 56,512,247 | $ | — | $ | — | $ | 56,512,247 | ||||||||
113
| NOTES TO FINANCIAL STATEMENTS |
| October 31, 2020 (Continued) |
| Emerging Markets Stock | ||||||||||||||||
| Assets | Level 1 | Level 2 | Level 3 | Total | ||||||||||||
| Common Stocks * | $ | 14,844,195 | $ | 73,370,614 | $ | — | $ | 88,214,809 | ||||||||
| Closed End Fund | — | 526,284 | — | 526,284 | ||||||||||||
| Warrants | 5,366 | 393 | — | 5,759 | ||||||||||||
| Collateral for Securities Loaned | 3,261,479 | — | — | 3,261,479 | ||||||||||||
| Total | $ | 18,111,040 | $ | 73,897,291 | $ | — | $ | 92,008,331 | ||||||||
| International Stock | ||||||||||||||||
| Assets | Level 1 | Level 2 | Level 3 | Total | ||||||||||||
| Common Stocks * | $ | 39,160,495 | $ | 81,039,452 | $ | — | $ | 120,199,947 | ||||||||
| Exchange Traded Funds | 1,262,192 | — | — | 1,262,192 | ||||||||||||
| Warrant | — | 6,155 | — | 6,155 | ||||||||||||
| Collateral for Securities Loaned | 8,764,809 | — | — | 8,764,809 | ||||||||||||
| Total | $ | 49,187,496 | $ | 81,045,607 | $ | — | $ | 130,233,103 | ||||||||
| Dynamic Macro | ||||||||||||||||
| Assets | Level 1 | Level 2 | Level 3 | Total | ||||||||||||
| Exchange Traded Funds * | $ | 13,071,526 | $ | — | $ | — | $ | 13,071,526 | ||||||||
| Purchased Options | 1,887,696 | — | — | 1,887,696 | ||||||||||||
| Short-Term Investments | 2,562,366 | 11,925,603 | — | 14,487,969 | ||||||||||||
| Collateral for Securities Loaned | 423,660 | — | — | 423,660 | ||||||||||||
| Total Assets | $ | 17,945,248 | $ | 11,925,603 | $ | — | $ | 29,870,851 | ||||||||
| Assets - Derivatives | ||||||||||||||||
| Futures Contracts | $ | 193,850 | $ | — | $ | — | $ | 193,850 | ||||||||
| Total Asset Derivatives | $ | 193,850 | $ | — | $ | — | $ | 193,850 | ||||||||
| Liabilities - Derivatives | ||||||||||||||||
| Futures Contracts | $ | 281,106 | $ | — | $ | — | $ | 281,106 | ||||||||
| Written Options | 402,800 | — | — | 402,800 | ||||||||||||
| Total Liability Derivatives | $ | 683,906 | $ | — | $ | — | $ | 683,906 | ||||||||
| Long/Short Credit | ||||||||||||||||
| Assets | Level 1 | Level 2 | Level 3 | Total | ||||||||||||
| Term Loans * | $ | — | $ | 2,539,554 | $ | — | $ | 2,539,554 | ||||||||
| Corporate Bonds * | — | 47,895,770 | — | 47,895,770 | ||||||||||||
| Common Stock * | — | 2,000,000 | 21,700 | 2,021,700 | ||||||||||||
| U.S. Government & Agencies | — | 56,863,941 | — | 56,863,941 | ||||||||||||
| Non-U.S. Government & Agencies | — | 288,743 | — | 288,743 | ||||||||||||
| Short-Term Investment | 17,218,740 | — | — | 17,218,740 | ||||||||||||
| Collateral for Securities Loaned | 18,515,308 | — | — | 18,515,308 | ||||||||||||
| Total Assets | $ | 35,734,048 | $ | 109,588,008 | $ | 21,700 | $ | 145,343,756 | ||||||||
| Assets - Derivatives | ||||||||||||||||
| Futures Contracts | $ | 457,418 | $ | — | $ | — | $ | 457,418 | ||||||||
| Swap Contracts | — | 326,237 | — | 326,237 | ||||||||||||
| Total Asset Derivatives | $ | 457,418 | $ | 326,237 | $ | — | $ | 783,655 | ||||||||
| Liabilities - Derivatives | ||||||||||||||||
| Swap Contracts | $ | — | $ | 243,581 | $ | — | $ | 243,581 | ||||||||
| Total Liability Derivatives | $ | — | $ | 243,581 | $ | — | $ | 243,581 | ||||||||
114
| NOTES TO FINANCIAL STATEMENTS |
| October 31, 2020 (Continued) |
| Monthly Distribution | ||||||||||||||||
| Assets | Level 1 | Level 2 | Level 3 | Total | ||||||||||||
| Common Stocks * | $ | 88,476,588 | $ | 563,712 | $ | — | $ | 89,040,300 | ||||||||
| Closed-End Fund | — | 2,747,308 | — | 2,747,308 | ||||||||||||
| Exchange Traded Funds | 5,686,114 | — | — | 5,686,114 | ||||||||||||
| Rights | 29,790 | 14,459 | — | 44,249 | ||||||||||||
| Warrants | — | 15,998 | — | 15,998 | ||||||||||||
| Purchased Options | 106,656 | 447,000 | — | 553,656 | ||||||||||||
| Short-Term Investment | 82,000,800 | — | — | 82,000,800 | ||||||||||||
| Collateral for Securities Loaned | 5,585,545 | — | — | 5,585,545 | ||||||||||||
| Total Assets | $ | 181,885,493 | $ | 3,788,477 | $ | — | $ | 185,673,970 | ||||||||
| Asset - Derivatives | ||||||||||||||||
| Swap Contracts | $ | — | $ | 856,763 | $ | — | $ | 856,763 | ||||||||
| Total Asset Derivatives | $ | — | $ | 856,763 | $ | — | $ | 856,763 | ||||||||
| Liabilities-Derivatives | ||||||||||||||||
| Written Options | $ | 139,720 | $ | 264,720 | $ | — | $ | 404,440 | ||||||||
| Swap Contracts | — | 29,436 | — | 29,436 | ||||||||||||
| Total Liability Derivatives | $ | 139,720 | $ | 294,156 | $ | — | $ | 433,876 | ||||||||
| Liabilities | ||||||||||||||||
| Securities Sold Short | $ | 44,575,354 | $ | — | $ | — | $ | 44,575,354 | ||||||||
| Total Liabilities | $ | 44,575,354 | $ | — | $ | — | $ | 44,575,354 | ||||||||
| Real Estate Stock | ||||||||||||||||
| Assets | Level 1 | Level 2 | Level 3 | Total | ||||||||||||
| Common Stocks * | $ | 27,561,724 | $ | — | $ | — | $ | 27,561,724 | ||||||||
| REITs * | 40,588,925 | — | — | 40,588,925 | ||||||||||||
| Collateral for Securities Loaned | 15,743,029 | — | — | 15,743,029 | ||||||||||||
| Total | $ | 83,893,678 | $ | — | $ | — | $ | 83,893,678 | ||||||||
| * | See each Fund’s Schedule of Investments for breakdown by industry. |
The following is a reconciliation for the Dunham Long/Short Credit Fund for which Level 3 inputs were used in determining value:
| Beginning | Net | Ending | ||||||||||||||||||||||||||||||
| balance | Total | Change in | transfers | balance | ||||||||||||||||||||||||||||
| October 31, | realized | unrealized | Net | in/(out) of | October 31, | |||||||||||||||||||||||||||
| 2019 | gain/(loss) | appreciation | Conversion | Purchases | Net Sales | Level 3 | 2020 | |||||||||||||||||||||||||
| Common Stock | $ | — | $ | — | $ | — | $ | — | $ | — | $ | — | $ | 21,700 | $ | 21,700 | ||||||||||||||||
Quantitative disclosures of unobservable inputs and assumptions used by Dunham Long/Short Credit Fund are below:
| Investments in Securities: | ||||||
| Common Stock | ||||||
| NII Holdings, Inc. | $ | 21,700 | Independent Valuation Discount for lack of marketability | |||
| Total Fair Value Securities | $ | 21,700 |
b. Foreign Currency Translations – The accounting records of the Funds are maintained in U.S. dollars. Investment securities and other assets and liabilities denominated in a foreign currency, and income receipts and expense payments, are translated into U.S. dollars using the prevailing exchange rates at the London market close. Purchases and sales of securities are translated into U.S. dollars at the contractual currency rates established at the approximate time of the trade.
Net realized gains and losses on foreign currency transactions represent net gains and losses from currency realized between the trade and settlement dates on securities transactions and the difference between income accrued versus income received. The effects of changes in foreign currency exchange rates on investments in securities are included with the net realized and unrealized gain or loss on investment securities.
115
| NOTES TO FINANCIAL STATEMENTS |
| October 31, 2020 (Continued) |
c. Forward Foreign Currency Exchange Contracts – As foreign securities are purchased, a Fund generally enters into forward foreign currency exchange contracts in order to hedge against foreign currency exchange rate risks. The market value of the contract fluctuates with changes in currency exchange rates. The contract is marked-to-market daily and the change in market value is recorded by a Fund as an unrealized gain or loss. As foreign securities are sold, a portion of the contract is generally closed and the Fund records a realized gain or loss equal to the difference between the value of the contract at the time it was opened and the value at the time it was closed. A Fund may also enter into forward foreign currency exchange contracts as an investment strategy consistent with that Fund’s investment objective. Realized gains and losses from contract transactions are included as a component of net realized gains (losses) from investments and forward foreign currency exchange contracts in the Statements of Operations.
d. Options – Dynamic Macro and Monthly Distribution are subject to stock market risk in the normal course of pursuing their investment objectives and may purchase or sell options to help hedge against this risk.
A Fund may write call options only if it (i) owns an offsetting position in the underlying security or (ii) has an absolute or immediate right to acquire that security without additional cash consideration or exchange of other securities held in its portfolio. When a Fund writes an option, there is no taxable event and an amount equal to the premium received is recorded by that Fund as a liability. The liability is thereafter valued to reflect the current value of the option. If the option is not exercised and expires, or if a Fund effects a closing purchase transaction, the Fund realizes a gain (or loss in the case of a closing purchase transaction where the cost to close the transaction exceeds the original premium received), and the liability related to the option is extinguished. Any such gain or loss generally is a short -term capital gain or loss for federal income tax purposes. If a call option that a Fund has written on any equity security is exercised, that Fund will realize a capital gain or loss (long-term or short-term, depending on the holding period of the underlying security) from the sale of the underlying security, and the proceeds from such sale are increased by the premium originally received. If a put option that a Fund has written on an equity security is exercised, the amount of the premium originally received reduces the cost of the security that a Fund purchases upon exercise of the option. When a Fund writes a put option, that Fund must deposit cash or liquid securities into a segregated account equal to the put option’s exercise value (number of shares times strike price).
A Fund may purchase put and call options. Put options are purchased to hedge against a decline in the value of securities held in that Fund’s portfolio. If such a decline occurs, the put options will permit that Fund to sell the securities underlying such options at the exercise price, or to close out the options at a profit. The premium paid for a put or call option plus any transaction costs will reduce the benefit, if any, realized by that Fund upon exercise of the option, and, unless the price of the underlying security rises or declines sufficiently, the option may expire worthless to that Fund. In addition, in the event that the price of the security in connection with which an option was purchased moves in a direction favorable to that Fund, the benefits realized by that Fund as a result of such favorable movement will be reduced by the amount of the premium paid for the option and related transaction costs. Written and purchased options are non-income producing securities.
e. Cash – The Funds consider their investments in an FDIC insured interest bearing savings account to be cash. The Funds maintain cash balances, which, at times, may exceed federally insured limits. The Funds maintain these balances with a high quality financial institution.
f. Swap Agreements – International Opportunity Bond, Long/Short Credit and Monthly Distribution are subject to stock market risk and fixed income risk in the normal course of pursuing their investment objectives. The Funds may enter into various swap transactions for investment purposes to manage equity risk and credit risk. These are two-party contracts entered into primarily to exchange the returns (or differentials in rates of returns) earned or realized on particular pre-determined investments or instruments. The gross returns to be exchanged or “swapped” between parties are calculated with respect to a notional amount, i.e., the return on or increase in value of a particular dollar amount invested at a particular interest rate, in a particular foreign currency, or in a “basket” of securities representing a particular index or market segment. Changes in the value of swap agreements are recognized as unrealized gains or losses in the Statements of Operations by “marking to market” on a daily basis to reflect the value of the swap agreement at the end of each trading day. Payments received or paid at the beginning of the agreement are reflected as such on the Statements of Assets and Liabilities and may be referred to as upfront payments. The Funds amortize upfront payments and/or accrue for the fixed payment stream on swap agreements on a daily basis with the net amount recorded as a component of unrealized gain or loss on the Statements of Operations. A liquidation payment received or made at the termination of the swap agreement is recorded as a realized gain or loss on the Statements of Operations. The Funds segregate liquid securities having a value at least equal to the amount of its current obligation under any swap transaction. Entering into these agreements involves, to varying degrees, lack of liquidity and elements of credit, market, and counterparty risk in excess of amounts recognized on the Statements of Assets and Liabilities. The Funds’ maximum risk of loss from counterparty credit risk is the discounted net value of the cash flows to be received from/paid to the counterparty over the contract’s remaining life, to the extent that that amount is positive.
g. Futures Contracts – International Opportunity Bond, Dynamic Macro, and Long/Short Credit are subject to equity risk, interest rate risk and forward currency exchange rate risk in the normal course of pursuing their investment objectives. The Funds may purchase or sell futures contracts to gain exposure to, or hedge against, changes in the value of equities, interest rates, and foreign exchange rates. Initial margin deposits required upon entering into futures contracts are satisfied by the segregation of specific securities or cash as collateral for the account of the broker (the Fund’s agent in acquiring the futures position). During the period the futures contracts are open, changes in the value of the contracts are recognized as unrealized gains or losses by “marking to market” on a daily basis to reflect the market value of the contracts at the end of each day’s trading. Variation margin payments are received or made depending upon whether unrealized gains or losses are incurred. When the contracts are closed, the Funds recognize a realized gain or
116
| NOTES TO FINANCIAL STATEMENTS |
| October 31, 2020 (Continued) |
loss equal to the difference between the proceeds from, or cost of, the closing transaction and the Fund’s basis in the contract. If the Funds were unable to liquidate a futures contract and/or enter into an offsetting closing transaction, the Funds would continue to be subject to market risk with respect to the value of the contracts and continue to be required to maintain the margin deposits on the futures contracts. The Funds segregate cash having a value at least equal to the amount of the current obligation under any open futures contract. Risks may exceed amounts recognized in the Statements of Assets and Liabilities. With futures, there is minimal counterparty credit risk to the Funds since futures are exchange traded and the exchange’s clearinghouse, as counterparty to all exchange traded futures, guarantees the futures against default.
h. Short Sales – A “short sale” is a transaction in which a Fund sells a security it does not own but has borrowed in anticipation that the market price of that security will decline. The Fund would be obligated to replace the security borrowed by purchasing it on the open market at a later date. If the price of the security sold short increases between the time of the short sale and the time the Fund replaces the borrowed security, the Fund will incur a loss. Conversely, if the price declines, the Fund will realize a gain.
i. Impact of Derivatives on the Statements of Assets and Liabilities and Statements of Operations – The following is a summary of the location of derivative investments of each Fund in the Statement of Assets and Liabilities as of October 31, 2020:
| Location on the Statements of Assets and Liabilities | ||||
| Derivatives Investment Type | Asset Derivatives | Liability Derivatives | ||
| Equity/Currency/Commodity Interest rate contracts | Investments in securities Unrealized appreciation on futures Unrealized appreciation on swap contracts Unrealized appreciation on forward foreign currency exchange contracts | Option contracts written Unrealized depreciation on futures Unrealized depreciation on swap contracts Unrealized depreciation on forward foreign currency exchange contracts | ||
The following table sets forth the fair value of each Fund’s derivative contracts by primary risk exposure as of October 31, 2020:
| Asset Derivatives Investment Value | ||||||||||||||||
| Total value at | ||||||||||||||||
| Equity | Currency | Interest Rate | October 31, | |||||||||||||
| Contracts | Contracts | Contracts | 2020 | |||||||||||||
| International Opportunity Bond | ||||||||||||||||
| Forward Foreign Currency Exchange Contracts | $ | — | $ | 373,385 | $ | — | $ | 373,385 | ||||||||
| Futures Contracts | — | — | 89,040 | 89,040 | ||||||||||||
| Swap Contracts | — | — | 26,989 | 26,989 | ||||||||||||
| Dynamic Macro | ||||||||||||||||
| Futures Contracts | $ | 115,090 | $ | — | $ | 78,760 | $ | 193,850 | ||||||||
| Purchased Options | 546,075 | — | 1,341,621 | 1,887,696 | ||||||||||||
| Long/Short Credit | ||||||||||||||||
| Credit Default Swap Contracts | $ | 302,375 | $ | — | $ | — | $ | 302,375 | ||||||||
| Total Return Swap Contracts | — | — | 23,862 | 23,862 | ||||||||||||
| Futures Contracts | — | — | 457,418 | 457,418 | ||||||||||||
| Monthly Distribution | ||||||||||||||||
| Purchased Options | $ | 553,656 | $ | — | $ | — | $ | 553,656 | ||||||||
| Total Return Swap Contracts | 856,763 | — | — | 856,763 | ||||||||||||
117
| NOTES TO FINANCIAL STATEMENTS |
| October 31, 2020 (Continued) |
| Liability Derivatives Investment Value | ||||||||||||||||
| Total value at | ||||||||||||||||
| Equity | Currency | Interest Rate | October 31, | |||||||||||||
| Contracts | Contracts | Contracts | 2020 | |||||||||||||
| International Opportunity Bond | ||||||||||||||||
| Forward Foreign Currency Exchange Contracts | $ | — | $ | 36,702 | $ | — | $ | 36,702 | ||||||||
| Futures Contracts | — | — | 9,725 | 9,725 | ||||||||||||
| Dynamic Macro | ||||||||||||||||
| Futures Contracts | $ | 255,930 | $ | — | $ | 25,176 | $ | 281,106 | ||||||||
| Written Options | 402,800 | — | — | 402,800 | ||||||||||||
| Long/Short Credit | ||||||||||||||||
| Credit Default Swap Contracts | $ | 130,151 | $ | — | $ | — | $ | 130,151 | ||||||||
| Total Return Swap Contract | — | — | 113,430 | 113,430 | ||||||||||||
| Monthly Distribution | ||||||||||||||||
| Written Options | $ | 404,440 | $ | — | $ | — | $ | 404,440 | ||||||||
| Total Return Swap Contracts | 29,436 | — | — | 29,436 | ||||||||||||
The following is a summary of the location of derivative investments of each Fund in the Statements of Operations for the year ended October 31, 2020.
| Derivative Investment Type | Location of Gain (Loss) on Derivatives | |
| Equity/Currency/Commodity/Interest rate contracts | Net realized gain (loss) from: Futures , Purchased options, Written options, Swap contracts, Forward foreign currency exchange contracts
Net change in unrealized appreciation (depreciation) on: Futures , Purchased options, Written options, Swap contracts, and Forward foreign currency exchange contracts |
The following is a summary of each Fund’s realized gain (loss) and change in unrealized appreciation (depreciation) on derivative investments recognized in the Statements of Operations categorized by primary risk exposure for the year ended October 31, 2020:
| Realized gain (loss) on derivatives recognized in the Statements of Operations | ||||||||||||||||
| Total value at | ||||||||||||||||
| Equity | Currency | Interest Rate | October 31, | |||||||||||||
| Derivative Investment type | Contracts | Contracts | Contracts | 2020 | ||||||||||||
| International Opportunity Bond | ||||||||||||||||
| Futures Contracts | $ | — | $ | — | $ | (610,074 | ) | $ | (610,074 | ) | ||||||
| Swap Contracts | — | — | (101,057 | ) | (101,057 | ) | ||||||||||
| Forward Foreign Currency Exchange Contracts | — | (724,118 | ) | — | (724,118 | ) | ||||||||||
| Dynamic Macro | ||||||||||||||||
| Futures Contracts | $ | (3,209,875 | ) | $ | — | $ | 52,618 | $ | (3,157,257 | ) | ||||||
| Purchased Options | 747,673 | — | 948,712 | 1,696,385 | ||||||||||||
| Written Options | (971,020 | ) | — | — | (971,020 | ) | ||||||||||
| Long/Short Credit | ||||||||||||||||
| Futures Contracts | $ | — | $ | — | $ | (1,830,966 | ) | $ | (1,830,966 | ) | ||||||
| Swaps Contracts | (113,226 | ) | — | (164,898 | ) | (278,124 | ) | |||||||||
| Monthly Distribution | ||||||||||||||||
| Purchased Options | $ | (3,243,326 | ) | $ | — | $ | — | $ | (3,243,326 | ) | ||||||
| Written Options | 3,626,762 | — | — | 3,626,762 | ||||||||||||
| Swaps Contracts | (946,566 | ) | — | — | (946,566 | ) | ||||||||||
118
| NOTES TO FINANCIAL STATEMENTS |
| October 31, 2020 (Continued) |
| Changes in unrealized appreciation (depreciation) on derivatives recognized in the Statements of Operations | ||||||||||||||||
| Total value at | ||||||||||||||||
| Equity | Currency | Interest Rate | October 31, | |||||||||||||
| Derivative Investment type | Contracts | Contracts | Contracts | 2020 | ||||||||||||
| International Opportunity Bond | ||||||||||||||||
| Futures Contracts | $ | — | $ | — | $ | 64,522 | $ | 64,522 | ||||||||
| Swap Contracts | — | — | 26,989 | 26,989 | ||||||||||||
| Forward Foreign Currency Exchange Contracts | — | 345,835 | — | 345,835 | ||||||||||||
| Dynamic Macro | ||||||||||||||||
| Futures Contracts | $ | (168,494 | ) | $ | — | $ | (150,498 | ) | $ | (318,992 | ) | |||||
| Purchased Options | 352,225 | — | (108,145 | ) | 244,080 | |||||||||||
| Written Options | (237,467 | ) | — | — | (237,467 | ) | ||||||||||
| Long/Short Credit | ||||||||||||||||
| Futures Contracts | $ | — | $ | — | $ | 176,153 | $ | 176,153 | ||||||||
| Swaps Contracts | 156,416 | — | (116,794 | ) | 39,622 | |||||||||||
| Monthly Distribution | ||||||||||||||||
| Purchased Options | $ | 175,946 | $ | — | $ | — | $ | 175,946 | ||||||||
| Written Options | 198,294 | — | — | 198,294 | ||||||||||||
| Swaps Contracts | 974,826 | — | — | 974,826 | ||||||||||||
The average notional value of the derivative instruments for the year ended October 31, 2020 is disclosed below:
| Average Notional Value | ||||||||||||||||||||||||||||
| Long | Short | Purchased | Written | Long | Short | FX | ||||||||||||||||||||||
| Futures | Futures | Options | Options | Swaps | Swaps | Contracts | ||||||||||||||||||||||
| International Opportunity Bond | $ | 13,881,452 | $ | 12,411,476 | $ | — | $ | — | $ | — | $ | 965,250 | $ | (149,236 | ) | |||||||||||||
| Dynamic Macro | 27,240,909 | 16,891,088 | 26,341,375 | 12,856,563 | — | — | — | |||||||||||||||||||||
| Long/Short Credit | — | 32,320,641 | — | — | 39,000,000 | 9,500,000 | — | |||||||||||||||||||||
| Monthly Distribution | — | — | 16,676,738 | 25,331,350 | 4,385,316 | 7,003,973 | — | |||||||||||||||||||||
119
| NOTES TO FINANCIAL STATEMENTS |
| October 31, 2020 (Continued) |
j. Offsetting of Financial Assets & Liabilities and Derivative Assets & Liabilities – International Opportunity Bond, Dynamic Macro, Long/Short Credit, and Monthly Distribution policies are to recognize a gross asset or liability equal to the unrealized on futures contracts, forward foreign currency exchange contracts, swaps and written options. The following table shows additional information regarding the offsetting of assets and liabilities at October 31, 2020.
| International Opportunity Bond | ||||||||||||||||||||||||||
| Gross Amounts Not Offset in the | ||||||||||||||||||||||||||
| Statements of Assets & | ||||||||||||||||||||||||||
| Assets: | Liabilities | |||||||||||||||||||||||||
| Gross | ||||||||||||||||||||||||||
| Amounts | ||||||||||||||||||||||||||
| Gross | Offset in the | Net Amounts of | ||||||||||||||||||||||||
| Amounts of | Statements of | Assets Presented in | Cash | |||||||||||||||||||||||
| Recognized | Assets & | the Statements of | Financial | Collateral | ||||||||||||||||||||||
| Description | Counterparty | Assets | Liabilities | Assets & Liabilities | Instruments | Received | Net Amount | |||||||||||||||||||
| Forward Foreign Currency Exchange Contracts | Barclays | $ | 8,926 | $ | — | $ | 8,926 | $ | — | $ | — | $ | 8,926 | |||||||||||||
| Citigroup | 281,152 | — | 281,152 | (24,557 | ) | — | 256,595 | |||||||||||||||||||
| JP Morgan Chase | 83,307 | — | 83,307 | (12,145 | ) | — | 71,162 | |||||||||||||||||||
| Futures Contracts | Barclays | 89,040 | — | 89,040 | (9,725 | ) | — | 79,315 | ||||||||||||||||||
| Credit Default Swap | Citibank | 26,989 | — | 26,989 | — | — | 26,989 | |||||||||||||||||||
| Total | $ | 489,414 | $ | — | $ | 489,414 | $ | (46,427 | ) | $ | — | $ | 442,987 | |||||||||||||
| Gross Amounts Not Offset in the | ||||||||||||||||||||||||||
| Liabilities: | Statements of Assets & | |||||||||||||||||||||||||
| Liabilities | ||||||||||||||||||||||||||
| Gross | ||||||||||||||||||||||||||
| Gross | Amounts | Net Amounts of | ||||||||||||||||||||||||
| Amounts of | Offset in the | Liabilities Presented | Cash | |||||||||||||||||||||||
| Recognized | Statements of | in the Statements of | Financial | Collateral | ||||||||||||||||||||||
| Description | Counterparty | Liabilities | Assets & | Assets & Liabilities | Instruments (1) | Pledged | Net Amount | |||||||||||||||||||
| Forward Foreign Currency Exchange Contracts | Citigroup | $ | (24,557 | ) | $ | — | $ | (24,557 | ) | $ | 24,557 | $ | — | $ | — | |||||||||||
| JP Morgan Chase | (12,145 | ) | — | (12,145 | ) | 12,145 | — | — | ||||||||||||||||||
| Futures Contracts | Barclays | (9,725 | ) | — | (9,725 | ) | 9,725 | — | — | |||||||||||||||||
| Total | $ | (46,427 | ) | $ | — | $ | (46,427 | ) | $ | 46,427 | $ | — | $ | — | ||||||||||||
| Dynamic Macro | ||||||||||||||||||||||||||
| Gross Amounts Not Offset in the | ||||||||||||||||||||||||||
| Assets: | Statements of Assets & Liabilities | |||||||||||||||||||||||||
| Net Amounts of Assets | ||||||||||||||||||||||||||
| Gross Amounts | Gross Amounts Offset | Presented in the | ||||||||||||||||||||||||
| of Recognized | in the Statements of | Statements of Assets | Financial | Cash Collateral | ||||||||||||||||||||||
| Description | Counterparty | Assets | Assets & Liabilities | & Liabilities | Instruments | Received | Net Amount | |||||||||||||||||||
| Futures Contracts | Goldman Sachs | $ | 193,850 | $ | — | $ | 193,850 | $ | — | $ | — | $ | 193,850 | |||||||||||||
| Purchased Options | Goldman Sachs | 1,887,696 | — | 1,887,696 | — | — | 1,887,696 | |||||||||||||||||||
| Total | $ | 2,081,546 | $ | — | $ | 2,081,546 | $ | — | $ | — | $ | 2,081,546 | ||||||||||||||
| Gross Amounts Not Offset in the | ||||||||||||||||||||||||||
| Liabilities: | Statements of Assets & Liabilities | |||||||||||||||||||||||||
| Net Amounts of | ||||||||||||||||||||||||||
| Gross Amounts | Gross Amounts Offset | Liabilities Presented in | ||||||||||||||||||||||||
| of Recognized | in the Statements of | the Statements of | Financial | Cash Collateral | ||||||||||||||||||||||
| Description | Counterparty | Liabilities | Assets & Liabilities | Assets & Liabilities | Instruments | Pledged (1) | Net Amount | |||||||||||||||||||
| Futures Contracts | Goldman Sachs | $ | (281,106 | ) | $ | — | $ | (281,106 | ) | $ | 281,106 | $ | — | $ | — | |||||||||||
| Written Options | Goldman Sachs | (402,800 | ) | — | (402,800 | ) | 402,800 | — | — | |||||||||||||||||
| Total | $ | (683,906 | ) | $ | — | $ | (683,906 | ) | $ | 683,906 | $ | — | $ | — | ||||||||||||
| (1) | The amount is limited to the derivative liability balance and accordingly, does not include excess collateral pledged. |
120
| NOTES TO FINANCIAL STATEMENTS |
| October 31, 2020 (Continued) |
| Long/Short Credit | ||||||||||||||||||||||||||
| Gross Amounts Not Offset in the | ||||||||||||||||||||||||||
| Assets: | Statements of Assets & Liabilities | |||||||||||||||||||||||||
| Gross Amounts | Net Amounts of | |||||||||||||||||||||||||
| Gross Amounts of | Offset in the | Assets Presented in | ||||||||||||||||||||||||
| Recognized | Statements of | the Statements of | Financial | Cash Collateral | ||||||||||||||||||||||
| Description | Counterparty | Assets | Assets & Liabilities | Assets & Liabilities | Instruments | Received | Net Amount | |||||||||||||||||||
| Futures Contracts | HSBC | $ | 457,418 | $ | — | $ | 457,418 | $ | — | $ | — | $ | 457,418 | |||||||||||||
| Credit Default Swaps | HSBC | 91,658 | — | 91,658 | — | — | 91,658 | |||||||||||||||||||
| Credit Default Swaps | Barclays | 124,497 | — | 124,497 | — | — | 124,497 | |||||||||||||||||||
| Credit Default Swaps | Goldman Sachs | 86,220 | — | 86,220 | — | — | 86,220 | |||||||||||||||||||
| Total Return Swaps | Goldman Sachs | 23,862 | — | 23,862 | — | — | 23,862 | |||||||||||||||||||
| Total | $ | 783,655 | $ | — | $ | 783,655 | $ | — | $ | — | $ | 783,655 | ||||||||||||||
| Gross Amounts Not Offset in the | ||||||||||||||||||||||||||
| Liabilities: | Statements of Assets & Liabilities | |||||||||||||||||||||||||
| Gross Amounts | Net Amounts of | |||||||||||||||||||||||||
| Gross Amounts of | Offset in the | Liabilities Presented | ||||||||||||||||||||||||
| Recognized | Statements of | in the Statements of | Financial | Cash Collateral | ||||||||||||||||||||||
| Description | Counterparty | Liabilities | Assets & Liabilities | Assets & Liabilities | Instruments | Pledged (1) | Net Amount | |||||||||||||||||||
| Credit Default Swaps | Barclays | $ | (36,277 | ) | $ | — | $ | (36,277 | ) | $ | — | $ | — | $ | (36,277 | ) | ||||||||||
| Credit Default Swaps | Goldman Sachs | (42,801 | ) | — | (42,801 | ) | — | 42,801 | — | |||||||||||||||||
| Credit Default Swaps | JP Morgan | (51,073 | ) | — | (51,073 | ) | — | 51,073 | — | |||||||||||||||||
| Total Return Swap | Goldman Sachs | (113,430 | ) | — | (113,430 | ) | — | 113,430 | — | |||||||||||||||||
| Total | $ | (243,581 | ) | $ | — | $ | (243,581 | ) | $ | — | $ | 207,304 | $ | (36,277 | ) | |||||||||||
| Monthly Distribution | ||||||||||||||||||||||||||
| Gross Amounts Not Offset in the | ||||||||||||||||||||||||||
| Assets: | Statements of Assets & Liabilities | |||||||||||||||||||||||||
| Gross Amounts | Net Amounts of | |||||||||||||||||||||||||
| Gross Amounts | Offset in the | Assets Presented in | ||||||||||||||||||||||||
| of Recognized | Statements of | the Statements of | Financial | Cash Collateral | ||||||||||||||||||||||
| Description | Counterparty | Assets | Assets & Liabilities | Assets & Liabilities | Instruments | Received | Net Amount | |||||||||||||||||||
| Purchased Options | JP Morgan | $ | 553,656 | $ | — | $ | 553,656 | $ | — | $ | — | $ | 553,656 | |||||||||||||
| Total Return Swap | JP Morgan | 856,763 | — | 856,763 | (29,436 | ) | — | 827,327 | ||||||||||||||||||
| Total | $ | 1,410,419 | $ | — | $ | 1,410,419 | $ | (29,436 | ) | $ | — | $ | 1,380,983 | |||||||||||||
| Gross Amounts Not Offset in the | ||||||||||||||||||||||||||
| Liabilities: | Statements of Assets & Liabilities | |||||||||||||||||||||||||
| Gross Amounts | Net Amounts of | |||||||||||||||||||||||||
| Gross Amounts | Offset in the | Liabilities Presented | ||||||||||||||||||||||||
| of Recognized | Statements of | in the Statements of | Financial | Cash Collateral | ||||||||||||||||||||||
| Description | Counterparty | Liabilities | Assets & Liabilities | Assets & Liabilities | Instruments (1) | Pledged (1) | Net Amount | |||||||||||||||||||
| Written Options | JP Morgan | $ | (404,440 | ) | $ | — | $ | (404,440 | ) | $ | — | $ | — | $ | (404,440 | ) | ||||||||||
| Total Return Swaps | JP Morgan | (29,436 | ) | — | (29,436 | ) | 29,436 | — | — | |||||||||||||||||
| Total | $ | (433,876 | ) | $ | — | $ | (433,876 | ) | $ | 29,436 | $ | — | $ | (404,440 | ) | |||||||||||
| (1) | The amount is limited to the derivative liability balance and accordingly, does not include excess collateral pledged. |
k. Deposits with Broker for futures, options and swaps
| Fund | Broker | Deposit with Broker | ||||
| International Opportunity Bond | Barclays | $ | 147,576 | |||
| Citibank | 276,567 | |||||
| Dynamic Macro | Goldman Sachs | 255,090 | ||||
| Long/Short Credit | Goldman Sachs | 1,390,000 | ||||
| HSBC | 691,157 | |||||
| JP Morgan | 270,000 | |||||
| Monthly Distribution | JP Morgan | 75,391,618 | ||||
121
| NOTES TO FINANCIAL STATEMENTS |
| October 31, 2020 (Continued) |
l. Exchange Traded Funds – The Funds may invest in exchange traded funds (“ETFs”). ETFs are a type of index fund bought and sold on a securities exchange. An ETF trades like common stock and represents a fixed portfolio of securities. A Fund may purchase an ETF to temporarily gain exposure to a portion of the U.S. or a foreign market while awaiting purchase of underlying securities. The risks of owning an ETF generally reflect the risks of owning the underlying securities they are designed to track, although the lack of liquidity on an ETF could result in it being more volatile. Additionally, ETFs have fees and expenses that reduce their value.
m. Investment Transactions, Investment Income and Expenses – Investment transactions are recorded on a trade date basis. Realized gains and losses from investment transactions and foreign exchange transactions are calculated using the identified cost method. Dividend income and expense is recorded on the ex-dividend date (“ex-date”) except in the case of certain dividends from foreign securities, which are recorded as soon after the ex-date that the respective Fund, using reasonable diligence, becomes aware of such dividends. Interest income is recorded on an accrual basis. Discounts are accreted and premiums are amortized as adjustments to interest income and the identified cost of investments. Expenses of the Trust that are directly identifiable to a specific Fund are charged to that Fund. Expenses, which are not readily identifiable to a specific Fund, are allocated in such a manner as deemed equitable, taking into consideration the nature and type of expense and the relative sizes of the Funds. Each Fund’s income, expenses (other than the class specific distribution fees) and realized and unrealized gains and losses are allocated proportionally each day between the classes based upon the relative net assets of each class.
n. Concentration of Risk – Investing in securities of foreign issuers and currency transactions may involve certain considerations and risks not typically associated with investments in the United States. These risks include revaluation of currencies, adverse fluctuations in foreign currency values and possible adverse political, social and economic developments, including those particular to a specific industry, country or region. These conditions could cause the securities and their markets to be less liquid and prices more volatile than those of comparable U.S. companies and U.S. government securities.
Small capitalization (“small cap”) companies may be more vulnerable than larger capitalization companies to adverse business or economic developments. Small cap companies may also have limited product lines, markets or financial resources, and may be dependent on a relatively small management group. Securities of such companies may be less liquid and more volatile than securities of larger capitalization companies or the market averages in general and therefore may involve greater risk than investing in larger capitalization companies.
The ability of issuers of debt securities held by the Funds to meet their obligations may be affected by economic and political developments particular to a specific industry, country, state or region. Investments in lower grade debt securities are subject to special risks, including greater price volatility and a greater risk of loss of principal and interest.
Certain Funds may invest in collateralized mortgage obligations which are secured by groups of individual mortgages, but are similar to a conventional bond where the investor looks only to the issuer for payment of principal and interest. Although the obligations are recourse obligations to the issuer, the issuer typically has no significant assets, other than assets pledged as collateral for the obligations, and the market value of the collateral, which is sensitive to interest rate movements, may affect the market value of the obligations. A public market for a particular collateralized mortgage obligation may or may not develop and thus, there can be no guarantee of liquidity of an investment in such obligations.
The risk in writing a call option is that a Fund may forgo the opportunity of profit if the market value of the underlying security increases and the option is exercised, although any potential loss is reduced by the amount of option premium received. The risk in writing a put option is that a Fund may be called on to pay the exercise price of the option for a security that has decreased (potentially to zero) in market price, although any potential loss is reduced by the amount of option premium received. Generally, option transactions also involve risks concerning liquidity of the options market. An illiquid market for an option may limit a Fund’s ability to write options or enter closing transactions. As the options written by the Funds are traded on a national exchange, counterparty and credit risk are limited to the failure of the exchange on which the options are traded.
o. LIBOR Risk – The Funds Investment, payment obligations and financing terms may be based on floating rates such as the London Interbank Offered Rate, or “LIBOR,” which is the offered rate for short-term Eurodollar deposits between major international banks. Plans are underway to phase out the use of LIBOR by the end of 2021. There remains uncertainty regarding the nature of any replacement rate and the impact of the transition from LIBOR on the Funds transactions and the financial markets generally. As such, the potential effect of the transition away from the LIBOR on the Funds’ investments cannot yet be determined.
p. Natural Disaster/Epidemic Risk – Natural or environmental disasters, such as earthquakes, fires, floods, hurricanes, tsunamis, and other severe weather-related phenomena generally, and widespread disease and illness, including pandemics and epidemics, have been and can be highly disruptive to economies and markets. They may adversely impact individual companies, sectors, industries, markets, currencies, interest and inflation rates, credit ratings, investor sentiment, and other factors affecting the value of the Funds’ investments. For example, the novel coronavirus (COVID -19), which was first detected in 2019, has resulted in, among other things, stressors to healthcare service infrastructure, country border closings, business and school closings, and disruptions to supply chains and customer activity. Natural disaster/epidemic risk could have a significant adverse impact on the Funds’ portfolio investments.
122
| NOTES TO FINANCIAL STATEMENTS |
| October 31, 2020 (Continued) |
q. Federal Income Taxes – It is each Fund’s policy to continue to comply with all sections of the Internal Revenue Code applicable to regulated investment companies and to distribute all of its taxable income and gains, if any, to its shareholders and therefore, no provision for federal income tax has been made. Each Fund is treated as a separate taxpayer for federal income tax purposes. The Funds recognize the tax benefits of uncertain tax positions only when the position is “more likely than not” to be sustained assuming examination by tax authorities. Management has reviewed the tax positions in the open tax years of 2017 to 2019 and expected to be taken in tax year 2020 and concluded that no liability for unrecognized tax benefits should be recorded related to uncertain tax positions taken in the above open tax years. The Funds identify their major tax jurisdiction as U.S. Federal. The Funds recognize interest and penalties, if any, related to unrecognized tax benefits as income tax expense in the Statements of Operations. During the year, the Funds did not incur any interest or penalties. Generally tax authorities can examine tax returns filed for the last three years.
r. Distributions to Shareholders – It is each Fund’s policy to distribute its respective net investment income and net capital gains, if any, annually except for Corporate/Government Bond, Floating Rate Bond, High-Yield Bond, International Opportunity Bond, Long/Short Credit, and Monthly Distribution which will distribute their respective net investment income, if any, monthly. Distributions of net investment income and net capital gains are determined in accordance with income tax regulations which may differ from GAAP. Differences in dividends from net investment income per share between the classes are due to service and distribution related expenses. Dividends and distributions to shareholders are recorded on ex-date. Monthly Distribution’s distribution policy is to make twelve monthly distributions to shareholders. The level of monthly distributions (including any return of capital) is not fixed but is expected to be at or near the level of the prime interest rate (“Prime Rate”). Additionally, Monthly Distribution’s distribution policy is not designed to generate, and is not expected to result in, distributions that equal a fixed percentage of Monthly Distribution’s current net asset value per share. Shareholders receiving periodic payments from Monthly Distribution may be under the impression that they are receiving net income. However, all or a portion of a distribution may consist of a return of capital. Shareholders should not assume that the source of a distribution from Monthly Distribution is net income.
s. Real Estate Investment Trusts – Real Estate Stock invests primarily in Real Estate Investment Trusts (REITs). Distributions from REITs may be characterized as dividends, capital gains, and/or return of capital.
t. Indemnification – The Trust indemnifies its officers and Trustees for certain liabilities that may arise from the performance of their duties to the Trust. Additionally, in the normal course of business, each Fund enters into contracts that contain a variety of representations and warranties and which provide general indemnities. A Fund’s maximum exposure under these arrangements is unknown, as this would involve future claims that may be made against the Fund that have not yet occurred. However, based on experience, the Funds expect the risk of loss due to these warranties and indemnities to be remote.
| 3. | INVESTMENT ADVISORY FEES AND OTHER TRANSACTIONS WITH AFFILIATES |
| a. | Management Fees – Dunham & Associates serves as each Fund’s investment adviser. Pursuant to an investment advisory agreement with the Trust, on behalf of the Funds, Dunham & Associates, subject to the supervision of the Board and in conformity with the stated policies of the Funds, manages the operations of the Funds. The Adviser, subject to the review and approval of the Board, selects Sub-Advisers for each Fund and supervises and monitors the performance of each Sub-Adviser. As compensation for its services, each Fund pays the Adviser a fixed fee, accrued daily and paid monthly, based on each Fund’s respective average daily net assets. The Adviser has entered into a Sub-Advisory Agreement with each Sub-Adviser and the Trust, on behalf of each Fund. Under the Sub-Advisory Agreements, each Fund pays the Sub-Adviser a “Fulcrum Fee.” A Fulcrum Fee is a performance fee whereby the Sub-Adviser is rewarded when out-performing, or is penalized when under-performing, a Fund’s benchmark index. As a result of the Fulcrum Fee arrangement, the total annual management fee for a Fund will have a range as shown in the table below. |
| Adviser’s | Sub-Adviser’s | |||||
| Management Fee | Portion | Portion | ||||
| Corporate/Government Bond | 0.65% – 0.95% | 0.50% | 0.15% – 0.45% | |||
| Floating Rate Bond | 0.70% – 1.06% | 0.60% | 0.10% – 0.46% | |||
| High-Yield Bond | 0.82% – 1.02% | 0.60% | 0.22% – 0.42% | |||
| International Opportunity Bond | 0.80% – 1.30% | 0.60% | 0.20% – 0.70% | |||
| Large Cap Value | 0.75% – 1.15% | 0.65% | 0.10% – 0.50% | |||
| Small Cap Value | 0.75% – 1.45% | 0.65% | 0.10% – 0.80% | |||
| Focused Large Cap Growth | 0.85% – 1.15% | 0.65% | 0.20% – 0.50% | |||
| Small Cap Growth | 0.65% – 1.65% | 0.65% | 0.00% – 1.00% | |||
| Emerging Markets Stock | 0.70% – 1.50% | 0.65% | 0.05% – 0.85% | |||
| International Stock | 0.95% – 1.65% | 0.65% | 0.30% – 1.00% | |||
| Dynamic Macro | 1.05% – 1.75% | 0.65% | 0.40% – 1.10% | |||
| Long/Short Credit | 0.70% – 1.80% | 0.65% | 0.05% – 1.15% | |||
| Monthly Distribution | 0.87% – 1.63% | 0.65% | 0.22% – 0.98% | |||
| Real Estate Stock * | 0.80% – 1.40% | 0.65% | 0.15% – 0.75% |
| * | Prior to January 1, 2020, the Sub-Adviser’s portion for Real Estate Stock was 0.10%-0.70% and the Management Fee was 0.75%-1.35%. |
123
| NOTES TO FINANCIAL STATEMENTS |
| October 31, 2020 (Continued) |
Each Fund’s Sub-Advisory Fulcrum Fee is calculated daily using an annual base Sub-Advisory fee of a specified amount of the average daily net assets of the Fund (the “Base Fee”), adjusted by the Fund’s Class N share performance relative to the Fund’s benchmark (the “Performance Fee”). Depending on a Fund’s net performance versus its benchmark, the Sub-Adviser will receive a fee adjustment in accordance with a formula that equates a percentage of out- or under-performance to a percentage of fee increases or decreases, respectively. In addition, some Fulcrum Fees employ a “null zone” around the base fee, whereby small differences in performance versus the benchmark will not trigger a fee increase or decrease. During the first 12 months of the Fulcrum Fee arrangement, the Performance Fee is calculated daily from inception date of the agreement to the calculation date and is applied to the average daily net assets of the Funds during the calculation period. After the initial 12 months, the Performance Fee is calculated on a daily basis based on comparative performance over a rolling 12-month period. All Funds, with the exception of International Opportunity Bond and Real Estate Stock which are in the initial year of a new Fulcrum Fee arrangement, are calculating Performance Fees on a rolling 12-month basis as of January 1, 2020.
Depending on the particular Sub-Advisory Agreement, the Performance Fee can adjust the Base Fee up or down by as much as 100% of the Base Fee, such that the Sub-Advisory fee can vary anywhere from 0.00% (the “Minimum Fee”) to twice the Base Fee (the “Maximum Fee”). However, because each such Sub-Advisory Agreement requires that the Sub-Adviser only be paid out the monthly Minimum Fee during the first year (in most cases, 0.10%), the Sub-Adviser, in most cases, will receive less compensation until the end of the first year. At the end of the first year of the agreement, the Sub-Adviser will be paid a lump sum that reflects the accrued Fulcrum Fee over the year, less any Minimum Fees paid out during the first year. Therefore, in the first year, the Fulcrum Fee methodology has three elements: 1) daily calculation of the Performance Fee and daily accrual of the Fulcrum Fee; 2) monthly payment of the Minimum Fee only (if any); and 3) a lump sum payment at the end of the initial 12-month period of the accrued Fulcrum Fee less the Minimum Fee.
By virtue of using average daily net assets over a “rolling” 12-month period for purposes of calculating the Performance Fee while using average daily net assets for the most recent month for purposes of calculating the Base Fee, the actual total Fulcrum Fee paid by the Fund to the Sub-Adviser may be higher or lower than the maximum or minimum annual rates described above if the average daily net assets do not remain constant during the rolling 12-month period. If the Fund is significantly underperforming versus the Index and the Fund’s net assets have declined significantly, the monthly total Fulcrum Fee can be a negative number (although the performance fee rate can never be negative, the Performance Fee can be negative). In such instances, if the negative Fulcrum Fee is not earned back or offset the following month, the Sub-Adviser must reimburse the Fund the amount of the negative Fulcrum Fee within an agreed upon time. Likewise, in the case where the Fund has significantly underperformed versus the Index but net assets have increased significantly, the monthly total Fulcrum Fee can be positive although the performance fee rate may be 0.00%. In such instances, the Fund will pay the Sub-Adviser the monthly Fulcrum Fee.
The table below lists the current Sub-Advisers along with their Fulcrum Fee arrangements.
| Null | Minimum | Maximum | ||||
| Fund | Sub-Adviser | Benchmark | Base Fee | Zone | Fee | Fee |
| Corporate/Government Bond | New fleet Asset Management, LLC | Bloomberg Barclays Aggregate Bond Index | 0.30% | +/- 0.15% | 0.15% | 0.45% |
| Floating Rate Bond | New fleet Asset Management, LLC | Credit Suisse Leveraged Loan Total Return Index | 0.28% | +/- 0.00% | 0.10% | 0.46% |
| High-Yield Bond | PineBridge Investments LLC | Barclays U.S. Corporate High Yield Bond Ba/B 2% Issuer Capped Index | 0.32% | +/- 0.00% | 0.22% | 0.42% |
| International Opportunity Bond * | Stone Harbor Investment Partners LP | Barclays Global ex US Aggregate Bond Index (Hedged) | 0.45% | +/- 0.00% | 0.20% | 0.70% |
| Large Cap Value | Rothschild & Co. Asset Management US Inc. | Russell 1000 Value Index | 0.30% | +/- 0.00% | 0.10% | 0.50% |
| Small Cap Value | Ziegler Capital Management, LLC | Russell 2000 Value Index | 0.45% | +/- 0.00% | 0.10% | 0.80% |
| Focused Large Cap Growth | The Ithaka Group, LLC | Russell 1000 Growth Index | 0.35% | +/- 0.30% | 0.20% | 0.50% |
| Small Cap Growth | Pier Capital, LLC | Russell 2000 Growth Index | 0.50% | +/- 0.20% | 0.00% | 1.00% |
| Emerging Markets Stock | NS Partners Ltd. | MSCI Emerging Markets Index (Net) | 0.45% | +/- 0.00% | 0.05% | 0.85% |
| International Stock | Arrow street Capital L.P. | MSCI All Country World Index ex USA (Net) | 0.65% | +/- 0.20% | 0.30% | 1.00% |
| Dynamic Macro | Mellon Investments Corporation | IQ Hedge Global Macro Beta Index | 0.75% | +/- 0.00% | 0.40% | 1.10% |
| Long/Short Credit | Metlife Investment Advisors, LLC | BofA Merrill Lynch US 3-month Treasury Bill Index PLUS 300 bps (3.00%) | 0.60% | +/- 0.00% | 0.05% | 1.15% |
| Monthly Distribution | Weiss Multi-Strategy Advisers, LLC | IQ Hedge Market Neutral Total Return Index | 0.60% | +/- 0.00% | 0.22% | 0.98% |
| Real Estate Stock ** | American Assets Capital Advisers, LLC | Dow Jones US Real Estate Total Return Index | 0.45% | +/- 0.00% | 0.15% | 0.75% |
| * | Effective January 1, 2020 Stone Harbor Investment Partners replaced Allianz Global Investors U.S. LLC as the sub-adviser to International Opportunity Bond. Allianz Global Investors U.S. LLC had a Base fee of 0.45%, a Minimum fee of 0.20% and a Maximum Fee of 0.70%. |
| ** | Effective January 1, 2020 American Assets Capital Advisers, LLC replaced Barings LLC. as the sub-adviser to Real Estate Stock. Barings LLC had a Base fee of 0.40%, a Minimum fee of 0.10% and a Maximum Fee of 0.70%. |
124
| NOTES TO FINANCIAL STATEMENTS |
| October 31, 2020 (Continued) |
b. Administration, Fund Accounting and Transfer Agency Fees – Gemini Fund Services, LLC (“GFS” or the “Administrator”) serves as the administrator, fund accountant and transfer agent for the Funds. For providing administration services, GFS receives from each Fund a monthly fee based on the combined average daily net assets at the following annual rates; 0.07% on the first $250 million of average net assets; 0.05% on average net assets between $250 million and $500 million; 0.03% on average net assets over $500 million; and 0.01% on average net assets over $1 billion. Prior to January 1, 2020 the fees were as follows; 0.07% on the first $250 million of average net assets; 0.06% on average net assets between $250 million and $500 million; 0.04% on average net assets over $500 million; and 0.02% on average net assets over $1 billion. Such fees are subject to an annual minimum of $400,000 in total for the entire Trust. For providing fund accounting services, GFS receives from the Trust a minimum annual fee of $245,000. For providing transfer agent services, GFS receives from the Trust a minimum annual fee of $200,000. Pursuant to the terms of a Custody Administration Agreement, Monthly Distribution pays GFS a monthly fee of $300.
Blu Giant, LLC, (“Blu Giant”), an affiliate of GFS, provides EDGAR conversion and filing services as well as some print management services for the Funds on an ad-hoc basis. For the provision of these services, Blu Giant receives customary fees from the Funds. An individual from GFS serves as an officer for the Trust and receives no additional compensation from the Trust for serving in that role.
c. Distributor – The Distributor of the Funds is Dunham & Associates (the “Distributor”). The Funds have adopted an Amended and Restated Rule 12b-1 Plan (the “Plan”) in accordance with Rule 12b -1 under the 1940 Act for Class A and Class C shares. The Plan for Class A shares authorizes the Funds to pay distribution fees to the Distributor or other entities on a monthly basis at an annualized rate of up to 0.25% of the average daily net assets attributable to Class A shares. The Plan for Class C shares authorizes the Funds to pay distribution fees at the annualized rate of 0.75% for the equity Funds and 0.50% for the fixed income Funds and shareholder servicing fees at the annualized rate of 0.25% to the Distributor or other entities on a monthly basis based on the average daily net assets attributable to Class C shares. Class N shares do not pay distribution fees or shareholder servicing fees.
| Distributor Sales Charges | ||||
| Fund | Class A | |||
| Corporate/Government Bond | $ | 74 | ||
| Floating Rate Bond | 935 | |||
| High-Yield Bond | 2,102 | |||
| International Opportunity Bond | 58 | |||
| Large Cap Value | 55,905 | |||
| Small Cap Value | 2,625 | |||
| Focused Large Cap Growth | 68,401 | |||
| Small Cap Growth | 64,861 | |||
| Emerging Markets Stock | 2,418 | |||
| International Stock | 1,159 | |||
| Dynamic Macro | 450 | |||
| Long/Short Credit | 6,066 | |||
| Monthly Distribution | 39,057 | |||
| Real Estate Stock | 4,743 | |||
d. Trustees’ Fees – The Board has approved the following Trustee compensation schedule: Each Trustee who is not an interested person of the Trust will receive $ 6,250 for each Board meeting attended in-person; $2,500 for all electronically-attended Board meetings; $1,000 for in-person committee meetings and $500 for telephonic committee meetings, unless the committee meeting is on the same day as a Board meeting, in which case the Trustee will not be compensated for the committee meeting. The Funds also reimburse each such Trustee for travel and other expenses incurred in attending meetings of the Board.
With the exception of the Trust’s Chief Compliance Officer as discussed below, officers of the Trust and Trustees who are interested persons of the Trust do not receive any compensation from the Trust or any other Funds managed by the Adviser. The Trust has agreed to pay the Adviser a fee in the amount of $150,000 per annum plus an annual discretionary bonus as may be awarded as compensation for providing an officer or employee of the Adviser to serve as Chief Compliance Officer for the Funds (each Fund bearing its pro rata share of the fee), plus the cost of reasonable expenses related to the performance of the Chief Compliance Officer’s duties, including travel expenses, and may compensate the Adviser for the time of other officers or employees of the Adviser who serve in other compliance capacities for the Funds.
125
| NOTES TO FINANCIAL STATEMENTS |
| October 31, 2020 (Continued) |
e. Commission Recapture – During the year ended October 31, 2020, certain Funds had portfolio trades executed with a certain brokers pursuant to a commission recapture agreement under which the brokers returned a portion of the Fund’s brokerage commissions on the Fund’s behalf. Such amounts, under such commission recapture agreement, are included in fees paid indirectly in the Funds’ Statements of Operations and will be paid directly by the brokers for the expenses of the Fund. For the year ended October 31, 2020, the amounts received by the Administrator on behalf of certain participating Funds under this arrangement were: Large Cap Value - $3,171,Small Cap Value - $49,836, Focused Large Cap Growth - $4,019, Small Cap Growth - $18,856 and International Stock - $1,524.
| 4. | INVESTMENT TRANSACTIONS |
The cost of purchases and the proceeds from sales of investments, other than short-term investments, for the year ended October 31, 2020 were as follows:
| Purchases | Sale Proceeds | Proceeds of | ||||||||||||||
| (excluding U.S. | (excluding U.S. | Purchases of | U.S. | |||||||||||||
| Government | Government | U.S. Government | Government | |||||||||||||
| Fund | Securities) | Securities) | Securities | Securities | ||||||||||||
| Corporate/Government Bond | $ | 41,943,803 | $ | 30,229,621 | $ | 18,086,983 | $ | 10,326,800 | ||||||||
| Floating Rate Bond | 128,418,200 | 136,652,151 | — | — | ||||||||||||
| High-Yield Bond | 71,926,311 | 78,322,534 | — | — | ||||||||||||
| International Opportunity Bond | 60,878,105 | 53,078,498 | — | — | ||||||||||||
| Large Cap Value | 49,764,182 | 37,950,722 | — | — | ||||||||||||
| Small Cap Value | 77,960,848 | 73,997,334 | — | — | ||||||||||||
| Focused Large Cap Growth | 22,587,883 | 22,009,142 | — | — | ||||||||||||
| Small Cap Growth | 91,577,405 | 102,737,093 | — | — | ||||||||||||
| Emerging Markets Stock | 92,263,439 | 88,995,437 | — | — | ||||||||||||
| International Stock | 196,993,851 | 206,256,395 | — | — | ||||||||||||
| Dynamic Macro | 23,639,876 | 24,246,545 | — | — | ||||||||||||
| Long/Short Credit | 169,503,499 | 153,524,785 | 107,380,740 | 103,747,409 | ||||||||||||
| Monthly Distribution | 791,293,085 | 883,910,473 | — | — | ||||||||||||
| Real Estate Stock | 89,033,869 | 75,197,019 | — | — | ||||||||||||
| 5. | AGGREGATE UNREALIZED APPRECIATION AND DEPRECIATION – TAX BASIS |
The identified cost of investments in securities owned by each Fund for federal income tax purposes, and its respective gross unrealized appreciation and depreciation at October 31, 2020, were as follows:
| Gross | Gross | Net Unrealized | ||||||||||||||
| Tax | Unrealized | Unrealized | Appreciation/ | |||||||||||||
| Cost | Appreciation | Depreciation | (Depreciation) | |||||||||||||
| Corporate/Government Bond | $ | 82,993,546 | $ | 2,133,055 | $ | (611,250 | ) | $ | 1,521,805 | |||||||
| Floating Rate Bond | 180,051,794 | 672,805 | (8,223,055 | ) | (7,550,250 | ) | ||||||||||
| High-Yield Bond | 97,216,975 | 3,299,443 | (3,249,344 | ) | 50,099 | |||||||||||
| International Opportunity Bond | 47,765,372 | 1,802,829 | (1,648,232 | ) | 154,597 | |||||||||||
| Large Cap Value | 80,348,107 | 19,375,223 | (3,417,398 | ) | 15,957,825 | |||||||||||
| Small Cap Value | 57,781,000 | 5,700,465 | (4,256,457 | ) | 1,444,008 | |||||||||||
| Focused Large Cap Growth | 77,855,052 | 88,303,728 | (1,530,130 | ) | 86,773,598 | |||||||||||
| Small Cap Growth | 44,787,235 | 14,695,524 | (2,970,512 | ) | 11,725,012 | |||||||||||
| Emerging Markets Stock | 77,456,211 | 20,207,344 | (5,655,224 | ) | 14,552,120 | |||||||||||
| International Stock | 123,078,869 | 16,401,738 | (9,247,504 | ) | 7,154,234 | |||||||||||
| Dynamic Macro | 27,452,663 | 3,339,756 | (1,411,624 | ) | 1,928,132 | |||||||||||
| Long/Short Credit | 144,799,865 | 1,831,116 | (747,151 | ) | 1,083,965 | |||||||||||
| Monthly Distribution | 146,919,626 | 7,257,456 | (13,651,510 | ) | (6,394,054 | ) | ||||||||||
| Real Estate Stock | 77,374,354 | 9,978,704 | (3,459,380 | ) | 6,519,324 | |||||||||||
126
| NOTES TO FINANCIAL STATEMENTS |
| October 31, 2020 (Continued) |
| 6. | SHARES OF BENEFICIAL INTEREST |
Following is a summary of shareholder transactions for each Fund for the year ended October 31, 2020 and the year ended October 31, 2019, respectively:
For the year ended October 31, 2020:
| Class N Shares | Class A Shares | |||||||||||||||||||||||||||||||
| Net Increase | Net Increase | |||||||||||||||||||||||||||||||
| Distributions | (Decrease) in | Distributions | (Decrease) in | |||||||||||||||||||||||||||||
| Fund | Issued | Reinvested | Redeemed | Shares | Issued | Reinvested | Redeemed | Shares | ||||||||||||||||||||||||
| Corporate/Government Bond | 2,442,311 | 66,476 | (1,328,640 | ) | 1,180,147 | 294,446 | 9,157 | (250,960 | ) | 52,643 | ||||||||||||||||||||||
| Floating Rate Bond | 3,849,760 | 592,036 | (6,066,744 | ) | (1,624,948 | ) | 810,520 | 80,421 | (1,027,096 | ) | (136,155 | ) | ||||||||||||||||||||
| High-Yield Bond | 2,455,724 | 433,543 | (3,601,390 | ) | (712,123 | ) | 460,273 | 58,376 | (528,449 | ) | (9,800 | ) | ||||||||||||||||||||
| International Opportunity Bond | 2,299,451 | 89,247 | (1,311,372 | ) | 1,077,326 | 456,811 | 13,291 | (186,162 | ) | 283,940 | ||||||||||||||||||||||
| Large Cap Value | 2,399,060 | 138,361 | (1,252,393 | ) | 1,285,028 | 658,171 | 34,070 | (543,574 | ) | 148,667 | ||||||||||||||||||||||
| Small Cap Value | 2,415,552 | — | (1,820,596 | ) | 594,956 | 470,660 | — | (386,664 | ) | 83,996 | ||||||||||||||||||||||
| Focused Large Cap Growth | 1,137,971 | 97,550 | (1,086,213 | ) | 149,308 | 582,227 | 27,824 | (677,311 | ) | (67,260 | ) | |||||||||||||||||||||
| Small Cap Growth | 837,545 | 40,552 | (1,232,242 | ) | (354,145 | ) | 480,062 | 11,564 | (580,869 | ) | (89,243 | ) | ||||||||||||||||||||
| Emerging Markets Stock | 1,853,780 | 34,748 | (1,572,886 | ) | 315,642 | 459,657 | 5,711 | (363,721 | ) | 101,647 | ||||||||||||||||||||||
| International Stock | 2,284,755 | 138,030 | (2,661,981 | ) | (239,196 | ) | 514,676 | 28,085 | (621,576 | ) | (78,815 | ) | ||||||||||||||||||||
| Dynamic Macro | 784,689 | — | (1,599,151 | ) | (814,462 | ) | 221,207 | — | (479,227 | ) | (258,020 | ) | ||||||||||||||||||||
| Long/Short Credit | 8,085,347 | 163,905 | (3,899,273 | ) | 4,349,979 | 1,087,252 | 24,191 | (502,836 | ) | 608,607 | ||||||||||||||||||||||
| Monthly Distribution | 1,427,177 | 175,987 | (2,120,885 | ) | (517,721 | ) | 298,337 | 38,406 | (569,549 | ) | (232,806 | ) | ||||||||||||||||||||
| Real Estate Stock | 1,563,413 | 170,517 | (933,460 | ) | 800,470 | 426,430 | 36,244 | (308,616 | ) | 154,058 | ||||||||||||||||||||||
| Class C Shares | ||||||||||||||||||||||||||||||||
| Net Increase | ||||||||||||||||||||||||||||||||
| Distributions | (Decrease) in | |||||||||||||||||||||||||||||||
| Fund | Issued | Reinvested | Redeemed | Shares | ||||||||||||||||||||||||||||
| Corporate/Government Bond | 455,539 | 3,711 | (449,782 | ) | 9,468 | |||||||||||||||||||||||||||
| Floating Rate Bond | 433,161 | 25,748 | (619,674 | ) | (160,765 | ) | ||||||||||||||||||||||||||
| High-Yield Bond | 127,404 | 22,144 | (461,812 | ) | (312,264 | ) | ||||||||||||||||||||||||||
| International Opportunity Bond | 79,096 | 2,354 | (104,595 | ) | (23,145 | ) | ||||||||||||||||||||||||||
| Large Cap Value | 140,599 | 10,700 | (222,263 | ) | (70,964 | ) | ||||||||||||||||||||||||||
| Small Cap Value | 141,105 | — | (162,323 | ) | (21,218 | ) | ||||||||||||||||||||||||||
| Focused Large Cap Growth | 126,528 | 12,296 | (171,171 | ) | (32,347 | ) | ||||||||||||||||||||||||||
| Small Cap Growth | 60,791 | 4,355 | (106,446 | ) | (41,300 | ) | ||||||||||||||||||||||||||
| Emerging Markets Stock | 93,733 | 665 | (149,063 | ) | (54,665 | ) | ||||||||||||||||||||||||||
| International Stock | 133,574 | 6,779 | (247,349 | ) | (106,996 | ) | ||||||||||||||||||||||||||
| Dynamic Macro | 62,303 | — | (127,248 | ) | (64,945 | ) | ||||||||||||||||||||||||||
| Long/Short Credit | 606,976 | 6,997 | (646,224 | ) | (32,251 | ) | ||||||||||||||||||||||||||
| Monthly Distribution | 136,689 | 47,226 | (550,746 | ) | (366,831 | ) | ||||||||||||||||||||||||||
| Real Estate Stock | 89,003 | 11,800 | (75,792 | ) | 25,011 | |||||||||||||||||||||||||||
127
| NOTES TO FINANCIAL STATEMENTS |
| October 31, 2020 (Continued) |
For the year ended October 31, 2019:
| Class N Shares | Class A Shares | |||||||||||||||||||||||||||||||
| Net Increase | Net Increase | |||||||||||||||||||||||||||||||
| Distributions | (Decrease) in | Distributions | (Decrease) in | |||||||||||||||||||||||||||||
| Fund | Issued | Reinvested | Redeemed | Shares | Issued | Reinvested | Redeemed | Shares | ||||||||||||||||||||||||
| Corporate/Government Bond | 1,358,705 | 85,602 | (1,548,844 | ) | (104,537 | ) | 238,649 | 10,366 | (120,020 | ) | 128,995 | |||||||||||||||||||||
| Floating Rate Bond | 4,135,951 | 779,224 | (5,195,790 | ) | (280,615 | ) | 691,894 | 95,516 | (535,999 | ) | 251,411 | |||||||||||||||||||||
| High-Yield Bond | 2,250,727 | 527,921 | (3,558,884 | ) | (780,236 | ) | 353,882 | 63,555 | (462,947 | ) | (45,510 | ) | ||||||||||||||||||||
| International Opportunity Bond | 699,740 | 22,947 | (794,969 | ) | (72,282 | ) | 147,890 | 1,757 | (112,758 | ) | 36,889 | |||||||||||||||||||||
| Large Cap Value | 695,868 | 214,901 | (687,966 | ) | 222,803 | 384,880 | 49,142 | (221,805 | ) | 212,217 | ||||||||||||||||||||||
| Small Cap Value | 688,673 | 319,621 | (408,023 | ) | 600,271 | 232,547 | 65,268 | (122,444 | ) | 175,371 | ||||||||||||||||||||||
| Focused Large Cap Growth | 959,514 | 225,236 | (743,219 | ) | 441,531 | 841,812 | 57,629 | (561,841 | ) | 337,600 | ||||||||||||||||||||||
| Small Cap Growth | 899,200 | 444,127 | (680,884 | ) | 662,443 | 278,378 | 149,638 | (268,644 | ) | 159,372 | ||||||||||||||||||||||
| Emerging Markets Stock | 749,368 | 80,396 | (775,088 | ) | 54,676 | 363,428 | 13,390 | (277,895 | ) | 98,923 | ||||||||||||||||||||||
| International Stock | 1,246,392 | 435,239 | (862,721 | ) | 818,910 | 447,321 | 86,701 | (249,533 | ) | 284,489 | ||||||||||||||||||||||
| Dynamic Macro | 462,025 | 89,536 | (1,109,155 | ) | (557,594 | ) | 234,015 | 18,240 | (318,335 | ) | (66,080 | ) | ||||||||||||||||||||
| Long/Short Credit | 5,434,899 | 199,627 | (2,368,449 | ) | 3,266,077 | 680,269 | �� | 24,160 | (199,739 | ) | 504,690 | |||||||||||||||||||||
| Monthly Distribution | 1,550,592 | 287,081 | (2,207,230 | ) | (369,557 | ) | 481,103 | 61,442 | (529,598 | ) | 12,947 | |||||||||||||||||||||
| Real Estate Stock | 285,995 | 55,368 | (859,354 | ) | (517,991 | ) | 150,462 | 9,521 | (219,442 | ) | (59,459 | ) | ||||||||||||||||||||
| Class C Shares | ||||||||||||||||||||||||||||||||
| Net Increase | ||||||||||||||||||||||||||||||||
| Distributions | (Decrease) in | |||||||||||||||||||||||||||||||
| Fund | Issued | Reinvested | Redeemed | Shares | ||||||||||||||||||||||||||||
| Corporate/Government Bond | 37,167 | 3,771 | (61,875 | ) | (20,937 | ) | ||||||||||||||||||||||||||
| Floating Rate Bond | 379,932 | 33,786 | (240,739 | ) | 172,979 | |||||||||||||||||||||||||||
| High-Yield Bond | 104,964 | 34,960 | (151,150 | ) | (11,226 | ) | ||||||||||||||||||||||||||
| International Opportunity Bond | 26,236 | 248 | (25,990 | ) | 494 | |||||||||||||||||||||||||||
| Large Cap Value | 88,590 | 14,327 | (37,247 | ) | 65,670 | |||||||||||||||||||||||||||
| Small Cap Value | 73,760 | 25,630 | (27,700 | ) | 71,690 | |||||||||||||||||||||||||||
| Focused Large Cap Growth | 137,733 | 28,599 | (118,605 | ) | 47,727 | |||||||||||||||||||||||||||
| Small Cap Growth | 84,693 | 66,749 | (110,039 | ) | 41,403 | |||||||||||||||||||||||||||
| Emerging Markets Stock | 53,034 | 2,497 | (59,245 | ) | (3,714 | ) | ||||||||||||||||||||||||||
| International Stock | 82,464 | 27,672 | (62,141 | ) | 47,995 | |||||||||||||||||||||||||||
| Dynamic Macro | 42,791 | 2,794 | (31,545 | ) | 14,040 | |||||||||||||||||||||||||||
| Long/Short Credit | 126,205 | 10,251 | (38,884 | ) | 97,572 | |||||||||||||||||||||||||||
| Monthly Distribution | 309,307 | 78,470 | (345,815 | ) | 41,962 | |||||||||||||||||||||||||||
| Real Estate Stock | 30,559 | 1,724 | (32,045 | ) | 238 | |||||||||||||||||||||||||||
128
| NOTES TO FINANCIAL STATEMENTS |
| October 31, 2020 (Continued) |
| 7. | DISTRIBUTIONS TO SHAREHOLDERS AND TAX COMPONENTS OF CAPITAL |
The tax character of dividends paid during the year or period ended October 31, 2020 and October 31, 2019 was as follows:
| For fiscal year ended | Ordinary | Long-Term | Return of | |||||||||||||
| 10/31/2020 | Income | Capital Gains | Capital | Total | ||||||||||||
| Corporate/Government Bond ** | $ | 1,137,278 | $ | — | $ | — | $ | 1,137,278 | ||||||||
| Floating Rate Bond ** | 6,315,171 | — | — | 6,315,171 | ||||||||||||
| High-Yield Bond ** | 4,586,673 | — | — | 4,586,673 | ||||||||||||
| International Opportunity Bond | 598,123 | — | 329,450 | 927,573 | ||||||||||||
| Large Cap Value | 933,518 | 1,931,134 | — | 2,864,652 | ||||||||||||
| Small Cap Value | — | — | — | — | ||||||||||||
| Focused Large Cap Growth | — | 3,668,052 | — | 3,668,052 | ||||||||||||
| Small Cap Growth | 116,998 | 825,002 | — | 942,000 | ||||||||||||
| Emerging Markets Stock * | 834,088 | — | — | 834,088 | ||||||||||||
| International Stock * | 3,234,865 | — | — | 3,234,865 | ||||||||||||
| Dynamic Macro | — | — | — | — | ||||||||||||
| Long/Short Credit ** | 1,890,160 | — | — | 1,890,160 | ||||||||||||
| Monthly Distribution ** | 2,397,356 | — | 6,523,968 | 8,921,324 | ||||||||||||
| Real Estate Stock | 1,519,797 | 2,213,358 | — | 3,733,155 | ||||||||||||
| For fiscal year ended | Ordinary | Long-Term | Return of | |||||||||||||
| 10/31/2019 | Income | Capital Gains | Capital | Total | ||||||||||||
| Corporate/Government Bond | $ | 1,364,485 | $ | — | $ | — | $ | 1,364,485 | ||||||||
| Floating Rate Bond | 8,609,420 | — | — | 8,609,420 | ||||||||||||
| High-Yield Bond ** | 5,606,169 | — | 1,997 | 5,608,166 | ||||||||||||
| International Opportunity Bond | 78,557 | 143,753 | 2,685 | 224,995 | ||||||||||||
| Large Cap Value | 1,029,945 | 2,475,280 | — | 3,505,225 | ||||||||||||
| Small Cap Value | 1,864,480 | 3,196,685 | 23,516 | 5,084,681 | ||||||||||||
| Focused Large Cap Growth | — | 6,222,027 | — | 6,222,027 | ||||||||||||
| Small Cap Growth | 3,935,267 | 5,125,659 | — | 9,060,926 | ||||||||||||
| Emerging Markets Stock * | 1,399,913 | — | — | 1,399,913 | ||||||||||||
| International Stock * | 1,605,914 | 6,332,594 | — | 7,938,508 | ||||||||||||
| Dynamic Macro | 771,551 | — | 228,780 | 1,000,331 | ||||||||||||
| Long/Short Credit | 2,186,769 | — | — | 2,186,769 | ||||||||||||
| Monthly Distribution | — | — | 14,962,154 | 14,962,154 | ||||||||||||
| Real Estate Stock | 963,717 | — | — | 963,717 | ||||||||||||
| * | The difference between ordinary distributions paid from book and ordinary distributions paid from tax relates to allowable foreign tax credits of $449,736 and $203,526 for fiscal year ended October 31, 2020 for the International Stock Fund and Emerging Markets Stock Fund respectively, and $454,755 and $196,218 for fiscal year ended October 31, 2019 for the International Stock Fund and Emerging Markets Stock Fund respectively, which have been passed through to the Funds’ underlying shareholders and are deemed dividends for tax purposes. |
| ** | Differences in distributions between the Statements of Changes paid from book and tax on the income funds relate to the adjustments for dividends payable for tax purposes. |
129
| NOTES TO FINANCIAL STATEMENTS |
| October 31, 2020 (Continued) |
Permanent book and tax differences, primarily attributable to the reclass of net operating losses and fund distributions and the expiration of capital loss carry forwards, resulted in reclassification for the tax year ended October 31, 2020 as follows:
| Paid | ||||||||
| In | Accumulated | |||||||
| Fund | Capital | Earnings (Loss) | ||||||
| Corporate/Government Bond | $ | — | $ | — | ||||
| Floating Rate Bond | — | — | ||||||
| High-Yield Bond | — | — | ||||||
| International Opportunity Bond | — | — | ||||||
| Large Cap Value | — | — | ||||||
| Small Cap Value | — | — | ||||||
| Focused Large Cap Growth | (338,360 | ) | 338,360 | |||||
| Small Cap Growth | — | — | ||||||
| Emerging Markets Stock | — | — | ||||||
| International Stock | — | — | ||||||
| Dynamic Macro | (63 | ) | 63 | |||||
| Long/Short Credit | — | — | ||||||
| Monthly Distribution | 257,363 | (257,363 | ) | |||||
| Real Estate Stock | (147,594 | ) | 147,594 | |||||
Net assets were unaffected by the above reclassifications.
As of each of the Fund’s tax year-ended October 31, 2020, the components of distributable earnings on a tax basis were as follows:
| Undistributed | Undistributed | Post October Loss | Capital Loss | Other | Unrealized | Total | ||||||||||||||||||||||
| Ordinary | Long-Term | and | Carry | Book/Tax | Appreciation/ | Accumulated | ||||||||||||||||||||||
| Fund | Income | Capital Gains | Late Year Loss | Forwards | Differences | (Depreciation) | Earnings/(Deficits) | |||||||||||||||||||||
| Corporate/Government Bond | $ | 31,740 | $ | — | $ | — | $ | (1,523,599 | ) | $ | (747 | ) | $ | 1,521,805 | $ | 29,199 | ||||||||||||
| Floating Rate Bond | 313,241 | — | — | (11,671,053 | ) | (2,664 | ) | (7,550,250 | ) | (18,910,726 | ) | |||||||||||||||||
| High-Yield Bond | 65,115 | — | — | (8,941,917 | ) | (5,843 | ) | 50,099 | (8,832,546 | ) | ||||||||||||||||||
| International Opportunity Bond | — | — | — | (442,099 | ) | (234 | ) | 151,908 | (290,425 | ) | ||||||||||||||||||
| Large Cap Value | 840,718 | 0.00 | — | (35,068 | ) | — | 15,957,825 | 16,763,475 | ||||||||||||||||||||
| Small Cap Value | 311,089 | — | — | (5,861,913 | ) | — | 1,444,008 | (4,106,816 | ) | |||||||||||||||||||
| Focused Large Cap Growth | — | 3,869,602 | (1,348,225 | ) | — | — | 86,773,598 | 89,294,975 | ||||||||||||||||||||
| Small Cap Growth | 3,589,384 | 5,463,299 | — | — | — | 11,725,012 | 20,777,695 | |||||||||||||||||||||
| Emerging Markets Stock | 125,474 | — | — | (243,844 | ) | — | 14,548,978 | 14,430,608 | ||||||||||||||||||||
| International Stock | 1,074,955 | 70,639 | — | — | — | 7,164,979 | 8,310,573 | |||||||||||||||||||||
| Dynamic Macro | 148,493 | — | — | (2,532,651 | ) | — | 1,943,024 | (441,134 | ) | |||||||||||||||||||
| Long/Short Credit | 2,559,523 | — | — | — | (3,331 | ) | 1,079,578 | 3,635,770 | ||||||||||||||||||||
| Monthly Distribution | — | — | (676,660 | ) | — | (164,836 | ) | (6,574,783 | ) | (7,416,279 | ) | |||||||||||||||||
| Real Estate Stock | — | 5,909,275 | — | — | — | 6,519,324 | 12,428,599 | |||||||||||||||||||||
The difference between book basis and tax basis unrealized appreciation (depreciation), undistributed net investment income (loss) and accumulated net realized gain (loss) from security transactions are primarily attributable to the tax deferral of losses on wash sales, the mark-to-market treatment of open forward foreign currency contracts, options, dividend payable and swap contracts, and adjustments for partnerships, perpetual bonds, passive foreign investment companies, 1256 option contracts and C Corporation return of capital distributions. The unrealized appreciation (depreciation) in the table above includes unrealized foreign currency gains (losses) for the Funds. In addition, the amount listed under other book/tax differences are primarily attributable to the tax deferral of losses on straddles and constructive sales, and tax adjustments for accrued dividend payable.
130
| NOTES TO FINANCIAL STATEMENTS |
| October 31, 2020 (Continued) |
Late year losses incurred after December 31 within the fiscal year are deemed to arise on the first business day of the following fiscal year for tax purposes. The Funds incurred and elected to defer such late year losses as follows:
| Late Year | ||||
| Fund | Losses | |||
| Corporate/Government Bond | $ | — | ||
| Floating Rate Bond | — | |||
| High-Yield Bond | — | |||
| International Opportunity Bond | — | |||
| Large Cap Value | — | |||
| Small Cap Value | — | |||
| Focused Large Cap Growth | 1,348,225 | |||
| Small Cap Growth | — | |||
| Emerging Markets Stock | — | |||
| International Stock | — | |||
| Dynamic Macro | — | |||
| Long/Short Credit | — | |||
| Monthly Distribution | 676,660 | |||
| Real Estate Stock | — | |||
At October 31, 2020, the following Funds had capital loss carryforwards for federal income tax purposes available to offset future capital gains as follows:
| Capital Loss Carry | ||||||||||||||||
| Fund | Short-Term | Long-Term | Total | Forward Utilized | ||||||||||||
| Corporate/Government Bond | $ | 946,087 | $ | 577,512 | $ | 1,523,599 | $ | 1,661,249 | ||||||||
| Floating Rate Bond | 1,896,219 | 9,774,834 | 11,671,053 | — | ||||||||||||
| High-Yield Bond | 3,478,880 | 5,463,037 | 8,941,917 | — | ||||||||||||
| International Opportunity Bond | 386,984 | 55,115 | 442,099 | — | ||||||||||||
| Large Cap Value | — | 35,068 | 35,068 | — | ||||||||||||
| Small Cap Value | 1,118,935 | 4,742,978 | 5,861,913 | — | ||||||||||||
| Focused Large Cap Growth | — | — | — | — | ||||||||||||
| Small Cap Growth | — | — | — | — | ||||||||||||
| Emerging Markets Stock | 243,844 | — | 243,844 | 1,228,480 | ||||||||||||
| International Stock | — | — | — | 4,689,441 | ||||||||||||
| Dynamic Macro | 2,479,933 | 52,718 | 2,532,651 | — | ||||||||||||
| Long/Short Credit | — | — | — | — | ||||||||||||
| Monthly Distribution | — | — | — | 1,071,140 | ||||||||||||
| Real Estate Stock | — | — | — | — | ||||||||||||
131
| NOTES TO FINANCIAL STATEMENTS |
| October 31, 2020 (Continued) |
| 8. | LINE OF CREDIT |
Currently, the Funds have a $50,000,000 uncommitted line of credit provided by U.S. Bank National Association (the “Bank”) under an agreement (the “Uncommitted Line”). Any advance under the Uncommitted Line is contemplated primarily for temporary or emergency purposes, including the meeting of redemption requests that otherwise might require the untimely disposition of securities. Interest on borrowings is payable on an annualized basis at rate of Prime less .5%. The Uncommitted Line is not a “committed” line of credit, which is to say that the Bank is not obligated to lend money to a Fund. Accordingly, it is possible that a Fund may wish to borrow money for a temporary or emergency purpose but may not be able to do so. Based only on the days borrowed, the average amount of borrowings outstanding were as follows:
| Average borrowings | Average | |||||||
| Fund | outstanding | borrowings rate | ||||||
| Corporate/Government Bond | $ | 1,364,600 | 3.35 | % | ||||
| Floating Rate Bond | 1,309,667 | 3.25 | % | |||||
| High-Yield Bond | 188,000 | 2.75 | % | |||||
| International Opportunity Bond | 446,000 | 3.92 | % | |||||
| Large Cap Value | 137,000 | 4.25 | % | |||||
| Small Cap Value | 703,814 | 3.06 | % | |||||
| Focused Large Cap Growth | 1,051,294 | 3.90 | % | |||||
| Small Cap Growth | 585,667 | 2.75 | % | |||||
| Emerging Markets Stock | 505,268 | 3.11 | % | |||||
| International Stock | 653,448 | 3.19 | % | |||||
| Dynamic Macro | 3,985,500 | 3.50 | % | |||||
| Real Estate Stock | 598,407 | 2.97 | % | |||||
The interest expense for all the Funds listed above is immaterial.
As of October 31, 2020, all the Funds listed above except Emerging Markets, which had $250,000 line of credit outstanding had no outstanding borrowings on the Uncommitted Line. Funds not listed above did not access the line of credit during the year ended October 31, 2020.
| 9. | SECURITIES LENDING |
The Funds have entered into separate Securities Lending Agreements (“Agreements”) with the US Bank NA and Securities Finance Trust Company (“SFTC”). High Yield Bond, Small Cap Growth and Monthly Distribution lend securities with SFTC. All other Funds lend securities with US Bank NA. Each participating Fund can lend their securities to brokers, dealers and other financial institutions approved by the Board to earn additional income. Loans are collateralized at a value at least equal to 105% of the then current market value of any loaned security that are foreign, or 102% of the then current market value of any other loaned security. International Stock is below the 105% threshold due to market fluctuation. All interest and dividend payments received on securities which are held on loan, provided that there is no material default, will be paid to the respective Fund. A portion of the income generated by the investment in the Funds collateral, net of any rebates paid by the Bank to the borrowers is remitted to US Bank or SFTC as lending agent and the remainder is paid to the Fund(s).
Securities lending income is disclosed in the Funds’ Statements of Operations and is net of fees retained by the counterparty. Although risk is mitigated by the collateral, the Funds could experience a delay in recovering their securities and possible loss of income or value if the Borrower fails to return them. Should the borrower of the securities fail financially, each Fund has the right to repurchase the securities using the collateral in the open market. The remaining contractual maturity of all securities lending transactions are overnight and continuous.
132
| NOTES TO FINANCIAL STATEMENTS |
| October 31, 2020 (Continued) |
The below table shows the collateral held by each Fund at the end of the year.
| Gross Amounts Not Offset in the | ||||||||||||||||||||||||||
| Statement of Assets & Liabilities | ||||||||||||||||||||||||||
| Gross Amounts | Net Amounts of | |||||||||||||||||||||||||
| Gross Amounts | Offset in the | Liabilities Presented | ||||||||||||||||||||||||
| of Recognized | Statement of Assets | in the Statement of | Financial | Cash Collateral | ||||||||||||||||||||||
| Description | Counterparty | Liabilities | & Liabilities | Assets & Liabilities | Instruments | Pledged | Net Amount | |||||||||||||||||||
| Corporate/Government Bond | ||||||||||||||||||||||||||
| Liabilities | ||||||||||||||||||||||||||
| Securities Loaned | US Bank | $ | (14,414,493 | ) | $ | — | $ | (14,414,493 | ) | $ | 14,414,493 | $ | — | $ | — | |||||||||||
| Floating Rate Bond | ||||||||||||||||||||||||||
| Liabilities | ||||||||||||||||||||||||||
| Securities Loaned | US Bank | $ | (2,056,793 | ) | $ | — | $ | (2,056,793 | ) | $ | 2,056,793 | $ | — | $ | — | |||||||||||
| High-Yield Bond | ||||||||||||||||||||||||||
| Liabilities | ||||||||||||||||||||||||||
| Securities Loaned | SFTC | $ | (2,648,549 | ) | $ | — | $ | (2,648,549 | ) | $ | 2,648,549 | $ | — | $ | — | |||||||||||
| International Opportunity Bond | ||||||||||||||||||||||||||
| Liabilities | ||||||||||||||||||||||||||
| Securities Loaned | US Bank | $ | (1,968,855 | ) | $ | — | $ | (1,968,855 | ) | $ | 1,968,855 | $ | — | $ | — | |||||||||||
| Large Cap Value | ||||||||||||||||||||||||||
| Liabilities | ||||||||||||||||||||||||||
| Securities Loaned | US Bank | $ | (3,920,117 | ) | $ | — | $ | (3,920,117 | ) | $ | 3,920,117 | $ | — | $ | — | |||||||||||
| Small Cap Value | ||||||||||||||||||||||||||
| Liabilities | ||||||||||||||||||||||||||
| Securities Loaned | US Bank | $ | (6,248,698 | ) | $ | — | $ | (6,248,698 | ) | $ | 6,248,698 | $ | �� | $ | — | |||||||||||
| Focused Large Cap Growth | ||||||||||||||||||||||||||
| Liabilities | ||||||||||||||||||||||||||
| Securities Loaned | US Bank | $ | (12,361,094 | ) | $ | — | $ | (12,361,094 | ) | $ | 12,361,094 | $ | — | $ | — | |||||||||||
| Small Cap Growth | ||||||||||||||||||||||||||
| Liabilities | ||||||||||||||||||||||||||
| Securities Loaned | SFTC | $ | (885,126 | ) | $ | — | $ | (885,126 | ) | $ | 885,126 | $ | — | $ | — | |||||||||||
| Emerging Markets Stock | ||||||||||||||||||||||||||
| Liabilities | ||||||||||||||||||||||||||
| Securities Loaned | US Bank | $ | (3,261,479 | ) | $ | — | $ | (3,261,479 | ) | $ | 3,261,479 | $ | — | $ | — | |||||||||||
| International Stock | ||||||||||||||||||||||||||
| Liabilities | ||||||||||||||||||||||||||
| Securities Loaned | US Bank | $ | (8,764,809 | ) | $ | — | $ | (8,764,809 | ) | $ | 8,764,809 | $ | — | $ | — | |||||||||||
| Dynamic Macro | ||||||||||||||||||||||||||
| Liabilities | ||||||||||||||||||||||||||
| Securities Loaned | US Bank | $ | (423,660 | ) | $ | — | $ | (423,660 | ) | $ | 423,660 | $ | — | $ | — | |||||||||||
| Long/Short Credit | ||||||||||||||||||||||||||
| Liabilities | ||||||||||||||||||||||||||
| Securities Loaned | US Bank | $ | (18,515,308 | ) | $ | — | $ | (18,515,308 | ) | $ | 18,515,308 | $ | — | $ | — | |||||||||||
| Monthly Distribution | ||||||||||||||||||||||||||
| Liabilities | ||||||||||||||||||||||||||
| Securities Loaned | SFTC | $ | (5,585,545 | ) | $ | — | $ | (5,585,545 | ) | $ | 5,585,545 | $ | — | $ | — | |||||||||||
| Real Estate Stock | ||||||||||||||||||||||||||
| Liabilities | ||||||||||||||||||||||||||
| Securities Loaned | US Bank | $ | (15,743,029 | ) | $ | — | $ | (15,743,029 | ) | $ | 15,743,029 | $ | — | $ | — | |||||||||||
133
| NOTES TO FINANCIAL STATEMENTS |
| October 31, 2020 (Continued) |
The following table presents financial instruments that are subject to enforceable netting arrangements as of October 31, 2020.
| Gross Amounts of Assets Presented in the Statements of Assets and Liabilities | ||||||||
| Market Value of Loaned | Market Value of | |||||||
| Fund | Securities | Collateral (1) | ||||||
| Corporate/Government Bond (2) | $ | 13,884,502 | $ | 13,884,502 | ||||
| Floating Rate Bond | 1,990,961 | 1,990,961 | ||||||
| High-Yield Bond | 2,551,319 | 2,551,319 | ||||||
| International Opportunity Bond * | 1,905,266 | 1,905,266 | ||||||
| Large Cap Value | 3,854,024 | 3,854,024 | ||||||
| Small Cap Value | 5,999,517 | 5,999,517 | ||||||
| Focused Large Cap Growth | 11,899,810 | 11,899,810 | ||||||
| Small Cap Growth | 834,470 | 834,470 | ||||||
| Emerging Markets Stock * | 3,077,002 | 3,077,002 | ||||||
| International Stock * | 8,356,960 | 8,356,960 | ||||||
| Dynamic Macro * (3) | 410,851 | 410,851 | ||||||
| Long/Short Credit | 18,010,190 | 18,010,190 | ||||||
| Monthly Distribution | 5,465,358 | 5,465,358 | ||||||
| Real Estate Stock | 15,109,492 | 15,109,492 | ||||||
| (1) | The amount is limited to the loaned securities and accordingly, does not include excess collateral pledged. |
| (2) | Securities loaned with a value of $112,827 have been sold and are pending settlement. |
| (3) | Securities loaned with a value of $391,000 have been sold and are pending settlement. |
| * | Securities collateralized below 102% or 105% for foreign securities. The Trust’s securities lending policies and procedures require that the borrower: (i) deliver cash or U.S. Government securities as collateral with respect to each new loan of U.S. securities, equal to at least 102% or 105% of the value of the portfolio securities loaned, and (ii) at all times thereafter mark-to-market the collateral on a daily basis so that the market value of such collateral is at least 100% of the value of securities loaned. From time to time the collateral may not be 102% or 105% due to end of day market movement. The next business day, additional collateral is obtained/received from the borrower to replenish/reestablish 102% or 105%. |
| 10. | UNDERLYING INVESTMENTS IN OTHER INVESTMENT COMPANIES |
The Funds invest in other investment companies. Each underlying fund, including each ETF, is subject to specific risks, depending on the nature of the underlying fund. These risks could include liquidity risk, sector risk, foreign and related currency risk and high yield risk. Investors in the Funds will indirectly bear fees and expenses charged by the underlying investment companies in which the Funds invest in addition to the Funds’ direct fees and expenses. All the Funds may invest in investment companies. Such investments would subject the Funds to similar risks.
The performance of Dynamic Macro will be directly affected by the performance of the SPDR S&P 500 ETF Trust. The financial statements of this Fund, including the portfolio of investments, can be found at the Securities and Exchange Commission’s (“SEC”) website www.sec.gov and should be read in conjunction with Dynamic Macro’s financial statements. As of October 31, 2020, the percentage of Dynamic Macro Fund invested in the SPDR S&P 500 ETF Trust was 27.5%.
The performance of Monthly Distribution will be directly affected by the performance of the Fidelity Government Portfolio – Class Institutional. The financial statements of this Fund, including the portfolio of investments, can be found at the SEC website www.sec.gov and should be read in conjunction with Monthly Distribution’s financial statements. As of October 31, 2020, the percentage of Monthly Distribution Fund invested in the Fidelity Government Portfolio – Class Institutional was 37.9%.
| 11. | SUBSEQUENT EVENTS |
Subsequent events after the date of the Statements of Assets and Liabilities have been evaluated through the date the financial statements were issued. Management has determined that no events or transactions occurred requiring adjustment or disclosure in the financial statements.
134

REPORT OF INDEPENDENT REGISTERED PUBLIC ACCOUNTING FIRM
To the Board of Trustees and the Shareholders of Dunham Funds
Opinion on the Financial Statements
We have audited the accompanying statements of assets and liabilities of Dunham Corporate/Government Bond Fund, Dunham Floating Rate Bond Fund, Dunham High-Yield Bond Fund, Dunham International Opportunity Bond Fund, Dunham Large Cap Value Fund, Dunham Small Cap Value Fund, Dunham Focused Large Cap Growth Fund, Dunham Small Cap Growth Fund, Dunham Emerging Markets Stock Fund, Dunham International Stock Fund, Dunham Dynamic Macro Fund, Dunham Long/Short Credit Fund, Dunham Monthly Distribution Fund, and Dunham Real Estate Stock Fund, each a series of shares of beneficial interest in Dunham Funds (the “Funds”), including the schedules of investments, as of October 31, 2020, and the related statements of operations for the year then ended, the statements of changes in net assets for each of the years in the two-year period then ended, the financial highlights for each of the years in the five-year period then ended, and the related notes (collectively referred to as the “financial statements”). In our opinion, the financial statements present fairly, in all material respects, the financial position of the Funds as of October 31, 2020, and the results of their operations for the year then ended, the changes in their net assets for each of the years in the two-year period then ended and their financial highlights for each of the years in the five- year period then ended, in conformity with accounting principles generally accepted in the United States of America.
Basis for Opinion
These financial statements are the responsibility of the Funds’ management. Our responsibility is to express an opinion on the Funds’ financial statements based on our audits. We are a public accounting firm registered with the Public Company Accounting Oversight Board (United States) (“PCAOB”) and are required to be independent with respect to the Funds in accordance with the U.S. federal securities law and the applicable rules and regulations of the Securities and Exchange Commission and the PCAOB.
We conducted our audits in accordance with the standards of the PCAOB. Those standards require that we plan and perform the audits to obtain reasonable assurance about whether the financial statements are free of material misstatement, whether due to error or fraud. The Funds are not required to have, nor were we engaged to perform, an audit of their internal control over financial reporting. As part of our audits we are required to obtain an understanding of internal control over financial reporting but not for the purpose of expressing an opinion on the effectiveness of the Funds’ internal control over financial reporting. Accordingly, we express no such opinion.
135
Our audits included performing procedures to assess the risk of material misstatement of the financial statements, whether due to error or fraud, and performing procedures that respond to those risks. Such procedures included examining, on a test basis, evidence regarding the amounts and disclosures in the financial statements. Our procedures included confirmation of securities owned as of October 31, 2020 by correspondence with the custodian, brokers, and other appropriate parties or by other appropriate auditing procedures where replies from brokers were not received. Our audits also included evaluating the accounting principles used and significant estimates made by management, as well as evaluating the overall presentation of the financial statements. We believe that our audits provide a reasonable basis for our opinion.

BBD, LLP
We have served as the auditor of one or more of the Funds in the Dunham Funds since 2007.
Philadelphia, Pennsylvania
December 30, 2020
136
| TRUSTEES & OFFICERS (Unaudited) |
Trustees and officers of the Trust, together with information as to their principal business occupations during the last five years, are shown below. Each Trustee who is considered an “interested person” of the Trust (as defined in Section 2(a)(19) of the 1940 Act) is indicated by an asterisk next to his name. Unless otherwise noted, the address of each Trustee and Officer is 10251 Vista Sorrento Parkway, Suite 200 San Diego, CA 92121.
| Name, Age and Address | Position(s) Held with Trust | Term of Office and Length of Time Served ^ | Principal Occupation(s) During the Past 5 Years and Current Directorships | Number of Funds in the Trust Overseen by Trustee | Other Directorships During the Past 5 Years |
| Non-Interested Trustees | |||||
| Henry R. Goldstein Age:89 | Trustee | Since January 2008 | Retired; Self-employed consultant/mediator (financial services), 2009-2017; Independent Contractor, RBC Daniels (financial services company for telecom industry), 2007-2009. | 14 | None |
| Paul A. Rosinack Age:73 | Trustee | Since January 2008 | Retired; President/Chief Executive Officer / Director, Qualigen, Inc., (manufacturer of medical products and equipment) 2004-2017. | 14 | None |
| Interested Trustees and Officers | |||||
| Jeffrey A. Dunham* Age: 59 | Trustee, Chairman of Board, President & Principal Executive Officer | Since January 2008 | Chief Executive Officer, Dunham & Associates Investment Counsel, Inc., (registered investment adviser, broker-dealer and distributor for mutual funds), 1985-present; Chief Executive Officer, Dunham & Associates Holdings, Inc. (holding company), 1999-present; Chief Executive Officer, Dunham & Associates Securities, Inc. (general partner for various limited partnerships), 1986-present; Chief Executive Officer, Asset Managers, Inc. (general partner for various limited partnerships), 1985-present; Chairman and Chief Executive Officer, Dunham Trust Company, 1999-present. | 14 | None |
| Denise S. Iverson Age: 61 | Treasurer & Principal Financial Officer | Since January 2008 | Chief Financial Officer, Dunham & Associates Investment Counsel, Inc. (registered investment adviser, broker-dealer, and distributor for mutual funds), 1999-present; Chief Financial Officer, Dunham & Associates Holdings, Inc. (holding company), 1999-present; Chief Financial Officer, Dunham & Associates Securities, Inc. (general partner for various limited partnerships), 1999-present; Chief Financial Officer, Asset Managers, Inc. (general partner for various limited partners), 1999-present; Chief Financial Officer and Director, Dunham Trust Company, 1999-present. | N/A | N/A |
| Joseph P. Kelly II Age: 45 | Chief Compliance Officer | Since January 2014 | General Counsel and Chief Compliance Officer, Dunham & Associates, Investment Counsel, Inc. (registered investment adviser, broker-dealer and distributor for mutual funds), November 2013-present; Senior Associate, Dechert LLP (law firm), 2005-October 2013. | N/A | N/A |
| Tamara Beth Wendoll Age: 48 | Secretary, AML Officer, and Chief Operating Officer | Since December 2008 and September 2010 | Chief Operating Officer, Dunham & Associates Investment Counsel, Inc. (registered investment advisers, broker-dealer and distributor for mutual funds), 2008-present. | N/A | N/A |
| Ryan Dykmans Age: 38 | Assistant Secretary | Since October 2015 | Director of Research, June 2013-present; Senior Investment Analyst from 2009-2013, Dunham & Associates Investment Counsel, Inc. (registered investment adviser, broker-dealer and distributor for mutual funds). | N/A | N/A |
| James Colantino Gemini Fund Services, LLC 4221 North 203rd Street, Suite 100, Elkhorn, Nebraska 68022-3474 Age: 51 | Assistant Treasurer | Since January 2008 | Senior Vice President – Fund Administration, 2012-present; Vice President (2004-2012); Senior Fund Administrator (1999-2004), Gemini Fund Services, LLC. | N/A | N/A |
| ^ | Each Trustee will serve an indefinite term until his successor, if any, is duly elected and qualified. Officers of the Trust are elected annually. |
137
| DUNHAM FUNDS’ EXPENSES (Unaudited) |
Example
Shareholders of mutual funds will pay (1) transitional costs, such as sales load, and (2) ongoing expenses, such as advisory fees, distribution and service fees (12b-1), and other fund expenses. The following examples are intended to help you understand the ongoing cost (in dollars) of investing in a fund and to compare these costs with the ongoing costs of investing in other mutual funds. Please note, the expenses shown in the tables are meant to highlight ongoing costs only and do not reflect any transactional costs, such as sales charges (loads), or contingent deferred sales charges on redemptions which may be assessed by mutual funds. This Example is based on an investment of $1,000 invested at the beginning of the period and held for the entire period as indicated below.
Actual Expenses
The columns under the heading entitled “Actual” help you estimate the actual expenses you paid over the period. The “Actual-Ending Account Value” shown is derived from the Fund’s actual return, and the “Actual- Expenses Paid During Period” shows the dollar amount that would have been paid by an investor who started with $1,000 in the Fund. To estimate the expenses you paid on your account during this period, simply divide your account value by $1,000 (for example, an $8,600 account value divided by $1,000 = 8.6), then multiply the result by the number in the column under the heading entitled “Actual-Expenses Paid During Period”.
Hypothetical Examples for Comparison Purposes
The columns under the heading entitled “Hypothetical” provide information about hypothetical account value and hypothetical expenses based on the Fund’s actual expense ratio and an assumed rate of return of 5% per year before expenses, which is not the Fund’s actual return. The hypothetical account values and expenses may not be used to estimate the actual ending account balance or expenses you paid for the period. You may use this information to compare the ongoing costs of investing in the Fund and other funds. To do so, compare this 5% hypothetical example with the 5% hypothetical examples that appear in the shareholder reports of other funds.
Please note that the expenses shown in the table are meant to highlight your ongoing costs only and do not reflect any transactional costs which may be applicable to your account. Therefore, the last column of the table (Hypothetical- Expenses Paid During Period) is useful in comparing ongoing costs only, and will not help you determine the relative total costs of owning different funds. In addition, if these transactional costs were included, your costs would have been higher.
| Actual | Hypothetical | |||||||||||
| Fund’s | Ending | Ending | ||||||||||
| Annualized | Beginning | Account | Expenses | Account | Expenses | |||||||
| Expense | Account | Value | Paid During | Value | Paid During | |||||||
| Ratio | Value 5/1/20 | 10/31/20 | Period* | 10/31/20 | Period* | |||||||
| Class N: | ||||||||||||
| Corporate/Government Bond Fund | 1.21% | $1,000.00 | $1,047.70 | $6.24 | $1,019.04 | $6.15 | ||||||
| Floating Rate Bond Fund | 0.94% | $1,000.00 | $1,069.30 | $4.87 | $1,020.43 | $4.76 | ||||||
| High-Yield Bond Fund | 1.14% | $1,000.00 | $1,102.20 | $6.04 | $1,019.39 | $5.80 | ||||||
| International Opportunity Bond Fund | 1.30% | $1,000.00 | $1,117.40 | $6.94 | $1,018.58 | $6.62 | ||||||
| Large Cap Value Fund | 1.26% | $1,000.00 | $1,072.70 | $6.55 | $1,018.81 | $6.38 | ||||||
| Small Cap Value Fund | 1.00% | $1,000.00 | $1,071.00 | $5.21 | $1,020.11 | $5.08 | ||||||
| Focused Large Cap Growth Fund | 1.32% | $1,000.00 | $1,265.30 | $7.52 | $1,018.50 | $6.70 | ||||||
| Small Cap Growth Fund | 1.99% | $1,000.00 | $1,364.90 | $11.80 | $1,015.15 | $10.06 | ||||||
| Emerging Markets Stock Fund | 1.90% | $1,000.00 | $1,223.70 | $10.63 | $1,015.58 | $9.63 | ||||||
| International Stock Fund | 2.01% | $1,000.00 | $1,140.50 | $10.83 | $1,015.01 | $10.20 | ||||||
| Dynamic Macro Fund | 1.55% | $1,000.00 | $1,062.70 | $8.04 | $1,017.34 | $7.86 | ||||||
| Long/Short Credit Fund | 1.44% | $1,000.00 | $1,038.10 | $7.36 | $1,017.91 | $7.29 | ||||||
| Monthly Distribution Fund | 1.96% | $1,000.00 | $1,018.60 | $9.95 | $1,015.28 | $9.93 | ||||||
| Real Estate Stock Fund | 1.74% | $1,000.00 | $1,087.80 | $9.13 | $1,016.39 | $8.81 | ||||||
| Class A: | ||||||||||||
| Corporate/Government Bond Fund | 1.46% | $1,000.00 | $1,046.50 | $7.53 | $1,017.78 | $7.42 | ||||||
| Floating Rate Bond Fund | 1.19% | $1,000.00 | $1,066.70 | $6.18 | $1,019.16 | $6.04 | ||||||
| High-Yield Bond Fund | 1.39% | $1,000.00 | $1,099.70 | $7.35 | $1,018.13 | $7.07 | ||||||
| International Opportunity Bond Fund | 1.56% | $1,000.00 | $1,115.90 | $8.29 | $1,017.30 | $7.91 | ||||||
| Large Cap Value Fund | 1.51% | $1,000.00 | $1,071.40 | $7.85 | $1,017.56 | $7.65 | ||||||
| Small Cap Value Fund | 1.24% | $1,000.00 | $1,069.50 | $6.46 | $1,018.89 | $6.30 | ||||||
| Focused Large Cap Growth Fund | 1.57% | $1,000.00 | $1,263.60 | $8.93 | $1,017.24 | $7.96 | ||||||
| Small Cap Growth Fund | 2.23% | $1,000.00 | $1,362.80 | $13.24 | $1,013.93 | $11.29 | ||||||
| Emerging Markets Stock Fund | 2.15% | $1,000.00 | $1,222.50 | $12.02 | $1,014.32 | $10.90 | ||||||
| International Stock Fund | 2.27% | $1,000.00 | $1,139.30 | $12.20 | $1,013.73 | $11.48 | ||||||
| Dynamic Macro Fund | 1.80% | $1,000.00 | $1,061.10 | $9.33 | $1,016.08 | $9.13 | ||||||
| Long/Short Credit Fund | 1.62% | $1,000.00 | $1,037.00 | $8.29 | $1,017.00 | $8.21 | ||||||
| Monthly Distribution Fund | 2.21% | $1,000.00 | $1,017.30 | $11.21 | $1,014.03 | $11.19 | ||||||
| Real Estate Stock Fund | 1.99% | $1,000.00 | $1,086.40 | $10.43 | $1,015.14 | $10.07 | ||||||
138
| DUNHAM FUNDS’ EXPENSES (Unaudited) (Continued) |
| Actual | Hypothetical | |||||||||||
| Fund’s | Ending | Ending | ||||||||||
| Annualized | Beginning | Account | Expenses | Account | Expenses | |||||||
| Expense | Account | Value | Paid During | Value | Paid During | |||||||
| Ratio | Value 5/1/20 | 10/31/20 | Period* | 10/31/20 | Period* | |||||||
| Class C: | ||||||||||||
| Corporate/Government Bond Fund | 1.98% | $1,000.00 | $1,043.30 | $10.15 | $1,015.20 | $10.01 | ||||||
| Floating Rate Bond Fund | 1.69% | $1,000.00 | $1,065.20 | $8.78 | $1,016.63 | $8.58 | ||||||
| High-Yield Bond Fund | 1.89% | $1,000.00 | $1,097.20 | $9.98 | $1,015.62 | $9.59 | ||||||
| International Opportunity Bond Fund | 2.05% | $1,000.00 | $1,113.70 | $10.88 | $1,014.84 | $10.37 | ||||||
| Large Cap Value Fund | 2.26% | $1,000.00 | $1,067.60 | $11.74 | $1,013.79 | $11.43 | ||||||
| Small Cap Value Fund | 2.01% | $1,000.00 | $1,065.70 | $10.43 | $1,015.04 | $10.17 | ||||||
| Focused Large Cap Growth Fund | 2.32% | $1,000.00 | $1,258.70 | $13.17 | $1,013.47 | $11.74 | ||||||
| Small Cap Growth Fund | 2.99% | $1,000.00 | $1,358.00 | $17.74 | $1,010.09 | $15.12 | ||||||
| Emerging Markets Stock Fund | 2.91% | $1,000.00 | $1,217.10 | $16.20 | $1,010.53 | $14.69 | ||||||
| International Stock Fund | 3.02% | $1,000.00 | $1,135.50 | $16.23 | $1,009.94 | $15.27 | ||||||
| Dynamic Macro Fund | 2.55% | $1,000.00 | $1,056.40 | $13.18 | $1,012.32 | $12.90 | ||||||
| Long/Short Credit Fund | 2.41% | $1,000.00 | $1,033.10 | $12.33 | $1,013.01 | $12.20 | ||||||
| Monthly Distribution Fund | 2.96% | $1,000.00 | $1,013.30 | $14.99 | $1,010.24 | $14.97 | ||||||
| Real Estate Stock Fund | 2.74% | $1,000.00 | $1,082.30 | $14.33 | $1,011.37 | $13.84 | ||||||
| * | Expenses Paid During Period are equal to the Fund’s annualized expense ratio, multiplied by the average account value over the period, multiplied by 184 days and divided by 366 (to reflect the number of days in the six month period ending October 31, 2020). |
139
Privacy Notice
| FACTS | WHAT DO THE DUNHAM FUNDS DO WITH YOUR PERSONAL INFORMATION? |
| Why? | Financial companies choose how they share your personal information. Federal law gives consumers the right to limit some but not all sharing. Federal law also requires us to tell you how we collect, share, and protect your personal information. Please read this notice carefully to understand what we do. |
| What? | The types of personal information we collect and share depend on the product or service you have with us. This information can include:
■ Social Security number and wire transfer instructions
■ account transactions and transaction history
■ investment experience and purchase history
When you are no longer a customer, we continue to share your information as described in this notice. |
| How? | All financial companies need to share customers’ personal information to run their everyday business. In the section below, we list the reasons financial companies can share their customers’ personal information; the reasons the Dunham Funds chooses to share; and whether you can limit this sharing. |
| Reasons we can share your personal information | Do Dunham Funds share? | Can you limit this sharing? |
| For our everyday business purposes - such as to process your transactions, maintain your account(s), respond to court orders and legal investigations, or report to credit bureaus | Yes | No |
| For our marketing purposes - to offer our products and services to you | Yes | No |
| For joint marketing with other financial companies | No | We don’t share |
| For our affiliates’ everyday business purposes - information about your transactions and experiences | No | We don’t share |
| For our affiliates’ everyday business purposes - information about your creditworthiness | No | We don’t share |
| For nonaffiliates to market to you | No | We don’t share |
| Questions? | Call (800) 442-4358 or go to www.dunham.com |
140
| What we do | |
| How do Dunham Funds protect my personal information? | To protect your personal information from unauthorized access and use, we use security measures that comply with federal law. These measures include computer safeguards and secured files and buildings.
We permit only authorized parties and affiliates (as permitted by law) who have signed an agreement (which protects your personal information) with us to have access to customer information. |
| How do Dunham Funds collect my personal information? | We collect your personal information, for example, when you ■ open and account or deposit money
■ direct us to buy securities or direct us to sell your securities
■ seek advice about your investments
We also collect your personal information from others, such as credit bureaus, affiliates, or other companies. |
| Why can’t I limit all sharing? | Federal law gives you the right to limit only ■ sharing for affiliates’ everyday business purposes-information about your creditworthiness
■ affiliates from using your information to market to you
■ sharing for nonaffiliates to market to you
State laws and individual companies may give you additional rights to limit sharing. |
| Definitions | |
| Affiliates | Companies related by common ownership or control. They can be financial and nonfinancial companies.
■ Our affiliates include financial companies, such as Dunham & Associates Investment Counsel, Inc. |
| Nonaffiliates | Companies not related by common ownership or control. They can be financial and nonfinancial companies.
■ Dunham Funds do not share with nonaffiliates so they can market to you. |
| Joint marketing | A formal agreement between nonaffiliated financial companies that together market financial products or services to you.
■ Dunham Funds doesn’t jointly market |
141
How to Obtain Proxy Voting Information
Information regarding how the Funds voted proxies relating to portfolio securities for the most recent 12-month period ended June 30 as well as a description of the policies and procedures that the Funds use to determine how to vote proxies is available without charge, upon request, by calling (888)-3DUNHAM (338-6426) or by referring to the Securities and Exchange Commission’s (“SEC”) website at http://www.sec.gov.
How to Obtain 1st and 3rd Fiscal Quarter Portfolio Holdings
Each Fund files its complete schedule of portfolio holdings with the SEC for the first and third quarters of each fiscal year on Form N-PORT. Form N-PORT is available on the SEC’s website at http://www.sec.gov and may be reviewed and copied at the SEC’s Public Reference Room in Washington, DC (800)-SEC-0330. The information on Form N-PORT is available without charge, upon request, by calling (888)-3DUNHAM (338-6426).

| P.O. Box 910309 |
| San Diego, California 92191 |
| (800) 442-4358 |
Distributed by Dunham & Associates Investment Counsel, Inc. Member FINRA/SIPC
THIS REPORT AND FINANCIAL STATEMENTS CONTAINED HEREIN ARE NOT INTENDED TO BE A FORECAST OF FUTURE EVENTS, A GUARANTEE OF FUTURE RESULTS, OR INVESTMENT ADVICE. FURTHER, THERE IS NO ASSURANCE THAT CERTAIN SECURITIES WILL REMAIN IN OR OUT OF EACH FUND’S PORTFOLIO.
THE FIGURES IN THIS REPORT REPRESENT PAST PERFORMANCE AND DO NOT GUARANTEE FUTURE RESULTS. THE PRINCIPAL VALUE OF AN INVESTMENT AND INVESTMENT RETURN WILL FLUCTUATE SO THAT AN INVESTOR’S SHARES, WHEN REDEEMED, MAY BE WORTH MORE OR LESS THAN THEIR ORIGINAL COST.
Item 2. Code of Ethics.
(a) As of the end of the period covered by this report, the registrant has adopted a code of ethics that applies to the registrant's principal executive officer, principal financial officer, principal accounting officer or controller, or persons performing similar functions, regardless of whether these individuals are employed by the registrant or a third party.
(b) For purposes of this item, “code of ethics” means written standards that are reasonably designed to deter wrongdoing and to promote:
| (1) | Honest and ethical conduct, including the ethical handling of actual or apparent conflicts of interest between personal and professional relationships; |
| (2) | Full, fair, accurate, timely, and understandable disclosure in reports and documents that a registrant files with, or submits to, the Commission and in other public communications made by the registrant; |
(3) Compliance with applicable governmental laws, rules, and regulations;
| (4) | The prompt internal reporting of violations of the code to an appropriate person or persons identified in the code; and |
(5) Accountability for adherence to the code.
(c) Amendments:
During the period covered by the report, there have not been any amendments to the provisions of the code of ethics.
(d) Waivers:
During the period covered by the report, the registrant has not granted any express or implicit waivers from the provisions of the code of ethics.
Item 3. Audit Committee Financial Expert.
| (a) | Timothy M. Considine, who served as an audit committee financial expert, resigned as a member of the Board of Trustees effective October 8, 2019. The search for his replacement is ongoing. As a result, the Registrant’s Board of Trustees has determined that it does not have an audit committee financial expert serving on its audit committee. In the interim, the Registrant believes that the experience provided by each member of the audit committee together offer the Registrant adequate oversight for the Registrant’s level of financial complexity. |
Item 4. Principal Accountant Fees and Services.
| (a) | Audit Fees |
FY 2020 $ 173,600
FY 2019 $ 173,600
| (b) | Audit-Related Fees |
FY 2020 $ 0
FY 2019 $ 0
Nature of the fees:
| (c) | Tax Fees |
FY 2020 $ 30,800
FY 2019 $ 30,800
Nature of the fees: Preparation of federal and state tax returns and review of annual dividend calculations.
| (d) | All Other Fees |
Registrant Adviser
FY 2020 $ 0 $ 0
FY 2019 $ 0 $ 0
Nature of the fees:
| (e) | (1) Audit Committee’s Pre-Approval Policies |
The registrant’s Audit Committee is required to pre-approve all audit services and, when appropriate, any non-audit services (including audit-related, tax and all other services) to the registrant. The registrant’s Audit Committee is also required to pre-approve, when appropriate, any non-audit services (including audit-related, tax and all other services) to its adviser, or any entity controlling, controlled by or under common control with the adviser that provides ongoing services to the registrant to the extent that the services are determined to have a direct impact on the operations or financial reporting of the registrant. Services are reviewed on an engagement by engagement basis by the audit committee.
| (2) | Percentages of 2020 Services Approved by the Audit Committee |
Registrant Adviser
Audit-Related Fees: 0 % 0 %
Tax Fees: 0 % 0 %
All Other Fees: 0 % 0 %
(f) During audit of registrant's financial statements for the most recent fiscal year, less than 50 percent of the hours expended on the principal accountant's engagement were attributed to work performed by persons other than the principal accountant's full-time, permanent employees.
(g) The aggregate non-audit fees billed by the registrant's accountant for services rendered to the registrant, and rendered to the registrant's investment adviser (not including any sub-adviser whose role is primarily portfolio management and is subcontracted with or overseen by another investment adviser), and any entity controlling, controlled by, or under common control with the adviser that provides ongoing services to the registrant:
Registrant Adviser
FY 2020 $30,800 $ None
FY 2019 $30,800 $ None
(h) Not applicable. All non-audit services to the registrant were pre-approved by the Audit Committee.
Item 5. Audit Committee of Listed Companies. Not applicable to open-end investment companies.
Item 6. Schedule of Investments. Schedule of investments in securities of unaffiliated issuers is included under Item 1.
Item 7. Disclosure of Proxy Voting Policies and Procedures for Closed-End Funds. Not applicable to open-end investment companies.
Item 8. Portfolio Managers of Closed-End Funds. Not applicable to open-end investment companies.
Item 9. Purchases of Equity Securities by Closed-End Funds. Not applicable to open-end investment companies.
Item 10. Submission of Matters to a Vote of Security Holders. None
Item 11. Controls and Procedures.
(a) Based on an evaluation of the registrant’s disclosure controls and procedures as of a date within 90 days of filing date of this Form N-CSR, the disclosure controls and procedures are reasonably designed to ensure that the information required in filings on Forms N-CSR is recorded, processed, summarized, and reported on a timely basis.
(b) There were no significant changes in the registrant’s internal control over financial reporting that occurred during the registrant’s last fiscal half-year that have materially affected, or are reasonably likely to materially affect, the registrant’s internal control over financial reporting.
Item 12. Disclosure of Securities Lending Activities for Closed-End Management Investment Companies. Not applicable to open-end investment companies.
Item 13. Exhibits.
(a)(1) Code of Ethics filed herewith.
(a)(3) Not applicable.
SIGNATURES
Pursuant to the requirements of the Securities Exchange Act of 1934 and the Investment Company Act of 1940, the registrant has duly caused this report to be signed on its behalf by the undersigned, thereunto duly authorized.
(Registrant) Dunham Funds
By (Signature and Title)
/s/ Jeffrey Dunham
Jeffrey Dunham, Principal Executive Officer/President
Date 1/8/21
Pursuant to the requirements of the Securities Exchange Act of 1934 and the Investment Company Act of 1940, this report has been signed below by the following persons on behalf of the registrant and in the capacities and on the dates indicated.
By (Signature and Title)
/s/ Jeffrey Dunham
Jeffrey Dunham, Principal Executive Officer/President
Date 1/8/21
By (Signature and Title)
/s/ Denise Iverson
Denise Iverson, Principal Financial Officer/Treasurer
Date 1/8/21