Exhibit (c)(10)
Corporate and Investment Banking | Global Power Corporate and Investment Banking | Global Power May 27, 2016 Project Revere Citi Presentation to Talen’s Board of Directors [***] indicates information that has been omitted on the basis of a confidential treatment request pursuant to Rule 24b-2 of the Securities Exchange Act of 1934, as amended (the “Exchange Act“). This information has been filed separately with the Securities and Exchange Commission (the “SEC). Strictly Private and Confidential
Confidential Material Disclaimer The following pages contain material provided to the Board of Directors of Talen Energy Corporation (“Talen” or the “Company”) by Citigroup Global Markets Inc. (“Citi”) in connection with a proposal from Riverstone Holdings LLC (“Riverstone”). The accompanying material was compiled or prepared on a confidential basis solely for the use of the Board of Directors of the Company and not with a view toward public disclosure under any securities laws or otherwise. The information contained in the accompanying material was obtained from the Company and other sources. Any estimates and projections contained herein have been prepared or adopted by management of the Company, obtained from public sources, or are based upon such estimates and projections, and involve numerous and significant subjective determinations, and there is no assurance that such estimates and projections will be realized. Citi does not take responsibility for such estimates and projections, or the basis on which they were prepared. No representation or warranty, express or implied, is made as to the accuracy or completeness of such information and nothing contained herein is, or shall be relied upon as, a representation, whether as to the past, the present or the future. In preparing the accompanying material, Citi assumed and relied, without independent verification, upon the accuracy and completeness of all financial and other information and data publicly available or provided to or otherwise reviewed by or discussed with Citi and upon the assurances of the management of the Company, that they are not aware of any relevant information that has been omitted or that remains undisclosed to Citi. The accompanying material was not prepared for use by readers not as familiar with the Company as the Board of Directors of the Company and, accordingly, neither the Company nor Citi nor their respective legal or financial advisors or accountants take any responsibility for the accompanying material if used by persons other than the Board of Directors of the Company. The accompanying material is necessarily based upon information available to Citi, and financial, stock market and other conditions and circumstances existing and disclosed to Citi, as of the date of the accompanying material. Citi does not have any obligation to update or otherwise revise the accompanying material. Nothing contained herein shall be construed as legal, regulatory, tax or accounting advice. 1

Project Revere Overview As you know, Project Revere has been ongoing since December 2015. Set forth below is a general timeline and overview of the salient points related to Project Revere. General Timeline o Project Revere commenced on December 3, 2015, when Riverstone sent an email to Talen's Chairman with an offer to buy the 65% of the Company it did not already own for $11.00 per share, representing a 45.3% premium to the closing price on December 2, 2015 of $7.57 per share; a letter was sent to Talen's Board (the "Board") on December 11, 2015 confirming this offer o At a Talen Board meeting on December 18, 2015, Riverstone presented its offer, and Citi was present to give a market overview to the Board, while Kirkland & Ellis presented the Board with its fiduciary responsibilities o On January 11, 2016, Citi presented a valuation analysis to the Board and Kirkland & Ellis addressed fiduciary responsibilities o After reviewing Riverstone's proposal with the assistance of its financial and legal advisors, the Board concluded that the proposal undervalued the Company and determined not to pursue the offer, and this message was relayed by Talen's Chairman on January 14, 2016 o On January 29, 2016, Riverstone indicated to Talen's Chairman that it was willing to increase its offer price from $11.00 per share to $13.00 per share, and in a letter addressed to the Board and dated February 3, 2016, Riverstone confirmed this increase in offer price o After reviewing the increased offer price, the Board authorized the Company to engage with Riverstone to explore a potential Transaction based on the valuation previously conveyed by Riverstone and expressed this authorization in a letter addressed to Riverstone on February 4, 2016, after which a non-disclosure agreement was executed - Since then, there have been numerous diligence sessions and exchanges of a draft merger agreement between Riverstone, Talen and each entity's respective financial and legal advisors o On March 31, 2016, [***] executed a non-disclosure agreement with Talen, and a management presentation was given by the Company to [***] on April 7, 2016 - There have been several diligence sessions with management o On April 1, 2016, an article was published in SparkSpread (a Power trade publication) referencing a potential LBO of Talen o On April 13, 2016, [***] sent a letter to Talen's management with a proposal to buy 100% of the Company for $13.50 - 14.00 per share o On April 19, 2016, a formal Process Letter was sent to each Riverstone and [***] indicating that Final Bids would be on May 20, 2016 o On May 23, 2016, the Board met to continue to evaluate the transaction o On May 24, 2016, PJM announced auction results for 2019/2020 which were lower than expectations, resulting in a downward EBITDA impact in 2019 and 2020 o On May 26, 2016, Riverstone sent a letter to the Board reaffirming its $13.00 per share offer and an updated contract Process Overview o For the entirety of Project Revere, the Independent Board members have had numerous meetings and calls to discuss progress and updates; these meetings and calls have included updates from the Company's financial and legal advisors o Throughout the process, and since the receipt of [***]'s non-binding proposal, both Riverstone and [***] have been granted access to the same information and the same level of diligence o The advisors have been in ongoing dialogue with [***], who has indicated that it was considering sending the Board an updated offer letter [***] indicates information that has been omitted on the basis of confidential treatment request to Rule 24b-2 of the Exchange Act. This information has been separately with the SEC.

Talen & IPP Stock Price Analysis Talen Stock Price Commentary Talen’s Implied Stock Price if Indexed to Peers1(Indexed as of March 31, 2016)Relative IPP Stock Price Performance(As of March 31, 2016)(10.0) 0.0 10.0 20.0 30.0 40.0 50.0% 3/31/2016 4/11/2016 4/22/2016 5/3/2016 5/14/2016 5/25/2016 TLN CPN DYN NRG IPP TLN: 23.4% DYN: 23.1% NRG: 21.8% CPN: (4.4%) IPP: 13.5% $9.00 $9.11 $10.22 44.4% 42.7% 27.2% 03/31/2016 04/01/2016 05/25/2016 55.6% 53.7% 37.0% Talen has outperformed peers year-to-date Talen stock price moved 11.6% on the day of the SparkSpread leak Riverstone’s $13.00 per share proposal represents: – 44.4% premium to Talen’s pre-SparkSpread leak stock price of $9.00 – 27.2% premium to Talen’s current implied stock price of $10.22 if Talen performed consistently with its peers Source: FactSet. Note: Market data as of May 25, 2016. SparkSpread leak occurred on April 1, 2016. 1. Peer IPP index calculated using simple average of CPN, DYN, and NRG share price performance. $9.00 $10.04 $11.11 44.4% 29.5% 17.0% 03/31/2016 04/01/2016 05/25/2016 55.6% 39.4% 26.0% Implied premium based on $13.00 per share proposal SparkSpread Leak SparkSpread Leak SparkSpread Leak Implied premium based on $14.00 per share proposal Implied premium based on $13.00 per share proposal Implied premium based on $14.00 per share proposal 3

IPP Valuations Have Improved Since January 2016 FY+1 EV/EBITDA Multiples – January 7, 2016 to Present($ in millions, except per share data)Source: 2016 Q2 Reforecast – Open, Talen 2016 – 2020 Business Plan- Post Mitigation, FactSet and Company filings. Note: Market data as of May 25, 2016. Market data for January 11, 2016 presentation was as of January 7, 2016 and market data for May 23, 2016 presentation was as of May 19, 2016. 1. TLN January 7, 2016 financials based on Talen 2016 – 2020 Business Plan-Post Mitigation; TLN May 19, 2016 and May 25, 2016 financials based on 2016 Q2 Reforecast – Open. TLN CPN DYN NRG FCF Yield – January 7, 2016 to Present($ in millions, except per share data)The average FY+1 EV/EBITDA multiple for Talen’s peers has increased by ~0.5x, while Talen’s WACC has decreased by ~0.7% since January 7, 2016. Commentary IPP trading multiples have recovered from their lows earlier in the year Over the past several years, IPP trading multiples have been fairly volatile – On 9/24/2014, CPN traded at an FY+1 EV/EBITDA multiple of 10.1x, implying a share price of $29.10 for Talen today – On 1/13/2016, Talen traded at an FY+1 EV/EBITDA multiple of 5.8x, based on its $5.76 share price Since Talen commenced trading publicly on 6/2/2015, its FY+1 EV/EBITDA multiple has been consistently at a ~1.5x discount to peers Low High TLN CPN DYN NRG TLN CPN DYN NRG TLN CPN DYN NRG Share Price $6.32 $14.35 $12.53 $11.26 $12.49 $14.53 $18.18 $15.49 $11.11 $14.51 $17.69 $15.85 Firm Value 4,229 16,730 8,082 23,261 4,955 16,912 10,444 24,682 4,773 16,905 10,385 24,797 2017 EBITDA Consensus1 717 2,023 1,241 2,881 704 1,998 1,464 2,865 704 1,998 1,464 2,865 5.9x 7.0x 6.8x 8.3x 8.5x 8.5x 6.5x 7.1x 7.1x 8.1x 8.6x 8.7x January 7, 2016 May 19, 2016 May 25, 2016 WACC's Since Jan 7, 2016 Low Mid High January 7, 2016 6.7% 7.0% 7.3% May 19, 2016 6.0 6.3 6.7 May 25, 2016 6.0 6.3 6.6 TLN CPN DYN NRG TLN CPN DYN NRG TLN CPN DYN NRG Share Price $6.32 $14.35 $12.53 $11.26 $12.49 $14.53 $18.18 $15.49 $11.11 $14.51 $17.69 $15.85 Equity Value 815 5,194 1,527 3,598 1,643 5,310 2,178 4,950 1,461 5,303 2,119 5,065 2016 FCF Guidance1 275 785 400 1,100 370 785 333 1,100 370 785 333 1,100 33.7% 22.5% 25.3% 15.1% 14.8% 14.8% 26.2% 15.3% 15.7% 30.6% 22.2% 21.7% January 7, 2016 May 19, 2016 May 25, 2016 4

Stock Price Performance Following the PJM Auction The IPP stocks declined following the announcement of the PJM auction results on May 24, 2016, which came in below the forecasts of most analysts. Stock Price Performance Source: FactSet. Note: Market data as of May 25, 2016. $12.06 $14.95 $18.59 $16.02 $2,076 $11.11 $14.51 $17.69 $15.85 $2,091 TLN CPN DYN NRG S&P 500 (7.9%) (2.9%) (4.8%) (1.1%) 0.7% May 24, 2016 May 25, 2016 One-Day Return 5
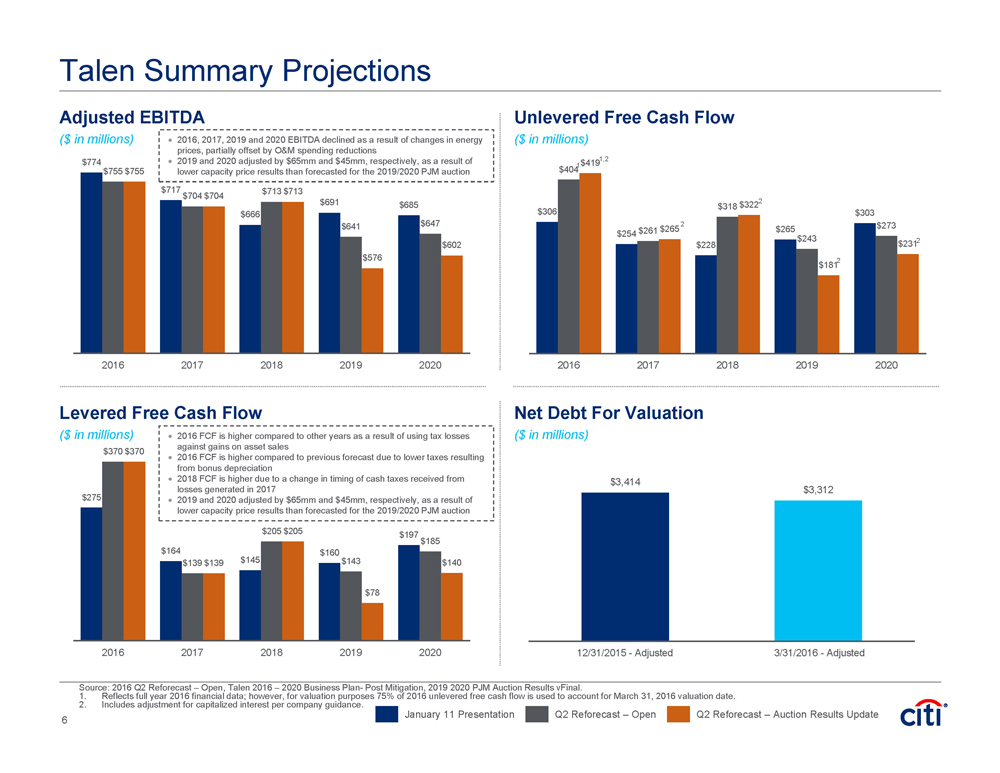
Talen Summary Projections Adjusted EBITDA($ in millions)Unlevered Free Cash Flow($ in millions)$275 $164 $145 $160 $197 $370 $139 $205 $143 $185 $370 $139 $205 $78 $140 2016 2017 2018 2019 2020 $306 $254 $228 $265 $303 $404 $261 $318 $243 $273 $419 $265 $322 $181 $231 2016 2017 2018 2019 2020 $774 $717 $666 $691 $685 $755 $704 $713 $641 $647 $755 $704 $713 $576 $602 2016 2017 2018 2019 2020 January 11 Presentation Q2 Reforecast – Open Levered Free Cash Flow($ in millions)Net Debt For Valuation($ in millions)Source: 2016 Q2 Reforecast – Open, Talen 2016 – 2020 Business Plan- Post Mitigation, 2019 2020 PJM Auction Results vFinal. 1. Reflects full year 2016 financial data; however, for valuation purposes 75% of 2016 unlevered free cash flow is used to account for March 31, 2016 valuation date. 2. Includes adjustment for capitalized interest per company guidance. $3,414 $3,312 12/31/2015 - Adjusted 3/31/2016 - Adjusted 1,2 2016, 2017, 2019 and 2020 EBITDA declined as a result of changes in energy prices, partially offset by O&M spending reductions 2019 and 2020 adjusted by $65mm and $45mm, respectively, as a result of lower capacity price results than forecasted for the 2019/2020 PJM auction 2016 FCF is higher compared to other years as a result of using tax losses against gains on asset sales 2016 FCF is higher compared to previous forecast due to lower taxes resulting from bonus depreciation 2018 FCF is higher due to a change in timing of cash taxes received from losses generated in 2017 2019 and 2020 adjusted by $65mm and $45mm, respectively, as a result of lower capacity price results than forecasted for the 2019/2020 PJM auction Q2 Reforecast – Auction Results Update 1 2 2 2 2 6
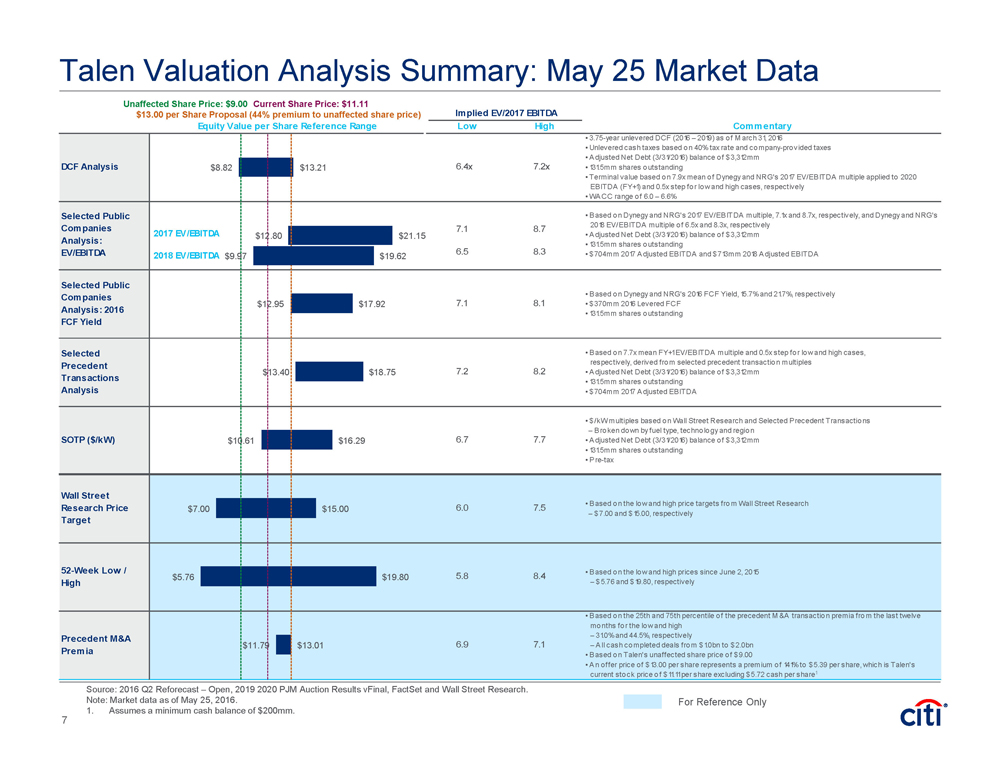
Talen Valuation Analysis Summary: May 25 Market Data For Reference Only $13.00 per Share Proposal (44% premium to unaffected share price) Unaffected Share Price: $9.00 Current Share Price: $11.11 Implied EV/2017 EBITDA Equity Value per Share Reference Range Low High Commentary DCF Analysis 6.4x 7.2x • 3.75-year unlevered DCF (2016 – 2019) as of M arch 31, 2016 • Unlevered cash taxes based on 40% tax rate and company-provided taxes • Adjusted Net Debt (3/31/2016) balance of $3,312mm • 131.5mm shares outstanding • Terminal value based on 7.9x mean of Dynegy and NRG's 2017 EV/EBITDA multiple applied to 2020 EBITDA (FY+1) and 0.5x step for low and high cases, respectively • WACC range of 6.0 – 6.6% 7.1 8.7 6.5 8.3 Selected Public Companies Analysis: 2016 FCF Yield 7.1 8.1 • Based on Dynegy and NRG's 2016 FCF Yield, 15.7% and 21.7%, respectively • $370mm 2016 Levered FCF • 131.5mm shares outstanding Selected Precedent Transactions Analysis 7.2 8.2 • Based on 7.7x mean FY+1 EV/EBITDA multiple and 0.5x step for low and high cases, respectively, derived from selected precedent transaction multiples • Adjusted Net Debt (3/31/2016) balance of $3,312mm • 131.5mm shares outstanding • $704mm 2017 Adjusted EBITDA SOTP ($/kW) 6.7 7.7 • $/kW multiples based on Wall Street Research and Selected Precedent Transactions – Broken down by fuel type, technology and region • Adjusted Net Debt (3/31/2016) balance of $3,312mm • 131.5mm shares outstanding • Pre-tax Wall Street Research Price Target 6.0 7.5 • Based on the low and high price targets from Wall Street Research – $7.00 and $15.00, respectively 52-Week Low / High 5.8 8.4 • Based on the low and high prices since June 2, 2015 – $5.76 and $19.80, respectively Precedent M&A Premia 6.9 7.1 • Based on the 25th and 75th percentile of the precedent M &A transaction premia from the last twelve months for the low and high – 31.0% and 44.5%, respectively – All cash completed deals from $1.0bn to $2.0bn • Based on Talen's unaffected share price of $9.00 • An offer price of $13.00 per share represents a premium of 141% to $5.39 per share, which is Talen's current stock price of $11.11 per share excluding $5.72 cash per share1 Selected Public Companies Analysis: EV/EBITDA • Based on Dynegy and NRG's 2017 EV/EBITDA multiple, 7.1x and 8.7x, respectively, and Dynegy and NRG's 2018 EV/EBITDA multiple of 6.5x and 8.3x, respectively • Adjusted Net Debt (3/31/2016) balance of $3,312mm • 131.5mm shares outstanding • $704mm 2017 Adjusted EBITDA and $713mm 2018 Adjusted EBITDA $8.82 $12.80 $12.95 $13.40 $10.61 $7.00 $5.76 $11.79 $13.21 $21.15 $17.92 $18.75 $16.29 $15.00 $19.80 $13.01 $9.97 $19.62 2017 EV/EBITDA 2018 EV/EBITDA Source: 2016 Q2 Reforecast – Open, 2019 2020 PJM Auction Results vFinal, FactSet and Wall Street Research. Note: Market data as of May 25, 2016. 1. Assumes a minimum cash balance of $200mm. 7
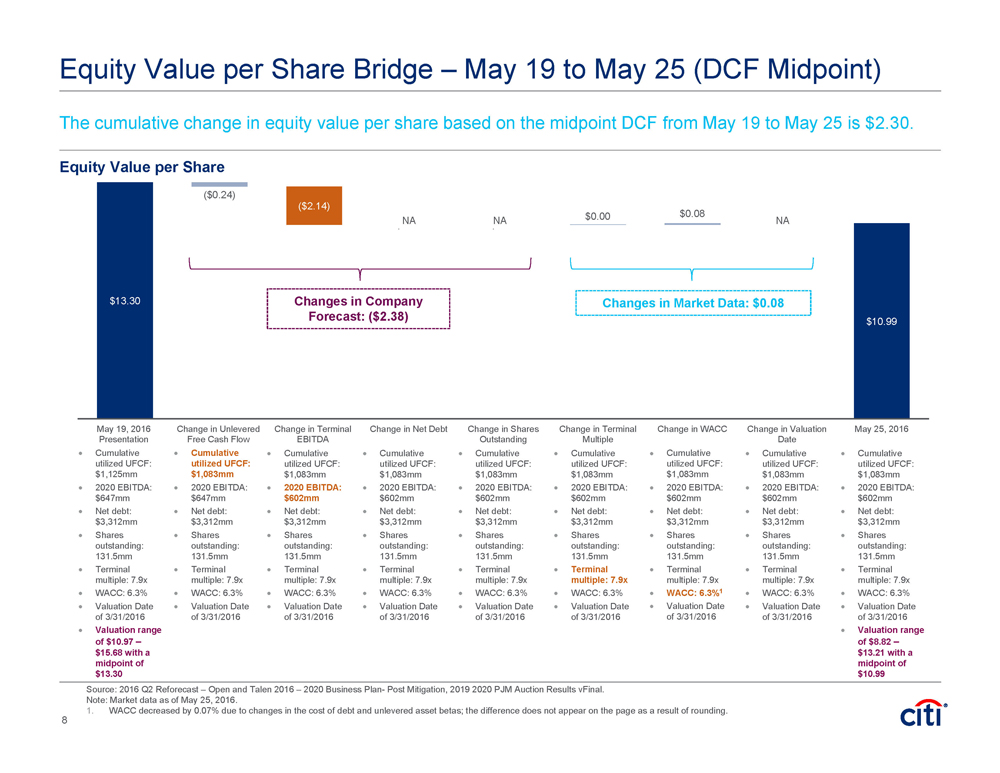
Equity Value per Share Bridge – May 19 to May 25 (DCF Midpoint) The cumulative change in equity value per share based on the midpoint DCF from May 19 to May 25 is $2.30. Cumulative utilized UFCF: $1,125mm 2020 EBITDA: $647mm Net debt: $3,312mm Shares outstanding: 131.5mm Terminal multiple: 7.9x WACC: 6.3% Valuation Date of 3/31/2016 Valuation range of $10.97 – $15.68 with a midpoint of $13.30 Equity Value per Share Source: 2016 Q2 Reforecast – Open and Talen 2016 – 2020 Business Plan- Post Mitigation, 2019 2020 PJM Auction Results vFinal. Note: Market data as of May 25, 2016. 1. WACC decreased by 0.07% due to changes in the cost of debt and unlevered asset betas; the difference does not appear on the page as a result of rounding. $13.30 $10.99 ($0.24) ($2.14) $0.00 $0.00 $0.00 $0.08 $0.00 May 19, 2016 Presentation Change in Unlevered Free Cash Flow Change in Terminal EBITDA Change in Net Debt Change in Shares Outstanding Change in Terminal Multiple Change in WACC Change in Valuation Date May 25, 2016 Changes in Changes in Company Market Data: $0.08 Forecast: ($2.38) Cumulative utilized UFCF: $1,083mm 2020 EBITDA: $647mm Net debt: $3,312mm Shares outstanding: 131.5mm Terminal multiple: 7.9x WACC: 6.3% Valuation Date of 3/31/2016 Cumulative utilized UFCF: $1,083mm 2020 EBITDA: $602mm Net debt: $3,312mm Shares outstanding: 131.5mm Terminal multiple: 7.9x WACC: 6.3% Valuation Date of 3/31/2016 Cumulative utilized UFCF: $1,083mm 2020 EBITDA: $602mm Net debt: $3,312mm Shares outstanding: 131.5mm Terminal multiple: 7.9x WACC: 6.3% Valuation Date of 3/31/2016 Cumulative utilized UFCF: $1,083mm 2020 EBITDA: $602mm Net debt: $3,312mm Shares outstanding: 131.5mm Terminal multiple: 7.9x WACC: 6.3% Valuation Date of 3/31/2016 Cumulative utilized UFCF: $1,083mm 2020 EBITDA: $602mm Net debt: $3,312mm Shares outstanding: 131.5mm Terminal multiple: 7.9x WACC: 6.3% Valuation Date of 3/31/2016 Cumulative utilized UFCF: $1,083mm 2020 EBITDA: $602mm Net debt: $3,312mm Shares outstanding: 131.5mm Terminal multiple: 7.9x WACC: 6.3%1 Valuation Date of 3/31/2016 Cumulative utilized UFCF: $1,083mm 2020 EBITDA: $602mm Net debt: $3,312mm Shares outstanding: 131.5mm Terminal multiple: 7.9x WACC: 6.3% Valuation Date of 3/31/2016 Cumulative utilized UFCF: $1,083mm 2020 EBITDA: $602mm Net debt: $3,312mm Shares outstanding: 131.5mm Terminal multiple: 7.9x WACC: 6.3% Valuation Date of 3/31/2016 Valuation range of $8.82 – $13.21 with a midpoint of $10.99 NA NA NA 8
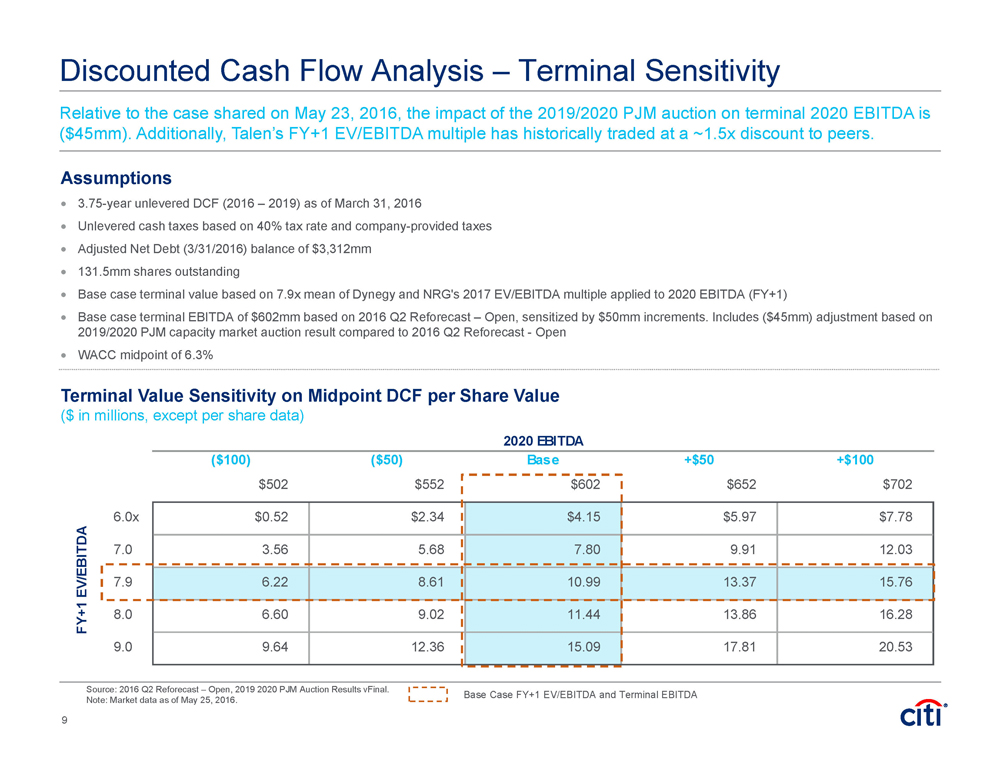
2020 EBITDA ($100) ($50) Base +$50 +$100 10.99 $502 $552 $602 $652 $702 6.0x $0.52 $2.34 $4.15 $5.97 $7.78 7.0 3.56 5.68 7.80 9.91 12.03 7.9 6.22 8.61 10.99 13.37 15.76 8.0 6.60 9.02 11.44 13.86 16.28 9.0 9.64 12.36 15.09 17.81 20.53 FY+1 EV/EBITDA Discounted Cash Flow Analysis – Terminal Sensitivity Source: 2016 Q2 Reforecast – Open, 2019 2020 PJM Auction Results vFinal. Note: Market data as of May 25, 2016. Assumptions 3.75-year unlevered DCF (2016 – 2019) as of March 31, 2016 Unlevered cash taxes based on 40% tax rate and company-provided taxes Adjusted Net Debt (3/31/2016) balance of $3,312mm 131.5mm shares outstanding Base case terminal value based on 7.9x mean of Dynegy and NRG's 2017 EV/EBITDA multiple applied to 2020 EBITDA (FY+1) Base case terminal EBITDA of $602mm based on 2016 Q2 Reforecast – Open, sensitized by $50mm increments. Includes ($45mm) adjustment based on 2019/2020 PJM capacity market auction result compared to 2016 Q2 Reforecast - Open WACC midpoint of 6.3% Base Case FY+1 EV/EBITDA and Terminal EBITDA Terminal Value Sensitivity on Midpoint DCF per Share Value ($ in millions, except per share data) 9 Relative to the case shared on May 23, 2016, the impact of the 2019/2020 PJM auction on terminal 2020 EBITDA is ($45mm). Additionally, Talen’s FY+1 EV/EBITDA multiple has historically traded at a ~1.5x discount to peers.
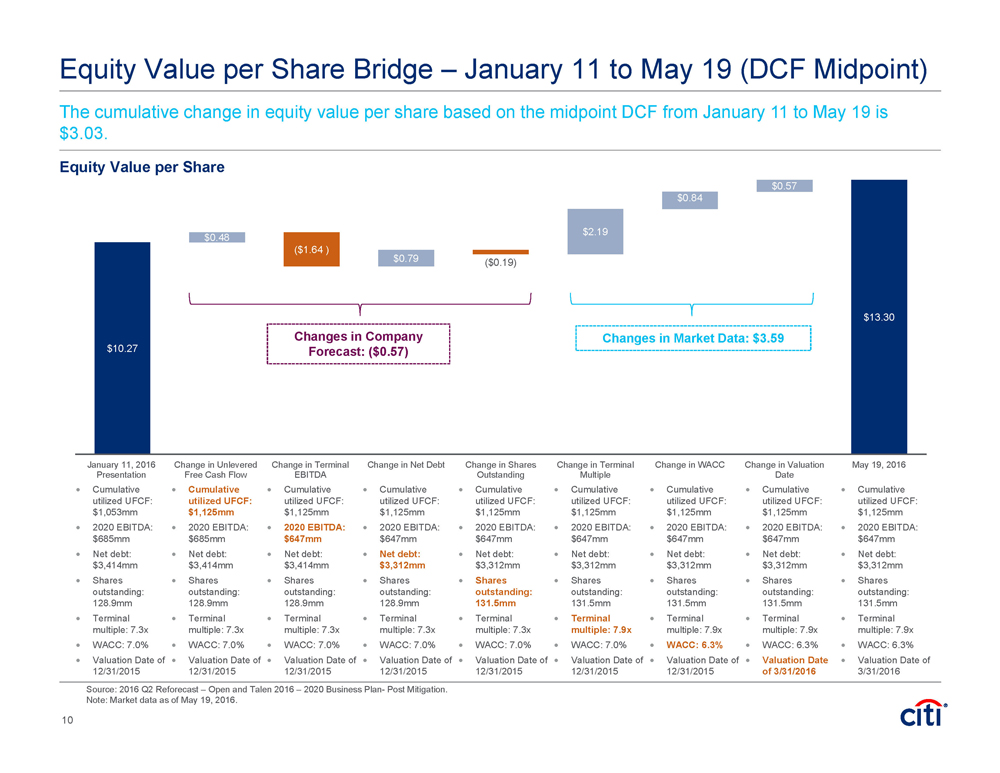
Equity Value per Share Bridge – January 11 to May 19 (DCF Midpoint) The cumulative change in equity value per share based on the midpoint DCF from January 11 to May 19 is $3.03. Cumulative utilized UFCF: $1,053mm 2020 EBITDA: $685mm Net debt: $3,414mm Shares outstanding: 128.9mm Terminal multiple: 7.3x WACC: 7.0% Valuation Date of 12/31/2015 Equity Value per Share Source: 2016 Q2 Reforecast – Open and Talen 2016 – 2020 Business Plan- Post Mitigation. Note: Market data as of May 19, 2016. $10.27 $13.30 $0.48 ($1.64 ) $0.79 ($0.19) $2.19 $0.84 $0.57 January 11, 2016 Presentation Change in Unlevered Free Cash Flow Change in Terminal EBITDA Change in Net Debt Change in Shares Outstanding Change in Terminal Multiple Change in WACC Change in Valuation Date May 19, 2016 Changes in Changes in Company Market Data: $3.59 Forecast: ($0.57) Cumulative utilized UFCF: $1,125mm 2020 EBITDA: $685mm Net debt: $3,414mm Shares outstanding: 128.9mm Terminal multiple: 7.3x WACC: 7.0% Valuation Date of 12/31/2015 Cumulative utilized UFCF: $1,125mm 2020 EBITDA: $647mm Net debt: $3,414mm Shares outstanding: 128.9mm Terminal multiple: 7.3x WACC: 7.0% Valuation Date of 12/31/2015 Cumulative utilized UFCF: $1,125mm 2020 EBITDA: $647mm Net debt: $3,312mm Shares outstanding: 128.9mm Terminal multiple: 7.3x WACC: 7.0% Valuation Date of 12/31/2015 Cumulative utilized UFCF: $1,125mm 2020 EBITDA: $647mm Net debt: $3,312mm Shares outstanding: 131.5mm Terminal multiple: 7.3x WACC: 7.0% Valuation Date of 12/31/2015 Cumulative utilized UFCF: $1,125mm 2020 EBITDA: $647mm Net debt: $3,312mm Shares outstanding: 131.5mm Terminal multiple: 7.9x WACC: 7.0% Valuation Date of 12/31/2015 Cumulative utilized UFCF: $1,125mm 2020 EBITDA: $647mm Net debt: $3,312mm Shares outstanding: 131.5mm Terminal multiple: 7.9x WACC: 6.3% Valuation Date of 12/31/2015 Cumulative utilized UFCF: $1,125mm 2020 EBITDA: $647mm Net debt: $3,312mm Shares outstanding: 131.5mm Terminal multiple: 7.9x WACC: 6.3% Valuation Date of 3/31/2016 Cumulative utilized UFCF: $1,125mm 2020 EBITDA: $647mm Net debt: $3,312mm Shares outstanding: 131.5mm Terminal multiple: 7.9x WACC: 6.3% Valuation Date of 3/31/2016 10

Appendix

Discounted Cash Flow Analysis Source: 2016 Q2 Reforecast – Open, 2019 2020 PJM Auction Results vFinal. Note: Market data as of May 25, 2016. 1. 2016 data reflects partial year financials to adjust for a valuation date of 3/31/2016. 2. Unlevered cash taxes based on 40% tax rate and company-provided taxes. Discounted Cash Flow Analysis 20161 2017 2018 2019 2020($ in millions)3/31/2016 8/15/2016 6/30/2017 6/30/2018 6/30/2019 6/30/2020 Adjusted EBITDA $566 $704 $713 $576 $602 Adj. Cash Taxes2 (13) (92) (44) (43) (68) Nuclear Fuel 106 136 137 135 136 Other Cash Adjustments 60 1 (7) (19) (16) Capital Expenditures (405) (483) (478) (468) (423) Unlevered Free Cash Flow $0 $314 $265 $322 $181 $231Unlevered Free Cash Flow Utilized For Valuation 314 265 322 181 0Unlevered Valuation Analysis(in millions, except per share values)Terminal Values Key Metrics Low Mid High 3/31/2016 2020 EBITDA $602 $602 $602 Debt $4,264 FY+1 EV/EBITDA 7.4x 7.9x 8.4x Cash (952) Terminal Enterprise Value $4,443 $4,744 $5,045 Adjusted Net Debt (3/31/2016) $3,312 Shares Outstanding 131.5 Present Value of Cash Flows Present Value of Terminal Value EV/EBITDA 7.4x 7.9x 8.4x 6.0% $987 $987 $987 6.0% $3,577 $3,819 $4,062 6.3 982 982 982 6.3 3,535 3,775 4,015 6.6 978 978 978 6.6 3,494 3,731 3,968 Enterprise Value Equity Value EV/EBITDA 7.4x 7.9x 8.4x EV/EBITDA 7.4x 7.9x 8.4x 6.0% $4,564 $4,806 $5,049 6.0% $1,252 $1,494 $1,737 6.3 4,518 4,757 4,997 6.3 1,206 1,445 1,685 6.6 4,472 4,709 4,946 6.6 1,160 1,397 1,634 Equity Value per Share Implied EV/2017 EBITDA EV/EBITDA 7.4x 7.9x 8.4x EV/EBITDA 7.4x 7.9x 8.4x 6.0% $9.52 $11.36 $13.21 6.0% 6.5x 6.8x 7.2x 6.3 9.17 10.99 12.81 6.3 6.4 6.8 7.1 6.6 8.82 10.62 12.42 6.6 6.4 6.7 7.0 WACC WACC WACC WACC WACC WACC 11

Selected Public Companies Analysis Selected IPP Companies($ in millions, except per share values)EV/EBITDA Multiples(in millions, except per share values)Based on Dynegy and NRG’s respective 2017 EV/EBITDA multiples Based on Dynegy and NRG’s respective 2016 FCF Yields Talen FCF based on 2016 Levered FCF, excluding growth capex (consistent with how IPP peers give FCF guidance) Source: 2016 Q2 Reforecast – Open, FactSet, Company Filings and Wall Street Research. Note: Market data as of May 25, 2016. 2017 and 2018 EBITDA based on consensus estimates. 2016 FCF Yield based on company guidance. 1. Dynegy EBITDA from Wall Street Research for 2017 – 2018, and is pro forma for its acquisition of the ENGIE US Fossil Generation Portfolio for 2017 and 2018. Dynegy 2016 FCF based on 2016 FCF guidance, adjusted for the ENGIE US Fossil Generation Portfolio’s 2017 FCF as a proxy for 2016 FCF. % Premium / (Disc) to 52 Week Selected IPP Companies Closing Stock Price High Low Equity Value Enterprise Value 2017 EV/EBITDA 2018 EV/EBITDA 2016 FCF Yield Dynegy1 $17.69 (48.0%) 138.1% $2,119 $10,385 7.1x 6.5x 15.7% NRG 15.85 (37.6) 76.5 5,065 24,797 8.7 8.3 21.7 Low (48.0%) 76.5% $2,119 $10,385 7.1x 6.5x 15.7% High (37.6) 138.1 5,065 24,797 8.7 8.3 21.7 Mean (42.8) 107.3 3,592 17,591 7.9 7.4 18.7 Median (42.8) 107.3 3,592 17,591 7.9 7.4 18.7 % Premium / (Disc) to 52 Week Excluded from Analysis Closing Stock Price High Low Equity Value Enterprise Value 2017 EV/EBITDA 2018 EV/EBITDA 2016 FCF Yield Calpine $14.51 (29.4%) 23.0% $5,303 $16,905 8.5x 7.8x 14.8% Implied Equity Value Per Share 2017 EV/EBITDA 2016 FCF Yield Low High Low High 2017 Adjusted EBITDA $704 $704 2016 Levered FCF $370 $370 2017 EV/EBITDA Multiple 7.1x 8.7x 2016 FCF Yield 21.7% 15.7% Enterprise Value $4,996 $6,094 Equity Value $1,703 $2,357 Adjusted Net Debt (3/31/2016) 3,312 3,312 Shares Outstanding 131.5 131.5 Equity Value $1,684 $2,782 Equity Value per Share $12.95 $17.92 Shares Outstanding 131.5 131.5 Equity Value per Share $12.80 $21.15 12
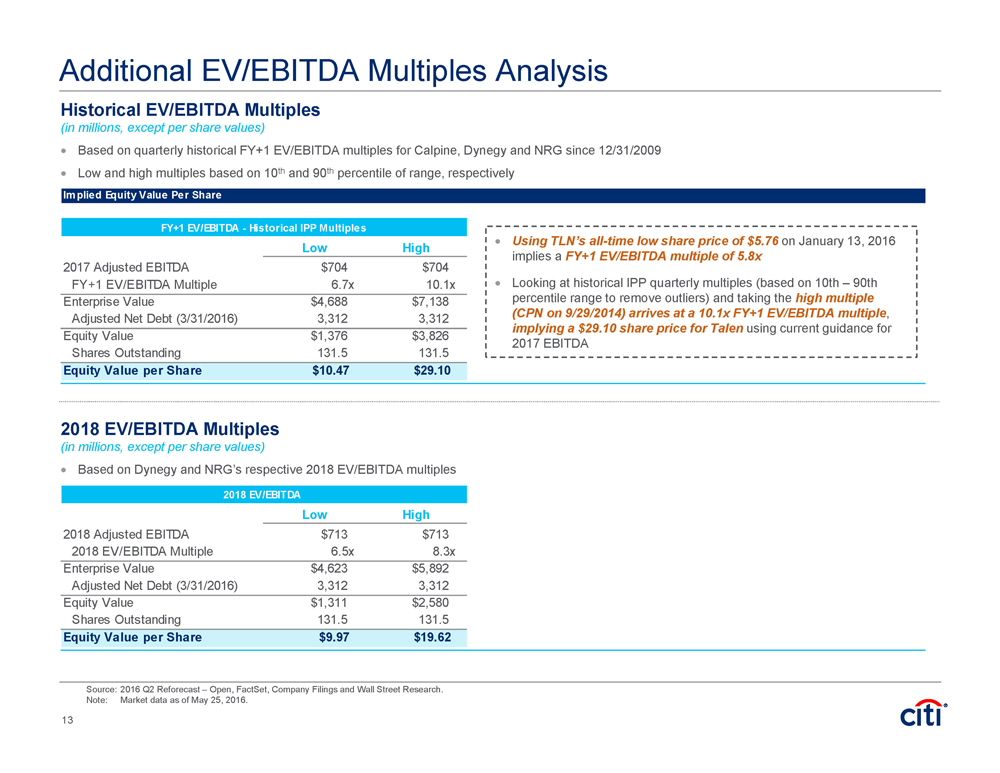
Additional EV/EBITDA Multiples Analysis Historical EV/EBITDA Multiples(in millions, except per share values)Based on quarterly historical FY+1 EV/EBITDA multiples for Calpine, Dynegy and NRG since 12/31/2009 Low and high multiples based on 10th and 90th percentile of range, respectively Source: 2016 Q2 Reforecast – Open, FactSet, Company Filings and Wall Street Research. Note: Market data as of May 25, 2016. 2018 EV/EBITDA Multiples(in millions, except per share values)Based on Dynegy and NRG’s respective 2018 EV/EBITDA multiplesUsing TLN’s all-time low share price of $5.76on January 13, 2016 implies aFY+1 EV/EBITDA multiple of 5.8xLooking at historical IPP quarterly multiples (based on 10th – 90th percentile range to remove outliers) and taking thehigh multiple (CPN on 9/29/2014) arrives at a 10.1x FY+1 EV/EBITDA multiple,implying a $29.10 share price for Talenusing current guidance for 2017 EBITDA 2018 EV/EBITDA Low High 2018 Adjusted EBITDA $713 $713 2018 EV/EBITDA Multiple 6.5x 8.3x Enterprise Value $4,623 $5,892 Adjusted Net Debt (3/31/2016) 3,312 3,312 Equity Value $1,311 $2,580 Shares Outstanding 131.5 131.5 Equity Value per Share $9.97 $19.62 Implied Equity Value Per Share FY+1 EV/EBITDA - Historical IPP Multiples Low High 2017 Adjusted EBITDA $704 $704 FY+1 EV/EBITDA Multiple 6.7x 10.1x Enterprise Value $4,688 $7,138 Adjusted Net Debt (3/31/2016) 3,312 3,312 Equity Value $1,376 $3,826 Shares Outstanding 131.5 131.5 Equity Value per Share $10.47 $29.10 13
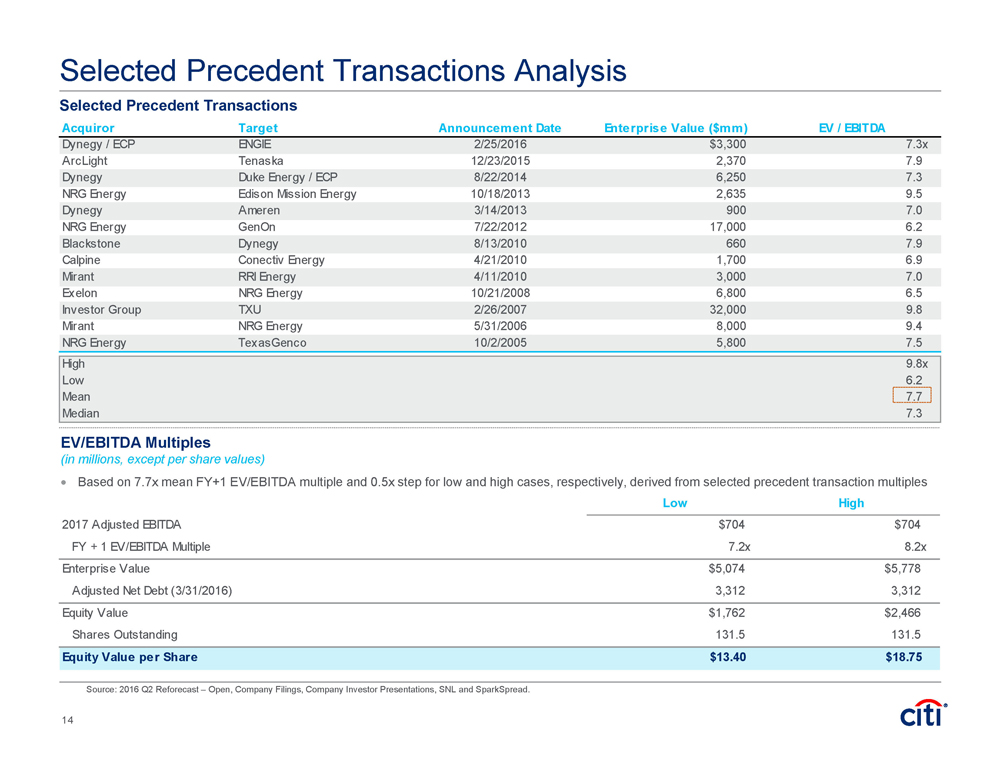
Acquiror Target Announcement Date Enterprise Value ($mm) EV / EBITDA Dynegy / ECP ENGIE 2/25/2016 $3,300 7.3x ArcLight Tenaska 12/23/2015 2,370 7.9 Dynegy Duke Energy / ECP 8/22/2014 6,250 7.3 NRG Energy Edison Mission Energy 10/18/2013 2,635 9.5 Dynegy Ameren 3/14/2013 900 7.0 NRG Energy GenOn 7/22/2012 17,000 6.2 Blackstone Dynegy 8/13/2010 660 7.9 Calpine Conectiv Energy 4/21/2010 1,700 6.9 Mirant RRI Energy 4/11/2010 3,000 7.0 Exelon NRG Energy 10/21/2008 6,800 6.5 Investor Group TXU 2/26/2007 32,000 9.8 Mirant NRG Energy 5/31/2006 8,000 9.4 NRG Energy TexasGenco 10/2/2005 5,800 7.5 High 9.8x Low 6.2 Mean 7.7 Median 7.3 Selected Precedent Transactions Selected Precedent Transactions Analysis Source: 2016 Q2 Reforecast – Open, Company Filings, Company Investor Presentations, SNL and SparkSpread. EV/EBITDA Multiples(in millions, except per share values)Based on 7.7x mean FY+1 EV/EBITDA multiple and 0.5x step for low and high cases, respectively, derived from selected precedent transaction multiples Low High 2017 Adjusted EBITDA $704 $704 FY + 1 EV/EBITDA Multiple 7.2x 8.2x Enterprise Value $5,074 $5,778 Adjusted Net Debt (3/31/2016) 3,312 3,312 Equity Value $1,762 $2,466 Shares Outstanding 131.5 131.5 Equity Value per Share $13.40 $18.75 14
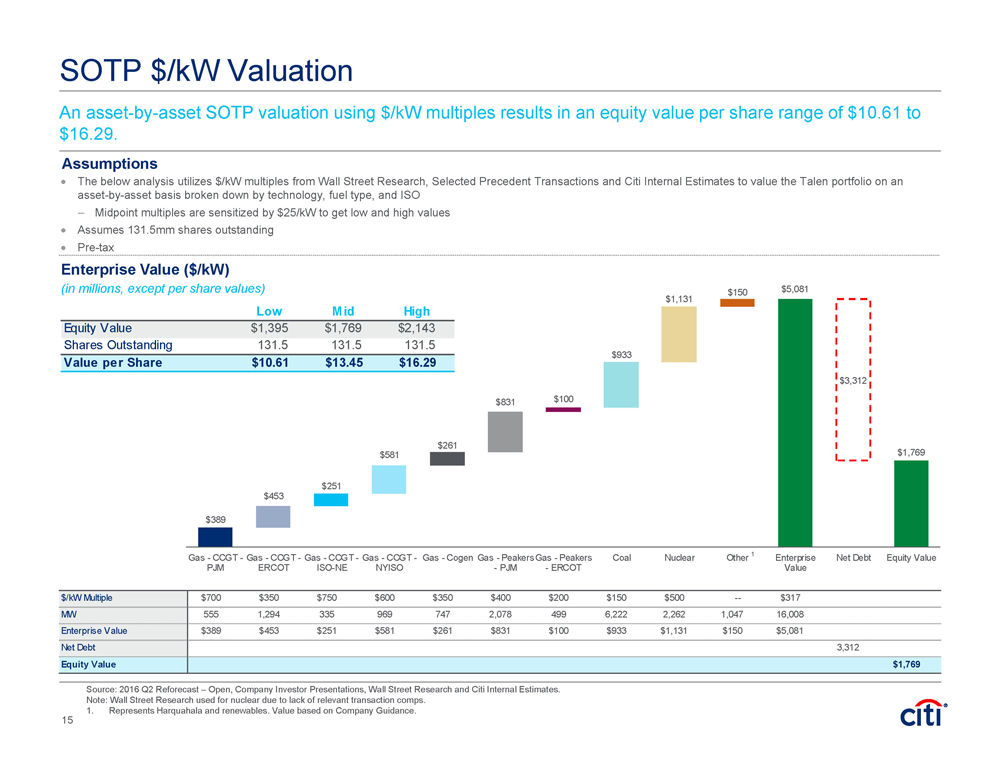
SOTP $/kW Valuation An asset-by-asset SOTP valuation using $/kW multiples results in an equity value per share range of $10.61 to $16.29. The below analysis utilizes $/kW multiples from Wall Street Research, Selected Precedent Transactions and Citi Internal Estimates to value the Talen portfolio on an asset-by-asset basis broken down by technology, fuel type, and ISO – Midpoint multiples are sensitized by $25/kW to get low and high values Assumes 131.5mm shares outstanding Pre-tax Assumptions Enterprise Value ($/kW)(in millions, except per share values)Source: 2016 Q2 Reforecast – Open, Company Investor Presentations, Wall Street Research and Citi Internal Estimates. Note: Wall Street Research used for nuclear due to lack of relevant transaction comps. 1. Represents Harquahala and renewables. Value based on Company Guidance. 1 $/kW Multiple $700 $350 $750 $600 $350 $400 $200 $150 $500 -- $317 MW 555 1,294 335 969 747 2,078 499 6,222 2,262 1,047 16,008 Enterprise Value $389 $453 $251 $581 $261 $831 $100 $933 $1,131 $150 $5,081 Net Debt 3,312 Equity Value $1,769 $389 $389 $841 $1,093 $1,674 $1,936 $2,767 $2,867 $3,800 $5,081 $1,769 $453 $251 $581 $261 $831 $933 $1,131 $150 $3,312 $100 Gas - CCGT - PJM Gas - CCGT - ERCOT Gas - CCGT - ISO-NE Gas - CCGT - NYISO Gas - Cogen Gas - Peakers - PJM Gas - Peakers - ERCOT Coal Nuclear Other Enterprise Value Net Debt Equity Value Low Mid High Equity Value $1,395 $1,769 $2,143 Shares Outstanding 131.5 131.5 131.5 Value per Share $10.61 $13.45 $16.29 15
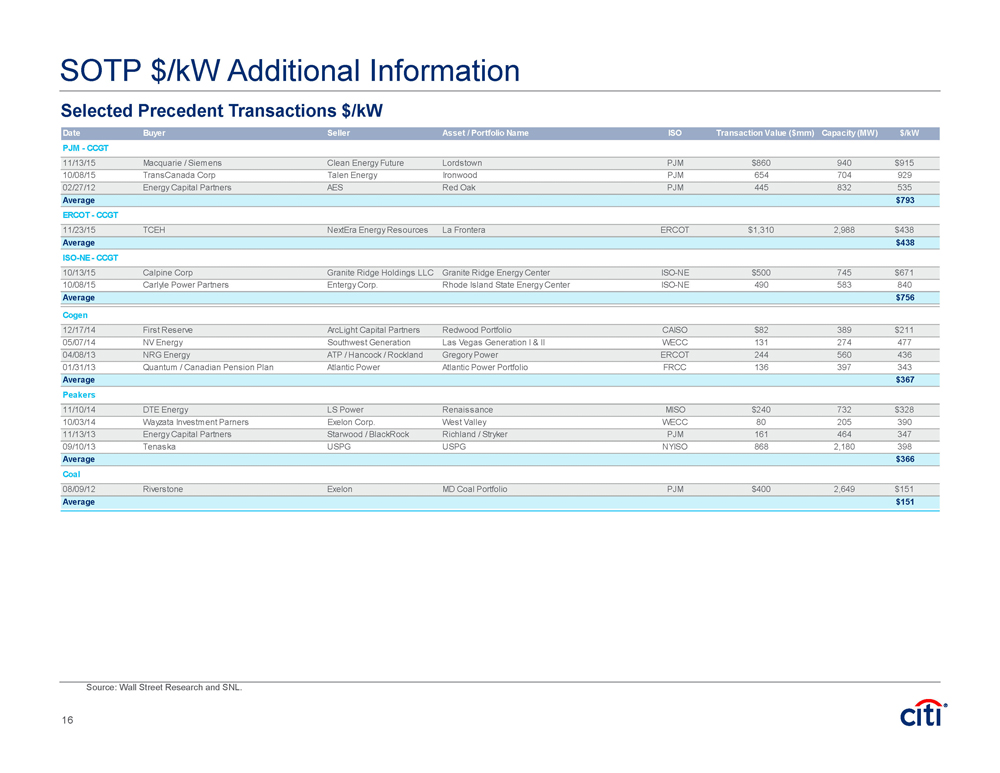
SOTP $/kW Additional Information Source: Wall Street Research and SNL. Selected Precedent Transactions $/kW Date Buyer Seller Asset / Portfolio Name ISO Transaction Value ($mm) Capacity (MW) $/kW PJM - CCGT 11/13/15 Macquarie / Siemens Clean Energy Future Lordstown PJM $860 940 $915 10/08/15 TransCanada Corp Talen Energy Ironwood PJM 654 704 929 02/27/12 Energy Capital Partners AES Red Oak PJM 445 832 535 Average $793 ERCOT - CCGT 11/23/15 TCEH NextEra Energy Resources La Frontera ERCOT $1,310 2,988 $438 Average $438 ISO-NE - CCGT 10/13/15 Calpine Corp Granite Ridge Holdings LLC Granite Ridge Energy Center ISO-NE $500 745 $671 10/08/15 Carlyle Power Partners Entergy Corp. Rhode Island State Energy Center ISO-NE 490 583 840 Average $756 Cogen 12/17/14 First Reserve ArcLight Capital Partners Redwood Portfolio CAISO $82 389 $211 05/07/14 NV Energy Southwest Generation Las Vegas Generation I & II WECC 131 274 477 04/08/13 NRG Energy ATP / Hancock / Rockland Gregory Power ERCOT 244 560 436 01/31/13 Quantum / Canadian Pension Plan Atlantic Power Atlantic Power Portfolio FRCC 136 397 343 Average $367 Peakers 11/10/14 DTE Energy LS Power Renaissance MISO $240 732 $328 10/03/14 Wayzata Investment Parners Exelon Corp. West Valley WECC 80 205 390 11/13/13 Energy Capital Partners Starwood / BlackRock Richland / Stryker PJM 161 464 347 09/10/13 Tenaska USPG USPG NYISO 868 2,180 398 Average $366 Coal 08/09/12 Riverstone Exelon MD Coal Portfolio PJM $400 2,649 $151 Average $151 16
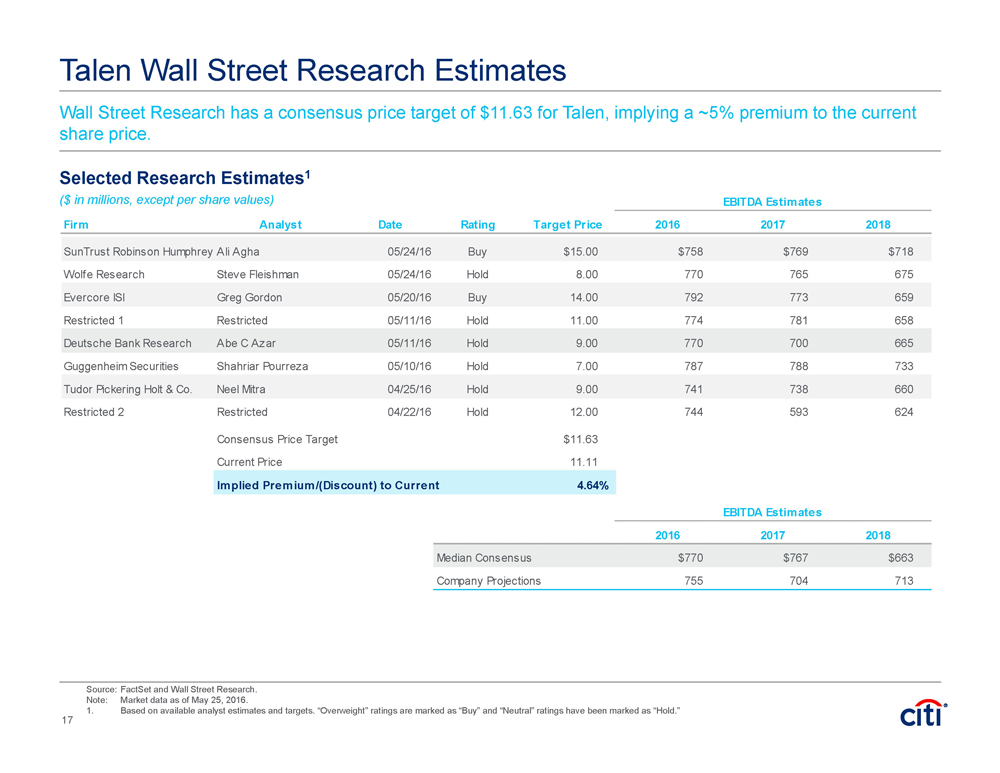
Source: FactSet and Wall Street Research. Note: Market data as of May 25, 2016. 1. Based on available analyst estimates and targets. “Overweight” ratings are marked as “Buy” and “Neutral” ratings have been marked as “Hold.” Talen Wall Street Research Estimates Selected Research Estimates1($ in millions, except per share values)Wall Street Research has a consensus price target of $11.63 for Talen, implying a ~5% premium to the current share price. EBITDA Estimates Firm Analyst Date Rating Target Price 2016 2017 2018 SunTrust Robinson Humphrey Ali Agha 05/24/16 Buy $15.00 $758 $769 $718 Wolfe Research Steve Fleishman 05/24/16 Hold 8.00 770 765 675 Evercore ISI Greg Gordon 05/20/16 Buy 14.00 792 773 659 Restricted 1 Restricted 05/11/16 Hold 11.00 774 781 658 Deutsche Bank Research Abe C Azar 05/11/16 Hold 9.00 770 700 665 Guggenheim Securities Shahriar Pourreza 05/10/16 Hold 7.00 787 788 733 Tudor Pickering Holt & Co. Neel Mitra 04/25/16 Hold 9.00 741 738 660 Restricted 2 Restricted 04/22/16 Hold 12.00 744 593 624 Consensus Price Target $11.63 Current Price 11.11 Implied Premium/(Discount) to Current 4.64% EBITDA Estimates 2016 2017 2018 Median Consensus $770 $767 $663 Company Projections 755 704 713 17
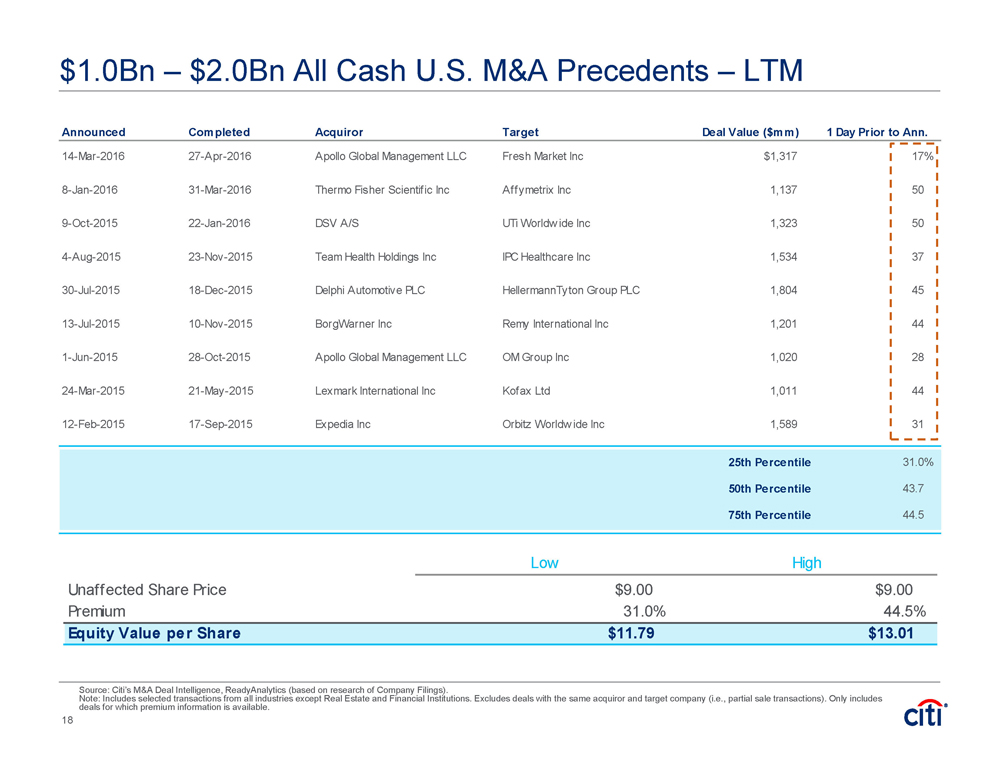
$1.0Bn – $2.0Bn All Cash U.S. M&A Precedents – LTM Source: Citi’s M&A Deal Intelligence, ReadyAnalytics (based on research of Company Filings). Note: Includes selected transactions from all industries except Real Estate and Financial Institutions. Excludes deals with the same acquiror and target company (i.e., partial sale transactions). Only includes deals for which premium information is available. Low High Unaffected Share Price $9.00 $9.00 Premium 31.0% 44.5% Equity Value per Share $11.79 $13.01 Announced Completed Acquiror Target Deal Value ($mm) 1 Day Prior to Ann. 14-Mar-2016 27-Apr-2016 Apollo Global Management LLC Fresh Market Inc $1,317 17% 8-Jan-2016 31-Mar-2016 Thermo Fisher Scientific Inc Affymetrix Inc 1,137 50 9-Oct-2015 22-Jan-2016 DSV A/S UTi Worldwide Inc 1,323 50 4-Aug-2015 23-Nov-2015 Team Health Holdings Inc IPC Healthcare Inc 1,534 37 30-Jul-2015 18-Dec-2015 Delphi Automotive PLC HellermannTyton Group PLC 1,804 45 13-Jul-2015 10-Nov-2015 BorgWarner Inc Remy International Inc 1,201 44 1-Jun-2015 28-Oct-2015 Apollo Global Management LLC OM Group Inc 1,020 28 24-Mar-2015 21-May-2015 Lexmark International Inc Kofax Ltd 1,011 44 12-Feb-2015 17-Sep-2015 Expedia Inc Orbitz Worldwide Inc 1,589 31 25th Percentile 31.0% 50th Percentile 43.7 75th Percentile 44.5 18

WACC and Beta with 40% Tax Rate Consistent with target leverage of 55.0% – 65.0% per Talen management Expected long-term debt yield of 7.0% based on median of peer set (CPN, DYN, NRG) Tax rate of 40.0% Equity market premium range of 5.5% – 6.7% Adjusted Equity Beta based on regression with MSCI Global Index for weekly data for five-year history Unlevered Asset Beta of 0.57, median of selected companies Debt Beta of 0.3 for high-yield companies Small-cap risk premium of 1.71% Summary of Assumptions Source: FactSet, Company Filings and Talen Management. Note: Market data as of May 25, 2016. 1. Book value of net debt. 2. Expected long-term debt yield of 7.0% based on median of peer set (CPN, DYN, NRG). 3. Median unlevered asset beta of selected companies rather than Talen’s specific unlevered asset beta given Talen’s short and illiquid trading history. 4. Talen’s June 2, 2015 – May 25, 2016 adjusted beta of 1.554 has not been used in the WACC calculation given TLN’s limited trading history. Cost of Debt Related Metrics Capital Structure Value of Market Value Net Debt / Total Statutory Long Term Net Debt1 of Equity Capital Ratio Marginal Tax Rate Yield Calpine Corporation $11,633 $5,303 68.7% 40.0% 6.0% NRG Energy, Inc. 17,647 5,065 77.7 40.0 7.0 Dynegy Inc. 8,054 2,119 79.2 40.0 8.0 High $17,647 $5,303 79.2% 8.0% Median 11,633 5,065 77.7 7.0 Mean 12,445 4,162 75.2 7.0 Low 8,054 2,119 68.7 6.0 Cost of Equity Related Metrics Adjusted High- Unlevered Equity Beta4 Yield Issuer Debt Beta Asset Beta Calpine Corporation 0.97 Y 0.30 0.59 NRG Energy, Inc. 1.06 Y 0.30 0.55 Dynegy Inc. 1.20 Y 0.30 0.57 High 1.20 0.59 Median 1.06 0.57 Mean 1.07 0.57 Low 0.97 0.55 WACC Calculation Inputs Target Capital Structure (Net Debt / Total Capital): 55.0 – 65.0 % Median Capital Structure of Selected Companies: 77.7 % After-Tax Cost of Debt: 4.2 % Expected Long-Term Yield2: 7.0 % – Statutory Marginal Tax Rate: 40.0 % Cost of Equity: 5.5% Equity Market Risk Premium 8.6 – 9.2 % 6.7% Equity Market Risk Premium 9.6 – 10.3 % Risk-Free Rate (30-Year Treasury Bond): 2.7 % Assumed Equity Market Risk Premium - low : 5.5 % Assumed Equity Market Risk Premium - high: 6.7 % Relevered Equity Beta: 0.77 – 0.88 – Unlevered Asset Beta3 0.57 – Implied Net Debt / Equity Ratio: 122.2 – 185.7 % Small Cap Risk Premium: 1.7 % High Yield Issuer? (Y / N) Y Weighted Average Cost of Capital: 6.0 – 6.6 % 5.5% Equity Market Risk Premium 6.2 – 6.0 % 6.7% Equity Market Risk Premium 6.6 – 6.3 % Low -end of WACC is based on low -end of equity market risk premium (5.5%) and high-end of net debt / total capital ratio. High-end is based on high-end of equity market risk premium (6.7%) and low -end of capital structure. 19
IRS Circular 230 Disclosure: Citigroup Inc. and its affiliates do not provide tax or legal advice. Any discussion of tax matters in these materials (i) is not intended or written to be used, and cannot be used or relied upon, by you for the purpose of avoiding any tax penalties and (ii) may have been written in connection with the "promotion or marketing" of any transaction contemplated hereby ("Transaction"). Accordingly, you should seek advice based on your particular circumstances from an independent tax advisor. In any instance where distribution of this communication is subject to the rules of the US Commodity Futures Trading Commission ("CFTC"), this communication constitutes an invitation to consider entering into a derivatives transaction under U.S. CFTC Regulations §§ 1.71 and 23.605, where applicable, but is not a binding offer to buy/sell any financial instrument.Any terms set forth herein are intended for discussion purposes only and are subject to the final terms as set forth in separate definitive written agreements. This presentation is not a commitment to lend, syndicate a financing, underwrite or purchase securities, or commit capital nor does it obligate us to enter into such a commitment, nor are we acting as a fiduciary to you. By accepting this presentation, subject to applicable law or regulation, you agree to keep confidential the information contained herein and the existence of and proposed terms for any Transaction. Prior to entering into any Transaction, you should determine, without reliance upon us or our affiliates, the economic risks and merits (and independently determine that you are able to assume these risks) as well as the legal, tax and accounting characterizations and consequences of any such Transaction. In this regard, by accepting this presentation, you acknowledge that (a) we are not in the business of providing (and you are not relying on us for) legal, tax or accounting advice, (b) there may be legal, tax or accounting risks associated with any Transaction, (c) you should receive (and rely on) separate and qualified legal, tax and accounting advice and (d) you should apprise senior management in your organization as to such legal, tax and accounting advice (and any risks associated with any Transaction) and our disclaimer as to these matters. By acceptance of these materials, you and we hereby agree that from the commencement of discussions with respect to any Transaction, and notwithstanding any other provision in this presentation, we hereby confirm that no participant in any Transaction shall be limited from disclosing the U.S. tax treatment or U.S. tax structure of such Transaction. We are required to obtain, verify and record certain information that identifies each entity that enters into a formal business relationship with us. We will ask for your complete name, street address, and taxpayer ID number. We may also request corporate formation documents, or other forms of identification, to verify information provided. Any prices or levels contained herein are preliminary and indicative only and do not represent bids or offers. These indications are provided solely for your information and consideration, are subject to change at any time without notice and are not intended as a solicitation with respect to the purchase or sale of any instrument. The information contained in this presentation may include results of analyses from a quantitative model which represent potential future events that may or may not be realized, and is not a complete analysis of every material fact representing any product. Any estimates included herein constitute our judgment as of the date hereof and are subject to change without any notice. We and/or our affiliates may make a market in these instruments for our customers and for our own account. Accordingly, we may have a position in any such instrument at any time. Although this material may contain publicly available information about Citi corporate bond research, fixed income strategy or economic and market analysis, Citi policy (i) prohibits employees from offering, directly or indirectly, a favorable or negative research opinion or offering to change an opinion as consideration or inducement for the receipt of business or for compensation; and (ii) prohibits analysts from being compensated for specific recommendations or views contained in research reports. So as to reduce the potential for conflicts of interest, as well as to reduce any appearance of conflicts of interest, Citi has enacted policies and procedures designed to limit communications between its investment banking and research personnel to specifically prescribed circumstances. © 2016 Citigroup Global Markets Inc. Member SIPC. All rights reserved. Citi and Citi and Arc Design are trademarks and service marks of Citigroup Inc. or its affiliates and are used and registered throughout the world. Citi believes that sustainability is good business practice. We work closely with our clients, peer financial institutions, NGOs and other partners to finance solutions to climate change, develop industry standards, reduce our own environmental footprint, and engage with stakeholders to advance shared learning and solutions. Citi’s Sustainable Progress strategy focuses on sustainability performance across three pillars: Environmental Finance; Environmental and Social Risk Management; and Operations and Supply Chain. Our cornerstone initiative is our $100 Billion Environmental Finance Goal – to lend, invest and facilitate $100 billion over 10 years to activities focused on environmental and climate solutions.