Exhibit (c)(1)
Private and Confidential Project Raptor Goldman, Sachs & Co. May 16, 2016 Goldman Sachs does not provide accounting, tax, or legal advice. Notwithstanding anything in this document to the contrary, you (and each of your employees, representatives, and other agents) may disclose to any and all persons the US federal income and state tax treatment and tax structure of the transaction and all materials of any kind (including tax opinions and other tax analyses) that are provided to you relating to such tax treatment and tax structure, without Goldman Sachs imposing any limitation of any kind.
Disclaimer Private and Confidential These materials have been prepared and are provided by Goldman Sachs on a confidential basis solely for the information and assistance of the Board of Directors (the "Board") and senior management of Riverstone Holdings LLC (the "Company") in connection with their consideration of the matters referred to herein. These materials and Goldman Sachs’ presentation relating to these materials (the “Confidential Information”) may not be disclosed to any third party or circulated or referred to publicly or used for or relied upon for any other purpose without the prior written consent of Goldman Sachs. The Confidential Information was not prepared with a view to public disclosure or to conform to any disclosure standards under any state, federal or international securities laws or other laws, rules or regulations, and Goldman Sachs does not take any responsibility for the use of the Confidential Information by persons other than those set forth above. Notwithstanding anything in this Confidential Information to the contrary, the Company may disclose to any person the US federal income and state income tax treatment and tax structure of any transaction described herein and all materials of any kind (including tax opinions and other tax analyses) that are provided to the Company relating to such tax treatment and tax structure, without Goldman Sachs imposing any limitation of any kind. The Confidential Information has been prepared by the Investment Banking Division of Goldman Sachs and is not a product of its research department. Goldman Sachs and its affiliates are engaged in advisory, underwriting and financing, principal investing, sales and trading, research, investment management and other financial and non-financial activities and services for various persons and entities. Goldman Sachs and its affiliates and employees, and funds or other entities they manage or in which they invest or have other economic interests or with which they co-invest, may at any time purchase, sell, hold or vote long or short positions and investments in securities, derivatives, loans, commodities, currencies, credit default swaps and other financial instruments of the Company, any other party to any transaction and any of their respective affiliates or any currency or commodity that may be involved in any transaction. Goldman Sachs’ investment banking division maintains regular, ordinary course client service dialogues with clients and potential clients to review events, opportunities, and conditions in particular sectors and industries and, in that connection, Goldman Sachs may make reference to the Company, but Goldman Sachs will not disclose any confidential information received from the Company. The Confidential Information has been prepared based on historical financial information, forecasts and other information obtained by Goldman Sachs from publicly available sources, the management of the Company or other sources (approved for our use by the Company in the case of information from management and non-public information). In preparing the Confidential Information, Goldman Sachs has relied upon and assumed, without assuming any responsibility for independent verification, the accuracy and completeness of all of the financial, legal, regulatory, tax, accounting and other information provided to, discussed with or reviewed by us, and Goldman Sachs does not assume any liability for any such information. Goldman Sachs does not provide accounting, tax, legal or regulatory advice. Goldman Sachs has not made an independent evaluation or appraisal of the assets and liabilities (including any contingent, derivative or other off-balance sheet assets and liabilities) of the Company or any other party to any transaction or any of their respective affiliates and has no obligation to evaluate the solvency of the Company or any other party to any transaction under any state or federal laws relating to bankruptcy, insolvency or similar matters. The analyses contained in the Confidential Information do not purport to be appraisals nor do they necessarily reflect the prices at which businesses or securities actually may be sold or purchased. Goldman Sachs’ role in any due diligence review is limited solely to performing such a review as it shall deem necessary to support its own advice and analysis and shall not be on behalf of the Company. Analyses based upon forecasts of future results are not necessarily indicative of actual future results, which may be significantly more or less favorable than suggested by these analyses, and Goldman Sachs does not assume responsibility if future results are materially different from those forecast. The Confidential Information does not address the underlying business decision of the Company to engage in any transaction, or the relative merits of any transaction or strategic alternative referred to herein as compared to any other transaction or alternative that may be available to the Company. The Confidential Information is necessarily based on economic, monetary, market and other conditions as in effect on, and the information made available to Goldman Sachs as of, the date of such Confidential Information and Goldman Sachs assumes no responsibility for updating or revising the Confidential Information based on circumstances, developments or events occurring after such date. The Confidential Information does not constitute any opinion, nor does the Confidential Information constitute a recommendation to the Board, any security holder of the Company or any other person as to how to vote or act with respect to any transaction or any other matter. The Confidential Information, including this disclaimer, is subject to, is governed by, any written agreement between the Company, the Board and/or any committee thereof, on the one hand, and Goldman Sachs, on the other hand. 2
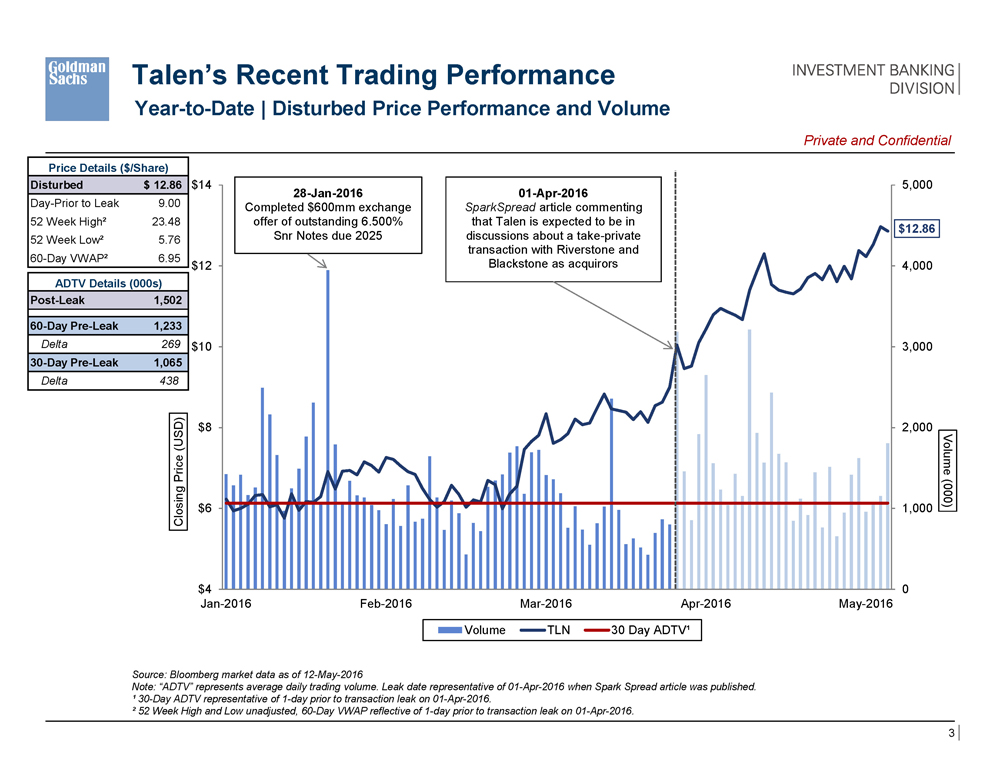
Talen’s Recent Trading Performance Year-to-Date | Disturbed Price Performance and Volume Private and Confidential Price Details ($/Share) Disturbed $12.86 Day-Prior to Leak 9.00 52 Week High² 23.48 52 Week Low² 5.76 60-Day VWAP² 6.95 ADTV Details (000s) Post-Leak 1,502 60-Day Pre-Leak 1,233 Delta 269 30-Day Pre-Leak 1,065 Delta 438 $14 Closing Price (USD) $12 $10 $8 $6 $4 Jan-2016 Feb-2016 Mar-2016 Apr-2016 May-2016 Volume Volume TLN 30 Day ADTV¹ 28-Jan-2016 Completed $600mm exchange offer of outstanding 6.500% Snr Notes due 2025 01-Apr-2016 SparkSpread article commenting that Talen is expected to be in discussions about a take-private transaction with Riverstone and Blackstone as acquirors 5,000 $12.86 4,000 3,000 2,000 1,000 0 Volume (000) Source: Bloomberg market data as of 12-May-2016 Note: “ADTV” represents average daily trading volume. Leak date representative of 01-Apr-2016 when Spark Spread article was published. ¹ 30-Day ADTV representative of 1-day prior to transaction leak on 01-Apr-2016. ² 52 Week High and Low unadjusted, 60-Day VWAP reflective of 1-day prior to transaction leak on 01-Apr-2016. 3
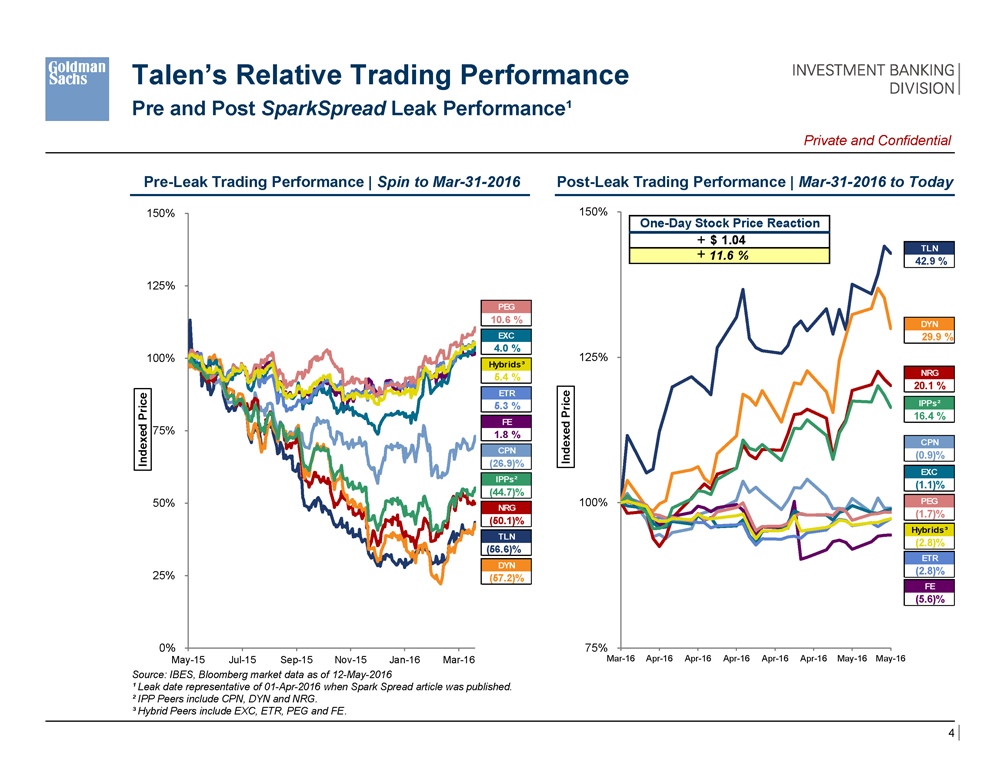
Talen’s Relative Trading Performance Pre and Post SparkSpread Leak Performance¹ Private and Confidential Pre-Leak Trading Performance | Spin to Mar-31-2016 Post-Leak Trading Performance | Mar-31-2016 to Today Indexed Price 150% 125% 100% 75% 50% 25% 0% May-15 Jul-15 Sep-15 Nov-15 Jan-16 Mar-16 PEG 10.6% EXC 4.0% Hybrids³ 5.4% ETR 5.3% FE 1.8% CPN (26.9)% IPPs² (44.7)% NRG (50.1)% TLN (56.6)% DYN (57.2)% Indexed Price 150% 125% 100% 75% One-Day Stock Price Reaction +$1.04 +11.6% TLN 42.9% DYN 29.9% NRG 20.1% IPPs²16.4% CPN (0.9)% EXC (1.1)% PEG (1.7)% Hybrids³ (2.8)% ETR (2.8)% FE (5.6)% Mar-16 Apr-16 Apr-16 Apr-16 Apr-16 Apr-16 May-16 May-16 Source: IBES, Bloomberg market data as of 12-May-2016 ¹ Leak date representative of 01-Apr-2016 when Spark Spread article was published. ² IPP Peers include CPN, DYN and NRG. ³ Hybrid Peers include EXC, ETR, PEG and FE. 4
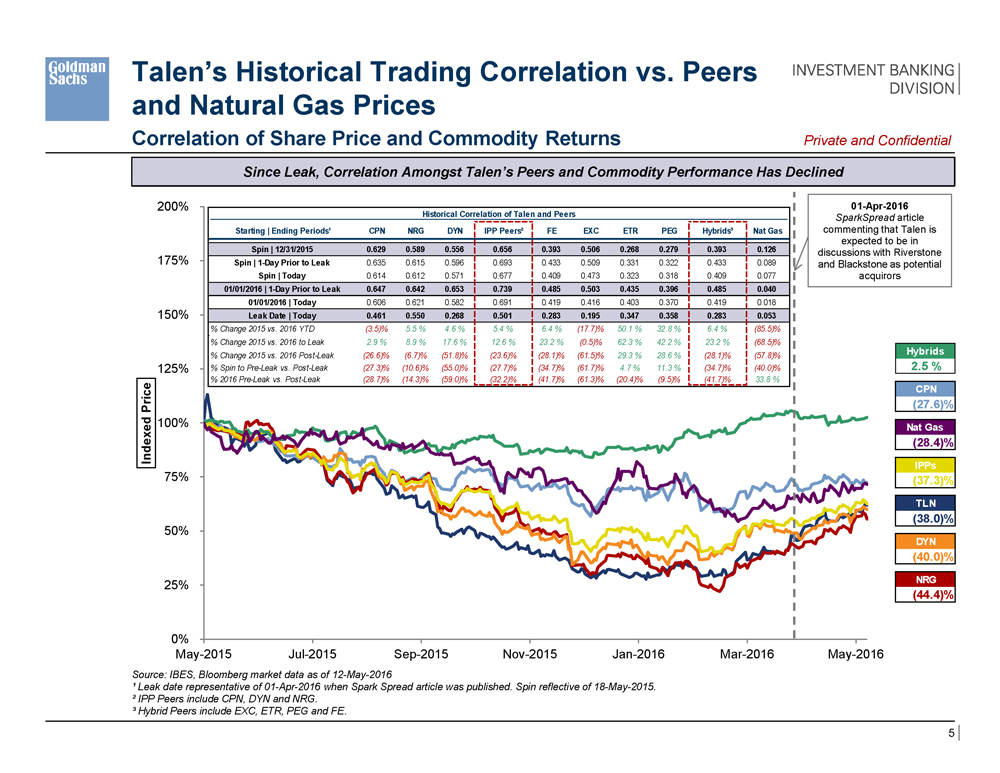
Talen’s Historical Trading Correlation vs. Peers and Natural Gas Prices Correlation of Share Price and Commodity Returns Private and Confidential Since Leak, Correlation Amongst Talen’s Peers and Commodity Performance Has Declined Indexed Price 200% 175% 150% 125% 100% 75% 50% 25% 0% May-2015 Jul-2015 Sep-2015 Nov-2015 Jan-2016 Mar-2016 May-2016 Historical Correlation of Talen and Peers Starting | Ending Periods¹ CPN NRG DYN IPP Peers² FE EXC ETR PEG Hybrids³ Nat Gas Spin | 12/31/20150.6290.5890.5560.6560.3930.5060.2680.2790.3930.126Spin | 1-Day Prior to Leak0.6350.6150.5960.6930.4330.5090.3310.3220.4330.089Spin | Today0.6140.6120.5710.6770.4090.4730.3230.3180.4090.07701/01/2016 | 1-Day Prior to Leak0.6470.6420.6530.7390.4850.5030.4350.3960.4850.04001/01/2016 | Today0.6060.6210.5820.6910.4190.4160.4030.3700.4190.018Leak Date | Today0.4610.5500.2680.5010.2830.1950.3470.3580.2830.053% Change 2015 vs. 2016 YTD(3.5)%5.5%4.6%5.4%6.4%(17.7)%50.1%32.8%6.4%(85.5)%% Change 2015 vs. 2016 to Leak2.9%8.9%17.6%12.6%23.2%(0.5)%62.3%42.2%23.2%(68.5)%% Change 2015 vs. 2016 Post-Leak(26.6)%(6.7)%(51.8)%(23.6)%(28.1)%(61.5)%29.3%28.6%(28.1)%(57.8)%% Spin to Pre-Leak vs. Post-Leak(27.3)%(10.6)%(55.0)%(27.7)%(34.7)%(61.7)%4.7%11.3%(34.7)%(40.0)%% 2016 Pre-Leak vs. Post-Leak(28.7)%(14.3)%(59.0)%(32.2)%(41.7)%(61.3)%(20.4)%(9.5)%(41.7)%33.8% 01-Apr-2016 SparkSpread article commenting that Talen is expected to be in discussions with Riverstone and Blackstone as potential acquirors Hybrids 2.5% CPN (27.6)% Nat Gas (28.4)% IPPs (37.3)% TLN (38.0)% DYN (40.0)% NRG (44.4)% Source: IBES, Bloomberg market data as of 12-May-2016 ¹ Leak date representative of 01-Apr-2016 when Spark Spread article was published. Spin reflective of 18-May-2015. ² IPP Peers include CPN, DYN and NRG. ³ Hybrid Peers include EXC, ETR, PEG and FE. 5
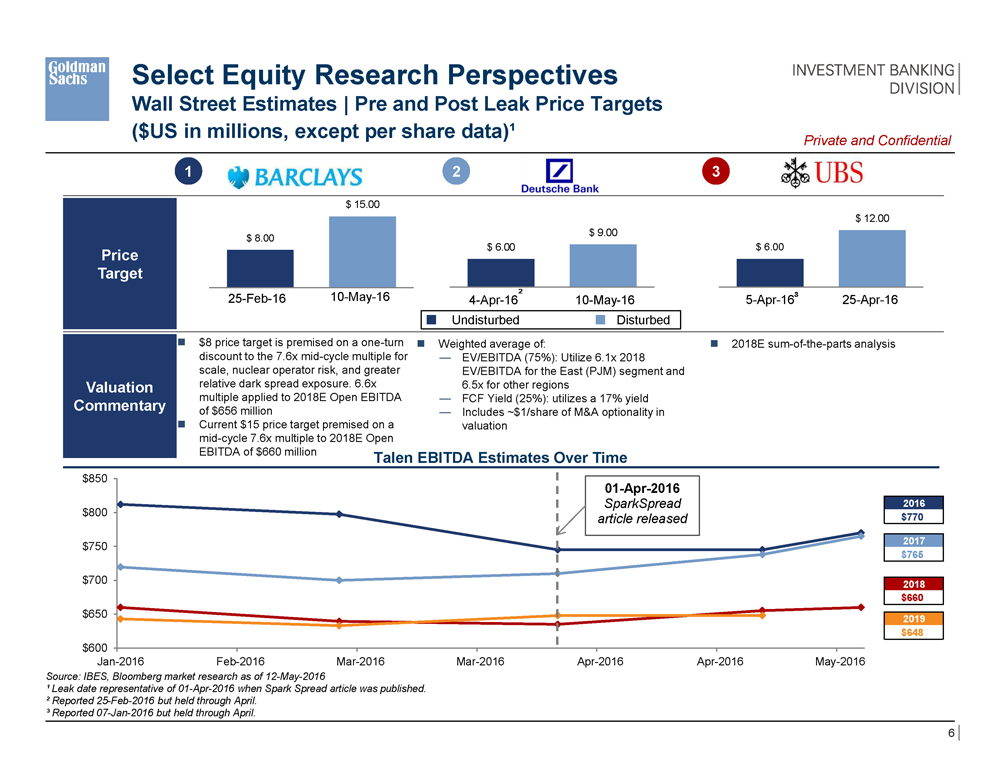
Select Equity Research Perspectives Wall Street Estimates | Pre and Post Leak Price Targets ($US in millions, except per share data)¹ Private and Confidential 1 2 3 Price Target $ 8.00 25-Feb-16 $ 15.00 10-May-16 $ 6.00 4-Apr-162 $ 9.00 10-May-16 $ 6.00 5-Apr-163 $ 12.00 25-Apr-16 Undisturbed Disturbed Valuation Commentary $8 price target is premised on a one-turn discount to the 7.6x mid-cycle multiple for scale, nuclear operator risk, and greater relative dark spread exposure. 6.6x multiple applied to 2018E Open EBITDA of $656 million Current $15 price target premised on a mid-cycle 7.6x multiple to 2018E Open EBITDA of $660 million Weighted average of: EV/EBITDA (75%): Utilize 6.1x 2018 EV/EBITDA for the East (PJM) segment and 6.5x for other regions FCF Yield (25%): utilizes a 17% yield Includes ~$1/share of M&A optionality in valuation 2018E sum-of-the-parts analysis Talen EBITDA Estimates Over Time $650 $700 $750 $800 $850 $600 Jan-2016Feb-2016Mar-2016Mar-2016Apr-2016Apr-2016May-2016 01-Apr-2016 SparkSpread article released 2016 $770 2017 $765 2018 $660 2019 $648 Source: IBES, Bloomberg market research as of 12-May-2016 ¹ Leak date representative of 01-Apr-2016 when Spark Spread article was published. ² Reported 25-Feb-2016 but held through April. ³ Reported 07-Jan-2016 but held through April. 6
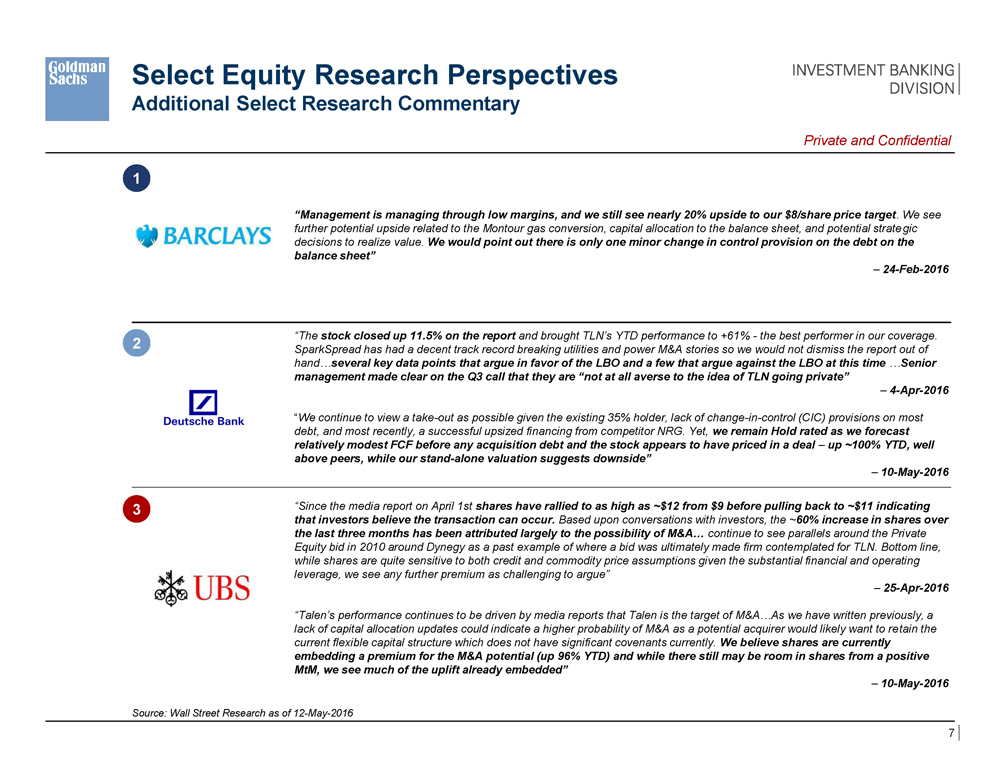
Select Equity Research Perspectives Additional Select Research Commentary Private and Confidential 1 “Management is managing through low margins, and we still see nearly 20% upside to our $8/share price target. We see further potential upside related to the Montour gas conversion, capital allocation to the balance sheet, and potential strategic decisions to realize value. We would point out there is only one minor change in control provision on the debt on the balance sheet” – 24-Feb-2016 2 “The stock closed up 11.5% on the report and brought TLN’s YTD performance to +61% - the best performer in our coverage. SparkSpread has had a decent track record breaking utilities and power M&A stories so we would not dismiss the report out of hand…several key data points that argue in favor of the LBO and a few that argue against the LBO at this time …Senior management made clear on the Q3 call that they are “not at all averse to the idea of TLN going private” – 4-Apr-2016 “We continue to view a take-out as possible given the existing 35% holder, lack of change-in-control (CIC) provisions on most debt, and most recently, a successful upsized financing from competitor NRG. Yet, we remain Hold rated as we forecast relatively modest FCF before any acquisition debt and the stock appears to have priced in a deal – up ~100% YTD, well above peers, while our stand-alone valuation suggests downside” – 10-May-2016 3 “Since the media report on April 1st shares have rallied to as high as ~$12 from $9 before pulling back to ~$11 indicating that investors believe the transaction can occur. Based upon conversations with investors, the ~60% increase in shares over the last three months has been attributed largely to the possibility of M&A… continue to see parallels around the Private Equity bid in 2010 around Dynegy as a past example of where a bid was ultimately made firm contemplated for TLN. Bottom line, while shares are quite sensitive to both credit and commodity price assumptions given the substantial financial and operating leverage, we see any further premium as challenging to argue” – 25-Apr-2016 “Talen’s performance continues to be driven by media reports that Talen is the target of M&A…As we have written previously, a lack of capital allocation updates could indicate a higher probability of M&A as a potential acquirer would likely want to retain the current flexible capital structure which does not have significant covenants currently. We believe shares are currently embedding a premium for the M&A potential (up 96% YTD) and while there still may be room in shares from a positive MtM, we see much of the uplift already embedded” – 10-May-2016 Source: Wall Street Research as of 12-May-2016 7
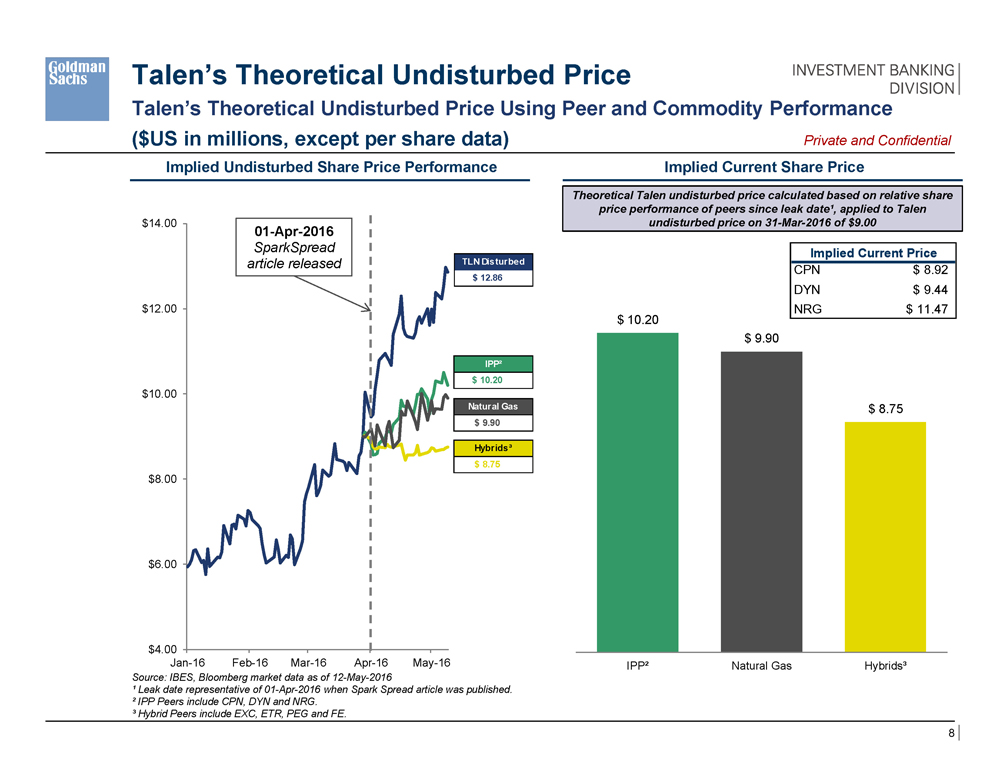
Talen’s Theoretical Undisturbed Price Talen’s Theoretical Undisturbed Price Using Peer and Commodity Performance ($US in millions, except per share data) Private and Confidential Implied Undisturbed Share Price Performance $4.00 $6.00 $8.00 $10.00 $12.00 $14.00 Jan-16 Feb-16 Mar-16 Apr-16 May-16 01-Apr-2016 SparkSpread article released TLN Disturbed $ 12.86 IPP² $ 10.20 Natural Gas $ 9.90 Hybrids³ $ 8.75 Theoretical Talen undisturbed price calculated based on relative share price performance of peers since leak date¹, applied to Talen undisturbed price on 31-Mar-2016 of $9.00 Implied Current Price CPN $8.92 DYN $9.44 NRG $11.47 $ 10.20 $ 9.90 $ 8.75 IPP² Natural Gas Hybrids³ Source: IBES, Bloomberg market data as of 12-May-2016 ¹ Leak date representative of 01-Apr-2016 when Spark Spread article was published. ² IPP Peers include CPN, DYN and NRG. ³ Hybrid Peers include EXC, ETR, PEG and FE. 8
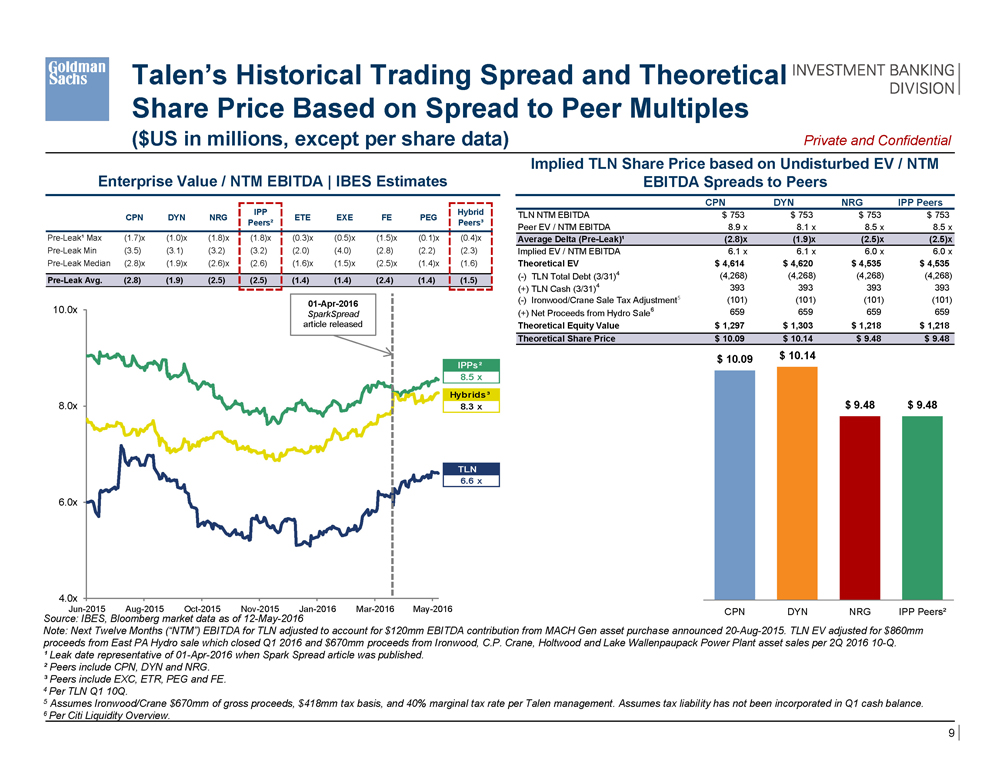
Talen’s Historical Trading Spread and Theoretical Share Price Based on Spread to Peer Multiples ($US in millions, except per share data) Private and Confidential Enterprise Value / NTM EBITDA | IBES Estimates CPN DYN NRG IPP Peers² ETE EXE FE PEG Hybrid Peers³ Pre-Leak¹ Max (1.7)x (1.0)x (1.8)x (1.8)x (0.3)x (0.5)x (1.5)x (0.1)x (0.4)x Pre-Leak Min (3.5) (3.1) (3.2) (3.2) (2.0) (4.0) (2.8) (2.2) (2.3) Pre-Leak Median (2.8)x (1.9)x (2.6)x (2.6) (1.6)x (1.5)x (2.5)x (1.4)x (1.6) Pre-Leak Avg. (2.8) (1.9) (2.5) (2.5) (1.4) (1.4) (2.4) (1.4) (1.5) 4.0x 6.0x 8.0x 10.0x Jun-2015 Aug-2015 Oct-2015 Nov-2015 Jan-2016 Mar-2016 May-2016 01-Apr-2016 SparkSpread article released IPPs² 8.5 x Hybrids³ 8.3 x TLN 6.6 x Implied TLN Share Price based on Undisturbed EV / NTM EBITDA Spreads to Peers CPN DYN NRG IPP Peers TLN NTM EBITDA $ 753 $ 753 $ 753 $ 753 Peer EV / NTM EBITDA 8.9 x 8.1 x 8.5 x 8.5 x Average Delta (Pre-Leak)¹ (2.8)x (1.9)x (2.5)x (2.5)x Implied EV / NTM EBITDA 6.1 x 6.1 x 6.0 x 6.0 x Theoretical EV $ 4,614 $ 4,620 $ 4,535 $ 4,535 (-) TLN Total Debt (3/31)4 (4,268) (4,268) (4,268) (4,268) (+) TLN Cash (3/31)4 393 393 393 393 (-) Ironwood/Crane Sale Tax Adjustment5 (101) (101) (101) (101) (+) Net Proceeds from Hydro Sale6 659 659 659 659 Theoretical Equity Value $ 1,297 $ 1,303 $ 1,218 $ 1,218 Theoretical Share Price $ 10.09 $ 10.14 $ 9.48 $ 9.48 $ 10.09 $ 10.14 $ 9.48 $ 9.48 CPN DYN NRG IPP Peers² Source: IBES, Bloomberg market data as of 12-May-2016 Note: Next Twelve Months (“NTM”) EBITDA for TLN adjusted to account for $120mm EBITDA contribution from MACH Gen asset purchase announced 20-Aug-2015. TLN EV adjusted for $860mm proceeds from East PA Hydro sale which closed Q1 2016 and $670mm proceeds from Ironwood, C.P. Crane, Holtwood and Lake Wallenpaupack Power Plant asset sales per 2Q 2016 10-Q. ¹ Leak date representative of 01-Apr-2016 when Spark Spread article was published. ² Peers include CPN, DYN and NRG. ³ Peers include EXC, ETR, PEG and FE. 4 Per TLN Q1 10Q. 5 Assumes Ironwood/Crane $670mm of gross proceeds, $418mm tax basis, and 40% marginal tax rate per Talen management. Assumes tax liability has not been incorporated in Q1 cash balance. 6 Per Citi Liquidity Overview. 9