Exhibit (c)(5)
| Corporate and Investment Banking | Global Power January 11, 2016 Project Revere Citi Presentation to Talen’s Board of Directors |
| Confidential Material Disclaimer The following pages contain material provided to the Board of Directors of Talen Energy Corporation (“Talen” or the “Company”) by Citigroup Global Markets Inc. (“Citi”) in connection with a proposal from Riverstone Holdings LLC (“Riverstone”). The accompanying material was compiled or prepared on a confidential basis solely for the use of the Board of Directors of the Company and not with a view toward public disclosure under any securities laws or otherwise. The information contained in the accompanying material was obtained from the Company and other sources. Any estimates and projections contained herein have been prepared or adopted by management of the Company, obtained from public sources, or are based upon such estimates and projections, and involve numerous and significant subjective determinations, and there is no assurance that such estimates and projections will be realized. Citi does not take responsibility for such estimates and projections, or the basis on which they were prepared. No representation or warranty, express or implied, is made as to the accuracy or completeness of such information and nothing contained herein is, or shall be relied upon as, a representation, whether as to the past, the present or the future. In preparing the accompanying material, Citi assumed and relied, without independent verification, upon the accuracy and completeness of all financial and other information and data publicly available or provided to or otherwise reviewed by or discussed with Citi and upon the assurances of the management of the Company, that they are not aware of any relevant information that has been omitted or that remains undisclosed to Citi. The accompanying material was not prepared for use by readers not as familiar with the Company as the Board of Directors of the Company and, accordingly, neither the Company nor Citi nor their respective legal or financial advisors or accountants take any responsibility for the accompanying material if used by persons other than the Board of Directors of the Company. The accompanying material is necessarily based upon information available to Citi, and financial, stock market and other conditions and circumstances existing and disclosed to Citi, as of the date of the accompanying material. Citi does not have any obligation to update or otherwise revise the accompanying material. Nothing contained herein shall be construed as legal, regulatory, tax or accounting advice. 1 |
| Agenda • Market Overview • Valuation Summary • Sensitivity Analysis • Strategic Decision Overview 2 |
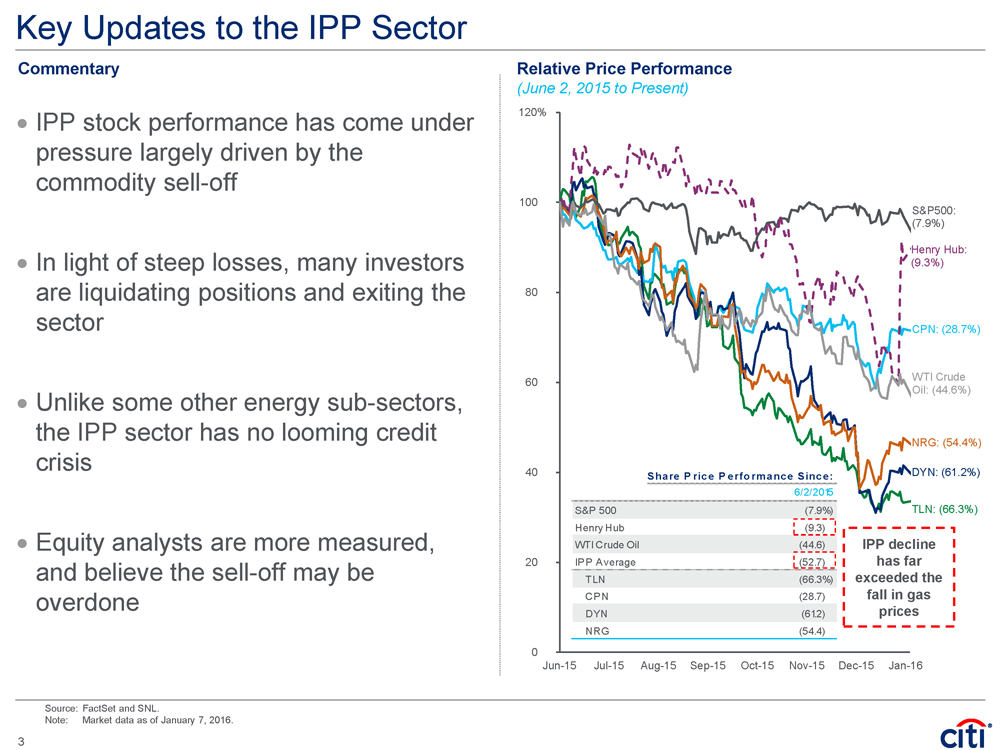
| 0 20 40 60 80 100 120%Jun-15 Jul-15 Aug-15 Sep-15 Oct-15 Nov-15 Dec-15 Jan-16 S&P500: (7.9%) Henry Hub: (9.3%) CPN: (28.7%) NRG: (54.4%) DYN: (61.2%) TLN: (66.3%) WTI Crude Oil: (44.6%) Key Updates to the IPP Sector • IPP stock performance has come under pressure largely driven by the commodity sell-off • In light of steep losses, many investors are liquidating positions and exiting the sector • Unlike some other energy sub-sectors, the IPP sector has no looming credit crisis • Equity analysts are more measured, and believe the sell-off may be overdone Relative Price Performance (June 2, 2015 to Present) Source: FactSet and SNL. Note: Market data as of January 7, 2016. Commentary Share P rice Performance Since: 6/2/2015 S&P 500 (7.9%) Henry Hub (9.3) WTI Crude Oil (44.6) IPP Average (52.7) TLN (66.3%) CPN (28.7) DYN (61.2) NRG (54.4) IPP decline has far exceeded the fall in gas prices 3 |
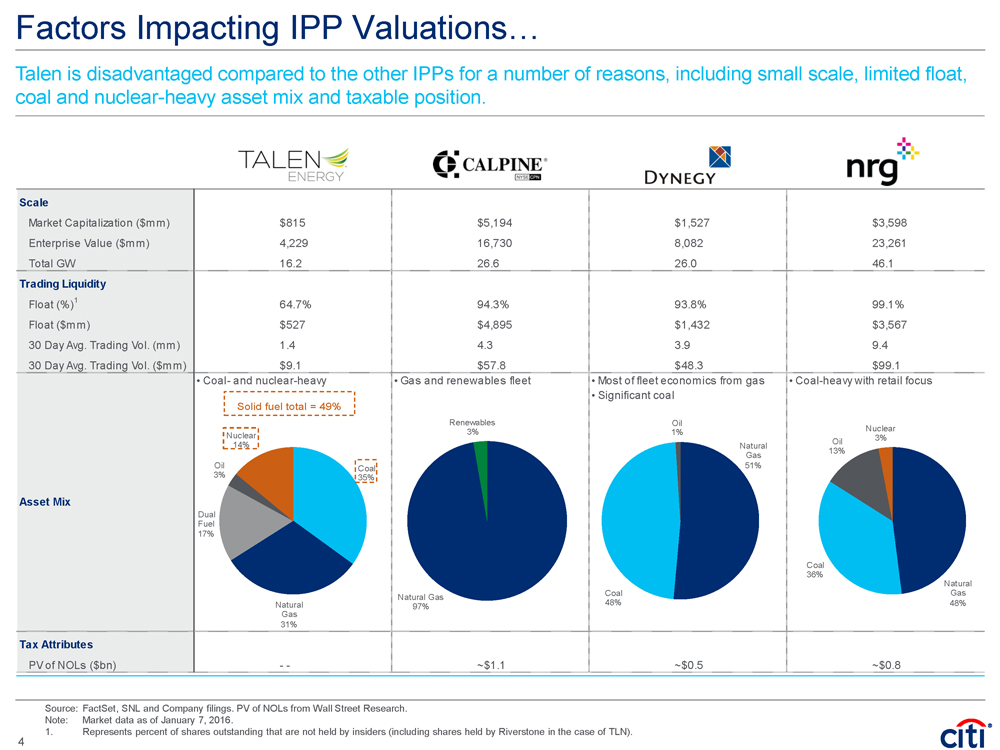
| Scale Market Capitalization ($mm) $815 $5,194 $1,527 $3,598 Enterprise Value ($mm) 4,229 16,730 8,082 23,261 Total GW 16.2 26.6 26.0 46.1 Trading Liquidity Float (%)1 64.7% 94.3% 93.8% 99.1% Float ($mm) $527 $4,895 $1,432 $3,567 30 Day Avg. Trading Vol. (mm) 1.4 4.3 3.9 9.4 30 Day Avg. Trading Vol. ($mm) $9.1 $57.8 $48.3 $99.1 Asset Mix • Coal- and nuclear-heavy • Gas and renewables fleet • Most of fleet economics from gas • Significant coal • Coal-heavy with retail focus Tax Attributes PV of NOLs ($bn) - - ~$1.1 ~$0.5 ~$0.8 Coal 35% Natural Gas 31% Dual Fuel 17%Oil 3%Nuclear 14% Natural Gas 97% Renewables 3% Natural Gas 51% Coal 48% Oil 1% Natural Gas 48% Coal 36% Oil 13% Nuclear 3% Factors Impacting IPP Valuations… Source: FactSet, SNL and Company filings. PV of NOLs from Wall Street Research. Note: Market data as of January 7, 2016. 1. Represents percent of shares outstanding that are not held by insiders (including shares held by Riverstone in the case of TLN). Talen is disadvantaged compared to the other IPPs for a number of reasons, including small scale, limited float, coal and nuclear-heavy asset mix and taxable position. 4 Solid fuel total = 49% |
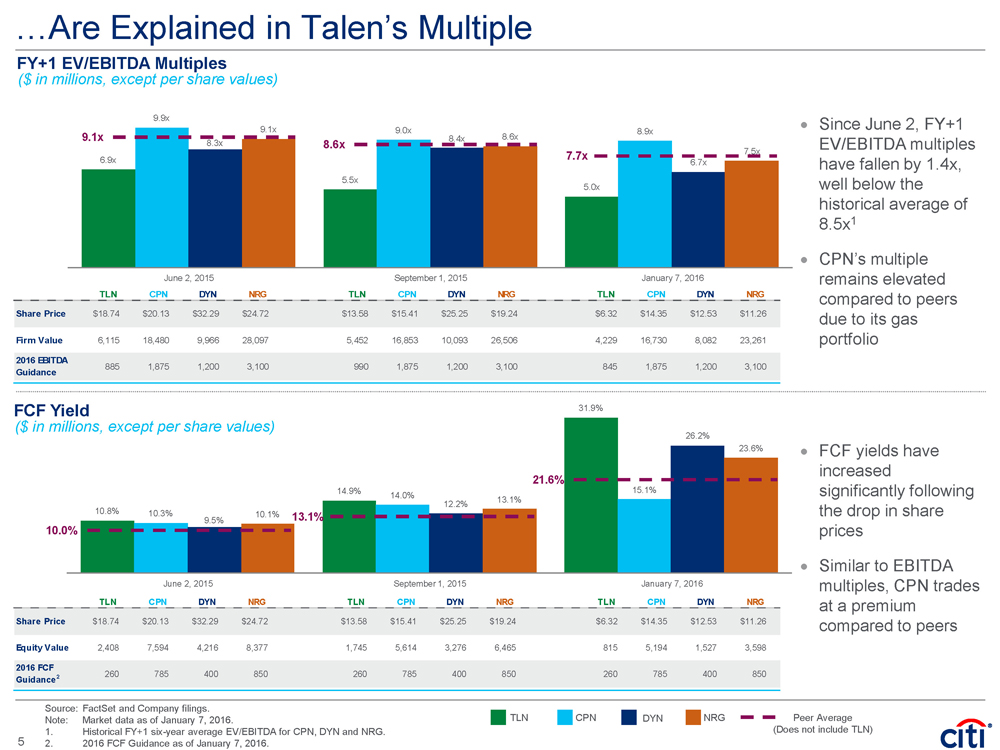
| TLN CPN DYN NRG TLN CPN DYN NRG TLN CPN DYN NRG Share Price $18.74 $20.13 $32.29 $24.72 $13.58 $15.41 $25.25 $19.24 $6.32 $14.35 $12.53 $11.26 Equity Value 2,408 7,594 4,216 8,377 1,745 5,614 3,276 6,465 815 5,194 1,527 3,598 2016 FCF Guidance2 260 785 400 850 260 785 400 850 260 785 400 850 10.8% 14.9% 31.9% 10.3% 14.0% 15.1% 9.5% 12.2% 26.2% 10.1% 13.1% 23.6% June 2, 2015 September 1, 2015 January 7, 2016 TLN CPN DYN NRG TLN CPN DYN NRG TLN CPN DYN NRG Share Price $18.74 $20.13 $32.29 $24.72 $13.58 $15.41 $25.25 $19.24 $6.32 $14.35 $12.53 $11.26 Firm Value 6,115 18,480 9,966 28,097 5,452 16,853 10,093 26,506 4,229 16,730 8,082 23,261 2016 EBITDA Guidance 885 1,875 1,200 3,100 990 1,875 1,200 3,100 845 1,875 1,200 3,100 6.9x 5.5x 5.0x 9.9x 9.0x 8.9x 8.3x 8.4x 6.7x 9.1x 8.6x 7.5x June 2, 2015 September 1, 2015 January 7, 2016 …Are Explained in Talen’s Multiple FY+1 EV/EBITDA Multiples Source: FactSet and Company filings. Note: Market data as of January 7, 2016. 1. Historical FY+1 six-year average EV/EBITDA for CPN, DYN and NRG. 2. 2016 FCF Guidance as of January 7, 2016. • Since June 2, FY+1 EV/EBITDA multiples have fallen by 1.4x, well below the historical average of 8.5x1 • CPN’s multiple remains elevated compared to peers due to its gas portfolio 9.1x ($ in millions, except per share values) TLN CPN DYN NRG Peer Average (Does not include TLN) 8.6x 7.7x 10.0% 13.1% 21.6% FCF Yield ($ in millions, except per share values) • FCF yields have increased significantly following the drop in share prices • Similar to EBITDA multiples, CPN trades at a premium compared to peers 5 |
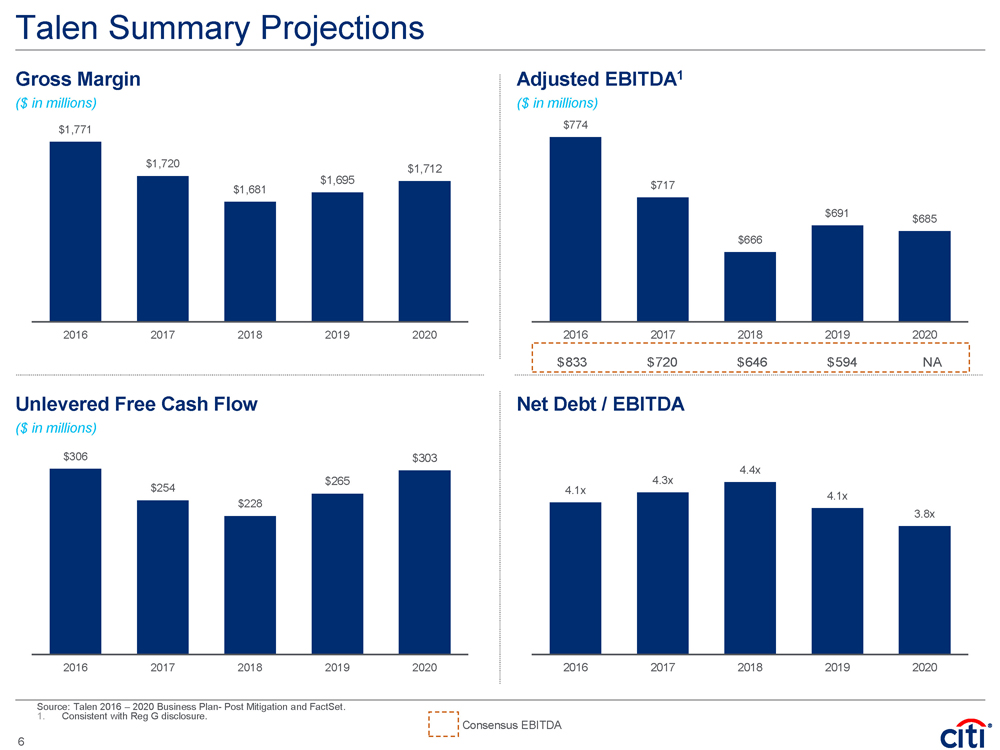
| Talen Summary Projections Gross Margin ($ in millions) Adjusted EBITDA1 ($ in millions) Unlevered Free Cash Flow ($ in millions) Net Debt / EBITDA Source: Talen 2016 – 2020 Business Plan- Post Mitigation and FactSet. 1. Consistent with Reg G disclosure. 4.1x 4.3x 4.4x 4.1x 3.8x 2016 2017 2018 2019 2020 $306 $254 $228 $265 $303 2016 2017 2018 2019 2020 $774 $717 $666 $691 $685 2016 2017 2018 2019 2020 $1,771 $1,720 $1,681 $1,695 $1,712 2016 2017 2018 2019 2020 $833 $720 $646 Consensus EBITDA 6 |
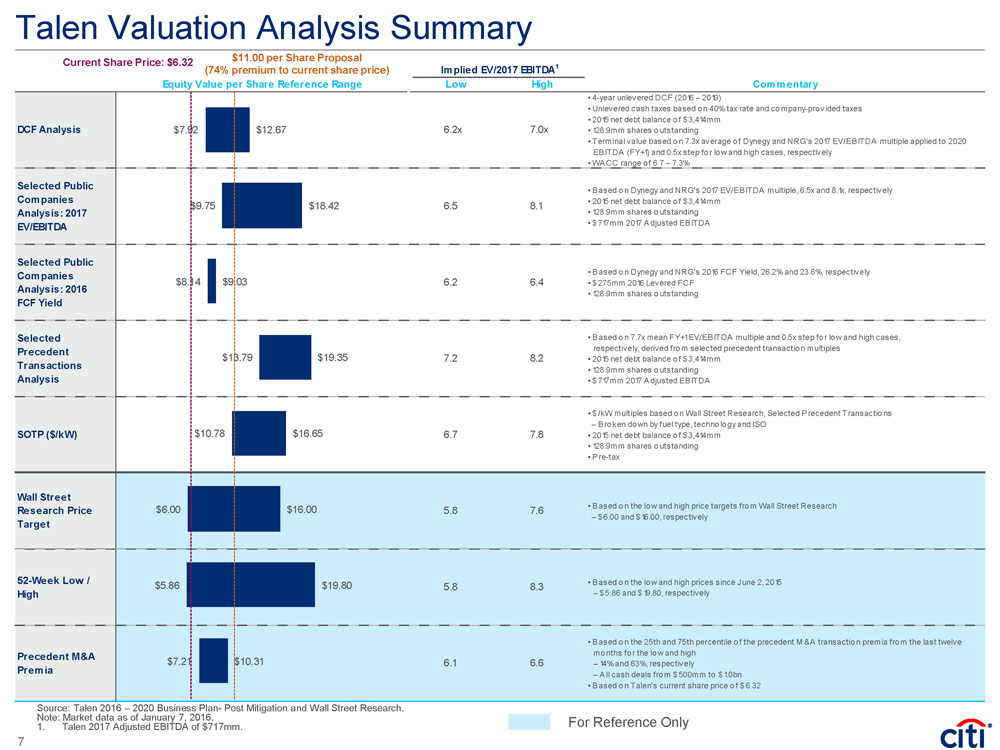
| Talen Valuation Analysis Summary Source: Talen 2016 – 2020 Business Plan- Post Mitigation and Wall Street Research. Note: Market data as of January 7, 2016. 1. Talen 2017 Adjusted EBITDA of $717mm. $11.00 per Share Proposal (74% premium to current share price) For Reference Only Current Share Price: $6.32 Implied EV/2017 EBITDA1 Equity Value per Share Reference Range Low High Commentary DCF Analysis 6.2x 7.0x • 4-year unlevered DCF (2016 – 2019) • Unlevered cash taxes based on 40% tax rate and company-provided taxes • 2015 net debt balance of $ 3,414mm • 128.9mm shares outstanding • Terminal value based on 7.3x average of Dynegy and NRG's 2017 EV/EBITDA multiple applied to 2020 EBITDA (FY+1) and 0.5x step for low and high cases, respectively • WA CC range of 6.7 – 7.3% Selected Public Companies Analysis: 2017 EV/EBITDA 6.5 8.1 • Based on Dynegy and NRG's 2017 EV/EBITDA multiple, 6.5x and 8.1x, respectively • 2015 net debt balance of $ 3,414mm • 128.9mm shares outstanding • $ 717mm 2017 Adjusted EBITDA Selected Public Companies Analysis: 2016 FCF Yield 6.2 6.4 • Based on Dynegy and NRG's 2016 FCF Yield, 26.2% and 23.6%, respectively • $ 275mm 2016 Levered FCF • 128.9mm shares outstanding Selected Precedent Transactions Analysis 7.2 8.2 • Based on 7.7x mean FY+1 EV/EB ITDA multiple and 0.5x step for low and high cases, respectively, derived from selected precedent transaction multiples • 2015 net debt balance of $ 3,414mm • 128.9mm shares outstanding • $ 717mm 2017 Adjusted EB ITDA SOTP ($/kW) 6.7 7.8 • $ /kW multiples based on Wall Street Research, Selected Precedent Transactions – Bro ken down by fuel type, technology and ISO • 2015 net debt balance of $ 3,414mm • 128.9mm shares outstanding • Pre-tax Wall Street Research Price Target 5.8 7.6 • Based on the lo w and high price targets from Wall Street Research – $ 6.00 and $ 16.00, respectively 52-Week Low / High 5.8 8.3 • Based on the lo w and high prices since June 2, 2015 – $ 5.86 and $ 19.80, respectively Precedent M&A Premia 6.1 6.6 • Based on the 25th and 75th percentile of the precedent M &A transaction premia from the last twelve months for the low and high – 14% and 63%, respectively – All cash deals from $ 500mm to $ 1.0bn • Based on Talen's current share price of $ 6.32 $7.92 $9.75 $8.14 $13.79 $10.78 $6.00 $5.86 $7.21 $12.67 $18.42 $9.03 $19.35 $16.65 $16.00 $19.80 $10.31 7 |
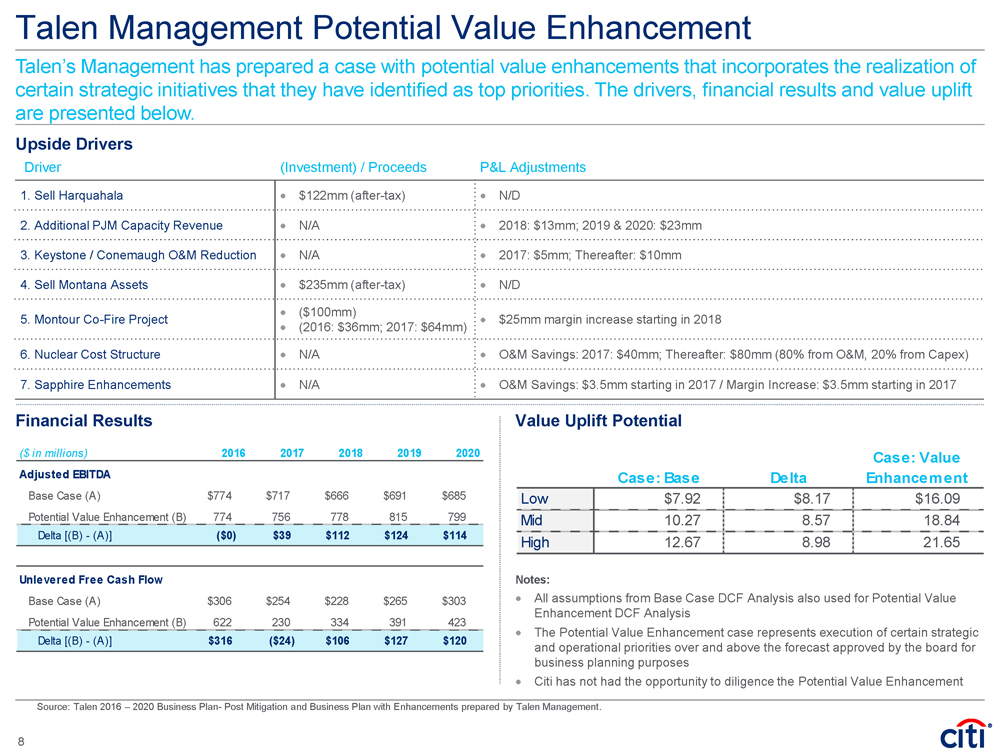
| Talen Management Potential Value Enhancement Upside Drivers Financial Results Value Uplift Potential Notes: • All assumptions from Base Case DCF Analysis also used for Potential Value Enhancement DCF Analysis • The Potential Value Enhancement case represents execution of certain strategic and operational priorities over and above the forecast approved by the board for business planning purposes • Citi has not had the opportunity to diligence the Potential Value Enhancement Talen’s Management has prepared a case with potential value enhancements that incorporates the realization of certain strategic initiatives that they have identified as top priorities. The drivers, financial results and value uplift are presented below. Driver (Investment) / Proceeds P&L Adjustments 1. Sell Harquahala • $122mm (after-tax) • N/D 2. Additional PJM Capacity Revenue • N/A • 2018: $13mm; 2019 & 2020: $23mm 3. Keystone / Conemaugh O&M Reduction • N/A • 2017: $5mm; Thereafter: $10mm 4. Sell Montana Assets • $235mm (after-tax) • N/D 5. Montour Co-Fire Project • ($100mm) • (2016: $36mm; 2017: $64mm) • $25mm margin increase starting in 2018 6. Nuclear Cost Structure • N/A • O&M Savings: 2017: $40mm; Thereafter: $80mm (80% from O&M, 20% from Capex) 7. Sapphire Enhancements • N/A • O&M Savings: $3.5mm starting in 2017 / Margin Increase: $3.5mm starting in 2017 |
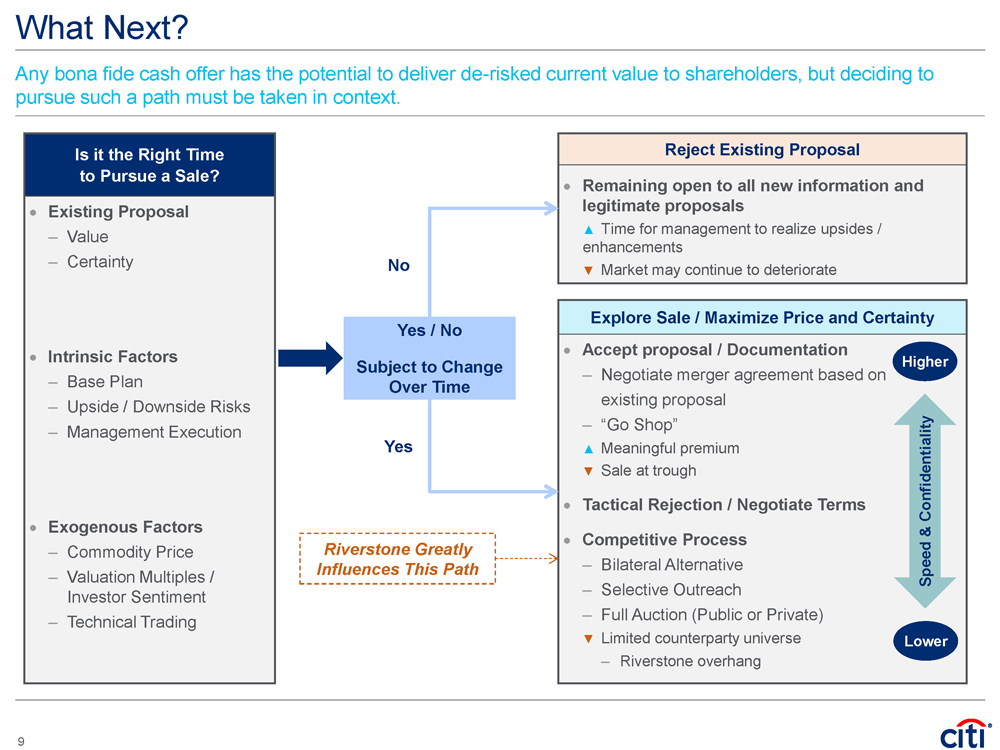
| What Next? Any bona fide cash offer has the potential to deliver de-risked current value to shareholders, but deciding to pursue such a path must be taken in context. Is it the Right Time to Pursue a Sale? • Existing Proposal – Value – Certainty • Intrinsic Factors – Base Plan – Upside / Downside Risks – Management Execution • Exogenous Factors – Commodity Price – Valuation Multiples / Investor Sentiment – Technical Trading |

| Appendix |
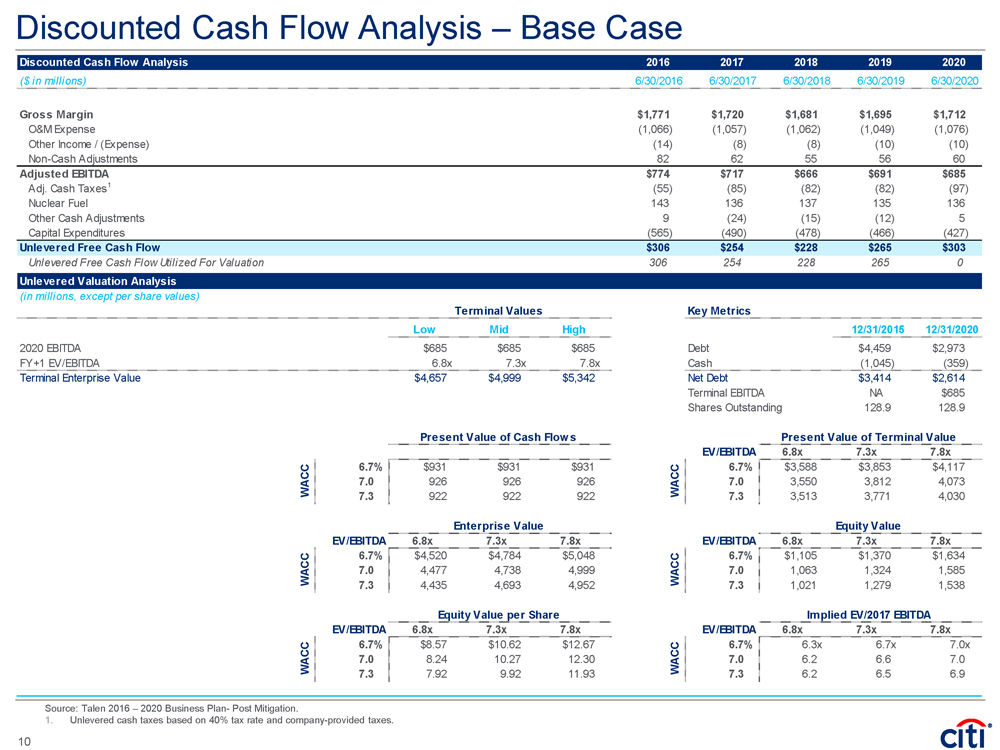
| Discounted Cash Flow Analysis – Base Case Source: Talen 2016 – 2020 Business Plan- Post Mitigation. 1. Unlevered cash taxes based on 40% tax rate and company-provided taxes. Discounted Cash Flow Analysis 2016 2017 2018 2019 2020 ($ in millions) 12/31/2015 6/30/2016 6/30/2017 6/30/2018 6/30/2019 6/30/2020 Gross Margin $1,771 $1,720 $1,681 $1,695 $1,712 O&M Expense (1,066) (1,057) (1,062) (1,049) (1,076) Other Income / (Expense) (14) (8) (8) (10) (10) Non-Cash Adjustments 82 62 55 56 60 Adjusted EBITDA $774 $717 $666 $691 $685 Adj. Cash Taxes1 (55) (85) (82) (82) (97) Nuclear Fuel 143 136 137 135 136 Other Cash Adjustments 9 (24) (15) (12) 5 Capital Expenditures (565) (490) (478) (466) (427) Unlevered Free Cash Flow $0 $306 $254 $228 $265 $303 Unlevered Free Cash Flow Utilized For Valuation 306 254 228 265 0 Unlevered Valuation Analysis (in millions, except per share values) Terminal Values Key Metrics Low Mid High 12/31/2015 12/31/2020 2020 EBITDA $685 $685 $685 Debt $4,459 $2,973 FY+1 EV/EBITDA 6.8x 7.3x 7.8x Cash (1,045) (359) Terminal Enterprise Value $4,657 $4,999 $5,342 Net Debt $3,414 $2,614 Terminal EBITDA NA $685 Shares Outstanding 128.9 128.9 Present Value of Cash Flows Present Value of Terminal Value EV/EBITDA 6.8x 7.3x 7.8x 6.7% $931 $931 $931 6.7% $3,588 $3,853 $4,117 7.0 926 926 926 7.0 3,550 3,812 4,073 7.3 922 922 922 7.3 3,513 3,771 4,030 Enterprise Value Equity Value EV/EBITDA 6.8x 7.3x 7.8x EV/EBITDA 6.8x 7.3x 7.8x 6.7% $4,520 $4,784 $5,048 6.7% $1,105 $1,370 $1,634 7.0 4,477 4,738 4,999 7.0 1,063 1,324 1,585 7.3 4,435 4,693 4,952 7.3 1,021 1,279 1,538 Equity Value per Share Implied EV/2017 EBITDA EV/EBITDA 6.8x 7.3x 7.8x EV/EBITDA 6.8x 7.3x 7.8x 6.7% $8.57 $10.62 $12.67 6.7% 6.3x 6.7x 7.0x 7.0 8.24 10.27 12.30 7.0 6.2 6.6 7.0 7.3 7.92 9.92 11.93 7.3 6.2 6.5 6.9 WACC WACC WACC WACC WACC WACC 10 |
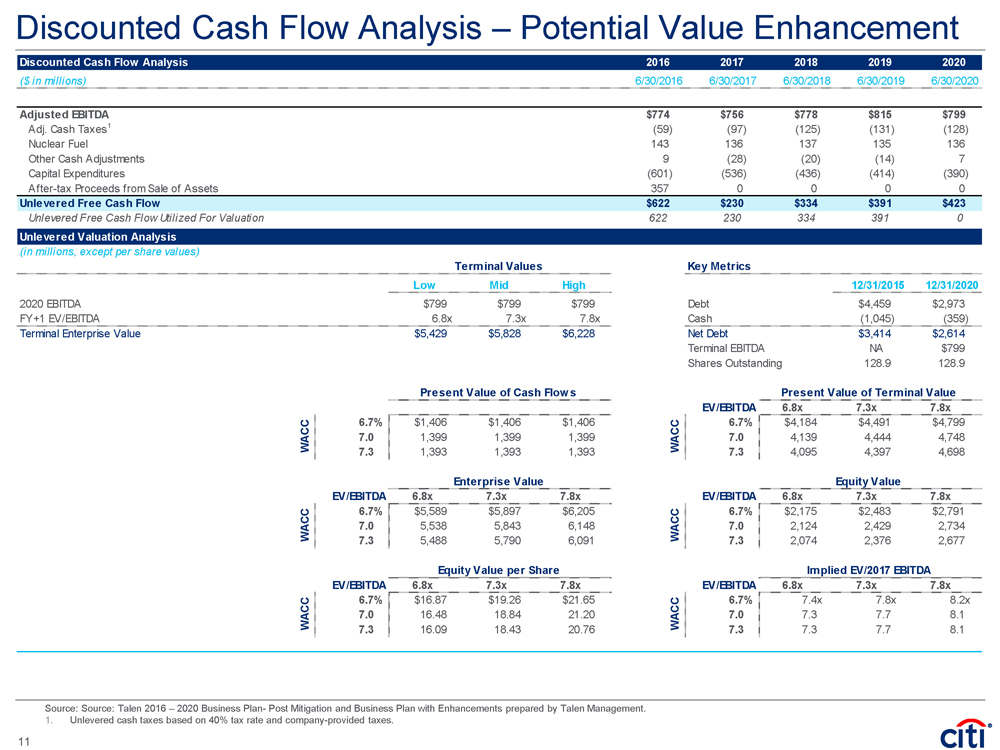
| Discounted Cash Flow Analysis – Potential Value Enhancement Source: Source: Talen 2016 – 2020 Business Plan- Post Mitigation and Business Plan with Enhancements prepared by Talen Management. 1. Unlevered cash taxes based on 40% tax rate and company-provided taxes. 11 Discounted Cash Flow Analysis 2016 2017 2018 2019 2020 ($ in millions) 12/31/2015 6/30/2016 6/30/2017 6/30/2018 6/30/2019 6/30/2020 Adjusted EBITDA $774 $756 $778 $815 $799 Adj. Cash Taxes1 (59) (97) (125) (131) (128) Nuclear Fuel 143 136 137 135 136 Other Cash Adjustments 9 (28) (20) (14) 7 Capital Expenditures (601) (536) (436) (414) (390) After-tax Proceeds from Sale of Assets 357 0 0 0 0 Unlevered Free Cash Flow $0 $622 $230 $334 $391 $423 Unlevered Free Cash Flow Utilized For Valuation 622 230 334 391 0 Unlevered Valuation Analysis (in millions, except per share values) Terminal Values Key Metrics Low Mid High 12/31/2015 12/31/2020 2020 EBITDA $799 $799 $799 Debt $4,459 $2,973 FY+1 EV/EBITDA 6.8x 7.3x 7.8x Cash (1,045) (359) Terminal Enterprise Value $5,429 $5,828 $6,228 Net Debt $3,414 $2,614 Terminal EBITDA NA $799 Shares Outstanding 128.9 128.9 Present Value of Cash Flows Present Value of Terminal Value EV/EBITDA 6.8x 7.3x 7.8x 6.7% $1,406 $1,406 $1,406 6.7% $4,184 $4,491 $4,799 7.0 1,399 1,399 1,399 7.0 4,139 4,444 4,748 7.3 1,393 1,393 1,393 7.3 4,095 4,397 4,698 Enterprise Value Equity Value EV/EBITDA 6.8x 7.3x 7.8x EV/EBITDA 6.8x 7.3x 7.8x 6.7% $5,589 $5,897 $6,205 6.7% $2,175 $2,483 $2,791 7.0 5,538 5,843 6,148 7.0 2,124 2,429 2,734 7.3 5,488 5,790 6,091 7.3 2,074 2,376 2,677 Equity Value per Share Implied EV/2017 EBITDA EV/EBITDA 6.8x 7.3x 7.8x EV/EBITDA 6.8x 7.3x 7.8x 6.7% $16.87 $19.26 $21.65 6.7% 7.4x 7.8x 8.2x 7.0 16.48 18.84 21.20 7.0 7.3 7.7 8.1 7.3 16.09 18.43 20.76 7.3 7.3 7.7 8.1 WACC WACC WACC WACCWACC WACC |
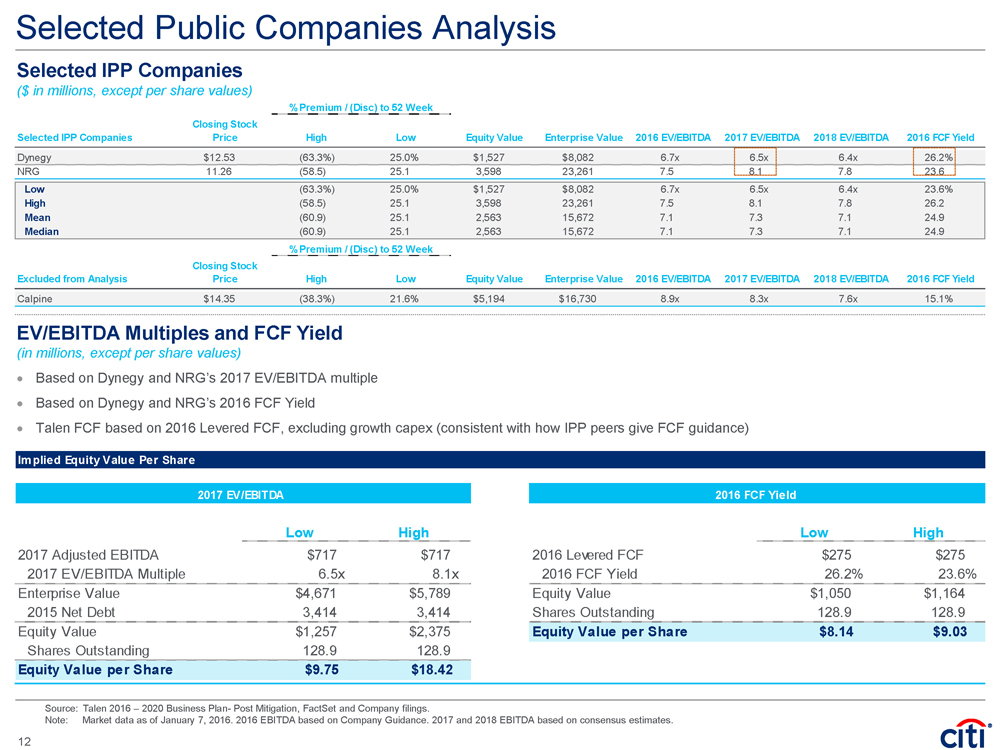
| Selected Public Companies Analysis Selected IPP Companies ($ in millions, except per share values) EV/EBITDA Multiples and FCF Yield (in millions, except per share values) • Based on Dynegy and NRG’s 2017 EV/EBITDA multiple • Based on Dynegy and NRG’s 2016 FCF Yield • Talen FCF based on 2016 Levered FCF, excluding growth capex (consistent with how IPP peers give FCF guidance) Source: Talen 2016 – 2020 Business Plan- Post Mitigation, FactSet and Company filings. Note: Market data as of January 7, 2016. 2016 EBITDA based on Company Guidance. 2017 and 2018 EBITDA based on consensus estimates. % Premium / (Disc) to 52 Week Selected IPP Companies Closing Stock Price High Low Equity Value Enterprise Value 2016 EV/EBITDA 2017 EV/EBITDA 2018 EV/EBITDA 2016 FCF Yield Dynegy $12.53 (63.3%) 25.0% $1,527 $8,082 6.7x 6.5x 6.4x 26.2% NRG 11.26 (58.5) 25.1 3,598 23,261 7.5 8.1 7.8 23.6 Low (63.3%) 25.0% $1,527 $8,082 6.7x 6.5x 6.4x 23.6% High (58.5) 25.1 3,598 23,261 7.5 8.1 7.8 26.2 Mean (60.9) 25.1 2,563 15,672 7.1 7.3 7.1 24.9 Median (60.9) 25.1 2,563 15,672 7.1 7.3 7.1 24.9 % Premium / (Disc) to 52 Week Excluded from Analysis Closing Stock Price High Low Equity Value Enterprise Value 2016 EV/EBITDA 2017 EV/EBITDA 2018 EV/EBITDA 2016 FCF Yield Calpine $14.35 (38.3%) 21.6% $5,194 $16,730 8.9x 8.3x 7.6x 15.1% 12 Implied Equity Value Per Share 2017 EV/EBITDA 2016 FCF Yield Low High Low High 2017 Adjusted EBITDA $717 $717 2016 Levered FCF $275 $275 2017 EV/EBITDA Multiple 6.5x 8.1x 2016 FCF Yield 26.2% 23.6% Enterprise Value $4,671 $5,789 Equity Value $1,050 $1,164 2015 Net Debt 3,414 3,414 Shares Outstanding 128.9 128.9 Equity Value $1,257 $2,375 Equity Value per Share $8.14 $9.03 Shares Outstanding 128.9 128.9 Equity Value per Share $9.75 $18.42 |
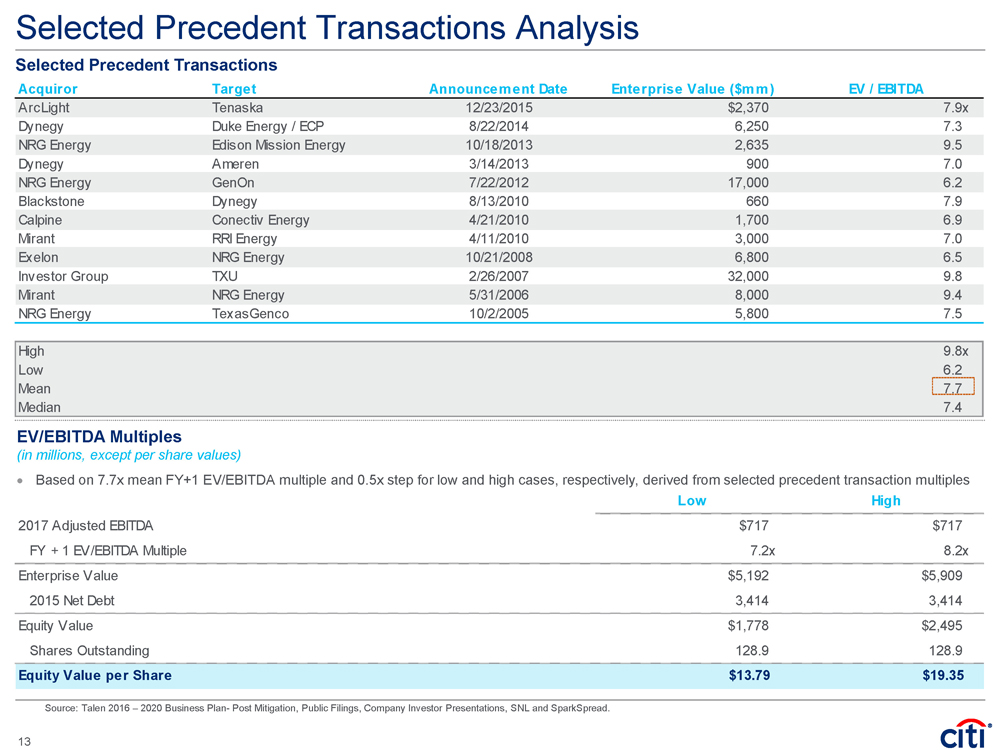
| Acquiror Target Announcement Date Enterprise Value ($mm) EV / EBITDA ArcLight Tenaska 12/23/2015 $2,370 7.9x Dynegy Duke Energy / ECP 8/22/2014 6,250 7.3 NRG Energy Edison Mission Energy 10/18/2013 2,635 9.5 Dynegy Ameren 3/14/2013 900 7.0 NRG Energy GenOn 7/22/2012 17,000 6.2 Blackstone Dynegy 8/13/2010 660 7.9 Calpine Conectiv Energy 4/21/2010 1,700 6.9 Mirant RRI Energy 4/11/2010 3,000 7.0 Exelon NRG Energy 10/21/2008 6,800 6.5 Investor Group TXU 2/26/2007 32,000 9.8 Mirant NRG Energy 5/31/2006 8,000 9.4 NRG Energy TexasGenco 10/2/2005 5,800 7.5 High 9.8x Low 6.2 Mean 7.7 Median 7.4 Selected Precedent Transactions Selected Precedent Transactions Analysis Source: Talen 2016 – 2020 Business Plan- Post Mitigation, Public Filings, Company Investor Presentations, SNL and SparkSpread. EV/EBITDA Multiples (in millions, except per share values) • Based on 7.7x mean FY+1 EV/EBITDA multiple and 0.5x step for low and high cases, respectively, derived from selected precedent transaction multiples Low High 2017 Adjusted EBITDA $717 $717 FY + 1 EV/EBITDA Multiple 7.2x 8.2x Enterprise Value $5,192 $5,909 2015 Net Debt 3,414 3,414 Equity Value $1,778 $2,495 Shares Outstanding 128.9 128.9 Equity Value per Share $13.79 $19.35 13 |
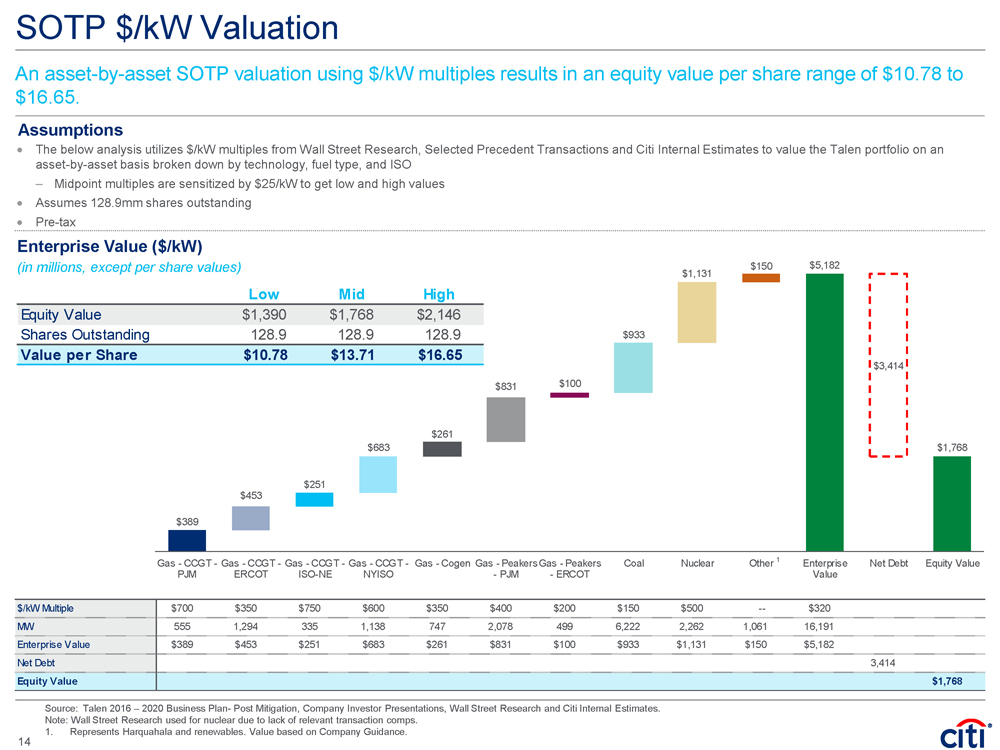
| SOTP $/kW Valuation An asset-by-asset SOTP valuation using $/kW multiples results in an equity value per share range of $10.78 to $16.65. • The below analysis utilizes $/kW multiples from Wall Street Research, Selected Precedent Transactions and Citi Internal Estimates to value the Talen portfolio on an asset-by-asset basis broken down by technology, fuel type, and ISO – Midpoint multiples are sensitized by $25/kW to get low and high values • Assumes 128.9mm shares outstanding • Pre-tax Assumptions Enterprise Value ($/kW) (in millions, except per share values) Source: Talen 2016 – 2020 Business Plan- Post Mitigation, Company Investor Presentations, Wall Street Research and Citi Internal Estimates. Note: Wall Street Research used for nuclear due to lack of relevant transaction comps. 1. Represents Harquahala and renewables. Value based on Company Guidance. 1 $/kW Multiple $700 $350 $750 $600 $350 $400 $200 $150 $500 -- $320 MW 555 1,294 335 1,138 747 2,078 499 6,222 2,262 1,061 16,191 Enterprise Value $389 $453 $251 $683 $261 $831 $100 $933 $1,131 $150 $5,182 Net Debt 3,414 Equity Value $1,768 $389 $389 $841 $1,093 $1,775 $2,037 $2,868 $2,968 $3,901 $5,182 $1,768 $453 $251 $683 $261 $831 $933 $1,131 $150 $3,414 $100 Gas - CCGT - PJM Gas - CCGT - ERCOT Gas - CCGT - ISO-NE Gas - CCGT - NYISO Gas - Cogen Gas - Peakers - PJM Gas - Peakers - ERCOT Coal Nuclear Other Enterprise Value Net Debt Equity Value Low Mid High Equity Value $1,390 $1,768 $2,146 Shares Outstanding 128.9 128.9 128.9 Value per Share $10.78 $13.71 $16.65 14 |
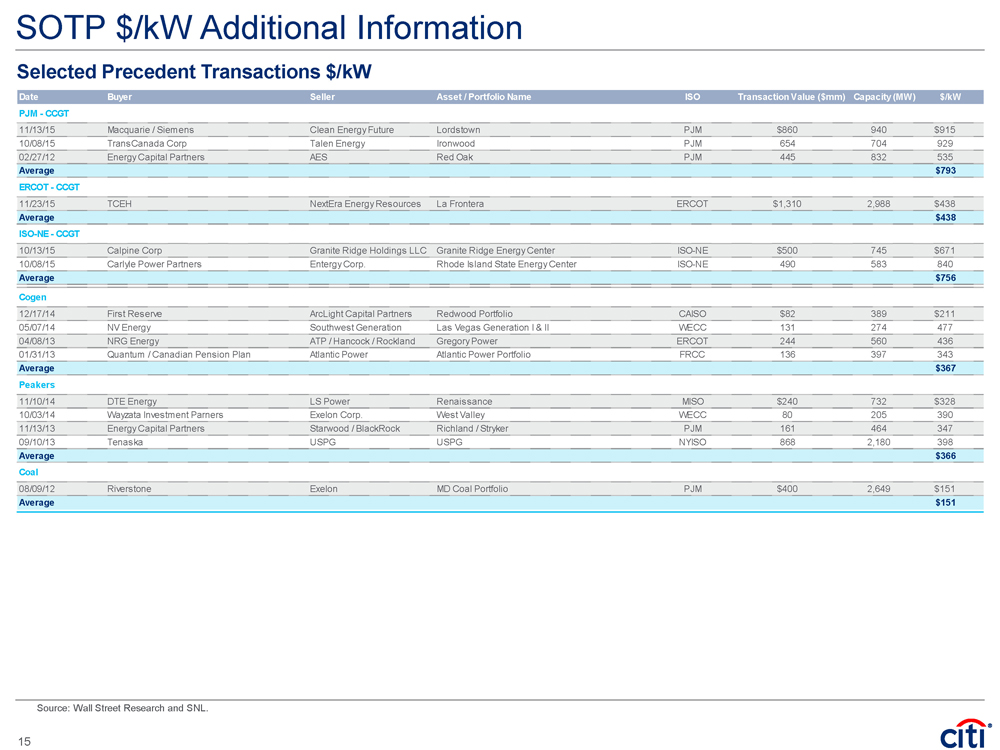
| SOTP $/kW Additional Information Source: Wall Street Research and SNL. Selected Precedent Transactions $/kW Date Buyer Seller Asset / Portfolio Name ISO Transaction Value ($mm) Capacity (MW) $/kW PJM - CCGT 11/13/15 Macquarie / Siemens Clean Energy Future Lordstown PJM $860 940 $915 10/08/15 TransCanada Corp Talen Energy Ironwood PJM 654 704 929 02/27/12 Energy Capital Partners AES Red Oak PJM 445 832 535 Average $793 ERCOT - CCGT 11/23/15 TCEH NextEra Energy Resources La Frontera ERCOT $1,310 2,988 $438 Average $438 ISO-NE - CCGT 10/13/15 Calpine Corp Granite Ridge Holdings LLC Granite Ridge Energy Center ISO-NE $500 745 $671 10/08/15 Carlyle Power Partners Entergy Corp. Rhode Island State Energy Center ISO-NE 490 583 840 Average $756 Cogen 12/17/14 First Reserve ArcLight Capital Partners Redwood Portfolio CAISO $82 389 $211 05/07/14 NV Energy Southwest Generation Las Vegas Generation I & II WECC 131 274 477 04/08/13 NRG Energy ATP / Hancock / Rockland Gregory Power ERCOT 244 560 436 01/31/13 Quantum / Canadian Pension Plan Atlantic Power Atlantic Power Portfolio FRCC 136 397 343 Average $367 Peakers 11/10/14 DTE Energy LS Power Renaissance MISO $240 732 $328 10/03/14 Wayzata Investment Parners Exelon Corp. West Valley WECC 80 205 390 11/13/13 Energy Capital Partners Starwood / BlackRock Richland / Stryker PJM 161 464 347 09/10/13 Tenaska USPG USPG NYISO 868 2,180 398 Average $366 Coal 08/09/12 Riverstone Exelon MD Coal Portfolio PJM $400 2,649 $151 Average $151 15 |
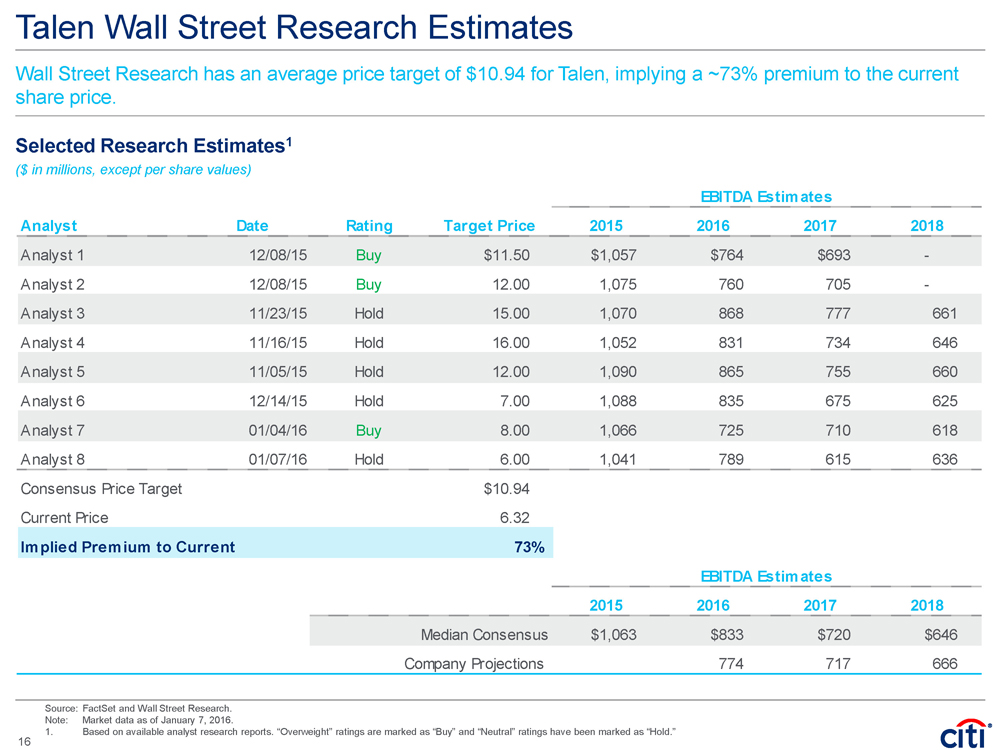
| Source: FactSet and Wall Street Research. Note: Market data as of January 7, 2016. 1. Based on available analyst research reports. “Overweight” ratings are marked as “Buy” and “Neutral” ratings have been marked as “Hold.” Talen Wall Street Research Estimates Selected Research Estimates1 ($ in millions, except per share values) Wall Street Research has an average price target of $10.94 for Talen, implying a ~73% premium to the current share price. EBITDA Estimates Analyst Date Rating Target Price 2015 2016 2017 2018 Analyst 1 12/08/15 Buy $11.50 $1,057 $764 $693 - Analyst 2 12/08/15 Buy 12.00 1,075 760 705 - Analyst 3 11/23/15 Hold 15.00 1,070 868 777 661 Analyst 4 11/16/15 Hold 16.00 1,052 831 734 646 Analyst 5 11/05/15 Hold 12.00 1,090 865 755 660 Analyst 6 12/14/15 Hold 7.00 1,088 835 675 625 Analyst 7 01/04/16 Buy 8.00 1,066 725 710 618 Analyst 8 01/07/16 Hold 6.00 1,041 789 615 636 Consensus Price Target $10.94 Current Price 6.32 Implied Premium to Current 73% EBITDA Estimates 2015 2016 2017 2018 Median Consensus $1,063 $833 $720 $646 Company Projections 774 717 666 16 |
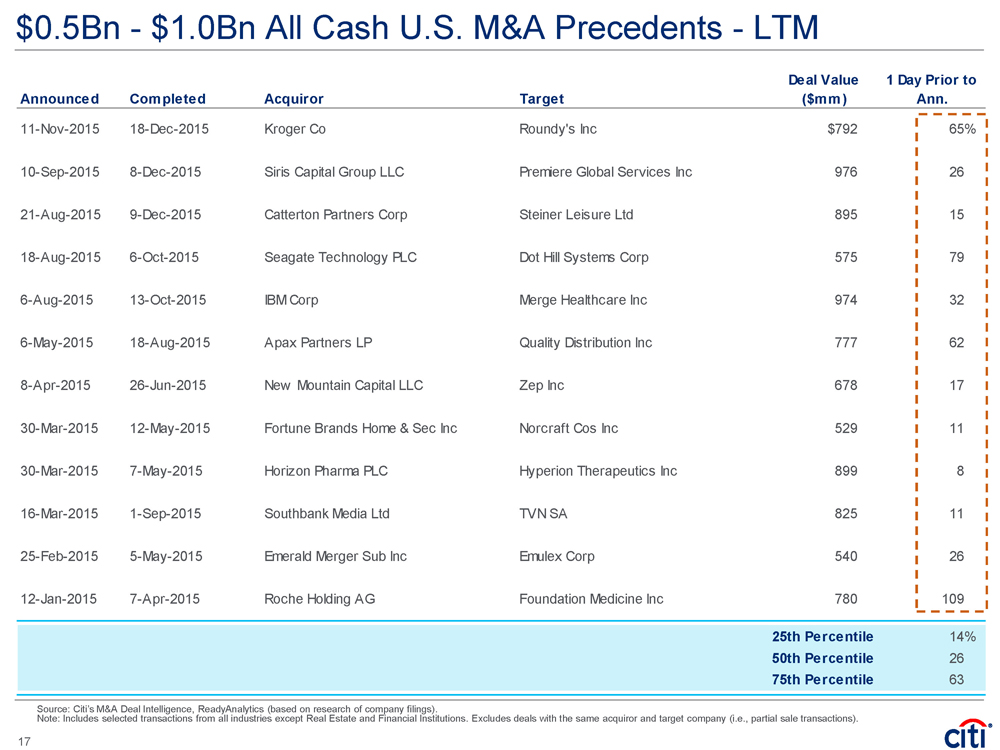
| Announced Completed Acquiror Target Deal Value ($mm) 1 Day Prior to Ann. 11-Nov-2015 18-Dec-2015 Kroger Co Roundy's Inc $792 65% 10-Sep-2015 8-Dec-2015 Siris Capital Group LLC Premiere Global Services Inc 976 26 21-Aug-2015 9-Dec-2015 Catterton Partners Corp Steiner Leisure Ltd 895 15 18-Aug-2015 6-Oct-2015 Seagate Technology PLC Dot Hill Systems Corp 575 79 6-Aug-2015 13-Oct-2015 IBM Corp Merge Healthcare Inc 974 32 6-May-2015 18-Aug-2015 Apax Partners LP Quality Distribution Inc 777 62 8-Apr-2015 26-Jun-2015 New Mountain Capital LLC Zep Inc 678 17 30-Mar-2015 12-May-2015 Fortune Brands Home & Sec Inc Norcraf t Cos Inc 529 11 30-Mar-2015 7-May-2015 Horizon Pharma PLC Hyperion Therapeutics Inc 899 8 16-Mar-2015 1-Sep-2015 Southbank Media Ltd TVN SA 825 11 25-Feb-2015 5-May-2015 Emerald Merger Sub Inc Emulex Corp 540 26 12-Jan-2015 7-Apr-2015 Roche Holding AG Foundation Medicine Inc 780 109 25th Percentile 14% 50th Percentile 26 75th Percentile 63 $0.5Bn - $1.0Bn All Cash U.S. M&A Precedents - LTM Source: Citi’s M&A Deal Intelligence, ReadyAnalytics (based on research of company filings). Note: Includes selected transactions from all industries except Real Estate and Financial Institutions. Excludes deals with the same acquiror and target company (i.e., partial sale transactions). 17 |
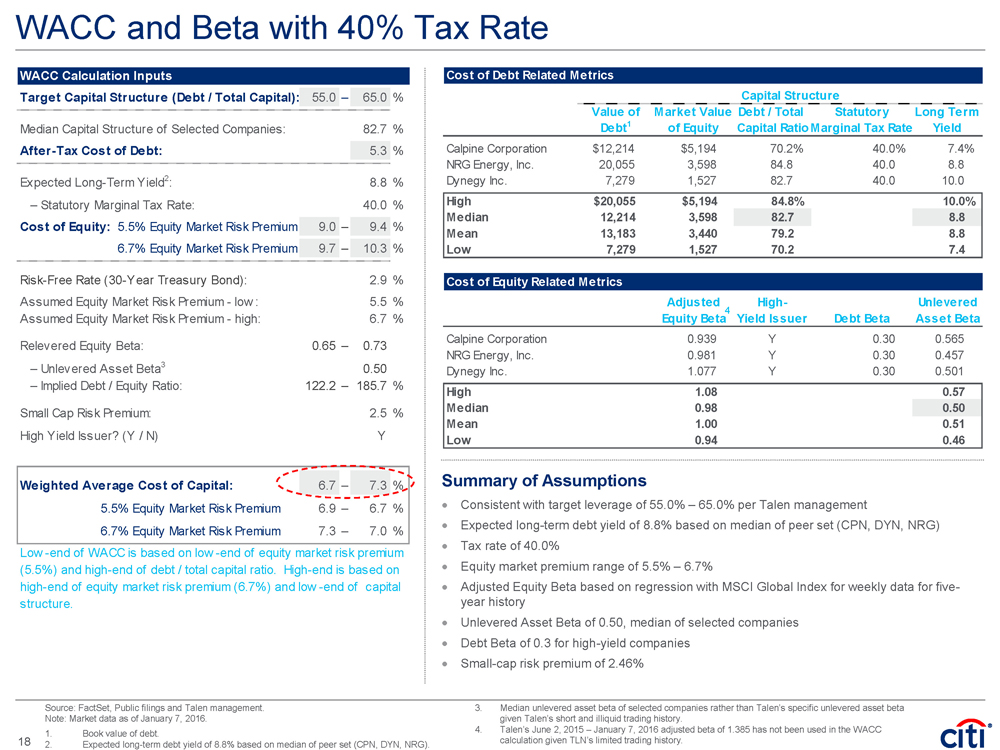
| WACC and Beta with 40% Tax Rate • Consistent with target leverage of 55.0% – 65.0% per Talen management • Expected long-term debt yield of 8.8% based on median of peer set (CPN, DYN, NRG) • Tax rate of 40.0% • Equity market premium range of 5.5% – 6.7% • Adjusted Equity Beta based on regression with MSCI Global Index for weekly data for five-year history • Unlevered Asset Beta of 0.50, median of selected companies • Debt Beta of 0.3 for high-yield companies • Small-cap risk premium of 2.46% Summary of Assumptions Source: FactSet, Public filings and Talen management. Note: Market data as of January 7, 2016. 1. Book value of debt. 2. Expected long-term debt yield of 8.8% based on median of peer set (CPN, DYN, NRG). 4 3. Median unlevered asset beta of selected companies rather than Talen’s specific unlevered asset beta given Talen’s short and illiquid trading history. 4. Talen’s June 2, 2015 – January 7, 2016 adjusted beta of 1.385 has not been used in the WACC calculation given TLN’s limited trading history. Cost of Debt Related Metrics Capital Structure Value of Market Value Debt / Total Statutory Long Term Debt1 of Equity Capital RatioMarginal Tax Rate Yield Calpine Corporation $12,214 $5,194 70.2% 40.0% 7.4% NRG Energy, Inc. 20,055 3,598 84.8 40.0 8.8 Dynegy Inc. 7,279 1,527 82.7 40.0 10.0 High $20,055 $5,194 84.8% 10.0% Median 12,214 3,598 82.7 8.8 Mean 13,183 3,440 79.2 8.8 Low 7,279 1,527 70.2 7.4 Cost of Equity Related Metrics Adjusted High- Unlevered Equity Beta Yield Issuer Debt Beta Asset Beta Calpine Corporation 0.939 Y 0.30 0.565 NRG Energy, Inc. 0.981 Y 0.30 0.457 Dynegy Inc. 1.077 Y 0.30 0.501 High 1.08 0.57 Median 0.98 0.50 Mean 1.00 0.51 Low 0.94 0.46 WACC Calculation Inputs Target Capital Structure (Debt / Total Capital): 55.0 – 65.0 % Median Capital Structure of Selected Companies: 82.7 % After-Tax Cost of Debt: 5.3 % Expected Long-Term Yield2: 8.8 % – Statutory Marginal Tax Rate: 40.0 % Cost of Equity: 5.5% Equity Market Risk Premium 9.0 – 9.4 % 6.7% Equity Market Risk Premium 9.7 – 10.3 % Risk-Free Rate (30-Year Treasury Bond): 2.9 % Assumed Equity Market Risk Premium - low : 5.5 % Assumed Equity Market Risk Premium - high: 6.7 % Relevered Equity Beta: 0.65 – 0.73 – Unlevered Asset Beta3 0.50 – Implied Debt / Equity Ratio: 122.2 – 185.7 % Small Cap Risk Premium: 2.5 % High Yield Issuer? (Y / N) Y Weighted Average Cost of Capital: 6.7 – 7.3 % 5.5% Equity Market Risk Premium 6.9 – 6.7 % 6.7% Equity Market Risk Premium 7.3 – 7.0 % Low -end of WACC is based on low -end of equity market risk premium (5.5%) and high-end of debt / total capital ratio. High-end is based on high-end of equity market risk premium (6.7%) and low -end of capital structure. 18 |
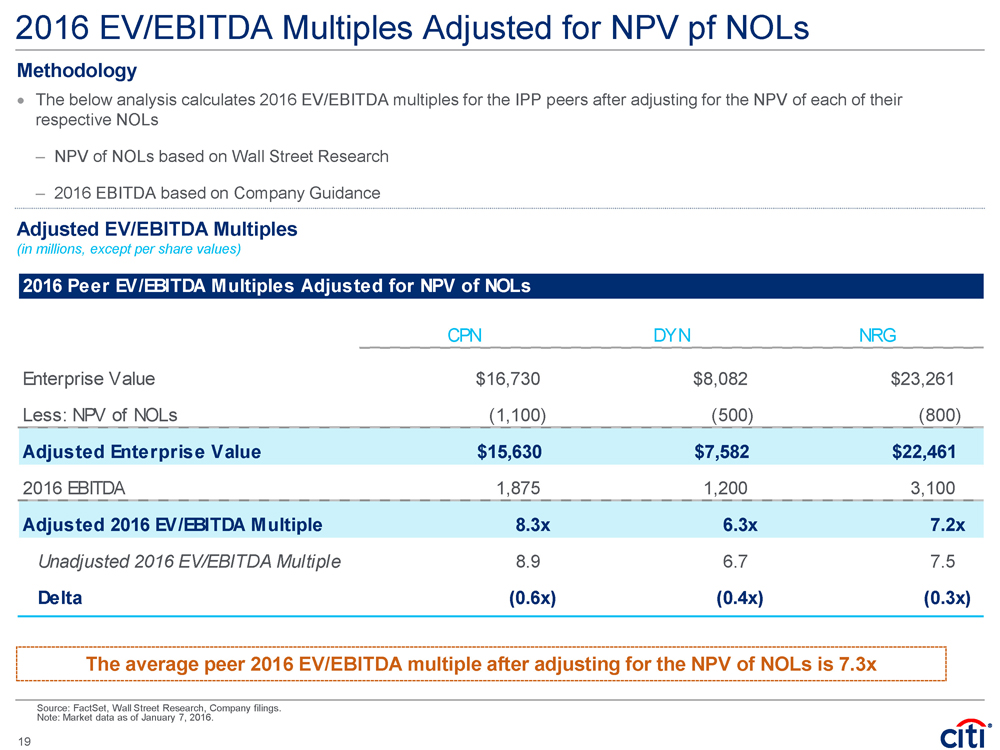
| 2016 EV/EBITDA Multiples Adjusted for NPV pf NOLs Source: FactSet, Wall Street Research, Company filings. Note: Market data as of January 7, 2016. • The below analysis calculates 2016 EV/EBITDA multiples for the IPP peers after adjusting for the NPV of each of their respective NOLs – NPV of NOLs based on Wall Street Research – 2016 EBITDA based on Company Guidance Methodology Adjusted EV/EBITDA Multiples (in millions, except per share values) The average peer 2016 EV/EBITDA multiple after adjusting for the NPV of NOLs is 7.3x 19 2016 Peer EV/EBITDA Multiples Adjusted for NPV of NOLs CPN DYN NRG Enterprise Value $16,730 $8,082 $23,261 Less: NPV of NOLs (1,100) (500) (800) Adjusted Enterprise Value $15,630 $7,582 $22,461 2016 EBITDA 1,875 1,200 3,100 Adjusted 2016 EV/EBITDA Multiple 8.3x 6.3x 7.2x Unadjusted 2016 EV/EBITDA Multiple 8.9 6.7 7.5 Delta (0.6x) (0.4x) (0.3x) |
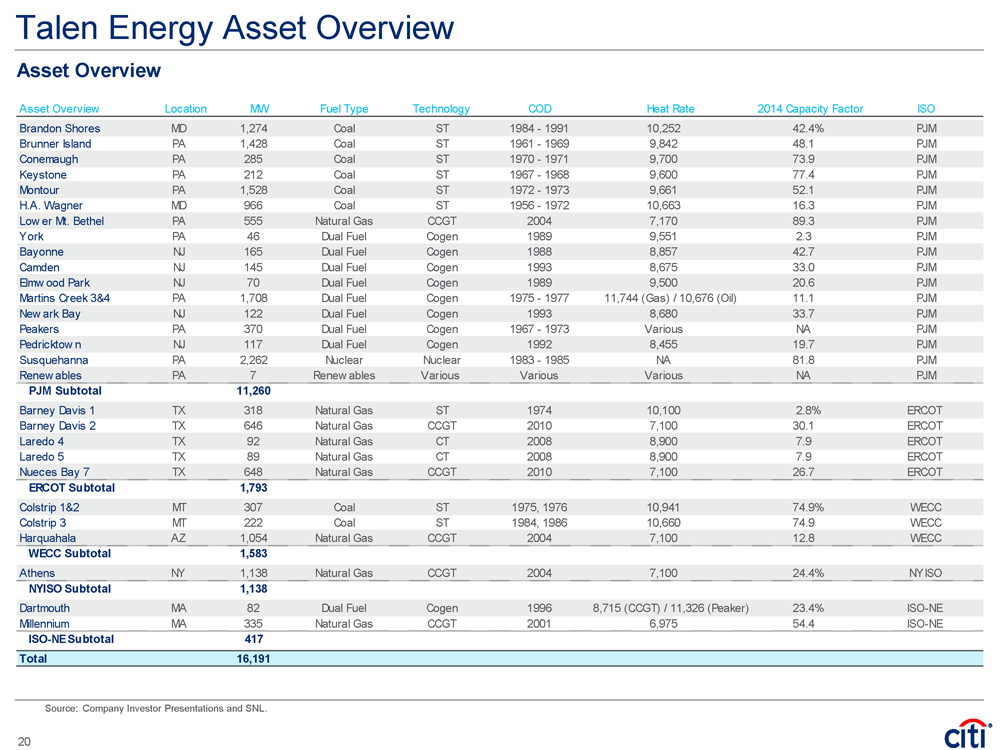
| Talen Energy Asset Overview Source: Company Investor Presentations and SNL. Asset Overview Asset Overview Location MW Fuel Type Technology COD Heat Rate 2014 Capacity Factor ISO Brandon Shores MD 1,274 Coal ST 1984 - 1991 10,252 42.4% PJM Brunner Island PA 1,428 Coal ST 1961 - 1969 9,842 48.1 PJM Conemaugh PA 285 Coal ST 1970 - 1971 9,700 73.9 PJM Keystone PA 212 Coal ST 1967 - 1968 9,600 77.4 PJM Montour PA 1,528 Coal ST 1972 - 1973 9,661 52.1 PJM H.A. Wagner MD 966 Coal ST 1956 - 1972 10,663 16.3 PJM Lower Mt. Bethel PA 555 Natural Gas CCGT 2004 7,170 89.3 PJM York PA 46 Dual Fuel Cogen 1989 9,551 2.3 PJM Bayonne NJ 165 Dual Fuel Cogen 1988 8,857 42.7 PJM Camden NJ 145 Dual Fuel Cogen 1993 8,675 33.0 PJM Elmwood Park NJ 70 Dual Fuel Cogen 1989 9,500 20.6 PJM Martins Creek 3&4 PA 1,708 Dual Fuel Cogen 1975 - 1977 11,744 (Gas) / 10,676 (Oil) 11.1 PJM New ark Bay NJ 122 Dual Fuel Cogen 1993 8,680 33.7 PJM Peakers PA 370 Dual Fuel Cogen 1967 - 1973 Various NA PJM Pedricktown NJ 117 Dual Fuel Cogen 1992 8,455 19.7 PJM Susquehanna PA 2,262 Nuclear Nuclear 1983 - 1985 NA 81.8 PJM Renewables PA 7 Renewables Various Various Various NA PJM PJM Subtotal 11,260 Barney Davis 1 TX 318 Natural Gas ST 1974 10,100 2.8% ERCOT Barney Davis 2 TX 646 Natural Gas CCGT 2010 7,100 30.1 ERCOT Laredo 4 TX 92 Natural Gas CT 2008 8,900 7.9 ERCOT Laredo 5 TX 89 Natural Gas CT 2008 8,900 7.9 ERCOT Nueces Bay 7 TX 648 Natural Gas CCGT 2010 7,100 26.7 ERCOT ERCOT Subtotal 1,793 Colstrip 1&2 MT 307 Coal ST 1975, 1976 10,941 74.9% WECC Colstrip 3 MT 222 Coal ST 1984, 1986 10,660 74.9 WECC Harquahala AZ 1,054 Natural Gas CCGT 2004 7,100 12.8 WECC WECC Subtotal 1,583 Athens NY 1,138 Natural Gas CCGT 2004 7,100 24.4% NYISO NYISO Subtotal 1,138 Dartmouth MA 82 Dual Fuel Cogen 1996 8,715 (CCGT) / 11,326 (Peaker) 23.4% ISO-NE Millennium MA 335 Natural Gas CCGT 2001 6,975 54.4 ISO-NE ISO-NE Subtotal 417 Total 16,191 20 |
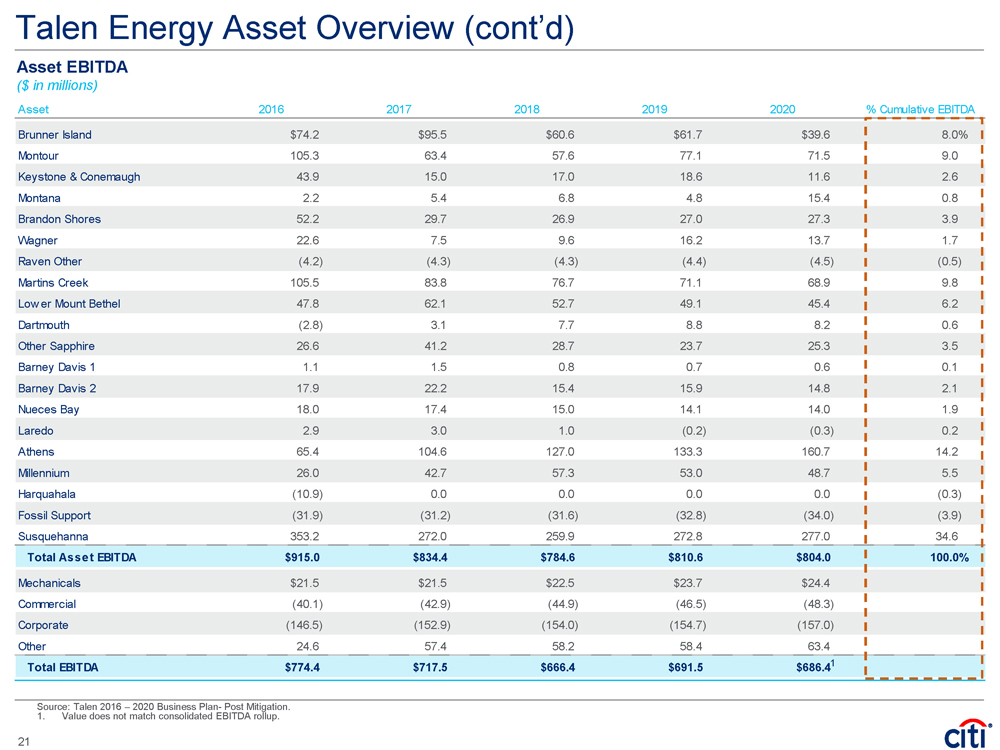
| Talen Energy Asset Overview (cont’d) Asset EBITDA ($ in millions) Source: Talen 2016 – 2020 Business Plan- Post Mitigation. 1. Value does not match consolidated EBITDA rollup. Asset 2016 2017 2018 2019 2020 % Cumulative EBITDA Brunner Island $74.2 $95.5 $60.6 $61.7 $39.6 8.0% Montour 105.3 63.4 57.6 77.1 71.5 9.0 Keystone & Conemaugh 43.9 15.0 17.0 18.6 11.6 2.6 Montana 2.2 5.4 6.8 4.8 15.4 0.8 Brandon Shores 52.2 29.7 26.9 27.0 27.3 3.9 Wagner 22.6 7.5 9.6 16.2 13.7 1.7 Raven Other (4.2) (4.3) (4.3) (4.4) (4.5) (0.5) Martins Creek 105.5 83.8 76.7 71.1 68.9 9.8 Lower Mount Bethel 47.8 62.1 52.7 49.1 45.4 6.2 Dartmouth (2.8) 3.1 7.7 8.8 8.2 0.6 Other Sapphire 26.6 41.2 28.7 23.7 25.3 3.5 Barney Davis 1 1.1 1.5 0.8 0.7 0.6 0.1 Barney Davis 2 17.9 22.2 15.4 15.9 14.8 2.1 Nueces Bay 18.0 17.4 15.0 14.1 14.0 1.9 Laredo 2.9 3.0 1.0 (0.2) (0.3) 0.2 Athens 65.4 104.6 127.0 133.3 160.7 14.2 Millennium 26.0 42.7 57.3 53.0 48.7 5.5 Harquahala (10.9) 0.0 0.0 0.0 0.0 (0.3) Fossil Support (31.9) (31.2) (31.6) (32.8) (34.0) (3.9) Susquehanna 353.2 272.0 259.9 272.8 277.0 34.6 Total Asset EBITDA $915.0 $834.4 $784.6 $810.6 $804.0 100.0% 0.0%Mechanicals $21.5 $21.5 $22.5 $23.7 $24.4 Commercial (40.1) (42.9) (44.9) (46.5) (48.3) Corporate (146.5) (152.9) (154.0) (154.7) (157.0) Other 24.6 57.4 58.2 58.4 63.4 Total EBITDA $774.4 $717.5 $666.4 $691.5 $686.41 21 |

| IRS Circular 230 Disclosure: Citigroup Inc. and its affiliates do not provide tax or legal advice. Any discussion of tax matters in these materials (i) is not intended or written to be used, and cannot be used or relied upon, by you for the purpose of avoiding any tax penalties and (ii) may have been written in connection with the "promotion or marketing" of any transaction contemplated hereby ("Transaction"). Accordingly, you should seek advice based on your particular circumstances from an independent tax advisor. In any instance where distribution of this communication is subject to the rules of the US Commodity Futures Trading Commission ("CFTC"), this communication constitutes an invitation to consider entering into a derivatives transaction under U.S. CFTC Regulations §§ 1.71 and 23.605, where applicable, but is not a binding offer to buy/sell any financial instrument. Any terms set forth herein are intended for discussion purposes only and are subject to the final terms as set forth in separate definitive written agreements. This presentation is not a commitment to lend, syndicate a financing, underwrite or purchase securities, or commit capital nor does it obligate us to enter into such a commitment, nor are we acting as a fiduciary to you. By accepting this presentation, subject to applicable law or regulation, you agree to keep confidential the information contained herein and the existence of and proposed terms for any Transaction. Prior to entering into any Transaction, you should determine, without reliance upon us or our affiliates, the economic risks and merits (and independently determine that you are able to assume these risks) as well as the legal, tax and accounting characterizations and consequences of any such Transaction. In this regard, by accepting this presentation, you acknowledge that (a) we are not in the business of providing (and you are not relying on us for) legal, tax or accounting advice, (b) there may be legal, tax or accounting risks associated with any Transaction, (c) you should receive (and rely on) separate and qualified legal, tax and accounting advice and (d) you should apprise senior management in your organization as to such legal, tax and accounting advice (and any risks associated with any Transaction) and our disclaimer as to these matters. By acceptance of these materials, you and we hereby agree that from the commencement of discussions with respect to any Transaction, and notwithstanding any other provision in this presentation, we hereby confirm that no participant in any Transaction shall be limited from disclosing the U.S. tax treatment or U.S. tax structure of such Transaction. We are required to obtain, verify and record certain information that identifies each entity that enters into a formal business relationship with us. We will ask for your complete name, street address, and taxpayer ID number. We may also request corporate formation documents, or other forms of identification, to verify information provided. Any prices or levels contained herein are preliminary and indicative only and do not represent bids or offers. These indications are provided solely for your information and consideration, are subject to change at any time without notice and are not intended as a solicitation with respect to the purchase or sale of any instrument. The information contained in this presentation may include results of analyses from a quantitative model which represent potential future events that may or may not be realized, and is not a complete analysis of every material fact representing any product. Any estimates included herein constitute our judgment as of the date hereof and are subject to change without any notice. We and/or our affiliates may make a market in these instruments for our customers and for our own account. Accordingly, we may have a position in any such instrument at any time. Although this material may contain publicly available information about Citi corporate bond research, fixed income strategy or economic and market analysis, Citi policy (i) prohibits employees from offering, directly or indirectly, a favorable or negative research opinion or offering to change an opinion as consideration or inducement for the receipt of business or for compensation; and (ii) prohibits analysts from being compensated for specific recommendations or views contained in research reports. So as to reduce the potential for conflicts of interest, as well as to reduce any appearance of conflicts of interest, Citi has enacted policies and procedures designed to limit communications between its investment banking and research personnel to specifically prescribed circumstances. © 2016 Citigroup Global Markets Inc. Member SIPC. All rights reserved. Citi and Citi and Arc Design are trademarks and service marks of Citigroup Inc. or its affiliates and are used and registered throughout the world. Citi believes that sustainability is good business practice. We work closely with our clients, peer financial institutions, NGOs and other partners to finance solutions to climate change, develop industry standards, reduce our own environmental footprint, and engage with stakeholders to advance shared learning and solutions. Highlights of Citi's unique role in promoting sustainability include: (a) releasing in 2007 a Climate Change Position Statement, the first US financial institution to do so; (b) targeting $50 billion over 10 years to address global climate change: includes significant increases in investment and financing of renewable energy, clean technology, and other carbon-emission reduction activities; (c) committing to an absolute reduction in GHG emissions of all Citi owned and leased properties around the world by 10% by 2011; (d) purchasing more than 234,000 MWh of carbon neutral power for our operations over the last three years; (e) establishing in 2008 the Carbon Principles; a framework for banks and their U.S. power clients to evaluate and address carbon risks in the financing of electric power projects; (f) producing equity research related to climate issues that helps to inform investors on risks and opportunities associated with the issue; and (g) engaging with a broad range of stakeholders on the issue of climate change to help advance understanding and solutions. Citi works with its clients in greenhouse gas intensive industries to evaluate emerging risks from climate change and, where appropriate, to mitigate those risks. efficiency, renewable energy and mitigation |