Exhibit (c)(11)

Corporate and Investment Banking | Global Power Corporate and Investment Banking | Global Power June 2, 2016 Project Revere Presentation to Talen Independent Board of Directors [***] indicates information that has been omitted on the basis of a confidential treatment request pursuant to Rule 24b-2 of the Securities Exchange Act of 1934, as amended (the "Exchange Act"). This information has been filed separately with the Securities and Exchange Commission (the "SEC). Strictly Private and Confidential
Confidential Material Disclaimer The following pages contain material provided to the Board of Directors of Talen Energy Corporation (“Talen” or the “Company”) by Citigroup Global Markets Inc. (“Citi”) in connection with a potential transaction with Riverstone Holdings LLC (“Riverstone”). The accompanying material was compiled or prepared on a confidential basis solely for the use of the Board of Directors of the Company and not with a view toward public disclosure under any securities laws or otherwise. The information contained in the accompanying material was obtained from the Company and other sources. Any estimates and projections contained herein have been prepared or adopted by management of the Company, obtained from public sources, or are based upon such estimates and projections, and involve numerous and significant subjective determinations, and there is no assurance that such estimates and projections will be realized. Citi does not take responsibility for such estimates and projections, or the basis on which they were prepared. No representation or warranty, express or implied, is made as to the accuracy or completeness of such information and nothing contained herein is, or shall be relied upon as, a representation, whether as to the past, the present or the future. In preparing the accompanying material, Citi assumed and relied, without independent verification, upon the accuracy and completeness of all financial and other information and data publicly available or provided to or otherwise reviewed by or discussed with Citi and upon the assurances of the management and other representatives of the Company that they are not aware of any relevant information that has been omitted or that remains undisclosed to Citi. The accompanying material was not prepared for use by readers not as familiar with the Company as the Board of Directors of the Company and, accordingly, neither the Company nor Citi nor their respective legal or financial advisors or accountants take any responsibility for the accompanying material if used by persons other than the Board of Directors of the Company. The accompanying material is necessarily based upon information available to Citi, and financial, stock market and other conditions and circumstances existing and disclosed to Citi, as of the date of the accompanying material. Citi does not have any obligation to update or otherwise revise the accompanying material. Nothing contained herein shall be construed as legal, regulatory, tax or accounting advice. 1
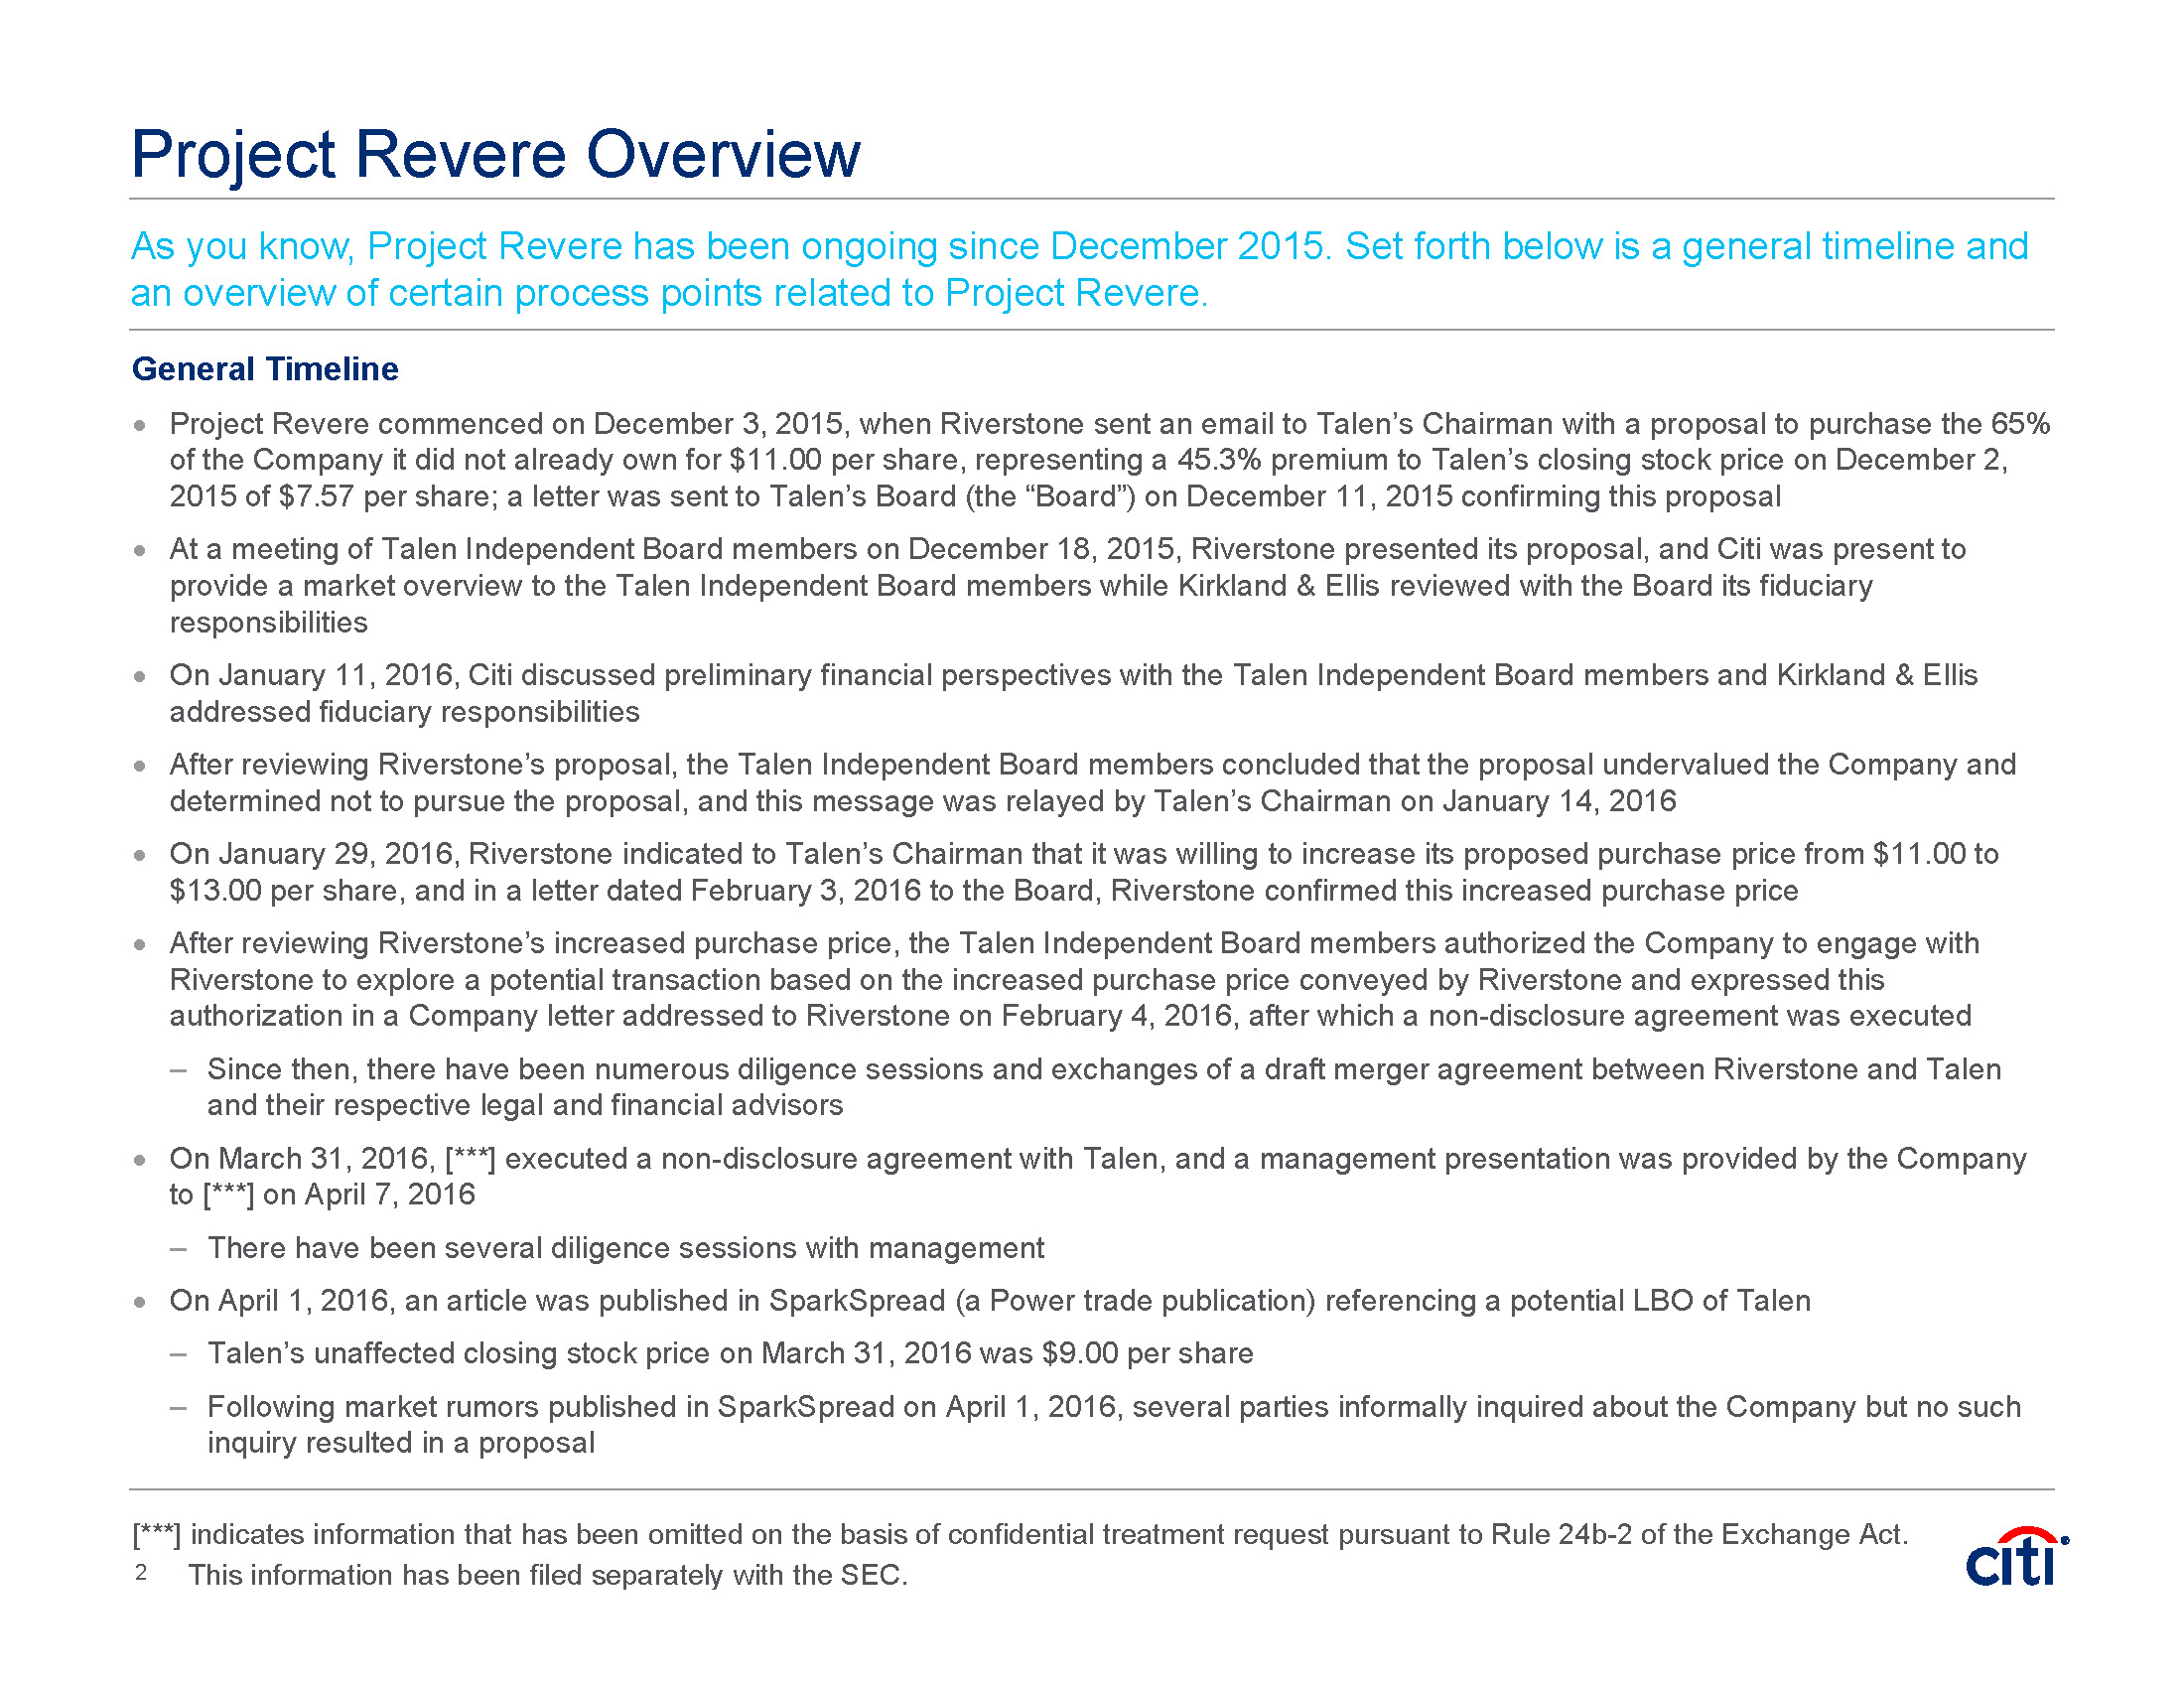
Project Revere Overview As you know, Project Revere has been ongoing since December 2015. Set forth below is a general timeline and an overview of certain process points related to Project Revere. General Timeline o Project Revere commenced on December 3, 2015, when Riverstone sent an email to Talen's Chairman with a proposal to purchase the 65% of the Company it did not already own for $11.00 per share, representing a 45.3% premium to Talen's closing stock price on December 2, 2015 of $7.57 per share; a letter was sent to Talen's Board (the "Board") on December 11, 2015 confirming this proposal o At a meeting of Talen Independent Board members on December 18, 2015, Riverstone presented its proposal, and Citi was present to provide a market overview to the Talen Independent Board members while Kirkland & Ellis reviewed with the Board its fiduciary responsibilities o On January 11, 2016, Citi discussed preliminary financial perspectives with the Talen Independent Board members and Kirkland & Ellis addressed fiduciary responsibilities o After reviewing Riverstone's proposal, the Talen Independent Board members concluded that the proposal undervalued the Company and determined not to pursue the proposal, and this message was relayed by Talen's Chairman on January 14, 2016 o On January 29, 2016, Riverstone indicated to Talen's Chairman that it was willing to increase its proposed purchase price from $11.00 to $13.00 per share, and in a letter dated February 3, 2016 to the Board, Riverstone confirmed this increased purchase price o After reviewing Riverstone's increased purchase price, the Talen Independent Board members authorized the Company to engage with Riverstone to explore a potential transaction based on the increased purchase price conveyed by Riverstone and expressed this authorization in a Company letter addressed to Riverstone on February 4, 2016, after which a non-disclosure agreement was executed - Since then, there have been numerous diligence sessions and exchanges of a draft merger agreement between Riverstone and Talen and their respective legal and financial advisors o On March 31, 2016, [***] executed a non-disclosure agreement with Talen, and a management presentation was provided by the Company to [***] on April 7, 2016 - There have been several diligence sessions with management o On April 1, 2016, an article was published in SparkSpread (a Power trade publication) referencing a potential LBO of Talen - Talen's unaffected closing stock price on March 31, 2016 was $9.00 per share - Following market rumors published in SparkSpread on April 1, 2016, several parties informally inquired about the Company but no such inquiry resulted in a proposal [***] indicates information has been omitted on the confidential treatment request pursuant to Rule 24b-2 of the Exchange Act. This information been filed separately with the SEC.
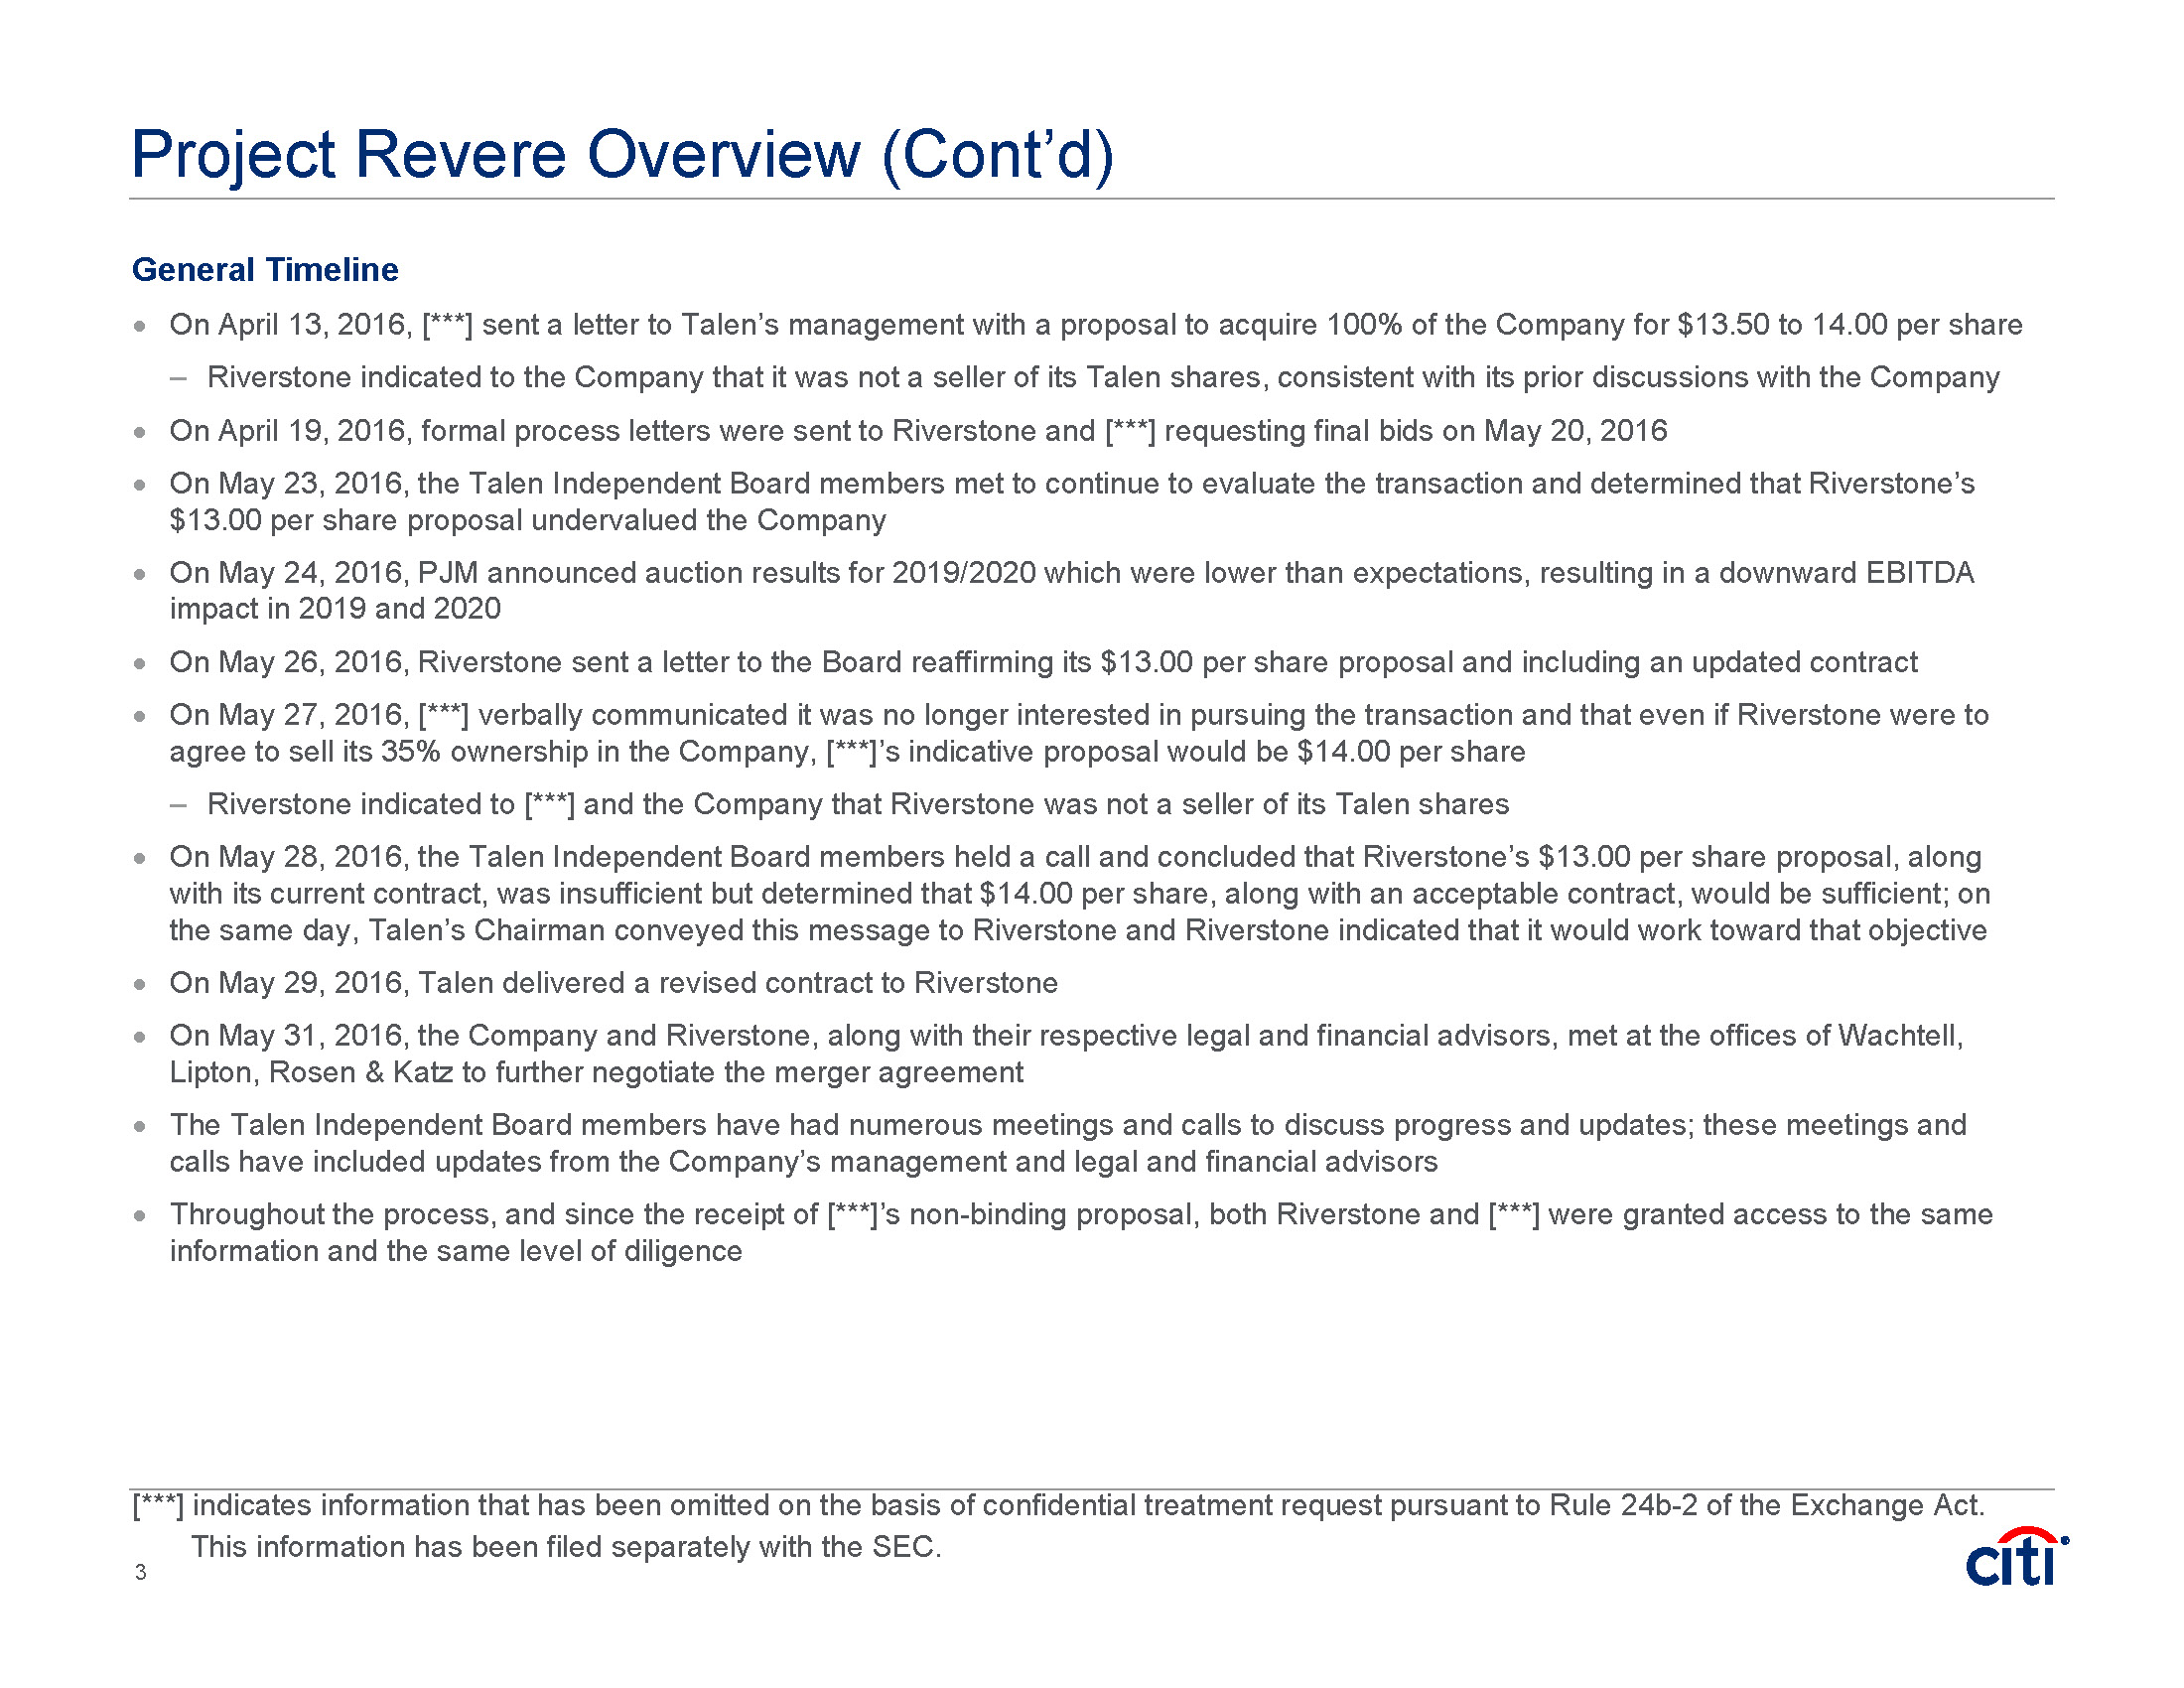
Project Revere Overview (Cont'd) General Timeline o On April 13, 2016, [***] sent a letter to Talen's management with a proposal to acquire 100% of the Company for $13.50 to 14.00 per share - Riverstone indicated to the Company that it was not a seller of its Talen shares, consistent with its prior discussions with the Company o On April 19, 2016, formal process letters were sent to Riverstone and [***] requesting final bids on May 20, 2016 o On May 23, 2016, the Talen Independent Board members met to continue to evaluate the transaction and determined that Riverstone's $13.00 per share proposal undervalued the Company o On May 24, 2016, PJM announced auction results for 2019/2020 which were lower than expectations, resulting in a downward EBITDA impact in 2019 and 2020 o On May 26, 2016, Riverstone sent a letter to the Board reaffirming its $13.00 per share proposal and including an updated contract o On May 27, 2016, [***] verbally communicated it was no longer interested in pursuing the transaction and that even if Riverstone were to agree to sell its 35% ownership in the Company, [***]'s indicative proposal would be $14.00 per share - Riverstone indicated to [***] and the Company that Riverstone was not a seller of its Talen shares o On May 28, 2016, the Talen Independent Board members held a call and concluded that Riverstone's $13.00 per share proposal, along with its current contract, was insufficient but determined that $14.00 per share, along with an acceptable contract, would be sufficient; on the same day, Talen's Chairman conveyed this message to Riverstone and Riverstone indicated that it would work toward that objective o On May 29, 2016, Talen delivered a revised contract to Riverstone o On May 31, 2016, the Company and Riverstone, along with their respective legal and financial advisors, met at the offices of Wachtell, Lipton, Rosen & Katz to further negotiate the merger agreement o The Talen Independent Board members have had numerous meetings and calls to discuss progress and updates; these meetings and calls have included updates from the Company's management and legal and financial advisors o Throughout the process, and since the receipt of [***]'s non-binding proposal, both Riverstone and [***] were granted access to the same information and the same level of diligence [***] indicates information that has been omitted on the basis of confidential treatment request pursuant to Rule 24b-2 of the Exchange Act. This information has been filed separately with the SEC.
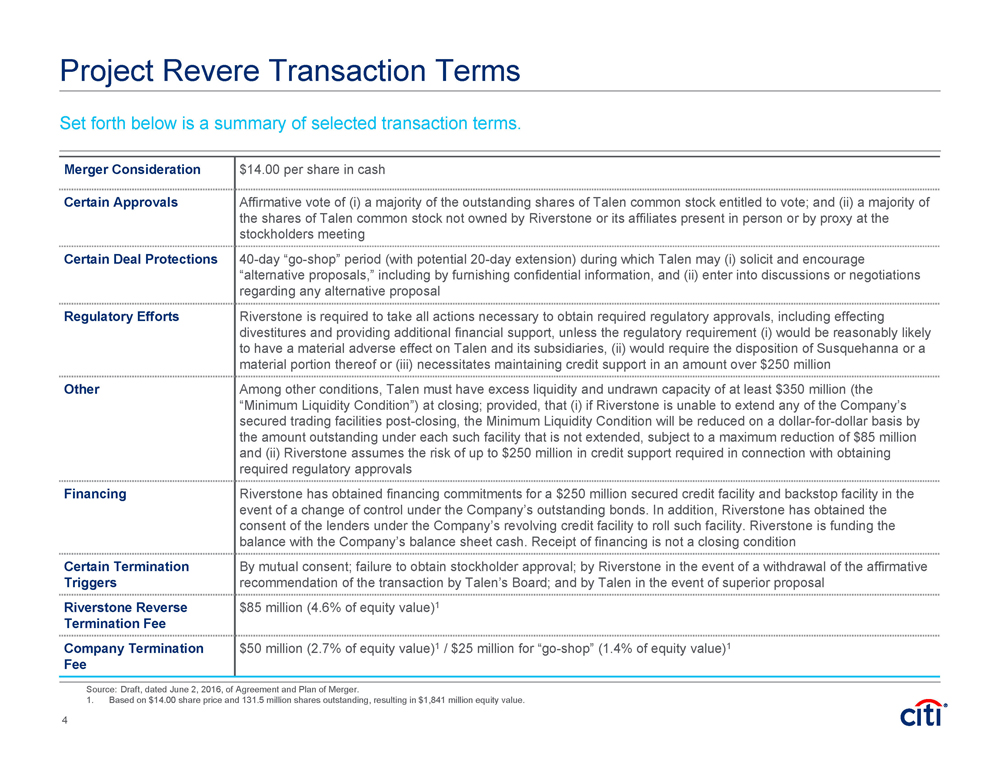
Project Revere Transaction Terms Set forth below is a summary of selected transaction terms. 4 Merger Consideration $14.00 per share in cash Certain Approvals Affirmative vote of (i) a majority of the outstanding shares of Talen common stock entitled to vote; and (ii) a majority of the shares of Talen common stock not owned by Riverstone or its affiliates present in person or by proxy at the stockholders meeting Certain Deal Protections 40-day “go-shop” period (with potential 20-day extension) during which Talen may (i) solicit and encourage “alternative proposals,” including by furnishing confidential information, and (ii) enter into discussions or negotiations regarding any alternative proposal Regulatory Efforts Riverstone is required to take all actions necessary to obtain required regulatory approvals, including effecting divestitures and providing additional financial support, unless the regulatory requirement (i) would be reasonably likely to have a material adverse effect on Talen and its subsidiaries, (ii) would require the disposition of Susquehanna or a material portion thereof or (iii) necessitates maintaining credit support in an amount over $250 million Other Among other conditions, Talen must have excess liquidity and undrawn capacity of at least $350 million (the “Minimum Liquidity Condition”) at closing; provided, that (i) if Riverstone is unable to extend any of the Company’s secured trading facilities post-closing, the Minimum Liquidity Condition will be reduced on a dollar-for-dollar basis by the amount outstanding under each such facility that is not extended, subject to a maximum reduction of $85 million and (ii) Riverstone assumes the risk of up to $250 million in credit support required in connection with obtaining required regulatory approvals Financing Riverstone has obtained financing commitments for a $250 million secured credit facility and backstop facility in the event of a change of control under the Company’s outstanding bonds. In addition, Riverstone has obtained the consent of the lenders under the Company’s revolving credit facility to roll such facility. Riverstone is funding the balance with the Company’s balance sheet cash. Receipt of financing is not a closing condition Certain Termination Triggers By mutual consent; failure to obtain stockholder approval; by Riverstone in the event of a withdrawal of the affirmative recommendation of the transaction by Talen’s Board; and by Talen in the event of superior proposal Riverstone Reverse Termination Fee $85 million (4.6% of equity value)1 Company Termination Fee $50 million (2.7% of equity value)1 / $25 million for “go-shop” (1.4% of equity value)1 Source: Draft, dated June 2, 2016, of Agreement and Plan of Merger. 1. Based on $14.00 share price and 131.5 million shares outstanding, resulting in $1,841 million equity value.
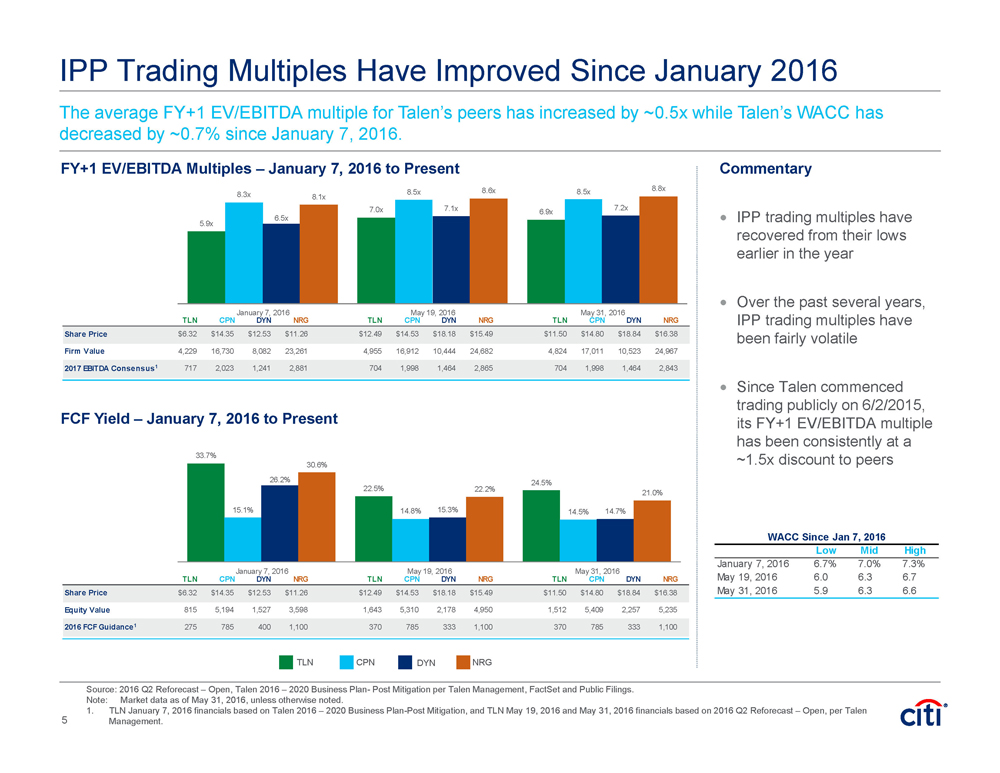
IPP Trading Multiples Have Improved Since January 2016 FY+1 EV/EBITDA Multiples – January 7, 2016 to Present ($ in millions, except per share data) Source: 2016 Q2 Reforecast – Open, Talen 2016 – 2020 Business Plan- Post Mitigation per Talen Management, FactSet and Public Filings. Note: Market data as of May 31, 2016, unless otherwise noted. 1. TLN January 7, 2016 financials based on Talen 2016 – 2020 Business Plan-Post Mitigation, and TLN May 19, 2016 and May 31, 2016 financials based on 2016 Q2 Reforecast – Open, per Talen Management. TLN CPN DYN NRG FCF Yield – January 7, 2016 to Present ($ in millions, except per share data) The average FY+1 EV/EBITDA multiple for Talen’s peers has increased by ~0.5x while Talen’s WACC has decreased by ~0.7% since January 7, 2016. Commentary IPP trading multiples have recovered from their lows earlier in the year Over the past several years, IPP trading multiples have been fairly volatile Since Talen commenced trading publicly on 6/2/2015, its FY+1 EV/EBITDA multiple has been consistently at a ~1.5x discount to peers TLN CPN DYN NRG TLN CPN DYN NRG TLN CPN DYN NRG Share Price $6.32 $14.35 $12.53 $11.26 $12.49 $14.53 $18.18 $15.49 $11.50 $14.80 $18.84 $16.38 Firm Value 4,229 16,730 8,082 23,261 4,955 16,912 10,444 24,682 4,824 17,011 10,523 24,967 2017 EBITDA Consensus1 717 2,023 1,241 2,881 704 1,998 1,464 2,865 704 1,998 1,464 2,843 5.9x 7.0x 6.9x 8.3x 8.5x 8.5x 6.5x 7.1x 7.2x 8.1x 8.6x 8.8x January 7, 2016 May 19, 2016 May 31, 2016 TLN CPN DYN NRG TLN CPN DYN NRG TLN CPN DYN NRG Share Price $6.32 $14.35 $12.53 $11.26 $12.49 $14.53 $18.18 $15.49 $11.50 $14.80 $18.84 $16.38 Equity Value 815 5,194 1,527 3,598 1,643 5,310 2,178 4,950 1,512 5,409 2,257 5,235 2016 FCF Guidance1 275 785 400 1,100 370 785 333 1,100 370 785 333 1,100 33.7% 22.5% 24.5% 15.1% 14.8% 14.5% 26.2% 15.3% 14.7% 30.6% 22.2% 21.0% January 7, 2016 May 19, 2016 May 31, 2016 WACC Since Jan 7, 2016 Low Mid High January 7, 2016 6.7% 7.0% 7.3% May 19, 2016 6.0 6.3 6.7 May 31, 2016 5.9 6.3 6.6 5

Talen Summary Projections Adjusted EBITDA ($ in millions) Unlevered Free Cash Flow ($ in millions) $275 $164 $145 $160 $197 $370 $139 $205 $143 $185 $370 $139 $205 $78 $140 2016 2017 2018 2019 2020 $306 $254 $228 $265 $303 $404 $261 $318 $243 $273 $419 $265 $322 $181 $231 2016 2017 2018 2019 2020 $774 $717 $666 $691 $685 $755 $704 $713 $641 $647 $755 $704 $713 $576 $602 2016 2017 2018 2019 2020 Q2 Reforecast – Open January 11 Preliminary Discussion Materials Levered Free Cash Flow ($ in millions) Net Debt ($ in millions) Source: 2016 Q2 Reforecast – Open, Talen 2016 – 2020 Business Plan- Post Mitigation, 2019 2020 PJM Auction Results vFinal per Talen Management. 1. Reflects full year 2016 financial data; however, 75% of 2016 unlevered free cash flow is used to account for March 31, 2016 present value date. 2. Includes adjustment for capitalized interest per Talen Management. $3,414 $3,312 12/31/2015 - Adjusted 3/31/2016 - Adjusted 1,2 2016, 2017, 2019 and 2020 EBITDA declined as a result of changes in energy prices, partially offset by O&M spending reductions 2019 and 2020 adjusted by $65mm and $45mm, respectively, as a result of lower capacity price results than forecasted for 2019/2020 PJM auction 2016 FCF is higher compared to other years as a result of using tax losses against gains on asset sales 2016 FCF is higher compared to previous forecast due to lower taxes resulting from bonus depreciation 2018 FCF is higher due to change in timing of cash taxes received from losses generated in 2017 2019 and 2020 adjusted by $65mm and $45mm, respectively, as a result of lower capacity price results than forecasted for 2019/2020 PJM auction Q2 Reforecast – Auction Results Update 1 2 2 2 2 6

Implied EV/2017 EBITDA Implied Equity Value per Share Reference Range Low High Commentary DCF Analysis 6.4x 7.3x • 3.75-year unlevered DCF (2016 – 2019) as of M arch 31, 2016 • Unlevered cash taxes based on 40% tax rate and Talen-provided taxes • Adjusted Net Debt (3/31/2016) balance of $3,312mm • 131.5mm shares outstanding • Terminal value based on 8.0x mean of Dynegy's and NRG's 2017 EV/EBITDA multiple applied to 2020 EB ITDA (FY+1) and 0.5x step for low and high cases, respectively • WACC range of 5.9% – 6.6% 7.2 8.8 6.6 8.3 Selected Public Companies Analysis: 2016 FCF Yield 7.2 8.3 • Based on Dynegy's and NRG's 2016 FCF Yield of 14.7% and 21.0%, respectively • $370mm 2016 Levered FCF • 131.5mm shares outstanding Selected Precedent Transactions Analysis 7.2 8.2 • Based on 7.7x mean FY+1 EV/EBITDA multiple and 0.5x step for low and high cases, respectively, derived from selected precedent transaction multiples • Adjusted Net Debt (3/31/2016) balance of $3,312mm • 131.5mm shares outstanding • $704mm 2017 Adjusted EBITDA SOTP Analysis ($/kW) 6.7 7.7 • $/kW multiples based on Wall Street research and selected precedent transactions – Categorized by fuel type, technology and region • Adjusted Net Debt (3/31/2016) balance of $3,312mm • 131.5mm shares outstanding • P re-tax Wall Street Research Stock Price Target 6.0 7.5 • Based on low and high stock price targets of Wall Street research analysts – $7.00 – $15.00 52-Week Low / High 5.8 8.4 • Based on low and high stock prices since June 2, 2015 – $5.76 and $19.80, respectively Selected Precedent M&A Premia 6.9 7.2 • Based on 25th – 75th percentile of selected precedent M&A transactions premia from last 12 months for low and high – 30.3% – 45.9% – All cash completed deals from $1.0 billion – $2.0 billion • Based on Talen unaffected stock price of $9.00 on 3/31/2016 Selected Public Companies Analysis: EV/EBITDA • Based on Dynegy and NRG's 2017 EV/EBITDA multiple of 7.2x and 8.8x, respectively, and Dynegy's and NRG's 2018 EV/EBITDA multiple of 6.6x and 8.3x, respectively • Adjusted Net Debt (3/31/2016) balance of $3,312mm • 131.5mm shares outstanding • $704mm 2017 Adjusted EBITDA and $713mm $10.44 $19.92 2018 Adjusted EBITDA $9.24 $13.31 $13.39 $13.40 $10.61 $7.00 $5.76 $11.72 $13.66 $21.83 $19.09 $18.75 $16.29 $15.00 $19.80 $13.13 2017 EV/EBITDA 2018 EV/EBITDA Talen Financial Analysis Summary For Informational Reference Only $14.00 per Share Merger Consideration (56% premium to unaffected stock price)1 Talen Unaffected Stock Price (3/31/2016): $9.00 Talen Closing Stock (Price 5/31/2016): $11.50 Source: 2016 Q2 Reforecast – Open, 2019 2020 PJM Auction Results vFinal per Talen Management, FactSet and Wall Street research. Note: Market data as of May 31, 2016. 1. Merger consideration of $14.00 per share represents an implied premium of 142% to $5.78 per share, which is Talen's closing 7 stock price of $11.50 per share on 5/31/2016 excluding $5.72 cash per share. Assumes minimum cash balance of $200mm.
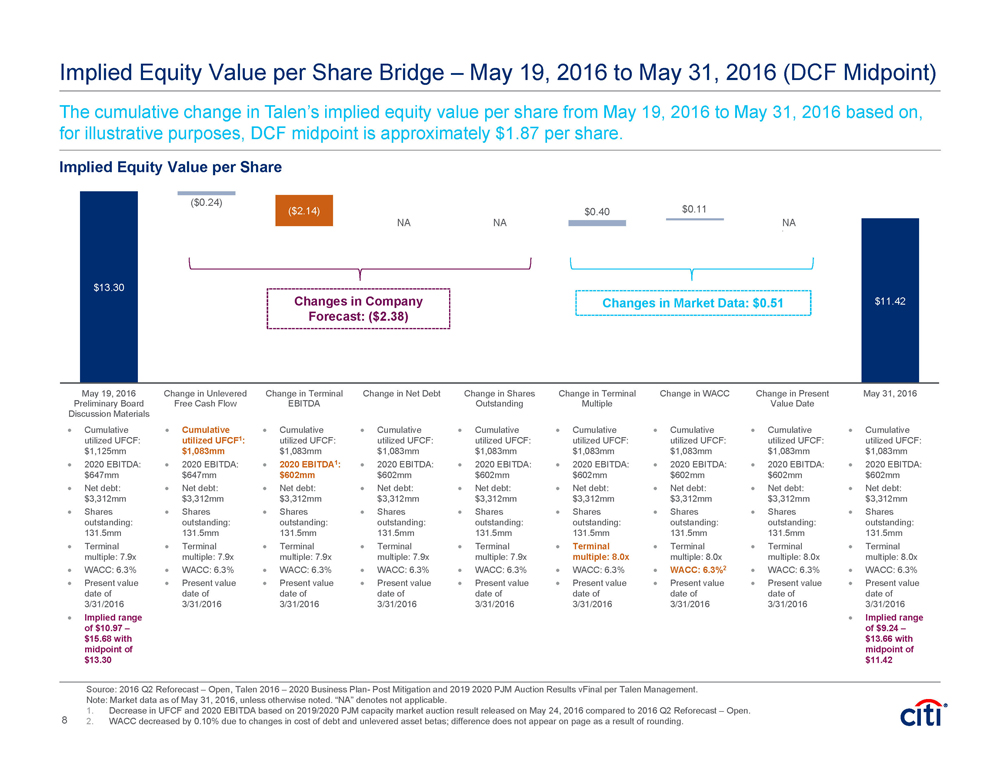
Implied Equity Value per Share Bridge – May 19, 2016 to May 31, 2016 (DCF Midpoint) The cumulative change in Talen’s implied equity value per share from May 19, 2016 to May 31, 2016 based on, for illustrative purposes, DCF midpoint is approximately $1.87 per share. Cumulative utilized UFCF: $1,125mm 2020 EBITDA: $647mm Net debt: $3,312mm Shares outstanding: 131.5mm Terminal multiple: 7.9x WACC: 6.3% Present value date of 3/31/2016 Implied range of $10.97 – $15.68 with midpoint of $13.30 Implied Equity Value per Share Source: 2016 Q2 Reforecast – Open, Talen 2016 – 2020 Business Plan- Post Mitigation and 2019 2020 PJM Auction Results vFinal per Talen Management. Note: Market data as of May 31, 2016, unless otherwise noted. “NA” denotes not applicable. 1. Decrease in UFCF and 2020 EBITDA based on 2019/2020 PJM capacity market auction result released on May 24, 2016 compared to 2016 Q2 Reforecast – Open. 2. WACC decreased by 0.10% due to changes in cost of debt and unlevered asset betas; difference does not appear on page as a result of rounding. $13.30 $11.42 ($0.24) ($2.14) $0.00 $0.00 $0.40 $0.11 $0.00 May 19, 2016 Preliminary Board Discussion Materials Change in Unlevered Free Cash Flow Change in Terminal EBITDA Change in Net Debt Change in Shares Outstanding Change in Terminal Multiple Change in WACC Change in Present Value Date May 31, 2016 Changes in Changes in Company Market Data: $0.51 Forecast: ($2.38) Cumulative utilized UFCF1: $1,083mm 2020 EBITDA: $647mm Net debt: $3,312mm Shares outstanding: 131.5mm Terminal multiple: 7.9x WACC: 6.3% Present value date of 3/31/2016 Cumulative utilized UFCF: $1,083mm 2020 EBITDA1: $602mm Net debt: $3,312mm Shares outstanding: 131.5mm Terminal multiple: 7.9x WACC: 6.3% Present value date of 3/31/2016 Cumulative utilized UFCF: $1,083mm 2020 EBITDA: $602mm Net debt: $3,312mm Shares outstanding: 131.5mm Terminal multiple: 7.9x WACC: 6.3% Present value date of 3/31/2016 Cumulative utilized UFCF: $1,083mm 2020 EBITDA: $602mm Net debt: $3,312mm Shares outstanding: 131.5mm Terminal multiple: 7.9x WACC: 6.3% Present value date of 3/31/2016 Cumulative utilized UFCF: $1,083mm 2020 EBITDA: $602mm Net debt: $3,312mm Shares outstanding: 131.5mm Terminal multiple: 8.0x WACC: 6.3% Present value date of 3/31/2016 Cumulative utilized UFCF: $1,083mm 2020 EBITDA: $602mm Net debt: $3,312mm Shares outstanding: 131.5mm Terminal multiple: 8.0x WACC: 6.3%2 Present value date of 3/31/2016 Cumulative utilized UFCF: $1,083mm 2020 EBITDA: $602mm Net debt: $3,312mm Shares outstanding: 131.5mm Terminal multiple: 8.0x WACC: 6.3% Present value date of 3/31/2016 Cumulative utilized UFCF: $1,083mm 2020 EBITDA: $602mm Net debt: $3,312mm Shares outstanding: 131.5mm Terminal multiple: 8.0x WACC: 6.3% Present value date of 3/31/2016 Implied range of $9.24 – $13.66 with midpoint of $11.42 NA NA NA 8
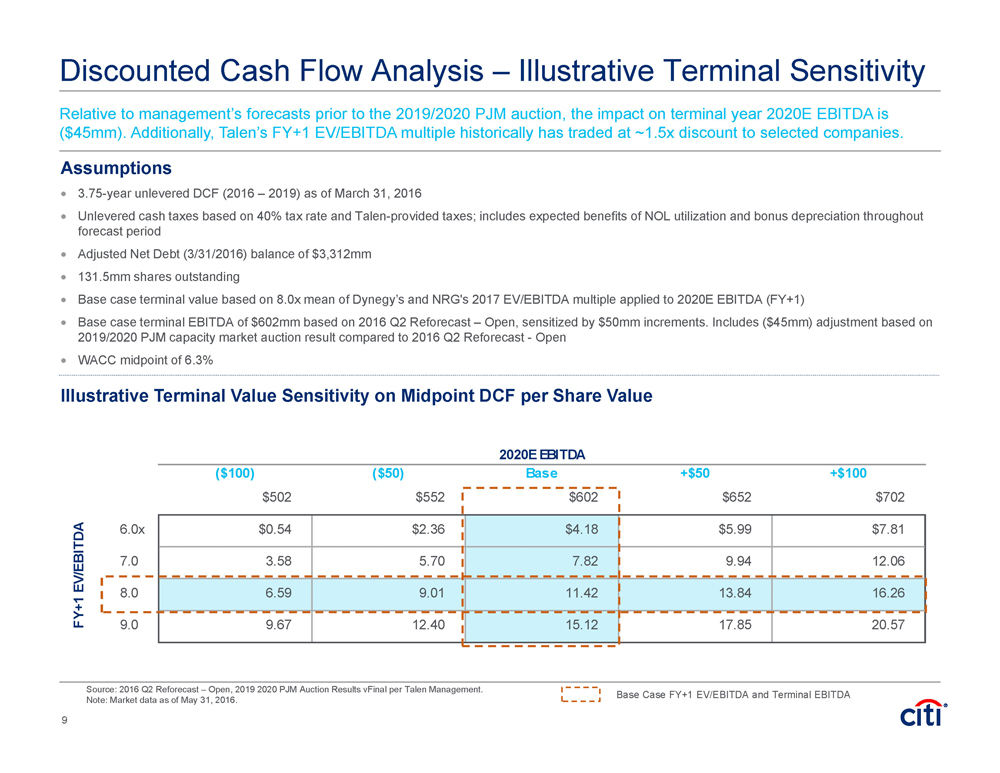
2020E EBITDA ($100) ($50) Base +$50 +$100 11.42 $502 $552 $602 $652 $702 6.0x $0.54 $2.36 $4.18 $5.99 $7.81 7.0 3.58 5.70 7.82 9.94 12.06 8.0 6.59 9.01 11.42 13.84 16.26 9.0 9.67 12.40 15.12 17.85 20.57 FY+1 EV/EBITDA Discounted Cash Flow Analysis – Illustrative Terminal Sensitivity Source: 2016 Q2 Reforecast – Open, 2019 2020 PJM Auction Results vFinal per Talen Management. Note: Market data as of May 31, 2016. Assumptions 3.75-year unlevered DCF (2016 – 2019) as of March 31, 2016 Unlevered cash taxes based on 40% tax rate and Talen-provided taxes; includes expected benefits of NOL utilization and bonus depreciation throughout forecast period Adjusted Net Debt (3/31/2016) balance of $3,312mm 131.5mm shares outstanding Base case terminal value based on 8.0x mean of Dynegy’s and NRG's 2017 EV/EBITDA multiple applied to 2020E EBITDA (FY+1) Base case terminal EBITDA of $602mm based on 2016 Q2 Reforecast – Open, sensitized by $50mm increments. Includes ($45mm) adjustment based on 2019/2020 PJM capacity market auction result compared to 2016 Q2 Reforecast - Open WACC midpoint of 6.3% Base Case FY+1 EV/EBITDA and Terminal EBITDA Illustrative Terminal Value Sensitivity on Midpoint DCF per Share Value ($ in millions, except per share data) Relative to management’s forecasts prior to the 2019/2020 PJM auction, the impact on terminal year 2020E EBITDA is ($45mm). Additionally, Talen’s FY+1 EV/EBITDA multiple historically has traded at ~1.5x discount to selected companies. 9

Appendix
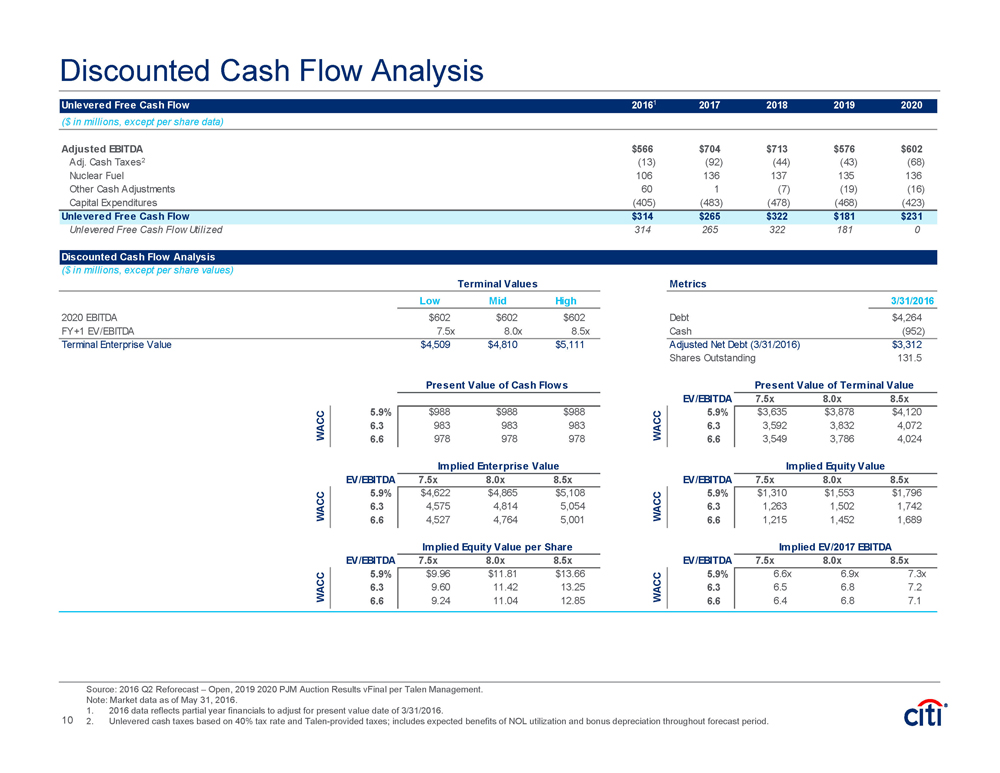
Discounted Cash Flow Analysis Source: 2016 Q2 Reforecast – Open, 2019 2020 PJM Auction Results vFinal per Talen Management. Note: Market data as of May 31, 2016. 1. 2016 data reflects partial year financials to adjust for present value date of 3/31/2016. 2. Unlevered cash taxes based on 40% tax rate and Talen-provided taxes; includes 10 expected benefits of NOL utilization and bonus depreciation throughout forecast period. Unlevered Free Cash Flow 2016 2017 2018 2019 2020 ($ in millions, except per share data) 3/31/2016 8/15/2016 6/30/2017 6/30/2018 6/30/2019 6/30/2020 Adjusted EBITDA $566 $704 $713 $576 $602 Adj. Cash Taxes2 (13) (92) (44) (43) (68) Nuclear Fuel 106 136 137 135 136 Other Cash Adjustments 60 1 (7) (19) (16) Capital Expenditures (405) (483) (478) (468) (423) Unlevered Free Cash Flow $0 $314 $265 $322 $181 $231 Unlevered Free Cash Flow Utilized 314 265 322 181 0 Discounted Cash Flow Analysis ($ in millions, except per share values) Terminal Values Metrics Low Mid High 3/31/2016 2020 EBITDA $602 $602 $602 Debt $4,264 FY+1 EV/EBITDA 7.5x 8.0x 8.5x Cash (952) Terminal Enterprise Value $4,509 $4,810 $5,111 Adjusted Net Debt (3/31/2016) $3,312 Shares Outstanding 131.5 Present Value of Cash Flows Present Value of Terminal Value EV/EBITDA 7.5x 8.0x 8.5x 5.9% $988 $988 $988 5.9% $3,635 $3,878 $4,120 6.3 983 983 983 6.3 3,592 3,832 4,072 6.6 978 978 978 6.6 3,549 3,786 4,024 Implied Enterprise Value Implied Equity Value EV/EBITDA 7.5x 8.0x 8.5x EV/EBITDA 7.5x 8.0x 8.5x 5.9% $4,622 $4,865 $5,108 5.9% $1,310 $1,553 $1,796 6.3 4,575 4,814 5,054 6.3 1,263 1,502 1,742 6.6 4,527 4,764 5,001 6.6 1,215 1,452 1,689 Implied Equity Value per Share Implied EV/2017 EBITDA EV/EBITDA 7.5x 8.0x 8.5x EV/EBITDA 7.5x 8.0x 8.5x 5.9% $9.96 $11.81 $13.66 5.9% 6.6x 6.9x 7.3x 6.3 9.60 11.42 13.25 6.3 6.5 6.8 7.2 6.6 9.24 11.04 12.85 6.6 6.4 6.8 7.1 WACC WACC WACC WACC WACC WACC 1
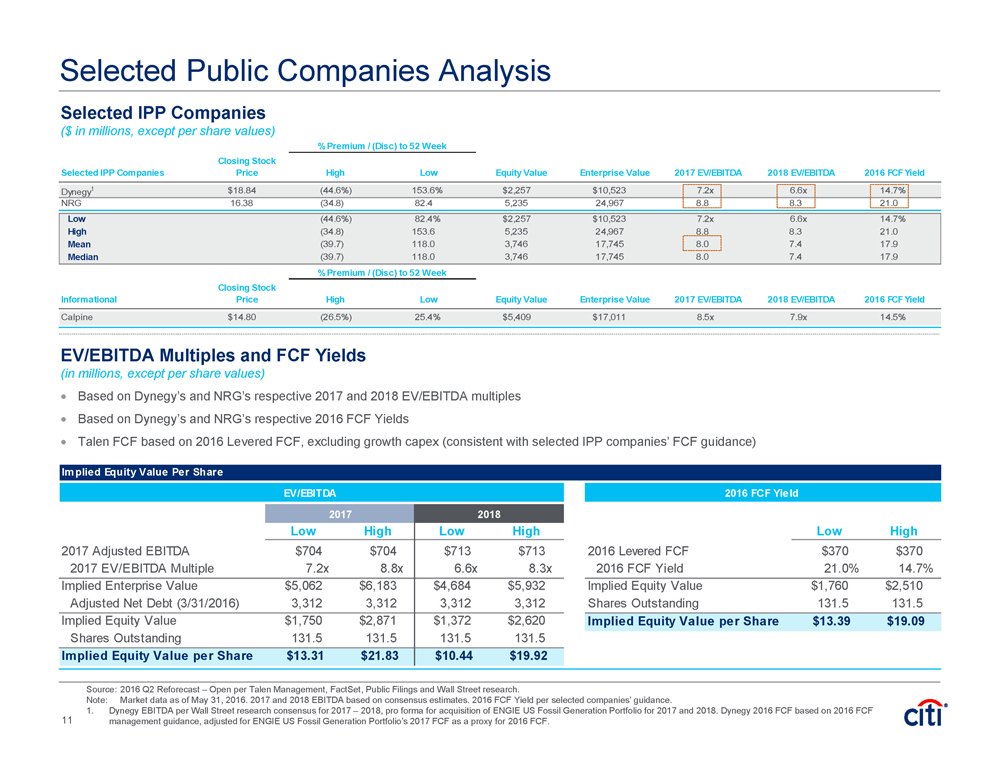
Selected Public Companies Analysis Selected IPP Companies ($ in millions, except per share values) EV/EBITDA Multiples and FCF Yields (in millions, except per share values) Based on Dynegy’s and NRG’s respective 2017 and 2018 EV/EBITDA multiples Based on Dynegy’s and NRG’s respective 2016 FCF Yields Talen FCF based on 2016 Levered FCF, excluding growth capex (consistent with selected IPP companies’ FCF guidance) Source: 2016 Q2 Reforecast – Open per Talen Management, FactSet, Public Filings and Wall Street research. Note: Market data as of May 31, 2016. 2017 and 2018 EBITDA based on consensus estimates. 2016 FCF Yield per selected companies’ guidance. 1. Dynegy EBITDA per Wall Street research consensus for 2017 – 2018, pro forma for acquisition of ENGIE US Fossil Generation Portfolio for 2017 and 2018. Dynegy 2016 FCF based on 2016 FCF management guidance, adjusted for ENGIE US Fossil Generation Portfolio’s 2017 FCF as a proxy for 2016 FCF. % Premium / (Disc) to 52 Week Selected IPP Companies Closing Stock Price High Low Equity Value Enterprise Value 2017 EV/EBITDA 2018 EV/EBITDA 2016 FCF Yield Dynegy1 $18.84 (44.6%) 153.6% $2,257 $10,523 7.2x 6.6x 14.7% NRG 16.38 (34.8) 82.4 5,235 24,967 8.8 8.3 21.0 Low (44.6%) 82.4% $2,257 $10,523 7.2x 6.6x 14.7% High (34.8) 153.6 5,235 24,967 8.8 8.3 21.0 Mean (39.7) 118.0 3,746 17,745 8.0 7.4 17.9 Median (39.7) 118.0 3,746 17,745 8.0 7.4 17.9 % Premium / (Disc) to 52 Week Informational Closing Stock Price High Low Equity Value Enterprise Value 2017 EV/EBITDA 2018 EV/EBITDA 2016 FCF Yield Calpine $14.80 (26.5%) 25.4% $5,409 $17,011 8.5x 7.9x 14.5% 11 Implied Equity Value Per Share EV/EBITDA 2016 FCF Yield 2017 2018 Low High Low High Low High 2017 Adjusted EBITDA $704 $704 $713 $713 2016 Levered FCF $370 $370 2017 EV/EBITDA Multiple 7.2x 8.8x 6.6x 8.3x 2016 FCF Yield 21.0% 14.7% Implied Enterprise Value $5,062 $6,183 $4,684 $5,932 Implied Equity Value $1,760 $2,510 Adjusted Net Debt (3/31/2016) 3,312 3,312 3,312 3,312 Shares Outstanding 131.5 131.5 Implied Equity Value $1,750 $2,871 $1,372 $2,620 Implied Equity Value per Share $13.39 $19.09 Shares Outstanding 131.5 131.5 131.5 131.5 Implied Equity Value per Share $13.31 $21.83 $10.44 $19.92
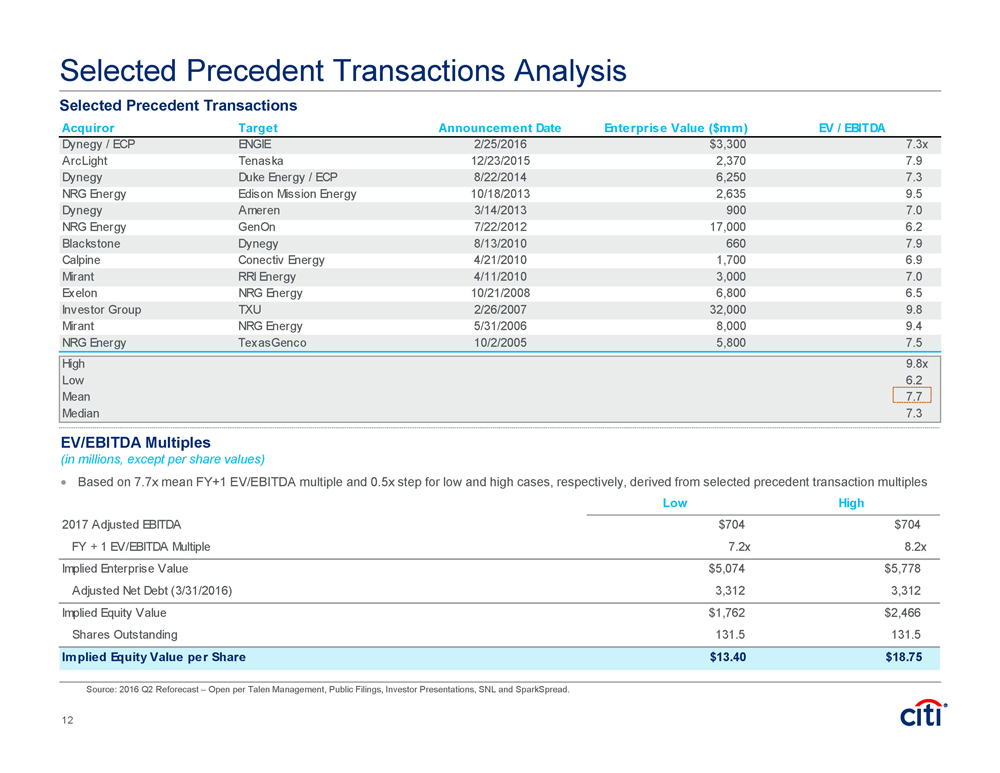
Acquiror Target Announcement Date Enterprise Value ($mm) EV / EBITDA Dynegy / ECP ENGIE 2/25/2016 $3,300 7.3x ArcLight Tenaska 12/23/2015 2,370 7.9 Dynegy Duke Energy / ECP 8/22/2014 6,250 7.3 NRG Energy Edison Mission Energy 10/18/2013 2,635 9.5 Dynegy Ameren 3/14/2013 900 7.0 NRG Energy GenOn 7/22/2012 17,000 6.2 Blackstone Dynegy 8/13/2010 660 7.9 Calpine Conectiv Energy 4/21/2010 1,700 6.9 Mirant RRI Energy 4/11/2010 3,000 7.0 Exelon NRG Energy 10/21/2008 6,800 6.5 Investor Group TXU 2/26/2007 32,000 9.8 Mirant NRG Energy 5/31/2006 8,000 9.4 NRG Energy TexasGenco 10/2/2005 5,800 7.5 High 9.8x Low 6.2 Mean 7.7 Median 7.3 Selected Precedent Transactions Selected Precedent Transactions Analysis Source: 2016 Q2 Reforecast – Open per Talen Management, Public Filings, Investor Presentations, SNL and SparkSpread. EV/EBITDA Multiples (in millions, except per share values) Based on 7.7x mean FY+1 EV/EBITDA multiple and 0.5x step for low and high cases, respectively, derived from selected precedent transaction multiples Low High 2017 Adjusted EBITDA $704 $704 FY + 1 EV/EBITDA Multiple 7.2x 8.2x Implied Enterprise Value $5,074 $5,778 Adjusted Net Debt (3/31/2016) 3,312 3,312 Implied Equity Value $1,762 $2,466 Shares Outstanding 131.5 131.5 Implied Equity Value per Share $13.40 $18.75 12

SOTP Analysis $/kW multiples from Wall Street research and selected precedent transactions to derive estimated value of Talen portfolio on asset-by-asset basis categorized by technology, fuel type, and ISO – Midpoint multiples sensitized by $25/kW for low and high implied values Assumes 131.5mm shares outstanding Pre-tax Assumptions Implied Enterprise Value ($/kW) (in millions, except per share values) Source: 2016 Q2 Reforecast – Open per Talen Management, Investor Presentations and Wall Street research. Note: Wall Street research used for nuclear given lack of relevant selected transactions. 1. Represents Harquahala and renewables; estimated value per Talen management. 1 $/kW Multiple $700 $350 $750 $600 $350 $400 $200 $150 $500 — $317 MW 555 1,294 335 969 747 2,078 499 6,222 2,262 1,047 16,008 Implied Enterprise Value $389 $453 $251 $581 $261 $831 $100 $933 $1,131 $150 $5,081 Net Debt 3,312 Implied Equity Value $1,769 $389 $389 $841 $1,093 $1,674 $1,936 $2,767 $2,867 $3,800 $5,081 $1,769 $453 $251 $581 $261 $831 $933 $1,131 $150 $3,312 $100 Gas - CCGT - PJM Gas - CCGT - ERCOT Gas - CCGT - ISO-NE Gas - CCGT - NYISO Gas - Cogen Gas - Peakers - PJM Gas - Peakers - ERCOT Coal Nuclear Other Enterprise Value Net Debt Equity Value 13 Low Mid High Implied Equity Value $1,395 $1,769 $2,143 Shares Outstanding 131.5 131.5 131.5 Implied Equity Value per Share $10.61 $13.45 $16.29
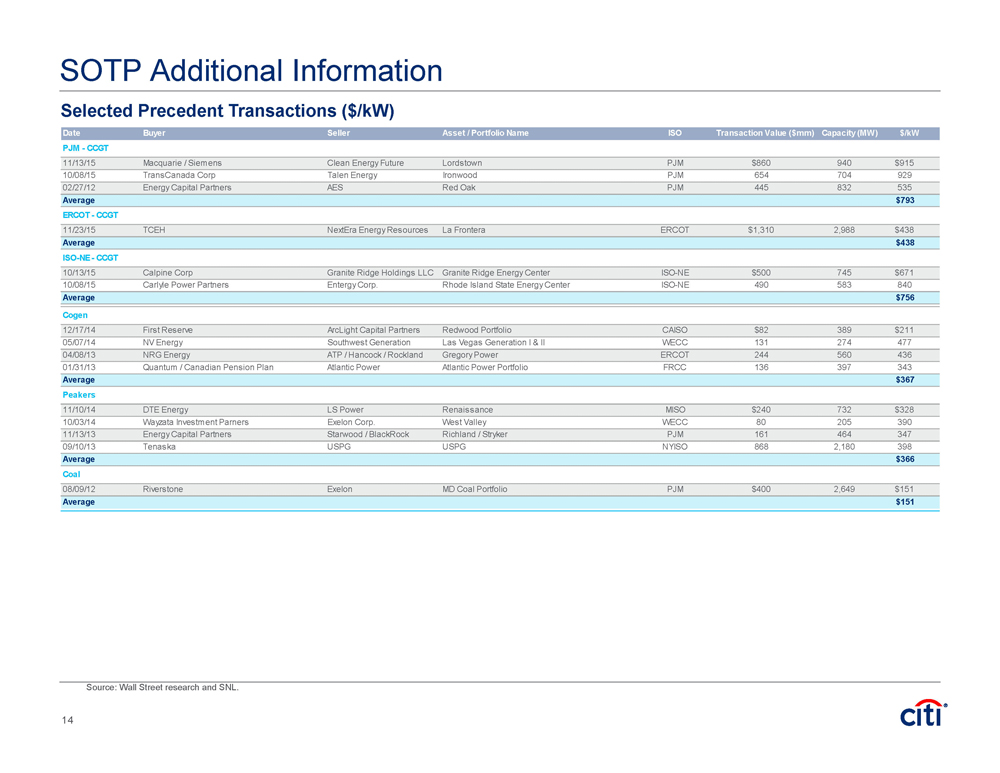
SOTP Additional Information Source: Wall Street research and SNL. Selected Precedent Transactions ($/kW) Date Buyer Seller Asset / Portfolio Name ISO Transaction Value ($mm) Capacity (MW) $/kW PJM - CCGT 11/13/15 Macquarie / Siemens Clean Energy Future Lordstown PJM $860 940 $915 10/08/15 TransCanada Corp Talen Energy Ironwood PJM 654 704 929 02/27/12 Energy Capital Partners AES Red Oak PJM 445 832 535 Average $793 ERCOT - CCGT 11/23/15 TCEH NextEra Energy Resources La Frontera ERCOT $1,310 2,988 $438 Average $438 ISO-NE - CCGT 10/13/15 Calpine Corp Granite Ridge Holdings LLC Granite Ridge Energy Center ISO-NE $500 745 $671 10/08/15 Carlyle Power Partners Entergy Corp. Rhode Island State Energy Center ISO-NE 490 583 840 Average $756 Cogen 12/17/14 First Reserve ArcLight Capital Partners Redwood Portfolio CAISO $82 389 $211 05/07/14 NV Energy Southwest Generation Las Vegas Generation I & II WECC 131 274 477 04/08/13 NRG Energy ATP / Hancock / Rockland Gregory Power ERCOT 244 560 436 01/31/13 Quantum / Canadian Pension Plan Atlantic Power Atlantic Power Portfolio FRCC 136 397 343 Average $367 Peakers 11/10/14 DTE Energy LS Power Renaissance MISO $240 732 $328 10/03/14 Wayzata Investment Parners Exelon Corp. West Valley WECC 80 205 390 11/13/13 Energy Capital Partners Starwood / BlackRock Richland / Stryker PJM 161 464 347 09/10/13 Tenaska USPG USPG NYISO 868 2,180 398 Average $366 Coal 08/09/12 Riverstone Exelon MD Coal Portfolio PJM $400 2,649 $151 Average $151 14
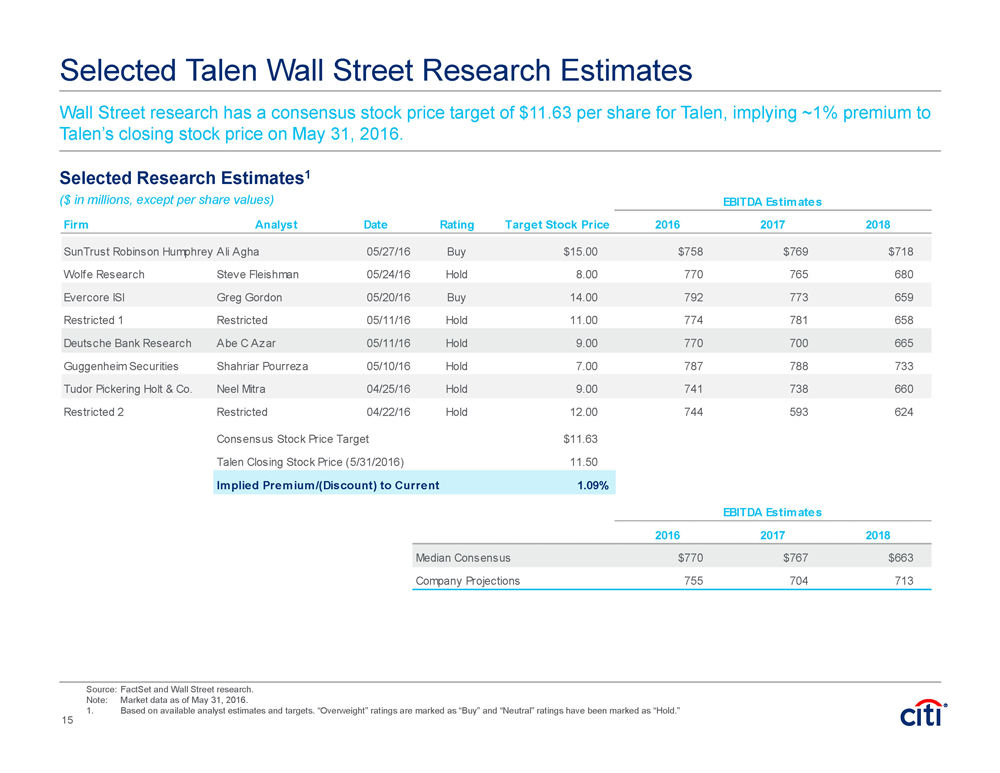
Source: FactSet and Wall Street research. Note: Market data as of May 31, 2016. 1. Based on available analyst estimates and targets. “Overweight” ratings are marked as “Buy” and “Neutral” ratings have been marked as “Hold.” Selected Talen Wall Street Research Estimates Selected Research Estimates1 ($ in millions, except per share values) Wall Street research has a consensus stock price target of $11.63 per share for Talen, implying ~1% premium to Talen’s closing stock price on May 31, 2016. 15 EBITDA Estimates Firm Analyst Date Rating Target Stock Price 2016 2017 2018 SunTrust Robinson Humphrey Ali Agha 05/27/16 Buy $15.00 $758 $769 $718 Wolfe Research Steve Fleishman 05/24/16 Hold 8.00 770 765 680 Evercore ISI Greg Gordon 05/20/16 Buy 14.00 792 773 659 Restricted 1 Restricted 05/11/16 Hold 11.00 774 781 658 Deutsche Bank Research Abe C Azar 05/11/16 Hold 9.00 770 700 665 Guggenheim Securities Shahriar Pourreza 05/10/16 Hold 7.00 787 788 733 Tudor Pickering Holt & Co. Neel Mitra 04/25/16 Hold 9.00 741 738 660 Restricted 2 Restricted 04/22/16 Hold 12.00 744 593 624 Consensus Stock Price Target $11.63 Talen Closing Stock Price (5/31/2016) 11.50 Implied Premium/(Discount) to Current 1.09% EBITDA Estimates 2016 2017 2018 Median Consensus $770 $767 $663 Company Projections 755 704 713
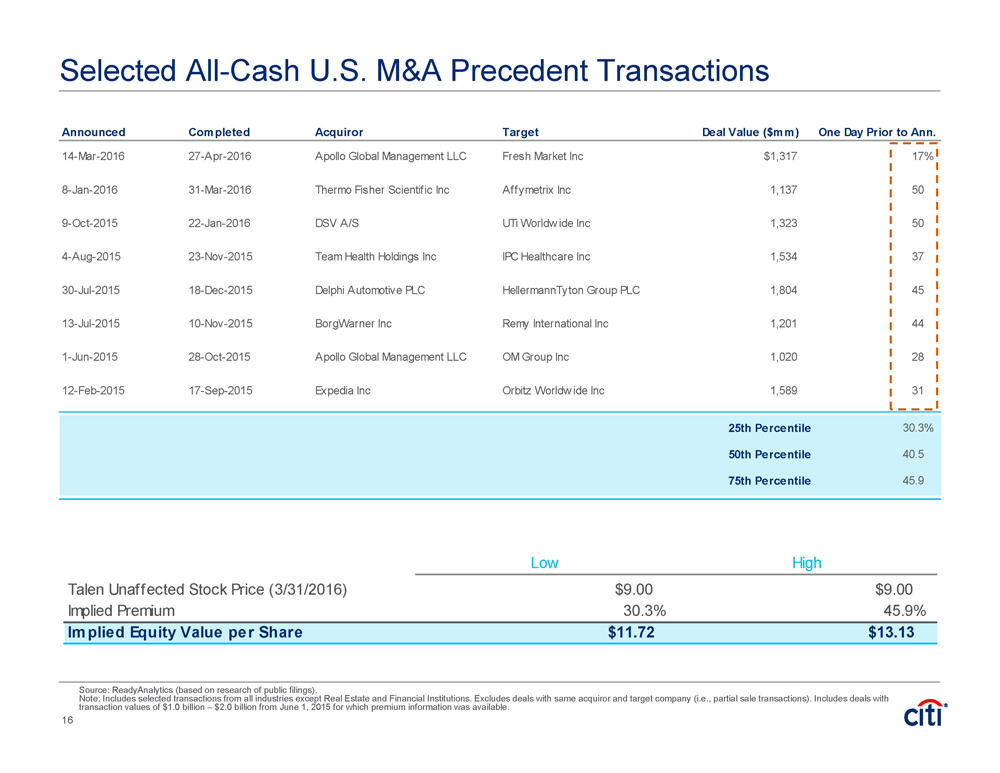
Selected All-Cash U.S. M&A Precedent Transactions Source: ReadyAnalytics (based on research of public filings). Note: Includes selected transactions from all industries except Real Estate and Financial Institutions. Excludes deals with same acquiror and target company (i.e., partial sale transactions). Includes deals with transaction values of $1.0 billion – $2.0 billion from June 1, 2015 for which premium information was available. Announced Completed Acquiror Target Deal Value ($mm) One Day Prior to Ann. 14-Mar-2016 27-Apr-2016 Apollo Global Management LLC Fresh Market Inc $1,317 17% 8-Jan-2016 31-Mar-2016 Thermo Fisher Scientific Inc Affymetrix Inc 1,137 50 9-Oct-2015 22-Jan-2016 DSV A/S UTi Worldwide Inc 1,323 50 4-Aug-2015 23-Nov-2015 Team Health Holdings Inc IPC Healthcare Inc 1,534 37 30-Jul-2015 18-Dec-2015 Delphi Automotive PLC HellermannTyton Group PLC 1,804 45 13-Jul-2015 10-Nov-2015 BorgWarner Inc Remy International Inc 1,201 44 1-Jun-2015 28-Oct-2015 Apollo Global Management LLC OM Group Inc 1,020 28 12-Feb-2015 17-Sep-2015 Expedia Inc Orbitz Worldwide Inc 1,589 31 25th Percentile 30.3% 50th Percentile 40.5 75th Percentile 45.9 16 Low High Talen Unaffected Stock Price (3/31/2016) $9.00 $9.00 Implied Premium 30.3% 45.9% Implied Equity Value per Share $11.72 $13.13
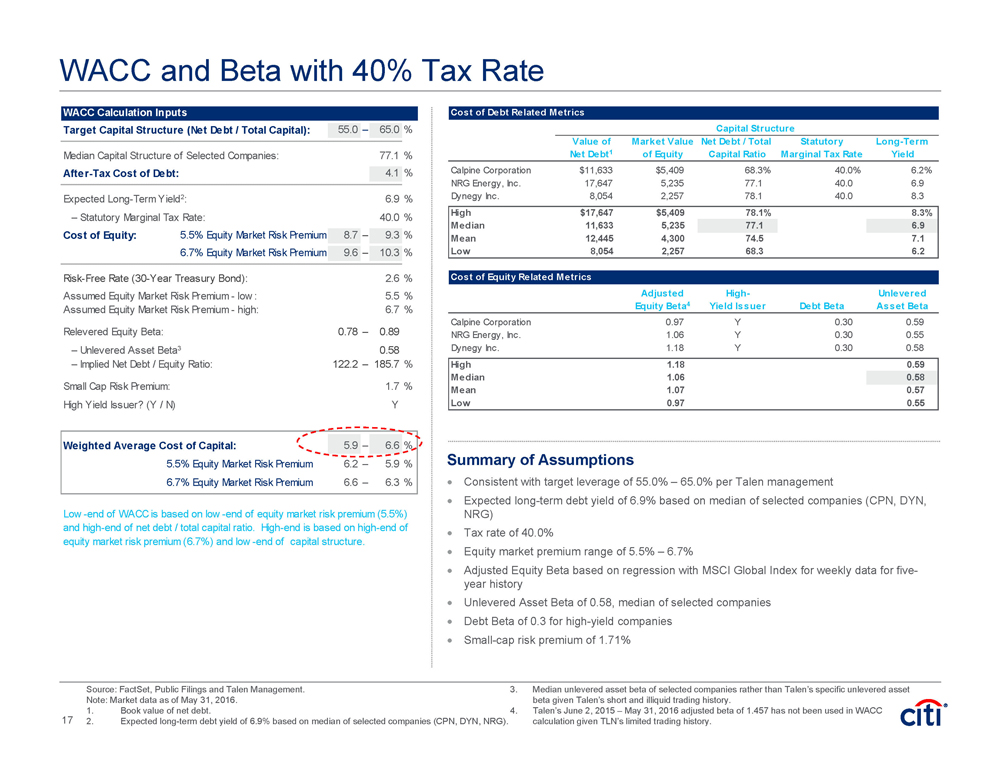
WACC and Beta with 40% Tax Rate Consistent with target leverage of 55.0% – 65.0% per Talen management Expected long-term debt yield of 6.9% based on median of selected companies (CPN, DYN, NRG) Tax rate of 40.0% Equity market premium range of 5.5% – 6.7% Adjusted Equity Beta based on regression with MSCI Global Index for weekly data for five-year history Unlevered Asset Beta of 0.58, median of selected companies Debt Beta of 0.3 for high-yield companies Small-cap risk premium of 1.71% Summary of Assumptions Source: FactSet, Public Filings and Talen Management. Note: Market data as of May 31, 2016. 1. Book value of net debt. 2. Expected long-term debt yield of 6.9% based on median of selected companies (CPN, DYN, NRG). 3. Median unlevered asset beta of selected companies rather than Talen’s specific unlevered asset beta given Talen’s short and illiquid trading history. 4. Talen’s June 2, 2015 – May 31, 2016 adjusted beta of 1.457 has not been used in WACC calculation given TLN’s limited trading history. WACC Calculation Inputs Target Capital Structure (Net Debt / Total Capital): 55.0 – 65.0 % Median Capital Structure of Selected Companies: 77.1 % After-Tax Cost of Debt: 4.1 % Expected Long-Term Yield2: 6.9 % – Statutory Marginal Tax Rate: 40.0 % Cost of Equity: 5.5% Equity Market Risk Premium 8.7 – 9.3 % 6.7% Equity Market Risk Premium 9.6 – 10.3 % Risk-Free Rate (30-Year Treasury Bond): 2.6 % Assumed Equity Market Risk Premium - low : 5.5 % Assumed Equity Market Risk Premium - high: 6.7 % Relevered Equity Beta: 0.78 – 0.89 – Unlevered Asset Beta3 0.58 – Implied Net Debt / Equity Ratio: 122.2 – 185.7 % Small Cap Risk Premium: 1.7 % High Yield Issuer? (Y / N) Y Weighted Average Cost of Capital: 5.9 – 6.6 % 5.5% Equity Market Risk Premium 6.2 – 5.9 % 6.7% Equity Market Risk Premium 6.6 – 6.3 % Low -end of WACC is based on low -end of equity market risk premium (5.5%) and high-end of net debt / total capital ratio. High-end is based on high-end of equity market risk premium (6.7%) and low -end of capital structure. Cost of Debt Related Metrics Capital Structure Value of Market Value Net Debt / Total Statutory Long-Term Net Debt1 of Equity Capital Ratio Marginal Tax Rate Yield Calpine Corporation $11,633 $5,409 68.3% 40.0% 6.2% NRG Energy, Inc. 17,647 5,235 77.1 40.0 6.9 Dynegy Inc. 8,054 2,257 78.1 40.0 8.3 High $17,647 $5,409 78.1% 8.3% Median 11,633 5,235 77.1 6.9 Mean 12,445 4,300 74.5 7.1 Low 8,054 2,257 68.3 6.2 Cost of Equity Related Metrics Adjusted High- Unlevered Equity Beta4 Yield Issuer Debt Beta Asset Beta Calpine Corporation 0.97 Y 0.30 0.59 NRG Energy, Inc. 1.06 Y 0.30 0.55 Dynegy Inc. 1.18 Y 0.30 0.58 High 1.18 0.59 Median 1.06 0.58 Mean 1.07 0.57 Low 0.97 0.55 17