Exhibit (c)(6)
| Project Revere Valuation Sensitivities January 14, 2016 Corporate and Investment Banking | Global Power Strictly Private and Confidential |
| Confidential Material Disclaimer The following pages contain material provided to the Board of Directors of Talen Energy Corporation (“Talen” or the “Company”) by Citigroup Global Markets Inc. (“Citi”) in connection with a proposal from Riverstone Holdings LLC (“Riverstone”). The accompanying material was compiled or prepared on a confidential basis solely for the use of the Board of Directors of the Company and not with a view toward public disclosure under any securities laws or otherwise. The information contained in the accompanying material was obtained from the Company and other sources. Any estimates and projections contained herein have been prepared or adopted by management of the Company, obtained from public sources, or are based upon such estimates and projections, and involve numerous and significant subjective determinations, and there is no assurance that such estimates and projections will be realized. Citi does not take responsibility for such estimates and projections, or the basis on which they were prepared. No representation or warranty, express or implied, is made as to the accuracy or completeness of such information and nothing contained herein is, or shall be relied upon as, a representation, whether as to the past, the present or the future. In preparing the accompanying material, Citi assumed and relied, without independent verification, upon the accuracy and completeness of all financial and other information and data publicly available or provided to or otherwise reviewed by or discussed with Citi and upon the assurances of the management of the Company, that they are not aware of any relevant information that has been omitted or that remains undisclosed to Citi. The accompanying material was not prepared for use by readers not as familiar with the Company as the Board of Directors of the Company and, accordingly, neither the Company nor Citi nor their respective legal or financial advisors or accountants take any responsibility for the accompanying material if used by persons other than the Board of Directors of the Company. The accompanying material is necessarily based upon information available to Citi, and financial, stock market and other conditions and circumstances existing and disclosed to Citi, as of the date of the accompanying material. Citi does not have any obligation to update or otherwise revise the accompanying material. Nothing contained herein shall be construed as legal, regulatory, tax or accounting advice. 1 |
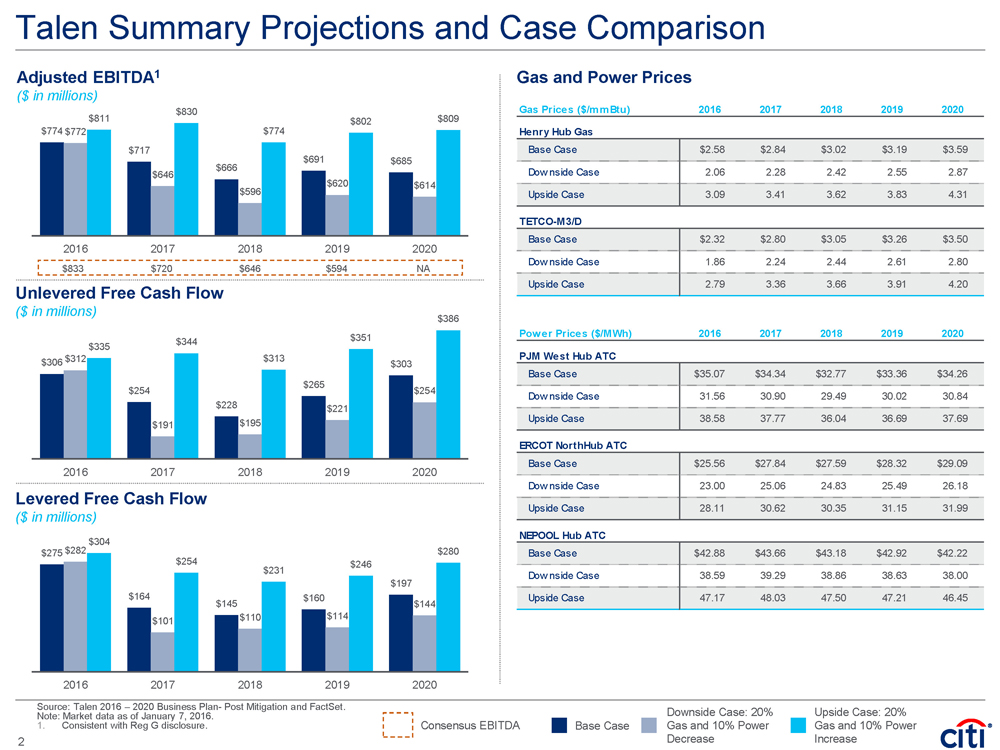
| Talen Summary Projections and Case Comparison Adjusted EBITDA1 ($ in millions) Unlevered Free Cash Flow ($ in millions) Source: Talen 2016 – 2020 Business Plan- Post Mitigation and FactSet. Note: Market data as of January 7, 2016. 1. Consistent with Reg G disclosure. Consensus EBITDA Base Case Gas and Power Prices 2 Levered Free Cash Flow ($ in millions) $774 $717 $666 $691 $685 $772 $646 $596 $620 $614 $811 $830 $774 $802 $809 2016 2017 2018 2019 2020 $306 $254 $228 $265 $303 $312 $191 $195 $221 $254 $335 $344 $313 $351 $386 2016 2017 2018 2019 2020 $275 $164 $145 $160 $197 $282 $101 $110 $114 $144 $304 $254 $231 $246 $280 2016 2017 2018 2019 2020 $833 $720 $646 $594 NA Downside Case: 20% Gas and 10% Power Decrease Upside Case: 20% Gas and 10% Power Increase Gas Prices ($/mmBtu) 2016 2017 2018 2019 2020 Henry Hub Gas Base Case $2.58 $2.84 $3.02 $3.19 $3.59 Downside Case 2.06 2.28 2.42 2.55 2.87 Upside Case 3.09 3.41 3.62 3.83 4.31 TETCO-M3/D Base Case $2.32 $2.80 $3.05 $3.26 $3.50 Downside Case 1.86 2.24 2.44 2.61 2.80 Upside Case 2.79 3.36 3.66 3.91 4.20 Power Prices ($/MWh) 2016 2017 2018 2019 2020 PJM West Hub ATC Base Case $35.07 $34.34 $32.77 $33.36 $34.26 Downside Case 31.56 30.90 29.49 30.02 30.84 Upside Case 38.58 37.77 36.04 36.69 37.69 ERCOT NorthHub ATC Base Case $25.56 $27.84 $27.59 $28.32 $29.09 Downside Case 23.00 25.06 24.83 25.49 26.18 Upside Case 28.11 30.62 30.35 31.15 31.99 NEPOOL Hub ATC Base Case $42.88 $43.66 $43.18 $42.92 $42.22 Downside Case 38.59 39.29 38.86 38.63 38.00 Upside Case 47.17 48.03 47.50 47.21 46.45 |
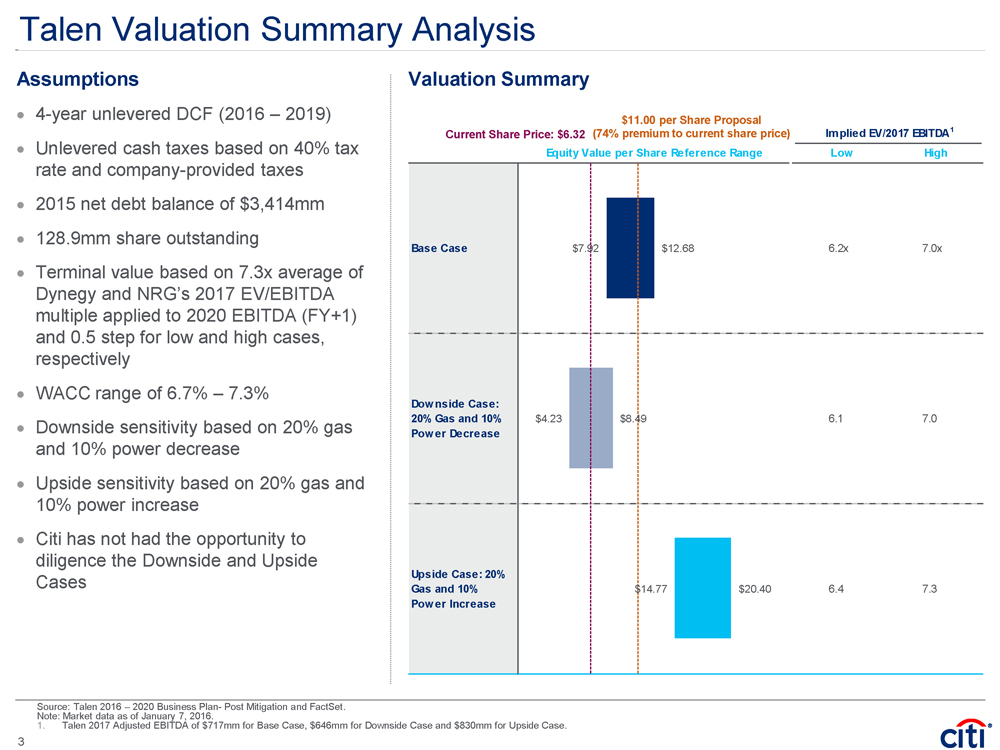
| Talen Valuation Summary Analysis Valuation Summary Assumptions • 4-year unlevered DCF (2016 – 2019) • Unlevered cash taxes based on 40% tax rate and company-provided taxes • 2015 net debt balance of $3,414mm • 128.9mm share outstanding • Terminal value based on 7.3x average of Dynegy and NRG’s 2017 EV/EBITDA multiple applied to 2020 EBITDA (FY+1) and 0.5 step for low and high cases, respectively • WACC range of 6.7% – 7.3% • Downside sensitivity based on 20% gas and 10% power decrease • Upside sensitivity based on 20% gas and 10% power increase • Citi has not had the opportunity to diligence the Downside and Upside Cases Source: Talen 2016 – 2020 Business Plan- Post Mitigation and FactSet. Note: Market data as of January 7, 2016. 1. Talen 2017 Adjusted EBITDA of $717mm for Base Case, $646mm for Downside Case and $830mm for Upside Case. $11.00 per Share Proposal (74% premium to current share price) Current Share Price: $6.32 Implied EV/2017 EBITDA1 Equity Value per Share Reference Range Low High Base Case 6.2x 7.0x Downside Case: 20% Gas and 10% Power Decrease 6.1 7.0 Upside Case: 20% Gas and 10% Power Increase 6.4 7.3 $7.92 $4.23 $14.77 $12.68 $8.49 $20.40 3 |

| Appendix |
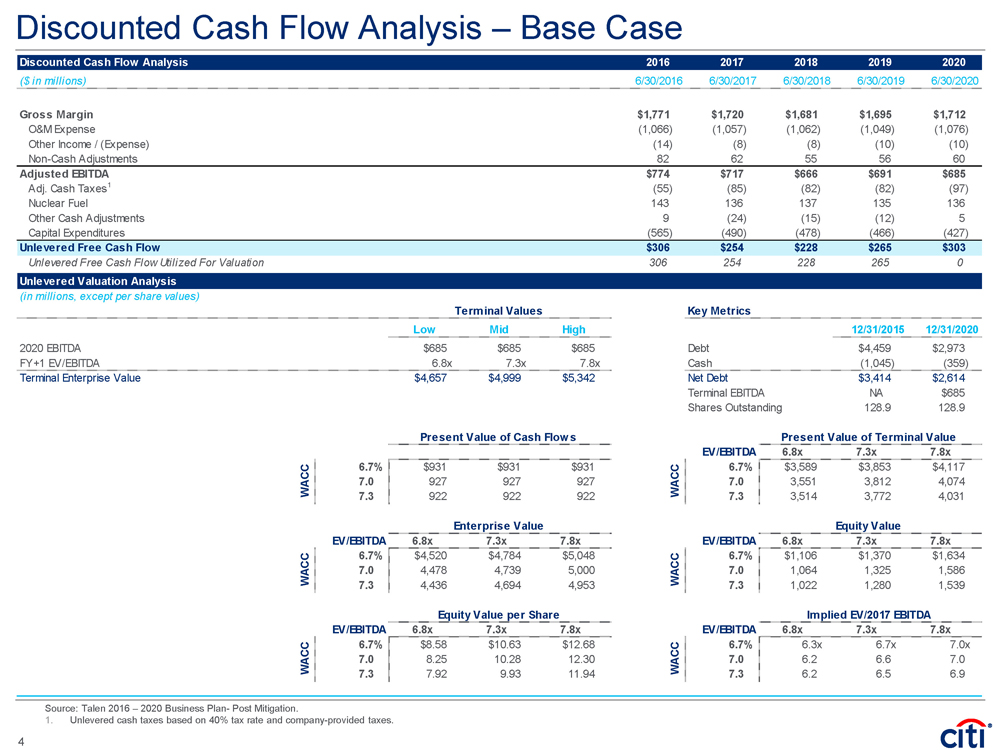
| Discounted Cash Flow Analysis – Base Case Source: Talen 2016 – 2020 Business Plan- Post Mitigation. 1. Unlevered cash taxes based on 40% tax rate and company-provided taxes. Discounted Cash Flow Analysis 2016 2017 2018 2019 2020 ($ in millions) 12/31/2015 6/30/2016 6/30/2017 6/30/2018 6/30/2019 6/30/2020 Gross Margin $1,771 $1,720 $1,681 $1,695 $1,712 O&M Expense (1,066) (1,057) (1,062) (1,049) (1,076) Other Income / (Expense) (14) (8) (8) (10) (10) Non-Cash Adjustments 82 62 55 56 60 Adjusted EBITDA $774 $717 $666 $691 $685 Adj. Cash Taxes1 (55) (85) (82) (82) (97) Nuclear Fuel 143 136 137 135 136 Other Cash Adjustments 9 (24) (15) (12) 5 Capital Expenditures (565) (490) (478) (466) (427) Unlevered Free Cash Flow $0 $306 $254 $228 $265 $303 Unlevered Free Cash Flow Utilized For Valuation 306 254 228 265 0 Unlevered Valuation Analysis (in millions, except per share values) Terminal Values Key Metrics Low Mid High 12/31/2015 12/31/2020 2020 EBITDA $685 $685 $685 Debt $4,459 $2,973 FY+1 EV/EBITDA 6.8x 7.3x 7.8x Cash (1,045) (359) Terminal Enterprise Value $4,657 $4,999 $5,342 Net Debt $3,414 $2,614 Terminal EBITDA NA $685 Shares Outstanding 128.9 128.9 Present Value of Cash Flows Present Value of Terminal Value EV/EBITDA 6.8x 7.3x 7.8x 6.7% $931 $931 $931 6.7% $3,589 $3,853 $4,117 7.0 927 927 927 7.0 3,551 3,812 4,074 7.3 922 922 922 7.3 3,514 3,772 4,031 Enterprise Value Equity Value EV/EBITDA 6.8x 7.3x 7.8x EV/EBITDA 6.8x 7.3x 7.8x 6.7% $4,520 $4,784 $5,048 6.7% $1,106 $1,370 $1,634 7.0 4,478 4,739 5,000 7.0 1,064 1,325 1,586 7.3 4,436 4,694 4,953 7.3 1,022 1,280 1,539 Equity Value per Share Implied EV/2017 EBITDA EV/EBITDA 6.8x 7.3x 7.8x EV/EBITDA 6.8x 7.3x 7.8x 6.7% $8.58 $10.63 $12.68 6.7% 6.3x 6.7x 7.0x 7.0 8.25 10.28 12.30 7.0 6.2 6.6 7.0 7.3 7.92 9.93 11.94 7.3 6.2 6.5 6.9 WACC WACC WACC WACC WACC WACC 4 |
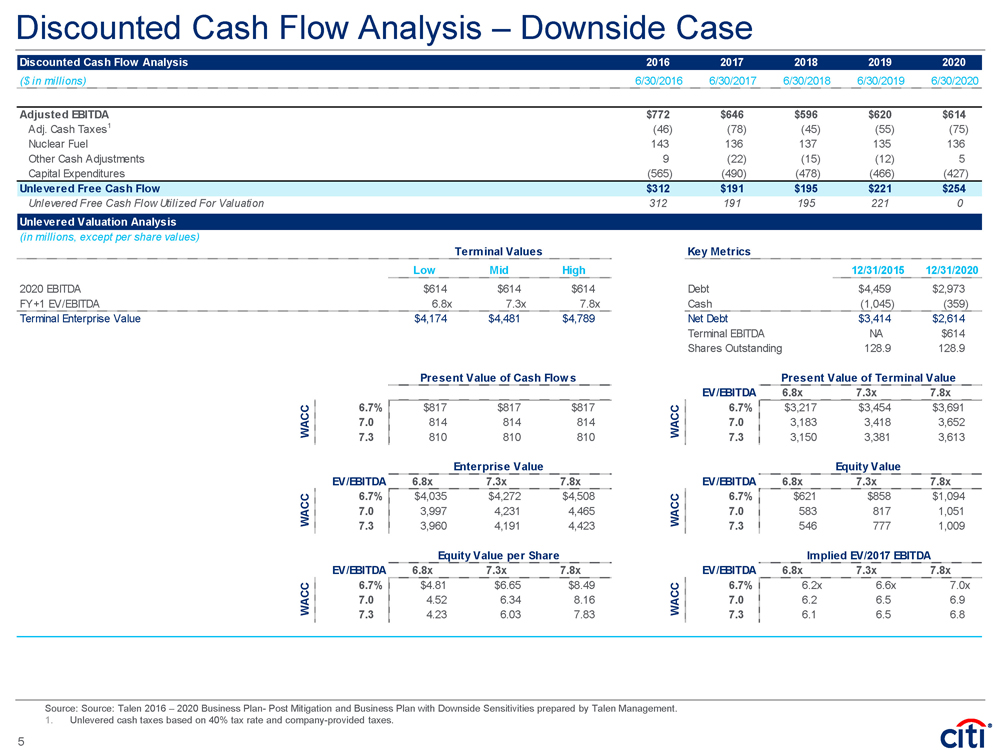
| Discounted Cash Flow Analysis – Downside Case Source: Source: Talen 2016 – 2020 Business Plan- Post Mitigation and Business Plan with Downside Sensitivities prepared by Talen Management. 1. Unlevered cash taxes based on 40% tax rate and company-provided taxes. Discounted Cash Flow Analysis 2016 2017 2018 2019 2020 ($ in millions) 12/31/2015 6/30/2016 6/30/2017 6/30/2018 6/30/2019 6/30/2020 Adjusted EBITDA $772 $646 $596 $620 $614 Adj. Cash Taxes1 (46) (78) (45) (55) (75) Nuclear Fuel 143 136 137 135 136 Other Cash Adjustments 9 (22) (15) (12) 5 Capital Expenditures (565) (490) (478) (466) (427) Unlevered Free Cash Flow $0 $312 $191 $195 $221 $254 Unlevered Free Cash Flow Utilized For Valuation 312 191 195 221 0 Unlevered Valuation Analysis (in millions, except per share values) Terminal Values Key Metrics Low Mid High 12/31/2015 12/31/2020 2020 EBITDA $614 $614 $614 Debt $4,459 $2,973 FY+1 EV/EBITDA 6.8x 7.3x 7.8x Cash (1,045) (359) Terminal Enterprise Value $4,174 $4,481 $4,789 Net Debt $3,414 $2,614 Terminal EBITDA NA $614 Shares Outstanding 128.9 128.9 Present Value of Cash Flows Present Value of Terminal Value EV/EBITDA 6.8x 7.3x 7.8x 6.7% $817 $817 $817 6.7% $3,217 $3,454 $3,691 7.0 814 814 814 7.0 3,183 3,418 3,652 7.3 810 810 810 7.3 3,150 3,381 3,613 Enterprise Value Equity Value EV/EBITDA 6.8x 7.3x 7.8x EV/EBITDA 6.8x 7.3x 7.8x 6.7% $4,035 $4,272 $4,508 6.7% $621 $858 $1,094 7.0 3,997 4,231 4,465 7.0 583 817 1,051 7.3 3,960 4,191 4,423 7.3 546 777 1,009 Equity Value per Share Implied EV/2017 EBITDA EV/EBITDA 6.8x 7.3x 7.8x EV/EBITDA 6.8x 7.3x 7.8x 6.7% $4.81 $6.65 $8.49 6.7% 6.2x 6.6x 7.0x 7.0 4.52 6.34 8.16 7.0 6.2 6.5 6.9 7.3 4.23 6.03 7.83 7.3 6.1 6.5 6.8 WACC WACC WACC WACC WACC WACC 5 |
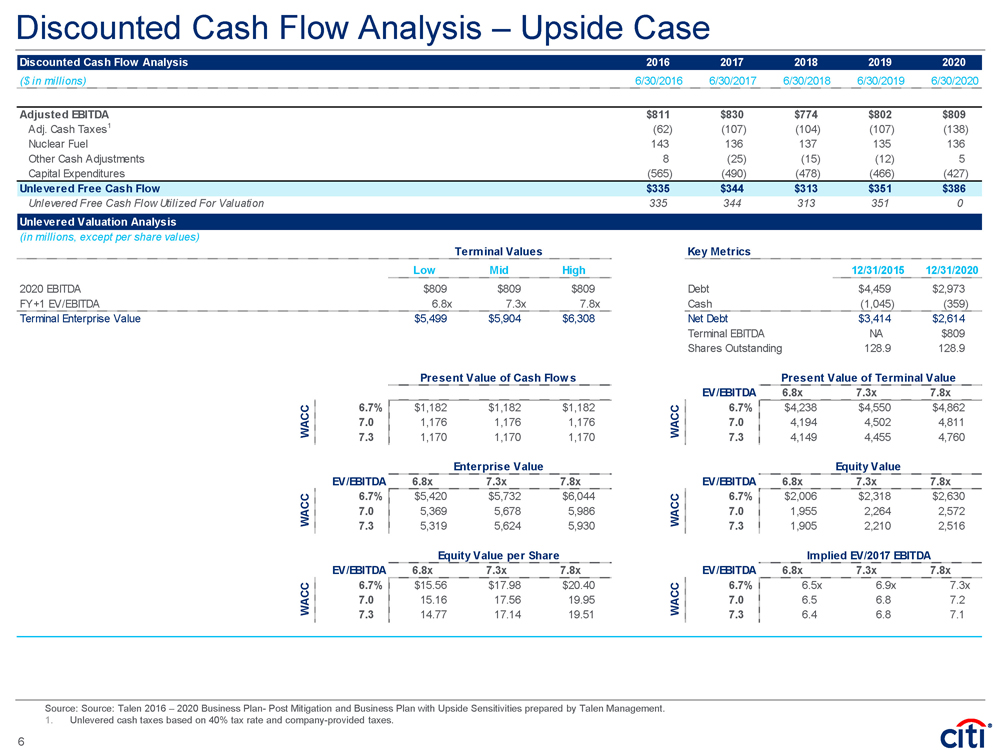
| Discounted Cash Flow Analysis – Upside Case Source: Source: Talen 2016 – 2020 Business Plan- Post Mitigation and Business Plan with Upside Sensitivities prepared by Talen Management. 1. Unlevered cash taxes based on 40% tax rate and company-provided taxes. Discounted Cash Flow Analysis 2016 2017 2018 2019 2020 ($ in millions) 12/31/2015 6/30/2016 6/30/2017 6/30/2018 6/30/2019 6/30/2020 Adjusted EBITDA $811 $830 $774 $802 $809 Adj. Cash Taxes1 (62) (107) (104) (107) (138) Nuclear Fuel 143 136 137 135 136 Other Cash Adjustments 8 (25) (15) (12) 5 Capital Expenditures (565) (490) (478) (466) (427) Unlevered Free Cash Flow $0 $335 $344 $313 $351 $386 Unlevered Free Cash Flow Utilized For Valuation 335 344 313 351 0 Unlevered Valuation Analysis (in millions, except per share values) Terminal Values Key Metrics Low Mid High 12/31/2015 12/31/2020 2020 EBITDA $809 $809 $809 Debt $4,459 $2,973 FY+1 EV/EBITDA 6.8x 7.3x 7.8x Cash (1,045) (359) Terminal Enterprise Value $5,499 $5,904 $6,308 Net Debt $3,414 $2,614 Terminal EBITDA NA $809 Shares Outstanding 128.9 128.9 Present Value of Cash Flows Present Value of Terminal Value EV/EBITDA 6.8x 7.3x 7.8x 6.7% $1,182 $1,182 $1,182 6.7% $4,238 $4,550 $4,862 7.0 1,176 1,176 1,176 7.0 4,194 4,502 4,811 7.3 1,170 1,170 1,170 7.3 4,149 4,455 4,760 Enterprise Value Equity Value EV/EBITDA 6.8x 7.3x 7.8x EV/EBITDA 6.8x 7.3x 7.8x 6.7% $5,420 $5,732 $6,044 6.7% $2,006 $2,318 $2,630 7.0 5,369 5,678 5,986 7.0 1,955 2,264 2,572 7.3 5,319 5,624 5,930 7.3 1,905 2,210 2,516 Equity Value per Share Implied EV/2017 EBITDA EV/EBITDA 6.8x 7.3x 7.8x EV/EBITDA 6.8x 7.3x 7.8x 6.7% $15.56 $17.98 $20.40 6.7% 6.5x 6.9x 7.3x 7.0 15.16 17.56 19.95 7.0 6.5 6.8 7.2 7.3 14.77 17.14 19.51 7.3 6.4 6.8 7.1 WACC WACC WACC WACC WACC WACC 6 |
| IRS Circular 230 Disclosure: Citigroup Inc. and its affiliates do not provide tax or legal advice. Any discussion of tax matters in these materials (i) is not intended or written to be used, and cannot be used or relied upon, by you for the purpose of avoiding any tax penalties and (ii) may have been written in connection with the "promotion or marketing" of any transaction contemplated hereby ("Transaction"). Accordingly, you should seek advice based on your particular circumstances from an independent tax advisor. In any instance where distribution of this communication is subject to the rules of the US Commodity Futures Trading Commission ("CFTC"), this communication constitutes an invitation to consider entering into a derivatives transaction under U.S. CFTC Regulations §§ 1.71 and 23.605, where applicable, but is not a binding offer to buy/sell any financial instrument. Any terms set forth herein are intended for discussion purposes only and are subject to the final terms as set forth in separate definitive written agreements. This presentation is not a commitment to lend, syndicate a financing, underwrite or purchase securities, or commit capital nor does it obligate us to enter into such a commitment, nor are we acting as a fiduciary to you. By accepting this presentation, subject to applicable law or regulation, you agree to keep confidential the information contained herein and the existence of and proposed terms for any Transaction. Prior to entering into any Transaction, you should determine, without reliance upon us or our affiliates, the economic risks and merits (and independently determine that you are able to assume these risks) as well as the legal, tax and accounting characterizations and consequences of any such Transaction. In this regard, by accepting this presentation, you acknowledge that (a) we are not in the business of providing (and you are not relying on us for) legal, tax or accounting advice, (b) there may be legal, tax or accounting risks associated with any Transaction, (c) you should receive (and rely on) separate and qualified legal, tax and accounting advice and (d) you should apprise senior management in your organization as to such legal, tax and accounting advice (and any risks associated with any Transaction) and our disclaimer as to these matters. By acceptance of these materials, you and we hereby agree that from the commencement of discussions with respect to any Transaction, and notwithstanding any other provision in this presentation, we hereby confirm that no participant in any Transaction shall be limited from disclosing the U.S. tax treatment or U.S. tax structure of such Transaction. We are required to obtain, verify and record certain information that identifies each entity that enters into a formal business relationship with us. We will ask for your complete name, street address, and taxpayer ID number. We may also request corporate formation documents, or other forms of identification, to verify information provided. Any prices or levels contained herein are preliminary and indicative only and do not represent bids or offers. These indications are provided solely for your information and consideration, are subject to change at any time without notice and are not intended as a solicitation with respect to the purchase or sale of any instrument. The information contained in this presentation may include results of analyses from a quantitative model which represent potential future events that may or may not be realized, and is not a complete analysis of every material fact representing any product. Any estimates included herein constitute our judgment as of the date hereof and are subject to change without any notice. We and/or our affiliates may make a market in these instruments for our customers and for our own account. Accordingly, we may have a position in any such instrument at any time. Although this material may contain publicly available information about Citi corporate bond research, fixed income strategy or economic and market analysis, Citi policy (i) prohibits employees from offering, directly or indirectly, a favorable or negative research opinion or offering to change an opinion as consideration or inducement for the receipt of business or for compensation; and (ii) prohibits analysts from being compensated for specific recommendations or views contained in research reports. So as to reduce the potential for conflicts of interest, as well as to reduce any appearance of conflicts of interest, Citi has enacted policies and procedures designed to limit communications between its investment banking and research personnel to specifically prescribed circumstances. © 2016 Citigroup Global Markets Inc. Member SIPC. All rights reserved. Citi and Citi and Arc Design are trademarks and service marks of Citigroup Inc. or its affiliates and are used and registered throughout the world. Citi believes that sustainability is good business practice. We work closely with our clients, peer financial institutions, NGOs and other partners to finance solutions to climate change, develop industry standards, reduce our own environmental footprint, and engage with stakeholders to advance shared learning and solutions. Highlights of Citi's unique role in promoting sustainability include: (a) releasing in 2007 a Climate Change Position Statement, the first US financial institution to do so; (b) targeting $50 billion over 10 years to address global climate change: includes significant increases in investment and financing of renewable energy, clean technology, and other carbon-emission reduction activities; (c) committing to an absolute reduction in GHG emissions of all Citi owned and leased properties around the world by 10% by 2011; (d) purchasing more than 234,000 MWh of carbon neutral power for our operations over the last three years; (e) establishing in 2008 the Carbon Principles; a framework for banks and their U.S. power clients to evaluate and address carbon risks in the financing of electric power projects; (f) producing equity research related to climate issues that helps to inform investors on risks and opportunities associated with the issue; and (g) engaging with a broad range of stakeholders on the issue of climate change to help advance understanding and solutions. Citi works with its clients in greenhouse gas intensive industries to evaluate emerging risks from climate change and, where appropriate, to mitigate those risks. efficiency, renewable energy and mitigation |