Exhibit (c)(5)
Project Alpha Discussion Materials for the Special Committee Preliminary | Subject to further review and revision Technology Investment Banking December 7, 2024 | Strictly Private and Confidential
2 PRELIMINARY – SUBJECT TO FURTHER REVIEW AND REVISION Disclaimer The following pages contain material provided to the Special Committee of the Board of Directors of Alpha (the “Company”) by Citigroup Global Markets Inc. (“Citi”) in connection with the proposed transaction involving the Company and Echo. The accompanying material was compiled or prepared on a confidential basis solely for the use of the Special Committee of the Board of Directors of the Company and not with a view toward public disclosure under any securities laws or otherwise. The information contained in the accompanying material was obtained from the Company and other sources. Any estimates and projections contained herein have been prepared or adopted by management of the Company, obtained from public sources, or are based upon such estimates and projections, and involve numerous and significant subjective determinations, and there is no assurance that such estimates and projections will be realized. Citi does not take responsibility for such estimates and projections, or the basis on which they were prepared. No representation or warranty, express or implied, is made as to the accuracy or completeness of such information and nothing contained herein is, or shall be relied upon as, a representation, whether as to the past, the present or the future. In preparing the accompanying material, Citi assumed and relied, without independent verification, upon the accuracy and completeness of all financial and other information and data publicly available or provided to or otherwise reviewed by or discussed with Citi and upon the assurances of the management of the Company, that they are not aware of any relevant information that has been omitted or that remains undisclosed to Citi. The accompanying material was not prepared for use by readers not as familiar with the Company and Echo as the Special Committee of the Board of Directors of the Company and, accordingly, neither the Company nor Citi nor their respective legal or financial advisors or accountants take any responsibility for the accompanying material if used by persons other than the Special Committee of the Board of Directors of the Company. The accompanying material is necessarily based upon information available to Citi, and financial, stock market and other conditions and circumstances existing and disclosed to Citi, as of the date of the accompanying material. Citi does not have any obligation to update or otherwise revise the accompanying material. Nothing contained herein shall be construed as legal, tax or accounting advice.
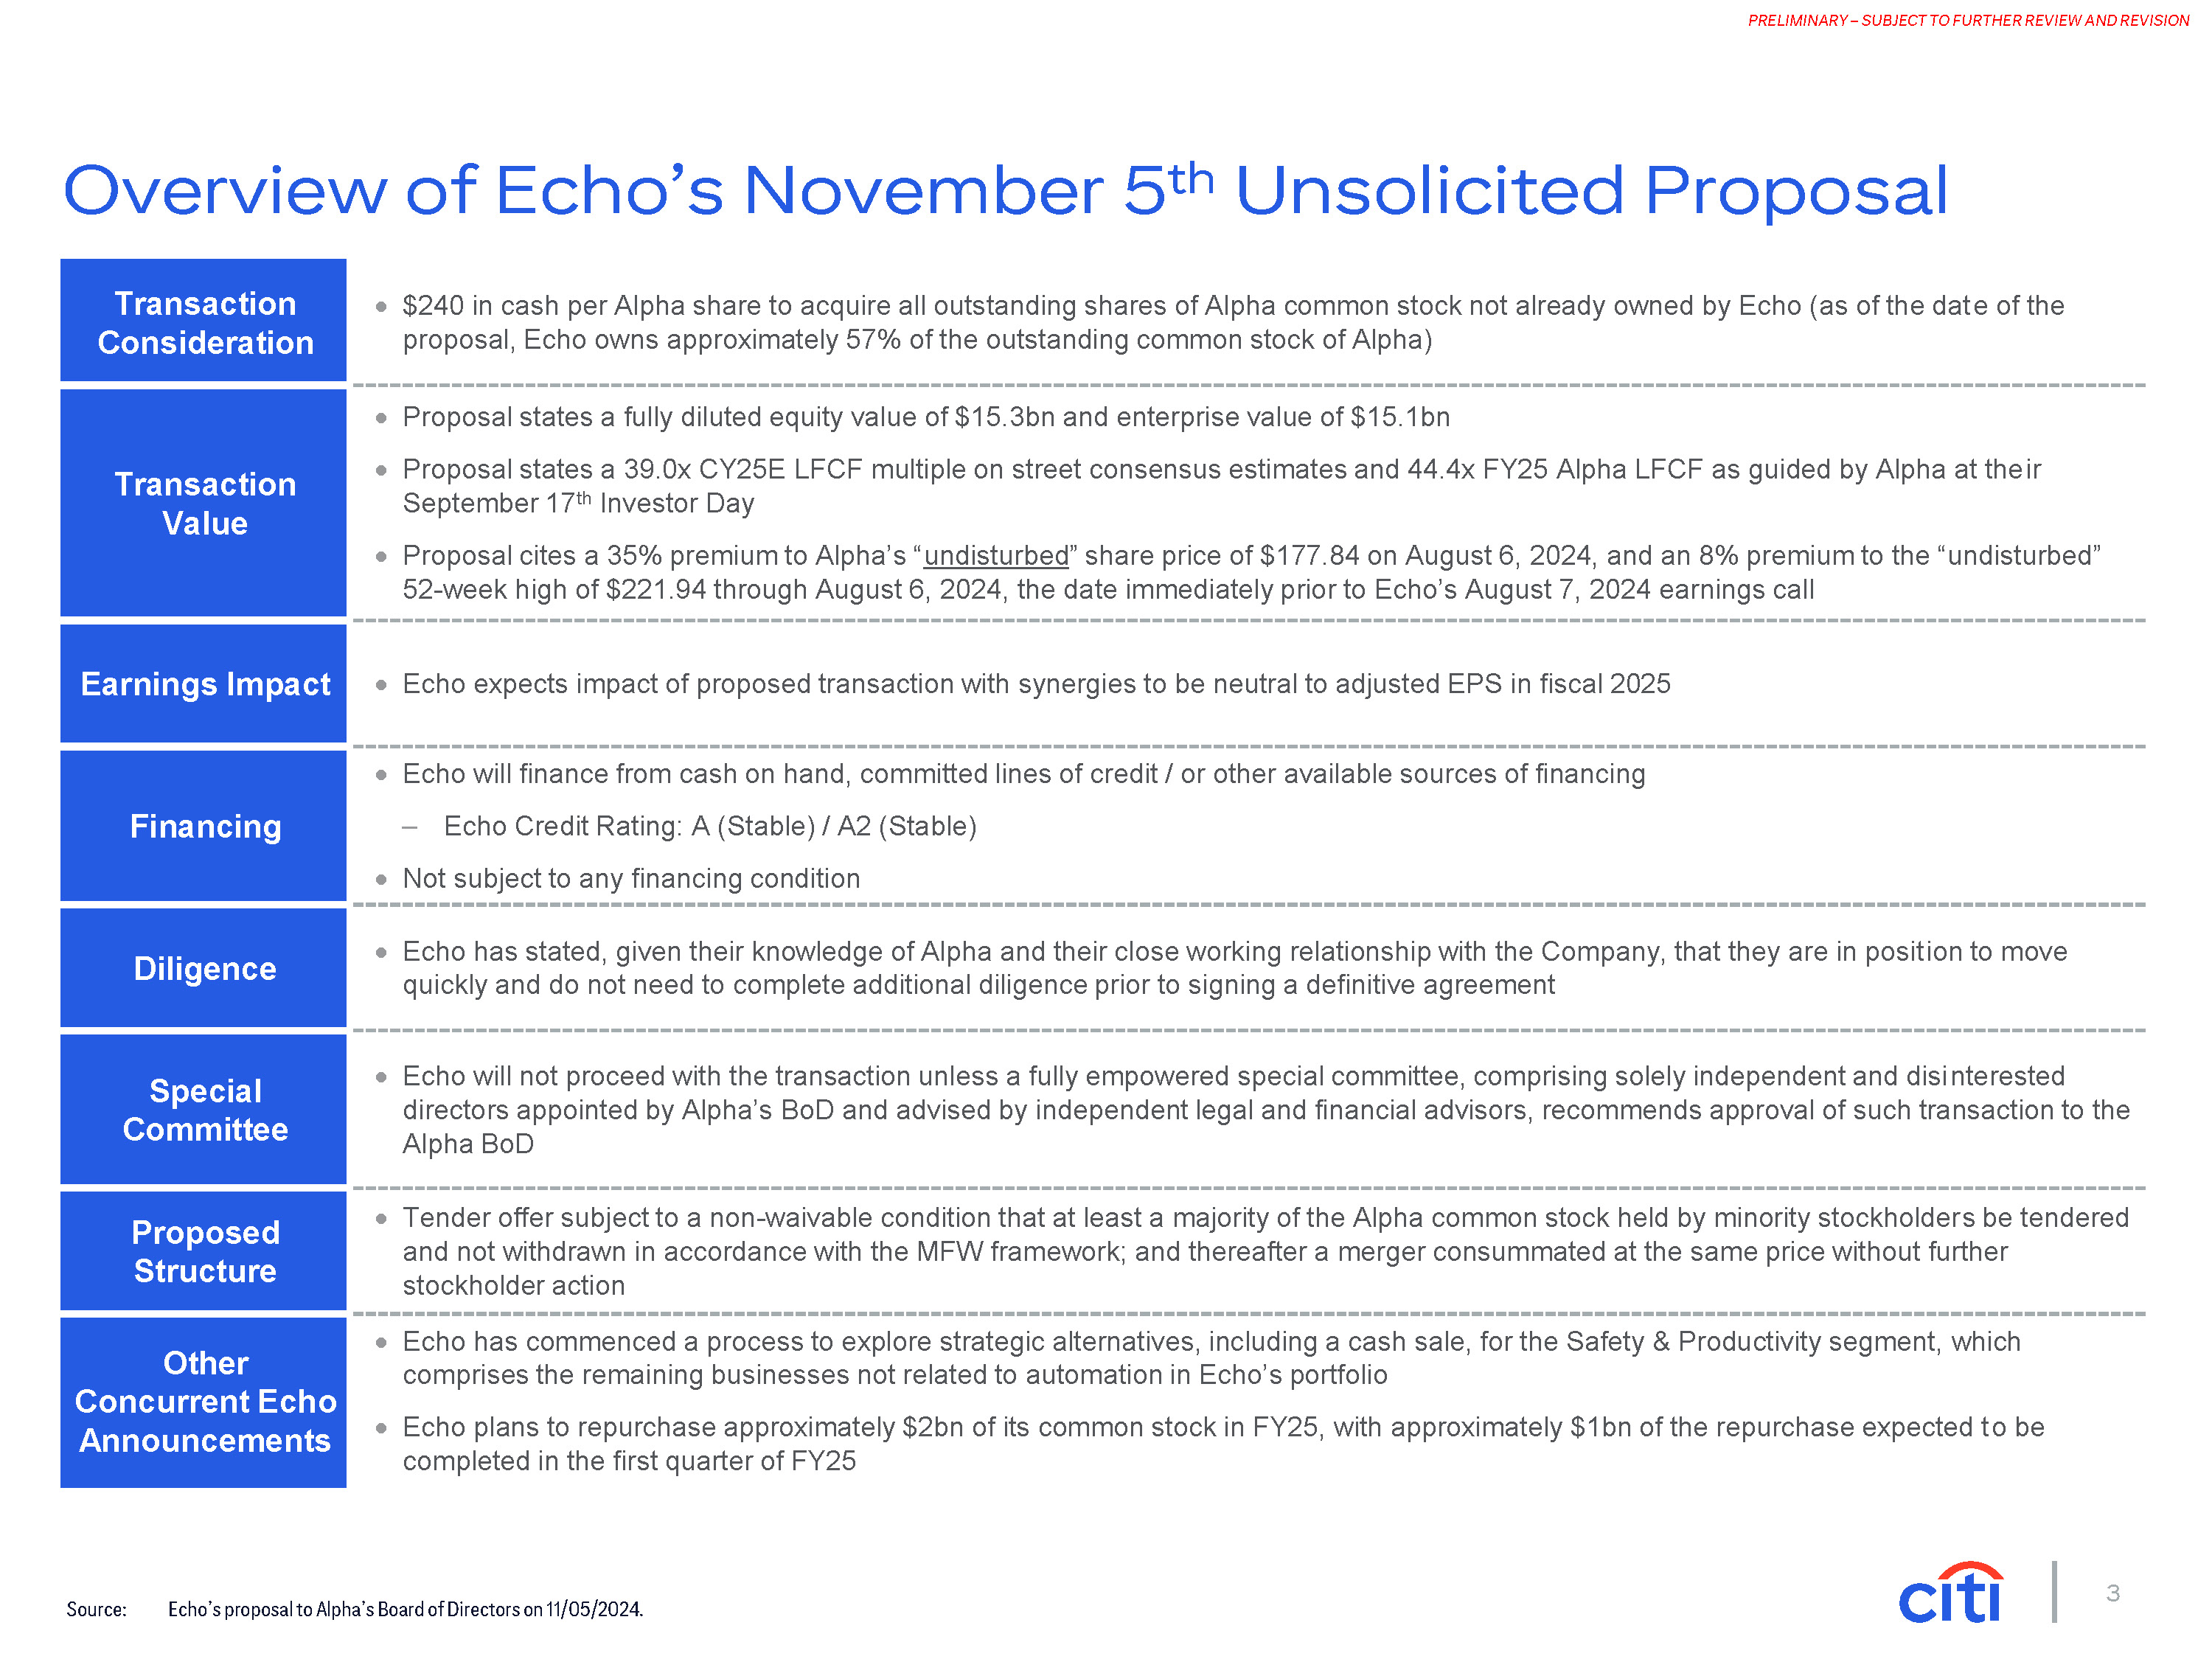
3 PRELIMINARY – SUBJECT TO FURTHER REVIEW AND REVISION Source: Echo’s proposal to Alpha’s Board of Directors on 11/05/2024. Overview of Echo’s November 5th Unsolicited Proposal Transaction Consideration $240 in cash per Alpha share to acquire all outstanding shares of Alpha common stock not already owned by Echo (as of the date of the proposal, Echo owns approximately 57% of the outstanding common stock of Alpha) Transaction Value Proposal states a fully diluted equity value of $15.3bn and enterprise value of $15.1bn Proposal states a 39.0x CY25E LFCF multiple on street consensus estimates and 44.4x FY25 Alpha LFCF as guided by Alpha at their September 17th Investor Day Proposal cites a 35% premium to Alpha’s “undisturbed” share price of $177.84 on August 6, 2024, and an 8% premium to the “undisturbed” 52-week high of $221.94 through August 6, 2024, the date immediately prior to Echo’s August 7, 2024 earnings call Earnings Impact Echo expects impact of proposed transaction with synergies to be neutral to adjusted EPS in fiscal 2025 Financing Echo will finance from cash on hand, committed lines of credit / or other available sources of financing ‒ Echo Credit Rating: A (Stable) / A2 (Stable) Not subject to any financing condition Diligence Echo has stated, given their knowledge of Alpha and their close working relationship with the Company, that they are in position to move quickly and do not need to complete additional diligence prior to signing a definitive agreement Special Committee Echo will not proceed with the transaction unless a fully empowered special committee, comprising solely independent and disinterested directors appointed by Alpha’s BoD and advised by independent legal and financial advisors, recommends approval of such transaction to the Alpha BoD Proposed Structure Tender offer subject to a non-waivable condition that at least a majority of the Alpha common stock held by minority stockholders be tendered and not withdrawn in accordance with the MFW framework; and thereafter a merger consummated at the same price without further stockholder action Other Concurrent Echo Announcements Echo has commenced a process to explore strategic alternatives, including a cash sale, for the Safety & Productivity segment, which comprises the remaining businesses not related to automation in Echo’s portfolio Echo plans to repurchase approximately $2bn of its common stock in FY25, with approximately $1bn of the repurchase expected to be completed in the first quarter of FY25

1. Preliminary Market Perspectives
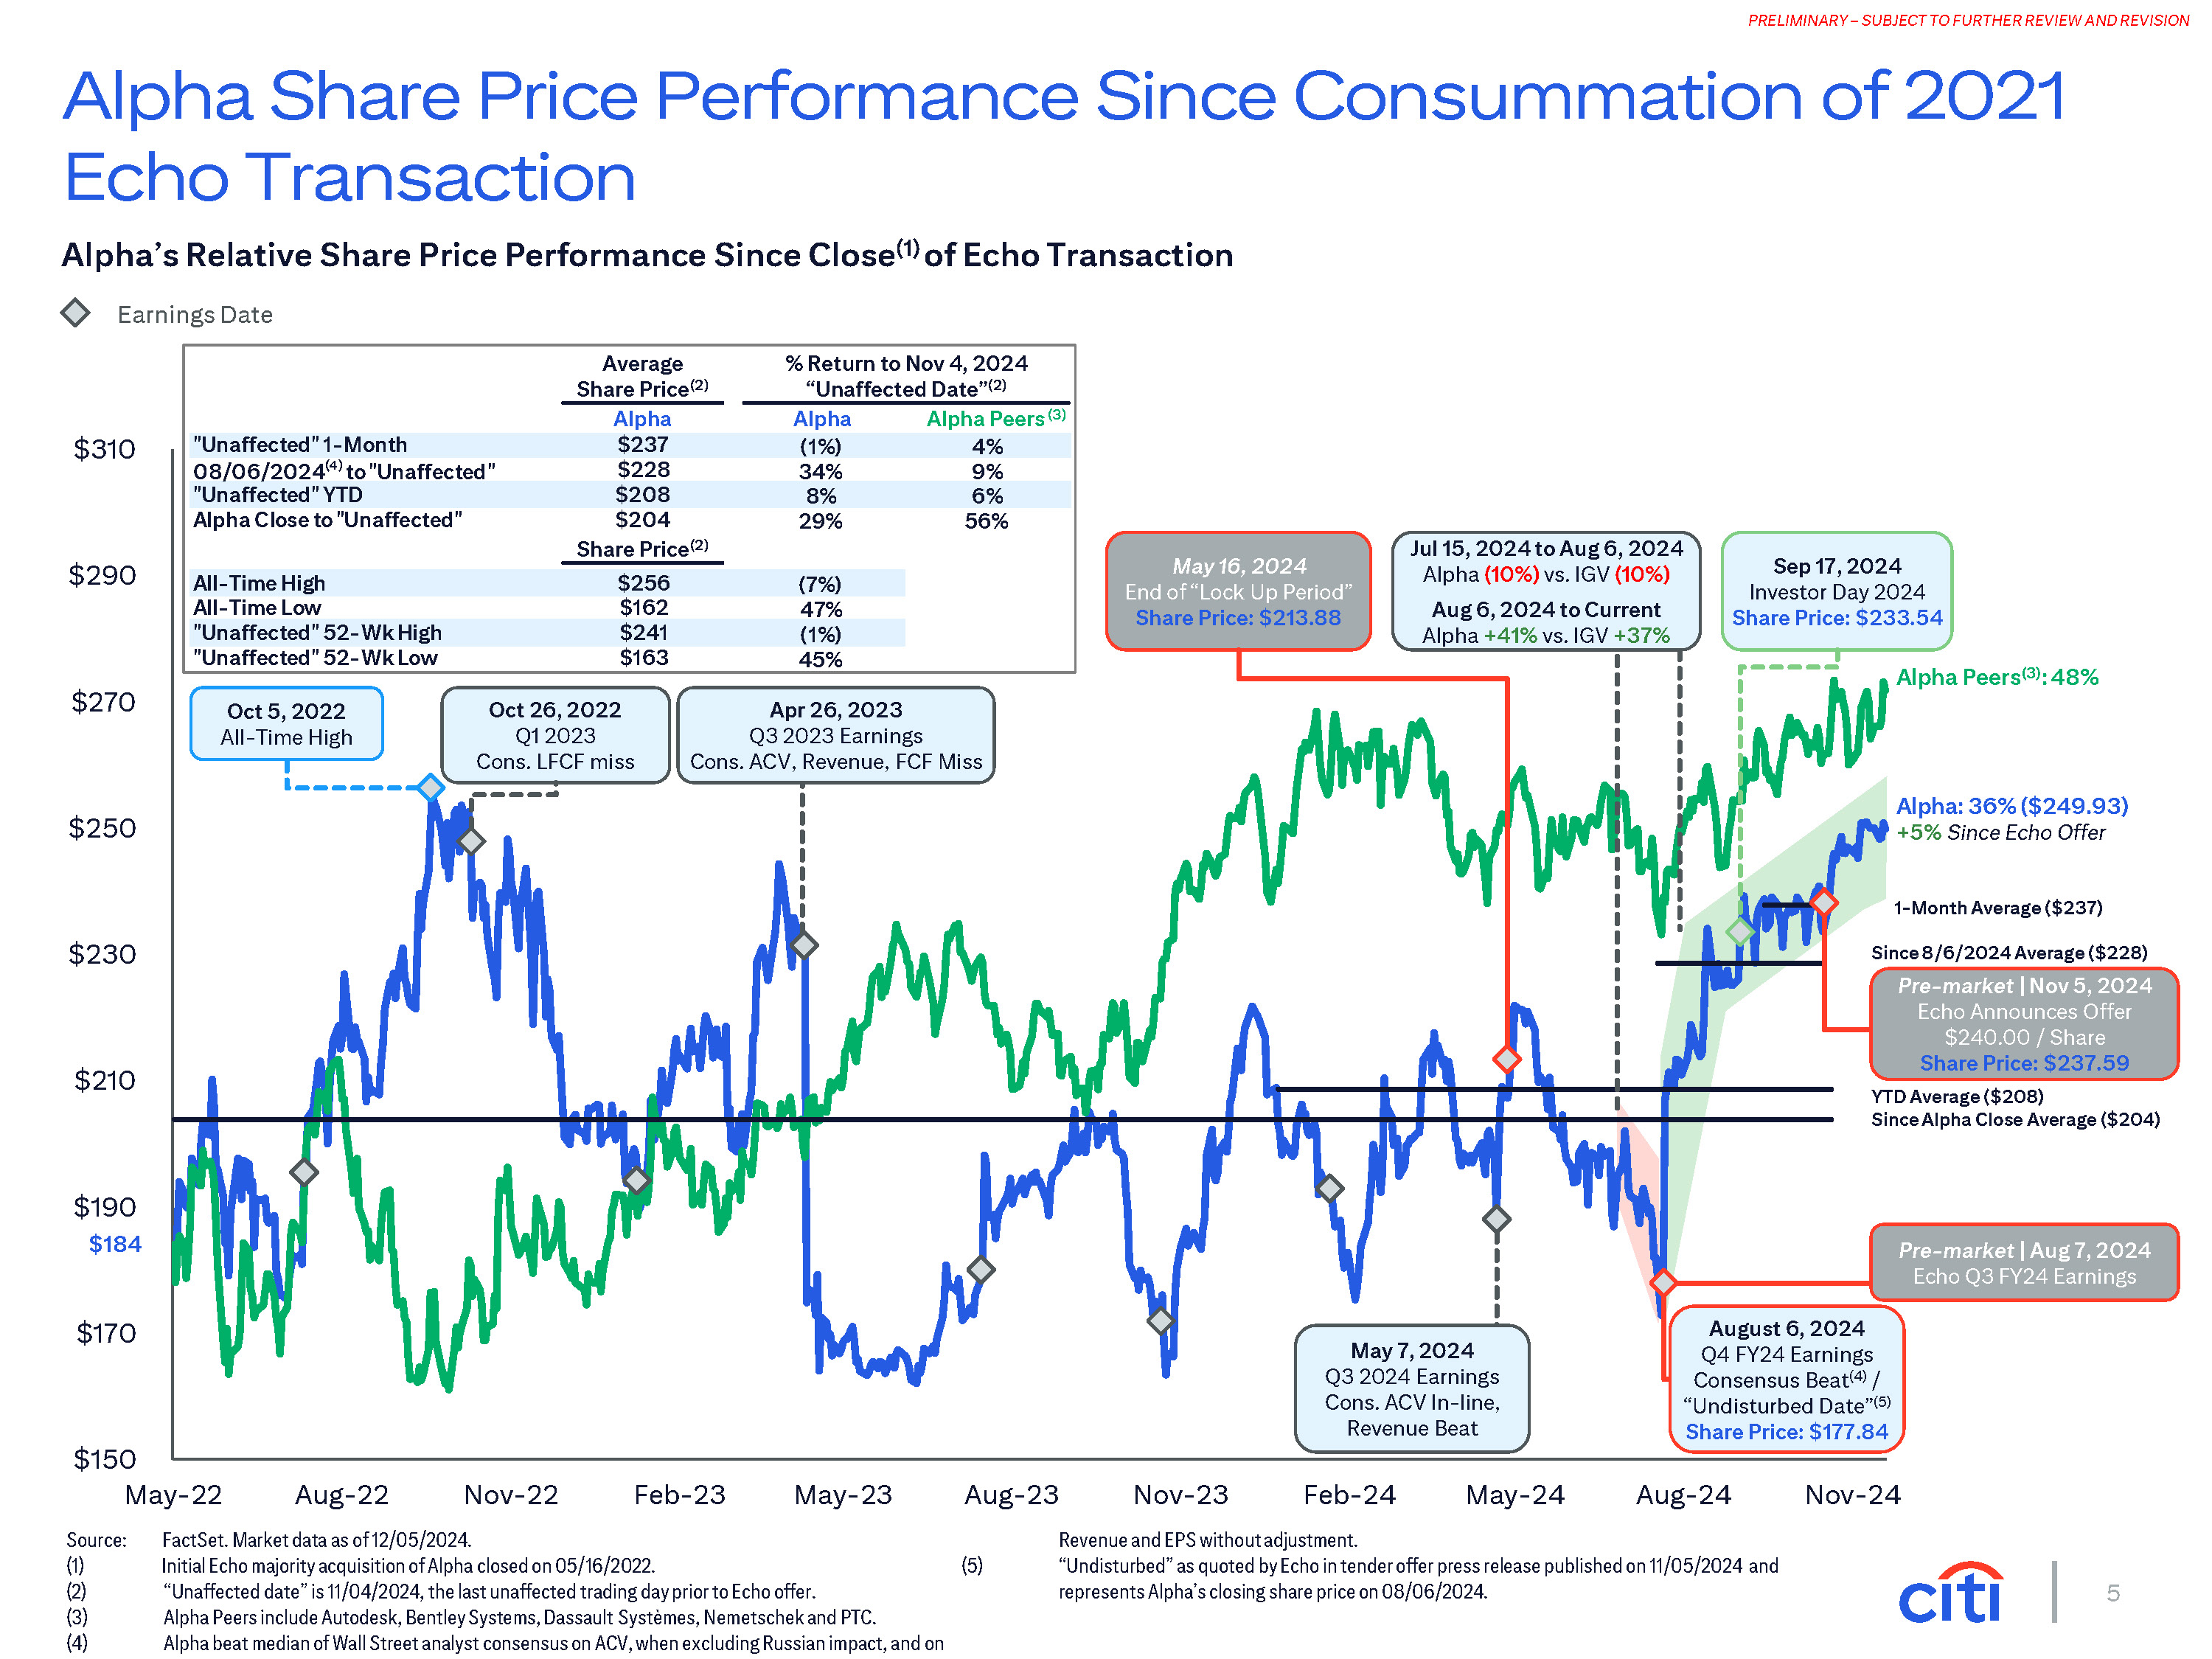
5 PRELIMINARY – SUBJECT TO FURTHER REVIEW AND REVISION $150 $170 $190 $184 $210 $230 $290 $310 May-22 Aug-22 Nov-22 Feb-23 May-23 Aug-24 Nov-24 Alpha Share Price Performance Since Consummation of 2021 Echo Transaction Source: FactSet. Market data as of 12/05/2024. Initial Echo majority acquisition of Alpha closed on 05/16/2022. “Unaffected date” is 11/04/2024, the last unaffected trading day prior to Echo offer. Alpha Peers include Autodesk, Bentley Systems, Dassault Systèmes, Nemetschek and PTC. Alpha beat median of Wall Street analyst consensus on ACV, when excluding Russian impact, and on Revenue and EPS without adjustment. “Undisturbed” as quoted by Echo in tender offer press release published on 11/05/2024 and represents Alpha’s closing share price on 08/06/2024. (5) Alpha Peers(3): 48% May 16, 2024 End of “Lock Up Period” Share Price: $213.88 Sep 17, 2024 Investor Day 2024 Share Price: $233.54 Alpha: 36% ($249.93) +5% Since Echo Offer 1-Month Average ($237) Alpha’s Relative Share Price Performance Since Close(1) of Echo Transaction Earnings Date Average % Return to Nov 4, 2024 Share Price(2) “Unaffected Date”(2) Alpha Alpha Alpha Peers(3) "Unaffected" 1-Month $237 (1%) 4% 08/06/2024(4) to "Unaffected" $228 34% 9% "Unaffected" YTD $208 8% 6% Alpha Close to "Unaffected" $204 Share Price(2) 29% 56% All-Time High $256 (7%) All-Time Low $162 47% "Unaffected" 52-Wk High $241 (1%) "Unaffected" 52-Wk Low $163 45% Pre-market | Aug 7, 2024 Echo Q3 FY24 Earnings Since 8/6/2024 Average ($228) Pre-market | Nov 5, 2024 Echo Announces Offer $240.00 / Share Share Price: $237.59 YTD Average ($208) Since Alpha Close Average ($204) August 6, 2024 Q4 FY24 Earnings Consensus Beat(4) / “Undisturbed Date”(5) Share Price: $177.84 Jul 15, 2024 to Aug 6, 2024 Alpha (10%) vs. IGV (10%) Aug 6, 2024 to Current Alpha +41% vs. IGV +37% $270 Oct 5, 2022 All-Time High Oct 26, 2022 Q1 2023 Cons. LFCF miss Apr 26, 2023 Q3 2023 Earnings Cons. ACV, Revenue, FCF Miss $250 May 7, 2024 Q3 2024 Earnings Cons. ACV In-line, Revenue Beat Aug-23 Nov-23 Feb-24 May-24

6 PRELIMINARY – SUBJECT TO FURTHER REVIEW AND REVISION 15.0 20.0 25.0 30.0 35.0 40.0 45.0 50.0 55.0 60.0 70.0x Jan-18 Jun-18 Dec-18 Jun-19 Dec-19 Jun-20 Dec-20 May-23 Nov-23 May-24 Nov-24 2018 2019 Alpha 28.3x 31.1x 33.2x 2023 2024YTD 11/4/2024 34.9x 40.0x 65.0 Autodesk 41.0x 24.6x 32.6x Bentley - 40.8x 33.1x 32.9x 39.4x 36.0x Dassault 37.5x 36.2x 29.8x Nemetschek 41.5x 45.7x - 43.6x 55.7x 32.1x 35.0x 43.7x 32.8x 54.6x 55.9x 38.0x 37.1x PTC 37.2x 27.7x 29.9x 36.6x 26.1x 24.5x Altair 62.9x 63.0x 69.2x 72.3x 46.2x Ansys 31.0x 34.1x 37.2x 33.4x 37.5x 51.8x 58.6x 38.5x 41.1x 41.9x - Aveva Technical SW Average 40.7x 38.4x 44.5x 46.7x Source: FactSet. Market data as of 11/04/2024, Alpha’s unaffected date prior to Echo’s acquisition proposal. (1) Technical Software includes Altair, Ansys, Autodesk, AVEVA, Bentley Systems, Dassault Systèmes, Nemetschek, and PTC. Altair included until 10/21/2024 which is the unaffected date prior to rumors of (2) acquisition by Siemens. Ansys included until 12/21/2023 which is the unaffected date prior to rumors of (3) acquisition by Synopsys. AVEVA included until 08/23/2022 which is the unaffected date prior to announcement of acquisition by Schneider Electric. Multiples greater than 100.0x deemed not meaningful, “NM”. Averages do not include acquired companies after their unaffected dates disclosed in footnote 1. Alpha and Technical Software LFCF Multiples Over Time Alpha 40.0x Technical SW(1) 33.0x Equity Value / NTM LFCF Since January 2018 to “Unaffected” Date (Research Consensus Estimates) Average Alpha NTM LFCF Multiple Prior to Initial Echo Acquisition 30.1x Oct 11, 2021 to May 16, 2022 Initial Echo Acquisition Announcement to Close Jun-21 Dec-21 Jun-22 Nov-22 Average Technical SW NTM LFCF Multiple Since Close of Initial Echo Acquisition 35.7x Average Alpha NTM LFCF Multiple Since Close of Initial Echo Acquisition 35.1x Average Multiple(1) 2020 2021 2022 28.7x 33.2x 36.2x 31.2x 34.8x 24.3x Average Technical SW NTM LFCF Multiple Prior to Initial Echo Acquisition 42.1x NM(2) “Unaffected” 32.0x(3) 26.2x 35.3x(3) 31.3x 27.1x 41.6x 43.2x 26.7x 26.0x 51.7x - - - - - 37.1x(3) 33.0x Technical SW index declined by ~4x upon the exclusion of Altair starting Oct 21, 2024. Including Altair’s unaffected multiple would increase the Technical SW average of 33.0x on Nov 4, 2024 to 36.7x.

2. Preliminary Perspectives on Value
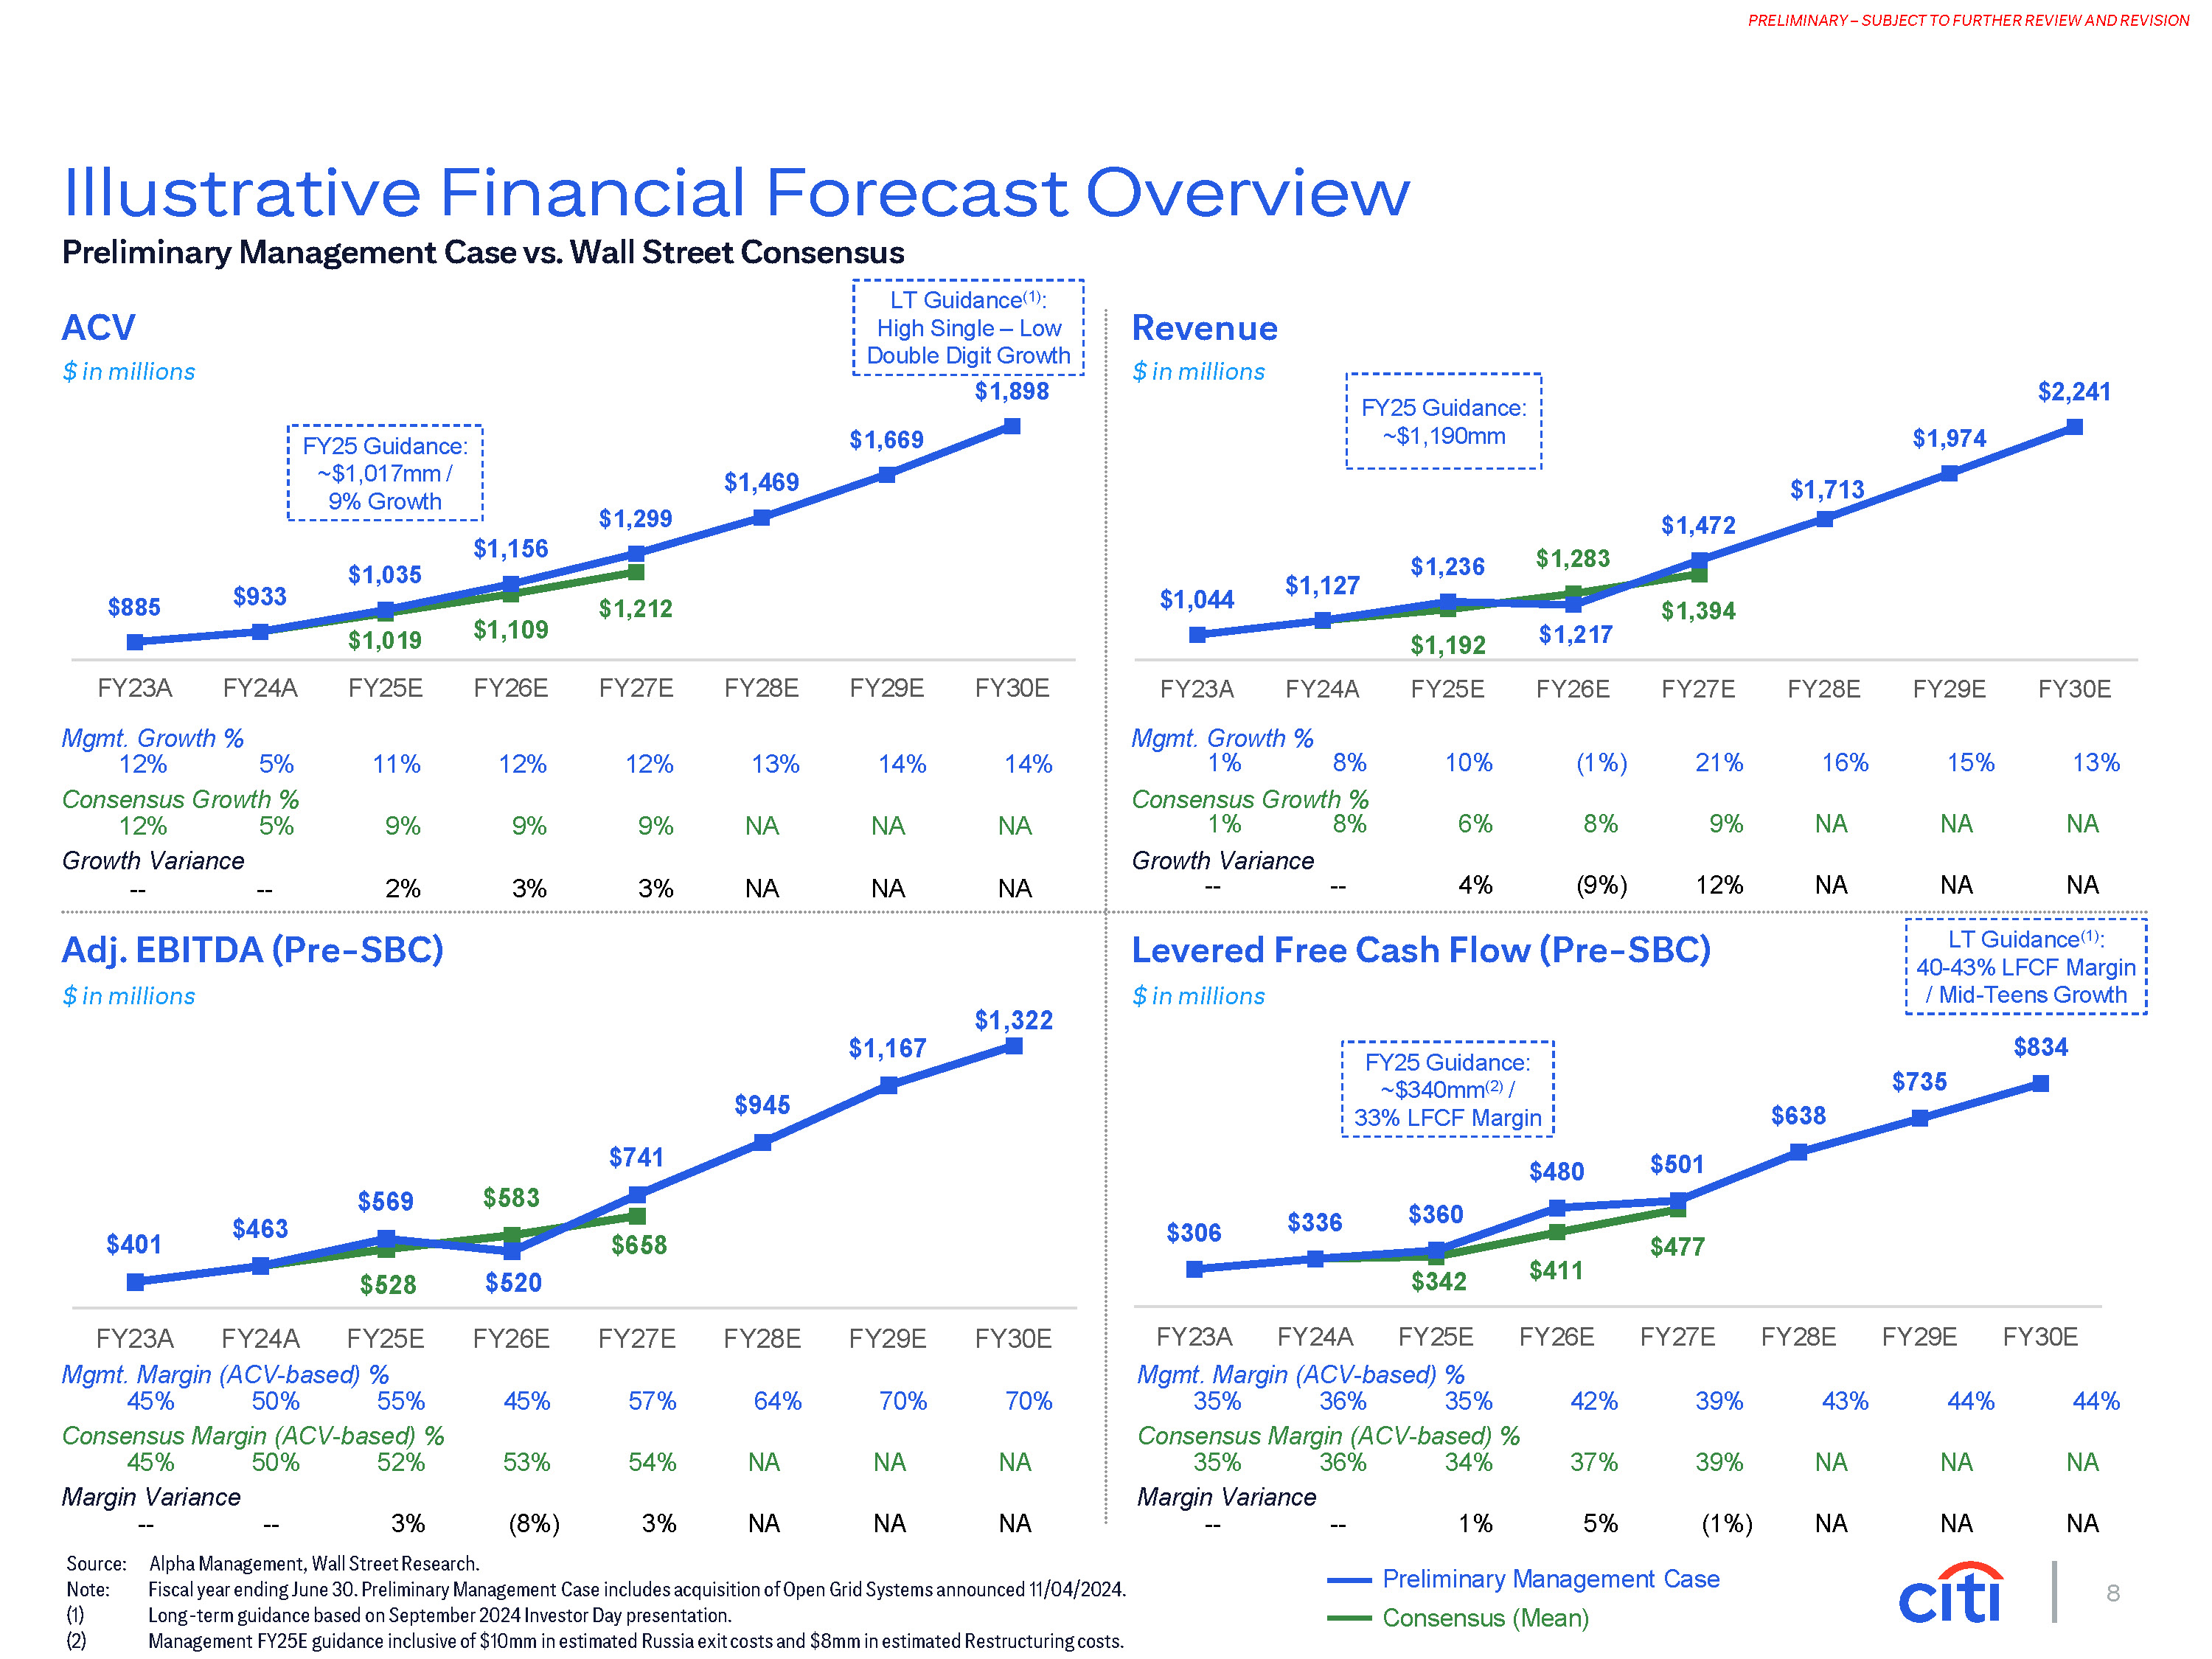
8 PRELIMINARY – SUBJECT TO FURTHER REVIEW AND REVISION Illustrative Financial Forecast Overview Preliminary Management Case vs. Wall Street Consensus ACV $ in millions Revenue $ in millions Adj. EBITDA (Pre-SBC) $ in millions Preliminary Management Case Consensus (Mean) $885 $933 $1,019 $1,109 $1,212 $1,035 $1,156 $1,299 $1,469 $1,669 $1,898 FY25E FY26E FY27E FY28E FY29E FY30E $1,044 $1,127 $1,192 $1,283 $1,394 $1,236 $1,217 $1,472 $1,713 $1,974 $2,241 FY25E FY26E FY27E FY28E FY29E FY30E $401 $463 $528 $583 $658 $569 $520 $741 $945 $1,167 $1,322 FY23A FY24A Mgmt. Growth % 12% 5% Consensus Growth % 12% Growth Variance -- -- 4% (9%) 12% Levered Free Cash Flow (Pre-SBC) $ in millions FY23A FY24A FY25E FY26E FY27E FY28E FY29E FY30E $306 $336 $477 $360 $480 $501 $638 $735 $342 $411 FY23A FY24A FY25E FY26E $834 FY27E FY28E FY29E FY30E 11% 12% 12% 13% 14% 14% 5% 9% 9% 9% NA NA NA 1% -- 2% 3% 3% NA NA NA Growth Variance -- FY23A FY24A Mgmt. Growth % 1% 8% Consensus Growth % 8% 10% (1%) 21% 16% 15% 13% 6% 8% 9% NA NA NA NA Mgmt. Margin (ACV-based) % 45% 50% 55% Consensus Margin (ACV-based) % 45% 50% 52% Margin Variance -- -- 3% Source: Alpha Management, Wall Street Research. 45% 57% 64% 70% 70% 53% 54% NA NA NA (8%) 3% NA NA NA Mgmt. Margin (ACV-based) % 35% 36% 35% Consensus Margin (ACV-based) % 35% 36% 34% Margin Variance -- -- 1% 42% 39% 43% 44% 44% 37% 39% NA NA NA 5% (1%) NA NA NA Note: Fiscal year ending June 30. Preliminary Management Case includes acquisition of Open Grid Systems announced 11/04/2024. Long-term guidance based on September 2024 Investor Day presentation. Management FY25E guidance inclusive of $10mm in estimated Russia exit costs and $8mm in estimated Restructuring costs. FY25 Guidance: ~$1,017mm / 9% Growth FY25 Guidance: ~$1,190mm LT Guidance(1): High Single – Low Double Digit Growth NA NA LT Guidance(1): 40-43% LFCF Margin / Mid-Teens Growth FY25 Guidance: ~$340mm(2) / 33% LFCF Margin
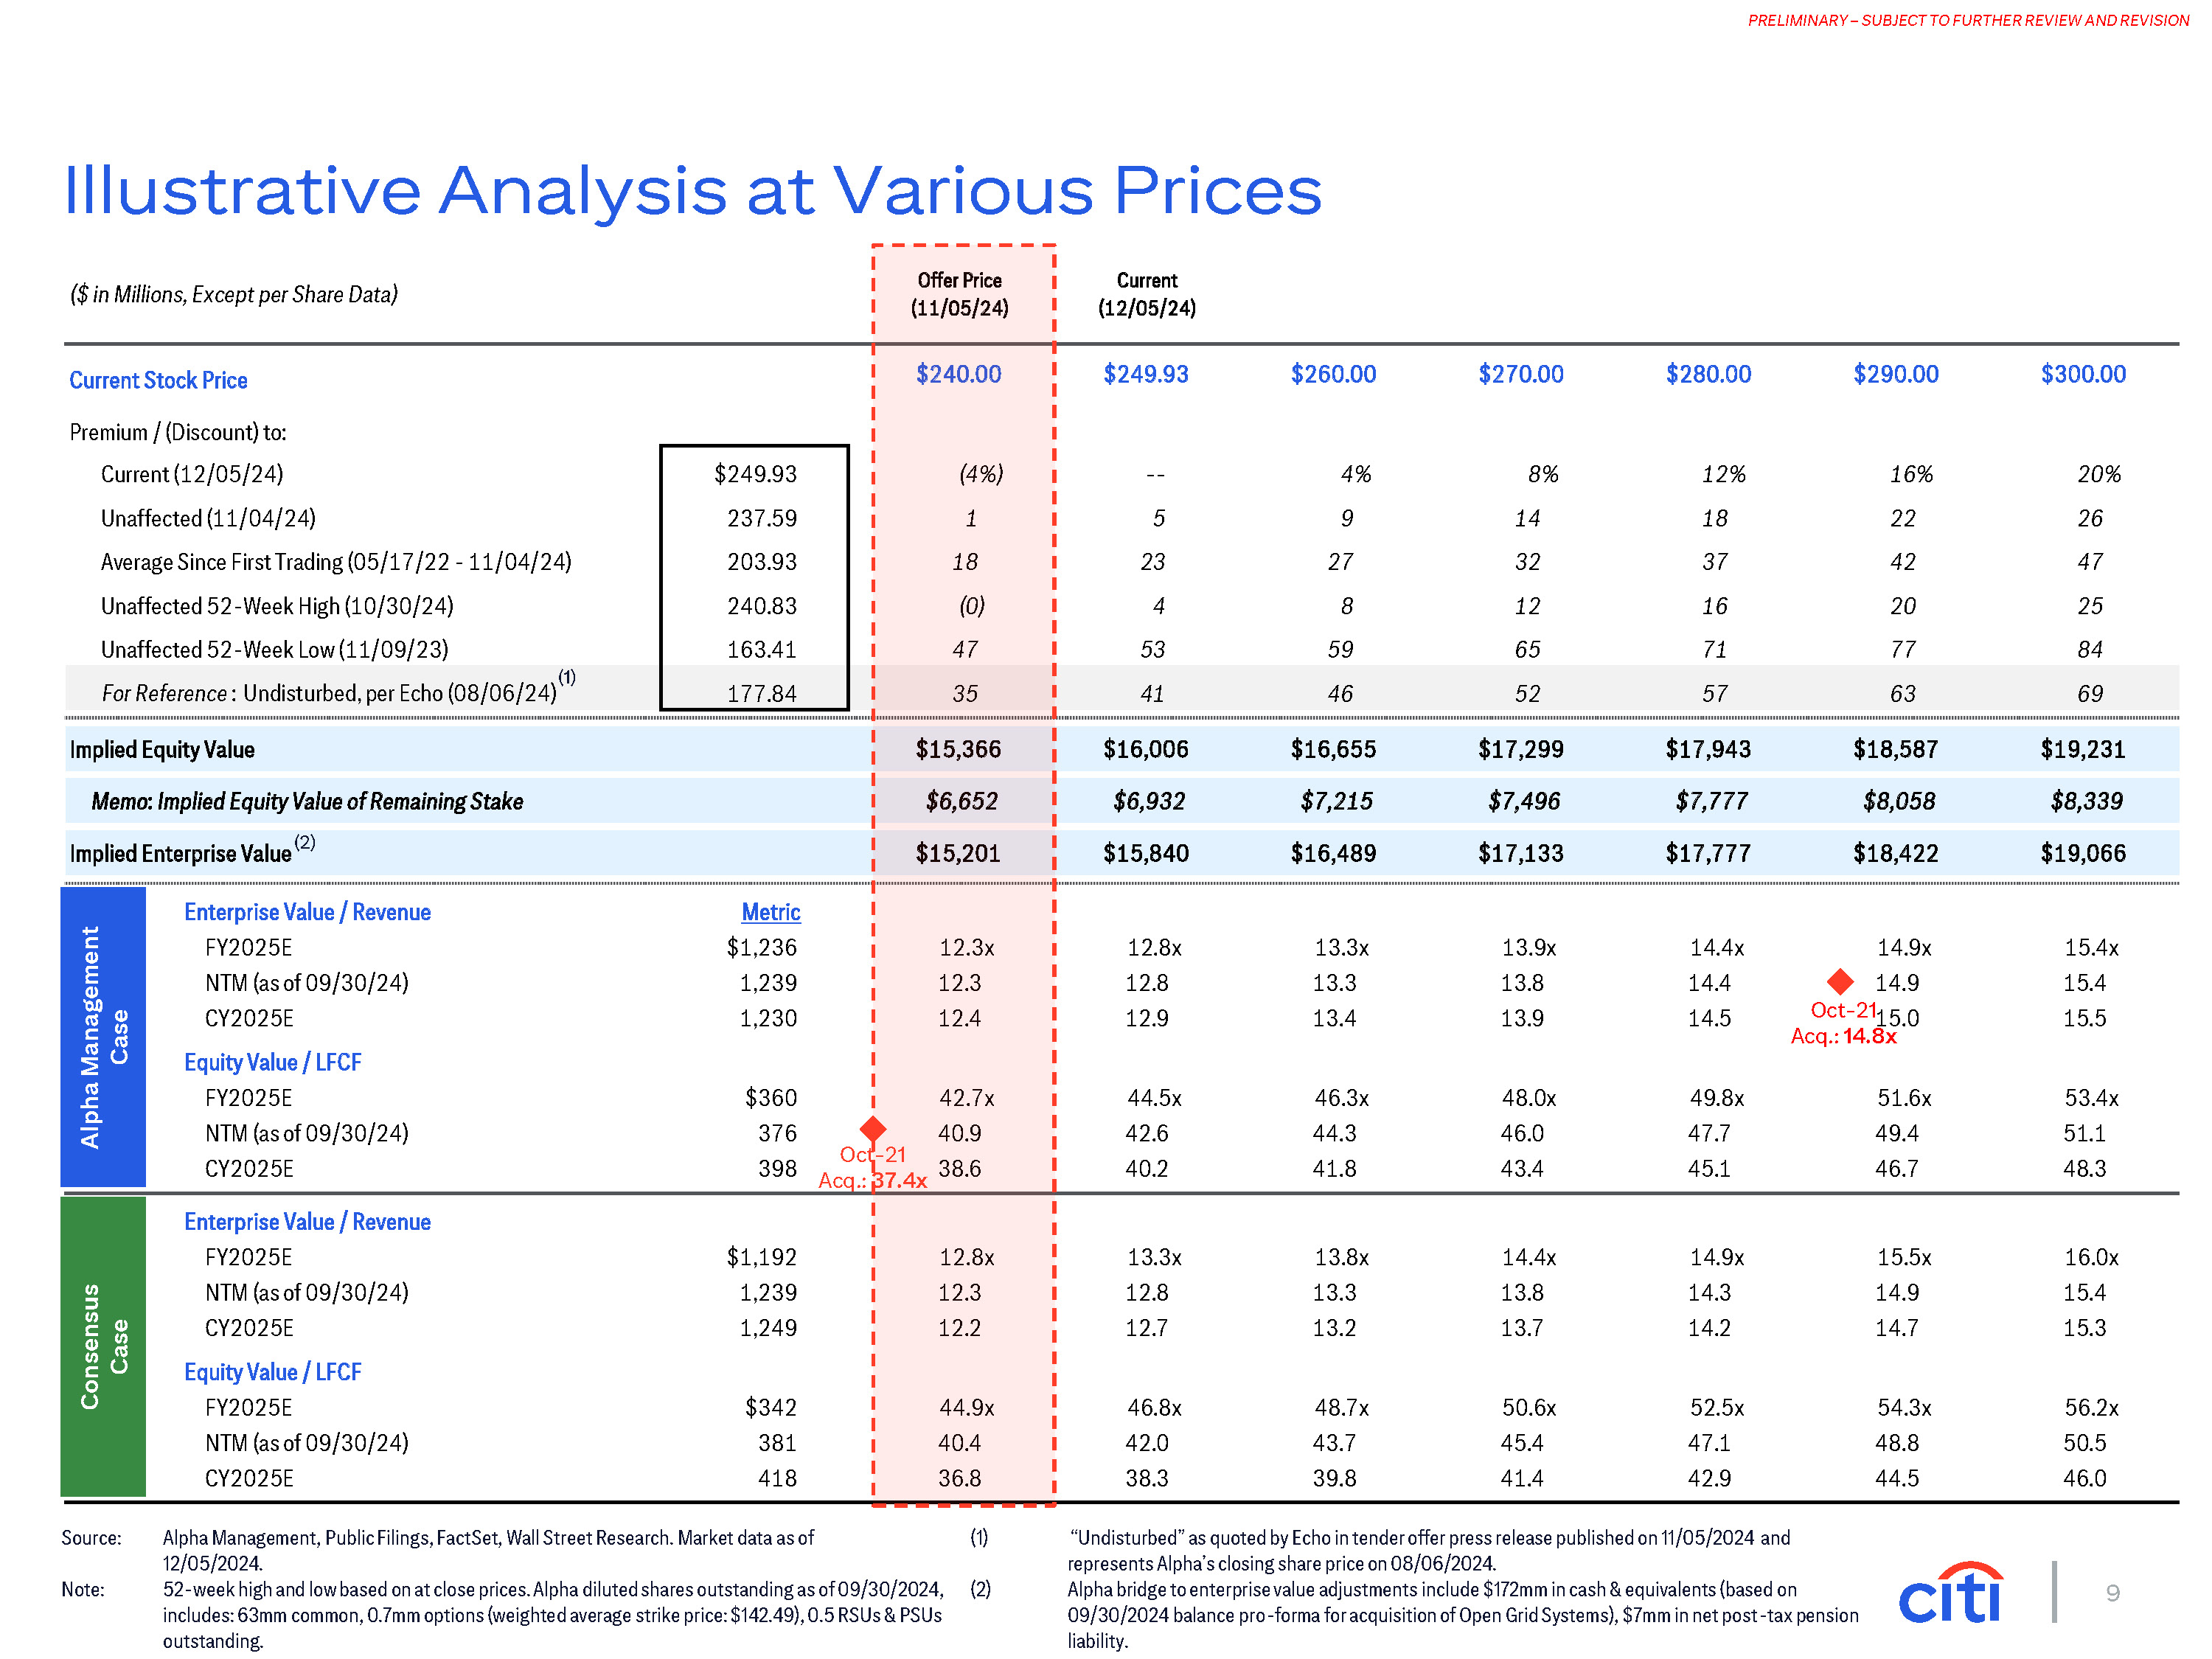
9 PRELIMINARY – SUBJECT TO FURTHER REVIEW AND REVISION ($ in Millions, Except per Share Data) Offer Price Current Current Stock Price Premium / (Discount) to: (11/05/24) (12/05/24) $240.00 $249.93 $260.00 $270.00 $280.00 $290.00 $300.00 $249.93 (4%) -- 4% 8% 12% 16% 20% Current (12/05/24) Unaffected (11/04/24) Average Since First Trading (05/17/22 - 11/04/24) Unaffected 52-Week High (10/30/24) Unaffected 52-Week Low (11/09/23) 237.59 203.93 240.83 163.41 1 18 (0) 47 5 23 4 53 9 27 8 59 14 32 12 65 18 37 16 71 22 42 20 77 26 47 25 84 177.84 35 41 46 52 57 63 69 Implied Equity Value $15,366 $16,006 $16,655 $17,299 $17,943 $18,587 $19,231 Memo: Implied Equity Value of Remaining Stake $6,652 $6,932 $7,215 $7,496 $7,777 $8,058 $8,339 $15,201 $15,840 $16,489 $17,133 $17,777 $18,422 $19,066 14.9x 14.9 Metric $1,236 1,239 1,230 12.3x 12.3 12.4 12.8x 12.8 12.9 13.3x 13.3 13.4 13.9x 13.8 13.9 14.4x 14.4 14.5 15.4x 15.4 15.5 Enterprise Value / Revenue FY2025E NTM (as of 09/30/24) CY2025E Equity Value / LFCF FY2025E NTM (as of 09/30/24) CY2025E $360 376 398 42.7x 40.9 38.6 44.5x 42.6 40.2 46.3x 44.3 41.8 48.0x 46.0 43.4 49.8x 47.7 45.1 51.6x 49.4 46.7 53.4x 51.1 48.3 $1,192 1,239 1,249 12.8x 12.3 12.2 13.3x 12.8 12.7 13.8x 13.3 13.2 14.4x 13.8 13.7 14.9x 14.3 14.2 15.5x 14.9 14.7 16.0x 15.4 15.3 Enterprise Value / Revenue FY2025E NTM (as of 09/30/24) CY2025E Equity Value / LFCF FY2025E NTM (as of 09/30/24) CY2025E $342 381 418 44.9x 40.4 36.8 46.8x 42.0 38.3 48.7x 43.7 39.8 50.6x 45.4 41.4 52.5x 47.1 42.9 54.3x 48.8 44.5 56.2x 50.5 46.0 For Reference : Undisturbed, per Echo (08/06/24)(1) Implied Enterprise Value(2) Source: Note: (1) Alpha Management, Public Filings, FactSet, Wall Street Research. Market data as of 12/05/2024. 52-week high and low based on at close prices. Alpha diluted shares outstanding as of 09/30/2024, (2) includes: 63mm common, 0.7mm options (weighted average strike price: $142.49), 0.5 RSUs & PSUs outstanding. “Undisturbed” as quoted by Echo in tender offer press release published on 11/05/2024 and represents Alpha’s closing share price on 08/06/2024. Alpha bridge to enterprise value adjustments include $172mm in cash & equivalents (based on 09/30/2024 balance pro-forma for acquisition of Open Grid Systems), $7mm in net post-tax pension liability. Illustrative Analysis at Various Prices Alpha Management Case Consensus Case Oct-2115.0 Acq.: 14.8x Oct-21 Acq.: 37.4x
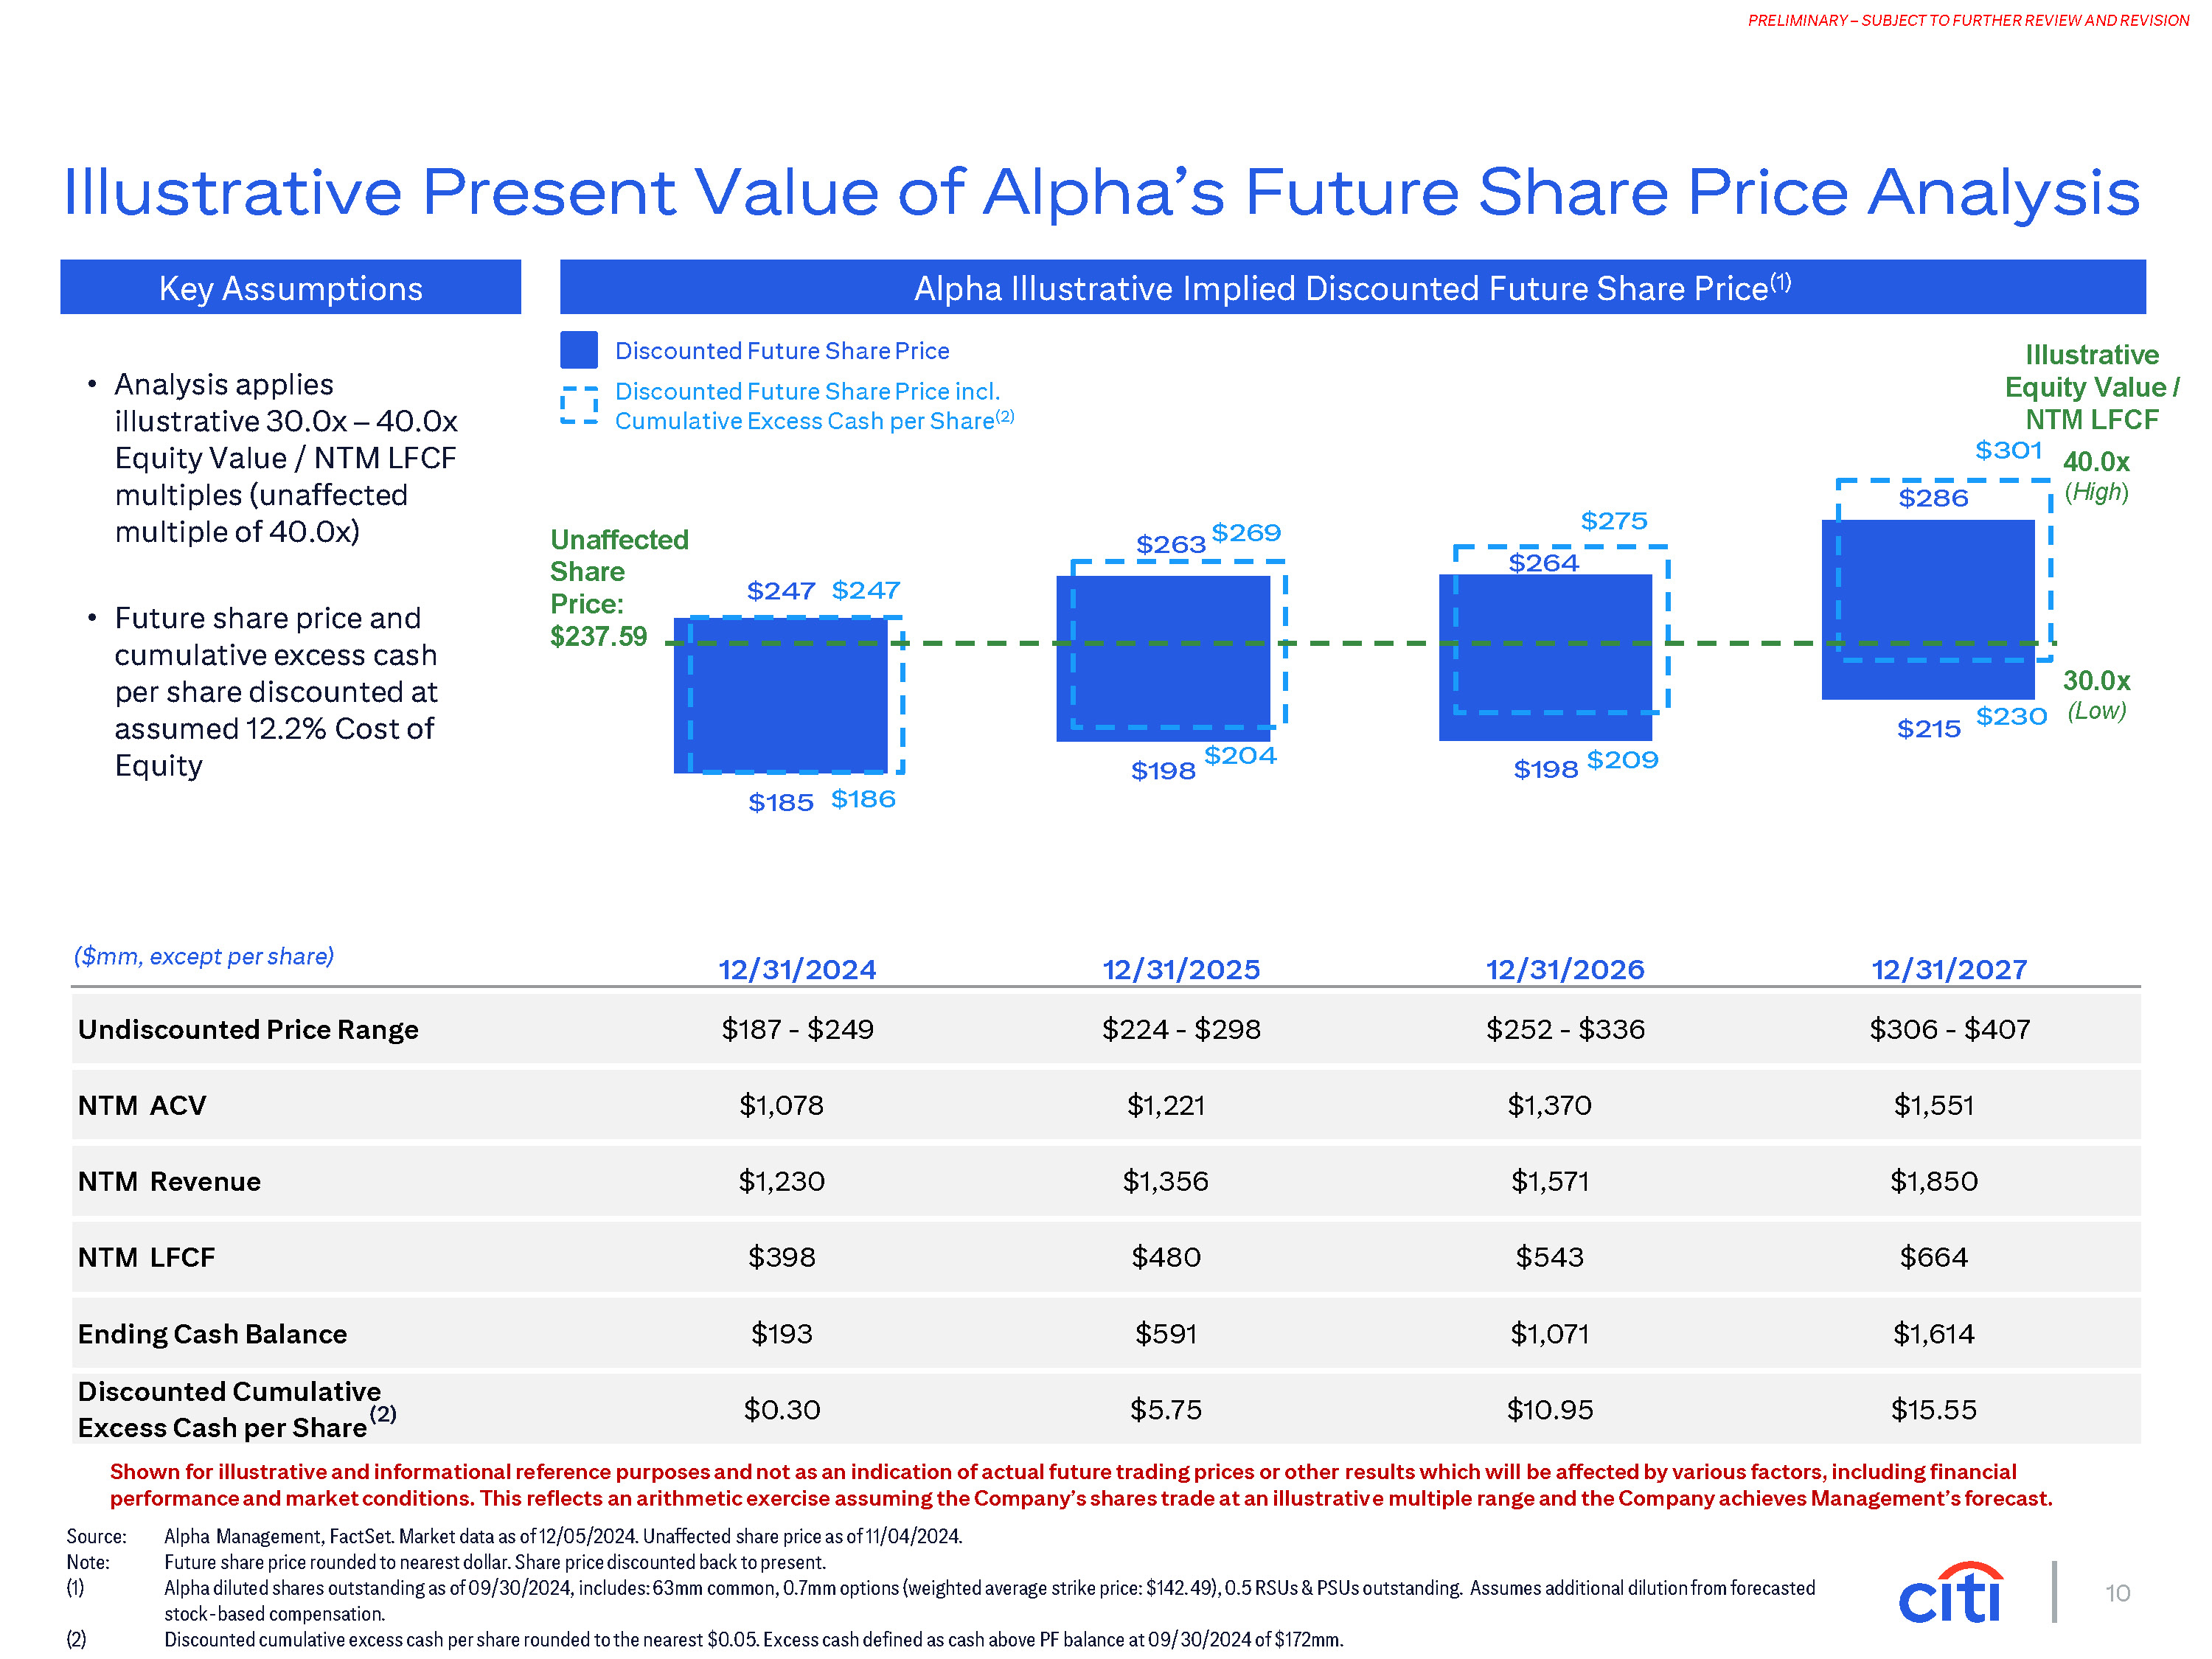
10 PRELIMINARY – SUBJECT TO FURTHER REVIEW AND REVISION $185 $186 $264 $286 $198 $204 $198 $209 $247 $247 $263 $269 $275 Alpha Illustrative Implied Discounted Future Share Price(1) Unaffected Share Price: $237.59 Analysis applies illustrative 30.0x – 40.0x Equity Value / NTM LFCF multiples (unaffected multiple of 40.0x) Future share price and cumulative excess cash per share discounted at assumed 12.2% Cost of Equity Key Assumptions Source: Note: (1) Alpha Management, FactSet. Market data as of 12/05/2024. Unaffected share price as of 11/04/2024. Future share price rounded to nearest dollar. Share price discounted back to present. Alpha diluted shares outstanding as of 09/30/2024, includes: 63mm common, 0.7mm options (weighted average strike price: $142.49), 0.5 RSUs & PSUs outstanding. Assumes additional dilution from forecasted stock-based compensation. Discounted cumulative excess cash per share rounded to the nearest $0.05. Excess cash defined as cash above PF balance at 09/30/2024 of $172mm. (2) ($mm, except per share) 30.0x $215 $230 (Low) Illustrative Equity Value / NTM LFCF $301 40.0x (High) Shown for illustrative and informational reference purposes and not as an indication of actual future trading prices or other results which will be affected by various factors, including financial performance and market conditions. This reflects an arithmetic exercise assuming the Company’s shares trade at an illustrative multiple range and the Company achieves Management’s forecast. Illustrative Present Value of Alpha’s Future Share Price Analysis 12/31/2024 12/31/2025 12/31/2026 12/31/2027 Undiscounted Price Range $187 - $249 $224 - $298 $252 - $336 $306 - $407 NTM ACV $1,078 $1,221 $1,370 $1,551 NTM Revenue $1,230 $1,356 $1,571 $1,850 NTM LFCF $398 $480 $543 $664 Ending Cash Balance $193 $591 $1,071 $1,614 Discounted Cumulative Excess Cash per Share(2) $0.30 $5.75 $10.95 $15.55 Discounted Future Share Price Discounted Future Share Price incl. Cumulative Excess Cash per Share(2)
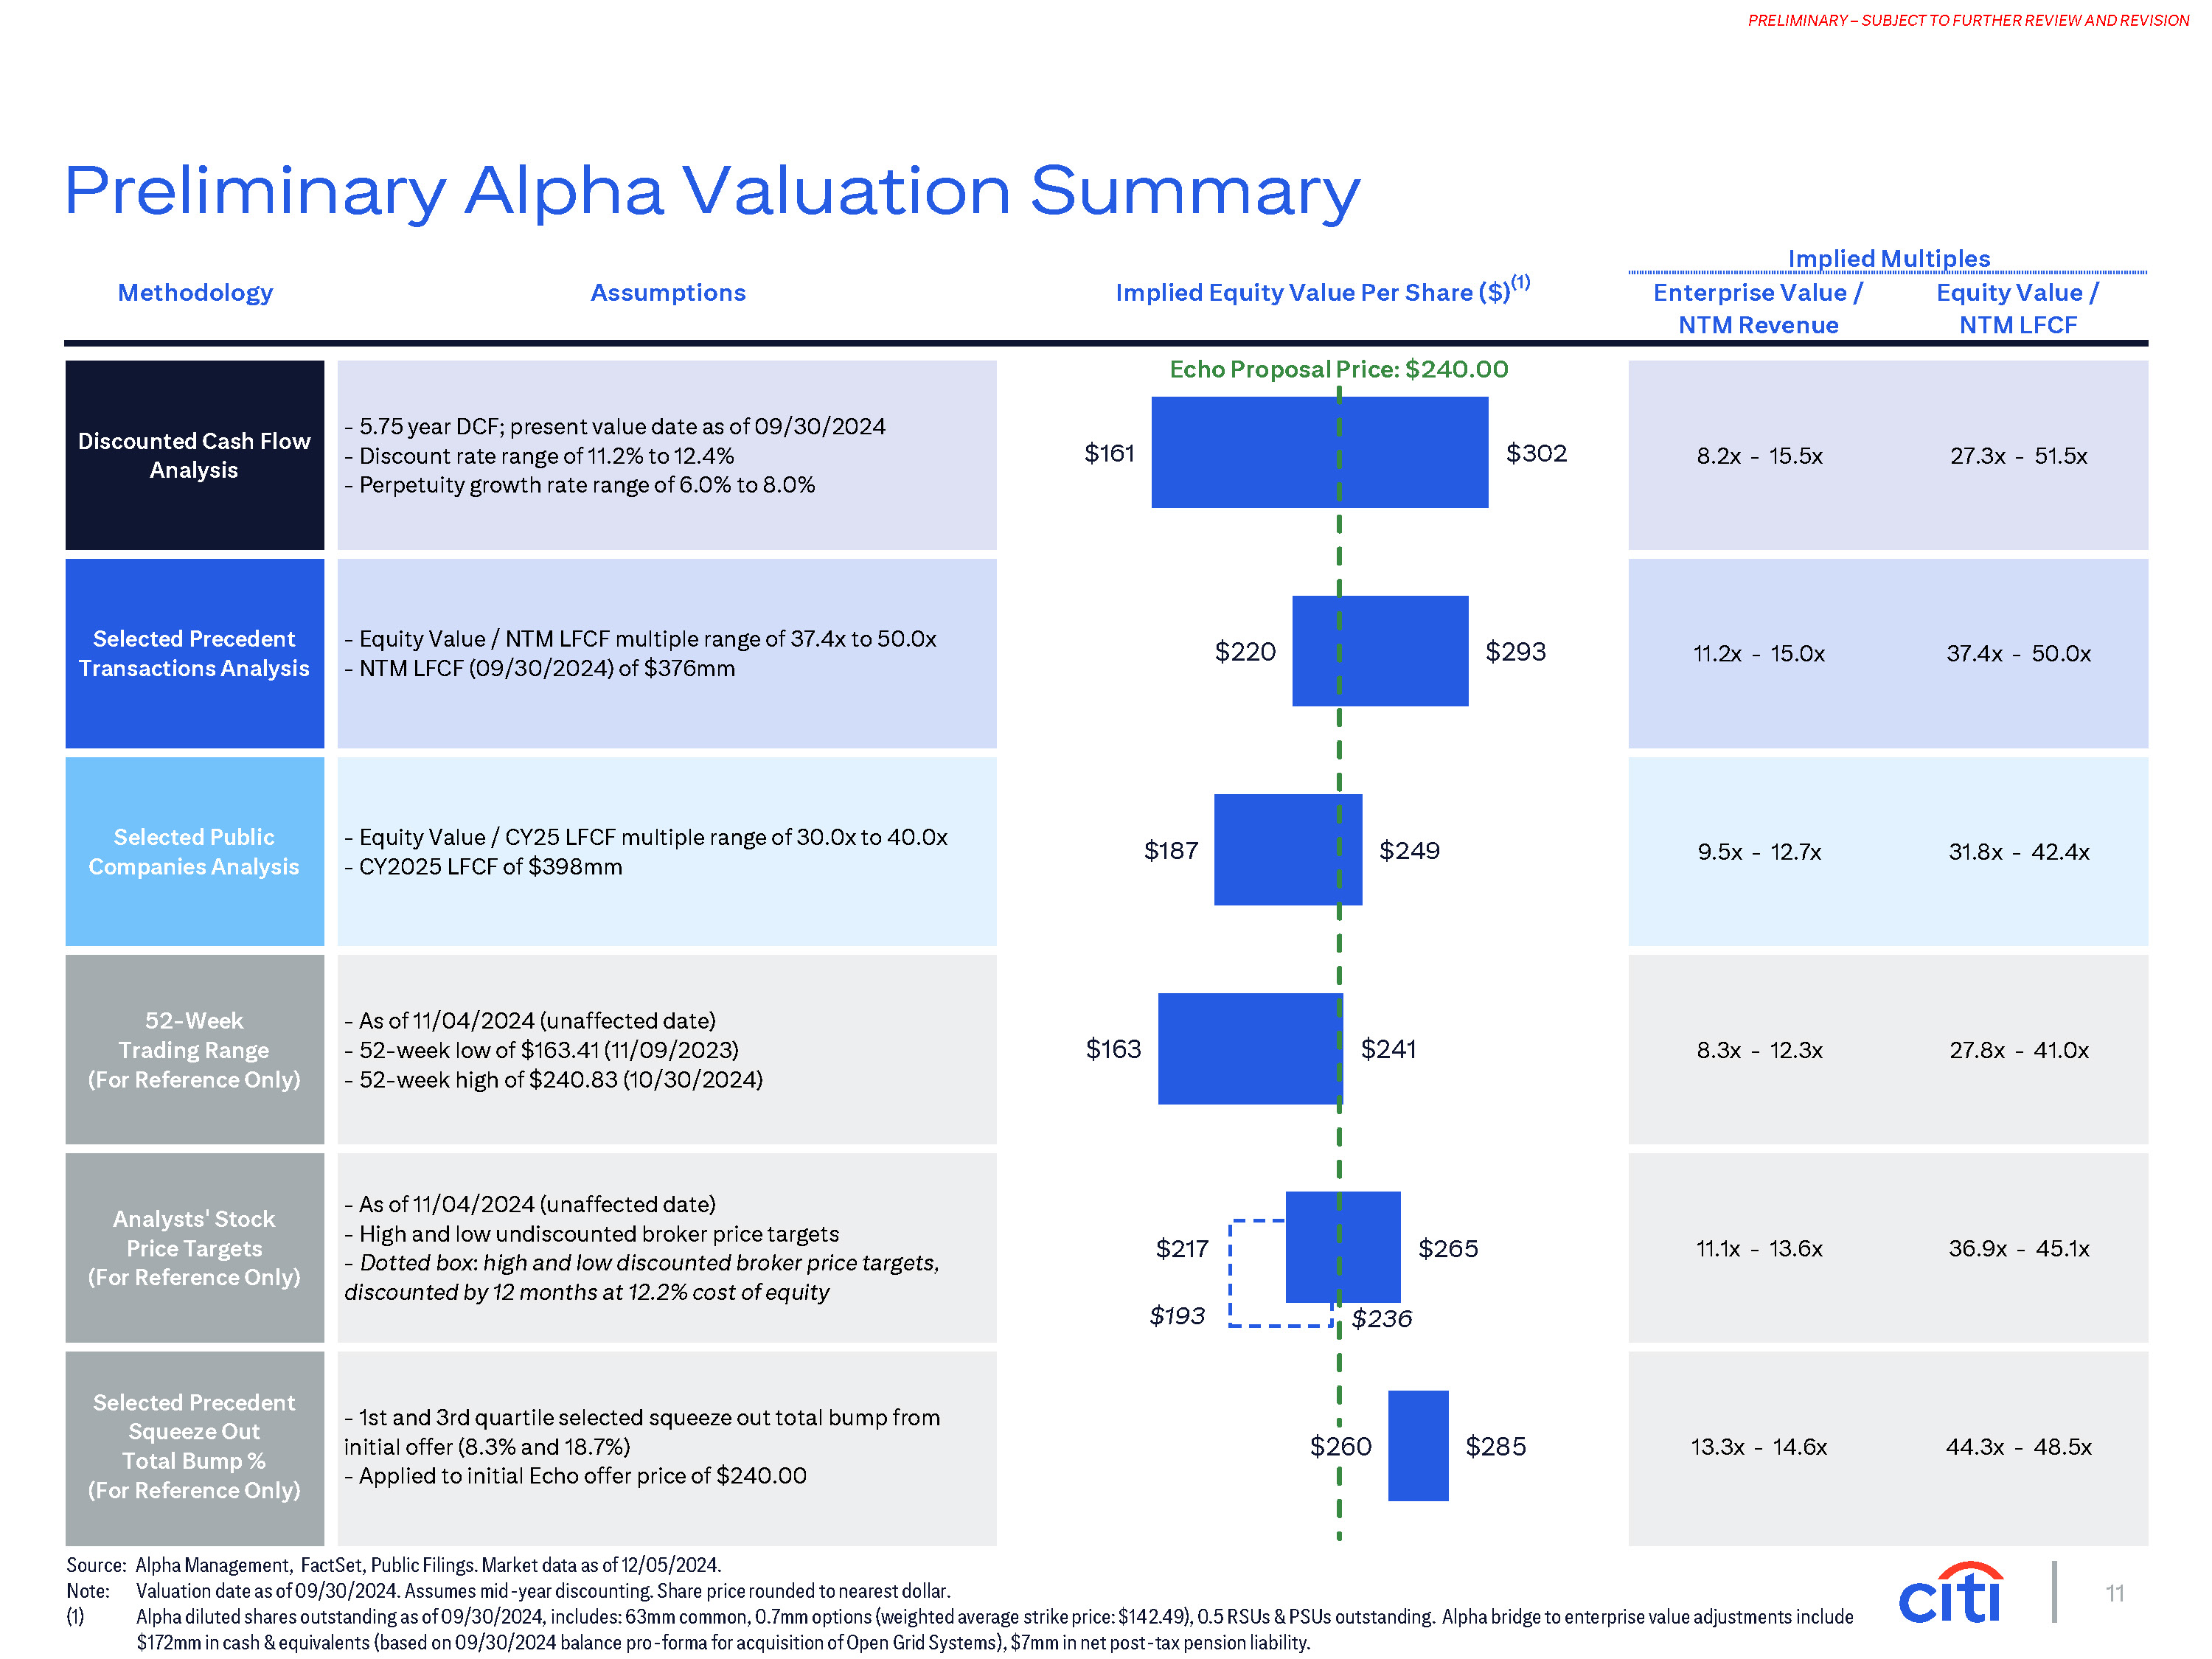
11 PRELIMINARY – SUBJECT TO FURTHER REVIEW AND REVISION Discounted Cash Flow Analysis 5.75 year DCF; present value date as of 09/30/2024 Discount rate range of 11.2% to 12.4% Perpetuity growth rate range of 6.0% to 8.0% Selected Precedent Transactions Analysis - Equity Value / NTM LFCF multiple range of 37.4x to 50.0x - NTM LFCF (09/30/2024) of $376mm Selected Public Companies Analysis Equity Value / CY25 LFCF multiple range of 30.0x to 40.0x CY2025 LFCF of $398mm 52-Week Trading Range (For Reference Only) - As of 11/04/2024 (unaffected date) - 52-week low of $163.41 (11/09/2023) - 52-week high of $240.83 (10/30/2024) 1 Analysts' Stock Price Targets (For Reference Only) As of 11/04/2024 (unaffected date) High and low undiscounted broker price targets Dotted box: high and low discounted broker price targets, 1discounted by 12 months at 12.2% cost of equity Selected Precedent Squeeze Out Total Bump % (For Reference Only) 1st and 3rd quartile selected squeeze out total bump from initial offer (8.3% and 18.7%) Applied to initial Echo offer price of $240.00 8.2x - 15.5x 27.3x - 51.5x 11.2x - 15.0x 37.4x - 50.0x 9.5x - 12.7x 31.8x - 42.4x 8.3x - 12.3x 27.8x - 41.0x 11.1x - 13.6x 36.9x - 45.1x 13.3x - 14.6x 44.3x - 48.5x Implied Multiples Enterprise Value / NTM Revenue Equity Value / NTM LFCF Methodology Assumptions Implied Equity Value Per Share ($)(1) $161 $220 $187 $163 $217 $260 $302 $293 $249 $241 $265 $285 $193 $236 Source: Alpha Management, FactSet, Public Filings. Market data as of 12/05/2024. Note: Valuation date as of 09/30/2024. Assumes mid-year discounting. Share price rounded to nearest dollar. (1) Alpha diluted shares outstanding as of 09/30/2024, includes: 63mm common, 0.7mm options (weighted average strike price: $142.49), 0.5 RSUs & PSUs outstanding. Alpha bridge to enterprise value adjustments include $172mm in cash & equivalents (based on 09/30/2024 balance pro-forma for acquisition of Open Grid Systems), $7mm in net post-tax pension liability. Preliminary Alpha Valuation Summary Echo Proposal Price: $240.00
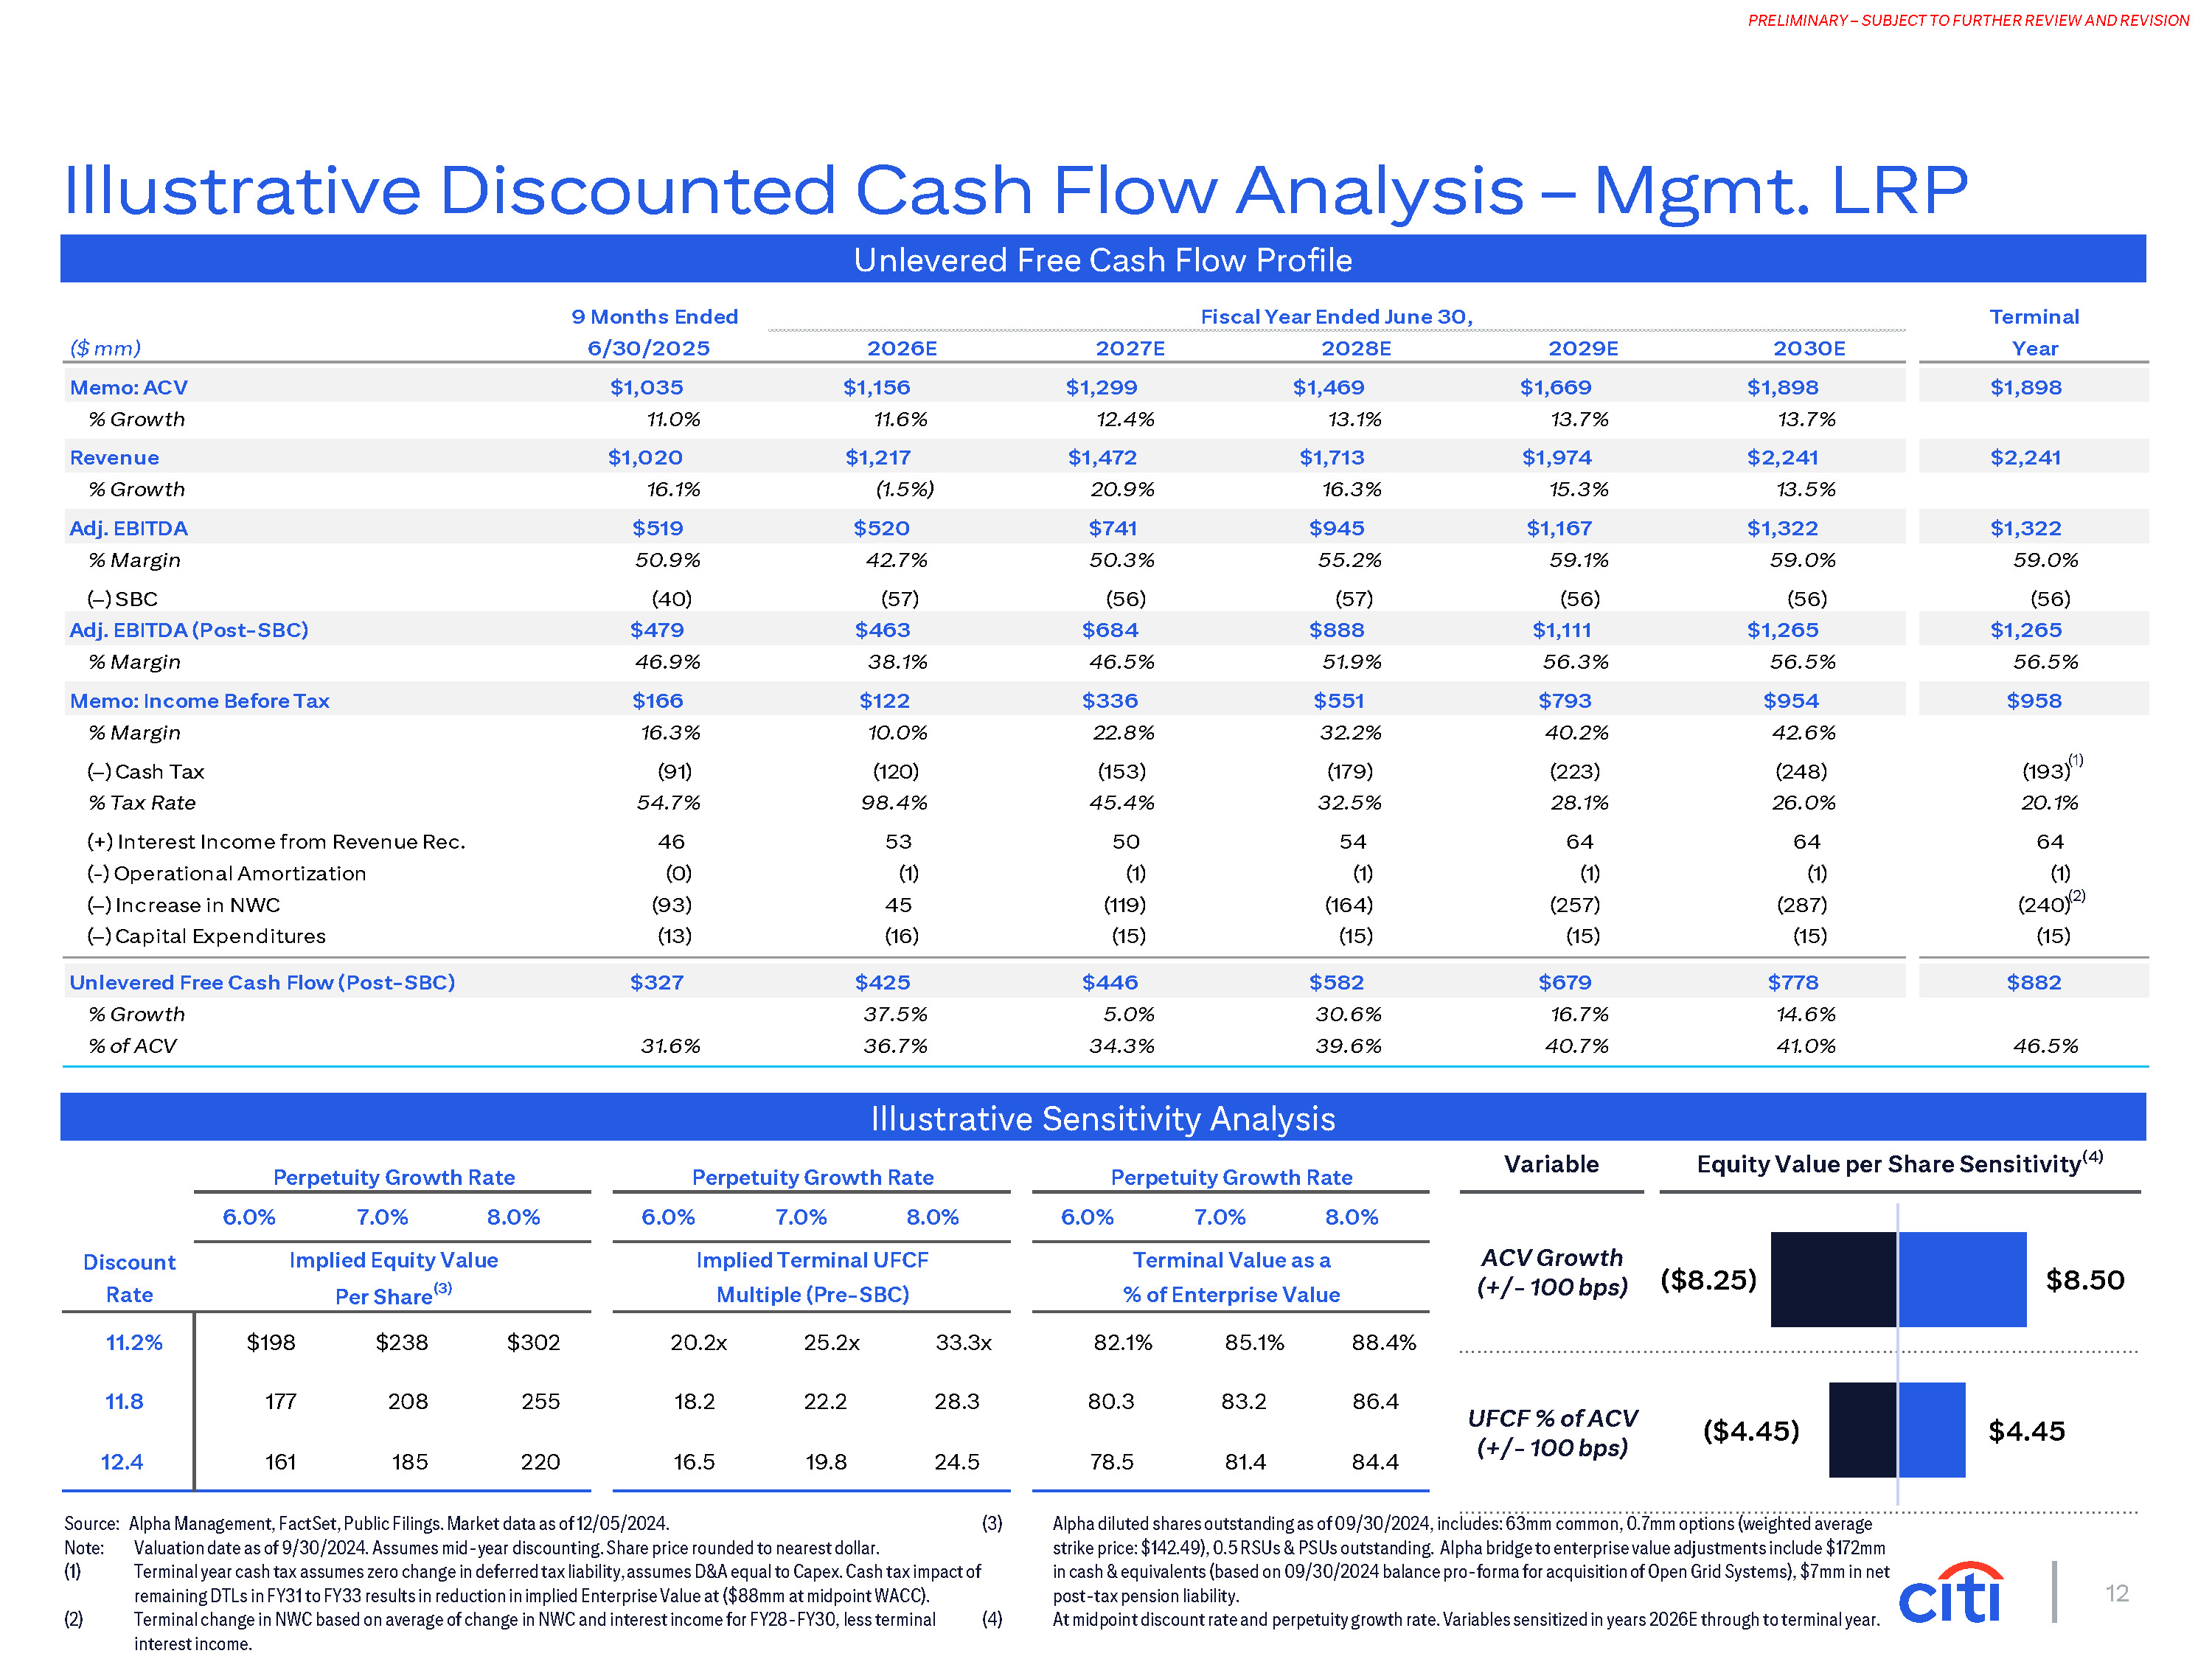
12 PRELIMINARY – SUBJECT TO FURTHER REVIEW AND REVISION Source: Alpha Management, FactSet, Public Filings. Market data as of 12/05/2024. Note: Valuation date as of 9/30/2024. Assumes mid-year discounting. Share price rounded to nearest dollar. Terminal year cash tax assumes zero change in deferred tax liability, assumes D&A equal to Capex. Cash tax impact of remaining DTLs in FY31 to FY33 results in reduction in implied Enterprise Value at ($88mm at midpoint WACC). Terminal change in NWC based on average of change in NWC and interest income for FY28-FY30, less terminal interest income. (3) Alpha diluted shares outstanding as of 09/30/2024, includes: 63mm common, 0.7mm options (weighted average strike price: $142.49), 0.5 RSUs & PSUs outstanding. Alpha bridge to enterprise value adjustments include $172mm in cash & equivalents (based on 09/30/2024 balance pro-forma for acquisition of Open Grid Systems), $7mm in net post-tax pension liability. At midpoint discount rate and perpetuity growth rate. Variables sensitized in years 2026E through to terminal year. (4) Unlevered Free Cash Flow Profile Illustrative Sensitivity Analysis Illustrative Discounted Cash Flow Analysis – Mgmt. LRP Perpetuity Growth Rate Perpetuity Growth Rate Perpetuity Growth Rate 6.0% 7.0% 8.0% Implied Equity Value Per Share(3) 6.0% 7.0% 8.0% Implied Terminal UFCF Multiple (Pre-SBC) 6.0% 7.0% 8.0% Terminal Value as a % of Enterprise Value Discount Rate 11.2% $198 $238 $302 11.8 177 208 255 12.4 161 185 220 20.2x 25.2x 33.3x 82.1% 85.1% 88.4% 18.2 22.2 28.3 80.3 83.2 86.4 16.5 19.8 24.5 78.5 81.4 84.4 Variable Equity Value per Share Sensitivity(4) ACV Growth (+/- 100 bps) UFCF % of ACV (+/- 100 bps) ($8.25) ($4.45) $8.50 $4.45 9 Months Ended Fiscal Year Ended June 30, Terminal ($ mm) 6/30/2025 2026E 2027E 2028E 2029E 2030E Year Memo: ACV $1,035 $1,156 $1,299 $1,469 $1,669 $1,898 $1,898 % Growth 11.0% 11.6% 12.4% 13.1% 13.7% 13.7% Revenue $1,020 $1,217 $1,472 $1,713 $1,974 $2,241 $2,241 % Growth 16.1% (1.5%) 20.9% 16.3% 15.3% 13.5% Adj. EBITDA $519 $520 $741 $945 $1,167 $1,322 $1,322 % Margin 50.9% 42.7% 50.3% 55.2% 59.1% 59.0% 59.0% (–) SBC (40) (57) (56) (57) (56) (56) (56) Adj. EBITDA (Post-SBC) $479 $463 $684 $888 $1,111 $1,265 $1,265 % Margin 46.9% 38.1% 46.5% 51.9% 56.3% 56.5% 56.5% Memo: Income Before Tax $166 $122 $336 $551 $793 $954 $958 % Margin 16.3% 10.0% 22.8% 32.2% 40.2% 42.6% (–) Cash Tax (91) (120) (153) (179) (223) (248) (193)(1) % Tax Rate 54.7% 98.4% 45.4% 32.5% 28.1% 26.0% 20.1% (+) Interest Income from Revenue Rec. 46 53 50 54 64 64 64 (-) Operational Amortization (0) (1) (1) (1) (1) (1) (1) (–) Increase in NWC (93) 45 (119) (164) (257) (287) (240)(2) (–) Capital Expenditures (13) (16) (15) (15) (15) (15) (15) Unlevered Free Cash Flow (Post-SBC) $327 $425 $446 $582 $679 $778 $882 % Growth 37.5% 5.0% 30.6% 16.7% 14.6% % of ACV 31.6% 36.7% 34.3% 39.6% 40.7% 41.0% 46.5%
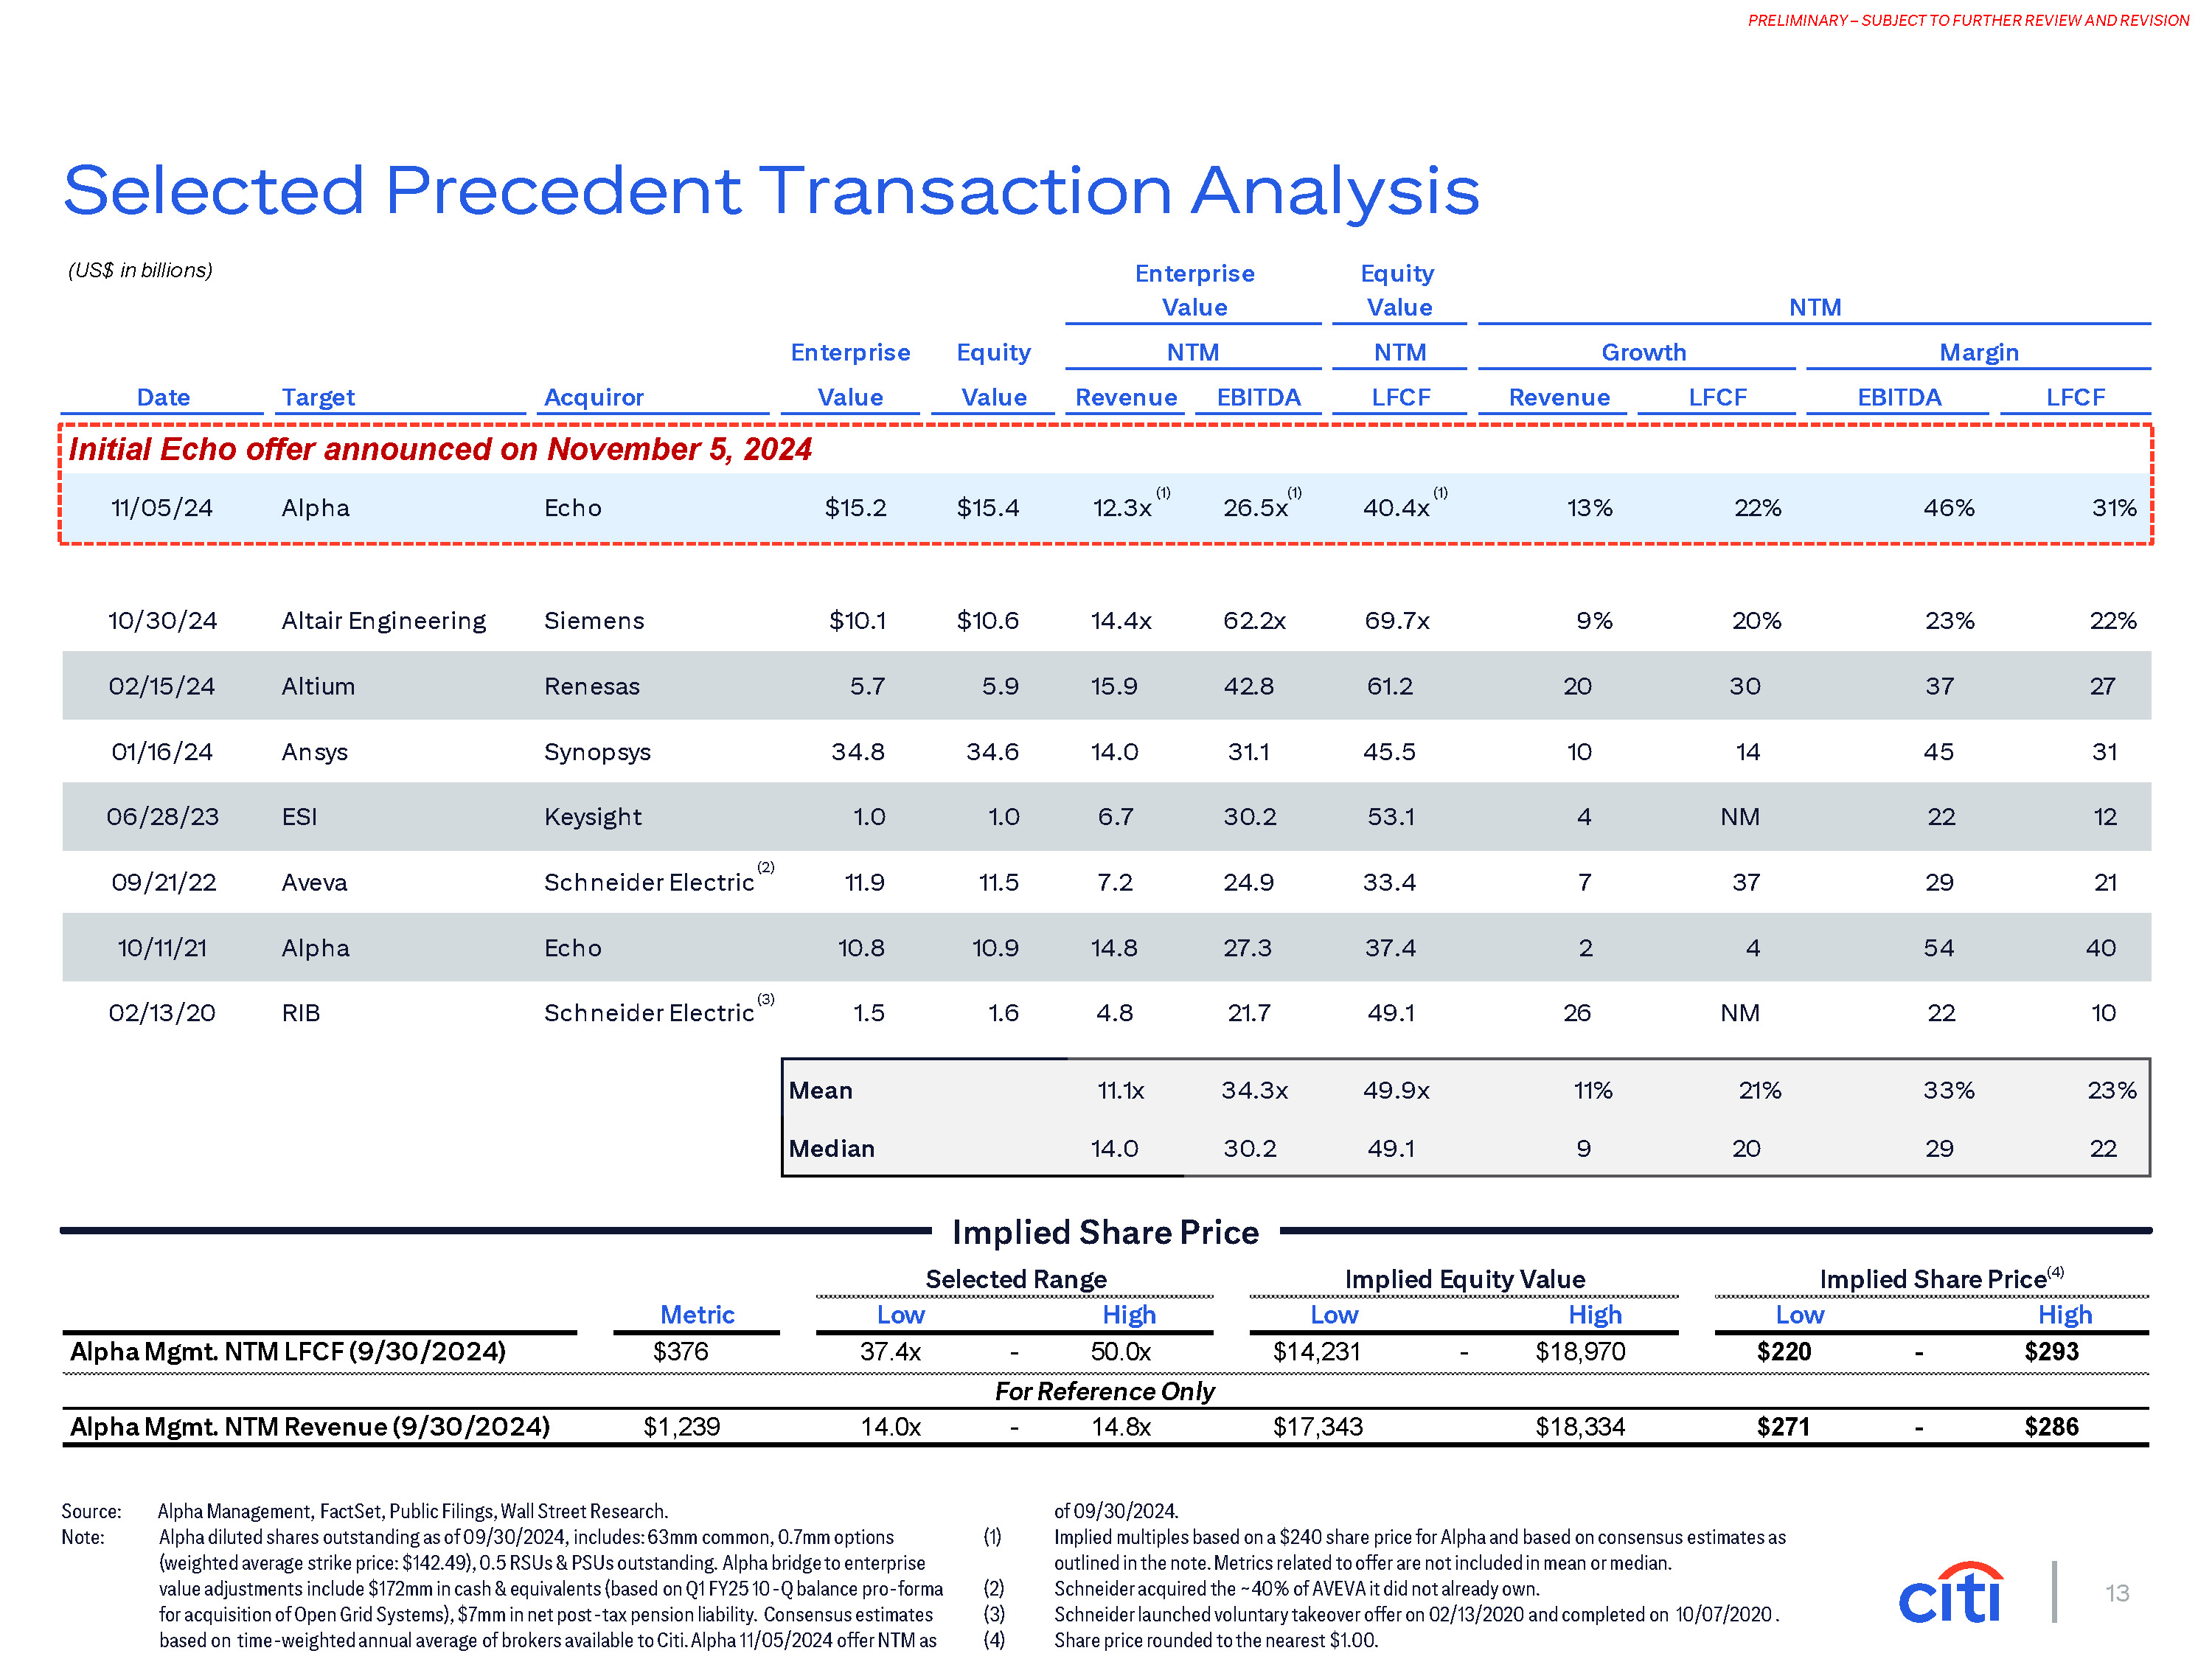
13 PRELIMINARY – SUBJECT TO FURTHER REVIEW AND REVISION 10/30/24 Altair Engineering Siemens $10.1 $10.6 14.4x 62.2x 69.7x 9% 20% 23% 22% 02/15/24 Altium Renesas 5.7 5.9 15.9 42.8 61.2 20 30 37 27 01/16/24 Ansys Synopsys 34.8 34.6 14.0 31.1 45.5 10 14 45 31 06/28/23 ESI Keysight 1.0 1.0 6.7 30.2 53.1 4 NM 22 12 09/21/22 Aveva Schneider Electric (2) 11.9 11.5 7.2 24.9 33.4 7 37 29 21 10/11/21 Alpha Echo 10.8 10.9 14.8 27.3 37.4 2 4 54 40 1.5 1.6 4.8 21.7 49.1 26 NM 22 10 Mean 11.1x 34.3x 49.9x 11% 21% 33% 23% Median 14.0 30.2 49.1 9 20 29 22 Implied Share Price Selected Range Implied Equity Value Implied Share Price(4) (US$ in billio ns) Enterprise Value Equity Value NTM NTM NTM Growth Margin Date Target Acquiror Enterprise Value Equity Value Revenue EBITDA LFCF Revenue LFCF EBITDA LFCF $15.2 $15.4 12.3x 26.5x 40.4x 13% 22% 46% 31% 02/13/20 RIB (3) Schneider Electric of 09/30/2024. Implied multiples based on a $240 share price for Alpha and based on consensus estimates as outlined in the note. Metrics related to offer are not included in mean or median. Schneider acquired the ~40% of AVEVA it did not already own. Schneider launched voluntary takeover offer on 02/13/2020 and completed on 10/07/2020 . Share price rounded to the nearest $1.00. (1) Source: Alpha Management, FactSet, Public Filings, Wall Street Research. Note: Alpha diluted shares outstanding as of 09/30/2024, includes: 63mm common, 0.7mm options (weighted average strike price: $142.49), 0.5 RSUs & PSUs outstanding. Alpha bridge to enterprise value adjustments include $172mm in cash & equivalents (based on Q1 FY25 10-Q balance pro-forma (2) for acquisition of Open Grid Systems), $7mm in net post-tax pension liability. Consensus estimates (3) based on time-weighted annual average of brokers available to Citi. Alpha 11/05/2024 offer NTM as (4) Selected Precedent Transaction Analysis (1) (1) (1) Initial Echo offer announced on November 5, 2024 11/05/24 Alpha Echo Metric Low High Low High Low High Alpha Mgmt. NTM LFCF (9/30/2024) $376 37.4x - 50.0x $14,231 - $18,970 $220 - $293 Alpha Mgmt. NTM Revenue (9/30/2024) $1,239 14.0x For Reference Only - 14.8x $17,343 $18,334 $271 - $286
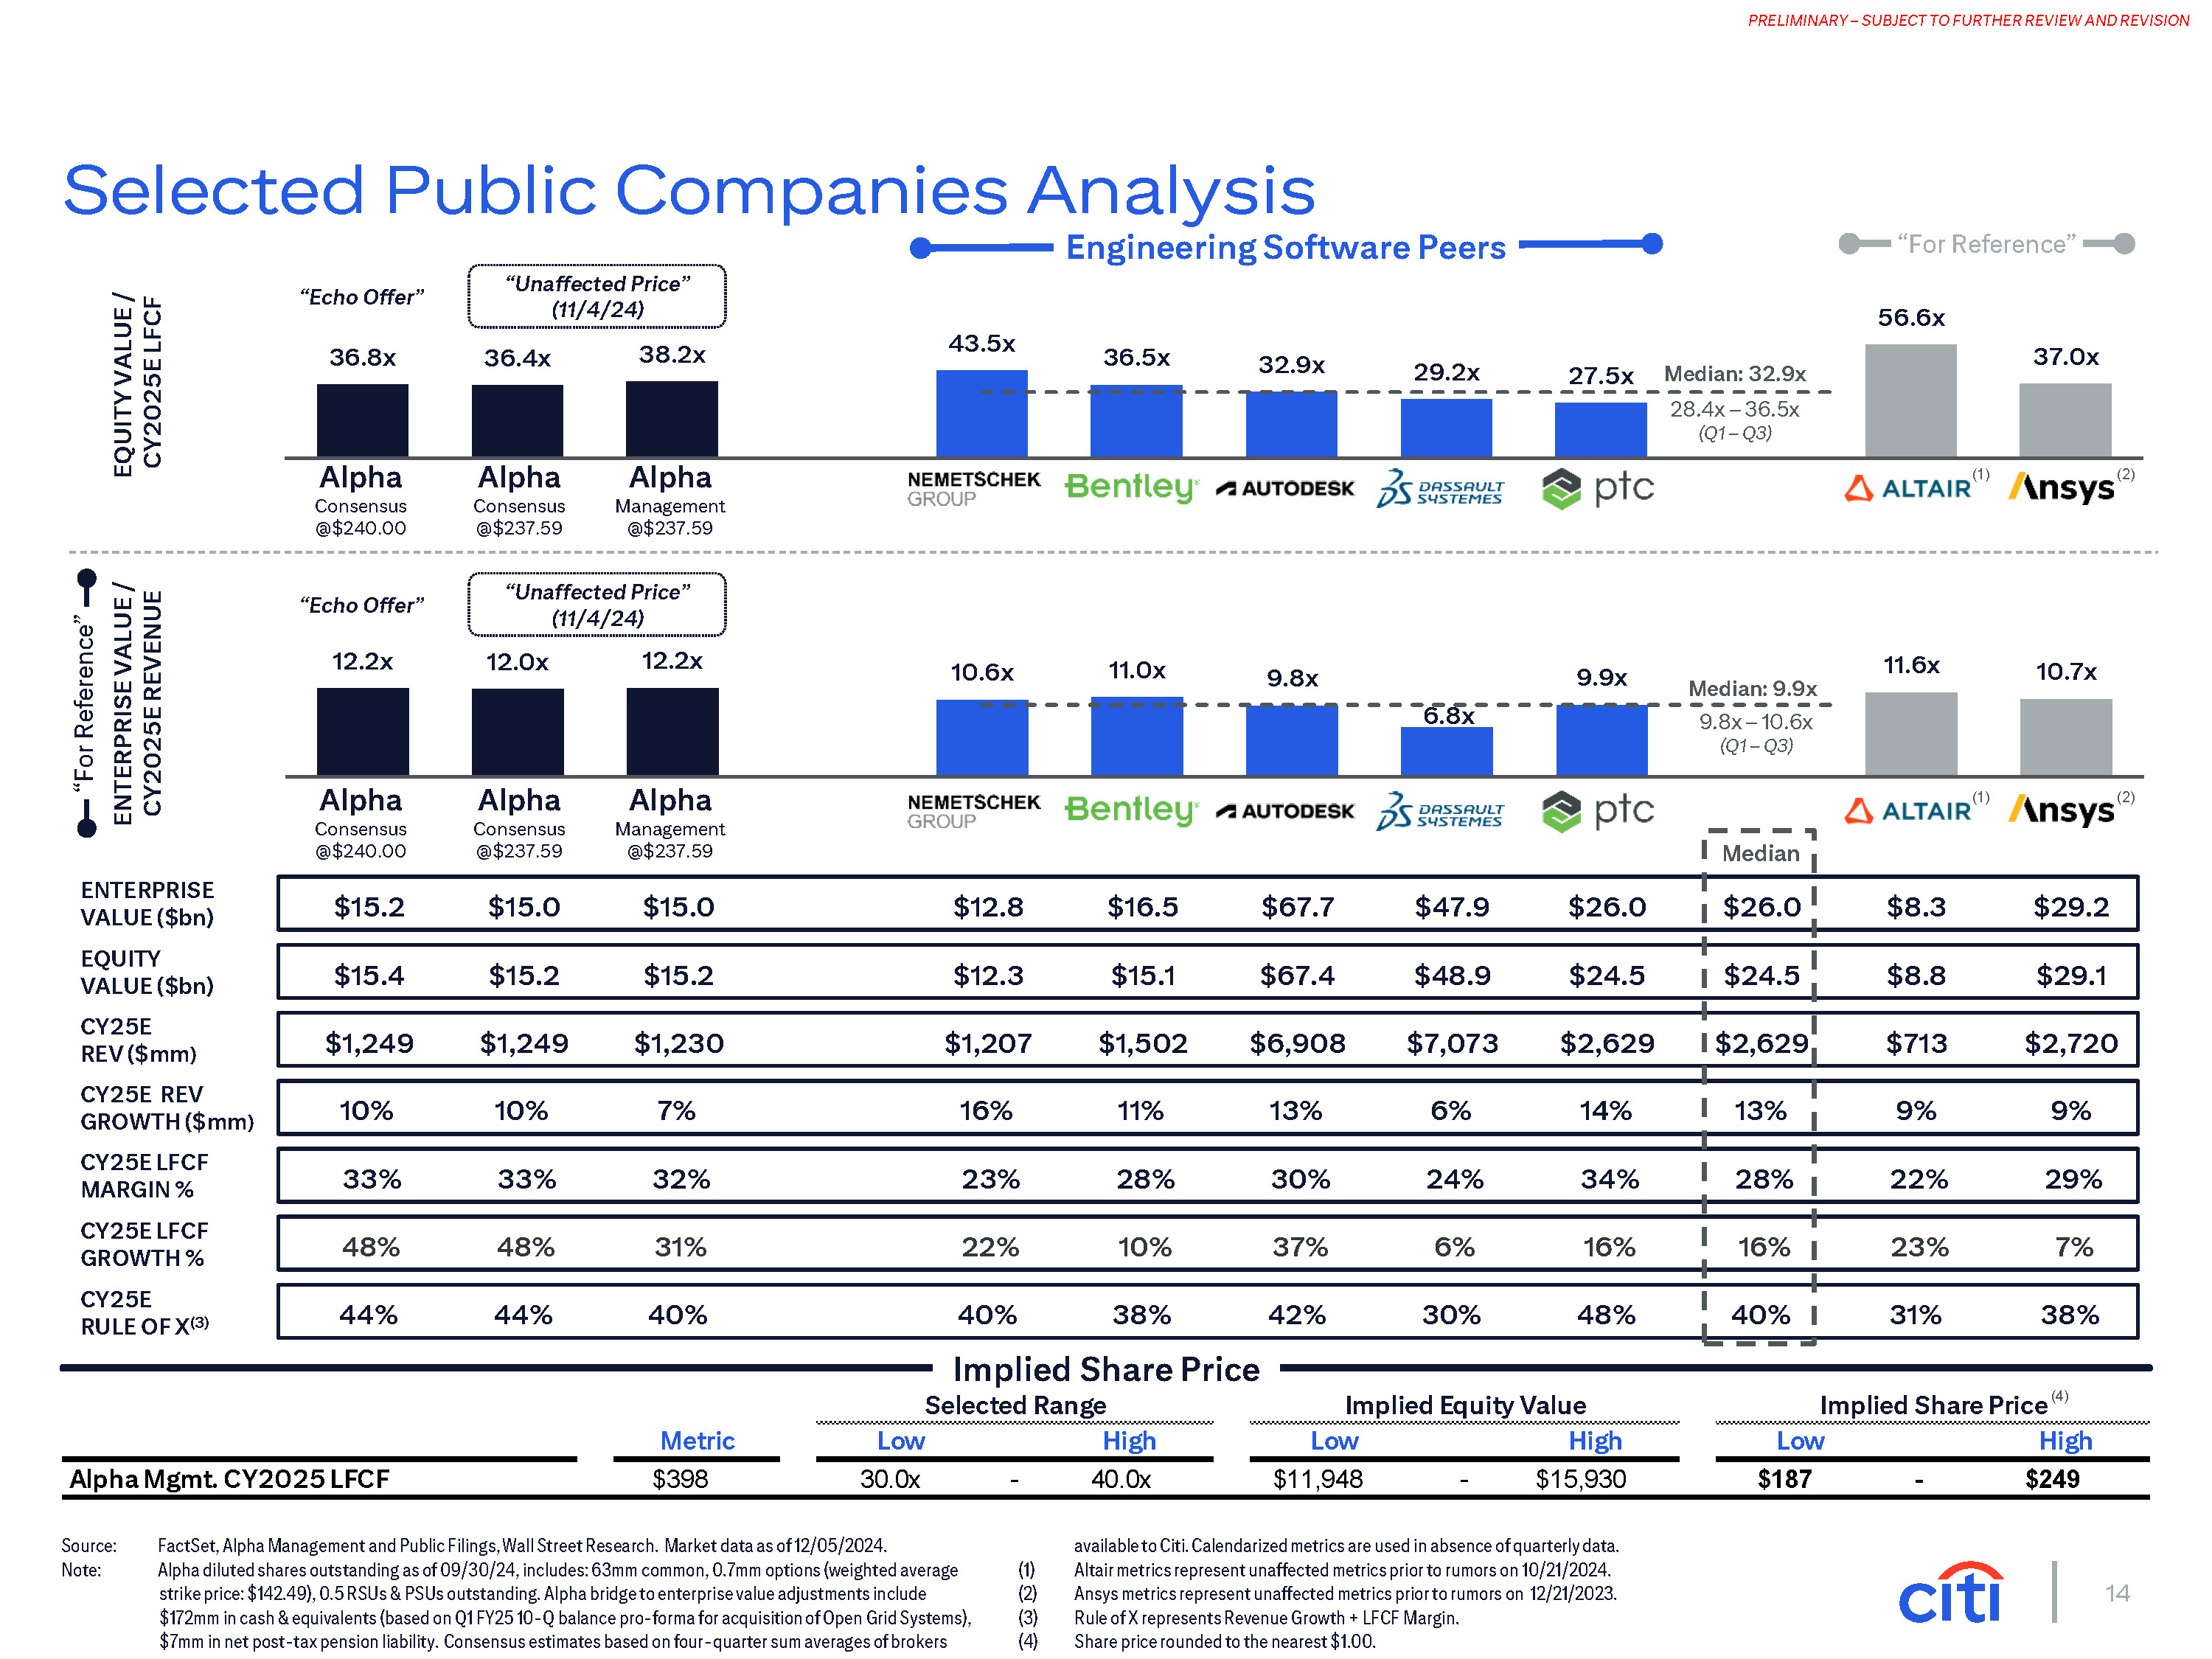
14 PRELIMINARY – SUBJECT TO FURTHER REVIEW AND REVISION 12.2x 10.6x 11.0x 9.8x 6.8x 9.9x 11.6x 10.7x Median: 9.9x 36.8x 36.4x 38.2x 43.5x 36.5x 32.9x 29.2x 27.5x 56.6x 37.0x Median: 32.9x Selected Range Implied Equity Value Metric Low High Low High Low High Alpha Mgmt. CY2025 LFCF $398 30.0x - 40.0x $11,948 - $15,930 $187 - $249 (2) Engineering Software Peers EQUITY VALUE / CY2025E LFCF ENTERPRISE VALUE ($bn) EQUITY VALUE ($bn) CY25E REV ($mm) CY25E REV GROWTH ($mm) CY25E LFCF MARGIN % CY25E LFCF GROWTH % CY25E RULE OF X(3) Alpha Consensus @$237.59 (1) Selected Public Companies Analysis “For Reference” ENTERPRISE VALUE / CY2025E REVENUE 28.4x – 36.5x (Q1 – Q3) 9.8x – 10.6x (Q1 – Q3) Alpha Management @$237.59 Implied Share Price Implied Share Price (4) Alpha Consensus @$240.00 “Echo Offer” “For Reference” “Unaffected Price” (11/4/24) “Echo Offer” “Unaffected Price” (11/4/24) 12.0x 12.2x (2) Alpha Consensus @$237.59 (1) Alpha Management @$237.59 Alpha Consensus @$240.00 Median $15.2 $15.0 $15.0 $12.8 $16.5 $67.7 $47.9 $26.0 $26.0 $8.3 $29.2 $15.4 $15.2 $15.2 $12.3 $15.1 $67.4 $48.9 $24.5 $24.5 $8.8 $29.1 $1,249 $1,249 $1,230 $1,207 $1,502 $6,908 $7,073 $2,629 $2,629 $713 $2,720 10% 10% 7% 16% 11% 13% 6% 14% 13% 9% 9% 33% 33% 32% 23% 28% 30% 24% 34% 28% 22% 29% 48% 48% 31% 22% 10% 37% 6% 16% 16% 23% 7% 44% 44% 40% 40% 38% 42% 30% 48% 40% 31% 38% Source: Note: FactSet, Alpha Management and Public Filings, Wall Street Research. Market data as of 12/05/2024. Alpha diluted shares outstanding as of 09/30/24, includes: 63mm common, 0.7mm options (weighted average strike price: $142.49), 0.5 RSUs & PSUs outstanding. Alpha bridge to enterprise value adjustments include $172mm in cash & equivalents (based on Q1 FY25 10-Q balance pro-forma for acquisition of Open Grid Systems), $7mm in net post-tax pension liability. Consensus estimates based on four-quarter sum averages of brokers available to Citi. Calendarized metrics are used in absence of quarterly data. Altair metrics represent unaffected metrics prior to rumors on 10/21/2024. Ansys metrics represent unaffected metrics prior to rumors on 12/21/2023. Rule of X represents Revenue Growth + LFCF Margin. Share price rounded to the nearest $1.00.
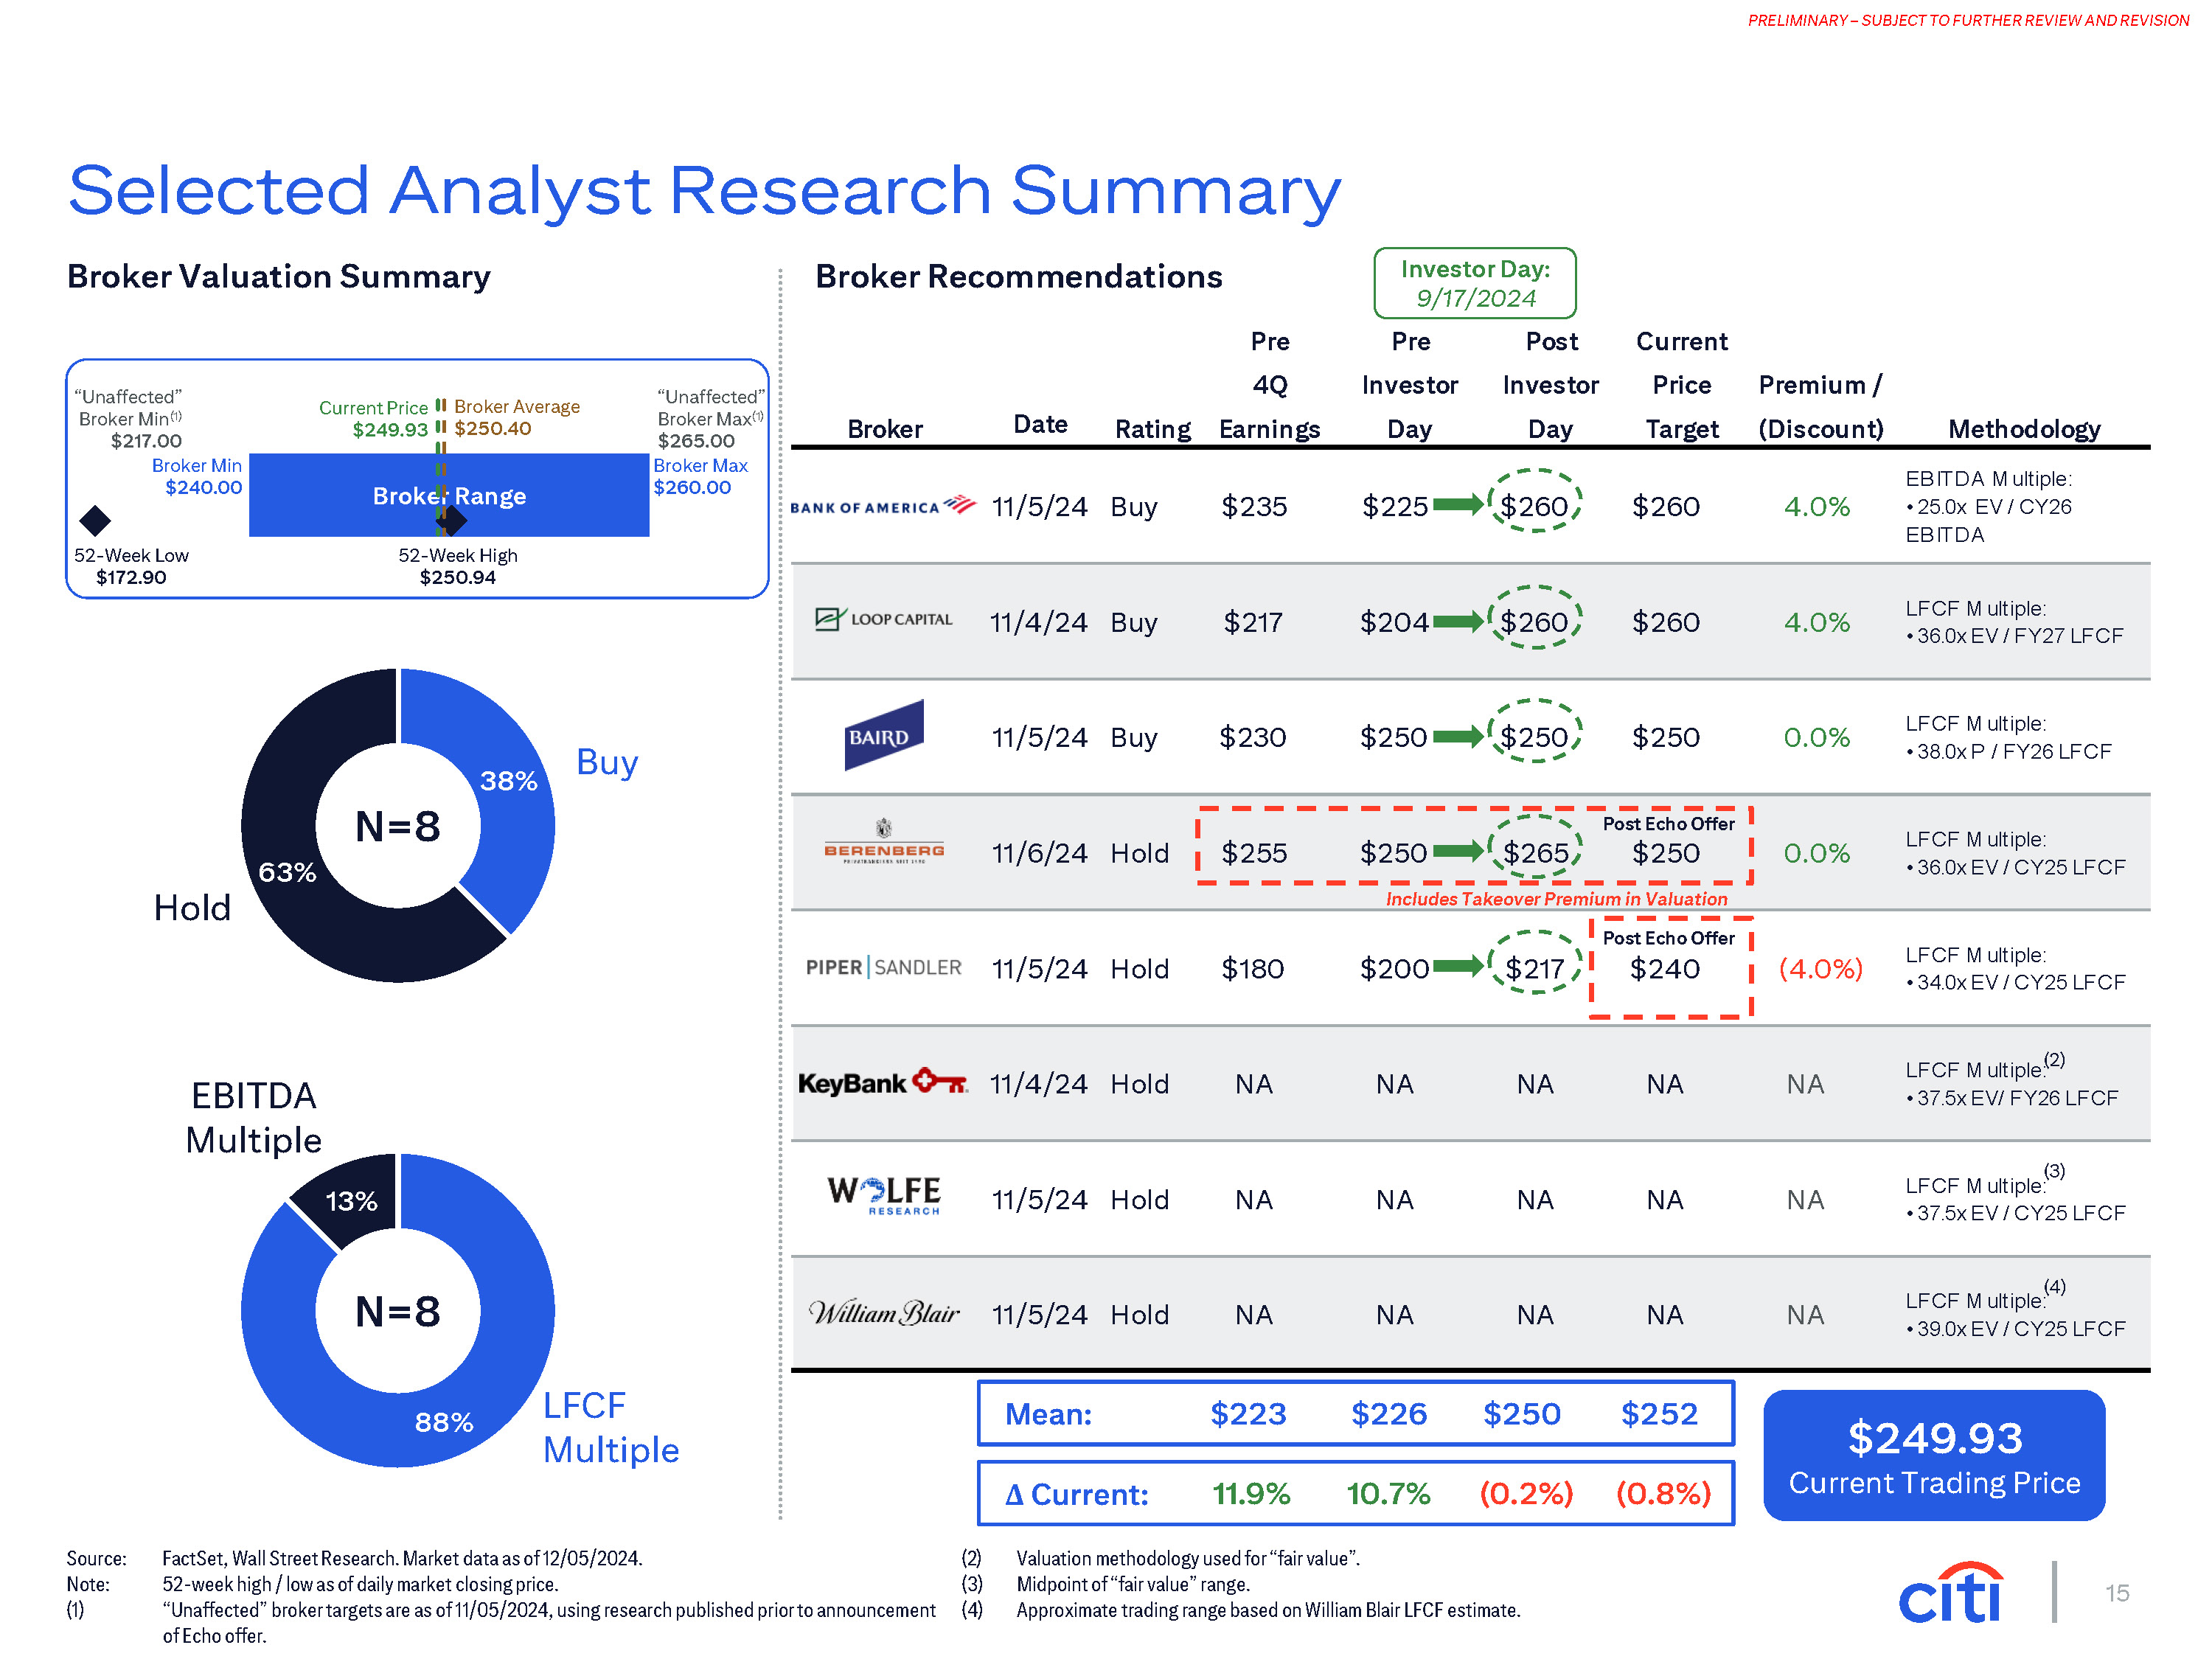
15 PRELIMINARY – SUBJECT TO FURTHER REVIEW AND REVISION Pre Pre Post Current Broker Date Rating 4Q Earnings Investor Day Investor Day Price Target Premium / (Discount) Methodology 11/5/24 Buy $235 $225 $260 $260 4.0% EB ITDA M ultiple: 25.0x EV / CY26 EB ITDA 11/4/24 Buy $217 $204 $260 $260 4.0% LFCF M ultiple: 36.0x EV / FY27 LFCF 11/5/24 Buy $230 $250 $250 $250 0.0% LFCF M ultiple: 38.0x P / FY26 LFCF 11/6/24 Hold $255 $250 0.0% LFCF M ultiple: 36.0x EV / CY25 LFCF 11/5/24 Hold $180 $200 $217 (4.0%) LFCF M ultiple: 34.0x EV / CY25 LFCF 11/4/24 Hold NA NA NA NA NA LFCF M ultiple: 37.5x EV/ FY26 LFCF 11/5/24 Hold NA NA NA NA NA LFCF M ultiple: 37.5x EV / CY25 LFCF 11/5/24 Hold NA NA NA NA NA LFCF M ultiple: 39.0x EV / CY25 LFCF 88% 13% Broker Valuation Summary Broker Recommendations Source: FactSet, Wall Street Research. Market data as of 12/05/2024. Note: (1) 52-week high / low as of daily market closing price. “Unaffected” broker targets are as of 11/05/2024, using research published prior to announcement of Echo offer. Valuation methodology used for “fair value”. Midpoint of “fair value” range. Approximate trading range based on William Blair LFCF estimate. Selected Analyst Research Summary N=8 LFCF Multiple EBITDA Multiple 38% 63% N=8 Buy Hold Broke r Range 52-Week Low $172.90 52-Week High $250.94 Broker Average $250.40 Current Price $249.93 (3) (4) $249.93 Current Trading Price (2) Investor Day: 9/17/2024 Mean: $223 $226 $250 $252 Δ Current: 11.9% 10.7% (0.2%) (0.8%) Includes Takeover Premium in Valuation Post Echo Offer $265 $250 Post Echo Offer $240 “Unaffected” Broker Max(1) $265.00 Broker Max $260.00 “Unaffected” Broker Min(1) $217.00 Broker Min $240.00
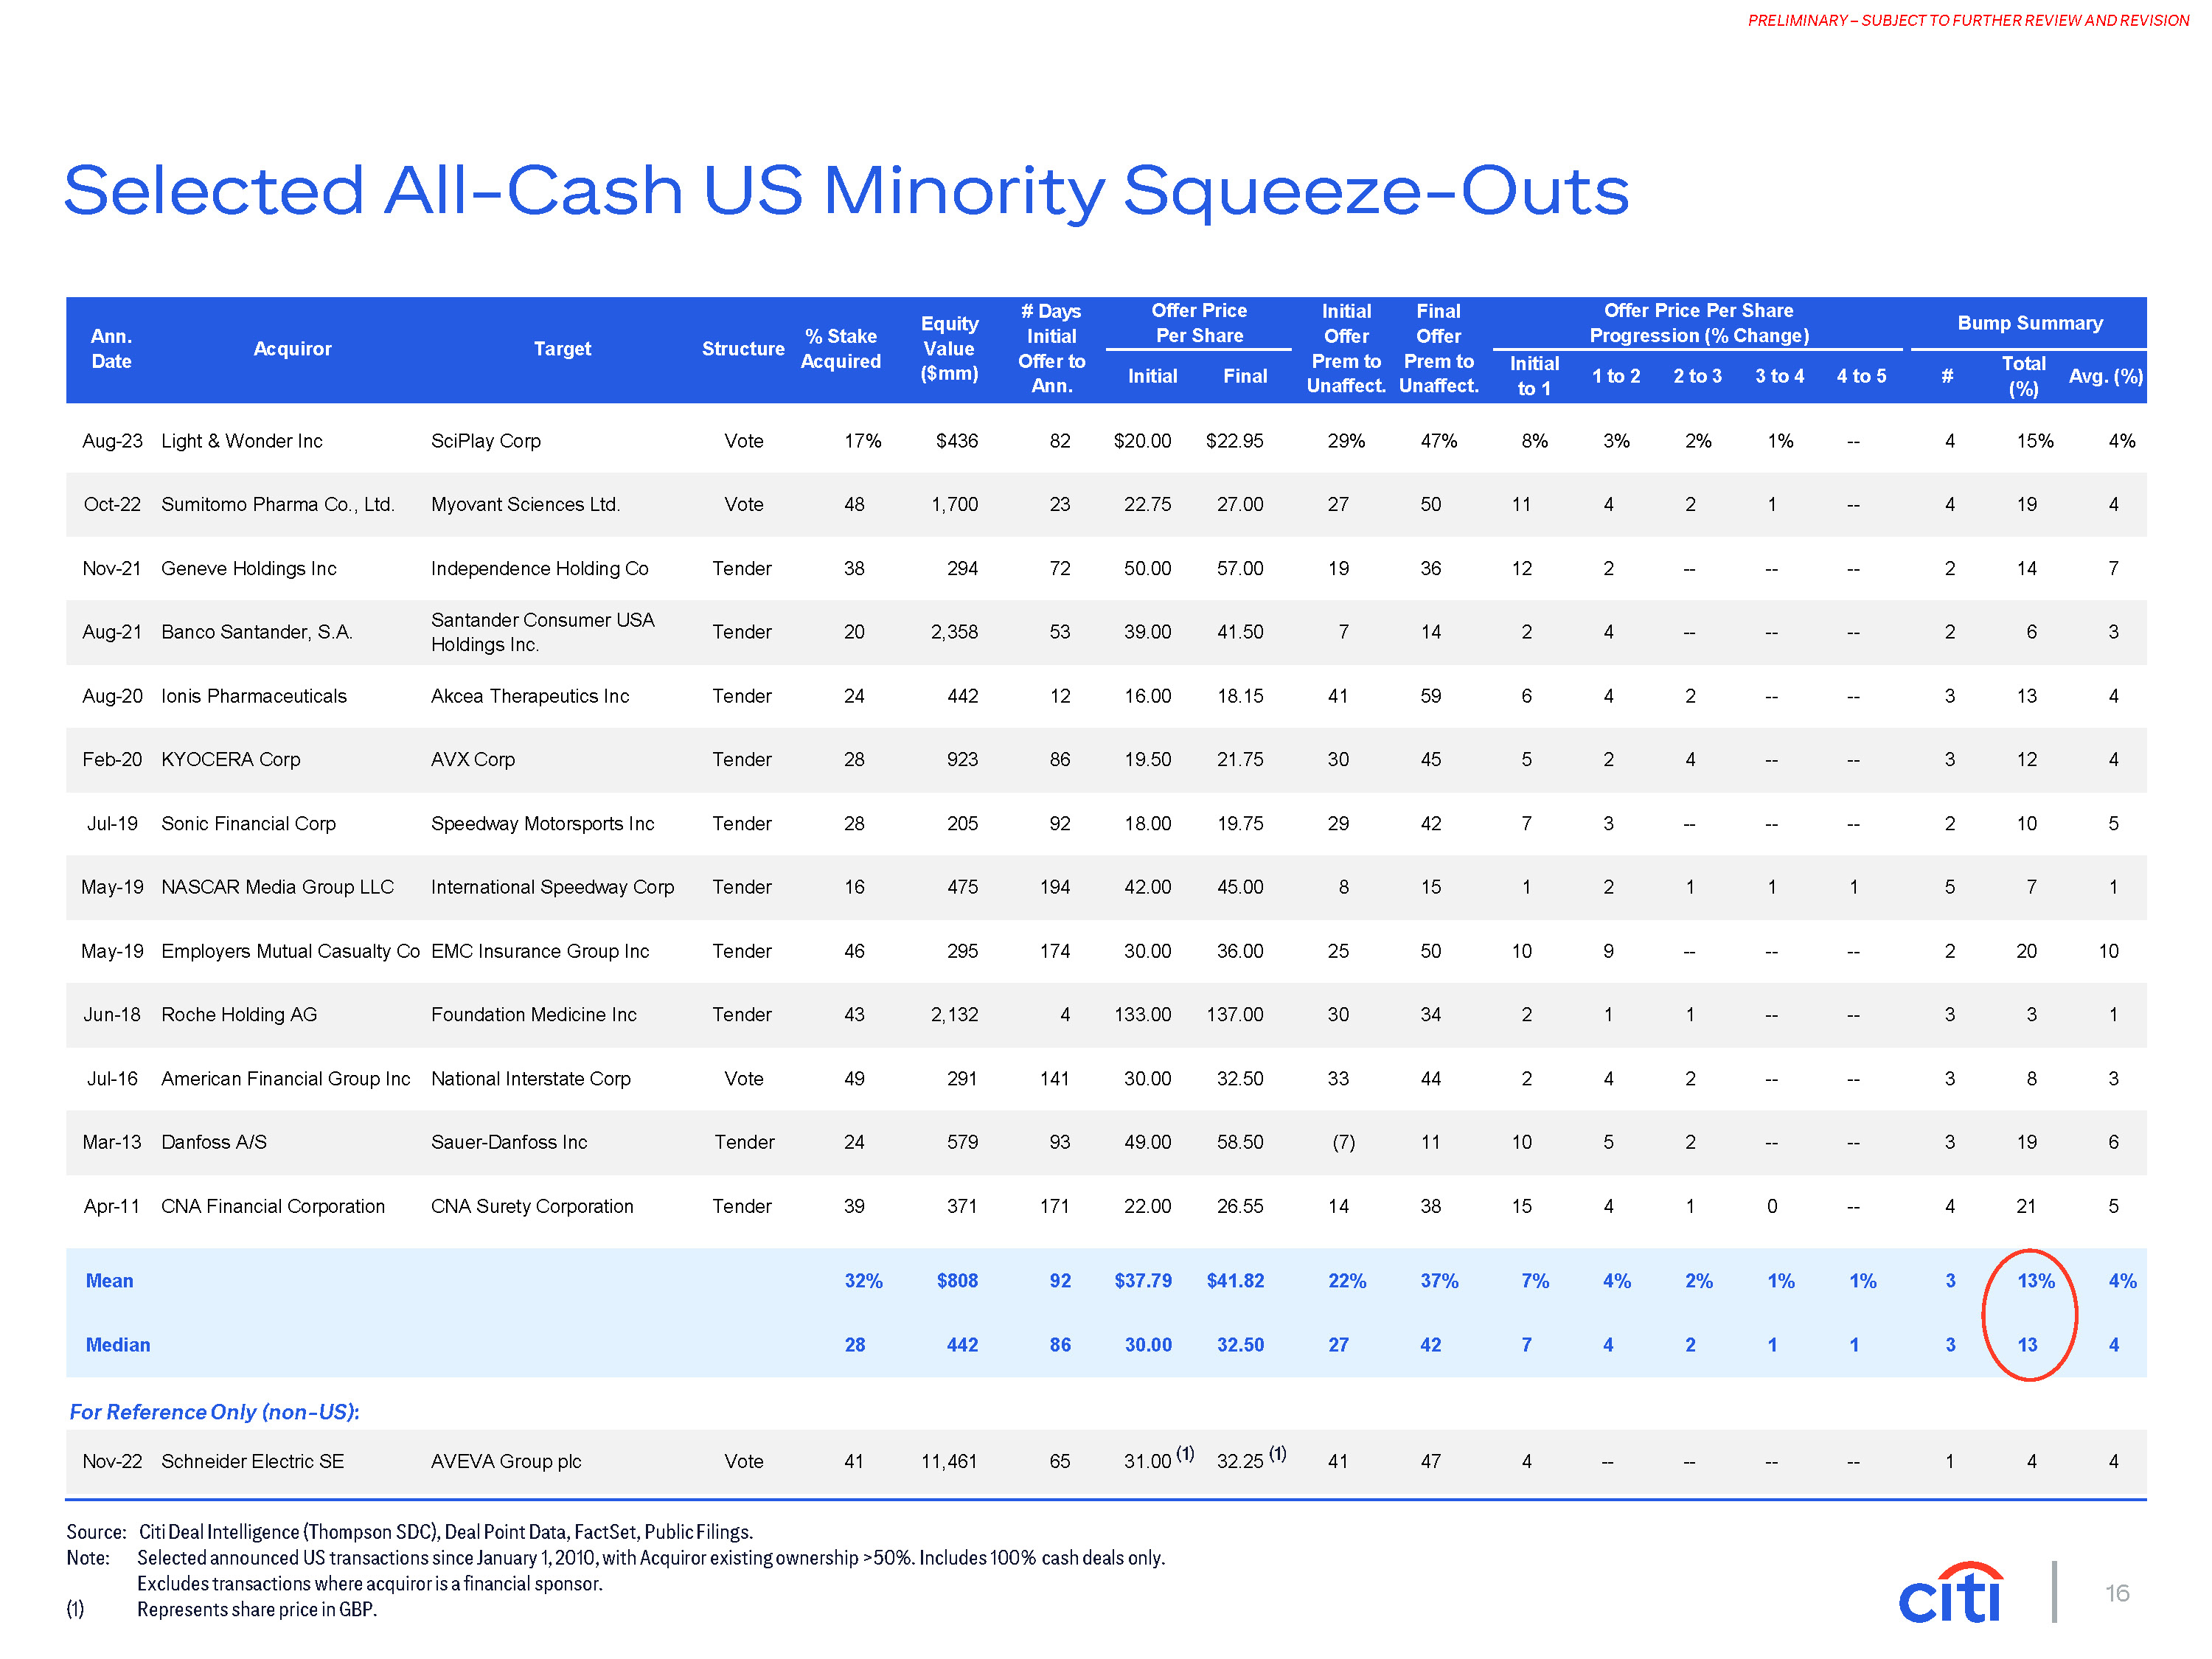
16 PRELIMINARY – SUBJECT TO FURTHER REVIEW AND REVISION Source: Citi Deal Intelligence (Thompson SDC), Deal Point Data, FactSet, Public Filings. Note: Selected announced US transactions since January 1, 2010, with Acquiror existing ownership >50%. Includes 100% cash deals only. Excludes transactions where acquiror is a financial sponsor. (1) Represents share price in GBP. Selected All-Cash US Minority Squeeze-Outs Ann. Date Acquiror Target Structure % Stake Acquired Equity Value ($mm) # Days Initial Offer to Ann. Offer Price Per Share Initial Final Initial Final Offer Offer Prem to Prem to Unaffect. Unaffect. Offer Price Per Share Progression (% Change) Bump Summary Initial 1 to 2 2 to 3 3 to 4 4 to 5 # Total Avg. (%) to 1 (%) Aug-23 Light & Wonder Inc SciPlay Corp Vote 17% $436 82 $20.00 $22.95 29% 47% 8% 3% 2% 1% -- 4 15% 4% Oct-22 Sumitomo Pharma Co., Ltd. Myovant Sciences Ltd. Vote 48 1,700 23 22.75 27.00 27 50 11 4 2 1 -- 4 19 4 Nov-21 Geneve Holdings Inc Independence Holding Co Tender 38 294 72 50.00 57.00 19 36 12 2 -- -- -- 2 14 7 Aug-21 Banco Santander, S.A. Santander Consumer USA Holdings Inc. Tender 20 2,358 53 39.00 41.50 7 14 2 4 -- -- -- 2 6 3 Aug-20 Ionis Pharmaceuticals Akcea Therapeutics Inc Tender 24 442 12 16.00 18.15 41 59 6 4 2 -- -- 3 13 4 Feb-20 KYOCERA Corp AVX Corp Tender 28 923 86 19.50 21.75 30 45 5 2 4 -- -- 3 12 4 Jul-19 Sonic Financial Corp Speedway Motorsports Inc Tender 28 205 92 18.00 19.75 29 42 7 3 -- -- -- 2 10 5 May-19 NASCAR Media Group LLC International Speedway Corp Tender 16 475 194 42.00 45.00 8 15 1 2 1 1 1 5 7 1 May-19 Employers Mutual Casualty Co EMC Insurance Group Inc Tender 46 295 174 30.00 36.00 25 50 10 9 -- -- -- 2 20 10 Jun-18 Roche Holding AG Foundation Medicine Inc Tender 43 2,132 4 133.00 137.00 30 34 2 1 1 -- -- 3 3 1 Jul-16 American Financial Group Inc National Interstate Corp Vote 49 291 141 30.00 32.50 33 44 2 4 2 -- -- 3 8 3 Mar-13 Danfoss A/S Sauer-Danfoss Inc Tender 24 579 93 49.00 58.50 (7) 11 10 5 2 -- -- 3 19 6 Apr-11 CNA Financial Corporation CNA Surety Corporation Tender 39 371 171 22.00 26.55 14 38 15 4 1 0 -- 4 21 5 Mean 32% $808 92 $37.79 $41.82 22% 37% 7% 4% 2% 1% 1% 3 13% 4% Median 28 442 86 30.00 32.50 27 42 7 4 2 1 1 3 13 4 Nov-22 Schneider Electric SE AVEVA Group plc Vote 41 11,461 65 31.00 (1) 32.25 (1) 41 47 4 -- -- -- -- 1 4 4 For Reference Only (non-US):

Appendix: Supporting Materials
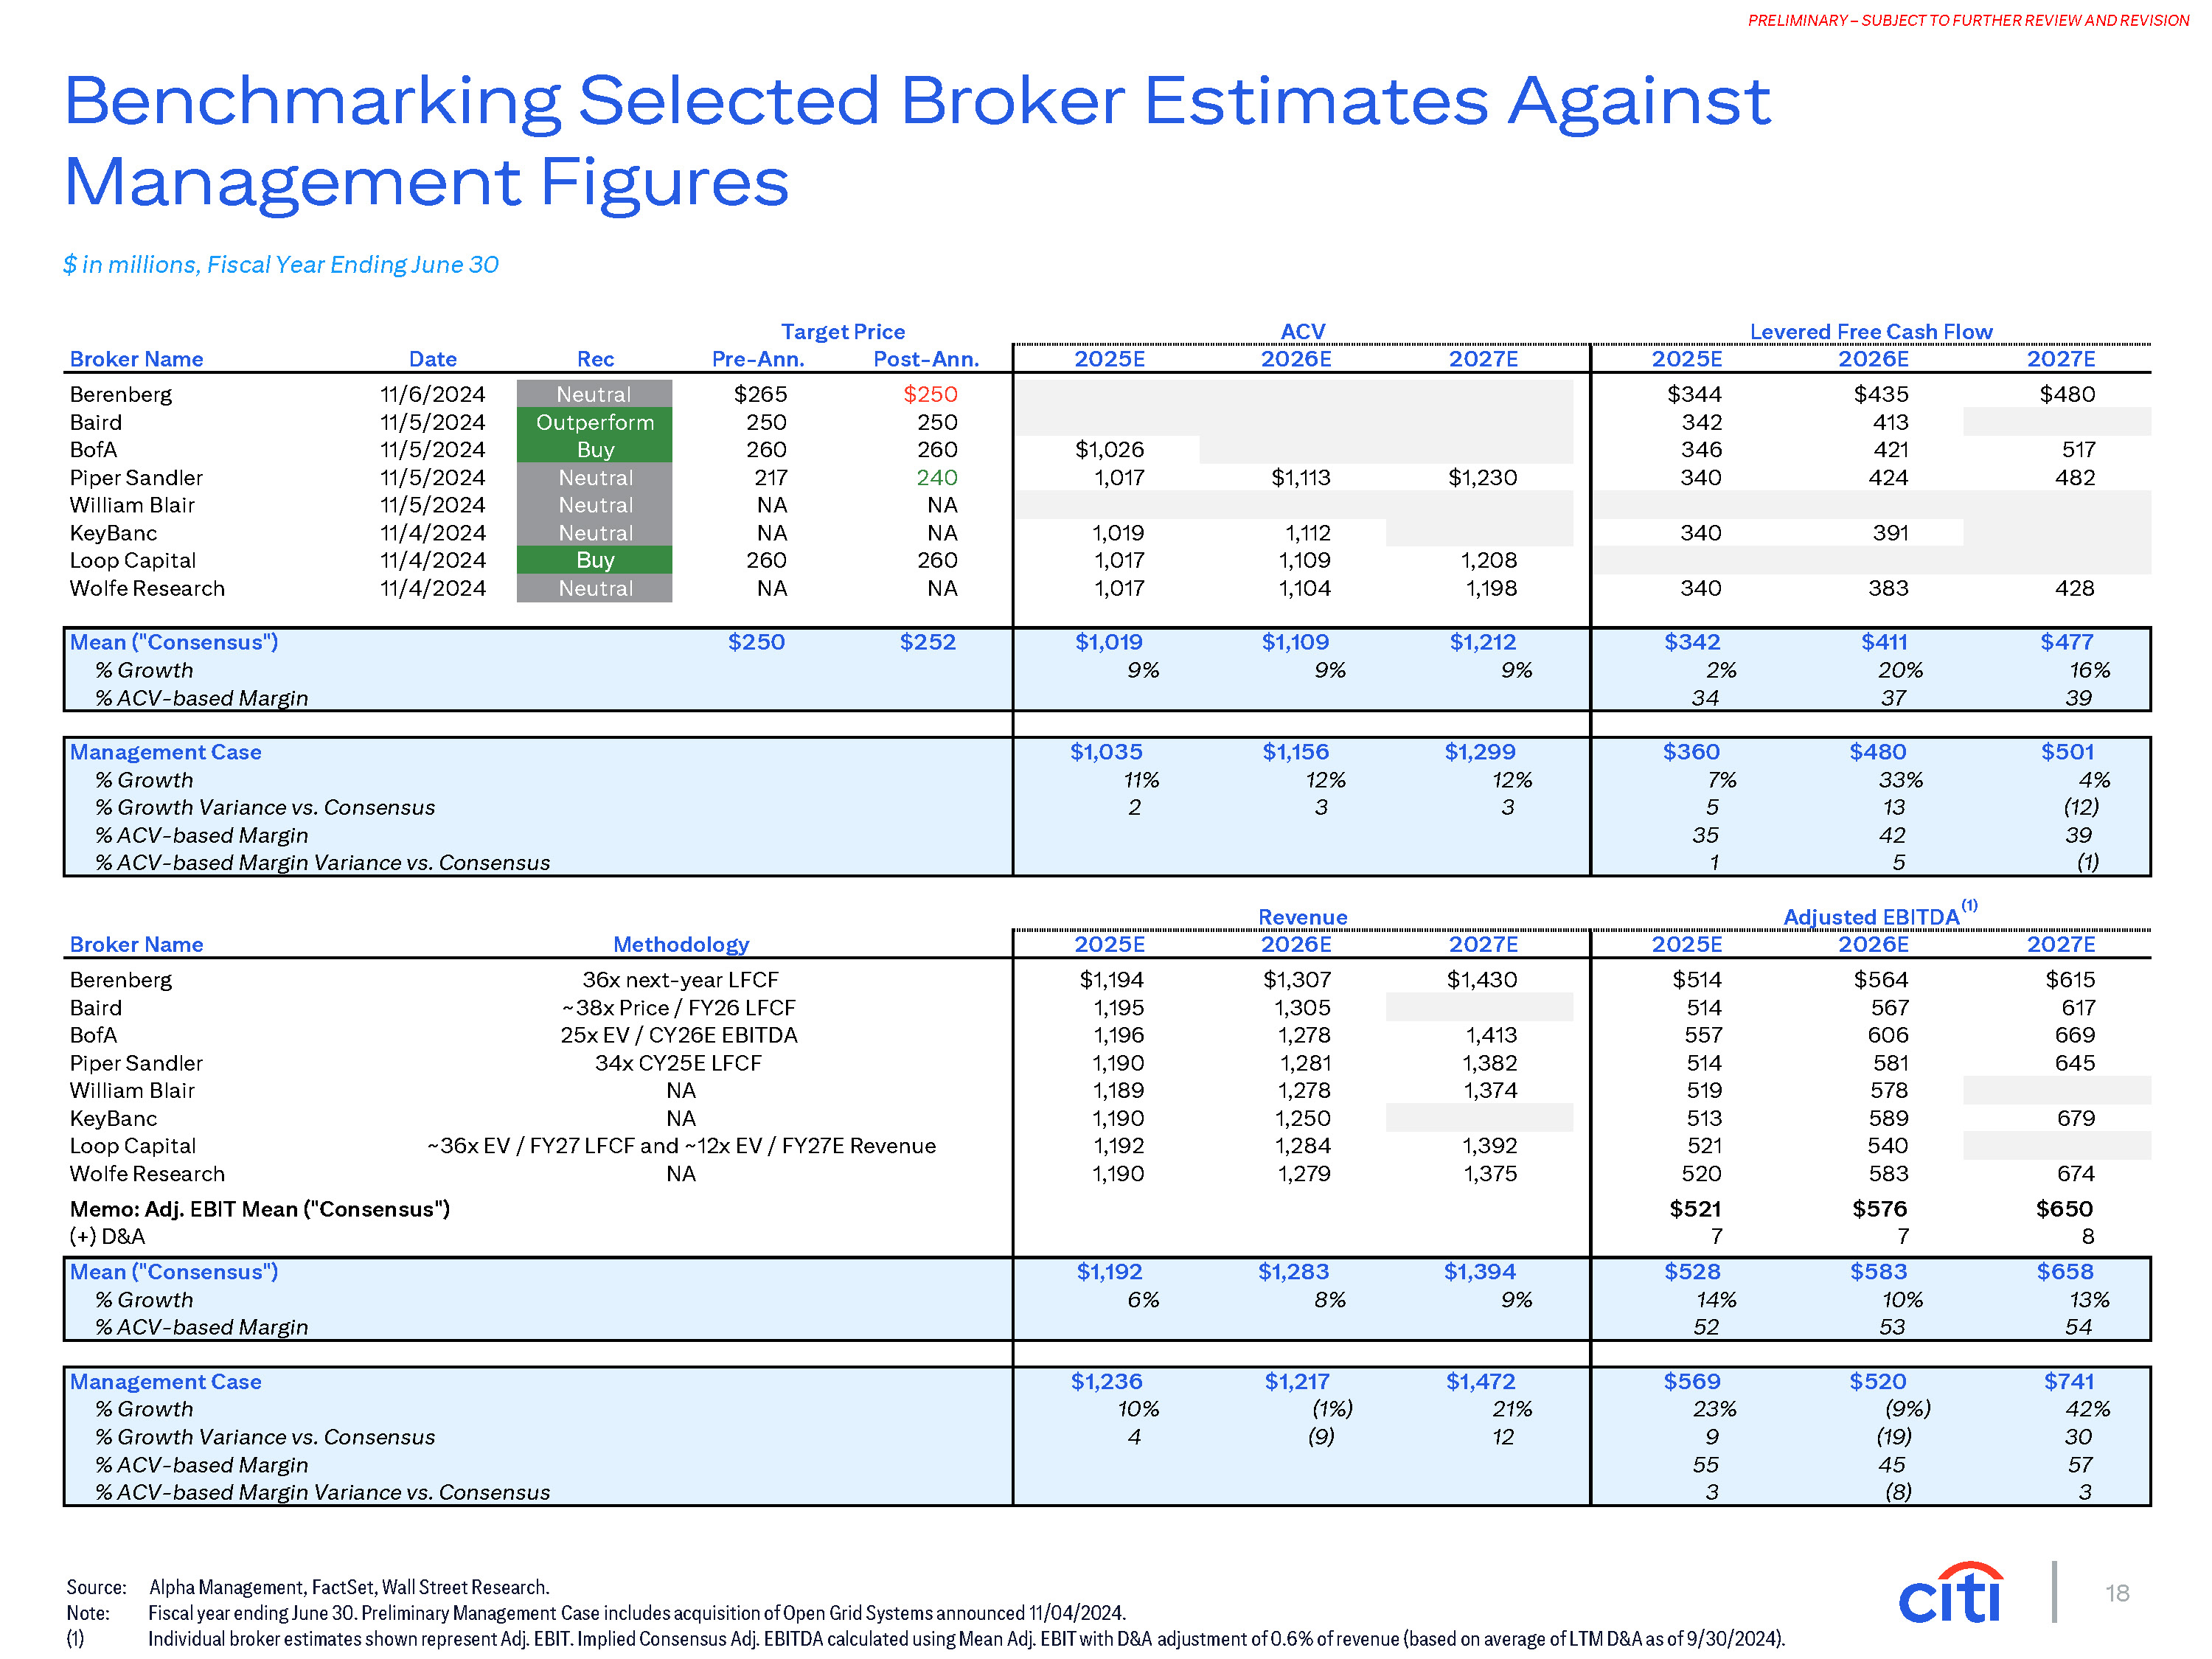
18 PRELIMINARY – SUBJECT TO FURTHER REVIEW AND REVISION Source: Alpha Management, FactSet, Wall Street Research. Note: (1) Fiscal year ending June 30. Preliminary Management Case includes acquisition of Open Grid Systems announced 11/04/2024. Individual broker estimates shown represent Adj. EBIT. Implied Consensus Adj. EBITDA calculated using Mean Adj. EBIT with D&A adjustment of 0.6% of revenue (based on average of LTM D&A as of 9/30/2024). Benchmarking Selected Broker Estimates Against Management Figures 2025E 2026E 2027E 2025E 2026E 2027E Berenberg 11/6/2024 Neutral $265 $250 $344 $435 $480 Baird 11/5/2024 Outperform 250 250 342 413 BofA 11/5/2024 Buy 260 260 $1,026 346 421 517 Piper Sandler 11/5/2024 Neutral 217 240 1,017 $1,113 $1,230 340 424 482 William Blair 11/5/2024 Neutral NA NA KeyBanc 11/4/2024 Neutral NA NA 1,019 1,112 340 391 Loop Capital 11/4/2024 Buy 260 260 1,017 1,109 1,208 Wolfe Research 11/4/2024 Neutral NA NA 1,017 1,104 1,198 340 383 428 Mean ("Consensus") $250 $252 $1,019 $1,109 $1,212 $342 $411 $477 % Growth 9% 9% 9% 2% 20% 16% % ACV-based Margin 34 37 39 Management Case $1,035 $1,156 $1,299 $360 $480 $501 % Growth 11% 12% 12% 7% 33% 4% % Growth Variance vs. Consensus 2 3 3 5 13 (12) % ACV-based Margin 35 42 39 % ACV-based Margin Variance vs. Consensus 1 5 (1) $ in millions, Fiscal Year Ending June 30 Target Price ACV Levered Free Cash Flow Broker Name Date Rec Pre-Ann. Post-Ann. Revenue Broker Name Methodology 2025E 2026E 2027E 2025E 2026E 2027E Berenberg 36x next-year LFCF $1,194 $1,307 $1,430 $514 $564 $615 Baird ~38x Price / FY26 LFCF 1,195 1,305 514 567 617 BofA 25x EV / CY26E EBITDA 1,196 1,278 1,413 557 606 669 Piper Sandler 34x CY25E LFCF 1,190 1,281 1,382 514 581 645 William Blair NA 1,189 1,278 1,374 519 578 KeyBanc NA 1,190 1,250 513 589 679 Loop Capital ~36x EV / FY27 LFCF and ~12x EV / FY27E Revenue 1,192 1,284 1,392 521 540 Wolfe Research NA 1,190 1,279 1,375 520 583 674 Memo: Adj. EBIT Mean ("Consensus") $521 $576 $650 (+) D&A 7 7 8 Mean ("Consensus") $1,192 $1,283 $1,394 $528 $583 $658 % Growth 6% 8% 9% 14% 10% 13% % ACV-based Margin 52 53 54 Management Case $1,236 $1,217 $1,472 $569 $520 $741 % Growth 10% (1%) 21% 23% (9%) 42% % Growth Variance vs. Consensus 4 (9) 12 9 (19) 30 % ACV-based Margin 55 45 57 % ACV-based Margin Variance vs. Consensus 3 (8) 3 Adjusted EBITDA(1)
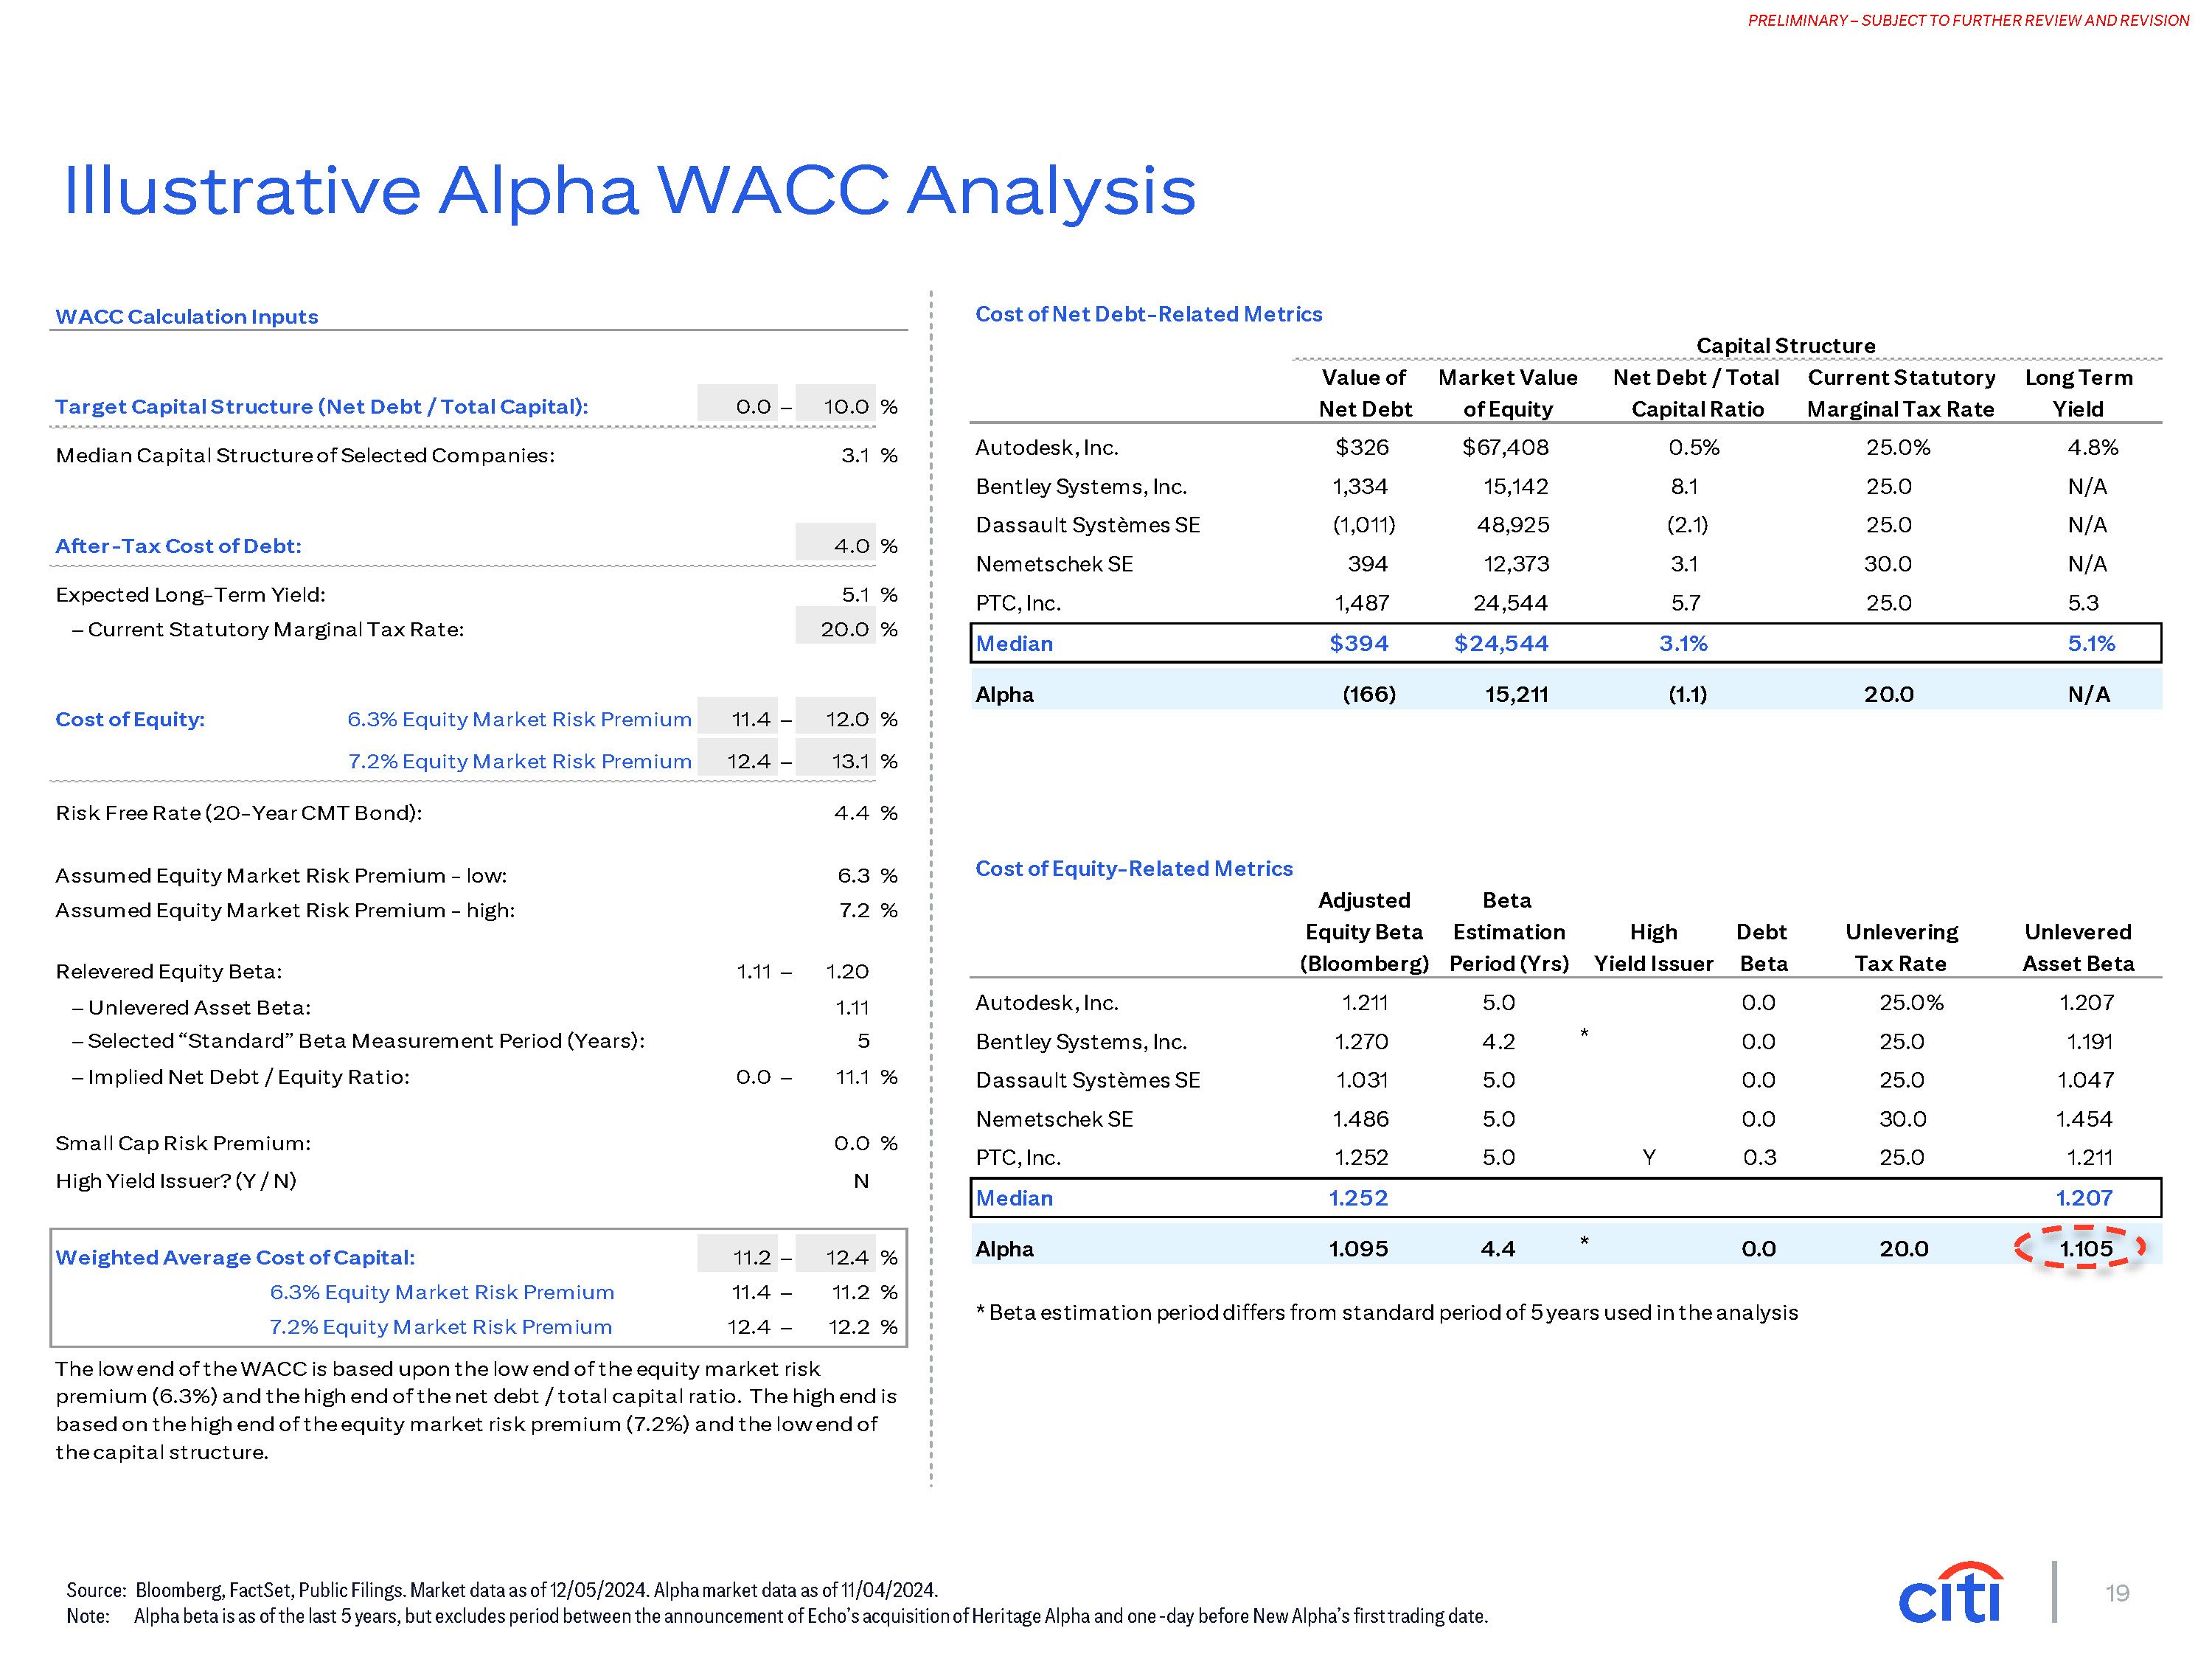
19 PRELIMINARY – SUBJECT TO FURTHER REVIEW AND REVISION Source: Bloomberg, FactSet, Public Filings. Market data as of 12/05/2024. Alpha market data as of 11/04/2024. Note: Alpha beta is as of the last 5 years, but excludes period between the announcement of Echo’s acquisition of Heritage Alpha and one-day before New Alpha’s first trading date. Illustrative Alpha WACC Analysis Cost of Equity: 6.3% Equity Market Risk Premium 7.2% Equity Market Risk Premium 11.4 – 12.4 – 12.0 % 13.1 % Risk Free Rate (20-Year CMT Bond): 4.4 % Assumed Equity Market Risk Premium - low: 6.3 % Assumed Equity Market Risk Premium - high: 7.2 % Relevered Equity Beta: Unlevered Asset Beta: Selected “Standard” Beta Measurement Period (Years): 1.11 – 1.20 1.11 5 – Implied Net Debt / Equity Ratio: 0.0 – 11.1 % WACC Calculation Inputs Target Capital Structure (Net Debt / Total Capital): 0.0 – 10.0 % Median Capital Structure of Selected Companies: 3.1 % After-Tax Cost of Debt: 4.0 % Expected Long-Term Yield: – Current Statutory Marginal Tax Rate: 5.1 % 20.0 % Small Cap Risk Premium: High Yield Issuer? (Y / N) 0.0 % N Weighted Average Cost of Capital: 11.2 – 12.4 % 6.3% Equity Market Risk Premium 11.4 – 11.2 % 7.2% Equity Market Risk Premium 12.4 – 12.2 % * Beta estimation period differs from standard period of 5 years used in the analysis The low end of the WACC is based upon the low end of the equity market risk premium (6.3%) and the high end of the net debt / total capital ratio. The high end is based on the high end of the equity market risk premium (7.2%) and the low end of the capital structure. Median $394 $24,544 3.1% 5.1% Alpha (166) 15,211 (1.1) 20.0 N/A Cost of Equity-Related Metrics Adjusted Equity Beta (Bloomberg) Beta Estimation Period (Yrs) High Yield Issuer Debt Beta Unlevering Tax Rate Unlevered Asset Beta Autodesk, Inc. 1.211 5.0 0.0 25.0% 1.207 Bentley Systems, Inc. 1.270 4.2 * 0.0 25.0 1.191 Dassault Systèmes SE 1.031 5.0 0.0 25.0 1.047 Nemetschek SE 1.486 5.0 0.0 30.0 1.454 PTC, Inc. 1.252 5.0 Y 0.3 25.0 1.211 Median 1.252 1.207 Alpha 1.095 4.4 * 0.0 20.0 1.105 Cost of Net Debt-Related Metrics Capital Structure Value of Net Debt Market Value of Equity Net Debt / Total Capital Ratio Current Statutory Marginal Tax Rate Long Term Yield Autodesk, Inc. $326 $67,408 0.5% 25.0% 4.8% Bentley Systems, Inc. 1,334 15,142 8.1 25.0 N/A Dassault Systèmes SE (1,011) 48,925 (2.1) 25.0 N/A Nemetschek SE 394 12,373 3.1 30.0 N/A PTC, Inc. 1,487 24,544 5.7 25.0 5.3