Exhibit (c)(10)

Discussion Materials for the Special Committee Project Alpha Technology Investment Banking January 26, 2025 | Strictly Private and Confidential
2 Disclaimer The following pages contain material provided to the Special Committee of the Board of Directors of Alpha (the “Company”) by Citigroup Global Markets Inc. (“Citi”) in connection with the proposed transaction involving the Company and Echo. The accompanying material was compiled or prepared on a confidential basis solely for the use of the Special Committee of the Board of Directors of the Company and not with a view toward public disclosure under any securities laws or otherwise. The information contained in the accompanying material was obtained from the Company and other sources. Any estimates and projections contained herein have been prepared or adopted by management of the Company, obtained from public sources, or are based upon such estimates and projections, and involve numerous and significant subjective determinations, and there is no assurance that such estimates and projections will be realized. Citi does not take responsibility for such estimates and projections, or the basis on which they were prepared. No representation or warranty, express or implied, is made as to the accuracy or completeness of such information and nothing contained herein is, or shall be relied upon as, a representation, whether as to the past, the present or the future. In preparing the accompanying material, Citi assumed and relied, without independent verification, upon the accuracy and completeness of all financial and other information and data publicly available or provided to or otherwise reviewed by or discussed with Citi and upon the assurances of the management of the Company, that they are not aware of any relevant information that has been omitted or that remains undisclosed to Citi. The accompanying material was not prepared for use by readers not as familiar with the Company and Echo as the Special Committee of the Board of Directors of the Company and, accordingly, neither the Company nor Citi nor their respective legal or financial advisors or accountants take any responsibility for the accompanying material if used by persons other than the Special Committee of the Board of Directors of the Company. The accompanying material is necessarily based upon information available to Citi, and financial, stock market and other conditions and circumstances existing and disclosed to Citi, as of the date of the accompanying material. Citi does not have any obligation to update or otherwise revise the accompanying material. Nothing contained herein shall be construed as legal, tax or accounting advice.
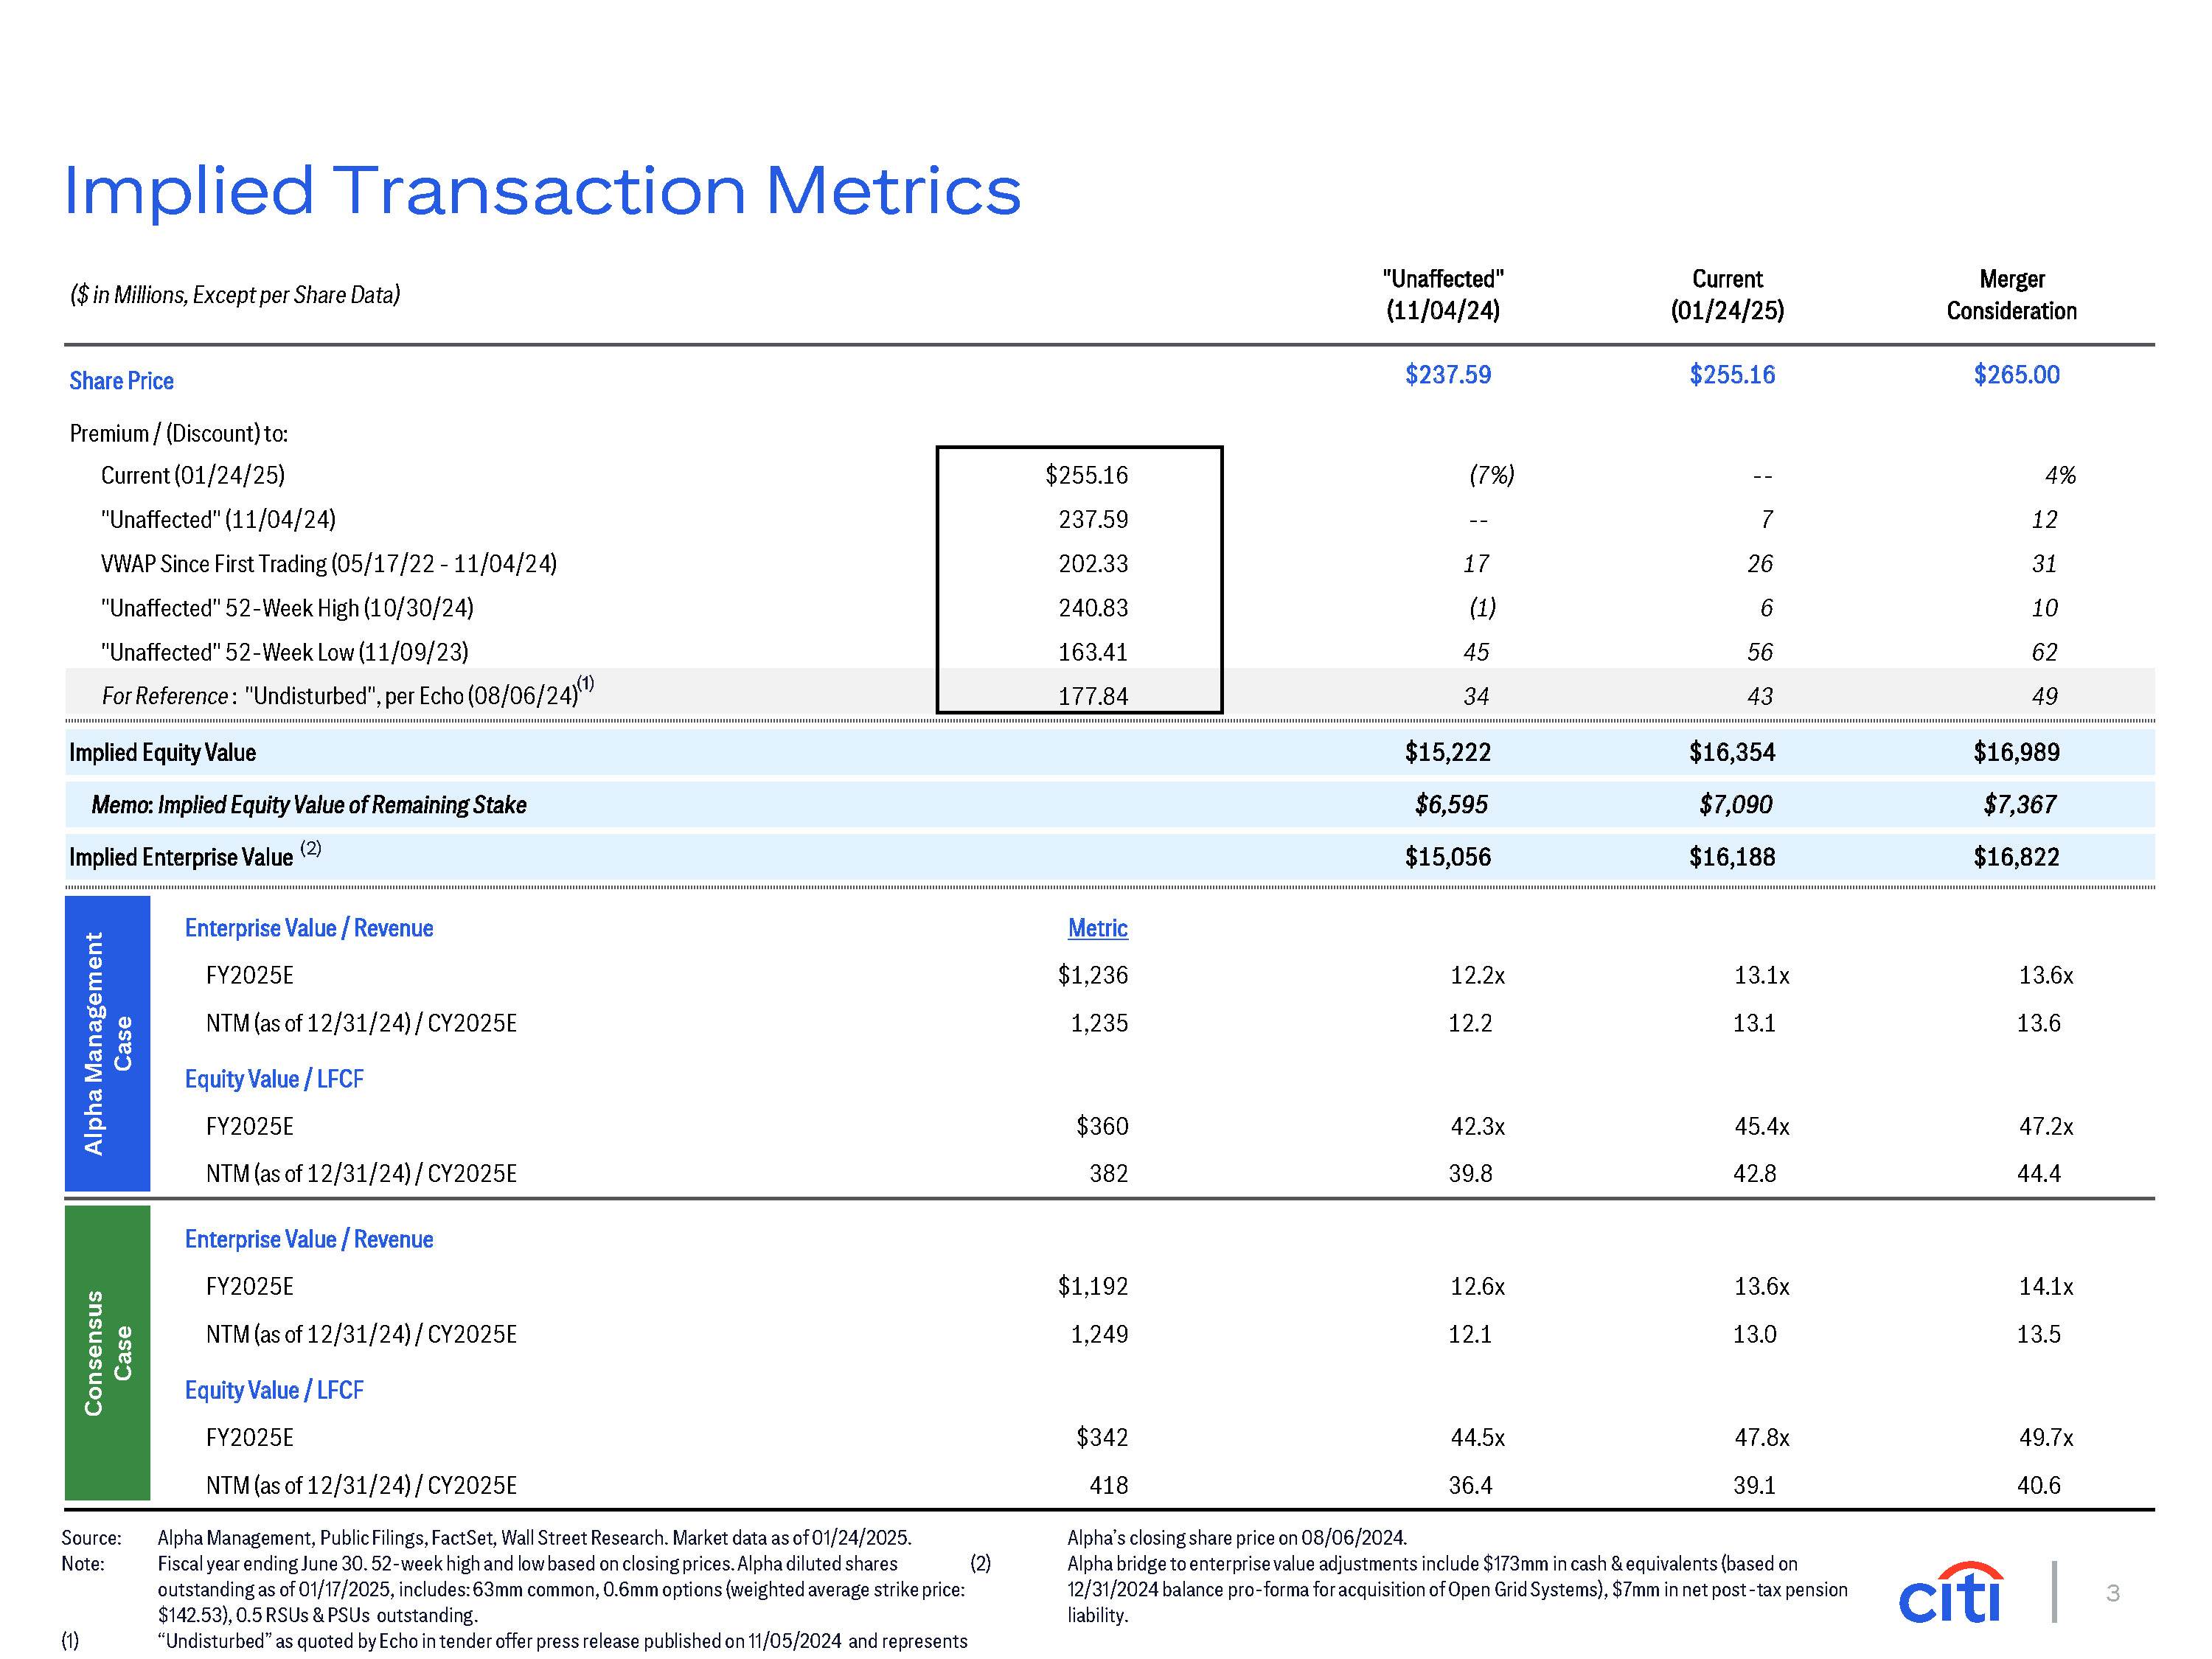
3 Share Price $237.59 $255.16 $265.00 Premium / (Discount) to: Current (01/24/25) $255.16 (7%) -- 4% "Unaffected" (11/04/24) 237.59 -- 7 12 VWAP Since First Trading (05/17/22 - 11/04/24) 202.33 17 26 31 "Unaffected" 52-Week High (10/30/24) 240.83 (1) 6 10 "Unaffected" 52-Week Low (11/09/23) 163.41 45 56 62 For Reference : "Undisturbed", per Echo (08/06/24)(1) 177.84 34 43 49 Implied Equity Value $15,222 $16,354 $16,989 Memo: Implied Equity Value of Remaining Stake $6,595 $7,090 $7,367 Implied Enterprise Value (2) $15,056 $16,188 $16,822 ($ in Millions, Except per Share Data) "Unaffected" (11/04/24) Current (01/24/25) Merger Consideration Enterprise Value / Revenue FY2025E NTM (as of 12/31/24) / CY2025E Metric $1,236 1,235 12.2x 12.2 13.1x 13.1 13.6x 13.6 Equity Value / LFCF FY2025E NTM (as of 12/31/24) / CY2025E $360 382 42.3x 39.8 45.4x 42.8 47.2x 44.4 $1,192 1,249 12.6x 12.1 13.6x 13.0 14.1x 13.5 Enterprise Value / Revenue FY2025E NTM (as of 12/31/24) / CY2025E Equity Value / LFCF FY2025E NTM (as of 12/31/24) / CY2025E $342 418 44.5x 36.4 47.8x 39.1 49.7x 40.6 Source: Alpha Management, Public Filings, FactSet, Wall Street Research. Market data as of 01/24/2025. Note: Fiscal year ending June 30. 52-week high and low based on closing prices. Alpha diluted shares outstanding as of 01/17/2025, includes: 63mm common, 0.6mm options (weighted average strike price: $142.53), 0.5 RSUs & PSUs outstanding. “Undisturbed” as quoted by Echo in tender offer press release published on 11/05/2024 and represents (1) Alpha’s closing share price on 08/06/2024. Alpha bridge to enterprise value adjustments include $173mm in cash & equivalents (based on 12/31/2024 balance pro-forma for acquisition of Open Grid Systems), $7mm in net post-tax pension liability. (2) Implied Transaction Metrics Alpha Management Case Consensus Case
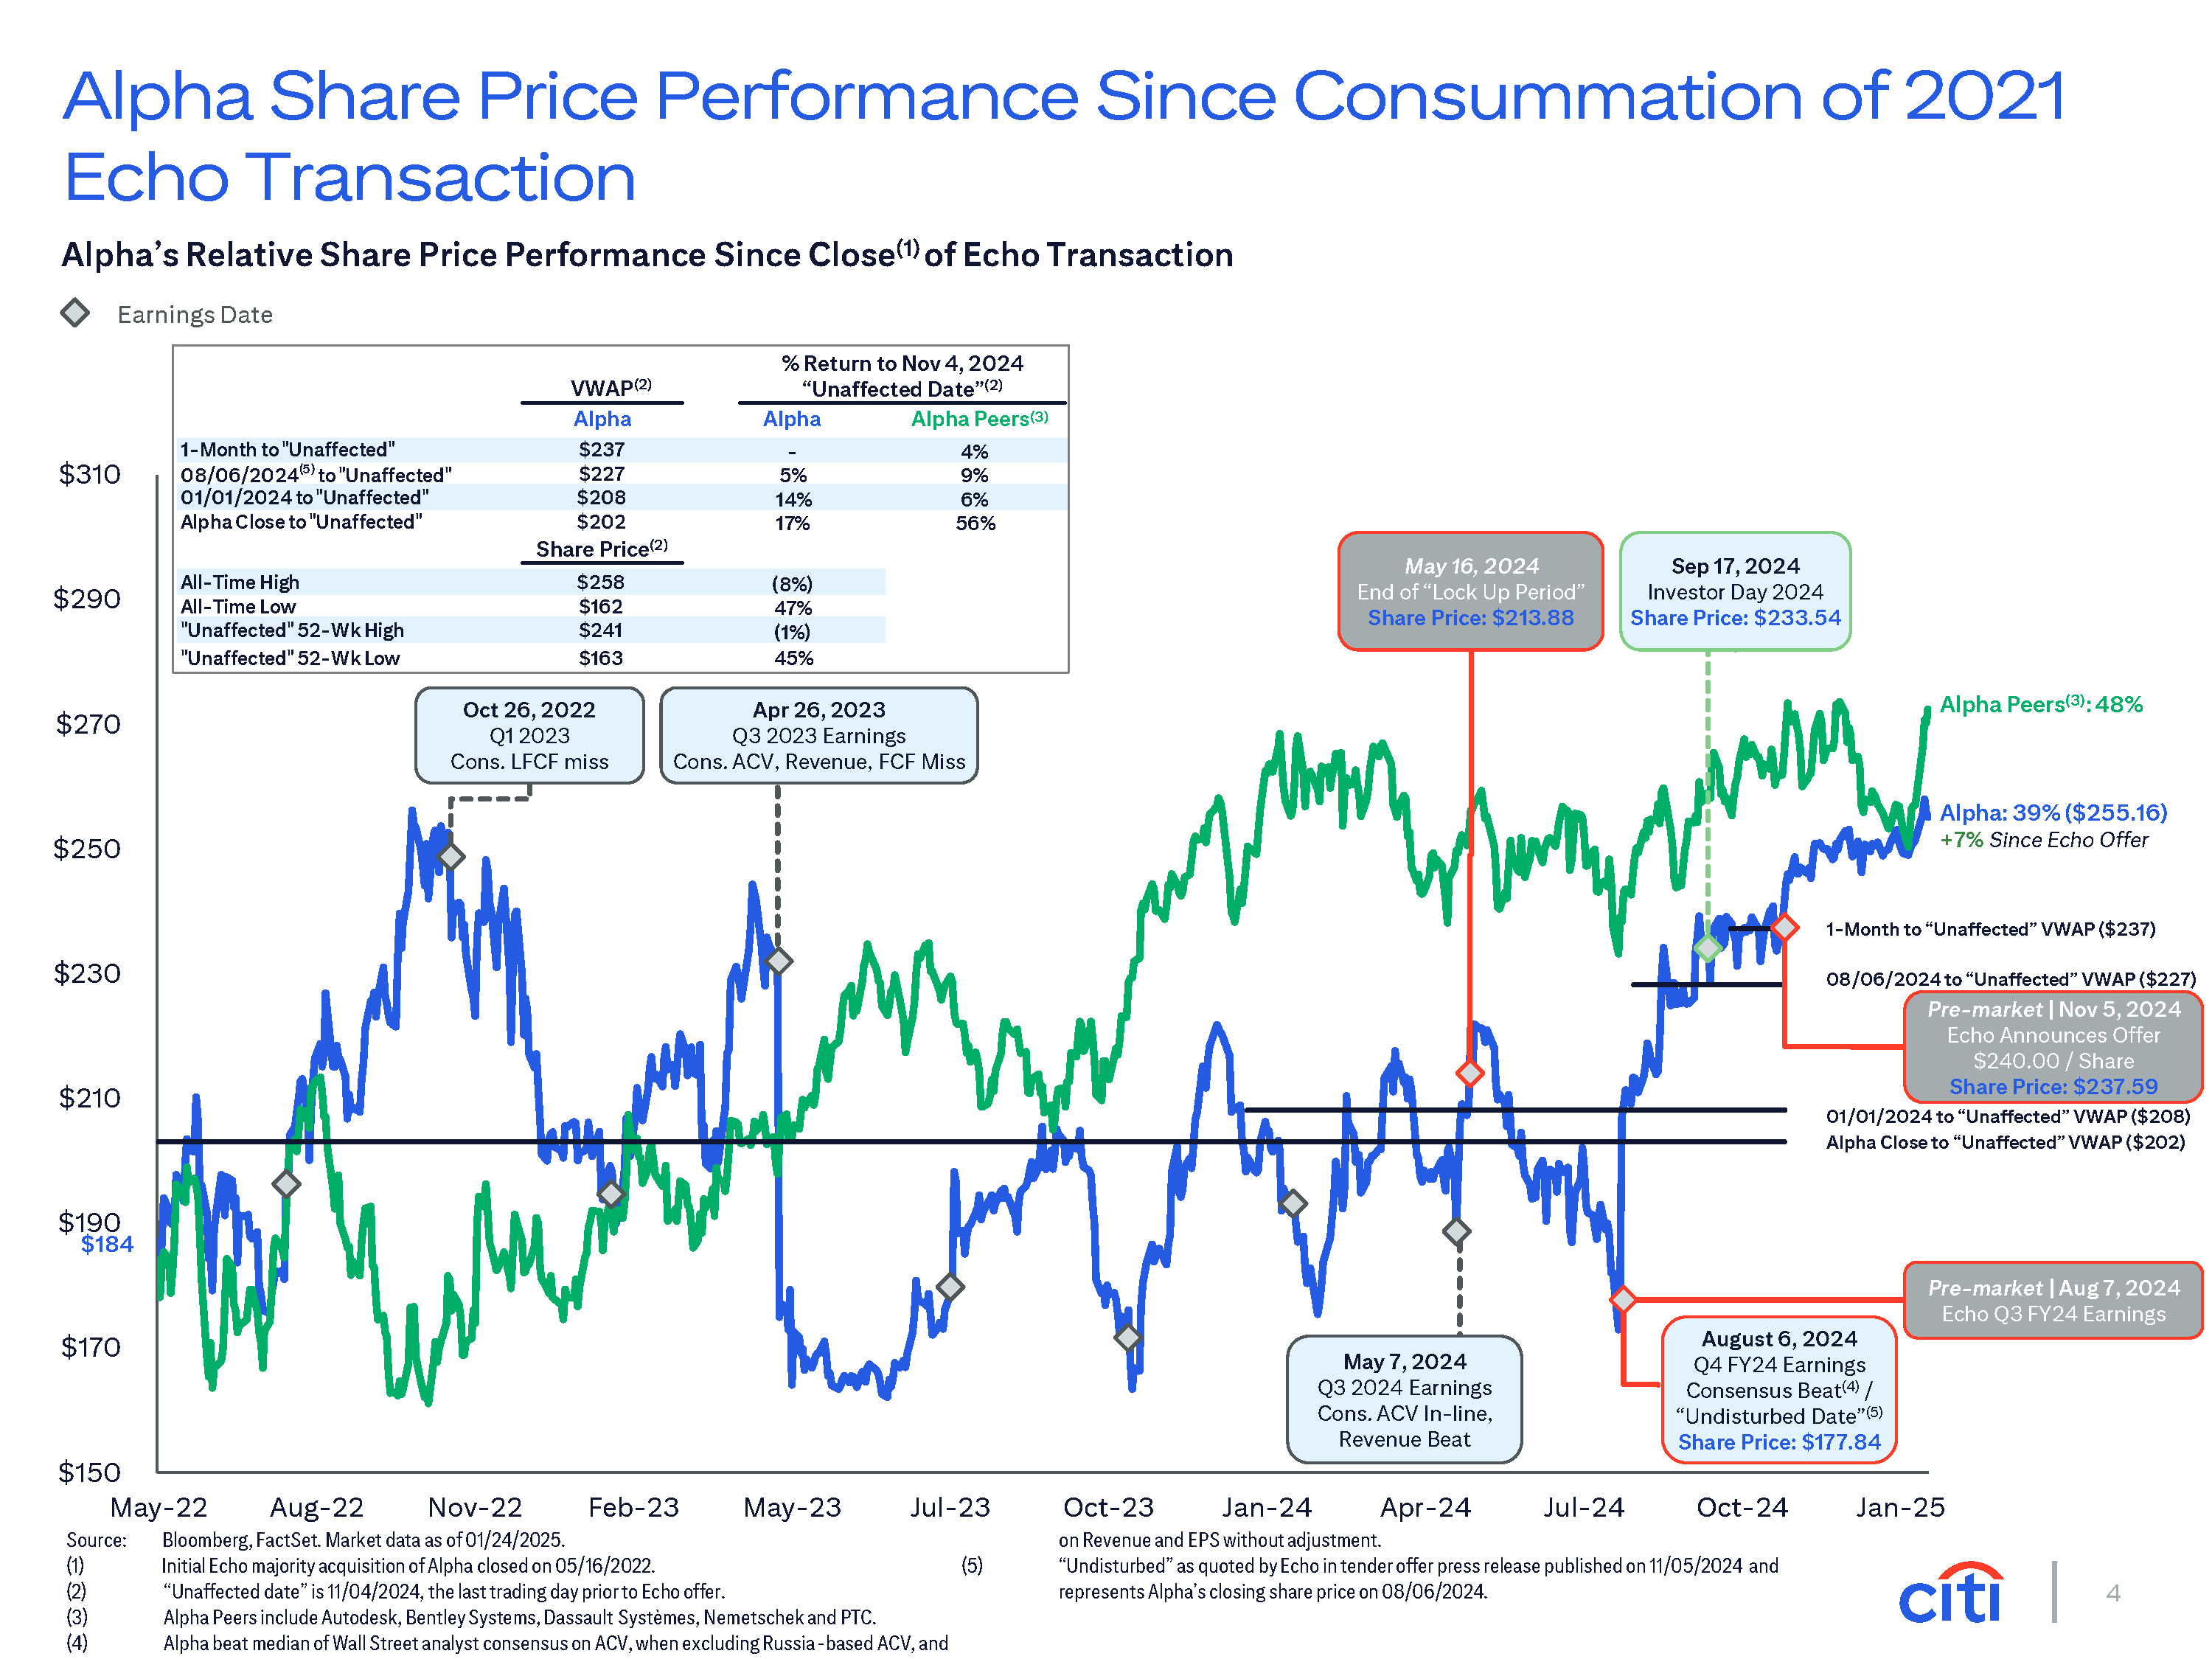
4 $150 $170 $190 $210 $230 $250 $270 $290 $310 May-22 Aug-22 Nov-22 Feb-23 May-23 Jul-23 Jul-24 Oct-24 Jan-25 Alpha Share Price Performance Since Consummation of 2021 Echo Transaction Source: Bloomberg, FactSet. Market data as of 01/24/2025. Initial Echo majority acquisition of Alpha closed on 05/16/2022. “Unaffected date” is 11/04/2024, the last trading day prior to Echo offer. Alpha Peers include Autodesk, Bentley Systems, Dassault Systèmes, Nemetschek and PTC. Alpha beat median of Wall Street analyst consensus on ACV, when excluding Russia-based ACV, and on Revenue and EPS without adjustment. “Undisturbed” as quoted by Echo in tender offer press release published on 11/05/2024 and represents Alpha’s closing share price on 08/06/2024. (5) Alpha Peers(3): 48% Oct 26, 2022 Q1 2023 Cons. LFCF miss Alpha: 39% ($255.16) +7% Since Echo Offer 1-Month to “Unaffected” VWAP ($237) Alpha’s Relative Share Price Performance Since Close(1) of Echo Transaction Earnings Date VWAP(2) Alpha % Return to Nov 4, 2024 “Unaffected Date”(2) Alpha Alpha Peers(3) 1-Month to "Unaffected" $237 - 4% 08/06/2024(5) to "Unaffected" $227 5% 9% 01/01/2024 to "Unaffected" $208 14% 6% Alpha Close to "Unaffected" $202 Share Price(2) 17% 56% All-Time High $258 (8%) All-Time Low $162 47% "Unaffected" 52-Wk High $241 (1%) "Unaffected" 52-Wk Low $163 45% $184 Pre-market | Aug 7, 2024 Echo Q3 FY24 Earnings 01/01/2024 to “Unaffected” VWAP ($208) Alpha Close to “Unaffected” VWAP ($202) 08/06/2024 to “Unaffected” VWAP ($227) Pre-market | Nov 5, 2024 Echo Announces Offer $240.00 / Share Share Price: $237.59 August 6, 2024 Q4 FY24 Earnings Consensus Beat(4) / “Undisturbed Date”(5) Share Price: $177.84 Apr 26, 2023 Q3 2023 Earnings Cons. ACV, Revenue, FCF Miss May 7, 2024 Q3 2024 Earnings Cons. ACV In-line, Revenue Beat Oct-23 Jan-24 Apr-24 Sep 17, 2024 Investor Day 2024 Share Price: $233.54 May 16, 2024 End of “Lock Up Period” Share Price: $213.88
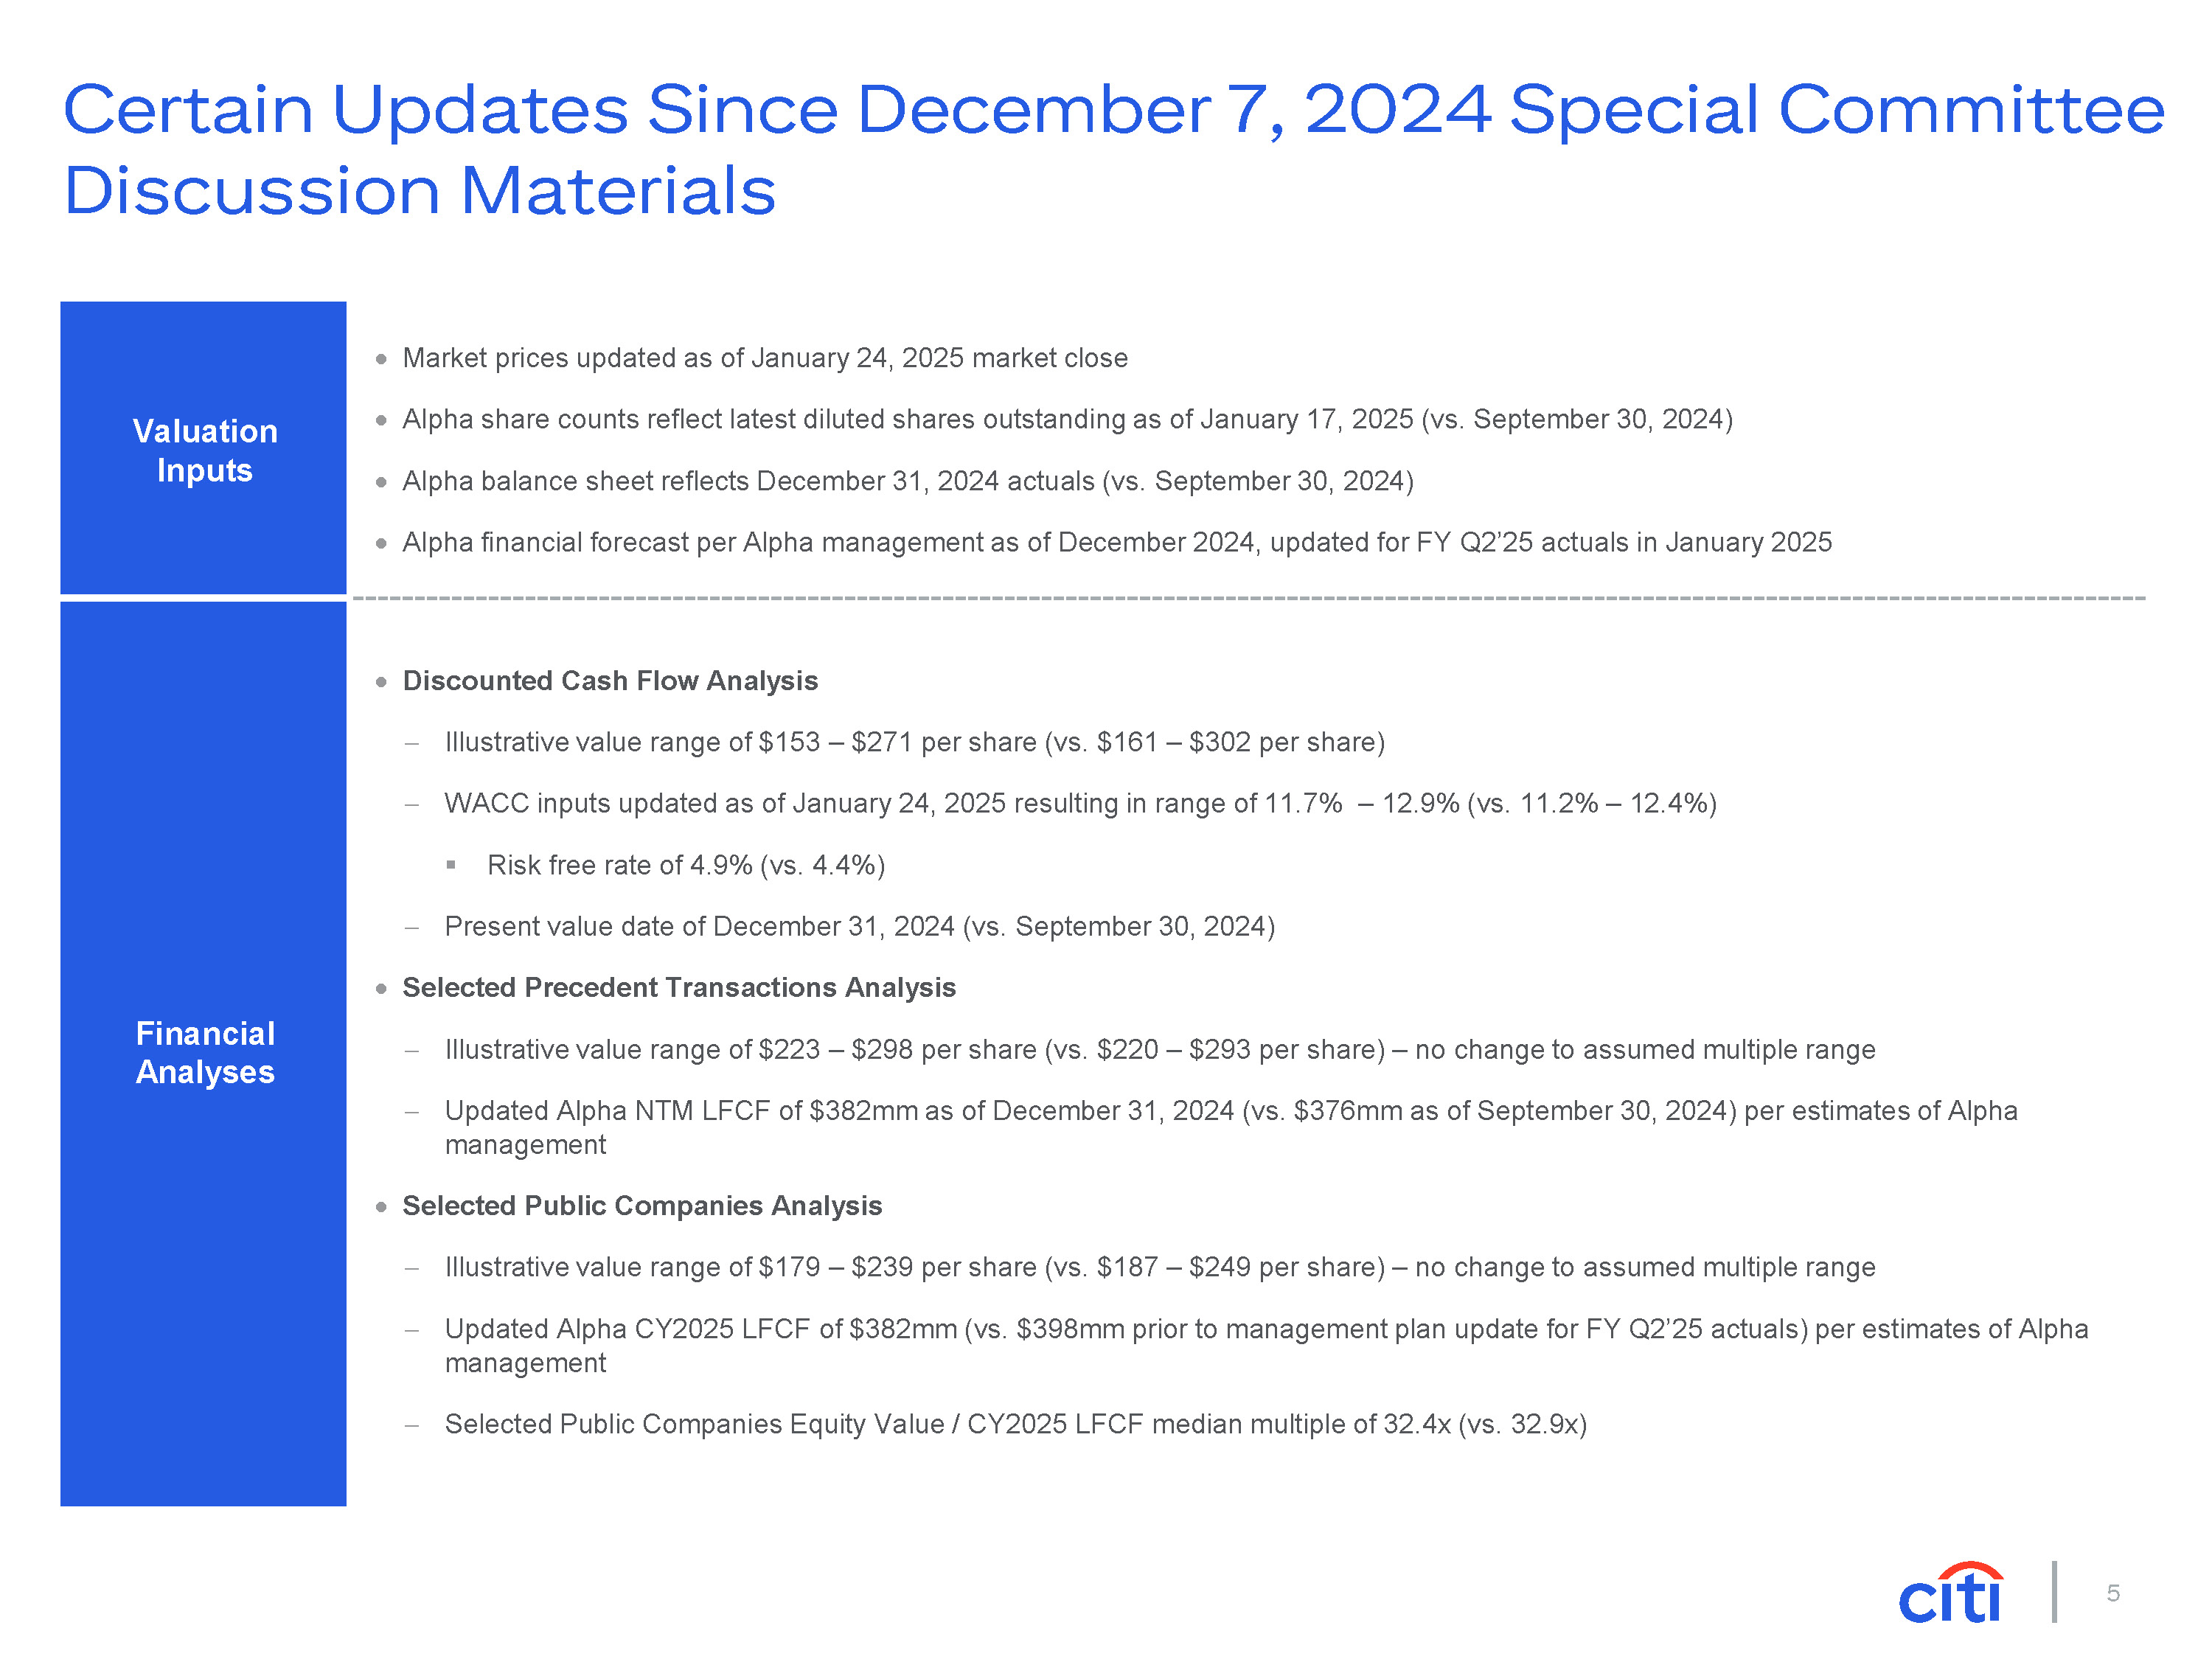
5 Certain Updates Since December 7, 2024 Special Committee Discussion Materials Valuation Inputs Market prices updated as of January 24, 2025 market close Alpha share counts reflect latest diluted shares outstanding as of January 17, 2025 (vs. September 30, 2024) Alpha balance sheet reflects December 31, 2024 actuals (vs. September 30, 2024) Alpha financial forecast per Alpha management as of December 2024, updated for FY Q2’25 actuals in January 2025 Financial Analyses Discounted Cash Flow Analysis Illustrative value range of $153 – $271 per share (vs. $161 – $302 per share) WACC inputs updated as of January 24, 2025 resulting in range of 11.7% – 12.9% (vs. 11.2% – 12.4%) Risk free rate of 4.9% (vs. 4.4%) Present value date of December 31, 2024 (vs. September 30, 2024) Selected Precedent Transactions Analysis Illustrative value range of $223 – $298 per share (vs. $220 – $293 per share) – no change to assumed multiple range Updated Alpha NTM LFCF of $382mm as of December 31, 2024 (vs. $376mm as of September 30, 2024) per estimates of Alpha management Selected Public Companies Analysis Illustrative value range of $179 – $239 per share (vs. $187 – $249 per share) – no change to assumed multiple range Updated Alpha CY2025 LFCF of $382mm (vs. $398mm prior to management plan update for FY Q2’25 actuals) per estimates of Alpha management Selected Public Companies Equity Value / CY2025 LFCF median multiple of 32.4x (vs. 32.9x)

6 Illustrative Financial Forecast Overview Management Case vs. Wall Street Consensus ACV $ in millions Revenue $ in millions Management Case Consensus (Mean) $885 $933 $1,019 $1,109 $1,212 $1,035 $1,156 $1,299 $1,469 $1,669 $1,898 FY23A FY24A FY25E FY26E FY27E FY28E FY29E FY30E $1,044 $1,127 $1,192 $1,283 $1,394 $1,236 $1,217 $1,472 $1,713 $1,974 $2,241 FY25E FY26E FY27E FY28E FY29E FY30E $401 $463 $583 $658 $569 $520 $741 $945 $1,167 $1,322 FY26E FY27E FY28E FY29E FY30E $306 $336 $411 $477 $360 $480 $501 $638 $735 $834 FY26E FY27E FY28E FY29E FY30E 11% 12% 12% 13% 14% 14% 9% 9% 9% NA NA NA 3% 3% NA NA NA Consensus Growth % NA NA Growth Variance NA NA 2% Adj. EBITDA (Pre-SBC) $ in millions Mgmt. Growth % 12% 5% 10% (1%) 21% 16% 15% 13% 6% 8% 9% NA NA NA 4% (9%) 12% NA NA NA 1% 8% Consensus Growth % NA NA Growth Variance NA NA Levered Free Cash Flow (Pre-SBC) $ in millions FY23A FY24A Mgmt. Growth % 45% 50% 55% 45% 57% 64% 70% 70% NA 52% 53% 54% NA NA NA NA 3% (8%) 3% NA NA NA Consensus Margin (ACV-based) % NA Margin Variance NA $528 FY23A FY24A FY25E Mgmt. Margin (ACV-based) % 35% 36% 35% 42% 39% 43% 44% 44% 34% 37% 39% NA NA NA 1% 5% (1%) NA NA NA Consensus Margin (ACV-based) % NA NA Margin Variance NA NA $342 FY23A FY24A FY25E Mgmt. Margin (ACV-based) % Source: Wall Street Research. Alpha management plan as of December 2024, updated for FY Q2’25 actuals in January 2025. Note: Fiscal year ending June 30. Preliminary Management Case includes acquisition of Open Grid Systems announced 11/04/2024. Long-term guidance based on September 2024 Investor Day presentation. Management FY25E guidance inclusive of $10mm in estimated Russia exit costs and $8mm in estimated Restructuring costs. FY25 Guidance: ~$1,017mm / 9% Growth FY25 Guidance: ~$1,190mm LT Guidance(1): High Single – Low Double Digit Growth LT Guidance(1): 40-43% LFCF Margin / Mid-Teens Growth FY25 Guidance: ~$340mm(2) / 33% LFCF Margin
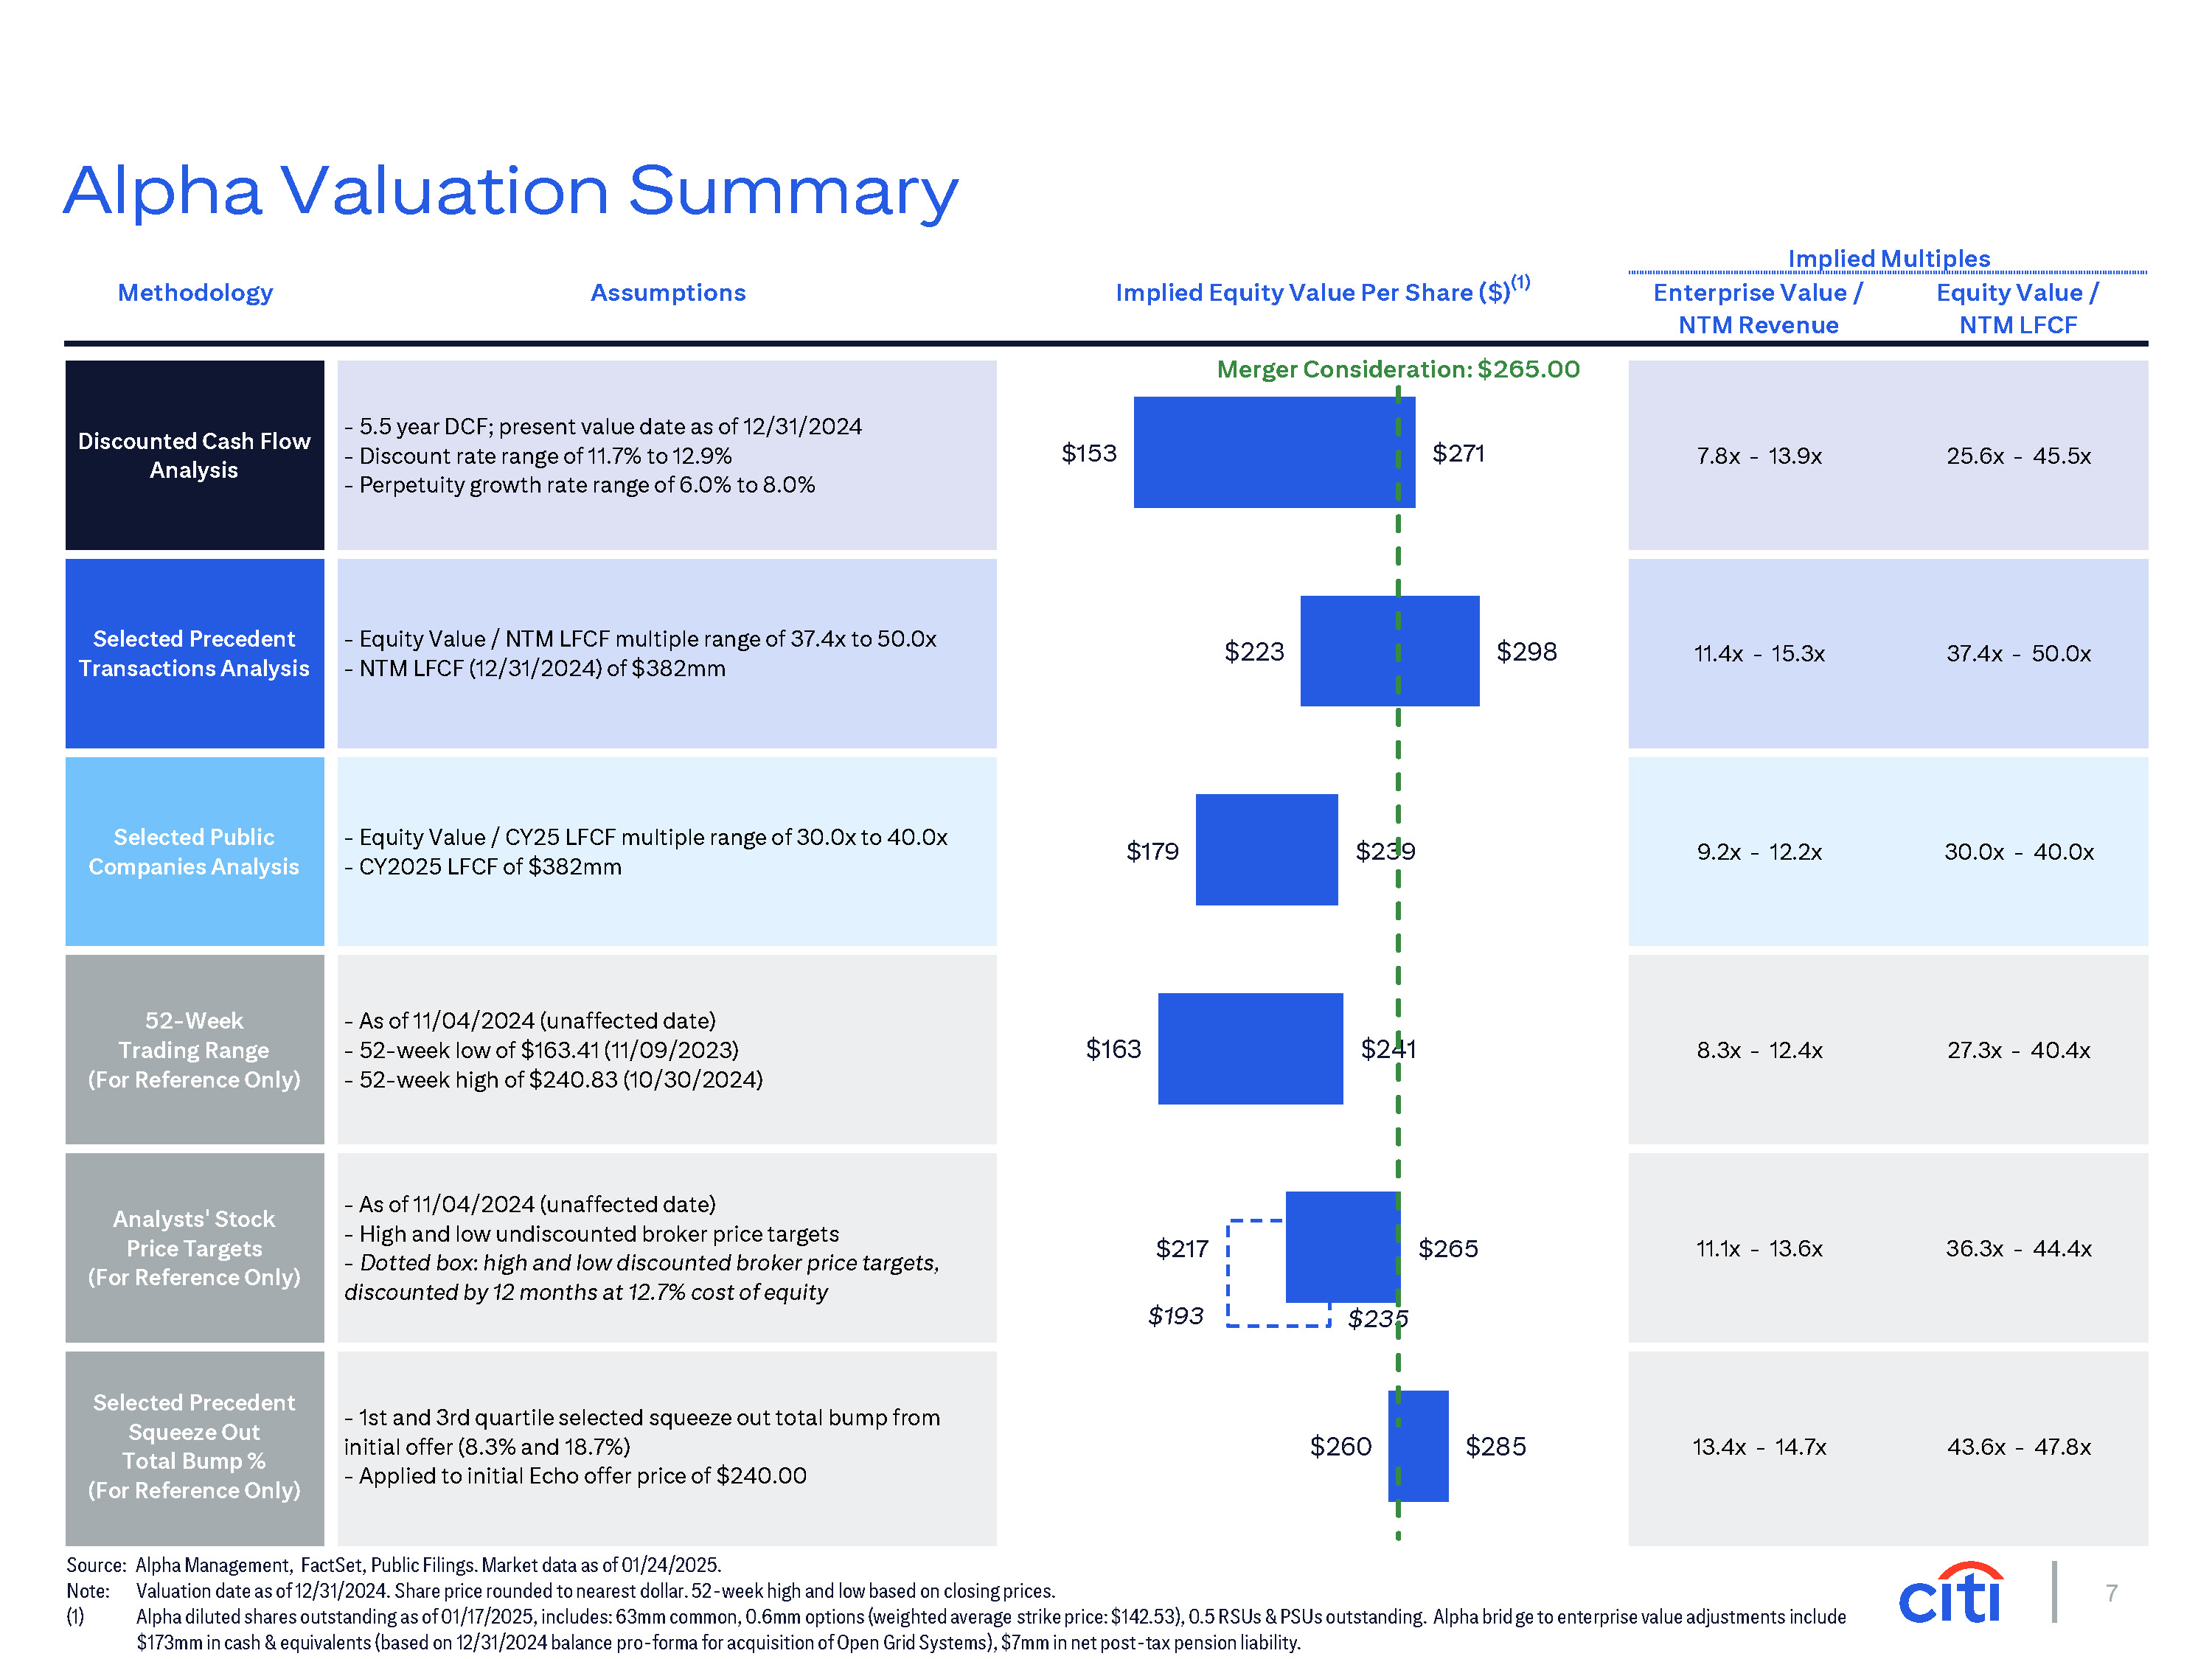
7 Discounted Cash Flow Analysis 5.5 year DCF; present value date as of 12/31/2024 Discount rate range of 11.7% to 12.9% Perpetuity growth rate range of 6.0% to 8.0% Selected Precedent Transactions Analysis - Equity Value / NTM LFCF multiple range of 37.4x to 50.0x - NTM LFCF (12/31/2024) of $382mm Selected Public Companies Analysis Equity Value / CY25 LFCF multiple range of 30.0x to 40.0x CY2025 LFCF of $382mm 52-Week Trading Range (For Reference Only) - As of 11/04/2024 (unaffected date) - 52-week low of $163.41 (11/09/2023) - 52-week high of $240.83 (10/30/2024) 1 Analysts' Stock Price Targets (For Reference Only) As of 11/04/2024 (unaffected date) High and low undiscounted broker price targets Dotted box: high and low discounted broker price targets, 1discounted by 12 months at 12.7% cost of equity Selected Precedent Squeeze Out Total Bump % (For Reference Only) 1st and 3rd quartile selected squeeze out total bump from initial offer (8.3% and 18.7%) Applied to initial Echo offer price of $240.00 7.8x - 13.9x 25.6x - 45.5x 11.4x - 15.3x 37.4x - 50.0x 9.2x - 12.2x 30.0x - 40.0x 8.3x - 12.4x 27.3x - 40.4x 11.1x - 13.6x 36.3x - 44.4x 13.4x - 14.7x 43.6x - 47.8x Implied Multiples Enterprise Value / NTM Revenue Equity Value / NTM LFCF Methodology Assumptions Implied Equity Value Per Share ($)(1) $153 $223 $179 $163 $217 $260 $271 $298 $239 $241 $265 $285 $193 $235 Source: Alpha Management, FactSet, Public Filings. Market data as of 01/24/2025. Note: Valuation date as of 12/31/2024. Share price rounded to nearest dollar. 52-week high and low based on closing prices. (1) Alpha diluted shares outstanding as of 01/17/2025, includes: 63mm common, 0.6mm options (weighted average strike price: $142.53), 0.5 RSUs & PSUs outstanding. Alpha bridge to enterprise value adjustments include $173mm in cash & equivalents (based on 12/31/2024 balance pro-forma for acquisition of Open Grid Systems), $7mm in net post-tax pension liability. Alpha Valuation Summary Merger Consideration: $265.00

8 Source: Alpha Management, FactSet, Public Filings. Market data as of 01/24/2025. Note: Valuation date as of 12/31/2024. Assumes mid-year discounting. Share price rounded to nearest dollar. Terminal year cash tax assumes zero change in deferred tax liability, assumes D&A equal to Capex. Cash tax impact of remaining DTLs in FY31 to FY33 results in reduction in implied Enterprise Value at ($88mm at midpoint WACC). Terminal change in NWC based on average of change in NWC and interest income for FY28-FY30, less terminal interest income. (3) Alpha diluted shares outstanding as of 01/17/2025, includes: 63mm common, 0.6mm options (weighted average strike price: $142.53), 0.5 RSUs & PSUs outstanding. Alpha bridge to enterprise value adjustments include $173mm in cash & equivalents (based on 12/31/2024 balance pro-forma for acquisition of Open Grid Systems), $7mm in net post-tax pension liability. At midpoint discount rate and perpetuity growth rate. Variables sensitized in years 2026E through to terminal year. (4) Unlevered Free Cash Flow Profile Illustrative Sensitivity Analysis Illustrative Discounted Cash Flow Analysis – Alpha Mgmt. LRP 6 Months Ended Fiscal Year Ended June 30, Terminal ($ mm) 6/30/2025 2026E 2027E 2028E 2029E 2030E Year Memo: ACV $1,035 $1,156 $1,299 $1,469 $1,669 $1,898 $1,898 % Growth 11.6% 12.4% 13.1% 13.7% 13.7% Revenue $716 $1,217 $1,472 $1,713 $1,974 $2,241 $2,241 % Growth (1.5%) 20.9% 16.3% 15.3% 13.5% Adj. EBITDA $368 $520 $741 $945 $1,167 $1,322 $1,322 % Margin 51.4% 42.7% 50.3% 55.2% 59.1% 59.0% 59.0% (–) SBC (26) (57) (56) (57) (56) (56) (56) Adj. EBITDA (Post-SBC) $343 $463 $684 $888 $1,111 $1,265 $1,265 % Margin 47.8% 38.1% 46.5% 51.9% 56.3% 56.5% 56.5% Memo: Income Before Tax $146 $122 $336 $551 $793 $954 $958 % Margin 20.4% 10.0% 22.8% 32.2% 40.2% 42.6% (–) Cash Tax (72) (120) (153) (179) (223) (248) (193)(1) % Tax Rate 48.8% 98.4% 45.4% 32.5% 28.1% 26.0% 20.1% (+) Interest Income from Revenue Rec. 29 53 50 54 64 64 64 (-) Operational Amortization (0) (1) (1) (1) (1) (1) (1) (–) Increase in NWC 14 45 (119) (164) (257) (287) (240)(2) (–) Capital Expenditures (9) (16) (15) (15) (15) (15) (15) Unlevered Free Cash Flow (Post-SBC) $305 $425 $446 $582 $679 $778 $882 % Growth 37.0% 5.0% 30.6% 16.7% 14.6% % of ACV 29.4% 36.7% 34.3% 39.6% 40.7% 41.0% 46.5% ACV Growth (+/- 100 bps) UFCF % of ACV (+/- 100 bps) ($4.15) ($7.65) $7.90 $4.15 Variable Equity Value per Share Sensitivity(4) Perpetuity Growth Rate 6.0% 7.0% 8.0% Perpetuity Growth Rate Perpetuity Growth Rate 6.0% 7.0% 8.0% 6.0% 7.0% 8.0% Discount Implied Equity Value Implied Terminal UFCF Terminal Value as a Rate Per Share(3) Multiple (Pre-SBC) % of Enterprise Value 11.7% $186 $220 $271 12.3 168 194 233 12.9 153 174 204 18.6x 22.8x 29.3x 80.9% 83.8% 86.9% 16.9 20.2 25.2 79.1 81.9 85.0 15.4 18.2 22.2 77.3 80.1 83.0
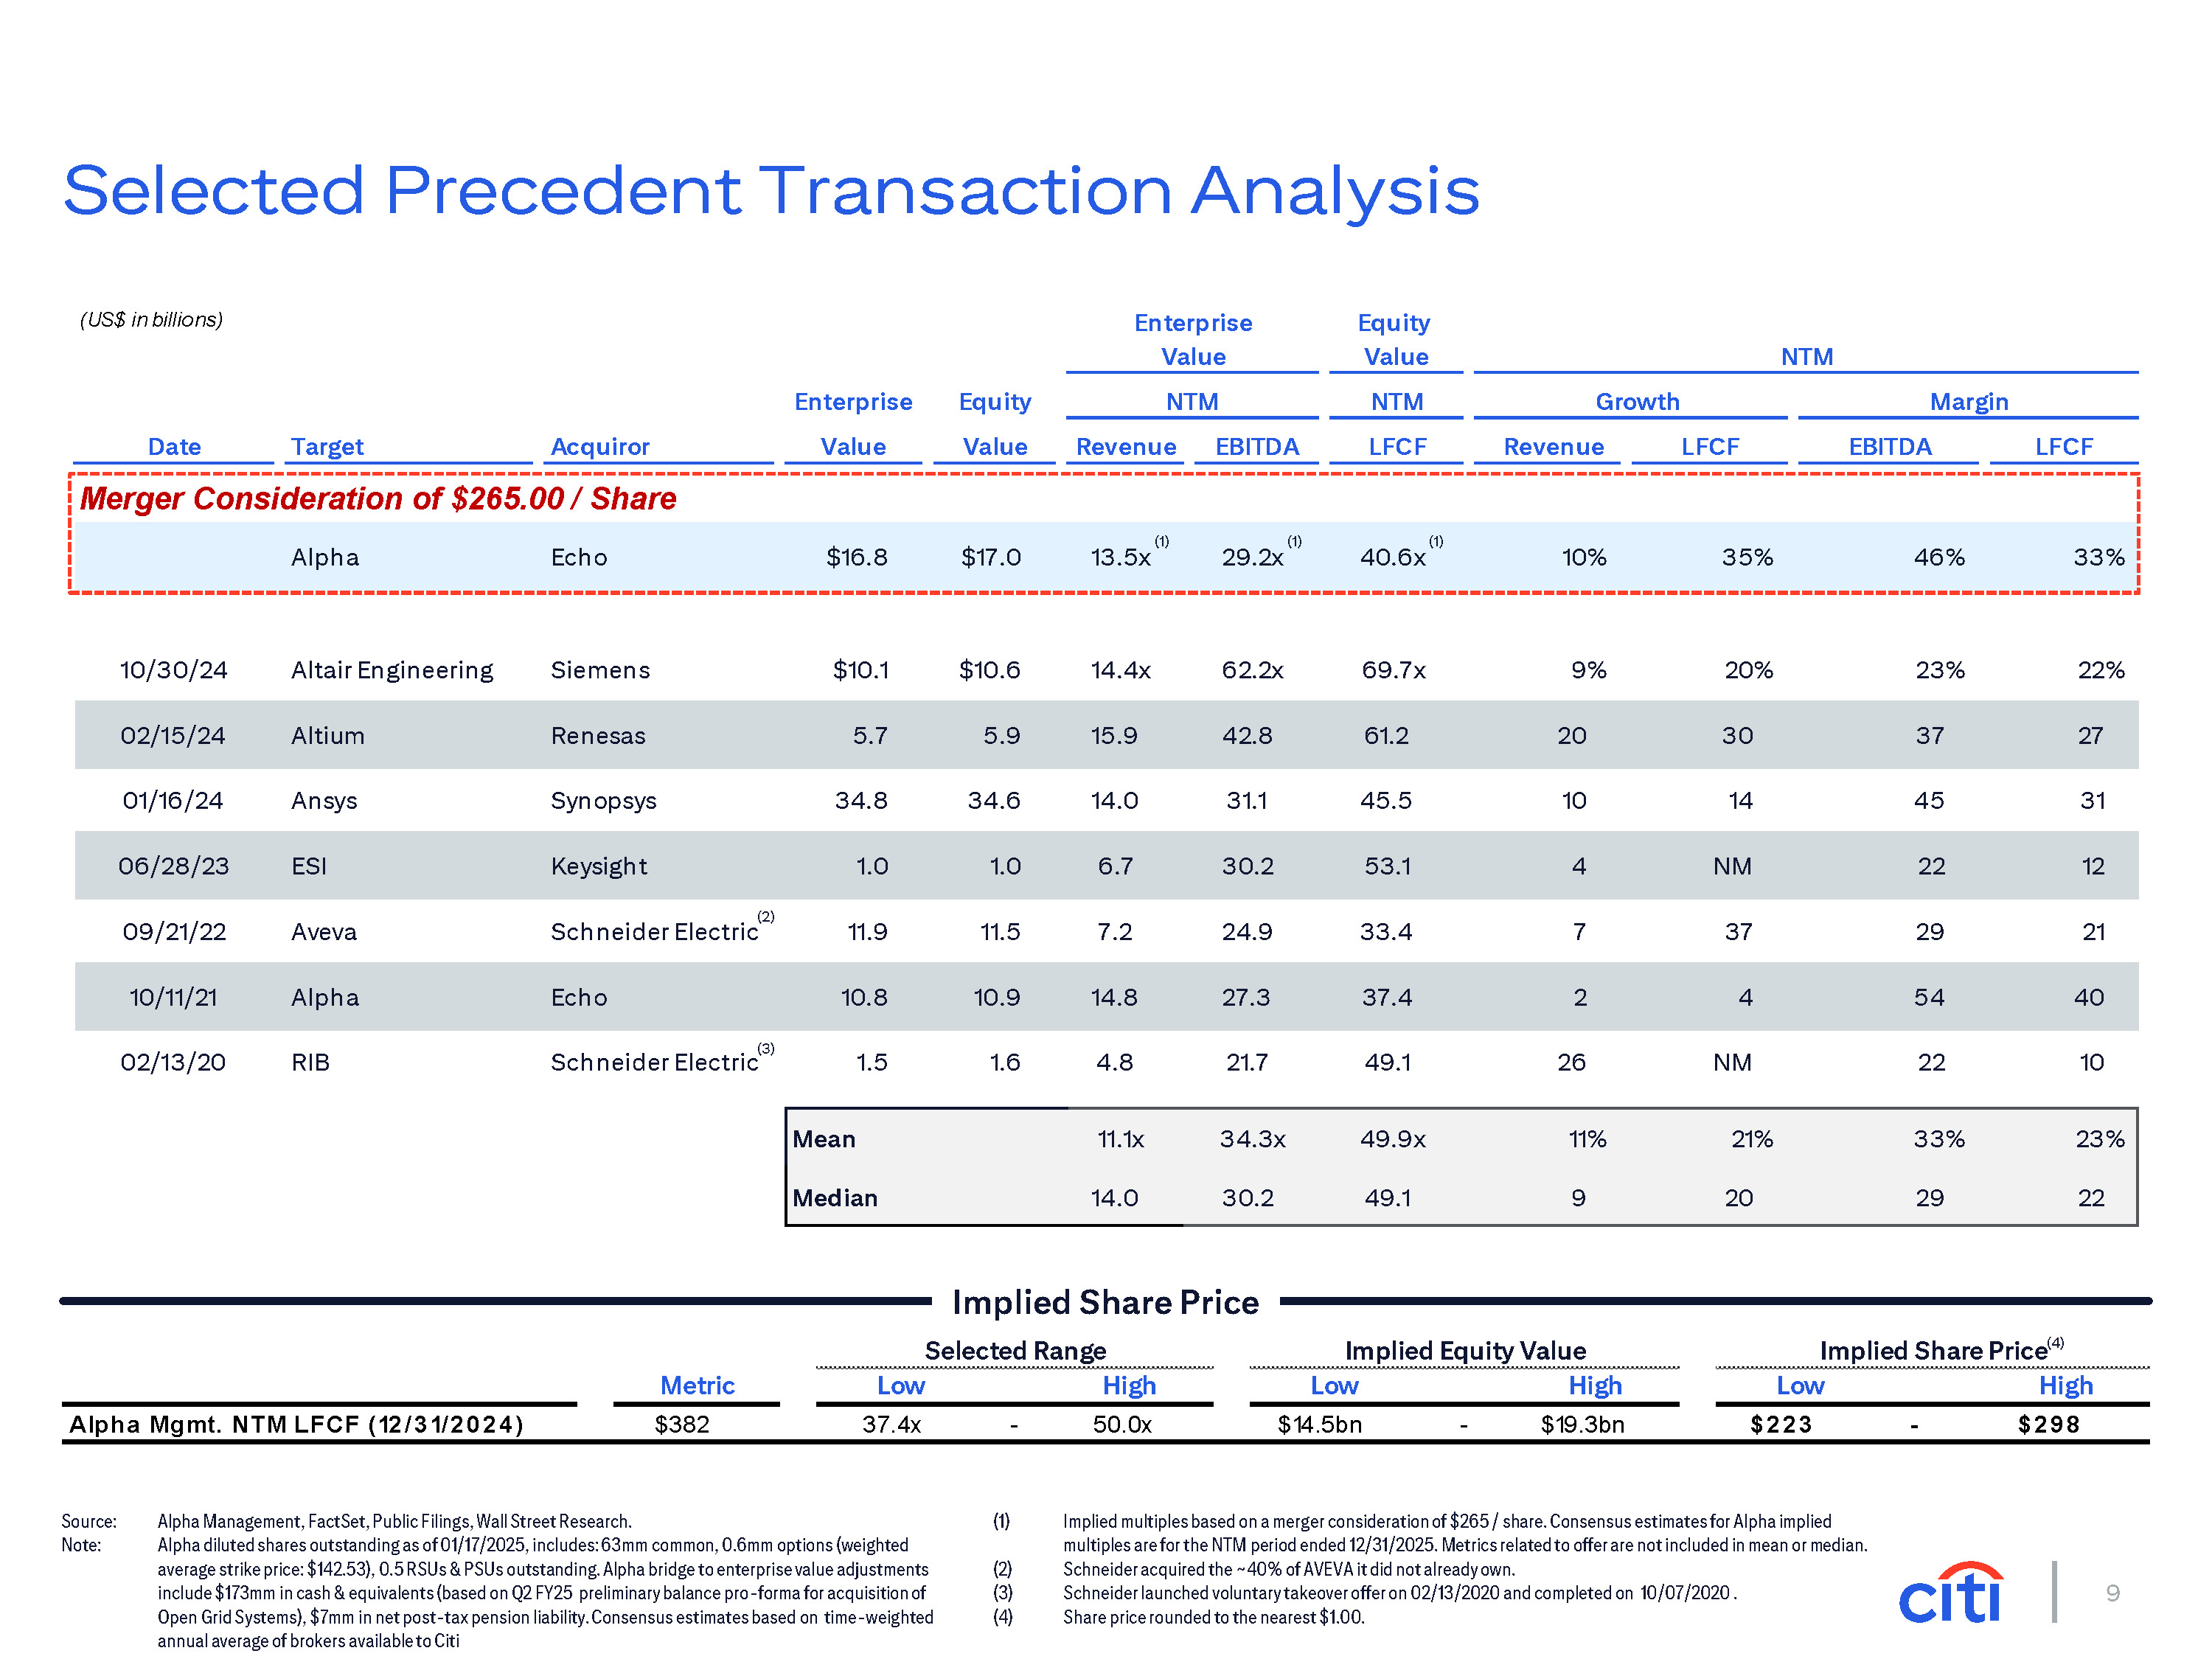
9 1.5 1.6 4.8 21.7 49.1 26 NM 22 10 Mean 11.1x 34.3x 49.9x 11% 21% 33% 23% Median 14.0 30.2 49.1 9 20 29 22 Implied Share Price (US$ in billio ns) Enterprise Value Equity Value NTM NTM NTM Growth Margin Enterprise Value Equity Value Revenue EBITDA LFCF Revenue LFCF EBITDA LFCF $16.8 $17.0 13.5x 29.2x 40.6x 10% 35% 46% 33% 10/30/24 Altair Engineering Siemens $10.1 $10.6 14.4x 62.2x 69.7x 9% 20% 23% 22% 02/15/24 Altium Renesas 5.7 5.9 15.9 42.8 61.2 20 30 37 27 01/16/24 Ansys Synopsys 34.8 34.6 14.0 31.1 45.5 10 14 45 31 06/28/23 ESI Keysight 1.0 1.0 6.7 30.2 53.1 4 NM 22 12 (2) 09/21/22 Aveva Schneider Electric 11.9 11.5 7.2 24.9 33.4 7 37 29 21 10/11/21 Alpha Echo 10.8 10.9 14.8 27.3 37.4 2 4 54 40 02/13/20 RIB Schneider Electric Source: Note: Alpha Management, FactSet, Public Filings, Wall Street Research. Alpha diluted shares outstanding as of 01/17/2025, includes: 63mm common, 0.6mm options (weighted average strike price: $142.53), 0.5 RSUs & PSUs outstanding. Alpha bridge to enterprise value adjustments include $173mm in cash & equivalents (based on Q2 FY25 preliminary balance pro-forma for acquisition of Open Grid Systems), $7mm in net post-tax pension liability. Consensus estimates based on time-weighted annual average of brokers available to Citi (1) Implied multiples based on a merger consideration of $265 / share. Consensus estimates for Alpha implied multiples are for the NTM period ended 12/31/2025. Metrics related to offer are not included in mean or median. Schneider acquired the ~40% of AVEVA it did not already own. Schneider launched voluntary takeover offer on 02/13/2020 and completed on 10/07/2020 . Share price rounded to the nearest $1.00. (2) (3) (4) Selected Precedent Transaction Analysis (1) (1) (1) Date Target Acquiror Merger Consideration of $265.00 / Share Alpha Echo Selected Range Implied Equity Value Implied Share Price(4) Metric Low High Low High Low High Alpha Mgmt. NTM LFCF (12 / 3 1/ 2 0 2 4 ) $382 37.4x - 50.0x $14.5bn - $19.3bn $223 - $298 (3)
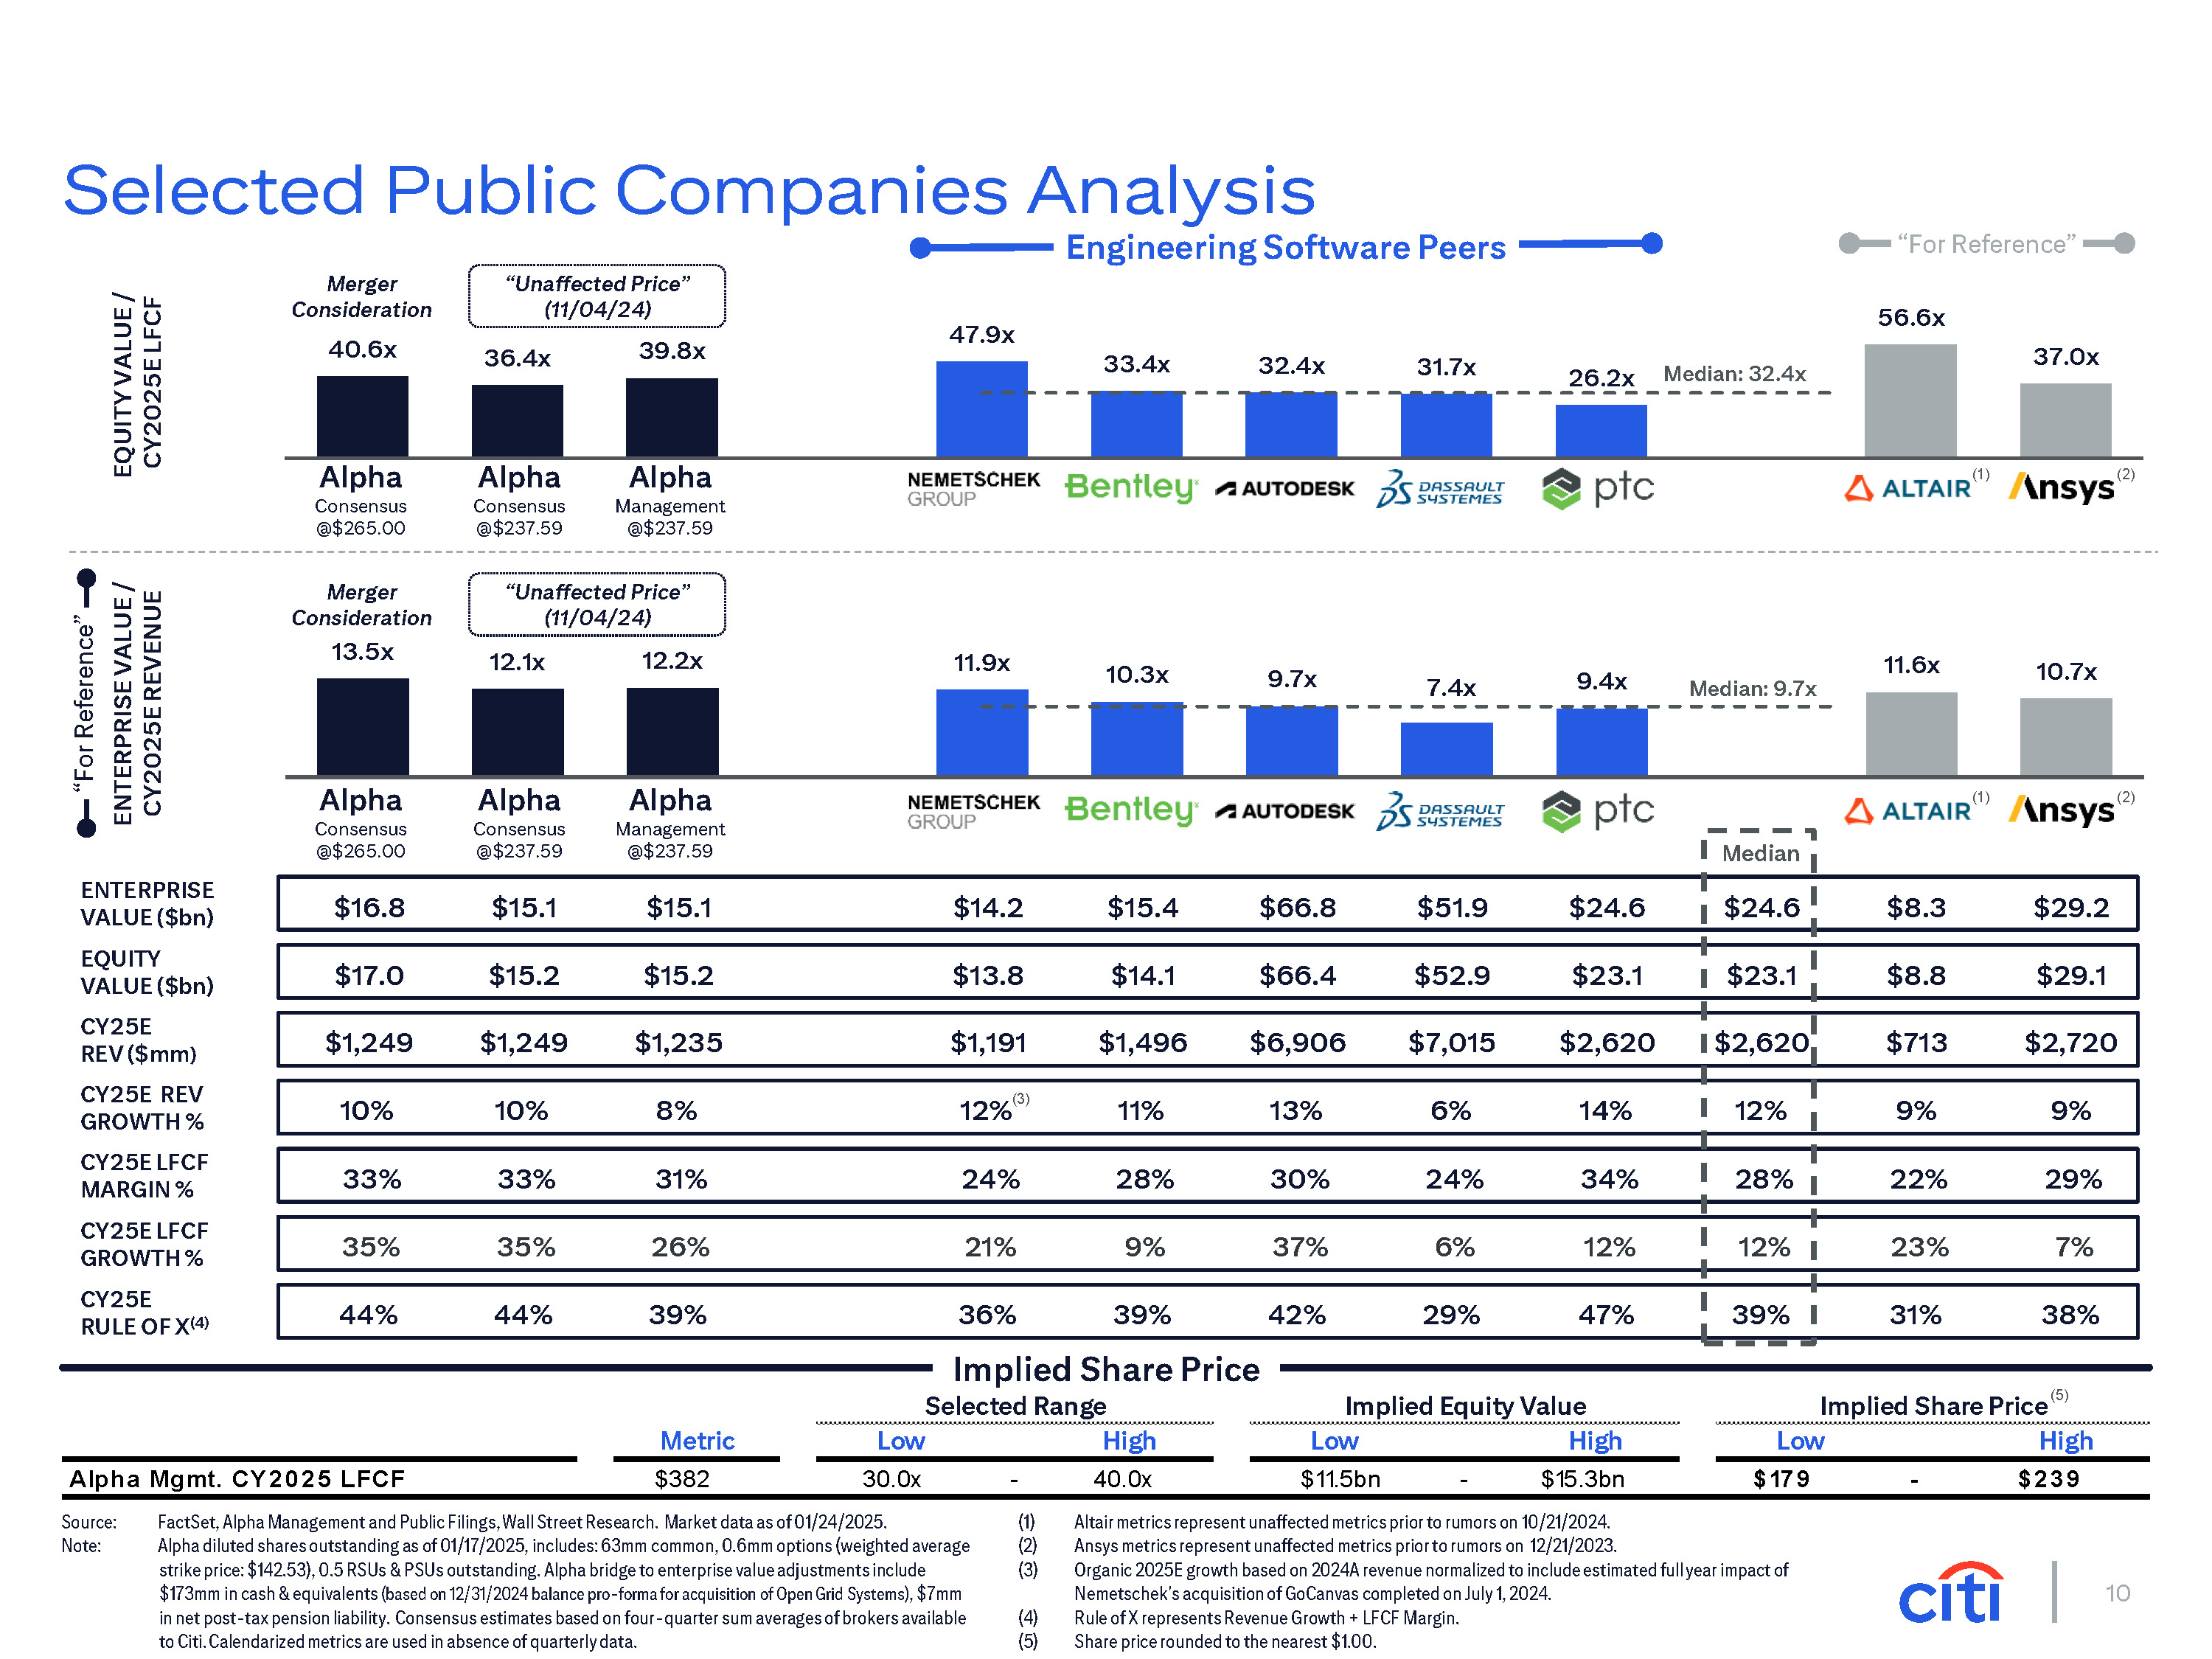
10 Merger Consideration 13.5x 11.9x 10.3x 9.7x 7.4x 9.4x 11.6x 10.7x Median: 9.7x Selected Range Implied Equity Value Metric Low High Low High Low High Alpha Mgmt. CY 2 0 2 5 LFCF $382 30.0x - 40.0x $11.5bn - $15.3bn $ 17 9 - $239 36.4x 39.8x 47.9x 33.4x 32.4x 31.7x 26.2x 56.6x 37.0x Median: 32.4x (2) Engineering Software Peers EQUITY VALUE / CY2025E LFCF ENTERPRISE VALUE ($bn) EQUITY VALUE ($bn) CY25E REV ($mm) CY25E REV GROWTH % CY25E LFCF MARGIN % CY25E LFCF GROWTH % CY25E RULE OF X(4) Alpha Consensus @$237.59 (1) Selected Public Companies Analysis “For Reference” ENTERPRISE VALUE / CY2025E REVENUE Alpha Management @$237.59 Implied Share Price Implied Share Price (5) Alpha Consensus @$265.00 Merger Consideration 40.6x “For Reference” “Unaffected Price” (11/04/24) “Unaffected Price” (11/04/24) 12.1x 12.2x (2) Alpha Consensus @$237.59 (1) Alpha Management @$237.59 Alpha Consensus @$265.00 Median $16.8 $15.1 $15.1 $14.2 $15.4 $66.8 $51.9 $24.6 $24.6 $8.3 $29.2 $17.0 $15.2 $15.2 $13.8 $14.1 $66.4 $52.9 $23.1 $23.1 $8.8 $29.1 $1,249 $1,249 $1,235 $1,191 $1,496 $6,906 $7,015 $2,620 $2,620 $713 $2,720 10% 10% 8% 12%(3) 11% 13% 6% 14% 12% 9% 9% 33% 33% 31% 24% 28% 30% 24% 34% 28% 22% 29% 35% 35% 26% 21% 9% 37% 6% 12% 12% 23% 7% 44% 44% 39% 36% 39% 42% 29% 47% 39% 31% 38% Source: Note: FactSet, Alpha Management and Public Filings, Wall Street Research. Market data as of 01/24/2025. Alpha diluted shares outstanding as of 01/17/2025, includes: 63mm common, 0.6mm options (weighted average strike price: $142.53), 0.5 RSUs & PSUs outstanding. Alpha bridge to enterprise value adjustments include $173mm in cash & equivalents (based on 12/31/2024 balance pro-forma for acquisition of Open Grid Systems), $7mm in net post-tax pension liability. Consensus estimates based on four-quarter sum averages of brokers available to Citi. Calendarized metrics are used in absence of quarterly data. Altair metrics represent unaffected metrics prior to rumors on 10/21/2024. Ansys metrics represent unaffected metrics prior to rumors on 12/21/2023. Organic 2025E growth based on 2024A revenue normalized to include estimated full year impact of Nemetschek's acquisition of GoCanvas completed on July 1, 2024. Rule of X represents Revenue Growth + LFCF Margin. Share price rounded to the nearest $1.00.

11 EBITDA Multiple: 11/5/24 Buy $235 $225 $260 $260 1.9% • 25.0x EV / CY26 EBITDA 11/4/24 Buy $217 $204 $260 $260 1.9% LFCF Multiple: 36.0x EV / FY27 LFCF (2) 11/4/24 Hold NA NA NA NA NA LFCF Multiple: 37.5x EV / FY26 LFCF 11/5/24 Hold NA NA NA NA (3) NA LFCF Multiple: 37.5x EV / CY25 LFCF 11/5/24 Hold NA NA NA NA LFCF Multiple(:4) NA • 39.0x EV / CY25 LFCF Mean: $223 $226 $250 $257 Pre Pre Post Current Broker Date Rating 4Q Earnings Investor Day Investor Day Price Target Premium / (Discount) Methodology 12/11/24 Buy $230 $250 $250 Post Echo Offer $275 7.8% LFCF Multiple: 42.0x P / FY26 LFCF 88% Source: FactSet, Wall Street Research. Market data as of 01/24/2025. Note: (1) 52-week high / low as of daily market closing price. “Unaffected” broker targets are as of 11/05/2024, using research published prior to announcement of Echo offer. Valuation methodology used for “fair value”. Midpoint of “fair value” range. Approximate trading range based on William Blair LFCF estimate. Selected Analyst Research Summary Broker Valuation Summary Broker Recommendations LFCF Multiple EBITDA Multiple 13% N=8 38% N=8 Buy 63% Hold Broker Max $275.00 52-Week Low $172.90 52-Week High $258.00 Current Broker Broker Min $240.00 11/6/24 Hold $255 Post Echo Offer $250 $265 $250 Includes Takeover Premium in Valuation (2.0%) LFCF Multiple: 36.0x EV / CY25 LFCF 11/5/24 Hold $180 $200 $217 Post Echo Offer $240 (5.9%) LFCF Multiple: 34.0x EV / CY25 LFCF Investor Day: 9/17/2024 “Unaffected” 1) Price $255.16 Average Broker Max( $257.00 $265.00 Broke r Range “Unaffected” Broker Min(1) $217.00 Includes Takeover Premium in Valuation
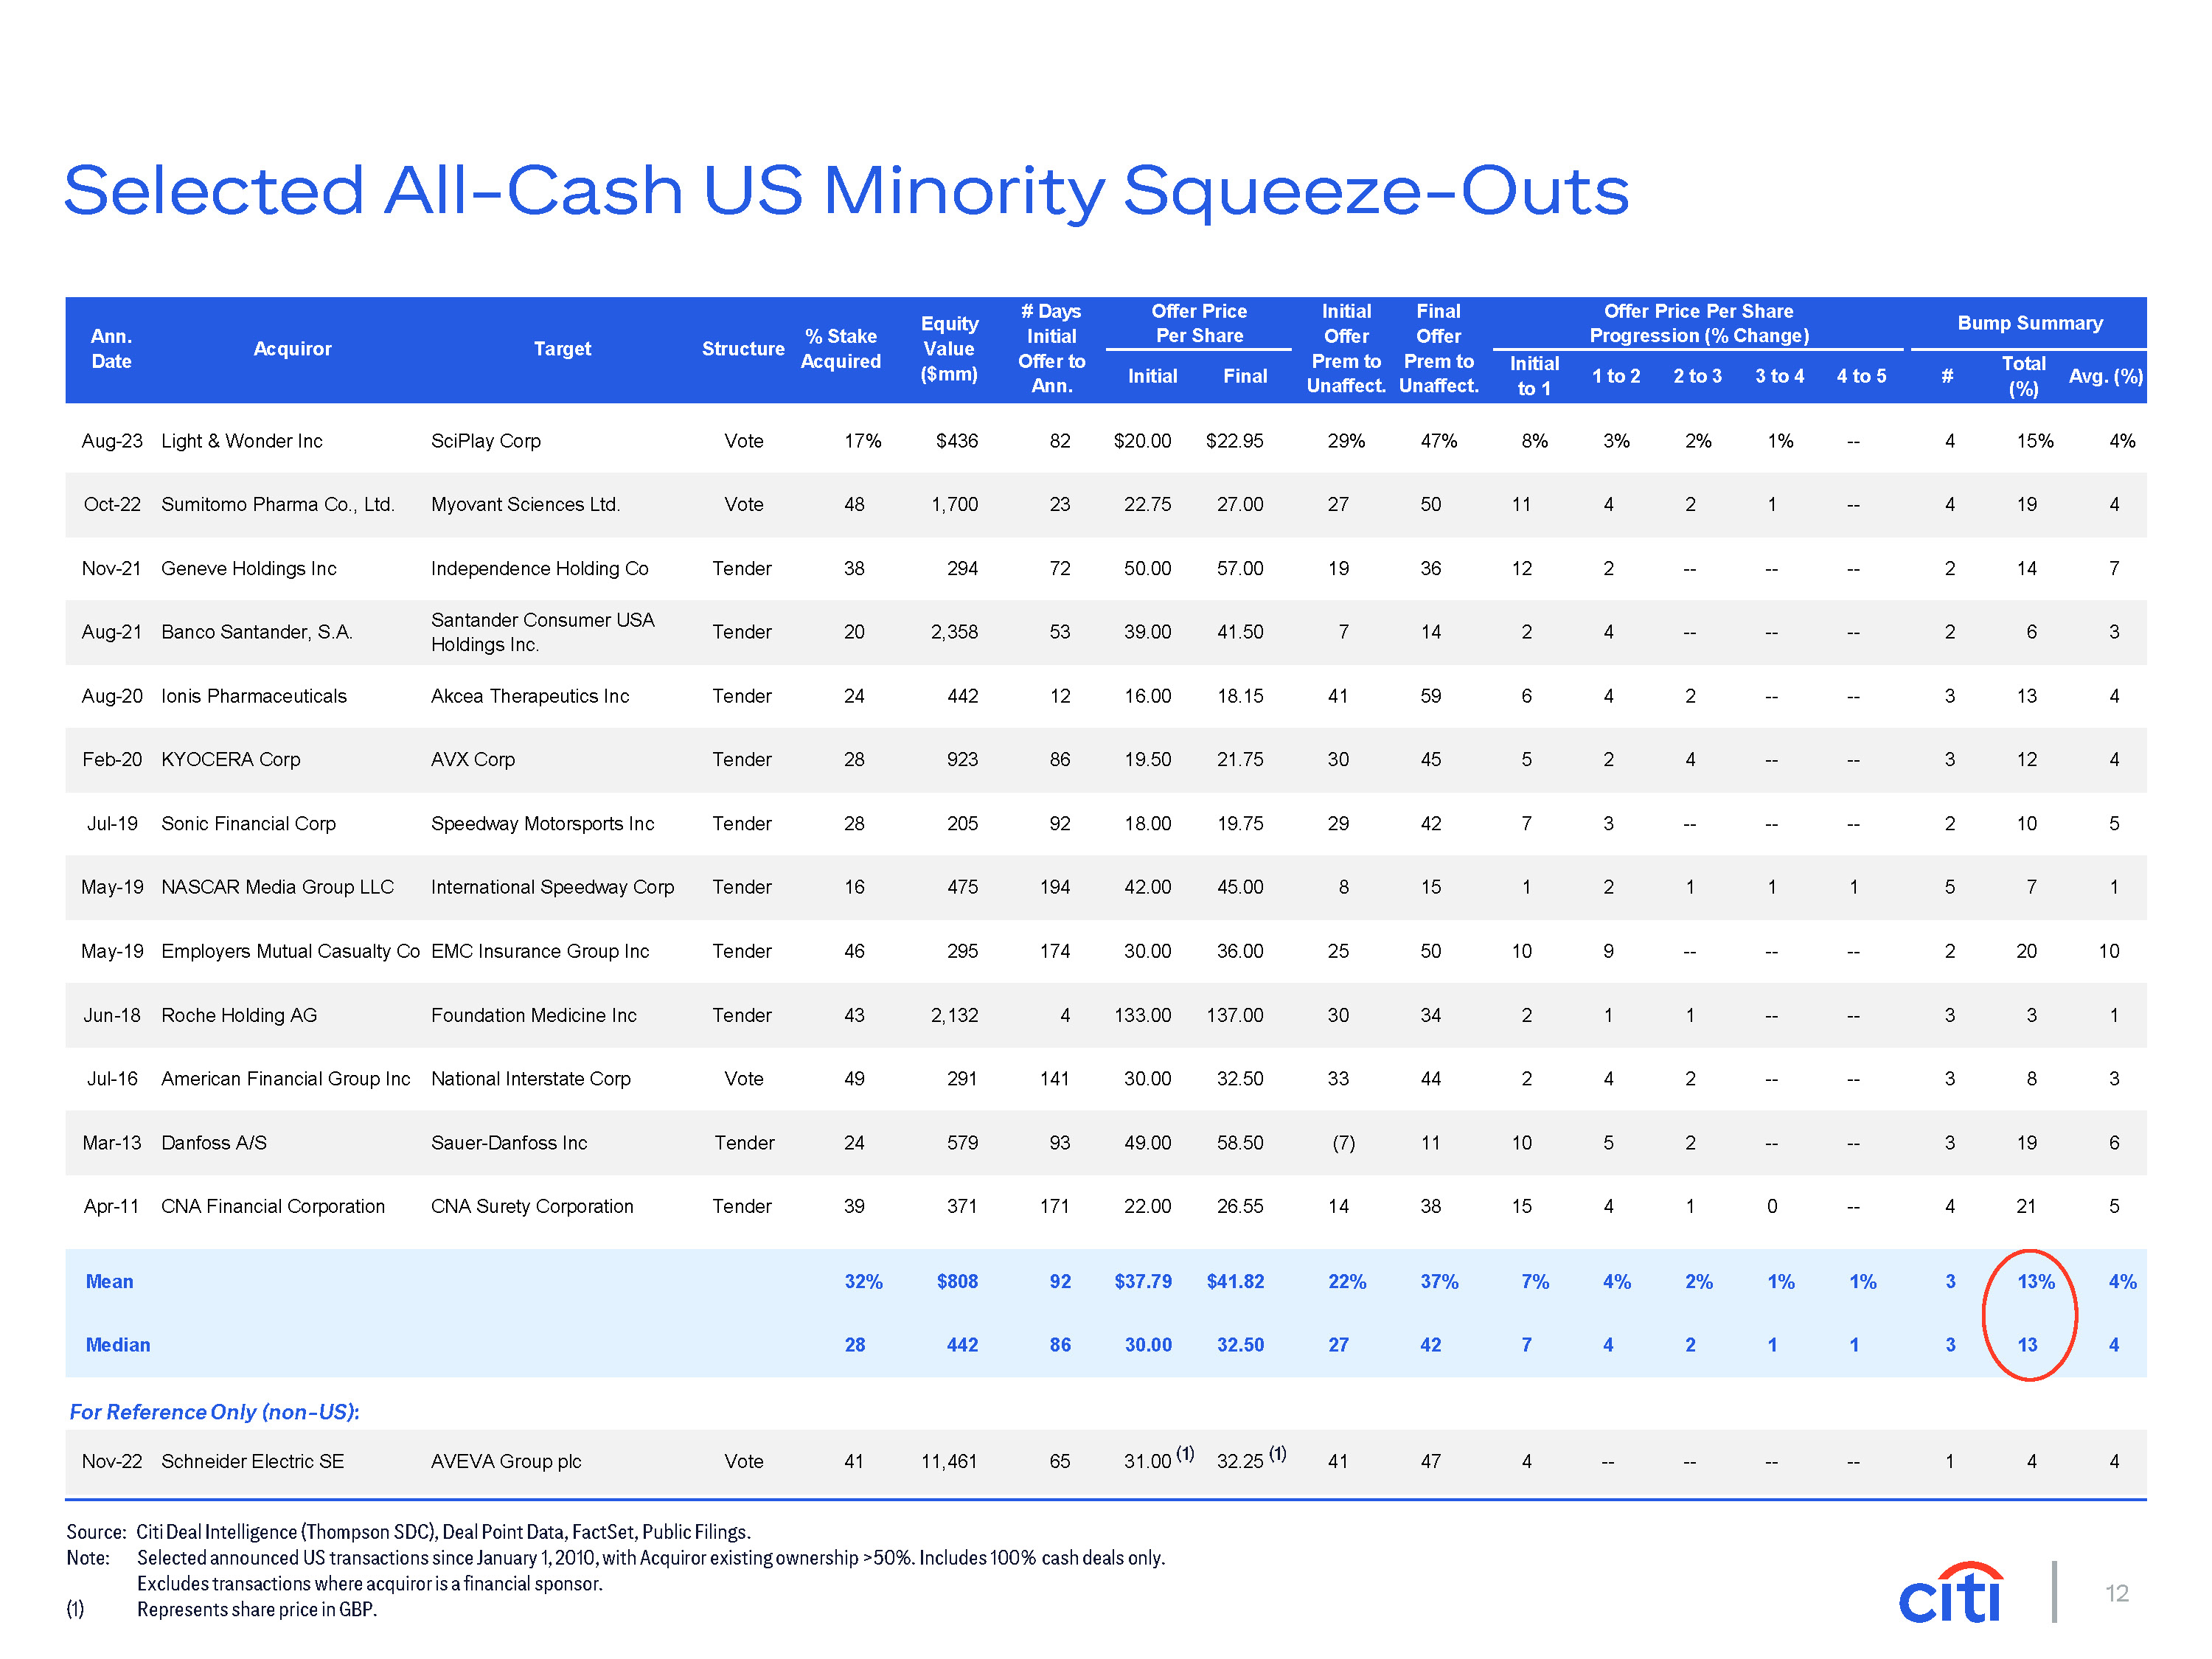
12 Source: Citi Deal Intelligence (Thompson SDC), Deal Point Data, FactSet, Public Filings. Note: Selected announced US transactions since January 1, 2010, with Acquiror existing ownership >50%. Includes 100% cash deals only. Excludes transactions where acquiror is a financial sponsor. (1) Represents share price in GBP. Selected All-Cash US Minority Squeeze-Outs Ann. Date Acquiror Target Structure % Stake Acquired Equity Value ($mm) # Days Initial Offer to Ann. Offer Price Per Share Initial Final Initial Final Offer Offer Prem to Prem to Unaffect. Unaffect. Offer Price Per Share Progression (% Change) Bump Summary Initial 1 to 2 2 to 3 3 to 4 4 to 5 # Total Avg. (%) to 1 (%) Aug-23 Light & Wonder Inc SciPlay Corp Vote 17% $436 82 $20.00 $22.95 29% 47% 8% 3% 2% 1% -- 4 15% 4% Oct-22 Sumitomo Pharma Co., Ltd. Myovant Sciences Ltd. Vote 48 1,700 23 22.75 27.00 27 50 11 4 2 1 -- 4 19 4 Nov-21 Geneve Holdings Inc Independence Holding Co Tender 38 294 72 50.00 57.00 19 36 12 2 -- -- -- 2 14 7 Aug-21 Banco Santander, S.A. Santander Consumer USA Holdings Inc. Tender 20 2,358 53 39.00 41.50 7 14 2 4 -- -- -- 2 6 3 Aug-20 Ionis Pharmaceuticals Akcea Therapeutics Inc Tender 24 442 12 16.00 18.15 41 59 6 4 2 -- -- 3 13 4 Feb-20 KYOCERA Corp AVX Corp Tender 28 923 86 19.50 21.75 30 45 5 2 4 -- -- 3 12 4 Jul-19 Sonic Financial Corp Speedway Motorsports Inc Tender 28 205 92 18.00 19.75 29 42 7 3 -- -- -- 2 10 5 May-19 NASCAR Media Group LLC International Speedway Corp Tender 16 475 194 42.00 45.00 8 15 1 2 1 1 1 5 7 1 May-19 Employers Mutual Casualty Co EMC Insurance Group Inc Tender 46 295 174 30.00 36.00 25 50 10 9 -- -- -- 2 20 10 Jun-18 Roche Holding AG Foundation Medicine Inc Tender 43 2,132 4 133.00 137.00 30 34 2 1 1 -- -- 3 3 1 Jul-16 American Financial Group Inc National Interstate Corp Vote 49 291 141 30.00 32.50 33 44 2 4 2 -- -- 3 8 3 Mar-13 Danfoss A/S Sauer-Danfoss Inc Tender 24 579 93 49.00 58.50 (7) 11 10 5 2 -- -- 3 19 6 Apr-11 CNA Financial Corporation CNA Surety Corporation Tender 39 371 171 22.00 26.55 14 38 15 4 1 0 -- 4 21 5 Mean 32% $808 92 $37.79 $41.82 22% 37% 7% 4% 2% 1% 1% 3 13% 4% Median 28 442 86 30.00 32.50 27 42 7 4 2 1 1 3 13 4 Nov-22 Schneider Electric SE AVEVA Group plc Vote 41 11,461 65 31.00 (1) 32.25 (1) 41 47 4 -- -- -- -- 1 4 4 For Reference Only (non-US):
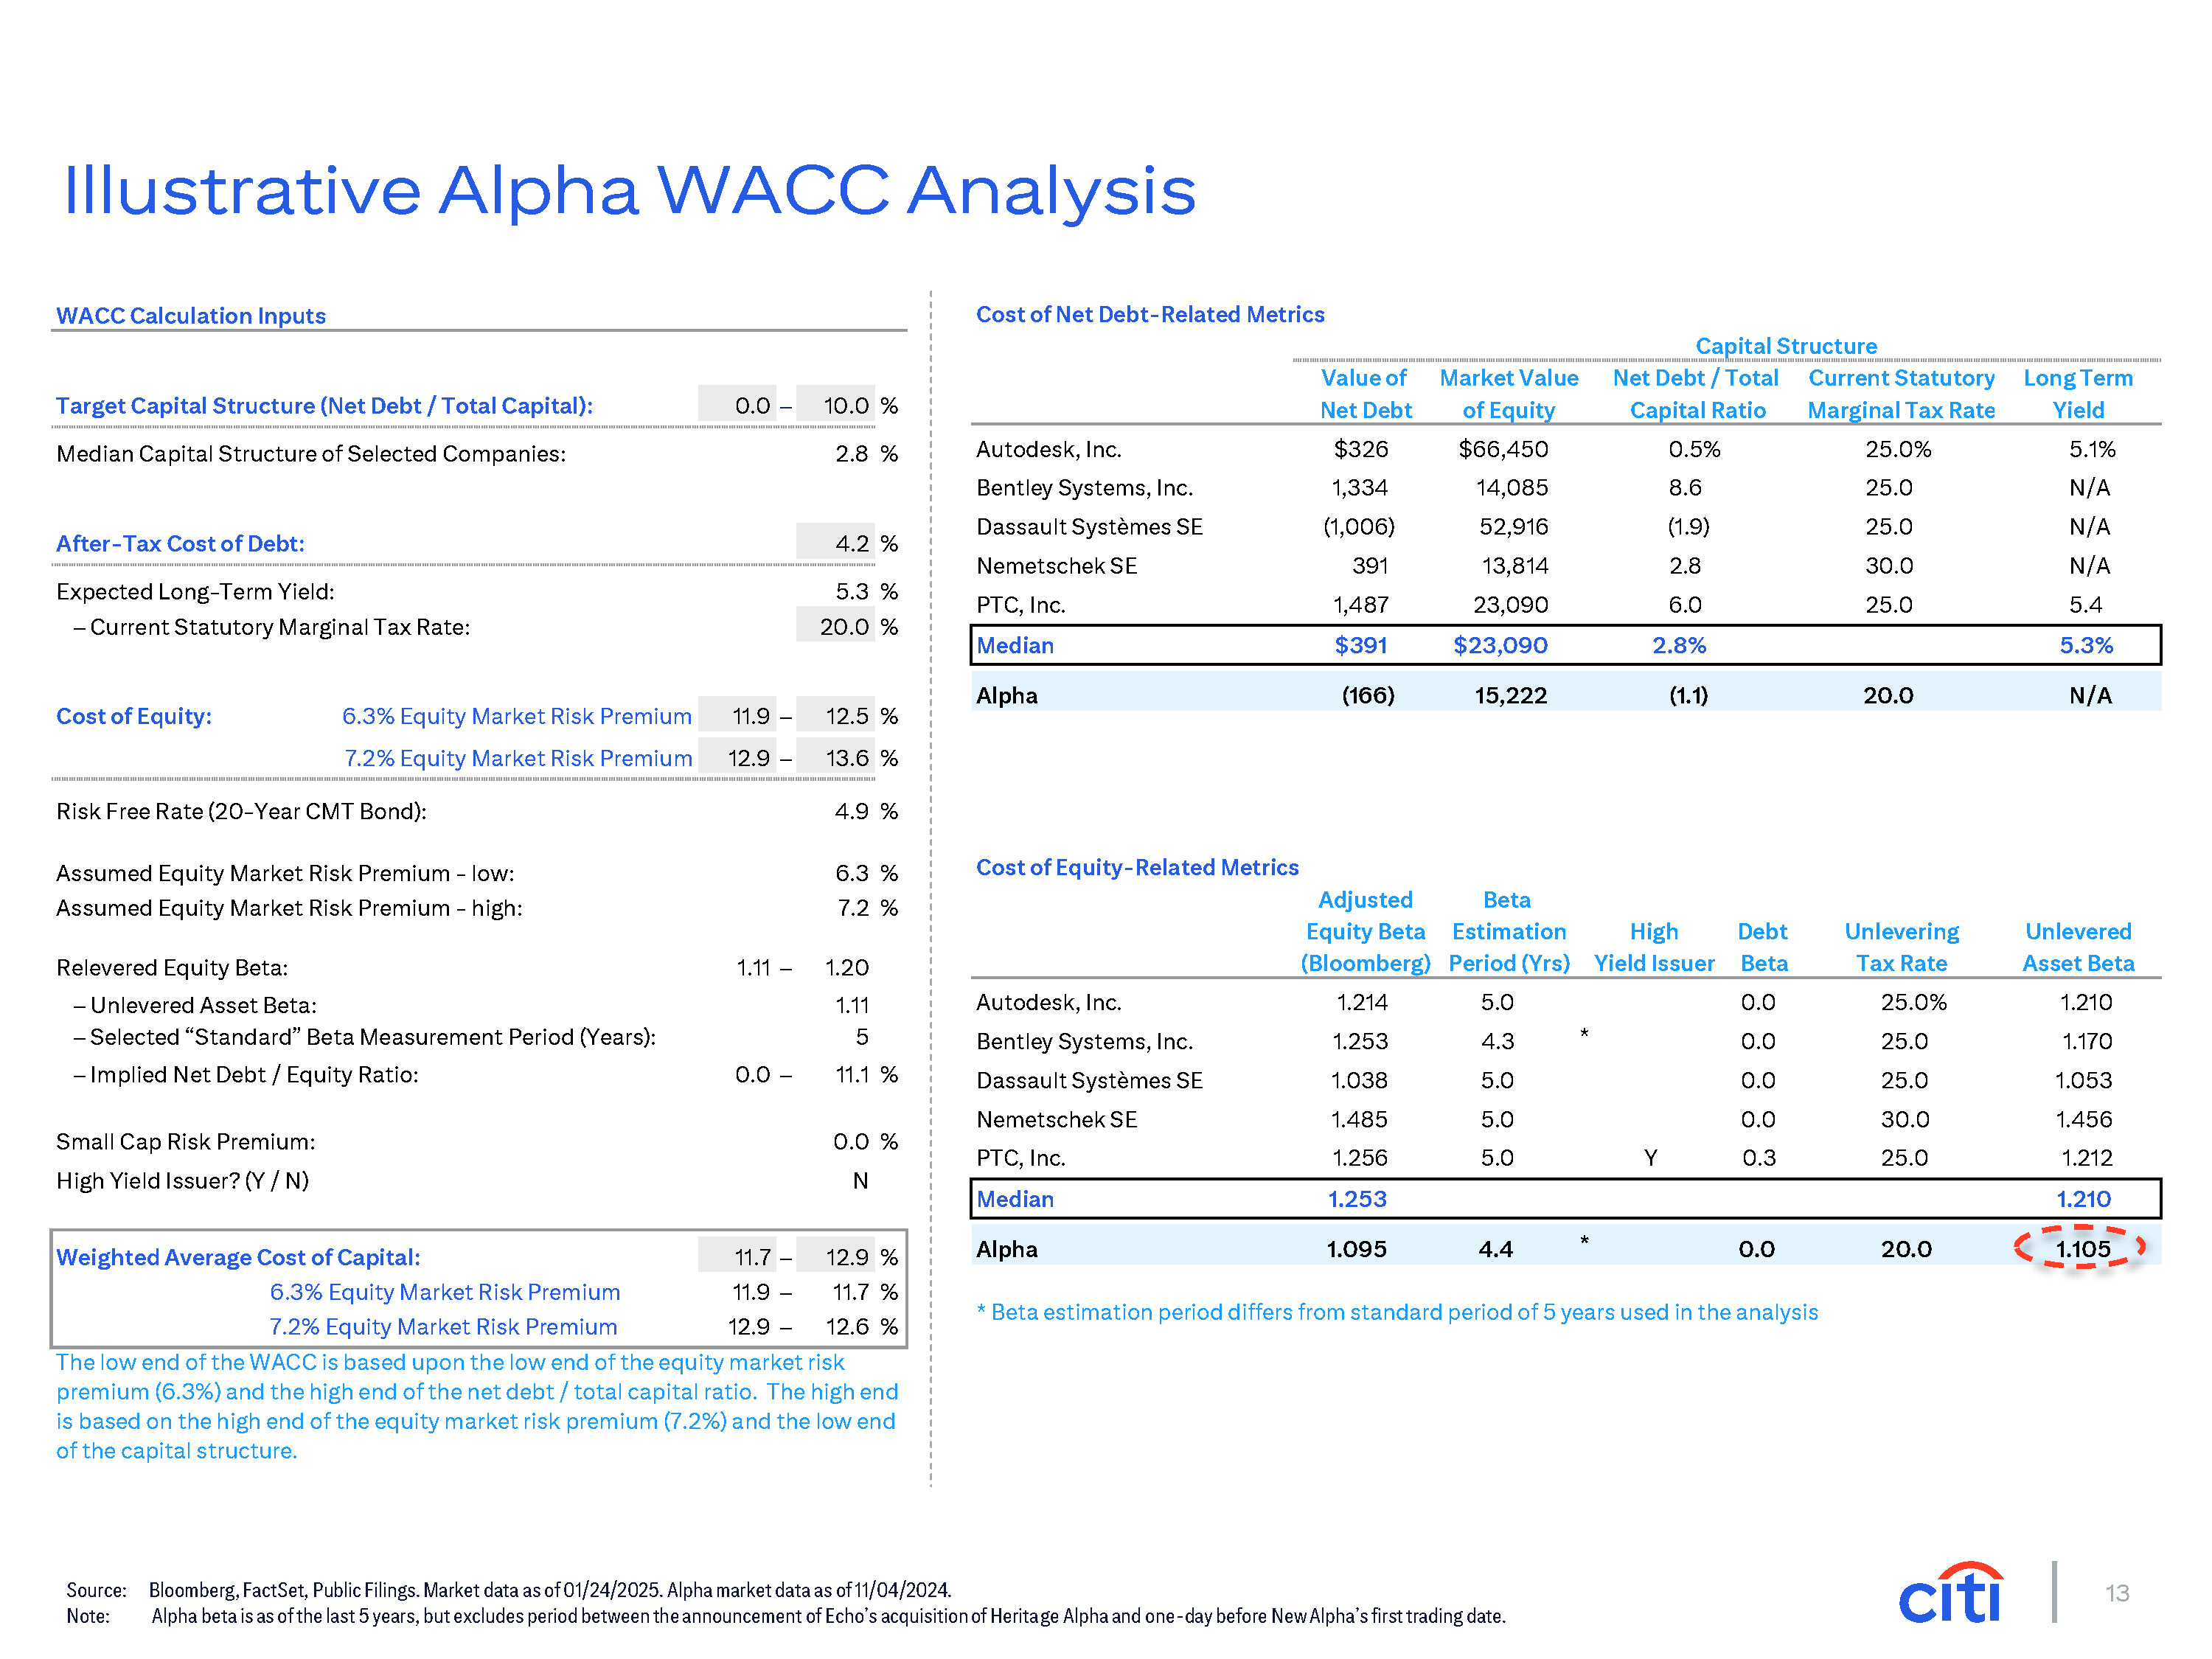
13 Source: Bloomberg, FactSet, Public Filings. Market data as of 01/24/2025. Alpha market data as of 11/04/2024. Note: Alpha beta is as of the last 5 years, but excludes period between the announcement of Echo’s acquisition of Heritage Alpha and one-day before New Alpha’s first trading date. Illustrative Alpha WACC Analysis WACC Calculation Inputs Target Capital Structure (Net Debt / Total Capital): 0.0 – 10.0 % Median Capital Structure of Selected Companies: 2.8 % After-Tax Cost of Debt: 4.2 % Expected Long-Term Yield: – Current Statutory Marginal Tax Rate: 5.3 % 20.0 % Cost of Equity: 6.3% Equity Market Risk Premium 7.2% Equity Market Risk Premium 11.9 – – 12.5 % % 12.9 13.6 Risk Free Rate (20-Year CMT Bond): 4.9 % Assumed Equity Market Risk Premium - low: Assumed Equity Market Risk Premium - high: 6.3 % 7.2 % Relevered Equity Beta: Unlevered Asset Beta: Selected “Standard” Beta Measurement Period (Years): Implied Net Debt / Equity Ratio: 0.0 – 1.11 – 1.20 1.11 5 11.1 % Small Cap Risk Premium: High Yield Issuer? (Y / N) 0.0 % N Weighted Average Cost of Capital: 11.7 – 12.9 % 6.3% Equity Market Risk Premium 11.9 – 11.7 % 7.2% Equity Market Risk Premium 12.9 – 12.6 % * Beta estimation period differs from standard period of 5 years used in the analysis The low end of the WACC is based upon the low end of the equity market risk premium (6.3%) and the high end of the net debt / total capital ratio. The high end is based on the high end of the equity market risk premium (7.2%) and the low end of the capital structure. Bentley Systems, Inc. 1,334 14,085 8.6 25.0 N/A Dassault Systèmes SE (1,006) 52,916 (1.9) 25.0 N/A Nemetschek SE 391 13,814 2.8 30.0 N/A PTC, Inc. 1,487 23,090 6.0 25.0 5.4 Median $391 $23,090 2.8% 5.3% Alpha (166) 15,222 (1.1) 20.0 N/A Cost of Net Debt-Related Metrics Capital Structure Value of Net Debt Market Value of Equity Net Debt / Total Capital Ratio Current Statutory Marginal Tax Rate Long Term Yield Autodesk, Inc. $326 $66,450 0.5% 25.0% 5.1% Cost of Equity-Related Metrics Adjusted Beta Equity Beta Estimation (Bloomberg) Period (Yrs) High Debt Yield Issuer Beta Unlevering Tax Rate Unlevered Asset Beta Autodesk, Inc. 1.214 5.0 0.0 25.0% 1.210 Bentley Systems, Inc. 1.253 4.3 * 0.0 25.0 1.170 Dassault Systèmes SE 1.038 5.0 0.0 25.0 1.053 Nemetschek SE 1.485 5.0 0.0 30.0 1.456 PTC, Inc. 1.256 5.0 Y 0.3 25.0 1.212 Median 1.253 1.210 Alpha 1.095 4.4 * 0.0 20.0 1.105