Exhibit (c)(6)
DRAFT | Confidential Preliminary | Subject to Further Review and Evaluation December 2024 Project Alpha Discussion Materials
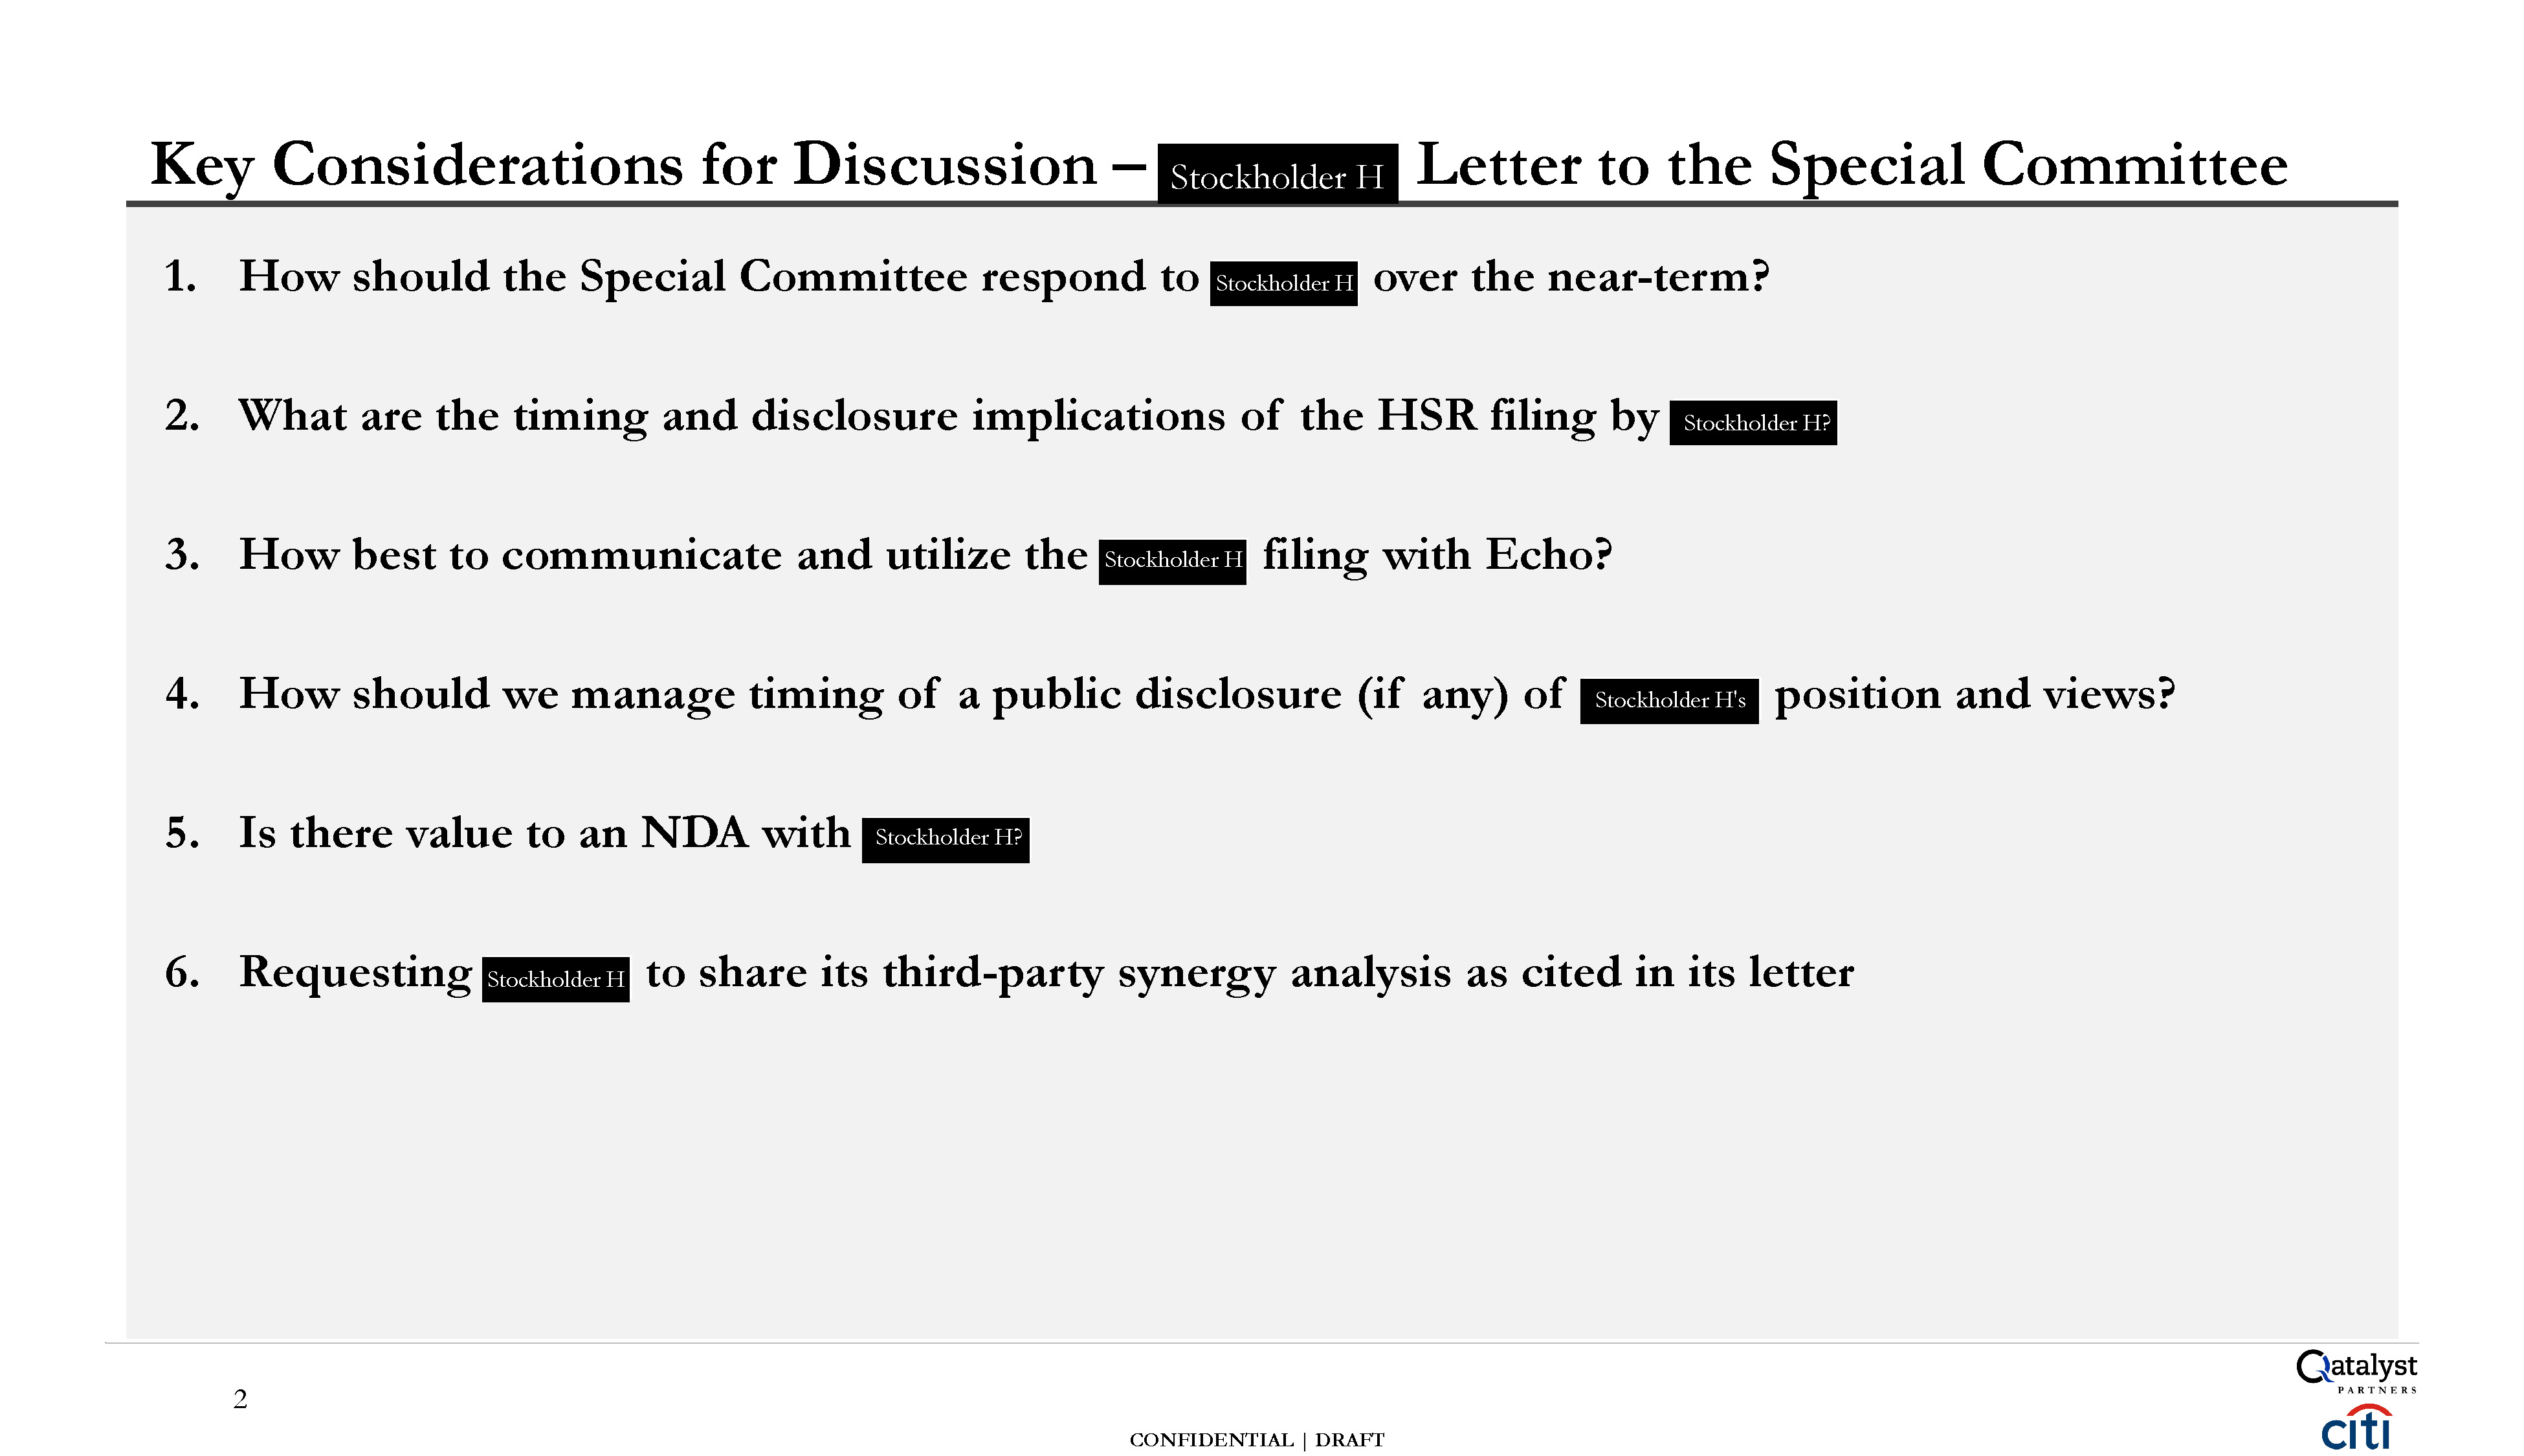
CONFIDENTIAL | DRAFT Key Considerations for Discussion – Letter to the Special Committee 1. How should the Special Committee respond to over the near-term? 2. What are the timing and disclosure implications of the HSR filing by 3. How best to communicate and utilize the filing with Echo? 4. How should we manage timing of a public disclosure (if any) of position and views? 5. Is there value to an NDA with 6. Requesting to share its third-party synergy analysis as cited in its letter 2 Stockholder H Stockholder H Stockholder H? Stockholder H Stockholder H's Stockholder H? Stockholder H

Appendix Supplementary Information
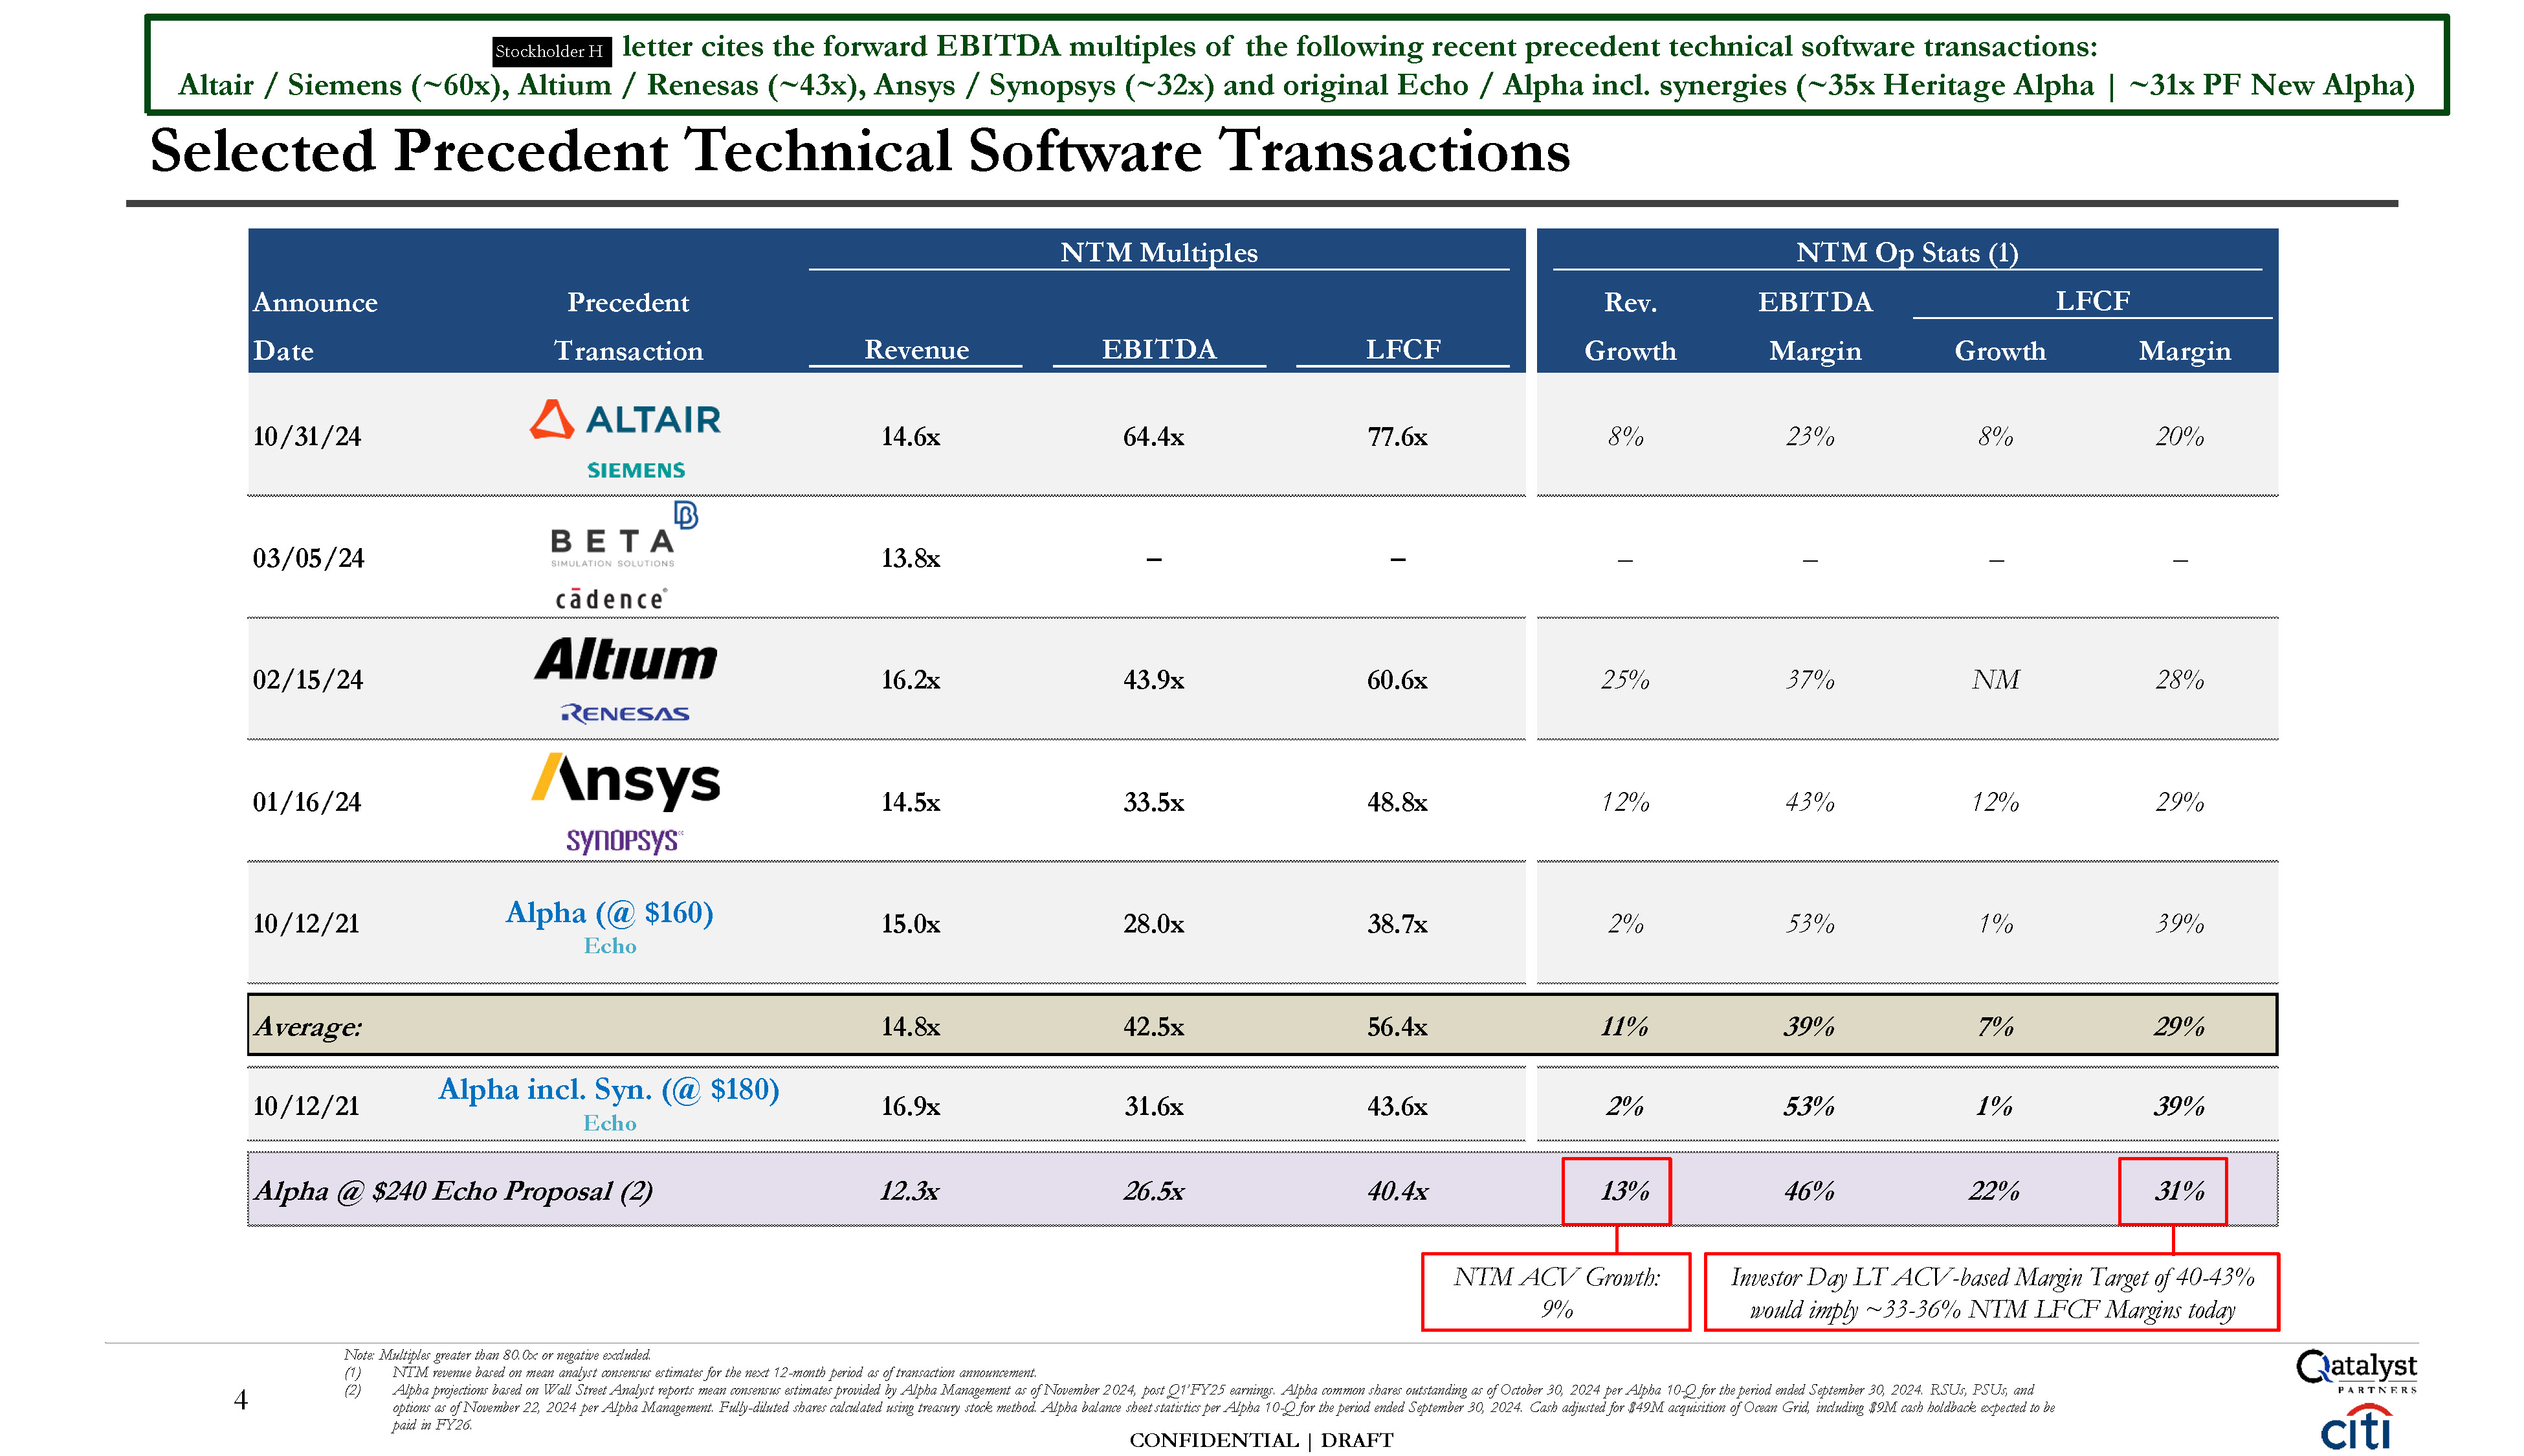
Note: Multiples greater than 80.0x or negative excluded. NTM revenue based on mean analyst consensus estimates for the next 12-month period as of transaction announcement. Alpha projections based on Wall Street Analyst reports mean consensus estimates provided by Alpha Management as of November 2024, post Q1’FY25 earnings. Alpha common shares outstanding as of October 30, 2024 per Alpha 10-Q for the period ended September 30, 2024. RSUs, PSUs, and options as of November 22, 2024 per Alpha Management. Fully-diluted shares calculated using treasury stock method. Alpha balance sheet statistics per Alpha 10-Q for the period ended September 30, 2024. Cash adjusted for $49M acquisition of Ocean Grid, including $9M cash holdback expected to be paid in FY26. CONFIDENTIAL | DRAFT 10/12/21 Alpha (@ $160) Echo 15.0x 28.0x 38.7x 2% 53% 1% 39% Average: 14.8x 42.5x 56.4x 11% 39% 7% 29% 10/12/21 Alpha incl. Syn. (@ $180) Echo 16.9x 31.6x 43.6x 2% 53% 1% 39% NTM Multiples NTM Op Stats (1) Announce Date Precedent Transaction Revenue EBITDA LFCF Rev. Growth 10/31/24 14.6x 64.4x 77.6x 8% EBITDA LFCF Margin Growth Margin 23% 8% 20% 03/05/24 13.8x – – – – – – 02/15/24 16.2x 43.9x 60.6x 25% 37% NM 28% 01/16/24 14.5x 33.5x 48.8x 12% 43% 12% 29% Alpha @ $240 Echo Proposal (2) 12.3x 26.5x 40.4x 13% 46% 22% 31% NTM ACV Growth: 9% Investor Day LT ACV-based Margin Target of 40-43% would imply ~33-36% NTM LFCF Margins today Selected Precedent Technical Software Transactions 4 letter cites the forward EBITDA multiples of the following recent precedent technical software transactions: Altair / Siemens (~60x), Altium / Renesas (~43x), Ansys / Synopsys (~32x) and original Echo / Alpha incl. synergies (~35x Heritage Alpha | ~31x PF New Alpha) Stockholder H
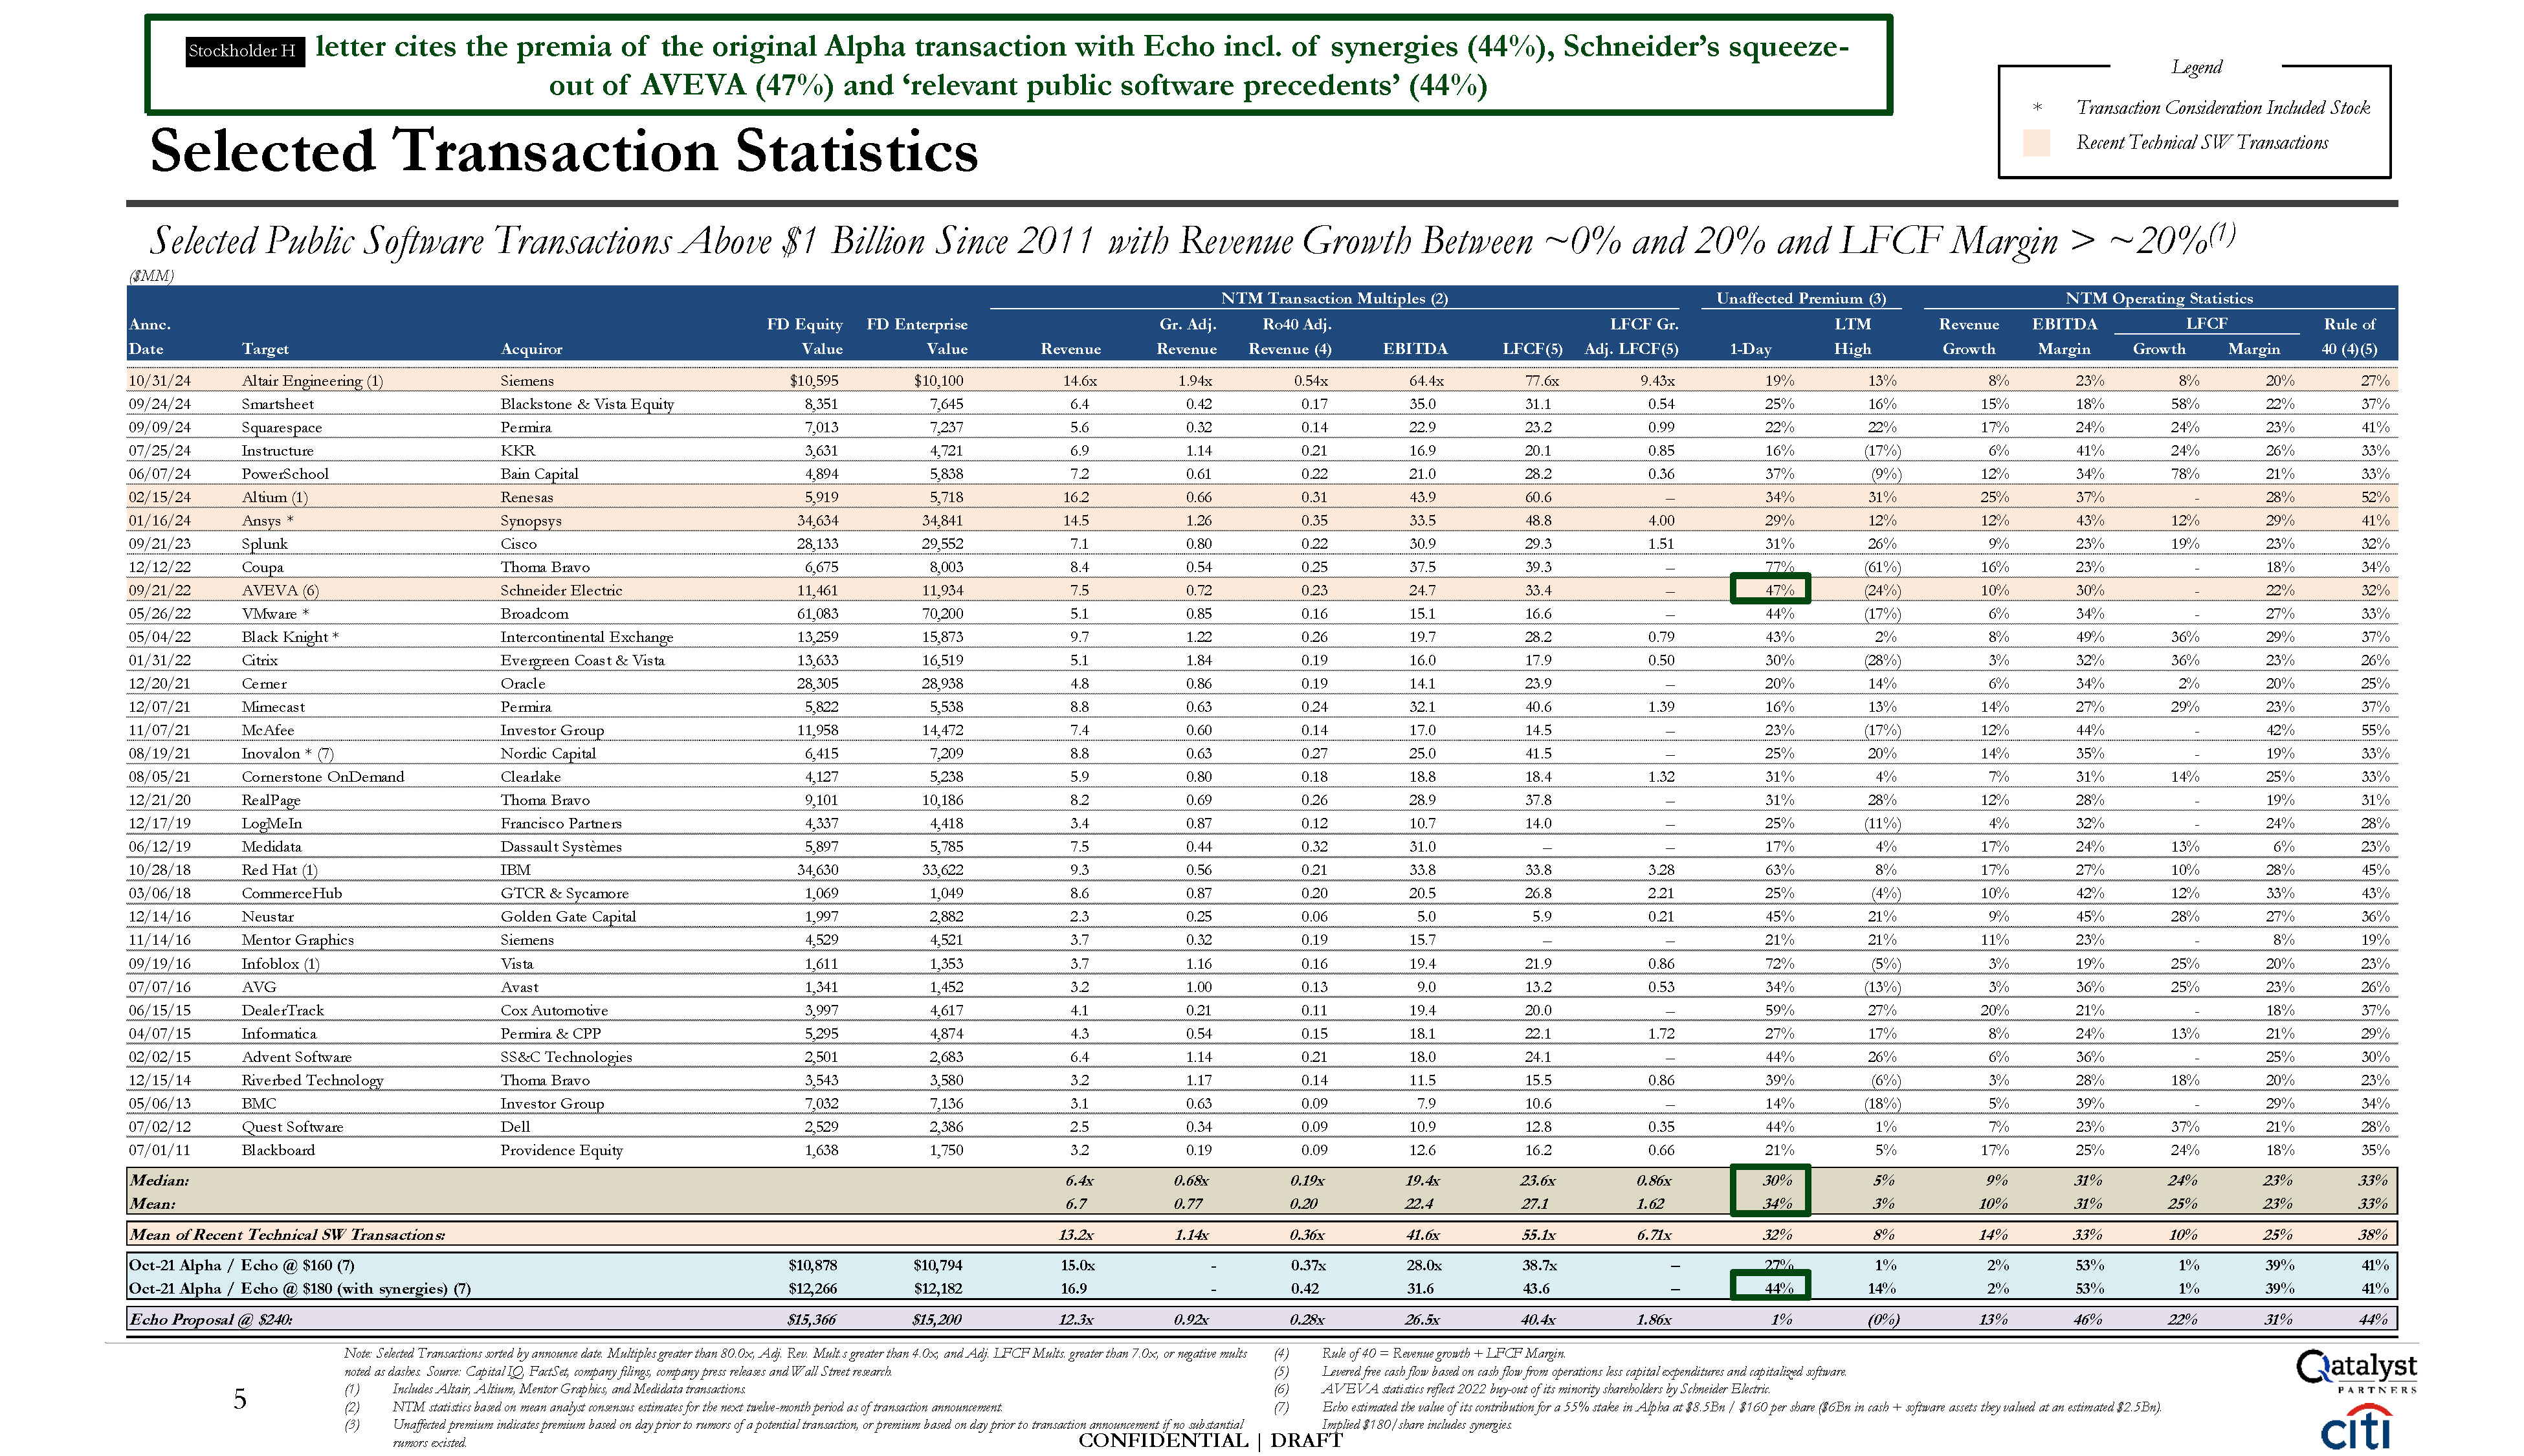
CONFIDENTIAL | DRAFT Median: 6.4x 0.68x 0.19x 19.4x 23.6x 0.86x 30% 5% 9% 31% 24% 23% 33% Mean: 6.7 0.77 0.20 22.4 27.1 1.62 34% 3% 10% 31% 25% 23% 33% Oct-21 Alpha / Echo @ $160 (7) $10,878 $10,794 15.0x - 0.37x 28.0x 38.7x – 27% 1% 2% 53% 1% 39% 41% Oct-21 Alpha / Echo @ $180 (with synergies) (7) $12,266 $12,182 16.9 - 0.42 31.6 43.6 – 44% 14% 2% 53% 1% 39% 41% Mean of Recent Technical SW Transactions: 13.2x 1.14x 0.36x 41.6x 55.1x 6.71x 32% 8% 14% 33% 10% 25% 38% Echo Proposal @ $240: $15,366 $15,200 12.3x 0.92x 0.28x 26.5x 40.4x 1.86x 1% (0%) 13% 46% 22% 31% 44% 09/21/22 AVEVA (6) Schneider Electric 11,461 11,934 7.5 0.72 0.23 24.7 33.4 – 47% (24%) 10% 30% - 22% 32% NTM Transaction Multiples (2) Unaffected Premium (3) NTM Operating Statistics Annc. FD Equity FD Enterprise Gr. Adj. Ro40 Adj. LFCF Gr. LTM Revenue EBITDA LFCF Rule of Date Target Acquiror Value Value Revenue Revenue Revenue (4) EBITDA LFCF(5) Adj. LFCF(5) 1-Day High Growth Margin Growth Margin 40 (4)(5) 10/31/24 Altair Engineering (1) Siemens $10,595 $10,100 14.6x 1.94x 0.54x 64.4x 77.6x 9.43x 19% 13% 8% 23% 8% 20% 27% 09/24/24 Smartsheet Blackstone & Vista Equity 8,351 7,645 6.4 0.42 0.17 35.0 31.1 0.54 25% 16% 15% 18% 58% 22% 37% 09/09/24 Squarespace Permira 7,013 7,237 5.6 0.32 0.14 22.9 23.2 0.99 22% 22% 17% 24% 24% 23% 41% 07/25/24 Instructure KKR 3,631 4,721 6.9 1.14 0.21 16.9 20.1 0.85 16% (17%) 6% 41% 24% 26% 33% 06/07/24 PowerSchool Bain Capital 4,894 5,838 7.2 0.61 0.22 21.0 28.2 0.36 37% (9%) 12% 34% 78% 21% 33% 02/15/24 Altium (1) Renesas 5,919 5,718 16.2 0.66 0.31 43.9 60.6 – 34% 31% 25% 37% - 28% 52% 01/16/24 Ansys * Synopsys 34,634 34,841 14.5 1.26 0.35 33.5 48.8 4.00 29% 12% 12% 43% 12% 29% 41% 09/21/23 Splunk Cisco 28,133 29,552 7.1 0.80 0.22 30.9 29.3 1.51 31% 26% 9% 23% 19% 23% 32% 12/12/22 Coupa Thoma Bravo 6,675 8,003 8.4 0.54 0.25 37.5 39.3 – 77% (61%) 16% 23% - 18% 34% 05/26/22 VMware * Broadcom 61,083 70,200 5.1 0.85 0.16 15.1 16.6 – 44% (17%) 6% 34% - 27% 33% 05/04/22 Black Knight * Intercontinental Exchange 13,259 15,873 9.7 1.22 0.26 19.7 28.2 0.79 43% 2% 8% 49% 36% 29% 37% 01/31/22 Citrix Evergreen Coast & Vista 13,633 16,519 5.1 1.84 0.19 16.0 17.9 0.50 30% (28%) 3% 32% 36% 23% 26% 12/20/21 Cerner Oracle 28,305 28,938 4.8 0.86 0.19 14.1 23.9 – 20% 14% 6% 34% 2% 20% 25% 12/07/21 Mimecast Permira 5,822 5,538 8.8 0.63 0.24 32.1 40.6 1.39 16% 13% 14% 27% 29% 23% 37% 11/07/21 McAfee Investor Group 11,958 14,472 7.4 0.60 0.14 17.0 14.5 – 23% (17%) 12% 44% - 42% 55% 08/19/21 Inovalon * (7) Nordic Capital 6,415 7,209 8.8 0.63 0.27 25.0 41.5 – 25% 20% 14% 35% - 19% 33% 08/05/21 Cornerstone OnDemand Clearlake 4,127 5,238 5.9 0.80 0.18 18.8 18.4 1.32 31% 4% 7% 31% 14% 25% 33% 12/21/20 RealPage Thoma Bravo 9,101 10,186 8.2 0.69 0.26 28.9 37.8 – 31% 28% 12% 28% - 19% 31% 12/17/19 LogMeIn Francisco Partners 4,337 4,418 3.4 0.87 0.12 10.7 14.0 – 25% (11%) 4% 32% - 24% 28% 06/12/19 Medidata Dassault Systèmes 5,897 5,785 7.5 0.44 0.32 31.0 – – 17% 4% 17% 24% 13% 6% 23% 10/28/18 Red Hat (1) IBM 34,630 33,622 9.3 0.56 0.21 33.8 33.8 3.28 63% 8% 17% 27% 10% 28% 45% 03/06/18 CommerceHub GTCR & Sycamore 1,069 1,049 8.6 0.87 0.20 20.5 26.8 2.21 25% (4%) 10% 42% 12% 33% 43% 12/14/16 Neustar Golden Gate Capital 1,997 2,882 2.3 0.25 0.06 5.0 5.9 0.21 45% 21% 9% 45% 28% 27% 36% 11/14/16 Mentor Graphics Siemens 4,529 4,521 3.7 0.32 0.19 15.7 – – 21% 21% 11% 23% - 8% 19% 09/19/16 Infoblox (1) Vista 1,611 1,353 3.7 1.16 0.16 19.4 21.9 0.86 72% (5%) 3% 19% 25% 20% 23% 07/07/16 AVG Avast 1,341 1,452 3.2 1.00 0.13 9.0 13.2 0.53 34% (13%) 3% 36% 25% 23% 26% 06/15/15 DealerTrack Cox Automotive 3,997 4,617 4.1 0.21 0.11 19.4 20.0 – 59% 27% 20% 21% - 18% 37% 04/07/15 Informatica Permira & CPP 5,295 4,874 4.3 0.54 0.15 18.1 22.1 1.72 27% 17% 8% 24% 13% 21% 29% 02/02/15 Advent Software SS&C Technologies 2,501 2,683 6.4 1.14 0.21 18.0 24.1 – 44% 26% 6% 36% - 25% 30% 12/15/14 Riverbed Technology Thoma Bravo 3,543 3,580 3.2 1.17 0.14 11.5 15.5 0.86 39% (6%) 3% 28% 18% 20% 23% 05/06/13 BMC Investor Group 7,032 7,136 3.1 0.63 0.09 7.9 10.6 – 14% (18%) 5% 39% - 29% 34% 07/02/12 Quest Software Dell 2,529 2,386 2.5 0.34 0.09 10.9 12.8 0.35 44% 1% 7% 23% 37% 21% 28% 07/01/11 Blackboard Providence Equity 1,638 1,750 3.2 0.19 0.09 12.6 16.2 0.66 21% 5% 17% 25% 24% 18% 35% Selected Public Software Transactions Above $1 Billion Since 2011 with Revenue Growth Between ~0% and 20% and LFCF Margin > ~20%(1) ($MM) Selected Transaction Statistics (1) (2) (3) Includes Altair, Altium, Mentor Graphics, and Medidata transactions. NTM statistics based on mean analyst consensus estimates for the next twelve-month period as of transaction announcement. Unaffected premium indicates premium based on day prior to rumors of a potential transaction, or premium based on day prior to transaction announcement if no substantial rumors existed. Note: Selected Transactions sorted by announce date. Multiples greater than 80.0x, Adj. Rev. Mult.s greater than 4.0x, and Adj. LFCF Mults. greater than 7.0x, or negative mults (4) noted as dashes. Source: Capital IQ, FactSet, company filings, company press releases and Wall Street research. (5) (6) (7) Rule of 40 = Revenue growth + LFCF Margin. Levered free cash flow based on cash flow from operations less capital expenditures and capitalized software. AVEVA statistics reflect 2022 buy-out of its minority shareholders by Schneider Electric. Echo estimated the value of its contribution for a 55% stake in Alpha at $8.5Bn / $160 per share ($6Bn in cash + software assets they valued at an estimated $2.5Bn). Implied $180/share includes synergies. Legend * Transaction Consideration Included Stock Recent Technical SW Transactions 5 letter cites the premia of the original Alpha transaction with Echo incl. of synergies (44%), Schneider’s squeeze- out of AVEVA (47%) and ‘relevant public software precedents’ (44%) Stockholder H
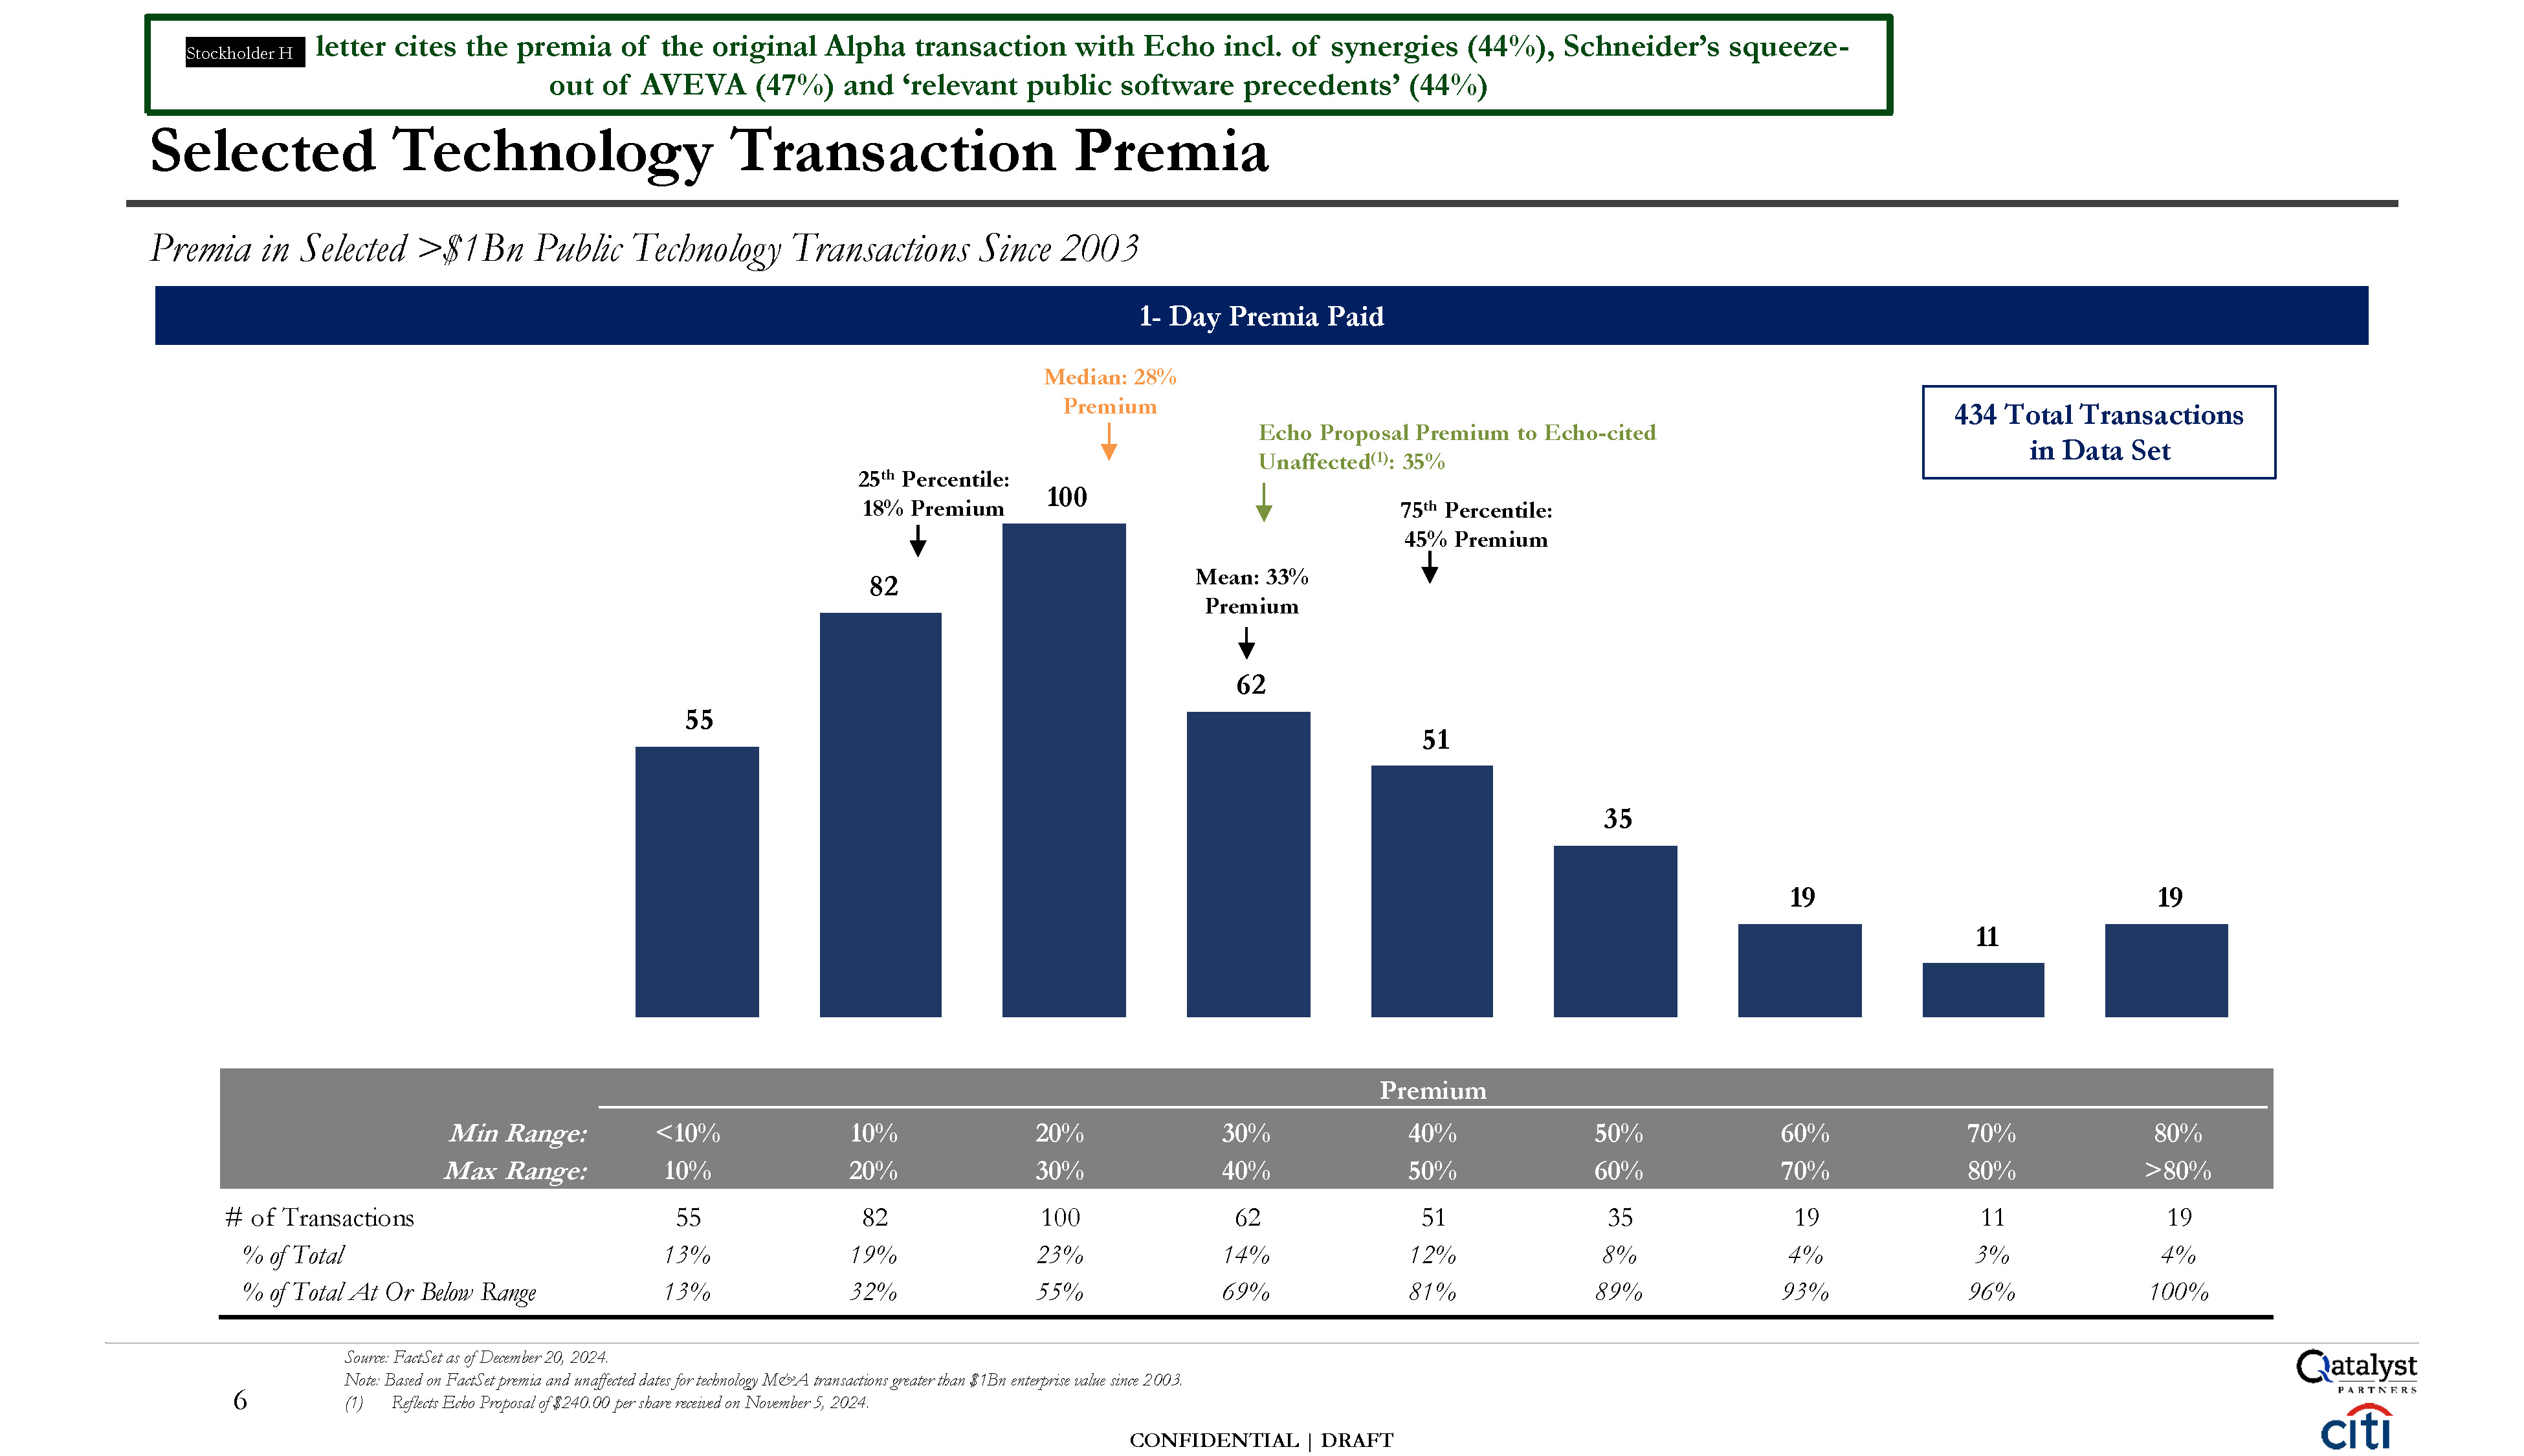
Premium Min Range: <10% 10% 20% 30% 40% 50% 60% 70% 80% Max Range: 10% 20% 30% 40% 50% 60% 70% 80% >80% # of Transactions 55 82 100 62 51 35 19 11 19 % of Total 13% 19% 23% 14% 12% 8% 4% 3% 4% % of Total At Or Below Range 13% 32% 55% 69% 81% 89% 93% 96% 100% Source: FactSet as of December 20, 2024. Note: Based on FactSet premia and unaffected dates for technology M&A transactions greater than $1Bn enterprise value since 2003. (1) Reflects Echo Proposal of $240.00 per share received on November 5, 2024. CONFIDENTIAL | DRAFT 55 82 100 62 51 35 19 11 19 Median: 28% Premium Selected Technology Transaction Premia Premia in Selected >$1Bn Public Technology Transactions Since 2003 6 1- Day Premia Paid 434 Total Transactions in Data Set 25th Percentile: 18% Premium Echo Proposal Premium to Echo-cited Unaffected(1): 35% 75th Percentile: 45% Premium Mean: 33% Premium letter cites the premia of the original Alpha transaction with Echo incl. of synergies (44%), Schneider’s squeeze- out of AVEVA (47%) and ‘relevant public software precedents’ (44%) Stockholder H
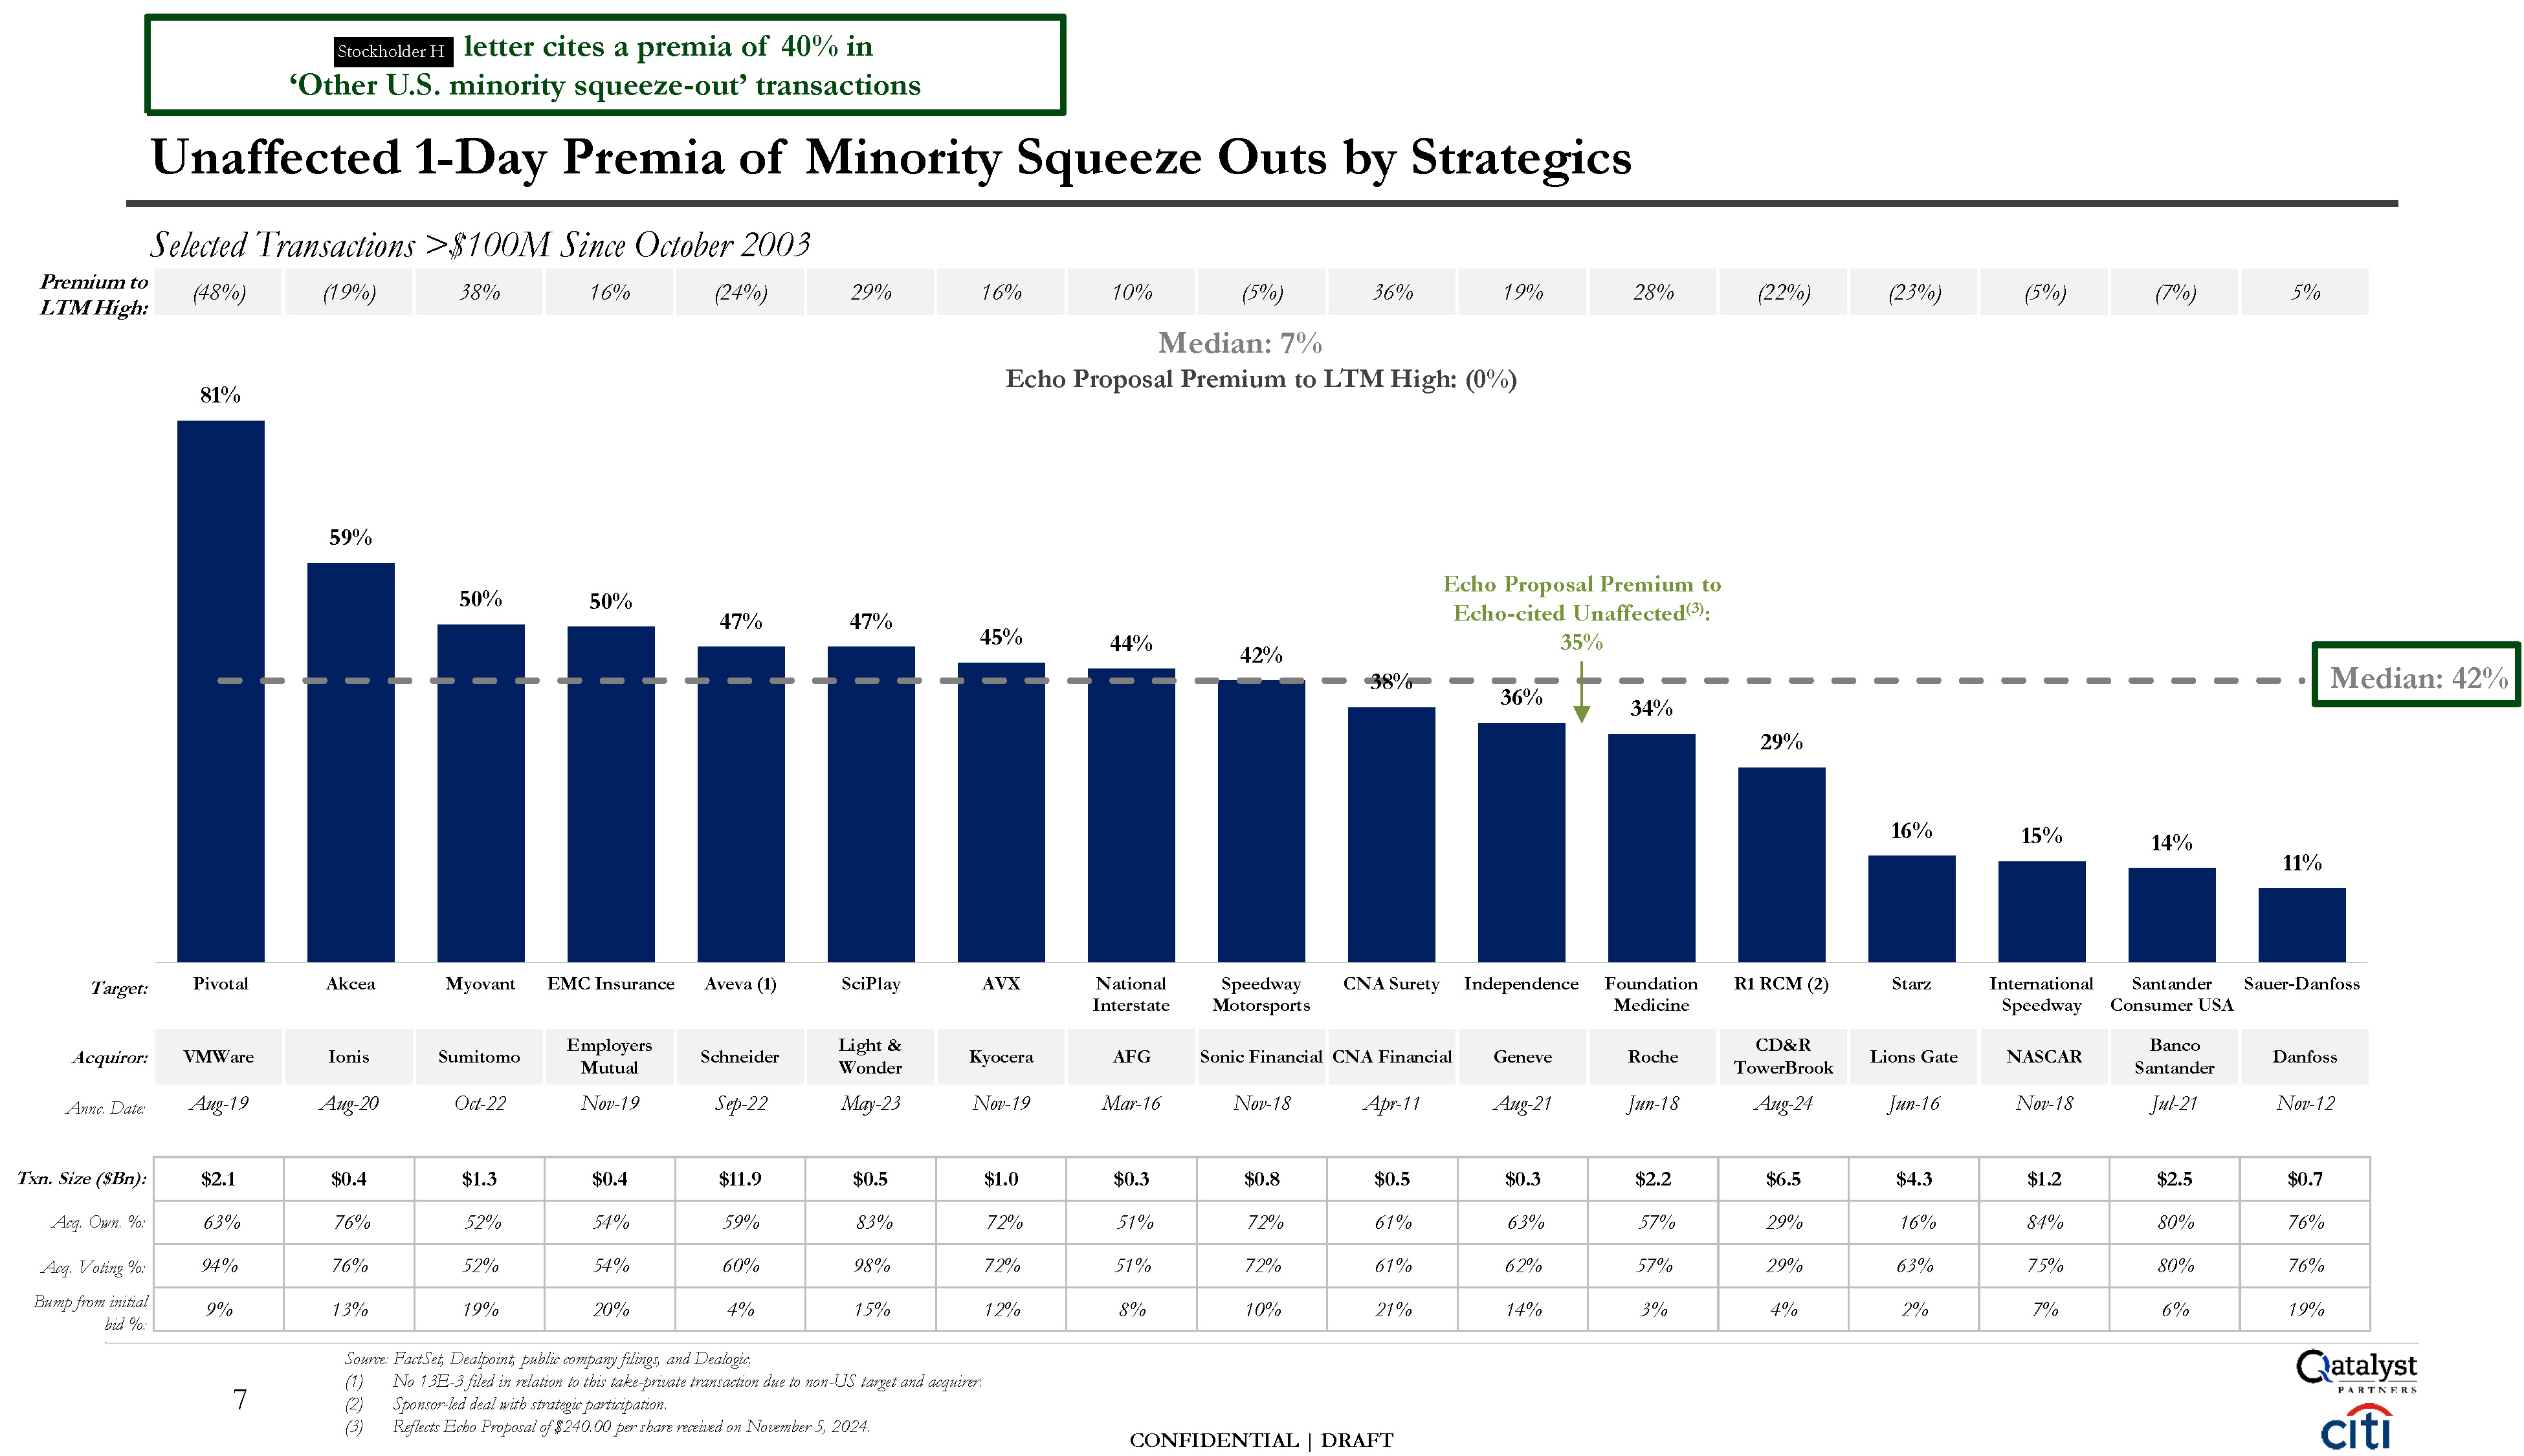
CONFIDENTIAL | DRAFT 81% 59% 50% 50% 47% 47% 45% 44% 42% 38% 36% 34% 29% 16% 15% 14% 11% Pivotal Akcea Myovant EMC Insurance Aveva (1) SciPlay AVX National Interstate Speedway Motorsports CNA Surety Independence Foundation Medicine R1 RCM (2) Starz International Speedway Santander Sauer-Danfoss Consumer USA Unaffected 1-Day Premia of Minority Squeeze Outs by Strategics Selected Transactions >$100M Since October 2003 Target: Source: FactSet, Dealpoint, public company filings, and Dealogic. No 13E-3 filed in relation to this take-private transaction due to non-US target and acquirer. Sponsor-led deal with strategic participation. Reflects Echo Proposal of $240.00 per share received on November 5, 2024. VMWare Ionis Sumitomo Employers Mutual Schneider Light & Wonder Kyocera AFG Sonic Financial CNA Financial Geneve Roche CD&R TowerBrook Lions Gate NASCAR Banco Santander Danfoss Aug-19 Aug-20 Oct-22 Nov-19 Sep-22 May-23 Nov-19 Mar-16 Nov-18 Apr-11 Aug-21 Jun-18 Aug-24 Jun-16 Nov-18 Jul-21 Nov-12 Acquiror: Annc. Date: Txn. Size ($Bn): Acq. Own. %: Acq. Voting %: Bump from initial bid %: $2.1 $0.4 $1.3 $0.4 $11.9 $0.5 $1.0 $0.3 $0.8 $0.5 $0.3 $2.2 $6.5 $4.3 $1.2 $2.5 $0.7 63% 76% 52% 54% 59% 83% 72% 51% 72% 61% 63% 57% 29% 16% 84% 80% 76% 94% 76% 52% 54% 60% 98% 72% 51% 72% 61% 62% 57% 29% 63% 75% 80% 76% 9% 13% 19% 20% 4% 15% 12% 8% 10% 21% 14% 3% 4% 2% 7% 6% 19% Median: 42% (48%) (19%) 38% 16% (24%) 29% 16% 10% (5%) 36% 19% 28% (22%) (23%) (5%) (7%) 5% Premium to LTM High: Median: 7% Echo Proposal Premium to LTM High: (0%) Echo Proposal Premium to Echo-cited Unaffected(3): 35% 7 letter cites a premia of 40% in ‘Other U.S. minority squeeze-out’ transactions Stockholder H
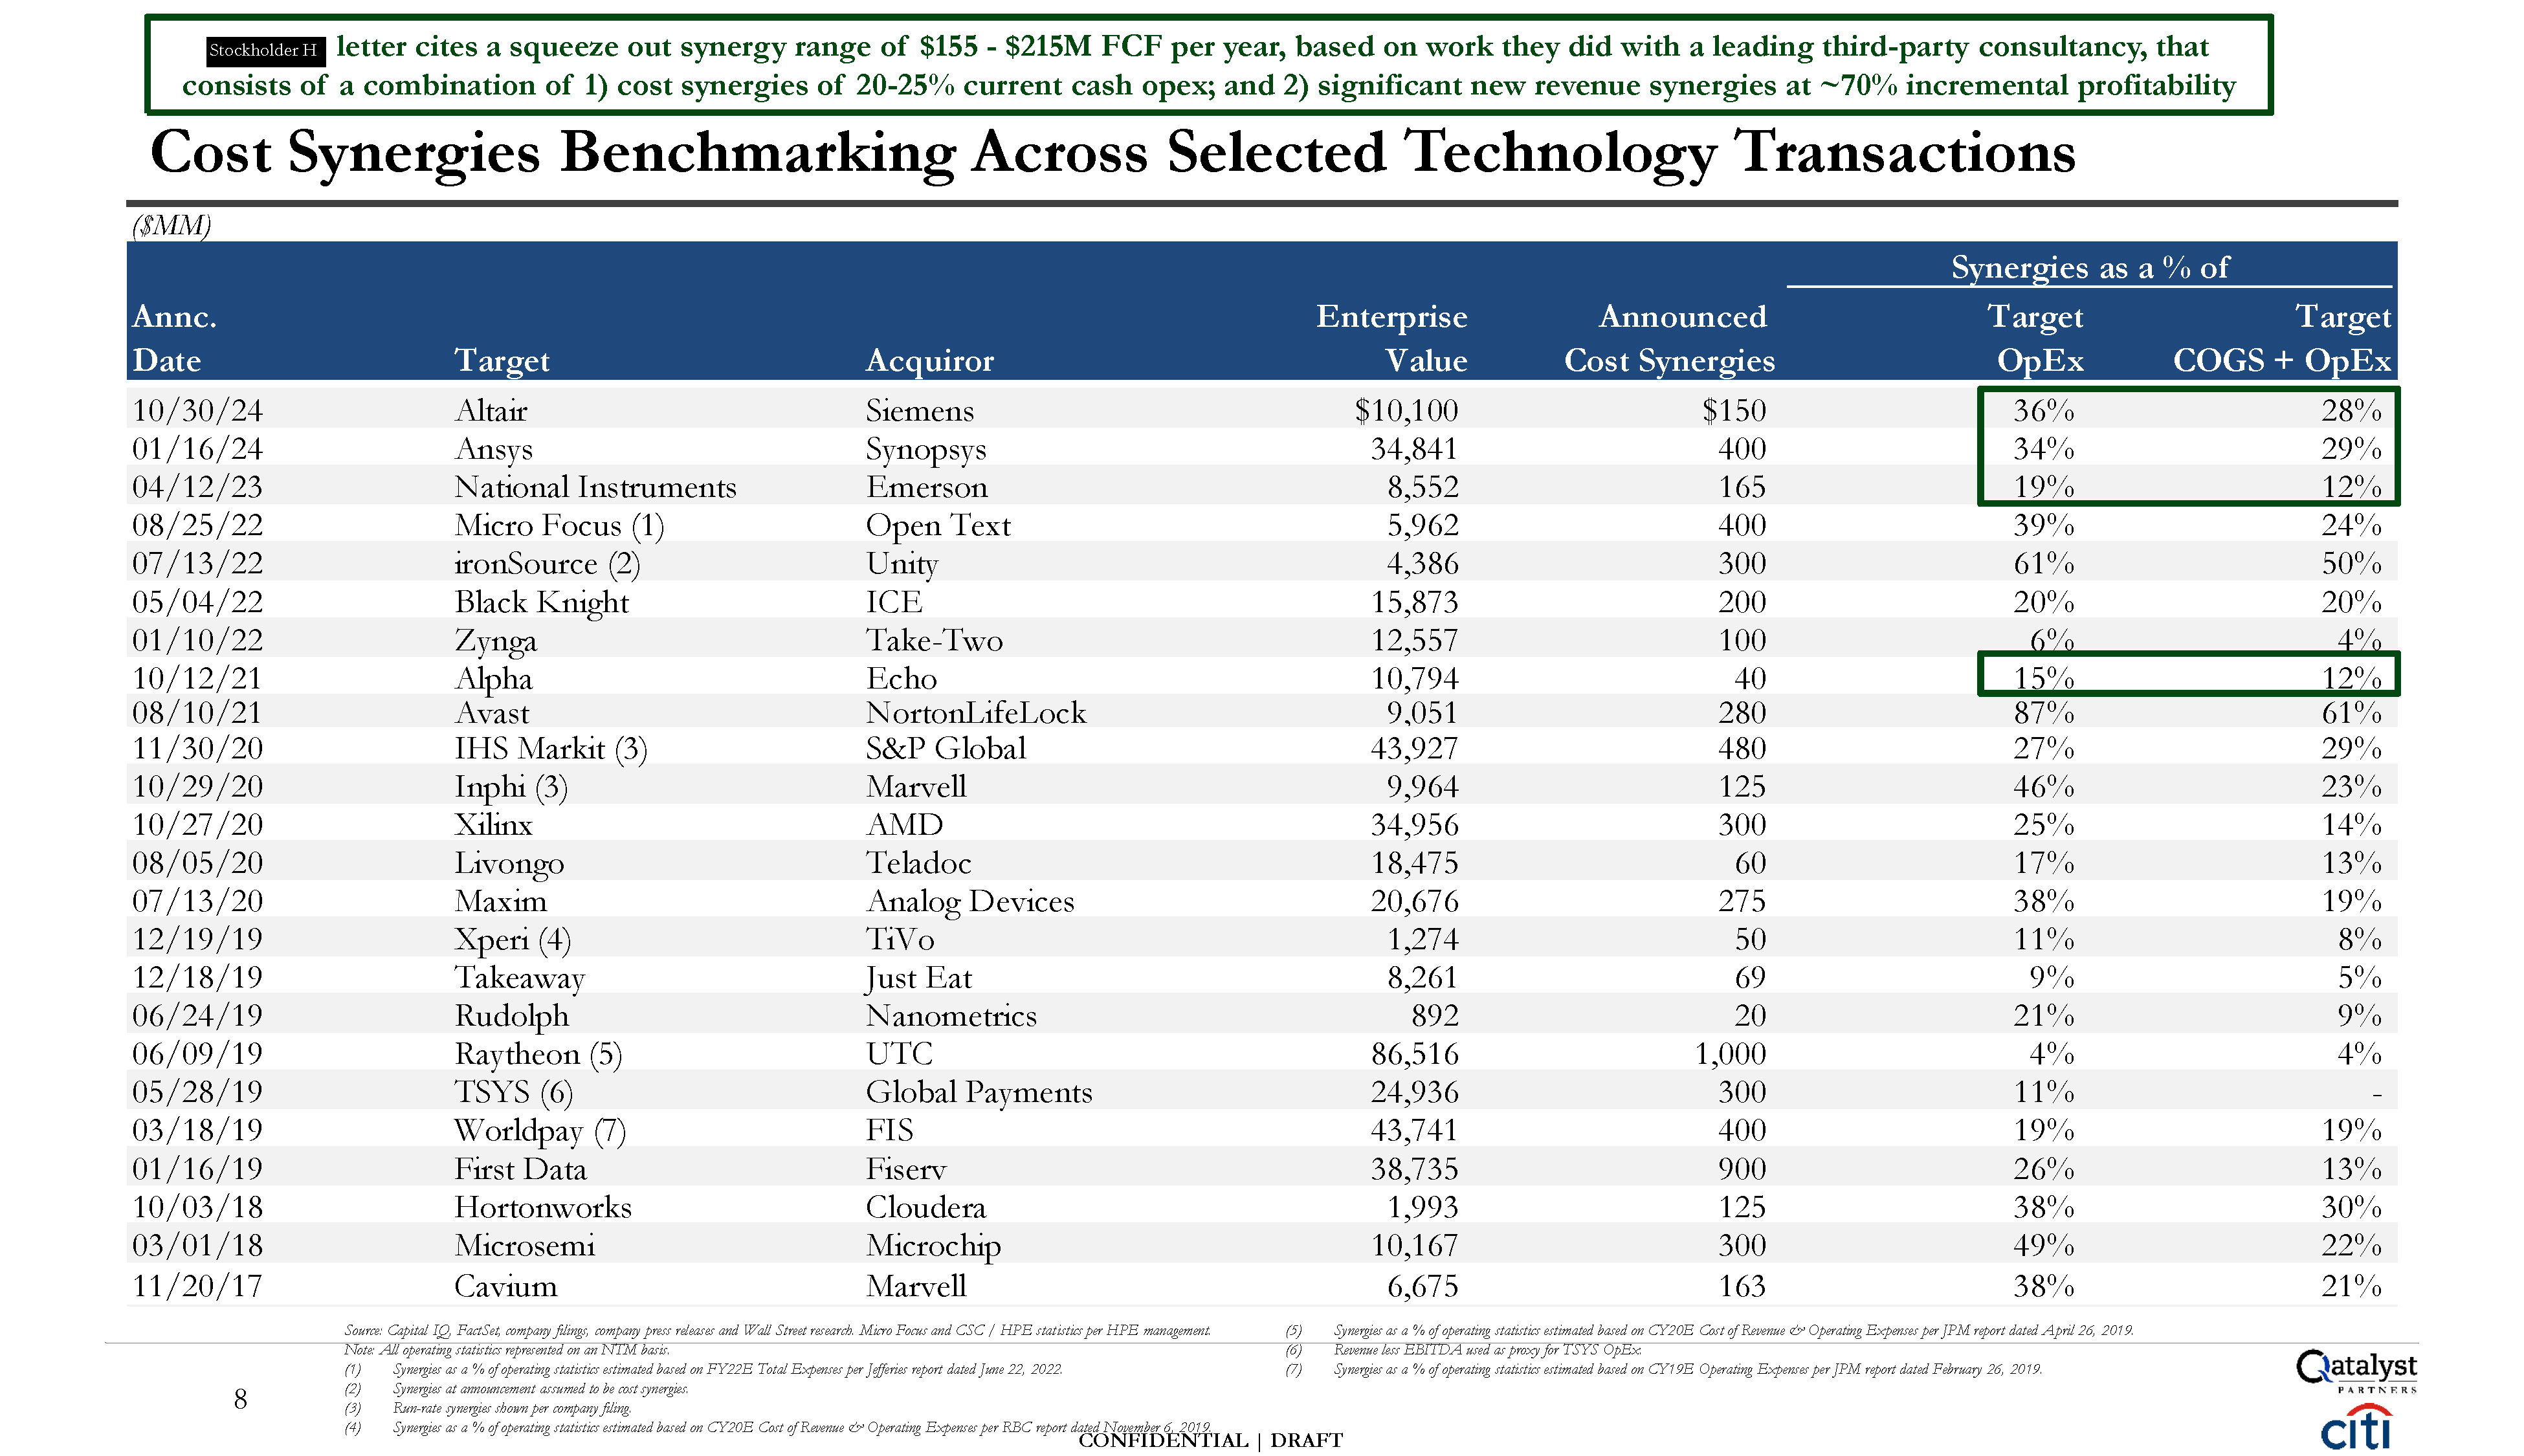
CONFIDENTIAL | DRAFT 8 Cost Synergies Benchmarking Across Selected Technology Transactions letter cites a squeeze out synergy range of $155 - $215M FCF per year, based on work they did with a leading third-party consultancy, that consists of a combination of 1) cost synergies of 20-25% current cash opex; and 2) significant new revenue synergies at ~70% incremental profitability ($MM) Synergies as a % of Annc. Enterprise Announced Target Target Date Target Acquiror Value Cost Synergies OpEx COGS + OpEx 10/30/24 Altair Siemens $10,100 $150 36% 28% 01/16/24 Ansys Synopsys 34,841 400 34% 29% 04/12/23 National Instruments Emerson 8,552 165 19% 12% 08/25/22 Micro Focus (1) Open Text 5,962 400 39% 24% 07/13/22 ironSource (2) Unity 4,386 300 61% 50% 05/04/22 Black Knight ICE 15,873 200 20% 20% 01/10/22 Zynga Take-Two 12,557 100 6% 4% 10/12/21 Alpha Echo 10,794 40 15% 12% 08/10/21 Avast NortonLifeLock 9,051 280 87% 61% 11/30/20 IHS Markit (3) S&P Global 43,927 480 27% 29% 10/29/20 Inphi (3) Marvell 9,964 125 46% 23% 10/27/20 Xilinx AMD 34,956 300 25% 14% 08/05/20 Livongo Teladoc 18,475 60 17% 13% 07/13/20 Maxim Analog Devices 20,676 275 38% 19% 12/19/19 Xperi (4) TiVo 1,274 50 11% 8% 12/18/19 Takeaway Just Eat 8,261 69 9% 5% 06/24/19 Rudolph Nanometrics 892 20 21% 9% 06/09/19 Raytheon (5) UTC 86,516 1,000 4% 4% 05/28/19 TSYS (6) Global Payments 24,936 300 11% - 03/18/19 Worldpay (7) FIS 43,741 400 19% 19% 01/16/19 First Data Fiserv 38,735 900 26% 13% 10/03/18 Hortonworks Cloudera 1,993 125 38% 30% 03/01/18 Microsemi Microchip 10,167 300 49% 22% 11/20/17 Cavium Marvell 6,675 163 38% 21% Source: Capital IQ, FactSet, company filings, company press releases and Wall Street research. Micro Focus and CSC / HPE statistics per HPE management. Note: All operating statistics represented on an NTM basis. Synergies as a % of operating statistics estimated based on FY22E Total Expenses per Jefferies report dated June 22, 2022. Synergies at announcement assumed to be cost synergies. Run-rate synergies shown per company filing. Synergies as a % of operating statistics estimated based on CY20E Cost of Revenue & Operating Expenses per RBC report dated November 6, 2019. Synergies as a % of operating statistics estimated based on CY20E Cost of Revenue & Operating Expenses per JPM report dated April 26, 2019. Revenue less EBITDA used as proxy for TSYS OpEx. (7) Synergies as a % of operating statistics estimated based on CY19E Operating Expenses per JPM report dated February 26, 2019. Stockholder H
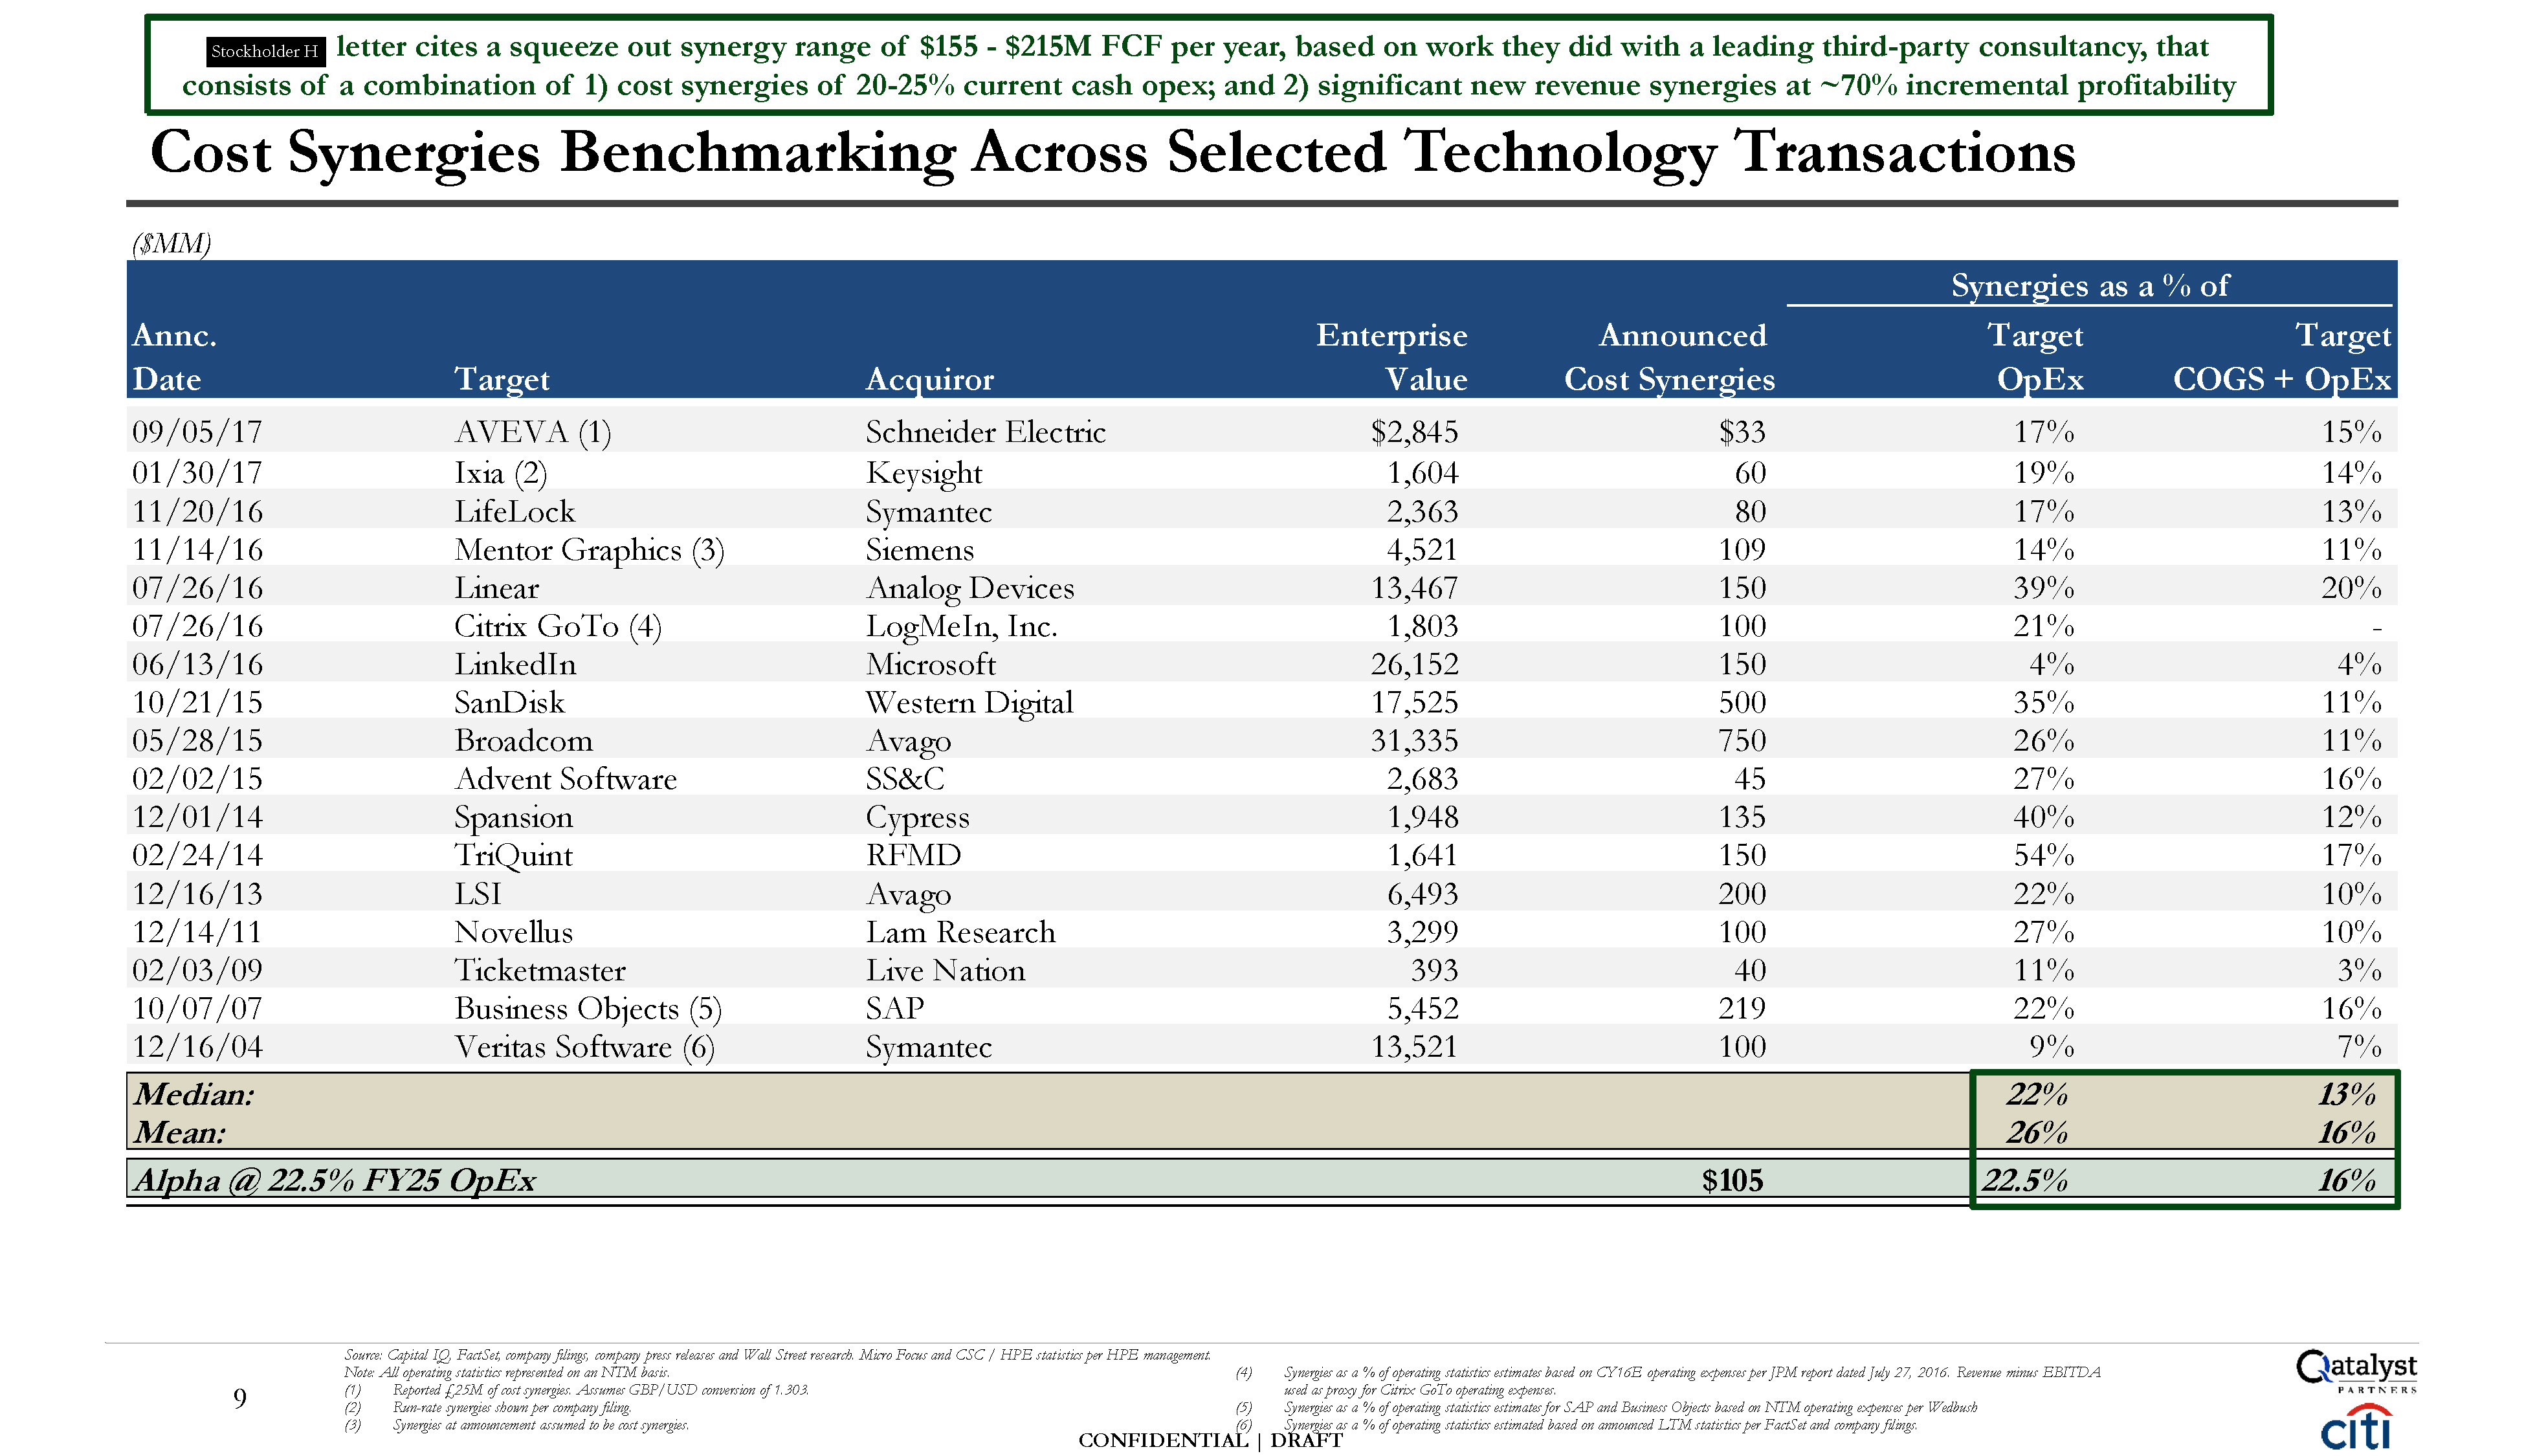
CONFIDENTIAL | DRAFT Median: Mean: 22% 13% 26% 16% Alpha @ 22.5% FY25 OpEx $105 22.5% 16% ($MM) Synergies as a % of Annc. Date Target Acquiror Enterprise Value Announced Cost Synergies Target OpEx Target COGS + OpEx 09/05/17 AVEVA (1) Schneider Electric $2,845 $33 17% 15% 01/30/17 Ixia (2) Keysight 1,604 60 19% 14% 11/20/16 LifeLock Symantec 2,363 80 17% 13% 11/14/16 Mentor Graphics (3) Siemens 4,521 109 14% 11% 07/26/16 Linear Analog Devices 13,467 150 39% 20% 07/26/16 Citrix GoTo (4) LogMeIn, Inc. 1,803 100 21% - 06/13/16 LinkedIn Microsoft 26,152 150 4% 4% 10/21/15 SanDisk Western Digital 17,525 500 35% 11% 05/28/15 Broadcom Avago 31,335 750 26% 11% 02/02/15 Advent Software SS&C 2,683 45 27% 16% 12/01/14 Spansion Cypress 1,948 135 40% 12% 02/24/14 TriQuint RFMD 1,641 150 54% 17% 12/16/13 LSI Avago 6,493 200 22% 10% 12/14/11 Novellus Lam Research 3,299 100 27% 10% 02/03/09 Ticketmaster Live Nation 393 40 11% 3% 10/07/07 Business Objects (5) SAP 5,452 219 22% 16% 12/16/04 Veritas Software (6) Symantec 13,521 100 9% 7% 9 Cost Synergies Benchmarking Across Selected Technology Transactions Source: Capital IQ, FactSet, company filings, company press releases and Wall Street research. Micro Focus and CSC / HPE statistics per HPE management. Note: All operating statistics represented on an NTM basis. Reported £25M of cost synergies. Assumes GBP/USD conversion of 1.303. Run-rate synergies shown per company filing. (3) Synergies at announcement assumed to be cost synergies. Synergies as a % of operating statistics estimates based on CY16E operating expenses per JPM report dated July 27, 2016. Revenue minus EBITDA used as proxy for Citrix GoTo operating expenses. Synergies as a % of operating statistics estimates for SAP and Business Objects based on NTM operating expenses per Wedbush (6) Synergies as a % of operating statistics estimated based on announced LTM statistics per FactSet and company filings. letter cites a squeeze out synergy range of $155 - $215M FCF per year, based on work they did with a leading third-party consultancy, that consists of a combination of 1) cost synergies of 20-25% current cash opex; and 2) significant new revenue synergies at ~70% incremental profitability Stockholder H
These materials have been prepared by Qatalyst Partners LP (including any affiliates “Qatalyst”) for the Qatalyst client or potential client to whom such materials are directly addressed and delivered or a special committee of the Board of Directors thereof (the “Company”) in connection with an actual or potential mandate or engagement and may not be used or relied upon for any purpose other than as specifically contemplated by a written agreement with Qatalyst. These materials are based on information provided by or on behalf of the Company and/or other potential transaction participants, from public sources or otherwise reviewed by Qatalyst. Qatalyst assumes no responsibility for independent investigation or verification of such information and has relied on such information being complete and accurate in all respects. To the extent such information includes estimates and forecasts of future financial performance (including estimates of potential cost savings and synergies) prepared by or reviewed with the managements of the Company and/or other potential transaction participants or obtained from public sources, Qatalyst has assumed that such estimates and forecasts have been reasonably prepared on bases reflecting the best currently available estimates and judgments of such managements (or, with respect to estimates and forecasts obtained from public sources, represent reasonable estimates). No representation or warranty, express or implied, is made as to the accuracy or completeness of such information and nothing contained herein is, or shall be relied upon as, a representation, whether as to the past, the present or the future. These materials were designed for use by specific persons familiar with the business and affairs of the Company and are being furnished and should be considered only in connection with other information, oral or written, being provided by Qatalyst in connection herewith. These materials are not intended to provide the sole basis for evaluating, and should not be considered a recommendation with respect to, any transaction or other matter. Prior to entering into any transaction the Company should determine, without reliance on Qatalyst, the economic risks and merits as well as the legal, tax and accounting characterizations and consequences of any such transaction. In this regard, by accepting this presentation, the Company acknowledges that (a) Qatalyst is not in the business of providing (and the Company is not relying on Qatalyst for) legal, tax or accounting advice, (b) there may be legal, tax or accounting risks associated with any transaction, (c) the Company should receive (and rely on) separate and qualified legal, tax and accounting advice and (d) the Company should apprise senior management as to such legal, tax and accounting advice (and any risks associated with any transaction) and Qatalyst’s disclaimer as to these matters. Qatalyst does not provide tax advice. Accordingly, any statements contained herein as to tax matters were neither written nor intended by Qatalyst to be used and cannot be used by any taxpayer for the purpose of avoiding tax penalties that may be imposed on such taxpayer. Any discussion of tax matters in these materials may have been written in connection with the “promotion” or “marketing” of any transaction contemplated hereby. Accordingly, any taxpayer should seek advice based on such taxpayer’s particular circumstances from an independent tax advisor. These materials do not constitute an offer or solicitation to sell or purchase any securities and are not a commitment by Qatalyst to provide or arrange any financing for any transaction or to purchase any security in connection therewith. Qatalyst is not acting in any other capacity as a fiduciary to the Company. Qatalyst assumes no obligation to update or otherwise revise these materials. These materials have not been prepared with a view toward public disclosure under state or federal securities laws or otherwise, are intended for the benefit and use of the Company, and may not be reproduced, disseminated, quoted, summarized or referred to, in whole or in part, without the prior written consent of Qatalyst. These materials may not reflect information known to other professionals in other business areas of Qatalyst. Qatalyst is a full service securities firm providing investment banking and other services and products to a wide range of corporations and individuals, domestically and offshore, from which conflicting interests or duties may arise. In the ordinary course of these activities, Qatalyst may at any time hold long or short positions, and may trade or otherwise effect transactions, for their own account or the accounts of customers, in debt or equity securities or loans of the Company, potential counterparties, or any other company that may be involved in a transaction. Qatalyst is required to obtain, verify and record certain information that identifies each entity that enters into a formal business relationship with it, which information includes the complete name and address and taxpayer ID number. Qatalyst may also request corporate formation documents, or other forms of identification, to verify information provided. CONFIDENTIAL | DRAFT Disclaimer
The preceding pages contain material provided to the Special Committee of the Board of Directors of Alpha (the “Company”) by Citigroup Global Markets Inc. (“Citi”) in connection with the proposed transaction involving the Company and Echo. The accompanying material was compiled or prepared on a confidential basis solely for the use of the Special Committee of the Board of Directors of the Company and not with a view toward public disclosure under any securities laws or otherwise. The information contained in the accompanying material was obtained from the Company and other sources. Any estimates and projections contained herein have been prepared or adopted by management of the Company, obtained from public sources, or are based upon such estimates and projections, and involve numerous and significant subjective determinations, and there is no assurance that such estimates and projections will be realized. Citi does not take responsibility for such estimates and projections, or the basis on which they were prepared. No representation or warranty, express or implied, is made as to the accuracy or completeness of such information and nothing contained herein is, or shall be relied upon as, a representation, whether as to the past, the present or the future. In preparing the accompanying material, Citi assumed and relied, without independent verification, upon the accuracy and completeness of all financial and other information and data publicly available or provided to or otherwise reviewed by or discussed with Citi and upon the assurances of the management of the Company, that they are not aware of any relevant information that has been omitted or that remains undisclosed to Citi. The accompanying material was not prepared for use by readers not as familiar with the Company and Echo as the Special Committee of the Board of Directors of the Company and, accordingly, neither the Company nor Citi nor their respective legal or financial advisors or accountants take any responsibility for the accompanying material if used by persons other than the Special Committee of the Board of Directors of the Company. The accompanying material is necessarily based upon information available to Citi, and financial, stock market and other conditions and circumstances existing and disclosed to Citi, as of the date of the accompanying material. Citi does not have any obligation to update or otherwise revise the accompanying material. Nothing contained herein shall be construed as legal, tax or accounting advice. CONFIDENTIAL | DRAFT Disclaimer