UNITED STATES
SECURITIES AND EXCHANGE COMMISSION
Washington, D.C. 20549
FORM N-CSR
CERTIFIED SHAREHOLDER REPORT OF REGISTERED
MANAGEMENT INVESTMENT COMPANIES
Investment Company Act file number 811-3445
The Merger Fund
(Exact name of registrant as specified in charter)
100 Summit Lake Drive
Valhalla, New York 10595
(Address of principal executive offices) (Zip code)
Roy Behren and Michael T. Shannon
The Merger Fund
100 Summit Lake Drive
Valhalla, New York 10595
(Name and address of agent for service)
1-800-343-8959
Registrant's telephone number, including area code
Date of fiscal year end: December 31
Date of reporting period: December 31, 2011
Item 1. Reports to Stockholders.
THE
MERGER
FUND®
ANNUAL REPORT
DECEMBER 31, 2011
February 1, 2012
Dear Fellow Shareholders:
The Merger Fund® bounced back nicely in the fourth quarter, posting a 2.9% gain which brought the Fund to a 1.7% gain for the calendar year, our 73rd gain in the 92 quarters since inception.1 Although the strong quarter coincided with strength in the overall equity markets, our performance was actually due to multiple deal completions and successful deal selection as well as a snap-back in overextended arbitrage spreads resulting from the third-quarter market turbulence.
Although we are not satisfied with a 1.7% rate of return, we did achieve our goal of providing non-correlated, positive returns in a difficult market environment. U.S. equity markets gained traction, finishing modestly in the black, thanks to the S&P 500’s stratospheric 11.8% fourth-quarter gain, while most of Europe remained stuck in the mud, ending the year with negative returns. Our take is that the macro environment remains challenging worldwide, despite apparent stability in various sectors of corporate earnings. Neither the European sovereign debt problems nor the U.S. fiscal and budgetary issues have been resolved, and therefore economic visibility is limited. Nobody knows whether the U.S. issues will progress before the November election amid Congressional gridlock, yet for reasons we will discuss below, we remain optimistic about future deal activity. Our 22nd gain in the past 24 years compares as follows with some relevant benchmarks and peer groups:
| | 2011 Return | Std. Deviation | Beta vs. S&P 500 |
| MERFX | 1.7% | 3.7 | 0.18 |
| HFRX Event Driven Index | -4.9% | 5.8 | 0.32 |
| HFRX Merger Arbitrage Index | -2.1% | 3.7 | 0.21 |
| S&P 500 | 2.1% | 15.9 | 1.00 |
| MSCI World Index | -5.0% | 17.5 | 1.08 |
We again accomplished this performance objective with less than one quarter of the volatility (standard deviation) and a beta (correlation) of less than one fifth of that of the S&P 500, reflecting our emphasis on risk-adjusted metrics and the uncorrelated nature of the Fund. Conservative deal selection and the prudent use of derivatives positively impacted performance.2 The Fund purchased put options, sold call options, and utilized forward contracts and total-return swap contracts for risk-management (as opposed to speculative) purposes as well as return-enhancement purposes.
We were invested in a total of 104 positions during the quarter and experienced one terminated transaction, consistent with our historic deal-selection success rate of 98% plus. We ended the quarter with 62 investments in the portfolio. However, due to the typical year-end dynamics of deal completions and seasonally low deal announcements, we also ended the year with approximately 16% in cash. This exceeds our target range of 5-10% but is not atypical for the end of the year. Rest assured that we will not invest in unattractive transactions or stray from our mandate merely to show a low cash position.
Nonetheless, our quarterly performance of +2.9% was obtained by opportunistically deploying our liquidity during the third-quarter European debt crisis as well as being invested in 26 successfully
| 1 | On December 29th, The Merger Fund® paid a distribution to shareholders of record as of December 28th of $0.4519 per share, consisting of $0.3689 in short-term capital gains and $0.0830 in net investment income. |
| 2 | TheFund typically uses derivative instruments for hedging purposes or as a more tax-efficient way to invest in foreign transactions. Use of these instruments may involve certain costs and risks. A complete description of the Fund’s principal and other risk factors are contained in the Fund’s prospectus and statement of additional information. |
completed deals prior to the end of the year. Reflecting this dynamic, our ratio of winning to losing investments for the quarter was three to one. Our largest loser during the period was our macro portfolio hedge, which cost 20 basis points while the S&P 500 Index was up almost 12%. The second largest detractor from performance was Pharmasset, Inc., an $11 billion biotech company with a Hepatitis C treatment pipeline. Pharmasset was the subject of a tender offer from Gilead Sciences Inc. The deal was announced in November and the transaction was completed in mid-January, entirely recouping the Fund’s fourth quarter negative mark-to-market.
Remarkably, the Fund made 0.13% in its only terminated transaction of the period, AT&T’s attempted $39 billion purchase of T-Mobile from Deutsche Telekom AG (“DT”). As we typically do, we structured our investment conservatively, in the form of an in-the-money buy-write strategy on AT&T, the buyer. Win, lose or draw, we thought that although the transaction was positive and highly accretive for AT&T, the stock price would be protected during the pendency of the transaction by its earnings power and high dividend yield. The U.S. Department of Justice sued to block the acquisition in August, which AT&T indicated it would fight, but the death knell then tolled in November when the FCC scheduled an administrative hearing on AT&T’s application. Within a month, AT&T, in agreement with DT, folded its tent and walked away from the deal, despite its contractual right to litigate, the strong strategic rationale for the deal and a $4 billion termination fee owed to DT. We were surprised by the timing as well as the decision, but although AT&T traded down modestly on the news, we were protected by the structure of an in-the-money call and the premium received for the call, combined with the insurance of a long put option, and thus escaped with a modest profit.
Our biggest winner for the quarter involved the interminable rental car saga of Dollar Thrifty Automotive Group (“DTG”). After being our second biggest loser in the third quarter, DTG bounced back to contribute 0.64% to our performance. It looks like we are nearing the end game, as there is persistent press speculation and non-denial from the parties regarding progress with the FTC approval process. In the meantime, Hertz continues to reiterate its commitment to the acquisition and DTG has continued to report solid earnings, so the price of poker appears to have gone up. Recall that DTG has not yet agreed to be acquired, so DTG’s asking price has probably gone up, and so has our potential downside price if no deal comes together. Hertz’s most recent offer, which has officially expired, valued DTG at $69.52 on February 1, compared to its closing price that day of $74.20. We would add that it is not a given that Avis has been gone too long from the process to consider returning to the fray.
Other significant contributors in the quarter were British Sky Broadcasting, from which we are completing an orderly exit after News Corp. withdrew its bid in light of a phone-hacking scandal (25 bps); Synthes Inc., the Swiss firm being bought by Johnson & Johnson (22 bps); and Motorola Mobility Holdings, Inc., the handset maker that Google is in the process of purchasing (13 bps).
Probably the most atypical holding at year end was NYSE Euronext (“NYX”), which although formally “engaged” but not yet married to Deutsche Boerse AG (“DB”), ran into significant regulatory problems. Although the U.S. Department of Justice cleared the transaction, the European Commission expressed concern with the combined company’s share of worldwide derivatives trading. Many investors thought that this was such a good deal for DB that its price would fall if the deal were to be blocked, and many investors also thought that the deal terms for NYX were below the price at which it would trade in the absence of a deal. Consequently, this was not a normal merger arbitrage situation, as NYX was bid up and DB sold down under the theory that NYX was worth more as a standalone company than the value of the deal consideration. These market forces caused the arbitrage spread to tighten and then trade at
a negative spread, i.e., NYX was trading above the deal price, so an investor would definitely lose money if the deal were successfully completed; however, there was the possibility that the investor would make money on a termination as the spread moved further into negative territory as NYX traded up and DB traded down. As our investors know, we are not in the business of conducting relative value trades, and when we are handed the opportunity to lock in a profit— particularly a profit which is greater than we would have received if the deal were successfully completed— we take it. Therefore, we unwound our NYX position in December at between $1 and $1.50 in excess of the deal price. Because of significant speculative activity in NYX, option volatility levels increased and option prices became inflated. We took advantage of this by selling calls against our long stock, thereby converting some of our position into a short term, deep in-the-money buy-write. As of the date of this letter, DB’s arguments ended up as wasted words and thus it was a stormy Monday on January 30th as the EU denied approval of the transaction on anti-trust grounds. Two days later, the parties decided not to waste any more time and immediately terminated the transaction. Time will tell if we left any money on the table but we are comfortable with our decision to avoid this directional bet. The NYX position contributed 20 bps during the quarter.
GLOBAL REVIEW
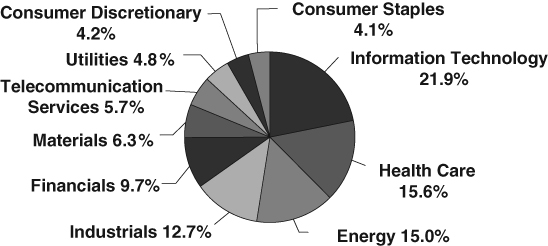
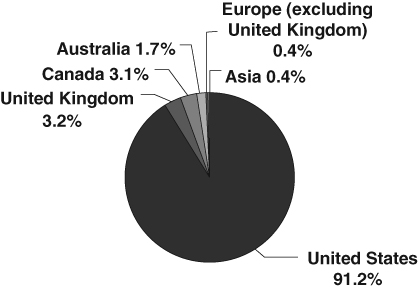
Unlike the prior quarter, new positions predominantly involved U.S. companies. Of the Fund’s 26 new investments, only five were international, with two Canadian targets, and one each from Japan, the United Kingdom and Australia. Sector distribution was diverse, with the most popular industries being information technology, healthcare and energy.
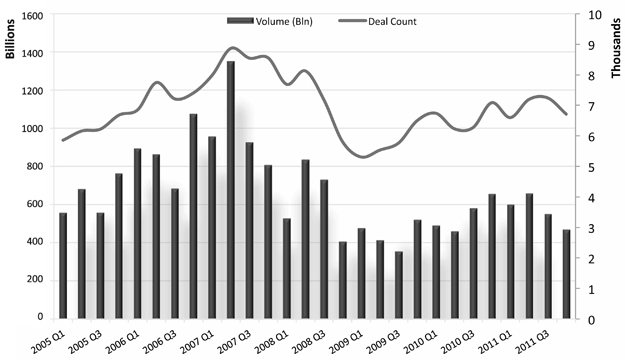
From a higher level perspective, here is how full-year worldwide activity stacked up:3
| | • | Globally, announced deal volume was essentially unchanged from 2010, with $2.27 trillion on 27,720 deals. However, the year was front-end loaded, as Q4 activity of $465 billion made it the slowest quarter of the year and represented a decrease of 29% year-over-year compared to Q4 of 2010. |
| | • | M&A activity in the Americas accounted for over 48% of global deal volume in 2011, followed by EMEA with 30% and APAC with 22%. The U.S. alone accounted for 38% of the Americas’ total volume. |
| | • | Private-equity transactions have exceeded $155 billion in North America this year, accounting for 23% of all deal activity. |
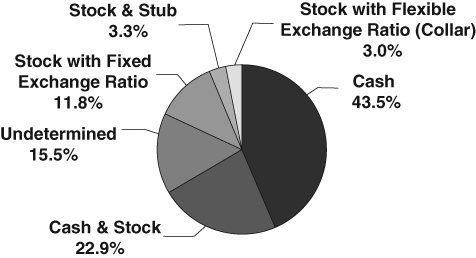
| | • | A significant majority of transactions, 56%, provided for cash consideration, while all-stock consideration represented only 17% of deal volume. |
There are multiple takeaways from these data. We have seen geographic as well as sector rotation in the past, and although last year’s activity trended strongly towards North America, trends often change course in short periods of time. M&A activity tends to be non-linear and there will be ebbs and flows even within up-cycles. The foundation has been laid for an extended period of corporate reorganization activity. As we have discussed before, strengthened corporate balance sheets coupled with record low funding rates incentivize companies to undertake transactions. The latest figure we have seen is that nonfinancial companies held a record $2.1 trillion in cash and other liquid assets at the end of September, according
| 3 | Bloomberg Global Financial Advisory Mergers & Acquisitions Rankings Q4 2011. |
to the Federal Reserve’s September flow of funds report.4 Earlier this month, Eastman Chemical reported that its after-tax funding cost for the $3.5 billion debt it needed to purchase Solutia, the specialty materials company, was expected to average 3% for a mix of five to 30-year obligations.
As we have seen, however, economic and political uncertainty can dampen activity, causing acquirers to stand back. “In my 30 years in the business, I can’t recall a time when political factors have had more of an impact than they do now,” Gene Sykes, co-head of global M&A at Goldman Sachs, was quoted as saying, and continued, “…we’ve had many discussions with boards and CEOs about deal opportunities, and while the desire to execute is there, until the picture becomes clearer, most of them are on hold.”5 In fact, the first month of 2012 has seen the lowest levels of dealmaking since 2003, with only $103 billion worth of transactions announced globally, nearly half the level of January 2011.
WHERE IT ALL BEGINS
Although there may be a lull in activity while companies wait for the smoke to clear, many bankers are observing a growing backlog. Larry Slaughter, co-head of North American investment banking at JPMorgan, noted in a recent FT article “…our pipeline of activity is up so we expect M&A to increase. Shareholders still prefer companies to grow, either via M&A or organically, rather than return cash to shareholders by dividends or stock buy-backs.”6 Aryeh Bourkoff, head of UBS AG’s investment banking for the Americas, also noted, “We’ve been spending time with companies and private-equity firms on planning so that when the obstacles to doing deals are alleviated, they are prepared to move. When there is more confidence and stability, you’ll see the deal gates open relatively quickly.”7 Echoing this sentiment was Henrik Aslaksen, global head of M&A at Deutsche Bank AG, who is quoted in the same article as saying, “If the macro environment cooperates, there will be big deals in 2012, even in Europe.”
Additionally, hostile approaches are often viewed as a leading indicator of an M&A rebound. Current unsolicited offers include Martin Marietta’s $5 billion bid for Vulcan Materials, Roche’s recent $5.7 billion bid for Illumina, and Westlake Chemical’s hostile $1.2 billion offer to buy Georgia Gulf Corporation. Companies that are having difficulty growing organically and can no longer cut costs often feel there is only one way out—to take immediate action to avoid the wrath of activist shareholders or even avoid becoming targets themselves.
The New York Times Dealbook recently cited a study by Ernst & Young in which 36% of companies surveyed plan to pursue an acquisition this year,8 so it is clearly not the end of the line for mergers.
And so, The Merger Fund® will be watching, cash in hand if necessary, for a revival of dealmaking. We will continue to be disciplined in our investment activities throughout the cycle rather than trying to force risky positions into the portfolio.
In any event, even if there are indeed blue skies ahead for merger activity, we find it necessary to recalibrate our expected returns in the near future. Given the extraordinary low cost of capital and risk-free interest rates,9 it is unrealistic to expect double-digit returns in this environment. High quality deals
| 4 | Wall Street Journal, 12/17/11, “Number of the Week: The Upside of Companies Sitting on Cash”. |
| 5 | Wall Street Journal, 1/3/12, “Europe’s Woes Even Dampened M&A”. |
| 6 | Financial Times, 1/29/12, “Sluggish start to year for M&A volumes”. |
| 8 | NYT Dealbook, 1/2/12, “On Wall Street, Renewed Optimism for Deal-Making”. |
| 9 | Six months Treasury Bills, slightly longer than the typical merger transaction takes to close, currently yield only .09% per annum. |
are currently trading at mid-to-high single digit annual returns in best-case scenarios. This would be the high end of our short-term return target since we vigorously manage portfolio risk. A merger arbitrage portfolio structured to provide double-digit returns in this environment would need to incur such high levels of risk and leverage that its capital account would head southbound very quickly.
OUR COMPANY
As we have mentioned, the Adviser, the Fund and the industry in general are at a crossroads. Regulatory authorities and sophisticated investors require institutional-quality infrastructure, compliance, reporting and risk-management processes. Our growth has enabled us to develop these programs and we have separated these functions from the portfolio management team. We have devoted significant resources to disaster recovery and business continuity. To that end we have implemented full real-time data backups to our co-location facility beyond the outskirts of town. Our COO has spearheaded this effort and we now have separate compliance, IT, accounting, middle and back office groups and have also implemented additional computer-driven compliance modules through a Bloomberg product called AIM (Bloomberg Asset and Investment Manager). We also remain vigilant to counterparty exposure. We recently had the pleasure of a routine eight week on-site examination by the Northeast Regional Office of the SEC, and we are awaiting the final results.
As we have mentioned, Westchester Capital Management is also managing (sub-advising) a ’40-Act registered mutual fund called the Dunham Monthly Distribution Fund, which provides a somewhat more conservative profile than The Merger Fund®. There is a significant strategy overlap and Merger Fund shareholders should feel comfortable that our attention is firmly focused on merger arbitrage.
Accordingly, although at some point we will develop additional product offerings as an adjunct to our flagship merger arbitrage products, we will do so only when we are comfortable that we have the appropriate infrastructure in place, including any additional personnel needed to ensure that the existing portfolio management team is not distracted from the task at hand. We will provide details as soon as legally permissible.
While we are on the subject of personnel, we are happy to announce that we have hired an additional senior analyst with experience in merger arbitrage, special situations and fixed-income analysis. Steve Tan has been in the investment business for 12 years, most recently as Vice President and Senior Analyst in the High Yield and Distressed Group at Avenue Capital Group in New York. He will be particularly helpful to the team as we analyze non-equity investments.
Finally, to reiterate our thoughts on the timing of our quarterly letters, we like being able to discuss the beginning of and outlook for the next quarter in addition to a discussion of the prior quarter. However, in an effort to provide more timely communications and necessary comparative statistics, we are making the statistical summary that is attached to each letter available no later than two weeks from the end of the quarter. It will be available electronically over the Internet or available upon request from the Fund. We will also endeavor to provide the letter and post it on the Internet within four weeks after the end of each quarter.
For convenience, investors can arrange for e-alerts of important Fund communications. Through our website at www.mergerfund.com, you can check account balances, make purchases and sales, and sign up for notification of trade confirmations, statements and shareholder communications via e-mail.
We appreciate your support and welcome your feedback. All of us at Westchester Capital Management and The Merger Fund® wish you a happy 2012.
Sincerely,
 |  |
| Roy Behren | Mike Shannon |
Before investing in The Merger Fund®, consider its investment objectives, risks, charges, and expenses. For a prospectus or summary prospectus containing this and other information, including current performance data that may be lower or higher than the data included herein, contact your investment professional or view it online at mergerfund.com. Please read it carefully. The performance data included herein represents past performance and does not guarantee future results. The Merger Fund’s share price and return will vary, and investors may have a gain or loss when they redeem their shares. Current month-end performance is available at www.mergerfund.com.
Past performance is not indicative of future results.
The S&P 500 TR is a broad based unmanaged index of 500 stocks, which is widely recognized as representative of the equity market in general. It is shown with dividends reinvested. You cannot invest directly in the index.
The MSCI World Index is a free float-adjusted market capitalization weighted index that is designed to measure the equity market performance of developed markets. The MSCI World Index consists of the following 24 developed market country indices: Australia, Austria, Belgium, Canada, Denmark, Finland, France, Germany, Greece, Hong Kong, Ireland, Israel, Italy, Japan, Netherlands, New Zealand, Norway, Portugal, Singapore, Spain, Sweden, Switzerland, the United Kingdom, and the United States.
The HFRX Indices (“HFRX”) are a series of benchmarks of hedge fund industry performance which are engineered to achieve representative performance of a larger universe of hedge fund strategies. Hedge Fund Research, Inc. (“HFR, Inc.”) employs the HFRX Methodology (UCITSIII compliant), a proprietary and highly quantitative process by which hedge funds are selected as constituents for the HFRX Indices. This methodology includes robust classification, cluster analysis, correlation analysis, advanced optimization and Monte Carlo simulations. More specifically, the HFRX Methodology defines certain qualitative characteristics, such as whether the fund is open to transparent fund investment and the satisfaction of the index manager’s due diligence requirements. Production of the HFRX Methodology results in a model output which selects funds that, when aggregated and weighted, have the highest statistical likelihood of producing a return series that is most representative of the reference universe of strategies.
HFRX Merger Arbitrage Index includes investment managers who employ an investment process primarily focused on opportunities in equity and equity related instruments of companies which are currently engaged in a corporate transaction. Merger Arbitrage involves primarily announced transactions, typically with limited or no exposure to situations which pre- or post-date a formal announcement or situations in which no formal announcement is expected to occur. Opportunities are frequently presented in cross border, collared and international transactions which incorporate multiple geographic regulatory institutions, with typically involve minimal exposure to corporate credits. Merger Arbitrage strategies typically have over 75% of positions in announced transactions over a given market cycle.
HFRX Event Driven Index includes investment managers who maintain positions in companies currently or prospectively involved in corporate transactions of a wide variety including but not limited to mergers, restructurings, financial distress, tender offers, shareholder buybacks, debt exchanges, security issuance or other capital structure adjustments. Security types can range from most senior in the capital structure to most junior or subordinated, and frequently involve additional derivative securities. Event Driven exposure includes a combination of sensitivities to equity markets, credit markets and idiosyncratic, company specific developments. Investment theses are typically predicated on fundamental characteristics (as opposed to quantitative), with the realization of the thesis predicated on a specific development exogenous to the existing capital structure.
Source: www.hedgefundresearch.com
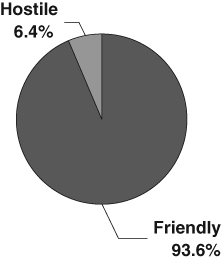
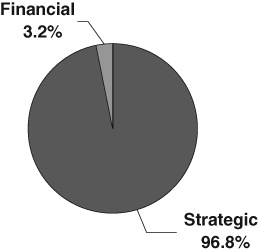
| Chart 1 | Chart 2 |
| | |
| PORTFOLIO COMPOSITION | PORTFOLIO COMPOSITION |
| By Type of Deal* | By Type of Buyer* |
| | |
 |  |
| | |
| Chart 3 |
| |
| PORTFOLIO COMPOSITION |
| By Deal Terms* |
| |
 |
| |
| * | Data expressed as a percentage of long common stock, corporate bonds and swap contract positions as of December 31, 2011. |
| Chart 4 |
| |
| PORTFOLIO COMPOSITION |
| By Sector* |
| |
 |
| |
| Chart 5 |
| |
| PORTFOLIO COMPOSITION |
| By Region* |
| |
 |
| |
| * | Data expressed as a percentage of long common stock, corporate bonds and swap contract positions as of December 31, 2011. |
The Global Industry Classification Standard (GICS®) was developed by and/or is the exclusive property of MSCI, Inc. and Standard & Poor Financial Services LLC (“S&P”). GICS is a service mark of MSCI and S&P and has been licensed for use by U.S. Bancorp Fund Services, LLC.
Chart 6
GLOBAL MERGER ACTIVITY
Source: Bloomberg M&A Advisory League Tables
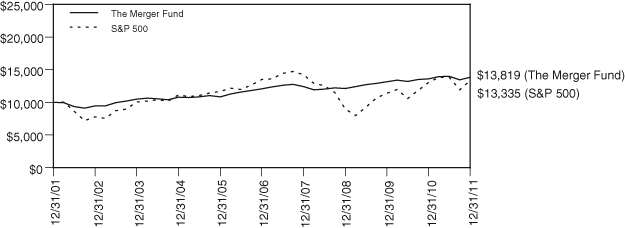
COMPARISON OF CHANGE IN VALUE OF $10,000 INVESTMENT
IN THE MERGER FUND AND S&P 500
| | | | Average |
| | Quarter Ended | | Annual Total Return |
| | December 31, 2011 | 1 Yr. | 3 Yr. | 5 Yr. | 10 Yr. |
| The Merger Fund | 2.90% | 1.66% | 4.49% | 2.80% | 3.29% |
| The Standard & Poor’s 500 Index | 11.82% | 2.11% | 14.11% | -0.25% | 2.92% |
The Standard & Poor’s 500 Index (S&P 500) is a capitalization-weighted index, representing the aggregate market value of the common equity of 500 stocks primarily traded on the New York Stock Exchange. This chart assumes an initial gross investment of $10,000 made on December 31, 2001. Returns shown include the reinvestment of all dividends. Past performance is not predictive of future performance. The graph and table do not reflect the deduction of taxes that a shareholder would pay on fund distributions or the redemption of fund shares. Investment return and principal value will fluctuate, so that your shares, when redeemed, may be worth more or less than the original cost.
The Merger Fund
EXPENSE EXAMPLE
December 31, 2011
(Unaudited)
As a shareholder of the Fund, you incur ongoing costs, including management fees; distribution and/or service fees; and other Fund expenses. As of January 27, 2012, the Fund no longer charges redemption fees. This Example is intended to help you understand your ongoing costs (in dollars) of investing in the Fund and to compare these costs with the ongoing costs of investing in other mutual funds. The Example is based on an investment of $1,000 for the six month period 7/01/11 – 12/31/11.
Actual Expenses
The first line of the table below provides information about actual account values and actual expenses. Although the Fund charges no sales load or transaction fees, you will be assessed fees for outgoing wire transfers, returned checks and stop-payment orders at prevailing rates charged by U.S. Bancorp Fund Services, LLC, the Fund’s transfer agent. If you request that a redemption be made by wire transfer, a $15.00 fee will be charged by the Fund’s transfer agent. IRAs will be charged a $15.00 annual maintenance fee. To the extent the Fund invests in shares of other investment companies as part of its investment strategy, you will indirectly bear your proportionate share of any fees and expenses charged by the underlying funds in which the Fund invests in addition to the expenses of the Fund. Actual expenses of the underlying funds are expected to vary among the various underlying funds. These expenses are not included in the example below. The example below includes, but is not limited to, management fees, shareholder servicing fees, fund accounting, custody and transfer agent fees. However, the example below does not include portfolio trading commissions and related expenses, and other extraordinary expenses as determined under U.S. generally accepted accounting principles. You may use the information in this line, together with the amount you invested, to estimate the expenses that you paid over the period. Simply divide your account value by $1,000 (for example, an $8,600 account value divided by $1,000 = 8.6), then multiply the result by the number in the first line under the heading entitled “Expenses Paid During Period’’ to estimate the expenses you paid on your account during this period.
Hypothetical Example for Comparison Purposes
The second line of the table below provides information about hypothetical account values and hypothetical expenses based on the Fund’s actual expense ratio and an assumed rate of return of 5% per year before expenses, which is not the Fund’s actual return. The hypothetical account values and expenses may not be used to estimate the actual ending account balance or expenses you paid for the period. You may use this information to compare the ongoing costs of investing in the Fund and other funds. To do so, compare this 5% hypothetical example with the 5% hypothetical examples that appear in the shareholder reports of the other funds. Please note that the expenses shown in the table are meant to highlight your ongoing costs only and do not reflect any transactional costs. Therefore, the second line of the table is useful in comparing ongoing costs only, and will not help you determine the relative total costs of owning different funds. In addition, if these transactional costs were included, your costs would have been higher.
| | Beginning Account | Ending Account | Expenses Paid During |
| | Value 7/01/11 | Value 12/31/11 | Period 7/01/11-12/31/11* |
Actual + (1) | $1,000.00 | $ 987.80 | $8.07 |
Hypothetical ++ (2) | $1,000.00 | $1,017.09 | $8.19 |
| + | Excluding interest expense, borrowing expense on securities sold short and dividends on securities sold short, your actual cost of investment in the Fund would be $6.61. |
| ++ | Excluding interest expense, borrowing expense on securities sold short and dividends on securities sold short, your hypothetical cost of investment in the Fund would be $6.72. |
| (1) | Ending account values and expenses paid during period based on a (1.22)% return. This actual return is net of expenses. |
| (2) | Ending account values and expenses paid during period based on a 5.00% annual return before expenses. |
| * | Expenses are equal to the Fund’s annualized expense ratio of 1.61%, multiplied by the average account value over the period, multiplied by 184/365 (to reflect the one-half year period). |
The Merger Fund
SCHEDULE OF INVESTMENTS
December 31, 2011
| Shares | | | | Value | |
| | | | | | |
| COMMON STOCKS — 68.41% | | | |
| | | | |
| | | AEROSPACE & DEFENSE — 6.19% | | | |
| | 2,515,929 | | Goodrich Corporation (g) | | $ | 311,220,417 | |
| | | | | | | | |
| | | | APPLICATION SOFTWARE — 3.90% | | | | |
| | 3,169,947 | | Magma Design Automation, Inc. (a) | | | 22,760,220 | |
| | 4,344,497 | | SuccessFactors, Inc. (a)(f)(j) | | | 173,215,095 | |
| | | | | | | 195,975,315 | |
| | | | | | | | |
| | | | BIOTECHNOLOGY — 1.48% | | | | |
| | 581,500 | | Pharmasset, Inc. (a) | | | 74,548,300 | |
| | | | | | | | |
| | | | COMMUNICATION EQUIPMENT — 7.18% | | | | |
| | 2,480,900 | | Blue Coat Systems, Inc. (a)(j) | | | 63,138,905 | |
| | 7,664,921 | | Motorola Mobility Holdings, Inc. (a)(f) | | | 297,398,935 | |
| | | | | | | 360,537,840 | |
| | | | | | | | |
| | | | COMPUTER STORAGE & PERIPHERALS — 0.10% | | | | |
| | 223,900 | | EMC Corp. (a) | | | 4,822,806 | |
| | | | | | | | |
| | | | CONSTRUCTION MATERIALS — 0.49% | | | | |
| | 620,400 | | Vulcan Materials Company | | | 24,412,740 | |
| | | | | | | | |
| | | | DIVERSIFIED CHEMICALS — 0.18% | | | | |
| | 910,400 | | Huntsman Corporation | | | 9,104,000 | |
| | | | | | | | |
| | | | DIVERSIFIED METALS & MINING — 0.46% | | | | |
| | 684,500 | | Grande Cache Coal Corporation (a)(b) | | | 6,658,547 | |
| | 565,885 | | Pilot Gold Inc. (a)(b) | | | 716,556 | |
| | 326,471 | | Rio Tinto plc — ADR | | | 15,970,961 | |
| | | | | | | 23,346,064 | |
| | | | | | | | |
| | | | DRUG RETAIL — 1.12% | | | | |
| | 1,705,300 | | Walgreen Company | | | 56,377,218 | |
| | | | | | | | |
| | | | ELECTRIC UTILITIES — 1.29% | | | | |
| | 1,152,910 | | Progress Energy Inc. | | | 64,586,018 | |
| | | | | | | | |
| | | | FOOD RETAIL — 0.20% | | | | |
| | 1,074,914 | | Winn Dixie Stores, Inc. (a) | | | 10,082,693 | |
| | | | | | | | |
| | | | GENERAL MERCHANDISE STORES — 1.14% | | | | |
| | 2,596,000 | | 99 Cents Only Stores (a) | | | 56,982,200 | |
| | | | | | | | |
| | | | HEALTH CARE EQUIPMENT — 0.16% | | | | |
| | 148,786 | | SonoSite, Inc. (a) | | | 8,013,614 | |
| | | | | | | | |
| | | | HEALTH CARE SERVICES — 1.16% | | | | |
| | 1,044,616 | | Medco Health Solutions, Inc. (a) | | | 58,394,035 | |
| | | | | | | | |
The accompanying notes are an integral part of these financial statements.
The Merger Fund
SCHEDULE OF INVESTMENTS (continued)
December 31, 2011
| Shares | | | | Value | |
| | | | | | |
| | | HOTELS, RESORTS & CRUISE LINES — 0.33% | | | |
| | 575,100 | | Marriott International Inc. | | $ | 16,775,667 | |
| | | | | | | | |
| | | | HOUSEHOLD PRODUCTS — 1.12% | | | | |
| | 610,900 | | Colgate-Palmolive Company | | | 56,441,051 | |
| | | | | | | | |
| | | | INDEPENDENT POWER PRODUCERS | | | | |
| | | | & ENERGY TRADERS — 2.64% | | | | |
| | 3,344,530 | | Constellation Energy Group Inc. | | | 132,677,505 | |
| | | | | | | | |
| | | | INTEGRATED OIL & GAS — 1.27% | | | | |
| | 877,300 | | ConocoPhillips | | | 63,928,851 | |
| | | | | | | | |
| | | | INTEGRATED TELECOMMUNICATION SERVICES — 4.13% | | | | |
| | 4,216,400 | | AT&T Inc. (f) | | | 127,503,936 | |
| | 1,767,182 | | CenturyLink, Inc. | | | 65,739,170 | |
| | 355,100 | | Verizon Communications Inc. | | | 14,246,612 | |
| | | | | | | 207,489,718 | |
| | | | | | | | |
| | | | INTERNET SOFTWARE & SERVICES — 1.59% | | | | |
| | 167,500 | | LoopNet, Inc. (a) | | | 3,061,900 | |
| | 32,100 | | RightNow Technologies, Inc. (a) | | | 1,371,633 | |
| | 4,675,200 | | Yahoo! Inc. (a)(f) | | | 75,410,976 | |
| | | | | | | 79,844,509 | |
| | | | | | | | |
| | | | LIFE & HEALTH INSURANCE — 0.50% | | | | |
| | 563,100 | | Delphi Financial Group, Inc. | | | 24,945,330 | |
| | | | | | | | |
| | | | MANAGED HEALTH CARE — 2.45% | | | | |
| | 2,260,783 | | Healthspring, Inc. (a) | | | 123,303,105 | |
| | | | | | | | |
| | | | OIL & GAS EXPLORATION & PRODUCTION — 2.69% | | | | |
| | 1,400,900 | | Chesapeake Energy Corp. | | | 31,226,061 | |
| | 6,602,800 | | Daylight Energy Ltd. (a)(b) | | | 65,266,450 | |
| | 3,723,675 | | EXCO Resources Inc. | | | 38,912,404 | |
| | | | | | | 135,404,915 | |
| | | | | | | | |
| | | | OIL & GAS STORAGE & TRANSPORTATION — 7.47% | | | | |
| | 7,274,128 | | El Paso Corporation (f) | | | 193,273,581 | |
| | 2,928,922 | | Southern Union Company | | | 123,336,905 | |
| | 1,792,400 | | Williams Companies, Inc. | | | 59,185,048 | |
| | | | | | | 375,795,534 | |
| | | | | | | | |
| | | | PACKAGED FOODS & MEATS — 0.86% | | | | |
| | 2,270,600 | | Sara Lee Corp. | | | 42,959,752 | |
The accompanying notes are an integral part of these financial statements.
The Merger Fund
SCHEDULE OF INVESTMENTS (continued)
December 31, 2011
| Shares | | | | Value | |
| | | | | | |
| | | PAPER PACKAGING — 3.56% | | | |
| | 5,648,872 | | Temple-Inland Inc. (j) | | $ | 179,125,731 | |
| | | | | | | | |
| | | | PHARMACEUTICALS — 1.13% | | | | |
| | 849,200 | | Abbott Laboratories | | | 47,750,516 | |
| | 429,300 | | Pfizer Inc. | | | 9,290,052 | |
| | | | | | | 57,040,568 | |
| | | | | | | | |
| | | | REINSURANCE — 1.58% | | | | |
| | 1,450,420 | | Transatlantic Holdings, Inc. (f) | | | 79,381,487 | |
| | | | | | | | |
| | | | SEMICONDUCTOR EQUIPMENT — 1.16% | | | | |
| | 1,407,700 | | Novellus Systems, Inc. (a) | | | 58,123,933 | |
| | | | | | | | |
| | | | SEMICONDUCTORS — 3.62% | | | | |
| | 3,670,572 | | NetLogic Microsystems Inc. (a)(j) | | | 181,950,254 | |
| | | | | | | | |
| | | | SPECIALIZED FINANCE — 3.11% | | | | |
| | 3,546,832 | | NYSE Euronext (f) | | | 92,572,315 | |
| | 2,574 | | Osaka Securities Exchange Co. (b) | | | 14,781,188 | |
| | 1,206,481 | | TMX Group Inc. (b) | | | 49,372,459 | |
| | | | | | | 156,725,962 | |
| | | | | | | | |
| | | | STEEL — 0.35% | | | | |
| | 1,266,800 | | Commercial Metals Company | | | 17,519,844 | |
| | | | | | | | |
| | | | SYSTEMS SOFTWARE — 0.15% | | | | |
| | 555,700 | | DemandTec, Inc. (a) | | | 7,318,569 | |
| | | | | | | | |
| | | | TRADING COMPANIES & DISTRIBUTORS — 0.32% | | | | |
| | 873,900 | | RSC Holdings, Inc. (a) | | | 16,167,150 | |
| | | | | | | | |
| | | | TRUCKING — 3.27% | | | | |
| | 2,338,825 | | Dollar Thrifty Automotive Group, Inc. (a)(f)(j) | | | 164,325,845 | |
| | | | | | | | |
| | | | WIRELESS TELECOMMUNICATION SERVICES — 0.06% | | | | |
| | 129,347 | | Telephone and Data Systems, Inc. — Class S | | | 3,079,752 | |
| | | | | | | | |
| | | | TOTAL COMMON STOCKS | | | | |
| | | | (Cost $3,469,101,353) | | | 3,438,728,292 | |
| | | | | | | | |
| WARRANTS — 0.01% | | | | |
| | 142,642 | | Kinross Gold Corporation (a)(b) | | | 203,024 | |
| | | | | | | | |
| | | | TOTAL WARRANTS | | | | |
| | | | (Cost $540,029) | | | 203,024 | |
The accompanying notes are an integral part of these financial statements
The Merger Fund
SCHEDULE OF INVESTMENTS (continued)
December 31, 2011
| Principal Amount | | | Value | |
| | | | | | |
| CORPORATE BONDS — 2.33% | | | |
| | | Level 3 Financing, Inc. | | | |
| $ | 20,026,000 | | 9.250%, 11/1/2014 | | $ | 20,576,715 | |
| | | | Terrestar Networks, Inc. | | | | |
| | 43,660,000 | | 15.000%, 2/15/2014 | | | | |
| | | | (Acquired 7/27/11 — 8/11/11, Cost $0) (d)(i)(k) | | | — | |
| | | | Washington Mutual, Inc. | | | | |
| | 11,636,000 | | 4.000%, 1/15/2009 (d) | | | 12,799,600 | |
| | 5,747,000 | | 4.200%, 1/15/2010 (d) | | | 6,436,640 | |
| | 9,377,000 | | 5.500%, 8/24/2011(d) | | | 10,924,205 | |
| | 20,154,000 | | 5.000%, 3/22/2012 (d) | | | 22,975,560 | |
| | 37,798,000 | | 5.250%, 9/15/2017 (d) | | | 43,373,205 | |
| | | | TOTAL CORPORATE BONDS | | | | |
| | | | (Cost $115,314,649) | | | 117,085,925 | |
| Contracts (100 shares per contract) | | | |
| | | | | | |
| PURCHASED PUT OPTIONS — 0.43% | | | |
| | | Abbott Laboratories | | | |
| | 6,243 | | Expiration: January 2012, Exercise Price: $47.50 | | | 34,337 | |
| | 2,249 | | Expiration: January 2012, Exercise Price: $50.00 | | | 20,241 | |
| | | | AT&T Inc. | | | | |
| | 11,029 | | Expiration: January 2012, Exercise Price: $25.00 | | | 16,543 | |
| | 30,178 | | Expiration: February 2012, Exercise Price: $25.00 | | | 181,068 | |
| | | | CenturyLink, Inc. | | | | |
| | 15,632 | | Expiration: January 2012, Exercise Price: $30.00 | | | 39,080 | |
| | | | Chesapeake Energy Corp. | | | | |
| | 9,152 | | Expiration: January 2012, Exercise Price: $20.00 | | | 210,496 | |
| | 4,882 | | Expiration: January 2012, Exercise Price: $21.00 | | | 202,603 | |
| | | | Colgate-Palmolive Company | | | | |
| | 6,109 | | Expiration: February 2012, Exercise Price: $75.00 | | | 152,725 | |
| | | | Commercial Metals Company | | | | |
| | 12,668 | | Expiration: January 2012, Exercise Price: $12.00 | | | 126,680 | |
| | | | ConocoPhillips | | | | |
| | 8,773 | | Expiration: January 2012, Exercise Price: $62.50 | | | 65,798 | |
| | | | Energy Select Sector SPDR Fund | | | | |
| | 4,880 | | Expiration: January 2012, Exercise Price: $70.00 | | | 1,032,120 | |
| | | | FTSE 100 | | | | |
| | 1,681 | | Expiration: February 2012, Exercise Price: $5,600.00 | | | 482,956 | |
The accompanying notes are an integral part of these financial statements.
The Merger Fund
SCHEDULE OF INVESTMENTS (continued)
December 31, 2011
Contracts (100 shares per contract) | | Value | |
| | | | |
| PURCHASED PUT OPTIONS — 0.43% (continued) | | | |
| | | Kinder Morgan, Inc. | | | |
| | 12,869 | | Expiration: June 2012, Exercise Price: $40.00 | | $ | 13,898,520 | |
| | | | Materials Select Sector SPDR Trust | | | | |
| | 636 | | Expiration: March 2012, Exercise Price: $36.00 | | | 211,470 | |
| | | | Pfizer Inc. | | | | |
| | 4,293 | | Expiration: March 2012, Exercise Price: $17.00 | | | 49,369 | |
| | | | Sara Lee Corp. | | | | |
| | 22,706 | | Expiration: January 2012, Exercise Price: $15.00 | | | 56,765 | |
| | | | SPDR S&P 500 ETF Trust | | | | |
| | 11,447 | | Expiration: January 2012, Exercise Price: $128.00 | | | 4,080,856 | |
| | | | SPDR S&P Retail ETF | | | | |
| | 390 | | Expiration: January 2012, Exercise Price: $53.00 | | | 56,745 | |
| | | | Technology Select Sector SPDR Fund | | | | |
| | 2,240 | | Expiration: March 2012, Exercise Price: $27.00 | | | 434,560 | |
| | | | Verizon Communications Inc. | | | | |
| | 3,551 | | Expiration: January 2012, Exercise Price: $31.00 | | | 7,102 | |
| | | | Vulcan Materials Company | | | | |
| | 3,102 | | Expiration: January 2012, Exercise Price: $29.00 | | | 23,265 | |
| | | | Walgreen Company | | | | |
| | 17,053 | | Expiration: January 2012, Exercise Price: $28.00 | | | 102,318 | |
| | | | Williams Companies, Inc. | | | | |
| | 14,870 | | Expiration: January 2012, Exercise Price: $22.50 | | | 74,350 | |
| | 3,054 | | Expiration: January 2012, Exercise Price: $25.00 | | | 24,432 | |
| | | | Yahoo! Inc. | | | | |
| | 38,725 | | Expiration: January 2012, Exercise Price: $12.50 | | | 116,175 | |
| | | | TOTAL PURCHASED PUT OPTIONS | | | | |
| | | | (Cost $37,915,905) | | | 21,700,574 | |
The accompanying notes are an integral part of these financial statements.
The Merger Fund
SCHEDULE OF INVESTMENTS (continued)
December 31, 2011
| Shares | | | | Value | |
| | | | | | |
| SHORT-TERM INVESTMENTS — 27.98% | | | |
| | 285,000,000 | | BlackRock Liquidity Funds TempFund Portfolio 0.11% (c)(g) | | $ | 285,000,000 | |
| | 285,000,000 | | Fidelity Institutional Government Portfolio 0.01% (c)(h) | | | 285,000,000 | |
| | 285,000,000 | | Goldman Sachs Financial Square | | | | |
| | | | Money Market Fund 0.17% (c)(h) | | | 285,000,000 | |
| | 266,389,252 | | Invesco Prime Portfolio Money Market 0.09% (c)(e)(j) | | | 266,389,252 | |
| | 285,000,000 | | The Liquid Asset Portfolio 0.02% (c)(e) | | | 285,000,000 | |
| | | | TOTAL SHORT-TERM INVESTMENTS | | | | |
| | | | (Cost $1,406,389,252) | | | 1,406,389,252 | |
| | | | TOTAL INVESTMENTS | | | | |
| | | | (Cost $5,029,261,188) — 99.16% | | $ | 4,984,107,067 | |
ADR — American Depository Receipt
ETF — Exchange Traded Fund
| (a) | Non-income producing security. |
| (c) | The rate quoted is the annualized seven-day yield as of December 31, 2011. |
| (d) | Default or other conditions exist and security is not presently accruing income. |
| (e) | All or a portion of the shares have been committed as collateral for open securities sold short. |
| (f) | All or a portion of the shares have been committed as collateral for written option contracts. |
| (g) | All or a portion of the shares have been committed as collateral for swap contracts. |
| (h) | All or a portion of the shares have been committed as collateral for forward currency exchange contracts. |
| (i) | Security exempt from registration under Rule 144A of the Securities Act of 1933. These securities may be resold in transactions exempt from registration normally to qualified institutional buyers. As of December 31, 2011, these securities represented 0.00% of total net assets. |
| (k) | Security fair valued in good faith. |
The Global Industry Classification Standard (GICS®) was developed by and/or is the exclusive property of MSCI, Inc. and Standard & Poor Financial Services LLC (“S&P”). GICS is a service mark of MSCI and S&P and has been licensed for use by U.S. Bancorp Fund Services, LLC.
The accompanying notes are an integral part of these financial statements.
The Merger Fund
SCHEDULE OF SECURITIES SOLD SHORT
December 31, 2011
| Shares | | | | Value | |
| | 66,021 | | Alleghany Corporation | | $ | 18,835,131 | |
| | 218,411 | | Colfax Corporation (b) | | | 6,229,081 | |
| | 6,203 | | CoStar Group Inc. | | | 413,926 | |
| | 394,037 | | Duke Energy Corporation | | | 8,668,814 | |
| | 885,281 | | Energy Transfer Equity, L.P. | | | 35,924,703 | |
| | 2,048,559 | | Exelon Corporation | | | 88,846,004 | |
| | 844,165 | | Express Scripts, Inc. | | | 37,725,734 | |
| | 370,805 | | Hertz Global Holdings, Inc. | | | 4,345,835 | |
| | 2,323,101 | | Johnson & Johnson (b) | | | 152,790,353 | |
| | 1,122,283 | | Kinder Morgan, Inc. | | | 36,103,844 | |
| | 7,429 | | Kinross Gold Corporation (a) | | | 84,809 | |
| | 327,535 | | Rio Tinto Ltd. (a)(b) | | | 20,389,282 | |
| | 119,000 | | Telephone and Data Systems, Inc. | | | 3,080,910 | |
| | 243,110 | | United Rentals, Inc. | | | 7,183,900 | |
| | 188,933 | | Validus Holdings Ltd (a). | | | 5,951,390 | |
| | 17,915 | | VMware Inc. | | | 1,490,349 | |
| | | | TOTAL SECURITIES SOLD SHORT | | | | |
| | | | (Proceeds $414,526,221) | | $ | 428,064,065 | |
| (b) | Security fair valued in good faith. |
The accompanying notes are an integral part of these financial statements.
The Merger Fund
SCHEDULE OF OPTIONS WRITTEN
December 31, 2011
Contracts (100 shares per contract) | | Value | |
| | | | |
| CALL OPTIONS WRITTEN | | | |
| | | Abbott Laboratories | | | |
| | 6,243 | | Expiration: January 2012, Exercise Price: $52.50 | | $ | 2,341,125 | |
| | 2,249 | | Expiration: January 2012, Exercise Price: $55.00 | | | 326,105 | |
| | | | ASX Ltd. | | | | |
| | 3,703 | | Expiration: January 2012, Exercise Price: AUD 30.00 | | | 338,421 | |
| | 2,377 | | Expiration: January 2012, Exercise Price: AUD 30.50 | | | 136,854 | |
| | | | AT&T Inc. | | | | |
| | 5,867 | | Expiration: January 2012, Exercise Price: $29.00 | | | 727,508 | |
| | 36,297 | | Expiration: February 2012, Exercise Price: $28.00 | | | 8,130,528 | |
| | | | Blue Coat Systems, Inc. | | | | |
| | 1,049 | | Expiration: January 2012, Exercise Price: $26.00 | | | 2,623 | |
| | | | CenturyLink, Inc. | | | | |
| | 9,268 | | Expiration: January 2012, Exercise Price: $36.00 | | | 1,390,200 | |
| | 6,350 | | Expiration: January 2012, Exercise Price: $37.00 | | | 476,250 | |
| | | | Chesapeake Energy Corp. | | | | |
| | 9,127 | | Expiration: January 2012, Exercise Price: $22.50 | | | 675,398 | |
| | 4,882 | | Expiration: January 2012, Exercise Price: $24.00 | | | 141,578 | |
| | | | Colgate-Palmolive Company | | | | |
| | 6,109 | | Expiration: February 2012, Exercise Price: $85.00 | | | 4,780,292 | |
| | | | Commercial Metals Company | | | | |
| | 12,668 | | Expiration: January 2012, Exercise Price: $14.00 | | | 443,380 | |
| | | | ConocoPhillips | | | | |
| | 8,773 | | Expiration: January 2012, Exercise Price: $70.00 | | | 3,053,004 | |
| | | | Dollar Thrifty Automotive Group, Inc. | | | | |
| | 6,421 | | Expiration: January 2012, Exercise Price: $65.00 | | | 3,756,285 | |
| | | | Duke Energy Corporation | | | | |
| | 26,169 | | Expiration: January 2012, Exercise Price: $19.00 | | | 7,850,700 | |
| | | | El Paso Corporation | | | | |
| | 11,094 | | Expiration: January 2012, Exercise Price: $24.00 | | | 2,851,158 | |
| | 2,500 | | Expiration: January 2012, Exercise Price: $25.00 | | | 392,500 | |
| | 1,687 | | Expiration: April 2012, Exercise Price: $24.00 | | | 463,925 | |
| | | | EXCO Resources Inc. | | | | |
| | 2,356 | | Expiration: January 2012, Exercise Price: $11.00 | | | 141,360 | |
| | | | Exelon Corporation | | | | |
| | 4,658 | | Expiration: January 2012, Exercise Price: $42.50 | | | 582,250 | |
| | 4,657 | | Expiration: January 2012, Exercise Price: $44.00 | | | 181,623 | |
| | 862 | | Expiration: February 2012, Exercise Price: $40.00 | | | 310,320 | |
| | 465 | | Expiration: February 2012, Exercise Price: $41.00 | | | 126,712 | |
| | | | Kinder Morgan, Inc. | | | | |
| | 12,869 | | Expiration: June 2012, Exercise Price: $40.00 | | | 160,863 | |
| | | | Lam Research Corporation | | | | |
| | 15,838 | | Expiration: June 2012, Exercise Price: $31.00 | | | 12,353,640 | |
The accompanying notes are an integral part of these financial statements.
The Merger Fund
SCHEDULE OF OPTIONS WRITTEN (continued)
December 31, 2011
Contracts (100 shares per contract) | | Value | |
| | | | | | |
| | | Marriott International Inc. | | | |
| | 5,751 | | Expiration: January 2012, Exercise Price: $28.00 | | $ | 905,783 | |
| | | | Motorola Mobility Holdings, Inc. | | | | |
| | 2,441 | | Expiration: January 2012, Exercise Price: $40.00 | | | 6,102 | |
| | | | NYSE Euronext | | | | |
| | 4,308 | | Expiration: January 2012, Exercise Price: $24.00 | | | 980,070 | |
| | 16,332 | | Expiration: January 2012, Exercise Price: $25.00 | | | 2,376,306 | |
| | 1,910 | | Expiration: January 2012, Exercise Price: $27.00 | | | 79,265 | |
| | 6,177 | | Expiration: March 2012, Exercise Price: $26.00 | | | 926,550 | |
| | | | Pfizer Inc. | | | | |
| | 4,293 | | Expiration: March 2012, Exercise Price: $19.00 | | | 1,197,747 | |
| | | | Sara Lee Corp. | | | | |
| | 22,706 | | Expiration: January 2012, Exercise Price: $17.50 | | | 3,292,370 | |
| | | | SPDR S&P 500 ETF Trust | | | | |
| | 953 | | Expiration: January 2012, Exercise Price: $132.00 | | | 24,778 | |
| | | | SuccessFactors, Inc. | | | | |
| | 4,875 | | Expiration: January 2012, Exercise Price: $40.00 | | | 24,375 | |
| | 1,804 | | Expiration: February 2012, Exercise Price: $40.00 | | | 4,510 | |
| | | | Transatlantic Holdings, Inc. | | | | |
| | 990 | | Expiration: January 2012, Exercise Price: $52.50 | | | 252,450 | |
| | 7,465 | | Expiration: January 2012, Exercise Price: $55.00 | | | 298,600 | |
| | | | Verizon Communications Inc. | | | | |
| | 3,551 | | Expiration: March 2012, Exercise Price: $36.00 | | | 1,463,012 | |
| | | | Vulcan Materials Company | | | | |
| | 6,204 | | Expiration: January 2012, Exercise Price: $34.00 | | | 3,412,200 | |
| | | | Walgreen Company | | | | |
| | 2,739 | | Expiration: January 2012, Exercise Price: $30.00 | | | 897,022 | |
| | 14,314 | | Expiration: January 2012, Exercise Price: $31.00 | | | 3,456,831 | |
| | | | Williams Companies, Inc. | | | | |
| | 14,870 | | Expiration: January 2012, Exercise Price: $28.00 | | | 7,583,700 | |
| | 3,054 | | Expiration: January 2012, Exercise Price: $30.00 | | | 977,280 | |
| | | | Yahoo! Inc. | | | | |
| | 39,971 | | Expiration: January 2012, Exercise Price: $14.00 | | | 8,813,606 | |
| | 6,781 | | Expiration: February 2012, Exercise Price: $14.00 | | | 1,674,907 | |
| | | | | | | 90,782,066 | |
| PUT OPTIONS WRITTEN | | | | |
| | | | SPDR S&P 500 ETF Trust | | | | |
| | 5,723 | | Expiration: January 2012, Exercise Price: $119.00 | | | 400,610 | |
| | | | TOTAL OPTIONS WRITTEN | | | | |
| | | | (Premiums received $83,679,758) | | $ | 91,182,676 | |
AUD — Australian Dollars
ETF — Exchange Traded Fund
The accompanying notes are an integral part of these financial statements.
The Merger Fund
SCHEDULE OF FORWARD CURRENCY EXCHANGE CONTRACTS*
December 31, 2011
| | | | | | | U.S. $ | | | | | | | U.S. $ | | | Unrealized | |
| Settlement | | Currency to | | Value at | | | Currency to | | Value at | | | Appreciation | |
| Date | | be Delivered | | Dec. 31, 2011 | | | be Received | | Dec. 31, 2011 | | | (Depreciation) | |
| 1/12/12 | | | 6,063,803 | | Australian Dollars | | $ | 6,192,395 | | | | 6,172,951 | | U.S. Dollars | | $ | 6,172,951 | | | $ | (19,444 | ) |
| 1/12/12 | | | 823,522 | | U.S. Dollars | | | 823,522 | | | | 807,938 | | Australian Dollars | | | 825,072 | | | | 1,550 | |
| 1/19/12 | | | 2,536,030 | | Australian Dollars | | | 2,587,486 | | | | 2,591,823 | | U.S. Dollars | | | 2,591,823 | | | | 4,337 | |
| 1/19/12 | | | 2,613,171 | | U.S. Dollars | | | 2,613,171 | | | | 2,536,030 | | Australian Dollars | | | 2,587,486 | | | | (25,685 | ) |
| 1/31/12 | | | 37,583,620 | | Australian Dollars | | | 38,289,019 | | | | 37,658,787 | | U.S. Dollars | | | 37,658,787 | | | | (630,232 | ) |
| 1/31/12 | | | 6,033,337 | | U.S. Dollars | | | 6,033,337 | | | | 6,001,350 | | Australian Dollars | | | 6,113,988 | | | | 80,651 | |
| 4/27/12 | | | 34,355,724 | | Australian Dollars | | | 34,696,945 | | | | 33,922,242 | | U.S. Dollars | | | 33,922,242 | | | | (774,703 | ) |
| 2/16/12 | | | 12,821,268 | | British Pounds | | | 19,902,342 | | | | 20,207,384 | | U.S. Dollars | | | 20,207,384 | | | | 305,042 | |
| 2/22/12 | | | 5,752,229 | | British Pounds | | | 8,928,608 | | | | 8,892,946 | | U.S. Dollars | | | 8,892,946 | | | | (35,662 | ) |
| 3/22/12 | | | 63,579,770 | | British Pounds | | | 98,659,200 | | | | 99,185,077 | | U.S. Dollars | | | 99,185,077 | | | | 525,877 | |
| 1/5/12 | | | 4,544,610 | | Canadian Dollars | | | 4,460,329 | | | | 4,410,530 | | U.S. Dollars | | | 4,410,530 | | | | (49,799 | ) |
| 1/5/12 | | | 283,938 | | U.S. Dollars | | | 283,938 | | | | 288,948 | | Canadian Dollars | | | 283,602 | | | | (336 | ) |
| 2/15/12 | | | 66,758,611 | | Canadian Dollars | | | 65,459,320 | | | | 64,743,727 | | U.S. Dollars | | | 64,743,727 | | | | (715,593 | ) |
| 2/23/12 | | | 6,845,000 | | Canadian Dollars | | | 6,710,560 | | | | 6,653,901 | | U.S. Dollars | | | 6,653,901 | | | | (56,659 | ) |
| 3/14/12 | | | 59,016,999 | | Canadian Dollars | | | 57,833,579 | | | | 60,005,913 | | U.S. Dollars | | | 60,005,913 | | | | 2,172,334 | |
| 3/14/12 | | | 3,218,062 | | U.S. Dollars | | | 3,218,062 | | | | 3,264,698 | | Canadian Dollars | | | 3,199,234 | | | | (18,828 | ) |
| 3/29/12 | | | 1,697,655 | | Canadian Dollars | | | 1,663,104 | | | | 1,649,971 | | U.S. Dollars | | | 1,649,971 | | | | (13,133 | ) |
| 1/18/12 | | | 1,153,854,000 | | Japanese Yen | | | 14,994,974 | | | | 15,039,866 | | U.S. Dollars | | | 15,039,866 | | | | 44,892 | |
| 1/18/12 | | | 14,859,678 | | U.S. Dollars | | | 14,859,678 | | | | 1,153,854,000 | | Japanese Yen | | | 14,994,974 | | | | 135,296 | |
| 3/30/12 | | | 1,158,300,000 | | Japanese Yen | | | 15,075,031 | | | | 14,879,636 | | U.S. Dollars | | | 14,879,636 | | | | (195,395 | ) |
| 4/26/12 | | | 151,115,888 | | Swiss Francs (a) | | | 162,071,604 | | | | 161,820,301 | | U.S. Dollars | | | 161,820,301 | | | | (251,303 | ) |
| | | | | | | | $ | 565,356,204 | | | | | | | | $ | 565,839,411 | | | $ | 483,207 | |
| * | JPMorgan Chase & Co. Inc. is the counterparty for all open forward currency exchange contracts held by the Fund as of December 31, 2011. |
| (a) | Security fair valued in good faith. |
The accompanying notes are an integral part of these financial statements.
The Merger Fund
SCHEDULE OF SWAP CONTRACTS
December 31, 2011
| | | | | | | | | | Unrealized | | |
| Termination | | | | | | | | | Appreciation | | |
| Date | Security | | Shares | | | Notional | | | (Depreciation)* | | Counterparty |
| LONG SWAP CONTRACTS | | | | | | | | | | |
| 2/23/12 | ASX Ltd. | | | 1,053,314 | | | $ | 32,637,292 | | | $ | 719,698 | | JPMorgan Chase & Co. Inc. |
| 4/20/12 | British Sky Broadcasting Group | | | 3,413,600 | | | | 38,662,297 | | | | (7,204,744 | ) | Merrill Lynch & Co. Inc. |
| 4/20/12 | British Sky Broadcasting Group | | | 5,078,964 | | | | 57,524,143 | | | | (8,231,100 | ) | JPMorgan Chase & Co. Inc. |
| 1/26/12 | Charter International PLC | | | 1,756,338 | | | | 25,511,881 | | | | 896,974 | | JPMorgan Chase & Co. Inc. |
| 3/15/12 | Extract Resources Limited | | | 1,135,810 | | | | 9,768,920 | | | | 122,333 | | Merrill Lynch & Co. Inc. |
| 3/15/12 | Extract Resources Limited | | | 2,835,950 | | | | 24,391,552 | | | | 522,171 | | JPMorgan Chase & Co. Inc. |
| 12/31/12 | Hillgrove Resources Ltd. | | | 13,139,699 | | | | 2,465,533 | | | | (467,116 | ) | JPMorgan Chase & Co. Inc. |
| 6/30/12 | Smith & Nephew PLC | | | 858,249 | | | | 8,205,187 | | | | (1,110,791 | ) | Merrill Lynch & Co. Inc. |
| 4/30/12 | Synthes, Inc. (a) | | | 1,818,964 | | | | 304,188,769 | | | | (5,570,458 | ) | JPMorgan Chase & Co. Inc. |
| 6/30/12 | TMX Group, Inc. | | | 98,200 | | | | 3,985,527 | | | | (358,499 | ) | Deutsche Bank AG |
| SHORT SWAP CONTRACTS | | | | | | | | | | | | | |
| 6/15/12 | Express Scripts, Inc. | | | (1,984 | ) | | | (87,971 | ) | | | 21,883 | | Merrill Lynch & Co. Inc. |
| 4/30/12 | Johnson & Johnson (a) | | | (100 | ) | | | (231 | ) | | | (231 | ) | Merrill Lynch & Co. Inc. |
| | | | | | | | | | | | $ | (20,659,880 | ) | |
| * | Net unrealized depreciation is a payable on the Statement of Assets and Liabilities. |
| (a) | Security fair valued in good faith. |
The accompanying notes are an integral part of these financial statements.
The Merger Fund
STATEMENT OF ASSETS AND LIABILITIES
December 31, 2011
| ASSETS: | | | | | | |
| Investments, at value | | | | | | |
| Investments in non affiliates (Cost $4,039,428,758) | | | | | $ | 3,955,961,985 | |
| Investments in affiliates (Cost $989,832,430) | | | | | | 1,028,145,082 | |
| Cash | | | | | | 6,104,391 | |
| Cash held in foreign currency (Cost $4,130,107) | | | | | | 4,177,337 | |
| Deposits at brokers | | | | | | 203,139,778 | |
| Receivable from brokers | | | | | | 414,526,221 | |
| Receivable for investments sold | | | | | | 61,307,744 | |
| Receivable for forward currency exchange contracts | | | | | | 3,269,979 | |
| Receivable for fund shares issued | | | | | | 28,898,901 | |
| Dividends and interest receivable | | | | | | 7,094,882 | |
| Prepaid expenses and other receivables | | | | | | 132,617 | |
| Total Assets | | | | | | 5,712,758,917 | |
| | | | | | | | |
| LIABILITIES: | | | | | | | |
| Securities sold short, at value (Proceeds of $414,526,221) | | $ | 428,064,065 | | | | | |
| Written option contracts, at value (Premiums received $83,679,758) | | | 91,182,676 | | | | | |
| Payable for forward currency exchange contracts | | | 2,786,772 | | | | | |
| Payable for swap contracts | | | 20,659,880 | | | | | |
| Payable for swap contracts closed | | | 64,795 | | | | | |
| Payable for swap interest | | | 216,130 | | | | | |
| Payable for investments purchased | | | 122,741,584 | | | | | |
| Payable for fund shares redeemed | | | 8,565,307 | | | | | |
| Investment advisory fee payable | | | 3,719,423 | | | | | |
| Distribution fees payable | | | 5,062,575 | | | | | |
| Dividends payable | | | 87,092 | | | | | |
| Accrued expenses and other liabilities | | | 3,048,358 | | | | | |
| Total Liabilities | | | | | | | 686,198,657 | |
| NET ASSETS | | | | | | $ | 5,026,560,260 | |
| NET ASSETS CONSIST OF: | | | | | | | | |
| Accumulated undistributed net investment income | | | | | | $ | 70,048,008 | |
| Accumulated undistributed net realized loss on investments, securities | | | | | | | | |
| sold short, written option contracts expired or closed, swap contracts, | | | | | | | | |
| foreign currency translation and forward currency exchange contracts | | | | | | | (67,281,793 | ) |
| Net unrealized appreciation (depreciation) on: | | | | | | | | |
| Investments | | | (45,154,121 | ) | | | | |
| Securities sold short | | | (13,537,844 | ) | | | | |
| Written option contracts | | | (7,502,918 | ) | | | | |
| Swap contracts | | | (20,659,880 | ) | | | | |
| Foreign currency translation | | | 47,230 | | | | | |
| Forward currency exchange contracts | | | 483,207 | | | | | |
| Net unrealized depreciation | | | | | | | (86,324,326 | ) |
| Paid-in capital | | | | | | | 5,110,118,371 | |
| Total Net Assets | | | | | | $ | 5,026,560,260 | |
| NET ASSET VALUE and offering price per share*, | | | | | | | | |
| ($5,026,560,260 / 322,459,516 shares of beneficial interest outstanding) | | | | | | $ | 15.59 | |
| * | The redemption price per share may vary based on the length of time a shareholder holds the Fund’s shares. |
The accompanying notes are an integral part of these financial statements.
The Merger Fund
STATEMENT OF OPERATIONS
For the Three Months Ended December 31, 2011*
| INVESTMENT INCOME: | | | | | | |
| Interest | | | | | | |
| Non Affiliates | | | | | $ | 999,673 | |
| Affiliates | | | | | | 41,868 | |
| Dividend income on long positions | | | | | | | |
| Non Affiliates (net of foreign withholding taxes of $69,759) | | | | | | 11,449,312 | |
| Affiliates | | | | | | 734,353 | |
| Total investment income | | | | | | 13,225,206 | |
| | | | | | | | |
| EXPENSES: | | | | | | | |
| Investment advisory fee | | $ | 12,593,719 | | | | | |
| Distribution fees | | | 3,144,918 | | | | | |
| Transfer agent and shareholder servicing agent fees | | | 1,511,430 | | | | | |
| Administration fees | | | 381,172 | | | | | |
| Professional fees | | | 228,668 | | | | | |
| Reports to shareholders | | | 137,820 | | | | | |
| Fund accounting expense | | | 103,698 | | | | | |
| Custody fees | | | 103,366 | | | | | |
| Federal and state registration fees | | | 91,535 | | | | | |
| Trustees’ fees and expenses | | | 46,541 | | | | | |
| Miscellaneous expenses | | | 37,018 | | | | | |
| Borrowing expense on securities sold short | | | 1,350,700 | | | | | |
| Dividends on securities sold short | | | 2,507,739 | | | | | |
| Total expenses before expense waiver by Adviser | | | | | | | 22,238,324 | |
| Less: Expense waived by Adviser | | | | | | | (1,639,710 | ) |
| Net expenses | | | | | | | 20,598,614 | |
| NET INVESTMENT LOSS | | | | | | | (7,373,408 | ) |
| REALIZED AND UNREALIZED GAIN (LOSS) ON INVESTMENTS: | | | | | | | | |
| Realized gain (loss) on: | | | | | | | | |
| Investments | | | (44,040,304 | ) | | | | |
| Securities sold short | | | 5,556,378 | | | | | |
| Written option contracts expired or closed | | | 27,444,127 | | | | | |
| Swap contracts | | | (22,684,511 | ) | | | | |
| Foreign currency translation | | | (2,211 | ) | | | | |
| Forward currency exchange contracts | | | 24,050,434 | | | | | |
| Net realized loss | | | | | | | (9,676,087 | ) |
| Change in unrealized appreciation / (depreciation) on: | | | | | | | | |
| Investments | | | 178,584,559 | | | | | |
| Securities sold short | | | (37,551,018 | ) | | | | |
| Written option contracts | | | (19,621,215 | ) | | | | |
| Swap contracts | | | 73,238,431 | | | | | |
| Foreign currency translation | | | 47,230 | | | | | |
| Forward currency exchange contracts | | | (37,949,764 | ) | | | | |
| Net unrealized appreciation | | | | | | | 156,748,223 | |
| NET REALIZED AND UNREALIZED GAIN ON INVESTMENTS | | | | | | | 147,072,136 | |
| NET INCREASE IN NET ASSETS RESULTING FROM OPERATIONS | | | | | | $ | 139,698,728 | |
| | | | | | | | | |
| * | The Fund changed its fiscal year end from September 30 to December 31. |
The accompanying notes are an integral part of these financial statements.
The Merger Fund
STATEMENT OF OPERATIONS
For the Year Ended September 30, 2011
| INVESTMENT INCOME: | | | | | | |
| Interest | | | | | $ | 6,004,227 | |
| Dividend income on long positions | | | | | | | |
| Non Affiliates | | | | | | 30,377,891 | |
| Affiliates | | | | | | 382,650 | |
| Total investment income | | | | | | 36,764,768 | |
| | | | | | | | |
| EXPENSES: | | | | | | | |
| Investment advisory fee | | $ | 43,967,215 | | | | | |
| Distribution fees | | | 10,771,317 | | | | | |
| Transfer agent and shareholder servicing agent fees | | | 5,345,165 | | | | | |
| Administration fees | | | 1,466,205 | | | | | |
| Federal and state registration fees | | | 594,519 | | | | | |
| Reports to shareholders | | | 510,024 | | | | | |
| Professional fees | | | 442,284 | | | | | |
| Fund accounting expense | | | 383,835 | | | | | |
| Custody fees | | | 289,098 | | | | | |
| Miscellaneous expenses | | | 220,112 | | | | | |
| Trustees’ fees and expenses | | | 153,048 | | | | | |
| Borrowing expense on securities sold short | | | 4,297,394 | | | | | |
| Dividends on securities sold short | | | 23,192,563 | | | | | |
| Total expenses before expense waiver by Adviser | | | | | | | 91,632,779 | |
| Less: Expense waived by Adviser | | | | | | | (5,296,618 | ) |
| Net expenses | | | | | | | 86,336,161 | |
| NET INVESTMENT LOSS | | | | | | | (49,571,393 | ) |
| REALIZED AND UNREALIZED GAIN (LOSS) ON INVESTMENTS: | | | | | | | | |
| Realized gain (loss) on: | | | | | | | | |
| Investments | | | | | | | | |
| Non Affiliates | | | 140,880,080 | | | | | |
| Affiliates | | | 54,028,443 | | | | | |
| Securities sold short | | | 1,339,501 | | | | | |
| Written option contracts expired or closed | | | 66,124,635 | | | | | |
| Swap contracts | | | 83,205,915 | | | | | |
| Foreign currency translation | | | 54,709 | | | | | |
| Forward currency exchange contracts | | | (73,002,999 | ) | | | | |
| Net realized gain | | | | | | | 272,630,284 | |
| Change in unrealized appreciation / (depreciation) on: | | | | | | | | |
| Investments | | | (317,491,636 | ) | | | | |
| Securities sold short | | | 57,146,628 | | | | | |
| Written option contracts | | | 4,818,800 | | | | | |
| Swap contracts | | | (100,869,422 | ) | | | | |
| Foreign currency translation | | | (7,083 | ) | | | | |
| Forward currency exchange contracts | | | 82,770,417 | | | | | |
| Net unrealized depreciation | | | | | | | (273,632,296 | ) |
| NET REALIZED AND UNREALIZED LOSS ON INVESTMENTS | | | | | | | (1,002,012 | ) |
| NET DECREASE IN NET ASSETS RESULTING FROM OPERATIONS | | | | | | $ | (50,573,405 | ) |
The accompanying notes are an integral part of these financial statements.
The Merger Fund
STATEMENT OF CHANGES IN NET ASSETS
| | | Three Months Ended | | | Year Ended | | | Year Ended | |
| | | December 31, 2011* | | | September 30, 2011 | | | September 30, 2010 | |
| | | | | | | | | | |
| Net investment loss | | $ | (7,373,408 | ) | | $ | (49,571,393 | ) | | $ | (35,261,194 | ) |
| Net realized gain (loss) on investments, securities | | | | | | | | | | | | |
| sold short, written option contracts expired or closed, | | | | | | | | | | | | |
| swap contracts, foreign currency translation and | | | | | | | | | | | | |
| forward currency exchange contracts | | | (9,676,087 | ) | | | 272,630,284 | | | | 153,002,878 | |
| Change in unrealized appreciation (depreciation) | | | | | | | | | | | | |
| on investments, securities sold short, written option | | | | | | | | | | | | |
| contracts, swap contracts, foreign currency translation | | | | | | | | | | | | |
| and forward currency exchange contracts | | | 156,748,223 | | | | (273,632,296 | ) | | | (10,669,250 | ) |
| Net increase (decrease) in net assets | | | | | | | | | | | | |
| resulting from operations | | | 139,698,728 | | | | (50,573,405 | ) | | | 107,072,434 | |
| Distributions to shareholders from: (Note 2) | | | | | | | | | | | | |
| Net investment income | | | (26,112,274 | ) | | | — | | | | (42,329 | ) |
| Net realized gains | | | (116,043,398 | ) | | | (70,276,496 | ) | | | — | |
| Total dividends and distributions | | | (142,155,672 | ) | | | (70,276,496 | ) | | | (42,329 | ) |
| Net increase in net assets from | | | | | | | | | | | | |
| capital share transactions (Note 4) | | | 115,163,137 | | | | 1,461,121,676 | | | | 1,655,172,030 | |
| Net increase in net assets | | | 112,706,193 | | | | 1,340,271,775 | | | | 1,762,202,135 | |
| | | | | | | | | | | | | |
| NET ASSETS: | | | | | | | | | | | | |
| Beginning of period | | | 4,913,854,067 | | | | 3,573,582,292 | | | | 1,811,380,157 | |
| End of period (including accumulated undistributed | | | | | | | | | | | | |
| net investment income of $70,048,008, | | | | | | | | | | | | |
| 78,326,065 and $7,037,435, respectively) | | $ | 5,026,560,260 | | | $ | 4,913,854,067 | | | $ | 3,573,582,292 | |
| * | For the period October 1, 2011 through December 31, 2011. The Fund changed its fiscal year end from September 30 to December 31. |
The accompanying notes are an integral part of these financial statements.
The Merger Fund
FINANCIAL HIGHLIGHTS
Selected per share data is based on a share of beneficial interest outstanding throughout each period.
| | | Three | | | | | | | | | | | | | | | | |
| | | Months | | | Year | | | Year | | | Year | | | Year | | | Year | |
| | | Ended | | | Ended | | | Ended | | | Ended | | | Ended | | | Ended | |
| | | Dec. 31, | | | Sept. 30, | | | Sept. 30, | | | Sept. 30, | | | Sept. 30, | | | Sept. 30, | |
| | | | 2011* | | | | 2011 | | | | 2010 | | | | 2009 | | | | 2008 | | | | 2007 | |
| | | | | | | | | | | | | | | | | | | | | | | | | |
| Net Asset Value, beginning of period | | $ | 15.59 | | | $ | 15.93 | | | $ | 15.26 | | | $ | 14.79 | | | $ | 16.55 | | | $ | 15.95 | |
| | | | | | | | | | | | | | | | | | | | | | | | | |
| Income from investment operations: | | | | | | | | | | | | | | | | | | | | | | | | |
Net investment income (loss)(1) | | | (0.02 | )(4) | | | (0.18 | )(4) | | | (0.02 | )(2) | | | 0.24 | (2) | | | 0.00 | (3)(5) | | | 0.13 | (3) |
| Net realized and unrealized gain (loss) | | | | | | | | | | | | | | | | | | | | | | | | |
| on investments | | | 0.47 | | | | 0.13 | | | | 0.69 | | | | 0.58 | | | | (0.70 | ) | | | 1.13 | |
| Total from investment operations | | | 0.45 | | | | (0.05 | ) | | | 0.67 | | | | 0.82 | | | | (0.70 | ) | | | 1.26 | |
| Redemption fees | | | 0.00 | (5) | | | 0.00 | (5) | | | 0.00 | (5) | | | 0.00 | (5) | | | 0.00 | (5) | | | 0.00 | (5) |
| | | | | | | | | | | | | | | | | | | | | | | | | |
| Less distributions: | | | | | | | | | | | | | | | | | | | | | | | | |
| Distributions from net investment income | | | (0.08 | ) | | | — | | | | 0.00 | (5) | | | (0.06 | ) | | | (0.37 | ) | | | (0.11 | ) |
| Distributions from net realized gains | | | (0.37 | ) | | | (0.29 | ) | | | — | | | | (0.05 | ) | | | (0.69 | ) | | | (0.55 | ) |
| Distributions from return to capital | | | — | | | | — | | | | — | | | | (0.24 | ) | | | — | | | | — | |
| Total distributions | | | (0.45 | ) | | | (0.29 | ) | | | — | | | | (0.35 | ) | | | (1.06 | ) | | | (0.66 | ) |
| Net Asset Value, end of period | | $ | 15.59 | | | $ | 15.59 | | | $ | 15.93 | | | $ | 15.26 | | | $ | 14.79 | | | $ | 16.55 | |
| | | | | | | | | | | | | | | | | | | | | | | | | |
| Total Return | | | 2.90 | %(9) | | | (0.34 | )% | | | 4.39 | % | | | 5.78 | % | | | (4.32 | )% | | | 8.15 | % |
| | | | | | | | | | | | | | | | | | | | | | | | | |
| Supplemental data and ratios: | | | | | | | | | | | | | | | | | | | | | | | | |
| Net assets, end of period (000’s) | | $ | 5,026,560 | | | $ | 4,913,854 | | | $ | 3,573,582 | | | $ | 1,811,380 | | | $ | 1,414,165 | | | $ | 1,821,714 | |
| Ratio of operating expenses to | | | | | | | | | | | | | | | | | | | | | | | | |
| average net assets | | | 1.64 | %(8) | | | 1.96 | % | | | 2.57 | % | | | 4.22 | % | | | 1.66 | % | | | 2.16 | % |
| Ratio of interest expense, dividends on | | | | | | | | | | | | | | | | | | | | | | | | |
| securities sold short and borrowing | | | | | | | | | | | | | | | | | | | | | | | | |
| expense on securities sold short to | | | | | | | | | | | | | | | | | | | | | | | | |
| average net assets | | | 0.31 | %(8) | | | 0.62 | % | | | 1.16 | % | | | 2.68 | % | | | 0.19 | % | | | 0.76 | % |
| Ratio of operating expenses to average | | | | | | | | | | | | | | | | | | | | | | | | |
| net assets excluding interest expense, | | | | | | | | | | | | | | | | | | | | | | | | |
| borrowing expense on securities sold short | | | | | | | | | | | | | | | | | | | | | | | | |
| and dividends on securities sold short | | | | | | | | | | | | | | | | | | | | | | | | |
| Before expense waiver | | | 1.46 | %(8) | | | 1.46 | % | | | 1.48 | % | | | 1.54 | % | | | 1.48 | % | | | 1.41 | % |
| After expense waiver | | | 1.33 | %(8) | | | 1.34 | % | | | 1.41 | % | | | 1.54 | % | | | 1.47 | % | | | 1.40 | %(6) |
| Ratio of net investment income (loss) | | | | | | | | | | | | | | | | | | | | | | | | |
| to average net assets | | | | | | | | | | | | | | | | | | | | | | | | |
| Before expense waiver | | | (0.72 | )%(8) | | | (1.25 | )% | | | (1.35 | )% | | | (2.49 | )% | | | (0.10 | )% | | | 0.82 | % |
| After expense waiver | | | (0.59 | )%(8) | | | (1.13 | )% | | | (1.28 | )% | | | (2.49 | )% | | | (0.09 | )% | | | 0.83 | % |
Portfolio turnover rate(7) | | | 48.13 | %(9) | | | 292.79 | % | | | 192.21 | % | | | 318.45 | % | | | 300.24 | % | | | 334.87 | % |
Footnotes To Financial Highlights On Following Page
The accompanying notes are an integral part of these financial statements.
The Merger Fund
FINANCIAL HIGHLIGHTS (continued)
| (1) | Net investment income (loss) before interest expense, borrowing expense on securities sold short and dividends on securities sold short for the three months ended December 31, 2011 and the years ended September 30, 2011, 2010, 2009, 2008 and 2007 was $(0.01), $(0.08), $0.12, $0.55, $0.02 and $0.26, respectively. |
| (2) | Net investment income (loss) per share is calculated using ending balance after consideration of adjustments for permanent book and tax differences. |
| (3) | Net investment income (loss) per share is calculated using ending balances prior to consideration of adjustments for permanent book and tax differences. |
| (4) | Net investment income (loss) per share represents net investment income (loss) divided by the average shares outstanding throughout the period. |
| (5) | Amount less than $0.005 per share. |
| (6) | The Fund incurred proxy expenses of approximately $525,000 in 2007 related to shareholder approval of changes in the Fund’s fundamental investment policies and the election of trustees. |
| (7) | The numerator for the portfolio turnover rate includes the lesser of purchases or sales (excluding short positions). The denominator includes the average long positions throughout the period. |
| * | For the period October 1, 2011 through December 31, 2011. The Fund changed its fiscal year end from September 30 to December 31. |
The accompanying notes are an integral part of these financial statements.
The Merger Fund
NOTES TO THE FINANCIAL STATEMENTS
December 31, 2011
Note 1 — ORGANIZATION
The Merger Fund (the “Fund”) is a no-load, open-end, non-diversified investment company organized as a trust under the laws of the Commonwealth of Massachusetts on April 12, 1982, and registered under the Investment Company Act of 1940, as amended (the “1940 Act”). The Fund was formerly known as the Risk Portfolio of The Ayco Fund. In January of 1989, the Fund’s fundamental investment policies were amended to permit the Fund to engage in merger arbitrage. At the same time, Westchester Capital Management, Inc. became the Fund’s investment adviser, and the Fund began to do business as The Merger Fund. In a transaction that closed on December 31, 2010, Westchester Capital Management, Inc. transferred substantially all of its business and assets to Westchester Capital Management, LLC (the “Adviser”), which became the Fund’s investment adviser. Merger arbitrage is a highly specialized investment approach generally designed to profit from the successful completion of proposed mergers, takeovers, tender offers, leveraged buyouts, liquidations and other types of corporate reorganizations. During the prior fiscal period, the Fund’s Board of Trustees approved a change in the Fund’s fiscal year end from September 30 to December 31.
Note 2 — SIGNIFICANT ACCOUNTING POLICIES
The following is a summary of significant accounting policies followed by the Fund in the preparation of its financial statements. These policies are in conformity with U.S. generally accepted accounting principles (“GAAP”). In preparing these financial statements, the Fund has evaluated events and transactions for potential recognition or disclosure through the date the financial statements were available to be issued. The presentation of financial statements in conformity with GAAP requires management to make estimates and assumptions that affect the reported amount of assets and liabilities at the date of the financial statements and the reported amounts of revenues and expenses during the reporting period. Actual results could differ from those estimates and assumptions.
A.Investment Valuation
Securities listed on the NASDAQ Global Market and the NASDAQ Global Select Market are valued at the NASDAQ Official Closing Price (“NOCP”). Investments in registered investment companies that are money market funds are valued at the end of day net asset value. Other listed securities are valued at the last sale price on the exchange on which such securities are primarily traded or, in the case of options, at the last sale price. These securities valued using quoted prices in active markets are classified as Level 1 investments. Securities not listed on an exchange and securities for which there are no transactions are valued at the average of the closing bid and asked prices. These securities, which include corporate bonds, are classified as Level 2 investments. When pricing options, if no sales are reported or if the last sale is outside the bid and asked parameters, the higher of the intrinsic value of the option or the mean between the last reported bid and asked prices will be used. Options purchased in an active market are classified as Level 1 investments, but options not listed on exchange are classified as Level 2 investments. Securities for which there are no such valuations are valued at fair value as determined in good faith by the Adviser under the supervision of the Board of Trustees. The Adviser reserves the right to value securities, including options, at prices other than last-sale prices, intrinsic value prices, or the average of closing bid and asked prices, when such prices are believed
The Merger Fund
NOTES TO THE FINANCIAL STATEMENTS (continued)
December 31, 2011
Note 2 — SIGNIFICANT ACCOUNTING POLICIES (continued)
unrepresentative of fair market value as determined in good faith by the Adviser. When fair-value pricing is employed, the prices of securities used by the Fund to calculate its net asset value (NAV) may differ from quoted or published prices for the same securities. In addition, due to the subjective and variable nature of fair-value pricing, it is possible that the value determined for a particular asset may be materially different from the value realized if the securities were sold. At December 31, 2011, securities fair valued in good faith represented 3.96% of net assets at the absolute value of long investments and securities sold short and at the absolute value of unrealized gains or losses on forward currency exchange and swap contracts. Investments in United States government securities (other than short-term securities) are valued at the average of the quoted bid and asked prices in the over-the-counter market. Short-term investments are carried at amortized cost, which approximates fair value.
The Fund has performed an analysis of all existing investments to determine the significance and character of all inputs to their fair value determination. Various inputs are used in determining the value of the Fund’s investments. These inputs are summarized in the three broad levels listed below:
| | Level 1 — | Quoted prices in active markets for identical securities. |
| | Level 2 — | Other significant observable inputs (including quoted prices for similar securities, interest rates, prepayment speeds, credit risk, etc.). |
| | Level 3 — | Model derived valuations in which one or more significant inputs or significant value drivers are unobservable. Unobservable inputs are those inputs that reflect the Fund’s own assumptions that market participants would use to price the asset or liability based on the best available information. |
The inputs or methodology used for valuing securities are not an indication of the risk associated with investing in those securities.
The following tables provide the fair value measurements of applicable Fund assets and liabilities by level within the fair value hierarchy for the Fund as of December 31, 2011. These assets and liabilities are measured on a recurring basis.
The Merger Fund
NOTES TO THE FINANCIAL STATEMENTS (continued)
December 31, 2011
Note 2 — SIGNIFICANT ACCOUNTING POLICIES (continued)
| | | Level 1 | | | Level 2 | | | Level 3 | | | Total | |
| Assets | | | | | | | | | | | | |
| Common Stocks* | | $ | 3,438,728,292 | | | $ | — | | | $ | — | | | $ | 3,438,728,292 | |
| Warrants | | | 203,024 | | | | — | | | | — | | | | 203,024 | |
| Corporate Bonds | | | — | | | | 117,085,925 | | | | — | | | | 117,085,925 | |
| Purchased Put Options | | | 21,217,618 | | | | 482,956 | | | | — | | | | 21,700,574 | |
| Short-Term Investments | | | 1,406,389,252 | | | | — | | | | — | | | | 1,406,389,252 | |
| Forward Currency | | | | | | | | | | | | | | | | |
| Exchange Contracts** | | | — | | | | 3,269,979 | | | | — | | | | 3,269,979 | |
| Liabilities | | | | | | | | | | | | | | | | |
| Securities Sold Short | | $ | 248,655,349 | | | $ | 179,408,716 | | | $ | — | | | $ | 428,064,065 | |
| Options Written | | | 90,707,401 | | | | 475,275 | | | | — | | | | 91,182,676 | |
| Swap Contracts** | | | — | | | | 20,659,880 | | | | — | | | | 20,659,880 | |
| Forward Currency | | | | | | | | | | | | | | | | |
| Exchange Contracts** | | | — | | | | 2,786,772 | | | | — | | | | 2,786,772 | |
| * | Please refer to the Schedule of Investments to view common stocks segregated by industry type. |
| ** | Swapcontracts and forward currency exchange contracts are valued at the unrealized appreciation (depreciation) on the instruments. |
The Fund did not invest in Level 3 Securities at December 31, 2011. There were no significant transfers into or out of Level 1 or 2 during the period. Transfers between levels are recognized at the end of the reporting period.
Recent Accounting Pronouncement
In May, 2011, the Financial Accounting Standards Board (“FASB”) issued Accounting Standards Update (“ASU”) No. 2011-04 “Amendments to Achieve Common Fair Value Measurement and Disclosure Requirements” in GAAP and the International Financial Reporting Standards (“IFRS”). ASU No. 2011-04 amends FASB Accounting Standards Codification (“ASC”) Topic 820, Fair Value Measurements and Disclosures, to establish common requirements for measuring fair value and for disclosing information about fair value measurements in accordance with GAAP and IFRS. ASU No. 2011-04 is effective for fiscal years beginning after December 15, 2011 and for interim periods within those fiscal years. Management is currently evaluating the impact of these amendments on the Fund’s financial statements.
B.Securities Sold Short
The Fund may sell securities or currencies short for economic hedging purposes. For financial statement purposes, an amount equal to the settlement amount is initially included in the Statement of Assets and Liabilities as an asset and an equivalent liability. The amount of the liability is subsequently marked-to-market to reflect the current value of the short position. Subsequent fluctuations in the market prices of securities or currencies sold, but not yet purchased, may require purchasing the securities or currencies at prices which may differ from the market value reflected on the Statement of Assets and Liabilities. Short sale transactions result in off balance sheet risk because the ultimate
The Merger Fund
NOTES TO THE FINANCIAL STATEMENTS (continued)
December 31, 2011
Note 2 — SIGNIFICANT ACCOUNTING POLICIES (continued)
obligation may exceed the related amounts shown in the Statement of Assets and Liabilities. The Fund will incur a loss if the price of the security increases between the date of the short sale and the date on which the Fund replaces the borrowed security. The Fund’s loss on a short sale is potentially unlimited because there is no upward limit on the price a borrowed security could attain.
The Fund is liable for any dividends payable on securities while those securities are sold short. Until the security is replaced, the Fund is required to pay to the lender any income earned which is recorded as an expense by the Fund. As collateral for its securities sold short, the Fund is required under the 1940 Act to maintain assets consisting of cash, cash equivalents or liquid securities. These assets are required to be adjusted daily to reflect changes in the value of the securities or currencies sold short.
C.Transactions with Brokers for Securities Sold Short
The Fund’s receivable from brokers for proceeds on securities sold short and deposits at brokers for securities sold short are with two securities dealers. The Fund does not require the brokers to maintain collateral in support of the receivable from brokers for proceeds on securities sold short. The Fund maintains cash deposits at brokers beyond the receivable for short sales. These cash deposits are presented as deposits at brokers on the Statement of Assets and Liabilities.
D.Federal Income Taxes
No provision for federal income taxes has been made since the Fund has complied to date with the provisions of Subchapter M of the Internal Revenue Code applicable to regulated investment companies and intends to continue to so comply in future years and to distribute investment company net taxable income and net capital gains to shareholders. Additionally, the Fund intends to make all required distributions to avoid federal excise tax.
The Fund has reviewed all open tax years and major jurisdictions and concluded that there is no impact on the Fund’s net assets and no tax liability resulting from unrecognized tax benefits relating to uncertain income tax positions taken or expected to be taken on a tax return. The Fund is also not aware of any tax positions for which it is reasonably possible that the total amounts of unrecognized tax benefits will significantly change in the next twelve months. As of December 31, 2011, open Federal and New York tax years include the tax years ended September 30, 2008 through 2011. The Fund has no tax examination in progress.
E.Written Option Contracts
The Fund is subject to equity price risk in the normal course of pursuing its investment objectives. The Fund writes (sells) call options to hedge portfolio investments. Uncovered put options can also be written by the Fund as part of a merger arbitrage strategy involving a pending corporate reorganization. When the Fund writes (sells) an option, an amount equal to the premium received by the Fund is included in the Statement of Assets and Liabilities as an asset and an equivalent liability. The amount of the liability is subsequently marked-to-market daily to reflect the current value of the option written. By writing an option, the Fund may become obligated during the term of the option to deliver or purchase the securities underlying the option at the exercise price if the option is exercised. Written option
The Merger Fund
NOTES TO THE FINANCIAL STATEMENTS (continued)
December 31, 2011
Note 2 — SIGNIFICANT ACCOUNTING POLICIES (continued)
contracts are valued at the higher of the intrinsic value of the option or the last sales price reported on the date of valuation. If no sale is reported or if the last sale is outside the parameters of the closing bid and asked prices, the written option contract is valued at the higher of the intrinsic value of the option or the mean between the last reported bid and asked prices on the day of valuation. When an option expires on its stipulated expiration date or the Fund enters into a closing purchase transaction, the Fund realizes a gain or loss if the cost of the closing purchase transaction differs from the premium received when the option was sold without regard to any unrealized gain or loss on the underlying security, and the liability related to such option is eliminated. When an option is exercised, the premium originally received decreases the cost basis of the security (or increases the proceeds on a sale of the security), and the Fund realizes a gain or loss from the sale of the underlying security. With written option contracts, there is minimal counterparty credit risk to the Fund since written option contracts are exchange traded. Refer to Note 2 S. for further derivative disclosures.
F.Purchased Options
The Fund is subject to equity price risk in the normal course of pursuing its investment objectives. The Fund purchases put or call options to hedge portfolio investments. Premiums paid for option contracts purchased are included in the Statement of Assets and Liabilities as an asset. Option contracts are valued daily at the higher of the intrinsic value of the option or the last sales price reported on the date of valuation. If no sale is reported or if the last sale is outside the parameters of the closing bid and asked prices, the option contract purchased is valued at the higher of the intrinsic value of the option or the mean between the last reported bid and asked prices on the day of valuation. When option contracts expire or are closed, realized gains or losses are recognized without regard to any unrealized gains or losses on the underlying securities. With purchased options, there is minimal counterparty credit risk to the Fund since purchased options are exchange traded. Refer to Note 2 S. for further derivative disclosures.
G.Forward Currency Exchange Contracts
The Fund is subject to foreign currency exchange rate risk in the normal course of pursuing its investment objectives. The Fund may use forward currency exchange contracts to hedge against changes in the value of foreign currencies. The Fund may enter into forward currency exchange contracts obligating the Fund to deliver and receive a currency at a specified future date. Forward contracts are valued daily, and unrealized appreciation or depreciation is recorded daily as the difference between the contract exchange rate and the closing forward rate applied to the face amount of the contract. A realized gain or loss is recorded at the time the forward contract expires. Credit risk may arise as a result of the failure of the counterparty to comply with the terms of the contract. The Fund considers the creditworthiness of each counterparty to a contract in evaluating potential credit risk quarterly. The counterparty risk to the Fund is limited to the net unrealized gain, if any, on the contract.
The use of forward currency exchange contracts does not eliminate fluctuations in the underlying prices of the Fund’s investment securities; however, it does establish a rate of exchange that can be achieved in the future. The use of forward currency exchange contracts involves the risk that
The Merger Fund
NOTES TO THE FINANCIAL STATEMENTS (continued)
December 31, 2011
Note 2 — SIGNIFICANT ACCOUNTING POLICIES (continued)
anticipated currency movements will not be accurately predicted. A forward currency exchange contract would limit the risk of loss due to a decline in the value of a particular currency; however it would also limit any potential gain that might result should the value of the currency increase instead of decrease. These contracts may involve market risk in excess of the amount of receivable or payable reflected on the Statement of Assets and Liabilities. Refer to Note 2 S. for further derivative disclosures.
H.Equity Swap Contracts
The Fund is subject to equity price risk and interest rate risk in the normal course of pursuing its investment objectives. The Fund has entered into both long and short equity swap contracts with multiple broker-dealers. A long equity swap contract entitles the Fund to receive from the counterparty any appreciation and dividends paid on an individual security, while obligating the Fund to pay the counterparty any depreciation on the security as well as interest on the notional amount of the contract at a rate equal to LIBOR plus 25 to 100 basis points. A short equity swap contract obligates the Fund to pay the counterparty any appreciation and dividends paid on an individual security, while entitling the Fund to receive from the counterparty any depreciation on the security as well as interest on the notional value of the contract at a rate equal to LIBOR less 25 to 100 basis points.
The Fund may also enter into equity swap contracts whose value is determined by the spread between a long equity position and a short equity position. This type of swap contract obligates the Fund to pay the counterparty an amount tied to any increase in the spread between the two securities over the term of the contract. The Fund is also obligated to pay the counterparty any dividends paid on the short equity holding as well as any net financing costs. This type of swap contract entitles the Fund to receive from the counterparty any gains based on a decrease in the spread as well as any dividends paid on the long equity holding and any net interest income.
Fluctuations in the value of an open contract are recorded daily as a net unrealized gain or loss. The Fund will realize a gain or loss upon termination or reset of the contract. Either party, under certain conditions, may terminate the contract prior to the contract’s expiration date.
Credit risk may arise as a result of the failure of the counterparty to comply with the terms of the contract. The Fund considers the creditworthiness of each counterparty to a contract in evaluating potential credit risk quarterly. The counterparty risk to the Fund is limited to the net unrealized gain, if any, on the contract, along with dividends receivable on long equity contracts and interest receivable on short equity contracts. Additionally, risk may arise from unanticipated movements in interest rates or in the value of the underlying securities. Refer to Note 2 S. for further derivative disclosures.
I.Distributions to Shareholders
Dividends from net investment income and net realized capital gains, if any, are declared and paid at least annually. Income and capital gain distributions are determined in accordance with income tax regulations which may differ from GAAP. These differences are due primarily to wash sale-loss deferrals, constructive sales, straddle-loss deferrals, adjustments on swap contracts, and unrealized gains or losses on Section 1256 contracts, which were realized, for tax purposes, at December 31,
The Merger Fund
NOTES TO THE FINANCIAL STATEMENTS (continued)
December 31, 2011
Note 2 — SIGNIFICANT ACCOUNTING POLICIES (continued)
2011. Accordingly, reclassifications are made within the net asset accounts for such amounts, as well as amounts related to permanent differences in the character of certain income and expense items for income tax and financial reporting purposes. At December 31, 2011, the Fund increased accumulated undistributed net investment income by $25,207,625, reduced accumulated undistributed net gain by $25,207,625, and did not change paid-in capital.
J.Foreign Securities
Investing in securities of foreign companies and foreign governments involves special risks and considerations not typically associated with investing in U.S. companies and the U.S. government. These risks include revaluation of currencies and adverse political and economic developments. Moreover, securities of many foreign companies and their markets may be less liquid and their prices more volatile than those of securities of comparable U.S. companies and the U.S. government.
K.Foreign Currency Translation
The books and records of the Fund are maintained in U.S. dollars. Foreign currency transactions are translated into U.S. dollars on the following basis: (i) market value of investment securities, assets and liabilities at the daily rates of exchange, and (ii) purchases and sales of investment securities, dividend and interest income and certain expenses at the rates of exchange prevailing on the respective dates of such transactions. For financial reporting purposes, the Fund does not isolate changes in the exchange rate of investment securities from the fluctuations arising from changes in the market prices of securities. However, for federal income tax purposes, the Fund does isolate and treat as ordinary income the effect of changes in foreign exchange rates on realized gain or loss from the sale of investment securities and payables and receivables arising from trade-date and settlement-date differences.
L.When-Issued Securities
The Fund may engage in securities transactions on a when-issued or delayed-delivery basis. Although the payment and interest terms of these securities are established at the time the Fund enters into the agreement, these securities may be delivered for cash proceeds at a future date. During this period, the securities are subject to market fluctuations. The Fund records sales of when-issued securities and reflects the values of such securities in determining net asset value in the same manner as other open short-sale positions. When delayed-delivery purchases are outstanding, the Fund segregates and maintains at all times cash, cash equivalents or other liquid securities in an amount at least equal to the market value.
M.Cash Equivalents
The Fund considers highly liquid temporary cash investments purchased with an original maturity of less than three months to be cash equivalents. Cash equivalents are included in short-term investments on the Schedule of Investments as well as in investments on the Statement of Assets and Liabilities.
N.Guarantees and Indemnifications
In the normal course of business, the Fund enters into contracts with service providers that contain general indemnification clauses. The Fund’s maximum exposure under these arrangements is
The Merger Fund
NOTES TO THE FINANCIAL STATEMENTS (continued)
December 31, 2011
Note 2 — SIGNIFICANT ACCOUNTING POLICIES (continued)
unknown, as this would involve future claims that may be made against the Fund that have not yet occurred. However, based on experience, the Fund expects the risk of loss to be remote.
O.Use of Estimates
The preparation of financial statements in conformity with GAAP requires the Adviser to make estimates and assumptions that affect the reported amounts of assets and liabilities and disclosure of contingent assets and liabilities at the date of the financial statements and the reported amounts of revenues and expenses during the reporting period. Actual results could differ from those estimates.
P.Other
Investment and shareholder transactions are recorded on the trade date. Realized gains and losses from security transactions are recorded on the identified cost basis. Dividend income and distributions to shareholders are recorded on the ex-dividend date. Interest is accounted for on the accrual basis and includes amortization of premiums and discounts on the interest method. Expenses include $1,350,700 of borrowing expense on securities sold short. The Fund may utilize derivative instruments such as options, forward currency exchange contracts and other instruments with similar characteristics to the extent that they are consistent with the Fund’s investment objectives and limitations. The use of these instruments may involve additional investment risks, including the possibility of illiquid markets or imperfect correlation between the value of the instruments and the underlying securities.
Q.Counterparty Risk
The Fund helps manage counterparty credit risk by entering into agreements only with counterparties the Adviser believes have the financial resources to honor their obligations and by having the Adviser monitor the financial stability of the counterparties. Collateral pledges are monitored and subsequently adjusted if and when the valuations fluctuate, either up or down, by at least the predetermined threshold amount.
R.The Right to Offset
Financial assets and liabilities as well as cash collateral received and posted are offset by counterparty, and the net amount is reported in the Statement of Assets and Liabilities when the Fund believes there exists a legally enforceable right to set off the recognized amounts.
S.Derivatives
The Fund has adopted authoritative standards regarding disclosure about derivatives and hedging activities and how they affect the Fund’s Statement of Assets and Liabilities and Statement of Operations. For the three months ended December 31, 2011: long option contracts (420,515 contracts) were purchased and $69,596,159 premiums were paid, written option contracts (615,569 contracts) were opened and $119,870,086 premiums were received, equity swap contracts were opened for a notional value of $545,566,927 and closed for a notional value of $1,139,001,509 and an average of 15 forward currency exchange contract positions were open during the period.
The Merger Fund
NOTES TO THE FINANCIAL STATEMENTS (continued)
December 31, 2011
Note 2 — SIGNIFICANT ACCOUNTING POLICIES (continued)
Statement of Assets and Liabilities
Fair values of derivative instruments as of December 31, 2011:
| | | Asset Derivatives | | | Liability Derivatives | |
| | | Statement of Assets | | | | | | Statement of Assets | | | | |
| Derivatives | | and Liabilities Location | | | Fair Value | | | and Liabilities Location | | | Fair Value | |
| Equity Contracts: | | | | | | | | | | | | |
| Purchased Options | | Investments | | | $ | 21,700,574 | | | | N/A | | | $ | — | |
| Written Option Contracts | | | N/A | | | | — | | | Written Option | | | | | |
| | | | | | | | | | Contracts | | | | 91,182,676 | |
| Swap Contracts | | Receivables | | | | — | | | Payables | | | | 20,659,880 | |
| Foreign exchange contracts: | | | | | | | | | | | | | | | | |
| Forward Currency | | | | | | | | | | | | | | | | |
| Exchange Contracts | | Receivables | | | | 3,269,979 | | | Payables | | | | 2,786,772 | |
| Total | | | | | | $ | 24,970,553 | | | | | | | $ | 114,629,328 | |
| | | | | | | | | | | | | | | | | |
Statement of Operations
The effect of derivative instruments on the Statement of Operations for the three months ended December 31, 2011:
| Amount of Realized Gain (Loss) on Derivatives | |
| | | | | | | | | Forward | | | | | | | |
| | | | | | Written | | | Currency | | | | | | | |
| | | Purchased | | | Options | | | Exchange | | | Swap | | | | |
| Derivatives | | Options | | | Contracts | | | Contracts | | | Contracts | | | Total | |
| Equity contracts | | $ | (39,492,537 | ) | | $ | 27,444,127 | | | $ | — | | | $ | (22,684,511 | ) | | $ | (34,732,921 | ) |
| Foreign exchange | | | | | | | | | | | | | | | | | | | | |
| contracts | | | — | | | | — | | | | 24,050,434 | | | | — | | | | 24,050,434 | |
| Total | | $ | (39,492,537 | ) | | $ | 27,444,127 | | | $ | 24,050,434 | | | $ | (22,684,511 | ) | | $ | (10,682,487 | ) |
| | | | | | | | | | | | | | | | | | | | | |
| Change in Unrealized Appreciation (Depreciation) on Derivatives | |
| | | | | | | | | | | Forward | | | | | | | | | |
| | | | | | | Written | | | Currency | | | | | | | | | |
| | | Purchased | | | Options | | | Exchange | | | Swap | | | | | |
| Derivatives | | Options | | | Contracts | | | Contracts | | | Contracts | | | Total | |
| Equity contracts | | $ | (42,486,121 | ) | | $ | (19,621,215 | ) | | $ | — | | | $ | 73,238,431 | | | $ | 11,131,095 | |
| Foreign exchange | | | | | | | | | | | | | | | | | | | | |
| contracts | | | — | | | | — | | | | (37,949,764 | ) | | | — | | | | (37,949,764 | ) |
| Total | | $ | (42,486,121 | ) | | $ | (19,621,215 | ) | | $ | (37,949,764 | ) | | $ | 73,238,431 | | | $ | (26,818,669 | ) |
| | | | | | | | | | | | | | | | | | | | | |
The Merger Fund
NOTES TO THE FINANCIAL STATEMENTS (continued)
December 31, 2011
Note 2 — SIGNIFICANT ACCOUNTING POLICIES (continued)
The effect of derivative instruments on the Statement of Operations for the year ended September 30, 2011:
| Amount of Realized Gain (Loss) on Derivatives | |
| | | | | | | | | Forward | | | | | | | |
| | | | | | Written | | | Currency | | | | | | | |
| | | Purchased | | | Options | | | Exchange | | | Swap | | | | |
| Derivatives | | Options | | | Contracts | | | Contracts | | | Contracts | | | Total | |
| Equity contracts | | $ | (39,435,378 | ) | | $ | 66,124,635 | | | $ | — | | | $ | 83,205,915 | | | $ | 109,895,172 | |
| Foreign exchange | | | | | | | | | | | | | | | | | | | | |
| contracts | | | — | | | | — | | | | (73,002,999 | ) | | | — | | | | (73,002,999 | ) |
| Total | | $ | (39,435,378 | ) | | $ | 66,124,635 | | | $ | (73,002,999 | ) | | $ | 83,205,915 | | | $ | 36,892,173 | |
Change in Unrealized Appreciation (Depreciation) on Derivatives
| | | | | | | | | Forward | | | | | | | |
| | | | | | Written | | | Currency | | | | | | | |
| | | Purchased | | | Options | | | Exchange | | | Swap | | | | |
| Derivatives | | Options | | | Contracts | | | Contracts | | | Contracts | | | Total | |
| Equity contracts | | $ | 29,356,987 | | | $ | 4,818,800 | | | $ | — | | | $ | (100,869,422 | ) | | $ | (66,693,635 | ) |
| Foreign exchange | | | | | | | | | | | | | | | | | | | | |
| contracts | | | — | | | | — | | | | 82,770,417 | | | | — | | | | 82,770,417 | |
| Total | | $ | 29,356,987 | | | $ | 4,818,800 | | | $ | 82,770,417 | | | $ | (100,869,422 | ) | | $ | 16,076,782 | |
Note 3 — AGREEMENTS
The Fund’s investment adviser is Westchester Capital Management, LLC pursuant to an investment advisory agreement with the Adviser dated as of January 1, 2011. Under the terms of this agreement, the Adviser is entitled to receive a fee, calculated daily and payable monthly, at the annual rate of 1.00% of the Fund’s average daily net assets. The Adviser has agreed to voluntarily waive 0.10% of its fee at net asset levels between $1.5 billion through $2 billion, 0.20% of its fee at net asset levels between $2 billion through $5 billion, and 0.25% of its fee at net asset levels exceeding $5 billion. Investment advisory fees voluntarily waived by the Adviser for the three month period ended December 31, 2011 were $1,639,710. Investment advisory fee voluntarily waived by the Adviser for the year ended September 30, 2011 were $5,296,618. Certain officers of the Fund are also officers of the Adviser.
U.S. Bancorp Fund Services, LLC, a subsidiary of U.S. Bancorp, a publicly held bank holding company, serves as transfer agent, administrator, fund accountant, dividend paying agent and shareholder servicing agent for the Fund. U.S. Bank, N.A. serves as custodian for the Fund.
Distribution services are performed pursuant to distribution contracts with broker-dealers and other qualified institutions.
The Merger Fund
NOTES TO THE FINANCIAL STATEMENTS (continued)
December 31, 2011
Note 4 — SHARES OF BENEFICIAL INTEREST
The Board of Trustees has the authority to issue an unlimited amount of shares of beneficial interest without par value.
Changes in shares of beneficial interest were as follows:
| | | Three Months Ended | | | Year Ended | | | Year Ended | |
| | | December 31, 2011 | | | September 30, 2011 | | | September 30, 2010 | |
| | | Shares | | | Amount | | | Shares | | | Amount | | | Shares | | | Amount | |
| Issued | | | 29,716,276 | | | $ | 471,436,947 | | | | 176,395,668 | | | $ | 2,824,267,550 | | | | 168,630,399 | | | $ | 2,646,030,009 | |
| Issued as | | | | | | | | | | | | | | | | | | | | | | | | |
| reinvestment | | | | | | | | | | | | | | | | | | | | | | | | |
| of dividends | | | 7,466,034 | | | | 116,320,806 | | | | 3,547,347 | | | | 55,977,137 | | | | 2,419 | | | | 37,612 | |
| Redemption fee | | | — | | | | 40,203 | | | | — | | | | 357,767 | | | | — | | | | 465,767 | |
| Redeemed | | | (29,854,090 | ) | | | (472,634,819 | ) | | | (89,150,638 | ) | | | (1,419,480,778 | ) | | | (62,995,581 | ) | | | (991,361,358 | ) |
| Net increase | | | | | | | | | | | | | | | | | | | | | | | | |
| (decrease) | | | 7,328,220 | | | $ | 115,163,137 | | | | 90,792,376 | | | $ | 1,461,121,676 | | | | 105,637,237 | | | $ | 1,655,172,030 | |
Note 5 — INVESTMENT TRANSACTIONS AND INCOME TAX INFORMATION
Purchases and sales of securities for the three month period ended December 31, 2011 (excluding short-term investments, options, forward currency contracts, swap contracts and short positions) aggregated $1,738,971,947 and $1,608,627,289, respectively. There were no purchases or sales of U.S. Government securities.
At December 31, 2011, the components of accumulated earnings (losses) on a tax basis were as follows:
| Cost of investments | | $ | 5,040,415,753 | |
| Gross unrealized appreciation | | | 110,956,863 | |
| Gross unrealized depreciation | | | (167,265,549 | ) |
| Net unrealized depreciation | | $ | (56,308,686 | ) |
| Undistributed ordinary income | | $ | 49,871,335 | |
| Undistributed long-term capital gain | | | — | |
| Total distributable earnings | | $ | 49,871,335 | |
| Other accumulated losses | | | (77,120,760 | ) |
| Total accumulated losses | | $ | (83,558,111 | ) |
The tax components of dividends paid during the three months ended December 31, 2011 and the fiscal years ended September 30, 2011 and 2010 were as follows:
| | | December 31, 2011 | | | September 30, 2011 | | | September 30, 2010 | |
| Ordinary Income | | $ | 142,155,672 | | | $ | 70,276,496 | | | $ | 42,329 | |
| Return of Capital | | | — | | | | — | | | | — | |
| Total Distributions | | $ | 142,155,672 | | | $ | 70,276,496 | | | $ | 42,329 | |
The Merger Fund
NOTES TO THE FINANCIAL STATEMENTS (continued)
December 31, 2011
Note 5 — INVESTMENT TRANSACTIONS (continued)
The Fund incurred a post-October capital loss of $5,371,346 for securities which is deferred for tax purposes until the next fiscal year. As of December 31, 2011, the Fund had short-term capital loss carryforwards of $24,849,619 and long-term capital loss carryforwards of $10,876,091.
For the three month period ended December 31, 2011, certain dividends paid by the Fund may be subject to a maximum tax rate of 15% as provided for by the Jobs and Growth Tax Relief Reconciliation Act of 2003. The percentage of dividends declared from net investment income designated as qualified dividend income for the three month period ended December 31, 2011 was 21.80% (unaudited) for the Fund.
For corporate shareholders, the percent of ordinary income distributions qualifying for the corporate dividends-received deduction for the three month period ended December 31, 2011 was 20.07% (unaudited) for the Fund. The percentage of taxable ordinary income distributions that are designated as short-term capital gain distributions under Internal Revenue Code Section 871(k)(2)(c) for the three month period ended December 31, 2011 was 97.71% (unaudited) for the Fund.
On December 22, 2010, the Regulated Investment Company Modernization Act of 2010 (the “Act”) was enacted, which changed various technical rules governing the tax treatment of regulated investment companies. The changes are generally effective for taxable years beginning after the date of enactment. One of the more prominent changes addresses capital loss carryforwards. Under the Act, the Fund is permitted to carry forward capital losses incurred in taxable years beginning after the date of enactment for an unlimited period. However, any losses incurred during those taxable years are required to be utilized prior to the losses incurred in pre-enactment taxable years, which carry an expiration date. As a result of this ordering rule, pre-enactment capital loss carryforwards may be more likely to expire unused. Additionally, post-enactment capital loss carryforwards retain their character as either short-term or long-term capital losses rather than being considered all short-term as permitted under previous regulations.
Note 6 — WRITTEN OPTION CONTRACTS
The premium amount and the number of option contracts written during the three month period ended December 31, 2011 were as follows:
| | | Premium Amount | | | Number of Contracts | |
| Options outstanding at September 30, 2011 | | $ | 51,470,103 | | | | 256,502 | |
| Options written | | | 119,870,086 | | | | 615,569 | |
| Options closed | | | (58,595,448 | ) | | | (333,316 | ) |
| Options exercised | | | (20,695,831 | ) | | | (86,131 | ) |
| Options expired | | | (8,369,152 | ) | | | (70,874 | ) |
| Options outstanding at December 31, 2011 | | $ | 83,679,758 | | | | 381,750 | |
The Merger Fund
NOTES TO THE FINANCIAL STATEMENTS (continued)
December 31, 2011
Note 7 — DISTRIBUTION PLAN
The Fund has adopted an Amended and Restated Plan of Distribution (the “Plan”) dated July 19, 2005, pursuant to Rule 12b-1 under the 1940 Act. Under the Plan, the Fund will compensate broker dealers or other qualified institutions with whom the Fund has entered into a contract to distribute Fund shares. Under the Plan, the amount of such compensation paid in any one year shall not exceed 0.25% annually of the average daily net assets of the Fund, which may be payable as a service fee for providing permitted recordkeeping, subaccounting, subtransfer agency and/or shareholder liaison services. For the three months ended December 31, 2011, the Fund incurred $3,144,918 pursuant to the Plan. For the year ended September 30, 2011, the Fund incurred $10,711,317 pursuant to the Plan. The Plan will remain in effect from year to year provided such continuance is approved at least annually by a vote either of a majority of the Trustees, including a majority of the non-interested Trustees, or a majority of the Fund’s outstanding shares.
Note 8 — TRANSACTIONS WITH AFFILIATES
Pursuant to Section (2)(a)(3) of the 1940 Act, if the Fund owns 5% or more of the outstanding voting securities of an issuer, the issuer is deemed to be an affiliate of the Fund. During the three months ended December 31, 2011, the Fund owned the following positions in such companies for investment purposes only:
| | | Share | | | | | | | | | Share | | | Market | | | | | | | |
| | | Balance at | | | | | | | | | Balance at | | | Value at | | | | | | | |
| | | October 1, | | | | | | | | | December 31, | | | December 31, | | | Dividend | | | Interest | |
| Issuer Name | | 2011 | | | Purchases | | | Sales | | | 2011 | | | 2011 | | | Income | | | Income | |
| Blue Coat | | | | | | | | | | | | | | | | | | | | | |
| Systems, Inc. | | | — | | | | 2,480,900 | | | | — | | | | 2,480,900 | | | $ | 63,138,905 | | | $ | — | | | $ | — | |
| Dollar Thrifty | | | | | | | | | | | | | | | | | | | | | | | | | | | | |
| Automotive | | | | | | | | | | | | | | | | | | | | | | | | | | | | |
| Group, Inc. | | | 2,338,825 | | | | — | | | | — | | | | 2,338,825 | | | | 164,325,845 | | | | — | | | | — | |
| Invesco Prime | | | | | | | | | | | | | | | | | | | | | | | | | | | | |
| Portfolio Money | | | | | | | | | | | | | | | | | | | | | | | | | | | | |
| Market | | | — | | | | 682,150,637 | | | | 415,761,385 | | | | 266,389,252 | | | | 266,389,252 | | | | — | | | | 41,868 | |
| NetLogic | | | | | | | | | | | | | | | | | | | | | | | | | | | | |
| Microsystems Inc. | | | 3,660,422 | | | | 10,150 | | | | — | | | | 3,670,572 | | | | 181,950,254 | | | | — | | | | — | |
| SuccessFactors, Inc. | | | — | | | | 4,344,497 | | | | — | | | | 4,344,497 | | | | 173,215,095 | | | | — | | | | — | |
| Temple-Inland Inc. | | | 5,161,371 | | | | 487,501 | | | | — | | | | 5,648,872 | | | | 179,125,731 | | | | 734,353 | | | | — | |
| | | | | | | | | | | | | | | | | | | $ | 1,028,145,082 | | | $ | 734,353 | | | $ | 41,868 | |
There were no realized gains or losses on transactions with affiliates during the three months ended December 31, 2011.
Report of Independent Registered Public Accounting Firm
To the Board of Trustees and Shareholders of
The Merger Fund:
In our opinion, the accompanying statement of assets and liabilities, including the schedule of investments, securities sold short, options written, forward currency exchange contracts and swap contracts, and the related statements of operations and of changes in net assets and the financial highlights present fairly, in all material respects, the financial position of The Merger Fund (the “Fund”) for the period October 1, 2011 to December 31, 2011, the results of its operations for the period then ended, the changes in its net assets and the financial highlights for the periods presented, in conformity with accounting principles generally accepted in the United States of America. These financial statements and financial highlights (hereafter referred to as “financial statements”) are the responsibility of the Fund’s management; our responsibility is to express an opinion on these financial statements based on our audits. We conducted our audits of these financial statements in accordance with the standards of the Public Company Accounting Oversight Board (United States). Those standards require that we plan and perform the audits to obtain reasonable assurance about whether the financial statements are free of material misstatement. An audit includes examining, on a test basis, evidence supporting the amounts and disclosures in the financial statements, assessing the accounting principles used and significant estimates made by management, and evaluating the overall financial statement presentation. We believe that our audits, which included confirmation of securities at December 31, 2011 by correspondence with the custodian and brokers, provide a reasonable basis for our opinion.

Milwaukee, Wisconsin
February 29, 2012
INFORMATION ABOUT TRUSTEES AND OFFICERS
The business and affairs of the Fund are managed under the direction of the Fund’s Board of Trustees. Information pertaining to the Fund’s Trustees and Officers is set forth below. The Statement of Additional Information includes additional information about the Fund’s Trustees and Officers and is available, without charge, upon request by calling 1-800-343-8959.
| | | Term of | | # of Portfolios | |
| | Position(s) | Office and | | | Other |
| | Held with | Length of | Principal Occupation | Overseen by | Directorships |
| Name, Address and Age | the Fund | Time Served | During Past Five Years | Trustee** | Held by Trustee |
| | | | | | |
| Roy Behren* | Co-President, | Indefinite; | Co-Portfolio Manager | 1 | None |
| Westchester Capital | Treasurer | since 2011 | and Co-President of | | |
| Management, LLC | and | | Westchester Capital | | |
| 100 Summit Lake Drive | Trustee | | Management, LLC, the | | |
| Valhalla, NY 10595 | | | Fund’s Adviser, since | | |
| Age: 51 | | | 2011. Co-Portfolio | | |
| | | | Manager of Westchester | | |
| | | | Capital Management, Inc., | | |
| | | | the Fund’s previous | | |
| | | | adviser, from 2007 to | | |
| | | | 2010. Research analyst | | |
| | | | for Westchester Capital | | |
| | | | Management, Inc. from | | |
| | | | 1994 until 2010. Chief | | |
| | | | Compliance Officer of the | | |
| | | | Fund and Westchester | | |
| | | | Capital Management, Inc. | | |
| | | | from 2004 to 2010. | | |
| | | | | | |
| James P. Logan, III | Independent | Indefinite; | Chairman of J.P. | 2 | None |
| c/o Westchester Capital | Trustee | since | Logan & Company. | | |
| Management, LLC | | inception | Chairman of | | |
| 100 Summit Lake Drive | | in 1989 | Logan-Chace, LLC, an | | |
| Valhalla, NY 10595 | | | executive search firm. | | |
| Age: 75 | | | | | |
| | | | | | |
| Michael J. Downey | Independent | Indefinite; | Private investor. | 2 | Chairman and |
| c/o Westchester Capital | Trustee | since | Consultant and | | Director of The |
| Management, LLC | | 1995 | independent financial | | Asia Pacific |
| 100 Summit Lake Drive | | | adviser since July 1993. | | Fund, Inc. |
| Valhalla, NY 10595 | | | | | Director of |
| Age: 68 | | | | | AllianceBernstein |
| | | | | | core mutual fund |
| | | | | | group |
| | | | | | |
| Barry Hamerling | Independent | Indefinite; | Managing Partner of | 2 | Trustee of AXA |
| c/o Westchester Capital | Trustee | since 2007 | Premium Ice Cream of | | Premier VIP |
| Management, LLC | | | America, since 1999. | | Trust |
| 100 Summit Lake Drive | | | Managing Partner | | |
| Valhalla, NY 10595 | | | of Let-US Creations, | | |
| Age: 65 | | | from 1999 to 2011. | | |
INFORMATION ABOUT TRUSTEES AND OFFICERS (continued)
| | | Term of | | # of Portfolios | |
| | Position (s) | Office and | | | Other |
| | Held with | Length of | Principal Occupation | Overseen by | Directorships |
| Name, Address and Age | the Fund | Time Served | During Past Five Years | Trustee** | Held by Trustee |
| | | | | | |
| Michael T. Shannon | Co-President | One-year | Co-Portfolio Manager | N/A | N/A |
| Westchester Capital | | term; | and Co-President of | | |
| Management, LLC | | since 2011 | Westchester Capital | | |
| 100 Summit Lake Drive | | | Management, LLC, the | | |
| Valhalla, NY 10595 | | | Fund’s Adviser, since | | |
| Age: 45 | | | 2011. Co-Portfolio | | |
| | | | Manager of Westchester | | |
| | | | Capital Management, Inc., | | |
| | | | the Fund’s previous | | |
| | | | adviser, from 2007 to | | |
| | | | 2010. | | |
| | | | | | |
| Bruce Rubin | Vice | One-year | Chief Operating Officer | N/A | N/A |
| Westchester Capital | President, | term; | of Westchester Capital | | |
| Management, LLC | Chief | since 2010 | Management, LLC, the | | |
| 100 Summit Lake Drive | Compliance | | Fund’s Adviser. Chief | | |
| Valhalla, NY 10595 | Officer and | | Operating Officer of | | |
| Age: 52 | Anti-Money | | Westchester Capital | | |
| | Laundering | | Management, Inc., the | | |
| | Compliance | | Fund’s previous adviser, | | |
| | Officer | | from March 2010 to | | |
| | | | December 2010. Chief | | |
| | | | Operating Officer of | | |
| | | | Seneca Capital from | | |
| | | | 2005 to 2010. | | |
| | | | | | |
| Jane Perl | Secretary | One-year | Director of Operations | N/A | N/A |
| Westchester Capital | | term; | of Westchester Capital | | |
| Management, LLC | | since 2011 | Management, LLC, the | | |
| 100 Summit Lake Drive | | | Fund’s Adviser, since | | |
| Valhalla, NY 10595 | | | 2011. Director of | | |
| Age: 63 | | | Operations of | | |
| | | | Westchester Capital | | |
| | | | Management, Inc., the | | |
| | | | Fund’s previous adviser | | |
| | | | from, 1988 to 2010. | | |
| * | Denotes a trustee who is an “interested person” (as that term is defined in Section 2(a)(19) of the Investment Company Act of 1940, as amended) of the Fund or of the Adviser. Mr. Behren is deemed to be an interested person because of his affiliation with the Fund’s investment adviser, Westchester Capital Management, LLC, and because he is an officer of the Fund. |
| ** | The fund complex consists of the Fund and The Merger Fund VL. |
The Merger Fund
AVAILABILITY OF PROXY VOTING INFORMATION
Information regarding how the Fund generally votes proxies relating to portfolio securities may be obtained without charge by calling the Fund’s Transfer Agent at 1-800-343-8959 or by visiting the SEC’s website at www.sec.gov. Information regarding how the Fund voted proxies during the most recent 12-month period ended June 30 is available on the SEC’s website or by calling the toll-free number listed above.
AVAILABILITY OF QUARTERLY PORTFOLIO SCHEDULE
The Fund files its complete schedule of portfolio holdings with the SEC for the first and third quarters of each fiscal year on Form N-Q. The Fund’s Forms N-Q are available on the SEC’s website at www.sec.gov and may be reviewed and copied at the SEC’s Public Reference Room in Washington, DC. Information on the operation of the Public Reference Room may be obtained by calling 1-800-SEC-0330.
(This Page Intentionally Left Blank.)
The Merger Fund
PRIVACY POLICY
We collect the following non-public personal information about you:
| | • | Information we receive from you on or in applications or other forms, correspondence, or conversations, including, but not limited to, your name, address, phone number, social security number, assets, income and date of birth; and |
| | • | Information about your transactions with us, our affiliates, or others, including, but not limited to, your account number and balance, payments history, parties to transactions, cost basis information, and other financial information. |
We do not disclose any non-public personal information about our current or former shareholders to non-affiliated third parties, except as permitted by law. For example, we are permitted by law to disclose all of the information we collect, as described above, to our transfer agent to process your transactions. Furthermore, we restrict access to your non-public personal information to those persons who require such information to provide products or services to you. We maintain physical, electronic, and procedural safeguards that comply with federal standards to guard your non-public personal information.
In the event that you hold shares of the Fund through a financial intermediary, including, but not limited to, a broker-dealer, bank, or trust company, the privacy policy of your financial intermediary would govern how your non-public personal information would be shared with non-affiliated third parties.
THIS PRIVACY POLICY IS NOT A PART OF THE ANNUAL REPORT
.Investment Adviser
Westchester Capital Management, LLC
100 Summit Lake Drive
Valhalla, NY 10595
(914) 741-5600
www.mergerfund.com
Administrator, Transfer Agent, Fund Accountant,
Dividend Paying Agent and Shareholder
Servicing Agent
U.S. Bancorp Fund Services, LLC
615 East Michigan Street
P.O. Box 701
Milwaukee, WI 53201-0701
(800) 343-8959
Custodian
U.S. Bank, N.A.
1555 North RiverCenter Drive, Suite 302
Milwaukee, WI 53212
(800) 343-8959
Trustees
Roy Behren
Michael J. Downey
James P. Logan, III
Barry Hamerling
Executive Officers
Roy Behren, Co-President and Treasurer
Michael T. Shannon, Co-President
Bruce Rubin, Vice President and
Chief Compliance Officer
Jane Perl, Secretary
Counsel
Fulbright & Jaworski L.L.P.
666 Fifth Avenue
New York, NY 10103
Independent Registered Public Accounting Firm
PricewaterhouseCoopers LLP
100 East Wisconsin Avenue
Milwaukee, WI 53202
Item 2. Code of Ethics.
The registrant has adopted a code of ethics that applies to the registrant’s principal executive officer and principal financial officer. The registrant has not made any amendments to its code of ethics during the period covered by this report. The registrant has not granted any waivers from any provisions of the code of ethics during the period covered by this report. A copy of the registrant’s Code of Ethics is filed herewith.
Item 3. Audit Committee Financial Expert.
The registrant’s board of trustees has determined that there is at least one audit committee financial expert serving on its audit committee. Michael J. Downey, James P. Logan III, and Barry Hamerling are “audit committee financial experts” and are considered to be “independent” as each term is defined in Item 3 of Form N-CSR.
Item 4. Principal Accountant Fees and Services.
The registrant has engaged its principal accountant to perform audit services, audit-related services, tax services and other services during the past two fiscal years. “Audit services” refer to performing an audit of the registrant's annual financial statements or services that are normally provided by the accountant in connection with statutory and regulatory filings or engagements for those fiscal years. “Tax services” refer to professional services rendered by the principal accountant for tax compliance, tax advice, and tax planning. The following table details the aggregate fees billed or expected to be billed for each of the last two fiscal years for audit fees, audit-related fees, tax fees and other fees by the principal accountant.
| | FYE 12/31/2011 | FYE 9/30/2011 |
| Audit Fees | $47,000 | $93,800 |
| Audit-Related Fees | | |
| Tax Fees | $15,000 | $11,500 |
| All Other Fees | | |
The audit committee has adopted pre-approval policies and procedures that require the audit committee to pre-approve all audit and non-audit services of the registrant, including services provided to any entity affiliated with the registrant. The audit committee did not approve any services for which the preapproval requirement was waived. All of the principal accountant’s hours spent on auditing the registrant’s financial statements were attributed to work performed by full-time permanent employees of the principal accountant.
There were no non-audit fees billed by the registrant’s accountant for services to the registrant and to the registrant’s investment adviser, and any entity controlling, controlled by, or under common control with the investment adviser that provides ongoing services to the registrant for each of the last two fiscal years of the registrant.
Item 5. Audit Committee of Listed Registrants.
Not applicable to registrants who are not listed issuers (as defined in Rule 10A-3 under the Securities Exchange Act of 1934).
Item 6. Investments.
Schedule of Investments is included as part of the report to shareholders filed under Item 1 of this Form.
Item 7. Disclosure of Proxy Voting Policies and Procedures for Closed-End Management Investment Companies.
Not applicable to open-end management investment companies.
Item 8. Portfolio Managers of Closed-End Management Investment Companies.
Not applicable to open-end management investment companies.
Item 9. Purchases of Equity Securities by Closed-End Management Investment Company and Affiliated Purchasers.
Not applicable to open-end management investment companies.
Item 10. Submission of Matters to a Vote of Security Holders.
There have been no material changes to the procedures by which shareholders may recommend nominees to the registrant’s board of trustees.
Item 11. Controls and Procedures.
| (a) | The Registrant’s Co-Presidents/Principal Executive Officers and Treasurer/Principal Financial Officer have reviewed the Registrant's disclosure controls and procedures (as defined in Rule 30a-3(c) under the Investment Company Act of 1940 (the “Act”)) as of a date within 90 days of the filing of this report, as required by Rule 30a-3(b) under the Act and Rules 13a-15(b) or 15d-15(b) under the Securities Exchange Act of 1934. Based on their review, such officers have concluded that the disclosure controls and procedures are reasonably designed to ensure that information required to be disclosed in this report is appropriately recorded, processed, summarized and reported and made known to them by others within the Registrant and by the Registrant’s service provider. |
| (b) | There were no changes in the Registrant's internal control over financial reporting (as defined in Rule 30a-3(d) under the Act) that occurred during the period covered by this report that has materially affected, or is reasonably likely to materially affect, the Registrant's internal control over financial reporting. |
Item 12. Exhibits.
| (a) | (1) Any code of ethics or amendment thereto, that is the subject of the disclosure required by Item 2, to the extent that the registrant intends to satisfy Item 2 requirements through filing an exhibit. Filed herewith. |
(2) A separate certification for each principal executive and principal financial officer pursuant to Section 302 of the Sarbanes-Oxley Act of 2002. Filed herewith.
(3) Any written solicitation to purchase securities under Rule 23c-1 under the Act sent or given during the period covered by the report by or on behalf of the registrant to 10 or more persons. Not applicable to open-end management investment companies.
| (b) | Certifications pursuant to Section 906 of the Sarbanes-Oxley Act of 2002. Furnished herewith. |
SIGNATURES
Pursuant to the requirements of the Securities Exchange Act of 1934 and the Investment Company Act of 1940, the registrant has duly caused this report to be signed on its behalf by the undersigned, thereunto duly authorized.
(Registrant) The Merger Fund
By (Signature and Title) /s/ Michael T. Shannon
Michael T. Shannon, Co-President
Date 03/02/2012
By (Signature and Title) /s/ Roy Behren
Roy Behren, Co-President and Treasurer
Date 03/02/2012
Pursuant to the requirements of the Securities Exchange Act of 1934 and the Investment Company Act of 1940, this report has been signed below by the following persons on behalf of the registrant and in the capacities and on the dates indicated.
By (Signature and Title)* /s/ Michael T. Shannon
Michael T. Shannon, Co-President
Date 03/02/2012
By (Signature and Title)* /s/ Roy Behren
Roy Behren, Co-President and Treasurer
Date 03/02/2012
* Print the name and title of each signing officer under his or her signature.