Exhibit 99(a)(5)(xxiv)
S
trategic scenario’s iBasis 2009-2012 July 8th, 2009 v0.3 JX 124 Highly Confidential KPN00106965

Description scenario’s Number of minutes (x mrd) Gross margin % (%) Revenu (x $ Min) Ebitda (x $ Min) 2009 2010 2009 2010 2009 2010 2009 2010 Annual Plan iBasis 24.1 n/a 9.8 n/a 1313 n/a 37.4 n/a Scenario Scenario description Scenario 1 iBasis is underperforming the market iBasis’ minutes turning point (from decreasing minutes to increasing minutes) takes place a quarter later in time than in the market Once minutes start growing, iBasis’ minutes growth is half the market growth Gross margin% slight growing from 12% in 2009 to 12,3% in 2012 Price decrease IARPM) of 5% = equal to price decrease in the marketplace Scenario 2 iBasis is on par with the market iBasis’ minutes turning point (from decreasing minutes to increasing minutes) takes place is equal as in the marketplace Once minutes start growing, iBasis’ minutes growth is equal to the market growth Gross margin% 12% flat between 2009 and 2012 Price decrease (ARPM) of 5% = equal to price decrease in the marketplace Scenario 3 iBasis’ minutes turning point (from decreasing minutes to increasing minutes) takes place is equal as in the market iBasis is outperforming the market Once minutes start growing, iBasis’ minutes growth is 1,5 times the market growth Gross margin% decreasing from 12% in 2009 to 11,4% in 2012 Price decrease (ARPM) of 5% = equal to price decrease in the marketplace Margin-strategy will be less strict than at present and is brought in more balance with the other KPI’s Scenario 4 iBasis’ minutes turning point (from decreasing minutes to increasing minutes) takes place is equal as in the marketplace Scenario 3 including outsourcing deals Once minutes start growing, iBasis’ minutes growth is 1,5 times the market growth Gross margin% decreasing from 12% in 2009 to 10,0% in 2012 2,5 mrd minutes extra per year due to outsource deals Price decrease (ARPM) of 5% = equal to price decrease in the marketplace Margin-strategy will be less strict than at present and is brought in more balance with the other KPI’s Assumptions market development Minutes turning point (from decreasing minutes to increasing minutes) takes place up from Q3 2009 Once minutes start growing, market minutes growth will be 6% per year Price decrease (ARPM) of 5% 1 Highly Confidential KPN00106966
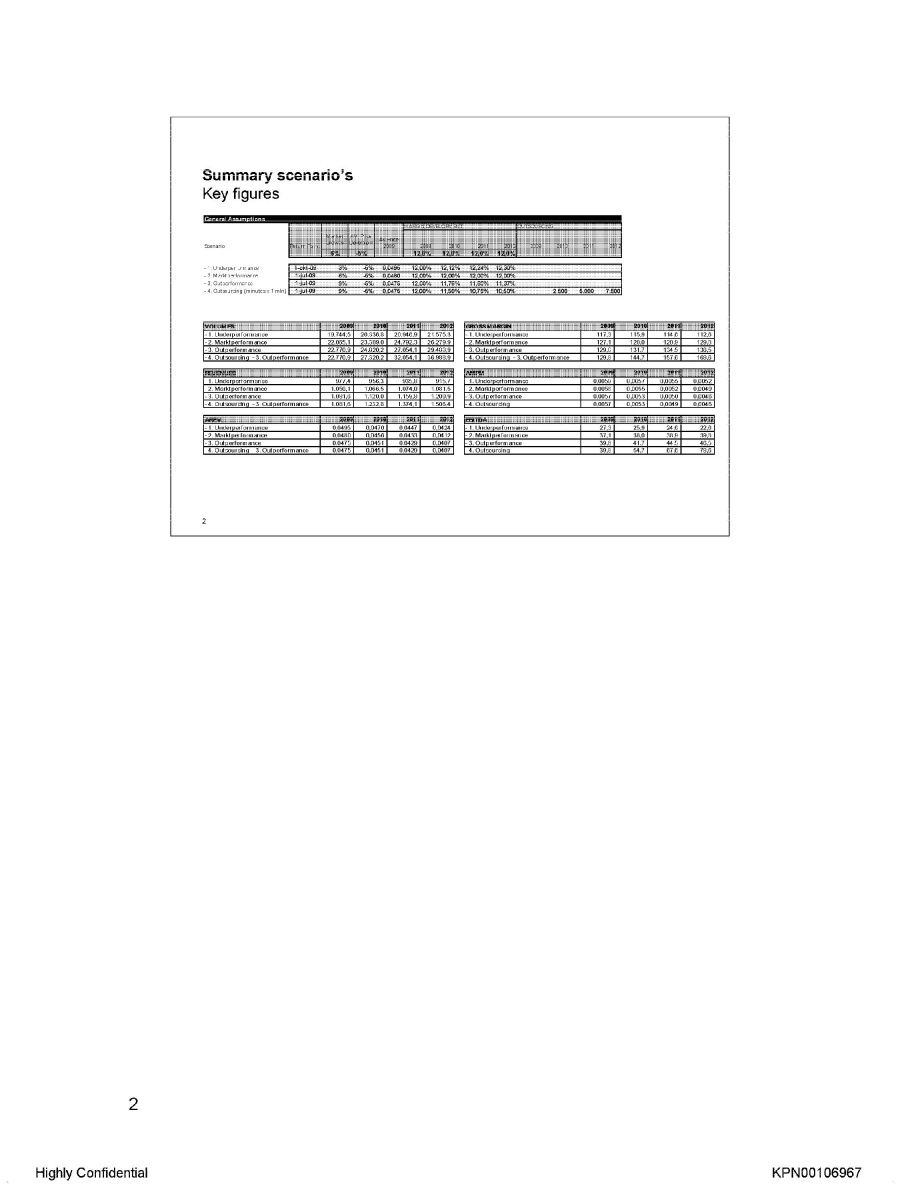
Summary scenario’s Key figures General Assumptions Scenario Return Point Market Growth AV Price Development AV Price Margin Development 2009 2010 2011 2012 12.0% 12.0% 12.0% 12.0% Outsourcing 2009 2010 2011 2012 1. Underperformance 1-okt-09 3% -5% 0.0495 12.00% 12.12% 12.24% 12.30% 2. Marktperformance 1-ju1-09 6% - -5% 0.0480 12.00% 12.00% 12.00% 12.00% 3. Outperformance 1-ju1-09 9% -5% 0.0475 12.00% 11.76% 11.60% 11.37% Outsourcing (minutes x 1 min) 1-jul-09 9% -5% 0,0475 12.00%.. 11.50% 10,75% 10,50% 2.500 5.000 7.500 VOLUMES 2009 20 10 2011 2012 1. Underperformance 19.744,5 20.336,8 20.946,9 21.575,3 2. Markt performance 22.065,1 23.389,0 24.792,3 26.279,9 3. Outperformance 22.770,9 24.820,2 27.054,1 29.488,9 4. Outsourcing 3. Outperformance 22.770,9 27.390,2 32.054,1 36.988,9 GROSS MARGIN 2009 2010 2011 2012 1. Underperformance 117,3 115,9 114,6 112,6 2. Markt performance 127,1 128,0 128,9 129,8 3. Outperformance 129,8 131.7 134,5 136,5 4. Outsourcing 3. Outperformance 129,8 144,7 157,6. 168,6 REVENUES 2009 2010 2011 2012 1. Underperformance 977,4 956,3 935,8 915,7 2. Markt performance 1.059,1.066,5 1074,0 1081,5 3. Outperformance 1.081,6 1.120,0 1.159,8 1.200,9 4. Outsourcing 3. Outperformance 1.081,6 1.232,8 1.374,1 1.506,4 AMPM I01 2009 2010 2011 2012 1. Underperformance 2. Markt performance 3. Outperformance 4. Outsourcing ARM 2009 20 10 2011 2012 1. Underperformance 2. Markt performance 0,0480 0,0456 0,0433 0,0412 3. Outperformance 0,0475 0,0451 0,0429 0,0407 4. Outsourcing - 3. Outperformance 0,0475 0,0451 0,0429 0,0407 EBITDA 2009 2010 2011 2012 1. Underperformance 27,3 25,9 24,6 22,6 2. Markt performance 37,1 38,0 38,9 39,8 3. Outperformance 39,8 41,7 44,5 46,5 4. Outsourcing 39,8 54,7 676 786 2 Highly Confidential KPN00106967

Scenario’s in (historisch) perspectief Outlook bij de deal in 2007 Initial projections (in USD) of the development of revenues, gross profit and EBITDA for the separate Companies, by Morgan Stanley (KPN GCS) and Imperial Capital (iBasis) Morgan Stanley Revenues Gross Profit Operating expenses EBITDA Capex Euro Value of Gross Margin Euro Value of EBITDA Imperial Capital Revenues Gross Profit Operating expenses EBITDA Capex Euro Value of Gross Margin Euro Value of EBITDA JEV en Jaarplan 2010 lager dan aangenomen ten tijde van de deal en ook bij de Celtic case van oktober 2008 Celtic outlook 1Q 08A 2Q 08A 3Q 08A 4Q 08E 1Q 09E 2Q 09E 3Q 09E 4Q 09E FY 2008 FY 2009 Revenues (x mln $) 321.1 342,0 376,2 353.7 1,393.0 Actual 321.1 342,0 332,3 Actual Acquisition case “Take action” case Do nothing EBITDA (x mln $) 5,9 7,6 6,4 Actual “Take action” case Do nothing October 2008 Exchange rate /€$ 1,48 3 Highly Confidential KPN00106968

Way forward iBasis has potential to outperform the market Integration finished, organisation ready for ‘back-on-track’ growth initiatives iBasis top-3 marketplayer; market consolidation always in favor of top marketplayers Long term sustainable growth (on all KPI’s) needs balancing thresholds of the main important KPI’s. Threshold levels gross margin For discussion What is the view of iBasis on these possible scenario’s? 4 Highly Confidential KPN00106969
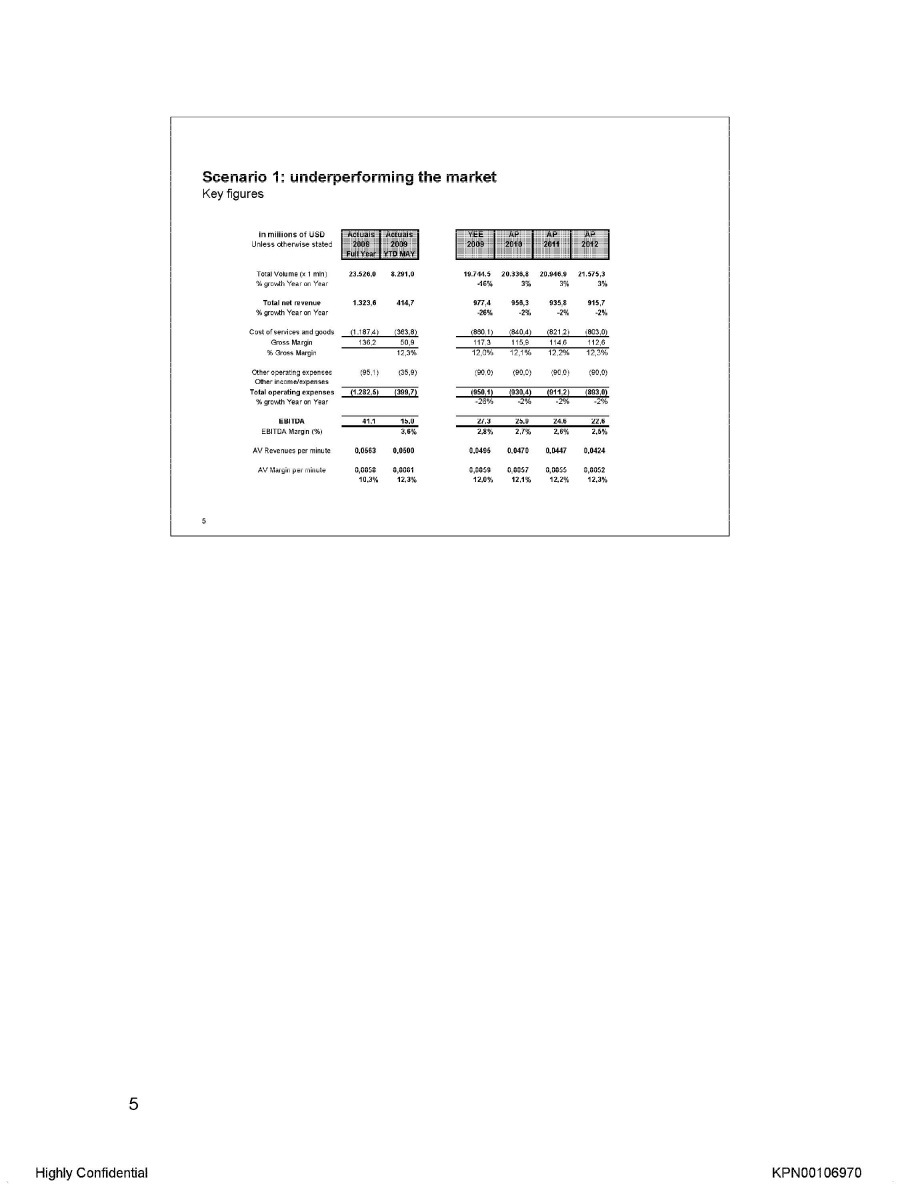
Scenario 1: underperforming the market Key figures In millions of USD unless otherwise stated Actuals 2008 Full year Actuals 2009 YTD May YEE 2009 AP 2010 AP 2011 AP 2012 Total Volume (x 1 mln) 23.526,0 8.291,0 19.744,5 20.336,8 20.946,9 21.575,3 % growth Year on Year -16% 3% 3% 3% Total net revenue 1.323,6 414,7 977,4 956,3 935,8 915,7 % growth Year on Year -26% -2% -2% -2% Cost of services and goods (1.187,4) (363,8) (860,1) (840,4) (821,2) (803,0) Gross Margin 136,2 50,9 117,3 115,9 114,6 112,6 % Gross Margin 12,3% 12,0% 12,1% 12,2% 12,3% Other operating expenses (95,1) (35,9) (90,0) (90,0) (90,0) (90,0) Other income/expenses Total operating expenses (1.282,5) (399,7) (950,1) (930,4) (911,2) (893,0) % growth Year on Year -26% -2% -2% -2% EBITDA 41,1 15,0 27,3 25,9 24,6 22,6 EBITDA Margin (%) 3,6% 2,8% 2,7% 2,6% 2,5% AV Revenues per minute 0,0563 0,0500 0,0495 0,0470 0,0447 0,0424 AV Margin per minute 0,0058 0,0061 0,0059 0,0057 0,0055 0,0052 10,3% 12,3% 12,0% 12,1% 12,2% 12,3% 5 Highly Confidential KPN00106970
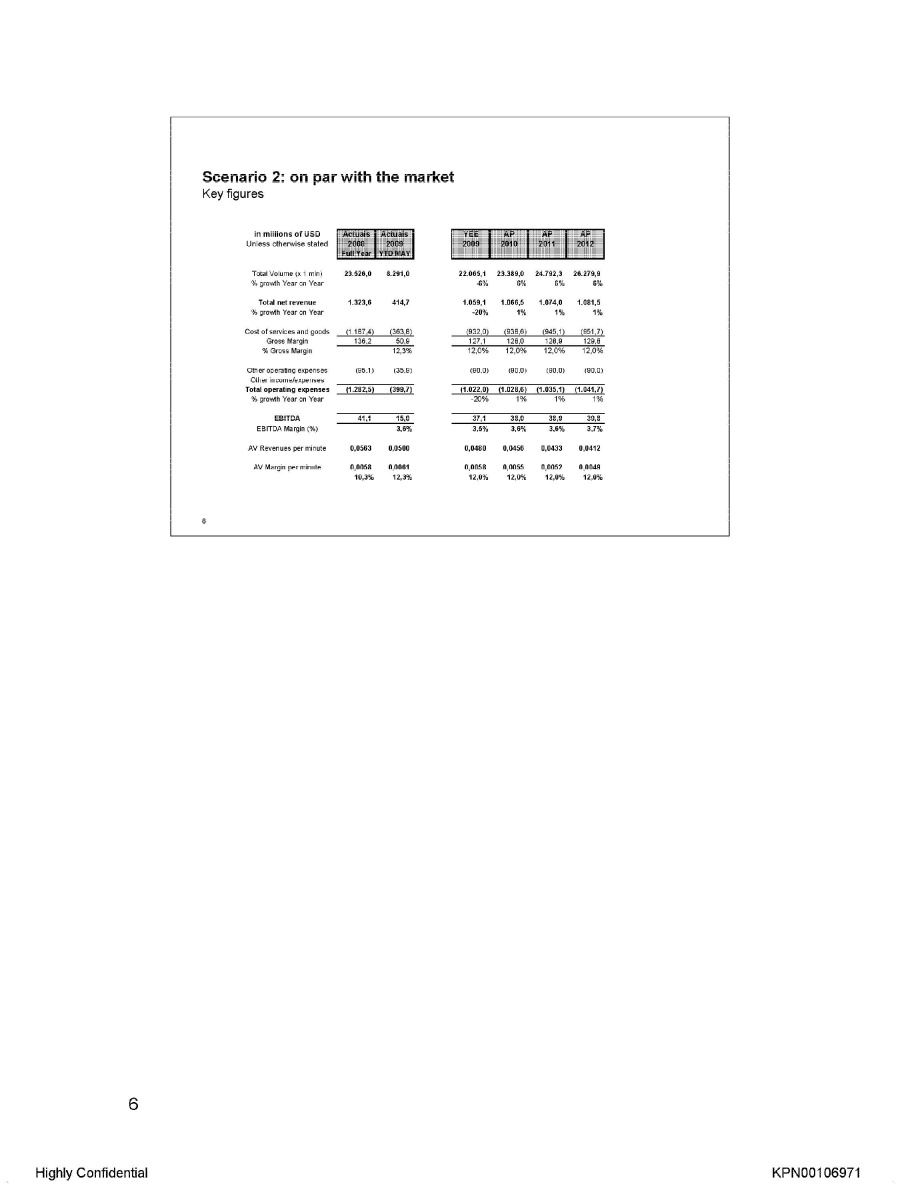
Scenario 2: on par with the market Key figures In millions of USD Unless otherwise stated Actuals 2008 Full year Actuals 2009 YTD May YEE 2009 AP 2010 AP 2011 AP 2012 Total Volume (x 1 mln) 23.526,0 8.291,0 22.065,1 23.389,0 24.792,3 26.279,9 % growth Year on Year -6% 6% 6% 6% Total net revenue 1.323,6 414,7 1.059,1 1.066,5 1.074,0 1.081,5 % growth Year on Year -20% 1% 1% 1% Cost of services and goods (1.187,4) (363,8) (932.0) (938,6) (945,1) (951,7) Gross Margin 136,2 50,9 127.1 128,0 128,9 129,9 % Gross Margin 12,3% 12,0% 12,0% 12,0% 12,0% Other operating expenses (95,1) (35,9) (90,0) (90,0) (90,0) (90,0) Other income/expenses Total operating expenses (1.282,5) (399,7) (1.022.0) (1.028,6) (1.035,1) (1.041,7) % growth Year on Year -20% 1% 1% 1% EBITDA 41,1 15,0 37.1 38,0 38,9 39,8 EBITDA Margin (%) 3,6% 3,5% 3,6% 3,6% 3,7% AV Revenues per minute 0,0563 0,0500 0,0480 0,0456 0,0433 0,0412 AV Margin per minute 0,0058 0,0061 0,0058 0,0055 0,0052 0,0049 10,3% 12,3% 12,0% 12,0% 12,0% 12,0% 6 Highly Confidential KPN00106971

Scenario 3: outperforming the market Key figures In millions of USD Unless otherwise stated Actuals 2008 Full year Actuals 2009 YTD May YEE 2009 AP 2010 AP 2011 AP 2012 Total Volume (x 1 mln) 23.526,0 8.291,0 22.770,9 24.820,2 27.054,1 29.488,9 % growth Year on Year -3% 9% 9% 9% Total net revenue 1.323,6 414,7 1.081,6 1.120,0 1.159,8 1.200,9 % growth Year on Year -18% 4% 4% 4% Cost of services and goods (1.187,4) (363,8) (951,8) (988,3) (1.025,2) (1.064,4) Gross Margin 136,2 50,9 129,8 131,7 134,5 136,5 % Gross Margin 12,3% 12,0% 11,8% 11,6% 11,4% Other operating expenses (95,1) (35,9) (90,0) (90,0) (90,0) (90,0) Other income/expenses Total operating expenses (1.282,5) (399,7) (1.041,8) (1.078,3) (1.115,2) (1.154,4) % growth Year on Year -19% 4% 3% 4% EBITDA 41,1 15,0 39,8 41,7 44,5 46,5 EBITDA Margin (%) 3,6% 3,7% 3,7% 3,8% 3,9% AV Revenues per minute 0,0563 0.0500 0,0475 0,0451 0,0429 0,0407 AV Margin per minute 0,0058 0.0061 0,0057 0,0053 0,0050 0,0046 10,3% 12,3% 12,0% 11,8% 11,5% 11,4% 7 Highly Confidential KPN00106972
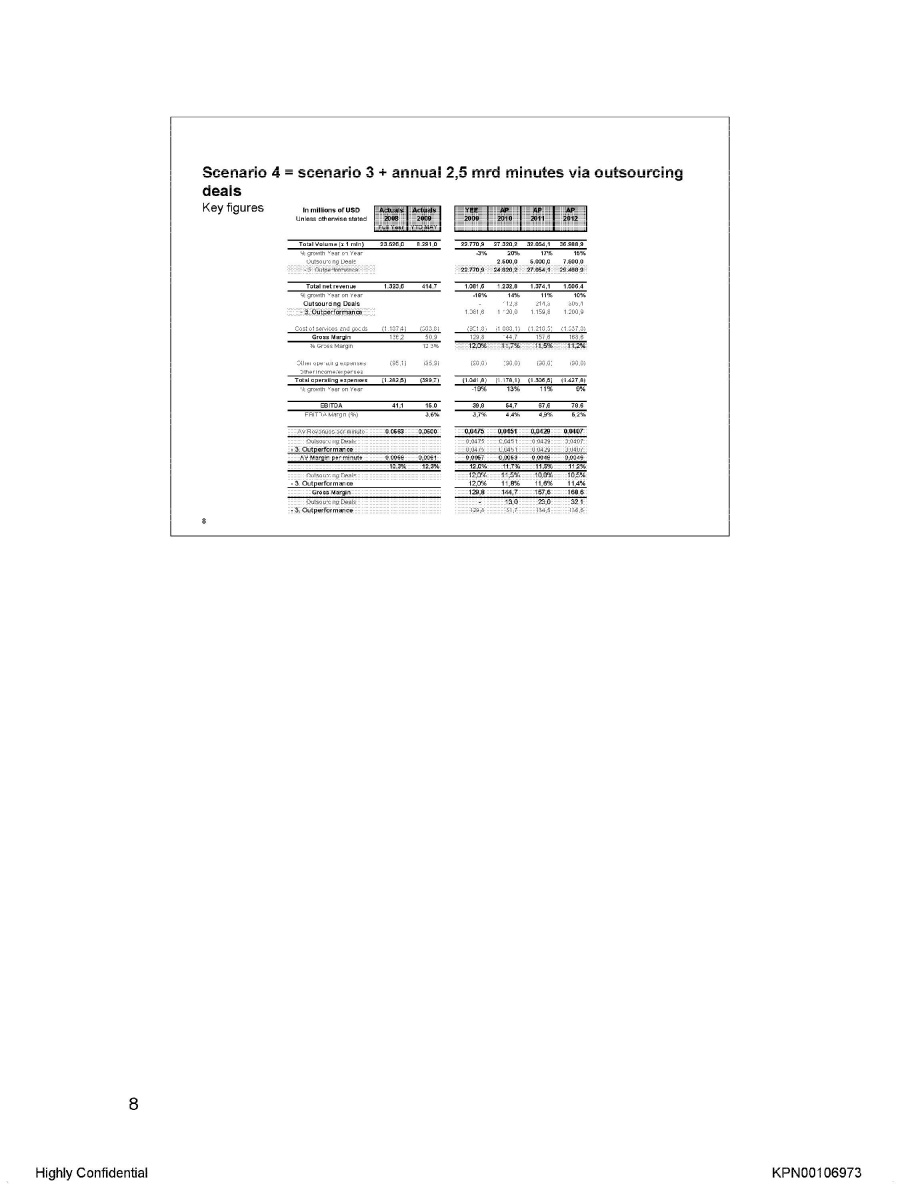
Scenario 4 = scenario 3 + annual 2,5 mrd minutes via outsourcing deals Key figures In millions of USD Unless otherwise stated Actuals 2008 Full year Actuals 2009 YTD May YEE 2009 AP 2010 AP 2011 AP 2012 In millions of USD Total Volume (x 1 min) 23.526,0 8.291,0 22.770,9 27.320,2 32.054,1 33.988,9 % growth Year on year -35 20% 17% 15% Outsourcing Deals 2.500,0 5.000,0 7.500,0 3. Outperformance 22.770,9 24.820,2 27.054,1 29.456,9 Total net revenue 1.323,6 414,7 1.081,6 1.232,8 1.374,1 1.506,4 % growth Year on year -18% 14% 11% 10% Outsourcing Deals – 112,8 214,3 305,4 3. Outperformance Cost of services and goods (1187,4) (363,8) Gross Margin % gross margin 12.3% 12.0% 11,7% 11.5% 11.2% Other operating expenses (95.1) (35.9) (90,0) (90,0) (90,0) (90,0) Other income/expenses Total operating expenses (1.282,5) (399,7) (1.041,8) (1.178,1) (1.306,5) (1.427,8) %growth Year on year -19% 13% 11% 9% EBITDA 41,1 15,0 39,8 54,7 67,6 78,6 EBITDA Margin (%) 3,6% 3,7% 4,4% 4,9% 5,2% AV Revenues per minute 0,0475 0,0451 0,0429 0,0407 Outsourcing Deals 0,0475 0,0451 0,0429 0,0407 3. Outperformance 0,0475 0,0451 0,0429 0,0407 AV Margin per minute 0.0060 0,0061 0,0067 0.0063 0.0049 0.0046 10.3%. 12,3% 12,0% 11.7% 11.5% 11.2% Outsourcing Deals 12,0% 11.5% 10.8% 10.5% 3. Outperformance 12.0% 11.8% 11.6% 11.4 Gross Margin 129.8 144.7 157.6 168.6 Outsourcing Deals 13.0 23,0 32.1 3. Outperformance 8 Highly Confidential KPN00106973
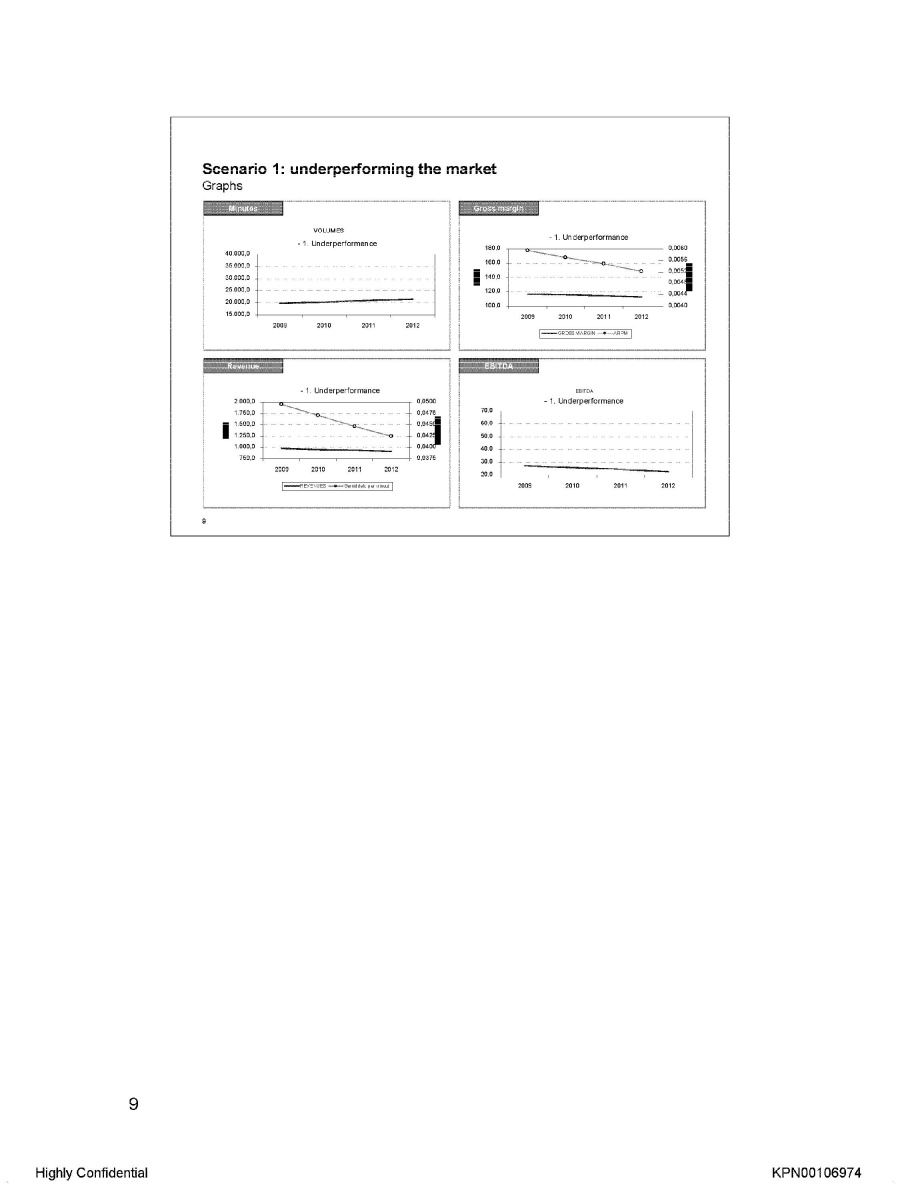
Scenario 1: underperforming the market Graphs Minutes VOLUMES 1 Underperformance 180 0 0 0060 40 000 0 35 000 0 30 000 0 25 000 0 20 000 0 2009 2010 2011 2012 Gross margin 1 Underperformance 180.0 160,0 140.0 120.0 100.0 0.0060 0.0056 0.0052 0.0048 0.0044 0.0040 2009 2010 2011 2012 Gross margin ARPM Revenue 1 Underperformance 2.000,0 1.750,0 1.500.0 1.000,0 750,0 0.0500 0.0475 0.0450 0.0400 0.0375 2009 2010 2011 2012 Revenues EBITDA EBITDA 1. Underperformance 70.0 60.0 50.0 40.0 30.0 20.0 2009 2010 2011 2012 9 Highly Confidential KPN00106974
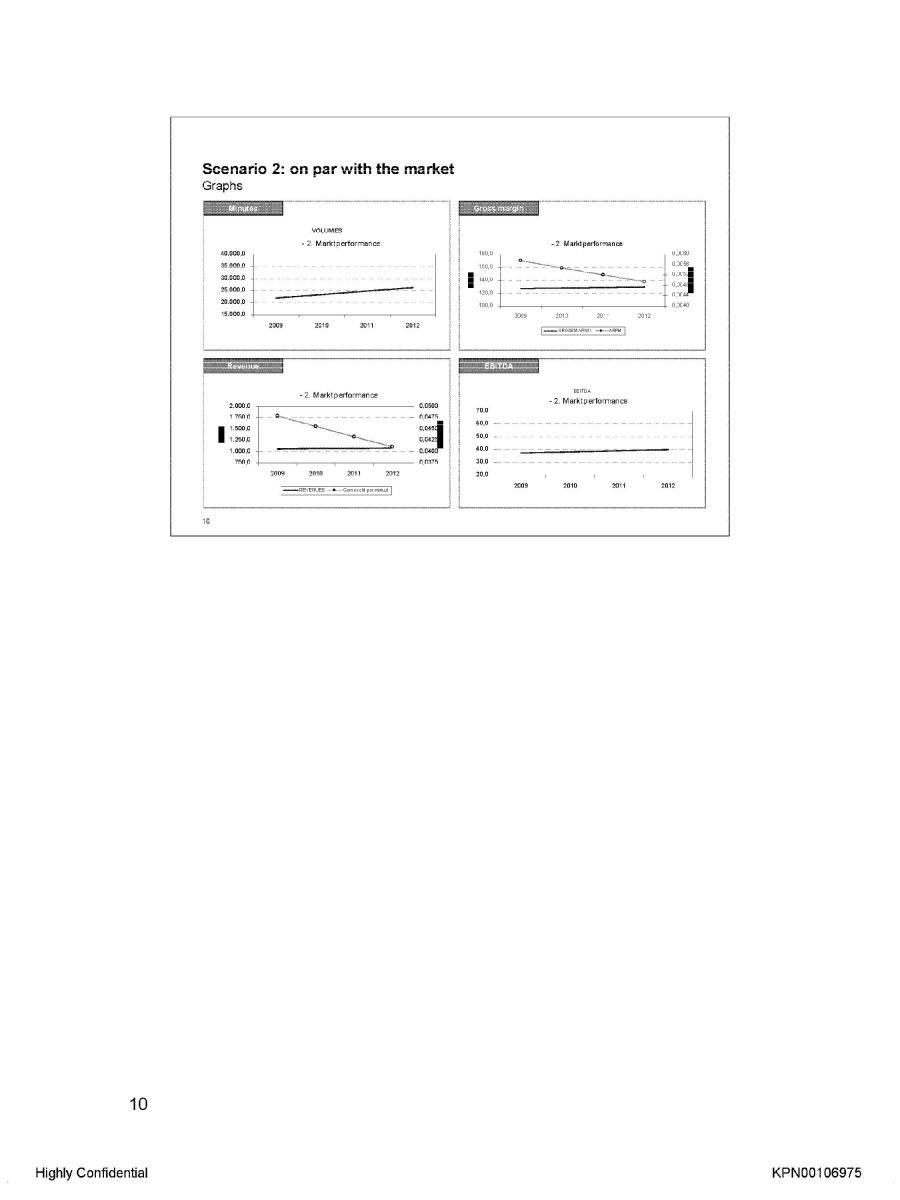
Scenario 2: on par with the market Graphs Minutes VOLUMES 2. Marktperformance 40.000,0 35.000,0 30.000,0 25.000,0 20.000,0 2009 2010 2011 2012 Gross margin 2. Marktperformance 180.0 160.0 140.0 120.0 100.0 0.0060 0.0056 0.0052 0.0048 0.0044 0.0040 2009 2010 2011 2012 Gross margin ARPM Revenue 2. Marktperformance 2.000,0 1.750,0 1.500.0 1.000,0 750,0 0.0500 0.0475 0.0450 0.0400 0.0375 2009 2010 2011 2012 Revenues EBITDA EBITDA 2. Marktperformance 70.0 60.0 50.0 40.0 30.0 20.0 2009 2010 2011 2012 10 Highly Confidential KPN00106975
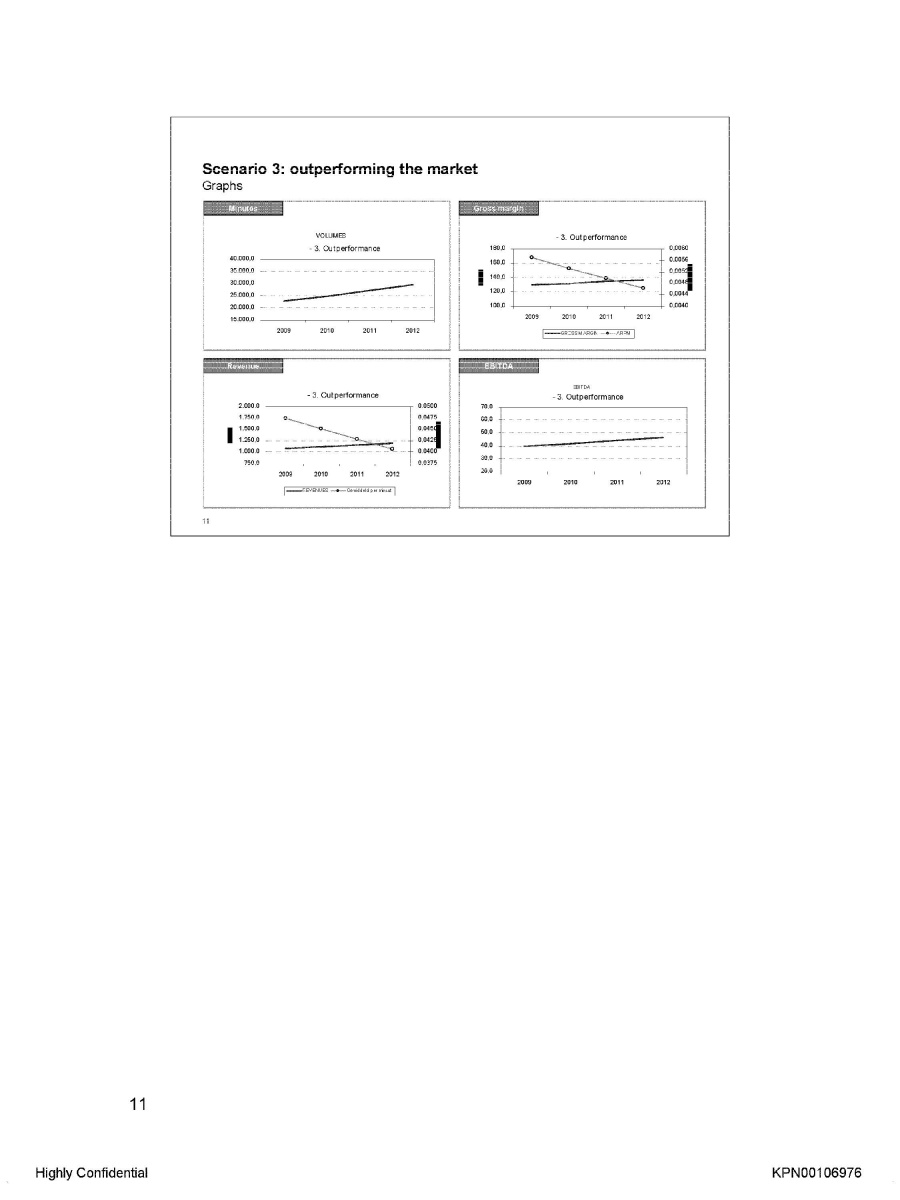
Scenario 3: outperforming the market Graphs Minutes VOLUMES 3. Outperformance 40.000,0 35.000,0 30.000,0 25.000,0 20.000,0 2009 2010 2011 2012 Gross margin 3. Outperformance 180.0 160.0 140.0 120.0 100.0 0.0060 0.0056 0.0052 0.0048 0.0044 0.0040 2009 2010 2011 2012 Gross margin ARPM Revenue 3. Outperformance 2.000,0 1.750,0 1.500.0 1.000,0 750,0 0.0500 0.0475 0.0450 0.0400 0.0375 2009 2010 2011 2012 Revenues EBITDA EBITDA 3. Outperformance 70.0 60.0 50.0 40.0 30.0 20.0 2009 2010 2011 2012 11 Highly Confidential KPN00106976
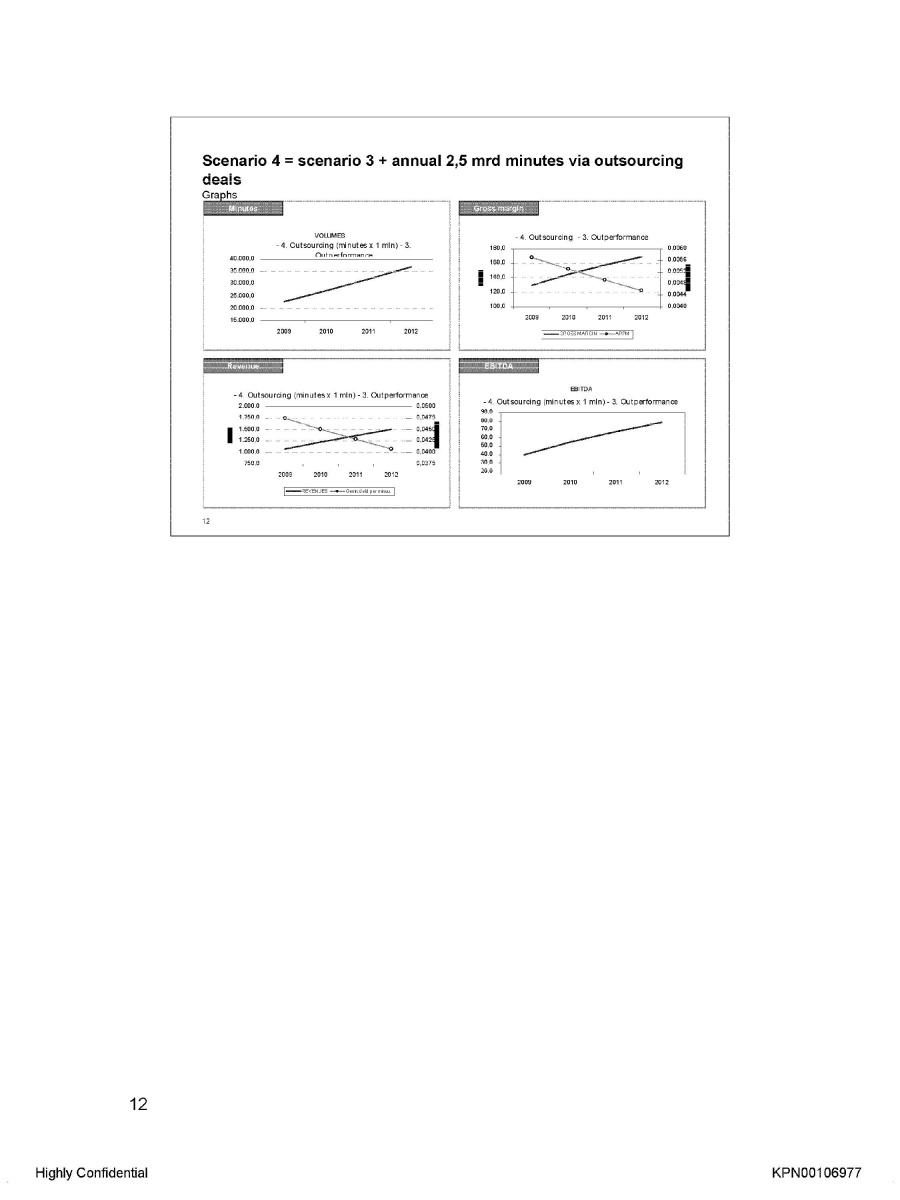
Scenario 4 = scenario 3 + annual 2,5 mrd minutes via outsourcing deals Graphs Minutes VOLUMES 4. Outsourcing (minutes x 1 mln) 3. Outperformance 40.000,0 35.000,0 30.000,0 25.000,0 20.000,0 2009 2010 2011 2012 Gross margin 4. Outsourcing (minutes x 1 mln) 3. Outperformance 180.0 160.0 140.0 120.0 100.0 0.0060 0.0056 0.0052 0.0048 0.0044 0.0040 2009 2010 2011 2012 Gross margin ARPM Revenue 4. Outsourcing (minutes x 1 mln) 3. Outperformance 2.000,0 1.750,0 1.500.0 1.000,0 750,0 0.0500 0.0475 0.0450 0.0400 0.0375 2009 2010 2011 2012 Revenues EBITDA EBITDA 4. Outsourcing (minutes x 1 mln) 3. Outperformance 70.0 60.0 50.0 40.0 30.0 20.0 2009 2010 2011 2012 12 Highly Confidential KPN00106977