American Realty Capital Healthcare Trust Iii Inactive
Filed: 29 Sep 17, 12:00am
Exhibit (c)(11)
Confidential Project Pelican Update for Special Committee Regarding Valuation Real Estate Investment Banking March 23, 2017 KeyBanc Capital Markets
KeyCorp & KeyBanc Capital Markets KeyBanc Capital Markets is a trade name under which the corporate and investment banking products and services of KeyCorp and its subsidiaries, KeyBanc Capital Markets Inc., Member NYSE/FINRA/SIPC, and KeyBank National Association (“KeyBank N.A.”), are marketed. Securities products and services are offered by KeyBanc Capital Markets Inc. and by its licensed securities representatives. Banking products and services are offered by KeyBank N.A. A number of our corporate and institutional team members are employed by both KeyBanc Capital Markets Inc. and KeyBank N.A. These “dual employees” are licensed securities representatives of KeyBanc Capital Markets Inc., and they are there to better serve your needs, by making available both securities and banking products and services. Further, in connection with our effort to deliver a comprehensive array of banking and securities products and services to you in a seamless manner, from time to time KeyBank N.A. and KeyBanc Capital Markets Inc. will share with each other certain non-public information that you provide to us. Of course, as always, this information will not be shared or otherwise disclosed outside of the KeyCorp organization without your express permission. Please also be assured that, as with other banks and broker-dealers, KeyBank N.A. and KeyBanc Capital Markets Inc. adhere to established internal procedures to safeguard your corporate information from areas within our organization that trade in or advise clients with respect to the purchase and sale of securities. THE OBLIGATIONS OF KEYBANC CAPITAL MARKETS INC. ARE NOT OBLIGATIONS OF KEYBANK N.A. OR ANY OF ITS AFFILIATE BANKS, AND NONE OF KEYCORP’S BANKS ARE RESPONSIBLE FOR, OR GUARANTEE, THE SECURITIES OR SECURITIES -RELATED PRODUCTS OR SERVICES SOLD, OFFERED OR RECOMMENDED BY KEYBANC CAPITAL MARKETS INC. OR ITS EMPLOYEES. SECURITIES AND OTHER INVESTMENT PRODUCTS SOLD, OFFERED OR RECOMMENDED BY KEYBANC CAPITAL MARKETS INC., IF ANY, ARE NOT BANK DEPOSITS OR OBLIGATIONS AND ARE NOT INSURED BY THE FDIC. KeyBanc Capital Markets 2
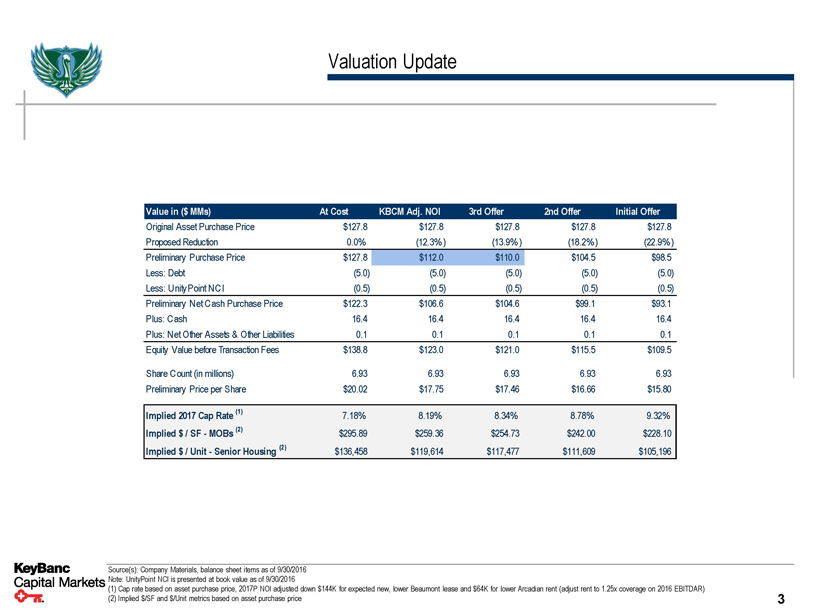
Valuation Update Value in ($MMs) At Cost KBCM Adj. NOI 3rd Offer 2nd Offer Initial Offer Original Asset Purchase Price $127.8 $127.8 $127.8 $127.8 $127.8 Proposed Reduction 0.0% (12.3%) (13.9%) (18.2%) (22.9%) Preliminary Purchase Price $127.8 $112.0 $110.0 $104.5 $98.5 Less: Debt (5.0) (5.0) (5.0) (5.0) (5.0) Less: UnityPoint NCI (0.5) (0.5) (0.5) (0.5) (0.5) Preliminary Net Cash Purchase Price $122.3 $106.6 $104.6 $99.1 $93.1 Plus: Cash 16.4 16.4 16.4 16.4 16.4 Plus: Net Other Assets & Other Liabilities 0.1 0.1 0.1 0.1 0.1 Equity Value before Transaction Fees $138.8 $123.0 $121.0 $115.5 $109.5 Share Count (in millions) 6.93 6.93 6.93 6.93 6.93 Preliminary Price per Share $20.02 $17.75 $17.46 $16.66 $15.80 Implied 2017 Cap Rate (1) 7.18% 8.19% 8.34% 8.78% 9.32% Implied $/ SF - MOBs (2) $295.89 $259.36 $254.73 $242.00 $228.10 Implied $/ Unit - Senior Housing (2) $136,458 $119,614 $117,477 $111,609 $105,196 KeyBanc Capital Markets Source(s): Company Materials, balance sheet items as of 9/30/2016 Note: UnityPoint NCI is presented at book value as of 9/30/2016 (1) Cap rate based on asset purchase price, 2017P NOI adjusted down $144K for expected new, lower Beaumont lease and $64K for lower Arcadian rent (adjust rent to 1.25x coverage on 2016 EBITDAR) (2) Implied $/SF and $/Unit metrics based on asset purchase price 3
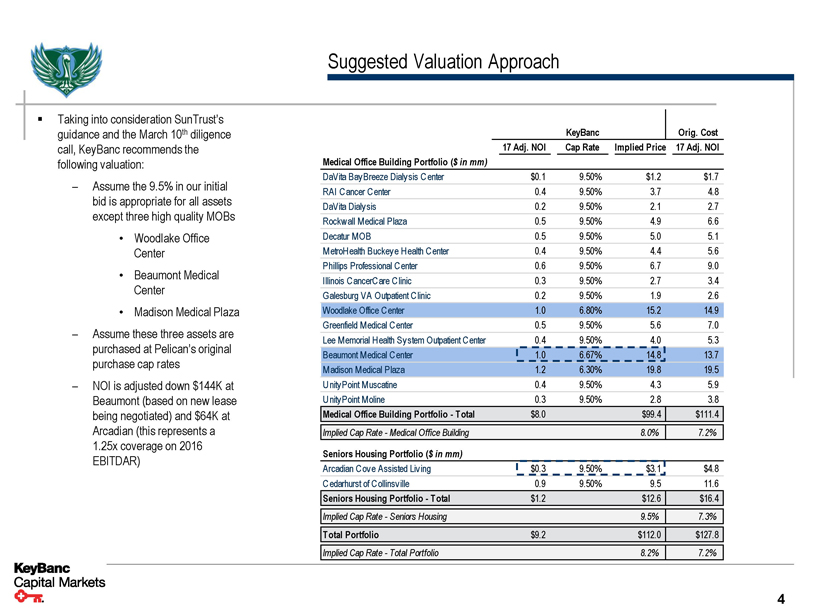
Suggested Valuation Approach ▪ Taking into consideration SunTrust’s guidance and the March 10th diligence call, KeyBanc recommends the following valuation: – Assume the 9.5% in our initial bid is appropriate for all assets except three high quality MOBs • Woodlake Office Center • Beaumont Medical Center • Madison Medical Plaza – Assume these three assets are purchased at Pelican’s original purchase cap rates – NOI is adjusted down $144K at Beaumont (based on new lease being negotiated) and $64K at Arcadian (this represents a 1.25x coverage on 2016 EBITDAR) KeyBanc Orig. Cost 17 Adj. NOI Cap Rate Implied Price 17 Adj. NOI Medical Office Building Portfolio ($in mm) DaVita BayBreeze Dialysis Center $0.1 9.50% $1.2 $1.7 RAI Cancer Center 0.4 9.50% 3.7 4.8 DaVita Dialysis 0.2 9.50% 2.1 2.7 Rockwall Medical Plaza 0.5 9.50% 4.9 6.6 Decatur MOB 0.5 9.50% 5.0 5.1 MetroHealth Buckeye Health Center 0.4 9.50% 4.4 5.6 Phillips Professional Center 0.6 9.50% 6.7 9.0 Illinois CancerCare Clinic 0.3 9.50% 2.7 3.4 Galesburg VA Outpatient Clinic 0.2 9.50% 1.9 2.6 Woodlake Office Center 1.0 6.80% 15.2 14.9 Greenfield Medical Center 0.5 9.50% 5.6 7.0 Lee Memorial Health System Outpatient Center 0.4 9.50% 4.0 5.3 Beaumont Medical Center 1.0 6.67% 14.8 13.7 Madison Medical Plaza 1.2 6.30% 19.8 19.5 UnityPoint Muscatine 0.4 9.50% 4.3 5.9 UnityPoint Moline 0.3 9.50% 2.8 3.8 Medical Office Building Portfolio - Total $8.0 $99.4 $111.4 Implied Cap Rate - Medical Office Building 8.0% 7.2% Seniors Housing Portfolio ($in mm) Arcadian Cove Assisted Living $0.3 9.50% $3.1 $4.8 Cedarhurst of Collinsville 0.9 9.50% 9.5 11.6 Seniors Housing Portfolio - Total $1.2 $12.6 $16.4 Implied Cap Rate - Seniors Housing 9.5% 7.3% Total Portfolio $9.2 $112.0 $127.8 Implied Cap Rate - Total Portfolio 8.2% 7.2% KeyBanc Capital Markets 4
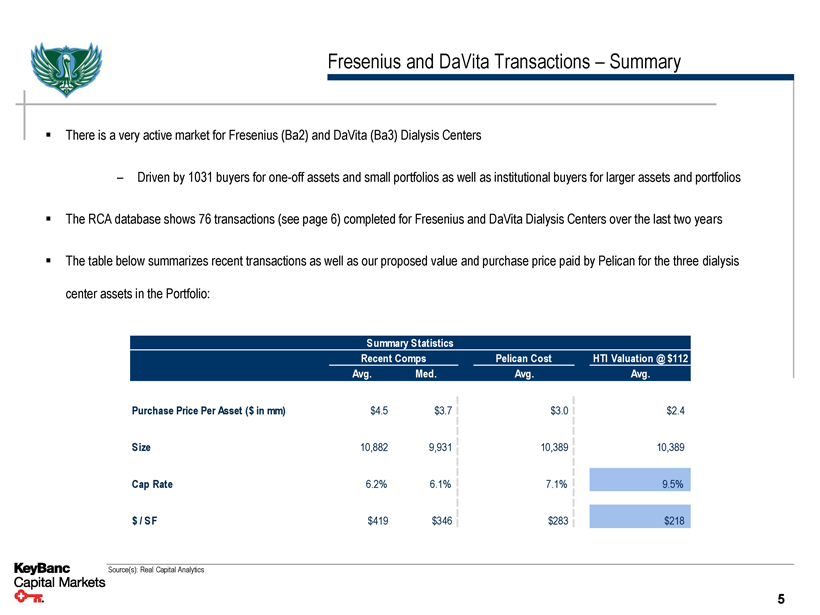
Fresenius and DaVita Transactions – Summary ▪ There is a very active market for Fresenius (Ba2) and DaVita (Ba3) Dialysis Centers – Driven by 1031 buyers for one-off assets and small portfolios as well as institutional buyers for larger assets and portfolios ▪ The RCA database shows 76 transactions (see page 6) completed for Fresenius and DaVita Dialysis Centers over the last two years ▪ The table below summarizes recent transactions as well as our proposed value and purchase price paid by Pelican for the three dialysis center assets in the Portfolio: Summary Statistics Recent Comps Pelican Cost HTI Valuation @ $112 Avg. Med. Avg. Avg. Purchase Price Per Asset ($in mm) $4.5 $3.7 $3.0 $2.4 Size 10,882 9,931 10,389 10,389 Cap Rate 6.2% 6.1% 7.1% 9.5% $/ SF $419 $346 $283 $218 Source(s): Real Capital Analytics KeyBanc Capital Markets 5
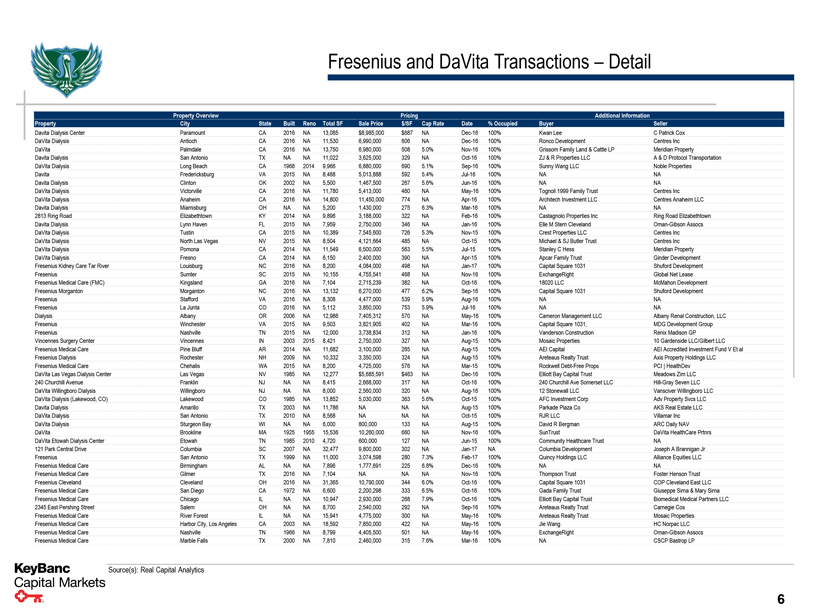
Fresenius and DaVita Transactions – Detail Property Overview Pricing Additional Information Property City State Built Reno Total SF Sale Price $/SF Cap Rate Date% Occupied Buyer Seller Davita Dialysis Center Paramount CA 2016 NA 13,085 $8,985,000 $687 NA Dec-16 100% Kwan Lee C Patrick Cox DaVita Dialysis Antioch CA 2016 NA 11,530 6,990,000 606 NA Dec-16 100% Ronco Development Centres Inc DaVita Palmdale CA 2016 NA 13,750 6,980,000 508 5.0% Nov-16 100% Grissom Family Land & Cattle LP Meridian Property Davita Dialysis San Antonio TX NA NA 11,022 3,625,000 329 NA Oct-16 100% ZJ & R Properties LLC A & D Protocol Transportation DaVita Dialysis Long Beach CA 1968 2014 9,966 6,880,000 690 5.1% Sep-16 100% Sunny Wang LLC Noble Properties Davita Fredericksburg VA 2015 NA 8,468 5,013,888 592 5.4% Jul-16 100% NA NA Davita Dialysis Clinton OK 2002 NA 5,500 1,467,500 267 5.6% Jun-16 100% NA NA DaVita Dialysis Victorville CA 2016 NA 11,780 5,413,000 460 NA May-16 100% Tognoli 1999 Family Trust Centres Inc DaVita Dialysis Anaheim CA 2016 NA 14,800 11,450,000 774 NA Apr-16 100% Architech Investment LLC Centres Anaheim LLC Davita Dialysis Miamisburg OH NA NA 5,200 1,430,000 275 6.3% Mar-16 100% NA NA 2813 Ring Road Elizabethtown KY 2014 NA 9,896 3,188,000 322 NA Feb-16 100% Castagnolo Properties Inc Ring Road Elizabethtown Davita Dialysis Lynn Haven FL 2015 NA 7,959 2,750,000 346 NA Jan-16 100% Elle M Stern Cleveland Oman-Gibson Assocs DaVita Dialysis Tustin CA 2015 NA 10,389 7,545,600 726 5.3% Nov-15 100% Crest Properties LLC Centres Inc DaVita Dialysis North Las Vegas NV 2015 NA 8,504 4,121,664 485 NA Oct-15 100% Michael & SJ Butler Trust Centres Inc DaVita Dialysis Pomona CA 2014 NA 11,549 6,500,000 563 5.5% Jul-15 100% Stanley C Hess Meridian Property DaVita Dialysis Fresno CA 2014 NA 6,150 2,400,000 390 NA Apr-15 100% Apcar Family Trust Ginder Development Fresenius Kidney Care Tar River Louisburg NC 2016 NA 8,200 4,084,000 498 NA Jan-17 100% Capital Square 1031 Shuford Development Fresenius Sumter SC 2015 NA 10,155 4,755,541 468 NA Nov-16 100% ExchangeRight Global Net Lease Fresenius Medical Care (FMC) Kingsland GA 2016 NA 7,104 2,715,239 382 NA Oct-16 100% 18020 LLC McMahon Development Fresenius Morganton Morganton NC 2016 NA 13,132 6,270,000 477 6.2% Sep-16 100% Capital Square 1031 Shuford Development Fresenius Stafford VA 2016 NA 8,308 4,477,000 539 5.9% Aug-16 100% NA NA Fresenius La Junta CO 2016 NA 5,112 3,850,000 753 5.9% Jul-16 100% NA NA Dialysis Albany OR 2006 NA 12,986 7,405,312 570 NA May-16 100% Cameron Management LLC Albany Renal Construction, LLC Fresenius Winchester VA 2015 NA 9,503 3,821,905 402 NA Mar-16 100% Capital Square 1031, MDG Development Group Fresenius Nashville TN 2015 NA 12,000 3,738,834 312 NA Jan-16 100% Vanderson Construction Renix Madison GP Vincennes Surgery Center Vincennes IN 2003 2015 8,421 2,750,000 327 NA Aug-15 100% Mosaic Properties 10 Gardenside LLC/Gilbert LLC Fresenius Medical Care Pine Bluff AR 2014 NA 11,682 3,100,000 265 NA Aug-15 100% AEI Capital AEI Accredited Investment Fund V Et al Fresenius Dialysis Rochester NH 2009 NA 10,332 3,350,000 324 NA Aug-15 100% Areteaus Realty Trust Axis Property Holdings LLC Fresenius Medical Care Chehalis WA 2015 NA 8,200 4,725,000 576 NA Mar-15 100% Rockwell Debt-Free Props PCI | HealthDev DaVita Las Vegas Dialysis Center Las Vegas NV 1985 NA 12,277 $5,685,591 $463 NA Dec-16 100% Elliott Bay Capital Trust Meadows Zim LLC 240 Churchill Avenue Franklin NJ NA NA 8,415 2,668,000 317 NA Oct-16 100% 240 Churchill Ave Somerset LLC Hill-Gray Seven LLC DaVita Willingboro Dialysis Willingboro NJ NA NA 8,000 2,560,000 320 NA Aug-16 100% 12 Stonewall LLC Vansciver Willingboro LLC DaVita Dialysis (Lakewood, CO) Lakewood CO 1985 NA 13,852 5,030,000 363 5.6% Oct-15 100% AFC Investment Corp Adv Property Svcs LLC Davita Dialysis Amarillo TX 2003 NA 11,786 NA NA NA Aug-15 100% Parkade Plaza Co AKS Real Estate LLC DaVita Dialysis San Antonio TX 2010 NA 8,568 NA NA NA Oct-15 100% RJR LLC Villamar Inc DaVita Dialysis Sturgeon Bay WI NA NA 6,000 800,000 133 NA Aug-15 100% David R Bergman ARC Daily NAV DaVita Brookline MA 1925 1955 15,536 10,260,000 660 NA Nov-16 100% SunTrust DaVita HealthCare Prtnrs DaVita Etowah Dialysis Center Etowah TN 1985 2010 4,720 600,000 127 NA Jun-15 100% Community Healthcare Trust NA 121 Park Central Drive Columbia SC 2007 NA 32,477 9,800,000 302 NA Jan-17 NA Columbia Development Joseph A Brannigan Jr Fresenius San Antonio TX 1999 NA 11,000 3,074,598 280 7.3% Feb-17 100% Quincy Holdings LLC Alliance Equities LLC Fresenius Medical Care Birmingham AL NA NA 7,896 1,777,691 225 6.8% Dec-16 100% NA NA Fresenius Medical Care Gilmer TX 2016 NA 7,104 NA NA NA Nov-16 100% Thompson Trust Foster Henson Trust Fresenius Cleveland Cleveland OH 2016 NA 31,365 10,790,000 344 6.0% Oct-16 100% Capital Square 1031 COP Cleveland East LLC Fresenius Medical Care San Diego CA 1972 NA 6,600 2,200,298 333 6.5% Oct-16 100% Gada Family Trust Giuseppe Sirna & Mary Sirna Fresenius Medical Care Chicago IL NA NA 10,947 2,930,000 268 7.9% Oct-16 100% Elliott Bay Capital Trust Biomedical Medical Partners LLC 2345 East Pershing Street Salem OH NA NA 8,700 2,540,000 292 NA Sep-16 100% Areteaus Realty Trust Carnegie Cos Fresenius Medical Care River Forest IL NA NA 15,941 4,775,000 300 NA May-16 100% Areteaus Realty Trust Mosaic Properties Fresenius Medical Care Harbor City, Los Angeles CA 2003 NA 18,592 7,850,000 422 NA May-16 100% Jie Wang HC Norpac LLC Fresenius Medical Care Nashville TN 1966 NA 8,799 4,405,500 501 NA May-16 100% ExchangeRight Oman-Gibson Assocs Fresenius Medical Care Marble Falls TX 2000 NA 7,810 2,460,000 315 7.6% Mar-16 100% NA CSCP Bastrop LP Source(s): Real Capital Analytics KeyBanc Capital Markets 6

Fresenius and DaVita Transactions – Detail Property Overview Pricing Additional Information Property City State Built Reno Total SF Sale Price $/SF Cap Rate Date% Occupied Buyer Seller 10 East Moreland Avenue Philadelphia PA 1939 NA 24,745 7,788,462 315 NA Mar-16 100% Areteaus Realty Trust Renal Enterprise LLC Fresenius Medical Care Center Abington PA 1964 NA 11,300 2,700,000 239 NA Feb-16 100% Tri Star Associates; Frank Grossman Cohen Financial Fresenius Medical Care Dialysis Center Bastrop TX 2015 NA 8,210 NA NA NA Jan-16 100% CV Sheldon Family LP Wellington Stevens III Fresenius Medical Care River Forest IL NA NA 15,941 3,071,990 193 NA Dec-15 100% Mosaic Properties Trust 12558607 Fresenius Albuquerque NM 2014 NA 19,839 NA NA NA Dec-15 100% Elliott Bay Healthcare Realty PCI | HealthDev Fresenius Medical Care Umatilla OR 2012 NA 6,240 2,020,000 324 NA Jun-15 100% NA 1213 Main-Milton-Freeman Ltd 135 Avera Dr Fort Valley GA 2003 NA 4,920 1,100,000 224 NA Jun-15 100% Community Healthcare Trust Avera Properties & Associates LLC Fresenius Medical Care Johnson City TN 2002 NA 12,006 3,294,000 274 6.9% Apr-15 100% Phoenix Realty Mgmt Stephen Moore Fresenius Medical Care - Centerville, TN Centerville TN NA NA 13,460 1,488,000 111 9.0% Apr-15 100% NA NA DaVita Dialysis North Las Vegas NV 1956 NA 10,249 3,245,000 317 6.1% Dec-16 100% Allan R Francescutti NLV - ZIM LLC DaVita Dialysis Dinuba CA 2013 NA 9,000 3,590,000 399 NA Jan-17 100% James W Naekel Trust RPM Realty LLC Davita Berlin WI NA NA 6,858 2,426,587 354 6.3% Oct-16 100% NA NA Davita Chilton WI NA NA 7,847 2,462,471 314 6.3% Oct-16 100% NA NA DaVita Redwood City CA 1977 2009 8,190 7,773,000 949 4.1% May-16 100% NorthWall Builders Christopher O'Brien; Brock Transportation DaVita Dialysis San Rafael CA 2015 NA 10,652 12,970,000 1,218 NA Apr-16 100% Moons Family Trust Meridian Property DaVita Dialysis Sacramento CA 2011 2015 15,007 4,400,000 293 5.3% Dec-15 100% NA Saca Development Patriot Commerce Center (Unit C D E in Bldg G) Moorpark CA 2009 NA 15,921 6,180,000 388 5.0% Nov-15 100% Gina Zhang DaVita HealthCare Prtnrs DaVita Dialysis Worth IL 2015 NA 7,423 4,000,000 539 NA Nov-15 100% John H & Mary C Santos Chiridge Harlem LLC 6825 Burden Blvd (Unit A & E) Pasco WA 2006 NA 9,066 2,713,000 299 6.9% Oct-15 100% Areteaus Realty Trust BLT LLC DaVita Dialysis Modesto CA 2013 NA 11,814 6,119,000 518 5.7% May-15 100% Hathaway Dinwiddie Meridian Property Fresenius Medical Care - Lubbock, TX Lubbock TX 1966 2013 16,872 5,415,000 321 5.6% Jul-16 95% Four Springs Capital Four Springs Cap Trust Fresenius Medical Center Polson MT 2016 NA 6,400 5,029,888 786 NA Jul-16 100% Rood Investments FRE Montana LLC Fresenius Medical Care Braselton GA 2014 NA 8,288 3,257,500 393 NA Apr-16 100% AEI Capital RFG Braselton LLC Fresenius Medical Care Marquette Marquette MI 2015 NA 9,580 3,260,000 340 6.1% Mar-16 100% NA NA Fresenius Medical Care Whitehall Whitehall PA 2010 NA 10,115 3,125,000 309 6.7% Jan-16 100% 1320 Mickley Road Developers Corp Lehigh Valley Diagnostic Imaging Fresenius Hephzibah GA 2015 NA 6,000 2,778,356 463 7.2% Jul-15 100% Global Net Lease Richmond County Dialysis LLC KeyBanc Capital Markets Source(s): Real Capital Analytics 7