American Realty Capital Healthcare Trust Iii Inactive
Filed: 29 Sep 17, 12:00am
Exhibit (c)(6)
Confidential Information Project Pelican Discussion Materials for the Special Committee of the Board of Directors June 15, 2017
Confidential Information Important Information These materials, and any other information (written or oral) delivered in connection herewith (collectively, the “materials”) are provided solely for the information of the Special Committee (the “Special Committee”) of the Board of Directors (the “Board”) of American Realty Capital Healthcare Trust III, Inc. (“HC III” or the “Company”) by SunTrust Robinson Humphrey, Inc. ("STRH"), in connection with the Special Committee's consideration of a potential transaction involving HC III and Healthcare Trust Inc. (the “Transaction”). The materials are provided subject to STRH’s engagement letter for the Special Committee in connection with its evaluation of the potential Transaction. The materials were prepared for a specific use by specific persons and were not prepared with a view to public disclosure or to conform with any disclosure standards under securities laws or otherwise. The materials were not prepared for use by readers not as familiar with the business and affairs of HC III as the Special Committee and, accordingly, none of the Special Committee, the Board, HC III nor STRH or their respective advisors take any responsibility for the materials when used by persons or entities other than the Special Committee. The materials are provided on a confidential basis for the information of the Special Committee. STRH imposes no restrictions on the disclosure by the Special Committee (including its members, representatives and agents) of the tax treatment or tax structure of any transaction, including those portions of any materials containing such information that are provided by STRH to the Special Committee. Any tax statement contained in the materials regarding any U.S. federal tax is not intended or written to be used, and cannot be used, by any taxpayer for the purpose of avoiding any penalties. Each taxpayer should seek advice based on the taxpayer's particular circumstances from an independent tax advisor. STRH is not an expert on, and nothing contained herein should be construed as advice with regard to, legal, accounting, regulatory, insurance or tax matters. The materials necessarily are based on financial, economic, market and other conditions as in effect on, and the information made available to STRH as of, the date of the materials. None of the Special Committee, the Board, HC III or STRH undertakes any obligation to update, revise or reaffirm the materials. Any statement contained in the materials is subject to change without notice and may differ from or be contrary to other statements expressed by STRH or its affiliates. The materials are not intended to provide the sole basis for evaluation of the Transaction, do not purport to contain all information that may be required or of interest and should not be considered an opinion, or a recommendation to the Special Committee, the Board, any security holder or any other person or entity as to how to vote or act with respect to any matter relating to the Transaction. STRH’s only opinion is the opinion, if any, that is actually delivered to the Special Committee. The analyses contained in the materials must be considered as a whole. Selecting portions of the analyses, without considering all analyses, would create an incomplete view. The implied reference range values indicated by STRH's analyses are illustrative and not necessarily indicative of actual values or predictive of future results or values, which may be significantly more or less favorable than those suggested by the analyses. In addition, any analyses relating to the value of assets, businesses or securities do not purport to be appraisals or to reflect the prices at which assets, businesses or securities actually may be sold, which may depend on a variety of factors, many of which are beyond the control of STRH. In preparing the materials, an STRH representative visited a number of the properties of HC III, but STRH did not otherwise conduct a physical inspection or appraisal or evaluation of any of the assets, properties or liabilities (contingent, derivative, off-balance sheet or otherwise) of HC III or any other participant in the Transaction, nor was STRH provided with any such appraisal or evaluation. The materials do not constitute a valuation opinion or credit rating, and STRH has no obligation to evaluate the solvency of HC III or any person or entity under any law. STRH has assumed and relied upon the accuracy and completeness of the financial and other information obtained from management of HC III and other participants in the Transaction and public sources without assuming any responsibility for independent verification of such information, makes no representation or warranty (express or implied) in respect of the accuracy or completeness of such information and has further relied upon the assurances of HC III and other participants in the Transaction that they are not aware of any facts or circumstances that would make such information inaccurate or misleading. To the extent such information includes estimates and forecasts of future financial performance (including estimates of potential cost savings and synergies) prepared by or reviewed or discussed with managements of HC III or other participants in the Transaction or obtained from public sources, with the Special Committee’s consent, STRH has assumed that such estimates and forecasts have been reasonably prepared on bases reflecting the best currently available estimates and judgments of HC III’s management (or, with respect to estimates and forecasts obtained from public sources, represent reasonable estimates). STRH takes no responsibility for, and expresses no views with respect to, such estimates or forecasts or the assumptions on which they are based. STRH and its affiliates have adopted policies and guidelines designed to preserve the independence of STRH’s and its affiliates’ research analysts. These policies prohibit employees from directly or indirectly offering a favorable research rating or a specific price target, or offering to change a research rating or price target, as consideration for or an inducement to obtain business or other compensation. These policies prohibit research analysts from being compensated for their involvement in investment banking transactions. STRH and its affiliates are engaged in advisory, underwriting and financing, principal investing, sales and trading, research, investment management and other financial and non-financial activities and services for various persons and entities. STRH and its affiliates and employees, and funds or other entities in which they invest or with which they co-invest, may at any time purchase, sell, hold or vote long or short positions and investments in securities, derivatives, loans, commodities, currencies, credit default swaps and other financial instruments of HC III, any other party to any transaction and any of their respective affiliates or any currency or commodity that may be involved in any transaction for the accounts of STRH and its affiliates and their employees and customers. None of the materials constitutes a commitment to lend money, underwrite any proposed transaction, purchase securities or other assets, provide financing, arrange financing, or provide any other services. STRH and its representatives and affiliates make no representation and have given no advice concerning the appropriate regulatory treatment, accounting treatment, or possible tax consequences of the Transaction. Prior to entering into the Transaction, each participant should determine, without reliance upon STRH or its representatives or affiliates, the economic risks and merits, as well as the legal, tax and accounting characteristics and consequences, of the Transaction and that such participant is able to assume these risks. The materials should not be relied upon for the maintenance of books and records or for any tax, accounting, legal or other purposes. The materials do not address the underlying business decision of the Special Committee, the Board or HC III to engage in the Transaction, or the relative merits of any strategic alternative as compared to any other alternative that may be available to HC III. Except as required by applicable law, STRH makes no representation or warranty, express or implied, to any person as to the content of the information contained herein. The materials may not reflect information known to other professionals in other business areas of STRH and its affiliates. www.suntrustrh.com 1
Confidential Information Table of Contents SECTION I SECTION II SECTION III APPENDICES Process Summary Proposed Transaction Overview / Summary of Proposal Financial Analyses Methodology and Summary a. Discounted Cash Flow Analysis Support b. Sum-of-the-Parts Analysis Support c. Selected Transaction Support d. Illustrative Net Asset Value Per Share www.suntrustrh.com 2

Section I Process Summary

Confidential Information SunTrust Robinson Humphrey, Inc. (“STRH”) was engaged by HC III on March 30, 2016 as financial advisor to HC III Special Committee in connection with a potential sale of the company, merger, recapitalization, listing of stock on an exchange or other extraordinary corporate transaction or business combination For the initial process, at the request of the Special Committee, STRH contacted 18 parties commencing in late April •1 (Party A(1)) party submitted an unsolicited proposal in April 2016 to acquire HC III •16 parties signed a Non-Disclosure Agreement (“NDA”) and were provided access to the Virtual Data Room (“VDR”) ‒At the direction of the Special Committee, all parties were informed that the Special Committee would consider (i) entity-level bids for HC III as a whole, and/or (ii) one-off bids for the individual assets •STRH also discussed a potential transaction with the financial advisor to HTI Initial Process Proposals Submitted between April and September 2016 •Party A(1) revised its earlier proposal: ‒April 7th proposal: $22.60 per share (implied gross value of approximately $147MM), with consideration in the form of all stock(2) ‒June 10th revised proposal: $22.00 per share (implied gross value of approximately $141MM), with consideration in the form of all stock(2) •After providing its revised proposal on August 15th, Party A(1) indicated that it would not continue to pursue a transaction with HC III and would focus instead on other transactions. Party A(1) also indicated that it would be several months before it would be in a position to reconsider a potential transaction with HC III •On September 2nd, Party C submitted a proposal of $129MM gross ($124MM net of mortgage) to purchase all assets of the portfolio, with consideration in the form of all cash ‒On September 12th, submitted a revised proposal of $132MM gross ($127MM net of mortgage) to purchase all assets of the portfolio, with consideration in the form of all cash Process Summary (1) Affiliated party (2) Party A stock value deemed to be the same as calculated NAV www.suntrustrh.com 4
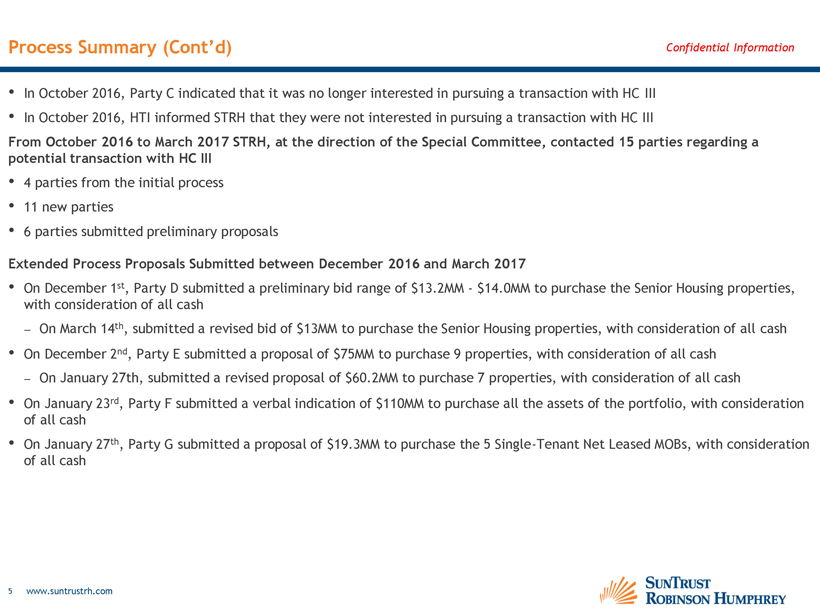
Confidential Information •In October 2016, Party C indicated that it was no longer interested in pursuing a transaction with HC III •In October 2016, HTI informed STRH that they were not interested in pursuing a transaction with HC III From October 2016 to March 2017 STRH, at the direction of the Special Committee, contacted 15 parties regarding a potential transaction with HC III •4 parties from the initial process •11 new parties •6 parties submitted preliminary proposals Extended Process Proposals Submitted between December 2016 and March 2017 •On December 1st, Party D submitted a preliminary bid range of $13.2MM - $14.0MM to purchase the Senior Housing properties, with consideration of all cash ‒On March 14th, submitted a revised bid of $13MM to purchase the Senior Housing properties, with consideration of all cash •On December 2nd, Party E submitted a proposal of $75MM to purchase 9 properties, with consideration of all cash ‒On January 27th, submitted a revised proposal of $60.2MM to purchase 7 properties, with consideration of all cash •On January 23rd, Party F submitted a verbal indication of $110MM to purchase all the assets of the portfolio, with consideration of all cash •On January 27th, Party G submitted a proposal of $19.3MM to purchase the 5 Single-Tenant Net Leased MOBs, with consideration of all cash Process Summary (Cont’d) www.suntrustrh.com 5
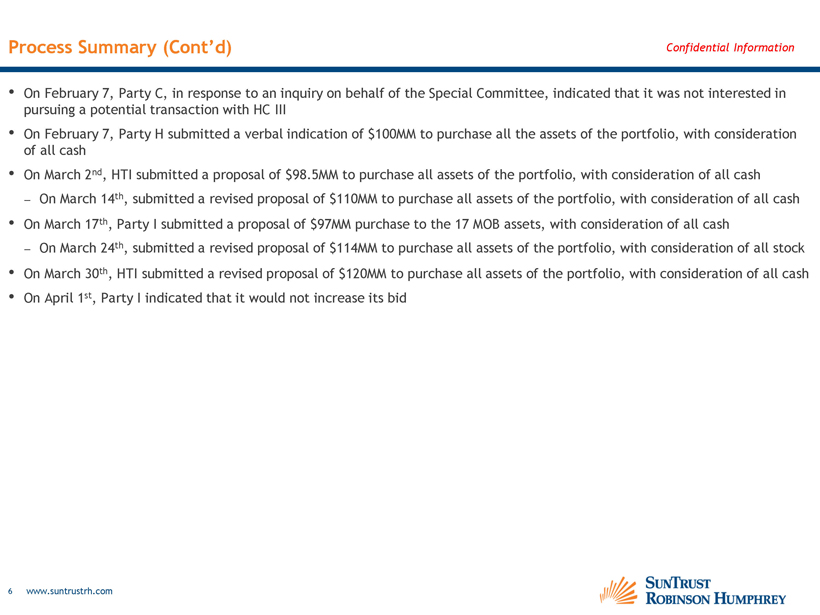
Confidential Information Process Summary (Cont’d) •On February 7, Party C, in response to an inquiry on behalf of the Special Committee, indicated that it was not interested in pursuing a potential transaction with HC III •On February 7, Party H submitted a verbal indication of $100MM to purchase all the assets of the portfolio, with consideration of all cash •On March 2nd, HTI submitted a proposal of $98.5MM to purchase all assets of the portfolio, with consideration of all cash ‒On March 14th, submitted a revised proposal of $110MM to purchase all assets of the portfolio, with consideration of all cash •On March 17th, Party I submitted a proposal of $97MM purchase to the 17 MOB assets, with consideration of all cash ‒On March 24th, submitted a revised proposal of $114MM to purchase all assets of the portfolio, with consideration of all stock •On March 30th, HTI submitted a revised proposal of $120MM to purchase all assets of the portfolio, with consideration of all cash •On April 1st, Party I indicated that it would not increase its bid www.suntrustrh.com 6
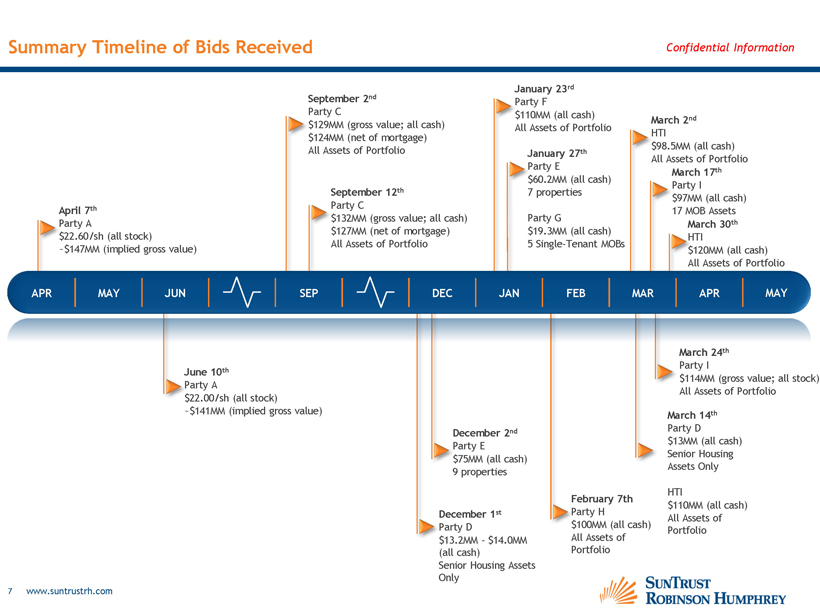
Summary Timeline of Bids Received Confidential Information April 7th Party A $22.60/sh (all stock) ~$147MM (implied gross value) September 2nd Party C $129MM (gross value; all cash) $124MM (net of mortgage) All Assets of Portfolio September 12th Party C $132MM (gross value; all cash) $127MM (net of mortgage) All Assets of Portfolio January 23rd Party F $110MM (all cash) March 2nd All Assets of Portfolio HTI January 27th $98.5MM (all cash) All Assets of Portfolio Party E March 17th $60.2MM (all cash) Party I 7 properties $97MM (all cash) Party G 17 MOB Assets March 30th $19.3MM (all cash) HTI 5 Single-Tenant MOBs $120MM (all cash) All Assets of Portfolio June 10th Party A $22.00/sh (all stock) ~$141MM (implied gross value) December 2nd Party E $75MM (all cash) 9 properties February 7th December 1 st Party H Party D $100MM (all cash) $13.2MM - $14.0MM All Assets of Portfolio (all cash) Senior Housing Assets Only March 24th Party I $114MM (gross value; all stock) All Assets of Portfolio March 14th Party D $13MM (all cash) Senior Housing Assets Only HTI $110MM (all cash) All Assets of Portfolio 7 www.suntrustrh.com
Section II Proposed Transaction Overview / Summary of Proposal

Summary of Proposal Confidential Information HTI has made a proposal to purchase the real estate portfolio of HC III for $120 million in cash. The $120 million will be reduced by the amount of the outstanding balance of the Philip Professional Center Loan as of the closing date (currently approximately $4.9 million). Summary of Proposal Proposed Purchase Price $120.0mm Form of Consideration 100% Cash Company (HC III) Termination Fee (3% of Proposed Purchase Price) $3.6mm Estimated Closing 3Q 17 Transaction Multiples: Implied Cap Rate (1) 7.74% Implied Price per Square Foot $256.45 Source: Draft, dated June 12, 2017 of the Purchase Agreement, Company projections prepared by American Realty Capital Healthcare III Advisors, LLC, external advisor to HC III and approved for use in STRH’s financial analyses by HC III’s Special Committee (1) Based on 2H 2017E annualized NOI, per company projections prepared by external advisor to HC III www.suntrustrh.com 9

Section III Financial Analyses Methodology and Summary
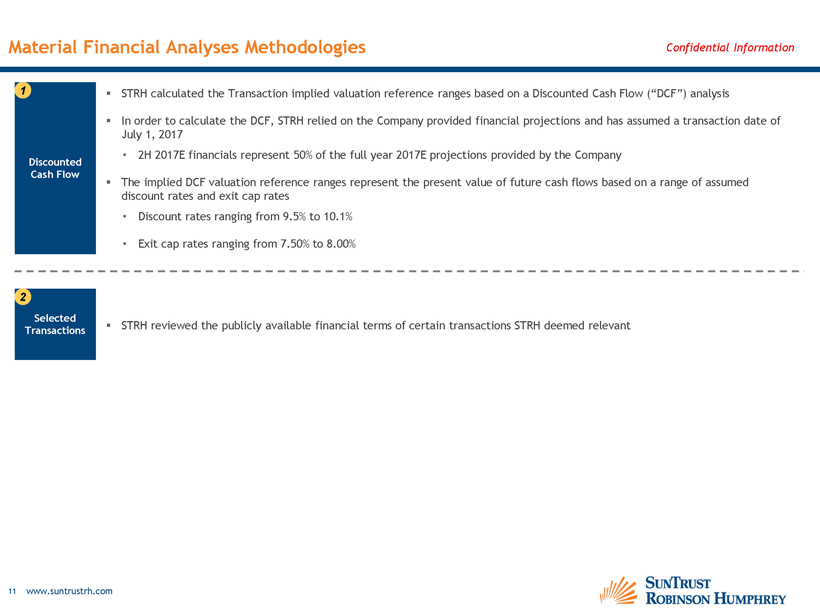
Confidential Information Material Financial Analyses Methodologies ▪STRH calculated the Transaction implied valuation reference ranges based on a Discounted Cash Flow (“DCF”) analysis ▪In order to calculate the DCF, STRH relied on the Company provided financial projections and has assumed a transaction date of July 1, 2017 •2H 2017E financials represent 50% of the full year 2017E projections provided by the Company ▪The implied DCF valuation reference ranges represent the present value of future cash flows based on a range of assumed discount rates and exit cap rates •Discount rates ranging from 9.5% to 10.1% •Exit cap rates ranging from 7.50% to 8.00% Discounted Cash Flow 1 Selected Transactions 2 ▪STRH reviewed the publicly available financial terms of certain transactions STRH deemed relevant www.suntrustrh.com 11
Confidential Information Longitudinal Changes (1) Adjusted 1-yr betas These discussion materials reflect certain changes as compared to the materials presented to the Special Committee on May 19, 2017 Discount Rate: •Weighted average cost of capital range of 9.3% - 9.9% in May 2017 and 9.5% - 10.1% in June 2017 •Risk Free Rate increased 1 bp since May 2017 •Peers debt to equity decreased from 33.0% in May 2017 to 30.8% June 2017 •The median adjusted(1) unlevered beta increased from 0.40 to 0.41 www.suntrustrh.com 12
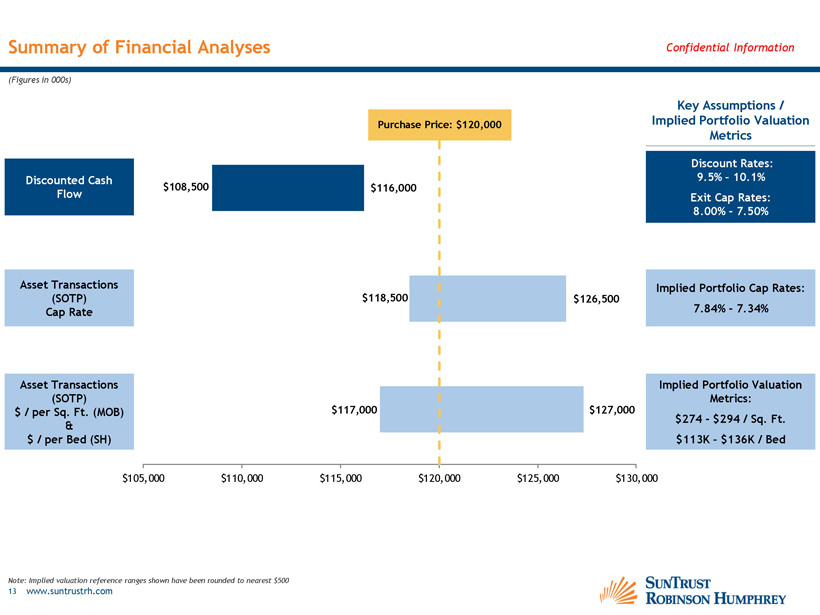
Summary of Financial Analyses Confidential Information (Figures in 000s) Purchase Price: $120,000 Discounted Cash $108,500 $116,000 Flow Asset Transactions Key Assumptions / Implied Portfolio Valuation Metrics Discount Rates: 9.5% – 10.1% Exit Cap Rates: 8.00% - 7.50% Implied Portfolio Cap Rates: (SOTP) $118,500 Cap Rate $126,500 7.84% - 7.34% Asset Transactions (SOTP) Implied Portfolio Valuation Metrics: $/ per Sq. Ft. (MOB) $117,000 & $/ per Bed (SH) $127,000 $274 - $294 / Sq. Ft. $113K – $136K / Bed $105,000 $110,000 $115,000 $120,000 $125,000 $130,000 Note: Implied valuation reference ranges shown have been rounded to nearest $500 13 www.suntrustrh.com

Summary of Financial Analyses – Supporting Detail Confidential Information (Figures in 000s, except for price per sq. ft.) Methodology Discount Rate Terminal Value - Exit Cap Rate Implied DCF Valuation Reference Range Low Mid High Low Mid High 9.5% 8.00% 7.75% 7.50% $110,759 $113,294 $115,997 Discounted Cash Flow 9.8% 8.00% 7.75% 7.50% 109,509 112,009 114,675 10.1% 8.00% 7.75% 7.50% 108,278 110,744 113,375 $108,278 $112,009 $115,997 Methodology 2017E NOI Implied Portfolio Cap Rates Aggregate SOTP Valuation Reference Range Low (1) Mid (1) High (1) Asset Transactions (SOTP) $9,289 7.84% 7.58% 7.34% Cap Rate Methodology Square Feet (MOB) Implied Price per Sq. Ft. (MOB) / Beds (SH) / Implied Price per Bed (SH) Asset Transactions (SOTP) Low (1) Mid (1) High (1) $/ per Sq. Ft. (MOB) 376,573 sq. ft. $274.05 $284.12 $294.19 $/ per Bed (SH) 120 beds 113,250 124,729 136,208 Low Mid High $118,520 $122,500 $126,480 Aggregate SOTP Valuation Reference Range Low Mid High $103,198 $106,991 $110,784 13,590 14,968 16,345 $116,788 $121,959 $127,129 Source: Company projections prepared by American Realty Capital Healthcare III Advisors, LLC, external advisor to HC III and approved for use in STRH’s financial analyses by HC III’s Special Committee (1) See appendices B & C for underlying selected transaction detail 14 www.suntrustrh.com

Appendices
Appendix A Discounted Cash Flow Analysis Support
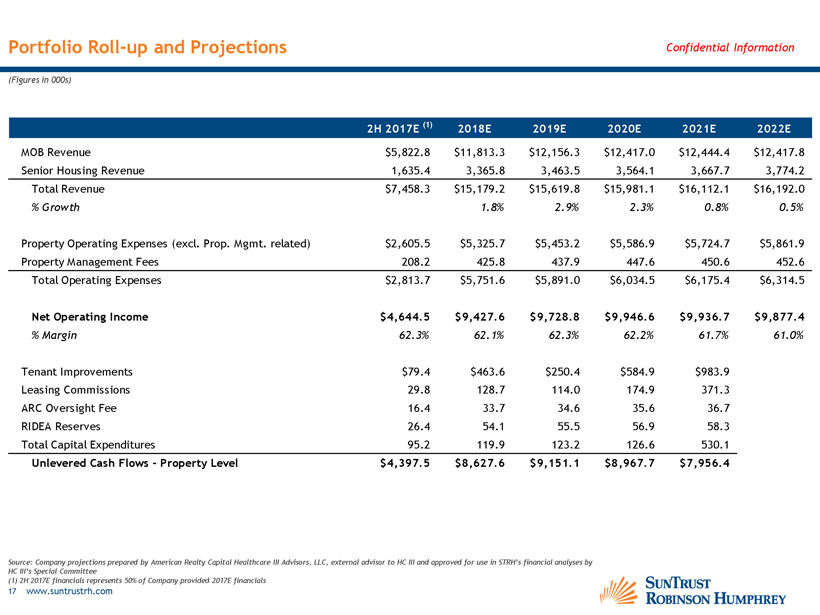
Portfolio Roll-up and Projections Confidential Information (Figures in 000s) 2H 2017E (1) 2018E 2019E 2020E 2021E 2022E MOB Revenue $5,822.8 $11,813.3 $12,156.3 $12,417.0 $12,444.4 $12,417.8 Senior Housing Revenue 1,635.4 3,365.8 3,463.5 3,564.1 3,667.7 3,774.2 Total Revenue $7,458.3 $15,179.2 $15,619.8 $15,981.1 $16,112.1 $16,192.0% Growth 1.8% 2.9% 2.3% 0.8% 0.5% Property Operating Expenses (excl. Prop. Mgmt. related) $2,605.5 $5,325.7 $5,453.2 $5,586.9 $5,724.7 $5,861.9 Property Management Fees 208.2 425.8 437.9 447.6 450.6 452.6 Total Operating Expenses $2,813.7 $5,751.6 $5,891.0 $6,034.5 $6,175.4 $6,314.5 Net Operating Income $4,644.5 $9,427.6 $9,728.8 $9,946.6 $9,936.7 $9,877.4% Margin 62.3% 62.1% 62.3% 62.2% 61.7% 61.0% Tenant Improvements $79.4 $463.6 $250.4 $584.9 $983.9 Leasing Commissions 29.8 128.7 114.0 174.9 371.3 ARC Oversight Fee 16.4 33.7 34.6 35.6 36.7 RIDEA Reserves 26.4 54.1 55.5 56.9 58.3 Total Capital Expenditures 95.2 119.9 123.2 126.6 530.1 Unlevered Cash Flows - Property Level $4,397.5 $8,627.6 $9,151.1 $8,967.7 $7,956.4 Source: Company projections prepared by American Realty Capital Healthcare III Advisors, LLC, external advisor to HC III and approved for use in STRH’s financial analyses by HC III’s Special Committee (1) 2H 2017E financials represents 50% of Company provided 2017E financials 17 www.suntrustrh.com
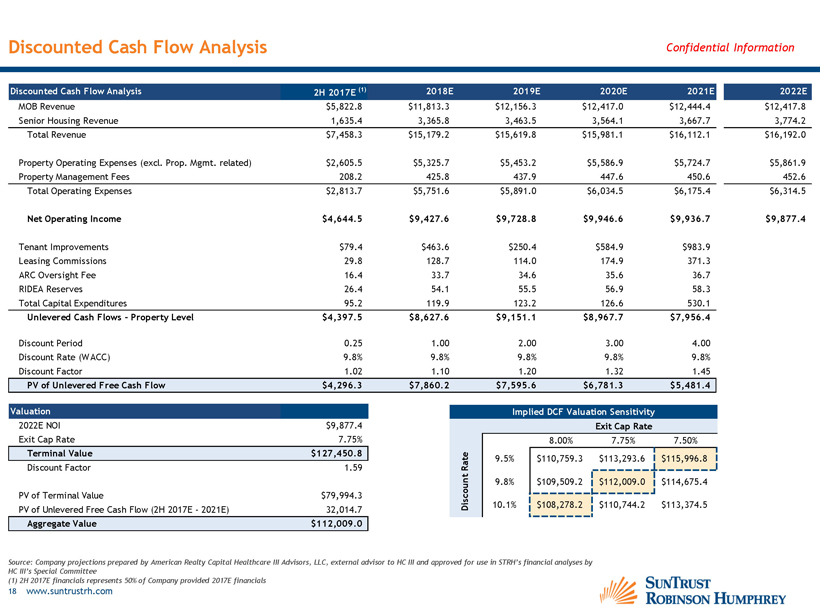
Discounted Cash Flow Analysis Confidential Information Discounted Cash Flow Analysis 2H 2017E (1) 2018E 2019E 2020E 2021E 2022E MOB Revenue $5,822.8 $11,813.3 $12,156.3 $12,417.0 $12,444.4 $12,417.8 Senior Housing Revenue 1,635.4 3,365.8 3,463.5 3,564.1 3,667.7 3,774.2 Total Revenue $7,458.3 $15,179.2 $15,619.8 $15,981.1 $16,112.1 $16,192.0 Property Operating Expenses (excl. Prop. Mgmt. related) $2,605.5 $5,325.7 $5,453.2 $5,586.9 $5,724.7 $5,861.9 Property Management Fees 208.2 425.8 437.9 447.6 450.6 452.6 Total Operating Expenses $2,813.7 $5,751.6 $5,891.0 $6,034.5 $6,175.4 $6,314.5 Net Operating Income $4,644.5 $9,427.6 $9,728.8 $9,946.6 $9,936.7 $9,877.4 Tenant Improvements $79.4 $463.6 $250.4 $584.9 $983.9 Leasing Commissions 29.8 128.7 114.0 174.9 371.3 ARC Oversight Fee 16.4 33.7 34.6 35.6 36.7 RIDEA Reserves 26.4 54.1 55.5 56.9 58.3 Total Capital Expenditures 95.2 119.9 123.2 126.6 530.1 Unlevered Cash Flows - Property Level $4,397.5 $8,627.6 $9,151.1 $8,967.7 $7,956.4 Discount Period 0.25 1.00 2.00 3.00 4.00 Discount Rate (WACC) 9.8% 9.8% 9.8% 9.8% 9.8% Discount Factor 1.02 1.10 1.20 1.32 1.45 PV of Unlevered Free Cash Flow $4,296.3 $7,860.2 $7,595.6 $6,781.3 $5,481.4 Valuation Implied DCF Valuation Sensitivity 2022E NOI $9,877.4 Exit Cap Rate 7.75% Terminal Value $127,450.8 Discount Factor 1.59 PV of Terminal Value $79,994.3 PV of Unlevered Free Cash Flow (2H 2017E - 2021E) 32,014.7 Aggregate Value $112,009.0 Exit Cap Rate 8.00% 7.75% 7.50% Rate 9.5% $110,759.3 $113,293.6 $115,996.8 Discount 9.8% $109,509.2 $112,009.0 $114,675.4 10.1% $108,278.2 $110,744.2 $113,374.5 Source: Company projections prepared by American Realty Capital Healthcare III Advisors, LLC, external advisor to HC III and approved for use in STRH’s financial analyses by HC III’s Special Committee (1) 2H 2017E financials represents 50% of Company provided 2017E financials 18 www.suntrustrh.com
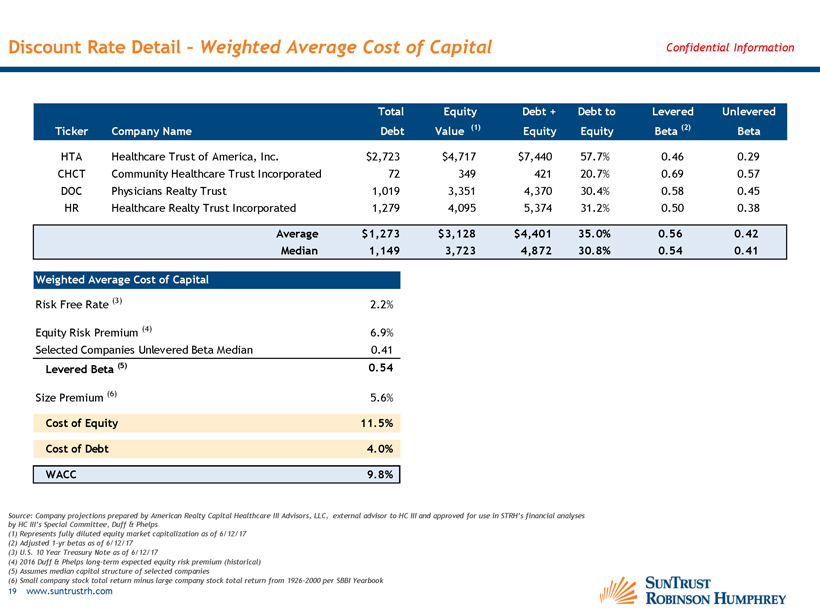
Discount Rate Detail – Weighted Average Cost of Capital Confidential Information Total Equity Debt + Debt to Levered Unlevered Ticker Company Name Debt Value (1) Equity Equity Beta (2) Beta HTA Healthcare Trust of America, Inc. $2,723 $4,717 $7,440 57.7% 0.46 0.29 CHCT Community Healthcare Trust Incorporated 72 349 421 20.7% 0.69 0.57 DOC Physicians Realty Trust 1,019 3,351 4,370 30.4% 0.58 0.45 HR Healthcare Realty Trust Incorporated 1,279 4,095 5,374 31.2% 0.50 0.38 Average $1,273 $3,128 $4,401 35.0% 0.56 0.42 Median 1,149 3,723 4,872 30.8% 0.54 0.41 Weighted Average Cost of Capital Risk Free Rate (3) 2.2% Equity Risk Premium (4) 6.9% Selected Companies Unlevered Beta Median 0.41 Levered Beta (5) 0.54 Size Premium (6) 5.6% Cost of Equity 11.5% Cost of Debt 4.0% WACC 9.8% Source: Company projections prepared by American Realty Capital Healthcare III Advisors, LLC, external advisor to HC III and approved for use in STRH’s financial analyses by HC III’s Special Committee, Duff & Phelps (1) Represents fully diluted equity market capitalization as of 6/12/17 (2) Adjusted 1-yr betas as of 6/12/17 (3) U.S. 10 Year Treasury Note as of 6/12/17 (4) 2016 Duff & Phelps long-term expected equity risk premium (historical) (5) Assumes median capital structure of selected companies (6) Small company stock total return minus large company stock total return from 1926-2000 per SBBI Yearbook 19 www.suntrustrh.com
Appendix B Sum-of-the-Parts Analysis Support
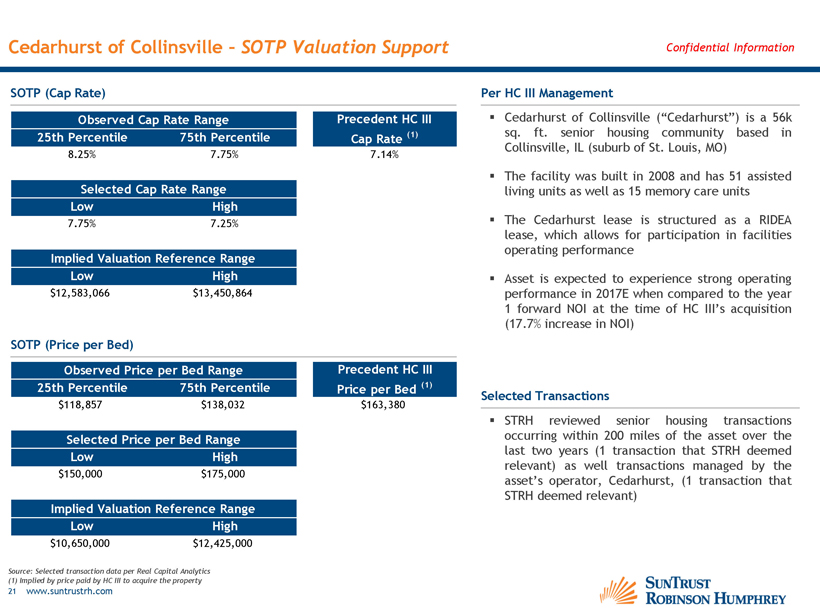
Cedarhurst of Collinsville – SOTP Valuation Support Confidential Information SOTP (Cap Rate) Observed Cap Rate Range Precedent HC III 25th Percentile 75th Percentile Cap Rate (1) 8.25% 7.75% 7.14% Selected Cap Rate Range Low High 7.75% 7.25% Implied Valuation Reference Range Low High $12,583,066 $13,450,864 SOTP (Price per Bed) Observed Price per Bed Range Precedent HC III 25th Percentile 75th Percentile Price per Bed (1) $118,857 $138,032 $163,380 Selected Price per Bed Range Low High $150,000 $175,000 Implied Valuation Reference Range Low High $10,650,000 $12,425,000 Per HC III Management ▪ Cedarhurst of Collinsville (“Cedarhurst”) is a 56k sq. ft. senior housing community based in Collinsville, IL (suburb of St. Louis, MO) ▪ The facility was built in 2008 and has 51 assisted living units as well as 15 memory care units ▪ The Cedarhurst lease is structured as a RIDEA lease, which allows for participation in facilities operating performance ▪ Asset is expected to experience strong operating performance in 2017E when compared to the year 1 forward NOI at the time of HC III’s acquisition (17.7% increase in NOI) Selected Transactions ▪ STRH reviewed senior housing transactions occurring within 200 miles of the asset over the last two years (1 transaction that STRH deemed relevant) as well transactions managed by the asset’s operator, Cedarhurst, (1 transaction that STRH deemed relevant) Source: Selected transaction data per Real Capital Analytics (1) Implied by price paid by HC III to acquire the property 21 www.suntrustrh.com
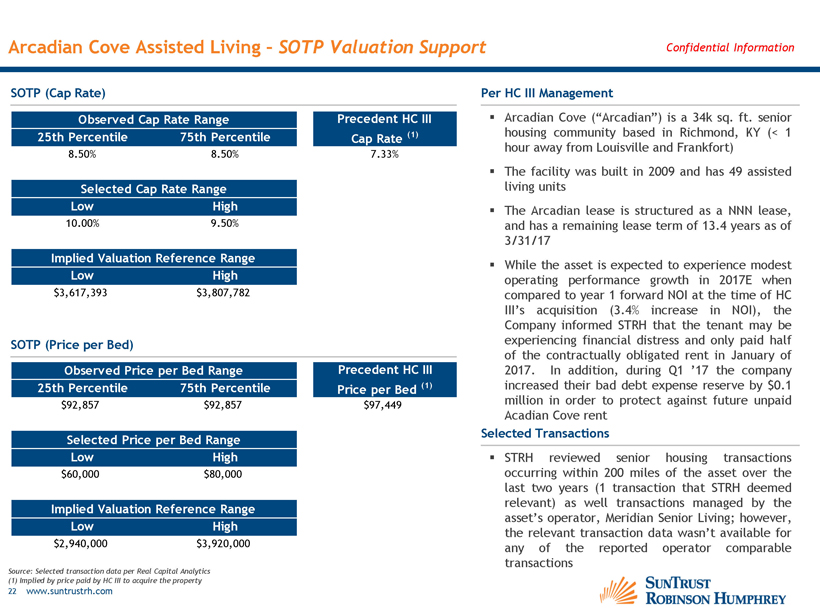
Arcadian Cove Assisted Living – SOTP Valuation Support Confidential Information SOTP (Cap Rate) Observed Cap Rate Range Precedent HC III 25th Percentile 75th Percentile Cap Rate (1) 8.50% 8.50% 7.33% Selected Cap Rate Range Low High 10.00% 9.50% Implied Valuation Reference Range Low High $3,617,393 $3,807,782 SOTP (Price per Bed) Observed Price per Bed Range Precedent HC III 25th Percentile 75th Percentile Price per Bed (1) $92,857 $92,857 $97,449 Selected Price per Bed Range Low High $60,000 $80,000 Implied Valuation Reference Range Low High $2,940,000 $3,920,000 Per HC III Management ▪ Arcadian Cove (“Arcadian”) is a 34k sq. ft. senior housing community based in Richmond, KY (< 1 hour away from Louisville and Frankfort) ▪ The facility was built in 2009 and has 49 assisted living units ▪ The Arcadian lease is structured as a NNN lease, and has a remaining lease term of 13.4 years as of 3/31/17 ▪ While the asset is expected to experience modest operating performance growth in 2017E when compared to year 1 forward NOI at the time of HC III’s acquisition (3.4% increase in NOI), the Company informed STRH that the tenant may be experiencing financial distress and only paid half of the contractually obligated rent in January of 2017. In addition, during Q1 ’17 the company increased their bad debt expense reserve by $0.1 million in order to protect against future unpaid Acadian Cove rent Selected Transactions ▪ STRH reviewed senior housing transactions occurring within 200 miles of the asset over the last two years (1 transaction that STRH deemed relevant) as well transactions managed by the asset’s operator, Meridian Senior Living; however, the relevant transaction data wasn’t available for any of the reported operator comparable transactions Source: Selected transaction data per Real Capital Analytics (1) Implied by price paid by HC III to acquire the property 22 www.suntrustrh.com
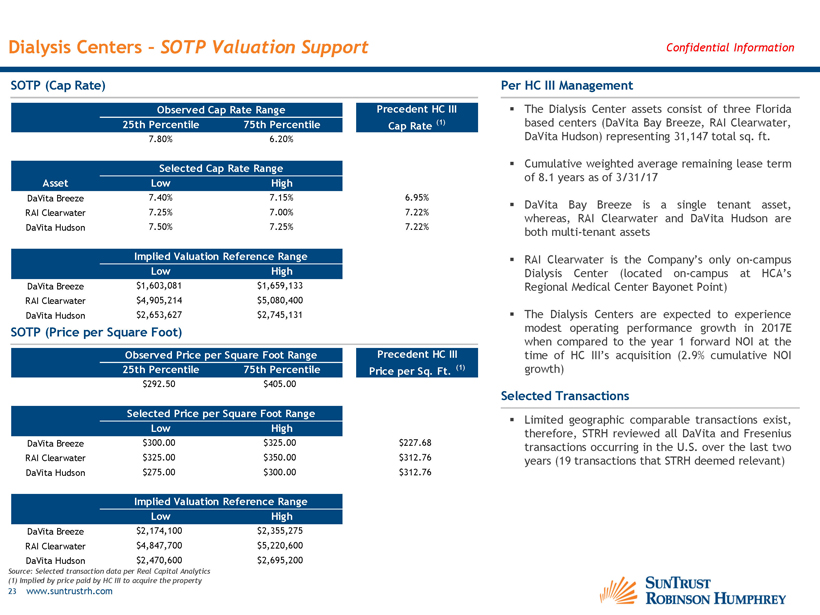
Dialysis Centers – SOTP Valuation Support Confidential Information SOTP (Cap Rate) Observed Cap Rate Range Precedent HC III 25th Percentile 75th Percentile Cap Rate (1) 7.80% 6.20% Selected Cap Rate Range Asset Low High DaVita Breeze 7.40% 7.15% 6.95% RAI Clearwater 7.25% 7.00% 7.22% DaVita Hudson 7.50% 7.25% 7.22% Implied Valuation Reference Range Low High DaVita Breeze $1,603,081 $1,659,133 RAI Clearwater $4,905,214 $5,080,400 DaVita Hudson $2,653,627 $2,745,131 SOTP (Price per Square Foot) Observed Price per Square Foot Range Precedent HC III 25th Percentile 75th Percentile Price per Sq. Ft. (1) $292.50 $405.00 Selected Price per Square Foot Range Low High DaVita Breeze $300.00 $325.00 $227.68 RAI Clearwater $325.00 $350.00 $312.76 DaVita Hudson $275.00 $300.00 $312.76 Implied Valuation Reference Range Low High DaVita Breeze $2,174,100 $2,355,275 RAI Clearwater $4,847,700 $5,220,600 DaVita Hudson $2,470,600 $2,695,200 Per HC III Management ▪ The Dialysis Center assets consist of three Florida based centers (DaVita Bay Breeze, RAI Clearwater, DaVita Hudson) representing 31,147 total sq. ft. ▪ Cumulative weighted average remaining lease term of 8.1 years as of 3/31/17 ▪ DaVita Bay Breeze is a single tenant asset, whereas, RAI Clearwater and DaVita Hudson are both multi-tenant assets ▪ RAI Clearwater is the Company’s only on-campus Dialysis Center (located on-campus at HCA’s Regional Medical Center Bayonet Point) ▪ The Dialysis Centers are expected to experience modest operating performance growth in 2017E when compared to the year 1 forward NOI at the time of HC III’s acquisition (2.9% cumulative NOI growth) Selected Transactions ▪ Limited geographic comparable transactions exist, therefore, STRH reviewed all DaVita and Fresenius transactions occurring in the U.S. over the last two years (19 transactions that STRH deemed relevant) Source: Selected transaction data per Real Capital Analytics (1) Implied by price paid by HC III to acquire the property 23 www.suntrustrh.com

Rockwall Medical Plaza – SOTP Valuation Support Confidential Information SOTP (Cap Rate) Observed Cap Rate Range Precedent HC III 25th Percentile 75th Percentile Cap Rate (1) 6.28% 6.19% 6.81% Selected Cap Rate Range Low High 7.25% 6.75% Implied Valuation Reference Range Low High $5,835,255 $6,267,496 SOTP (Price per Square Foot) Observed Price per Square Foot Range Precedent HC III 25th Percentile 75th Percentile Price per Sq. Ft. (1) $335.00 $345.00 $365.26 Selected Price per Square Foot Range Low High $325.00 $350.00 Implied Valuation Reference Range Low High $5,907,200 $6,361,600 Per HC III Management ▪ Rockwall Medical Plaza is a 18k sq. ft. MOB located on the campus of Texas Health Resources Presbyterian Hospital in Rockwall, TX (suburb of Dallas) ▪ The asset was built in 2008 and is occupied by three tenants with five leases ▪ The asset has a remaining lease term of 3.0 years as of 3/31/17 ▪ The asset’s 2017E NOI is expected to decline by 6.5% when compared to the year 1 forward NOI at the time of HC III’s acquisition Selected Transactions ▪ STRH reviewed multi-tenant MOB transactions occurring within 200 miles of the asset over the last two years (2 transactions that STRH deemed relevant) Source: Selected transaction data per Real Capital Analytics (1) Implied by price paid by HC III to acquire the property 24 www.suntrustrh.com
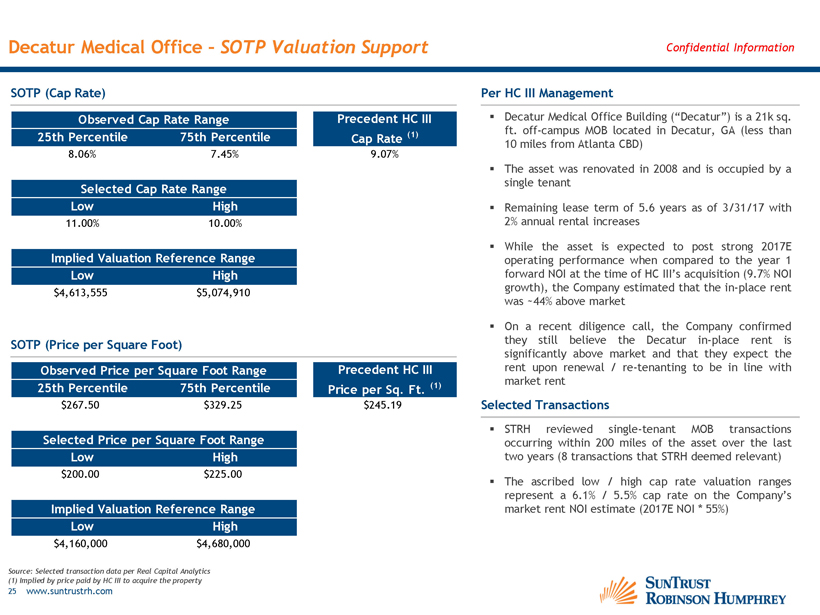
Decatur Medical Office – SOTP Valuation Support Confidential Information SOTP (Cap Rate) Observed Cap Rate Range Precedent HC III 25th Percentile 75th Percentile Cap Rate (1) 8.06% 7.45% 9.07% Selected Cap Rate Range Low High 11.00% 10.00% Implied Valuation Reference Range Low High $4,613,555 $5,074,910 SOTP (Price per Square Foot) Observed Price per Square Foot Range Precedent HC III 25th Percentile 75th Percentile Price per Sq. Ft. (1) $267.50 $329.25 $245.19 Selected Price per Square Foot Range Low High $200.00 $225.00 Implied Valuation Reference Range Low High $4,160,000 $4,680,000 Per HC III Management ▪ Decatur Medical Office Building (“Decatur”) is a 21k sq. ft. off-campus MOB located in Decatur, GA (less than 10 miles from Atlanta CBD) ▪ The asset was renovated in 2008 and is occupied by a single tenant ▪ Remaining lease term of 5.6 years as of 3/31/17 with 2% annual rental increases ▪ While the asset is expected to post strong 2017E operating performance when compared to the year 1 forward NOI at the time of HC III’s acquisition (9.7% NOI growth), the Company estimated that the in-place rent was ~44% above market ▪ On a recent diligence call, the Company confirmed they still believe the Decatur in-place rent is significantly above market and that they expect the rent upon renewal / re-tenanting to be in line with market rent Selected Transactions ▪ STRH reviewed single-tenant MOB transactions occurring within 200 miles of the asset over the last two years (8 transactions that STRH deemed relevant) ▪ The ascribed low / high cap rate valuation ranges represent a 6.1% / 5.5% cap rate on the Company’s market rent NOI estimate (2017E NOI * 55%) Source: Selected transaction data per Real Capital Analytics (1) Implied by price paid by HC III to acquire the property 25 www.suntrustrh.com
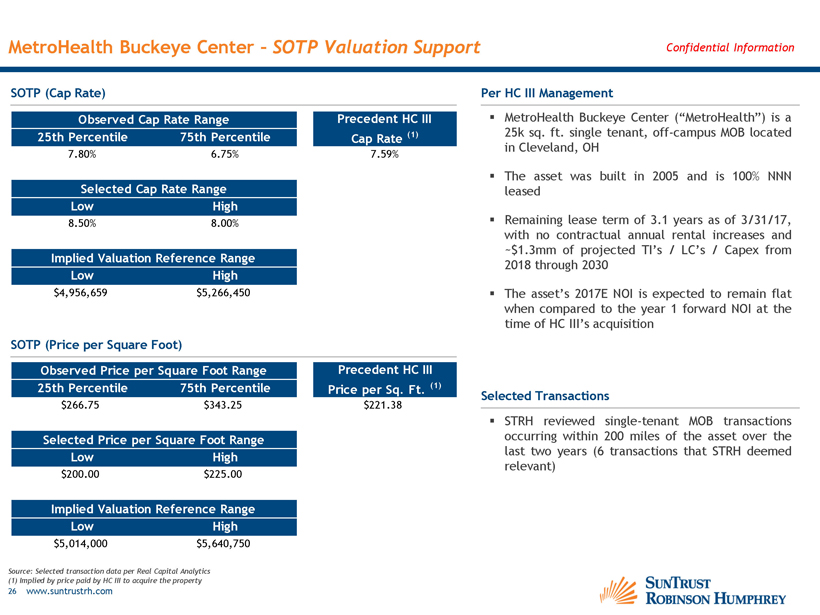
MetroHealth Buckeye Center – SOTP Valuation Support Confidential Information SOTP (Cap Rate) Observed Cap Rate Range Precedent HC III 25th Percentile 75th Percentile Cap Rate (1) 7.80% 6.75% 7.59% Selected Cap Rate Range Low High 8.50% 8.00% Implied Valuation Reference Range Low High $4,956,659 $5,266,450 SOTP (Price per Square Foot) Observed Price per Square Foot Range Precedent HC III 25th Percentile 75th Percentile Price per Sq. Ft. (1) $266.75 $343.25 $221.38 Selected Price per Square Foot Range Low High $200.00 $225.00 Implied Valuation Reference Range Low High $5,014,000 $5,640,750 Per HC III Management ▪ MetroHealth Buckeye Center (“MetroHealth”) is a 25k sq. ft. single tenant, off-campus MOB located in Cleveland, OH ▪ The asset was built in 2005 and is 100% NNN leased ▪ Remaining lease term of 3.1 years as of 3/31/17, with no contractual annual rental increases and ~$1.3mm of projected TI’s / LC’s / Capex from 2018 through 2030 ▪ The asset’s 2017E NOI is expected to remain flat when compared to the year 1 forward NOI at the time of HC III’s acquisition Selected Transactions ▪ STRH reviewed single-tenant MOB transactions occurring within 200 miles of the asset over the last two years (6 transactions that STRH deemed relevant) Source: Selected transaction data per Real Capital Analytics (1) Implied by price paid by HC III to acquire the property 26 www.suntrustrh.com

Philip Professional Center – SOTP Valuation Support Confidential Information SOTP (Cap Rate) Observed Cap Rate Range Precedent HC III 25th Percentile 75th Percentile Cap Rate (1) 7.09% 6.26% 6.50% Selected Cap Rate Range Low High 7.25% 6.75% Implied Valuation Reference Range Low High $7,584,000 $8,145,778 SOTP (Price per Square Foot) Observed Price per Square Foot Range Precedent HC III 25th Percentile 75th Percentile Price per Sq. Ft. (1) $298.25 $316.75 $285.87 Selected Price per Square Foot Range Low High $250.00 $275.00 Implied Valuation Reference Range Low High $7,870,750 $8,657,825 Per HC III Management ▪ Philip Professional Center (“Philip”) is a 31k sq. ft. multi-tenant MOB located in Lawrenceville, GA (suburb of Atlanta, GA) ▪ The asset is located 0.5 miles from the Gwinnett Medical Center (553-bed hospital) ▪ The asset was built in 2007 and is occupied by five tenants including the U.S. Veterans Administration and Kaiser Health Plan of Atlanta ▪ Weighted average remaining lease term of 11.6 years as of 3/31/17 with weighted average annual rental increases of 2.1% ▪ The asset’s 2017E NOI is expected to decline by 6.1% when compared to the year 1 forward NOI at the time of HC III’s acquisition Selected Transactions ▪ STRH reviewed multi-tenant MOB transactions occurring within 200 miles of the asset over the last two years (2 transactions that STRH deemed relevant) Source: Selected transaction data per Real Capital Analytics (1) Implied by price paid by HC III to acquire the property 27 www.suntrustrh.com
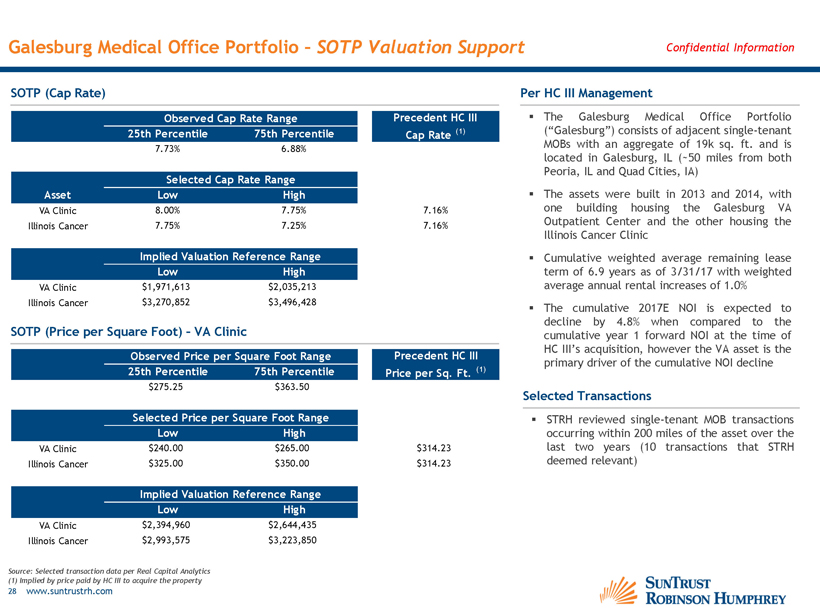
Galesburg Medical Office Portfolio – SOTP Valuation Support Confidential Information SOTP (Cap Rate) Observed Cap Rate Range Precedent HC III 25th Percentile 75th Percentile Cap Rate (1) 7.73% 6.88% Selected Cap Rate Range Asset Low High VA Clinic 8.00% 7.75% 7.16% Illinois Cancer 7.75% 7.25% 7.16% Implied Valuation Reference Range Low High VA Clinic $1,971,613 $2,035,213 Illinois Cancer $3,270,852 $3,496,428 SOTP (Price per Square Foot) – VA Clinic Observed Price per Square Foot Range Precedent HC III 25th Percentile 75th Percentile Price per Sq. Ft. (1) $275.25 $363.50 Selected Price per Square Foot Range Low High VA Clinic $240.00 $265.00 $314.23 Illinois Cancer $325.00 $350.00 $314.23 Implied Valuation Reference Range Low High VA Clinic $2,394,960 $2,644,435 Illinois Cancer $2,993,575 $3,223,850 Per HC III Management ▪ The Galesburg Medical Office Portfolio (“Galesburg”) consists of adjacent single-tenant MOBs with an aggregate of 19k sq. ft. and is located in Galesburg, IL (~50 miles from both Peoria, IL and Quad Cities, IA) ▪ The assets were built in 2013 and 2014, with one building housing the Galesburg VA Outpatient Center and the other housing the Illinois Cancer Clinic ▪ Cumulative weighted average remaining lease term of 6.9 years as of 3/31/17 with weighted average annual rental increases of 1.0% ▪ The cumulative 2017E NOI is expected to decline by 4.8% when compared to the cumulative year 1 forward NOI at the time of HC III’s acquisition, however the VA asset is the primary driver of the cumulative NOI decline Selected Transactions ▪ STRH reviewed single-tenant MOB transactions occurring within 200 miles of the asset over the last two years (10 transactions that STRH deemed relevant) Source: Selected transaction data per Real Capital Analytics (1) Implied by price paid by HC III to acquire the property 28 www.suntrustrh.com
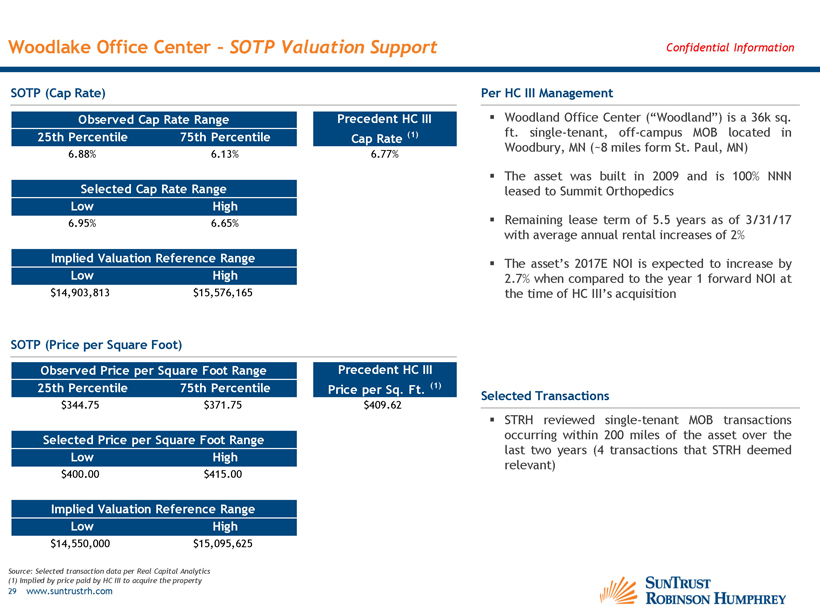
Woodlake Office Center – SOTP Valuation Support Confidential Information SOTP (Cap Rate) Observed Cap Rate Range Precedent HC III 25th Percentile 75th Percentile Cap Rate (1) 6.88% 6.13% 6.77% Selected Cap Rate Range Low High 6.95% 6.65% Implied Valuation Reference Range Low High $14,903,813 $15,576,165 SOTP (Price per Square Foot) Observed Price per Square Foot Range Precedent HC III 25th Percentile 75th Percentile Price per Sq. Ft. (1) $344.75 $371.75 $409.62 Selected Price per Square Foot Range Low High $400.00 $415.00 Implied Valuation Reference Range Low High $14,550,000 $15,095,625 Per HC III Management ▪ Woodland Office Center (“Woodland”) is a 36k sq. ft. single-tenant, off-campus MOB located in Woodbury, MN (~8 miles form St. Paul, MN) ▪ The asset was built in 2009 and is 100% NNN leased to Summit Orthopedics ▪ Remaining lease term of 5.5 years as of 3/31/17 with average annual rental increases of 2% ▪ The asset’s 2017E NOI is expected to increase by 2.7% when compared to the year 1 forward NOI at the time of HC III’s acquisition Selected Transactions ▪ STRH reviewed single-tenant MOB transactions occurring within 200 miles of the asset over the last two years (4 transactions that STRH deemed relevant) Source: Selected transaction data per Real Capital Analytics (1) Implied by price paid by HC III to acquire the property 29 www.suntrustrh.com
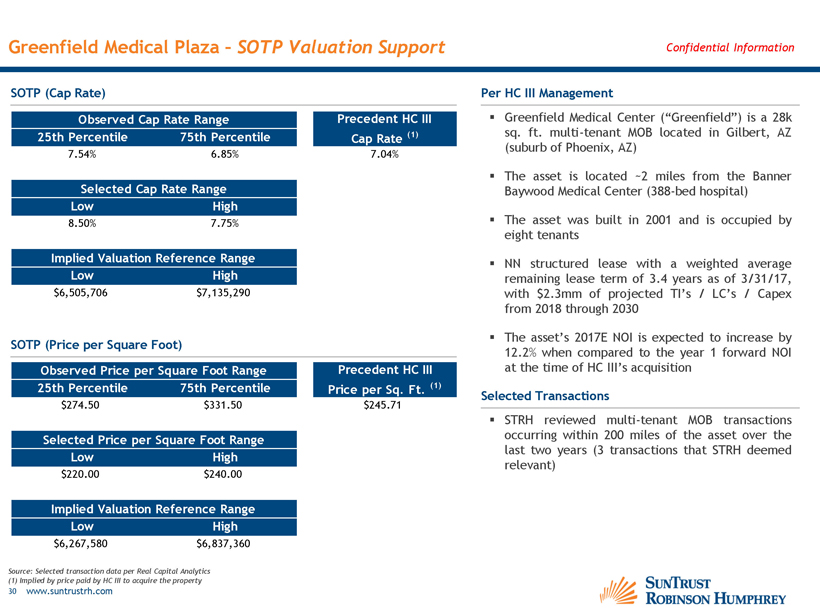
Greenfield Medical Plaza – SOTP Valuation Support Confidential Information SOTP (Cap Rate) Observed Cap Rate Range Precedent HC III 25th Percentile 75th Percentile Cap Rate (1) 7.54% 6.85% 7.04% Selected Cap Rate Range Low High 8.50% 7.75% Implied Valuation Reference Range Low High $6,505,706 $7,135,290 SOTP (Price per Square Foot) Observed Price per Square Foot Range Precedent HC III 25th Percentile 75th Percentile Price per Sq. Ft. (1) $274.50 $331.50 $245.71 Selected Price per Square Foot Range Low High $220.00 $240.00 Implied Valuation Reference Range Low High $6,267,580 $6,837,360 Per HC III Management ▪ Greenfield Medical Center (“Greenfield”) is a 28k sq. ft. multi-tenant MOB located in Gilbert, AZ (suburb of Phoenix, AZ) ▪ The asset is located ~2 miles from the Banner Baywood Medical Center (388-bed hospital) ▪ The asset was built in 2001 and is occupied by eight tenants ▪ NN structured lease with a weighted average remaining lease term of 3.4 years as of 3/31/17, with $2.3mm of projected TI’s / LC’s / Capex from 2018 through 2030 ▪ The asset’s 2017E NOI is expected to increase by 12.2% when compared to the year 1 forward NOI at the time of HC III’s acquisition Selected Transactions ▪ STRH reviewed multi-tenant MOB transactions occurring within 200 miles of the asset over the last two years (3 transactions that STRH deemed relevant) Source: Selected transaction data per Real Capital Analytics (1) Implied by price paid by HC III to acquire the property 30 www.suntrustrh.com

Lee Memorial Health Outpatient – SOTP Valuation Support Confidential Information SOTP (Cap Rate) Observed Cap Rate Range Precedent HC III 25th Percentile 75th Percentile Cap Rate (1) 7.33% 7.08% 7.16% Selected Cap Rate Range Low High 8.75% 8.25% Implied Valuation Reference Range Low High $4,293,874 $4,554,109 SOTP (Price per Square Foot) Observed Price per Square Foot Range Precedent HC III 25th Percentile 75th Percentile Price per Sq. Ft. (1) $281.75 $297.25 $218.21 Selected Price per Square Foot Range Low High $190.00 $210.00 Implied Valuation Reference Range Low High $4,593,060 $5,076,540 Per HC III Management ▪ Lee Memorial Health System Outpatient Center (“Lee Memorial”) is a 24k sq. ft. multi-tenant MOB located in Fort Myers, FL ▪ The asset is located in the Riverwalk Medical Park, a nine-property campus that totals more than 200k sq. ft. of medical office space ▪ The asset was built in 1998 and is occupied by five tenants ▪ NN structured lease with a weighted average remaining lease term of 1.5 years as of 3/31/17 and $1.5mm of projected TI’s / LC’s / Capex from 2018 through 2030 ▪ The asset’s 2017E NOI is expected to remain flat when compared to the year 1 forward NOI at the time of HC III’s acquisition Selected Transactions ▪ STRH reviewed multi-tenant MOB transactions occurring within 200 miles of the asset over the last two years (6 transactions that STRH deemed relevant) Source: Selected transaction data per Real Capital Analytics (1) Implied by price paid by HC III to acquire the property 31 www.suntrustrh.com

Beaumont Medical Center – SOTP Valuation Support Confidential Information SOTP (Cap Rate) Observed Cap Rate Range Precedent HC III 25th Percentile 75th Percentile Cap Rate (1) 7.77% 7.77% 8.08% Selected Cap Rate Range Low High 8.65% 8.15% Implied Valuation Reference Range Low High $12,842,220 $13,630,086 SOTP (Price per Square Foot) Observed Price per Square Foot Range Precedent HC III 25th Percentile 75th Percentile Price per Sq. Ft. (1) $294.00 $294.00 $387.57 Selected Price per Square Foot Range Low High $375.00 $350.00 Implied Valuation Reference Range Low High $13,207,125 $12,326,650 Per HC III Management ▪ Beaumont Medical Center (“Beaumont”) is a 35k sq. ft. multi-tenant MOB located in Warren, MI (suburb of Detroit, MI) ▪ The asset is located within a 10-mile radius of seven hospitals which have 3,141 aggregate beds ▪ The asset was built in 2005 and is occupied by five tenants ▪ NN structured lease with a weighted average remaining lease term of 4.8 years as of 3/31/17 and $1.6mm of projected TI’s / LC’s / Capex from 2018 through 2030 ▪ The asset’s 2017E NOI is expected to remain flat when compared to the year 1 forward NOI at the time of HC III’s acquisition Selected Transactions ▪ STRH reviewed multi-tenant MOB transactions occurring within 200 miles of the asset over the last two years (1 transaction that STRH deemed relevant) Source: Selected transaction data per Real Capital Analytics (1) Implied by price paid by HC III to acquire the property 32 www.suntrustrh.com
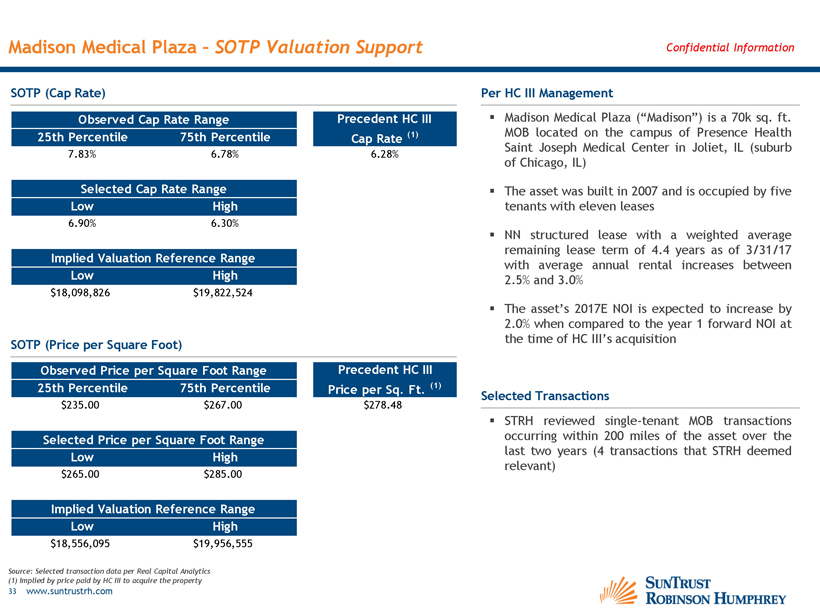
Madison Medical Plaza – SOTP Valuation Support Confidential Information SOTP (Cap Rate) Observed Cap Rate Range Precedent HC III 25th Percentile 75th Percentile Cap Rate (1) 7.83% 6.78% 6.28% Selected Cap Rate Range Low High 6.90% 6.30% Implied Valuation Reference Range Low High $18,098,826 $19,822,524 SOTP (Price per Square Foot) Observed Price per Square Foot Range Precedent HC III 25th Percentile 75th Percentile Price per Sq. Ft. (1) $235.00 $267.00 $278.48 Selected Price per Square Foot Range Low High $265.00 $285.00 Implied Valuation Reference Range Low High $18,556,095 $19,956,555 Per HC III Management ▪ Madison Medical Plaza (“Madison”) is a 70k sq. ft. MOB located on the campus of Presence Health Saint Joseph Medical Center in Joliet, IL (suburb of Chicago, IL) ▪ The asset was built in 2007 and is occupied by five tenants with eleven leases ▪ NN structured lease with a weighted average remaining lease term of 4.4 years as of 3/31/17 with average annual rental increases between 2.5% and 3.0% ▪ The asset’s 2017E NOI is expected to increase by 2.0% when compared to the year 1 forward NOI at the time of HC III’s acquisition Selected Transactions ▪ STRH reviewed single-tenant MOB transactions occurring within 200 miles of the asset over the last two years (4 transactions that STRH deemed relevant) Source: Selected transaction data per Real Capital Analytics (1) Implied by price paid by HC III to acquire the property 33 www.suntrustrh.com

Unity Point Clinic – SOTP Valuation Support Confidential Information SOTP (Cap Rate) Observed Cap Rate Range Precedent HC III 25th Percentile 75th Percentile Cap Rate (1) 7.76% 6.57% 7.00% Selected Cap Rate Range Low High 7.75% 7.35% Implied Valuation Reference Range Low High $8,281,119 $8,731,793 SOTP (Price per Square Foot) Observed Price per Square Foot Range Precedent HC III 25th Percentile 75th Percentile Price per Sq. Ft. (1) $263.25 $365.75 $265.16 Selected Price per Square Foot Range Low High $225.00 $275.00 Implied Valuation Reference Range Low High $8,191,575 $10,011,925 Per HC III Management ▪ The UnityPoint Clinics (“UnityPoints”) consist of single-tenant MOBs with an aggregate of 36k sq. ft. and are located in Moline, IL and Muscatine, IA ▪ The Moline property was built in 2013 and the Muscatine property was built in 2015 ▪ Both leases are NNN structured with a cumulative weighted average remaining lease term of 7.5 years as of 3/31/17 ▪ Both properties include a one-time 10% rent increase (Moline in 2020 and Muscatine in 2019) ▪ The cumulative 2017E NOI is expected to remain flat when compared to the cumulative year 1 forward NOI at the time of HC III’s acquisition Selected Transactions ▪ STRH reviewed single-tenant MOB transactions occurring within 200 miles of the asset over the last two years (12 transactions that STRH deemed relevant) Source: Selected transaction data per Real Capital Analytics (1) Implied by price paid by HC III to acquire the property 34 www.suntrustrh.com

Appendix C Selected Transaction Support
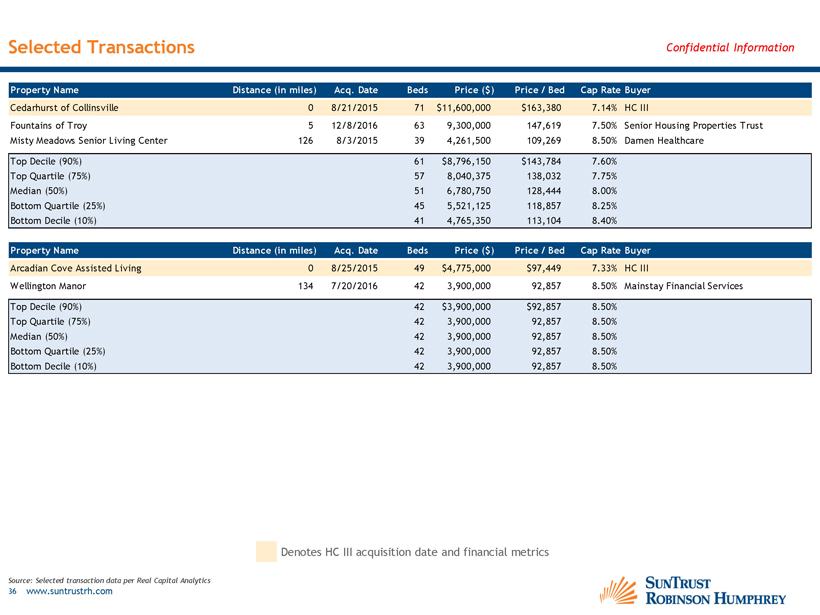
Selected Transactions Confidential Information Property Name Distance (in miles) Acq. Date Beds Price ($) Price / Bed Cap Rate Buyer Cedarhurst of Collinsville 0 8/21/2015 71 $11,600,000 $163,380 7.14% HC III Fountains of Troy 5 12/8/2016 63 9,300,000 147,619 7.50% Senior Housing Properties Trust Misty Meadows Senior Living Center 126 8/3/2015 39 4,261,500 109,269 8.50% Damen Healthcare Top Decile (90%) 61 $8,796,150 $143,784 7.60% Top Quartile (75%) 57 8,040,375 138,032 7.75% Median (50%) 51 6,780,750 128,444 8.00% Bottom Quartile (25%) 45 5,521,125 118,857 8.25% Bottom Decile (10%) 41 4,765,350 113,104 8.40% Property Name Distance (in miles) Acq. Date Beds Price ($) Price / Bed Cap Rate Buyer Arcadian Cove Assisted Living 0 8/25/2015 49 $4,775,000 $97,449 7.33% HC III Wellington Manor 134 7/20/2016 42 3,900,000 92,857 8.50% Mainstay Financial Services Top Decile (90%) 42 $3,900,000 $92,857 8.50% Top Quartile (75%) 42 3,900,000 92,857 8.50% Median (50%) 42 3,900,000 92,857 8.50% Bottom Quartile (25%) 42 3,900,000 92,857 8.50% Bottom Decile (10%) 42 3,900,000 92,857 8.50% Denotes HC III acquisition date and financial metrics Source: Selected transaction data per Real Capital Analytics 36 www.suntrustrh.com
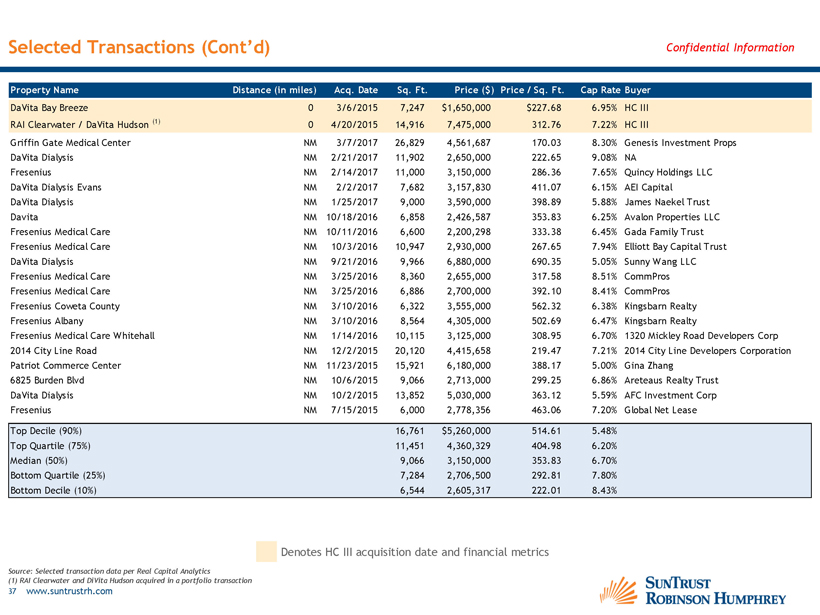
Selected Transactions (Cont’d) Confidential Information Property Name Distance (in miles) Acq. Date Sq. Ft. Price ($) Price / Sq. Ft. Cap Rate Buyer DaVita Bay Breeze 0 3/6/2015 7,247 $1,650,000 $227.68 6.95% HC III RAI Clearwater / DaVita Hudson (1) 0 4/20/2015 14,916 7,475,000 312.76 7.22% HC III Griffin Gate Medical Center NM 3/7/2017 26,829 4,561,687 170.03 8.30% Genesis Investment Props DaVita Dialysis NM 2/21/2017 11,902 2,650,000 222.65 9.08% NA Fresenius NM 2/14/2017 11,000 3,150,000 286.36 7.65% Quincy Holdings LLC DaVita Dialysis Evans NM 2/2/2017 7,682 3,157,830 411.07 6.15% AEI Capital DaVita Dialysis NM 1/25/2017 9,000 3,590,000 398.89 5.88% James Naekel Trust Davita NM 10/18/2016 6,858 2,426,587 353.83 6.25% Avalon Properties LLC Fresenius Medical Care NM 10/11/2016 6,600 2,200,298 333.38 6.45% Gada Family Trust Fresenius Medical Care NM 10/3/2016 10,947 2,930,000 267.65 7.94% Elliott Bay Capital Trust DaVita Dialysis NM 9/21/2016 9,966 6,880,000 690.35 5.05% Sunny Wang LLC Fresenius Medical Care NM 3/25/2016 8,360 2,655,000 317.58 8.51% CommPros Fresenius Medical Care NM 3/25/2016 6,886 2,700,000 392.10 8.41% CommPros Fresenius Coweta County NM 3/10/2016 6,322 3,555,000 562.32 6.38% Kingsbarn Realty Fresenius Albany NM 3/10/2016 8,564 4,305,000 502.69 6.47% Kingsbarn Realty Fresenius Medical Care Whitehall NM 1/14/2016 10,115 3,125,000 308.95 6.70% 1320 Mickley Road Developers Corp 2014 City Line Road NM 12/2/2015 20,120 4,415,658 219.47 7.21% 2014 City Line Developers Corporation Patriot Commerce Center NM 11/23/2015 15,921 6,180,000 388.17 5.00% Gina Zhang 6825 Burden Blvd NM 10/6/2015 9,066 2,713,000 299.25 6.86% Areteaus Realty Trust DaVita Dialysis NM 10/2/2015 13,852 5,030,000 363.12 5.59% AFC Investment Corp Fresenius NM 7/15/2015 6,000 2,778,356 463.06 7.20% Global Net Lease Top Decile (90%) 16,761 $5,260,000 514.61 5.48% Top Quartile (75%) 11,451 4,360,329 404.98 6.20% Median (50%) 9,066 3,150,000 353.83 6.70% Bottom Quartile (25%) 7,284 2,706,500 292.81 7.80% Bottom Decile (10%) 6,544 2,605,317 222.01 8.43% Denotes HC III acquisition date and financial metrics Source: Selected transaction data per Real Capital Analytics (1) RAI Clearwater and DiVita Hudson acquired in a portfolio transaction 37 www.suntrustrh.com
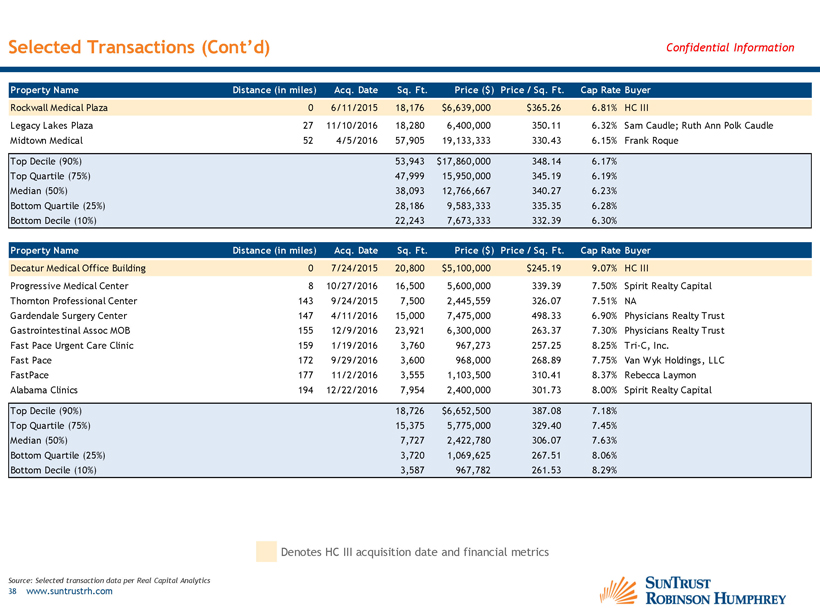
Selected Transactions (Cont’d) Confidential Information Property Name Distance (in miles) Acq. Date Sq. Ft. Price ($) Price / Sq. Ft. Cap Rate Buyer Rockwall Medical Plaza 0 6/11/2015 18,176 $6,639,000 $365.26 6.81% HC III Legacy Lakes Plaza 27 11/10/2016 18,280 6,400,000 350.11 6.32% Sam Caudle; Ruth Ann Polk Caudle Midtown Medical 52 4/5/2016 57,905 19,133,333 330.43 6.15% Frank Roque Top Decile (90%) 53,943 $17,860,000 348.14 6.17% Top Quartile (75%) 47,999 15,950,000 345.19 6.19% Median (50%) 38,093 12,766,667 340.27 6.23% Bottom Quartile (25%) 28,186 9,583,333 335.35 6.28% Bottom Decile (10%) 22,243 7,673,333 332.39 6.30% Property Name Distance (in miles) Acq. Date Sq. Ft. Price ($) Price / Sq. Ft. Cap Rate Buyer Decatur Medical Office Building 0 7/24/2015 20,800 $5,100,000 $245.19 9.07% HC III Progressive Medical Center 8 10/27/2016 16,500 5,600,000 339.39 7.50% Spirit Realty Capital Thornton Professional Center 143 9/24/2015 7,500 2,445,559 326.07 7.51% NA Gardendale Surgery Center 147 4/11/2016 15,000 7,475,000 498.33 6.90% Physicians Realty Trust Gastrointestinal Assoc MOB 155 12/9/2016 23,921 6,300,000 263.37 7.30% Physicians Realty Trust Fast Pace Urgent Care Clinic 159 1/19/2016 3,760 967,273 257.25 8.25% Tri-C, Inc. Fast Pace 172 9/29/2016 3,600 968,000 268.89 7.75% Van Wyk Holdings, LLC FastPace 177 11/2/2016 3,555 1,103,500 310.41 8.37% Rebecca Laymon Alabama Clinics 194 12/22/2016 7,954 2,400,000 301.73 8.00% Spirit Realty Capital Top Decile (90%) 18,726 $6,652,500 387.08 7.18% Top Quartile (75%) 15,375 5,775,000 329.40 7.45% Median (50%) 7,727 2,422,780 306.07 7.63% Bottom Quartile (25%) 3,720 1,069,625 267.51 8.06% Bottom Decile (10%) 3,587 967,782 261.53 8.29% Denotes HC III acquisition date and financial metrics Source: Selected transaction data per Real Capital Analytics 38 www.suntrustrh.com
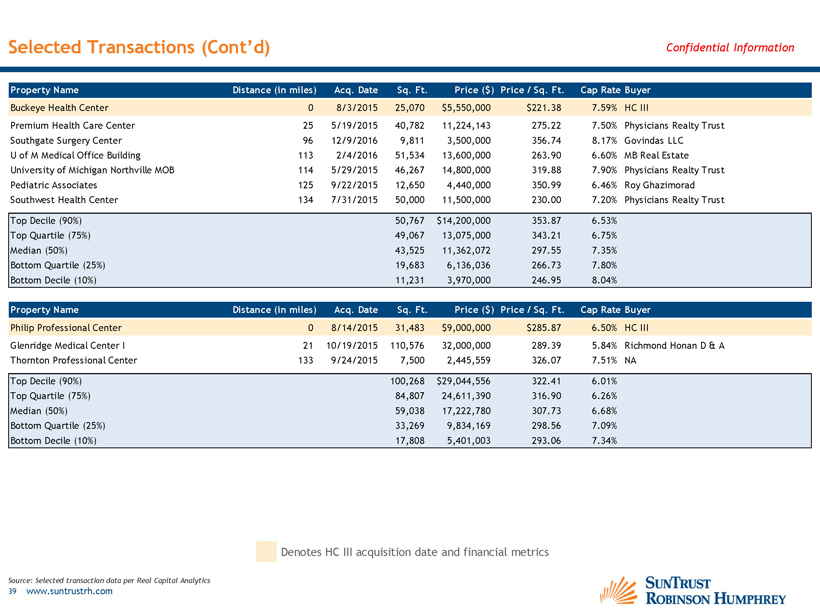
Selected Transactions (Cont’d) Confidential Information Property Name Distance (in miles) Acq. Date Sq. Ft. Price ($) Price / Sq. Ft. Cap Rate Buyer Buckeye Health Center 0 8/3/2015 25,070 $5,550,000 $221.38 7.59% HC III Premium Health Care Center 25 5/19/2015 40,782 11,224,143 275.22 7.50% Physicians Realty Trust Southgate Surgery Center 96 12/9/2016 9,811 3,500,000 356.74 8.17% Govindas LLC U of M Medical Office Building 113 2/4/2016 51,534 13,600,000 263.90 6.60% MB Real Estate University of Michigan Northville MOB 114 5/29/2015 46,267 14,800,000 319.88 7.90% Physicians Realty Trust Pediatric Associates 125 9/22/2015 12,650 4,440,000 350.99 6.46% Roy Ghazimorad Southwest Health Center 134 7/31/2015 50,000 11,500,000 230.00 7.20% Physicians Realty Trust Top Decile (90%) 50,767 $14,200,000 353.87 6.53% Top Quartile (75%) 49,067 13,075,000 343.21 6.75% Median (50%) 43,525 11,362,072 297.55 7.35% Bottom Quartile (25%) 19,683 6,136,036 266.73 7.80% Bottom Decile (10%) 11,231 3,970,000 246.95 8.04% Property Name Distance (in miles) Acq. Date Sq. Ft. Price ($) Price / Sq. Ft. Cap Rate Buyer Philip Professional Center 0 8/14/2015 31,483 $9,000,000 $285.87 6.50% HC III Glenridge Medical Center I 21 10/19/2015 110,576 32,000,000 289.39 5.84% Richmond Honan D & A Thornton Professional Center 133 9/24/2015 7,500 2,445,559 326.07 7.51% NA Top Decile (90%) 100,268 $29,044,556 322.41 6.01% Top Quartile (75%) 84,807 24,611,390 316.90 6.26% Median (50%) 59,038 17,222,780 307.73 6.68% Bottom Quartile (25%) 33,269 9,834,169 298.56 7.09% Bottom Decile (10%) 17,808 5,401,003 293.06 7.34% Denotes HC III acquisition date and financial metrics Source: Selected transaction data per Real Capital Analytics 39 www.suntrustrh.com
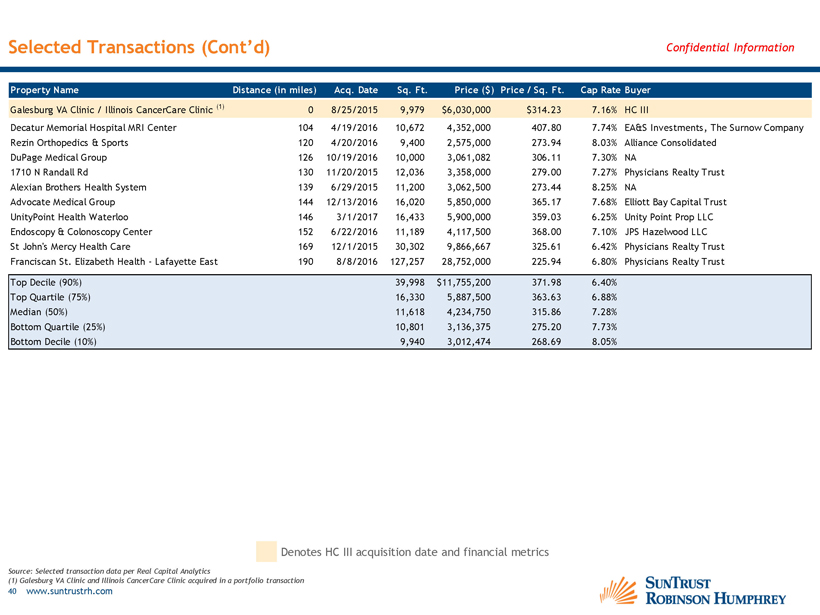
Selected Transactions (Cont’d) Confidential Information Property Name Distance (in miles) Acq. Date Sq. Ft. Price ($) Price / Sq. Ft. Cap Rate Buyer Galesburg VA Clinic / Illinois CancerCare Clinic (1) 0 8/25/2015 9,979 $6,030,000 $314.23 7.16% HC III Decatur Memorial Hospital MRI Center 104 4/19/2016 10,672 4,352,000 407.80 7.74% EA&S Investments, The Surnow Company Rezin Orthopedics & Sports 120 4/20/2016 9,400 2,575,000 273.94 8.03% Alliance Consolidated DuPage Medical Group 126 10/19/2016 10,000 3,061,082 306.11 7.30% NA 1710 N Randall Rd 130 11/20/2015 12,036 3,358,000 279.00 7.27% Physicians Realty Trust Alexian Brothers Health System 139 6/29/2015 11,200 3,062,500 273.44 8.25% NA Advocate Medical Group 144 12/13/2016 16,020 5,850,000 365.17 7.68% Elliott Bay Capital Trust UnityPoint Health Waterloo 146 3/1/2017 16,433 5,900,000 359.03 6.25% Unity Point Prop LLC Endoscopy & Colonoscopy Center 152 6/22/2016 11,189 4,117,500 368.00 7.10% JPS Hazelwood LLC St John's Mercy Health Care 169 12/1/2015 30,302 9,866,667 325.61 6.42% Physicians Realty Trust Franciscan St. Elizabeth Health - Lafayette East 190 8/8/2016 127,257 28,752,000 225.94 6.80% Physicians Realty Trust Top Decile (90%) 39,998 $11,755,200 371.98 6.40% Top Quartile (75%) 16,330 5,887,500 363.63 6.88% Median (50%) 11,618 4,234,750 315.86 7.28% Bottom Quartile (25%) 10,801 3,136,375 275.20 7.73% Bottom Decile (10%) 9,940 3,012,474 268.69 8.05% Denotes HC III acquisition date and financial metrics Source: Selected transaction data per Real Capital Analytics (1) Galesburg VA Clinic and Illinois CancerCare Clinic acquired in a portfolio transaction 40 www.suntrustrh.com

Selected Transactions (Cont’d) Confidential Information Property Name Distance (in miles) Acq. Date Sq. Ft. Price ($) Price / Sq. Ft. Cap Rate Buyer Woodlake Office Center 0 9/11/2015 36,375 $14,900,000 $409.62 6.77% HC III Prairie Care Maplewood 8 7/6/2016 13,950 4,886,243 350.27 7.10% Physicians Realty Trust Allina Health Lakeville Clinic 24 9/16/2015 12,462 5,104,780 409.63 5.77% Richard J Schreier Park Nicollet Clinic 27 2/8/2016 56,600 18,600,000 328.62 6.80% Physicians Realty Trust UnityPoint Health Waterloo 172 3/1/2017 16,433 5,900,000 359.03 6.25% Unity Point Prop LLC Top Decile (90%) 44,550 $14,790,000 394.45 5.91% Top Quartile (75%) 26,475 9,075,000 371.68 6.13% Median (50%) 15,192 5,502,390 354.65 6.53% Bottom Quartile (25%) 13,578 5,050,145 344.86 6.88% Bottom Decile (10%) 12,908 4,951,804 335.12 7.01% Property Name Distance (in miles) Acq. Date Sq. Ft. Price ($) Price / Sq. Ft. Cap Rate Buyer Greenfield Medical Plaza 0 10/8/2015 28,489 $7,000,000 $245.71 7.04% HC III Mayo Fountain Hills 17 9/30/2015 46,121 13,275,000 287.83 7.00% Physicians Realty Trust Thunderbird Square Medical I 35 4/12/2017 35,420 9,250,000 261.15 6.70% Montecito Medical Thumb Butte Medical Center 95 2/9/2017 12,000 4,500,000 375.00 8.08% Global Medical REIT Top Decile (90%) 43,981 $12,470,000 357.57 6.76% Top Quartile (75%) 40,771 11,262,500 331.41 6.85% Median (50%) 35,420 9,250,000 287.83 7.00% Bottom Quartile (25%) 23,710 6,875,000 274.49 7.54% Bottom Decile (10%) 16,684 5,450,000 266.49 7.86% Denotes HC III acquisition date and financial metrics Source: Selected transaction data per Real Capital Analytics 41 www.suntrustrh.com
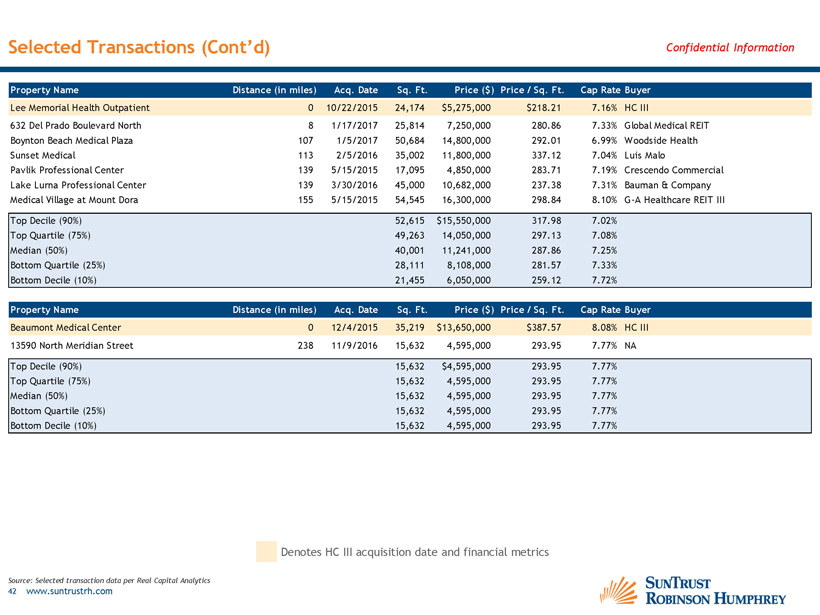
Selected Transactions (Cont’d) Confidential Information Property Name Distance (in miles) Acq. Date Sq. Ft. Price ($) Price / Sq. Ft. Cap Rate Buyer Lee Memorial Health Outpatient 0 10/22/2015 24,174 $5,275,000 $218.21 7.16% HC III 632 Del Prado Boulevard North 8 1/17/2017 25,814 7,250,000 280.86 7.33% Global Medical REIT Boynton Beach Medical Plaza 107 1/5/2017 50,684 14,800,000 292.01 6.99% Woodside Health Sunset Medical 113 2/5/2016 35,002 11,800,000 337.12 7.04% Luis Malo Pavlik Professional Center 139 5/15/2015 17,095 4,850,000 283.71 7.19% Crescendo Commercial Lake Lurna Professional Center 139 3/30/2016 45,000 10,682,000 237.38 7.31% Bauman & Company Medical Village at Mount Dora 155 5/15/2015 54,545 16,300,000 298.84 8.10% G-A Healthcare REIT III Top Decile (90%) 52,615 $15,550,000 317.98 7.02% Top Quartile (75%) 49,263 14,050,000 297.13 7.08% Median (50%) 40,001 11,241,000 287.86 7.25% Bottom Quartile (25%) 28,111 8,108,000 281.57 7.33% Bottom Decile (10%) 21,455 6,050,000 259.12 7.72% Property Name Distance (in miles) Acq. Date Sq. Ft. Price ($) Price / Sq. Ft. Cap Rate Buyer Beaumont Medical Center 0 12/4/2015 35,219 $13,650,000 $387.57 8.08% HC III 13590 North Meridian Street 238 11/9/2016 15,632 4,595,000 293.95 7.77% NA Top Decile (90%) 15,632 $4,595,000 293.95 7.77% Top Quartile (75%) 15,632 4,595,000 293.95 7.77% Median (50%) 15,632 4,595,000 293.95 7.77% Bottom Quartile (25%) 15,632 4,595,000 293.95 7.77% Bottom Decile (10%) 15,632 4,595,000 293.95 7.77% Denotes HC III acquisition date and financial metrics Source: Selected transaction data per Real Capital Analytics 42 www.suntrustrh.com
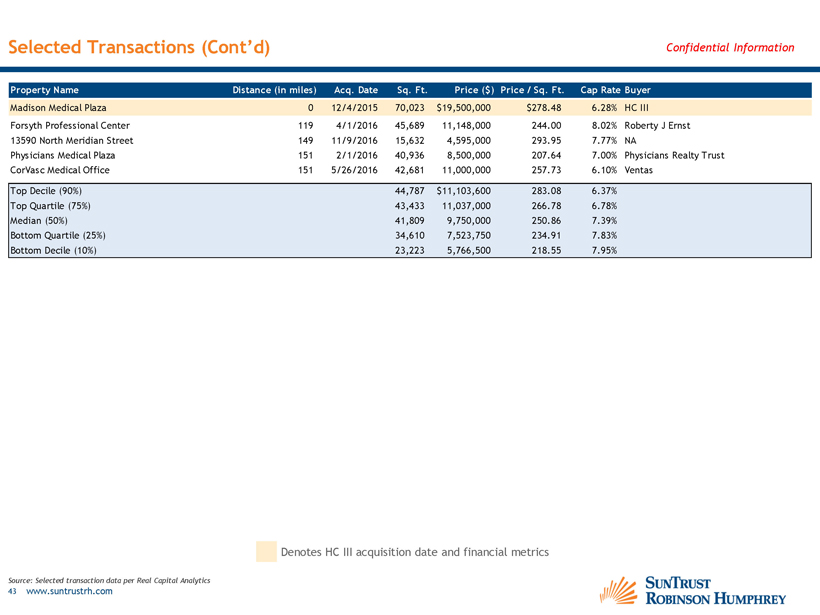
Selected Transactions (Cont’d) Confidential Information Property Name Distance (in miles) Acq. Date Sq. Ft. Price ($) Price / Sq. Ft. Cap Rate Buyer Madison Medical Plaza 0 12/4/2015 70,023 $19,500,000 $278.48 6.28% HC III Forsyth Professional Center 119 4/1/2016 45,689 11,148,000 244.00 8.02% Roberty J Ernst 13590 North Meridian Street 149 11/9/2016 15,632 4,595,000 293.95 7.77% NA Physicians Medical Plaza 151 2/1/2016 40,936 8,500,000 207.64 7.00% Physicians Realty Trust CorVasc Medical Office 151 5/26/2016 42,681 11,000,000 257.73 6.10% Ventas Top Decile (90%) 44,787 $11,103,600 283.08 6.37% Top Quartile (75%) 43,433 11,037,000 266.78 6.78% Median (50%) 41,809 9,750,000 250.86 7.39% Bottom Quartile (25%) 34,610 7,523,750 234.91 7.83% Bottom Decile (10%) 23,223 5,766,500 218.55 7.95% Denotes HC III acquisition date and financial metrics Source: Selected transaction data per Real Capital Analytics 43 www.suntrustrh.com
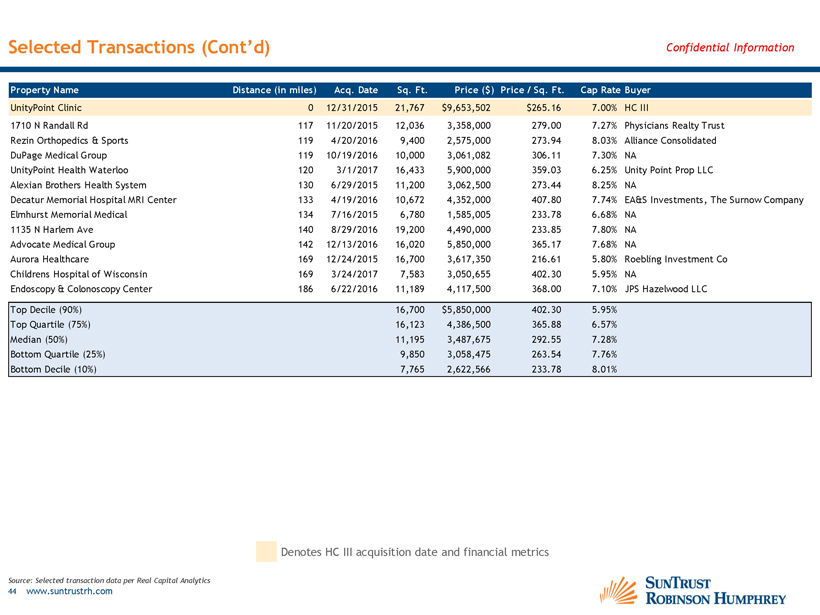
Selected Transactions (Cont’d) Confidential Information Property Name Distance (in miles) Acq. Date Sq. Ft. Price ($) Price / Sq. Ft. Cap Rate Buyer UnityPoint Clinic 0 12/31/2015 21,767 $9,653,502 $265.16 7.00% HC III 1710 N Randall Rd 117 11/20/2015 12,036 3,358,000 279.00 7.27% Physicians Realty Trust Rezin Orthopedics & Sports 119 4/20/2016 9,400 2,575,000 273.94 8.03% Alliance Consolidated DuPage Medical Group 119 10/19/2016 10,000 3,061,082 306.11 7.30% NA UnityPoint Health Waterloo 120 3/1/2017 16,433 5,900,000 359.03 6.25% Unity Point Prop LLC Alexian Brothers Health System 130 6/29/2015 11,200 3,062,500 273.44 8.25% NA Decatur Memorial Hospital MRI Center 133 4/19/2016 10,672 4,352,000 407.80 7.74% EA&S Investments, The Surnow Company Elmhurst Memorial Medical 134 7/16/2015 6,780 1,585,005 233.78 6.68% NA 1135 N Harlem Ave 140 8/29/2016 19,200 4,490,000 233.85 7.80% NA Advocate Medical Group 142 12/13/2016 16,020 5,850,000 365.17 7.68% NA Aurora Healthcare 169 12/24/2015 16,700 3,617,350 216.61 5.80% Roebling Investment Co Childrens Hospital of Wisconsin 169 3/24/2017 7,583 3,050,655 402.30 5.95% NA Endoscopy & Colonoscopy Center 186 6/22/2016 11,189 4,117,500 368.00 7.10% JPS Hazelwood LLC Top Decile (90%) 16,700 $5,850,000 402.30 5.95% Top Quartile (75%) 16,123 4,386,500 365.88 6.57% Median (50%) 11,195 3,487,675 292.55 7.28% Bottom Quartile (25%) 9,850 3,058,475 263.54 7.76% Bottom Decile (10%) 7,765 2,622,566 233.78 8.01% Denotes HC III acquisition date and financial metrics Source: Selected transaction data per Real Capital Analytics 44 www.suntrustrh.com
Appendix D Illustrative Net Asset Value Per Share

Illustrative Net Asset Value Per Share Confidential Information Selected Cap Rate Range Implied Valuation Reference Range Property 2017E NOI Low High Low High Cedarhurst of Collinsville $975,188 7.75% 7.25% $12,583,066 $13,450,864 Arcadian Cove Assisted Living 361,739 10.00% 9.50% 3,617,393 3,807,782 DaVita Bay Breeze 118,628 7.40% 7.15% 1,603,081 1,659,133 RAI Clearwater 355,628 7.25% 7.00% 4,905,214 5,080,400 DaVita Hudson 199,022 7.50% 7.25% 2,653,627 2,745,131 Rockwall Medical Plaza 423,056 7.25% 6.75% 5,835,255 6,267,496 Decatur Medical Office Building 507,491 11.00% 10.00% 4,613,555 5,074,910 MetroHealth Buckeye Center 421,316 8.50% 8.00% 4,956,659 5,266,450 Philip Professional Center 549,840 7.25% 6.75% 7,584,000 8,145,778 VA Clinic 157,729 8.00% 7.75% 1,971,613 2,035,213 Illinois Cancer 253,491 7.75% 7.25% 3,270,852 3,496,428 Woodlake Office Center 1,035,815 6.95% 6.65% 14,903,813 15,576,165 Greenfield Medical Plaza 552,985 8.50% 7.75% 6,505,706 7,135,290 Lee Memorial Health Outpatient 375,714 8.75% 8.25% 4,293,874 4,554,109 Beaumont Medical Center 1,110,852 8.65% 8.15% 12,842,220 13,630,086 Madison Medical Plaza 1,248,819 6.90% 6.30% 18,098,826 19,822,524 Unity Point Clinic 641,787 7.75% 7.35% 8,281,119 8,731,793 Total / Implied Cap Rates $9,289,100 7.84% 7.34% $118,519,872 $126,479,552 Plus: Other Assets (1) 15,949,000 15,949,000 Less: Liabilities (2) 8,136,000 8,136,000 Net Asset Value $126,332,872 $134,292,552 Common Shares Outstanding (3) 6,956,303 6,956,303 Net Asset Value per Share $18.16 $19.31 Source: Q1 2017 assets and liabilities in 10-Q used for assets and liabilities at transaction closing for illustrative purposes only. Liabilities do not include any expenses or fees payable in connection with the closing of the transaction. The actual amount of assets or liabilities at transaction closing may vary materially from figures shown above. Note: Provided for illustrative purposes only. SunTrust Robinson Humphrey does not express any view or opinion regarding the (i) allocation of the aggregate consideration as between American Realty Capital Healthcare Trust III Operating Partnership, L.P. (the “OP Seller”) and ARHC TRS Holdco III, LLC (the “Holdco Seller”), (ii) the distribution of the aggregate consideration to the equity holders of the OP Seller and the Holdco Seller, including, without limitation, the allocation of the proceeds of any such distribution among such equity holders, (iii) the dissolution or liquidation of the Company, including, without limitation, the amount of the proceeds that the shareholders of the Company may receive in such a dissolution and liquidation. Assumes, per Company management, that 100% of the escrow proceeds are distributed to the Sellers. Amounts shown without discounting such proceeds to present value. (1) Includes Q1 ’17 cash , restricted stock, prepaid expenses and other asset balances (2) Includes Q1 ’17 gross mortgage notes payable, accounts payable and accrued expenses (3) As of May 31, 2017 per American Realty Capital Healthcare III Advisors, LLC, external advisor to HC III 46 www.suntrustrh.com