American Realty Capital Healthcare Trust Iii Inactive
Filed: 29 Sep 17, 12:00am
Exhibit (c)(7)

Confidential Project Pelican Preliminary Discussion Materials for the Board of Directors Real Estate Investment Banking July 8, 2016
KeyCorp & KeyBanc Capital Markets KeyBanc Capital Markets is a trade name under which the corporate and investment banking products and services of KeyCorp and its subsidiaries, KeyBanc Capital Markets Inc., Member NYSE/FINRA/SIPC, and KeyBank National Association (“KeyBank N.A.”), are marketed. Securities products and services are offered by KeyBanc Capital Markets Inc. and by its licensed securities representatives. Banking products and services are offered by KeyBank N.A. A number of our corporate and institutional team members are employed by both KeyBanc Capital Markets Inc. and KeyBank N.A. These “dual employees” are licensed securities representatives of KeyBanc Capital Markets Inc., and they are there to better serve your needs, by making available both securities and banking products and services. Further, in connection with our effort to deliver a comprehensive array of banking and securities products and services to you in a seamless manner, from time to time KeyBank N.A. and KeyBanc Capital Markets Inc. will share with each other certain non-public information that you provide to us. Of course, as always, this information will not be shared or otherwise disclosed outside of the KeyCorp organization without your express permission. Please also be assured that, as with other banks and broker-dealers, KeyBank N.A. and KeyBanc Capital Markets Inc. adhere to established internal procedures to safeguard your corporate information from areas within our organization that trade in or advise clients with respect to the purchase and sale of securities. THE OBLIGATIONS OF KEYBANC CAPITAL MARKETS INC. ARE NOT OBLIGATIONS OF KEYBANK N.A. OR ANY OF ITS AFFILIATE BANKS, AND NONE OF KEYCORP’S BANKS ARE RESPONSIBLE FOR, OR GUARANTEE, THE SECURITIES OR SECURITIES-RELATED PRODUCTS OR SERVICES SOLD, OFFERED OR RECOMMENDED BY KEYBANC CAPITAL MARKETS INC. OR ITS EMPLOYEES. SECURITIES AND OTHER INVESTMENT PRODUCTS SOLD, OFFERED OR RECOMMENDED BY KEYBANC CAPITAL MARKETS INC., IF ANY, ARE NOT BANK DEPOSITS OR OBLIGATIONS AND ARE NOT INSURED BY THE FDIC. 2
Table of Contents Section I Executive Summary Section II Portfolio Overview Section III Individual Property Overviews Section IV Preliminary Valuation Appendix Benchmarking Analysis 3
Confidential Executive Summary
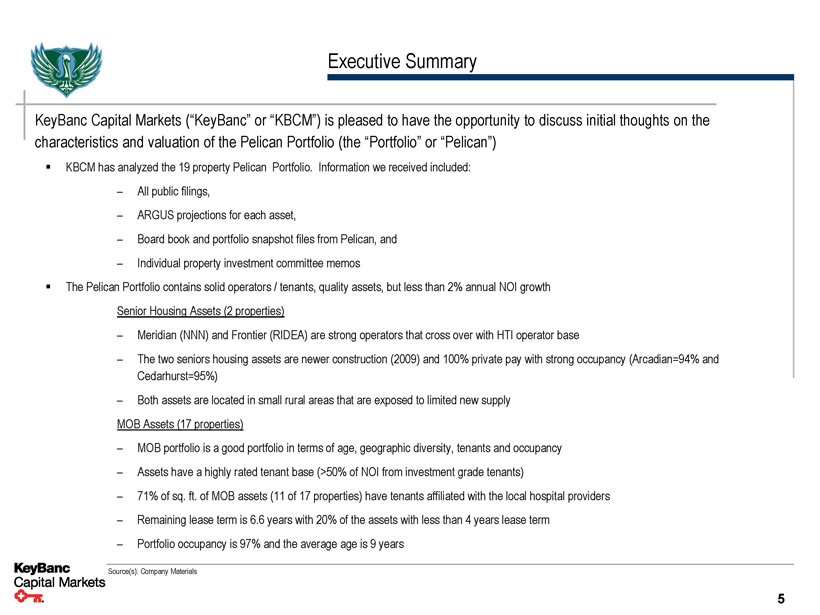
Executive Summary KeyBanc Capital Markets (“KeyBanc” or “KBCM”) is pleased to have the opportunity to discuss initial thoughts on the characteristics and valuation of the Pelican Portfolio (the “Portfolio” or “Pelican”) ▪ KBCM has analyzed the 19 property Pelican Portfolio. Information we received included: – All public filings, – ARGUS projections for each asset, – Board book and portfolio snapshot files from Pelican, and – Individual property investment committee memos ▪ The Pelican Portfolio contains solid operators / tenants, quality assets, but less than 2% annual NOI growth Senior Housing Assets (2 properties) – Meridian (NNN) and Frontier (RIDEA) are strong operators that cross over with HTI operator base – The two seniors housing assets are newer construction (2009) and 100% private pay with strong occupancy (Arcadian=94% and Cedarhurst=95%) – Both assets are located in small rural areas that are exposed to limited new supply MOB Assets (17 properties) – MOB portfolio is a good portfolio in terms of age, geographic diversity, tenants and occupancy – Assets have a highly rated tenant base (>50% of NOI from investment grade tenants) – 71% of sq. ft. of MOB assets (11 of 17 properties) have tenants affiliated with the local hospital providers – Remaining lease term is 6.6 years with 20% of the assets with less than 4 years lease term – Portfolio occupancy is 97% and the average age is 9 years Source(s): Company Materials 5

Executive Summary (cont’d.) ▪ KeyBanc believes the current cost basis of the portfolio of $127.8 million is an appropriate valuation for the portfolio, representing a per share value of $19.96 – Includes $16.7 million of cash, $5.1 million of outstanding debt and a 2.0% disposition fee for AR Capital – Reflects existing share count of 6.8 million – Implied cap rate of 6.91%(1) with MOB implied $/SF of $295.89 and $/Unit of $136,458 for senior housing assets ▪ From what we understand, Pelican’s advisors have reached out to a limited number of buyers – We believe current competition is AFIN with an all stock offer – Portfolio is unlikely to attract the public REITs or institutional private equity buyers ▪ We may have a window to acquire the portfolio at a discount – KeyBanc would recommend a 10% discount to cost implying a cash offer of $115(2) million or $18.13 per share (7.6% implied Cap Rate) Implied Price at Cost Value in ($MMs) Per Share Value Asset Purchase Price $127.8 $18.67 Plus: Cash 16.7 $2.44 Less: Debt (5.1) ($0.74) Purchase Price before Fees $139.4 $20.36 Less: ARC 2% Disposition Fee (2.8) ($0.41) Total Cost $136.6 $19.96 Divided by: Share Count 6.8 Purchase Price per Share $19.96 Implied 2016 Cap Rate (1) 6.91% Implied $/ SF - MOBs (1) $295.89 Implied $/ Unit - Senior Housing (1) $136,458 Implied Price at 10% Discount to Cost Value in ($MMs) Per Share Value Asset Purchase Price $127.8 $18.67 Proposed Reduction (10.0%) ($1.87) Reduced Purchase Price $115.0 $16.80 Plus: Cash 16.7 $2.44 Less: Debt (5.1) ($0.74) Purchase Price before Fees $126.6 $18.50 Less: ARC 2% Disposition Fee (2.5) ($0.37) Total Cost $124.1 $18.13 Divided by: Share Count 6.8 Purchase Price per Share $18.13 Implied 2016 Cap Rate (1) 7.60% Implied $/ SF - MOBs (1) $266.30 Implied $/ Unit - Senior Housing (1) $122,813 Source(s): Company Materials (1) Cap rate based on total cost, implied $/SF and $/Unit metrics based on asset purchase price (2) Including $16.7mm of cash on balance sheet, $5.1mm of debt, and a 2.0% ARC disposition fee, the net purchase prices equals $124.1mm 6
Executive Summary (cont’d.) ▪ An acquisition of Pelican provides a number of potential benefits: – Adds assets which are well known to our organization – Further strengthens exposure to in-favor MOB assets across existing portfolio at a reasonable price – Provides a growth opportunity going forward in the event a sale process does not provide an attractive offer – Increases overall portfolio occupancy – Broadens tenant/operator base – Greater private pay focused asset base in pro forma portfolio – Aggregated portfolio without paying premium – Marketed process helps cleanse potential blemishes from an affiliated deal – Ability to structure into sale process in a similar fashion to ongoing asset sales Source(s): Company Materials 7
Executive Summary (cont’d.) ▪ However, the Board should consider a number of factors regarding an acquisition of Pelican: – Concerns around acquisition of an affiliated entity – Relatively small portfolio does not move the needle – Certain assets have relatively short remaining lease term – Transaction is being marketed, will most likely generate additional competition – Limited NOI growth in Pelican Portfolio – Potential to create distractions in HTI sale process ▪ Pelican provides an opportunity to acquire an aggregated portfolio of known assets with good quality, and despite potential for distractions, could be integrated into the broader portfolio at a reasonable price Source(s): Company Materials 8

Confidential Overview of Pelican’s Portfolio
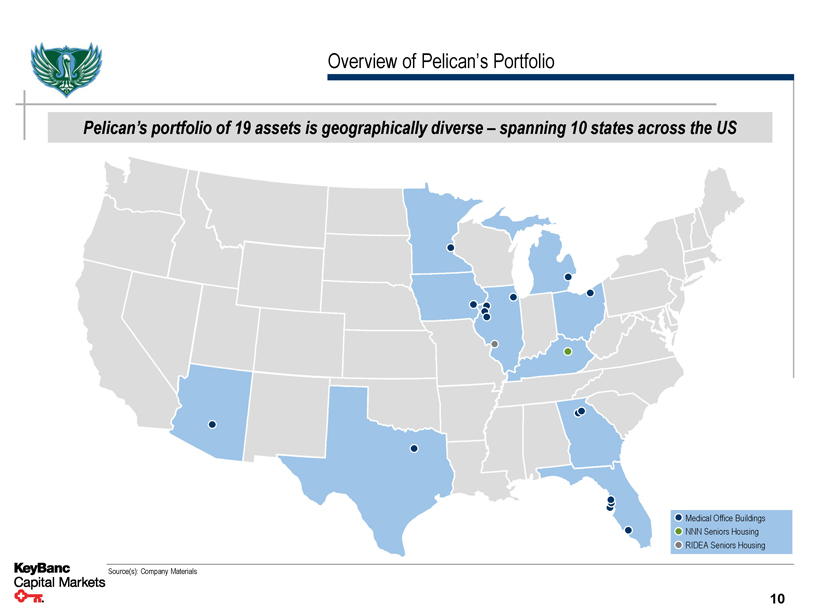
Overview of Pelican’s Portfolio Pelican’s portfolio of 19 assets is geographically diverse – spanning 10 states across the US Medical Office Buildings NNN Seniors Housing RIDEA Seniors Housing Source(s): Company Materials 10
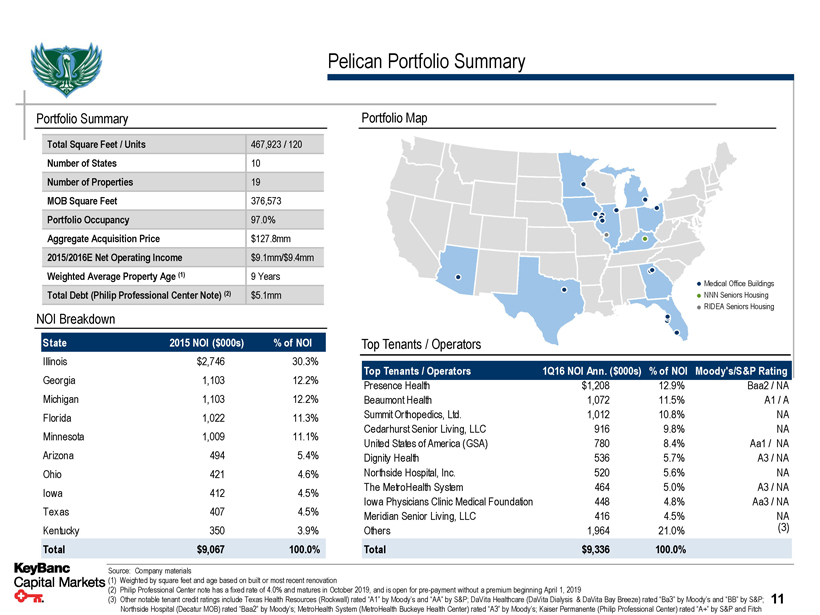
Pelican Portfolio Summary Portfolio Summary Total Square Feet / Units 467,923 / 120 Number of States 10 Number of Properties 19 MOB Square Feet 376,573 Portfolio Occupancy 97.0% Aggregate Acquisition Price $127.8mm 2015/2016E Net Operating Income $9.1mm/$9.4mm Weighted Average Property Age (1) 9 Years Total Debt (Philip Professional Center Note) (2) $5.1mm NOI Breakdown State 2015 NOI ($000s)% of NOI Illinois $2,746 30.3% Georgia 1,103 12.2% Michigan 1,103 12.2% Florida 1,022 11.3% Minnesota 1,009 11.1% Arizona 494 5.4% Ohio 421 4.6% Iowa 412 4.5% Texas 407 4.5% Kentucky 350 3.9% Total $9,067 100.0% Portfolio Map Medical Office Buildings NNN Seniors Housing RIDEA Seniors Housing Top Tenants / Operators Top Tenants / Operators 1Q16 NOI Ann. ($000s)% of NOI Moody's/S&P Rating Presence Health $1,208 12.9% Baa2 / NA Beaumont Health 1,072 11.5% A1 / A Summit Orthopedics, Ltd. 1,012 10.8% NA Cedarhurst Senior Living, LLC 916 9.8% NA United States of America (GSA) 780 8.4% Aa1 / NA Dignity Health 536 5.7% A3 / NA Northside Hospital, Inc. 520 5.6% NA The MetroHealth System 464 5.0% A3 / NA Iowa Physicians Clinic Medical Foundation 448 4.8% Aa3 / NA Meridian Senior Living, LLC 416 4.5% NA Others 1,964 21.0% (3) Total $9,336 100.0% Source: Company materials (1) Weighted by square feet and age based on built or most recent renovation (2) Philip Professional Center note has a fixed rate of 4.0% and matures in October 2019, and is open for pre-payment without a premium beginning April 1, 2019 (3) Other notable tenant credit ratings include Texas Health Resources (Rockwall) rated “A1” by Moody’s and “AA” by S&P; DaVita Healthcare (DaVita Dialysis & DaVita Bay Breeze) rated “Ba3” by Moody’s and “BB” by S&P; 11 Northside Hospital (Decatur MOB) rated “Baa2” by Moody’s; MetroHealth System (MetroHealth Buckeye Health Center) rated “A3” by Moody’s; Kaiser Permanente (Philip Professional Center) rated “A+” by S&P and Fitch

Property Listing Property / Portfolio Location Yr. Built / Primary Tenant Acquisition Rentable Square M / S Tenant Occupancy Reno. Date Feet NNN / RIDEA Medical Office Buildings DaVita Bay Breeze Dialysis Center Largo, FL 2012 DaVita Bay Breeze-Largo Mar-15 7,247 S 100.0% RAI Care Center Palm Harbor, FL 1973 / 2009 RAI Care Centers of Florida Apr-15 14,936 M 100.0% DaVita Dialysis Hudson, FL 1973 / 2009 Total Renal Care, Inc. May -15 8,984 M 100.0% Rockwall Medical Plaza Rockwall, TX 2009 PedMed Rockwall, LLC Jun-15 18,176 M 100.0% Decatur MOB Decatur, GA 1993 Georgia Cancer Specialists Jul-15 20,800 S 100.0% MetroHealth Buckeye Health Center Cleveland, OH 2005 MetroHealth System Aug-15 25,070 S 100.0% Philip Professional Center (2 buildings) Lawrenceville, GA 2008 Kaiser Foundation of GA Aug-15 31,483 M 93.9% Illinois CancerCare Clinic Galesburg, IL 2014 Illinois CancerCare, P.C. Aug-15 9,211 S 100.0% Galesburg VA Outpatient Clinic Galesburg, IL 2013 The United States of America Aug-15 9,979 S 100.0% Woodlake Office Center Woodbury, MN 2009 Summit Orthopedics Sep-15 36,375 S 100.0% Greenfield Medical Center Gilbert, AZ 2001 SMI Imaging, LLC Oct-15 28,489 M 100.0% Lee Memorial Health System Outpatient Center Fort Myers, FL 1998 Lee Memorial Health System Oct-15 24,174 S 100.0% Beaumont Medical Center Warren, MI 2005 William Beaumont Hospital Dec-15 35,219 M 95.2% Madison Medical Plaza Joliet, IL 2007 Presence Health Dec-15 70,023 M 89.4% UnityPoint Muscatine Muscatine , IA 2015 UnityPoint Clinic Dec-15 21,767 S 100.0% UnityPoint Moline Moline , IL 2013 Trinity Medical Center Dec-15 14,640 S 100.0% Medical Office Buildings Total 376,573 97.1% NNN Seniors Housing Arcadian Cove Assisted Living Richmond, KY 2009 Meridian Senior Living Aug-15 34,650 SF / 49 Units NNN 100.0% (1) NNN Seniors Housing 34,650 SF / 49 Units 100.0% RIDEA Seniors Housing Cedarhurst of Collinsville Collinsville, IL 2009 Cedarhurst Senior Living, LLC Aug-15 56,700 SF / 71 Units RIDEA 94.7% RIDEA Seniors Housing 56,700 SF / 71 Units 94.7% Total Portfolio 467,923 97.0% Source: Company materials, SEC filings (1) Operating occupancy of 94.1% as of 3/31/2016 12
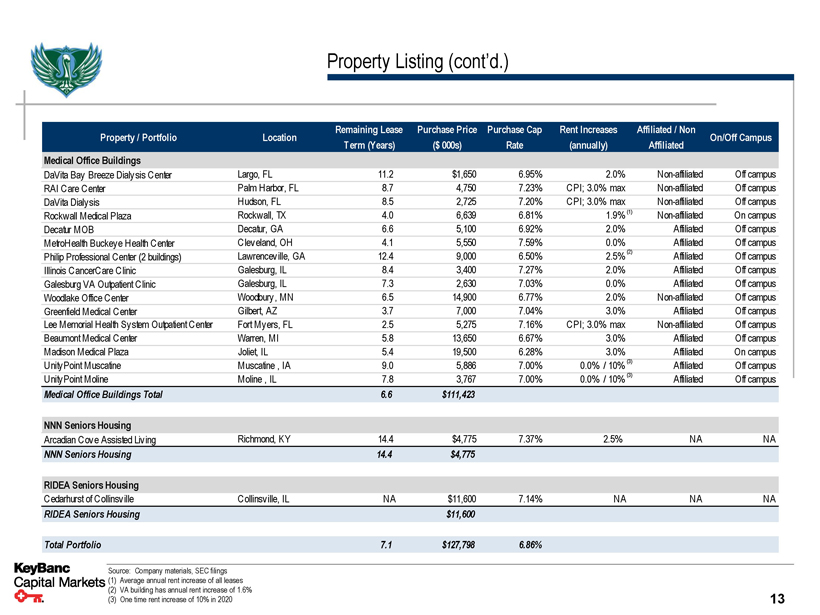
Property Listing (cont’d.) Property / Portfolio Location Remaining Lease Purchase Price Purchase Cap Rent Increases Affiliated / Non On/Off Campus Term (Years) ($000s) Rate (annually) Affiliated Medical Office Buildings DaVita Bay Breeze Dialysis Center Largo, FL 11.2 $1,650 6.95% 2.0% Non-affiliated Off campus RAI Care Center Palm Harbor, FL 8.7 4,750 7.23% CPI; 3.0% max Non-affiliated Off campus DaVita Dialysis Hudson, FL 8.5 2,725 7.20% CPI; 3.0% max Non-affiliated Off campus Rockwall Medical Plaza Rockwall, TX 4.0 6,639 6.81% 1.9% (1) Non-affiliated On campus Decatur MOB Decatur, GA 6.6 5,100 6.92% 2.0% Affiliated Off campus MetroHealth Buckeye Health Center Cleveland, OH 4.1 5,550 7.59% 0.0% Affiliated Off campus Philip Professional Center (2 buildings) Lawrenceville, GA 12.4 9,000 6.50% 2.5% (2) Affiliated Off campus Illinois CancerCare Clinic Galesburg, IL 8.4 3,400 7.27% 2.0% Affiliated Off campus Galesburg VA Outpatient Clinic Galesburg, IL 7.3 2,630 7.03% 0.0% Affiliated Off campus Woodlake Office Center Woodbury, MN 6.5 14,900 6.77% 2.0% Non-affiliated Off campus Greenfield Medical Center Gilbert, AZ 3.7 7,000 7.04% 3.0% Affiliated Off campus Lee Memorial Health System Outpatient Center Fort Myers, FL 2.5 5,275 7.16% CPI; 3.0% max Non-affiliated Off campus Beaumont Medical Center Warren, MI 5.8 13,650 6.67% 3.0% Affiliated Off campus Madison Medical Plaza Joliet, IL 5.4 19,500 6.28% 3.0% Affiliated On campus UnityPoint Muscatine Muscatine , IA 9.0 5,886 7.00% 0.0% / 10% (3) Affiliated Off campus UnityPoint Moline Moline , IL 7.8 3,767 7.00% 0.0% / 10% (3) Affiliated Off campus Medical Office Buildings Total 6.6 $111,423 NNN Seniors Housing Arcadian Cove Assisted Living Richmond, KY 14.4 $4,775 7.37% 2.5% NA NA NNN Seniors Housing 14.4 $4,775 RIDEA Seniors Housing Cedarhurst of Collinsville Collinsville, IL NA $11,600 7.14% NA NA NA RIDEA Seniors Housing $11,600 Total Portfolio 7.1 $127,798 6.86% Source: Company materials, SEC filings (1) Average annual rent increase of all leases (2) VA building has annual rent increase of 1.6% 13 (3) One time rent increase of 10% in 2020

Top Tenants / Operators Tenant / Asset Presence Health (12.9% of NOI) Madison Medical Plaza Beaumont Health (11.5% of NOI) Beaumont Medical Center Summit Orthopedics (10.8% of NOI) Woodlake Office Center Overview ▪ Presence Health is the second largest health system based in Illinois, with more than 150 locations around the state, including 11 hospitals, 27 long-term care and senior living facilities, more than 50 primary and specialty care clinics, and 6 home health agencies ▪ The health system has hospital operations throughout Chicago, as well as in Des Plains, Evanston, Aurora, Elgin, Joliet, Kankakee, Urbana, and Danville ▪ Rated “Baa2”/”BBB+” by Moody’s and S&P, respectively ▪ Presence Health leases 58.2% of the assets’ square feet (65% of the occupied square feet) ▪ Beaumont Health, a not-for-profit, is the largest healthcare system in Southeast Michigan with $4.1 billion in total revenues ▪ It consists of eight 8 hospitals with 3,399 beds, 168 outpatient sites 5,000 physicians and 35,000 employees ▪ In 2015, the combined organizations had 177,819 inpatient admissions, 17,151 births and 545,825 emergency visits ▪ It has affiliations with Oakland University William Beaumont School of Medicine, Michigan State University College of Osteopathic Medicine, and Wayne State University School of Medicine ▪ Rated “A1”/”A” by Moody’s and S&P, respectively ▪ Beaumont Health leases 56.7% of the assets’ square feet (60.0% of occupied square feet) ▪ Summit Orthopedics was founded over 25 years ago and is one of Minnesota’s largest orthopedic groups ▪ The group is headquartered in Woodbury, Minnesota and is home to over 40 surgeons and non-operative physicians offering a full spectrum of orthopedic sub-specialty care ▪ Summit has more than 500 full-time employees providing quality care at its numerous locations throughout Minnesota Tenant / Asset Frontier Management (9.8% of NOI) Cedarhurst of Collinsville United States of America (GSA) (8.4% of NOI) Galesburg VA / Philip Professional Center Dignity Health (5.7% of NOI) Greenfield Medical Center Overview ▪ Frontier Management is a national operator of seniors housing facilities committed to providing best-in-class service to improve the lives of its residents each day ▪ Headquartered in Portland, Oregon, Frontier currently manages over sixty properties located in nine states ▪ The majority of Frontier’s properties are in the Pacific Northwest, but the operator is growing in the Midwest and currently operates eight communities in the region ▪ Frontier operates 9 assets comprised of 734 units with annualized NOI of approximately $9.2 million for HTI ▪ The Veterans Health Administration is America’s largest integrated health care system with over 1,700 sites of care, serving 8.76 million Veterans each year ▪ The VHA provides a broad range of primary care, specialized care, and related medical and social support services ▪ The VHA is also the Nation’s largest integrated provider of health care education and training for physician residents and other health care trainees ▪ The Galesburg VA functions very similarly to a typical doctor’s office and provides primary care, preventative health, and wellness services ▪ The Philip Professional Center location provides counseling, family therapy and readjustment counseling services ▪ Founded in 1986, and headquartered in San Francisco, Dignity Health is the fifth largest health system in the nation and the largest hospital provider in California ▪ Dignity Health is comprised of 39 hospitals and more than 400 care centers in communities across California, Arizona, and Nevada ▪ The system is made up of more than 60,000 caregivers and staff who deliver excellent care to diverse communities across 21 states ▪ Rated “A” by Moody’s 14
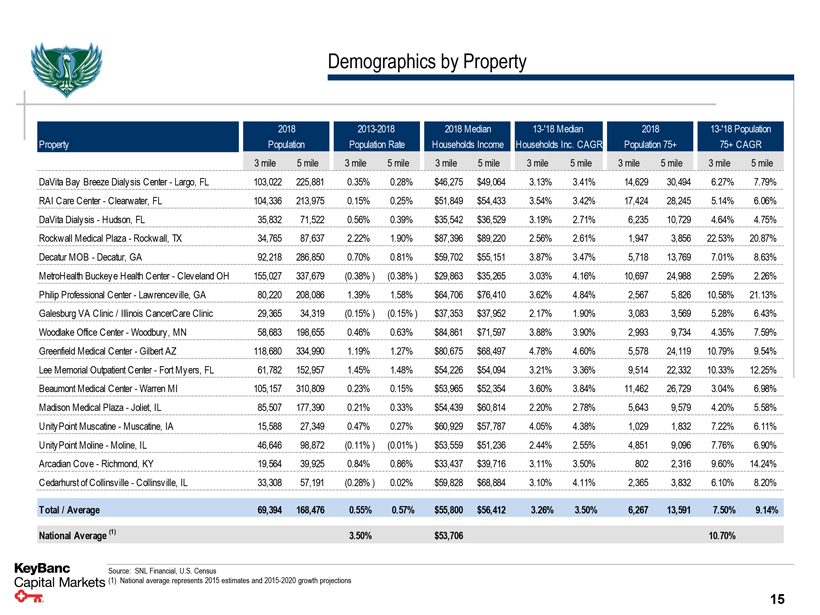
Demographics by Property 2018 2013-2018 2018 Median 13-'18 Median 2018 13-'18 Population Property Population Population Rate Households Income Households Inc. CAGR Population 75+ 75+ CAGR 3 mile 5 mile 3 mile 5 mile 3 mile 5 mile 3 mile 5 mile 3 mile 5 mile 3 mile 5 mile DaVita Bay Breeze Dialysis Center - Largo, FL 103,022 225,881 0.35% 0.28% $46,275 $49,064 3.13% 3.41% 14,629 30,494 6.27% 7.79% RAI Care Center - Clearwater, FL 104,336 213,975 0.15% 0.25% $51,849 $54,433 3.54% 3.42% 17,424 28,245 5.14% 6.06% DaVita Dialysis - Hudson, FL 35,832 71,522 0.56% 0.39% $35,542 $36,529 3.19% 2.71% 6,235 10,729 4.64% 4.75% Rockwall Medical Plaza - Rockwall, TX 34,765 87,637 2.22% 1.90% $87,396 $89,220 2.56% 2.61% 1,947 3,856 22.53% 20.87% Decatur MOB - Decatur, GA 92,218 286,850 0.70% 0.81% $59,702 $55,151 3.87% 3.47% 5,718 13,769 7.01% 8.63% MetroHealth Buckeye Health Center - Cleveland OH 155,027 337,679 (0.38%) (0.38%) $29,863 $35,265 3.03% 4.16% 10,697 24,988 2.59% 2.26% Philip Professional Center - Lawrenceville, GA 80,220 208,086 1.39% 1.58% $64,706 $76,410 3.62% 4.84% 2,567 5,826 10.58% 21.13% Galesburg VA Clinic / Illinois CancerCare Clinic 29,365 34,319 (0.15%) (0.15%) $37,353 $37,952 2.17% 1.90% 3,083 3,569 5.28% 6.43% Woodlake Office Center - Woodbury, MN 58,683 198,655 0.46% 0.63% $84,861 $71,597 3.88% 3.90% 2,993 9,734 4.35% 7.59% Greenfield Medical Center - Gilbert AZ 118,680 334,990 1.19% 1.27% $80,675 $68,497 4.78% 4.60% 5,578 24,119 10.79% 9.54% Lee Memorial Outpatient Center - Fort Myers, FL 61,782 152,957 1.45% 1.48% $54,226 $54,094 3.21% 3.36% 9,514 22,332 10.33% 12.25% Beaumont Medical Center - Warren MI 105,157 310,809 0.23% 0.15% $53,965 $52,354 3.60% 3.84% 11,462 26,729 3.04% 6.98% Madison Medical Plaza - Joliet, IL 85,507 177,390 0.21% 0.33% $54,439 $60,814 2.20% 2.78% 5,643 9,579 4.20% 5.58% UnityPoint Muscatine - Muscatine, IA 15,588 27,349 0.47% 0.27% $60,929 $57,787 4.05% 4.38% 1,029 1,832 7.22% 6.11% UnityPoint Moline - Moline, IL 46,646 98,872 (0.11%) (0.01%) $53,559 $51,236 2.44% 2.55% 4,851 9,096 7.76% 6.90% Arcadian Cove - Richmond, KY 19,564 39,925 0.84% 0.86% $33,437 $39,716 3.11% 3.50% 802 2,316 9.60% 14.24% Cedarhurst of Collinsville - Collinsville, IL 33,308 57,191 (0.28%) 0.02% $59,828 $68,884 3.10% 4.11% 2,365 3,832 6.10% 8.20% Total / Average 69,394 168,476 0.55% 0.57% $55,800 $56,412 3.26% 3.50% 6,267 13,591 7.50% 9.14% National Average (1) 3.50% $53,706 10.70% Source: SNL Financial, U.S. Census (1) National average represents 2015 estimates and 2015-2020 growth projections 15

Impact of the Pelican Portfolio HTI Pelican Pro Forma HTI Gross Real Estate Investment(1) Number of Properties Number of States Square Footage Units Occupancy% GLA from on-campus or affiliated MOBs Weighted Average Lease Term $2,349 Million $128 Million $2,476 Million 166 19 185 29 10 31 8,494,520 + 467,923 = 8,962,443 7,075 120 7,195 92% 97% 92% 85% 76% 84% 8.2 Years 7.1 Years 8.2 Years Source: Company materials, SEC filings, Q1 2016 Data book for HTI (1) HTI metric defined as “Gross Asset Value” from HTI Q1 2016 Data Book as of 3/31/2016 and Pelican metric defined as “base purchase price” from Pelican 3/31/2016 10-Q 16
Confidential Individual Property Overviews

Confidential MOB Property Overviews
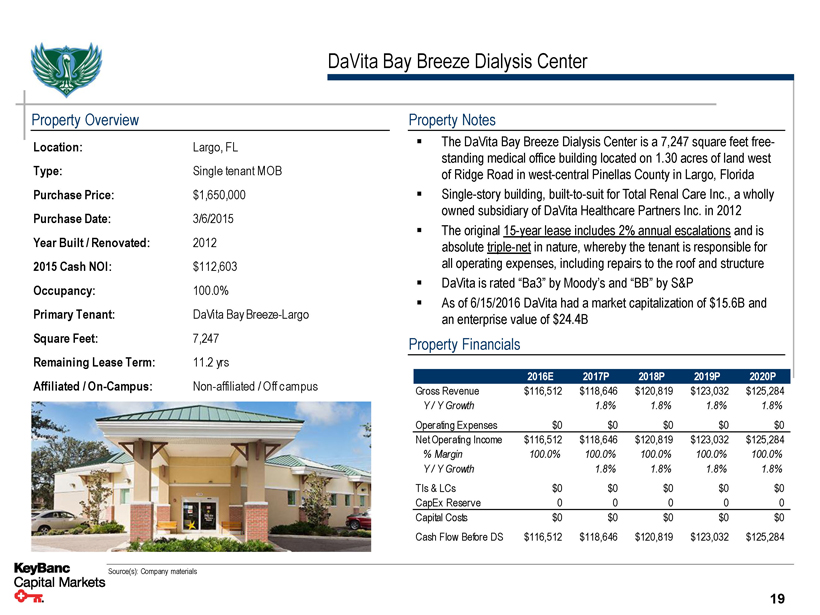
DaVita Bay Breeze Dialysis Center Property Overview Location: Largo, FL Type: Single tenant MOB Purchase Price: $1,650,000 Purchase Date: 3/6/2015 Year Built / Renovated: 2012 2015 Cash NOI: $112,603 Occupancy: 100.0% Primary Tenant: DaVita Bay Breeze-Largo Square Feet: 7,247 Remaining Lease Term: 11.2 yrs Property Notes ▪ The DaVita Bay Breeze Dialysis Center is a 7,247 square feet free-standing medical office building located on 1.30 acres of land west of Ridge Road in west-central Pinellas County in Largo, Florida ▪ Single-story building, built-to-suit for Total Renal Care Inc., a wholly owned subsidiary of DaVita Healthcare Partners Inc. in 2012 ▪ The original 15-year lease includes 2% annual escalations and is absolute triple-net in nature, whereby the tenant is responsible for all operating expenses, including repairs to the roof and structure ▪ DaVita is rated “Ba3” by Moody’s and “BB” by S&P ▪ As of 6/15/2016 DaVita had a market capitalization of $15.6B and an enterprise value of $24.4B Property Financials 2016E 2017P 2018P 2019P 2020P Gross Revenue $116,512 $118,646 $120,819 $123,032 $125,284 Y / Y Growth 1.8% 1.8% 1.8% 1.8% Operating Expenses $0 $0 $0 $0 $0 Net Operating Income $116,512 $118,646 $120,819 $123,032 $125,284% Margin 100.0% 100.0% 100.0% 100.0% 100.0% Y / Y Growth 1.8% 1.8% 1.8% 1.8% TIs & LCs $0 $0 $0 $0 $0 CapEx Reserve 0 0 0 0 0 Capital Costs $0 $0 $0 $0 $0 Cash Flow Before DS $116,512 $118,646 $120,819 $123,032 $125,284 Source(s): Company materials 19
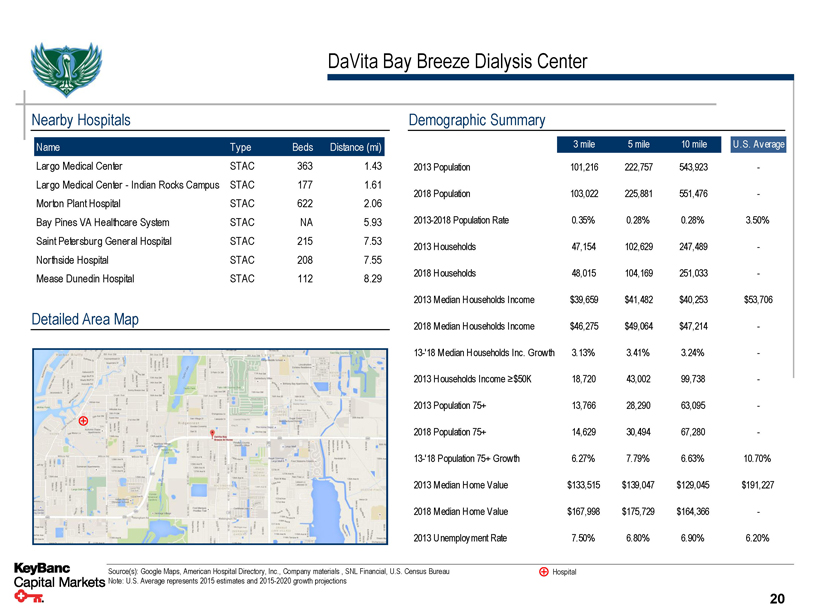
DaVita Bay Breeze Dialysis Center Nearby Hospitals Name Type Beds Distance (mi) Largo Medical Center STAC 363 1.43 Largo Medical Center - Indian Rocks Campus STAC 177 1.61 Morton Plant Hospital STAC 622 2.06 Bay Pines VA Healthcare System STAC NA 5.93 Saint Petersburg General Hospital STAC 215 7.53 Northside Hospital STAC 208 7.55 Mease Dunedin Hospital STAC 112 8.29 Detailed Area Map Demographic Summary 3 mile 5 mile 10 mile U .S. Average 2013 Population 101,216 222,757 543,923 - 2018 Population 103,022 225,881 551,476 - 2013-2018 Population Rate 0.35% 0.28% 0.28% 3.50% 2013 Households 47,154 102,629 247,489 - 2018 Households 48,015 104,169 251,033 - 2013 Median Households Income $39,659 $41,482 $40,253 $53,706 2018 Median Households Income $46,275 $49,064 $47,214 - 13-'18 Median Households Inc. Growth 3.13% 3.41% 3.24% - 2013 Households Income ≥$50K 18,720 43,002 99,738 - 2013 Population 75+ 13,766 28,290 63,095 - 2018 Population 75+ 14,629 30,494 67,280 - 13-'18 Population 75+ Growth 6.27% 7.79% 6.63% 10.70% 2013 Median Home Value $133,515 $139,047 $129,045 $191,227 2018 Median Home Value $167,998 $175,729 $164,366 - 2013 Unemployment Rate 7.50% 6.80% 6.90% 6.20% Source(s): Google Maps, American Hospital Directory, Inc., Company materials , SNL Financial, U.S. Census Bureau Hospital Note: U.S. Average represents 2015 estimates and 2015-2020 growth projections 20
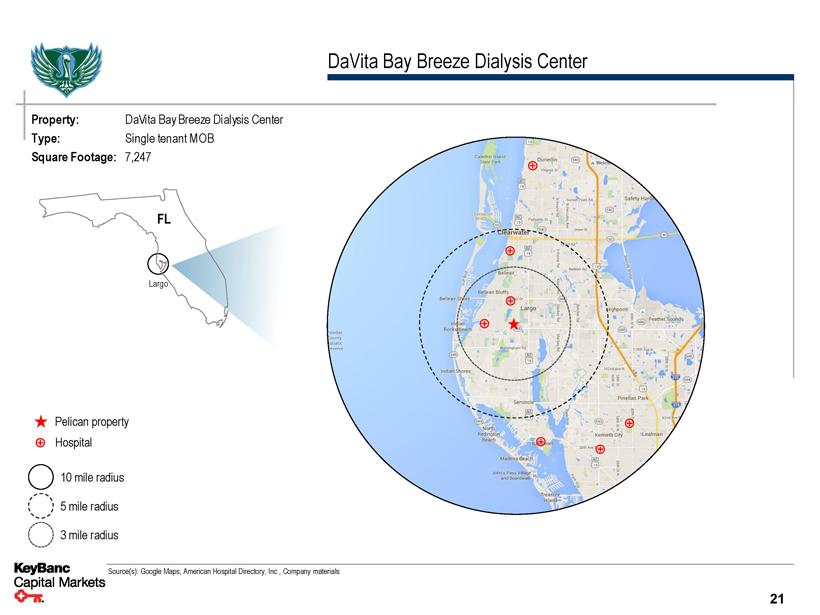
DaVita Bay Breeze Dialysis Center Property: DaVita Bay Breeze Dialysis Center Type: Single tenant MOB Square Footage: 7,247 FL Largo Pelican property Hospital 10 mile radius 5 mile radius 3 mile radius Source(s): Google Maps, American Hospital Directory, Inc., Company materials 21
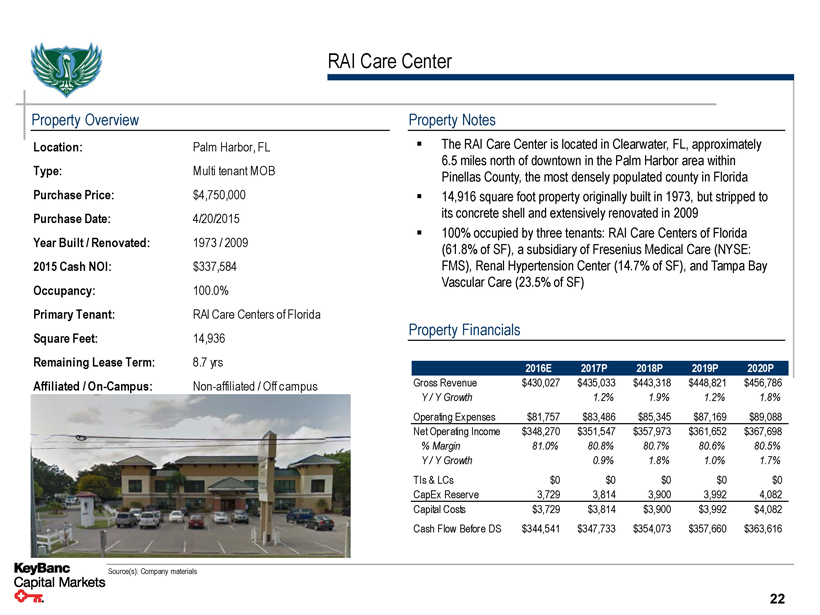
RAI Care Center Property Overview Location: Palm Harbor, FL Type: Multi tenant MOB Purchase Price: $4,750,000 Purchase Date: 4/20/2015 Year Built / Renovated: 1973 / 2009 2015 Cash NOI: $337,584 Occupancy: 100.0% Primary Tenant: RAI Care Centers of Florida Square Feet: 14,936 Remaining Lease Term: 8.7 yrs Affiliated / On-Campus: Non-affiliated / Off campus Property Notes ▪ The RAI Care Center is located in Clearwater, FL, approximately 6.5 miles north of downtown in the Palm Harbor area within Pinellas County, the most densely populated county in Florida ▪ 14,916 square foot property originally built in 1973, but stripped to its concrete shell and extensively renovated in 2009 ▪ 100% occupied by three tenants: RAI Care Centers of Florida (61.8% of SF), a subsidiary of Fresenius Medical Care (NYSE: FMS), Renal Hypertension Center (14.7% of SF), and Tampa Bay Vascular Care (23.5% of SF) Property Financials 2016E 2017P 2018P 2019P 2020P Gross Revenue $430,027 $435,033 $443,318 $448,821 $456,786 Y / Y Growth 1.2% 1.9% 1.2% 1.8% Operating Expenses $81,757 $83,486 $85,345 $87,169 $89,088 Net Operating Income $348,270 $351,547 $357,973 $361,652 $367,698% Margin 81.0% 80.8% 80.7% 80.6% 80.5% Y / Y Growth 0.9% 1.8% 1.0% 1.7% TIs & LCs $0 $0 $0 $0 $0 CapEx Reserve 3,729 3,814 3,900 3,992 4,082 Capital Costs $3,729 $3,814 $3,900 $3,992 $4,082 Cash Flow Before DS $344,541 $347,733 $354,073 $357,660 $363,616 Source(s): Company materials 22
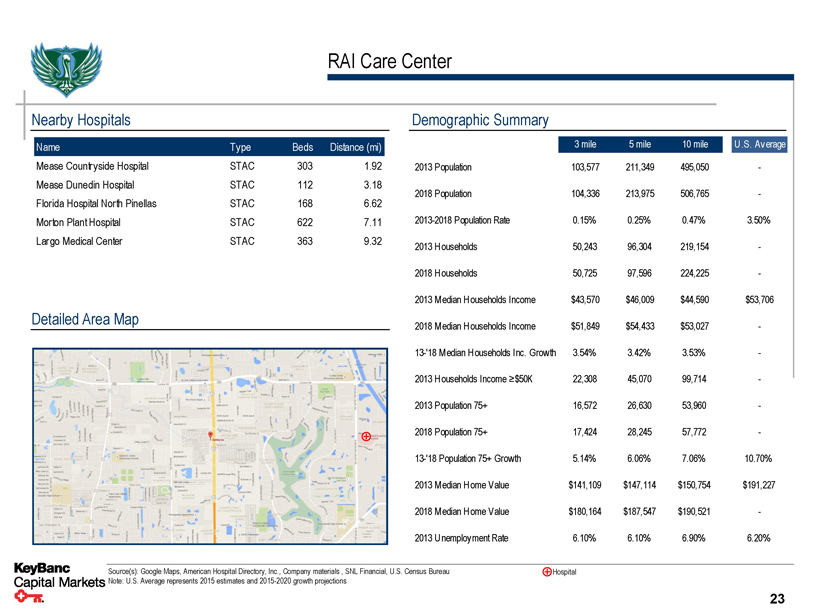
RAI Care Center Nearby Hospitals Name Type Beds Distance (mi) Mease Countryside Hospital STAC 303 1.92 Mease Dunedin Hospital STAC 112 3.18 Florida Hospital North Pinellas STAC 168 6.62 Morton Plant Hospital STAC 622 7.11 Largo Medical Center STAC 363 9.32 Detailed Area Map Demographic Summary 3 mile 5 mile 10 mile U ..S. Average 2013 Population 103,577 211,349 495,050 - 2018 Population 104,336 213,975 506,765 - 2013-2018 Population Rate 0.15% 0.25% 0.47% 3.50% 2013 Households 50,243 96,304 219,154 - 2018 Households 50,725 97,596 224,225 - 2013 Median Households Income $43,570 $46,009 $44,590 $53,706 2018 Median Households Income $51,849 $54,433 $53,027 - 13-'18 Median Households Inc. Growth 3.54% 3.42% 3.53% - 2013 Households Income ≥$50K 22,308 45,070 99,714 - 2013 Population 75+ 16,572 26,630 53,960 - 2018 Population 75+ 17,424 28,245 57,772 - 13-'18 Population 75+ Growth 5.14% 6.06% 7.06% 10.70% 2013 Median Home Value $141,109 $147,114 $150,754 $191,227 2018 Median Home Value $180,164 $187,547 $190,521 - 2013 Unemployment Rate 6.10% 6.10% 6.90% 6.20% Source(s): Google Maps, American Hospital Directory, Inc., Company materials , SNL Financial, U.S. Census Bureau Hospital Note: U.S. Average represents 2015 estimates and 2015-2020 growth projections 23
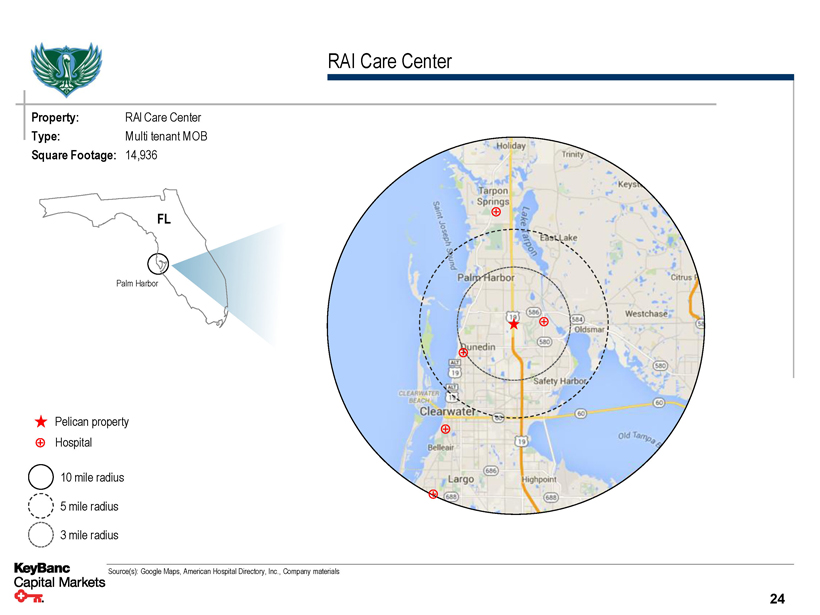
RAI Care Center Property: RAI Care Center Type: Multi tenant MOB Square Footage: 14,936 FL Palm Harbor Pelican property Hospital 10 mile radius 5 mile radius 3 mile radius Source(s): Google Maps, American Hospital Directory, Inc., Company materials 24
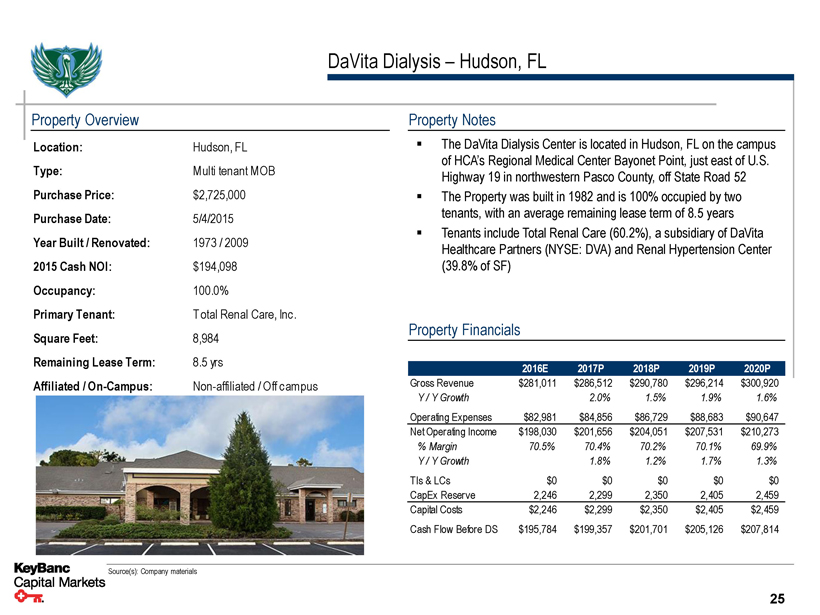
DaVita Dialysis – Hudson, FL Property Overview Location: Hudson, FL Type: Multi tenant MOB Purchase Price: $2,725,000 Purchase Date: 5/4/2015 Year Built / Renovated: 1973 / 2009 2015 Cash NOI: $194,098 Occupancy: 100.0% Primary Tenant: T otal Renal Care, Inc. Square Feet: 8,984 Remaining Lease Term: 8.5 yrs Affiliated / On-Campus: Non-affiliated / Off campus Property Notes ▪ The DaVita Dialysis Center is located in Hudson, FL on the campus of HCA’s Regional Medical Center Bayonet Point, just east of U.S. Highway 19 in northwestern Pasco County, off State Road 52 ▪ The Property was built in 1982 and is 100% occupied by two tenants, with an average remaining lease term of 8.5 years ▪ Tenants include Total Renal Care (60.2%), a subsidiary of DaVita Healthcare Partners (NYSE: DVA) and Renal Hypertension Center (39.8% of SF) Property Financials 2016E 2017P 2018P 2019P 2020P Gross Revenue $281,011 $286,512 $290,780 $296,214 $300,920 Y / Y Growth 2.0% 1.5% 1.9% 1.6% Operating Expenses $82,981 $84,856 $86,729 $88,683 $90,647 Net Operating Income $198,030 $201,656 $204,051 $207,531 $210,273% Margin 70.5% 70.4% 70.2% 70.1% 69.9% Y / Y Growth 1.8% 1.2% 1.7% 1.3% TIs & LCs $0 $0 $0 $0 $0 CapEx Reserve 2,246 2,299 2,350 2,405 2,459 Capital Costs $2,246 $2,299 $2,350 $2,405 $2,459 Cash Flow Before DS $195,784 $199,357 $201,701 $205,126 $207,814 Source(s): Company materials 25
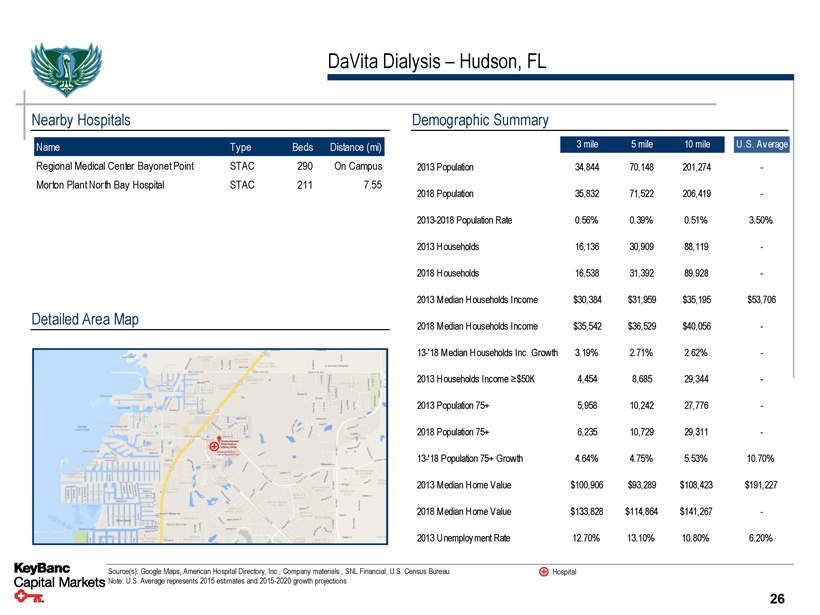
DaVita Dialysis – Hudson, FL Nearby Hospitals Name Type Beds Distance (mi) Regional Medical Center Bayonet Point STAC 290 On Campus Morton Plant North Bay Hospital STAC 211 7.55 Detailed Area Map Demographic Summary 3 mile 5 mile 10 mile U .S. Average 2013 Population 34,844 70,148 201,274 - 2018 Population 35,832 71,522 206,419 - 2013-2018 Population Rate 0.56% 0.39% 0.51% 3.50% 2013 Households 16,136 30,909 88,119 - 2018 Households 16,538 31,392 89,928 - 2013 Median Households Income $30,384 $31,959 $35,195 $53,706 2018 Median Households Income $35,542 $36,529 $40,056 - 13-'18 Median Households Inc. Growth 3.19% 2.71% 2.62% - 2013 Households Income ≥$50K 4,454 8,685 29,344 - 2013 Population 75+ 5,958 10,242 27,776 - 2018 Population 75+ 6,235 10,729 29,311 - 13-'18 Population 75+ Growth 4.64% 4.75% 5.53% 10.70% 2013 Median Home Value $100,906 $93,289 $108,423 $191,227 2018 Median Home Value $133,828 $114,864 $141,267 - 2013 Unemployment Rate 12.70% 13.10% 10.80% 6.20% Source(s): Google Maps, American Hospital Directory, Inc., Company materials , SNL Financial, U.S. Census Bureau Hospital Note: U.S. Average represents 2015 estimates and 2015-2020 growth projections 26
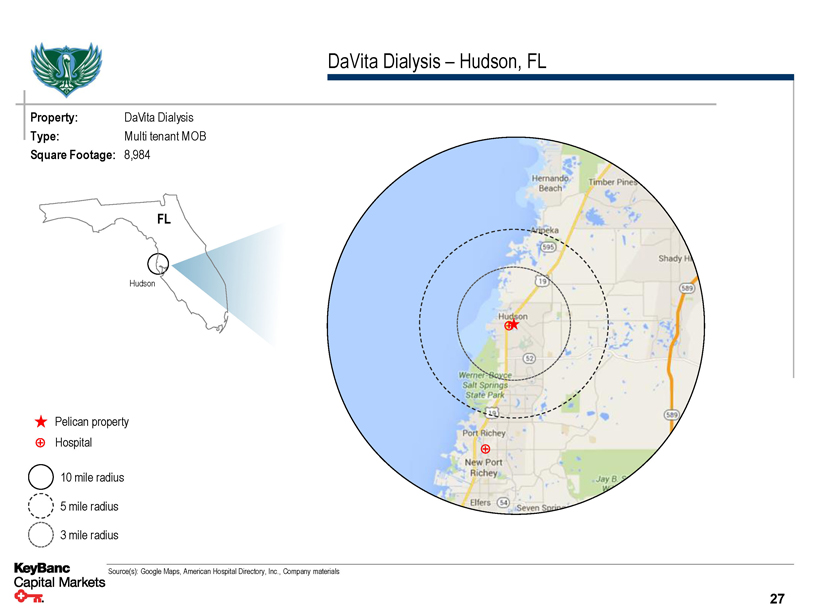
DaVita Dialysis – Hudson, FL Property: DaVita Dialysis Type: Multi tenant MOB Square Footage: 8,984 FL Hudson Pelican property Hospital 10 mile radius 5 mile radius 3 mile radius Source(s): Google Maps, American Hospital Directory, Inc., Company materials 27
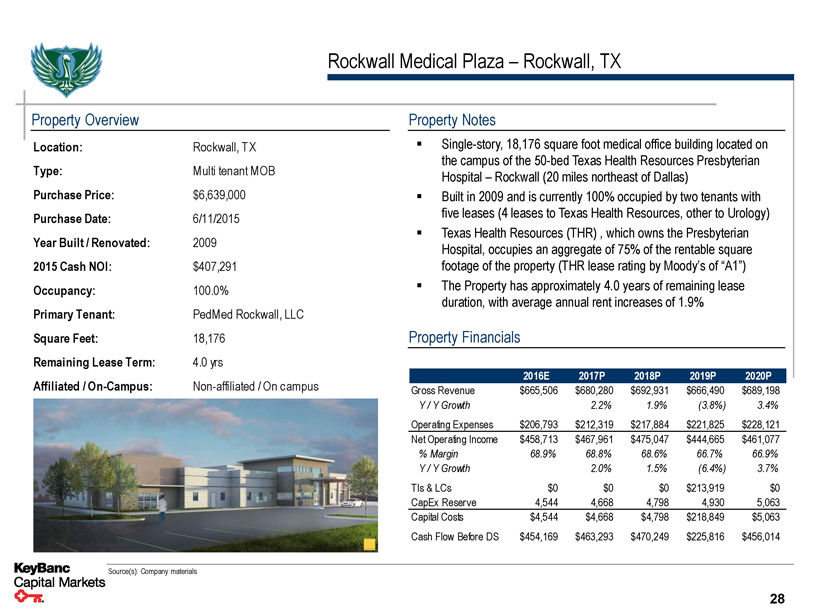
Rockwall Medical Plaza – Rockwall, TX Property Overview Location: Rockwall, T X Type: Multi tenant MOB Purchase Price: $6,639,000 Purchase Date: 6/11/2015 Year Built / Renovated: 2009 2015 Cash NOI: $407,291 Occupancy: 100.0% Primary Tenant: PedMed Rockwall, LLC Square Feet: 18,176 Remaining Lease Term: 4.0 yrs Affiliated / On-Campus: Non-affiliated / On campus Property Notes ▪ Single-story, 18,176 square foot medical office building located on the campus of the 50-bed Texas Health Resources Presbyterian Hospital – Rockwall (20 miles northeast of Dallas) ▪ Built in 2009 and is currently 100% occupied by two tenants with five leases (4 leases to Texas Health Resources, other to Urology) ▪ Texas Health Resources (THR) , which owns the Presbyterian Hospital, occupies an aggregate of 75% of the rentable square footage of the property (THR lease rating by Moody’s of “A1”) ▪ The Property has approximately 4.0 years of remaining lease duration, with average annual rent increases of 1.9% Property Financials 2016E 2017P 2018P 2019P 2020P Gross Revenue $665,506 $680,280 $692,931 $666,490 $689,198 Y / Y Growth 2.2% 1.9% (3.8%) 3.4% Operating Expenses $206,793 $212,319 $217,884 $221,825 $228,121 Net Operating Income $458,713 $467,961 $475,047 $444,665 $461,077% Margin 68.9% 68.8% 68.6% 66.7% 66.9% Y / Y Growth 2.0% 1.5% (6.4%) 3.7% TIs & LCs $0 $0 $0 $213,919 $0 CapEx Reserve 4,544 4,668 4,798 4,930 5,063 Capital Costs $4,544 $4,668 $4,798 $218,849 $5,063 Cash Flow Before DS $454,169 $463,293 $470,249 $225,816 $456,014 Source(s): Company materials 28
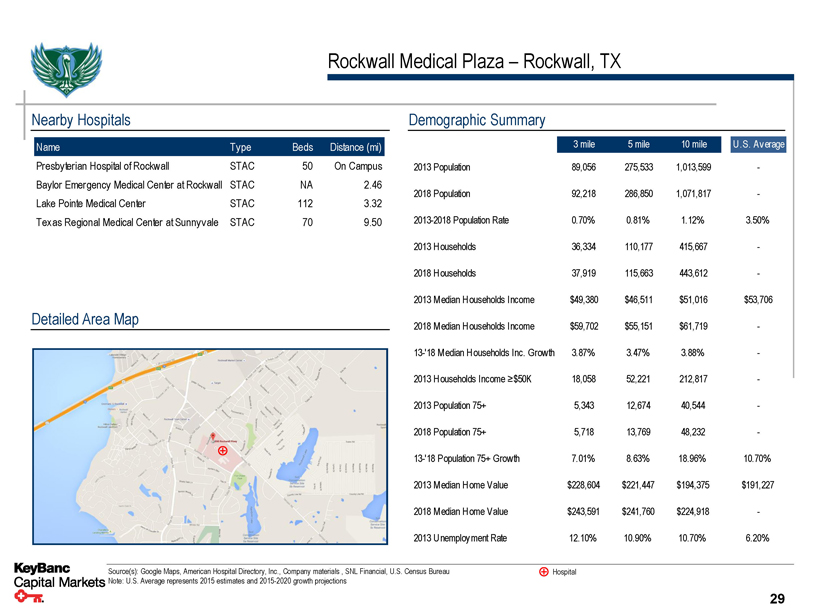
Rockwall Medical Plaza – Rockwall, TX Nearby Hospitals Name Type Beds Distance (mi) Presbyterian Hospital of Rockwall STAC 50 On Campus Baylor Emergency Medical Center at Rockwall STAC NA 2.46 Lake Pointe Medical Center STAC 112 3.32 Texas Regional Medical Center at Sunnyvale STAC 70 9.50 Detailed Area Map Demographic Summary 3 mile 5 mile 10 mile U .S. Average 2013 Population 89,056 275,533 1,013,599 - 2018 Population 92,218 286,850 1,071,817 - 2013-2018 Population Rate 0.70% 0.81% 1.12% 3.50% 2013 Households 36,334 110,177 415,667 - 2018 Households 37,919 115,663 443,612 - 2013 Median Households Income $49,380 $46,511 $51,016 $53,706 2018 Median Households Income $59,702 $55,151 $61,719 - 13-'18 Median Households Inc. Growth 3.87% 3.47% 3.88% - 2013 Households Income ≥$50K 18,058 52,221 212,817 - 2013 Population 75+ 5,343 12,674 40,544 - 2018 Population 75+ 5,718 13,769 48,232 - 13-'18 Population 75+ Growth 7.01% 8.63% 18.96% 10.70% 2013 Median Home Value $228,604 $221,447 $194,375 $191,227 2018 Median Home Value $243,591 $241,760 $224,918 - 2013 Unemployment Rate 12.10% 10.90% 10.70% 6.20% Source(s): Google Maps, American Hospital Directory, Inc., Company materials , SNL Financial, U.S. Census Bureau Hospital Note: U.S. Average represents 2015 estimates and 2015-2020 growth projections 29
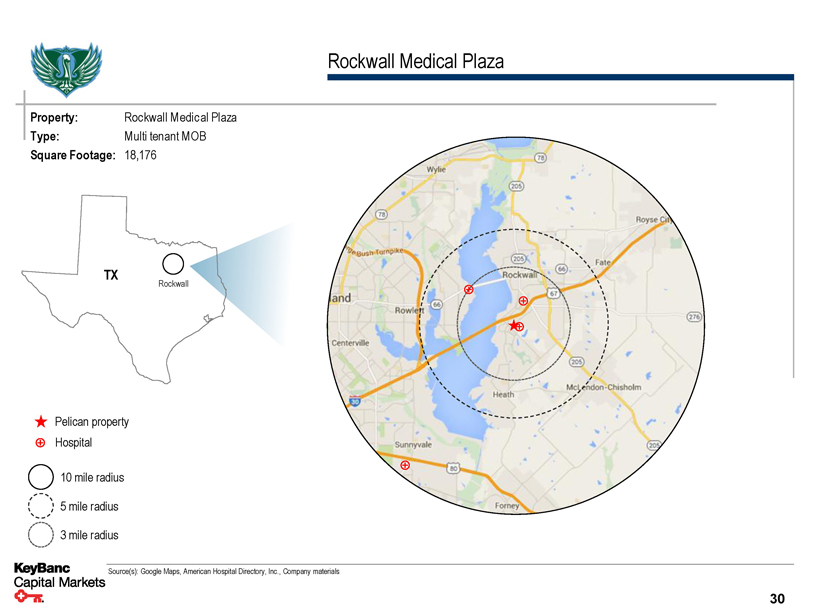
Rockwall Medical Plaza Property: Rockwall Medical Plaza Type: Multi tenant MOB Square Footage: 18,176 TX Rockwall Pelican property Hospital 10 mile radius 5 mile radius 3 mile radius Source(s): Google Maps, American Hospital Directory, Inc., Company materials 30
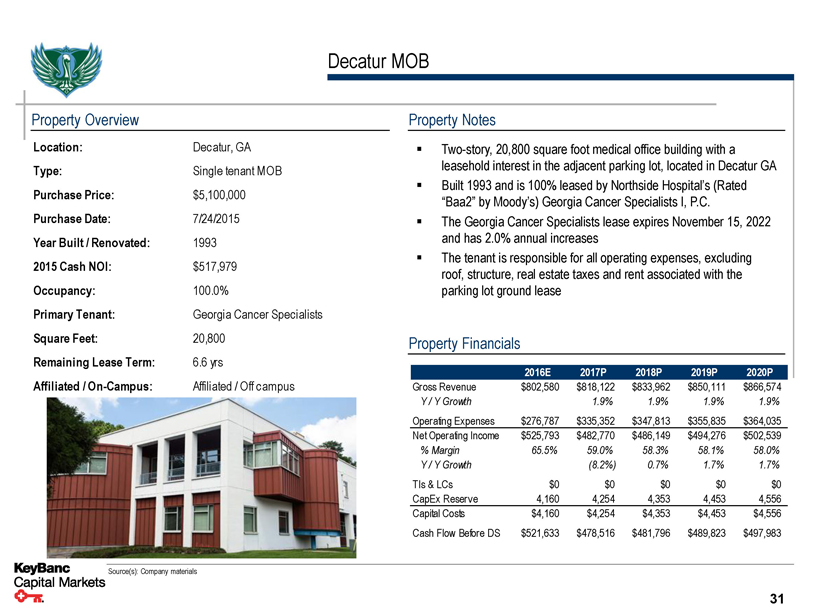
Decatur MOB Property Overview Location: Decatur, GA Type: Single tenant MOB Purchase Price: $5,100,000 Purchase Date: 7/24/2015 Year Built / Renovated: 1993 2015 Cash NOI: $517,979 Occupancy: 100.0% Primary Tenant: Georgia Cancer Specialists Square Feet: 20,800 Remaining Lease Term: 6.6 yrs Affiliated / On-Campus: Affiliated / Off campus Property Notes ▪ Two-story, 20,800 square foot medical office building with a leasehold interest in the adjacent parking lot, located in Decatur GA ▪ Built 1993 and is 100% leased by Northside Hospital’s (Rated “Baa2” by Moody’s) Georgia Cancer Specialists I, P.C. ▪ The Georgia Cancer Specialists lease expires November 15, 2022 and has 2.0% annual increases ▪ The tenant is responsible for all operating expenses, excluding roof, structure, real estate taxes and rent associated with the parking lot ground lease Property Financials 2016E 2017P 2018P 2019P 2020P Gross Revenue $802,580 $818,122 $833,962 $850,111 $866,574 Y / Y Growth 1.9% 1.9% 1.9% 1.9% Operating Expenses $276,787 $335,352 $347,813 $355,835 $364,035 Net Operating Income $525,793 $482,770 $486,149 $494,276 $502,539% Margin 65.5% 59.0% 58.3% 58.1% 58.0% Y / Y Growth (8.2%) 0.7% 1.7% 1.7% TIs & LCs $0 $0 $0 $0 $0 CapEx Reserve 4,160 4,254 4,353 4,453 4,556 Capital Costs $4,160 $4,254 $4,353 $4,453 $4,556 Cash Flow Before DS $521,633 $478,516 $481,796 $489,823 $497,983 Source(s): Company materials 31
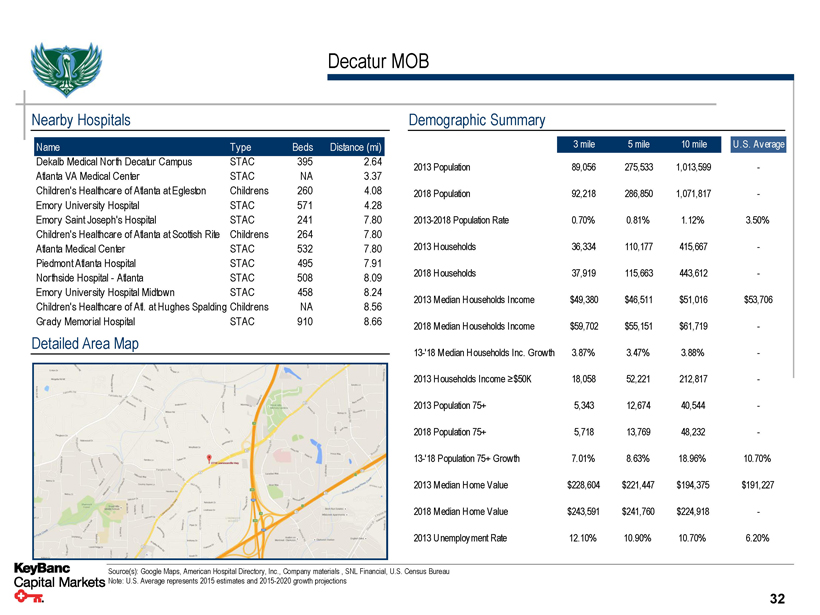
Decatur MOB Nearby Hospitals Name Type Beds Distance (mi) Dekalb Medical North Decatur Campus STAC 395 2.64 Atlanta VA Medical Center STAC NA 3.37 Children's Healthcare of Atlanta at Egleston Childrens 260 4.08 Emory University Hospital STAC 571 4.28 Emory Saint Joseph's Hospital STAC 241 7.80 Children's Healthcare of Atlanta at Scottish Rite Childrens 264 7.80 Atlanta Medical Center STAC 532 7.80 Piedmont Atlanta Hospital STAC 495 7.91 Northside Hospital - Atlanta STAC 508 8.09 Emory University Hospital Midtown STAC 458 8.24 Children's Healthcare of Atl. at Hughes Spalding Childrens NA 8.56 Grady Memorial Hospital STAC 910 8.66 Detailed Area Map Demographic Summary 3 mile 5 mile 10 mile U .S. Average 2013 Population 89,056 275,533 1,013,599 - 2018 Population 92,218 286,850 1,071,817 - 2013-2018 Population Rate 0.70% 0.81% 1.12% 3.50% 2013 Households 36,334 110,177 415,667 - 2018 Households 37,919 115,663 443,612 - 2013 Median Households Income $49,380 $46,511 $51,016 $53,706 2018 Median Households Income $59,702 $55,151 $61,719 - 13-'18 Median Households Inc. Growth 3.87% 3.47% 3.88% - 2013 Households Income ≥$50K 18,058 52,221 212,817 - 2013 Population 75+ 5,343 12,674 40,544 - 2018 Population 75+ 5,718 13,769 48,232 - 13-'18 Population 75+ Growth 7.01% 8.63% 18.96% 10.70% 2013 Median Home Value $228,604 $221,447 $194,375 $191,227 2018 Median Home Value $243,591 $241,760 $224,918 - 2013 Unemployment Rate 12.10% 10.90% 10.70% 6.20% Source(s): Google Maps, American Hospital Directory, Inc., Company materials , SNL Financial, U.S. Census Bureau Note: U.S. Average represents 2015 estimates and 2015-2020 growth projections 32
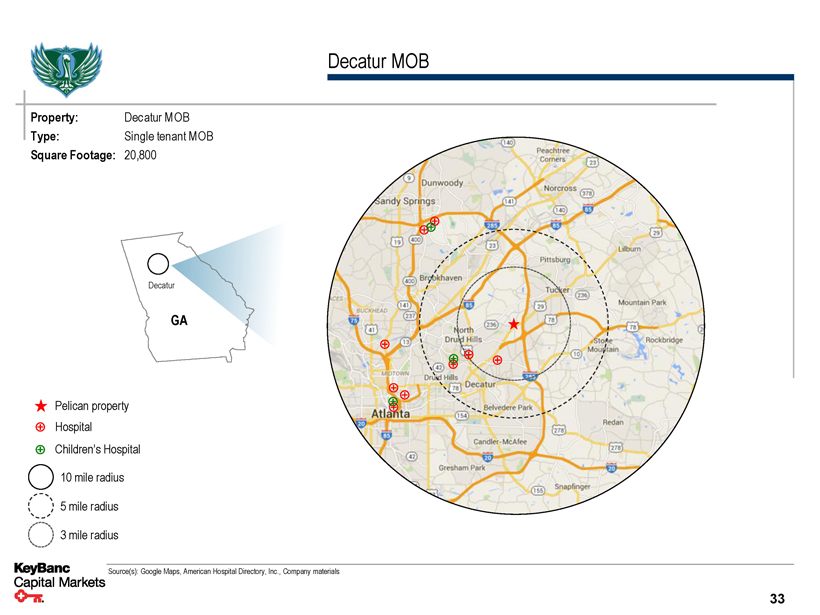
Decatur MOB Property: Decatur MOB Type: Single tenant MOB Square Footage: 20,800 Decatur GA Pelican property Hospital Children’s Hospital 10 mile radius 5 mile radius 3 mile radius Source(s): Google Maps, American Hospital Directory, Inc., Company materials 33
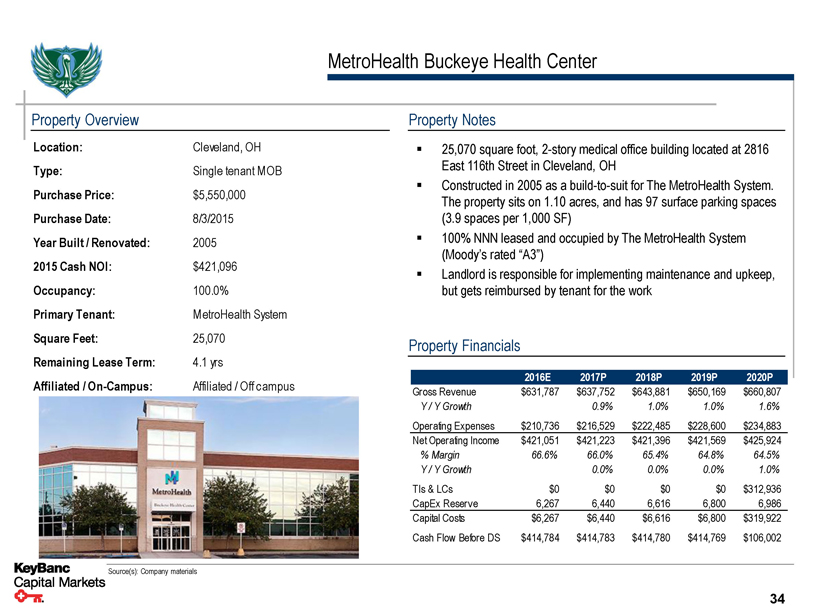
MetroHealth Buckeye Health Center Property Overview Location: Cleveland, OH Type: Single tenant MOB Purchase Price: $5,550,000 Purchase Date: 8/3/2015 Year Built / Renovated: 2005 2015 Cash NOI: $421,096 Occupancy: 100.0% Primary Tenant: MetroHealth System Square Feet: 25,070 Remaining Lease Term: 4.1 yrs Affiliated / On-Campus: Affiliated / Off campus Property Notes ▪ 25,070 square foot, 2-story medical office building located at 2816 East 116th Street in Cleveland, OH ▪ Constructed in 2005 as a build-to-suit for The MetroHealth System. The property sits on 1.10 acres, and has 97 surface parking spaces (3.9 spaces per 1,000 SF) ▪ 100% NNN leased and occupied by The MetroHealth System (Moody’s rated “A3”) ▪ Landlord is responsible for implementing maintenance and upkeep, but gets reimbursed by tenant for the work Property Financials 2016E 2017P 2018P 2019P 2020P Gross Revenue $631,787 $637,752 $643,881 $650,169 $660,807 Y / Y Growth 0.9% 1.0% 1.0% 1.6% Operating Expenses $210,736 $216,529 $222,485 $228,600 $234,883 Net Operating Income $421,051 $421,223 $421,396 $421,569 $425,924% Margin 66.6% 66.0% 65.4% 64.8% 64.5% Y / Y Growth 0.0% 0.0% 0.0% 1.0% TIs & LCs $0 $0 $0 $0 $312,936 CapEx Reserve 6,267 6,440 6,616 6,800 6,986 Capital Costs $6,267 $6,440 $6,616 $6,800 $319,922 Cash Flow Before DS $414,784 $414,783 $414,780 $414,769 $106,002 Source(s): Company materials 34
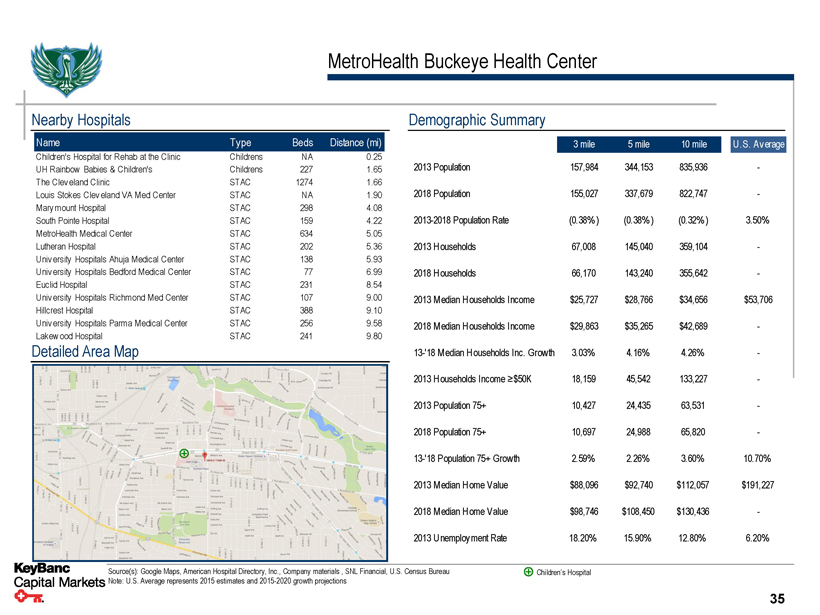
MetroHealth Buckeye Health Center Nearby Hospitals Name Type Beds Distance (mi) Children's Hospital for Rehab at the Clinic Childrens NA 0.25 UH Rainbow Babies & Children's Childrens 227 1.65 The Clev eland Clinic STAC 1274 1.66 Louis Stokes Clev eland VA Med Center STAC NA 1.90 Mary mount Hospital STAC 298 4.08 South Pointe Hospital STAC 159 4.22 MetroHealth Medical Center STAC 634 5.05 Lutheran Hospital STAC 202 5.36 Univ ersity Hospitals Ahuja Medical Center STAC 138 5.93 Univ ersity Hospitals Bedford Medical Center STAC 77 6.99 Euclid Hospital STAC 231 8.54 Univ ersity Hospitals Richmond Med Center STAC 107 9.00 Hillcrest Hospital STAC 388 9.10 Univ ersity Hospitals Parma Medical Center STAC 256 9.58 Lakew ood Hospital STAC 241 9.80 Detailed Area Map Demographic Summary 3 mile 5 mile 10 mile U .S. Average 2013 Population 157,984 344,153 835,936 - 2018 Population 155,027 337,679 822,747 - 2013-2018 Population Rate (0.38%) (0.38%) (0.32%) 3.50% 2013 Households 67,008 145,040 359,104 - 2018 Households 66,170 143,240 355,642 - 2013 Median Households Income $25,727 $28,766 $34,656 $53,706 2018 Median Households Income $29,863 $35,265 $42,689 - 13-'18 Median Households Inc. Growth 3.03% 4.16% 4.26% - 2013 Households Income ≥$50K 18,159 45,542 133,227 - 2013 Population 75+ 10,427 24,435 63,531 - 2018 Population 75+ 10,697 24,988 65,820 - 13-'18 Population 75+ Growth 2.59% 2.26% 3.60% 10.70% 2013 Median Home Value $88,096 $92,740 $112,057 $191,227 2018 Median Home Value $98,746 $108,450 $130,436 - 2013 Unemployment Rate 18.20% 15.90% 12.80% 6.20% Source(s): Google Maps, American Hospital Directory, Inc., Company materials , SNL Financial, U.S. Census Bureau Children’s Hospital Note: U.S. Average represents 2015 estimates and 2015-2020 growth projections 35
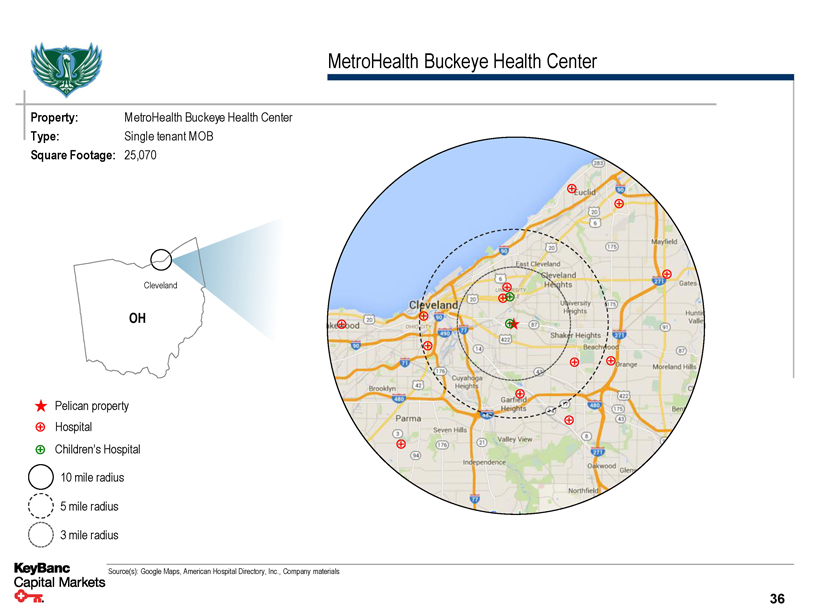
MetroHealth Buckeye Health Center Property: MetroHealth Buckeye Health Center Type: Single tenant MOB Square Footage: 25,070 Cleveland OH Pelican property Hospital Children’s Hospital 10 mile radius 5 mile radius 3 mile radius Source(s): Google Maps, American Hospital Directory, Inc., Company materials 36
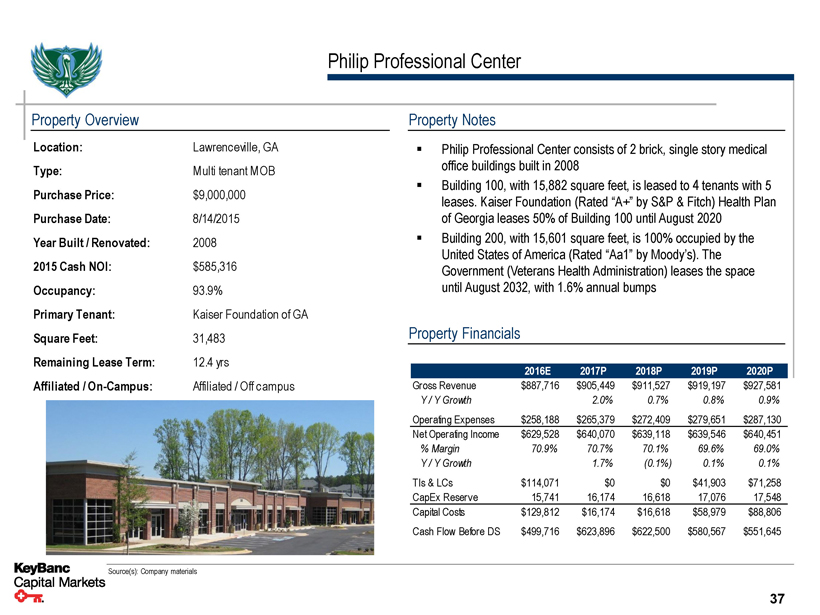
Philip Professional Center Property Overview Location: Lawrenceville, GA Type: Multi tenant MOB Purchase Price: $9,000,000 Purchase Date: 8/14/2015 Year Built / Renovated: 2008 2015 Cash NOI: $585,316 Occupancy: 93.9% Primary Tenant: Kaiser Foundation of GA Square Feet: 31,483 Remaining Lease Term: 12.4 yrs Affiliated / On-Campus: Affiliated / Off campus Property Notes ▪ Philip Professional Center consists of 2 brick, single story medical office buildings built in 2008 ▪ Building 100, with 15,882 square feet, is leased to 4 tenants with 5 leases. Kaiser Foundation (Rated “A+” by S&P & Fitch) Health Plan of Georgia leases 50% of Building 100 until August 2020 ▪ Building 200, with 15,601 square feet, is 100% occupied by the United States of America (Rated “Aa1” by Moody’s). The Government (Veterans Health Administration) leases the space until August 2032, with 1.6% annual bumps Property Financials 2016E 2017P 2018P 2019P 2020P Gross Revenue $887,716 $905,449 $911,527 $919,197 $927,581 Y / Y Growth 2.0% 0.7% 0.8% 0.9% Operating Expenses $258,188 $265,379 $272,409 $279,651 $287,130 Net Operating Income $629,528 $640,070 $639,118 $639,546 $640,451% Margin 70.9% 70.7% 70.1% 69.6% 69.0% Y / Y Growth 1.7% (0.1%) 0.1% 0.1% TIs & LCs $114,071 $0 $0 $41,903 $71,258 CapEx Reserve 15,741 16,174 16,618 17,076 17,548 Capital Costs $129,812 $16,174 $16,618 $58,979 $88,806 Cash Flow Before DS $499,716 $623,896 $622,500 $580,567 $551,645 Source(s): Company materials 37
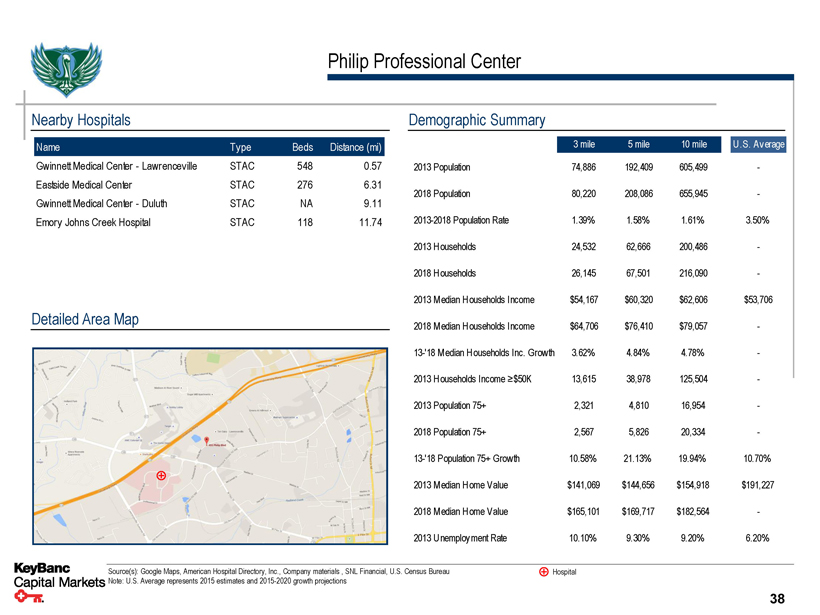
Philip Professional Center Nearby Hospitals Name Type Beds Distance (mi) Gwinnett Medical Center - Lawrenceville STAC 548 0.57 Eastside Medical Center STAC 276 6.31 Gwinnett Medical Center - Duluth STAC NA 9.11 Emory Johns Creek Hospital STAC 118 11.74 Detailed Area Map Demographic Summary 3 mile 5 mile 10 mile U .S. Average 2013 Population 74,886 192,409 605,499 - 2018 Population 80,220 208,086 655,945 - 2013-2018 Population Rate 1.39% 1.58% 1.61% 3.50% 2013 Households 24,532 62,666 200,486 - 2018 Households 26,145 67,501 216,090 - 2013 Median Households Income $54,167 $60,320 $62,606 $53,706 2018 Median Households Income $64,706 $76,410 $79,057 - 13-'18 Median Households Inc. Growth 3.62% 4.84% 4.78% - 2013 Households Income ≥$50K 13,615 38,978 125,504 - 2013 Population 75+ 2,321 4,810 16,954 - 2018 Population 75+ 2,567 5,826 20,334 - 13-'18 Population 75+ Growth 10.58% 21.13% 19.94% 10.70% 2013 Median Home Value $141,069 $144,656 $154,918 $191,227 2018 Median Home Value $165,101 $169,717 $182,564 - 2013 Unemployment Rate 10.10% 9.30% 9.20% 6.20% Source(s): Google Maps, American Hospital Directory, Inc., Company materials , SNL Financial, U.S. Census Bureau Hospital Note: U.S. Average represents 2015 estimates and 2015-2020 growth projections 38
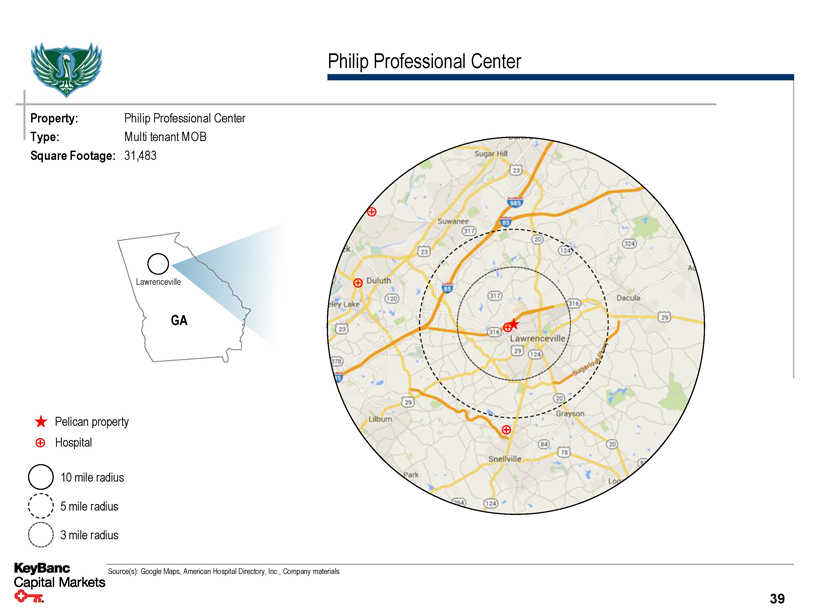
Philip Professional Center Property: Philip Professional Center Type: Multi tenant MOB Square Footage: 31,483 Lawrenceville GA Pelican property Hospital 10 mile radius 5 mile radius 3 mile radius Source(s): Google Maps, American Hospital Directory, Inc., Company materials 39
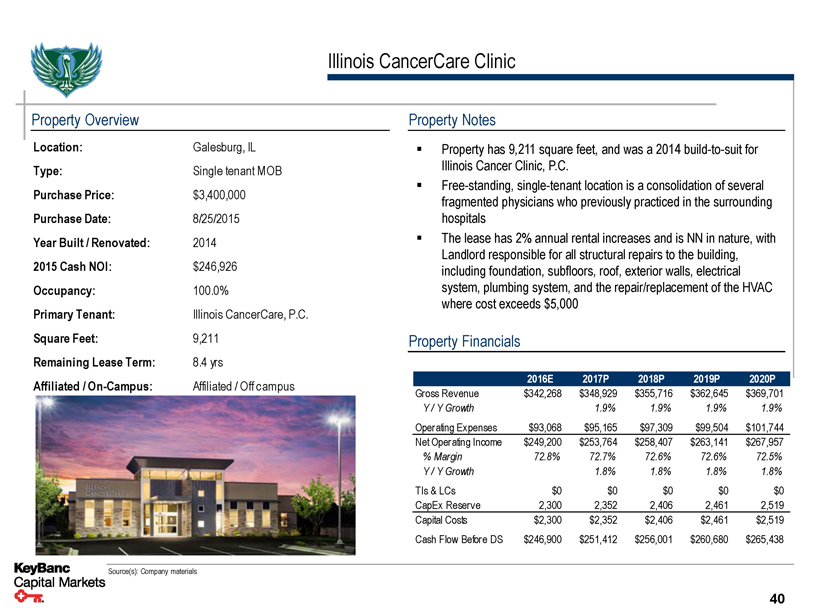
Illinois CancerCare Clinic Property Overview Location: Galesburg, IL Type: Single tenant MOB Purchase Price: $3,400,000 Purchase Date: 8/25/2015 Year Built / Renovated: 2014 2015 Cash NOI: $246,926 Occupancy: 100.0% Primary Tenant: Illinois CancerCare, P.C. Square Feet: 9,211 Remaining Lease Term: 8.4 yrs Affiliated / On-Campus: Affiliated / Off campus Property Notes ▪ Property has 9,211 square feet, and was a 2014 build-to-suit for Illinois Cancer Clinic, P.C. ▪ Free-standing, single-tenant location is a consolidation of several fragmented physicians who previously practiced in the surrounding hospitals ▪ The lease has 2% annual rental increases and is NN in nature, with Landlord responsible for all structural repairs to the building, including foundation, subfloors, roof, exterior walls, electrical system, plumbing system, and the repair/replacement of the HVAC where cost exceeds $5,000 Property Financials 2016E 2017P 2018P 2019P 2020P Gross Revenue $342,268 $348,929 $355,716 $362,645 $369,701 Y / Y Growth 1.9% 1.9% 1.9% 1.9% Operating Expenses $93,068 $95,165 $97,309 $99,504 $101,744 Net Operating Income $249,200 $253,764 $258,407 $263,141 $267,957% Margin 72.8% 72.7% 72.6% 72.6% 72.5% Y / Y Growth 1.8% 1.8% 1.8% 1.8% TIs & LCs $0 $0 $0 $0 $0 CapEx Reserve 2,300 2,352 2,406 2,461 2,519 Capital Costs $2,300 $2,352 $2,406 $2,461 $2,519 Cash Flow Before DS $246,900 $251,412 $256,001 $260,680 $265,438 Source(s): Company materials 40
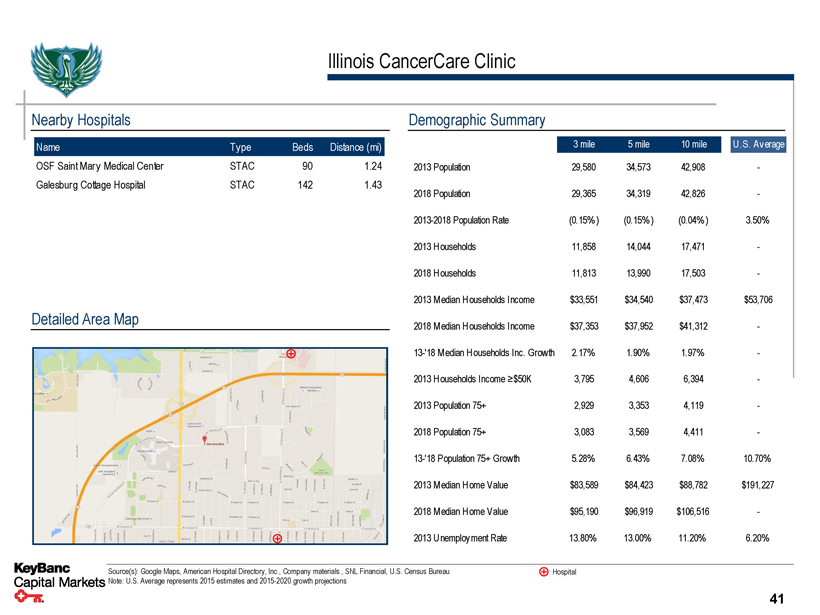
Illinois CancerCare Clinic Nearby Hospitals Name Type Beds Distance (mi) OSF Saint Mary Medical Center STAC 90 1.24 Galesburg Cottage Hospital STAC 142 1.43 Detailed Area Map Demographic Summary 3 mile 5 mile 10 mile U .S. Average 2013 Population 29,580 34,573 42,908 - 2018 Population 29,365 34,319 42,826 - 2013-2018 Population Rate (0.15%) (0.15%) (0.04%) 3.50% 2013 Households 11,858 14,044 17,471 - 2018 Households 11,813 13,990 17,503 - 2013 Median Households Income $33,551 $34,540 $37,473 $53,706 2018 Median Households Income $37,353 $37,952 $41,312 - 13-'18 Median Households Inc. Growth 2.17% 1.90% 1.97% - 2013 Households Income ≥$50K 3,795 4,606 6,394 - 2013 Population 75+ 2,929 3,353 4,119 - 2018 Population 75+ 3,083 3,569 4,411 - 13-'18 Population 75+ Growth 5.28% 6.43% 7.08% 10.70% 2013 Median Home Value $83,589 $84,423 $88,782 $191,227 2018 Median Home Value $95,190 $96,919 $106,516 - 2013 Unemployment Rate 13.80% 13.00% 11.20% 6.20% Source(s): Google Maps, American Hospital Directory, Inc., Company materials , SNL Financial, U.S. Census Bureau Hospital Note: U.S. Average represents 2015 estimates and 2015-2020 growth projections 41

Illinois CancerCare Clinic (Galesburg Portfolio) Property: Illinois CancerCare Clinic Type: Single tenant MOB Square Footage: 9,211 IL Galesburg Pelican property Hospital 10 mile radius 5 mile radius 3 mile radius Source(s): Google Maps, American Hospital Directory, Inc., Company materials 42
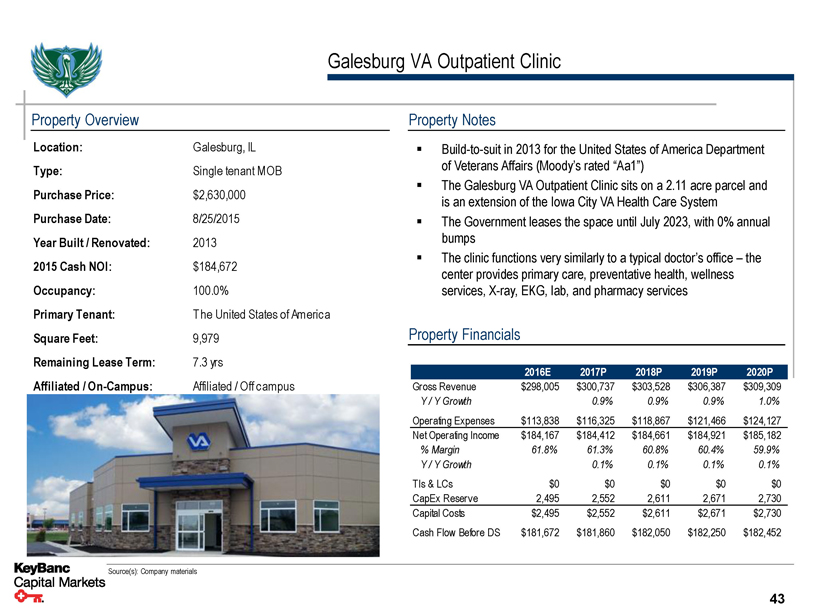
Galesburg VA Outpatient Clinic Property Overview Location: Galesburg, IL Type: Single tenant MOB Purchase Price: $2,630,000 Purchase Date: 8/25/2015 Year Built / Renovated: 2013 2015 Cash NOI: $184,672 Occupancy: 100.0% Primary Tenant: T he United States of America Square Feet: 9,979 Remaining Lease Term: 7.3 yrs Affiliated / On-Campus: Affiliated / Off campus Property Notes ▪ Build-to-suit in 2013 for the United States of America Department of Veterans Affairs (Moody’s rated “Aa1”) ▪ The Galesburg VA Outpatient Clinic sits on a 2.11 acre parcel and is an extension of the Iowa City VA Health Care System ▪ The Government leases the space until July 2023, with 0% annual bumps ▪ The clinic functions very similarly to a typical doctor’s office – the center provides primary care, preventative health, wellness services, X-ray, EKG, lab, and pharmacy services Property Financials 2016E 2017P 2018P 2019P 2020P Gross Revenue $298,005 $300,737 $303,528 $306,387 $309,309 Y / Y Growth 0.9% 0.9% 0.9% 1.0% Operating Expenses $113,838 $116,325 $118,867 $121,466 $124,127 Net Operating Income $184,167 $184,412 $184,661 $184,921 $185,182% Margin 61.8% 61.3% 60.8% 60.4% 59.9% Y / Y Growth 0.1% 0.1% 0.1% 0.1% TIs & LCs $0 $0 $0 $0 $0 CapEx Reserve 2,495 2,552 2,611 2,671 2,730 Capital Costs $2,495 $2,552 $2,611 $2,671 $2,730 Cash Flow Before DS $181,672 $181,860 $182,050 $182,250 $182,452 Source(s): Company materials 43

Galesburg VA Outpatient Clinic Nearby Hospitals Name Type Beds Distance (mi) OSF Saint Mary Medical Center STAC 90 1.24 Galesburg Cottage Hospital STAC 142 1.43 Detailed Area Map Demographic Summary 3 mile 5 mile 10 mile U .S. Average 2013 Population 29,580 34,573 42,908 - 2018 Population 29,365 34,319 42,826 - 2013-2018 Population Rate (0.15%) (0.15%) (0.04%) 3.50% 2013 Households 11,858 14,044 17,471 - 2018 Households 11,813 13,990 17,503 - 2013 Median Households Income $33,551 $34,540 $37,473 $53,706 2018 Median Households Income $37,353 $37,952 $41,312 - 13-'18 Median Households Inc. Growth 2.17% 1.90% 1.97% - 2013 Households Income ≥$50K 3,795 4,606 6,394 - 2013 Population 75+ 2,929 3,353 4,119 - 2018 Population 75+ 3,083 3,569 4,411 - 13-'18 Population 75+ Growth 5.28% 6.43% 7.08% 10.70% 2013 Median Home Value $83,589 $84,423 $88,782 $191,227 2018 Median Home Value $95,190 $96,919 $106,516 - 2013 Unemployment Rate 13.80% 13.00% 11.20% 6.20% Source(s): Google Maps, American Hospital Directory, Inc., Company materials , SNL Financial, U.S. Census Bureau Hospital Note: U.S. Average represents 2015 estimates and 2015-2020 growth projections 44
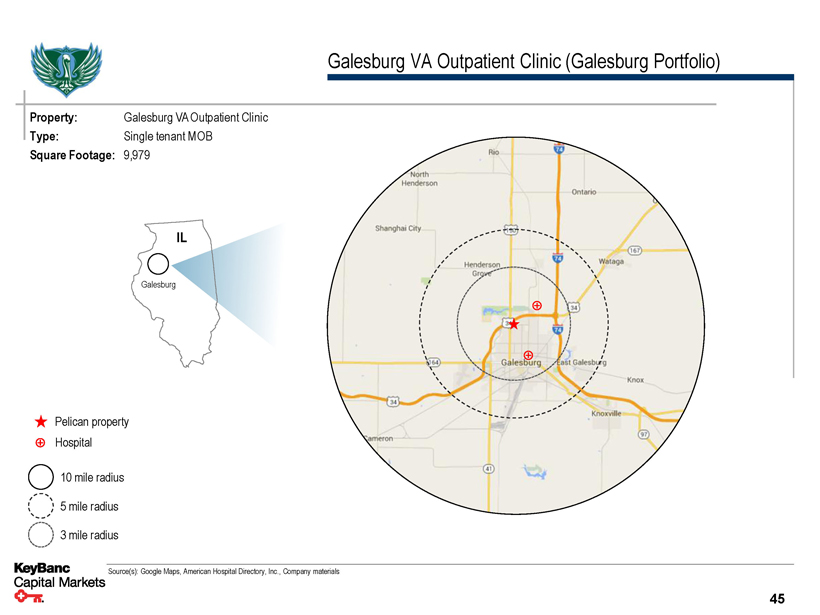
Galesburg VA Outpatient Clinic (Galesburg Portfolio) Property: Galesburg VA Outpatient Clinic Type: Single tenant MOB Square Footage: 9,979 IL Galesburg Pelican property Hospital 10 mile radius 5 mile radius 3 mile radius Source(s): Google Maps, American Hospital Directory, Inc., Company materials 45
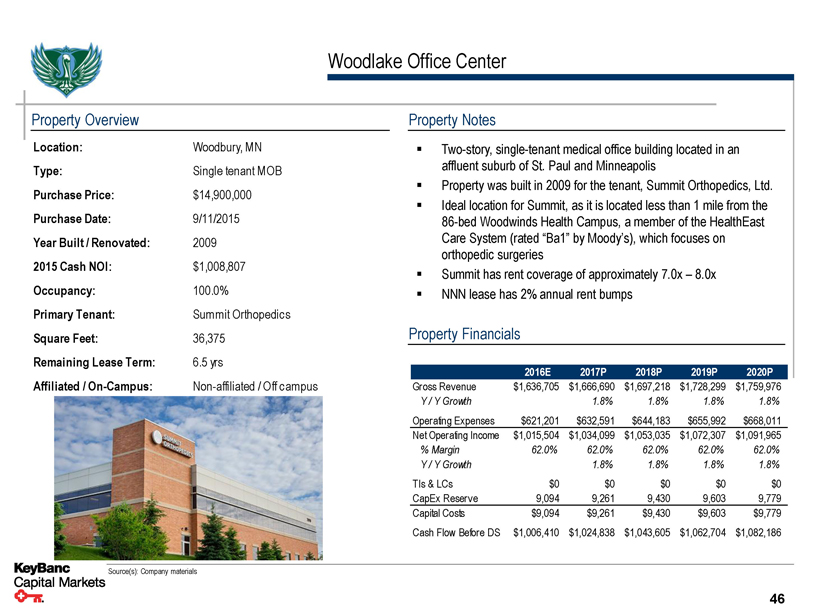
Woodlake Office Center Property Overview Location: Woodbury, MN Type: Single tenant MOB Purchase Price: $14,900,000 Purchase Date: 9/11/2015 Year Built / Renovated: 2009 2015 Cash NOI: $1,008,807 Occupancy: 100.0% Primary Tenant: Summit Orthopedics Square Feet: 36,375 Remaining Lease Term: 6.5 yrs Affiliated / On-Campus: Non-affiliated / Off campus Property Notes ▪ Two-story, single-tenant medical office building located in an affluent suburb of St. Paul and Minneapolis ▪ Property was built in 2009 for the tenant, Summit Orthopedics, Ltd. ▪ Ideal location for Summit, as it is located less than 1 mile from the 86-bed Woodwinds Health Campus, a member of the HealthEast Care System (rated “Ba1” by Moody’s), which focuses on orthopedic surgeries ▪ Summit has rent coverage of approximately 7.0x – 8.0x ▪ NNN lease has 2% annual rent bumps Property Financials 2016E 2017P 2018P 2019P 2020P Gross Revenue $1,636,705 $1,666,690 $1,697,218 $1,728,299 $1,759,976 Y / Y Growth 1.8% 1.8% 1.8% 1.8% Operating Expenses $621,201 $632,591 $644,183 $655,992 $668,011 Net Operating Income $1,015,504 $1,034,099 $1,053,035 $1,072,307 $1,091,965% Margin 62.0% 62.0% 62.0% 62.0% 62.0% Y / Y Growth 1.8% 1.8% 1.8% 1.8% TIs & LCs $0 $0 $0 $0 $0 CapEx Reserve 9,094 9,261 9,430 9,603 9,779 Capital Costs $9,094 $9,261 $9,430 $9,603 $9,779 Cash Flow Before DS $1,006,410 $1,024,838 $1,043,605 $1,062,704 $1,082,186 Source(s): Company materials 46
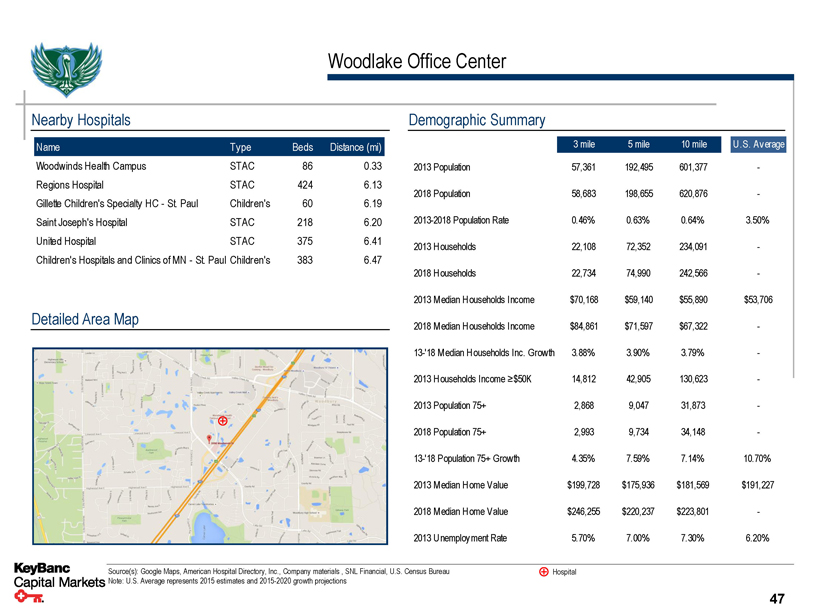
Woodlake Office Center Nearby Hospitals Name Type Beds Distance (mi) Woodwinds Health Campus STAC 86 0.33 Regions Hospital STAC 424 6.13 Gillette Children's Specialty HC - St. Paul Children's 60 6.19 Saint Joseph's Hospital STAC 218 6.20 United Hospital STAC 375 6.41 Children's Hospitals and Clinics of MN - St. Paul Children's 383 6.47 Detailed Area Map Demographic Summary 3 mile 5 mile 10 mile U .S. Average 2013 Population 57,361 192,495 601,377 - 2018 Population 58,683 198,655 620,876 - 2013-2018 Population Rate 0.46% 0.63% 0.64% 3.50% 2013 Households 22,108 72,352 234,091 - 2018 Households 22,734 74,990 242,566 - 2013 Median Households Income $70,168 $59,140 $55,890 $53,706 2018 Median Households Income $84,861 $71,597 $67,322 - 13-'18 Median Households Inc. Growth 3.88% 3.90% 3.79% - 2013 Households Income ≥$50K 14,812 42,905 130,623 - 2013 Population 75+ 2,868 9,047 31,873 - 2018 Population 75+ 2,993 9,734 34,148 - 13-'18 Population 75+ Growth 4.35% 7.59% 7.14% 10.70% 2013 Median Home Value $199,728 $175,936 $181,569 $191,227 2018 Median Home Value $246,255 $220,237 $223,801 - 2013 Unemployment Rate 5.70% 7.00% 7.30% 6.20% Source(s): Google Maps, American Hospital Directory, Inc., Company materials , SNL Financial, U.S. Census Bureau Hospital Note: U.S. Average represents 2015 estimates and 2015-2020 growth projections 47
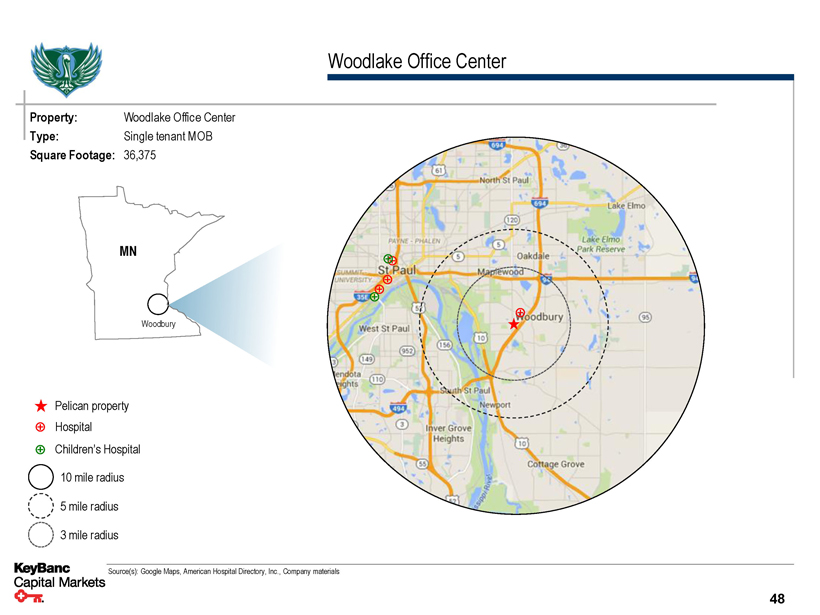
Woodlake Office Center Property: Woodlake Office Center Type: Single tenant MOB Square Footage: 36,375 MN Woodbury Pelican property Hospital Children’s Hospital 10 mile radius 5 mile radius 3 mile radius Source(s): Google Maps, American Hospital Directory, Inc., Company materials 48
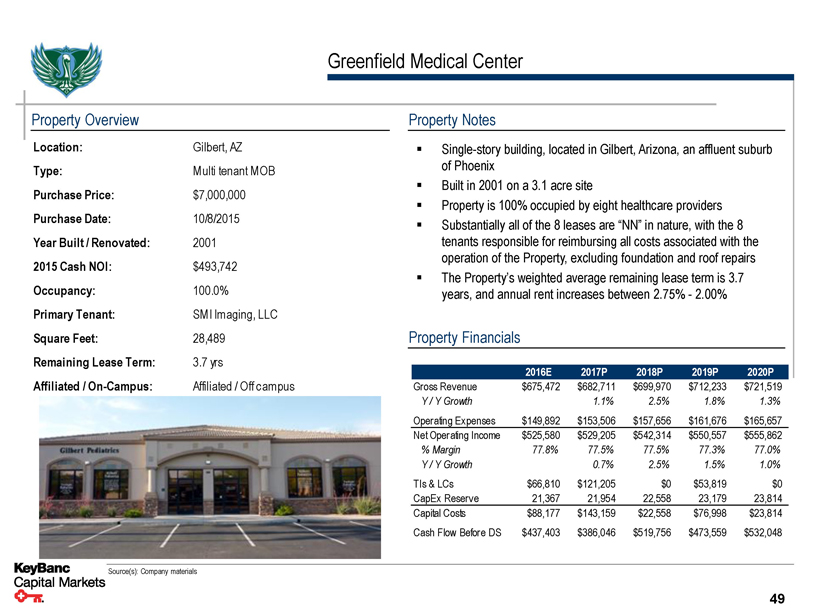
Greenfield Medical Center Property Overview Location: Gilbert, AZ Type: Multi tenant MOB Purchase Price: $7,000,000 Purchase Date: 10/8/2015 Year Built / Renovated: 2001 2015 Cash NOI: $493,742 Occupancy: 100.0% Primary Tenant: SMI Imaging, LLC Square Feet: 28,489 Remaining Lease Term: 3.7 yrs Affiliated / On-Campus: Affiliated / Off campus Property Notes ▪ Single-story building, located in Gilbert, Arizona, an affluent suburb of Phoenix ▪ Built in 2001 on a 3.1 acre site ▪ Property is 100% occupied by eight healthcare providers ▪ Substantially all of the 8 leases are “NN” in nature, with the 8 tenants responsible for reimbursing all costs associated with the operation of the Property, excluding foundation and roof repairs ▪ The Property’s weighted average remaining lease term is 3.7 years, and annual rent increases between 2.75% - 2.00% Property Financials 2016E 2017P 2018P 2019P 2020P Gross Revenue $675,472 $682,711 $699,970 $712,233 $721,519 Y / Y Growth 1.1% 2.5% 1.8% 1.3% Operating Expenses $149,892 $153,506 $157,656 $161,676 $165,657 Net Operating Income $525,580 $529,205 $542,314 $550,557 $555,862% Margin 77.8% 77.5% 77.5% 77.3% 77.0% Y / Y Growth 0.7% 2.5% 1.5% 1.0% TIs & LCs $66,810 $121,205 $0 $53,819 $0 CapEx Reserve 21,367 21,954 22,558 23,179 23,814 Capital Costs $88,177 $143,159 $22,558 $76,998 $23,814 Cash Flow Before DS $437,403 $386,046 $519,756 $473,559 $532,048 Source(s): Company materials 49
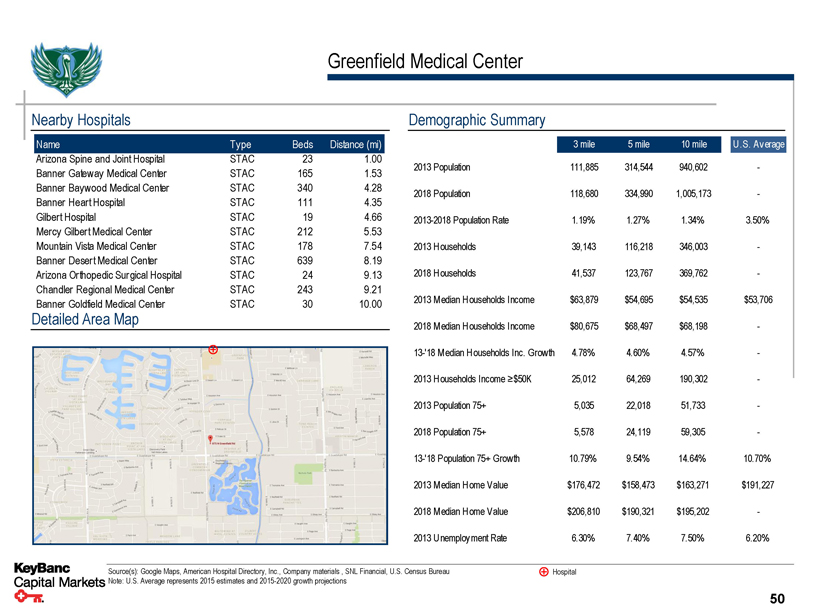
Greenfield Medical Center Nearby Hospitals Name Type Beds Distance (mi) Arizona Spine and Joint Hospital STAC 23 1.00 Banner Gateway Medical Center STAC 165 1.53 Banner Baywood Medical Center STAC 340 4.28 Banner Heart Hospital STAC 111 4.35 Gilbert Hospital STAC 19 4.66 Mercy Gilbert Medical Center STAC 212 5.53 Mountain Vista Medical Center STAC 178 7.54 Banner Desert Medical Center STAC 639 8.19 Arizona Orthopedic Surgical Hospital STAC 24 9.13 Chandler Regional Medical Center STAC 243 9.21 Banner Goldfield Medical Center STAC 30 10.00 Detailed Area Map Demographic Summary 3 mile 5 mile 10 mile U .S. Average 2013 Population 111,885 314,544 940,602 - 2018 Population 118,680 334,990 1,005,173 - 2013-2018 Population Rate 1.19% 1.27% 1.34% 3.50% 2013 Households 39,143 116,218 346,003 - 2018 Households 41,537 123,767 369,762 - 2013 Median Households Income $63,879 $54,695 $54,535 $53,706 2018 Median Households Income $80,675 $68,497 $68,198 - 13-'18 Median Households Inc. Growth 4.78% 4.60% 4.57% - 2013 Households Income ≥$50K 25,012 64,269 190,302 - 2013 Population 75+ 5,035 22,018 51,733 - 2018 Population 75+ 5,578 24,119 59,305 - 13-'18 Population 75+ Growth 10.79% 9.54% 14.64% 10.70% 2013 Median Home Value $176,472 $158,473 $163,271 $191,227 2018 Median Home Value $206,810 $190,321 $195,202 - 2013 Unemployment Rate 6.30% 7.40% 7.50% 6.20% Source(s): Google Maps, American Hospital Directory, Inc., Company materials , SNL Financial, U.S. Census Bureau Hospital Note: U.S. Average represents 2015 estimates and 2015-2020 growth projections 50
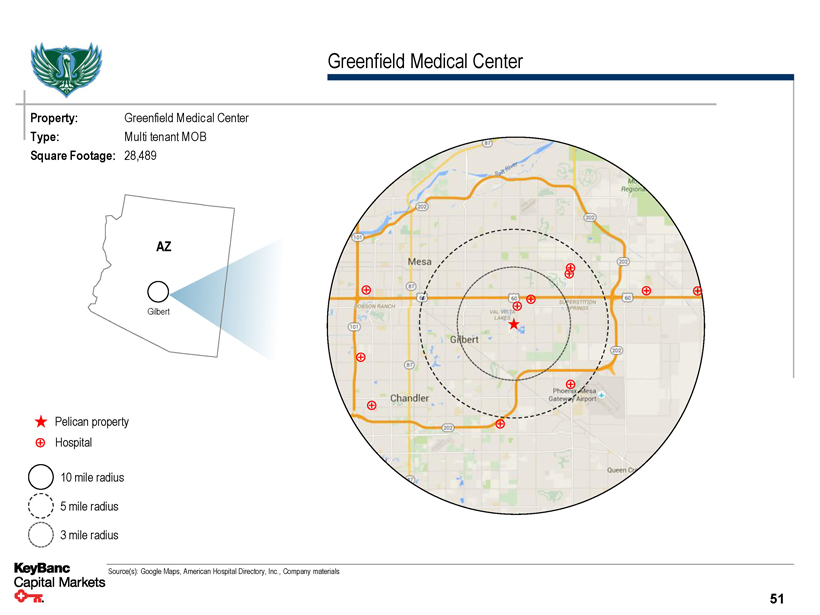
Greenfield Medical Center Property: Greenfield Medical Center Type: Multi tenant MOB Square Footage: 28,489 AZ Gilbert Pelican property Hospital 10 mile radius 5 mile radius 3 mile radius Source(s): Google Maps, American Hospital Directory, Inc., Company materials 51
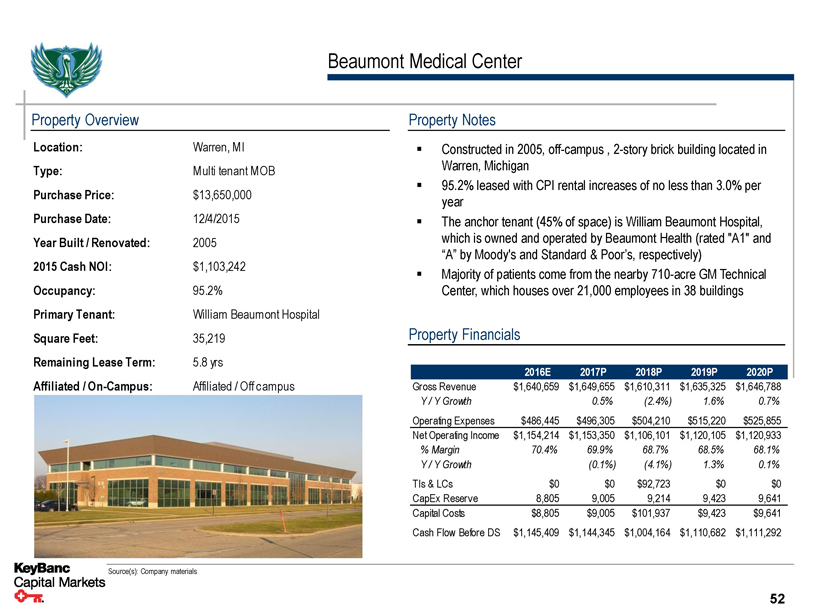
Beaumont Medical Center Property Overview Location: Warren, MI Type: Multi tenant MOB Purchase Price: $13,650,000 Purchase Date: 12/4/2015 Year Built / Renovated: 2005 2015 Cash NOI: $1,103,242 Occupancy: 95.2% Primary Tenant: William Beaumont Hospital Square Feet: 35,219 Remaining Lease Term: 5.8 yrs Affiliated / On-Campus: Affiliated / Off campus Property Notes ▪ Constructed in 2005, off-campus , 2-story brick building located in Warren, Michigan ▪ 95.2% leased with CPI rental increases of no less than 3.0% per year ▪ The anchor tenant (45% of space) is William Beaumont Hospital, which is owned and operated by Beaumont Health (rated "A1" and “A” by Moody's and Standard & Poor’s, respectively) ▪ Majority of patients come from the nearby 710-acre GM Technical Center, which houses over 21,000 employees in 38 buildings Property Financials 2016E 2017P 2018P 2019P 2020P Gross Revenue $1,640,659 $1,649,655 $1,610,311 $1,635,325 $1,646,788 Y / Y Growth 0.5% (2.4%) 1.6% 0.7% Operating Expenses $486,445 $496,305 $504,210 $515,220 $525,855 Net Operating Income $1,154,214 $1,153,350 $1,106,101 $1,120,105 $1,120,933% Margin 70.4% 69.9% 68.7% 68.5% 68.1% Y / Y Growth (0.1%) (4.1%) 1.3% 0.1% TIs & LCs $0 $0 $92,723 $0 $0 CapEx Reserve 8,805 9,005 9,214 9,423 9,641 Capital Costs $8,805 $9,005 $101,937 $9,423 $9,641 Cash Flow Before DS $1,145,409 $1,144,345 $1,004,164 $1,110,682 $1,111,292 Source(s): Company materials 52
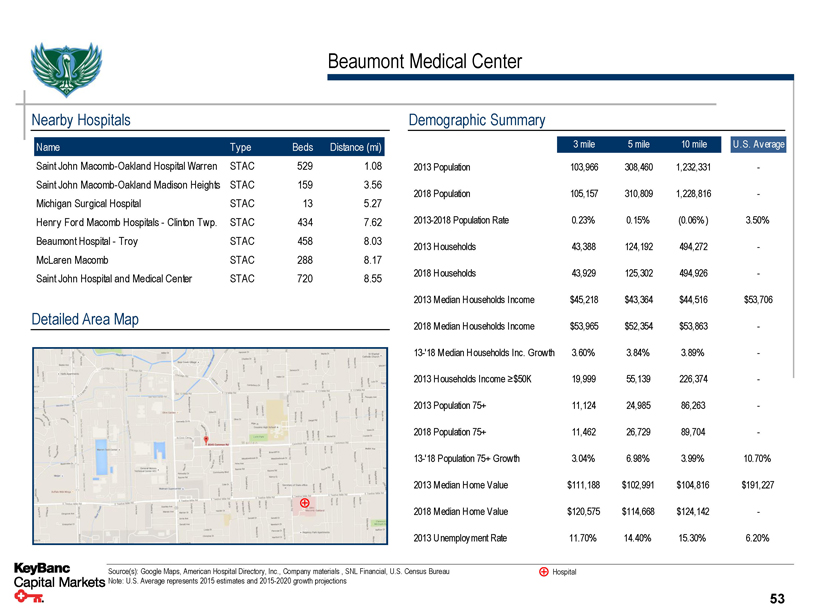
Beaumont Medical Center Nearby Hospitals Name Type Beds Distance (mi) Saint John Macomb-Oakland Hospital Warren STAC 529 1.08 Saint John Macomb-Oakland Madison Heights STAC 159 3.56 Michigan Surgical Hospital STAC 13 5.27 Henry Ford Macomb Hospitals - Clinton Twp. STAC 434 7.62 Beaumont Hospital - Troy STAC 458 8.03 McLaren Macomb STAC 288 8.17 Saint John Hospital and Medical Center STAC 720 8.55 Detailed Area Map Demographic Summary 3 mile 5 mile 10 mile U .S. Average 2013 Population 103,966 308,460 1,232,331 - 2018 Population 105,157 310,809 1,228,816 - 2013-2018 Population Rate 0.23% 0.15% (0.06%) 3.50% 2013 Households 43,388 124,192 494,272 - 2018 Households 43,929 125,302 494,926 - 2013 Median Households Income $45,218 $43,364 $44,516 $53,706 2018 Median Households Income $53,965 $52,354 $53,863 - 13-'18 Median Households Inc. Growth 3.60% 3.84% 3.89% - 2013 Households Income ≥$50K 19,999 55,139 226,374 - 2013 Population 75+ 11,124 24,985 86,263 - 2018 Population 75+ 11,462 26,729 89,704 - 13-'18 Population 75+ Growth 3.04% 6.98% 3.99% 10.70% 2013 Median Home Value $111,188 $102,991 $104,816 $191,227 2018 Median Home Value $120,575 $114,668 $124,142 - 2013 Unemployment Rate 11.70% 14.40% 15.30% 6.20% Source(s): Google Maps, American Hospital Directory, Inc., Company materials , SNL Financial, U.S. Census Bureau Hospital Note: U.S. Average represents 2015 estimates and 2015-2020 growth projections 53
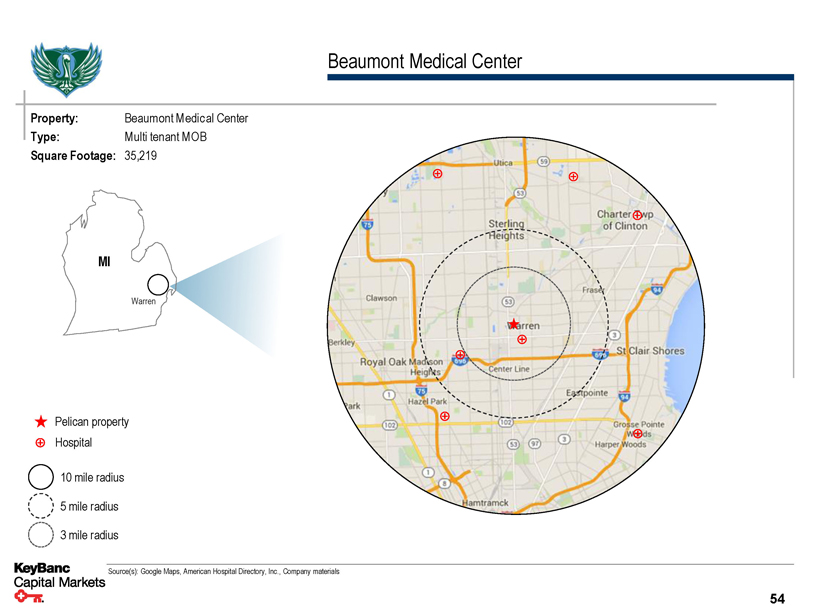
Beaumont Medical Center Property: Beaumont Medical Center Type: Multi tenant MOB Square Footage: 35,219 MI Warren Pelican property Hospital 10 mile radius 5 mile radius 3 mile radius Source(s): Google Maps, American Hospital Directory, Inc., Company materials 54
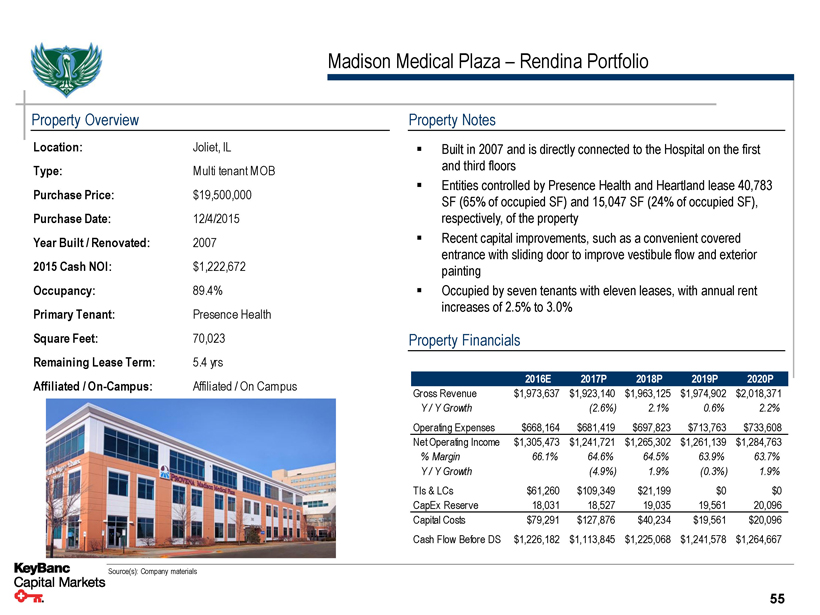
Madison Medical Plaza – Rendina Portfolio Property Overview Location: Joliet, IL Type: Multi tenant MOB Purchase Price: $19,500,000 Purchase Date: 12/4/2015 Year Built / Renovated: 2007 2015 Cash NOI: $1,222,672 Occupancy: 89.4% Primary Tenant: Presence Health Square Feet: 70,023 Remaining Lease Term: 5.4 yrs Affiliated / On-Campus: Affiliated / On Campus Property Notes ▪ Built in 2007 and is directly connected to the Hospital on the first and third floors ▪ Entities controlled by Presence Health and Heartland lease 40,783 SF (65% of occupied SF) and 15,047 SF (24% of occupied SF), respectively, of the property ▪ Recent capital improvements, such as a convenient covered entrance with sliding door to improve vestibule flow and exterior painting ▪ Occupied by seven tenants with eleven leases, with annual rent increases of 2.5% to 3.0% Property Financials 2016E 2017P 2018P 2019P 2020P Gross Revenue $1,973,637 $1,923,140 $1,963,125 $1,974,902 $2,018,371 Y / Y Growth (2.6%) 2.1% 0.6% 2.2% Operating Expenses $668,164 $681,419 $697,823 $713,763 $733,608 Net Operating Income $1,305,473 $1,241,721 $1,265,302 $1,261,139 $1,284,763% Margin 66.1% 64.6% 64.5% 63.9% 63.7% Y / Y Growth (4.9%) 1.9% (0.3%) 1.9% TIs & LCs $61,260 $109,349 $21,199 $0 $0 CapEx Reserve 18,031 18,527 19,035 19,561 20,096 Capital Costs $79,291 $127,876 $40,234 $19,561 $20,096 Cash Flow Before DS $1,226,182 $1,113,845 $1,225,068 $1,241,578 $1,264,667 Source(s): Company materials 55
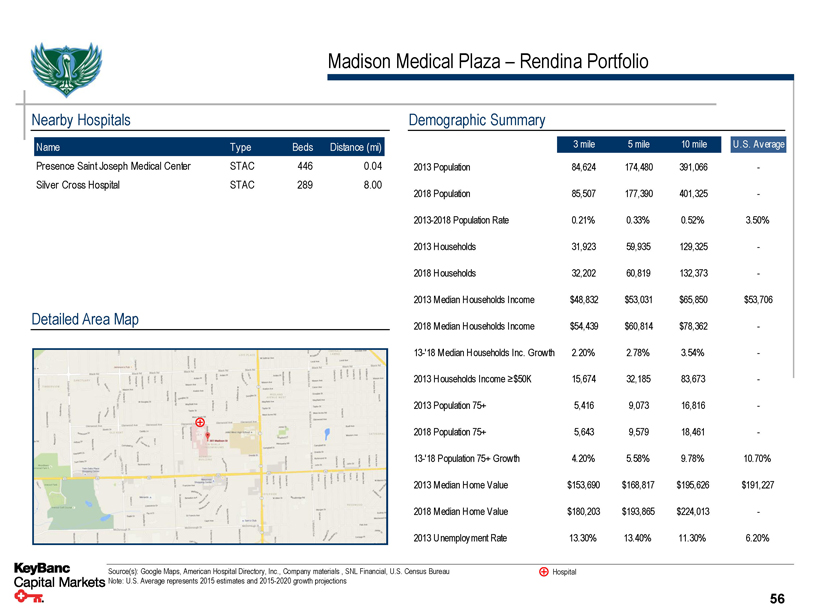
Madison Medical Plaza – Rendina Portfolio Nearby Hospitals Name Type Beds Distance (mi) Presence Saint Joseph Medical Center STAC 446 0.04 Silver Cross Hospital STAC 289 8.00 Detailed Area Map Demographic Summary 3 mile 5 mile 10 mile U .S. Average 2013 Population 84,624 174,480 391,066 - 2018 Population 85,507 177,390 401,325 - 2013-2018 Population Rate 0.21% 0.33% 0.52% 3.50% 2013 Households 31,923 59,935 129,325 - 2018 Households 32,202 60,819 132,373 - 2013 Median Households Income $48,832 $53,031 $65,850 $53,706 2018 Median Households Income $54,439 $60,814 $78,362 - 13-'18 Median Households Inc. Growth 2.20% 2.78% 3.54% - 2013 Households Income ≥$50K 15,674 32,185 83,673 - 2013 Population 75+ 5,416 9,073 16,816 - 2018 Population 75+ 5,643 9,579 18,461 - 13-'18 Population 75+ Growth 4.20% 5.58% 9.78% 10.70% 2013 Median Home Value $153,690 $168,817 $195,626 $191,227 2018 Median Home Value $180,203 $193,865 $224,013 - 2013 Unemployment Rate 13.30% 13.40% 11.30% 6.20% Source(s): Google Maps, American Hospital Directory, Inc., Company materials , SNL Financial, U.S. Census Bureau Hospital Note: U.S. Average represents 2015 estimates and 2015-2020 growth projections 56

Madison Medical Plaza – Rendina Portfolio Property: Madison Medical Plaza Type: Multi tenant MOB Square Footage: 70,023 Joliet IL Pelican property Hospital 10 mile radius 5 mile radius 3 mile radius Source(s): Google Maps, American Hospital Directory, Inc., Company materials 57

Lee Memorial Health System Outpatient Center Property Overview Location: Fort Myers, FL Type: Single tenant MOB Purchase Price: $5,275,000 Purchase Date: 10/22/2015 Year Built / Renovated: 1998 2015 Cash NOI: $377,543 Occupancy: 100.0% Primary Tenant: Lee Memorial Health System Square Feet: 24,174 Remaining Lease Term: 2.5 yrs Affiliated / On-Campus: Non-affiliated / Off campus Property Notes ▪ Built 1998 and is 100% NN-leased and occupied by LMHS with 4 leases and 5 different suites that each include renewal options ▪ The 4 leases have annual rental increases based on CPI (capped at a maximum of 3.0%) during the term ▪ The two-story facility features automatic entrance doors and a drive-thru porte-cochere, providing a covered drop-off area for patients ▪ The Center is situated within the Riverwalk Medical Park, a nine-property campus that totals more than 200,000-square feet of medical office space Property Financials 2016E 2017P 2018P 2019P 2020P Gross Revenue $607,054 $620,953 $580,944 $568,793 $652,417 Y / Y Growth 2.3% (6.4%) (2.1%) 14.7% Operating Expenses $232,392 $237,717 $243,166 $248,734 $254,431 Net Operating Income $374,662 $383,236 $337,778 $320,059 $397,986% Margin 61.7% 61.7% 58.1% 56.3% 61.0% Y / Y Growth 2.3% (11.9%) (5.2%) 24.3% TIs & LCs $0 $0 $224,685 $522,140 $0 CapEx Reserve 6,044 6,182 6,324 6,468 6,618 Capital Costs $6,044 $6,182 $231,009 $528,608 $6,618 Cash Flow Before DS $368,618 $377,054 $106,769 ($208,549) $391,368 Source(s): Company materials 58
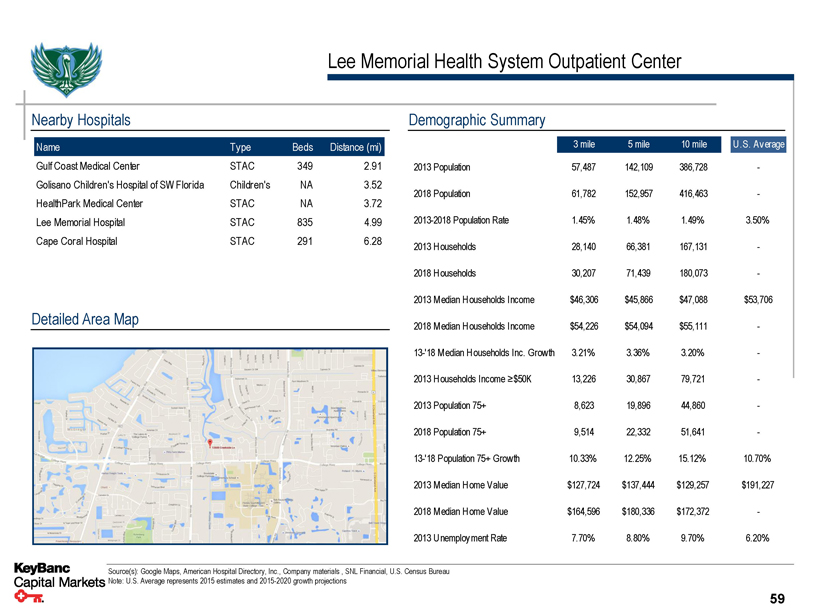
Lee Memorial Health System Outpatient Center Nearby Hospitals Name Type Beds Distance (mi) Gulf Coast Medical Center STAC 349 2.91 Golisano Children's Hospital of SW Florida Children's NA 3.52 HealthPark Medical Center STAC NA 3.72 Lee Memorial Hospital STAC 835 4.99 Cape Coral Hospital STAC 291 6.28 Detailed Area Map Demographic Summary 3 mile 5 mile 10 mile U .S. Average 2013 Population 57,487 142,109 386,728 - 2018 Population 61,782 152,957 416,463 - 2013-2018 Population Rate 1.45% 1.48% 1.49% 3.50% 2013 Households 28,140 66,381 167,131 - 2018 Households 30,207 71,439 180,073 - 2013 Median Households Income $46,306 $45,866 $47,088 $53,706 2018 Median Households Income $54,226 $54,094 $55,111 - 13-'18 Median Households Inc. Growth 3.21% 3.36% 3.20% - 2013 Households Income ≥$50K 13,226 30,867 79,721 - 2013 Population 75+ 8,623 19,896 44,860 - 2018 Population 75+ 9,514 22,332 51,641 - 13-'18 Population 75+ Growth 10.33% 12.25% 15.12% 10.70% 2013 Median Home Value $127,724 $137,444 $129,257 $191,227 2018 Median Home Value $164,596 $180,336 $172,372 - 2013 Unemployment Rate 7.70% 8.80% 9.70% 6.20% Source(s): Google Maps, American Hospital Directory, Inc., Company materials , SNL Financial, U.S. Census Bureau Note: U.S. Average represents 2015 estimates and 2015-2020 growth projections 59
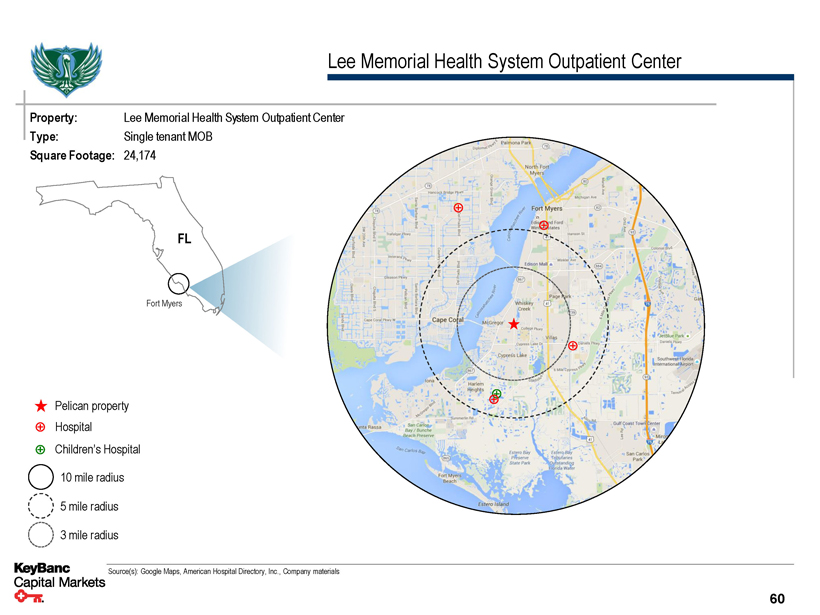
Lee Memorial Health System Outpatient Center Property: Lee Memorial Health System Outpatient Center Type: Single tenant MOB Square Footage: 24,174 FL Fort Myers Pelican property Hospital Children’s Hospital 10 mile radius 5 mile radius 3 mile radius Source(s): Google Maps, American Hospital Directory, Inc., Company materials 60
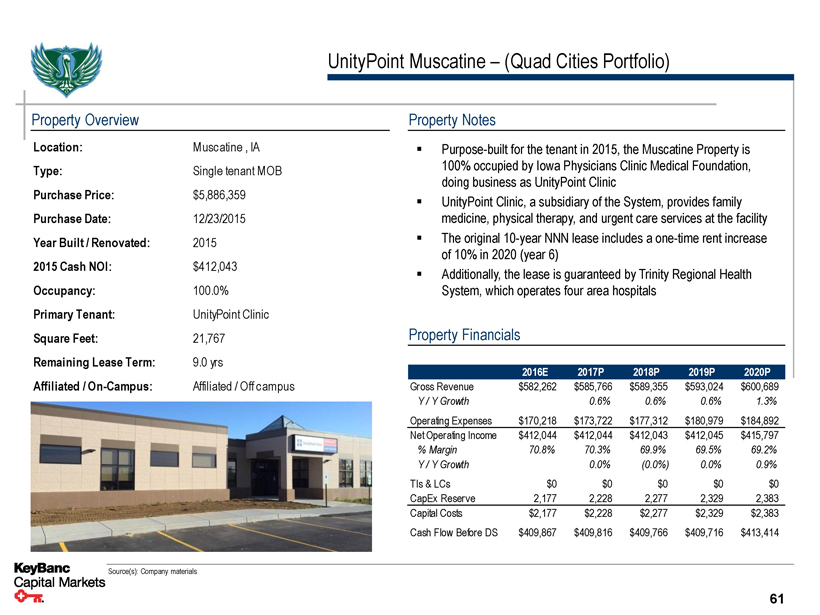
UnityPoint Muscatine – (Quad Cities Portfolio) Property Overview Location: Muscatine , IA Type: Single tenant MOB Purchase Price: $5,886,359 Purchase Date: 12/23/2015 Year Built / Renovated: 2015 2015 Cash NOI: $412,043 Occupancy: 100.0% Primary Tenant: UnityPoint Clinic Square Feet: 21,767 Remaining Lease Term: 9.0 yrs Affiliated / On-Campus: Affiliated / Off campus Property Notes ▪ Purpose-built for the tenant in 2015, the Muscatine Property is 100% occupied by Iowa Physicians Clinic Medical Foundation, doing business as UnityPoint Clinic ▪ UnityPoint Clinic, a subsidiary of the System, provides family medicine, physical therapy, and urgent care services at the facility ▪ The original 10-year NNN lease includes a one-time rent increase of 10% in 2020 (year 6) ▪ Additionally, the lease is guaranteed by Trinity Regional Health System, which operates four area hospitals Property Financials 2016E 2017P 2018P 2019P 2020P Gross Revenue $582,262 $585,766 $589,355 $593,024 $600,689 Y / Y Growth 0.6% 0.6% 0.6% 1.3% Operating Expenses $170,218 $173,722 $177,312 $180,979 $184,892 Net Operating Income $412,044 $412,044 $412,043 $412,045 $415,797% Margin 70.8% 70.3% 69.9% 69.5% 69.2% Y / Y Growth 0.0% (0.0%) 0.0% 0.9% TIs & LCs $0 $0 $0 $0 $0 CapEx Reserve 2,177 2,228 2,277 2,329 2,383 Capital Costs $2,177 $2,228 $2,277 $2,329 $2,383 Cash Flow Before DS $409,867 $409,816 $409,766 $409,716 $413,414 Source(s): Company materials 61
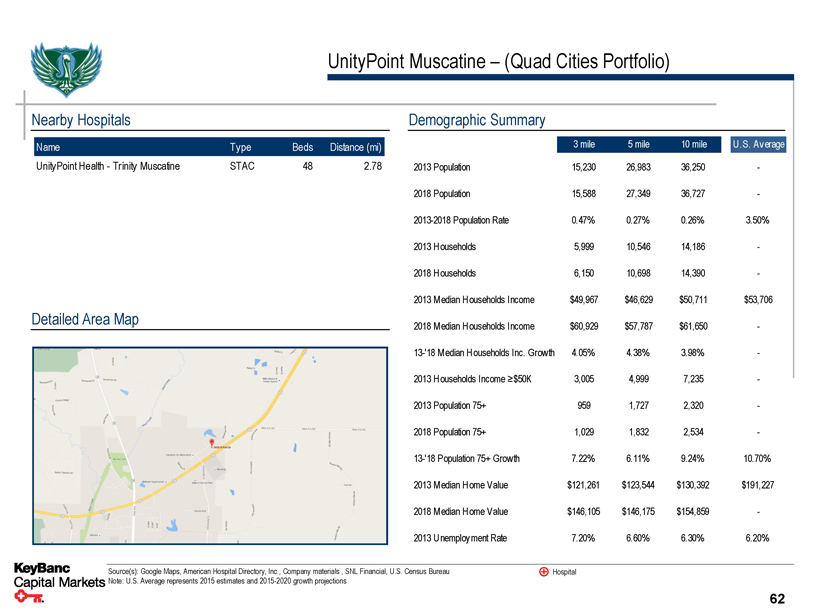
UnityPoint Muscatine – (Quad Cities Portfolio) Nearby Hospitals Name Type Beds Distance (mi) UnityPoint Health - Trinity Muscatine STAC 48 2.78 Detailed Area Map Demographic Summary 3 mile 5 mile 10 mile U .S. Average 2013 Population 15,230 26,983 36,250 - 2018 Population 15,588 27,349 36,727 - 2013-2018 Population Rate 0.47% 0.27% 0.26% 3.50% 2013 Households 5,999 10,546 14,186 - 2018 Households 6,150 10,698 14,390 - 2013 Median Households Income $49,967 $46,629 $50,711 $53,706 2018 Median Households Income $60,929 $57,787 $61,650 - 13-'18 Median Households Inc. Growth 4.05% 4.38% 3.98% - 2013 Households Income ≥$50K 3,005 4,999 7,235 - 2013 Population 75+ 959 1,727 2,320 - 2018 Population 75+ 1,029 1,832 2,534 - 13-'18 Population 75+ Growth 7.22% 6.11% 9.24% 10.70% 2013 Median Home Value $121,261 $123,544 $130,392 $191,227 2018 Median Home Value $146,105 $146,175 $154,859 - 2013 Unemployment Rate 7.20% 6.60% 6.30% 6.20% Source(s): Google Maps, American Hospital Directory, Inc., Company materials , SNL Financial, U.S. Census Bureau Hospital Note: U.S. Average represents 2015 estimates and 2015-2020 growth projections 62
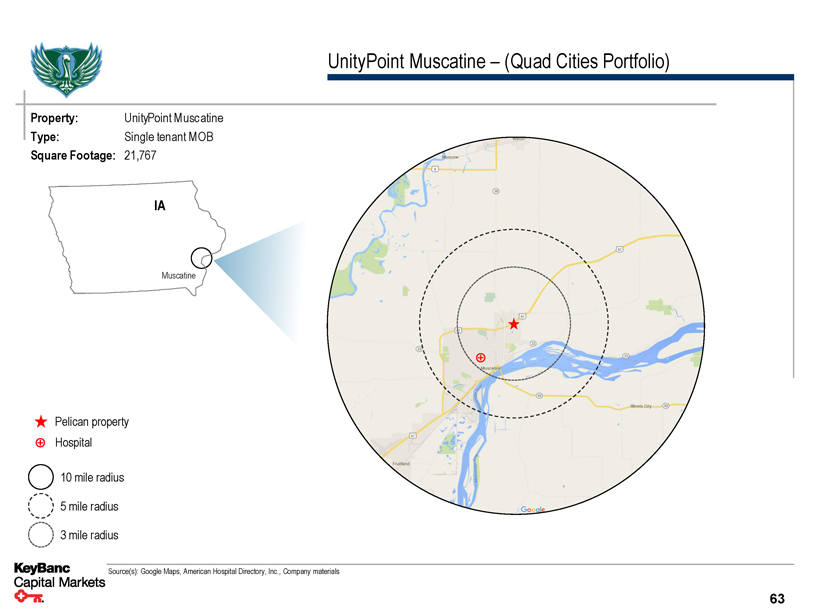
UnityPoint Muscatine – (Quad Cities Portfolio) Property: UnityPoint Muscatine Type: Single tenant MOB Square Footage: 21,767 IA Muscatine Pelican property Hospital 10 mile radius 5 mile radius 3 mile radius Source(s): Google Maps, American Hospital Directory, Inc., Company materials 63
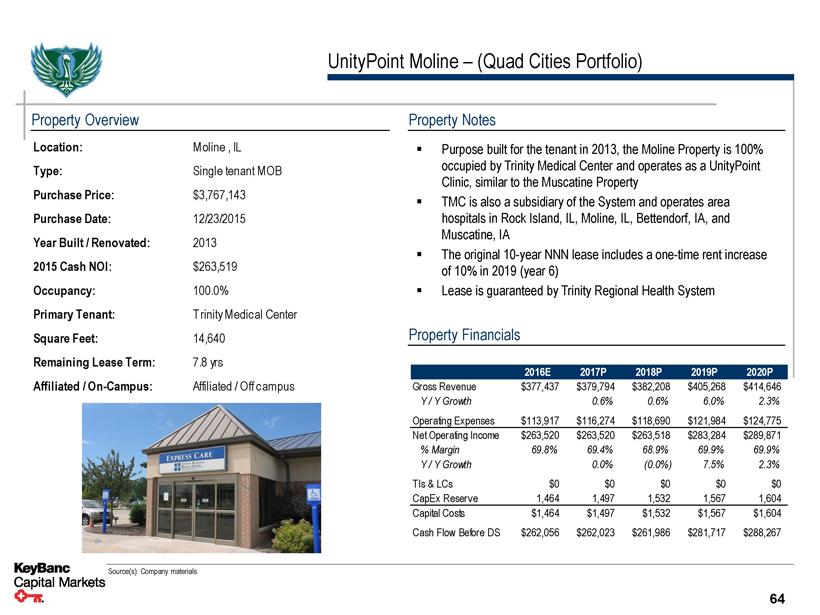
UnityPoint Moline – (Quad Cities Portfolio) Property Overview Location: Moline , IL Type: Single tenant MOB Purchase Price: $3,767,143 Purchase Date: 12/23/2015 Year Built / Renovated: 2013 2015 Cash NOI: $263,519 Occupancy: 100.0% Primary Tenant: T rinity Medical Center Square Feet: 14,640 Remaining Lease Term: 7.8 yrs Affiliated / On-Campus: Affiliated / Off campus Property Notes ▪ Purpose built for the tenant in 2013, the Moline Property is 100% occupied by Trinity Medical Center and operates as a UnityPoint Clinic, similar to the Muscatine Property ▪ TMC is also a subsidiary of the System and operates area hospitals in Rock Island, IL, Moline, IL, Bettendorf, IA, and Muscatine, IA ▪ The original 10-year NNN lease includes a one-time rent increase of 10% in 2019 (year 6) ▪ Lease is guaranteed by Trinity Regional Health System Property Financials 2016E 2017P 2018P 2019P 2020P Gross Revenue $377,437 $379,794 $382,208 $405,268 $414,646 Y / Y Growth 0.6% 0.6% 6.0% 2.3% Operating Expenses $113,917 $116,274 $118,690 $121,984 $124,775 Net Operating Income $263,520 $263,520 $263,518 $283,284 $289,871% Margin 69.8% 69.4% 68.9% 69.9% 69.9% Y / Y Growth 0.0% (0.0%) 7.5% 2.3% TIs & LCs $0 $0 $0 $0 $0 CapEx Reserve 1,464 1,497 1,532 1,567 1,604 Capital Costs $1,464 $1,497 $1,532 $1,567 $1,604 Cash Flow Before DS $262,056 $262,023 $261,986 $281,717 $288,267 Source(s): Company materials 64
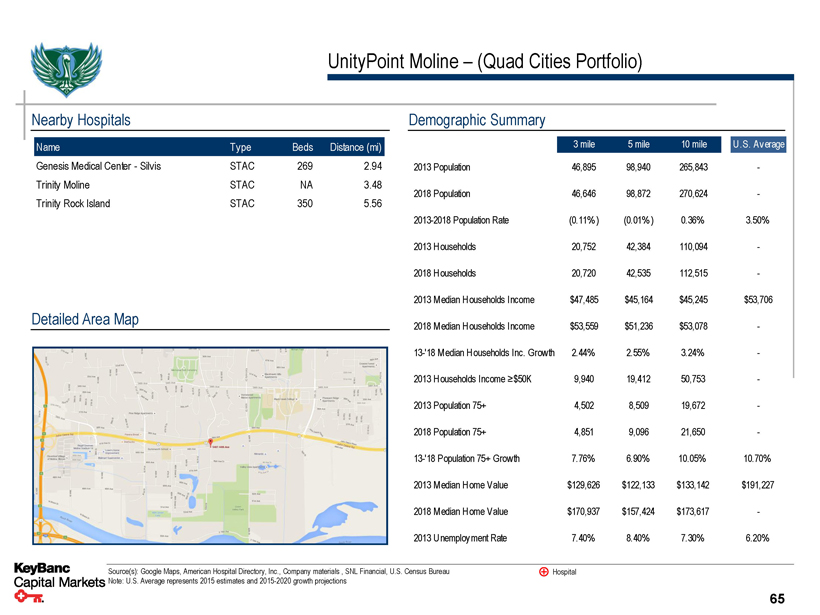
UnityPoint Moline – (Quad Cities Portfolio) Nearby Hospitals Name Type Beds Distance (mi) Genesis Medical Center - Silvis STAC 269 2.94 Trinity Moline STAC NA 3.48 Trinity Rock Island STAC 350 5.56 Detailed Area Map Demographic Summary 3 mile 5 mile 10 mile U .S. Average 2013 Population 46,895 98,940 265,843 - 2018 Population 46,646 98,872 270,624 - 2013-2018 Population Rate (0.11%) (0.01%) 0.36% 3.50% 2013 Households 20,752 42,384 110,094 - 2018 Households 20,720 42,535 112,515 - 2013 Median Households Income $47,485 $45,164 $45,245 $53,706 2018 Median Households Income $53,559 $51,236 $53,078 - 13-'18 Median Households Inc. Growth 2.44% 2.55% 3.24% - 2013 Households Income ≥$50K 9,940 19,412 50,753 - 2013 Population 75+ 4,502 8,509 19,672 - 2018 Population 75+ 4,851 9,096 21,650 - 13-'18 Population 75+ Growth 7.76% 6.90% 10.05% 10.70% 2013 Median Home Value $129,626 $122,133 $133,142 $191,227 2018 Median Home Value $170,937 $157,424 $173,617 - 2013 Unemployment Rate 7.40% 8.40% 7.30% 6.20% Source(s): Google Maps, American Hospital Directory, Inc., Company materials , SNL Financial, U.S. Census Bureau Hospital Note: U.S. Average represents 2015 estimates and 2015-2020 growth projections 65
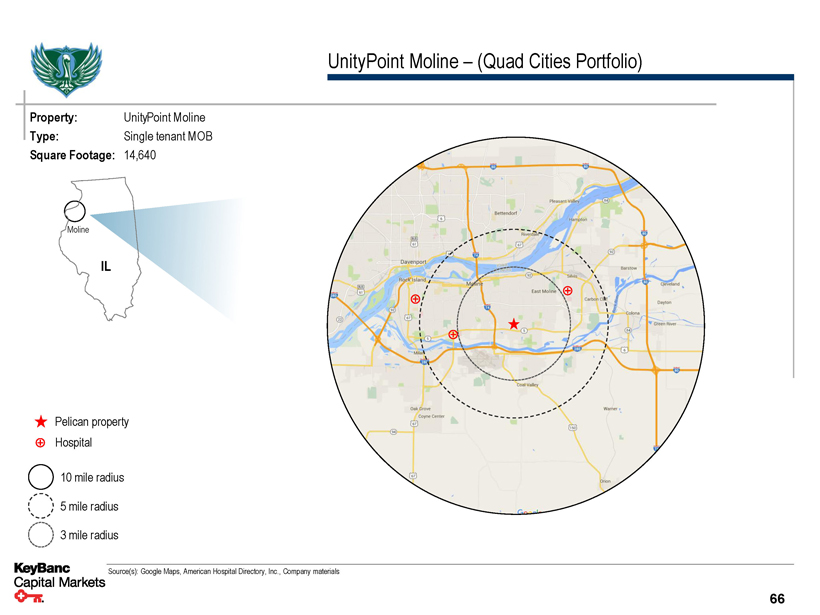
UnityPoint Moline – (Quad Cities Portfolio) Property: UnityPoint Moline Type: Single tenant MOB Square Footage: 14,640 Moline IL Pelican property Hospital 10 mile radius 5 mile radius 3 mile radius Source(s): Google Maps, American Hospital Directory, Inc., Company materials 66
Confidential Seniors Housing Property Overviews

Arcadian Cove Property Overview Location: Richmond, KY Type: NNN Assisted Living Purchase Price: $4,775,000 Purchase Date: 8/25/2015 Year Built / Renovated: 2009 2015 Cash NOI: $350,000 Occupancy: 100.0%(1) Primary Tenant: Meridian Senior Living Square Feet: 34,650 SF / 49 Units Remaining Lease Term: 14.4 yrs Units: 49 AL apartments Property Notes ▪ Property contains a total of 49 Assisted Living units (“ALF”) operated by Merdian Senior Living ▪ Purpose built in 2009 on a tract of land approximately 10.7 acres ▪ The Property is currently 94.1% occupied with a private pay census of 100% ▪ Current approximate rent coverage of 1.1x ▪ 15-year NNN lease that includes two, five year renewal options ▪ The lease payments increase by 2.5% annually Property Financials 2016E 2017P 2018P 2019P 2020P Gross Revenue $353,646 $361,740 $370,017 $378,482 $387,139 Y / Y Growth 2.3% 2.3% 2.3% 2.3% Operating Expenses $0 $0 $0 $0 $0 Net Operating Income $353,646 $361,740 $370,017 $378,482 $387,139% Margin 100.0% 100.0% 100.0% 100.0% 100.0% Y / Y Growth 2.3% 2.3% 2.3% 2.3% TIs & LCs $0 $0 $0 $0 $0 CapEx Reserve 0 0 0 0 0 Capital Costs $0 $0 $0 $0 $0 Cash Flow Before DS $353,646 $361,740 $370,017 $378,482 $387,139 Source(s): Company materials (1) Operating occupancy as of 3/31/2016 was 94.1% 68
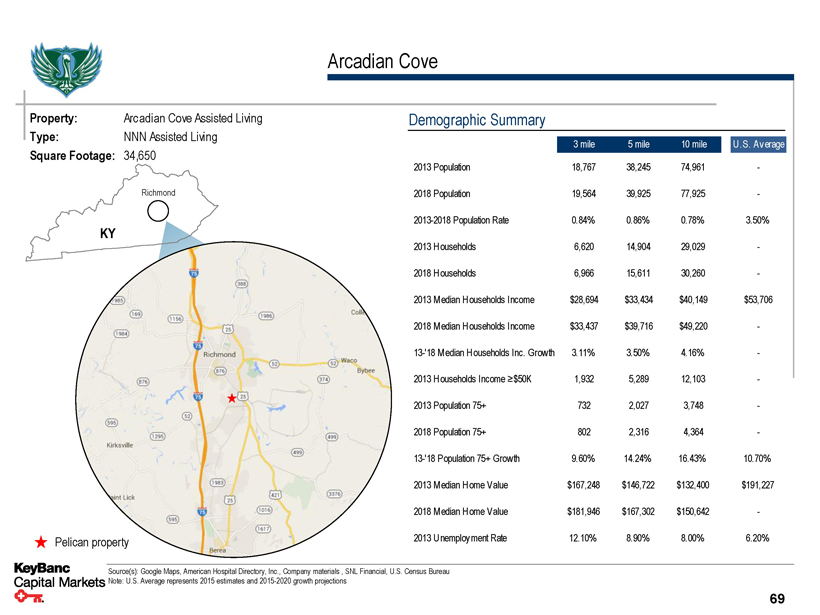
Arcadian Cove Property: Arcadian Cove Assisted Living Type: NNN Assisted Living Square Footage: 34,650 Richmond KY Pelican property Demographic Summary 3 mile 5 mile 10 mile U .S. Average 2013 Population 18,767 38,245 74,961 - 2018 Population 19,564 39,925 77,925 - 2013-2018 Population Rate 0.84% 0.86% 0.78% 3.50% 2013 Households 6,620 14,904 29,029 - 2018 Households 6,966 15,611 30,260 - 2013 Median Households Income $28,694 $33,434 $40,149 $53,706 2018 Median Households Income $33,437 $39,716 $49,220 - 13-'18 Median Households Inc. Growth 3.11% 3.50% 4.16% - 2013 Households Income ≥$50K 1,932 5,289 12,103 - 2013 Population 75+ 732 2,027 3,748 - 2018 Population 75+ 802 2,316 4,364 - 13-'18 Population 75+ Growth 9.60% 14.24% 16.43% 10.70% 2013 Median Home Value $167,248 $146,722 $132,400 $191,227 2018 Median Home Value $181,946 $167,302 $150,642 - 2013 Unemployment Rate 12.10% 8.90% 8.00% 6.20% Source(s): Google Maps, American Hospital Directory, Inc., Company materials , SNL Financial, U.S. Census Bureau Note: U.S. Average represents 2015 estimates and 2015-2020 growth projections 69
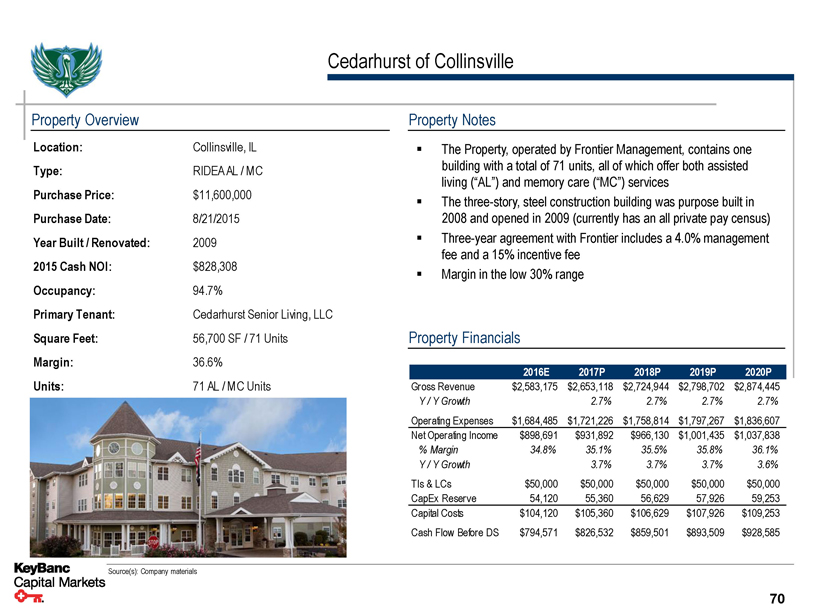
Cedarhurst of Collinsville Property Overview Location: Collinsville, IL Type: RIDEA AL / MC Purchase Price: $11,600,000 Purchase Date: 8/21/2015 Year Built / Renovated: 2009 2015 Cash NOI: $828,308 Occupancy: 94.7% Primary Tenant: Cedarhurst Senior Living, LLC Square Feet: 56,700 SF / 71 Units Margin: 36.6% Units: 71 AL / MC Units Property Notes ▪ The Property, operated by Frontier Management, contains one building with a total of 71 units, all of which offer both assisted living (“AL”) and memory care (“MC”) services ▪ The three-story, steel construction building was purpose built in 2008 and opened in 2009 (currently has an all private pay census) ▪ Three-year agreement with Frontier includes a 4.0% management fee and a 15% incentive fee ▪ Margin in the low 30% range Property Financials 2016E 2017P 2018P 2019P 2020P Gross Revenue $2,583,175 $2,653,118 $2,724,944 $2,798,702 $2,874,445 Y / Y Growth 2.7% 2.7% 2.7% 2.7% Operating Expenses $1,684,485 $1,721,226 $1,758,814 $1,797,267 $1,836,607 Net Operating Income $898,691 $931,892 $966,130 $1,001,435 $1,037,838% Margin 34.8% 35.1% 35.5% 35.8% 36.1% Y / Y Growth 3.7% 3.7% 3.7% 3.6% TIs & LCs $50,000 $50,000 $50,000 $50,000 $50,000 CapEx Reserve 54,120 55,360 56,629 57,926 59,253 Capital Costs $104,120 $105,360 $106,629 $107,926 $109,253 Cash Flow Before DS $794,571 $826,532 $859,501 $893,509 $928,585 Source(s): Company materials 70

Cedarhurst of Collinsville Competition Detail 0 - 3 Mile 3 - 5 Mile 5 - 10 Mile Radius Radius Radius Existing Properties IL - # of Properties 0 0 2 IL - Average Age NA NA 29 AL - # of Properties 0 1 8 AL - Average Age NA 10 10 IL Units 0 0 358 AL Units 0 103 535 MC Units 0 0 169 Total Units 0 103 1,062 Under Construction IL - # of Properties 0 0 0 AL - # of Properties 0 0 0 IL Units 0 0 0 AL Units 0 0 0 MC Units 0 0 0 Total Units 0 0 0% of Total NA 0.0% 0.0% Total Units (Existing & Construction) 0 103 1,062 Demographic Summary 3 mile 5 mile 10 mile U .S. Average 2013 Population 33,771 57,121 262,334 - 2018 Population 33,308 57,191 263,253 - 2013-2018 Population Rate (0.28%) 0.02% 0.07% 3.50% 2013 Households 14,172 23,181 103,370 - 2018 Households 14,015 23,248 103,981 - 2013 Median Households Income $51,348 $56,308 $52,982 $53,706 2018 Median Households Income $59,828 $68,884 $62,378 - 13-'18 Median Households Inc. Growth 3.10% 4.11% 3.32% - 2013 Households Income ≥$50K 7,313 13,074 54,993 - 2013 Population 75+ 2,229 3,542 16,265 - 2018 Population 75+ 2,365 3,832 17,112 - 13-'18 Population 75+ Growth 6.10% 8.20% 5.21% 10.70% 2013 Median Home Value $161,683 $171,171 $160,580 $191,227 2018 Median Home Value $203,838 $217,415 $212,224 - 2013 Unemployment Rate 9.30% 9.70% 10.90% 6.20% Source(s): SNL Financial, U.S. Census Bureau, NIC Map Note: U.S. Average represents 2015 estimates and 2015-2020 growth projections 71
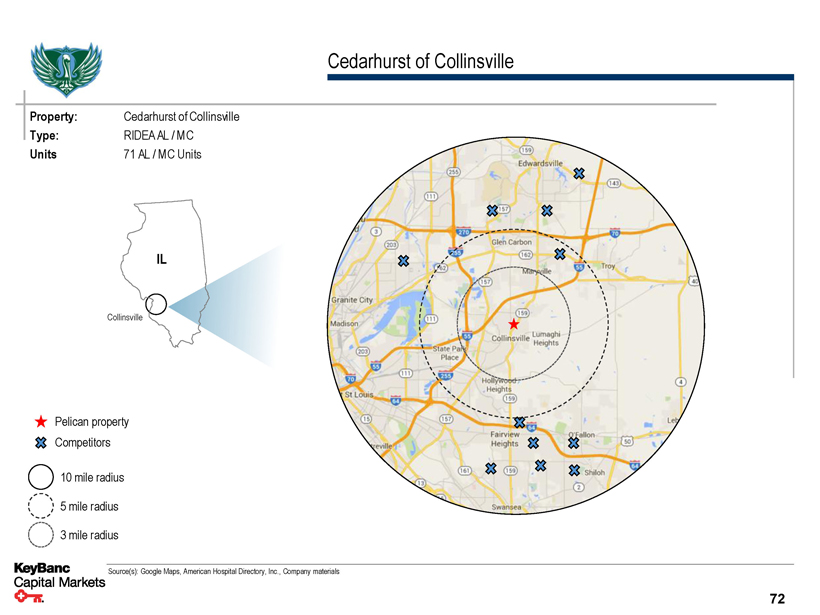
Cedarhurst of Collinsville Property: Cedarhurst of Collinsville Type: RIDEA AL / MC Units 71 AL / MC Units IL Collinsville Pelican property Competitors 10 mile radius 5 mile radius 3 mile radius Source(s): Google Maps, American Hospital Directory, Inc., Company materials 72
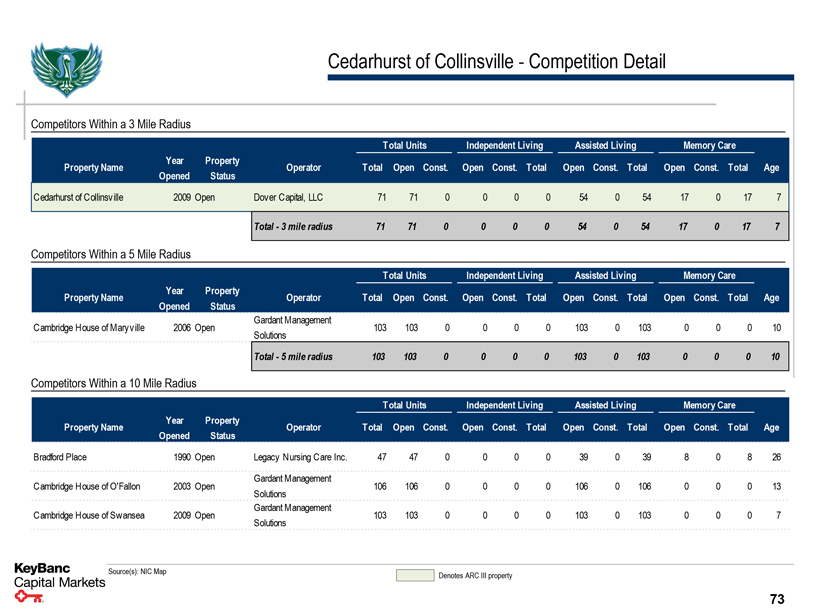
Cedarhurst of Collinsville - Competition Detail Competitors Within a 3 Mile Radius Total Units Independent Living Assisted Living Memory Care Property Name Year Property Operator Total Open Const. Open Const. Total Open Const. Total Open Const. Total Age Opened Status Cedarhurst of Collinsville 2009 Open Dover Capital, LLC 71 71 0 0 0 0 54 0 54 17 0 17 7 Total - 3 mile radius 71 71 0 0 0 0 54 0 54 17 0 17 7 Competitors Within a 5 Mile Radius Total Units Independent Living Assisted Living Memory Care Property Name Year Property Operator Total Open Const. Open Const. Total Open Const. Total Open Const. Total Age Opened Status Cambridge House of Maryville 2006 Open Gardant Management 103 103 0 0 0 0 103 0 103 0 0 0 10 Solutions Total - 5 mile radius 103 103 0 0 0 0 103 0 103 0 0 0 10 Competitors Within a 10 Mile Radius Total Units Independent Living Assisted Living Memory Care Property Name Year Property Operator Total Open Const. Open Const. Total Open Const. Total Open Const. Total Age Opened Status Bradford Place 1990 Open Legacy Nursing Care Inc. 47 47 0 0 0 0 39 0 39 8 0 8 26 Cambridge House of O'Fallon 2003 Open Gardant Management 106 106 0 0 0 0 106 0 106 0 0 0 13 Solutions Cambridge House of Swansea 2009 Open Gardant Management 103 103 0 0 0 0 103 0 103 0 0 0 7 Solutions Source(s): NIC Map Denotes ARC III property 73
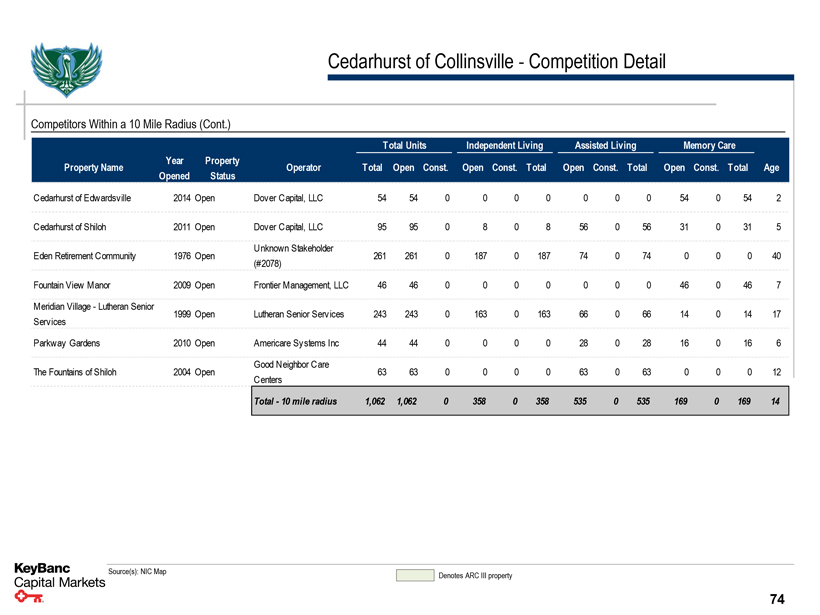
Cedarhurst of Collinsville - Competition Detail Competitors Within a 10 Mile Radius (Cont.) Total Units Independent Living Assisted Living Memory Care Property Name Year Property Operator Total Open Const. Open Const. Total Open Const. Total Open Const. Total Age Opened Status Cedarhurst of Edwardsville 2014 Open Dover Capital, LLC 54 54 0 0 0 0 0 0 0 54 0 54 2 Cedarhurst of Shiloh 2011 Open Dover Capital, LLC 95 95 0 8 0 8 56 0 56 31 0 31 5 Eden Retirement Community 1976 Open Unknown Stakeholder 261 261 0 187 0 187 74 0 74 0 0 0 40 (#2078) Fountain View Manor 2009 Open Frontier Management, LLC 46 46 0 0 0 0 0 0 0 46 0 46 7 Meridian Village - Lutheran Senior 1999 Open Lutheran Senior Services 243 243 0 163 0 163 66 0 66 14 0 14 17 Services Parkway Gardens 2010 Open Americare Systems Inc 44 44 0 0 0 0 28 0 28 16 0 16 6 The Fountains of Shiloh 2004 Open Good Neighbor Care 63 63 0 0 0 0 63 0 63 0 0 0 12 Centers Total - 10 mile radius 1,062 1,062 0 358 0 358 535 0 535 169 0 169 14 Source(s): NIC Map Denotes ARC III property 74

Confidential Preliminary Valuation
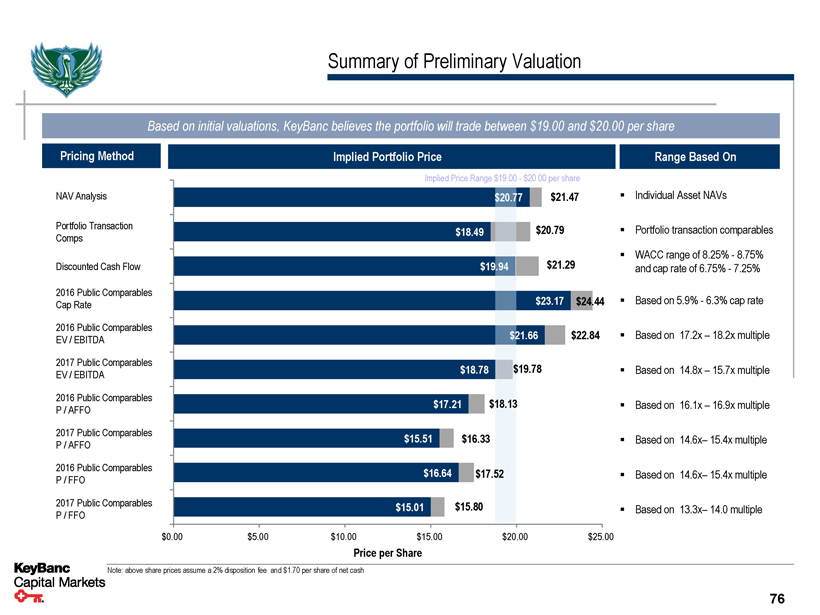
Summary of Preliminary Valuation Based on initial valuations, KeyBanc believes the portfolio will trade between $19.00 and $20.00 per share Pricing Method Implied Portfolio Price Range Based On NAV Analysis Portfolio Transaction Comps Discounted Cash Flow 2016 Public Comparables Cap Rate 2016 Public Comparables EV / EBITDA 2017 Public Comparables EV / EBITDA 2016 Public Comparables P / AFFO 2017 Public Comparables P / AFFO 2016 Public Comparables P / FFO 2017 Public Comparables P / FFO Implied Price Range $19.00 - $20.00 per share $21.47 $18.49 $20.79 $19 $21.29 $23.17 $24.44 ..66 $22.84 $18.78 $19.78 $17.21 $18.13 $15.51 $16.33 $16.64 $17.52 $15.01 $15.80 ▪ Individual Asset NAVs ▪ Portfolio transaction comparables ▪ WACC range of 8.25% - 8.75% and cap rate of 6.75% - 7.25% ▪ Based on 5.9% - 6.3% cap rate ▪ Based on 17.2x – 18.2x multiple ▪ Based on 14.8x – 15.7x multiple ▪ Based on 16.1x – 16.9x multiple ▪ Based on 14.6x– 15.4x multiple ▪ Based on 14.6x– 15.4x multiple ▪ Based on 13.3x– 14.0 multiple $0.00 $5.00 $10.00 $15.00 $20.00 $25.00 Price per Share Note: above share prices assume a 2% disposition fee and $1.70 per share of net cash 76
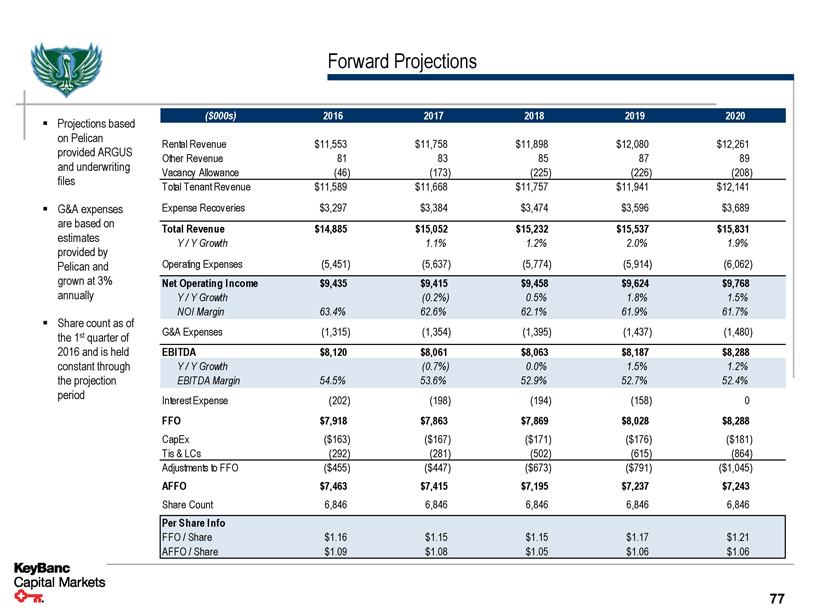
Forward Projections ▪ Projections based on Pelican provided ARGUS and underwriting files ▪ G&A expenses are based on estimates provided by Pelican and grown at 3% annually ▪ Share count as of the 1st quarter of 2016 and is held constant through the projection period ($000s) 2016 2017 2018 2019 2020 Rental Revenue $11,553 $11,758 $11,898 $12,080 $12,261 Other Revenue 81 83 85 87 89 Vacancy Allowance (46) (173) (225) (226) (208) Total Tenant Revenue $11,589 $11,668 $11,757 $11,941 $12,141 Expense Recoveries $3,297 $3,384 $3,474 $3,596 $3,689 Total Revenue $14,885 $15,052 $15,232 $15,537 $15,831 Y / Y Growth 1.1% 1.2% 2.0% 1.9% Operating Expenses (5,451) (5,637) (5,774) (5,914) (6,062) Net Operating Income $9,435 $9,415 $9,458 $9,624 $9,768 Y / Y Growth (0.2%) 0.5% 1.8% 1.5% NOI Margin 63.4% 62.6% 62.1% 61.9% 61.7% G&A Expenses (1,315) (1,354) (1,395) (1,437) (1,480) EBITDA $8,120 $8,061 $8,063 $8,187 $8,288 Y / Y Growth (0.7%) 0.0% 1.5% 1.2% EBITDA Margin 54.5% 53.6% 52.9% 52.7% 52.4% Interest Expense (202) (198) (194) (158) 0 FFO $7,918 $7,863 $7,869 $8,028 $8,288 CapEx ($163) ($167) ($171) ($176) ($181) Tis & LCs (292) (281) (502) (615) (864) Adjustments to FFO ($455) ($447) ($673) ($791) ($1,045) AFFO $7,463 $7,415 $7,195 $7,237 $7,243 Share Count 6,846 6,846 6,846 6,846 6,846 Per Share Info FFO / Share $1.16 $1.15 $1.15 $1.17 $1.21 AFFO / Share $1.09 $1.08 $1.05 $1.06 $1.06 77
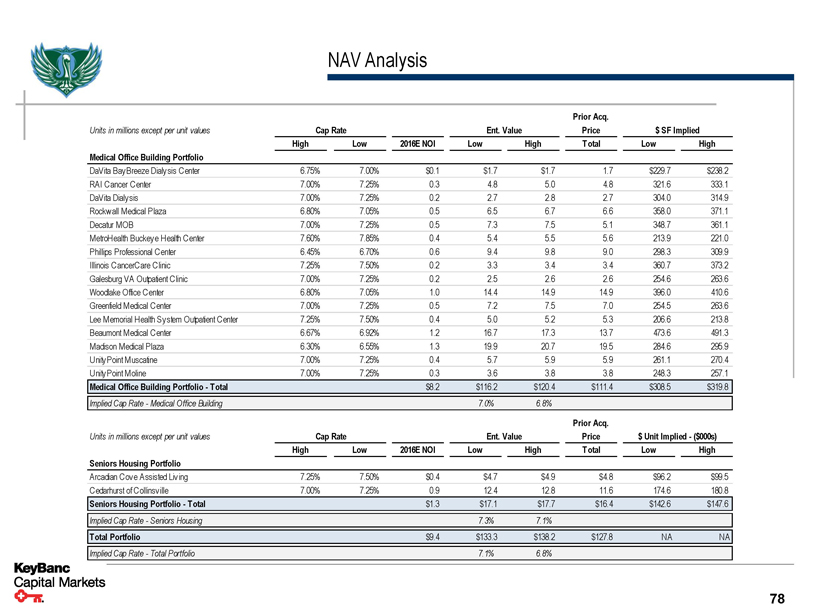
NAV Analysis Prior Acq. Units in millions except per unit values Cap Rate Ent. Value Price $SF Implied High Low 2016E NOI Low High Total Low High Medical Office Building Portfolio DaVita BayBreeze Dialysis Center 6.75% 7.00% $0.1 $1.7 $1.7 1.7 $229.7 $238.2 RAI Cancer Center 7.00% 7.25% 0.3 4.8 5.0 4.8 321.6 333.1 DaVita Dialysis 7.00% 7.25% 0.2 2.7 2.8 2.7 304.0 314.9 Rockwall Medical Plaza 6.80% 7.05% 0.5 6.5 6.7 6.6 358.0 371.1 Decatur MOB 7.00% 7.25% 0.5 7.3 7.5 5.1 348.7 361.1 MetroHealth Buckeye Health Center 7.60% 7.85% 0.4 5.4 5.5 5.6 213.9 221.0 Phillips Professional Center 6.45% 6.70% 0.6 9.4 9.8 9.0 298.3 309.9 Illinois CancerCare Clinic 7.25% 7.50% 0.2 3.3 3.4 3.4 360.7 373.2 Galesburg VA Outpatient Clinic 7.00% 7.25% 0.2 2.5 2.6 2.6 254.6 263.6 Woodlake Office Center 6.80% 7.05% 1.0 14.4 14.9 14.9 396.0 410.6 Greenfield Medical Center 7.00% 7.25% 0.5 7.2 7.5 7.0 254.5 263.6 Lee Memorial Health System Outpatient Center 7.25% 7.50% 0.4 5.0 5.2 5.3 206.6 213.8 Beaumont Medical Center 6.67% 6.92% 1.2 16.7 17.3 13.7 473.6 491.3 Madison Medical Plaza 6.30% 6.55% 1.3 19.9 20.7 19.5 284.6 295.9 UnityPoint Muscatine 7.00% 7.25% 0.4 5.7 5.9 5.9 261.1 270.4 UnityPoint Moline 7.00% 7.25% 0.3 3.6 3.8 3.8 248.3 257.1 Medical Office Building Portfolio - Total $8.2 $116.2 $120.4 $111.4 $308.5 $319.8 Implied Cap Rate - Medical Office Building 7.0% 6.8% Prior Acq. Units in millions except per unit values Cap Rate Ent. Value Price $Unit Implied - ($000s) High Low 2016E NOI Low High Total Low High Seniors Housing Portfolio Arcadian Cove Assisted Living 7.25% 7.50% $0.4 $4.7 $4.9 $4.8 $96.2 $99.5 Cedarhurst of Collinsville 7.00% 7.25% 0.9 12.4 12.8 11.6 174.6 180.8 Seniors Housing Portfolio - Total $1.3 $17.1 $17.7 $16.4 $142.6 $147.6 Implied Cap Rate - Seniors Housing 7.3% 7.1% Total Portfolio $9.4 $133.3 $138.2 $127.8 NA NA Implied Cap Rate - Total Portfolio 7.1% 6.8% 78
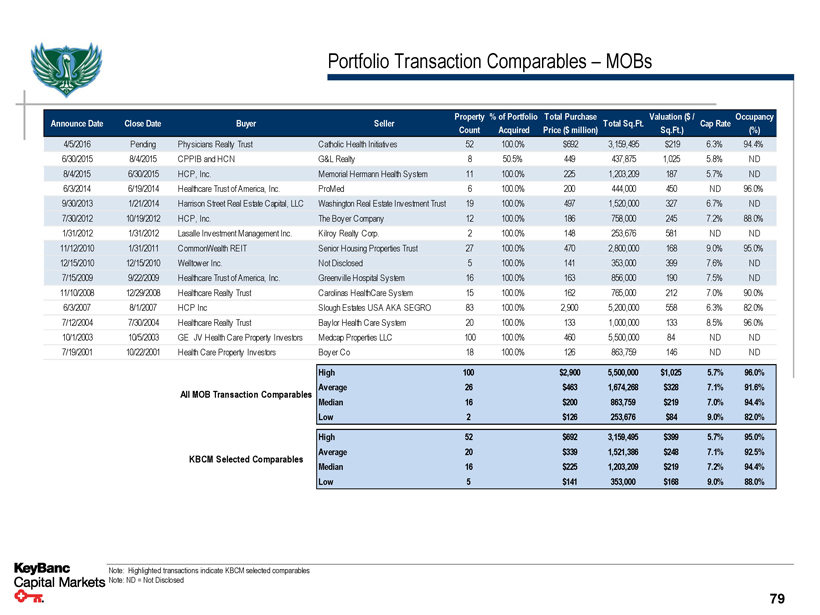
Portfolio Transaction Comparables – MOBs Announce Date Close Date Buyer Seller Property% of Portfolio Total Purchase Total Sq.Ft. Valuation ($/ Cap Rate Occupancy Count Acquired Price ($million) Sq.Ft.) (%) 4/5/2016 Pending Physicians Realty Trust Catholic Health Initiatives 52 100.0% $692 3,159,495 $219 6.3% 94.4% 6/30/2015 8/4/2015 CPPIB and HCN G&L Realty 8 50.5% 449 437,875 1,025 5.8% ND 8/4/2015 6/30/2015 HCP, Inc. Memorial Hermann Health System 11 100.0% 225 1,203,209 187 5.7% ND 6/3/2014 6/19/2014 Healthcare Trust of America, Inc. ProMed 6 100.0% 200 444,000 450 ND 96.0% 9/30/2013 1/21/2014 Harrison Street Real Estate Capital, LLC Washington Real Estate Investment Trust 19 100.0% 497 1,520,000 327 6.7% ND 7/30/2012 10/19/2012 HCP, Inc. The Boyer Company 12 100.0% 186 758,000 245 7.2% 88.0% 1/31/2012 1/31/2012 Lasalle Investment Management Inc. Kilroy Realty Corp. 2 100.0% 148 253,676 581 ND ND 11/12/2010 1/31/2011 CommonWealth REIT Senior Housing Properties Trust 27 100.0% 470 2,800,000 168 9.0% 95.0% 12/15/2010 12/15/2010 Welltower Inc. Not Disclosed 5 100.0% 141 353,000 399 7.6% ND 7/15/2009 9/22/2009 Healthcare Trust of America, Inc. Greenville Hospital System 16 100.0% 163 856,000 190 7.5% ND 11/10/2008 12/29/2008 Healthcare Realty Trust Carolinas HealthCare System 15 100.0% 162 765,000 212 7.0% 90.0% 6/3/2007 8/1/2007 HCP Inc Slough Estates USA AKA SEGRO 83 100.0% 2,900 5,200,000 558 6.3% 82.0% 7/12/2004 7/30/2004 Healthcare Realty Trust Baylor Health Care System 20 100.0% 133 1,000,000 133 8.5% 96.0% 10/1/2003 10/5/2003 GE JV Health Care Property Investors Medcap Properties LLC 100 100.0% 460 5,500,000 84 ND ND 7/19/2001 10/22/2001 Health Care Property Investors Boyer Co 18 100.0% 126 863,759 146 ND ND High 100 $2,900 5,500,000 $1,025 5.7% 96.0% All MOB Transaction Comparables Average 26 $463 1,674,268 $328 7.1% 91.6% Median 16 $200 863,759 $219 7.0% 94.4% Low 2 $126 253,676 $84 9.0% 82.0% High 52 $692 3,159,495 $399 5.7% 95.0% KBCM Selected Comparables Average 20 $339 1,521,386 $248 7.1% 92.5% Median 16 $225 1,203,209 $219 7.2% 94.4% Low 5 $141 353,000 $168 9.0% 88.0% Note: Highlighted transactions indicate KBCM selected comparables Note: ND = Not Disclosed 79
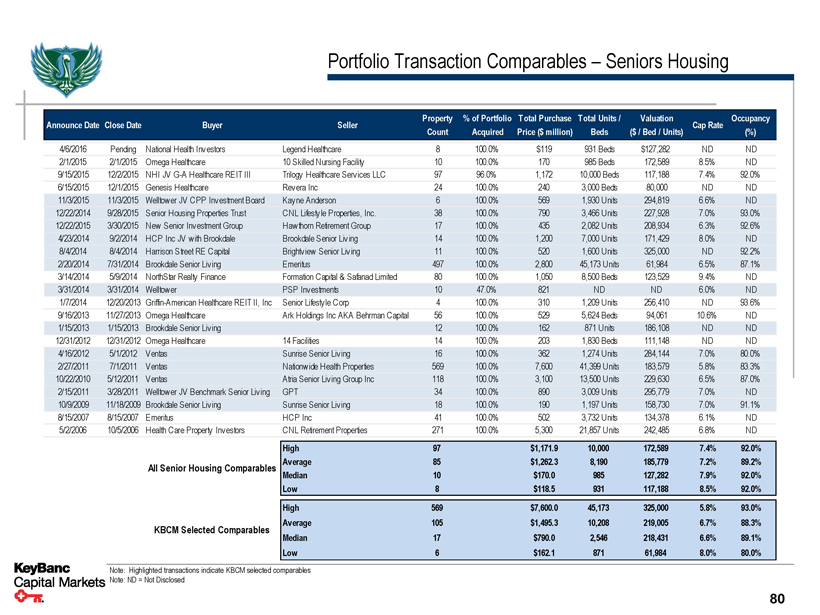
Portfolio Transaction Comparables – Seniors Housing Announce Date Close Date Buyer Seller Property% of Portfolio Total Purchase Total Units / Valuation Cap Rate Occupancy Count Acquired Price ($million) Beds ($/ Bed / Units) (%) 4/6/2016 Pending National Health Investors Legend Healthcare 8 100.0% $119 931 Beds $127,282 ND ND 2/1/2015 2/1/2015 Omega Healthcare 10 Skilled Nursing Facility 10 100.0% 170 985 Beds 172,589 8.5% ND 9/15/2015 12/2/2015 NHI JV G-A Healthcare REIT III Trilogy Healthcare Services LLC 97 96.0% 1,172 10,000 Beds 117,188 7.4% 92.0% 6/15/2015 12/1/2015 Genesis Healthcare Revera Inc 24 100.0% 240 3,000 Beds 80,000 ND ND 11/3/2015 11/3/2015 Welltower JV CPP Investment Board Kayne Anderson 6 100.0% 569 1,930 Units 294,819 6.6% ND 12/22/2014 9/28/2015 Senior Housing Properties Trust CNL Lifestyle Properties, Inc. 38 100.0% 790 3,466 Units 227,928 7.0% 93.0% 12/22/2015 3/30/2015 New Senior Investment Group Hawthorn Retirement Group 17 100.0% 435 2,082 Units 208,934 6.3% 92.6% 4/23/2014 9/2/2014 HCP Inc JV with Brookdale Brookdale Senior Living 14 100.0% 1,200 7,000 Units 171,429 8.0% ND 8/4/2014 8/4/2014 Harrison Street RE Capital Brightview Senior Living 11 100.0% 520 1,600 Units 325,000 ND 92.2% 2/20/2014 7/31/2014 Brookdale Senior Living Emeritus 497 100.0% 2,800 45,173 Units 61,984 6.5% 87.1% 3/14/2014 5/9/2014 NorthStar Realty Finance Formation Capital & Safanad Limited 80 100.0% 1,050 8,500 Beds 123,529 9.4% ND 3/31/2014 3/31/2014 Welltower PSP Investments 10 47.0% 821 ND ND 6.0% ND 1/7/2014 12/20/2013 Griffin-American Healthcare REIT II, Inc Senior Lifestyle Corp 4 100.0% 310 1,209 Units 256,410 ND 93.6% 9/16/2013 11/27/2013 Omega Healthcare Ark Holdings Inc AKA Behrman Capital 56 100.0% 529 5,624 Beds 94,061 10.6% ND 1/15/2013 1/15/2013 Brookdale Senior Living 12 100.0% 162 871 Units 186,108 ND ND 12/31/2012 12/31/2012 Omega Healthcare 14 Facilities 14 100.0% 203 1,830 Beds 111,148 ND ND 4/16/2012 5/1/2012 Ventas Sunrise Senior Living 16 100.0% 362 1,274 Units 284,144 7.0% 80.0% 2/27/2011 7/1/2011 Ventas Nationwide Health Properties 569 100.0% 7,600 41,399 Units 183,579 5.8% 83.3% 10/22/2010 5/12/2011 Ventas Atria Senior Living Group Inc 118 100.0% 3,100 13,500 Units 229,630 6.5% 87.0% 2/15/2011 3/28/2011 Welltower JV Benchmark Senior Living GPT 34 100.0% 890 3,009 Units 295,779 7.0% ND 10/9/2009 11/18/2009 Brookdale Senior Living Sunrise Senior Living 18 100.0% 190 1,197 Units 158,730 7.0% 91.1% 8/15/2007 8/15/2007 Emeritus HCP Inc 41 100.0% 502 3,732 Units 134,378 6.1% ND 5/2/2006 10/5/2006 Health Care Property Investors CNL Retirement Properties 271 100.0% 5,300 21,857 Units 242,485 6.8% ND High 97 $1,171.9 10,000 172,589 7.4% 92.0% All Senior Housing Comparables Average 85 $1,262.3 8,190 185,779 7.2% 89.2% Median 10 $170.0 985 127,282 7.9% 92.0% Low 8 $118.5 931 117,188 8.5% 92.0% High 569 $7,600.0 45,173 325,000 5.8% 93.0% KBCM Selected Comparables Average 105 $1,495.3 10,208 219,005 6.7% 88.3% Median 17 $790.0 2,546 218,431 6.6% 89.1% Low 6 $162.1 871 61,984 8.0% 80.0% Note: Highlighted transactions indicate KBCM selected comparables Note: ND = Not Disclosed 80
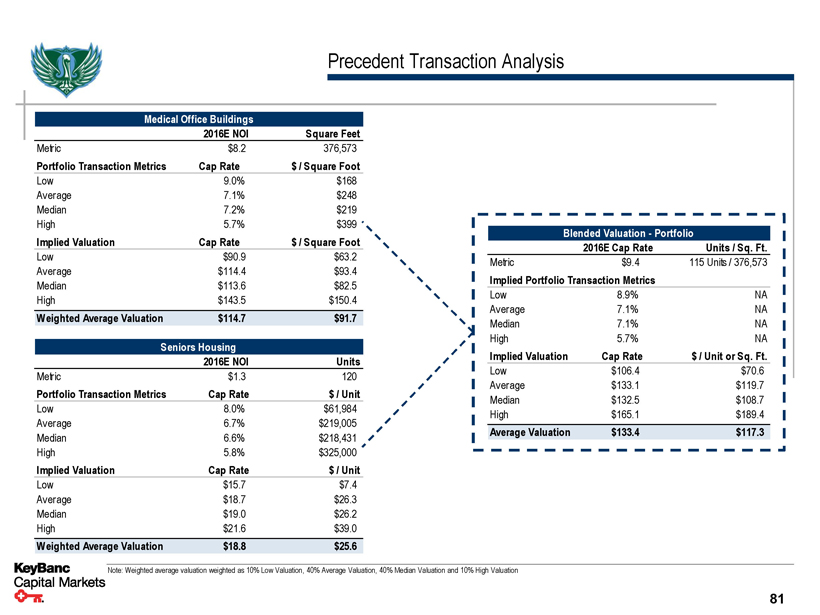
Precedent Transaction Analysis Medical Office Buildings 2016E NOI Square Feet Metric $8.2 376,573 Portfolio Transaction Metrics Cap Rate $/ Square Foot Low 9.0% $168 Average 7.1% $248 Median 7.2% $219 High 5.7% $399 Implied Valuation Cap Rate $/ Square Foot Low $90.9 $63.2 Average $114.4 $93.4 Median $113.6 $82.5 High $143.5 $150.4 Weighted Average Valuation $114.7 $91.7 Seniors Housing 2016E NOI Units Metric $1.3 120 Portfolio Transaction Metrics Cap Rate $/ Unit Low 8.0% $61,984 Average 6.7% $219,005 Median 6.6% $218,431 High 5.8% $325,000 Implied Valuation Cap Rate $/ Unit Low $15.7 $7.4 Average $18.7 $26.3 Median $19.0 $26.2 High $21.6 $39.0 Weighted Average Valuation $18.8 $25.6 Blended Valuation - Portfolio 2016E Cap Rate Units / Sq. Ft. Metric $9.4 115 Units / 376,573 Implied Portfolio Transaction Metrics Low 8.9% NA Average 7.1% NA Median 7.1% NA High 5.7% NA Implied Valuation Cap Rate $/ Unit or Sq. Ft. Low $106.4 $70.6 Average $133.1 $119.7 Median $132.5 $108.7 High $165.1 $189.4 Average Valuation $133.4 $117.3 Note: Weighted average valuation weighted as 10% Low Valuation, 40% Average Valuation, 40% Median Valuation and 10% High Valuation 81
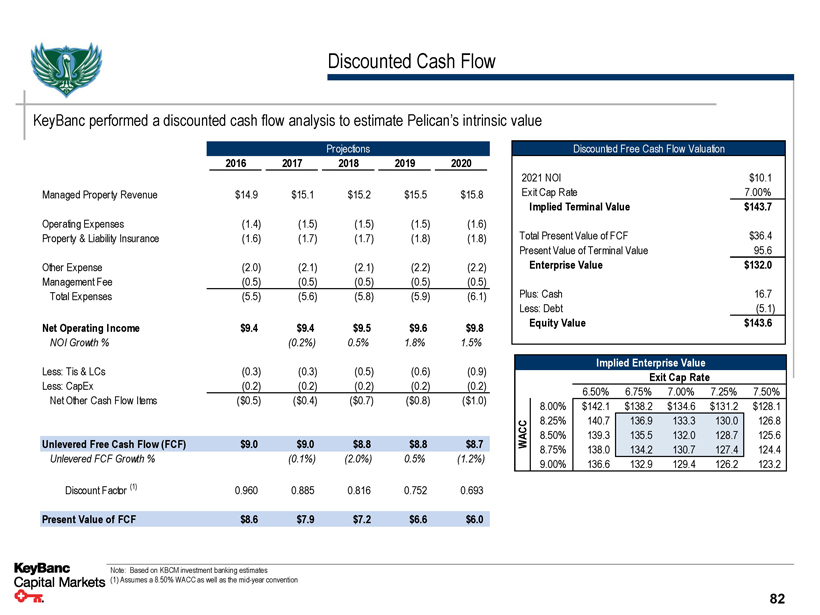
Discounted Cash Flow KeyBanc performed a discounted cash flow analysis to estimate Pelican’s intrinsic value Projections 2016 2017 2018 2019 2020 Managed Property Revenue $14.9 $15.1 $15.2 $15.5 $15.8 Operating Expenses (1.4) (1.5) (1.5) (1.5) (1.6) Property & Liability Insurance (1.6) (1.7) (1.7) (1.8) (1.8) Other Expense (2.0) (2.1) (2.1) (2.2) (2.2) Management Fee (0.5) (0.5) (0.5) (0.5) (0.5) Total Expenses (5.5) (5.6) (5.8) (5.9) (6.1) Net Operating Income $9.4 $9.4 $9.5 $9.6 $9.8 NOI Growth% (0.2%) 0.5% 1.8% 1.5% Less: Tis & LCs (0.3) (0.3) (0.5) (0.6) (0.9) Less: CapEx (0.2) (0.2) (0.2) (0.2) (0.2) Net Other Cash Flow Items ($0.5) ($0.4) ($0.7) ($0.8) ($1.0) Unlevered Free Cash Flow (FCF) $9.0 $9.0 $8.8 $8.8 $8.7 Unlevered FCF Growth% (0.1%) (2.0%) 0.5% (1.2%) Discount Factor (1) 0.960 0.885 0.816 0.752 0.693 Present Value of FCF $8.6 $7.9 $7.2 $6.6 $6.0 Discounted Free Cash Flow Valuation 2021 NOI $10.1 Exit Cap Rate 7.00% Implied Terminal Value $143.7 Total Present Value of FCF $36.4 Present Value of Terminal Value 95.6 Enterprise Value $132.0 Plus: Cash 16.7 Less: Debt (5.1) Equity Value $143.6 Implied Enterprise Value Exit Cap Rate 6.50% 6.75% 7.00% 7.25% 7.50% 8.00% $142.1 $138.2 $134.6 $131.2 $128.1 WACC 8.25% 140.7 136.9 133.3 130.0 126.8 8.50% 139.3 135.5 132.0 128.7 125.6 8.75% 138.0 134.2 130.7 127.4 124.4 9.00% 136.6 132.9 129.4 126.2 123.2 Note: Based on KBCM investment banking estimates (1) Assumes a 8.50% WACC as well as the mid-year convention 82
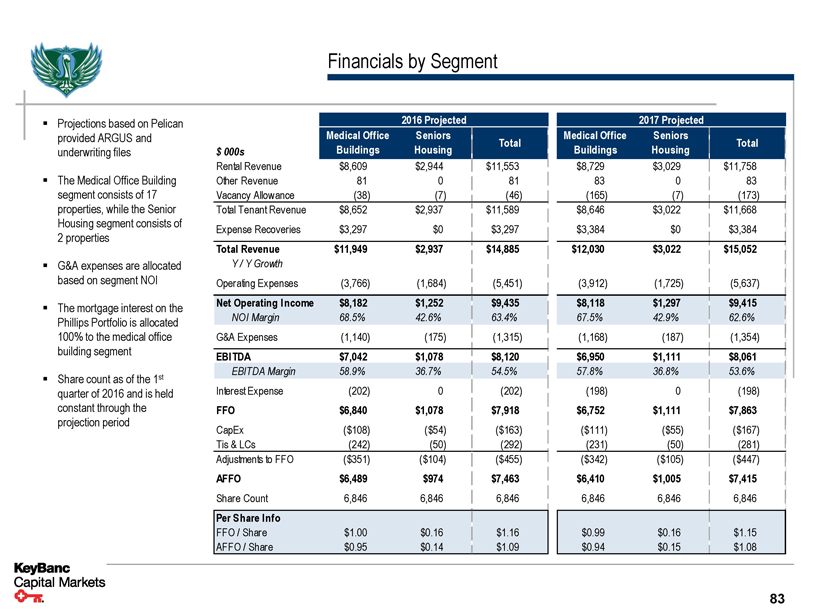
Financials by Segment ▪ Projections based on Pelican provided ARGUS and underwriting files ▪ The Medical Office Building segment consists of 17 properties, while the Senior Housing segment consists of 2 properties ▪ G&A expenses are allocated 2016 Projected 2017 Projected Medical Office Seniors Total Medical Office Seniors Total $000s Buildings Housing Buildings Housing Rental Revenue $8,609 $2,944 $11,553 $8,729 $3,029 $11,758 Other Revenue 81 0 81 83 0 83 Vacancy Allowance (38) (7) (46) (165) (7) (173) Total Tenant Revenue $8,652 $2,937 $11,589 $8,646 $3,022 $11,668 Expense Recoveries $3,297 $0 $3,297 $3,384 $0 $3,384 Total Revenue $11,949 $2,937 $14,885 $12,030 $3,022 $15,052 Y / Y Growth based on segment NOI ▪ The mortgage interest on the Phillips Portfolio is allocated 100% to the medical office building segment ▪ Share count as of the 1st quarter of 2016 and is held constant through the projection period Operating Expenses (3,766) (1,684) (5,451) Net Operating Income $8,182 $1,252 $9,435 NOI Margin 68.5% 42.6% 63.4% G&A Expenses (1,140) (175) (1,315) EBITDA $7,042 $1,078 $8,120 EBITDA Margin 58.9% 36.7% 54.5% Interest Expense (202) 0 (202) FFO $6,840 $1,078 $7,918 CapEx ($108) ($54) ($163) Tis & LCs (242) (50) (292) Adjustments to FFO ($351) ($104) ($455) AFFO $6,489 $974 $7,463 Share Count 6,846 6,846 6,846 Per Share Info FFO / Share $1.00 $0.16 $1.16 AFFO / Share $0.95 $0.14 $1.09 (3,912) (1,725) (5,637) $8,118 $1,297 $9,415 67.5% 42.9% 62.6% (1,168) (187) (1,354) $6,950 $1,111 $8,061 57.8% 36.8% 53.6% (198) 0 (198) $6,752 $1,111 $7,863 ($111) ($55) ($167) (231) (50) (281) ($342) ($105) ($447) $6,410 $1,005 $7,415 6,846 6,846 6,846 $0.99 $0.16 $1.15 $0.94 $0.15 $1.08 83

Public Comps Valuation Matrix – 2016 Medical Office Buildings Seniors Housing Total Portfolio P / FFO P / AFFO EV / Cap Rate P / FFO P / AFFO EV / Cap Rate P / FFO P / AFFO EV / Cap Rate $in 000s EBITDA EBITDA EBITDA 2016 Implied Valuation Metric $6,840 $6,489 $7,042 $8,182 $1,078 $974 $1,078 $1,252 $7,918 $7,463 $8,120 $9,435 Peer Multiple 17.9x 19.6x 21.1x 5.1% 11.2x 12.0x 14.2x 7.5% 17.0x 18.6x 20.2x 5.3% Market Cap $122,352 $127,422 $158,149 $169,109 $12,043 $11,720 $17,546 $19,003 $134,395 $139,142 $175,696 $188,112 Plus: Debt 5,069 5,069 5,069 5,069 0 0 0 0 5,069 5,069 5,069 5,069 Less: Cash (14,467) (14,467) (14,467) (14,467) (2,214) (2,214) (2,214) (2,214) (16,681) (16,681) (16,681) (16,681) Enterprise Value $112,954 $118,024 $148,752 $159,712 $9,828 $9,506 $15,332 $16,789 $122,783 $127,531 $164,084 $176,500 Enterprise Value Discount to Peers - based on 2016 0.0% $112,954 $118,024 $148,752 $159,712 $9,828 $9,506 $15,332 $16,789 $122,783 $127,531 $164,084 $176,500 (5.0%) $107,307 $112,123 $141,314 $151,726 $9,337 $9,031 $14,565 $15,949 $116,644 $121,154 $155,879 $167,675 (10.0%) $101,659 $106,222 $133,877 $143,740 $8,845 $8,556 $13,799 $15,110 $110,504 $114,778 $147,675 $158,850 (15.0%) $96,011 $100,321 $126,439 $135,755 $8,354 $8,080 $13,032 $14,270 $104,365 $108,401 $139,471 $150,025 (20.0%) $90,364 $94,419 $119,001 $127,769 $7,863 $7,605 $12,266 $13,431 $98,226 $102,024 $131,267 $141,200 84
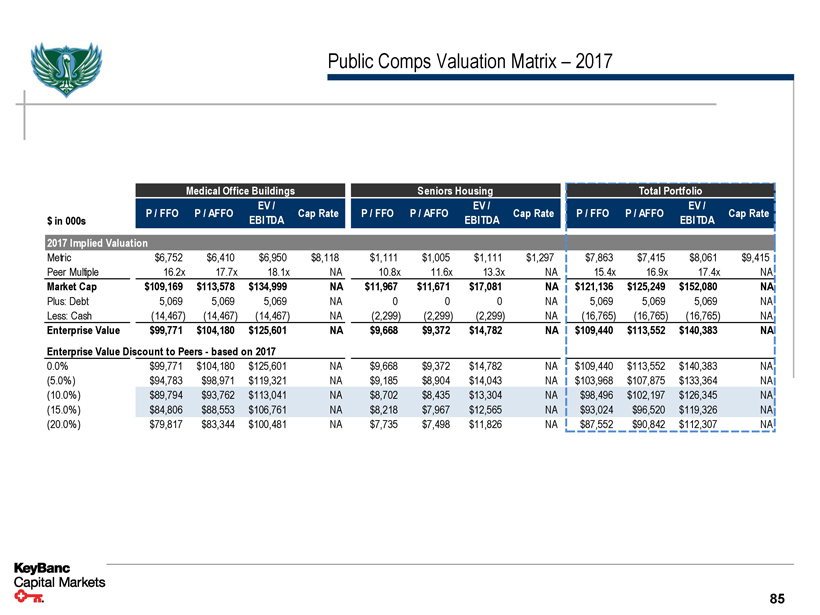
Public Comps Valuation Matrix – 2017 Medical Office Buildings Seniors Housing Total Portfolio P / FFO P / AFFO EV / Cap Rate P / FFO P / AFFO EV / Cap Rate P / FFO P / AFFO EV / Cap Rate $in 000s EBITDA EBITDA EBITDA 2017 Implied Valuation Metric $6,752 $6,410 $6,950 $8,118 $1,111 $1,005 $1,111 $1,297 $7,863 $7,415 $8,061 $9,415 Peer Multiple 16.2x 17.7x 18.1x NA 10.8x 11.6x 13.3x NA 15.4x 16.9x 17.4x NA Market Cap $109,169 $113,578 $134,999 NA $11,967 $11,671 $17,081 NA $121,136 $125,249 $152,080 NA Plus: Debt 5,069 5,069 5,069 NA 0 0 0 NA 5,069 5,069 5,069 NA Less: Cash (14,467) (14,467) (14,467) NA (2,299) (2,299) (2,299) NA (16,765) (16,765) (16,765) NA Enterprise Value $99,771 $104,180 $125,601 NA $9,668 $9,372 $14,782 NA $109,440 $113,552 $140,383 NA Enterprise Value Discount to Peers - based on 2017 0.0% $99,771 $104,180 $125,601 NA $9,668 $9,372 $14,782 NA $109,440 $113,552 $140,383 NA (5.0%) $94,783 $98,971 $119,321 NA $9,185 $8,904 $14,043 NA $103,968 $107,875 $133,364 NA (10.0%) $89,794 $93,762 $113,041 NA $8,702 $8,435 $13,304 NA $98,496 $102,197 $126,345 NA (15.0%) $84,806 $88,553 $106,761 NA $8,218 $7,967 $12,565 NA $93,024 $96,520 $119,326 NA (20.0%) $79,817 $83,344 $100,481 NA $7,735 $7,498 $11,826 NA $87,552 $90,842 $112,307 NA 85
Confidential Appendix
Confidential Benchmarking Analysis
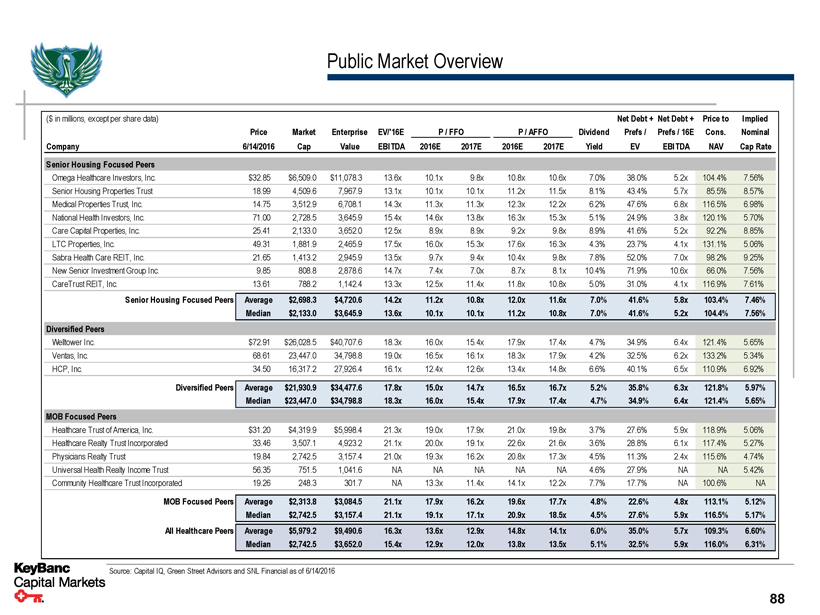
Public Market Overview ($in millions, except per share data) Net Debt + Net Debt + Price to Implied Price Market Enterprise EV/'16E P / FFO P / AFFO Dividend Prefs / Prefs / 16E Cons. Nominal Company 6/14/2016 Cap Value EBITDA 2016E 2017E 2016E 2017E Yield EV EBITDA NAV Cap Rate Senior Housing Focused Peers Omega Healthcare Investors, Inc. $32.85 $6,509.0 $11,078.3 13.6x 10.1x 9.8x 10.8x 10.6x 7.0% 38.0% 5.2x 104.4% 7.56% Senior Housing Properties Trust 18.99 4,509.6 7,967.9 13.1x 10.1x 10.1x 11.2x 11.5x 8.1% 43.4% 5.7x 85.5% 8.57% Medical Properties Trust, Inc. 14.75 3,512.9 6,708.1 14.3x 11.3x 11.3x 12.3x 12.2x 6.2% 47.6% 6.8x 116.5% 6.98% National Health Investors, Inc. 71.00 2,728.5 3,645.9 15.4x 14.6x 13.8x 16.3x 15.3x 5.1% 24.9% 3.8x 120.1% 5.70% Care Capital Properties, Inc. 25.41 2,133.0 3,652.0 12.5x 8.9x 8.9x 9.2x 9.8x 8.9% 41.6% 5.2x 92.2% 8.85% LTC Properties, Inc. 49.31 1,881.9 2,465.9 17.5x 16.0x 15.3x 17.6x 16.3x 4.3% 23.7% 4.1x 131.1% 5.06% Sabra Health Care REIT, Inc. 21.65 1,413.2 2,945.9 13.5x 9.7x 9.4x 10.4x 9.8x 7.8% 52.0% 7.0x 98.2% 9.25% New Senior Investment Group Inc. 9.85 808.8 2,878.6 14.7x 7.4x 7.0x 8.7x 8.1x 10.4% 71.9% 10.6x 66.0% 7.56% CareTrust REIT, Inc. 13.61 788.2 1,142.4 13.3x 12.5x 11.4x 11.8x 10.8x 5.0% 31.0% 4.1x 116.9% 7.61% Senior Housing Focused Peers Average $2,698.3 $4,720.6 14.2x 11.2x 10.8x 12.0x 11.6x 7.0% 41.6% 5.8x 103.4% 7.46% Median $2,133.0 $3,645.9 13.6x 10.1x 10.1x 11.2x 10.8x 7.0% 41.6% 5.2x 104.4% 7.56% Diversified Peers Welltower Inc. $72.91 $26,028.5 $40,707.6 18.3x 16.0x 15.4x 17.9x 17.4x 4.7% 34.9% 6.4x 121.4% 5.65% Ventas, Inc. 68.61 23,447.0 34,798.8 19.0x 16.5x 16.1x 18.3x 17.9x 4.2% 32.5% 6.2x 133.2% 5.34% HCP, Inc. 34.50 16,317.2 27,926.4 16.1x 12.4x 12.6x 13.4x 14.8x 6.6% 40.1% 6.5x 110.9% 6.92% Diversified Peers Average $21,930.9 $34,477.6 17.8x 15.0x 14.7x 16.5x 16.7x 5.2% 35.8% 6.3x 121.8% 5.97% Median $23,447.0 $34,798.8 18.3x 16.0x 15.4x 17.9x 17.4x 4.7% 34.9% 6.4x 121.4% 5.65% MOB Focused Peers Healthcare Trust of America, Inc. $31.20 $4,319.9 $5,998.4 21.3x 19.0x 17.9x 21.0x 19.8x 3.7% 27.6% 5.9x 118.9% 5.06% Healthcare Realty Trust Incorporated 33.46 3,507.1 4,923.2 21.1x 20.0x 19.1x 22.6x 21.6x 3.6% 28.8% 6.1x 117.4% 5.27% Physicians Realty Trust 19.84 2,742.5 3,157.4 21.0x 19.3x 16.2x 20.8x 17.3x 4.5% 11.3% 2.4x 115.6% 4.74% Universal Health Realty Income Trust 56.35 751.5 1,041.6 NA NA NA NA NA 4.6% 27.9% NA NA 5.42% Community Healthcare Trust Incorporated 19.26 248.3 301.7 NA 13.3x 11.4x 14.1x 12.2x 7.7% 17.7% NA 100.6% NA MOB Focused Peers Average $2,313.8 $3,084.5 21.1x 17.9x 16.2x 19.6x 17.7x 4.8% 22.6% 4.8x 113.1% 5.12% Median $2,742.5 $3,157.4 21.1x 19.1x 17.1x 20.9x 18.5x 4.5% 27.6% 5.9x 116.5% 5.17% All Healthcare Peers Average $5,979.2 $9,490.6 16.3x 13.6x 12.9x 14.8x 14.1x 6.0% 35.0% 5.7x 109.3% 6.60% Median $2,742.5 $3,652.0 15.4x 12.9x 12.0x 13.8x 13.5x 5.1% 32.5% 5.9x 116.0% 6.31% Source: Capital IQ, Green Street Advisors and SNL Financial as of 6/14/2016 88
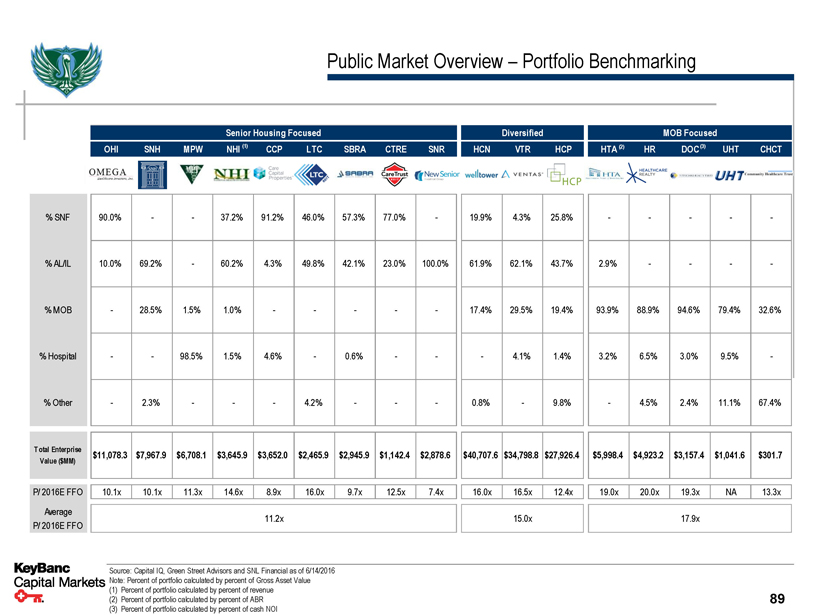
Public Market Overview – Portfolio Benchmarking Senior Housing Focused Diversified MOB Focused OHI SNH MPW NHI (1) CCP LTC SBRA CTRE SNR HCN VTR HCP HTA (2) HR DOC (3) UHT CHCT% SNF 90.0% - - 37.2% 91.2% 46.0% 57.3% 77.0% - 19.9% 4.3% 25.8% - - - - -% AL/IL 10.0% 69.2% - 60.2% 4.3% 49.8% 42.1% 23.0% 100.0% 61.9% 62.1% 43.7% 2.9% - - - -% MOB - 28.5% 1.5% 1.0% - - - - - 17.4% 29.5% 19.4% 93.9% 88.9% 94.6% 79.4% 32.6%% Hospital - - 98.5% 1.5% 4.6% - 0.6% - - - 4.1% 1.4% 3.2% 6.5% 3.0% 9.5% -% Other - 2.3% - - - 4.2% - - - 0.8% - 9.8% - 4.5% 2.4% 11.1% 67.4% Total Enterprise $11,078.3 $7,967.9 $6,708.1 $3,645.9 $3,652.0 $2,465.9 $2,945.9 $1,142.4 $2,878.6 $40,707.6 $34,798.8 $27,926.4 $5,998.4 $4,923.2 $3,157.4 $1,041.6 $301.7 Value ($MM) P/ 2016E FFO 10.1x 10.1x 11.3x 14.6x 8.9x 16.0x 9.7x 12.5x 7.4x 16.0x 16.5x 12.4x 19.0x 20.0x 19.3x NA 13.3x Average 11.2x 15.0x 17.9x P/ 2016E FFO Source: Capital IQ, Green Street Advisors and SNL Financial as of 6/14/2016 Note: Percent of portfolio calculated by percent of Gross Asset Value (1) Percent of portfolio calculated by percent of revenue 89 (2) Percent of portfolio calculated by percent of ABR (3) Percent of portfolio calculated by percent of cash NOI
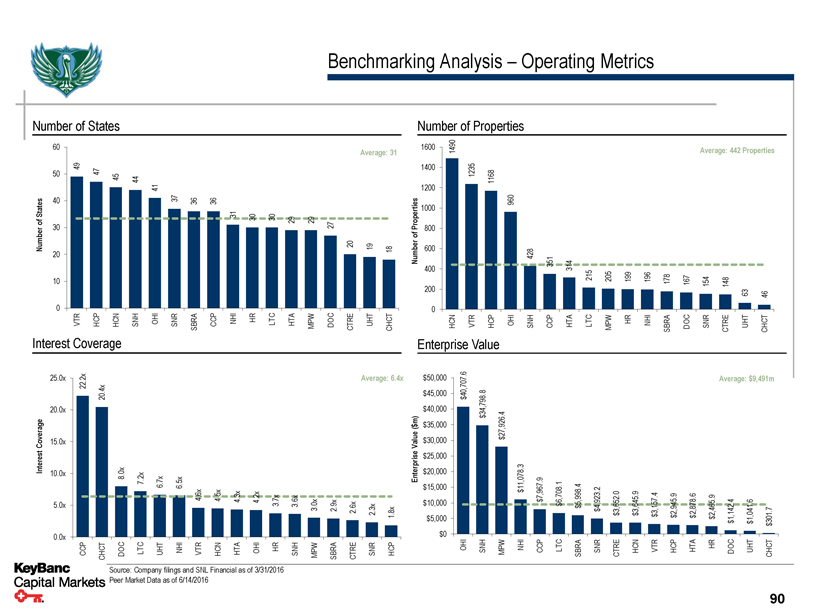
Benchmarking Analysis – Operating Metrics Number of States 60 47 49 50 45 44 41 States 40 37 36 36 31 30 30 29 29 of Number 30 20 10 0 HCP HCN SNH OHI SNR SBRA CCP NHI HR LTC HTA MPW VTR Interest Coverage 25.0x 22.2x 20.4x 20.0x Coverage 15.0x Interest 10.0x 8.0x 7.2x 6.7x 6.5x 4.6x 4.5x 4.3x 4.2x 3.7x 3.6x 3.0x 5.0x 0.0x Number of Properties Average: 31 1600 1490 1400 1235 1168 1200 $960 Properties 1000 27 800 of 20 19 18 Number 600 428 351 314 400 215 200 DOC CTRE UHT CHCT 0 HCN VTR HCP OHI SNH CCP HTA LTC Enterprise Value Average: 6.4x $50,000 .6 .8 $45,000 $$$40,000 ..4 ( $35,000 $Value $30,000 $25,000 .3 Enterprise $20,000 $.9 .1 $15,000 .4 .2 2.9x 2.6x $10,000 $$$$2.3x 1.8x $5,000 $0 205 199 196 HR NHI MPW$.0 $.9 $.4 178 167 154 148 63 46 SBRA DOC SNR CTRE UHT CHCT Average: $9,491m $.9 $.6 $.9 $.4 $.6 $.7 Average: 442 Properties CCP CHCT DOC LTC UHT NHI VTR HCN HTA OHI HR SNH MPW Source: Company filings and SNL Financial as of 3/31/2016 Peer Market Data as of 6/14/2016 SBRA CTRE SNR HCP OHI SNH MPW NHI CCP LTC SBRA SNR CTRE HCN VTR HCP HTA HR DOC UHT CHCT 90
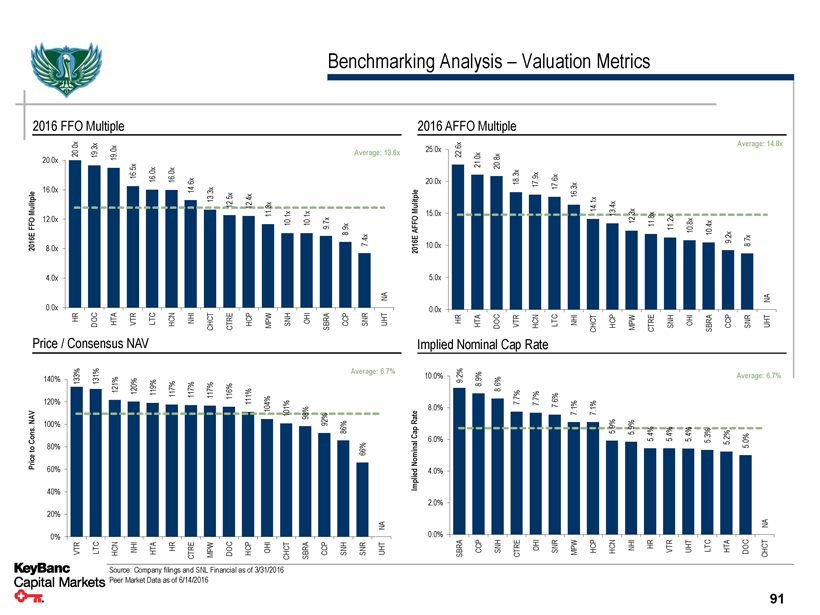
Benchmarking Analysis – Valuation Metrics 2016 FFO Multiple 20.0x 20.0x 19.3x 19.0x 16.5x 16.0x 16.0x Mulitple 12.0x FFO 2016E 8.0x 4.0x 0.0x HR DOC HTA VTR LTC Price / Consensus NAV 140% 131% 121% 120% 119% 133% 120% NAV 100% Cons. to 80% Price 60% 40% 20% 0% LTCHCN NHI HTA VTR 2016 AFFO Multiple Average: 13.6x 25.0x 22.6x 21.0x 20.8x 16.0x 14.6x 20.0x 18.3x 17.9x 17.6x 13.3x 12.5x 12.4x Mulitple 11.3x 10.1x 10.1x 15.0x 9.7x AFFO 8.9x 7.4x 2016E 10.0x 5.0x NA HCN NHI CHCT CTRE HCP MPW SNH OHI SBRA CCP SNR UHT 0.0x HR HTA DOC VTR HCN LTC Implied Nominal Cap Rate Average: 6.7% 10.0% 8.9% 8.6% 117% 117% 117% 116% 9.2% 111% 7.7% 7.7% 104% 7.6% 101% 98% 8.0% 92% Rate 86% Cap 6.0% 66% Nominal Implied 4.0% 2.0% NA HR CTRE MPW DOC HCP OHI CHCT SBRA CCP SNH SNR UHT 0.0% CCP SNH CTRE OHI SNR SBRA Average: 14.8x 16.3x 14.1x 13.4x 12.3x 11.8x 11.2x 10.8x 10.4x 9.2x 8.7x NA NHI CHCT HCP MPW CTRE SNH OHI SBRA CCP SNR UHT Average: 6.7% 7.1% 7.1% 5.9% 5.9% 5.4% 5.4% 5.4% 5.3% 5.2% 5.0% NA MPW HCP HCN NHI HR VTR UHT LTC HTA DOC CHCT Source: Company filings and SNL Financial as of 3/31/2016 Peer Market Data as of 6/14/2016 91
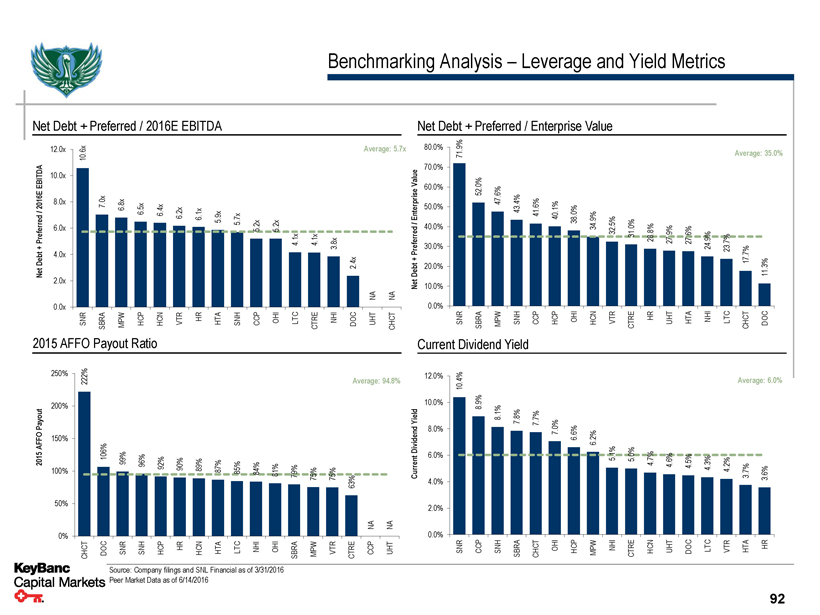
Benchmarking Analysis – Leverage and Yield Metrics Net Debt + Preferred / 2016E EBITDA 12.0x 10.6x EBITDA 10.0x 2016E 8.0x 7.0x 6.8x 6.5x 6.4x 6.2x 6.1x 5.9x / Preferred 6.0x + Debt 4.0x Net 2.0x 0.0x SNR SBRA MPW HCP HCN VTR HR HTA 2015 AFFO Payout Ratio 250% 222% Payout 200% AFFO 150% 106% 2015 99% 96% 92% 90% 89% 87% 100% 50% 0% DOC SNR SNH HCP HR HCN HTA CHCT Net Debt + Preferred / Enterprise Value Average: 5.7x 80.0% 71.9% Average: 35.0% Value 70.0% 60.0% 52.0% 47.6% Enterprise 43.4% 41.6% 40.1% 50.0% 38.0% 34.9% 5.7x 5.2x 5.2x 32.5% 31.0% / 40.0% 28.8% Preferred 27.9% 27.6% 24.9% 4.1x 4.1x 3.8x 30.0% 23.7% 17.7% 2.4x + 11.3% Debt 20.0% Net 10.0% NA NA 0.0% SNH CCP OHI LTC CTRE NHI DOC UHT CHCT SNR SBRA MPW SNH CCP HCP OHI HCN VTR CTRE HR UHT HTA NHI LTC CHCT DOC Current Dividend Yield Average: 94.8% 12.0% Average: 6.0% 10.4% 10.0% 8.9% 8.1% Yield 7.8% 7.7% 7.0% Dividend 8.0% 6.6% 6.2% 5.1% 5.0% 4.7% 4.6% Current 6.0% 4.5% 4.3% 4.2% 85% 84% 81% 79% 75% 75% 63% 4.0% 3.7% 3.6% 2.0% NA NA 0.0% LTC NHI OHI SBRA MPW VTR CTRE CCP UHT CCP SNH SBRA CHCT OHI HCP MPW NHI CTRE HCN UHT DOC LTC VTR HTA HR SNR Source: Company filings and SNL Financial as of 3/31/2016 Peer Market Data as of 6/14/2016 92

Benchmarking Analysis – MOB Peers MOB $Investment ($millions) Number of MOB Properties 6,000 Average: $2,703m 5,169 5,000 Investments 3,980 3,806 4,000 3,507 3,032 2,912 3,000 — MOBs 2,000 1,864 1,000 60 NA 0 HCN HTA HCP SNH HR DOC CHCT UHT VTR MOB Square Feet (000s) 25,000 Average: 11,073 sq. ft. ('000s) 19,800 20,000 17,154 17,117 Footage 15,000 15,010 12,823 Square 11,444 — 10,000 MOBs 5,798 mm)$5,000 512 NA 0 HCN HCP HTA HR SNH DOC CHCT UHT VTR Source: Company filings and SNL Financial as of 3/31/2016 Peer Market Data as of 6/14/2016 400 364 350 300 295 260 $Properties 250 227 # — 200 MOB ( 150 100 50 0 HTA HCN HCP VTR Acquisition Price / MOB Square Foot 350 322 300 265 261 254 250 Footage 200 Square 150 MOB 100 / Price 50 0 SNH VTR HTA DOC 177 158 HR DOC 232 227 HCN HR Average: 185 Properties 122 50 15 SNH UHT CHCT Average: $235.3 205 117 NA HCP CHCT UHT 93
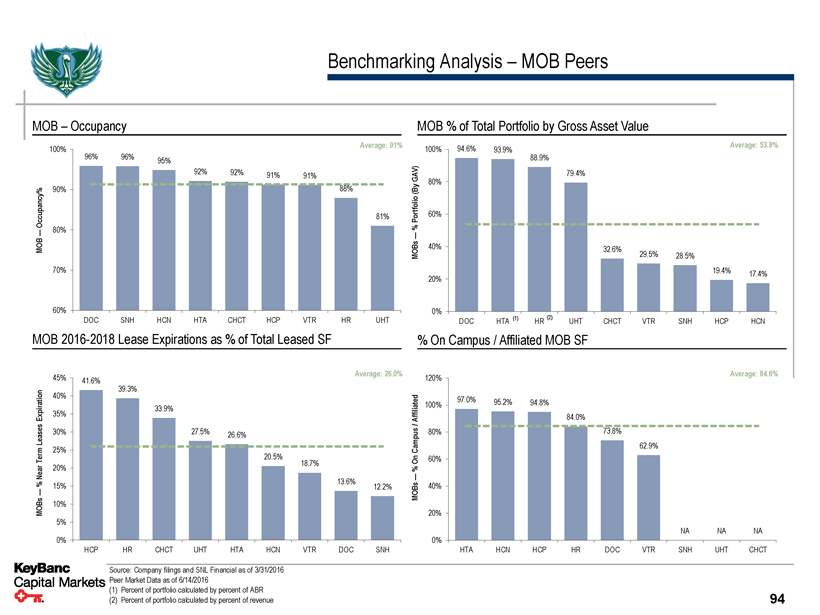
Benchmarking Analysis – MOB Peers MOB – Occupancy 100% Average: 91% 96% 96% 95% 92% 92% 91% 91% Occupancy% 90% 88% 81% — 80% MOB 70% 60% SNH HCN HTA CHCT HCP VTR HR UHT DOC MOB 2016-2018 Lease Expirations as% of Total Leased SF 45% Average: 26.0% 41.6% Expiration 40% 39.3% 35% 33.9% Leases 30% 27.5% 26.6% Term 25% 20.5% 18.7% Near 20%% 15% 13.6% 12.2% — MOBs 10% 5% 0% HR CHCT UHT HTA HCN VTR DOC SNH HCP Source: Company filings and SNL Financial as of 3/31/2016 Peer Market Data as of 6/14/2016 (1) Percent of portfolio calculated by percent of ABR (2) Percent of portfolio calculated by percent of revenue MOB% of Total Portfolio by Gross Asset Value 100% 94.6% 93.9% Average: 53.8% 88.9% GAV) 79.4% 80% (By Portfolio 60%% — MOBs 40% 32.6% 29.5% 28.5% 19.4% 17.4% 20% 0% DOC HTA (1) HR (2) UHT CHCT VTR SNH HCP HCN% On Campus / Affiliated MOB SF 120% Average: 84.6% Affiliated 97.0% 95.2% 94.8% 100% 84.0% / Campus 80% 73.8% 62.9% On 60%% — MOBs 40% 20% NA NA NA 0% HCN HCP HR DOC VTR SNH UHT CHCT HTA 94
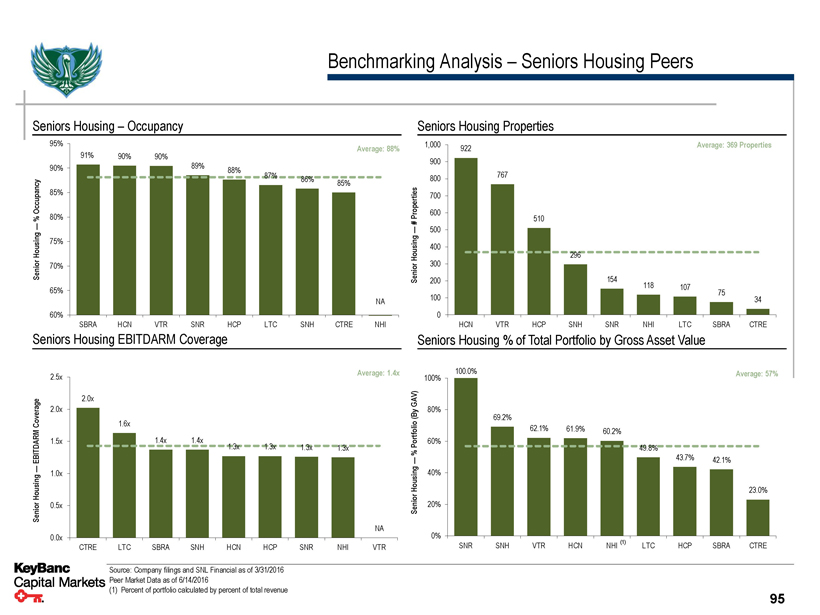
Benchmarking Analysis – Seniors Housing Peers Seniors Housing – Occupancy 95% 91% 90% 90% 90% 89% 88% 87% Occupancy 85%% 80% — Housing 75% Senior 70% 65% 60% SBRA HCN VTR SNR HCP LTC Seniors Housing EBITDARM Coverage 2.5x Coverage 2.0x 2.0x 1.6x EBITDARM 1.5x 1.4x 1.4x 1.3x 1.3x — 1.0x Housing Senior 0.5x 0.0x CTRE LTC SBRA SNH HCN HCP Source: Company filings and SNL Financial as of 3/31/2016 Peer Market Data as of 6/14/2016 (1) Percent of portfolio calculated by percent of total revenue Average: 88% 86% 85% NA SNH CTRE NHI Average: 1.4x 1.3x 1.3x NA SNR NHI VTR Seniors Housing Properties 1,000 Average: 369 Properties 922 900 800 767 Properties 700 600 510 # — 500 Housing 400 296 Senior 300 200 154 118 107 75 100 34 0 VTR HCP SNH SNR NHI LTC SBRA CTRE HCN Seniors Housing% of Total Portfolio by Gross Asset Value 100% 100.0% Average: 57% GAV) (By 80% 69.2% Portfolio 62.1% 61.9% 60.2% 60% 49.8%% — 43.7% 42.1% Housing 40% 23.0% Senior 20% 0% SNH VTR HCN NHI (1) LTC HCP SBRA CTRE SNR 95