American Realty Capital Healthcare Trust Iii Inactive
Filed: 29 Sep 17, 12:00am
Exhibit (c)(10)
Confidential Project Pelican Update for Special Committee Regarding Our Call with Pelican Management Real Estate Investment Banking March 13, 2017 KeyBanc Capital Markets
KeyCorp & KeyBanc Capital Markets KeyBanc Capital Markets is a trade name under which the corporate and investment banking products and services of KeyCorp and its subsidiaries, KeyBanc Capital Markets Inc., Member NYSE/FINRA/SIPC, and KeyBank National Association (“KeyBank N.A.”), are marketed. Securities products and services are offered by KeyBanc Capital Markets Inc. and by its licensed securities representatives. Banking products and services are offered by KeyBank N.A. A number of our corporate and institutional team members are employed by both KeyBanc Capital Markets Inc. and KeyBank N.A. These “dual employees” are licensed securities representatives of KeyBanc Capital Markets Inc., and they are there to better serve your needs, by making available both securities and banking products and services. Further, in connection with our effort to deliver a comprehensive array of banking and securities products and services to you in a seamless manner, from time to time KeyBank N.A. and KeyBanc Capital Markets Inc. will share with each other certain non-public information that you provide to us. Of course, as always, this information will not be shared or otherwise disclosed outside of the KeyCorp organization without your express permission. Please also be assured that, as with other banks and broker-dealers, KeyBank N.A. and KeyBanc Capital Markets Inc. adhere to established internal procedures to safeguard your corporate information from areas within our organization that trade in or advise clients with respect to the purchase and sale of securities. THE OBLIGATIONS OF KEYBANC CAPITAL MARKETS INC. ARE NOT OBLIGATIONS OF KEYBANK N.A. OR ANY OF ITS AFFILIATE BANKS, AND NONE OF KEYCORP’S BANKS ARE RESPONSIBLE FOR, OR GUARANTEE, THE SECURITIES OR SECURITIES -RELATED PRODUCTS OR SERVICES SOLD, OFFERED OR RECOMMENDED BY KEYBANC CAPITAL MARKETS INC. OR ITS EMPLOYEES. SECURITIES AND OTHER INVESTMENT PRODUCTS SOLD, OFFERED OR RECOMMENDED BY KEYBANC CAPITAL MARKETS INC., IF ANY, ARE NOT BANK DEPOSITS OR OBLIGATIONS AND ARE NOT INSURED BY THE FDIC. KeyBanc Capital Markets 2
Executive Summary KeyBanc and Leslie Michelson participated in a call with Todd Jensen, President of Pelican’s Advisor, and various asset managers on March 10 The focus of discussion was clarity on upcoming lease expirations at certain MOB assets as well as in-place rents versus market rents The assets we discussed included two class A MOB assets (Beaumont and Madison), five class B+ / B MOB assets (Rockwall, MetroHealth, Phillips, Greenfield, and Lee Memorial), and one seniors housing asset (Arcadian) Conclusion: Assets seem to be performing well and the leasing conversations to date are positive; in-place rents are generally market – One exception is Beaumont where the tenant is negotiating a new long-term lease with lower than in-place rents. NOI adjustment is approximately $140K less KeyBanc Capital Markets 3
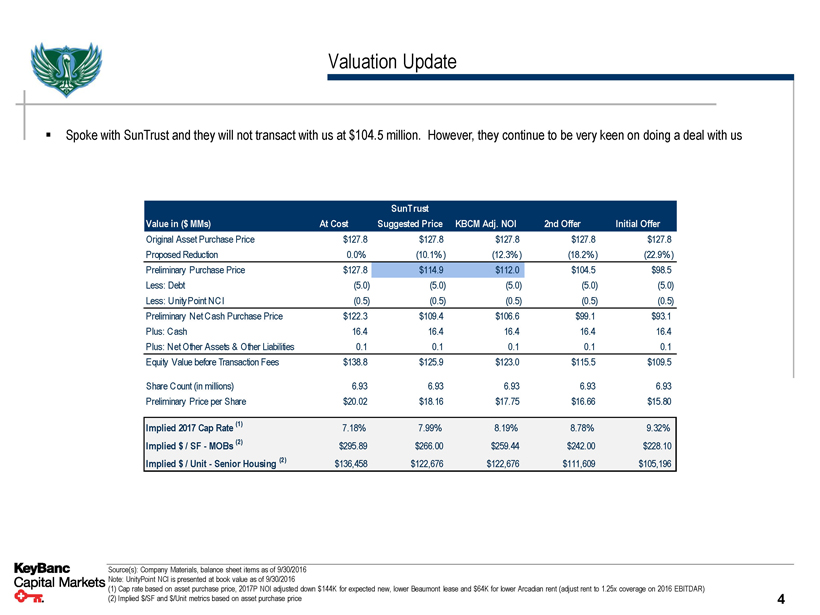
Valuation Update ▪ Spoke with SunTrust and they will not transact with us at $104.5 million. However, they continue to be very keen on doing a deal with us SunTrust Value in ($MMs) At Cost Suggested Price KBCM Adj. NOI 2nd Offer Initial Offer Original Asset Purchase Price $127.8 $127.8 $127.8 $127.8 $127.8 Proposed Reduction 0.0% (10.1%) (12.3%) (18.2%) (22.9%) Preliminary Purchase Price $127.8 $114.9 $112.0 $104.5 $98.5 Less: Debt (5.0) (5.0) (5.0) (5.0) (5.0) Less: UnityPoint NCI (0.5) (0.5) (0.5) (0.5) (0.5) Preliminary Net Cash Purchase Price $122.3 $109.4 $106.6 $99.1 $93.1 Plus: Cash 16.4 16.4 16.4 16.4 16.4 Plus: Net Other Assets & Other Liabilities 0.1 0.1 0.1 0.1 0.1 Equity Value before Transaction Fees $138.8 $125.9 $123.0 $115.5 $109.5 Share Count (in millions) 6.93 6.93 6.93 6.93 6.93 Preliminary Price per Share $20.02 $18.16 $17.75 $16.66 $15.80 Implied 2017 Cap Rate (1) 7.18% 7.99% 8.19% 8.78% 9.32% Implied $/ SF - MOBs (2) $295.89 $266.00 $259.44 $242.00 $228.10 Implied $/ Unit - Senior Housing (2) $136,458 $122,676 $122,676 $111,609 $105,196 KeyBanc Capital Markets Source(s): Company Materials, balance sheet items as of 9/30/2016 Note: UnityPoint NCI is presented at book value as of 9/30/2016 (1) Cap rate based on asset purchase price, 2017P NOI adjusted down $144K for expected new, lower Beaumont lease and $64K for lower Arcadian rent (adjust rent to 1.25x coverage on 2016 EBITDAR) (2) Implied $/SF and $/Unit metrics based on asset purchase price 4

SunTrust’s Suggested Valuation Approach – Updated ▪ Taking into consideration SunTrust’s guidance and the March 10th diligence call, KeyBanc recommends the following valuation: – Assume the 9.5% in our initial bid is appropriate for all assets except three high quality MOBs • Woodlake Office Center • Beaumont Medical Center • Madison Medical Plaza – Assume these three assets are purchased at Pelican’s original purchase cap rates – NOI is adjusted down $144K at Beaumont (based on new lease being negotiated) and $64K at Arcadian (this represents a 1.25x coverage on 2016 EBITDAR) SunTrust Suggested KeyBanc Orig. Cost 2017E NOI Cap Rate Implied Price 17 Adj. NOI Cap Rate Implied Price 17 Adj. NOI Medical Office Building Portfolio ($in mm) DaVita BayBreeze Dialysis Center $0.1 9.50% $1.2 $0.1 9.50% $1.2 $1.7 RAI Cancer Center 0.4 9.50% 3.7 0.4 9.50% 3.7 4.8 DaVita Dialysis 0.2 9.50% 2.1 0.2 9.50% 2.1 2.7 Rockwall Medical Plaza 0.5 9.50% 4.9 0.5 9.50% 4.9 6.6 Decatur MOB 0.5 9.50% 5.0 0.5 9.50% 5.0 5.1 MetroHealth Buckeye Health Center 0.4 9.50% 4.4 0.4 9.50% 4.4 5.6 Phillips Professional Center 0.6 9.50% 6.7 0.6 9.50% 6.7 9.0 Illinois CancerCare Clinic 0.3 9.50% 2.7 0.3 9.50% 2.7 3.4 Galesburg VA Outpatient Clinic 0.2 9.50% 1.9 0.2 9.50% 1.9 2.6 Woodlake Office Center 1.0 6.80% 15.2 1.0 6.80% 15.2 14.9 Greenfield Medical Center 0.5 9.50% 5.6 0.5 9.50% 5.6 7.0 Lee Memorial Health System Outpatient Center 0.4 9.50% 4.0 0.4 9.50% 4.0 5.3 Beaumont Medical Center 1.1 6.67% 17.0 1.0 6.67% 14.8 13.7 Madison Medical Plaza 1.2 6.30% 19.8 1.2 6.30% 19.8 19.5 UnityPoint Muscatine 0.4 9.50% 4.3 0.4 9.50% 4.3 5.9 UnityPoint Moline 0.3 9.50% 2.8 0.3 9.50% 2.8 3.8 Medical Office Building Portfolio - Total $8.1 $101.6 $8.0 $99.4 $111.4 Implied Cap Rate - Medical Office Building 8.0% 8.0% 7.2% Seniors Housing Portfolio ($in mm) Arcadian Cove Assisted Living $0.4 9.50% $3.8 $0.3 9.50% $3.1 $4.8 Cedarhurst of Collinsville 0.9 9.50% 9.5 0.9 9.50% 9.5 11.6 Seniors Housing Portfolio - Total $1.3 $13.3 $1.2 $12.6 $16.4 Implied Cap Rate - Seniors Housing 9.5% 9.5% 7.3% Total Portfolio $9.4 $114.9 $9.2 $112.0 $127.8 Implied Cap Rate - Total Portfolio 8.2% 8.2% 7.2% KeyBanc Capital Markets 5
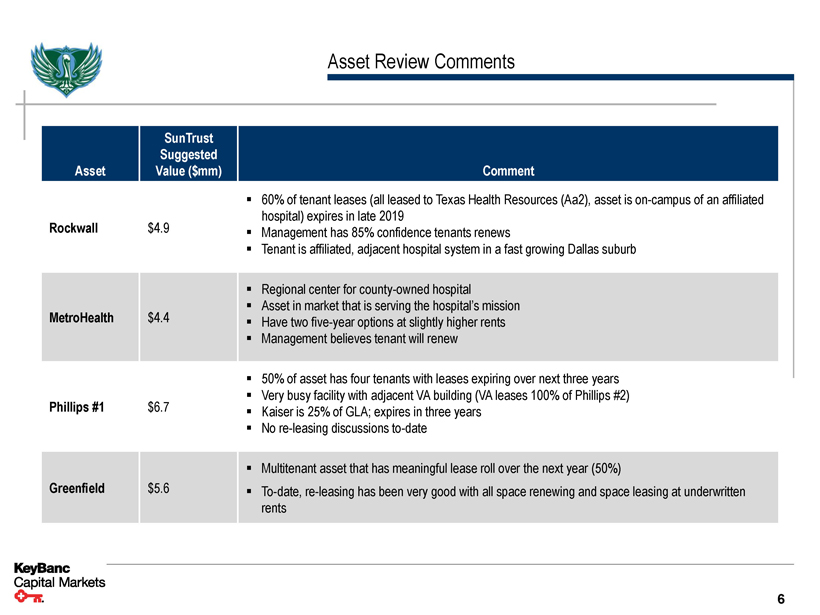
Asset Review Comments SunTrust Suggested Asset Value ($mm) Comment ▪ 60% of tenant leases (all leased to Texas Health Resources (Aa2), asset is on-campus of an affiliated Rockwall $4.9 hospital) expires in late 2019 ▪ Management has 85% confidence tenants renews ▪ Tenant is affiliated, adjacent hospital system in a fast growing Dallas suburb ▪ Regional center for county-owned hospital MetroHealth $4.4 ▪ Asset in market that is serving the hospital’s mission ▪ Have two five-year options at slightly higher rents ▪ Management believes tenant will renew ▪ 50% of asset has four tenants with leases expiring over next three years Phillips #1 $6.7 ▪ Very busy facility with adjacent VA building (VA leases 100% of Phillips #2) ▪ Kaiser is 25% of GLA; expires in three years ▪ No re-leasing discussions to-date ▪ Multitenant asset that has meaningful lease roll over the next year (50%) Greenfield $5.6 ▪ To-date, re-leasing has been very good with all space renewing and space leasing at underwritten rents KeyBanc Capital Markets 6
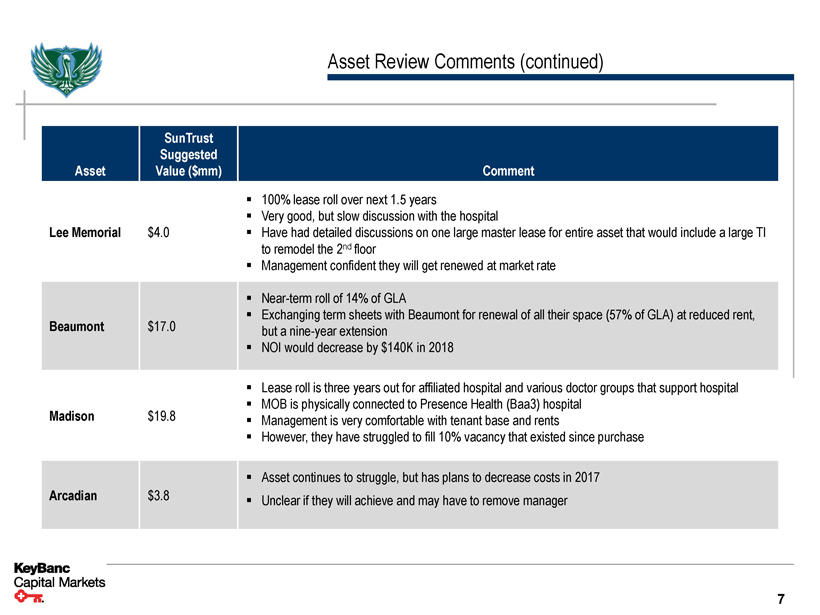
Asset Review Comments (continued) SunTrust Suggested Asset Value ($mm) Comment ▪ 100% lease roll over next 1.5 years ▪ Very good, but slow discussion with the hospital Lee Memorial $4.0 ▪ Have had detailed discussions on one large master lease for entire asset that would include a large TI to remodel the 2nd floor ▪ Management confident they will get renewed at market rate ▪ Near-term roll of 14% of GLA Beaumont $17.0 ▪ Exchanging term sheets with Beaumont for renewal of all their space (57% of GLA) at reduced rent, but a nine-year extension ▪ NOI would decrease by $140K in 2018 ▪ Lease roll is three years out for affiliated hospital and various doctor groups that support hospital Madison $19.8 ▪ MOB is physically connected to Presence Health (Baa3) hospital ▪ Management is very comfortable with tenant base and rents ▪ However, they have struggled to fill 10% vacancy that existed since purchase ▪ Asset continues to struggle, but has plans to decrease costs in 2017 Arcadian $3.8 ▪ Unclear if they will achieve and may have to remove manager KeyBanc Capital Markets 7
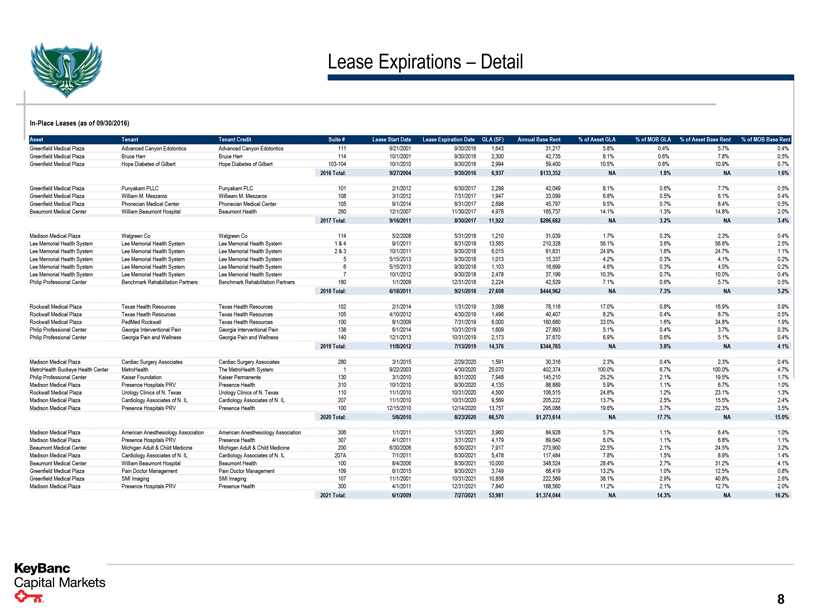
Lease Expirations – Detail In-Place Leases (as of 09/30/2016) Asset Tenant Tenant Credit Suite # Lease Start Date Lease Expiration Date GLA (SF) Annual Base Rent% of Asset GLA% of MOB GLA% of Asset Base Rent% of MOB Base Rent Greenfield Medical Plaza Advanced Canyon Edotontics Advanced Canyon Edotontics 111 9/21/2001 9/30/2016 1,643 31,217 5.8% 0.4% 5.7% 0.4% Greenfield Medical Plaza Bruce Herr Bruce Herr 114 10/1/2001 9/30/2016 2,300 42,735 8.1% 0.6% 7.8% 0.5% Greenfield Medical Plaza Hope Diabetes of Gilbert Hope Diabetes of Gilbert 103-104 10/1/2010 9/30/2016 2,994 59,400 10.5% 0.8% 10.9% 0.7% 2016 Total: 9/27/2004 9/30/2016 6,937 $133,352 NA 1.8% NA 1.6% Greenfield Medical Plaza Punyakam PLLC Punyakam PLC 101 2/1/2012 6/30/2017 2,299 42,049 8.1% 0.6% 7.7% 0.5% Greenfield Medical Plaza William M. Meszaros Willieam M. Meszaros 108 3/1/2012 7/31/2017 1,947 33,099 6.8% 0.5% 6.1% 0.4% Greenfield Medical Plaza Phonecian Medical Center Phonecian Medical Center 105 9/1/2014 8/31/2017 2,698 45,797 9.5% 0.7% 8.4% 0.5% Beaumont Medical Center William Beaumont Hospital Beaumont Health 260 12/1/2007 11/30/2017 4,978 165,737 14.1% 1.3% 14.8% 2.0% 2017 Total: 9/16/2011 8/30/2017 11,922 $286,682 NA 3.2% NA 3.4% Madison Medical Plaza Walgreen Co Walgreen Co 114 5/2/2008 5/31/2018 1,210 31,039 1.7% 0.3% 2.3% 0.4% Lee Memorial Health System Lee Memorial Health System Lee Memorial Health System 1 & 4 9/1/2011 8/31/2018 13,565 210,328 56.1% 3.6% 56.6% 2.5% Lee Memorial Health System Lee Memorial Health System Lee Memorial Health System 2 & 3 10/1/2011 9/30/2018 6,015 91,831 24.9% 1.6% 24.7% 1.1% Lee Memorial Health System Lee Memorial Health System Lee Memorial Health System 5 5/15/2013 9/30/2018 1,013 15,337 4.2% 0.3% 4.1% 0.2% Lee Memorial Health System Lee Memorial Health System Lee Memorial Health System 6 5/15/2013 9/30/2018 1,103 16,699 4.6% 0.3% 4.5% 0.2% Lee Memorial Health System Lee Memorial Health System Lee Memorial Health System 7 10/1/2012 9/30/2018 2,478 37,199 10.3% 0.7% 10.0% 0.4% Philip Professional Center Benchmark Rehabilitation Partners Benchmark Rehabilitation Partners 160 1/1/2009 12/31/2018 2,224 42,529 7.1% 0.6% 5.7% 0.5% 2018 Total: 6/18/2011 9/21/2018 27,608 $444,962 NA 7.3% NA 5.2% Rockwall Medical Plaza Texas Health Resources Texas Health Resources 102 2/1/2014 1/31/2019 3,098 78,116 17.0% 0.8% 16.9% 0.9% Rockwall Medical Plaza Texas Health Resources Texas Health Resources 105 4/10/2012 4/30/2019 1,496 40,407 8.2% 0.4% 8.7% 0.5% Rockwall Medical Plaza PedMed Rockwall Texas Health Resources 100 8/1/2009 7/31/2019 6,000 160,680 33.0% 1.6% 34.8% 1.9% Philip Professional Center Georgia Interventional Pain Georgia Interventional Pain 138 6/1/2014 10/31/2019 1,609 27,893 5.1% 0.4% 3.7% 0.3% Philip Professional Center Georgia Pain and Wellness Georgia Pain and Wellness 140 12/1/2013 10/31/2019 2,173 37,670 6.9% 0.6% 5.1% 0.4% 2019 Total: 11/8/2012 7/13/2019 14,376 $344,765 NA 3.8% NA 4.1% Madison Medical Plaza Cardiac Surgery Associates Cardiac Surgery Associates 280 3/1/2015 2/29/2020 1,591 30,316 2.3% 0.4% 2.3% 0.4% MetroHealth Buckeye Health Center MetroHealth The MetroHealth System 1 9/22/2003 4/30/2020 25,070 402,374 100.0% 6.7% 100.0% 4.7% Philip Professional Center Kaiser Foundation Kaiser Permanente 130 3/1/2010 8/31/2020 7,948 145,210 25.2% 2.1% 19.5% 1.7% Madison Medical Plaza Presence Hospitals PRV Presence Health 310 10/1/2010 9/30/2020 4,135 88,889 5.9% 1.1% 6.7% 1.0% Rockwall Medical Plaza Urology Clinics of N. Texas Urology Clinics of N. Texas 110 11/1/2010 10/31/2020 4,500 106,515 24.8% 1.2% 23.1% 1.3% Madison Medical Plaza Cardiology Associates of N. IL Cardiology Associates of N. IL 207 11/1/2010 10/31/2020 9,569 205,222 13.7% 2.5% 15.5% 2.4% Madison Medical Plaza Presence Hospitals PRV Presence Health 100 12/15/2010 12/14/2020 13,757 295,088 19.6% 3.7% 22.3% 3.5% 2020 Total: 5/6/2010 8/23/2020 66,570 $1,273,614 NA 17.7% NA 15.0% Madison Medical Plaza American Anesthesiology Association American Anesthesiology Association 306 1/1/2011 1/31/2021 3,960 84,928 5.7% 1.1% 6.4% 1.0% Madison Medical Plaza Presence Hospitals PRV Presence Health 307 4/1/2011 3/31/2021 4,179 89,640 6.0% 1.1% 6.8% 1.1% Beaumont Medical Center Michigan Adult & Child Medicine Michigan Adult & Child Medicine 200 6/30/2006 6/30/2021 7,917 273,900 22.5% 2.1% 24.5% 3.2% Madison Medical Plaza Cardiology Associates of N. IL Cardiology Associates of N. IL 207A 7/1/2011 6/30/2021 5,478 117,484 7.8% 1.5% 8.9% 1.4% Beaumont Medical Center William Beaumont Hospital Beaumont Health 100 8/4/2006 8/30/2021 10,000 348,524 28.4% 2.7% 31.2% 4.1% Greenfield Medical Plaza Pain Doctor Management Pain Doctor Management 109 6/1/2015 9/30/2021 3,749 68,419 13.2% 1.0% 12.5% 0.8% Greenfield Medical Plaza SMI Imaging SMI Imaging 107 11/1/2001 10/31/2021 10,858 222,589 38.1% 2.9% 40.8% 2.6% Madison Medical Plaza Presence Hospitals PRV Presence Health 300 4/1/2011 12/31/2021 7,840 168,560 11.2% 2.1% 12.7% 2.0% 2021 Total: 6/1/2009 7/27/2021 53,981 $1,374,044 NA 14.3% NA 16.2% KeyBanc Capital Markets 8
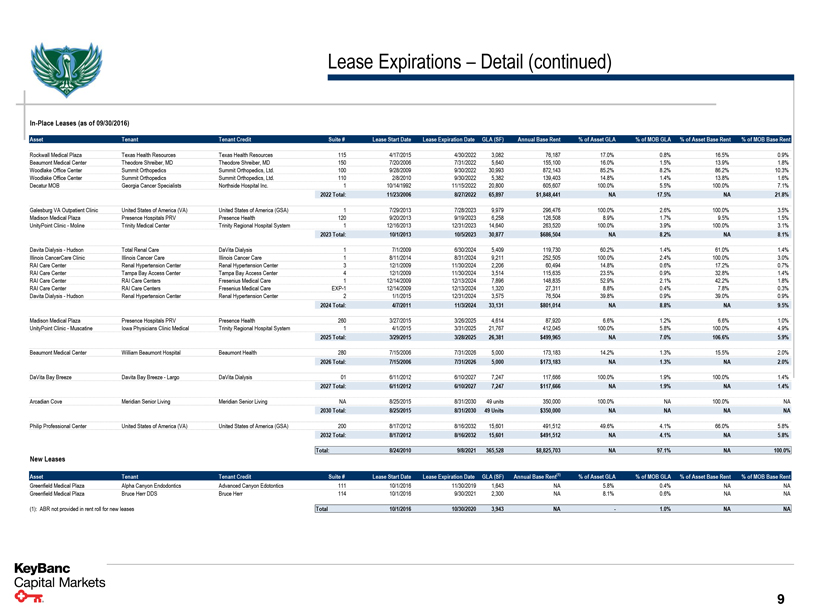
Lease Expirations – Detail (continued) In-Place Leases (as of 09/30/2016) Asset Tenant Tenant Credit Suite # Lease Start Date Lease Expiration Date GLA (SF) Annual Base Rent% of Asset GLA% of MOB GLA% of Asset Base Rent% of MOB Base Rent Rockwall Medical Plaza Texas Health Resources Texas Health Resources 115 4/17/2015 4/30/2022 3,082 76,187 17.0% 0.8% 16.5% 0.9% Beaumont Medical Center Theodore Shreiber, MD Theodore Shreiber, MD 150 7/20/2006 7/31/2022 5,640 155,100 16.0% 1.5% 13.9% 1.8% Woodlake Office Center Summit Orthopedics Summit Orthopedics, Ltd. 100 9/28/2009 9/30/2022 30,993 872,143 85.2% 8.2% 86.2% 10.3% Woodlake Office Center Summit Orthopedics Summit Orthopedics, Ltd. 110 2/8/2010 9/30/2022 5,382 139,403 14.8% 1.4% 13.8% 1.6% Decatur MOB Georgia Cancer Specialists Northside Hospital Inc. 1 10/14/1992 11/15/2022 20,800 605,607 100.0% 5.5% 100.0% 7.1% 2022 Total: 11/23/2006 8/27/2022 65,897 $1,848,441 NA 17.5% NA 21.8% Galesburg VA Outpatient Clinic United States of America (VA) United States of America (GSA) 1 7/29/2013 7/28/2023 9,979 296,476 100.0% 2.6% 100.0% 3.5% Madison Medical Plaza Presence Hospitals PRV Presence Health 120 9/20/2013 9/19/2023 6,258 126,508 8.9% 1.7% 9.5% 1.5% UnityPoint Clinic - Moline Trinity Medical Center Trinity Regional Hospital System 1 12/16/2013 12/31/2023 14,640 263,520 100.0% 3.9% 100.0% 3.1% 2023 Total: 10/1/2013 10/5/2023 30,877 $686,504 NA 8.2% NA 8.1% Davita Dialysis - Hudson Total Renal Care DaVita Dialysis 1 7/1/2009 6/30/2024 5,409 119,730 60.2% 1.4% 61.0% 1.4% Illinois CancerCare Clinic Illinois Cancer Care Illinois Cancer Care 1 8/11/2014 8/31/2024 9,211 252,505 100.0% 2.4% 100.0% 3.0% RAI Care Center Renal Hypertension Center Renal Hypertension Center 3 12/1/2009 11/30/2024 2,206 60,494 14.8% 0.6% 17.2% 0.7% RAI Care Center Tampa Bay Access Center Tampa Bay Access Center 4 12/1/2009 11/30/2024 3,514 115,635 23.5% 0.9% 32.8% 1.4% RAI Care Center RAI Care Centers Fresenius Medical Care 1 12/14/2009 12/13/2024 7,896 148,835 52.9% 2.1% 42.2% 1.8% RAI Care Center RAI Care Centers Fresenius Medical Care EXP-1 12/14/2009 12/13/2024 1,320 27,311 8.8% 0.4% 7.8% 0.3% Davita Dialysis - Hudson Renal Hypertension Center Renal Hypertension Center 2 1/1/2015 12/31/2024 3,575 76,504 39.8% 0.9% 39.0% 0.9% 2024 Total: 4/7/2011 11/3/2024 33,131 $801,014 NA 8.8% NA 9.5% Madison Medical Plaza Presence Hospitals PRV Presence Health 260 3/27/2015 3/26/2025 4,614 87,920 6.6% 1.2% 6.6% 1.0% UnityPoint Clinic - Muscatine Iowa Physicians Clinic Medical Trinity Regional Hospital System 1 4/1/2015 3/31/2025 21,767 412,045 100.0% 5.8% 100.0% 4.9% 2025 Total: 3/29/2015 3/28/2025 26,381 $499,965 NA 7.0% 106.6% 5.9% Beaumont Medical Center William Beaumont Hospital Beaumont Health 280 7/15/2006 7/31/2026 5,000 173,183 14.2% 1.3% 15.5% 2.0% 2026 Total: 7/15/2006 7/31/2026 5,000 $173,183 NA 1.3% NA 2.0% DaVita Bay Breeze Davita Bay Breeze - Largo DaVita Dialysis 01 6/11/2012 6/10/2027 7,247 117,666 100.0% 1.9% 100.0% 1.4% 2027 Total: 6/11/2012 6/10/2027 7,247 $117,666 NA 1.9% NA 1.4% Arcadian Cove Meridian Senior Living Meridian Senior Living NA 8/25/2015 8/31/2030 49 units 350,000 100.0% NA 100.0% NA 2030 Total: 8/25/2015 8/31/2030 49 Units $350,000 NA NA NA NA Philip Professional Center United States of America (VA) United States of America (GSA) 200 8/17/2012 8/16/2032 15,601 491,512 49.6% 4.1% 66.0% 5.8% 2032 Total: 8/17/2012 8/16/2032 15,601 $491,512 NA 4.1% NA 5.8% Total: 8/24/2010 9/8/2021 365,528 $8,825,703 NA 97.1% NA 100.0% New Leases Asset Tenant Tenant Credit Suite # Lease Start Date Lease Expiration Date GLA (SF) Annual Base Rent(1)% of Asset GLA% of MOB GLA% of Asset Base Rent% of MOB Base Rent Greenfield Medical Plaza Alpha Canyon Endodontics Advanced Canyon Edotontics 111 10/1/2016 11/30/2019 1,643 NA 5.8% 0.4% NA NA Greenfield Medical Plaza Bruce Herr DDS Bruce Herr 114 10/1/2016 9/30/2021 2,300 NA 8.1% 0.6% NA NA (1): ABR not provided in rent roll for new leases Total 10/1/2016 10/30/2020 3,943 NA - 1.0% NA NA KeyBanc Capital Markets 9