Exhibit (c)(8)

Confidential Project Pelican Preliminary Discussion Materials for the Board of Directors Real Estate Investment Banking March 2, 2017

KeyCorp & KeyBanc Capital Markets KeyBanc Capital Markets is a trade name under which the corporate and investment banking products and services of KeyCorp and its subsidiaries, KeyBanc Capital Markets Inc., Member NYSE/FINRA/SIPC, and KeyBank National Association (“KeyBank N.A.”), are marketed. Securities products and services are offered by KeyBanc Capital Markets Inc. and by its licensed securities representatives. Banking products and services are offered by KeyBank N.A. A number of our corporate and institutional team members are employed by both KeyBanc Capital Markets Inc. and KeyBank N.A. These “dual employees” are licensed securities representatives of KeyBanc Capital Markets Inc., and they are there to better serve your needs, by making available both securities and banking products and services. Further, in connection with our effort to deliver a comprehensive array of banking and securities products and services to you in a seamless manner, from time to time KeyBank N.A. and KeyBanc Capital Markets Inc. will share with each other certain non-public information that you provide to us. Of course, as always, this information will not be shared or otherwise disclosed outside of the KeyCorp organization without your express permission. Please also be assured that, as with other banks and broker-dealers, KeyBank N.A. and KeyBanc Capital Markets Inc. adhere to established internal procedures to safeguard your corporate information from areas within our organization that trade in or advise clients with respect to the purchase and sale of securities. THE OBLIGATIONS OF KEYBANC CAPITAL MARKETS INC. ARE NOT OBLIGATIONS OF KEYBANK N.A. OR ANY OF ITS AFFILIATE BANKS, AND NONE OF KEYCORP’S BANKS ARE RESPONSIBLE FOR, OR GUARANTEE, THE SECURITIES OR SECURITIES -RELATED PRODUCTS OR SERVICES SOLD, OFFERED OR RECOMMENDED BY KEYBANC CAPITAL MARKETS INC. OR ITS EMPLOYEES. SECURITIES AND OTHER INVESTMENT PRODUCTS SOLD, OFFERED OR RECOMMENDED BY KEYBANC CAPITAL MARKETS INC., IF ANY, ARE NOT BANK DEPOSITS OR OBLIGATIONS AND ARE NOT INSURED BY THE FDIC. 2
Table of Contents Section I Executive Summary Section II Portfolio Overview Section III Preliminary Valuation Section IV Individual Property Overviews Appendix Benchmarking Analysis 3
Confidential Executive Summary
Executive Summary KeyBanc Capital Markets (“KeyBanc” or “KBCM”) is pleased to meet the special committee of Blue Jay (“Blue Jay” or the “Company”) to discuss our initial thoughts on the Pelican Portfolio (the “Portfolio” or “Pelican”) and our preliminary valuation range ▪ KBCM has analyzed the 19 property Pelican Portfolio. Information we received included: – All public filings, – Consolidated financial model, – ARGUS projections for each asset, – Individual property investment committee memos ▪ The Pelican Portfolio contains solid operators / tenants, quality assets, achieved most of 2016 budgets, but less than 2% annual NOI growth Senior Housing Assets (2 properties) – Meridian (NNN) and Cedarhurst (RIDEA) are considered good operators that cross over with HTI operator base – The two seniors housing assets are newer construction (2009) and 100% private pay with strong operating occupancy (Arcadian=98% and Cedarhurst=96% (1)). Arcadian seems to be struggling to manage expenses, but Cedarhurst is doing very well – Both assets are located in small rural areas that are exposed to limited new supply MOB Assets (17 properties) – MOB portfolio is a good portfolio in terms of age, geographic diversity, tenants and occupancy – Assets have a highly rated tenant base (>50% of annual rent from investment grade tenants) – 71% of sq. ft. of MOB assets (11 of 17 properties) have anchor tenants affiliated with the local hospital providers – Remaining lease term is 6.8 years with 20% of the assets with less than 4 years lease term – Portfolio occupancy is 97% and the average age is 9 years (15 of 17 MOB assets are 100% occupied) Source(s): Company Materials (1) Based on Pelican’s Q3 Investor Presentation, as of 9/30/2016 5
Executive Summary (cont’d.) ▪ The strategic benefits of acquiring Pelican include: – Adds assets which are well known to our organization – Further strengthens exposure to in-favor MOB assets across existing portfolio – Continues to grow the Company’s asset base at a reasonable price – Increases overall portfolio occupancy – Broadens tenant/operator base with additional investment grade tenants – Greater private pay focused asset base in pro forma portfolio – Acquisition of an aggregated portfolio without paying a portfolio premium – Broadly marketed process helps remove potential issues created by a acquisition of an affiliated company Source(s): Company Materials 6
Executive Summary (cont’d.) ▪ However, the Board should consider a number of factors regarding an acquisition of Pelican: – Concerns around acquisition of an affiliated entity – Relatively small portfolio does not move the needle – Four MOB assets have relatively short remaining lease term and potential re-tenanting may be required over next three years (96K sq. ft. of 377K total MOB sq. ft.) – Limited NOI growth in Pelican Portfolio as many tenants have NNN leases with minimal annual rent increases – A number of the assets are located in smaller, rural markets that have below average growth profiles ▪ Pelican provides an opportunity to acquire an aggregated portfolio of known assets with good quality that could be integrated into the broader portfolio at a reasonable price Source(s): Company Materials 7
Executive Summary (cont’d.) ▪ KeyBanc believes the current cost basis of the portfolio of $127.8 million is an appropriate valuation for the portfolio – Implied cap rate of 7.4%(1) with MOB implied $/SF of $295.89 and $/Unit of $136,458 for senior housing assets ▪ From what we understand, Pelican’s advisors broadly marketed the Portfolio for almost a year without finding buyers for the entire Portfolio – Pelican’s Advisor has stated that there are a number of potential buyers for pieces of the Portfolio – Issues for potential buyers include the Portfolio’s broad geographic reach, small individual asset size, and a perception of a broken process ▪ We may have a window to acquire the portfolio at a discount – Significant fatigue on part of Board and Advisor – Acquisition of all assets significantly removes execution risk – KeyBanc believes original purchase price of $127.8 million is a fair value, but a lower valuation may be achievable Value in ($MMs) At Cost 15% Discount 20% Discount Original Asset Purchase Price $127.8 $127.8 $127.8 Proposed Reduction 0.0% (15.0%) (20.0%) Preliminary Purchase Price $127.8 $108.6 $102.2 Less: Debt (5.0) (5.0) (5.0) Less: Muscatine NCI (0.5) (0.5) (0.5) Preliminary Net Cash Purchase Price $122.3 $103.2 $96.8 Plus: Cash 16.4 16.4 16.4 Plus: Net Other Assets & Other Liabilities 0.1 0.1 0.1 Equity Value before Transaction Fees $138.8 $119.6 $113.2 Share Count (in millions) 6.93 6.93 6.93 Preliminary Price per Share $20.02 $17.26 $16.33 – KeyBanc would recommend proposing a 20% discount to cost implying a cash offer of $102.2 (2) million (9.2% implied Cap Rate) Implied 2017 Cap Rate (1) 7.35% 8.64% 9.18% Implied $/ SF - MOBs (1) $295.89 $251.50 $236.71 Implied $/ Unit - Senior Housing (1) $136,458 $115,990 $109,167 Source(s): Company Materials, balance sheet items as of 9/30/2016 Note: UnityPoint NCI is presented at book value as of 9/30/2016 (1) Cap rate, implied $/SF and $/Unit metrics based on asset purchase price (2) Implies $16.33 per share 8
Execution and Diligence Considerations Additional Considerations ▪ KeyBanc recommends Blue Jay purchase the assets rather than the stock of Pelican – An asset acquisition is preferred as Blue Jay is not exposed to the liabilities of Pelican’s ownership entity ▪ KeyBanc expects this transaction to be financed using Blue Jay’s credit facility – We have not yet discussed the financing of the transaction with our lending organization – Subsequent to the Special Committee approval we will coordinate the financing with our lending partners Additional Diligence Considerations ▪ Further conversations with various asset managers, specifically with respect to tenant releasing, current market rents versus in-place rents, and any expected concessions / free rent ▪ Discuss G&A with Pelican management to gain a deeper understanding into specific costs ▪ Confirm future CapEx assumptions ▪ Determine how quickly ownership transfers can be executed for any licensed / regulated facilities ▪ KeyBanc’s analyses are based on the consolidated financial model provided by Pelican; confirm these projections via detailed evaluation of lease by lease assumptions included in ARGUS and reconcile to Pelican databook ▪ Review Blue Jay’s standalone information and perform accretion dilution analysis ▪ Do we need to hire third parties to review environmental, property condition assessments, etc.? 9
Illustrative Process Timeline Prep Internal Negotiation Process Proxy Closing Dates Description March 2 • Present Project Pelican to Blue Jay Special Committee March 3 • Submit Preliminary Indication of Interest (IOI) Week of March 6 • Negotiate purchase price and key terms Week of March 13 • Agree to value and key terms Weeks of March 13, • Begin Confirmatory Due Diligence 20, and 27 • Prepare APA • Deliver fairness opinion Week of April 3 • Sign APA • Announce signing of definitive agreement via press release Weeks of April 10 & • Preparation of proxy materials by Pelican April 17 Weeks of April 24 – • Distribute Proxy Materials May 15 • File Merger Proxy with SEC Week of May 22 • Pelican holds Proxy Vote Week of May 29 • Closing (assumes efficient closing of any license transfers, third party approvals and debt assumptions) Calendar March 2017 S M T W T F S 1 2 3 4 5 6 7 8 9 10 11 12 13 14 15 16 17 18 19 20 21 22 23 24 25 26 27 28 29 30 31 April 2017 S M T W T F S 1 2 3 4 5 6 7 8 9 10 11 12 13 14 15 16 17 18 19 20 21 22 23 24 25 26 27 28 29 30 May 2017 S M T W T F S 1 2 3 4 5 6 7 8 9 10 11 12 13 14 15 16 17 18 19 20 21 22 23 24 25 26 27 28 29 30 31 Federal Holiday Key Dates 10

Confidential Overview of Pelican’s Portfolio
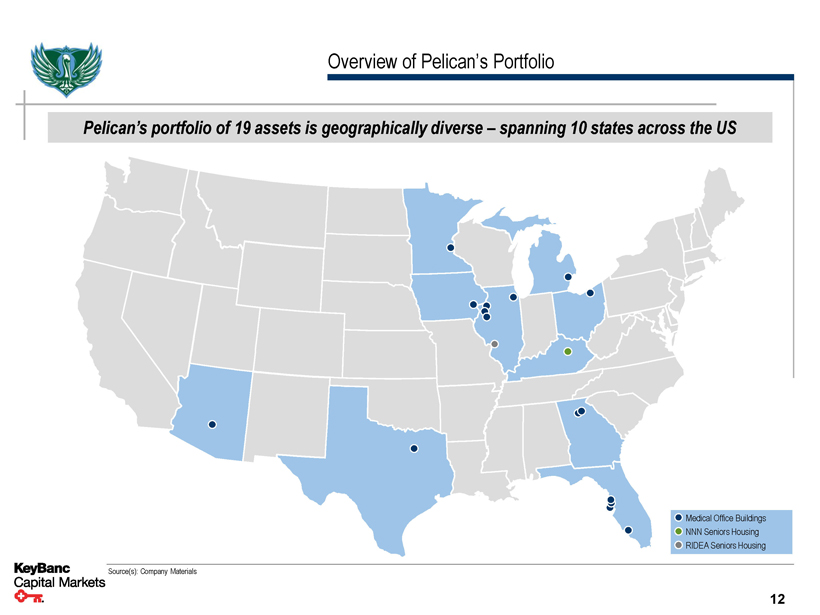
Overview of Pelican’s Portfolio Pelican’s portfolio of 19 assets is geographically diverse – spanning 10 states across the US Medical Office Buildings NNN Seniors Housing RIDEA Seniors Housing Source(s): Company Materials 12
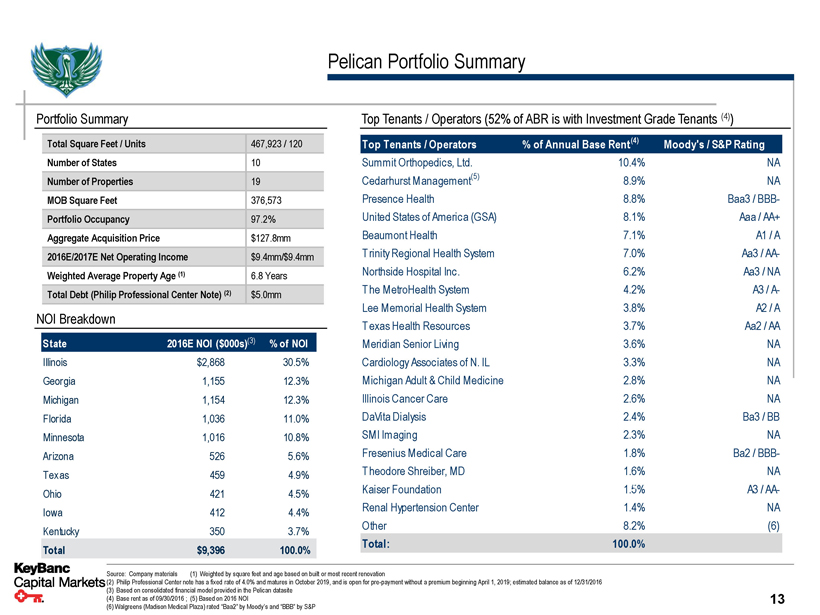
Pelican Portfolio Summary Portfolio Summary Total Square Feet / Units 467,923 / 120 Number of States 10 Number of Properties 19 MOB Square Feet 376,573 Portfolio Occupancy 97.2% Aggregate Acquisition Price $127.8mm 2016E/2017E Net Operating Income $9.4mm/$9.4mm Weighted Average Property Age (1) 6.8 Years Total Debt (Philip Professional Center Note) (2) $5.0mm NOI Breakdown State 2016E NOI ($000s)(3)% of NOI Illinois $2,868 30.5% Georgia 1,155 12.3% Michigan 1,154 12.3% Florida 1,036 11.0% Minnesota 1,016 10.8% Arizona 526 5.6% Texas 459 4.9% Ohio 421 4.5% Iowa 412 4.4% Kentucky 350 3.7% Total $9,396 100.0% Top Tenants / Operators (52% of ABR is with Investment Grade Tenants (4)) Top Tenants / Operators% of Annual Base Rent(4) Moody's / S&P Rating Summit Orthopedics, Ltd. 10.4% NA Cedarhurst Management(5) 8.9% NA Presence Health 8.8% Baa3 / BBB- United States of America (GSA) 8.1% Aaa / AA+ Beaumont Health 7.1% A1 / A T rinity Regional Health System 7.0% Aa3 / AA- Northside Hospital Inc. 6.2% Aa3 / NA T he MetroHealth System 4.2% A3 / A- Lee Memorial Health System 3.8% A2 / A T exas Health Resources 3.7% Aa2 / AA Meridian Senior Living 3.6% NA Cardiology Associates of N. IL 3.3% NA Michigan Adult & Child Medicine 2.8% NA Illinois Cancer Care 2.6% NA DaVita Dialysis 2.4% Ba3 / BB SMI Imaging 2.3% NA Fresenius Medical Care 1.8% Ba2 / BBB- T heodore Shreiber, MD 1.6% NA Kaiser Foundation 1.5% A3 / AA- Renal Hypertension Center 1.4% NA Other 8.2% (6) Total: 100.0% Source: Company materials (1) Weighted by square feet and age based on built or most recent renovation (2) Philip Professional Center note has a fixed rate of 4.0% and matures in October 2019, and is open for pre-payment without a premium beginning April 1, 2019; estimated balance as of 12/31/2016 (3) Based on consolidated financial model provided in the Pelican datasite 13 (4) Base rent as of 09/30/2016 ; (5) Based on 2016 NOI (6) Walgreens (Madison Medical Plaza) rated “Baa2” by Moody’s and “BBB” by S&P

Property Listing Property / Portfolio Location Yr. Built / Primary Tenant Acquisition Rentable Square M / S Tenant Occupancy Reno. Date Feet NNN / RIDEA Medical Office Buildings DaVita Bay Breeze Dialysis Center Largo, FL 2012 DaVita Inc. Mar-15 7,247 S 100.0% RAI Care Center Palm Harbor, FL 1973 / 2009 Fresenius Medical Care Apr-15 14,936 M 100.0% DaVita Dialysis Hudson, FL 1973 / 2009 DaVita Inc. May -15 8,984 M 100.0% Rockwall Medical Plaza Rockwall, TX 2009 Texas Health Resources Jun-15 18,176 M 100.0% Decatur MOB Decatur, GA 1993 Northside Hospital, Inc. Jul-15 20,800 S 100.0% MetroHealth Buckeye Health Center Cleveland, OH 2005 The MetroHealth System Aug-15 25,070 S 100.0% Philip Professional Center (2 buildings) Lawrenceville, GA 2008 United States of America (GSA) Aug-15 31,483 M 93.9% Illinois CancerCare Clinic Galesburg, IL 2014 Illinois Cancer Care, P.C. Aug-15 9,211 S 100.0% Galesburg VA Outpatient Clinic Galesburg, IL 2013 United States of America (GSA) Aug-15 9,979 S 100.0% Woodlake Office Center Woodbury, MN 2009 Summit Orthopedics, Ltd. Sep-15 36,375 S 100.0% Greenfield Medical Center Gilbert, AZ 2001 SMI Imaging, LLC Oct-15 28,489 M 100.0% Lee Memorial Health System Outpatient Center Fort Myers, FL 1998 Lee Memorial Health System Oct-15 24,174 S 100.0% Beaumont Medical Center Warren, MI 2005 Beaumont Health Dec-15 35,219 M 95.2% Madison Medical Plaza Joliet, IL 2007 Presence Health Dec-15 70,023 M 89.4% UnityPoint Muscatine Muscatine , IA 2015 Trinity Regional Health System Dec-15 21,767 S 100.0% UnityPoint Moline Moline , IL 2013 Trinity Regional Health System Dec-15 14,640 S 100.0% Medical Office Buildings Total 376,573 97.1% NNN Seniors Housing Arcadian Cove Assisted Living Richmond, KY 2009 Meridian Senior Living Aug-15 34,650 SF / 49 Units NNN 100.0% (1) NNN Seniors Housing 34,650 SF / 49 Units 100.0% RIDEA Seniors Housing Cedarhurst of Collinsville Collinsville, IL 2009 Cedarhurst Senior Living, LLC Aug-15 56,700 SF / 71 Units RIDEA 96.2% RIDEA Seniors Housing 56,700 SF / 71 Units 96.2% Total Portfolio 467,923 97.2% Source: Company materials, SEC filings (1) Operating occupancy of 98.0% as of 9/30/2016 14
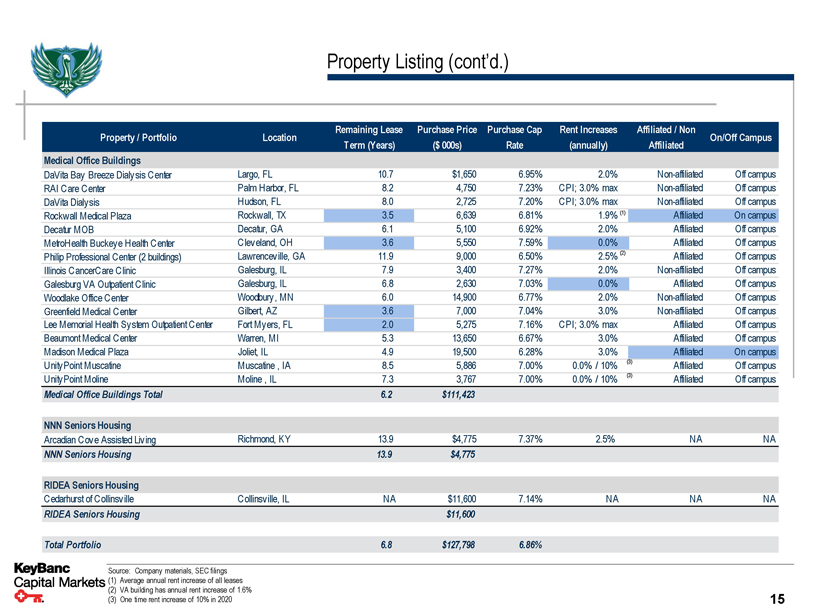
Property Listing (cont’d.) Property / Portfolio Location Remaining Lease Purchase Price Purchase Cap Rent Increases Affiliated / Non On/Off Campus Term (Years) ($000s) Rate (annually) Affiliated Medical Office Buildings DaVita Bay Breeze Dialysis Center Largo, FL 10.7 $1,650 6.95% 2.0% Non-affiliated Off campus RAI Care Center Palm Harbor, FL 8.2 4,750 7.23% CPI; 3.0% max Non-affiliated Off campus DaVita Dialysis Hudson, FL 8.0 2,725 7.20% CPI; 3.0% max Non-affiliated Off campus Rockwall Medical Plaza Rockwall, TX 3.5 6,639 6.81% 1.9% (1) Affiliated On campus Decatur MOB Decatur, GA 6.1 5,100 6.92% 2.0% Affiliated Off campus MetroHealth Buckeye Health Center Cleveland, OH 3.6 5,550 7.59% 0.0% Affiliated Off campus Philip Professional Center (2 buildings) Lawrenceville, GA 11.9 9,000 6.50% 2.5% (2) Affiliated Off campus Illinois CancerCare Clinic Galesburg, IL 7.9 3,400 7.27% 2.0% Non-affiliated Off campus Galesburg VA Outpatient Clinic Galesburg, IL 6.8 2,630 7.03% 0.0% Affiliated Off campus Woodlake Office Center Woodbury, MN 6.0 14,900 6.77% 2.0% Non-affiliated Off campus Greenfield Medical Center Gilbert, AZ 3.6 7,000 7.04% 3.0% Non-affiliated Off campus Lee Memorial Health System Outpatient Center Fort Myers, FL 2.0 5,275 7.16% CPI; 3.0% max Affiliated Off campus Beaumont Medical Center Warren, MI 5.3 13,650 6.67% 3.0% Affiliated Off campus Madison Medical Plaza Joliet, IL 4.9 19,500 6.28% 3.0% Affiliated On campus UnityPoint Muscatine Muscatine , IA 8.5 5,886 7.00% 0.0% / 10% (3) Affiliated Off campus UnityPoint Moline Moline , IL 7.3 3,767 7.00% 0.0% / 10% (3) Affiliated Off campus Medical Office Buildings Total 6.2 $111,423 NNN Seniors Housing Arcadian Cove Assisted Living Richmond, KY 13.9 $4,775 7.37% 2.5% NA NA NNN Seniors Housing 13.9 $4,775 RIDEA Seniors Housing Cedarhurst of Collinsville Collinsville, IL NA $11,600 7.14% NA NA NA RIDEA Seniors Housing $11,600 Total Portfolio 6.8 $127,798 6.86% Source: Company materials, SEC filings (1) Average annual rent increase of all leases (2) VA building has annual rent increase of 1.6% 15 (3) One time rent increase of 10% in 2020

Top Tenants / Operators Tenant / Asset Summit Orthopedics (10.4% of rent) Woodlake Office Center Woodbury, MN Cedarhurst Management (8.9% of rent) Cedarhurst of Collinsville Collinsville, IL Presence Health (8.8% of rent) Madison Medical Plaza Joliet, IL Overview ▪ Summit Orthopedics was founded over 25 years ago and is one of Minnesota’s largest orthopedic groups ▪ The group is headquartered in Woodbury, Minnesota and is home to over 40 surgeons and non-operative physicians offering a full spectrum of orthopedic sub-specialty care ▪ Summit has more than 500 full-time employees providing quality care at its numerous locations throughout Minnesota ▪ Woodlake is a flagship location for Summit and is one of 14 facilities they operate in ▪ Cedarhurst Living is Midwest-focused operator of seniors housing facilities providing best in class memory care, assisted living, and independent living services to its residents ▪ Headquartered in Saint Louis, Missouri, Cedarhurst currently manages eight properties, with six opening in 2017, located in Missouri, Kansas, and Illinois ▪ Cedarhurst is a subsidiary of Dover Development led by CEO Joshua Jennings who has a strong track record of developing diverse assets in Midwestern markets ▪ Presence Health is the second largest health system based in Illinois, with more than 150 locations around the state, including 11 hospitals, 27 long-term care and senior living facilities, more than 50 primary and specialty care clinics, and 6 home health agencies ▪ The health system has hospital operations throughout Chicago, as well as in Des Plains, Evanston, Aurora, Elgin, Joliet, Kankakee, Urbana, and Danville ▪ Rated “Baa3”/”BBB-” by Moody’s and S&P, respectively ▪ Presence Health leases 58.2% of the assets’ square feet (65% of the occupied square feet) Tenant / Asset United States of America (GSA) (8.1% of rent) Galesburg VA and Philip Professional Center Galesburg, IL and Lawrenceville, GA Beaumont Health (7.1% of rent) Beaumont Medical Center Warren, MI Trinity Health (7.0% of rent) UnityPoint Moline and UnityPoint Muscatine Moline, IA and Muscatine, IA Overview ▪ The Veterans Health Administration is America’s largest integrated health care system with over 1,700 sites of care, serving 8.76 million Veterans each year ▪ The VHA provides a broad range of primary care, specialized care, and related medical and social support services ▪ The VHA is also the Nation’s largest integrated provider of health care education and training for physician residents and other health care trainees ▪ The Galesburg VA functions very similarly to a typical doctor’s office and provides primary care, preventative health, and wellness services ▪ The Philip Professional Center location provides counseling, family therapy and readjustment counseling services ▪ Beaumont Health, a not-for-profit, is the largest healthcare system in Southeast Michigan with $4.1 billion in total revenues ▪ It consists of eight hospitals with 3,399 beds, 168 outpatient sites 5,000 physicians and 35,000 employees ▪ In 2015, the combined organizations had 177,819 inpatient admissions, 17,151 births and 545,825 emergency visits ▪ It has affiliations with Oakland University William Beaumont School of Medicine, Michigan State University College of Osteopathic Medicine, and Wayne State University School of Medicine ▪ Rated “A1”/”A” by Moody’s and S&P, respectively ▪ Beaumont Health leases 56.7% of the assets’ square feet (60.0% of occupied square feet) ▪ Founded in 1978 ,Trinity Health is a health system with nationwide coverage across 22 states ▪ Trinity Health is comprised of 93 hospitals, 120 continuing care facilities and home agencies generating annual operating revenues of $15.9 billion, with total assets of over $23.4 billion ▪ Trinity employs more than 97,000 employees, including 5,300 physicians ▪ Rated “Aa3”/”AA-” by Moody’s and S&P, respectively 16
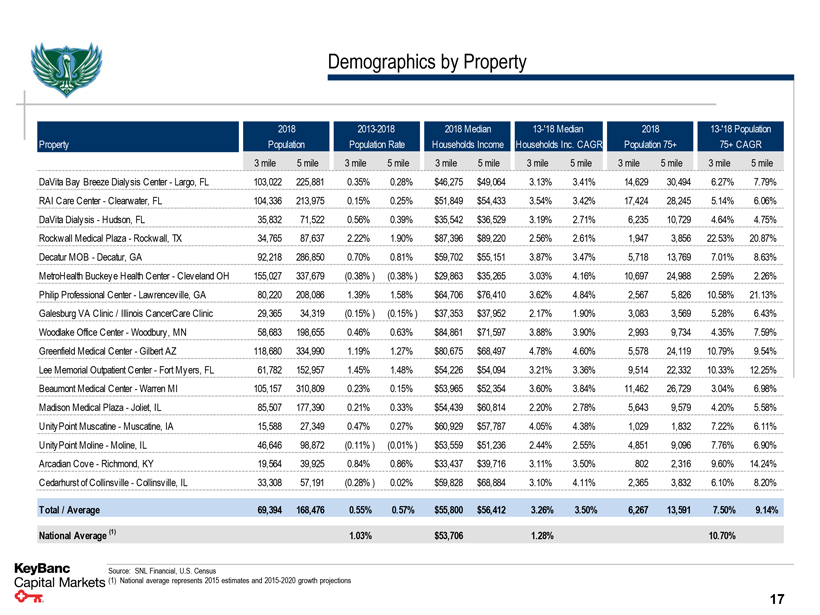
Demographics by Property 2018 2013-2018 2018 Median 13-'18 Median 2018 13-'18 Population Property Population Population Rate Households Income Households Inc. CAGR Population 75+ 75+ CAGR 3 mile 5 mile 3 mile 5 mile 3 mile 5 mile 3 mile 5 mile 3 mile 5 mile 3 mile 5 mile DaVita Bay Breeze Dialysis Center - Largo, FL 103,022 225,881 0.35% 0.28% $46,275 $49,064 3.13% 3.41% 14,629 30,494 6.27% 7.79% RAI Care Center - Clearwater, FL 104,336 213,975 0.15% 0.25% $51,849 $54,433 3.54% 3.42% 17,424 28,245 5.14% 6.06% DaVita Dialysis - Hudson, FL 35,832 71,522 0.56% 0.39% $35,542 $36,529 3.19% 2.71% 6,235 10,729 4.64% 4.75% Rockwall Medical Plaza - Rockwall, TX 34,765 87,637 2.22% 1.90% $87,396 $89,220 2.56% 2.61% 1,947 3,856 22.53% 20.87% Decatur MOB - Decatur, GA 92,218 286,850 0.70% 0.81% $59,702 $55,151 3.87% 3.47% 5,718 13,769 7.01% 8.63% MetroHealth Buckeye Health Center - Cleveland OH 155,027 337,679 (0.38%) (0.38%) $29,863 $35,265 3.03% 4.16% 10,697 24,988 2.59% 2.26% Philip Professional Center - Lawrenceville, GA 80,220 208,086 1.39% 1.58% $64,706 $76,410 3.62% 4.84% 2,567 5,826 10.58% 21.13% Galesburg VA Clinic / Illinois CancerCare Clinic 29,365 34,319 (0.15%) (0.15%) $37,353 $37,952 2.17% 1.90% 3,083 3,569 5.28% 6.43% Woodlake Office Center - Woodbury, MN 58,683 198,655 0.46% 0.63% $84,861 $71,597 3.88% 3.90% 2,993 9,734 4.35% 7.59% Greenfield Medical Center - Gilbert AZ 118,680 334,990 1.19% 1.27% $80,675 $68,497 4.78% 4.60% 5,578 24,119 10.79% 9.54% Lee Memorial Outpatient Center - Fort Myers, FL 61,782 152,957 1.45% 1.48% $54,226 $54,094 3.21% 3.36% 9,514 22,332 10.33% 12.25% Beaumont Medical Center - Warren MI 105,157 310,809 0.23% 0.15% $53,965 $52,354 3.60% 3.84% 11,462 26,729 3.04% 6.98% Madison Medical Plaza - Joliet, IL 85,507 177,390 0.21% 0.33% $54,439 $60,814 2.20% 2.78% 5,643 9,579 4.20% 5.58% UnityPoint Muscatine - Muscatine, IA 15,588 27,349 0.47% 0.27% $60,929 $57,787 4.05% 4.38% 1,029 1,832 7.22% 6.11% UnityPoint Moline - Moline, IL 46,646 98,872 (0.11%) (0.01%) $53,559 $51,236 2.44% 2.55% 4,851 9,096 7.76% 6.90% Arcadian Cove - Richmond, KY 19,564 39,925 0.84% 0.86% $33,437 $39,716 3.11% 3.50% 802 2,316 9.60% 14.24% Cedarhurst of Collinsville - Collinsville, IL 33,308 57,191 (0.28%) 0.02% $59,828 $68,884 3.10% 4.11% 2,365 3,832 6.10% 8.20% Total / Average 69,394 168,476 0.55% 0.57% $55,800 $56,412 3.26% 3.50% 6,267 13,591 7.50% 9.14% National Average (1) 1.03% $53,706 1.28% 10.70% Source: SNL Financial, U.S. Census (1) National average represents 2015 estimates and 2015-2020 growth projections 17
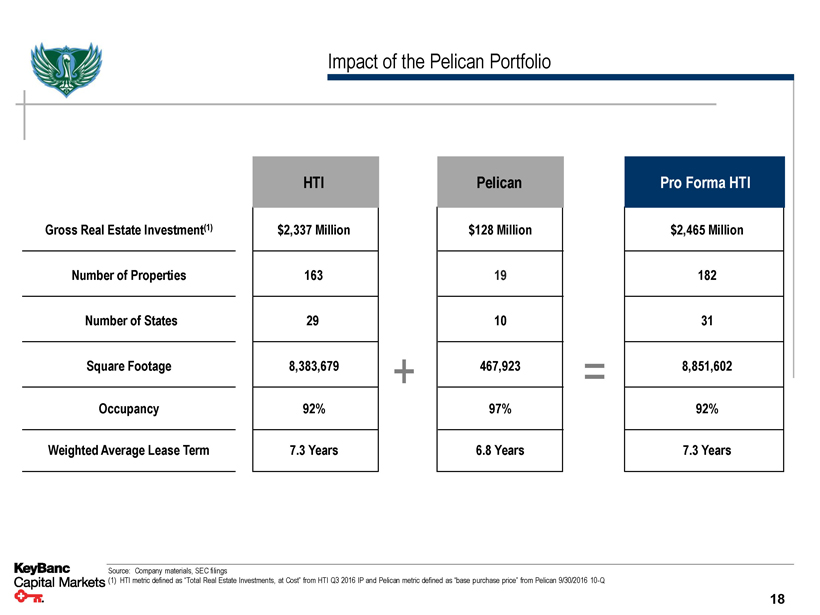
Impact of the Pelican Portfolio HTI Pelican Pro Forma HTI Gross Real Estate Investment(1) $2,337 Million $128 Million $2,465 Million Number of Properties 163 19 182 Number of States 29 10 31 Square Footage 8,383,679 + 467,923 = 8,851,602 Occupancy 92% 97% 92% Weighted Average Lease Term 7.3 Years 6.8 Years 7.3 Years Source: Company materials, SEC filings (1) HTI metric defined as “Total Real Estate Investments, at Cost” from HTI Q3 2016 IP and Pelican metric defined as “base purchase price” from Pelican 9/30/2016 10-Q 18
Confidential Preliminary Valuation

Pelican’s Projections ▪ Projections ($000s) 2016P 2017P 2018P 2019P 2020P 2021P through 2020 Total Tenant Revenue $11,651 $11,750 $11,832 $12,014 $12,218 $12,408 based on Pelican Expense Recoveries 3,236 3,314 3,402 3,525 3,617 3,718 provided Total Revenue $14,887 $15,064 $15,233 $15,539 $15,835 $16,126 consolidated Y / Y Growth 1.2% 1.1% 2.0% 1.9% 1.8% financial model Operating Expenses (5,491) (5,678) (5,817) (5,957) (6,108) (6,272) ▪ 2021+ projections assume revenue, expense, and capex growth consistent with 2016-2020 CAGRs ▪ Assumes 5% UnityPoint NCI stays in place and Philip Professional Center debt is assumed Net Operating Income $9,396 $9,386 $9,417 $9,581 $9,727 $9,854 Y / Y Growth (0.1%) 0.3% 1.7% 1.5% 1.3% NOI Margin 63.1% 62.3% 61.8% 61.7% 61.4% 61.1% Adjustment: NOI Attributable to NCI (1) (34) (34) (21) (21) (21) (21) NOI after NCI $9,362 $9,352 $9,396 $9,561 $9,706 $9,832 G&A Expenses (2) (3) (1,400) (1,435) (1,471) (1,508) (1,545) (1,584) EBITDA $7,962 $7,917 $7,925 $8,053 $8,160 $8,248 Y / Y Growth (0.6%) 0.1% 1.6% 1.3% 1.1% EBITDA Margin 53.5% 52.6% 52.0% 51.8% 51.5% 51.1% Plus: Non-Cash FFO Adj. (4) 706 554 377 203 40 40 Less: Interest Expense (201) (197) (193) (189) (184) (184) FFO $8,467 $8,274 $8,109 $8,068 $8,016 $8,104 Y / Y Growth (2.3%) (2.0%) (0.5%) (0.6%) 1.1% Less: Non-Cash FFO Adj. (4) (706) (554) (377) (203) (40) (40) Less: Capex (2) (283) (289) (295) (301) (307) (313) Adjustments to FFO ($989) ($843) ($672) ($504) ($347) ($353) AFFO $7,478 $7,431 $7,437 $7,564 $7,669 $7,751 Y / Y Growth (0.6%) 0.1% 1.7% 1.4% 1.1% (1) 5% UnityPoint non-controlling interest (2) Based on REIT guidance and the provided consolidated financial model, not based on ARGUS files (3) General and administrative expenses primarily consists of professional fees, board of director costs and directors' and officers‘ insurance 20 (4) Includes straight line rent, above and below market leases, and above market ground lease liabilities

Summary of Preliminary Valuation Based on initial valuations, KeyBanc believes the Portfolio has a value between $120 and $128 million Pricing Method NAV Analysis Portfolio Transaction Comps Discounted Cash Flow 2017 Public Comparables Cap Rate 2017 Public Comparables EV / EBITDA 2018 Public Comparables EV / EBITDA 2017 Public Comparables P / AFFO 2018 Public Comparables P / AFFO 2017 Public Comparables P / FFO 2018 Public Comparables P / FFO Implied Portfolio Price Range Based On Implied Price Range $120mm - $128mm ▪ Individual Asset NAVs $124. $133.4 $125 $128.3 ▪ Portfolio transaction comparables $126.9 ▪ WACC range of 9.00% - 11.00%; $112.4 exit cap rate of 7.25% - 7.75% $141.3 $149.7 ▪ Based on 6.2% - 6.6% cap rate $120.8 $127.9 ▪ Based on 15.3x – 16.2x multiple $110.5 $117.0 ▪ Based on 13.7x – 14.5x multiple $117.1 $124.0 ▪ Based on 15.0x – 16.0x multiple $112.2 $118.9 ▪ Based on 14.4x– 15.3x multiple $116.9 $123.8 ▪ Based on 13.5x– 14.3x multiple $105.5 $111.7 ▪ Based on 12.7x– 13.5 multiple $20.0 $40.0 $60.0 $80.0 $100.0 $120.0 $140.0 $160.0 $0.0 Asset Value ($mm) 21
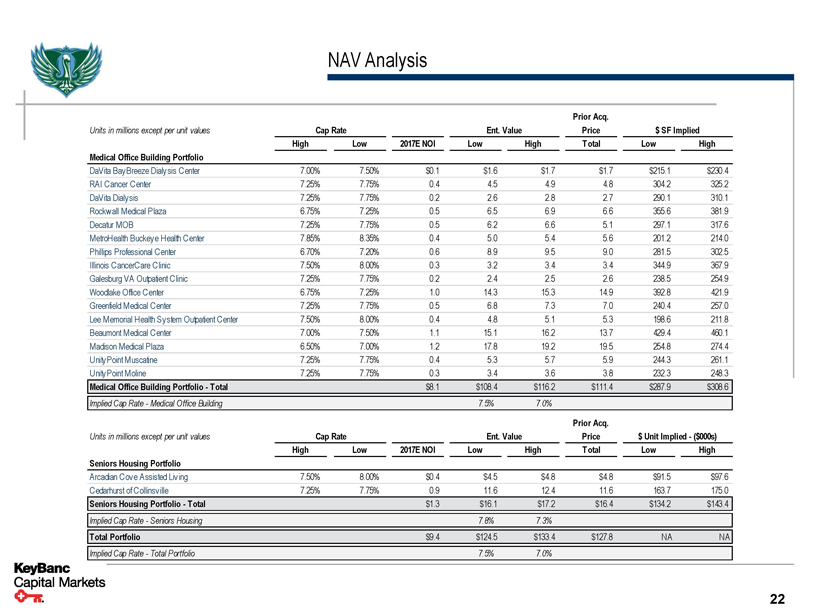
NAV Analysis Prior Acq. Units in millions except per unit values Cap Rate Ent. Value Price $SF Implied High Low 2017E NOI Low High Total Low High Medical Office Building Portfolio DaVita BayBreeze Dialysis Center 7.00% 7.50% $0.1 $1.6 $1.7 $1.7 $215.1 $230.4 RAI Cancer Center 7.25% 7.75% 0.4 4.5 4.9 4.8 304.2 325.2 DaVita Dialysis 7.25% 7.75% 0.2 2.6 2.8 2.7 290.1 310.1 Rockwall Medical Plaza 6.75% 7.25% 0.5 6.5 6.9 6.6 355.6 381.9 Decatur MOB 7.25% 7.75% 0.5 6.2 6.6 5.1 297.1 317.6 MetroHealth Buckeye Health Center 7.85% 8.35% 0.4 5.0 5.4 5.6 201.2 214.0 Phillips Professional Center 6.70% 7.20% 0.6 8.9 9.5 9.0 281.5 302.5 Illinois CancerCare Clinic 7.50% 8.00% 0.3 3.2 3.4 3.4 344.9 367.9 Galesburg VA Outpatient Clinic 7.25% 7.75% 0.2 2.4 2.5 2.6 238.5 254.9 Woodlake Office Center 6.75% 7.25% 1.0 14.3 15.3 14.9 392.8 421.9 Greenfield Medical Center 7.25% 7.75% 0.5 6.8 7.3 7.0 240.4 257.0 Lee Memorial Health System Outpatient Center 7.50% 8.00% 0.4 4.8 5.1 5.3 198.6 211.8 Beaumont Medical Center 7.00% 7.50% 1.1 15.1 16.2 13.7 429.4 460.1 Madison Medical Plaza 6.50% 7.00% 1.2 17.8 19.2 19.5 254.8 274.4 UnityPoint Muscatine 7.25% 7.75% 0.4 5.3 5.7 5.9 244.3 261.1 UnityPoint Moline 7.25% 7.75% 0.3 3.4 3.6 3.8 232.3 248.3 Medical Office Building Portfolio - Total $8.1 $108.4 $116.2 $111.4 $287.9 $308.6 Implied Cap Rate - Medical Office Building 7.5% 7.0% Prior Acq. Units in millions except per unit values Cap Rate Ent. Value Price $Unit Implied - ($000s) High Low 2017E NOI Low High Total Low High Seniors Housing Portfolio Arcadian Cove Assisted Living 7.50% 8.00% $0.4 $4.5 $4.8 $4.8 $91.5 $97.6 Cedarhurst of Collinsville 7.25% 7.75% 0.9 11.6 12.4 11.6 163.7 175.0 Seniors Housing Portfolio - Total $1.3 $16.1 $17.2 $16.4 $134.2 $143.4 Implied Cap Rate - Seniors Housing 7.8% 7.3% Total Portfolio $9.4 $124.5 $133.4 $127.8 NA NA Implied Cap Rate - Total Portfolio 7.5% 7.0% 22
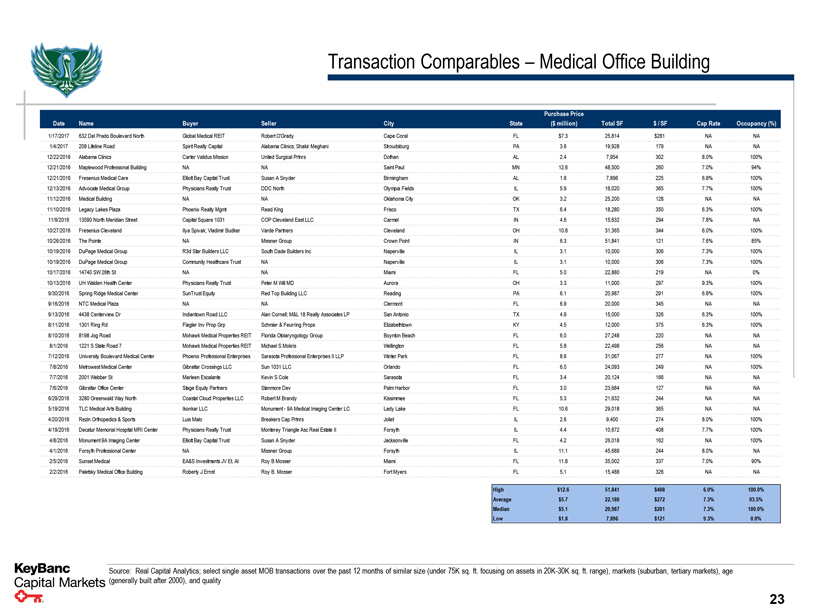
Transaction Comparables – Medical Office Building Purchase Price Date Name Buyer Seller City State ($million) Total SF $/ SF Cap Rate Occupancy (%) 1/17/2017 632 Del Prado Boulevard North Global Medical REIT Robert O'Grady Cape Coral FL $7.3 25,814 $281 NA NA 1/4/2017 208 Lifeline Road Spirit Realty Capital Alabama Clinics; Shakir Meghani Stroudsburg PA 3.6 19,928 179 NA NA 12/22/2016 Alabama Clinics Carter Validus Mission United Surgical Prtnrs Dothan AL 2.4 7,954 302 8.0% 100% 12/21/2016 Maplewood Professional Building NA NA Saint Paul MN 12.6 48,500 260 7.0% 94% 12/21/2016 Fresenius Medical Care Elliott Bay Capital Trust Susan A Snyder Birmingham AL 1.8 7,896 225 6.8% 100% 12/13/2016 Advocate Medical Group Physicians Realty Trust DDC North Olympia Fields IL 5.9 16,020 365 7.7% 100% 11/12/2016 Medical Building NA NA Oklahoma City OK 3.2 25,200 128 NA NA 11/10/2016 Legacy Lakes Plaza Phoenix Realty Mgmt Read King Frisco TX 6.4 18,280 350 6.3% 100% 11/9/2016 13590 North Meridian Street Capital Square 1031 COP Cleveland East LLC Carmel IN 4.6 15,632 294 7.8% NA 10/27/2016 Fresenius Cleveland Ilya Spivak; Vladimir Budker Varde Partners Cleveland OH 10.8 31,365 344 6.0% 100% 10/26/2016 The Pointe NA Missner Group Crown Point IN 6.3 51,841 121 7.6% 85% 10/19/2016 DuPage Medical Group R3d Star Builders LLC South Dade Builders Inc Naperville IL 3.1 10,000 306 7.3% 100% 10/19/2016 DuPage Medical Group Community Healthcare Trust NA Naperville IL 3.1 10,000 306 7.3% 100% 10/17/2016 14740 SW 26th St NA NA Miami FL 5.0 22,880 219 NA 0% 10/13/2016 UH Walden Health Center Physicians Realty Trust Peter M Will MD Aurora OH 3.3 11,000 297 9.3% 100% 9/30/2016 Spring Ridge Medical Center SunTrust Equity Red Top Building LLC Reading PA 6.1 20,987 291 6.8% 100% 9/16/2016 NTC Medical Plaza NA NA Clermont FL 6.9 20,000 345 NA NA 9/13/2016 4438 Centerview Dr Indiantown Road LLC Alan Cornell; M&L 18 Realty Associates LP San Antonio TX 4.9 15,000 326 6.3% 100% 8/11/2016 1301 Ring Rd Flagler Inv Prop Grp Schmier & Feurring Props Elizabethtown KY 4.5 12,000 375 6.3% 100% 8/10/2016 8198 Jog Road Mohawk Medical Properties REIT Florida Otolaryngology Group Boynton Beach FL 6.0 27,248 220 NA NA 8/1/2016 1221 S State Road 7 Mohawk Medical Properties REIT Michael S Mokris Wellington FL 5.8 22,498 256 NA NA 7/12/2016 University Boulevard Medical Center Phoenix Professional Enterprises Sarasota Professional Enterprises II LLP Winter Park FL 8.6 31,067 277 NA 100% 7/8/2016 Metrowest Medical Center Gibraltar Crossings LLC Sun 1031 LLC Orlando FL 6.0 24,093 249 NA 100% 7/7/2016 2001 Webber St Marleen Escalante Kevin S Cole Sarasota FL 3.4 20,124 166 NA NA 7/6/2016 Gibraltar Office Center Stage Equity Partners Stanmore Dev Palm Harbor FL 3.0 23,684 127 NA NA 6/29/2016 3280 Greenwald Way North Coastal Cloud Properties LLC Robert M Brandy Kissimmee FL 5.3 21,632 244 NA NA 5/19/2016 TLC Medical Arts Building Ikonkar LLC Monument - 9A Medical Imaging Center LC Lady Lake FL 10.6 29,018 365 NA NA 4/20/2016 Rezin Orthopedics & Sports Luis Malo Breakers Cap Prtnrs Joliet IL 2.6 9,400 274 8.0% 100% 4/19/2016 Decatur Memorial Hospital MRI Center Physicians Realty Trust Monterey Triangle Asc Real Estate II Forsyth IL 4.4 10,672 408 7.7% 100% 4/8/2016 Monument 9A Imaging Center Elliott Bay Capital Trust Susan A Snyder Jacksonville FL 4.2 26,018 162 NA 100% 4/1/2016 Forsyth Professional Center NA Missner Group Forsyth IL 11.1 45,689 244 8.0% NA 2/5/2016 Sunset Medical EA&S Investments JV Et. Al Roy B Mosser Miami FL 11.8 35,002 337 7.0% 90% 2/2/2016 Paletsky Medical Office Building Roberty J Ernst Roy B. Mosser Fort Myers FL 5.1 15,488 326 NA NA High $12.6 51,841 $408 6.0% 100.0% Average $5.7 22,180 $272 7.3% 93.5% Median $5.1 20,987 $281 7.3% 100.0% Low $1.8 7,896 $121 9.3% 0.0% Source: Real Capital Analytics; select single asset MOB transactions over the past 12 months of similar size (under 75K sq. ft. focusing on assets in 20K-30K sq. ft. range), markets (suburban, tertiary markets), age (generally built after 2000), and quality 23
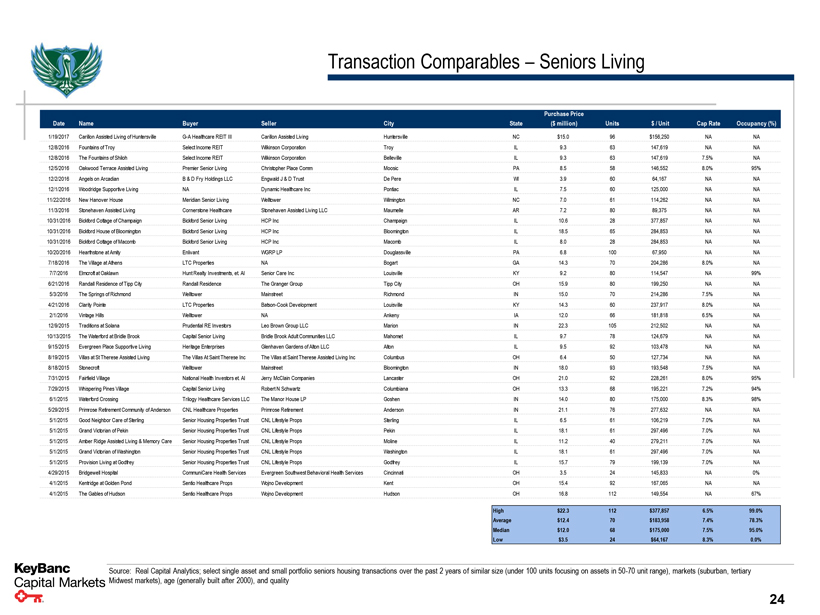
Transaction Comparables – Seniors Living Purchase Price Date Name Buyer Seller City State ($million) Units $/ Unit Cap Rate Occupancy (%) 1/19/2017 Carillon Assisted Living of Huntersville G-A Healthcare REIT III Carillon Assisted Living Huntersville NC $15.0 96 $156,250 NA NA 12/8/2016 Fountains of Troy Select Income REIT Wilkinson Corporation Troy IL 9.3 63 147,619 NA NA 12/8/2016 The Fountains of Shiloh Select Income REIT Wilkinson Corporation Belleville IL 9.3 63 147,619 7.5% NA 12/5/2016 Oakwood Terrace Assisted Living Premier Senior Living Christopher Place Comm Moosic PA 8.5 58 146,552 8.0% 95% 12/2/2016 Angels on Arcadian B & D Fry Holdings LLC Engwald J & D Trust De Pere WI 3.9 60 64,167 NA NA 12/1/2016 Woodridge Supportive Living NA Dynamic Healthcare Inc Pontiac IL 7.5 60 125,000 NA NA 11/22/2016 New Hanover House Meridian Senior Living Welltower Wilmington NC 7.0 61 114,262 NA NA 11/3/2016 Stonehaven Assisted Living Cornerstone Healthcare Stonehaven Assisted Living LLC Maumelle AR 7.2 80 89,375 NA NA 10/31/2016 Bickford Cottage of Champaign Bickford Senior Living HCP Inc Champaign IL 10.6 28 377,857 NA NA 10/31/2016 Bickford House of Bloomington Bickford Senior Living HCP Inc Bloomington IL 18.5 65 284,853 NA NA 10/31/2016 Bickford Cottage of Macomb Bickford Senior Living HCP Inc Macomb IL 8.0 28 284,853 NA NA 10/20/2016 Hearthstone at Amity Enlivant WGRP LP Douglassville PA 6.8 100 67,950 NA NA 7/18/2016 The Village at Athens LTC Properties NA Bogart GA 14.3 70 204,286 8.0% NA 7/7/2016 Elmcroft at Oaklawn Hunt Realty Investments, et. Al Senior Care Inc Louisville KY 9.2 80 114,547 NA 99% 6/21/2016 Randall Residence of Tipp City Randall Residence The Granger Group Tipp City OH 15.9 80 199,250 NA NA 5/3/2016 The Springs of Richmond Welltower Mainstreet Richmond IN 15.0 70 214,286 7.5% NA 4/21/2016 Clarity Pointe LTC Properties Batson-Cook Development Louisville KY 14.3 60 237,917 8.0% NA 2/1/2016 Vintage Hills Welltower NA Ankeny IA 12.0 66 181,818 6.5% NA 12/9/2015 Traditions at Solana Prudential RE Investors Leo Brown Group LLC Marion IN 22.3 105 212,502 NA NA 10/13/2015 The Waterford at Bridle Brook Capital Senior Living Bridle Brook Adult Communities LLC Mahomet IL 9.7 78 124,679 NA NA 9/15/2015 Evergreen Place Supportive Living Heritage Enterprises Glenhaven Gardens of Alton LLC Alton IL 9.5 92 103,478 NA NA 8/19/2015 Villas at St Therese Assisted Living The Villas At Saint Therese Inc The Villas at Saint Therese Assisted Living Inc Columbus OH 6.4 50 127,734 NA NA 8/18/2015 Stonecroft Welltower Mainstreet Bloomington IN 18.0 93 193,548 7.5% NA 7/31/2015 Fairfield Village National Health Investors et. Al Jerry McClain Companies Lancaster OH 21.0 92 228,261 8.0% 95% 7/29/2015 Whispering Pines Village Capital Senior Living Robert N Schwartz Columbiana OH 13.3 68 195,221 7.2% 94% 6/1/2015 Waterford Crossing Trilogy Healthcare Services LLC The Manor House LP Goshen IN 14.0 80 175,000 8.3% 98% 5/29/2015 Primrose Retirement Community of Anderson CNL Healthcare Properties Primrose Retirement Anderson IN 21.1 76 277,632 NA NA 5/1/2015 Good Neighbor Care of Sterling Senior Housing Properties Trust CNL Lifestyle Props Sterling IL 6.5 61 106,219 7.0% NA 5/1/2015 Grand Victorian of Pekin Senior Housing Properties Trust CNL Lifestyle Props Pekin IL 18.1 61 297,496 7.0% NA 5/1/2015 Amber Ridge Assisted Living & Memory Care Senior Housing Properties Trust CNL Lifestyle Props Moline IL 11.2 40 279,211 7.0% NA 5/1/2015 Grand Victorian of Washington Senior Housing Properties Trust CNL Lifestyle Props Washington IL 18.1 61 297,496 7.0% NA 5/1/2015 Provision Living at Godfrey Senior Housing Properties Trust CNL Lifestyle Props Godfrey IL 15.7 79 199,139 7.0% NA 4/29/2015 Bridgewell Hospital CommuniCare Health Services Evergreen Southwest Behavioral Health Services Cincinnati OH 3.5 24 145,833 NA 0% 4/1/2015 Kentridge at Golden Pond Sentio Healthcare Props Wojno Development Kent OH 15.4 92 167,065 NA NA 4/1/2015 The Gables of Hudson Sentio Healthcare Props Wojno Development Hudson OH 16.8 112 149,554 NA 67% High $22.3 112 $377,857 6.5% 99.0% Average $12.4 70 $183,958 7.4% 78.3% Median $12.0 68 $175,000 7.5% 95.0% Low $3.5 24 $64,167 8.3% 0.0% Source: Real Capital Analytics; select single asset and small portfolio seniors housing transactions over the past 2 years of similar size (under 100 units focusing on assets in 50-70 unit range), markets (suburban, tertiary Midwest markets), age (generally built after 2000), and quality 24
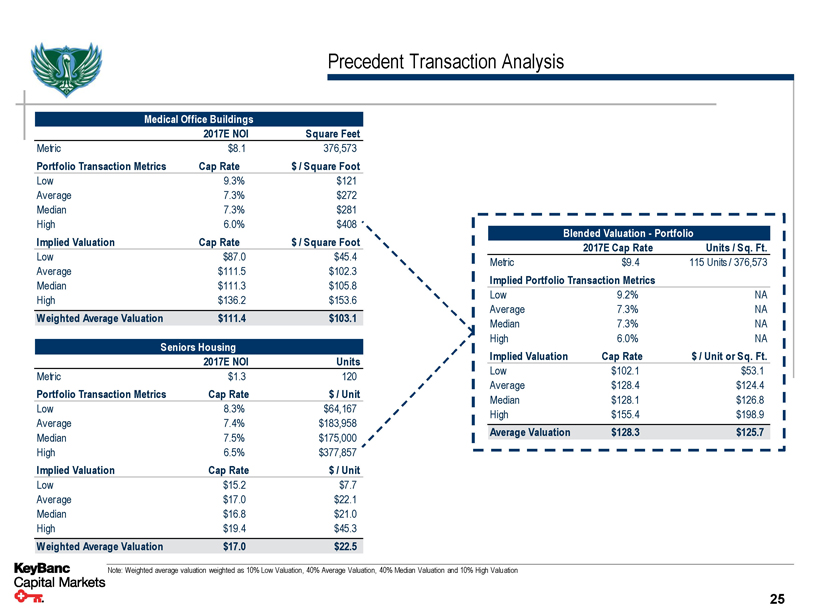
Precedent Transaction Analysis Medical Office Buildings 2017E NOI Square Feet Metric $8.1 376,573 Portfolio Transaction Metrics Cap Rate $/ Square Foot Low 9.3% $121 Average 7.3% $272 Median 7.3% $281 High 6.0% $408 Implied Valuation Cap Rate $/ Square Foot Low $87.0 $45.4 Average $111.5 $102.3 Median $111.3 $105.8 High $136.2 $153.6 Weighted Average Valuation $111.4 $103.1 Seniors Housing 2017E NOI Units Metric $1.3 120 Portfolio Transaction Metrics Cap Rate $/ Unit Low 8.3% $64,167 Average 7.4% $183,958 Median 7.5% $175,000 High 6.5% $377,857 Implied Valuation Cap Rate $/ Unit Low $15.2 $7.7 Average $17.0 $22.1 Median $16.8 $21.0 High $19.4 $45.3 Weighted Average Valuation $17.0 $22.5 Blended Valuation - Portfolio 2017E Cap Rate Units / Sq. Ft. Metric $9.4 115 Units / 376,573 Implied Portfolio Transaction Metrics Low 9.2% NA Average 7.3% NA Median 7.3% NA High 6.0% NA Implied Valuation Cap Rate $/ Unit or Sq. Ft. Low $102.1 $53.1 Average $128.4 $124.4 Median $128.1 $126.8 High $155.4 $198.9 Average Valuation $128.3 $125.7 Note: Weighted average valuation weighted as 10% Low Valuation, 40% Average Valuation, 40% Median Valuation and 10% High Valuation 25

Discounted Cash Flow KeyBanc performed a discounted cash flow analysis to estimate Pelican’s intrinsic value Projections 2017 2018 2019 2020 2021 Total Revenue $15.1 $15.2 $15.5 $15.8 $16.1 Total Operating Expenses (5.7) (5.8) (6.0) (6.1) (6.3) Net Operating Income $9.4 $9.4 $9.6 $9.7 $9.9 NOI Growth% 0.3% 1.7% 1.5% 1.3% Less: CapEx (0.3) (0.3) (0.3) (0.3) (0.3) Net Other Cash Flow Items ($0.3) ($0.3) ($0.3) ($0.3) ($0.3) Unlevered Free Cash Flow (FCF) $9.1 $9.1 $9.3 $9.4 $9.5 Unlevered FCF Growth% 0.3% 1.7% 1.5% 1.3% Discount Factor (1) 0.953 0.867 0.788 0.716 0.651 Present Value of FCF $8.7 $7.9 $7.3 $6.7 $6.2 Discounted Free Cash Flow Valuation 2022 NOI $10.0 Exit Cap Rate 7.50% Implied Terminal Value $132.8 Total Present Value of FCF $36.9 Present Value of Terminal Value 82.5 Enterprise Value $119.3 Less: Debt (5.0) Less: Muscatine NCI (0.5) Equity Value $113.9 Implied Enterprise Value Exit Cap Rate 7.00% 7.25% 7.50% 7.75% 8.00% 8.00% $135.3 $132.0 $128.9 $126.0 $123.2 WACC 9.00% 130.1 126.9 124.0 121.2 118.6 10.00% 125.2 122.2 119.3 116.7 114.2 11.00% 120.5 117.6 114.9 112.4 110.0 12.00% 116.1 113.3 110.7 108.3 106.0 Note: Based on KBCM investment banking estimates (1) Assumes a 10.00% WACC as well as the mid-year convention 26
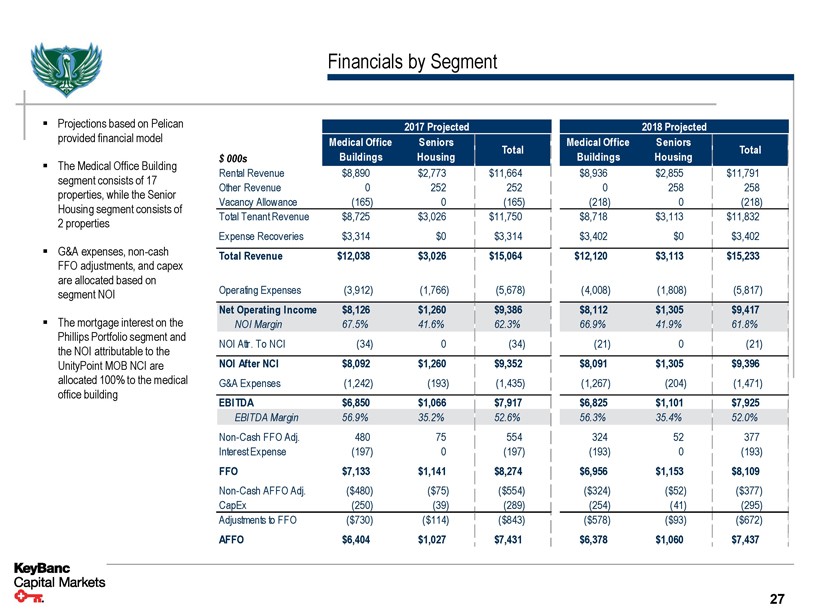
Financials by Segment ▪ Projections based on Pelican provided financial model ▪ The Medical Office Building segment consists of 17 properties, while the Senior Housing segment consists of 2 properties ▪ G&A expenses, non-cash FFO adjustments, and capex are allocated based on segment NOI ▪ The mortgage interest on the Phillips Portfolio segment and the NOI attributable to the UnityPoint MOB NCI are allocated 100% to the medical office building 2017 Projected Medical Office Seniors Total $000s Buildings Housing Rental Revenue $8,890 $2,773 $11,664 Other Revenue 0 252 252 Vacancy Allowance (165) 0 (165) Total Tenant Revenue $8,725 $3,026 $11,750 Expense Recoveries $3,314 $0 $3,314 Total Revenue $12,038 $3,026 $15,064 Operating Expenses (3,912) (1,766) (5,678) Net Operating Income $8,126 $1,260 $9,386 NOI Margin 67.5% 41.6% 62.3% NOI Attr. To NCI (34) 0 (34) NOI After NCI $8,092 $1,260 $9,352 G&A Expenses (1,242) (193) (1,435) EBITDA $6,850 $1,066 $7,917 EBITDA Margin 56.9% 35.2% 52.6% Non-Cash FFO Adj. 480 75 554 Interest Expense (197) 0 (197) FFO $7,133 $1,141 $8,274 Non-Cash AFFO Adj. ($480) ($75) ($554) CapEx (250) (39) (289) Adjustments to FFO ($730) ($114) ($843) AFFO $6,404 $1,027 $7,431 2018 Projected Medical Office Seniors Total Buildings Housing $8,936 $2,855 $11,791 0 258 258 (218) 0 (218) $8,718 $3,113 $11,832 $3,402 $0 $3,402 $12,120 $3,113 $15,233 (4,008) (1,808) (5,817) $8,112 $1,305 $9,417 66.9% 41.9% 61.8% (21) 0 (21) $8,091 $1,305 $9,396 (1,267) (204) (1,471) $6,825 $1,101 $7,925 56.3% 35.4% 52.0% 324 52 377 (193) 0 (193) $6,956 $1,153 $8,109 ($324) ($52) ($377) (254) (41) (295) ($578) ($93) ($672) $6,378 $1,060 $7,437 27
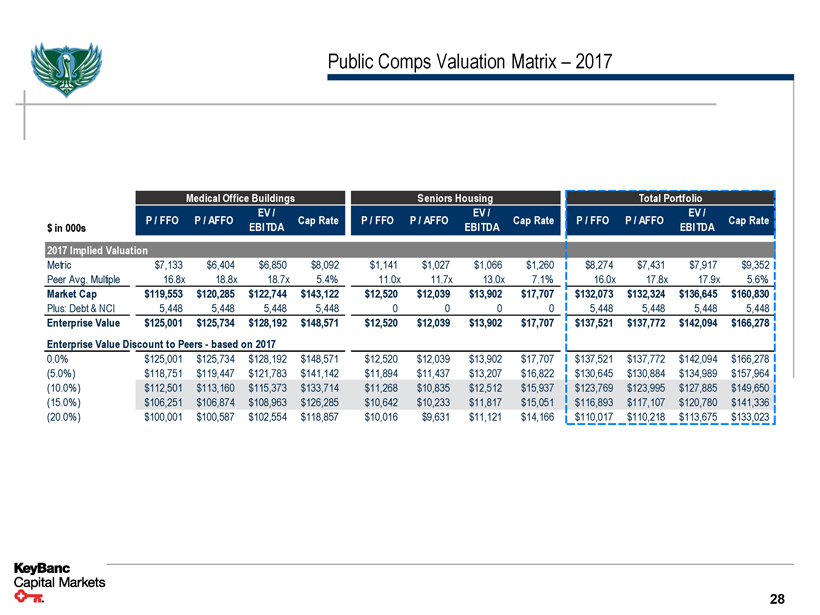
Public Comps Valuation Matrix – 2017 Medical Office Buildings Seniors Housing Total Portfolio P / FFO P / AFFO EV / Cap Rate P / FFO P / AFFO EV / Cap Rate P / FFO P / AFFO EV / Cap Rate $in 000s EBITDA EBITDA EBITDA 2017 Implied Valuation Metric $7,133 $6,404 $6,850 $8,092 $1,141 $1,027 $1,066 $1,260 $8,274 $7,431 $7,917 $9,352 Peer Avg. Multiple 16.8x 18.8x 18.7x 5.4% 11.0x 11.7x 13.0x 7.1% 16.0x 17.8x 17.9x 5.6% Market Cap $119,553 $120,285 $122,744 $143,122 $12,520 $12,039 $13,902 $17,707 $132,073 $132,324 $136,645 $160,830 Plus: Debt & NCI 5,448 5,448 5,448 5,448 0 0 0 0 5,448 5,448 5,448 5,448 Enterprise Value $125,001 $125,734 $128,192 $148,571 $12,520 $12,039 $13,902 $17,707 $137,521 $137,772 $142,094 $166,278 Enterprise Value Discount to Peers - based on 2017 0.0% $125,001 $125,734 $128,192 $148,571 $12,520 $12,039 $13,902 $17,707 $137,521 $137,772 $142,094 $166,278 (5.0%) $118,751 $119,447 $121,783 $141,142 $11,894 $11,437 $13,207 $16,822 $130,645 $130,884 $134,989 $157,964 (10.0%) $112,501 $113,160 $115,373 $133,714 $11,268 $10,835 $12,512 $15,937 $123,769 $123,995 $127,885 $149,650 (15.0%) $106,251 $106,874 $108,963 $126,285 $10,642 $10,233 $11,817 $15,051 $116,893 $117,107 $120,780 $141,336 (20.0%) $100,001 $100,587 $102,554 $118,857 $10,016 $9,631 $11,121 $14,166 $110,017 $110,218 $113,675 $133,023 28
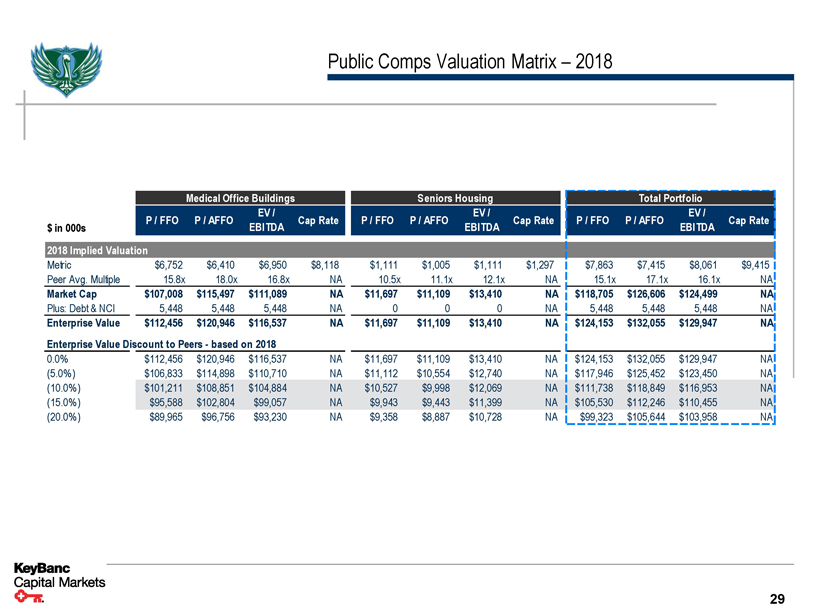
Public Comps Valuation Matrix – 2018 Medical Office Buildings Seniors Housing Total Portfolio P / FFO P / AFFO EV / Cap Rate P / FFO P / AFFO EV / Cap Rate P / FFO P / AFFO EV / Cap Rate $in 000s EBITDA EBITDA EBITDA 2018 Implied Valuation Metric $6,752 $6,410 $6,950 $8,118 $1,111 $1,005 $1,111 $1,297 $7,863 $7,415 $8,061 $9,415 Peer Avg. Multiple 15.8x 18.0x 16.8x NA 10.5x 11.1x 12.1x NA 15.1x 17.1x 16.1x NA Market Cap $107,008 $115,497 $111,089 NA $11,697 $11,109 $13,410 NA $118,705 $126,606 $124,499 NA Plus: Debt & NCI 5,448 5,448 5,448 NA 0 0 0 NA 5,448 5,448 5,448 NA Enterprise Value $112,456 $120,946 $116,537 NA $11,697 $11,109 $13,410 NA $124,153 $132,055 $129,947 NA Enterprise Value Discount to Peers - based on 2018 0.0% $112,456 $120,946 $116,537 NA $11,697 $11,109 $13,410 NA $124,153 $132,055 $129,947 NA (5.0%) $106,833 $114,898 $110,710 NA $11,112 $10,554 $12,740 NA $117,946 $125,452 $123,450 NA (10.0%) $101,211 $108,851 $104,884 NA $10,527 $9,998 $12,069 NA $111,738 $118,849 $116,953 NA (15.0%) $95,588 $102,804 $99,057 NA $9,943 $9,443 $11,399 NA $105,530 $112,246 $110,455 NA (20.0%) $89,965 $96,756 $93,230 NA $9,358 $8,887 $10,728 NA $99,323 $105,644 $103,958 NA 29
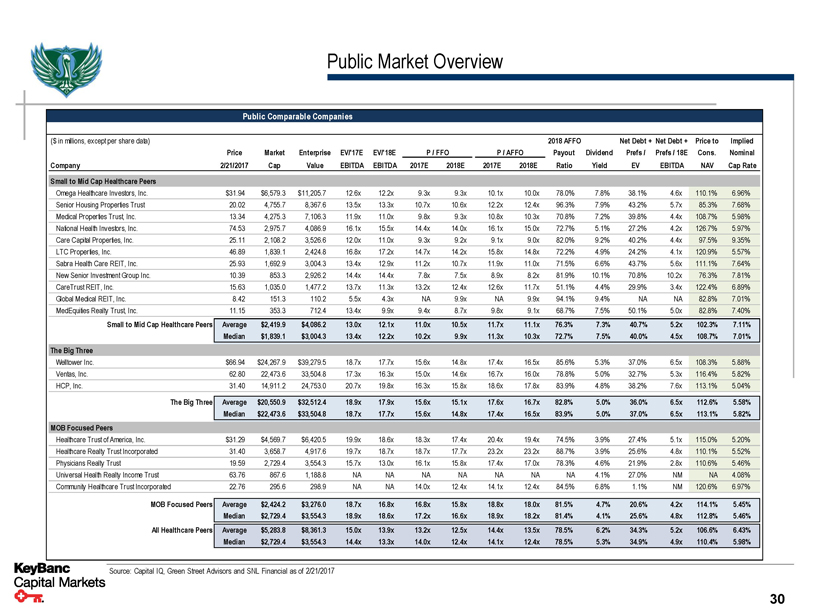
Public Market Overview Public Comparable Companies ($in millions, except per share data) 2018 AFFO Net Debt + Net Debt + Price to Implied Price Market Enterprise EV/'17E EV/'18E P / FFO P / AFFO Payout Dividend Prefs / Prefs / 18E Cons. Nominal Company 2/21/2017 Cap Value EBITDA EBITDA 2017E 2018E 2017E 2018E Ratio Yield EV EBITDA NAV Cap Rate Small to Mid Cap Healthcare Peers Omega Healthcare Investors, Inc. $31.94 $6,579.3 $11,205.7 12.6x 12.2x 9.3x 9.3x 10.1x 10.0x 78.0% 7.8% 38.1% 4.6x 110.1% 6.96% Senior Housing Properties Trust 20.02 4,755.7 8,367.6 13.5x 13.3x 10.7x 10.6x 12.2x 12.4x 96.3% 7.9% 43.2% 5.7x 85.3% 7.68% Medical Properties Trust, Inc. 13.34 4,275.3 7,106.3 11.9x 11.0x 9.8x 9.3x 10.8x 10.3x 70.8% 7.2% 39.8% 4.4x 108.7% 5.98% National Health Investors, Inc. 74.53 2,975.7 4,086.9 16.1x 15.5x 14.4x 14.0x 16.1x 15.0x 72.7% 5.1% 27.2% 4.2x 126.7% 5.97% Care Capital Properties, Inc. 25.11 2,108.2 3,526.6 12.0x 11.0x 9.3x 9.2x 9.1x 9.0x 82.0% 9.2% 40.2% 4.4x 97.5% 9.35% LTC Properties, Inc. 46.89 1,839.1 2,424.8 16.8x 17.2x 14.7x 14.2x 15.8x 14.8x 72.2% 4.9% 24.2% 4.1x 120.9% 5.57% Sabra Health Care REIT, Inc. 25.93 1,692.9 3,004.3 13.4x 12.9x 11.2x 10.7x 11.9x 11.0x 71.5% 6.6% 43.7% 5.6x 111.1% 7.64% New Senior Investment Group Inc. 10.39 853.3 2,926.2 14.4x 14.4x 7.8x 7.5x 8.9x 8.2x 81.9% 10.1% 70.8% 10.2x 76.3% 7.81% CareTrust REIT, Inc. 15.63 1,035.0 1,477.2 13.7x 11.3x 13.2x 12.4x 12.6x 11.7x 51.1% 4.4% 29.9% 3.4x 122.4% 6.89% Global Medical REIT, Inc. 8.42 151.3 110.2 5.5x 4.3x NA 9.9x NA 9.9x 94.1% 9.4% NA NA 82.8% 7.01% MedEquities Realty Trust, Inc. 11.15 353.3 712.4 13.4x 9.9x 9.4x 8.7x 9.8x 9.1x 68.7% 7.5% 50.1% 5.0x 82.8% 7.40% Small to Mid Cap Healthcare Peers Average $2,419.9 $4,086.2 13.0x 12.1x 11.0x 10.5x 11.7x 11.1x 76.3% 7.3% 40.7% 5.2x 102.3% 7.11% Median $1,839.1 $3,004.3 13.4x 12.2x 10.2x 9.9x 11.3x 10.3x 72.7% 7.5% 40.0% 4.5x 108.7% 7.01% The Big Three Welltower Inc. $66.94 $24,267.9 $39,279.5 18.7x 17.7x 15.6x 14.8x 17.4x 16.5x 85.6% 5.3% 37.0% 6.5x 108.3% 5.88% Ventas, Inc. 62.80 22,473.6 33,504.8 17.3x 16.3x 15.0x 14.6x 16.7x 16.0x 78.8% 5.0% 32.7% 5.3x 116.4% 5.82% HCP, Inc. 31.40 14,911.2 24,753.0 20.7x 19.8x 16.3x 15.8x 18.6x 17.8x 83.9% 4.8% 38.2% 7.6x 113.1% 5.04% The Big Three Average $20,550.9 $32,512.4 18.9x 17.9x 15.6x 15.1x 17.6x 16.7x 82.8% 5.0% 36.0% 6.5x 112.6% 5.58% Median $22,473.6 $33,504.8 18.7x 17.7x 15.6x 14.8x 17.4x 16.5x 83.9% 5.0% 37.0% 6.5x 113.1% 5.82% MOB Focused Peers Healthcare Trust of America, Inc. $31.29 $4,569.7 $6,420.5 19.9x 18.6x 18.3x 17.4x 20.4x 19.4x 74.5% 3.9% 27.4% 5.1x 115.0% 5.20% Healthcare Realty Trust Incorporated 31.40 3,658.7 4,917.6 19.7x 18.7x 18.7x 17.7x 23.2x 23.2x 88.7% 3.9% 25.6% 4.8x 110.1% 5.52% Physicians Realty Trust 19.59 2,729.4 3,554.3 15.7x 13.0x 16.1x 15.8x 17.4x 17.0x 78.3% 4.6% 21.9% 2.8x 110.6% 5.46% Universal Health Realty Income Trust 63.76 867.6 1,188.8 NA NA NA NA NA NA NA 4.1% 27.0% NM NA 4.08% Community Healthcare Trust Incorporated 22.76 295.6 298.9 NA NA 14.0x 12.4x 14.1x 12.4x 84.5% 6.8% 1.1% NM 120.6% 6.97% MOB Focused Peers Average $2,424.2 $3,276.0 18.7x 16.8x 16.8x 15.8x 18.8x 18.0x 81.5% 4.7% 20.6% 4.2x 114.1% 5.45% Median $2,729.4 $3,554.3 18.9x 18.6x 17.2x 16.6x 18.9x 18.2x 81.4% 4.1% 25.6% 4.8x 112.8% 5.46% All Healthcare Peers Average $5,283.8 $8,361.3 15.0x 13.9x 13.2x 12.5x 14.4x 13.5x 78.5% 6.2% 34.3% 5.2x 106.6% 6.43% Median $2,729.4 $3,554.3 14.4x 13.3x 14.0x 12.4x 14.1x 12.4x 78.5% 5.3% 34.9% 4.9x 110.4% 5.98% Source: Capital IQ, Green Street Advisors and SNL Financial as of 2/21/2017 30
Confidential Individual Property Overviews
Confidential MOB Property Overviews
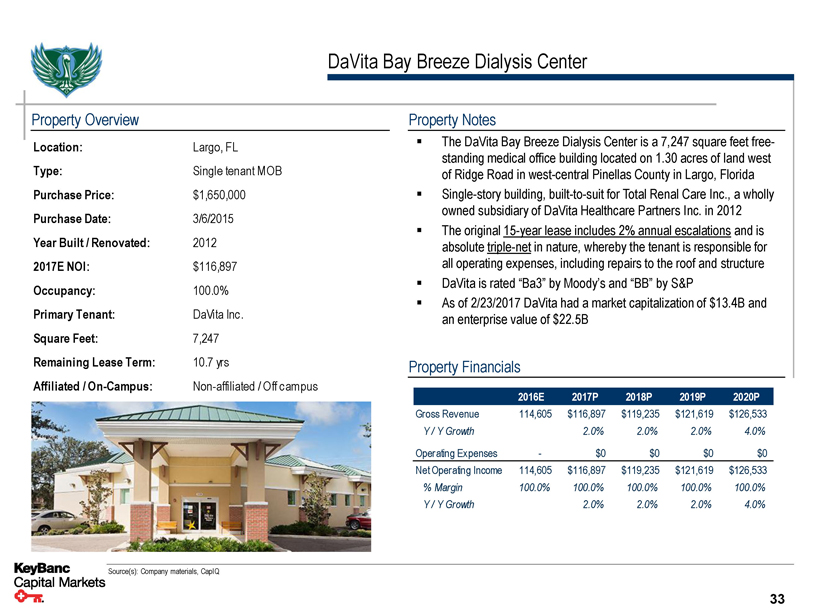
DaVita Bay Breeze Dialysis Center Property Overview Location: Largo, FL Type: Single tenant MOB Purchase Price: $1,650,000 Purchase Date: 3/6/2015 Year Built / Renovated: 2012 2017E NOI: $116,897 Occupancy: 100.0% Primary Tenant: DaVita Inc. Square Feet: 7,247 Remaining Lease Term: 10.7 yrs Property Notes ▪ The DaVita Bay Breeze Dialysis Center is a 7,247 square feet free-standing medical office building located on 1.30 acres of land west of Ridge Road in west-central Pinellas County in Largo, Florida ▪ Single-story building, built-to-suit for Total Renal Care Inc., a wholly owned subsidiary of DaVita Healthcare Partners Inc. in 2012 ▪ The original 15-year lease includes 2% annual escalations and is absolute triple-net in nature, whereby the tenant is responsible for all operating expenses, including repairs to the roof and structure ▪ DaVita is rated “Ba3” by Moody’s and “BB” by S&P ▪ As of 2/23/2017 DaVita had a market capitalization of $13.4B and an enterprise value of $22.5B Property Financials 2016E 2017P 2018P 2019P 2020P Gross Revenue 114,605 $116,897 $119,235 $121,619 $126,533 Y / Y Growth 2.0% 2.0% 2.0% 4.0% Operating Expenses - $0 $0 $0 $0 Net Operating Income 114,605 $116,897 $119,235 $121,619 $126,533% Margin 100.0% 100.0% 100.0% 100.0% 100.0% Y / Y Growth 2.0% 2.0% 2.0% 4.0% Source(s): Company materials, CapIQ 33
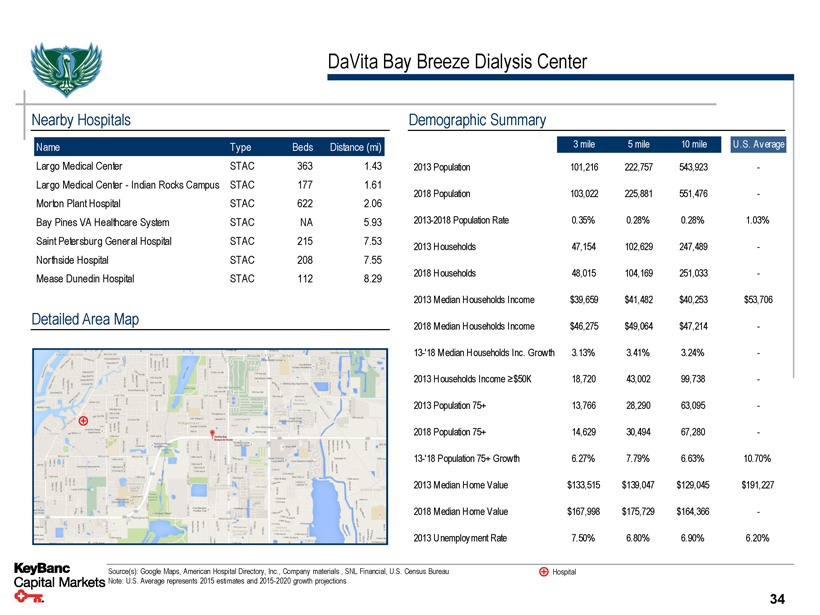
DaVita Bay Breeze Dialysis Center Nearby Hospitals Name Type Beds Distance (mi) Largo Medical Center STAC 363 1.43 Largo Medical Center - Indian Rocks Campus STAC 177 1.61 Morton Plant Hospital STAC 622 2.06 Bay Pines VA Healthcare System STAC NA 5.93 Saint Petersburg General Hospital STAC 215 7.53 Northside Hospital STAC 208 7.55 Mease Dunedin Hospital STAC 112 8.29 Detailed Area Map Demographic Summary 3 mile 5 mile 10 mile U .S. Average 2013 Population 101,216 222,757 543,923 - 2018 Population 103,022 225,881 551,476 - 2013-2018 Population Rate 0.35% 0.28% 0.28% 1.03% 2013 Households 47,154 102,629 247,489 - 2018 Households 48,015 104,169 251,033 - 2013 Median Households Income $39,659 $41,482 $40,253 $53,706 2018 Median Households Income $46,275 $49,064 $47,214 - 13-'18 Median Households Inc. Growth 3.13% 3.41% 3.24% - 2013 Households Income ≥$50K 18,720 43,002 99,738 - 2013 Population 75+ 13,766 28,290 63,095 - 2018 Population 75+ 14,629 30,494 67,280 - 13-'18 Population 75+ Growth 6.27% 7.79% 6.63% 10.70% 2013 Median Home Value $133,515 $139,047 $129,045 $191,227 2018 Median Home Value $167,998 $175,729 $164,366 - 2013 Unemployment Rate 7.50% 6.80% 6.90% 6.20% Source(s): Google Maps, American Hospital Directory, Inc., Company materials , SNL Financial, U.S. Census Bureau Hospital Note: U.S. Average represents 2015 estimates and 2015-2020 growth projections 34
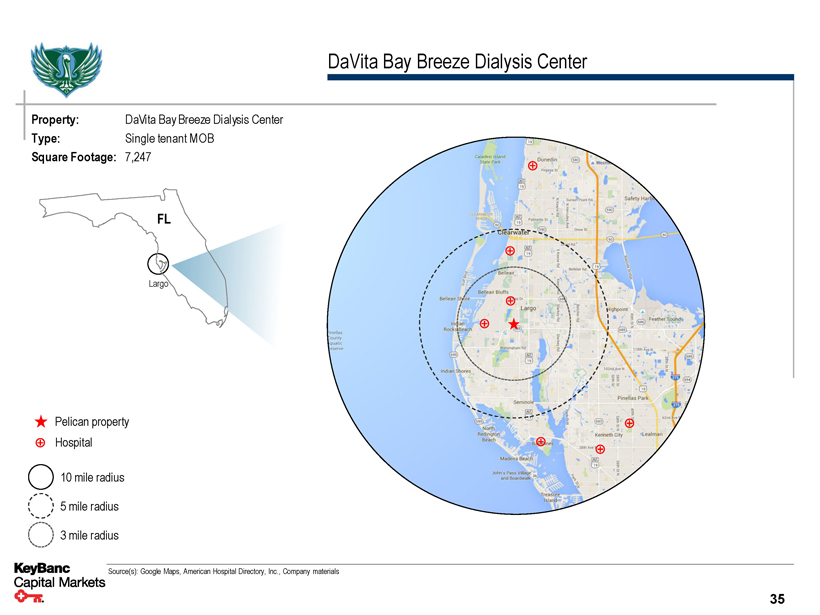
DaVita Bay Breeze Dialysis Center Property: DaVita Bay Breeze Dialysis Center Type: Single tenant MOB Square Footage: 7,247 FL Largo Pelican property Hospital 10 mile radius 5 mile radius 3 mile radius Source(s): Google Maps, American Hospital Directory, Inc., Company materials 35
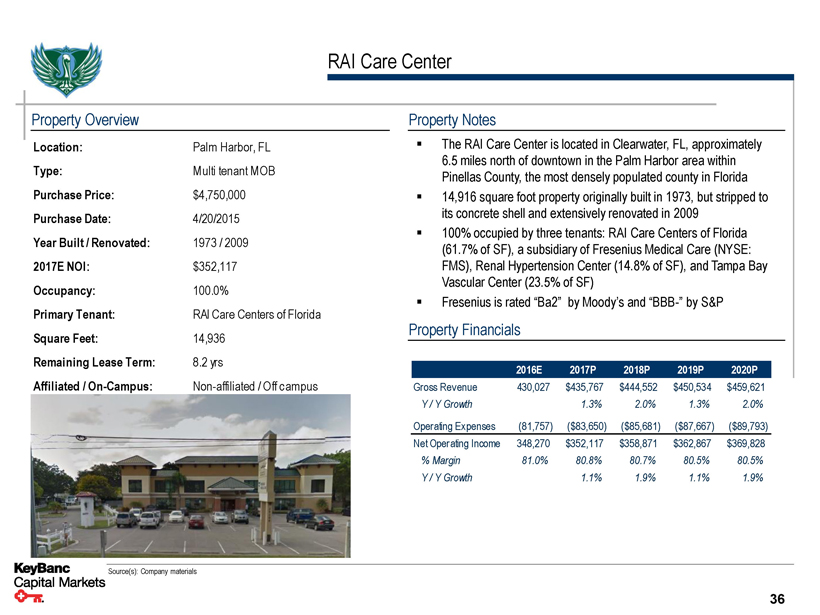
RAI Care Center Property Overview Location: Palm Harbor, FL Type: Multi tenant MOB Purchase Price: $4,750,000 Purchase Date: 4/20/2015 Year Built / Renovated: 1973 / 2009 2017E NOI: $352,117 Occupancy: 100.0% Primary Tenant: RAI Care Centers of Florida Square Feet: 14,936 Remaining Lease Term: 8.2 yrs Affiliated / On-Campus: Non-affiliated / Off campus Property Notes ▪ The RAI Care Center is located in Clearwater, FL, approximately 6.5 miles north of downtown in the Palm Harbor area within Pinellas County, the most densely populated county in Florida ▪ 14,916 square foot property originally built in 1973, but stripped to its concrete shell and extensively renovated in 2009 ▪ 100% occupied by three tenants: RAI Care Centers of Florida (61.7% of SF), a subsidiary of Fresenius Medical Care (NYSE: FMS), Renal Hypertension Center (14.8% of SF), and Tampa Bay Vascular Center (23.5% of SF) ▪ Fresenius is rated “Ba2” by Moody’s and “BBB-” by S&P Property Financials 2016E 2017P 2018P 2019P 2020P Gross Revenue 430,027 $435,767 $444,552 $450,534 $459,621 Y / Y Growth 1.3% 2.0% 1.3% 2.0% Operating Expenses (81,757) ($83,650) ($85,681) ($87,667) ($89,793) Net Operating Income 348,270 $352,117 $358,871 $362,867 $369,828% Margin 81.0% 80.8% 80.7% 80.5% 80.5% Y / Y Growth 1.1% 1.9% 1.1% 1.9% Source(s): Company materials 36
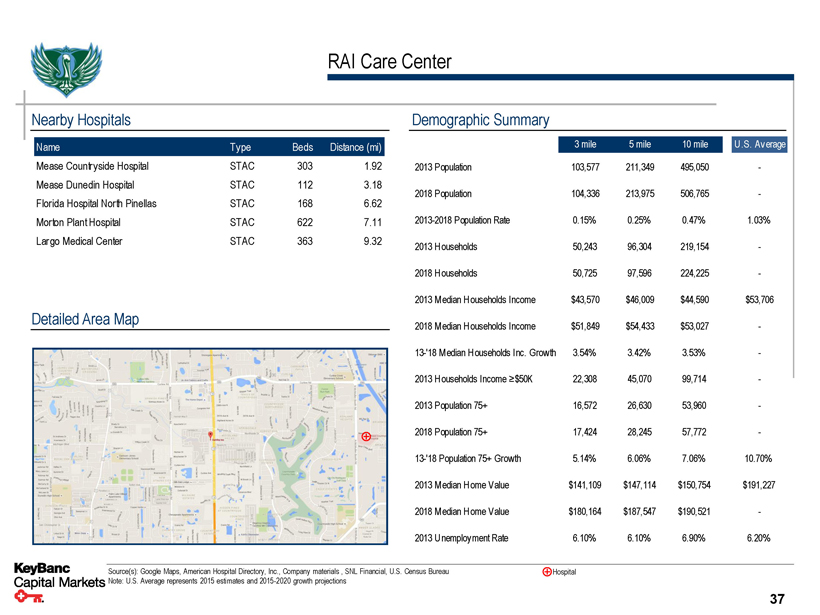
RAI Care Center Nearby Hospitals Name Type Beds Distance (mi) Mease Countryside Hospital STAC 303 1.92 Mease Dunedin Hospital STAC 112 3.18 Florida Hospital North Pinellas STAC 168 6.62 Morton Plant Hospital STAC 622 7.11 Largo Medical Center STAC 363 9.32 Detailed Area Map Demographic Summary 3 mile 5 mile 10 mile U ..S. Average 2013 Population 103,577 211,349 495,050 - 2018 Population 104,336 213,975 506,765 - 2013-2018 Population Rate 0.15% 0.25% 0.47% 1.03% 2013 Households 50,243 96,304 219,154 - 2018 Households 50,725 97,596 224,225 - 2013 Median Households Income $43,570 $46,009 $44,590 $53,706 2018 Median Households Income $51,849 $54,433 $53,027 - 13-'18 Median Households Inc. Growth 3.54% 3.42% 3.53% - 2013 Households Income ≥$50K 22,308 45,070 99,714 - 2013 Population 75+ 16,572 26,630 53,960 - 2018 Population 75+ 17,424 28,245 57,772 - 13-'18 Population 75+ Growth 5.14% 6.06% 7.06% 10.70% 2013 Median Home Value $141,109 $147,114 $150,754 $191,227 2018 Median Home Value $180,164 $187,547 $190,521 - 2013 Unemployment Rate 6.10% 6.10% 6.90% 6.20% Source(s): Google Maps, American Hospital Directory, Inc., Company materials , SNL Financial, U.S. Census Bureau Hospital Note: U.S. Average represents 2015 estimates and 2015-2020 growth projections 37
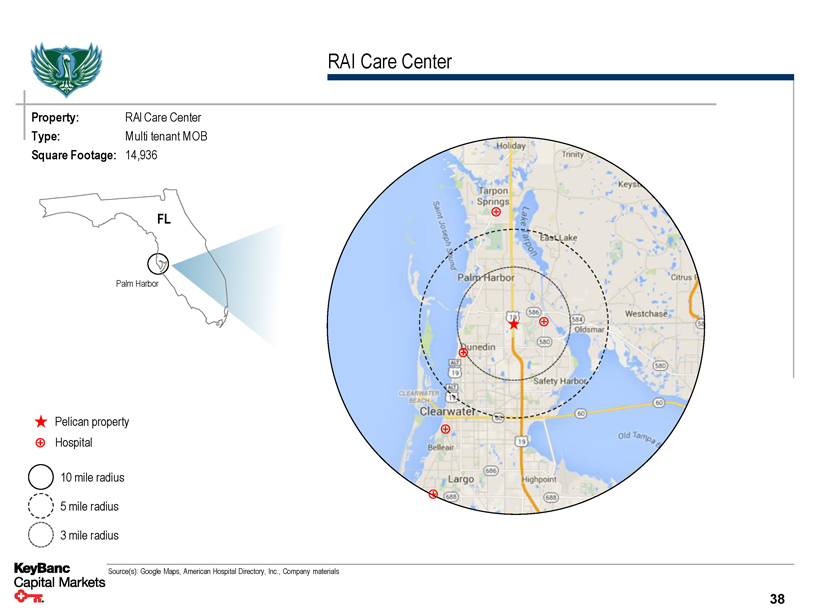
RAI Care Center Property: RAI Care Center Type: Multi tenant MOB Square Footage: 14,936 FL Palm Harbor Pelican property Hospital 10 mile radius 5 mile radius 3 mile radius Source(s): Google Maps, American Hospital Directory, Inc., Company materials 38

DaVita Dialysis – Hudson, FL Property Overview Location: Hudson, FL Type: Multi tenant MOB Purchase Price: $2,725,000 Purchase Date: 5/4/2015 Year Built / Renovated: 1973 / 2009 2017E NOI: $201,990 Occupancy: 100.0% Primary Tenant: DaVita Inc. Square Feet: 8,984 Remaining Lease Term: 8.0 yrs Affiliated / On-Campus: Non-affiliated / Off campus Property Notes ▪ The DaVita Dialysis Center is located in Hudson, FL adjacent to the campus of HCA’s Regional Medical Center Bayonet Point, just east of U.S. Highway 19 in northwestern Pasco County, off State Road 52 ▪ The Property was built in 1973 and is 100% occupied by two tenants, with an average remaining lease term of 8.0 years ▪ Tenants include Total Renal Care (60.2% of SF), a subsidiary of DaVita Healthcare Partners (NYSE: DVA) and Renal Hypertension Center (39.8% of SF) ▪ DaVita is rated “Ba3” by Moody’s and “BB” by S&P Property Financials 2016E 2017P 2018P 2019P 2020P Gross Revenue 281,011 $287,015 $291,542 $297,776 $302,504 Y / Y Growth 2.1% 1.6% 2.1% 1.6% Operating Expenses (82,981) ($85,025) ($87,071) ($89,216) ($91,365) Net Operating Income 198,030 $201,990 $204,471 $208,560 $211,139% Margin 70.5% 70.4% 70.1% 70.0% 69.8% Y / Y Growth 2.0% 1.2% 2.0% 1.2% Source(s): Company materials 39
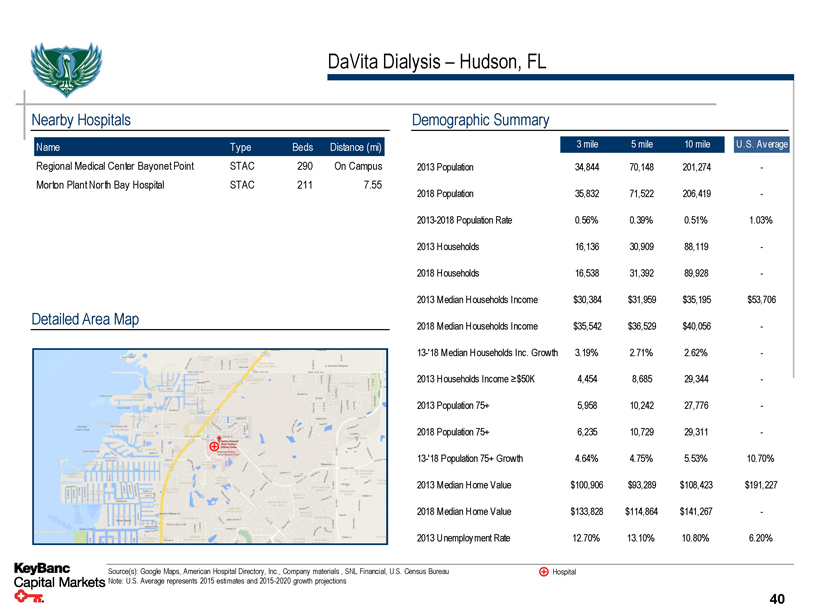
DaVita Dialysis – Hudson, FL Nearby Hospitals Name Type Beds Distance (mi) Regional Medical Center Bayonet Point STAC 290 On Campus Morton Plant North Bay Hospital STAC 211 7.55 Detailed Area Map Demographic Summary 3 mile 5 mile 10 mile U .S. Average 2013 Population 34,844 70,148 201,274 - 2018 Population 35,832 71,522 206,419 - 2013-2018 Population Rate 0.56% 0.39% 0.51% 1.03% 2013 Households 16,136 30,909 88,119 - 2018 Households 16,538 31,392 89,928 - 2013 Median Households Income $30,384 $31,959 $35,195 $53,706 2018 Median Households Income $35,542 $36,529 $40,056 - 13-'18 Median Households Inc. Growth 3.19% 2.71% 2.62% - 2013 Households Income ≥$50K 4,454 8,685 29,344 - 2013 Population 75+ 5,958 10,242 27,776 - 2018 Population 75+ 6,235 10,729 29,311 - 13-'18 Population 75+ Growth 4.64% 4.75% 5.53% 10.70% 2013 Median Home Value $100,906 $93,289 $108,423 $191,227 2018 Median Home Value $133,828 $114,864 $141,267 - 2013 Unemployment Rate 12.70% 13.10% 10.80% 6.20% Source(s): Google Maps, American Hospital Directory, Inc., Company materials , SNL Financial, U.S. Census Bureau Hospital Note: U.S. Average represents 2015 estimates and 2015-2020 growth projections 40

DaVita Dialysis – Hudson, FL Property: DaVita Dialysis Type: Multi tenant MOB Square Footage: 8,984 FL Hudson Pelican property Hospital 10 mile radius 5 mile radius 3 mile radius Source(s): Google Maps, American Hospital Directory, Inc., Company materials 41
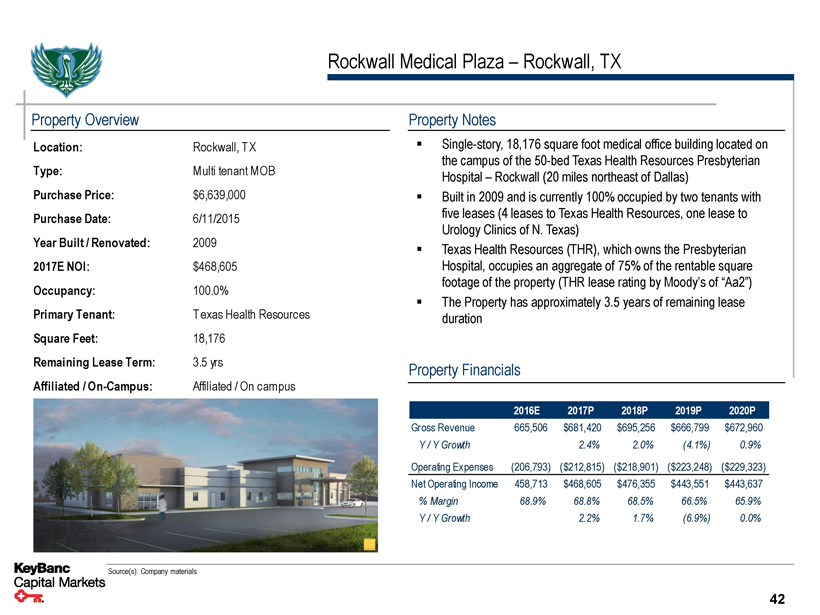
Rockwall Medical Plaza – Rockwall, TX Property Overview Location: Rockwall, T X Type: Multi tenant MOB Purchase Price: $6,639,000 Purchase Date: 6/11/2015 Year Built / Renovated: 2009 2017E NOI: $468,605 Occupancy: 100.0% Primary Tenant: T exas Health Resources Square Feet: 18,176 Remaining Lease Term: 3.5 yrs Affiliated / On-Campus: Affiliated / On campus Property Notes ▪ Single-story, 18,176 square foot medical office building located on the campus of the 50-bed Texas Health Resources Presbyterian Hospital – Rockwall (20 miles northeast of Dallas) ▪ Built in 2009 and is currently 100% occupied by two tenants with five leases (4 leases to Texas Health Resources, one lease to Urology Clinics of N. Texas) ▪ Texas Health Resources (THR), which owns the Presbyterian Hospital, occupies an aggregate of 75% of the rentable square footage of the property (THR lease rating by Moody’s of “Aa2”) ▪ The Property has approximately 3.5 years of remaining lease duration Property Financials 2016E 2017P 2018P 2019P 2020P Gross Revenue 665,506 $681,420 $695,256 $666,799 $672,960 Y / Y Growth 2.4% 2.0% (4.1%) 0.9% Operating Expenses (206,793) ($212,815) ($218,901) ($223,248) ($229,323) Net Operating Income 458,713 $468,605 $476,355 $443,551 $443,637% Margin 68.9% 68.8% 68.5% 66.5% 65.9% Y / Y Growth 2.2% 1.7% (6.9%) 0.0% Source(s): Company materials 42
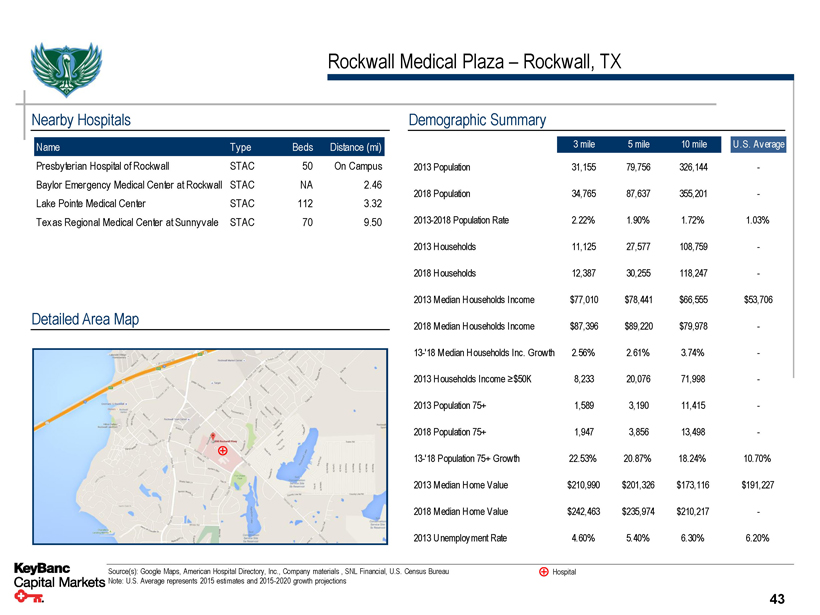
Rockwall Medical Plaza – Rockwall, TX Nearby Hospitals Name Type Beds Distance (mi) Presbyterian Hospital of Rockwall STAC 50 On Campus Baylor Emergency Medical Center at Rockwall STAC NA 2.46 Lake Pointe Medical Center STAC 112 3.32 Texas Regional Medical Center at Sunnyvale STAC 70 9.50 Detailed Area Map Demographic Summary 3 mile 5 mile 10 mile U .S. Average 2013 Population 31,155 79,756 326,144 - 2018 Population 34,765 87,637 355,201 - 2013-2018 Population Rate 2.22% 1.90% 1.72% 1.03% 2013 Households 11,125 27,577 108,759 - 2018 Households 12,387 30,255 118,247 - 2013 Median Households Income $77,010 $78,441 $66,555 $53,706 2018 Median Households Income $87,396 $89,220 $79,978 - 13-'18 Median Households Inc. Growth 2.56% 2.61% 3.74% - 2013 Households Income ≥$50K 8,233 20,076 71,998 - 2013 Population 75+ 1,589 3,190 11,415 - 2018 Population 75+ 1,947 3,856 13,498 - 13-'18 Population 75+ Growth 22.53% 20.87% 18.24% 10.70% 2013 Median Home Value $210,990 $201,326 $173,116 $191,227 2018 Median Home Value $242,463 $235,974 $210,217 - 2013 Unemployment Rate 4.60% 5.40% 6.30% 6.20% Source(s): Google Maps, American Hospital Directory, Inc., Company materials , SNL Financial, U.S. Census Bureau Hospital Note: U.S. Average represents 2015 estimates and 2015-2020 growth projections 43
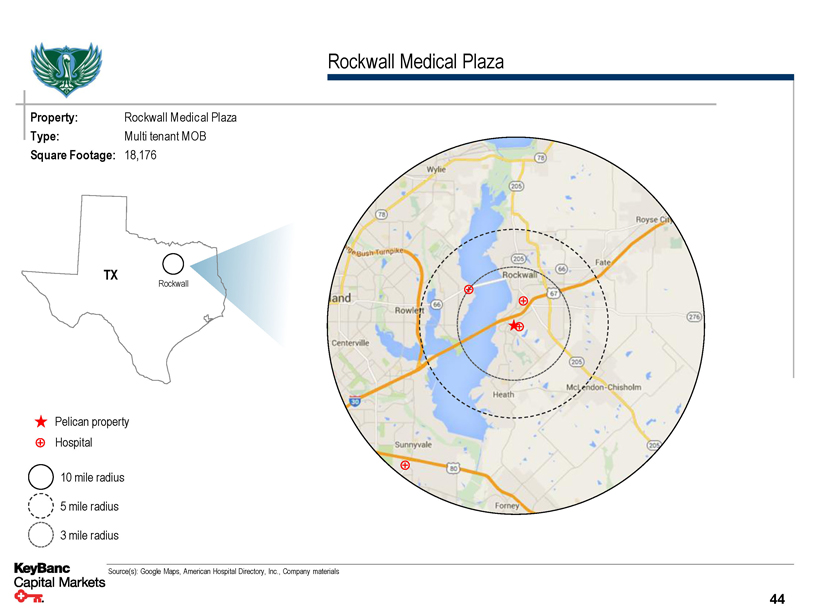
Rockwall Medical Plaza Property: Rockwall Medical Plaza Type: Multi tenant MOB Square Footage: 18,176 TX Rockwall Pelican property Hospital 10 mile radius 5 mile radius 3 mile radius Source(s): Google Maps, American Hospital Directory, Inc., Company materials 44
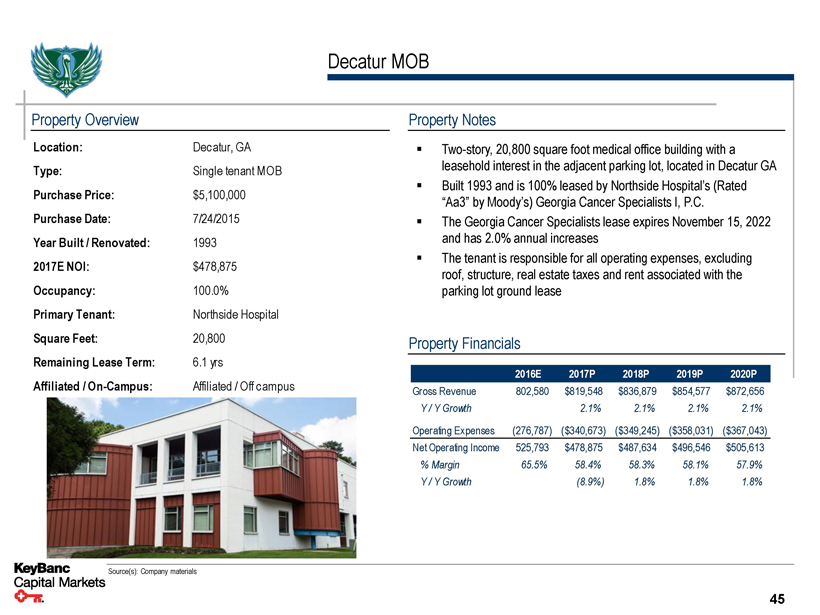
Decatur MOB Property Overview Location: Decatur, GA Type: Single tenant MOB Purchase Price: $5,100,000 Purchase Date: 7/24/2015 Year Built / Renovated: 1993 2017E NOI: $478,875 Occupancy: 100.0% Primary Tenant: Northside Hospital Square Feet: 20,800 Remaining Lease Term: 6.1 yrs Affiliated / On-Campus: Affiliated / Off campus Property Notes ▪ Two-story, 20,800 square foot medical office building with a leasehold interest in the adjacent parking lot, located in Decatur GA ▪ Built 1993 and is 100% leased by Northside Hospital’s (Rated “Aa3” by Moody’s) Georgia Cancer Specialists I, P.C. ▪ The Georgia Cancer Specialists lease expires November 15, 2022 and has 2.0% annual increases ▪ The tenant is responsible for all operating expenses, excluding roof, structure, real estate taxes and rent associated with the parking lot ground lease Property Financials 2016E 2017P 2018P 2019P 2020P Gross Revenue 802,580 $819,548 $836,879 $854,577 $872,656 Y / Y Growth 2.1% 2.1% 2.1% 2.1% Operating Expenses (276,787) ($340,673) ($349,245) ($358,031) ($367,043) Net Operating Income 525,793 $478,875 $487,634 $496,546 $505,613% Margin 65.5% 58.4% 58.3% 58.1% 57.9% Y / Y Growth (8.9%) 1.8% 1.8% 1.8% Source(s): Company materials 45
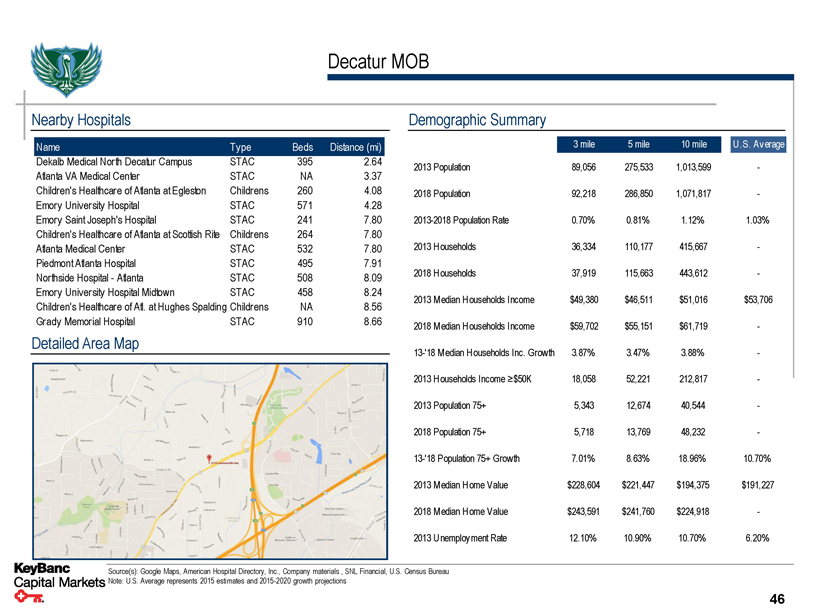
Decatur MOB Nearby Hospitals Name Type Beds Distance (mi) Dekalb Medical North Decatur Campus STAC 395 2.64 Atlanta VA Medical Center STAC NA 3.37 Children's Healthcare of Atlanta at Egleston Childrens 260 4.08 Emory University Hospital STAC 571 4.28 Emory Saint Joseph's Hospital STAC 241 7.80 Children's Healthcare of Atlanta at Scottish Rite Childrens 264 7.80 Atlanta Medical Center STAC 532 7.80 Piedmont Atlanta Hospital STAC 495 7.91 Northside Hospital - Atlanta STAC 508 8.09 Emory University Hospital Midtown STAC 458 8.24 Children's Healthcare of Atl. at Hughes Spalding Childrens NA 8.56 Grady Memorial Hospital STAC 910 8.66 Detailed Area Map Demographic Summary 3 mile 5 mile 10 mile U .S. Average 2013 Population 89,056 275,533 1,013,599 - 2018 Population 92,218 286,850 1,071,817 - 2013-2018 Population Rate 0.70% 0.81% 1.12% 1.03% 2013 Households 36,334 110,177 415,667 - 2018 Households 37,919 115,663 443,612 - 2013 Median Households Income $49,380 $46,511 $51,016 $53,706 2018 Median Households Income $59,702 $55,151 $61,719 - 13-'18 Median Households Inc. Growth 3.87% 3.47% 3.88% - 2013 Households Income ≥$50K 18,058 52,221 212,817 - 2013 Population 75+ 5,343 12,674 40,544 - 2018 Population 75+ 5,718 13,769 48,232 - 13-'18 Population 75+ Growth 7.01% 8.63% 18.96% 10.70% 2013 Median Home Value $228,604 $221,447 $194,375 $191,227 2018 Median Home Value $243,591 $241,760 $224,918 - 2013 Unemployment Rate 12.10% 10.90% 10.70% 6.20% Source(s): Google Maps, American Hospital Directory, Inc., Company materials , SNL Financial, U.S. Census Bureau Note: U.S. Average represents 2015 estimates and 2015-2020 growth projections 46
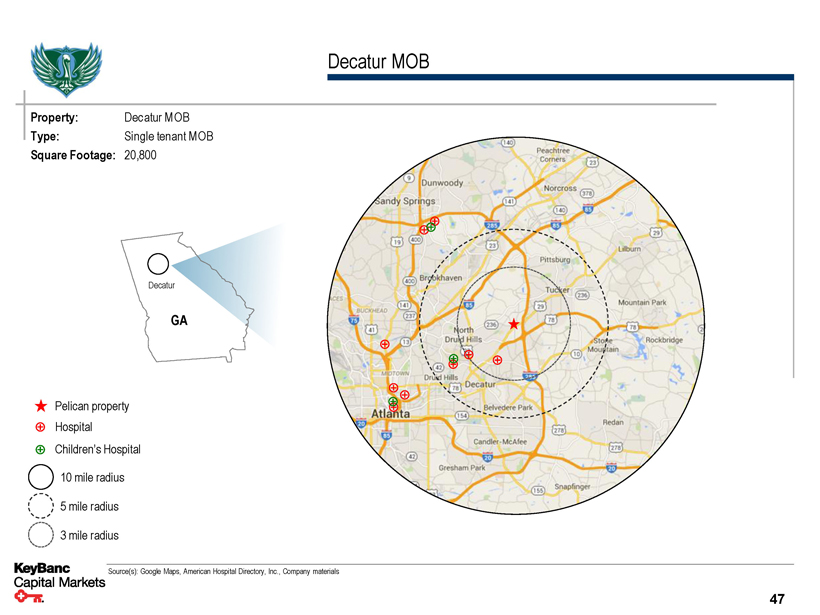
Decatur MOB Property: Decatur MOB Type: Single tenant MOB Square Footage: 20,800 Decatur GA Pelican property Hospital Children’s Hospital 10 mile radius 5 mile radius 3 mile radius Source(s): Google Maps, American Hospital Directory, Inc., Company materials 47
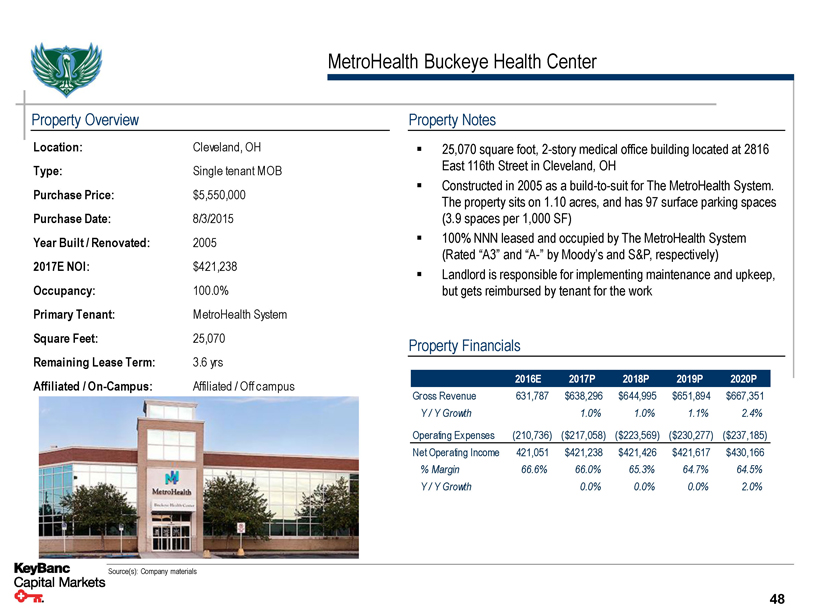
MetroHealth Buckeye Health Center Property Overview Location: Cleveland, OH Type: Single tenant MOB Purchase Price: $5,550,000 Purchase Date: 8/3/2015 Year Built / Renovated: 2005 2017E NOI: $421,238 Occupancy: 100.0% Primary Tenant: MetroHealth System Square Feet: 25,070 Remaining Lease Term: 3.6 yrs Affiliated / On-Campus: Affiliated / Off campus Property Notes ▪ 25,070 square foot, 2-story medical office building located at 2816 East 116th Street in Cleveland, OH ▪ Constructed in 2005 as a build-to-suit for The MetroHealth System. The property sits on 1.10 acres, and has 97 surface parking spaces (3.9 spaces per 1,000 SF) ▪ 100% NNN leased and occupied by The MetroHealth System (Rated “A3” and “A-” by Moody’s and S&P, respectively) ▪ Landlord is responsible for implementing maintenance and upkeep, but gets reimbursed by tenant for the work Property Financials 2016E 2017P 2018P 2019P 2020P Gross Revenue 631,787 $638,296 $644,995 $651,894 $667,351 Y / Y Growth 1.0% 1.0% 1.1% 2.4% Operating Expenses (210,736) ($217,058) ($223,569) ($230,277) ($237,185) Net Operating Income 421,051 $421,238 $421,426 $421,617 $430,166% Margin 66.6% 66.0% 65.3% 64.7% 64.5% Y / Y Growth 0.0% 0.0% 0.0% 2.0% Source(s): Company materials 48
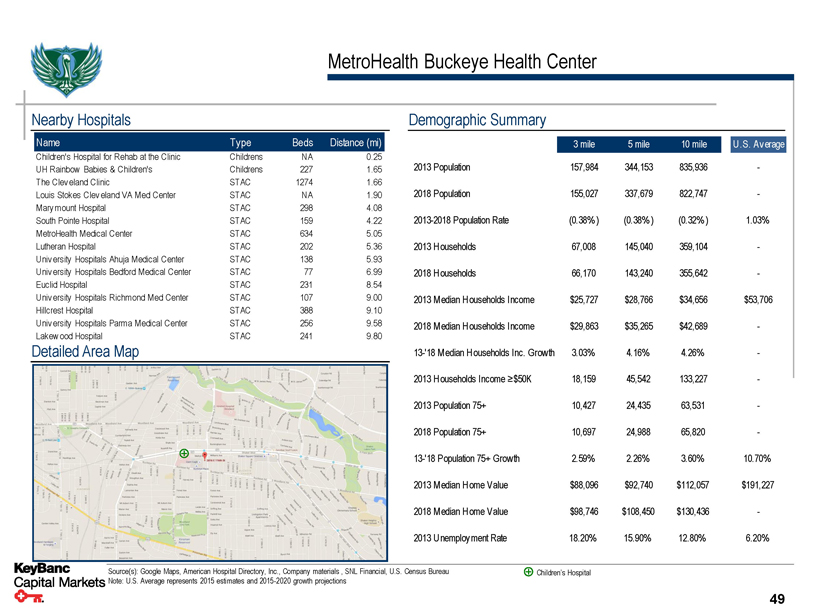
MetroHealth Buckeye Health Center Nearby Hospitals Name Type Beds Distance (mi) Children's Hospital for Rehab at the Clinic Childrens NA 0.25 UH Rainbow Babies & Children's Childrens 227 1.65 The Clev eland Clinic STAC 1274 1.66 Louis Stokes Clev eland VA Med Center STAC NA 1.90 Mary mount Hospital STAC 298 4.08 South Pointe Hospital STAC 159 4.22 MetroHealth Medical Center STAC 634 5.05 Lutheran Hospital STAC 202 5.36 Univ ersity Hospitals Ahuja Medical Center STAC 138 5.93 Univ ersity Hospitals Bedford Medical Center STAC 77 6.99 Euclid Hospital STAC 231 8.54 Univ ersity Hospitals Richmond Med Center STAC 107 9.00 Hillcrest Hospital STAC 388 9.10 Univ ersity Hospitals Parma Medical Center STAC 256 9.58 Lakew ood Hospital STAC 241 9.80 Detailed Area Map Demographic Summary 3 mile 5 mile 10 mile U .S. Average 2013 Population 157,984 344,153 835,936 - 2018 Population 155,027 337,679 822,747 - 2013-2018 Population Rate (0.38%) (0.38%) (0.32%) 1.03% 2013 Households 67,008 145,040 359,104 - 2018 Households 66,170 143,240 355,642 - 2013 Median Households Income $25,727 $28,766 $34,656 $53,706 2018 Median Households Income $29,863 $35,265 $42,689 - 13-'18 Median Households Inc. Growth 3.03% 4.16% 4.26% - 2013 Households Income ≥$50K 18,159 45,542 133,227 - 2013 Population 75+ 10,427 24,435 63,531 - 2018 Population 75+ 10,697 24,988 65,820 - 13-'18 Population 75+ Growth 2.59% 2.26% 3.60% 10.70% 2013 Median Home Value $88,096 $92,740 $112,057 $191,227 2018 Median Home Value $98,746 $108,450 $130,436 - 2013 Unemployment Rate 18.20% 15.90% 12.80% 6.20% Source(s): Google Maps, American Hospital Directory, Inc., Company materials , SNL Financial, U.S. Census Bureau Children’s Hospital Note: U.S. Average represents 2015 estimates and 2015-2020 growth projections 49

MetroHealth Buckeye Health Center Property: MetroHealth Buckeye Health Center Type: Single tenant MOB Square Footage: 25,070 Cleveland OH Pelican property Hospital Children’s Hospital 10 mile radius 5 mile radius 3 mile radius Source(s): Google Maps, American Hospital Directory, Inc., Company materials 50
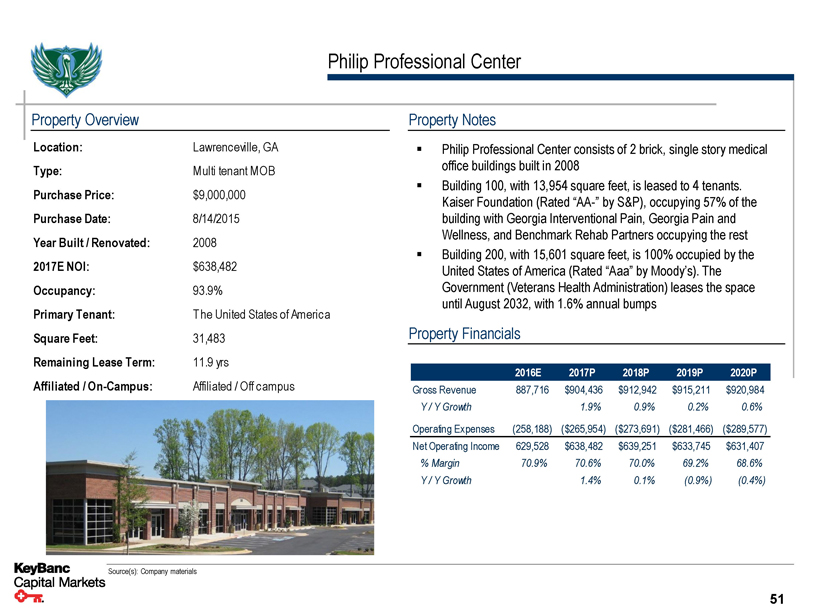
Philip Professional Center Property Overview Location: Lawrenceville, GA Type: Multi tenant MOB Purchase Price: $9,000,000 Purchase Date: 8/14/2015 Year Built / Renovated: 2008 2017E NOI: $638,482 Occupancy: 93.9% Primary Tenant: T he United States of America Square Feet: 31,483 Remaining Lease Term: 11.9 yrs Affiliated / On-Campus: Affiliated / Off campus Property Notes ▪ Philip Professional Center consists of 2 brick, single story medical office buildings built in 2008 ▪ Building 100, with 13,954 square feet, is leased to 4 tenants. Kaiser Foundation (Rated “AA-” by S&P), occupying 57% of the building with Georgia Interventional Pain, Georgia Pain and Wellness, and Benchmark Rehab Partners occupying the rest ▪ Building 200, with 15,601 square feet, is 100% occupied by the United States of America (Rated “Aaa” by Moody’s). The Government (Veterans Health Administration) leases the space until August 2032, with 1.6% annual bumps Property Financials 2016E 2017P 2018P 2019P 2020P Gross Revenue 887,716 $904,436 $912,942 $915,211 $920,984 Y / Y Growth 1.9% 0.9% 0.2% 0.6% Operating Expenses (258,188) ($265,954) ($273,691) ($281,466) ($289,577) Net Operating Income 629,528 $638,482 $639,251 $633,745 $631,407% Margin 70.9% 70.6% 70.0% 69.2% 68.6% Y / Y Growth 1.4% 0.1% (0.9%) (0.4%) Source(s): Company materials 51
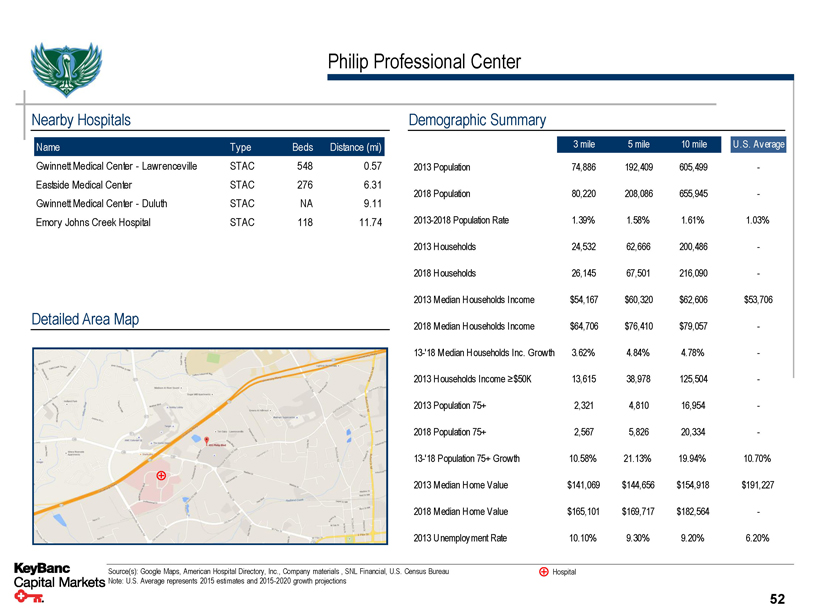
Philip Professional Center Nearby Hospitals Name Type Beds Distance (mi) Gwinnett Medical Center - Lawrenceville STAC 548 0.57 Eastside Medical Center STAC 276 6.31 Gwinnett Medical Center - Duluth STAC NA 9.11 Emory Johns Creek Hospital STAC 118 11.74 Detailed Area Map Demographic Summary 3 mile 5 mile 10 mile U .S. Average 2013 Population 74,886 192,409 605,499 - 2018 Population 80,220 208,086 655,945 - 2013-2018 Population Rate 1.39% 1.58% 1.61% 1.03% 2013 Households 24,532 62,666 200,486 - 2018 Households 26,145 67,501 216,090 - 2013 Median Households Income $54,167 $60,320 $62,606 $53,706 2018 Median Households Income $64,706 $76,410 $79,057 - 13-'18 Median Households Inc. Growth 3.62% 4.84% 4.78% - 2013 Households Income ≥$50K 13,615 38,978 125,504 - 2013 Population 75+ 2,321 4,810 16,954 - 2018 Population 75+ 2,567 5,826 20,334 - 13-'18 Population 75+ Growth 10.58% 21.13% 19.94% 10.70% 2013 Median Home Value $141,069 $144,656 $154,918 $191,227 2018 Median Home Value $165,101 $169,717 $182,564 - 2013 Unemployment Rate 10.10% 9.30% 9.20% 6.20% Source(s): Google Maps, American Hospital Directory, Inc., Company materials , SNL Financial, U.S. Census Bureau Hospital Note: U.S. Average represents 2015 estimates and 2015-2020 growth projections 52

Philip Professional Center Property: Philip Professional Center Type: Multi tenant MOB Square Footage: 31,483 Lawrenceville GA Pelican property Hospital 10 mile radius 5 mile radius 3 mile radius Source(s): Google Maps, American Hospital Directory, Inc., Company materials 53
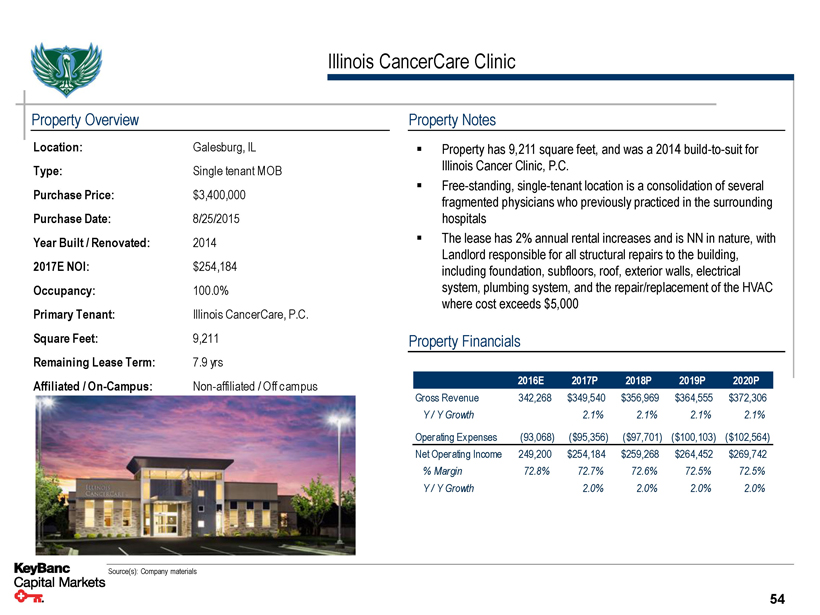
Illinois CancerCare Clinic Property Overview Location: Galesburg, IL Type: Single tenant MOB Purchase Price: $3,400,000 Purchase Date: 8/25/2015 Year Built / Renovated: 2014 2017E NOI: $254,184 Occupancy: 100.0% Primary Tenant: Illinois CancerCare, P.C. Square Feet: 9,211 Remaining Lease Term: 7.9 yrs Affiliated / On-Campus: Non-affiliated / Off campus Property Notes ▪ Property has 9,211 square feet, and was a 2014 build-to-suit for Illinois Cancer Clinic, P.C. ▪ Free-standing, single-tenant location is a consolidation of several fragmented physicians who previously practiced in the surrounding hospitals ▪ The lease has 2% annual rental increases and is NN in nature, with Landlord responsible for all structural repairs to the building, including foundation, subfloors, roof, exterior walls, electrical system, plumbing system, and the repair/replacement of the HVAC where cost exceeds $5,000 Property Financials 2016E 2017P 2018P 2019P 2020P Gross Revenue 342,268 $349,540 $356,969 $364,555 $372,306 Y / Y Growth 2.1% 2.1% 2.1% 2.1% Operating Expenses (93,068) ($95,356) ($97,701) ($100,103) ($102,564) Net Operating Income 249,200 $254,184 $259,268 $264,452 $269,742% Margin 72.8% 72.7% 72.6% 72.5% 72.5% Y / Y Growth 2.0% 2.0% 2.0% 2.0% Source(s): Company materials 54
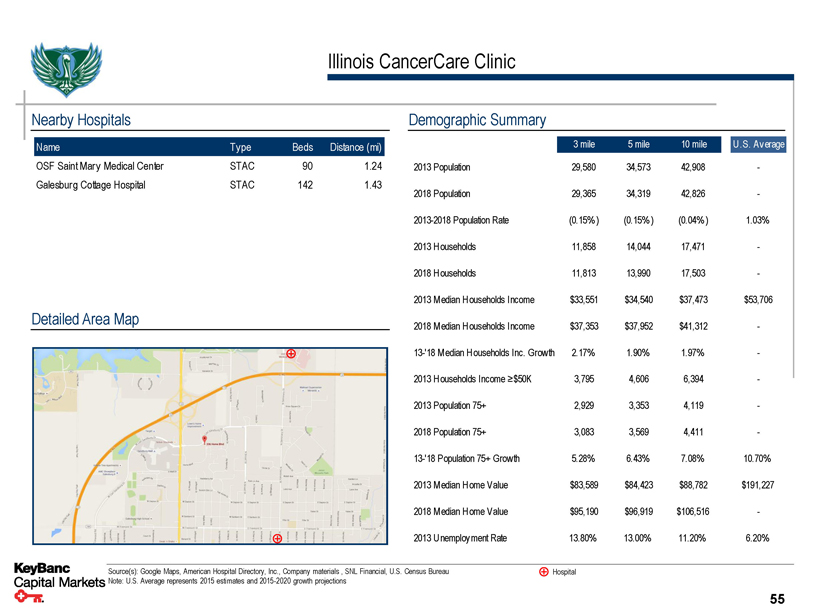
Illinois CancerCare Clinic Nearby Hospitals Name Type Beds Distance (mi) OSF Saint Mary Medical Center STAC 90 1.24 Galesburg Cottage Hospital STAC 142 1.43 Detailed Area Map Demographic Summary 3 mile 5 mile 10 mile U .S. Average 2013 Population 29,580 34,573 42,908 - 2018 Population 29,365 34,319 42,826 - 2013-2018 Population Rate (0.15%) (0.15%) (0.04%) 1.03% 2013 Households 11,858 14,044 17,471 - 2018 Households 11,813 13,990 17,503 - 2013 Median Households Income $33,551 $34,540 $37,473 $53,706 2018 Median Households Income $37,353 $37,952 $41,312 - 13-'18 Median Households Inc. Growth 2.17% 1.90% 1.97% - 2013 Households Income ≥$50K 3,795 4,606 6,394 - 2013 Population 75+ 2,929 3,353 4,119 - 2018 Population 75+ 3,083 3,569 4,411 - 13-'18 Population 75+ Growth 5.28% 6.43% 7.08% 10.70% 2013 Median Home Value $83,589 $84,423 $88,782 $191,227 2018 Median Home Value $95,190 $96,919 $106,516 - 2013 Unemployment Rate 13.80% 13.00% 11.20% 6.20% Source(s): Google Maps, American Hospital Directory, Inc., Company materials , SNL Financial, U.S. Census Bureau Hospital Note: U.S. Average represents 2015 estimates and 2015-2020 growth projections 55
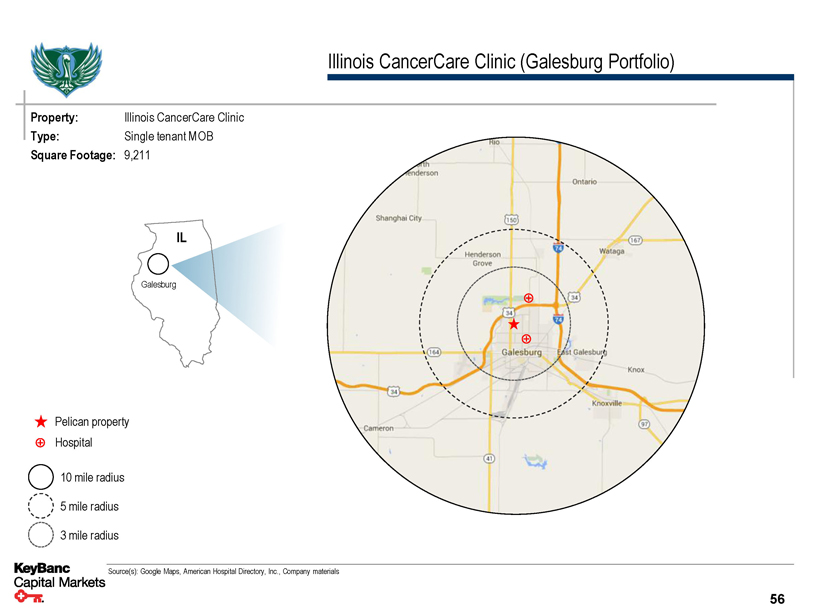
Illinois CancerCare Clinic (Galesburg Portfolio) Property: Illinois CancerCare Clinic Type: Single tenant MOB Square Footage: 9,211 IL Galesburg Pelican property Hospital 10 mile radius 5 mile radius 3 mile radius Source(s): Google Maps, American Hospital Directory, Inc., Company materials 56
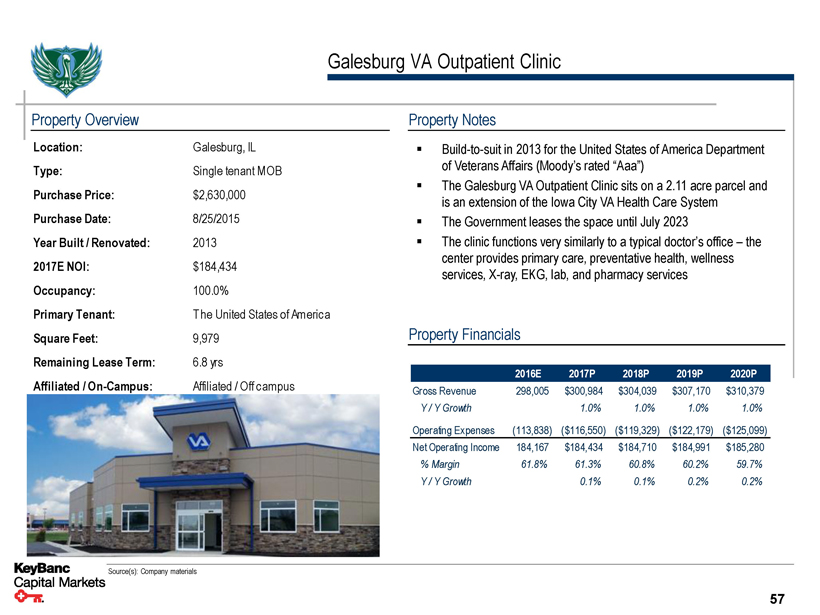
Galesburg VA Outpatient Clinic Property Overview Location: Galesburg, IL Type: Single tenant MOB Purchase Price: $2,630,000 Purchase Date: 8/25/2015 Year Built / Renovated: 2013 2017E NOI: $184,434 Occupancy: 100.0% Primary Tenant: T he United States of America Square Feet: 9,979 Remaining Lease Term: 6.8 yrs Affiliated / On-Campus: Affiliated / Off campus Property Notes ▪ Build-to-suit in 2013 for the United States of America Department of Veterans Affairs (Moody’s rated “Aaa”) ▪ The Galesburg VA Outpatient Clinic sits on a 2.11 acre parcel and is an extension of the Iowa City VA Health Care System ▪ The Government leases the space until July 2023 ▪ The clinic functions very similarly to a typical doctor’s office – the center provides primary care, preventative health, wellness services, X-ray, EKG, lab, and pharmacy services Property Financials 2016E 2017P 2018P 2019P 2020P Gross Revenue 298,005 $300,984 $304,039 $307,170 $310,379 Y / Y Growth 1.0% 1.0% 1.0% 1.0% Operating Expenses (113,838) ($116,550) ($119,329) ($122,179) ($125,099) Net Operating Income 184,167 $184,434 $184,710 $184,991 $185,280% Margin 61.8% 61.3% 60.8% 60.2% 59.7% Y / Y Growth 0.1% 0.1% 0.2% 0.2% Source(s): Company materials 57
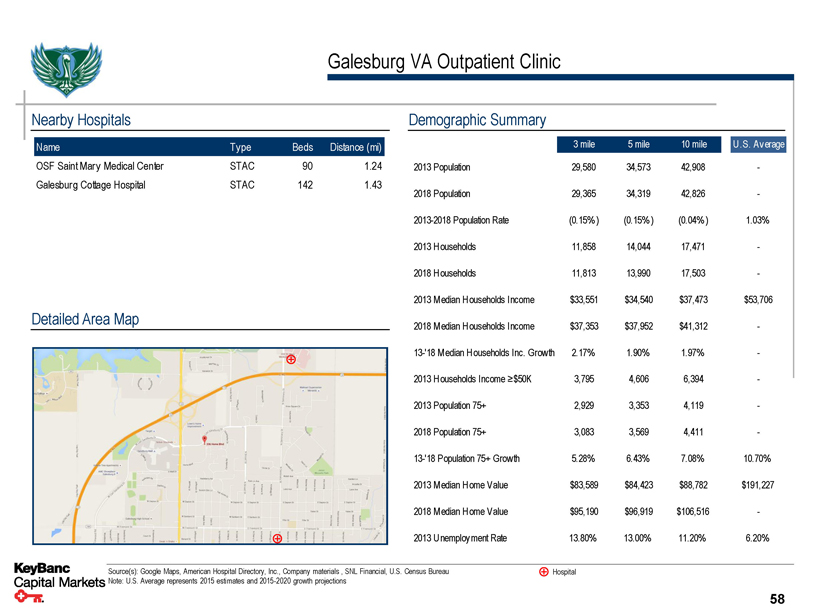
Galesburg VA Outpatient Clinic Nearby Hospitals Name Type Beds Distance (mi) OSF Saint Mary Medical Center STAC 90 1.24 Galesburg Cottage Hospital STAC 142 1.43 Detailed Area Map Demographic Summary 3 mile 5 mile 10 mile U .S. Average 2013 Population 29,580 34,573 42,908 - 2018 Population 29,365 34,319 42,826 - 2013-2018 Population Rate (0.15%) (0.15%) (0.04%) 1.03% 2013 Households 11,858 14,044 17,471 - 2018 Households 11,813 13,990 17,503 - 2013 Median Households Income $33,551 $34,540 $37,473 $53,706 2018 Median Households Income $37,353 $37,952 $41,312 - 13-'18 Median Households Inc. Growth 2.17% 1.90% 1.97% - 2013 Households Income ≥$50K 3,795 4,606 6,394 - 2013 Population 75+ 2,929 3,353 4,119 - 2018 Population 75+ 3,083 3,569 4,411 - 13-'18 Population 75+ Growth 5.28% 6.43% 7.08% 10.70% 2013 Median Home Value $83,589 $84,423 $88,782 $191,227 2018 Median Home Value $95,190 $96,919 $106,516 - 2013 Unemployment Rate 13.80% 13.00% 11.20% 6.20% Source(s): Google Maps, American Hospital Directory, Inc., Company materials , SNL Financial, U.S. Census Bureau Hospital Note: U.S. Average represents 2015 estimates and 2015-2020 growth projections 58

Galesburg VA Outpatient Clinic (Galesburg Portfolio) Property: Galesburg VA Outpatient Clinic Type: Single tenant MOB Square Footage: 9,979 IL Galesburg Pelican property Hospital 10 mile radius 5 mile radius 3 mile radius Source(s): Google Maps, American Hospital Directory, Inc., Company materials 59

Woodlake Office Center Property Overview Location: Woodbury, MN Type: Single tenant MOB Purchase Price: $14,900,000 Purchase Date: 9/11/2015 Year Built / Renovated: 2009 2017E NOI: $1,035,814 Occupancy: 100.0% Primary Tenant: Summit Orthopedics Square Feet: 36,375 Remaining Lease Term: 6.0 yrs Affiliated / On-Campus: Non-affiliated / Off campus Property Notes ▪ Two-story, single-tenant medical office building located in an affluent suburb of St. Paul and Minneapolis ▪ Property was built in 2009 for the tenant, Summit Orthopedics, Ltd. ▪ Ideal location for Summit, as it is located less than 1 mile from the 86-bed Woodwinds Health Campus, a member of the HealthEast Care System (Rated “Ba1” by Moody’s), which focuses on orthopedic surgeries ▪ Flagship location for dominant orthopedics group in area. One of 35 locations in which Summit operates ▪ NNN lease has 2% annual rent bumps Property Financials 2016E 2017P 2018P 2019P 2020P Gross Revenue 1,636,705 $1,669,439 $1,702,827 $1,736,883 $1,771,623 Y / Y Growth 2.0% 2.0% 2.0% 2.0% Operating Expenses (621,201) ($633,625) ($646,298) ($659,223) ($672,408) Net Operating Income 1,015,504 $1,035,814 $1,056,529 $1,077,660 $1,099,215% Margin 62.0% 62.0% 62.0% 62.0% 62.0% Y / Y Growth 2.0% 2.0% 2.0% 2.0% Source(s): Company materials 60

Woodlake Office Center Nearby Hospitals Name Type Beds Distance (mi) Woodwinds Health Campus STAC 86 0.33 Regions Hospital STAC 424 6.13 Gillette Children's Specialty HC - St. Paul Children's 60 6.19 Saint Joseph's Hospital STAC 218 6.20 United Hospital STAC 375 6.41 Children's Hospitals and Clinics of MN - St. Paul Children's 383 6.47 Detailed Area Map Demographic Summary 3 mile 5 mile 10 mile U .S. Average 2013 Population 57,361 192,495 601,377 - 2018 Population 58,683 198,655 620,876 - 2013-2018 Population Rate 0.46% 0.63% 0.64% 1.03% 2013 Households 22,108 72,352 234,091 - 2018 Households 22,734 74,990 242,566 - 2013 Median Households Income $70,168 $59,140 $55,890 $53,706 2018 Median Households Income $84,861 $71,597 $67,322 - 13-'18 Median Households Inc. Growth 3.88% 3.90% 3.79% - 2013 Households Income ≥$50K 14,812 42,905 130,623 - 2013 Population 75+ 2,868 9,047 31,873 - 2018 Population 75+ 2,993 9,734 34,148 - 13-'18 Population 75+ Growth 4.35% 7.59% 7.14% 10.70% 2013 Median Home Value $199,728 $175,936 $181,569 $191,227 2018 Median Home Value $246,255 $220,237 $223,801 - 2013 Unemployment Rate 5.70% 7.00% 7.30% 6.20% Source(s): Google Maps, American Hospital Directory, Inc., Company materials , SNL Financial, U.S. Census Bureau Hospital Note: U.S. Average represents 2015 estimates and 2015-2020 growth projections 61
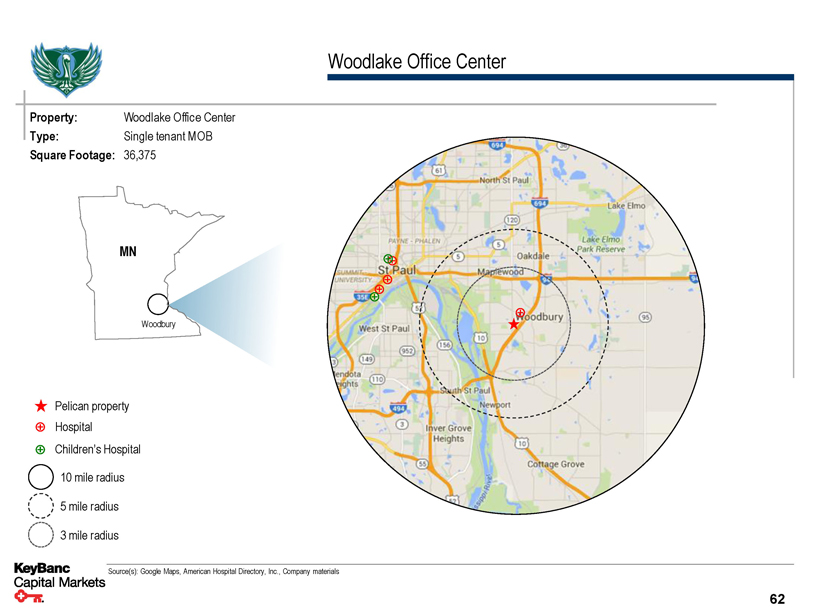
Woodlake Office Center Property: Woodlake Office Center Type: Single tenant MOB Square Footage: 36,375 MN Woodbury Pelican property Hospital Children’s Hospital 10 mile radius 5 mile radius 3 mile radius Source(s): Google Maps, American Hospital Directory, Inc., Company materials 62
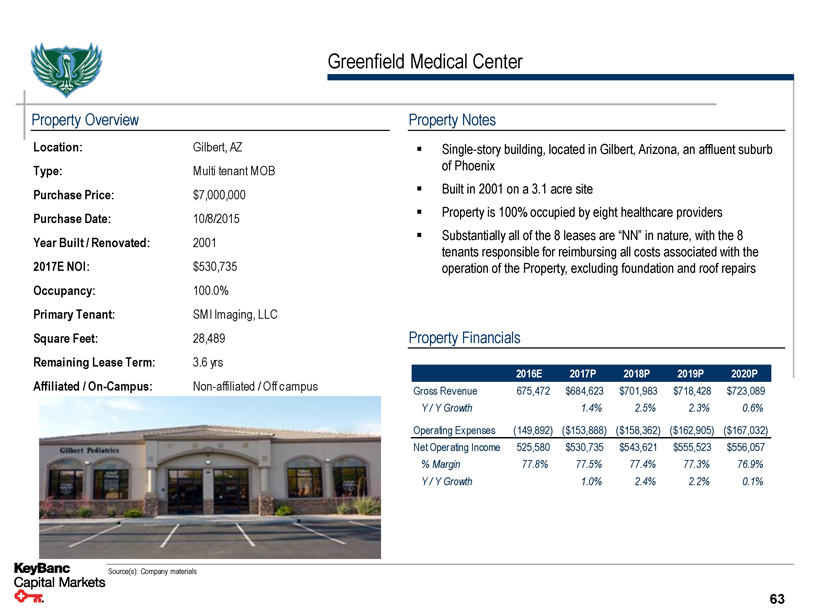
Greenfield Medical Center Property Overview Location: Gilbert, AZ Type: Multi tenant MOB Purchase Price: $7,000,000 Purchase Date: 10/8/2015 Year Built / Renovated: 2001 2017E NOI: $530,735 Occupancy: 100.0% Primary Tenant: SMI Imaging, LLC Square Feet: 28,489 Remaining Lease Term: 3.6 yrs Affiliated / On-Campus: Non-affiliated / Off campus Property Notes ▪ Single-story building, located in Gilbert, Arizona, an affluent suburb of Phoenix ▪ Built in 2001 on a 3.1 acre site ▪ Property is 100% occupied by eight healthcare providers ▪ Substantially all of the 8 leases are “NN” in nature, with the 8 tenants responsible for reimbursing all costs associated with the operation of the Property, excluding foundation and roof repairs Property Financials 2016E 2017P 2018P 2019P 2020P Gross Revenue 675,472 $684,623 $701,983 $718,428 $723,089 Y / Y Growth 1.4% 2.5% 2.3% 0.6% Operating Expenses (149,892) ($153,888) ($158,362) ($162,905) ($167,032) Net Operating Income 525,580 $530,735 $543,621 $555,523 $556,057% Margin 77.8% 77.5% 77.4% 77.3% 76.9% Y / Y Growth 1.0% 2.4% 2.2% 0.1% Source(s): Company materials 63
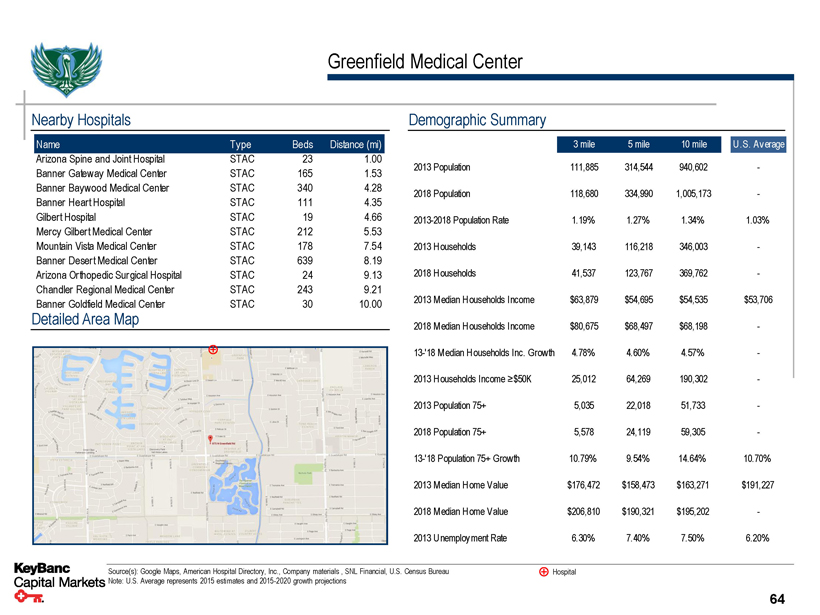
Greenfield Medical Center Nearby Hospitals Name Type Beds Distance (mi) Arizona Spine and Joint Hospital STAC 23 1.00 Banner Gateway Medical Center STAC 165 1.53 Banner Baywood Medical Center STAC 340 4.28 Banner Heart Hospital STAC 111 4.35 Gilbert Hospital STAC 19 4.66 Mercy Gilbert Medical Center STAC 212 5.53 Mountain Vista Medical Center STAC 178 7.54 Banner Desert Medical Center STAC 639 8.19 Arizona Orthopedic Surgical Hospital STAC 24 9.13 Chandler Regional Medical Center STAC 243 9.21 Banner Goldfield Medical Center STAC 30 10.00 Detailed Area Map Demographic Summary 3 mile 5 mile 10 mile U .S. Average 2013 Population 111,885 314,544 940,602 - 2018 Population 118,680 334,990 1,005,173 - 2013-2018 Population Rate 1.19% 1.27% 1.34% 1.03% 2013 Households 39,143 116,218 346,003 - 2018 Households 41,537 123,767 369,762 - 2013 Median Households Income $63,879 $54,695 $54,535 $53,706 2018 Median Households Income $80,675 $68,497 $68,198 - 13-'18 Median Households Inc. Growth 4.78% 4.60% 4.57% - 2013 Households Income ≥$50K 25,012 64,269 190,302 - 2013 Population 75+ 5,035 22,018 51,733 - 2018 Population 75+ 5,578 24,119 59,305 - 13-'18 Population 75+ Growth 10.79% 9.54% 14.64% 10.70% 2013 Median Home Value $176,472 $158,473 $163,271 $191,227 2018 Median Home Value $206,810 $190,321 $195,202 - 2013 Unemployment Rate 6.30% 7.40% 7.50% 6.20% Source(s): Google Maps, American Hospital Directory, Inc., Company materials , SNL Financial, U.S. Census Bureau Hospital Note: U.S. Average represents 2015 estimates and 2015-2020 growth projections 64

Greenfield Medical Center Property: Greenfield Medical Center Type: Multi tenant MOB Square Footage: 28,489 AZ Gilbert Pelican property Hospital 10 mile radius 5 mile radius 3 mile radius Source(s): Google Maps, American Hospital Directory, Inc., Company materials 65
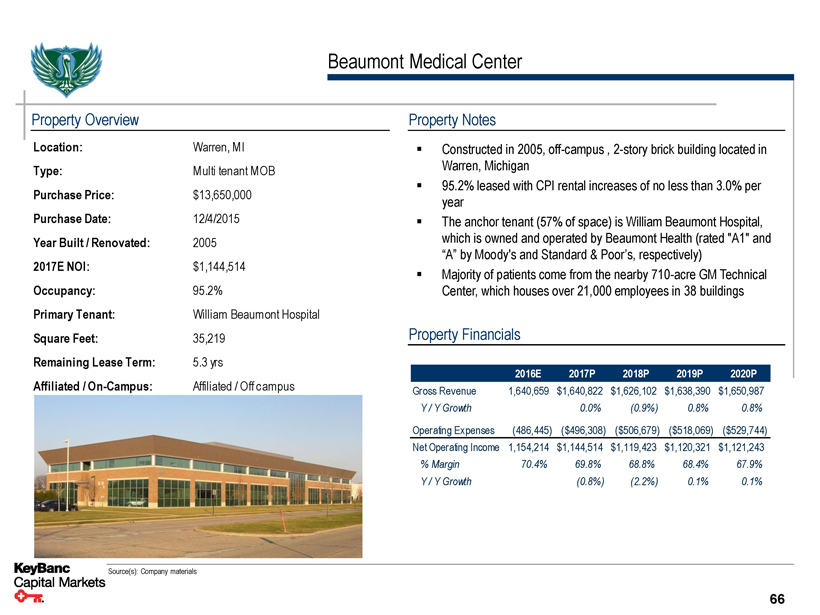
Beaumont Medical Center Property Overview Location: Warren, MI Type: Multi tenant MOB Purchase Price: $13,650,000 Purchase Date: 12/4/2015 Year Built / Renovated: 2005 2017E NOI: $1,144,514 Occupancy: 95.2% Primary Tenant: William Beaumont Hospital Square Feet: 35,219 Remaining Lease Term: 5.3 yrs Affiliated / On-Campus: Affiliated / Off campus Property Notes ▪ Constructed in 2005, off-campus , 2-story brick building located in Warren, Michigan ▪ 95.2% leased with CPI rental increases of no less than 3.0% per year ▪ The anchor tenant (57% of space) is William Beaumont Hospital, which is owned and operated by Beaumont Health (rated "A1" and “A” by Moody's and Standard & Poor’s, respectively) ▪ Majority of patients come from the nearby 710-acre GM Technical Center, which houses over 21,000 employees in 38 buildings Property Financials 2016E 2017P 2018P 2019P 2020P Gross Revenue 1,640,659 $1,640,822 $1,626,102 $1,638,390 $1,650,987 Y / Y Growth 0.0% (0.9%) 0.8% 0.8% Operating Expenses (486,445) ($496,308) ($506,679) ($518,069) ($529,744) Net Operating Income 1,154,214 $1,144,514 $1,119,423 $1,120,321 $1,121,243% Margin 70.4% 69.8% 68.8% 68.4% 67.9% Y / Y Growth (0.8%) (2.2%) 0.1% 0.1% Source(s): Company materials 66
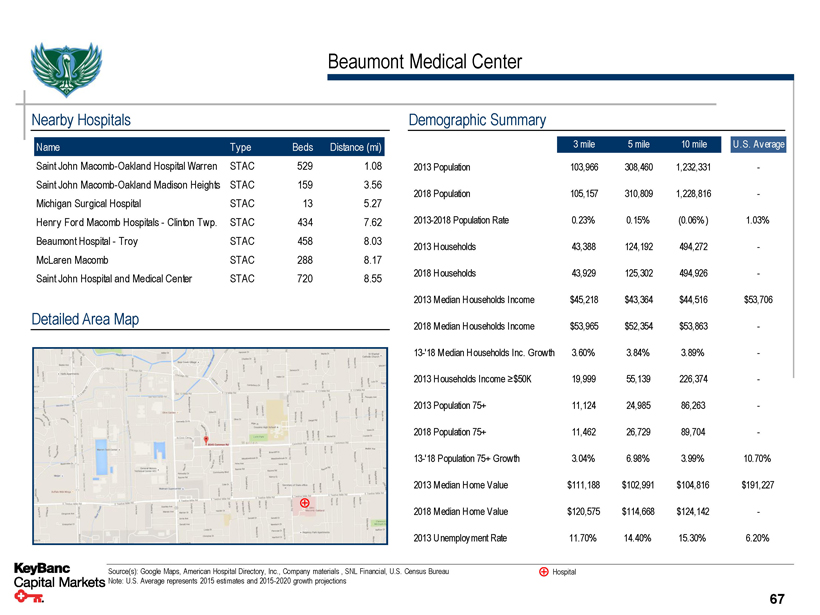
Beaumont Medical Center Nearby Hospitals Name Type Beds Distance (mi) Saint John Macomb-Oakland Hospital Warren STAC 529 1.08 Saint John Macomb-Oakland Madison Heights STAC 159 3.56 Michigan Surgical Hospital STAC 13 5.27 Henry Ford Macomb Hospitals - Clinton Twp. STAC 434 7.62 Beaumont Hospital - Troy STAC 458 8.03 McLaren Macomb STAC 288 8.17 Saint John Hospital and Medical Center STAC 720 8.55 Detailed Area Map Demographic Summary 3 mile 5 mile 10 mile U .S. Average 2013 Population 103,966 308,460 1,232,331 - 2018 Population 105,157 310,809 1,228,816 - 2013-2018 Population Rate 0.23% 0.15% (0.06%) 1.03% 2013 Households 43,388 124,192 494,272 - 2018 Households 43,929 125,302 494,926 - 2013 Median Households Income $45,218 $43,364 $44,516 $53,706 2018 Median Households Income $53,965 $52,354 $53,863 - 13-'18 Median Households Inc. Growth 3.60% 3.84% 3.89% - 2013 Households Income ≥$50K 19,999 55,139 226,374 - 2013 Population 75+ 11,124 24,985 86,263 - 2018 Population 75+ 11,462 26,729 89,704 - 13-'18 Population 75+ Growth 3.04% 6.98% 3.99% 10.70% 2013 Median Home Value $111,188 $102,991 $104,816 $191,227 2018 Median Home Value $120,575 $114,668 $124,142 - 2013 Unemployment Rate 11.70% 14.40% 15.30% 6.20% Source(s): Google Maps, American Hospital Directory, Inc., Company materials , SNL Financial, U.S. Census Bureau Hospital Note: U.S. Average represents 2015 estimates and 2015-2020 growth projections 67

Beaumont Medical Center Property: Beaumont Medical Center Type: Multi tenant MOB Square Footage: 35,219 MI Warren Pelican property Hospital 10 mile radius 5 mile radius 3 mile radius Source(s): Google Maps, American Hospital Directory, Inc., Company materials 68
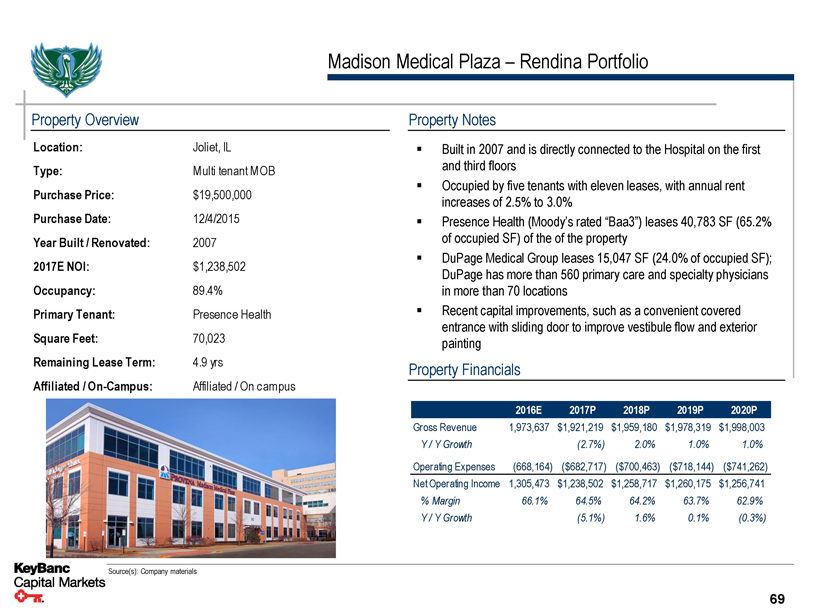
Madison Medical Plaza – Rendina Portfolio Property Overview Location: Joliet, IL Type: Multi tenant MOB Purchase Price: $19,500,000 Purchase Date: 12/4/2015 Year Built / Renovated: 2007 2017E NOI: $1,238,502 Occupancy: 89.4% Primary Tenant: Presence Health Square Feet: 70,023 Remaining Lease Term: 4.9 yrs Affiliated / On-Campus: Affiliated / On campus Property Notes ▪ Built in 2007 and is directly connected to the Hospital on the first and third floors ▪ Occupied by five tenants with eleven leases, with annual rent increases of 2.5% to 3.0% ▪ Presence Health (Moody’s rated “Baa3”) leases 40,783 SF (65.2% of occupied SF) of the of the property ▪ DuPage Medical Group leases 15,047 SF (24.0% of occupied SF); DuPage has more than 560 primary care and specialty physicians in more than 70 locations ▪ Recent capital improvements, such as a convenient covered entrance with sliding door to improve vestibule flow and exterior painting Property Financials 2016E 2017P 2018P 2019P 2020P Gross Revenue 1,973,637 $1,921,219 $1,959,180 $1,978,319 $1,998,003 Y / Y Growth (2.7%) 2.0% 1.0% 1.0% Operating Expenses (668,164) ($682,717) ($700,463) ($718,144) ($741,262) Net Operating Income 1,305,473 $1,238,502 $1,258,717 $1,260,175 $1,256,741% Margin 66.1% 64.5% 64.2% 63.7% 62.9% Y / Y Growth (5.1%) 1.6% 0.1% (0.3%) Source(s): Company materials 69

Madison Medical Plaza – Rendina Portfolio Nearby Hospitals Name Type Beds Distance (mi) Presence Saint Joseph Medical Center STAC 446 0.04 Silver Cross Hospital STAC 289 8.00 Detailed Area Map Demographic Summary 3 mile 5 mile 10 mile U .S. Average 2013 Population 84,624 174,480 391,066 - 2018 Population 85,507 177,390 401,325 - 2013-2018 Population Rate 0.21% 0.33% 0.52% 1.03% 2013 Households 31,923 59,935 129,325 - 2018 Households 32,202 60,819 132,373 - 2013 Median Households Income $48,832 $53,031 $65,850 $53,706 2018 Median Households Income $54,439 $60,814 $78,362 - 13-'18 Median Households Inc. Growth 2.20% 2.78% 3.54% - 2013 Households Income ≥$50K 15,674 32,185 83,673 - 2013 Population 75+ 5,416 9,073 16,816 - 2018 Population 75+ 5,643 9,579 18,461 - 13-'18 Population 75+ Growth 4.20% 5.58% 9.78% 10.70% 2013 Median Home Value $153,690 $168,817 $195,626 $191,227 2018 Median Home Value $180,203 $193,865 $224,013 - 2013 Unemployment Rate 13.30% 13.40% 11.30% 6.20% Source(s): Google Maps, American Hospital Directory, Inc., Company materials , SNL Financial, U.S. Census Bureau Hospital Note: U.S. Average represents 2015 estimates and 2015-2020 growth projections 70
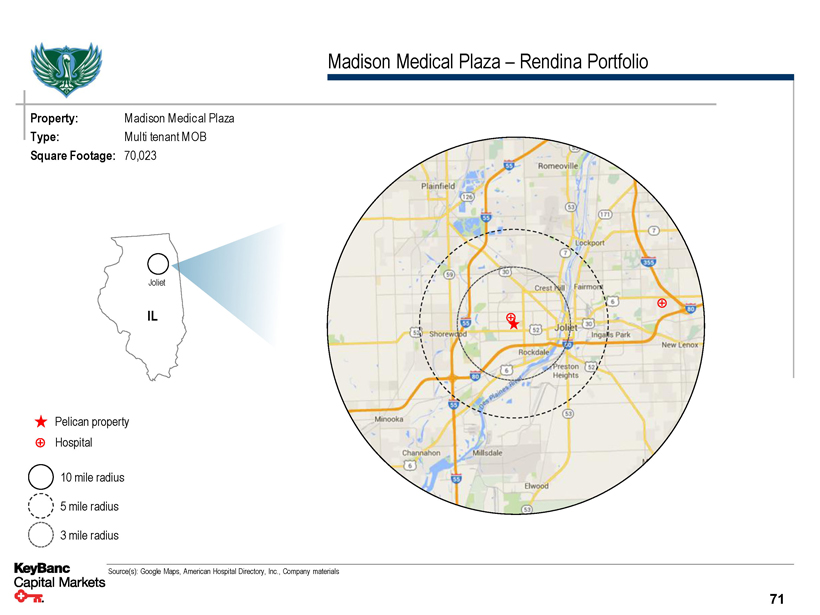
Madison Medical Plaza – Rendina Portfolio Property: Madison Medical Plaza Type: Multi tenant MOB Square Footage: 70,023 Joliet IL Pelican property Hospital 10 mile radius 5 mile radius 3 mile radius Source(s): Google Maps, American Hospital Directory, Inc., Company materials 71
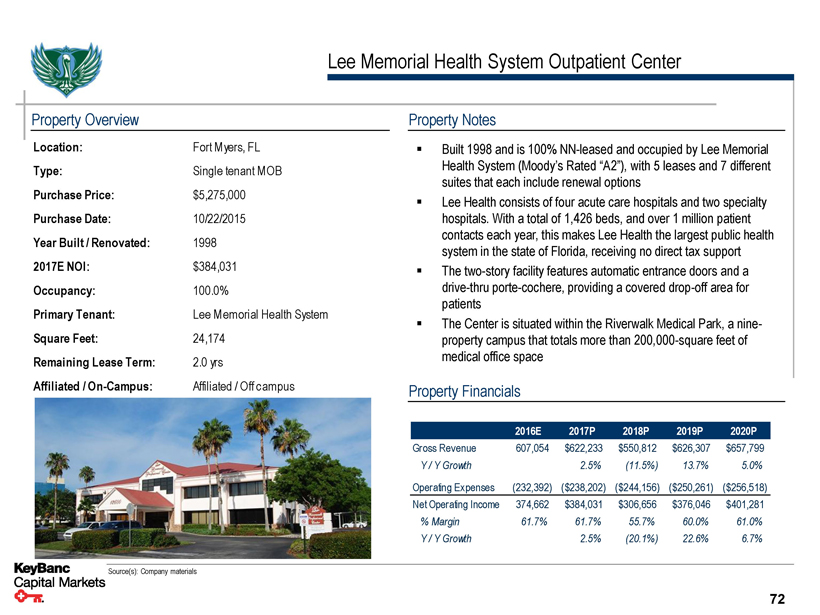
Lee Memorial Health System Outpatient Center Property Overview Location: Fort Myers, FL Type: Single tenant MOB Purchase Price: $5,275,000 Purchase Date: 10/22/2015 Year Built / Renovated: 1998 2017E NOI: $384,031 Occupancy: 100.0% Primary Tenant: Lee Memorial Health System Square Feet: 24,174 Remaining Lease Term: 2.0 yrs Affiliated / On-Campus: Affiliated / Off campus Property Notes ▪ Built 1998 and is 100% NN-leased and occupied by Lee Memorial Health System (Moody’s Rated “A2”), with 5 leases and 7 different suites that each include renewal options ▪ Lee Health consists of four acute care hospitals and two specialty hospitals. With a total of 1,426 beds, and over 1 million patient contacts each year, this makes Lee Health the largest public health system in the state of Florida, receiving no direct tax support ▪ The two-story facility features automatic entrance doors and a drive-thru porte-cochere, providing a covered drop-off area for patients ▪ The Center is situated within the Riverwalk Medical Park, a nine-property campus that totals more than 200,000-square feet of medical office space Property Financials 2016E 2017P 2018P 2019P 2020P Gross Revenue 607,054 $622,233 $550,812 $626,307 $657,799 Y / Y Growth 2.5% (11.5%) 13.7% 5.0% Operating Expenses (232,392) ($238,202) ($244,156) ($250,261) ($256,518) Net Operating Income 374,662 $384,031 $306,656 $376,046 $401,281% Margin 61.7% 61.7% 55.7% 60.0% 61.0% Y / Y Growth 2.5% (20.1%) 22.6% 6.7% Source(s): Company materials 72
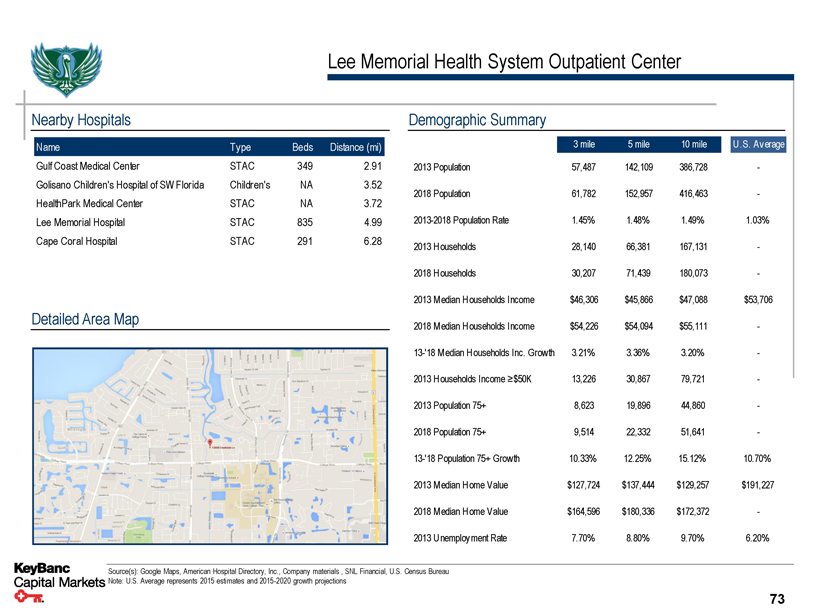
Lee Memorial Health System Outpatient Center Nearby Hospitals Name Type Beds Distance (mi) Gulf Coast Medical Center STAC 349 2.91 Golisano Children's Hospital of SW Florida Children's NA 3.52 HealthPark Medical Center STAC NA 3.72 Lee Memorial Hospital STAC 835 4.99 Cape Coral Hospital STAC 291 6.28 Detailed Area Map Demographic Summary 3 mile 5 mile 10 mile U .S. Average 2013 Population 57,487 142,109 386,728 - 2018 Population 61,782 152,957 416,463 - 2013-2018 Population Rate 1.45% 1.48% 1.49% 1.03% 2013 Households 28,140 66,381 167,131 - 2018 Households 30,207 71,439 180,073 - 2013 Median Households Income $46,306 $45,866 $47,088 $53,706 2018 Median Households Income $54,226 $54,094 $55,111 - 13-'18 Median Households Inc. Growth 3.21% 3.36% 3.20% - 2013 Households Income ≥$50K 13,226 30,867 79,721 - 2013 Population 75+ 8,623 19,896 44,860 - 2018 Population 75+ 9,514 22,332 51,641 - 13-'18 Population 75+ Growth 10.33% 12.25% 15.12% 10.70% 2013 Median Home Value $127,724 $137,444 $129,257 $191,227 2018 Median Home Value $164,596 $180,336 $172,372 - 2013 Unemployment Rate 7.70% 8.80% 9.70% 6.20% Source(s): Google Maps, American Hospital Directory, Inc., Company materials , SNL Financial, U.S. Census Bureau Note: U.S. Average represents 2015 estimates and 2015-2020 growth projections 73
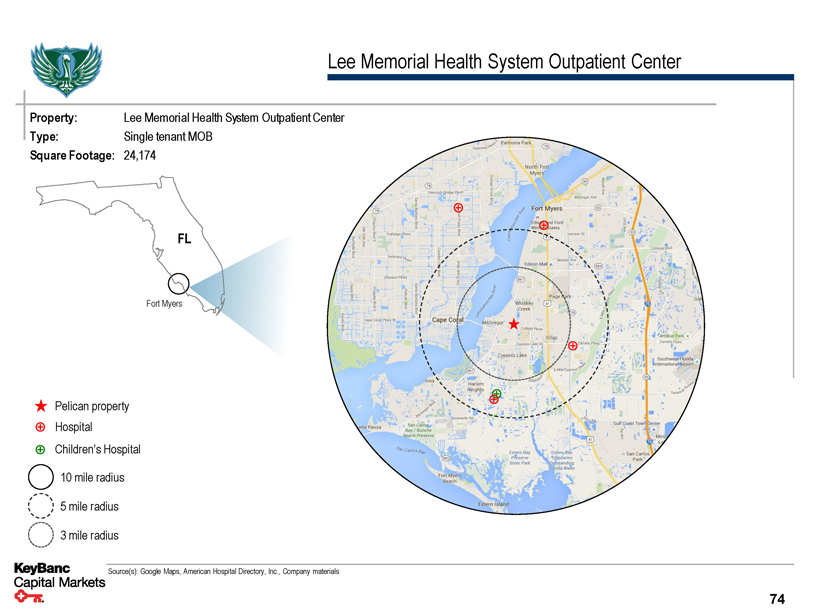
Lee Memorial Health System Outpatient Center Property: Lee Memorial Health System Outpatient Center Type: Single tenant MOB Square Footage: 24,174 FL Fort Myers Pelican property Hospital Children’s Hospital 10 mile radius 5 mile radius 3 mile radius Source(s): Google Maps, American Hospital Directory, Inc., Company materials 74

UnityPoint Muscatine – (Quad Cities Portfolio) Property Overview Location: Muscatine , IA Type: Single tenant MOB Purchase Price: $5,886,359 Purchase Date: 12/23/2015 Year Built / Renovated: 2015 2017E NOI: $412,043 Occupancy: 100.0% Primary Tenant: T rinity Medical Center Square Feet: 21,767 Remaining Lease Term: 8.5 yrs Affiliated / On-Campus: Affiliated / Off campus Property Notes ▪ Purpose-built for the tenant in 2015, the Muscatine Property is 100% occupied by Trinity Regional Health System, doing business as UnityPoint Clinic ▪ UnityPoint Clinic, a subsidiary of the System, provides family medicine, physical therapy, and urgent care services at the facility ▪ Additionally, the lease is guaranteed by Trinity Regional Health System (Moody’s Rated “Aa3”), which operates four area hospitals ▪ 95% / 5% Joint Venture with an affiliate of the property’s developer – Build to Suit, Inc. Build to Suit is a national developer of medical office and industrial properties. Build to Suit has completed projects in 13 states. Build to Suit does not have a promoted interest based on performance of the asset and after a two-year period, majority owner will have option to purchase Build to Suit’s 5% interest Property Financials 2016E 2017P 2018P 2019P 2020P Gross Revenue 582,262 $586,088 $590,008 $594,030 $616,034 Y / Y Growth 0.7% 0.7% 0.7% 3.7% Operating Expenses (170,218) ($174,045) ($177,964) ($181,986) ($186,821) Net Operating Income 412,044 $412,043 $412,044 $412,044 $429,213% Margin 70.8% 70.3% 69.8% 69.4% 69.7% Y / Y Growth (0.0%) 0.0% 0.0% 4.2% Source(s): Company materials 75

UnityPoint Muscatine – (Quad Cities Portfolio) Nearby Hospitals Name Type Beds Distance (mi) UnityPoint Health - Trinity Muscatine STAC 48 2.78 Detailed Area Map Demographic Summary 3 mile 5 mile 10 mile U .S. Average 2013 Population 15,230 26,983 36,250 - 2018 Population 15,588 27,349 36,727 - 2013-2018 Population Rate 0.47% 0.27% 0.26% 1.03% 2013 Households 5,999 10,546 14,186 - 2018 Households 6,150 10,698 14,390 - 2013 Median Households Income $49,967 $46,629 $50,711 $53,706 2018 Median Households Income $60,929 $57,787 $61,650 - 13-'18 Median Households Inc. Growth 4.05% 4.38% 3.98% - 2013 Households Income ≥$50K 3,005 4,999 7,235 - 2013 Population 75+ 959 1,727 2,320 - 2018 Population 75+ 1,029 1,832 2,534 - 13-'18 Population 75+ Growth 7.22% 6.11% 9.24% 10.70% 2013 Median Home Value $121,261 $123,544 $130,392 $191,227 2018 Median Home Value $146,105 $146,175 $154,859 - 2013 Unemployment Rate 7.20% 6.60% 6.30% 6.20% Source(s): Google Maps, American Hospital Directory, Inc., Company materials , SNL Financial, U.S. Census Bureau Hospital Note: U.S. Average represents 2015 estimates and 2015-2020 growth projections 76
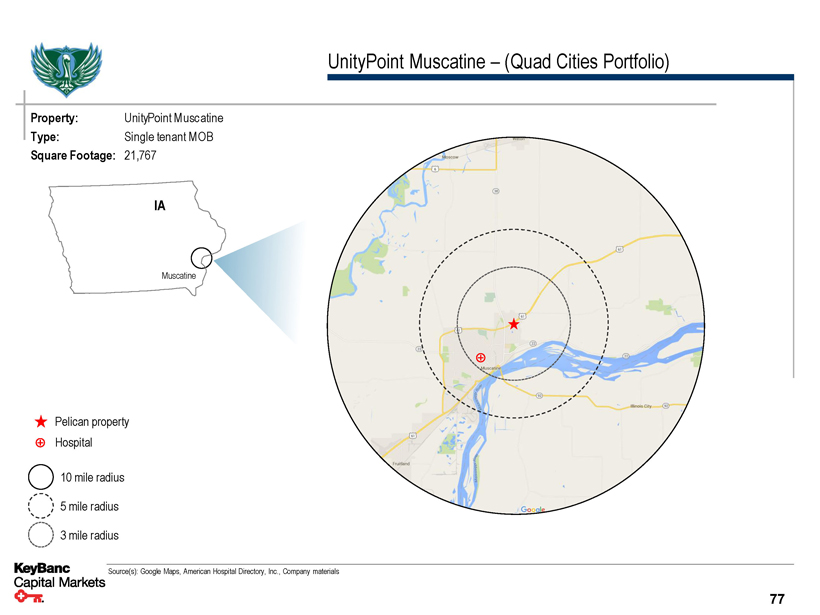
UnityPoint Muscatine – (Quad Cities Portfolio) Property: UnityPoint Muscatine Type: Single tenant MOB Square Footage: 21,767 IA Muscatine Pelican property Hospital 10 mile radius 5 mile radius 3 mile radius Source(s): Google Maps, American Hospital Directory, Inc., Company materials 77
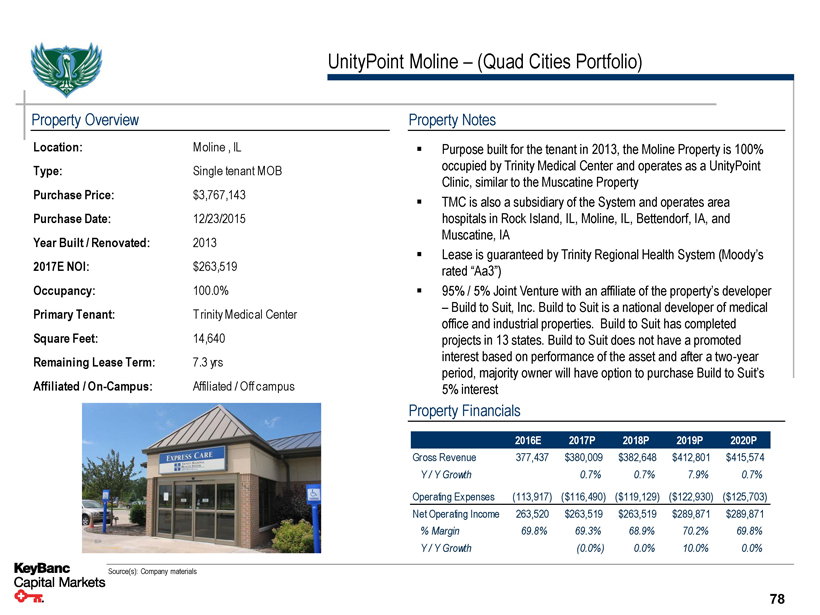
UnityPoint Moline – (Quad Cities Portfolio) Property Overview Location: Moline , IL Type: Single tenant MOB Purchase Price: $3,767,143 Purchase Date: 12/23/2015 Year Built / Renovated: 2013 2017E NOI: $263,519 Occupancy: 100.0% Primary Tenant: T rinity Medical Center Square Feet: 14,640 Remaining Lease Term: 7.3 yrs Affiliated / On-Campus: Affiliated / Off campus Property Notes ▪ Purpose built for the tenant in 2013, the Moline Property is 100% occupied by Trinity Medical Center and operates as a UnityPoint Clinic, similar to the Muscatine Property ▪ TMC is also a subsidiary of the System and operates area hospitals in Rock Island, IL, Moline, IL, Bettendorf, IA, and Muscatine, IA ▪ Lease is guaranteed by Trinity Regional Health System (Moody’s rated “Aa3”) ▪ 95% / 5% Joint Venture with an affiliate of the property’s developer – Build to Suit, Inc. Build to Suit is a national developer of medical office and industrial properties. Build to Suit has completed projects in 13 states. Build to Suit does not have a promoted interest based on performance of the asset and after a two-year period, majority owner will have option to purchase Build to Suit’s 5% interest Property Financials 2016E 2017P 2018P 2019P 2020P Gross Revenue 377,437 $380,009 $382,648 $412,801 $415,574 Y / Y Growth 0.7% 0.7% 7.9% 0.7% Operating Expenses (113,917) ($116,490) ($119,129) ($122,930) ($125,703) Net Operating Income 263,520 $263,519 $263,519 $289,871 $289,871% Margin 69.8% 69.3% 68.9% 70.2% 69.8% Y / Y Growth (0.0%) 0.0% 10.0% 0.0% Source(s): Company materials 78

UnityPoint Moline – (Quad Cities Portfolio) Nearby Hospitals Name Type Beds Distance (mi) Genesis Medical Center - Silvis STAC 269 2.94 Trinity Moline STAC NA 3.48 Trinity Rock Island STAC 350 5.56 Detailed Area Map Demographic Summary 3 mile 5 mile 10 mile U .S. Average 2013 Population 46,895 98,940 265,843 - 2018 Population 46,646 98,872 270,624 - 2013-2018 Population Rate (0.11%) (0.01%) 0.36% 1.03% 2013 Households 20,752 42,384 110,094 - 2018 Households 20,720 42,535 112,515 - 2013 Median Households Income $47,485 $45,164 $45,245 $53,706 2018 Median Households Income $53,559 $51,236 $53,078 - 13-'18 Median Households Inc. Growth 2.44% 2.55% 3.24% - 2013 Households Income ≥$50K 9,940 19,412 50,753 - 2013 Population 75+ 4,502 8,509 19,672 - 2018 Population 75+ 4,851 9,096 21,650 - 13-'18 Population 75+ Growth 7.76% 6.90% 10.05% 10.70% 2013 Median Home Value $129,626 $122,133 $133,142 $191,227 2018 Median Home Value $170,937 $157,424 $173,617 - 2013 Unemployment Rate 7.40% 8.40% 7.30% 6.20% Source(s): Google Maps, American Hospital Directory, Inc., Company materials , SNL Financial, U.S. Census Bureau Hospital Note: U.S. Average represents 2015 estimates and 2015-2020 growth projections 79
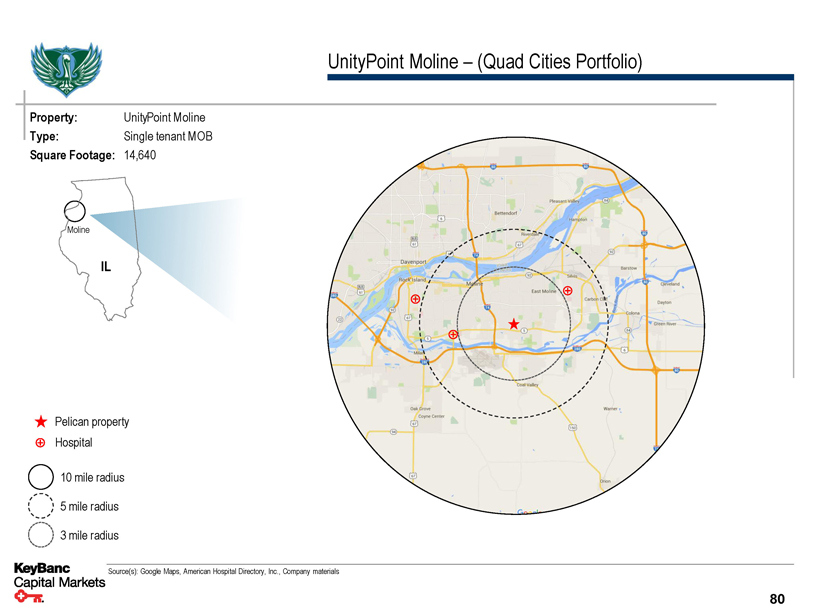
UnityPoint Moline – (Quad Cities Portfolio) Property: UnityPoint Moline Type: Single tenant MOB Square Footage: 14,640 Moline IL Pelican property Hospital 10 mile radius 5 mile radius 3 mile radius Source(s): Google Maps, American Hospital Directory, Inc., Company materials 80
Confidential Seniors Housing Property Overviews
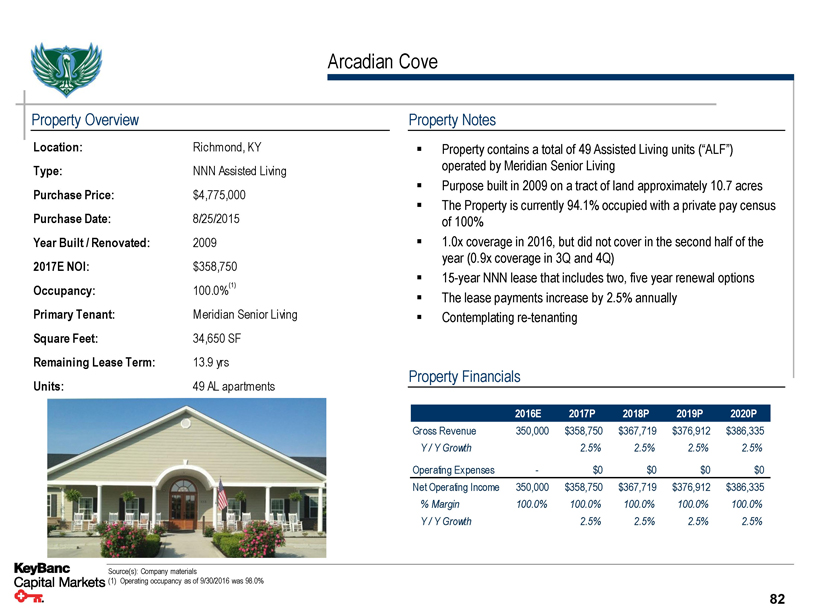
Arcadian Cove Property Overview Location: Richmond, KY Type: NNN Assisted Living Purchase Price: $4,775,000 Purchase Date: 8/25/2015 Year Built / Renovated: 2009 2017E NOI: $358,750 Occupancy: 100.0%(1) Primary Tenant: Meridian Senior Living Square Feet: 34,650 SF Remaining Lease Term: 13.9 yrs Units: 49 AL apartments Property Notes ▪ Property contains a total of 49 Assisted Living units (“ALF”) operated by Meridian Senior Living ▪ Purpose built in 2009 on a tract of land approximately 10.7 acres ▪ The Property is currently 94.1% occupied with a private pay census of 100% ▪ 1.0x coverage in 2016, but did not cover in the second half of the year (0.9x coverage in 3Q and 4Q) ▪ 15-year NNN lease that includes two, five year renewal options ▪ The lease payments increase by 2.5% annually ▪ Contemplating re-tenanting Property Financials 2016E 2017P 2018P 2019P 2020P Gross Revenue 350,000 $358,750 $367,719 $376,912 $386,335 Y / Y Growth 2.5% 2.5% 2.5% 2.5% Operating Expenses - $0 $0 $0 $0 Net Operating Income 350,000 $358,750 $367,719 $376,912 $386,335% Margin 100.0% 100.0% 100.0% 100.0% 100.0% Y / Y Growth 2.5% 2.5% 2.5% 2.5% Source(s): Company materials (1) Operating occupancy as of 9/30/2016 was 98.0% 82

Arcadian Cove – Summary Historical Financials Historical Financials Historical Financials - Common Size Q415 Q116 Q216 Q316 Q416 2016 Q415 Q116 Q216 Q316 Q416 2016 Residents 47.8 49.2 49.4 49.6 49.1 49.3 Occupied Units 47.0 47.4 48.1 48.3 47.9 47.9 Total Units 49.0 49.0 49.0 49.0 49.0 49.0 Occupancy% 95.8% 96.7% 98.3% 98.5% 97.7% 97.8% Total Revenue $360,297 $362,673 $374,189 $358,519 $373,867 $1,469,247 100.0% 100.0% 100.0% 100.0% 100.0% 100.0% Period over Period Chg. 0.7% 3.2% (4.2%) 4.3% - - - - Total Personal Care Services $69,884 $62,276 $53,870 $54,217 $52,014 $222,378 19.4% 17.2% 14.4% 15.1% 13.9% 15.1% Total Health Services 8,672 8,762 16,794 20,568 21,621 67,746 2.4% 2.4% 4.5% 5.7% 5.8% 4.6% Total Activities & Recreations 6,581 4,262 4,135 1,235 614 10,248 1.8% 1.2% 1.1% 0.3% 0.2% 0.7% Total Transportation 96 611 196 219 295 1,321 0.0% 0.2% 0.1% 0.1% 0.1% 0.1% Total Dietary 53,542 48,263 41,218 46,606 53,424 189,512 14.9% 13.3% 11.0% 13.0% 14.3% 12.9% Total Housekeeping/Laundry 6,572 5,512 5,980 5,173 7,126 23,790 1.8% 1.5% 1.6% 1.4% 1.9% 1.6% Total Maintenance 10,824 13,844 16,186 20,263 16,065 66,358 3.0% 3.8% 4.3% 5.7% 4.3% 4.5% Total Administration 43,855 55,067 47,749 53,137 58,573 214,526 12.2% 15.2% 12.8% 14.8% 15.7% 14.6% Total Utilities 21,827 24,400 22,925 23,018 21,167 91,511 6.1% 6.7% 6.1% 6.4% 5.7% 6.2% Total Property Taxes 8,844 8,844 8,844 8,844 22,811 49,343 2.5% 2.4% 2.4% 2.5% 6.1% 3.4% Total Insurance 19,859 20,584 24,025 24,004 21,565 90,178 5.5% 5.7% 6.4% 6.7% 5.8% 6.1% Total Management Service Fee 17,759 18,134 18,709 17,926 18,693 73,462 4.9% 5.0% 5.0% 5.0% 5.0% 5.0% Total Operating Expense $268,314 $270,560 $260,632 $275,211 $293,969 $1,100,372 74.5% 74.6% 69.7% 76.8% 78.6% 74.9% Period over Period Chg. 0.8% (3.7%) 5.6% 6.8% NET OPERATING INCOME $91,983 $92,113 $113,557 $83,307 $79,898 $368,875 25.5% 25.4% 30.3% 23.2% 21.4% 25.1% Period over Period Chg. 0.1% 23.3% (26.6%) (4.1%) NOI Margin 25.4% 30.3% 23.2% 21.4% 25.1% Rent/Lease Total Rent/Lease $87,500 $87,500 $87,500 $88,958 $88,958 $352,917 24.3% 24.1% 23.4% 24.8% 23.8% 24.0% Period over Period Chg. - - 1.7% - - Coverage 1.1x 1.1x 1.3x 0.9x 0.9x 1.0x Period over Period Chg. 0.1% 23.3% (27.8%) (4.1%) 83
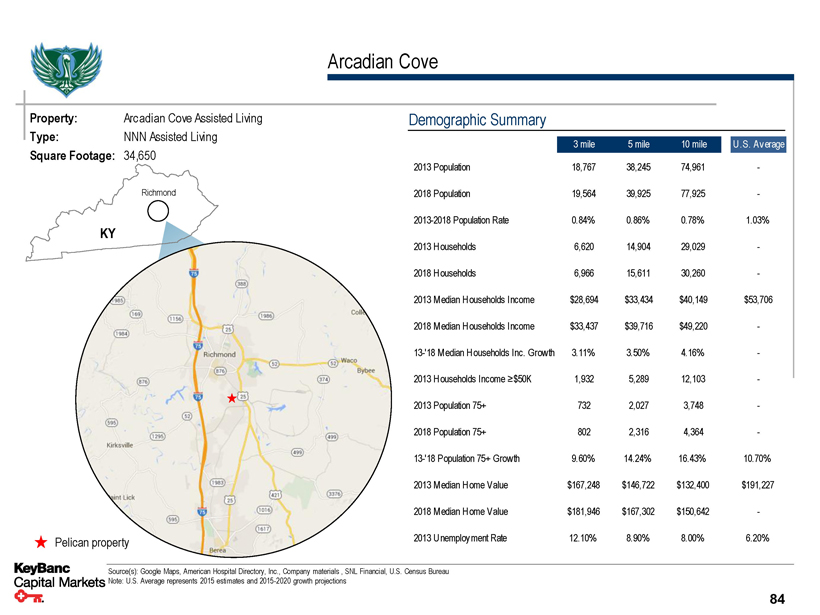
Arcadian Cove Property: Arcadian Cove Assisted Living Type: NNN Assisted Living Square Footage: 34,650 Richmond KY Pelican property Demographic Summary 3 mile 5 mile 10 mile U .S. Average 2013 Population 18,767 38,245 74,961 - 2018 Population 19,564 39,925 77,925 - 2013-2018 Population Rate 0.84% 0.86% 0.78% 1.03% 2013 Households 6,620 14,904 29,029 - 2018 Households 6,966 15,611 30,260 - 2013 Median Households Income $28,694 $33,434 $40,149 $53,706 2018 Median Households Income $33,437 $39,716 $49,220 - 13-'18 Median Households Inc. Growth 3.11% 3.50% 4.16% - 2013 Households Income ≥$50K 1,932 5,289 12,103 - 2013 Population 75+ 732 2,027 3,748 - 2018 Population 75+ 802 2,316 4,364 - 13-'18 Population 75+ Growth 9.60% 14.24% 16.43% 10.70% 2013 Median Home Value $167,248 $146,722 $132,400 $191,227 2018 Median Home Value $181,946 $167,302 $150,642 - 2013 Unemployment Rate 12.10% 8.90% 8.00% 6.20% Source(s): Google Maps, American Hospital Directory, Inc., Company materials , SNL Financial, U.S. Census Bureau Note: U.S. Average represents 2015 estimates and 2015-2020 growth projections 84
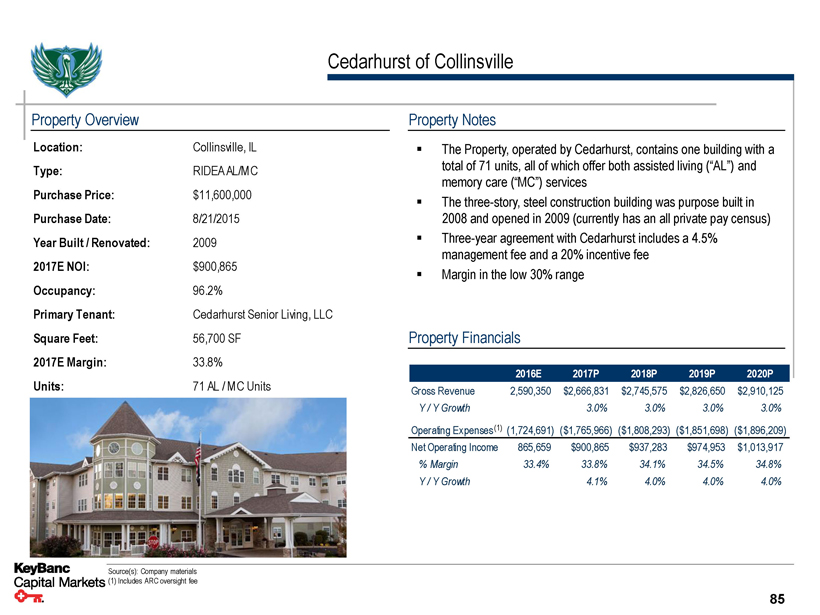
Cedarhurst of Collinsville Property Overview Location: Collinsville, IL Type: RIDEA AL/MC Purchase Price: $11,600,000 Purchase Date: 8/21/2015 Year Built / Renovated: 2009 2017E NOI: $900,865 Occupancy: 96.2% Primary Tenant: Cedarhurst Senior Living, LLC Square Feet: 56,700 SF 2017E Margin: 33.8% Units: 71 AL / MC Units Property Notes ▪ The Property, operated by Cedarhurst, contains one building with a total of 71 units, all of which offer both assisted living (“AL”) and memory care (“MC”) services ▪ The three-story, steel construction building was purpose built in 2008 and opened in 2009 (currently has an all private pay census) ▪ Three-year agreement with Cedarhurst includes a 4.5% management fee and a 20% incentive fee ▪ Margin in the low 30% range Property Financials 2016E 2017P 2018P 2019P 2020P Gross Revenue 2,590,350 $2,666,831 $2,745,575 $2,826,650 $2,910,125 Y / Y Growth 3.0% 3.0% 3.0% 3.0% Operating Expenses (1) (1,724,691) ($1,765,966) ($1,808,293) ($1,851,698) ($1,896,209) Net Operating Income 865,659 $900,865 $937,283 $974,953 $1,013,917% Margin 33.4% 33.8% 34.1% 34.5% 34.8% Y / Y Growth 4.1% 4.0% 4.0% 4.0% Source(s): Company materials (1) Includes ARC oversight fee 85
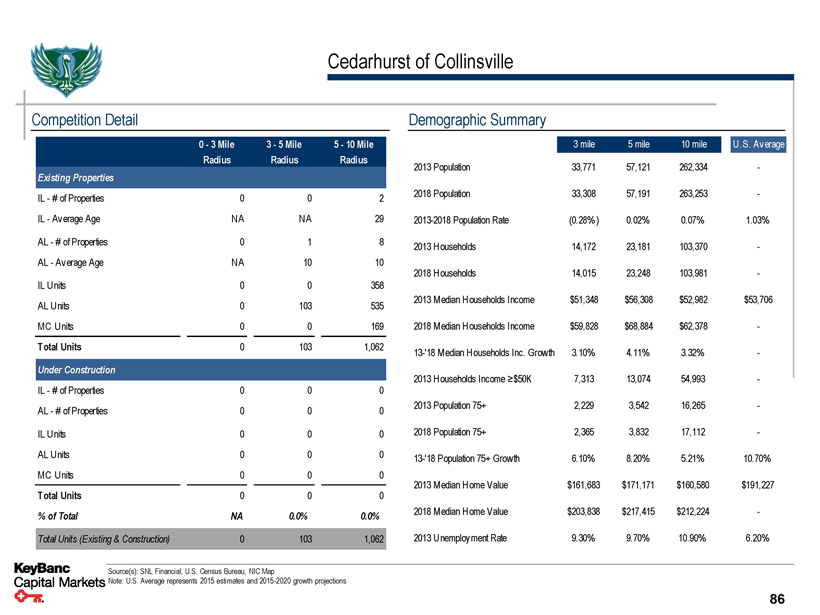
Cedarhurst of Collinsville Competition Detail 0 - 3 Mile 3 - 5 Mile 5 - 10 Mile Radius Radius Radius Existing Properties IL - # of Properties 0 0 2 IL - Average Age NA NA 29 AL - # of Properties 0 1 8 AL - Average Age NA 10 10 IL Units 0 0 358 AL Units 0 103 535 MC Units 0 0 169 Total Units 0 103 1,062 Under Construction IL - # of Properties 0 0 0 AL - # of Properties 0 0 0 IL Units 0 0 0 AL Units 0 0 0 MC Units 0 0 0 Total Units 0 0 0% of Total NA 0.0% 0.0% Total Units (Existing & Construction) 0 103 1,062 Demographic Summary 3 mile 5 mile 10 mile U .S. Average 2013 Population 33,771 57,121 262,334 - 2018 Population 33,308 57,191 263,253 - 2013-2018 Population Rate (0.28%) 0.02% 0.07% 1.03% 2013 Households 14,172 23,181 103,370 - 2018 Households 14,015 23,248 103,981 - 2013 Median Households Income $51,348 $56,308 $52,982 $53,706 2018 Median Households Income $59,828 $68,884 $62,378 - 13-'18 Median Households Inc. Growth 3.10% 4.11% 3.32% - 2013 Households Income ≥$50K 7,313 13,074 54,993 - 2013 Population 75+ 2,229 3,542 16,265 - 2018 Population 75+ 2,365 3,832 17,112 - 13-'18 Population 75+ Growth 6.10% 8.20% 5.21% 10.70% 2013 Median Home Value $161,683 $171,171 $160,580 $191,227 2018 Median Home Value $203,838 $217,415 $212,224 - 2013 Unemployment Rate 9.30% 9.70% 10.90% 6.20% Source(s): SNL Financial, U.S. Census Bureau, NIC Map Note: U.S. Average represents 2015 estimates and 2015-2020 growth projections 86
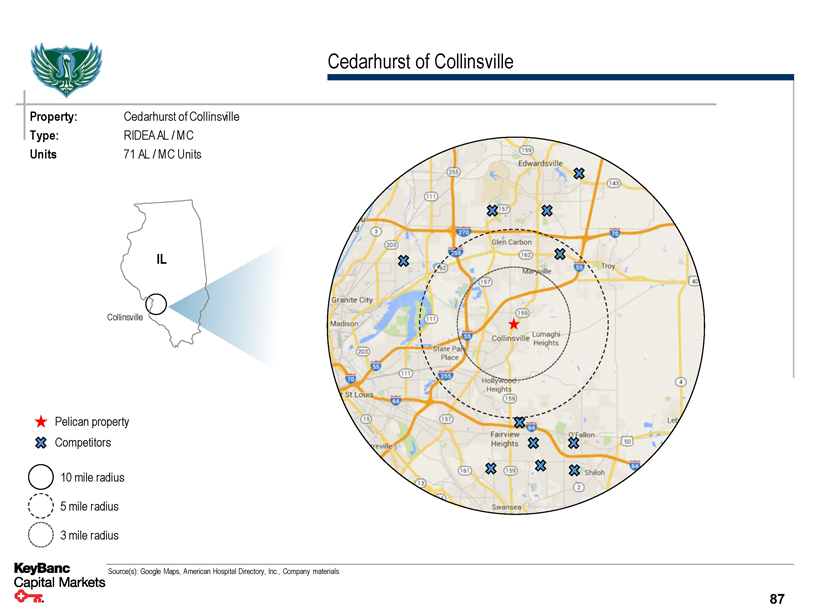
Cedarhurst of Collinsville Property: Cedarhurst of Collinsville Type: RIDEA AL / MC Units 71 AL / MC Units IL Collinsville Pelican property Competitors 10 mile radius 5 mile radius 3 mile radius Source(s): Google Maps, American Hospital Directory, Inc., Company materials 87
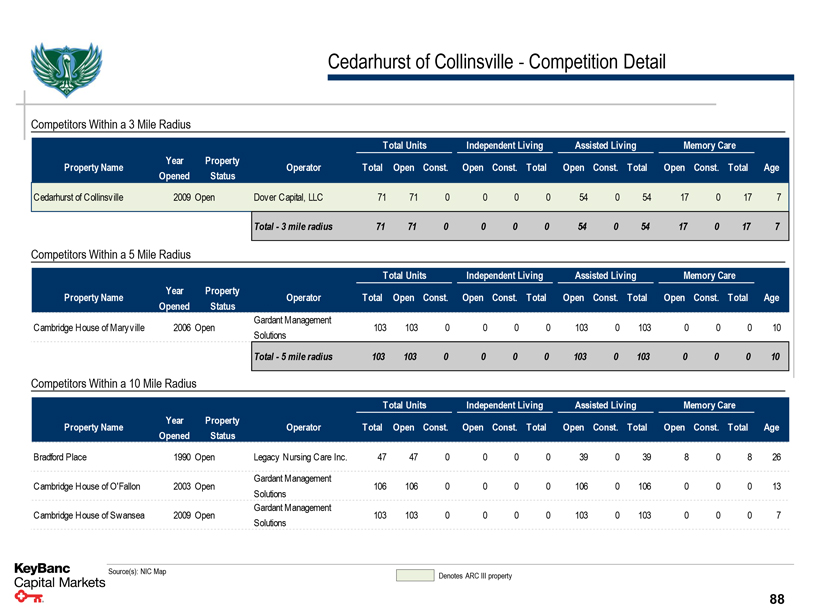
Cedarhurst of Collinsville - Competition Detail Competitors Within a 3 Mile Radius Total Units Independent Living Assisted Living Memory Care Property Name Year Property Operator Total Open Const. Open Const. Total Open Const. Total Open Const. Total Age Opened Status Cedarhurst of Collinsville 2009 Open Dover Capital, LLC 71 71 0 0 0 0 54 0 54 17 0 17 7 Total - 3 mile radius 71 71 0 0 0 0 54 0 54 17 0 17 7 Competitors Within a 5 Mile Radius Total Units Independent Living Assisted Living Memory Care Property Name Year Property Operator Total Open Const. Open Const. Total Open Const. Total Open Const. Total Age Opened Status Cambridge House of Maryville 2006 Open Gardant Management 103 103 0 0 0 0 103 0 103 0 0 0 10 Solutions Total - 5 mile radius 103 103 0 0 0 0 103 0 103 0 0 0 10 Competitors Within a 10 Mile Radius Total Units Independent Living Assisted Living Memory Care Property Name Year Property Operator Total Open Const. Open Const. Total Open Const. Total Open Const. Total Age Opened Status Bradford Place 1990 Open Legacy Nursing Care Inc. 47 47 0 0 0 0 39 0 39 8 0 8 26 Cambridge House of O'Fallon 2003 Open Gardant Management 106 106 0 0 0 0 106 0 106 0 0 0 13 Solutions Cambridge House of Swansea 2009 Open Gardant Management 103 103 0 0 0 0 103 0 103 0 0 0 7 Solutions Source(s): NIC Map Denotes ARC III property 88
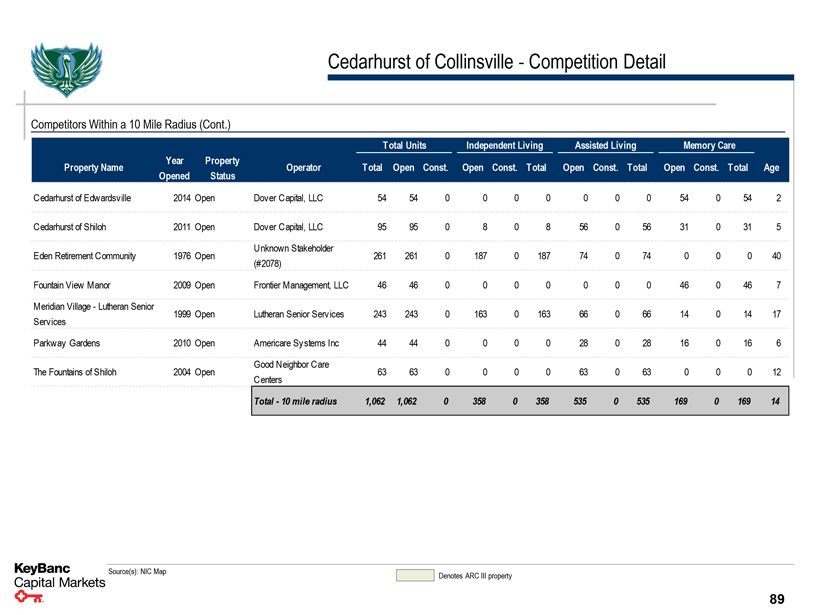
Cedarhurst of Collinsville - Competition Detail Competitors Within a 10 Mile Radius (Cont.) Total Units Independent Living Assisted Living Memory Care Property Name Year Property Operator Total Open Const. Open Const. Total Open Const. Total Open Const. Total Age Opened Status Cedarhurst of Edwardsville 2014 Open Dover Capital, LLC 54 54 0 0 0 0 0 0 0 54 0 54 2 Cedarhurst of Shiloh 2011 Open Dover Capital, LLC 95 95 0 8 0 8 56 0 56 31 0 31 5 Eden Retirement Community 1976 Open Unknown Stakeholder 261 261 0 187 0 187 74 0 74 0 0 0 40 (#2078) Fountain View Manor 2009 Open Frontier Management, LLC 46 46 0 0 0 0 0 0 0 46 0 46 7 Meridian Village - Lutheran Senior 1999 Open Lutheran Senior Services 243 243 0 163 0 163 66 0 66 14 0 14 17 Services Parkway Gardens 2010 Open Americare Systems Inc 44 44 0 0 0 0 28 0 28 16 0 16 6 The Fountains of Shiloh 2004 Open Good Neighbor Care 63 63 0 0 0 0 63 0 63 0 0 0 12 Centers Total - 10 mile radius 1,062 1,062 0 358 0 358 535 0 535 169 0 169 14 Source(s): NIC Map Denotes ARC III property 89
Confidential Appendix

Confidential Benchmarking Analysis

Public Market Overview – Portfolio Benchmarking Small to Mid Cap Healthcare Peers The Big Three MOB Focused OHI SNH MPW NHI (1) CCP LTC SBRA SNR CTRE GMRE MRT HCN VTR HCP HTA (2) HR DOC (3) UHT CHCT% SNF 88.6% - - 34.6% 91.5% 44.9% 56.0% - 78.8% - 75.0% 18.3% 4.3% - - - - - -% AL/IL 11.4% 70.1% - 62.9% 4.1% 51.4% 43.4% 100.0% 21.2% - - 63.5% 60.1% 45.1% 0.8% - - - -% MOB - 27.6% 1.5% 1.0% - - - - - 12.9% 4.2% 17.3% 29.7% 29.8% 96.3% 90.1% 96.2% 80.0% 32.7%% Hospital - - 98.5% 1.5% 4.4% - 0.5% - - 16.1% 16.7% - 4.1% NA 2.8% 5.0% 2.1% 9.2% -% Other - 2.3% - - - 3.7% - - - 71.0% 4.2% 0.9% 1.9% 25.1% - 5.0% 1.7% 10.8% 67.3% Total Enterprise $11,205.7 $8,367.6 $7,106.3 $4,086.9 $3,526.6 $2,424.8 $3,004.3 $2,926.2 $1,477.2 $110.2 $712.4 $39,279.5 $33,504.8 $24,753.0 $6,420.5 $4,917.6 $3,554.3 $1,188.8 $298.9 Value ($MM) P/ 2017E FFO 9.3x 10.7x 9.8x 14.4x 9.3x 14.7x 11.2x 7.8x 13.2x NA 9.4x 15.6x 15.0x 16.3x 18.3x 18.7x 16.1x NA 14.0x Average 11.0x 15.6x 16.8x P/ 2017E FFO P/ 2018E FFO 9.3x 10.6x 9.3x 14.0x 9.2x 14.2x 10.7x 7.5x 12.4x 9.9x 8.7x 14.8x 14.6x 15.8x 17.4x 17.7x 15.8x NA 12.4x Average 10.5x 15.1x 15.8x P/ 2018E FFO Source: Capital IQ, Green Street Advisors and SNL Financial as of 2/21/2017 Note: Percent of portfolio calculated by percent of Gross Asset Value (1) Percent of portfolio calculated by percent of revenue 92 (2) Percent of portfolio calculated by percent of ABR (3) Percent of portfolio calculated by percent of cash NOI

Number of States 60 49 50 45 43 43 42 States 40 37 36 36 32 31 30 30 29 of 27 Number 30 20 10 0 HCN HCP SNH OHI SNR CCP SBRA NHI HTA LTC MPW DOC HR VTR Interest Coverage 14.0x 11.5x 12.0x Coverage 10.0x 8.1x 8.0x 5.9x 5.9x Interest 6.0x 4.8x 4.7x 4.7x 4.6x 4.5x 3.7x 3.7x 3.5x 4.0x 3.0x 2.7x 2.0x 0.0x LTC NHI UHT OHI HR HCN HTA VTR SNH CTRE SBRA HCP MPW DOC Source: Company filings and SNL Financial as of 12/31/2016 Peer Market Data as of 2/21/2017 Benchmarking Analysis – Operating Metrics Number of Properties Average: 30 1,600 1,464 1,400 1,232 1,200 981 $Properties 1,000 802 800 of 20 20 18 Number 600 431 14 400 355 340 235 216 205 205 202 4 200 CTRE UHT CHCT GMRE MRT 0 HCN VTR OHI HCP SNH HTA CCP DOC LTC MPW NHI HR Enterprise Value Average: 4.9x $50,000 .5 $45,000 $.8 ( $40,000 $.0 $35,000 Value $30,000 $Enterprise $25,000 .7 $20,000 .6 .3 2.6x $15,000 $$$.5 .6 .9 .3 .6 .3 $10,000 $$$$$$NA NA NA NA $5,000 SNR CCP CHCT GMRE MRT $0 VTR HCP OHI SNH MPW HTA HR NHI DOC CCP SBRA HCN Average: 386 Properties 182 154 151 65 52 31 24 SBRA SNR CTRE UHT CHCT GMRE MRT Average: $8,361m $.2 $.8 $.2 $.8 $.4 $.9 $.2 SNR LTC CTRE UHT MRT CHCT GMRE 93
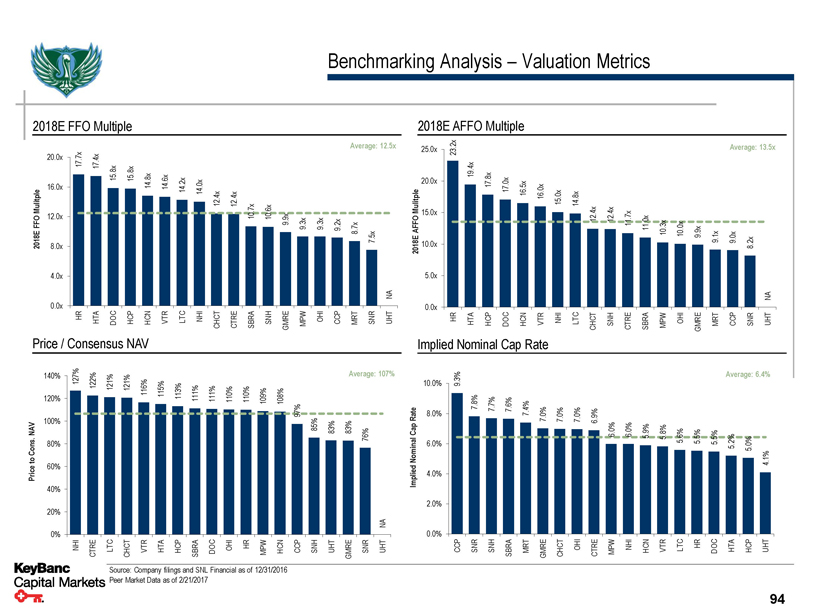
Benchmarking Analysis – Valuation Metrics 2018E FFO Multiple Average: 12.5x 20.0x 17.4x 15.8x 15.8x 17.7x 14.8x 14.6x 14.2x 14.0x 16.0x Mulitple 12.4x 12.4x 10.7x 10.6x 9.9x FFO 12.0x 9.3x 9.3x 9.2x 8.7x 2018E 7.5x 8.0x 4.0x NA 0.0x HTA DOC HCP HCN VTR LTC NHI CHCT CTRE SBRA SNH GMRE MPW OHI CCP MRT SNR UHT HR Price / Consensus NAV 140% 127% 122% 121% 121% 116% 115% Average: 107% 113% 111% 111% 110% 110% 109% 108% 120% 97% NAV 100% 85% 83% 83% 76% Cons. 80% to Price 60% 40% 20% NA 0% NHI CTRE LTC CHCT VTR HTA HCP SBRA DOC OHI HR MPW HCN CCP SNH UHT GMRE SNR UHT 2018E AFFO Multiple 25.0x 23.2x 19.4x 17.8x 17.0x 20.0x 16.5x 16.0x Mulitple 15.0x AFFO 2018E 10.0x 5.0x 0.0x HTA HCP DOC HCN VTR HR Implied Nominal Cap Rate 10.0% 9.3% Rate 8.0% 7.8% 7.7% 7.6% 7.4% 7.0% Cap Nominal 6.0% Implied 4.0% 2.0% 0.0% CCP SNR SNH SBRA MRT GMRE Average: 13.5x 15.0x 14.8x 12.4x 12.4x 11.7x 11.0x 10.3x 10.0x 9.9x 9.1x 9.0x 8.2x NA NHI LTC CHCT SNH CTRE SBRA MPW OHI GMRE MRT CCP SNRUHT Average: 6.4% 7.0% 7.0% 6.9% 6.0% 6.0% 5.9% 5.8% 5.6% 5.5% 5.5% 5.2% 5.0% 4.1% CHCT OHI CTRE MPW NHI HCN VTR LTC HR DOC HTA HCP UHT Source: Company filings and SNL Financial as of 12/31/2016 Peer Market Data as of 2/21/2017 94
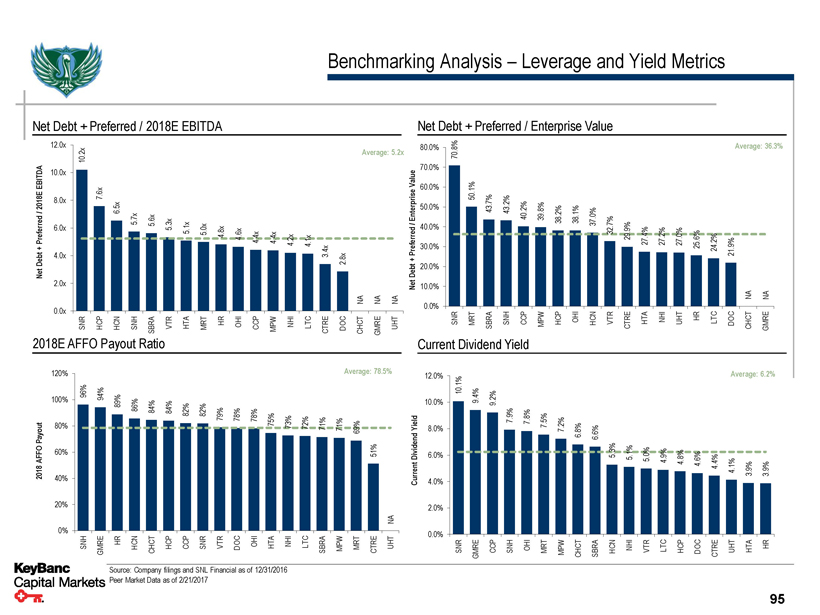
Benchmarking Analysis – Leverage and Yield Metrics Net Debt + Preferred / 2018E EBITDA 12.0x 10.2x EBITDA 10.0x 7.6x 2018E 8.0x 6.5x / 5.7x Preferred 6.0x 5.6x 5.3x 5.1x 5.0x 4.8x + Debt 4.0x Net 2.0x 0.0x HCP HCN VTR HTA MRT HR SNR SNH SBRA 2018E AFFO Payout Ratio Net Debt + Preferred / Enterprise Value Average: 5.2x 80.0% Average: 36.3% 70.8% Value 70.0% 60.0% 50.1% Enterprise 50.0% 43.7% 43.2% 40.2% 39.8% 38.2% 38.1% 37.0% / 4.6x 4.4x 4.4x Preferred 40.0% 32.7% 29.9% 27.4% 27.2% 27.0% 25.6% 4.2x 24.2% 4.1x 21.9% 30.0% 3.4x 2.8x + Debt 20.0% Net 10.0% NA NA NA NA NA OHICCP MPW NHI LTCCTREDOCCHCT GMRE UHT 0.0% SNH CCP MPWHCP OHI HCNVTRCTREHTA NHI UHT HRLTCDOCCHCT GMRE SNRMRTSBRA Current Dividend Yield 120% 100% Average: 78.5% 96% 94% 89% 86% 84% 84% 12.0% 10.0% 10.1% 9.4%9.2% Average: 6.2% Payout AFFO 2018 80% 60% 40% 20% 0% 82% 82% 79% 78% 78% 75% 73% 72% Yield 71% 71% 69% 51% Dividend Current NA SNH GMRE HR HCN CHCT HCP CCP SNR VTR DOC OHI HTA NHI LTC SBRA MPW MRT CTRE UHT 8.0% 6.0% 4.0% 2.0% 0.0% 7.9% 7.8% 7.5% 7.2% 6.8% 6.6% 5.3% 5.1% 5.0% 4.9% 4.8% 4.6% 4.4% 4.1% 3.9% 3.9% SNR GMRE CCP SNH OHI MRT MPW CHCT SBRA HCN NHI VTR LTC HCP DOC CTRE UHT HTA HR Source: Company filings and SNL Financial as of 12/31/2016 Peer Market Data as of 2/21/2017 95
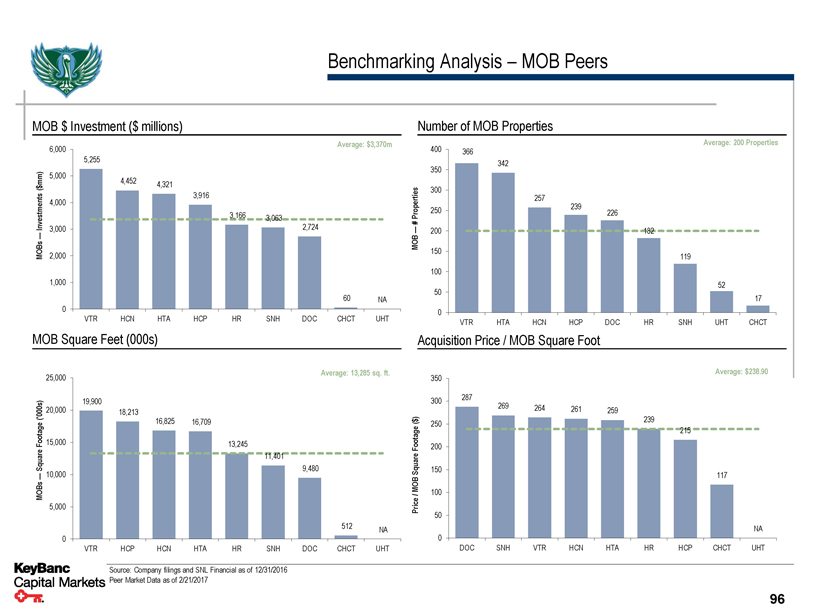
Benchmarking Analysis – MOB Peers MOB $Investment ($millions) Number of MOB Properties 6,000 Average: $3,370m 400 Average: 200 Properties 366 5,255 342 350 5,000 4,452 4,321 300 3,916 $257 Investments 4,000 3,166 3,063 Properties 250 239 226 # 3,000 2,724 — 200 182 — MOB MOBs 150 2,000 119 100 1,000 52 50 60 17 NA 0 0 HCN HTA HCP HR SNH DOC CHCT UHT VTR VTR HTA HCN HCP DOC HR SNH UHT CHCT MOB Square Feet (000s) Acquisition Price / MOB Square Foot 25,000 Average: 13,285 sq. ft. ( 350 Average: $238.90 287 ('000s) 19,900 300 269 264 20,000 18,213 261 259 239 16,825 Footage 16,709 250 Footage 215 15,000 13,245 200 Square 10,000 11,401 9,480 Square 150 — 117 MOB MOBs 100 / mm)$5,000 Price 50 512 NA NA 0 0 HCP HCN HTA HR SNH DOC CHCT UHT SNH VTR HCN HTA HR HCP CHCT UHT VTR DOC Source: Company filings and SNL Financial as of 12/31/2016 Peer Market Data as of 2/21/2017 96
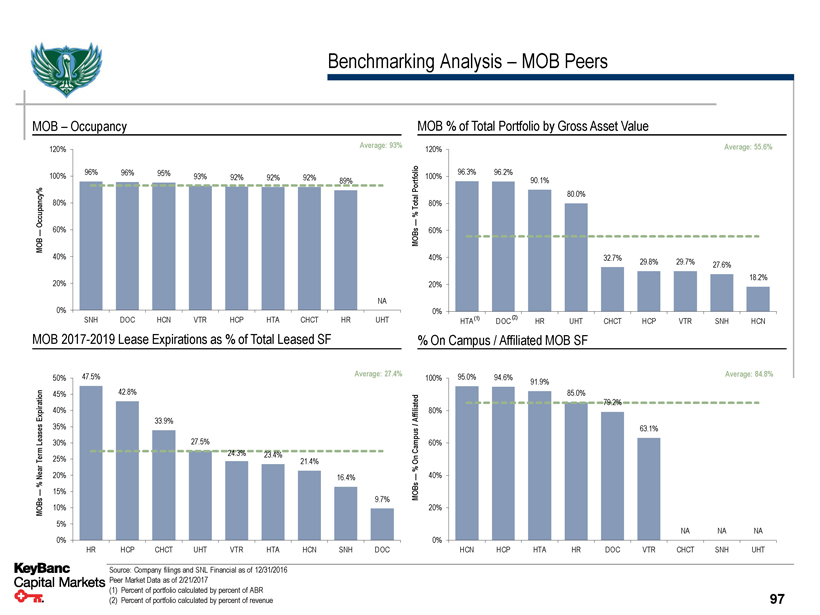
Benchmarking Analysis – MOB Peers MOB – Occupancy 120% Average: 93% 100% 96% 96% 95% 93% 92% 92% 92% 89% Occupancy% 80% — 60% MOB 40% 20% NA 0% DOC HCN VTR HCP HTA CHCT HR UHT SNH MOB 2017-2019 Lease Expirations as% of Total Leased SF 50% 47.5% Average: 27.4% Expiration 45% 42.8% 40% 33.9% Leases 35% 30% 27.5% Term 25% 24.3% 23.4% 21.4% Near 20% 16.4%% — 15% MOBs 9.7% 10% 5% 0% HR HCP CHCT UHT VTR HTA HCN SNH DOC Source: Company filings and SNL Financial as of 12/31/2016 Peer Market Data as of 2/21/2017 (1) Percent of portfolio calculated by percent of ABR (2) Percent of portfolio calculated by percent of revenue MOB% of Total Portfolio by Gross Asset Value 120% Average: 55.6% Portfolio 100% 96.3% 96.2% 90.1% Total 80.0% 80%% — MOBs 60% 40% 32.7% 29.8% 29.7% 27.6% 20% 18.2% 0% DOC (2) HR UHT CHCT HCP VTR SNH HCN HTA(1)% On Campus / Affiliated MOB SF 100% 95.0% 94.6% Average: 84.8% 91.9% Affiliated 85.0% 79.2% 80% / Campus 63.1% 60% On% — 40% MOBs 20% NA NA NA 0% HCN HCP HTA HR DOC VTR CHCT SNH UHT 97
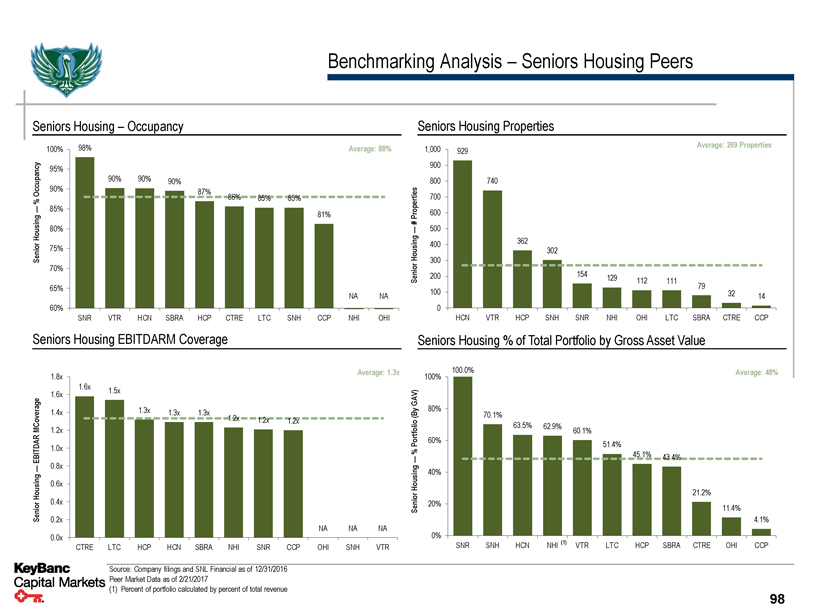
Benchmarking Analysis – Seniors Housing Peers Seniors Housing – Occupancy 100%98% Occupancy 95% 90% 90% 90% 90% 87% 86% 85% 85%% — 85% Housing 80% Senior 75% 70% 65% 60% SNR VTR HCN SBRA HCP CTRE LTC SNH Seniors Housing EBITDARM Coverage 1.8x 1.6x 1.5x 1.6x MCoverage 1.4x 1.3x 1.3x 1.3x 1.2x 1.2x 1.2x 1.2x EBITDAR 1.0x — 0.8x Housing 0.6x Senior 0.4x 0.2x 0.0x CTRE LTC HCP HCN SBRA NHI SNR CCP Source: Company filings and SNL Financial as of 12/31/2016 Peer Market Data as of 2/21/2017 (1) Percent of portfolio calculated by percent of total revenue Seniors Housing Properties Average: 88% 1,000 929 Average: 269 Properties 900 800 740 Properties 700 81% 600 # — 500 Housing 400 362 302 300 Senior 200 154 129 112 111 79 100 NA NA 32 14 0 CCP NHI OHI HCN VTR HCP SNH SNR NHI OHI LTC SBRA CTRE CCP Seniors Housing% of Total Portfolio by Gross Asset Value Average: 1.3x 100% 100.0% Average: 48% GAV) (By 80% 70.1% Portfolio 63.5% 62.9% 60.1% 60% 51.4%% 45.1% — 43.4% Housing 40% Senior 21.2% 20% 11.4% 4.1% NA NA NA 0% OHI SNH VTR SNH HCN NHI (1) VTR LTC HCP SBRA CTRE OHI CCP SNR 98


