Merrill Lynch TMT Conference
London – June 6, 2006
Eric Meurice – CEO
Exhibit 99.8

Safe Harbor
“Safe Harbor” Statement under the U.S. Private Securities
Litigation Reform Act of 1995: the matters discussed in this
presentation may include forward-looking statements that are
subject to risks and uncertainties including, but not limited to:
economic conditions, product demand and semiconductor
equipment industry capacity, worldwide demand and
manufacturing capacity utilization for semiconductors (the
principal product of our customer base), competitive products
and pricing, manufacturing efficiencies, new product
development, ability to enforce patents, the outcome of
intellectual property litigation, availability of raw materials and
critical manufacturing equipment, trade environment, and
other risks indicated in the risk factors included in ASML’s
Annual Report on Form 20-F and other filings with the U.S.
Securities and Exchange Commission.
/ Slide 2
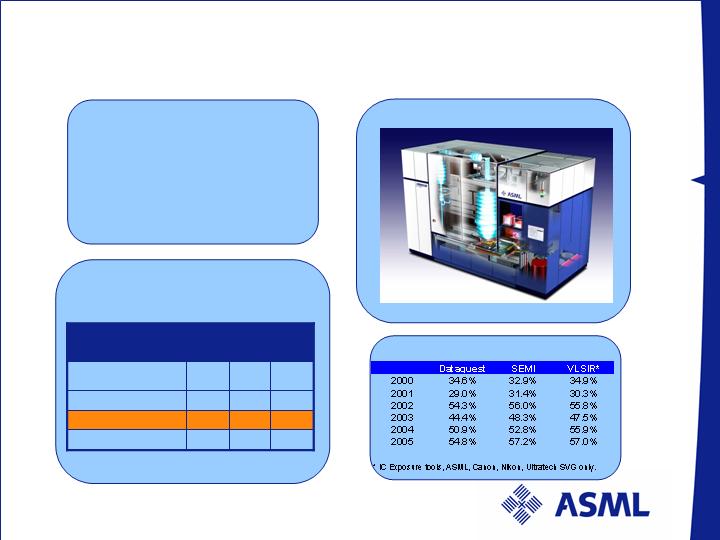
ASML overview
-7.1%
23396.8
25191.0
Total Market
+2.7%
2786.9
2712.4
ASML
-6.3%
3480.9
3714.0
Tokyo Electron Ltd.
-22.9%
4444.7
5768.1
Applied Materials
2004/
2005
2005
2004
IC Fabrication
Equipment
Key facts:
Headquarters: Veldhoven,
the Netherlands
Revenue 2005 ~ €2.5 B
Market cap ~ €7.75 B
Employees 5100
Technology Leader/Innovator
ASML TWINSCAN
The world’s leading supplier of Lithography equipment
ASML outperforms in 2005
VLSI Research
Growing market share (revs)
/ Slide 3
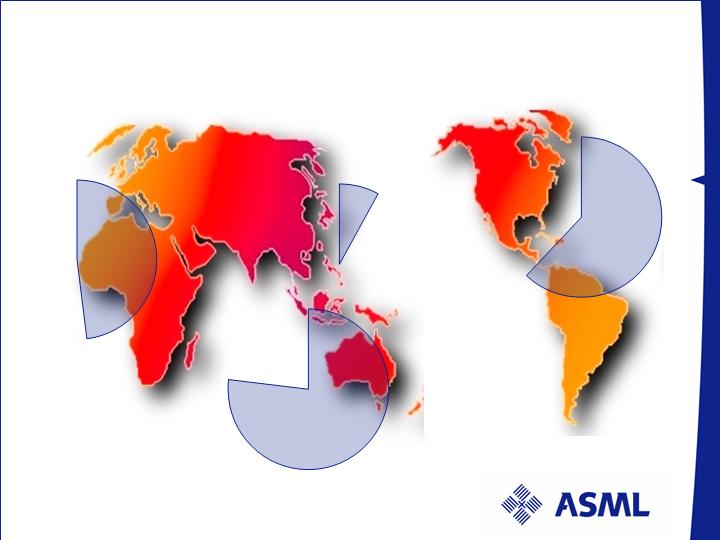
ASML market share per region in ($)
WW market share 57% in 2005
Europe
Asia
without
Japan
USA
Source: ASML
48%
8%
77%
62%
Japan
/ Slide 4
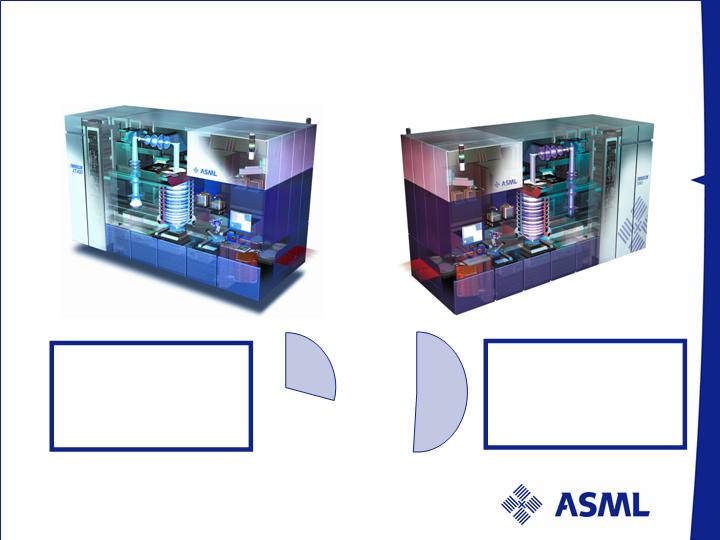
TWINSCAN™ XT:400 and XT:760 creating value
in non and mid critical applications
XT:400E
Resolution: 350nm
Throughput: 129wph
Lowest CoO in 300mm I-line
XT:760F
Resolution: 130nm
Throughput: 134wph
Superior CoO in 300mm KrF
I-line
29%
KrF
51%
Source: ASML
/ Slide 5
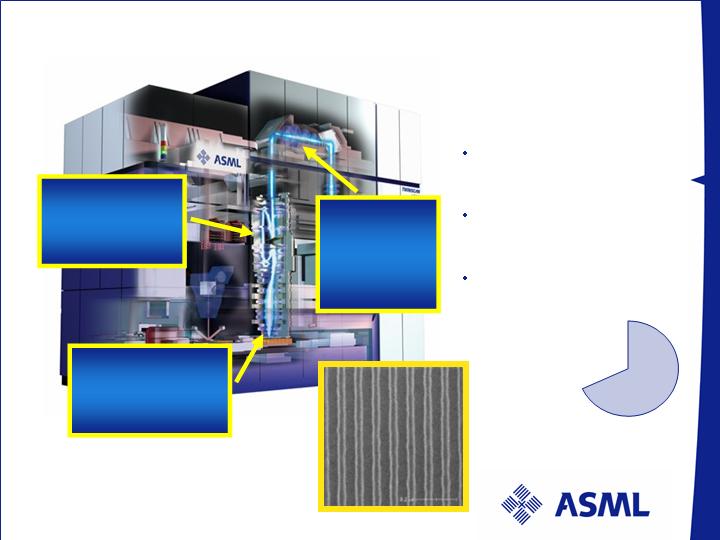
TWINSCAN XT:1700i 1.2 NA with 26x33mm2 field
Imaging
Resolution 45-nm
Overlay
System 7-nm
Throughput
125 shots 122 wph
In-line
Catadioptric
lens design
4th generation
immersion
technology
High
Efficiency
Polarized
Illuminator
42nm
Market share wet + dry
ArF 68%
Source: ASML
/ Slide 6
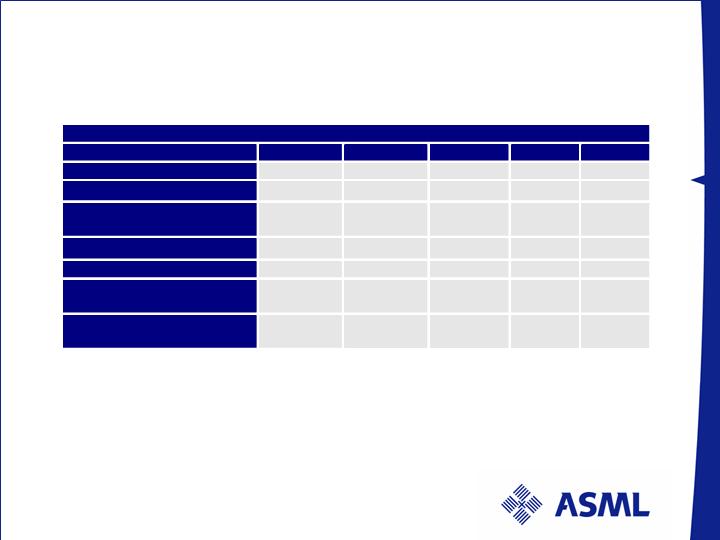
Key financial trends 2005 - 2006
/ Slide 7
Numbers have been rounded for readers’ convenience
Profit & Loss Statement
M€
Q1 0
5
Q2 0
5
Q3 0
5
Q4 0
5
Q1
0
6
Units
59
51
39
47
51
Sales
685
763
533
548
62
9
Gross margin
Gross margin %
274
40.0
%
299
39.1
%
197
37.0
%
204
37.3
%
251
40.0
%
R&D
79
82
80
82
87
SG&A
51
55
48
47
50
O
perating income
Operating
income %
144
21.0
%
162
21.2
%
69
12.9
%
75
13.6
%
114
18.2
%
Net income
Net income %
100
14.6
%
112
14.6
%
48
9.0
%
52
9.4
%
80
12.7
%
Mid-Term Market Update

Market Status Summary
2006 IC Unit growth forecast at about 10% / 11%
growth y-o-y
Inventory at appropriate levels for continuous FAB
capacity build up - under scrutiny
Utilization rates at approx. 92 % with wide range of
customers hitting capacity limits
Industry shows sign of maturing as swings are
smaller in amplitude and length
/ Slide 9
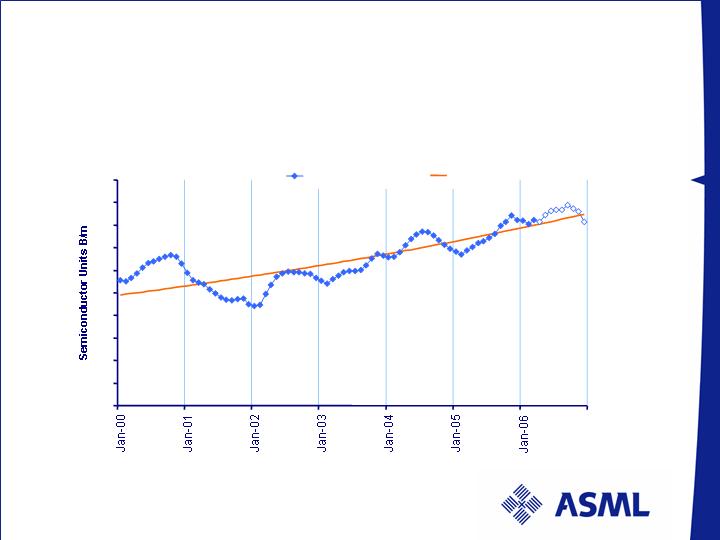
Source: ASML MCC
25% -21% 14% 9% 18% 4% 11%
Semiconductor Units history and forecast
2006 Semiconductor consensus growth forecast at +11%
Semiconductor unit Forecast
0
5
10
15
20
25
30
35
40
45
50
Semiconductor Units
Unit Trend
/ Slide 10
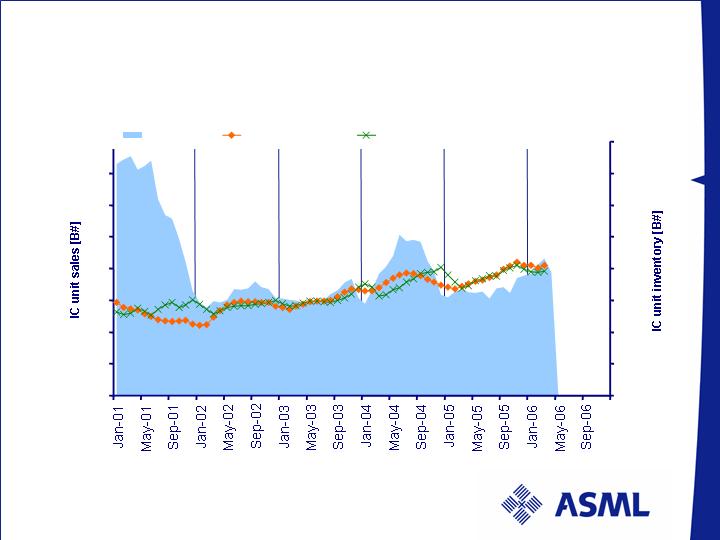
IC unit sales and inventory
Steady demand - inventory under control
Source: WSTS, VLSI Research, ASML
Last data point: March 2006
IC unit sales and inventory
0
10
20
30
40
50
60
70
80
-
10
20
30
40
50
60
70
80
IC inventory
3mma IC unit Sales
3mma IC unit sales corrected for Inventory
/ Slide 11
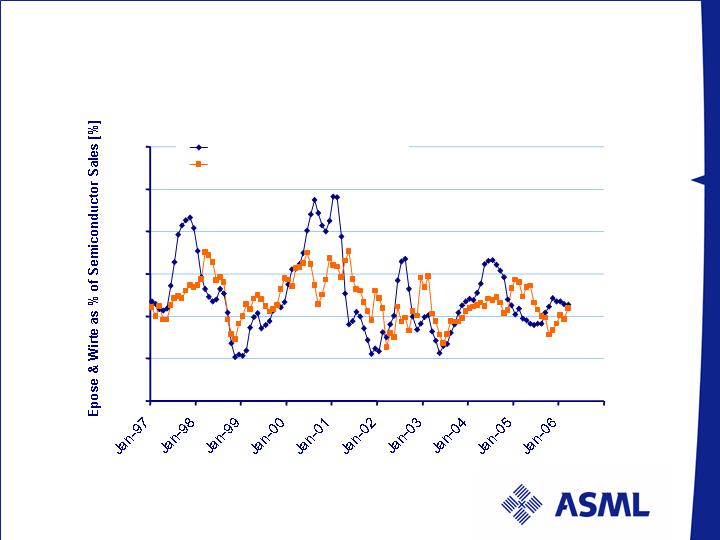
Source: SEMI, WSTS, ASML
Last data point: March 2006
Litho Bookings and Billings as % of Semiconductor Revenue
Relative Litho spending in range of control
Expose & Write Bookings and Billings as % of Semiconductor
sales
0%
1%
2%
3%
4%
5%
6%
E&W bookings as % of Semi $Sadj 3MMA
E&W billings as % of Semi $ Sadj 3MMA
/ Slide 12
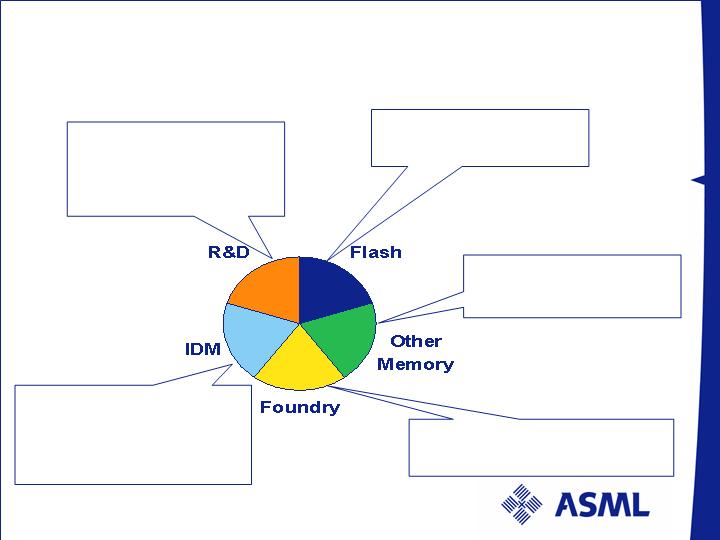
Growth from Multiple independent Segments
Each Segment with its own investment cycle
Flash shrink - 12 to 15
month investment cycle
DRAM – closely follows
Flash investment cycle
Foundries represent classic
supply/demand cycle
Moore’s law, 18 to 24
months - invest for new
product development -
volume to Foundry
Shrink for new
functionality and cost per
function - 12 to 24 month
investment cycle
/ Slide 13
Further Growth engines:
26 new fab projects under construction:
9 Flash fabs
6 other Memory fabs
11 Foundry or IDM fabs
Immersion enabling 55 nm/45 nm next generation
node for early 2007 production ramp:
Flash next generation
High integration/complexity Logic designs
STRONG BOOKINGS OUTLOOK IN Q2 2006
FOR DELIVERIES IN Q3 06, Q4 06, Q1 07
NO SHORT TERM OVERHEATING FORESEEN
/ Slide 14

Long-Term Trajectory

Company focus
Execution on Technology – Cost – Leadtime
Execute on Leadership:
Volume production ramp of the TWINSCAN XT:1700i,
hyper NA tool for 45 nm node: 20 - 25 tools to ship in 2006
2 EUV alpha tools mid 2006
R&D investment increased to sustain an accelerated
roadmap 1 node/year
Execute on cost of goods reduction:
Redesigns for cost - for performance/availability/throughput
Internal target of 15% cost of ownership reduction
Execute on lead time reduction
Leadtime reduction of 30%
Capacity increase: 50% +
/ Slide 16
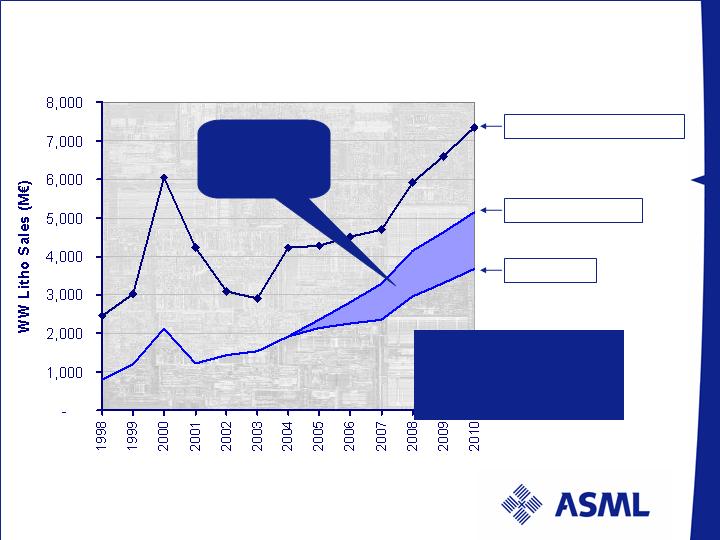
ASML Secular Growth model
Source: Average of Dataquest, VLSI Research and ASML fab based simultion model – NOT A FORECAST
Average WW litho sales
ASML’s potential
Status quo
Natural growth
potential towards
4-5 B€ range
ASML’s
opportunity
window
Assumption: 9% IC unit Growth/year
/ Slide 17

ASML is well positioned for value generation
Growth
Target of 70% market share
Potential to double top line in 5 years (reference 2005)
Profitability
Track record of last 8 quarters - average 17.1% EBIT
margin
Improvement through scaling
Liquidity
Average M €79 cash generation from operations in last
8 quarters
/ Slide 18
/ Slide 19