Exhibit 99.137
[LOGO] LAKE SHORE GOLD CORP. | | 181 University Ave., Suite 2000
Toronto, ON M5H 3M7
Tel: 416.703-6298
Fax: 416-703-7764 |
NEWS RELEASE
LAKE SHORE GOLD REPORTS RESULTS OF UNDERGROUND EXPLORATION AT
TIMMINS MINE 650-LEVEL TEST BLOCK
· Underground diamond drill holes in 50-metre test block above 650 Level confirm widths and grades of mineralization to be consistent with original resource estimate.
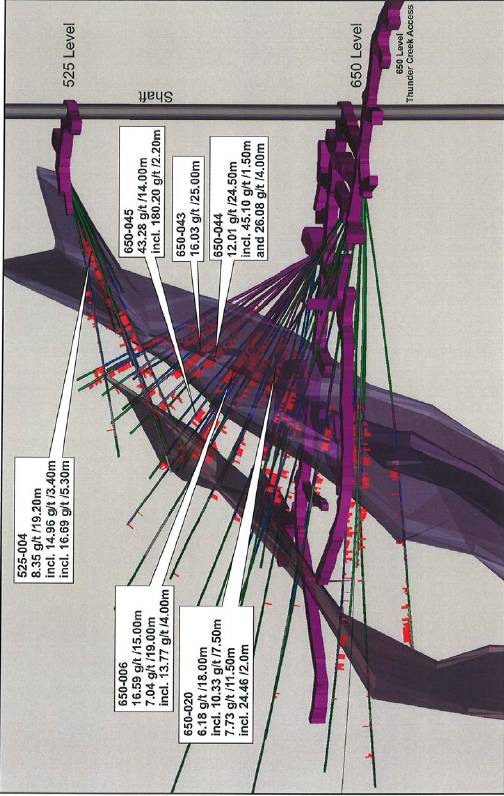
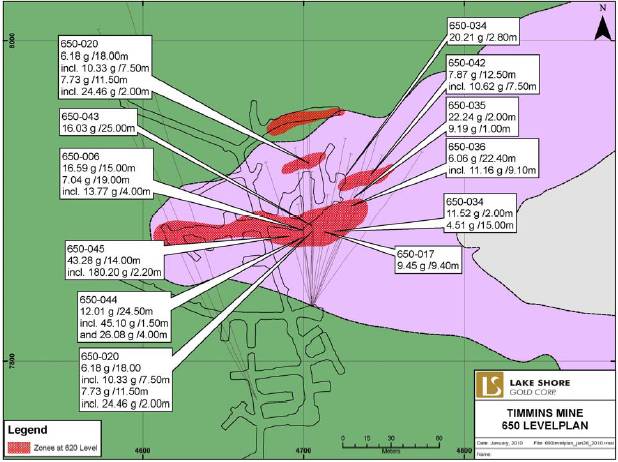
· 650-043 intersects 16.03 gpt over 25.00 metres, including 25.84 gpt over 11.50 metres, 650-044 intersects 12.01 gpt over 24.50 metres, 650-045 intersects 43.28 gpt over 14.00 metres, including 180.20 gpt over 2.20 metres, and 650-006 intersects 16.59 gpt over 15.00 metres.
· Results in test block show increased tonnes and ounces and higher-grade core to mineralization averaging 10.53 gpt.
· 525-004 intersects 8.35 gpt over 19.20 metres, confirms upward extension of mineralization near 525 Level.
· Average grades from chip and muck samples in Ultramafic Zone confirm average gold grades in new resource block model at 650 Level.
Toronto, Ontario (February 17, 2010) — Lake Shore Gold Corp. (LSG-TSX) (“Lake Shore Gold” or the “Company”) today announced results for 50 holes (5,555 metres) drilled as part of the ongoing underground diamond drilling, development and sampling program in a 50-metre test block above the 650 Level at the 100% owned Timmins Mine. Among significant intersections from the new drilling are 16.03 gpt over 25.00 metres, including 25.84 gpt over 11.50 metres, in 650-043, 12.01 gpt over 24.50 metres in 650-044, 43.28 gpt over 14.00 metres, including 180.20 gpt over 2.20 metres, in 650-045 and 16.59 gpt over 15.00 metres in 650-006. These intersections are located in the central portion of the Ultramafic Zone and show a higher-grade core to the mineralization in the test block. 525-004 intersected 8.35 gpt over 19.20 metres and confirmed the upward extension of this higher-grade core towards the 525 Level. The overall widths and grades of mineralization being intersected in the new holes continue to be consistent with previous surface and recently released underground drilling. Typical core widths intersected range from 5 to 25 metres with the overall strike length of the main Ultramafic Zone on 650 Level totaling 125 metres.
The holes being reported today are the latest results from an 87 hole, 14,255 metre program being carried out from the 525 and 650 levels of which results from 25 holes and 5,323 metres have been previously reported (see press releases dated August 25, 2009 and October 29, 2009). Drilling from the most recent part of the program was targeting the Ultramafic and Upper Footwall zones, which make up the bulk of the total resource between the 650 and 525 metre levels. This part of the drill program was designed to provide coverage between 20 and 60 metres above the 650 Level at 12.5 metre centers.
Recent modeling and estimation of indicated resources near the 650 Level using results of all diamond drill holes assayed to date shows an updated indicated resource for the Ultramafic and Upper Footwall zones in the test block area of 335,005 tonnes grading 8.07 gpt (86,969 ounces) compared to the original resource of 263,136 tonnes grading 9.30 gpt (78,710 ounces) (see Table 2 for more information). The new estimation was conducted using inverse distance block modeling with application of a 95 gpt capping factor, which represents the 99th percentile of all gold assays in the zone. The increased tonnage and ounces for the new estimation is the result of using more rigorous estimation methods, reducing cutoff grades and assuming more of a bulk approach for mining of the Ultramafic Zone compared to the estimates in the latest National Instrument 43-101 report (October 2009).
Tony Makuch, President and CEO of Lake Shore Gold, commented: “We are very encouraged by the results to date from underground drilling, development and sampling at Timmins Mine. Through the more detailed underground drilling program, we have been able to verify that the original resource estimates based on surface drilling are holding up well. We are also encouraged that a higher-grade core exists within the test-block resource averaging 10.53 gpt and that an opportunity exists to increase mineable ounces. We are continuing to drill underground and to extend a development ramp above the 650 Level with plans to establish a series of sub-levels and commence stoping in the fourth quarter. We continue to be on schedule to complete our shaft to the 710 metre level and change over to a production format by early May. Underground development to Thunder Creek from Timmins Mine is also progressing well and we expect to reach mineralization from the 200 Level by July and from the 650 Level by the end of September.”
Geological mapping on the 650 Level at Timmins Mine indicates that mineralization occurs as a series of east-west trending lenses surrounding a steep west plunging fold nose formed at the contact between ultramafic and volcanic rocks. The bulk of the mineralization identified to date is closely associated with swarms of quartz veins controlled by east trending shear zones as well as sulphide minerals located immediately adjacent to the veins. The Ultramafic Zone appears related to a shear structure following close to the axial plane of the plunging fold with the Upper Footwall Zone related to secondary structures immediately to the north and close to the contact between the ultramafic and mafic volcanic rocks.
To compliment mapping and diamond drilling on the 650 Level, chip and muck samples were collected from each round of development resulting in a total database of over 1,000 chips and 1,800 muck samples from the Ultramafic Zone. The average grade of the chip and muck samples collected for the Zone is 8.41 gpt (uncut) and 5.65 gpt (cut to 50 gpt), which is similar to the cut gold grade reported from the new block model at the same elevation using all drilling to date.
Today’s results brings the total holes reported to 75 (10,878 metres) of the 87 hole (14,255 metre) program. Results from the remaining holes will be received prior to the end of the second quarter of 2010. In addition to the above, the Company is continuing with additional drilling near the 650 Level to infill certain key sections to a minimum 7.50 metre centres, as well as to test for expansions of the zones, mainly in the areas up and down plunge of existing resources. The Company is also continuing with further extension of a development ramp above the 650 Level with plans to establish a series of sub-levels.
Quality Control
The Company’s Qualified Person (“QP”) for the underground drill program at the Timmins Mine property is Stephen Conquer, P.Geo. and for resource estimate at Timmins Mine is Bob Kusins, P.Geo. As QPs, they have prepared or supervised the preparation of the scientific or technical information for the property and have verified the data disclosed in this press release. Both QPs are employees of Lake Shore Gold.
Additional information regarding exploration and resources at Timmins Mine is set out in the technical report entitled, “Updated NI 43-101 Technical Report on the Timmins Mine Property, Ontario, Canada,” dated October 1, 2009, filed on SEDAR on October 6, 2009 (www.sedar.com). The new resource estimate is effective as of February 17, 2010.
2
Lake Shore Gold has implemented a quality-control program to ensure best practice in the sampling and analysis of the drill core. Samples are obtained from BQTK-sized diamond drill core, with roughly 75% of sampled core being sawn in half and the remaining 25% being whole core sampled. All remaining core materials, including the remaining half of sawn core is retained on site in a secure location. Drill core samples are stored for sample preparation and gold analysis performed by ALS Chemex. ALS Chemex is an ISO 9001-200 registered laboratory, preparing for ISO 17025 certification. Drill core samples are transported in security-sealed bags to ALS Chemex’s Timmins Sample Preparation Facility. Sample preparation is completed in Timmins, and the prepared sample pulps are then transported to ALS Chemex’s analytical laboratory in Vancouver, BC. Gold grades are obtained on all samples via Fire Assay with Atomic Absorption finish, using 50g aliquots. For samples that return a gold content greater than 3 gpt, the sample is reanalyzed via Fire Assay with Gravimetric finish, again using a 50g aliquot.
About Lake Shore Gold Corp.
Lake Shore Gold is a rapidly growing mining company with large land positions on the west and east sides of the Timmins Gold Camp. The Company is carrying out an underground advanced exploration program at its 100%-owned Timmins Mine project, where it has both a shaft and a ramp, and is currently commencing advanced exploration work at the adjacent Thunder Creek property. The Bell Creek Mill, located on the east side of Timmins, has been refurbished to a capacity of 1,500 tonnes per day. The Company is also making progress with an underground advanced exploration program at its Bell Creek Complex, including the Bell Creek Mine, Schumacher and Vogel properties, which is moving forward to become the Company’s second mining operation in the Timmins Camp. The Company continues to invest aggressively in exploration primarily in Timmins and in select other areas of Northern Ontario and Quebec, and owns a large land position in Mexico. The Company’s common shares trade on the TSX under the symbol LSG.
Forward-looking Statements
Certain statements in this press release relating to the Company’s exploration activities, project expenditures and business plans are “forward-looking statements” within the meaning of securities legislation. The Company does not intend, and does not assume any obligation, to update these forward-looking statements. These forward-looking statements represent management’s best judgment based on current facts and assumptions that management considers reasonable, including that operating and capital plans will not be disrupted by issues such as mechanical failure, unavailability of parts, labour disturbances, interruption in transportation or utilities, or adverse weather conditions, that there are no material unanticipated variations in budgeted costs, that contractors will complete projects according to schedule, and that actual mineralization on properties will not be less than identified mineral reserves. The Company makes no representation that reasonable business people in possession of the same information would reach the same conclusions. Forward-looking statements involve known and unknown risks, uncertainties and other factors which may cause the actual results, performance or achievements of the Company to be materially different from any future results, performance or achievements expressed or implied by the forward-looking statements. In particular, fluctuations in the price of gold or in currency markets could prevent the Company from achieving its targets. Readers should not place undue reliance on forward-looking statements. More information about risks and uncertainties affecting the Company and its business is available in Lake Shore Gold’s most recent Annual Information Form and other regulatory filings which are posted on sedar at www.sedar.com.
There is no guarantee that drill results reported in this news release will lead to the identification of a deposit that can be mined economically, and further work is required to identify a reserve or resource.
3
FOR FURTHER INFORMATION PLEASE CONTACT:
Tony Makuch
President & CEO
Lake Shore Gold
(416) 703-6298
Email: info@lsgold.com
Mark Utting
Vice-President, Investor Relations
Lake Shore Gold
(416) 703-6298
Email: info@lsgold.com
Website: www.lsgold.com
4
Table 1. Timmins Mine - Significant New Assay Results from Underground Drilling
Hole | | From | | To | | Assay | | Interval | |
Number | | (m) | | (m) | | gpt Au | | (m) | |
525-004 | | 42.50 | | 61.70 | | 8.35 | | 19.20 | |
includes | | 42.50 | | 45.90 | | 14.96 | | 3.40 | |
and | | 56.40 | | 61.70 | | 16.69 | | 5.30 | |
| | 74.80 | | 77.80 | | 7.29 | | 3.00 | |
| | 95.50 | | 96.20 | | 4.45 | | 0.70 | |
| | 124.00 | | 126.00 | | 3.52 | | 2.00 | |
| | 133.00 | | 135.70 | | 6.59 | | 2.70 | |
| | 157.00 | | 158.00 | | 3.58 | | 1.00 | |
525-008 | | 119.70 | | 120.10 | | 915.00 | | 0.40 | |
525-011 | | 40.45 | | 43.00 | | 5.87 | | 2.55 | |
| | 68.90 | | 69.70 | | 3.73 | | 0.80 | |
525-012 | | 41.10 | | 41.90 | | 27.60 | | 0.80 | |
| | 120.90 | | 121.60 | | 3.19 | | 0.70 | |
525-015 | | 52.00 | | 54.00 | | 4.83 | | 2.00 | |
| | 63.60 | | 64.60 | | 5.69 | | 1.00 | |
525-016 | | 65.40 | | 74.30 | | 6.04 | | 8.90 | |
| | 78.00 | | 79.00 | | 4.37 | | 1.00 | |
| | 82.00 | | 83.00 | | 3.57 | | 1.00 | |
525-017 | | 50.00 | | 51.00 | | 12.60 | | 1.00 | |
| | 73.30 | | 74.00 | | 13.30 | | 0.70 | |
525-019 | | 96.00 | | 99.00 | | 6.05 | | 3.00 | |
| | 104.50 | | 107.10 | | 3.15 | | 2.60 | |
| | 104.50 | | 107.10 | | 3.15 | | 2.60 | |
525-021 | | 35.90 | | 36.70 | | 6.06 | | 0.80 | |
| | 72.80 | | 73.30 | | 7.40 | | 0.50 | |
650-006 | | 47.00 | | 62.00 | | 16.59 | | 15.00 | |
includes | | 47.00 | | 49.00 | | 21.73 | | 2.00 | |
| | 85.00 | | 104.00 | | 7.04 | | 19.00 | |
includes | | 85.00 | | 89.00 | | 13.77 | | 4.00 | |
650-017 | | 41.80 | | 42.30 | | 13.55 | | 0.50 | |
| | 47.50 | | 56.90 | | 9.45 | | 9.40 | |
650-020 | | 43.00 | | 61.00 | | 6.18 | | 18.00 | |
includes | | 48.20 | | 55.70 | | 10.33 | | 7.50 | |
| | 91.00 | | 102.50 | | 7.73 | | 11.50 | |
includes | | 96.00 | | 98.00 | | 24.46 | | 2.00 | |
650-022 | | 44.50 | | 50.00 | | 6.35 | | 5.50 | |
| | 95.00 | | 101.20 | | 9.54 | | 6.20 | |
650-024 | | 121.00 | | 124.00 | | 11.93 | | 3.00 | |
5
Table 1. Timmins Mine - Significant New Assay Results from Underground Drilling (Cont’d)
��
Hole | | From | | To | | Assay | | Interval | |
Number | | (m) | | (m) | | gpt Au | | (m) | |
650-029 | | 116.00 | | 120.00 | | 6.91 | | 4.00 | |
| | 126.50 | | 127.20 | | 12.25 | | 0.70 | |
| | 173.70 | | 174.70 | | 3.57 | | 1.00 | |
| | 178.70 | | 188.50 | | 7.78 | | 9.80 | |
includes | | 182.30 | | 188.50 | | 10.67 | | 6.20 | |
650-031 | | 97.00 | | 121.00 | | 4.99 | | 24.00 | |
includes | | 97.00 | | 102.00 | | 12.65 | | 5.00 | |
and | | 110.50 | | 113.00 | | 10.47 | | 2.50 | |
650-034 | | 47.50 | | 49.50 | | 11.52 | | 2.00 | |
| | 60.80 | | 75.80 | | 4.51 | | 15.00 | |
includes | | 60.80 | | 69.80 | | 6.31 | | 9.00 | |
| | 102.00 | | 104.80 | | 20.21 | | 2.80 | |
650-035 | | 51.30 | | 52.80 | | 5.68 | | 1.50 | |
| | 69.00 | | 71.00 | | 22.24 | | 2.00 | |
| | 83.70 | | 84.70 | | 9.19 | | 1.00 | |
| | 110.00 | | 110.80 | | 9.32 | | 0.80 | |
650-036 | | 53.40 | | 54.00 | | 7.97 | | 0.60 | |
| | 55.40 | | 56.30 | | 3.60 | | 0.90 | |
| | 62.00 | | 89.00 | | 6.06 | | 22.40 | |
includes | | 63.60 | | 72.70 | | 11.16 | | 9.10 | |
| | 96.90 | | 97.60 | | 4.15 | | 0.70 | |
650-038 | | 54.00 | | 55.50 | | 13.30 | | 1.50 | |
| | 60.00 | | 61.80 | | 13.48 | | 1.80 | |
| | 69.30 | | 82.40 | | 4.88 | | 13.10 | |
includes | | 75.00 | | 77.00 | | 9.73 | | 2.00 | |
includes | | 80.00 | | 82.40 | | 10.73 | | 2.40 | |
| | 109.40 | | 111.00 | | 5.88 | | 1.60 | |
650-039 | | 68.00 | | 72.80 | | 4.58 | | 4.80 | |
650-042 | | 107.50 | | 120.00 | | 7.87 | | 12.50 | |
includes | | 107.50 | | 115.00 | | 10.62 | | 7.50 | |
650-043 | | 50.00 | | 51.00 | | 4.77 | | 1.00 | |
| | 57.00 | | 82.00 | | 16.03 | | 25.00 | |
includes | | 64.00 | | 75.50 | | 25.84 | | 11.50 | |
650-044 | | 49.50 | | 74.00 | | 12.01 | | 24.50 | |
includes | | 49.50 | | 51.00 | | 45.10 | | 1.50 | |
and | | 65.00 | | 69.00 | | 26.08 | | 4.00 | |
| | 93.00 | | 99.50 | | 4.19 | | 6.50 | |
includes | | 93.00 | | 94.50 | | 11.08 | | 1.50 | |
6
Table 1. Timmins Mine - Significant New Assay Results from Underground Drilling (Cont’d)
Hole | | From | | To | | Assay | | Interval | |
Number | | (m) | | (m) | | gpt Au | | (m) | |
650-045 | | 52.00 | | 66.00 | | 43.28 | | 14.00 | |
includes | | 54.80 | | 57.00 | | 180.20 | | 2.20 | |
| | 84.00 | | 86.00 | | 10.21 | | 2.00 | |
| | 108.00 | | 109.00 | | 6.10 | | 1.00 | |
650-046 | | 61.00 | | 75.00 | | 7.96 | | 14.00 | |
includes | | 61.00 | | 63.80 | | 24.13 | | 2.80 | |
| | 92.60 | | 93.60 | | 9.83 | | 1.00 | |
| | 104.20 | | 104.70 | | 9.65 | | 0.50 | |
650-047 | | 61.9 | | 65.4 | | 4.55 | | 3.50 | |
| | 75.8 | | 85 | | 6.64 | | 9.20 | |
and | | 75.8 | | 78 | | 17.71 | | 2.20 | |
650-048 | | 63.70 | | 65.50 | | 6.49 | | 1.80 | |
| | 71.90 | | 74.40 | | 4.28 | | 2.50 | |
Notes:
1) Holes 525-003, 525-007, 525-020, 525-023, 525-024, 525-025, 525-027, 650-011, 650-014A, 650-019, 650-021, 650-023, 650-025, 650-027, 650-027A, 650-030, 650-052, 650-052A, 650-053, 650-053A, 650-054, 650-055 returned weak or no significant values
2) 650-043 lost core 51.0-52.0 and 57.4-58.0.
3) Assays reported are uncut.
4) True widths are not reported at this time.
7
Table 2. Results of New Resource Model and Estimate for Ultramafic and Upper Footwall Zones (600 to 650 Levels)
Full Strike Length of Mineralization Identified to Date
| | | | | | | | New Estimate | | Original Resource | |
Zone | | Bottom | | Top | | Height | | Tonnes | | Grade | | Ounces | | Grade | | Ounces | | Tonnes | | Grade | | Ounces | |
| | | | | | | | | | (cut) | | (cut) | | (uncut) | | (uncut) | | | | (cut) | | (cut) | |
Ultramafic Zone | | 9367.5 | | 9417.5 | | 50 | | 285,185 | | 8.19 | | 75,115 | | 9.06 | | 83,102 | | 241,029 | | 9.53 | | 73,873 | |
Upper Footwall Zone | | 9367.5 | | 9417.5 | | 50 | | 49,820 | | 7.40 | | 11,854 | | 7.40 | | 11,854 | | 22,107 | | 6.81 | | 4,837 | |
Total | | 9367.5 | | 9417.5 | | 50 | | 335,005 | | 8.07 | | 86,969 | | 8.82 | | 94,957 | | 263,136 | | 9.30 | | 78,710 | |
Centre section of Ultramafic zone (4668E to 4718E)
| | | | | | | | New Estimate | |
Zone | | Bottom | | Top | | Height | | Tonnes | | Grade | | Ounces | | Grade | | Ounces | |
| | | | | | | | | | (cut) | | (cut) | | (uncut) | | (uncut) | |
| | | | | | | | | | | | | | | | | |
Ultramafic Zone | | 9367.5 | | 9417.5 | | 50 | | 132,546 | | 10.53 | | 44,881 | | 11.89 | | 50,653 | |
Detailed Resource Summary by Elevation (600 to 650 Levels)
| | | | | | | | Ultramafic Zonet | |
| | | | | | | | New Estimate | | Original Resource | |
Level | | Bottom | | Top | | Height | | Tonnes | | Grade | | Ounces | | Grade | | Ounces | | Tonnes | | Grade | | Ounces | |
| | | | | | | | | | (cut) | | (cut) | | (uncut) | | (uncut) | | | | (cut) | | (cut) | |
650 Drift Elevation | | 9367.5 | | 9372.5 | | 5 | | 26,375 | | 5.51 | | 4,672 | | 5.64 | | 4,783 | | 11,634 | | 6.56 | | 2,454 | |
15m slice above 650 | | 9372.5 | | 9387.5 | | 15 | | 89,078 | | 6.48 | | 18,555 | | 6.72 | | 19,260 | | 57,477 | | 7.65 | | 14,144 | |
15 to 30m above 650 | | 9387.5 | | 9402.5 | | 15 | | 89,633 | | 9.02 | | 25,982 | | 10.44 | | 30,072 | | 91,407 | | 9.11 | | 26,771 | |
30 to 45m above 650 | | 9402.5 | | 9417.5 | | 15 | | 80,099 | | 10.06 | | 25,905 | | 11.26 | | 28,988 | | 80,511 | | 11.78 | | 30,504 | |
Total | | | | | | 50 | | 285,185 | | 8.19 | | 75,115 | | 9.06 | | 83,102 | | 241,029 | | 9.53 | | 73,873 | |
| | | | | | | | Upper Footwall Zone | |
| | | | | | | | New Estimate | | Original Resource | |
Level | | Bottom | | Top | | Height | | Tonnes | | Grade | | Ounces | | Grade | | Ounces | | Tonnes | | Grade | | Ounces | |
| | | | | | | | | | (cut) | | (cut) | | (uncut) | | (uncut) | | | | (cut) | | (cut) | |
650 Drift Elevation | | 9367.5 | | 9372.5 | | 5 | | 2,573 | | 7.08 | | 586 | | 7.08 | | 586 | | 4,129 | | 7.27 | | 965 | |
15m slice above 650 | | 9372.5 | | 9387.5 | | 15 | | 8,028 | | 5.62 | | 1,452 | | 5.62 | | 1,452 | | 1,644 | | 6.84 | | 362 | |
15 to 30m above 650 | | 9387.5 | | 9402.5 | | 15 | | 11,494 | | 5.82 | | 2,151 | | 5.82 | | 2,151 | | 1,538 | | 4.68 | | 231 | |
30 to 45m above 650 | | 9402.5 | | 9417.5 | | 15 | | 27,725 | | 8.60 | | 7,666 | | 8.60 | | 7,666 | | 14,796 | | 6.89 | | 3,279 | |
Total | | | | | | 50 | | 49,820 | | 7.40 | | 11,854 | | 7.40 | | 11,854 | | 22,107 | | 6.81 | | 4,837 | |
Notes:
l) Estimation conducted with Inverse distance cubed estimation method and 95 gpt capping factor. Lower cutoff grade used for reporting of results was 0.5 gpt for the Ultramafic zone and 3 gpt forthe Upper Footwall Zone
8
Figure 1. 3D View
9
Figure 2. Plan View (New Drilling)
10
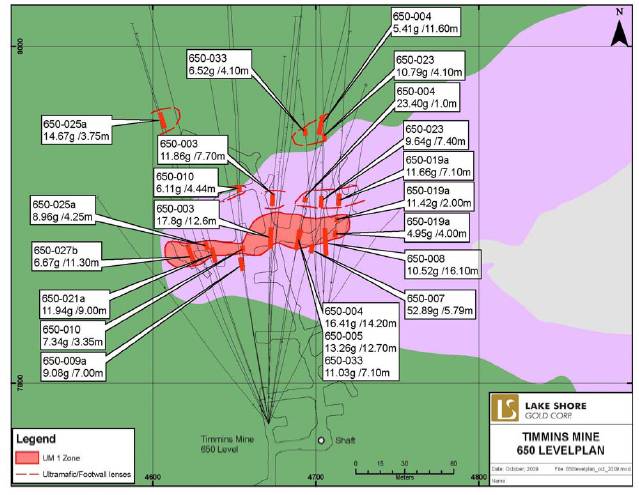
Figure 3. Plan View (Previously Reported Drilling)
11